Update of Market Analysis Study for the Richland Wye Area
75
Thomas/Lane & Associates economic & public policy consultants 1 Update of Market Analysis Study for the Richland Wye Area City of Richland, Washington 1. Introduction 1.1 Objectives This updated Master Plan is designed to shape the future development of the Wye area. The Richland Wye area is a 350-acre mixed-use area bounded on the north by the Columbia River, on the west by the SR 240, on the south by SR 240 and the Tapteal commercial development, and on the east by Columbia Park and the City of Kennewick. The purpose of this Report is to update the short ―market assessment‖ section of the original Master Plan and provide a current market assessment of the Richland Wye area. The report provides a general economic and real estate guide that can be used in planning the future development of the Richland Wye area. This section of the overall masterplan report does not provide detailed development plans for individual parcels or sites, but defines the market parameters, which should guide the future development potentials of these parcels and sites. Within these defined parameters, the report offers some general recommendations for actions that the City of Richland can take to enhance the Wye area‘s future development potential. The goals of the market assessment are: Provide an overview of the Richland-Pasco-Kennewick MSA‘s economy. Assess the City of Richland‘s economic and fiscal status within the context of the Benton County and MSA economies. Describe the major attributes, ownership patterns and locational characteristics of the Wye area‘s real estate market. Provide generalized projections of likely future growth in the City of Richland and the Wye area. Present a discussion of the alternative development potentials and strategies for the Wye area.
-
Upload
khangminh22 -
Category
Documents
-
view
0 -
download
0
Transcript of Update of Market Analysis Study for the Richland Wye Area

Thomas/Lane & Associates economic & public policy consultants
1
Update of Market Analysis Study for the Richland Wye Area
City of Richland, Washington
1. Introduction
1.1 Objectives
This updated Master Plan is designed to shape the future development of the Wye
area. The Richland Wye area is a 350-acre mixed-use area bounded on the north
by the Columbia River, on the west by the SR 240, on the south by SR 240 and
the Tapteal commercial development, and on the east by Columbia Park and the
City of Kennewick. The purpose of this Report is to update the short ―market
assessment‖ section of the original Master Plan and provide a current market
assessment of the Richland Wye area.
The report provides a general economic and real estate guide that can be used in
planning the future development of the Richland Wye area. This section of the
overall masterplan report does not provide detailed development plans for
individual parcels or sites, but defines the market parameters, which should guide
the future development potentials of these parcels and sites. Within these defined
parameters, the report offers some general recommendations for actions that the
City of Richland can take to enhance the Wye area‘s future development
potential.
The goals of the market assessment are:
Provide an overview of the Richland-Pasco-Kennewick MSA‘s economy.
Assess the City of Richland‘s economic and fiscal status within the
context of the Benton County and MSA economies.
Describe the major attributes, ownership patterns and locational
characteristics of the Wye area‘s real estate market.
Provide generalized projections of likely future growth in the City of
Richland and the Wye area.
Present a discussion of the alternative development potentials and
strategies for the Wye area.

Thomas/Lane & Associates economic & public policy consultants
2
1.2 Methods
The method of analysis used in this report consists of two parts: (a) establishing a
realistic analysis of Richland‘s past and future major economic development
trends, and (b) identifying the real estate absorption implications of these trends
for the Wye area.
The report uses shift-share and regression (time series) analysis to identify the
extent to which Richland‘s economy has grown because it (a) partook in the
overall growth of all industries in Washington State, (b) enjoyed an above-
average concentration of economic activity that happened to be growing across
the state, (c) participated in the competitively driven growth resulting from the
location of economic activity in the State, or (d) all – or parts – of each the above.
Traditional shift-share analysis is modified to include an analysis of the
occupational make-up of Richland‘s work force. Many industries have both a
high-tech and low-tech component. For a city such as Richland, with its high-end
work force, the inclusion of occupational data is vitally important.
The second part of our approach uses real estate market analysis to identify
potential absorption of land in the Wye area, including the strategic implications
of such factors as infrastructure requirements, likely build-out schedules and
creation of development institutions and authorities (such as a redevelopment
agency).
The amount and kind of real estate developments that will be exerting a demand
for space in the future is determined by projecting the numbers of employees by
industry and occupation. Different industries and occupations within industries
obviously require different types of real estate development.
1.3 Limits
This section of the report is of a type sometimes referred to as a ―high altitude
reconnaissance‖ study. It proceeds from the view of an airplane flying over
Richland at an altitude of about 25,000 feet – low enough to make out the
significant, broad outlines of Richland and the Wye area‘s economic and real
estate markets. This level of analysis is appropriate to updating the overall Wye
Area Master Plan. To get down to detailed planning of specific parcels or sites

Thomas/Lane & Associates economic & public policy consultants
3
however will require much more detailed analysis than are contained in this
section of the report but may be addressed within other sections.
Finally, this section assumes:
The U.S. economy will continue to exhibit moderate real economic growth
with relatively low levels of inflation. The Federal Reserve will continue
to slowly increase interest rates, and both budget and trade deficits –
although continuing to be large – will be brought under control.
The U.S. will engage in no new wars or suffer major terrorist attacks.
The long-term relationship between the economies of the U.S. and the
State of Washington will remain essentially the same as they have been for
the past quarter of a century.
The long-term trend toward integration and globalization of the world‘s
economies will continue, although probably at a somewhat slower pace
then was true during the last decade.
Thomas/Lane & Associates economic & public policy consultants
4
2. Overview of the Richland-Pasco-Kennewick MSA’s Economy
2.1 The MSA Compared to the State’s Economy
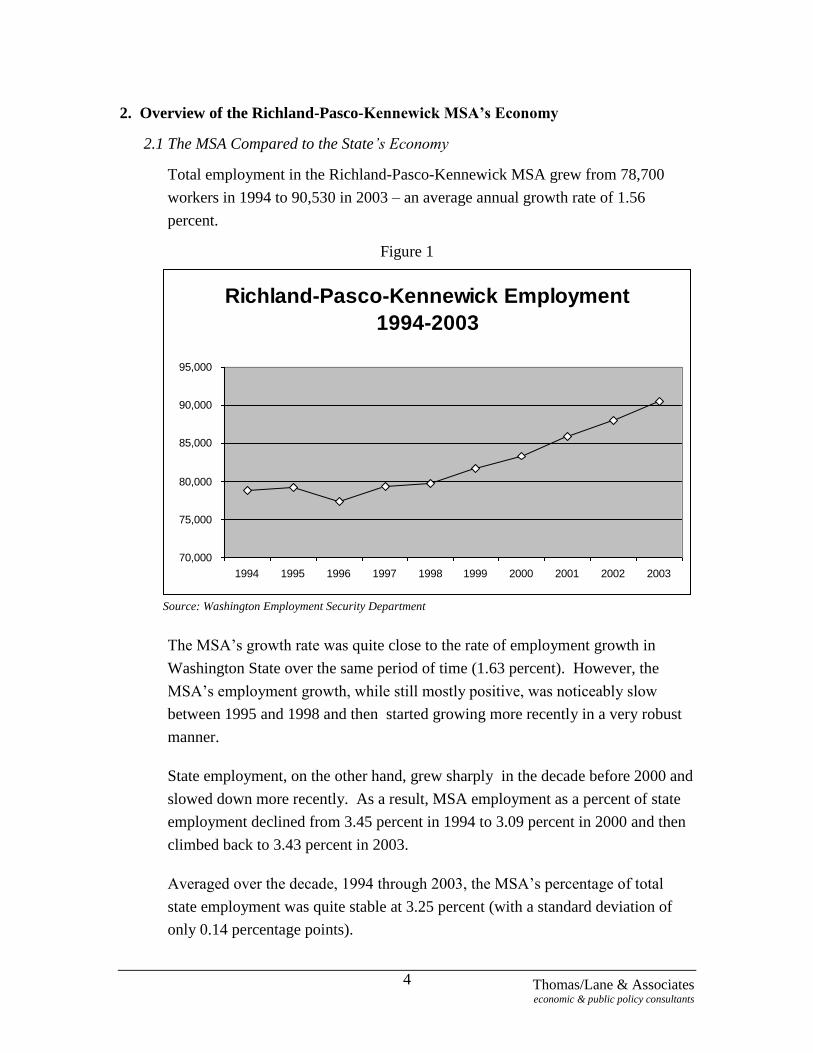
Total employment in the Richland-Pasco-Kennewick MSA grew from 78,700
workers in 1994 to 90,530 in 2003 – an average annual growth rate of 1.56
percent.
Figure 1
Richland-Pasco-Kennewick Employment
1994-2003
70,000
75,000
80,000
85,000
90,000
95,000
1994 1995 1996 1997 1998 1999 2000 2001 2002 2003
Source: Washington Employment Security Department
The MSA‘s growth rate was quite close to the rate of employment growth in
Washington State over the same period of time (1.63 percent). However, the
MSA‘s employment growth, while still mostly positive, was noticeably slow
between 1995 and 1998 and then started growing more recently in a very robust
manner.
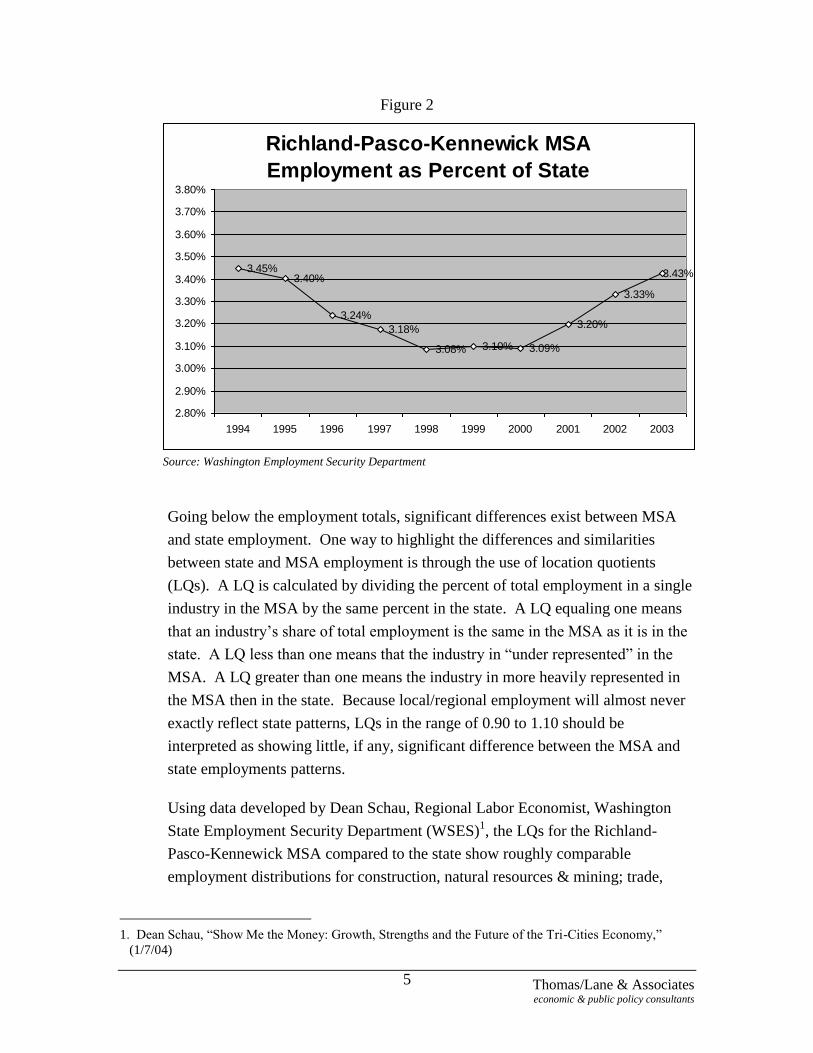
State employment, on the other hand, grew sharply in the decade before 2000 and
slowed down more recently. As a result, MSA employment as a percent of state
employment declined from 3.45 percent in 1994 to 3.09 percent in 2000 and then
climbed back to 3.43 percent in 2003.
Averaged over the decade, 1994 through 2003, the MSA‘s percentage of total
state employment was quite stable at 3.25 percent (with a standard deviation of
only 0.14 percentage points).
Thomas/Lane & Associates economic & public policy consultants
5
Figure 2
Richland-Pasco-Kennewick MSA
Employment as Percent of State
3.45%3.40%
3.24%
3.18%
3.08% 3.10% 3.09%
3.20%
3.33%
3.43%
2.80%
2.90%
3.00%
3.10%
3.20%
3.30%
3.40%
3.50%
3.60%
3.70%
3.80%
1994 1995 1996 1997 1998 1999 2000 2001 2002 2003
Source: Washington Employment Security Department
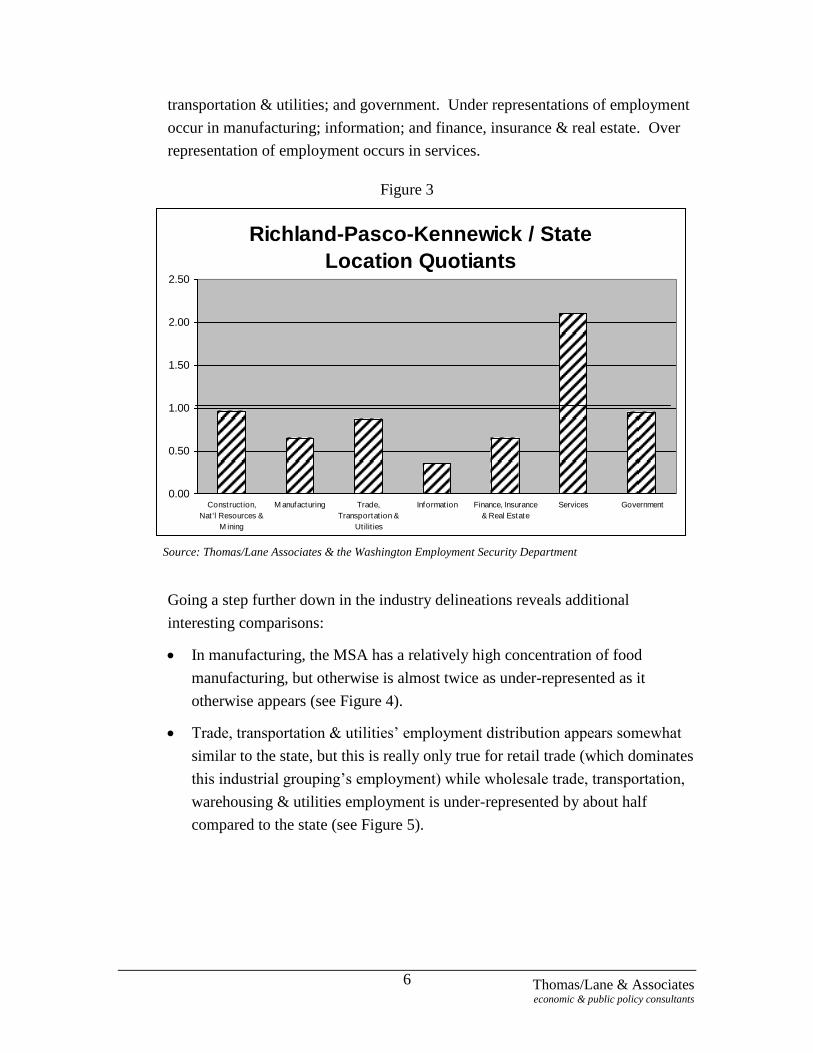
Going below the employment totals, significant differences exist between MSA
and state employment. One way to highlight the differences and similarities
between state and MSA employment is through the use of location quotients
(LQs). A LQ is calculated by dividing the percent of total employment in a single
industry in the MSA by the same percent in the state. A LQ equaling one means
that an industry‘s share of total employment is the same in the MSA as it is in the
state. A LQ less than one means that the industry in ―under represented‖ in the
MSA. A LQ greater than one means the industry in more heavily represented in
the MSA then in the state. Because local/regional employment will almost never
exactly reflect state patterns, LQs in the range of 0.90 to 1.10 should be
interpreted as showing little, if any, significant difference between the MSA and
state employments patterns.
Using data developed by Dean Schau, Regional Labor Economist, Washington
State Employment Security Department (WSES)1, the LQs for the Richland-
Pasco-Kennewick MSA compared to the state show roughly comparable
employment distributions for construction, natural resources & mining; trade,
1. Dean Schau, ―Show Me the Money: Growth, Strengths and the Future of the Tri-Cities Economy,‖
(1/7/04)
Thomas/Lane & Associates economic & public policy consultants
6
transportation & utilities; and government. Under representations of employment
occur in manufacturing; information; and finance, insurance & real estate. Over
representation of employment occurs in services.
Figure 3
Richland-Pasco-Kennewick / State
Location Quotiants
0.00
0.50
1.00
1.50
2.00
2.50
Construct ion,
Nat 'l Resources &
M ining
M anufacturing Trade,
Transportat ion &
Utilit ies
Information Finance, Insurance
& Real Estate
Services Government
Source: Thomas/Lane Associates & the Washington Employment Security Department
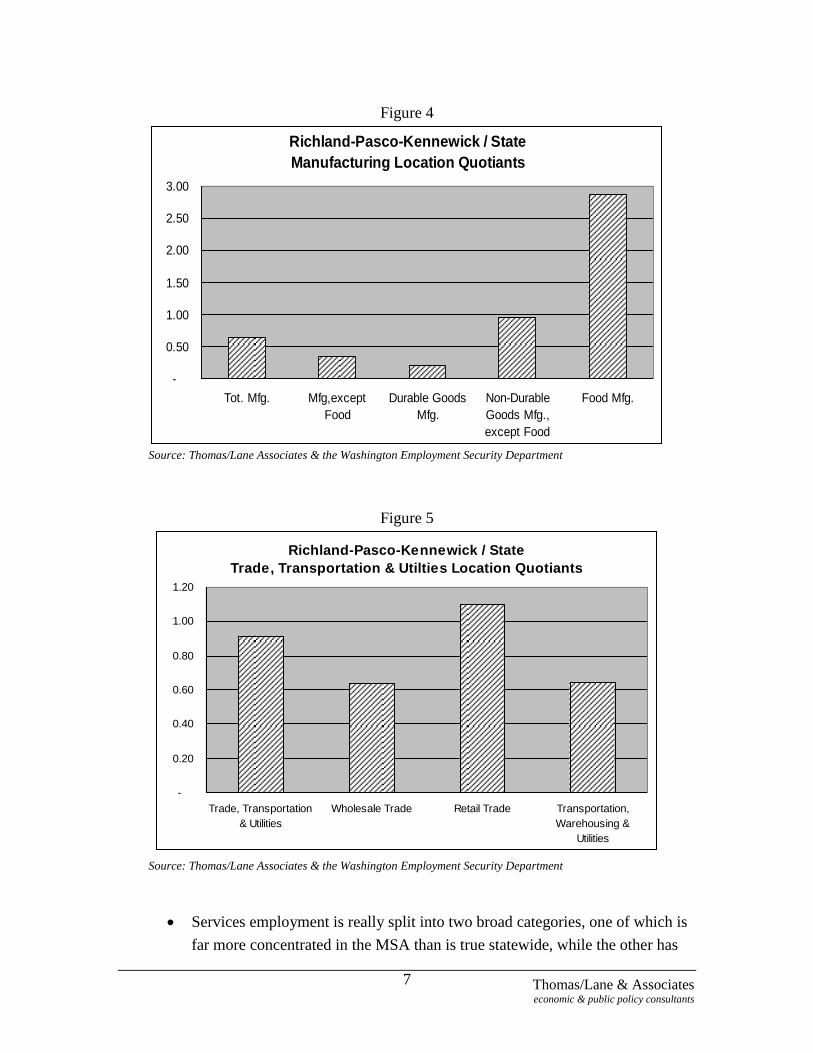
Going a step further down in the industry delineations reveals additional
interesting comparisons:
In manufacturing, the MSA has a relatively high concentration of food
manufacturing, but otherwise is almost twice as under-represented as it
otherwise appears (see Figure 4).
Trade, transportation & utilities‘ employment distribution appears somewhat
similar to the state, but this is really only true for retail trade (which dominates
this industrial grouping‘s employment) while wholesale trade, transportation,
warehousing & utilities employment is under-represented by about half
compared to the state (see Figure 5).
Thomas/Lane & Associates economic & public policy consultants
7
Figure 4
Richland-Pasco-Kennewick / State
Manufacturing Location Quotiants
-
0.50
1.00
1.50
2.00
2.50
3.00
Tot. Mfg. Mfg,except
Food
Durable Goods
Mfg.
Non-Durable
Goods Mfg.,
except Food
Food Mfg.
Source: Thomas/Lane Associates & the Washington Employment Security Department
Figure 5
Richland-Pasco-Kennewick / State
Trade, Transportation & Utilties Location Quotiants
-
0.20
0.40
0.60
0.80
1.00
1.20
Trade, Transportation
& Utilities
Wholesale Trade Retail Trade Transportation,
Warehousing &
Utilities
Source: Thomas/Lane Associates & the Washington Employment Security Department
Services employment is really split into two broad categories, one of which is
far more concentrated in the MSA than is true statewide, while the other has
Thomas/Lane & Associates economic & public policy consultants
8
roughly the same relative concentration. The category that is two to three
times more concentrated consists of two industry classifications: professional,
scientific & technical services (which, in the MSA, contains Pacific Northwest
National Laboratory ) and waste & remediation services (Fluor & Bechtel)
which are closely tied to the nuclear cleanup efforts at Hanford.
2.2. Recent MSA Growth Patterns
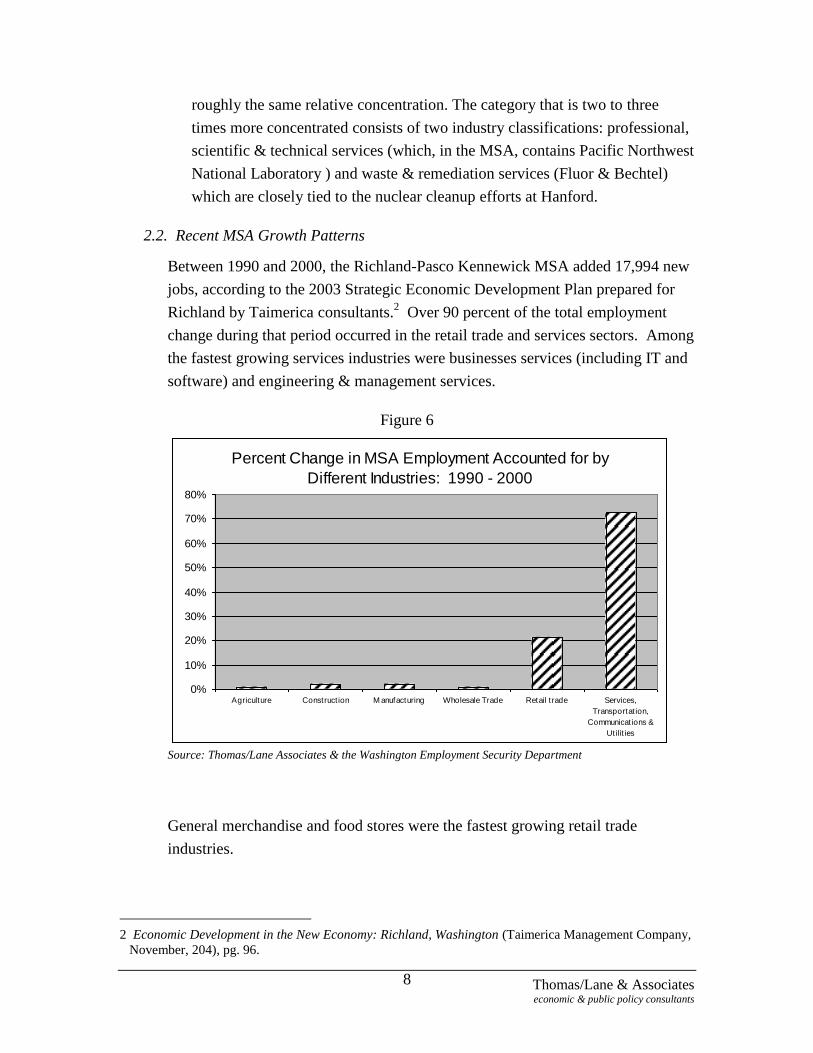
Between 1990 and 2000, the Richland-Pasco Kennewick MSA added 17,994 new
jobs, according to the 2003 Strategic Economic Development Plan prepared for
Richland by Taimerica consultants.2 Over 90 percent of the total employment
change during that period occurred in the retail trade and services sectors. Among
the fastest growing services industries were businesses services (including IT and
software) and engineering & management services.
Figure 6
Percent Change in MSA Employment Accounted for by
Different Industries: 1990 - 2000
0%
10%
20%
30%
40%
50%
60%
70%
80%
Agriculture Construct ion M anufacturing Wholesale Trade Retail t rade Services,
Transportat ion,
Communicat ions &
Utilit ies
Source: Thomas/Lane Associates & the Washington Employment Security Department
General merchandise and food stores were the fastest growing retail trade
industries.
2 Economic Development in the New Economy: Richland, Washington (Taimerica Management Company,
November, 204), pg. 96.
Thomas/Lane & Associates economic & public policy consultants
9
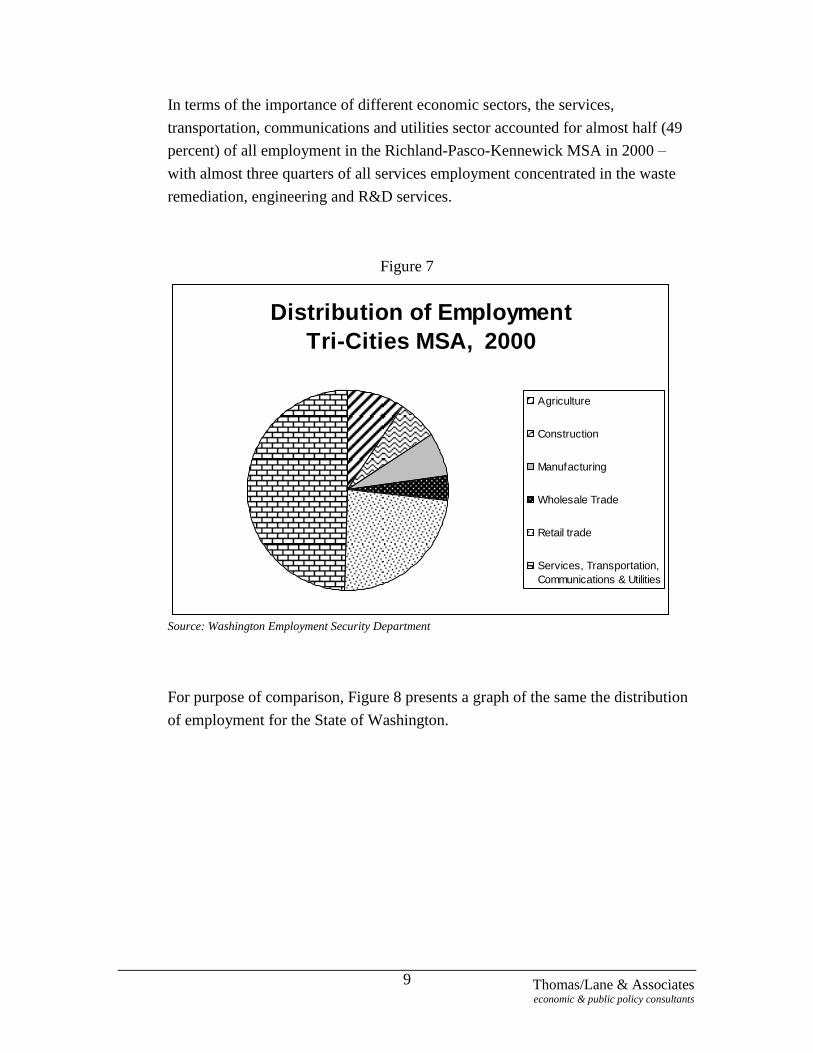
In terms of the importance of different economic sectors, the services,
transportation, communications and utilities sector accounted for almost half (49
percent) of all employment in the Richland-Pasco-Kennewick MSA in 2000 –
with almost three quarters of all services employment concentrated in the waste
remediation, engineering and R&D services.
Figure 7
Distribution of Employment
Tri-Cities MSA, 2000
Agriculture
Construction
Manufacturing
Wholesale Trade
Retail trade
Services, Transportation,
Communications & Utilities
Source: Washington Employment Security Department
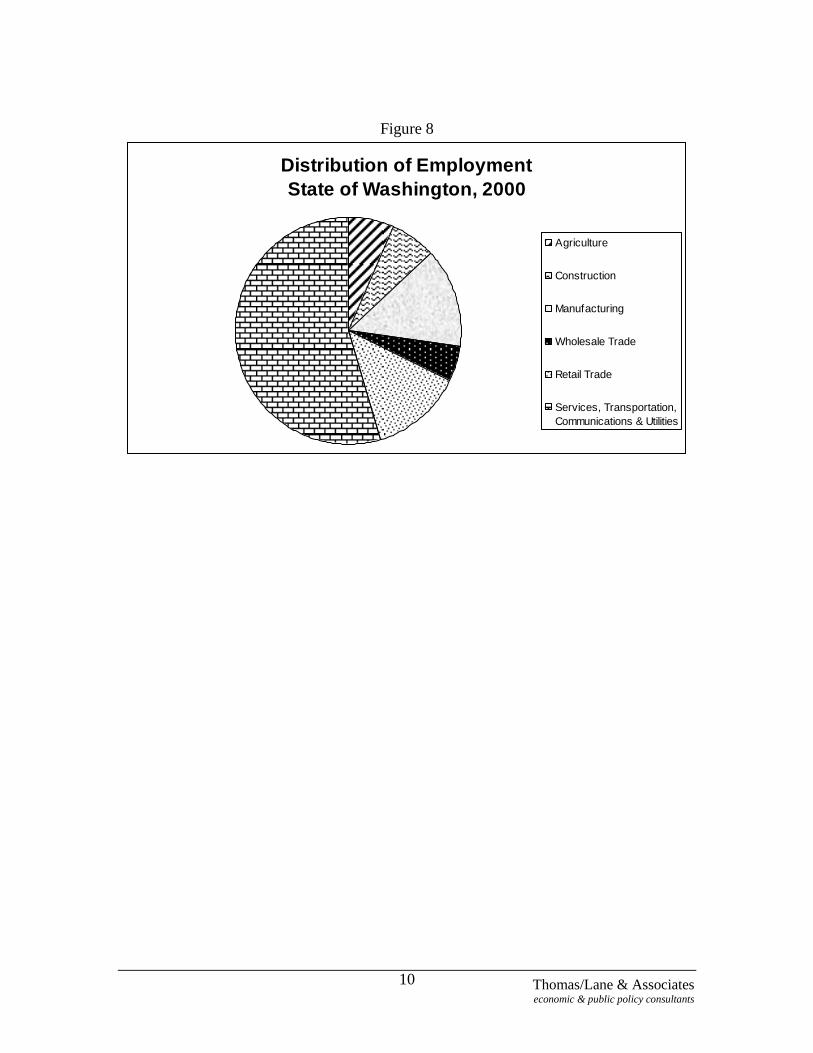
For purpose of comparison, Figure 8 presents a graph of the same the distribution
of employment for the State of Washington.
Thomas/Lane & Associates economic & public policy consultants
10
Figure 8
Distribution of Employment
State of Washington, 2000
Agriculture
Construction
Manufacturing
Wholesale Trade
Retail Trade
Services, Transportation,
Communications & Utilities
Thomas/Lane & Associates economic & public policy consultants
11
3 Overview of the Benton County and Richland Economies
3.1. Benton County
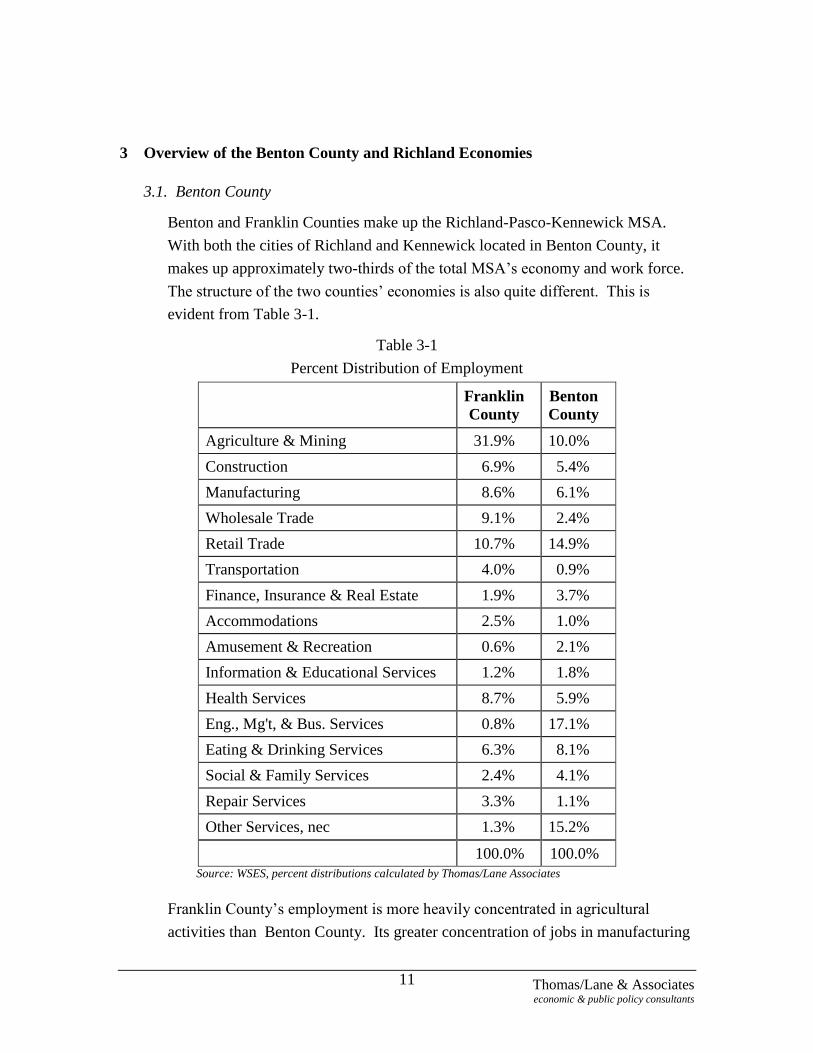
Benton and Franklin Counties make up the Richland-Pasco-Kennewick MSA.
With both the cities of Richland and Kennewick located in Benton County, it
makes up approximately two-thirds of the total MSA‘s economy and work force.
The structure of the two counties‘ economies is also quite different. This is
evident from Table 3-1.
Table 3-1
Percent Distribution of Employment
Franklin
County
Benton
County
Agriculture & Mining 31.9% 10.0%
Construction 6.9% 5.4%
Manufacturing 8.6% 6.1%
Wholesale Trade 9.1% 2.4%
Retail Trade 10.7% 14.9%
Transportation 4.0% 0.9%
Finance, Insurance & Real Estate 1.9% 3.7%
Accommodations 2.5% 1.0%
Amusement & Recreation 0.6% 2.1%
Information & Educational Services 1.2% 1.8%
Health Services 8.7% 5.9%
Eng., Mg't, & Bus. Services 0.8% 17.1%
Eating & Drinking Services 6.3% 8.1%
Social & Family Services 2.4% 4.1%
Repair Services 3.3% 1.1%
Other Services, nec 1.3% 15.2%
100.0% 100.0%
Source: WSES, percent distributions calculated by Thomas/Lane Associates
Franklin County‘s employment is more heavily concentrated in agricultural
activities than Benton County. Its greater concentration of jobs in manufacturing
Thomas/Lane & Associates economic & public policy consultants
12
and transportation are primarily in food processing and related activities – which
are related to the county‘s agricultural base. Franklin County also has a small
concentration of employment in health services.
Benton County‘s most notable concentration of employees is in engineering,
management and business services, which includes both the scientific and
technical work taking place at PNNL and in ―other services,‖ which includes the
waste & remediation services being done by Fluor, CH2Mhill, Bechtel, and
others.
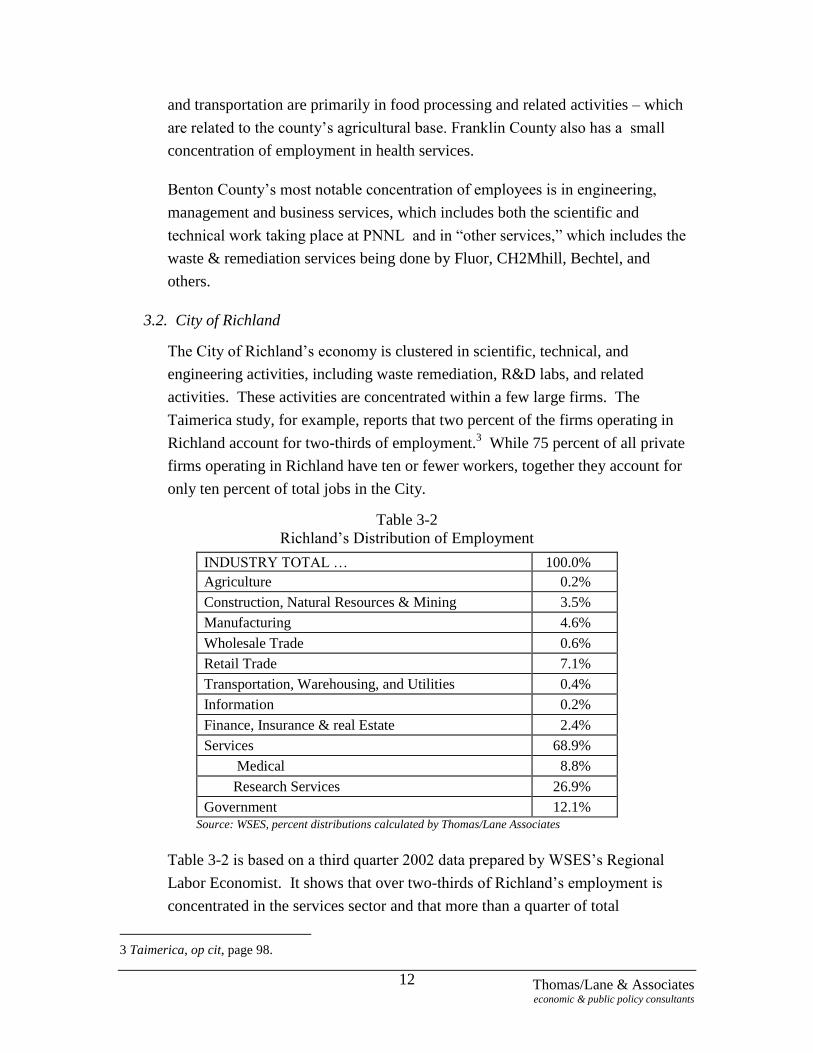
3.2. City of Richland
The City of Richland‘s economy is clustered in scientific, technical, and
engineering activities, including waste remediation, R&D labs, and related
activities. These activities are concentrated within a few large firms. The
Taimerica study, for example, reports that two percent of the firms operating in
Richland account for two-thirds of employment.3 While 75 percent of all private
firms operating in Richland have ten or fewer workers, together they account for
only ten percent of total jobs in the City.
Table 3-2
Richland‘s Distribution of Employment
INDUSTRY TOTAL … 100.0%
Agriculture 0.2%
Construction, Natural Resources & Mining 3.5%
Manufacturing 4.6%
Wholesale Trade 0.6%
Retail Trade 7.1%
Transportation, Warehousing, and Utilities 0.4%
Information 0.2%
Finance, Insurance & real Estate 2.4%
Services 68.9%
Medical 8.8%
Research Services 26.9%
Government 12.1% Source: WSES, percent distributions calculated by Thomas/Lane Associates
Table 3-2 is based on a third quarter 2002 data prepared by WSES‘s Regional
Labor Economist. It shows that over two-thirds of Richland‘s employment is
concentrated in the services sector and that more than a quarter of total
3 Taimerica, op cit, page 98.
Thomas/Lane & Associates economic & public policy consultants
13
employment is engaged in some type of research activity – including professional,
scientific & technical services and waste treatment and remediation services. The
next largest economic sector is government, which includes the federal
Department of Energy, the Richland School District and WSU-TC, as well as
ongoing state, county and local public administration services. Retail trade
accounts for just over seven percent of total employment.
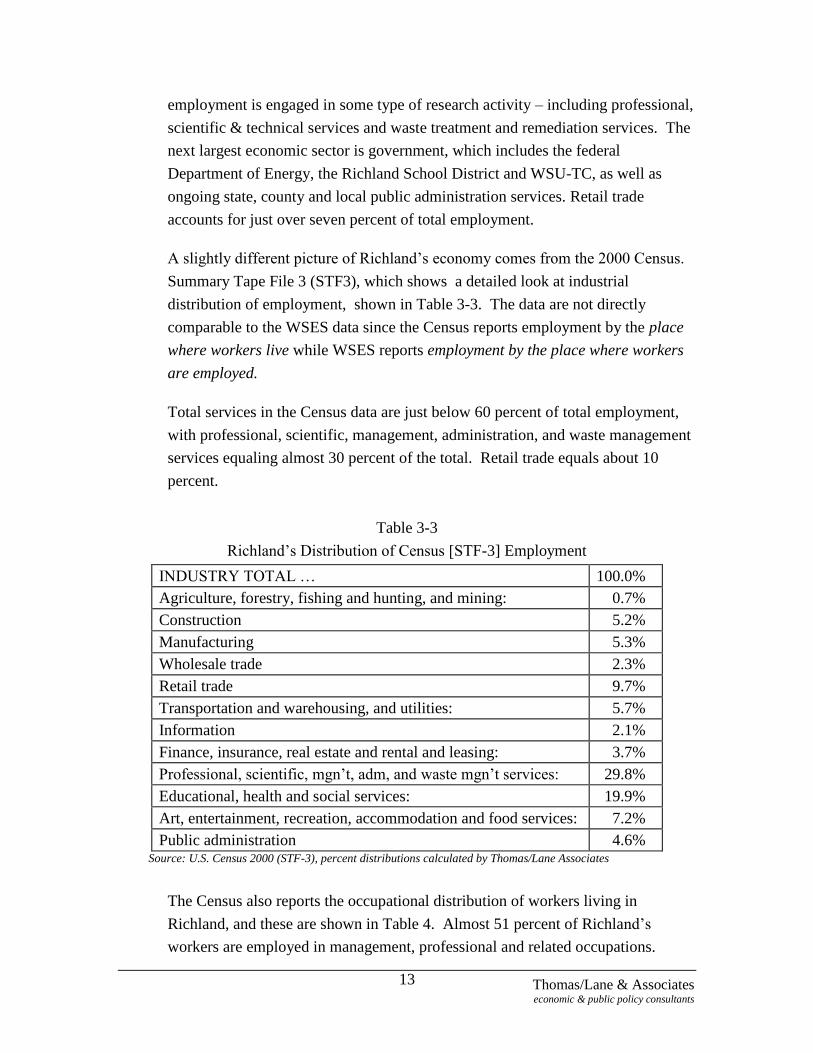
A slightly different picture of Richland‘s economy comes from the 2000 Census.
Summary Tape File 3 (STF3), which shows a detailed look at industrial
distribution of employment, shown in Table 3-3. The data are not directly
comparable to the WSES data since the Census reports employment by the place
where workers live while WSES reports employment by the place where workers
are employed.
Total services in the Census data are just below 60 percent of total employment,
with professional, scientific, management, administration, and waste management
services equaling almost 30 percent of the total. Retail trade equals about 10
percent.
Table 3-3
Richland‘s Distribution of Census [STF-3] Employment
INDUSTRY TOTAL … 100.0%
Agriculture, forestry, fishing and hunting, and mining: 0.7%
Construction 5.2%
Manufacturing 5.3%
Wholesale trade 2.3%
Retail trade 9.7%
Transportation and warehousing, and utilities: 5.7%
Information 2.1%
Finance, insurance, real estate and rental and leasing: 3.7%
Professional, scientific, mgn‘t, adm, and waste mgn‘t services: 29.8%
Educational, health and social services: 19.9%
Art, entertainment, recreation, accommodation and food services: 7.2%
Public administration 4.6% Source: U.S. Census 2000 (STF-3), percent distributions calculated by Thomas/Lane Associates
The Census also reports the occupational distribution of workers living in
Richland, and these are shown in Table 4. Almost 51 percent of Richland‘s
workers are employed in management, professional and related occupations.
Thomas/Lane & Associates economic & public policy consultants
14
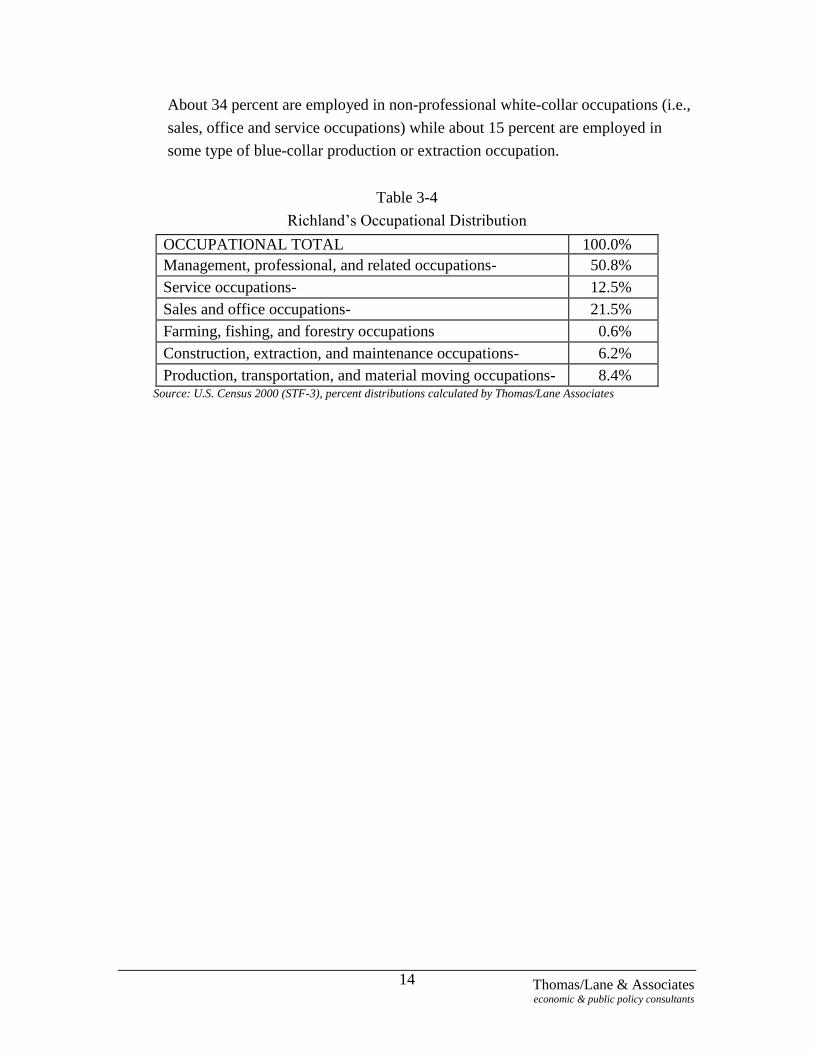
About 34 percent are employed in non-professional white-collar occupations (i.e.,
sales, office and service occupations) while about 15 percent are employed in
some type of blue-collar production or extraction occupation.
Table 3-4
Richland‘s Occupational Distribution
OCCUPATIONAL TOTAL 100.0%
Management, professional, and related occupations- 50.8%
Service occupations- 12.5%
Sales and office occupations- 21.5%
Farming, fishing, and forestry occupations 0.6%
Construction, extraction, and maintenance occupations- 6.2%
Production, transportation, and material moving occupations- 8.4% Source: U.S. Census 2000 (STF-3), percent distributions calculated by Thomas/Lane Associates
Thomas/Lane & Associates economic & public policy consultants
15
4. Overview of the Local Real Estate Market
4.1. Specialization Within the Tri-Cities Market Area
The Tri-Cities real estate market area is self-contained and somewhat specialized.
It is isolated within Southeastern Washington, and it is not a part of, or even near,
another large concentration of competitive urban real estate. This attribute gives
the Tri-Cities real estate market its self-contained character.
Businesses would choose the Tri-Cities market as a location for one of several
general reasons:
to be located near to the Hanford complex or the labor force that has been
attracted to it,
to take advantage of opportunities provided by the growing, processing and
production of the region‘s agriculture/viniculture,
to locate warehouse/distribution/production facilities central to the Pacific
Northwest‘s economy with relatively easy access to the northern Rockies,
eastern Washington/Oregon, and inland British Columbia (via US 395, I-90 &
I-82), and
to serve the existing and expected population and businesses in the Tri-Cities
area.
Industrial and business parks associated with the Hanford complex of scientific-
industrial facilities dominate the Richland portion of the Tri-Cities area. Richland,
and to a lesser extent Pasco and Kennewick, offer a range of price levels for
newer and older residential areas, including the recently developed Columbia
Point mixed-use area. Much of Pasco‘s real estate is used for the storage,
processing, and manufacturing of agricultural and other resource-based products.
Kennewick is the location of a regional shopping mall that is surrounded by many
other freestanding retail buildings and strip-shopping centers. In addition,
Kennewick also provides a location for significant ―suburban style‖ quality office
space that is near its retail concentrations.
Thomas/Lane & Associates economic & public policy consultants
16
All three of the Tri-Cities communities have older downtown areas that are
diffuse and struggling. Richland has a long linear downtown/central business
district composed of three parts: (1) an ―uptown‖ area located near an old strip
shopping center of the same name left over from the post-war new town period
that also includes retail activity located in several smaller, but newer shopping
centers along George Washington Blvd; (2) a recently revitalized ―downtown‖
area; and (3) a ―central business district‖ that includes the city and federal
government complex along with a concentration of medical facilities around the
Kadlec Medical Center.
All three of the communities also have concentrations of suburban type retail
shopping centers adjacent to I-182. Recent developments in the newly developing
suburban portion of Pasco, the Queensgate area of south Richland, and southern
suburban areas of Kennewick are rapidly adding significant retail space. Pasco
also has a small but emerging business park area proximate to the airport.
Washington State University‘s Tri-Cities campus is located in north Richland near
PNNL and the Hanford contractors. Columbia Basin Community College is
located near the airport in Pasco.
Also near the Pasco airport is a 1960‘s-era hotel complex that in the past served as
the main regional convention center. A major outdoor event and recreation
complex is located in close proximity to the newer suburban areas in Pasco.
A recently completed convention center complex in Kennewick is expected to
attract major meetings. Kennewick also has a multi-events arena near the new
convention center, its airport and regional mall. Long linear shoreline parks and
recreation spaces in Richland, Kennewick and Pasco along the Columbia River
are a major regional recreational resource featuring the river shoreline.
The federal government has plans to (a) lower the flood control levee along the
Columbia River in the Wye area and (b) revitalize that stretch of shoreline for
open space, park, and recreational uses.
Freeways link the three Tri-Cities communities. These freeways also divide,
separate, and (to some extent) isolate portions of each community‘s real estate
markets. Two freeways run north-south through the Tri-Cities area. The US-395
corridor connects older areas of Pasco and Kennewick. The I-182 freeway
corridor links newer areas of all three communities. The Wye area is located near
Thomas/Lane & Associates economic & public policy consultants
17
the I-182 corridor and adjacent to SR-240, which is a main east-west connector
through Kennewick and Richland. A major widening of SR-240 and rebuilding
of the bridges over the Yakima River between Richland and Kennewick is
currently under construction. This re-alignment and reconfiguration of the SR-
240 freeway in the area will provide better access to the Richland Wye area.
While each community has an airport with significant land around it for
development, only the airport in Pasco has scheduled interregional service.
Pasco‘s industrial areas make the most use of the Columbia River for
transportation/shipping.
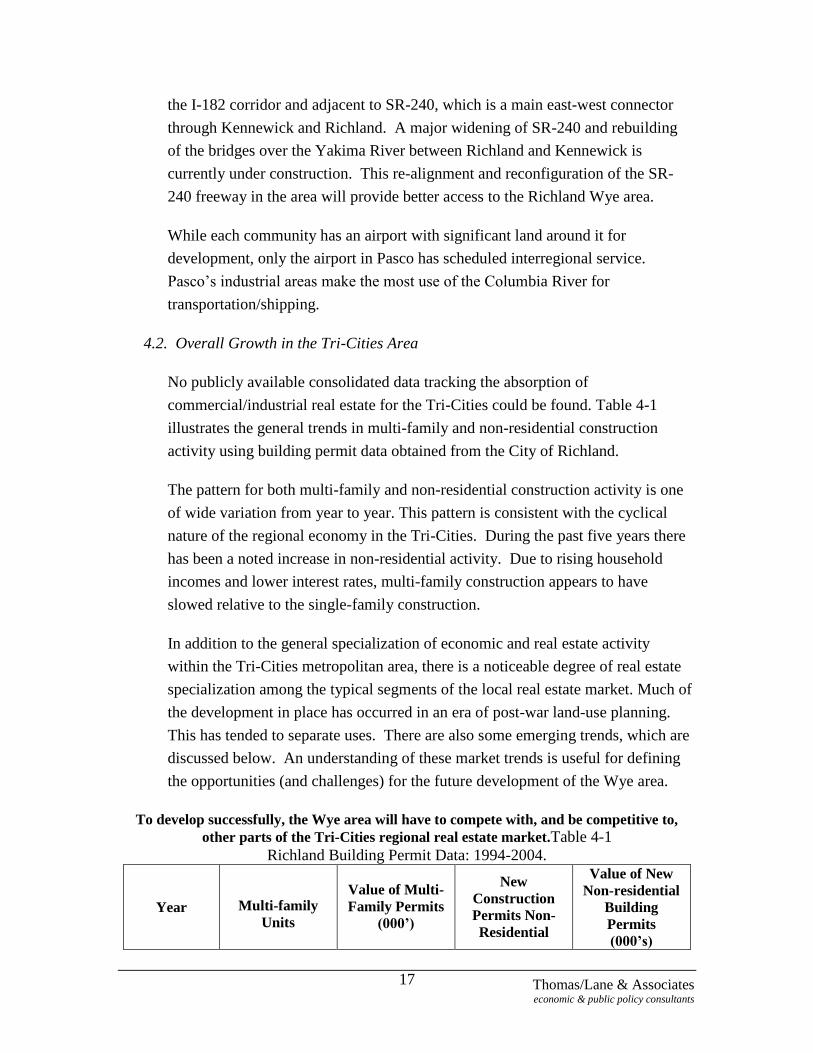
4.2. Overall Growth in the Tri-Cities Area
No publicly available consolidated data tracking the absorption of
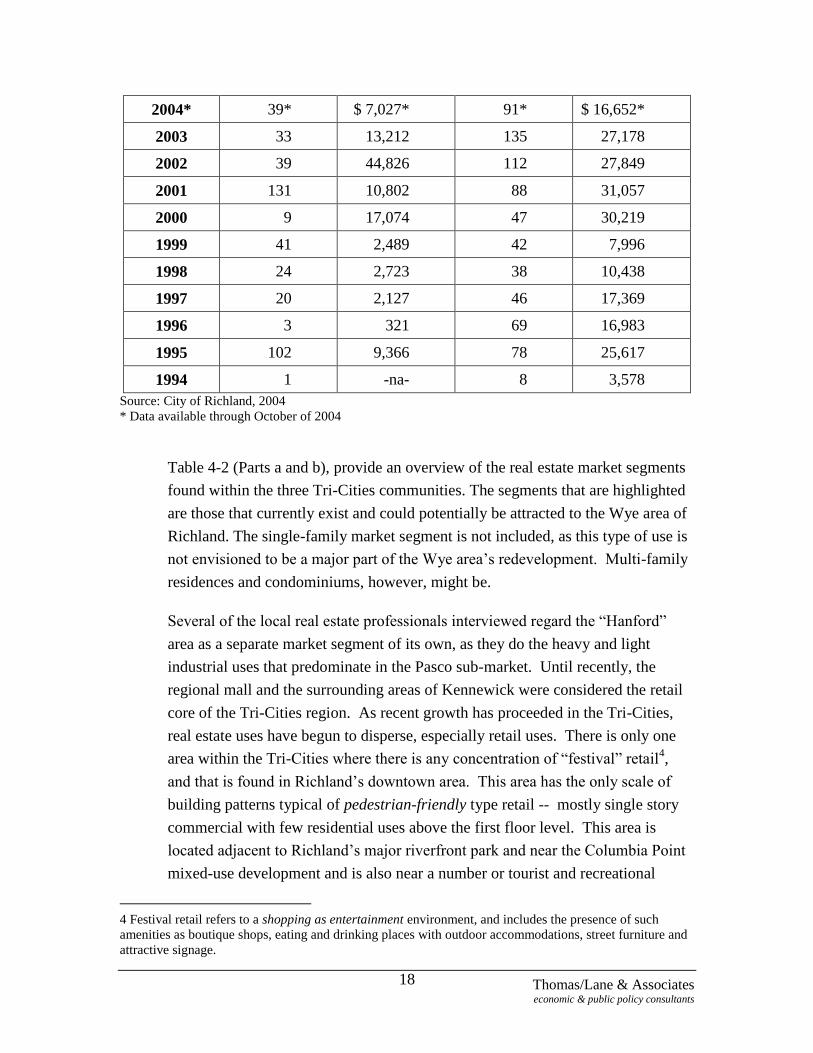
commercial/industrial real estate for the Tri-Cities could be found. Table 4-1
illustrates the general trends in multi-family and non-residential construction
activity using building permit data obtained from the City of Richland.
The pattern for both multi-family and non-residential construction activity is one
of wide variation from year to year. This pattern is consistent with the cyclical
nature of the regional economy in the Tri-Cities. During the past five years there
has been a noted increase in non-residential activity. Due to rising household
incomes and lower interest rates, multi-family construction appears to have
slowed relative to the single-family construction.
In addition to the general specialization of economic and real estate activity
within the Tri-Cities metropolitan area, there is a noticeable degree of real estate
specialization among the typical segments of the local real estate market. Much of
the development in place has occurred in an era of post-war land-use planning.
This has tended to separate uses. There are also some emerging trends, which are
discussed below. An understanding of these market trends is useful for defining
the opportunities (and challenges) for the future development of the Wye area.
To develop successfully, the Wye area will have to compete with, and be competitive to,
other parts of the Tri-Cities regional real estate market.Table 4-1
Richland Building Permit Data: 1994-2004.
Year Multi-family
Units
Value of Multi-
Family Permits
(000’)
New
Construction
Permits Non-
Residential
Value of New
Non-residential
Building
Permits
(000’s)
Thomas/Lane & Associates economic & public policy consultants
18
2004* 39* $ 7,027* 91* $ 16,652*
2003 33 13,212 135 27,178
2002 39 44,826 112 27,849
2001 131 10,802 88 31,057
2000 9 17,074 47 30,219
1999 41 2,489 42 7,996
1998 24 2,723 38 10,438
1997 20 2,127 46 17,369
1996 3 321 69 16,983
1995 102 9,366 78 25,617
1994 1 -na- 8 3,578
Source: City of Richland, 2004
* Data available through October of 2004
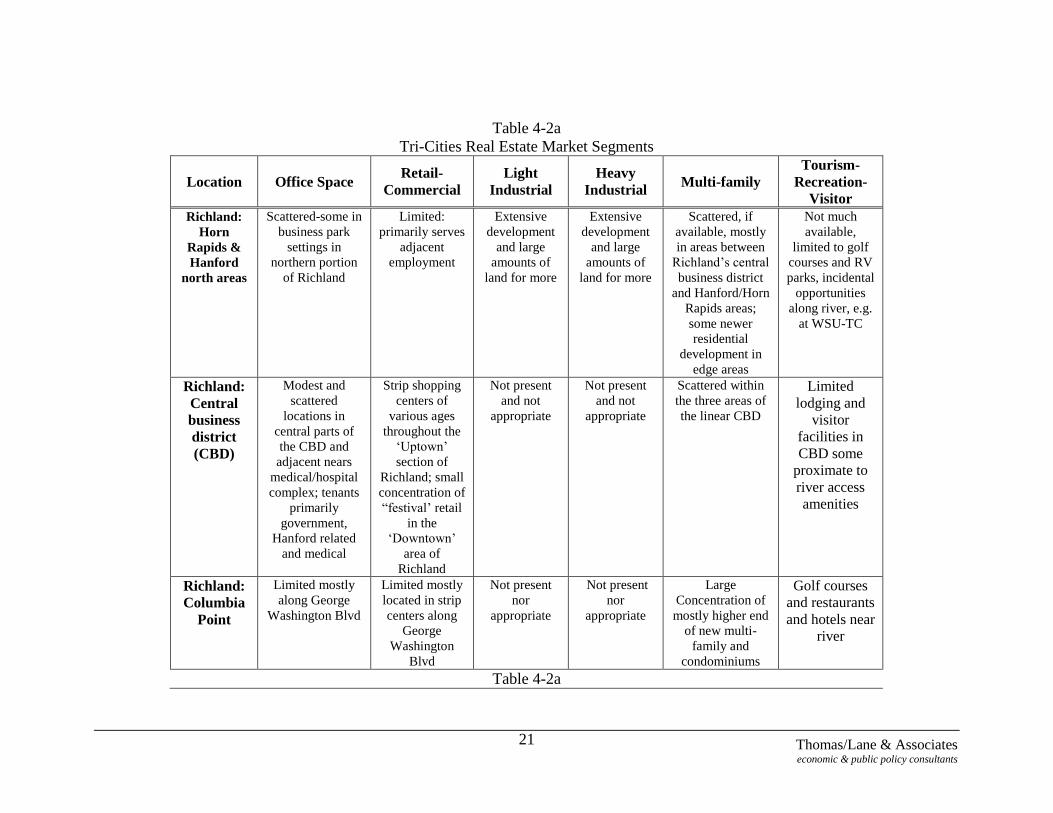
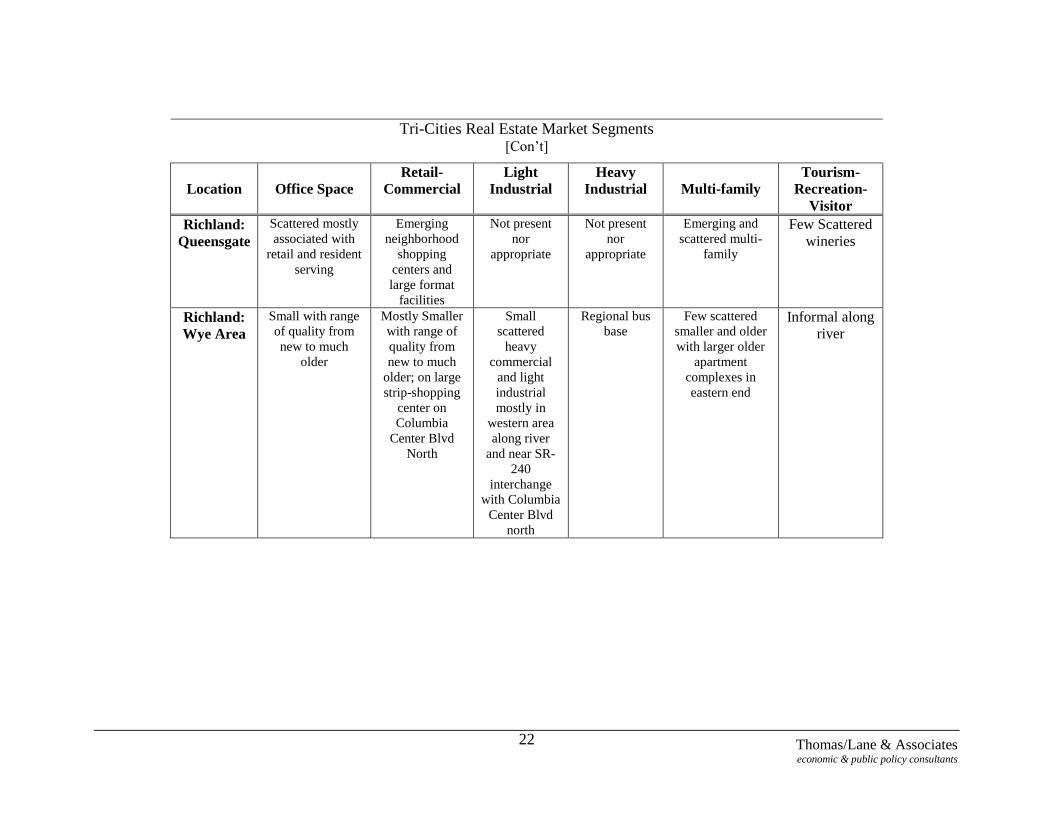
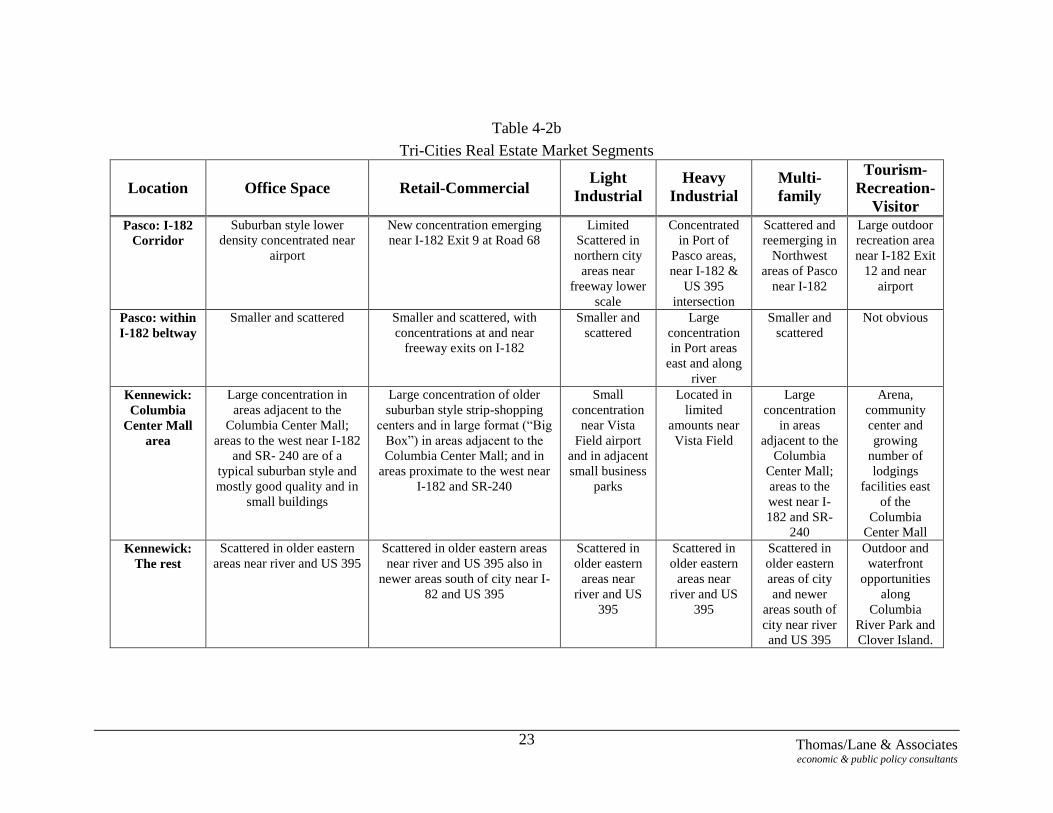
Table 4-2 (Parts a and b), provide an overview of the real estate market segments
found within the three Tri-Cities communities. The segments that are highlighted
are those that currently exist and could potentially be attracted to the Wye area of
Richland. The single-family market segment is not included, as this type of use is
not envisioned to be a major part of the Wye area‘s redevelopment. Multi-family
residences and condominiums, however, might be.
Several of the local real estate professionals interviewed regard the ―Hanford‖
area as a separate market segment of its own, as they do the heavy and light
industrial uses that predominate in the Pasco sub-market. Until recently, the
regional mall and the surrounding areas of Kennewick were considered the retail
core of the Tri-Cities region. As recent growth has proceeded in the Tri-Cities,
real estate uses have begun to disperse, especially retail uses. There is only one
area within the Tri-Cities where there is any concentration of ―festival‖ retail4,
and that is found in Richland‘s downtown area. This area has the only scale of
building patterns typical of pedestrian-friendly type retail -- mostly single story
commercial with few residential uses above the first floor level. This area is
located adjacent to Richland‘s major riverfront park and near the Columbia Point
mixed-use development and is also near a number or tourist and recreational
4 Festival retail refers to a shopping as entertainment environment, and includes the presence of such
amenities as boutique shops, eating and drinking places with outdoor accommodations, street furniture and
attractive signage.
Thomas/Lane & Associates economic & public policy consultants
19
attractions. Other recreational, tourist and public assembly attractions are either
located on the river shoreline or in public buildings in Pasco and Kennewick.
Tables 4-2a and 4-2b summarize the location of real estate uses that are currently
available and could compete with sites in the Wye are:
4.3. Real Estate Market Attributes
There are a number of attributes of the overall Tri-Cities real estate market that
will affect the potential of the Wye area‘s redevelopment potential. The
following is a listing of overall factors that affect real estate in most of the sub-
markets and locations within the Tri-Cities, including Richland.
Land availability – A striking characteristic of the Tri-Cities, especially the
areas south of the Columbia River (Richland and Kennewick), is that there are
literally thousands of acres of raw vacant land available. While the abundance
of land at relatively low prices is a good for attracting firms from outside the
area, it does not lead to dense development or to building for speculative or
rental markets. Such abundance of cheap developable land makes the
redevelopment of previously developed areas relatively expensive because of
the relocation, demolition, infrastructure replacement costs involved.
Land ownership patterns – The overwhelming amount of available land is
held for sale by public entities including the Ports of Kennewick and Benton,
the Kennewick Irrigation District, and the City of Richland. The development
incentives for these public owners are not the same as those for private
landowners.
Owner/users and commercial condominiums – in smaller metropolitan areas,
office development is an emerging trend. In addition, there has been a noted
dispersion of office industries throughout the State of Washington relative to
larger metropolitan areas. Other than the real estate sub-market associated
with Hanford, most private development occurs in small separated office
buildings in Richland and Kennewick. There is a large concentration of free-
standing owner-occupied, low density, high quality office buildings near
Columbia Center Mall; a small concentration near the Pasco airport, and a
scattering of small office buildings (plus a few multi-story office buildings) in
north Richland and along Jadwin Way and George Washington Boulevard in
downtown Richland. Government agencies, Hanford-related tenants, and
Thomas/Lane & Associates economic & public policy consultants
20
medical organizations occupy many of the buildings in this latter portion of
the market. A noticeable portion of these smaller and higher quality buildings
are condominiums.
Thomas/Lane & Associates economic & public policy consultants
21
Table 4-2a
Tri-Cities Real Estate Market Segments
Location
Office Space Retail-
Commercial
Light
Industrial
Heavy
Industrial
Multi-family
Tourism-
Recreation-
Visitor
Richland:
Horn
Rapids &
Hanford
north areas
Scattered-some in
business park
settings in
northern portion
of Richland
Limited:
primarily serves
adjacent
employment
Extensive
development
and large
amounts of
land for more
Extensive
development
and large
amounts of
land for more
Scattered, if
available, mostly
in areas between
Richland‘s central
business district
and Hanford/Horn
Rapids areas;
some newer
residential
development in
edge areas
Not much
available,
limited to golf
courses and RV
parks, incidental
opportunities
along river, e.g.
at WSU-TC
Richland:
Central
business
district
(CBD)
Modest and
scattered
locations in
central parts of
the CBD and
adjacent nears
medical/hospital
complex; tenants
primarily
government,
Hanford related
and medical
Strip shopping
centers of
various ages
throughout the
‗Uptown‘
section of
Richland; small
concentration of
―festival‘ retail
in the
‗Downtown‘
area of
Richland
Not present
and not
appropriate
Not present
and not
appropriate
Scattered within
the three areas of
the linear CBD
Limited
lodging and
visitor
facilities in
CBD some
proximate to
river access
amenities
Richland:
Columbia
Point
Limited mostly
along George
Washington Blvd
Limited mostly
located in strip
centers along
George
Washington
Blvd
Not present
nor
appropriate
Not present
nor
appropriate
Large
Concentration of
mostly higher end
of new multi-
family and
condominiums
Golf courses
and restaurants
and hotels near
river
Table 4-2a
Thomas/Lane & Associates economic & public policy consultants
22
Tri-Cities Real Estate Market Segments [Con‘t]
Location
Office Space
Retail-
Commercial
Light
Industrial
Heavy
Industrial
Multi-family
Tourism-
Recreation-
Visitor
Richland:
Queensgate
Scattered mostly
associated with
retail and resident
serving
Emerging
neighborhood
shopping
centers and
large format
facilities
Not present
nor
appropriate
Not present
nor
appropriate
Emerging and
scattered multi-
family
Few Scattered
wineries
Richland:
Wye Area
Small with range
of quality from
new to much
older
Mostly Smaller
with range of
quality from
new to much
older; on large
strip-shopping
center on
Columbia
Center Blvd
North
Small
scattered
heavy
commercial
and light
industrial
mostly in
western area
along river
and near SR-
240
interchange
with Columbia
Center Blvd
north
Regional bus
base
Few scattered
smaller and older
with larger older
apartment
complexes in
eastern end
Informal along
river
Thomas/Lane & Associates economic & public policy consultants
23
Table 4-2b
Tri-Cities Real Estate Market Segments
Location
Office Space
Retail-Commercial Light
Industrial
Heavy
Industrial
Multi-
family
Tourism-
Recreation-
Visitor
Pasco: I-182
Corridor
Suburban style lower
density concentrated near
airport
New concentration emerging
near I-182 Exit 9 at Road 68
Limited
Scattered in
northern city
areas near
freeway lower
scale
Concentrated
in Port of
Pasco areas,
near I-182 &
US 395
intersection
Scattered and
reemerging in
Northwest
areas of Pasco
near I-182
Large outdoor
recreation area
near I-182 Exit
12 and near
airport
Pasco: within
I-182 beltway
Smaller and scattered Smaller and scattered, with
concentrations at and near
freeway exits on I-182
Smaller and
scattered
Large
concentration
in Port areas
east and along
river
Smaller and
scattered
Not obvious
Kennewick:
Columbia
Center Mall
area
Large concentration in
areas adjacent to the
Columbia Center Mall;
areas to the west near I-182
and SR- 240 are of a
typical suburban style and
mostly good quality and in
small buildings
Large concentration of older
suburban style strip-shopping
centers and in large format (―Big
Box‖) in areas adjacent to the
Columbia Center Mall; and in
areas proximate to the west near
I-182 and SR-240
Small
concentration
near Vista
Field airport
and in adjacent
small business
parks
Located in
limited
amounts near
Vista Field
Large
concentration
in areas
adjacent to the
Columbia
Center Mall;
areas to the
west near I-
182 and SR-
240
Arena,
community
center and
growing
number of
lodgings
facilities east
of the
Columbia
Center Mall
Kennewick:
The rest
Scattered in older eastern
areas near river and US 395
Scattered in older eastern areas
near river and US 395 also in
newer areas south of city near I-
82 and US 395
Scattered in
older eastern
areas near
river and US
395
Scattered in
older eastern
areas near
river and US
395
Scattered in
older eastern
areas of city
and newer
areas south of
city near river
and US 395
Outdoor and
waterfront
opportunities
along
Columbia
River Park and
Clover Island.
Thomas/Lane & Associates economic & public policy consultants
24
Development climate – Recent years have produced a sustained positive development
climate propelled both by Hanford-related activities and the growth in the rest of the local
economy. The cyclical experiences of the past, as well as the size of the regional market,
have produced a gradual and incremental patterns in most real estate market segments.
These patterns featurer the predominance of owner-users, shopping centers being an
exception.
Columbia Center Mall and environs – A significant portion of the Tri-Cities non-
industrial real estate activity occurs in areas around the Columbia Center mall. Some real
estate planning and business professionals consider the Wye to be part of this market area
because of its physical proximity.
Geographically and from the perspective of transportation infrastructure, the Columbia
Center mall area is centrally located and accessible from most areas within the Tri-Cities
MSA. In some ways it functions as the central business district of the region (i.e., the
region‘s concentration of retail, office, recreation, tourist and commercial activity);
however unlike most central business districts, it is not an area of dense development.
Instead, it has a suburban horizontal character.
Often surrounding most central business districts there is an area of general-purpose real
estate occupied by businesses needing to be close to the central business district, but that
do not have to be in the higher priced buildings where their clients/customers are located.
The Wye area has the potential to draw these types of businesses.
The environs near the Columbia Center regional mall have attracted many retail
establishments that want to be close to a regional mall, but not in them. The relatively
newer (past twenty years) ―Big Box‖ or large format freestanding retailers have been
attracted to this portion of the Tri-Cities. As the Tri-Cities grows, this type of retail will
want to disperse to locations close to freeway exits. The Queensgate area in south
Richland, the Clearwater and Southridge areas in Kennewick, and the Road 68 area in
Pasco are locations that will compete for the types of retail currently in the Columbia
Center mall area.
Speculative/rental/lease – Large business and office park developments have not been
prevalent as a real estate pattern in the Tri-Cities. The exception is the Hanford area in
north Richland. Real estate developers tend to make a significant portion of their profit
Thomas/Lane & Associates economic & public policy consultants
25
by buying land, securing needed permits, building facilities, leasing-up and then selling
their projects to long-term institutional investors. In a market with lower priced and
abundant land this process tends to be more difficult; and speculative developers
interested in selling to institutional investors are rare.
Land prices and rents levels – Interviews with real estate professionals and published
reports indicate that commercial land at well located sites in the areas around the Wye
area sell for $2.50 to $6.00 per square foot. The land in the Port of Kennewick‘s
Spaulding Business Park goes at $2.75 to $3.25 per sq. foot. Office and better
commercial building space rents at up to $20.00 per square foot in the Gage Blvd area
west of the regional mall. Less desirable/locations and older buildings draw $8.00 to
$16.50 per square foot.
The re-development of the Wye area will by necessity fit into, and to some degree be framed
by, these overall regional real estate market patterns.
Thomas/Lane & Associates economic & public policy consultants
26
5. Real Estate & Location Analysis of the Richland Wye Area
5.1. Current Land/Real Estate Uses in Wye Area
Current land/real estate uses within the Wye area are a combination of single family
residences, multi-family apartment complexes, vacant land, local and regional retail, heavy
industrial (the Benton-Franklin Transit bus base), light industrial, small offices, public
waterfront/park recreational, and heavy commercial. This latter category, a type of
commercial real estate that typically does not have customers or clients visit the business,
tends to emphasize the repair and servicing of small, high valued equipment and machinery.
This type of real estate typically does not need the amenities of shopping centers or business
parks. Parking for trucks and service vehicles is desired, but large amounts of landscaping
and higher quality signature buildings are not. Heavy commercial uses are attracted to areas
adjacent to CBD‘s. Heavy commercial is a notable current use among the businesses in the
Wye area of Richland.
There is significant vacant land that is ready for development within the Wye area. The Port
of Kennewick has developed the 30-acre Spaulding Business Park, and is seeking to sell
parcels for development. There is a large, vacant, and presumably buildable lot — the site of
a former drive-in theater — along Columbia Park Trail immediately to the northeast of
Spaulding Business Park, on the east side of Georgia Avenue across from the marina
containing the Columbia River Journeys jet boats. Removal of some of the more seriously
deteriorated buildings and clean up of outside storage would produce more vacant space. In
addition, there are some smaller vacant sites within the area. Significant public ownership
exists in addition to the roadways, utilities corridors and port‘s holdings. The regional Benton
Franklin transit system has their major facility there. The area along the Columbia River
contains a shoreline area, a flood protection levee and City parklands, and there may be some
parcels available as a result of the freeway reconfiguration and new interchange that would
be owned by the State.
5.2. Physical Description
The following are key physical characteristics of the Wye area.
The area generally slopes to the north from the south affording views to the river and
north beyond the river to West Pasco, as well as to the east and also toward Saddle
Thomas/Lane & Associates economic & public policy consultants
27
Mountain. Sites at the top of the hill and near the freeway have views back across the
freeway and up the hill to the Columbia Center Mall area.
Much of the Wye area does not have significant tree coverage.
There are two major arterials: the east-west Columbia Park Trail Boulevard and North
Columbia Center Way along with Steptoe Boulevard, South of Columbia Park Trail
leading to the Tapteal Development.
A major exit/entrance to the SR-240 freeway exists central in the site at North Columbia
Center Way. The configuration of this interchange will be altered significantly as a result
of the proposed widening of the freeway.
Columbia River Park (a large regional park recreational facility) and the City of
Kennewick form the Wye area‘s boundary on the east side. The SR-240 freeway forms
the area‘s boundary on the south and west, while the Columbia River delineates the
area‘s northern boundary. Residential and public ownerships bound the Wye area on the
east.
Interviews with public officials reflected that there may be some concerns about
contaminated soils issues though the area since has been used as storage for autos and
parts as well as commercial/ industrial vehicle and machinery repair services.
Access to the rest of the MSA via SR-240 is easy from the south side of the Wye area and
access to SR-240 is also relatively easy from the west end.
There is a small boat launching and marina facility on the river near Bateman Island and
Columbia Park Marina.
Other than these attributes there are no other apparent or outstanding features that are
obvious.
5.3. Ownership Patterns
There are several key property owners, who are either owner-users or who have acquired
land for future or potential development or redevelopment. Owner-users include: Port of
Kennewick, the Benton-Franklin Transit System, the City of Richland, U.S Army Corps of
Engineers, State of Washington, and many local businesses and residents.
Properties that could be developed quickly are: the Port of Kennewick‘s Spaulding Business
park, the owners(s) of the vacant ―drive-in‖ theater site, two individual property owners who
own a large strip shopping center (Columbia Center North) and major parking areas plus
parcels in the southeastern corner of the Wye area along Fowler Avenue east of the North
Thomas/Lane & Associates economic & public policy consultants
28
Columbia Center Way. There is a large linear site on the south (Tapteal) side of the SR-240
freeway owned by the Robert Young Company. While this prime site is considered part of
the Wye Master Plan area, it is physically and functionally separated, and is not included in
our analysis.
In short, there is private sector interest in redevelopment. Once sites are assembled, the
challenge of development will be less daunting to them.
5.4. Locational Attributes
The Wye area has several strategic locational characteristics that provide potential developers
and businesses with important real estate advantages. These characteristics include:
A central location within the Tri-Cities MSA at the intersection of a major freeway
corridor. Several existing businesses in the Wye area stated that their location choice was
based on being able to get to all parts of the Tri-Cities MSA quickly and easily.
Proximity and sight lines to the Columbia Center Mall and the large concentration of the
retail commercial and other real estate attractions in that area. Some regional real estate
professionals and businesses in the Wye area consider that proximity a significant asset
for locating in the Wye area.
Visibility from the SR-240 freeway is a positive for businesses that need to draw support
from passing traffic. This attribute could also be an attractive feature for a firm that
wants its corporate image announced and visible to the region‘s residents and businesses.
Close proximity to the river is a positive business amenity, as well as a potential
recreation asset. It contributes value to both residential and non-residential real estate
within the Wye area.
The Wye area is adjacent to one of the last stretches of unimproved shoreline on the
Columbia River. The City of Richland and the U.S. Corps of Engineers plan to make it
more accessible as a recreational attraction by lowering the levee along that stretch of the
river. This should also add value to the real estate in the Wye area.
Relatively easy and quick access to the Port of Benton‘s Richland airport, Kennewick‘s
Vista Field airport and the scheduled air service at the Pasco airport is another potential
valuable locational attribute for sites within the Wye area.
Thomas/Lane & Associates economic & public policy consultants
29
However there are several locational aspects of the Wye area that provide a challenge for
development and redevelopment. These include:
The Wye area‘s close association with the regional mall is tenuous, particularly if the
regional mall has problems like other malls around the country with maintaining
competitive retail strength within a region in the face of new forms of dispersed retail,
especially large format retail. This could also be a challenge if the trend of moving
resident-serving retail to outlying locations within the region continues. If the future
development of the Wye area is less oriented to retail development, its association to the
mall is less of a potential problem.
Separation from the main areas of Richland by the Yakima River delta and I-182 plus
separation from the rest of the MSA by the SR-240 freeway and the Columbia River limit
the practical access to the Wye area to only a few points.
The current image presented to the traffic on SR-240 and historic reputation of the Wye
area (as being low income, low amenity and crime ridden) present challenges for some
types of future development. The location of a concentration of new auto dealers‘ sales,
service and storage lots along the southern and freeway visible edge of the Spaulding
Business Park cuts both ways. It is a strong identification and reinforces the area as a
retail site. It may not add much to enhancing a higher quality mixed-use ‗urban village‘
image for the area however. Some of this ambiguity could be managed by site and
amenity design and separation from the north sloped portion of the business park.
The word ―challenge‖ was selected advisedly in the above list since none of the
disadvantages are crucial to all types of real estate development and none of the locational
disadvantages seem insurmountable.
5.5. Reasons Current Uses Located in the Richland Wye Area
Interviews with current businesses in the Wye area produced a range of responses to
questions about why they were located there and/or why they stayed. The reasons included:
Central location within the Tri-Cities regional market.
Location near the mall reinforced their retail reputation and destination.
Proximity to and identification with the river and territorial views, recreation and regional
attraction of the Columbia River and its outdoor, open space and recreational facilities.
Thomas/Lane & Associates economic & public policy consultants
30
Cheaper land and buildings.
As one might expect, the businesses and property owners interviewed that were located in the
Wye Area had a better opinion of it than almost everyone else. They thought reports of
crime and drug problems were overstated. They pointed to the restaurants and retail stores
located in the Wye area and their ability to attract customers from throughout the Tri-Cities
MSA. They also pointed to the draw of the marina, boat launch, fishing and recreation
facilities as a strong positive that counters any of the negative historical images; and said that
when freeway construction displaced businesses, most desired to stay in the area. In
addition, they pointed to the presence of a number of well-kept owner-occupied single-family
commercial buildings that are sprinkled throughout the area. They also remarked favorably
about the small but cohesive community nature of the area.
The following are potentials that form a firm basis for development and redevelopment in the
Wye area:
Significant planned and proposed public and private projects in the master plan area.
Significant number of property owners who have major amounts of property assembled.
Basic real estate locational advantages within the Tri-cites regional market.
Existing and planned infrastructure improvements.
Existing viable, though small, businesses.
Significant areas that could change, i.e., older and modest single family and commercial
buildings, and underutilized sites and buildings.
5.6. Challenges, Opportunities and Uncertainties for Wye Master Plan Area
If no concerted action, other than the enforcement of the City‘s zoning and land use
regulations and planned public infrastructure improvements occur, the Wye will continue to
provide an area for low-income housing, and a place for less expensive and convenient
locations for smaller businesses. Market forces will eventually fill in the land that is
currently available. This process will probably be slow, given the nature of the overall real
estate development patterns in the region. However, there are enough large to medium sized
parcels in the Wye area that it would not take very long to have a major transformation occur.
Should the City of Richland decide to put forth a major redevelopment effort for the Wye
area, there are some short term and less expensive activities that can and should be
undertaken, including:
Thomas/Lane & Associates economic & public policy consultants
31
Identification and organization of the key property owners in the Wye master plan area.
Examination of state laws and application of public-private financing mechanisms for
redevelopment and blighted area actions, such as the Community Renewal Act‘s
mandates, local improvement district, and potential of a public development authority as
a vehicle for redevelopment.
Complete information and data gathering to reduce areas of uncertainties related to
physical site and infrastructure improvement, as well as design and costing of appropriate
infrastructure improvements for the Wye area.
Segmentation of the Wye area into parts that could provide a sharper focus for specific
appropriate real estate market segments and/or implementation actions.
Organize and staff multi-year, multi-jurisdiction, multi-constituent planning process for
the area to assure continuity.
Assure periodic constructive input from the local real estate development, marketing and
property management sector, periodically revisiting the Wye area‘s zoning and regulatory
approach and leaving sufficient flexibility to address unforeseen opportunities that may
arise.
Develop an information campaign to counter any lingering ―image‖ problems for the
area.
Develop a specific and explicit redevelopment strategy that identifies:
o Who will have what redevelopment responsibilities,
o What long term and short term actions and projects will be undertaken,
o Why that set of actions will result in redevelopment, i.e., be clear about the strategy
being followed that makes realistic economic and real estate sense,
o How will each component of the strategy be implemented, what are the action steps,
what are the sources and uses of funds,
o Set priorities for the sub-parts within the Wye master planning area for action, and
o Establish a reasonable phasing and monitoring process.
o Opportunities to determine if the water, sewer, storm or street capacity can handle
build out of redevelopment, and who will pay?
A range of redevelopment strategies for the Wye master planning area is discussed below.
5.7. Potential Land Uses/Real Estate Segments Appropriate for the Wye Master Plan Area
Thomas/Lane & Associates economic & public policy consultants
32
Heavy industrial uses, extensive processing, and storage uses and single family detached real
estate and market segments were not considered for the Wye area. Heavy industrial uses
usually require rail or marine transportation facilities, large amounts of outside storage, ‗lay-
down‘ areas, and often produce a whole range of ‗spillover‘ effects (dust, noise, smells, etc)
that are incompatible with existing or proposed and uses at the site.
Single-family residential development could be an appropriate land use at the site, but the
elimination of many current uses, rationalizing land ownership, and elimination of blighted
conditions would be necessary. In addition, there are many better locations in the region for
such uses. Multi-family and condominium residential uses could be developed in portions of
the Wye area if they were appropriately separated from non-residential uses. Reflecting the
high average age of workers employed at Hanford-related facilities, there may be a strong
―empty nester‖ market for mid-rise waterfront condos, similar to the type of development
that exists in the Columbia Point area.
Overall market assessment:
There is potentially a large amount of real estate development that could be
accommodated in the Wye area immediately, located in vacant and under-utilized areas
and eventually through redevelopment.
The Wye area will increasingly have to compete with other areas of the regional real
estate market to attract tenants.
The Wye area‘s advantages are: (1) proximity to and views of the river, (2) proximity to
other regional economic engines (Kennewick‘s mall, retail, office, and recreational
assets), (3) access to regionally important transportation networks, (4) significant existing
vacant and assembled land, (5) viable businesses already there, and (6) public agency
interest in its development and redevelopment.
Retail market assessment:
Neighborhood shopping centers – There already is a large concentration of retail
establishments south of the site. There are not large concentrations of residents nearby
and the Wye area is not centrally or conveniently located within an established or
emerging neighborhood. Eventually, should large amounts of condominiums and multi-
family residential units be developed in the Wye area, there could be some demand for
convenience and neighborhood retail.
Thomas/Lane & Associates economic & public policy consultants
33
Community shopping centers – There are better-located existing competitive locations
that are approximate to emerging and established concentrations of population within the
region.
Regional shopping centers - There is an established regional mall very close by. Some
portions of the Wye area, primarily the relatively flat southern portion adjacent to and
visible from SR-240 and the mall areas, could attract large format region serving retail
establishments, but the trend is for such large format retailers to disperse closer to new
and growing portions of the region.
Retailers with a need for large outside storage and display areas, e.g., auto sales, RV,
truck dealers new and used – There are appropriate sites on the relatively flat southern
portion adjacent to and visible from SR-240 and the mall areas that could attract such
region serving retail establishments. Separating such uses from the other types of uses
would be important.
Restaurants, entertainment facilities, lodging (short and long stay), recreational facilities
and specialty retail uses that complement and support them could be attracted to sites
near to, or visible from, the river, especially when the levee‘s height is reduced and park,
open space and recreation improvements are provided.
―Festival‖ retail – There is very little of this type of pedestrian oriented retail in the Tri-
Cities. There are almost no existing environments that could evolve into this type of use.
However if a modest size ―urban village‖ project were to develop in the Wye area‘ then
such ―festival‖ retail could be a part of it. This seems like a fairly long-term prospect and
would require dramatic change in the underlying development climate and parameters in
the Tri-Cities area.
Commercial market assessment:
Offices, small office parks, medium density office buildings; free standing, owner-user,
or multi-tenant development -- The river views, open space, recreational amenities,
integration with residential uses and proximity to existing similar developments up the
hill in the areas around the mall are reasons to believe that the Wye area could attract this
type of real estate market segment. The Brashears office building proposed at the
Columbia Park Trail Boulevard entrance to the Spaulding Business Park is a signal
project, and could demonstrate this market segment as a viable use here.
Heavy Commercial – This use is already a viable use in this area. The Lincare Medical
Products Company, electrical contractors, and professional services engineering and

Thomas/Lane & Associates economic & public policy consultants
34
surveying firms are examples. The Wye area‘s central location in the region is a strong
locational attraction for this type of use.
Medical/dental offices and labs would be a type of office use that could be attracted to
this area once appropriate amenities are present.
Thomas/Lane & Associates economic & public policy consultants
35
Business Park market assessment
Typically, business parks are oriented to different types of activities: office types, light
industrial types and hybrid types – a few of which are found within the Tri-Cities market.
Unless a major effort is made to assemble a large percentage of land in the Wye area, the
potential for business parks will produce relatively smaller versions, which, may be
appropriate to the size of the Tri-Cities market area.
Multi-family and condominium market assessment
Once the open space, recreational, park and waterfront amenities are in place, the Wye
area will be a very attractive location.
Thomas/Lane & Associates economic & public policy consultants
36
6. Projections of Future Growth in Richland
6.1. Projected Employment Growth
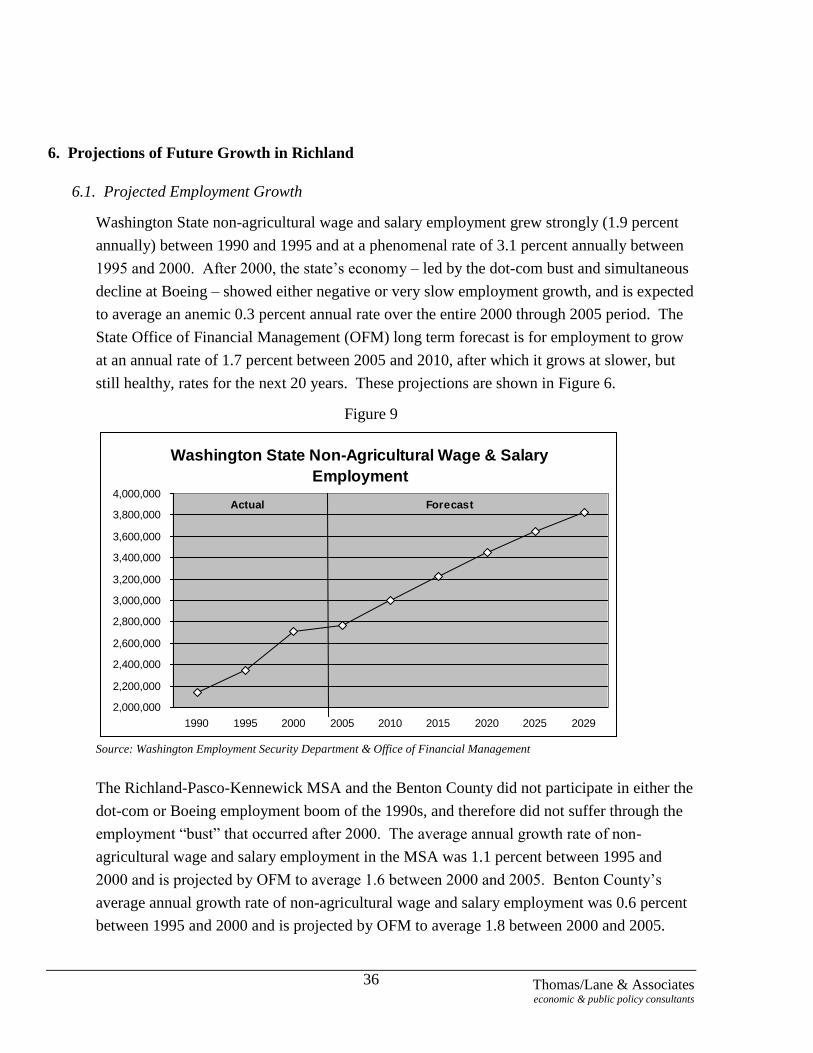
Washington State non-agricultural wage and salary employment grew strongly (1.9 percent
annually) between 1990 and 1995 and at a phenomenal rate of 3.1 percent annually between
1995 and 2000. After 2000, the state‘s economy – led by the dot-com bust and simultaneous
decline at Boeing – showed either negative or very slow employment growth, and is expected
to average an anemic 0.3 percent annual rate over the entire 2000 through 2005 period. The
State Office of Financial Management (OFM) long term forecast is for employment to grow
at an annual rate of 1.7 percent between 2005 and 2010, after which it grows at slower, but
still healthy, rates for the next 20 years. These projections are shown in Figure 6.
Figure 9
Washington State Non-Agricultural Wage & Salary
Employment
2,000,000
2,200,000
2,400,000
2,600,000
2,800,000
3,000,000
3,200,000
3,400,000
3,600,000
3,800,000
4,000,000
1990 1995 2000 2005 2010 2015 2020 2025 2029
Actual Forecast
Source: Washington Employment Security Department & Office of Financial Management
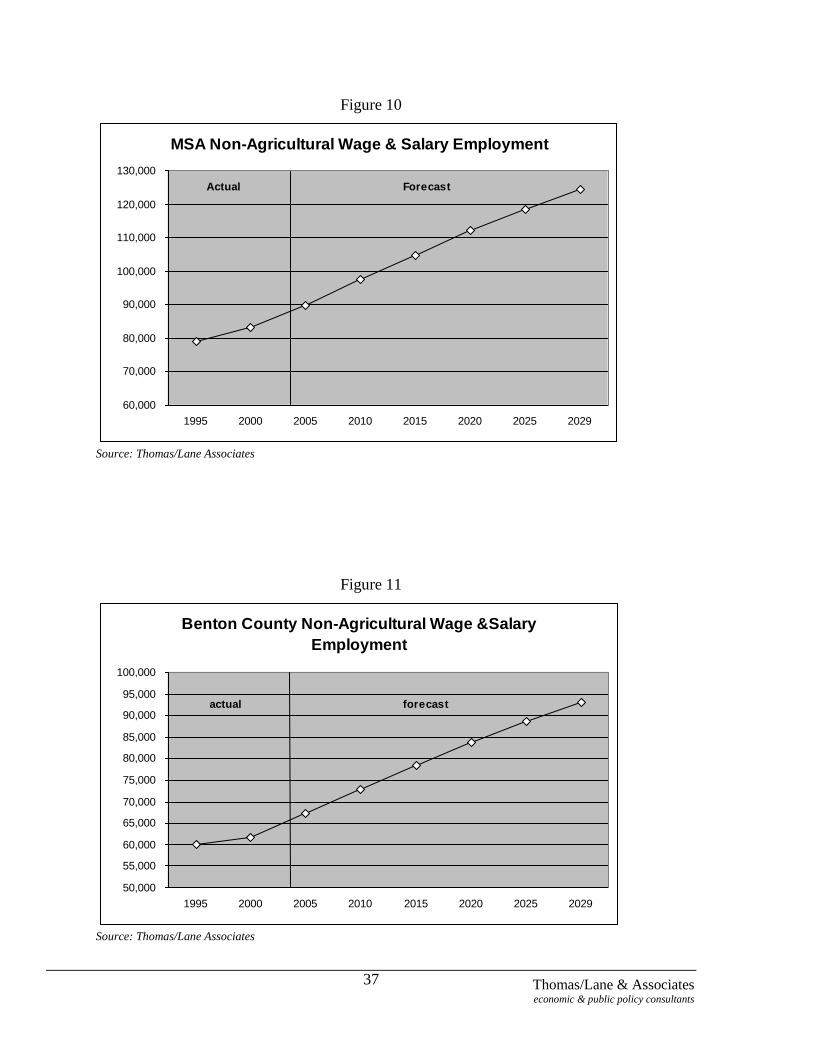
The Richland-Pasco-Kennewick MSA and the Benton County did not participate in either the
dot-com or Boeing employment boom of the 1990s, and therefore did not suffer through the
employment ―bust‖ that occurred after 2000. The average annual growth rate of non-
agricultural wage and salary employment in the MSA was 1.1 percent between 1995 and
2000 and is projected by OFM to average 1.6 between 2000 and 2005. Benton County‘s
average annual growth rate of non-agricultural wage and salary employment was 0.6 percent
between 1995 and 2000 and is projected by OFM to average 1.8 between 2000 and 2005.
Thomas/Lane & Associates economic & public policy consultants
37
Figure 10
MSA Non-Agricultural Wage & Salary Employment
60,000
70,000
80,000
90,000
100,000
110,000
120,000
130,000
1995 2000 2005 2010 2015 2020 2025 2029
Actual Forecast
Source: Thomas/Lane Associates
Figure 11
Benton County Non-Agricultural Wage &Salary
Employment
50,000
55,000
60,000
65,000
70,000
75,000
80,000
85,000
90,000
95,000
100,000
1995 2000 2005 2010 2015 2020 2025 2029
actual forecast
Source: Thomas/Lane Associates

Thomas/Lane & Associates economic & public policy consultants
38
Richland‘s growth of non-agricultural wage and salary employment is projected to closely
track Benton County patterns. Employment increased by 800 net new jobs between 1995
and 2000 – an average annual growth rate of 0.6 percent – and is projected to increase by just
over 2,600 net new jobs between 2000 and 2005 – an average annual growth rate of 1.8
percent. By 2029, non-agricultural wage and salary employment in the City of Richland is
expected to grow from its 2000 level of 28,900 to 43,600.
Figure 12
Richland Non-Agricultural Wage & Salary
Employment
20,000
25,000
30,000
35,000
40,000
45,000
1995 2000 2005 2010 2015 2020 2025 2029
actual forecast
Source: Thomas/Lane Associates
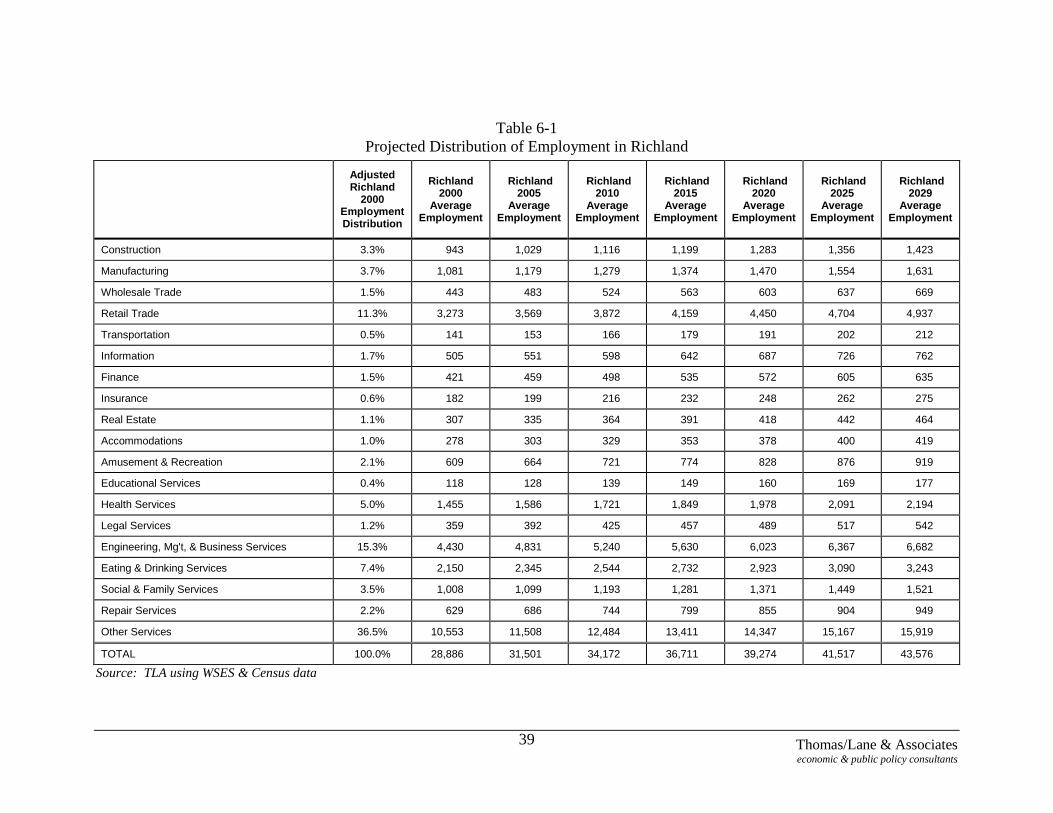
6.2. Distribution of Employment by Industry
The distribution of Richland‘s non-agricultural wage and salary workforce is based on its
adjusted percentage distribution by North American Industrial Classification System
(NAICS) industry codes for 2000. The ―adjustment‖ to the actual 2000 distributions reflects
both a time trending of industry patterns and weighting for different occupational
distributions in Richland and all of Benton County. The resulting distribution of
employment, by industry and by 5-year increment, is shown in Table 6-1.
Thomas/Lane & Associates economic & public policy consultants
39
Table 6-1
Projected Distribution of Employment in Richland
Adjusted Richland
2000 Employment Distribution
Richland 2000
Average Employment
Richland 2005
Average Employment
Richland 2010
Average Employment
Richland 2015
Average Employment
Richland 2020
Average Employment
Richland 2025
Average Employment
Richland 2029
Average Employment
Construction 3.3% 943 1,029 1,116 1,199 1,283 1,356 1,423
Manufacturing 3.7% 1,081 1,179 1,279 1,374 1,470 1,554 1,631
Wholesale Trade 1.5% 443 483 524 563 603 637 669
Retail Trade 11.3% 3,273 3,569 3,872 4,159 4,450 4,704 4,937
Transportation 0.5% 141 153 166 179 191 202 212
Information 1.7% 505 551 598 642 687 726 762
Finance 1.5% 421 459 498 535 572 605 635
Insurance 0.6% 182 199 216 232 248 262 275
Real Estate 1.1% 307 335 364 391 418 442 464
Accommodations 1.0% 278 303 329 353 378 400 419
Amusement & Recreation 2.1% 609 664 721 774 828 876 919
Educational Services 0.4% 118 128 139 149 160 169 177
Health Services 5.0% 1,455 1,586 1,721 1,849 1,978 2,091 2,194
Legal Services 1.2% 359 392 425 457 489 517 542
Engineering, Mg't, & Business Services 15.3% 4,430 4,831 5,240 5,630 6,023 6,367 6,682
Eating & Drinking Services 7.4% 2,150 2,345 2,544 2,732 2,923 3,090 3,243
Social & Family Services 3.5% 1,008 1,099 1,193 1,281 1,371 1,449 1,521
Repair Services 2.2% 629 686 744 799 855 904 949
Other Services 36.5% 10,553 11,508 12,484 13,411 14,347 15,167 15,919
TOTAL 100.0% 28,886 31,501 34,172 36,711 39,274 41,517 43,576
Source: TLA using WSES & Census data
Thomas/Lane & Associates economic & public policy consultants
40
Engineering, Management & Business Services employment is projected to
continue to grow even though there will be a workforce reduction after the
Hanford waste treatment (vitrification) plant is completed. As reported in The
Impact of the Waste Treatment Plant on the Hanford Communities report, the
annual peak of about 4,500 jobs over the eleven-year life of the project will be in
addition to the expected growth of almost 15,000 net new jobs in the Richland-
Pasco-Kennewick MSA projected to occur under a baseline – no vitrification
plant – scenario. Given the occupational and industrial composition of Richland‘s
economy, a significant number of those jobs will be in the Engineering,
Management and Business Services sector – particularly in the engineering and
scientific R&D industries.5
Other Services, is a catchall category. However much of its expected growth is
expected to occur in services associated with the aging of the Richland-Pasco-
Kennewick MSA‘s population.
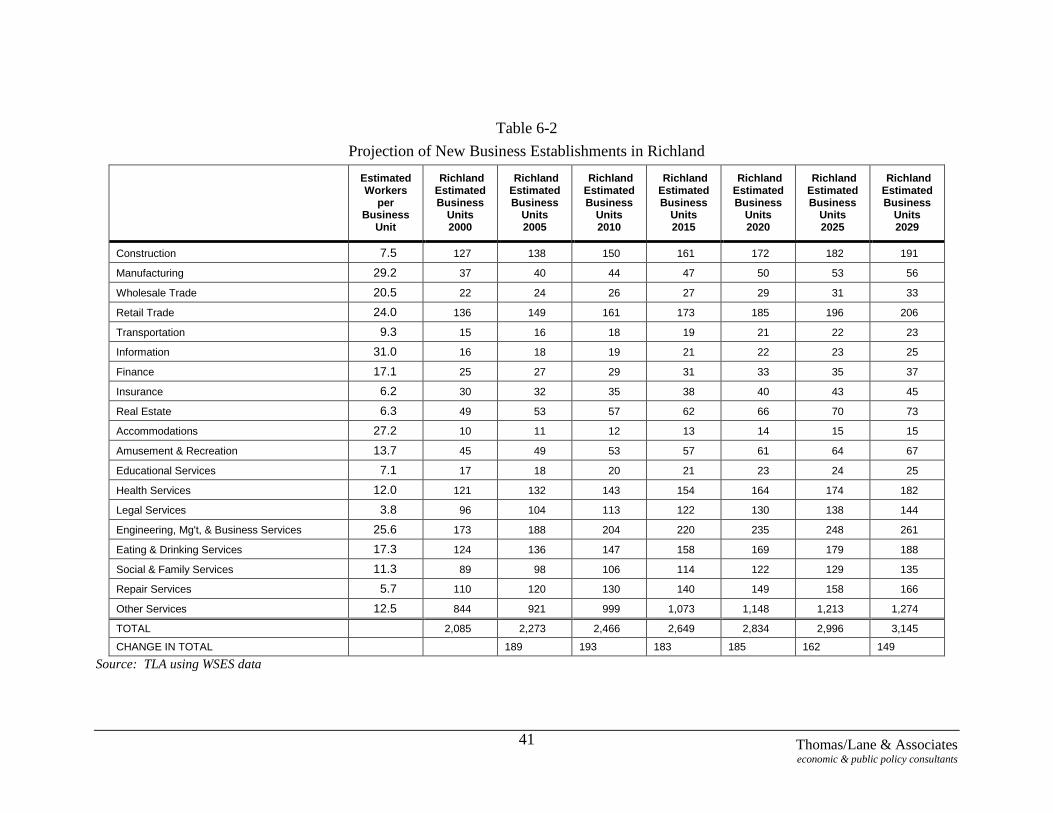
6.3. New Business Establishments by Industry
The number of new business establishments in Richland was projected by
dividing each industry‘s employment by the average number of workers per
establishment reported by WSES. These projections are shown in Table 6-6, on
the following page.
Between 2000 and 2020, Richland is projected to have between 180 and 190 net
new business establishments every five years, with this number falling to a level
of 150 land 160 net new business establishments for each five-year period
thereafter.
The industries with the most number of net new firms are projected to be
engineering, management and business services; retail trade; and eating and
drinking places.
5 Perteet Engineering, Thomas/Lane & Associates, and SCM Consultants, The Impact of the Waste
Treatment Plant Project on the Hanford Communities (The Hanford Communities, October, 201), pg3-3.
Thomas/Lane & Associates economic & public policy consultants
41
Table 6-2
Projection of New Business Establishments in Richland
Estimated Workers
per Business
Unit
Richland Estimated Business
Units 2000
Richland Estimated Business
Units 2005
Richland Estimated Business
Units 2010
Richland Estimated Business
Units 2015
Richland Estimated Business
Units 2020
Richland Estimated Business
Units 2025
Richland Estimated Business
Units 2029
Construction 7.5 127 138 150 161 172 182 191
Manufacturing 29.2 37 40 44 47 50 53 56
Wholesale Trade 20.5 22 24 26 27 29 31 33
Retail Trade 24.0 136 149 161 173 185 196 206
Transportation 9.3 15 16 18 19 21 22 23
Information 31.0 16 18 19 21 22 23 25
Finance 17.1 25 27 29 31 33 35 37
Insurance 6.2 30 32 35 38 40 43 45
Real Estate 6.3 49 53 57 62 66 70 73
Accommodations 27.2 10 11 12 13 14 15 15
Amusement & Recreation 13.7 45 49 53 57 61 64 67
Educational Services 7.1 17 18 20 21 23 24 25
Health Services 12.0 121 132 143 154 164 174 182
Legal Services 3.8 96 104 113 122 130 138 144
Engineering, Mg't, & Business Services 25.6 173 188 204 220 235 248 261
Eating & Drinking Services 17.3 124 136 147 158 169 179 188
Social & Family Services 11.3 89 98 106 114 122 129 135
Repair Services 5.7 110 120 130 140 149 158 166
Other Services 12.5 844 921 999 1,073 1,148 1,213 1,274
TOTAL 2,085 2,273 2,466 2,649 2,834 2,996 3,145
CHANGE IN TOTAL 189 193 183 185 162 149
Source: TLA using WSES data
Thomas/Lane & Associates economic & public policy consultants
42
7. Future Land Use Demand in the Richland Wye Area
7.1 Current Absorption Patterns
In recent years, the Wye area has seen the establishment of the Spaulding
Business Park by the Port of Kennewick and a limited number of other new
developments. Several of the businesses displaced by WSDOT‘s reconfiguration
of the SR-240 interchange have chosen to stay in the area and developed new
buildings. There are newer mixed use or small office buildings. There have been
several businesses that have purchased sites in the Fowler Avenue portion of the
Wye area near the Columbia Center Way North and SR-240 interchange. Some
churning of tenants has occurred at the Colombia Center North shopping center.
A mixed general tenant office building is proposed for site at the entrance to the
Spaulding Business Park. Most of these uses are light industrial/heavy
commercial uses, regionally focused specialty retail, or small professional office
uses.
7.2. Future Development Potential
A multi-stepped process was followed to obtain projections of future growth that
are realistic for the Wye area. First, data on 22 occupational categories and 164
industrial (the new NAICS industrial) categories of employment were examined
and separated in eight real estate market segments that were appropriate for the
Wye area of Richland. Secondly, the employment projections for Richland
developed in Section 6 (see Table 6-1) were divided among those real estate
market segments. It was assumed that Wye area development would be generated
by new economic activity or expansion of such activity rather than movements
within the market, though that may also occur. Thirdly, capture rates were
derived for each real estate segment based on the analysis of the market trends,
conditions and patterns that are in existence and could reasonably be projected for
the Wye area (see Sections 4 and 5). Typical employment densities for suburban
areas were used to estimate land needed for the real estate market segments that
would be attracted to the Wye area. Both low and high range absorption
projections were made. This range was appropriate both because the projection
period is long term and there is a range of potential strategic development
approaches available to the City (see Section 8 below).
Thomas/Lane & Associates economic & public policy consultants
43
Several assumptions about the Wye area were made, including:
New development in the near term would be mostly located on currently
vacant properties,
That there would be no additional major ‗move-outs‘ from the Wye area,
That the WSDOT ramp improvements do occur and that the City of Richland
and Corps of Engineers improvements to the river dike system are undertaken,
That zoning within the Wye area will not be an obstacle for location of
businesses,
The capacity of road and utility systems will not be an obstacle for location of
businesses into the area, and
The absorption projections were made for two time periods, consistent with
the employment projections 2005-2015 and 2015-2029.
Key considerations for land absorption in the Wye area rest on the strengths and
challenges discussed above.
Absorption projections were made for six non-residential real estate market
segments:
General office space,
Office space specialized for health services, such as doctors offices and
laboratories,
Lodgings,
Retail space:
o shopping centers,
o non-shopping center, and
o arterial and auto-oriented
Gaming, entertainment, recreation & amusement, and
Light industrial/heavy commercial.
There are a substantial number of retail businesses Richland that are not attracted
to shopping centers or are indifferent to locating within them. This type of retail
Thomas/Lane & Associates economic & public policy consultants
44
activity is categorized in the ―non-shopping‖ center retail category. The other
category of retail includes businesses that are oriented to locations on arterials
(e.g. fast food limited service restaurants), and such businesses that sell autos,
parts and services vehicles.
Development absorption projections were also made for multi-family residential
development.
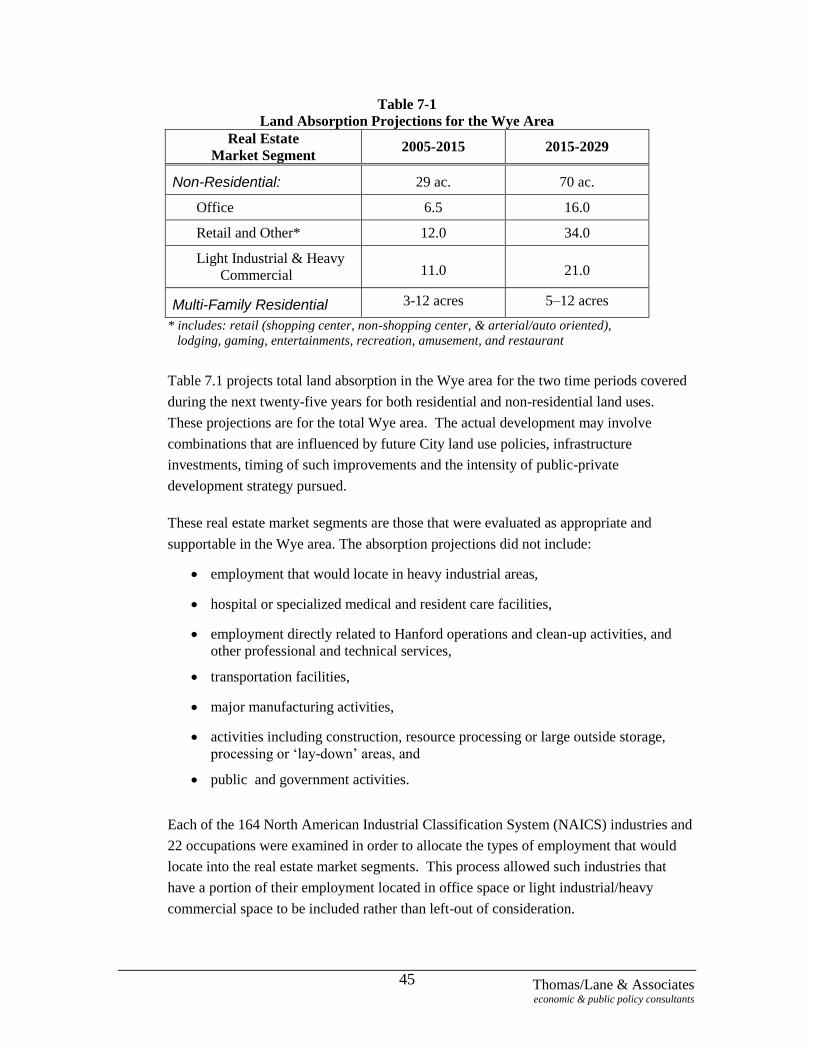
Thomas/Lane & Associates economic & public policy consultants
45
Table 7-1
Land Absorption Projections for the Wye Area
Real Estate
Market Segment 2005-2015 2015-2029
Non-Residential: 29 ac. 70 ac.
Office 6.5 16.0
Retail and Other* 12.0 34.0
Light Industrial & Heavy
Commercial 11.0 21.0
Multi-Family Residential 3-12 acres 5–12 acres
* includes: retail (shopping center, non-shopping center, & arterial/auto oriented),
lodging, gaming, entertainments, recreation, amusement, and restaurant
Table 7.1 projects total land absorption in the Wye area for the two time periods covered
during the next twenty-five years for both residential and non-residential land uses.
These projections are for the total Wye area. The actual development may involve
combinations that are influenced by future City land use policies, infrastructure
investments, timing of such improvements and the intensity of public-private
development strategy pursued.
These real estate market segments are those that were evaluated as appropriate and
supportable in the Wye area. The absorption projections did not include:
employment that would locate in heavy industrial areas,
hospital or specialized medical and resident care facilities,
employment directly related to Hanford operations and clean-up activities, and
other professional and technical services,
transportation facilities,
major manufacturing activities,
activities including construction, resource processing or large outside storage,
processing or ‗lay-down‘ areas, and
public and government activities.
Each of the 164 North American Industrial Classification System (NAICS) industries and
22 occupations were examined in order to allocate the types of employment that would
locate into the real estate market segments. This process allowed such industries that
have a portion of their employment located in office space or light industrial/heavy
commercial space to be included rather than left-out of consideration.
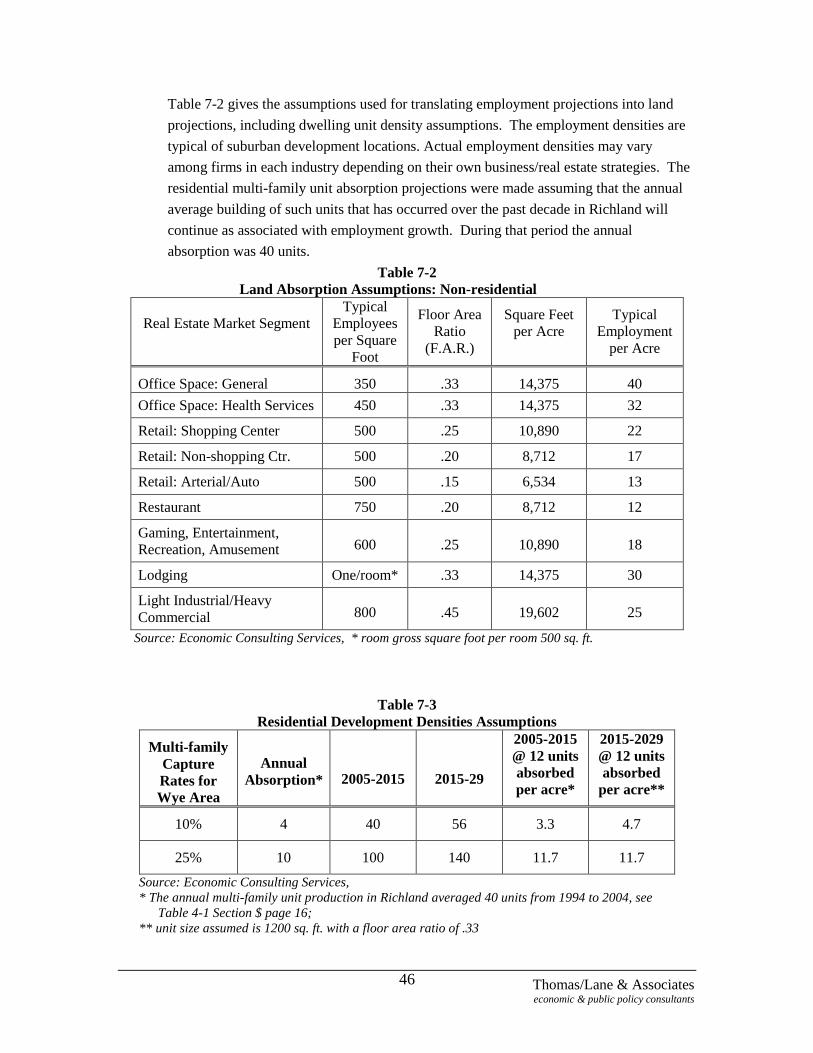
Thomas/Lane & Associates economic & public policy consultants
46
Table 7-2 gives the assumptions used for translating employment projections into land
projections, including dwelling unit density assumptions. The employment densities are
typical of suburban development locations. Actual employment densities may vary
among firms in each industry depending on their own business/real estate strategies. The
residential multi-family unit absorption projections were made assuming that the annual
average building of such units that has occurred over the past decade in Richland will
continue as associated with employment growth. During that period the annual
absorption was 40 units.
Table 7-2
Land Absorption Assumptions: Non-residential
Real Estate Market Segment
Typical
Employees
per Square
Foot
Floor Area
Ratio
(F.A.R.)
Square Feet
per Acre
Typical
Employment
per Acre
Office Space: General 350 .33 14,375 40
Office Space: Health Services 450 .33 14,375 32
Retail: Shopping Center 500 .25 10,890 22
Retail: Non-shopping Ctr. 500 .20 8,712 17
Retail: Arterial/Auto 500 .15 6,534 13
Restaurant 750 .20 8,712 12
Gaming, Entertainment,
Recreation, Amusement 600 .25 10,890 18
Lodging One/room* .33 14,375 30
Light Industrial/Heavy
Commercial 800 .45 19,602 25
Source: Economic Consulting Services, * room gross square foot per room 500 sq. ft.
Table 7-3
Residential Development Densities Assumptions
Multi-family
Capture
Rates for
Wye Area
Annual
Absorption* 2005-2015 2015-29
2005-2015
@ 12 units
absorbed
per acre*
2015-2029
@ 12 units
absorbed
per acre**
10% 4 40 56 3.3 4.7
25% 10 100 140 11.7 11.7
Source: Economic Consulting Services,
* The annual multi-family unit production in Richland averaged 40 units from 1994 to 2004, see
Table 4-1 Section $ page 16;
** unit size assumed is 1200 sq. ft. with a floor area ratio of .33

Thomas/Lane & Associates economic & public policy consultants
47
8. Implications for Strategic Development in the Wye Area
8.1. Alternative Development Scenarios
During interviews with local officials, businesspersons and other Richland Wye
area stakeholders, it became evident that a range of alternate development
scenarios existed, and that not all of them were necessarily compatible (i.e., some
might involve trade-offs). The following are the issues associated with the major
development alternatives identified:
Should development of the Richland Wye area (a) maximize creation of
jobs that will be needed to off-set the expected loss of Hanford DOE jobs,
(b) expand Richland‘s tax base, or (c) some combination of both?
The Richland Wye area is a significant location of low-income housing. If
it is redeveloped, should there be provision for relocating the low-income
households that now live there?
Should Columbia Point‘s development concept of upscale condos and
recreational land uses combined with retail and hospitality uses be
replicated?
What is the right mix of zoning and land use regulations that will optimize
development of the Richland Wye area? Should development emphasize
residential, commercial or retail uses?
How can the Columbia River shoreline that marks the northeast boundary
of the Richland Wye area be enhanced and used to promote regional and
city convention and/or visitor activity?
Should the Richland Wye area be developed to compete with the high
technology industrial and business areas that rim the City‘s north end (e.g.,
the Horn Rapids business center, the Horn Rapids industrial park, the
Richland industrial center, the Battelle campus, the technology and
business campus, etc.)?
Should the City of Richland create a development authority as a vehicle
for guiding the Richland Wye area‘s future development?
Before addressing these issues, the range of uncertainties that will surround any
development effort need to be made explicit.

Thomas/Lane & Associates economic & public policy consultants
48
8.2. Uncertainties
Any development scenario involves certain assumptions. In this report, the major
assumptions are:
The relationship between Richland‘s historical and projected economies
will be relatively constant, including the growth of the City within the
context of the Richland-Pasco-Kennewick MSA, and the growth of the
MSA within the context of the state‘s total economy, and
The relationship between the demand for developable land and local
economic growth will not change appreciably in the foreseeable future.
The development strategies (page 46-52) depend heavily on the lowering
of the levee and the improvements to the shoreline that currently remain
unfunded.
Further, it is the underlying assumption of this report that private market forces
are the best promoters of economic development, and that the appropriate role of
City government is to provide the infrastructure and regulatory regime under
which private market forces work best.
8.3. Alternative Development Strategies
The transformation of the Wye area will require a well thought out sustained
development strategy over a long period of time. There are a series of activities
that if undertaken at the beginning will increase the chances and also the pace of
such redevelopment (see section V-6 above). There are many combinations and
permutations of alternative intensity strategies that could be followed depending
on the selection of potential uses and identification of sub-parts of the Wye area
for focus/phasing. The ultimate strategy should be developed as full public
private-multi-jurisdictional process. The following are preliminary ideas to begin
discussions.
Alternative Strategic Development Concepts
The short-term market for development in the Wye area is known. The State
Department of Transportation has plans to reconfigure the SR-240 exit; the
City of Richland and Corps of Engineers have dramatic plans for
redevelopment of the flood control levee along the Columbia river in the Wye
area; there have been recent locations and sales of retail/heavy commercial
Thomas/Lane & Associates economic & public policy consultants
49
properties in the Wye area, mainly along the Fowler Street portion near SR-
240; there are plans for the locations of a auto dealer also along the SR-240
frontage and a proposed office building at the Columbia Park Trail entrance of
the Port of Kennewick‘s business park, which has other vacant sites available;
Roger‘s Surveying has built a 10,000 square foot office building, Gamache
Landscaping plans to relocate to the Wye area, and there still are underutilized
commercial and residential sites that could be developed. Land prices are
reported at $2.75 to 3.25 per square foot and higher quality office buildings
can rent good space for $18-20 per square foot. The market analysis in this
section has concentrated more on the long term than short-term market trends.
The following are general development strategies that the City could pursue
over the longer term in order to redevelop the Wye area.
Passive Laissez-faire Strategy
After the City of Richland has completed the sub-area planning for the
Wye area, the private property owners and private regional market
forces are relied upon to accomplish the redevelopment of the area.
The area will get wide notice once the transportation (freeway exit)
and waterfront improvements are made and that may stimulate more
interest in the area. The city provides marketing assistance as it does
with the other focus areas of its economic development strategy.
Market Facilitation Strategy
The City enforces its zoning and building codes, and follows its
economic development strategy as private land owners and developers
reveal their plans. The City assists with facilitating the development
process for the area and proceeds with infrastructure plans for the
riverfront, roadway improvements and utility systems. The city also
markets and emphasizes the area with a strategic planning process, but
leaves the primary tasks of land assembly, and development to the
private property owners there and developers who may recognize the
opportunities that are inherent in the Wye area. As City funds are
available other amenities and improvements maybe made to assist and
stimulate interest and facilitate improvement of the location of firms
into the area.
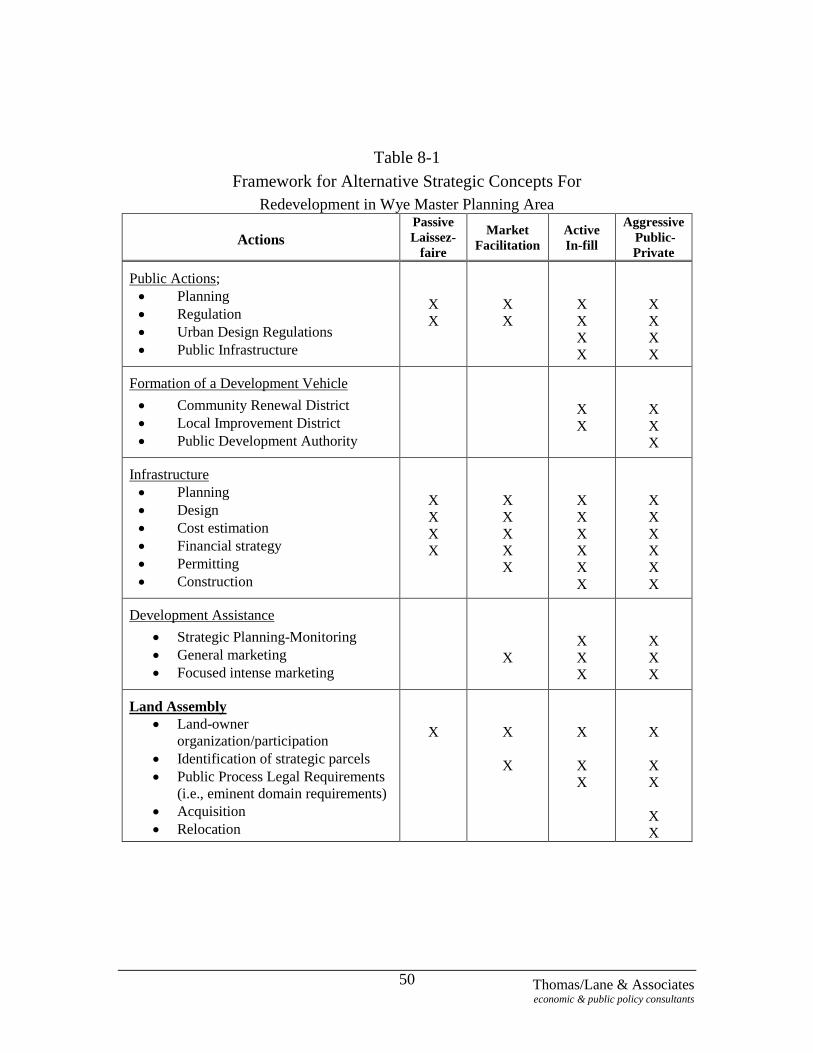
Thomas/Lane & Associates economic & public policy consultants
50
Table 8-1
Framework for Alternative Strategic Concepts For
Redevelopment in Wye Master Planning Area
Actions
Passive
Laissez-
faire
Market
Facilitation
Active
In-fill
Aggressive
Public-
Private
Public Actions;
Planning
Regulation
Urban Design Regulations
Public Infrastructure
X
X
X
X
X
X
X
X
X
X
X
X
Formation of a Development Vehicle
Community Renewal District
Local Improvement District
Public Development Authority
X
X
X
X
X
Infrastructure
Planning
Design
Cost estimation
Financial strategy
Permitting
Construction
X
X
X
X
X
X
X
X
X
X
X
X
X
X
X
X
X
X
X
X
X
Development Assistance
Strategic Planning-Monitoring
General marketing
Focused intense marketing
X
X
X
X
X
X
X
Land Assembly
Land-owner
organization/participation
Identification of strategic parcels
Public Process Legal Requirements
(i.e., eminent domain requirements)
Acquisition
Relocation
X
X
X
X
X
X
X
X
X
X
X
Thomas/Lane & Associates economic & public policy consultants
51
Active In-fill Strategy
The City accomplishes the planning of public infrastructure
improvements envisioned and also targets certain strategic parcels,
most probably those that will benefit and complement the waterfront
areas. The city would also take steps to acquire or be the catalyst for
development on a piecemeal basis as property owners make there
plans obvious. A phased plan of acquisition, public-private investment
and infrastructure improvements are made, as is a coordinated
marketing of the area.
Aggressive Public-Private Strategy
After a well thought out strategic planning process that actively
includes the private property owners and others in the community who
are active in segments of the regional real estate industry, the city
accomplishes the legal actions that will enable it to acquire property in
the area and implements an aggressive redevelopment process. This is
a very expensive and long-term program, but is the best assurance for
the complete redevelopment of the Wye master planning area.
These suggestive strategic concepts are a starting point for a discussion of the
alternatives for redevelopment of the area.
8.4. Recommended Development Scenarios
The Richland Wye area is large and diverse – too large and diverse for any single
development concept to work everywhere. The following discussion, therefore,
addresses recommended development scenarios for different parts of the total
area.
The part of the Richland Wye area that borders the Columbia River
(roughly the area north of Columbia Park Trail and east of Montana
Street) should be reserved for water oriented public and private
recreational developments.
Current plans are for the Corps of Engineers to reduce the levee along the
river by four to five feet and use the spoilings from the top of the levee to
put in a long linear shore side park and walking trail. Expectations are
Thomas/Lane & Associates economic & public policy consultants
52
that this $2.3 to $2.5 million project will be completed sometime between
2006 and 2010.
The City should continue to continue to maintain such areas as the Lewis
& Clark Trail Overlook, and proceed with development of the Columbia
Park West on the east end of the Richland Wye area. Encouragement
should be given to the owners/operators of Sundown Marine and the City
might consider encouraging Columbia River Journeys to relocate to a new
facility located along the river. Priority development in the future should
go to private developers of non-industrial marine oriented businesses –
particularly businesses associated with recreation and tourist activities.
The City should consider supporting the development of a mixed income
housing project in the part the Richland Wye area south of Columbia Park
Trail and east of the new SR-240 interchange (the area in and around
Nevada Avenue).
Creation of a low-moderate income housing project will allow for the
relocation of households that will be displaced when the Richland Wye
area is redeveloped. The City should consider opening discussions with
the Washington State Housing Finance Commission about methods and
techniques of raising funding to support the construction of such a project.
It is our understanding that the Port of Kennewick‘s Spaulding Center has
reached agreement with the Washington State Department of
Transportation (WSDOT) to obtain the land immediately to its south. This
area, together with southern half of the Spaulding Center property, has the
potential to be developed as an auto-plex park. This could include getting
some MSA auto dealers to relocate from their present locations to a
Spaulding Center Location.
For automobile dealers, the south side of the Spaulding Center property is
an excellent location. It has visibility from SR-240, it has good access to
the entire Tri-Cities MSA‘s population, and it can draw from people
attracted to the Columbia Center/Tapteal area retail concentrations.
For the City of Richland, creation of a concentration of automobile dealers
would create a source of big ticket sales that would enhance to the City‘s
tax base.
Thomas/Lane & Associates economic & public policy consultants
53
Even though one developer who was interested in the autoplex concept
has decided not to pursue it in the Spaulding Center, we feel the market
advantages of the Center for this type of use are still strong. Given the
large potential of this type of development to contribute to Richland‘s tax
base, we recommend that the City of Richland actively go after creation of
an autoplex development in the south part of the Spaulding Center.
The City should consider the possibility of attracting a planned unit
development for active elderly persons in the east end of the Richland
Wye area.
A recent analysis of demographic patterns among workers employed at
Richland‘s engineering, scientific and R&D establishments conducted by
WSES‘s regional economist indicates that a large number of them will be
reaching retirement age within the next ten years. These households will
likely have significant asset holdings and retirement incomes, and many
will be looking for retirement living arrangements in the Tri-Cities area.
An attractive, up-scale retirement living community on the east side of the
Richland Wye area that connects to the planned river shoreline trail area
and has walking access to Bateman Island may represent a feasible market
potential.
It would also bring a significant source of purchasing power to Richland‘s
economy, and would help support numerous additional development
potentials.
The City should beautify and enhance the street entries to businesses at the
park off Fowler, Columbia Center Blvd., and the former freeway off-ramp.
Partnership with property owners and the Port should be sought.
8.5. Implementation Strategies
Development of the Richland Wye area will require a series of pro-active
initiatives on the part of the City of Richland. This action has been started
by the new State Highway project resulting in the demolition and clean up
of some of the older buildings. Partnership with property owners and the
Port should be sought.
Thomas/Lane & Associates economic & public policy consultants
54
Access to the Richland Wye area from Fowler to Columbia Center Blvd.
needs to be improved.
The City should consider qualifying the Richland Wye area under the
rules for a Neighborhood Revitalization service Area (NRSA) five year
plan that would allow use of the City‘s CDBG funds for both housing and
economic development in the area.
The City should consider establishing either a District for the purpose of
promoting economic development in the Richland Wye area. Such a
District would benefit development efforts in the area in several ways.
First, it would give the City the option of adding a small amount to the
area‘s property taxes, which would be dedicated to redevelopment efforts
(the Port of Kennewick created such a district and added 45 cents per
thousand dollars of property value, and it has apparently been successful).
Second, a district could aid in the assemblage of the many small parcels
that now exist in the Richland Wye area if it were provided with eminent
domain power. Finally, a district would provide a central locus for a
multi-year redevelopment effort.
Surface Transportation Program or other such funds should be sought.
Thomas/Lane & Associates economic & public policy consultants
55
Appendix A
Statistical Tables
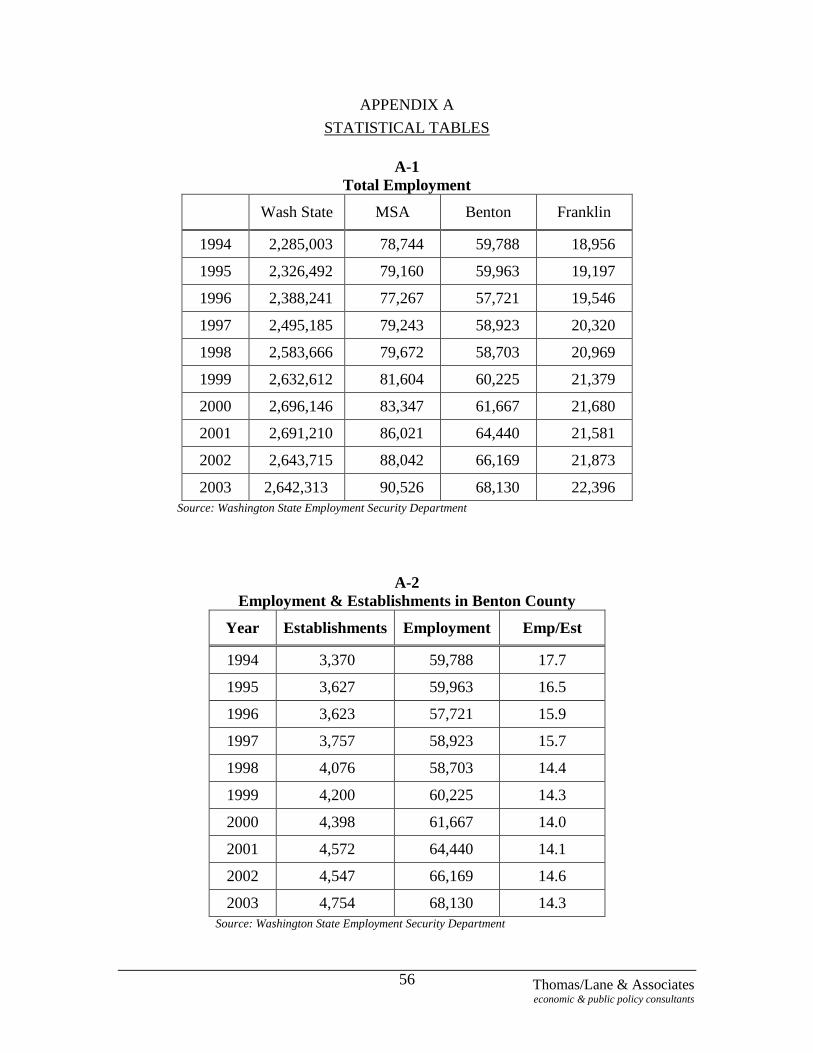
Thomas/Lane & Associates economic & public policy consultants
56
APPENDIX A
STATISTICAL TABLES
A-1
Total Employment
Wash State MSA Benton Franklin
1994 2,285,003 78,744 59,788 18,956
1995 2,326,492 79,160 59,963 19,197
1996 2,388,241 77,267 57,721 19,546
1997 2,495,185 79,243 58,923 20,320
1998 2,583,666 79,672 58,703 20,969
1999 2,632,612 81,604 60,225 21,379
2000 2,696,146 83,347 61,667 21,680
2001 2,691,210 86,021 64,440 21,581
2002 2,643,715 88,042 66,169 21,873
2003 2,642,313 90,526 68,130 22,396
Source: Washington State Employment Security Department
A-2
Employment & Establishments in Benton County
Year Establishments Employment Emp/Est
1994 3,370 59,788 17.7
1995 3,627 59,963 16.5
1996 3,623 57,721 15.9
1997 3,757 58,923 15.7
1998 4,076 58,703 14.4
1999 4,200 60,225 14.3
2000 4,398 61,667 14.0
2001 4,572 64,440 14.1
2002 4,547 66,169 14.6
2003 4,754 68,130 14.3
Source: Washington State Employment Security Department
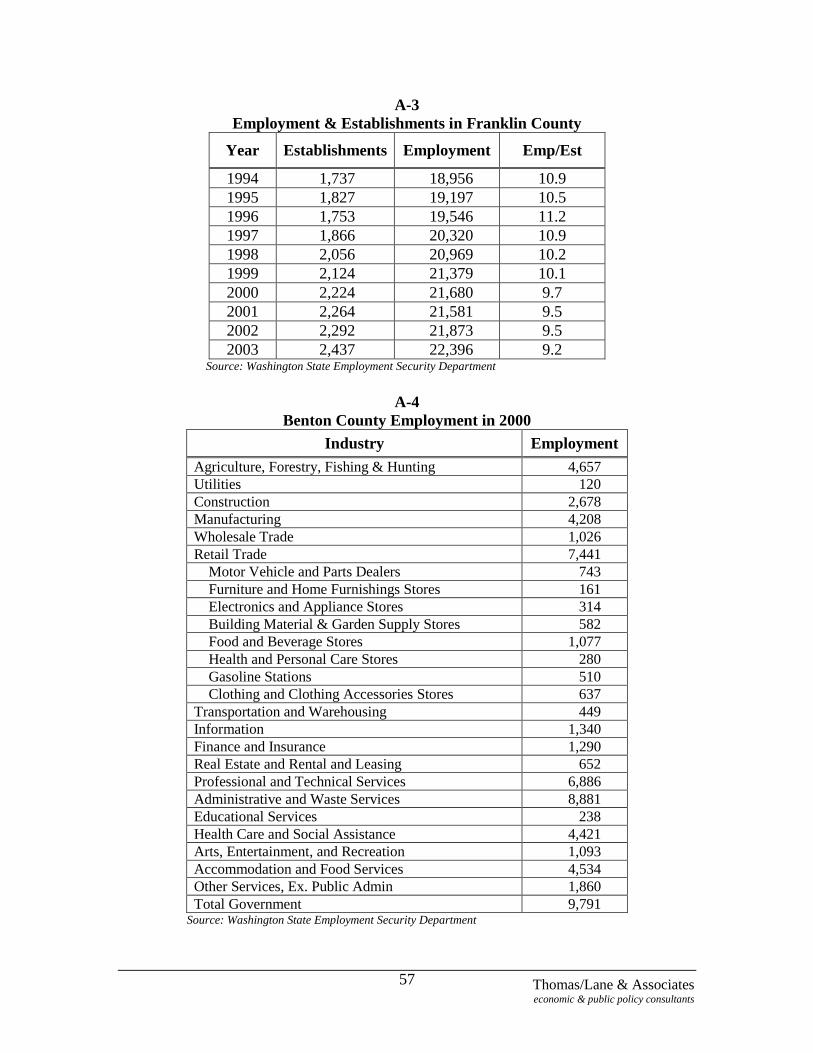
Thomas/Lane & Associates economic & public policy consultants
57
A-3
Employment & Establishments in Franklin County
Year Establishments Employment Emp/Est
1994 1,737 18,956 10.9
1995 1,827 19,197 10.5
1996 1,753 19,546 11.2
1997 1,866 20,320 10.9
1998 2,056 20,969 10.2
1999 2,124 21,379 10.1
2000 2,224 21,680 9.7
2001 2,264 21,581 9.5
2002 2,292 21,873 9.5
2003 2,437 22,396 9.2 Source: Washington State Employment Security Department
A-4
Benton County Employment in 2000
Industry Employment
Agriculture, Forestry, Fishing & Hunting 4,657
Utilities 120
Construction 2,678
Manufacturing 4,208
Wholesale Trade 1,026
Retail Trade 7,441
Motor Vehicle and Parts Dealers 743
Furniture and Home Furnishings Stores 161
Electronics and Appliance Stores 314
Building Material & Garden Supply Stores 582
Food and Beverage Stores 1,077
Health and Personal Care Stores 280
Gasoline Stations 510
Clothing and Clothing Accessories Stores 637
Transportation and Warehousing 449
Information 1,340
Finance and Insurance 1,290
Real Estate and Rental and Leasing 652
Professional and Technical Services 6,886
Administrative and Waste Services 8,881
Educational Services 238
Health Care and Social Assistance 4,421
Arts, Entertainment, and Recreation 1,093
Accommodation and Food Services 4,534
Other Services, Ex. Public Admin 1,860
Total Government 9,791 Source: Washington State Employment Security Department
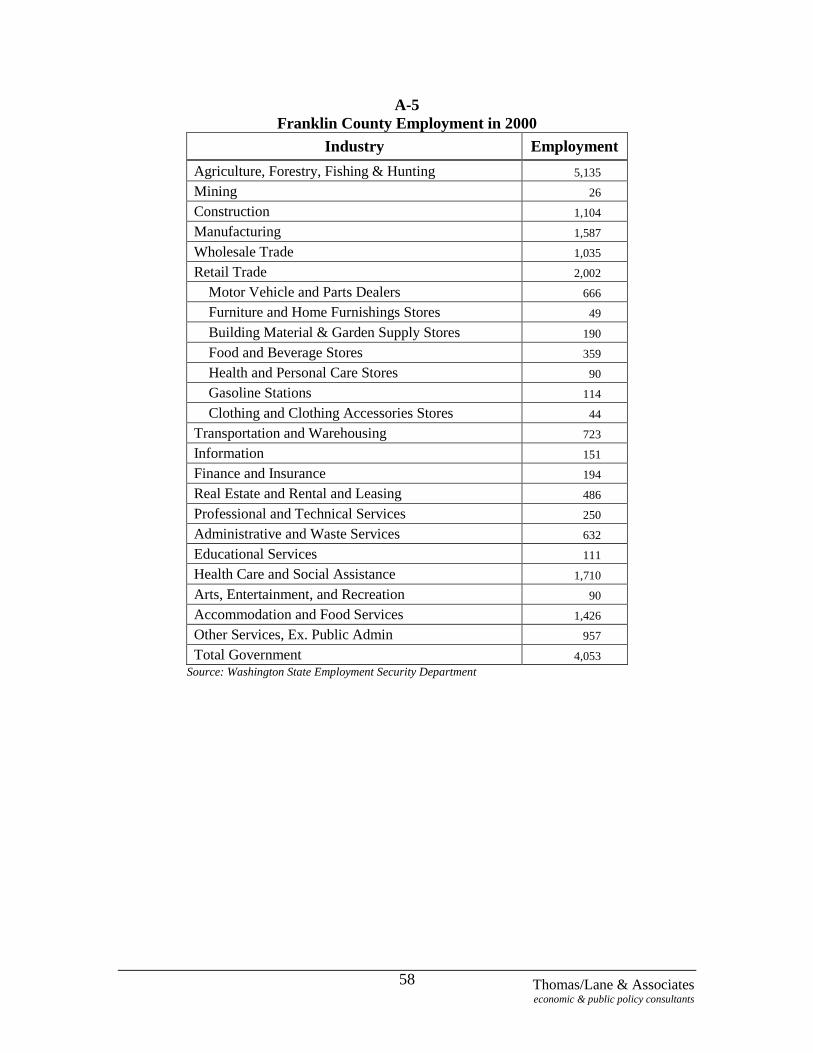
Thomas/Lane & Associates economic & public policy consultants
58
A-5
Franklin County Employment in 2000
Industry Employment
Agriculture, Forestry, Fishing & Hunting 5,135
Mining 26
Construction 1,104
Manufacturing 1,587
Wholesale Trade 1,035
Retail Trade 2,002
Motor Vehicle and Parts Dealers 666
Furniture and Home Furnishings Stores 49
Building Material & Garden Supply Stores 190
Food and Beverage Stores 359
Health and Personal Care Stores 90
Gasoline Stations 114
Clothing and Clothing Accessories Stores 44
Transportation and Warehousing 723
Information 151
Finance and Insurance 194
Real Estate and Rental and Leasing 486
Professional and Technical Services 250
Administrative and Waste Services 632
Educational Services 111
Health Care and Social Assistance 1,710
Arts, Entertainment, and Recreation 90
Accommodation and Food Services 1,426
Other Services, Ex. Public Admin 957
Total Government 4,053
Source: Washington State Employment Security Department

Thomas/Lane & Associates economic & public policy consultants
59
A-6
City of Richland
Third Quarter Employment in 2002
Employer
Units
3rd
Qtr.
Average
Monthly
Employment
INDUSTRY TOTAL … 1,519 30,995
Total Farm 16 65
Construction, Natural Resources & Mining 121 1,085
Manufacturing 34 1,441
Wholesale Trade 20 172
Retail Trade 134 2,194
Transportation, Warehousing, and Utilities 15 138
Information 15 69
Finance, Insurance, and Real Estate 89 739
SERVICES 760 21,348
Medical 138 2,742
Research Services 164 8,341
GOVERNMENT 13 3,743
Source: Washington State Employment Security Department
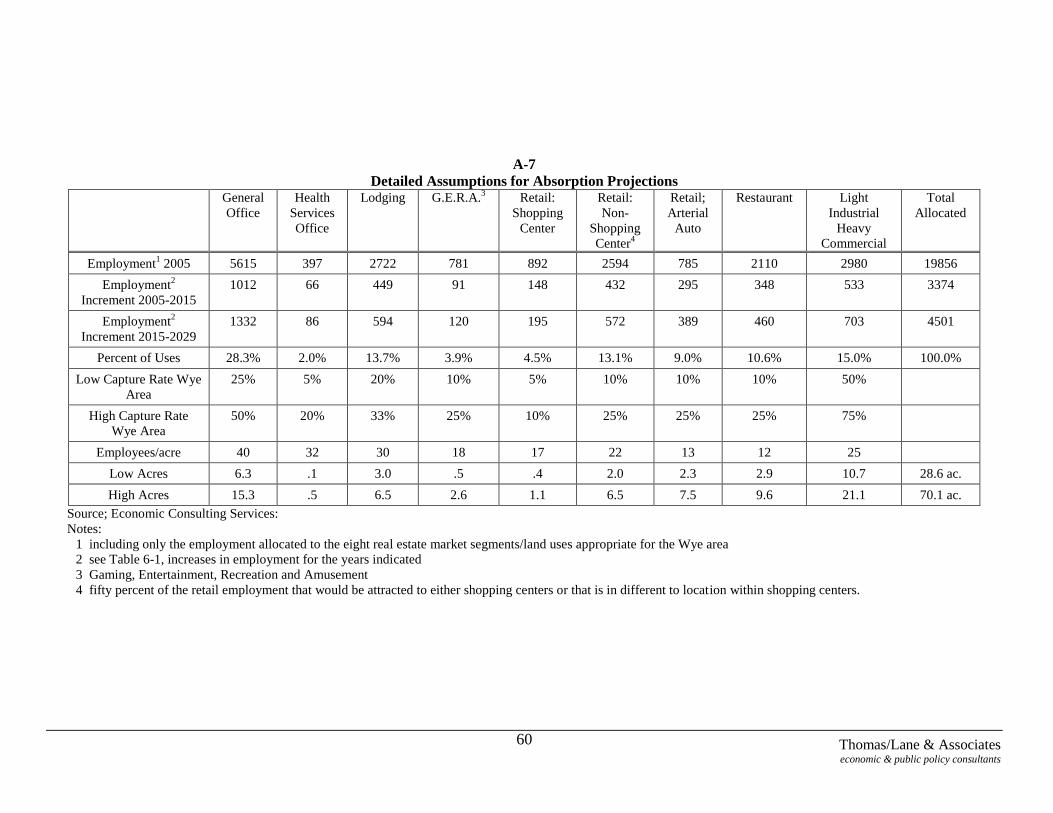
Thomas/Lane & Associates economic & public policy consultants
60
A-7
Detailed Assumptions for Absorption Projections General
Office
Health
Services
Office
Lodging G.E.R.A.3 Retail:
Shopping
Center
Retail:
Non-
Shopping
Center4
Retail;
Arterial
Auto
Restaurant Light
Industrial
Heavy
Commercial
Total
Allocated
Employment1 2005 5615 397 2722 781 892 2594 785 2110 2980 19856
Employment2
Increment 2005-2015
1012 66 449 91 148 432 295 348 533 3374
Employment2
Increment 2015-2029
1332 86 594 120 195 572 389 460 703 4501
Percent of Uses 28.3% 2.0% 13.7% 3.9% 4.5% 13.1% 9.0% 10.6% 15.0% 100.0%
Low Capture Rate Wye
Area
25% 5% 20% 10% 5% 10% 10% 10% 50%
High Capture Rate
Wye Area
50% 20% 33% 25% 10% 25% 25% 25% 75%
Employees/acre 40 32 30 18 17 22 13 12 25
Low Acres 6.3 .1 3.0 .5 .4 2.0 2.3 2.9 10.7 28.6 ac.
High Acres 15.3 .5 6.5 2.6 1.1 6.5 7.5 9.6 21.1 70.1 ac.
Source; Economic Consulting Services:
Notes:
1 including only the employment allocated to the eight real estate market segments/land uses appropriate for the Wye area
2 see Table 6-1, increases in employment for the years indicated
3 Gaming, Entertainment, Recreation and Amusement
4 fifty percent of the retail employment that would be attracted to either shopping centers or that is in different to location within shopping centers.
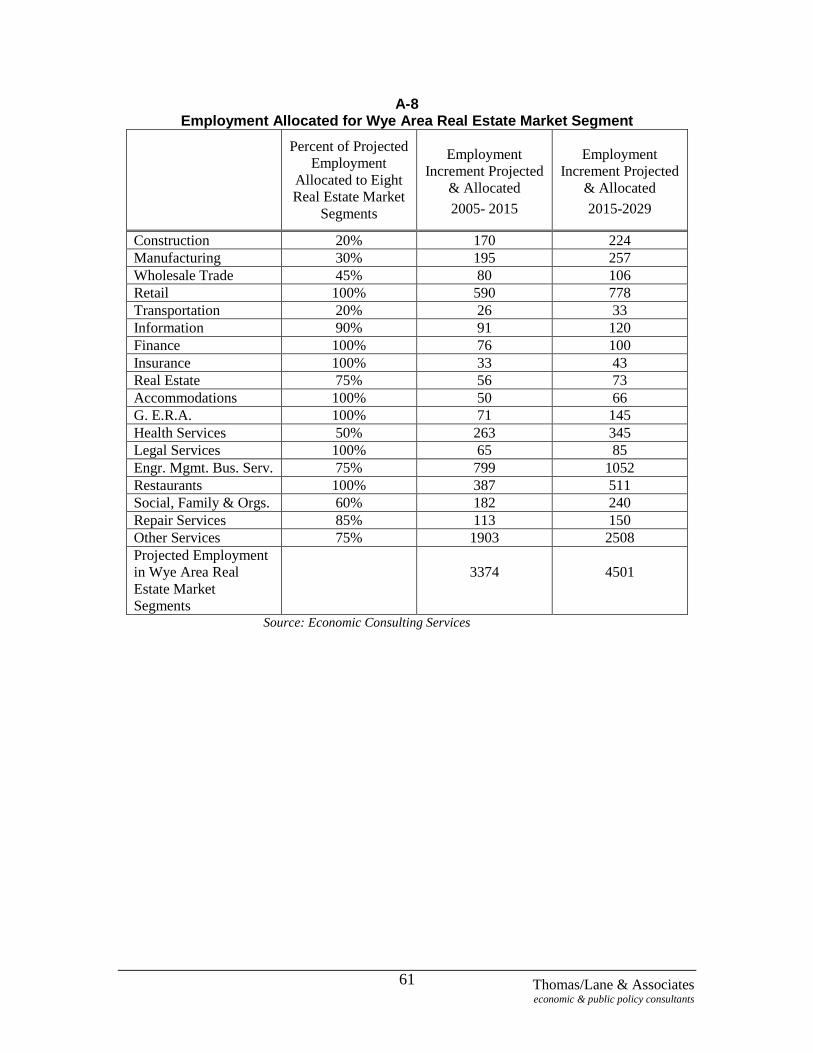
Thomas/Lane & Associates economic & public policy consultants
61
A-8 Employment Allocated for Wye Area Real Estate Market Segment
Percent of Projected
Employment
Allocated to Eight
Real Estate Market
Segments
Employment
Increment Projected
& Allocated
2005- 2015
Employment
Increment Projected
& Allocated
2015-2029
Construction 20% 170 224
Manufacturing 30% 195 257
Wholesale Trade 45% 80 106
Retail 100% 590 778
Transportation 20% 26 33
Information 90% 91 120
Finance 100% 76 100
Insurance 100% 33 43
Real Estate 75% 56 73
Accommodations 100% 50 66
G. E.R.A. 100% 71 145
Health Services 50% 263 345
Legal Services 100% 65 85
Engr. Mgmt. Bus. Serv. 75% 799 1052
Restaurants 100% 387 511
Social, Family & Orgs. 60% 182 240
Repair Services 85% 113 150
Other Services 75% 1903 2508
Projected Employment
in Wye Area Real
Estate Market
Segments
3374
4501
Source: Economic Consulting Services
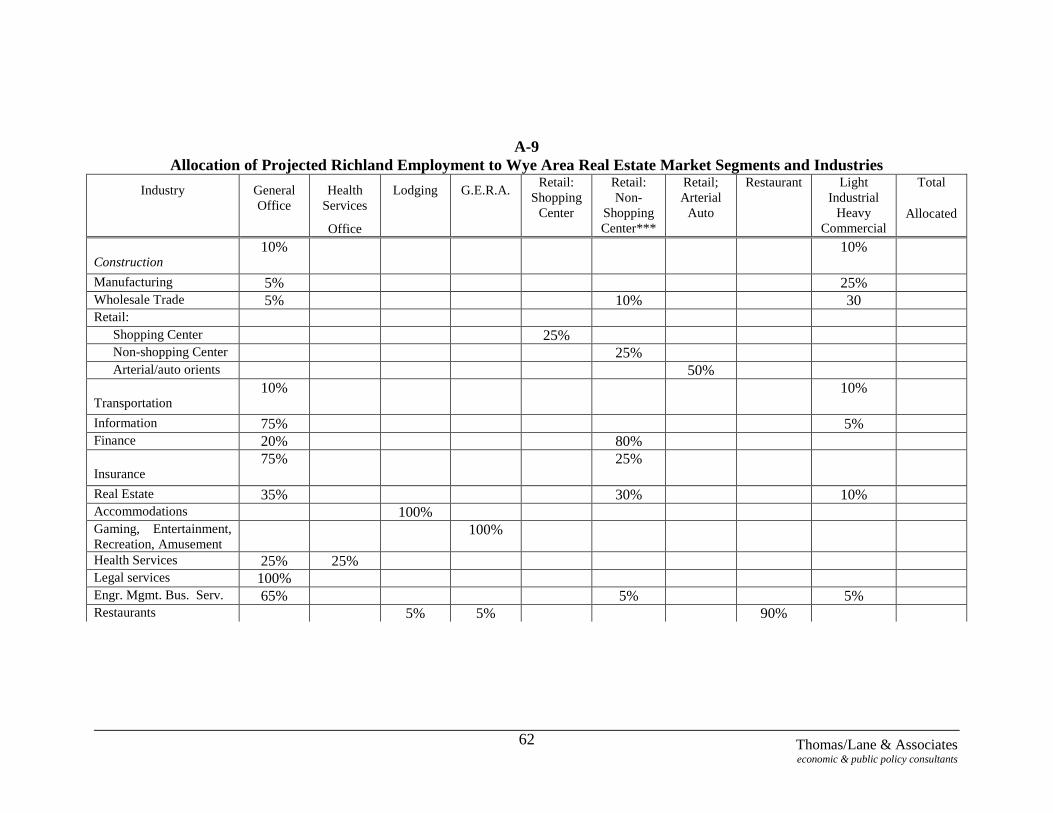
Thomas/Lane & Associates economic & public policy consultants
62
A-9
Allocation of Projected Richland Employment to Wye Area Real Estate Market Segments and Industries
Industry General
Office
Health
Services
Office
Lodging G.E.R.A. Retail:
Shopping
Center
Retail:
Non-
Shopping
Center***
Retail;
Arterial
Auto
Restaurant Light
Industrial
Heavy
Commercial
Total
Allocated
Construction 10% 10%
Manufacturing 5% 25% Wholesale Trade 5% 10% 30 Retail:
Shopping Center 25% Non-shopping Center 25% Arterial/auto orients 50%
Transportation 10% 10%
Information 75% 5% Finance 20% 80%
Insurance 75% 25%
Real Estate 35% 30% 10% Accommodations 100% Gaming, Entertainment,
Recreation, Amusement 100%
Health Services 25% 25% Legal services 100% Engr. Mgmt. Bus. Serv. 65% 5% 5% Restaurants 5% 5% 90%
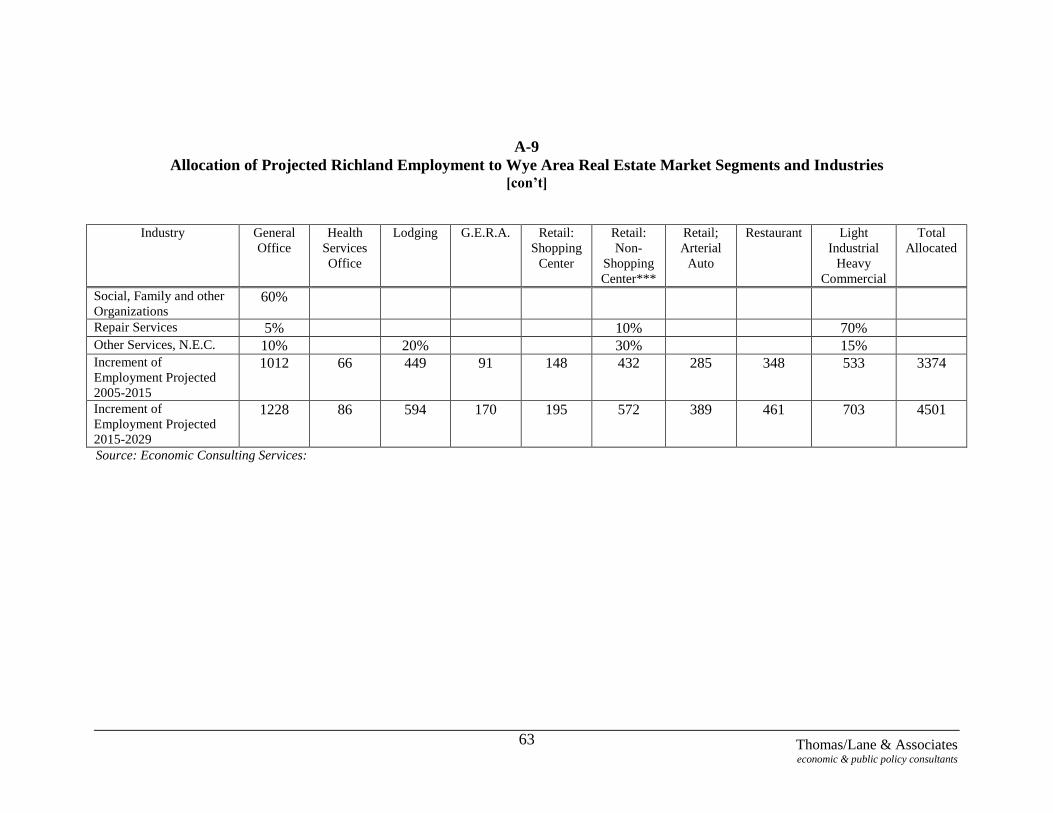
Thomas/Lane & Associates economic & public policy consultants
63
A-9
Allocation of Projected Richland Employment to Wye Area Real Estate Market Segments and Industries [con’t]
Industry General
Office
Health
Services
Office
Lodging G.E.R.A. Retail:
Shopping
Center
Retail:
Non-
Shopping
Center***
Retail;
Arterial
Auto
Restaurant Light
Industrial
Heavy
Commercial
Total
Allocated
Social, Family and other
Organizations 60%
Repair Services 5% 10% 70% Other Services, N.E.C. 10% 20% 30% 15% Increment of
Employment Projected
2005-2015
1012 66 449 91 148 432 285 348 533 3374
Increment of
Employment Projected
2015-2029
1228 86 594 170 195 572 389 461 703 4501
Source: Economic Consulting Services:
Thomas/Lane & Associates economic & public policy consultants
64
Appendix B
Technical Note on the
Calculation of Absorption
Rates
Thomas/Lane & Associates economic & public policy consultants
65
APPENDIX B
TECHNICAL NOTE ON THE CALCULATION OF ABSORPTION RATES
Appendix Table A-7 is a summary of the detailed calculations that produce the absorption amount
projected for the Wye area. Projected Richland Employment in 2005 was allocated to eight real
estate market segments that would be expected to be attracted to the Wye area. The employment
increment for the two periods: 2005-2015 and 2015-2029 were adjusted to reflect the amount that
would be appropriate for each of the eight real estate categories. The assumptions for
development densities, i.e., floor area ratios are typical for suburban locations where land prices
are typically cheaper and there are generous parking and landscaping requirement. The
employment densities are also typical for suburban areas and non-residential development. For an
example office space per employee in suburban locations is often 300-400 square feet per
employee, whereas in high-rise central business districts it is 200-250 sq. ft. per employee.
The steps used to arrive at the eight real estate market segments‘ employment allocation were the
following:
create a matrix of 164 NAICS industries by 22 OES occupational groups
the 22 occupational groups (OES numbers) were reduced to eight likely real estate market
segments:
Office: OES occupation group numbers – 11, 13, 15, 17, 23, 43
Office health services: 29, 31
Lodgings: 39
Gaming, entertainment, recreation & amusement: 27
Retail: 41
Restaurants: 25
Light industrial/heavy commercial: 19, 49, 51
[Not allocated were: OES occupation groups public sector 25, 33 and heavy
industrial 37, 45,47, 53
Percentages of employment in each segment were calculated and the 164 industries were
grouped in 22 NAICS industries for which there were projections available for the
Richland portion of the Tri-cities labor market; adjustments were made, see below
Employment increments projected for two time periods 2005-2015 and 2015-2029
The allocated projected employment were calculated for the 22 industries and eight market
segments see Appendix Table B below
The totals employment allocations were summed for each real estate market segment, see
Appendix Table C below
The projected and allocated employment totals were used as the major inputs and used in the
Appendix Table and the employment and development density assumptions were applied
to arrive at projections of land that is potentially available to the Wye area.
The percentage of each industry‘s employment that is allocated for to each of the real estate
segments is displayed in Appendix Table A-8. That table displays the percentage of each industry
reported for and projected for Richland industry that would occur in the eight real estate
categories. It displays the percentages of the total Richland employment projected and allocated
to these 22 NAICS industrial categories and real estate segments. The remainder of each
Thomas/Lane & Associates economic & public policy consultants
66
industry‘s employment was determined as inappropriate for the Wye area or not likely to locate
there. That table also includes the amount of employment in those eight categories for the two
time periods. The amount employment projected into the eight real estate segments is also
displayed by 22 industrial categories.
Appendix Table A-9 displays the percentages of each industry‘s employment that is allocated into
each of the eight real estate market segments appropriate for the Wye area. In addition the
employment that would be associated with that allocation is summed. These summed amounts for
each of the 22 industries and eight real estate market segments are the major input into the Table
A-7 that uses employment and development densities to determine projected absorption of land.
Two assumptions were made to adjust the data for a realistic allocation of projected employment
in to the real estate market segments.
The portion of the Richland ―Engineering, Management and Business Services‖ industry
employment that would be associated with remediation services, i.e. that category most
closely associated with the activities of the Hanford clean-up was not include. Real estate
professionals in the Tri-cities area regard this employment as a separate market niche.
Taking the percent of this category in the Benton County employment of 2002 and
removing it, approximately 36%, adjusted for the portion of remedial service
employment in this category of Richland‘s employment projections for 2005-2029. This
is probably an understatement, which still leaves some of this employment category in
the absorption projections, which is also probably realistic. The remainder, 64% is
allocated among the real estate segments.
1. An allocation for retail industries that tend to not locate in shopping centers was made.
Those businesses that would either locate or not into shopping centers was allocated to
this real estate segment. This amount which would locate into shopping centers or not
was then reduce by half based on the assumption that some this category would or could
locate into shopping centers but would not locate in the Wye area. There is a shopping
center in the Wye area. It could expand, increase its density or expand and that or the
appearance of a small shopping center is taken care of in the shopping center retail
category. This adjustment is aimed at that portion that would not go to shopping centers
and could be attracted to the Wye area.

Thomas/Lane & Associates economic & public policy consultants
67
Appendix C
Sources
Thomas/Lane & Associates economic & public policy consultants
68
APPENDIX C
SOURCES
Bucher, Willis & Ratliff, Wye Master Plan, (City of Richland, December, 1998).
Buxton Company, Retail Location Analysis (prepared for the Cities of Richland and Kennewick, May, 2004).
City of Richland, 2004 Annual Budget, The Challenge of Change.
City of Richland, 2004 Community Survey (Public Information Office, June, 2004).
Fitzpatrick, Clara, “Y, oh Y”, Tri-City Herald (October, 2004), pg A6.
Hopkin, Mary, “Tavern Closure Marks End of Era,” Tri-City Herald, (October 17, 2004), pg. A6.
Speakers Compendium, Tri-Cities Regional Economic Outlook Forum (TRIDEC, January, 2003).
Schau, Dean, “Show Me the Money: Growth, Strengths and the Future of the Tri-Cities Economy” (Washington State Employment Security department, January 7, 2004).
Timerica Management Company, Economic Development in the New Economy: A Strategic Plan for Richland, Washington (November, 2003).
TRIDEC, Tri-Cities Fact Sheet (Tri-City Industrial Development Council, 2004).
Washington State Employment Security Department, Employment & Payrolls in Washington State (multiple years).
Washington State Employment Security Department, Occupational Employment Statistics (multiple years).
Washington State Office of Financial Management, Long Term State Forecasts.

Thomas/Lane & Associates economic & public policy consultants
69
Appendix D
Persons Interviewed
Thomas/Lane & Associates economic & public policy consultants
70
APPENDIX D
PERSONS INTERVIEWED
Tim Arntzen Port of Kennewick
Darin K. Arrasmith City of Richland
Planning & Development Services
Wyn Birkenthal City of Richland
Parks & Recreation Department
Tim Bush Suzuki Dealership Owner
David W. Fraley Fluor Hanford
Information Resources Management
Maureen Frix Richland Chamber of Commerce
Diahann Howard City of Richland
Business & Economic Development
R. Bryan Kidder CH2M Hill
Hanford Group, Inc.
William B. King City of Richland
Deputy City Manager
Marvin J. Kinney Port of Benton
Assistant Executive Director/Airport Director
Rita Mazur City of Richland
City Councilmember
Joseph J. Schiessl City of Richland
Housing & Redevelopment
Dean Schau Washinton State Employment Security Department
Regional Economist
Jerry Schneider Fluor Hanford
Economic Diversification
Rick Simon City of Richland
Community & Development Services

Thomas/Lane & Associates economic & public policy consultants
71
Appendix E
North American Industrial
Classification System
Industries
Thomas/Lane & Associates economic & public policy consultants
72
APPENDIX E
NORTH AMERICAN INDUSTRIAL CLASSIFICATION SYSTEM INDUSTRIES
Industry Codes
Industry Titles
1100 Agriculture
1151 Support activities for crop production
2123 Nonmetallic mineral mining and quarrying
2213 Water, sewage and other systems
2361 Residential building construction
2362 Nonresidential building construction
2371 Utility system construction
2372 Land subdivision
2373 Highway, street, and bridge construction
2379 Other heavy construction
2381 Building foundation and exterior contractors
2382 Building equipment contractors
2383 Building finishing contractors
2389 Other specialty trade contractors
3111 Animal food manufacturing
3114 Fruit and vegetable preserving and specialty
3116 Animal slaughtering and processing
3118 Bakeries and tortilla manufacturing
3121 Beverage manufacturing
3212 Plywood and engineered wood product mfg.
3219 Other wood product manufacturing
3231 Printing and related support activities
3253 Agricultural chemical manufacturing
3261 Plastics product manufacturing
3323 Architectural and structural metals mfg.
3327 Machine shops and threaded product mfg.
3328 Coating, engraving, and heat treating metals
3332 Industrial machinery manufacturing
3334 HVAC and commercial refrigeration equipment
3339 Other general purpose machinery manufacturing
3345 Electronic instrument manufacturing
3363 Motor vehicle parts manufacturing
3371 Household and institutional furniture mfg.
3391 Medical equipment and supplies manufacturing
3399 Other miscellaneous manufacturing
4231 Motor vehicle and parts merchant wholesalers
4232 Furniture and furnishing merchant wholesalers
4233 Lumber and const. supply merchant wholesalers
Thomas/Lane & Associates economic & public policy consultants
73
4234 Commercial equip. merchant wholesalers
4235 Metal and mineral merchant wholesalers
4236 Electric goods merchant wholesalers
4237 Hardware and plumbing merchant wholesalers
4238 Machinery and supply merchant wholesalers
4239 Misc. durable goods merchant wholesalers
4241 Paper and paper product merchant wholesalers
4244 Grocery and Related Product Wholesalers
4245 Farm product raw material merch. whls.
4247 Petroleum merchant wholesalers
4249 Misc. nondurable goods merchant wholesalers
4251 Electronic markets and agents and brokers
4411 Automobile dealers
4412 Other motor vehicle dealers
4413 Auto parts, accessories, and tire stores
4421 Furniture stores
4422 Home furnishings stores
4431 Electronics and appliance stores
4441 Building material and supplies dealers
4442 Lawn and garden equipment and supplies stores
4451 Grocery stores
4452 Specialty food stores
4453 Beer, wine, and liquor stores
4461 Health and personal care stores
4471 Gasoline stations
4481 Clothing stores
4482 Shoe stores
4483 Jewelry, luggage, and leather goods stores
4511 Sporting goods and musical instrument stores
4512 Book, periodical, and music stores
4521 Department stores
4529 Other general merchandise stores
4531 Florists
4532 Office supplies, stationery, and gift stores
4539 Other miscellaneous store retailers
4543 Direct selling establishments
4811 Scheduled air transportation
4821 Rail transportation
4841 General freight trucking
4842 Specialized freight trucking
4881 Support activities for air transportation
4884 Support activities for road transportation
4885 Freight transportation arrangement
4921 Couriers
4931 Warehousing and storage

Thomas/Lane & Associates economic & public policy consultants
74
5111 Newspaper, book, and directory publishers
5112 Software publishers
5121 Motion picture and video industries
5151 Radio and television broadcasting
5172 Wireless telecommunications carriers
5173 Telecommunications resellers
5181 ISPs and web search portals
5221 Depository credit intermediation
5222 Nondepository credit intermediation
5223 Activities related to credit intermediation
5231 Securities and commodity contracts brokerage
5239 Other financial investment activities
5241 Insurance carriers
5242 Insurance agencies, brokerages, and related
5311 Lessors of real estate
5312 Offices of real estate agents and brokers
5313 Activities related to real estate
5321 Automotive equipment rental and leasing
5322 Consumer goods rental
5323 General rental centers
5324 Machinery and equipment rental and leasing
5411 Legal services
5412 Accounting and bookkeeping services
5413 Architectural and engineering services
5414 Specialized design services
5415 Computer systems design and related services
5416 Management and technical consulting services
5418 Advertising and related services
5419 Other professional and technical services
5511 Management of companies and enterprises
5611 Office administrative services
5613 Employment services
5614 Business support services
5615 Travel arrangement and reservation services
5616 Investigation and security services
5617 Services to buildings and dwellings
5619 Other support services
5629 Remediation and other waste services
6110 Educational Services
6211 Offices of physicians
6212 Offices of dentists
6213 Offices of other health practitioners
6214 Outpatient care centers
6215 Medical and diagnostic laboratories
6216 Home health care services
Thomas/Lane & Associates economic & public policy consultants
75
6219 Other ambulatory health care services
6221 General medical and surgical hospitals
6231 Nursing care facilities
6232 Residential mental health facilities
6233 Community care facilities for the elderly
6241 Individual and family services
6242 Emergency and other relief services
6243 Vocational rehabilitation services
6244 Child day care services
7112 Spectator sports
7115 Independent artists, writers, and performers
7121 Museums, historical sites, zoos, and parks
7132 Gambling industries
7139 Other amusement and recreation industries
7211 Traveler accommodation
7212 RV parks and recreational camps
7221 Full-service restaurants
7222 Limited-service eating places
7223 Special food services
7224 Drinking places, alcoholic beverages
8111 Automotive repair and maintenance
8112 Electronic equipment repair and maintenance
8113 Commercial machinery repair and maintenance
8114 Household goods repair and maintenance
8121 Personal care services
8122 Death care services
8123 Drycleaning and laundry services
8129 Other personal services
8132 Grantmaking and giving services
8133 Social advocacy organizations
8134 Civic and social organizations
8139 Professional and similar organizations
8141 Private households