Optical Biosensors for the Detection of Rheumatoid Arthritis ...
Upload
khangminh22Category
view
0download
0
Page 1 of 275
Upadacitinib for treating moderate to severe rheumatoid arthritis [ID1400]
A Single Technology Appraisal
Produced by Peninsula Technology Assessment Group (PenTAG) University of Exeter Medical School South Cloisters St Luke’s Campus Heavitree Road Exeter EX1 2LU
Authors Dr Max Barnish, Research Fellow1
Dr Ewen Cummins, Health Economist2
Dr Helen Coelho, Research Fellow1 Dr Rhona Johnston, Computer Programmer2 Mr David Packman, Research Assistant1
Ms Naomi Shaw, Information Specialist1
Dr Richard C Haigh, Consultant Rheumatologist3
Ms Louise Crathorne, Senior Research Fellow1
Prof G.J. Melendez-Torres, Professor of Clinical and Social Epidemiology1 1 Peninsula Technology Assessment Group (PenTAG), University of Exeter Medical School, Exeter 2 McMDC Ltd, Harrogate 3 Royal Devon and Exeter Hospital, Exeter
Correspondence to Dr Max Barnish 3.09f South Cloisters, St Luke’s Campus, Heavitree Road, Exeter, EX1 2LU; [email protected]
Date completed 10/09/2019
Source of funding This report was commissioned by the NIHR Systematic Reviews Programme as project number 12/82/32.
Copyright 2019 Queen's Printer and Controller of HMSO. All rights reserved
Page 2 of 275
Declared competing interests of the authors
Dr Richard C. Haigh declares that Pfizer (manufacturer of tofacitinib, a drug in the same class as upadacitinib) provided an educational grant to cover the registration fee to attend the British Society for Rheumatology Conference 2019. No other authors declare any competing interests.
Rider on responsibility for document
The views expressed in this report are those of the authors and not necessarily those of the NIHR SR Programme. Any errors are the responsibility of the authors. The ERG noted that the elements of the model which are programmed in visual basic should be treated as a “black box” and as such the ERG was not able to parse the programming accuracy of these elements of the electronic model (discussed with NICE July 2019). However, the ERG will cross validate model outputs with the ERG model from TA375.
This report should be referenced as follows
Barnish M, Cummins E, Coelho H, Johnston R, Packman D, Shaw N, Haigh RC, Crathorne L, Melendez-Torres GJ. 0BUpadacitinib for treating moderate to severe rheumatoid arthritis [ID1400]: A Single Technology Appraisal. Peninsula Technology Assessment Group (PenTAG), 2019.
Copyright © 2019 PenTAG, University of Exeter
Copyright 2019 Queen's Printer and Controller of HMSO. All rights reserved

Page 3 of 275
Contents
Upadacitinib for treating moderate to severe rheumatoid arthritis [ID1400] ..................... 1
Contents ......................................................................................................................... 3
List of tables .................................................................................................................... 7
List of figures ................................................................................................................ 12
Abbreviations ................................................................................................................ 13
1 Summary ............................................................................................................... 17
Critique of the decision problem in the company submission .......................... 17
Summary of clinical effectiveness evidence submitted by the company .......... 18
Summary of the ERG’s critique of the clinical effectiveness evidence submitted 20
Summary of cost-effectiveness evidence submitted by the company .............. 22
Summary of the ERG’s critique of the cost-effectiveness evidence submitted . 25
ERG commentary on the robustness of evidence submitted by the company . 28
1.6.1 Strengths ................................................................................................. 28
1.6.2 Weaknesses ............................................................................................ 28
1.6.3 Areas of uncertainty ................................................................................. 29
Summary of exploratory and sensitivity analyses undertaken by the ERG ...... 30
2 Background ............................................................................................................ 32
Critique of company’s description of underlying health problem ...................... 32
Critique of company’s overview of current service provision ........................... 32
3 Critique of company’s definition of decision problem .............................................. 35
Population ....................................................................................................... 35
Intervention ..................................................................................................... 35
Comparators ................................................................................................... 36
Outcomes ....................................................................................................... 37
Other relevant factors ..................................................................................... 37
4 Clinical effectiveness ............................................................................................. 39
Critique of the methods of review(s) ................................................................ 39
4.1.1 Searches ................................................................................................. 39
4.1.2 Inclusion criteria ....................................................................................... 41
4.1.3 Critique of screening and data extraction processes ................................ 44
4.1.4 Quality assessment.................................................................................. 44
4.1.5 Evidence synthesis .................................................................................. 45
Critique of trials of the technology of interest, their analysis and interpretation (and any standard meta-analyses of these) ............................................................... 45
Copyright 2019 Queen's Printer and Controller of HMSO. All rights reserved

Page 4 of 275
4.2.1 Excluded studies ...................................................................................... 45
4.2.2 Included studies ....................................................................................... 47
4.2.3 Quality assessment.................................................................................. 74
4.2.4 Clinical effectiveness of the technology of interest ................................... 76
4.2.5 Results of any standard meta-analyses of upadacitinib studies ............... 92
4.2.6 Applicability to clinical practice ................................................................. 92
4.2.7 Safety of UPA .......................................................................................... 93
Critique of trials identified and included in the indirect comparison and/or multiple treatment comparison ................................................................................. 103
4.3.1 Search strategy ...................................................................................... 103
4.3.2 Feasibility assessment ........................................................................... 104
4.3.3 Study selection criteria ........................................................................... 104
4.3.4 Included studies ..................................................................................... 107
4.3.5 Quality assessment of studies included in network meta-analysis.......... 126
Critique of the indirect comparison and/or multiple treatment comparison ..... 128
4.4.1 Summary of analyses undertaken .......................................................... 128
4.4.2 Critique of network meta-analysis assumptions ..................................... 130
4.4.3 Correspondence to NICE scope population ........................................... 131
4.4.4 Results of network meta-analysis ........................................................... 132
4.4.5 Overall comment on network meta-analysis ........................................... 141
Additional work on clinical effectiveness undertaken by the ERG .................. 141
4.5.1 Additional searches undertaken by the ERG .......................................... 141
4.5.2 Additional work on network meta-analysis undertaken by the ERG ........ 144
Conclusions of the clinical effectiveness section ........................................... 151
5 Cost-effectiveness ............................................................................................... 153
ERG comment on companies review of cost-effectiveness evidence ............ 153
5.1.1 Objective ................................................................................................ 153
5.1.2 Search strategy ...................................................................................... 153
5.1.3 Inclusion/exclusion criteria ..................................................................... 154
5.1.4 Results................................................................................................... 156
5.1.5 Conclusions ........................................................................................... 157
Summary of company’s submitted economic evaluation ............................... 157
5.2.1 NICE reference case checklist ............................................................... 158
5.2.2 Model structure ...................................................................................... 160
5.2.3 Population .............................................................................................. 162
5.2.4 Interventions and comparators ............................................................... 163
Copyright 2019 Queen's Printer and Controller of HMSO. All rights reserved

Page 5 of 275
5.2.5 Perspective, time horizon and discounting ............................................. 169
5.2.6 Treatment effectiveness and extrapolation ............................................. 169
5.2.7 Health related quality of life .................................................................... 175
5.2.8 Resources and costs ............................................................................. 175
5.2.9 Cost effectiveness results ...................................................................... 179
5.2.10 Sensitivity analyses................................................................................ 188
5.2.11 Model validation and face validity check ................................................ 189
ERG cross check and critique ....................................................................... 191
5.3.1 Base case results .................................................................................. 191
5.3.2 Data Inputs: Correspondence of written submission with sources cited . 191
5.3.3 Data Inputs: Correspondence of written submission with electronic model 194
5.3.4 ERG commentary on model structure, assumptions and data inputs ..... 195
Exploratory and sensitivity analyses undertaken by the ERG ........................ 215
5.4.1 ERG preferred treatment sequences: UPA+MTX vs UPA ...................... 215
5.4.2 ERG treatment sequences for modelling moderate RA patients............. 216
5.4.3 ERG treatment sequences for modelling severe RA patients ................. 222
5.4.4 ERG model revisions ............................................................................. 222
5.4.5 ERG Sensitivity analyses ....................................................................... 223
5.4.6 ERG modelling results: Position 2a: Moderate RA: MTX intolerant, RTX tolerant, failed ≥2 csDMARDs .............................................................................. 224
5.4.7 ERG modelling results: Position 2b: Moderate RA: MTX tolerant, RTX tolerant, failed ≥2 csDMARDs .............................................................................. 226
5.4.8 ERG modelling results: Position 2c: Moderate RA: MTX intolerant, RTX intolerant, failed ≥2 csDMARDs ........................................................................... 228
5.4.9 ERG modelling results: Position 3a: Severe RA, MTX intolerant, RTX tolerant, failed ≥2 csDMARDs .............................................................................. 230
5.4.10 ERG modelling results: Position 3b: Severe RA, MTX tolerant, RTX tolerant, failed ≥2 csDMARDs .............................................................................. 230
5.4.11 ERG modelling results: Position 4b: Severe RA, MTX tolerant, RTX intolerant, failed one bDMARD ............................................................................. 231
5.4.12 ERG modelling results: Position 5: Severe RA, MTX tolerant, RTX tolerant, failed one bDMARD ............................................................................................. 232
5.4.13 ERG modelling results: Position 6: Severe RA, MTX tolerant, RTX tolerant, failed RTX ............................................................................................................ 232
Conclusions of the cost-effectiveness section ............................................... 233
6 Impact on the ICER of additional clinical and economic analyses undertaken by the ERG ............................................................................................................................ 236
7 End of life ............................................................................................................. 238
Copyright 2019 Queen's Printer and Controller of HMSO. All rights reserved

Page 6 of 275
8 Overall conclusions .............................................................................................. 239
Implications for research ............................................................................... 239
Acknowledgements ..................................................................................................... 241
References ................................................................................................................. 242
Appendix 1. Additional searches undertaken by the ERG ........................................... 271
Appendix 2. Health utilities and costs searches........................................................... 275
Copyright 2019 Queen's Printer and Controller of HMSO. All rights reserved

Page 7 of 275
List of tables Table 1. Comparators by position in treatment pathway ................................................ 36 Table 2: Eligibility criteria for clinical review ................................................................... 41 Table 3. Overview of pivotal clinical effectiveness studies ............................................. 48 Table 4. Comparative summary of trial methodology .................................................... 52 Table 5. Hypothesis and associated statistical analysis for each trial ............................ 59 Table 6. Baseline characteristics of trial populations ..................................................... 62 Table 7. Baseline characteristics of moderate trial population ....................................... 65 Table 8. Baseline characteristics of severe trial population ........................................... 69 Table 9. QA for the four pivotal trials ............................................................................. 75 Table 10. Summary of clinical effectiveness results for SELECT-COMPARE ............... 77 Table 11. Summary of clinical effectiveness results for SELECT-NEXT ........................ 80 Table 12. Least squared mean (LSM) changes from baseline and percentage of responders for MCID and for normative values at Week 12 after UPA initiation ............ 83 Table 13. Summary of clinical effectiveness results for SELECT-BEYOND .................. 84 Table 14. Summary of clinical effectiveness results for SELECT-MONOTHERAPY ...... 85 Table 15. Baseline characteristics and efficacy outcomes for the moderate RA subgroup across all four registration trials ..................................................................................... 90 Table 16. Baseline characteristics and efficacy outcomes for the severe RA subgroup across all four registration trials ..................................................................................... 91 Table 17. Summary of key safety events from SELECT-COMPARE ............................. 94 Table 18. Summary of key safety events from SELECT-MONOTHERAPY ................... 95 Table 19. Summary of key safety events from SELECT-NEXT ..................................... 97 Table 20. Summary of key safety events from SELECT-BEYOND .............................. 101 Table 21. Study details of all studies included in the NMA (csDMARD-experienced population) .................................................................................................................. 109 Table 22. Study details of all studies included in the NMA (bDMARD-experienced population) .................................................................................................................. 123 Table 23. Critique of the QA for the randomly selected trials ....................................... 127 Table 24. Estimates of ACR treatment effect in csDMARD-experienced population at six months ........................................................................................................................ 134 Table 25. Estimates of EULAR treatment effect in csDMARD-experienced population at six months ................................................................................................................... 136 Table 26. Estimates of ACR treatment effect in bDMARD-experienced population at six months ........................................................................................................................ 139 Table 27. Estimates of EULAR treatment effect in bDMARD-experienced population at six months ................................................................................................................... 140 Table 28. Estimates of ACR treatment effect in csDMARD-experienced population at six months, excluding SELECT-SUNRISE ....................................................................... 142
Copyright 2019 Queen's Printer and Controller of HMSO. All rights reserved

Page 8 of 275
Table 29. Estimates of EULAR treatment effect in csDMARD-experienced population at six months, excluding SELECT-SUNRISE .................................................................. 143 Table 30. Corrected patient demographics and baseline characteristics of studies included in the NMA (bDMARD-experienced population) ............................................ 145 Table 31. Corrected ACR response rate at 12-16-week follow-up (bDMARD-experienced population) .................................................................................................................. 148 Table 32. Corrected ACR response rate at 18-30-week follow-up (bDMARD-experienced population) .................................................................................................................. 149 Table 33. Eligibility criteria for review of cost-effectiveness studies ............................. 154 Table 34. NICE reference case checklist ..................................................................... 158 Table 35. Patient baseline characteristics ................................................................... 162 Table 36. Sequence: 1a: Moderate RA: MTX intolerant, RTX tolerant, failed one csDMARD: Among moderate patients ......................................................................... 163 Table 37. Sequence: 1a: Moderate RA: MTX intolerant, RTX tolerant, failed one csDMARD: Among patients who have progressed to severe ...................................... 163 Table 38. Sequence: 1b: Moderate RA: MTX tolerant, RTX tolerant, failed one csDMARD: Among moderate patients ......................................................................... 164 Table 39. Sequence: 1b: Moderate RA: MTX tolerant, RTX tolerant, failed one csDMARD: Among patients who have progressed to severe ...................................... 164 Table 40. Sequence: 2a: Moderate RA: MTX intolerant, RTX tolerant, failed ≥2 csDMARD: Among moderate patients ......................................................................... 164 Table 41. Sequence: 2a: Moderate RA: MTX intolerant, RTX tolerant, failed ≥2 csDMARDs: Among patients who have progressed to severe ..................................... 165 Table 42. Sequence: 2b: Moderate RA: MTX tolerant, RTX tolerant, failed ≥2 csDMARDs: Among moderate patients ....................................................................... 165 Table 43. Sequence: 2b: Moderate RA: MTX tolerant, RTX tolerant, failed ≥2 csDMARDs: Among patients who have progressed to severe ..................................... 165 Table 44. Sequence: 3a: Severe RA: MTX intolerant, RTX tolerant, failed ≥2 csDMARDs ................................................................................................................................... 166 Table 45. Sequence: 3b: Severe RA: MTX tolerant, RTX tolerant, failed ≥2 csDMARDs ................................................................................................................................... 166 Table 46. Sequence: 4a: Severe RA: MTX intolerant, RTX tolerant, failed one bDMARD ................................................................................................................................... 167 Table 47. Sequence: 4b: Severe RA: MTX tolerant, RTX intolerant, failed one bDMARD ................................................................................................................................... 168 Table 48. Sequence: 5: Severe RA: MTX tolerant, RTX tolerant, failed one bDMARD 168 Table 49. Sequence: 6: Severe RA: MTX tolerant, RTX tolerant, failed RTX ............... 169 Table 50. Mean EULAR response rates ...................................................................... 170 Table 51. EULAR responses relationship with HAQ changes ...................................... 171 Table 52. ∆DAS-28 from baseline as a function of ∆HAQ from baseline ..................... 173 Table 53. Baseline HAQ and mortality hazard ratios ................................................... 174 Table 54. Direct drug and administration costs: bDMARDs ......................................... 177
Copyright 2019 Queen's Printer and Controller of HMSO. All rights reserved

Page 9 of 275
Table 55. Inpatient costs as a function of HAQ............................................................ 178 Table 56. Monitoring costs .......................................................................................... 178 Table 57. Position 1a: Moderate RA, MTX intolerant, RTX tolerant, failed one csDMARD ................................................................................................................................... 180 Table 58. Position 1b: Moderate RA, MTX tolerant, RTX tolerant, failed one csDMARD ................................................................................................................................... 180 Table 59. Position 2a: Moderate RA, MTX intolerant, RTX tolerant, failed ≥2 csDMARDs ................................................................................................................................... 181 Table 60. Position 2b: Moderate RA, MTX tolerant, RTX tolerant, failed ≥2 csDMARDs ................................................................................................................................... 182 Table 61. Position 3a: Severe RA, MTX intolerant, RTX tolerant, failed ≥2 csDMARDs ................................................................................................................................... 182 Table 62. Position 3b: Severe RA, MTX tolerant, RTX tolerant, failed ≥2 csDMARDs . 183 Table 63. Position 4a: Severe RA, MTX intolerant, RTX tolerant, failed one bDMARD 184 Table 64. Position 4b: Severe RA, MTX tolerant, RTX intolerant, failed one bDMARD 185 Table 65. Position 5: Severe RA, MTX tolerant, RTX tolerant, failed one bDMARD .... 186 Table 66. Position 6: Severe RA, MTX tolerant, RTX tolerant, failed RTX ................... 188 Table 67. Model validation vs TA375 model: severe RA bDMARDs vs MTX ICERs .... 190 Table 68. Model validation vs TA375 model: moderate RA ADA+MTX vs MTX ICERs 190 Table 69. Position 5: Severe RA, MTX tolerant, RTX tolerant, failed one bDMARD: ERG cross check ................................................................................................................. 191 Table 70. Position 2b: Moderate RA, MTX eligible, failed ≥2 csDMARDs: Effect of transfer to severe RA .................................................................................................. 198 Table 71. Position 2b: Moderate RA, MTX eligible, failed ≥2 csDMARDs: Effect of including the intercept term of the ∆ HAQ to ∆ DAS analysis ....................................... 199
Table 72. Not differentiating responses by bDMARD experience ................................ 204 Table 73. Differentiating responses by bDMARD experience ...................................... 204 Table 74. SELECT trials: Control arm ACR response rates......................................... 205 Table 75. Sequence: 2a: Moderate RA: MTX intolerant, RTX tolerant, failed ≥2 csDMARD: Among moderate patients ......................................................................... 205 Table 76. EULAR response rates: SELECT-COMPARE vs model .............................. 206 Table 77. EULAR response rates: SELECT csDMARD-IR trials mapping vs model .... 207 Table 78. SELECT trials: Control arm ACR responses over time ................................ 209 Table 79. SELECT-COMPARE rescue treatment by arm ............................................ 210 Table 80. Sequence 1b: Moderate RA, one csDMARD fail, MTX tolerant ................... 210 Table 81. Modified sequence 1b: Moderate RA, one csDMARD fail, MTX tolerant ...... 212 Table 82. Modified sequence 3a: Severe RA, ≥2 csDMARD fail, MTX intolerant ......... 213 Table 83. ERG Position: 2a: Moderate RA: MTX intolerant, RTX tolerant, failed ≥2 csDMARDs: Among moderate RA patients ................................................................. 217 Table 84. ERG Position: 2a: Moderate RA: MTX intolerant, RTX tolerant, failed ≥2 csDMARDs: Among patients who have progressed to severe ..................................... 217
Copyright 2019 Queen's Printer and Controller of HMSO. All rights reserved

Page 10 of 275
Table 85. ERG Position: 2a: Moderate RA: MTX intolerant, RTX tolerant, failed ≥2 csDMARDs: Among patients who have progressed to severe: Scenario 01 ................ 217 Table 86. ERG Position: 2a: Moderate RA: MTX intolerant, RTX tolerant, failed ≥2 csDMARDs: Among patients who have progressed to severe: Scenario 02 ................ 218 Table 87. ERG Position: 2a: Moderate RA: MTX intolerant, RTX tolerant, failed ≥2 csDMARDs: Among patients who have progressed to severe RA: Scenario 04 .......... 218 Table 88. ERG Position: 2b: Moderate RA: MTX tolerant, RTX tolerant, failed ≥2 csDMARDs: Among moderate patients ....................................................................... 219 Table 89. ERG Position: 2b: Moderate RA: MTX tolerant, RTX tolerant, failed ≥2 csDMARDs: Among patients who have progressed to severe RA ............................... 219 Table 90. ERG Position: 2b: Moderate RA: MTX tolerant, RTX tolerant, failed ≥2 csDMARDs: Among patients who have progressed to severe RA: Scenario 01 .......... 219 Table 91. ERG Position: 2b: Moderate RA: MTX tolerant, RTX tolerant, failed ≥2 csDMARDs: Among patients who have progressed to severe RA: Scenario 02 .......... 220 Table 92. ERG Position: 2b: Moderate RA: MTX tolerant, RTX tolerant, failed ≥2 csDMARDs: Among patients who have progressed to severe RA: Scenario 04 .......... 220 Table 93. ERG Seq: 2c: Moderate RA: MTX intolerant, RTX intolerant, failed ≥2 csDMARDs: Among moderate patients ....................................................................... 221 Table 94. Sequence: 2c: Moderate RA: MTX intolerant, RTX intolerant, failed ≥2 csDMARDs: Among patients who have progressed to severe RA ............................... 221 Table 95. Sequence: 2c: Moderate RA: MTX intolerant, RTX intolerant, failed ≥2 csDMARDs: Among patients who have progressed to severe RA: Scenario 01 .......... 221 Table 96. Sequence: 2c: Moderate RA: MTX intolerant, RTX intolerant, failed ≥2 csDMARDs: Among patients who have progressed to severe RA: Scenario 02 .......... 221 Table 97. ERG Position: 2c: Moderate RA: MTX intolerant, RTX intolerant, failed ≥2 csDMARDs: Among patients who have progressed to severe RA: Scenario 04 .......... 222 Table 98. ERG base case: Position 2a vs csDMARDs: Moderate RA: MTX intolerant, RTX tolerant, failed ≥2 csDMARDs ............................................................................. 225 Table 99. ERG base case: Position 2a vs PBO / BSC: Moderate RA: MTX intolerant, RTX tolerant, failed ≥2 csDMARDs ............................................................................. 225 Table 100. ERG scenario analyses: Position 2a vs csDMARDs: Moderate RA: MTX intolerant, RTX tolerant, failed ≥2 csDMARDs ............................................................. 225 Table 101. ERG scenario analyses: Position 2a vs PBO / BSC: Moderate RA: MTX intolerant, RTX tolerant, failed ≥2 csDMARDs ............................................................. 226 Table 102. ERG base case: Position 2b vs csDMARDs: Moderate RA: MTX tolerant, RTX tolerant, failed ≥2 csDMARDs ............................................................................. 226 Table 103. ERG base case: Position 2b vs PBO / BSC: Moderate RA: MTX tolerant, RTX tolerant, failed ≥2 csDMARDs ..................................................................................... 227 Table 104. ERG scenario analyses: Position 2b vs csDMARDs: Moderate RA: MTX tolerant, RTX tolerant, failed ≥2 csDMARDs ............................................................... 227 Table 105. ERG scenario analyses: Position 2b vs PBO / BSC: Moderate RA: MTX tolerant, RTX tolerant, failed ≥2 csDMARDs ............................................................... 227 Table 106. ERG base case: Position 2c vs csDMARDs: Moderate RA: MTX intolerant, RTX intolerant, failed ≥2 csDMARDs .......................................................................... 228
Copyright 2019 Queen's Printer and Controller of HMSO. All rights reserved

Page 11 of 275
Table 107. ERG base case: Position 2c vs PBO / BSC: Moderate RA: MTX intolerant, RTX intolerant, failed ≥2 csDMARDs .......................................................................... 228 Table 108. ERG scenario analyses: Position 2c vs csDMARDs: Moderate RA: MTX intolerant, RTX intolerant, failed ≥2 csDMARDs .......................................................... 229 Table 109. ERG scenario analyses: Position 2c vs PBO / BSC: Moderate RA: MTX intolerant, RTX intolerant, failed ≥2 csDMARDs .......................................................... 229 Table 110. ERG modelling: Position 3a: Severe RA, MTX intolerant, RTX tolerant, failed ≥2 csDMARDs ............................................................................................................ 230 Table 111. ERG modelling: Position 3b: Severe RA, MTX tolerant, RTX tolerant, failed ≥2 csDMARDs ................................................................................................................. 230 Table 112. ERG modelling: Position 4b: Severe RA, MTX tolerant, RTX intolerant, failed one bDMARD .............................................................................................................. 231 Table 113. ERG modelling: Position 5: Severe RA, MTX tolerant, RTX tolerant, failed one bDMARD .............................................................................................................. 232 Table 114. ERG modelling: Position 6: Severe RA, MTX tolerant, RTX tolerant, failed RTX ............................................................................................................................ 232
Copyright 2019 Queen's Printer and Controller of HMSO. All rights reserved

Page 12 of 275
List of figures Figure 1. Positioning of UPA within the existing NICE pathway ..................................... 33 Figure 2. PRISMA flow diagram for updated clinical effectiveness searches ................. 46 Figure 3. ACR response rates at Week 12 in SELECT-COMPARE ............................... 78 Figure 4. Clinical remission and LDA at Week 12 in SELECT-COMPARE .................... 79 Figure 5. ACR response rates at Week 12 in SELECT-NEXT ....................................... 81 Figure 6. Clinical remission and LDA at Week 12 in SELECT-NEXT†,a,b ........................ 82 Figure 7. ACR response rates at Week 12 in SELECT-MONOTHERAPY†.................... 86 Figure 8. Model structure ............................................................................................ 161 Figure 9. Treatment cessation curve: Moderate RA .................................................... 172 Figure 10. Treatment cessation curve: Severe RA ...................................................... 172 Figure 11. TA375 and company HAQ score related inpatient costs (2018 prices) ....... 194 Figure 12. Company HAQ to pain function and TA375 HAQ to pain data .................... 196 Figure 13. Company and TA375 HAQ to QoL functions .............................................. 197
Copyright 2019 Queen's Printer and Controller of HMSO. All rights reserved

Page 13 of 275
Abbreviations
ABT abatacept
ACR American College of Rheumatology
ADA adalimumab
AEs adverse events
AIC Akaike information criterion
AIMS Arthritis Impact Measurement Scales
bDMARD biologic disease-modifying antirheumatic drugs
BIC Bayesian information criterion
BID twice-daily
BIW twice-weekly
BRC baricitinib
BSC best supportive care
BSRBR British Society of Rheumatology Biologics Register
CDAI clinical disease activity index
CMU Commercial Medicines Unit
cPAS comparator patient access scheme
CPK creatine phosphokinase
CR complete response
CrI credible interval
CRP C-reactive protein
CS company submission
csDMARDs conventional synthetic disease-modifying antirheumatic drugs
CSR clinical study report
CT controlled trial
CTZ certolizumab pegol
DAS-28 disease activity score 28-joint count
DB double blind
DIC deviance information criterion
DMARDs disease-modifying antirheumatic drugs
E events
EAER exposure adjusted event rates
EAIR exposure adjusted incidence rates
EMA European Medicines Agency
EOW every other week
EPAR European public assessment report
EQ-5D-3L three-level EuroQol five dimension
EQ-5D-5L five-level EuroQol five dimension
ERG Evidence Review Group
Copyright 2019 Queen's Printer and Controller of HMSO. All rights reserved

Page 14 of 275
ERG Evidence Review Group
ESR erythrocyte sedimentation rate
ETN etanercept
EU European
EULAR European League Against Rheumatism
FACIT-F Functional Assessment of Chronic Illness Therapy - Fatigue
FAD final appraisal determination
FAS full analysis set
g gram
GOL golimumab
HAQ-DI health assessment questionnaire disability index
HCHS hospital and community health services
HCQ hydroxychloroquine
HRQoL health-related quality of life
HTA health technology assessment
ICER incremental cost-effectiveness ratio
IFX infliximab
IL-1/6 interleukin-1/6
Increm. incremental
IQR interquartile range
ITT intention to treat
IV intravenous
JAK Janus kinase
kg kilogram
KM Kaplan-Meier
LDA low disease activity
LOCF last observation carried forward
M median
MACE major adverse cardiac event
MACTAR McMaster Toronto Arthritis patient preference questionnaire
mg milligram
mITT modified intention to treat
MJS morning joint stiffness
MTX methotrexate
NA not applicable
NG NICE guideline
NHS National Health Service
NICE National Institute for Health and Care Excellence
NMA network meta-analysis
Copyright 2019 Queen's Printer and Controller of HMSO. All rights reserved

Page 15 of 275
NR Not reported
NRI non-responder imputation
OL open-label
PAS patient access scheme
PASLU Patient Access Schemes Liaison Unit
PBO placebo
PC placebo-controlled
PG parallel group
PICOS population, interventions, comparators, outcomes, and study design
PRISMA Preferred Reporting Items for Systematic Reviews and Meta-Analyses PSSRU Personal Social Services Research Unit
PYs person years
QA quality assessment
QALYs quality-adjusted life years
QD once-daily
QW once weekly
qXw every x weeks
RA rheumatoid arthritis
RCT randomised controlled trial
RTX rituximab
SAEs serious adverse events
SB single blind
SC subcutaneous
SD standard deviation
SDAI simple disease activity index
SE standard error
SF-36 36-item short form survey
SJC swollen joint count
SJC swollen joint count
SLR systematic literature review
SmPC summary of product characteristics
SOPs standard operating procedures
SRK sirukumab,
SRL sarilumab
STA single technology appraisal
SUCRA surface under the cumulative ranking curve
TA technology appraisal
TCZ tocilizumab
TE treatment emergent
Copyright 2019 Queen's Printer and Controller of HMSO. All rights reserved

Page 16 of 275
TEAEs treatment emergent adverse events
TFC tofacitinib
TJC tender joint count
TNF-alpha tumour necrosis factor alpha
Trt treatment
tsDMARDs targeted synthetic disease-modifying antirheumatic drugs
UPA upadacitinib
VAS visual analogue scale
vs versus
WPAI-RA work productivity and activity impairment questionnaire: rheumatoid arthritis
Copyright 2019 Queen's Printer and Controller of HMSO. All rights reserved

Page 17 of 275
1 Summary
Critique of the decision problem in the company submission
The National Institute for Health and Care Excellence (NICE) final scope for TA1400
defines the population of interest as adults with moderate to severe rheumatoid arthritis
(RA) who have responded inadequately to one or more disease-modifying antirheumatic
drugs (DMARDs). This represents the same position in the treatment pathway at which
other advanced therapies are recommended in the European League Against
Rheumatism (EULAR) guidelines. Unlike in prior appraisals, the company sought to
position upadacitinib (UPA) as an option irrespective of methotrexate (MTX) tolerance.
The Evidence Review Group (ERG) considered the population in the company
submission (CS) to be appropriate and to be consistent with the NICE final scope for this
appraisal.
The intervention in the decision problem is UPA, a selective oral Janus kinase (JAK)-1
inhibitor, either as monotherapy or in combination with conventional synthetic (cs)
DMARDS, including MTX. The dose of UPA in the decision problem was 15 mg QD. The
anticipated date of European Medicines Agency (EMA) approval for UPA in this
indication is ************. The ERG considered the description of the technology of
interest in the CS to be appropriate. Included trials considered UPA as both
monotherapy and in combination with MTX or adalimumab (ADA). Comparators in this
appraisal varied depending on disease severity, the number of csDMARD failures, as
well as tolerance or intolerance to MTX. While the ERG considered the comparators in
the CS to be compatible with those presented in the NICE final scope, it considered that
best supportive care would not be used in routine practice, while rituximab (RTX) may be
used earlier in the treatment pathway.
The NICE final scope includes the following outcomes: disease activity, physical
function, joint damage, pain, mortality, fatigue, radiological progression, extra-articular
manifestations, adverse effects of treatment and health-related quality of life. The ERG
considered the outcomes reported in the CS for UPA to be appropriate, and noted that
only safety data were available for extra-articular manifestations.
The ERG agreed with the company that there were no significant equity issues in the
context of this appraisal.
A patient access scheme (PAS) has been submitted to the Patient Access Schemes
Liaison Unit (PASLU) for consideration. During the course of this appraisal,
************************************************************************
Copyright 2019 Queen's Printer and Controller of HMSO. All rights reserved

Page 18 of 275
Summary of clinical effectiveness evidence submitted by the company
The company presented a systematic literature review (SLR) of randomised controlled
trials (RCTs) on UPA (and comparators) for the treatment of moderate and severe RA.
Four key trials were included from the SLR: SELECT-COMPARE which compared UPA
15 mg QD with ADA 40 mg every other week (eow), and with placebo (PBO) followed by
UPA 15 mg QD; SELECT-NEXT which compared UPA 15 mg QD with UPA 30 mg QD
and with PBO followed by UPA 15 mg or 30 mg QD; SELECT-MONOTHERAPY which
compared UPA 15 mg QD with UPA 30 mg QD and with MTX; and SELECT-BEYOND
which compared UPA 15 mg QD with UPA 30 mg QD and with PBO followed by UPA 15
mg or 30 mg QD. In the pivotal trials except SELECT-MONOTHERAPY, UPA was
administered in combination with other csDMARDs: SELECT-COMPARE included stable
background therapy of MTX while SELECT-NEXT and SELECT-BEYOND included
stable background therapy of up to two csDMARDs. SELECT-MONOTHERAPY did not
include any UK sites, while UK sites were included in the remaining three pivotal RCTs.
In
*****************************************************************************************************
*****************************************************************************************************
*****************************************************************************************************
************************************
An additional RCT – SELECT-SUNRISE – was not included in the company’s
presentation of the clinical effectiveness evidence, but was included in the network meta-
analysis (NMA) and therefore informed the company’s economic model. SELECT-
SUNRISE was conducted in an exclusively Japanese population and was not an EMA
registration trial.
ACR response was assessed in all four trials. When compared with PBO over a 12-week
period (SELECT-NEXT and SELECT-BEYOND), and over a 14-week period (SELECT-
MONOTHERAPY), UPA 15 mg QD demonstrated higher ACR20/50/70 and clinical
remission in, despite differences between trials in concomitant treatments. The SELECT-
COMPARE trial (through Week 26), a head-to-head comparison with ADA, demonstrated
that the ACR20 response rate at Week 12 was significantly higher among UPA 15 mg
QD treated patients compared with the 327 ADA-treated patients, at 71% versus 63%
(p<0.05).
Clinical remission was assessed in all four trials based on DAS-28 CRP <2.6. Clinical
remission with UPA 15 mg at 12-14 weeks (14 weeks in SELECT MONOTHERAPY and
Copyright 2019 Queen's Printer and Controller of HMSO. All rights reserved

Page 19 of 275
12 weeks in the other three trials) was consistent across all trials (28.7%, 30.8%, 28%
and 28.7% in SELECT COMPARE, SELECT NEXT, SELECT MONOTHERAPY and
SELECT BEYOND respectively), despite differences between trials in concomitant
treatments. Clinical remission was consistently higher with UPA 15 mg than with PBO:
the clinical remission rates for PBO at 12-14 weeks (across the three PBO controlled
trials) were 6.1%, 10.0% and 9.5% for SELECT COMPARE, SELECT NEXT and
SELECT BEYOND respectively.
At 14 weeks, the clinical remission rate with UPA 15 mg QD monotherapy was
significantly higher than that for MTX monotherapy (28% versus 8%, p<0.001). When
taken in combination with MTX, UPA 15 mg QD also resulted in a significantly higher
remission rate than ADA combined with MTX at both 12 weeks (UPA 15 mg 28.7% ADA
18.0%, p<0.001) and 26 weeks (UPA 15 mg 40.9% ADA 26.9%, p<0.001).
The EQ-5D-5L and the SF-36 PCS were used to assess HRQoL at 12-14 weeks in all
four trials (14 weeks for SELECT MONOTHERAPY). For SELECT COMPARE, EQ-5D-
5L data were also reported at 26 weeks.
In all three PC trials (SELECT COMPARE, SELECT NEXT and SELECT BEYOND), and
despite differences in concomitant treatments, UPA 15mg resulted in greater
improvement on the EQ-5D-5L index at 12-14 weeks (0.2 versus 0.10 respectively in all
three studies, p<0.001 in all three trials). Similar results were found for the SF-36 PCS at
12 weeks: there was greater improvement with UPA 15 mg QD than with PBO (mean
change from baseline 7.9 versus 3.6 respectively, p<0.001 for SELECT COMPARE, 7.6
versus 3.0 respectively, p<0.001 for SELECT NEXT; 5.8 versus 2.4, p<0.001 for
SELECT BEYOND). In SELECT COMPARE there was also greater improvement on the
EQ-5D-5L with UPA 15 mg QD versus PBO at 26 weeks (EQ-5D-5L 0.22 versus 0.11
respectively, p<0.001).
At 14 weeks, there was greater improvement on both the EQ-5D-5L index and the SF-
36-PCS with UPA 15 mg QD monotherapy compared with MTX monotherapy (EQ-5D-5L
0.2 vs 0.1 respectively, p<0.001; SF-36 PCS 8·3 versus 4·3 respectively, p<0·001).
When taken in combination with MTX, UPA 15 mg QD resulted in a similar improvement
on the EQ-5D-5L index as ADA combined with MTX at both 12 weeks (UPA 15 mg 0.21
ADA 0.17) and 26 weeks (UPA 15 mg 0.22 ADA 0.20). Change from baseline in SF-36
PCS scores was also similar with UPA 15 mg and ADA at 12 weeks (7.9 versus 6.3
respectively).
Copyright 2019 Queen's Printer and Controller of HMSO. All rights reserved

Page 20 of 275
The network meta-analyses (NMA) submitted by the company related to two broad
populations: csDMARD-experienced populations and bDMARD-experienced
populations. NMAs focused only on ACR outcomes, using a statistical model to integrate
ACR20, ACR50 and ACR70 outcomes even when trials reported more than one of
these. The company then used a probabilistic algorithm to match NMA findings on ACR
outcomes onto EULAR response, which then informed the cost-effectiveness model.
NMAs supported the effectiveness of UPA in improving the probability of ACR20, ACR50
and ACR70 in both populations. Because SELECT trial data contributed three-month
time points, the company used a meta-regression method together with other trials’ data
from three months and from six months to ‘project’ the effectiveness of UPA at six
months.
Thus, key findings relate to effectiveness at six months as ‘projected’ for UPA. In the
csDMARD-experienced population, UPA 15 mg yielded a probability of ACR20 of
***************************************************************************************************.
UPA 15 mg in combination with csDMARDs yielded a probability of ACR20 of
*******************************************************************************************. For
both regimens, the probability of inferiority as compared to PBO was <0.001, and as
compared to csDMARDs alone was <0.001 as well. In the bDMARD-experienced
population, UPA 15 mg in combination with csDMARDs yielded a probability of ACR20
*****************************************************************************************************
** The probability of inferiority as compared to csDMARDs alone was 0.003.
Summary of the ERG’s critique of the clinical effectiveness evidence submitted
The company conducted a SLR that was appropriately aligned with the NICE final scope.
The ERG considered the company’s search strategies to be well-conducted and
reported. Although some issues were noted, the ERG was broadly satisfied that the
company identified all relevant RCTs for UPA and comparators. The ERG was broadly
satisfied with the study selection and quality assessment (QA) methods for the UPA
trials. The ERG noted however that there was a lack of detail on how the study selection
criteria were applied, meaning that the ERG could not definitively confirm that no trials
for the technology of interest were inappropriately excluded during the screening
process. Moreover, the ERG considered that the SELECT-SUNRISE trial did meet the
inclusion criteria for the SLR and therefore detailed clinical effectiveness evidence
should have been provided for this trial, especially since it informs the NMA and
economic modelling.
Copyright 2019 Queen's Printer and Controller of HMSO. All rights reserved

Page 21 of 275
The ERG considered the four trials that were included as pivotal trials in the clinical
evidence submission to be appropriate and fulfilled the inclusion criteria. All were RCTs
and the study designs were in line with the NICE final scope and the SLR inclusion
criteria. The ERG noted that UPA was used as monotherapy in one of the pivotal trials
(SELECT-MONOTHERAPY), and was administered in combination with MTX and other
csDMARDs in other trials. The included trials were a mixture of PBO and/or active
controlled trials – active control was with ADA in SELECT-COMPARE and with MTX in
SELECT-MONOTHERAPY. The ERG noted that there were no UK sites in SELECT-
MONOTHERAPY and that the
************************************************************************************* The ERG
considered the study populations in all four trials to be relevant to the decision problem
and to exhibit a large degree of between-trial comparability, although differences in prior
medication regimens were noted.
Head-to-head evidence is provided for certain comparisons, although the key clinical
effectiveness comparisons that serve as inputs to the economic model are comparative
data derived from an NMA, in order to take into account the totality of the available
evidence across the network. The evidence presented in the CS broadly covered the
range of outcomes included in the NICE final scope, although it was noted that only
safety data were available for extra-articular manifestations. The ERG agreed that there
was generally a low risk of bias in the four pivotal trials for the technology of interest.
The ERG found no discrepancies in trial results compared to the respective CSRs. The
ERG noted that here was some variation between the studies in the primary and
secondary outcomes used to assess clinical and functional efficacy and HRQoL of UPA.
The ERG also noted that, for three of the trials, between-group data were reported only
at 12-14 weeks. It is important to consider that the 26 week data include patients who
switched treatments.
Feasibility assessment was not explicitly reported for the NMAs undertaken. This is a
major omission that threatens the credibility of the NMAs presented. The ERG
considered the inclusion criteria for the NMA to be largely appropriate. However, due to a
lack of clarity in the reasons of exclusion, the ERG could not rule out the potential of
inappropriate exclusion of trials from the NMAs. The company appraised the quality of
the 61 trials included in the two NMAs (55 that were included in the NMA for the biologic
(b)DMARDs experienced population and 12 that were included in the NMA for the
csDMARD experienced population, noting that six trials were included in both NMAs). In
order to provide a general check of accuracy of these 61 QA assessments, the ERG
Copyright 2019 Queen's Printer and Controller of HMSO. All rights reserved

Page 22 of 275
randomly selected seven of these studies (≈10%). One of the studies randomly selected
by the ERG was the SELECT BEYOND study; a critique of the QA for SELECT
BEYOND had already been performed. For five of the remaining six selected studies, the
ERG was mostly in agreement with the ratings made by the company. However, for one
of these studies,1 the ERG found errors in the QA that are likely to underestimate the
quality of this study. The ERG also noted that the QA was not used to select or weight
studies in the NMA, or in the economic modelling. The ERG considered, therefore, that
any errors or potential errors in the QA of the remaining studies could affect transitivity of
networks in NMA, but would not necessarily impact choice of studies for NMA or
economic modelling.
In addition to these issues, the ERG urges caution in the interpretation of these NMAs for
several reasons. First, as noted above, data for six months from SELECT relies on a
‘projection’ from three month data, though sensitivity analyses to these projections
suggested results were reasonably robust. Second, the ERG identified potential issues in
inclusion and exclusion of studies as well as data extraction that preclude certainty as to
whether all studies and all data from studies were appropriately included. Third, while the
statistical methods and assumptions used were standard and appropriate, the ERG was
unable to replicate the company’s NMA due to an issue with the code provided and with
the time allotted could not reconstruct the NMA in alternate software. Fourth, the ERG
noted remaining ambiguities as to how reference arm probabilities were pooled to
estimate the ‘absolute’ probabilities of response for each treatment in each network.
Fifth, the ERG considered that interpretation of NMA findings was complicated by the
need for strong conceptual assumptions relating to exchangeability of effect at different
points in the treatment pathway and different disease severities; that is, moderate and
severe RA were not considered separately, and treatment effects are assumed to be
equivalent, for example, after one csDMARD and after two or more csDMARDs, or after
one bDMARD and after two or more bDMARDs. This also means that data used to
inform comparisons where no head-to-head data exist include people who are potentially
not ‘at risk’ of receiving these treatments.
Summary of cost-effectiveness evidence submitted by the company
Note that all results in this document include the UPA PAS but do not include the other
advanced DMARDs’ PAS or the confidential prices of the biosimilars. The prices for
biosimilars of ADA and ETN have a particularly large effect upon some results, as
presented in the cPAS appendix.
Copyright 2019 Queen's Printer and Controller of HMSO. All rights reserved

Page 23 of 275
The company performed a literature review to identify economic evaluations of
interventions used to treat people with moderate or severe RA. No prior economic
evaluations of UPA in the specified population were identified. The company also
presented an SLR of utilities and healthcare resource utilisation and costs, and used
identified studies to inform model parameters.
The company develops a de novo individual patient discrete event simulation model
programmed in visual basic, with an Excel front end acting as a database store of
values. Each model run simulates 10,000 patients and shows reasonable convergence.
The structure and inputs to it mirror much of that of TA375. The main differences are that
the company:
• Models the progression from moderate RA to severe RA, this relying upon a HAQ
to DAS-28 mapping derived from the SELECT trials.
• Derives an alternative HAQ to pain mapping function from the SELECT trials and
applies this to estimate quality of life values using the same HAQ and pain to EQ-
5D quality of life function as TA375.
The company presents validation data that shows the company model closely replicates
the results of the TA375 model provided that the progression from moderate RA to
severe RA is not applied and that the TA375 HAQ to pain mapping function is applied.
Patients receive either first line UPA monotherapy or first-line UPA in combination with
MTX. Among moderate RA patients the first-line treatment in the comparator arm is
either BSC, MTX or intensified csDMARDs depending upon the position sought. Among
severe RA patients the full range of advanced DMARDs are considered as possible
alternative first-line treatments, as monotherapy or with MTX depending upon the
position sought.
EULAR response rates are taken from the company csDMARD-IR NMA and bDMARD-
IR NMA. BSC is assumed to have a 0% EULAR response rate.
Patients who achieve a EULAR response remain on treatment and their HAQ score is
reduced. Patients who do not achieve a EULAR response have that line of treatment
withdrawn and their HAQ rebounds to the baseline value. They may then try a
subsequent line of treatment and if they achieve a EULAR response to that line of
treatment their HAQ score is reduced.
Copyright 2019 Queen's Printer and Controller of HMSO. All rights reserved

Page 24 of 275
Those remaining on bDMARDs are assumed to have a constant HAQ, which is the same
assumption as made in TA375. Those not on bDMARDs see their HAQ worsen over
time, based upon the same function as used in TA375.
Those who achieve a EULAR response do not remain on that line of treatment forever.
Treatment discontinuation curves are derived from TA375, differentiated by whether
patients have moderate RA or severe RA.
Patients progress through the various line of treatment and eventually reach BSC or
palliative care.
As noted above, quality of life values are calculated from a HAQ and pain score mapping
function to EQ-5D values. This is the same function that was used in TA375. The
difference is that the company derives a HAQ to pain score mapping function from the
SELECT trial data whereas that of TA375 was based upon the large NDB dataset.
In addition to the direct drug costs the TA375 administration and monitoring costs are
applied, uplifted to 2018 prices using the HCHS index. The TA375 HAQ to inpatient
costs are also used, though the company adopts a quadratic fit to the TA375 costs rather
than applying the TA375 costs directly.
The company models the following 10 population subgroups, with the resulting cost
effectiveness estimates.
• 1a: Moderate RA, MTX intolerant, RTX tolerant, failed one csDMARD. UPA
monotherapy compared to intensified csDMARDs has a cost effectiveness of
£16,554 per QALY.
• 1b: Moderate RA, MTX tolerant, RTX tolerant, failed one csDMARD. UPA
monotherapy compared to intensified csDMARDs has a cost effectiveness of
£22,659 per QALY. UPA with MTX compared to intensified csDMARDs has a
cost effectiveness of £21,631 per QALY.
• 2a: Moderate RA, MTX intolerant, RTX tolerant, failed ≥2 csDMARD. UPA
monotherapy compared to BSC has a cost effectiveness of £8,885 per QALY.
• 2b: Moderate RA, MTX tolerant, RTX tolerant, failed ≥2 csDMARD. UPA
monotherapy compared to MTX has a cost effectiveness of £13,568 per QALY.
UPA with MTX compared to MTX has a cost effectiveness of £13,434 per QALY.
Copyright 2019 Queen's Printer and Controller of HMSO. All rights reserved

Page 25 of 275
• 3a: Severe RA, MTX intolerant, RTX tolerant, failed ≥2 csDMARD. UPA
monotherapy dominates almost all bDMARDs. Tocilizumab (TCZ) results in
slightly higher patient gains but its cost effectiveness is poor at around £500k per
QALY.
• 3b: Severe RA, MTX tolerant, RTX tolerant, failed ≥2 csDMARD. UPA
monotherapy dominates or is very cost effective compared to bDMARDs. UPA
with MTX dominates all bDMARDs with the exception of certoluzumab pegol
which confers slightly greater patient benefits but has a poor cost effectiveness of
around £800k per QALY.
• 4a: Severe RA, MTX intolerant, RTX tolerant, failed one bDMARD. UPA
monotherapy is estimated to be quite a lot cheaper and marginally better than
bDMARDs, so formally dominates them.
• 4b: Severe RA, MTX tolerant, RTX intolerant, failed one bDMARD. UPA
monotherapy dominates or is very cost effective compared to bDMARDs. UPA
with MTX dominates all bDMARDs with the exception of intravenous TCZ which
confers slightly greater patient benefits but has a poor cost effectiveness of over
£2mn per QALY.
• 5: Severe RA, MTX tolerant, RTX tolerant, failed one bDMARD. RTX dominates
both UPA monotherapy and UPA with MTX.
• 6: Severe RA, MTX tolerant, RTX tolerant, failed RTX. Compared to UPA
monotherapy both sarilumab (SRL) with MTX and intravenous TCZ with MTX
yield slight benefits but at considerable additional cost and a cost effectiveness of
£988k per QALY and £298k per QALY respectively. UPA with MTX dominates
sarilumab with MTX. Compared to UPA with MTX intravenous TCZ with MTX
yields slight benefits but at considerable additional cost and a cost effectiveness
of £420k per QALY.
Summary of the ERG’s critique of the cost-effectiveness evidence submitted
The key difference from the TA375 modelling is that moderate RA patients can progress
to be severe RA patients. This requires that the relationship between the HAQ and the
DAS-28 be specified. The company estimates this from the three-month and six-month
data of the SELECT trials. This is then used to extrapolate over the 45-year time horizon
of the model. It may be questionable to use six-month data when the HAQ and the DAS-
Copyright 2019 Queen's Printer and Controller of HMSO. All rights reserved

Page 26 of 275
28 are generally improving to extrapolate over 45 years when the HAQ is generally
modelled as worsening. There is also a question about a disappearing company
intercept term and whether it should be applied in the modelling. The application of the
intercept term generally worsens the cost-effectiveness estimates.
The ERG corrected some bDMARDs drug and administration costs.
The ERG preferred the HAQ to inpatient costs mapping of TA375 but this had little effect
upon results.
The ERG preferred the HAQ to pain mapping of TA375, in part due to the size of the
database it stems from and in part due to the visual fit to the SELECT trials’ quality of life
data. This worsens the cost-effectiveness estimates by a reasonable margin, but in itself
is unlikely to change the overall conclusions.
The ERG thinks that the csDMARD-IR NMA results should be applied to patients who
are bDMARD naïve and that the bDMARD-IR NMA results should be applied to patients
who are bDMARD experienced. In the modelling of moderate RA patients this implies
that for those progressing to severe RA the clinical effectiveness of first-line ADA for
treatment of severe RA in the UPA arm should be drawn from the bDMARD-IR NMA
while in the comparator arm it should be drawn from the csDMARD-IR NMA. The
response rates of the bDMARD-IR NMA are typically worse than those of the csDMARD-
IR NMA. But due to a lack of evidence, company assumptions mean that the response
rates for ADA monotherapy in the csDMARD-IR NMA are a little worse than in the
bDMARD-IR NMA. Given this, the ERG thinks that the cost-effectiveness estimates for
MTX-tolerant moderate RA patients are likely to be more reliable than the cost
effectiveness estimates for MTX intolerant moderate RA patients.
For moderate RA patients the company models treatment sequences where after UPA it
is possible to intensify csDMARDs. ERG modelling suggests that among moderate RA
patients it is more cost effective to intensify csDMARDs prior to using UPA and to use
UPA among those failing to response to intensified csDMARDs; i.e. try the cheap
treatment first and use the expensive treatment if this does not work.
A key difference between the company and the ERG is that the company thinks that
when UPA is compared with BSC, BSC should be assumed to have 0% EULAR
response rates. The ERG notes that in all SELECT trials there were significant EULAR
response rates in the control arms. Whether the response rates in the control arms were
due to natural recovery or to a pure trial or PBO effect is not known. The ERG thinks that
Copyright 2019 Queen's Printer and Controller of HMSO. All rights reserved

Page 27 of 275
BSC should be assumed to have the EULAR response rates of PBO in the company
NMA or of the control arms in the SELECT trials. If the company approach is accepted
UPA is estimated to be cost effective for moderate RA patients at conventional
willingness to pay thresholds. If the ERG approach is accepted UPA is estimated to be
not cost effective for moderate RA patients at conventional willingness to pay thresholds.
It should be noted that the company NMA results for PBO and intensified csDMARDs
may be subject to more uncertainty than those for advanced DMARDs. But applying the
head to head results of the SELECT trials generally results in qualitatively similar cost
effectiveness estimates for the modelling of moderate RA patients.
A key question if UPA is approved among moderate RA patients is whether, as a last in
line therapy, if a patient fails to achieve a moderate EULAR response but shows some
DAS-28 improvement they would have UPA withdrawn. The ERG thinks that if those
trialling UPA who receive some benefit but do not achieve a EULAR response will tend
to remain on UPA the cost effectiveness of UPA for moderate RA patients will be
considerably worse that the estimates presented in this document. A related question is
the possible ease of manipulating DAS-28 scores, given the significance of the patient
reported general health visual analogue score to its calculation.
A difference between the ERG modelling and both the company modelling and the
modelling of TA375 is that the ERG does not include a final line of MTX monotherapy.
The ERG thinks that it is not appropriate to model patients who have failed on other lines
of therapy such as intensified csDMARDs, who by implication have already previously
failed on MTX monotherapy, as having a response to a last line of MTX monotherapy.
But the modelling that includes this somewhat worsens the cost-effectiveness estimates.
The ERG thinks that it is likely that those who do not respond to their final line of
treatment will receive some ongoing treatment and that this will have some effect, if not a
EULAR response. If this was included in the modelling the ERG thinks that this would
worsen the cost-effectiveness estimates.
The ERG revisions to the company modelling of severe RA patients do not particularly
affect the cost-effectiveness estimates and the results that should be drawn from them.
UPA is estimated to be cost effective among those who have failed to respond to RTX. It
should be noted that these patients will have had at least two previous advanced
DMARDs. The bDMARD-IR NMA estimates may be less reliable for these patients. It can
also be noted that less than 20% of SELECT-BEYOND patients were RTX experienced.
Copyright 2019 Queen's Printer and Controller of HMSO. All rights reserved

Page 28 of 275
The main differences of opinion between the ERG modelling and the company modelling
are:
• The treatment sequences. Is it sensible to model EULAR responses to a last line
treatment with MTX monotherapy when by definition these patients will have
previously failed on MTX monotherapy?
• The treatment sequences. Is it sensible or likely to be cost effective to try UPA
before trying intensified csDMARDs?
• Should natural recovery and the PBO effect be included in the comparator arm,
given that they will be present in the UPA arm?
• Is the HAQ to pain mapping of TA375 more reliable than the company estimates
from the SELECT trials?
• Are the ERG revised drug costs more accurate?
ERG commentary on the robustness of evidence submitted by the company
1.6.1 Strengths
• The company’s SLR was well aligned with the NICE scope for this appraisal.
• The company’s literature searches were generally appropriate and well-reported.
• The ERG was broadly satisfied with the study selection criteria and QA methods
for the UPA trials.
• The four included trials all appeared relevant and appropriate, and were largely
considered to be at low risk of bias.
• The study populations in all four trials were relevant to the decision problem and
exhibited a large degree of between-trial comparability.
• The NMA inclusion criteria were largely appropriate.
1.6.2 Weaknesses
• The ERG noted however that there was a lack of detail on how the study
selection criteria were applied.
• The ERG considered that the SELECT-SUNRISE trial fulfilled the SLR inclusion
crtieria and should have been presented in the clinical effectiveness evidence,
not solely in the NMA and economic model sections.
Copyright 2019 Queen's Printer and Controller of HMSO. All rights reserved

Page 29 of 275
• One of the four included trials did not include any UK sites, while the proportion in
the other three trials was ***.
• Between-trial differences in prior medication regimens were noted.
• Feasibility assessment was not explicitly reported for the NMAs undertaken. This
is a major omission that threatens the credibility of the NMAs presented.
• NMA data for six months relies on a ‘projection’ from three-month data.
• The ERG identified a range of potential issues in inclusion and exclusion of
studies as well as data extraction that preclude certainty as to whether all studies
and all data from studies were appropriately included.
• The ERG was unable to replicate the company’s NMA due to an issue with the
code provided.
• The ERG noted remaining ambiguities as to how reference arm probabilities were
pooled to estimate the ‘absolute’ probabilities of response for each treatment in
each network.
• The ERG considered that interpretation of NMA findings was complicated by the
need for strong conceptual assumptions relating to exchangeability of effect at
different points in the treatment pathway and different disease severities; that is,
moderate and severe RA were not considered separately, and treatment effects
are assumed to be equivalent, for example, after one csDMARD and after two or
more csDMARD, or after one bDMARD and after two or more bDMARDs. This
also means that data used to inform comparisons where no head-to-head data
exist include people who are potentially not ‘at risk’ of receiving these treatments.
1.6.3 Areas of uncertainty
Remaining areas of uncertainty include:
• What should be assumed for those who are without a response and are at end of
line? These patients are assumed to receive palliative care with no benefit.
Moderate RA patients may tend to be treated with whatever combination of
csDMARDs worked best for them, even if a EULAR response was not achieved.
The ERG thinks that including this would worsen the cost effectiveness
estimates.
• If UPA is trialled as last in line among moderate RA patients would those who got
some benefit from it but did not achieve a EULAR response tend to remain on it?
Copyright 2019 Queen's Printer and Controller of HMSO. All rights reserved

Page 30 of 275
The ERG thinks that if they would this would considerably worsen the cost-
effectiveness estimates.
• Is it reasonable to extrapolate the company HAQ to DAS relationship based upon
six-month improvements in the SELECT trials to 45 years when the HAQ is
generally modelled as worsening? The ERG thinks that if this relationship breaks
down over time this could worsen the cost-effectiveness estimates, though
whether this is more of a modelling issue than a real world concern is debateable.
• Are EULAR response rates the same at different lines of treatment? The
response rates in the bDMARD-IR NMA are typically worse than those of the
csDMARD-IR NMA. The ERG thinks that this does not particularly affect the
modelling of moderate RA patients, but it might mean that progressing to severe
RA is more serious and so more to be avoided. What effect this would have upon
the cost-effectiveness estimates is difficult to speculate upon, in part due to the
bDMARD-IR NMA applying from first-line therapy for severe RA in the UPA arm
but only applying from second-line therapy for severe RA in the comparator arm.
• Are the clinical effectiveness estimates applicable to those who have failed RTX?
The ERG noted that these patients would have failed at least two lines of
advanced DMARDs and that only a small proportion of SELECT-BEYOND
patients were RTX experienced.
• While more of a clinical issue there may also be concerns about the reliability of
the NMAs’ clinical effectiveness estimates for PBO and intensified csDMARDs.
The ERG explored this by applying the head-to-head results of the SELECT
trials.
Summary of exploratory and sensitivity analyses undertaken by the ERG
The ERG modelling of moderate RA patients differs from the company in four main
ways.
• Having modelled a comparison of (1) intensification of csDMARDs after trialling
UPA with (2) intensification of csDMARDs before trialling UPA and found (1) to be
not cost effective, the main ERG modelling does not consider intensification of
csDMARDs after UPA.
Copyright 2019 Queen's Printer and Controller of HMSO. All rights reserved

Page 31 of 275
• Where UPA is compared with BSC, the ERG applies the PBO response rates of
the company csDMARD-IR NMA or the SELECT trials’ head-to-head results for
UPA compared to the control arm.
• The ERG applies the TA375 HAQ to pain mapping.
• The ERG corrects some comparator drug and administration costs.
The ERG typically estimates that among moderate RA patients UPA is not cost effective,
with cost-effectiveness estimates exceeding £30k per QALY and often exceeding £50k
per QALY.
If the treatment sequences for those transitioning from moderate RA to severe RA are
differentiated by arm as seems reasonable this tends to worsen the cost effectiveness
estimates.
Applying the company HAQ to pain mapping function typically improves the cost
effectiveness estimates but does not qualitatively change the main thrust of the results.
The exception to this is if it is assumed that (1) there was no natural recovery in the
SELECT trials’ comparator arms and (2) any PBO effect in the SELECT trials should not
be applied. This causes the ERG to estimate UPA to be cost effective compared to BSC
among moderate RA patients.
The ERG costs-effectiveness estimates among severe RA patients are qualitatively
similar to the company estimates.
Copyright 2019 Queen's Printer and Controller of HMSO. All rights reserved

Page 32 of 275
2 Background
Critique of company’s description of underlying health problem
The health condition and treatment pathways is provided in the CS (pages 18-29).
Rheumatoid arthritis (RA) is an inflammatory autoimmune disease that typically affects
the synovial tissue of the small joints of the hands and feet but can affect any synovial
joint, causing swelling, stiffness, pain and progressive joint destruction. Extra-articular
manifestations of RA can include the lungs, heart and eyes.
The incidence of RA has been estimated to be 40 per 100,000 person years.2 Globally,
the prevalence of RA has been estimated to be between 0.5% and 1% of the population,
with a higher prevalence in women and the elderly.3 RA risk can be attributed to a
combination of environmental and genetic factors, the latter predicting around 50% of the
risk.4
Disease activity is the key clinical indicator and prognostic marker in RA and is classified
using the disease activity score 28-joint count (DAS-28) scoring system,5 a composite
measure based upon the number of joints impacted by disease and biomarkers of
inflammation. It also usually includes a patient reported outcome for global health
assessment based on a 100 mm visual analogue scale (VAS) scored from 0 to 100. A
DAS-28 score between 3.2 and 5.1 indicates moderate RA, while a score over 5.1
indicates severe RA. A score less than 2.6 indicates disease remission.6 Forty-three
percent of RA patients have been estimated to have moderate RA according to DAS-28,
27% severe RA and 31% mild RA.7
ERG comment:
The ERG considered the company’s description of the disease area to be appropriate
and broadly representative of the literature.
Critique of company’s overview of current service provision
The CS states that the treatment pathway is based on NICE Clinical Guideline (CG) 1008
as depicted in Figure 1.
NICE CG100 recommends that first-line treatment for newly diagnosed RA should be
with csDMARD monotherapy with oral MTX, leflunomide or sulfasalazine. If patients are
intolerant or do not respond to the first csDMARD, additional csDMARDs (oral MTX,
leflunomide, sulfasalazine or hydroxychloroquine [HCQ]) should be offered in
combination in a step-up strategy when the treatment target (remission or low disease
Copyright 2019 Queen's Printer and Controller of HMSO. All rights reserved

Page 33 of 275
activity) has not been achieved despite dose escalation. In the NICE CG100 treatment
pathway, ‘advanced therapies’ – bDMARDs (including interleukin-6 [IL-6] inhibitors) – are
introduced only for patients with severe RA. NICE TAs 375, 466, 480 and 485
recommend bDMARDs (ADA, etanercept [ETN], infliximab [IFX], certolizumab pegol
[CTZ], golimumab [GOL], tocilizumab [TCZ], abatacept [ABT] and sarilumab [SRL]) or
other targeted synthetic (ts) DMARDs (baricitinib [BRC] and tofacitinib [TFC]) each in
combination with MTX (if not intolerant/contraindicated) for severe RA only.
EULAR guidelines9, in contrast, introduce advanced therapies at an earlier stage in the
treatment pathway. EULAR guidelines recommend that advanced therapies such as a
bDMARD or tsDMARD should be considered if the treatment target is not met with the
first csDMARD strategy and poor prognostic factors are present. This distinction is
relevant to the company’s proposed positioning of udadacitinib as critiqued in Section 3
of this report. The company considered that: “In the UK the lack of flexibility allowed to
clinicians to tailor the use of advanced therapy to the needs of patients may result in
poorer long-term outcomes” (CS, p.27).10
Figure 1. Positioning of UPA within the existing NICE pathway
Abbreviations: csDMARDs, conventionsl synthetic disease modifying antirheumatic drugs; NICE, National Institute for Health and Care Excellence; UPA, upadacitinib
Source: CS, p.29, Figure 2.
Copyright 2019 Queen's Printer and Controller of HMSO. All rights reserved
Page 34 of 275
The company estimated that there would be ****** moderate RA and ****** candidates for
advanced therapies one year after launch, rising to ****** and ****** respectively after five
years (Company budget impact assessment, p.8, Tables 3 and 5). The ERG noted,
however, that these figures related to all advanced therapies and were not specific to
UPA. Not all eligible patients commence UPA due to the existence of a range of
treatment options in the corresponding position in the treatment pathway. The company
estimated a market share for UPA of ** one year after launch in severe RA rising to ***
after five years (Company budget impact assessment, p.14, Table 19). It is projected that
this would put UPA in ****** place in terms of market share *********** For moderate RA,
the estimated market share was **** after one year rising to **** after five years
(Company budget impact assessment, p.15, Table 21).
ERG comment:
The ERG considered the company’s description of current service provision to be
appropriate and relevant to the appraisal. The treatment pathway was considered to be
reasonably representative of standard NHS treatment for moderate and severe RA in
England and Wales, and to be in line with NICE CG100. It was considered that BSC
would rarely be used, instead being largely a historical treatment. It was considered that
RTX may in routine clinical practice be used earlier in the treatment pathway than
shown. It was also considered that the diagram may make a sharper delineation
between how moderate and severe RA are treated than would be observed in routine
clinical practice where a more pragmatic approach following the ‘treat to target’ principle
(i.e. where treatments are chosen and combined to reach patient-defined treatment
goals), and patient preference may also play an important role. No service provision
beyond the current levels of monitoring and assessment would be necessitated by the
introduction of UPA into the current treatment pathway. The ERG noted that there were
considerable simplifications in the assumptions underpinning the budget impact
projections for moderate RA.
Copyright 2019 Queen's Printer and Controller of HMSO. All rights reserved

Page 35 of 275
3 Critique of company’s definition of decision problem
Population
The population corresponds to the full proposed marketing authorisation for UPA. This is
for the treatment of moderate to severe active RA in adult patients who have responded
inadequately to, or who are intolerant to one or more csDMARDs, i.e the position in the
treatment pathway at which advanced therapies are recommended in the EULAR
guidelines. The ERG agreed with the company that the population presented in the CS is
consistent with the final scope for this appraisal.11 The ERG noted that the CS
categorised the populations and associated comparators by tolerance or intolerance to
MTX. Previous NICE TAs have only recommended advanced therapies for severe RA in
patients who are intolerant to MTX or for whom it is contraindicated, or when patients
have not responded to prior csDMARDs. The company sought to position UPA as an
option as a monotherapy regardless of MTX tolerance. Additionally, on the advice of an
advisory board,12 the company considered a population of severe active RA that has not
responded adequately to both MTX and RTX.
ERG comment:
The ERG considered the population in the CS to be appropriate. The trials were largely
similar in their demographic and clinical profiles, although they did differ in terms of
permitted prior medication regimens.
Intervention
The intervention in the scope and decision problem is UPA (brand name unknown), an
oral JAK-1 inhibitor, either as monotherapy or in combination with other csDMARDS,
including MTX. The dose of UPA in the decision problem is 15 mg QD. The draft
summary of product characteristics (SmPC) and European public assessment report
(EPAR) were provided in Appendix C of the CS. Note that UPA does not currently have
EU marketing authorisation. In the CS, the company stated that it submitted an
application in December 2018, with European approval expected in ************. The CS
did state that the planned launch for UPA in the UK is ******* and that a submission to
the Scottish Medicines Consortium was also planned.
ERG comment:
The ERG considered the description of the technology of interest in the CS to be
accurate. The scope for this appraisal and the trials included in the CS consider UPA
both as monotherapy and in combination with other csDMARDS, including MTX. This
Copyright 2019 Queen's Printer and Controller of HMSO. All rights reserved

Page 36 of 275
dual positioning is a factor that needs to be taken into consideration in this appraisal. In
all trials, the dose of UPA corresponds to the dose in the decision problem.
Comparators
UPA is compared to a range of comparators in the CS, categorised by disease activity
(moderate or severe RA according to DAS-28) and tolerance or intolerance to MTX, in
addition to a specific sub-population of severe active RA that has not responded
adequately to both MTX and RTX. The comparators in the company decision problem in
each position in the treatment pathway are shown in Table 1.
Table 1. Comparators by position in treatment pathway
1 and 2: For moderate active RA that has not responded adequately to therapy with csDMARDs (comparators will vary dependent upon MTX tolerance/contraindication and one or two csDMARD failure):
o Combination therapy with csDMARDs (including MTX and at least one other DMARD, such as sulfasalazine and leflunomide).
o csDMARD monotherapy with dose escalation. o BSC (only where csDMARDs are not appropriate due to intolerance).
3a & 3b: For severe active RA that has not responded adequately to therapy with csDMARDs only and who tolerate MTX and it is not contraindicated:
o Advanced therapies in combination with MTX (ADA, ETN, IFX, CTZ, GOL, TCZ, ABT, BRC, TFC or SRL).
3a: For severe active RA that has not responded adequately to therapy with csDMARDs only and who do not tolerate MTX, or it is contraindicated:
o ADA, ETN, CTZ, TCZ, BRC, TFC or SRL (each as monotherapy) 4a: For severe active RA that has not responded adequately to therapy with advanced therapies and when RTX is contraindicated or withdrawn due to adverse events and who do not tolerate MTX, or it is contraindicated:
o ADA, ETN, CTZ, TCZ, TFC, BRC, or SRL (each as monotherapy) 4b: For severe active RA that has not responded adequately to therapy with advanced therapies and when RTX is contraindicated or withdrawn due to AEs and who tolerate MTX and it is not contraindicated:
o ADA, ETN, IFX, ABT, TCZ, CTZ, GOL, BRC, TFC, or SRL, each in combination with MTX
5: For severe active RA that has not responded adequately to therapy with advanced therapies either in combination with MTX or as monotherapy and who tolerate MTX and RTX and it is not contraindicated:
o RTX in combination with MTX 6: For severe active RA that has not responded adequately to therapy with RTX and MTX:
o TCZ, SRL in combination with MTX Abbreviations: ABT, abatacept; ADA, adalimumab; AEs, adverse events; BRC, baricitinib; BSC, best supportive care; CTZ, certolizumab pegol; csDMARDs, conventional synthetic disease modifying antirheumatic drugs; ETN, etanercept; GOL, golimumab; IFX, infliximab; MTX, methotrexate; RA, rheumatoid arthritis; RTX, rituximab; SRL, sarilumab; TCZ, tocilizumab; TFC, tofacitinib
Source: CS, pp.13-14, Table 1.
The CS categorises the population additionally by tolerance or intolerance to MTX, in
addition to presenting a sub-population for people who have not responded to both MTX
Copyright 2019 Queen's Printer and Controller of HMSO. All rights reserved

Page 37 of 275
and RTX. This presents the population in greater granularity than the NICE scope, but is
not incompatible with it, and is principally relevant to UPA as a monotherapy rather than
in combination with MTX.
ERG comment:
The ERG considered the comparators in the CS to be compatible with those presented
in the NICE scope. The ERG considered that BSC would not be used in routine practice,
while RTX may be used earlier in the pathway. Therefore, while the positioning of
comparators in the pathway may align with clinical guidelines, it may not align completely
with routine clinical practice.
Outcomes
The outcomes reported in the decision problem, described in the CS, and used in the
economic evaluation, match those in the NICE scope subject to one proviso. The
outcomes in the NICE scope are: disease activity, physical function, joint damage, pain,
mortality, fatigue, radiological progression, extra-articular manifestations of disease,
adverse effects (AEs) of treatment, and health-related quality of life (HRQoL). It is
reported in the CS (pages 14-15, Table 1) that: “extra-articular manifestations of disease
were not captured as a specific outcome in the SELECT clinical trial programme.
However, the relevant related outcomes are reported in the safety analysis in Section
B.2”.
ERG comment:
The ERG considered the outcomes reported in the CS for UPA to be appropriate. The
ERG noted that only safety data and not clinical effectiveness data were available for
extra-articular manifestations, which is a limitation in terms of capturing the full clinical
impact of RA. Nevertheless, disease activity is the key measure.
Other relevant factors
The company stated that there were no significant equity issues in the context of this
appraisal. A PAS has been submitted to the PASLU for consideration.
ERG comment:
The ERG agreed with the company that there were unlikely to be significant equity
issues in the context of this appraisal.
*****************************************************************************************************
Copyright 2019 Queen's Printer and Controller of HMSO. All rights reserved

Page 38 of 275
**********************, which has been taken into account in the work of the ERG,
***************************************************
Copyright 2019 Queen's Printer and Controller of HMSO. All rights reserved

Page 39 of 275
4 Clinical effectiveness
Critique of the methods of review(s)
4.1.1 Searches
Searches to identify RCTs relevant to UPA (and comparators) in patients with RA were
completed by the company in December 2017, and updated in April 2019. The clinical
effectiveness searches are reported in Appendix D of the CS.
The following bibliographic databases were searched: Ovid Embase, MEDLINE, and
EBM Reviews (incorporating the Cochrane Library databases). The search strategy uses
a combination of indexing (e.g. MeSH in MEDLINE) and free text (i.e. title and abstract)
terms, and searches were not limited by language. Additional searches were conducted
for trials in conference proceedings, on health technology assessment (HTA) websites
and on ClinicalTrials.gov.
The clinical effectiveness searches use a combination of terms for the population (RA),
intervention (UPA), comparators (ADA, ETN, IFX, GOL, CTZ, TFC, baracitinib, filgotinib,
peficitinib, RTX, ABT, TCZ, SRL, and anakinra) and study design (RCTs). These were
combined appropriately using Boolean logic.
The population component of the search used the exploded subject heading for
rheumatoid arthritis and free text term for ‘rheumatoid arthritis’. The searches did not
include alternative synonyms for rheumatoid arthritis as utilized in search strategies for
the NICE guideline,8 such as inflammatory arthritis, polyarthritis and rheumarthritis.
However, the ERG considered that their inclusion in the search strategy was unlikely to
yield additional relevant trials.
Searches for all biosimilars and brand names for comparators have not been included in
the search strategies. Subject headings were used for generic drug names, but the
following free-text search terms for the comparators were not used in search strategies:
• For IFX: Inflectra, Renflexis, Zessly, Revellex, Ixifi, Flixabi, Flammegis, Infimab
• For ETN: Erelzi, Lifmior, TuNEX (ENIA11), Brenzys, Intacept, Etacept, Davictrol
• For ADA: Amjevita, Amgevita, Cyltezo, Halimatoz, Hefiya, Hyrimoz, Hulio, abp
501, abp501, Imraldi, Solymbic, Exemptia, Adfrar
• For TCZ: LusiNEX, atlizumab, R1569
• For TFC: tasocitinib
• For sirukumab (SRK): Plivensia
Copyright 2019 Queen's Printer and Controller of HMSO. All rights reserved

Page 40 of 275
• For RTX: Tuxella, Rituzena, Ritemvia, Blitzima, Truxima, Riximyo, Rixathon,
Reditux; Zytix, AcellBia, Maball, MabTas, Rituxirel
Furthermore, search terms for drug categories such as tumour necrosis factor (TNF)-
alpha, bDMARDs, and JAK inhibitors were not included in the search strategies. As a
result, the searches may have failed to identify all relevant trials for comparators.
The company has not cited a validated filter for RCTs, and this is not one the ERG
recognised. However, the company used a variety of terms for RCTs. The company also
completed a search in all databases combining search terms for UPA, with RA terms
(with no study design filter) in order to identify observational studies for UPA only.
We undertook a search using additional drug terms for biosimilars and brand names,
with a validated filter for identifying RCTs13 (search date: 6th August 2019), and we did
not retrieve any further trials. Details of the ERG’s additional literature search are
available in Section 4.5.1.
The ERG noted several other issues with the searches. The Embase search excluded
abstract report publication types, and as a result may have missed conference abstracts
indexed with this term. Update searches completed in April 2019 did not include all
relevant date fields, and update searches may have failed to identify all new records
added to the database since the original search. For example, in Ovid MEDLINE, .dt.
(Create Date) and .ez. (Entrez Date, i.e. the date the citation was added to PubMed),14
and in Ovid Embase, .em. (Entry Week) and .dc. (Date Created)15 could also be applied
for a comprehensive update search.
The Ovid MEDLINE update search includes an error in the .ed. date limit. The .ed. field
refers to Entry Date, or the date that processing of a record is completed by PubMed.
The CS search was limited in error up until January 2019 (instead of April 2019). This
search may have failed to identify any new trials added to MEDLINE between January
and April 2019.
The supplementary searches of conference proceedings, HTA websites and
ClinicalTrials.gov are not well reported in Appendix D of the CS. In a response to a
clarification question, the company confirmed that searches were completed for ongoing
trials in ClinicalTrials.gov using the term ‘rheumatoid arthritis’. This is an appropriate
approach to identify ongoing trials for all comparators.
ERG comment:
Overall the bibliographic database searches for clinical effectiveness were well-
conducted and reported. The ERG noted several issues outlined above. The ERG
Copyright 2019 Queen's Printer and Controller of HMSO. All rights reserved

Page 41 of 275
conducted additional searches (Section 4.5.1) and are now broadly satisfied that the
search strategy utilized by company identified all relevant RCTs for UPA and
comparators.
4.1.2 Inclusion criteria
The inclusion and exclusion criteria for the SLR were provided in the CS (Table 1,
Appendix D.1.4), which is reproduced below (Table 2). These criteria were designed to
match the population, interventions, comparators, outcomes, and study design (PICOS)
in the NICE final scope and the ERG agreed that the inclusion criteria and the NICE
scope were broadly in agreement.
Table 2: Eligibility criteria for clinical review
# Inclusion criteria Exclusion criteria Justification Population Adult patients (≥18 years of
age) meeting the ACR Classification criteria for RA, and an inadequate response to csDMARDs or bDMARDs
Patients with any other disease
In line with NICE potential scope
Interventions UPA 15 mg or 30 mg QD in monotherapy or in combination
- In line with NICE potential scope
Comparators JAK-inhibitors: • TFC (Xeljanz®) • BRC (Olumiant®) • Filgotinib • Peficitinib
bDMARDs TNF-α inhibitors: • ADA (Humira®) • ETN (Enbrel®) • IFX (Remicade®) • GOL (Simponi®) • CTZ (Cimzia®)
Anti-B-cell therapy • RTX (Rituxan®)
Co-stimulatory inhibitor molecules: • ABTOrencia®)
Anti IL-6 therapy • TCZ (Actemra®) • SRL
Anti IL-1 therapy: • Anakinra (Kineret®)
Additional interventions: • Filgotinib and peficitinib
Any intervention other than the included list
In line with NICE potential scope
Copyright 2019 Queen's Printer and Controller of HMSO. All rights reserved

Page 42 of 275
# Inclusion criteria Exclusion criteria Justification Biosimilars to any of the interventions listed above
Outcomes Clinical study SLR (final list of outcomes of interest to be agreed in conjunction with Abbvie) Efficacy • ACR 20/50/70 response
rate to treatment (defined as a 20%/50%/70% improvement in TJC and SJC and the same level of improvement in three of the five following variables: patient and physician global assessments, pain, HAQ-DI, and acute phase reactants).
• HAQ-DI (change from baseline)
• EULAR response (‘good’, ‘moderate’, ‘good/moderate’, ‘no response’; may also be reported as DAS-28 response)
• DAS-28 score (change from baseline, assessed using ESR or CRP)
• DAS-28 remission (defined based on DAS-28 score)
• CDAI score • Patient assessment of
functional ability (HAQ-DI, AIMS, MACTAR).
• Radiographic progression (as measured by a valid scoring system e.g. Larsen/Sharp/modified Sharp score).
• Patient’s assessment of pain (VAS or Likert scale).
• Patient/physician assessment of disease activity (VAS or Likert scale)
• Morning stiffness, number of flares
• Fatigue (FACIT-F; Worse Tiredness Score)
• Disease activity (SDAI) • Physical function (MJS) • RA-related mortality
Outcome(s) not listed
In line with NICE potential reference case
Copyright 2019 Queen's Printer and Controller of HMSO. All rights reserved

Page 43 of 275
# Inclusion criteria Exclusion criteria Justification • Extra-articular
manifestations of the disease (captured under safety reporting)
Safety • Incidence of AEs,
including allergic reactions, infections, and thromboembolic events
• Incidence of SAEs, including MACE
• Treatment withdrawal (and reason for withdrawal, e.g. lack of efficacy, AEs, SAEs)
HRQoL: • As measured by SF-36
or other instruments • EQ-5D-5L and 3L • WPAI-RA
Study design RCTs, with no restriction on phase or study design (long term extensions will be included if randomisation is maintained) Observational studies, to include prospective cohort studies, case-control studies, registries for UPA only
Any other study design
In line with NICE potential reference case
Language restrictions
English language publications and English language abstracts of foreign language publications
Foreign language publications without an English abstract
-
Date of publication No restriction - - Countries/global reach
No restriction - -
Abbreviations: ABT, abatacept; ACR, American College of Rheumatology; ADA, adalimumab; AEs, adverse events; AIMS, Arthritis Impact Measurement Scales ; bDMARDs, biologic disease modifying antirheumatic drugs; BRC, baricitinib; BSC, best supportive care; CDAI, Clinical disease activity index; CRP, C-reactive protein; CTZ, certolizumab pegol; csDMARDs, conventional synthetic disease modifying antirheumatic drugs; DAS-28, disease activity score 28-joint count; EQ-5D-3L, three-level EuroQol five dimension; EQ-5D-5L, five-level EuroQol five dimension; ESR, erythrocyte sedimentation rate; ETN, etanercept; EULAR, European League Against Rheumatism; FACIT-F, Functional Assessment of Chronic Illness Therapy – Fatigue; GOL, golimumab; HAQ-DI, Health assessment questionnaire disability index; HRQoL, health-related quality of life; IFX, infliximab; IL-1/6, interleukin 1/6; JAK, Janus kinase; MACE, major adverse cardiac event; MACTAR, McMaster Toronto Arthritis patient preference questionnaire; MJS, morning joint stiffness; MTX, methotrexate; NICE, National Institute for Health and Care Excellence; QD, once daily; RA, rheumatoid arthritis; RCTs, randomised controlled trials; RTX, rituximab; SAEs, serious adverse events; SDAI, simple disease activity index; SF-36, 36-item short form survey; SJC, swollen joint count; SLR, systematic literature review; SRL, sarilumab; TCZ, tocilizumab; TFC, tofacitinib; TJC, tender joint count; TNF-alpha, tumour necrosis factor alpha; WPAI-RA, Work Productivity and Activity Impairment Questionnaire: Rheumatoid arthritis
Source: Reproduced from Table 1, CS Appendix D.1.4, page 42
Copyright 2019 Queen's Printer and Controller of HMSO. All rights reserved

Page 44 of 275
The company stated that the included comparators were those currently used to treat
moderate-to-severe RA. Investigational and off-label therapies were initially searched for
and included in the SLR even if not finally included in analyses due to lack of relevance
to the submission (refer to Table 4, D.1.10, Appendix D of the CS for details on studies
included in the SLR but excluded from the NMA in the CS). The ERG additionally noted
that, in addition to the comparators listed in Table 2, csDMARDs, BSC, and PBO were
eligible comparators in the decision problem (refer to Section 2.1 for further detail).
The ERG also noted that in Table 2, UPA was included as an intervention at 15 mg and
30 mg QD dosages. This is consistent with the NICE final scope, even though the
company’s decision problem focuses on the 15 mg QD dosage. The ERG considered
that it was appropriate to include both dosages as interventions in the SLR.
4.1.3 Critique of screening and data extraction processes
The company provide limited information about screening and data extraction processes.
Appendix D.1.7 of the CS stated that screening was conducted by two reviewers
according to pre-defined inclusion/exclusion criteria (refer to Section 4.1.2) with
discrepancies resolved by a third person. This is in line with usual practice, although the
ERG noted that it was not clearly specified whether double-independent screening
occurred at both stages of the screening process (title and abstract screening; full text
screening).
Appendix D.1.7 of the CS reported that data were extracted into a template by one
reviewer and checked by a second reviewer (with inconsistencies resolved through
discussion). This is consistent with usual practice. No additional details about the data
extraction template were provided, so the ERG could not further comment on the data
extraction processes.
4.1.4 Quality assessment
QA for the four pivotal RCTs (SELECT-COMPARE, SELECT-MONOTHERAPY,
SELECT-NEXT and SELECT-BEYOND) were provided in Appendix D of the CS (refer to
Section D.1.17, Table 30) together with the QA for all studies included in the network
meta-analyses (see Section 4.3.4.1 for a critique of the QA of these studies). The QA
was performed using the checklist provided in the NICE single technology appraisal
(STA) user guide,16 and therefore based upon guidance from the Centre for Reviews and
Dissemination (University of York).17
Copyright 2019 Queen's Printer and Controller of HMSO. All rights reserved

Page 45 of 275
ERG comment:
The ERG considered the company QA to have been conducted using appropriate
methods. In accordance with usual practice, the QA conducted by the company was
primarily concerned with internal validity. ERG comments on the external validity of the
trials are provided in Section 4.2 of this report.
4.1.5 Evidence synthesis
The CS did not present a meta-analysis of UPA trials. The company stated that: “whilst a
meta-analysis of RCTs was theoretically feasible, the fact that a comprehensive network
meta-analysis of all relevant comparators was conducted and allowed for more precise
estimates of treatment effects to be calculated meant that this approach was favoured
instead of a meta-analysis of these RCT studies” (CS, p.86).
ERG comment:
The ERG noted that it is recommended to also provide pairwise meta-analyses in
addition to NMAs.18 However, the ERG considered the presentation of pairwise meta-
analyses not to be essential in this appraisal given the characteristics of the network
structure with a wide range of comparisons and relatively few trials contributing to each
potential pairwise comparison. The ERG was therefore broadly satisfied with the
company’s decision to only present the NMA results, since the ERG considered these to
be the most relevant clinical effectiveness results in the decision-making context of this
appraisal. The ERG critique of the NMA is presented in Section 4.4.
Critique of trials of the technology of interest, their analysis and interpretation (and any standard meta-analyses of these)
4.2.1 Excluded studies
As discussed in Section 4.1.1, the company conducted a SLR to identify potentially
relevant trials. The clinical effectiveness PRISMA flow diagram is provided in the CS
(Appendix D, Figure 1, p.57). A PRISMA flow diagram from the company’s updated
search was provided in the company’s response to the ERG clarification questions, and
is reproduced below as Figure 2.
Copyright 2019 Queen's Printer and Controller of HMSO. All rights reserved

Page 46 of 275
Figure 2. PRISMA flow diagram for updated clinical effectiveness searches
Abbreviations: bDMARDs, biologic disease modifying antirheumatic drugs; csDMARDs, conventional synthetic disease modifying antirheumatic drugs; NMA, network meta-analysis; SR, systematic review
Source: Company clarification response pt. 1, A4.
A table of studies excluded from the SLR is provided in the CS (Appendix D, Table 2,
pp. 58-100) for the original search and CS Appendix D (Table 3, pp.100-106) for the
updated search. Only broad classifications of the reasons for exclusion are provided,
listed as ‘Outcomes’, ‘Copy/duplicate’, ‘Study design’, ‘Intervention’, ‘Population’ and
‘Review/editorial’. These reasons are potentially consistent with the inclusion and
exclusion criteria for the SLR. However, with the exception of ‘Copy/duplicate’ and
‘Review/editorial’, the information in the CS lacked sufficient detail in order to allow the
ERG to critique whether or not any studies for the technology of interest may have been
inappropriately excluded during the screening process. The ERG also noted that the
Copyright 2019 Queen's Printer and Controller of HMSO. All rights reserved

Page 47 of 275
reason for exclusion for two studies in Table 2 was stated as ‘0’, which may be a
typographical error by the company, as there was no indication provided what this code
represents.
4.2.2 Included studies
The CS presents four pivotal clinical effectiveness studies for the technology of interest
UPA: SELECT-COMPARE,19,20 SELECT-NEXT,21,22 SELECT-MONOTHERAPY23,24 and
SELECT-BEYOND. 25,26 All are RCTs, were used to support the application for marketing
authorisation and are used in the economic model. A summary profile of these four trials
was provided in the CS as Table 3, p.36, and is reproduced below as Table 3.
Copyright 2019 Queen's Printer and Controller of HMSO. All rights reserved

Page 48 of 275
Table 3. Overview of pivotal clinical effectiveness studies
Study SELECT-COMPARE SELECT-NEXT SELECT-MONOTHERAPY SELECT-BEYOND
Study Design
Phase III multicentre randomised, double-blind, parallel-group, PBO-controlled and active comparator-controlled trial
Phase III multicentre, randomised, double-blind, parallel-group, PBO-controlled trial
Phase III multicentre, randomised, double-blind, parallel-group, controlled trial
Phase III multicentre, randomised, double-blind, parallel-group, PBO-controlled period
Population
Subjects with moderately to severely active RA who are on a stable background of MTX and who have an inadequate response to MTX
Subjects with moderately to severely active RA who are on a stable dose of csDMARDs and had an inadequate response to csDMARDs
Subjects with moderately to severely active RA despite stable doses of MTX (inadequate response to MTX)
Subjects with moderately to severely active RA who are on a stable dose of csDMARDs and had an inadequate response to or intolerance to at least 1 bDMARD.
Intervention
UPA 15 mg orally QD (N=651) from Day 1 to Week 48 (Period 1) and thereafter up to 5 years (Period 2)
UPA 15 mg (N=221) and 30 mg (N=219) orally QD (N=200) from Day 1 to Week 12 (Period 1) and thereafter up to 5 years (Period 2)
UPA 15 mg (N=217) and 30 mg (N=215) orally QD (N=200) from Day 1 to Week 14 (Period 1) and thereafter up to Week 226 (Period 2)
UPA 15 mg (N=164) and 30 mg orally QD (N=165) from Day 1 to Week 24 (Period 1) and thereafter up to Week 216 (Period 2)
Comparators
PBO (N=651) either orally QD or SC eow according to the matching drug (UPA or ADA) from Day 1 to Week 26, followed by UPA 15 mg QD from Week 26 to Week 48 (Period 1) and thereafter up to 5 years (Period 2) ADA 40 mg SC eow (N=327) from Day 1 to Week 48 (Period 1) and thereafter up to 5 years (Period 2)
PBO (N=221) from Day 1 to Week 12, followed by UPA 15 mg or 30 mg orally QD (in two different randomised groups) at Week 12 and thereafter up to 5 years
MTX (N=216) once weekly from Day 1 to Week 14 (Period 1), followed by UPA 15 mg or 30 mg orally QD at Week 14 and thereafter up to Week 226 (Period 2)
PBO (N=169) from Day 1 to Week 12, followed by UPA 15 mg or 30 mg orally QD (in two different randomised groups) at Week 12 to Week 24 (Period 1) and thereafter up to Week 216 (Period 2)
Permitted and disallowed concomitant medication
• Subjects should continue their stable background MTX therapy up to Week 24.
• Subjects taking MTX should take a dietary supplement of oral folic acid throughout study participation.
• Subjects should continue their stable background csDMARD therapy up to Week 24.
• Subjects taking MTX should take a dietary supplement of oral folic acid throughout study participation.
• Subjects taking MTX should take a dietary supplement of oral folic acid throughout study participation.
• Subjects should continue their stable doses of NSAIDs, acetaminophen/paracetamol, or inhaled corticosteroids.
• Subjects should continue their stable background csDMARD therapy up to Week 24.
• Subjects taking MTX should take a dietary supplement of oral folic acid throughout study participation.
Copyright 2019 Queen's Printer and Controller of HMSO. All rights reserved

Page 49 of 275
Study SELECT-COMPARE SELECT-NEXT SELECT-MONOTHERAPY SELECT-BEYOND • Subjects should continue their
stable doses of NSAIDs, acetaminophen/paracetamol, or inhaled corticosteroids.
• Prior exposure to JAK inhibitors is not allowed.
• Oral corticosteroids are not allowed during the first 24 weeks of the study.
• All biologic therapies are prohibited during the study (i.e., Periods 1 and 2).
• Systemic use of known strong CYP3A inhibitors or strong CYP3A inducers is excluded from the Screening Visit through the end of the study (i.e., end of Period 2).
• High potency opiates are not permitted during the study (i.e., Periods 1 and 2).
• Investigational drugs are also prohibited during the study.
• Live vaccines are not allowed within 4 weeks prior to the first dose of study drug and during the study (i.e., Periods 1 and 2).
• Oral traditional Chinese medicine is not permitted during the study.
• Subjects should continue their stable doses of NSAIDs, acetaminophen/paracetamol, or inhaled corticosteroids.
• Prior exposure to JAK inhibitors is not allowed.
• Oral corticosteroids are not allowed during the first 24 weeks of the study.
• All biologic therapies are prohibited during the study (i.e., Periods 1 and 2).
• Systemic use of known strong CYP3A inhibitors or strong CYP3A inducers is excluded from the Screening Visit through the end of the study (i.e., end of Period 2).
• High potency opiates are not permitted during the study (i.e., Periods 1 and 2).
• Investigational drugs are also prohibited during the study. Live vaccines are not allowed within 4 weeks prior to the first dose of study drug and during the study (i.e., Periods 1 and 2).
• Oral traditional Chinese medicine is not permitted during the study.
• Prior exposure to JAK inhibitors is not allowed.
• Oral corticosteroids are not allowed during the first 24 weeks of the study.
• Subjects must have discontinued all csDMARDs (other than MTX) prior to the first dose of study drug as specified in the washout procedures.
• All biologic therapies are prohibited during the study (i.e., Periods 1 and 2).
• Systemic use of known strong CYP3A inhibitors or strong CYP3A inducers is excluded from the Screening Visit through the end of the study (i.e., end of Period 2).
• High potency opiates are not permitted during the study (i.e., Periods 1 and 2).
• Investigational drugs are also prohibited during the study.
• Live vaccines are not allowed within 4 weeks prior to the first dose of study drug and during the study (i.e., Periods 1 and 2).
• Oral traditional Chinese medicine is not permitted during the study.
• Subjects should continue their stable doses of NSAIDs, acetaminophen/paracetamol, or inhaled corticosteroids.
• Prior exposure to JAK inhibitors is not allowed.
• Oral corticosteroids are not allowed during the first 24 weeks of the study.
• All biologic therapies are prohibited during the study (i.e., Periods 1 and 2).
• Systemic use of known strong CYP3A inhibitors or strong CYP3A inducers is excluded from the Screening Visit through the end of the study (i.e., end of Period 2).
• High potency opiates are not permitted during the study (i.e., Periods 1 and 2).
• Investigational drugs are also prohibited during the study. Live vaccines are not allowed within 4 weeks prior to the first dose of study drug and during the study (i.e., Periods 1 and 2).
• Oral traditional Chinese medicine is not permitted during the study.
Copyright 2019 Queen's Printer and Controller of HMSO. All rights reserved

Page 50 of 275
Study SELECT-COMPARE SELECT-NEXT SELECT-MONOTHERAPY SELECT-BEYOND Does trial support MAA? Yes Yes Yes Yes
Is trial used in model Yes Yes Yes Yes
Reported outcomes specified in the decision problem
• Disease activity • Physical function • Joint damage, pain • Fatigue • Radiological progression • AEs of treatment • HRQoL
• Disease activity • Physical function • Joint damage, pain • Fatigue • AEs of treatment • HRQoL
• Disease activity • Physical function • Joint damage, pain • AEs of treatment • HRQoL
• Disease activity • Physical function • Joint damage, pain • AEs of treatment • HRQoL
Abbreviations: ADA, adalimumab; bDMARD, biological disease modifying anti-rheumatic drug; csDMARDs , conventional synthetic disease modifying anti-rheumatic drug; eow, every other week; MAA, marketing authorization application; MTX, methotrexate; PBO, placebo; QD, once daily; RA, rheumatoid arthritis; SC, subcutaneous; UPA, upadacitinib
Source: CS, Table 3, p.36.
Copyright 2019 Queen's Printer and Controller of HMSO. All rights reserved

Page 51 of 275
A fifth UPA trial also features in the CS. This is the SELECT SUNRISE trial.27,28 This was
also a Phase III RCT. The company explained that the: “data [for that trial] are not
presented in this section [clinical effectiveness evidence]” because the trial was
“comprised entirely of Japanese patients [and] this was not an EMA registration trial”
(CS, p.35). The ERG considered that the exclusively Japanese population of SELECT
SUNRISE may be a limitation of the trial in terms of relevance to the UK decision-making
context. Nevertheless, the ERG considered that this trial did meet the SLR inclusion
criteria and should not have been excluded from the presentation of clinical effectiveness
evidence. It should be noted that the SELECT SUNRISE trial was included in the
company’s base case NMA, although a scenario analysis was presented excluding this
trial. Indeed, the company stated: “Please note, data from SELECT-SUNRISE were
available and included in the NMAs as it met the NMA selection criteria.” (CS, p.36).
Therefore, this trial does inform the company base case economic model, and as such
the ERG considered that its clinical effectiveness should therefore have been profiled in
detail in the CS. The ERG’s critique of study design, population characteristics,
intervention characteristics, outcome assessment and QA in the following sections were
conducted on the four pivotal RCTs as defined by the company and profiled in detail in
the clinical effectiveness section of the CS.
Comparator trials and their assessment for potential inclusion in the NMA are critiqued in
Section 4.3.
4.2.2.1 Study design
The methodology of the four pivotal trials is summarised by the company in CS (refer to
Table 4, pp.43-48), and reproduced below as Table 4.
Copyright 2019 Queen's Printer and Controller of HMSO. All rights reserved

Page 52 of 275
Table 4. Comparative summary of trial methodology
Study SELECT-COMPARE SELECT-NEXT SELECT-MONOTHERAPY SELECT-BEYOND
Location where the data was collected
286 study sites located in 41 countries (Argentina, Australia, Belarus, Belgium, Bosnia and Herzegovina, Brazil, Bulgaria, Canada, Chile, Colombia, Croatia, Czech Republic, Estonia, France, Germany, Greece, Hong Kong, Hungary, Israel, Italy, Kazakhstan, Republic Of Korea, Latvia, Lithuania, Malaysia, Mexico, New Zealand, Poland, Portugal, Puerto Rico, Romania, Russian Federation, Serbia, Slovakia, South Africa, Spain, Taiwan [Province Of China], Turkey, Ukraine, United Kingdom, United States)
150 study sites located in 35 countries (Argentina, Australia, Austria, Belgium, Bosnia and Herzegovina, Bulgaria, Canada, Croatia, Czech Republic, Estonia, Finland, France, Germany, Greece, Hong Kong, Hungary, Ireland, Kazakhstan, Korea, Latvia, Lithuania, Mexico, New Zealand, Poland, Portugal, Romania, Russian Federation, Slovakia, South Africa, Spain, Switzerland, Taiwan, Ukraine, United Kingdom, United States)
138 study sites located in 24 countries (Argentina, Austria, Belgium, Bulgaria, Chile, Czech Republic, Estonia, Greece, Hungary, Israel, Italy, Japan, Mexico, Poland, Portugal, Puerto Rico, Romania, Russian Federation, Serbia, South Africa, Spain, Turkey, Ukraine, United States)
152 sites in 26 countries (Australia, Austria, Belgium, Canada, Czech Republic, Estonia, Finland, France, Germany, Greece, Hungary, Ireland, Israel, Korea, Latvia, New Zealand, Poland, Portugal, Puerto Rico, Russian Federation, Slovakia, Spain, Sweden, Turkey, United Kingdom, United States)
Trial Design Phase III multicenter study that includes two periods. Period 1 is a 48-week randomised, double-blind, parallel-group, PC and active comparator-controlled period designed to compare the safety and efficacy of UPA 15 mg QD versus PBO, and versus ADA, for the treatment of signs and symptoms of subjects with moderately to severely active RA who were on a stable dose of MTX and had an inadequate response to MTX. Period 1 was also designed to compare the efficacy of UPA 15 mg QD versus PBO for the prevention of structural progression. Period 2 is a long-term extension to evaluate the safety, tolerability, and efficacy of UPA 15 mg QD in subjects with RA who had completed Period 1.
Phase III multicenter study that includes two periods. Period 1 was a 12-week, randomised, double-blind, parallel-group, PC period designed to compare the safety and efficacy of UPA 30 mg QD and 15 mg QD versus PBO for the treatment of signs and symptoms of subjects with moderately to severely active RA who were on a stable dose of csDMARDs and had an inadequate response to csDMARDs. Period 2 is a blinded long-term extension period to evaluate the long-term safety, tolerability, and efficacy of UPA 30 mg QD and 15 mg QD in subjects with RA who had completed Period 1.
Phase III multicenter study that includes two periods. Period 1 was a 14-week, randomised, double-blind, parallel-group, controlled treatment period designed to compare the safety and efficacy of UPA 30 mg QD alone and 15 mg QD alone versus continuing MTX alone for the treatment of signs and symptoms of RA in subjects with moderately to severely active RA despite stable doses of MTX (inadequate response to MTX). Period 2 is a blinded, long-term extension period to evaluate the long-term safety, tolerability, and efficacy of UPA 30 mg QD and 15 mg QD in subjects with RA who have completed Period 1.
Phase III multicenter study that included two periods. Period 1 was a 24-week, randomised, double-blind, parallel-group, PC period designed to compare the safety and efficacy of UPA 30 mg QD and 15 mg QD versus PBO for the treatment of signs and symptoms of subjects with moderately to severely active RA who were on a stable dose of csDMARDs and had an inadequate response to or intolerance to at least 1 bDMARD. Period 2 is a blinded long-term extension period to evaluate the long-term safety, tolerability, and efficacy of UPA 30 mg QD and 15 mg QD in subjects with RA who had completed Period 1.
Copyright 2019 Queen's Printer and Controller of HMSO. All rights reserved
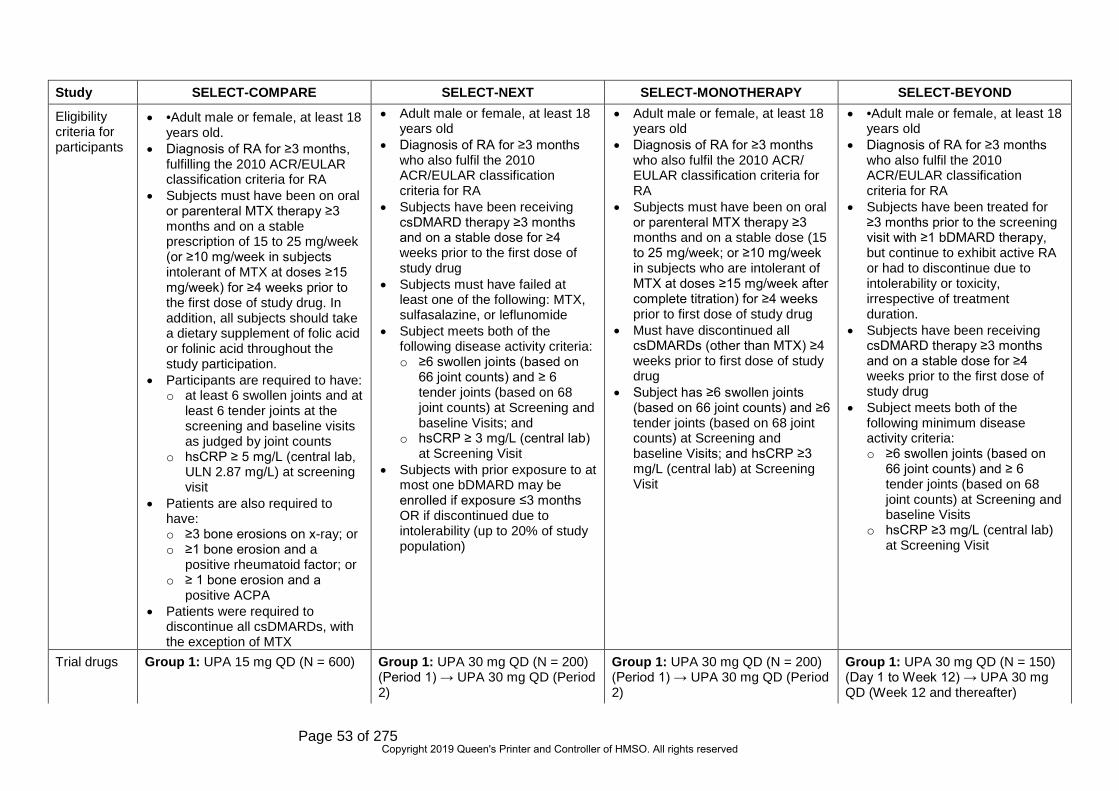
Page 53 of 275
Study SELECT-COMPARE SELECT-NEXT SELECT-MONOTHERAPY SELECT-BEYOND
Eligibility criteria for participants
• •Adult male or female, at least 18 years old.
• Diagnosis of RA for ≥3 months, fulfilling the 2010 ACR/EULAR classification criteria for RA
• Subjects must have been on oral or parenteral MTX therapy ≥3 months and on a stable prescription of 15 to 25 mg/week (or ≥10 mg/week in subjects intolerant of MTX at doses ≥15 mg/week) for ≥4 weeks prior to the first dose of study drug. In addition, all subjects should take a dietary supplement of folic acid or folinic acid throughout the study participation.
• Participants are required to have: o at least 6 swollen joints and at
least 6 tender joints at the screening and baseline visits as judged by joint counts
o hsCRP ≥ 5 mg/L (central lab, ULN 2.87 mg/L) at screening visit
• Patients are also required to have: o ≥3 bone erosions on x-ray; or o ≥1 bone erosion and a
positive rheumatoid factor; or o ≥ 1 bone erosion and a
positive ACPA • Patients were required to
discontinue all csDMARDs, with the exception of MTX
• Adult male or female, at least 18 years old
• Diagnosis of RA for ≥3 months who also fulfil the 2010 ACR/EULAR classification criteria for RA
• Subjects have been receiving csDMARD therapy ≥3 months and on a stable dose for ≥4 weeks prior to the first dose of study drug
• Subjects must have failed at least one of the following: MTX, sulfasalazine, or leflunomide
• Subject meets both of the following disease activity criteria: o ≥6 swollen joints (based on
66 joint counts) and ≥ 6 tender joints (based on 68 joint counts) at Screening and baseline Visits; and
o hsCRP ≥ 3 mg/L (central lab) at Screening Visit
• Subjects with prior exposure to at most one bDMARD may be enrolled if exposure ≤3 months OR if discontinued due to intolerability (up to 20% of study population)
• Adult male or female, at least 18 years old
• Diagnosis of RA for ≥3 months who also fulfil the 2010 ACR/ EULAR classification criteria for RA
• Subjects must have been on oral or parenteral MTX therapy ≥3 months and on a stable dose (15 to 25 mg/week; or ≥10 mg/week in subjects who are intolerant of MTX at doses ≥15 mg/week after complete titration) for ≥4 weeks prior to first dose of study drug
• Must have discontinued all csDMARDs (other than MTX) ≥4 weeks prior to first dose of study drug
• Subject has ≥6 swollen joints (based on 66 joint counts) and ≥6 tender joints (based on 68 joint counts) at Screening and baseline Visits; and hsCRP ≥3 mg/L (central lab) at Screening Visit
• •Adult male or female, at least 18 years old
• Diagnosis of RA for ≥3 months who also fulfil the 2010 ACR/EULAR classification criteria for RA
• Subjects have been treated for ≥3 months prior to the screening visit with ≥1 bDMARD therapy, but continue to exhibit active RA or had to discontinue due to intolerability or toxicity, irrespective of treatment duration.
• Subjects have been receiving csDMARD therapy ≥3 months and on a stable dose for ≥4 weeks prior to the first dose of study drug
• Subject meets both of the following minimum disease activity criteria: o ≥6 swollen joints (based on
66 joint counts) and ≥ 6 tender joints (based on 68 joint counts) at Screening and baseline Visits
o hsCRP ≥3 mg/L (central lab) at Screening Visit
Trial drugs Group 1: UPA 15 mg QD (N = 600) Group 1: UPA 30 mg QD (N = 200) (Period 1) → UPA 30 mg QD (Period 2)
Group 1: UPA 30 mg QD (N = 200) (Period 1) → UPA 30 mg QD (Period 2)
Group 1: UPA 30 mg QD (N = 150) (Day 1 to Week 12) → UPA 30 mg QD (Week 12 and thereafter)
Copyright 2019 Queen's Printer and Controller of HMSO. All rights reserved

Page 54 of 275
Study SELECT-COMPARE SELECT-NEXT SELECT-MONOTHERAPY SELECT-BEYOND Group 2: PBO (N = 600) Group 2: UPA 15 mg QD (N = 200)
(Period 1) → UPA 15 mg QD (Period 2)
Group 2: UPA 15 mg QD (N = 200) (Period 1) → UPA 15 mg QD (Period 2)
Group 2: UPA 15 mg QD (N = 150) (Day 1 to Week 12) → UPA 15 mg QD (Week 12 and thereafter)
Group 3: ADA (40 mg eow) (N = 300)
Group 3: PBO (N = 100) (Period 1) → UPA 30 mg QD (Period 2)
Group 3: MTX (N = 100) (Period 1) → UPA 30 mg QD (Period 2)
Group 3: PBO (N = 75) (Day 1 to Week 12) → UPA 30 mg QD (Week 12 and thereafter)
Group 4: PBO (N = 100) (Period 1) → UPA 15 mg QD (Period 2)
Group 4: MTX (N = 100) (Period 1) → UPA 15 mg QD (Period 2)
Group 4: PBO (N = 75) (Day 1 to Week 12) → UPA 15 mg QD (Week 12 and thereafter)
Permitted and disallowed concomitant medication
• Subjects should continue their stable background MTX therapy up to Week 24.
• Subjects taking MTX should take a dietary supplement of oral folic acid throughout study participation.
• Subjects should continue their stable doses of NSAIDs, acetaminophen/paracetamol, or inhaled corticosteroids.
• Prior exposure to JAK inhibitors is not allowed.
• Oral corticosteroids are not allowed during the first 24 weeks of the study.
• All biologic therapies are prohibited during the study (i.e., Periods 1 and 2).
• Systemic use of known strong CYP3A inhibitors or strong CYP3A inducers is excluded from the Screening Visit through the end of the study (i.e., end of Period 2).
• High potency opiates are not permitted during the study (i.e., Periods 1 and 2).
• Subjects should continue their stable background csDMARD therapy up to Week 24.
• Subjects taking MTX should take a dietary supplement of oral folic acid throughout study participation.
• Subjects should continue their stable doses of NSAIDs, acetaminophen/paracetamol, or inhaled corticosteroids.
• Prior exposure to JAK inhibitors is not allowed.
• Oral corticosteroids are not allowed during the first 24 weeks of the study.
• All biologic therapies are prohibited during the study (i.e., Periods 1 and 2).
• Systemic use of known strong CYP3A inhibitors or strong CYP3A inducers is excluded from the Screening Visit through the end of the study (i.e., end of Period 2).
• High potency opiates are not permitted during the study (i.e., Periods 1 and 2).
• Subjects taking MTX should take a dietary supplement of oral folic acid throughout study participation.
• Subjects should continue their stable doses of NSAIDs, acetaminophen/paracetamol, or inhaled corticosteroids.
• Prior exposure to JAK inhibitors is not allowed.
• Oral corticosteroids are not allowed during the first 24 weeks of the study.
• Subjects must have discontinued all csDMARDs (other than MTX) prior to the first dose of study drug as specified in the washout procedures.
• All biologic therapies are prohibited during the study (i.e., Periods 1 and 2).
• Systemic use of known strong CYP3A inhibitors or strong CYP3A inducers is excluded from the Screening Visit through the end of the study (i.e., end of Period 2).
• Subjects should continue their stable background csDMARD therapy up to Week 24.
• Subjects taking MTX should take a dietary supplement of oral folic acid throughout study participation.
• Subjects should continue their stable doses of NSAIDs, acetaminophen/paracetamol, or inhaled corticosteroids.
• Prior exposure to JAK inhibitors is not allowed.
• Oral corticosteroids are not allowed during the first 24 weeks of the study.
• All biologic therapies are prohibited during the study (i.e., Periods 1 and 2).
• Systemic use of known strong CYP3A inhibitors or strong CYP3A inducers is excluded from the Screening Visit through the end of the study (i.e., end of Period 2).
• High potency opiates are not permitted during the study (i.e., Periods 1 and 2).
Copyright 2019 Queen's Printer and Controller of HMSO. All rights reserved

Page 55 of 275
Study SELECT-COMPARE SELECT-NEXT SELECT-MONOTHERAPY SELECT-BEYOND • Investigational drugs are also
prohibited during the study. • Live vaccines are not allowed
within 4 weeks prior to the first dose of study drug and during the study (i.e., Periods 1 and 2).
• Oral traditional Chinese medicine is not permitted during the study.
• Investigational drugs are also prohibited during the study. Live vaccines are not allowed within 4 weeks prior to the first dose of study drug and during the study (i.e., Periods 1 and 2).
• Oral traditional Chinese medicine is not permitted during the study.
• High potency opiates are not permitted during the study (i.e., Periods 1 and 2).
• Investigational drugs are also prohibited during the study.
• Live vaccines are not allowed within 4 weeks prior to the first dose of study drug and during the study (i.e., Periods 1 and 2).
• Oral traditional Chinese medicine is not permitted during the study.
• Investigational drugs are also prohibited during the study. Live vaccines are not allowed within 4 weeks prior to the first dose of study drug and during the study (i.e., Periods 1 and 2).
• Oral traditional Chinese medicine is not permitted during the study.
Primary outcome
• Proportion of patients achieving ACR20 response
• Proportion achieving clinical remission (defined by a DAS-28 score based on CRP <2.6)
• Proportion of patients achieving an ACR20 response
• Proportion achieving LDA (defined by a DAS-28 score based on CRP ≤3.2)
• Proportion of patients achieving an ACR20 response
• Proportion achieving LDA (defined by a DAS-28 score based on CRP ≤3.2)
• Proportion of patients achieving an ACR20 response
• Proportion achieving LDA (defined by a DAS-28 score based on CRP ≤3.2)
Major secondary outcomes
• Change in HAQ-DI score • Change in HAQ-DI score
(superiority versus ADA) • Proportion of patients achieving
LDA based on CDAI • Proportion of patients with no
radiographic progression at week 26
• Change in morning stiffness severity
• Change in DAS-28 CRP • Change in SF-36 PCS from
baseline • Change in FACIT-F from
baseline • Change in mTSS at Week 26 • ACR50 response rates
(superiority and non-inferiority versus ADA)
• ACR50 response rates • ACR70 response rates
• Change in DAS-28 CRP • Proportion of patients achieving
ACR50/70 response • Change in the HAQDI score from
baseline • Change in SF-36 PCS from
baseline • Proportion of patients achieving
clinical remission (DAS-28 CRP <2.6)
• Change in FACIT-F from baseline
• Change in RA-WIS score at baseline
• Proportion of changes in morning stiffness severity
• Decrease in DAS-28 CRP from baseline
• Proportion of patients achieving an ACR50/70 response
• Change in HAQ-DI score from baseline
• Change in SF-36 PCS from baseline
• Proportion of patients achieving clinical remission (DAS-28 CRP <2.6)
• Proportion of changes in morning stiffness severity
• Change in DAS-28 CRP • Changes in the HAQ-DI score
from baseline • Proportion of patients achieving
ACR20/50/70 response • Change in SF-36 PCS score
from baseline • ACR20 response rate at Week 1
Copyright 2019 Queen's Printer and Controller of HMSO. All rights reserved

Page 56 of 275
Study SELECT-COMPARE SELECT-NEXT SELECT-MONOTHERAPY SELECT-BEYOND • Proportion of patients achieving
LDA (defined by a DAS-28 score based on CRP ≤3.2) (non-inferiority versus ADA)
• Proportion of patients achieving LDA (defined by a DAS-28 score based on CRP ≤3.2)
• Change from baseline in patients assessment of pain (superiority of UPA versus ADA)
• Change in RA-WIS score at baseline
Pre-planned subgroups (primary efficacy endpoints)
• Age (<40, 40 to 64, ≥65 years) • Sex (male or female) • Weight (<60 kg or ≥60 kg); • BMI (<25 or ≥25) • Race (white, non-white), • Geographic region (North
America, South/Central America, Western Europe, Eastern Europe, Asia, other)
• RA disease duration (<5 or ≥5 years)
• Baseline RF status (positive or negative)
• Baseline anti-CCP antibody status (positive or negative)
• Baseline RF and anti-CCP (at least one negative or double positive)
• Baseline RF and anti-CCP (at least one positive or double negative)
• Baseline DAS-28 (hsCRP) (≤5.1 or >5.1); and
• Prior bDMARD use (yes or no).
• Age (<40, 40 to 64, ≥65 years) • Sex (male or female) • Weight (<60 kg or ≥60 kg) • BMI (<25 or ≥25) • Race (white, non-white),
geographic region (North America, Western Europe, Eastern Europe, other)
• Duration of RA diagnosis (<5 or ≥5 years)
• Baseline RF status (positive or negative)
• Baseline anti-CCP antibody status (positive or negative)
• Baseline both RF positive and anti-CCP positive (yes or no)
• Baseline both RF negative and anti-CCP negative (yes or no)
• Baseline DAS-28 (CRP) (≤5.1 or >5.1); and
• Prior bDMARD use (yes or no)
• Age (<40, 40 to 64, ≥65 years) • Sex (male or female) • Weight (<60 kg or ≥60 kg) • BMI (<25 or ≥25) • Race (white, non-white), • Geographic region (North
America, South/Central America, Western Europe, Eastern Europe, Asia, other)
• RA disease duration (<5 or ≥5 years)
• Baseline RF status (positive or negative
• Baseline anti-CCP antibody status (positive or negative)
• Baseline RF and anti-CCP (at least one negative or double positive)
• Baseline RF and anti-CCP (at least one positive or double negative)
• Baseline DAS-28 (hsCRP) (≤5.1 or >5.1)
• Age (<40, 40 to 64, ≥65 years) • Sex (male or female) • Weight (<60 kg or ≥60 kg) • BMI (<25 or ≥25) • Race (white, non-white), • Geographic region (North
America, South/Central America, Western Europe, Eastern Europe, other
• Duration of RA diagnosis (<10 or ≥10 years)
• Baseline RF status (positive or negative)
• Baseline anti-CCP antibody status (positive or negative)
• Baseline RF and anti-CCP (at least one negative or double positive)
• Baseline RF and anti-CCP (at least one positive or double negative)
• Baseline DAS-28 (hsCRP) (≤5.1 or >5.1)
• Prior failed bDMARD; and failed anti-IL6 due to lack of efficacy
Abbreviations: ACR, American College of Rheumatology; ACR20/50/70, American College of Rheumatology 20%, 50%, 70% response; bDMARD, biologic disease-modifying anti-rheumatic drug; BMI, body mass index; CCP, cyclic citrullinated peptide; CDAI, Clinical Disease Activity Index; CRP, C-reactive protein; csDMARDs, conventional synthetic disease-modifying anti-
Copyright 2019 Queen's Printer and Controller of HMSO. All rights reserved

Page 57 of 275
rheumatic drug(s); DAS-28, disease activity score 28-joint count; eow, every other week; FACIT-F, Functional Assessment of Chronic Illness Therapy — Fatigue; HAQ-DI, Health Assessment Questionnaire — Disability Index; hsCRP, high-sensitivity C-reactive protein; JAK, Janus kinase; LDA, low disease activity; mTSS, modified Total Sharp Score; MTX, methotrexate; NSAIDs, non-steroidal anti-inflammatory drugs; PCS, physical component summary; QD, once daily; RA, rheumatoid arthritis; RF, rheumatoid factor; SF-36, Short Form-36; ULN, upper limit of normal; WIS, Work Instability Scale
Source: CS, Table 4, pp. 43-48
Copyright 2019 Queen's Printer and Controller of HMSO. All rights reserved
Page 58 of 275
The ERG considered the study design of the trials included in the CS to be appropriate
for the SLR inclusion criteria. The trials evaluated the clinical effectiveness of UPA
versus either PBO or an active comparator – ADA or MTX. Head-to-head evidence is
provided for certain comparisons, although the key clinical effectiveness comparisons
that serve as inputs to the economic model are derived from NMAs (see Section 4.4), in
order to take into account the totality of the available evidence across the network.
All four studies were conducted across a large number of sites located in a wide range of
sites globally. SELECT-COMPARE was conducted in 286 sites across 41 countries,
SELECT-NEXT on 150 sites across 35 countries, SELECT-MONOTHERAPY on 138
sites across 24 countries, and SELECT-BEYOND on 152 sites across 26 countries. It
was noted that in the figures for SELECT-COMPARE and SELECT-NEXT, Taiwan and
Hong Kong were counted as separate countries. One of the trials – SELECT-
MONOTHERAPY did not include any UK sites, while the other three pivotal trials did
include centres in the UK. However,
*****************************************************************************************************
*****************************************************************************************************
*****************************************************************************************************
*******************************************************************
All four trials included two periods, the first of which was the main trial period and the
second was a long-term extension period to assess longer term efficacy, safety and
tolerability. ERG noted differences in the duration of the main trial period between the
trials: 12 weeks (SELECT-NEXT), 14 weeks (SELECT-MONOTHERAPY), 24 weeks
(SELECT-BEYOND), and 48 weeks (SELECT-COMPARE).
The planned sample size and power calculation for each of the pivotal trials is presented
in CS Appendix D, Table 39, pp.258-259, and reproduced below as Table 5.
Copyright 2019 Queen's Printer and Controller of HMSO. All rights reserved

Page 59 of 275
Table 5. Hypothesis and associated statistical analysis for each trial
Trial number (acronym)
Statistical analysis Sample size, power calculation
Data management, patient withdrawals
SELECT COMPARE
Comparisons of the primary endpoint were made between the UPA 15 mg QD group and the PBO group using the Cochran-Mantel-Haenszel test adjusting for stratification factor of prior bDMARD use
The planned total sample size of 1,500 for this study (with a 2:2:1 randomization ratio) provided at least 90% power for a 22% difference in ACR20 response rate (assuming a PBO ACR20 response rate of 37%) at 2-sided significance level of 0.05 and accounting for a 10% dropout rate. It also provided at least 90% power for a 19.3% difference in CR response rate (assuming a PBO CR response rate of 6.2%)
Data Management was done by BI according to BI SOPs and Statistical Evaluation was done by AbbVie according to BI SOPs.
SELECT NEXT Comparison of the primary endpoint was made between each UPA dose group and the combined PBO groups using the Cochran-Mantel-Haenszel test adjusted for main stratification factors.
The planned total sample size of 600 for this study provided at least 90% power for a 21% difference in ACR20 response rate (assuming a PBO ACR20 response rate of 37%), as well as at least 90% power for a 22% difference in LDA response rate (based on DAS-28 [CRP] [assuming a PBO LDA response rate of 15%]), at 2-sided significance level of 0.025 and accounting for a 10% dropout rate.
Data Management was done by BI according to BI SOPs and Statistical Evaluation was done by AbbVie according to BI SOPs.
SELECT MONOTHERAPY
Comparisons of the primary endpoint were made between each UPA dose and the combined MTX group using the Cochran-Mantel-Haenszel test adjusting for stratification factor of geographic region.
The planned total sample size of 600 for this study provided at least 90% power to detect a 21% difference in ACR20 response rate (assuming an ACR20 response rate of 37% in the continuing MTX group), as well as at least 90% power to detect a 22% difference in LDA response rate based on DAS-28 (CRP) criteria (assuming an LDA response rate of 15% in the continuing MTX group), at 2-sided α = 0.025 and accounting for 10% dropout rate.
Data Management was done by BI according to BI SOPs and Statistical Evaluation was done by AbbVie according to BI SOPs.
Copyright 2019 Queen's Printer and Controller of HMSO. All rights reserved

Page 60 of 275
Trial number (acronym)
Statistical analysis Sample size, power calculation
Data management, patient withdrawals
SELECT BEYOND
Comparison of the primary endpoint was made between each UPA dose group and the combined PBO groups using the Cochran-Mantel-Haenszel test adjusted for main stratification factors.
The planned total sample size of 450 for this study provided at least 90% power for a 20% difference in ACR20 response rate (assuming a PBO ACR20 response rate of 27%), as well as at least 90% power for a 17% difference in LDA response rate (based on DAS-28 [CRP] [assuming a PBO LDA response rate of 12%]), at a 2-sided significance level of 0.025 and accounting for a 10% dropout rate.
Data Management was done by BI according to BI SOPs and Statistical Evaluation was done by AbbVie according to BI SOPs.
Abbreviations: ACR20, American College of Rheumatology 20%; bDMARD, biologic disease modifying anti-rheumatic drugs; CRP, C-reactive protein; CR, complete response; DAS-28, disease activity score 28-joint count; LDA, low disease activity; MTX, methotrexate; SOPs, standard operating procedures
Source: CS Appendix D, Table 39, pp.258-259.
SELECT-BEYOND was planned to be the smallest of the four trials, with a total planned
sample size of 450, both SELECT-NEXT and SELECT-BEYOND had a planned total
sample size of 600, while SELECT-COMPARE was planned as the largest trial with a
planned sample size of 1,500. A dropout rate of 10% was assumed for each trial. In each
trial, the planned sample size offered 90% power to detect the intended outcome.
SELECT-COMPARE was powered on a 22% difference in ACR 20 response and a
19.3% difference in CR response. SELECT-NEXT was powered on a 21% difference in
ACR 20 response and a 22% difference in LDA response. SELECT-MONOTHERAPY
was powered on a 21% difference in ACR 20 response and a 22% difference in LDA
response. SELECT-BEYOND was powered on a 20% difference in ACR 20 response
and a 17% difference in low disease activity (LDA) response. The ERG noted these
differences in the measures and thresholds upon which the power calculation was based
between trials.
4.2.2.2 Population characteristics
Inclusion and exclusion criteria for the four pivotal trials were presented above in Table
3.
Copyright 2019 Queen's Printer and Controller of HMSO. All rights reserved

Page 61 of 275
All four trials included both male and female participants, and were conducted in an
exclusively adult population. All four trials required participants to have been diagnosed
with RA for at least three months. In all trials, participants had to fulfil the 2010
ACR/EULAR criteria for RA.29 In all trials, participants were required to have at least six
swollen joints and at least six tender joints. The ERG noted the high level of consistency
between trials in terms of permitted clinical characteristics.
However, the ERG noted differences in terms of prior medication regimens as detailed in
Table 3. In all trials, participants were required to have been on prior therapy for at least
three months before trial enrolment. In SELECT-COMPARE, this prior therapy was
required to be MTX. In SELECT-NEXT, participants were required to have had
inadequate response to at least one of MTX, sulfasalazine or leflunomide. In SELECT-
MONOTHERAPY, prior MTX therapy was required. In SELECT-BEYOND, experience
with at least one bDMARD was required along with continued active RA or
discontinuation of the bDMARD due to intolerability or toxicity. In addition, in SELECT-
COMPARE, participants had to discontinue prior csDMARD therapy upon trial enrolment,
with the exception of MTX, and were additionally required to take a dietary supplement of
folic acid or folinic acid throughout trial participation. In SELECT-MONOTHERAPY,
participants were required to have discontinued all prior DMARDs except MTX at least
four weeks prior to the first dose of trial medication. The ERG considered that it was
important to consider these differences in prior medication status at baseline and that
this may introduce between trial heterogeneity.
Baseline characteristics for each pivotal trial were initially provided in the CS, but were
provided with more detail in response to a clarification response from the ERG. Baseline
characteristics for the total trial populations for each of the four pivotal trials are provided
below as Table 6.
Baseline characteristics for participants with moderate RA and severe RA are provided in
Table 7 and Table 8, respectively.
Copyright 2019 Queen's Printer and Controller of HMSO. All rights reserved
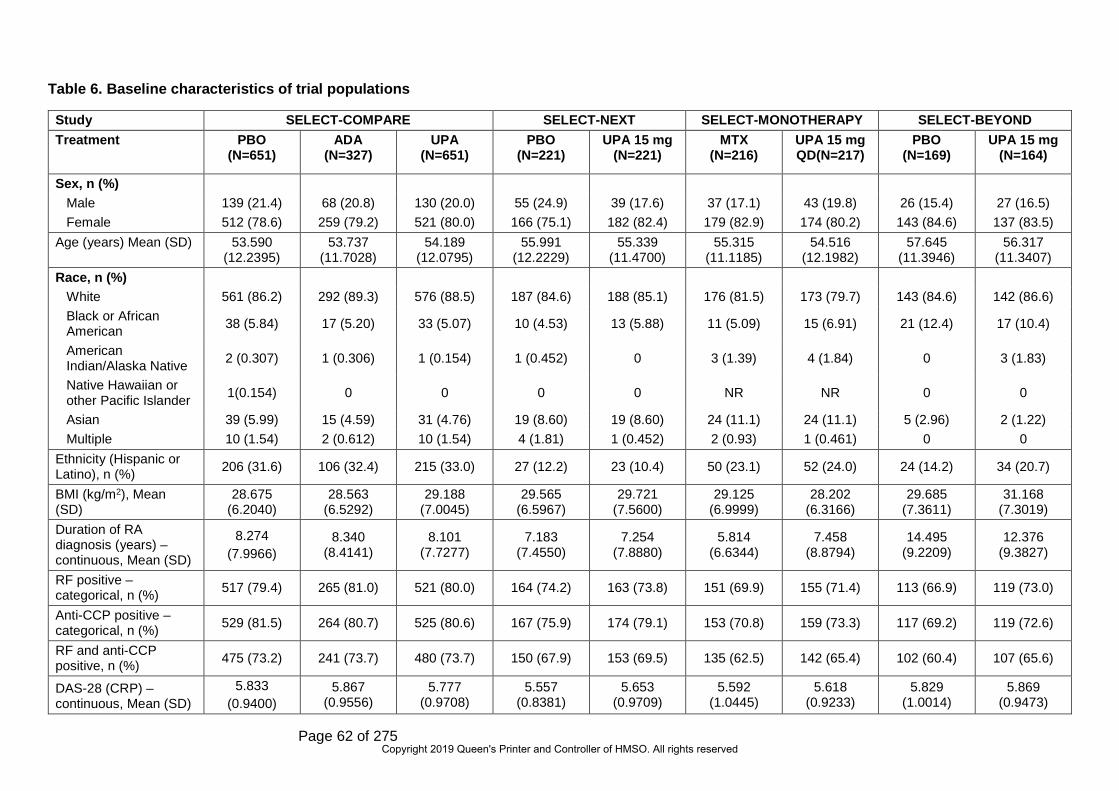
Page 62 of 275
Table 6. Baseline characteristics of trial populations
Study SELECT-COMPARE SELECT-NEXT SELECT-MONOTHERAPY SELECT-BEYOND Treatment PBO
(N=651) ADA
(N=327) UPA
(N=651) PBO
(N=221) UPA 15 mg
(N=221) MTX
(N=216) UPA 15 mg QD(N=217)
PBO (N=169)
UPA 15 mg (N=164)
Sex, n (%) Male 139 (21.4) 68 (20.8) 130 (20.0) 55 (24.9) 39 (17.6) 37 (17.1) 43 (19.8) 26 (15.4) 27 (16.5) Female 512 (78.6) 259 (79.2) 521 (80.0) 166 (75.1) 182 (82.4) 179 (82.9) 174 (80.2) 143 (84.6) 137 (83.5)
Age (years) Mean (SD) 53.590 (12.2395)
53.737 (11.7028)
54.189 (12.0795)
55.991 (12.2229)
55.339 (11.4700)
55.315 (11.1185)
54.516 (12.1982)
57.645 (11.3946)
56.317 (11.3407)
Race, n (%) White 561 (86.2) 292 (89.3) 576 (88.5) 187 (84.6) 188 (85.1) 176 (81.5) 173 (79.7) 143 (84.6) 142 (86.6) Black or African American 38 (5.84) 17 (5.20) 33 (5.07) 10 (4.53) 13 (5.88) 11 (5.09) 15 (6.91) 21 (12.4) 17 (10.4)
American Indian/Alaska Native 2 (0.307) 1 (0.306) 1 (0.154) 1 (0.452) 0 3 (1.39) 4 (1.84) 0 3 (1.83)
Native Hawaiian or other Pacific Islander 1(0.154) 0 0 0 0 NR NR 0 0
Asian 39 (5.99) 15 (4.59) 31 (4.76) 19 (8.60) 19 (8.60) 24 (11.1) 24 (11.1) 5 (2.96) 2 (1.22) Multiple 10 (1.54) 2 (0.612) 10 (1.54) 4 (1.81) 1 (0.452) 2 (0.93) 1 (0.461) 0 0
Ethnicity (Hispanic or Latino), n (%) 206 (31.6) 106 (32.4) 215 (33.0) 27 (12.2) 23 (10.4) 50 (23.1) 52 (24.0) 24 (14.2) 34 (20.7)
BMI (kg/m2), Mean (SD)
28.675 (6.2040)
28.563 (6.5292)
29.188 (7.0045)
29.565 (6.5967)
29.721 (7.5600)
29.125 (6.9999)
28.202 (6.3166)
29.685 (7.3611)
31.168 (7.3019)
Duration of RA diagnosis (years) – continuous, Mean (SD)
8.274 (7.9966)
8.340 (8.4141)
8.101 (7.7277)
7.183 (7.4550)
7.254 (7.8880)
5.814 (6.6344)
7.458 (8.8794)
14.495 (9.2209)
12.376 (9.3827)
RF positive – categorical, n (%) 517 (79.4) 265 (81.0) 521 (80.0) 164 (74.2) 163 (73.8) 151 (69.9) 155 (71.4) 113 (66.9) 119 (73.0)
Anti-CCP positive – categorical, n (%) 529 (81.5) 264 (80.7) 525 (80.6) 167 (75.9) 174 (79.1) 153 (70.8) 159 (73.3) 117 (69.2) 119 (72.6)
RF and anti-CCP positive, n (%) 475 (73.2) 241 (73.7) 480 (73.7) 150 (67.9) 153 (69.5) 135 (62.5) 142 (65.4) 102 (60.4) 107 (65.6)
DAS-28 (CRP) – continuous, Mean (SD)
5.833 (0.9400)
5.867 (0.9556)
5.777 (0.9708)
5.557 (0.8381)
5.653 (0.9709)
5.592 (1.0445)
5.618 (0.9233)
5.829 (1.0014)
5.869 (0.9473)
Copyright 2019 Queen's Printer and Controller of HMSO. All rights reserved

Page 63 of 275
Study SELECT-COMPARE SELECT-NEXT SELECT-MONOTHERAPY SELECT-BEYOND Treatment PBO
(N=651) ADA
(N=327) UPA
(N=651) PBO
(N=221) UPA 15 mg
(N=221) MTX
(N=216) UPA 15 mg QD(N=217)
PBO (N=169)
UPA 15 mg (N=164)
CDAI – continuous, Mean (SD)
40.028 (12.7322)
39.800 (13.1799)
39.704 (12.9204)
37.764 (11.8121)
38.268 (11.8638)
37.755 (14.3901)
37.986 (13.1208)
40.966 (13.2972)
41.654 (13.2776)
TJC68, Mean (SD) 25.989
(14.3009) 26.373
(15.1555) 26.435
(15.1497) 24.697
(14.9610) 25.158
(13.7952) 25.227
(15.9852) 24.465
(15.0987) 28.491
(15.2749) 27.762
(16.3061)
SJC66, Mean (SD) 16.206
(8.9711) 16.294
(9.1922) 16.571
(10.3089) 15.367
(9.2381) 15.955
(10.0439) 16.912
(11.5242) 16.415
(10.9423) 16.320
(9.5826) 17.037
(10.7509)
HAQ-DI Mean (SD) 1.609
(0.6082) 1.647
(0.5897) 1.633
(0.6352) 1.425
(0.6343) 1.478
(0.6076) 1.466
(0.6581) 1.471
(0.6603) 1.564
(0.6035) 1.669
(0.6428) CRP (mg/L), Mean (SD)
17.974 (21.5172)
19.809 (21.5103)
17.896 (22.4855)
12.578 (13.9597)
16.622 (19.1698)
14.526 (17.3302)
13.952 (16.4865)
16.298 (21.1013)
16.246 (18.6238)
Baseline mTSS, Mean (SD)
35.892 (51.6590)
34.534 (47.0621)
34.031 (50.0755) NR NR NR NR NR NR
Baseline joint erosion score Mean (SD)
16.958 (27.4302)
15.414 (23.0983)
16.512 (26.4161) NR NR NR NR NR NR
Baseline JSN score, Mean (SD)
18.948 (26.1216)
19.170 (25.8428)
17.482 (25.0995) NR NR NR NR NR NR
Morning stiffness duration (minutes), Mean (SD)
142.444 (169.7796)
146.083 (184.9339)
141.538 (187.6118)
138.861 (213.9702)
152.406 (241.9026)
153.033 (221.7151)
144.203 (215.0519)
138.426 (178.5935)
140.415 (189.7186)
EUROQOL 5D Index score, Mean (SD)
0.548 (0.2689)
0.540 (0.2741)
0.546 (0.2687)
0.623 (0.2339)
0.603 (0.2454)
0.598 (0.2550)
0.587 (0.2507)
0.573 (0.2571)
0.521 (0.2712)
MTX dose at Baseline (mg), Mean (SD)
16.840 (3.8197)
17.097 (3.7618)
17.019 (4.1669) NR NR 16.719
(4.4102) 16.798
(4.2139) NR NR
Oral corticosteroid dosing at Baseline, n (%)
392 (60.2) 202 (61.8) 388 (59.6) NR NR 115 (53.2) 114 (52.5) NR NR
Oral corticosteroid dose (mg), Mean (SD)
6.266 (2.4082)
6.499 (2.4383)
6.226 (2.2715) NR NR 6.165
(2.5604) 6.103
(2.5232) NR NR
Prior biologic DMARD use, n (%) 63 (9.7) 34 (10.4) 54 (8.3) 29 (13.1) 27 (12.2) NR NR 169 (100) 164 (100)
Copyright 2019 Queen's Printer and Controller of HMSO. All rights reserved
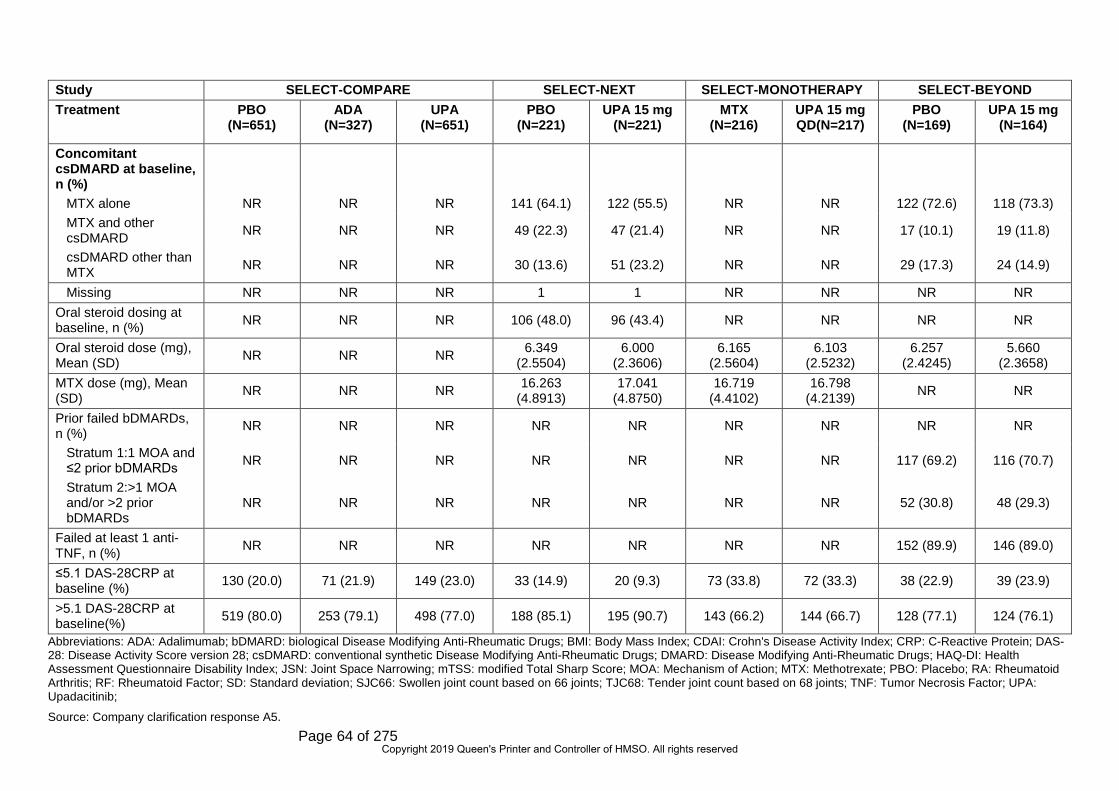
Page 64 of 275
Study SELECT-COMPARE SELECT-NEXT SELECT-MONOTHERAPY SELECT-BEYOND Treatment PBO
(N=651) ADA
(N=327) UPA
(N=651) PBO
(N=221) UPA 15 mg
(N=221) MTX
(N=216) UPA 15 mg QD(N=217)
PBO (N=169)
UPA 15 mg (N=164)
Concomitant csDMARD at baseline, n (%)
MTX alone NR NR NR 141 (64.1) 122 (55.5) NR NR 122 (72.6) 118 (73.3) MTX and other csDMARD NR NR NR 49 (22.3) 47 (21.4) NR NR 17 (10.1) 19 (11.8)
csDMARD other than MTX NR NR NR 30 (13.6) 51 (23.2) NR NR 29 (17.3) 24 (14.9)
Missing NR NR NR 1 1 NR NR NR NR Oral steroid dosing at baseline, n (%) NR NR NR 106 (48.0) 96 (43.4) NR NR NR NR
Oral steroid dose (mg), Mean (SD) NR NR NR 6.349
(2.5504) 6.000
(2.3606) 6.165
(2.5604) 6.103
(2.5232) 6.257
(2.4245) 5.660
(2.3658) MTX dose (mg), Mean (SD) NR NR NR 16.263
(4.8913) 17.041
(4.8750) 16.719
(4.4102) 16.798
(4.2139) NR NR
Prior failed bDMARDs, n (%) NR NR NR NR NR NR NR NR NR
Stratum 1:1 MOA and ≤2 prior bDMARDs NR NR NR NR NR NR NR 117 (69.2) 116 (70.7)
Stratum 2:>1 MOA and/or >2 prior bDMARDs
NR NR NR NR NR NR NR 52 (30.8) 48 (29.3)
Failed at least 1 anti-TNF, n (%) NR NR NR NR NR NR NR 152 (89.9) 146 (89.0)
≤5.1 DAS-28CRP at baseline (%) 130 (20.0) 71 (21.9) 149 (23.0) 33 (14.9) 20 (9.3) 73 (33.8) 72 (33.3) 38 (22.9) 39 (23.9)
>5.1 DAS-28CRP at baseline(%) 519 (80.0) 253 (79.1) 498 (77.0) 188 (85.1) 195 (90.7) 143 (66.2) 144 (66.7) 128 (77.1) 124 (76.1)
Abbreviations: ADA: Adalimumab; bDMARD: biological Disease Modifying Anti-Rheumatic Drugs; BMI: Body Mass Index; CDAI: Crohn's Disease Activity Index; CRP: C-Reactive Protein; DAS-28: Disease Activity Score version 28; csDMARD: conventional synthetic Disease Modifying Anti-Rheumatic Drugs; DMARD: Disease Modifying Anti-Rheumatic Drugs; HAQ-DI: Health Assessment Questionnaire Disability Index; JSN: Joint Space Narrowing; mTSS: modified Total Sharp Score; MOA: Mechanism of Action; MTX: Methotrexate; PBO: Placebo; RA: Rheumatoid Arthritis; RF: Rheumatoid Factor; SD: Standard deviation; SJC66: Swollen joint count based on 66 joints; TJC68: Tender joint count based on 68 joints; TNF: Tumor Necrosis Factor; UPA: Upadacitinib;
Source: Company clarification response A5.
Copyright 2019 Queen's Printer and Controller of HMSO. All rights reserved

Page 65 of 275
Table 7. Baseline characteristics of moderate trial population
Study SELECT-COMPARE SELECT-NEXT SELECT-MONOTHERAPY SELECT-BEYOND Treatment PBO
(N=126) ADA
(N=70) UPA
(N=145) PBO
(N=69) UPA 15 mg
(N=64) MTX
(N=72) UPA 15 mg
QD (N=72)
PBO (N=38)
UPA 15 mg (N=39)
Sex, n (%) Male ********* ********* ********* ********** ********** ********** ********* ********* ******** Female ********** ********* ********** ********** ********** ********** ********* ********** *********
Age (years) Mean (SD) **************** **************** **************** **************** **************** **************** **************** **************** ****************
Race, n (%) White *********** ********** ********** ********** ********* ********** ********* ********** ********* Black or African American ******** ******** ******* ******** ******* ******** ******* ********* ********
American Indian/Alaska Native
******** ******** * * * ******** ******* * *******
Native Hawaiian or other Pacific Islander
* * * * * * * * *
Asian ******* ******** ******** ********** ******* ********** ********* ******* ******* Multiple ******** ** ******* * * ******* ******* * *
Ethnicity (Hispanic or Latino), n (%) ********** ********** ********* ********** ******** ********** ********* ******* ********
BMI (kg/m2), Mean (SD) *************** *************** *************** *************** *************** *************** *************** *************** ***************
Duration of RA diagnosis (years) – continuous, Mean (SD)
************** ************** ************** ************** ************** ************** ************** *************** ****************
RF positive– categorical, n (%) ********* ********* ********** ********** ********* ********** ********* ********** *********
Anti-CCP positive – categorical, n (%) *********** ********** ********** ********** ********* ********** ********* ********** *********
Copyright 2019 Queen's Printer and Controller of HMSO. All rights reserved

Page 66 of 275
Study SELECT-COMPARE SELECT-NEXT SELECT-MONOTHERAPY SELECT-BEYOND Treatment PBO
(N=126) ADA
(N=70) UPA
(N=145) PBO
(N=69) UPA 15 mg
(N=64) MTX
(N=72) UPA 15 mg
QD (N=72)
PBO (N=38)
UPA 15 mg (N=39)
RF and anti-CCP positive, n (%) ********** ********** ********** ********** ********* ********** ********* ********** *********
DAS-28 (CRP) – continuous, Mean (SD)
************** ************** ************** ************** ************** ************** ************** ************** **************
CDAI – continuous, Mean (SD) *************** *************** *************** *************** *************** *************** *************** *************** ***************
TJC68, Mean (SD) *************** *************** *************** *************** *************** *************** *************** *************** *************** SJC66, Mean (SD) *************** ************** ************** *************** *************** *************** *************** *************** *************** HAQ-DI Mean (SD) ************** ************** ************** ************** ************** ************** ************** ************** ************** CRP (mg/L), Mean (SD) ************** ************** *************** ************** ************** ************** ************** ************** ****************
Baseline mTSS, Mean (SD) **************** **************** **************** ** ** ** ** ** **
Baseline joint erosion score Mean (SD) **************** **************** **************** ** ** ** ** ** **
Baseline JSN score, Mean (SD) **************** **************** **************** ** ** ** ** ** **
Morning stiffness duration (minutes), Mean (SD)
*****************
******************
******************
******************
******************
******************
***************** **************** ****************
EUROQOL 5D Index score, Mean (SD) ************** ************** ************** ************** ************** ************** ************** ************** **************
SF-36 Physical component summary *************** *************** *************** *************** *************** *************** *************** ************* *************
Functional assessment of chronic illness therapy-fatigue
**************** **************** **************** ** ** ** ** ** **
Fatigue scale ** ** ** **************** **************** ** ** ** **
Copyright 2019 Queen's Printer and Controller of HMSO. All rights reserved

Page 67 of 275
Study SELECT-COMPARE SELECT-NEXT SELECT-MONOTHERAPY SELECT-BEYOND Treatment PBO
(N=126) ADA
(N=70) UPA
(N=145) PBO
(N=69) UPA 15 mg
(N=64) MTX
(N=72) UPA 15 mg
QD (N=72)
PBO (N=38)
UPA 15 mg (N=39)
MTX dose at Baseline (mg), Mean (SD)
*************** *************** *************** *************** *************** *************** *************** ** **
Oral corticosteroid dosing at Baseline, n (%)
********** ********** ********* ********** ********* ********** ********* ********** *********
Oral corticosteroid dose (mg), Mean (SD)
************** ************** ************** ************** ************** ************** ************** ************** **************
Prior biologic DMARD use, n (%) *********** ********* ********* ********* ********** ** ** ** **
Concomitant csDMARD at baseline, n (%)
MTX alone ** ** ** ********** ********* ** ** ********** ********* MTX and other csDMARD ** ** ** ********** ********* ** ** ********* ********
csDMARD other than MTX ** ** ** ********** ********* ** ** ********* ********
Missing ** ** ** * * ** ** * * Oral steroid dosing at baseline, n (%) ** ** ** ********** ********* ** ********** ********** *********
Oral steroid dose (mg), Mean (SD) ** ** ** ************** ************** ** ************** ************** **************
MTX dose (mg), Mean (SD) ** ** ** *************** *************** ** *************** ** **
Prior failed bDMARDs, n (%)
Stratum 1:1 MOA and ≤ 2 prior bDMARDs
** ** ** ** ** ** ** ********** *********
Copyright 2019 Queen's Printer and Controller of HMSO. All rights reserved

Page 68 of 275
Study SELECT-COMPARE SELECT-NEXT SELECT-MONOTHERAPY SELECT-BEYOND Treatment PBO
(N=126) ADA
(N=70) UPA
(N=145) PBO
(N=69) UPA 15 mg
(N=64) MTX
(N=72) UPA 15 mg
QD (N=72)
PBO (N=38)
UPA 15 mg (N=39)
Stratum 2:> 1 MOA and/or > 2 prior bDMARDs
** ** ** ** ** ** ** ******** *********
Failed at least 1 anti-TNF, n (%) ** ** ** ** ** ** ** ********** *********
Abbreviations: ADA: Adalimumab; bDMARD: biological Disease Modifying Anti-Rheumatic Drugs; BMI: Body Mass Index; CDAI: Crohn's Disease Activity Index; CRP: C-Reactive Protein; DAS-28: Disease Activity Score version 28; csDMARD: conventional synthetic Disease Modifying Anti-Rheumatic Drugs; DMARD: Disease Modifying Anti-Rheumatic Drugs; HAQ-DI: Health Assessment Questionnaire Disability Index; JSN: Joint Space Narrowing; mTSS: modified Total Sharp Score; MOA: Mechanism of Action; MTX: Methotrexate; PBO: Placebo; RA: Rheumatoid Arthritis; RF: Rheumatoid Factor; SD: Standard deviation; SJC66: Swollen joint count based on 66 joints; TJC68: Tender joint count based on 68 joints; TNF: Tumor Necrosis Factor; UPA: Upadacitinib;
Source: Company clarification response A5.
Copyright 2019 Queen's Printer and Controller of HMSO. All rights reserved

Page 69 of 275
Table 8. Baseline characteristics of severe trial population
Study SELECT-COMPARE SELECT-NEXT SELECT-MONOTHERAPY SELECT-BEYOND
Treatment PBO
(N=519) ADA
(N=253) UPA 15 mg
(N=498) PBO
(N=152) UPA 15 mg
(N=151) MTX
(N=143) UPA 15 mg
QD (N=144)
PBO (N=128)
UPA 15 mg (N=124)
Sex, n (%) Male ********** ********* ********* ********* ********* ********* ********* ********* ********* Female ********* ********** ********** ********** ********** ********** ********** ********** **********
Age (years) Mean (SD) ****************
****************
****************
****************
****************
****************
****************
****************
****************
Race, n (%) White ********** ********** ********** ********** ********** ********** ********** ********** ********** Black or African American ******** ******** ******** ******* ******** ******* ******* ********* **********
American Indian/Alaska Native ******* * ******* ******* * ******* ******* * *******
Native Hawaiian or other Pacific Islander ******* * * * * * * * *
Asian ******** ******** ******** ******* ******** ******** ******** ******* ******* Multiple ******* ******* ******* ******* ******* ******* * * *
Ethnicity (Hispanic or Latino), n (%) ********** ********* ********** ********* ******** ********* ********* ********* *********
BMI (kg/m2), Mean (SD) *************** *************** *************** *************** *************** *************** *************** *************** *************** Duration of RA diagnosis (years) – continuous, Mean (SD)
************** ************** ************** ************** ************** ************** *************** *************** ***************
RF – categorical, n (%) ********** ********** ********** ********* ********* ********** ********** ********* ********* Anti-CCP – categorical, n (%) ********** ********** ********** ********* ********* ********** ********** ********* *********
RF and anti-CCP, n (%) ********** ********** ********** ********* ********* ********* ********* ********* ********* DAS-28 (CRP) – continuous, Mean (SD) ************** ************** ************** ************** ************** ************** ************** ************** **************
CDAI – continuous, Mean (SD)
****************
****************
****************
****************
****************
****************
****************
****************
****************
Copyright 2019 Queen's Printer and Controller of HMSO. All rights reserved

Page 70 of 275
Study SELECT-COMPARE SELECT-NEXT SELECT-MONOTHERAPY SELECT-BEYOND
Treatment PBO
(N=519) ADA
(N=253) UPA 15 mg
(N=498) PBO
(N=152) UPA 15 mg
(N=151) MTX
(N=143) UPA 15 mg
QD (N=144)
PBO (N=128)
UPA 15 mg (N=124)
TJC68, Mean (SD) ****************
****************
****************
****************
****************
****************
****************
****************
****************
SJC66, Mean (SD) *************** *************** ****************
****************
****************
****************
****************
****************
****************
HAQ-DI Mean (SD) ************** ************** ************** ************** ************** ************** ************** ************** ************** CRP (mg/L), Mean (SD) ************* ************** *************** ***************
* ***************
* ***************
* ***************
* ***************
* ***************
* Baseline mTSS, Mean (SD)
****************
****************
**************** ** ** ** ** ** **
Baseline joint erosion score Mean (SD)
****************
****************
**************** ** ** ** ** ** **
Baseline JSN score, Mean (SD)
****************
****************
**************** ** ** ** ** ** **
Morning stiffness duration (minutes), Mean (SD)
******************
******************
******************
******************
******************
******************
******************
******************
******************
EUROQOL 5D Index score, Mean (SD) ************** ************** ************** ************** ************** ************** ************** ************** **************
SF-36 PCS *************** *************** *************** *************** *************** *************** *************** *************** *************** Fatigue Scale ***************
* ***************
* ***************
* ***************
* ***************
* ** ** ** **
MTX dose at Baseline (mg), Mean (SD) *************** *************** *************** ** ** ** ** ** **
Oral corticosteroid dosing at Baseline, n (%) ** ** ** ** ** ** ** ** **
Oral corticosteroid dose (mg), Mean (SD) ** ** ** ** ** ** ** ********* *********
Prior biologic DMARD use, n (%) ******** ********* ******** ********* ********* ** ** ** **
Concomitant csDMARD at baseline, n (%)
MTX alone ** ** ** ********** ********* ** ** ********* *********
Copyright 2019 Queen's Printer and Controller of HMSO. All rights reserved

Page 71 of 275
Study SELECT-COMPARE SELECT-NEXT SELECT-MONOTHERAPY SELECT-BEYOND
Treatment PBO
(N=519) ADA
(N=253) UPA 15 mg
(N=498) PBO
(N=152) UPA 15 mg
(N=151) MTX
(N=143) UPA 15 mg
QD (N=144)
PBO (N=128)
UPA 15 mg (N=124)
MTX and other csDMARD ** ** ** ********* ********* ** ** ******** *********
csDMARD other than MTX ** ** ** ********* ********* ** ** ********* *********
Missing ** ** ** * * ** ** * * Oral steroid dosing at baseline, n (%) ** ** ** ********* ********* ********* ********* ********* *********
Oral steroid dose (mg), Mean (SD) ** ** ** ************** ************** ************** ************** ************** **************
MTX dose (mg), Mean (SD) ** ** ** ************* ************* ************* ************* ** **
Prior failed bDMARDs, n (%)
Stratum 1:1 MOA and ≤ 2 prior bDMARDs ** ** ** ** ** ** ** ********* *********
Others ** ** ** ** ** ** ** ******** ********* Failed at least 1 anti-TNF, n (%) ** ** ** ** ** ** ** ********* *********
Abbreviations: ADA: Adalimumab; bDMARD: biological Disease Modifying Anti-Rheumatic Drugs; BMI: Body Mass Index; CDAI: Crohn's Disease Activity Index; CRP: C-Reactive Protein; DAS-28: Disease Activity Score version 28; csDMARD: conventional synthetic Disease Modifying Anti-Rheumatic Drugs; DMARD: Disease Modifying Anti-Rheumatic Drugs; HAQ-DI: Health Assessment Questionnaire Disability Index; JSN: Joint Space Narrowing; mTSS: modified Total Sharp Score; MOA: Mechanism of Action; MTX: Methotrexate; PBO: Placebo; RA: Rheumatoid Arthritis; RF: Rheumatoid Factor; SD: Standard deviation; SJC66: Swollen joint count based on 66 joints; TJC68: Tender joint count based on 68 joints; TNF: Tumor Necrosis Factor; UPA: Upadacitinib
Source: Company clarification response A5.
Copyright 2019 Queen's Printer and Controller of HMSO. All rights reserved

Page 72 of 275
The ERG considered the trials to show a consistent gender profile with around 80% of
participants being female, which was considered to be representative of clinical practice.
The gender profile was comparable between the moderate and severe trial populations.
The trials all had a largely middle-aged population that was comparable between the
moderate and several trial populations. An average age in the 50s was considered to be
representative of clinical practice. The trials all recruited a predominantly white
population, with the percentage of white participants only falling below 80% on one trial –
SELECT-MONOTHERAPY. The trials may over-represent white patients compared to a
typical NHS clinical practice setting in England and Wales. The arm-level mean BMI
figures for the total trial population (28.2 to 31.2) were all higher than the national
average for adults in England from the 2017 Health Survey for England (27.7).30 The
severe RA trial populations demonstrated a higher BMI profile than moderate RA
populations, potentially reflecting greater activity limitations.
Indicators of clinical status were consistently poorer in the severe RA populations than
the moderate RA populations. The ERG considered DAS28 to be the key clinical
indicator.
*****************************************************************************************************
********************* Disease duration varied across trials and was longest in SELECT-
BEYOND, indicating a population with more established disease. Mean DAS scores
were not, however, notably different in this trial. Indicators of inflammation, tender and
swollen joints, and quality of life were comparable across trials. The ERG considered the
four pivotal trials to be generally comparable in terms of their population characteristics.
4.2.2.3 Intervention characteristics
Intervention characteristics of the four pivotal trials were presented above in Table 4.
In all four trials, participants could be randomised to receive oral UPA 15 mg QD. As
outlined in the CS (p.11), this dose of UPA, either as monotherapy or in combination
therapy, is the technology under appraisal in this submission. In SELECT-COMPARE,
there were 600 patients randomised to UPA 15 mg QD. There were two further arms in
the trial: PBO (n=600) and ADA 40 mg eow (n=300). In SELECT-NEXT, there were 200
participants who received UPA 15 mg QD from trial onset. There were three further arms
in the trial: UPA 30 mg QD (n=200), PBO in period one going onto UPA 30 mg QD in
period two (n=100) and PBO in period one going onto UPA 15 mg QD in period two
(n=100). In SELECT-MONOTHERAPY, there were 200 participants who received
quizartinib 15 mg QD from trial onset. There were three further arms in the trial: UPA 30
mg QD (n=200), MTX in period one going onto UPA 15 mg QD in period two (n=100)
Copyright 2019 Queen's Printer and Controller of HMSO. All rights reserved

Page 73 of 275
and MTX in period one going onto UPA 30 mg QD in period two (n=100). In SELECT-
BEYOND, there were 150 participants who received UPA 15mg QD from trial onset.
There were a further three arms in the trial: UPA 30 mg QD from trial onset, PBO initially
going onto UPA 15 mg QD at 12 weeks and PBO initially going onto UPA 30 mg QD at
12 weeks.
The NICE final scope 11 for this appraisal permitted UPA to be given either as
monotherapy or in combination with other conventional dMARDS, including MTX.
However, Table 4 in the CS (pp. 43-48) only mentions UPA and its relevant dosing
quantity and dosing schedule for UPA arms, and does not state that IN three of the trials,
UPA is co-administered with MTX. However, Table 63b in the CS (p.159), profiling the
clinical effectiveness inputs to the economic model, clarifies that SELECT-
MONOTHERAPY is a source of data regarding UPA given as monotherapy, whereas
SELECT-COMPARE, SELECT-NEXT and SELECT-BEYOND provide information on
UPA administered in combination with MTX.
4.2.2.4 Outcome assessment
The outcomes evaluated in the included trials are summarised above in Table 3, and
methods of statistical analysis used to analyse the trial data are reported above in Table
5.
All four pivotal trials included as a primary outcome the proportion of participants
achieving ACR20 response. In all but SELECT-COMPARE, the proportion achieving
LDA defined by DAS-28 score of less than or equal to 3.2 was also a primary outcome,
while in SELECT-COMPARE the other primary outcome is the proportion achieving
clinical remission defined by DAS-28 score of less than 2.6.
EULAR response was not available consistently across trials and is not listed as a
primary outcome or major secondary outcome in any of the four pivotal trials. Therefore,
the primary clinical response measure in the economic model EULAR response was
mapped from ACR20 response (CS, Table 63b, pp.159-60) which was available for all
pivotal trials.
Change in health assessment questionnaire disability index (HAQ-DI) from baseline as a
measure of physical function was included as a major secondary outcome in all four
pivotal trials. HAQ scores were used in the economic model to map to utilities (CS, Table
63b, pp.159-60).
Copyright 2019 Queen's Printer and Controller of HMSO. All rights reserved

Page 74 of 275
HRQoL measures were not listed among the primary or major secondary outcomes in
Table 4. The CS stated that EQ-5D-5L data were collected in the UPA Phase III trials;
however, these were not used in the base case economic model (Section 5.2.2), but
solely for validation purposes, in order to align modelling with previous TAs of
interventions in RA such as TA37531 and TA48032 (CS, B.3.4.1, p.147).
4.2.3 Quality assessment
The findings of the QA as conducted by the company are presented in Table 9. QA was
provided for all pivotal trials. The company’s QA concluded that there was a low risk of
bias in all four pivotal UPA trials. Additional columns have been added to Table 9 to
summarise the ERG’s commentary on the company’s QA (summary additional
comments from the ERG are also provided in the last row of the table).
Copyright 2019 Queen's Printer and Controller of HMSO. All rights reserved

Page 75 of 275
Table 9. QA for the four pivotal trials
Study Name SELECT-COMPARE SELECT-MONOTHERAPY SELECT-NEXT SELECT-BEYOND
Company ERG Company ERG Company ERG Company ERG Was randomisation adequate? Unclear
Randomisation method NR
Yes: IRT Unclear Randomisation method NR
Yes: IRT Yes: IVRS Yes: IVRS Yes: IVRS Yes: IVRS
Was allocation adequately concealed?
Unclear Allocation
method NR
Yes: IRT Unclear Allocation
method NR
Yes: IRT Yes: IVRS Yes: IVRS Yes: IVRS Yes: IVRS
Were the groups similar at the outset of the study in terms of prognostic factors?
Yes Yes Unclear Yes Yes Yes Yes Yes
Were the care providers, participants and outcome assessors blind to treatment allocation?
Yes: Double blind
Yes: Double blind
Yes: Double blind
Yes: Double blind
Yes: Double blind
Yes: Double blind
Yes: Double blind
Yes: Double blind
Were there unexpected imbalances in dropouts between groups?
Unclear No Unclear No No No Yesc Yesc,d
Were any outcomes measured but not reported?
Unclear Unclear Unclear Unclear No No Unclear Unclear
Did the analysis include an ITT analysis? If so, was this appropriate and were appropriate methods used to account for missing data?
Yes: mITT; Unclear
Yes, mITT; Yes,
NRI/LOCF/linear
extrapolation
Yes, ITT; Unclear
Yes, ITT; Yes: NRI/MI
Yes: ITT; Unclear
Yes: ITT; *******b
Yes: FAS; NRI
Yes: FAS; NRI
Additional ERG comments: There is now an additional publication for this study,33
which accounts for updates to the company ratings.
*********************************************************************
The company’s QA ratings did not appear to include
information available in Smolen 201934
*********************************************************************
********************************************************************.
*********************************************************************
Abbreviations: NR = not reported; NR I= non-responder imputation; ITT = intention-to-treat analysis; mITT = modified intention- to-treat analysis; IRT = interactive response technology; LOCF = last observation carried forward; M I= multiple imputation; QA = quality assessment.
Notes: a Company ratings were taken from Appendix Section D.1.17, Table 30; b ***************************************************************; c In the first 12 weeks, the proportion of patients who discontinued the study drug because of adverse events was higher in UPA 30 mg group; d The proportion of patients discontinuing due to lack of efficacy was higher in the PBO group
Copyright 2019 Queen's Printer and Controller of HMSO. All rights reserved

Page 76 of 275
ERG comment:
The ERG noted that for two of the four pivotal trials (SELECT-COMPARE and SELECT-
MONOTHERAPY) the information given in the main body of the CS did not entirely
match with the QA ratings provided in Appendix D of the CS (refer to Section B.2.5 and
Section D.1.17, Tables 30 and 31). Based on the latest available data (including a newly
published study for SELECT-COMPARE),33 the ERG has found the information provided
in Section B.2.5 of the CS, rather than the tabulated data in Appendix D to be correct. In
order to clarify the inaccuracies in the QA data table provided in the CS (Appendix
Section D.1.17, Table 30), which are likely due to omitting the most recent publications
for these studies.33,34 Table 9 provides a summary of the company’s QA ratings for the
four pivotal trials, alongside ratings and comments made by the ERG.
The ERG agreed that there was generally a low risk of bias in the four pivotal trials in the
CS: all trials used appropriate computerised randomisation and allocation using
interactive response technology, there were no apparent baseline imbalances, patients
and study investigators were blinded (*****************************, analyses were
conducted on intention to treat (ITT), full analysis set (FAS) or modified intention to treat
(mITT) samples, and appropriate methods were used to account for missing data (Table
9). The ERG highlights an imbalance in discontinuations in SELECT-BEYOND, whereby
patients in UPA 30 mg group were more likely to discontinue the study drug because of
adverse events than those in the UPA 15 mg and PBO groups (8%, 2% and 4%
respectively), and those in the PBO group were more likely to discontinue due to lack of
efficacy than those in the UPA 30 mg and 15 mg groups (6%, 1%, 0% respectively). The
ERG noted that whilst these differences are important to consider, they are unlikely to
result in substantial bias, and that primary efficacy analyses were conducted on the FAS
with appropriate methods used to account for missing data.
4.2.4 Clinical effectiveness of the technology of interest
The trials identified included a population of RA patients with moderate-to-severe
disease with inadequate response to csDMARDs, bDMARDs (SELECT-NEXT and
SELECT-BEYOND, respectively), and MTX (SELECT-MONOTHERAPY AND SELECT-
COMPARE). Section B.2.6.1 of the CS provided the results from all four of the pivotal
trials (SELECT COMPARE, SELECT NEXT, SELECT MONOTHERAPY and SELECT
BEYOND). The ERG has checked the results reported in the CS against the respective
CSRs.20,22,24,26 The following sub-sections provide a summary of the available evidence.
Copyright 2019 Queen's Printer and Controller of HMSO. All rights reserved

Page 77 of 275
4.2.4.1 SELECT-COMPARE
SELECT-COMPARE, compared UPA 15 mg (+ MTX) with ADA (+ MTX) and PBO (+
MTX) at 12 and 26 weeks. A summary of clinical effectiveness results was provided in
the CS (Section B.2.6.1, p.57); refer to Table 10 (below).
Table 10. Summary of clinical effectiveness results for SELECT-COMPARE
Endpoints Week 12 Week 26 PBO (+MTX) (N=651)
ADA (+MTX) (N=327)
UPA 15 mg (+MTX) (N=651)
PBO (+MTX) (N=651)
ADA (+MTX) (N=327)
UPA 15 mg (+MTX) (N=651)
ACR20 response 36.4 63*** 70.5***# 35.6 57.2** 67.4*** ACR50 response 14.9 29.1*** 45.2***## 20.9 41.9*** 53.9*** ACR70 response 4.9 13.5*** 24.9***## 9.5 22.9*** 34.7*** Clinical remission based on DAS28 (CRP)
6.1 18.0*** 28.7***## 9.2 26.9*** 40.9***
DAS28 (CRP) CFB –1.1 –2.0*** –2.5*** –1.2 –2.3*** –2.8*** EQ-5D-5L CFB 0.1 0.2* 0.2*** 0.1 0.2* 0.2*** FACIT-F CFB 4.8 7.4* 9.0*** 5.48 8.24* 9.68*** HAQ-DI CFB –0.3 –0.5** –0.6*** –0.3 –0.6** –0.7*** LDA CDAI 16.3 30** 40.4*** 22.1 38.2 52.7*** LDA DAS28(CRP) 13.8 28.7*** 45.0***## 18.0 38.5*** 54.7*** LDA DAS28(CRP) - Non -Inferiority
13.8 28.7 45.0 NA NA NA
Morning stiffness duration (minutes) change
–48.6 -82.7 –92.6*** -53.88 -91.36 -100.25***
mTSS CFB NA NA NA 0.9 0.1 0.2*** Patient's global assessment of pain change
-15.5 –25.3*** –31.8*** NA NA NA
Proportion of subjects with no radiographic progression
NA NA NA 76 86.8 83.5
RA-WIS score CFB -2.0 -4.5 -5.2 NA NA NA SF-36 PCS CFB 3.6 6.3** 7.9*** NA NA NA
Abbreviations: ACR20/50/70 = American College of Rheumatology 20%, 50%, 70% response; CDAI = Clinical Disease Activity Index; CFB = Change From Baseline; CRP = C-reactive protein; DAS28 = Disease Activity Score 28; FACIT-F = Functional Assessment of Chronic Illness Therapy – Fatigue; HAQ-DI = Health Assessment Questionnaire – Disability Index; LDA = low disease activity; PBO, placebo; PCS = physical component summary; QD = once daily; SF-36 = Short Form-36; UPA, upadacitinib Notes: ***, **, * Statistically significant at 0.001, 0.01, and 0.05 level, respectively UPA vs placebo; #, ## Statistically significant at 0.05, and 0.001 level respectively for UPA vs ADA
Reproduced from CS, Section B.2.6.1, Table 7, page 57
The primary endpoints were ACR20 response and the proportion of patients achieving
clinical remission (DAS-28 CRP <2.6) at Week 12. Key secondary endpoints included
Copyright 2019 Queen's Printer and Controller of HMSO. All rights reserved

Page 78 of 275
clinical remission at 26 weeks, ACR 50 and 70, LDA (based on DAS-28 (CRP) ≤ 3.2),
patient's assessment of pain, HAQ-DI and EQ-5D-5L.
The UPA 15 mg group achieved the highest ACR20 response (UPA 15 mg 70.5%, ADA
63.0%, PBO 36.4%; refer to Figure 3, reproduced from the CS) and this was also the
case at 26 weeks (refer to Table 10).
Figure 3. ACR response rates at Week 12 in SELECT-COMPARE
Abbreviations: ACR20/50/70, American College of Rheumatology 20%, 50%, 70% response; ADA, adalimumab; MTX, methotrexate; PBO, placebo; UPA, upadacitinib † Primary endpoints included ACR20 and clinical remission based on DAS28 (CRP) for UPA vs. PBO (superiority). Ranked secondary endpoints included ACR50 versus ADA (both non-inferiority and superiority) and LDA versus ADA (non-inferiority) and vs. PBO (superiority). All other comparisons were not adjusted for multiplicity. Not all ranked secondary endpoints shown. *** Denotes statistical significance at the 0.001 level for comparison versus PBO; # Denotes statistical significance at the 0.05 level for comparison versus ADA; ### Denotes statistical significance at the 0.001 level for comparison versus ADA
Reproduced from CS, Section B.2.6.1.1, Figure 7, page 59
36%
15%
5%
63%
29%
13%
*** #71%
*** ###45%
*** ###25%
0%
10%
20%
30%
40%
50%
60%
70%
80%
90%
100%
ACR 20 ACR 50 ACR 70
Res
pons
e ra
tes
(%)
PlaceboN=651
Adalimumab40mg + MTXN=327
Upadacitinib15 mg + MTXN=651
Copyright 2019 Queen's Printer and Controller of HMSO. All rights reserved

Page 79 of 275
Figure 4. Clinical remission and LDA at Week 12 in SELECT-COMPARE
Abbreviations: DAS-28, Disease Activity Score 28; MTX, methotrexate
Notes: † Primary endpoints included ACR20 and clinical remission based on DAS28 (CRP) for UPA versus placebo (superiority). Ranked secondary endpoints included ACR50 versus ADA (both non-inferiority and superiority) and LDA versus ADA (non-inferiority) and versus placebo (superiority). All other comparisons were not adjusted for multiplicity. Not all ranked secondary endpoints shown; *** Denotes statistical significance at the 0.001 level for comparison versus placebo. ### Denotes statistical significance at the 0.001 level for comparison versus ADA; a Clinical remission was based on DAS28[CRP] less than 2.6; b LDA was defined by a clinical response DAS28 CRP less than or equal to 3.2
Reproduced from CS, Section B.2.6.1.1, Figure 8, page 59
UPA 15 mg also resulted in the highest clinical remission rate (based on DAS-28 CRP
<2.6; UPA 15 mg 28.7% ADA 18.0%, PBO 6.1%; refer to Figure 4, reproduced from the
CS) at 12 weeks. With regards to clinical remission at 26 weeks, UPA 15 mg resulted in
the highest remission rate (UPA 15 mg 40.9% ADA 26.9%, PBO 9.2%). Additionally,
UPA 15 mg outperformed ADA and PBO with regards ACR 50 and ACR 70 at 12 weeks
(refer to Figure 3), LDA (based on DAS28 (CRP) ≤3.2) at 12 weeks (UPA 15 mg 45.0%,
ADA 28.7%, PBO 13.8%; refer to Figure 4), and LDA (based on DAS28 (CRP) ≤3.2) at
26 weeks (UPA 15 mg 54.7%, ADA 38.5%, PBO 18.0%).
Physical function was measured at 12 weeks using the HAQ-DI, with UPA 15 mg
performing better than the comparators (UPA 15 mg -0.6, ADA -0.5, PBO -0.3; and the
ERG noted that this was also the case at 26 weeks, refer to Table 10). With regards to
reduction in pain at 12 weeks (VAS based Patient's Assessment of Pain), UPA 15 mg
significantly outperformed PBO (UPA group -31.8, PBO group -15.5) and showed greater
improvement than for ADA (-25.3).
HRQoL was assessed using the EQ-5D-5L index at both 12 and 26 weeks and the SF-36
PCS CFB at 12 weeks. UPA 15mg resulted in greater improvement on these HRQoL
6%14%18%
29%*** ###
29%
*** ###
45%
0%10%20%30%40%50%60%70%80%90%
100%
Clinical remission (DAS-28 CRP) Low disease activity (DAS28-CRP)
Res
pons
e ra
tes
(%)
PlaceboN=651
Adalimumab40mg + MTXN=327
Upadacitinib15mg + MTXN=651
Copyright 2019 Queen's Printer and Controller of HMSO. All rights reserved

Page 80 of 275
indexes (EQ-5D-5L at 12 weeks, UPA 15 mg 0.21, ADA 0.17, PBO 0.10; EQ-5D-5L at 26
weeks UPA 15 mg 0.22, ADA 0.20 and PBO 0.11; SF-36 PCS CFB at 12 weeks UPA 15
mg 7.9, ADA 6.3, PBO 3.6).
4.2.4.2 SELECT-NEXT
SELECT-NEXT compared efficacy of UPA 15 mg QD versus PBO for the treatment of
signs and symptoms of subjects with moderately to severely active RA who were on a
stable dose of csDMARDs and had an inadequate response to csDMARDs at 12 weeks.
*****************************************************************************************************
****************************************************************************************** A
summary of clinical effectiveness results was provided in the CS (Section B.2.6.2, p.62);
refer also to Table 11 (below).
Table 11. Summary of clinical effectiveness results for SELECT-NEXT
Endpoints
Week 12 PBO
(+csDMARDs) (N=221)
UPA 15 mg (+ csDMARDs)
(N=221) ACR20 response 35.7 63.8***
ACR50 response 14.9 38.0***
ACR70 response 5.9 20.8***
Clinical remission based on DAS28 (CRP) 10.0 30.8***
DAS28 (CRP) CFB –1.0 –2.2***
EQ-5D-5L CFB 0.1 0.2***
FACIT-F CFB 3.0 7.9***
HAQ-DI CFB –0.3 –0.6***
LDA CDAI 19.0 40.3***
LDA DAS28(CRP) 17.2 48.4***
Morning stiffness duration (minutes) change –34.3 –85.3***
RA-WIS CFB –1.6 –4.3
SF-36 PCS CFB 3.0 7.6*** Abbreviations: ACR20/50/70, American College of Rheumatology 20%, 50%, 70% response; CDAI, Clinical Disease Activity Index; CFB, Change From Baseline; CRP, C-reactive protein; DAS28, Disease Activity Score 28; FACIT-F, Functional Assessment of Chronic Illness Therapy – Fatigue; HAQ-DI, Health Assessment Questionnaire – Disability Index; LDA, low disease activity; PBO, placebo; PCS, physical component summary; QD, once daily; SF-36, Short Form-36; UPA, upadacitinib Notes: *** Statistically significant at 0.001 level
Reproduced from CS, Section B.2.6.2, p.62
At Week 12, ACR-20 was achieved by 63.8% in the UPA 15 mg group compared with
35.7% in the placebo group (p<0.001). These data are shown alongside ACR-50 and
Copyright 2019 Queen's Printer and Controller of HMSO. All rights reserved

Page 81 of 275
ACR-70 results in Figure 5 (reproduced from the CS).
*****************************************************************************************************
***************
Figure 5. ACR response rates at Week 12 in SELECT-NEXT
Abbreviations: ACR20/50/70, American College of Rheumatology 20%, 50%, 70% response
Notes: Responses for ACR20, ACR50, and ACR70 over 12 weeks, with non-responder imputation; ***Denotes statistical significance at the p<0.001 for comparison versus placebo.
Reproduced from CS, Section B.2.6.2.1, Figure 9, page 63
Similarly, there was a significant between-group difference in the proportion of patients
who achieved low disease activity (DAS-28 - CRP ≤3.2) at 12 weeks: 47.9% of those
receiving UPA 15mg compared with 17.2% of those receiving PBO, p<0.001; refer to
Figure 6, reproduced from the CS).
*****************************************************************************************************
****************************************************************************. Similar results were
found for CDAI data: UPA 15 mg outperformed PBO (40.3% versus 19.0% respectively,
p<0.001; *********************).
36%
15%6%
***
64%
***
38%***
21%
0%10%20%30%40%50%60%70%80%90%
100%
ACR 20 ACR 50 ACR 70
PlaceboN=221
Upadacitinib15mgN=221
Copyright 2019 Queen's Printer and Controller of HMSO. All rights reserved
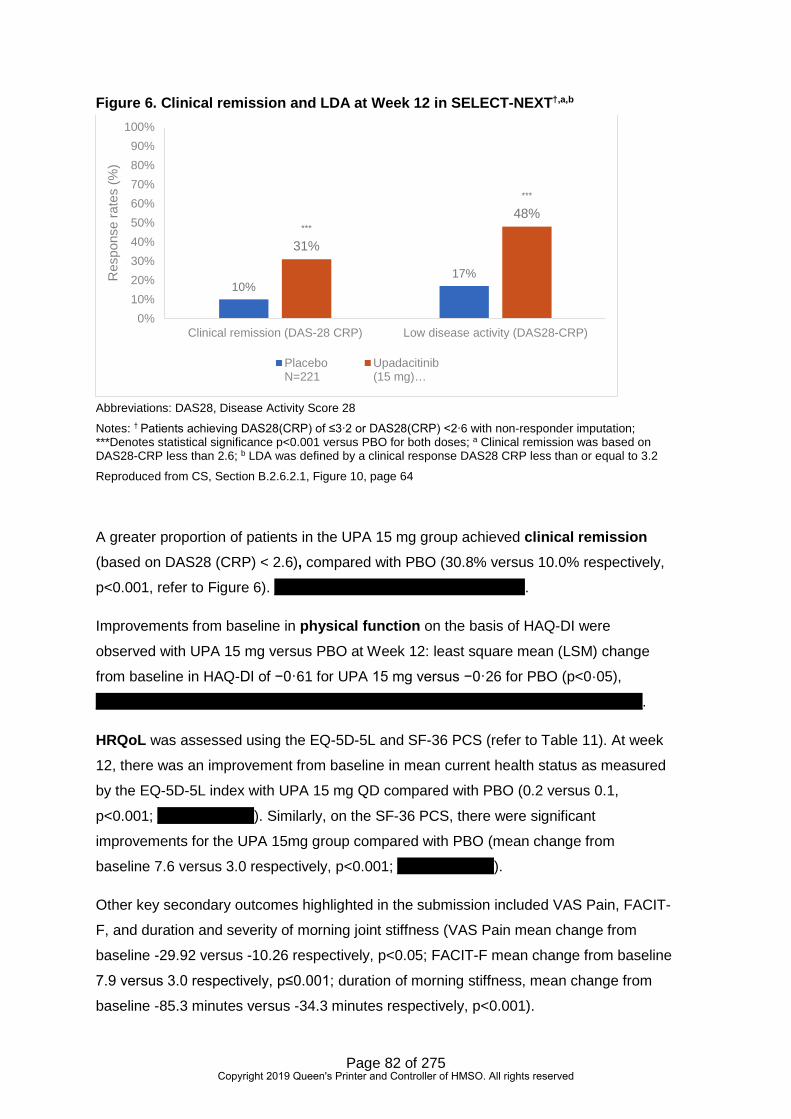
Page 82 of 275
Figure 6. Clinical remission and LDA at Week 12 in SELECT-NEXT†,a,b
Abbreviations: DAS28, Disease Activity Score 28
Notes: † Patients achieving DAS28(CRP) of ≤3∙2 or DAS28(CRP) <2∙6 with non-responder imputation; ***Denotes statistical significance p<0.001 versus PBO for both doses; a Clinical remission was based on DAS28-CRP less than 2.6; b LDA was defined by a clinical response DAS28 CRP less than or equal to 3.2
Reproduced from CS, Section B.2.6.2.1, Figure 10, page 64
A greater proportion of patients in the UPA 15 mg group achieved clinical remission
(based on DAS28 (CRP) < 2.6), compared with PBO (30.8% versus 10.0% respectively,
p<0.001, refer to Figure 6). ********************************************.
Improvements from baseline in physical function on the basis of HAQ-DI were
observed with UPA 15 mg versus PBO at Week 12: least square mean (LSM) change
from baseline in HAQ-DI of −0·61 for UPA 15 mg versus −0·26 for PBO (p<0·05),
************************************************************************************************.
HRQoL was assessed using the EQ-5D-5L and SF-36 PCS (refer to Table 11). At week
12, there was an improvement from baseline in mean current health status as measured
by the EQ-5D-5L index with UPA 15 mg QD compared with PBO (0.2 versus 0.1,
p<0.001; *****************). Similarly, on the SF-36 PCS, there were significant
improvements for the UPA 15mg group compared with PBO (mean change from
baseline 7.6 versus 3.0 respectively, p<0.001; *****************).
Other key secondary outcomes highlighted in the submission included VAS Pain, FACIT-
F, and duration and severity of morning joint stiffness (VAS Pain mean change from
baseline -29.92 versus -10.26 respectively, p<0.05; FACIT-F mean change from baseline
7.9 versus 3.0 respectively, p≤0.001; duration of morning stiffness, mean change from
baseline -85.3 minutes versus -34.3 minutes respectively, p<0.001).
10%17%
***
31%
***
48%
0%10%20%30%40%50%60%70%80%90%
100%
Clinical remission (DAS-28 CRP) Low disease activity (DAS28-CRP)
Res
pons
e ra
tes
(%)
PlaceboN=221
Upadacitinib(15 mg)…
Copyright 2019 Queen's Printer and Controller of HMSO. All rights reserved

Page 83 of 275
*****************************************************************************************************
*****************************************************************************************************
*****
For the outcomes related to physical function, HRQoL, fatigue, pain and stiffness, similar
patterns of results were found for scores ≥ minimum clinically important differences and
≥ normative values (refer to Table 12).
Table 12. Least squared mean (LSM) changes from baseline and percentage of responders for MCID and for normative values at Week 12 after UPA initiation
PRO Change from baseline % responders LSM Reporting scores
≥MCID, n (%) Reporting scores
≥normative values, n (%)
PBO N=221
UPA 15 mg N=221
PBO N=221
UPA 15 mg N=221
PBO N=221
UPA 15 mg N=221
HAQ-DI -0.26 -0.61* 109 (49.3) 156 (72.2)*
30 (13.6) 56 (25.9)*
Tag -10.36 -29.67* 94 (42.5) 153 (70.5)*
32 (14.5) 78 (35.9)*
Pain VAS -10.26 -29.92* 97 (43.9) 158 (72.8)*
- -
FACIT-F 2.96 7.91* 91 (41.2) 138 (63.9)*
35.8 (15.8)
60 (27.8)*
Duration morning stiffnessa
-34.27 -85.28* 29 (13.4) 57 (26.3)*,
b - -
Severity morning stiffnessb
-1.38 -2.88* 130 (60.2) 165 (76.0)*,b
- -
SF-36 PCS 3.03 7.58* 106 (48.0) 152 (69.4)*
18 (8.1) 39 (17.8)*
SF-36 MCS 2.58 4.69* 91 (41.2) 120 (54.8)*
102 (46.2) 114 (52.1)
Abbreviations: HAQ-DI, Health Assessment Questionnaire, Disability Index; LSM, least squares mean; MCID, minimum clinically important differences; MCS, Mental component summary; PCS, physical component summary; PtGA, Patient’s Global Assessment of Disease Activity PRO, patient reported outcomes; QD, once daily; SF-36, Short Form-36; VAS, Visual Analogue Scale
Reproduced from CS, Section B.2.6.2, p.66
4.2.4.3 SELECT-BEYOND
SELECT-BEYOND compared the efficacy of UPA 15 mg QD versus PBO for the
treatment of signs and symptoms of subjects with moderately to severely active RA who
were on a stable dose of csDMARDs and had an inadequate response to or intolerance
Copyright 2019 Queen's Printer and Controller of HMSO. All rights reserved

Page 84 of 275
to at least one prior bDMARD at 12 and 24 weeks. A summary of clinical effectiveness
results was provided in the CS (Section B.2.6.4, p.71); refer also to Table 13 (below).
Table 13. Summary of clinical effectiveness results for SELECT-BEYOND
Endpoints Week 12 Week 24
PBO (+ csDMARDs)
UPA 15 mg (+ csDMARDs)
UPA 15 mg (+ csDMARDs)
n = 169 n = 164 n = 164
ACR20 response 28.4 64.6*** 61.6
ACR20 response at Week 1 10.7 27.4*** NA
ACR50 response 11.8 34.1*** 42.7
ACR70 response 6.5 11.6* 22.0
Clinical remission (DAS28- CRP ≤2.6) 9.5 28.7*** 32.3
CDAI CFB -13.3 -24.4*** -27.5
DAS-28 (CRP) CFB -1.0 -2.3*** -2.6
EQ-5D-5L CFB 0.1 0.2** 0.52
HAQ-DI change from baseline -0.2 -0.4*** -0.4
LDA based on DAS-28 (CRP) ≤ 3.2 14.2 43.3*** 52.4
SDAI CFB -13.5 -25.6*** -28.4
SF-36 PCS CFB 2.4 5.8*** 5.7 Abbreviations: ACR20/50/70, American College of Rheumatology 20%, 50%, 70% response; CDAI, Clinical Disease Activity Index; CFB, Change From Baseline; CRP, C-reactive protein; DAS28, Disease Activity Score 28; FACIT-F, Functional Assessment of Chronic Illness Therapy – Fatigue; HAQ-DI, Health Assessment Questionnaire – Disability Index; LDA, low disease activity; PCS, physical component summary; QD, once daily; SF-36, Short Form-36
Notes: *** Statistically significant at 0.001 level
Reproduced from CS, Section B.2.6.4, p.71
At Week 12, ACR20 was achieved by 106 (65%; 95% CI 57–72) of 164 patients
receiving UPA 15 mg QD compared with 48 (28%; 22–35) of 169 patients receiving PBO
(p<0·0001). At Week 24, ACR20 response was achieved in 61.6% of patients treated
with UPA 15 mg QD + csDMARDs from study entry. LDA (DAS-28 (CRP)) of 3·2 or less
was achieved by 71 (43%; 95% CI 36–51) of 164 patients receiving UPA 15 mg QD
versus 24 (14%; 9–20) of 169 patients receiving PBO (p<0·0001). Comparisons to PBO
+ csDMARDs cannot be made at Week 24, since all PBO patients received either UPA
15 mg QD + csDMARDs or UPA 30 mg QD + csDMARDs from Week 12.
4.2.4.4 SELECT-MONOTHERAPY
SELECT-MONOTHERAPY compared the efficacy of UPA 15 mg QD monotherapy
versus continuing MTX monotherapy at 14 weeks for the treatment of signs and
symptoms of RA in subjects with moderately to severely active RA despite stable doses
Copyright 2019 Queen's Printer and Controller of HMSO. All rights reserved

Page 85 of 275
of MTX (inadequate response to MTX). A summary of clinical effectiveness results was
provided in the CS (Section B.2.6.2, p.62); refer also to Table 14 (below).
Table 14. Summary of clinical effectiveness results for SELECT-MONOTHERAPY
Endpoints
Week 14 cMTX
(N=216) UPA 15 mg QD
(N=217) ACR20 response 41.2 67.7***
ACR50 response 15.3 41.9***
ACR70 response 2.8 22.6***
Clinical remission based on DAS-28 (CRP) 8.3 28.1***
DAS28 (CRP) CFB –1.20 –2.29***
EQ-5D-5L CFB 0.1 0.2***
HAQ-DI CFB –0.32 –0.65***
LDA DAS28(CRP) 19.4 44.7***
Morning stiffness duration (minutes) change –53.03 –94.56**
SF-36 PCS CFB 4.32 8.28*** Abbreviations: ACR20/50/70, American College of Rheumatology 20%, 50%, 70% response; CFB, Change From Baseline; CRP, C-reactive protein; DAS-28, Disease Activity Score 28; HAQ-DI, Health Assessment Questionnaire – Disability Index; LDA, low disease activity; PCS, physical component summary; PBO, placebo; QD, once daily; SF-36, 36-item Short Form questionnaire; UPA, upadacitinib
Notes: ** Statistically significant at 0.01 level; *** Statistically significant at 0.001 level
Reproduced from CS, Section B.2.6.3, p.68
The primary outcomes demonstrated that at Week 14, a significantly greater proportion
of patients receiving UPA 15 mg QD achieved an ACR20 response compared with
patients receiving MTX monotherapy (67.7% versus 41.2% respectively, p<0.001; refer
to Figure 7). DAS28 (CRP) 3·2 or lower was met by 42 (19%) of 216 (95% CI 14–25)
receiving MTX, 97 (45%) of 217 (38–51) receiving UPA 15 mg QD monotherapy
(p<0·0001).
Copyright 2019 Queen's Printer and Controller of HMSO. All rights reserved

Page 86 of 275
Figure 7. ACR response rates at Week 12 in SELECT-MONOTHERAPY†
Abbreviations: ACR20/50/70 = American College of Rheumatology 20%, 50%, 70% response; MTX = Methotrexate
Notes: †All Week 14 endpoints shown in the table achieved p-values of <0.001 versus MTX for both doses. Not all ranked secondary endpoints shown. ACR50 and ACR70 were not ranked secondary endpoints. MTX patients shown are patients who continued on their baseline MTX dose in a blinded manner. Reproduced from CS, Section B.2.6.3, Figure 11, p.69
The CS also highlighted analyses for the following secondary endpoints: clinical
remission at 14 weeks, ACR 50 and 70 (Table 14), LDA (based on DAS-28 (CRP) <2.6),
HAQ-DI HRQoL (EQ-5D-5L, SF-36), and duration of morning stiffness (Table 14).
At Week 14, a significantly greater proportion of patients receiving UPA 15 mg QD
monotherapy achieved clinical remission (based on DAS-28(CRP) <2.6) compared
with patients receiving MTX monotherapy (28% versus 8% respectively, p<0.001).
Improvements from baseline in physical function on the basis of HAQ-DI were
observed with UPA 15 mg QD monotherapy versus continued MTX at Week 14: least
square mean (LSM) change from baseline in HAQ-DI of −0·65 (95% CI −0·73 to −0·57)
for UPA 15 mg QD monotherapy versus −0·32 (−0·41 to −0·24) for continued MTX
(p<0·001). The minimum clinically important difference (≤−0·22) was achieved by 140
(66%) of 213 patients (95% CI 59–72) on UPA 15 mg QD monotherapy, and 98 (48%) of
205 patients (95% CI 41–55) on continued MTX (p<0·0001).
HRQoL was assessed using the EQ-5D-5L and SF-36 PCS. Patients reported an
improved HRQoL as indicated by improvements in SF-36 PCS for UPA 15 mg QD
monotherapy (8·3; 95% CI 7·2–9·4) versus continued MTX (4·3; 3·2–5·4) at Week 14
(p<0·001). Patients also reported an improvement from baseline in mean current health
41%
15%
3%
68%
42%
23%
0%10%20%30%40%50%60%70%80%90%
100%
ACR 20 ACR 50 ACR 70
Res
pons
e ra
tes
(%)
MTXN=216
Upadacitinib15mg…
Copyright 2019 Queen's Printer and Controller of HMSO. All rights reserved

Page 87 of 275
status as measured by EQ-5D-5L for UPA 15 mg QD monotherapy versus continued
MTX (0.2 vs 0.1, p=0.001).
ERG comment
When checking the results reported in the CS against the respective CSRs, no
discrepancies were identified.20,22,24,26
The ERG noted that here was some variation between the studies in the primary and
secondary outcomes used to assess clinical and functional efficacy and HRQoL of UPA
(refer to Section 4.2.2.4).
The ERG also noted that, for three of the trials, between-group data were reported only
at 12-14 weeks (14 weeks in SELECT MONOTHERAPY and 12 weeks in SELECT
NEXT and SELECT COMPARE). For SELECT COMPARE, data are reported at 12
weeks and also at 26 weeks. It is important to consider that the 26 week data include
patients who switched treatments (rescue therapy - from PBO to UPA, UPA to ADA, or
ADA to UPA - could be implemented at weeks 14, 18, 22, or 26 for patients with <20%
improvement in TJC and SJC). Rates of rescue therapy up until 26 weeks were as
follows: PBO group not rescued 346 (53.1%), rescued 305 (46.9%); ADA group not
rescued 250 (76.5%), rescued 77 (23.5%); UPA group not rescued 526 (80.8%), rescued
125 (19.2%).
*****************************************************************************************************
***************************************************************************************************.
In ERG has provided a comment on the results of the pivotal trials for the following key
outcomes: ACR response, clinical remission and HRQoL.
ACR response:
ACR response was assessed in all four trials. When compared with PBO over a 12-week
period (SELECT-NEXT and SELECT-BEYOND), and over a 14-week period (SELECT-
MONOTHERAPY), UPA 15 mg QD demonstrated higher ACR20/50/70 and clinical
remission in, despite differences between trials in concomitant treatments. The SELECT-
COMPARE trial (through Week 26), a head-to-head comparison with ADA, demonstrated
that the ACR20 response rate at Week 12 was significantly higher among UPA 15 mg
QD treated patients compared with the 327 ADA-treated patients, at 71% versus 63%
(p<0.05).
Copyright 2019 Queen's Printer and Controller of HMSO. All rights reserved

Page 88 of 275
Clinical remission:
Clinical remission was assessed in all four trials based on DAS-28 CRP <2.6. Clinical
remission with UPA 15 mg at 12-14 weeks (14 weeks in SELECT MONOTHERAPY and
12 weeks in the other three trials) was consistent across all trials (28.7%, 30.8%, 28%
and 28.7% in SELECT COMPARE, SELECT NEXT, SELECT MONOTHERAPY and
SELECT BEYOND respectively), despite differences between trials in concomitant
treatments. Clinical remission was consistently higher with UPA 15 mg than with PBO:
the clinical remission rates for PBO at 12-14 weeks (across the three PC trials) were
6.1%, 10.0% and 9.5% for SELECT COMPARE, SELECT NEXT and SELECT BEYOND
respectively.
At 14 weeks, the clinical remission rate with UPA 15 mg QD monotherapy was
significantly higher than that for MTX monotherapy (28% versus 8%, p<0.001). When
taken in combination with MTX, UPA 15 mg QD also resulted in a significantly higher
remission rate than ADA combined with MTX at both 12 weeks (UPA 15 mg 28.7% ADA
18.0%, p<0.001) and 26 weeks (UPA 15 mg 40.9% ADA 26.9%, p<0.001).
Health-related quality of life:
The EQ-5D-5L and the SF-36 PCS were used to assess HRQoL at 12-14 weeks in all
four trials (14 weeks for SELECT MONOTHERAPY). For SELECT COMPARE, EQ-5D-
5L data were also reported at 26 weeks.
In all three PC trials (SELECT COMPARE, SELECT NEXT and SELECT BEYOND), and
despite differences in concomitant treatments, UPA 15mg resulted in greater
improvement on the EQ-5D-5L index at 12-14 weeks (0.2 versus 0.10 respectively in all
three studies, p<0.001 in all three trials). Similar results were found for the SF-36 PCS at
12 weeks: there was greater improvement with UPA 15 mg QD than with PBO (mean
change from baseline 7.9 versus 3.6 respectively, p<0.001 for SELECT COMPARE, 7.6
versus 3.0 respectively, p≤0.001 for SELECT NEXT; 5.8 versus 2.4, p<0.001 for
SELECT BEYOND). In SELECT COMPARE there was also greater improvement on the
EQ-5D-5L with UPA 15 mg QD versus PBO at 26 weeks (EQ-5D-5L 0.22 versus 0.11
respectively, p<0.001).
At 14 weeks, there was greater improvement on both the EQ-5D-5L index and the SF-
36-PCS with UPA 15 mg QD monotherapy compared with MTX monotherapy (EQ-5D-5L
0.2 vs 0.1 respectively, p=0.001; SF-36 PCS 8·3 versus 4·3 respectively, p<0·001).
When taken in combination with MTX, UPA 15 mg QD resulted in a similar improvement
Copyright 2019 Queen's Printer and Controller of HMSO. All rights reserved

Page 89 of 275
on the EQ-5D-5L index as ADA combined with MTX at both 12 weeks (UPA 15 mg 0.21
ADA 0.17) and 26 weeks (UPA 15 mg 0.22 ADA 0.20). Change from baseline in SF-36
PCS scores was also similar with UPA 15 mg and ADA at 12 weeks (7.9 versus 6.3
respectively).
4.2.4.5 Subgroup analyses
In Section B.2.7 of the CS, the company presented post-hoc subgroup analyses (for
ACR20, clinical remission (DAS-28-CRP ≤2.6), and LDA based on DAS-28 (CRP) ≤3.2)
for patients with moderate RA. Similar data were not provided in the CS for patients with
severe RA. This was queried by the ERG, and in the clarification response from the
company, baseline data and clinical effectiveness data were provided separately for the
moderate and severe populations. These data are summarised in Table 15 (moderate
RA population) and Table 16 (severe RA population).
ERG comment
The ERG noted that the data for the moderate sub-group differed slightly in the CS and
in the clarification response from the company (for SELECT COMPARE, SELECT NEXT
and SELECT BEYOND) data were provided for fewer participants in the clarification
response than the CS). As the most recently provided data, the data taken from the
clarification response are presented and discussed here. The ERG highlight that
comparisons based on these moderate and severe RA sub-groups were post-hoc
analyses and, likely due to this, there was insufficient data in the CSRs with which to
check the accuracy of these data. It does appear that, overall, lower p values were found
in these between-treatment clinical efficacy analyses for the severe RA subgroup than
for the moderate RA subgroup.
Copyright 2019 Queen's Printer and Controller of HMSO. All rights reserved

Page 90 of 275
Table 15. Baseline characteristics and efficacy outcomes for the moderate RA subgroup across all four registration trials
Study SELECT-COMPARE SELECT-NEXT SELECT-MONOTHERAPY SELECT-BEYOND
Treatment PBO ADA UPA 15 mg PBO UPA 15 mg MTX UPA 15 mg PBO UPA 15 mg Total N (moderate) ****** ****** ******* ****** ****** ****** ****** ****** ****** Baseline demographics & clinical characteristics Sex, n (%)
Male ********* ********* ********* ********* ********* ********* ********* ******** ******** Female ********** ********* ********** ********* ********* ********* ********* ********* *********
Age (years) mean (SD) *********** *********** *********** *********** *********** *********** *********** *********** *********** Duration of RA diagnosis (years) – continuous, mean (SD)
********* ********* ********* ********* ********* ********* ********* ********** ***********
TJC68, mean (SD) ********** ********** ********** ********** ********** ********** ********** ********** ********** SJC66, mean (SD) ********** ********** ********* ********** ********** ********** ********** ********** ********** HAQ-DI mean (SD) ********* ********* ********* ********* ********* ********* ********* ********* ********* DAS 28 based on CRP ********* ********* ********* ********* ********* ********* ********* ********* ********* Efficacy outcomes timepoint Week 12 Week 12 Week 14 Week 12 ACR20 response rate (% week 12) **************** **************** **************** ****************
** ****************
**** ****************
** ****************
**** ****************
** ****************
*** Clinical remission (DAS-28- CRP ≤2.6) (responder %)
*****************
*******************
******************* ****************
* ****************
**** ****************
* ****************
***** ****************
* ****************
***
LDA based on DAS-28 (CRP) ≤3.2 (responder %)
*****************
*********************
********************
******************
*********************
******************
********************
******************
********************
Abbreviations: ACR20, America College of Rheumatology 20% response; ADA, adalimumab; CRP, C-reactive protein; csDMARD, conventional synthetic disease modifying antirheumatic drug; DAS-28, ; HAQ-DI, health assessment questionnaire disability index; LDA, low disease activity; MTX, methotrexate; PBO, placebo; RA, rheumatoid arthritis; SD, standard deviation; SJC, swollen joint count; TJC, tender joint count; UPA, upadacitinib Notes: Values rounded to 1 decimal place ; *p<0.05; ** p<0.01; *** p<0.001 vs placebo
Source: CS, Section B.2.7, Table 13 (p.80) and Table 14 (p.81)
Copyright 2019 Queen's Printer and Controller of HMSO. All rights reserved

Page 91 of 275
Table 16. Baseline characteristics and efficacy outcomes for the severe RA subgroup across all four registration trials
Study SELECT-COMPARE SELECT-NEXT SELECT-MONOTHERAPY SELECT-BEYOND
Treatment PBO ADA UPA 15 mg PBO UPA 15 mg MTX UPA 15 mg PBO UPA 15 mg Total N (severe) ******* ******* ******* ******* ******* ******* ******* ******* ******* Baseline demographics & clinical characteristics Sex, n (%)
Male ********** ********* ********* ********* ********* ********* ********* ********* ********* Female ********* ********** ********** ********** ********** ********** ********** ********** **********
Age (years) mean (SD) *********** *********** *********** *********** *********** *********** *********** *********** *********** Duration of RA diagnosis (years) – continuous, mean (SD)
********* ********* ********* ********* ********* ********* ********** ********** **********
TJC68, mean (SD) *********** *********** *********** *********** *********** *********** *********** *********** *********** SJC66, mean (SD) ********** ********** *********** *********** *********** *********** *********** *********** *********** HAQ-DI mean (SD) ********* ********* ********* ********* ********* ********* ********* ********* ********* DAS 28 based on CRP ********* ********* ********* ********* ********* ********* ********* ********* ********* Efficacy outcomes timepoint Week 12 Week 12 Week 14 Week 12
ACR20 response rate (% week 12) ***************** **************** ******************
* **************
*** **************
****** **************
*** **************
****** **************
*** *************
******* Clinical remission (DAS-28- CRP ≤2.6) (responder %)
************** **************** ********************
***************
******************** ************** **************
****** **************
* *************
*******
LDA based on DAS-28 (CRP) ≤3.2 (responder %) **************** ***************** ******************
** **************
** **************
****** **************
** **************
****** **************
** *************
******* Abbreviations: ACR20, America College of Rheumatology 20% response; ADA, adalimumab; CRP, C-reactive protein; csDMARD, conventional synthetic disease modifying antirheumatic drug; DAS-28, ; HAQ-DI, health assessment questionnaire disability index; LDA, low disease activity; MTX, methotrexate; PBO, placebo; RA, rheumatoid arthritis; SD, standard deviation; SJC, swollen joint count; TJC, tender joint count; UPA, upadacitinib Notes: *** p<0.001 vs PBO
Source: Company clarification response, Table 4 (p.11), Table 10 (p.23), Table 13 (p.26), Table 19 (p.29). Table 22 (p.31)
Copyright 2019 Queen's Printer and Controller of HMSO. All rights reserved

Page 92 of 275
The company also presented results with both moderate and severe patient populations
combined, stratified by rheumatoid factor status, anti-CCP status and after one and two
or more csDMARD failures, in order to understand the efficacy of UPA in patients who
could be classified as moderate RA displaying poor prognostic factors as determined by
EULAR criteria (refer to Section B.2.7, Table 16 [p.85] and Table 17 [p.85] of the CS).
The relative efficacy of UPA was reported in the CS as numerically similar or slightly
improved for those with poor prognostic factors (positive rheumatoid factor anti-CCP
antibody status and after two csDMARD or more failures) than those without.
4.2.5 Results of any standard meta-analyses of upadacitinib studies
No standard meta-analyses of UPA trials were presented (see Section 4.1.5 for the ERG
critique of this decision).
4.2.6 Applicability to clinical practice
The profile of demographic and clinical characteristics was in largely line with clinical
expectations, although there may be an overrepresentation of White patients in the trials.
All four trials were international with a ************************** (no UK sites in SELECT-
MONOTHERAPY ****************************************************************), and
therefore will include patients undergoing treatment in settings where treatment context
and treatment pathways differ considerably from routine practice in England and Wales.
An ERG critique of the treatment sequences used in the company economic model is
provided in Section 5.2.4.
In addition, the ERG noted that while the trials covered a range of potential treatment
scenarios, including comparisons between UPA monotherapy and in combination with
csDMARDs against csDMARDs and against bDMARDs, each trial as designed also
addressed a range of populations. This is important because decisions for treatment of
moderate RA will have different options in the first instance as compared to treatments
for severe RA. In response to clarification question A8, the company clarified that
treatment severity was not a stratifying factor at randomisation. While subgroup analyses
by DAS score were pre-planned, it is not clear that analyses by disease activity were
sufficiently powered. In addition, the diverse treatment histories in the included trials
mean that estimates from each trial do not map precisely onto different points in the
treatment pathway, requiring an assumption of exchangeability of effect among these
different points in the treatment pathway.
Copyright 2019 Queen's Printer and Controller of HMSO. All rights reserved

Page 93 of 275
4.2.7 Safety of UPA
The company provided the key safety data for the four pivotal trials in Section B.2.10 of
the CS. Further safety data were provided in Appendix F of the CS. The ERG has
checked these safety data against the published data for each trial and, where relevant,
the data provided in the clinical study report (CSR). The ERG noted that, for all four
studies, the unit of reporting of safety data in the CS was the number of patients
experiencing adverse events rather than the number of events. Where relevant, the ERG
has supplemented these data with the event rates provided in the CSRs.20,22,24,26
4.2.7.1 Safety data from SELECT-COMPARE
For SELECT COMPARE, the company summarised safety data for both the PBO-
controlled and active comparator periods of the study (i.e. at 14 weeks and at 26 weeks;
refer to B.2.10 and Appendix F of the CS). Table 28 of the CS (p. 112), summarised the
key safety data from SELECT-COMPARE. The ERG has checked the data in Table 28
of the CS against the CSR and published papers for the study.19,20,33,35 For clarity, this
table has been reproduced below (Table 17).
The ERG noted that, through to Week 14,
*****************************************************************************************************
****************************************************************************************************.20 This was not highlighted in the CS, but is highlighted in the CSR.
*****************************************************************************************************
*****************************************************************************************************
*****************************************************************************************************
*****************************************************************************************************
*****************************************************************************************************
*****************************************************************************************************
*****************************************************************************************************
*****************************************************************************************************
*****************************************************************************************************
*****************************************************************************************************
*****************************************************************************************************
***************************************************************************20
Copyright 2019 Queen's Printer and Controller of HMSO. All rights reserved

Page 94 of 275
Table 17. Summary of key safety events from SELECT-COMPARE
SELECT-COMPARE
Week 14 Week 26
PBO (N=651)
ADA (N=327)
UPA (N=651)
PBO (N=651)
ADA (N=327)
UPA (N=651)
Any AE, n (%) 303 (46.5) 158 (48.3) 348 (53.5) 347 (53.2) 197 (60.2) 417 (64.2)
Any SAE, n (%) 14 (2.1) 8 (2.4) 18 (2.8) 19 (2.9) 14 (4.3) 24 (3.7)
Any AE leading to discontinuation of study drug, n (%)
12 (1.8) 16 (4.9) 18 (2.8) 15 (2.3) 20 (6.1) 24 (3.7)
Any severe AEa, n (%) 22 (3.4) 10 (3.1) 20 (3.1) 26 (4.0) 15 (4.6) 29 (4.5)
Any AE with reasonable possibility of being related to study drugb, n (%)
119 (18.3) 74 (22.6) 174 (26.8) 144 (22.1) 94 (28.7) 212 (32.6)
Any AE leading to death, n (%)
2 (0.3) 1 (0.3) 0 2 (0.3) 2 (0.6) 0
Deathsc, n (%) 2 (0.3) 1 (0.3) 0 2 (0.3) 2 (0.6) 0 Abbreviations: AE, adverse event; PBO, placebo; ADA, adalimumab; SAE, serious adverse event; UPA, Upadacitinib
Notes: a: Severe AEs were defined as events with Grade 3 or above based on the Rheumatology CTC for AEs; b: As assessed by investigator; c: Any death including non-treatment-emergent deaths
Reproduced from CS, Table 28, page 111
The ERG cross-checked data on deaths and specific AEs through to 26 weeks,
censored at treatment switching: no deaths were reported in the UPA 15 mg group (two
deaths occurred in the ADA group and two deaths in the PBO group); the most
frequently reported AEs (≥5% of patients) in the UPA 15 mg group were upper
respiratory tract infection (5.7%) and nasopharyngitis (5.5%); the most frequently
reported SAEs in the UPA 15 mg group were appendicitis (0.3%), gastroenteritis (0.3%)
and spontaneous abortion (0.3%); and rates of serious infections were 1.8% in the UPA
group, 1.5% in the ADA group and 0.8% in the PBO group (noting that all patients were
taking MTX).
Adverse events of special interest were described in the text of the CS (refer to B.2.10)
and also in Table 42, Appendix F of the CS. The ERG checked the accuracy of these
data against the CSR. The ERG noted that rates of treatment-emergent anaemia were
not highlighted in Section B.2.10 of the CS (although these data are provided in Table
42, Appendix F of the CS), but for clarity, the ERG highlighted that these rates were
comparable across groups at both 14 and 26 weeks (for UPA, ADA and PBO
Copyright 2019 Queen's Printer and Controller of HMSO. All rights reserved

Page 95 of 275
respectively, these rates were 1.2%, 1.5% and 2.1% at 14 weeks and 1.4%, 1.8% and
2.6% at 26 weeks).
4.2.7.2 Safety data from SELECT-MONOTHERAPY
For SELECT-MONOTHERAPY, 14-week safety data were summarised (i.e. data for the
controlled period of the study, refer to B.2.10 and Appendix F of the CS). Table 30 of the
CS (p. 115), summarised the key safety data from SELECT-MONOTHERAPY and this
has been reproduced below (Table 18).
*****************************************************************************************************
*****************************************************************************************************
**********************************************************************24 As a result, the ERG
checked the 14-week data provided in the CS against the available published data for
this study.23,34,36,37
Table 18. Summary of key safety events from SELECT-MONOTHERAPY
Week 14
cMTX
(N=216) UPA 15 mg
QD (N=217)
UPA 30 mg (N=215)
Any AE, n (%) 102 (47.2) 103 (47.5) 105 (48.8) Any SAE, n (%) 6 (2.8) 11 (5.1) 6 (2.8) Any AE leading to discontinuation of study drug, n (%)
6 (2.8) 8 (3.7) 6 (2.8)
Any severe AE, n (%) 5 (2.3) 7 (3.2) 9 (4.2) Any AE with reasonable possibility of being related to study druga, n (%)
43 (19.9) 49 (22.6) 56 (26.0)
Any AE leading to death, n (%) 0 1 (0.5) 0 Deathsb, n (%) 0 1 (0.5) 0
Abbreviations: AE, adverse event; cMTX, continuing methotrexate; SAE, serious adverse event; UPA, upadacitinib Notes: a As assessed by investigator; b Any death including non-treatment-emergent deaths Reproduced from CS, Table 30, page 114
The ERG confirmed that through to 14 weeks, TEAEs occurred, and led to
discontinuation, in similar proportions across the three study groups (refer to Table 18).
However, SAEs were more common in the UPA 15 mg group than the continuation MTX
and UPA 30 mg groups (5.1%, 2.8% and 2.8% respectively). The ERG confirmed that
there was one death (haemorrhagic stroke due to a ruptured aneurysm) in the UPA 15
mg group, and no deaths in the other two groups, during the 14-week initial study period.
*****************************************************************************************************
*****************************************************************************************************
*****************************************************************************************************
Copyright 2019 Queen's Printer and Controller of HMSO. All rights reserved

Page 96 of 275
*****************************************************************************************************
*****************************************************************************************************
***************************
With regards to specific AEs, the CS stated that there were no AEs that occurred in ≥5 of
patients and that for those receiving UPA 15 mg, the most frequently reported AEs
during the initial 14 weeks of the study were urinary tract infection (4.1%), upper
respiratory tract infection (4.1%), increased blood creatine phosphokinase (2.3%) and
bronchitis (1.8%). Further data on specific AEs were given in Appendix F, Table 46 of the
CS.
The main publication for SELECT-MONOTHERAPY reported that the lowest rates of
infection through to Week 14 were in in the UPA 15 mg arm of the study (19% versus
26% in the continuation MTX arm and 25% in the UPA 30 mg arm).34 Consistent with the
main publication for the study, 34 the CS reported that there was a single treatment
emergent serious infection in the UPA 15 mg group (and another in the continuation
MTX group) and that there was one MACE event in the UPA 15 mg group and two in the
30 mg group.
The ERG noted that the following 14-week safety data are highlighted in the main
publication for SELECT-MONOTHERAPY,34 and whilst reported in Table 46, Appendix F
of the CS, are not highlighted: i) herpes zoster occurred in 2.8% of patients in the UPA
30 mg arm, 1.4% patients in the UPA 15 mg arm and 0.5% of patients in the continued
MTX arm; ii) there were two malignancies in the UPA 15 mg arm (non-Hodgkin’s
lymphoma, breast cancer); iii) Grade 3 haemoglobin decrease was more frequent in the
UPA 30 mg than the updacitinib 15 mg and continuation MTX arms, and there was one
patient with a Grade 4 haemoglobin decrease in the UPA 30 mg arm. The ERG
confirmed that through to Week 14, there were no reports of renal dysfunction in any
group.
4.2.7.3 Safety data from SELECT-NEXT
For SELECT-NEXT, 12-week safety data were summarised, i.e. data for the PBO-
controlled period of the study (refer to B.2.10 and Appendix F of the CS). Table 29 of the
CS (pp.113-114), summarised the key safety data for this study, and this has been
reproduced below (Table 19). The ERG checked the data provided in the CS against
both the available published data and the CSR.21,22,38-43 It is important to consider that in
SELECT-NEXT, all patients were continuing on csDMARDS.
Copyright 2019 Queen's Printer and Controller of HMSO. All rights reserved

Page 97 of 275
The ERG confirmed that AEs were reported at similar rates in the UPA 15 mg (56.6%)
and UPA 30 mg group (53.9%) compared with 48.9% in the PBO group. However,
discontinuations due to AEs occurred in 3.2% of those in the UPA 15 mg and PBO
groups and at a higher rate in the upadacitinb 30 mg group (5.9%) even though SAEs
were highest in the UPA 15 mg group (4.1%; refer to Table 19). The ERG confirmed
that, through to 12 weeks, there were no deaths reported.
Table 19. Summary of key safety events from SELECT-NEXT
SELECT-NEXT Week 12
PBO (N=221)
UPA 15 mg (N=221)
UPA 30 mg (N=219)
Any AE, n (%) 108 (48.9) 125 (56.6) 118 (53.9) Any SAE, n (%) 5 (2.3) 9 (4.1) 6 (2.7) Any AE leading to discontinuation of study drug, n (%)
7 (3.2) 7 (3.2) 13 (5.9)
Any severe AEa, n (%) 5 (2.3) 8 (3.6) 7 (3.2) Any AE with reasonable possibility of being related to study drugb, n (%)
45 (20.4) 47 (21.3) 52 (23.7)
Any AE leading to death, n (%) 0 0 0 Deathsc, n (%) 0 0 0
Abbreviations: AE, adverse event; PBO, placebo; ADA, adalimumab; SAE, serious adverse event; UPA, upadacitinib Notes: a Severe AEs were defined as events with Grade 3 or above based on the Rheumatology CTC for AEs; b As assessed by investigator; c Any death including non-treatment-emergent deaths Reproduced from CS, Table 29, page 112
In the UPA 15 mg group, the most commonly reported AEs (≥5% of patients) were
nausea (7.2%), nasopharyngitis (5.4%) and upper respiratory tract infection (5.4%). The
ERG additionally highlights that
*****************************************************************************************************
*****************************************************************************************************
*********************************** Table 43, Appendix F of the CS reported lower values for
these AEs because only AEs that were assessed as having a reasonable possibility of
being related to the study drugs were included.
As stated in Section B.2.10 of the CS, the most commonly reported SAEs in the UPA 15
mg group were wrist fractures (0.9%), coronary artery disease (05%), enterocolitis
infectious (0.5%), spinal compression fracture (0.5%), osteoarthritis (0.5%), ovarian germ
cell teratoma benign (0.5%), suicide attempt (0.5%) and nephrolithiasis. SAEs across all
groups were provided by the company in Appendix F of the CS.
Copyright 2019 Queen's Printer and Controller of HMSO. All rights reserved

Page 98 of 275
The company noted that the incidence of infection was higher in both groups receiving
upadactinib compared with the PBO group (29% in the UPA 15 mg group, 31.5% in the
upadactinib 30 mg group, and 21.3% in the PBO group) and these data have been
checked against the CSR by the ERG. Similarly, the ERG confirms that serious
infections were reported in one patient in the UPA 15 mg group, one patient in the PBO
group but in three patients in the UPA 30 mg group and that there were no malignancies
or major adverse cardiac events (MACE) reported with UPA 15 mg (there was a single
MACE and two malignancies reported with UPA 30 mg). However, there were two
patients in the UPA 15 mg group who experienced other cardiovascular events (refer to
Table 45, Appendix F of the CS).
The ERG additionally noted that, with respect to other TEAEs of special interest,
neutropenia and increased blood creatine phosphokinase was more common in the UPA
15 mg group and the UPA 30 mg group than in the PBO group. Furthermore, the ERG
highlights that there were no cases of TE anaemia reported in the UPA 15 mg group,
whilst there were three cases each in the UPA 30 mg and PBO groups. These data are
provided in Table 45, Appendix F of the CS.
4.2.7.4 Safety data from SELECT-BEYOND
For SELECT-BEYOND, safety data were summarised in Section B.2.10 of the CS, for
both the PBO-controlled period (up until 12 weeks) and the extension phase (12–24
weeks) of the study. The extension phase data reported in Section B.2.10 of the CS
were provided separately for patients who started the study in the two UPA groups and
for patients who started in the PBO group, resulting in four groups (UPA 15 mg, UPA 30
mg, PBO to UPA 15 mg and PBO to UPA 30 mg). Table 31 of the CS (p.118),
summarised these data; for clarity these data have also been reproduced below (Table
20). Cumulative safety data (i.e. across the two study periods) were given in Appendix F
of the CS as EAIRs.
*****************************************************************************************************
*****************************************************************************************************
*****************************************************************************************************
************* The ERG checked the data provided in the CS against the available
published data and the CSR for the study.25,26,44-50 In the interpretation of the safety data
from SELECT BEYOND, is important to consider that patients were receiving
continuation csDMARDS and this may account for adverse events in any of the study
arms.
Copyright 2019 Queen's Printer and Controller of HMSO. All rights reserved

Page 99 of 275
The CS reported that, during the first 12 weeks of the study, rates of TEAEs were similar
in the PBO and UPA 15 mg arms (56.2% and 55.5% respectively), but higher in the UPA
30 mg arm (67.3%). The ERG highlighted that during Weeks 12 to 24, rates of TEAEs
were similar in the two groups that had received UPA from the start of the study (53% for
UPA 15 mg and 56% for UPA 30 mg), lower for the group that switched from PBO to
UPA 15 mg (42%) and higher for the group that switched from PBO to UPA 30 mg
(67%).
*****************************************************************************************************
*****************************************************************************************************
*********
The ERG agreed with the company that during the first 12 weeks of the study, SAEs
were more common in the UPA 30 mg group (7.3%) than the UPA 15 mg group (4.9%),
and highlights that there were no SAEs in the PBO group during this time. During the
extension phase of the study, SAEs were more common in the groups that switched from
PBO to UPA 15 mg or 30 mg (7% for each group), than those who started the study with
UPA 15 mg or 30 mg (3% in each group). The CSR additionally confirmed
*****************************************************************************************************
*****************************************
Section B.2.10 of CS reported that AEs leading to discontinuations were highest with
UPA 30 mg (9.1%) and lowest with UPA 15 mg (2.4%) during the initial phase of the
study. The ERG checked and agreed this and also agreed that discontinuations due to
AEs were similar across all four groups between 12 and 24 weeks (4% in the group that
switched from PBO to UPA 30 mg and 3% in the groups receiving UPA from baseline
and in the group that switched from PBO to UPA 15 mg). The CSR reported
*****************************************************************************************************
*****************************************************************************************************
**
There were two deaths reported across the two SELECT-BEYOND study periods, both
in patients taking UPA. One death occurred during the PBO-controlled phase of the
study (cardiac failure and pulmonary embolism in a patient receiving UPA 30 mg,
*****************************************************************************************). The
other death occurred during the extension phase of the study in a patient receiving UPA
15 mg (unwitnessed death due to cardiac arrest and adjudicated as an
undetermined/unknown cause of death
*****************************************************************************************************
Copyright 2019 Queen's Printer and Controller of HMSO. All rights reserved

Page 100 of 275
*****************************************************************************************************
****************************************
In the UPA 15 mg group, the ERG confirmed that during the first 12 weeks of the study,
the most frequently reported AEs (>5% of patients) were urinary tract infections (9.1%)
and upper respiratory tract infections (7.9%). In the UPA 30 mg the rates of urinary tract
infections and upper respiratory tract infections were 5.5% and 6.1% respectively, and
these data are correctly reported in Appendix F of the CS, but mislabelled as data
pertaining to the upadacitibib 15 mg group in Section B.2.10 of the CS. The ERG
additionally noted that the rates of urinary tract infections and upper respiratory tract
infections in the PBO group during the same period were 5.9% and 7.7% respectively.
The company reported that although serious infections were more common with UPA 30
mg (2.4%) than UPA 15 mg (0.6%) during the first 12 weeks of the study, and that there
were no serious infections in the PBO group during that time, the rates of serious
infections were similar across groups during Weeks 12 to 24 of the study, when all
groups were receiving UPA. The ERG agreed with this, but additionally confirmed that
although rates of serious infection were low during the extension period of the study,
they were highest in the group that switched from PBO to UPA 15 mg (refer to Table 20).
Details on opportunistic infections are provided in Appendix F and in the text of the main
body of the CS (Section B.2.10). These were checked by the ERG against the CSR and
appeared to be correct.
Copyright 2019 Queen's Printer and Controller of HMSO. All rights reserved
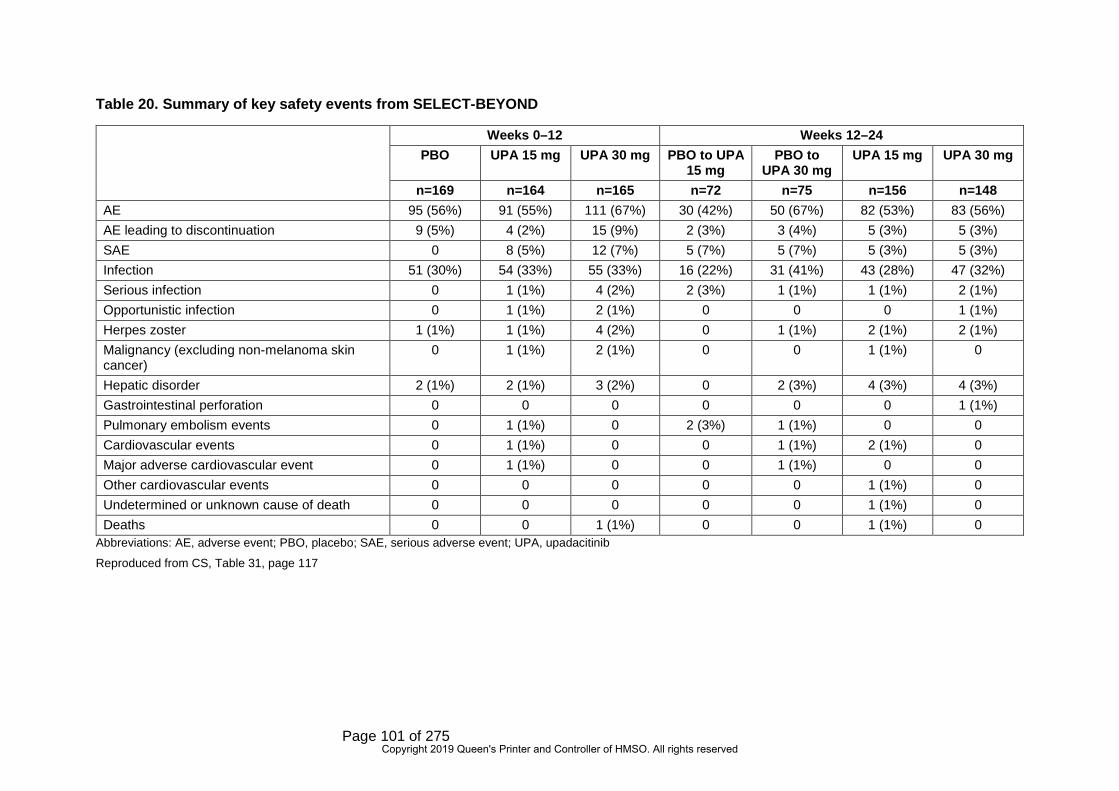
Page 101 of 275
Table 20. Summary of key safety events from SELECT-BEYOND
Abbreviations: AE, adverse event; PBO, placebo; SAE, serious adverse event; UPA, upadacitinib
Reproduced from CS, Table 31, page 117
Weeks 0–12 Weeks 12–24 PBO UPA 15 mg UPA 30 mg PBO to UPA
15 mg PBO to
UPA 30 mg UPA 15 mg UPA 30 mg
n=169 n=164 n=165 n=72 n=75 n=156 n=148 AE 95 (56%) 91 (55%) 111 (67%) 30 (42%) 50 (67%) 82 (53%) 83 (56%) AE leading to discontinuation 9 (5%) 4 (2%) 15 (9%) 2 (3%) 3 (4%) 5 (3%) 5 (3%) SAE 0 8 (5%) 12 (7%) 5 (7%) 5 (7%) 5 (3%) 5 (3%) Infection 51 (30%) 54 (33%) 55 (33%) 16 (22%) 31 (41%) 43 (28%) 47 (32%) Serious infection 0 1 (1%) 4 (2%) 2 (3%) 1 (1%) 1 (1%) 2 (1%) Opportunistic infection 0 1 (1%) 2 (1%) 0 0 0 1 (1%) Herpes zoster 1 (1%) 1 (1%) 4 (2%) 0 1 (1%) 2 (1%) 2 (1%) Malignancy (excluding non-melanoma skin cancer)
0 1 (1%) 2 (1%) 0 0 1 (1%) 0
Hepatic disorder 2 (1%) 2 (1%) 3 (2%) 0 2 (3%) 4 (3%) 4 (3%) Gastrointestinal perforation 0 0 0 0 0 0 1 (1%) Pulmonary embolism events 0 1 (1%) 0 2 (3%) 1 (1%) 0 0 Cardiovascular events 0 1 (1%) 0 0 1 (1%) 2 (1%) 0 Major adverse cardiovascular event 0 1 (1%) 0 0 1 (1%) 0 0 Other cardiovascular events 0 0 0 0 0 1 (1%) 0 Undetermined or unknown cause of death 0 0 0 0 0 1 (1%) 0 Deaths 0 0 1 (1%) 0 0 1 (1%) 0
Copyright 2019 Queen's Printer and Controller of HMSO. All rights reserved

Page 102 of 275
Other AEs of special interest for SELECT-BEYOND are provided in Table 51, Appendix
F of the CS. The ERG confirmed that throughout the study there were two patients who
experienced a MACE (one whist receiving UPA 15 mg, and one whilst receiving UPA 30
mg), and three reports of renal dysfunction (one in the UPA 15 mg group and two in the
30 mg group). The ERG also noted that in the first 12 weeks of the study there were
three malignancies (one in the UPA 15 mg group and two in the UPA 30 mg group), and
that from baseline to Week 24 there were four malignancies (two in patients who
received UPA 15 mg and two in participants who received UPA 30 mg). From baseline to
Week 24, there were 11 patients who experienced TE anaemia (four whilst receiving
UPA 15 mg and seven in whilst receiving UPA 30 mg). Similarly, TE neutropenia was
seen in patients whilst receiving UPA, but not in patients whilst receiving PBO (refer to
Appendix F, Table 51 of the CS).
4.2.7.5 Summary of safety data across the SELECT studies
When considering the four pivotal studies together, the company stated that there was a
comparable safety profile for UPA 15 mg and comparators (ADA, MTX and PBO). Whilst
this largely appears to be the case, the ERG highlighted that in the PBO-controlled
period of SELECT-COMPARE,
*****************************************************************************************************
*********************************************************************; in the initial period of
SELECT-MONOTHERAPY a greater proportion of patients in the UPA 15 mg group
experienced SAEs than the continuation MTX and UPA 30 mg groups (5.1%, 2.8% and
2.8% respectively); in the PBO controlled period of SELECT-NEXT a higher proportion of
patients in the UPA 15 mg group experienced SAEs than those in the UPA 30 mg group
and the PBO group; and in the PBO-controlled phase of SELECT-BEYOND, SAEs
occurred in those taking UPA (30 mg group 7.3%; 15 mg group 4.9%) but not in those
taking PBO.
The company also summarised that, in patients who received UPA 15 mg, fewer than
7.5% had SAEs, only two SAEs were reported in >0.5% of that sample, and that there
were two deaths (haemorrhagic stroke, cardiac arrest). For clarity, the ERG summarised
all deaths that occurred across the four studies: across 26 weeks of SELECT-
COMPARE there were no deaths with UPA 15 mg, two with ADA and two with PBO;
across 14 weeks of SELECT-MONOTHERAPY there was one death with UPA 15 mg,
none with UPA 30 mg and none with continuation MTX
*****************************************************************************************************
************************************; there were no deaths reported across the 12-week
Copyright 2019 Queen's Printer and Controller of HMSO. All rights reserved

Page 103 of 275
initial phase of SELECT-NEXT; and there were two deaths reported during SELECT-
BEYOND, one in the PBO-controlled phase with UPA 30 mg, and one in the extension
phase with upadactinib 15 mg
(******************************************************************************************).
With regard to serious infections, the ERG agreed with the company that frequencies of
serious infections were similar to those seen in patients taking bDMARDS: in SELECT-
COMPARE rates of serious infection through to week 26 were 1.8% in the UPA 15 mg
group and 1.5% in the ADA group. The rates of serious infection with UPA 15 mg in the
remaining studies was as follows: 0.5% during the initial period of SELECT-
MONOTHERAPY, 0.5% during the initial period of SELECT-NEXT and 1% in both
treatment periods of SELECT-BEYOND (amongst those who received UPA from the
start of the study, but 3% during the extension period of SELECT-BEYOND amongst
patients who switched from PBO to UPA 15 mg).
The ERG also agreed with the company that malignancies and MACE were uncommon,
but they did occur in the UPA groups of two of the pivotal trials: in SELECT-
MONOTHERAPY there was a single MACE in the UPA 15 mg group, and in SELECT-
BEYOND there were two MACE (one in a patient who received 15 mg, and one in a
patient who received 30 mg, of UPA). Malignancies were also uncommon: in SELECT-
COMPARE there were no malignancies in the UPA group, and similarly there were no
malignancies in the UPA 15 mg group in SELECT-NEXT. There were, however, two
malignancies in the UPA 15 mg group in SELECT-MONOTHERAPY and two
malignancies in patients who received UPA 15 mg in SELECT-BEYOND.
The company reported, and the ERG agreed, that across the trials the most commonly
reported adverse events in patients receiving UPA were: upper respiratory tract
infections, nausea, cough and increased blood creatine phosphokinase (CPK). The ERG
additionally noted the following commonly reported AEs: urinary tract infections (in
SELECT-MONOTHERAPY and SELECT-BEYOND), and
***********************************************************************************************).
Critique of trials identified and included in the indirect comparison and/or multiple treatment comparison
4.3.1 Search strategy
The company did not conduct a separate search to identify relevant RCTs for
comparators for inclusion in the NMA.
Copyright 2019 Queen's Printer and Controller of HMSO. All rights reserved

Page 104 of 275
ERG comment:
The searches for the clinical effectiveness SLR (including comparators) are critiqued in
Section 4.1.1. These searches also encompass the identification of trials for the NMA.
4.3.2 Feasibility assessment
Feasibility assessment was not explicitly reported for the NMAs undertaken. This is a
major omission that threatens the credibility of the NMAs presented. Ideally, feasibility
assessment should have considered the quantity and quality of included evidence, with a
view towards similarity of trials within networks of evidence. As discussed below in
Section 4.3.3, feasibility assessment should have considered the similarity of trials within
the networks comprised of csDMARD-experienced and bDMARD-experienced
populations. This examination should also have explicitly considered transitivity, which
includes, among other characteristics, the similarity of populations across trials in each
network, the relevance of all included treatments to the population targeted by the NMA,
and the quality of evidence included.
The ERG regarded that the included characteristics of studies within each network
(discussed further in Section 4.3.4), together with the application of inclusion and
exclusion criteria for the NMA, provided some evidence of balance in terms of population
characteristics across each network. However, the high rate of missingness for key
population characteristics in included trials precludes confidence that trial populations
are similar within each NMA. For example, number of previous DMARDs, an important
indicator of treatment ‘stage’, was frequently unreported in the included trials. Relatedly,
the broad characteristics used to shape each network—namely inadequate response to
csDMARDs and inadequate response to bDMARDs, regardless of disease severity—
obscure potential heterogeneity in disease stage and treatment sequence that may be
clinically relevant or predictive of treatment response. While the ERG acknowledged that
there is some basis to proceed with NMAs based on the evidence provided, it would urge
caution in the interpretation of the NMAs.
4.3.3 Study selection criteria
Following inclusion in the SLR (see Section 4.1.2 for ERG critique), trials were further
assessed for potential inclusion in the NMA.
The NMA was divided into two populations (CS, p. 53): i) csDMARD-experienced:
patients with RA who had an inadequate response or were intolerant to at least one
Copyright 2019 Queen's Printer and Controller of HMSO. All rights reserved

Page 105 of 275
csDMARD and ii) bDMARD-experienced: patients with RA who had an inadequate
response or were intolerant to at least one bDMARD.
Furthermore, in order to be included in the NMA, trials had to be:
• A Phase III or higher RCT
• EMA licensed treatments for moderate-to-severe RA approved by NICE
• Reporting ACR outcomes between 9- and 15 weeks (12-week network) and
between 20 and 30 weeks (24-week network)
Assessment windows allowed for the inclusion of additional clinical evidence, although
the majority of clinical evidence is reported at the 12- and 24-week time points. This was
in accordance with precedence from TA37531, TA46651 and TA48032 in RA. However, the
ERG noted an inconsistency between inclusion criteria in CS Appendix D.1.6, which
states that three-month follow-up data could range from 9 to 15 week follow-up, findings
as presented in CS Appendix D.1.13, Table 12, which describes three-month findings as
ranging from 12 to 16 week follow-up; similarly, six-month follow-up is described in CS
Appendix D.1.6 as 20 to 30 weeks, whereas Table 13 describes these as 18 to 30
weeks.
Studies comparing two methods of administration of the same agent were included.
Based on the NICE recommendations for these particular agents, GOL, IFX, ABT, and
RTX were only considered in combination therapies. RCTs from any geographical
location were considered. Trials with early escape were only included if an appropriate
imputation of data was employed.
The list of trials included in the SLR but excluded from the NMA is presented in the CS
Appendix D Table 4 for the csDMARD experienced population and Appendix D Table 5
for the bDMARD inadequate response population.
For the csDMARD-experienced population, the listed reasons for exclusion were:
• Study design – Phase 2
• Study design – phase unclear
• Study design – other
• Treatments – biosimilar
Copyright 2019 Queen's Printer and Controller of HMSO. All rights reserved

Page 106 of 275
• Treatments – no intervention
• Treatments – no comparator
• Outcomes – timepoint
• Outcomes – not of interest
• Study population – bio experienced
• Study population – MTX naïve
• Study population – disease severity and study population – other.
For the bDMARD-experienced population, the reasons listed for exclusion were: study
design –early termination, study design – other, treatments – no intervention, treatments
– no comparator, treatments – biosimilar, outcomes – not of interest and study
population – bio naïve.
ERG comment:
The ERG considered the inclusion criteria for the NMA to be largely appropriate.
However, the ERG sought further information at the clarification stage regarding the
restriction to phase III or higher trials, the use of MTX-naïve as a possible exclusion
criterion and the criterion related to early escape. The ERG critiqued the list of studies
excluded from the NMA and the listed reasons for exclusion. The inclusion criteria for the
csDMARD-experienced population NMA in the CS did not specify that prior treatment
had to be with MTX. The NICE final scope for this appraisal11 stated that prior
combination therapy should include MTX, but does not make this stipulation for prior
csDMARD monotherapy. “Study population – MTX naïve” was listed in the CS as a
reason for exclusion in the csDMARD-experienced population. In the clarification
response (A16), the company stated that MTX “was not required as a previous
csDMARD for included trials [and that] trials were only excluded if the results of the
results of the subgroup of csDMARD-experienced patients were not reported”.
Ambiguities in the time points included in the analysis also present a potential source of
uncertainty in interpretation of NMAs arising from this SLR.
Furthermore, the ERG noted that studies of biosimilars had been excluded and that this
was not a stated exclusion criterion. Indeed, the NICE final scope11 states that: “the
availability and cost of biosimilar products should be taken into account” (p.4).
Copyright 2019 Queen's Printer and Controller of HMSO. All rights reserved

Page 107 of 275
The ERG considered the categories “study population – other” and “study design –
other” (at times written just as “study population” and “study design” due to inconsistency
in the terminology in the CS Appendix D (Table 4, p. 106-142) to be too imprecise to
make a definitive judgement on appropriateness.
With regard to the bDMARD-experienced population, the ERG noted the same concerns
as above regarding the “study design – other” and “treatments – biosimilar” reasons for
exclusion as described above for the csDMARD-experienced population.
The ERG considered that the potential of inappropriate exclusion of trials from the NMAs
could not be ruled out.
4.3.4 Included studies
4.3.4.1 csDMARD-experienced population
The csDMARD-experienced population NMA included 55 unique studies profiled across
207 publications. The included studies are profiled in the CS Appendix D (Table 7,
pp.152-69), and reproduced below as Table 21.
The ERG checked the reasons for inclusion or exclusion of the studies identified in
TA37531 and TA48552 with regards to the SLR and NMAs, to determine whether studies
that had not been included in the company’s SLR or NMAs for this appraisal would have
qualified. A number of these studies contained relevant interventions but were not
included by the company’s SLRs: AUGUST II53, ETN Study 30954,55, IIBCREATE56,
Wong 200957 and Zhang 200658. AUGUST II and ETN Study 309 were excluded in the
company’s SLR for reasons of study design, but the studies by Wong and by Zhang
were identified in the ERG’s replication of the company search but were not included in
the company’s SLR nor on the list of full-text excluded studies. The ERG regarded that
Wong 200957 was excluded on the basis of study outcome, as ACR was not reported,
and that IIBCREATE56 was excluded on the basis of study design, as it was described as
a phase II trial. The ERG could not definitively consider whether Zhang 200658 should
have been excluded, though the title of the study characterises its design as
‘preliminary’, which suggests it may have been excluded on the basis of phase II design.
The study by Wajdula et al. 200059 was identified in the SLR of cost-effectiveness
evidence and included in the economic evaluation (see the inclusion of Chen 200660 in
the CS, Appendix D [Table 53, p.322-331), but was not identified in the SLR of clinical-
effectiveness evidence. However, the ERG did not agree with the company’s exclusion
of the RCT by Kay et al. 200861 on the grounds of the timepoint of the study outcomes,
Copyright 2019 Queen's Printer and Controller of HMSO. All rights reserved

Page 108 of 275
despite ACR data at Week 16 being reported. This may be related to an ambiguity in
time points used in NMAs, described above in Section 4.3.3.
Copyright 2019 Queen's Printer and Controller of HMSO. All rights reserved

Page 109 of 275
Table 21. Study details of all studies included in the NMA (csDMARD-experienced population)
Study name (Author year) (ref), Country
Treatment name Study design Study duration; Primary endpoint
Outcomes reported
Main prior treatment criteria
Inclusion criteria
Secondary Reference
ACQUIRE62 Global
• ABT 10 mg/kg q4w + MTX
• ABT 125 mg weekly + MTX
RCT, DB, DD, MC, PG (Phase 3b)
26 weeks • ACR20/50/70 • DAS 28 • HAQ-DI score
Patients had to have had an inadequate response to 3 months of MTX therapy
• RA who were in functional classes I, II or III
63-68
ACT-RAY69 UK
• TCZ 8 mg/kg q4w + MTX
• TCZ 8 mg/kg q4w + PBO
RCT, DB (Phase 3) 24 weeks, 12 weeks
• ACR20/50/70 • EULAR • DAS-28
Score • HAQ-DI score
Anti TNF-α naïve • RA, DAS-28-ESR >4.4
70-75
ADACTA76 US/Global
• ADA 40 mg q2w • TCZ 8 mg/kg q4w
RCT, DB, PG (Phase 4)
25 weeks; 12 Weeks
• DAS-28 score • ACR20/50/70 • EULAR • HAQ-DI score
Anti TNF-α naive • Age ≥18 years
• Active RA, intolerant to MTX
77-79
AIM80 US, Mexico, Europe
• ABT ~10 mg/kg + MTX ≥10 mg/week
• PBO + MTX ≥10 mg/week
RCT, DB, MC, PC (Phase 3)
52 weeks/26 weeks
• ACR20/50/70 • HAQ-DI score • DAS 28
Treated with MTX (15 mg/w) for 3 months or longer, with a stable dose for 28 days before enrolment.
• Age ≥18 years
• RA for at least 1 year
81-88
Amano, 201589 Japan
• ABT 125 mg SC weekly + MTX + PBO
• ABT ∼10 mg/kg IV + MTX + PBO
MC, RCT, DB, DD (Phase 2/3)
24 Week/ day 169
• ACR20/50/70 • DAS 28 • HAQ-DI score
Patients had an inadequate response to MTX (patients had to have received MTX for 3 months at a stable dose (6-8 mg/week) prior to entry)
• Japanese adults
• Age 20 years
• RA, who were MTX-IR
• ≥10 SJC/ ≥12 TJC joints
90
Copyright 2019 Queen's Printer and Controller of HMSO. All rights reserved
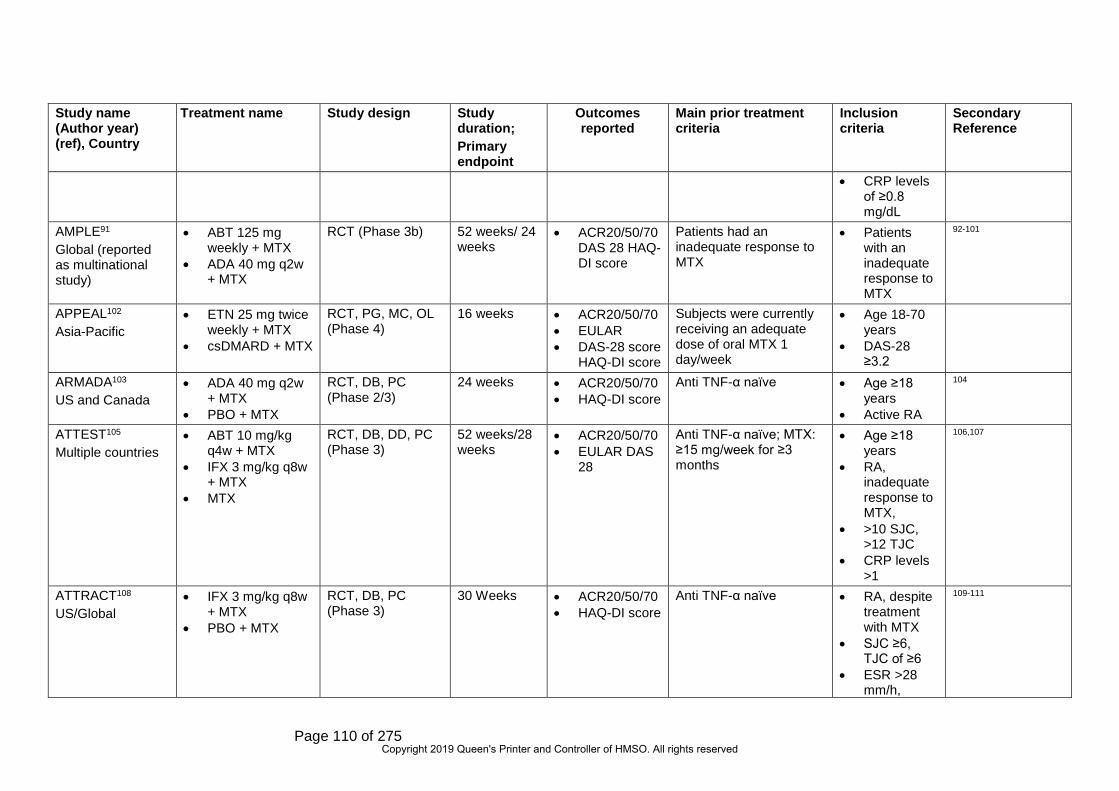
Page 110 of 275
Study name (Author year) (ref), Country
Treatment name Study design Study duration; Primary endpoint
Outcomes reported
Main prior treatment criteria
Inclusion criteria
Secondary Reference
• CRP levels of ≥0.8 mg/dL
AMPLE91 Global (reported as multinational study)
• ABT 125 mg weekly + MTX
• ADA 40 mg q2w + MTX
RCT (Phase 3b) 52 weeks/ 24 weeks
• ACR20/50/70 DAS 28 HAQ-DI score
Patients had an inadequate response to MTX
• Patients with an inadequate response to MTX
92-101
APPEAL102 Asia-Pacific
• ETN 25 mg twice weekly + MTX
• csDMARD + MTX
RCT, PG, MC, OL (Phase 4)
16 weeks • ACR20/50/70 • EULAR • DAS-28 score
HAQ-DI score
Subjects were currently receiving an adequate dose of oral MTX 1 day/week
• Age 18-70 years
• DAS-28 ≥3.2
ARMADA103 US and Canada
• ADA 40 mg q2w + MTX
• PBO + MTX
RCT, DB, PC (Phase 2/3)
24 weeks • ACR20/50/70 • HAQ-DI score
Anti TNF-α naïve • Age ≥18 years
• Active RA
104
ATTEST105 Multiple countries
• ABT 10 mg/kg q4w + MTX
• IFX 3 mg/kg q8w + MTX
• MTX
RCT, DB, DD, PC (Phase 3)
52 weeks/28 weeks
• ACR20/50/70 • EULAR DAS
28
Anti TNF-α naïve; MTX: ≥15 mg/week for ≥3 months
• Age ≥18 years
• RA, inadequate response to MTX,
• >10 SJC, >12 TJC
• CRP levels >1
106,107
ATTRACT108 US/Global
• IFX 3 mg/kg q8w + MTX
• PBO + MTX
RCT, DB, PC (Phase 3)
30 Weeks • ACR20/50/70 • HAQ-DI score
Anti TNF-α naïve • RA, despite treatment with MTX
• SJC ≥6, TJC of ≥6
• ESR >28 mm/h,
109-111
Copyright 2019 Queen's Printer and Controller of HMSO. All rights reserved

Page 111 of 275
Study name (Author year) (ref), Country
Treatment name Study design Study duration; Primary endpoint
Outcomes reported
Main prior treatment criteria
Inclusion criteria
Secondary Reference
• CRP > 2 mg/dL
BREVACTA112 US/Global
• TCZ 162 mg q2w + MTX
• PBO + DMARDs
RCT, DB, PC, PG, MC (Phase 3)
24 weeks • ACR20/50/70 • DAS-28
Score • HAQ-DI score
Anti TNF-α naïve • Age ≥18 years
• SJC= 6 (66-joint count) and TJC= 8 (68-joint count)
• CRP level 10 mg/litre and/or
• ESR 28 mm/hour
• Inadequate response to 1 DMARD
113-115
CERTAIN116 Europe
• CTZ 200 mg q2w + csDMARD
• PBO + csDMARDs
RCT, DB, PC (Phase 3b)
52 weeks, 24 weeks
• ACR20/50/70 • EULAR • DAS-28 score • HAQ-DI score
Patients must have received mono or combination DMARD therapy
• Age ≥18 years
• Moderate • ≥2 TJC, ≥2
SJC • ESR ≥28
mm/h • CRP >10
mg/L).
117,118
CHANGE119 Japan
• ADA 40 mg q2w • PBO
RCT, DB, MC, PC (Phase 2/3)
24 weeks • ACR20/50/70 • HAQ-DI score
Anti TNF-α naive • Japanese 20 years or older
• Active RA, had failed treatment with at least
Copyright 2019 Queen's Printer and Controller of HMSO. All rights reserved

Page 112 of 275
Study name (Author year) (ref), Country
Treatment name Study design Study duration; Primary endpoint
Outcomes reported
Main prior treatment criteria
Inclusion criteria
Secondary Reference
one prior DMARD
• 10 SJC,12 TJC
• CRP 2 mg/dl
DE019120 US, and Canada
• ADA 40 mg q2w + MTX
• PBO + MTX
RCT, DB, PC, PG (Phase 3)
52 weeks/ 24 weeks
• ACR20/50/70 • HAQ-DI score
Anti TNF-α naïve • Age ≥18 years
• Active RA • ≥9 TJC of
68 evaluated), ≥6 SJC (of 66 evaluated
• CRP >1 mg/dl,
• Rheumatoid factor positive
121,122
EXXELERATE123 Multiple countries
• CTZ 200 mg q2w + MTX
• ADA 40 mg q2w + MTX
• SRL 150 mg q2w + MTX
• SRL 200 mg q2w + MTX
• PBO + MTX
RCT, DB (DB until Week12, SB thereafter), PG, MC (Phase 4)
104 Weeks, 12 weeks
• ACR20 Patients were bDMARD-naive and with active disease despite a minimum 12-week course of MTX therapy.
• Age ≥18 years
• DAS-28-ESR higher than 3·2,
• SJC ≥4 • CRP ≥10
mg/L • ESR ≥28
mm/h allowed, if the
Go-Forth124 Japan
• GOL 50 mg q4w + MTX
RCT, DB, MC, PC, PG (Phase 2/3)
24 weeks, 14 weeks
• ACR20/50/70 • EULAR
Anti TNF-α naïve • Age 20-75 years
125-128
Copyright 2019 Queen's Printer and Controller of HMSO. All rights reserved

Page 113 of 275
Study name (Author year) (ref), Country
Treatment name Study design Study duration; Primary endpoint
Outcomes reported
Main prior treatment criteria
Inclusion criteria
Secondary Reference
• PBO + MTX • DAS-28 score • HAQ-DI score
• Active RA
GO-FORWARD129 Multiple countries
• GOL 50 mg q4w + MTX
• PBO + MTX
RCT, DB Multicentre (Phase 3)
24 weeks, 14 weeks
• ACR20/50/70 • EULAR • HAQ-DI score
Anti TNF-α naïve • Age ≥18 years
• Active RA
130-136
JESMR137 Japan
• ETN 25 mg q2w + MTX
• ETN 25 mg q2w
RCT, OL (Phase 3) 24 weeks • ACR20/50/70 • EULAR • DAS-28 score • HAQ-DI score
Patients also had to be ACR functional class I-III, receiving not less than 6 mg/week of MTX for a minimum of 3 months, and be dose stable for at least 4 weeks at the time of study enrolment
• Age ≥18 years
• At least 6 TJC and 6 SJC
• CRP level of more than 2 mg/dl
• ESR of no less than 28 mm
J-RAPID138 Japan
• CTZ 200 mg q2w + MTX
• PBO + MTX
RCT, DB, MC, PC (Phase 2/3)
24 weeks; 12 weeks
• ACR20/50/70 • EULAR • DAS-28 score • HAQ-DI score
Anti TNF-α naive • Age 20-74 years
• Active RA
Kim, 2007139 Korea
• ADA 40 mg q2w + MTX
• PBO + MTX
RCT, DB, PC (Phase 3)
24 weeks • ACR20/50/70 • HAQ-DI score
Anti TNF-α naïve • Age ≥18 years
• Active RA • ≥6 SJC and
≥9 TJC
Kim, 2013140 Korea
• IFX 3 mg/kg q8w + MTX
• PBO + MTX
RCT, DB, PC (Phase 3)
84 Weeks, 30 weeks
• ACR20/50/7 • HAQ-DI score
Anti TNF-α naïve • Active RA despite MTX
• ≥6 SJC, ≥6 TJC
• ESR >28 mm/h,
• CRP >2 mg/dL
Copyright 2019 Queen's Printer and Controller of HMSO. All rights reserved

Page 114 of 275
Study name (Author year) (ref), Country
Treatment name Study design Study duration; Primary endpoint
Outcomes reported
Main prior treatment criteria
Inclusion criteria
Secondary Reference
LARA141 Latin America
• ETN 50 mg qw SC + MTX
• csDMARD + MTX
RCT, PG (Phase 4) 24 weeks • ACR20/50/70 • EULAR • HAQ-DI score
Prior nonbiologic DMARDs other than MTX could not have been received within 3 months before screening.
• Active RA
Li, 2016142 China
• GOL 50 mg q4w + MTX
• PBO + MTX
RCT, DB, MC, PC, PG (Phase 3)
25 weeks, 14 weeks
• ACR20/50/70 • DAS Score • HAQ-DI score
Anti TNF-α naïve • RA ≥18 years
• ≥4/66 SJC, ≥4/68 TJC
• CRP ≥15 mg/L
• ESR ≥28 mm/
143
LITHE144 US/Global
• TCZ 8 mg/kg q4w + MTX
• PBO + MTX
RCT, DB, PC (Phase 3)
52 weeks/12 and 24 Week
• ACR20/50/70 • DAS 28 • HAQ-DI score
Patients had an inadequate response to MTX (stable at a dosage of 10-25 mg/week for ≥8 weeks)
• RA, inadequate response to MTX
• SJC ≥6, TJC of ≥8
• CRP ≥1 mg/dl
• ESR ≥28 mm/h
145-147
MOBILITY148 Global
• SAR150 mg q2w + MTX
• SRL 200 mg q2w + MTX
• PBO + MTX
RCT, DB, PC, MC (Phase 3)
52 week/16 and 24 weeks
• ACR20/50/70 • DAS 28 • HAQ-DI score
Patients had an inadequate response to MTX
• Age ≥18 years
• SJC ≥6, TJC ≥8;
• CRP ≥0.6 mg/dl
149-152
MONARCH153 Multiple countries
• ADA 40 mg q2w • SRL 200 mg q2w
RCT, DB, DD (Phase 3)
24 weeks • DAS-28 score • ACR20/50/70 • HAQ-DI score
Active RA, defined as ≥6 of 66 swollen and ≥8 of 68 tender joints
• Age ≥18 years
• Active RA
154,155 156-160
Copyright 2019 Queen's Printer and Controller of HMSO. All rights reserved

Page 115 of 275
Study name (Author year) (ref), Country
Treatment name Study design Study duration; Primary endpoint
Outcomes reported
Main prior treatment criteria
Inclusion criteria
Secondary Reference
• ≥6 of 66 SJC and ≥8 of 68 TJC
• CRP ≥8 mg/L
• ESR (ESR) ≥28 mm/hours
• DAS-28-ESR) >5.1
Moreland, 1999161 North America
• ETN 25 mg q2w • PBO
RCT, DB, PC (Phase 3)
26 weeks, 13weeks
• ACR20/50/70 Inadequate response to one to four DMARDs
• Age ≥18 years
• RA, inadequate response to one to four DMARDs
OPTION162 Global
• TCZ 8 mg/kg q4w + MTX
• PBO + MTX
RCT, DB, PC, MC International (Phase 3)
24 weeks/24 weeks
• ACR20/50/70 • EULAR • Change from
baseline in DAS 28
• HAQ-DI score
Adult patients with moderate to severe active RA
• Moderate to severe active RA
ORAL SCAN163 US/Global
• TFC 5 mg bid + MTX
• PBO + MTX
RCT, DB, PC, PG (Phase 3)
26 weeks, 13weeks
• ACR20/50/70 • EULAR • DAS-28
Score • HAQ-DI score
Anti TNF-α naïve • Age ≥18 years
• Active RA
164-168 169
ORAL Standard170 Global
• TFC 5 mg bid + MTX
• ADA 40 mg q2w + MTX
RCT, PC (Phase 3) 52 weeks, 26 weeks
• ACR20/50/70 • EULAR • DAS-28 score • HAQ-DI score
Anti TNF-α naive • Age ≥18 years
• Active
171-175
Copyright 2019 Queen's Printer and Controller of HMSO. All rights reserved

Page 116 of 275
Study name (Author year) (ref), Country
Treatment name Study design Study duration; Primary endpoint
Outcomes reported
Main prior treatment criteria
Inclusion criteria
Secondary Reference
• PBO Followed by TFC, 5 mg
ORAL Strategy176 Global
• TFC 5mg bid • TFC 5mg bid +
MTX • ADA 40 mg q2w
+ MTX
RCT, TD, DB, MC (phase3b/4)
6 months • ACR 20/50/70
• EULAR • DAS 28
Adult patients with active RA despite treatment with MTX 15-25 mg per week
• Age ≥18 years
• ≥4 tender or painful joints on motion and ≥4 SJC
177-180
ORAL Sync181 Global
• TFC 5 mg bid + MTX
• PBO + csDMARD
RCT, DB, MC (Phase 3)
52 weeks, 13 weeks
• ACR20/50/70 • EULAR • DAS-28
Score • HAQ-DI score
Anti TNF-α naïve • RA diagnosis, ≥18 years
• ≥4 TJC, ≥4 or SJC
• ESR ≥28 mm/h
• CRP >66.7 nmol/L
• Inadequate response DMARDs
182
RA0025183 Korea
• CTZ 200 mg q2w + MTX
• PBO + MTX
RCT, DB, PC (Phase 3)
24 weeks • ACR20/50/70 • HAQ-DI score
Anti TNF-α naïve • Active RA • ≥9
TJC/SJC • CRP >15
mg/L • ESR ≥30
mm/h
184
RA-BEAM185 Global
• ADA 40 mg q2w + MTX
• BAR 4 mg QD + MTX; PBO + MTX
RCT, DB, PC (Phase 3)
52 weeks, 12 weeks
• ACR20/50/70 • DAS-28 score • HAQ-DI score
Anti TNF-α naive • Age ≥18 years
• Active RA • ≥6/68 TJC,
≥6/66 SJC
186-201
Copyright 2019 Queen's Printer and Controller of HMSO. All rights reserved

Page 117 of 275
Study name (Author year) (ref), Country
Treatment name Study design Study duration; Primary endpoint
Outcomes reported
Main prior treatment criteria
Inclusion criteria
Secondary Reference
• CRP ≥6 mg/L
• Patients had inadequate response to MTX
RA-BUILD202 Global
• PBO + csDMARD • BAR 2 mg qd +
csDMARD • BAR 4 mg qd +
csDMARD
RCT, DB, DD, PC, MC International (Phase3)
24 weeks/ 12 and 24 weeks
• ACR20/50/70 • DAS-28 score
An insufficient response (despite prior therapy) or intolerance to ≥1 csDMARDs
• Age ≥18 years
• Active RA • ≥6/68 TJC
and ≥6/66 SJC
• CRP ≥3.6 mg/L
• Insufficient response ≥1 csDMARDs
203-206
RACAT207 US and Canada
• SSZ 1 g daily + HCQ 400 mg daily + MTX + PBO + ETN weekly
• ETN 50 mg weekly + PBO SSZ and HCQ daily
RCT, MC, DB, (Phase 4)^
48 week/24 weeks
• DAS-28 score • ACR20/50/70 • HAQ-DI score
MTX at stable doses of 15 to 25 mg weekly for at least 12 weeks
• Age ≥18 years
• Active RA
RAPID-1208 US, and Europe
• CTZ 200 mg q2w + MTX
• PBO + MTX
RCT, DB, MC, PC, PG (Phase 3)
52 weeks, 24 weeks
• ACR20/50/70 • HAQ-DI score
Anti TNF-α naïve (patients excluded if any within the last 6 months)
• Age ≥18 years
• >9 TJC, >9 SJC
• ESR >30 mm/h
• CRP >15 mg/litre
209-218
Copyright 2019 Queen's Printer and Controller of HMSO. All rights reserved

Page 118 of 275
Study name (Author year) (ref), Country
Treatment name Study design Study duration; Primary endpoint
Outcomes reported
Main prior treatment criteria
Inclusion criteria
Secondary Reference
RAPID-2219 US and Europe
• CTZ 200 mg q2w + MTX
• PBO + MTX
RCT, DB, MC, PC (Phase 3)
24 weeks; 12 weeks
• ACR20/50/70 • DAS-28 score • HAQ-DI score
10% anti TNF-α exposed • Age ≥18 years
• Active RA
220-224
RA BALANCE225 China, Brazil, Argentina
• BRC 4 mg QD • PBO
RCT, DB, PC, MC (Phase 3)
52 weeks; 12 weeks
• ACR20/50/70 • DAS 28 • HAQ-DI score
Previously treated with MTX
• Active RA (tender joint counts >=6 & swollen joint counts >=6 & hsCRP >=6 mg/L)
226,227
RA-SCORE228 Europe
• PBO + MTX • RTX 2x500 mg
q24w + MTX • RTX 2x1000 mg
q24w + MTX
RCT, DB, PC, MC International (Phase3b)
52 weeks/24 weeks
• ACR20/50/70 • EULAR DAS-
28
patients had experienced an Inadequate response to MTX
• DAS-28-CRP score ≥3.2
• inadequate response to MTX
REALISTIC229 US, Canada and Europe
• CTZ 200 mg q2w + csDMARD
• PBO + csDMARD
RCT, DB, MC (Phase 3b)
12 weeks/ 12 weeks
• ACR20/50/70 Unsatisfactory response or intolerance to at least one DMARD
• Age ≥18 years
• 5 TJC, 4 SJC
• ≥10 mg/l CRP
• ≥28 mm/h ESR
230-236
SAMURAI237 Japan
• TCZ 8 mg/kg q4w • csDMARD
RCT, MC (Phase 3), SB (reader blind)
52 week/12 and 24 weeks
• ACR20/50/70 • DAS-28 • HAQ-DI score
All candidates had an inadequate response to at least one DMARD or immunosuppressant
• Age >20 years
• >6 TJC (of 49 evaluated), >6 SJC (of 46 evaluated)
Copyright 2019 Queen's Printer and Controller of HMSO. All rights reserved

Page 119 of 275
Study name (Author year) (ref), Country
Treatment name Study design Study duration; Primary endpoint
Outcomes reported
Main prior treatment criteria
Inclusion criteria
Secondary Reference
• ESR of >30 mm/h
• CRP of >20 mg/l
SATORI238 Japan
• TCZ 8 mg/kg q4w + csDMARD
• MTX
RCT, DB, MC (Phase 3)
24 weeks • ACR20/50/70 • EULAR • DAS-28
Score • HAQ-DI score
Assumed Anti TNF-α naive
• Age 20 and 75 years
• 6 TJC (of 49 evaluated), 6 SJC (of 46 evaluated)
• ESR 30 mm/h
• CRP 10 mg/l
• Inadequate response to MTX
239
SELECT–COMPARE19
• PBO • UPA 15 mg QD • ADA 40 mg EOW
RCT, DB, AC, MC (Phase 3)
26 weeks; 12 weeks
• ACR20/50/70 • DAS 28 • HAQ-DI score
Previously treated with MTX
• Active RA patients
• Previously treated with MTX
-
SELECT MONOTHERAPY23
• UPA 15 mg QD • UPA 30 mg QD • cMTX
RCT, DB (Phase 3)
14 weeks • ACR20 • DAS 28 • HAQ-DI score
MTX treatment • Active RA (TJC >=6, SJC>=6, hsCRP >=3 mg/L)
• Stable dose of MTX previously
36,37
SELECT NEXT21
• UPA15 mg QD • UPA 30 mg QD • PBO
RCT, DB, PC (Phase 3)
12 weeks • ACR20/50/70 • DAS-28 score • HAQ-DI score
Patients with prior exposure to any JAK inhibitor, and patients who are considered
• Patients with RA
38-43
Copyright 2019 Queen's Printer and Controller of HMSO. All rights reserved

Page 120 of 275
Study name (Author year) (ref), Country
Treatment name Study design Study duration; Primary endpoint
Outcomes reported
Main prior treatment criteria
Inclusion criteria
Secondary Reference
inadequate responders to csDMARD
• Inadequate response to csDMARDs
SELECT SUNRISE27 Japan
• UPA 7.5 mg QD • UPA 15 mg QD • UPA 30 mg QD • PBO
RCT, DB, PC (Phase 2/3)
12 weeks • ACR20/50/70 • DAS 28 • HAQ-DI score
csDMARDs • Active RA Japanese patients
-
SERENE240 Global
• RTX 2x1000 mg q24w + MTX
• PBO + MTX
RCT, DB, PC, MC (Phase 3)
24 weeks • ACR20/50/70 • EULAR • DAS-28
Score • HAQ-DI score
Anti TNF-α naïve • Active RA, inadequate response to MTX
241
STAR242 US, Canada
• ADA 40 mg q2w • PBO
RCT, DB, PC, MC (Phase 3)
24-week/ 24 weeks
• Safety • ACR20/50/70 • EULAR • DAS-28
standard antirheumatic therapy in patients with active RA not adequately responding to such therapies
• Age ≥18 years
• Active RA • At least 6
SJC and at least 9 TJC
START243 North/South America, Europe
• IFX 3 mg/kg q8w + MTX
• PBO + MTX
RCT, PC (Phase 3) 22 weeks • ACR20/50/70 • EULAR • DAS-28
Score • HAQ-DI score
Anti TNF-α naïve • Active RA
SURPRISE244 Japan
• TCZ 8 mg/kg q4w + MTX
• TCZ 8 mg/kg q4w
RCT (Phase 4) 52 weeks, 24 weeks
• ACR20/50/70 • EULAR • DAS-28
Score • HAQ-DI score
Anti TNF-α naïve • DAS-28 based on the ESR of more than 3.2
245-247
TEMPO248 Europe, Israel, Australia
• ETN 25 mg q2w • ETN 25 mgq2w +
MTX • MTX
RCT, DB, PG, (Phase 3)
52 weeks, 24 weeks
• ACR20/50/70 • DAS-28
Score • HAQ-DI score
Anti TNF-α naïve • Inadequate response to at least DMARD
249-252
Copyright 2019 Queen's Printer and Controller of HMSO. All rights reserved

Page 121 of 275
Study name (Author year) (ref), Country
Treatment name Study design Study duration; Primary endpoint
Outcomes reported
Main prior treatment criteria
Inclusion criteria
Secondary Reference
other than MTX
TOWARD253 US/Global
• TCZ 8 mg/kg q4w + csDMARD
• PBO + csDMARD
RCT, DB, MC, PC (Phase 3)
24 weeks • ACR20/50/70 • EULAR • DAS-28
Score • HAQ-DI score
Anti TNF-α naïve • Age ≥18 years
• Moderate-to severe RA
• SJC of 6, and TJC of 8
• CRP level 1 mg/dl
• ESR 28 mm/h
254
VAN DE PUTTE, 20041 Europe, Canada, Australia
• ADA 40 mg q2w • PBO
RCT, DB, PC (Phase 3)
26 weeks • ACR20/50/70 • EULAR • DAS-28 score • HAQ-DI score
Anti TNF-α naive • Age ≥18 years
• >12 TJC,>10
WEINBLATT, 1999255 US
• ETN 25 mg q2w + MTX
• PBO + MTX
RCT, DB, (Phase 2/3)
24 weeks, 12 weeks
• ACR20/50/70 • HAQ-DI score
Anti TNF-α naïve • Age ≥18 years
• Active RA
Abbreviations: ABT, abatacept, ACR, American College of Rheumatology; ACR20/50/70, American College of Rheumatology 20%/50%/70% response; ADA, adalimumab, BID, twice daily, BIW, twice weekly, CRP, C-reactive protein; csDMARD, conventional synthetic disease modifying antirheumatic drugs; CTZ, certolizumab pegol, DAS-28, disease activity score 28-joint count; DB, double blind, DMARD, disease-modifying antirheumatic drugs; ESR, erythrocyte sedimentation rate; ETN, etanercept, EULAR, European League Against Rheumatism; g, gram, HAQ-DI, health assessment questionnaire disability index; HCQ, hydroxychloroquine, IQR, Interquartile range, IFX, infliximab, ITT, intention to treat, IV, intravenous, Kg, kilogram, M, median; MC, multicentre; mg, milligram, MTX, methotrexate, NMA, network meta-analysis, NR, not reported, OL, open-label, QW, once weekly, PBO, placebo; PC, placebo-controlled; PG, parallel group; qd, once weekly; q2w, every two weeks, q4w, every four weeks, q8w, every 8 weeks; RA, rheumatoid arthritis; RCT, randomised controlled trial, RTX, rituximab, SRL, sarilumab; SB, single blind, SC, subcutaneous, SD, standard deviation, SE, standard error, SJC, swollen joint, SRK, sirukumab, SSZ, sulfasalazine, TJC, tender joint count; TNF, tumour necrosis factor; TCZ, tocilizumab, TFC, tofacitinib
Source: CS Appendix, Table 7, pp. 152-69. References have been checked and updated where necessary.
Copyright 2019 Queen's Printer and Controller of HMSO. All rights reserved

Page 122 of 275
ERG comment:
The ERG performed a 10% check on the company’s data extraction for the csDMARD-
experienced population NMA, and the results of this are presented in Section 4.5.2. One trial
was conducted in a UK-specific population.69 The majority of trials were either global or
conducted across a wide range of countries. Seven trials were conducted in an exclusively
North American population, while 14 trials were conducted exclusively in Asia or the Asia-
Pacific region. All included trials were RCTs, although study duration ranged from 12 to 104
weeks. The outcomes considered varied across trials, but there was an outcome – ACR20
response – that was common to all trials in the csDMARD-experienced population NMA.
4.3.4.2 bDMARD-experienced population
The bDMARD-experienced population NMA included 12 unique studies profiled across 68
publications. The included studies are profiled in CS, Appendix D (Table 9, pp.171-4), and
provided below in Table 22. The ERG checked the reasons for inclusion or exclusion of the
studies identified in TA375 and TA485 with regards to the NMA, to determine whether
studies that had not been included in the NMA for this appraisal would have qualified. This
was not the case for the biologic experienced population.
Copyright 2019 Queen's Printer and Controller of HMSO. All rights reserved

Page 123 of 275
Table 22. Study details of all studies included in the NMA (bDMARD-experienced population)
Study name (Author year) (ref)
Treatment name Study design Study duration; Primary endpoint
Outcomes reported Main prior treatment criteria
Inclusion criteria Secondary reference
ASCERTAIN256 • SRL 150 mg q2w • SRL 200 mg q2w • TCZ 4 mg/kg q4w
RCT, DB, DD MC, Phase 3
24 weeks • ACR20/50/70 bDMARDs • Age ≥18 years • RA more than 3
months
257
ATTAIN258 North America and Europe
• ABT 10 mg/kg q4w + DMARDs
• PBO + DMARDs
RCT, DB, MC, PC, Phase 3
24 weeks • ACR 20/50/70 • DAS-28 • HAQ-DI score
3 months of anti-TNF-α therapy either ETN or IFX or both
• Age ≥18 years • At least 10 SJC,
an at least 12 TJC
259-262
BREVACTA112 Global
• TCZ 162 mg + DMARDs
• PBO + DMARDs
RCT, DB, MC, PC, Phase 3
24 weeks • ACR 20/50/70 • DAS-28 • HAQ-DI score
Inadequate response to ≥1 DMARD
• Age ≥18 years • Active RA • SJC ≥6 (66-joint
count), TJC ≥8 (68-joint count),
113-115
GO-AFTER263 Austria, Australia, Canada, Finland, Germany, Netherlands, New Zealand, Spain, UK, and US
• GOL SC 50 mg q4w ± DMARD
• PBO
RCT, DB, MC, PC, Phase 3
24 weeks/ 12 weeks
• ACR 20/50/70 • HAQ-DI score
Had been treated with ≥1 dose of a TNF inhibitor
• Age ≥18 years • ≥4 SJC, ≥4 TJC
264-271
MOBILITY148 Global
• SRL 150 mg q2w + MTX
• SRL 200 mg q2w + MTX
• PBO + MTX
RCT, DB, PC, MC, International, phase-3
52 weeks/24 weeks
• ACR20/50/70 Patients with prior exposure to tumour necrosis factor-α inhibitor (TNF-I)
• Patients with Moderate-to-Severe Rheumatoid Arthritis and with/without prior biologic use.
149-152
ORAL-STEP272 North America, Europe, and Latin America
• TFC 5mg bid • PBO
RCT, DB, MC, PC, Phase 3
24 weeks/12 weeks
• ACR 20/50/70 • DAS-28 • HAQ-DI score
Patients had previous inadequate response or intolerance to 1 or more approved TNF inhibitors
• Age ≥18 years • CRP >66·67
nmol/L • Inadequate
response to TNFi
273
Copyright 2019 Queen's Printer and Controller of HMSO. All rights reserved

Page 124 of 275
Study name (Author year) (ref)
Treatment name Study design Study duration; Primary endpoint
Outcomes reported Main prior treatment criteria
Inclusion criteria Secondary reference
RA- BEACON274 North America, South America, Europe, Asia and UK
• BAR 2 mg QD • BAR 4mg QD • PBO
CT, DB, MC, PC, Phase 3
12 weeks, 24 weeks
• ACR 20/50/70 • DAS-28
Patients with inadequate response or intolerance to ≥1 TNF inhibitor (TNFi).
• Active RA • TJC & SJC ≥6 • CRP ≥3mg/L
275-279
RADIATE280 North America and western Europe
• TCZ 4 mg/kg + MTX
• TCZ 8 mg/kg + MTX
• PBO + MTX
RCT, DB, PC (Phase-3)
24 weeks/12 weeks
• ACR20/50/70 • EULAR • DAS-28 Score • HAQ-DI score
Moderate to severe active RA and failure to respond or intolerance to one or more TNF antagonists
• Age ≥18 years • Moderate to
severe active RA • SJC ≥6, TJC ≥8
CRP >1.0 mg/dl • ESR >28 mm/h
281-284
REALISTIC229 US, Canada, Europe
• CTZ 400-200 mg qw
• PBO
RCT, DB, MC, PC, Phase 3b
12 weeks • ACR 20/50/70 • DAS-28
Patients showed an unsatisfactory response or intolerance to DMARD (MTX, LEF, SSZ, chloroquine or HCQ, AZA, and/or gold)
• Age ≥18 years • RA intolerance to
at least one DMARD
230-236
REFLEX285 US, Europe, Canada, and Israel
• RTX 1,000 mg + MTX
• PBO + MTX
RCT, DB, PC, Phase 3
24 weeks/ 12 weeks
• ACR20/50/70 • EULAR • DAS-28 Score • HAQ-DI score
Patients had inadequate response to previous or current treatment with the anti-TNF
• Active RA • ≥8 SJC, ≥8 TJC, • CRP level 1.5
mg/dl • ESR ≥28 mm/h
286,287
SELECT BEYOND25
• PBO • UPA 15 mg QD • UPA 30 mg QD
RCT, DB, DD, MC, PC, Phase 3
24 weeks/12 weeks
• ACR 20/50/70 • DAS-28 • HAQ-DI score
3 months of bDMARD treatment
• Age ≥18 years • Active RA • SJC ≥6 (66-joint
count), TJC ≥6 (68-joint count),
44,47 45,46,48-50
Copyright 2019 Queen's Printer and Controller of HMSO. All rights reserved

Page 125 of 275
Study name (Author year) (ref)
Treatment name Study design Study duration; Primary endpoint
Outcomes reported Main prior treatment criteria
Inclusion criteria Secondary reference
TARGET288 Global
• SRL 200 mg q2w + csDMARDs
• SRL 150 mg q2w + csDMARDs
• PBO + csDMARDs
RCT, DB, PC, MC, Phase-3
24 weeks/12 weeks
• ACR20/50/70 • DAS-28 Score • HAQ-DI score
Moderate to-severely active disease; disease duration ≥6 months; inadequate responses or intolerance to ≥1 TNFi
• TNFi intolerant adults
• Age ≥18 years • Moderate to
severely active RA
• SJC ≥6, TJC ≥8, • CRP ≥0.6 mg/dL
289-298
Abbreviations: ABT, abatacept, ACR, American College of Rheumatology; ACR20/50/70, American College of Rheumatology 20%/50%/70% response; ADA, adalimumab, bDMARDs, biologic disease modifying antirheumatic drugs; BID, twice daily, BIW, twice weekly, CRP, C-reactive protein; csDMARD, conventional synthetic disease modifying antirheumatic drugs; CT, controlled trial; CTZ, certolizumab pegol, DAS-28, disease activity score 28-joint count; DB, double blind, DMARD, disease-modifying antirheumatic drugs; ESR, erythrocyte sedimentation rate; ETN, etanercept, EULAR, European League Against Rheumatism; g, gram, HAQ-DI, health assessment questionnaire disability index; HCQ, hydroxychloroquine, IQR, Interquartile range, IFX, infliximab, ITT, intention to treat, IV, intravenous, Kg, kilogram, M, median; MC, multicentre; mg, milligram, MTX, methotrexate, NMA, network meta-analysis, NR, not reported, OL, open-label, QW, once weekly, PBO, placebo; PC, placebo-controlled; PG, parallel group; qd, once weekly; q2w, every two weeks, q4w, every four weeks, q8w, every 8 weeks; RA, rheumatoid arthritis; RCT, randomised controlled trial, RTX, rituximab, SRL, sarilumab; SB, single blind, SC, subcutaneous, SD, standard deviation, SE, standard error, SJC, swollen joint, SRK, sirukumab, SSZ, sulfasalazine, TJC, tender joint count; TNF, tumour necrosis factor; TCZ, tocilizumab, TFC, tofacitinib. Source: CS Appendix, Table 9, pp. 171-4. References have been checked and updated where necessary.
Copyright 2019 Queen's Printer and Controller of HMSO. All rights reserved

Page 126 of 275
ERG comment:
The ERG performed a check on the company’s data extraction for all studies in the
bDMARD-experienced population NMA, and the results of this are presented in Section
4.5.2. Included trials covered a wide range of countries and none were restricted to non-
European populations. All trials were listed as RCTs, except for RA-BEACON which was
listed as a controlled trial (CT). Having checked the primary reference,274 the ERG noted
that this trial is described as randomised. Study duration ranged from 12 to 52 weeks,
although all but one study reported results at 24 weeks. Only 12-week data were
available for the REALISTIC trial.229
4.3.5 Quality assessment of studies included in network meta-analysis
The company appraised the quality of the 61 trials included in the two NMAs (55 that
were included in the NMA for the csDMARD-experienced population and 12 that were
included in the NMA for the bDMARD-experienced population, noting that six trials were
included in both NMAs). The methods used to assess risk of bias for these studies were
the same as those used for the four pivotal trials (refer to Sections 4.1.4 and 4.2.3), and
the company’s QA ratings can be found in Tables 30 and 31, Appendix D.1.17 of the CS.
ERG comment:
In order to provide a general check of accuracy of these 61 QA assessments, the ERG
randomly selected seven of these studies (≈10%) with a view to performing a full check
of the company’s QA for these studies in order to estimate the likelihood of inaccuracies
in the QA ratings for the remainder of the studies. One of the studies randomly selected
by the ERG was the SELECT-BEYOND study; a critique of the QA for SELECT-
BEYOND had already been performed (refer to Section 4.2.3). The remaining six
randomly selected studies were assessed by the ERG. Table 23 provides a summary of
pertinent comments and disagreements in ratings between the company and ERG.
For five of the six selected studies, the ERG was mostly in agreement with the ratings
made by the company, although some additional points and clarifications were noted
(refer to Table 23. Critique of the QA for the randomly selected trials). However, for one
of these studies,1 the ERG found errors in the QA that are likely to underestimate the
quality of this study. These errors are outlined in Table 23.
Copyright 2019 Queen's Printer and Controller of HMSO. All rights reserved

Page 127 of 275
Table 23. Critique of the QA for the randomly selected trials
Study QA Item Company or ERG
Ratings and comments
ARMADA103 Blinding Company Yes – Double-blind ERG The ERG agrees that the study was described as double-
blind but also notes that (with the exception of patients) it is unclear exactly who was blind (e.g. treating clinicians only, all clinical site personnel, all assessors)
ASCERTAIN256 Blinding Company Yes – Double-blind ERG The ERG agrees that the study was described as double-
blind but also notes that (with the exception of patients) it is unclear exactly who was blind (e.g. treating clinicians only, all clinical site personnel, all assessors)
Drop-outs Company Yes - Higher discontinuation observed in SRL 150 mg q2w group
ERG The ERG notes that although higher discontinuation rates were found in the SRL 150 mg q2w group, it was not reported whether this difference was statistically significant
ITT analyses
Company Yes, ITT; Uncleara ERG The ERG disagrees that ITT analyses were reported - only
safety analyses are reported and these were based on all randomised participants according to actual treatment received. Efficacy analyses were not available for the final sample and it remains unclear whether ITT data will be provided
CERTAIN116 Blinding Company Yes – Double-blind ERG The ERG noted that although the study was described as
double-blind, the clinicians administering treatments were not blind
ITT analyses
Company Yes ITT: Yes ITT; LOCF ERG Yes ITT: Yes ITT; NRI/LOCF
J-RAPID138 Blinding Company Yes – Double-blind ERG The ERG notes that patients and assessors were blind but
clinicians administering treatments were not blind Drop-outs Company No
ERG The ERG agrees that there were no unexpected differences between groups in drop-outs, but noted an expected difference (more withdrawals and fewer completions in the PBO+MTX group than the CTZ + MTX group)
LI142 Blinding Company Yes – Double-blind ERG The ERG agrees that the study was described as double-
blind but also notes that (with the exception of patients) it is unclear exactly who was blind (e.g. treating clinicians only, all clinical site personnel, all assessors)
VAN DE PUTTE 1
Blinding Company Yes – Double-blind ERG The ERG agrees that the study was described as double-
blind but also notes that (with the exception of patients) it is unclear exactly who was blind (e.g. treating clinicians only, all clinical site personnel, all assessors)
Company Yesb
Copyright 2019 Queen's Printer and Controller of HMSO. All rights reserved

Page 128 of 275
Study QA Item Company or ERG
Ratings and comments
Prognostic indicators
ERG The ERG disagrees with the company’s rating that the groups were not similar at baseline: the main publication for the study explicitly states that they were similar and the ERG did not detect any evidence to the contrary
Drop-outs Company Yes - Higher withdrawals observed in ADA group ERG The ERG disagrees with the company that there were
higher withdrawals with ADA; in fact the publication states that “Withdrawals occurred in 118/434 (27.2%) ADA treated patients and 62/110 (56.4%) PBO treated patients”1
ITT analyses
Company Yes ITT: Yes ITT; study did not use imputation ERG The ERG disagrees that the study did not use imputation
and instead felt that the handling of missing data were not clearly reported; the publication mentioned that non-completers were assumed to be non-responders, but the handling of other missing data was not reported
Abbreviations: ADA, adalimumab; CTZ, certolizumab pegol; ITT, intention-to-treat; LOCF, last observation carried forward; MTX, methotrexate; NRI, non-responder imputation; PBO, placebo; q2w, every two weeks; QA, quality appraisal; SRL, sarilumab Notes: a Refers to methods used to account for missing data; b Refers to an imbalance between groups at baseline on prognostic indicators
Due to the errors found, the ERG noted the possibility of further errors in the company’s
QA of the remaining 51 studies across the two NMAs. However, the ERG also noted that
the QA was not used to select or weight studies in the NMA, or in the economic
modelling. The ERG considered, therefore, that any errors or potential errors in the QA
of the remaining studies could affect transitivity of networks in NMA, but would not
necessarily impact choice of studies for NMA or economic modelling.
Critique of the indirect comparison and/or multiple treatment comparison
4.4.1 Summary of analyses undertaken
The CS presented NMAs for ACR outcomes, integrating findings from studies reporting
one or more of ACR20, ACR50 or ACR70, for each of csDMARD-experienced and
bDMARD-experienced populations (see CS B.2.9.7). Meta-analyses for additional
outcomes were not undertaken (see clarification response A19). To integrate findings
from each of these response thresholds, especially when studies reported more than one
of them, response was modelled as a latent probit-distributed variable with fixed effects
for threshold. Put otherwise, the underlying difference in response between each pair of
treatments was modelled as a continuous variable, with empirically derived thresholds
used to convert this continuous variable into odds ratios for each pair of treatments
comparing the probability of achieving each of ACR20, ACR50 and ACR70. This is
Copyright 2019 Queen's Printer and Controller of HMSO. All rights reserved

Page 129 of 275
broadly the analysis approach recommended in NICE Technical Support Document 2.18
Networks integrated evidence for response at three months with evidence for response
at six months using a meta-regression based method, with a random effect at the trial
level to capture the dependence of measures. This was done to compare findings from
the pivotal SELECT trials, which primarily captured data at three months instead of six
months, to the broader network of evidence. Put otherwise, findings at six months for
UPA in the NMA are based on meta-regression estimates ‘projecting’ the three-month
data forward using a common effect for the difference in effectiveness between three
and six months.
Results were presented as probabilities of response for each threshold for each
treatment. To estimate these probabilities, the probability of non-response in a reference
treatment was calculated, and the odds ratios generated from the NMA estimated. The
ERG queried this at clarification and in response to question A23, the company noted
that: “non-response for the csDMARD arm was estimated using the maximum likelihood
estimator based on the observed ACR20 non-response data from observed data of all
csDMARD arms”. While this is at face a reasonable approach, no further details were
presented to determine what was meant by “maximum likelihood estimation” and
whether this was undertaken in a separate analysis. ACR outcomes were then mapped
onto EULAR response using a probabilistic algorithm.
Analyses were undertaken in a Bayesian framework using JAGS (see clarification
response A18), with convergence assessed using the Gelman-Rubin diagnostic (see
clarification response A20). Several alternative models were considered, including
random and fixed effects for the distribution of treatment effects, and sensitivity analyses
testing imputation strategies to extrapolate data from the SELECT trials to six months.
Models were compared using the deviance information criterion (DIC), as well as the
between study variance parameter tau and the residual deviance. Inconsistency was
tested for each network by comparing an inconsistency model against a consistency
model in terms of model fit and parameter estimates.
ERG comment:
Methods used to undertake the NMAs were broadly appropriate and in line with NICE
Technical Support Document recommendations. However, the DIC is a suboptimal index
to compare model fit when models are sparse, as was especially the case in the
bDMARD-experienced population NMA. Model choice should be driven by substantive
considerations.
Copyright 2019 Queen's Printer and Controller of HMSO. All rights reserved

Page 130 of 275
The ERG noted the remaining ambiguity in how non-response probabilities in reference
arms were estimated. It was unclear from the clarification response and from the code
presented whether the pooling of non-response probabilities in the reference arm was
undertaken separately. While it appears that the analysis was not undertaken as a
‘simultaneous model’, which would have the inappropriate impact of analysis of
reference arm non-response influencing analysis of relative treatment effects, the
assumptions used to estimate the pooled probability of non-response remained vague. In
addition, mapping of treatment effects to EULAR response required additional
clarification to understand how this was undertaken probabilistically. Because of this,
results from the NMA should be interpreted with caution. In addition, ambiguities in the
exact time period considered for inclusion at three-month and six-month follow-up
preclude clear interpretation of findings.
Finally, the company made several references to ranking of treatments in presentation of
results. It appeard that this was undertaken ‘numerically’, that is by ranking parameter
estimates. The ERG regarded that use of a ranking measure that incorporated
uncertainty in estimation was more suitable and requested surface under the cumulative
ranking curve (SUCRA) estimates in clarification, which were provided. The ERG uses
these to consider treatment ranking throughout the results presented here.
4.4.2 Critique of network meta-analysis assumptions
NMAs presented required several statistical assumptions. Vague prior distributions were
assumed for all model parameters with the exception of the between-study standard
deviation in the bDMARD-experienced population analysis (see CS p 90). This relied on
a standard informative prior distribution of log normal form with mean -2.56 and standard
deviation 1.74. The use of an informative prior can be useful to stabilise estimation when
information is sparse, as would be expected for between-study standard deviation,
estimation of which is frequently underpowered in NMAs. In addition, treatment effects
were assumed exchangeable, consistency was assumed, and thresholds used to
convert the latent probit response variable to probabilities of response were assumed to
be fixed. Clarification elicited several additional assumptions used to estimate NMA
models (see clarification response A22): between-study variance was assumed equal
across all relative treatment effects, the meta-regression coefficient used to compare
three-month and six-month results was assumed equal across all relative treatment
effects, and trial-specific baselines were treated as nuisance parameters.
Copyright 2019 Queen's Printer and Controller of HMSO. All rights reserved

Page 131 of 275
4.4.3 Correspondence to NICE scope population
The analysis as undertaken considered two populations: csDMARD-experienced people
with inadequate response, and bDMARD-experienced people with inadequate response.
A similar approach has been undertaken in the last three key STAs to assess new
treatments for rheumatoid arthritis.32,51,52 Focusing on csDMARD-experienced and
bDMARD-experienced populations as major groupings for NMA has several benefits.
These include relative tractability in terms of data extraction from included trials and
mapping against a key decision points in existing treatment pathways (i.e. the transition
from csDMARD-only strategies to bDMARD-included strategies after two or more
csDMARDs have not induced an adequate response). To the extent that all relevant
comparators were included in the search for trials and inclusion and exclusion criteria
generally matched the NICE final scope (see 4.3.4), the NMAs as presented met the
NICE final scope.
However, this approach also requires several conceptual assumptions. These include
the similarity of treatment effects between moderate and severe RA populations, which
may not be reasonable; and exchangeability of treatment effects at different points in the
treatment pathway, which may not be appropriate, given that clinical advice provided to
the ERG is that the ‘prognosis’ of drugs’ effectiveness decreases with each successive
line of treatment attempted. Related to this assumption is the concern that populations
from each trial will include people who are not strictly ‘at risk’ for receiving every other
comparator in the network, either due to prior exposure to other comparators or
contraindications. As a hypothetical example, included trials elsewhere in the bDMARD-
experienced network will likely include at least some patients who are not eligibile for
RTX; but data from these patients are used to estimate the comparative efficacy of RTX
against other therapies. The approach used also requires locating subgroup data from
trials that “blend” csDMARD-experienced and bDMARD-experienced populations, data
which it may not always be possible to obtain. In fact, this stipulation led to the exclusion
of at least eight trials that did not report findings for csDMARD-experienced subgroups
(clarification response A16). It also requires subsuming subgroups defined by the NICE
treatment pathway (e.g. patients with severe RA who are intolerant of or who have had
an inadequate response to RTX) into a group with all those trialling a second bDMARD.
The ERG acknowledges that the “optimal” approach, which would include stratifying
NMAs by line of treatment (e.g. inadequate response to one csDMARD; inadequate
response to two or more csDMARDs; inadequate response to two or more csDMARDs
and one bDMARD), would not be feasible given the limitations of available data.
Copyright 2019 Queen's Printer and Controller of HMSO. All rights reserved

Page 132 of 275
Regardless, the strong assumptions relating to similarity of effect and exchangeability
between different points in the pathway, and the ‘collapsing’ of different groups in the
NICE scope into one NMA, suggest that the results of the NMA should be used with
caution.
It is also of note that only upadactinib in its 15 mg dose, with or without csDMARD, that
is considered in the NMAs. As noted above in Section 3.2, this is consistent with the
company’s general approach to the different dosages tested.
Only ACR response was considered as an outcome in NMAs, at variance with prior TAs
that have considered a wider range of outcomes relevant to RA. The company chose to
map ACR response onto EULAR response to inform the economic model. Previous TAs
have used EULAR outcomes directly,32,51,52 though in some cases with pre-processing of
study-level data via probabilistic mapping of ACR to EULAR. Given the importance of
EULAR in the economic model against the high levels of missing data for EULAR
response, the ERG regards that the methodological strategy undertaken was not
unreasonable, though it does add uncertainty.
A final point relates to the treatment of csDMARD dose escalation, which is noted as a
comparator for those with moderate RA that has not responded adequately to therapy
with csDMARDs. This is never explicitly defined as a treatment strategy, and it remains
unclear how this is operationalised in the included NMAs. One trial (APPEAL102) is noted
in the CS (Section D.1.12), as including intensive csDMARDs, but it is unclear how this
relates to the scoped comparator of csDMARD dose escalation. This is important as
treatment effects relating to intensive csDMARDs are included in treatment sequencing
as part of the economic model (Section 5.2.4).
4.4.4 Results of network meta-analysis
Results for the NMA undertaken on csDMARD-experienced populations are provided in
Table 23 of the CS, with mapping onto EULAR response categories in the CS Table 25.
Similarly, results for the NMA undertaken on bDMARD-experienced populations are
provided in the CS Tables 26 and 27. On clarification, the company provided
probabilities of superiority of each treatment compared to PBO, csDMARDs generally,
UPA and UPA in combination with csDMARDs. The company also provided updated
results for the bDMARD-experienced population as inaccurate results were presented in
the CS.
Copyright 2019 Queen's Printer and Controller of HMSO. All rights reserved

Page 133 of 275
4.4.4.1 NMA findings for the csDMARD-experienced population
Findings for the csDMARD-experienced population at six months are reproduced in
Table 24 below. UPA 15 mg yielded a probability of ACR20 of
*************************************************************** and of ACR70 of
******************** UPA 15 mg in combination with csDMARDs yielded a probability of
**************************************************************) and of ACR70 of
********************* For both regimens, the probability of inferiority as compared to PBO
was <0.001, and as compared to csDMARDs alone was <0.001 as well. It is of note that
these data are ‘extrapolated’ in that no six-month data from the SELECT trials were
included in the NMA. Findings from the mapped analysis for EULAR can be found in
Table 25. Consideration of surface under the cumulative ranking curve (SUCRA) values
in Table 24 suggest that upadactinib 15 mg with csDMARDs is a particularly highly
ranked option, with a SUCRA value and modelled response probabilities similar to TFC
10 mg with csDMARD and superseded by TCZ 8 mg/kg and CTZ 200 mg with
csDMARD.
Convergence of this model was evidenced via a Gelman-Rubin diagnostic with a value
very close to 1 (1.000415; see clarification response A20). The company justifies use of
a random effects model by noting that a random effects model had lower total residual
deviance and lower deviance information criterion as compared to a fixed effects model
(CS p 97). The ERG acknowledged that these summary indices are useful for
interpretation, but submits that a random effects model would have been appropriate
regardless as this choice should have been driven by substantive considerations. In
addition, the company notes that an inconsistency model did not generate meaningful
improvements in fit over a consistency model and did not generate meaningfully or
systematically different pairwise estimates. It appeared that the company undertook this
examination separately for three-month and six-month results, given inconsistencies
between CS p 94 and CS appendix D.1.14. However, the ERG accepted the company’s
conclusion that the NMAs were not notably inconsistent.
Copyright 2019 Queen's Printer and Controller of HMSO. All rights reserved
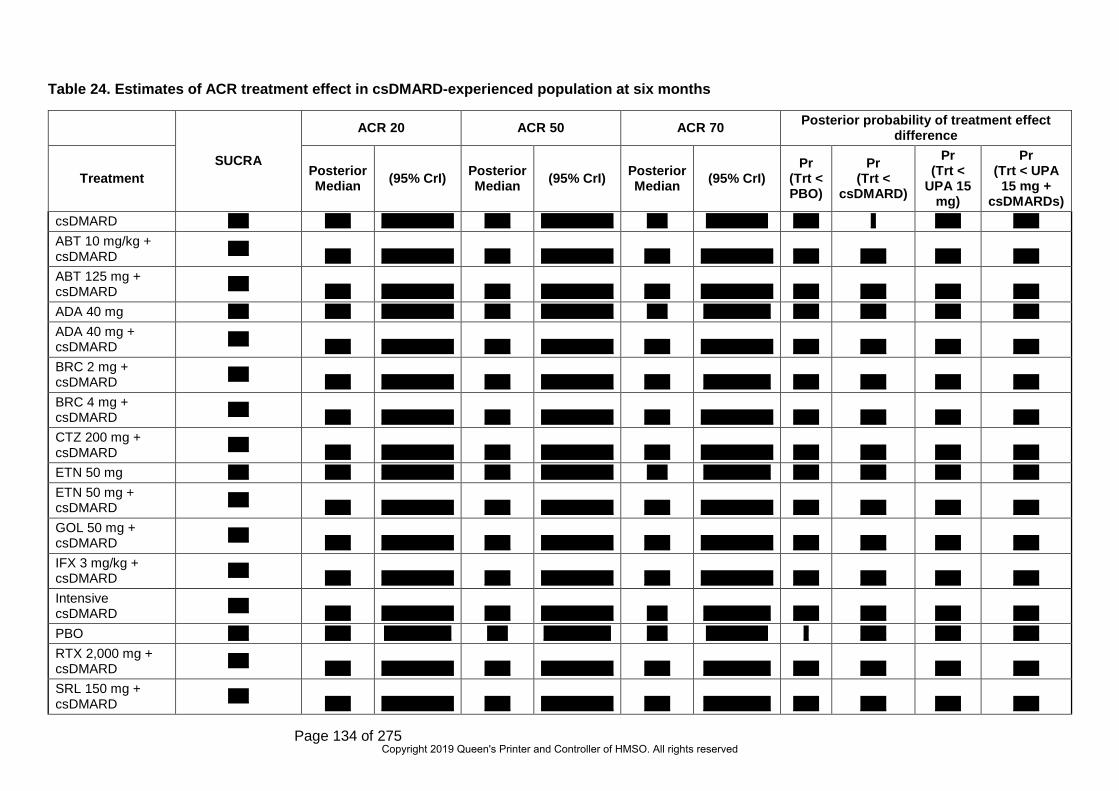
Page 134 of 275
Table 24. Estimates of ACR treatment effect in csDMARD-experienced population at six months
SUCRA
ACR 20 ACR 50 ACR 70 Posterior probability of treatment effect difference
Treatment Posterior Median (95% CrI) Posterior
Median (95% CrI) Posterior Median (95% CrI)
Pr (Trt < PBO)
Pr (Trt <
csDMARD)
Pr (Trt <
UPA 15 mg)
Pr (Trt < UPA
15 mg + csDMARDs)
csDMARD **** ***** ************** ***** ************** **** ************ ***** * ***** ***** ABT 10 mg/kg + csDMARD **** ***** ************** ***** ************** ***** ************** ***** ***** ***** ***** ABT 125 mg + csDMARD **** ***** ************** ***** ************** ***** ************** ***** ***** ***** ***** ADA 40 mg **** ***** ************** ***** ************** **** ************* ***** ***** ***** ***** ADA 40 mg + csDMARD **** ***** ************** ***** ************** ***** ************** ***** ***** ***** ***** BRC 2 mg + csDMARD **** ***** ************** ***** ************** ***** ************* ***** ***** ***** ***** BRC 4 mg + csDMARD **** ***** ************** ***** ************** ***** ************** ***** ***** ***** ***** CTZ 200 mg + csDMARD **** ***** ************** ***** ************** ***** ************** ***** ***** ***** ***** ETN 50 mg **** ***** ************** ***** ************** **** ************* ***** ***** ***** ***** ETN 50 mg + csDMARD **** ***** ************** ***** ************** ***** ************** ***** ***** ***** ***** GOL 50 mg + csDMARD **** ***** ************** ***** ************** ***** ************** ***** ***** ***** ***** IFX 3 mg/kg + csDMARD **** ***** ************** ***** ************** ***** ************** ***** ***** ***** ***** Intensive csDMARD **** ***** ************** ***** ************** **** ************* ***** ***** ***** ***** PBO **** ***** ************* **** ************* **** ************ * ***** ***** ***** RTX 2,000 mg + csDMARD **** ***** ************** ***** ************** ***** ************* ***** ***** ***** ***** SRL 150 mg + csDMARD **** ***** ************** ***** ************** ***** ************* ***** ***** ***** *****
Copyright 2019 Queen's Printer and Controller of HMSO. All rights reserved

Page 135 of 275
SUCRA
ACR 20 ACR 50 ACR 70 Posterior probability of treatment effect difference
Treatment Posterior Median (95% CrI) Posterior
Median (95% CrI) Posterior Median (95% CrI)
Pr (Trt < PBO)
Pr (Trt <
csDMARD)
Pr (Trt <
UPA 15 mg)
Pr (Trt < UPA
15 mg + csDMARDs)
SRL 200 mg **** ***** ************** ***** ************** ***** ************* ***** ***** ***** ***** SRL 200 mg + csDMARD **** ***** ************** ***** ************** ***** ************** ***** ***** ***** ***** TCZ 8 mg/kg **** ***** ************** ***** ************** ***** ************** ***** ***** ***** ***** TCZ 8 mg/kg + csDMARD **** ***** ************** ***** ************** ***** ************** ***** ***** ***** ***** TCZ 162 mg + csDMARD **** ***** ************** ***** ************** ***** ************* ***** ***** ***** ***** TFC 10 mg + csDMARD **** ***** ************** ***** ************** ***** ************** ***** ***** ***** ***** TFC 5 mg **** ***** ************** ***** ************** ***** ************* ***** ***** ***** ***** TFC 5 mg + csDMARD **** ***** ************** ***** ************** ***** ************** ***** ***** ***** ***** UPA 15 mg **** ***** ************** ***** ************** ***** ************* ***** ***** * ***** UPA 15 mg + csDMARD **** ***** ************** ***** ************** ***** ************** ***** ***** ***** *
Abbreviations: ABT, abatacept; ACR, American College of Rheumatology; ADA, adalimumab; BRC, baricitinib; csDMARD, conventional synthetic disease modifying antirheumatic drug; CrI, credible interval; CTZ, certolizumab pegol; ETN, etanercept; GOL, golimumab; IFX, infliximab; PBO: placebo; RA, rheumatoid arthritis; SRL, sarilumab; TCZ, tocilizumab; TFC, tofacitinib; Trt: treatment; UPA, upadacitinib
Notes: a Posterior probability of treatment effect difference is presented in this table. For example, Pr (Trt < PBO) is the posterior probability that treatment effect difference between active treatment and PBO is less than 0; b The posterior probability of treatment effect difference is the same for ACR 20, ACR 50 and ACR 70.
Source: Clarification response A21, A29
Copyright 2019 Queen's Printer and Controller of HMSO. All rights reserved

Page 136 of 275
Table 25. Estimates of EULAR treatment effect in csDMARD-experienced population at six months
Treatment Response Posterior probability of treatment effect difference No Response
(95% CrI) Moderate Response
(95% CrI) Good Response
(95% CrI) Pr (Trt < PBO)
Pr (Trt <
csDMARD)
Pr (Trt < UPA
15 mg)
Pr (Trt < UPA
15 mg + csDMARDs
) csDMARD ***** ************** ***** ************** ***** ************** ***** * ***** ***** ABT 10 mg/kg + csDMARD ***** ************** ***** ************** ***** ************** ***** ***** ***** ***** ABT 125 mg + csDMARD ***** ************** ***** ************** ***** ************** ***** ***** ***** ***** ADA 40 mg ***** ************** ***** ************** ***** ************** ***** ***** ***** ***** ADA 40 mg + csDMARD ***** ************** ***** ************** ***** ************** ***** ***** ***** ***** BRC 2 mg + csDMARD ***** ************** ***** ************** ***** ************** ***** ***** ***** ***** BRC 4 mg + csDMARD ***** ************** ***** ************** ***** ************** ***** ***** ***** ***** CTZ 200 mg + csDMARD ***** ************** ***** ************** ***** ************** ***** ***** ***** ***** ETN 50 mg ***** ************** ***** ************** ***** ************** ***** ***** ***** ***** ETN 50 mg + csDMARD ***** ************** ***** ************** ***** ************** ***** ***** ***** ***** GOL 50 mg + csDMARD ***** ************** ***** ************** ***** ************** ***** ***** ***** ***** IFX 3 mg/kg + csDMARD ***** ************** ***** ************** ***** ************** ***** ***** ***** ***** Intensive csDMARD ***** ************** ***** ************** ***** ************** ***** ***** ***** ***** PBO ***** ************** ***** ************** ***** ************* * ***** ***** *****
Copyright 2019 Queen's Printer and Controller of HMSO. All rights reserved

Page 137 of 275
Treatment Response Posterior probability of treatment effect difference No Response
(95% CrI) Moderate Response
(95% CrI) Good Response
(95% CrI) Pr (Trt < PBO)
Pr (Trt <
csDMARD)
Pr (Trt < UPA
15 mg)
Pr (Trt < UPA
15 mg + csDMARDs
) RTX 2,000 mg + csDMARD ***** ************** ***** ************** ***** ************** ***** ***** ***** ***** SRL 150 mg + csDMARD ***** ************** ***** ************** ***** ************** ***** ***** ***** ***** SRL 200 mg ***** ************** ***** ************** ***** ************** ***** ***** ***** ***** SRL 200 mg + csDMARD ***** ************** ***** ************** ***** ************** ***** ***** ***** ***** TCZ 8 mg/kg ***** ************** ***** ************** ***** ************** ***** ***** ***** ***** TCZ 8 mg/kg + csDMARD ***** ************** ***** ************** ***** ************** ***** ***** ***** ***** TCZ 162 mg + csDMARD ***** ************** ***** ************** ***** ************** ***** ***** ***** ***** TFC 10 mg + csDMARD ***** ************** ***** ************** ***** ************** ***** ***** ***** ***** TFC 5 mg ***** ************** ***** ************** ***** ************** ***** ***** ***** ***** TFC 5 mg + csDMARD ***** ************** ***** ************** ***** ************** ***** ***** ***** ***** UPA 15 mg ***** ************** ***** ************** ***** ************** ***** ***** * ***** UPA 15 mg + csDMARD ***** ************** ***** ************** ***** ************** ***** ***** ***** *
Abbreviations: ABT, abatacept; ADA, adalimumab; BRC, baricitinib; csDMARD, conventional synthetic disease modifying antirheumatic drug; CrI, credible interval; CTZ, certolizumab pegol; ETN, etanercept; EULAR, European League Against Rheumatism; GOL, golimumab; IFX, infliximab; PBO: placebo; RA, rheumatoid arthritis; SRL, sarilumab; TCZ, tocilizumab; TFC, tofacitinib; Trt: treatment; UPA, upadacitinib
Notes: a Posterior probability of treatment effect difference is presented in this table. For example, Pr (Trt < PBO) is the posterior probability that treatment effect difference between active treatment and PBO is less than 0; b The posterior probability of treatment effect difference is the same for EULAR response categories
Source: clarification response A29
Copyright 2019 Queen's Printer and Controller of HMSO. All rights reserved

Page 138 of 275
4.4.4.2 NMA findings for the bDMARD-experienced population
Findings for the bDMARD-experienced population at six months are reproduced in Table
26 below. UPA 15 mg in combination with csDMARDs yielded a probability of ACR20 of
***************************************************************and of ACR70 of
********************* The probability of inferiority as compared to csDMARDs alone was
0.003. As above, these data are “extrapolated” in that no six-month data from the
SELECT trials were included in the NMA. Findings from the mapped analysis for EULAR
can be found in Table 27.
*****************************************************************************************************
*****************************************************************************************************
********************************************************************************
Convergence of this model was evidenced via a Gelman-Rubin diagnostic with a value
very close to 1 (1.000943; see clarification response A20). As above, the company
justified the use of a random effects model based on similarity of total residual deviance
and lower DIC as compared to a fixed effects model (CS, p 98). Again, the ERG
considered that a random effects model would have been appropriate regardless as this
choice should have been driven by substantive considerations. In this case, estimation of
a random effects model was facilitated by use of an informative prior for the between-
study variance. In addition, the company noted that consideration of inconsistency was
not relevant to this network given the absence of head-to-head evidence. The ERG
noted that this assertion was not strictly accurate, given the inclusion of trials testing non-
csDMARD treatments against each other, but accepted that a test of inconsistency
would not be meaningful for this analysis.
4.4.4.3 Additional sensitivity analyses undertaken by the company
A number of sensitivity analyses were undertaken to impute six-month data for the
relevant UPA trials using an ‘optimistic’ approach, with six-month data for patients on
UPA and three-month data from the csDMARD arms carried forward, and a
‘conservative’ approach, with three-month data used for six-month data. Results are
presented in CS Appendix D.1.15 and are substantially similar to those from the main
analyses; however, ‘conservative’ imputation yielded different results for ACR response
for patients with upadactinib 15 mg with csDMARD in the csDMARD-experienced
population (***************************************************************************]).
Copyright 2019 Queen's Printer and Controller of HMSO. All rights reserved

Page 139 of 275
Table 26. Estimates of ACR treatment effect in bDMARD-experienced population at six months
Treatment SUCRA
ACR 20 ACR 50 ACR 70 Posterior probability of
treatment effect difference
Posterior Median (95% CrI) Posterior
Median (95% CrI) Posterior Median (95% CrI)
Pr (Trt <
csDMARD)
Pr (Trt < UPA
15 mg + csDMARDs)
csDMARD **** ***** ************** **** ************* **** ************* * *****
ABT 10 mg/kg + csDMARD **** ***** ************** ***** ************** ***** ************** ***** *****
BRC 2 mg + csDMARD **** ***** ************** ***** ************** **** ************** ***** *****
BRC 4 mg + csDMARD **** ***** ************** ***** ************** ***** ************** ***** *****
CTZ 200 mg + csDMARD **** ***** ************** ***** ************* **** ************** ***** *****
GOL 50 mg + csDMARD **** ***** ************** ***** ************** ***** ************** ***** *****
RTX 2,000 mg + csDMARD **** ***** ************** ***** ************** ***** ************** ***** *****
SRL 150 mg + csDMARD **** ***** ************** ***** ************** ***** ************** ***** *****
SRL 200 mg + csDMARD **** ***** ************** ***** ************** ***** ************** ***** *****
TCZ 8 mg/kg + csDMARD **** ***** ************** ***** ************** ***** *************** ***** *****
TCZ 162 mg + csDMARD **** ***** ************** ***** ************** ***** ************** ***** *****
TFC 10 mg + csDMARD **** ***** ************** ***** ************** ***** ************** ***** ***** TFC 5 mg + csDMARD **** ***** ************** ***** ************** ***** ************** ***** *****
UPA 15 mg + csDMARD **** ***** ************** ***** ************** ***** ************** ***** * Abbreviations: ABT, abatacept; ACR, American College of Rheumatology; ADA, adalimumab; BRC, baricitinib; csDMARD, conventional synthetic disease modifying antirheumatic drug; CrI, credible interval; CTZ, certolizumab pegol; ETN, etanercept; GOL, golimumab; IFX, infliximab; PBO, placebo; RA, rheumatoid arthritis; SRL, sarilumab; TCZ, tocilizumab; TFC, tofacitinib; Trt, treatment; UPA, upadacitinib
Notes: a Posterior probability of treatment effect difference is presented in this table. For example, Pr (Trt < csDMARD) is the posterior probability that treatment effect difference between active treatment and csDMARD is less than 0; b. The posterior probability of treatment effect difference is the same for ACR 20, ACR 50 and ACR 70
Source: Clarification response A21, A29
Copyright 2019 Queen's Printer and Controller of HMSO. All rights reserved

Page 140 of 275
Table 27. Estimates of EULAR treatment effect in bDMARD-experienced population at six months
Treatment Response Posterior probability of treatment effect difference
No Response (95% CrI)
Moderate Response (95% CrI)
Good Response (95% CrI) Pb
(Trt < csDMARD)
Pr (Trt < UPA 15
mg + csDMARDs)
csDMARD ***** ************** ****** *************** ***** ************** ***** *****
ABA10 mg/kg + csDMARD ***** ************** ****** *************** ***** ************** ***** *****
BRC 2 mg + csDMARD ***** ************** ****** *************** ***** ************** ***** *****
BRC 4 mg + csDMARD ***** ************** ****** *************** ***** ************** ***** *****
CTZ 200 mg + csDMARD ***** ************** ****** *************** ***** ************** ***** *****
GOL 50 mg + csDMARD ***** ************** ****** *************** ***** ************** ***** *****
RTX 2,000 mg + csDMARD ***** ************** ****** *************** ***** ************** ***** *****
SRL 150 mg + csDMARD ***** ************** ****** *************** ***** ************** ***** *****
SRL 200 mg + csDMARD ***** ************** ****** *************** ***** ************** ***** *****
TCZ 8 mg/kg + csDMARD ***** ************** ****** *************** ***** ************** ***** *****
TCZ 162 mg + csDMARD ***** ************** ****** *************** ***** ************** ***** *****
TFC 10 mg + csDMARD ***** ************** ****** *************** ***** ************** ***** *****
TFC 5 mg + csDMARD ***** ************** ****** *************** ***** ************** ***** *****
UPA 15 mg + csDMARD ***** ************** ****** *************** ***** ************** ***** * Abbreviations: ABT, abatacept; ADA, adalimumab; BRC, baricitinib; csDMARD, conventional synthetic disease modifying antirheumatic drug; CrI, credible interval; CTZ, certolizumab pegol; ETN, etanercept; EULAR, European League Against Rheumatism; GOL, golimumab; IFX, infliximab; PBO: placebo; RA, rheumatoid arthritis; SRL, sarilumab; TCZ, tocilizumab; TFC, tofacitinib; Trt: treatment; UPA, upadacitinib
Notes:a Posterior probability of treatment effect difference is presented in this table. For example, Pr (Trt < PBO) is the posterior probability that treatment effect difference between active treatment and PBO is less than 0; b The posterior probability of treatment effect difference is the same for EULAR response categories
Source: clarification response A29
Copyright 2019 Queen's Printer and Controller of HMSO. All rights reserved

Page 141 of 275
In addition, the ERG requested at clarification a set of NMA analyses excluding data
from SELECT-SUNRISE, given the dissimilarity in population between SELECT-
SUNRISE and the trials used for regulatory approval. Findings from this NMA, which
relate to the csDMARD-experienced population, are presented below in Table 28 and
Table 29. On the whole, the impact of excluding SELECT-SUNRISE on results and their
interpretation was minimal.
4.4.5 Overall comment on network meta-analysis
While the company’s approach to the NMAs followed precedent in terms of using
csDMARD-experienced and bDMARD-experienced groupings and used appropriate
statistical techniques, the ERG raised a number of concerns that suggest caution is
required when interpreting the results of the NMAs. For example, the ERG noticed some
inconsistencies between studies included in this appraisal and included in prior
appraisals; inconsistencies in the presentation of results; a number of ambiguities
relating to the inclusion and exclusion of trials and the formation of nodes (e.g. for
intensive csDMARDs as a treatment strategy). From a statistical perspective, the ERG
noted a persisting lack of clarity on how trial arms from reference groups were pooled to
generate probabilities across all treatments. The ERG also noted strong assumptions
required for the interpretation and application of findings across different points in the
treatment pathways, eligibility of populations in networks for all relevant treatments,
severities of disease and treatment sequencing, and exclusion of data from potentially
informative trials that did not include subgroups.
Additional work on clinical effectiveness undertaken by the ERG
4.5.1 Additional searches undertaken by the ERG
The ERG conducted a search on Ovid MEDLINE (search completed 6 August 2019) with
additional free-text terms for biosimilars and brand names, and using the validated RCT
filter (sensitivity and precision maximising version) developed by Cochrane.13 We used
Boolean NOT to identify unique records not retrieved by the company’s original search
(as reported in Appendix D of the CS). The search retrieved 882 records, and these were
single-screened by the ERG. The ERG’s full search strategy is available in Appendix 1.
The modified search did not identify additional relevant randomized controlled trials for
UPA or comparators (from database inception to April 2019, the date of the company’s
updated review searches).
Copyright 2019 Queen's Printer and Controller of HMSO. All rights reserved

Page 142 of 275
Table 28. Estimates of ACR treatment effect in csDMARD-experienced population at six months, excluding SELECT-SUNRISE
ACR 20 ACR 50 ACR 70 Treatment Posterior Median (95% CrI) Posterior Median (95% CrI) Posterior Median (95% CrI)
csDMARD ***** ************** ***** ************** **** ************ ABT 10 mg/kg + csDMARD ***** ************** ***** ************** ***** ************** ABT 125 mg + csDMARD ***** ************** ***** ************** ***** ************** ADA 40 mg ***** ************** ***** ************** **** ************* ADA 40 mg + csDMARD ***** ************** ***** ************** ***** ************** BRC 2 mg + csDMARD ***** ************** ***** ************** ***** ************* BRC 4 mg + csDMARD ***** ************** ***** ************** ***** ************** CTZ 200 mg + csDMARD ***** ************** ***** ************** ***** ************** ETN 50 mg ***** ************** ***** ************** **** ************* ETN 50 mg + csDMARD ***** ************** ***** ************** ***** ************** GOL 50 mg + csDMARD ***** ************** ***** ************** ***** ************** IFX 3 mg/kg + csDMARD ***** ************** ***** ************** ***** ************** Intensive csDMARD ***** ************** ***** ************** **** ************* PBO ***** ************* **** ************* **** ************ RTX 2,000 mg + csDMARD ***** ************** ***** ************** ***** ************* SRL 150 mg + csDMARD ***** ************** ***** ************** ***** ************* SRL 200 mg ***** ************** ***** ************** ***** ************* SRL 200 mg + csDMARD ***** ************** ***** ************** ***** ************** TCZ 8 mg/kg ***** ************** ***** ************** ***** ************** TCZ 8 mg/kg + csDMARD ***** ************** ***** ************** ***** ************** TCZ 162 mg + csDMARD ***** ************** ***** ************** ***** ************* TFC 10 mg + csDMARD ***** ************** ***** ************** ***** ************** TFC 5 mg ***** ************** ***** ************** ***** ************* TFC 5 mg + csDMARD ***** ************** ***** ************** ***** ************** UPA 15 mg ***** ************** ***** ************** ***** ************* UPA 15 mg + csDMARD ***** ************** ***** ************** ***** **************
Abbreviations: ABT, abatacept; ACR, American College of Rheumatology; ADA, adalimumab; BRC, baricitinib; csDMARD, conventional synthetic disease modifying antirheumatic drug; CrI, credible interval; CTZ, certolizumab pegol; ETN, etanercept; GOL, golimumab; IFX, infliximab; PBO: placebo; SRL, sarilumab; TCZ, tocilizumab; TFC, tofacitinib; UPA, upadacitinib; Source: Clarification response A25
Copyright 2019 Queen's Printer and Controller of HMSO. All rights reserved

Page 143 of 275
Table 29. Estimates of EULAR treatment effect in csDMARD-experienced population at six months, excluding SELECT-SUNRISE
No response Moderate Response Good Response Treatment Posterior Median (95% Crl) Posterior Median (95% Crl) Posterior Median (95% Crl) csDMARD ***** ************** ***** ************** ***** ************** ABT 10 mg/kg + csDMARD ***** ************** ***** ************** ***** ************** ABT 125 mg + csDMARD ***** ************** ***** ************** ***** ************** ADA 40 mg ***** ************** ***** ************** ***** ************** ADA 40 mg + csDMARD ***** ************** ***** ************** ***** ************** BRC 2 mg + csDMARD ***** ************** ***** ************** ***** ************** BRC 4 mg + csDMARD ***** ************** ***** ************** ***** ************** CTZ 200 mg + csDMARD ***** ************** ***** ************** ***** ************** ETN 50 mg ***** ************** ***** ************** ***** ************** ETN 50 mg + csDMARD ***** ************** ***** ************** ***** ************** GOL 50 mg + csDMARD ***** ************** ***** ************** ***** ************** IFX 3 mg/kg + csDMARD ***** ************** ***** ************** ***** ************** Intensive csDMARD ***** ************** ***** ************** ***** ************** PBO ***** ************** ***** ************** ***** ************* RTX 2000 mg + csDMARD ***** ************** ***** ************** ***** ************** SRL 150 mg + csDMARD ***** ************** ***** ************** ***** ************** SRL 200 mg ***** ************** ***** ************** ***** ************** SRL 200 mg + csDMARD ***** ************** ***** ************** ***** ************** TCZ 8 mg/kg ***** ************** ***** ************** ***** ************** TCZ 8 mg/kg + csDMARD ***** ************** ***** ************** ***** ************** TCZ 162 mg + csDMARD ***** ************** ***** ************** ***** ************** TFC 10 mg + csDMARD ***** ************** ***** ************** ***** ************** TFC 5 mg ***** ************** ***** ************** ***** ************** TFC 5 mg + csDMARD ***** ************** ***** ************** ***** ************** UPA 15 mg ***** ************** ***** ************** ***** ************** UPA 15 mg + csDMARD ***** ************** ***** ************** ***** ************** Abbreviations: ABT, abatacept; ACR, American College of Rheumatology; ADA, adalimumab; BRC, baricitinib; csDMARD, conventional synthetic disease modifying antirheumatic drug; CrI, credible interval; CTZ, certolizumab pegol; ETN, etanercept; EULAR, European League Against Rheumatism; GOL, golimumab; IFX, infliximab; PBO: placebo; RA, rheumatoid arthritis; SRL, sarilumab; TCZ, tocilizumab; TFC, tofacitinib; UPA, upadacitinib Source: Clarification response A25
Copyright 2019 Queen's Printer and Controller of HMSO. All rights reserved

Page 144 of 275
4.5.2 Additional work on network meta-analysis undertaken by the ERG
The ERG checked the patient demographics, baseline characteristics, ACR response
rates and the inclusion and exclusion criteria for all of the studies included in the NMA for
the bDMARD experienced population and for 10% of the studies included in the NMA for
the csDMARD experienced population (as referred to in Section 4.3). For the 10% of
studies checked for the csDMARD experienced population, the values matched those
reported in Appendix D of the company’s submission. There were discrepancies in the
baseline characteristics reported in Appendix D for the biologic experienced population in
studies for which DAS28 had been assessed using both CRP and ESR, mostly likely due
to a pasting error. The patient demographics, baseline characteristics and ACR response
rates for patients allocated TFC 10 mg BID + csDMARD in the ORAL-STEP trial were
missing from Tables 11 and 16 in Appendix D of the company’s submission, and a few
minor errors for other studies (for example, the reported follow-up for the GO-AFTER
trial) were identified in Table 16 and Table 17 in Appendix D of the company’s
submission. Corrected versions of these tables (Table 30, Table 31, and Table 32).
Where the values reported in Appendix D of the company’s submission could not be
checked using the sources referenced, alternative sources were identified for this
purpose and have been referenced in the tables. The ERG has checked the data
extraction file used in the NMA and these errors were not present. However, there were
significant differences between the ACR response rates at week 24 for the bDMARD
experienced population in the REFLEX trial in the data extraction R file and the values
reported by Cohen et al. 2006, which those reported in Table 17 in Appendix D. This
reinforces the need for caution in interpreting the company’s NMA results.
The NMA was implemented using a nonstandard package for R that was not available
on the Comprehensive R Archive Network (CRAN). The ERG checked the R code
provided by the company in their clarification response but, despite extensive efforts to
‘debug’ the code, the ERG was unable to reproduce the NMA results provided in section
B.2.9.8 of Appendix D, due to the code structure rather than an error to the probability
distributions parameterised. Within the timeline of this STA, the ERG was unable to
reconstruct the company’s NMA in alternative software to confirm results presented.
Copyright 2019 Queen's Printer and Controller of HMSO. All rights reserved

Page 145 of 275
Table 30. Corrected patient demographics and baseline characteristics of studies included in the NMA (bDMARD-experienced population)
Study name (Author year) (ref)
Treatment name ITT N Age mean (SD)
Female (%) Mean (SD) DAS28
[CRP/ESR]
Rheumatoid factor (% positive)
Mean no. of previous
DMARDs (SD)
Mean disease
duration in years (SD)
Mean swollen
joint count (SD)
ATTAIN Genovese, 2005258
ABT 10 mg/kg q4w + DMARDs
258 53.4 (12.4)
77.1 CRP: 6.5 (0.9) 189 (73.3) NR 12.2 (8.5) 22.3 (10.2)
PBO + DMARDs 133 52.7 (11.3)
79.7 CRP: 6.5 (0.8) 97 (72.9) NR 11.4 (8.9) 22.0 (10.0)
ASCERTAIN Emery, 2019256
SRL 150 mg q2w 49 54.8 (12.1)
83.7 CRP: 5.85 (0.92) 39 (83.0) NR 13.6 (8.2) 16.0 (8.9)
SRL 200 mg q2w 51 51.7 (13.1)
76.5 CRP: 5.88 (0.97) 29 (58.0) NR 10.5 (7.6) 16.0 (8.1)
TCZ 4 mg/kg q4w 102 50.4 (13.0)
80.4 CRP: 5.91 (1.01) 79 (78.2) NR 10.8 (8.9) 15.2 (7.6)
BREVACTA Kivitz, 2014112
TCZ 162 mg + DMARDs
432 52.1 (11.4) ††
85.8†† 6.70 (0.9) †† 349 (80.8) †† 1.3 (0.7) †† 11.1 (8.2) †† 17.5 (10.3) ††
PBO + DMARDs 218 52.0 (11.7) ††
82.6†† 6.60 (0.9) †† 178 (81.7) †† 1.4 (0.8) †† 11.1 (8.4) †† 17.6 (9.9) ††
GO-AFTER Smolen, 2009263
GOL 50 mg q4w SC ± DMARD
153 55.0 (46.0-63.0) †
74 6.3 (5.6-7.2) 108 (72) NR 9.6 (5.6-17.2)
† 14.0 (9.0-
25.0) †
PBO 155 54.0 (46.0-64.0)†
85 6.3 (5.5-7.1) 110 (73) NR 9.8 (4.9-17.6)
† 14.0 (9.0-
23.0) †
ORAL-STEP Burmester, 2013272
TFC 5 mg bid + MTX
132 55.4 (11.5)
85 CRP: 5.4 (1.0) ESR: 6.5 (1.1)
80 (60.6) NR 13.0 (1.2-55.0)§
16.2 (10.1)
TFC 10 mg bid + MTX
133 55.1 (11.3)
86.6 CRP: 5.3 (0.9) ESR: 6.4 (0.9)
83 (61.9) 12.6 (0.7 – 42.0)
16.6 (9.9)
PBO 131 54.4 (11.3)
80.3 CRP: 5.4 (1.0) ESR: 6.4 (1.1)
86 (65.6) NR 11.3 (0.4-47.0)§
17.2 (10.7)
MOBILITY Genovese, 2015148
SRL 150 mg q2w + MTX
400 50.1 (11.9)
79.8 CRP: 6.0 (0.9) (87.1) NR 9.5 (8.5) 16.6 (9.0)
SRL 200 mg q2w + MTX
399 50.8 (11.8)
84.5 CRP: 6.0 (0.9) (82.6) NR 8.6 (7.0) 16.8 (9.7)
Copyright 2019 Queen's Printer and Controller of HMSO. All rights reserved

Page 146 of 275
Study name (Author year) (ref)
Treatment name ITT N Age mean (SD)
Female (%) Mean (SD) DAS28
[CRP/ESR]
Rheumatoid factor (% positive)
Mean no. of previous
DMARDs (SD)
Mean disease
duration in years (SD)
Mean swollen
joint count (SD)
PBO + MTX 398 50.9 (11.2)
80.7 CRP: 5.9 (0.9) (84.4) NR 9.1 (8.1) 16.7 (9.3)
RADIATE Emery, 2008280
TCZ 4mg/kg + MTX
161 50.9 (12.5)
81 Unclear: 6.78 (1.0)
(73) 2.0 (1.6) 11.0 (8.5) 19.5 (10.4)
TCZ 8mg/kg + MTX
170 53.9 (12.7)
84 Unclear: 6.8 (0.9) (79) 1.9 (1.7) 12.6 (9.3) 18.9 (10.9)
PBO + MTX 160 53.4 (13.3)
79 Unclear: 6.8 (1.1) (75) 2.1 (1.6) 11.4 (9.2) 18.9 (11.1)
RA- BEACON Genovese, 2015274
BRC 2 mg OD 174 55.1 (11.1)
78.7 CRP: 6.03 (0.9) ESR: 6.7 (1.0)
128 (74) NR 14 (8) 19 (12)
BRC 4 mg OD 177 55.9 (11.3)
84.2 CRP: 5.87 (1.0) ESR: 6.6 (1.06)
128 (72) NR 14 (9) 16 (9)
PBO 176 56 (10.7) 82.4 CRP: 5.89 (0.94) ESR: 6.6 (0.9)
130 (74) NR 14 (10) 17 (11)
REALISTIC Weinblatt, 2012229
CTZ 400-200 mg OD
851 55.4 (12.4) ††
77.6†† CRP: 5.7 (0.9) ††
ESR: 6.4 (0.9) †† 555 (73.9) NR 8.6 (8.8) †† 11.8 (5.6) ††
PBO 212 53.9 (12.7) ††
79.7†† CRP: 5.7 (0.9) ††
ESR: 6.4 (0.9) †† 137 (76.5) NR 8.9 (9.1) †† 11.1 (5.2) ††
REFLEX Cohen, 2006285
RTX 1,000 mg + MTX
308 52.2 (12.2)
81 Unclear: 6.9 (1.0) 242 (79) 2.6 (1.8) 12.1 (8.3) 23.4 (11.8)
PBO + MTX 209 52.8 (12.6)
81 Unclear: 6.8 (1.0) 165 (79) 2.4 (1.8) 11.7 (7.7) 22.9 (12.7)
SELECT BEYOND Genovese, 201825
PBO 169 57.6 (11.4)
85 CRP: 5.8 (1.0) 113 (67) NR 13.2 (9.5) 16.3 (9.6)
UPA 15 mg QD 164 56.3 (11.3)
84 CRP: 5.9 (1.0) 119 (73) NR 17.0 (10.8)
UPA 30 mg QD 165 57.3 (11.6)
84 CRP: 5.8 (0.9) 113 (68) NR 17.2 (11.4)
TARGET Fleischmann, 2017288
SRL 200 mg q2w + csDMARDs
184 52.9 (12.9)
82.1 CRP: 6.3 (1.0) 132 (72.9) NR 12.7 (9.6) 20.0 (11.9)
SRL 150 mg q2w + csDMARDs
181 54.0 (11.7)
78.5 CRP: 6.1 (0.9) 135 (74.6) NR 11.6 (8.6) 19.6 (11.2)
Copyright 2019 Queen's Printer and Controller of HMSO. All rights reserved

Page 147 of 275
Study name (Author year) (ref)
Treatment name ITT N Age mean (SD)
Female (%) Mean (SD) DAS28
[CRP/ESR]
Rheumatoid factor (% positive)
Mean no. of previous
DMARDs (SD)
Mean disease
duration in years (SD)
Mean swollen
joint count (SD)
PBO + csDMARDs
181 51.9 (12.4)
85.1 CRP: 6.2 (0.9) 142 (78.9) NR 12.0 (10.0) 20.2 (11.3)
Abbreviations: ABT, Abatacept; ADA, adalimumab; bid, twice a day; CTZ, certolizumab pegol ; ETN, Etanercept; HCQ, hydroxychloroquine; g, gram; IQR, Interquartile range; IFX, infliximab; ITT, intention to treat; IV, intravenous; Kg, kilogram; mg, milligram; M: Median; MTX, methotrexate; NMA, network meta-analysis; NR, not reported; PBO, placebo; PsA, psoriatic arthritis; OD, once weekly; q2w, every 2 weeks; q4w, every 4 weeks; q8w, every 8 weeks; RTX, rituximab; SRL, sarilumab; SC, subcutaneous; SD, standard deviation; SE, standard error; SRK, Sirukumab; SSZ, sulfasalazine; TCZ, Tocilizumab; TFC, Tofacitinib Notes: † = median (IQR), ‡ = median (range), § = mean (range); †† = Baseline demographics captured for overall population
Copyright 2019 Queen's Printer and Controller of HMSO. All rights reserved

Page 148 of 275
Table 31. Corrected ACR response rate at 12-16-week follow-up (bDMARD-experienced population)
Author, year Intervention Follow-up, weeks
Analysis (e.g. ITT) N
ACR 20 (patients achieving 20% improvement)
ACR 50 (patients achieving 50% improvement)
ACR 70 (patients achieving 70% improvement)
# % # % # %
ORAL-STEP Burmester, 2013272
TFC 5mg bid 12 mITT
132 55 41.7 35 26.5 18 13.6 TFC 10mg bid 133 64 48.1 37 27.8 14 10.5
PBO 131 32 24.4 11 8.4 2 1.5 RA-BEACON Genovese, 2015274
BRC 4 mg QD 12 mITT
177 NR 55.4 NR 28.2 NR 11.3 BRC 2 mg QD 174 NR 48.9 NR 20.1 NR 12.6
PBO 176 NR 27.3 NR 8 NR 2.3 REALISTIC Weinblatt, 2012229
CTZ 400-200 mg QOW 12 ITT
320 NR 47.2 NR 21.6 NR 9.1
PBO 80 NR 27.5 NR 11.3 NR 3.8
SELECT BEYOND Genovese, 201825
PBO 12 FAS
169 48 28 20 12 11 7 UPA 15 mg OD 164 106 65 56 34 19 12 UPA 30 mg OD 165 93 56 59 36 38 23
GO-AFTER Smolen, 2009263
GOL 50 mg 14 ITT
153 54 35 25 16 16 10
PBO 155 28 18 10 6 3 2
TARGET STUDY Fleischmann 2017288
PBO + csDMARDs
12 ITT
181 NR 37.6 NR 13.3 NR 2.2 SRL 150 mg q2w +
csDMARDs 181 NR 54.1 NR 30.4 NR 13.8
SRL 200 mg q2w + csDMARDs 184 NR 62.5 NR 33.2 NR 14.7
Abbreviations: ACR, American College of Rheumatology; BRC, baricitinib; CTZ, certolizumab pegol GOL, golimumab; ITT, intention to treat; mITT, modified intention to treat; NR, not reported; PBO, Placebo; QD, once daily; SRK, sirukumab; SRL, sarilumab; RTX, rituximab; TFC, tofacitinib
Copyright 2019 Queen's Printer and Controller of HMSO. All rights reserved

Page 149 of 275
Table 32. Corrected ACR response rate at 18-30-week follow-up (bDMARD-experienced population)
Author, year Intervention Follow-up,
weeks Analysis (e.g. ITT) N
ACR 20 (patients achieving 20% improvement)
ACR 50 (patients achieving 50% improvement)
ACR 70 (patients achieving 70% improvement)
# % # % # % ASCERTAIN^ Emery, 2019256
SRL 150 mg q2w 24 ITT
49 NR 63.3 NR 36.7 NR 18.4 SRL 200 mg q2w 51 NR 68.6 NR 41.2 NR 13.7 TCZ 4 mg/kg q4w 102 NR 75.5 NR 41.2 NR 22.5
ATTAIN Genovese, 2005258
ABT 10 mg/kg q4w + DMARDs 24 mITT
258 NR 50.4 NR 20.3 NR 10.2
PBO + DMARDs 133 NR 19.5 NR 3.8 NR 1.5 BREVACTA Kivitz, 2014112
TCZ-SC 24 mITT
89 NR 48 NR 28 NR 14 PBO-SC 47 NR 17 NR 13 NR 2
MOBILITY Genovese, 2015148
PBO + MTX
24 Unclear
109 NR 33 NR 12 NR 4 SRL 150 mg q2w +
MTX 108 NR 59 NR 36 NR 20
SRL 200 mg q2w + MTX 110 NR 64 NR 41 NR 19
TARGET Fleischmann, 2017288
PBO + csDMARDs
24 ITT
181 61 33.7 33 18.2 13 7.2 SRL 150 mg q2w +
csDMARDs 181 101 55.8 67 37 36 19.9
SRL 200 mg q2w + csDMARDs 184 112 60.9 75 40.8 30 16.3
RADIATE Emery, 2008280
4 mg/kg TCZ + MTX 24 ITT
161 NR 30.4 NR 16.8 NR 5 8 mg/kg TCZ + MTX 170 NR 50 NR 28.8 NR 12.4
PBO + MTX 158 NR 10.1 NR 3.8 NR 1.3
RA- BEACON Genovese, 2015274
PBO 24 mITT
176 NR 27.3 NR 13.1 NR 3.4 BRC 2 mg QD 174 NR 44.8 NR 23 NR 13.2 BRC 4 mg QD 177 NR 46.3 NR 29.4 NR 16.9
REFLEX Cohen, 2006285
PBO + MTX 24 mITT
201 NR 18 NR 5 NR 1 RTX 1,000 mg +
MTX 298 NR 51 NR 27 NR 12
Copyright 2019 Queen's Printer and Controller of HMSO. All rights reserved

Page 150 of 275
Author, year Intervention Follow-up,
weeks Analysis (e.g. ITT) N
ACR 20 (patients achieving 20% improvement)
ACR 50 (patients achieving 50% improvement)
ACR 70 (patients achieving 70% improvement)
# % # % # % GO-AFTER Smolen, 2009263
PBO 24 ITT
155 26 17 8 5 5 3 50 mg GOL 153 52 34 28 18 18 12
Abbreviations: ABT, abatacept; ACR, American College of Rheumatology; BRC, baricitinib; csDMARD, conventional disease modifying anti-rheumatic drug; GOL, golimumab; ITT, intention to treat;, IV, intravenous; mITT, modified intention to treat; MTX, methotrexate; NR, not reported; PBO, Placebo; Q2W, every 2 weeks; QD, once daily; RTX, rituximab;, SRK, sirukumab; SRL, sarilumab; TCZ, tocilizumab.
Copyright 2019 Queen's Printer and Controller of HMSO. All rights reserved

Page 151 of 275
Conclusions of the clinical effectiveness section
The company conducted a SLR that was appropriately aligned with the NICE final scope.
The ERG considered the company’s search strategies to be well-conducted and
reported. Although some issues were noted, the ERG was broadly satisfied that the
company identified all relevant RCTs for UPA and comparators. The ERG was broadly
satisfied with the study selection and quality assessment (QA) methods for the UPA
trials. The ERG noted however that there was a lack of detail on how the study selection
criteria were applied, meaning that the ERG could not definitively confirm that no trials
for the technology of interest were inappropriately excluded during the screening
process. Moreover, the ERG considered that the SELECT-SUNRISE trial did meet the
inclusion criteria for the SLR and therefore detailed clinical effectiveness evidence
should have been provided for this trial, especially since it informs the NMA and
economic modelling.
The ERG considered the four trials that were included as pivotal trials in the clinical
evidence submission to be appropriate and fulfilled the inclusion criteria. All were RCTs
and the study designs were in line with the NICE final scope and the SLR inclusion
criteria. The ERG noted that UPA was used as monotherapy in one of the pivotal trials
(SELECT-MONOTHERAPY), and was administered in combination with MTX and other
csDMARDs in other trials. The included trials were a mixture of PBO and/or active
controlled trials – active control was with ADA in SELECT-COMPARE and with MTX in
SELECT-MONOTHERAPY. The ERG noted that there were no UK sites in SELECT-
MONOTHERAPY and that the
************************************************************************************* The ERG
considered the study populations in all four trials to be relevant to the decision problem
and to exhibit a large degree of between-trial comparability, although differences in prior
medication regimens were noted. The ERG also noted that the range of populations in
each trial means that each trial ‘evidences’ multiple points on the NICE treatment
pathway, which could pose a challenge to interpretation and application of study findings.
Head-to-head evidence is provided for certain comparisons, although the key clinical
effectiveness comparisons that serve as inputs to the economic model are comparative
data derived from an NMA, in order to take into account the totality of the available
evidence across the network. The evidence presented in the CS broadly covered the
range of outcomes included in the NICE final scope, although it was noted that only
safety data were available for extra-articular manifestations. The ERG agreed that there
was generally a low risk of bias in the four pivotal trials for the technology of interest.
Copyright 2019 Queen's Printer and Controller of HMSO. All rights reserved

Page 152 of 275
The ERG found no discrepancies in trial results compared to the respective CSRs. The
ERG noted that there was some variation between the studies in the primary and
secondary outcomes used to assess clinical and functional efficacy and HRQoL of UPA.
The ERG also noted that, for three of the trials, between-group data were reported only
at 12-14 weeks. It is important to consider that the 26 week data include patients who
switched treatments.
Feasibility assessment was not explicitly reported for the NMAs undertaken. This is a
major omission that threatens the credibility of the NMAs presented. The ERG
considered the inclusion criteria for the NMA to be largely appropriate. However, due to a
lack of clarity in the reasons of exclusion, the ERG could not rule out the potential of
inappropriate exclusion of trials from the NMAs. While the ERG found errors in the QA of
included trials, the ERG also noted that the QA was not used to select or weight studies
in the NMA, or in the economic modelling. The ERG considered, therefore, that any
errors or potential errors in the QA of the remaining studies could affect transitivity of
networks in NMA, but would not necessarily impact choice of studies for NMA or
economic modelling.
The results of the NMA evidenced the effectiveness of UPA both as monotherapy, where
appropriate, and in combination with csDMARDs relative to comparators. These findings
were generally robust to sensitivity analysis. UPA ranked highly against other treatment
options in both the csDMARD-experienced and bDMARD-experienced treatment
networks. The statistical methods and assumptions described were appropriate, though
specific ambiguities (including the generation of reference group probabilities) remain.
However, the ERG urges caution in the interpretation of NMAs due to the strong
conceptual assumptions of exchangeability between populations and treatment
pathways required; challenges in replicating inclusion and exclusion decisions and the
analyses undertaken; and the ERG’s inability to recreate the findings of the NMA.
Copyright 2019 Queen's Printer and Controller of HMSO. All rights reserved

Page 153 of 275
5 Cost-effectiveness
ERG comment on companies review of cost-effectiveness evidence
5.1.1 Objective
The company performed a literature search in order to identify economic evaluations of
interventions used to treat people with moderate or severe RA.
5.1.2 Search strategy
The company completed searches to identify cost-effectiveness studies relevant to UPA
(and comparators) in patients with rheumatoid arthritis in December 2017, and these
were updated in April 2019. The cost effectiveness searches are reported in Appendix G
of the CS.
The following bibliographic databases were searched: Ovid Embase, MEDLINE, EBM
Reviews (incorporating the Cochrane Library databases), and EconLit. The search
strategy uses a combination of indexing (e.g. MeSH in MEDLINE) and free text (i.e. title
and abstract terms), and searches were not limited by language. Additional searches
were conducted for cost effectiveness studies in reference lists of included studies,
conference proceedings, HTA websites, the CEA Registry and EconPapers in RePEc.
The cost effectiveness searches use a combination of terms for the population
(rheumatoid arthritis), intervention (UPA), comparators, and study design (cost utility
analyses, cost effectiveness analyses, cost-benefit analyses, cost-minimisation
analyses), combined appropriately using Boolean logic.
The ERG noted several issues with the cost-effectiveness searches. Searches for all
biosimilars and brand names for comparators were not included in the cost-effectiveness
search strategies. Update searches completed in April 2019 did not use all relevant date
fields to limit searches (see Section 4.1.1 for further details). The company has not cited
a validated filter for the identification of cost-effectiveness studies, and subject headings
have not been adapted for each bibliographic databases. Several relevant subject
headings have not been included (for e.g. health economics/ in Embase). The NHS
Economic Evaluation Database was searched as part of EBM Reviews, and economic
terms have been applied unnecessarily. As a result of these issues, all relevant cost-
effectiveness studies may not have been identified.
Supplementary searches have not been fully reported, and search strategies have not
been provided for CEA Registry or EconPapers. The conference proceeding searches
Copyright 2019 Queen's Printer and Controller of HMSO. All rights reserved
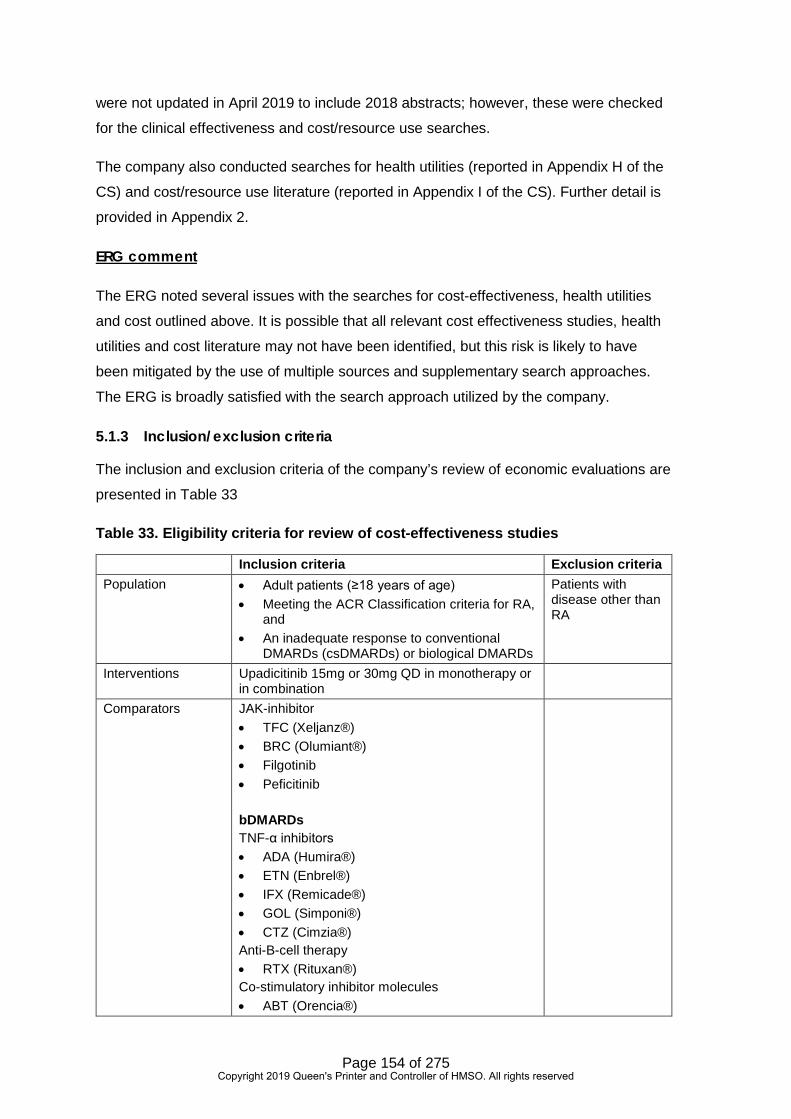
Page 154 of 275
were not updated in April 2019 to include 2018 abstracts; however, these were checked
for the clinical effectiveness and cost/resource use searches.
The company also conducted searches for health utilities (reported in Appendix H of the
CS) and cost/resource use literature (reported in Appendix I of the CS). Further detail is
provided in Appendix 2.
ERG comment
The ERG noted several issues with the searches for cost-effectiveness, health utilities
and cost outlined above. It is possible that all relevant cost effectiveness studies, health
utilities and cost literature may not have been identified, but this risk is likely to have
been mitigated by the use of multiple sources and supplementary search approaches.
The ERG is broadly satisfied with the search approach utilized by the company.
5.1.3 Inclusion/exclusion criteria
The inclusion and exclusion criteria of the company’s review of economic evaluations are
presented in Table 33
Table 33. Eligibility criteria for review of cost-effectiveness studies
Inclusion criteria Exclusion criteria Population • Adult patients (≥18 years of age)
• Meeting the ACR Classification criteria for RA, and
• An inadequate response to conventional DMARDs (csDMARDs) or biological DMARDs
Patients with disease other than RA
Interventions Upadicitinib 15mg or 30mg QD in monotherapy or in combination
Comparators JAK-inhibitor • TFC (Xeljanz®) • BRC (Olumiant®) • Filgotinib • Peficitinib bDMARDs TNF-α inhibitors • ADA (Humira®) • ETN (Enbrel®) • IFX (Remicade®) • GOL (Simponi®) • CTZ (Cimzia®) Anti-B-cell therapy • RTX (Rituxan®) Co-stimulatory inhibitor molecules • ABT (Orencia®)
Copyright 2019 Queen's Printer and Controller of HMSO. All rights reserved

Page 155 of 275
Inclusion criteria Exclusion criteria Anti-IL-6 therapy • TCZ (Actemra®) • SRK • SRL Anti-IL-1 therapy • Anakinra (Kineret®) Biosimilars to any of the interventions listed above PBO Interventions may be used alone or in combination with any other biological/ conventional DMARDs. No restrictions to drug dose or formulation, mode of delivery or duration of treatment. However, studies with at least one treatment arm with a licensed dose are of primary interest.
Outcomes Main outcomes: • ICER: Cost per QALY • ICER: Cost per DALY • ICER: Cost per event avoided Additional outcomes: • Range of ICERs as per sensitivity analyses • Assumptions underpinning model structures • Key costs drivers • Sources of clinical, cost and quality of life
inputs • Discounting of costs and health outcomes • Model summary and structure
Outcome(s) not listed
Study design • Cost-utility analyses • Cost-effectiveness analyses • Cost-benefit analyses • Cost-minimisation analyses
Language restrictions
English abstracts of foreign publications will be considered.
Foreign language publications without an English abstract
Date of publication No restriction
-
Countries/global reach
No restriction -
Key: ABT, abatacept; ACR, American College of Rheumatology, ADA, adalimumab; bDMARDs, biologic disease modifying antirheumatic drugs; BRC, baricitinib; csDMARDs, Conventional Disease-modifying Antirheumatic Drugs; CTZ, certolizumab pegol; ETN, etanercept; GOL, golimujmab; IFX, infliximab; NICE, National Institute for Health and Care Excellence; RA, rheumatoid arthritis; RTX, rituximab; SRK, sirukumab; SRL, sarilumab; TCZ, tocilizumab; TFC, tofacitinib; UK, United Kingdom
Source: CS, Appendix G, p292
The criteria set out by the company in Table 38 of the CS (CS, Appendix G) were aligned
with NICE scope. The ERG noted that the company specified economic evaluations
comparing UPA (15 mg or 30 mg QD) versus biological DMARDs; however, given the list
Copyright 2019 Queen's Printer and Controller of HMSO. All rights reserved
Page 156 of 275
of studies included the ERG consider it more likely that the inclusion criteria reflect those
specified for the company’s reviews of health-related quality of life and of cost and
healthcare resource use whereby studies evaluating any biological DMARD (as mono- or
combination therapy) (in line with NICE scope) compared with another biological
DMARD (in line with NICE scope). The ERG considers, however, that this is likely a
reporting error.
The company also presented eligibility criteria for its reviews of HRQoL and of cost and
healthcare resource use (CS, Appendix H [Table 65], and CS, Appendix I [Table 69],
respectively). The criteria for these reviews were broadly aligned with the NICE final
scope.
5.1.4 Results
The review was conducted in two stages: an initial review was conducted in December
2017 and an update was performed in April 2019 (refer to CS Appendix G, Section G.7.1
and G.7.2). A Preferred Reporting Items for Systematic Reviews and Meta-Analyses
(PRISMA) flow diagram combining the original and update reviews is presented by the
company in Figure 36 of the CS (CS, Appendix G). The ERG queried a discrepancy in
the PRISMA flow diagram which the company satisfactorily addressed in the clarification
response (refer to clarification response B1). A total of 241 publications (reporting 238
economic evaluations) were considered eligible for inclusion in the review. Of these, 228
publications were economic evaluations, and 13 publications reported health technology
assessment (HTA) reports with economic models. Among the included studies the
company identified 32 UK-based economic evaluations, of which 17 were NICE
technology appraisals.
The company focused on published cost-effectiveness reviews that were set within a UK
context. The ERG considers this to be a pragmatic way in which to reduce the number of
studies to summarise. A description and critical appraisal using the Drummond checklist
of these economic evaluations was provided by the Company in Appendix G of the CS
(CS Appendix G, Section G.8 and G.10, respectively). Although the non-UK economic
evaluations were not discussed further, a list of studies was provided by the company in
Section G.9 (Table 55; Appendix G) of the CS.
The company reported that the economic model developed was “consistent with the
assessment group (AG) model/approach in TA375,31 and the recent submissions of BRC
(TA466),51 TFC (TA480),32 and SRL (TA485)52 for the treatment of RA; with necessary
adaptations or additions in order to incorporate the modelling of UPA therapy and
Copyright 2019 Queen's Printer and Controller of HMSO. All rights reserved

Page 157 of 275
additional patient populations.” (CS Document B, Section B.3.2). The model for TA37531
has been published in a peer-reviewed journal.299
In the review of HRQoL, the ERG queried the exclusion of 131 studies on publication
date (year ≤2017). In clarification response B3, the company confirmed that these
studies had indeed been identified in the original search. The review of HRQoL followed
the same approach as the review of economic evaluations in that the company focused
on studies that compared interventions (aligned with NICE scope), that were set within a
UK context. A list of non-UK studies was also provided (CS, Appendix H, Table 66).
Outcomes of interest were utilities for health states or mode of administration, and
mapping studies. Eligible studies were not summarised although some had been
captured in the review of economic evaluations. Studies were, however, quality
assessed (CS Appendix H, Table 68).
In the review of cost and healthcare resource use, a total of 17 unique studies from 18
publications were identified (CS Appendix I, Figure 40). Eligible studies were
summarised (CS, Appendix I, Table 70), and methodological limitations were assessed
using the checklist reported by Molinier and colleagues300 (CS Appendix I, Table 71 and
Table 72).
5.1.5 Conclusions
None of the economic evaluations identified included UPA. As such, the company
developed a de novo health economic model to assess the cost effectiveness of UPA
(Section 5.2). Studies identified in the reviews of utilities and of cost and healthcare
resource use were used to inform model parameters.
Summary of company’s submitted economic evaluation
The company developed a de novo economic model to assess the cost effectiveness of
UPA in adults with moderate-to-severe RA, though much of it mirrors the structure and
inputs of the TA375 model.
The company model is programmed in Visual Basic for Applications (VBA) with a
Microsoft Excel front end acting as a database store of input values and model outputs.
In discussion with NICE, the ERG has treated the VBA programming as a black box
model.
The evaluation of the company’s submitted economic evaluation has been hampered by
a series of staggered changes subsequent to the ERG receiving the original submission
on 5 July 2019. At different times over the course of the assessment:
Copyright 2019 Queen's Printer and Controller of HMSO. All rights reserved

Page 158 of 275
• The UPA PAS was changed.
• The list of bDMARD PASs plus a CMU price for biosimilar IFX was extended to
CMU prices for all the biosimilars.
• The company model was revised to alter the time to discontinuation of treatment
curves, but this introduced further errors.
• The company model was revised a second time to correct the first model revision
but additional errors were identified around the implementation of comparator
PASs, requiring a 3rd model revision.
The final set of company results was received by the ERG on the 27 August 2019. The
final company model was received by the ERG on the 29 August 2019. The deadline for
the ERG report was the 10 September 2019.
The following subsections describe the company’s methods in more detail based upon
the written submissions of the company, including the model structure, the data sources
used and applicability of the analysis in comparison to the NICE reference case.
5.2.1 NICE reference case checklist
The NICE reference case checklist is given in Table 34.
Table 34. NICE reference case checklist
Attribute Reference case and TA Methods guidance
Does the de novo economic evaluation match the reference case
Comparator(s) Therapies routinely used in the NHS, including technologies regarded as current best practice.
Among moderate RA patients UPA is compared with BSC, MTX and intensified csDMARDs. Among severe RA patients UPA is compared with other advanced DMARDs. The ERG agrees with the general approach but questions the logic of some of the treatment sequences.
Patient group As per NICE scope. “Adults with moderate to severe active rheumatoid arthritis whose disease has responded inadequately to or who are intolerant of one or more DMARDs, including csDMARDs or bDMARDs”
Yes
Perspective costs NHS & Personal Social Services
Yes.
Copyright 2019 Queen's Printer and Controller of HMSO. All rights reserved

Page 159 of 275
Attribute Reference case and TA Methods guidance
Does the de novo economic evaluation match the reference case
Perspective benefits All health effects on individuals
Yes.
Form of economic evaluation
Cost-effectiveness analysis Cost utility analysis.
Time horizon Sufficient to capture differences in costs and outcomes
45 years. This is sufficient to be a lifetime horizon for the vast majority of patients.
Synthesis of evidence on outcomes
Systematic review The company applies the clinical effectiveness estimates of its two NMAs: the csDMARD-IR NMA and the bDMARD-IR NMA. Given the NICE methods guide, it can be argued that the head to head results of the SELECT trials should be applied in the modelling where UPA is being compared to BSC, control or PBO.
Outcome measure Quality adjusted life years Yes. Health states for QALY Described using a
standardised and validated instrument
The approach to quality of life involves mapping from the modelled HAQ scores to pain scores, and applying the combination of these to map onto an EQ-5D quality of life function from the literature. This is the same approach as in TA375, but the company derives its own HAQ to pain mapping function from SELECT trials’ data.
Benefit valuation Time-trade off or standard gamble
The EQ-5D mapping function is not stated in the paper, but the lowest feasible value corresponds with that of the usual UK tariff.
Source of preference data for valuation of changes in HRQL
Representative sample of the public
Yes, for the EQ-5D values within the HAQ and pain mapping function taken from the literature.
Discount rate An annual rate of 3.5% on both costs and health effects
Yes.
Equity An additional QALY has the same weight regardless of the other characteristics of the individuals receiving the health benefit
Yes.
Probabilistic modelling Probabilistic modelling Yes. The ERG has not undertaken any probabilistic modelling due to time constraints.
Copyright 2019 Queen's Printer and Controller of HMSO. All rights reserved

Page 160 of 275
Attribute Reference case and TA Methods guidance
Does the de novo economic evaluation match the reference case
Sensitivity analysis A wide range of univariate sensitivity analyses are included.
Abbreviations: bDMARD, biologic disease modifying antirhumatic drug; BSC, best supportive care; csDMARD, conventional synthetic disease modifying antirheuamtic drug; DMARD, disease modifying antirheumatic drug; EQ-5D, Euroqol five dimensions; ERG, Evidence Review Group; HAQ, health assessment questionnaire; HRQoL, health-related quality of life; MTX, methotrexate; NHS, National Health Service; NICE, National Institute for Health and Care Excellence; QALY, quality adjusted life year; TA, tehcnology appraisal
5.2.2 Model structure
The company has updated the model structure diagram to take into account the
possibility of worsening from moderate RA to severe RA. In general, patients trial a first-
line treatment and if they achieve a EULAR response at six months remain on it and
have a corresponding reduction in their HAQ. Those not achieving a EULAR response at
six months go on to trial the next treatment in the sequence. Treatment cessation curves
are also modelled. When a patient ceases treatment their HAQ score rebounds to
baseline, but will improve if they have a EULAR response to their next in line treatment.
Copyright 2019 Queen's Printer and Controller of HMSO. All rights reserved

Page 161 of 275
Figure 8. Model structure
Abbreviations: BSC, best supportive care; DAS28, disease activity score in 28 joints; EQ-5D, EuroQol Five Dimensions; EULAR, European League Against Rheumatism; HAQ, health assessment questionnaire; RA, rheumatoid arthritis
Copyright 2019 Queen's Printer and Controller of HMSO. All rights reserved

Page 162 of 275
5.2.3 Population
The company models the following 10 population subgroups:
• 1a: Moderate RA, MTX intolerant, RTX tolerant, failed one csDMARD
• 1b: Moderate RA, MTX tolerant, RTX tolerant, failed one csDMARD
• 2a: Moderate RA, MTX intolerant, RTX tolerant, failed ≥2 csDMARD
• 2b: Moderate RA, MTX tolerant, RTX tolerant, failed ≥2 csDMARD
• 3a: Severe RA, MTX intolerant, RTX tolerant, failed ≥2 csDMARD
• 3b: Severe RA, MTX tolerant, RTX tolerant, failed ≥2 csDMARD
• 4a: Severe RA, MTX intolerant, RTX tolerant, failed one bDMARD
• 4b: Severe RA, MTX tolerant, RTX intolerant, failed one bDMARD
• 5: Severe RA, MTX tolerant, RTX tolerant, failed one bDMARD
• 6: Severe RA, MTX tolerant, RTX tolerant, failed RTX
The baseline characteristics of the patient subgroups are based upon the pooled
SELECT trial data (Table 35).
Table 35. Patient baseline characteristics
csDMARD-IR bDMARD-IR Moderate RA Severe RA Severe RA Mean (SD) Mean (SD) Mean (SD)
Age ***** ******* ***** ******* ***** ****
HAQ **** ****** **** ****** **** ******
Weight ***** ****** ***** ******* ***** *******
DAS **** ****** **** ****** **** ******
Disease duration **** ****** **** ****** ***** ******
Female *** ***** *** ***** *** ***** Abbreviations: bDMARD, biologic disease modifying antirheumatic drugs; csDMARD, conventional synthetic disease modifying antirheumatic drugs; DAS, disease activity score; HAQ, health assessment questionnaire; IR, inadequate response; RA, rheumatoid arthritis; SD, standard deviation
The model is an individual patient discrete event simulation. The company samples
10,000 patients using the above distributions. It appears that the model shows
reasonable convergence when 10,000 patients are run through it.
Copyright 2019 Queen's Printer and Controller of HMSO. All rights reserved

Page 163 of 275
5.2.4 Interventions and comparators
In common with the previous NICE assessments in RA, individual treatments are not
directly compared. Rather, treatment sequences are compared. For the modelling of
moderate RA patients UPA is typically assumed to lengthen the treatment sequence,
and a longer UPA containing treatment sequence is compared with a shorter non-UPA
treatment sequence. For the modelling of severe RA patients UPA is typically assumed
to displace another treatment and treatment sequences of the same length are
compared.
5.2.4.1 Position: 1a: Moderate RA: MTX intolerant, RTX tolerant, failed one csDMARD
The treatment sequences for those remaining with moderate RA are provided in Table
36.
Table 36. Sequence: 1a: Moderate RA: MTX intolerant, RTX tolerant, failed one csDMARD: Among moderate patients
Sequence First-line Second-line Third-line 1. UPA Int.csDMARD BSC
2. Int.csDMARD BSC .. Abbreviations: bDMARD, biologic disease modifying antirheumatic drugs; BSC, best supportive care; csDMARD, conventional synthetic disease modifying antirheumatic drugs; int, intensified; UPA, upadacitinib
Those progressing to severe RA receive a different treatment sequence depending upon
their treatment when they were moderate (Table 37). Those worsening to severe having
been on Sequence 1 when moderate receive Sequence 3 when severe. Similarly, those
worsening to severe having been on Sequence 2 when moderate receive Sequence 4
when severe.
Table 37. Sequence: 1a: Moderate RA: MTX intolerant, RTX tolerant, failed one csDMARD: Among patients who have progressed to severe
Sequence First-line Second-line Third-line Fourth-line 3. ADA SRL BSC ..
4. BRC ADA SRL BSC Abbreviations: ADA, adalimumab; BRC, baricitinib; BSC, best supportive care; SRL, sarilumab; UPA, upadacitinib
In the above BRC monotherapy is assumed to have the same efficacy as BRC+MTX in
the cDMARD-IR NMA.
Copyright 2019 Queen's Printer and Controller of HMSO. All rights reserved

Page 164 of 275
5.2.4.2 Position: 1b: Moderate RA: MTX tolerant, RTX tolerant, failed one csDMARD
The treatment sequences for those remaining with moderate RA are provided in Table
38.
Table 38. Sequence: 1b: Moderate RA: MTX tolerant, RTX tolerant, failed one csDMARD: Among moderate patients
Sequence First-line Second-line Third-line Fourth-line 1. UPA+MTX Int.csDMARD MTX BSC
2. UPA Int.csDMARD MTX BSC
3. Int.csDMARD MTX BSC .. Abbreviations: BSC, best supportive care; csDMARD, conventional synthetic disease modifying antirheumatic drugs; int, intolerant; MTX, methotrexate; SRL, sarilumab; UPA, upadacitinib
As with the treatment sequences for the MTX intolerant, among the MTX tolerant those
progressing to severe RA receive a different treatment sequence depending upon their
treatment when they were moderate: Sequence 1 to Sequence 4, Sequence 2 to
Sequence 5 and Sequence 3 to Sequence 6 (Table 39).
Table 39. Sequence: 1b: Moderate RA: MTX tolerant, RTX tolerant, failed one csDMARD: Among patients who have progressed to severe
Sequence First-line Second-line
Third-line Fourth-line Fifth-line Sixth-line
4. ADA+MTX RTX+MTX TCZIV+MTX MTX BSC ..
5. ADA+MTX RTX+MTX TCZIV+MTX MTX BSC ..
6. BRC+MTX ADA+MTX RTX+MTX TCZIV+MTX MTX BSC Abbreviations: ADA, adalimumab; BRC, baricitinib; BSC, best supportive care; IV, intravenous; MTX, methotrexate; RTX, rituximab; TCZ, tocilizumab
5.2.4.3 Position: 2a: Moderate RA: MTX intolerant, RTX tolerant, failed ≥2 csDMARDs
The treatment sequences for those remaining with moderate RA are provided in Table
40.
Table 40. Sequence: 2a: Moderate RA: MTX intolerant, RTX tolerant, failed ≥2 csDMARD: Among moderate patients
Sequence First-line Second-line 1. UPA BSC
2. BSC .. Abbreviations: BSC, best supportive care; UPA, upadacitinib
Copyright 2019 Queen's Printer and Controller of HMSO. All rights reserved

Page 165 of 275
As before, those progressing to severe RA receive a different treatment sequence
depending upon their treatment when they were moderate (Table 41).
Table 41. Sequence: 2a: Moderate RA: MTX intolerant, RTX tolerant, failed ≥2 csDMARDs: Among patients who have progressed to severe
Sequence First-line Second-line Third-line Fourth-line 3. ADA SRL BSC ..
4. BRC ADA SRL BSC Abbreviations: ADA, adalimumab; BRC, baricitinib; BSC, best supportive care; SRL, sarilumab
In the above, BRC monotherapy is assumed to have the same efficacy as BRC+MTX,
taken from the cDMARD-IR NMA.
5.2.4.4 Position: 2b: Moderate RA: MTX tolerant, RTX tolerant, failed ≥2 csDMARDs
The treatment sequences for those remaining with moderate RA are provided in Table
42.
Table 42. Sequence: 2b: Moderate RA: MTX tolerant, RTX tolerant, failed ≥2 csDMARDs: Among moderate patients
Sequence First-line Second-line Third-line 1. UPA+MTX MTX BSC
2. UPA MTX BSC
3. MTX BSC .. Abbreviations: BSC, best supportive care; MTX, methotrexate; UPA, upadacitinib
Again, the treatment sequences for those worsening to severe RA depend upon which
treatment sequence was received when with moderate RA (Table 43).
Table 43. Sequence: 2b: Moderate RA: MTX tolerant, RTX tolerant, failed ≥2 csDMARDs: Among patients who have progressed to severe
Sequence First-line Second-line
Third-line Fourth-line Fifth-line Sixth-line
4. ADA+MTX RTX+MTX TCZIV+MTX MTX BSC ..
5. ADA+MTX RTX+MTX TCZIV+MTX MTX BSC ..
6. BRC+MTX ADA+MTX RTX+MTX TCZIV+MTX MTX BSC Abbreviations: ADA, adalimumab; BRC, baricitinib; BSC, best supportive care; IV, intravenous; MTX, methotrexate; RTX, rituximab; TCZ, tocilizumab
Copyright 2019 Queen's Printer and Controller of HMSO. All rights reserved

Page 166 of 275
5.2.4.5 Position: 3a: Severe RA: MTX intolerant, RTX tolerant, failed ≥2 csDMARDs
The company models the following treatment sequences for the comparison of UPA at
first-line against the bDMARDs. The bDMARDs are not pooled but considered
individually with there being seven treatment sequences with bDMARD comparators at
first-line.
Table 44. Sequence: 3a: Severe RA: MTX intolerant, RTX tolerant, failed ≥2 csDMARDs
Sequence First-line Second-line Third-line 1. UPA SRL BSC
2. bDMARD SRL BSC Abbreviations: bDMARDs, biologic disease modifying antirheumatic drugs; BSC, best supportive care; SRL, sarilumab; UPA, upadacitinib
The seven bDMARDs considered as comparators at first-line are: ADA, BRC, CTZ, ETN,
SRL, TFC, TCZIV and TCZSC.
For the sequence with SRL at first-line, the second-line treatment is assumed to be BRC.
The effectiveness of BRC and CTZ is assumed to be the same as ADA, taken from the
cDMARD-IR NMA. The effectiveness of TCZSC is assumed to be the same as TCZIV,
taken from the cDMARD-IR NMA.
5.2.4.6 Position: 3b: Severe RA: MTX tolerant, RTX tolerant, failed ≥2 csDMARDs
The company models the following treatment sequences for the comparison of UPA at
first-line against the bDMARDs (Table 45). The bDMARDs are not pooled but considered
individually with there being 12 treatment sequences with bDMARD+MTX comparators
at first-line.
Table 45. Sequence: 3b: Severe RA: MTX tolerant, RTX tolerant, failed ≥2 csDMARDs
Sequence First-line Second-line Third-line Fourth-line Fifth-line 1. UPA+MTX RTX+MTX TCZIV+MTX MTX BSC
2. UPA RTX+MTX TCZIV+MTX MTX BSC
3. bDMARD+MTX RTX+MTX TCZIV+MTX MTX BSC Abbreviations: bDMARDs, biologic disease modifying antirheumatic drugs; BSC, best supportive care; IV, intravenous; MTX, methotrexate; RTX, rituximab; TCZ, tocilizumab; UPA, upadacitinib
Copyright 2019 Queen's Printer and Controller of HMSO. All rights reserved

Page 167 of 275
The 12 bDMARDs+MTX considered as comparators at first-line are: ABTIV+MTX,
ABTSC+MTX, ADA+MTX, BRC+MTX, CTZ+MTX, ETN+MTX, GOL+MTX, IFX+MTX,
SRL+MTX, TFC+MTX, TCZIV+MTX and TCZSC+MTX.
For the treatment sequences with TCZIV+MTX and TCZSC+MTX at first-line, the third-line
treatment is assumed to be SRL+MTX.
5.2.4.7 Position: 4a: Severe RA: MTX intolerant, RTX tolerant, failed one bDMARD
The company models the following treatment sequences for the comparison of UPA at
“first-line” against the bDMARDs, though obviously this is among patients who have
already received and failed on one bDMARD (Table 46). The bDMARDs are not pooled
but considered individually with there being eight treatment sequences with bDMARD
comparators at first-line.
Table 46. Sequence: 4a: Severe RA: MTX intolerant, RTX tolerant, failed one bDMARD
Sequence First-line Seconline 1. UPA BSC
2. bDMARD BSC Abbreviations: bDMARDs, biologic disease modifying antirheumatic drugs; BSC, best supportive care; UPA, upadacitinib
The eight bDMARDs considered as comparators at first-line are: ADA, BRC, CTZ, ETN,
SRL, TFC, TCZIV and TCZSC.
The effectiveness of all treatments is assumed to be the same as BRC+MTX, taken from
the bDMARD-IR NMA.
5.2.4.8 Position: 4b: Severe RA: MTX tolerant, RTX intolerant, failed one bDMARD
The company models the following treatment sequences for the comparison of UPA at
first-line against the bDMARDs (Table 47). The bDMARDs are not pooled but considered
individually with there being treatment sequences with bDMARD+MTX comparators at
first-line.
Copyright 2019 Queen's Printer and Controller of HMSO. All rights reserved

Page 168 of 275
Table 47. Sequence: 4b: Severe RA: MTX tolerant, RTX intolerant, failed one bDMARD
Sequence First-line Second-line Third-line Fourth-line 1. UPA+MTX TCZIV+MTX MTX BSC
2. UPA TCZIV+MTX MTX BSC
3. bDMARD+MTX TCZIV+MTX MTX BSC Abbreviations: bDMARDs, biologic disease modifying antirheumatic drugs; BSC, best supportive care; IV, intravenous; MTX, methotrexate; TCZ, tocilizumab; UPA, upadacitinib
The 12 bDMARDs+MTX considered as comparators at first-line are: ABTIV+MTX,
ABTSC+MTX, ADA+MTX, BRC+MTX, CTZ+MTX, ETN+MTX, GOL+MTX, IFX+MTX,
SRL+MTX, TFC+MTX, TCZIV+MTX and TCZSC+MTX.
For the treatment sequences with TCZIV+MTX and TCZSC+MTX at first-line, the second-
line treatment is assumed to be SRL+MTX.
ABTSC+MTX is assumed to have the same efficacy as ABTIV+MTX, taken from the
bDMARD-IR NMA.
ADA+MTX ETN+MTX and IFX+MTX are assumed to have the same efficacy as
BRC+MTX, taken from the bDMARD-IR NMA.
5.2.4.9 Position: 5: Severe RA: MTX tolerant, RTX tolerant, failed one bDMARD
The company models the following treatment sequences for the comparison of UPA at
first-line against the RTX+MTX (Table 48).
Table 48. Sequence: 5: Severe RA: MTX tolerant, RTX tolerant, failed one bDMARD
Sequence First-line Second-line Third-line Fourth-line 1. UPA+MTX TCZIV+MTX MTX BSC
2. UPA TCZIV+MTX MTX BSC
3. RTX+MTX TCZIV+MTX MTX BSC Abbreviations: BSC, best supportive care; IV, intravenous; MTX, methotrexate; RTX, rituximab; TCZ, tocilizumab; UPA, upadacitinib
UPA is assumed to have the same efficacy as BRC+MTX, taken from the bDMARD-IR
NMA.
5.2.4.10 Position: 6: Severe RA: MTX tolerant, RTX tolerant, failed RTX
The company models the following treatment sequences for the comparison of UPA at
first-line against the RTX+MTX (Table 49).
Copyright 2019 Queen's Printer and Controller of HMSO. All rights reserved

Page 169 of 275
Table 49. Sequence: 6: Severe RA: MTX tolerant, RTX tolerant, failed RTX
Sequence First-line Second-line Third-line 1. UPA+MTX MTX BSC
2. UPA MTX BSC
2. SRL+MTX MTX BSC
3. TCZIV+MTX MTX BSC Abbreviations: BSC, best supportive care; IV, intravenous; MTX, methotrexate; TCZ, tocilizumab; SRL, sarilumab; UPA, upadacitinib
UPA is assumed to have the same efficacy as BRC+MTX, taken from the bDMARD-IR
NMA.
5.2.5 Perspective, time horizon and discounting
The perspective and discounting are as per the NICE reference case.
The time horizon is 45 years for the base case. Given mean (SD) baseline ages of 54
(13) years for the moderate population, and 54 (12) years for the severe population a
reasonable number of people with RA will remain alive at the end of the time horizon:
around 8% and 5% of the moderate and severe populations, respectively.
If the time horizon is extended to 60 years, for the company modelling at position 2b this
only worsens the ICER from £13,434 per QALY to £13,549 per QALY. Given that the
model does not anticipate any survival gains, it seems likely that towards the end of the
model the patient experience is similar in both arms and so there is little net effect from
lengthening the time horizon. The ERG does not explore this further.
5.2.6 Treatment effectiveness and extrapolation
5.2.6.1 Treatment effectiveness: EULAR response rates
The treatment effectiveness estimates are based upon the EULAR response estimates
of the two company NMAs: the csDMARD-IR NMA and the bDMARD-IR NMA. An
additional “treatment” of BSC is included, which is assumed to have zero EULAR
response rates. The mean EULAR response rates that are derived from the company
NMA estimates, in order of increasing effectiveness within the cDMARD-IR NMA, are
provided in Table 50.
Copyright 2019 Queen's Printer and Controller of HMSO. All rights reserved

Page 170 of 275
Table 50. Mean EULAR response rates
Company NMA results csDMARD-IR bDMARD-IR Treatment Abbreviation Mod. Good Mod. Good Best supportive care BSC ** ** ** **
Placebo PBO *** *** ** **
cDMARD MTX *** *** *** ***
Intensive cDMARD Int cDMARD *** *** ** **
Etanercept 50mg ETN *** *** ** **
Adalimumab 40mg ADA *** *** ** **
Tofacitinib 5mg TFC *** *** ** **
Sarilumab 150mg + cDMARD n.a. *** *** *** ***
Sarilumab 200mg SRL *** *** ** **
Rituximab 2g + cDMARD RTX+MTX *** *** *** ***
Infliximab 3mg/kg + cDMARD IFX+MTX *** *** ** **
Abatacept 125mg + cDMARD ABTSC+MTX *** *** ** **
Abatacept 10mg/kg + cDMARD ABTIV+MTX *** *** *** ***
Etanercept 50mg + cDMARD ETN+MTX *** *** ** **
Baricitinib 2mg + cDMARD BRC+MTX *** *** *** ***
Adalimumab 40mg + cDMARD ADA+MTX *** *** ** **
Upadacitinib 15mg UPA *** *** ** **
Tofacitinib 5mg + cDMARD TFC+MTX *** *** *** ***
Baricitinib 4mg + cDMARD BRC+MTX *** *** *** ***
Tocilizumab 162mg + cDMARD TCZSC+MTX *** *** *** ***
Golimumab 50mg + cDMARD GOL+MTX *** *** *** ***
Sarilumab 200mg + cDMARD SRL+MTX *** *** *** ***
Tocilizumab 8mg/kg + cDMARD TCZIV+MTX *** *** *** ***
Tocilizumab 8mg/kg TCZIV *** *** ** **
Tofacitinib 10mg + cDMARD TFC+MTX *** *** *** ***
Upadacitinib 15mg + cDMARD UPA+MTX *** *** *** ***
Certolizumab 200 mg + cDMARD CTZ+MTX *** *** *** *** Abbreviations: bDMARD, biologic disease modifying antirheumatic drugs; csDMARDs, conventional synthetic disease modifying antirheumatic drugs; EULAR, European League Against Rheumatism; IR, inadequate response; Mod, moderate; NMA, network meta-analysis
Where the NMAs do not provide EULAR response estimates for a treatment, it is
assumed to have the same clinical effectiveness as another treatment within the NMA,
typically that of BRC or ADA. These assumptions are summarised in more detail in
Section 5.2.4 above.
Copyright 2019 Queen's Printer and Controller of HMSO. All rights reserved

Page 171 of 275
5.2.6.2 Treatment effectiveness: EULAR response rates and the HAQ
The model is largely driven by (1) direct drug and administration costs and (2) the
evolution of patients’ HAQ scores. The HAQ scores determine quality of life and inpatient
costs. EULAR responses are assumed to result in the following improvements in
patients’ HAQ scores. The base case values are the same as those applied in TA37531,
with the company supplying an additional set of values based upon the pooled SELECT
trials’ data.
Table 51. EULAR responses relationship with HAQ changes
Base case SELECT trials Mean (SE) Mean (SE) None 0.000 .. -0.123 (0.018)
Moderate -0.317 (0.048) -0.481 (0.016)
Good -0.673 (0.112) -0.755 (0.019) Abbreviations: HAQ, health assessment questionnaire; SE, standard error
HAQ changes are not differentiated by whether a patient has moderate RA or severe
RA. For the SELECT trials’ data the HAQ change for those without a EULAR response
appeared to be set to zero.
Given the patient baseline characteristics, the above changes imply that a substantial
proportion of those with a good EULAR response will see their HAQ fall to zero: perhaps
a little over 20% among those with moderate RA.
The model contains the facility to assume that the HAQ change occurs immediately,
evolves linearly over six months or occurs at six months. The company base case
assumes that the HAQ changes at six months. It can be argued that this is conservative
towards the most effective treatment.
The ERG does not explore applying the SELECT trials’ HAQ changes as it appears that
the HAQ change for no EULAR response is probably ignored. It can be noted that the
net effect relative to no EULAR response is -0.358 for a moderate EULAR response and
-0.632 for a good EULAR response. These net effects are not that different from the
values of the base case.
5.2.6.3 Extrapolation: Treatment cessation
The company digitised the treatment cessation curves estimated in TA37531 from the
British Society of Rheumatology Biologics Register (BSRBR) data from 7,743 patients,
Copyright 2019 Queen's Printer and Controller of HMSO. All rights reserved

Page 172 of 275
with there being separate curves for moderate RA patients and for severe RA patients.
The company then fitted the usual set of functional forms to them. The original company
model was found to have errors in the statistical analyses and the company submitted a
revised model, with the ERG receiving the final company model on the 29 August. The
digitized curves and the fitted generalised gammas derived by the ERG from clarification
data are provided in Figure 9, the curves for those with a moderate EULAR response
being to the left and for those with a good EULAR response to the right.
Figure 9. Treatment cessation curve: Moderate RA
Abbreviations: KM, Kaplan-Meier
Figure 10. Treatment cessation curve: Severe RA
Abbreviations: KM, Kaplan-Meier
Copyright 2019 Queen's Printer and Controller of HMSO. All rights reserved
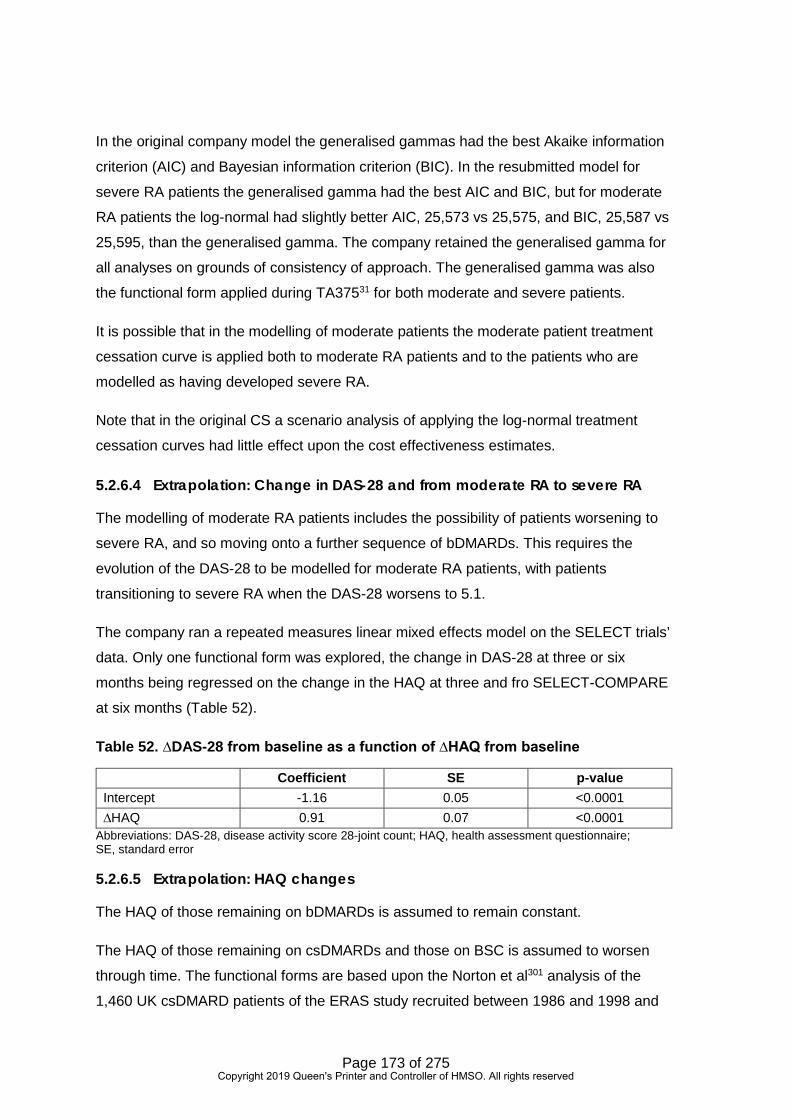
Page 173 of 275
In the original company model the generalised gammas had the best Akaike information
criterion (AIC) and Bayesian information criterion (BIC). In the resubmitted model for
severe RA patients the generalised gamma had the best AIC and BIC, but for moderate
RA patients the log-normal had slightly better AIC, 25,573 vs 25,575, and BIC, 25,587 vs
25,595, than the generalised gamma. The company retained the generalised gamma for
all analyses on grounds of consistency of approach. The generalised gamma was also
the functional form applied during TA37531 for both moderate and severe patients.
It is possible that in the modelling of moderate patients the moderate patient treatment
cessation curve is applied both to moderate RA patients and to the patients who are
modelled as having developed severe RA.
Note that in the original CS a scenario analysis of applying the log-normal treatment
cessation curves had little effect upon the cost effectiveness estimates.
5.2.6.4 Extrapolation: Change in DAS-28 and from moderate RA to severe RA
The modelling of moderate RA patients includes the possibility of patients worsening to
severe RA, and so moving onto a further sequence of bDMARDs. This requires the
evolution of the DAS-28 to be modelled for moderate RA patients, with patients
transitioning to severe RA when the DAS-28 worsens to 5.1.
The company ran a repeated measures linear mixed effects model on the SELECT trials’
data. Only one functional form was explored, the change in DAS-28 at three or six
months being regressed on the change in the HAQ at three and fro SELECT-COMPARE
at six months (Table 52).
Table 52. ∆DAS-28 from baseline as a function of ∆HAQ from baseline
Coefficient SE p-value Intercept -1.16 0.05 <0.0001 ∆HAQ 0.91 0.07 <0.0001
Abbreviations: DAS-28, disease activity score 28-joint count; HAQ, health assessment questionnaire; SE, standard error
5.2.6.5 Extrapolation: HAQ changes
The HAQ of those remaining on bDMARDs is assumed to remain constant.
The HAQ of those remaining on csDMARDs and those on BSC is assumed to worsen
through time. The functional forms are based upon the Norton et al301 analysis of the
1,460 UK csDMARD patients of the ERAS study recruited between 1986 and 1998 and
Copyright 2019 Queen's Printer and Controller of HMSO. All rights reserved

Page 174 of 275
with 10 years follow up. This was also the source used to model the HAQ of those
remaining on cDMARDs in TA37531. The worsening of HAQ is limited to 15 years, which
the company states is in line with TA37531.
5.2.6.6 Extrapolation: Mortality
The mortality hazard ratios of TA37531 are applied using the same method of TA375 to
the individual patients’ baseline HAQ scores (Table 53).
Table 53. Baseline HAQ and mortality hazard ratios
Baseline HAQ Mortality HR 0.000 1.0
0.125-0.375 1.4
0.500-0.875 1.5
1.000-1.375 1.8
1.500-1.875 2.7
2.000-2.375 4.0
2.500-3.000 5.5 Abbreviations; HAQ, health assessment questionnaire; HR, hazard ratio
Note that the mortality multipliers are only applied to baseline HAQ scores to estimate
individual patients’ survival, as per TA37531. The model does not anticipate any survival
gain from UPA.
5.2.6.7 Adverse event rates
Adverse event rates were estimated from SELECT-COMPARE with the control arm
providing estimates for csDMARDs, ADA for bDMARDs and UPA for JAK inhibitors.
Annual rates of SAEs were 0.096 for csDMARDs, 0.156 for bDMARDs and 0.129 for
JAK inhibitors.
The ERG does not know how rescue therapy was handled within this analysis. The ERG
assumes that patients were analysed on the basis of treatment arm with no
consideration of rescue treatment. As a consequence, given the higher adverse event
rates with UPA and the extent of UPA rescue therapy in the control arm of SELECT-
COMPARE, the adverse event rate for csDMARDs may be too high.
Copyright 2019 Queen's Printer and Controller of HMSO. All rights reserved

Page 175 of 275
5.2.7 Health related quality of life
5.2.7.1 HAQ, Pain and the EQ-5D
In common with TA37531 the company model first maps the HAQ to pain scores. The
HAQ and the resulting pain scores then determine the main quality of life values. But the
company model bases its mapping from the HAQ to pain scores upon an analysis of the
pooled SELECT trials’ data, in contrast to TA37531 which based it upon an analysis of
100,398 observations from the NDB, as reviewed in greater detail in Section 5.3.4.3
below.
5.2.7.2 Adverse events and quality of life
The submission does not contain any reference to adverse events quality of life effects,
and there are no obvious elements of the electronic model relating to this. The ERG
assumption is that none are modelled. This will slightly bias the analysis in favour of the
advanced DMARDs and against the csDMARDs and BSC.
5.2.8 Resources and costs
5.2.8.1 Direct drug and administration costs
The original CS included a simple UPA PAS of ***. Midway through the ERG review of
the CS the company revised the UPA PAS to ***. A complex PAS of 12 weeks free
supply applies to CTZ. Simple PASs also apply to:
• ABT: Abatacept
• BRC: Baricitinib
• GOL: Golimumab
• SRL: Sarilumab
• TFC: Tofacitinib
There are also a number of biosimilars available for the older bDMARDs. The company
generally applies the list price of the cheapest biosimilar as below:
• ADA: Adalimumab: Hulio®
• ETN: Etanercept: Benepali®
• IFX: Infliximab: Flixabi®
Copyright 2019 Queen's Printer and Controller of HMSO. All rights reserved

Page 176 of 275
• RTX: Rituximab: Rixathon®
Erelzi® is marginally cheaper than Benepali® at list prices, but the small difference is
irrelevant to decision making. In common with TA37531, the interval between RTX doses
is assumed to be nine months. All the older bDMARDs with biosimilars also have
confidential discounts. The Commercial Medicines Unit (CMU) has provided these to
NICE, which has forwarded them to the ERG.
All results in this document include the revised UPA *** PAS and the CTZ complex PAS,
but do not include the other comparators’ simple PASs or the CMU price discounts for
the older bDMARDs. The results inclusive of all price discounts are presented within the
cPAS appendix.
Intravenous (IV) administration costs of £159 are applied, apparently based upon the
TA375 cost of £154, marginally uprated for inflation by 3% with the company giving the
hospital and community health services (HCHS) index as the source of the inflation uplift.
Subcutaneous (SC) administration costs of £3.14 are applied, apparently based upon the
£26.10 TA247302 cost uprated for inflation by 46% using the HCHS. The TA375 cost was
based upon 10% of SC administrations requiring a district nurse at a cost of £30.50, an
increase on the £26.10 district nurse cost of TA247.
The drug and administration prices applied in the modelling for the first six months prior
to assessment of EULAR response and annually thereafter are provided in Table 54.
Copyright 2019 Queen's Printer and Controller of HMSO. All rights reserved

Page 177 of 275
Table 54. Direct drug and administration costs: bDMARDs
1st 6 months Annual thereafter Treatment Drug Admin Total Drug Admin Total ABTIV: AbataceptIV £7,278 £1,273 £8,551 £11,834 £2,070 £13,904 ABTSC: AbataceptSC £7,889 £82 £7,971 £15,779 £164 £15,943 CTZ: Certoluzumab pegol £2,518 £41 £2,559 £9,327 £82 £9,409 GOL: Golimumab £4,976 £20 £4,997 £9,953 £41 £9,994 SRL: Sarilumab £5,950 £41 £5,991 £11,900 £82 £11,982 TCZIV: TocilizumabIV £5,343 £1,035 £6,378 £10,686 £2,070 £12,756 TCZSC: TocilizumabSC £5,956 £82 £6,038 £11,911 £164 £12,075 BRC: Baricitinib £5,254 £0 £5,254 £10,508 £0 £10,508 TFC: Tofacitinib £4,501 £0 £4,501 £9,001 £0 £9,001 UPA: Upadacitinib ****** £0 ****** ****** £0 ****** ADA: Adalimumab £4,019 £41 £4,060 £8,039 £82 £8,121 ETN: Etanercept £4,279 £82 £4,361 £8,557 £164 £8,721 IFX: Infliximab £6,233 £874 £7,108 £7,377 £1,035 £8,412 RTX: Rituximab £2,096 £106 £2,201 £4,191 £212 £4,403
Abbreviations: bDMARDs, biologic disease modifying antirheumatic drugs
Note that no pharmacy costs are included in the model. Most bDMARDs are formulated
as four-weekly preparations and, given the cost of bDMARDs, it seems unlikely that
relatively minor pharmacy costs which would be similar across the bDMARDs would
much affect net results.
The costs for csDMARD of £8 for the initial six months and £17 thereafter are based
upon the cost of MTX. The BNF recommends 7.5 mg once weekly, adjusted according to
response with a maximum of 20 mg per week. The company chooses the maximum
20 mg dose, but MTX is so cheap this will have little to no impact upon results.
The costs for intensified csDMARDs of £107 for the initial six months and £215 thereafter
are based upon the cost of MTX, plus daily 6.5mg/kg hydroxychloroquine, daily 7.5mg
prednisolone and 3 g daily sulfasalazine. Again, these are the maxima recommended in
the BNF for hydroxychloroquine and sulfasalazine. Given this, the costs cross check with
CMU EMIT prices.
5.2.8.2 Inpatient costs
HAQ related annual inpatient costs are applied, based upon the values of TA37531
inflated to 2018 prices using the HCHS index (Table 55).
Copyright 2019 Queen's Printer and Controller of HMSO. All rights reserved

Page 178 of 275
Table 55. Inpatient costs as a function of HAQ
HAQ Cost HAQ Cost 0.000 £263 1.625 £491
0.125 £194 1.750 £532
0.250 £167 1.875 £718
0.375 £149 2.000 £905
0.500 £131 2.125 £1,087
0.625 £112 2.250 £1,275
0.750 £96 2.375 £1,643
0.875 £163 2.500 £2,005
1.000 £231 2.625 £2,380
1.125 £302 2.750 £2,747
1.250 £371 2.875 £3,456
1.375 £411 3.000 £4,155
1.500 £452 Abbreviations: HAQ health assessment questionnaire
5.2.8.3 Ongoing monitoring costs
Ongoing monitoring costs, based upon Malottki et al303 inflated to 2018 prices using the
HCHS index, are differentiated by where the patient is in terms of treatment (Table 56).
This approach is in line with TA37531 .
Table 56. Monitoring costs
Period Cost Pre-treatment £175
6 months assessment period £1,752
Monthly thereafter £138
BSC has an annual £742 ongoing cost, based upon the value of TA375 inflated to 2018
prices using the HCHS index. This appears to be in addition to the HAQ-related inpatient
costs summarised in Section 5.2.8.2 above.
NICE CG1008 recommended monthly monitoring while treatment is being established,
with an annual review once the patient is stabilised.
5.2.8.4 Adverse event costs
Adverse event costs of a little over £1,500 per event are taken from the same source as
TA375, Oppong et al304, inflated to 2018 costs using the HCHS.
Copyright 2019 Queen's Printer and Controller of HMSO. All rights reserved

Page 179 of 275
5.2.9 Cost effectiveness results
The company presents a large number of tables of results. For reasons that are not clear
the company chooses to separate the cost effectiveness estimates for UPA from those of
UPA+MTX despite these being within the same patient group and against the same set
of comparator treatments and sequences. For reasons of space and consistency the
ERG consolidates these and presents:
• A fully incremental analysis, with the treatment sequences that are compared
ranked in order of increasing cost.
• The pairwise cost effectiveness estimates of UPA containing sequence against
the other treatment sequences that are compared.
• The pairwise cost effectiveness estimates of UPA+MTX containing sequence
against the other treatment sequences that are compared.
The ERG presentation of results adopts a common format for all positions sought in
order to ease scanning of results, despite some elements being redundant for some
comparisons; e.g. for the MTX intolerant UPA+MTX does not feature as a comparator.
Due to the staggered submission process and ongoing issues with the company
submitted model, the company results reported in section 5.2.9 are based upon the word
document addendum received by the ERG on the 27th August 2019. As a consequence,
the ERG reported pairwise ICERs are subject to rounding errors.
The ERG has cross checked the results reported in Section 5.2.9 with those generated
by the final company model received on the 29 August. There are reasonable differences
between these and those of the original CS, with the revised ICERs typically being
somewhat better than those produced by the originally submitted model even when the
modelling using the original model with the updates UPA PAS of ***. These
improvements arise from two sources:
• The company revising the visual basic of the model so that those modelled as
transitioning from moderate RA to severe RA do not see their HAQ rebound to
their original baseline when they were with moderate RA, but rebound to the HAQ
score that is modelled when they transition to severe RA.
• The revised time to treatment discontinuation functions, as outlined in section
5.2.6.3.
Copyright 2019 Queen's Printer and Controller of HMSO. All rights reserved

Page 180 of 275
The results of Section 5.4 and of the cPAS appendix use the company model receives
on the 29 August.
5.2.9.1 Position 1a: Moderate RA, MTX intolerant, RTX tolerant, failed one csDMARD
The company estimates of the cost effectiveness of UPA among moderate RA patients
who are MTX intolerant, RTX tolerant and have failed to respond to a single csDMARD
are provided in Table 57.
Table 57. Position 1a: Moderate RA, MTX intolerant, RTX tolerant, failed one csDMARD
ICERs
Costs QALYs Costs QALYs Increm. UPA UPA+MTX
Int csDMARD ******* ***** ** ** .. £16,554 .. UPA ******* ***** ******* ***** £16,554 .. ..
Abbreviations: csDMARDs, conventional synthetic disease modifying antirheumatic drugs; ICER, incremental cost-effectiveness ratio; increm., incremental; int., intolerant; MTX, methotrexate; QALYs, quality adjusted life years; UPA, upadacitinib
The cost effectiveness of UPA relative to intensified csDMARDs is estimated to be
comfortably below the £20k/QALY threshold.
The probabilistic modelling results in an ICER of £16,248 per QALY and probabilities of
UPA being cost effective at thresholds of £20k per QALY and £30k per QALY of 68%
and 94% respectively.
5.2.9.2 Position 1b: Moderate RA, MTX tolerant, RTX tolerant, failed one csDMARD
The company estimates of the cost effectiveness of UPA among moderate RA patients
who are MTX tolerant, RTX tolerant and have failed to respond to a single csDMARD are
provided in Table 58.
Table 58. Position 1b: Moderate RA, MTX tolerant, RTX tolerant, failed one csDMARD
ICERs
Costs QALYs Costs QALYs Increm. UPA UPA+MTX
Int csDMARD ******* ***** ** ** .. £22,659 £21,631 UPA ******* ***** ******* ***** Ext.Dom. .. £7,183 UPA+MTX ******* ***** ******* ***** £21,631 .. ..
Abbreviations: csDMARDs, conventional synthetic disease modifying antirheumatic drugs; ext.dom., extended dominated; ICER, incremental cost-effectiveness ratio; increm., incremental; int., intolerant; MTX, methotrexate; QALYs, quality adjusted life years; UPA, upadacitinib
Copyright 2019 Queen's Printer and Controller of HMSO. All rights reserved

Page 181 of 275
Both UPA and UPA+MTX are estimated to have a cost effectiveness above the
£20k/QALY threshold but below the £30k/QALY threshold in pairwise comparisons with
intensified cDMARDs. But UPA is extendedly dominated by UPA+MTX.
For the pairwise comparison of UPA with intensified csDMARDs the probabilistic
modelling results in an ICER of £23,145 per QALY and probabilities of UPA being cost
effective at thresholds £20k per QALY and £30k per QALY of 36% and 75% respectively.
For the pairwise comparison of UPA+MTX with intensified csDMARDs the probabilistic
modelling results in an ICER of £23,428 per QALY and probabilities of UPA+MTX being
cost effective at thresholds £20k per QALY and £30k per QALY of 32% and 77%
respectively.
5.2.9.3 Position 2a: Moderate RA, MTX intolerant, RTX tolerant, failed ≥2 csDMARDs
The company estimates of the cost effectiveness of UPA among moderate RA patients
who are MTX intolerant, RTX tolerant and have failed to respond to at least two
csDMARDs are provided in Table 59.
Table 59. Position 2a: Moderate RA, MTX intolerant, RTX tolerant, failed ≥2 csDMARDs
ICERs Costs QALYs Costs QALYs Increm. UPA UPA+MTX BSC ******* ***** ** ** .. £8,885 .. UPA ******* ***** ****** ***** £8,885 .. ..
Abbreviations: BSC, best supportive care; ICER, incremental cost-effectiveness ratio; increm., incremental; MTX, methotrexate; QALYs, quality adjusted life years; UPA, upadacitinib
UPA is estimated to have a very good cost effectiveness compared to BSC of £8,885 per
QALY.
The probabilistic modelling results in an ICER of £9,560 per QALY and probabilities of
UPA being cost effective at both thresholds of £20k per QALY and £30k per QALY of
100%.
5.2.9.4 Position 2b: Moderate RA, MTX tolerant, RTX tolerant, failed ≥2 csDMARDs
The company estimates of the cost effectiveness of UPA among moderate RA patients
who are MTX tolerant, RTX tolerant and have failed to respond to at least two
csDMARDs are provided in Table 60.
Copyright 2019 Queen's Printer and Controller of HMSO. All rights reserved

Page 182 of 275
Table 60. Position 2b: Moderate RA, MTX tolerant, RTX tolerant, failed ≥2 csDMARDs
ICERs Costs QALYs Costs QALYs Increm. UPA UPA+MTX MTX ******* ***** ** ** .. £13,568 £13,434 UPA ******* ***** ****** ***** Ext.Dom. .. £12,261 UPA+MTX ******* ***** ****** ***** £13,434 .. ..
Abbreviations: ICER, incremental cost-effectiveness ratio; increm., incremental; MTX, methotrexate; QALYs, quality adjusted life years; UPA, upadacitinib
In the pairwise comparisons both UPA and UPA+MTX have a cost effectiveness
estimate compared to MTX that is comfortably below the £20k/QALY threshold. The cost
effectiveness of UPA+MTX compared to UPA is also well below £20k/QALY.
For the pairwise comparison of UPA with intensified MTX the probabilistic modelling
results in an ICER of £14,867 per QALY and probabilities of UPA being cost effective at
thresholds £20k per QALY and £30k per QALY of 76% and 97% respectively.
For the pairwise comparison of UPA+MTX with intensified MTX the probabilistic
modelling results in an ICER of £15,323 per QALY and probabilities of UPA+MTX being
cost effective at thresholds £20k per QALY and £30k per QALY of 75% and 75%
respectively.
5.2.9.5 Position 3a: Severe RA, MTX intolerant, RTX tolerant, failed ≥2 csDMARDs
The company estimates of the cost effectiveness of UPA among severe RA patients who
are MTX intolerant, RTX tolerant and have failed to respond to at least two csDMARDs
are provided in Table 61.
Table 61. Position 3a: Severe RA, MTX intolerant, RTX tolerant, failed ≥2 csDMARDs
ICERs Costs QALYs Costs QALYs Increm. UPA UPA+MTX
UPA ******* ***** ** ** Reference .. ..
ADA ******** ***** ******* ****** Dominated Dominant ..
ETN ******** ***** ******* ****** Dominated Dominant ..
CTZ ******** ***** ******* ****** Dominated Dominant ..
TFC ******** ***** ******* ****** Dominated Dominant ..
BRC ******** ***** ******* ****** Dominated Dominant ..
SRL ******** ***** ******* ****** Dominated Dominant ..
Copyright 2019 Queen's Printer and Controller of HMSO. All rights reserved

Page 183 of 275
ICERs Costs QALYs Costs QALYs Increm. UPA UPA+MTX
TCZSC ******** ***** ******* ***** £502k £502k SW ..
TCZIV ******** ***** **** ***** Ext.Dom £506k SW .. Abbreviations: ADA, adalimumab; BRC, baricitinib; csDMARDs, conventional synthetic disease modifying antirheumatic drugs; CTZ, certolizumab pegol; ETN, etanercept; ext. dom., extended dominated; ICER, incremental cost-effectiveness ratio; increm., incremental; IV, intravenous; MTX, methotrexate; QALYs, quality adjusted life years; SC, subcutaneous; SRL, sarilumab; TCZ, tocilizumab; TFC, tofacitinib; UPA, upadacitinib
UPA is estimated to dominate all the other comparators with the exception of TCZSC, but
the cost effectiveness of TCZSC relative to UPA is extremely poor due to only minor
QALY gains and quite large additional costs resulting in a cost effectiveness estimate for
TCZSC of £502k per QALY.
The probabilistic modelling estimates a cost effectiveness for UPA against TCZSC of
£512k per QALY, and probabilities UPA+MTX being cost effective at thresholds of both
£20k per QALY and £30k per QALY of 100%.
5.2.9.6 Position 3b: Severe RA, MTX tolerant, RTX tolerant, failed ≥2 csDMARDs
The company estimates of the cost effectiveness of UPA among severe RA patients who
are MTX tolerant, RTX tolerant and have failed to respond to at least two csDMARDs are
provided in Table 62.
Table 62. Position 3b: Severe RA, MTX tolerant, RTX tolerant, failed ≥2 csDMARDs
ICERs Costs QALYs ∆Cost ∆QALY Increm. UPA UPA+MTX
UPA ******** ***** .. £526
UPA+MTX ******** ***** *** ***** £526 .. ..
IFX+MTX ******** ***** ******* ****** Dominate
d Dominant Dominant
ADA+MTX ******** ***** ******* ****** Dominate
d Dominant Dominant
ETN+MTX ******** ***** ******* ****** Dominate
d £3.7mn
SW Dominant
TFC+MTX ******** ***** ******* ****** Dominate
d Dominant Dominant
GOL+MTX ******** ***** ******* ****** Dominate
d £1.1mn
SW Dominant
CTZ+MTX ******** ***** ******* ***** £828,052 £354k SW £828k SW
BRC+MTX ******** ***** ****** ****** Dominate
d Dominant Dominant
TCZSC+MTX ******** ***** ******* ****** Dominate
d £13mn SW Dominant
Copyright 2019 Queen's Printer and Controller of HMSO. All rights reserved

Page 184 of 275
ICERs Costs QALYs ∆Cost ∆QALY Increm. UPA UPA+MTX
SRL+MTX ******** ***** ******* ****** Dominate
d £1.8mn
SW Dominant
TCZIV+MTX ******** ***** ******* ****** Dominate
d £1.2mn
SW Dominant
ABTIV+MTX ******** ***** ******* ****** Dominate
d 7.3mn SW Dominant
ABTSC+MTX ******** ***** ******* ****** Dominate
d Dominant Dominant Abbreviations: ABT, abatacept; ADA, adalimumab; BRC, baricitinib; csDMARDs, conventional synthetic disease modifying antirheumatic drugs; CTZ, certolizumab pegol; ETN, etanercept; GOL, golimumab; ICER, incremental cost-effectiveness ratio; IFX, infliximab; increm., incremental; IV, intravenous; MTX, methotrexate; QALYs, quality adjusted life years; SC, subcutaneous; SRL, sarilumab; TCZ, tocilizumab; TFC, tofacitinib; UPA, upadacitinib
UPA is estimated to be somewhat cheaper than all the other comparators, though only
slightly cheaper than UPA+MTX. Any comparator patient benefits over UPA involve such
an increase in costs as to be clearly outside usual cost effectiveness thresholds. This is
with the exception of UPA+MTX which is estimated to have an excellent cost
effectiveness estimate of £526 per QALY compared to UPA.
The probabilistic modelling estimates pairwise ICERs for UPA and UPA+MTX against
CTZ+MTX of £481k per QALY in the SW quadrant and £1.6mn per QALY in the SW
quadrant respectively, with both being estimated to have a 100% probability of cost
effectiveness at thresholds of £20k per QALY and £30k per QALY.
5.2.9.7 Position 4a: Severe RA, MTX intolerant, RTX tolerant, failed one bDMARD
The company estimates of the cost effectiveness of UPA among severe RA patients who
are MTX intolerant, RTX tolerant and have failed to respond to one bDMARD are
provided in Table 63.
Table 63. Position 4a: Severe RA, MTX intolerant, RTX tolerant, failed one bDMARD
ICERs Costs QALYs Costs QALYs Increm. UPA UPA+MTX
UPA ******* ***** ** ** .. .. ..
ADA ******* ***** ******* ****** Dominated Dominant ..
ETN ******* ***** ******* ****** Dominated Dominant ..
CTZ ******* ***** ******* ****** Dominated Dominant ..
TFC ******* ***** ******* ***** Ext.Dom. Dominant ..
BRC ******* ***** ******* ***** Ext.Dom Dominant ..
SRL ******* ***** ******* ****** Dominated Dominant ..
Copyright 2019 Queen's Printer and Controller of HMSO. All rights reserved

Page 185 of 275
ICERs Costs QALYs Costs QALYs Increm. UPA UPA+MTX
TCZSC ******* ***** ******* ****** Dominated Dominant ..
TCZIV ******* ***** ******* ***** Dominated Dominant .. Abbreviations: ADA, adalimumab; BRC, baricitinib; bDMARD, biologic disease modifying antirheumatic drugs; CTZ, certolizumab pegol; ETN, etanercept; ICER, incremental cost-effectiveness ratio; increm., incremental; IV, intravenous; MTX, methotrexate; QALYs, quality adjusted life years; SC, subcutaneous; SRL, sarilumab; TCZ, tocilizumab; UPA, upadacitinib
UPA is estimated to dominate all the other comparators, essentially being estimated to
be as effective as all the other treatments but cheaper. This is not due any clinical
evidence, but due to the company assuming clinical equivalence which renders the
above of questionable relevance.
The probabilistic modelling estimates that UPA no longer dominates TCZSC, but has a
reasonable cost effectiveness estimate of £45,253 per QALY in the SW quadrant. It is
also estimated to have a 100% probability of cost effectiveness at thresholds of £20k per
QALY and £30k per QALY.
Given the lack of clinical effectiveness evidence for this position the ERG does not
further consider it, with the exception of providing the cPAS inclusive results for it in the
cPAS appendix.
5.2.9.8 Position 4b: Severe RA, MTX tolerant, RTX intolerant, failed one bDMARD
The company estimates of the cost effectiveness of UPA among severe RA patients who
are MTX tolerant, RTX intolerant and have failed to respond to one bDMARD are
provided in Table 64.
Table 64. Position 4b: Severe RA, MTX tolerant, RTX intolerant, failed one bDMARD
ICERs Costs QALYs ∆Cost ∆QALY Increm. UPA UPA+MTX
UPA+MTX ******* ***** * * Reference
UPA ******* ***** *** ****** Dominated Dominant
ADA+MTX ******** ***** ******* ****** Dominated Dominant Dominant
IFX+MTX ******** ***** ******* ****** Dominated Dominant Dominant
ETN+MTX ******** ***** ******* ****** Dominated Dominant Dominant
CTZ+MTX ******** ***** ******* ****** Dominated Dominant Dominant
GOL+MTX ******** ***** ******* ****** Dominated Dominant Dominant
TFC+MTX ******** ***** ******* ****** Dominated Dominant Dominant
BRC+MTX ******** ***** ******* ****** Dominated Dominant Dominant
Copyright 2019 Queen's Printer and Controller of HMSO. All rights reserved

Page 186 of 275
ICERs Costs QALYs ∆Cost ∆QALY Increm. UPA UPA+MTX
TCZSC+MTX ******** ***** ******* ****** Dominated £5.3mn SW Dominant
SRL+MTX ******** ***** ******* ****** Dominated £1.5mn SW Dominant
TCZIV+MTX ******** ***** ******* ***** £2,155,336 £686k SW £2.1mn SW
ABTIV+MTX ******** ***** ****** ****** Dominated £1.2mn SW Dominant
ABTSC+MTX ******** ***** ******* ****** Dominated £1.5mn SW Dominant Abbreviations: ABT, abatacept; ADA, adalimumab; BRC, baricitinib; csDMARDs, conventional synthetic disease modifying antirheumatic drugs; CTZ, certolizumab pegol; ETN, etanercept; GOL, golimumab; ICER, incremental cost-effectiveness ratio; IFX, infliximab; increm., incremental; IV, intravenous; MTX, methotrexate; QALYs, quality adjusted life years; SC, subcutaneous; SRL, sarilumab; TCZ, tocilizumab; TFC, tofacitinib; UPA, upadacitinib
Unusually, given the results of the original company analyses at the previous UPA PAS,
the revised UPA PAS and revised model causes UPA+MTX to be estimated to be both
cheaper and more effective than UPA and so to dominate it. UPA+MTX is also estimated
to dominate or have an extremely good cost effectiveness against all the other
comparators.
The probabilistic model estimates that UPA has a good cost effectiveness relative to
TCZIV+MTX of £2mn per QALY in the SW quadrant, while UPA+MTX dominates
TCZIV+MTX. Both are estimates to have a 100% probability of cost effectiveness at
thresholds of £20k per QALY and £30k per QALY.
5.2.9.9 Position 5: Severe RA, MTX tolerant, RTX tolerant, failed one bDMARD
The company estimates of the cost effectiveness of UPA among severe RA patients who
are MTX tolerant, RTX tolerant and have failed to respond to one bDMARD are provided
in Table 65.
Table 65. Position 5: Severe RA, MTX tolerant, RTX tolerant, failed one bDMARD
ICERs Costs QALYs ∆Cost ∆QALY Increm. UPA UPA+MTX
RTX+MTX ******* ***** * * .. Dominated Dominated
UPA ******* ***** **** ****** Dominated Dominated £461k
UPA+MTX ******** ***** ******* ****** Dominated .. .. Abbreviations: ICERs, incremental cost-effectiveness ratio; increm., incremental; MTX, methotrexate; QALYs, quality-adjusted life years; RTX, rituximab; UPA, upadacitinib
Despite the increase in the UPA PAS, RTX+MTX is estimated to dominate both UPA and
UPA+MTX. UPA+MTX has a poor cost effectiveness compared to UPA.
Copyright 2019 Queen's Printer and Controller of HMSO. All rights reserved

Page 187 of 275
The probabilistic modelling estimates that at central estimates RTX+MTX dominates both
UPA and UPA+MTX. Perhaps surprisingly in the light of this, it still estimates probabilities
of UPA being cost effective at thresholds of £20k per QALY and £30k per QALY of 43%
and 40%, while the corresponding probabilities for UPA+MTX are reported as 45% and
45%.
5.2.9.10 Position 6: Severe RA, MTX tolerant, RTX tolerant, failed RTX
The company estimates of the cost effectiveness of UPA among severe RA patients who
are MTX tolerant, RTX tolerant and have failed to respond to RTX are provided in Table
66.
Copyright 2019 Queen's Printer and Controller of HMSO. All rights reserved

Page 188 of 275
Table 66. Position 6: Severe RA, MTX tolerant, RTX tolerant, failed RTX
ICERs Cost QALY ∆Cost ∆QALY Increm. UPA UPA+MTX
UPA ******* ***** * * .. £10,000
UPA+MTX ******* ***** **** ***** £10,000 .. ..
SRL+MTX ******* ***** ******* ****** Dominated £988kSW Dominant
TCZIV+MTX ******** ***** ******* ***** £420k £298kSW £420kSW Abbreviations: ICERs, incremental cost-effectiveness ratio; increm., incremental; IV, intravenous; MTX, methotrexate; QALYs, quality-adjusted life years; SRL, sarilumab; TCZ, tocilizumab; UPA, upadacitinib
The cost effectiveness of UPA+MTX against UPA is good at £10,000 per QALY. Nut the
clinical effectiveness for UPA is based upon an assumed equivalence with BRC+MTX so
should probably be disregarded for this comparison. SRL+MTX is dominated by
UPA+MTX, while the cost effectiveness of TCZIV+MTX is very poor.
The probabilistic modelling estimates pairwise ICERs for UPA and UPA+MTX against
TCZIV+MTX of £304k per QALY in the SW quadrant and £445k per QALY in the SW
quadrant respectively, with both being estimated to have a 100% probability of cost
effectiveness at thresholds of £20k per QALY and £30k per QALY.
5.2.10 Sensitivity analyses
The company scenario analyses for the modelling among moderate RA patients
suggests results are reasonably stable for most of the scenario analyses, but are
sensitive to:
• The UPA drug costs (±25%)
• Whether the HAQ progression for csDMARDs is linear
• The comparator drug costs (±25%)
• Mapped pain scores (±25%)
The company scenario analyses for the modelling among severe RA patients for the
pairwise comparison with CTZ+MTX suggests results are reasonably stable for most of
the scenario analyses, but are sensitive to:
• The UPA proportion with a moderate response (95% CI)
• The comparator proportion with a moderate response (95% CI)
Copyright 2019 Queen's Printer and Controller of HMSO. All rights reserved

Page 189 of 275
• The UPA proportion with a good response (95% CI)
• The comparator proportion with a good response (95% CI)
• Patients’ HAQ scores, presumably at baseline
• The HAQ effect upon the hazard ratio for mortality
But these sensitivities are in the context of UPA+MTX dominating CTZ+MTX. It is
unclear whether the values reported in figures A.3 and A.4 of the company addendum
sent to NICE on 23rd August are bounded by £0 or if this is an error of reporting. It seems
likely that the sensitivity to the HAQ HR for mortality is due to extremely small QALY
differences being simulated.
5.2.11 Model validation and face validity check
The model is programmed within Visual Basic for Applications (VBA), with an Excel front
end that acts as a database store of values. VBA is not on the list of NICE approved
software.
NICE has instructed the ERG that the elements of the model which are programmed in
VBA should be treated as a “black box” and that the ERG is not required to parse the
programming accuracy of these elements of the electronic model.
The ERG provided a range of validation exercises for the company model:
• Black box testing: The model inputs were changed and the output was checked
to assess whether in line with expectations. This also sought to replicate the
TA375 model structure to the extent possible as presented in Section 5.2.11.1.
• Comparison with TA375 model: The company has provided estimates of its
model attempting to replicate the results of the TA375 model. These are reported
in Section 5.2.11.2 below. NICE agreed an approach whereby the ERG used the
TA375 model to help validate the outputs of the company model as presented in
Section 5.2.11.3. However, due to time constraints and the staggered nature of
the CS this has not been possible before the ERG report submission deadline.
• Model input values were cross-checked, with discrepancies presented in Sections
5.3.2 and 5.3.3.
• Consideration of the stated model structure, how it compared with those of
previous NICE assessments and the degree to which it incorporated the ERG
and/or final appraisal determination (FAD) recommended model changes of those
Copyright 2019 Queen's Printer and Controller of HMSO. All rights reserved

Page 190 of 275
assessments. The innovations of the current model compared to the model of
TA375 are reviewed in greater detail in sections 5.3.4.3, 5.3.4.6, 5.3.4.5 and
5.3.4.6 below.
5.2.11.1 Black box testing
A variety of black box testing has been undertaken by the ERG, which has led to some
major model revisions by the company. Where particular concerns have arisen these are
highlighted in the relevant sections of section 5.3 below
5.2.11.2 Company model outputs compared to TA375 model
The company addendum received by the ERG on the 29 August provides the results of a
model validation exercise that compares the ICERs the company model estimates when
applying the TA375 HAQ to pain mapping with those of TA375 for severe RA patients
(Table 67).
Table 67. Model validation vs TA375 model: severe RA bDMARDs vs MTX ICERs
Company model TA375 base case MTX Reference Reference ADA + MTX £41,853 £41,567 ETN + MTX £40,504 £42,494 IFX + MTX £38,978 £38,503 CTZ + MTX £41,287 £39,924 GOL + MTX £42,060 £41,611
Abbreviations: ADA, adalimumab, bDMARD, biologic disease modifying antirheumatic drug; CTZ, certolizumab pegol, ETN, etanercept, GOL, golimumab, ICER, incremental cost-effectiveness ratio; IFX, infliximab, MTX, methotrexate, TCZ, tocilizumab
This provides reassurance for the modelling of severe RA patients when using the
company model.
For the validation among moderate RA patients the company provides the following
(Table 68).
Table 68. Model validation vs TA375 model: moderate RA ADA+MTX vs MTX ICERs
Company model TA375 base case MTX Reference Reference ADA + MTX £63,293 £63,513
Abbreviations: ADA, adalimumab, MTX, methotrexate
Copyright 2019 Queen's Printer and Controller of HMSO. All rights reserved

Page 191 of 275
It should be noted that the main innovation of the company model is in the modelling of
moderate RA patients, and how they transition to severe RA. It appears that this aspect
of the company model was turned off for the above validation exercise. It would have
been helpful if the company had provided an additional comparison with this aspect of
the model turned on. As shown in Section 5.3.4.4 below it has a considerable impact
upon model results.
5.2.11.3 TA375 model outputs compared to company model
Multiple revisions to the UPA PAS, late delivery (27 August) of company results and late-
breaking revisions to the company’s economic model (final version received 29 August)
have required the revision and re-examination of key aspects of the ERG’s work during
this appraisal. The ERG has therefore not had sufficient time to run the TA375 model
with similar settings to those of the company model as a model validation cross check.
ERG cross check and critique
5.3.1 Base case results
The ERG has re-run the company model received on the 27 August 2019 and derives
results that cross check with those reported in Section 5.2.9 above. The only exception
to this is the results for UPA+MTX at Position 5, with the ERG cross check resulting in
the following.
Table 69. Position 5: Severe RA, MTX tolerant, RTX tolerant, failed one bDMARD: ERG cross check
ICERs Costs QALYs ∆Cost ∆QALY Increm. UPA UPA+MTX
RTX+MTX ******* ***** * * .. Dominated Dominated
UPA+MTX ******* ***** **** ****** Dominated Dominated ..
UPA ******* ***** **** ****** Dominated .. Dominant Abbreviations: ICERs, incremental cost-effectiveness ratio; increm., incremental; MTX, methotrexate; QALYs, quality-adjusted life years; RTX, rituximab; UPA, upadacitinib
5.3.2 Data Inputs: Correspondence of written submission with sources cited
The written submission broadly corresponds with the cited sources. The exceptions to
this are some of the direct drug and administration costs and the HAQ score related
inpatient costs.
The cross-check of the direct drug and administration costs is based upon the
information in the Drug_Costs worksheet of the model.
Copyright 2019 Queen's Printer and Controller of HMSO. All rights reserved

Page 192 of 275
5.3.2.1 Upadacitinib list price per packet
The CS in Table 2 of Document B and does not provide a pack price for UPA, and only
gives an annual list price of *******.
The model applies an annual list price cost for UPA of *******. Within the model there is
at times some confusion between calendar months and periods of 28 days.
*****************************************************************************************************
*************** The revised UPA PAS is then applied to this list price.
5.3.2.2 Direct drug and administration costs: RTX
The company calculates a direct drug cost of RTX of £2,096 plus an additional £105
administration cost during the response period. RTX is administered as a course of 2 IV
administrations, one at baseline and one at two weeks, each of 1,000 mg. The BNF list
price of a 500 mg vial of Rixathon® is £785.84 which implies a cost of £3,143 for 2,000
mg. The IV administration cost is £159, which given the requirement for two infusions per
course implies a cost of £318.
The company £2,096 corresponds to 6/9 of £3,143. The company £106 corresponds to
6/9 of £159 which is half the intended amount.
TA195 does not specify an assessment period for cessation of RTX, but rather specifies
that treatment should only be continued if an adequate response is maintained following
retreatment with a dosing interval of at least six months. The costing of RTX in NICE
assessments has typically assumed nine-monthly dosing.
Despite the cost of a course of RTX being incurred during the first two weeks the
company assumes that this cost extends to nine months. Thereafter it appears that the
long term nine-monthly dosing cost is applied pro-rata either as a monthly amount or as
a continuous amount; i.e. a patient discontinuing at 12 months would have the initial six-
month cost applied and then six months of the long term nine-monthly dosing cost.
Given non-responder rates of 35% in the csDMARD-IR NMA and 39% for RTX in the
bDMARD-IR NMA, the RTX costs for these non-responders is too low. But for the
majority of patients who respond and remain on treatment given the model structure and
assessment of response at six months, the ERG agrees with the company approach
provided that the subsequent monthly costing of RTX is similarly applied on a pro-rata
basis until treatment discontinuation, as appears to be the case. This will also
underestimate the longer-term RTX direct drug costs as some will cease treatment some
time before the nine-month re-administration periods, though again this is complicated by
Copyright 2019 Queen's Printer and Controller of HMSO. All rights reserved

Page 193 of 275
the nine month being an average with actual re-administrations differing between
patients.
During both the initial six-month period and the subsequent longer term costing the
administration costs are half what they should be.
5.3.2.3 Direct drug and administration costs: ABTIV
The SmPC specifies three loading doses two weeks apart then extending the dosing
frequency to four weekly: “Following the initial administration, ORENCIA should be given
two and four weeks after the first infusion, then every four weeks thereafter”.305 The
company starts the routine dosing frequency on Day 42 whereas the ERG thinks Day 56
is more appropriate. It appears that the company costing includes an additional two
weeks ABTIV during the initial six-month assessment period, which at list prices is an
additional £454 cost.
5.3.2.4 Direct drug and administration costs: GOL
The GOL SmPC specifies monthly dosing on the same date each month.306 The
company takes this to mean four-weekly dosing. This inflates the GOL cost by 9%.
5.3.2.5 Direct drug and administration costs: IFX
The SmPC specifies three loading doses then extending the dosing frequency to eight
weekly: “3 mg/kg given as an intravenous infusion followed by additional 3 mg/kg
infusion doses at two and six weeks after the first infusion, then every eight weeks
thereafter”.307 The company starts the routine dosing frequency on Day 42 whereas the
ERG thinks Day 98 is more appropriate. The company costing inflates the IFX costs
during the initial six-month assessment period by around 22%.
5.3.2.6 HAQ related inpatient costs: Minor Issue
The company derives HAQ score related inpatient costs from TA37531. TA375 provides
HAQ related inpatient costs by banded HAQ. The company interpolates reasonable
values based upon the TA375 data, though its HAQ cost function has a tendency to lie
above that of TA375 for higher HAQ scores. What is more questionable is the
extrapolation of the costs for the TA375 banded category of HAQ scores greater than or
equal to 2.6. Uprated to 2018 prices using the HCHS as per the company suggests a
TA375 cost of £2,747. The company extrapolates from this to estimate costs of £3,456
for a HAQ score of 2.875 and £4,155 for a HAQ score of 3.000.
Copyright 2019 Queen's Printer and Controller of HMSO. All rights reserved

Page 194 of 275
Figure 11. TA375 and company HAQ score related inpatient costs (2018 prices)
Abbreviations: HAQ, health assessment questionnaire; TA, technology appraisal
In the light of the above the ERG will apply the TA375 HAQ score cost function, updated
to 2018 prices. This seems unlikely to much affect results as few patients will be
simulated as worsening to these HAQ scores. For instance, the ICER for UPA+MTX
versus MTX at position 2b only worsens from £13,434 per QALY to £13,365 per QALY.
5.3.3 Data Inputs: Correspondence of written submission with electronic model
While the written submission generally corresponds with the electronic model it does not
fully itemise the model structure and inputs to it. The ERG has tried to address this in
Section 5.2.
There appear to be some discrepancies in the equivalence assumptions as reviewed
below in Section 5.3.3.1.
5.3.3.1 Clinical equivalence assumptions for treatments with no NMA estimates.
At both position 1a and position 2a, for those transitioning to severe RA first-line BRC in
the intensified csDMARDs arm is not assumed to have the same efficacy as BRC+MTX,
moderate and good EULAR response rates of 30% and 39% but is rather assumed to
have the same efficacy as ADA, moderate and good EULAR response rates of 26% and
28%. This seems likely to bias the analysis in favour of UPA.
Copyright 2019 Queen's Printer and Controller of HMSO. All rights reserved

Page 195 of 275
5.3.4 ERG commentary on model structure, assumptions and data inputs
5.3.4.1 Model cPAS implementation
An issue arose during the course of the assessment, with the model giving incorrect
results for the cPAS analyses. The company submitted a revised model. The ERG has
cross checked this through black box testing using the cPAS percentages of the
comparator treatments and running the model for moderate RA patients.
As a further cross check the ERG applied a 50% PAS for all the other treatments1,
further halved the cost of UPA2 and halved the administration costs3. The model run that
resulted in a cost effectiveness estimate for UPA+MTX versus intensified csDMARDs
among moderate RA patients of £21,631 per QALY was then re-run. The direct drug and
administration costs in the UPA+MTX arm were 54% of the previous model run while the
direct drug and administration costs in the intensified csDMARDs arm were 60% of the
previous model run. Further halving the annual BSC costs4 resulted in the reported drug
and administration costs in both arms being 50% of the original model run. This suggests
that the model correctly implements the cPAS percentages.
5.3.4.2 Model implementation of upadacitinib PAS
When providing the final 29 August model the company outlined that the comparator
treatments should have their cPAS percentages applied in a given column of the Drug
Costs worksheet. But the UPA PAS should not be applied in this column. Rather the
UPA price inclusive of its PAS should be entered directly into a different column of the
Drug Costs worksheet. The ERG has cross checked that using TFC as a proxy, applying
a cPAS percentage to equalise its costs with the UPA PAS inclusive price and assuming
it has the same response rates as UPA results in the same model outputs when TFC
replaces UPA in the moderate RA treatment sequence. This suggests that the model
correctly implements the UPA PAS.
5.3.4.3 Non-TA375: HAQ to pain mapping and QoL
The company estimates a function mapping HAQ to pain from pooled SELECT trial data.
TA37531 estimated a mapping function from National Databank for Rheumatic Diseases
(NDB) data. The company uses its HAQ to pain mapping function to simulate pain
1 Implemented by setting Drug costs cells Y11:Y13, Y19, Y23, Y25, Y32, Y35, Y41, Y43, Y45, Y47, Y48, Y52, Y54, Y56, Y60 equal to 50%. Note that this does not affect the price of CTZ, but CTZ is not in any of the treatment sequences that are modelled for this comparison. 2 Implemented by multiplying Drug costs cell Z67 by 50%. 3 Implemented by multiplying Admin costs cells E5:E7 by 50%. 4 Implemented by multiplying Raw – drug acquisition cost cell D27 by 50%.
Copyright 2019 Queen's Printer and Controller of HMSO. All rights reserved

Page 196 of 275
scores, with these HAQ and pain scores then being fed into the same functional form as
TA375 to estimate patients’ QoL. The mapping of HAQ to pain of the company and of
TA375 is provided in Figure 12.
Figure 12. Company HAQ to pain function and TA375 HAQ to pain data
Abbreviations: HAQ, health assessment questionnaire; TA, technology appraisal
The two curves appear to reasonably similar in slope but the company mapping lies
everywhere above the TA375 curve. The curves clearly diverge towards the upper end of
the HAQ scale.
Results are reasonably sensitive to whether the company HAQ to pain function or the
TA375 derived HAQ to pain function is applied, the latter having more of a concave
shape than the former. The net QALYs of the company base case modelling for
Sequence 1b: moderate RA patients who are MTX and RTX tolerant and have failed on
one csDMARD fall by around 13% when the mapping of TA375 is applied.
The HTA monograph of TA375299 (page 260) notes that for simulating the expected pain
score associate with the HAQ:
“Health Assessment Questionnaire and pain are not related in a simple linear fashion
as shown in data from the NDB and data from ERAS, which incorporate 100,398
observations for the NDB and 13,357 from ERAS. Data from the NDB are used to
Copyright 2019 Queen's Printer and Controller of HMSO. All rights reserved

Page 197 of 275
populate the mathematical model, with the mean pain score (and its variance) being
estimated for each feasible HAQ score.”
The quality of life values that result from each approach can be compared with those
observed within the SELECT trials.
Figure 13. Company and TA375 HAQ to QoL functions
Abbreviations: HAQ, health assessment questionnaire; TA, technology appraisal
Unfortunately, the company has only supplied the mean SELECT quality of life values by
HAQ. There are no measures of dispersion and the number of observations contributing
to each data point is unknown. But it seems likely that somewhat fewer observations will
underlie the mean values for the very high HAQ values.
Both the company and the TA375 QoL functions are a bit flatter than the SELECT trials’
EQ-5D data up to a HAQ of around 1.375. They then both steepen to become steeper
than the SELECT trials’ EQ-5D data, with the company QoL function steepening
somewhat more than that of TA375. This is to the extent that the company QoL function
drops below the values of the SELECT trials’ EQ-5D data from a HAQ of 2.000. The
steepening of the TA375 QoL modelling is less severe and its values converges with the
SELECT trials’ EQ-5D data towards the upper range of the HAQ, and only lie above the
SELECT trials’ EQ-5D data for the highest HAQ values of 2.875 and 3.000. Given that
the slope of the QoL function is what determines the net QALY gains, when compared
Copyright 2019 Queen's Printer and Controller of HMSO. All rights reserved

Page 198 of 275
with the SELECT trials’ EQ-5D data the ERG has a preference for the TA375 QoL
function.
It cannot be definitively determined whether the company mapping based upon SELECT
trial data or the TA375 Assessment Group mapping based upon NDB data is superior.
But the very large number of observations contributing to the TA375 mapping is a strong
argument in its favour, and the ERG preference for the TA375 mapping as a fit for the
SELECT trial EQ-5D data further pulls in this direction.
In the light of that above the ERG will apply the TA375 HAQ to pain mapping in its
revised base case. It will apply the company HAQ to pain mapping as a sensitivity
analysis.
5.3.4.4 Non-TA375: Moderate RA patients worsening to severe RA
It appears that a key model difference from the TA37531 model is that moderate RA
patients can see their DAS-28 worsen to >5.1 and so become severe RA patients. These
patients then receive a treatment sequence of bDMARDs.
The model has the facility to turn off this aspect of the model. As an example, for the
moderate having failed at least two csDMARDs, among the MTX eligible the cost
effectiveness estimates worsen as below (Table 70).
Table 70. Position 2b: Moderate RA, MTX eligible, failed ≥2 csDMARDs: Effect of transfer to severe RA
ICERs incl. transfer to severe ICERs excl. transfer to severe Increm. UPA UPA+MTX Increm. UPA UPA+MTX MTX .. £13,568 £13,434 .. £22,742 £22,220
UPA Ext.Dom. .. £12,261 Ext.Dom. .. £16,316
UPA+MTX £13,434 .. .. £22,220 .. .. Abbreviations: csDMARDs, conventional synthetic disease modifying antirheumatic drugs; excl, excluding; ICERs, incremental cost-effectiveness ratio; increm., incremental; MTX, methotrexate; RA, rheumatoid arthritis; UPA, upadacitinib
The modelling of moderate RA patients worsening to have severe RA is a key
determinant of the estimated cost effectiveness of UPA among moderate RA patients.
The written submission contains no detail of how this aspect of the model works, what
the parameter inputs are or how these parameters were estimated. A brief account of
this has been supplied at clarification, with it being determined by the modelling of the
change in patients’ DAS-28 as reviewed in Section 5.3.4.5 below.
Copyright 2019 Queen's Printer and Controller of HMSO. All rights reserved

Page 199 of 275
5.3.4.5 Extrapolation: Change in DAS-28 and from moderate RA to severe RA
As outlined in the summary of the model structure, the company ran a repeated
measures linear mixed effects model on the SELECT trials’ three and six month data to
estimate the change in DAS-28 between baseline and timepoint T as a function of the
change in HAQ between baseline and timepoint T. Within a hidden worksheet the
original company model contained the following function.
(DAS-28T-DAS-28BASELINE) = -1.16 + 0.91 (HAQT-HAQBASELINE)
Both the intercept and the ∆ HAQ coefficient were significant with p-values < 0.0001.
The original model did not apply the intercept. The company response to ERG
clarifications questions mentions the ∆ HAQ coefficient but not the intercept. The
company worked example supplied at clarification also only applies the ∆ HAQ
coefficient and there is no mention of the intercept. The models submitted at clarification
and subsequent to clarification have deleted all the references to the intercept term.
Within the front end Excel database to the VBA model it is possible to apply the intercept
term. Doing so5 changes the cost-effectiveness estimates for Position 2b as follows.
Table 71. Position 2b: Moderate RA, MTX eligible, failed ≥2 csDMARDs: Effect of including the intercept term of the ∆ HAQ to ∆ DAS analysis
ICERs incl. intercept ICERs excl. intercept Increm. UPA UPA+MTX Increm. UPA UPA+MTX MTX .. £13,568 £13,434 .. £22,742 £22,220
UPA Ext.Dom. .. £12,261 Ext.Dom. .. £16,316
UPA+MTX £13,434 .. .. £22,220 .. .. Abbreviations: csDMARDs, conventional synthetic disease modifying antirheumatic drugs; excl, excluding; ICERs, incremental cost-effectiveness ratio; increm., incremental; MTX, methotrexate; RA, rheumatoid arthritis; UPA, upadacitinib
The ERG cannot state unequivocally that it has correctly applied the intercept terms as it
is unclear how the VBA handles the data stored in the Excel front end, and indeed quite
how the intercept term should be interpreted. But it appears that applying the intercept
results in the model not simulating any patients worsening to severe RA, as the ICERs
that result are the same as those that result from turning off consideration of transitioning
from moderate RA to severe RA.
5 Implemented in the Mod to sev transition worksheet by subtracting 1.16 from cells D5:D57
Copyright 2019 Queen's Printer and Controller of HMSO. All rights reserved

Page 200 of 275
More generally, a point to note is that within the pooled three and six month data of the
SELECT trials not only was the mean change in HAQ an improvement, but it was an
improvement for the three subgroups with EULAR responses of none, moderate and
good. As a consequence, it appears that much of the data within the regression will
relate to HAQ improvements at three and six months.
By definition, those on bDMARDs are assumed to have an unchanging HAQ after the
initial treatment effect so the regression is in effect not applied until these patients cease
all bDMARD treatment and move onto either cDMARDs or BSC.
It appears that the regression is only really applied among those on cDMARDs and on
BSC. But here it is also being applied during extrapolation beyond six months out to as
much as 45 years, and in the context of the HAQ worsening. It is not obvious that a
regression estimated during the first six months of treatment when the HAQ is generally
improving can simply be reversed to apply to situations where the HAQ is worsening
during the subsequent 45 years.
The regression appears to imply that for moderate RA patients there is a general
improvement in the DAS-28, independent of the changes in the HAQ. The company
avoids this by simply not applying the regression intercept. This seems invalid, and
suggests that the model overestimates patients’ DAS-28 by 1.16. As a consequence, the
model will estimate that moderate RA patients on csDMARDs and BSC develop severe
RA somewhat sooner than that implied by the company regression. This appears to
apply to two circumstances:
• The HAQ of those on csDMARDs worsening while they remain on csDMARDs
due to natural progression.
• The HAQ of those on csDMARDs rebounding, by assumption, to baseline when
they cease treatment.
In the opinion of the ERG given the company regression, among moderate RA patients
the model should estimate an improvement in the DAS-28 independent of the change in
HAQ. The model may simulate moderate RA patients developing severe RA too quickly.
Assuming that a regression based upon six-month data during which HAQ improvements
were the norm can be reversed to apply over the 45 year time horizon of the model when
the HAQ is modelled as worsening is a concern.
Copyright 2019 Queen's Printer and Controller of HMSO. All rights reserved

Page 201 of 275
5.3.4.6 Difference from TA375: Treatment sequences
The treatment sequences explored naturally show some differences from those of
TA37531, given the greater range of advanced DMARDs which are now available. Rather
than review the TA375 treatment sequences, the ERG relies upon expert opinion to
determine the probable sequences of treatments. As reviewed in greater detail later, for
patients ceasing one type of treatment due to a lack of response the choice of the next in
line is guided by:
• Trying a treatment with a different method of action; e.g. a JAK is unlikely to be
followed by a JAK.
• Clinical effectiveness among treatments with a given method of action.
• Cost.
The first bullet would apply with less force among those ceasing one type of therapy due
to an AE, but this cannot be incorporated in the modelling. The ERG presents its
preferred set of treatment sequences later in section 5.4 due to the intervening sections
having a bearing upon this.
5.3.4.7 Difference from TA375: Revised treatment cessation curves: Minor issue
The company revised the company model during the course of the assessment, a
reasonably major revision being made to the treatment cessation curves as presented in
Section 5.2.6.3 above.
The originally presented treatment cessation curves do lie unreasonably above the
company digitised IPD data derived from the Kaplan Meier figures in TA37531. But the
revised curve for the moderate may also not be reasonable. It appears that the company
may have simply fitted a generalised gamma to the start and end points of company
pseudo Kaplan Meier curves.
The generalised gamma fit to the pseudo Kaplan Meier curve for the severe is
reasonable. But the generalised gamma fit to the pseudo Kaplan Meier curve for the
moderate appears poor. It seems to tend to lie somewhat below the pseudo Kaplan
Meier curve.
If the original generalised gamma is applied for moderate RA patients, at Position 2b the
ICER worsens from £13,434 per QALY to £13,601 per QALY. The ERG does not explore
this aspect further.
Copyright 2019 Queen's Printer and Controller of HMSO. All rights reserved

Page 202 of 275
5.3.4.8 Constant EULAR response rates by line of treatment
A key assumption of the modelling is that when applying the results of; e.g., the
bDMARD-IR NMA, the EULAR response rates of a treatment does not decline as
patients move through lines of treatment; i.e. using TFC as a third-line treatment has
exactly the same EULAR response rates among the patients being treated at third-line
as using TFC as a first-line treatment among patients being treated at first-line.
It is generally the case that the EULAR response rates of the bDMARD-IR NMA are
worse than those of the csDMARD-IR NMA. To the ERG this suggests that there is a
tendency for the EULAR response rates of a treatment to decline as patients move
through lines of treatment. This may simply be due to those progressing through lines of
being a subgroup of patients who tend not to respond and are harder to treat for
whatever reason.
If EULAR response rates do decline by line of treatment, it can be argued that there are
no estimates for how much it declines among the advanced DMARD experienced
population. A simplifying assumption is required. Assuming the same EULAR responses
regardless of treatment line may be the most reasonable, and it may not be too serious
when treatment sequences of equal length are being compared.
But if EULAR response rates do decline by line of treatment and the treatment
sequences that are being compared are not of equal length, it seems likely that this
assumption will bias the analysis in favour of the longer treatment sequence. This should
be considered if it is felt that UPA will lengthen the treatment sequences patients may
receive.
The assumption of constant EULAR response rates by line of treatment may be
particularly questionable when assessing UPA later in the treatment pathway. This may
apply with particular force to the assessment of UPA among those who have failed to
respond to RTX therapy, and it can be noted that in SELECT-BEYOND prior exposure to
RTX was only 14%6.
5.3.4.9 Treatment effect estimates at first-line and at subsequent lines of treatment
The company modelling of UPA among moderate RA patients applies the response rates
for the first-line treatment in both the UPA treatment sequence and the comparator
sequence using the csDMARD-IR NMA results, which is appropriate. But based upon the
6 CSR Table 14.1_8.1.2
Copyright 2019 Queen's Printer and Controller of HMSO. All rights reserved

Page 203 of 275
written submission it appears that the model also applies response rates taken from the
csDMARD-IR NMA results for treatment of moderate RA patients at second-line, third-
line etc., which seems incorrect. This should be differentiated by arm.
• Those who have failed to respond to UPA should have response rates at second-
line, third-line etc. drawn from the bDMARD-IR NMA.
• Those in the comparator arm who have only failed to respond to csDMARDs
should have response rates at second-line, third-line etc. drawn from the
csDMARD-IR NMA.
When modelling moderate RA patients, patients can worsen to severe RA and so be
treated with a sequence of bDMARDs. Again, based upon the written submission, it
appears that the company modelling uses the same NMA to estimates the effectiveness
of the first-line bDMARD among those moving into severe RA. The same point applies,
in that these should be differentiated by arm.
• Those who received UPA when in moderate RA and have since worsened to
severe RA should have clinical effectiveness estimates for the first-line bDMARD
when severe drawn from the bDMARD-IR NMA.
• Those in the comparator arm who only received csDMARDs when in moderate
RA and have since worsened to severe RA should have clinical effectiveness
estimates for the first-line bDMARD when severe drawn from the csDMARD-IR
NMA.
The EULAR response rates within the cDMARD-IR NMA are better than those of the
bDMARD-IR NMA. The company approach biases the clinical effect estimates in favour
of UPA.
When modelling severe RA patients on their first bDMARD it appears that the model
applies EULAR response rates of the csDMARD-IR NMA to all treatments regardless of
whether they are first-line or a subsequent line of treatment. It seems more appropriate
to apply the EULAR response rates of the bDMARD-IR NMA to lines of treatment
subsequent to the first-line of treatment. It seems likely that the company approach will
bias the clinical effect estimates in favour of the less effective treatment.
This can be illustrated by revising the modelling at position 1b of moderate RA patients
who are eligible for MTX and RTX. In the light of ERG comments, to abstract from the
effects of unequal treatment sequences and the questionable application of MTX
Copyright 2019 Queen's Printer and Controller of HMSO. All rights reserved

Page 204 of 275
response rates for moderate RA patients UPA+MTX can be compared directly with
intensive csDMARDs, with only BSC among non-responders. Those progressing to
severe RA can be assumed to have a common treatment sequence of ADA+MTX,
followed by RTX+MTX, followed by TCZIV+MTX followed by BSC. The company
approach of applying the response rates of the csDMARD-IR NMA results in the
following cost effectiveness estimates.
Table 72. Not differentiating responses by bDMARD experience
Costs QALYs ∆Cost ∆QALY ICER
Int.csDMARDs ******* ***** ** **
UPA+MTX ******* ***** ******* ***** £47,649 Abbreviations: bDMARD, biologic disease-modifying antirheumatic drugs; csDMARDs, conventional synthetic disease modifying antirheumatic drugs; ICERs, incremental cost-effectiveness ratio; MTX, methotrexate; QALYS, quality-adjusted life years; RA, rheumatoid arthritis; UPA, upadacitinib
The ERG approach7 of applying the csDMARD-IR NMA response estimates for those
failing to respond to csDMARDs and the bDMARD-IR NMA response estimates for those
failing to respond to bDMARDs results in the following cost effectiveness estimates.
Table 73. Differentiating responses by bDMARD experience
Costs QALYs ∆Cost ∆QALY ICER
Int.csDMARDs ******* ***** ** **
UPA+MTX ******* ***** ******* ***** £50,159 Abbreviations: bDMARD, biologic disease-modifying antirheumatic drugs; csDMARDs, conventional synthetic disease modifying antirheumatic drugs; ICERs, incremental cost-effectiveness ratio; MTX, methotrexate; QALYS, quality-adjusted life years; RA, rheumatoid arthritis; UPA, upadacitinib
It should be borne in mind that the costs in the above do not take into account the
comparator cPAS prices. The main effect of differentiating response rates between the
bDMARD naïve and the bDMARD experienced is to reduce the net QALY gains by
around 7-8%. Total costs do change slightly and the change in the list prices ICER is
less; it worsens by around 5%.
7 This requires the model to be run twice, the run estimating costs and QALYs for the upadacitinib arm applying the bDMARD-IR NMA response rates for ADA+MTX, RTX+MTX and TCZIV+MTX and the run estimating the costs and QALYs for the intensive csDMARDs arm applying the cDMARD-IR NMA response rates for ADA+MTX and the bDMARD-IR NMA response rates for RTX+MTX and TCZIV+MTX.
Copyright 2019 Queen's Printer and Controller of HMSO. All rights reserved

Page 205 of 275
The ERG will differentiate the source of effectiveness estimates based upon whether
patients have only failed to respond to csDMARDs or have failed to respond to at least 1
bDMARD.
5.3.4.10 Natural recovery and the placebo effect
Within the SELECT trials the control arms showed reasonably high ACR20 and ACR50
response rates, and non-negligible ACR70 response rates (Table 74).
Table 74. SELECT trials: Control arm ACR response rates
PBO/control arm UPA arm SELECT Cont. ACR20 ACR50 ACR70 ACR20 ACR50 ACR70 COMPARE (Wk 12) PBO 36% 15% 5% 71% 45% 25%
COMPARE (Wk 26) PBO 36% 21% 10% 67% 54% 35%
NEXT PBO 36% 15% 6% 64% 38% 21%
MONOTHERAPY MTX 41% 15% 3% 68% 42% 23%
BEYOND PBO 28% 12% 7% 65% 34% 12% Abbreviations: ACR 20/50/70, American College of Rheumatology 20%/50%/70% response; Cont., control; MTX, methotrexate; PBO, placebo; UPA, upadacitinib
ERG expert opinion notes that this is generally the case within RA trials. The company
csDMARD-IR also estimates non-negligible response rates for the pooled PBO control
arms: ACR20, ACR50 and ACR70. The degree to which this is due to natural recovery
and to which it is a pure PBO effect is unclear. The scope suggests that natural recovery
occurs among some patients11:
“Rheumatoid arthritis is usually a chronic relapsing condition which has a pattern of
flare-ups followed by periods of lower disease activity; however, for some people, the
disease is constantly progressive.”
To the ERG this suggested that the company model should seek to estimate the cost
effectiveness of UPA relative to an active comparator or relative to PBO. But among
moderate RA patients the company modelling approach assumes 0% ACR20, 0%
ACR50 and 0% ACR70 response rates in the comparator arm. This is most easily seen
in the modelling of Sequence 2a, Table 40 being reproduced below for ease of
reference.
Table 75. Sequence: 2a: Moderate RA: MTX intolerant, RTX tolerant, failed ≥2 csDMARD: Among moderate patients
Sequence First-line Second-line
Copyright 2019 Queen's Printer and Controller of HMSO. All rights reserved

Page 206 of 275
1. UPA BSC
2. BSC .. Abbreviations: BSC, best supportive care; UPA, upadacitinib
Based upon the CS csDMARD-IR NMA, in Sequence 1 first-line UPA has
**********************************, and response rates, with these being both the absolute
response rates for UPA and the net response rates relative to BSC. This compares to
Week 14 net effects during SELECT-MONOTHERAPY, the trial linking UPA
monotherapy into the csDMARD-IR NMA, for UPA monotherapy compared to MTX of
****************************************************************************************************
UPA and MTX.
The company clarification response reported 26 week EULAR response rates for
SELECT-COMPARE, calculated based upon NRI and LOCF.
Table 76. EULAR response rates: SELECT-COMPARE vs model
EULAR response rates
Cont. UPA Net
SELECT-COMPARE Wk Cont Mod. Good Mod. Good Mod. Good
NRI 26 PBO 24% 17% 19% 54% -5% 37%
LOCF 26 PBO 36% 18% 31% 59% -5% 41%
Modelling UPA+csDMARD .. BSC 0% 0% 31% 42% 31% 42%
Abbreviations: Cont, control; csDMARDs, conventional synthetic disease-modiyfing antirheumatic drugs; EULAR, European League Against Rheumatism; LOCF, last observation carried forward; Mod, moderate; NRI, non-responder imputation; PBO, placebo; UPA, upadacitinib; vs, versus
While the net proportions with a good EULAR response are reasonably aligned between
SLEECT-COMPARE and the model inputs, the net proportions with a moderate EULAR
response are not aligned with the model inputs somewhat favouring UPA. Note that
these values have only been supplied at clarification, there is no ready means of cross
checking them.
It is unclear whether the above EULAR response estimates are mapped from ACR rates
or are directly reported in the SELECT-COMPARE trial. It should be borne in mind that
EULAR response rates are not reported for any of the trials in the clinical effectiveness
sections of the CSs. A free text search for “EULAR” in the SELECT-COMPARE CSR
only seems to return Boolean EULAR remission, i.e. Yes/No, and does not appear to
consider rates of EULAR moderate response and EULAR good response. As a
consequence, it is not clear to the ERG quite what is being reported in the above, why
Copyright 2019 Queen's Printer and Controller of HMSO. All rights reserved

Page 207 of 275
the above was not reported in the clinical effectiveness sections of the CSs and why this
has not been reported for the other SELECT trials.
Applying the company ACR response to EULAR response mapping to the central ACR
response estimates8 of the SELECT trials included in the company cDMARD-IR NMA,
ignoring the Japanese SELECT-SUNRISE results in the following (Table 77) which can
be compared with the modelling for UPA monotherapy and UPA+csDMARDs when
compared to BSC.
Table 77. EULAR response rates: SELECT csDMARD-IR trials mapping vs model
EULAR response rates
Control UPA Net
SELECT Wk Cont Mod. Good Mod. Good Mod. Good
For comparison with UPA+csDMARDs modelling
COMPARE 12 PBO 24% 22% 31% 40% 7% 18%
COMPARE 26 PBO 23% 23% 30% 40% 7% 17%
NEXT 12 PBO 24% 22% 31% 36% 6% 14%
Modelling UPA+csDMARD .. BSC 0% 0% 31% 42% 31% 42%
For comparison with UPA monotherapy modelling
MONOTHERAPY 14 MTX 25% 25% 31% 38% 6% 14%
Modelling UPA .. BSC 0% 0% 30% 38% 30% 38% Abbreviations: Cont: Control, csDMARDs, conventional synthetic disease modifying antirheumatic drugs; IR, inadequate response; Mod., moderate; vs., versus
The SELECT trials’ control arms’ mapped response rates are very similar across the
three trials reported above. This is perhaps unsurprising In SELECT-COMPARE patients
had previously failed to respond adequately to MTX, and while the control arm is PBO
patients in all arms remained on background MTX. Similarly, in SELECT-NEXT patients
had previously failed to respond adequately to csDMARDs, and while the control arm is
PBO patients in all arms remained on background csDMARDs. SELECT-
MONOTHERAPY is a little different in that patients had previously failed to respond
adequately to MTX and the control arm was MTX, but across all three trials it seems
patients in the control arm received either MTX or csDMARDs.
The modelling assumes a much larger net treatment effect over the control arm than was
observed during the SELECT trials, due to significant and clinically meaningful response
rates in the SELECT trials’ control arms being ignored in the modelling. It is not clear
8 It would be formally more correct to undertake this mapping probabilistically as outlined in section 4.4.1.
Copyright 2019 Queen's Printer and Controller of HMSO. All rights reserved

Page 208 of 275
whether the response rates in the SELECT trials’ control arms arose from natural
recovery, a pure PBO effect or some combination of the two but it seems incorrect to
entirely ignore it.
If the response rates in the control arms arose from natural recovery or a delayed
treatment effect it is definitely incorrect to ignore them.
If the there is no degree of natural recovery or delayed treatment effect among patients
and the response rates in the control arms are pure PBO effect, it can be argued that this
effect would not apply in day-to-day clinical practice. But in the opinion of the ERG the
cost effectiveness estimates should not include the PBO effect in only one arm. To argue
otherwise is, in extremis, to suggest that an active treatment which during its RCT
showed a minimal but statistically significant benefit over the control arm is still cost
effective due to it realising the PBO effect; i.e. a treatment with a statistically significant
5% improvement over a PBO control arm with a 50% response rate should be granted
the full 55% response rate, but the comparator arm nothing. Homeopathic remedies,
even those with a high price, would be estimated to be very cost effective under this
approach.
In the light of this, where the length of treatment sequences differs the ERG will apply a
control arm treatment effect for BSC at the line of treatment where it is being compared
with an active comparator. When considering the trials’ data for comparisons with
UPA+MTX, the ERG will apply SELECT-COMPARE data supplied by the company at
clarification. The company has only supplied the week 26 SELECT-COMPARE EULAR
response rates, as reported in Table 76 above so the ERG does not have the values
before rescue therapy. The ERG selects the LOCF values on the basis of LOCF being
the default method for analysing secondary variables in the SELECT-COMPARE CSR.
The less optimistic SELECT-NEXT response rates are provided as a scenario analysis.
When considering the trials’ data for comparisons with UPA, the ERG will apply the
Week 12 response rates of SELECT-MONOTHERAPY.
While less immediately obvious, the consideration of natural recovery and the PBO effect
in the SELECT trials also applies in all the comparisons where UPA lengthens the
treatment sequence such that at some point in the treatment sequences, the nth line of
treatment, there is an active treatment in the UPA containing sequence but only BSC in
the comparator sequence.
Note that these considerations do not apply when comparing active treatment sequences
of the same length. It also seems likely that they will not matter for decision making
purposes when comparing sequences of differing lengths if the longer sequence is
Copyright 2019 Queen's Printer and Controller of HMSO. All rights reserved

Page 209 of 275
estimated to not be cost effective. Including the control arm treatment effect would
probably just further worsen the cost effectiveness estimate, and so not affect the
decision. They only matter when comparing sequences of differing lengths if the longer
sequence is estimated to be cost effective.
5.3.4.11 Possible evidence of ongoing natural recovery
There may be some evidence to support the possibility of natural improvement over time
from the SELECT trial data, ACR response rates being reported at Week 1 and Week 12
for SELECT-BEYOND and at Week 12 and Week 26 for SELECT-COMPARE (Table
78).
Table 78. SELECT trials: Control arm ACR responses over time
SELECT Week ACR20 ACR50 ACR70
BEYOND 1 10.7% NA NA
12 28.4% 11.8% 6.5%
COMPARE 12 36.4% 14.9% 4.9% 26 35.6% 20.9% 9.5%
Abbreviations: ACR 20/50/70, American College of Rheumatology 20%/50%/70% response; NA, not applicable
Within SELECT-BEYOND the initial ACR20 response of 10.7% at Week 1 increase to
28.4% by Week 12. Within SELECT-COMPARE the proportion of patients with an
ACR20 response remained largely unchanged between Week 12 and Week 26. But
among those with an ACR20 response there is evidence of further improvements
between Week 12 and Week 26, with the ACR70 response rate roughly doubling from
4.9% to 9.5%. While it cannot be stated unequivocally, this can be interpreted as roughly
5% of the ACR20 but not ACR50 at Week 12 improving to an ACR50 by Week 26, and
similarly roughly 5% of the ACR50 but not ACR70 at Week 12 improving to an ACR70 by
Week 26.
But within SELECT-COMPARE rescue treatment was permitted in all arms at weeks 14,
18 and 22. Those not achieving at least a 20% improvement in their TJC were permitted
to switch treatment, with the PBO arm and ADA arm patients receiving rescue UPA and
the UPA arm patients receiving rescue ADA. Rates of rescue were highest in the PBO
arm, with the UPA arm having the lowest rates of rescue as per the CSR report table
14.1_1.4.
Copyright 2019 Queen's Printer and Controller of HMSO. All rights reserved

Page 210 of 275
Table 79. SELECT-COMPARE rescue treatment by arm
Week PBO ADA UPA 14 ***** ***** *****
18 **** **** ****
22 **** **** **** Abbreviations: ADA, adalimumab; PBO, placebo; UPA, upadacitinib
Despite the higher rates of rescue in the PBO arm, the PBO arm ACR20 response rate
remains reasonably constant between Week 12 and Week 26. This appears to be due to
patients receiving rescue therapy being analysed for secondary variables (i.e. beyond
the primary endpoints of ACR20 at 12 weeks and DAS28-CRP clinical remission) on the
basis of LOCF from the point of rescue. The ongoing improvement in the distribution
across the ACR20, ACR50 and ACR70 response rates in the PBO arm among those
remaining on PBO and not receiving rescue therapy may suggest ongoing natural
recovery between Week 12 and Week 26.
If there is ongoing natural recovery or some treatment effect among those who receive
rescue treatment, the differential rates of rescue therapy between the arms and so
differential rates of LOCF being applied may give rise to some concerns about the net
effects estimated at Week 26. But any consideration of this may complicated if there
might be a treatment effect in addition to natural recovery in the active treatment arms.
Perhaps the most that can be said is that rescue therapy and LOCF makes interpretation
of the SELECT-COMPARE week 26 ACR response rates more difficult than
interpretation of the week 12 ACR response rates. Indeed, NMA estimates of UPA
effectiveness at six months rely on meta-regression estimates (see Section 4.4.1).
5.3.4.12 Moderate RA: lines of treatment
As an illustration, for Position 1b (Section 5.2.4.2), the following treatment sequences
apply for patients who remain with moderate RA (Table 80).
Table 80. Sequence 1b: Moderate RA, one csDMARD fail, MTX tolerant
Sequence First-line Second-line Third-line Fourth-line 1 UPA+MTX Int csDMARDs MTX BSC
2 UPA Int csDMARDs MTX BSC
3 Int csDMARDs MTX BSC .. Abbreviations: BSC, best supportive care; cDMARDs, conventional synthetic disease modifying antirheumatic drugs; int., intolerant; MTX, methotrexate; RA, rheumatoid arthritis; UPA, upadacitinib
Copyright 2019 Queen's Printer and Controller of HMSO. All rights reserved

Page 211 of 275
The patients in this comparison will by definition have already tried and failed MTX
before trying UPA. It appears that the model structure assumes that in the above MTX
will be associated with the EULAR response rates of the csDMARD-IR NMA. ERG expert
opinion is that the above treatment sequences make little clinical sense. ERG opinion is
that even if the above treatment sequences do make clinical sense, the EULAR
response estimates for MTX subsequent to both UPA and intensified csDMARDs are not
be relevant to the patient population being modelled.
ERG expert opinion is that moderate RA patients who remain without a EULAR response
typically do not have their treatment withdrawn to then be placed upon BSC, unless this
is with a view to provoking a flare to severe RA, so making the advanced DMARDs
available. In the current context of only csDMARDs being available for moderate RA
patients, ERG expert opinion is that patients without a EULAR response to csDMARDs
will remain on whichever combination of csDMARDs proved best, possibly with the
addition of courses of steroids. In the context of NICE approving UPA for moderate RA it
is less clear what would happen, given the cost of UPA. Moderate RA patients without a
EULAR response might remain on UPA, but if so given the cost of UPA it might seem
perverse not to try a different advanced DMARD. Or UPA might be withdrawn and
patients placed back on whichever combination of csDMARDs proved best.
In the context of the modelling this raises two possibilities:
• Assume that those without a EULAR response to first-line treatment remain on
their existing first-line treatment and incur its costs, but remain without a EULAR
response.
• Assume that those without a EULAR response revert to csDMARDs in both arms
and incur a common cost, but remain without a EULAR response.
But this does not address patient benefits. These patients would by definition not have
achieved a EULAR response but they would have had some improvement from baseline.
The SELECT trials provide some evidence of an improvement in the HAQ of a mean of
0.123 among those without a EULAR response.
Unfortunately, the economic model has not been constructed to permit an exploration of
this. As a consequence, the ERG exploration of this is limited to restricting the number of
treatments prior to BSC to a single line of treatment so as to avoid modelling patients
who have already failed on MTX having a response to subsequent treatment with MTX.
Copyright 2019 Queen's Printer and Controller of HMSO. All rights reserved

Page 212 of 275
As an example, in the modelling of moderate RA patients the cost effectiveness of
UPA+MTX against intensified csDMARDs if both are only followed by BSC is £35,148
per QALY. If both can be followed by MTX before going onto BSC the cost effectiveness
worsens to £44,687 per QALY. While in some manner this approximates to patients with
a poor response not having treatment entirely withdrawn, at least for a period, in the
opinion of the ERG applying the MTX response rates among patients who have
previously failed on MTX is unlikely to be reliable.
The preference of the ERG is to leave the question of what happens to patients who do
not respond to intensification of treatment as an unquantified uncertainty. This may mean
that the ERG modelled ICERs for moderate RA patients are biased in favour of UPA.
The extent of this bias is difficult to quantify.
5.3.4.13 Moderate RA: positioning of UPA pre and post intensified csDMARDs
The company model does not consider the optimal positioning of UPA within the
moderate treatment sequence. Common sense suggests it may be more cost effective to
trial a patient on intensified cDMARDs, which are very cheap, prior to using UPA among
treatment failures, compared to trialling the patient on UPA, which is very expensive, and
only trying intensified cDMARDs among treatment failures. As an example, and in the
light of previous comments on the inappropriateness of modelling a second response to
MTX, among those with moderate RA who have failed one csDMARD this suggests
exploring the following possibilities9.
Table 81. Modified sequence 1b: Moderate RA, one csDMARD fail, MTX tolerant
Sequence First-line Second-line Third-line 1 UPA+MTX Int csDMARDs BSC
2 Int csDMARDs UPA+MTX BSC
3 UPA Int csDMARDs BSC
4 Int csDMARDs UPA BSC Abbreviations: BSC, best supportive care; csDMARDs, conventional synthetic disease modifying antirheumatic drugs; int., intolerant; MTX, methotrexate; RA, rheumatoid arthritis; UPA, upadacitinib
Sequence 1 compared to Sequence 2 involves an additional ****** cost and results in an
additional ***** QALYs, which suggests an ICER of £49,715 per QALY. This result is also
robust if the same treatment sequence for those progressing to severe RA is assumed,
9 The ERG modelling of this sets the treatment sequence for those developing severe RA to be equal across Sequences 1 to 4, and to be equal to the severe RA treatment sequence of Sequence 1 of Table 35 of the CS.
Copyright 2019 Queen's Printer and Controller of HMSO. All rights reserved

Page 213 of 275
which in the opinion of the ERG is the more reasonable comparison, this yielding and
ICER of £77,658 per QALY.
Similarly, Sequence 3 compared to Sequence 4 involves an additional ****** cost and
results in an additional ***** QALYs, which suggests an ICER of £73,369 per QALY. The
more reasonable comparison with a common treatment sequence for those progressing
to severe RA yields an ICER of £76,793 per QALY.
At conventional willingness to pay thresholds for moderate RA patients the model
estimates that it is substantially more cost effective to trial intensified csDMARDs before
trialling the somewhat more expensive UPA, much as intuition would suggest. While the
cPAS inclusive ICERs cannot be reported here, they do not affect this conclusion.
This suggests that among moderate RA patients, UPA should only be considered
towards the end of the line after at least some of the cheaper intensified cDMARDs have
been tried. As a consequence, the ERG does not further consider UPA at Position 1 and
only considers it at Position 2 for treatment of moderate RA patients.
5.3.4.14 Severe RA: positioning of UPA vs cheaper bDMARDs
A similar argument to Section 5.3.4.13 applies among severe RA patients. For instance,
at Position 3a the following comparison is possible.
Table 82. Modified sequence 3a: Severe RA, ≥2 csDMARD fail, MTX intolerant
Sequence First-line Second-line Third-line 1 UPA ADA BSC
2 ADA UPA BSC Abbreviations: ADA, adalimumab; BSC, best supportive care; csDMARD, conventional synthetic disease-modifying antirheumatic drug; MTX, methotrexate; RA, rheumatoid arthritis; UPA, upadacitinib
The costs effectiveness of sequence 1 compared to sequence 2 is for it to be cost saving
in terms of the drug and administration costs by ******, but net costs everywhere else to
be roughly the same between the arms. Sequence 1 only confers an additional *****
QALYs compared to sequence 2. This does apply the revised *** UPA PAS but does not
take into account the substantially lower confidential prices of ADA and its biosimilars.
The cPAS inclusive ICER cannot be reported here, but applying the cPAS price
discounts results in Sequence 1 involving reasonably substantial additional direct drug
and administration costs compared to Sequence 2. Given the minimal QALY gains that
Copyright 2019 Queen's Printer and Controller of HMSO. All rights reserved

Page 214 of 275
are modelled, the resulting ICER for Sequence 1 compared to Sequence 2 is in the
millions of pounds per QALY.
For the modelling of moderate RA patients who progress to severe RA, to the ERG this
suggests that the company Sequence 2 should be revised to move JAK usage from
before ADA to after ADA, and for the JAK to be UPA rather than BRC.
But the situation is more complicated for the modelling of severe RA patients due the
number of bDMARDs that have been approved by NICE. Some may be more expensive
than UPA and some cheaper. It may be less reasonable for UPA to be singled out for the
above comparison and the other bDMARDs not considered similarly. As a consequence,
the ERG will not particularly seek to take this into account other than noting that TA375
recommended “Start treatment with the least expensive drug (taking into account
administration costs, dose needed and product price per dose). This may need to be
varied for some people because of differences in the mode of administration and
treatment schedules.”
5.3.4.15 Severe RA: multiple advanced DMARDs before RTX
ERG expert opinion is that clinicians will recommend RTX among severe RA patients
who have failed to respond to one advanced DMARD. But ERG expert opinion also
noted that patients can be well informed and demanding, and that some have a strong
preference for oral and SC administration over IV infusion. A proportion of patients may
consequently receive more than one advanced DMARD before being treated with RTX.
ERG expert opinion is that RTX is tending to fall more into the box of advanced DMARDs
rather than being in a box of its own as in the company treatment diagram and
necessarily the second-line bDMARD where tolerated.
5.3.4.16 Severe RA: RTX monotherapy
In contrast to IFX which is apparently always administered as IFX+MTX and so cannot
be administered to patients who are MTX intolerant, ERG expert opinion is that it is
relatively common practice for RTX to be administered as monotherapy among the MTX
intolerant and that there is a relatively good evidence base for this.
5.3.4.17 Tociluzumab IV vs tociluzumab SC vs sarilumab SC
The company sequences suggest that the preferred interleukin is TCZIV. The preference
for IV administration obviates consideration of SRL which is only available as SC
administration.
Copyright 2019 Queen's Printer and Controller of HMSO. All rights reserved

Page 215 of 275
ERG expert opinion notes that there is a strong patient preference for SC over IV, and
among his patients receiving TCZ only three are receiving TCZIV compared to 40–50 who
are receiving TCZSC. ERG expert opinion also indicates that if SRLSC were locally
cheaper than TCZSC, SRLSC would be used.
In the light of this the ERG will assume interleukin administration to be SC and will base
the treatment sequence on the least costly interleukin.
5.3.4.18 Palliative care costs for moderate RA patients
An annual £742 palliative care cost is applied, which the ERG assumes applies to BSC.
This is based upon a palliative care / rescue therapy cost of £720 in TA37531. This cost is
in addition to the HAQ based inpatient costs.
In the light of this cost being additional to inpatient costs, it may be questionable for the
same palliative care costs to be applied to those with moderate RA as to those with
severe RA, or indeed for there to be any palliative care costs among those with
moderate RA given that patient monitoring is accounted for elsewhere. As an example,
setting the BSC cost to zero worsens the company ICER of position 2b from £13,434 per
QALY to £16,755 per QALY. But it should be recognised that setting the BSC to zero
applied this not only among moderate RA patients who go on to receive BSC, but also
among severe RA patients who go on to receive BSC. This scenario analysis
consequently exaggerates the effect of setting the BSC among moderate RA patients to
zero. It remains an unquantifiable uncertainty and possible model bias in favour of UPA
among moderate RA patients.
5.3.4.19 Monitoring frequency
In newly diagnosed RA, NICE CG1008 recommends monthly monitoring when initiating
treatment until disease is stabilised, a review at six months after achieving stability and
an annual review thereafter. Longer term monitoring of resource use may consequently
be too high. But since no survival gains are modelled the ERG thinks that this is likely to
net out between the arms and not particularly affect results.
Exploratory and sensitivity analyses undertaken by the ERG
5.4.1 ERG preferred treatment sequences: UPA+MTX vs UPA
In general the company finds UPA+MTX to be cost effective relative to UPA where both
can be used. As a consequence, for patients tolerant of MTX the ERG only considers
UPA+MTX and for patients intolerant of MTX the ERG only considers UPA.
Copyright 2019 Queen's Printer and Controller of HMSO. All rights reserved

Page 216 of 275
5.4.2 ERG treatment sequences for modelling moderate RA patients
The discussion of Section 5.3.4.13 highlights that for moderate RA patients it is unlikely
to be cost effective to trial UPA or UPA+MTX prior to intensifying the much cheaper
csDMARDs. The ERG does not consider Position 1 any further.
As a consequence, when modelling moderate RA patients the ERG only compares UPA
with intensified csDMARDs and BSC. It should be noted that the ERG also applies the
effectiveness estimates of the SELECT trial control arms for BSC at the position where
BSC10 is at the same line of therapy as UPA among moderate RA patients.
ERG expert opinion is that among those progressing from moderate RA to severe RA
most will be treated with the cheapest advanced DMARD, ADA. Those tolerant of RTX
will tend to receive it next, even if they are intolerant of MTX. Third-line treatment may be
an interleukin. But since JAKs and interleukins act through similar pathways, those who
received UPA when in moderate RA might tend instead to receive a treatment with a
different method of action such as ABT. This will be presented as a scenario analysis by
the ERG, and again due to patient preference it will be assumed to be ABTSC rather than
ABTIV (Scenario 01). Patients also often have a preference for oral over subcutaneous
administration and as a consequence UPA might be used for those with severe disease
who did not receive UPA when in moderate RA (Scenario 02). The changes of Scenario
01, ABTSC for severe RA in the UPA arm, and of Scenario 02, UPA for severe RA in the
comparator arm, can be combined to yield Scenario 3. Finally, Scenario 4 mirroring the
company treatment sequences but also reflecting the considerations of Section 5.3.4.14
can be defined as the sequences of the ERG base case but with the additional insertion
of UPA after ADA into the treatment sequence for severe RA in the comparator arm.
5.4.2.1 ERG Position: 2a: Moderate MTX intolerant RTX tolerant failed ≥2 csDMARDs
This results in the following treatment sequences for those with moderate RA who are
tolerant of RTX but intolerant of MTX. Note that within this, due to the discussion in
sections 5.3.4.9 and 5.3.4.12, UPA is compared on a pairwise basis with Sequences 2a
and 2b.
10 This requires that a placeholder in the model be used for control or placebo BSC to avoid it becoming confused with BSC when all treatment has been ceased and it is assumed no patients have a EULAR response. The ERG has selected TCZIV for this due to TCZSC being available and much preferred by patients. This means that in the model implementation TCZIV is assumed to have zero drug and administration costs, the latter by assuming it to be oral. It is then assumed to have the relevant SELECT trial control arm treatment effectiveness. It can be further argued that the 6 month treatment establishment monitoring costs of £1,752 should be roughly halved to the £828 cost of routing ongoing monitoring.
Copyright 2019 Queen's Printer and Controller of HMSO. All rights reserved

Page 217 of 275
Table 83. ERG Position: 2a: Moderate RA: MTX intolerant, RTX tolerant, failed ≥2 csDMARDs: Among moderate RA patients
Sequence Firstine Second-line 1. UPA BSC
2a. Int.csDMARD BSC
2b. PBO / BSC BSC Abbreviations: BSC, best supportive care; csDMARD, conventional synthetic disease-modifying antirheumatic drug; PBO, placebo; RA, rheumatoid arthritis; UPA, upadacitinib
The treatment sequences for those worsening to severe RA depend upon which
treatment sequence was received when with moderate RA (Table 43).
Table 84. ERG Position: 2a: Moderate RA: MTX intolerant, RTX tolerant, failed ≥2 csDMARDs: Among patients who have progressed to severe
Sequence First-line Second-line Third-line Fourth-line 1. ADA RTX SRL BSC
2a.& 2b ADA RTX SRL BSC Abbreviations: ADA, adalimumab; BSC, best supportive care; csDMARD, conventional synthetic disease-modifying antirheumatic drug; MTX, methotrexate; RA, rheumatoid arthritis; RTX, rituximab; SRL, sarilumab; UPA, upadacitinib
The bDMARD-IR NMA does not provide estimates for RTX and the ERG has applied
those of RTX+MTX. This may be too optimistic.
And the following scenario analyses for those progressing to severe RA.
Table 85. ERG Position: 2a: Moderate RA: MTX intolerant, RTX tolerant, failed ≥2 csDMARDs: Among patients who have progressed to severe: Scenario 01
Sequence First-line Second-line Third-line Fourth-line 1. ADA RTX ABTSC BSC
2a.& 2b ADA RTX SRL BSC Abbreviations: ADA, adalimumab; ABT, abatacept; BSC, best supportive care; csDMARD, conventional synthetic disease-modifying antirheumatic drug; MTX, methotrexate; RA, rheumatoid arthritis; RTX, rituximab; SC, subcutaneous; SRL, sarilumab; UPA, upadacitinib
The bDMARD-IR NMA does not provide estimates for ABTSC and the ERG has applied
those of TCZSC.
Copyright 2019 Queen's Printer and Controller of HMSO. All rights reserved

Page 218 of 275
Table 86. ERG Position: 2a: Moderate RA: MTX intolerant, RTX tolerant, failed ≥2 csDMARDs: Among patients who have progressed to severe: Scenario 02
Sequence First-line Second-line Third-line Fourth-line 1. ADA RTX SRL BSC
2a.& 2b ADA RTX UPA BSC Abbreviations: ADA, adalimumab; ABT, abatacept; BSC, best supportive care; csDMARD, conventional synthetic disease-modifying antirheumatic drug; MTX, methotrexate; RA, rheumatoid arthritis; RTX, rituximab; SC, subcutaneous; SRL, sarilumab; UPA, upadacitinib
The above also suggests a Scenario 03 of third-line treatment of severe RA patients with
ABTSC following treatment with UPA when in moderate RA and with UPA following
treatment with intensified csDMARD or PBO/BSC when in moderate RA.
The ERG will also model treatment sequences for those who have progressed to severe
that mirror the assumptions of the company but also reflect the considerations of
Section 5.3.4.14.
Table 87. ERG Position: 2a: Moderate RA: MTX intolerant, RTX tolerant, failed ≥2 csDMARDs: Among patients who have progressed to severe RA: Scenario 04
Sequence First-line Second-line Third-line Fourth-line Fifth-line 1. ADA RTX SRL BSC ..
2a.& 2b ADA UPA RTX SRL BSC Abbreviations: ADA, adalimumab; ABT, abatacept; BSC, best supportive care; csDMARD, conventional synthetic disease-modifying antirheumatic drug; MTX, methotrexate; RA, rheumatoid arthritis; RTX, rituximab; SC, subcutaneous; SRL, sarilumab; UPA, upadacitinib
Scenario 4 is subject to the concerns around possible biases that may arise from
modelling sequences of differing lengths when combined with the working assumption of
there being no decline in EULAR response rates by line of treatment.
5.4.2.2 ERG Position: 2b: Moderate MTX tolerant RTX tolerant failed ≥2 csDMARDs
This results in the following treatment sequences for those with moderate RA who are
tolerant of RTX and tolerant of MTX. Note that within this, due to the discussion of
Sections 5.3.4.12 and 5.3.4.13 UPA+MTX is compared on a pairwise basis with
Sequences 2a and 2b.
Copyright 2019 Queen's Printer and Controller of HMSO. All rights reserved

Page 219 of 275
Table 88. ERG Position: 2b: Moderate RA: MTX tolerant, RTX tolerant, failed ≥2 csDMARDs: Among moderate patients
Sequence First-line Second-line 1. UPA+MTX BSC
2a. Int.csDMARD BSC
2b. PBO / BSC BSC Abbreviations: BSC, best supportive care; csDMARD, conventional synthetic disease-modifying antirheumatic drug; MTX, methotrexate; PBO, placebo; RA, rheumatoid arthritis; RTX, rituximab; UPA, upadacitinib
The ERG also explores MTX at second-line followed by BSC at third-line as Scenario 00.
The treatment sequences for those worsening to severe RA depend upon which
treatment sequence was received when with moderate RA (Table 43).
Table 89. ERG Position: 2b: Moderate RA: MTX tolerant, RTX tolerant, failed ≥2 csDMARDs: Among patients who have progressed to severe RA
Sequence First-line Second-line Third-line Fourth-line 1. ADA+MTX RTX+MTX SRL+MTX BSC
2a.& 2b ADA+MTX RTX+MTX SRL+MTX BSC Abbreviations: ADA, adalimumab; BSC, best supportive care; csDMARD, conventional synthetic disease-modifying antirheumatic drug; MTX, methotrexate; RA, rheumatoid arthritis; RTX, rituximab; SRL, sarilumab
And the following scenario analyses for those progressing to severe RA.
Table 90. ERG Position: 2b: Moderate RA: MTX tolerant, RTX tolerant, failed ≥2 csDMARDs: Among patients who have progressed to severe RA: Scenario 01
Sequence First-line Second-line Third-line Fourth-line 1. ADA+MTX RTX+MTX ABTSC+MTX BSC
2a.& 2b ADA+MTX RTX+MTX SRL+MTX BSC Abbreviations: ABT, abatacept; ADA, adalimumab; BSC, best supportive care; csDMARD, conventional synthetic disease-modifying antirheumatic drug; MTX, methotrexate; RA, rheumatoid arthritis; RTX, rituximab; SC, subcutaneous; SRL, sarilumab; UPA, upadacitinib
The bDMARD-IR NMA does not provide estimates for ABTSC+MTX and the ERG has
applied those of TCZSC+MTX.
Copyright 2019 Queen's Printer and Controller of HMSO. All rights reserved

Page 220 of 275
Table 91. ERG Position: 2b: Moderate RA: MTX tolerant, RTX tolerant, failed ≥2 csDMARDs: Among patients who have progressed to severe RA: Scenario 02
Sequence First-line Second-line Third-line Fourth-line 1. ADA+MTX RTX+MTX SRL+MTX BSC
2a.& 2b ADA+MTX RTX+MTX UPA+MTX BSC Abbreviations: ADA, adalimumab; BSC, best supportive care; csDMARD, conventional synthetic disease-modifying antirheumatic drug; MTX, methotrexate; RA, rheumatoid arthritis; RTX, rituximab; SRL, sarilumab; UPA, upadacitinib
The above also suggests a Scenario 03 of third-line treatment of severe RA patients with
ABTSC+MTX following treatment with UPA when in moderate RA and with UPA+MTX
following treatment with intensified csDMARD or PBO/BSC when in moderate RA.
The ERG will also model treatment sequences for those who have progressed to severe
that mirror the assumptions of the company but also reflect the considerations of
Section 5.3.4.14.
Table 92. ERG Position: 2b: Moderate RA: MTX tolerant, RTX tolerant, failed ≥2 csDMARDs: Among patients who have progressed to severe RA: Scenario 04
Sequence First-line Second-line Third-line Fourth-line Fifth-line 1. ADA+MTX RTX+MTX SRL+MTX BSC ..
2a.& 2b ADA+MTX UPA+MTX RTX+MTX SRL+MTX BSC Abbreviations: ADA, adalimumab; BSC, best supportive care; csDMARD, conventional synthetic disease-modifying antirheumatic drug; MTX, methotrexate; RA, rheumatoid arthritis; RTX, rituximab; SRL, sarilumab; UPA, upadacitinib
Scenario 4 is subject to the concerns around possible biases that may arise from
modelling sequences of differing lengths when combined with the working assumption of
there being no decline in EULAR response rates by line of treatment.
5.4.2.3 ERG Seq: 2c: Moderate MTX intolerant RTX intolerant failed ≥2 csDMARDs
This results in the following treatment sequences for those with moderate RA who are
intolerant of RTX and intolerant of MTX.
Copyright 2019 Queen's Printer and Controller of HMSO. All rights reserved

Page 221 of 275
Table 93. ERG Seq: 2c: Moderate RA: MTX intolerant, RTX intolerant, failed ≥2 csDMARDs: Among moderate patients
Sequence First-line Second-line 1. UPA BSC
2a. Int.csDMARD BSC
2b. PBO / BSC BSC Abbreviations: BSC, best supportive care; csDMARD, conventional synthetic disease-modifying antirheumatic drug; MTX, methotrexate; PBO, placebo; RA, rheumatoid arthritis; RTX, rituximab; UPA, upadacitinib
The treatment sequences for those worsening to severe RA depend upon which
treatment sequence was received when with moderate RA (Table 43).
Table 94. Sequence: 2c: Moderate RA: MTX intolerant, RTX intolerant, failed ≥2 csDMARDs: Among patients who have progressed to severe RA
Sequence First-line Second-line Third-line 1. ADA SRL BSC
2a.& 2b ADA SRL BSC Abbreviations: ADA, adalimumab; BSC, best supportive care; csDMARD, conventional synthetic disease-modifying antirheumatic drug; MTX, methotrexate; RA, rheumatoid arthritis; RTX, rituximab; SRL, sarilumab
And the following scenario analyses for those progressing to severe RA.
Table 95. Sequence: 2c: Moderate RA: MTX intolerant, RTX intolerant, failed ≥2 csDMARDs: Among patients who have progressed to severe RA: Scenario 01
Sequence First-line Second-line Third-line 1. ADA ABTSC BSC
2a.& 2b ADA SRL BSC Abbreviations: ABT, abatacept; ADA, adalimumab; BSC, best supportive care; csDMARD, conventional synthetic disease-modifying antirheumatic drug; MTX, methotrexate; RA, rheumatoid arthritis; RTX, rituximab; SC, subcutaneous; SRL, sarilumab
Table 96. Sequence: 2c: Moderate RA: MTX intolerant, RTX intolerant, failed ≥2 csDMARDs: Among patients who have progressed to severe RA: Scenario 02
Sequence First-line Second-line Third-line 1. ADA SRL BSC
2a.& 2b ADA UPA BSC Abbreviations: ADA, adalimumab; BSC, best supportive care; csDMARD, conventional synthetic disease-modifying antirheumatic drug; MTX, methotrexate; RA, rheumatoid arthritis; RTX, rituximab; SRL, sarilumab; UPA, upadacitinib
Copyright 2019 Queen's Printer and Controller of HMSO. All rights reserved

Page 222 of 275
The above also suggests a Scenario 03 of third-line treatment of severe RA patients with
ABTSC following treatment with UPA when in moderate RA and with UPA following
treatment with intensified csDMARD or PBO/BSC when in moderate RA.
The ERG will also model treatment sequences for those who have progressed to severe
that mirror the assumptions of the company but also reflect the considerations of
Section 5.3.4.14.
Table 97. ERG Position: 2c: Moderate RA: MTX intolerant, RTX intolerant, failed ≥2 csDMARDs: Among patients who have progressed to severe RA: Scenario 04
Sequence First-line Second-line Third-line Fourth-line 1. ADA SRL BSC ..
2a.& 2b ADA UPA SRL BSC Abbreviations: ADA, adalimumab; BSC, best supportive care; csDMARD, conventional synthetic disease-modifying antirheumatic drug; MTX, methotrexate; RA, rheumatoid arthritis; RTX, rituximab; SRL, sarilumab
Scenario 4 is subject to the concerns around possible biases that may arise from
modelling sequences of differing lengths when combined with the working assumption of
there being no decline in EULAR response rates by line of treatment.
5.4.3 ERG treatment sequences for modelling severe RA patients
For the modelling of severe RA patients the ERG broadly follows the treatment
sequences of the company but with the following changes:
• For patients tolerant of MTX, UPA monotherapy is not considered and only
UPA+MTX is modelled.
• The use of TCZIV and TCZIV+MTX subsequent to first-line treatment is replaced
by SRL and SRL+MTX
• A final treatment line of MTX is not considered.
• Position 4a is not considered due to the company essentially assuming clinical
equivalence between the first-line treatments.
5.4.4 ERG model revisions
For its preferred base case the ERG revised the company model of the 29 August along
the following lines:
• Correcting the direct drug and administration costs.
• Applying the TA375 HAQ to pain mapping function.
Copyright 2019 Queen's Printer and Controller of HMSO. All rights reserved

Page 223 of 275
• Applying the TA375 HAQ to inpatient cost mapping function, updated to 2018
prices.
• Applying the csDMARD-IR NMA results for PBO for first-line PBO / BSC for
moderate RA patients.
• Applying the csDMARD-IR NMA estimates for bDMARD treatment naïve patients
and the bDMARD-IR NMA estimates for bDMARD treatment experienced
patients.
Note that the revision of the last bullet mainly affects the treatment efficacy of ADA and
ADA+MTX after UPA or UPA+MTX. But for ADA, the company assumptions have the
perverse result of applying worse EULAR response rates for the csDMARD-IR NMA than
for the bDMARD-IR NMA. For ADA+MTX the company assumptions result in a better
EULAR response rates for the csDMARD-IR NMA than for the bDMARD-IR NMA as
seems reasonable. As a consequence, in what follows the ICERs for positions 2a and 2c
may be too optimistic, while those for Position 2b may be more reliable.
The revision of the last bullet has only been implemented by the ERG for the modelling
of moderate RA patients. It is most likely to be a major issue for moderate RA patients
because for the first-line treatment of those transitioning to severe RA the bDMARD-IR
NMA results are being used in the UPA arm, whereas the csDMARD-IR NMA results are
being used in the comparator arms. It also requires that the model be run separately for
each arm that it being considered. The modelling of moderate RA patients only considers
three arms. The modelling of severe RA patients considers up to 14 arms at times. Time
constraints prevented the ERG running this number of analyses.
It should also be noted that the ERG has had to run the company DES model hundreds
of times in a very short period of time. It is inevitable that there will be some modelling
errors in the results reported below, and the ERG urges the company to cross check
these. But unless the ERG has made a major systematic error in its modelling, this
seems unlikely to alter the main thrust of the results and the conclusions that flow from
them.
5.4.5 ERG Sensitivity analyses
The ERG undertakes the following sensitivity analyses for the modelling of moderate RA
patients.
• SA01: Applying the relevant SELECT trials’ head-to-head clinical effectiveness
estimates for the modelling of moderate RA patients when UPA+MTX or UPA is
Copyright 2019 Queen's Printer and Controller of HMSO. All rights reserved

Page 224 of 275
being evaluated at the same line of treatment as BSC / PBO. For SELECT-
COMPARE the EULAR response rates are applied, with an additional scenario
analysis of applying the EULAR response rates mapped from the ACR response
rates that were reported in the CS. The EULAR response rates mapped from the
ACR response rates that were reported in the CS are applied for SELECT-NEXT
and SELECT-MONOTHERAPY.
• SA02: Assuming no natural recovery and no PBO effect for PBO / BSC.
• SA03: Applying the company HAQ to pain mapping function.
• SA04: Applying the company DAS-28 to HAQ intercept term in the modelling of
moderate RA patients.
For the modelling of severe RA patients SA01, SA02 and SA04 do not apply. Only SA03
applies. Due to the severe RA modelling comparing UPA with other advanced DMARDs
at first-line, and the analyses including the UPA PAS but not the other comparator
cPASs, SA03 shows little of interest and so is not reported for the severe for reasons of
space.
5.4.6 ERG modelling results: Position 2a: Moderate RA: MTX intolerant, RTX tolerant, failed ≥2 csDMARDs
The ERG base case results for the comparison of UPA with intensified csDMARDs at
this position are provided in Table 98.
Copyright 2019 Queen's Printer and Controller of HMSO. All rights reserved

Page 225 of 275
Table 98. ERG base case: Position 2a vs csDMARDs: Moderate RA: MTX intolerant, RTX tolerant, failed ≥2 csDMARDs
Costs QALYs ∆Cost ∆QALY ICER
Int. csDMARDs ******* *****
UPA ******* ***** ******* ***** £52,990 Abbreviations: csDMARD, conventional synthetic disease-modifying antirheumatic drug; ICER, incremental cost-effectiveness ratio; MTX, methotrexate; QALYs, quality-adjusted life years; RA, rheumatoid arthritis; RTX, rituximab; UPA, upadacitinib
The ERG base case results for the comparison of UPA with PBO / BSC at this position
are provided in Table 99.
Table 99. ERG base case: Position 2a vs PBO / BSC: Moderate RA: MTX intolerant, RTX tolerant, failed ≥2 csDMARDs
Costs QALYs ∆Cost ∆QALY ICER
PBO / BSC ******* *****
UPA ******* ***** ******* ***** £38,432 Abbreviations: BSC, best supportive care; csDMARD, conventional synthetic disease-modifying antirheumatic drug; ICER, incremental cost-effectiveness ratio; MTX, methotrexate; PBO, placebo; QALYs, quality-adjusted life years; RA, rheumatoid arthritis; RTX, rituximab; UPA, upadacitinib
The scenario and sensitivity analyses for the comparison of UPA with intensified
csDMARDs at this position are provided in Table 100.
Table 100. ERG scenario analyses: Position 2a vs csDMARDs: Moderate RA: MTX intolerant, RTX tolerant, failed ≥2 csDMARDs
∆Cost ∆QALY ICER
Base case sequences ******* ***** £52,990
Scenario 01 sequences ******* ***** £57,335
Scenario 02 sequences ******* ***** £63,220
Scenario 03 sequences ******* ***** £67,565
Scenario 04 sequences ******* ***** £66,328
SA03: Company HAQ to pain mapping ******* ***** £47,006
SA04: Company HAQ to DAS-28 intercept ******* ***** £56,626 Abbreviations: BSC, best supportive care; csDMARD, conventional synthetic disease-modifying antirheumatic drug; DAS-28, disease activity score in 28 joints; HAQ, health assessment questionnaire; ICER, incremental cost-effectiveness ratio; MTX, methotrexate; PBO, placebo; QALYs, quality-adjusted life years; RA, rheumatoid arthritis; RTX, rituximab; UPA, upadacitinib
The scenario and sensitivity analyses for the comparison of UPA with PBO / BSC at this
position are provided in Table 101.
Copyright 2019 Queen's Printer and Controller of HMSO. All rights reserved

Page 226 of 275
Table 101. ERG scenario analyses: Position 2a vs PBO / BSC: Moderate RA: MTX intolerant, RTX tolerant, failed ≥2 csDMARDs
∆Cost ∆QALY ICER
Base case sequences ******* ***** £38,432
Scenario 01 sequences ******* ***** £41,991
Scenario 02 sequences ******* ***** £47,907
Scenario 03 sequences ******* ***** £51,466
Scenario 04 sequences ******* ***** £46,354
SA01a: COMPARE EULAR **** **** n.a.
SA01b: COMPARE EULAR mapped **** **** n.a.
SA01c: NEXT EULAR Mapped **** **** n.a.
SA01d: MONOTHERAPY EULAR mapped ******* ***** £87,847
SA02: PBO / BSC 0% EULAR responses ******* ***** £17,506
SA03: Company HAQ to pain mapping ******* ***** £32,545
SA04: Company HAQ to DAS-28 intercept ******* ***** £41,400 Abbreviations: BSC, best supportive care; csDMARD, conventional synthetic disease-modifying antirheumatic drug; DAS-28, disease activity score in 28 joints; EULAR, European League Against Rheumatism; HAQ, health assessment questionnaire; ICER, incremental cost-effectiveness ratio; MTX, methotrexate; n.a., not applicable; PBO, placebo; QALYs, quality-adjusted life years; RA, rheumatoid arthritis; RTX, rituximab; UPA, upadacitinib
5.4.7 ERG modelling results: Position 2b: Moderate RA: MTX tolerant, RTX tolerant, failed ≥2 csDMARDs
The ERG base case results for the comparison of UPA with intensified csDMARDs at
this position are provided in Table 102.
Table 102. ERG base case: Position 2b vs csDMARDs: Moderate RA: MTX tolerant, RTX tolerant, failed ≥2 csDMARDs
Costs QALYs ∆Cost ∆QALY ICER
Int. csDMARDs ******* *****
UPA+MTX ******* ***** ******* ***** £47,466 Abbreviations: csDMARD, conventional synthetic disease-modifying antirheumatic drug; ICER, incremental cost-effectiveness ratio; MTX, methotrexate; PBO, placebo; QALYs, quality-adjusted life years; RA, rheumatoid arthritis; RTX, rituximab; UPA, upadacitinib
The ERG base case results for the comparison of UPA with PBO / BSC at this position
are provided in Table 103.
Copyright 2019 Queen's Printer and Controller of HMSO. All rights reserved

Page 227 of 275
Table 103. ERG base case: Position 2b vs PBO / BSC: Moderate RA: MTX tolerant, RTX tolerant, failed ≥2 csDMARDs
Costs QALYs ∆Cost ∆QALY ICER
PBO / BSC ******* *****
UPA+MTX ******* ***** ******* ***** £35,958 Abbreviations: csDMARD, conventional synthetic disease-modifying antirheumatic drug; ICER, incremental cost-effectiveness ratio; MTX, methotrexate; PBO, placebo; QALYs, quality-adjusted life years; RA, rheumatoid arthritis; RTX, rituximab; UPA, upadacitinib
The scenario and sensitivity analyses for the comparison of UPA with intensified
csDMARDs at this position are provided in Table 104.
Table 104. ERG scenario analyses: Position 2b vs csDMARDs: Moderate RA: MTX tolerant, RTX tolerant, failed ≥2 csDMARDs
∆Cost ∆QALY ICER
Base case sequences ******* ***** £47,466
Scenario 01 sequences ******* ***** £51,130
Scenario 02 sequences ******* ***** £56,678
Scenario 03 sequences ******* ***** £60,272
Scenario 04 sequences ******* ***** £57,703
SA03: Company HAQ to pain mapping ******* ***** £42,014
SA04: Company HAQ to DAS-28 intercept ******* ***** £50,874 Abbreviations: BSC, best supportive care; csDMARD, conventional synthetic disease-modifying antirheumatic drug; DAS-28, disease activity score in 28 joints; HAQ, health assessment questionnaire; ICER, incremental cost-effectiveness ratio; MTX, methotrexate; PBO, placebo; QALYs, quality-adjusted life years; RA, rheumatoid arthritis; RTX, rituximab; UPA, upadacitinib
The scenario and sensitivity analyses for the comparison of UPA with PBO / BSC at this
position are provided in Table 105.
Table 105. ERG scenario analyses: Position 2b vs PBO / BSC: Moderate RA: MTX tolerant, RTX tolerant, failed ≥2 csDMARDs
∆Cost ∆QALY ICER
Base case sequences ******* ***** £35,958
Scenario 01 sequences ******* ***** £39,308
Scenario 02 sequences ******* ***** £44,619
Scenario 03 sequences ******* ***** £47,892
Scenario 04 sequences ******* ***** £43,507
SA01a: COMPARE EULAR ******* ***** £44,163
SA01b: COMPARE EULAR mapped ******* ***** £69,164
SA01c: NEXT EULAR Mapped ******* ***** £94,563
Copyright 2019 Queen's Printer and Controller of HMSO. All rights reserved

Page 228 of 275
∆Cost ∆QALY ICER
SA01d: MONOTHERAPY EULAR mapped **** **** n.a.
SA02: PBO / BSC 0% EULAR responses ******* ***** £16,729
SA03: Company HAQ to pain mapping ******* ***** £30,512
SA04: Company HAQ to DAS-28 intercept ******* ***** £38,757 Abbreviations: BSC, best supportive care; csDMARD, conventional synthetic disease-modifying antirheumatic drug; DAS-28, disease activity score in 28 joints; EULAR, European League Against Rheumatism; HAQ, health assessment questionnaire; ICER, incremental cost-effectiveness ratio; MTX, methotrexate; n.a., not applicable; PBO, placebo; QALYs, quality-adjusted life years; RA, rheumatoid arthritis; RTX, rituximab; UPA, upadacitinib
5.4.8 ERG modelling results: Position 2c: Moderate RA: MTX intolerant, RTX intolerant, failed ≥2 csDMARDs
The ERG base case results for the comparison of UPA with intensified csDMARDs at
this position are provided in Table 106.
Table 106. ERG base case: Position 2c vs csDMARDs: Moderate RA: MTX intolerant, RTX intolerant, failed ≥2 csDMARDs
Costs QALYs ∆Cost ∆QALY ICER
Int. csDMARDs ******* *****
UPA ******* ***** ******* ***** £52,359 Abbreviations: csDMARD, conventional synthetic disease-modifying antirheumatic drug; ICER, incremental cost-effectiveness ratio; MTX, methotrexate; PBO, placebo; QALYs, quality-adjusted life years; RA, rheumatoid arthritis; RTX, rituximab; UPA, upadacitinib
The ERG base case results for the comparison of UPA with PBO / BSC at this position
are as provided in Table 107.
Table 107. ERG base case: Position 2c vs PBO / BSC: Moderate RA: MTX intolerant, RTX intolerant, failed ≥2 csDMARDs
Costs QALYs ∆Cost ∆QALY ICER
PBO / BSC ******* *****
UPA ******* ***** ******* ***** £37,991 Abbreviations: csDMARD, conventional synthetic disease-modifying antirheumatic drug; ICER, incremental cost-effectiveness ratio; MTX, methotrexate; PBO, placebo; QALYs, quality-adjusted life years; RA, rheumatoid arthritis; RTX, rituximab; UPA, upadacitinib
The scenario and sensitivity analyses for the comparison of UPA with intensified
csDMARDs at this position are as below.
Copyright 2019 Queen's Printer and Controller of HMSO. All rights reserved

Page 229 of 275
Table 108. ERG scenario analyses: Position 2c vs csDMARDs: Moderate RA: MTX intolerant, RTX intolerant, failed ≥2 csDMARDs
∆Cost ∆QALY ICER
Base case sequences ******* ***** £52,359
Scenario 01 sequences ******* ***** £59,025
Scenario 02 sequences ******* ***** £66,968
Scenario 03 sequences ******* ***** £73,633
Scenario 04 sequences ******* ***** £70,860
SA03: Company HAQ to pain mapping ******* ***** £45,755
SA04: Company HAQ to DAS-28 intercept ******* ***** £56,626 Abbreviations: BSC, best supportive care; csDMARD, conventional synthetic disease-modifying antirheumatic drug; DAS-28, disease activity score in 28 joints; HAQ, health assessment questionnaire; ICER, incremental cost-effectiveness ratio; MTX, methotrexate; PBO, placebo; QALYs, quality-adjusted life years; RA, rheumatoid arthritis; RTX, rituximab; UPA, upadacitinib
The scenario and sensitivity analyses for the comparison of UPA with PBO / BSC at this
position are provided in Table 109.
Table 109. ERG scenario analyses: Position 2c vs PBO / BSC: Moderate RA: MTX intolerant, RTX intolerant, failed ≥2 csDMARDs
∆Cost ∆QALY ICER
Base case sequences ******* ***** £37,991
Scenario 01 sequences ******* ***** £43,378
Scenario 02 sequences ******* ***** £50,812
Scenario 03 sequences ******* ***** £56,199
Scenario 04 sequences ******* ***** £50,050
SA01a: COMPARE EULAR **** **** n.a.
SA01b: COMPARE EULAR mapped **** **** n.a.
SA01c: NEXT EULAR Mapped **** **** n.a.
SA01d: MONOTHERAPY EULAR mapped ******* ***** £76,405
SA02: PBO / BSC 0% EULAR responses ******* ***** £17,114
SA03: Company HAQ to pain mapping ******* ***** £31,887
SA04: Company HAQ to DAS-28 intercept ******* ***** £41,400 Abbreviations: BSC, best supportive care; csDMARD, conventional synthetic disease-modifying antirheumatic drug; DAS-28, disease activity score in 28 joints; EULAR, European League Against Rheumatism; HAQ, health assessment questionnaire; ICER, incremental cost-effectiveness ratio; MTX, methotrexate; n.a., not applicable; PBO, placebo; QALYs, quality-adjusted life years; RA, rheumatoid arthritis; RTX, rituximab; UPA, upadacitinib
Copyright 2019 Queen's Printer and Controller of HMSO. All rights reserved

Page 230 of 275
5.4.9 ERG modelling results: Position 3a: Severe RA, MTX intolerant, RTX tolerant, failed ≥2 csDMARDs
The ERG estimates of the cost effectiveness of UPA among severe RA patients who are
MTX intolerant, RTX tolerant and have failed to respond to at least two csDMARDs are
provided in Table 110.
Table 110. ERG modelling: Position 3a: Severe RA, MTX intolerant, RTX tolerant, failed ≥2 csDMARDs
ICERs Costs QALYs Costs QALYs Increm. UPA UPA+MTX
UPA ******* ***** ** ** Reference .. ..
ADA ******** ***** ******* ****** Dominated Dominant ..
GOL ******** ***** ******* ****** Dominated Dominant ..
ETN ******** ***** ******* ****** Dominated Dominant ..
CTZ ******** ***** ******* ****** Dominated Dominant ..
TFC ******** ***** ******* ****** Dominated Dominant ..
BRC ******** ***** ******* ****** Dominated Dominant ..
SRL ******** ***** ******* ****** Dominated Dominant ..
TCZ SC ******** ***** ******* ***** £651k £651kSW ..
TCZ IV ******** ***** **** ***** Ext.Dom. £656kSW .. Abbreviations: ADA, adalimumab; BRC, baricitinib; csDMARDs, conventional synthetic disease modifying antirheumatic drugs; CTZ, certolizumab pegol; ETN, etanercept; ext. dom., extended dominated; ICER, incremental cost-effectiveness ratio; increm., incremental; IV, intravenous; MTX, methotrexate; QALYs, quality adjusted life years; SC, subcutaneous; SRL, sarilumab; TCZ, tocilizumab; TFC, tofacitinib; UPA, upadacitinib
5.4.10 ERG modelling results: Position 3b: Severe RA, MTX tolerant, RTX tolerant, failed ≥2 csDMARDs
The ERG estimates of the cost effectiveness of UPA among severe RA patients who are
MTX tolerant, RTX tolerant and have failed to respond to at least two csDMARDs are
provided in Table 111.
Table 111. ERG modelling: Position 3b: Severe RA, MTX tolerant, RTX tolerant, failed ≥2 csDMARDs
ICERs Costs QALYs ∆Cost ∆QALY Increm. UPA UPA+MTX
UPA+MTX ******* ***** ** ** .. .. ..
IFX + MTX ******** ***** ******* ****** Dominated .. Dominant
ADA + MTX ******** ***** ******* ****** Dominated .. Dominant
ETN + MTX ******** ***** ******* ****** Dominated .. Dominant
Copyright 2019 Queen's Printer and Controller of HMSO. All rights reserved

Page 231 of 275
ICERs Costs QALYs ∆Cost ∆QALY Increm. UPA UPA+MTX
GOL + MTX ******** ***** ******* ****** Dominated .. Dominant
TFC + MTX ******** ***** ******* ****** Dominated .. Dominant
CTZ + MTX ******** ***** ******* ***** £142mn .. £142mnS
W
BRC + MTX ******** ***** ****** ****** Dominated .. Dominant
SRL + MTX ******** ***** ******* ****** Dominated .. Dominant
TCZSC+MTX ******** ***** ******* ****** Dominated .. Dominant
TCZIV+MTX ******** ***** ******* ****** Dominated .. Dominant
ABTIV+MTX ******** ***** ******* ****** Dominated .. Dominant
ABTSC+MTX ******** ***** ******* ****** Dominated .. Dominant Abbreviations: ABT, abatacept; ADA, adalimumab; BRC, baricitinib; csDMARDs, conventional synthetic disease modifying antirheumatic drugs; CTZ, certolizumab pegol; ETN, etanercept; GOL, golimumab; ICER, incremental cost-effectiveness ratio; IFX, infliximab; increm., incremental; IV, intravenous; MTX, methotrexate; QALYs, quality adjusted life years; SC, subcutaneous; SRL, sarilumab; TCZ, tocilizumab; TFC, tofacitinib; UPA, upadacitinib
5.4.11 ERG modelling results: Position 4b: Severe RA, MTX tolerant, RTX intolerant, failed one bDMARD
The ERG estimates of the cost effectiveness of UPA among severe RA patients who are
MTX tolerant, RTX intolerant and have failed to respond to one bDMARD are provided in
Table 112.
Table 112. ERG modelling: Position 4b: Severe RA, MTX tolerant, RTX intolerant, failed one bDMARD
ICERs Costs QALYs ∆Cost ∆QALY Increm. UPA UPA+MTX
UPA+MTX ******* ***** * * .. ..
ADA+MTX ******** ***** ******* ****** Dominated .. Dominant
IFX+MTX ******** ***** ******* ****** Dominated .. Dominant
GOL+MTX ******** ***** ******* ****** Dominated .. Dominant
CTZ+MTX ******** ***** ******* ****** Dominated .. Dominant
TFC+MTX ******** ***** ******* ****** Dominated .. Dominant
ETN+MTX ******** ***** ******* ****** Dominated .. Dominant
BRC+MTX ******** ***** ******* ****** Dominated .. Dominant
TCZSC+MTX ******** ***** ******* ***** Ext.Dom. .. £940kSW
SRL+MTX ******** ***** ******* ***** Ext.Dom. .. £680kSW
ABTIV+MTX ******** ***** ******* ****** Dominated .. Dominant
Copyright 2019 Queen's Printer and Controller of HMSO. All rights reserved

Page 232 of 275
ICERs Costs QALYs ∆Cost ∆QALY Increm. UPA UPA+MTX
TCZIV+MTX ******** ***** ******* ***** £483k .. £483kSW
ABTSC+MTX ******** ***** ****** ****** Dominated .. Dominant Abbreviations: ABT, abatacept; ADA, adalimumab; BRC, baricitinib; csDMARDs, conventional synthetic disease modifying antirheumatic drugs; CTZ, certolizumab pegol; ETN, etanercept; GOL, golimumab; ICER, incremental cost-effectiveness ratio; IFX, infliximab; increm., incremental; IV, intravenous; MTX, methotrexate; QALYs, quality adjusted life years; SC, subcutaneous; SRL, sarilumab; TCZ, tocilizumab; TFC, tofacitinib; UPA, upadacitinib
5.4.12 ERG modelling results: Position 5: Severe RA, MTX tolerant, RTX tolerant, failed one bDMARD
The ERG estimates of the cost effectiveness of UPA among severe RA patients who are
MTX tolerant, RTX tolerant and have failed to respond to one bDMARD are provided in
Table 113.
Table 113. ERG modelling: Position 5: Severe RA, MTX tolerant, RTX tolerant, failed one bDMARD
ICERs Costs QALYs ∆Cost ∆QALY Increm. UPA UPA+MTX
RTX+MTX ******* ***** * * .. .. Dominated
UPA+MTX ******* ***** **** ****** Dominated .. .. Abbreviations: ICERs, incremental cost-effectiveness ratio; increm., incremental; MTX, methotrexate; QALYs, quality-adjusted life years; RTX, rituximab; UPA, upadacitinib
5.4.13 ERG modelling results: Position 6: Severe RA, MTX tolerant, RTX tolerant, failed RTX
The ERG estimates of the cost effectiveness of UPA among severe RA patients who are
MTX tolerant, RTX tolerant and have failed to respond to RTX are provided in Table 114.
Table 114. ERG modelling: Position 6: Severe RA, MTX tolerant, RTX tolerant, failed RTX
ICERs Cost QALY ∆Cost ∆QALY Increm. UPA UPA+MTX
UPA+MTX ******* ***** .. ..
SRL+MTX ******* ***** ******* ****** Dominated .. Dominant
TCZSC+MTX ******* ***** ******* ***** Ext.Dom. .. £1mnSW
TCZIV+MTX ******** ***** ******* ***** £505k .. £505kSW Abbreviations: ICERs, incremental cost-effectiveness ratio; increm., incremental; IV, intravenous; MTX, methotrexate; QALYs, quality-adjusted life years; SRL, sarilumab; TCZ, tocilizumab; UPA, upadacitinib
Copyright 2019 Queen's Printer and Controller of HMSO. All rights reserved

Page 233 of 275
Conclusions of the cost-effectiveness section
The intention of the company model is to largely mirror that of TA375. The key
conceptual difference is that the company model includes a relationship between the
HAQ and the DAS-28 which permits it to model moderate RA patients worsening to
severe RA. Some input values also differ from those of TA375, mainly in terms of the
company cDMARD-IR NMA results, the company bDMARD-IR NMA results and the
company HAQ to pain score mapping.
The company presents validation data that suggests that if the modelling of the transition
from moderate RA to severe RA is turned off and the TA375 mapping from HAQ to pain
scores is applied, the company model closely replicates the results of the model of
TA375.
The key difference from the TA375 modelling is that moderate RA patients can progress
to be severe RA patients. This requires that the relationship between the HAQ and the
DAS-28 be specified. The company estimates this from the three-month and six-month
data of the SELECT trials. This is then used to extrapolate over the 45-year time horizon
of the model. It may be questionable to use the six-month data when the HAQ and the
DAS-28 are generally improving to extrapolate over 45 years when the HAQ is generally
modelled as worsening. There is also a question about the disappearing company
intercept term and whether it should be applied in the modelling. The application of the
intercept term generally worsens the cost effectiveness estimates.
The ERG corrects some drug costs. The ERG prefers the HAQ to inpatient costs
mapping and the HAQ to pain mapping of TA375. The former has little impact upon
results. The latter is more important, but in itself is unlikely to change the overall
conclusions.
The ERG thinks that the csDMARD-IR NMA results should be applied to patients who
are bDMARD naïve and that the bDMARD-IR NMA results should be applied to patients
who are bDMARD experienced. In the modelling of moderate RA patients this implies
that for those progressing to severe RA the clinical effectiveness of first-line ADA for
treatment of severe RA in the UPA arm should be drawn from the bDMARD-IR NMA
while in the comparator arm it should be drawn from the csDMARD-IR NMA. The
response rates of the bDMARD-IR NMA are typically worse than those of the csDMARD-
IR NMA. But due to a lack of evidence, company assumptions mean that the response
rates for ADA monotherapy in the csDMARD-IR NMA are a little worse than in the
bDMARD-IR NMA. In the light of this the ERG thinks that the cost effectiveness
Copyright 2019 Queen's Printer and Controller of HMSO. All rights reserved

Page 234 of 275
estimates for MTX tolerant moderate RA patients are likely to be more reliable than the
cost-effectiveness estimates for MTX intolerant moderate RA patients.
For moderate RA patients the company models treatment sequences where after UPA it
is possible to intensify csDMARDs. ERG modelling suggests that among moderate RA
patients it is more cost effective to intensify csDMARDs prior to using UPA and to use
UPA among those failing to response to intensified csDMARDs.
The main difference between the ERG modelling and the company modelling is in the
modelling of moderate RA patients. The company thinks that when UPA is compared
with BSC, BSC should be assumed to have 0% EULAR response rates. The ERG notes
that in all SELECT trials there were considerable EULAR response rates in the control
arms. Whether the response rates in the control arms were due to natural recovery or a
pure trial or PBO effect is not known. The ERG thinks that BSC should be assumed to
have the EULAR response rates of PBO in the company NMA or of the control arms in
the SELECT trials. If the company approach is accepted UPA is estimated to be cost
effective for moderate RA patients at conventional willingness to pay thresholds. If the
ERG approach is accepted UPA is estimated to be not cost effective for moderate RA
patients at conventional willingness to pay thresholds.
It should be noted that the company NMA results for placebo and intensified csDMARDs
may be subject to more uncertainty than those for advanced DMARDs. But applying the
head to head results of the SELECT trials generally results in qualitatively similar cost
effectiveness estimates for the modelling of moderate RA patients.
A key question if UPA is approved among moderate RA patients is whether, as a last in
line therapy, if a patient fails to achieve a moderate EULAR response but shows some
DAS-28 improvement they would have UPA withdrawn. The ERG thinks that if those
trialling UPA who receive some benefit but do not achieve a EULAR response will
remain on UPA the cost effectiveness of UPA for moderate RA patients would be
considerably worse that the estimates presented in this chapter. A related question is the
possible ease of manipulating DAS-28 scores, given the significance of the patient
reported general health visual analogue score to its calculation.
A difference between the ERG modelling and both the company modelling and the
modelling of TA375 is that the ERG does not include a final line of MTX monotherapy.
The ERG thinks that it is not appropriate to model patients who have failed on other lines
of therapy such as intensified csDMARDs, and by implication have already previously
failed on MTX monotherapy, as having a response to a last line of MTX monotherapy.
Copyright 2019 Queen's Printer and Controller of HMSO. All rights reserved

Page 235 of 275
But the modelling that includes this somewhat worsens the cost effectiveness estimates.
The ERG thinks that it is likely that those who do not respond to their final line of
treatment will receive some ongoing treatment and that this will have some effect, if not a
EULAR response. If this was included in the modelling the ERG thinks that this would
worsen the cost effectiveness estimates.
The ERG revisions to the company modelling of severe RA patients do not particularly
affect the cost-effectiveness estimates and the results that should be drawn from them.
UPA is estimated to be cost effective among those who have failed to respond to RTX. It
should be noted that these patients will have had at least two previous advanced
DMARDs. The bDMARD-IR NMA estimates may not be reliable among these patients. It
can also be noted that less than 20% of SELECT-BEYOND patients were RTX
experienced.
It should be stressed that all results in this document include the UPA patient access
scheme but do not include the other advanced DMARDs’ PASs or the confidential prices
of the biosimilars. The prices for biosimilars of ADA and ETN have a particularly large
effect upon results, as presented in the cPAS appendix.
Copyright 2019 Queen's Printer and Controller of HMSO. All rights reserved

Page 236 of 275
6 Impact on the ICER of additional clinical and economic analyses undertaken by the ERG
The ERG modelling of moderate RA patients differs from the company in four main
ways.
• Having modelled a comparison of (1) intensification of csDMARDs after trialling
UPA with (2) intensification of csDMARDs before trialling UPA and found (1) to be
not cost effective, the main ERG modelling does not consider intensification of
csDMARDs after trialling UPA.
• Where UPA is compared with BSC, the ERG applies the PBO response rates of
the company csDMARD-IR NMA or the SELECT trials’ head-to-head results for
UPA compared to the control arm.
• The ERG applies the TA375 HAQ to pain mapping.
• The ERG corrects some comparator drug and administration costs.
The ERG typically estimates that among moderate RA patients UPA is not cost effective,
with cost effectiveness estimates exceeding £30k per QALY and often exceeding £50k
per QALY. The ERG ICERs are tabulated in section 5.4 above.
If the treatment sequences for those transitioning from moderate RA to severe RA are
differentiated by arm as seems reasonable this tends to worsen the cost effectiveness
estimates. This particularly applies if UPA is used for severe RA in the comparator arm.
Applying the company HAQ to pain mapping function typically improves the cost
effectiveness estimates but does not qualitatively change the main thrust of the results.
The exception to this is if it is assumed that (1) there was no natural recovery in the
SELECT trials’ comparator arms and (2) any PBO effect in the SELECT trials should not
be applied. This causes the ERG to estimate UPA to be cost effective compared to BSC
among moderate RA patients.
The ERG costs effectiveness estimates among severe RA patients are qualitatively
similar to the company estimates.
Unquantifiable issues include:
• What should be assumed for those who are without a response and are at end of
line? These patients are assumed to receive palliative care with no benefit.
Copyright 2019 Queen's Printer and Controller of HMSO. All rights reserved

Page 237 of 275
Moderate RA patients may tend to be treated with whatever combination of
csDMARDs worked best for them, even if a EULAR response was not achieved.
The ERG thinks that including this would worsen the cost effectiveness
estimates.
• If UPA is trialled as last in line among moderate RA patients would those who got
some benefit from it but did not achieve a EULAR response tend to remain on it?
The ERG thinks that if they would this would considerably worsen the cost-
effectiveness estimates.
• Is it reasonable to extrapolate the company HAQ to DAS relationship based upon
six month improvements in the SELECT trials to 45 years when the HAQ is
generally modelled as worsening? The ERG thinks that if this relationship breaks
down over time this could worsen the cost effectiveness estimates, though
whether this is more of a modelling issue than a real world concern is debatable.
• Are EULAR response rates the same at different lines of treatment? The
response rates in the bDMARD-IR NMA are typically worse than those of the
csDMARD-IR NMA. The ERG thinks that this does not particularly affect the
modelling of moderate RA patients, but it might mean that progressing to severe
RA is more serious and so more to be avoided. What effect this would have upon
the cost effectiveness estimates is difficult to speculate upon, in part due to the
bDMARD-IR NMA applying from first-line therapy for severe RA in the UPA arm
but only applying from second-line therapy for severe RA in the comparator arm.
• Are the clinical effectiveness estimates applicable to those who have failed RTX?
The ERG notes that these patients would have failed at least two lines of
advanced DMARDs and that only a small proportion of SELECT-BEYOND
patients were RTX experienced.
It should be stressed that all results in this document include the UPA patient access
scheme but do not include the other advanced DMARDs’ patient access schemes or the
confidential prices of the biosimilars. The prices for biosimilars of ADA and ETN have a
particularly large effect upon results, as presented in the cPAS appendix.
Copyright 2019 Queen's Printer and Controller of HMSO. All rights reserved

Page 238 of 275
7 End of life No evidence was presented as to a survival benefit arising from UPA. The CS does not
address end of life criteria; therefore, end of life criteria are unlikely to be met.
Copyright 2019 Queen's Printer and Controller of HMSO. All rights reserved

Page 239 of 275
8 Overall conclusions The ERG reviewed the clinical and cost-effectiveness for UPA in adults with moderate
and severe RA. The clinical effectiveness evidence supported a benefit for UPA versus
relevant comparators. The safety profile of UPA was generally consistent with that of
PBO as well as the active comparators ADA and MTX. Some concerns over the
robustness of the SLR process and procedures raise questions about the robustness of
the clinical effectiveness evidence.
The ERG noted that NMA results covered a range of positions in the treatment pathway,
and encompassed substantial clinical heterogeneity in treatment experience and disease
severity of trial populations. This remains a major source of uncertainty in interpretations
of NMA results.
Moreover, the use of csDMARD-experienced or bDMARD-experienced estimates of
effectiveness was a point of difference in the company’s application of NMA results and
the ERG’s application of NMA results in cost-effectiveness modelling.
The main differences between the ERG economic modelling and the company economic
modelling are:
• The treatment sequences. Is it sensible to model EULAR responses to a last line
of treatment with MTX monotherapy when by definition these patients will have
previously failed on MTX monotherapy?
• The treatment sequences. Is it sensible or likely to be cost effective to try UPA
before trying intensified csDMARDs?
• Should natural recovery and the PBO effect be included in the comparator arm
given that they will be present in the UPA arm?
• Is the HAQ to pain mapping of TA375 more reliable than the company estimates
from the SELECT trials?
• Are the ERG revised drug costs more accurate?
Implications for research
The ERG considered there to already be considerable RCT evidence for the potential
benefit of UPA for this indication. However, the ERG considered that the clinical
evidence base would be further strengthened by an RCT incorporating pre-stratification
by baseline disease severity in order to offer greater clarity about the impact of disease
Copyright 2019 Queen's Printer and Controller of HMSO. All rights reserved

Page 240 of 275
severity on the clinical effectiveness of UPA, and therefore its optimal positioning in the
treatment pathway for moderate and severe RA.
Future analyses should seek to consider through within-trial, pre-planned subgroups, the
differential effectiveness of DMARDs based on treatment history and experience. In
addition, future NMAs may include a more explicit approach to accounting for effect
modification according to treatment history and disease severity, and the implications of
this for cost-effectiveness. Baseline risk adjustment as an analysis strategy is unlikely to
yield clinically meaningful results given a) the use of existing treatment pathways and,
thus, treatment history to shape forward treatment decisions and b) the difficulty in
translating these findings to clinical practice.
Copyright 2019 Queen's Printer and Controller of HMSO. All rights reserved

Page 241 of 275
Acknowledgements The authors acknowledge the valued administrative support provided by Mrs Sue Whiffin
and Ms Jenny Lowe (both PenTAG) and research assistance on modelling approaches
undertaken in prior appraisals provided by Dr Andriy Kharechko (PenTAG).
Contribution of authors
Dr Max Barnish (Research Fellow) provided overall project management, managed the
clinical effectiveness team, critiqued the clinical effectiveness evidence, contributed to
writing the clinical effectiveness chapter, wrote the background, decision problem and
conclusions sections, and contributed to writing the executive summary.
Dr Ewen Cummins (Health Economist) reviewed the economics of the CS.
Dr Helen Coelho (Research Fellow) critiqued the clinical effectiveness evidence; wrote
the assessment of bias in included trials and in the trials included in the NMA, critiqued
the inclusion criteria, study selection, and data extraction, and critiqued the safety data.
Dr Rhona Johnston (Computer Programmer) reviewed and ran the electronic models.
Mr David Packman (Research Assistant) examined the methodology for the NMA with
reference to the NICE Technical Support recommendations and contributed to the writing
and editing the ERG report. He checked the company’s data extraction for the NMA and
the reasons for inclusion or exclusion of the studies identified in the relevant previous
appraisals.
Ms Naomi Shaw (Information Specialist) wrote the sections of the report relating to the
critique of the literature searches and managed the ERG EndNote library.
Dr Richard C Haigh (Consultant Rheumatologist) served as clinical advisor to the ERG.
Ms Louise Crathorne (Senior Research Fellow) critiqued the review of cost-
effectiveness studies, contributed to the writing of the report, and reviewed and edited
the ERG report.
Prof G.J. Melendez-Torres (Professor of Social and Clinical Epidemiology) critiqued the
NMA, supported review of the clinical effectiveness evidence and is the guarantor of the
work.
Copyright
Copyright is retained by AbbVie for tables and figures copied and/or adapted from the
CS and other submitted company documents.
Copyright 2019 Queen's Printer and Controller of HMSO. All rights reserved

Page 242 of 275
References 1. van de Putte LB, Atkins C, Malaise M, Sany J, Russell AS, van Riel PL, et al. Efficacy and safety of adalimumab as monotherapy in patients with rheumatoid arthritis for whom previous disease modifying antirheumatic drug treatment has failed. Annals of the Rheumatic Diseases. 2004;63(5):508-16.
2. Humphreys JH, Verstappen SM, Hyrich KL, Chipping JR, Marshall T, Symmons DP. The incidence of rheumatoid arthritis in the UK: comparisons using the 2010 ACR/EULAR classification criteria and the 1987 ACR classification criteria. Results from the Norfolk Arthritis Register. Annals of the Rheumatic Diseases. 2013;72(8):1315-20.
3. Cross M, Smith E, Hoy D, Carmona L, Wolfe F, Vos T, et al. The global burden of rheumatoid arthritis: estimates from the global burden of disease 2010 study. Annals of the Rheumatic Diseases. 2014;73(7):1316-22.
4. Scott DL, Wolfe F, Huizinga TW. Rheumatoid arthritis. Lancet. 2010;376(9746):1094-108.
5. Prevoo MLL, Van'T Hof MA, Kuper HH, Van Leeuwen MA, Van De Putte LBA, Van Riel PLCM. Modified disease activity scores that include twenty-eight-joint counts development and validation in a prospective longitudinal study of patients with rheumatoid arthritis. Arthritis and Rheumatism. 1995;38(1):44-8.
6. Fransen J, Creemers MC, Van Riel PL. Remission in rheumatoid arthritis: agreement of the disease activity score (DAS28) with the ARA preliminary remission criteria. Rheumatology (Oxford). 2004;43(10):1252-5.
7. AbbVie. UK RA market opportunity research. Source: Primary market research project completed by Praxis Research between November 2018 – January 2019. 2019.
8. NICE. Rheumatoid arthritis in adults: management. NICE guideline [NG100]: National Institute for Health and Care Excellence; 2018. Available from: https://www.nice.org.uk/guidance/ng100.
9. Smolen JS, Landewe R, Bijlsma J, Burmester G, Chatzidionysiou K, Dougados M, et al. EULAR recommendations for the management of rheumatoid arthritis with synthetic and biological disease-modifying antirheumatic drugs: 2016 update. Annals of the Rheumatic Diseases. 2017;76(6):960-77.
10. Gwinnutt JM, Symmons DPM, MacGregor AJ, Chipping JR, Marshall T, Lunt M, et al. Twenty-year outcome and association between early treatment and mortality and disability in an inception cohort of patients with rheumatoid arthritis: results from the Norfolk Arthritis Register. Arthritis & Rheumatology. 2017;69(8):1566-75.
11. NICE. Upadacitinib for treating moderate to severe rheumatoid arthritis. Final scope: National Institute for Health and Care Excellence; 2019. Available from: https://www.nice.org.uk/guidance/gid-ta10389/documents/final-scope.
12. AbbVie. Clinical Advisory Board. 2018.
13. Higgins JPT, Green S. Cochrane highly sensitive search strategy for identifying randomized trials in MEDLINE: sensitivity- and precision-maximizing version (2008 revision); Ovid format. Cochrane Handbook for Systematic Reviews of Interventions
Copyright 2019 Queen's Printer and Controller of HMSO. All rights reserved

Page 243 of 275
Version 5.1.0: The Cochrane Collaboration; 2011. Available from: https://training.cochrane.org/handbook.
14. Ovid. MEDLINE 2019 Database Guide: Wolters Kluwer; 2019. Available from: https://ospguides.ovid.com/OSPguides/medline.htm.
15. Ovid. Embase: Excerpta Medica Database Guide: Wolters Kluwer; 2019. Available from: https://ospguides.ovid.com/OSPguides/embase.htm.
16. NICE. Single technology appraisal: user guide for company evidence submission template: National Institute for Health and Care Excellence; 2017. Available from: https://www.nice.org.uk/process/pmg24/chapter/instructions-for-companies.
17. Centre for Reviews and Dissemination. Systematic reviews: CRD's guidance for undertaking reviews in health care York, UK: Centre for Reviews and Dissemination, University of York; 2009. Available from: https://www.york.ac.uk/media/crd/Systematic_Reviews.pdf.
18. Dias S, Welton NJ, Sutton AJ, Ades AE. NICE DSU Technical Support Document 2: a generalised linear modelling framework for pairwise and network meta-analysis of randomised controlled trials. Sheffield, UK: Decision Support Unit, ScHARR; 2016.
19. Fleischmann R, Pangan AL, Mysler E, Bessette L, Peterfy C, Durez P, et al. A phase 3, randomized, double-blind study comparing upadacitinib to placebo and to adalimumab, in patients with active rheumatoid arthritis with inadequate response to methotrexate. Arthritis & Rheumatology. 2018;70(Suppl 9):988-90.
20. AbbVie. Upadacitinib (ABT-494). M14-465 Clinical Study Report - week 26. 2018.
21. Burmester GR, Kremer JM, Van den Bosch F, Kivitz A, Bessette L, Li Y, et al. Safety and efficacy of upadacitinib in patients with rheumatoid arthritis and inadequate response to conventional synthetic disease-modifying anti-rheumatic drugs (SELECT-NEXT): a randomised, double-blind, placebo-controlled phase 3 trial. Lancet. 2018;391(10139):2503-12.
22. AbbVie. Upadacitinib (ABT-494). M13-549 Clinical Study Report - period 1. 2018.
23. Smolen J, Cohen S, Emery P, Rigby W, Tanaka Y, Zhang Y, et al. Upadacitinib as monotherapy: a phase 3 randomised controlled double-blind study in patients with active rheumatoid arthritis and inadequate response to methotrexate. Annals of the Rheumatic Diseases. 2018;77(Suppl 2):67-8.
24. AbbVie. Upadacitinib (ABT-494). M15-555 Clinical Study Report - week 48. 2018.
25. Genovese MC, Fleischmann R, Combe B, Hall S, Rubbert-Roth A, Zhang Y, et al. Safety and efficacy of upadacitinib in patients with active rheumatoid arthritis refractory to biologic disease-modifying anti-rheumatic drugs (SELECT-BEYOND): a double-blind, randomised controlled phase 3 trial. Lancet. 2018;391(10139):2513-24.
26. AbbVie. Upadacitinib (ABT-494). M13-542 Clinical Study Report - period 1. 2018.
27. Tanaka Y, Takeuchi T, Yamaoka K, Oribe M, Kawano M, Zhou Y, et al. A phase 2b/3 randomised, placebo-controlled, double-blind study of upadacitinib, a selective JAK1 inhibitor, in Japanese patients with active rheumatoid arthritis and inadequate
Copyright 2019 Queen's Printer and Controller of HMSO. All rights reserved
Page 244 of 275
response to conventional synthetic DMARDs. Annals of the Rheumatic Diseases. 2018;77(Suppl 2):991-2.
28. Abbvie. Upadacitinib (ABT-494). M14-663 Clinical Study Report - week 60. 2018.
29. Aletaha D, Neogi T, Silman AJ, Funovits J, Felson DT, Bingham CO, 3rd, et al. 2010 rheumatoid arthritis classification criteria: an American College of Rheumatology/European League Against Rheumatism collaborative initiative. Annals of the Rheumatic Diseases. 2010;69(9):1580-8.
30. NHS Digital. Health Survey for England 2017. Adult and child overweight and obesity 2018. Available from: https://files.digital.nhs.uk/3F/6971DC/HSE17-Adult-Child-BMI-rep.pdf.
31. NICE. Adalimumab, etanercept, infliximab, certolizumab pegol, golimumab, tocilizumab and abatacept for rheumatoid arthritis not previously treated with DMARDs or after conventional DMARDs only have failed. Technology appraisal guidance [TA375]: National Institute for Health and Care Excellence; 2016. Available from: https://www.nice.org.uk/guidance/ta375/.
32. NICE. Tofacitinib for treating moderate to severe active rheumatoid arthritis after the failure of disease-modifying anti-rheumatic drugs. Technology appraisal guidance [TA480]: National Institute for Health and Care Excellence; 2017. Available from: https://www.nice.org.uk/guidance/ta480.
33. Fleischmann R, Pangan AL, Song I-H, Mysler E, Bessette L, Peterfy C, et al. Upadacitinib versus placebo or adalimumab in patients with rheumatoid arthritis and an inadequate response to methotrexate: results of a phase 3, double-blind, randomized controlled trial. Arthritis & Rheumatology. 2019:epub ahead of print.
34. Smolen JS, Pangan AL, Emery P, Rigby W, Tanaka Y, Vargas JI, et al. Upadacitinib as monotherapy in patients with active rheumatoid arthritis and inadequate response to methotrexate (SELECT-MONOTHERAPY): a randomised, placebo-controlled, double-blind phase 3 study. Lancet. 2019;393(10188):2303-11.
35. Fleischmann R, Pangan A, Mysler E, Bessette L, Peterfy C, Durez P, et al. A phase 3, randomized, double-blind study comparing upadacitinib to placebo and to adalimumab, in patients with active rheumatoid arthritis with inadequate response to methotrexate. Arthritis & Rheumatology. 2018;70(Suppl 10):Abstract Number 890.
36. Smolen JS, Cohen S, Emery P, Rigby WFC, Tanaka Y, Zhang Y, et al. Upadacitinib as monotherapy: a phase 3 randomized controlled double-blind study in patients with active rheumatoid arthritis and inadequate response to methotrexate. Arthritis & Rheumatology. 2018;70(Suppl 9):987-8.
37. Strand V, Buch M, Tundia N, Camp HS, Suboticki J, Goldschmidt D, et al. Upadacitinib monotherapy improves patient-reported outcomes in patients with rheumatoid arthritis and inadequate response to methotrexate. Arthritis & Rheumatology. 2018;70(Suppl 9):2833-4.
38. Burmester G, Kremer J, Van Den Bosch F, Li Y, Zhou Y, Othman A, et al. A phase 3 randomised, placebo-controlled, double-blind study of upadacitinib (ABT-494), a selective JAK-1 inhibitor, in patients with active rheumatoid arthritis with inadequate response to conventional synthetic DMARDs. Annals of the Rheumatic Diseases. 2018;77(Suppl 2):68-9.
Copyright 2019 Queen's Printer and Controller of HMSO. All rights reserved

Page 245 of 275
39. Burmester GR, Kremer J, Van Den Bosch F, Li Y, Zhou Y, Othman AA, et al. A phase 3 randomized, placebo-controlled, double-blind study of upadacitinib (ABT-494), a selective JAK-1 inhibitor, in patients with active rheumatoid arthritis with inadequate response to conventional synthetic DMARDs. Arthritis & Rheumatology. 2017;69(Suppl 10):Abstract Number: 1904.
40. Burmester GR, Kremer J, Van Den Bosch F, Li Y, Zhou Y, Othman AA, et al. A phase III randomised placebo-controlled double-blind study of upadacitinib (ABT-494), a selective JAK-1 inhibitor, in patients with active rheumatoid arthritis with inadequate response to conventional synthetic DMARDs. Rheumatology (United Kingdom). 2018;57(Suppl 3):iii148-iii9.
41. Burmester GR, Kremer JM, Van Den Bosch F, Li Y, Zhou Y, Othman AA, et al. A phase-3 randomized, placebo-controlled, double-blind study of upadacitinib (ABT-494), a selective JAK-1 inhibitor, in patients with active rheumatoid arthritis with inadequate response to conventional synthetic DMARDs. Journal of Clinical Rheumatology. 2018;24(3 Suppl 1):S88.
42. Strand V, Pope J, Tundia N, Friedman A, Camp HS, Pangan A, et al. Upadacitinib improves patient-reported outcomes in patients with rheumatoid arthritis and inadequate response to conventional synthetic disease-modifying anti-rheumatic drugs: results from SELECT NEXT. Annals of the Rheumatic Diseases. 2018;77(Suppl 2):989-90.
43. Wells AF, Lee YC, Tundia N, Suboticki J, Chen K, Friedman A, et al. Effect of upadacitinib on pain and morning stiffness in patients with rheumatoid arthritis and inadequate response to conventional synthetic or biologic disease-modifying anti-rheumatic drugs. Arthritis & Rheumatology. 2018;70(Suppl 9):2806-7.
44. FitzGerald O, Rubbert-Roth A, Chen K, Meerwein S, Enejosa J, Shaw T, et al. Rapid response with upadacitinib treatment in patients with rheumatoid arthritis and an inadequate response to csDMARDs or bDMARDs. Swiss Medical Weekly. 2018;148(Suppl 231):22S.
45. FitzGerald O, Rubbert-Roth A, Chen K, Meerwein S, Enejosa J, Shaw T, et al. Rapid response with upadacitinib treatment in patients with rheumatoid arthritis and an inadequate response to csDMARDS or bDMARDs. Annals of the Rheumatic Diseases. 2018;77(Suppl 2):981.
46. FitzGerald O, Rubbert-Roth A, Chen K, Meerwein S, Enejosa JJ, Shaw T, et al. Rapid response with upadacitinib treatment in patients with rheumatoid arthritis and an inadequate response to csDMARDs or bDMARDs. Arthritis & Rheumatology. 2018;70(Suppl 9):2804-6.
47. Strand V, Schiff M, Tundia N, Friedman A, Meerwein S, Pangan A, et al. Patient reported outcomes of upadacitinib: results from biologic inadequate responders (SELECT BEYOND phase III trial). Annals of the Rheumatic Diseases. 2018;77(Suppl 2):990.
48. Van Vollenhoven R, Dore R, Chen K, Camp HS, Enejosa J, Shaw T, et al. Impact of 12 weeks of upadacitinib treatment on individual and composite disease measures in patients with rheumatoid arthritis and inadequate response to conventional synthetic or biologic DMARDs. Annals of the Rheumatic Diseases. 2018;77(Suppl 2):984.
Copyright 2019 Queen's Printer and Controller of HMSO. All rights reserved

Page 246 of 275
49. Van Vollenhoven R, Dore RK, Chen K, Camp HS, Enejosa JJ, Shaw T, et al. Impact of 12-weeks of upadacitinib treatment on individual and composite disease measures in patients with rheumatoid arthritis and inadequate response to conventional synthetic or biologic DMARDs. Arthritis & Rheumatology. 2018;70(Suppl 9):2826-8.
50. Genovese MC, Fleischmann R, Combe B, Hall S, Zhang Y, Zhou Y, et al. Upadacitinib in patients with active rheumatoid arthritis and inadequate response or intolerance to biological DMARDS: a phase 3 randomized, placebocontrolled, double-blind study of a selective JAK1 inhibitor. Annals of the Rheumatic Diseases. 2018;77(Suppl 2):970.
51. NICE. Baricitinib for moderate to severe rheumatoid arthritis (TA466). Technology appraisal guidance [TA466]: National Institute for Health and Care Excellence; 2017. Available from: https://www.nice.org.uk/guidance/ta466.
52. NICE. Sarilumab for moderate to severe rheumatoid arthritis. Technology appraisal guidance [TA485]: National Institute for Health and Care Excellence; 2017. Available from: https://www.nice.org.uk/guidance/ta485.
53. van Vollenhoven RF, Kinnman N, Vincent E, Wax S, Bathon J. Atacicept in patients with rheumatoid arthritis and an inadequate response to methotrexate: results of a phase II, randomized, placebo-controlled trial. Arthritis and Rheumatism. 2011;63(7):1782-92.
54. Combe B, Codreanu C, Fiocco U, Gaubitz M, Geusens PP, Kvien TK, et al. Efficacy, safety and patient-reported outcomes of combination etanercept and sulfasalazine versus etanercept alone in patients with rheumatoid arthritis: a double-blind randomised 2-year study. Annals of the Rheumatic Diseases. 2009;68(7):1146-52.
55. Combe B, Codreanu C, Fiocco U, Gaubitz M, Geusens PP, Kvien TK, et al. Etanercept and sulfasalazine, alone and combined, in patients with active rheumatoid arthritis despite receiving sulfasalazine: a double-blind comparison. Annals of the Rheumatic Diseases. 2006;65(10):1357-62.
56. Keystone EC, Wang MM, Layton M, Hollis S, McInnes IB. Clinical evaluation of the efficacy of the P2X7 purinergic receptor antagonist AZD9056 on the signs and symptoms of rheumatoid arthritis in patients with active disease despite treatment with methotrexate or sulphasalazine. Annals of the Rheumatic Diseases. 2012;71(10):1630-5.
57. Wong M, Oakley SP, Young L, Jiang BY, Wierzbicki A, Panayi G, et al. Infliximab improves vascular stiffness in patients with rheumatoid arthritis. Annals of the Rheumatic Diseases. 2009;68(8):1277-84.
58. Zhang F-C, Hou Y, Huang F, Wu D-H, Bao C-D, Ni L-Q, et al. Infliximab versus placebo in rheumatoid arthritis patients receiving concomitant methotrexate: a preliminary study from China. APLAR Journal of Rheumatology. 2006;9(2):127-30.
59. Wajdula J. A double-blind, placebo controlled study of the efficacy and safety of four different doses of etanercept in patients with rheumatoid arthritis. Annals of the Rheumatic Diseases. 2000;59(Suppl):163.
60. Chen YF, Jobanputra P, Barton P, Jowett S, Bryan S, Clark W, et al. A systematic review of the effectiveness of adalimumab, etanercept and infliximab for the treatment of rheumatoid arthritis in adults and an economic evaluation of their cost-effectiveness. Health Technology Assessment. 2006;10(42):iii-iv, xi-xiii, 1-229.
Copyright 2019 Queen's Printer and Controller of HMSO. All rights reserved

Page 247 of 275
61. Kay J, Matteson EL, Dasgupta B, Nash P, Durez P, Hall S, et al. Golimumab in patients with active rheumatoid arthritis despite treatment with methotrexate: a randomized, double-blind, placebo-controlled, dose-ranging study. Arthritis and Rheumatism. 2008;58(4):964-75.
62. Genovese MC, Covarrubias A, Leon G, Mysler E, Keiserman M, Valente R, et al. Subcutaneous abatacept versus intravenous abatacept: a phase IIIb noninferiority study in patients with an inadequate response to methotrexate. Arthritis and Rheumatism. 2011;63(10):2854-64.
63. D'Agostino MA, Alten R, Mysler E, Le Bars M, Ye J, Murthy B, et al. Body mass index does not affect response to subcutaneous or intravenous abatacept in patients with rheumatoid arthritis. Arthritis & Rheumatology. 2016;68(Suppl 10):1960-2.
64. D'Agostino MA, Alten R, Mysler E, Le Bars M, Ye J, Murthy B, et al. Body mass index and clinical response to intravenous or subcutaneous abatacept in patients with rheumatoid arthritis. Clinical Rheumatology. 2017;36(12):2655-65.
65. Genovese MC, Cobos AC, Leon G, Mysler EF, Keiserman MW, Valente RM, et al. Subcutaneous (SC) abatacept (ABA) versus intravenous (IV) ABA in patients (PTS) with rheumatoid arthritis: long-term data from the ACQUIRE (abatacept comparison of subqucutaneous versus intravenous in inadequate responders to methotrexate) trial. Arthritis and Rheumatism. 2011;63(10 Suppl 1):S150.
66. Genovese MC, Covarrubias JA, Leon G, Mysler EF, Keiserman MW, Valente RM, et al. A large, phase IIIb non-inferiority trial of subcutaneous (SC) abatacept compared with intravenous (IV) abatacept, in patients with rheumatoid arthritis (RA). Arthritis and Rheumatism. 2010;62(Suppl 10):2173.
67. Genovese MC, Cobos AC, Leon G, Mysler EF, Keiserman MW, Valente RM, et al. Subcutaneous abatacept versus intravenous abatacept in patients with rheumatoid arthritis: long-term data from the ACQUIRE trial. Rheumatology (United Kingdom). 2012;51(Suppl 3):iii128-iii9.
68. Genovese MC, Pacheco-Tena C, Covarrubias A, Leon G, Mysler E, Keiserman M, et al. Longterm safety and efficacy of subcutaneous abatacept in patients with rheumatoid arthritis: 5-year results from a phase IIIb trial. Journal of Rheumatology. 2018;45(8):1085-92.
69. Dougados M, Kissel K, Sheeran T, Tak PP, Conaghan PG, Mola EM, et al. Adding tocilizumab or switching to tocilizumab monotherapy in methotrexate inadequate responders: 24-week symptomatic and structural results of a 2-year randomised controlled strategy trial in rheumatoid arthritis (ACT-RAY). Annals of the Rheumatic Diseases. 2013;72(1):43-50.
70. Dougados M, Kissel K, Amital H, Conaghan PG, Martin-Mola E, Nasonov EL, et al. Double-blind study of tocilizumab plus methotrexate vs tocilizumab plus placebo in patients with active rheumatoid arthritis despite prior methotrexate: progression of structural damage, quality of life, and physical function at 24 weeks. Arthritis and Rheumatism. 2011;63(10 Suppl 1):S1032-S3.
71. Dougados M, Kissel K, Conaghan PG, Martin-Mola E, Schett GA, Amital H, et al. Clinical, radiographic, and immunogenic effects after 1 year of tocilizumab-based treatment strategy with and without methotrexate in rheumatoid arthritis: the ACT-RAY study. Arthritis and Rheumatism. 2012;64(Suppl 10):S1077-S8.
Copyright 2019 Queen's Printer and Controller of HMSO. All rights reserved

Page 248 of 275
72. Dougados M, Kissel K, Amital H, Conaghan P, Martin-Mola E, Nasonov E, et al. Double-blind study of tocilizumab+ methotrexate versus tocilizumab+placebo in patients with active rheumatoid arthritis despite prior methotrexate: progression of structural damage, quality of life and physical function at 24 weeks. Rheumatology (United Kingdom). 2012;51(Suppl 3):iii28-iii9.
73. Dougados M, Kissel K, Conaghan PG, Mola EM, Schett G, Gerli R, et al. Clinical, radiographic and immunogenic effects after 1 year of tocilizumab-based treatment strategies in rheumatoid arthritis: the ACT-RAY study. Annals of the Rheumatic Diseases. 2014;73(5):803-9.
74. Huizinga TW, Conaghan PG, Martin-Mola E, Schett G, Amital H, Xavier RM, et al. Clinical and radiographic outcomes at 2 years and the effect of tocilizumab discontinuation following sustained remission in the second and third year of the ACT-RAY study. Annals of the Rheumatic Diseases. 2015;74(1):35-43.
75. Moller B, Scholz G, Dougados M, Huizinga T, Villiger PM, Finckh A. Anemia is a better predictor for radiographic damage in rheumatoid arthritis than DAS28 when determined before start of tocilizumab-treatment-a secondary analysis from the ACT-ray trial. Annals of the Rheumatic Diseases. 2017;76(Suppl 2):569.
76. Gabay C, Emery P, van Vollenhoven R, Dikranian A, Alten R, Pavelka K, et al. Tocilizumab monotherapy versus adalimumab monotherapy for treatment of rheumatoid arthritis (ADACTA): a randomised, double-blind, controlled phase 4 trial. Lancet. 2013;381(9877):1541-50.
77. Gabay C, Emery P, Van Vollenhoven R, Dikranian A, Alten R, Klearman M, et al. Tocilizumab (TCZ) monotherapy is superior to adalimumab (ADA) monotherapy in reducing disease activity in patients with rheumatoid arthritis (RA): 24-week data from the phase 4 ADACTA trial. Annals of the Rheumatic Diseases. 2012;71(Suppl 3):152.
78. Kavanaugh A, Emery P, Van Vollenhoven RF, Dikranian AH, Alten R, Klearman M, et al. Tocilizumab monotherapy compared with adalimumab monotherapy in patients with rheumatoid arthritis: results of a 24-week study. Arthritis and Rheumatism. 2012;64(Suppl 10):S333-S4.
79. Gabay C, Emery P, Van Vollenhoven R. Erratum: Tocilizumab monotherapy versus adalimumab monotherapy for treatment of rheumatoid arthritis (ADACTA): a randomised, double-blind, controlled phase 4 trial (The Lancet (2013) 381 (1541-1550)). Lancet. 2013;381(9877):1540.
80. Kremer JM, Genant HK, Moreland LW, Russell AS, Emery P, Abud-Mendoza C, et al. Effects of abatacept in patients with methotrexate-resistant active rheumatoid arthritis: a randomized trial. Annals of Internal Medicine. 2006;144(12):865-76.
81. Russell AS, Wallenstein GV, Li T, Martin MC, Maclean R, Blaisdell B, et al. Abatacept improves both the physical and mental health of patients with rheumatoid arthritis who have inadequate response to methotrexate treatment. Annals of the Rheumatic Diseases. 2007;66(2):189-94.
82. Kremer J, Russell AS, Westhovens R, Teng J, Rosenblatt L, Emery P. Sustained and clinically meaningful improvements in both day-and night-time aspects of HRQoL are observed with abatacept treatment in patients with rheumatoid arthritis (RA) and previous inadequate response to MTX: 5-year data from the AIM trial. Arthritis and Rheumatism. 2010;62(Suppl 10):1836.
Copyright 2019 Queen's Printer and Controller of HMSO. All rights reserved

Page 249 of 275
83. Russell A, Dougados M, Khraishi M, Flipo RM, Le Loet X, Smolen J, et al. Efficacy with abatacept in patients with earlier versus more longstanding disease: insights from the AIM trial. Journal of Rheumatology. 2012;39(8):1714.
84. Russell AS, Kremer JM, Emery P, Abud-Mendoza C, Szechinski J, Zhao C, et al. Safety and efficacy of abatacept over 4 years of treatment in patients with rheumatoid arthritis and an inadequate response to methotrexate in the AIM trial. Journal of Rheumatology. 2009;36(11):2608-9.
85. Shim SC, Park SH, Bae SC, Song YW, MacAraeg GM, Delvaux A, et al. Efficacy and safety of abatacept in Korean patients with active rheumatoid arthritis and inadequate response to methotrexate: a phase III, multicenter, randomized, double-blind, placebo-controlled bridging study. International Journal of Rheumatic Diseases. 2010;13(Suppl 1):101.
86. Sibilia J, Flipo RM, Combe B, Gaillez C, Le Bars M, Poncet C, et al. Abatacept confers clinical efficacy regardless of baseline CRP status in patients with rheumatoid arthritis and inadequate response to methotrexate in the AIM trial. Rheumatology (United Kingdom). 2012;51(Suppl 3):iii124-iii5.
87. Vecchio P, Russell AS, Emery P, Abud-Mendoza C, Szechinski J, Zhao C, et al. The AIM trial: four-year safety and efficacy of abatacept in rheumatoid arthritis patients with inadequate response to methotrexate. Internal Medicine Journal. 2009;39(Suppl 2):A73.
88. Kremer JM, Russell AS, Emery P, Abud-Mendoza C, Szechinski J, Becker JC, et al. Abatacept demonstrates consistent safety and sustained improvements in efficacy through 5 years of treatment in biologic-naive patients with rheumatoid arthritis. Rheumatology. 2010;49(Suppl 1):i104-i5.
89. Amano K, Matsubara T, Tanaka T, Inoue H, Iwahashi M, Kanamono T, et al. Long-term safety and efficacy of treatment with subcutaneous abatacept in Japanese patients with rheumatoid arthritis who are methotrexate inadequate responders. Modern Rheumatology. 2015;25(5):665-71.
90. Iwahashi M, Inoue H, Matsubara T, Tanaka T, Amano K, Kanamono T, et al. Efficacy, safety, pharmacokinetics and immunogenicity of abatacept administered subcutaneously or intravenously in Japanese patients with rheumatoid arthritis and inadequate response to methotrexate: a phase II/III, randomized study. Modern Rheumatology. 2014;24(6):885-91.
91. Weinblatt ME, Schiff M, Valente R, Van Der Heijde D, Citera G, Zhao C, et al. Head-to-head comparison of subcutaneous abatacept versus adalimumab for rheumatoid arthritis: findings of a phase IIIb, multinational, prospective, randomized study. Arthritis and Rheumatism. 2013;65(1):28-38.
92. Fleischmann R, Weinblatt ME, Schiff M, Khanna D, Maldonado MA, Nadkarni A, et al. Patient-reported outcomes from a two-year head-to-head comparison of subcutaneous abatacept and adalimumab for rheumatoid arthritis. Arthritis Care & Research. 2016;68(7):907-13.
93. Fleischmann R, Weinblatt ME, Schiff M, Khanna D, Maldonado MA, Nadkarni A, et al. 2-year results from the AMPLE (abatacept versus adalimumab comparison in biologic-naive RA patients with background methotrexate) trial: changes in patient-
Copyright 2019 Queen's Printer and Controller of HMSO. All rights reserved

Page 250 of 275
reported outcomes in response to subcutaneous abatacept or adalimumab in rheumatoid arthritis. Arthritis and Rheumatism. 2013;65(Suppl 10):S183.
94. Fleischmann R, Weinblatt ME, Schiff MH, Khanna D, Furst D, Maldonado MA. Changes in patient reported outcomes in response to subcutaneous abatacept or adalimumab in rheumatoid arthritis: results from the AMPLE (abatacept versus adalimumab comparison in biologic naive RA subjects with background methotrexate) trial. Arthritis and Rheumatism. 2012;64(9):Abstract Number 1342.
95. Fleischmann R, Weinblatt M, Schiff M, Khanna D, Rosenblatt L, Maldonado M, et al. Improved quality of life, work productivity, general activity and independence in response to subcutaneous abatacept or adalimumab in rheumatoid arthritis: results from the AMPLE trial. Zeitschrift fur Rheumatologie. 2013;72(2 Suppl 1):109-10.
96. Fleischmann R, Connolly SE, Maldonado MA, Schiff M. Brief report: estimating disease activity using multi-biomarker disease activity scores in rheumatoid arthritis patients treated with abatacept or adalimumab. Arthritis & Rheumatology. 2016;68(9):2083-9.
97. Maldonado M, Fleischmann R, Weinblatt M, Schiff M, Khanna D, Furst D. Changes in patient-reported outcomes in response to subcutaneous abatacept or adalimumab in rheumatoid arthritis: results from the AMPLE (abatacept versus adalimumab comparison in biologic-naive RA subjects with background methotrexate) trial. Journal of Rheumatology. 2013;40(6):1006.
98. Maldonado M, Weinblatt M, Schiff M, Fleischmann R, Valente R, Van Der Heijde D, et al. Head-to-head comparison of subcutaneous abatacept versus adalimumab in the treatment of rheumatoid arthritis: key efficacy and safety results from the AMPLE (abatacept versus adalimumab comparison in biologic-naive RA subjects with background methotrexate) trial. Journal of Rheumatology. 2014;40(6):1005-6.
99. Schiff M, Weinblatt ME, Valente R, Van Der Heijde D, Citera G, Elegbe A, et al. Head-to-head comparison of subcutaneous abatacept versus adalimumab for rheumatoid arthritis: two-year efficacy and safety findings from AMPLE trial. Annals of the Rheumatic Diseases. 2014;73(1):86-94.
100. Weinblatt ME, Schiff MH, Fleischmann R, Valente R, Van Der Heijde D, Citera G, et al. Head to head comparison of subcutaneous abatacept versus adalimumab in the treatment of rheumatoid arthritis: key efficacy and safety results from the AMPLE (abatacept versus adalimumab comparison in biologic-naive RA subjects with background methotrexate) trial. Arthritis and Rheumatism. 2012;64(Suppl 10):S1031.
101. Weinblatt M, Schiff MH, R. V, Van Der Heijde D, Citera G, Elegbe A, et al. Head-to-head comparison of subcutaneous abatacept versus adalimumab on background methotrexate in rheumatoid arthritis: blinded two-year results from the AMPLE study. Rheumatology. 2014;53(Suppl 1):i88.
102. Kim HY, Hsu PN, Barba M, Sulaiman W, Robertson D, Vlahos B, et al. Randomized comparison of etanercept with usual therapy in an Asian population with active rheumatoid arthritis: the APPEAL trial. International Journal of Rheumatic Diseases. 2012;15(2):188-96.
103. Weinblatt ME, Keystone EC, Furst DE, Moreland LW, Weisman MH, Birbara CA, et al. Adalimumab, a fully human anti-tumor necrosis factor alpha monoclonal antibody,
Copyright 2019 Queen's Printer and Controller of HMSO. All rights reserved

Page 251 of 275
for the treatment of rheumatoid arthritis in patients taking concomitant methotrexate: the ARMADA trial. Arthritis and Rheumatism. 2003;48(1):35-45.
104. Yount S, Sorensen MV, Cella D, Sengupta N, Grober J, Chartash EK. Adalimumab plus methotrexate or standard therapy is more effective than methotrexate or standard therapies alone in the treatment of fatigue in patients with active, inadequately treated rheumatoid arthritis. Clinical and Experimental Rheumatology. 2007;25(6):838-46.
105. Schiff M, Keiserman M, Codding C, Songcharoen S, Berman A, Nayiager S, et al. Efficacy and safety of abatacept or infliximab vs placebo in ATTEST: a phase III, multi-centre, randomised, double-blind, placebo-controlled study in patients with rheumatoid arthritis and an inadequate response to methotrexate. Annals of the Rheumatic Diseases. 2008;67(8):1096-103.
106. Schiff M, Keiserman M, Codding C, Songcharoen S, Berman A, Nayiager S, et al. Clinical response and tolerability to abatacept in patients with rheumatoid arthritis previously treated with infliximab or abatacept: open-label extension of the ATTEST study. Annals of the Rheumatic Diseases. 2011;70(11):2003-7.
107. Schiff M, Keiserman M, Codding C, Songcharoen S, Berman A, Nayiager S, et al. 2-year efficacy and safety in abatacept treated patients with rheumatoid arthritis who received continuous therapy or switched from infliximab to abatacept: the ATTEST trial. Rheumatology. 2010;49(Suppl 1):i99.
108. Maini R, St Clair EW, Breedveld F, Furst D, Kalden J, Weisman M, et al. Infliximab (chimeric anti-tumour necrosis factor alpha monoclonal antibody) versus placebo in rheumatoid arthritis patients receiving concomitant methotrexate: a randomised phase III trial. Lancet. 1999;354(9194):1932-9.
109. Breedveld FC, Han C, Bala M, van der Heijde D, Baker D, Kavanaugh AF, et al. Association between baseline radiographic damage and improvement in physical function after treatment of patients with rheumatoid arthritis. Annals of the Rheumatic Diseases. 2005;64(1):52-5.
110. Smolen JS, Han C, Bala M, Maini RN, Kalden JR, Van Der Heijde D, et al. Evidence of radiographic benefit of treatment with infliximab plus methotrexate in rheumatoid arthritis patients who had no clinical improvement: a detailed subanalysis of data from the anti-tumor necrosis factor trial in rheumatoid arthritis with concomitant therapy study. Arthritis and Rheumatism. 2005;52(4):1020-30.
111. Lipsky PE, Van Der Heijde DMFM, St. Clair EW, Furst DE, Breedveld FC, Kalden JR, et al. Infliximab and methotrexate in the treatment of rheumatoid arthritis. New England Journal of Medicine. 2000;343(22):1594-602.
112. Kivitz A, Olech E, Borofsky M, Zazueta BM, Navarro-Sarabia F, Radominski SC, et al. Subcutaneous tocilizumab versus placebo in combination with disease-modifying antirheumatic drugs in patients with rheumatoid arthritis. Arthritis Care & Research. 2014;66(11):1653-61.
113. Kivitz A, Olech E, Borofsky MA, Zazueta BM, Navarro-Sarabia F, Radominski SC, et al. The safety and efficacy of tocilizumab subcutaneous in combination with traditional DMARDS in patients with moderate to severe rheumatoid arthritis up to 48 weeks (BREVACTA). Arthritis and Rheumatism. 2013;65(Suppl 10):S604-S5.
Copyright 2019 Queen's Printer and Controller of HMSO. All rights reserved

Page 252 of 275
114. Kivitz AJ, Olech E, Borofsky MA, Zazueta BM, Navarro-Sarabia F, Rowell L, et al. A randomized, double-blind, parallel-group study of the safety and efficacy of tocilizumab subcutaneous versus placebo in combination with traditional DMARDs in patients with moderate to severe rheumatoid arthritis (BREVACTA). Arthritis and Rheumatism. 2012;64(12):4170.
115. Kivitz A, Olech E, Borofsky MA, Zazueta BM, Navarro-Sarabia F, Radominski SC, et al. The efficacy and safety of tocilizumab subcutaneous Q2W and following escalation from Q2W to QW therapy in combination with traditional DMARDs in patients with moderate to severe rheumatoid arthritis at 96 weeks. Arthritis & Rheumatology. 2014;66(Suppl 10):S1076-S7.
116. Smolen JS, Emery P, Ferraccioli GF, Samborski W, Berenbaum F, Davies OR, et al. Certolizumab pegol in rheumatoid arthritis patients with low to moderate activity: the CERTAIN double-blind, randomised, placebo-controlled trial. Annals of the Rheumatic Diseases. 2015;74(5):843-50.
117. Smolen JS, Emery P, Ferraccioli G, Samborski W, Berenbaum F, Davies O, et al. Maintenance of remission in rheumatoid arthritis patients with low-moderate disease activity following withdrawal of certolizumab pegol treatment: week 52 results from the certain study. Annals of the Rheumatic Diseases. 2013;71(Suppl 3):361-2.
118. Emery P, Smolen JS, Samborski W, Berenbaum F, Davies O, Ambrugeat J, et al. Efficacy and safety of certolizumab pegol after incomplete response to dmards in rheumatoid arthritis patients with low moderate disease activity: results from CERTAIN, a phase IIIB study. Rheumatology. 2012;51(Suppl 3):iii134.
119. Miyasaka N. Clinical investigation in highly disease-affected rheumatoid arthritis patients in Japan with adalimumab applying standard and general evaluation: the CHANGE study. Modern Rheumatology. 2008;18(3):252-62.
120. Keystone EC, Kavanaugh AF, Sharp JT, Tannenbaum H, Hua Y, Teoh LS, et al. Radiographic, clinical, and functional outcomes of treatment with adalimumab (a human anti-tumor necrosis factor monoclonal antibody) in patients with active rheumatoid arthritis receiving concomitant methotrexate therapy: a randomized, placebo-controlled, 52-week trial. Arthritis and Rheumatism. 2004;50(5):1400-11.
121. Jamal S, Patra K, Keystone EC. Adalimumab response in patients with early versus established rheumatoid arthritis: DE019 randomized controlled trial subanalysis. Clinical Rheumatology. 2009;28(4):413-9.
122. Keystone E, Van Der Heijde D, Weinblatt ME, Mozaffarian N, Guerette B, Kupper H, et al. Initial combination therapy with adalimumab plus methotrexate leads to better long-term outcomes in patients with advanced rheumatoid arthritis: analysis of the final 10-year results of an open-label extension of a phase 3 trial. Arthritis and Rheumatism. 2011;63(10 Suppl 1):S870-S1.
123. Smolen JS, Burmester GR, Combe B, Curtis JR, Hall S, Haraoui B, et al. Head-to-head comparison of certolizumab pegol versus adalimumab in rheumatoid arthritis: 2-year efficacy and safety results from the randomised EXXELERATE study. Lancet. 2016;388(10061):2763-74.
124. Tanaka Y, Harigai M, Takeuchi T, Yamanaka H, Ishiguro N, Yamamoto K, et al. Golimumab in combination with methotrexate in Japanese patients with active
Copyright 2019 Queen's Printer and Controller of HMSO. All rights reserved

Page 253 of 275
rheumatoid arthritis: results of the GO-FORTH study. Annals of the Rheumatic Diseases. 2012;71(6):817-24.
125. Tanaka Y, Harigai M, Takeuchi T, Yamanaka H, Ishiguro N, Yamamoto K, et al. Clinical efficacy, radiographic progression, and safety through 156 weeks of therapy with subcutaneous golimumab in combination with methotrexate in Japanese patients with active rheumatoid arthritis despite prior methotrexate therapy: final results of the randomized GO-FORTH trial. Modern Rheumatology. 2016;26(4):481-90.
126. Tanaka Y, Harigai M, Takeuchi T, Yamanaka H, Ishiguro N, Yamamoto K, et al. 52-week results of clinical, radiographic and pharmacokinetic assessments: golimumab, a human anti-TNF monoclonal antibody, administered subcutaneously every four weeks in patients with active rheumatoid arthritis despite methotrexate therapy. Annals of the Rheumatic Diseases. 2012;71(Suppl 10):S175.
127. Takeuchi T, Ishii Y, Tanaka K, Ukyo Y, Sekine H. Analysis on predictors for long-term clinical efficacies of golimumab in patients with rheumatoid arthritis. Arthritis & Rheumatology. 2014;66(Suppl 10):S1102.
128. Tanaka Y, Harigai M, Takeuchi T, Yamanaka H, Ishiguro N, Yamamoto K, et al. Golimumab administered subcutaneously every four weeks in patients with active rheumatoid arthritis despite methotrexate therapy: long-term clinical, radiographic and safety results, including evaluation of remission using the new ACR/EULAR criteria. Annals of the Rheumatic Diseases. 2013;72(Suppl 3):442.
129. Keystone EC, Genovese MC, Klareskog L, Hsia EC, Hall ST, Miranda PC, et al. Golimumab, a human antibody to tumour necrosis factor {alpha} given by monthly subcutaneous injections, in active rheumatoid arthritis despite methotrexate therapy: the GO-FORWARD Study. [Erratum appears in Ann Rheum Dis. 2011 Jan;70(1):238]. Annals of the Rheumatic Diseases. 2009;68(6):789-96.
130. Keystone EC, Genovese MC, Hall S, Miranda PC, Bae SC, Palmer W, et al. Golimumab in patients with active rheumatoid arthritis despite methotrexate therapy: results through 2 years of the GO-FORWARD study extension. Journal of Rheumatology. 2013;40(7):1097-103.
131. Hall S, Genovese MC, Keystone E, Hsia EC, Buchanan J, Klareskog L, et al. Golimumab significantly improves physical function, health-related quality of life, and fatigue in rheumatoid arthritis (GO-FORWARD study). Internal Medicine Journal. 2009;39(S2):A71.
132. Keystone E, Genovese MC, Hall S, Miranda P, Bae SC, Han C, et al. Final 5-year safety and efficacy results of a phase 3, randomized placebo-controlled trial of golimumab in patients with active rheumatoid arthritis despite prior treatment with methotrexate. Arthritis and Rheumatism. 2013;65(Suppl 10):S597-S8.
133. Keystone E, Genovese MC, Hall S, Miranda PC, Bae SC, Han C, et al. Five-year safety and efficacy of golimumab in patients with active rheumatoid arthritis despite prior treatment with methotrexate: final study results of the phase 3, randomized placebo-controlled GO-FORWARD trial. Annals of the Rheumatic Diseases. 2013;72(12):A867-A8.
134. Keystone E, Genovese MC, Hall S, Miranda PC, Bae SC, Han C, et al. Final 5-year safety and efficacy results of a phase 3, randomized placebo-controlled trial of
Copyright 2019 Queen's Printer and Controller of HMSO. All rights reserved

Page 254 of 275
golimumab in patients with active rheumatoid arthritis despite prior treatment with methotrexate. Rheumatology. 2014;53(Suppl 1):i99.
135. Keystone EC, Genovese MC, Hall S, Bae SC, Han C, Gathany TA, et al. Safety and efficacy of subcutaneous golimumab in patients with active rheumatoid arthritis despite methotrexate therapy: final 5-year results of the GO-FORWARD trial. Journal of Rheumatology. 2016;43(2):298-306.
136. Genovese MC, Keystone EC, Hsia EC, Buchanan J, Klareskog L, Murphy FT, et al. Impact of golimumab on physical function, health-related quality of life, productivity and employment in rheumatoid arthritis patients: week 52 results from the GO-FORWARD study. International Journal of Rheumatic Diseases. 2010;13(Suppl 1):88.
137. Kameda H, Ueki Y, Saito K, Nagaoka S, Hidaka T, Atsumi T, et al. Etanercept (ETN) with methotrexate (MTX) is better than ETN monotherapy in patients with active rheumatoid arthritis despite MTX therapy: a randomized trial. Modern Rheumatology. 2010;20(6):531-8.
138. Yamamoto K, Takeuchi T, Yamanaka H, Ishiguro N, Tanaka Y, Eguchi K, et al. Efficacy and safety of certolizumab pegol plus methotrexate in Japanese rheumatoid arthritis patients with an inadequate response to methotrexate: the J-RAPID randomized, placebo-controlled trial. Modern Rheumatology. 2014;24(5):715-24.
139. Kim HY, Lee SK, Song YW, Yoo DH, Koh EM, Yoo B, et al. A randomized, double-blind, placebo-controlled, phase III study of the human anti-tumor necrosis factor antibody adalimumab administered as subcutaneous injections in Korean rheumatoid arthritis patients treated with methotrexate. APLAR Journal of Rheumatology. 2007;10(1):9-16.
140. Kim J, Ryu H, Yoo DH, Park SH, Song GG, Park W, et al. A clinical trial and extension study of infliximab in Korean patients with active rheumatoid arthritis despite methotrexate treatment. Journal of Korean Medical Science. 2013;28(12):1716-22.
141. Machado DA, Guzman RM, Xavier RM, Simon JA, Mele L, Pedersen R, et al. Open-label observation of addition of etanercept versus a conventional disease-modifying antirheumatic drug in subjects with active rheumatoid arthritis despite methotrexate therapy in the Latin American region. Journal of Clinical Rheumatology. 2014;20(1):25-33.
142. Li Z, Zhang F, Kay J, Fei K, Han C, Zhuang Y, et al. Efficacy and safety results from a phase 3, randomized, placebo-controlled trial of subcutaneous golimumab in Chinese patients with active rheumatoid arthritis despite methotrexate therapy. International Journal of Rheumatic Diseases. 2016;19(11):1143-56.
143. Li Z, Zhang F, Kay J, Fei K, Han C, Zhuang Y, et al. Safety and efficacy of subcutaneous golimumab in Chinese patients with active rheumatoid arthritis despite MTX therapy: results from a randomized, placebo-controlled, phase 3 trial. Annals of the Rheumatic Diseases. 2013;72(Suppl 3):A444.
144. Kremer JM, Blanco R, Brzosko M, Burgos-Vargas R, Halland AM, Vernon E, et al. Tocilizumab inhibits structural joint damage in rheumatoid arthritis patients with inadequate responses to methotrexate: results from the double-blind treatment phase of a randomized placebo-controlled trial of tocilizumab safety and prevention of structural joint damage at one year. Arthritis and Rheumatism. 2011;63(3):609-21.
Copyright 2019 Queen's Printer and Controller of HMSO. All rights reserved

Page 255 of 275
145. Bay-Jensen AC, Platt A, Byrjalsen I, Vergnoud P, Christiansen C, Karsdal MA. Effect of tocilizumab combined with methotrexate on circulating biomarkers of synovium, cartilage, and bone in the LITHE study. Seminars in Arthritis and Rheumatism. 2014;43(4):470-8.
146. Fleischmann RM, Halland AM, Brzosko M, Burgos-Vargas R, Mela C, Vernon E, et al. Tocilizumab inhibits structural joint damage and improves physical function in patients with rheumatoid arthritis and inadequate responses to methotrexate: LITHE study 2-year results. Journal of Rheumatology. 2013;40(2):113-26.
147. Huizinga T, Nigrovic P, Ruderman E, Schulze-Koops H. Tocilizumab inhibits structural joint damage in rheumatoid arthritis patients with inadequate responses to methotrexate: results from the double-blind treatment phase of a randomized placebo-controlled trial of tocilizumab safety and prevention of structural joint damage at one year - Commentary. International Journal of Advances in Rheumatology. 2011;9(3):98-9.
148. Genovese MC, Fleischmann R, Kivitz AJ, Rell-Bakalarska M, Martincova R, Fiore S, et al. Sarilumab plus methotrexate in patients with active rheumatoid arthritis and inadequate response to methotrexate: results of a phase III study. Arthritis & Rheumatology. 2015;67(6):1424-37.
149. Genovese MC, Van Hoogstraten H, Kampman W, Jayawardena S, Huizinga TW. Association between clinical and radiographic responses, and physical function in a phase 3 study of sarilumab plus methotrexate in patients with active, moderate-to-severe rheumatoid arthritis. Annals of the Rheumatic Diseases. 2017;76(Suppl 2):576-7.
150. Fleischmann R, Decktor DL, Fan C, Van Hoogstraten H, Genovese MC. Comparable efficacy with sarilumab plus methotrexate in biologic-experienced and biologic-naive patients with moderate-to-severe rheumatoid arthritis from a phase 3, randomized, double-blind, placebo-controlled, international study. Arthritis & Rheumatology. 2014;66(Suppl 10):S1232-S3.
151. Genovese MC, Mangan EK, Kimura T, Iglesias-Rodriguez M, Van Hoogstraten H, Huizinga TWJ. Duration of response in a phase 3 study of sarilumab plus methotrexate in patients with rheumatoid arthritis (RA). Internal Medicine Journal. 2018;48(Suppl 4):20-1.
152. Strand V, Kosinski M, Joseph G, Chen C, Van Hoogstraten H, Graham N, et al. Improvements in health related quality of life (HRQOL) reported by rheumatoid arthritis (RA) patients in a randomized controlled trial (RCT) of sarilumab (MOBILITY) that met or exceeded the patient acceptable symptom state (PASS) and normative values. Annals of the Rheumatic Diseases. 2015;74(Suppl 3):440.
153. Burmester GR, Lin Y, Patel R, van Adelsberg J, Mangan EK, Graham NM, et al. Efficacy and safety of sarilumab monotherapy versus adalimumab monotherapy for the treatment of patients with active rheumatoid arthritis (MONARCH): a randomised, double-blind, parallel-group phase III trial. Annals of the Rheumatic Diseases. 2017;76(5):840-7.
154. Burmester G, Lin Y, Patel R, Van Adelsberg J, Mangan E, Van Hoogstraten H, et al. Efficacy and safety of sarilumab versus adalimumab in a phase 3, randomized, double-blind, monotherapy study in patients with active rheumatoid arthritis with intolerance or inadequate response to methotrexate. Arthritis & Rheumatology. 2016;68(Suppl 10):4308-9.
Copyright 2019 Queen's Printer and Controller of HMSO. All rights reserved

Page 256 of 275
155. Burmester G, Lin Y, Mangan E, Van Hoogstraten H, Vargas J, Lee E. Efficacy and safety of sarilumab versus adalimumab in a phase 3, randomized, double-blind, monotherapy study in patients with active rheumatoid arthritis with intolerance or inadequate response to methotrexate. Internal Medicine Journal. 2017;47(Suppl 2):26.
156. Genovese MC, Van Hoogstraten H, Mangan EK, Jayawardena S, Burmester GR. Sarilumab as monotherapy or combination therapy in patients with RA and intolerance or inadequate response to methotrexate. International Journal of Rheumatic Diseases. 2017;20(Suppl 1):6-7.
157. Burmester GR, Lin Y, Mangan EK, Van Hoogstraten H, Kimura T, Vargas JI, et al. Efficacy and safety of sarilumab monotherapy versus adalimumab monotherapy in patients with active rheumatoid arthritis in the phase 3 MONARCH study, including subpopulations. Annals of the Rheumatic Diseases. 2017;76(Supp 2):849.
158. Burmester GR, Hagino O, Dong Q, Stanislav M, Gomez-Centeno A, Selmi C, et al. Unique changes in hemoglobin with sarilumab versus adalimumab are independent of better disease control in patients with rheumatoid arthritis (RA). Arthritis & Rheumatology. 2018;70 (Suppl 9):1688-90.
159. Gossec L, Strand V, Proudfoot C, Chen CI, Guillonneau S, Kimura T, et al. Effects of sarilumab on patient-reported impact of rheumatoid arthritis using the Rheumatoid Arthritis Impact of Disease scale. Journal of Rheumatology. 2019;46(8):15.
160. Strand V, Gossec L, Proudfoot CWJ, Chen CI, Reaney M, Guillonneau S, et al. Patient-reported outcomes from a randomized phase III trial of sarilumab monotherapy versus adalimumab monotherapy in patients with rheumatoid arthritis. Arthritis Research & Therapy. 2018;20(1):129.
161. Moreland LW, Schiff MH, Baumgartner SW, Tindall EA, Fleischmann RM, Bulpitt KJ, et al. Etanercept therapy in rheumatoid arthritis. A randomized, controlled trial. Annals of Internal Medicine. 1999;130(6):478-86.
162. Smolen JS, Beaulieu A, Rubbert-Roth A, Ramos-Remus C, Rovensky J, Alecock E, et al. Effect of interleukin-6 receptor inhibition with tocilizumab in patients with rheumatoid arthritis (OPTION study): a double-blind, placebo-controlled, randomised trial. Lancet. 2008;371(9617):987-97.
163. Van Der Heijde D, Tanaka Y, Fleischmann R, Keystone E, Kremer J, Zerbini C, et al. Tofacitinib (CP-690,550) in patients with rheumatoid arthritis receiving methotrexate: twelve-month data from a twenty-four-month phase III randomized radiographic study. Arthritis and Rheumatism. 2013;65(3):559-70.
164. Fleischmann R, Mease P, Schwartzman S, Hwang LJ, Soma K, Connell C, et al. Efficacy of tofacitinib in patients with rheumatoid arthritis stratified by background methotrexate dose group. Clinical Rheumatology. 2017;36(1):15-24.
165. Fleischmann R, Mease PJ, Schwartzman S, Hwang LJ, Patel A, Soma K, et al. Effect of methotrexate dose on the efficacy of tofacitinib: treatment outcomes from a phase 3 clinical trial of patients with rheumatoid arthritis. Arthritis & Rheumatology. 2015;67(Suppl 10):Abstract Number 1640.
166. Strand V, Lee EB, Yazici Y, Dikranian A, Wilkinson B, Takiya L, et al. Evaluation of disease activity in patients with rheumatoid arthritis treated with tofacitinib by RAPID3: post hoc analyses from two phase 3 trials. Clinical Rheumatology. 2018;37(8):2043-53.
Copyright 2019 Queen's Printer and Controller of HMSO. All rights reserved

Page 257 of 275
167. Strand V, Kavanaugh A, Kivitz AJ, van der Heijde D, Kwok K, Akylbekova E, et al. Long-term radiographic and patient-reported outcomes in patients with rheumatoid arthritis treated with tofacitinib: ORAL START and ORAL SCAN post-hoc analyses. Rheumatology and Therapy. 2018;5(2):341-53.
168. van der Heijde D, Strand V, Tanaka Y, Keystone E, Kremer J, Zerbini CAF, et al. Tofacitinib in combination with methotrexate in patients with rheumatoid arthritis: clinical efficacy, radiographic and safety outcomes from a twenty-four-month, phase III study. Arthritis & Rheumatology. 2019;71(6):878-91.
169. Yamanaka H, Tanaka Y, Takeuchi T, Sugiyama N, Hirose T, Yoshii N, et al. Effects of tofacitinib, an oral janus kinase inhibitor, on patient-reported outcomes in Japanese patients with rheumatoid arthritis. Annals of the Rheumatic Diseases. 2017;76(Suppl 1):274-5.
170. Van Vollenhoven RF, Fleischmann R, Cohen S, Lee EB, Meijide JAG, Wagner S, et al. Tofacitinib or adalimumab versus placebo in rheumatoid arthritis. New England Journal of Medicine. 2012;367(6):508-19.
171. Strand V, van Vollenhoven RF, Lee EB, Fleischmann R, Zwillich SH, Gruben D, et al. Tofacitinib or adalimumab versus placebo: patient-reported outcomes from a phase 3 study of active rheumatoid arthritis. Rheumatology (United Kingdom). 2016;55(6):1031-41.
172. Genovese MC, Van Vollenhoven RF, Wilkinson B, Wang L, Zwillich SH, Gruben D, et al. Tofacitinib, an oral janus kinase inhibitor, in a rheumatoid arthritis open-label extension study following adalimumab therapy in a phase 3 randomised clinical trial. Arthritis and Rheumatism. 2013;65(Suppl 10):S190-S1.
173. Van Vollenhoven R, Cohen S, Mendelsohn A, Bananis E, Fan H, Takiya L, et al. Efficacy of adalimumab and tofacitinib in rheumatoid arthritis: post-hoc analyses from a phase 3 study. Annals of the Rheumatic Diseases. 2016;75(Suppl 2):1042.
174. Van Vollenhoven RF, Krishnaswami S, Benda B, Gruben D, Wilkinson B, Mebus CA, et al. Tofacitinib and adalimumab achieve similar rates of low disease activity in rheumatoid arthritis-lack of improvement in disease activity score by 3 months predicts low likelihood of low disease activity at 1 year. Arthritis and Rheumatism. 2012;64(Suppl 10):S556.
175. van Vollenhoven RF, Lee EB, Fallon L, Zwillich SH, Wilkinson B, Chapman D, et al. Tofacitinib in rheumatoid arthritis: lack of early change in disease activity and the probability of achieving low disease activity at month 6. Arthritis Care & Research. 2019;71(1):71-9.
176. Fleischmann R, Mysler E, Hall S, Kivitz AJ, Moots RJ, Luo Z, et al. Efficacy and safety of tofacitinib monotherapy, tofacitinib with methotrexate, and adalimumab with methotrexate in patients with rheumatoid arthritis (ORAL Strategy): a phase 3b/4, double-blind, head-to-head, randomised controlled trial. Lancet. 2017;390(10093):457-68.
177. Fleischmann R, Mysler E, Hall S, Kivitz A, Moots R, Luo Z, et al. Tofacitinib with and without methotrexate versus adalimumab with methotrexate for the treatment of rheumatoid arthritis: results from ORAL Strategy, a phase 3B/4 randomised trial. Annals of the Rheumatic Diseases. 2017;76(Suppl 2):149-50.
Copyright 2019 Queen's Printer and Controller of HMSO. All rights reserved

Page 258 of 275
178. Calabrese LH, Abud-Mendoza C, Lindsey S, Lee SH, Takiya L, Iikuni N, et al. Evaluation of live zoster vaccine in a subset of patients with rheumatoid arthritis treated with tofacitinib with or without methotrexate, and adalimumab with methotrexate: results from a phase 3b/4 randomised trial. Annals of the Rheumatic Diseases. 2018;77(Suppl 2):971.
179. Fleischmann R, Wollenhaupt J, Cohen S, Smolen JS, Dahl P, Iikuni N, et al. Impact of glucocorticoids on efficacy and safety of tofacitinib with and without methotrexate and adalimumab with methotrexate for rheumatoid arthritis: results from a phase 3b/4 randomised trial. Annals of the Rheumatic Diseases. 2018;77(Suppl 2):985-6.
180. Strand V, Mysler E, Moots RJ, Wallenstein G, DeMasi R, Gruben D, et al. Tofacitinib with and without methotrexate versus adalimumab with methotrexate for the treatment of rheumatoid arthritis: patient-reported outcomes from a phase 3b/4 randomised trial. Annals of the Rheumatic Diseases. 2018;77(Suppl 2):990-1.
181. Kremer J, Li ZG, Hall S, Fleischmann R, Genovese M, Martin-Mola E, et al. Tofacitinib in combination with nonbiologic disease-modifying antirheumatic drugs in patients with active rheumatoid arthritis: a randomized trial. Annals of Internal Medicine. 2013;159(4):253-61.
182. An Y, Li Z, Wu Q, Kwok K, Wang L. Efficacy and safety of tofacitinib in Chinese patients with active rheumatoid arthritis: subgroup analysis from a phase 3 study of tofacitinib in combination with nonbiologic disease-modifying antirheumatic drugs. Annals of the Rheumatic Diseases. 2015;74(Suppl 2):1071.
183. Kang YM, Park YE, Park W, Choe JY, Cho CS, Shim SC, et al. Rapid onset of efficacy predicts response to therapy with certolizumab plus methotrexate in patients with active rheumatoid arthritis. Korean Journal of Internal Medicine. 2018;33(6):1224-33.
184. Kang YM, Park W, Park YE, Choe JY, Bae SC, Cho CS, et al. Efficacy and safety of certolizumab pegol (CZP) with concomitant methotrexate (MTX) in Korean rheumatoid arthritis (RA) patients (PTS) with an inadequate response to MTX. Annals of the Rheumatic Diseases. 2012;71(Suppl 3):666.
185. Taylor PC, Keystone EC, Van Der Heijde D, Weinblatt ME, Del Carmen Morales L, Gonzaga JR, et al. Baricitinib versus placebo or adalimumab in rheumatoid arthritis. New England Journal of Medicine. 2017;376(7):652-62.
186. Fautrel B, Taylor PC, Michaud K, Patel H, Zhu B, Gaich CL, et al. Improved patient-reported outcomes in patients with rheumatoid arthritis who failed adalimumab or placebo treatment and were rescued with baricitinib. Arthritis & Rheumatology. 2017;69(Suppl 10):Abstract Number: 508.
187. Keystone E, Taylor P, Tanaka Y, Gaich C, DeLozier AM, Dudek A, et al. Patient-reported outcomes from a phase 3 study of baricitinib versus placebo or adalimumab in patients with active rheumatoid arthritis and an inadequate response to background methotrexate therapy. Annals of the Rheumatic Diseases. 2016;75(Suppl 2):412-3.
188. Alten R, Nitschmann S. Janus kinase inhibitor baricitinib for rheumatoid arthritis: randomized, double-blind, placebo- and active-controlled, phase 3 study evaluating the efficacy and safety of baricitinib in patients with moderately to severely active rheumatoid
Copyright 2019 Queen's Printer and Controller of HMSO. All rights reserved

Page 259 of 275
arthritis who have had an inadequate response to methotrexate therapy (RA-BEAM). [German]. Internist. 2017;58(12):1341-4.
189. Taylor PC, Krogulec M, Dudek A, Dudler J, Drescher E, Cseuz R, et al. Efficacy and safety of baricitinib versus placebo and adalimumab in patients with moderately to severely active rheumatoid arthritis and inadequate response to methotrexate: summary results from the 52-week phase 3 RA-BEAM study. Rheumatology (United Kingdom). 2017;56(Suppl 2):ii26-ii7.
190. Taylor PC, Krogulec M, Dudek A, Dudler J, Drescher E, Cseuz R, et al. Baricitinib versus placebo or adalimumab in patients with rheumatoid arthritis and inadequate response to methotrexate: results of a 52-week study. International Journal of Rheumatic Diseases. 2017;20(Suppl 1):37.
191. Taylor PC, Keystone EC, Van Der Heijde D, Tanaka Y, Ishii T, Emoto K, et al. Baricitinib versus placebo or adalimumab in patients with active rheumatoid arthritis (RA) and an inadequate response to background methotrexate therapy: results of a phase 3 study. Arthritis & Rheumatology. 2015;67(Suppl 10):Abstract Number 2L.
192. Nash P, Pope J, Cardoso A, Casillas M, Schlichting D, Zhu B, et al. Reduction in disease activity in patients with RA and an inadequate response to MTX: baricitinib compared to adalimumab and placebo. Journal of Rheumatology. 2018;45(7):1004.
193. Dougados M, Zhu B, Tang AC, Quebe A, Stoykov I, Cai Z, et al. A high level of clinical response based on composite indices is associated with improved health-related quality of life: analyses from a phase 3 clinical trial in patients with rheumatoid arthritis. Annals of the Rheumatic Diseases. 2017;76(Suppl 2):524.
194. Fautrel B, Van De Laar M, Kirkham B, Alten R, Cseuz R, Van Der Geest S, et al. Differences in patient-reported outcomes between baricitinib and comparators among patients with rheumatoid arthritis who achieved low disease activity or remission. Annals of the Rheumatic Diseases. 2017;76(Suppl 2):230.
195. Kvien TK, Van Riel P, Rubbert-Roth A, Blanco R, Liu-Leage SS, Larsson E, et al. Baricitinib versus adalimumab in patients with active rheumatoid arthritis: analysis of patients achieving a moderate EULAR response at week 4. Annals of the Rheumatic Diseases. 2017;76(Suppl 2):794-5.
196. Michaud K, Zhu B, Gaich C, DeLozier AM, Arora V, Dickson C, et al. Pain reduction is associated with improved work productivity in patients with rheumatoid arthritis. Annals of the Rheumatic Diseases. 2017;76(Suppl 2):517.
197. Pincus T, Zhu B, Larmore CJ, Bradley JD, Patel N, Gaich CL, et al. A RAPID3-like index documents superior efficacy of baricitinib to adalimumab and placebo, similar to DAS28 and CDAI in the RA-BEAM clinical trial in patients with rheumatoid arthritis. Annals of the Rheumatic Diseases. 2017;76(Suppl 2):794.
198. Taylor P, Fleischmann R, Perkins E, Lisse J, Zhu B, Gaich C, et al. Rapid and sustained pain improvement in rheumatoid arthritis patients treated with baricitinib compared toadalimumab or placebo. Journal of Clinical Rheumatology. 2018;24(3 Suppl 1):S84.
199. Giles JT, Nurmohamed MT, Rinder HM, Krishnan V, Crowe BJ, Saifan C, et al. Mean platelet volume changes with baricitinib indicate reduced new platelet production in
Copyright 2019 Queen's Printer and Controller of HMSO. All rights reserved

Page 260 of 275
baricitinib-treated rheumatoid arthritis patients. Arthritis & Rheumatology. 2018;70(Suppl 9):1698-9.
200. Dougados M, Fautrel B, Van De Laar MAFJ, Kirkham B, Alten R, Cseuz R, et al. Summary of baricitinib effect on patient-reported outcomes (PROs) in methotrexate-inadequate responder patient population. Internal Medicine Journal. 2018;48(Suppl 4):42-3.
201. Dougados M, Fautrel BJ, Van De Laar MAFJ, Kirkham B, Alten R, Cseuz R, et al. Summary of baricitinib effect on patient-reported outcomes (PROs) in methotrexate inadequate responder patient population. Rheumatology (United Kingdom). 2018;57(Suppl 3):iii140-iii1.
202. Dougados M, Van Der Heijde D, Chen YC, Greenwald M, Drescher E, Liu J, et al. Baricitinib in patients with inadequate response or intolerance to conventional synthetic DMARDs: results from the RA-BUILD study. Annals of the Rheumatic Diseases. 2017;76(1):88-95.
203. Dougados M, Van Der Heijde D, Chen YC, Greenwald M, Drescher E, Liu J, et al. Baricitinib, an oral janus kinase (JAK)1/JAK2 inhibitor, in patients with active rheumatoid arthritis (RA) and an inadequate response to cDMARD therapy: results of the phase 3 RA-build study. Journal of Rheumatology. 2016;43(6):1188.
204. Dougados M, Van Der Heijde D, Chen YC, Greenwald M, Drescher E, Liu J, et al. Baricitinib, an oral janus kinase (JAK)1/JAK2 inhibitor, in patients with active rheumatoid arthritis (RA) and an inadequate response to cDMARD therapy: results of the phase-3 RA-build study. Journal fur Mineralstoffwechsel. 2015;22(4):114-5.
205. Emery P, Gaich CL, DeLozier AM, De Bono S, Liu J, Chang C, et al. Patient-reported outcomes from a phase 3 study of baricitinib in patients with rheumatoid arthritis with inadequate response to conventional synthetic disease-modifying antirheumatic drugs. Arthritis & Rheumatology. 2015;67(Suppl 10):Abstract No: 2730.
206. Fleischmann R, Genovese MC, Cardoso A, Sun L, Chen YF, Walls CD, et al. Longitudinal efficacy analysis of patients with active rheumatoid arthritis and inadequate response to conventional synthetic DMARDs: response following rescue from baricitinib 2mg to 4mg once-daily. Arthritis & Rheumatology. 2018;70(Suppl 9):622-4.
207. O'Dell JR, Mikuls TR, Taylor TH, Ahluwalia V, Brophy M, Warren SR, et al. Therapies for active rheumatoid arthritis after methotrexate failure. New England Journal of Medicine. 2013;369(4):307-18.
208. Keystone E, Heijde D, Mason D, Jr., Landewe R, Vollenhoven RV, Combe B, et al. Certolizumab pegol plus methotrexate is significantly more effective than placebo plus methotrexate in active rheumatoid arthritis: findings of a fifty-two-week, phase III, multicenter, randomized, double-blind, placebo-controlled, parallel-group study.[Erratum appears in Arthritis Rheum. 2009 May;60(5):1249]. Arthritis and Rheumatism. 2008;58(11):3319-29.
209. Curtis JR, Luijtens K, Kavanaugh A. Predicting future response to certolizumab pegol in rheumatoid arthritis patients: features at 12 weeks associated with low disease activity at 1 year. Arthritis Care & Research. 2012;64(5):658-67.
210. Haraoui B, Combe B, Champsaur M, Luijtens K, Keystone E. Effects of different steroid doses on adverse events and radiographic progression of certolizumab pegol-
Copyright 2019 Queen's Printer and Controller of HMSO. All rights reserved

Page 261 of 275
treated rheumatoid arthritis patients. Annals of the Rheumatic Diseases. 2013;71(Suppl 3):498.
211. Haraoui P, Keystone E, Schiff M, Mease P, Van Vollenhoven RF, Desai C, et al. Combination therapy with certolizumab pegol plus methotrexate maintains long-term efficacy in the treatment of rheumatoid arthritis: a 2-year analysis. Journal of Rheumatology. 2009;36(11):2572.
212. Keystone E, Landewe R, van Vollenhoven R, Combe B, Strand V, Mease P, et al. Long-term safety and efficacy of certolizumab pegol in combination with methotrexate in the treatment of rheumatoid arthritis: 5-year results from the RAPID 1 trial and open-label extension. Annals of the Rheumatic Diseases. 2014;73(12):2094-100.
213. Smolen J, Keystone E, Schiff M, Mease P, Van Vollenhoven R, Desai C. Sustained long-term efficacy of certolizumab pegol plus methotrexate in the treatment of rheumatoid arthritis: a 2-year analysis of the RAPID 1 study. Rheumatology. 2009;48(Suppl 1):i85-i6.
214. Strand V, Coteur G, Ionescu L. Certolizumab pegol demonstrates response as early as week 1 in moderate-severe RA patients. Rheumatology. 2009;48(Suppl 1):i89.
215. Van Der Heijde D, Weinblatt M, Landewe R, Goel N, Fleischmann R. Rapid inhibition of progression of structural damage with certolizumab pegol, a novel SC pegylated, FC-free anti-TNF. Rheumatology. 2009;48(Suppl 1):i18.
216. Cividino A, Fleischmann R, Keystone E, Luijtens K, Furst DE. Patients with rheumatoid arthritis achieve a rapid response when treated with certolizumab pegol irrespective of background treatment. Journal of Rheumatology. 2009;36(11):2568.
217. Strand V, Mease P, Burmester GR, Nikai E, Coteur G, Van Vollenhoven R, et al. Rapid and sustained improvements in health-related quality of life, fatigue, and other patient-reported outcomes in rheumatoid arthritis patients treated with certolizumab pegol plus methotrexate over 1 year: results from the RAPID 1 randomized controlled trial. Arthritis Research & Therapy. 2009;11(6):R170.
218. Berenbaum F, Pham T, Claudepierre P, de Chalus T, Joubert JM, Saadoun C, et al. Early non-response to certolizumab pegol in rheumatoid arthritis predicts treatment failure at one year. Data from a randomised phase III clinical trial. Joint Bone Spine. 2018;85(1):59-64.
219. Smolen J, Landewe RB, Mease P, Brzezicki J, Mason D, Luijtens K, et al. Efficacy and safety of certolizumab pegol plus methotrexate in active rheumatoid arthritis: the RAPID 2 study. A randomised controlled trial. Annals of the Rheumatic Diseases. 2009;68(6):797-804.
220. Smolen J, Van Vollenhoven R, Kavanaugh A, Luijtens K, Van Der Heijde D, Curtis J. Efficacy sustained after dose de-escalation of certolizumab pegol in rheumatoid arthritis patients: post-hoc analysis of the RAPID 2 open-label extension. Reumatologia Clinica Suplementos. 2011;7:136.
221. Smolen J, Van Vollenhoven R, Kavanaugh A, Fichtner A, Strand V, Vencovsky J, et al. Efficacy and safety of certolizumab pegol plus methotrexate in patients with rheumatoid arthritis: 3-year data from the RAPID 2 study. Reumatologia Clinica Suplementos. 2011;7:136.
Copyright 2019 Queen's Printer and Controller of HMSO. All rights reserved

Page 262 of 275
222. Smolen JS, van Vollenhoven R, Kavanaugh A, Strand V, Vencovsky J, Schiff M, et al. Certolizumab pegol plus methotrexate 5-year results from the rheumatoid arthritis prevention of structural damage (RAPID) 2 randomized controlled trial and long-term extension in rheumatoid arthritis patients. Arthritis Research & Therapy. 2015;17(1):245.
223. Smolen J, Van Vollenhoven R, Kavanaugh A, Strand V, Vencovsky J, Schiff M, et al. Long-term safety and efficacy of certolizumab pegol in combination with methotrexate in the treatment of rheumatoid arthritis: 5-year results from a 24-week randomized controlled trial and open-label extension study. Journal of Rheumatology. 2014;41(7):1505-6.
224. Smolen JS, Van Vollenhoven R, Kavanaugh A, Strand V, Vencovsky J, Schiff MH, et al. Long-term safety and efficacy of certolizumab pegol in combination with methotrexate in the treatment of rheumatoid arthritis: 5-year results from a 24-week randomized controlled trial and open-label extension study. Arthritis and Rheumatism. 2013;65(Suppl 10):S988-S9.
225. Hu J, Bao C, Li X, Spindler A, Zhang X, Xu J, et al. Efficacy and safety of baricitinib in MTX-IR patients with rheumatoid arthritis: 52 week results from a phase 3 study (RA-BALANCE). Annals of the Rheumatic Diseases. 2018;77(Suppl 2):969-70.
226. Yue Y, Hu J, Bao C, Li X, Spindler AJ, Zhang X, et al. Patient-reported outcomes from a phase 3 study (RA-BALANCE) of baricitinib versus placebo in rheumatoid arthritis. International Journal of Rheumatic Diseases. 2018;21(Suppl 1):40.
227. Yang Y, Hu J, Bao C, Li X, Zhang X, Xu J, et al. Efficacy and safety of baricitinib in MTX-Ir Chinese patients with rheumatoid arthritis: 52 week results from a phase 3 study. International Journal of Rheumatic Diseases. 2018;21(Suppl 1):3.
228. Peterfy C, Emery P, Tak PP, Ostergaard M, DiCarlo J, Otsa K, et al. MRI assessment of suppression of structural damage in patients with rheumatoid arthritis receiving rituximab: results from the randomised, placebo-controlled, double-blind RA-SCORE study. Annals of the Rheumatic Diseases. 2016;75(1):170-7.
229. Weinblatt ME, Fleischmann R, Huizinga TW, Emery P, Pope J, Massarotti EM, et al. Efficacy and safety of certolizumab pegol in a broad population of patients with active rheumatoid arthritis: results from the REALISTIC phase IIIb study. Rheumatology. 2012;51(12):2204-14.
230. Pope J, Bingham CO, Fleischmann RM, Dougados M, Massarotti EM, Wollenhaupt J, et al. Impact of certolizumab pegol on patient-reported outcomes in rheumatoid arthritis and correlation with clinical measures of disease activity. Arthritis Research & Therapy. 2015;17(1):343.
231. Pope J, Emery P, Keystone EC. Tocilizumab (TCZ) rapidly and significantly improves outcomes in patients with rheumatoid arthritis (RA) who have inadequate response (IR) to TNF antagonists. Journal of Rheumatology. 2009;36(11):2579.
232. Pope J, Fleischmann R, Dougados M, Bingham CO, Massarotti EM, Wollenhaupt J, et al. Rapid reductions in fatigue and sleep problems and correlation with improvements in patient-reported outcomes in patients with active rheumatoid arthritis treated with certolizumab pegol in the REALISTIC 12-week phase iiib randomized controlled study. Rheumatology (United Kingdom). 2012;51(Suppl 3):iii135-iii6.
Copyright 2019 Queen's Printer and Controller of HMSO. All rights reserved

Page 263 of 275
233. Weinblatt ME, Fleischmann R, Van Vollenhoven R, Emery P, Huizinga TWJ, Goldermann R, et al. Certolizumab pegol in patients with active rheumatoid arthritis aligned with NICE guidance for anti-TNF therapy: post-hoc analyses of the REALISTIC phase IIIB randomized controlled study. Rheumatology. 2012;51(Suppl 3):ii125-6.
234. Weinblatt M, Fleischmann R, Emery P, Goel N, Bingham CO, Pope J, et al. Efficacy and safety of certolizumab pegol in a clinically representative population of patients (pts) with active rheumatoid arthritis (RA): results of the REALISTIC phase IIIb randomized controlled study. Arthritis and Rheumatism. 2010;62(Suppl 10):1805.
235. Weinblatt M, Fleischmann RM, Vollenhoven RF, Van Emery P, Huizinga TWJ, Cutolo M, et al. Efficacy and safety of certolizumab pegol in a broad population of patients with active rheumatoid arthritis: week 28 results from a phase IIIB randomized controlled study. Arthritis and Rheumatism. 2011;63(10 Suppl):S490-S1.
236. Weinblatt ME, Fleischmann R, van Vollenhoven RF, Emery P, Huizinga TW, Cutolo M, et al. Twenty-eight-week results from the REALISTIC phase IIIb randomized trial: efficacy, safety and predictability of response to certolizumab pegol in a diverse rheumatoid arthritis population. Arthritis Research & Therapy. 2015;17(325):15.
237. Nishimoto N, Hashimoto J, Miyasaka N, Yamamoto K, Kawai S, Takeuchi T, et al. Study of active controlled monotherapy used for rheumatoid arthritis, an IL-6 inhibitor (SAMURAI): evidence of clinical and radiographic benefit from an x ray reader-blinded randomised controlled trial of tocilizumab. Annals of the Rheumatic Diseases. 2007;66(9):1162-7.
238. Nishimoto N, Miyasaka N, Yamamoto K, Kawai S, Takeuchi T, Azuma J, et al. Study of active controlled tocilizumab monotherapy for rheumatoid arthritis patients with an inadequate response to methotrexate (SATORI): significant reduction in disease activity and serum vascular endothelial growth factor by IL-6 receptor inhibition therapy. Modern Rheumatology. 2009;19(1):12-9.
239. Nishimoto N, Takagi N. Assessment of the validity of the 28-joint disease activity score using erythrocyte sedimentation rate (DAS28-ESR) as a disease activity index of rheumatoid arthritis in the efficacy evaluation of 24-week treatment with tocilizumab: subanalysis of the SATORI study. Modern Rheumatology. 2010;20(6):539-47.
240. Emery P, Deodhar A, Rigby WF, Isaacs JD, Combe B, Racewicz AJ, et al. Efficacy and safety of different doses and retreatment of rituximab: a randomised, placebo-controlled trial in patients who are biological naïve with active rheumatoid arthritis and an inadequate response to methotrexate (Study Evaluating Rituximab's Efficacy in MTX iNadequate rEsponders (SERENE)). Annals of the Rheumatic Diseases. 2010;69(9):1629-35.
241. Emery P, Deodhar A, Rigby WF. Efficacy and safety of different doses and retreatment of rituximab: a randomised, placebo-controlled trial in patients who are biological naive with active rheumatoid arthritis and an inadequate response to methotrexate (Study Evaluating Rituximab's Efficacy in MTX iNadequate rEsponders (SERENE)) (Annals of the Rheumatic Diseases (2010) 69, (1629-1635)). Annals of the Rheumatic Diseases. 2011;70(8):1519.
242. Furst DE, Schiff MH, Fleischmann RM, Strand V, Birbara CA, Compagnone D, et al. Adalimumab, a fully human anti-tumor necrosis factor-a monoclonal antibody, and concomitant standard antirheumatic therapy for the treatment of rheumatoid arthritis:
Copyright 2019 Queen's Printer and Controller of HMSO. All rights reserved

Page 264 of 275
results of STAR (Safety Trial of Adalimumab in Rheumatoid Arthritis). Journal of Rheumatology. 2003;30(12):2563-71.
243. Westhovens R, Yocum D, Han J, Berman A, Strusberg I, Geusens P, et al. The safety of infliximab, combined with background treatments, among patients with rheumatoid arthritis and various comorbidities: a large, randomized, placebo-controlled trial. Arthritis and Rheumatism. 2006;54(4):1075-86.
244. Kaneko Y, Atsumi T, Tanaka Y, Inoo M, Kobayashi-Haraoka H, Amano K, et al. Comparison of adding tocilizumab to methotrexate with switching to tocilizumab in patients with rheumatoid arthritis with inadequate response to methotrexate: 52-week results from a prospective, randomised, controlled study (SURPRISE study). Annals of the Rheumatic Diseases. 2016;75(11):1917-23.
245. Takeuchi T, Kaneko Y, Atsumi T, Tanaka Y, Inoh M, Kobayashi H, et al. Adding tocilizumab or switching to tocilizumab monotherapy in RA patients with inadequate response to methotrexate: 24-week results from a randomized controlled study (SURPRISE study). Annals of the Rheumatic Diseases. 2013;72(Suppl 3):A62-A3.
246. Takeuchi T, Kaneko Y, Atsumi T, Tanaka Y, Inoh M, Kobayashi H, et al. Clinical and radiographic effects after 52-week of adding tocilizumab or switching to tocilizumab in RA patients with inadequate response to methotrexate: results from a prospective randomized controlled study (SURPRISE study). Annals of the Rheumatic Diseases. 2014;73(Suppl 2):686.
247. Kaneko Y, Kato M, Tanaka Y, Inoo M, Kobayashi-Haraoka H, Amano K, et al. Tocilizumab discontinuation after attaining remission in patients with rheumatoid arthritis who were treated with tocilizumab alone or in combination with methotrexate: results from a prospective, randomised, controlled study (the second year of the SURPRISE study). Annals of the Rheumatic Diseases. 2018;77(Suppl 2):105-6.
248. Klareskog L, Van Der Heijde D, De Jager JP, Gough A, Kalden J, Malaise M, et al. Therapeutic effect of the combination of etanercept and methotrexate compared with each treatment alone in patients with rheumatoid arthritis: double-blind randomised controlled trial. Lancet. 2004;363(9410):675-81.
249. van der Heijde D, Burmester G, Melo-Gomes J, Codreanu C, Mola EM, Pedersen R, et al. The safety and efficacy of adding etanercept to methotrexate or methotrexate to etanercept in moderately active rheumatoid arthritis patients previously treated with monotherapy. Annals of the Rheumatic Diseases. 2008;67(2):182-8.
250. Van Der Heijde D, Klareskog L, Rodriguez-Valverde V, Codreanu C, Bolosiu H, Melo-Gomes J, et al. Comparison of etanercept and methotrexate, alone and combined, in the treatment of rheumatoid arthritis: two-year clinical and radiographic results from the TEMPO study, a double-blind, randomized trial. Arthritis and Rheumatism. 2006;54(4):1063-74.
251. Kavanaugh A, Klareskog L, van der Heijde D, Li J, Freundlich B, Hooper M. Improvements in clinical response between 12 and 24 weeks in patients with rheumatoid arthritis on etanercept therapy with or without methotrexate. Annals of the Rheumatic Diseases. 2008;67(10):1444-7.
252. Van Der Heijde D, Klareskog L, Singh A, Tornero J, Melo-Gomes J, Codreanu C, et al. Patient reported outcomes in a trial of combination therapy with etanercept and
Copyright 2019 Queen's Printer and Controller of HMSO. All rights reserved

Page 265 of 275
methotrexate for rheumatoid arthritis: the TEMPO trial. Annals of the Rheumatic Diseases. 2006;65(3):328-34.
253. Genovese MC, McKay JD, Nasonov EL, Mysler EF, Da Silva NA, Alecock E, et al. Interleukin-6 receptor inhibition with tocilizumab reduces disease activity in rheumatoid arthritis with inadequate response to disease-modifying antirheumatic drugs: the tocilizumab in combination with traditional disease-modifying antirheumatic drug therapy study. Arthritis and Rheumatism. 2008;58(10):2968-80.
254. Gomez-Reino JJ, Nasonov EL, McKay JD, Mysler EF, Da Silva N, Alecock E, et al. Rapid and significant reduction in disease activity with tocilizumab in combination with six different DMARDs in rheumatoid arthritis patients with an inadequate response to disease-modifying anti-rheumatic drugs: the TOWARD study. Rheumatology. 2009;48(Suppl 1):i89.
255. Weinblatt ME, Kremer JM, Bankhurst AD, Bulpitt KJ, Fleischmann RM, Fox RI, et al. A trial of etanercept, a recombinant tumor necrosis factor receptor:Fc fusion protein, in patients with rheumatoid arthritis receiving methotrexate. New England Journal of Medicine. 1999;340(4):253-9.
256. Emery P, Rondon J, Parrino J, Lin Y, Pena-Rossi C, van Hoogstraten H, et al. Safety and tolerability of subcutaneous sarilumab and intravenous tocilizumab in patients with rheumatoid arthritis. Rheumatology. 2019;58(5):849-58.
257. Emery P, Rondon J, Garg A, van Hoogstraten H, Graham N, Liu M, et al. Safety and tolerability of subcutaneous sarilumab compared to intravenous tocilizumab in patients with RA. Abstract Number: 971. Arthritis & Rheumatology. 2015;67(Suppl 10):1268-9.
258. Genovese MC, Becker JC, Schiff M, Luggen M, Sherrer Y, Kremer J, et al. Abatacept for rheumatoid arthritis refractory to tumor necrosis factor alpha inhibition. New England Journal of Medicine. 2005;353(11):1114-23.
259. Genovese MC, Schiff M, Luggen M, Becker JC, Aranda R, Teng J, et al. Efficacy and safety of the selective co-stimulation modulator abatacept following 2 years of treatment in patients with rheumatoid arthritis and an inadequate response to anti-tumour necrosis factor therapy. Annals of the Rheumatic Diseases. 2008;67(4):547-54.
260. Fernandez-Lopez C, Blanco FJ. ATTAIN study: efficacy of abatacept in patients with rheumatoid arthritis and inadequate response to anti-TNF-alpha. [Spanish]. Reumatologia Clinica Suplementos. 2006;1(2):34-43.
261. Genovese MC, Schiff M, Luggen M, Le Bars M, Aranda R, Elegbe A, et al. Longterm safety and efficacy of abatacept through 5 years of treatment in patients with rheumatoid arthritis and an inadequate response to tumor necrosis factor inhibitor therapy. Journal of Rheumatology. 2012;39(8):1546-54.
262. Hassett AL, Li T, Buyske S, Savage SV, Gignac MA. The multi-faceted assessment of independence in patients with rheumatoid arthritis: preliminary validation from the ATTAIN study. Current Medical Research & Opinion. 2008;24(5):1443-53.
263. Smolen JS, Kay J, Doyle MK, Landewe R, Matteson EL, Wollenhaupt J, et al. Golimumab in patients with active rheumatoid arthritis after treatment with tumour necrosis factor alpha inhibitors (GO-AFTER study): a multicentre, randomised, double-blind, placebo-controlled, phase III trial. Lancet. 2009;374(9685):210-21.
Copyright 2019 Queen's Printer and Controller of HMSO. All rights reserved

Page 266 of 275
264. Smolen JS, Kay J, Landewe RB, Matteson EL, Gaylis N, Wollenhaupt J, et al. Golimumab in patients with active rheumatoid arthritis who have previous experience with tumour necrosis factor inhibitors: results of a long-term extension of the randomised, double-blind, placebo-controlled GO-AFTER study through week 160. Annals of the Rheumatic Diseases. 2012;71(10):1671-9.
265. Smolen JS, Kay J, Doyle MK, Landewe R, Matteson E, Wollenhaupt J, et al. Golimumab in rheumatoid arthritis patients previously treated with anti-TNF alpha agents: 2 year results from GO-AFTER study. Rheumatology (United Kingdom). 2011;50(Suppl 2):ii3.
266. Smolen JS, Kay J, Doyle MK, Landewe R, Matteson EL, Wollenhaupt J, et al. Golimumab in rheumatoid arthritis patients previously treated with anti-TNF agents (GO-AFTER study): week 52 results. Arthritis and Rheumatism. 2009;60(Suppl 10):1669.
267. Smolen JS, Kay J, Landewe R, Matteson EK, Gaylis N, Wollenhaupt J, et al. Final 5-year safety and efficacy results of a phase 3, randomized, placebo-controlled trial of golimumab in patients with active rheumatoid arthritis despite previous anti-tumor necrosis factor therapy. Rheumatology (United Kingdom). 2014;53(Suppl 1):i87-i8.
268. Smolen JS, Kay J, Landewe R, Matteson EL, Gaylis N, Wollenhaupt J, et al. Five-year safety and efficacy of golimumab in patients with active rheumatoid arthritis despite previous anti-tumor necrosis factor therapy: final study results of the phase 3, randomized, placebo-controlled GO-AFTER trial. Annals of the Rheumatic Diseases. 2013;72(Suppl 3):A232.
269. Hall S, Smolen J, Kay J, Doyle MK, Landewe R, Matteson EL, et al. Golimumab, a human TNF-alpha monoclonal antibody, in rheumatoid arthritis patients previously treated with anti-TNF-A agents (GO-AFTER study). Internal Medicine Journal. 2009;39(Suppl 2):A71.
270. Smolen JS, Kay J, Doyle M, Landewe R, Matteson EL, Gaylis N, et al. Golimumab in patients with active rheumatoid arthritis after treatment with tumor necrosis factor alpha inhibitors: findings with up to five years of treatment in the multicenter, randomized, double-blind, placebo-controlled, phase 3 GO-AFTER study. Arthritis Research & Therapy. 2015;17(1):14.
271. Smolen JS, Kay J, Landewe R, Matteson EL, Gaylis NB, Wollenhaupt J, et al. Final 5-year safety and efficacy results of a phase 3, randomized, placebo-controlled trial of golimumab in patients with active rheumatoid arthritis despite previous anti-tumor necrosis factor therapy. Arthritis and Rheumatism. 2013;65(Suppl 10):S991.
272. Burmester GR, Blanco R, Charles-Schoeman C, Wollenhaupt J, Zerbini C, Benda B, et al. Tofacitinib (CP-690,550) in combination with methotrexate in patients with active rheumatoid arthritis with an inadequate response to tumour necrosis factor inhibitors: a randomised phase 3 trial. Lancet. 2013;381(9865):451-60.
273. Strand V, Burmester GR, Zerbini CA, Mebus CA, Zwillich SH, Gruben D, et al. Tofacitinib with methotrexate in third-line treatment of patients with active rheumatoid arthritis: patient-reported outcomes from a phase III trial. Arthritis Care & Research. 2015;67(4):475-83.
274. Genovese MC, Kremer J, Zamani O, Ludivico C, Krogulec M, Xie L, et al. Baricitinib, an oral janus kinase (JAK)1/JAK2 inhibitor, in patients with active rheumatoid
Copyright 2019 Queen's Printer and Controller of HMSO. All rights reserved

Page 267 of 275
arthritis (RA) and an inadequate response to TNF inhibitors: results of the phase 3 RA-BEACON study. Annals of the Rheumatic Diseases. 2015;74(Suppl 2):75-6.
275. Smolen JS, Kremer JM, Gaich CL, DeLozier AM, Schlichting DE, Xie L, et al. Patient-reported outcomes from a randomised phase III study of baricitinib in patients with rheumatoid arthritis and an inadequate response to biological agents (RA-BEACON). Annals of the Rheumatic Diseases. 2016;76(4):694-700.
276. Genovese M, Kremer J, Zamani O, Ludivico C, Krogulec M, Xie L, et al. Baricitinib, an oral janus kinase (JAK)1/JAK2 inhibitor, in patients with active rheumatoid arthritis (RA) and an inadequate response to TNF inhibitors: results of the phase 3 RA-BEACON study. Journal of Rheumatology. 2016;43(6):1188.
277. Genovese MC, Kremer JM, Kartman C, Schlichting DE, Xie L, Carmack T, et al. Previous biologic disease-modifying antirheumatic drug (BDMARD) exposure and efficacy and safety analysis from a phase 3 study of baricitinib in patients with rheumatoid arthritis and an inadequate response to tumor necrosis factor inhibitors. Arthritis & Rheumatology. 2015;67(Suppl 10):Abstract Number: 1046.
278. Genovese MC, Kremer J, Zamani O, Ludivico C, Krogulec M, Xie L, et al. Baricitinib, an oral janus kinase (JAK)1/JAK2 inhibitor, in patients with active rheumatoid arthritis (RA) and an inadequate response to TNF inhibitors: results of the phase-3 RA-BEACON study. Journal fur Mineralstoffwechsel. 2015;22(4):115.
279. Smolen JS, Kremer J, Gaich C, DeLozier AM, Schlichting D, Xie L, et al. Patient-reported outcomes from a phase 3 study of baricitinib in patients with rheumatoid arthritis (RA) and an inadequate response to tumor necrosis factor inhibitors. Annals of the Rheumatic Diseases. 2015;74(Suppl 2):785-6.
280. Emery P, Keystone E, Tony HP, Cantagrel A, Van Vollenhoven R, Sanchez A, et al. IL-6 receptor inhibition with tocilizumab improves treatment outcomes in patients with rheumatoid arthritis refractory to anti-tumour necrosis factor biologicals: results from a 24-week multicentre randomised placebo-controlled trial. Annals of the Rheumatic Diseases. 2008;67(11):1516-23.
281. Emery P, Keystone E, Tony HP, Law A, Woodworth T, Kremer J. Tocilizumab significantly improves patient outcomes regardless of prior inadequate response to tumour necrosis factor antagonists in rheumatoid arthritis. Rheumatology. 2009;48(Suppl 1):i19.
282. Hall S, Youssef P, Kissel K, Vernon E, John A, Emery P. Tocilizumab improves health-related quality of life (QoL) in patients with rheumatoid arthritis (RA) and inadequate response to prior TNF inhibitor therapy (TNFi-IR): RADIATE. International Journal of Rheumatic Diseases. 2010;13(Suppl 1):98-9.
283. Sanchez Ortiz A, Kissel K, Alecock E, Emery P. Tocilizumab improves health-related quality of life in RA patients with inadequate response to prior anti-TNF therapy: the RADIATE study. Journal of Clinical Rheumatology. 2010;16(Suppl 3):S43.
284. Strand V, Burmester GR, Ogale S, Devenport J, John A, Emery P. Improvements in health-related quality of life after treatment with tocilizumab in patients with rheumatoid arthritis refractory to tumour necrosis factor inhibitors: results from the 24-week randomized controlled RADIATE study. Rheumatology (United Kingdom). 2012;51(10):1860-9.
Copyright 2019 Queen's Printer and Controller of HMSO. All rights reserved

Page 268 of 275
285. Cohen SB, Emery P, Greenwald MW, Dougados M, Furie RA, Genovese MC, et al. Rituximab for rheumatoid arthritis refractory to anti-tumor necrosis factor therapy: results of a multicenter, randomized, double-blind, placebo-controlled, phase III trial evaluating primary efficacy and safety at twenty-four weeks. Arthritis and Rheumatism. 2006;54(9):2793-806.
286. Blocka K, Mease PJ, Keystone E. SDAI and CDAI for predicting outcome of a second course of rituximab for patients with rheumatoid arthritis (RA). Journal of Rheumatology. 2009;36(11):2565.
287. Cohen SB, Keystone EC, Genovese M, Emery P, Peterfy C, Tak PP, et al. Continued inhibition of structural damage in rheumatoid arthritis patients treated with rituximab at 2 years: REFLEX study. Rheumatology. 2009;48(Suppl 1):i88.
288. Fleischmann R, van Adelsberg J, Lin Y, Castelar-Pinheiro GD, Brzezicki J, Hrycaj P, et al. Sarilumab and nonbiologic disease-modifying antirheumatic drugs in patients with active rheumatoid arthritis and inadequate response or intolerance to tumor necrosis factor inhibitors. Arthritis & Rheumatology. 2017;69(2):277-90.
289. Burmester G, Hrycaj P, Pacheco-Tena C, Van Hoogstraten H, Mangan EK, Lin Y, et al. Clinical remission outcomes with sarilumab plus csDMARDs in active, moderate-to-severe RA patients with inadequate response to tumor necrosis factor inhibitors. Annals of the Rheumatic Diseases. 2016;75(Suppl 2):727-8.
290. Burmester GR, Van Hoogstraten H, Mangan EK, Lin Y, Graham NMH, Kimura T, et al. Efficacy of sarilumab plus csDMARDs in subgroups of patients with rheumatoid arthritis and an inadequate response to TNF inhibitors. International Journal of Rheumatic Diseases. 2017;20(Suppl 1):39-40.
291. Emery P, Van Hoogstraten H, Mangan EK, Van Adelsberg J, Fan C, Kivitz A, et al. Clinical responses of sarilumab based on rheumatoid factor and anti-cyclic citrullinated peptide antibody status in patients with rheumatoid arthritis. Annals of the Rheumatic Diseases. 2016;75(Suppl 2):732.
292. Fleischmann R, Van Hoogstraten H, Jayawardena S, Mangan EK, Ching D, Burmester GR. Efficacy of sarilumab in combination with csDMARDs in patients with rheumatoid arthritis and inadequate response to TNF inhibitors by baseline levels of disease activity. Arthritis & Rheumatology. 2017;69(Suppl 10):Abstract Number: 2470.
293. Fleischmann R, Castelar-Pinheiro G, Brzezicki J, Hrycaj P, Lin Y, Van Adelsberg J, et al. Efficacy and safety of sarilumab in combination with csDMARDs in patients with active rheumatoid arthritis who were inadequate responders or intolerant of anti-TNF-+/- therapy: results from a phase 3 study. Arthritis & Rheumatology. 2015;67(Suppl 10):Abstract Number 970.
294. Fleischmann R, Geraldo Da RCP, Brzezicki J, Hrycaj P, Lin Y, Van Adelsberg J, et al. Efficacy and safety of sarilumab in combination with csDMARDs in patients with active rheumatoid arthritis who were inadequate responders or intolerant of anti-TNF-alpha therapy: results from a phase 3 study. Internal Medicine Journal. 2016;46(Suppl 2):41.
295. Genovese M, Pinheiro G, Mangan E, Lin Y, Van Hoogstraten H, Fleischmann R. Efficacy of sarilumab plus csDMARDs in rheumatoid arthritis patients who had an inadequate response to one or more than one prior TNF inhibitor. Internal Medicine Journal. 2017;47(Suppl 2):29.
Copyright 2019 Queen's Printer and Controller of HMSO. All rights reserved
Page 269 of 275
296. Genovese MC, Da RC, Pinheiro G, Mangan EK, Lin Y, Van Adelsberg J, et al. Efficacy of sarilumab plus csDMARDS in rheumatoid arthritis patients who had an inadequate response to one or more than one prior TNF inhibitor. Annals of the Rheumatic Diseases. 2016;75(Suppl 2):730-1.
297. Strand V, Kosinski M, Graham N, Chen CI, Joseph GJ, Bauer D, et al. Impact of sarilumab on fatigue, pain, morning stiffness, productivity, and health related quality of life (HRQoL) in patients with active rheumatoid arthritis who were inadequate responders or intolerant of anti-TNF-+/- therapy: results from a phase 3 study (RCT). Arthritis & Rheumatology. 2015;67(Suppl 10):Abstract Number 435.
298. Gossec L, Strand V, Proudfoot C, Chen C, Guillonneau S, Kimura T, et al. FRI0240 Rheumatoid arthritis (RA) impact following treatment with sarilumab: patient reported outcomes using the raid scale from two randomized phase III trials. Annals of the Rheumatic Diseases. 2017;76(Suppl 2):575-6.
299. Stevenson M, Archer R, Tosh J, Simpson E, Everson-Hock E, Stevens J, et al. Adalimumab, etanercept, infliximab, certolizumab pegol, golimumab, tocilizumab and abatacept for the treatment of rheumatoid arthritis not previously treated with disease-modifying antirheumatic drugs and after the failure of conventional disease-modifying antirheumatic drugs only: Systematic review and economic evaluation. Health Technology Assessment. 2016;20(35):1-610.
300. Molinier L, Bauvin E, Combescure C, Castelli C, Rebillard X, Soulie M, et al. Methodological considerations in cost of prostate cancer studies: a systematic review. Value Health. 2008;11(5):878-85.
301. Norton S, Fu B, Scott DL, Deighton C, Symmons DP, Wailoo AJ, et al. Health Assessment Questionnaire disability progression in early rheumatoid arthritis: systematic review and analysis of two inception cohorts. Seminars in Arthritis and Rheumatism. 2014;44(2):131-44.
302. NICE. Tocilizumab for the treatment of rheumatoid arthritis. Technology appraisal guidance [TA247]: National Institute for Health and Care Excellence; 2012. Available from: https://www.nice.org.uk/guidance/ta247.
303. Malottki K, Barton P, Tsourapas A, Uthman AO, Liu Z, Routh K, et al. Adalimumab, etanercept, infliximab, rituximab and abatacept for the treatment of rheumatoid arthritis after the failure of a tumour necrosis factor inhibitor: a systematic review and economic evaluation. Health Technology Assessment. 2011;15(14):1-278.
304. Oppong R, Kaambwa B, Nuttall J, Hood K, Smith RD, Coast J. The impact of using different tariffs to value EQ-5D health state descriptions: an example from a study of acute cough/lower respiratory tract infections in seven countries. European Journal of Health Economics. 2013;14(2):197-209.
305. eMC. ORENCIA 250mg powder for concentrate for solution for infusion: electronic Medicines Compendium, Datapharm Ltd; 2019. Available from: https://www.medicines.org.uk/emc/product/334/smpc.
306. eMC. Simponi 50mg solution for injection in pre-filled pen: electronic Medicines Compendium, Datapharm Ltd; 2019. Available from: https://www.medicines.org.uk/emc/product/8122/smpc.
Copyright 2019 Queen's Printer and Controller of HMSO. All rights reserved

Page 270 of 275
307. eMC. Remicade 100mg powder for concentrate for solution for infusion: electronic Medicines Compendium, Datapharm Ltd; 2019. Available from: https://www.medicines.org.uk/emc/product/3831/smpc.
Copyright 2019 Queen's Printer and Controller of HMSO. All rights reserved

Page 271 of 275
Appendix 1. Additional searches undertaken by the ERG Database: Ovid MEDLINE(R) ALL <1946 to August 05, 2019> Search Strategy:
1 exp arthritis, rheumatoid/ (109237)
2 rheumatoid arthritis.mp. (101391)
3 or/1-2 (142519)
4 janus kinase inhibitors/ (184)
5 (JAK* adj inhibitor*).tw. (2400)
6 janus kinase inhibitor*.tw. (469)
7 tumor necrosis factor-alpha/ (120216)
8 exp monoclonal antibodies/ (224445)
9 tumo?r necrosis* factor*.tw. (135649)
10 TNF-alpha.tw. (121814)
11 exp upadacitinib/ or (upadacitinib or ABT-494).af. (46)
12 exp adalimumab/ or (adalimumab or Humira or trudexa or Amjevita or Amgevita or
Cyltezo or Halimatoz or Hefiya or Hyrimoz or Hulio or abp501 or Imraldi or Solymbic or
Exemptia or Adfrar).af. (7742)
13 exp etanercept/ or (etanercept or Enbrel or Benepali or SB4 or 185243-69-0 or
200013-86-1 or Erelzi or Lifmior or TuNEX or ENIA11 or Brenzys or Intacept or Etacept
or Davictrol).af. (8312)
14 exp infliximab/ or (infliximab or Remicade or Remsima or CT-P10 or CT-P13 or
170277-31-3 or Inflectra or Renflexis or Zessly or Revellex or Ixifi or Flixabi or
Flammegis or Infimab).af. (14030)
15 exp golimumab/ or (golimumab or Simponi or CNTO 148 or cnto-148 or 476181-
74-5).af. (1103)
16 exp certolizumab pegol/ or (certolizumab or Cimzia or CDP870 or 428863-50-7).af.
(1186)
17 exp tocilizumab/ or (tocilizumab or Actemra or RoActemra or 375823-41-9 or
LusiNEX or atlizumab or R1569).af. (2734)
18 exp abatacept/ or (abatacept or Orencia or CTLA-4Ig or 332348-12-6).af. (3601)
Copyright 2019 Queen's Printer and Controller of HMSO. All rights reserved

Page 272 of 275
19 exp tofacitinib/ or (tofacitinib or tasaocitinib or CP-690550 or Xeljanz or 540737-29-
9 or tasocitinib).af. (1130)
20 exp rituximab/ or (rituximab or Rituxan or Mabthera or 174722-31-7 or Tuxella or
Rituzena or Ritemvia or Blitzima or Truxima or Riximyo or Rixathon or Reditux or
Zytix or AcellBia or Maball or MabTas or Rituxirel).af. (21589)
21 anakinra/ or (anakinra or Kineret or 143090-92-0).af. (5700)
22 baricitinib/ or (baricitinib or Olumiant or LY3009104 or LY 3009104 or 1187594-09-
7).af. (202)
23 exp sarilumab/ or (sarilumab or Kevzara or SAR 153191 or SAR153191 or REGN
88 or REGN88 or 1189541-98-7).af. (87)
24 exp sirukumab/ or (sirukumab or CNTO-136 or CNTO136 or 1194585-53-9 or
Plivensia).af. (49)
25 exp filgotinib/ or (Filgotinib or GLPG0634 or GLPG-0634).af. (65)
26 exp peficitinib/ or (Peficitinib or ASP015K).af. (39)
27 or/4-26 (452201)
28 randomized controlled trial.pt. (486665)
29 controlled clinical trial.pt. (93195)
30 randomized.ab. (451498)
31 placebo.ab. (199946)
32 Clinical Trials as Topic/ (187867)
33 randomly.ab. (316207)
34 trial.ti. (203103)
35 28 or 29 or 30 or 31 or 32 or 33 or 34 (1232128)
36 exp animals/ not humans.sh. (4605671)
37 35 not 36 (1133313)
38 3 and 27 and 37 (2772)
39 exp arthritis, rheumatoid/ (109237)
40 rheumatoid arthritis.mp. (101391)
41 39 or 40 (142519)
Copyright 2019 Queen's Printer and Controller of HMSO. All rights reserved

Page 273 of 275
42 exp upadacitinib/ or (upadacitinib or ABT-494).af. (46)
43 exp adalimumab/ or (adalimumab or Humira or trudexa).af. (7737)
44 exp etanercept/ or (etanercept or Enbrel or Benepali or SB4 or 185243-69-0 or
200013-86-1).af. (8311)
45 exp infliximab/ or (infliximab or Remicade or Remsima or CT-P10 or CT-P13 or
170277-31-3).af. (14027)
46 exp golimumab/ or (golimumab or Simponi or CNTO 148 or cnto-148 or 476181-
74-5).af. (1103)
47 exp certolizumab pegol/ or (certolizumab or Cimzia or CDP870 or 428863-50-7).af.
(1186)
48 exp tocilizumab/ or (tocilizumab or Actemra or RoActemra or 375823-41-9).af.
(2712)
49 exp abatacept/ or (abatacept or Orencia or CTLA-4Ig or 332348-12-6).af. (3601)
50 exp tofacitinib/ or (tofacitinib or tasaocitinib or CP-690550 or Xeljanz or 540737-29-
9).af. (1126)
51 exp rituximab/ or (rituximab or Rituxan or Mabthera or 174722-31-7).af. (21589)
52 anakinra/ or (anakinra or Kineret or 143090-92-0).af. (5700)
53 baricitinib/ or (baricitinib or Olumiant or LY3009104 or LY 3009104 or 1187594-09-
7).af. (202)
54 exp sarilumab/ or (sarilumab or Kevzara or SAR 153191 or SAR153191 or REGN
88 or REGN88 or 1189541-98-7).af. (87)
55 exp sirukumab/ or (sirukumab or CNTO-136 or CNTO136 or 1194585-53-9).af. (49)
56 exp filgotinib/ or (Filgotinib or GLPG0634 or GLPG-0634).af. (65)
57 exp peficitinib/ or (Peficitinib or ASP015K).af. (39)
58 or/42-57 (54246)
59 Randomized controlled trials as Topic/ (125554)
60 Randomized controlled trial/ (486665)
61 Random allocation/ (99887)
62 Double blind method/ (152508)
63 Single blind method/ (27122)
Copyright 2019 Queen's Printer and Controller of HMSO. All rights reserved

Page 274 of 275
64 Clinical trial/ (517294)
65 exp Clinical Trials as Topic/ (328712)
66 (clinic$ adj trial$1).tw. (338742)
67 ((singl$ or doubl$ or treb$ or tripl$) adj (blind$3 or mask$3)).tw. (165465)
68 placebo$.tw. or Placebo/ (206463)
69 Randomly allocated.tw. (26714)
70 (allocated adj2 random).tw. (788)
71 or/59-70 (1379868)
72 Case report.tw. (292443)
73 Letter/ (1038052)
74 Historical article/ (353122)
75 Case study.tw. (67309)
76 or/72-75 (1732546)
77 71 not 76 (1345369)
78 41 and 58 and 77 (2930)
79 41 and 42 (31)
80 78 or 79 (2946)
81 animal/ not (human/ and animal/) (4572711)
82 80 not 81 (2936)
83 38 not 82 (882)
Copyright 2019 Queen's Printer and Controller of HMSO. All rights reserved

Page 275 of 275
Appendix 2. Health utilities and costs searches Health utilities search
The company completed searches to identify health-related quality of life studies
(HRQoL) or health utilities literature in December 2017. Searches were updated in April
2019. The health-related quality of life searches are reported in Appendix H of the CS.
The following bibliographic databases were searched: Ovid MEDLINE, Embase, EBM
Reviews incorporating the Cochrane Library databases (CDSR, CENTRAL, DARE, HTA
and NHS EED). The search uses a combination of indexing terms (e.g. MeSH in
MEDLINE) and free-text (i.e. title and abstract) for the population (rheumatoid arthritis)
and health utilities. Additional searches were conducted on reference lists of included
studies, conference proceedings, HTA websites and other relevant websites (e.g.
EuroQOL, ScHARRHud).
Update searches completed in April 2019 did not use all relevant date fields to limit
searches (see Section 4.1.1 for further details). The company did not cite a validated
filter for identifying health-related quality of life literature, however, appropriate
terminology was included in search strategies.
Costs search
The company completed searches to identify cost and resource use literature in
December 2017. Searches were updated in April 2019. The cost and resource use
searches are reported in Appendix I of the CS.
The following bibliographic databases were searched: Ovid MEDLINE, Embase, EBM
Reviews incorporating the Cochrane Library databases (CDSR, CENTRAL, DARE, HTA,
NHS EED) and EconLit. Additional searches were conducted on reference lists of
included studies, HTA websites, conference proceedings and other relevant websites
(CEA Registry and EconPapers within RePEc). Searches were limited to literature
published from 2008.
Update searches completed in April 2019 did not use all relevant date fields to limit
searches (see Section 4.1.1 for further details).
Copyright 2019 Queen's Printer and Controller of HMSO. All rights reserved
Copyright © 2022 FDOKUMEN