Untitled - Index of
94
111111111111111111111111111111 9459
-
Upload
khangminh22 -
Category
Documents
-
view
2 -
download
0
Transcript of Untitled - Index of
111111111111111111111111111111 9459
An Affirmative Action/ Equal Opportunity Employer
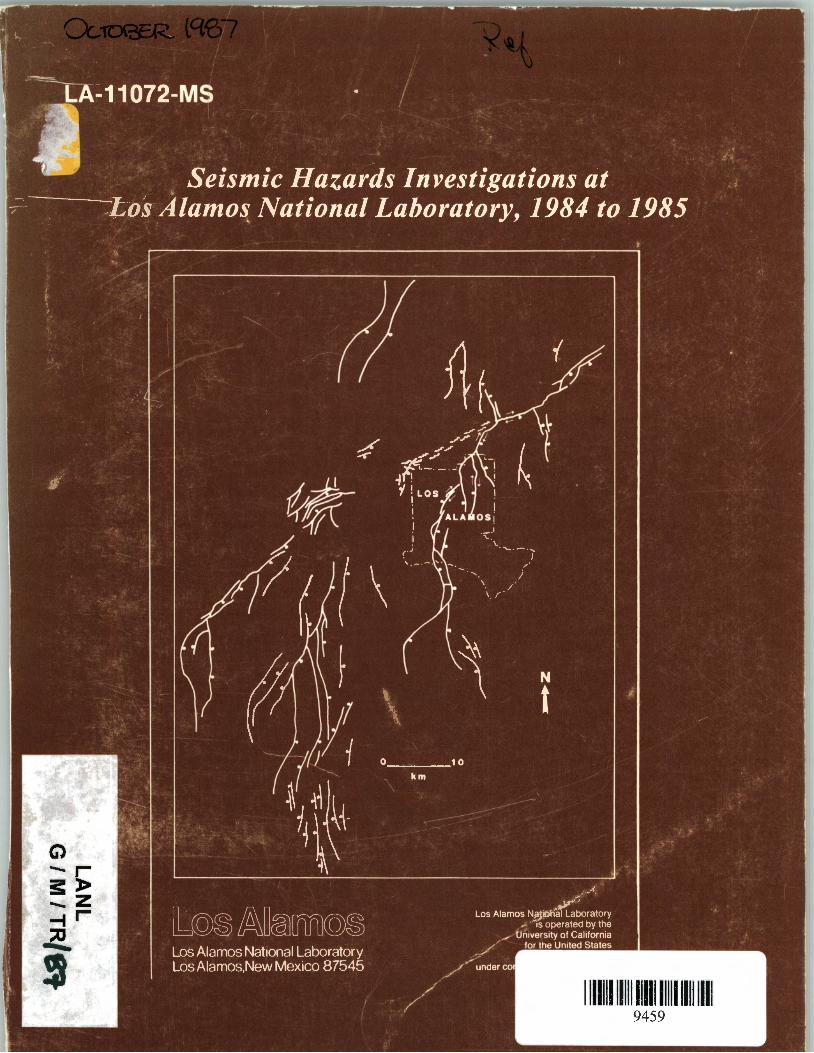
Cover Map: Major faults in the Jemez Mountains region.
DISCLAIMER
This report was prepared as an account of work sponsored by an agency of the United States Government. Neither the United States Government nor any agency thereof, nor any of their employees, makes any warranty, express or implied, or assumes any legal liability or responsibility for the accuracy, completeness. or usefulness of any information, apparatus. product, or process disclosed, or represents that its use would not infringe privately owned rights. Reference herein to any specific commercial product. process. or service by trade name, trademark, manufacturer. or otherwise, does not necessarily constitute or imply its endorsement, recommendation, or favoring by the United States Government or any agency thereof. The views and opinions of authors expressed herein do not necessarily state or reflect those of the United States Government or any agency thereof.
LA-11072-MS
UC-11 Issued: October 1987
Seismic Hazards Investigations at Los Alamos National Laboratory, 1984 to 1985
Jamie N. Gardner Leigh House
with contributions from
M. J. Aldrich, Jr. W. S. Baldridge D. Broxton D. J. Cash D.P. Dethier* B. J. Dransfield**
F. Goff C. D. Harrington J. W. Hawleyt L. W. Maassen D. Wachs+
*Collaborator at Los Alamos. Department of Geology, Williams College, Williamstown, MA 01267. **Guest Scientist at Los Alamos. Department of Geology, University of Alabama, University, AL35486. tCollaborator at Los Alamos. New Mexico Bureau of Mines and Mineral Resources, Socorro, NM 87801. :j:Collaborator at Los Alamos. Geological Survey of Israel, 30 Malkhe Yisrael Street, Jerusalem 95501 , ISRAEL.
Los Alamos National Laboratory Los Alamos, New Mexico 87545

CONTENTS
EXECUTIVE SUMMARY
ABSTRACT . • . . . . . . . . . . . . . . . . . .
I: INTRODUCTION • . •••......•
I-A: Background .
I-B: Approach •
I -c: Usage of t1agni tude, Intensity, and Capab 1 e Fault .
1-D: Seismic Hazards Earthquake Concepts
I-E: Tectonic Province of Los Alamos
II: FIELD STUDIES OF THE PAJARITO FAULT SYSTEM
II-A:
II-B:
1.
2.
3.
II-C:
1.
2.
3.
II-D:
1.
Introduction
Southern Segment of the Pajarito Fault System .
Faults
Style of Deformation
Rates and Recency of Movements . . • .
Central Segment of the Pajarito Fault System
Faults
Style of Deformation
Rates and Recency of Movements
Northern Segment of the Pajarito Fault System •
Faults . . . . . . . . ....... .
Page
vii
ix
1
2
3
4
4
7
9
10
11
15
17
19
24
25
27
27
33
33
2. Style of Deformation . . . • • • • • . • • • • . • • • 34
3. Rates and Recency of Movements
III: SEISMOLOGICAL STUDIES
III-A: Background
III-B: Historical Earthquakes
34
38
39
41
v
IV:
v:
III-C: Response Spectra
III-D: Network Monitoring
DISCUSSION OF PRELIMINARY HAZARD MAPS
44
45
48
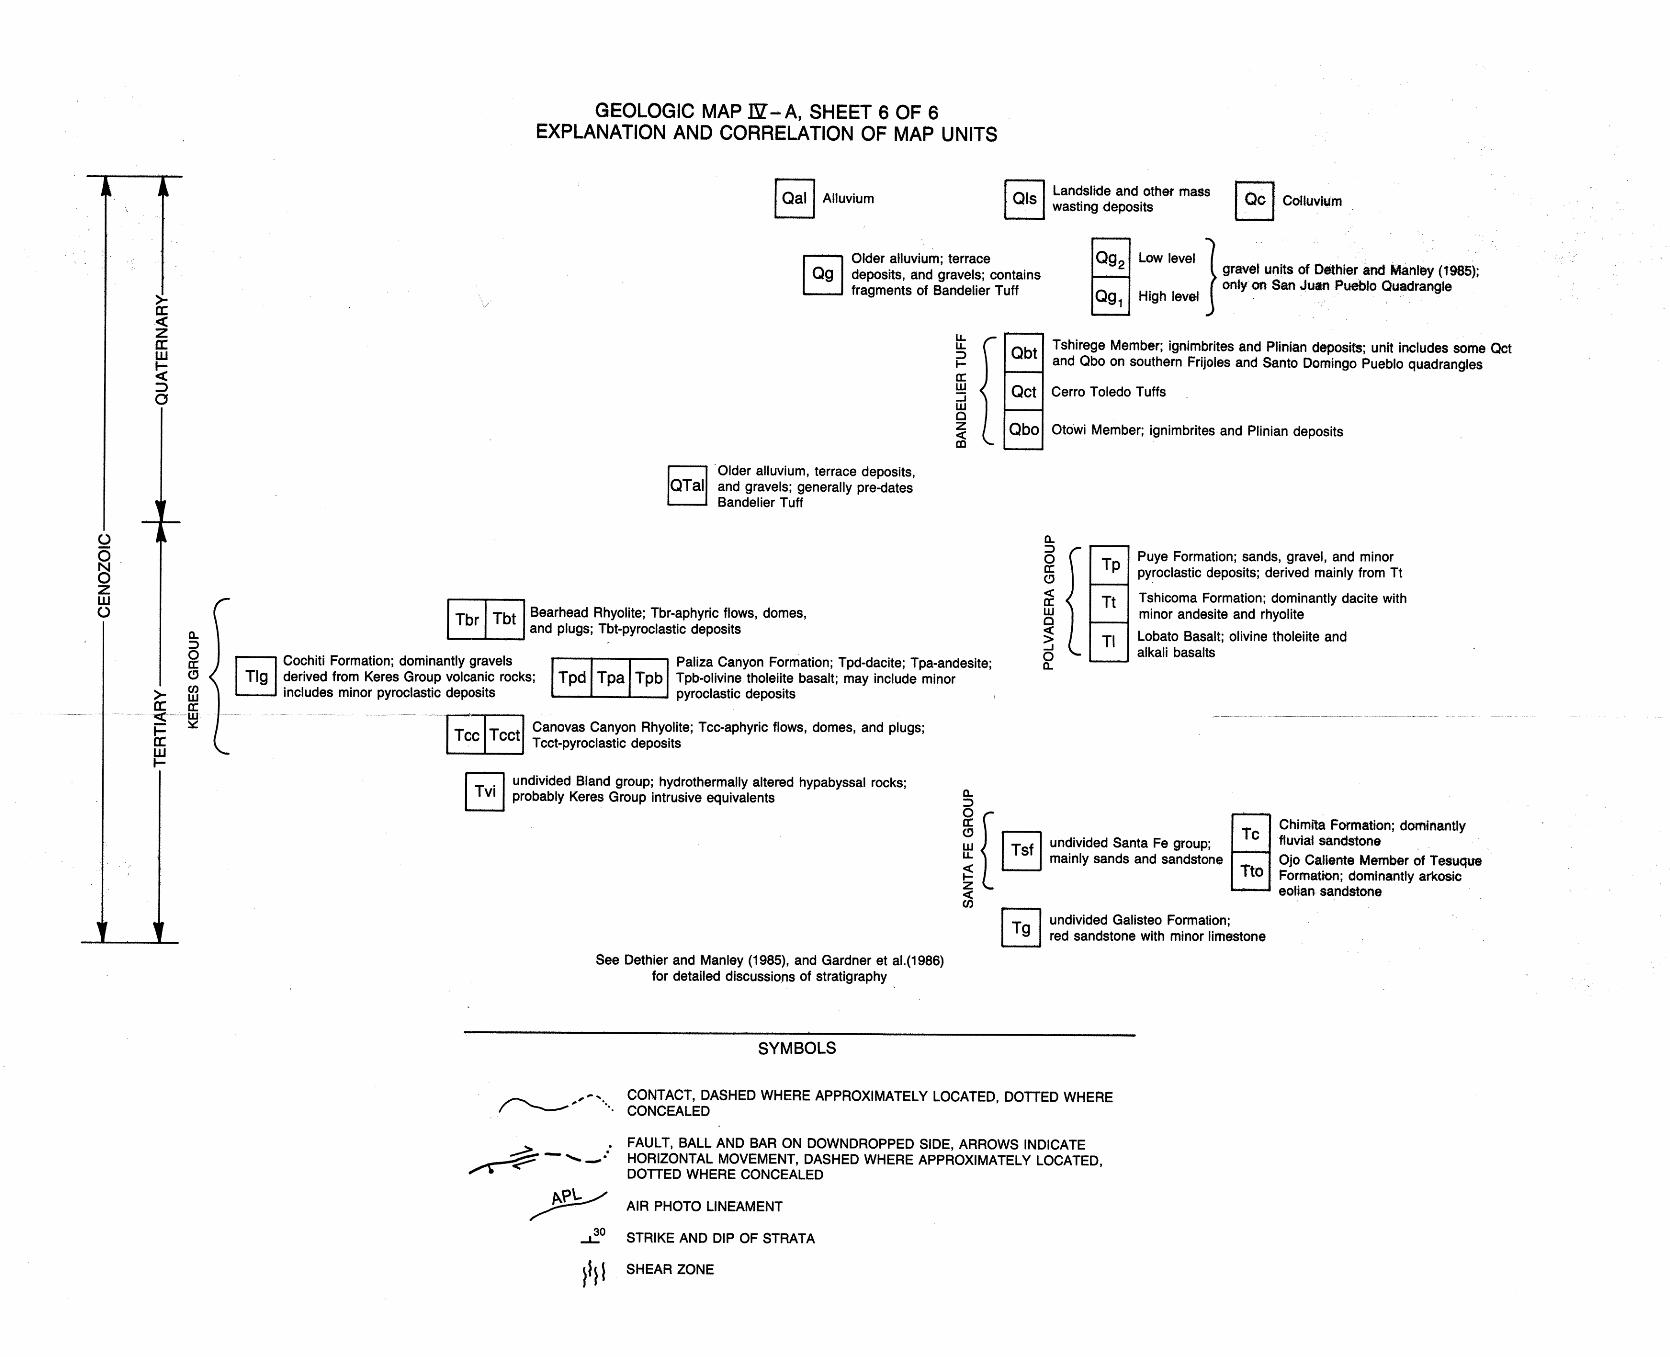
IV-A: Geologic Map 49
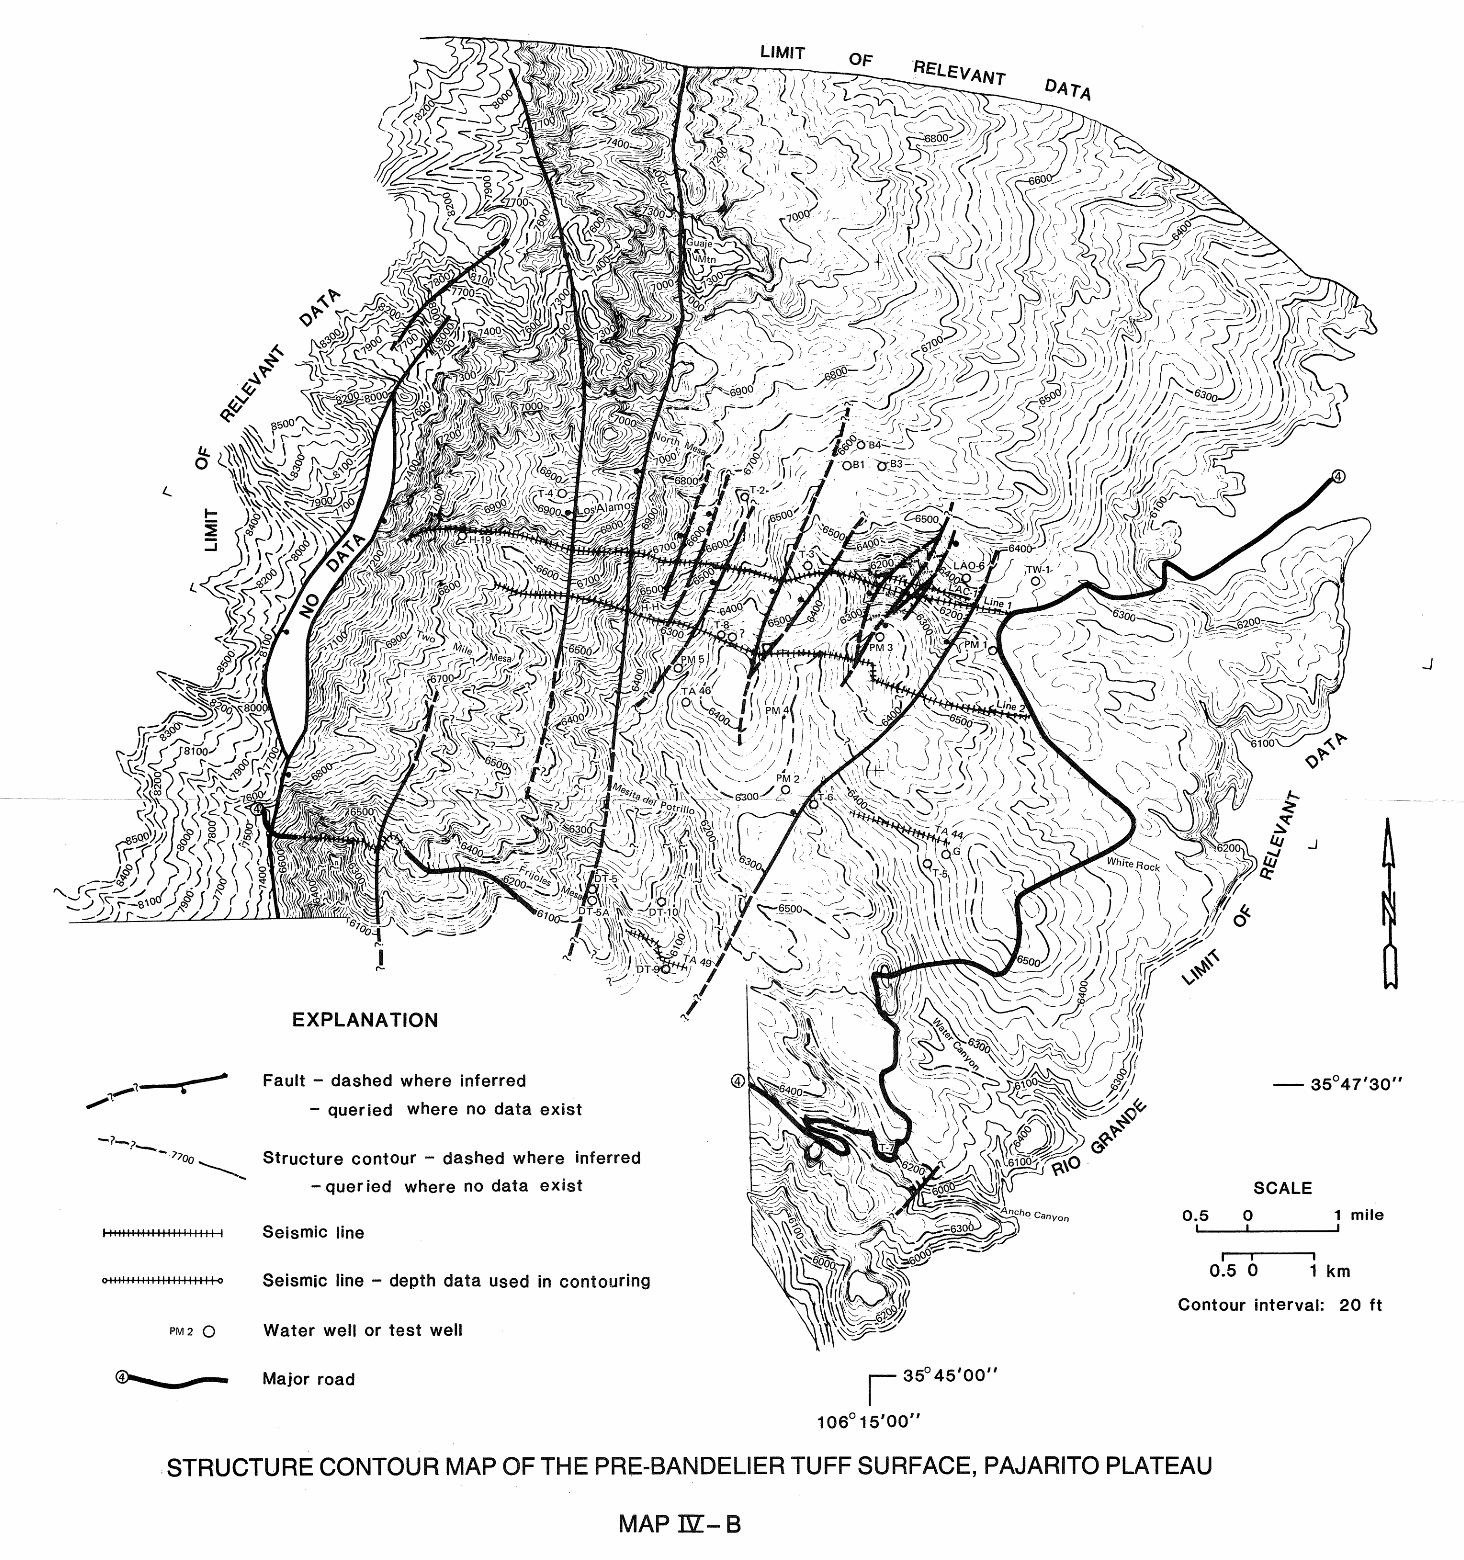
IV-B: Structure Contour Map of the Pre-Bandelier Tuff Surface 49
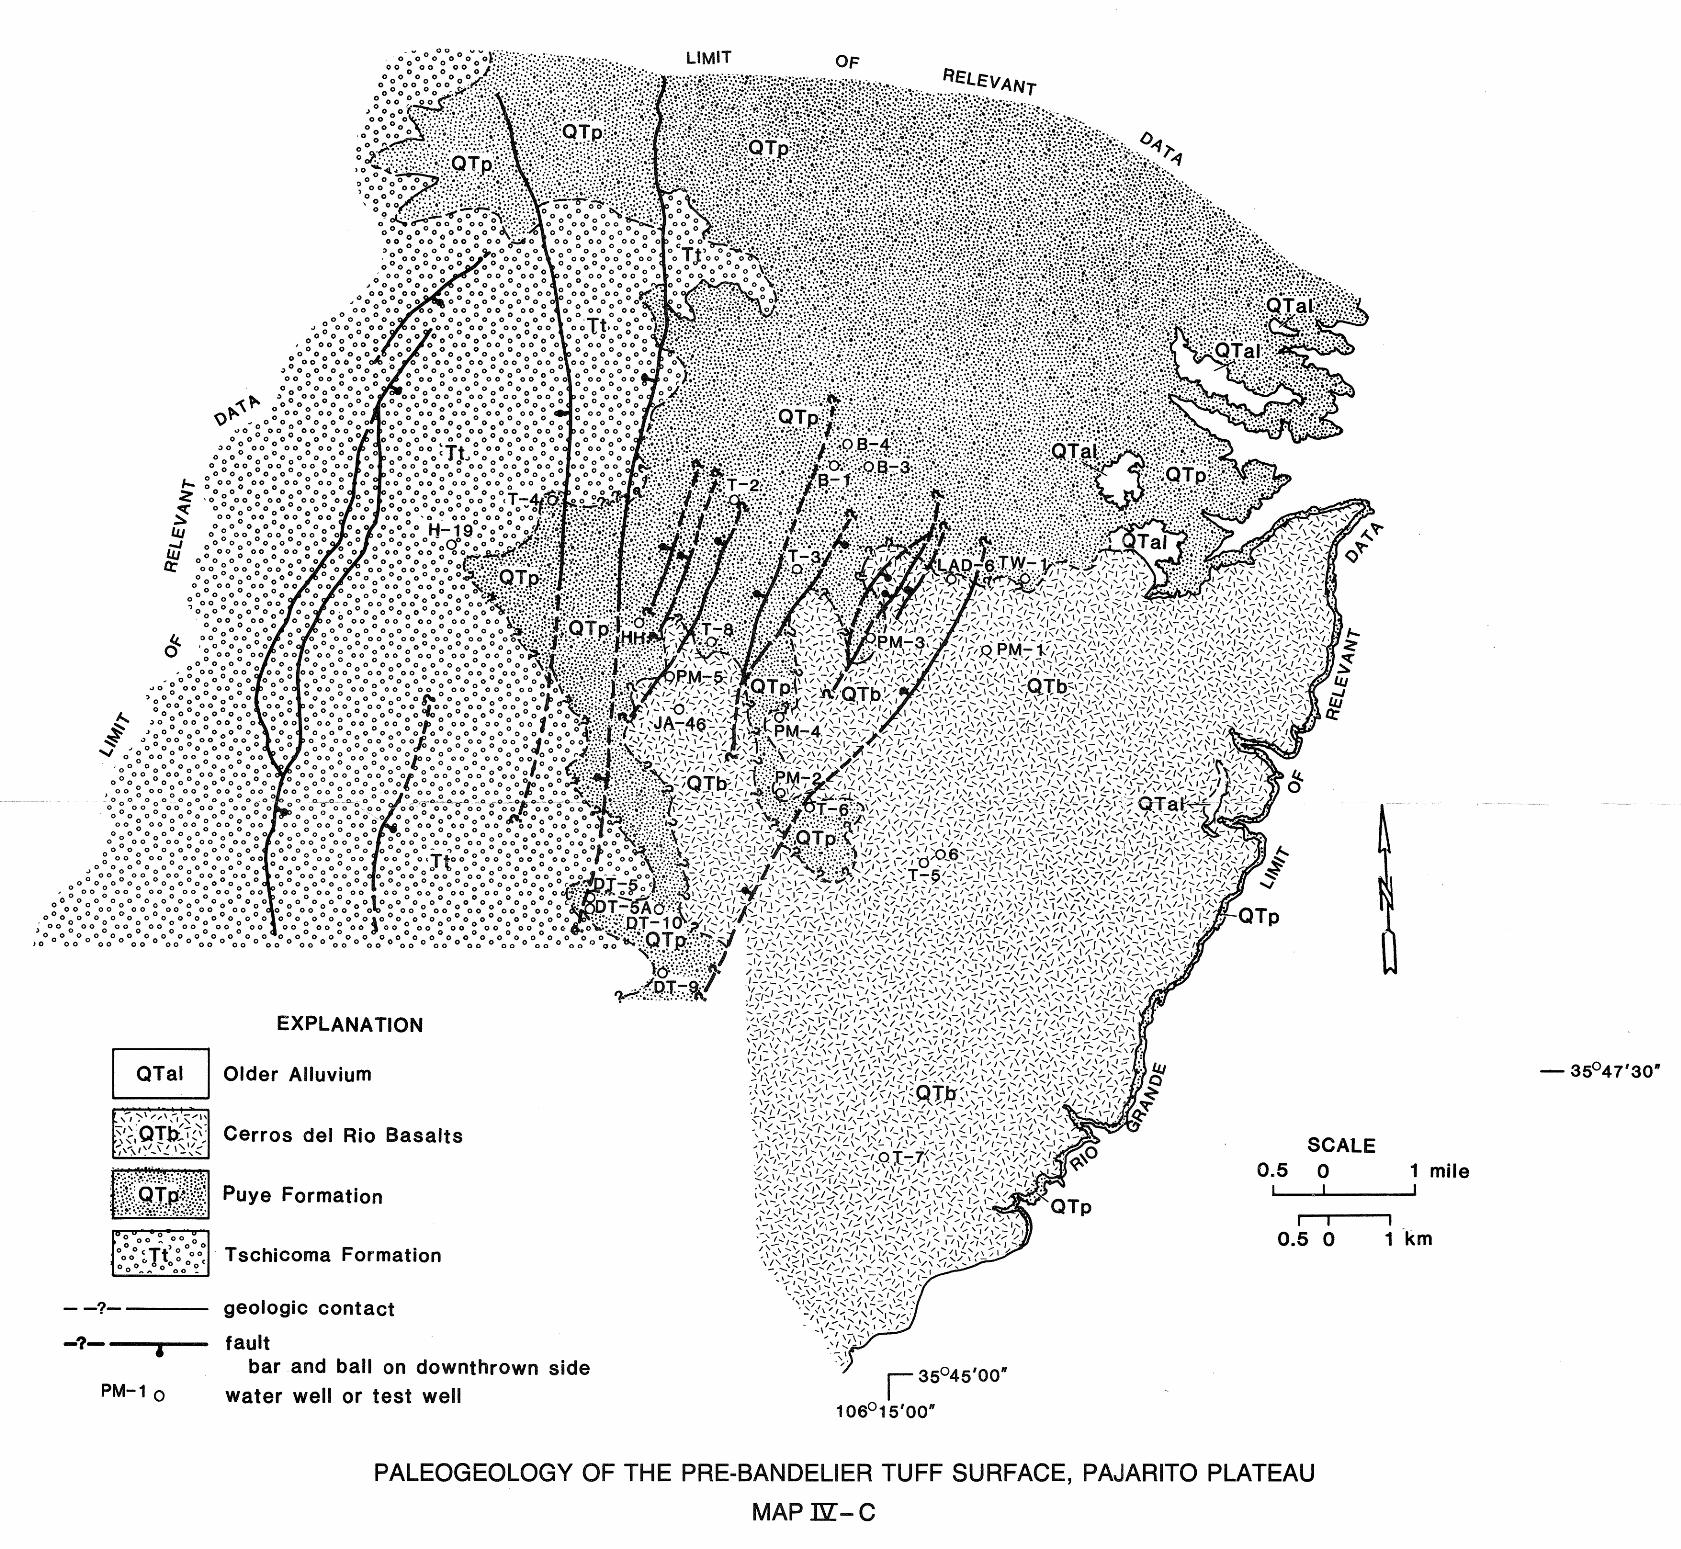
IV-C: Paleogeology of the Pre-Bandelier Tuff Surface 50
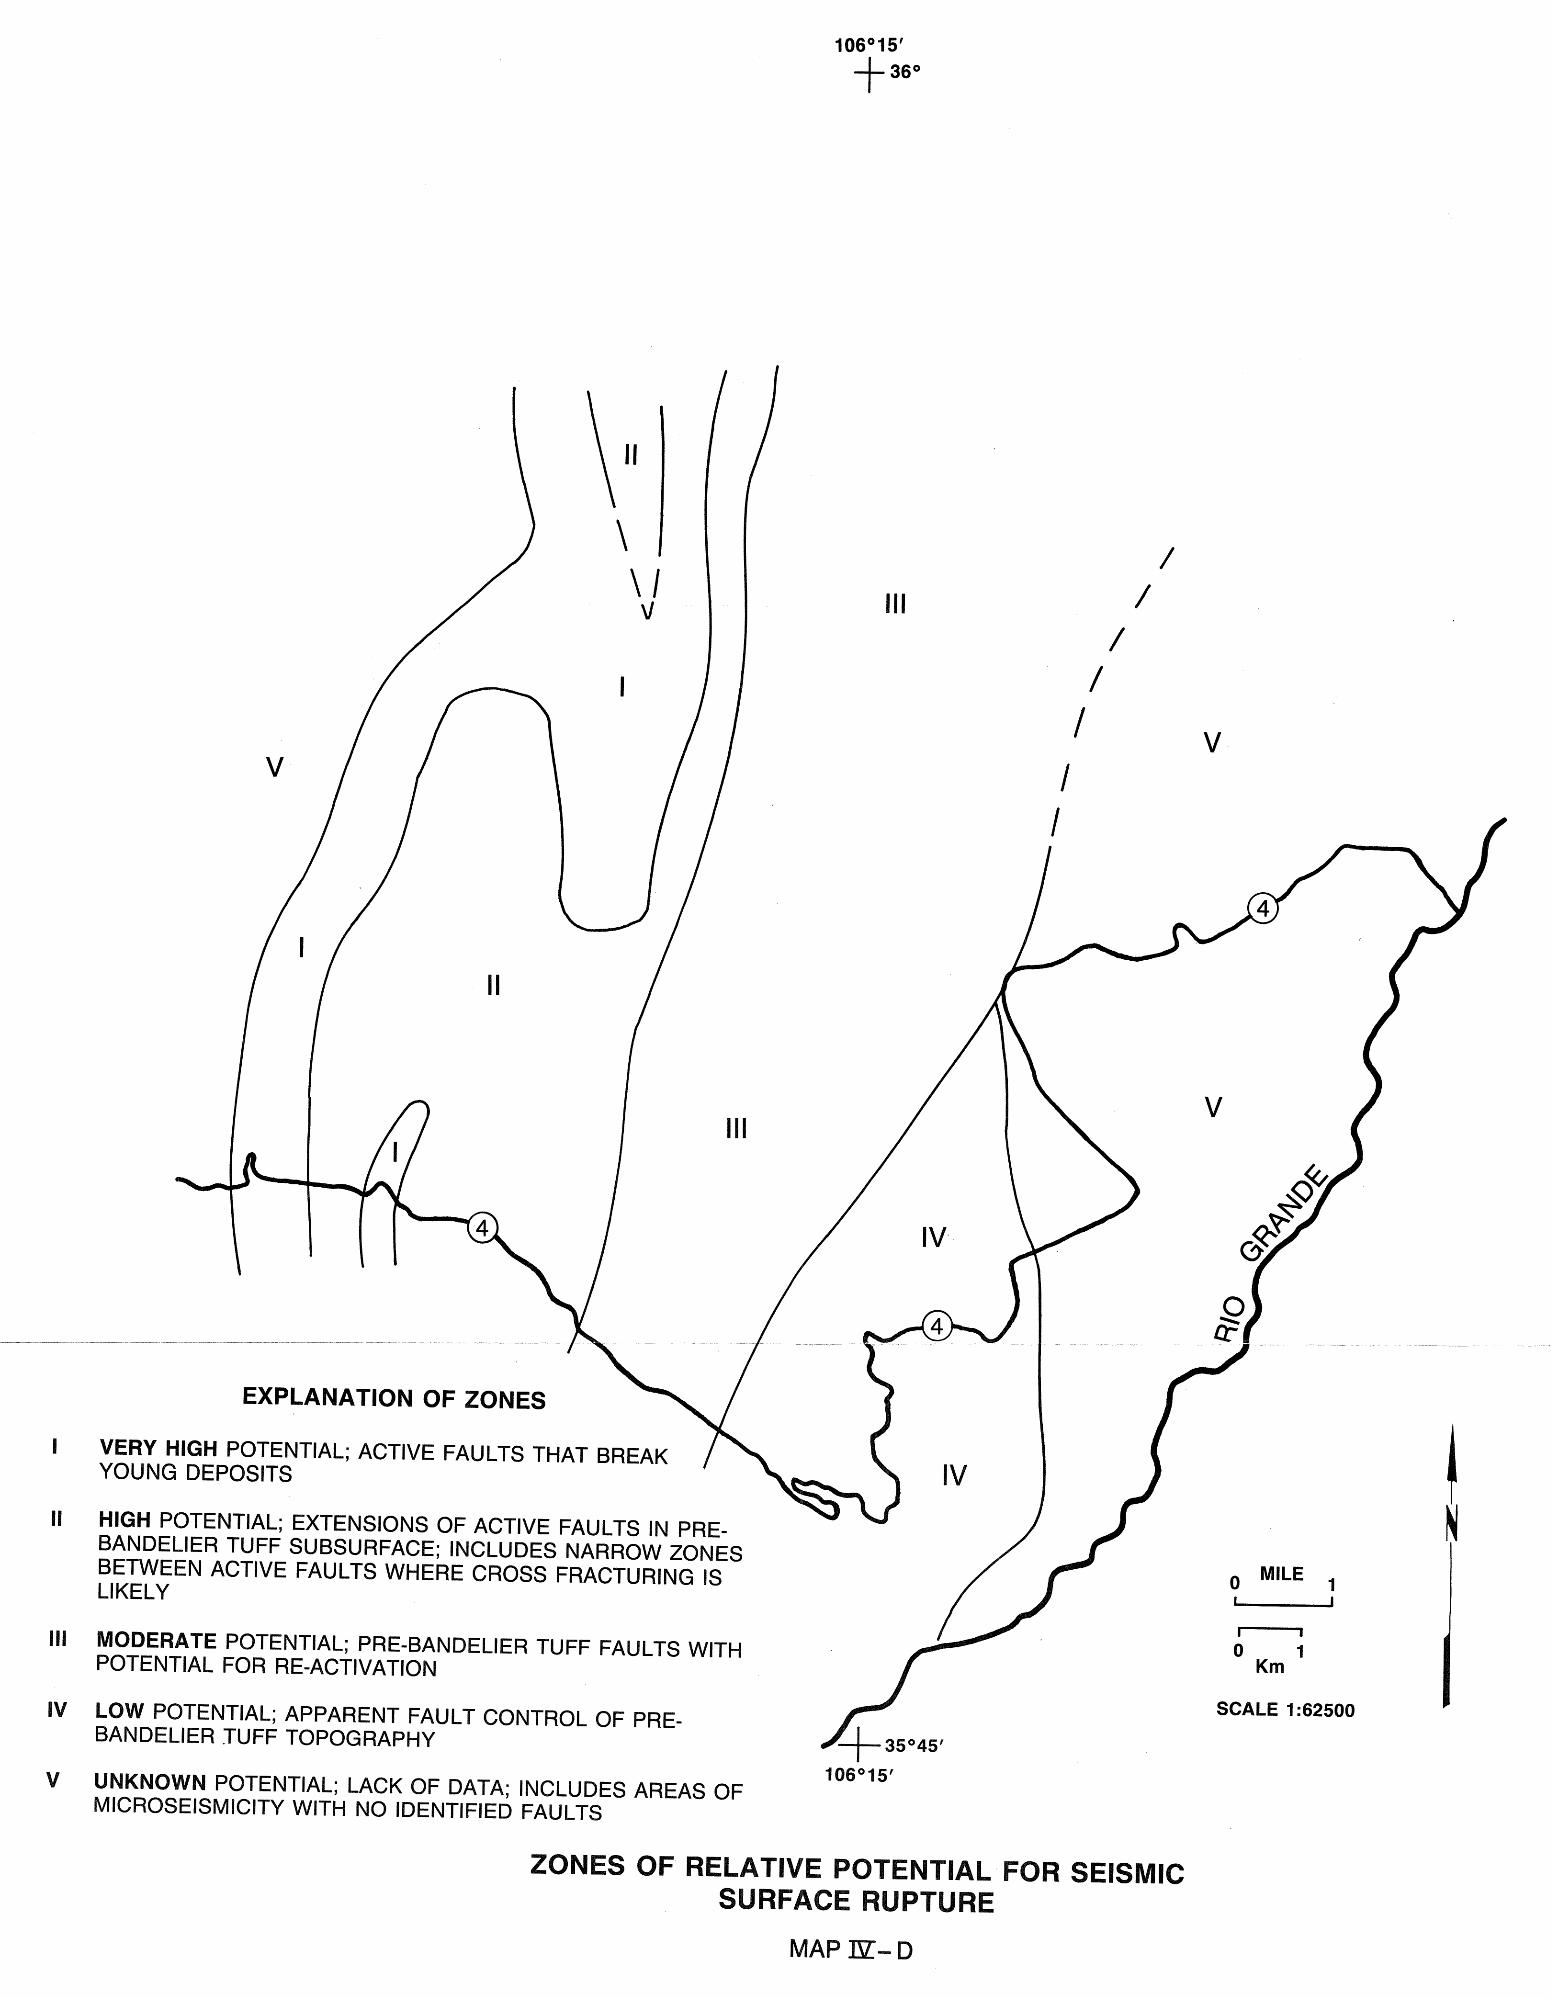
IV-D: Zones of Relative Potential for Seismic Surface Rupture • • 50
IV-E: Preliminary Map of Potentially Hazardous Mass Wasting During an Earthquake • • • • • • • • • 50
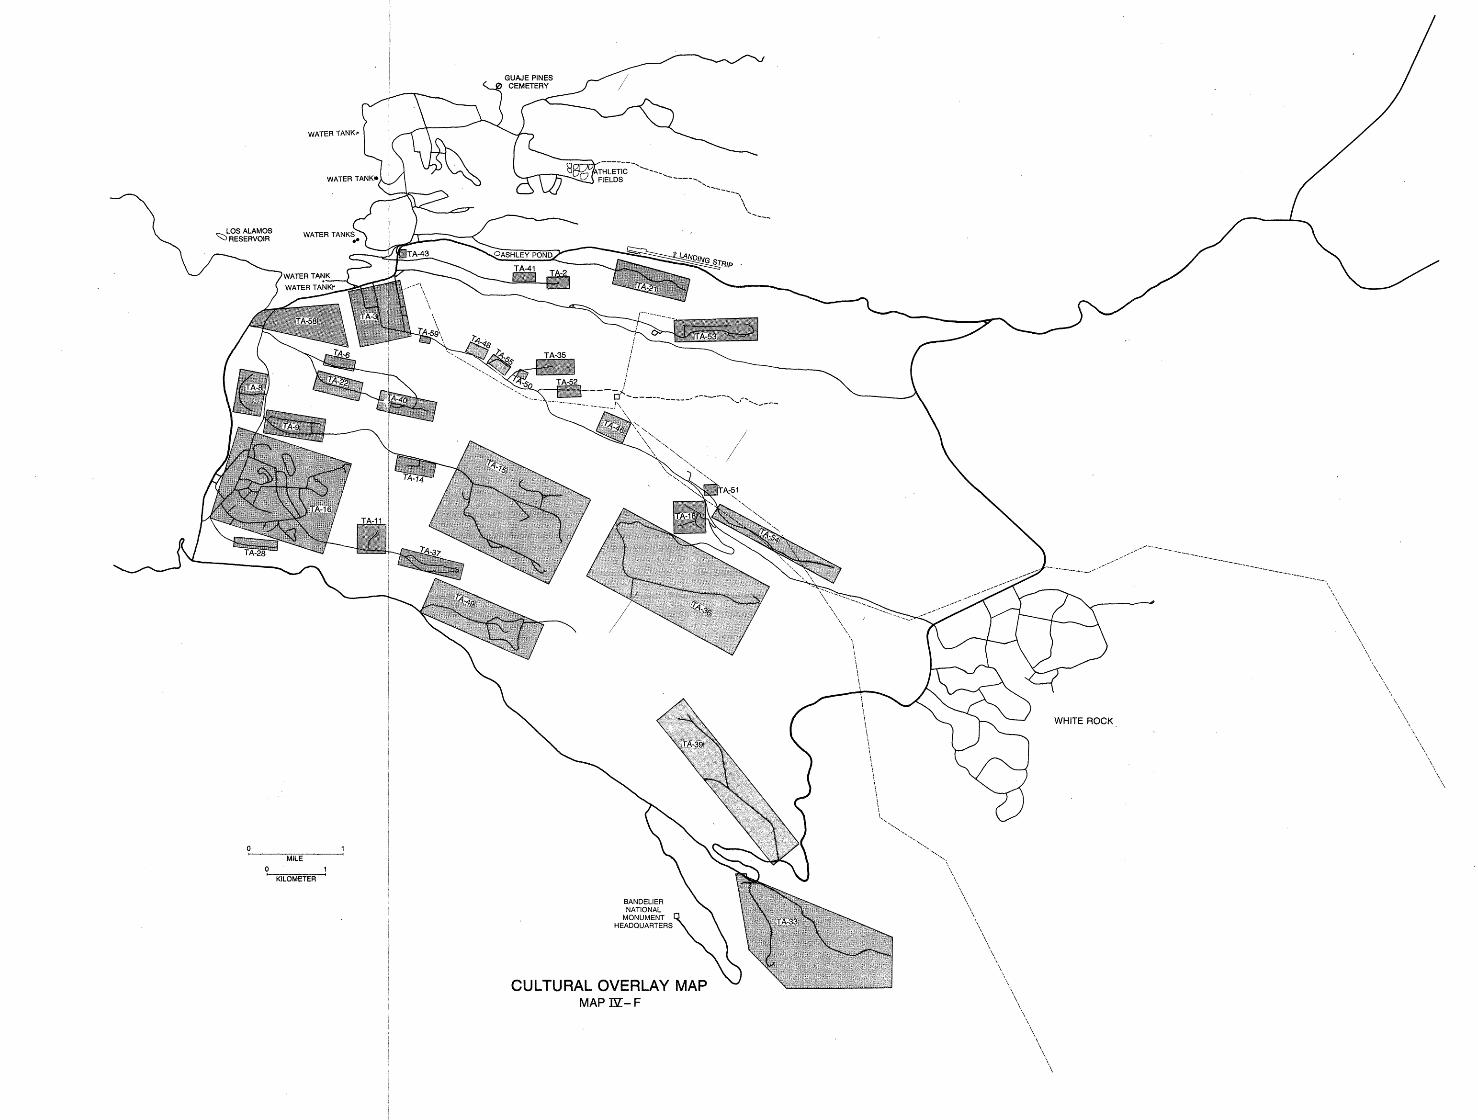
IV-F: Cultural Overlay Map 51
IV-G: Map of Geomorphic Surfaces, Southern San Juan Pueblo Quadrangle • • • • • • • • • • • 51
CONCLUSIONS 52
APPENDIX: PREVIOUS STUDIES
REFERENCES
55
69
vi
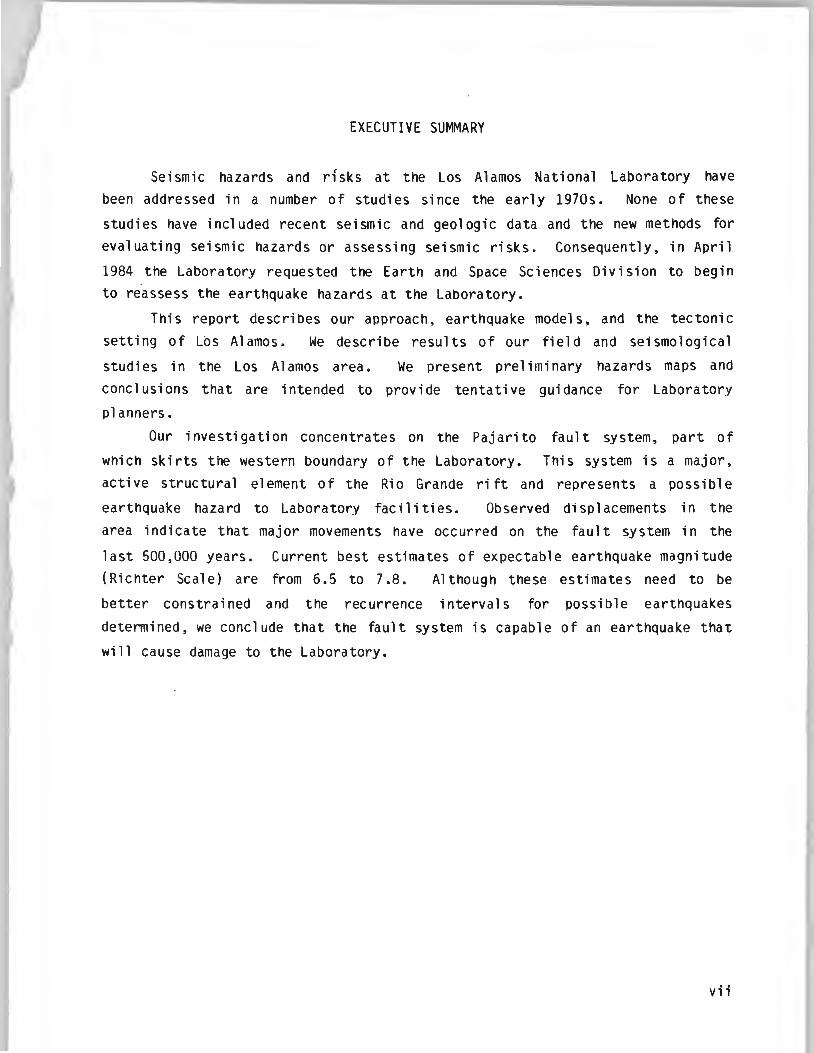
EXECUTIVE SUMMARY
Seismic hazards and r1 sks at the Los A 1 amos National Laboratory have
been addressed in a number of studies si nee the early 1970s. None of these
studies have included recent seismic and geologic data and the new methods for
evaluating seismic hazards or assessing seismic risks. Consequently, in April
1984 the Laboratory requested the Earth and Space Sciences Division to begin
to reassess the earthquake hazards at the Laboratory.
This report describes our approach, earthquake models, and the tectonic
setting of Los Alamos. We describe results of our field and seismological
studies in the Los Alamos area. We present prel irni nary hazards maps and
conclusions that are intended to provide tentative guidance for Laboratory
planners.
Our investigation concentrates on the Pajarito fault system, part of
which skirts the western boundary of the Laboratory. This system is a major,
active structural element of the Rio Grande rift and represents a possible
earthquake hazard to Laboratory facilities. Observed di sp 1 acements in the
area indicate that major movements have occurred on the fault system in the
last 500,000 years. Current best estimates of expectable earthquake magnitude
(Richter Scale) are from 6.5 to 7.8. Although these estimates need to be
better constrained and the recurrence intervals for possible earthquakes
determined, we conclude that the fault system is capable of an earthquake that
will cause damage to the Laboratory.
vii
SEISMIC HAZARQS INVESTIGATIONS AT LOS ALAMOS NATIONAL LABORATORY, 1984 TO 1985
by
Jamie N. Gardner and Leigh House
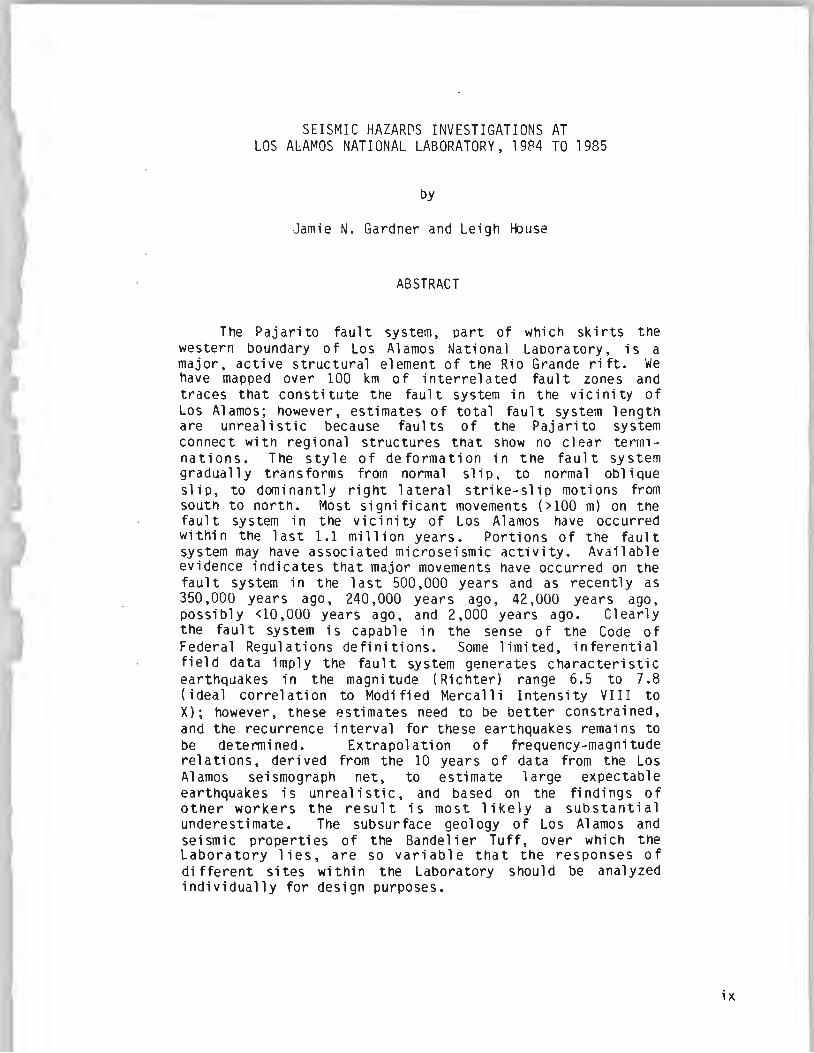
ABSTRACT
The Pajarito fault system, part of which skirts the western boundary of Los Alamos National Laboratory, is a major, active structural element of the Rio Grande rift. We have mapped over 100 km of interrelated fault zones and traces that constitute the fault system in the vicinity of Los Alamos; however, estimates of total fault system length are unrealistic because faults of the Pajarito system connect with regional structures that show no clear terminations. The style of deformation in the fault system gradually transforms from normal slip, to normal oblique slip, to dominantly right lateral strike-slip motions from south to north. Most significant movements (>100m) on tne fault system in the vicinity of Los Alamos have occurred within the last 1.1 million years. Portions of tne fault system may have associated microseismic activity. Available evidence indicates that major movements have occurred on the fault system in the last 500,000 years and as recen tly as 350,000 years ago, 240,000 years ago, 42,000 year s ago, possibly <10,000 years ago, and 2,000 years ago. Clearly the fault system is capable in the sense of the Code of Federal Regulations definitions. Some limited, inferential field data imply the fault system generates characteristic earthquakes in the magnitude (Richter) range 6.5 to 7.8 (ideal correlation to Modified Mercalli Intensity VIII to X); however, these estimates need to be better constrained, and the recurrence interval for these earthquakes remains to be detenni ned. Extra pol ati on of frequency-magnitude relations, derived from the 10 years of data from the Los Alamos seismograph net, to estimate large expectable earthquakes is unrealistic, and based on the findings of other workers the result is most likely a substantial underestimate. The subsurface geology of Los Alamos and seismic properties of the Bandelier Tuff, over which the Laboratory lies, are so variable that the responses of different sites within the Laboratory should be analyzed individually for design purposes.
ix

CHAPTER I: INTRODUCTION
'

1-A: BACKGROUND
Seismic hazards and seismic risk at Los Alamos National Laboratory have
been variably addressed in a number of topical studies since the early 1970s
(see Appendix "Previous Studies"). However, since 1972 (Dames and Moore,
1972) there have been no comprehensive seismic hazards or risk ana 1 yses of the
Laboratory that include the recently available seismic and geologic data and
the new developments in the way these data a re treated in determining seismic
risk (e.g., see Tillson, 1984). In a 1985 review of major research and
development il.Ctivities of tne Earth and Space Sciences (ESS) Division of Los
Alamos, R. M. Hamilton, Chief Geologist of the U.S. Geological Survey, wrote
the following to ,J. H. Bi re ly (Associate Director for Chemistry, Earth, and
Life Sciences at Los Alamos):
"Tne only recommendation that I would like to make
concerns seismic hazards in the LANL areil. ... fault offsets tnat
hav~ recently been studied in the area, and, more generally, the
tectonic setting of the LANL area, il.ppear to deserve attention.
ESS staff are well qu a li fi ed to investigate this problem. I
recommend, therefore, that a project be established to investigate
seismic Mzards in the LANL region."
In April 1984, the ESS IJivision was asked by the Laboratory to begin
seismological and geological studies related to earthquake hazards at Los
Alamos. Activities were to include instrumental earthquake monitoring,
revision of a Laboratory-specific response spectrum, analysis of existing
seismic data, evaluation of past seismic hazards studies at Los Alamos, and
new geologic mapping of fault zones, as necessary. On review of past studies
in light of modern seismic hazards assessment methodologies, it became evident
that much work beyond the scope of tile ori gina l project would be ne cessary to
provide a state-of-tne-art seismic risk assessment of the Laboratory. He nce,
tasks were modified, redirected, and/or added, and on-going research in other
programs was incorporated into the program so as to provide as much useful
information as possible 1-Jitnin the two fiscal years (1984 and 1985) of the
original program (see Section I-B: Approach).
In February 1985, we presented our preliminary results to representa
tives of Labor a tory management and made recommendations for necessary
additional work as a second phase of the program. Work on the second phase
began in January 1986 and will continue for the next several years. Thus,
2
J
this report is documentation of work still in progress. In this chapter we
describe our approach, earthquake models, and the tectonic setting of Los
Alamos. In Chapters II and III we describe results of our field and
seismological studies in the Los Alamos area. We present preliminary hazards
maps and conclusions that are intended to provide tentative guidance for
Labortltory planners. The Appendix "Previous Studies" is a partially annotated
bibliography of work relevant to seismic hazards at Los Alamos.
I -B: APPROACH
An important semantic distinction is the difference between a seismic
hazards evaluation and a seismic risk analysis. A seismic risk analysis must
include
1) a seismic hazards evaluation,
2) an evaluation of seismic designs and seismic exposures of facilities in
light of probabilities of various seismic effects, and
3) a determination of acceptable risks to personnel, property, and the
environment.
Our program addresses only Step 1, the seismic hazards evaluation. A seismic
risk analysis for Los Alamos should include Laboratory management, engineers,
and safety experts, as well as geoscientists, and is beyond the scope of the
current program. Given the results of a risk analysis, structural upgrades,
retrofits, remedial construction, and emergency contingency planning must be
done to mitigate the risks that are determined to be unacceptable.
As closely as practical, the approach we have developed and the defini
tions we employ are based on the 1985 Code of Federal Regulations, Title 10
(Energy: Nuclear Regulatory Commission) Part 100, Appendix A., pages 818-826
(hereafter referred to as 10 CFR 100-A). The Nuclear Regulatory Commission's
guidelines of 10 CFR 100-A provide a legally defined approach to investigation
and quantitative assessment of seismic hazards at a nuclear facility. The
guidelines of 10 CFR 100-A define a deterministic approach to seismic risk
assessment. In that the scope of i nves ti ga ti ons required by 10 CFR 100-A is
large and beyond the current l.evel of effort of our program, we have placed
highest priority on obtaining the determi ni sti c data necessary for subsequent
seismic risk assessment:
3
1} critical review of pertinent literature (10 CFR 100-A, Sec. IV);
2} determi nation of subsurface geology (10 CFR 100-A, Sec. IV, paragraphs
a-1, a-2, and a-4};
3} identification of capable faults (10 CFR 100-A, Sec. IV, paragraph b-4};
4} for the capable faults, determination of the nature of associated
earthquakes (see Section 1-D: Seismic Hazards Earthquake Concepts},
fault length, relations of faults to regional structures, and the
nature, amount, and geologic history of displacements along the fault
(10 CFR 100-A, Sec. IV, paragraphs a-8 and b-7};
5} evaluation of tectonic structures, underlying the site, whether buried
or expressed at the surface, with regard to their potential for surface
rupture (10 CFR 100-A, Sec. IV, paragraph b-2};
6} instrumental monitoring of seismic activity (10 CFR 100-A, Sec. VI}; and
7} determination of seismic response of geologic materials at the site (10
CFR 100-A, Sec. V}.
1-C: USAGE OF MAGNITUDE, INTENSITY, AND CAPABLE FAULT
Throughout this report, unless otherwise specified, we use the term
magnitude to mean the Richter or 1 oca 1 magnitude of an earthquake. Abundant
deterministic, empirical data exist that allow estima tion of the size of
earthquakes, with numerical values on the Richter scale, from measurable fault
parameters and seismic data. The intensity of an earthquake is a measure of
its effect on humans, on human-bui 1 t structures, and on the earth's surface at
a given location. Intensity, with an upper-case "I, " means the numerical
value on the Modified Mercalli Intensity (MMI} scale (Table I}. A capable
fault is one with potential for generating earthquakes. A capable fault is a
fault with demonstrable historic macrosei smi city, recurrent movements within
0.5 Ma, and/or one movement within 0.035 Ma (10 CFR 100-A).
1-D: SEISMIC HAZARDS EARTHQUAKE CONCEPTS
Several concepts and models for earthquakes that are prevalent in seis
mic hazards analyses warrant discussion at this point. The "Safe Shutdown
Earthquake" and the "Operating Basis Earthquake" are the earthquake mode 1 s
utilized in 10 CFR 100-A. The Safe Shutdown Earthquake (also called the
"Design Basis Earthquake"} is that earthquake which wi 11 produce maximum
vibratory ground motion at the site, based on evaluation of regional and local
4
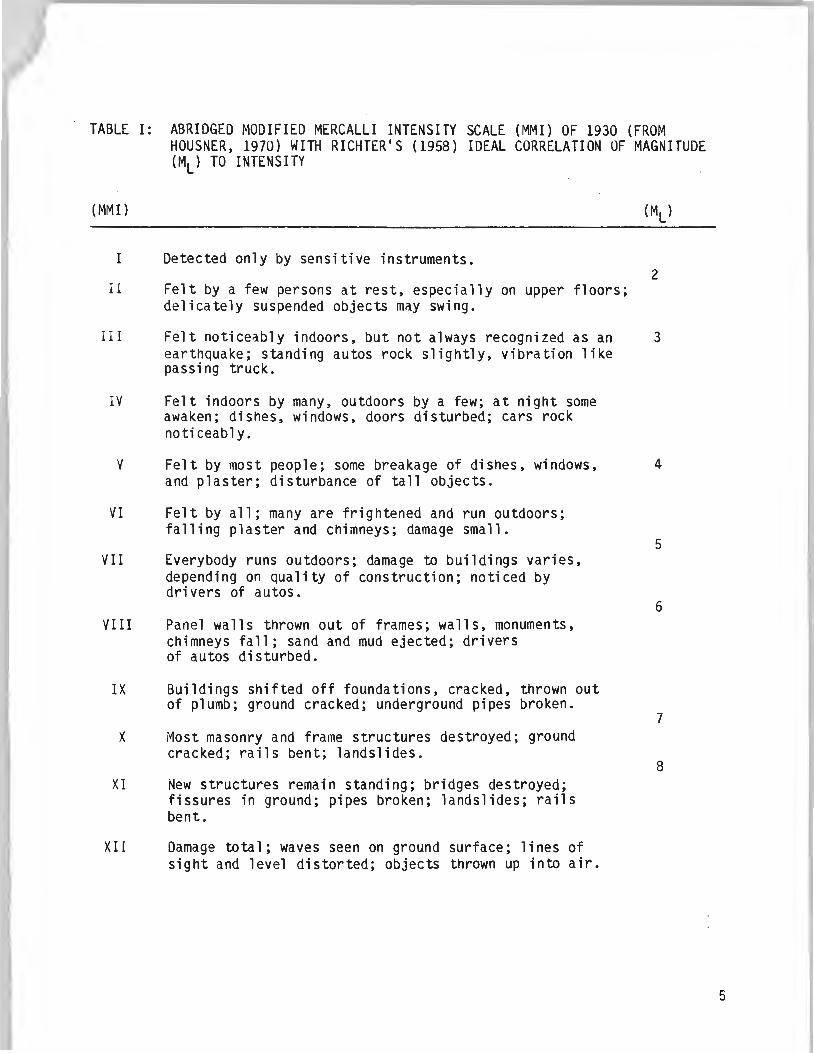
TABLE I: ABRIDGED MODIFIED MERCALLI INTENSITY SCALE (MMI) OF 1930 (FROM HOUSNER, 1970) WITH RICHTER'S (1958) IDEAL CORRELATION OF MAGNITUDE (ML) TO INTENSITY
I Detected only by sensitive instruments.
II Felt by a few persons at rest, especially on upper floors; delicately suspended objects may swing.
I I I Felt noticeably indoors, but not always recognized as an earthquake; standing autos rock slightly, vibration like passing truck.
IV Felt indoors by many, outdoors by a few; at night some awaken; dishes, windows, doors disturbed; cars rock noti ceab 1 y.
v Felt by most people; some breakage of dishes, windows, and plaster; disturbance of tall objects.
VI Felt by all; many are frightened and run outdoors; falling plaster and chimneys; damage small.
VII Everybody runs outdoors; damage to buildings varies, depending on quality of construction; noticed by drivers of autos.
VIII Panel walls thrown out of frames; walls, monuments, chimneys fall; sand and mud ejected; drivers of autos disturbed.
IX Buildings shifted off foundations, cracked, thrown out of plumb; ground cracked; underground pipes broken.
X Most masonry and frame structures destroyed; ground cracked; rails bent; landslides.
XI New structures remain standing; bridges destroyed; fissures in ground; pipes broken; landslides; rails bent.
XII Damage total; waves seen on ground surface; lines of sight and level distorted; objects thrown up into air.
2
3
4
5
6
7
8
5
geology and seismology and specific materials properties of the site. In the
absence of site-specific deterministic data for the site and/or faults near
the site, the Safe Shutdown Earthquake is commonly taken to be the largest
earthquake--or highest intensity of ground motion--known to have occurred
within the site's tectonic province (see Tectonic Province of Los Alamos).
Seismic design bases are then determined by assuming occurrence of the Safe
Shutdown Earthquake at the point on the tectonic structure or tectonic
province nearest to the site. Design of facilities for the Safe Shutdown
Earthquake must assure that cri ti ca 1 structures, systems, and components (such
as containment and coolant systems) remain functional so as to have the
capability to execute and maintain a safe shutdown, and to prevent or mitigate
the consequences of accidents. Thus, critical components of nuclear facili
ties must be designed to survive the Safe Shutdown Earthquake and continue to
function to the point of preventing or mitigating damage to personnel,
property, and the environment.
The Operating Basis Earthquake (also commonly referred to as the
"Probable Earthquake") of 10 CFR 100-A is that earthquake which, considering
the regional and local geology and seismology and specific characteristics of
local subsurface material, could reasonably be expected to affect the site
during the site's operating life. The operating life of a nuclear power plant
is usually taken to be 30 years. Seismic design for the Operating Basis
Earthquake requires that a 11 structures, systems, and components not only
survive the earthquake itself but also sustain no damage sufficient to impair
continued operation of the facility without undue risk to the health and
safety of personnel, the public, and the environment.
Recent research on individual faults and segments of larger fault zones
in California and Utah suggests that individual faults generate the same size
earthquakes with a narrow range of magnitudes near the maximum and with
similar time lapses between events (Schwartz et al., 1981; Schwartz and
Coppersmith, 1984). These earthquakes, specifically their magnitude and
recurrence, are referred to as tne "Characteristic Earthquake" for the fault.
Loosely, the Characteristic Earthquake is comparable to the Safe Shutdown
Earthquake except that the Cha racteri sti c Earthquake has a specific proba
bility (that is, recurrence interval), is fault-specific, and its magnitude
approximates that of the maximum earthquake (Safe Shutdown Earthquake).
6
Thus, for Los Alamos with proximal or near-field capable faults (within
5 miles or about 8 km), we take the Characteristic Earthquake as the most
realistic model for expectable large earthquakes. The Operating Basis
Earthquake for Los Alamos may best be based on the regional historical and
instrumental seismicity.
I-E: TECTONIC PROVINCE OF LOS ALAMOS
Los Alamos National Laboratory lies within the Rio Grande rift, which is
a subprovince of the larger Basin and Range tectonic province. Some workers
maintain that certain characteristics (particularly geophysical) distinguish
the Basin and Range from the Rio Grande rift in southern New Mexico and Mexico
(Seager and Morgan, 1979), but they imply that, if anything, the rift is the
more tectonically active of the two. Certainly the Basin and Range and Rio
Grande rift have remarkably similar tectonic and magmatic histories over the
last approximately 30 million years (Atwater, 1970; Christiansen and Lipman,
1972; Crowe, 1978; McKee et al., 1970; Chapin, 1979; Chapin and Seager, 1975;
Baldridge et al ., 1980; Gardner and Goff, 1984; Gardner, 1985), and both share
a genesis in the extensional deformation resultant from plate boundary inter
actions of the North American and Pacific plates (Atwater, 1970). The North
American-Pacific plate boundary is active in the present day (San Andreas
fault), and the de formation in the Basin and Range continues as we 11. Both
the Basin and Range and the Rio Grande rift have experienced historic
macroseismicity (for example, Wollard, 1968; Stein and Bucknam, 1985; Arabasz
et a 1., 1979; Dames and Moore, 1972). Furthermore, the Basin and Range and
Rio Grande rift show similar styles of deformation, present-day state-of
stress patterns, and both are microseismically active (for example, Smith and
Bruhn, 1984; Wall ace, 1984; Cash and Wolff, 1984; Zoback and Zoback, 1980;
Aldrich and Laughlin, 1982). Hence, according to the definitions of 10 CFR
100-A the Basin and Range and the Rio Grande rift are one in the same tectonic
province.
As discussed above, 10 CFR 100-A requires, in the absence of site
specific, deterministic data, the Safe Shutdown Earthquake for a given site
within a tectonic province to be based on the history of the entire tectonic
province. At least seven historical earthquakes with magnitudes greater than
7 have occurred in the Basin and Range since 1871 (DuBois and Smith, 1980;
7
Stein and Bucknam, 1985). One of these earthquakes, with an estimated magni
tude of greater than 7. 2, produced surface rupture that ex tended within a few
kilometers of the intersection of the New Mexico-Arizona-Mexico borders in
1887 (DuBois and Smith, 1980). Furthermore, recent work on the paleoseismic
ity of some young faults in the central Rio Grande rift indicates they have
repeatedly genera ted earthquakes with magnitudes of 6.8 to 7.1 (Machette,
1986). Hence, without the site-specific, deterministic data that we seek to
obtain in this program, the Safe Shutdown Earthquake based on the tectonic
province approach for Los Alamos would have to be greater than magnitude 7.
8

CHAPTER II: FIELD STUDIES OF THE PAJARITO FAULT SYSTEM
9
II -A: INTRODUCTION
We use the term Pajari to fault system to refer to the series of faults
and fault zones that define the active western and northwestern boundary of
the Espanola Basin of the Rio Grande rift. Because of structural, geometric,
and genetic relations of fault zones in the area, we conclude they all
constitute the zone of active or potentially active rift-bounding deformation
in the vicinity of Los Alamos, as suggested by Golombek (1981) and Gardner and
Goff (1984). The Pajarito fault system consists of the faults and fault zones
that comprise the structural elements of the intrabasin Velarde graben as
proposed and/or discussed by Budding (1978), Manley (1979), Dransfield and
Gardner (1985), and Aldrich (1986). In that these faults and fault zones
constitute a single, albeit complex, structural entity, they all must be
considered integral members of the same system (see below).
The Pajarito fault system includes four fault zones that have been active
in the Quaternary (see below); however, in a regional context the Pajarito
fault system is also related to the active Jemez fault zone in the western
Jemez Mountains, the post-Pliocene Santa Ana Mesa fault zone in the southern
Jemez Mountains, the inactive Miocene Canada de Cochiti fault zone in the
southern Jemez Mountains, the post-Pliocene La Bajada fault southeast of
Cochiti, and the active eastern Embudo and Velarde fault zones north of
Espanola (Smith et al., 1970; Dames and 1"1 oore, 1972; Muehlberger, 1978, 1979;
Manley, 1979; Goff and Kron, 1980; Gardner and Goff, 1984; Manley, 1984;
Gardner, 1985; Aldrich, 1986).
We divide the Pajari to fault system into three geographic segments for
purposes of discussion (Figure 1). It must be emphasized that these segments
are geographic, not structural. We make these divisions strictly for descrip
tive purposes and do not imply lack of continuity of the fault system. Each
segment of the fault system has yielded different kinds and variable amounts
of information relevant to seismic hazards. The southern segment extends from
the Rio Grande near Cochiti on the south to the southern boundary of Los
Alamos County on the north. The southern segment provides limited information
on young fault movements, structural continuity
well-preserved >100-m Quaternary fault scarps.
all elements of the fault system within Los
with more regional faults, and
The centra 1 segment includes
A 1 amos County. The centra 1
segment exhibits disrupted stream gradients across faults, 100-m Quaternary
scarps, changes in sense of movement, and localities where vertical movements
10
have dammed drainages. The northern segment comprises the fault system north
of Los Alamos to the Rio Chama. In the northern segment there is abundant
geomorphic evidence for young and recurrent movements in the fault system. In
discussing each segment of the fault system, we provide brief descriptions of
structural relations of faults and fault zones, relations to regional
structures, results of field studies that constrain nature, history, ages,
amounts, and/or rates of faulting, and areas where data are lacking. Table II
provides a summary of some of the results of the field studies and their
seismic hazards implications.
li-B: SOUTHERN SEGMENT OF THE PAJARITO FAULT SYSTEM
The southern segment of the Pajarito fault system as defined here
stretches from State Highway 4 south across the east side of St. Peters Dome
(MAP IV-A, Sheets 1 and 2). At this point the fault zone splays, with one
group of faults continuing due south to south-southeast toward the La Bajada
fault east of the Rio Grande and the other group of faults trending southwest
for another 6 km. Smith et al. (1970) show the south-trending splay joining
the La Bajada fault and show the southwest-trending splay bending south and
dying out in Tertiary sediments in the northern Santo Domingo Basin. Along
its entire 30-km 1 ength the southern segment of the Pajari to fault zone shows
significant offset of stratigraphic units and zones of gouge and breccia in
canyon exposures.
The oldest rocks in the southern segment area are west-til ted sandstones
and conglomerates of the Eocene Galisteo Formation. This sequence is bounded
on the east and southeast by the Pajarito fault zone and is unconformably
overlain by non- to weakly indurated sands tones and si 1 ts tones of the Miocene
Santa Fe Group. Many thin flows and pillow-palagonite zones of alkali basalt
are scattered throughout upper horizons of the Santa Fe Group, and a K-Ar date
on one of these basalts is 16.5 Ma (Gardner and Goff, 1984). Unconformably
overlying the Santa Fe Group is the Keres Group, the earliest sequence of
Jemez volcanic rocks. Volcaniclastic rocks of the Keres Group generally dip
from 3° to l0°W, and the Keres Group sequence ranges in age from >13 to 6 Ma
(Gardner et al ., 1986).
Overlying the Keres Group is one flow of Tschicoma dacite (3.67 Ma;
Dalrymple et al., 1967) of the Polvadera Group in upper Frijoles Canyon and
flows and tuffs of the Tewa Group. Tewa Group rocks consist primarily of
11
Los Alamos County
St. Peters Dome
miles 0
kilometers 0 5
White Rock . ./
10
I /
/./
5
j
/ J
j
. 10
" \ ~
\ . ,., ..;,!
Espanola?
{j/ c§"f' & .
. sJ ~
/
\ /
/ '
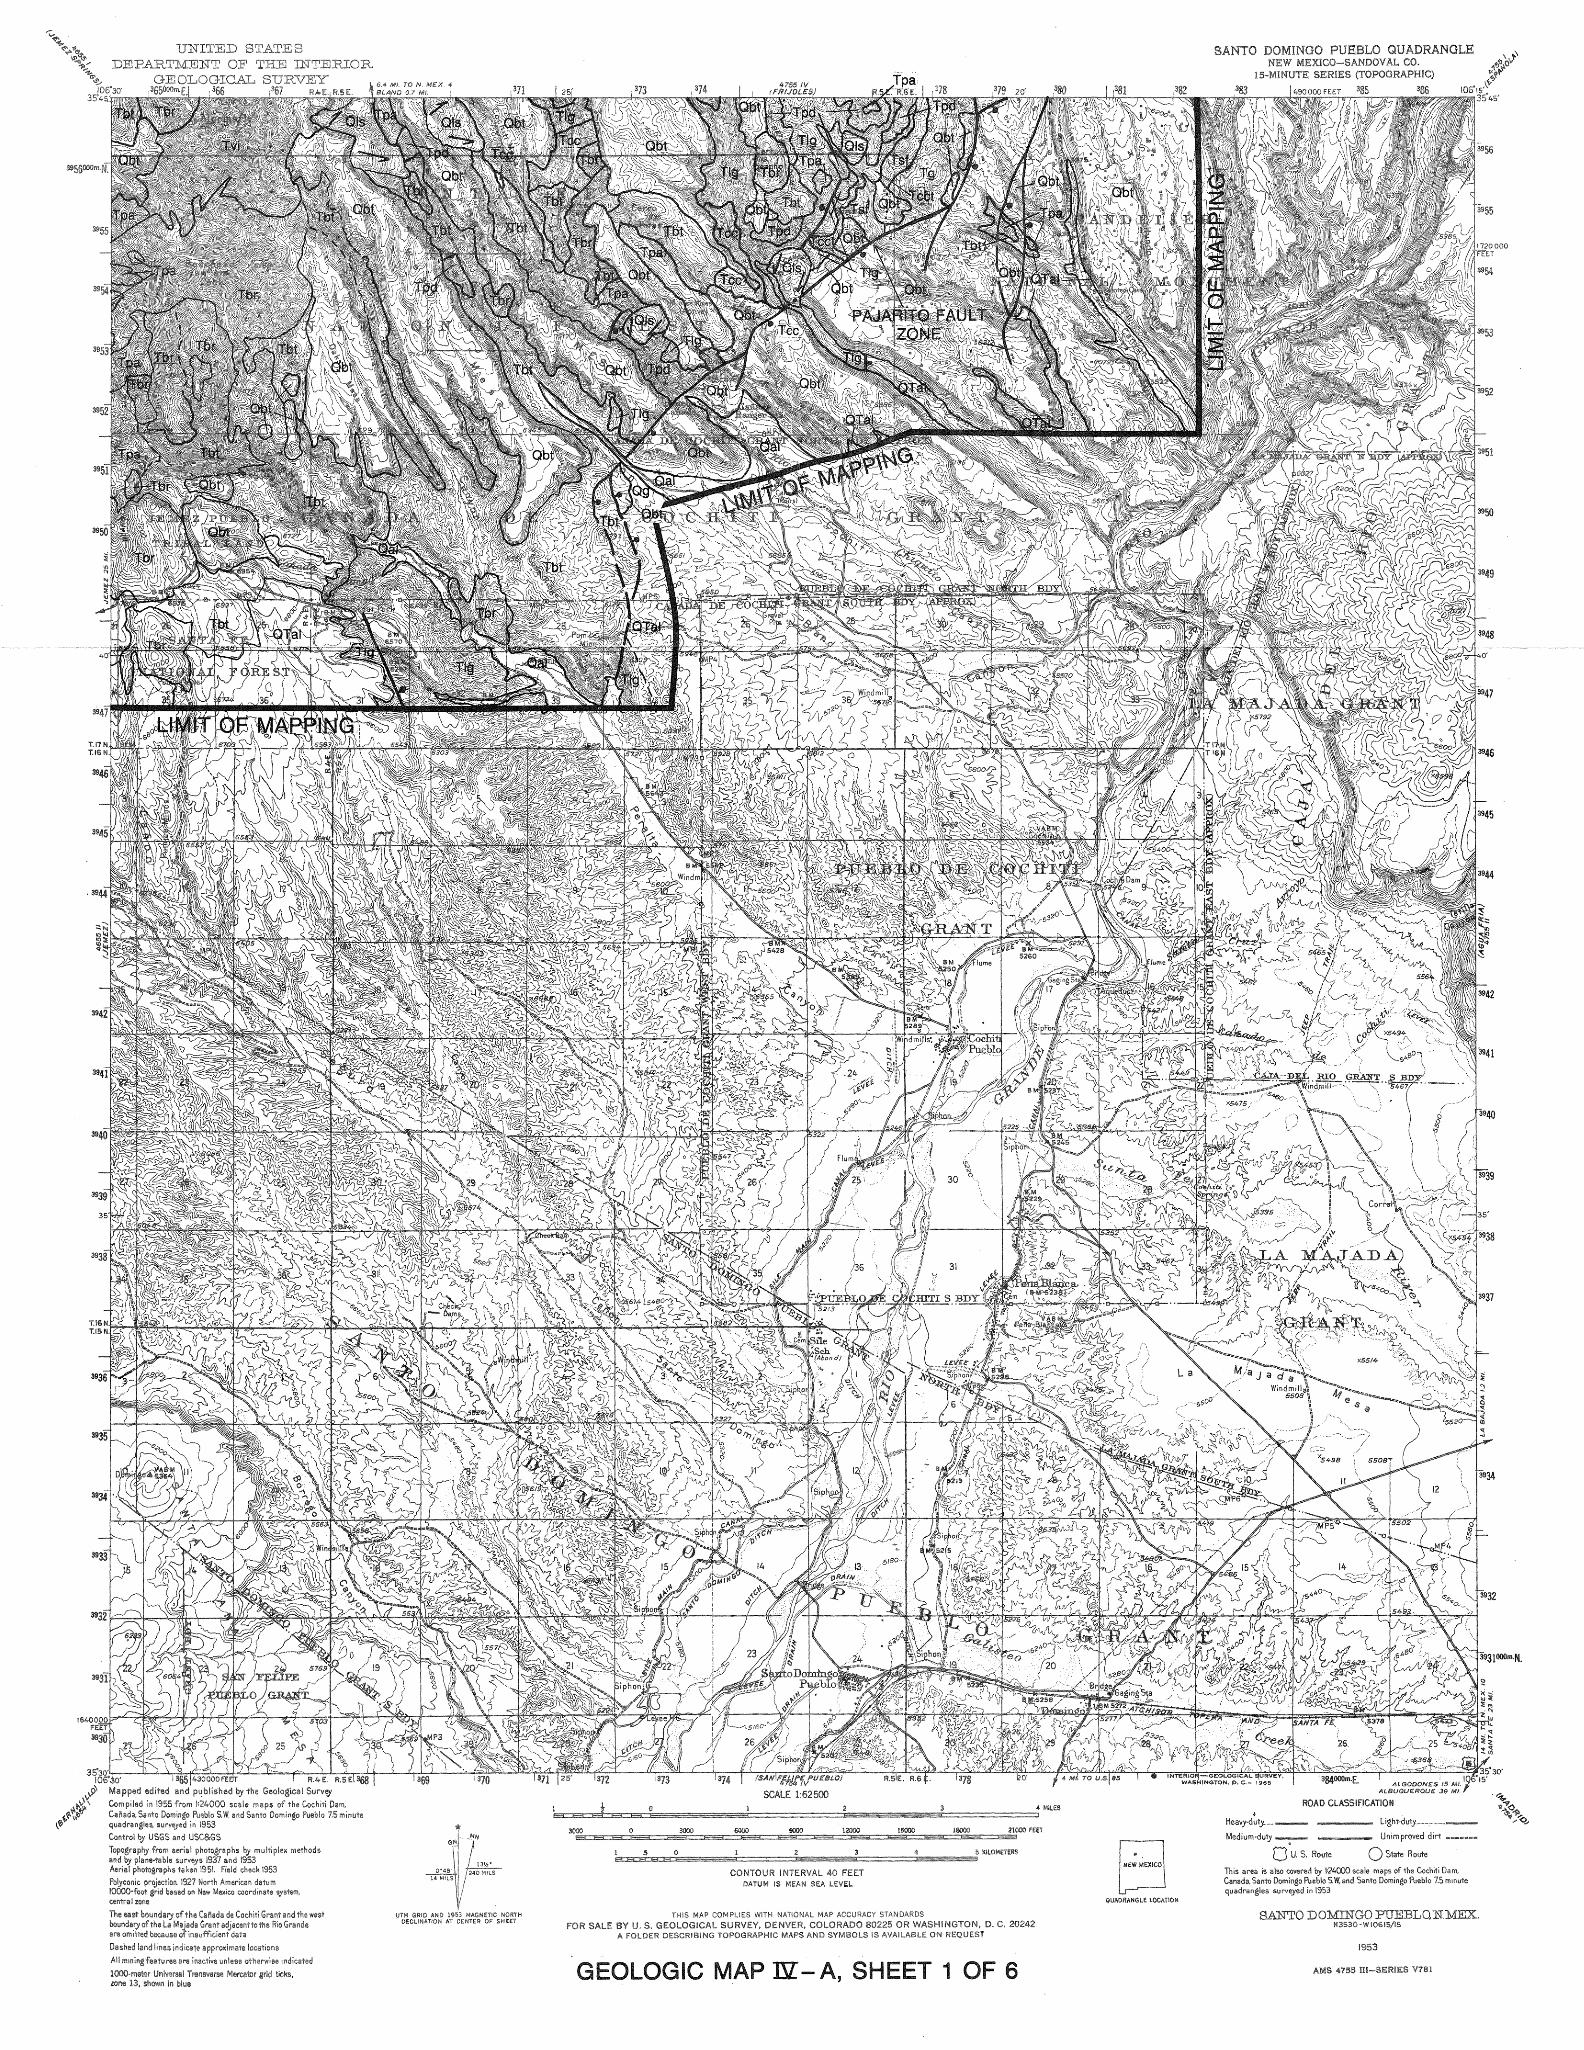
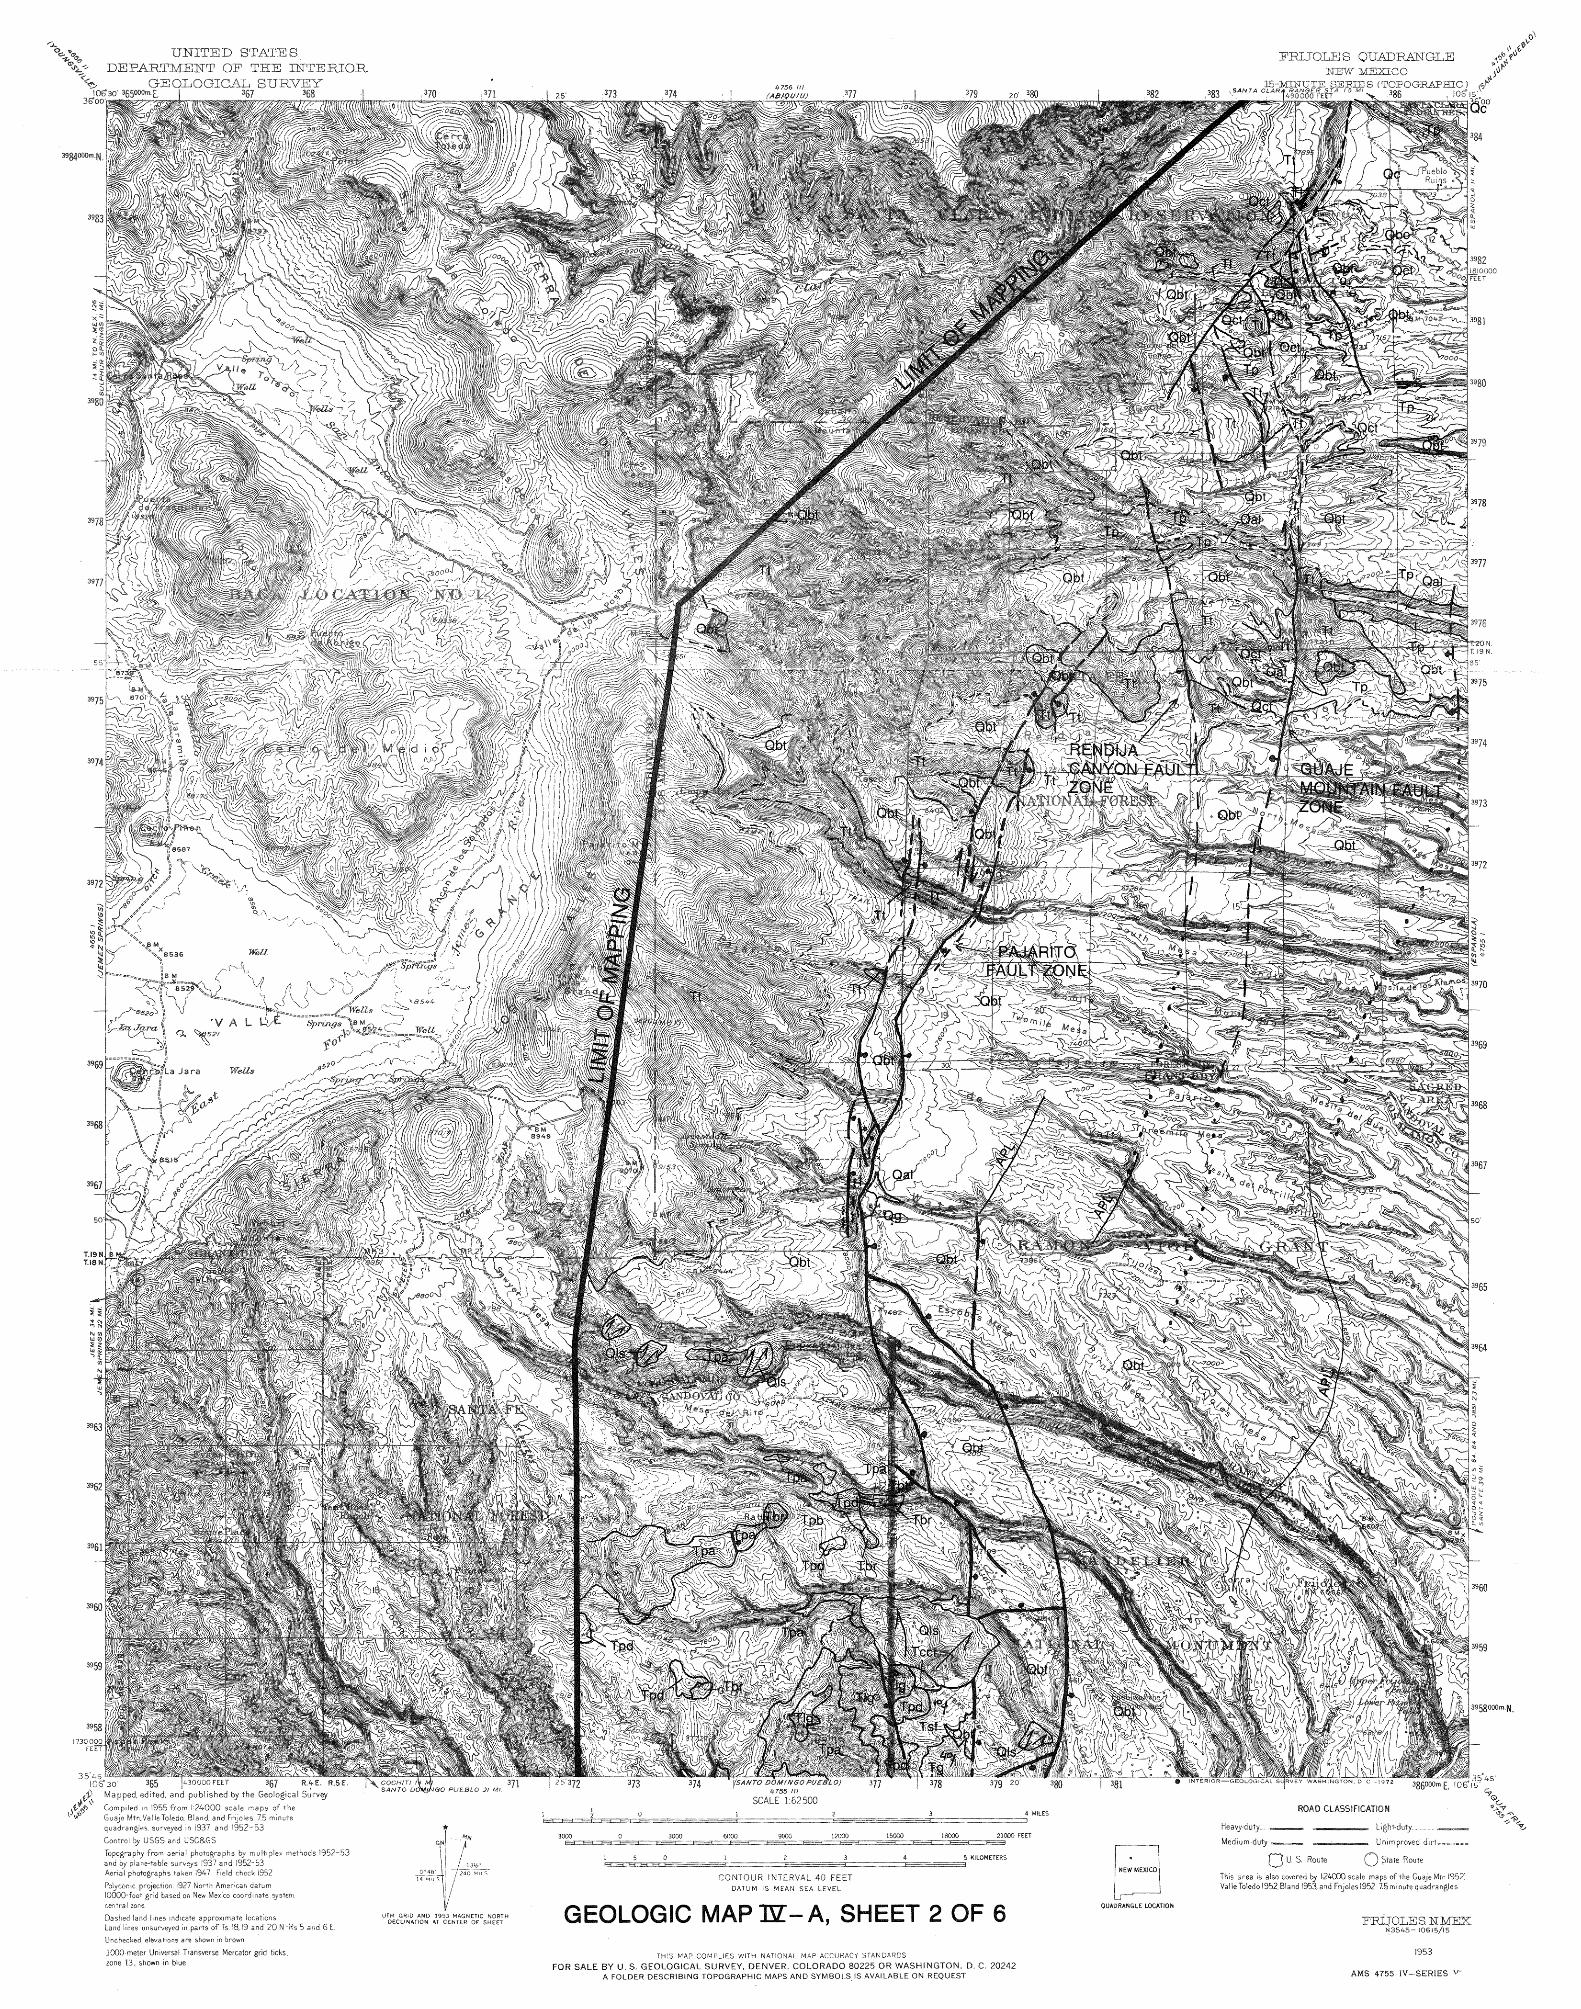
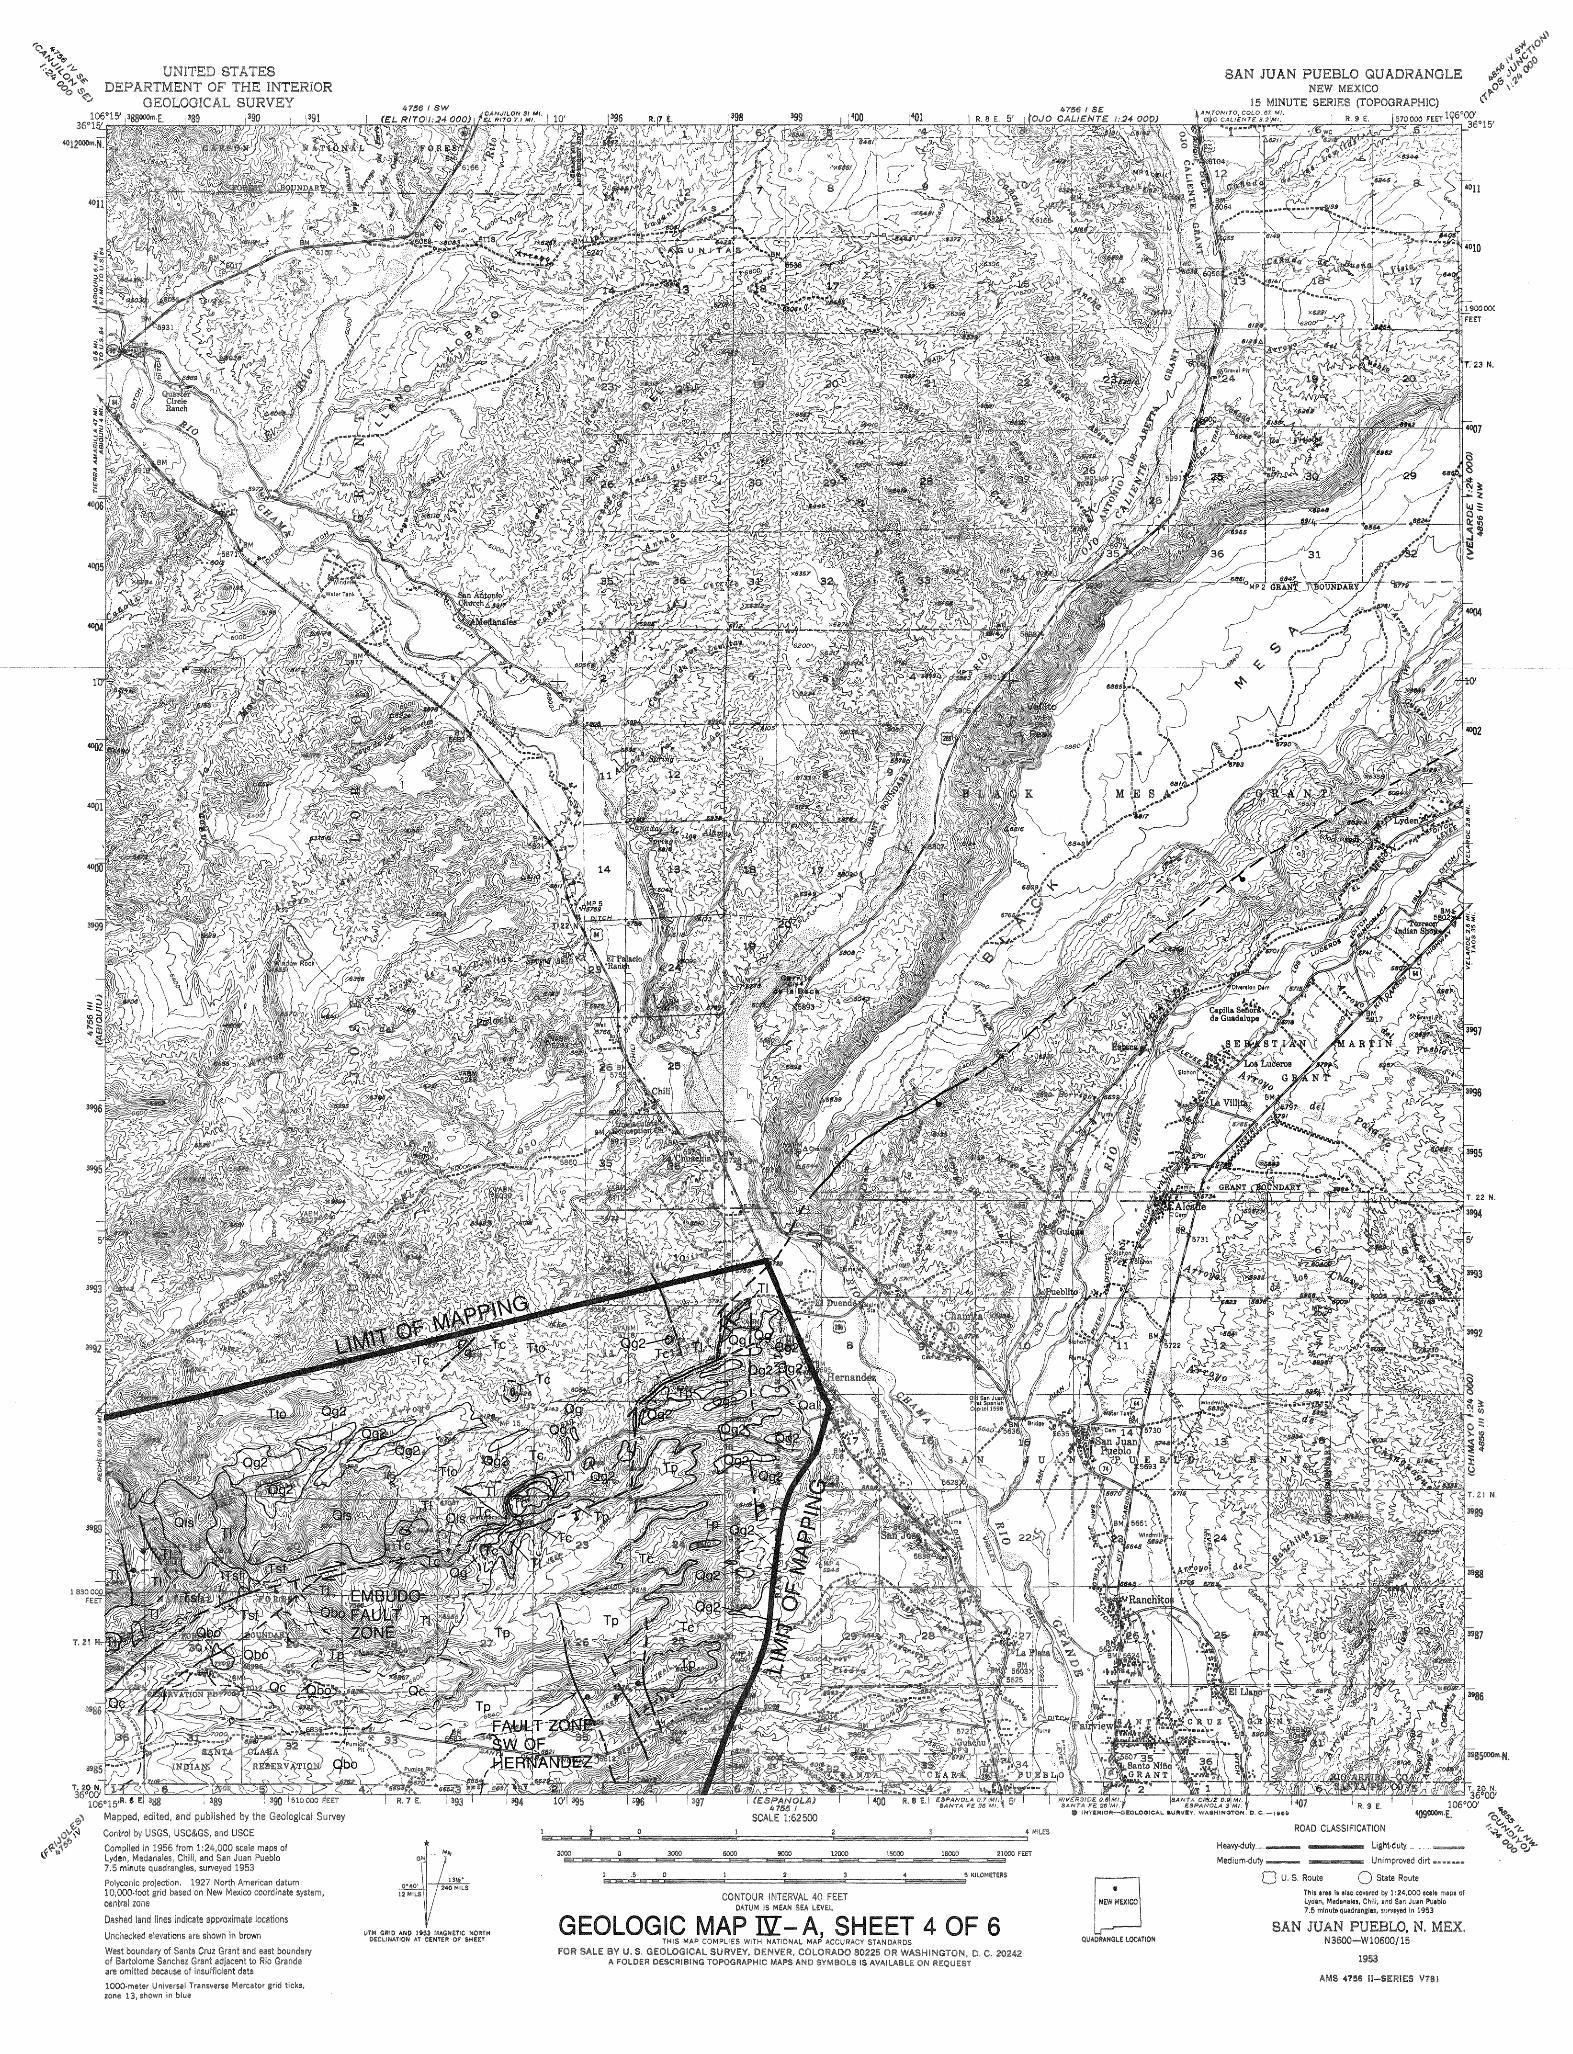
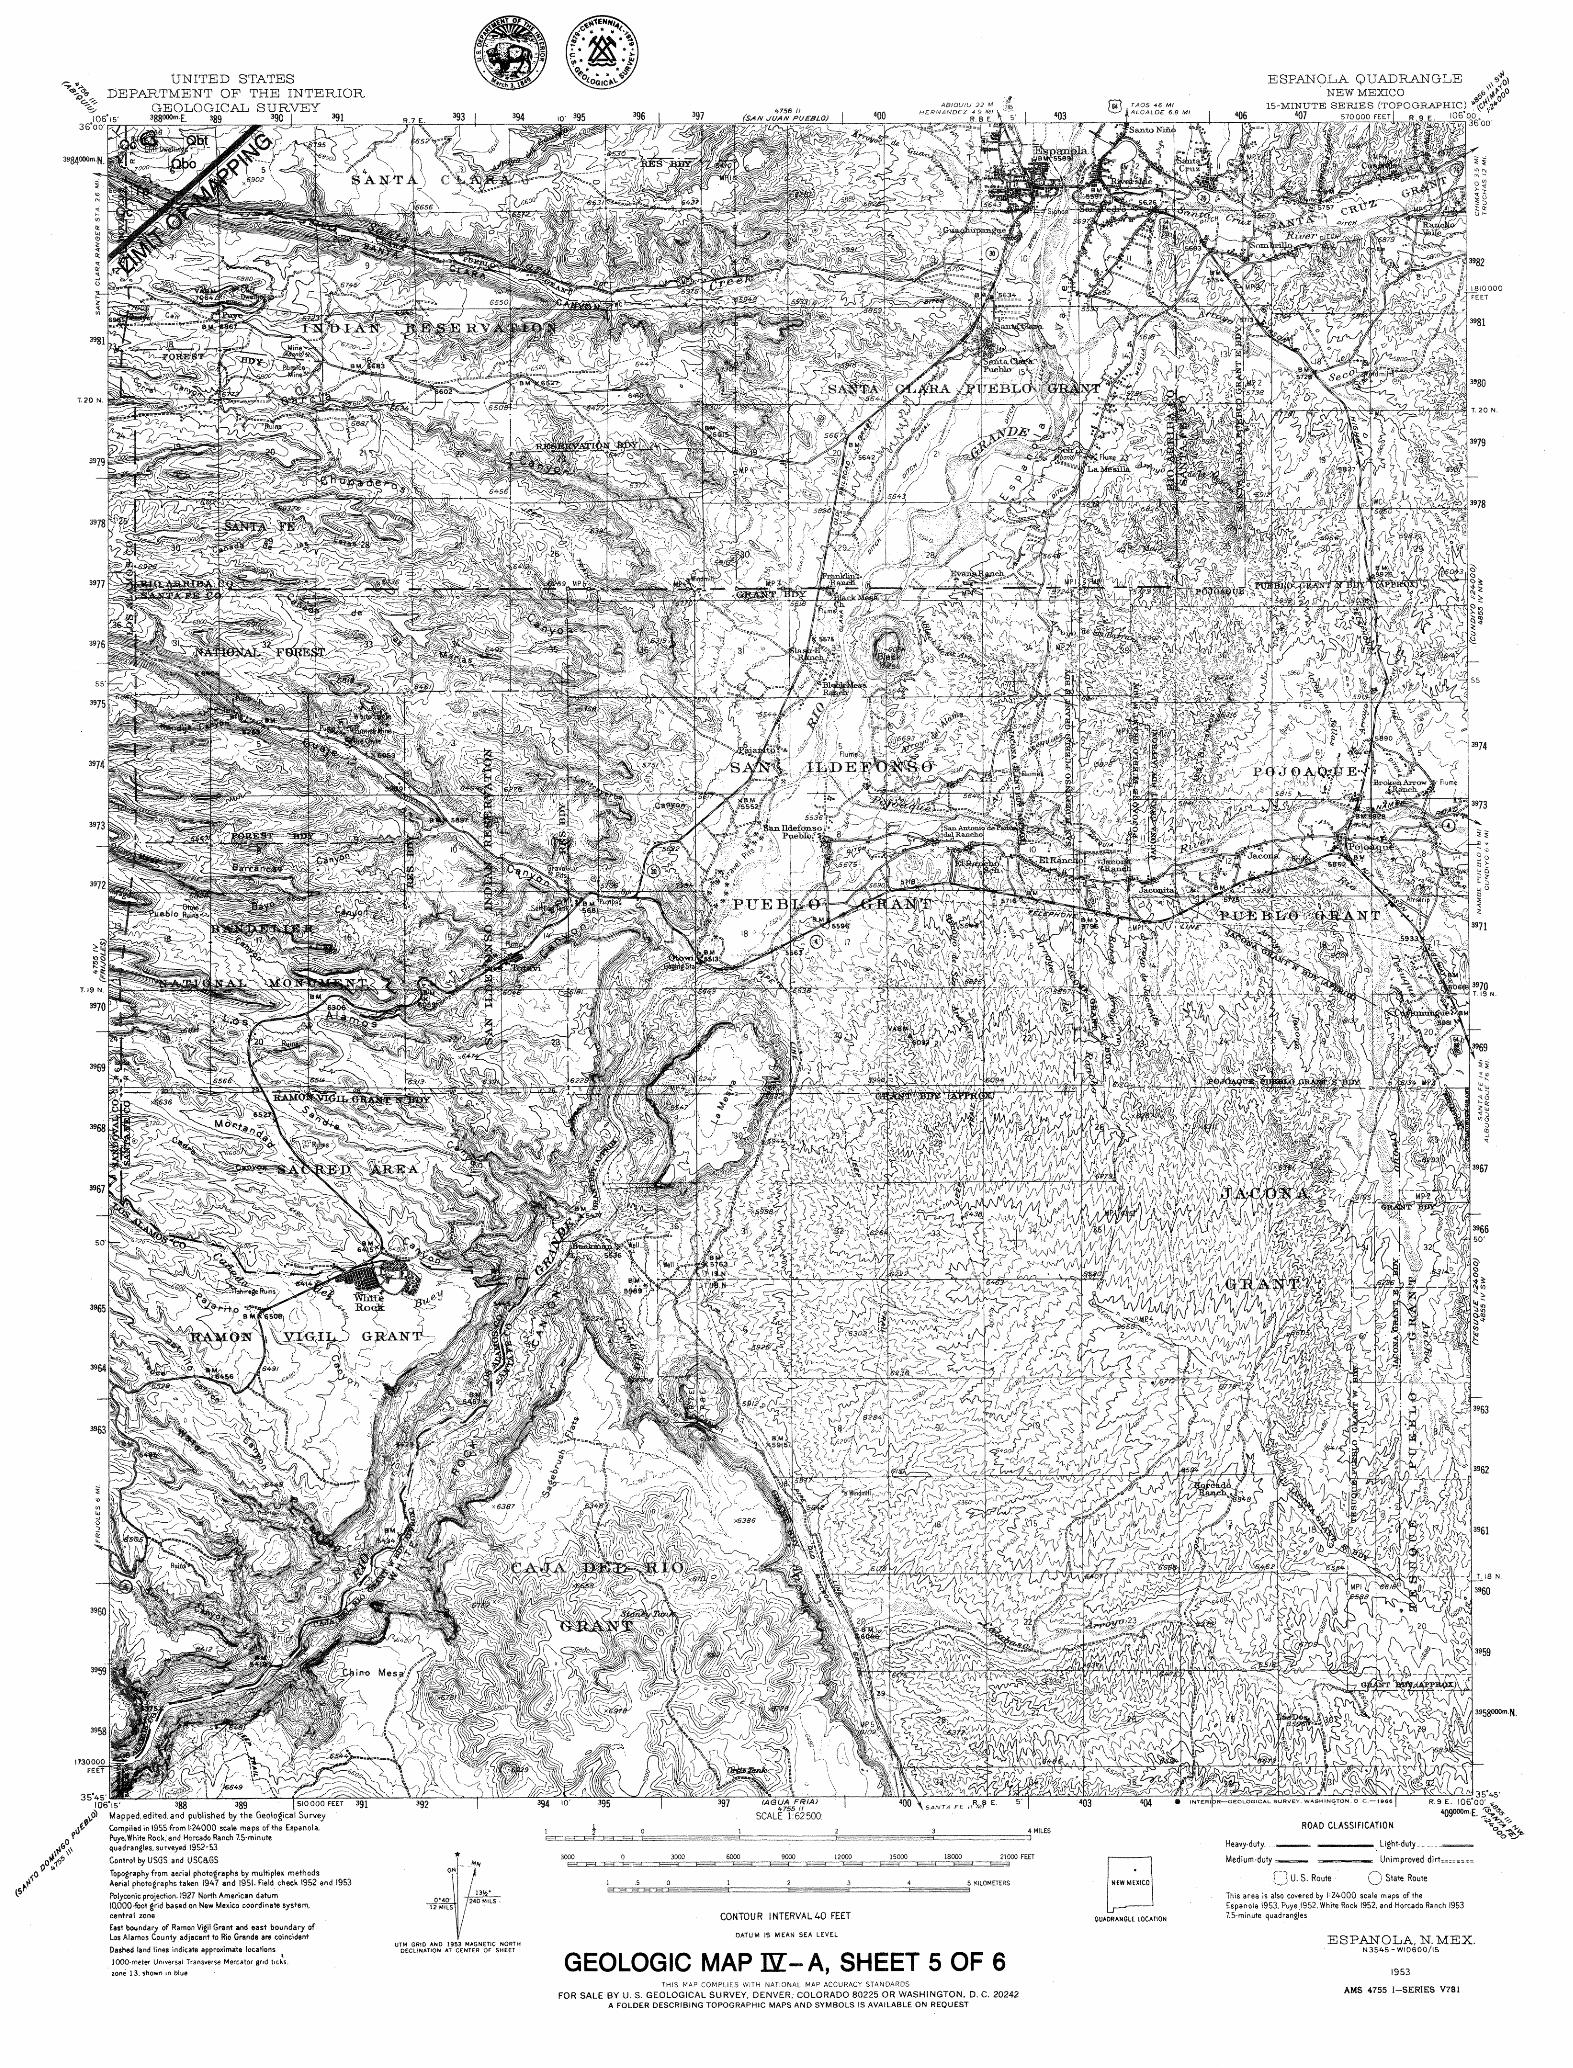
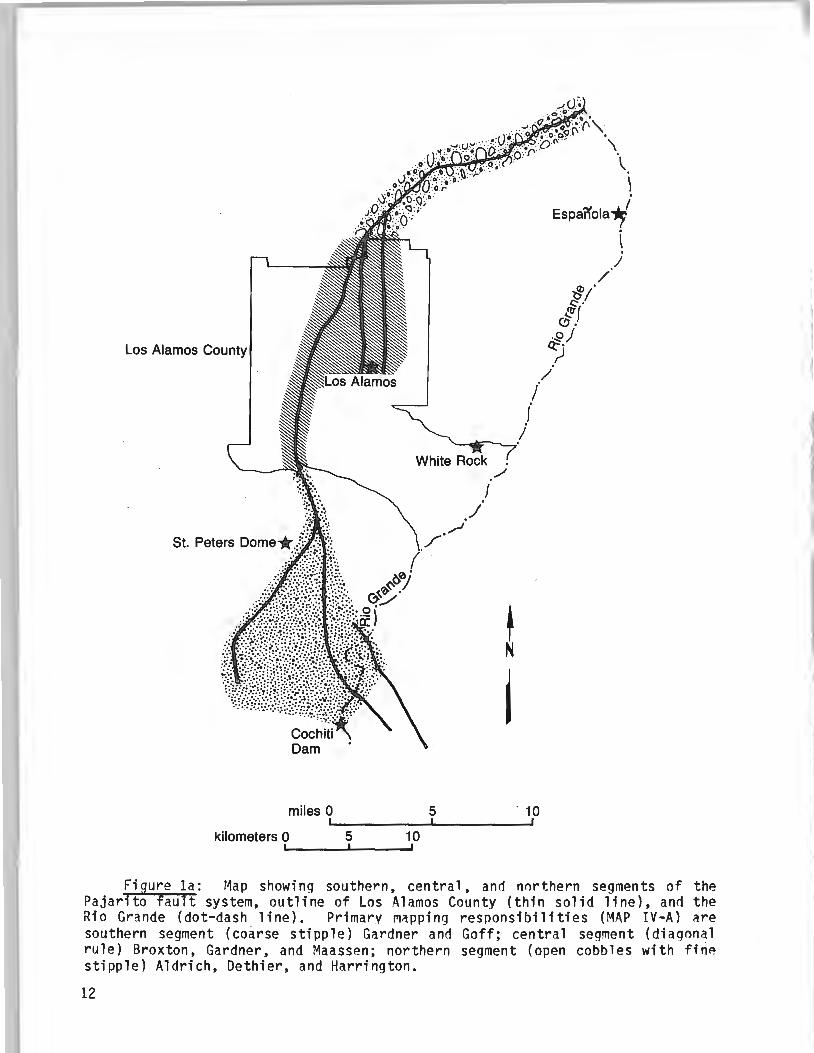
Figure la: r~ap showing southern, central, an<1 northern segments of the Pajarito fault system, outline of Los Alamos County (thin solid line), and the Rio Grande (dot-dash line). Primary r1apping responsibilities (MAP IV-A) are southern segment (coarse stipple) Gardner and Goff; central segment (diagonal rule) Broxton, Gardner, and Maassen; northern segment (open cobbles with fine stipple) Aldrich, Dethier, and Harrington.
12
106°30' 106°15' 106°00' 36°15'~~----------------+-----------------~-36°15'
ABIQUIU 15' QUAD.
SAN JUAN PUEBLO 15' QUAD.
36°00'-t-------------r+-------...,-+--~-36°00' FRIJOLES Espanola
15' QUAD.
SANTO DOMINGO PUEBLO 15' QUAD.
0
35 °30'--+-----------------+-35 °30'
106°30'
/ r'
(
)
/ /
I
,.J
ESPANOLA 15' QUAD
35°45'
106°00'
N
t 5 10 miles
Q 5 10 kilometers I .
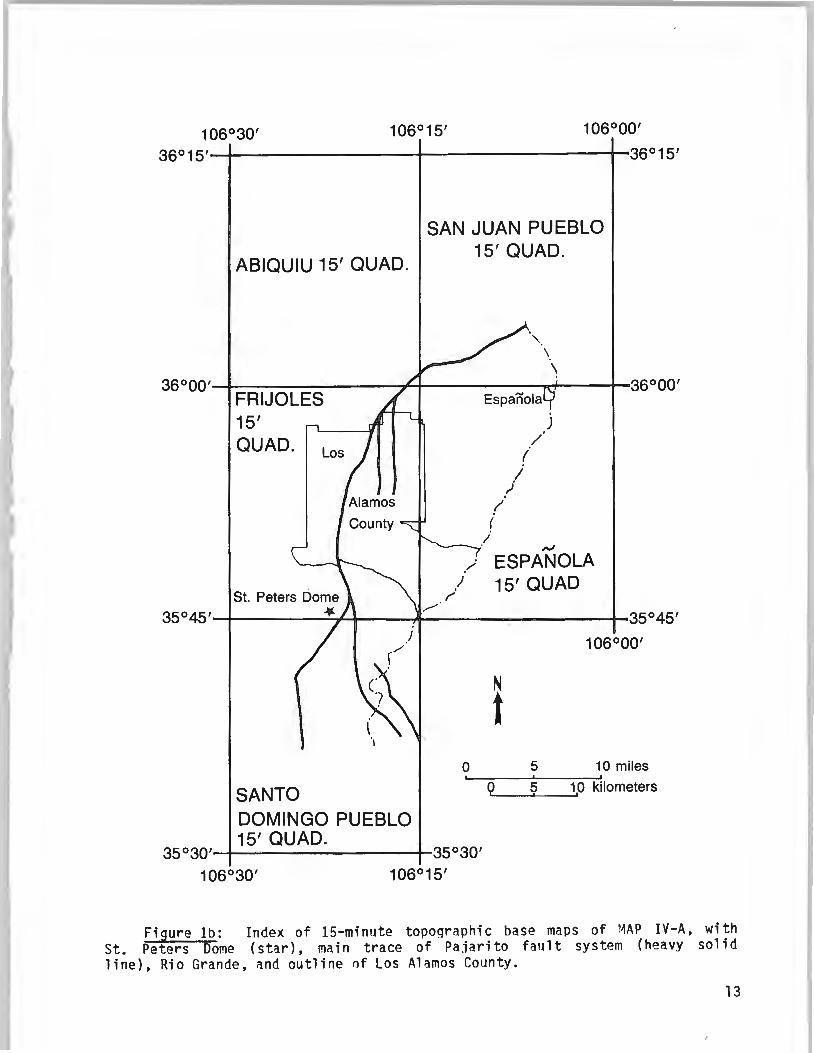
Figure lb: Index of 15-mi nute topographic base maps of ~~AP IV-A, with St. Peters Dome (star), main trace of Pajarito fault system (heavy solid line), Rio Grande, and outline of Los Alamos County.
13

TABLE II: RESULTS FROM FIELD STUDIES WITH DIRECT SEISMIC HAZARDS IMPLICATIONS
Age
<1.1 Ma
<500 Ka ( 7)
<600-350 Ka
<500-300 Ka
<350 Ka
<240 Ka
<42 Ka
Holocene ( <10 Ka)
"2 Ka
Offset
6 m
0.5 m
0.2 m
Rate (cm/yr)
O.Z-0.4
0.2
0.02
0.02-0.04
0.03
0.02
0.005
0.002
0.001
14
RECENCY OF FAULT MOVEMENTS
Remarks
Offset Bandelier Tuff and younger rocks throughout entire fault system.
6-m offset of older alluvium, Pajarito fault in Bland Canyon; alluvium contains cobbles of Bandelier Tuff, but age otherwise not well constrained.
o1 geomorphic surface deformed on Embudo and Pajarito faults .
60 to 110 m drainage gradient disruption, Pajarito fault in W~ter Canyon.
50-m downdropping of 01 geomorphic surface, Embudo fault.
Faulted channel deposits younger than 02 geomorphic surface, Embudo fault.
Faulted paleochannel surface, Arroyo de la Presa, Embudo fault.
Dammed drainages and alluvial thicknesses, Rendija and Guaje canyons, Guaje Mountain fault; evidence indirect and not conclusive.
Disrupted soil profiles, fault southwest of Hernandez.
ESTIMATES OF EARTHQUAKE MAGNITUDE BASED ON DISPLACEMENT PER EVENT RELATIONSHIP
(Figure 25 of Slemmons, 1977)
Magnitude Remarks
7.B Based on assumption of one event causing entire offset of older alluvium, Pajarito f~ult in Bland Canyon.
6.8 Faulted paleochannel, Arroyo de la Presa, Embudo fault.
6.5 Faulted channel fill cut into 02 geomorphic surface, Embudo fault.
ESTIMATES OF MAGNITUDE AND RECURRENCE ASSUMING AVERAGE MINIMUM RATES OF MOVEMENTS REPRESENT STRAIN RATES
(Based on Figure 2 of Slemmons, 1977)
11agni tude /Recurrence
6-6.3/100 yr
6/100 yr
6/1000 yr
6-6.5/1000 yr
6.2/1000 yr
6/1000 yr
6.4/10,000 yr
6/10,000 yr
5.8/10,000 yr
Remarks
Water Canyon; average over 0. 05 t1a; es tim~ te y1;f1 i z.e~ nonconservative incision rates that may be unrealistic.
Near Hernandez; average over 0.002 Ma.
South of Frijoles Canyon; average over 1.1 Ma.
Water Canyon; average over 0.5 Ma.
Santa Clara Canyon; average over 2 Ma.
Embudo fault; average over 0.25 Ma.
Lobato Mesa; average over 10 Ma.
Lobato Mesa; average over 1.1 Ma.
Arroyo de la Presa; average over 0.042 Ma.
welded lower and upper Bandelier Tuffs (1.45 and 1.12 Ma respectively; Doell
et al., 1968; Izett et al., 1980). Lower Bandelier Tuff (Otowi Member) is
thickest northwest of St. Peters Dome suggesting it ponded in a low area
between Valles caldera and the uplifted St. Peters Dome complex. Thin flows
and tuffs of Cerro Toledo Rhyolite (1.43 Ma; F. Goff, unpub. data) outcrop
between the Bande 1 i er Tuffs in the northwestern part of Alamo Canyon. The
youngest volcanic unit is the El Cajete pumice (0.13 Ma; Marvin and Dobson,
1979), which has accumulated in south- and east-facing slopes or forms a thin
veneer on plateau tops.
Other Quaternary age units in the vicinity of the southern segment of the
Pajarito fault system include landslide or mass-wasting deposits, colluvium,
"older" alluvium, and active alluvium.
1. Faults
The northern half of the southern segment of the Pajarito fault system is
a zone roughly 1 to 3 km wide marked by two parallel faults with down-to-the
east displacement of the upper member of the Bandelier Tuff. The maximum
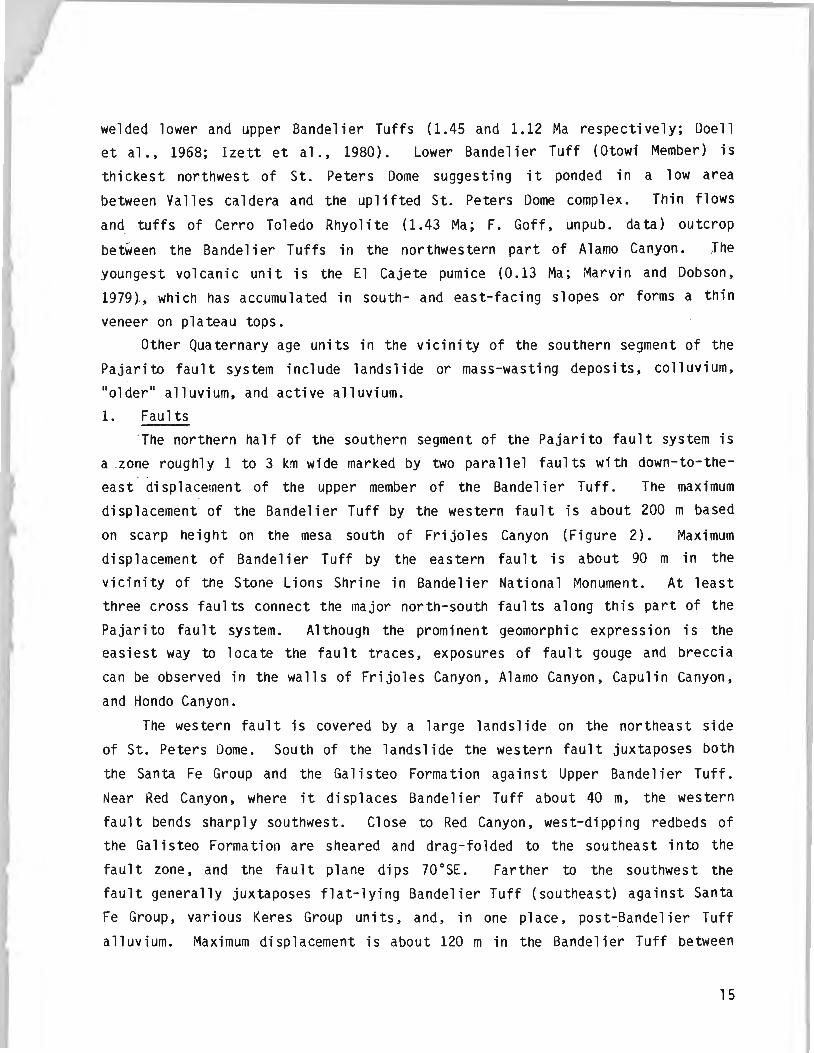
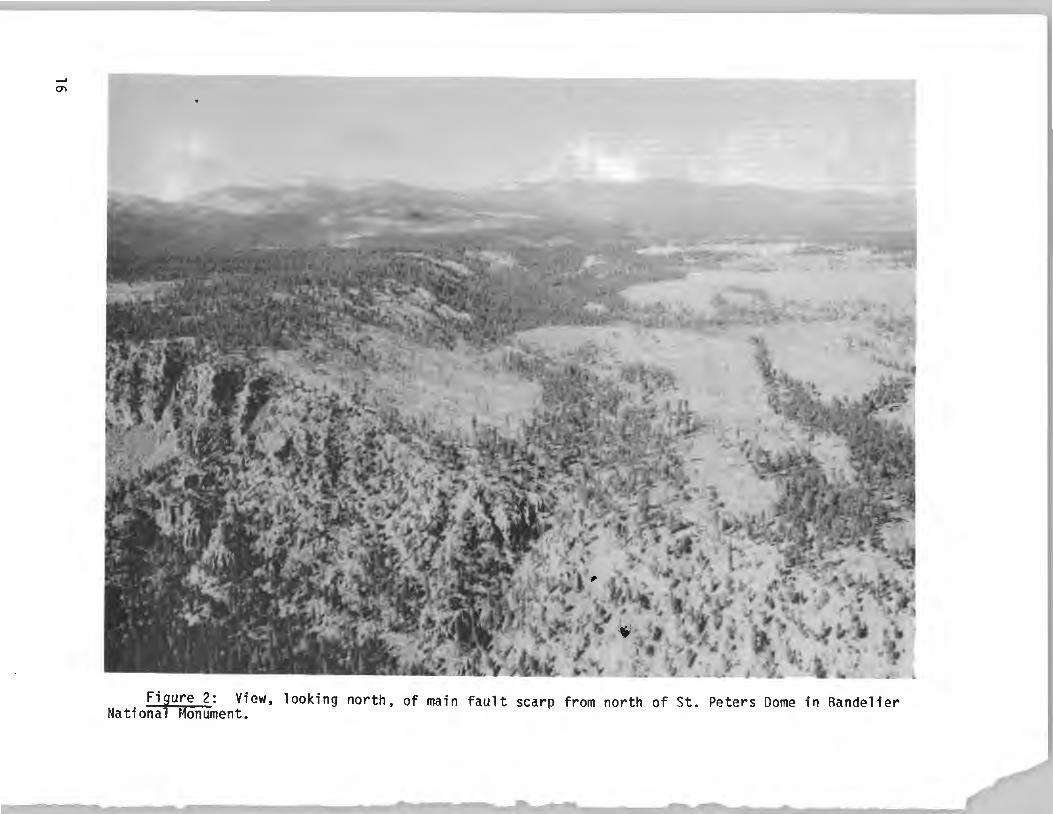
displacement of the Bandelier Tuff by the western fault is about 200 m based
on scarp height on the mesa south of Frijoles Canyon (Figure 2). Maximum
displacement of Bandelier Tuff by the eastern fault is about 90 m in the
vicinity of the Stone Lions Shrine in Bandelier National Monument. At least
three cross faults connect the major north-south faults along this part of the
Pajari to fault system. A 1 though the prominent geomorphic expression is the
easiest way to locate the fault traces, exposures of fault gouge and breccia
can be observed in the walls of Frijoles Canyon, Alamo Canyon, Capulin Canyon,
and Hondo Canyon.
The western fault is covered by a large landslide on the northeast side
of St. Peters Dome. South of the landslide the western fault juxtaposes both
the Santa Fe Group and the Galisteo Formation against Upper Bandelier Tuff.
Near Red Canyon, where it displaces Bandelier Tuff about 40 m, the western
fault bends sharply southwest. Close to Red Canyon, west-dipping redbeds of
the Galisteo Formation are sheared and drag-folded to the southeast into the
fault zone, and the fault plane dips 70°SE. Farther to the southwest the
fault generally juxtaposes flat-lying Bandelier Tuff (southeast) against Santa
Fe Group, various Keres Group units, and, in one place, post-Bandelier Tuff
alluvium. Maximum displacement is about 120m in the Bandelier Tuff between
15
0"1
Figure 2: View, looking north, of main fault scarp from north of St. Peters Dome in Bandelier National Monument.
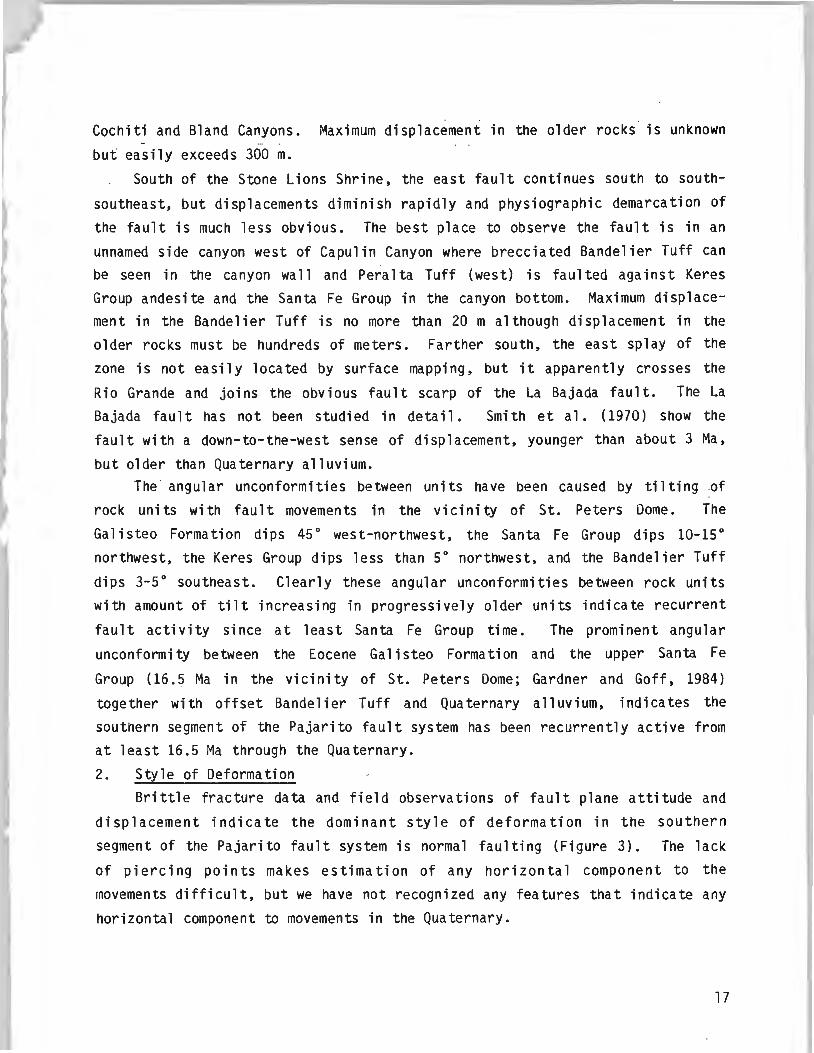
Cochiti and Bland Canyons. Maximum displacement in the older rocks is unknown
but easily exceeds 300 m.
South of the Stone Lions Shrine, the east fault continues south to south
southeast, but displacements diminish rapidly and physiographic demarcation of
the fault is much less obvious. The best place to observe the fault is in an
unnamed side canyon west of Capulin Canyon where brecciated Bandelier Tuff can
be seen in the canyon wall and Peralta Tuff (west) is faulted against Keres
Group andesite and the Santa Fe Group in the canyon bottom. Maximum displace
ment in the Bandelier Tuff is no more than 20 m although displacement in the
older rocks must be hundreds of meters. Farther south, the east splay of the
zone is not easily located by surface mapping, but it apparently crosses the
Rio Grande and joins the obvious fault scarp of the La Bajada fault. The La
Bajada fault has not been studied in deta i 1. Smith et a 1. ( 1970) show the
fault with a down-to-the-west sense of di sp 1 a cement, younger than about 3 Ma,
but older than Quaternary alluvium.
The angular unconformities between units have been caused by tilting of
rock units with fault movements in the vicinity of St. Peters Dome. The
Galisteo Formation dips 45° west-northwest, the Santa Fe Group dips 10-15°
northwest, the Keres Group dips less than 5° northwest, and the Bandelier Tuff
dips 3-So southeast. Clearly these angular unconformities between rock units
with amount of tilt increasing in progressively older units indicate recurrent
fault activity since at least Santa Fe Group time. The prominent angular
unconformity between the Eocene Ga 1 i steo Formation and the upper Santa Fe
Group (16.5 Ma in the vicinity of St. Peters Dome; Gardner and Goff, 1984)
together with offset Bandelier Tuff and Quaternary alluvium, indicates the
southern segment of the Pajarito fault system has been recurrently active from
at least 16.5 Ma through the Quaternary.
2. Style of Deformation
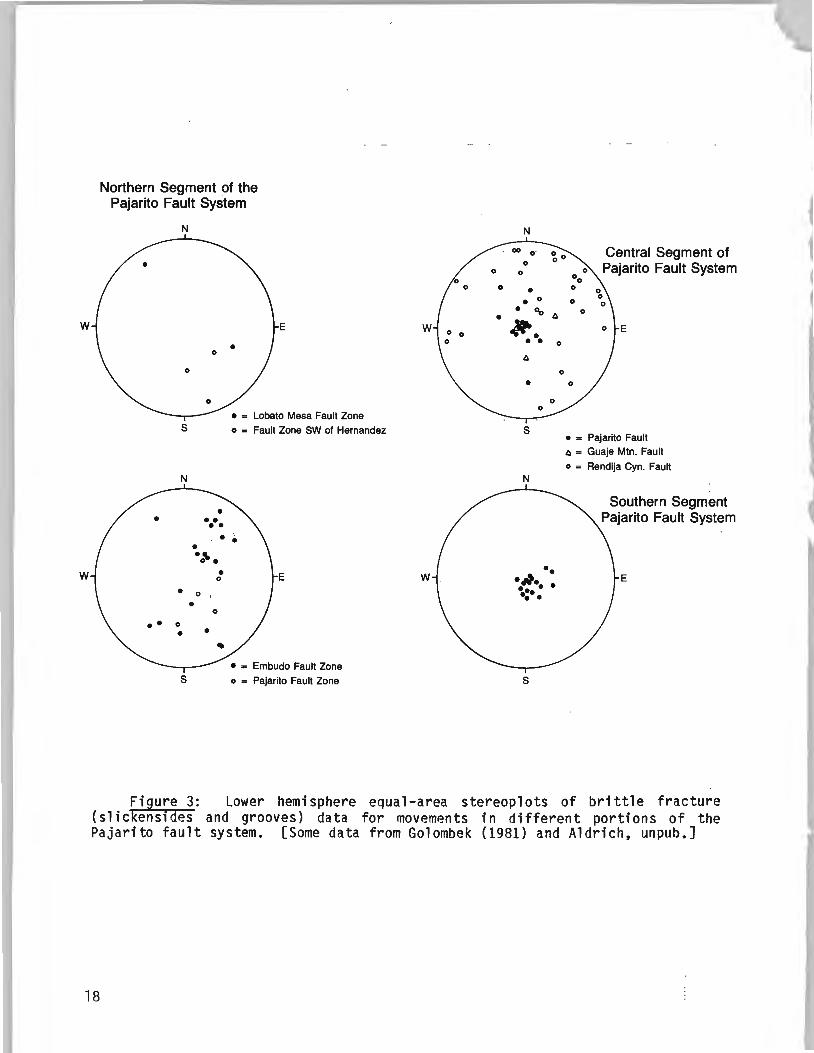
Brittle fracture data and field observations of fault plane attitude and
displacement indicate the dominant style of deformation in the southern
segment of the Pajarito fault system is normal faulting (Figure 3). The lack
of piercing points makes estimation of any horizontal component to the
movements difficult, but we have not recognized any features that indicate any
horizontal component to movements in the Quaternary.
17
w
w
Northern Segment of the Pajarito Fault System
N N
Central Segment of 0 0 Pajarito Fault System
0 • • 0 0
• 00 0 • (;.
E w ~. • • 0 • 0 (;.
0 0
• 0
• = Lobato Mesa Fault Zone s o = Fault Zone SW of Hernandez s • = Pajarito Fault
t;. = Guaje Mtn. Fault
o = Rendija Cyn. Fault N N
Southern Segment • •• Pajarito Fault System • •
• • • . ,.. • • •
0 E w •A·. • E
• 0 ••• • •• • 0
•• 0
• •
• = Embudo Fault Zone s o = Pajarito Fault Zone s
Figure 3: Lower hemisphere equal-area stereoplots of brittle fracture (slickensides and grooves) data for movements in different portions of the Pajarito fault system. [Some data from Golombek (1981) and Aldrich, unpub.]
18
i 1
3. Rates and Recency of Movements
Maximum displacement of Miocene and older rock units in the southern
segment of the Pajarito fault systems exceeds 300 m, but evidence for episodic
movements and lack of dated, correlated faulted units prohibit estimates of
rates of fault movements based on these rocks. Although fault movements since
deposition of the Bandelier Tuff have probably continued recurrently, a
minimum, average rate of movement can be \ estimated for the last 1 million
years. Since 1.1 Ma, when the upper Bandelier Tuff was erupted, a minimum,
average rate of vertical displacement has been 200 m/1.1 million years or
about 0.02 em/yr.
At the mouth of Bland Canyon, the southwest splay of the Pajari to fault
system crosses the canyon at right angles. On the north canyon wall, the
fault forms a major bench in the Bandelier Tuff and juxtaposes Bandelier Tuff
(east) against Peralta Tuff of the Bearhead Rhyolite (west). In the canyon
bottom on the south side of Bland Creek, late Quaternary alluvium, which
contains pebbles of Bandelier Tuff, is in fault contact with Peralta Tuff
(6.81 ± 0.15 Ma; Gardner et al., 1986) (Figure 4). The fault plane dips about
70° to the southeast and is marked by slickensides between tuff and alluvium
and by subtle drag-type deformation in the poorly bedded alluvium. The
exposure indicates at least 6 m of displacement of the alluvium.
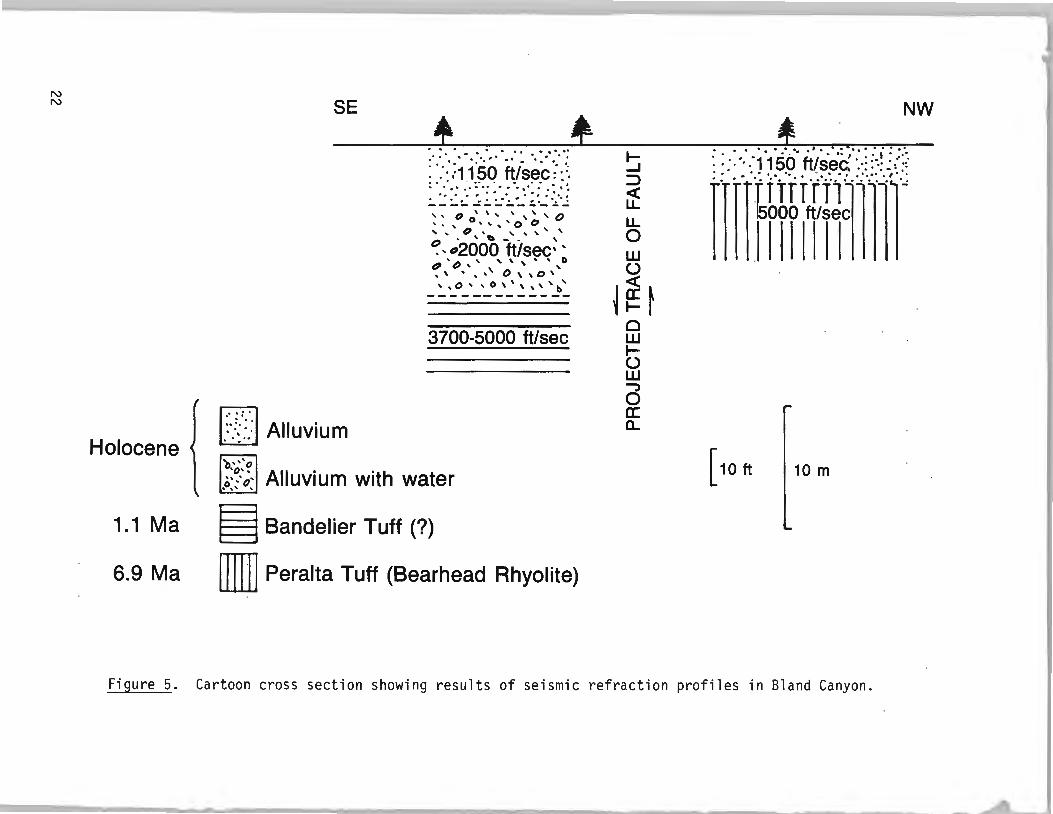
Three parallel seismic refraction profiles were done both upstream and
downstream of the fault in Bland Canyon to locate the stream channel cut into
bedrock, determine thickness of alluvium across the fault, and determine
offset of the bedrock channel in the subsurface. Measured seismic P-wave
velocities for the rock units are shown in Table III. The data indicate that
alluvium overlying Peralta Tuff on the upthrown side of the fault is about 3m
thick (10 ft), whereas alluvium overlying Bandelier Tuff on the downthrown
side is over 12 m (40 ft) thick (Figure 5). Hence, a scarp of aoout 9 m
(30ft) exists in the stream's bedrock channel.
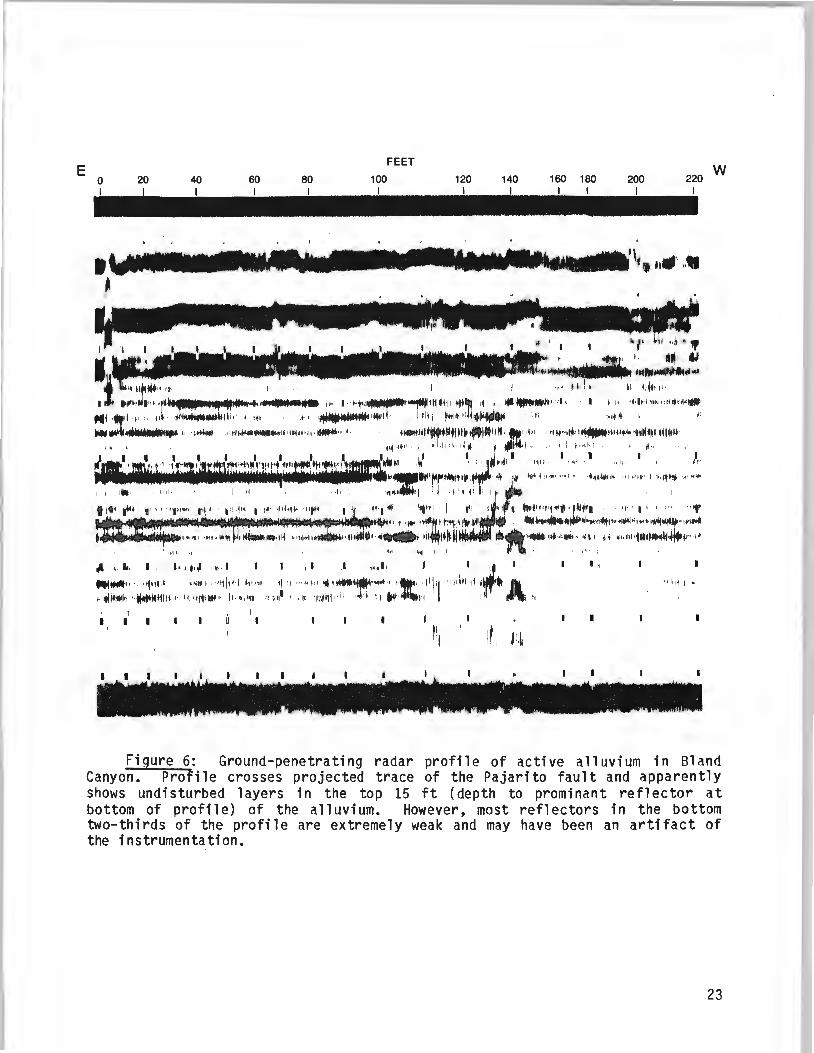
A ground-penetrating radar profile that was obtained across the fault in
Bland Canyon is shown in Figure 6. This profile suggests that at least the
youngest alluvial strata (top several meters) are not disturbed by faulting.
However, radar reflectors in the lower two-thirds of the profile are so weak,
it is difficult to be conclusive. These reflectors could have been an
artifact of the instrumentation.
19
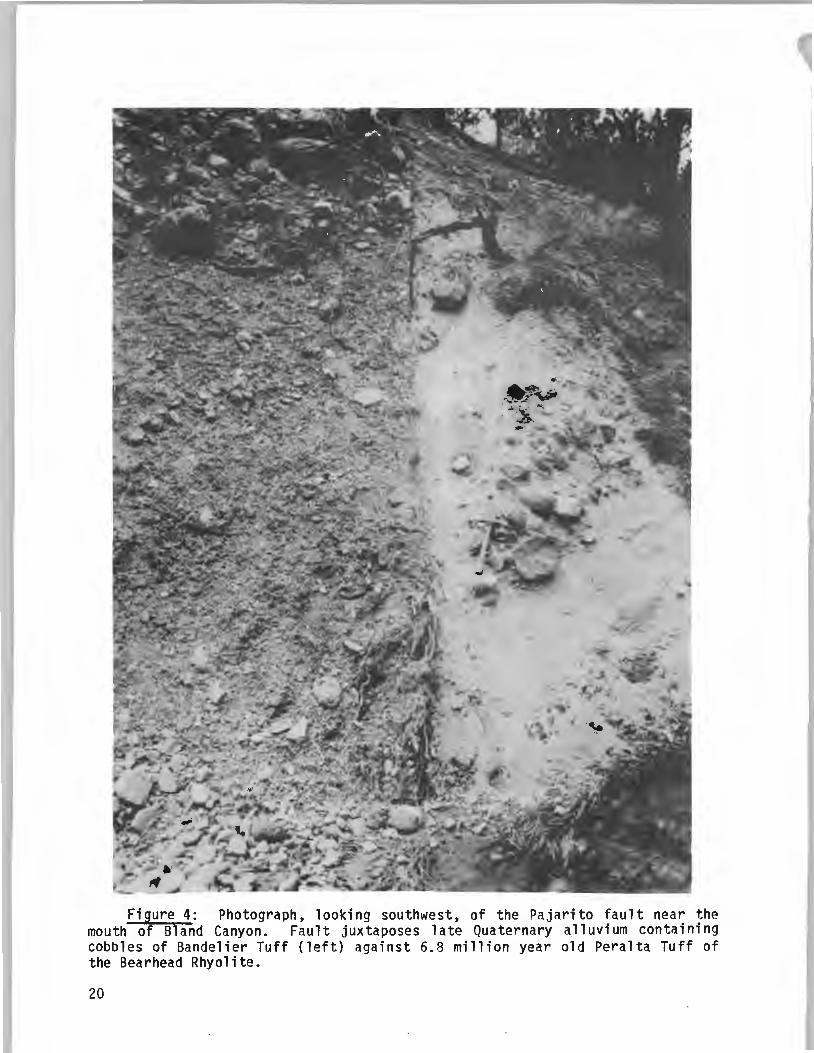
Figure 4: Photograph, looking southwest, of the Pajarito fault near the mouth of Bland Canyon. Fault juxtaposes 1 ate Quaternary a 11 uvi urn containing cobbles of Bandelier Tuff (left) against 6.8 million year old Peralta Tuff of the Bearhead Rhyolite.
20
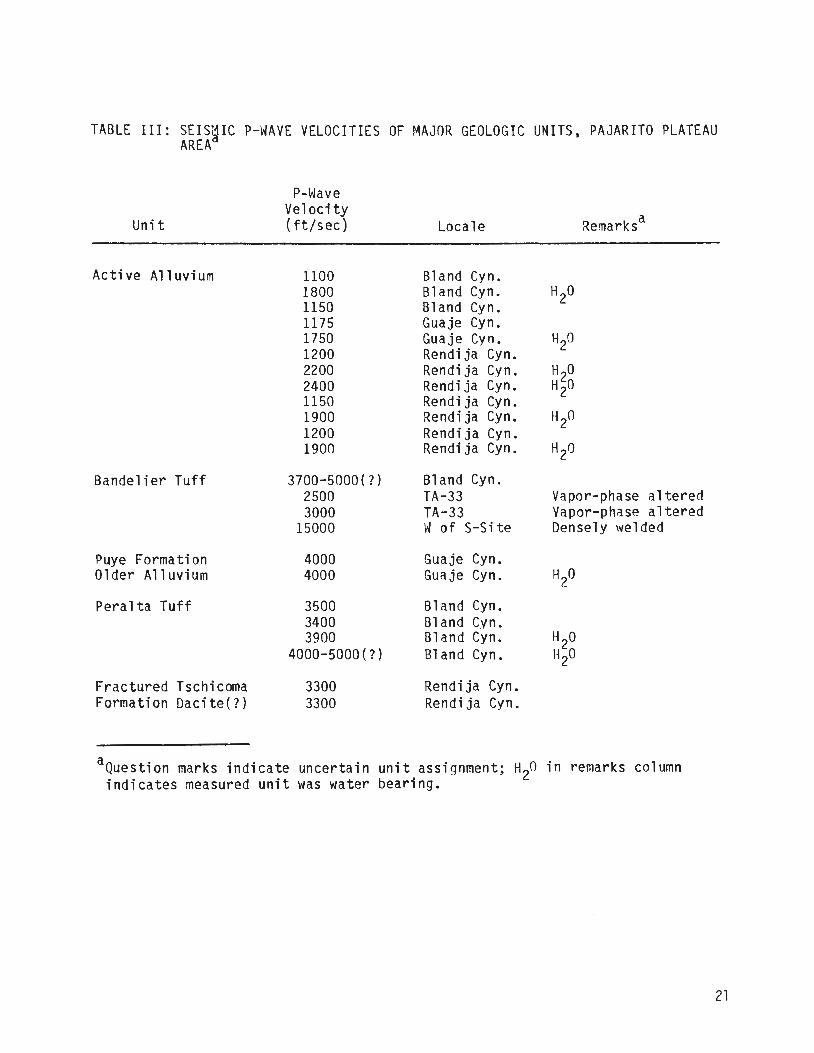
TABLE III: SEIS~IC P-WAVE VELOCITIES OF MAJOR GEOLOGIC UNITS, PAJARITO PLATEAU AREA
Unit
Active Alluvium
Bandelier Tuff
Puye Formation Older Alluvium
Peralta Tuff
Fractured Tschicoma Formation Dacite(?)
P-~Jave Velocity (ft/sec)
1100 1800 1150 1175 1750 1200 2200 2400 1150 1900 1200 1900
3700-5000(?) 2500 3000
15000
4000 4000
3500 3400 3900
4000-5000(?)
3300 3300
Locale Remarks a
Bland Cyn. Bland Cyn. H2o Bland Cyn. Guaje Cyn. Guaje Cyn. H20 Rendija Cyn. Rendija Cyn. H20 Rendija Cyn. H20 Rendija Cyn. Rendija Cyn. H20 Rendija Cyn. Rendija Cyn. H2o
Bland Cyn. TA-33 Vapor-phase altered TA-33 Vapor-phase altered W of S-Site Densely welded
Guaje Cyn. Guaje Cyn. H20
Bland Cyn. Bland Cyn. Bland Cyn. H2o Bland Cyn. H20
Rendija Cyn. Rendija Cyn.
aQuestion marks indicate uncertain unit assignment; H20 in remarks column indicates measured unit was water bearing.
21
N N
Holocene
1.1 Ma
6.9 Ma
SE + • ~ NW
l.::.f:~: l Alluvium
: · ·:::,:1·1~·0 ·~,~~~··;·:·.:. ~·~·~~·~·~~~~-~ ·~:~ ~.:j
,,, ' ''0 ', o o. ' , o' o ' ' " ' ' ' ,, 1:1, ,,,
... 't.- . ' ~. o2000 ttl sec· ~ 'o,, - ,,,,,, "'·. ·' o,,o, ' ' ' ' ' ,,0• ,o, ,,, b
3700-5000 ft/sec
o'''o
l.o:~.-~~1 Alluvium with water
§ Bandelier Tuff (?)
[ll] Peralta Tuff (Bearhead Rhyolite)
~ :::> ~ LL. 0 w (.) <(
~ g: ~ Cl w 1-(.) w ...., 0 a: a_
• ~ • • • • • • • - •. • I • ~ • .: ~ • "' • : ' : • :.
: -: · ·. :1150 ttl sec; ·.- ::··:~;·::·
llflHtr;t!111r1·~
[ 10 ft 10m
Figure 5. Cartoon cross section showing results of seismic refraction profiles in Bland Canyon.
E FEET
'II 'I
w
Figure 6: Ground-penetrating radar profile of active alluvium in Bland Canyon. Profile crosses projected trace of the Pajari to fault and apparently shows undisturbed layers in the top 15 ft (depth to prominant reflector at bottom of profi 1 e) of the a 11 uvi urn. However, most reflectors in the bottom two-thirds of the profi1e are extremely weak and may have been an artifact of the instrumentation.
23
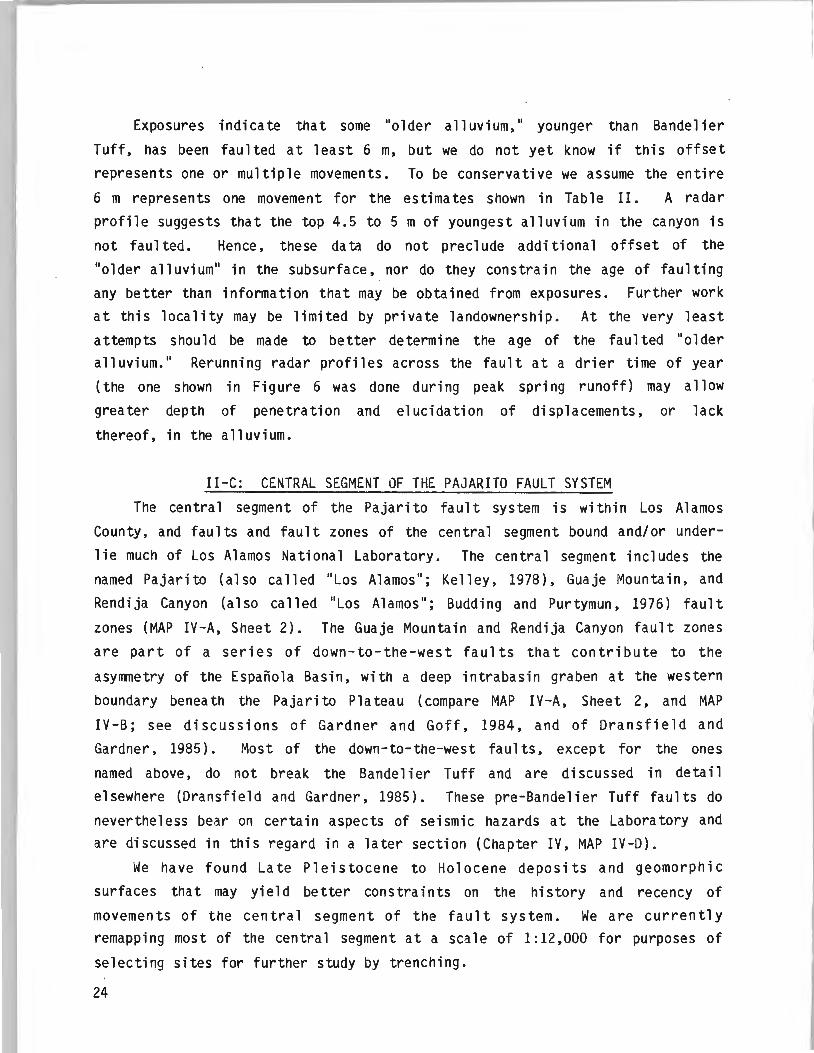
Exposures indicate that some "older alluvium," younger than Bandelier
Tuff, has been faulted at least 6 m, but we do not yet know if this offset
represents one or multiple movements. To be conservative we assume the entire
6 m represents one movement for the estimates shown in Table II. A radar
profile suggests that the top 4.5 to 5 m of youngest alluvium in the canyon is
not faulted. Hence, these data do not preclude additional offset of the
"older alluvium" in the subsurface, nor do they constrain the age of faulting
any better than information that may be obtained from exposures. Further work
at this locality may be limited by private landownership. At the very least
attempts should be made to better determine the age of the faulted "older
alluvium." Rerunning radar profiles across the fault at a drier time of year
(the one shown in Figure 6 was done during peak spring runoff) may allow
greater depth of penetration and elucidation of displacements, or lack
thereof, in the alluvium.
II-C: CENTRAL SEGMENT OF THE PAJARITO FAULT SYSTEM
The central segment of the Pajarito fault system is within Los Alamos
County, and faults and fault zones of the central segment bound and/or under
lie much of Los Alamos National Laboratory. The central segment includes the
named Pajarito (also called "Los Alamos"; Kelley, 1978), Guaje Mountain, and
Rendija Canyon (also called "Los Alamos"; Budding and Purtymun, 1976) fault
zones (MAP IV-A, Sheet 2). The Guaje Mountain and Rendija Canyon fault zones
are part of a series of down-to-the-west faults that contribute to the
asymmetry of the Espanola Basin, with a deep intrabasin graben at the western
boundary beneath the Pajarito Plateau (compare MAP IV-A, Sheet 2, and MAP
IV-B; see discussions of Gardner and Goff, 1984, and of Dransfield and
Gardner, 1985). Most of the down-to-the-west faults, except for the ones
named above, do not break the Bandelier Tuff and are discussed in detail
elsewhere (Dransfield and Gardner, 1985). These pre - Bandelier Tuff faults do
nevertheless bear on certain aspects of seismic hazards at the Laboratory and
are discussed in this regard in a later section (Chapter IV, MAP IV-D).
We have found Late Pleistocene to Holocene deposits and geomorphic
surfaces that may yield better constraints on the history and recency of
movements of the central segment of the fault system. We are currently
remapping most of the central segment at a scale of 1:12,000 for purposes of
selecting sites for further study by trenching.
24
' I
1. Faults
Near the southern boundary of Los A 1 amos County, the Pajari to fault zone
is a narrow swath of north-trending normal faults. The master fault of this
portion of the fault zone offsets densely welded Bandelier Tuff (1.1 Ma) about
125 m. Although El Cajete pumice (0.130 Ma) is found within the fault zone,
it is not clear if the pumice deposits have been faulted, as suggested in
Keller (1968), or have simply accumulated on the lee-side of topographic
obstructions in the El Cajete ejecta plume. The main fault scarp from State
Road 4 to Los Alamos Canyon is steep (50° to 70° dip to the east) and sur
prisingly clear of talus or colluvium. A few small deposits of postscarp
landslides too small to be shown on MAP IV-A have been noted, and one of these
is cut by a north-trending linear of foliage. At least two postscarp alluvial
fans built from Water and Pajarito canyons across the fault zone have been
abandoned and are currently being incised. The postscarp deposits and
features are the subject of on-going, detailed study.
In the vicinity of Los Alamos Canyon the fault zone widens, the dominant
sense of movement apparently changes, and the clear geomorphic expression of
the main fault scarp disappears.
Two fault segments are exposed in Los Alamos Canyon near the Los Alamos
Reservoir. We ca 11 these the East Reservoir and West Reservoir faults. Both
faults are well exposed in the north wall of the canyon; exposures on the
south wall are covered by soil and colluvial deposits.
East Reservoir fault strikes north, following a shallow, linear gully up
the north wall of the canyon. This gully empties onto the canyon floor at the
picnic area about 100 m east of the reservoir spillway. The fault is recog
nized by drag folds within lavas of the Tschicoma Formation and by juxtaposi
tion of lithologically distinct rock units.
Volcanic units on the east side of the fault consist of, in ascending
stratigraphic order, coarsely porphyritic rhyolite, coarsely porphyritic
dacite, and Bandelier Tuff. The coarsely porphyritic dacite is an excellent
marker bed because it forms a prominent ledge and because it has a distinctive
autoclastic rubble zone and vitrophyre at its base. On the western side of
the fault, the stratigraphic succession is, in ascending order, moderately
porphyritic dacite, sparsely porphyritic andesite, coarsely porphyritic dacite
lava, and Bandelier Tuff. The coarsely porphyritic dacite is the same lava as
25
that exposed beneath the Bandelier Tuff on the east side of the fault. How
ever. below this distinctive marker bed. stratigraphic units are dissimilar
across the fault.
The Tschicorna volcanic rocks in Los Alamos Canyon generally dip less than
20° toward the east or northeast. However. within 25 m of East Reservoir
fiiult. rocks east of the fiiult are rotated to dips of up to 70°NW. The rubble
zone at the base of the coarsely porphyritic dacite is displaced 60 m down to
the east across the fault. The Bandelier Tuff is displaced 25 m down to east
across the fault. indicating both recurrent movement and substantia 1 di sp 1 ace
ment on the fault within the last 1.1 m.y. Foliations within the Bandelier
Tuff are not rotated to steep dips like those within the underlying units on
the east side of the fault.
The East Reservoir fault has had a history of recurrent movement with a
significant component of vertical displacement. Certain features of the fault
are also suggestive of a lateral component of displacement. These features
include (1) drag folds on the east side of the fault that could be interpreted
as indicating left lateral displacement. (2) reduction in the vertical dis
placement of the coarsely porphyritic dacite away from the fault. and (3) the
presence of dissimilar stratigraphic units below the coarsely porphyritic
dacite. These features are difficult to reconcile with vertical displacements
only. A lateral component of movement cannot be clearly demonstrated frorn the
limited exposures of this area. but oblique slip is probable.
The West Reservoir fault is located 200 m west of the East Reservoir
fault and strikes north across the central portion of Los Alamos reservoir.
This fault together with the East Reservoir fault bounds a narrow horst that
strikes north.
The West Reservoir fault is recognized by drag folding within the
Tschicoma coarsely porphyritic dacite described above. by juxtaposition of
dacite against Bandelier Tuff across the fault. and by a prominent air photo
linear cutting Bandelier Tuff north of Los Alamos Canyon. Stratigraphic units
beneath the coarsely porphyritic dacite are not exposed in the vicinity of the
fault because of thick deposits of colluvium. However. rhyolites clearly
underlie the dacite about 300m west of the fault. and andesites crop out
beneath the dacite about 50 m east of the fault.
The coarsely porphyritic dacite on the downthrown western block is
abruptly rotated to dips of 50°NE by the fault. East of the fault. this unit
26
is subhorizontal. Vertical offset on this unit is about 70 m. The Bandelier
Tuff (1.1 Ma) shows similar amounts of displacement across the fault.
From Los Alamos Canyon the Pajarito fault zone bends to the northeast and
apparently becomes segmented into en echelon strands, which together with poor
exposures, renders it difficult to trace. Also north from Los Alamos Canyon
the Guaje Mountain and Rendija Canyon fault zones break the Bandelier Tuff
(1.1 Ma) with a down-to-the-west sense of vertical displacement. Although
vertical components to movements are easiest to document, air photostudies
reveal drainages offset in a right lateral sense on the Pajarito, Rendija
Canyon, and Guaje Mountain fault zones north of Los Alamos Canyon. The Guaje
Mountain fault offsets the course of Guaje Canyon about 370 m. The canyon is
cut through resistant dacite that is surrounded by more easily erodible
gravels of the Puye Formation (MAP · IV-A, Sheet 2). These relations together
with data that suggest significant hori zonta 1 components to movements (Figure
3) indicate the canyon offset is due to fault movements and is not simply a
fortui taus crook in the canyon's course. To the south, the fault offsets
smaller drainages (presumably younger) cut in Bandelier Tuff about 60 m. The
north wall of Pueblo Canyon is offset several meters in a right lateral sense
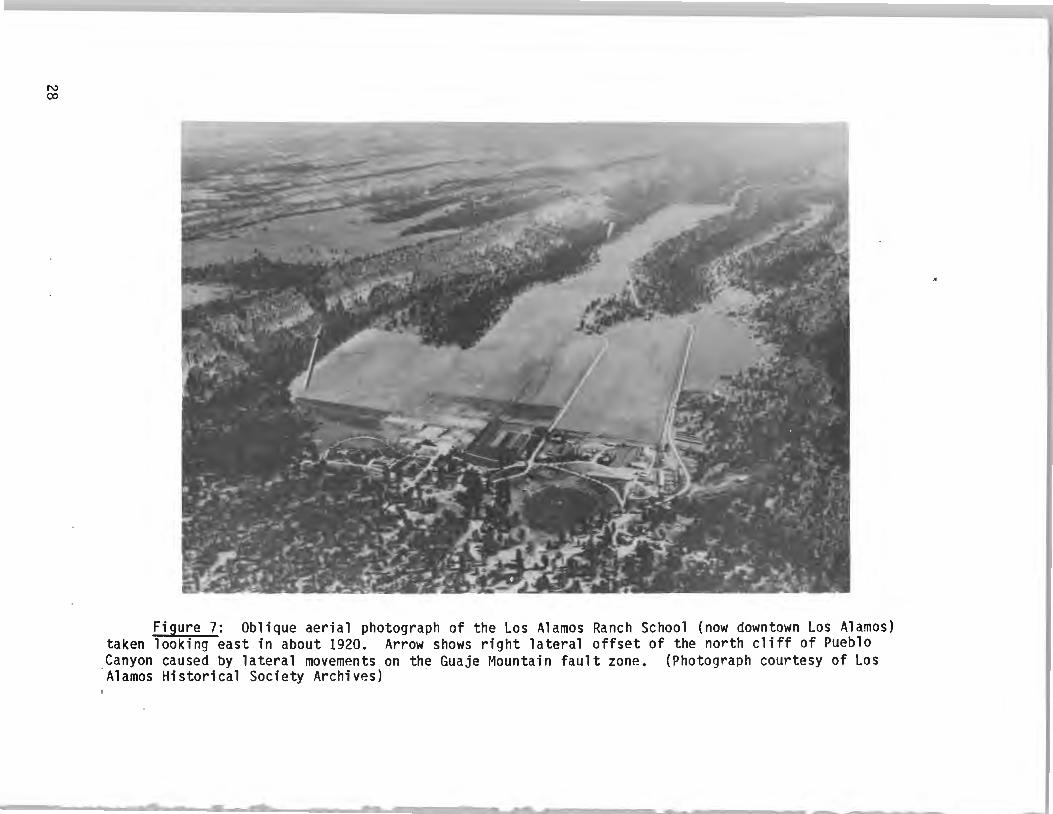
by the Guaje Mountain fault (Figure 7). One splay of the Pajarito fault zone
between Los Alamos and Pueblo canyons also shows right lateral movement of
about 280 m, with a small north-trending drainage developed along the fault
splay.
2. Style of Deformation
As discussed above, field evidence indicates the style of deformation
within the fault system transforms from dominantly normal faulting in the
southern part of the central segment to oblique slip in the northern portions
of the central segment. These observations are consistent with the brittle
fracture data shown in Figure 3. Although oblique slip for the northern
portion of the central segment of the fault system is a plausible style of
deformation in light of the data, we note that most slickensides in the
northern portion of the central segment have near-horizontal orientations.
This implies that the most recent movements have been dominantly horizontal,
whereas older movements may have caused the vertical displacements.
3. Rates and Recency of Movements
A number of workers have reported evidence for recurrent movements along
the central segment of the Pajarito fault system since at least Pliocene time
27
N co
Figure 7: Oblique aerial photograph of the Los Alamos Ranch School (now downtown Los Alamos) taken looking east in about 1920. Arrow shows right lateral offset of the north cliff of Pueblo Canyon caused by lateral movements on the Guaje Mountain fault zone. (Photograph courtesy of Los Alamos Historical Society Archives)
(for example, Griggs, 1964; Golombek, 1981; Goff and Grigsby, 1982), and some
workers have inferred multiple movements in the fault system within the last
1.0 to 0.5 million years (for example, Dames and Moore, 1972; Budding and
Purtymun, 1976). Although the most recent movements within the central
segment are the focus of ongoing studies, some preliminary information is
presented here.
Based on information from 7 .5-minute topographic maps, the gradients of
the drainages of Water, del Valle, Pajarito, and Los Alamos canyons all change
abruptly where the canyons cross the Pajarito fault zone. In that the gra
dient changes are substantial enough to be detected at the coarse resolution
provided by the topographic maps and that the changes occur at the main trace
of the fault zone·, it is probable that at least some of the disruption of the
gradients has been caused by young fault movements. We have examined one of
these disrupted stream gradients, Water Canyon, in detail. We have noted
that, on the Pajari to Plateau, portions of canyons away from faults and cut
into Bandelier Tuff only are invariably about 150-200 m deep when V-shaped in
cross section. The V-shape and low sinuosity of these canyons allow the
reasonable assumption that most of the stream's erosive energy has been
expended in downcutting. Hence, one may estimate an average, minimum stream
incision rate into Bandelier Tuff to be about 0.02 em/yr. In reality, these
incision rates into Bandelier Tuff must be higher because of climatic varia
tions in water supply with glacial and interglacial periods over the last
1 million years (age of the Bandelier Tuff of the Pajarito Plateau). Further
more, the average minimum incision rate is very conservative because the Rio
Grande drainages in this area have been actively downcutting only about 10,000
out of every 100,000 years (J. Hawley, pers. comm., 1986; C. Harrington, pers.
comm., 1986); thus, one could argue that the average minimum incision rate of
0.02 cm/yr is low by at least one order of magnitude. For our purposes the
more conservative rates are useful because estimates of, for example, timing
of fault movements can only be maxima.
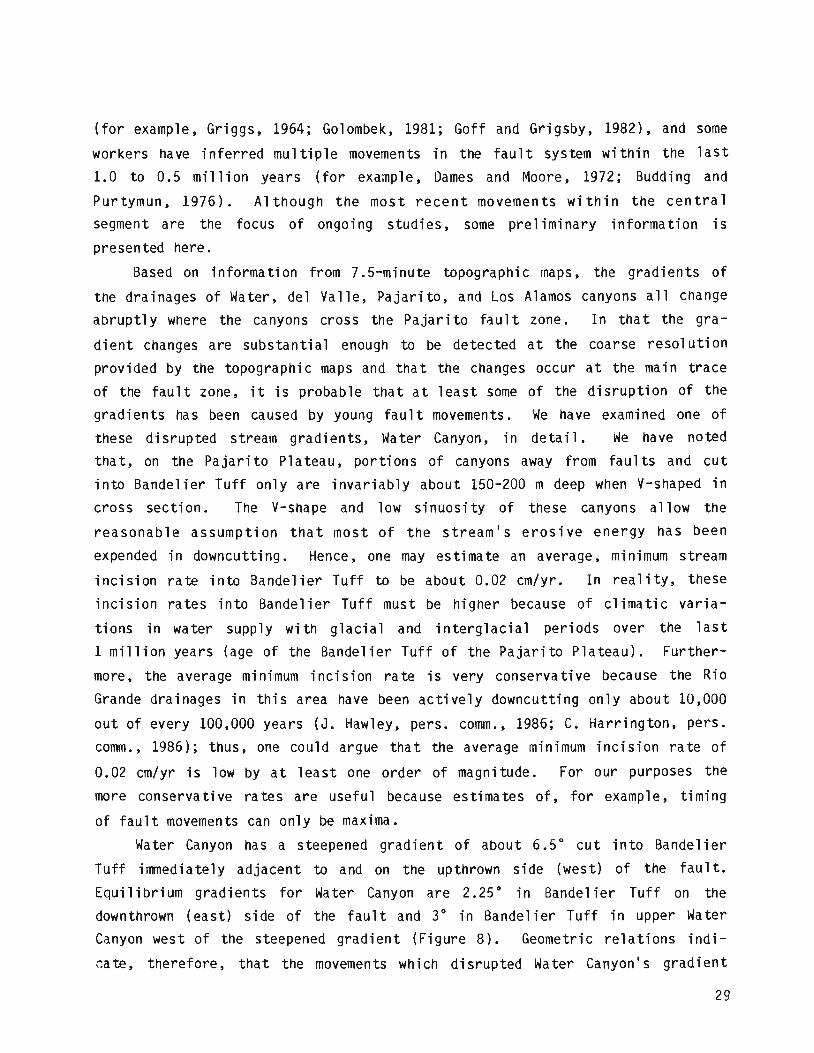
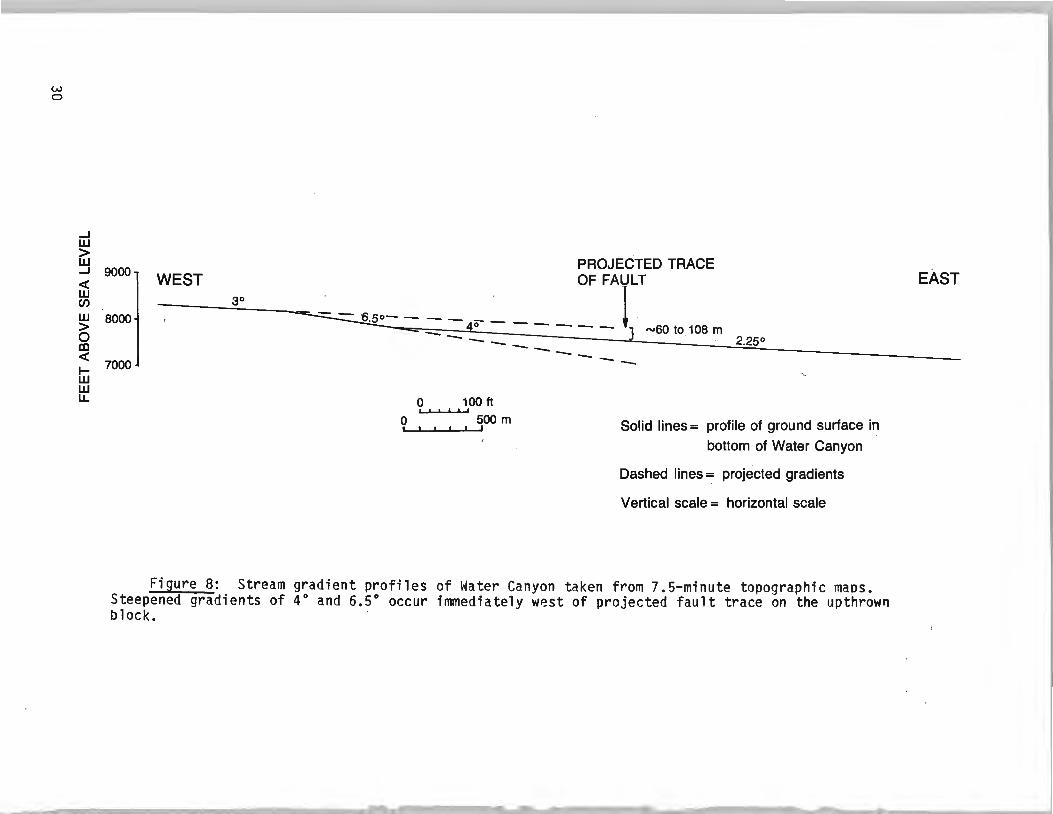
Water Canyon has a steepened gradient of about 6.5° cut into Bandelier
Tuff irmnediately adjacent to and on the upthrown side (west) of the fault.
Equilibrium gradients for Water Canyon are 2.25° in Bandelier Tuff on the
downthrown (east) side of the fault and 3° in Bandelier Tuff in upper Water
Canyon west of the steepened gradient (Figure 8). Geometric relations indi
cate, therefore, that the movements which disrupted Water Canyon's gradient
29
w 0
...J w > w
WEST ~ 90001 <10 --(/)
PROJECTED TRACE
..., OF FAUILT
w > 0 m <(
I-w w LL
8000
7000
- - ·s.so- - - --= _ F - - - - } "-'60 to 108 m
--- 2.25°
0 100ft I I I I I I
0 500 m I I I I I I
--------------
Solid lines= profile of ground surface in
bottom of Water Canyon
Dashed lines= projected gradients
Vertical scale= horizontal scale
Figure 8: Stream gradient profiles of Water Canyon taken from 7.5-minute topographic maos. Steepened gradients of 4° and 6.5° occur immediately west of projected fault trace on the upthrown block.
EAST
caused 60 to 110 m of displacement and occurred less than 0.5 to 0.3 Ma.
Significantly, these data indicate that most of the 125-m scarp at Water
Canyon has been created within the last 500,000 to 300,000 years . Average
minimum rates of fault movements, based on these data, are abou t 0.02 to 0.04
cm/yr for the Water Canyon locality.
Seismic refraction profiles were run across the Guaje Mountain fault zone
to test the hypothesis that recent vertical fault movements (down-to-the-west)
may have dammed the east-flowing drainages of Guaje and Rendija canyons. In
Guaje Canyon alluvium has accumulated only on the upstream (west) side of the
fault zone, suggesting that indeed young fault movements have dammed the
drainage. Seismic refraction measurements indicate the alluvium accumulating
upstream of the fault is about 2.5 m (8 ft) thick, and it overlies the Puye
Formation (Table III).
In Kendi ja Canyon seismic refraction data indicate that the thickness of
alluvium on the downthrown, upstream (west) side of the fault exceeds 12 m
(40ft), whereas on the upthrown side alluvium is only 6.8 m (22 ft) thick.
Ground-penetrating radar profiles of the alluvium across the Guaje Mountain
fault in Rendija Canyon show some interesting features (for example, Figure
9), but recent excavation of this area reveals most disrupted reflectors in
the profile are alluvial channel scours.
31

WEST 0
I I
I I
50 I
feet 100
[ 150 I
EAST
Figure 9: Ground-penetrating radar profile of active alluvium within the Guaje Mountain fault zone in Rendija Canyon. Recent excavation of this area reveals many of the reflectors in the profile show offsets which are the result of complex fluvial channel geometries. Lowest dark reflector at bottom of profile is about 15 ft deep.
32

II-D: NORTHERN SEGMENT OF THE PAJARITO FAULT SYSTEM
The northern segment of the Pajarito fault system extends north and north
east from Los Alamos County. In the northern segment the fault system
includes the Pajarito fault zone (also called "Los Alamos," Kelley, 1978), the
Lobato Mesa fault zone, the western Embudo fault zone (also called "Los
Alamos," Kelley, 1978; also called "Santa Clara," Harrington and Aldrich,
1984), and the fault zone southwest of Hernandez (a 1 so ca 11 ed "north
trending," Harrington and Aldrich, 1984) (MAP IV-A, Sheets 3, 4, and 5).
1. Faults
From the northern boundary of Los Alamos County, near the intersection
with the Rendija Canyon and Guaje Mountain fault zones, the trend of the
Pajarito fault zone bends to the northeast. From this bend to where it inter
sects the Rio Chama, a distance of about 20 km, the fault zone bears the name
"western Embudo fault zone." The distinction is purely semantic, in that
there is no structural reason to distinguish the Pajarito and Embudo zones.
We utilize both names only to assure geographic clarity and to emphasize
continuity of the Pajari to system as the Embudo zone nearly to Taos. We have
not studied the Embudo fault zone east of the Rio Chama in any detail.
Muehlberger (1979), Manley (1984), Machette and Personius (1984), and
Personius and Machette (1984) report recurrent Pleistocene to Holocene move
ments on the eastern Embudo fault zone.
The Lobato Mesa fault zone consists of a series of north-northwest
trending faults that splay from the western Embudo fault zone near Clara Peak.
The Lobato zone clearly persists at least as far north as the town of Abiquiu.
The Lobato Mesa faults have been mapped by Dethier and Martin (1984) and will
not be discussed in detail here. Dethier and Martin (1984) report most
tectonic activity in the Lobato Mesa zone was concentrated around 10 Ma, but
they also report that at least one fault of the zone has Quaternary movements
in that it offsets Bandelier Tuff less than 15 m. As discussed below, prelim
inary data suggest the Lobato Mesa, western Embudo, and southwest of Hernandez
fault zones constitute integral parts of the fault system.
The fault zone southwest of Hernandez is a series of faults that inter
sect the western Embudo zone from the south, roughly 2 to 5 km southwest of
the Embudo-Rio Chama intersection. The southern extent of this fault zone,
south of the Santa Clara Indian Reservation, has not been mapped. As dis
cussed below, these faults show abundant evidence for Quaternary movements.
33
2. Style of Deformation
All fault zones in the northern segment of the Pajarito fault system show
evidence of movements with horizontal as well as vertical components (Figure
3). In fact, brittle deformation data indicate the most recent movements
within these zones have been dominantly right slip. These data, together with
the geometric relations of the fault zones, are what lead us to suggest that
the Lobato Mesa, western Embudo, and southwest of Hernandez fault zones
constitute integra 1 parts of a fault system. The hori zonta 1 components to
movements, the sense of movements, and the deformation of Quaternary
geomorphic surfaces require that faults of the several fault zones must have
operated in concert. The fault zones are parts of a complex rotational defor
mation of intrarift blocks of the Espanola Basin as discussed by Muehlberger
(1979), Aldrich (1986), and Brown and Golombek (1986).
3. Rates and Recency of Movements
Topographic features along the Embudo fault zone and south of it and east
of the Pajarito fault zone provide evidence that the fault system has been
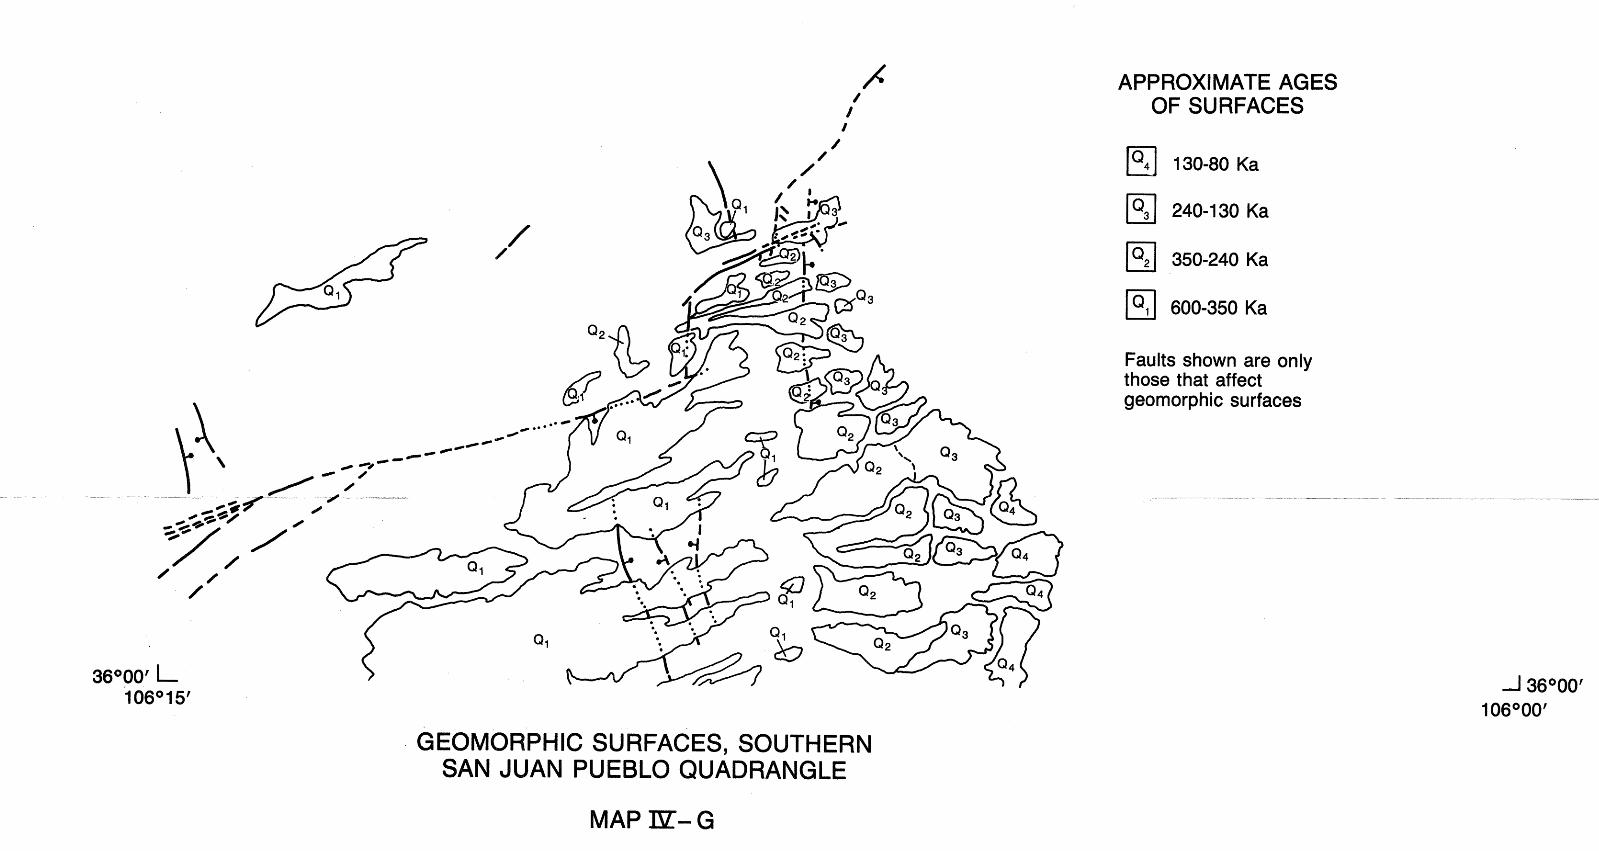
recurrently active during the last O.S Ma. Four erosional surfaces, from
oldest to youngest designated Q1, Q2 , Q3 , and Q4 , have formed across this
portion of the northeastern Jemez Mountains during Quaternary time (MAP IV-G).
The oldest, and highest, surface (Q 1) has been deformed by movements on the
Pajarito fault zone and Embudo fault zone. This surface, formed 600 to 3SO Ka
(thousands of years before present) (Dethier and Harrington, 1986; Dethier,
unpublished data), has been rotated by movements on the Embudo fault zone and
Pajari to fault zone, decreasing the surface gradient and changing its slope
direction from east to northeast (Figure 4 of and discussion in Harrington and
A 1 dri ch, 1984) .
Evidence for additional deformation of the Q1 surface by movement along
the Embudo fault zone is a marked increase in surface gradient near the fault.
The Q1 surface within O.S km of the fault has a surface gradient of 4S m/km,
approximately three times its gradient away from the fault. Projection of the
lower-gradient portion of the Q1 surface to the fault zone places the surface ·
at an elevation approximately SO m higher than that obtained by a similar
projection of the portion with the steeper gradient. Thus, the block
southeast of the Embudo fault zone has been downdropped by SO m since 3SO Ka
(a rate of about 0.02 cm/yr). The base of the Puye Formation, which is
subparallel to the Q1 surface elsewhere, is also steeply tilted (61 m/km) at
34
this same locality. Hence, recurrent downdropping of the block southeast of
the Embudo fault zone has occurred since 2 Ma (constraint on upper age of Puye
Formation; Manley, 1979; Gardner et al., 1986).
A fault that trends northeast, within the Embudo fault zone, is exposed
in an arroyo (NW1/4,Secl3,T21N,R7E) just north of the graded road. The fault
cuts a colluvial channel fill, displacing the base "'0.2 m. The channel is cut
into the Q2 surface (350 to 240 Ka), and the colluvial fill possesses no
appreciable carbonate accumulation. Hence, the channel is younger than the Q2 surface, and the time of faulting is substantially more recent than Q2 development.
At the western end of a paleochannel of Arroyo de la Presa (Sec12,T21N,
R7E), a Lobato Basalt flow dips gently north and abruptly terminates against
beds of the Chamita Formation (Santa Fe Group), which dip steeply southeast.
Several low-angle faults within the Lobato outcrop are offset hlO em) by
several high-angle faults with dips to the north. Above the Lobato flow is a
coarse volcanic-clast-rich gravel, ·which fills the broad paleochannel. The
volcanic boulder gravel that fills the bottom of the channel thickens to 10 m
at its southern edge. The gravel is overlain by a sandy unit that thickens to
the south across the paleochannel to a maximum of 2 m. The sandy unit extends
farther south than the gravel bed, although it decreases in thickness. The
trends of the paleochannel, upper Arroyo de la Presa, the gravel terminus, and
the basalt terminus are a 11 para 11 el to the trend of the adjacent Embudo
fault. The pa 1 eochanne 1 fi 11 is cut by two modern arroyos. The major arroyo
(1) has a linear trend (N60-65°E) on line with the basalt and gravel terminus,
(2) is on strike with the Embudo fault zone, (3) is cut across the topographic
slope rather than down the slope, (4) is not cut at the low part of the
paleochannel surface, which occurs 30 m to the north, and (5) lies at the base
of a small scarp ("'0.5 m high), which forms the north wall of the modern
channel. The topographic surface behind the scarp, if projected south across
the channel, would be over 1 m higher than the present surface. Thus, the
modern arroyo appears to be cut along the trace of a fault of the Embudo fault
zone, and movement on this fault must postdate development of the paleochannel
surface. Varnish cation ratios (see for example, Harrington, 1986a, 1986b)
from boulders on this surface indicate an age for this portion of the surface
of 42 Ka. Vertical displacement on the fault in excess of 0.5 m has occurred
with the south side down since 42 Ka. As movement on the Embudo fault zone
35

usua.lly has a large strike-slip component, net slip must have been
considerably more than 0.5 m. Minimum rate of motion for the fault is thus
0.001 em/yr.
The .fauU zone· southwest of Hernandez consists of a series of north- to
northwest-trending ·faults that occur within 4 km of the Embudo fault zone.
One of these faults, exposed in the south wall of the arroyo (above) cut along
the Embudo fault zone, strikes N40°W with a 60°N dip on the fault plane. This
fault has slickensides that rake 80°N, indicating motion east side down on the
fault . with a dip-slip component. An undated tephra bed has been downdropped
-v1.5 m on the eastern block. The fault plane can be traced to within 0.3 m of
the · surface and .may extend even higher. Soil profiles across the fault are
markedly different. On the upthrown block the soil profile has a 0.3-m A
hori . .zon; the calc'ic B horizon extends down to 2.0 m with Stage II development .
T.he soil ·profile : on th-e downthrown block has an A hOrizon thickness similar to
that across the . fault, but the calcic B horizon extends only to 1.0 m depth
with Stage I development.
Sediment on the downthrown block is 6 m thick. Beds within the lower
part ' of the sediment'; · in particular thin gravel layers, are bent and stretched
along the fault plane, thinning and terminating -v3.0 m below ground surface.
Upper · beds curve and become . asymptotic as:, the fault is approached. The
deformation of the lower beds and the .difference in orientation compared with
the upper ,bed~ suggest movement on · the fault following deposition of the lower
beds · and ·· before deposition of. the upper beds. Therefore, at least three
periods of motion have occurred along the fau·lt based on displacement of the
tephra bed, sediment deformation ., and disruption of the soil profiles across
the fault. The fault truncates the volcanic boulder gravel and appears to
break the topographic. surface (42 Ka) of the paleochannel. Minimum
displacement along the fault yields an average rate of 0.2 cm/yr with last
motion no earlier than Holocene . and possibly about 2,000 years ago (minimum
time to accumulate Stage I carbonate in the soil).
There are no piercing points that can be used to determine the net slip
on the Pajarito fault zone, but by considering several pieces of data a
reasonable estimate can be made. A 10.6-Ma dike is offset nearly 0.5 km in a
right lateral · sense by a major basin-bounding northwest- to north-trending
east-side-.down fault of the Lobato Mesa zone (Dethier and Martin, 1984;
Dethier and Aldrich, unpub. data). Slickensides and grooves on the fault
36

plane rake !5°S and 35°S, respectively. If these orientations are taken to
reflect the range in net slip values, then the net slip on the fault since
10.6 Ma is somewhere between 490 and 520 m. The smaller slip (slickensides)
rake angle probably reflects the counterclockwise rotation of the i ntrarift
blocks (cf. Muehlberger, 1979; Aldrich, 1986), and the larger slip (grooves)
rake angle the E-W extension that is occurring simultaneously with the block
rotations. If we assume that the fault has been moving from the time the dike
was emplaced, it has a minimum average movement rate of 0.005 em/year. This
fault juxtaposes the Ojo Caliente Sandstone and Chama-El Rito members of the
Tesuque Formation (both of the Santa Fe Group) and has a vertical thrmtl in the
range of 112 to 228 m (based on the slip indicator and displacement of the
offset dike), which is consistent with the observed stratigraphic separation.
Estimates of rates of movement based on Dethi er and Martin • s ( 1984) reported
offset of Bandelier Tuff (15 m) yield minimum average rates of about 0.002
cm/yr over the last 1 million years.
Along the Pajarito fault, on the Santa Clara Indian Reservation, a high
erosional surface on the Puye Formation immediately north of Santa Clara
Canyon and west of the fault is at or near the stratigraphic top of the Puye
Formation that formed in the eastern Jemez Mountains during the Pliocene.
This surface is approximately 120 m higher than the top of the Puye east of
the fault. The fault, then, has a minimum throw of 120 m at this location,
which has developed since the Puye fan ceased forming around 2 Ma (Manley,
1979; Gardner et al., 1986). Although the slickensides of the synthetic fault
2 . 5 k m sou t h of San ta C 1 a r a Canyon are h or i z on ta 1 , the n e t s 1 i p on the
Pajari to fault zone must have had some dip-slip component to drop the east
side some 120m since the late Pliocene. The slickensides, therefore, do not
represent the average net-slip orientation. When we assume that the average
net-slip rake is approximately the same as that of the western-basin-bounding
fault of the Lobato Mesa zone (l5°-35°S), then the net slip on the Pajarito
fault in the past 2 Ma has been somewhere between about 220 m and 500 m, and
the movement rate has been in the range of 0.01 to 0.025 em/year.
37
CHAPTER II I: SEISMOLOGICAL STUDIES
38
III-A: BACKGROUND
Most comprehensive of the previous studies of seismic hazards in Los
Alamos were those done by Dames and Moore {1972) and Tera {1984). The Dames
and Moore {1972) study was done for design of the Plutonium Facility {TA-55),
while the Tera {1984) study was commissioned by the Department of Energy
through Lawrence Livermore Na tiona 1 Labor a tory. Of the two. the Dames and
Moore {1972) study is more comprehensive. In addition, a number of other
seismic hazards-related studies of the Los Alamos area have been done {e.g.,
Slemmons. 1975; Budding and Purtymun, 1976; Sanford, 1976; and Savage et al.,
1977). The discussion that follows focuses on the Dames and Moore {1972) and
Tera {1984) studies; the others cited are summarized in the Appendix "Previous
Studies."
Dames and Moore. The Dames and Moore {1972) report, "Report of geologic,
foundation, hydrologic, and seismic investigation: plutonium processing
facility, Los Alamos Scientific Laboratory, Los Alamos, New Mexico," discusses
the work done to establish design criteria for the Plutonium Facility {TA-55).
The seismic investigations were of seismicity and of seismic response at the
site. The seismicity investigations were based on the available historic and
instrumental seismicity. Estimating the seismic response of the site was done
by calculations applied to real and synthetic strong earthquake ground motions.
The intent of the Oames and Moore {1972) study was to establish a level
for the Operating Basis and Safe Shutdown Earthquakes. Although the amount of
instrumental seismicity information from northern New Mexico was small in
1972, the investigators compiled what was available from various sources, and
hence, the Dames and Moore {1972) report represents a fairly comprehensive
source of information about earthquakes near Los Alamos up to 1972. The
result of the seismicity investigations is that Dames and Moore {1972) argue
that "it is unlikely that earthquake ground motion greater than Intensity VI
has been experienced at the proposed site [Los Alamos] since the date of the
first reported New Mexico earthquake in 1849." Note, however, that the term
"unlikely" is not quantified, so there is no probability associated with it.
Dames and Moore {1972) take Intensity VIII as the highest seismic intensity
that the Plutonium Processing Facility will experience during its design
lifetime. Note that Intensity VIII is the maximum experienced during the
Socorro earthquake swarm of 1906.
39
The next step that Dames and Moore (1972) took was to correlate a peak
horizontal ground acceleration of 0.33 g with the maximum Intensity value of
VIII. Correlations between earthquake Intensity and peak ground acceleration
are poor (Trifunac and Brady, 1975), yet such correlations are generally used
by the earthquake engineering community. . The Intensity-peak acce 1 era ti on
relation from Trifunac and Brady "(1975) shows a peak ground acceleration for
Intensity VIII of 0.26 g, but the data are scattered (standard deviation of
0.08 to 0.10 g); hence, the value chosen by Dames and Moore (1972) may not be
as conservative as it might appear. Dames and Moore (1972) take a peak
acceleration of 0.33 g for the Safe Shutdown Earthquake and about half that
value (0.17 g) for the Operating Basis Earthquake.
Response spectra presented by Dames and Moore (1972) are taken from
recordings of two earthquakes as we 11 as three computer-synthesized earth
quakes that were modified for presumed responses at both the recording and the
TA-55 sites. To estimate the material properties beneath theTA-55 site,
Dames and Moore (1972) took corings from the top 180 ft and assumed properties
to presumed basement at 7000 ft. Because of the widely varying seismic
velocities (Table III) and thickness of the Bandelier Tuff, particularly
within the area of the Laboratory (Dransfield and Gardner, 1985), the response
spectra computed for TA-55 may be unreliable for other sites.
Tera. The Tera Corporation (1984) report, 11 Seismic hazard analysis for
the Bendix, Los Alamos, Mound, Pantex, Rocky Flats, Sandia-Albuquerque, Sandia
Livermore, and Pinellas sites, .. is a revision of a report originally issued in
1981. For purposes of this discussion, only the section on Los Alamos is
considered. This study purports to be a 11 detailed seismic hazard analysis .. of
the Los Ala~os DOE site. The principal result of the study is a probabilistic
determination that the Los Alamos area would experience a peak horizontal
ground acceleration of 0.08 g with a return period of 100 years and 0.22 g
with a return period of 1,000 years. Much of this report is based on the work
originally reported in Dames and Moore (1972).
The documentation in the Tera (1984) report is inadequate to determine
the credibility of the results. The recent (historic) seismicity is used as
input to the probabilistic model. The probabilistic model itself is not
documented nor even summarized in this report. A 1 though .. sensitivity
analysis .. is mentioned several times in the report, nowhere is there any quan
titative discussion of what was varied and what the outcomes were. Although
40
terms such as "best estimate" and "weighted average" are used, there is no
mention of how the estimate is "best" or how the individual items were
"weighted." The response spectral curves shown in Figure 3-11 of Tera (1984)
are simply taken from the Dames and Moore (1972) study and scaled to 1 g peak
acce 1 era ti on.
III-B: HISTORICAL EARTHQUAKES
Evaluating seismic hazards in Los Alamos from seismologic data requires
using historical seismicity to extend the time duration of the instrumental
earthquake record. In particular, two types of historical earthquakes are of I
interest: those large enough and close enough to be felt at Los Alamos, and
those that are the largest earthquakes known to have occurred in the Rio
Grande rift.
The record of earthquakes felt in Los Alamos extends back only about 45
years, since the Laboratory's beginnings in the early 1940s. Table IV lists
all felt earthquakes that were located within about 100 km of Los Alamos.
Felt reports of earthquakes before about 1950 are very sparse. Four earth
quakes have been felt by residents of Los Alamos; all were located within 25
km of Los Alamos. The first occurred on August 17, 1952, and since the only
felt reports were from Los Alamos, its epicenter was presumably nearby. This
earthquake was of maximum Intensity V (magnitude about 4) (Coffman and von
Hake, 1973). The second event, felt on February 17, 1971, had a maximum
Intensity of II and was barely perceptible (Dames and r~oore, 1972). This
event was too weak to be located by the sparse seismograph coverage of that
time (the nearest was at Albuquerque). It apparently was felt only in Los
Alamos, and hence, it must have been located nearby. The time of this earth
quake may be wrong; the felt report might have been from an earthquake that
occurred early the next morning and was located about 70 km east-northeast of
Los Alamos, although it seems unlikely that Los Alamos residents could have
felt such a small shock (ML = 3.4) located that far away.
A third earthquake was felt on December 5, 1971, and had a maximum
Intensity of V. It was located instrumentally at 36.1°N, 106.3°W (Sanford,
1976), about 25 km north of Los Alamos, and was assigned a magnitude (ML) of
3.3. Minor damage (for example, slight cracks in adobe walls) and audible
rumblings were experienced in the epicentral region. Three other tremors were
reported within an hour of the main shock (Sanford, 1976).
41
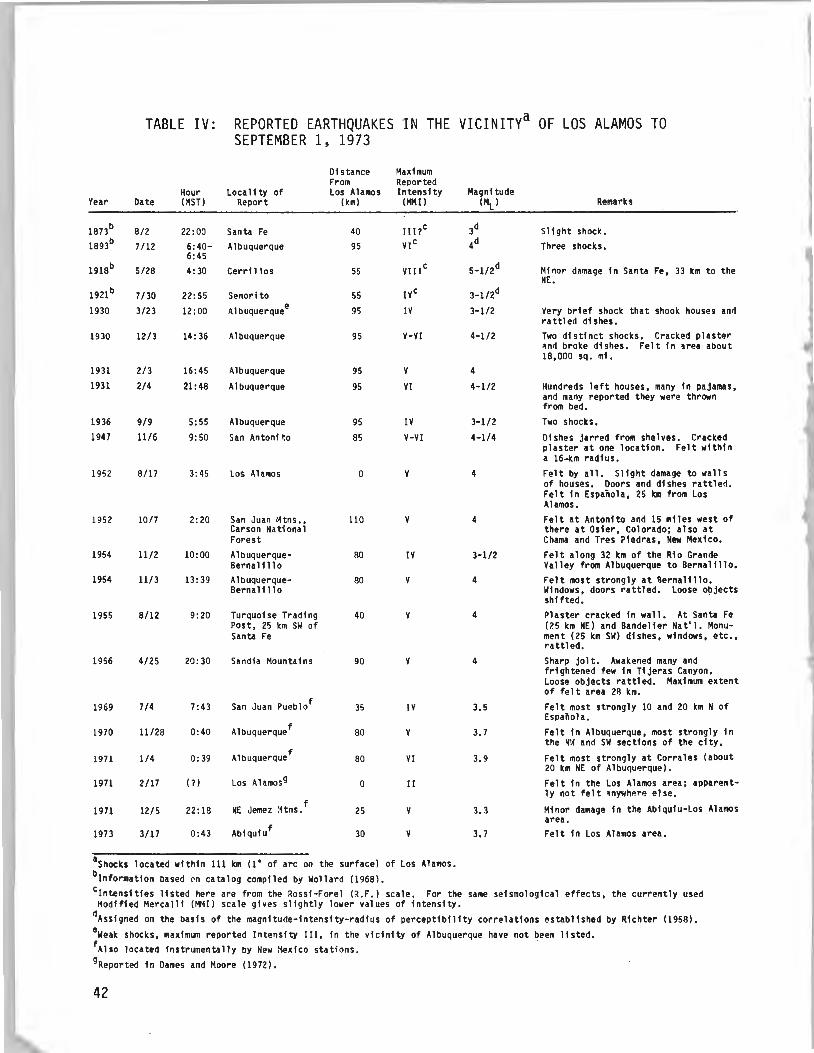
TABLE IV: REPORTED EARTHQUAKES IN THE VICINITYa OF LOS ALAMOS TO SEPTEMBER 1, 1973
Year
1921b
1930
1930
1931 1931
1936 1947
1952
1952
1954
1954
1955
1956
1969
1970
1971
1971
1971
1973
Date
8/2
7/12
5/28
7/30 3/23
12/3
2/3
2/4
9/9
11/6
8/17
10/7
11/2
11/3
8/12
4/25
7/4
11/28
1/4
2/17
12/5
3/17
Hour (MST)
22:00 6:40-6: 45 4:30
22 : 55
12:00
14:36
16:45
21:48
5:55
9:50
3:45
2:20
10:00
13:39
9:20
20 : 30
7:43
0: 40
0:39
( 1)
22:18
0:43
Loca 1 i ty of Report
Santa Fe Albuquerque
Cerrfll os
Senod to Albuquerquee
AlbuquP.rque
A 1 buquerque
Albuquerque
Albuquerque
San Antoni to
Los Alamos
San Juan M tns., Carson National Forest AlbuquerqueBernalillo AlbuquerqueBerna 1 i 11 o
Turquoise Trading Post, 25 km SW of Santa Fe
Sandia Mountains
San Juan Pueblof
Albuquerquef
Albuquerquef
Los Alamosg
NE Jemez ~1tns. f
Abiquiuf
Distance From Los Alamos
(km)
40 95
55
55
95
95
95
95
95
BS
0
110
80
80
40
90
35
80
80
0
25
30
Maximum Reported Intensity
(MMil
V-VI
v VI
IV
V-VI
v
v
IV
v
IV
v
VI
II
v
v
aShocks located within 111 km (1• of arc on the surface) of Los Alamos. blnformation based rn catalog compiled by Wollard (1968).
3d 4d
5-1/2d
3-1/2d
3-1/2
4-1/2
4
4-1/2
3-1/2
4-1/4
4
4
3-1/2
4
4
4
3.5
3,7
3.9
3.3
3.7
Remarks
Slight shock. Three shocks.
Minor damage in Santa Fe, 33 km to the NE.
Very brief shock that shook houses an~ rattled dishes. Two distinct shocks. Cracked plaster ~nd broke dishes. Felt in ~rea about 18,000 sq. mi.
Hundreds left houses, many in pajamas, and many reported they were thrown from bed,
Two shocks.
Dishes jarred from shelves. Cracked plaster at one location. Felt within a 16-km radius. Felt by all, Slight damage to walls of houses. Doors and dishes rattled, Felt in Espanola, 25 km from Los Alamos. Felt at Antonito and 15 miles west of there at Osier, Colorado; also at Chama and Tres Piedras, New Mexico.
Felt along 32 km of the Rio Grande Valley from Albuquerque to Bernalillo. Felt most strongly at Bernalillo. Windows, doors rattled. Loose objects shifted. Plaster cracked in wall, At Santa Fe (?.5 km NE) and Bandelier Nat'l. Monument (25 km SW) dishes, windows, etc., rattled. Sharp jolt. Awakened many and frightened few in Tijeras Canyon. Loose objects rattled. Maximum extent of felt area 2R km.
Felt most strongly 10 and 20 km N of Espanola,
Felt in Albuquerque, most strongly in the Nli and SW sections of the city.
Felt most strongly at Corrales (about 20 km NE of AlbuquP.rque),
Felt in the Los Alamos area; apparently not felt ~nywhere else.
Minor damage in the Abiquiu-Los Alamos area. Felt in Los Alamos area.
clntensities listed here are from the Rossi-Forel (R.F.) scale. For the same seismological effects, the currently used 11odffied Mercalli (MMI) scale gives slightly lower values of intensity.
dAssigned on the basis of the magnitude-intensity-radius of perceptibility correlations established by Richter (1958).
eWeak shocks, maximum reported Intensity III, in the vicinity of Albuquerque have not been listed. fAlso located instrumentally by New r1exico stations . 9Reported in Dames and Moore (1972).
42

The fourth earthquake felt in Los Alamos occurred on March 17, 1973, and
was reported by NOAA/USGS (1975) as "felt in the Los Alamos area." The
earthquake was shallow (depth of a few kilometers) and its epicenter was at
36.1 oN, 106.2°W, in nearly the same area as the December 5, 1971, event. The
event was small, with a magnitude (ML) of 3.6 and maximum Intensity of V. A
survey taken by local seismologists found that the earthquake was felt in
other nearby communities, especially those closer to the epicenter than Los
Alamos.
Among the earthquakes that occurred farther away, but still within the
Rio Grande rift, was the Cerrillos earthquake of May 28, 1918. There is no
known documentation of the effects of this event in the immediate Los Alamos
area, but it may have had the greatest intensities in Los Alamos of all the
earthquakes known in the past 100 years. Its maximum Intensity has usually
been reported as VIII (magnitude of 5.5 to 6). Olsen (1979) reinterpreted
historical records and concluded that the event had a maximum Intensity of VII
and a magnitude of 4.5 to 5.5. He argues that a maximum Intensity of VIII is
an exaggerated interpretation of the felt reports. Olsen (1979) placed the
epicenter of this event at about 35.5°N, 105.1°W (near Cerrillos and about
45 km south-southeast of Los Alamos) because the greatest intensities were
reported from Cerri 11 os. The tremor was fe 1 t over an area of 31,000 km2 . We
note, however, that fe 1 t reports from the Cerri 11 os earthquake are sparse and
allow interpretations different from Olsen•s (1979) both in earthquake size
and in location. Hence, if the Cerrillos earthquake is used for estimating
seismic hazards at Los Alamos, the larger size should be taken, and its
epicenter should be taken to have been closer to Los Alamos.
A more recent, damaging earthquake, the Dulce earthquake of January 22,
1966, occurred within the Colorado Plateau physiographic province (that is,
outside the Rio Grande rift) along a possible extension of structures associ
ated with those of the western margin of the Rio Grande rift. The Dulce
earthquake had a magnitude (ML) of 4. 5 to 5.1 ( ESSA, 1968; Cash, 1971). The
earthquake was located at about 37.0°N, 107.0°W, and was felt over an area of
42,000 km2
with a maximum Intensity of VII (Cash, 1971; Herrmann et al.,
1980). The earthquake was very shallow, perhaps less than 3 km deep. Damage
from the Dulce event was moderate, although many homes sustained structural
damage.
43
The largest earthquakes to occur in New Mexico in historic times were
part of a swarm that was located near Socorro in 1906. Many events were felt,
almost daily, in a swarm that lasted from July 1906 until January 1907 (Reid,
1911). · Two events have been assigned maximum Intensities of VIII (Sanford et
al., 1981), one of which occurred on November 15, 1906, and was felt in Santa
Fe, Roswell, and El Paso. Damage in the epicentral area included fallen
chimneys, damaged walls (the corner of one building collapsed), and rock
falls. Many people abandoned their homes for tents and temporary wooden
shelters. Fear may have been heightened by the fact that the famous San
Francisco earthquake and fire had occurred about three months before the
beginning of the 1906-1907 Socorro activity (Sanford, 1963). The foci of the
swarm are thought to have been under Socorro Mountain, a few kilometers west
of Socorro. Although their epicenters were a considerable distance
(approximately 200 km) from Los Alamos, the earthquakes occurred within the
Rio Grande r i ft. In the standard procedure of 10 CFR 100-A, the seismicity of
one part of a geological feature is significant to the evaluation of the
seismic hazards of any other part.
III-C: RESPONSE SPECTRA
We were asked by the Labor a tory to revise the Dames and Moore ( 1972)
response spectra using seismograms recorded at Los Alamos. Because currently
there are no recordings at Los Alamos of the moderate-size earthquakes that
are of interest to engineers, obtaining response spectra for Los Alamos still
involves a certain amount of data manipulation. One of the original intents
of the seismological effort was to exploit the fact that a nuclear explosion,
Gasbuggy, from the Plowshare peaceful nuclear explosion series, had been
recorded at Los Alamos at the LAMPF site (Mickey et al., 1968). The Gasbuggy
explosion was located about 40 km south-southwest of the epicenter of the 1966
Dulce earthquake. The epicenter of the Dulce earthquake was about 140 km
north-northwest of Los Alamos. Since the source signatures of nuclear
explosions and earthquakes are dissimilar, the Los Alamos recording of
Gasbuggy could not be used directly for computing meaningful earthquake
response spectra. Instead, a way of correcting the Los Alamos recording of
Gasbuggy was needed. Both the Gasbuggy explosion and the Dulce earthquake
were recorded at Albuquerque, at the World-Wide Standard Seismograph Network
(WWSSN) station there. Because of the proximity of the two seismic sources,
44
•
the seismic ray paths to both Los Alamos and Albuquerque are nearly identical
for the two events. Hence, the difference in the seismograms from the two
events at Albuquerque would largely be the result of the difference in the
sources. The source difference then caul d be app 1 i ed to the Gasbuggy sei smo
gram from Los Alamos, and an "equivalent" seismogram from the Dulce earthquake
could be obtained. This equivalent seismogram could then be used to compute
response spectra for the Los Alamos site. Unfortunately, two problems devel
oped, both related to availability of original seismograms. First, the Los
Alamos recordings of the Gasbuggy explosion could not be located. Second, the
requisite Albuquerque seismograms from the Dulce earthquake also could not be
located (broadband seismograms were needed to make the technique work).
Therefore, in our current work, a different approach is being taken to obtain
response spectra. This approach wi 11 use recordings of sma 11 1 oca 1
earthquakes to synthesize the seismograms due to a larger event.
111-D: NETWORK MONITORING
During the period of the initial studies, 1984 to 1985, the existing
northern New r·1exico network was maintained and recorded on a "status quo"
basis, without major effort to expand or maintain stations. For calendar year
1984, events were timed and located, and an earthquake catalog was issued,
along the lines of the previous earthquake catalogs (Wolff et al., 1985).
During 1985, the number of stations operating declined so much that routine
locations of local events were not systematically possible, so they were no
longer attempted, except for significant events (Cash, pers. comm., 1986).
The reasons for the declining number of stations were twofold. First, the
existing stations were not able to be kept operational, and second, data
communication by the New Mexico state microwave system was turned off because
of its great expense. Data from the more distant stations were transmitted
via the New Mexico state microwave system back to the recording facilities at
DP-Site (TA-21) at the Laboratory. Total expenses of the data links became
prohibitive with the available funding.
A total of 102 events were located from 1984. Figure 10 is a plot of the
events located during 1984; for comparison, Figure 11 shows the events located
from 1973 to 1984. Activity during 1984 did, in general, continue to define
the areas that were already seen as seismically active before 1984. A few
events were located away from the zones of prominent activity, such as the two
4.5
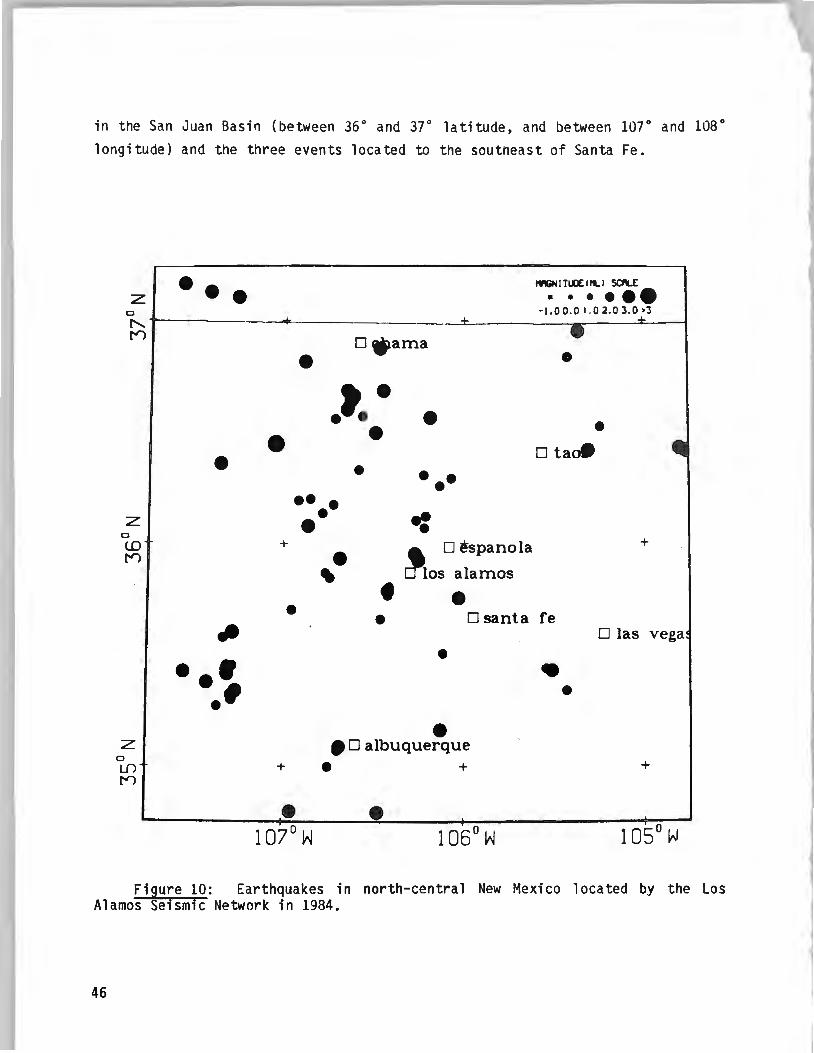
in the San Juan Basin (between 36° and 37° latitude, and between 107° and 108° longitude) and the three events located to the soutneast of Santa Fe .
••• lftON I Tl.U: ll'l..l SCALE:
z • ••••• 0 -1.0 0.0 1. 0 2.0 3.0_:3 ['.. • [")
owama • • .t. • • • • • Dta~ • • • •• •• • z • -: • 0
+ lD + ~ D ~spanola [") • ' los alamos • • • D santa fe • fit D las vega
• ··- • ·' •
• z • D albuquerque 0 Lf) + • + + [")
• • 107°W 106°W 105° w
Figure 10: Earthquakes in north-centra 1 New Me xi co 1 oca ted by the Los Alamos Seismic Network in 1984.
46
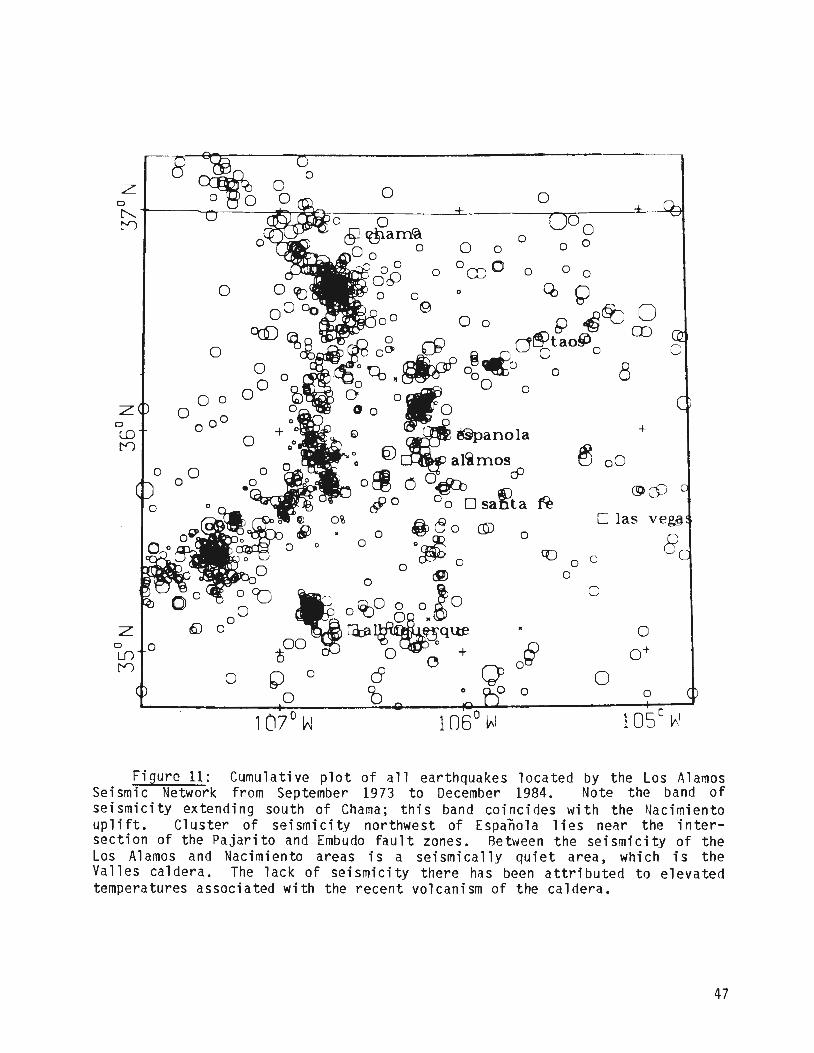
z
z
z 0 0 Ul [")
0
0 0
00 0 0
0 0 oO
0
0
0 0
0
0 0 0
0 0 ~ Q .~f'..-' 0 ° g 0 0 {;) .t{jttJ J?
& ,0 a@tao~
O%
0
o r¥'r-nP o~Co 0 o o (b~~ 00 8
0 oWJI 0
0 0 1!.0 6l ~~anola
Q)~alimos ~ oO
0~ 0 0~ c9 # o 0 o 0 sa~ta ~
0 las o @JC3o C!D o
0 0~ 0 0
0 t9)
0 ~0 8 o.~o
C() 0 0
0
0
Gbl~~~~~que tJ oo -q;o~ 0 +
o 0 a c 0 0
+
0
0
Figure 11: Cumulative plot of all earthquakes located by the Los Alamos Seismic Network from September 1973 to December 1984. Note the band of seismicity extending south of Chama; this band coincides with the Nacimiento uplift. Cluster of seismicity northwest of Espanola lies near the intersection of the Pajarito and Embudo fault zones. Between the seismicity of the Los Alamos and Nacimiento areas is a seismically quiet area, which is the Valles caldera. The lack of seismicity there has been attributed to elevated temperatures associated with the recent volcanism of the caldera.
47

CHAPTER IV:
DISCUSSION OF PRELIMINARY HAZARD MAPS
48
Seven maps, all at the same scale of 1:62,500, are included with this
report. Most of these maps must be considered preliminary and should be
updated as more relevant data become available. A brief discussion of the
maps, their limitations, if any, and their intended utility follows.
IV-A: GEOLOGIC MAP
Five 15-minute U.S. Geological Survey topographic sheets serve as the
base for the geologic mapping of the Pajarito fault system. Particular
emphasis in the mapping is placed on the regional context and continuity of
the main structural elements of the fault system. Because of limitations of
level of effort, we have not mapped portions of the Pajarito Plateau removed
from the fault zones; hence, some small faults may not be shown, and much of
the geology of these areas is taken from Griggs (1964). Much of the geology
of the southern segment of the fault system has been modified from Gardner
(1985), and a few areas in the central segment are modified from Smith et al.
(1970). Much of the geology of the southern San Juan Pueblo quadrangle has
been modified from Dethier and Manley (1985). Detailed discussions of
stratigraphic relations may be found in Dethier and Manley (1985) and Gardner
et al. (1986). MAP IV-A also serves as a base for overlay of the other
preliminary seismic hazards maps.
IV-B: STRUCTURE CONTOUR MAP OF THE PRE-BANDELIER TUFF SURFACE
This map is taken from Dransfield and Gardner (1985), wherein one may
find discussions. Comparison of this map to the geologic map reveals con
tinuations of surface structures into the pre-Bandelier Tuff subsurface.
Furthermore, the structure contour map shows that the Guaje Mountain and
Rendi ja Canyon faults, together with the other down-to-the-west faults beneath
the Pajarito Plateau, contribute to the asymmetry of the Espanola Basin with
the deepest part, the intrarift Velarde Graben, along the western boundary.
Perhaps most significantly, the structure contour map shows that the Guaje
Mountain and Rendija Canyon fault zones persist in the pre-Bandelier Tuff
subsurface beneath the Laboratory. In that portions of these faults show
evidence of young movements (Chapter II), their subsurface continuations
beneath the Laboratory must be considered as having relatively high potential
for surface rupture (see Chapter I, Approach, and MAP IV-D).
49
IV-C: PALEOGEOLOGY OF THE PRE-BANDELIER TUFF SURFACE
This map, based on l"lAP IV-B and well log information, is also taken from
Dransfield and Gardner (1985). The map shows that three main geologic units,
each with its own characteristic paleogeomorphic expression on MAP IV-B, under
lie the Bandelier Tuff of the Pajarito Plateau. The three main lithologies
beneath the Bandelier Tuff and the Laboratory are dacite, old alluvium (Puye
Formation), and basalt, all of which apparently interfinger beneath the
central portions of the Laboratory. These different subsurface geologic
units, together with properties of overlying Bandelier Tuff and distance from
an earthquake source, will cause potentially large differences in seismic
response of a given site within the Laboratory. Hence, one response spectrum
for the entire Laboratory is probably unrealistic.
IV-0: ZONES OF RELATIVE POTENTIAL FOR SEISMIC SURFACE RUPTURE
This map is a preliminary relative delineation of areas within the
La bora tory with respect to potentia 1 for seismic surface rupture. It must be
stressed that these zones are relative only to each other within the area of
the Laboratory; comparisons of the relative potential for surface rupture with
other seismically active areas, such as California, are neither intended nor
applicable. Areas we judge to bear highest potential for seismic surface
rupture include active fault traces, their continuations in the pre-Bandelier
Tuff subsurface, and areas with potential for cross rupture between narrowly
spaced active faults. Zones with probably 1 ower potentia 1 for seismic surface
rupture include areas with faults that do not break the Bandelier Tuff, but
that bear potential for reactivation because of structural and geometric
relations to active faults, and areas in which pre-Bandelier Tuff topography
has apparent fault control. The width of zones with highest potential for
seismic surface rupture is the result of application of the minimum fault zone
control width of 10 CFR 100-A. -
IV-E: PRELIMINARY MAP OF POTENTIALLY HAZARDOUS MASS WASTING
DURING AN EARTHQUAKE
This map simply delineates areas where topography (slope) and the
competence of the geologic materials indicate a potential for hazardous
mass wasting by rockfall, debris flow, and/or landslide. The shaded zones on
this map are areas that warrant further stability analysis. Consideration of
50
addi tiona 1 factors, such as fracture density and degree of water sa tura ti on,
would greatly refine this hazard map.
IV-F: CULTURAL OVERLAY MAP
This map shows main roads and Laboratory technical areas taken from
recent 7.5-minute topographic maps. The scale has been reduced from 1:24,000
to 1:62,500 so that this map may be used as an overlay with the other
preliminary hazards maps.
IV-G: MAP OF GEOMORPHIC SURFACES, SOUTHERN SAN JUAN PUEBLO QUADRANGLE
Because of the abundant geomorphic i nforma ti on on young fault movements
in the southern San Juan Pueblo quadrangle, and because such information is
difficult to convey on conventional geologic maps, we include this map of
Quaternary geomorphic surfaces. The only faults shown are those that affect
the Quaternary surfaces. The ages of the surfaces generally are the times of
surface stabilization. These ages have been determined with the rock varnish
cation ratio technique (Harrington, 1986a, 1986b) and radiometric techniques.
51
CHAPTER V: CONCLUSIONS
52
1. The Pajarito fault system is a major element of the regional Rio
Grande rift system. Estimates of the total linear extent of the fault system
are difficult to make because faults of the system connect with other regional
structures that show no clear terminations. In this study we have mapped more
than 100 km of major, interrelated fault traces.
2. The Paj ari to fault system has experienced recurrent movements over a
long period of time (greater than 16 million years), and most significant
movements have occurred within the last 1.1 million years. Microseismic
activity may be associated with portions of the fault system. Available
evidence indicates that major movements have occurred within the last 500,000
years and as recently as 350,000 years ago, 240,000 years ago, 42,000 years
ago, possibly <10,000 years ago, and 2,000 years ago (Table II). Clearly the
fault system is capable in the sense of 10 CFR 100-A.
3. We have identified three localities which provide data that may be
interpreted so as to yield amount of vertical displacement per earthquake
event. Estimates based on these data must be considered tentative and will be
refined as new and better constraints become available. Using empirical
relations of magnitude to displacement (Figure 25 of Slemmons, 1977), we
deduce from these observed or inferred displacements the following: an
earthquake of magnitude 7.8 occurred on the Paj ari to fault (Bland Canyon)
sometime within the last 500,000(?) years; an earthquake of magnitude 6.8
occurred on a splay of the Embudo fault (Arroyo de la Presa) within the last
42,000 years; and an earthquake of magnitude 6.5 occurred on the Embudo fault
(Arroyo de la Presa) within the last 240,000 years (Table II).
4. The style of deformation in the Pajarito fault system transforms from
dominantly normal faulting in the southern segment, to apparently oblique
normal to right lateral slip in the central segment, to dominantly right
lateral slip in the northern segment.
5. Using 12 years of microseismic data recorded by the Los Alamos Seismic
Network, a simple earthquake frequency-magnitude relation would imply a "once
per hundred years" earthquake of magnitude 4.5 in the Los Alamos area.
However, such results must be considered in the context of results by Schwartz
and Coppersmith (1984) and Davison and Scholz (1985). Both of these studies,
the former based on geologic and seismic information, the 1 atter based on
long-term seismologic information, found that the magnitudes of the character
; stic earthquakes extrapolated from short-term earthquake data, such as that
53
of the Los Alamos Seismic Network, were underestimated by one to two magnitude
units. In addition, Sanford (1976) noted that current levels of seismicity in
the northern Rio Grande rift are abnormally low. Hence, the estimate of the
"once per hundred year" earthquake of magnitude 4.5, based on the Los Alamos
Seismic Network data, is most likely a substantial underestimate.
6. At present we cannot make a realistic estimate of recurrence interval
for the characteristic earthquake and cannot, therefore, estimate probabili
ties so as to address the question of seismic risk at Los Alamos. 1-bwever,
commonly in seismic hazards studies the assumption that average minimum rates
of movements (discussed in Chapter II) can be taken to represent strain rates
is made to generate crude estimates of size and recurrence of earthquakes (for
example, Figure 2 of Slemmons, 1977). These estimates, shown in Table II, are
so variable and the relations on which they are based are so dubious that we
question the significance of the estimates.
7. In light of the variable seismic properties of the Bandelier Tuff
(Table III), the variable thickness of Bandelier Tuff on the Pajarito Plateau
(MAP IV-A and MAP IV-B), and the variable subsurface geology of the Pajarito
Plateau (MAP IV-C), one response spectrum for the entire Laboratory may be
unrealistic.
8. Previous recommendations for ground accelerations based on earthquakes
of Intensity VII to VIII (Dames and r~oore, 1972; Tera, 1984) may be too low,
because ideal correlations of magnitude estimates, discussed in Conclusion 3,
above, to the Modified Mercalli Intensity scale give MMI VIII to X (Table I).
9. Preliminary seismic hazards maps, most of which need to be revised
with further detailed studies, significantly imply the Laboratory and Los
Alamos County will be isolated by road in the event of a large earthquake due
to induced mass wasting and/or surface rupture.
54
I
l •

APPENDIX:
PREVIOUS STUDIES
55
In this appendix we present a list of previous studies most relevant to
seismic hazards at Los Alamos National Laboratory. For the most important of
these works we provide critical discussion. For the reports that offer
relevant pieces of data we have reproduced the author's abstract. Reports
regarding structura 1 and/ or seismic background specific to the Los Alamos area
are simply 1 i sted for reference. It should be noted that we have not 1 i sted
general references to the Rio Grande rift region. The works of Dransfield and
Gardner (1985), Wachs et al. (in prep.), House and Cash (in prep.), and
various earthquake catalogs are not listed herein because relevant data from
these studies have been incorporated into the body of this report.
Aldrich, M. J., Jr., 1986, Tectonics of the Jemez lineament in the Jemez Mountains and Rio Grande rift: J. Geophys. Res., v. 91, p. 1753-1762.
Author's abstract: "The Jemez lineament is a NE trending crustal flaw that controlled volcanism and tectonism in the Jemez Mountains and the Rio Grande rift zone. The fault system associated with the lineament in the rift zone includes, fr001 west to east, the Jemez fault zone southwest of the VallesToledo caldera complex, a series of NE trending faults on the resurgent dome in the Valles caldera, a structural discontinuity with a high fracture intensity in the NE Jemez Mountains, and the Embudo fault zone in the Espanola Basin. The active western boundary faulting of the Espanola Basin may have been restricted to the south side of the lineament since the mid-Miocene. The fa u.l t i n g a p p a r en t 1 y began on the S i err i ta fa u 1 t on the e a s t s i de of the Nacimiento Mountains in the late Oligocene and stepped eastward in the early Miocene to the Canada de Cochiti fault zone. At the end of the Miocene (about 5 Ma) the active boundary faulting again stepped eastward to the Pajarito fault zone on the east side of the Jemez Mountains. The north end of the Pajarito fault terminates against the Jemez lineament at a point where it changes from a structural discontinuity (zone of high fracture intensity) on the west to the Embudo fault zone on the east. Major transcurrent movement occurred on the Embudo fault zone during the Pliocene and has continued at a much slower rate since then. The relative sense of displacement changes from right slip on the western part of the fault zone to left slip on the east. The kinematics of this faulting probably reflect [sic] the combined effects of faster spreading in the Espanola Basin than the area north of the lineament (Abiquiu embayment and San Luis Basin), the right step in the rift that juxtaposes the San Luis Basin against the Picuris Mountains, and counterclockwise rotation of various crustal blocks within the rift zone. No strike-slip displacements have occurred on the lineament in the central and eastern Jemez Mountains since at least the mid-Miocene, although movements on the sti 11 active Jemez fault zone, in the western Jemez Mountains, may have a significant strike-slip component. Basaltic volcanism was occurring in the Jemez Mountains at four discrete vent areas on the 1 i neament between about 15 M a a n d 1 0 M a a n d p o s s i b 1 y a s 1 a te a s 7 M a , i n d i c a t i n g t h a t i t w a s be i n g ex tended duri [lg that time."
56
Aldrich, M. J., Jr., and Harrington, C. D., 1984, Pliocene to Recent deformation in the northeast Jemez Mountains, New Mexico: Geol. Soc. Am. abstracts w/programs, v. 16, no. 4, p. 213. Authors' abstract: "The
northeast Jemez Mountains is [sic] a seismically active area characterized by a major northeast-trending (N.60°E.) fault zone and north-trending normal faults. The fault zone, which lies on and parallel to the Jemez lineament, consists of an en echelon series of left-stepping, northeast-trending faults connected by shorter north to north-northwest-trending faults. Between about five and two million years ago, several kilometers of right oblique slip occurred along the northeast-trending fault zone resulting in rotation of Santa Fe beds and flows of Lobato basalt into the vertical or near vertical along much of the fault zone west of Chili, New Mexico. In most places the steeply inclined beds dip south; however, at one locality tt1ey are overturned and dip north at 75°. The deformational style indicates that significant compressional stresses were associated with the faulting. This fault zone is part of a transform fault system separating two basins (San Luis and Espanola) of the Rio Grande Rift.
"Erosional and constructional surfaces that have developed on the Santa Fe Group, Puye (~2.1- 3.0 m.y.B.P.), and Bandelier (1.1- 1.4 m.y.B.P.) formations record recent motions on the north-trending faults in several locations. Field evidence, including offsets of young Quaternary (<1.0 m.y. old)Holocene(?) gravel deposits and soil profiles indicate that these faults in the northeast Jemez Mountains have been active throughout Quaternary and Recent time. Slickenside orientations show that movements on the northtrending faults have been predominatly dip slip."
Aubele, J. C., 1978, Geology of the Cerros del Rio volcanic field, Santa Fe, Sandoval, and Los Alamos counties, New Mexico: Univ. New Mexico, M.S. thesis, 136 p.
Aubele, J. C., 1978, Geology of the Cerros del Rio volcanic field: New Mexico Bureau of Mines and Mineral Resources Circular 163, p. 198-201.
Axelrod, D. I., and Bailey, H. P., 1976, Tertiary vegetation, climate, and altitude of the Rio Grande depression, New Mexico-Colorado: Paleobiology, v. 2, p. 235-254.
Bachman, G. 0., and Mehnert, H. H., 1978, New K-Ar dates and the Late Pliocene to Holocene geomorphic history of the central Rio Grande Rift: Geol. Soc. Am. Bull., v. 89, p. 283-292.
Baltz, E. H., Abrallams, J. H., Jr., and Purtymun, W. D., 1963, Preliminary report on the geology and hydrology of Mortandad Canyon near Los Alamos, New Mexico, with reference to disposal of liquid low-level radioactive waste: U.S. Geological Survey (Albuquerque, NM), open-file report, 105 p • w I 13 p 1 a te s •
Bridwell, R. J., Homuth, E. F., and Potzick, of Cenozoic, Mesozoic, and Paleozoic Mesa, Los Alamos County, New Mexico): unpub. report, 18 p.
C., 1979, Preliminary predictions stratigraphy of EGH-LA-1 (Sigma Los Alamos Scientific Laboratory,
57
Browne, C. I., 1982 (response to request for review of reports for the "Natural Phenomena Hazards Guideline Model Development Project," [see Tera, 1981, 1984, below] submitted to H. E. Valencia, Area Manager, Los A 1 amos Area, U.S. Dept. of Energy), Los A 1 amos Nation a 1 La bora tory, written commun., May 5, 1982, #ADTS-82-131, 12 p.
Budding, A. J., 1978, Subsurface geology of the Pajarito Plateau: interpre-tation of gravity data: New Mexico Bureau of Mines and 1"1ineral Resources Circular 163, p. 196-198.
Budding, A. J., 1978, Gravity survey of the Pajarito Plateau, Los Alamos and Santa Fe counties, New Mexico: Los Alamos Scientific Laboratory report LA-7419-MS.
Budding, A. J., and Purtymun, W. D., 1976, Seismicity of the Los Alamos area based on geologic data: Los Alamos Scientific Laboratory report LA-6278-MS. In this report geological structures in the Los Alamos area
are used to estimate lengths, offsets, and ages of what are termed "major" faults near Los Alamos. The authors assumed that an individual seismic event would rupture the entire mapped length of the faults and that all slip is released seismically. We note, however, that all faults in the area, particularly the Pajari to fault zone, are much longer than their assumed length of surface rupture, and further that most major faults interconnect (see MAP IV-A). The authors obtained estimates of maximum earthquake magnitude which averaged 6.7. They then estimated an average recurrence interval of about 8,000 years for these maximum magnitude earthquakes. The recurrence interval was derived from using the 1.1 million year age of the Bandelier Tuff and the number of maximum magnitude earthquakes needed to account for the offsets they observed. They then extrapolated, on a frequency-magnitude diagram, using a b-value of 1.0, a largest probable earthquake of ML = 4.8 per century within or very close to Los Alamos County. This approach is appropriate for estimating a rate of strain release or a rate of seismic energy release, but is not appropriate for estimating probable earthquakes with regard to seismic haz-1rd or seismic risk. It is not the time average over 1,000s of years that is pertinent to hazards and risk but rather the exposure and likelihood of occurrence in a specific time period.
Cash, D. J., 1982 (internal memo regarding review documents from Tera Corporation, submitted to summarized in Browne, 1982, above), Los Alamos written commun., 6 p.
of two seismic risk Allen Stoker, H-8;
National Laboratory,
Cash, D. J., 1983, Seismicity near S-site, Los Alamos National Laboratory: unpub. report, 20 p.
Cooper, J. B., Purtymun, W. D., and John, E. C., 1965, Records of water-supply wells Guaje Canyon 6, Pajarito Mesa 1, and Pajarito Mesa 2, Los Alamos, New Mexico: U.S. Geological Survey (Albuquerque, NM), Basic Data Report, 90 p. w/original well logs.
Cordell, L., 1979, Gravimetric expression of graben faulting in Santa Fe County and the Espanola Basin, New Mexico: New Mexico Geological Society Guidebook, Santa Fe Country, 30th field conference, p. 59-64.
58
Dames and Moore, 1972, Report of geologic, foundation, hydrologic, and seismic investigation: Plutonium Processing Facility, Los Alamos Scientific Laboratory, Los Alamos, NM: Dames and Moore consulting report, job number 0651-120-02, Los Angeles, CA. This study was done for site
engineering for the Plutonium Facility at Los Alamos (TA-55). It notes the sparseness of information about historic seismicity in New Mexico and summarizes the known earthquakes that would influence seismic design. It is a comprehensive source for citations of historic northern New Mexico earthquakes, although it presents only information regarding time, intensity, and general location.
The report notes the sparseness of instrumental coverage for the state of New 1"1exico as a whole, and for northern New Mexico in particular. Central and southern New Mexico have been better studied, in part because of the occurrence of a swarm of events in 1906-1907 in the Socorro area. The Socorro swarm included three events with Intensities as high as VIII (Modified Mercalli Intensity scale).
The report notes that " ... sufficient [earthquake] data has [sic] not yet been collected. It will be necessary to collect such data in the coming years to serve as a basis for performing a meaningful analysis." Although the report notes that the largest earthquakes reported in the rift have been from the Socorro area, it also notes "there is no indication that the tectonic structure to the north near Los Alamos is any different." Nevertheless, the report asserts that "It is unlikely that earthquake ground motion greater than Intensity VI has been experienced at the proposed site [Los Alamos] since the date of the first reported New Mexico earthquake in 1849."
The report presents a series of "recurrence curves" (Plate S-3) that do not show the data points from which the lines were drawn. It notes that "while an average interval between events may be calculated, no mathematical probability of occurrence should be directly derived from it ... it should be recognized that this record may be too incomplete for statistical significance." Without further discussion, Intensity VIII is taken as the maximum earthquake intensity that Los Alamos will experience.
In the Engineering Seismology section the peak acceleration is correlated with the Intensity VIII. Trifunac and Brady (1975) state that the correlations between maximum earthquake Intensity and peak acce 1 era ti on show sea tter of one order of magnitude or more. Trifunac and Brady (1975) derive a relation that yields a peak acceleration of 0.26 g for an earthquake of maximum Intensity VIII, but in their data set (a total of four earthquakes), the standard deviation is relatively large, 0.08 to 0.10 g. Dames and Moore (1972) chose an accelerogram from the 1940 Imperial Valley, California, earthquake that was written at El Centro to determine a peak acceleration value for the Safe Shutdown Earthquake. The Intensity reported for the Imperia 1 Va 11 ey earthquake at El Centro was VIII, and the peak acceleration written was 0.33 g. Dames and Moore then state that "We have had occasion to inspect and verify the 1940 damage and have compared it with other events at both higher and lower levels to confirm the 0.33 g-Intensity VIII correlation." No data are presented, so the adequacy of the Dames and Moore conclusions cannot be independently judged.
The El Centro record from the 1940 Imperial Valley earthquake was written at a distance of 10 km from the epicenter. Hanks and Johnson (1976) provide a quantitative analysis of peak acceleration as a function of earthquake magnitude. They show that many earthquakes of magnitudes smaller than 7.1 produced accelerations greater than 0.35 g at comparable distances. Hence,
59
the significance of the peak acceleration chosen by Dames and Moore (1972) is not clear.
In the Dames and Moore report, the section entitled Design Earthquake Values, the choice of peak acceleration for the Operating Basis Earthquake is discussed. The report states, "It is probable that the maximum level of ground motion experienced in the past century at the site has been no more than Intensity VI. However, the occurrence of an earthquake similar to the 1918 Cerrillos event at Los Alamos, with a site Intensity of VII to VIII, is not improbable. For this condition, the maximum horizontal ground acceleration at the site would probably be on the order of 0.17 g. This is the level of ground motion which we recommend for the Operating Basis Earthquake." Where the 0.17 g comes from and what the probability is for such ground motion are not documented.
Dames and Moore (1972) devised response spectra for the TA-55 site. Documentation of their methodology is inadequate. While they claimed to have modeled the upper 7000 ft of the material beneath the site, they actually measured velocities from only the upper 180 ft and assumed velocities for the next 6820 ft. The overall conclusion was that, at frequencies above about 2 Hz, the site response attenuated "bedrock" motion, but at frequencies below about 2Hz, the site amplified "bedrock" motion. Because of the sparse documentation of the methods used, it is difficult to evaluate the significance of these assertions.
Dethier, D. P., and i~anley, K., 1985, Geologic map of the Chili quadrangle, Rio Arriba County, New Mexico, Scale 1:24,000: U.S. Geological Survey, Map MF-1814.
Gardner, J. N., 1985, Tectonic and petrologic evolution of the Keres Group: implications for the development of the Jemez Volcanic Field: Univ. of California, Davis, Ph.D. dissertation, 293 p.
Gardner, J. N., and Goff, F., 1984, Potassium-argon dates from the Jemez Volcanic Field: implications for tectonic activity in the north-central Rio Grande Rift: New Mexico Geological Society Guidebook 35, pp. 75-81.
Gardner and Goff discuss the tectonic activity of the Espanola Basin of the Rio Grande rift in the context of the volcanic evolution of the Jemez volcanic field. Of particular significance to seismic hazards studies at Los Alamos they note: the deep intrarift graben beneath the Pajarito Plateau, revealed in various geophysical studies, is bounded on the west by the Pajarito fault system; the Pajarito fault system has been active since about 4 Ma and is the presently active western deformational boundary of the basin; and various estimates of rates of movement and amounts of extension by Golombek and coworkers (see below) are unrealistically low because the Golombek models fail to include significant relevant information on fault zones.
Goff, F. E., and Gardner, J. N., 1980, Geologic map of the Sulphur Springs area, Valles caldera geothermal system, New Mexico: Los Alamos Scientific Laboratory report LA-8634-MAP.
Goff, F., and Grigsby, C. 0., 1982, Valles caldera geothermal systems, New Mexico, U.S.A.: J. Hydrol ., v. 56, p. 119-136.
60
Goff, F., and Kron, A., 1980, In-progress geologic map of Canon de San Diego, Jemez Springs, New Mexico, and lithologic log of Jemez Springs geothermal well: Los Alamos Scientific Laboratory report LA-8276-IVIAP.
Goff, F., 1982, Subsurface structure of Valles ca 1 dera: a resurgent cauldron in northern New Mexico: Geol. Soc. Am. Abst. w/programs, v. 15, no. 5, p. 381.
Golombek, M. P., 1981, Structural analysis of the Pajarito fault zone in the Espanola Basin of the Rio Grande Rift, New Mexico: Ph.D. dissertation, Univ. Massachusetts, 129 p.
Golombek, M. P., 1983, Geology, structure, and tectonics of the Pajarito fault zone in the Espanola Basin of the Rio Grande Rift, New !Vlexico: Geol. Soc. Am. Bull., v. 94, p'. 192-205. (See discussion of Gardner and Goff, 1984). Author's abstract: "The Pajarito fault zone forms the western
border of the Velarde graben, the presently active, central subbasin of the Espanola basin section of the Rio Grande rift in north-central New Mexico. The fault zone is a north-northeast-trending zone of predominantly down-tothe-east faults that cut Miocene to Pliocene volcanic rocks along the eastern flank of the Jemez Mountains. Where the fault zone cuts the 1.1-m.y.-old Tshirege Member of the Bandelier Tuff, it has produced a steep, 50- to 100-m-high fault scarp. The total displacement across the fault zone during its 5-m.y. history is between 200 and 600 m. Rates of displacement for the time periods 0-5, 0-1.1, and 1.1-5 m.y. ago range from 0.02 to 0.136 mm/yr.
"Abrupt facies changes between older volcanics and volcaniclastic sediments of the Jemez Mountains appear to have controlled the local position, trend, and character of the Pajarito fault zone. The fault zone bows and/or steps eastward where two large volcanic complexes are present but is found farther \'lest in between and at either end of the volcanic complexes. One complex was sufficiently massive to interfere with the development of the Velarde graben.
"Slickensides on mesoscopic faults in the Tshirege Member of the Bandelier Tuff indicate that the Pajarito fault zone has undergone extension in two directions during the pnst 1.1 m.y., approximately parallel and perpendicular to the local trend of the fault zone. These directions indicate that the Pajarito fault zone has reoriented the regional m1n1mum and intermediate stress directions to perpendicular and parallel, respectively, to the local trend of the fault zone, and that both minimum and intermediate stress directions are tensional.
"A tectonic history for the Pajarito fault zone area of the Espanola basin begins with relatively stable accumulation of prerift and synrift sediments from Eocene to Oligocene time. Sedimentation concomitant with faulting, unrelated to the Pajarito fault zone, filled deep central depressions within the Espai'lola basin. This faulting ceased prior to the end of the filling of the basin, around 10 m.y. ago in the local area. Jemez r~ountain volcanism began about this time, before movement along the western-margin border faults of the Espanola basin caused west-ti 1 ting of old volcanics and sediments, about 7.5 m.y. ago. Volcanism continued under relatively stable conditions until 5 m.y. ago. At this time, the Pajarito fault zone and Velarde graben formed. Faulting has continued to the present, localized along this central subbasin."
61
Golombek, M. P., McGill, G. E., and Brown, L., 1983, Tectonic and geolog ic evolution of the Espanola Basin, Rio Grande Rift: structure, rate of extension, and relation to the state of stress in the western U.S. : Tectonophysics, v. 94, p. 483-507.
Griggs, R. L., 1964, Geology and ground water resources of the Los Alamos area, New Mexico: U.S. Geological Survey Water Supply Paper 1753. This
report provides the best available geologic map of Los Alamos County. Griggs identified the major structures and rock units of the area and noted evidence for recurrent movements on the Pajarito fault zone since at least Pliocene times.
Harrington, C. D., and Aldrich, M. J., Jr., 1984, Development and deformation of Quaternary surfaces in the northeast Jemez !"1ountains, New Mexico: Geol. Soc. Am. Abstracts w/programs, v. 16, no. 4, p. 224. Authors'
abstract: "Quaternary erosional and deformational events in the northeastern Jemez Mountains have yielded a topography consisting of a complex sequence of stepped, erosional surface segments. Tectonic-geomorphic studies show that three erosional surfaces developed across the northeastern flank of the mountains during Quaternary time. The uppermost surface (Q 1) truncates the Bandelier Formation (1.1 - 1.4 m.y.B.P.) and is graded to the northeast. It is capped primarily by pediment gravels and colluvial deposits. The Q2 and lowermost Q3 surfaces are graded eastward into the Espanola Basin. Capping deposits on these surfaces largely consist of pediment gravels, alluvial fan deposits, and alluvial-valley fills. Each surface has been dissected by streams whose valley floors were then graded to the next lower surface. In addition to the three erosional surfaces, undeformed Holocene(?) alluvial terraces are present in most of the larger arroyos.
"The erosional surfaces within this area have been displaced by movement a 1 ong faults. Tile north-trending faults, some recently active, have broken the surfaces into a complex arrangement of steps which are generally down to the east. A northeast-trending fault zone that has undergone significant oblique-slip displacement broke the surfaces parallel to their slopes and raised the terrain to the north. Mast di sp 1 a cement a 1 ong this zone occurred prior to formation of the Q1 surface; however, small movements have occurred since the surface formed.
"Ongoing studies, uti 1 i zing severa 1 Qua ternary dating techniques are expected to result in more accurate dating of fault motions and Quaternary surface deve 1 opment within the northeastern Jemez Mountains."
Harrington, C. D., and Aldrich, M. J., Jr., 1984, Development and deformation of Qua ternary surfaces on the northeastern flank of the Jemez Mountains: New Mexico Geological Society Guidebook 35, p. 235-239. This paper
documents three erosional surfaces that developed along the western margin of the Espanola Basin during the Qua ternary. De formation of these surfaces records recurrent motion along the Santa Clara fault zone and adjacent north-trending fau 1 ts. One north-northwest-trending fault has di sp 1 aced a basalt boulder gravel formed on the youngest of these surfaces (22,000 ± 3,000 years old), a minimum distance of 10m.
John, E. C., Enyart, E., and Purtymun, W. D., 1966, Record of wells, test holes, springs, and surface-water stations in the Los Alamos area, New Mexico: U.S. Geological Survey (Albuquerque, New Mexico), open-file report, 139 p.
62
Keller, M. D. (ed.), 1968, Geologic studies and material properties investigations of Mesita de Los Alamos, Los Alamos Scientific Laboratory report LA-3728. Contributors to this report asserted that the Pajari to fault
offsets the El Cajete pumice, which they assumed to be 50,000 years old, because the pumice occurs on the downthrown side of the fault. They attributed its absence on the upthrown side to removal by erosion. Then, using a maximum offset of the El Cajete of 500 ft, and assuming that each displacement by the Pajarito averaged 10 ft, they calculated that one increment of displacement has occurred every 1000 years. However, there is no definitive evidence that the El Cajete pumice is offset by the Pajari to fault.
The report concluded from ( 1) the presence of tent rocks, many of which are capped by boulders, (2) the existence of old, undamaged adobe structures, (3) the lack of Spanish and Mexican records of earthquakes, and (4) the lack of significant seismicity recorded during this study (nine days) that the likelihood of severe seismic damage in the Los Alamos area was remote. No quantitative estimate of seismic risk was given.
The lines of evidence on which these conclusions are based are tenuous. Earthquake damage to adobe structures and, for that matter, tent rocks will be dependent on distance from the earthquake, the nature of the intervening geology, the size of the earthquake, and the geology at the specific site. Furthermore, adobe structures are virtually under continuous repair, and we do not know how quickly tent rocks can form. A lack of historic records of earthquakes in New Mexico may be as much a result of sparse population and disorganized record keeping as a lack of earthquakes. Finally, nine days of seismic monitoring is inadequate for extrapolating levels of future seismicity.
Kelley, V. C., 1978, Geology of the Espanola Basin, New Mexico: New Mexico Bureau of Mines and Mineral Resources, Geologic Map 48. This is the best
general map of the geology of the Espanola Basin, including the more regional structural relations of the Pajarito fault zone. It also includes a generalized tectonic map of the central Rio Grande rift. Ke lley does not specifically address Quaternary or Holocene faulting.
Kelley, V. C., 1979, Tectonics, middle Rio Grande rift, New Mexico: in Riecker, R. E., ed., Rio Grande Rift: Tectonics and Magmatism, Am. Geophys. Union, Washington, D.C., spec. pub. p. 57-70.
Kelley, V. C., Woodward, L. A., Kudo, A. M., and Callender, J. F., 1976, Guidebook to Albuquerque Basin of the Rio Grande Rift, New Mexico: New Mexico Bureau of Mines and Mineral Resources Circular 153, 31 p.
Lewis, L. M., 1980, A gravity study of north-central New Mexico: Univ. of Texas, El Paso, 1"1.S. thesis, 78 p.
Los Alamos National Laboratory, 1985 Emergency Response Plan. On page X-4 of the Laboratory's Emergency Response Plan there appears the following:
"EARTHQUAKE: Earthquakes are rare in the Los Alamos area; however, a major fault lies some 35 miles to the east of the Laboratory. Records indicate that this area has been relatively free of major earthquakes, and although the Rio Grande fault has generated earthquakes, they have been well south of the Labor a tory."
63
Machette, M. N., and Personius, S. F., 1984, Map of Quaternary and Pliocene faults in the eastern part of the Aztec 1 °X2° quadrangle and the western part of the Raton 1°X2° quadrangle, northern New Mexico: U.S. Geological Survey Map MF -1465-B. This map shows faults in north-centra 1 New Mexico
along which movement has occurred during the last 5 million years. Several faults of this age occur in the Espanola-Abiquiu area. They show 12 localities with Pleistocene and 1 locality with Holocene movements along the eastern Embudo fault zone.
Manley, K., 1976, The Late Cenozoic history of the Espanola Basin, New Mexico: Univ. of Colorado, Ph.D. dissertation, 171 p.
Manley, K., 1978, Cenozoic geology of Espai'iola Basin: New Mexico Bureau of Mines and Mineral Resources Circular 163, p. 201-210.
Manley, K., 1979, Stratigraphy and structure of the Espanola Basin, Rio Grande Rift, New Mexico: .:!!l Rio Grande Rift: Tectonics and Magmatism, R. E. Riecker, ed., Am. Geophys. Union Spec. Pub., p. 71-86.
r~ickey, W. V., 1968 (memo regarding seismograms from LASAL [sic]-LAMPF, submitted to M. D. Keller, ENG-9), U.S. Department ofCommerce, Environmental Science Services Administration, written commun., ref. C233, Feb. 19, 1968, 3 p.
Newton, C. A., Cash, D. J., Olsen, K. H., and Homuth, E. F., 1976, LASL seismic programs in the vicinity of Los Alamos, New Mexico: Los Alamos Scientific Laboratory report LA-6406-MS.
Nyhan, J. W., Hacker, L. W., Calhoun, T. E., and Young, D. L., 1978, Soil survey of Los Alamos County, New Mexico: Los Alamos Scientific Laboratory report LA-6779-MS.
P e 1 1 e t te , P . R . , En de b r o c k , E . G . , G i 1 e s , P . r~ • , a n d S h a w , R . H . , 19 7 7 , Seismic qualification of equipment for the TA-55 Plutonium Processing Facility: Los Alamos Scientific Laboratory report LA-6787-MS. Working
frcxn the 11 Design Basis Earthquake .. (DBE) and the .. Operating Basis Earthquake .. (OBE) as determined from the Dames and Moore (1972) study, this report discusses the procedures used to verify that critical equipment intended for installation at the Plutonium Facility would withstand the chosen ground motions. Individual items of operating equipment (generator, pumps, motors, fans, etc.) were tested on shake tables.
Purtymun, W. D., 1984, Hydrologic characteristics of the main aquifer in the Los Alamos area: development of ground water supplies: Los Alamos National Laboratory report LA-9957-MS.
Purtymun, W. D., 1967, Record of water-supply well PM-3, Los Alamos, New Mexico: U.S. Geological Survey (Santa Fe, NM), open-file report, 22 pages w/original well logs.
Purtymun, W. D., Becker, N. 1~ •• and Maes, M., 1983, Water supply at Los Alamos during 1981: Los Alamos National Laboratory report LA-9734-PR, 46 p.
64
Purtymun, W. D., Becker, N. M., and Maes, M., 1984, Water supply at Los Alamos during 1982, Los Alamos National Laboratory report LA-9896-PR, 46 p.
Purtymun, W. D., and Cooper, J. B., 1969, Development of ground-water supplies on the Pajarito Plateau, Los Alamos County, New Mexico: U.S. Geological Survey Prof. Paper 650-B, p. B149-B153.
Purtymun, W. D., and Jordan, H. S., 1973, Seismic program of the Los Alamos Scientific Laboratory: Los Alamos Scientific Laboratory report LA-5386-MS. The moti va ti on for and anticipated scope of earthquake and
explosion seismology at Los Alamos are briefly summarized. Seismologic work was an offshoot of the weapons program carried out in Group J-9. Motivation for seismologic studies was (1) environmental monitoring, (2) studies associated with the geothermal program, (3) studies of underground explosions and their effects, and (4) strong-motion studies.
Reynolds, C. B. (no date), Experimental shallow seismic reflection survey, Los Alamos area, New Mexico, unpublished consulting report, C. B. Reynolqs, Registered Geophysicist and Certified Professional Geologist, Californ1a, 16 p.
Rodean, H. C., 1970, Explosion-produced ground motion: Technical summary with respect to seismic hazards, in Symposium on Engineering with Nuclear Explosives, Conf. Proceedings,-Am. Nuclear Soc. and U.S. Atomic Energy Comm., CONF-700101, p. 1024-1050.
Sanford, A. R., 1976, Seismicity of the Los Alamos region based on seismo-logical data: Los Alamos Scientific Laboratory report LA-6416-MS.
Sanford investigated the seismicity and seismic risk of the Los Alamos region using entirely seismologic information. From 10 years of instrumentally monitored seismicity (1962 to 1972), Sanford estimates that the largest event that will occur in the Los Alamos area in the next hundred year period (the 11 0nce per hundred year earthquake,.) will be of magnitude 4.8. On the other hand, he notes that, compared with the preceding 50 years, seismic activity during the period 1962 to 1972 was abnormally low. Without information regarding recurrence i nterva 1 s of earthquakes, the once per hundred years' earthquake should not be taken to be smaller than what has been observed in the past 100 years. Hence, a reasonable estimate for the once per hundred years' earthquake must be at least 5.0 to 5.5, based on the 1918 Cerrillos earthquake (see Chapter Ill, Seismological Studies).
Savage, W. U., Ely, R. W., and Tocher, D., 1977, Review of the Los Alamos seismic monitoring program in relation to the Hot Dry Rock geothermal project: Woodward-Clyde consulting report L47-85930-1. 28 p. This
report is a thorough and critical review of the seismic monitoring efforts undertaken particularly for the Hot Dry Rock project at Fenton Hi 11; it also reviews the seismic monitoring done for Los Alamos in general. Among the conclusions that are also pertinent to seismic hazards studies of Los Alamos are the following: 1) ,.In general, the degree of detail and documentation of geologic mapping in the vicinity of the Valles Caldera is insufficient to support a state-ofthe-art seismic hazard assessment ... The same is true of [the lack of detailed] studies conducted for faults near LASL ... "
65
2) "Because Fenton Hill and LASL are located within an active, first order tectonic feature (the Rio Grande Rift) and adjacent to a major Quaternary volcanic center (the Valles Caldera), we feel that prudence requires a thorough evaluation of geologic hazards in the surrounding area. Because of the national importance of the HDRG [Hot Dry Rock Geothermal] research at LASL, the political consequences of failure to have done this may be severe in the event of a significant earthquake or volcanic eruption." 3) "In a siting study prepared by Dames and Moore (1972), seismic risk for the plutonium enrichment facility at LASL was estimated. However, the risk estimation methodology has been incompletely presented and implemented."
The most fundamental recommendations from this report that are relevant to evaluating seismic hazards in Los Alamos are in the areas of geologic studies: 1) "Integration and synthesis of existing geologic, seismologic, and geophysical data, with the objective of identifying locations for future detailed study, as well as areas of insufficient data." ' 2) "Detailed study of the faults identified ... as having experienced displacements in the last 100,000 years. This program should include trenching, large scale (1:24,000) geologic mapping along fault traces, stratigraphic study of late Quaternary deposits, and remote sensing to help determine the earthquake recurrence interval on these faults."
Slemmons, D. B., 1975, Fault activity and seismicity near the Los Alamos Scientific Laboratory geothermal test site, Jemez Mountains, New Mexico: Los Alamos Scientific Laboratory report LA-5911-MS. Slemmons investi
gated the seismic hazards that the Fenton Hill Hot Dry Rock site (located about 40 miles WSW of Los Alamos) might be exposed to and concluded that "the hazard that the experiment [site] will be disturbed by future surface faulting or by large local earthquakes is very slight." His study was based on geologic field work, in particular aerial surveillance and photography, as well as the available seismic record. In addition, he asserts that the current "tectonic flux" (the rate of seismic energy release per unit area) in the Rio Grande Rift is about a factor of 10 less than in the Basin and Range province of California-Nevada-Utah. We note the significance of current tectonic flux with respect to recurrence of large earthquakes is ambiguous. Note also that this study considered seismic hazards to the Fenton Hill site, and not to Los Alamos itself.
Smith, R. L., Bailey, R. A., and Ross, C. S., 1970, Geologic map of the Jemez Mountains, New Mexico: US Geological Survey Misc. Geol. Investigations Map
:I-571. This is the best general map of the geology of the Jemez Mountains. Area includes the Pajarito fault zone. Much of this information was compiled by Kelley (1978).
Tera Corporation, 1981 Seismic hazard analysis for the Bendix, Los Alamos, Mound, Pantex, Rocky Flats, Sandia-Albuquerque, Sandia-Livermore, and Pinellas sites; Tera, 1984, Seismic hazard analysis for Los Alamos Scientific Laboratory and Sandia Laboratories, New Mexico, unpub. con s:~ lting report #B-81-63, Tera Corporation, Berkeley, CA. (Revised 1984, wnsulting report #B-82-261, 38 p.) (Only the section pertinent to
Los Alamos is considered.) This study purports to be a "detailed seismic hazard analysis" of the Los Alamos DOE site (among others). The principal result of the study is a probabilistic determination that the Los Alamos area would experience a horizontal peak ground acceleration of 0.08 g with a return
66
period of 100 years and of 0.22 g with a return period of 1,000 years. In addition, the study presents response spectra, normalized to 1 g. Response spectra 1 shapes were taken from Dames and r~oore ( 1972).
The documentation in the Tera report is inadequate to determi-ne the credibility of the results. The recent (historic) seismicity is used as input to the probabilistic modeling, but the probabilistic model itself is not documented nor even summarized in this report. Although "sensitivity analysis" is mentioned several times in the report, nowhere is there any quantitative discussion of what was varied and what the outcome was. Although terms such as "best estimate" and "weighted average" are used, there is no mention of how the estimate is "best" or how the individual items were "weighted."
Fundamental to the approach employed by Tera are data regarding ages, recurrence intervals, and sizes of earthquakes associated with the faults near the site under evaluation, as well as information on the regional historical and instrumentally measured seismicity. In that Tera generated no new data and considered only a few years of regional seismicity beyond that included in Dames and Moore (1972), much of the data necessary for a credible probabilistic model does not yet exist. Hence, the Tera probabilistic seismic risk analysis adds nothing to previous studies and brings us no closer to being able to address the question of seismic risk at Los Alamos.
Williams, L. M., 1979, Gravity study of· the Los Alamos area, New Mexico: Los Alamos Scientific Laboratory report LA-8154-MS.
Williston, McNeil, and Associates, 1979, A time domain survey of the Los Alamos region, New Mexico: Los Alamos Scientific Laboratory report LA-7657-MS.
67

REFERENCES
69
Aldrich, M. J., 1986, Tectonics of the Jemez Lineament in the Jemez Mountains and Rio Grande rift: J. Geophys. Res. 91(82), 1753-1762.
Aldrich, M. J., and Laughlin, A. W., 1982, Orientation of least-principal hori zonta 1 stress: Arizona, New Mexico, and the Trans-Pecos area of west Texas (stress data and references): Los Alamos National Laboratory report LA-9158-MAP. -
Arabasz, W. J., Smith, R. B., and Richins, W. D., 1979, Earthquake studies in Utah, 1950 to 1978: University of Utah Spec. Pub., 552 p.
Atwater, T., 1970, Implications of plate tectonics for the Cenozoic tectonic evolution of Western North America: Geol. Soc. Am. Bull. 81, 3513-3535.
Baldridge, W. S., Damon, P. E., Shafiqullah, M., and Bridwell, R. J., 1980, Evolution of the central Rio Grande rift: New potassium-argon ages: Earth Planet. Sci. Lett. 51, 309-321.
Brown, L. L., and Golombek, M. P., 1986, Block rotations in the Rio Grande rift, New Mexico: Tectonics 2. 423-438.
Budding A. J., 1978, Gr:wity survey of the Pajarito Plateau, Los Alamos and Santa Fe counties, New Mexico: Los Alamos Scientific Laboratory report LA-7419-MS.
Budding, A. J., and Purtymun, W. D., 1976, Seismicity of the Los Alamos area based on geologic data: Los Alamos Scientific Laboratory report LA-6278-MS.
Cash, D. J., 1971, The Dulce, New Mexico, earthquake of January 23, 1966: Location, focal mechanism, magnitude, and source parameters: Ph.D. dissertation, New Mexico Institute of Mining and Technology, Socorro, NM.
Cash, D. J., and Wolff, J. J., 1984, Seismicity of the Rio Grande rift in northern New Mexico, 1973-1983: New Mexico Geol. Soc. Guidebook 35, 24-28.
Chapin, C. E., 1979, Evolution of the Rio Grande rift: A summary: in Rio Grande Rift: Tectonics and Magmatism, R. E. Ri ecker, ed., Am. Geophys. Union (Washington, D.C.) Spec. Pub., p. 1-6.
Chapin, C. E., and Seager, W. R., 1975, Evolution of the Rio Grande rift in the Socorro and Las Cruces areas: Ne\'1 Mexico Geol. Soc. Guidebook 26, 297-322.
Christiansen, R. L., and Lipman, P. W., 1972, Cenozoic volcanism and plate-tectonic evolution of the western United States. II. Late Cenozoic: Royal Soc. London Philos. Trans. 271, 249-284.
Coffman, J. L., and von Hake, C. A., (eds.), 1973, Earthquake history of the United States: U.S. Dept. of Commerce (Washington, D. C.), Publication 41-1, 208 p.
70
Crowe, B. M., 1978, Cenozoic volcanic geology and probable age of inception of basin-range faulting in the southeasternmost Chocolate Mountains, California: Geol. Soc. Am. Bull. 89, 251-264.
Dalrymple, G. B., Cox, A., Doell, R. R., and Gromme, C. S., 1967, Pliocene geomagnetic polarity epochs: Earth Planet. Sci. Lett. f, 163-173.
Dames and Moore, 1972, Report of geologic, foundation, investigation: Plutonium processing facility, Laboratory, Los Alamos, NM: Dames and Moore (Los report, job number 0651-120-02.
hydrologic, and seismic Los Alamos Scientific Angeles, CA) consulting
Davison, F. C., and Scholz, C. H., 1985, Frequency-movement distribution of eartt1quakes in the Aleutian Arc: A test of the characteristic earthquake model: Bull. Seismol. Soc. Am. 75, 1349-1361.
Dethier, D. P., and Harrington, C. D., 1986, Late Quaternary erosion history of the western Espanola Basin, New Mexico: Geol. Soc. Am., Abstr. with Programs 18(5), 351.
Dethier, D. P., and Manley, K., 1985, Geologic map of the Chile Quadrangle, Rio Arriba County, New Mexico: U.S. Geol. Surv., Misc. Field Studies Map, MF-1814, scale 1:24,000.
Dethier, D. P., and Martin, B. A., 1984, Geology and structure along part of the northeast Jemez Mountains, New Mexico: New Mexico Geol. Soc. Guide-book 35, 145-150.
Doell, R. R., Dalrymple, G. B., Smith, R. L., and Bailey, R. A., 1968, Paleomagnetism, potassium-argon ages, and geology of rhyolites and associated rocks of the Valles caldera: Mem. Geol. Soc. Am. 116, 211-248.
Dransfield, B. J., and Gardner, J. N., 1985, Subsurfa ce geology of the Pajarito Plateau, Espanola Basin, New Mexico: Los Alamos National Laboratory report LA-10455-MS, 15 p.
DuBois, S. M., and Smith, A. W., 1980, The 1887 earthquake in San Bernardino Valley, Sonora: Arizona Bureau of Geology and Mineral Technology, University of Arizona, Special paper 3, 112 p.
ESSA, 1968, United States earthquakes 1966, U.S. Dept. of Commerce, Earth Sciences Services Admin. (Washington, D.C.), 110 p.
Gardner, J. N., 1985, Tectonic and petrologic evolution of the Keres Group: Impl~~ations for the development of the Jemez volcanic field, New Mexico: Ph.D. dissertation, University of California, Davis, 293 p.
Gardner, J. N., and Goff, F., 1984, Potassium-argon dates from the Jemez volcanic field: Implications for tectonic activity in the north-central Rio Grande rift: New Mexico Geol. Soc. Guidebook 35, 75-81.
Gardner, J. N., Goff, F., Garcia, S., and Hagan, R. C., 1986, Stratigraphic relations and lithologic variations in the Jemez volcanic field, New Mexico: J. Geophys. Res. 91(B2), 1763-1778.
71

Goff, F., and Grigsby, C. 0., 1982, Valles caldera geothermal systems, New Mexico, U.S.A.: J. Hydrol. 56, 119-136.
Goff, F., and Kron, A., 1980, In-progress geologic map of Canon de San Diego, Jemez Springs, New Mexico, and lithologic log of Jemez Springs geothermal well: Los Alamos Scientific Laboratory report LA-8276-MAP.
Golombek, M.P., 1981, Structural analysis of the Pajarito fault zone in the Espanola Basin of the Rio Grande rift, New Mexico: Ph.D. dissertation, University of Massachusetts, 129 p.
Griggs, R. L., 1964, Geology and ground water resources of the Los Alamos area, New Mexico: U.S. Geol. Surv. Water Supply paper 1753, 107 p.
Hanks, T. C., and Johnson, D. A., 1976, Geophysical assessment of peak accelerations: Bull. Seismol. Soc. Am. 66, 959-968.
Harrington, C. 0., 1986a, The use of rock varnish as a Quaternary dating method within the central Rio Grande rift, New Mexico and the Nevada Test Site: Geol. Soc. Am., Abstr. w/Programs 18(5), 360.
Harrington, C. D., 1986b, Rock varnish dating: A new tool in the assessment of fault hazard potential: EOS, Trans. Am. Geophys. Union 67(44), 1211.
Harrington, C. D., and Aldrich, M. J., 1984, Development and deformation of Qua ternary surfaces on the northeastern flank of the Jemez Mountains: New Mexico Geol. Soc. Guidebook 35, 235-239.
Herrmann, R. B., Dewey, J. W., and Park, S. K., 1980, The Dulce, New Mexico, earthquake of 23 January, 1966: Bull. Seismol. Soc. Am. 70, 2171-2183.
House, L. S., and Cash, 0. J. (in prep.), A review of historic and instrumental earthquake activity and studies of seismic hazards near Los Alamos: Los Alamos National Laboratory report.
Housner, G. W., 1970, Strong ground motion: in Earthquake Engineering, R. L. Wiegel, ed., Prentice-Hall Pub. (Englewood Cliffs, NY), 75-91.
Izett, G., Obradovich, J., Naeser, C., and Cebula, G., 1980, K-Ar and fission track zircon ages of Cerro Toledo Rhyolite tephra units in the Jemez r~ountains, New l~exico: U.S. Geol. Soc. Prof. Paper 1199, 37-41.
Keller, M. D. (ed.), 1968, Geologic studies and material properties investigations of Mesita de Los Alamos: Los Alamos Scientific Laboratory report LA-3728.
Kelley, V. C., 1978, Geology of the Espanola Basin, New Mexico: New Mexico Bureau of Mines and Mineral Resources, Geologic Map 48.
Machette, M. N., 1986, History of Quaternary offset and paleoseismicity along the La Jencia fault, central Rio Grande rift, New Mexico: Bull. Seismol. Soc. Am. 76, 259-272.
72
Machette, M. N., and Personius, S. F., 1984, Map of Quaternary and Pliocene faults in the eastern part of the Aztec 1 x 2 degree quadrangle and the western part of the Raton 1 x 2 degree quadrangle, northern New Mexico: U.S. Geological Survey, Misc. Field Studies Map MF-1465-B.
Manley, K., 1979, Stratigraphy and structure of the Espanola Basin, Rio Grande rift, New Mexico: in Rio Grande Rift: Tectonics and Magmatism, R. E. Riecker, ed., Am. Geophys. Union (Washington, D. C.), Spec. Pub., 71-86.
Manley K., 1984, First-day road log from Taos to Embudo, Dixon, Penasco, Vadito, Tres Ritos, Holman Hill, and back to Taos via U.S. Hill and Talpa: New Mexico Geol. Soc. Guidebook 35, 303-319.
Marvin, R. F., and Dobson, S. W., 1979, Radiometric ages: Compilation B., U.S. Geological Survey: Isochron West 26, 2-32.
McKee, E. H., Nobel, D. C., and Silberman, M. L., 1970, Middle Miocene hiatus in volcanic activity in the Great Basin area of the western United States: Earth Planet. Sci. Lett. ~. 93-96.
Mickey, W. V., Devine, J. F., and Meyer, A. V. C., 1968, Project Gasbuggy: Response of the Mesita de Los Alamos to the Gasbuggy experiment and induced vibrations: U.S. Dept. of Commerce, Earth Sciences Services Admin., and U.S. Coast and Geodetic Survey (Rockville, MD).
Muehlberger, W. R., 1978, Frontal fault zone of northern Picuris Range: in Guidebook to Rio Grande rift in New Mexico and Colorado, J. W. Hawley, ed., New Mexico Bureau of Mines and Mineral Resources, Circular 163, 44-46.
Muehlberger, W. R., 1979, The Embudo fault between Pilar and Arroyo Hondo, New r"1exico: An active intracontinental transform fault: New Mexico Geol. Soc. Guidebook 30, 77-82.
NOAA/USGS, 1975, United States earthquakes, 1973: U.S. Oept. of Commerce, National Oceanic and Atmospheric Admin., and U.S. Geological Survey (Washington, D.C.).
Olsen, K. H., 1979, The seismicity of north-central New Mexico with particular reference to the Cerrillos earthquake of t'lay 28, 1918: New Mexico Geol. Soc. Guidebook 30, 65-75.
Personius, S. F., and Machette, M. N., 1984, Quaternary and Pliocene faulting in the Taos Plateau region, northern New Mexico: New 1"1exico Geol. Soc. Guidebook 35, 83-90.
Reid, H. F., 1911, Remarkable earthquakes in central New Mexico in 1906 and 1907: Bull. Seismol. Soc. Am. l· 10-16.
Richter, C. F., 1958, Elementary Seismology: Freeman Pub. (New York, NY).
Sanford, A. R., 1963, Seismic activity near Socorro: New fv1exico Geol. Soc. Guidebook 14, 146-151.
73
Sanford, A. R., 1976, Seismicity of the Los Alamos region based on seismological data: Los Alamos Scientific Laboratory report LA-6416-MS.
Sanford, A. R., Olsen, K. H., and Jaksha, L. H., 1981, Earthquakes in New !v1exico, 1849-1977: New rv1exico Bureau of Mines and Mineral Resources Circular 171, 20 p.
Savage, W. U., Ely, R. W., and Tocher, D., 1977, Review of the Los Alamos seismic monitoring program in relation to the Hot Dry Rock geothermal project: Woodward-Clyde Consultants (San Francisco, CA), consulting report L47-85930, 28 p.
Schwartz, D.P., and Coppersmith, K. H., 1984, Fault behavior and char-acteristic earthquakes: Examp 1 es from the Wasatch and San Andreas Fault Zones: J. Geophys. Res. 89(87), 5681-5698.
Schwartz, D. P., Coppersmith, K. H., and Swan, F. H., 1981, Characteristic earthquakes on intraplate normal faults: Earthquake Notes 52, 71.
Seager, W. R., and iv1organ, P., 1979, Rio Grande Rift in southern New Mexico, West Texas, nnd Northern Chihuahua: in Rio Grande Rift: Tectonics and Magmatism, R. E. Riecker, ed., Am. Geophys. Union (Washington, D.C.) Special Pub., 87-106.
Slemmons, D. B., 1975, Fault activity and seismicity near the Los Alamos Scientific Laboratory geothermal test site, Jemez rv1ountains, New Mexico: Los Ala~os Scientific Laboratory report LA-5911-MS.
Sl emmons, D. B., 1977, State-of-the-art for assessing earthquake hazards in tne United States: Report 6, Faults and earthquake magnitude: U.S. Army, Corps of Engineers, Waterways Experiment Station, Misc. Paper S-73-I, 129 p. w/appendix.
Smith, R. B., and Bruhn, R. L., 1984, Intraplate extensional tectonics of the eilstern Basin and Range: Inferences on structural style from seismic reflection data, regional tectonics, nnd thermal-mechanical models of brittle-ductile deformation: J. Geophys. Res. 89(B7), 5733-5762.
Smith, R. L., Bailey, R. A., ~nd Ross, C. S., 1970, Geologic map of the Jemez fv1ountains, New i·~exico: U.S. Geol. Surv. l~isc. Geol. Invest. Map. I-571.
Stein, R. S., and Bucknam, R. C., 1985, Basin and Range viewed from Borah Peak: EOS, Trans. Am. Geophys. Union 66, 603.
Tera Corporation, 1984, Seismic hanrd analysis for the Bendix, Los Alamos, Mound, Pantex, Rocky Flats, Sandia-Albuquerque, Sandia-Livermore, and Pinellas sites; Tera Corp. (Berkeley, CA), consulting report B-82-261.
Tillson, D. D., 1984, ESS Division earthquake risk assessment program: lJ. D. Tillson, Inc., consulting report C-3100, 9 p.
Trifunac, t~. D., and Brady, A. G., 1975, On the correlation of seismic intensity scales with the peaks of recorded strong ground motion: Bull. Seismol. Soc. Am. 65, 139-162.
74
Wachs, D., Harrington, C. 0., Gardner, J. N., and Maassen, L. W., (in prep.), Evidence of young fault movements on the Pajarito fault system in tne area of Los Alamos, New Mexico: Los Alamos National Laboratory report.
Wallace, R. E., 1984, Patterns and timing of Late Quaternary faulting in the Great Basin province and relation to some regional tectonic features: J. Geophys. Res. 89(B7), 5763-5769.
Wolff, J. J., Cash, D. J., Olsen, K. H., and Stewart, J. N., 1985, Earthquake catalog for northern New Mexico, 1984: Los Alamos National Laboratory report LA-10598-PR.
Wollard, G. P., 1968, A catalogue of earthquakes in the United States prior to 1925: Hawaii Institute of Geophysics, University of Hawaii, Data Report No. 10.
Zoback, M. L., and Zoback, M., 1980, State of stress in the conterminous United States: J. Geophys. Res. 85, 6113-6156.
75

76
POCKET CONTENTS
Geologic Map IV-A, 6 sheets
Map IV-B, Structure Contour Map of the Pre-Bandelier Tuff Surfare, Paj arito Plateau
Map IV-C, Paleogeology of the Pre-Bandelier Tuff Surface, Pajarito Plateau
Map IV-D, Zones of Relative Potential for Seismic Surface Rupture
Map IV-E, Preliminary Map of Potentially Hazardous Mass Wasting During an Earthquake (Shaded) (Includes Rockfall, Debris Flow, and Landslide)
Map IV-F, Cultural Overlay Map
Map IV-G, Geomorphic Surfaces, Southern San Juan Pueblo Quadrangle
NTIS Page Range Price Code Page Range
001 -025 A02 151 -175 026-050 A03 176-200 051 -075 A04 201 -225 076-100 A05 226-250 101 -125 A06 25 1-275 126-150 A07 276-300
•contact NTIS for a price quote.
Printed in the United States of America Available from
National Technical Information Service US Department of Commerce
5285 Port Royal Road Springfield, VA 22161
Microfiche (AO I)
NTIS NTIS Price Code Page Range Price Code
A08 30 1-325 A14 A09 326-350 A15 AIO 351 -375 Al6 All 376-400 Al7 Al2 401 -425 Al8 Al3 426-450 Al9
NTIS Page Range Price Code
451 -475 A20 476-500 A21 50 1-525 A22 526-550 A23 551 -575 A24 576-600 A25 601 -up• A99