UNIVERSITY OF AGRICULTURE, FAISALABAD 2015
209
1 PRESENT STATUS AND FUTURE SCOPE OF WATER USERS’ ASSOCIATIONS IN THE PUNJAB, PAKISTAN BY MUHAMMAD ARSHAD JAVED M.Sc. (HONS.) AGRICULTURAL EXTENSION 93-ag-1188 A THESIS SUBMITTED IN PARTIAL FULFILLMENT OF THE REQUIREMENTS FOR THE DEGREE OF DOCTOR OF PHILOSOPHY IN AGRICULTURAL EXTENSION INSTITUTE OF AGRICULTURAL EXTENSION AND RURAL DEVELOPMENT UNIVERSITY OF AGRICULTURE, FAISALABAD 2015
-
Upload
khangminh22 -
Category
Documents
-
view
4 -
download
0
Transcript of UNIVERSITY OF AGRICULTURE, FAISALABAD 2015
1
PRESENT STATUS AND FUTURE SCOPE OF WATER
USERS’ ASSOCIATIONS IN THE PUNJAB, PAKISTAN
BY
MUHAMMAD ARSHAD JAVED
M.Sc. (HONS.) AGRICULTURAL EXTENSION
93-ag-1188
A THESIS SUBMITTED IN PARTIAL FULFILLMENT OF THE
REQUIREMENTS FOR THE DEGREE OF
DOCTOR OF PHILOSOPHY
IN
AGRICULTURAL EXTENSION
INSTITUTE OF AGRICULTURAL EXTENSION AND RURAL
DEVELOPMENT
UNIVERSITY OF AGRICULTURE,
FAISALABAD
2015

2
To
The Controller of Examinations,
University of Agriculture,
Faisalabad.
We, the supervisory committee, certify that the contents and form of the thesis
submitted by MUHAMMAD ARSHAD JAVED Regd. No. 93-ag-1188 have been
found satisfactory and recommend that it be processed for the award of the degree.
SUPERVISORY COMMITTEE
____________________________
1. CHAIRMAN PROF. DR. SHER MUHAMMAD
____________________________ 2. MEMBER DR. KHALID MAHMOOD CH.
____________________________
3. MEMBER DR. SAIRA AKHTAR

3
DEDICATED
to
My Holy Prophet (PBUH)
my graceful and polite father
my most loving mother
who live in my mind and soul
whose love is more precious
than pearls and diamonds
who are those whom I say my own
whose love will never change
whose prayers will never die
and
who are nearest, dearest and deepest to me

4
ACKNOWLEDGEMENTS
I am indebted to ALMIGHTY ALLAH, the propitious, the benevolent and
sovereign whose blessings and glories flourished my thoughts and thrived my ambitions,
giving me talented teachers, affectionate parents, sweet brothers and unique friends.
Trembling lips and wet eyes praise for HOLY PROPHET MUHAMMAD (PBUH) for
enlightening our conscience with the essence of faith in ALLAH, converging all his
kindness and mercy upon him.
If there were dreams to sell, marry and sad to tell and crier rings the bell, what
would you buy, I will say that “University Charming Days”. Actually it is impossible, but
it shows my blind love to this institution, which is homeland of knowledge, wisdom and
intellectuality. I love my Alma-mater with the soul of my heart, because it is just like the
lap of mother. I am proud of being student of this university.
The work presented in this manuscript was accomplished under the kind
supervision of Dr. Sher Muhammad, Professor, Institute of Agricultural Extension and
Rural Development, University of Agriculture, Faisalabad. His thorough analysis and
rigorous critique improved not only the quality of this dissertation, but also my overall
understanding of Agricultural Extension. I am grateful to his ever-inspiring guidance,
keen interest, scholarly comments and constructive suggestions throughout the course of
my studies.
I deem it my utmost pleasure in expressing my gratitude with profound
benedictions to Dr. Khalid Mahmood Ch., Associate Professor, Institute of Agricultural
Extension and Rural Development, University of Agriculture, Faisalabad for providing
me with strategic command at every step. His efforts towards the inculcation of spirit of
hard work and maintenance of professional integrity besides other valuable suggestions
will always serve as a beacon of light throughout the course of my life. I extend deep
emotions of appreciation, gratitude and indebtedness for his valuable guidance.
Earnest and devout appreciation to Dr. Saira Akhtar, Associate Professor,
Department of Rural Sociology, University of Agriculture, Faisalabad, for her time to
time constructive criticism and valuable suggestions during the course of this study.

5
I express my thankful feelings for all my friends and special thanks to all my class
fellows for the sincere help and encouragement.
No acknowledgements could ever adequately express my obligations to my
affectionate and adoring mother, father Ch. Sardar Ali, brothers Dr. Tassawar Nadeem
and Eng. Mubashar Javed, sisters, my wife and my children Saad, Sania and Abdul
Arham, whose hands always raised in prayers for me and without whose moral and
financial support, the present distinction would have merely been a dream. They always
acted as a light house for me in the dark oceans of life path. No words can really express
the feelings that I have for my beloved parents. The names of my parents will always be
in front of my eyes, as I will look on the cover of my thesis, even though my name may
be printed on it.
Finally, I apologize if I have caused any offence to anybody and the errors that
remain in the manuscript, which are mine alone.
May ALLAH ALMIGHTY bless all these people with long, happy and peaceful
lives (Ameen).
Muhammad Arshad Javed
6
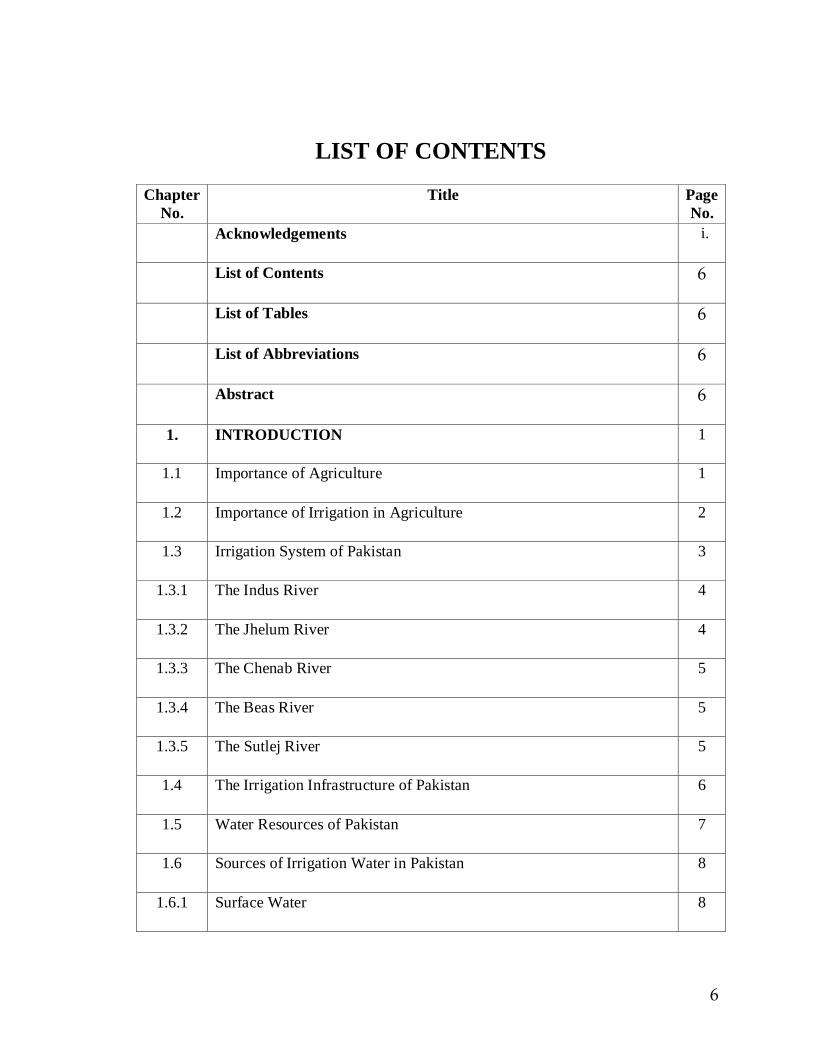
LIST OF CONTENTS
Chapter
No.
Title Page
No.
Acknowledgements i.
List of Contents 6
List of Tables 6
List of Abbreviations 6
Abstract 6
1. INTRODUCTION 1
1.1 Importance of Agriculture 1
1.2 Importance of Irrigation in Agriculture 2
1.3 Irrigation System of Pakistan 3
1.3.1 The Indus River 4
1.3.2 The Jhelum River 4
1.3.3 The Chenab River 5
1.3.4 The Beas River 5
1.3.5 The Sutlej River 5
1.4 The Irrigation Infrastructure of Pakistan 6
1.5 Water Resources of Pakistan 7
1.6 Sources of Irrigation Water in Pakistan 8
1.6.1 Surface Water 8
7
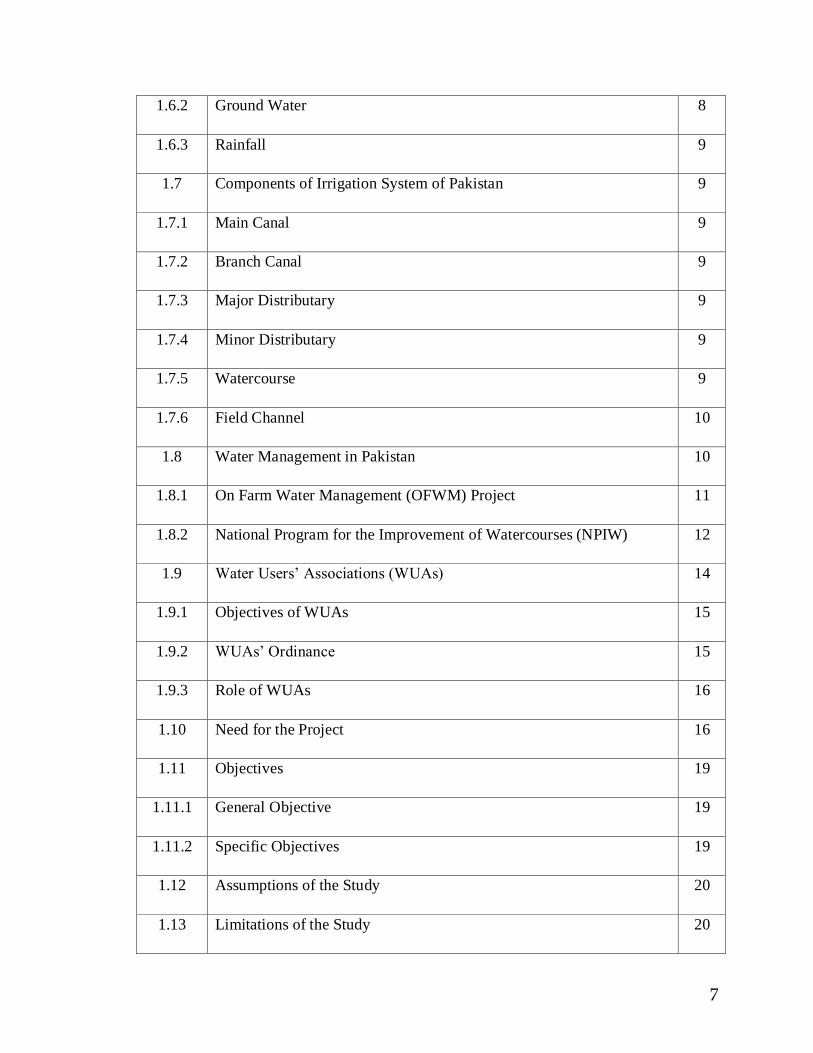
1.6.2 Ground Water 8
1.6.3 Rainfall 9
1.7 Components of Irrigation System of Pakistan 9
1.7.1 Main Canal 9
1.7.2 Branch Canal 9
1.7.3 Major Distributary 9
1.7.4 Minor Distributary 9
1.7.5 Watercourse 9
1.7.6 Field Channel 10
1.8 Water Management in Pakistan 10
1.8.1 On Farm Water Management (OFWM) Project 11
1.8.2 National Program for the Improvement of Watercourses (NPIW) 12
1.9 Water Users’ Associations (WUAs) 14
1.9.1 Objectives of WUAs 15
1.9.2 WUAs’ Ordinance 15
1.9.3 Role of WUAs 16
1.10 Need for the Project 16
1.11 Objectives 19
1.11.1 General Objective 19
1.11.2 Specific Objectives 19
1.12 Assumptions of the Study 20
1.13 Limitations of the Study 20
8
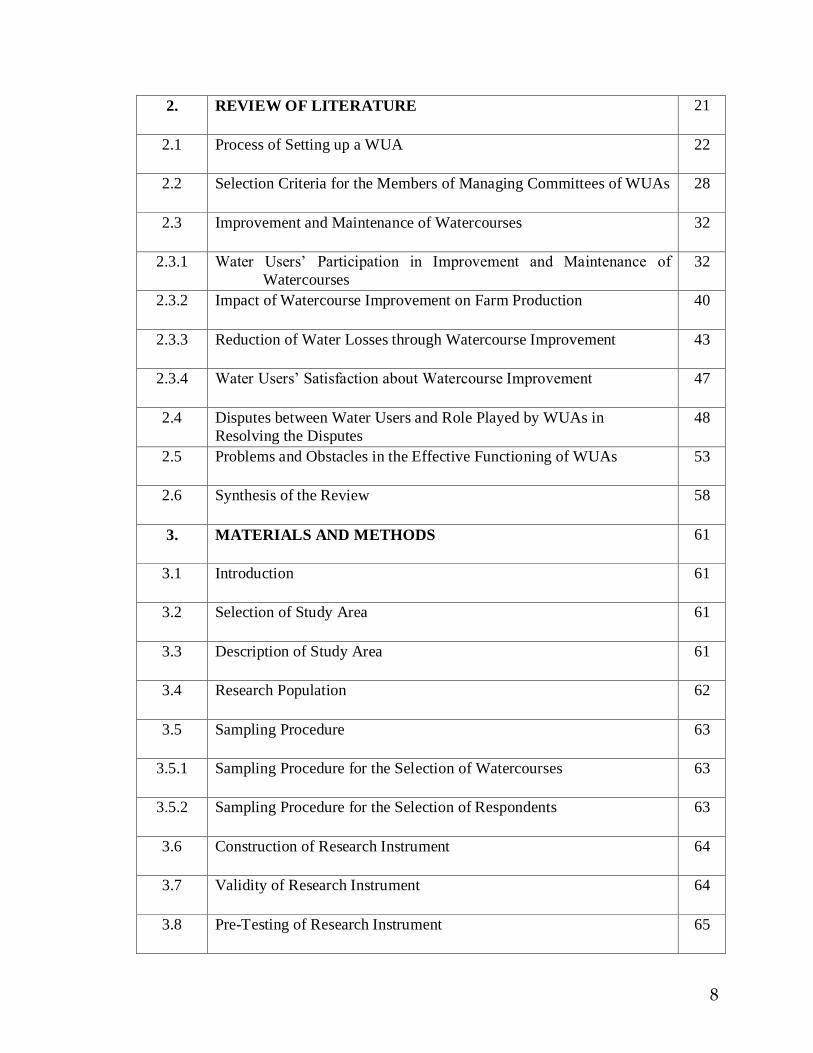
2. REVIEW OF LITERATURE 21
2.1 Process of Setting up a WUA 22
2.2 Selection Criteria for the Members of Managing Committees of WUAs
28
2.3 Improvement and Maintenance of Watercourses
32
2.3.1 Water Users’ Participation in Improvement and Maintenance of
Watercourses
32
2.3.2 Impact of Watercourse Improvement on Farm Production
40
2.3.3 Reduction of Water Losses through Watercourse Improvement
43
2.3.4 Water Users’ Satisfaction about Watercourse Improvement
47
2.4 Disputes between Water Users and Role Played by WUAs in
Resolving the Disputes
48
2.5 Problems and Obstacles in the Effective Functioning of WUAs 53
2.6 Synthesis of the Review 58
3. MATERIALS AND METHODS 61
3.1 Introduction 61
3.2 Selection of Study Area 61
3.3 Description of Study Area 61
3.4 Research Population 62
3.5 Sampling Procedure 63
3.5.1 Sampling Procedure for the Selection of Watercourses 63
3.5.2 Sampling Procedure for the Selection of Respondents 63
3.6 Construction of Research Instrument 64
3.7 Validity of Research Instrument 64
3.8 Pre-Testing of Research Instrument 65

9
3.9 Reliability of Research Instrument 65
3.10 Interviewing the Respondents 66
3.11 Analysis of Data 66
3.12 Difficulties faced during Data Collection 66
4. RESULTS AND DISCUSSION 68
4.1 Socio-economic Characteristics of the Respondents 68
4.1.1 Age (years) 69
4.1.2 Education (years of schooling) 70
4.1.3 Farm Size (acres) 71
4.1.4 Tenancy Status 72
4.1.5 Occupation 73
4.2 Process of Setting up a WUA 74
4.2.1 Position in WUA 76
4.2.2 Specific Position Held in WUA 76
4.2.3 Procedure Adopted for the Constitution of Executive Body of WUA 77
4.2.4 Steps Involved in Setting up a WUA 77
4.2.4.1 Presence of Shareholders in the Process of Selection/Election of WUA 78
4.2.4.2 Transparency of Selection/Election Process 78
4.2.4.3 Announcement of the Results at the Spot 78
4.2.4.4 Agreement Signed by the Shareholders on the Stamp Paper 78
4.2.4.5 Registration of WUA by DO (OFWM) 78
4.2.4.6 Representation of WUA from all Reaches of Watercourse 79
10
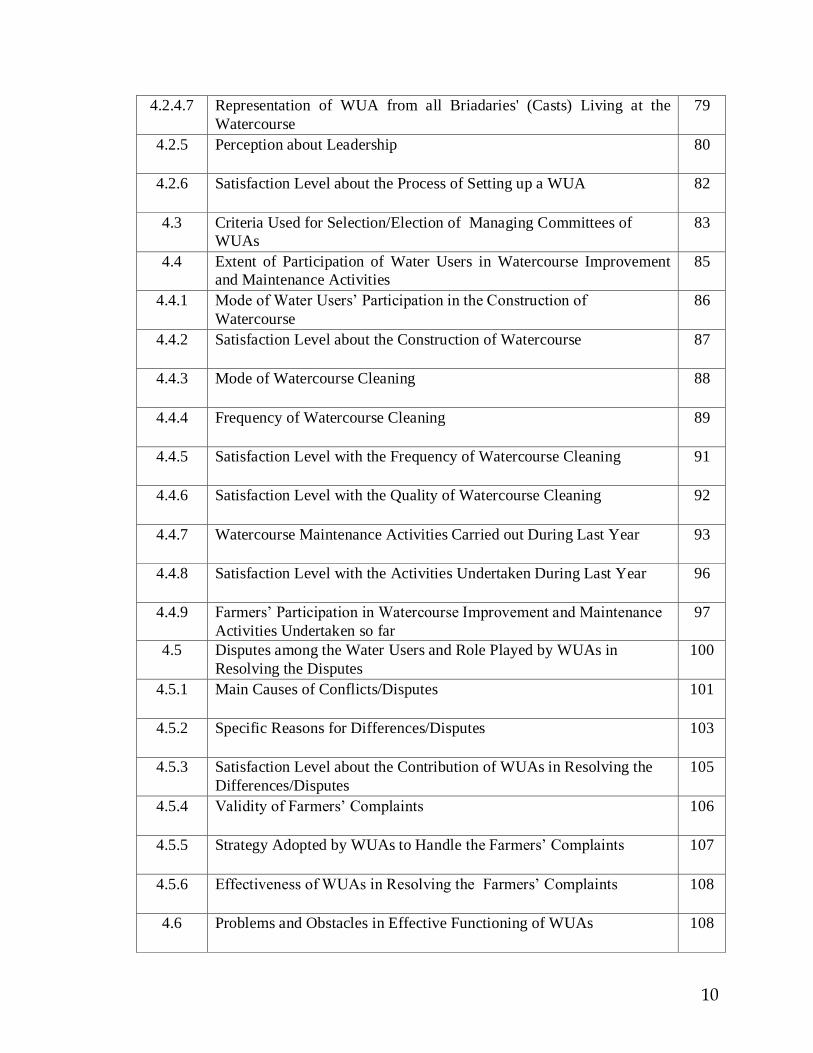
4.2.4.7 Representation of WUA from all Briadaries' (Casts) Living at the
Watercourse
79
4.2.5 Perception about Leadership 80
4.2.6 Satisfaction Level about the Process of Setting up a WUA 82
4.3 Criteria Used for Selection/Election of Managing Committees of
WUAs
83
4.4 Extent of Participation of Water Users in Watercourse Improvement
and Maintenance Activities
85
4.4.1 Mode of Water Users’ Participation in the Construction of
Watercourse
86
4.4.2 Satisfaction Level about the Construction of Watercourse 87
4.4.3 Mode of Watercourse Cleaning 88
4.4.4 Frequency of Watercourse Cleaning 89
4.4.5 Satisfaction Level with the Frequency of Watercourse Cleaning 91
4.4.6 Satisfaction Level with the Quality of Watercourse Cleaning 92
4.4.7 Watercourse Maintenance Activities Carried out During Last Year 93
4.4.8 Satisfaction Level with the Activities Undertaken During Last Year 96
4.4.9 Farmers’ Participation in Watercourse Improvement and Maintenance
Activities Undertaken so far
97
4.5 Disputes among the Water Users and Role Played by WUAs in
Resolving the Disputes
100
4.5.1 Main Causes of Conflicts/Disputes 101
4.5.2 Specific Reasons for Differences/Disputes 103
4.5.3 Satisfaction Level about the Contribution of WUAs in Resolving the
Differences/Disputes
105
4.5.4 Validity of Farmers’ Complaints 106
4.5.5 Strategy Adopted by WUAs to Handle the Farmers’ Complaints 107
4.5.6 Effectiveness of WUAs in Resolving the Farmers’ Complaints 108
4.6 Problems and Obstacles in Effective Functioning of WUAs 108

11
4.6.1 Problems Before the Improvement of Watercourses 109
4.6.2 Problems During the Improvement of Watercourses 111
4.6.3 Problems After the Improvement of Watercourses 114
4.7 Future Scope of WUAs 116
4.7.1 Expected Level of Effectiveness of WUAs During Future 116
4.7.2 Expected Overall Performance of WUAs During Future 119
4.7.3 Continuation of WUAs to Play Effective Role in Future 120
4.8 Relationships Between Dependent and Independent Variables 122
4.8.1 Relationship of Age of the Respondents with their Level of
Participation in
Watercourse Improvement Activities
123
4.8.2 Relationship of Education of the Respondents with their Level of
Participation
in Watercourse Improvement Activities
124
4.8.3 Relationship of Land Holding of the Respondents with their Level of
Participation in Watercourse Improvement Activities
125
4.8.4 Relationship Between the Location of Land of the Respondents with
their Level of Participation in Watercourse Improvement Activities
126
4.8.5 Relationship of Age of the Respondents with their Level of
Satisfaction in
Watercourse Improvement Activities
127
4.8.6 Relationship of Education of the Respondents with their Level of
Satisfaction
in Watercourse Improvement Activities
128
4.8.7 Relationship of Land Holding of the Respondents with their Level of
Satisfaction in Watercourse Improvement Activities
129
4.8.8 Relationship Between the Location of Land of the Respondents with
their Level of Satisfaction in Watercourse Improvement Activities
130
4.8.9 Relationship Between Age of the Respondents with the Frequency of
Watercourse Cleaning
131
4.8.10 Relationship Between Education of the Respondents with the
Frequency of Watercourse Cleaning
132
4.8.11 Relationship Between Land Holding of the Respondents with the
Frequency of Watercourse Cleaning
133
4.8.12 Relationship Between Location of Land of the Respondents with the
Frequency of Watercourse Cleaning
134

12
5. SUMMARY, RESULTS AND RECOMMENDATIONS 135
5.1 Summary 135
5.2 Results/Findings 138
5.2.1 Socio-economic Characteristics of the Respondents 138
5.2.2 Process of Setting up a WUA 138
5.2.3 Criteria Used for Selection/Election of Managing Committees of
WUAs
139
5.2.4 Extent of Participation of Water Users in Watercourse Improvement
and Maintenance Activities
139
5.2.5 Disputes among the Water Users and Role Played by WUAs in
Resolving the Disputes
140
5.2.6 Problems and Obstacles in Effective Functioning of WUAs 141
5.2.7 Future Scope of WUAs 141
5.2.8 Relationships Between Dependent and Independent Variables 142
5.2.9 Key Findings 142
5.3 Recommendations 144
5.3.1 Recommendations for Water Users 144
5.3.2 Recommendations for WUAs 144
5.3.3 Recommendations for the Department 145
5.3.4 Recommendations for Future Researchers 146
LITERATURE CITED 147
APPENDIX-I 174
APPENDIX-II 185

13
LIST OF TABLES S.
No. Title
Page
No.
1 Distribution of respondents according to their age 69
2 Distribution of respondents according to their education level 71
3 Distribution of respondents according to their land holding 72
4 Distribution of respondents according to their tenancy status 73
5 Distribution of respondents according to their occupation 74
6 Distribution of respondents according to their position in WUA 76
7 Distribution of respondents according to specific position held in WUA 76
8 Distribution of respondents according to the procedure adopted for the
constitution of managing committee of WUA 77
9 Distribution of respondents according to the steps involved in setting up
a WUA 79
10 Distribution of respondents according to their perception about the
leadership emerged as a result of selection/election 81
11 Distribution of respondents according to their satisfaction level about
the process of setting up a WUA 82
12 Distribution of respondents according to the characteristics possessed by
the managing committees of WUAs 84
13 Distribution of respondents based on water users’ participation in the
construction of watercourse 86
14 Distribution of respondents according to their satisfaction level about
the construction of watercourse 87
15 Distribution of respondents according to mode of watercourse cleaning 89
16 Distribution of respondents according to the frequency of watercourse
cleaning 90
17 Distribution of respondents according to their satisfaction level about
the frequency of watercourse cleaning 91
18 Distribution of respondents according to their satisfaction level about
the quality of watercourse cleaning 92
19 Distribution of respondents according to maintenance activities carried
out during last year 95
20 Ranking of watercourse maintenance activities undertaken during last
year based on the satisfaction level of the respondents 97
21 Ranking of watercourse improvement and maintenance activities
undertaken so far based on the level of farmers’ participation 99
22 Distribution of respondents according to the main causes of
conflicts/disputes 102
23 Distribution of respondents according to the specific reasons for
differences/disputes 104

14
24 Distribution of respondents according to satisfaction level about the
contribution of WUAs in resolving the disputes 105
25 Distribution of respondents according to the ways WUAs respond to
farmers’ complaints 106
26 Distribution of respondents according to the strategies adopted by
WUAs to handle the farmers’ complaints 107
27 Distribution of respondents according to their response about the level
of effectiveness of WUAs in resolving the farmers’ complaints 108
28 Ranking of various problems in the effective functioning of WUAs
before the improvement of watercourses 111
29 Ranking of various problems in the effective functioning of WUAs
during the improvement of watercourses 113
30 Ranking of various problems in the effective functioning of WUAs after
the improvement of watercourses 115
31 Distribution of respondents according to the expected level of
effectiveness of WUAs during future 118
32 Distribution of respondents according to the expected overall
performance of WUAs during future 119
33 Distribution of respondents according to the continuation of WUAs to
play effective role in future 121
34 Relationship between age of the respondents and their level of
participation in watercourse improvement activities 123
35 Relationship between education of the respondents and their level of
participation in watercourse improvement activities 124
36 Relationship between land holding of the respondents and their level of
participation in watercourse improvement activities 125
37 Relationship between location of land of the respondents and their level
of participation in watercourse improvement activities 126
38 Relationship between age of the respondents and their level of
satisfaction in watercourse improvement activities 127
39 Relationship between education of the respondents and their of level of
satisfaction in watercourse improvement activities 128
40 Relationship between land holding of the respondents and their level of
satisfaction in watercourse improvement activities 129
41 Relationship between location of land of the respondents and their level
of satisfaction in watercourse improvement activities 130
42 Relationship between age of the respondents and the frequency of
watercourse cleaning 131
43 Relationship between education of the respondents and the frequency of
watercourse cleaning 132
44 Relationship between land holding of the respondents and the frequency
of watercourse cleaning 133
45 Relationship between location of land of the respondents and the
frequency of watercourse cleaning 134

15
LIST OF ABBREVIATIONS
AAE Assistant Agriculture Engineer
Agri. Agriculture
AJK Azad Jammu and Kashmir
ARBEC Asian Review of Biodiversity and Environmental Conservation
Dept. Department
DO District Officer
Eco. Economics
ed. Edition
Ed. Editor
Eds. Editors
EFS Extension Field Staff
Ext. Extension
FANA Federally Administered Northern Areas
FAO Food and Agriculture Organization
FATA Federally Administered Tribal Areas
FCR Final Completion Report
FSL Full Supply Level
GDP Gross Domestic Product
GISs Geographical Information Systems
Govt. Government
ICT Islamabad Capital Territory
IFAD International Fund for Agricultural Development
IMT Irrigation Management Transfer
INPIM Indian Network on Participatory Irrigation Management
IWMI International Water Management Institute
IWUG Integrated Water Users’ Group
JBIC Japan Bank for International Cooperation
Jr. Journal
Km. Kilometer
LID Land Improvement Districts
MAF Million Acre Feet
MSC Mkoji Sub-Catchment
MWMS Modernization of Water Management Systems

16
N/A Not Applicable
NARC National Agricultural Research Council
NGOs Non Governmental Organizations
NPIW National Program for the Improvement of Watercourses
NRSP National Rural Support Program
NS Non-Significant
NWCF Nepal Water Conservation Foundation
OFWM On Farm Water Management
PARC Pakistan Agricultural Research Council
PBUH Peace Be Upon Him
PID Provincial Irrigation Department
PIDA Punjab Irrigation and Drainage Authority
PIM Participatory Irrigation Management
Pk. Pakistan
PPSGDP Punjab Private Sector Ground Water Development Project
PRSP Punjab Rural Support Program
PT & EFWM Participatory Training & Extension in Farmers’ Water
Management
RS Rural Sociology
SD Standard Deviation
SPSS Statistical Package for Social Sciences
Sq. Km. Square Kilometer
STCP Sustainable Tree Crops Program
UAF University of Agriculture, Faisalabad
UK United Kingdom
Univ. University
USA United States of America
W/c. Watercourse
WAPDA Water and Power Development Authority
WCs Water Committees
WS Weighted Score
WUAs Water Users’ Associations
WUOs Water Users’ Organizations

17
ABSTRACT
Pakistani farmers are facing many constraints, of which shortage of irrigation water is
the major one. On-Farm Water Management Department has introduced Water Users’
Associations (WUAs) throughout the country to operate, maintain and re-habilitate the water
distribution system in an efficient and effective manner. Moreover, WUAs are also
responsible for providing logistic support and communication bridge between the water users
and the Govt. Departments. The present study deals with the importance of the WUAs for the
efficient management of irrigation water. The study deals exclusively with the prevailing
contingencies which may support or hinder farmers' participation through WUAs for the
management of irrigation water. Thus the main focus of the study was on the analysis of the
prevailing formal and informal interventions at farm level for the management of irrigation
water through the active participation of water users. The socio-economic regulatory patterns
such as age, education, land holding, location of land with respect to watercourse and
‘biradary’ (caste) play a dominant role in determining the direction and extent of activities of
the WUAs. The institutional, socio-political and cultural factors were considered to be the
main determinants of effective functioning of WUAs within the context of watercourse
improvement/maintenance. The present study was carried out in all tehsils of district
Sargodha in central Punjab. From each tehsil, one markaz was selected randomly. From each
selected markaz, five improved watercourses were selected at random and from each selected
improved watercourse, fifteen water users were selected randomly for interview. The data
were collected through validated and pre-tested interview schedule. The data were analyzed
with the help of Statistical Package for Social Sciences (SPSS). The results show that a large
majority of the respondents rated WUAs’ leadership as good, while slightly more than one-
fifth of the respondents were of the view that leadership was excellent. About half of the
respondents provided both cash and labor as per requirement in the watercourse
improvement. A vast majority of the respondents cleaned their watercourses by joint
operation and was highly satisfied with the interval/frequency and quality of watercourse
cleaning. Rivalry among different ‘briadaries’ (castes), water thefts and non-cooperative
behavior of some farmers were the main causes of conflicts among the water users. All the
respondents regarded ‘biradary’ (caste) heads’ interventions to resolve the farmers’
complaints. Lack of finance on the part of small/poor farmers, lack of interest on the part of
big landlords and lack of unity among the water users were the main problems in the
effective functioning of WUAs before the improvement of the watercourse. Majority of the
respondents was highly satisfied with the contribution of WUAs in resolving the disputes and
thought that WUAs never listened to the complaintee only while taking decision on various
issues but listened to both the parties besides judging the situation at site with the view that
level of effectiveness of WUAs in resolving the complaints was high. Participation of water
users in watercourse improvement/maintenance got the highest score while productivity
enhancement as a result of watercourse improvement/maintenance was ranked at the top. A
large majority of the respondents thought that WUAs will continue to play effective role in
future. There existed a highly significant relationship between the land holding of the

18
respondents and their level of satisfaction in watercourse improvement activities. A highly
significant relationship was found between the location of land of the respondents and their
level of participation in watercourse improvement activities. There existed a highly
significant relationship between age of the respondents and the frequency of watercourse
cleaning.

19
CHAPTER 1
INTRODUCTION
1.1 IMPORTANCE OF AGRICULTURE
Agriculture sector continues to play a central role in Pakistan’s economy. It is the
second largest sector after services sector, accounting for over 21.4% of GDP, and
remains by far the largest employer, absorbing 45% of country’s total labor force and
contributes in the growth of other sectors of the economy. The agriculture sector’s strong
linkages with the rest of the economy are not fully apprehended in the statistics. While on
the one hand, the sector is a primary supplier of raw materials to downstream industry,
contributing substantially to Pakistan’s exports, on the other, it is a large market for
industrial products such as fertilizers, pesticides, tractors and agricultural implements.
Despite its critical importance to growth, exports, incomes, and food security, the
agriculture sector has been suffering from deterioration. Growth in the sector, particularly
in the crop sub sector, has been falling for the past three decades. Productivity remains
low, with yield gaps rising. Regular investments in new seeds, farming technology and
techniques, and the water infrastructure are not being made. Without major new
investments in agriculture, it is unclear how prepared Pakistan would be to tackle
emerging challenges such as declining water availability, and climate change (Govt. of
Pakistan, 2013).
Pakistan witnessed unprecedented drought during the first two years of the
decade of 2000 which resulted in contraction of agricultural value added. In other words,
agriculture registered negative growth in these two years. The next two years (2002-03
and 2003-04) witnessed a modest recovery in agricultural growth with the availability of
water for irrigation purpose. A stronger than expected performance of agriculture had
been one of the hallmarks of the fiscal year 2004-05 with high growth on account of
unprecedented increase in cotton and wheat production due to timely rains. The
performance of agriculture remained weak during 2005-06 because its crops sector
particularly major crops could not perform up to the expectations mainly due to the un-

20
availability of irrigation water at critical crop stages. Growth in the agriculture sector
registered a sharp recovery in 2006-07 but performed poorly in 2007-08. The poor
performance can be attributed to an equally poor performance of major crops mainly due
to the shortage of irrigation water. The performance of agriculture sector remained
stronger than expected during 2008-09 on account of bumper wheat, rice and maize
mainly due to the timely availability of irrigation water to the crops. During the year
2009-10 and 2010-11, the overall performance of agriculture sector had been weaker than
target because of negative growth of major crops due to unprecedented floods. During
2011-12, the overall performance of agriculture sector exhibited a positive growth due to
timely regular rains and farmers received good prices for rice, cotton and sugarcane,
which allowed for greater financial resources passed on to the rural economy. During
2012-13, agriculture sector showed a positive growth due to the weather condition and
timely availability of irrigation water (Ibid).
The value added in major crops accounts for 33.4% of the value added in overall
agriculture and 6.5% to GDP, due to timely ample rains and availability of water for crop
during 2008-09. For the year 2009-10, the value added in major crops accounts for 32.8%
of the value added in overall agriculture and 7.1% to GDP. During the year 2010-11, the
value added in major crops accounts for 31% of the value added in overall agriculture
and 5.9% to GDP. The value added in major crops accounts for 32% of the value added
in overall agriculture and 6.0% to GDP, due to timely regular rains and good prices for
crops during 2011-12, while, the value added in major crops accounts for 25.2% of the
value added in overall agriculture and 5.4% to GDP during 2012-13 (Ibid).
1.2 IMPORTANCE OF IRRIGATION IN AGRICULTURE
Agriculture is the largest single user of water, as about 75% of the world’s fresh
water is being currently used for irrigation. In some countries, irrigation accounts for as
much as 90% of the total amount of water available (FAO, 2005). Pakistan’s agricultural
output is closely linked to the supply of irrigation water. For the years 2008-09 & 2009-
10, against the normal surface water availability at canal heads (103.5 million acres feet),
the overall water availability has been less in the range of 2.5% (2005-06) to 20.6%
(2004-05). During the fiscal year 2010-11, the availability of water as a basic input has
been 20% less than the normal supplies. The availability of water for 2011-12 has been

21
10% less than the normal supplies but 13% higher than last year. During 2012-13, the
availability of irrigation water as an essential input was 14% less than the normal supplies
but to compare with last year, it was 4.4% less (Govt. of Pakistan, 2013).
The main sources of irrigation water in Pakistan are canals and underground
water pumped through tube-wells. The country is endowed with huge water resources
including precipitation (rainfall, dew, fog, hails etc.), surface water and ground water
(Govt. of Pakistan, 2006). On the other hand, it has also been pointed out that 53% of
water is lost in the main canals, distributaries and watercourses due to which the overall
irrigation efficiency remains only 47% (Govt. of Pakistan, 2004). The goal of self-
sufficiency is beyond the reach due to low productivity, one of the main reasons for that
remains insufficient irrigation water (Bashir, 2006).
1.3 IRRIGATION SYSTEM OF PAKISTAN
Agriculture in Pakistan owes a great deal to the irrigation network developed by
lying out of canals and the sinking of tube wells. A chain of enormous dams and barrages
harnesses the water of the five great rivers that flow through the country - Sutlej, Ravi,
Chenab, Jhelum and Indus and carries it to individual farms through hundreds of miles of
canals. As a result, half of the 20 million acres of cropped area is irrigated by canals and
one quarter by tubewells. During the decade of 90’s, the government heavily subsidized
the sinking of tube wells by the farmers, with the result that their number has doubled
during the decade (Ali, 1995).
Pakistan possesses a number of rivers which are tributaries to Indus. Five main
rivers joining its eastern side are the Jhelum, Chenab, Ravi, Beas and Sutlej beside three
minor rivers the Soan, Harrow and Siran draining certain sub mountainous areas. A
number of comparatively small rivers join the Indus on the west side. The biggest is the
Kabul with its main tributaries, the Swat, Panjkora and Kunar. Kurram, Gomal, Kohat
Tai, Tank and several other small streams also join on the right side of the Indus. In the
mountainous area of nearly 80450 sq. km, several hilly tributaries join the Indus (Ahmad,
1993).
Actually there are innumerable tributaries in the hilly area constantly draining the
yield from the melting of snow and permanent glaciers, some of which are the biggest in
the world. These continue to add water to the main rivers. Only two small streams the Gaj
22
and Baran join the Indus. These are active only during monsoon. Several rivers of
Baluchistan disappear in the land surface. A few such as the Malir, Hub, Porai, Hinga,
Snodi and Doasht drain independently into the Arabian Sea (Ibid).
1.3.1 The Indus River
The Indus River originates in a spring called Singikahad near Mansarwar Lake on
the north side of Himalaya range in Kaillas Parbat in Tibet at an altitude of 5486 m above
mean sea level. Traversing about 805 km in north western direction, it is joined by the
Shyok near Skardu at an elevation of 2743 m. Flowing in the same direction for another
161 km before it turns round Nanga Parbat; it is joined by the Gilgit on elevation of 1524
m. The river then flows another 322 km in south western direction opening out at
Kalabagh into the plains at an elevation of about 244 m. Up to Durband where sediment
discharge data was started to be collected in 1954, the river still lies in the hilly tract at an
elevation of about 610 m. Below Durband near Tarbela, Siran a small flashy stream rising
from low elevation of 4572 m and draining alluvial lands of Mansehra, Abbottabad and a
part of Haripur joins the Indus. The drainage area of this river above Warsak is 4183 sq.
km. It has its source in the ranges of Safed Koh, Koh-i-Baba and Hindu Kush. Its main
tributaries are the Logar, the Panjahir, the Alugar and the Kunar which is also called
Chitral River in the upper reaches. Below Warsak another tributary the Swat joins it,
increasing the total catchments at this site to about 6758 sq. km. About 8 km below
Attock, Harrows’ small flashy stream draining the district of Attack (Campbellpur) and
some area of Murree, Hassanabdal, and Rawalpindi joins it. The catchment of this river is
about 3862 sq. km up to the Grand Trunk Road. About 11 km above Jinnah (Kalabagh)
Barrage, a stream draining the largest and worst eroded areas of Rawalpindi, Jhelum and
Attock districts with catchments area equal to 7723 sq. km joins it. Below Jinnah
Barrage, the important western tributaries of the Indus are the Kurram, Gomal and Zoab
(Ibid).
1.3.2 The Jhelum River
The Jhelum River is a big eastern tributary of the Indus. It drains the areas west of
Pir Panjal separating the provinces of Jammu and Kashmir. It rises from the North West
side of Pir Panjal and flows in a direction parallel to the Indus at an average elevation of
1676 m. It drains about 3700 sq. km of alluvial lands of Kashmir valley and has
23
important sources of water from glaciers on the north of the valley. It flows through Dal
and Wular Lake into which it drops to coarse grades of sediment. Wular Lake is bigger
than Dal. On emergence from Wular Lake near Baramula, it runs through a 129 km long
gorge at an average slope of about 6 m/km. At Domel near Muzaffarabad, it is joined by
its biggest tributary Kishan Ganga now called Nelum which drains about 4505 sq. km of
hilly area lying on the eastern side of Naga Parbat. This river drains Himalayan ranges
between 4572 to 6096 m high perpetually covered by snow and glaciers. Throughout its
length of 241 km, it flows through fairly stable mountains covered by forests (Ibid).
1.3.3 The Chenab River
The Chenab River originates in Kulu and Kangra districts of Himachal Pardesh
province of India. The two chief streams of the Chenab, the Chandra and Bhaga rise on
opposite side of Baralcha pass at an elevation of about 4877 m. These join at Tandi in
Jammu & Kashmir state nearly 2770 m above mean sea level. The combined streams
traversing about 216 km take a sharp turn along Pir Pinjal near Kishtwar. The river after
traversing about 644 km of mountainous regions and falling nearly 7 m/km opens out into
the plains near Akhnur. The river enters Pakistan in Sialkot district near Diawara village
(Ibid).
1.3.4 The Beas River
The Beas River has now the shortest length of the Punjab Rivers. It is only about
397 km long. In 18th century, it joined the Sutlej near Harike. Originally it used to join
the Chenab at Panjnad. Rim station for this river is at Mandi Plan near Talwara, district
Hoshiarpur. Pandoh ad Pong Dams have been built over it. Ravi Beas Link carries the
water of the Madhopur. After the completion of the Dam, complete flow of the Ravi will
be stored and used in India (Ibid).
1.3.5 The Sutlej River
The Sutlej River originates in Western Tibet in the Kailas mountain Range, near
the source of the Indus, of the Ganges and the Bramaputra. It flow through the Panjal and
Siwalik mountains ranges and then enters the plains of Indian Punjab. The length of the
river is about 1552 km and its catchments area is 75784 sq. km (Ibid).
24
1.4 THE IRRIGATION INFRASTURCUTRE OF PAKISTAN
The irrigation network of Pakistan consists of three large dams, 12 link canals, 18
weirs and barrages, and 89,000 watercourses. Pakistan irrigation system is one of the
world’s greatest irrigation systems. The province of Punjab contains the largest canal
irrigation network, with about 54,000 watercourses serving about 20 million acres of
land. Total water availability at farm gate is 58.38 MAF. It has also been pointed out that
52% of water is lost in the main canals, watercourses, and field applications and overall
irrigation efficiency remains only 48% (Akhtar, 1997).
Pakistan possesses the worlds’ largest contiguous irrigation system commonly
called as Indus Basin irrigation system. It commands an area of about 14.3 million
hectares (35 million acres), and encompasses the Indus River and its major tributaries.
The system includes three large reservoirs (Tarbela, Mangla and Chashma), 23
barrages/head works/siphons, 12 inter river links and 45 canal commands for about 60,
800 km to serve over 140,000 farmer operated watercourses. Irrigated agriculture is the
backbone of the national economy. The level of agricultural production is directly related
to the opportunities for further development of water resources (Govt. of Pakistan, 2010).
The water shortage scenario in Pakistan is further aggravated with high variability
of rainfall. The onset of climate change and global warming is likely to severely affect
the availability of water. To aggravate the situation, after the loss of 3 major rivers, Ravi,
Sutlej and Beas, to India under the Indus Water Treaty 1960, India’s construction of
water storage infrastructure at Baghlihar and Kishanganga, is threatening to disrupt the
uninterrupted flow of water downstream into Pakistan (Ibid).
Compounding lower availability is the issue of inadequate water storage. Pakistan
stores around 40% of the world’s average in terms of storage. In comparison, the storage
capacity of Colorado is 497%, Nile 347%, India 33% while Pakistan has just 9% storage
capacity. As population size increases, resources become scarce in terms of per capita the
same is in case with water resources that are statistic in nature we may conserve and
manage them only. The current per capita water availability at 1066 m3/person is low,
with Pakistan in the category of a high water stress country, that requires to concentrate
on water resource development, urban and rural water supply and sanitation, industrial
water supply, irrigation and drainage, hydropower and environment protection (Ibid).
25
Pakistan is blessed with one of the largest contiguous irrigation infrastructures.
However, it was designed for water requirements of the 20 th century and not for the 21st
century. The design of system was for 60% cropping intensity and now the cropping
intensity has crossed over 120%. Further the cropping pattern on which water demands
and withdrawals were worked out was not supposed to cater to crops like sugarcane and
rice which require high water use. The system maintenance also requires a lot more
attention due to deferred maintenance over the last 100 years. Challenges of the 21st
century required the frontiers of knowledge and innovative approaches rather than
historic practices. The institutions need redefining of their roles and to develop their
capacities according to new responsibilities (Ibid).
1.5 WATER RESOURCES OF PAKISTAN
Water resources of Pakistan consist mainly of rainfall, glacier, groundwater etc.
There are two major sources of rainfall in Pakistan i.e. the Monsoon and Western
disturbances. Flow of Indus basin depends heavily upon the glaciers of Western
Himalayas (Govt. of Pakistan, 2010).
In 1960s, the Indus Water Treaty was signed by India and Pakistan. According to
this treaty, Pakistan got full rights on its Western rivers i.e. Indus, Kabul, Jhelum and
Chenab. The average annual runoff of these rivers is 140 MAF, with minimum recorded
so far as low as 97 MAF and maximum172 MAF. Corresponding to this, annual
diversion at the barrages for irrigation purposes is about 104 MAF (Ibid).
There are three primary storage reservoirs at Tarbela, Mangla and Chashma with
an average total storage capacity of 18.37 MAF. The reservoirs regulate the natural flows
for irrigation purposes and hydropower generation and help in utilizing the stored water
during the low flow season. From 15.75 MAF of live storage of reservoir 4.18 MAF
about 27 percent has lost due to sedimentation. Due to less storage, agriculture of
Pakistan is facing shortage during low flow season. According to Indus River System
Authority (IRSA) the shortage has gone up to 30 percent. Consequently it is becoming
difficult for IRSA to fulfill the demand of the provinces (Ibid).
The surface water of the Indus system is utilized through 19 barrages, 12 links
canals, 43 canal commands and 100,000 tertiary irrigation commands (Chaks/villages).
Irrigation releases from the reservoirs are planned by the IRSA (Ibid).

26
Water under the Indus irrigation system is plentiful and is derived from
infiltration of surface water as well as rainfall. However, depending upon the quality, the
useable groundwater is confined to an area of 10 hectares. The development of this
resource is through private tube wells and accounts for a gross abstraction of about 40
MAF per annum. In many canal commands, pumpage is greater than recharge, thus
causing subsidence. It is no regular and proper monitoring of private tube wells capacity,
their pumping hours and utilization (Ibid).
According to Water Accord 1991, 117 MAF water is required for irrigation by the
provinces. The water sources available for further development are 36 MAF of river flow
5.6 MAF of groundwater contribution and 3 MAF rainfall harvesting. Besides,
agriculture requirements, the estimated additional water needs to meet the capital water
supply, rural potable and sanitation industry and environment are estimated at 8 MAF (as
per annual water Policy, 2003).
1.6 SOURCES OF IRRIGATION WATER IN PAKISTAN
Mainly, there are three sources of irrigation water i.e. dams, lift pumps and dug
wells. The dam is the main source of irrigation water. Some farmers who can afford to
buy a pump, lift water from streams and in some areas, where there is no stream, or dam
or farmers cannot afford to buy a lift pump, they are using dug-wells for irrigation
purpose. Where dam water is not available, dug wells are the main source of water
(Cheema and Bandaragoda, 1997).
Primarily, there are three sources of irrigation water in Pakistan, namely, surface
water (canal water), ground water and rainfall.
1.6.1 Surface Water
The major sources of surface water in the Indus Basin are the snow melts and
precipitation, over the mountainous region. Runoff water through streams and rivers is
stored in reservoirs or is diverted through canal systems to the fields for irrigation.
1.6.2 Ground Water
The ground water has been in use since ancient times. Ground water, which meets
about 40 to 50% of the irrigation water requirements, is obtained by pumping water from
ground (aquifer). Pakistan is very fortunate to possess a rich source of ground water.
27
1.6.3 Rainfall
The third major source of water is rainfall, which is neither sufficient nor reliable.
The annual rainfall over the Indus Basin varies from 12.7 to 35.5 cm plains and above
50.8 cm in the northern areas. Annually, about 9 MAF net rainfalls is estimated to reach
the irrigation system for crop use (Chaudhary, 2001).
1.7 COMPONENTS OF IRRIGATION SYSTEM OF PAKISTAN
Components of irrigation system are as follows:
1.7.1 Main Canal
Main canal takes its supply directly from the river through a dam or a barrage.
Direct irrigation is usually not carried out from the main canal. The upper Jhelum, lower
Jhelum, upper Chenab, Lower Chenab, Upper Bari Doab and Lower Bari Doab are the
examples of main canals.
1.7.2 Branch Canal
Branch canals take off from the main canals through diversion structures such as
head works and convey water to different parts of the irrigated areas through
distributaries. The branch canals usually are not provided with outlets for delivery of
water to the fields except in special cases. These include Gugera and Rakh branches etc.
1.7.3 Major Distributary
Major distributaries (usually called distributaries or “rajbah”) take off from
branch canals and sometimes form main canals and supply water to minor distributaries
or directly to canal outlets. The examples of major distributaries are Niazbeg, Shahkot,
Nasrana etc.
1.7.4 Minor Distributary
Minor distributaries (usually called minors) take off from major distributaries and
rarely from branch canals. These supply water to watercourses for irrigation. For
example, Kamogil minor and Thatti minor are the minor distributaries of Niazbeg
distributary.
1.7.5 Watercourse
A watercourse is defined as any channel that receives water from a canal or
distributary and leads to the farms and fields. It is operated and managed by the
Provincial Irrigation Department (PID) but maintained by the farmers. On the average, a

28
watercourse commands about 400 acres of land and water is shared by about 50 farmers
according to a rotation called “warabandi”. Each watercourse receives water from canal
outlet whose location and size is approved by the PID. Water flows continuously in a
watercourses as long as there is water in the minor or distributary.
1.7.6 Field Channel
Field channels or farmer branches carry water to the individual fields from the
main watercourses. These are constructed, operated and maintained by the farmers
themselves individually or in groups. Generally, the size of field channels is the same as
that of main watercourses because they have to carry full flow received from the main
watercourses (Ibid).
1.8 WATER MANAGEMENT IN PAKISTAN
Under arid and semi-arid climatic conditions of Pakistan where annual rainfall is
25.4 to 35.5 cm against a potential demand of about 177.8 cm of water for agriculture,
irrigation is considered essential. Increasing pressure of population demands increased
crop production. This necessitates multiple cropping, better use of fertilizers and high
yielding crop varieties which cannot be practiced without providing requisite irrigation
water (Chaudhary, 2001).
Water is essential for the existence of all forms of life and for a broad range of
economic and social activities. It is essential for growing food; for household water uses
including drinking, cooking and sanitation; as a critical input into industry; for tourism
and cultural purposes. Fresh water is used primarily in three ways: domestically for
drinking and sanitation; industrially: and agriculture, primarily for irrigation and
livestock. While the pattern of use varies significantly from one country to another
country, on average, 10% is consumed domestically, 25% industrially and 65% in
agriculture. In parts of the developing world irrigation can absorb a 90% share of fresh
water use (Bonder, 2001).
Water becomes a precious commodity everywhere and its management at all
levels is important. Even at the micro level of a relatively small river system in South
Asia, the context of water management exhibits high physical, social, institutional and
cultural variability (NWCF, 1999). Water is continuously flowing resource with
unreliable dimensions and whose characteristics vary tremendously across societies.

29
Trapping and managing of such flowing commodity for the enhancement of livelihood in
natural and social diversity is equally challengeable.
Water is vital input and a basic pre-requisite for the agricultural development. The
equitable distribution of water could not be accomplished without an improved
distribution (watercourses) system from outlet to fields. The channels were, in many
cases of insufficient size to carry the design flow. There were no distribution structures
and leaks abound. The only farmers receiving a full share of water were those whose
farms were adjacent to the outlet. When this improvement was coupled with precision
land leveling and the introduction of proper irrigation structure such as siphon tubes,
portable dams, permanent gates (nakkas or outlets) and measuring devices, the
distribution system becomes complete (Clyma and Corey, 1974).
1.8.1 On Farm Water Management (OFWM) Project
Almost 37 million acre feet (MAF) water is lost only in watercourses (Govt. of
Pakistan, 2004). Keeping in view huge water losses, the Govt. of Pakistan launched an
On Farm Water Management Project (OFWM) in 1977. Later on various OFWM projects
were implemented with the help of different donor agencies (Ibid).
After successful completion of the pilot OFWM project in 1980-81 in seven
tehsils of the Punjab, an intensified water management program was launched in fifteen
irrigated districts of the Punjab during 1981-82. This program provides for improvement
of watercourses on cost share basis. The use of layout intensive methods lies at the heart
of this program. The start of any watercourses improvement is based on the joint efforts
of the water users on that particular watercourse. The farmers come close together for
their own greater good and forget about the age old rivalries over water shortage and
pilferage of each other’s share. The construction of pacca nakka eliminates the possibility
of un-authorized cuts and increased availability of water causes satisfaction in the hearts
of farmers over the arrangements of water distribution. However the watercourses
improvement is not an end in itself. The water that we save has to be used judiciously and
it makes the activation of farmers’ organizations (Yousaf, 1998).
The number of watercourses being improved is increasing day by day and it
requires now the attention of the authorities to maintain these works for a longer period
of time. The more pressing problem, therefore, is that of the maintenance of watercourses
30
after improvement. The rate of deterioration is rapid in case of earthen improvement. The
post improvement/maintenance is, thus essential in order to prolong the span of benefits
compatible with the investment on such a nationwide program. The check-structures and
lined portions also need a proper look after and maintenance, though at longer intervals
as compared to the earthen improved section of the watercourses. The field observations
show that in most of the cases improved watercourses gave rather shabby look after some
time of their renovation and it is feared that sizeable amount of the public as well as
farmers’ investment in terms of their financial contribution and labor input will go all in
vain because of negligence on the part of water users to keep up their watercourses. For
this purpose the need for the organization and productive groupings of the farmers at
gross root level was felt from the very beginning of this program. Lack of viable farmers’
organization may be one of the missing links in improving water management. The need
for such an organization has been felt at all levels, but the fundamental question is to
evolve the type and kind of structure that will be compatible with our socio economic
environments (Ibid).
1.8.2 National Program for the Improvement of Watercourses (NPIW)
The improved methods of irrigation can help to judiciously utilize the water
resources which is need of the day. At farm level, an efficient management of irrigation
water is needed to achieve high water use efficiency (Govt. of Pakistan, 2005). Keeping
in view the water losses from watercourses, Govt. of Pakistan started National Program
for the Improvement of Watercourses (NPIW) with a huge amount of 66 billion rupees.
The Government of Pakistan has approved the NPIW in Pakistan in April 2004 which is
being implemented in all the four provinces of Pakistan as well as in Azad Jammu &
Kashmir (AJK), Federally Administered Tribal Areas (FATA), Federally Administered
Northern Areas (FANA), and Islamabad Capital Territory (ICT). According to this
program the lining of 86003 watercourses in the country over a period of four years at a
cost of 66 billion rupees is a major initiative that would strengthen the agriculture sector
in a significant way (Govt. of Punjab, 2004).
The program has the following objectives; 1) to increase agricultural production
with the effective utilization of irrigation water through the improvement of the canal
command watercourses, 2) to enhance agricultural production in barani/non-canal

31
commanded areas through improvement of irrigation facilities in these tracts, 3) to
strengthen farmers’ participation to improve their capabilities for better management of
water at the farm level, and 4) to increase employment opportunities in the rural sector by
utilizing local resources (Ibid).
OFWM functions in Agriculture Department have been developed in district
governments after promulgation of Devolution Plan 2001. Under new set up, offices of
District Officers (OFWM) have been established in all districts of the Punjab to supervise
the OFWM activities. Physical execution of work is carried out by OFWM staff
comprising one Water Management Officer, two Water Management Supervisors and
other support staff headed by a Deputy District Officer (OFWM) at tehsil level. It is
however, pointed out that offices of Deputy District Officer (OFWM) could only be
established at 88 tehsil headquarters, out of which 70 are located in irrigated areas and 18
are in barani tracts. The district governments are creating these offices in their respective
27 uncovered rural tehsils, out of their own financial resources, with staff strength
equivalent to that where such establishment already exists. The said staff would,
however, be responsible to only undertake OFWM activates to be funded out of district
government resources. It is, accordingly, planned to create 260 new offices (Field Teams)
in irrigated area of the province to implement the proposed project. Each of the newly
established office will be headed by an Assistant Agriculture Engineer (Field Team In-
charge) and comprised one Water Management Officer, Six Water Management
Supervisors, One Computer Operator, One Naib Qasid and six Rodmen (Govt. of Punjab,
2004).
The main project components include formation of Water Users’ Associations
(WUAs), improvement of watercourses and installation of lift irrigation schemes which
are being implemented in both irrigated and barani areas of the Punjab by OFWM and
National Rural Support Program (NRSP) field teams/units (Ibid).
All activities pertaining to the improvement of watercourses and other physical
works were being carried out by the field teams/units of OFWM and Punjab Rural
Support Program (PRSP)/NRSP at national level with active participation of farming
communities (Ibid).
32
1.9 WATER USERS’ ASSOCIATIONS (WUAs)
Keeping in view the need for a rapid and sustainable breakthrough in agriculture
productivity, accelerated government interventions and efforts are underway. These
efforts include subsidies on essential farm inputs coupled with interest free and soft
interest rate credit, support prices, development of farm infrastructure i.e. farm to market
roads, and farm machinery units. Moreover, to meet the future challenges and increasing
needs of irrigation water, various irrigation projects are under consideration. Despite all
these efforts made at Govt. level, the performance of agriculture sector has not been very
encouraging.
The poor performance of agriculture sector in Pakistan is partly attributed to poor
water management practices at farm level due to institutional barriers, both at the macro
and micro levels. At the macro level, the system is facing a centralized bureaucratic
system supported by a century old rigid and insensitive package of irrigation acts and
practices. At the micro level, on the other hand, the irrigated agriculture is confronted
with a set of rural norms, traditions, social stratification based on social regulatory
patterns such as caste, biradary, faction, outdated agricultural and irrigation practices and
so on.
Therefore, the importance of farmers’ participation in various agriculture
activities is the need of the day. The significance of their participation becomes more
vital for the management of irrigation projects, because the involvement of different
actors such as hydrologists, engineers, politicians, etc. makes it necessary to secure
benefits for the farmers by playing an active role. In an era of increased concern for the
participation of various beneficiaries in the projects planned for them, the importance of
water users, the main beneficiaries in the irrigation projects, holds a central place. This
aspect is being more and more emphasized as; the success of an irrigation project
depends largely on the active participation and cooperation of individual farmers. In this
context, Agriculture Development Bank (ADB) in 1973 argued that a group such as a
farmers’ association should be organized, because irrigation technicians alone cannot
satisfactorily operate and maintain the system.
In the last few decades, the importance of efficient management of human
resources to optimally profit from the natural resources has caught a special attention. In
33
irrigation water management not only it is important to overcome the physical and
technical constraints, but it is also essential to focus on human resource development.
The establishment of WUAs provides the most suitable mechanism for the human
resource development. The development of WUAs must be emphasized because the
indigenous knowledge of the water users is the basis for achieving an increase in the
agricultural production through efficient management of irrigation water.
During 1960, a Small Dam Organization headed by a Chief Engineer and placed
under the control of the Provincial Governor, was established for this purpose. At present
the Organization is under the control of the Irrigation and Power Department of the
Government of the Punjab and is headed by a Project Director. The Small Dam
Organization is entrusted with the tasks of identification, investigation and construction
of small dams of low and medium heights for improving the agriculture economy of
barani areas of the Punjab province. The total cost of the Small Dams Project was
Rs.7811.2 million with a foreign exchange cost component of Rs.220.432 million
(Shahid and Ashraf, 1989; Iqbal and Khan, 1991).
1.9.1 Objectives of WUAs
The objective of WUAs is to get the maximum water out of their allocated supply.
But the critical problem has been that of effectively organizing farmers especially for the
maintenance of watercourses after improvement. Frequent and regular maintenance was
essential if the farmers were to reap the benefits of watercourses improvement. Thus,
there was a need to design, develop and diffuse an important institutional arrangement of
the shareholders on each watercourse. It was recommended by experts that farmers on
each watercourse should be organized into WUAs (Saqib, 2006).
1.9.2 WUAs’ Ordinance
WUAs ordinance was promulgated in 1981, through which it was made
obligatory for the field staff of OFWM Department to have an Association registered
prior to starting any renovation work on a water course. The ordinance provides platform
for ensuring farmers’ participation for renovation and further maintenance of the
watercourses. The ordinance was meant to ensure farmers’ participation and the salient
features were; 1) The formation of WUA is a pre-requisite to starting any renovation
work, 2) The Association will be registered when the majority of the total number of

34
irrigators have agreed to improve their watercourses, 3) Once an Association is formed
all the users of the watercourses will be bound to participate in the renovation program
which requires manual labor. This will be mutually decided among themselves as also the
share of the cost of maintenance prescribed by the field officer, 4) Future maintenance of
the improved watercourses will be the responsibility of the Association subject to such
conditions as may be laid down by the field officer, and 5) The leadership role will be
played by the officers of the Association duly elected by the users from amongst
themselves (Govt. of Punjab, 2004).
1.9.3 Role of WUAs
Improvement of watercourses and formation of WUA is not only a well-received
idea for the reduction of water losses which occur during its conveyance from outlet to
the farm but also an indirect major tool for rural development, since it prepares the
peasantry for a cooperative action through imbibing and instilling in them the much
needed cooperative spirit. In about 37 countries of the world, the Association is traced to
appear under various titles such as WUAs, Irrigators’ Association, Community of
Irrigators or some similar names with the basic objective of operating, maintaining and
rehabilitating the water system in efficient and effective manner and assisting in proper
application of water on the farm (Ashraf, 1997).
1.10 NEED FOR THE PROJECT
Improvement of watercourses is not a serious problem. The more pressing
problem, therefore, is the maintenance of watercourses after the improvement. The rate of
deterioration is rapid in case of earthen improvement. The post improvement/
maintenance are, thus essential in order to prolong the span of benefits compatible with
the investment on such a nationwide program. The field observations show that in most
of the previous cases/projects, the improved watercourses gave rather shabby look after
some time of their renovation. The farmers’ investment in terms of their financial
contribution and labor input goes all in vain, because of negligence on the part of the
water users to keep up their watercourses. For the purpose the need for the organizations
and productive groupings of the farmers or water users at gross root level is necessary.
Lack of viable farmers’ organization may be one of the missing links in improving water
management. The need for such an organization has been felt at all levels, but the
35
fundamental question is to evolve the type and kind of structure that will be compatible
with our socio economic environments.
Pakistan is faced with poor management and unequal allocation of water among
the provinces. This has led to serious conflicts among them. In big cities, industries are
the main consumers of water. These include use of water for hydroelectric power. Such
exploitation takes place in most Third World countries and arises mainly because of
mismanagement and degradation of land. The natural water cycle has been vastly
disturbed by unplanned water system and expanding deforestation (Mustafa, 2002).
Pakistan is one of the largest nations of the world that depends on a single river
system. The water from the Indus River and its tributaries supports the bulk of the
agricultural water supply for its 130 million people. The Indus Basin is the most
important and significant river basin in the context of the Pakistan’s economy. The
importance of the Indus River system for the country is well known. At both the city and
village levels, the Indus River is the main source of domestic and industrial water. The
estimate is that at least 80% of all the water consumption comes from streams, canal
reservoirs and wells recharged by the river or its tributaries (Qaiser, 2002).
The 77 years inflow data of Indus River (1922-23 to 1999-2000) indicate that the
watersheds of the Indus River yield about 138.7 MAF of water annually. The River Indus
alone provides 65% of the total river flows while share of Jhelum and Chenab is 17 and
19% respectively. At this stage, the country would need more food and fiber to meet the
needs of a growing population while under the present conditions; the Indus River
System will not be able to meet the water requirement of domestic, industrial and
agriculture sectors. The growing shortage of both surface and ground water in the country
has been causing the danger of desertification. The problem is most severe in Baluchistan
where many river basins are experiencing depletion rates exceeding over one meter per
year. Acute shortage of water is to be faced in the days to come due to reduction of water
resources and growing demands. As finding new sources of water may not be possible in
the current circumstances, it is important that the available water resources should be
managed properly and used most efficiently and sensibly for maximum crop production
per unit of applied water (Munir, 2002).
36
Despite favorable climate, fertile land, hardworking farmers, improved
infrastructure and possession of the world’s largest integrated irrigation system, per unit
agriculture yield in Pakistan lags far behind that of other countries with almost similar
conditions. In this situation one may pose the question why such a set of supportive
factors did not provide enough incentive for a better management of water. The factor
which might be missing in this set of arrangement is active participation of water users
as, without active involvement of the real managers, the farmers, the effective and
efficient management of such a huge system to secure the desired results seems illusion.
It should therefore, be acknowledged that a better management of irrigation water
through water users participation is the most effective and promising way to secure high
yields at sustainable grounds. Therefore, to achieve higher agricultural production to
satisfy the increasing needs in Pakistan, the active involvement of water users in
agricultural development is highly desired.
The main emphasis of the study is laid on analyzing the present status and future
scope of WUAs for the management of irrigation systems through their active
participation. The study also examined the factors which had motivated the water users to
involve themselves actively in the management of irrigation system or hindered them
from doing so. The study analyzed the role of the water users’ participation in the
management and operation of irrigation practices as the participatory approach has
introduced some new dimensions to the irrigation management. The effective
participation of water users can, indeed, guarantee the effective development of the
irrigation system. The success of the system, however, needs to be capitalized into
institution building at the community level. In other words, water users’ participation in
water management is the first step towards social organization for development.
Ample empirical evidence are available to prove that there occur heavy losses of
irrigation water particularly beyond canal outlet from the badly constructed and poorly
maintained watercourses which have existed through past several decades. These losses
are mainly due to seepage and side leakage from the watercourses. The thin, distorted and
silt loaded watercourses’ banks, zigzag sections, trees and shrubs are some of the
important sources of the operational losses from the watercourses system. These losses
must be controlled by way of maintaining watercourses in proper order. However, the

37
watercourses improvement is not an end in itself. Continuous efforts are required to
maintain improved watercourses in proper shape. Moreover, the water thus saved has to
be used judiciously through activation of some formal farmers’ organizations (Javed,
1991).
Amongst the factors which affect the performance of WUAs, limited participation
of the shareholders in the cleaning and maintenance program, high number of small
shareholders and resultant lack of interest due to smallness of holding size, absence of
bye-laws to restore mutual faith and interest, assumption of ambivalent position by the
shareholders towards traditional and legal authorities, village problems having no
relevance to irrigation water and lack of interaction of the retired officers (shareholders)
with other shareholders and OFWM field staff, are the important ones (Ashraf, 1997).
It is an admitted fact that due to non-sustainability of WUAs, real benefits could
not be properly achieved. Now under the NPIW, the government wants that WUAs be
made functional even after the improvement of watercourses.
In view of the above discussion, it seems very much imperative to undertake this
research project to analyze the present status and future scope of WUAs as effective
devices for water management in the Province.
1.11 OBJECTIVES
1.11.1 General Objective
To study the present status and future scope of water users’ associations in the
Punjab, Pakistan
1.11.2 Specific Objectives
To study the process of setting up a WUA.
To examine the criteria used for the selection of members of managing
committees of WUAs.
To determine the extent of participation of water users in the improvement
and maintenance of watercourses.
To analyze the disputes between water users and the role played by WUAs
in resolving them.
To identify the problems and obstacles in the effective functioning of
WUAs.

38
To determine the prospective role of WUAs
1.12 ASSUMPTIONS OF THE STUDY
The data collected would be helpful for providing necessary guidance and
insight about the present status and future scope of WUAs.
The results of the study would be useful for the EFS to improve their
interventions with WUAs.
All respondents may not answer all the questions of this research study.
Therefore, the respondents would not be forced to give their views regarding
each question what so ever appropriate the word “No response/NA” was
included in some questions.
1.13 LIMITATIONS OF THE STUDY
The study was confined to the Punjab Province.
The study was further confined to district Sargodha.
The reliability of the responses was limited to the extent of accuracy of
information provided by the respondents.
The study was limited to the quantitative data provided by the water users.
39
CHAPTER 2
REVIEW OF LITERATURE
Review of literature highlights the findings of related studies and eliminates the
possibility of un-necessary duplication of efforts. Its function is to “look again” (re-view)
at the literature in a related area (Leady, 1989). It involves locating, reading and
evaluating reports of research, reports of casual observations and opinion that are related
to the individual’s planned research project.
Review of literature provides an opportunity to the researcher to know what has
been done previously. Until it is learned what others have done and what remains still to
be done in a particular area, it is difficult to plan a useful study. Thus, the review of
literature forms the foundation upon which all future research work must be built (Borg
and Gall, 2002).
Literature review process is an activity that identifies and analyzes the earlier
work done relating to current study to meet desired performance goals and objectives. It
includes the search terms and the main data bases. As regards the search terms, various
key words were used to conduct the review of literature such as water users, water users’
associations, water management, improvement and maintenance of watercourses,
participation, resolution of disputes etc. Various data bases used for the review included
Science Direct, Google Scholar, HEC Repository, Journal of Agricultural Water
Management, Irrigation and Drainage Systems, Water Resource Management, Journal of
Water Research, Journal of Agricultural Systems, Journal of Extension Systems etc.
The search was not confined to a specific time period. However, effort was made
to review the latest studies. The research studies having some bearing upon the study in
hand have been briefly reviewed in this chapter.
40
2.1 PROCESS OF SETTING UP A WUA
Luna (1973) studied that the loss of water has recently been calculated to be 52%,
bifurcating as 2.5% losses from main canals and branches, 11% from watercourses and
16% in the field. These losses can be reduced by better management of the watercourses
through the formation of effective local organization.
Samma (1973) reported that Pakistan has a modern irrigation system covering
doabs and more than 40,000 miles canals, branches and distributaries that make it the
world’s largest irrigation system. Being the world’s oldest and largest system, it is
obvious to appreciate the value of irrigation water management by the formation of
WUAs.
Radosevich (1975) stated that Pakistan ought to encourage the development of
legally based WUAs. A basic design and set of principles, derived from the water laws in
other countries are recommended for adoption in Pakistan.
Thornton (1975) described that the complex task of controlling water for
irrigation and in maximizing productivity of irrigation water depends very much on
successful organization both at the project level and at the national or even international
level through comprehensive legislation and policies.
Johnson et al. (1977) reported that the farmers’ organizations were not a new
phenomenon in the Indus Basin as many villages have cooperative groups. However,
management has been failed due to the inability of these organizations to provide service
that was not available elsewhere. Yet, even this may not be sufficient to keep a water
users’ organization (WUOs) viable and functioning but the farmers needed to be
convinced that there was an economic incentive to organize and operate a users’
organization. In order to assist in the formulation of the organization, simplified
procedures needed to be developed to facilitate the registration of WUOs.
Lowermilk et al. (1978) argued that the farmers were more organized on
regulated warabandi system. The biradary groups were the most central network
influencing farmer behavior. The villages with a past history of cooperation by major
caste and brotherhood groups in the establishment and up keep of common mosques,
schools and other organizations can be expected to cooperate in forming a watercourses
organization.
41
Radosevich (1978) concluded that WUAs could become the most important
instrument in Pakistan to implement improved technologies in irrigated agriculture. They
can, as they had done so in many other countries, be the instrument that keeps the water
distribution systems at the farm levels as efficient as possible under the varying
conditions and constraints faced by the irrigators.
Saeed (1978) indicated that the formal WUA could be developed in a village for
successful launching of the watercourses improvement program. Such associations
should be organized under the supervision of the Government technical experts for
cleaning and maintenance of watercourses in view of high delivery efficiency obtainable
after improvement.
Merry (1979) described that the legal and administrative mechanisms were
required to facilitate the formation of organizations. These organizations ought to be
given real responsibilities. It was found that sanctions were needed to be applied initially
to individuals and groups who sabotage organizational effects and local improvement
projects. Sufficient rewards need to be built-in to attract farmers to organize the
organization and continued these rewards to maintain the organization over the long run.
Reuses et al. (1979) reported that WUAs under a legal framework should be
initiated and used as a vehicle, not only for cleaning and maintenance, but also to educate
farmers to adopt improved agronomic and irrigation practices for more effective
utilization of saved water for effective management.
Dozina (1983) explained that the farmers are sensitive, pragmatic and responsible
members in the rural society. When they are convinced of the advantages of group action
for better water availability and use in their farms, they could be stimulated or guided for
useful group activity.
Laitos (1983) described that there was a relationship between water control and
the absence of any formal, local level social organization of irrigation. He observed that
where such organization was absent, on farm water control would primarily be based on
locational factors. The impact of two strategic locational variables was investigated. The
proximity to the watercourses and presence of intervening irrigation on four major
dependent variables i.e. irrigation behavior, farmer satisfaction, cropping intensities and
pattern and maintenance procedure were also investigated. He concluded that the degree
42
of a farm water control varied inversely with the two locational factors where no formal
organization of irrigators existed. These differing degrees of water control are related to
deviant irrigation behavior, poor farmer satisfaction, low cropping intensities and
ineffective maintenance procedures. It was recommended that water control be placed in
the hands of farmers via the establishment of an appropriate local level social
organization of irrigators.
Anderson (1984) described that private irrigation is traditional in the highlands of
Ecuador. In more recent decades, irrigation has expanded throughout coastal areas as
well. Private sector WUAs have been organized to administer, co-ordinate and manage
the distribution of water. In addition to private sector irrigation activities, the government
has, since the 1940s, engaged itself in the development and exploitation of large-scale
irrigation projects in both highland and coastal areas. However, during this period of
expansion of the public sector into irrigation development and control, there has been
little interaction or coordination with private sector efforts and parallel systems of
irrigation water management and delivery are currently operative. The study explored
recent recommendations extended to the government of Ecuador vis-a-vis its philosophy
toward private sector irrigation and suggests that the strengths, human resources and
widespread social legitimacy of private user organizations can be a vehicle for promoting
and enhancing water development and improved water distribution and use in the
country.
Ali (1986) studied that in WUAs, majority of managing committee members
(60%) were selected on the basis of mutual decision taken in the general meeting of the
shareholders on the watercourses, while one fourth were nominated by the village
leaders.
Merry (1986) reported that in Pakistan, during the 1970s when the government
became very concerned about alleged mismanagement of water by farmers at
watercourses level, a new organization was set up within the agriculture department. The
On Farm Water Management Directorate was established to take the lead in including
farmers to rehabilitate watercourses and precision land leveling.
Patil (1987) investigated that the Indian 6th and 7th National Plans had endorsed
the proposal for the formation of WUAs on the assumption that they would bring about a

43
much needed improvement in efficiency of use. However, underutilization of water
remains a problem and progress in forming WUAs has been extremely slow. It was
investigated that reasons for this state of affairs, limiting its assumption in respect of
technical and agronomic factors in the formation of WUAs looking first at the economics
and politics of irrigated agriculture and then presenting examples of successful and
unsuccessful WUAs in Maharashter and Gujrat.
Baxter and Laitos (1988) narrated that when six farmers managed irrigation
systems were compared to three government managed irrigation systems. Results
indicated that the organizational capacity of WUAs to manage and maintain the irrigation
system was the most important factor in achieving water control and productive irrigation
system. The effective WUAs demonstrated that they were able to; 1) mobilize significant
amount of labor and money on a continuing basis, 2) resolve local conflicts of water
theft, 3) allocate and distribute water equitably, 4) coordinate cropping patterns and
planting dates, and optimize the efficient use of available water. The farmer managed
systems showed a large degree of farmer cooperation satisfaction, even though most of
the system had substantial operation, maintenance and cost problems.
Shinn (1988) stated that in Pakistan an investigation was made on the
consequences of linkages between farmers and main system managers for irrigation water
control. Given the absence of adequate organizational links, water control was a function
of two variables; 1) location, which conferred advantage or disadvantage relative to canal
water supplies, 2) access to ground water through involvement in tube well organization.
Strong positive associations were found between water control, cropping intensity, water
sensitivity of crop consumptive demand, and yields. Given the importance of water
control, it was found that farmers would pay increased amounts to secure controllable
ground water supplies and willingly entered into small local water management
associations to secure supplies. Given appropriate conditions, farmers indicated their
willingness to support local irrigation organization which control water.
Tariq (1991) noted that the existence of solidarity groups, respondents’
unawareness about the WUAs’ charter and bylaws and respondents’ interaction with
OFWM officials were the major constraints in the formation of WUAs.
44
Rosegrant et al. (1995) indicated that the attempts of introducing water changes
and self-supporting attitudes in the Soviet period, without institutional changes at the
farm level, privatization and liberalization of marketing system proved disastrous. After
the disintegration of Soviet Union, under influence of the technical help rendered by
international organizations a new institutional structure at farm level was created.
FAO (1997) reported that first time WUAs were created in 1981 under the World
Bank supported OFWM project. They were formed at the watercourses level, with a
primary objective of rehabilitating the watercourses.
Meinzen-Dick et al. (1997) investigated that WUAs and contracting are rapidly
replacing the traditional institution of collective management, in many villages in
northern China. In particular, WUAs are gradually being recognized as the
representatives of water users in dealing with external agencies (such as irrigation
districts) and internally (within the village), by assuming the authority to mobilize
resources.
Asad (1999) observed that an institutional framework is typically characterized by
institutional arrangements such as laws, legal norms and regulations on one hand and
actors such as water users, government agencies and river basin agencies on the other.
AEO (2003) reported that the formation of water users’ organizations (WUOs)
was started in 1966. By 2004 the number of WUOs that had been set up numbered 15,463
and their command area accounted for 1.41 million hectares which is approximately 20%
of the total irrigated area. The area that is irrigated and beneficial was approximately 7.13
million hectares in 2002.
DFID (2003) reported that due to the land and agrarian reforms, approximately
53% of the population was allotted their own parcels of land. Rural committees
coordinated the process. The size of land depended on the number of family members at
the time of allocation. A 99-years lease from the state with land certificates were issued
to the family head with names of other family members who would take over the lease.
While land cannot be sold, farmers can form farmers associations and cooperatives and
have no restrictions on the crops they produce and sell in to the markets. There was no
state order system for crop production.

45
Dogar (2004) studied that the purpose of the establishment of WUAs was not only
to increase the supply of irrigation water to farm fields but also to improve the quality of
irrigation management practices by the farmers. He further reported that watercourses
improvement and the better water management practices improved the water use
efficiency and hence a positive impact on the crop productivity was recorded. In case of
cotton, productivity enhancement was recorded as high as 61%.
Herrfahrdt et al. (2006) reported that in 1997, the German Government passed a
bill that encouraged the establishment of WUAs. This bill was upgraded into a law in
2002, which provided the basis for established WUAs to take over on-farm irrigation
water management and infrastructure development. Currently there are 450 registered
WUAs in the country covering an area of approximately 710,000 ha with more than
166,000 members.
Hassan (2007) explained that under NPIW, 18000 watercourses have to be
improved by the formation of WUAs in the Punjab at a cost of Rs.10 billion, out of which
5200 watercourses have been improved through WUAs. The aims of the program are to
conserve the existing water resources, improving delivery systems, thus enhancing the
productivity and bringing more area under cultivation. The program also provides 11000
direct and 400000 indirect job opportunities to the people.
Hussain (2007) concluded that the construction of new watercourses on the small
dams and improve the existing watercourses, as well as formation of the WUAs seems
imperative to manage and improve these channels. The construction and improvement of
watercourses will create employment in the rural areas leading to reduction in poverty,
increase in crop production and upgradation in the living standard.
Huang et al. (2009) conducted a research study with an aim to provide
information regarding water management reform in China by increasing understanding of
newly emerging water institutions and identifying factors that lead to the creation of
reform-oriented irrigation institutions (WUAs and/or contracting) in one place but not in
another. Authors used two sets of survey data, one of which was representative of
northern China; they found that water management reform has spread steadily. In
northern China, 20 to 30% of villages have shifted away from traditional forms of
management. In their places, some villages are hiring individual contractors; others are
46
adopting WUAs. While China's new forms of water governance are not very participatory
(from the farmers’ point of view), water managers especially contractors are increasingly
being given more incentives to save and manage their water more effectively. Water
scarcity, other village characteristics, and policies implemented by local and regional
government water officials are the main drivers of water management reform.
2.2 SELECTION CRITERIA FOR THE MEMBERS OF MANAGING
COMMITTEES OF WUAs
Nawaz (1968) studied that the characteristics such as caste, community type, land
holdings, farming experience, education, age and income are significantly associated with
the adoption of improved irrigational practices.
Ali (1972) found that there is a positive relationship between education and
adoption of farm water innovations; those who had some formal schooling were high
adopters than those who had no formal schooling. Schooling has been valued as means of
increasing knowledge about new farm technology.
Coward (1977) noted that some nations focus on small social irrigation system, as
a part of their total irrigation development strategy. In these areas, the utilization of
indigenous principles of organizations may be even more applicable. Planners and policy
makers might have some erroneous ideas about indigenous irrigation system. These
myths could be dispelled only through the accumulation of more detailed information
about a wide array local systems operating in various natural and socio-economic
conditions.
Gill and Twitty (1977) observed that the success of the watercourses
improvement program would depend on the cooperation and enthusiasm of the members
of WUAs to maintain the system of watercourses.
Mirza and Merray (1979) found that WUAs established on a legal basis were
more effective in managing and maintaining the watercourses than informally organized
associations. The organizations characterized by a high level of participation by members
in the decision making process were relatively more successful. The other factors which
made such organizations successful include: a predominance of small but viable land
holding; relative equality of power/influence among farmers; a previous history of
cooperation on community projects and a minimum conflict; a high degree of
47
progressiveness; a small number of shareholders on the watercourse; single biradary
social structure on the watercourses and single branch watercourses.
Mirza and Haider (1979) elaborated that water users were of the opinion that
watercourse cleaning and maintenance is very important for watercourses improvement
program. The watercourses having a few influential persons capable of joint participation
could best serve the purpose of watercourses improvement program. The watercourses
dominated by self-cultivating large land owners, small refugee owners and single caste
farmers were found to be well maintained. The coordination of related Government
Departments should be largely ensured so that watercourses committees could be assisted
by irrigation, revenue and agriculture departments where needed. The watercourse level
association must federate at the village level or at the level of a canal distributary,
whichever was convenient from the stand point of providing farm services, such as,
tractor, wheat thresher, and supply of seed, fertilizer, storage and marketing of farm
produce.
Ali (1986) concluded from his study that the executive committee formulated on
the basis of mutual consent of farmers proved much effective in the improvement and
maintenance of watercourses and also water management officials should visit improved
watercourses so that the farmers may be careful.
Uphoff (1986) described that when someone trying to create a group basis for the
management, the social unit of organization was very important. It affects how
accustomed people were to be cooperating with one another, how willing they were to
make some sacrifices for other members, how much confidence they had in other
members in the group.
Chanbouleyron (1989) stated that the primary skills needed by the inspector are
related to the users associations’ water distribution function. On the other hand, the users
associations must operate within the province’s legal framework. Hence the users
associations must contribute to the budget of the General Irrigation Department and
perform administrative tasks to agreed standards. To meet all requirements, the inspector
should have a certain level of knowhow and experience. This required level of know how
has increased over the last decade because users associations formerly covered only one

48
tertiary unit (averaging 150 hectares) and now cover one lateral unit with an average size
of about 4000 hectares.
Mirza and Khan (1990) argued that a legal mode of decision making is not readily
accepted variable, it may be put in practice of traditional authority and personal influence
of a few who remain dominant.
Ambler (1993) observed that the management boundaries, as well as management
practices are foremost requirements for the accurate performance measurement of the
farmer managed irrigation system, while comparing internal and external evaluation, crop
yield, production, irrigated area and cost per unit of water are criteria for external
performance measurement.
Mansuri and Rao (2004) found that some scholars are concerned that the
dominance of local leaders might result in elite capture, where the benefits of
participatory projects are appropriated by elite members of the village, who are often
community leaders.
Gastineau (2006) argued that in many cases, WUAs have failed or remained
merely legal constructs without having the intended impact on water management,
because traditional forms of organization were neglected.
Vermillion (2006) explained that although governance of the reformed institutions
often takes some new features, reform has been a gradual process. Even today, WUAs are
not completely separated from the village leadership. In reformed villages, village
committees, which manage canals under collective management, retain full or shared
responsibility for certain irrigation tasks. There is still a large overlap between the
leadership of WUAs and that of the villages. The dominance of the village leadership is
also found in other countries that have established WUAs.
Basutro (2007) indicated that the role of the leader, who facilitates the design of
rules, norms and strategies in a community due to personal capacities, has been related to
the ability of groups to gain autonomy and design local institutions.
Ersten (2007) narrated that the irrigation system management is strictly related to
the differences in agricultural production system, cropping patterns, and infrastructure,
49
production regime (owners, tenants and owners-cum-tenants). These structures obviously
affect all performance indicators.
Vandersypen et al. (2007) found that the failures of WUAs in the Office du Niger
irrigation schemes were linked to the lack of support from community leaders.
Kazbekov et al. (2009) examined that the primary objective of an organization is
to provide efficient and effective management of water resources to achieve enhanced
agricultural production. Performance assessment studies provide a tool to evaluate and
promote this objective. The study examines the existing planning procedures and assesses
irrigation performance of four WUAs located in Osh Province, Kyrgyzstan. Performance
was evaluated using indicators of adequacy, efficiency, dependability and equity.
Indicators were calculated for each irrigation season over the period 2003 to 2007. In
general, all WUAs were found to be strong in terms of adequacy and efficiency
standards. However, performance with respect to dependability and equity was poor. The
results suggest that more effort is needed to improve temporal uniformity and equity in
water distribution. In order to achieve this, estimations of irrigation requirements by
WUA managers needs to be improved and mechanisms developed to request water in
quantities, which are needed to maintain equity across the WUA outlets and among water
users. The study concluded that the establishment of WUAs in Kyrgyzstan has helped to
address the problem of water distribution and allocation among a large number of
farmers. However, further training of farmers and managers is required to build their
capacity to share water and ensure equity among users particularly during periods of less
than optimal water supply. The findings of the research suggested that application of a
pre-determined set of indicators can be useful and cost effective tool to measure the
performance of WUAs to replace. This is particularly important for Central Asia where
the performance of the recently established and state initiated WUAs to replace former
collective farms is now a key element in future sustainable water management. The study
identified uncertainties in the estimation of WUA water demands based on previous
methods and suggested more attention and care required in calculating water
requirements.
50
2.3 IMPROVEMENT AND MAINTENANCE OF WATERCOURSES
2.3.1 Water Users’ Participation in the Improvement and Maintenance of
Watercourses
Eckert and Dimick (1975) described that the watercourses improvement required
group interaction among many farmers with lands served by the same watercourses.
Communal decisions are needed to select a plan, argue with government authorities for a
co-operative effort, provide labor from all farmers, accumulate funds from watercourses
members etc. in order to achieve these purposes satisfactorily, farmers will have to be
organized into some form of WUA having the powers to a portion the cost, ensure
compliance by all members, enter into contracts, supervise innovative water allocation
programs and ensure that each farmer receives his fair share of the benefits. Once a
satisfactorily instituted WUA is established, it will serve as the primary means of
organizing farmers for participation in a farm water management program and as the
point of contact between farmers and the relevant government agencies.
Mirza (1975) explained that village organizational factors affecting water
management decision making in Pakistan that are more difficult for the overall village to
organize collective decision making. It was concluded that the more there was an
organized and active panchayat (association), the greater would be the frequency that the
commonly held portion of watercourses were cleaned, and finally the more villages were
dominated by a small number of big landlords, the greater the factional tendencies and
the poorer the quality of water management decision making.
Charin (1976) stated that the farmers did not participate in the construction
process of irrigation facilities. About 700 years ago, in the ancient “Lan Na” era in
northern Thailand, farmers cooperated to build irrigation systems with diversion weir
(dam) made from bamboo. These irrigation systems were known as “Mueng Fai” or
people’s Irrigation. “Mueng” means an irrigation ditch and “Fai” means a weir in Thai.
World Bank (1976) reported that if the provision of watercourses cleaning and
maintenance stated in the central Act, 1973 were fulfilled, the farmers on 78000
watercourses in Pakistan would” save” approximately five million acre feet of water by

51
1978 without capital inputs. The farmers did not provide minimum levels of watercourses
cleaning and maintenance because they were not organized to do so.
Chaudhry et al. (1977) elaborated that the farmers’ participation in planning and
reconstruction of their watercourses gave them a sense of pride and was helpful in
gaining their support for continued maintaining of the watercourses in improved
conditions.
Amir (1978) viewed that 50% of the water entering the canals was lost before
reaching the farmers’ fields. The loss in the watercourses alone ranged around 15% of the
canal withdrawal. These figures indicated the imperative need of improving the
watercourses in a scientific way to minimize the loss. A few farmers independently in an
unorganized fashion could not accomplish this objective on a sustained basis.
Haider et al. (1979) indicated that most of the water users were of the opinion that
laws concerning watercourses cleaning need to be introduced and strictly enforced for
achieving regular cleaning and maintenance. The watercourses having a few influential
persons capable of joint participation can best serve the purpose of watercourses
improvement program. The watercourses dominated by self-cultivating large land
owners, small refugee owners and single caste farmers were found to be well maintained.
Natiq and Akram (1979) explained that the farmers have realized the importance
of watercourses improvement. Those who have improved their watercourses were
comparatively more educated. The cleaning behavior among the farmers was also
different. The majority of farmers cleaned the improved watercourses on regular schedule
whereas the unimproved watercourse was cleaned only when there was too much
obstruction in the watercourses flow.
Bashir (1980) studied that watercourse cleaning behavior was different among the
farmers. The improved watercourse was cleaned by 73.3% of farmers on regular
schedule, whereas the majority (66.67%) of the farmers on unimproved watercourses
indicated that it was cleaned only when too much obstruction in watercourses was
experienced, and this was frequent but without any specified schedule.
Silva (1981) viewed that the active participation of farmers in management
process was a vital pre-requisite for a successful water management program in any
irrigation project because it created an environment conducive to mobilize the talents of

52
the farmers themselves in eliminating the chaotic situation in irrigation projects regarding
use of water.
Qurban and Khurshid (1984) concluded that the farmers have to collectively
decide about their water management i.e. cleaning and maintenance of the common
watercourses and scheduling of turns along the watercourses.
Wijayaratna (1985) stated that the farmers also provided information relating to
design, operation and maintenance of their irrigation system and also participated actively
in organizational and management activities.
Ahmed and Faruqee (1995) argued that to solve the problems of water resources,
being faced by Pakistan, fundamental changes in water pricing and institutional structures
were necessary to improve the efficiency of the system. They also proposed the
devolution of the water management to the farmers' organizations.
Xianjun and Yunbi (1996) reported that according to study conducted in the
Jingaichaun district of China, the farmers’ participation in the irrigation management and
the introduction of simple techniques have led to the development of water saving
irrigation schedule and on farm water management.
Vermillion (1997) reported that the evidence from 29 separate studies around the
world indicate the transfer of irrigation management from government agencies to farmer
or other local non-governmental organizations. He found that participatory management
of an irrigation system could improve operational efficiency, prevent it from
deteriorating, and help to ease the governmental financial burden.
Clarke et al. (1998) stated that the planned irrigation supplies by WUAs and
compared them with the actual delivered amounts by the canal authority. To investigate
the current irrigation planning methods that are used widely by WUAs, the plans were
compared with the irrigation requirements. The study presents the short-term impacts of
an institutional initiative adopted to better manage water, improve user participation and
strengthen the role of WUA.
Meinzen-Dick (1998) reported that a review of evidence from South Asia shows
that female participation is minimal in WUAs. One reason for this is that the formal and
informal membership criteria exclude women. Moreover, the balance between costs and

53
benefits of participation is often negative for women because complying with the rules
and practices of the organization involves considerable time costs and social risks,
whereas other ways to obtain irrigation services may be more effective for female water
users. Although effective, these informal ways of obtaining irrigation services are also
typically less secure. More formal participation of women can strengthen women’s
bargaining position as resource users within households and communities. Greater
involvement of women can also strengthen the effectiveness of the organization by
improving women’s compliance with the rules and maintenance contribution.
Nagaraj (1999) reported that in France, the River Basin Committees and Water
Agencies are in-charge of managing water resources. However, many surface irrigation
networks were initiated and operated by the Regional Companies and farmer syndicates
exclusively for agricultural development in the southwest of the country. These water
institutions are playing an active role in water management with an objective of cost
recovery in order to improve the quality of irrigation services to the users. The
implementation of various innovative institutional management approaches by these
agencies have yielded a modest degree of success in addressing the crucial problems of
the irrigation sector in terms of pricing water, cost recovery, financial viability and
overall sustainability of the surface irrigation system.
Svendsen and Nott (1999) observed that the irrigation management in Turkey
represents one of the earlier cases of the “new generation” of transfer experiments that
are based on quick delineation of large groupings of water users holding common
interests in good quality irrigation service, but which do not involve extensive
community organization work at the local level.
Shoida (2000) said that the government constructed waterworks up to the on-
farm facilities without farmers’ expenses. Hence farmers did not participate in the
process of the project implementation. Therefore, the farmers did not have the feeling
that they owned the facilities.
Xu and Zhang (2002) studied first of all the methods used to increase
participatory irrigation management in the Netherlands, the United States, Indonesia,

54
Mexico, Kyrgyzstan, Iran, France, Japan, the Philippines, Sri Lanka and Pakistan. They
then developed recommendations for implementing WUAs in China.
Gao et al. (2003) analyzed the specifics of WUAs and made practical
recommendations for development of participatory irrigation management in China.
Zhang et al. (2003) studied the farmers’ participation in decision making in
irrigation management. They found that despite the important role that farmers play in
water management in some parts of the world, according to our data, participation in
decision making is not part of either collective management or contracting. Traditionally,
government services in China are conducted from the top down, with little consultation or
participation of local villagers.
Zafar (2004) reported that Pakistan has a total of about 140,000 watercourses.
Roughly one third of those have been lined over the years. The main work has been done
in the Punjab under the OFWM wing of the Provincial Department of Agriculture. But
the lining was carried out mostly under foreign aided projects. The indigenous nature of
the present initiative was a positive and heartening development. Using local resources
and involving beneficiaries were essential for long-term impact of any project,
particularly in the farming sector. A major aspect of the project was attention to tail end
farmers who were left high and dry by feudal element and politically resourceful
landowners. This should be welcomed by small farmers, poor and tail-enders that form
about two- thirds of the farming community and are the real contributors to Pakistan's
agriculture.
Gibson et al. (2005) indicated that the active participation of communities in
decision making might increase their own sense of ownership over the system. The
absence of a sense of ownership has been identified as one of the main reasons that
donor-funded infrastructure projects fail.
Garces-Restrepo et al. (2007) explained that more than 57 countries have begun
to reform their irrigation sectors and launched irrigation management transfer (IMT) or
participatory irrigation management (PIM) programs. IMT and PIM are two conceptually
different, but interrelated, programs. IMT specifically refers to the transfer of irrigation
management responsibilities from government bureaus to farmer-run organizations, while
55
PIM refers to the increasing involvement of farmers in irrigation management. In most
countries, core components of reform include establishing either WUAs or irrigation
associations and transferring irrigation management to those entities.
Hussain (2007) concluded that the overall conclusion of the study is that
improvement in watercourses lining/upgrading helps in saving water, resulting in higher
cropping intensity, higher crop productivity and improved crop incomes (for example per
hectare net crop incomes in improved areas of rice-wheat perennial and rice-wheat non-
perennial, systems are 18 and 15% higher, respectively, compared to those in unimproved
areas). He also suggested constructing new watercourses on the small dams and
improving the existing watercourses, thus formation of the WUAs seems imperative to
manage and improve these channels. The construction and improvement of watercourses
will create employment in the rural areas leading to reduction in poverty and increase in
production upgrade the living standard.
Ojeda-Bustamante et al. (2007) investigated that in the last two decades, Mexican
irrigated agriculture has faced large changes as a result of recurrent droughts and the
transfer of irrigation management from the federal government to WUA. The associations
faced a great challenge in the efficient operation of water distribution networks and use of
water. Under water scarcity conditions, new irrigation management strategies must be
implemented to estimate irrigation requirements at field scale and integrate them into
several operating levels of the irrigation network. A computer tool, Spriter, was
developed and transferred to several WUA of Mexican irrigation districts. The system
allows the dynamic generation of digital map reports, as mapping of physical features of
fields is linked to the main database. Software applications were presented to illustrate
the advantages of using spatial information technologies to improve water management
in large irrigation districts.
Shioda (2007) analyzed the successful factors and developed theory/concept for
the activation of WUOs in the Modernization of Water Management System (MWMS)
project in Thailand. The main successful factors are as follows; 1) improvement of
irrigation facilities with the farmers’ participation, 2) providing an opportunity for
discussions with the farmers to enable the adjustment of water allocation through the

56
establishment of Integrated Water Users’ Group (IWUG) in the early stages of the
project, 3) holding monthly meetings of the IWUG, and 4) developing, operating and
monitoring the water allocation plan in cooperation with both farmers and government
officials. Moreover, the MWMS project contributed to create a system that farmers can
acquire and use irrigation water with reliability.
Gorton et al. (2009) investigated the performance of Water Communities (WCs),
a form of self-managing organization for irrigation, in the Bregalnica region of the
Republic of Macedonia. While their introduction improved cost recovery, only modest
changes occurred in the cost of irrigation water and many farmers remained indifferent to
the WCs. Econometric analysis focused on the decision of farmers to join a WC,
determinants of farmers’ satisfaction with WCs, and factors associated with changes in
payment behavior. Key determinants identified included transparency and trust regarding
the conduct of WCs, cost recovery rates, farm size, and irrigation costs. Membership
satisfaction was an important determinant of payment behavior.
Huang et al. (2010) examined the development of irrigation management in
northern china using data from village and household panels. During the past decade,
reform oriented institutions, such as WUAs and contracting, have largely replaced the
traditional institution of collective management in village level irrigation systems. A
feature unique to China is that WUAs and contractors are provided with monetary
incentives to save water. WUAs have not yet achieved the broad-based participation of
farmers that some advocates consider as a primary goal for farming associations. Many
village leaders serve also as the leaders of WUA, thus possibly reducing opportunities for
receiving operational input and policy direction from farmers. However, they observed
improved performance of irrigation systems managed by WUAs, relative to collective
management, in terms of maintenance expenditures, the timelines of water deliveries, and
the rates of fee collection. Performance has improved also in systems managed by
contractors, although not as substantially as in the case of WUAs.
Uysal and Atis (2010) reported that in many countries today, irrigation systems
have been transferred to the WUAs. Accordingly, it is believed that the performance of
the irrigation systems is dependent on the performance of the WUAs. In this study, the
57
performance of participatory irrigation management (PIM) over time was assessed with
regard to the Kestel WUA serving a wide area of Turkey's Aegean coast. Data relating to
the WUA was obtained from both the State Hydraulic Works and WUAs’ own records.
In addition, two surveys were carried out with the members of the WUA with an 8-year
interval between them. Data had been analyzed within the framework of selected
irrigation performance criteria and indicators. The non-parametric Mann–Whitney U test
was used to compare the perceptions of the farmers on the WUA at different survey
periods. A Logit model was estimated to evaluate the relationship between the irrigation
problems and the level of satisfaction from the WUA. The performance of the WUA with
the indicators of utility, productivity, sustainability and financial efficiency was found to
be positive; while the performance of adequacy was identified as poor. The farmers were
generally satisfied of the WUAs’ operation, with their level of satisfaction improving
over time. On the other hand, the farmers were not fully convinced that they had input
with the system management. The initial design of the channel system and its
maintenance were identified to be the key factors affecting users’ satisfaction. Overall,
the Kestel WUA may be considered a successful example, thus supporting a promising
future for PIM. Yet improved control and farmer education is needed for a superior
performance of all indicators; and further enhanced farmer participation in management
should be achieved in order to raise the level of farmer satisfaction.
Lecina et al. (2011) conducted a study with a major purpose to contribute to the
development of a combined approach to evaluate irrigated areas based on irrigation
performance analysis intended to assess the productive impacts of irrigation practices and
infrastructures, and water accounting focused on the hydrological impacts of water use.
The results provide insights to support the decision-making processes of farmers, WUAs,
river basin authorities and policy makers. Water accounting overcomes the limitations
and hydrological misunderstandings of traditional analysis based on irrigation efficiency
to assess irrigated areas in the context of water scarcity and competitive agricultural
markets.
Veettil et al. (2011) investigated that to ensure efficient water allocation and use,
policy designers have adopted various strategies, including price setting, decentralizing
irrigation water management or improving water rights. Most of these strategies have

58
been applied individually, without considering the complementary relationships between
them. This paper uses a discrete choice model to analyses the scope for combinations of
tools for irrigation water demand management and farmers’ acceptance of these. In terms
of local irrigation water governance, the presence or absence of collective irrigation water
management, in the form of a WUA, is considered. Water rights are specified in terms of
the duration and quality of the entitlement and its transferability. Finally, four types of
water pricing methods (area, crop, block and volumetric pricing) are considered. Using a
choice experiment, we elicit the most preferred water pricing method, under different
water rights situations, at different price levels and under various contexts for local
irrigation water governance. Our results indicated that under conditions of improved
water rights, preference for volumetric pricing increases, whilst the presence of a WUA
reduces this preference. Furthermore, it was found that using an appropriate combination
of water demand management tools considerably increases the willingness to pay for a
change in scenario.
Marks and Davis (2012) stated that despite broad acceptance of the idea that
“sense of ownership” among users is critical to infrastructure sustainability in developing
countries, little is known about what sense of ownership is, or its drivers. They presented
a novel measure of sense of ownership for piped water systems using empirical data
collected from 1140 households in 50 rural Kenyan villages. The study established an
empirical reference for households’ sense of ownership. They found that some, but not
all, types of participation enhance community members’ sense of ownership for rural
water projects.
2.3.2 Impact of Watercourse Improvement on Farm Production
Akram and Kemper (1980) conducted a research study on the impact of
watercourses improvement. They concluded that with the watercourses improvement,
total area under crops increased, and time taken to irrigate the field decreased and
availability of water per acre for irrigation was also enhanced.
Awan et al. (1980) concluded that agricultural production can be enhanced by
watercourses improvement. Due to watercourses improvement, about 37% increase in
59
cropped area, 30% increase in cropping intensity and 25% increase in crop yield were
possible.
Khan and Sadiq (1981) argued that the land utilization, cropping intensities,
yields of major crops and the application of chemical fertilizers increased due to
watercourses improvement. Moreover, time to irrigate one acre was also saved by 21
minutes.
Govt. of Punjab (1982) in a study “Impact of watercourses improvement on farm
production” reported that saving of time to irrigate an acre after improvement was
28.36%. The report also indicated that increase in cropping intensity due to watercourses
improvement was 19.95%. The report further indicated that with the improvement of
their watercourses, the farmers have shifted to the crops with high delta of water like rice,
sugarcane etc. This clearly indicates a significant change in cropping pattern due to the
additional water on account of watercourses improvement.
Arshad and Rafique (1984) described that the improvement in the watercourses
had brought significant increase in irrigation water both by increasing the outlet discharge
as well as by reducing conveyance loss rate.
Munawar (1985) explained that the watercourses improvement was a recent
innovation in Pakistan. The government of the Punjab has embarked on the On Farm
Water Management in selected districts of the Punjab to increase water use efficiency and
agricultural production.
Iqbal and Khan (1991) described that about 70% of the population of Pakistan
that live in rural areas and depends on agriculture, improved their living standards when
their agricultural production increased. It raised by increasing the irrigation water,
through watercourses improvement. So, frequent and regular maintenance was essential if
the farmers have to reap the benefits of watercourses improvement.
Ali (1993) studied various aspects of optimal watercourses improvement in
Pakistan. The results indicated that about 53% water losses were reduced. While cropping
intensity was increased by about 20%, however per acre yield of major crops like cotton,
rice, sugarcane and wheat increased up to 66, 61, 42 and 15%, respectively.
Khin (1994) reported that according to a study in Myanmar the high priority has
been given to the new irrigation, realizing that without irrigation, agriculture

60
development is not possible, irrigation department is fully aware of the fact that
expanding the irrigation area alone cannot maintain the sustainable agriculture. Proper
maintenance of the system is also essential in order to increase the irrigation efficiency of
the system.
Bajpai (1997) viewed that the infrastructure regarding irrigation system played an
important role in increasing productivity. The productivity was higher in Allahabad
district because of improved watercourses as compared to Utter Pardesh district where
irrigation system was not properly managed.
Nazir (1997) studied that before the improvement of watercourses, the average
cropping intensity in respect of all the crops grown by the farmers was 116.38%, which
increased up to 139.78% after the improvement of watercourses.
Hammad-ur-Rehman (2000) explained that the watercourses improvement was
very important for agricultural development. Due to watercourses improvement, there
were low water losses, increase in irrigation water efficiency and increase in cropping
intensity.
Zhang and Zhang (2001) reported that with China’s rapid growth, the increasing
demand for limited water resources from rapidly growing industry and cities adds to the
existing pressure on the irrigation water supply through the repair and maintenance of the
system in the agricultural sector, especially in north China.
Govt. of Pak. (2002) reported that the agriculture is basically irrigated with 82%
of cultivated area equipped with irrigation infrastructures. It is necessary to maintain
these irrigation infrastructures. During the last four decades, the area with irrigation
facilities increased from 8.21 to 18.0 MAF growing at an average annual rate of 1.7%.
INPIM (2004) reported that the assessment of different OFWM projects has been
carried out by various agencies. The findings of these agencies indicate significant
benefits occurring from the renovation of watercourses, annual saving per watercourses is
243 acre-feet, increase in water delivery efficiency 38.5%, water saving to irrigate an acre
28.4%, increase in cropped area 13.4%, increase in cropping intensity 14.8%, and
increase in crop yields 17%, salinity control 4.9% and reduction in cultivable waste area
17%.

61
Yasmeen et al. (2004) found that unimproved watercourses affect the water
supply and yields of crops. The improved watercourse also urges changes for adopting
new agricultural technology by the farmers leading to higher level of productivity.
Rasheed (2005) studied that the lining of watercourses saved 33 to 40% water
which is true in case of sandy and gravel areas of Baluchistan and NWFP but not in case
of Sindh and Southern Punjab below Panjnad where soils are comparatively heavy.
Anonymous (2007) reported that the Baluchistan province had been facing water
shortage for the agricultural purpose creating problems for farmers and affecting
agricultural produce. Under the NPIW project, construction of 6366 water storage tanks
and lining of 7100 watercourses is underway with cost of Rs.60 million of which 1430
watercourses including 697 water storage tanks have been completed. The project
estimates to save 8 MAF water, will reduce water logging and salinity, increase cropping
intensity by 15 to 20%, crop productivity by 10-15% and equity in water distribution.
Hassan (2007) reported that under NPIW project, 18000 watercourses have to be
improved in the Punjab at a cost of Rs.10 billion, out of which 5200 watercourses have
been improved. The aims of the program are to conserve the existing water resources,
improving delivery systems, thus enhancing the productivity and bringing more area
under cultivation.
2.3.3 Reduction of Water Losses through Watercourses Improvement
Clyma and Corey (1974) reported that in Pakistan, losses along the watercourses
from outlet to the field are high. These losses (seepage, wastage and evapotranspiration
by non-beneficial plants) frequently range from 30 to more than 50% of the flow at the
outlet. Seepage is considered here to be that water which is infiltrated from the channel
cross section down into the social profile and eventually to the water table. Wastage is the
loss occurring to the ground surface either by overtopping, slow seepage, through the
side, breakage of the bund at nakkas or weak areas and operational losses.
Chert et al. (1975) stated that it is obvious that one percent of water saved at all
watercourses outlets would equal to a “saving “of about one million acre feet of water
across the country. Each acre inch of water saved has an approximate economic value to
the farmer of about Rs. 30/-.
62
Clyma and Afzal (1975) argued that in Pakistan, delivery efficiencies of
watercourses ranged from 35 to 95% with an average of nearly 60%, delivery efficiency
of more than 80% were pertinent to only a few well cleaned and better maintained
watercourses.
Hassan (1975) studied that the water losses in the watercourses located at Shahdra
(Lahore) and Lar (Multan) were estimated. The inflow-outflow method was used to
estimate the conveyance efficiency and cutthroat flumes were used as measuring devices.
It was observed that watercourses delivery losses ranged from 30 to 60%.
Thomas (1977) conducted a research trial on one watercourses located at Fathepur
Distributary in district Sargodha. This research was undertaken by measuring the
discharge available at the head of the watercourses and the amount or quantity of water
delivered to each farm gate during the entire turn period (warabandi) of the outlet. The
water conveyance efficiency was worked out by summing up the volume of water
delivered at each farm outlet (Nakka) against that available at inlet. On the basis of these
operational inflow and outflow measurements, the water losses to the extent of 52% were
reported from the watercourses.
Ahmad and Bowers (1978) described that the extensive cleaning and maintenance
work on several watercourses branches led to significant reduction (20-35%) in water
losses.
Nazim (1982) reported that according to a study made on two watercourses
improved under cooperative law, major sources of water losses were rodent and pest
activity, and vegetation. On the two watercourses improved under WUA ordinance, 1981,
major source of water loss was livestock, while on the other two unimproved
watercourses, major sources of water losses were rodent and pest activity.
Sahu (1982) argued that the polythene film lining reduces the seepage losses; it
was economical to provide in the smaller distributary and minors having less discharges
with very high efficiency. As compared with concrete lining, the cost of construction will
be about 25% only.
WAPDA (1985) in a study found that the farmers had reported reduction in water
losses, over 50% increase in cropped area, whereas about three-fourths of them indicated
63
increase in the yields of crops. They had also reported a rise of over 4% in annual
cropping intensity due to the improvement of their watercourses.
Anonymous (1996) reported that the watercourses upgrading reduced losses on an
average from 40% of flows at the mogha (outlet) and 25-30% at watercourses head.
Ashraf (1997) observed that after the improvement of watercourses, water losses
reduced by 40% and cropping intensity increased by 12%. However, the gross benefits
increased by 58%.
Khan (1997) stated that agricultural production in Pakistan can only be increased
if irrigation water is saved from wastage and managed in a proper way. He further stated
that 50% of irrigation water is wasted in water channels due to poor management of
water distribution, the farmers have to collectively decide about water management i.e.
cleaning and maintenance of the common watercourses.
Mukhtar (2000) concluded that more water can be stored for crops irrigation by
constructing dams, reservoirs, barrages and link canal and also water losses can be
controlled by watercourses improvement which can be made by construction of bricked
watercourses at farm level.
Munir (2003) reported that in Pakistan, the seven years inflow data of River Indus
reveal that water productivity is far below due to inadequate and untimely availability of
water causing stress at critical stages of the crop growth, water conveyance losses, field
losses due to unimproved watercourses and improper irrigation scheduling, low and
erratic rainfall, poor quality ground water, institutional and social problems. The change
in irrigation systems, water channels, farm layouts, methods of irrigation and using high
efficiency irrigation systems are required for increasing the agricultural produce.
Mustafa (2002) noted that in many parts of the world, the landowners and
government officials pointed out heavy losses of water from water reservoirs, rivers,
canals, watercourses and fields. So it was necessary to improve the irrigation system and
reduce the losses of water especially from watercourses and fields.
United Nation Report (2002) reported that a huge amount of water has been
wasted due to inadequate management and inefficient operation of irrigation system, poor
water application, unequal water distribution, depletion of ground water resources,
reduction in storage capacities of existing systems and wastage of summer river surpluses
64
and slow agricultural growth. It was stated that 25 to 30% of water is being lost in the
conveyance system of different countries of the world. A considerable amount of water is
lost during its conveyance due to seepage in lengthy canals; lining of the system channels
could reduce these losses.
Munir (2003) indicated that the lack of irrigation water is the main cause of the
low productivity, out of many reasons, seepage and percolation from the canals and
watercourses are the major ones. There should be improvement in irrigation facilities and
infrastructure. The corruption in the irrigation department should be checked and the
activities regarding on-farm water management should be improved, which would
increase water use efficiency and crop productivity.
Govt. of Pak. (2004) reported that the lining of watercourses reduced 33% of
water conveyance losses and increased delivery efficiency to the tune of 38.5%. While
the cropping intensity has been increased 20% and overall increase in crop yield has been
estimated around 24%.
PIDA (2004) reported that the watercourses are the backbone of the irrigation
system. About 35% of the water is lost from canal heads to outlets due to seepage,
percolation and evaporation. Similarly, 24% of the delivered water is lost in the
watercourses and 25% is lost during the field applications due to unleveled fields and
over irrigation. This huge loss of irrigation water can be reduced only by adopting
appropriate off-farm and on-farm water management practices that ensure the efficient
and economical use of irrigation water.
Anonymous (2005) reported that according to the estimates by the Agriculture
Department, the canal improvement has helped to expand the cropped area by 4.5%, raise
cropping intensity by 5.8% and increase in yield by 14.8%. Evaluation by the Agriculture
Department also showed that the OFWM project had led to 25% reduction in conveyance
losses from the canals and a decline in salinity by 4.9%.
Hassan (2006) stated that the irrigation efficiency of canal system is poor due to
considerable loss of water in the form of seepage, percolation, and evaporation. About
35% water is lost through canals, 24% though larger and smaller distributaries and 25%

65
during field application. It is suggested that lining of canals and watercourses will
protect seepage and percolation losses.
Maqbool and Abdullah (2006) concluded that among the total water supply, 40%
is lost in the canals and watercourses before reaching the farm gate. Total availability of
irrigation water at the farm gate is estimated at 134.77 MAF, out of which 62.5% is
supplied by canals and 30% by private tube-wells, while the remaining 7.5% was shared
by public tube-wells. It is suggested that water is becoming a critical resource. Therefore,
more focus should be given on conservation techniques. The government should play a
leading role to create awareness among farmers by disseminating conservation techniques
such as lining of canals and watercourses, laser land leveling, zero tillage, drought
resistant varieties etc.
2.3.4 Water Users’ Satisfaction about the Watercourse Improvement
Izhar (1993) found that as far as farmers’ satisfaction was concerned, about 83%
farmers were satisfied with watercourses improvement and irrigate one acre of land in 40
to 50 minutes. There was also a significant difference between the production of wheat,
rice and sugarcane of improved watercourses areas.
Tufail (2000) observed that about 72% farmers at the improved watercourses
were found to be satisfied with the availability of water whereas they were not satisfied
with the unimproved watercourses. After the improvement of watercourses one acre was
irrigated in 45-60 minutes, while before improvement, it took 76-90 minutes.
Muhammad et al. (2008) reported that in district Faisalabad about 79% of the
respondents were satisfied with the flow of improved watercourses and it is also reported
that farmers could irrigate one acre in 45-60 minutes after improvement of watercourses,
whereas before improvement it took 76-90 minutes. In the study it was further mentioned
that 72% of the respondents were satisfied with watercourses improvement while 24.2%
were with the unimproved watercourses.
66
2.4 DISPUTES BETWEEN WATER USERS AND THE ROLE PLAYED
BY WUAs IN RESOLVING THE DISPUTES
Kausar and Afzal (1960) explained that there were many problems in organizing
the WUAs. The past experience of cooperatives in the rural areas was not encouraging
and the rural masses could not be easily motivated to become the members of the same
type of organizations. They only cooperated with each other when they anticipated the
immediate and real benefits of the organization. When they were asked to contribute
funds as share and admission fee, they hesitated and thought it an undue burden without
any reward. There were doubts and misunderstanding about the functionaries of various
nation building departments in minds of the rural people and when they were asked to
undertake development activities, they quoted the previous experiences and did not
readily agree to share any joint venture. This created difficulties in organizing the rural
people. The social realities of village life, i.e. social feelings, vested interests of local
leaders and political confrontation made it much more difficult to organize successful
cooperative. For experimentation in the area of joint action, homogeneity of the
participating community with regard to their needs, structural composition and social
phenomenon were very crucial. But it was impossible to find such ideal situation on a
watercourse. There were some problems from the big land owners and the farmers on the
head of the watercourses during the improvement work.
Kirkwood and Radsevich (1975) reported that Pakistan lacked formal
organizations at village level for watercourses cleaning, maintenance and effective
utilization of water on farm. The major factor constraining the formation of the
organization was too absence of legal sanctions. The laws and regulations for water use
as well as the design and operation of water delivery system did not encourage
cooperative efforts among water users at farm level. The formation of WUAs would
provide the institutional framework for improving irrigation efficiency and increasing
agricultural production by getting farmers directly involved in the local decision making,
managing water delivered to the watercourses, solving some of the problems of small
farmers and resolving disputes among users serving as a vehicle and assistance on
improved water use, agricultural practices and technologies constituting a legal contact

67
point between government and water users and offering opportunities for increasing labor
intensive agriculture.
Coward (1979) noted that in irrigation system a cluster of institutions associated
with the function of water allocation is found in the role of ditch tender and another
cluster is found in the role of water user. The presence of these two roles allows for the
emergence of social organization in an irrigation system in the form of patterned
relationships between and among the ditch tenders and water users, while many tasks
must be organized to sustain the operation of an irrigation system, three are of
fundamental importance; 1) the organization of water allocation, 2) the organization of
physical maintenance activities, and 3) the organization of conflict management.
Mirza (1989) found that in the Punjab, inability of irrigation system to deliver
available water pointed to a need for changes in the organization of farmers. The study
explores the role of customs associated with kinship and caste as to greater cooperation
by farmers in solving the problem of formation of WUAs.
Yousaf (1998) observed that the farmers having land at the tail of the
watercourses got more representation on the managing committee. The major cause of
difference among the sharers during watercourses improvement was removing of
vegetation, trees etc. followed by installation of nakkas. It is satisfying to note that
majority of differences were settled mutually.
Vedeld (2000) observed that the operational rules that directly affect the
performance of community based drinking water organizations are highly influenced by
the decisions of the local water committees. The effect of leadership, networks, gender
composition and accumulated expertise of the members of these committees can be
crucial to better understand how these decisions are made and their impact on
performance. It is documented that prior organizational experience and local leadership
can overcome the collective action problems for effective solutions in particular settings.
Bustos (2001) stated that the participation of farmers in the users’ association
decreases sharply with the increase in farm size. Some of the contacts between farmers
and the users’ association are related to farmer knowledge of on-farm irrigation
technology. Strangely, no formal training or on-farm irrigation is available in the region.
The users’ association should join forces in providing extension to the farmers. This

68
could reduce the number of reported conflicts between the users’ association and, in
particular, the small farmers.
Isham and Kahkonen (2002) described that as opposed to supply-driven
approaches, in which communities are passive observers of decisions taken by others, it
is well documented that key factor that positively affects the sustainability of community
based drinking water organizations is community participation in their design,
administration and finance. They found that in some cases, the relationship of the water
committee with other organizations might help it access funds and share knowledge. The
empirical evidence indicated that the existence of other, non-water-related networks and
associations in a community help resolve collective action problems.
JBIC (2004) reported that the WUAs’ Centre was established in 1968. The
common observation was, “the farmers cannot manage water efficiently or effectively
since the on-farm irrigation ditches are missing”. As a result, efforts were made to
provide tertiary irrigation canals and to encourage farmers to participate in irrigation and
water management with a view to secure the sustainability. However, only few irrigation
systems had the desired results of upgraded sustainability even when irrigation ditches
were physically completed.
Soklie and Koppen (2004) elaborated that when considering water management,
formal institutions tend to overshadow the local informal ones although the latter guide
day-to-day interactions on water use. Conversely, Integrated Water Resources
Management has demonstrated a bias toward the formal state-based institutions for water
management. A study was carried out to examine how local water rights and local
informal institutional arrangements influence water management in the Great Ruaha
River catchment in the Rufiji basin in Tanzania. Participatory appraisals were carried out,
supplemented by focus group discussions, interviews, and a stakeholders’ workshop. It
was found that local water rights, local water rotations and local water user groups are
widely in use and are more influential than the formal water rights, water fees and
WUAs. Water allocation at the driest period depends on local informal relations among
irrigators. More than 70% of water users surveyed choose to settle disputes over water
via informal channels and the latter are more effective in resolving water conflicts and
69
reconciling the antagonists compared to the formal routes. It was also found that although
much emphasis and many resources have been expended in transforming local water
rights and water related organizations to formal registered ones, the former have
remained popular and water users feel more affiliated to local arrangements. They
concluded that local informal water management can offer the best lessons for the formal
management arrangements and should not be simply overlooked. Finally, they
recommend that the formal and informal institutions should be amalgamated to bring
forth a real integrated water resource management framework.
Pezon (2007) studied decisions related to conflicts involving the users of drinking
water services since the mid-19th century in France. After some discussion on how this
historical material might be used, it focuses on two critical periods, and presents evidence
of the contribution of the users’ cases in changing the way water services were developed
in the early 20th century and regulated in the late 1980s. In conclusion, author emphasized
the effectiveness of litigation in limiting local arrangements that are clearly contrary to
users’ interests, but also notes the limitations of the decisions by comparison with
participatory process.
Xie (2007) concluded that the village leadership that was traditionally responsible
for the management and maintenance of tertiary canals and on-farm structures became
dysfunctional. Deteriorating irrigation systems, unreliable water delivery, and poor cost
recovery were common. Author further concluded that in an environment of increasing
water scarcity, problems created by deteriorating irrigation systems have negatively
affected agricultural production and exacerbated conflicts among farmers. In China,
irrigation districts and local water resource bureaus often manage the upper levels of
irrigation systems (the main canals and branch canals) that transfer water out of major
rivers (e.g. the Yellow River) or reservoirs and channel it to lower levels. Local irrigation
systems (tertiary canals and below) are administered by county, township governments
and village committees.
Mehari et al. (2009) reported that the water rights system is expected to facilitate
water allocation. The water fees system aims at cost-recovery for water resources
management services. To enhance community involvement in water management, WUAs
70
are being established and, in areas with growing upstream–downstream conflicts, apex
bodies of all users along the stressed river stretch. The Mkoji sub-catchment (MSC) in
the Rufiji basin is one of the first where these formal water management systems are
being attempted. The study analyzes the effectiveness of these systems in the light of
their expected merits and the consequences of the juxtaposition of contemporary laws
with traditional approaches. The study employed mainly qualitative, but also quantitative
approaches on social and technical variables. Major findings were: 1) a good mix of
formal (water fees and WUAs) and traditional (rotation-based water sharing, the Zamu)
systems improved village-level water management services and reduced intra-scheme
conflicts; 2) the water rights system has not brought abstractions into line with allocations
and 3) so far, the MSC apex body failed to mitigate inter-scheme conflicts. A more
sophisticated design of allocation infrastructure and institutions is recommended.
Pavan et al. (2011) observed that geographical information systems (GISs) are
particularly relevant to WUAs management, due to the important amount of dereference
data that are processed. A GIS integrates hardware, software, and data for capturing,
managing, analyzing the farmers’ complaints and displaying all forms of geographically
referenced information.
Soto-Garcia et al. (2013) explained the role of Information and Communication
Technologies (ICTs) in the management of modernized WUAs. The Campo de Cartagena
WUA, a pioneering institution that has been applying ICTs to irrigation district
management in south-eastern Spain since 1999, was selected as the case study. They
analyzed the effects of ICTs (including the Decision Support System, Geographical
Information System, Supervisory Control and Data Acquisition System, Web and Mobile
Applications) on both the performance of WUA management tasks and the farmers’
adaptation to the new services. The main improvements in WUA management
performance were a more efficient and equitable allocation of water resources, the
establishment of water traceability, and the improvement in management transparency,
avoiding conflicts and vandalism.
71
2.5 PROBLEMS AND OBSTACLES IN THE EFFECTIVE
FUNCTIONING OF WUAs
Haq (1965) stated that the lessening of funds had reduced the efficacy of
irrigation system. Govt. is spending heavily on operation and maintenance of irrigation
system every year for saving it from deterioration but still shortage of funds is the major
problem.
Ishaque (1966) described that the conservation program about irrigational
techniques can be made successful only by developing most congenial and receptive
atmosphere in the villages to earn goodwill and whole hearted cooperation of the
villagers.
Haq (1968) pointed out that the lack of cooperation on the part of the local people,
inter community rivalries and poor socio-economic conditions were the main causes for
the failure of the irrigation program.
Lauderhill et al. (1976) stated that the fact, however, is that Pakistani farmers are
not adequately organized to obtain and apply irrigation water to meet the demands of
modernizing agriculture. The watercourses delivery efficiencies are low overall.
Approximately 50% of the water entering at the “head” is lost before reaching farmers’
fields.
Jahangir and Ali (1980) pointed out that one of the reasons for the lack of
knowledge about the time allocated is that some large farmers have their own
watercourses to irrigate their fields. Those watercourses are allocated to one farm
continuously. The tenants of the same landlord get water from the same watercourses
without any proportion and time and they were unable to give estimates about the time
allocation for their turn of water.
Kemper (1980) reported that about 45% of all the water in Pakistan’s man made
irrigation system was lost before reaching the arable land. He investigated the reasons for
water loss and ensuing development of an alternative water management program. The
primary causes of water loss included difficulty in organizing farmers to perform regular
maintenance. Cooperative improvements of earthen channels by farmers (using
government material and design) had favorable benefits/cost ratio (3:1). These were
eagerly accepted by the farmers. An education program was needed to demonstrate
72
clearly the cause and effects between maintenance and reduced losses. Laws need to be
passed to enable local leaders to organize farmers and penalize those on violating rules.
Brewer (1984) argued that in a large irrigation scheme where water was
controlled and operated both by a government agency and by farmers, it was important
that links were forged between the two. So, an environment of mutual respect was posted
and was conducive to the efficient working of the irrigation systems.
Kauser et al. (1991) stated that the officials’ response to the organization of WUA
under the WUA ordinance 1981 concluded that the requirements of the ordinance were
not being followed and due to built in weakness of the law they had no legal powers. The
work of the WUA could be carried out efficiently only if the law obligated the farmers to
accept their orders.
Ahmed and Kutcher (1992) described that the institutional obsolescence in the
management of the irrigation system contributes to the environmental degradation. Public
spending on the irrigation system has been decreased and thus under-investment has
contributed to the reduction of the efficiency of the system with regular breaches and
limited water supplies reaches to the tail end of the distributaries.
Hassan et al. (1993) explained that the degree of acceptance of new irrigation
techniques through extension depends directly on the educational standard and literacy
levels of the farming community. Unfortunately, most of the traditional irrigation systems
are located in areas where literacy levels were low. It was essential that good information
should be developed and disseminated in a simplified manner so that it is understandable
to the trainers and end users.
Healy (1994) stated that the use of participatory methodologies in irrigation
reflected the absence of documentation specifically dedicated to PRA. Whatever the
reasons to foster the problem of food security may be, new methodologies have been
used to avoid the bases of conventional assessment procedures as it is realized that
incorporation of water users’ views is essential as they will benefit from the findings of
high quality research.
Ahmed and Faruqee (1995) reported that the problems of water resources, being
faced by Pakistan, could be solved by fundamental changes in water pricing, and
institutional structures are necessary to improve the efficiency of the system. The
73
devolution of the water management to the farmers’ organizations is also required to
increase the water availability efficiency of the watercourses.
Alam (2002) stated that Pakistan is an agricultural country and canal irrigation is
its life blood. But due to inefficient water management practices and brackish
groundwater, a good deal of agricultural land has gone out of production due to water
logging and salinity. All the major crops such as cotton, rice, sugarcane, wheat etc., were
badly affected by ground water which is mostly unfit or partially fit for irrigation.
Johnson et al. (2002) observed that the problem of structural reform of irrigation
management systems in many countries, including Brazil, Mexico, Colombia, Nepal,
Philippines, Spain and China, they found that irrigation reform depended on two main
factors: farmers’ active participation and reform of irrigation institution (which can
interact with each other). They concluded that the problem of irrigation management
could not be solved with the simple establishment of a WUA without making necessary
reforms in the irrigation institution itself.
Munir (2002) indicated that the future demands of water for various sectors like
agriculture, domestic and industrial suppliers, navigation, salinity control, and fisheries
would reach a critical stage, the gap between the demand and supply could not be closed
even with full development of ground and surface water. By 2005, due to two reasons
predictions of future water use were difficult. Firstly, economic and social forces heavily
influenced the demand for water which themselves were virtually impossible to forecast
for more than a few years; secondly, changing climate would influence both the
availability of the resource itself and the demands for it. It was reported that acute
shortage of water will be faced in the coming days due to depletion of water resources
and growing demands. As finding new sources of water may not be possible in the
current circumstances, it is important that the available water resources should be
managed properly and used most efficiently and sensibly for maximum crop production
per unit of applied water.
United Nations Report (2002) reported that the water available for irrigation has
decreased because of decreased water resources i.e. rainfall and snowfall, low storage
capacity, excessive pumping and inefficient re-utilization of the available water by the

74
farmers. It was stated that water need is increasing at the rate of 3%, whereas the supply
of water is decreasing at 1% yearly. So, it is need of the time to reduce water losses from
different sources.
Kijne et al. (2003) observed that the pressure placed on freshwater resources in
water-deficient regions increases, so there is the need to conserve and use conventional
water resources more efficiently, because future increases in agricultural production will
have to rely heavily on existing water resources.
Manzoor (2003) indicated that the growing shortage of both surface and ground
water in the country has been causing the danger of desertification. The new sources of
water may not be possible in the current circumstances, it is important that the available
water resources should be managed properly and used most efficiently and sensibly for
maximum crop production per unit of applied water.
PCRWR (2003) reported that the average delivery efficiency was 35 to 40% from
the canal head to root zone. Most of the water losses were observed in the watercourses
and fields due to an inefficient use and lack of irrigation water management practices.
This high magnitude of surface water loss not only results in shortage of water for crops
but also contributes to water logging/salinity in the root zone.
Yercan (2003) identified the problems of irrigation management involved in
implementing participatory irrigation management schemes in Turkey. He found that
farmers generally preferred the management of irrigation schemes be turned over from
state to farmer control. However, he identified a number of issues regarding
institutionalization and legalization in the establishment of WUAs. In particular, adequate
capital often was lacking.
Mu et al. (2004) stated that WUAs in China faced issues such as the lack of
property rights, shortage of capital funds, weak economic status of agriculture, and often
inappropriate government intervention in agriculture and water use.
Tanaka and Sato (2005) examined the irrigation management within Japanese
WUAs, named Land Improvement Districts (LID), which are regarded as a successful
case of Participatory Irrigation Management (PIM). The authors conducted field and
questionnaire surveys in sample LIDs focusing on the social function of LID and village

75
communities. Among many factors, the authors paid special attention on how fairness
contributes to the sustainability of WUAs. The results of the surveys proved that farmers
operate the irrigation facilities in a self-serving way and have their own rule of fairness,
such as upstream superiority, based on the long-term traditional experiences of irrigation
systems management. The result of questionnaire survey proved that farmers do place
high priority in fairness in various ways. The application of fairness to irrigation
management is quite new and it is worthwhile to try this approach in other country's case
studies.
Johnson and Stoutjesdijk (2008) observed that individual farmers attempted to
rectify problems associated with water delivery but due to a lack of technical and
financial resources these efforts failed. In some cases water users created hydro-services
by recruiting former irrigation brigade staff, while other water users formed informal
farmers’ organizations to address problems farmers faced in managing their on-farm
irrigation needs. These organizations were formed without any technical assistance and
had no legal basis to function as participatory farmer organizations.

76
2.6 SYNTHESIS OF THE REVIEW
The review shows that Pakistan is facing a serious problem of poor management
and unequal allocation of water among the provinces, which has led to conflicts among
them (Qaiser, 2002). The improved methods of irrigation can help to judiciously utilize
the water resources which is need of the day. An efficient management of irrigation water
is needed to achieve high water use efficiency at farm level (Govt. of Pakistan, 2005).
The review further shows that Pakistan is blessed with one of the largest
contiguous irrigation infrastructures. However, it was designed for water requirements of
the 20th century and not for the 21st century. The system maintenance also requires a lot
more attention due to deferred maintenance over the last 100 years. Challenges of the 21st
century require the frontiers of knowledge and innovative approaches rather than historic
practices. The institutions need redefining of their roles and to develop their capacities
according to new responsibilities (Govt. of Pakistan, 2010).
The review also shows that water is vital input and a basic pre-requisite for the
agricultural development. The equitable distribution of water could not be accomplished
without an improved distribution (watercourse) system from outlet to fields. The channels
are in many cases, of insufficient size to carry the design flow. There are no distribution
structures and leaks abound. The only farmers receiving a full share of water are those
whose farms are adjacent to the outlet. When watercourse improvement is coupled with
precision land leveling and the introduction of proper irrigation structure such as siphon
tubes, portable dams, permanent gates (nakkas or outlets) and measuring devices, the
distribution system becomes complete (Clyma and Corey, 1974).
The review shows that water losses can be reduced by better management of the
watercourses through the formation of WUAs. WUAs could become the most important
instrument to implement improved technologies in irrigated agriculture (Radosevich,
1978). WUAs under a legal framework could be developed/organized not only for the
successful launching of watercourse improvement program through educating the frames
but also for the cleaning and maintenance of watercourses in view of high delivery
efficiency (Saeed, 1978). The purpose of the establishment of WUAs was not only to
increase the supply of irrigation water to fields but also to improve the quality of
irrigation management practices by the farmers (Dogar, 2004).

77
The review further shows that the agricultural production can only be increased if
irrigation water is saved from wastage and managed in a proper way (Khan, 1997).
Watercourse improvement has useful benefits. In water saving and in other living
standards of farming community, it increases the water flow and ease in irrigation to the
crops. Lining of watercourses showed significant differences in water saving compared to
earthen watercourses. Watercourse improvement and better water management practices
improved the water use efficiency and have a positive impact on the crop productivity
enhancement. The construction and improvement of watercourses will create
employment in the rural areas leading to reduction in poverty, increases in crop
productivity and upgradation in the living standard (Hussain, 2007).
The review also highlights that the lining of watercourse is very common and
useful intervention in water saving. It introduces not only the water saving but also
increases the water flow at farm level, which enhances production and area under
cultivation at tail of the watercourse where water flow is very low (Mustafa, 2000).
The review indicates that the number of watercourses being improved is
increasing day by day and it requires now the attention of the authorities to maintain
these works for a longer period of time. Improvement of watercourses is not a serious
problem. The more pressing problem, therefore, is the maintenance of watercourses after
the improvement (Yousaf, 1998).
The review further reveals that the purpose of WUAs is to get the maximum
water out of their allocated supply. But the critical problem has been that of effectively
organizing farmers especially for the maintenance of watercourses after improvement.
Frequent and regular maintenance is essential if the farmers are to reap the benefits of
watercourse improvement. Thus, there is a need to design, develop and diffuse an
important institutional arrangement of the shareholders on each watercourse. It was
recommended by experts that farmers on each watercourse should be organized into
WUAs (Saqib, 1981).
The review also shows that the primary objective of WUAs is to provide efficient
and effective management of water resources to achieve enhanced agricultural
production. The establishment of WUAs has helped to address the problem of water
distribution and allocation among a large number of farmers. However, further training of

78
farmers and managers is required to build their capacity to share water and insure equity
among water users (Kazbekov et al., 2009). The establishment of WUAs provides the
most suitable mechanism for the human resource development. The development of
WUAs must be emphasized because the indigenous knowledge of the water users is the
basis for achieving an increase in the agricultural production through efficient
management of irrigation water (Herrfahrdt et al., 2006).
It is also evident from the review that the active participation of farmers in
management process is a vital pre-requisite for a successful water management program
in any irrigation project (Silva, 1981). The farmer’s participation in planning and
reconstruction of their watercourses gave them a sense of pride and ownership and was
helpful in gaining their support for continued maintenance of the watercourses.
Therefore, the importance of farmers’ participation in various agriculture activities is the
need of the day. The significance of their participation becomes more vital for the
management of irrigation projects, because the involvement makes it necessary to secure
benefits for the farmers by playing an active role (Chaudhry et al., 1977).
The review further highlight that proper maintenance of the system is essential in
order to increase the irrigation efficiency of the system (Khin, 1994). So, it is necessary
to improve the irrigation system and reduce water losses especially from watercourse and
field (Mustafa, 2002). The performance of the irrigation system is dependent on the
performance of WUAs (Uysal and Atis, 2010). The disputes related to irrigation system
among WUAs are very common. However, WUAs can play an effective role in resolving
such disputes (Johnson and Stoutjesdijk, 2008).

79
CHAPTER 3
MATERIALS AND METHODS
3.1 INTRODUCTION
The research design and methodology are the basic tools that help the researcher
in the process of planning and conducting a valuable research study, which includes
collecting, analyzing and interpreting data relating to the problem under investigation. A
methodology is an essential part of any research study as it provides a guideline to future
researchers to evaluate any study to verify the results (Matin, 1989). The research design
is the “blueprint” that enables the researcher to come up with the solution to the problems
encountered during the research (Nachmias & Nachmias, 1992). Therefore, the main
objective of this chapter is to explain various tools and techniques employed for the
collection, analysis and interpretation of the data. These are discussed at length in this
chapter.
3.2 SELECTION OF STUDY AREA
The study was conducted in Sargodha district from the mixed cropping zone
where a variety of crops are grown along with the citrus orchards. The district is
important for citrus export and is a major source of foreign exchange earnings. Sargodha
is sensitive area from irrigation point of view as water requirements of the citrus orchards
are almost double than other crops. Moreover, being native of this district, it was quit
convenient for the researcher to collect quality data. Therefore Sargodha district was
selected for the present research.
3.3 DESCRIPTION OF STUDY AREA
The district derives its name from the headquarters town of Sargodha which is a
combination of the word “Sar” and “Godha” Sar, a Hindi word means a water pond while
“Godha” was the name of the Hindu Faqir who lived near that pond. Upon the
introduction of canal system in this area the settlement around the pond grew in
importance and came to be called Sargodha after the pond and the name of the Hindu

80
Faqir, the pond was later on filled up and is now included in the area of the district
headquarters hospital Sargodha (Govt. of Pakistan, 1999).
The total area of the district is 5854 sq. km comprising five tehils viz Sargodha,
Bhalwal, Sillanwali, Shahpur, and Shaiwal. It has one metropolitan corporation, two
municipal committees, ten town committees and a cantonment contributing 24.1% of
total population of the district, there are 832 villages in the district (Ibid).
The district is bounded on the north by Jhelum district on the east by Chenab
River beyond which lies the districts of Mandi Bahauddin and Hafizabad on the south by
Jhang districts and on the west by Khushab district, separating the two districts by Jhelum
River (Govt. of Punjab, 2012).
District Sargodha mainly comprises plains. There are a few small hills on
Sargodha Faisalabad road. Jhelum flows on the western and northern sides and Chenab
on the eastern side of the district. The district has extreme hot and cold climate. The
maximum temperature touches the 50oC in summer while the minimum temperature
recorded is as low as freezing point in the winter (Ibid).
The main crops grown during Rabi season are wheat, barley, gram, oil seeds, and
masoor and in Kharif season cotton, sugarcane rice, bajra, maize, mung, moth and mash.
In addition to these main crops, there are subsidiary crops known as Zaid Rabi and Zaid
Kharif like tobacco, vegetables, fodder, toria etc. Sargodha is famous for citrus fruits like
mussambi, kinno, red blood, lemon and feutrell early. Other fruits are mango falsa, ber,
date, loquat, guava, jaman etc (Ibid).
Irrigation is done by canals, lift irrigation, tube-wells and open surface wells. The
lower Jhelum canal, Muhajir branch canal, Shahpur branch canal (Northern branch) and
Chashma link canal are the four canals which supply water for irrigation in the district
(Ibid).
3.4 RESEARCH POPULATION
Any set of individuals or objects having some common observable characteristics
constitute population or universe (Dixon and Marry, 1957). The collection of all possible
observations relevant to some characteristics of interest is called a population or universe
(Chaudhary, 1984).

81
The research population of the present study comprised all the water users of
improved watercourses in district Sargodha.
3.5 SAMPLING PROCEDURE
The sample is smaller representation of a larger whole (Chaudhary, 1984).
Sample may be defined as a portion of all the elements in a population that is used to
obtain information about the entire population (Magill, 1995). Sampling is the process of
selecting a subset of individuals from a large group of individuals, the selection being
done with a view to draw inferences about the larger group on the basis of information
obtained from the subset. The subset of individuals is known as sample (Jafar, 1998).
The sample was drawn for this study using simple random sampling technique. All
the five tehsils were selected as the study area. From each tehsil, one markaz was selected
randomly. From each selected markaz, five improved watercourses were selected at
random. From each selected improved watercourses, 15 water users (five each from head,
middle and tail) were selected randomly, thereby making a total sample size of 375
respondents.
3.5.1 Sampling Procedure for the Selection of Watercourses
First of all separate list of improved watercourses from each selected markaz was
prepared with the help of the watercourses directory. The watercourses numbers along
with the name of the villages were written down on separate pieces of paper. All these
pieces of paper were folded and were put together in a box. Researcher himself drew the
piece of paper for the selection of watercourses. The process was repeated for the
selection of required number of watercourses for each selected markaz.
3.5.2 Sampling Procedure for the Selection of Respondents
First of all separate list of water users for each selected improved watercourses
was prepared with the help of warabandi list. The names of water users were written
down on separate pieces of paper. All the pieces of paper were folded and put together in
a box. The researcher himself drew five pieces of paper each from head, middle and tail
separately for the selection of water users. The process was repeated for the selection of
water users for each selected watercourses.
82
3.6 CONSTRUCTION OF RESEARCH INSTRUMENT
Keeping in view the nature of the study, the researcher decided to use interview
schedule as a technique for data collection. An interview schedule refers to a research
instrument comprising questions to be asked for data collection formulated according to
the study objectives. It is a technical procedure which enables a researcher to get the
information accurately (Godden and Hatt, 1952).
Considering the objectives of the study, an interview schedule was developed by the
researcher from the synthesis of the review of literature and discussion with experts and
personnel involved in the Water Management Department.
3.7 VALIDITY OF THE RESEARCH INSTRUMENT
Validity is concerned with measuring what one intends to measure (Nachmias &
Nachmias, 1992). Content validity refers to how well an instrument includes a
representative sample of questions that relate to the content domain being measured
(Patten, 2004; Wallen & Fraenkel, 2001). To ensure the content validity of the research
instrument, the researcher made a review of the literature related to the research topic to
develop appropriate instrument content. Moreover, to check the validity of the data
collection instrument, one Professor, one Associate Professor and one Assistant Professor
from the Division of Education and Extension, University of Agriculture, Faisalabad
(UAF), and also one Associate Professor, from the Department of Rural Sociology, UAF
were requested to look critically into the instrument. Each of them was provided with a
separate set of instrument along with objectives of the study. The researcher prepared the
initial draft under their guidance which was then got checked by the Director, Water
Management Research Institute, UAF. The Director General, Water Management, Lahore
was also consulted to check the validity of the instrument. The researcher also discussed
the initial draft with the water users. They were requested to suggest any improvement, if
needed, based on the relevance of the contents. The experts looked into the instrument
critically to judge the appropriateness of the statements. The experts determined whether
the instrument contained clear and appropriate content as deemed necessary to measure
the study objectives. Judgment was based on the relationship between study objectives
and study items. A number of changes were suggested by the experts. Research
83
instrument was finalized after making necessary deletion and addition according to the
available suggestions given by the experts.
3.8 PRE-TESTING OF THE RESEARCH INSTRUMENT
The interview schedule was pre-tested on 30 respondents, who were the water users of
the improved watercourses. For this purpose, one tehsil of the study district was selected
at random. From the selected tehsil, one markaz was selected randomly. From the
selected markaz, five improved watercourses were selected at random. From each
selected improved watercourse, six water users (two each from head, middle and tail)
were selected randomly, thereby making a total sample size of 30 respondents. However,
these respondents were not included in the sampling frame for final selection of the study
respondents.
3.9 RELIABILITY OF THE RESEARCH INSTRUMENT
One of the most important considerations for any researcher is to be sure that the
respondents had provided accurate information. Apart from the competence of
interviewer, the instrument itself plays an important role in obtaining reliable data.
Reliability is the level of internal consistency of the instrument (Borg and Gall, 2002).
Reliability indicates the degree to which a survey instrument is consistent with what it
measures (Litwin, 1995). A number of methods such as test-retest, alternative-form, split
half and coefficient alpha, can be used to measure the reliability of the instrument (Dane,
(1990); and De Vaus (1995). Cronbach’s Alpha (coefficient of internal consistency) is
commonly used to measure the reliability of research instrument (Schuster et al., 1997;
Lodhi, 2003; Idrees, 2003; Hedjazi & Sultani, 2005). In the present study interview
schedule was used for data collection. For this purpose, thirty water users, who were not
the members of the selected sample, but similar to the study population, were
interviewed. The researcher personally interviewed the waterusers. The Cronbach’s
Alpha was calculated from the responses for whole instrument using the computer
program statistical package for social science (SPSS). The overall coefficient thus
calculated was found with an average value of 0.83, which proved that the instrument
was quite reliable for data collection.

84
3.10 INTERVIEWING THE RESPONDENTS
The researcher interviewed the respondents personally at their homes and/or
farms. Although the interview schedule was constructed in English, yet the questions
were administered in Urdu and Punjabi languages for the convenience of interviewees to
get the required information with maximum accuracy. While interviewing, researcher
tried his best to maintain informal and friendly atmosphere in order to obtain the real data
from the respondents.
3.11 ANALYSIS OF DATA
The data were analyzed using computer software SPSS. Descriptive analysis such
as frequencies, percentages, standard deviation and means were used for interpretation of
the data. After analysis, tabulation process was done by the researcher and the data were
discussed, interpreted analytically and logical conclusions were drawn. Chi-square test
was used to find out the relationship between dependent and independent variables.
3.12 DIFFICULTIES FACED DURING DATA COLLECTION
The researcher faced certain unavoidable difficulties during the process of data
collection. Some respondents were found very accommodating and facilitated data
collection process but some others were reluctant to give the required information. At
time it became rather unmanageable to make the respondents understand because they
readily began to recount their own problems. Data collection became fairly difficult when
respondents were not literate. Despite the fact that the researcher tried his best to let the
respondents know about the purpose of the study, some water users were still suspicious
about the nature of the study and questioning. They thought that the information collected
may be used against them, especially when questions such as size of land holding and
tenancy status were put to them. Some respondents hesitated to give accurate information
due to the fear that the government might impose some new taxes on them. Some
respondents showed strong indifference and assumed that the researcher might be from
the banking sector or from the revenue department and collecting some secrete
information. The suspicious farmers were taken into confidence that the information
taken from them would be kept secret and conclusions would be publicized only for
educational purposes. The suspicious farmers were also satisfied by showing university
identity card and telling them that the researcher is a PhD student at UAF and have
85
nothing to do with tax department, banking sector or any other organization. The
researcher also assured that it was an essential part of the study to collect accurate data
from the respondents, which may lead to valuable results for the betterment of the
farming community. In some cases the researcher had to wait long for respondents
because they were not available in the village or at farm. Usually all the respondents were
not available on the first visit and the researcher had to manage repeated visits.
Transportation and communication facilities were not properly available in the study
area. Some of the villages were not connected by metaled road and thus researcher had to
face much difficulty in having meeting with the respondents on scheduled time. The
researcher approached such villages on foot in order to collect the required information.
There was a great threat of robbery whenever the researcher had to move late in the
evening. There had been frequent incidences of violence against wayfarers and the
researcher was strongly advised by the local people to wind up his task during the
daylight. Despite all these difficulties, the researcher tried his best to manage his efforts,
time and money in judicious way.
86
CHAPTER 4
RESULTS AND DISCUSSION
Water is one of the major critical inputs which influence the pattern of
agricultural production, productivity of land and ultimately the socio-economic
conditions of majority of the farmers. Much of the water is lost in main canals,
distributaries and watercourses which ultimately affects the crop production. Therefore, it
is need of the day to take all possible measures, which minimize/control water losses at
all levels. WUAs are expected to play an important role in this regard.
The purpose of the present study was to assess the present status and future scope
of WUAs. In this chapter, an effort has been made to discuss and interpret the responses
of 375 respondents registered as members of WUAs. The results of the study are
expected to serve as a scientific basis of information for the concerned department to
make the WUAs more effective and fruitful to the farmers, in the context of water
management and ultimate uplift of their socio-economic conditions.
4.1 SOCIO-ECONOMIC CHARACTERISTICS OF THE RESPONDENTS
Socio-economic characteristics mean a complex of attitude that are interrelated but
not form a single dimension (Khall and Davis, 1995). Socio-economic refers to
environmental, economic, social and industrial patterns, and their linkages that create the
framework of development (Huisinga, 1997). The importance of socio-economic
characters like age, education, size of land holding, title of land, social status play a
fundamental role in the field of agriculture (Hassan et al., 2002). The characteristics such
as caste, community type and size of land holding, farming experience, education, age
and income are significantly associated with the adoption of improved irrigational
practices (Nawaz, 1968).
In the present study, socio-economic characters refer to the attributes of age,
education, farm size, tenancy status and occupation of the farming community.
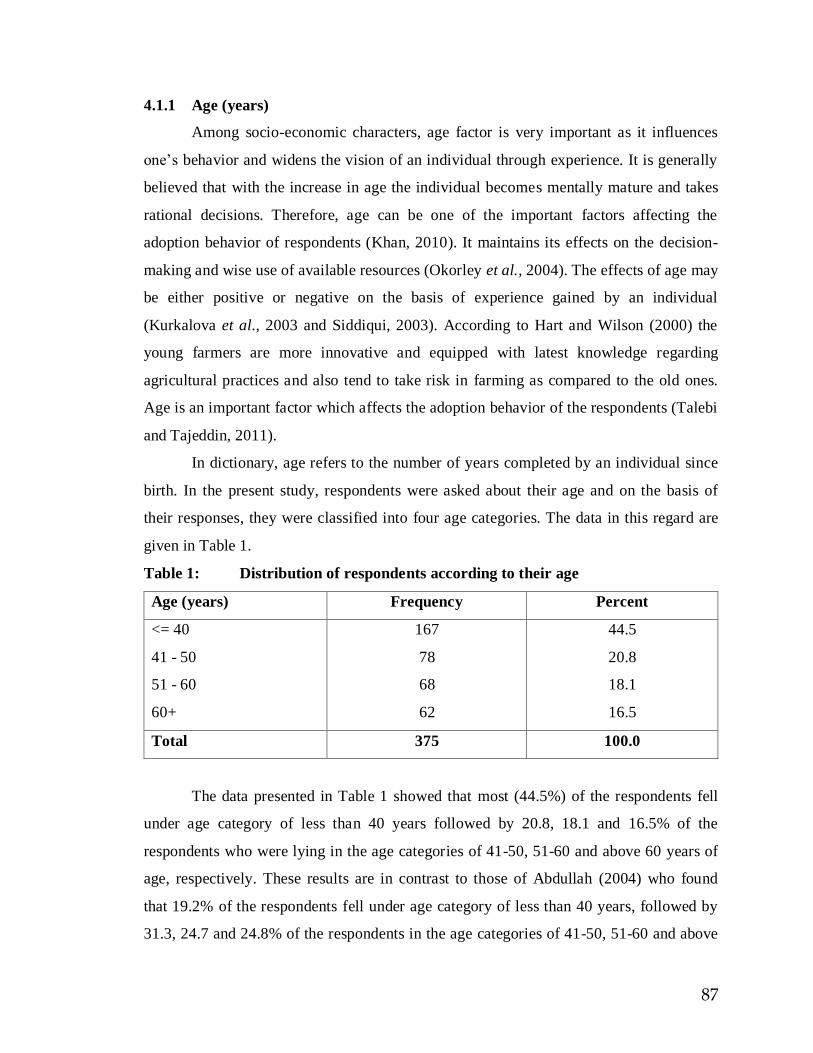
87
4.1.1 Age (years)
Among socio-economic characters, age factor is very important as it influences
one’s behavior and widens the vision of an individual through experience. It is generally
believed that with the increase in age the individual becomes mentally mature and takes
rational decisions. Therefore, age can be one of the important factors affecting the
adoption behavior of respondents (Khan, 2010). It maintains its effects on the decision-
making and wise use of available resources (Okorley et al., 2004). The effects of age may
be either positive or negative on the basis of experience gained by an individual
(Kurkalova et al., 2003 and Siddiqui, 2003). According to Hart and Wilson (2000) the
young farmers are more innovative and equipped with latest knowledge regarding
agricultural practices and also tend to take risk in farming as compared to the old ones.
Age is an important factor which affects the adoption behavior of the respondents (Talebi
and Tajeddin, 2011).
In dictionary, age refers to the number of years completed by an individual since
birth. In the present study, respondents were asked about their age and on the basis of
their responses, they were classified into four age categories. The data in this regard are
given in Table 1.
Table 1: Distribution of respondents according to their age
Age (years) Frequency Percent
<= 40
41 - 50
51 - 60
60+
167
78
68
62
44.5
20.8
18.1
16.5
Total 375 100.0
The data presented in Table 1 showed that most (44.5%) of the respondents fell
under age category of less than 40 years followed by 20.8, 18.1 and 16.5% of the
respondents who were lying in the age categories of 41-50, 51-60 and above 60 years of
age, respectively. These results are in contrast to those of Abdullah (2004) who found
that 19.2% of the respondents fell under age category of less than 40 years, followed by
31.3, 24.7 and 24.8% of the respondents in the age categories of 41-50, 51-60 and above
88
60 years of age, respectively. The results are also in line with the findings of Okwu et al.
(2007) where majority (65%) was below 50 years. Further, the results of the present study
are in accordance with those of Ashraf (2008); Gockoski et al. (2006); Fawole (2006);
Demiryurek et al. (2008); Ofuoku et al. (2008); and Omobolanle (2008) who found that
most of the respondents belonged to middle age category.
4.1.2 Education (years of schooling)
Education may be defined as the process of developing knowledge, wisdom,
character, general competence and desirable qualities of mind in humanbeings (Hassan et
al., 2003). Education is a consciously controlled process whereby changes in behavior are
produced in the person and through the person within group (Good and Markel, 1959).
Many research studies have confirmed that education performs a vital role in adoption
process because it is easy to understand and getting acquired information from educated
person than illiterate (Muro and Burchi, 2007). Education is the formal teaching of a
culture’s skill, knowledge and values from one generation to the next (Magill, 1995).
Education is the number of years of schooling required to complete the identified grade
level of the respondents. In other words, education is a fundamental part of development.
It is the process of developing knowledge, wisdom and hidden qualities of mind,
character and general capabilities (Evenson and Mwabu, 1998). Education not only
uplifts the mental level but also brings a positive change in the attitude and behavior of an
individual (Hassan et al., 2003). Education is the aggregate of all the processes for
bringing change in human behavior (Malik, 2005). Education has so many social benefits
as it is the solution to all the social evils (Khan, 2005). Education plays an important role
in individuals’ personality development and also has a vital role in nations building
(Khan, 2010). The ability of farmers to read or write may contribute to their information
seeking behavior (Ogunlade, 2007). Educated people are expected to have more
favorable attitude towards agricultural innovations as compared to uneducated ones
(Hassan, 2007). Farmers with more education get higher gains in income by using new
technologies and adjust them more rapidly to technological changes (FAO, 2000). It is
also considered very important in the adoption of latest agricultural technology and
innovations to increase agricultural production. Keeping in view the importance of

89
education, the respondents were asked questions regarding their education and the data in
this regard are presented in Table 2.
Table 2: Distribution of respondents according to their education level
Education (years of schooling) Frequency Percent
Illiterate (0)
Upto Primary (1 – 5)
Primary to Matriculate (6 – 10)
Above Matriculate (>10)
96
126
89
64
25.6
33.6
23.7
17.1
Total 375 100.0
It is evident from the data embodied in Table 2 that about one fourth (25.6%) of
the respondents were illiterate, about one third (33.6%) of the respondents had 1-5 years
of schooling, whereas 23.7% of the respondents fell under the category of 6-10 years of
schooling and 17.1% of the respondents were having above matric qualification. These
results are contradictory to those of Zain-ul-Abideen (2007) who found that 31.6% of the
respondents were illiterate, whereas, 20.7 and 38.0% of the respondents had primary and
primary to matric level education, respectively. While only 9.7% of the respondents had
above matric qualification. The results are less or more similar to those of Okwu et al.
(2007) where 37% of the respondents were illiterate while 29% of the respondents fell
under the category of primary level.
4.1.3 Farm Size (acres)
Size of farm or land holding refers to the piece of land cultivated by a farmer
and/or his family (Nawaz 1968). According to Ahmad (2003) farm size is the piece of
land owned by an individual farmer or by his family and is used for crops/plants and
livestock production. Size of land holding may have influence upon farmers’ decisions
about acquiring the knowledge pertinent to agricultural technology (Chaudary, 2006). It
is generally thought that the farmers having big holding can take risk and generally they
have more contacts with information sources. Research studies confirm the importance of
land and size of land holding has its own effect on the social status of an individual in
rural communities (Copplestone, 1985; Wesseling et al., 1997). Assi (1988) argued that
larger the size of land holding greater the adoption of agricultural innovations. The size
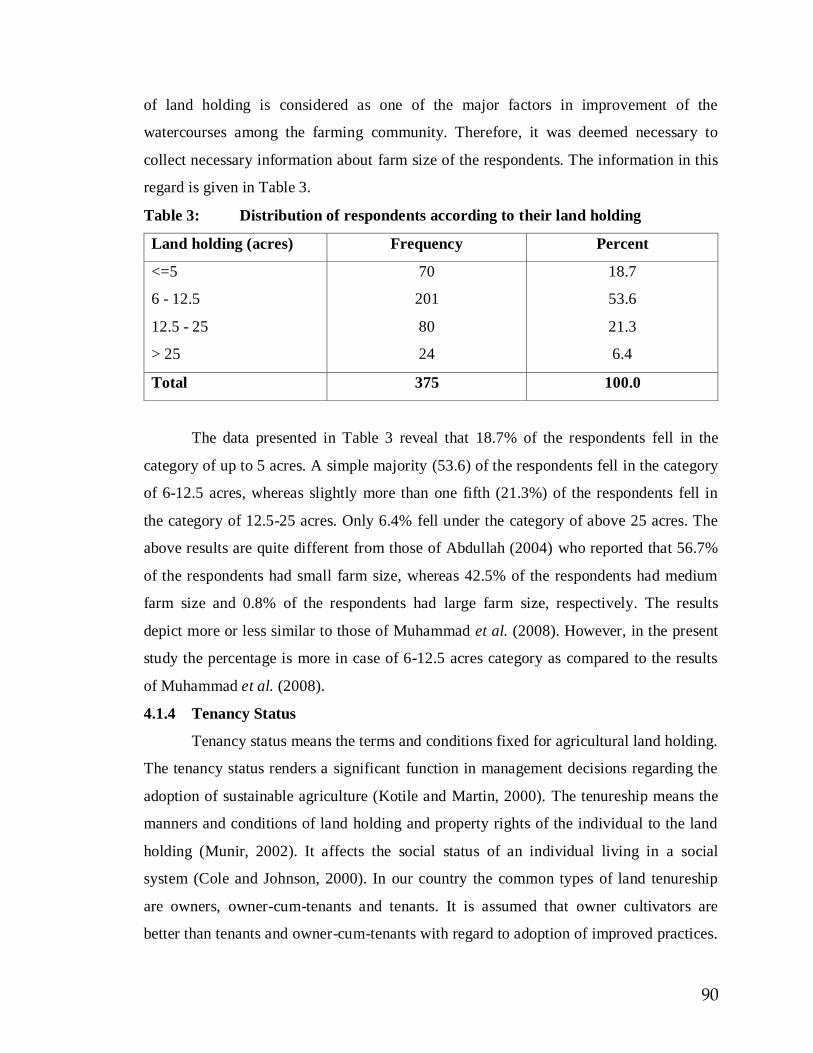
90
of land holding is considered as one of the major factors in improvement of the
watercourses among the farming community. Therefore, it was deemed necessary to
collect necessary information about farm size of the respondents. The information in this
regard is given in Table 3.
Table 3: Distribution of respondents according to their land holding
Land holding (acres) Frequency Percent
<=5
6 - 12.5
12.5 - 25
> 25
70
201
80
24
18.7
53.6
21.3
6.4
Total 375 100.0
The data presented in Table 3 reveal that 18.7% of the respondents fell in the
category of up to 5 acres. A simple majority (53.6) of the respondents fell in the category
of 6-12.5 acres, whereas slightly more than one fifth (21.3%) of the respondents fell in
the category of 12.5-25 acres. Only 6.4% fell under the category of above 25 acres. The
above results are quite different from those of Abdullah (2004) who reported that 56.7%
of the respondents had small farm size, whereas 42.5% of the respondents had medium
farm size and 0.8% of the respondents had large farm size, respectively. The results
depict more or less similar to those of Muhammad et al. (2008). However, in the present
study the percentage is more in case of 6-12.5 acres category as compared to the results
of Muhammad et al. (2008).
4.1.4 Tenancy Status
Tenancy status means the terms and conditions fixed for agricultural land holding.
The tenancy status renders a significant function in management decisions regarding the
adoption of sustainable agriculture (Kotile and Martin, 2000). The tenureship means the
manners and conditions of land holding and property rights of the individual to the land
holding (Munir, 2002). It affects the social status of an individual living in a social
system (Cole and Johnson, 2000). In our country the common types of land tenureship
are owners, owner-cum-tenants and tenants. It is assumed that owner cultivators are
better than tenants and owner-cum-tenants with regard to adoption of improved practices.
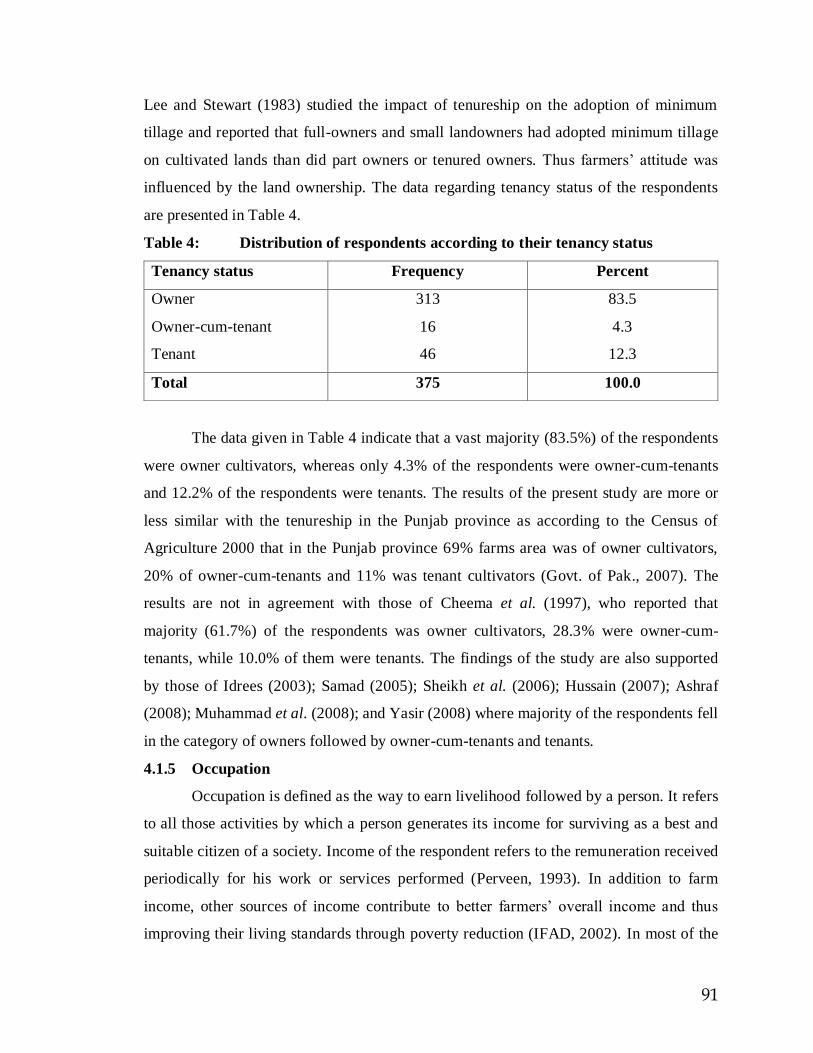
91
Lee and Stewart (1983) studied the impact of tenureship on the adoption of minimum
tillage and reported that full-owners and small landowners had adopted minimum tillage
on cultivated lands than did part owners or tenured owners. Thus farmers’ attitude was
influenced by the land ownership. The data regarding tenancy status of the respondents
are presented in Table 4.
Table 4: Distribution of respondents according to their tenancy status
Tenancy status Frequency Percent
Owner
Owner-cum-tenant
Tenant
313
16
46
83.5
4.3
12.3
Total 375 100.0
The data given in Table 4 indicate that a vast majority (83.5%) of the respondents
were owner cultivators, whereas only 4.3% of the respondents were owner-cum-tenants
and 12.2% of the respondents were tenants. The results of the present study are more or
less similar with the tenureship in the Punjab province as according to the Census of
Agriculture 2000 that in the Punjab province 69% farms area was of owner cultivators,
20% of owner-cum-tenants and 11% was tenant cultivators (Govt. of Pak., 2007). The
results are not in agreement with those of Cheema et al. (1997), who reported that
majority (61.7%) of the respondents was owner cultivators, 28.3% were owner-cum-
tenants, while 10.0% of them were tenants. The findings of the study are also supported
by those of Idrees (2003); Samad (2005); Sheikh et al. (2006); Hussain (2007); Ashraf
(2008); Muhammad et al. (2008); and Yasir (2008) where majority of the respondents fell
in the category of owners followed by owner-cum-tenants and tenants.
4.1.5 Occupation
Occupation is defined as the way to earn livelihood followed by a person. It refers
to all those activities by which a person generates its income for surviving as a best and
suitable citizen of a society. Income of the respondent refers to the remuneration received
periodically for his work or services performed (Perveen, 1993). In addition to farm
income, other sources of income contribute to better farmers’ overall income and thus
improving their living standards through poverty reduction (IFAD, 2002). In most of the

92
parts of rural world farming is the primary source of income (Lovenbalk et al., 2003). For
example, in Nigeria, majority of farmers adopt farming as their main occupation for
earning money (Onemolease, 2002). Keeping in view the importance of this factor, the
respondents were asked about their occupation and their responses in this regard are
given in Table 5.
Table 5: Distribution of respondents according to their occupation
Occupation Frequency Percent
Farming only
Farming & business
Farming & service
Farming & labor
272
62
36
5
72.5
16.5
9.6
1.3
Total 375 100.0
The information given in Table 5 reveals that a large majority (72.2%) of the
respondents had the farming occupation as their only source of income, 16.5% of the
respondents were involved both in farming and business. About one-tenth (9.6%) of the
respondents were doing service along with farming. Only a few (1.3%) respondents were
doing farming and labor at a time. Almost similar results were obtained by Abdullah
(2004) who reported that majority (66.7%) of the respondents were related to farming
occupation, the only source of income, 18.3% were related to farming and business,
12.5% were related to farming and service and only 2.5% were related to farming and
labor. The results of present research are in agreement with those of Khan et al. (2009)
who found that agriculture was the main source of income of the respondents, while 27
and 17% had jobs and business as additional sources respectively. The results of the
present study are also in line with those of Tariq (2008) who stated that agriculture was
the foremost source of income. From the results it may be concluded that major part of
farmers’ community were relying only on farming profession for earning its livelihood.
4.2. THE PROCESS OF SETTING UP A WUA
First time the water users’ associations (WUAs) were created in 1981 under the
World Bank supported On-Farm Water Management (OFWM) project. They were
formed at the watercourses level, with a primary objective of rehabilitating the
93
watercourses (FAO, 1997). Since the 1980s, conservation and development organizations
and international funding agencies have embraced the idea of devolving the decision-
making authority and management responsibility over natural resources from central
government agencies to local user groups (Shyamsundar et al., 2005).
Whenever the government undertakes a welfare work by the involvement of local
community, or in other words, a community-based project is started; an association of
some legally authorized, authentic and respectable persons is made. The association is
responsible for the failure or success of whole of the project. In the present case, a WUA
is made to solve the issues of the community relating to watercourses improvement. Now
a day, watercourses improvement has become hot issue due to water shortage throughout
the world. Day-by-day the water table of Pakistan is falling down. Due to the shortage of
water in our canal system, there is less irrigation water available to farmers. Most of the
water goes to ocean without any usage and almost same quantity is wasted in
watercourses. So, many projects of watercourses improvement have been started to
overcome water losses (Govt. of Punjab, 2005).
In improving a watercourse, the most important phase is the setting up a WUA. It
is the basic and most important procedure to set up and register a WUA. Many aspects
are involved in the process. Usually a WUA is made when at least 51% of waterusers of a
watercourse show their will for its construction and sign an agreement on which all the
by-laws are defined. Then a cabinet is made. This cabinet comprises usually seven
members (Ibid).
A President, he is responsible for the provision of all kind of resources and acts as
head of the Association. A Vice President, he is responsible for the work, preside the
meeting and takes decisions in the absence of the President. A Treasurer, it is the key post
of the Association. All the accounts and records regarding watercourses improvement are
in his custody. A Secretary, he looks after the duties that are just assigned by President.
Normally, he looks after masons/labor during construction work. Three Members, these
are honorary members only taken to complete staff and to minimize allegations of some
naughty persons. Their duties are to help all these four executive class members. Then
bank account is opened on the name of Association. Two account holders operate it
normally. They are usually, President and Treasurer and process of registration is started.

94
Registration fee (5 rupees/farmer) is collected and deposited in water management
account on 32-A Challan Form. This file is sent to DO (OFWM) for registration and
process of setting up a WUA is completed. A survey was done to check whether all these
steps were undertaken while setting up a WUA in the area.
4.2.1 Position in WUA
The respondents were asked whether they had any position in WUA in their
village, either they were the simple water users or worked as the members of WUA. The
data in this regard are presented in Table 6.
Table 6: Distribution of respondents according to their position in WUA
Position in WUA Frequency Percent
Yes
No
54
321
14.4
85.6
Total 375 100.0
The information given in Table 6 reveals that only 14.4% of the respondents
replied positively which means that they were having some positions in WUA. While
85.6% respondents were those who were just the shareholders or simple water uses of the
watercourses.
4.2.2 Specific Position Held in WUA
The respondents were also asked to mention their specific position held in WUA
i.e. President, Vice President, Treasurer, Secretary or Member. The data were collected
and given in Table 7.
Table 7: Distribution of respondents according to the specific position held in WUA
Specific position held Frequency Percent
President
Vice-President
Treasurer
Secretary
Member
13
4
7
10
20
3.5
1.1
2.7
1.9
5.3
Total 54 14.4

95
The data given in Table 7 reveal that 3.5% out of 54 respondents holding the
position of President, 1.1% respondents were having the position of Vice-President, 2.7%
respondents were serving as Treasurers, 1.9% was Secretaries and 5.3% respondents were
the executive members.
4.2.3 Procedure Adopted for the Constitution of Managing Committee of WUA
Constitution of managing committee is the legal procedure in the process of
setting up a WUA. It is an important step by which members of managing committee are
selected. The constitution of the managing committee of WUA may be done either
through mutual agreement or by election. The data in this regard are presented in Table 8.
Table 8: Distribution of respondents according to the procedure adopted for
the constitution of managing committee of WUA
Procedure adopted Frequency Percent
Through mutual agreement
By election
345
30
92.0
8.0
Total 375 100.0
The data presented in Table 8 show that 92.0% managing committee members
were selected through mutual agreement taken in the general meeting of the shareholders
on the watercourses, while only 8.0% were made by election. The above results are in
contrast to those of Ali (1986) who reported that 60% managing committee members
were selected on the basis of mutual decision taken in the general meeting of the
shareholders on the watercourses, while 40% were made by elections. The findings of the
study are not in line with those of Vandersypen et al. (2007) who reported that 53%
committee members were made by elections. Elections are seen as the mechanism that
ensures downward accountability (Ribot et al., 2006).
4.2.4 Steps Involved in Setting up a WUA
The steps involved in setting up a WUA include; 1) presence of shareholders
in the process of selection/election of WUA, 2) transparency of selection/election
process, 3) announcement of the results at the spot, 4) agreement signed by at least
51% shareholders on the stamp paper, 5) registration of WUA by DO (OFWM), 6)

96
representation of WUA from all reaches of watercourses (head, middle and tail), 7)
representation of WUA from all briadaries living at the watercourses.
4.2.4.1 Presence of shareholders in the process of selection/election of WUA
Presence of all the shareholders/beneficiaries/water users is essential in the
process of setting up a WUA and also in the constitution of the managing committee of
WUA. Presences of maximum shareholders/beneficiaries/waterusers indicate the
importance of watercourses improvement as well as the interest of farmers in WUA. The
respondents were asked whether or not they were present when the meeting of
selection/election of WUA was held.
4.2.4.2 Transparency of selection/election process
According to the dictionary meaning, transparency means unmistakably clear,
apparent. Transparency is the most important in the procedure adopted for the
constitution of WUA, either by selection or by election. Transparent selected/elected
WUA can play a vital role in the improvement and maintenance activities of the
watercourses. The respondents were then asked about their views about the
selection/election transparency.
4.2.4.3 Announcement of the results at the spot
Announcement of the results on the spot is another important step in the
formation of WUA. Just after the selection/election, it is very necessary to announce the
results at the spot for the satisfaction of the shareholders.
4.2.4.4 Agreement signed by the shareholders on the stamp paper
It is very necessary to sign the agreement by at least 51%
shareholders/beneficiaries/water users on the stamp paper, because it is a prerequisite in
the process of formation and registration of a WUA.
4.2.4.5 Registration of WUA by DO (OFWM)
The WUA submits an application for registration to the District Officer (OFWM)
in the prescribed manner and on the prescribed form along with the required documents
especially the bank account opening certificate by the scheduled bank. After that DO
(OFWM) issues a certificate of registration to the Association and such certificate is the
proof of the legal existence of the Association.

97
4.2.4.6 Representation of WUA from all reaches of watercourses
Location of respondents’ land on watercourses is another variable which may
affect farmers’ decision regarding the formation of WUA. A watercourses is divided into
three reaches; head, middle and tail. Farmers at head get maximum benefit as compare to
middle and tail farmers because more irrigation water is available at their end and
ultimately their farm production is also high. But they take less interest in the formation
of WUA as compare to middle and tail farmers.
4.2.4.7 Representation of WUA from all briadaries living at the watercourses
Caste or biradary defines a village group based on traditional occupation,
communal regulation and particular status and mode of behavior in the village (Mayer,
1965). It is a basic aspect of the village social structure leading towards factionalism and
ultimately affecting the functions of the whole structure. These have been taken as the
occupational categories in the villages of the Punjab, which are large in number.
Representation from all the briadaries present/living at the watercourses is too much
necessary in the formation of WUA.
The data relating to the process of setting up a WUA i.e. presence of shareholders
in the process of selection/election of WUA, transparency of the selection/election
process, announcement of results at the spot, agreement signed by at least 51%
shareholders on stamp paper, registration of WUA by DO (OFWM), representation of
WUA from all reaches of watercourses (head, middle, tail) and representation of WUA
from all briadaries living at the watercourses are presented in Table 9.
Table 9: Distribution of respondents according to the steps involved in setting
up a WUA
Steps involved Frequency Percent
Presence of shareholders in the process of
selection/election of WUA 339 90.4
Transparency of selection/election process 363 96.8
Announcement of the results at the spot 365 97.3
Agreement signed by shareholders on stamp paper 357 95.2
Registration of WUA by DO (OFWM) 357 95.2
Representation of WUA from all reaches of
watercourses (head, middle and tail) 371 98.9
Representation of WUA from all briadaries living at
the watercourses 371 98.9
98
The data presented in Table 9 show that 90.4% of the respondents were of the
view that they were present during selection/election of WUA. Similarly 96.8% of the
respondents were of the view that selection/election process was transparent. An
overwhelming majority (97.3%) of the respondents had the view that results were
announced at the spot. Likewise, 95.2% of the respondents were of the view that
agreement was signed by at least 51% shareholders on the stamp paper. Correspondingly,
95.2% of the respondents confirmed the registration of WUA from the DO (OFWM).
Almost all the respondents (98.9%) respondents were of the view that WUA had a
representation from all reaches of watercourses (head, middle, tail) and form all casts or
briadaries living at the watercourses. The above results are in contrast to those of Tariq
(1991) who reported that majority (68.3%) of the respondents was not present in the
process of setting up a WUA, while only 31.7% of the respondents were present in the
process of setting up a WUA. The results are also different from those of Tufail (2000)
who reported that 76.7% of the respondents reported that agreement was signed by at
least 51% shareholders on the stamp paper, whereas remaining 23.3% of the respondents
had an opinion against it. The findings of the study are supported by Herrfahrdt et al.
(2006) who stated the required formalities and steps involved in the establishment of
WUAs.
4.2.5 Perception about Leadership
Leadership is a role that leads toward goal achievement, involves interaction of
influence and usually results in some form of changed structure or behavior of groups,
organizations or communities (Lassey, 1976). Kotter (1988) described that leadership is a
process that directs and mobilizes people and their ideas to enhance overall group
productivity. Northouse (1997) concluded that leadership is an influence process that
assists groups of individuals toward goal attainment. Leadership is the capacity of an
individual to command and control behavior of others by virtue of one’s personal traits
like knowledge, skill, reputation of being honest and integrity (Akbar, 1986). For
successful functioning of the group, leadership plays a very critical role. The role of the
leader, who facilitates the design of rules, norms and strategies in a community due to
personal capacities, has been related to the ability of groups to gain autonomy and design
local institutions (Basutro, 2007). Leadership is a process whereby an individual

99
influences a group of individuals to achieve a common goal (Northouse, 2007).
Leadership is a process by which a person influences others to accomplish an objective
and directs the organization in a way that makes it more cohesive and coherent. The U.S.
military has studied leadership in depth. One of their definitions is a process by which a
soldier influences others to accomplish a mission (U.S. Army, 1983).
A leader should not be too young that people do not obey him and he should not
be too old that his performance is disturbed due to age factor. Education is another
important criterion affecting the leadership. Highly educated persons can easily
understand and run WUA effectively, whereas low qualifications cause hurdles in its
working. Social status of a leader really counts, whether he is socially sound or not and
makes his contribution effective in welfare work. Economic position of a leader is
another factor. If he is financially sound, he will do better for welfare but if he has
economic problems in his home, he will not give proper time to WUA. A competent
leader can be more effective to run an association. The respondents were asked to rate
their leadership on a five point Likert scale ranging from poor to excellent. Their
responses are given in Table 10.
Table 10: Distribution of respondents according to their perception about the
leadership emerged as a result of selection/election
Perception about leadership Frequency Percent
Excellent
Good
Satisfactory
Fair
Poor
84
271
18
2
0
22.4
72.3
4.8
0.5
-
Total 375 100.0
The data presented in Table 10 show that a large majority (72.3%) of the
respondents rated leadership emerged as a result of selection / election process as good.
Slightly more than one fifth (22.4%) of the respondents were of the view that leadership
was excellent. About 5.0% considered it satisfactory, while only 0.5% said that it was
fair. No one regarded the leadership as poor.
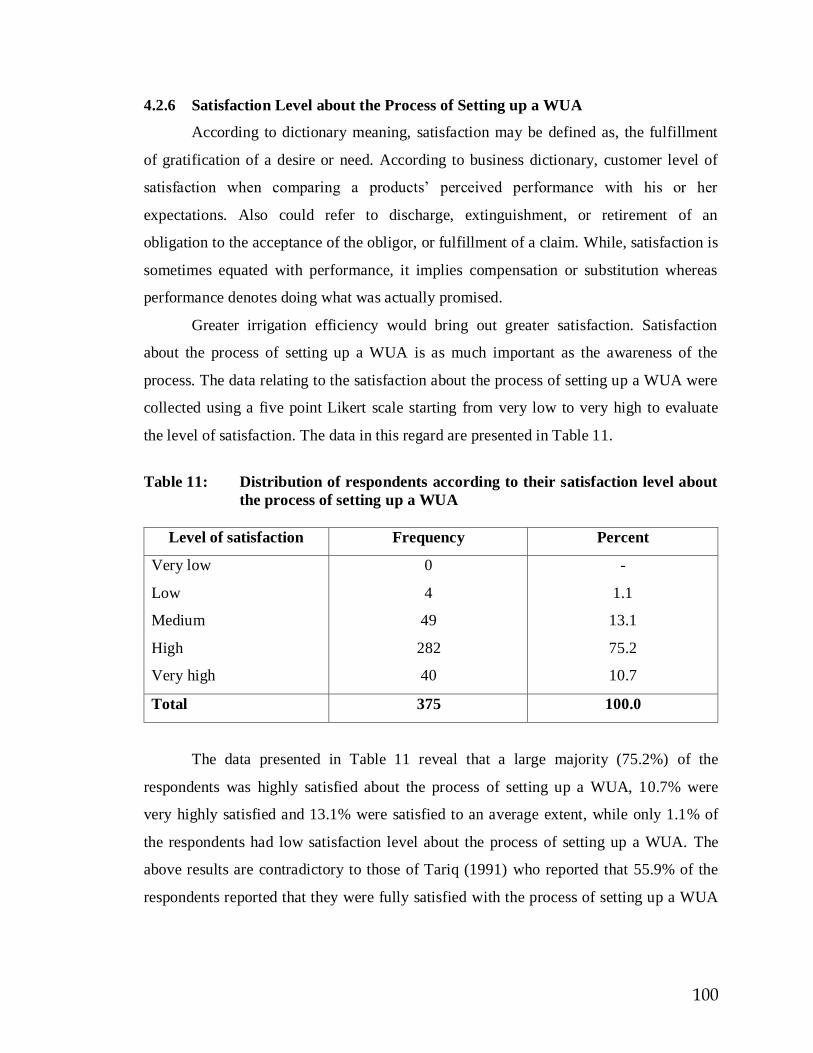
100
4.2.6 Satisfaction Level about the Process of Setting up a WUA
According to dictionary meaning, satisfaction may be defined as, the fulfillment
of gratification of a desire or need. According to business dictionary, customer level of
satisfaction when comparing a products’ perceived performance with his or her
expectations. Also could refer to discharge, extinguishment, or retirement of an
obligation to the acceptance of the obligor, or fulfillment of a claim. While, satisfaction is
sometimes equated with performance, it implies compensation or substitution whereas
performance denotes doing what was actually promised.
Greater irrigation efficiency would bring out greater satisfaction. Satisfaction
about the process of setting up a WUA is as much important as the awareness of the
process. The data relating to the satisfaction about the process of setting up a WUA were
collected using a five point Likert scale starting from very low to very high to evaluate
the level of satisfaction. The data in this regard are presented in Table 11.
Table 11: Distribution of respondents according to their satisfaction level about
the process of setting up a WUA
Level of satisfaction Frequency Percent
Very low
Low
Medium
High
Very high
0
4
49
282
40
-
1.1
13.1
75.2
10.7
Total 375 100.0
The data presented in Table 11 reveal that a large majority (75.2%) of the
respondents was highly satisfied about the process of setting up a WUA, 10.7% were
very highly satisfied and 13.1% were satisfied to an average extent, while only 1.1% of
the respondents had low satisfaction level about the process of setting up a WUA. The
above results are contradictory to those of Tariq (1991) who reported that 55.9% of the
respondents reported that they were fully satisfied with the process of setting up a WUA

101
while 44.1% were partially satisfied with the process of setting up a WUA. The findings
of the study are supported by Herrfahrdt et al. (2006).
4.2 CRITERIA USED FOR THE SELECTION/ELECTION OF MANAGING
COMMITTEES OF WUAs
While creating a group for management, the social unit of organization is very
important. It affects how accustomed people are to be cooperating with one another, how
willing they are to make some sacrifices for other members, how much confidence they
have in other members in the group (Uphoff, 1986). For successful functioning of the
group, leadership plays a very critical role. Leadership is the capacity of an individual to
command and control behavior of others by virtue of one’s personal traits like
knowledge, skill, reputation of being honest and integrity (Akbar, 1986). Some scholars
argue that the dominance of local leaders might result in elite capture, where the benefits
of participatory projects are appropriated by elite members of the village, who are often
community leaders (Mansuri and Rao, 2004). The role of the leader, who facilitates the
design of rules, norms and strategies in a community due to personal capacities, has been
related to the ability of groups to gain autonomy and design local institutions (Basutro,
2007). The failures of WUAs were linked to the lack of support from the community
leaders (Vandersypen et al., 2007). Key determinants of farmers’ satisfaction with water
committees) identified include transparency and trust regarding the conduct of water
committees, cost recovery rates, farm size, and irrigation costs. Membership satisfaction
is an important determinant of payment behavior (Gorton et al., 2009). Size of land
holding, cast (biradary) and location of land with respect to watercourses may be some
other criteria for selection. In this regard Ahmed (1993) argue that the size of land
holding plays no significant role in the selection of managing committee, but caste or
biradary play very important role in the selection of managing committee of a WUA. The
farmers having land at the tail of watercourses get more representation in the managing
committee.
Whenever a WUA is made, either through election or selection process, some
special criteria are generally kept in view to elect or select a person. The common criteria
include honest, trustworthy, responsible, social worker, cooperative, shareholder, leader
of biradary, man of commitment, devote time for WUA and popular among water users.

102
The data regarding the characteristics possessed by the managing committee of WUA as
perceived by the respondents are presented in Table 12.
Table 12: Distribution of respondents according to the characteristics possessed
by the managing committees of WUAs
Characteristics Responses
All
members
Most
members
Average
members
Some
members
No. % No. % No. % No. %
Honest 124 33.1 240 64.0 11 2.9 0 0
Trustworthy 124 33.1 240 64.0 11 2.9 0 0
Responsible 46 12.3 79 21.1 148 39.5 102 27.2
Social worker 24 6.4 94 25.1 196 52.3 61 16.3
Cooperative 26 6.9 88 23.5 200 53.3 61 16.3
Shareholder 345 92.0 26 6.9 4 1.1 0 0
Leader of biradary 56 14.9 108 28.8 57 15.2 154 41.1
Man of commitment 26 6.9 144 38.4 180 48.0 25 6.7
Devote time for WUA 64 17.1 174 46.4 103 27.5 34 9.1
Popular among water users 216 57.6 58 15.5 94 25.1 7 1.9
The data presented in Table 12 reveal that about two-thirds (64%) of the
respondents were of the view that most of the members were honest and trustworthy,
while about one third (33.1%) regarded all the members of the committee as honest and
trustworthy. About 40% regard the average members as responsible. More than half (52.3
and 53.3%) of the respondents regarded the average members as social workers and
cooperative, respectively. An overwhelming majority (92%) of the respondents regarded
all members as shareholders. More than 40% respondents regard some members as
leaders of the biradary (a particular caste), while 28.8% respondents were of the view that
most of the members were the leader of the biradary (caste). About half (48%) of the
respondents regard the average members as man of commitment, while about 40%
respondents regarded most of the members as man of commitment. Less than half

103
(46.4%) of the respondents were of the view that most of the members devote their time
for WUA. More than half (57.6%) of the respondents regarded all the members of the
committee popular among the water users.
4.3 EXTENT OF PARTICIPATION OF WATER USERS IN WATERCOURSE
IMPROVEMENT AND MAINTENANCE ACTIVITIES
A watercourse is usually very lengthy and it is quite difficult to carry out all
improvement process individually. There are many assignments to be done by the
members of WUA on collective basis. Therefore active participation of all members is
essential to carry out improvement and maintenance activities. In phase-I of watercourses
improvement, at least 50% of farmers’ share must be collected, and then the process of its
demolishing and earthen improvement starts. In Phase-I, at least 30% of earthen portion
must be improved to get government share. Government share is given in three
installments. First installment of government share (40%) is provided when at least 50%
of farmers’ share is collected and 30% of earthen improvement is done. In Phase-II,
second installment of government share (40%) is given when 100% farmers’ share is
collected and the entire earthen portion is fully improved. In Phase-III, remaining 20%
government share is provided, when 100% completion is done and final completion
report (FCR) is submitted by Field Consultant Engineer (Govt. of Punjab, 2005).
After improvement, government departments hand over the watercourses to WUA
for ever and it is their lifetime duty to maintain the watercourses including all water
controlling structures, lined and earthen portions. If earthen portion is disturbed, they
have to realign it. If any water controlling structure or lined portion is damaged, they
have to repair by themselves. Once or twice silt/bhal should be removed in a year,
vegetation removal is an important process and all other works like back earthen filling,
filling of rodents’ holes, uprooting of trees, embankment etc. are included in the vast term
of maintenance which is necessary to increase watercourses life.
The data were collected to determine the extent of participation of water users in
the improvement and maintenance activities of the watercourses. The results are
discussed below:
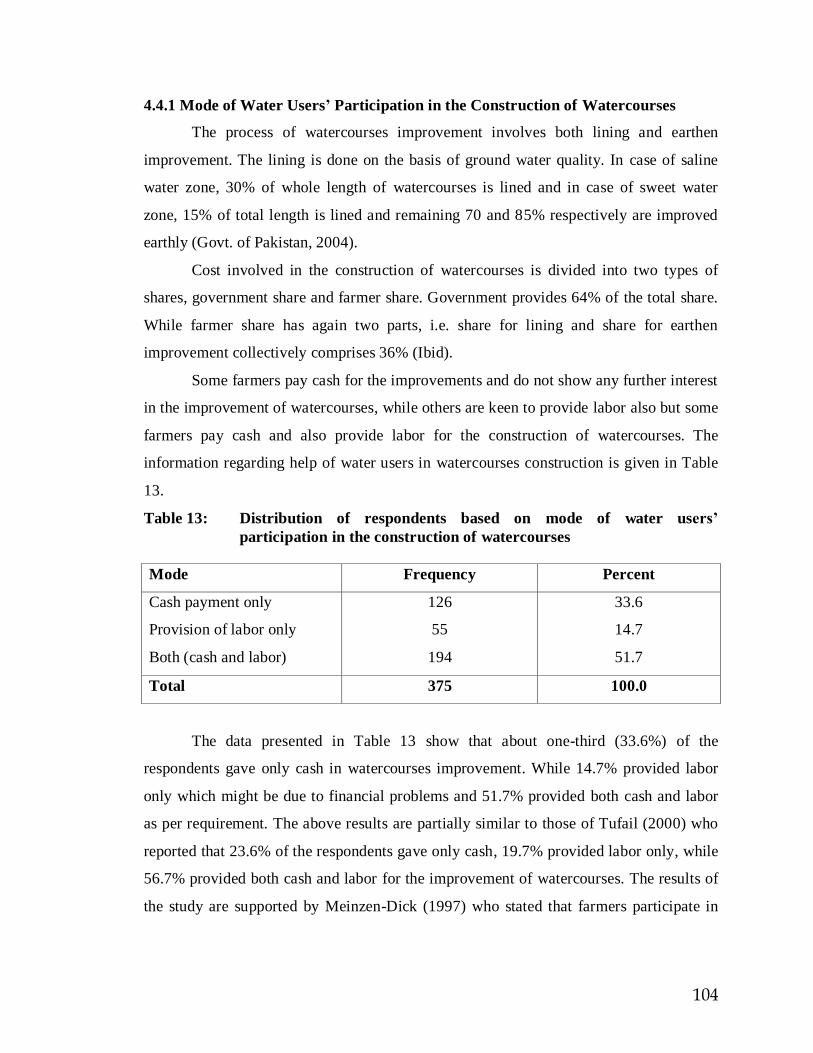
104
4.4.1 Mode of Water Users’ Participation in the Construction of Watercourses
The process of watercourses improvement involves both lining and earthen
improvement. The lining is done on the basis of ground water quality. In case of saline
water zone, 30% of whole length of watercourses is lined and in case of sweet water
zone, 15% of total length is lined and remaining 70 and 85% respectively are improved
earthly (Govt. of Pakistan, 2004).
Cost involved in the construction of watercourses is divided into two types of
shares, government share and farmer share. Government provides 64% of the total share.
While farmer share has again two parts, i.e. share for lining and share for earthen
improvement collectively comprises 36% (Ibid).
Some farmers pay cash for the improvements and do not show any further interest
in the improvement of watercourses, while others are keen to provide labor also but some
farmers pay cash and also provide labor for the construction of watercourses. The
information regarding help of water users in watercourses construction is given in Table
13.
Table 13: Distribution of respondents based on mode of water users’
participation in the construction of watercourses
Mode Frequency Percent
Cash payment only
Provision of labor only
Both (cash and labor)
126
55
194
33.6
14.7
51.7
Total 375 100.0
The data presented in Table 13 show that about one-third (33.6%) of the
respondents gave only cash in watercourses improvement. While 14.7% provided labor
only which might be due to financial problems and 51.7% provided both cash and labor
as per requirement. The above results are partially similar to those of Tufail (2000) who
reported that 23.6% of the respondents gave only cash, 19.7% provided labor only, while
56.7% provided both cash and labor for the improvement of watercourses. The results of
the study are supported by Meinzen-Dick (1997) who stated that farmers participate in
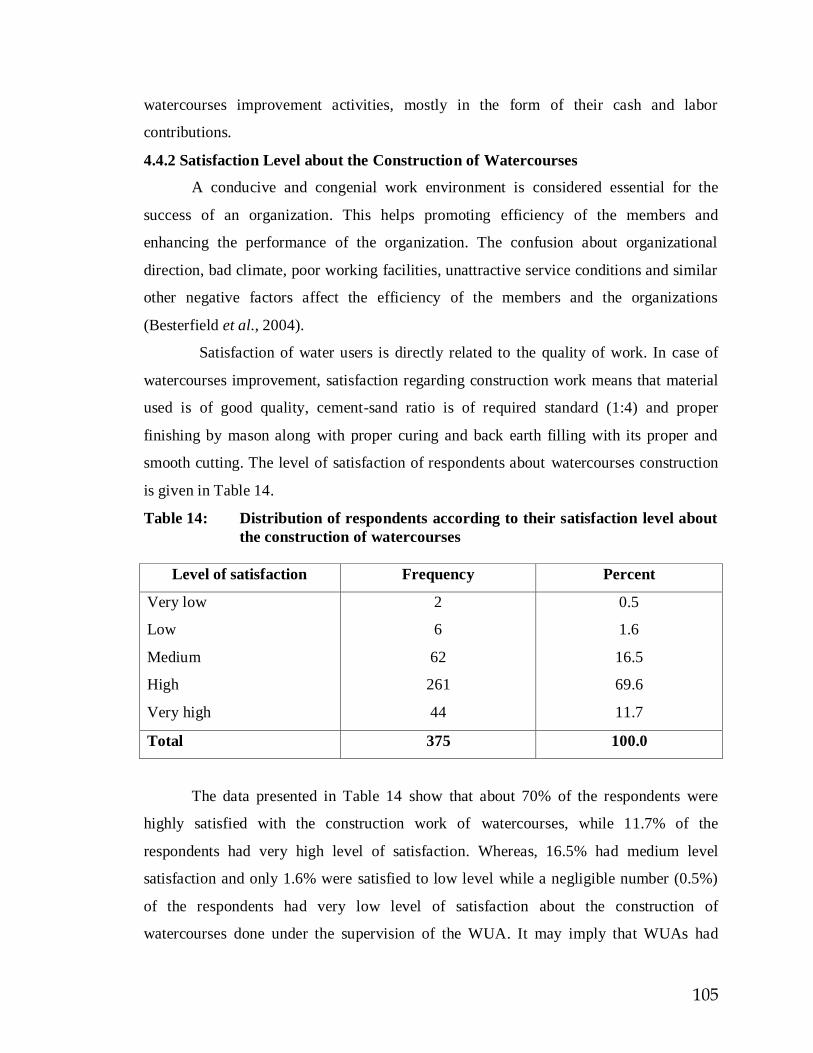
105
watercourses improvement activities, mostly in the form of their cash and labor
contributions.
4.4.2 Satisfaction Level about the Construction of Watercourses
A conducive and congenial work environment is considered essential for the
success of an organization. This helps promoting efficiency of the members and
enhancing the performance of the organization. The confusion about organizational
direction, bad climate, poor working facilities, unattractive service conditions and similar
other negative factors affect the efficiency of the members and the organizations
(Besterfield et al., 2004).
Satisfaction of water users is directly related to the quality of work. In case of
watercourses improvement, satisfaction regarding construction work means that material
used is of good quality, cement-sand ratio is of required standard (1:4) and proper
finishing by mason along with proper curing and back earth filling with its proper and
smooth cutting. The level of satisfaction of respondents about watercourses construction
is given in Table 14.
Table 14: Distribution of respondents according to their satisfaction level about
the construction of watercourses
Level of satisfaction Frequency Percent
Very low
Low
Medium
High
Very high
2
6
62
261
44
0.5
1.6
16.5
69.6
11.7
Total 375 100.0
The data presented in Table 14 show that about 70% of the respondents were
highly satisfied with the construction work of watercourses, while 11.7% of the
respondents had very high level of satisfaction. Whereas, 16.5% had medium level
satisfaction and only 1.6% were satisfied to low level while a negligible number (0.5%)
of the respondents had very low level of satisfaction about the construction of
watercourses done under the supervision of the WUA. It may imply that WUAs had

106
played a significant role during the construction of watercourses through community
education and proper monitoring, because water users had high level of satisfaction
regarding the construction of watercourses which was constructed under the supervision
of WUAs. Basically, WUA is the cluster of local water users of that local community;
they are very keen in maintaining the quality standards in watercourses improvement.
The above results are in contrast to those of Zain-ul-Abideen (2007) who reported that
25.3 and 26.7% of the respondents were satisfied to high and very high levels about the
construction of watercourses. Whereas 36.7% of the respondents were satisfied to
medium level, while 10 and 1.3% of the respondents were satisfied to low and very low
levels about the construction of watercourses.
4.4.3 Mode of Watercourse Cleaning
The extensive cleaning and maintenance work on several watercourses branches
has led to significant reduction of water losses. This reduction has been found between
20-35% (Ahmad and Bowers, 1978). Almost 50% of irrigation water is wasted in water
channels due to poor management of water distribution, the farmers have collectively
decided about the water management i.e. cleaning and maintenance of the common
watercourses (Khan, 1997). Water users were of the opinion that watercourses cleaning
and maintenance is very important for watercourses improvement program. Most of the
water users were of the opinion that laws concerning watercourses cleaning need to be
introduced and strictly enforced for achieving regular cleaning and maintenance (Mirza
and Haider, 1979). The agricultural production in Pakistan can only be increased if the
irrigation water which is limiting factor in crop production is saved from wastage and
managed in a proper way.
The cleaning and maintenance are the key factors to make efficient use of an
improved watercourse. It requires more attention from farmer side. Some farmers clean
their watercourses individually, while others are interested to do the work by joint
operation through WUA. Some farmers clean their own watercourses individually but the
main watercourses by joint operation. The data regarding mode of watercourses cleaning
are presented in Table 15.
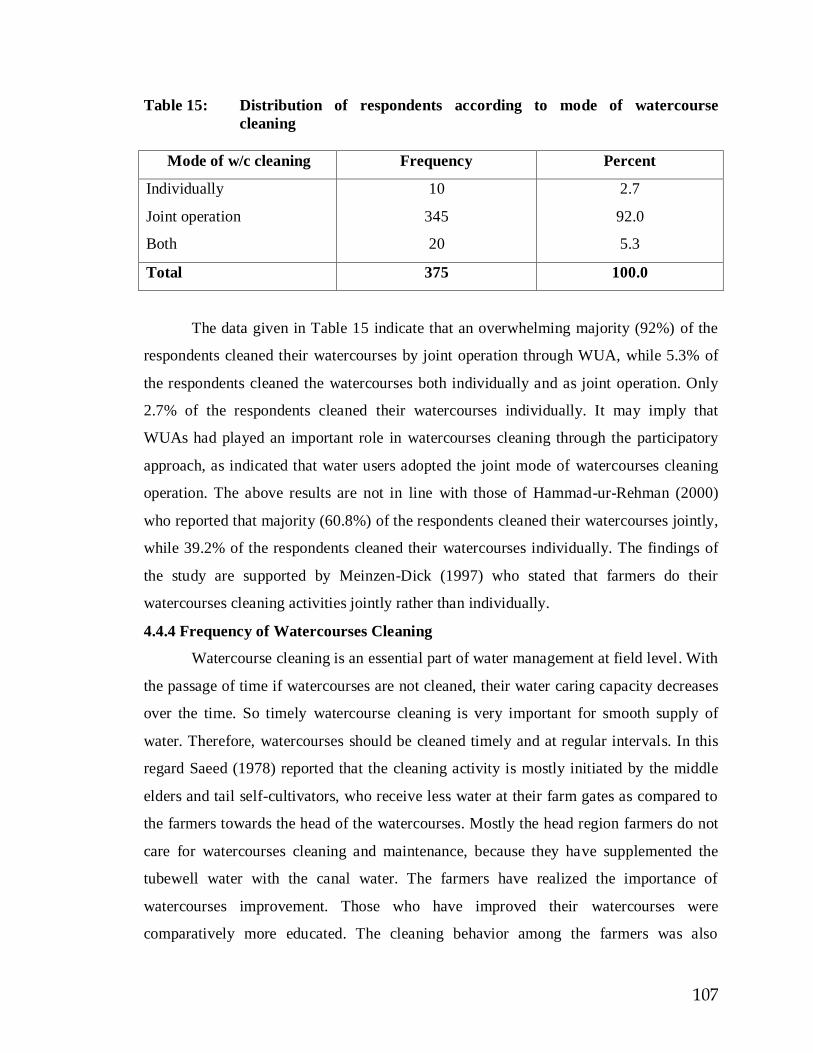
107
Table 15: Distribution of respondents according to mode of watercourse
cleaning
Mode of w/c cleaning Frequency Percent
Individually
Joint operation
Both
10
345
20
2.7
92.0
5.3
Total 375 100.0
The data given in Table 15 indicate that an overwhelming majority (92%) of the
respondents cleaned their watercourses by joint operation through WUA, while 5.3% of
the respondents cleaned the watercourses both individually and as joint operation. Only
2.7% of the respondents cleaned their watercourses individually. It may imply that
WUAs had played an important role in watercourses cleaning through the participatory
approach, as indicated that water users adopted the joint mode of watercourses cleaning
operation. The above results are not in line with those of Hammad-ur-Rehman (2000)
who reported that majority (60.8%) of the respondents cleaned their watercourses jointly,
while 39.2% of the respondents cleaned their watercourses individually. The findings of
the study are supported by Meinzen-Dick (1997) who stated that farmers do their
watercourses cleaning activities jointly rather than individually.
4.4.4 Frequency of Watercourses Cleaning
Watercourse cleaning is an essential part of water management at field level. With
the passage of time if watercourses are not cleaned, their water caring capacity decreases
over the time. So timely watercourse cleaning is very important for smooth supply of
water. Therefore, watercourses should be cleaned timely and at regular intervals. In this
regard Saeed (1978) reported that the cleaning activity is mostly initiated by the middle
elders and tail self-cultivators, who receive less water at their farm gates as compared to
the farmers towards the head of the watercourses. Mostly the head region farmers do not
care for watercourses cleaning and maintenance, because they have supplemented the
tubewell water with the canal water. The farmers have realized the importance of
watercourses improvement. Those who have improved their watercourses were
comparatively more educated. The cleaning behavior among the farmers was also
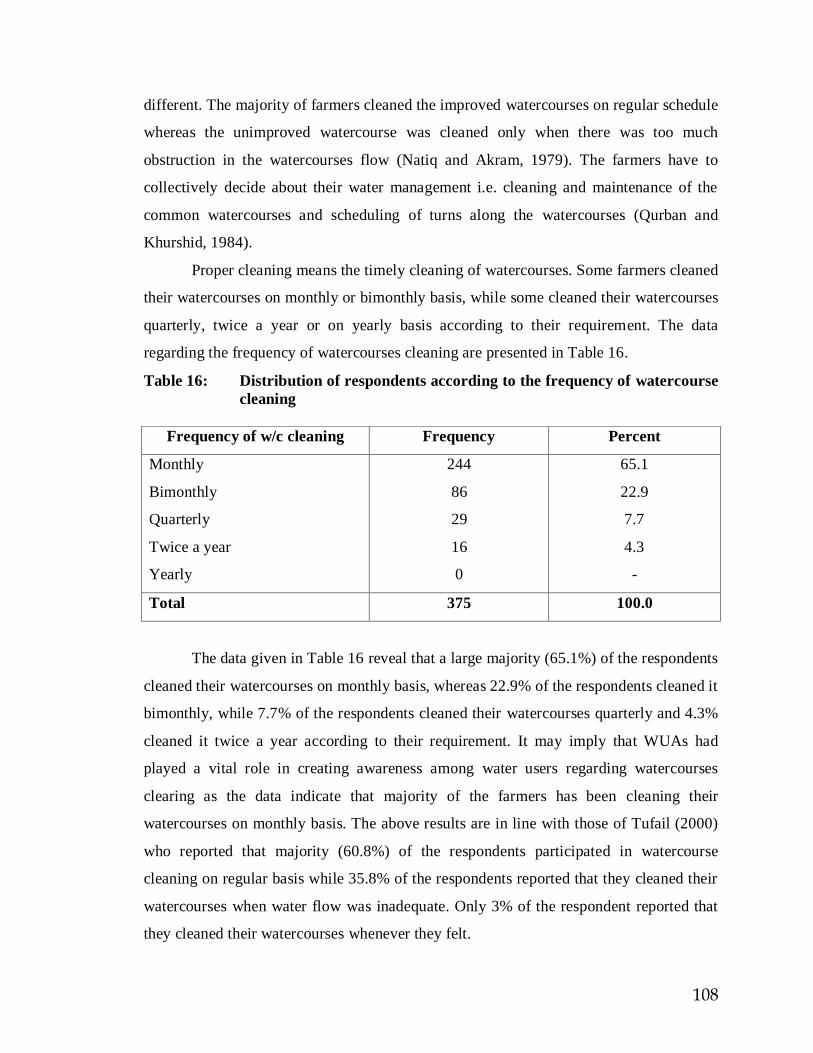
108
different. The majority of farmers cleaned the improved watercourses on regular schedule
whereas the unimproved watercourse was cleaned only when there was too much
obstruction in the watercourses flow (Natiq and Akram, 1979). The farmers have to
collectively decide about their water management i.e. cleaning and maintenance of the
common watercourses and scheduling of turns along the watercourses (Qurban and
Khurshid, 1984).
Proper cleaning means the timely cleaning of watercourses. Some farmers cleaned
their watercourses on monthly or bimonthly basis, while some cleaned their watercourses
quarterly, twice a year or on yearly basis according to their requirement. The data
regarding the frequency of watercourses cleaning are presented in Table 16.
Table 16: Distribution of respondents according to the frequency of watercourse
cleaning
Frequency of w/c cleaning Frequency Percent
Monthly
Bimonthly
Quarterly
Twice a year
Yearly
244
86
29
16
0
65.1
22.9
7.7
4.3
-
Total 375 100.0
The data given in Table 16 reveal that a large majority (65.1%) of the respondents
cleaned their watercourses on monthly basis, whereas 22.9% of the respondents cleaned it
bimonthly, while 7.7% of the respondents cleaned their watercourses quarterly and 4.3%
cleaned it twice a year according to their requirement. It may imply that WUAs had
played a vital role in creating awareness among water users regarding watercourses
clearing as the data indicate that majority of the farmers has been cleaning their
watercourses on monthly basis. The above results are in line with those of Tufail (2000)
who reported that majority (60.8%) of the respondents participated in watercourse
cleaning on regular basis while 35.8% of the respondents reported that they cleaned their
watercourses when water flow was inadequate. Only 3% of the respondent reported that
they cleaned their watercourses whenever they felt.
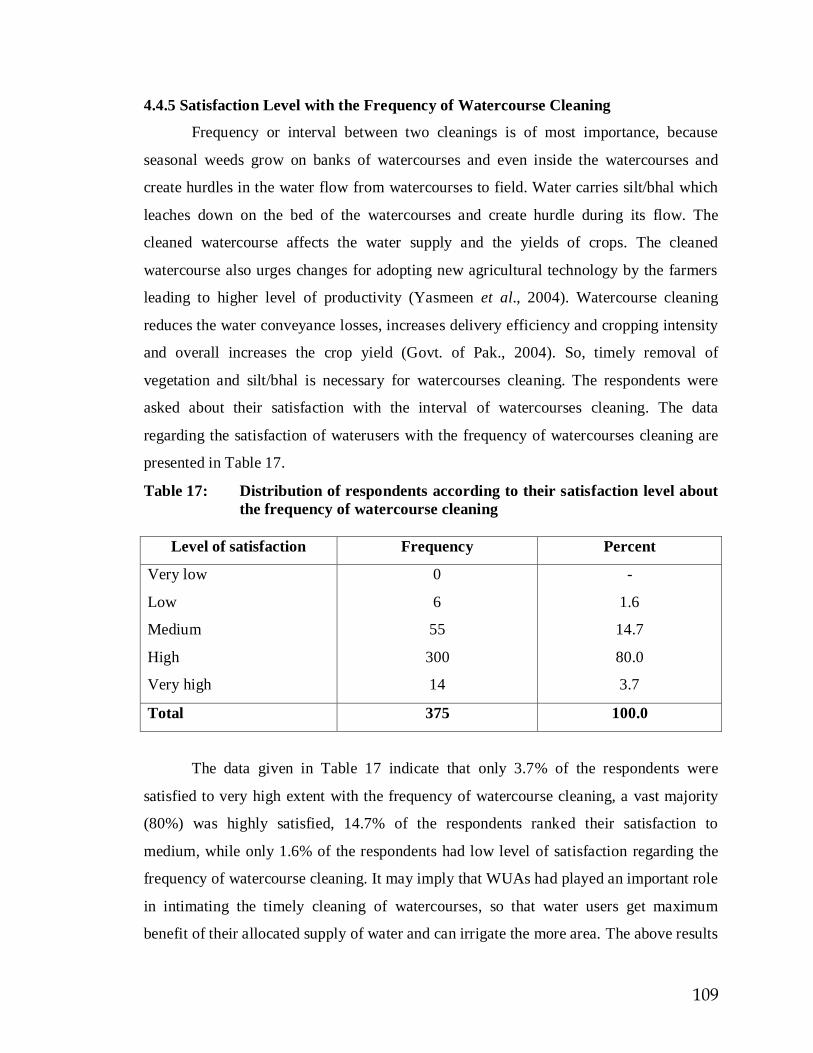
109
4.4.5 Satisfaction Level with the Frequency of Watercourse Cleaning
Frequency or interval between two cleanings is of most importance, because
seasonal weeds grow on banks of watercourses and even inside the watercourses and
create hurdles in the water flow from watercourses to field. Water carries silt/bhal which
leaches down on the bed of the watercourses and create hurdle during its flow. The
cleaned watercourse affects the water supply and the yields of crops. The cleaned
watercourse also urges changes for adopting new agricultural technology by the farmers
leading to higher level of productivity (Yasmeen et al., 2004). Watercourse cleaning
reduces the water conveyance losses, increases delivery efficiency and cropping intensity
and overall increases the crop yield (Govt. of Pak., 2004). So, timely removal of
vegetation and silt/bhal is necessary for watercourses cleaning. The respondents were
asked about their satisfaction with the interval of watercourses cleaning. The data
regarding the satisfaction of waterusers with the frequency of watercourses cleaning are
presented in Table 17.
Table 17: Distribution of respondents according to their satisfaction level about
the frequency of watercourse cleaning
Level of satisfaction Frequency Percent
Very low
Low
Medium
High
Very high
0
6
55
300
14
-
1.6
14.7
80.0
3.7
Total 375 100.0
The data given in Table 17 indicate that only 3.7% of the respondents were
satisfied to very high extent with the frequency of watercourse cleaning, a vast majority
(80%) was highly satisfied, 14.7% of the respondents ranked their satisfaction to
medium, while only 1.6% of the respondents had low level of satisfaction regarding the
frequency of watercourse cleaning. It may imply that WUAs had played an important role
in intimating the timely cleaning of watercourses, so that water users get maximum
benefit of their allocated supply of water and can irrigate the more area. The above results
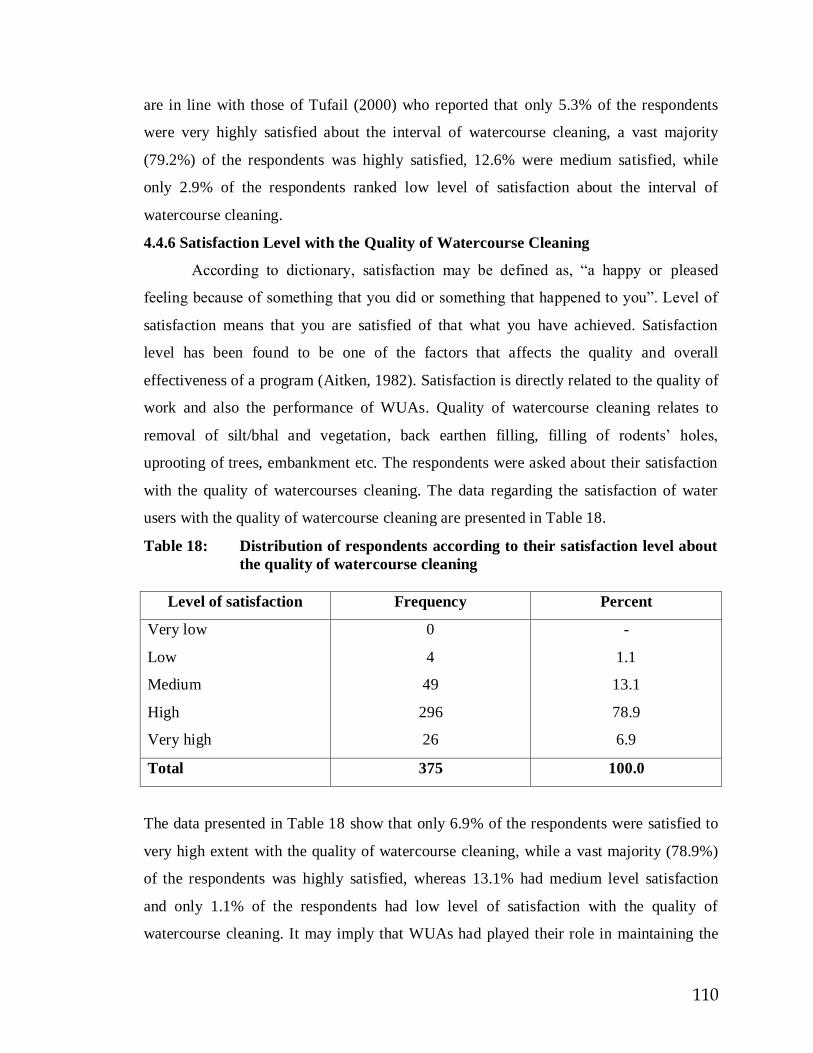
110
are in line with those of Tufail (2000) who reported that only 5.3% of the respondents
were very highly satisfied about the interval of watercourse cleaning, a vast majority
(79.2%) of the respondents was highly satisfied, 12.6% were medium satisfied, while
only 2.9% of the respondents ranked low level of satisfaction about the interval of
watercourse cleaning.
4.4.6 Satisfaction Level with the Quality of Watercourse Cleaning
According to dictionary, satisfaction may be defined as, “a happy or pleased
feeling because of something that you did or something that happened to you”. Level of
satisfaction means that you are satisfied of that what you have achieved. Satisfaction
level has been found to be one of the factors that affects the quality and overall
effectiveness of a program (Aitken, 1982). Satisfaction is directly related to the quality of
work and also the performance of WUAs. Quality of watercourse cleaning relates to
removal of silt/bhal and vegetation, back earthen filling, filling of rodents’ holes,
uprooting of trees, embankment etc. The respondents were asked about their satisfaction
with the quality of watercourses cleaning. The data regarding the satisfaction of water
users with the quality of watercourse cleaning are presented in Table 18.
Table 18: Distribution of respondents according to their satisfaction level about
the quality of watercourse cleaning
Level of satisfaction Frequency Percent
Very low
Low
Medium
High
Very high
0
4
49
296
26
-
1.1
13.1
78.9
6.9
Total 375 100.0
The data presented in Table 18 show that only 6.9% of the respondents were satisfied to
very high extent with the quality of watercourse cleaning, while a vast majority (78.9%)
of the respondents was highly satisfied, whereas 13.1% had medium level satisfaction
and only 1.1% of the respondents had low level of satisfaction with the quality of
watercourse cleaning. It may imply that WUAs had played their role in maintaining the

111
quality of watercourse cleaning. WUAs have motivated their members for watercourse
cleaning. That is why an overwhelming majority was satisfied with this aspect. Almost
similar results were obtained by Tufail (2000) who reported that only 6.6% of the
respondents were very highly satisfied with the quality of watercourse cleaning, while a
vast majority (72.8%) of the respondents was highly satisfied, whereas 17.2% had
medium level satisfaction and only 3.4% of the respondents had low level of satisfaction
with the quality of watercourse cleaning.
4.4.7 Watercourse Maintenance Activities Carried Out During Last Year
Agricultural production can be enhanced considerably by watercourse
improvement. Due to the watercourse improvement, about 37% increase in cropped area,
30% increase in cropping intensity and 25% increase in crop yield are possible (Awan et
al., 1980). The land utilization, cropping intensities, yields of major crops and the
application of chemical fertilizers increased due to watercourse improvements. Moreover,
time to irrigate one acre was also saved by 21 minutes (Khan and Sadiq, 1981). In a study
on “impact of watercourse improvement on farm production” Govt. of the Punjab
reported that saving of time to irrigate an acre after improvement was 28.36%. The report
also indicated that increase in cropping intensity due to watercourse improvement was
19.95%. The report further indicated that with the improvement of their watercourses, the
farmers have shifted to the crops with high delta of water like rice, sugarcane etc. This
clearly indicates a significant change in cropping pattern due to the additional water on
account of watercourses improvement (Govt. of Punjab, 1982). About 70% of the
population of Pakistan that live in rural areas and depends on the agriculture improved
their living standards when their agricultural production increased. It raised by increasing
the irrigation water, through watercourse improvement. So, frequent and regular
maintenance was essential if the farmers have to reap the benefits of watercourse
improvement (Iqbal and Khan, 1991).
The word maintenance is a wide term used for many works carried out. Especially
in terms of watercourse improvement activities, it involves processes like remodeling of
outlet, removal of silt/bhal from watercourse, removal of vegetation, up-rooting of trees,
filling of rodent holes, back earth filling of lined portion, realignment of the earthen
portion, embankment, and repair of culverts, nakkas and buffalo wallows.

112
Remodeling of outlet means the repairing of outlet during the canal closure. The
lined portion has no vegetation inside the section but there are many weeds and shrubs in
earthen portion, which should be removed. Any tree in the right of way of watercourses
should be removed but in some cases fruit trees are allowed but just on the banks not
inside the cross section. Rodents are not only injurious to some crops but also to the
watercourses. They make holes from inside section of the watercourses which causes
water loss (Govt. of Pakistan, 2004).
Back earth filling of lined portion is of great importance to increase its life and
efficacy. This activity should be done once or twice a year as per requirement. As the soil
settles down upper bricks of watercourses, walls become empty from soil and are
weakened, if gaps are not filled. The watercourses can be even damaged from these
portions which lead to much greater expenses. Embankment of earthen portion should not
be cut. Banks of the earthen portion should be realigned at least twice to thrice a year as it
is reshaped when water passes across it. All constructed portions like lined portion,
nakkas, culverts and buffalo wallow should also be repaired to avoid any kind of big loss
(Ibid).
The data regarding maintenance activities carried out during last year are
presented in Table 19.
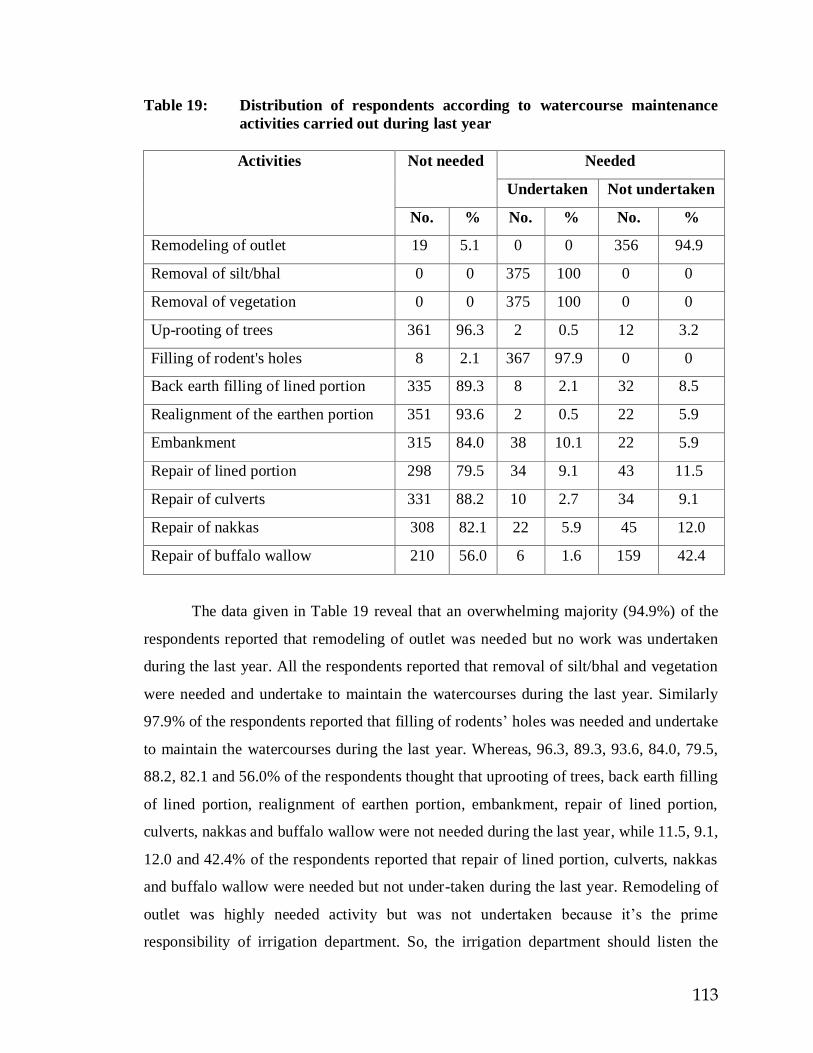
113
Table 19: Distribution of respondents according to watercourse maintenance
activities carried out during last year
Activities Not needed Needed
Undertaken Not undertaken
No. % No. % No. %
Remodeling of outlet 19 5.1 0 0 356 94.9
Removal of silt/bhal 0 0 375 100 0 0
Removal of vegetation 0 0 375 100 0 0
Up-rooting of trees 361 96.3 2 0.5 12 3.2
Filling of rodent's holes 8 2.1 367 97.9 0 0
Back earth filling of lined portion 335 89.3 8 2.1 32 8.5
Realignment of the earthen portion 351 93.6 2 0.5 22 5.9
Embankment 315 84.0 38 10.1 22 5.9
Repair of lined portion 298 79.5 34 9.1 43 11.5
Repair of culverts 331 88.2 10 2.7 34 9.1
Repair of nakkas 308 82.1 22 5.9 45 12.0
Repair of buffalo wallow 210 56.0 6 1.6 159 42.4
The data given in Table 19 reveal that an overwhelming majority (94.9%) of the
respondents reported that remodeling of outlet was needed but no work was undertaken
during the last year. All the respondents reported that removal of silt/bhal and vegetation
were needed and undertake to maintain the watercourses during the last year. Similarly
97.9% of the respondents reported that filling of rodents’ holes was needed and undertake
to maintain the watercourses during the last year. Whereas, 96.3, 89.3, 93.6, 84.0, 79.5,
88.2, 82.1 and 56.0% of the respondents thought that uprooting of trees, back earth filling
of lined portion, realignment of earthen portion, embankment, repair of lined portion,
culverts, nakkas and buffalo wallow were not needed during the last year, while 11.5, 9.1,
12.0 and 42.4% of the respondents reported that repair of lined portion, culverts, nakkas
and buffalo wallow were needed but not under-taken during the last year. Remodeling of
outlet was highly needed activity but was not undertaken because it’s the prime
responsibility of irrigation department. So, the irrigation department should listen the

114
voice of WUA and remodel the outlet as per demand and rules. Similarly repair of
buffalo wallow was also an important activity, which was not undertaken despite it was
needed as indicated by quite a few respondents. It indicates that WUAs have not been
successful with regard to these activities due to one or the other reason.
4.4.8 Satisfaction Level with the Activities Undertaken During Last Year
The respondents were asked whether they were satisfied with the activities which
were undertaken during the last year like removal of silt/bhal, vegetation, filling of
rodents’ holes, repair of lined portion, embankment, repairs of nakkas, culverts, back
earth filling of lined portion, repair of buffalo wallow, realignment of the earthen portion,
uprooting of trees and remodeling of outlets. The respondents were asked about the
satisfaction level and to indicate their perceptions regarding the satisfaction level with the
activities undertaken during the last year using a five point Likert scale i.e. 1= very low,
2= low, 3= medium, 4= high and 5= very high. Their responses are presented in Table 1
(Appendix-II). Based on their responses, the problems were ranked according to the
weighted score computed by multiplying the score value allotted to each category of the
scale with the frequency count and then adding up the same for each problem. The
weighted scores along with the means and SD are presented in Table 20.

115
Table 20: Ranking of watercourses maintenance activities undertaken during
the last year based on the satisfaction level of the respondents
Activities WS Rank Mean SD
Removal of silt/bhal 1619 1 4.32 0.56
Removal of vegetation 1619 1 4.32 0.56
Filling of rodent's holes 1383 2 3.77 0.65
Repair of lined portion 102 3 3.00 0.70
Embankment 100 4 2.63 0.75
Repair of nakkas 68 5 3.09 0.92
Repair of culverts 28 6 2.80 0.79
Back earth filling of lined portion 19 7 2.38 0.52
Repair of buffalo wallow 12 8 2.00 0.00
Realignment of the earthen portion 8 9 4.00 0.00
Up-rooting of trees 6 10 3.00 0.00
Remodeling of outlet 0 11 0.00 0.00
SD = Standard deviation; WS = Weighted score
The data given in Table 20 show that the satisfaction levels of the respondents
about the removal of silt/bhal and vegetation were ranked at 1st with weighted score of
1619 and mean value of 4.32. While filling of rodent’s holes and repair of lined portion
were ranked 2nd and 3rd based on respondents’ level of satisfaction. The other activities
like embankment, repairs of nakkas, culverts, back earth filling of lined portion, repair of
buffalo wallow, realignment of the earthen portion and uprooting of trees got very low
weighted scores and thereby ranked at 4th to 10th positions.
4.4.9 Farmers’ Participation in Watercourse Improvement and Maintenance
Activities Undertaken so far
The active participation of farmers in management process is a pre-requisite for a
successful water management program because it creates an environment conducive to
mobilize farmers in eliminating the chaotic situation in irrigation projects in regard to use
of water (Silva, 1981). The farmers provided information relating to design, operation
and maintenance of their irrigation system and also participated actively in organizational
and management activities (Wijayaratna, 1985). Instead of economic advantages of an
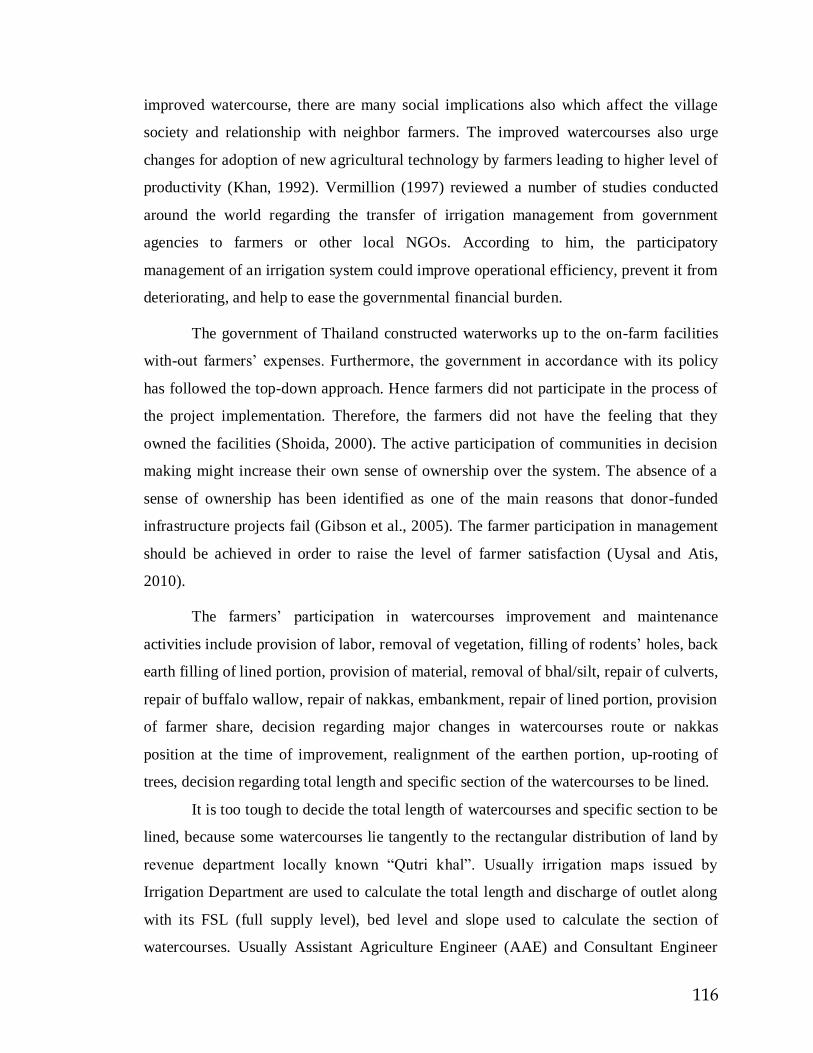
116
improved watercourse, there are many social implications also which affect the village
society and relationship with neighbor farmers. The improved watercourses also urge
changes for adoption of new agricultural technology by farmers leading to higher level of
productivity (Khan, 1992). Vermillion (1997) reviewed a number of studies conducted
around the world regarding the transfer of irrigation management from government
agencies to farmers or other local NGOs. According to him, the participatory
management of an irrigation system could improve operational efficiency, prevent it from
deteriorating, and help to ease the governmental financial burden.
The government of Thailand constructed waterworks up to the on-farm facilities
with-out farmers’ expenses. Furthermore, the government in accordance with its policy
has followed the top-down approach. Hence farmers did not participate in the process of
the project implementation. Therefore, the farmers did not have the feeling that they
owned the facilities (Shoida, 2000). The active participation of communities in decision
making might increase their own sense of ownership over the system. The absence of a
sense of ownership has been identified as one of the main reasons that donor-funded
infrastructure projects fail (Gibson et al., 2005). The farmer participation in management
should be achieved in order to raise the level of farmer satisfaction (Uysal and Atis,
2010).
The farmers’ participation in watercourses improvement and maintenance
activities include provision of labor, removal of vegetation, filling of rodents’ holes, back
earth filling of lined portion, provision of material, removal of bhal/silt, repair of culverts,
repair of buffalo wallow, repair of nakkas, embankment, repair of lined portion, provision
of farmer share, decision regarding major changes in watercourses route or nakkas
position at the time of improvement, realignment of the earthen portion, up-rooting of
trees, decision regarding total length and specific section of the watercourses to be lined.
It is too tough to decide the total length of watercourses and specific section to be
lined, because some watercourses lie tangently to the rectangular distribution of land by
revenue department locally known “Qutri khal”. Usually irrigation maps issued by
Irrigation Department are used to calculate the total length and discharge of outlet along
with its FSL (full supply level), bed level and slope used to calculate the section of
watercourses. Usually Assistant Agriculture Engineer (AAE) and Consultant Engineer
117
calculate and decide the total length and cross section of the watercourses according to
standards and specifications. Some watercourses do not lie on the specific route
mentioned by Irrigation Department. So, at the spot, decisions are made whether to
change the rout of watercourses or construct it as it is and also nakkas installation is done
on same basis (Govt. of Punjab, 2004).
The respondents were asked about the degree of farmers’ participation in
watercourses improvement and maintenance activities undertaken so far using a five
point Likert scale i.e. 1= very low, 2= low, 3= medium, 4= high and 5= very high. Their
responses are presented in Table 2 (Appendix-II). Based on their responses, the activities
were ranked using the same procedure as mentioned earlier in 4.4.8. The means, SD and
WS are presented in Table 21.
Table 21: Ranking of watercourse improvement and maintenance activities
undertaken so far based on the level of farmers’ participation
Activities WS Rank Mean SD
Removal of bhal/slit 1658 1 4.42 0.66
Removal of vegetation 1654 2 4.41 0.68
Filling of rodent’s holes 1502 3 4.01 0.90
Decision regarding major changes 1390 4 3.71 0.52
Decision regarding total length 1385 5 3.69 0.55
Back earth filling 1121 6 2.99 0.90
Realignment 1073 7 2.86 0.82
Repair of nakkas 1051 8 2.80 0.90
Up-Rooting of trees 991 9 2.64 0.84
Provision of labor 977 10 2.61 0.70
Repair of lined portion 971 11 2.59 0.74
Provision of material 966 12 2.58 0.70
Embankment 939 13 2.50 0.97
Provision of farmer’ share 899 14 2.40 0.66
Repair of culverts 803 15 2.14 0.62
Repair of buffalo wallow 679 16 1.81 0.84
SD = Standard deviation; WS = Weighted score
118
The data presented in Table 21 show the ranking of various watercourse
improvement and maintenance activities undertaken so far based on farmers’
participation. Removal of silt/bhal, removal of vegetation and filling of rodents’ holes
were ranked at 1st, 2nd and 3rd positions. The mean values with respect to these activities
indicate that farmers’ participation level was somewhere between high and very high
categories. Decision regarding major changes in watercourses route and decision
regarding total length of the watercourses were ranked at 4thand 5thpositions. The mean
values with respect to these activities indicate that farmers’ participation level was
between medium and high categories. Back earth filling, realignment of earthen portion,
repair of nakkas uprooting of trees, provision of labor, repair of lined potion and
provision of material were ranked at 6th, 7th, 8th, 9th, 10th 11th and 12th positions. The mean
values with respect to these activities indicate that farmers’ participation level was
between low and medium tending towards medium category. Embankment, provision of
farmer share and repair of culverts were ranked at 13th, 14th and 15th positions. The mean
values with respect to these activities indicate that farmers’ participation level was
between low and medium tending towards low category. Similarly, repair of buffalo
wallow was ranked at 16th position. The mean value with respect to this activity indicates
that farmers’ participation level was between low and very low categories tending
towards low category.
4.5 DISPUTES AMONG THE WATER USERS AND ROLE PLAYED BY
WUAs IN RESOLVING THE DISPUTES
There may be many problems in organizing the WUAs. The past experience of
cooperatives in the rural areas was not encouraging and the rural masses could not be
easily motivated to become the members of the same type of organizations. They only
cooperated with each other when they anticipated the immediate and real benefits of the
organization. When they were asked to contribute funds as share and admission fee, they
hesitated and thought it an undue burden without any reward. There were doubts and
misunderstanding about the functionaries of various nation building departments in minds
of the rural people and when they were asked to undertake development activities, they
quoted the previous experiences and did not readily agree to share any joint venture. This
created difficulties in organizing the rural people. The social realities of village life, i.e.,
119
social feelings, vested interests of local leaders and political confrontation made it much
more difficult to organize successful cooperative. For experimentation in the area of joint
action, homogeneity of the participating community with regard to their needs, structural
composition and social phenomenon was very crucial. But it was impossible to find such
ideal situation on a watercourse. There were some problems from the big land owners
and the farmers on the head of the watercourses during the improvement work (Kausar
and Afzal, 1960). In an environment of increasing water scarcity, problems created by
deteriorating irrigation systems have negatively affected agricultural production and
exacerbated conflicts among farmers (Xie, 2007).
Whenever a group of people is working together, there are chances that some
disputes may arise among the group members. A dispute is created when ideology of two
or more persons differs and they have to work together. In case of watercourses
improvement, many farmers with different backgrounds have to work together. In this
regard, a heap of disputes and problems is created, which is to be resolved, so much time
is consumed in their solution. These problems might be due to many reasons and
backgrounds including political, religious, rivalries among two briadaries (castes) or
families etc. The disputes may emerge on the issues like route of watercourses, specific
section to be lined, bed level, uprooting of trees, removal of bhal/silt and vegetation,
labor provision, ‘nakkas’ (outlets) installation and even demolishing of watercourses.
Some farmers do not allow demolishing their watercourses and when it is done in the
presence of some government officials, they simply lie down in front of machinery and
say that this work will be done over my dead body. Some water thieves do not want
construction of watercourses and deny paying their share.
All the disputes discussed above have to be resolved by WUA and if WUA fails
to play its role in solving them, its popularity among people decreases and trust vanishes
up. At this time, WUA requires a developmental support from government, which is
usually provided by OFWM, revenue and irrigation staff.
4.5.1 Main Causes of Conflicts/Disputes
Conflict can be defined as a struggle over values and claims to scare status, power
and resources in which the aims of the opponents are to neutralize, injure or eliminate
their rivals (Coser, 1965). When two or more persons or groups try to possess the same

120
objective and struggle over the same values, conflicts take place. Conflict is the central
part of the village social structure (Khan, 1997).
Every individual in the community has its own thoughts and views about the
nature, universe and any kind of process undergoing in the community and these views
may differ from the views of other, which is the basic cause of a conflict. Whenever a
work is going against the nature or benefits of a water user, it causes a conflict on
watercourses which leads to many problems. There are many reasons behind the conflict.
The picture on the screen usually does not represent the scenario behind the screen.
The main causes can be rivalry among different ‘briadaries’ (castes), rivalry
among two families, non-corporative behavior of some farmers, water thefts, local
politics or religious conflicts. It is the duty of WUA to resolve the conflicts and decrease
the number of complaints. The responses of the respondents on the main causes of
conflicts/disputes are given in Table 22.
Table 22: Distribution of respondents according to the main causes of
conflicts/disputes
Causes Frequency Percent
Rivalry among different ‘briadaries’ (castes) 331 88.3
Water thefts 263 70.1
Non-cooperative behavior of some farmers 243 64.8
Rivalry among families 176 46.9
Local politics 16 4.3
Religious conflicts 8 2.1
The data presented in Table 22 show that a vast majority (88.3%) of the
respondents thought that rivalry among different ‘briadaries’ was the main cause of the
conflicts/disputes. Similarly a large majority (70.1%) of the respondents was of the view
that water thefts were the main causes of conflicts/disputes among the water users. About
65% of the respondents thought that non-cooperative behavior of some farmers was the
main cause of conflicts/disputes while 46.9% of the respondents thought that rivalry
among families was the main cause of the conflicts. Only 4.3 and 2.1% of the
respondents regarded local politics and religious conflicts as the main causes of
121
conflicts/disputes among the water users, respectively. The results are supported by
Hamad-ur-Rehman (2000) who stated that conflicts among families or briadaries, water
thefts and religious issues are the main causes of conflicts among the water users.
4.5.2 Specific Reasons for Differences/Disputes
Whenever a complaint rises, it has a very strong reason behind it and cannot be
settled unless the reason is properly identified in its true perspective. In case of
watercourses improvement, WUA has to face a heap of differences/disputes and every
difference has its own reason(s). Some common reasons of disputes are discussed below:
Watercourses route may be a main problem as water users generally do not agree
on a specific route. Field situations produce hurdles in deciding about the section of
watercourses to be lined because farmer being unaware of engineering rules, cannot
understand the technicalities, so they disagree. Uprooting of trees in lined and earthen
portion may be a big and common problem. Moreover, removal of shrubs and weeds
requires a tiresome effort. Removal of bhal/silt is a community based action and farmer
would never execute it smoothly due to certain reasons. Farmers look others’ impression
for labor, if one refuses, all others immediately refuse to give labor on the basis of that
person. Also laborer looks each other for work, if one sits for rest, all other stop their
work and do not listen to WUAs’ executives even. Materials at village side are not of
good quality and bringing it from city is costly. Earthen portion is to be realigned again
and again along with the back earth filling of the lined portion, collection of farmer share
may also be a great problem and it can directly effect on going watercourses
improvement work. If ‘nakkas’ (outlets) are not installed in earthen portion the improved
watercourses goes back to same un-improved condition. Culverts are constructed on
watercourses, so that heavy machinery may not disturb the improved watercourses.
Buffalo wallows are constructed on watercourses, so that animals do not enter the
watercourses and damage it (Govt. of Pak., 2004).
The respondents were asked about the specific reasons for differences/disputes
among them and their responses in this regard are given in Table 23.
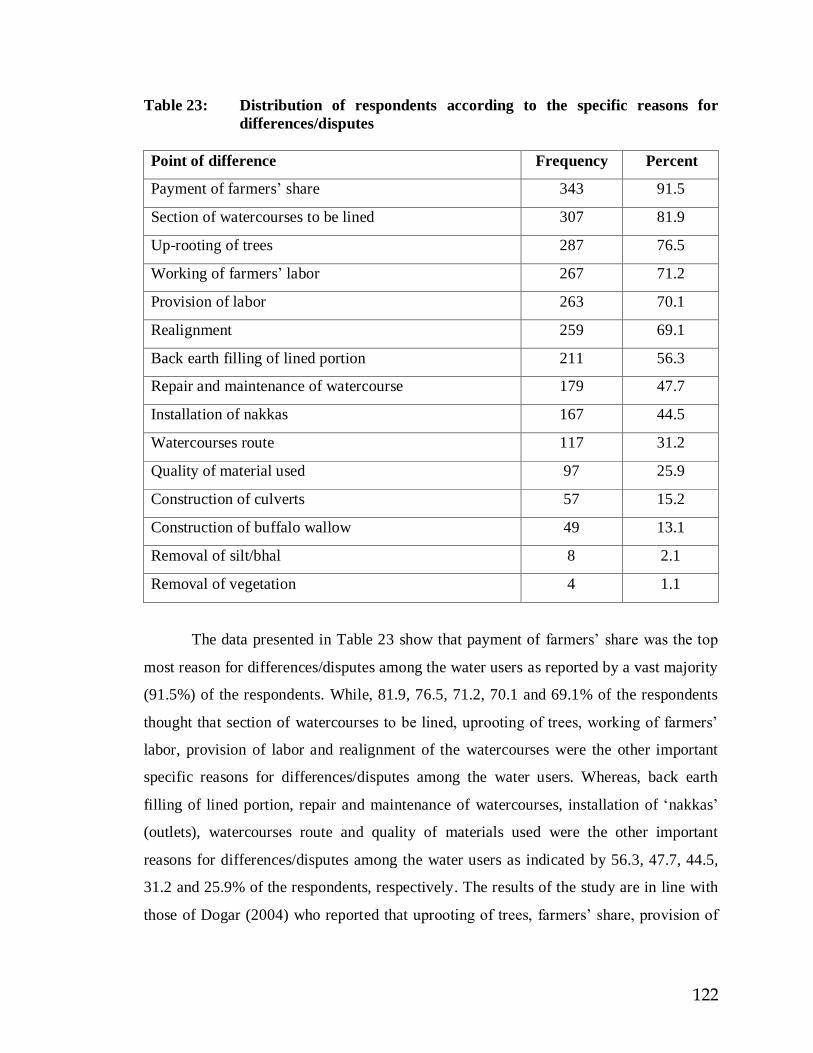
122
Table 23: Distribution of respondents according to the specific reasons for
differences/disputes
Point of difference Frequency Percent
Payment of farmers’ share 343 91.5
Section of watercourses to be lined 307 81.9
Up-rooting of trees 287 76.5
Working of farmers’ labor 267 71.2
Provision of labor 263 70.1
Realignment 259 69.1
Back earth filling of lined portion 211 56.3
Repair and maintenance of watercourse 179 47.7
Installation of nakkas 167 44.5
Watercourses route 117 31.2
Quality of material used 97 25.9
Construction of culverts 57 15.2
Construction of buffalo wallow 49 13.1
Removal of silt/bhal 8 2.1
Removal of vegetation 4 1.1
The data presented in Table 23 show that payment of farmers’ share was the top
most reason for differences/disputes among the water users as reported by a vast majority
(91.5%) of the respondents. While, 81.9, 76.5, 71.2, 70.1 and 69.1% of the respondents
thought that section of watercourses to be lined, uprooting of trees, working of farmers’
labor, provision of labor and realignment of the watercourses were the other important
specific reasons for differences/disputes among the water users. Whereas, back earth
filling of lined portion, repair and maintenance of watercourses, installation of ‘nakkas’
(outlets), watercourses route and quality of materials used were the other important
reasons for differences/disputes among the water users as indicated by 56.3, 47.7, 44.5,
31.2 and 25.9% of the respondents, respectively. The results of the study are in line with
those of Dogar (2004) who reported that uprooting of trees, farmers’ share, provision of

123
labor, installation of nakkas and watercourses route were the main reasons for disputes
among the water users.
4.5.3 Satisfaction Level about the Contribution of WUAs in Resolving the
Differences/Disputes
Prior to establishment of WUAs, Pakistan lacked formal organizations at village
level for watercourse cleaning, maintenance and effective utilization of water on farm.
The major factor constraining the formation of the organization was too absence of legal
sanctions. The laws and regulations for water use as well as the design and operation of
water delivery system did not encourage cooperative efforts among water users at farm
level. The formation of WUAs would provide the institutional framework for improving
irrigation efficiency and increasing agricultural production by getting farmers directly
involved in the local decision making, managing water delivered to the watercourses,
solving some of the problems of small farmers and resolving disputes among users
(Kirkwood and Radsevich, 1975).
The level of satisfaction regarding solutions of the problems and
contribution of WUAs in resolving the disputes may vary among water users. The data
regarding level of satisfaction about the contribution of WUA in resolving the disputes
were collected using a five point Likert scale; 1= very low, 2= low, 3= medium, 4= high
and 5= very high. The results are given in Table 24.
Table 24: Distribution of respondents according to satisfaction level about the
contribution of WUAs in resolving the disputes
Level of satisfaction Frequency Percent
Very low
Low
Medium
High
Very high
0
4
107
244
20
-
1.1
28.5
65.1
5.3
Total 375 100.0
The data presented in Table 24 reveal that only 5.3% of the respondents were
satisfied to a very high level with the contribution of WUAs in resolving the disputes,

124
while a large majority (65.1%) of the respondents was highly satisfied, whereas, 28.5%
of the respondents showed medium level satisfaction, and only 1.1% of the respondents
showed low level of satisfaction about the contribution of WUAs in resolving the
disputes. It can be concluded that by and large the WUAs were working efficiently and
effectively regarding this aspect. However, still there existed a lot of scope for further
improvement. The results of the study are supported by Tufail (2000) who observed that
majority of the respondents were highly satisfied with the role of WUAs in resolving the
disputes among the water users.
4.5.4 Validity of Farmers’ Complaints
It is the duty of WUA to judge the validity of farmers’ complaints which may be
either true or false. The managing committee of WUA being local and familiar to the area
can better analyze the situation to know the real nature of complaints and to come up with
appropriate solutions. There are many ways to judge the validity of complaints, which
include; 1) only listen to the complaintee and take action, these kind of actions can be
referred to as blind action, 2) listen to both the parties and take appropriate action, 3)
judge the situation at site, 4) discuss the issue with government officials (OFWM,
revenue or irrigation departments). The views of respondents on WUAs’ response to
farmers’ complaints are given in Table 25.
Table 25: Distribution of respondents according to the ways WUAs respond to
farmers’ complaints
WUAs’ ways to respond to farmers’ complaints Frequency Percent
Only listen to the complaintee 0 0
Listen to both the parties 371 98.9
Judge the situation at site 369 98.4
Discuss with government officials 113 30.1
The data presented in Table 25 show that all the respondents agreed that
managing committee of WUA never listened to the complaintee only while taking
decisions on various issues of water users. More than 98% respondents thought that

125
WUA listened to both the parties besides judging the situation at site. Only 30.1% of the
respondents were of the view that WUAs discuss farmers’ complaints with government
officials for the solution.
4.5.5 Strategy Adopted by WUAs to Handle the Farmers’ Complaints
Local leadership can overcome the collective action complaints for effective
solutions in particular settings (Vedeld, 2000). The existence of other, non-water related
networks and associations in a community helps resolve collective action complaints
(Isham & Kahkonen, 2002).
Handling of farmers’ complaints in watercourses improvement is an important
task for a WUA. However, if a WUA could not handle the complaints at its own level, it
may try to settle it through other interventions like political leaders, ‘biradary’ (caste)
heads, and OFWM, revenue and irrigation officials. The data regarding some possible
strategies adopted by WUAs to handle the farmers’ complaints are given in Table 26.
Table 26: Distribution of respondents according to the strategies adopted by
WUAs to handle the farmers’ complaints
Handling of farmers’ complaints through: Frequency Percent
Political leaders 54 14.1
Biradary heads 375 100.0
Government officials 165 44.0
The data presented in Table 26 show that 14.1% of the respondents regarded
political leaders’ involvement as a common strategy to resolve the farmers’ complaints.
While, all the respondents regarded biradary (caste) heads’ interventions as a common
strategy to resolve the farmers’ complaints, whereas 44% of the respondents reported
government officials’ involvement in resolving the farmers’ complaints emerged during
the watercourses improvement. The results of the study are supported by Hammad-ur-
Rehman (2000) who stated that biradary (caste) heads play an important role to resolve
the farmers’ complaints but some time involvement of political leaders is necessary to
resolve the issue.
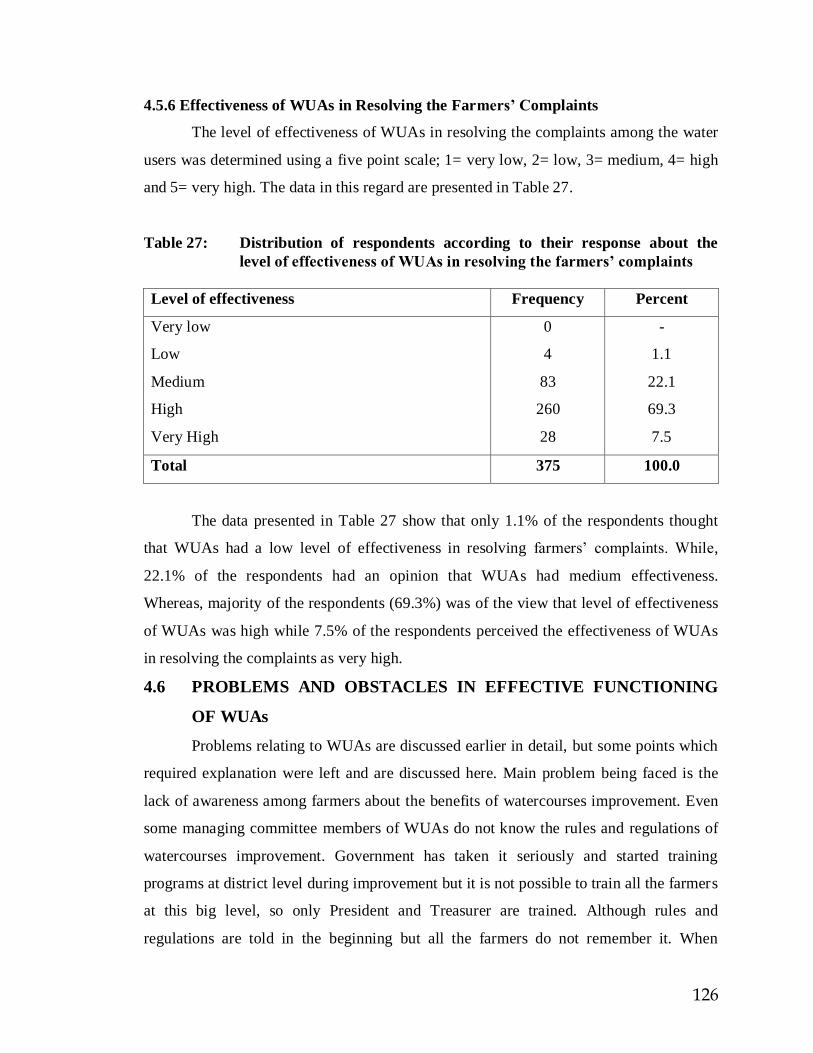
126
4.5.6 Effectiveness of WUAs in Resolving the Farmers’ Complaints
The level of effectiveness of WUAs in resolving the complaints among the water
users was determined using a five point scale; 1= very low, 2= low, 3= medium, 4= high
and 5= very high. The data in this regard are presented in Table 27.
Table 27: Distribution of respondents according to their response about the
level of effectiveness of WUAs in resolving the farmers’ complaints
Level of effectiveness Frequency Percent
Very low
Low
Medium
High
Very High
0
4
83
260
28
-
1.1
22.1
69.3
7.5
Total 375 100.0
The data presented in Table 27 show that only 1.1% of the respondents thought
that WUAs had a low level of effectiveness in resolving farmers’ complaints. While,
22.1% of the respondents had an opinion that WUAs had medium effectiveness.
Whereas, majority of the respondents (69.3%) was of the view that level of effectiveness
of WUAs was high while 7.5% of the respondents perceived the effectiveness of WUAs
in resolving the complaints as very high.
4.6 PROBLEMS AND OBSTACLES IN EFFECTIVE FUNCTIONING
OF WUAs
Problems relating to WUAs are discussed earlier in detail, but some points which
required explanation were left and are discussed here. Main problem being faced is the
lack of awareness among farmers about the benefits of watercourses improvement. Even
some managing committee members of WUAs do not know the rules and regulations of
watercourses improvement. Government has taken it seriously and started training
programs at district level during improvement but it is not possible to train all the farmers
at this big level, so only President and Treasurer are trained. Although rules and
regulations are told in the beginning but all the farmers do not remember it. When

127
watercourses improvement work is started, they create obstacles and even pretend that
they were not told about this work (Govt. of Punjab, 2004).
Another obstacle faced is the least interest on the part of big land lords who are
usually absentee farmers. So whenever construction or earthen work starts, they try to
stop it politically, which even causes the failure of that particular project. So it is
necessary to make prior contact with them and inform them about the terms and
conditions of the project and request them to help out the WUAs. Small land holdings
and lack of cooperation from farmers are other threats to WUAs. Small farmers don’t
have enough wealth and time to spend on watercourses. They are hand to mouth poor
people. So they don’t want any activity that would disturb their budget, so they don’t
cooperate with WUAs (Ibid).
Some problems are created at site in relation to different factors. These problems
cause disturbance in the construction work. These include farmer share collection,
uprooting of trees, demand of extra nakkas, decision about bed level, closing of outlets
and shifting of materials. When there is no sufficient balance in the account, it causes
much problems and even labor does not work, if it doesn’t get wages in evening.
Although trees in the area of right of way of the watercourses are government property,
but farmer, being unaware, does not allow uprooting such trees, thinking it his own
property. When they are uprooted with power, farmers even try to obtain court stay order
against the project. Bed level sometimes is also a problem, farmers being unaware of
engineering measures, create obstacle and switch off whole machinery and even disturb
the bed level and when they are requested, they simply claim extra illegal ‘nakkas’
(outlets) (Ibid).
4.6.1 Problems before the Improvement of Watercourses
Whenever any kind of community based organization is made, it has to face too
many obstacles and problems. In case of WUAs, there is a hell of problems, because they
directly relate to farming community. The main problems before the improvement of
watercourses include: 1) Lack of interest on the part of water users locating at the head of
watercourses: The farmers having their lands on the head of watercourses generally face
no problems regarding water usage and enjoy big opportunities of water theft. Usually
they don’t want watercourses to be constructed either to escape the share or for water
128
theft. 2) Lack of finance on the part of small/poor farmers is a big problem as they
cannot afford the construction/improvement of watercourses. 3) Small land holdings is
also a problem, small farmers are least interested in construction of watercourses. 4) Lack
of unity among the water users is a great problem and farmers hardly unite on anything.
If one agrees, others disagree, so it is difficult to make them think in the same way. 5)
Cooperation among water users is also a great problem as two consecutive farmers
always quarrel for all types of resources. They have a common problem of “banna” the
border between two consecutive acres and some water users also have problems like
water usage, crop damage by cattle etc. 6) Ignorance about the benefits of watercourses
improvement is very important. The farmer should be aware of benefits of watercourses
improvement. If they don’t see any kind of benefits in it, they do not take part actively.
Our community only thinks for personal interests, not public interest. 7) Lack of interest
on the part of big land lords in watercourses improvement sometimes creates hurdles. If
watercourse is being constructed without having a big land lord in or with WUA, he feels
insult and creates problems/obstacles in the improvement process. If a farmer does not
know procedure and steps of watercourses improvement, he will create hurdles. So it is
the duty of WUAs to take care of all such problems for the smooth running of
watercourses improvement (Govt. of Punjab, 2004).
The respondents were asked about the problems and to indicate their perceptions
regarding the problems before the improvement of watercourses using a five point Likert
scale i.e. 1= very low, 2= low, 3= medium, 4= high and 5= very high. Their responses are
presented in Table 3 (Appendix-II). Based on their responses, the problems were ranked
according to the weighted score computed by multiplying the score value allotted to each
category of the scale with the frequency count and then adding up the same for each
problem. The weighted scores along with the means and SD are presented in Table 28.

129
Table 28: Ranking of various problems in the effective functioning of WUAs
before the improvement of watercourses
Problems WS Rank Mean SD
Lack of finance on the part of small/poor farmers 1314 1 3.50 0.61
Lack of interest on the part of big land lords 1265 2 3.37 0.58
Lack of unity among the water users 1252 3 3.34 0.67
Ignorance about the benefits of w/c improvement 1243 4 3.31 0.56
Lack of interest of water users locating at the head 1179 5 3.14 0.80
Small land holdings 1117 6 2.98 0.85
SD = Standard deviation; WS = Weighted score
The data presented in Table 28 show that lack of finance on the part of small/poor
farmers was ranked at 1st with weighted score of 1314 and mean value of 3.50. While,
lack of interest on the part of big landlords was rank at 2nd position with weighted score
of 1265 and mean value of 3.37. Lack of unity among the water users, ignorance about
the benefits of watercourses improvement and lack of interest on the part of water users
locating at the head of watercourses were ranked at 3rd, 4th and 5th positions with weighted
score 1252, 1243 and 1179 with mean values of 3.34, 3.31 and 3.14 respectively. Small
land holdings were ranked at 6th and the lowest position with weighted score of 1117 and
mean value of 2.98.
4.6.2 Problems during the Improvement of Watercourses
The problems a WUA has to face during improvement of watercourses may
include; 1) up-routing of trees, which is a big problem, 2) demolishing of watercourses
for which tractor excavator has to enter the fields and crop is damaged, 3) collection of
farmer share especially from the farmers locating at the head of watercourses and from
small/poor farmers, 4) resistance from farmers for closing of outlet during pacca
watercourses improvement because of critical days of crop, so the government has to stop
water flow through irrigation department, 5) illegal demands for extra nakkas (outlets), 6)
watercourses alignment is another problem as some farmers do not agree on the
watercourses alignment, 7) decision regarding watercourses route is another problem as
discussed earlier that irrigation map and actual position of watercourses both are quite
130
different, 8) difficulty in shifting of material especially when a watercourses has no road
or katcha road along with it. Mostly WUAs on the behalf of OFWM officials announce to
leave 15 feet or more land across both sides of watercourses for this purpose but
generally farmers do not act upon it, 9) non-provision of labor for katcha improvement,
10) difficulty in acquiring material for pacca watercourses improvement, as WUAs have
to purchase it on credit because Govt. share comes only when standards and specification
are fulfilled, 11) non-cooperation by the Revenue department, 12) non-cooperation by the
OFWM staff, 13) non-cooperation from Irrigation department, 14) improper record
keeping of farmers’ share, 15) improper record keeping of materials used for the
watercourses improvement, 16) quality of bricks is an important problem, 17) acceptance
of bed level of watercourses is another problem, 18) improper cement sand ratios, 19)
quality of cement being purchased for watercourses improvement, 20) quality of nakkas
being purchased for watercourses improvement as per recommended by the Govt.
department, 21) acceptance of watercourses design and cost estimate is another important
problem (Govt. of Punjab, 2004).
The respondents were asked about the problems and to indicate their perceptions
regarding the problems during the improvement of watercourses using a five point Likert
scale i.e. 1= very low, 2= low, 3= medium, 4= high and 5= very high. Their responses are
presented in Table 4 (Appendix-II). Based on their responses, the problems were ranked
using the same procedure as mentioned earlier in 4.6.1. The means, SD and WS are
presented in Table 29.
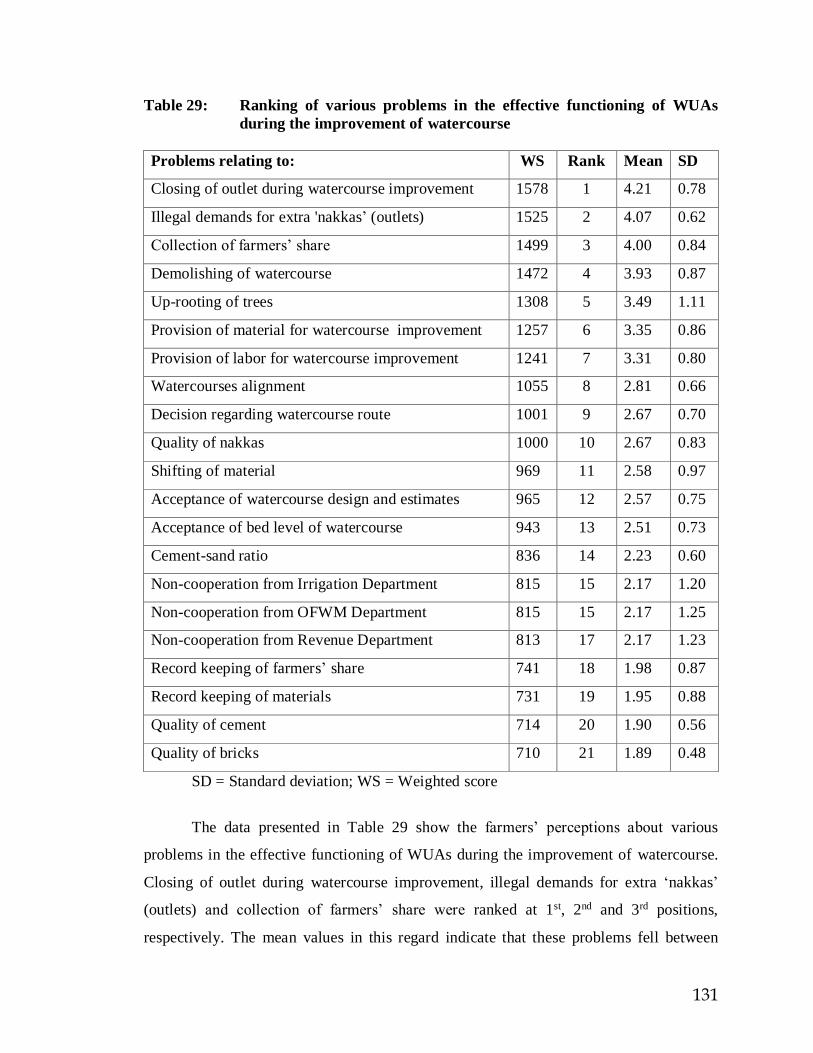
131
Table 29: Ranking of various problems in the effective functioning of WUAs
during the improvement of watercourse
Problems relating to: WS Rank Mean SD
Closing of outlet during watercourse improvement 1578 1 4.21 0.78
Illegal demands for extra 'nakkas’ (outlets) 1525 2 4.07 0.62
Collection of farmers’ share 1499 3 4.00 0.84
Demolishing of watercourse 1472 4 3.93 0.87
Up-rooting of trees 1308 5 3.49 1.11
Provision of material for watercourse improvement 1257 6 3.35 0.86
Provision of labor for watercourse improvement 1241 7 3.31 0.80
Watercourses alignment 1055 8 2.81 0.66
Decision regarding watercourse route 1001 9 2.67 0.70
Quality of nakkas 1000 10 2.67 0.83
Shifting of material 969 11 2.58 0.97
Acceptance of watercourse design and estimates 965 12 2.57 0.75
Acceptance of bed level of watercourse 943 13 2.51 0.73
Cement-sand ratio 836 14 2.23 0.60
Non-cooperation from Irrigation Department 815 15 2.17 1.20
Non-cooperation from OFWM Department 815 15 2.17 1.25
Non-cooperation from Revenue Department 813 17 2.17 1.23
Record keeping of farmers’ share 741 18 1.98 0.87
Record keeping of materials 731 19 1.95 0.88
Quality of cement 714 20 1.90 0.56
Quality of bricks 710 21 1.89 0.48
SD = Standard deviation; WS = Weighted score
The data presented in Table 29 show the farmers’ perceptions about various
problems in the effective functioning of WUAs during the improvement of watercourse.
Closing of outlet during watercourse improvement, illegal demands for extra ‘nakkas’
(outlets) and collection of farmers’ share were ranked at 1st, 2nd and 3rd positions,
respectively. The mean values in this regard indicate that these problems fell between

132
high and very high categories. The demolishing of watercourse, uprooting of trees,
provision of material for watercourse improvement and provision of labor for
watercourse improvement were ranked at 4nd, 5rd, 6th and 7th positions, respectively. The
mean values in this regard indicate that these problems fell between medium and high
tending towards high category. The watercourse alignment, decision regarding
watercourse route and qualities of nakkas, shifting of material, acceptance of watercourse
design and cost estimates, acceptance of bed level of watercourse, cement-sand ratio,
non-cooperation from irrigation department, non-cooperation from OFWM department
and non-cooperation from revenue department were ranked at 8th, 9th, 10th, 11th 12th, 13th,
14th, 15th, 16th and 17th positions, respectively. The mean values in this regard indicate
that these problems fell between low and medium tending towards medium category. The
recording keeping of farmers’ share, recording keeping of materials, quality of cement
and quality of bricks were ranked at 18th, 19th, 20th and 21st positions, respectively. The
mean values in this regard indicate that these problems fell between low and very low
tending towards low category.
4.6.3 Problems after the Improvement of Watercourse
These problems basically relate to; 1) provision of labor for dressing/repair of
watercourses, 2) back earth filling of lined portion, 3) removal of vegetation, 4) removal
of bhal/silt, 5) repair of nakkas, 6) repair of culverts, 7) repair of buffalo wallow, 8) repair
of lined portion and 9) filling of rodents’ holes (Govt. of Punjab, 2004).
The respondents were asked about the problems and to indicate their perceptions
regarding the problems after the improvement of watercourse using a five point Likert
scale i.e. 1= very low, 2= low, 3= medium, 4= high and 5= very high. Their responses are
presented in Table 5 (Appendix-II). Based on their responses, the problems were ranked
using the same procedure as mentioned earlier in 4.6.1. The means, SD and WS are
presented in Table 30.

133
Table 30: Ranking of various problems in the effective functioning of WUAs
after the improvement of watercourses
Problems relating to: WS Rank Mean SD
Provision of labor for dressing/repair of watercourses 1235 1 3.29 0.59
Repair of lined portion 1221 2 3.26 0.73
Back earth filling 1153 3 3.07 0.86
Repair of culverts 1113 4 2.97 0.98
Repair of nakkas 1061 5 2.83 0.85
Repair of buffalo wallow 915 6 2.44 0.95
Filling of rodent’s holes 835 7 2.23 0.64
Removal of bhal/silt 725 8 1.93 0.55
Removal of vegetation 725 8 1.93 0.56
SD = Standard deviation; WS = Weighted score
The data presented in Table 30 show the level of farmers’ perceptions about
various problems in the effective functioning of WUAs after the improvement of
watercourses. The provision of labor for decreasing/repair of watercourses, repair of lined
portion and back earth filling of lined portion were ranked at 1st, 2nd and 3rd positions,
respectively. The mean values in this regard indicate that these problems fell between
high and very high tending towards high category. The repair of culverts, ‘nakkas’
(outlets), buffalo wallow and filling of rodents’ holes were ranked 4th, 5th, 6th and 7th
positions, respectively. The mean values with respect to these problems indicate that
these problems fell between high and medium tending towards medium category. The
removal of silt/bhal and vegetation were ranked at last but same positions. The mean
values with respect to these problems indicate that these problems fell between low and
very low tending towards low category.

134
4.7 FUTURE SCOPE OF WUAs
4.7.1 Expected Level of Effectiveness of WUAs in Future
Assessing the performance of WUAs is a complex task. Literature associates a
large number of parameters with their success and failure. Participatory Irrigation
Management (PIM) is a distinct model for irrigation management, which involves
farmers organized in the form of a WUA in the management of their irrigation systems at
the local level. Bhatt (2012) argues that there are many complex problems with the
functioning of PIM, due to which, its progress is indolent. These problems emanate from
various fronts; and are concerned with implementation of PIM at the grassroots level due
to: i) the attitude of farmers, ii) organizational inadequacy of WUAs, iii) systemic issues
originating from the Irrigation Department and iv) operational issues in day to day
functioning of WUAs. Issues with the farmers are attitudinal in nature. Researchers have
identified farmers’ feeling, their lack of initiative, over dependence on the government
and reluctance to participate in the activities of WUA, absence of amiable leadership,
insufficient knowledge of technical issues, lack of homogeneity in caste and class, lack of
unifying community organizations, inequity between head and tail enders, lesser adoption
of profitable crops requiring more water and lack of involvement of tenant farmers in the
functioning of the WUAs. While, organizational issues include long delays in the process
of formation of a WUA, parallel functioning of WUAs and village level government
institutions, lack of political support for WUAs, difficulty in enforcing rules, lack of
cooperation between the WUAs and the irrigation department in providing training and
capacity building to the farmers and insufficient involvement of NGOs and lack of
supplementary sources of income for the WUAs (Gulati et al., 2005).
General issues comprise corruption in the irrigation department, poor main system
management leading to ineffective control of the WUAs over the actual time and quantity
of water availability, lack of provision for allowing WUAs to refuse payment of service
fee to the irrigation department in case they are dissatisfied with the quantity and timing
of water supply. Operational issues arise from the lack of financial provision to meet
operational costs; knowledge about record keeping and accounting procedures;
cooperation from other members; funds for operation and maintenance; a mechanism to
monitor the quality of work; full recovery of service fee particularly from influential
135
farmers; a stronger voice for WUAs in decisions regarding water allocation; ability to
check unauthorized lifting; ability to address inequities in water distribution; and
exclusion of the poor, small and marginal farmers in the decision-making (Bhatt, 2012).
Apart from the reasons of failure of WUAs, the indicators of their success have
also been discussed in a cross country analysis by Mukherjee et al. (2010), who listed
improvement in irrigation service fee collection rate, financial viability of WUA,
functional condition of infrastructure, equitable distribution of water between head and
tail, reliability and adequacy in water distribution, awareness of and participation in
WUA activities, reduction in frequency of disputes as essential characteristics of a
successful and sustainable WUA.
Keeping in view the existing functioning/performance, the respondents were
asked about various aspects relating to WUAs and to indicate their perceptions regarding
the expected level of effectiveness of WUAs in future using a five point Likert scale i.e.
1= very low, 2= low, 3= medium, 4= high and 5= very high. Their responses are
presented in Table 6 (Appendix-II). Based on their responses, the aspects were ranked
according to the weighted score computed by multiplying the score value allotted to each
category of the scale with the frequency count and then adding up the same for each
aspect. The weighted scores along with the means and SD are presented in Table 31.
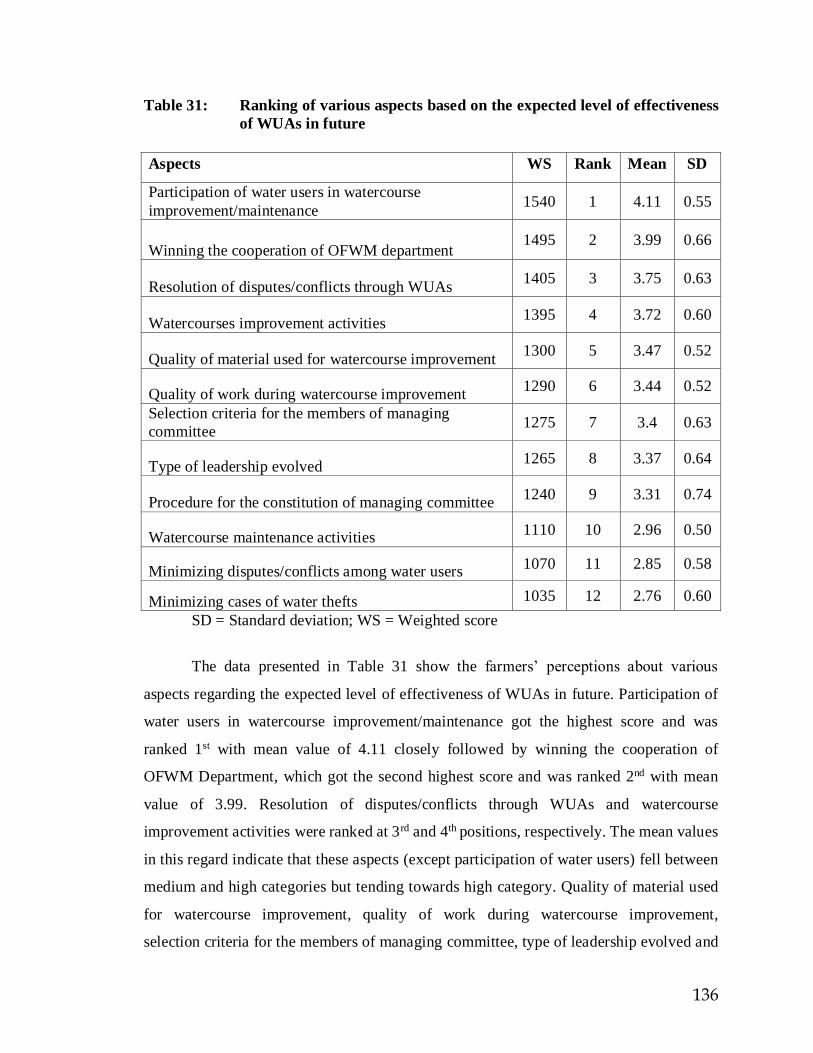
136
Table 31: Ranking of various aspects based on the expected level of effectiveness
of WUAs in future
SD = Standard deviation; WS = Weighted score
The data presented in Table 31 show the farmers’ perceptions about various
aspects regarding the expected level of effectiveness of WUAs in future. Participation of
water users in watercourse improvement/maintenance got the highest score and was
ranked 1st with mean value of 4.11 closely followed by winning the cooperation of
OFWM Department, which got the second highest score and was ranked 2nd with mean
value of 3.99. Resolution of disputes/conflicts through WUAs and watercourse
improvement activities were ranked at 3rd and 4th positions, respectively. The mean values
in this regard indicate that these aspects (except participation of water users) fell between
medium and high categories but tending towards high category. Quality of material used
for watercourse improvement, quality of work during watercourse improvement,
selection criteria for the members of managing committee, type of leadership evolved and
Aspects WS Rank Mean SD
Participation of water users in watercourse
improvement/maintenance 1540 1 4.11 0.55
Winning the cooperation of OFWM department 1495 2 3.99 0.66
Resolution of disputes/conflicts through WUAs 1405 3 3.75 0.63
Watercourses improvement activities 1395 4 3.72 0.60
Quality of material used for watercourse improvement 1300 5 3.47 0.52
Quality of work during watercourse improvement 1290 6 3.44 0.52
Selection criteria for the members of managing
committee 1275 7 3.4 0.63
Type of leadership evolved 1265 8 3.37 0.64
Procedure for the constitution of managing committee 1240 9 3.31 0.74
Watercourse maintenance activities 1110 10 2.96 0.50
Minimizing disputes/conflicts among water users 1070 11 2.85 0.58
Minimizing cases of water thefts 1035 12 2.76 0.60

137
procedure for the constitution of managing committee were ranked at 5th, 6th, 7th, 8th and
9th positions, respectively. The mean values in this regard indicate that these aspects fell
between medium and high categories but tending towards medium category. Watercourse
maintenance activities, minimizing disputes/conflicts among water users and minimizing
cases of water thefts were ranked at 10th, 11th and 12th positions, respectively. The mean
values in this regard indicate that these aspects fell between low and medium but tending
towards medium category. So these were the aspects about which the respondents were
expecting below average effectiveness in future.
4.7.2 Expected Overall Performance of WUAs in Future
The respondents were asked about various aspects relating to WUAs and to
indicate their perceptions regarding the expected overall performance of WUAs in future
using a five point Likert scale i.e. 1= very low, 2= low, 3= medium, 4= high and 5= very
high. Their responses are presented in Table 7 (Appendix-II). Based on their responses,
the aspects were ranked using the same procedure as mentioned earlier in 4.7.1. The
means, SD and WS are presented in Table 32.
Table 32: Ranking of various aspects based on the expected overall performance
of WUAs in future
SD = Standard deviation; WS = Weighted score
The data presented in Table 32 show the level of farmers’ perceptions about
various aspects of WUAs and the expected overall performance of WUAs in future.
Productivity enhancement as a result of watercourse improvement/maintenance was
ranked at the top with mean value of 4.40 closely followed by water saving through
watercourse improvement/maintenance, which was ranked at 2nd position with mean
Aspects WS Rank Mean SD
Productivity enhancement as a result of
watercourse improvement/maintenance 1650 1 4.40 0.542
Water saving through watercourse
improvement/maintenance 1640 2 4.37 0.484
Interest of water users in watercourse
improvement/maintenance 1525 3 4.07 0.574
Attitude of water users towards watercourse
improvement/maintenance 1510 4 4.03 0.462
Knowledge of water users about the benefits
of watercourse improvement 1070 5 2.85 0.509
138
value of 4.37. The mean values indicate that these aspects fell between high and very
high categories but tending towards high category. Interest of water users in watercourse
improvement/maintenance and attitude of water users towards watercourse
improvement/maintenance were ranked at 3rd and 4th positions, respectively. The mean
values indicate that these aspects fell between high and very high categories but tending
towards high category. Knowledge of water users about the benefits of watercourse
improvement was ranked at 5th position. The mean value indicates that this aspect fell
between low and medium categories but tending towards medium category. It clearly
indicates that respondents were expecting below average overall performance of WUAs
in future with regard to knowledge of water users about the benefits of watercourse
improvement.
4.7.3 Continuation of WUAs to Play Effective Role in Future
The formal WUAs could be developed in a village for successful launching of the
watercourse improvement program. Such associations should be organized under the
supervision of the government technical experts for cleaning and maintenance of
watercourse in view of high delivery efficiency obtainable after improvement (Saeed,
1978). The purpose of WUAs is to get the maximum water out of their allocated supply.
But the critical problem has been that of effectively organizing farmers especially for the
maintenance of watercourses after improvement. Frequent and regular maintenance was
essential if the farmers were to reap the benefits of watercourses improvement. Thus,
there was a need to design, develop and diffuse an important institutional arrangement of
the shareholders on each watercourse. It was recommended by experts that farmers on
each watercourse should be organized into WUA (Saqib, 1981).
Improvement of watercourses and formation of WUA is not only a well-received
idea for the reduction of water losses which occur during its conveyance from outlet to
the farm but also an indirect major tool for rural development, since it prepares the
peasantry for a cooperative action through imbibing and instilling in them the much
needed cooperative spirit. In about 37 countries of the world, the Association is traced to
appear under various titles such as WUAs, Irrigators’ Association, Community of
Irrigators or some similar names with the basic objective of operating, maintaining and
rehabilitating the water system in efficient and effective manner and assisting in proper

139
application of water on the farm (Ashraf, 1977). Murray-Rust and Snellen, (1993) found
that to improve the effectiveness of WUAs and to ensure that they are more compatible
with the local situation, it is important to review their progress and difficulties that they
face. One of the fundamental tasks of a WUA is to accurately plan irrigation water
requirements for the growing season and ensure the implementation of the plan. WUAs
were useful to safeguard farmers’ interests, to help reduce labor inputs and disputes about
water, to reduce irrigation costs, and to promote efficient water use (Qiao et al., 2009).
As far as the future of WUAs is concerned, the respondents do have sufficient experience
about the functioning/performance of WUAs upon which they can perceive the future
prospects of WUAs. Therefore, they were asked whether or not the WUAs will continue
to play effective role in future and their responses in this regard are given in Table 33.
Table 33: Distribution of respondents according to the continuation of WUAs to
play effective role in future
Will WUAs continue to play effective role in future? Frequency Percent
Yes
No
286
89
76.3
23.7
Total 375 100.0
The data presented in Table 33 depict that a large majority (76.3%) of the
respondents thought that WUAs will continue to play effective role in future while about
one-fourth (23.7%) of the respondents were having opposite views. It means, by
upholding the views of large majority, government should take initiative to sustain and
ensure the continuity of WUAs and also focus on the weak areas to make further
improvement in the system.
140
4.8 RELATIONSHIP BETWEEN DEPENDENT AND INDEPENDENT
VARIABLES
It is thought that socio-economic characteristics like age, education, land holding
and location of land of the respondents with respect to watercourses affect their
participation in watercourse improvement and maintenance activities, level of satisfaction
about watercourse improvement and maintenance activities and frequency of watercourse
cleaning. Socio-economic characteristics of the respondents played an important role in
determining their attitude towards the adoption or rejection of new ideas (Lynne et al.,
1995). In order to determine the relationship between dependent and independent
variables, Chi-square test was used.
Water users’ participation in watercourses improvement activities was calculated
by considering the number of activities participated and the extent of participation
reported by each respondent. The participation score was calculated on a five point Likert
scale ranging from 1 (very low) to 5 (very high) to get overall score for each respondent
by using a participation index. The respondents were divided into three groups i.e. low,
medium, and high on the basis of participation score in watercourse improvement
activities. The level of satisfaction was also calculated using the same procedure. The
respondents were divided into three groups i.e. low, medium, and high on the basis of
satisfaction score in watercourse improvement activities. While, according to the
frequency of watercourses cleaning, they were divided into four categories i.e. monthly,
bimonthly, quarterly and twice a year. The relationships of all above mentioned variables
are discussed in the following Tables:

141
Table 34: Relationship between age of the respondents and their level of
participation in watercourse improvement activities
Age Level of participation
Total Low Medium High
<= 40 58 67 42 167
43.9% 48.9% 39.6% 44.5%
41 – 50 24 26 28 78
18.2% 19.0% 26.4% 20.8%
51 – 60 30 20 18 68
22.7% 14.6% 17.0% 18.1%
60+ 20 24 18 62
15.2% 17.5% 17.0% 16.5%
Total 132 137 106 375
100.0% 100.0% 100.0% 100.0%
Chi-Square = 6.24 NS; d.f. = 6; Prob. = 0.397
The data presented in Table 34 indicate that the relationship between age of the
respondents and their level of participation in watercourse improvement activities was
non-significant. It means that the age of the respondents and their level of participation
were independent of each other. The findings of the study are supported by Talebi and
Tajeddin, (2011) who reported that the association between age of the respondents and
their level of participation was non-significant.
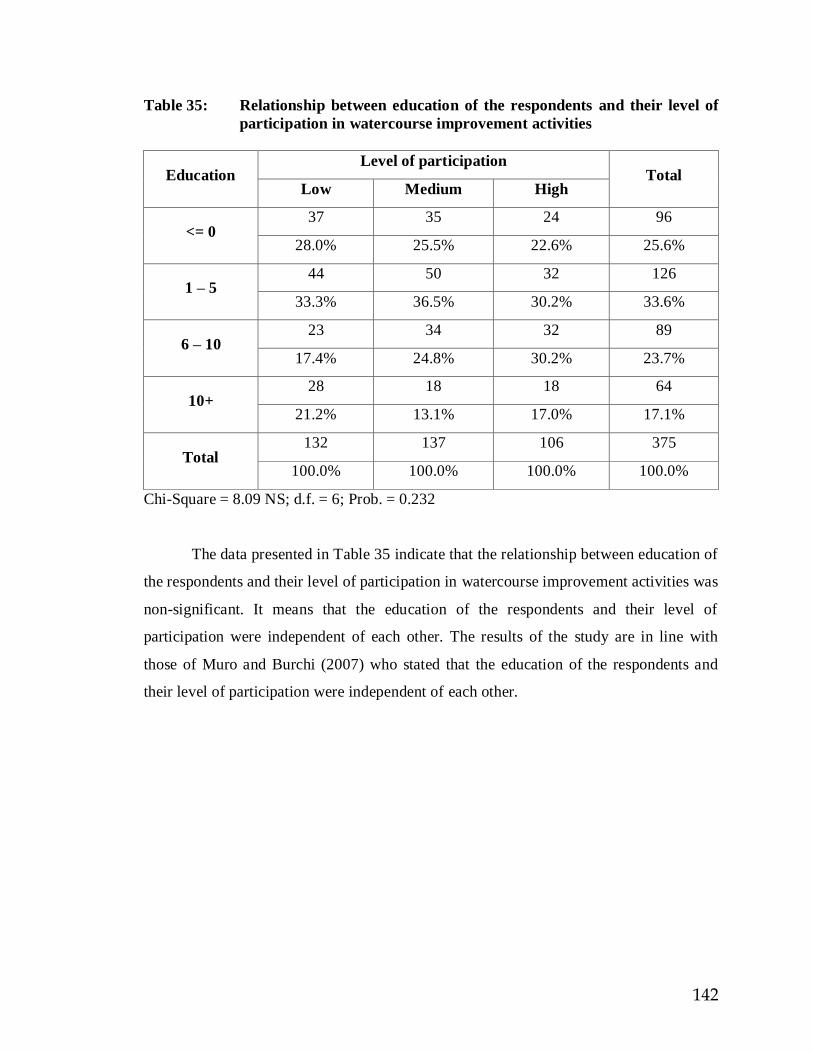
142
Table 35: Relationship between education of the respondents and their level of
participation in watercourse improvement activities
Education Level of participation
Total Low Medium High
<= 0 37 35 24 96
28.0% 25.5% 22.6% 25.6%
1 – 5 44 50 32 126
33.3% 36.5% 30.2% 33.6%
6 – 10 23 34 32 89
17.4% 24.8% 30.2% 23.7%
10+ 28 18 18 64
21.2% 13.1% 17.0% 17.1%
Total 132 137 106 375
100.0% 100.0% 100.0% 100.0%
Chi-Square = 8.09 NS; d.f. = 6; Prob. = 0.232
The data presented in Table 35 indicate that the relationship between education of
the respondents and their level of participation in watercourse improvement activities was
non-significant. It means that the education of the respondents and their level of
participation were independent of each other. The results of the study are in line with
those of Muro and Burchi (2007) who stated that the education of the respondents and
their level of participation were independent of each other.

143
Table 36: Relationship between land holding of the respondents and their level
of participation in watercourse improvement activities
Land holding Level of participation
Total Low Medium High
<= 5 24 28 18 70
18.2% 20.4% 17.0% 18.7%
6 – 12.5 76 69 56 201
57.6% 50.4% 52.8% 53.6%
12.5 – 25 26 28 26 80
19.7% 20.4% 24.5% 21.3%
25+ 6 12 6 24
4.5% 8.8% 5.7% 6.4%
Total 132 137 106 375
100.0% 100.0% 100.0% 100.0%
Chi-Square = 3.79 NS; d.f. = 6; Prob. = 0.705
The data presented in Table 36 indicate that their existed non-significant
relationship between the size of land holding of the respondents and their level of
participation in watercourse improvement activities. It means that the size of land holding
and level of participation of the respondents were independent of each other. The results
are not in agreement with those of Chaudary (2006) who found that their existed a
significant relationship between the size of land holding and level of participation of the
respondents.
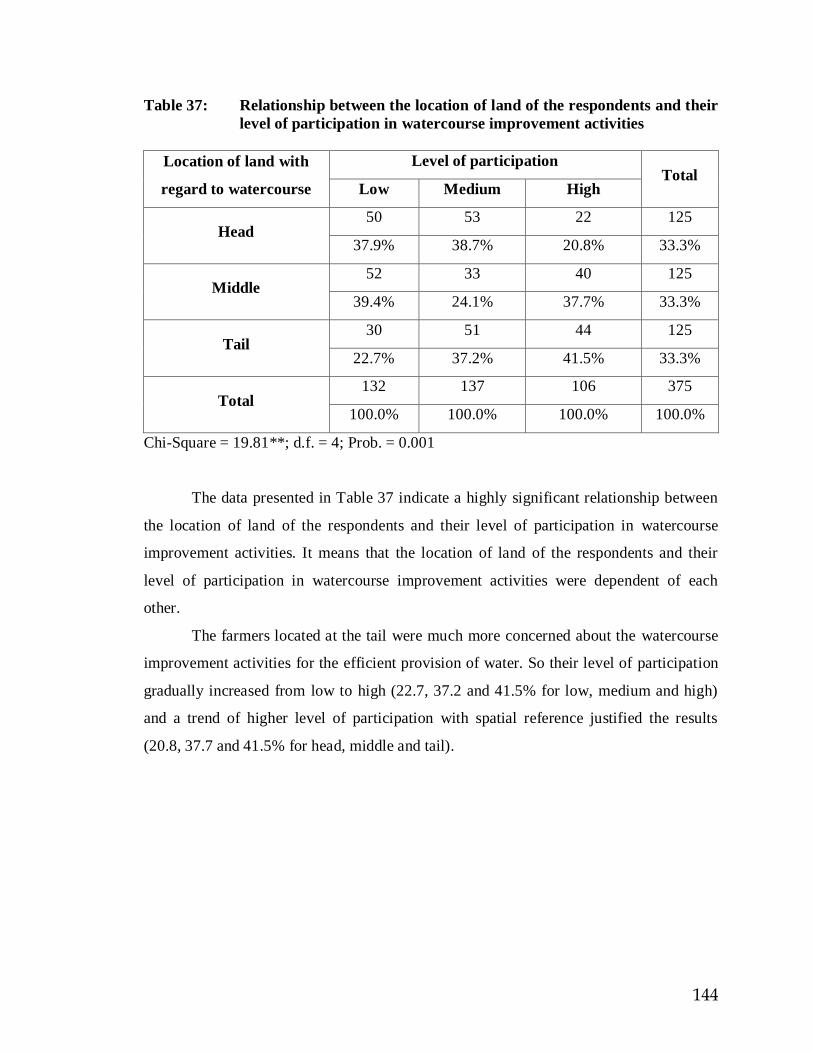
144
Table 37: Relationship between the location of land of the respondents and their
level of participation in watercourse improvement activities
Location of land with
regard to watercourse
Level of participation Total
Low Medium High
Head 50 53 22 125
37.9% 38.7% 20.8% 33.3%
Middle 52 33 40 125
39.4% 24.1% 37.7% 33.3%
Tail 30 51 44 125
22.7% 37.2% 41.5% 33.3%
Total 132 137 106 375
100.0% 100.0% 100.0% 100.0%
Chi-Square = 19.81**; d.f. = 4; Prob. = 0.001
The data presented in Table 37 indicate a highly significant relationship between
the location of land of the respondents and their level of participation in watercourse
improvement activities. It means that the location of land of the respondents and their
level of participation in watercourse improvement activities were dependent of each
other.
The farmers located at the tail were much more concerned about the watercourse
improvement activities for the efficient provision of water. So their level of participation
gradually increased from low to high (22.7, 37.2 and 41.5% for low, medium and high)
and a trend of higher level of participation with spatial reference justified the results
(20.8, 37.7 and 41.5% for head, middle and tail).
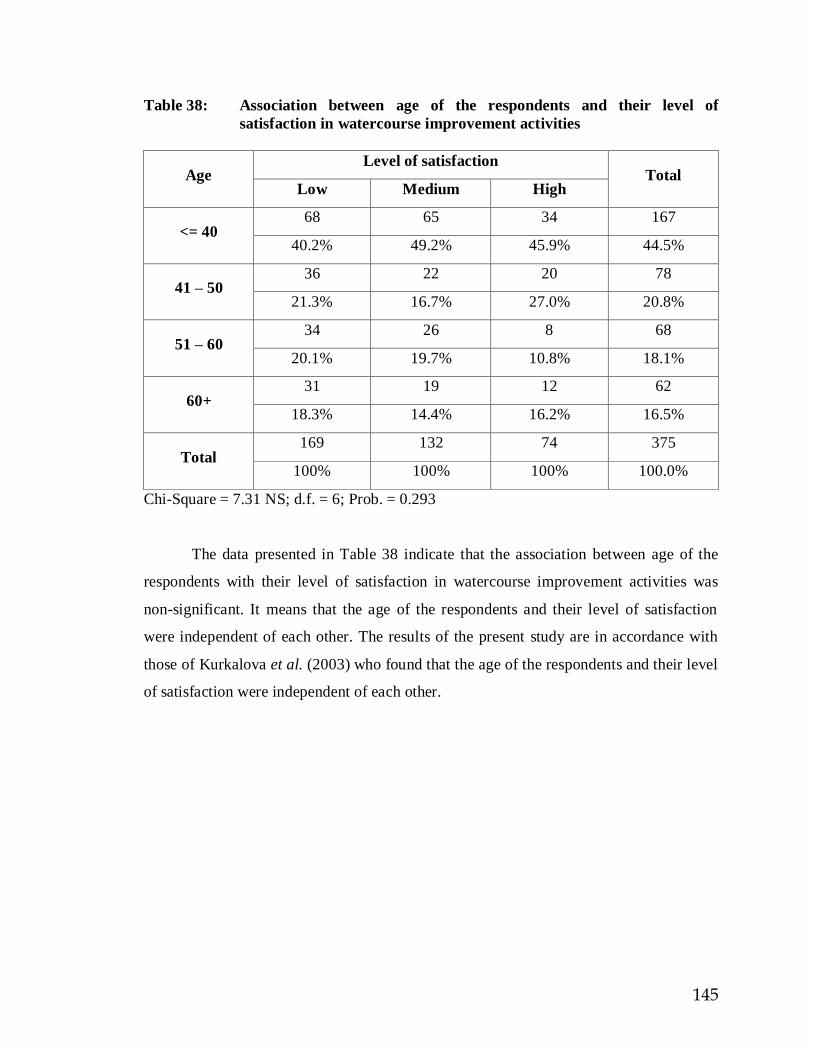
145
Table 38: Association between age of the respondents and their level of
satisfaction in watercourse improvement activities
Age Level of satisfaction
Total Low Medium High
<= 40 68 65 34 167
40.2% 49.2% 45.9% 44.5%
41 – 50 36 22 20 78
21.3% 16.7% 27.0% 20.8%
51 – 60 34 26 8 68
20.1% 19.7% 10.8% 18.1%
60+ 31 19 12 62
18.3% 14.4% 16.2% 16.5%
Total 169 132 74 375
100% 100% 100% 100.0%
Chi-Square = 7.31 NS; d.f. = 6; Prob. = 0.293
The data presented in Table 38 indicate that the association between age of the
respondents with their level of satisfaction in watercourse improvement activities was
non-significant. It means that the age of the respondents and their level of satisfaction
were independent of each other. The results of the present study are in accordance with
those of Kurkalova et al. (2003) who found that the age of the respondents and their level
of satisfaction were independent of each other.
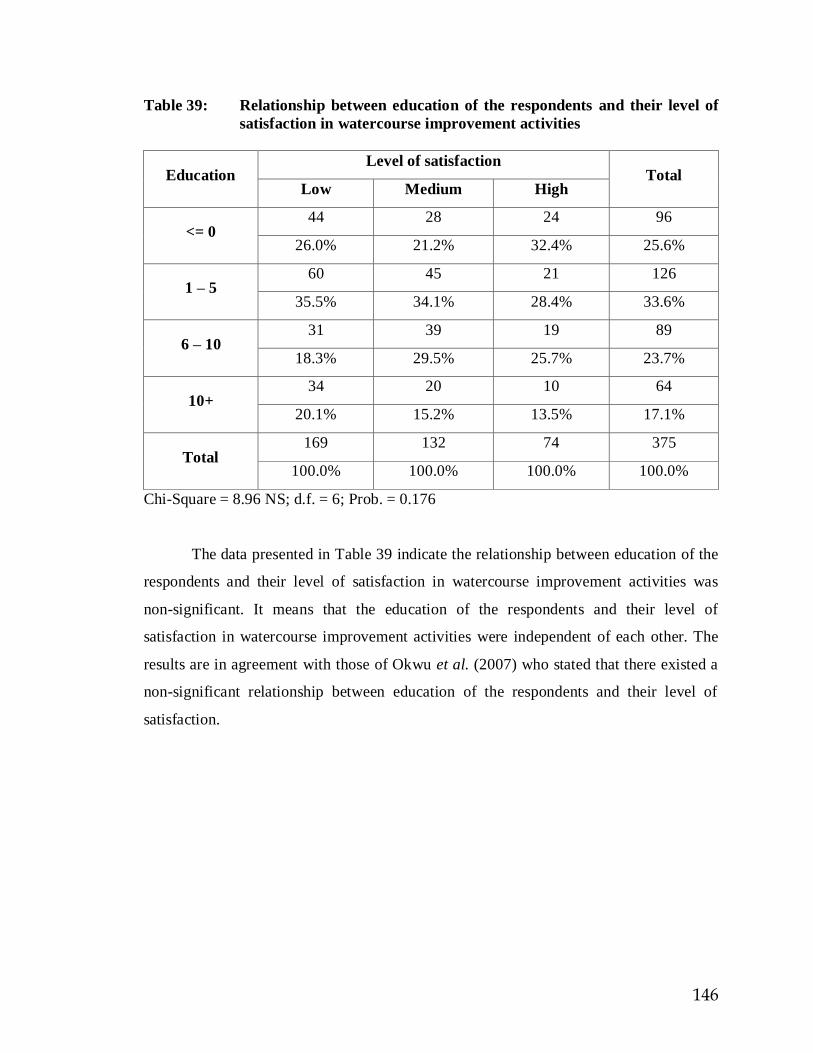
146
Table 39: Relationship between education of the respondents and their level of
satisfaction in watercourse improvement activities
Education Level of satisfaction
Total Low Medium High
<= 0 44 28 24 96
26.0% 21.2% 32.4% 25.6%
1 – 5 60 45 21 126
35.5% 34.1% 28.4% 33.6%
6 – 10 31 39 19 89
18.3% 29.5% 25.7% 23.7%
10+ 34 20 10 64
20.1% 15.2% 13.5% 17.1%
Total 169 132 74 375
100.0% 100.0% 100.0% 100.0%
Chi-Square = 8.96 NS; d.f. = 6; Prob. = 0.176
The data presented in Table 39 indicate the relationship between education of the
respondents and their level of satisfaction in watercourse improvement activities was
non-significant. It means that the education of the respondents and their level of
satisfaction in watercourse improvement activities were independent of each other. The
results are in agreement with those of Okwu et al. (2007) who stated that there existed a
non-significant relationship between education of the respondents and their level of
satisfaction.

147
Table 40: Relationship between land holding of the respondents and their level
of satisfaction in watercourse improvement activities
Land holding Level of satisfaction
Total Low Medium High
<= 5 38 22 10 70
22.5% 16.7% 13.5% 18.7%
6 – 12.5 81 81 39 201
47.9% 61.4% 52.7% 53.6%
12.5 – 25 32 27 21 80
18.9% 20.5% 28.4% 21.3%
25+ 18 2 4 24
10.7% 1.5% 5.4% 6.4%
Total 169 132 74 375
100.0% 100.0% 100.0% 100.0%
Chi-Square = 17.19**; d.f. = 4; Prob. = 0.009
The data presented in Table 40 indicate a highly significant relationship between
the land holding of the respondents and their level of satisfaction in watercourse
improvement activities. It means that size of land holding of the respondents and their
level of satisfaction in watercourse improvement activities was dependent of each other.
The level of satisfaction in watercourse improvement activities increased with the
increase in land holding up to 25 acres of the respondents and then decreased. The
highest satisfaction (53.6%) was found for the farmers with land holding 6 - 12.5 acres.
On the other hand, the farmers having only 5 acres had higher level of satisfaction
(18.7%) than that of the land owners with > 25 acres (6.4%).
The landowners with 6 - 12.5 acres showed higher level of satisfaction for the
index of medium (61.4%) and high (52.7%) than other land holders categories (< 5 or >
25 acres) so they were on the top for their satisfaction with the watercourse improvement
activities. The results are more or less similar to those of Ahmad (2003) who reported a
significant relationship between land holding and level of satisfaction of the respondents.
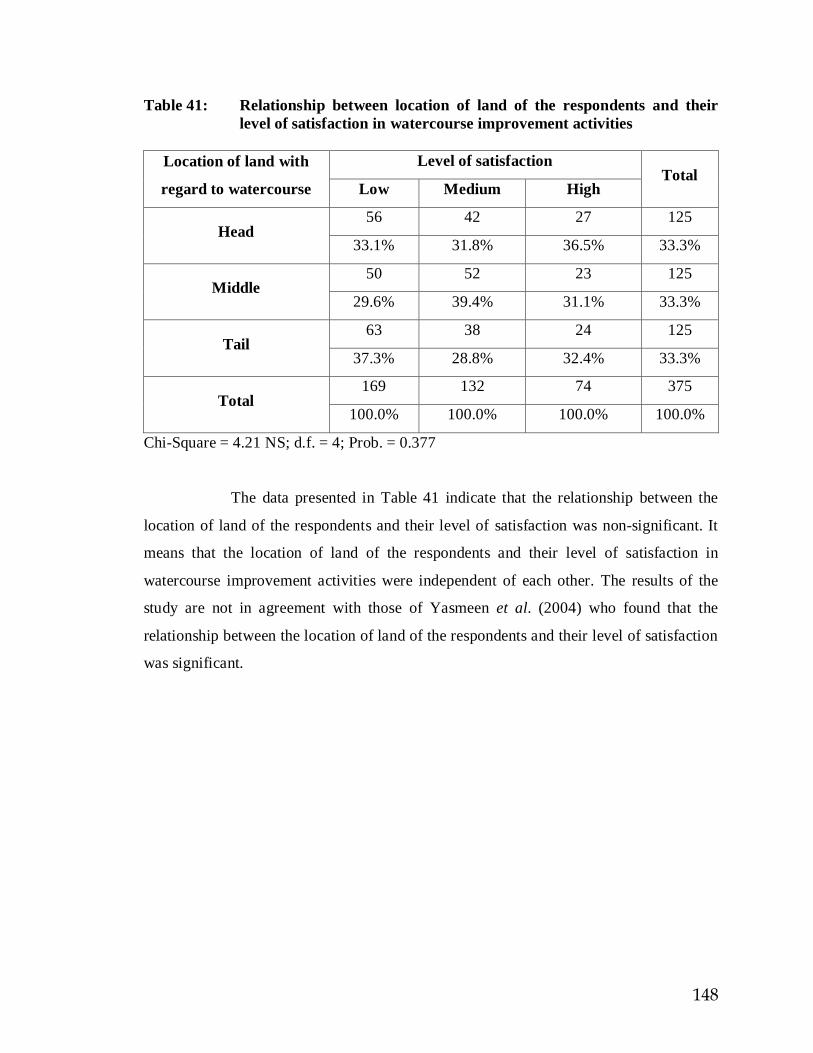
148
Table 41: Relationship between location of land of the respondents and their
level of satisfaction in watercourse improvement activities
Location of land with
regard to watercourse
Level of satisfaction Total
Low Medium High
Head 56 42 27 125
33.1% 31.8% 36.5% 33.3%
Middle 50 52 23 125
29.6% 39.4% 31.1% 33.3%
Tail 63 38 24 125
37.3% 28.8% 32.4% 33.3%
Total 169 132 74 375
100.0% 100.0% 100.0% 100.0%
Chi-Square = 4.21 NS; d.f. = 4; Prob. = 0.377
The data presented in Table 41 indicate that the relationship between the
location of land of the respondents and their level of satisfaction was non-significant. It
means that the location of land of the respondents and their level of satisfaction in
watercourse improvement activities were independent of each other. The results of the
study are not in agreement with those of Yasmeen et al. (2004) who found that the
relationship between the location of land of the respondents and their level of satisfaction
was significant.
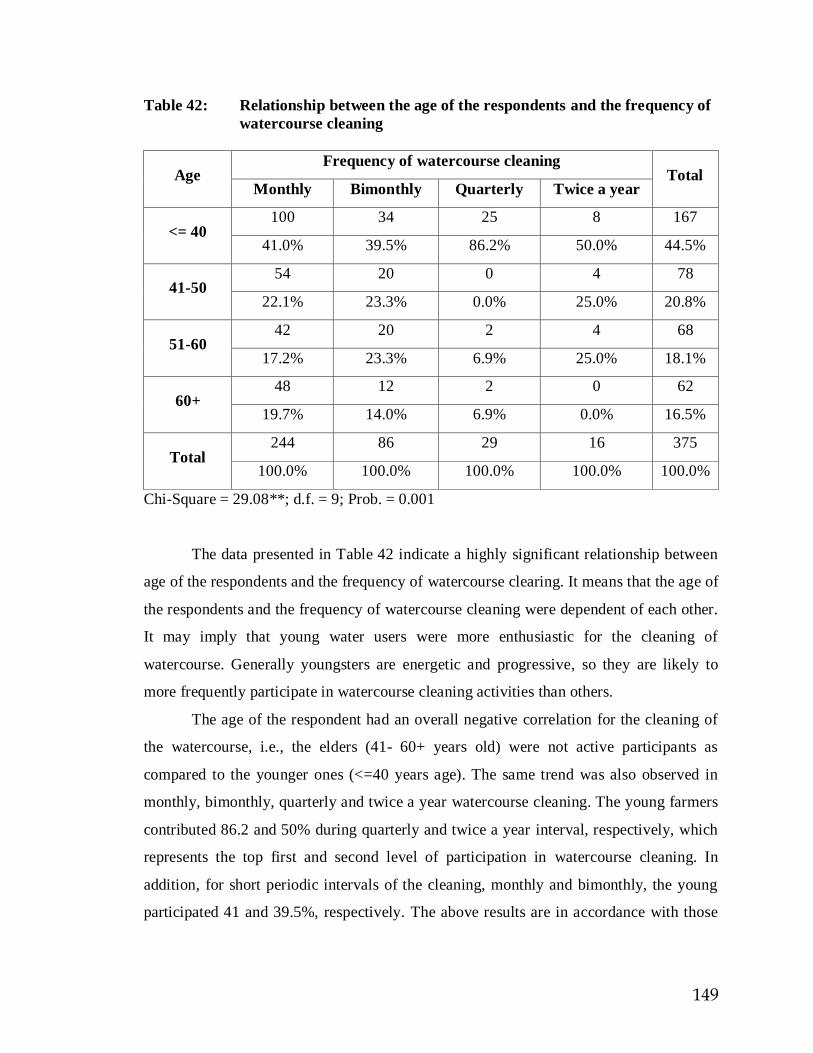
149
Table 42: Relationship between the age of the respondents and the frequency of
watercourse cleaning
Age Frequency of watercourse cleaning
Total Monthly Bimonthly Quarterly Twice a year
<= 40 100 34 25 8 167
41.0% 39.5% 86.2% 50.0% 44.5%
41-50 54 20 0 4 78
22.1% 23.3% 0.0% 25.0% 20.8%
51-60 42 20 2 4 68
17.2% 23.3% 6.9% 25.0% 18.1%
60+ 48 12 2 0 62
19.7% 14.0% 6.9% 0.0% 16.5%
Total 244 86 29 16 375
100.0% 100.0% 100.0% 100.0% 100.0%
Chi-Square = 29.08**; d.f. = 9; Prob. = 0.001
The data presented in Table 42 indicate a highly significant relationship between
age of the respondents and the frequency of watercourse clearing. It means that the age of
the respondents and the frequency of watercourse cleaning were dependent of each other.
It may imply that young water users were more enthusiastic for the cleaning of
watercourse. Generally youngsters are energetic and progressive, so they are likely to
more frequently participate in watercourse cleaning activities than others.
The age of the respondent had an overall negative correlation for the cleaning of
the watercourse, i.e., the elders (41- 60+ years old) were not active participants as
compared to the younger ones (<=40 years age). The same trend was also observed in
monthly, bimonthly, quarterly and twice a year watercourse cleaning. The young farmers
contributed 86.2 and 50% during quarterly and twice a year interval, respectively, which
represents the top first and second level of participation in watercourse cleaning. In
addition, for short periodic intervals of the cleaning, monthly and bimonthly, the young
participated 41 and 39.5%, respectively. The above results are in accordance with those
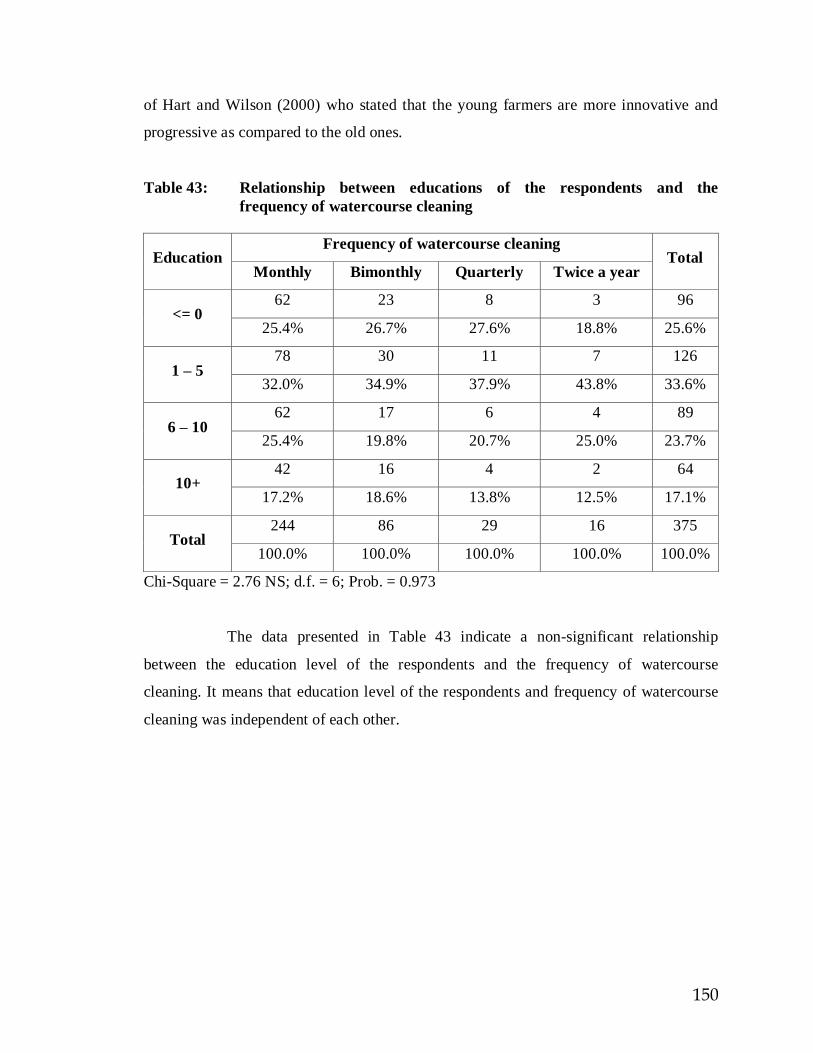
150
of Hart and Wilson (2000) who stated that the young farmers are more innovative and
progressive as compared to the old ones.
Table 43: Relationship between educations of the respondents and the
frequency of watercourse cleaning
Education Frequency of watercourse cleaning
Total Monthly Bimonthly Quarterly Twice a year
<= 0 62 23 8 3 96
25.4% 26.7% 27.6% 18.8% 25.6%
1 – 5 78 30 11 7 126
32.0% 34.9% 37.9% 43.8% 33.6%
6 – 10 62 17 6 4 89
25.4% 19.8% 20.7% 25.0% 23.7%
10+ 42 16 4 2 64
17.2% 18.6% 13.8% 12.5% 17.1%
Total 244 86 29 16 375
100.0% 100.0% 100.0% 100.0% 100.0%
Chi-Square = 2.76 NS; d.f. = 6; Prob. = 0.973
The data presented in Table 43 indicate a non-significant relationship
between the education level of the respondents and the frequency of watercourse
cleaning. It means that education level of the respondents and frequency of watercourse
cleaning was independent of each other.
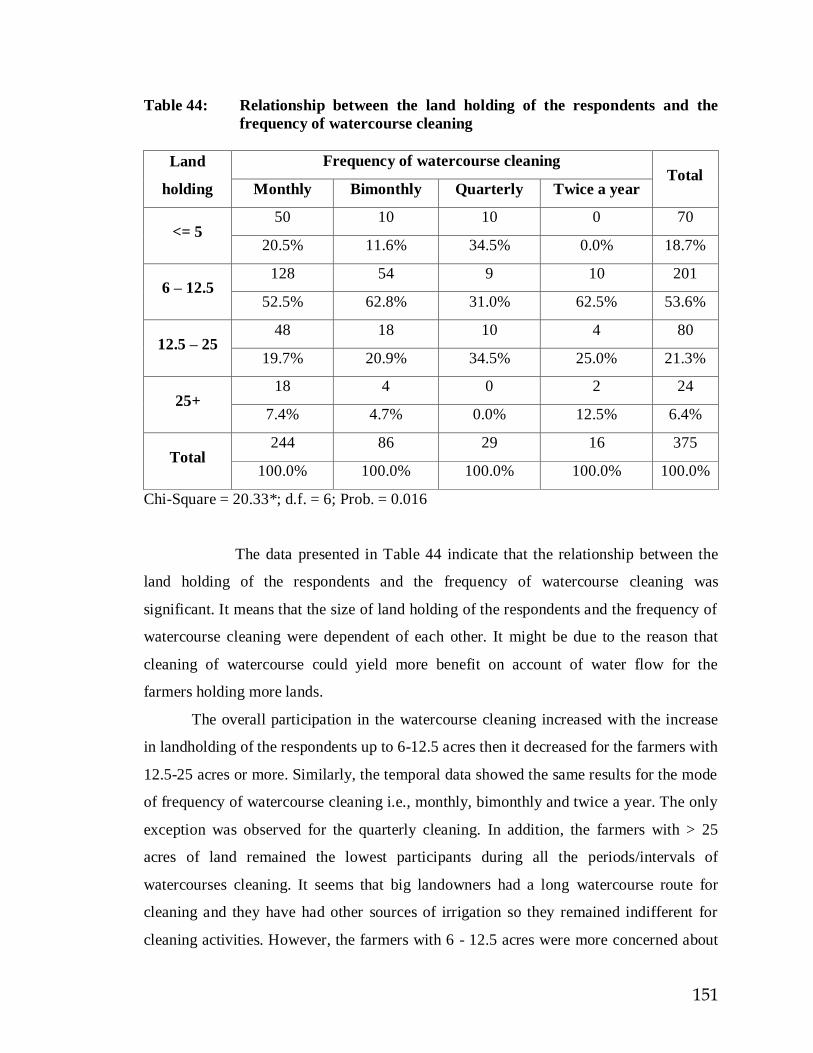
151
Table 44: Relationship between the land holding of the respondents and the
frequency of watercourse cleaning
Land
holding
Frequency of watercourse cleaning Total
Monthly Bimonthly Quarterly Twice a year
<= 5 50 10 10 0 70
20.5% 11.6% 34.5% 0.0% 18.7%
6 – 12.5 128 54 9 10 201
52.5% 62.8% 31.0% 62.5% 53.6%
12.5 – 25 48 18 10 4 80
19.7% 20.9% 34.5% 25.0% 21.3%
25+ 18 4 0 2 24
7.4% 4.7% 0.0% 12.5% 6.4%
Total 244 86 29 16 375
100.0% 100.0% 100.0% 100.0% 100.0%
Chi-Square = 20.33*; d.f. = 6; Prob. = 0.016
The data presented in Table 44 indicate that the relationship between the
land holding of the respondents and the frequency of watercourse cleaning was
significant. It means that the size of land holding of the respondents and the frequency of
watercourse cleaning were dependent of each other. It might be due to the reason that
cleaning of watercourse could yield more benefit on account of water flow for the
farmers holding more lands.
The overall participation in the watercourse cleaning increased with the increase
in landholding of the respondents up to 6-12.5 acres then it decreased for the farmers with
12.5-25 acres or more. Similarly, the temporal data showed the same results for the mode
of frequency of watercourse cleaning i.e., monthly, bimonthly and twice a year. The only
exception was observed for the quarterly cleaning. In addition, the farmers with > 25
acres of land remained the lowest participants during all the periods/intervals of
watercourses cleaning. It seems that big landowners had a long watercourse route for
cleaning and they have had other sources of irrigation so they remained indifferent for
cleaning activities. However, the farmers with 6 - 12.5 acres were more concerned about

152
the watercourse cleaning, so they were the most active participants for frequent and
regular watercourse cleaning.
Table 45: Relationship between locations of land of the respondents and the
frequency of watercourse cleaning
Location
of land
Frequency of watercourse cleaning Total
Monthly Bimonthly Quarterly Twice a year
Head 84 28 7 6 125
34.4% 32.6% 24.1% 37.5% 33.3%
Middle 83 32 6 4 125
34.0% 37.2% 20.7% 25.0% 33.3%
Tail 77 26 16 6 125
31.6% 30.2% 55.2% 37.5% 33.3%
Total 244 86 29 16 375
100.0% 100.0% 100.0% 100.0% 100.0%
Chi-Square = 7.77 NS; d.f. = 6; Prob. = 0.255
The data presented in Table 45 indicate that location of land of the
respondents and the frequency of watercourse cleaning was non-significant. It means that
the location of land of the respondents and the frequency of watercourse cleaning was
independent of each other.

153
CHAPTER 5
SUMMARY, RESULTS & RECOMMENDATIONS
5.1 SUMMARY
Agriculture sector continues to play a central role in Pakistan’s economy. It is
the second largest sector after services sector, accounting for over 21% of GDP, and
remains by far the largest employer, absorbing 45% of country’s total labor force.
Nearly 62% of the country’s population resides in rural areas, and is directly or
indirectly linked with agriculture for their livelihood. Agriculture in Pakistan owes a
great deal to the irrigation network developed by the laying out of canals and the
sinking of tube wells. Mainly, there are three sources of irrigation water i.e. dams, lift
pumps and dug wells. The dam is the main source of irrigation water. Some farmers
who can afford to buy a pump, lift water from streams and in some areas, where there
is no stream, or dam or farmers cannot afford to buy a lift pump, they are using dug-
wells for irrigation purpose. Where dam water is not available, dug wells are the main
source of water. The components of irrigation system are main canal, branch canal,
major distributary, minor distributary, watercourses and field channel.
The poor performance of agricultural sector in Pakistan is partly attributed to
poor water management practices at farm level due to institutional barriers, both at the
macro and micro levels. At the macro level, the system is facing a centralized
bureaucratic system supported by a century old rigid and insensitive package of
irrigation acts and practices. At the micro level, on the other hand, the irrigated
agriculture is confronted with a set of rural norms, traditions, social stratification based
on social regulatory patterns such as caste, faction, outdated agricultural and irrigation
practices and so on. Therefore, the importance of farmers’ participation in various
agricultural activities is the need of the day. The significance of their participation
becomes more vital for the management of irrigation projects, because the involvement
of different actors such as hydrologists, engineers, politicians, etc. makes it necessary to
secure benefits for the farmers by playing an active role. In an era of increased concern
for the participation of various beneficiaries in the projects planned for them, the

154
importance of waterusers, the main beneficiaries in the irrigation projects, holds a
central place. This aspect is being more and more emphasized as; the success of an
irrigation project depends largely on the active participation and cooperation of
individual farmers.
The purpose of WUAs is to get the maximum water out of their allocated
supply. WUAs ordinance was promulgated in 1981, through which it was made
obligatory for the field staff of OFWM department to have an association registered
prior to start any renovation work on a watercourse.
The status of the WUA in the community of the command area is to; 1) serve as
the legal device for the water users contracting with the government in order to
undertake watercourses and land leveling improvements, 2) provide assurance that the
watercourses will be properly operated, maintained and improved after construction of
the physical components, 3) provide a vehicle for farmers to gain an important identity
in the country and an opportunity for them to develop and assume individual and
collective responsibilities in the use of the nation’s natural recourses, 4) enable water
users at the watercourses level to gain economies of scale in the use of all resources
available to them, 5) reduce the risk of all users by simultaneously spreading the
responsibility in a more equitable fashion, 6) resolve disputes over water within the
watercourses and seek proper assistance from the Irrigation and Revenue Departments
or in the civil courts, 7) serve as a channel of communication between the water users
and the Irrigation Department, 8) increase the water supply by having tube wells
belonging to the association strategically located throughout the watercourses, and 9)
expand the benefits of co-operation and collective action into other related activities
common to the irrigators, such as obtaining credit and purchasing sprayers, seeds,
fertilizers, etc.
Improvement of watercourses is not a serious problem. The more pressing
problem, therefore, is the maintenance of watercourses after the improvement. The rate
of deterioration is rapid in case of earthen improvement. The post improvement
maintenance is, thus essential in order to prolong the span of benefits compatible with
the investment on such a nationwide program. The field observations show that in most
of the previous cases/projects, the improved watercourses gave rather shabby look after

155
some time of their renovation. The farmers’ investment in terms of their financial
contribution and labor input goes all in vain, because of negligence on the part of the
water users to keep up their watercourses. For the purpose, the need for the
organizations and productive groupings of the farmers or water users at gross root level
is necessary. Lack of viable farmers’ organization may be one of the missing links in
improving water management. The need for such an organization has been felt at all
levels, but the fundamental question is to evolve the type and kind of structure that will
be compatible with our socio economic environments.
It is an admitted fact that due to non-sustainability of WUAs, real benefits could
not be properly achieved. Now under the NPIW, the government wants that WUAs be
made functional even after the improvement of watercourses.
The present study was designed to analyze the present status and future scope of
WUAs as effective devices for water management in the province. The results of the
study would be helpful to identify the strengths and weaknesses of the existing system
and to suggest measures for further improvement.
The present study was conducted in district Sargodha. The population for the
study consisted of those farmers who were the registered water users locating at the
improved watercourses. A multistage random sampling technique was used for the
study. All the five tehsils of Sargodha district were selected for the study. From each
tehsil, one markaz was selected at random and from each selected markaz, five
improved watercourses were selected randomly. Thereby a total of 25 improved
watercourses were selected for the study. A list of registered water users was prepared
with the help of warabandi list. Therefore from each selected improved watercourses,
15 water users (five each from head, middle and tail) were selected, thereby making a
total sample size of 375 respondents. The data were collected through a validated and
pre-tested interview schedule. The data were analyzed with the help of statistical
package for social sciences (SPSS). Descriptive analysis such as frequencies,
percentages, standard deviation and means were used for interpretation of the data. After
analysis, tabulation process was done and the data were discussed, interpreted
analytically and logical conclusions were drawn. Chi-square test was used to find out the
relationship between dependent and independent variables.

156
5.2 FINDINGS/RESULTS
5.2.1 Socio-economic Characteristics of the Respondents
• Most (44.5%) of the respondents fell under age category of less than 40 years
followed by 20.8, 18.1 and 16.5% of the respondents who were lying in the age
categories of 41-50, 51-60 and above 61 years of age, respectively.
• About one-third (33.6%) of the respondents fell under the category of 1-5 years of
schooling, while 25.6, 23.7 and 17.1% respondents fell under the categories of 0,
6-10 and above 10 years of schooling according to their level of education.
• A simple majority (53.6%) of the respondents fell under the category of 6-12.5
acres, while 18.7, 21.3 and 6.4% respondents fell under the categories of equal or
less than 5, 12.5-25 and above 25 acres according to their size of land holding.
• A vast majority (83.5%) of the respondents was owner cultivators.
• A large majority (72.5%) of the respondents had the farming occupation as their
only source of income.
5.2.2 The Process of Setting up a WUA
• Only 14.4% of the respondents hold any position in the managing committees of a
WUA, while a vast majority (85.6%) of the respondents was those who were just
the shareholders/waterusers of the watercourse.
• More than 90% of the respondents reported that all the steps involved in setting
up a WUA had been followed as per procedure. These steps include; presence of
shareholders during the selection/election of WUA, transparency of
selection/election process, announcement of results at the spot, agreement signed
by the shareholders on the stamp paper, registration of WUA by DO (OFWM),
representation of WUA from all reaches of watercourse (head, middle and tail)
and form all briadaries present/living at the watercourse.
• A large majority (72.3%) of the respondents rated WUAs’ leadership as good,
while slightly more than one-fifth (22.4%) of the respondents were of the view
that leadership was excellent.

157
• A large majority (75.2%) of the respondents were highly satisfied about the
process of setting up a WUA.
5.2.3 Criteria Used for the Selection/Election of Managing Committees of WUAs
• About two-thirds (64.0%) of the respondents were of the view that most of the
members were honest and trustworthy. About 40% of the respondents regard the
average members as responsible. More than half (52.3 and 53.3%) of the
respondents regarded the average members as social workers and cooperative,
respectively. More than 40% respondents regard some members as leaders of the
biradary. About half (48%) of the respondents regard the average members as
men of commitment while 46.4% of the respondents were of the view that most of
the members devote their time for WUA. About 58% of the respondents regarded
all the members of the committee as popular among the water users.
5.2.4 Extent of Participation of Water Users in Watercourse Improvement and
Maintenance Activities
• About half (51.7%) of the respondents provided both cash and labor as per
requirement in the watercourse improvement.
• About 70% of the respondents were highly satisfied with the construction work of
watercourse.
• An overwhelming majority (92%) of the respondents cleaned their watercourses
by joint operation. Majority (65.1%) of the respondents cleaned their
watercourses on monthly basis. A vast majority (about 80%) of the respondents
was highly satisfied with the interval/frequency and quality of watercourse
cleaning.
• All the respondents reported that removal of silt/bhal and removal of vegetation
were undertaken to maintain the watercourse during the last year, while 97.9% of
the respondents reported that filling of rodents’ holes was done to maintain the
watercourse during the last year. Whereas the other operations were not needed
during the last one year.

158
• The satisfaction level about the removal of silt/bhal and removal of vegetation
were ranked at 1st position. While, rodent’s holes, repair of lined portion,
embankment, repair of nakkas, culverts and back earth filling of lined portion,
repair of buffalo wallow, realignment of the earthen portion and uprooting of trees
were ranked from 2nd to 10th positions, respectively.
• Removal of silt/bhal, vegetation and filling of rodents’ holes were ranked at 1st,
2nd and 3rd positions based on farmers’ participation. The mean values with
respect to these activities indicate that farmers’ participation level was somewhere
between high and very high categories.
5.2.5 Disputes among the Water Users and Role Played by WUAs in Resolving the
Disputes
• Rivalry among different ‘briadaries’ (castes), water thefts and non-cooperative
behavior of some farmers were the main causes of conflicts among the water
users as reported by 88.3, 70.1 and 64.8% of the respondents, respectively.
• Payment of farmers’ share, section of watercourse to be lined, uprooting of trees,
working of farmers’ labor and provision of labor were the specific reasons for
differences/disputes among the water users as reported by 91.5, 81.9, 76.5, 71.2
and 70.1% of the respondents, respectively.
• Majority (65.1%) of the respondents was highly satisfied with the contribution of
WUA in resolving the disputes.
• All the respondents thought that WUA never listened to the complaintee only
while taking decision on various issues of water uses. More than 98% respondents
thought that WUA listened to both the parties besides judging the situation at site.
• All the respondents regarded ‘biradary’ (caste) heads’ interventions to resolve the
farmers’ complaints, whereas 44% of the respondents reported Govt. officials’
involvement in resolving the farmers’ complaints.
• A majority (69.3%) of the respondents was of the view that level of effectiveness
of WUAs in resolving the complaints was high while 7.5% of the respondents
159
perceived the effectiveness of WUAs in resolving the complaints as very high.
Whereas, 22.1% of the respondents had an opinion that WUAs had a medium
role.
5.2.6 Problems and Obstacles in Effective Functioning of WUAs
• Lack of finance on the part of small/poor farmers, lack of interest on the part of
big landlords and lack of unity among the water users were ranked at 1st, 2nd and
3rd positions, respectively, which indicate that ranking of various problems in the
effective functioning of WUAs before the improvement of the watercourses was
somewhere between high and very high categories.
• The mean values with respect to activities like, closing of outlet during pacca
(lined) watercourse improvement, illegal demands for extra points (outlets) and
collection of farmers’ share were ranked at 1st, 2nd and 3rd positions, respectively,
which indicate that ranking of these problems in the effective functioning of
WUAs during the improvement of the watercourses was somewhere between high
and very high categories.
• The mean values with respect to activities like, provision of labor for
decreasing/repair of watercourse, repair of lined portion and back earth filling
were ranked at 1st, 2nd and 3rd positions, respectively, which indicate that ranking
of these problems in the effective functioning of WUAs after the improvement of
the watercourses was somewhere between high and very high categories.
5.2.7 Future Scope of WUAs
• Participation of water users in watercourse improvement/maintenance got the
highest score and was ranked 1st with mean value of 4.11 closely followed by
winning the cooperation of OFWM Department, which got the second highest
score and was ranked 2nd with mean value of 3.99.
• Resolution of disputes/conflicts through WUAs and watercourse improvement
activities was ranked at 3rd and 4th positions, respectively. The mean values in this
regard indicate that these aspects fell between medium and high categories but
tending towards high category.
160
• Productivity enhancement as a result of watercourse improvement/maintenance
was ranked at the top with mean value of 4.40 closely followed by water saving
through watercourse improvement/maintenance, which was ranked at 2nd position
with mean value of 4.37. The mean values indicate that these aspects fell between
high and very high categories but tending towards high category.
• A large majority (76.3%) of the respondents thought that WUAs will continue to
play an effective role in future.
5.2.8 Relationships between Dependent and Independent Variables
• Age of the respondents had non-significant relationship with the level of
participation and level of satisfaction in watercourse improvement activities,
while it had significant relationship with the frequency of watercourse cleaning.
• Education of the respondents had non-significant relationship with the level of
participation and level of satisfaction in watercourse improvement activities, as
well as with the frequency of watercourse cleaning.
• Size of land holding of the respondents had significant relationship with the level
of satisfaction in watercourse improvement activities as well as with the
frequency of watercourse cleaning while it had non- significant relationship with
the level of participation in watercourse improvement activities.
• Location of land of the respondents had significant relationship with the level of
participation in watercourse improvement activities while it had non- significant
relationship with the level of satisfaction in watercourse improvement activities as
well as with the frequency of watercourse cleaning.
5.2.9 Key Findings
• A large majority of the respondents was highly satisfied with the process of
setting up a WUA.
• A large majority of the respondents was highly satisfied with the construction
work of watercourse.
161
• Main causes of conflicts among the water users were the rivalry among different
‘briadaries’ (castes), water thefts and non-cooperative behavior of some farmers
as reported by a vast majority of the respondents.
• Specific reasons for differences/disputes among the water users were the payment
of farmers’ share, section of watercourse to be lined, uprooting of trees, working
of farmers’ labor and provision of labor as reported by a large majority of the
respondents.
• All the respondents regarded ‘biradary’ (caste) heads’ interventions important to
resolve the farmers’ complaints.
• Lack of finance on the part of small/poor farmers, lack of interest on the part of
big landlords and lack of unity among the water users were the various problems
in the effective functioning of WUAs before the improvement of the
watercourses.
• Closing of outlet during pacca (lined) watercourse improvement, illegal demands
for extra points (outlets) and collection of farmers’ share were the problems in the
effective functioning of WUAs during the improvement of the watercourses.
• Provision of labor for dressing/repair of watercourse, repair of lined portion and
back earth filling were the problems in the effective functioning of WUAs after
the improvement of the watercourses.
• Location of land of the respondents had significant relationship with the level of
participation in watercourse improvement activities while it had non- significant
relationship with the level of satisfaction in watercourse improvement activities as
well as with the frequency of watercourse cleaning.
• A large majority of the respondents thought that WUAs will continue to play an
effective role in future.

162
5.3 RECOMMENDATIONS
In the light of results and conclusions of present study, following
recommendations are made for bringing about further improvement in the functioning of
WUAs.
5.3.1 Recommendations for Water Users
Water users having more than 25 acres of land showed low level of satisfaction
and less participation in watercourses cleaning. So, it is recommended that there
must be a mechanism to motivate and educate them about the benefits of regular
watercourses cleaning.
The young water users were more regular and active participants in watercourses
cleaning than the older ones. The effect of aging results in the decline of physical
activity but the study highlights to consider the efficient role of the young water
users in watercourses cleaning as compared to the older ones. So, it is
recommended that the older members should be rigorously motivated to involve
young members of their families in watercourses cleaning/maintenance activities.
The water users located at the tail were much more concerned about the
watercourses cleaning to get an ample amount of water for their crops. Therefore,
their participation was higher than the farmers locating at the head of the
watercourses. So, the farmers located on the head should be legally bound to
participate in watercourses maintenance activities.
5.3.2 Recommendations for WUAs
• All the respondents regarded ‘biradary’ (caste) heads’ interventions as a common
strategy to resolve the farmers’ complaints. So, it is suggested that the ‘biradary’
heads should be involved as team members to help and assist the managing
committees of WUAs to resolve the conflicts/disputes raised from time to time
among the water users.
• Repair of buffalo wallows was the needed activity as reported by 42.4% of the
respondents, but only 1.6% of the respondents reported that this activity had been
performed by the WUAs. Therefore, WUAs need to focus their attention towards
the repair of buffalo wallows.
163
• More than 70% of the respondents reported that provision and working of
farmers’ labor were specific reasons for differences/disputes among the water
users. It means farmers/water users did not provide labor willingly for
watercourses improvement/maintenance. So, it is suggested that WUAs should
educate and sensitize the water users to provide the labor for their own benefits.
5.3.3 Recommendations for the Department
• A very low percentage (6.4, 6.9, 6.9, 12.3, 14.9 and 17.1%) of the respondents
reported that all the members of managing committees of WUAs were social
worker, cooperative, committed, responsible, ‘biradary’ head and devoted. So, it
is recommended that there must be a mechanism that only social worker,
cooperative, committed, responsible, ‘biradary’ head and devoted water users
should be selected/elected for better performance of WUAs.
• About one third (33.1%) of the respondents reported that all the members of
managing committees of WUAs were honest and trustworthy. So, it is
recommended that there must be a mechanism that preferably honest and
trustworthy water users should be selected/elected as members of managing
committees of WUAs, because it ultimately determines the success of WUAs
toward achieving its goals.
• An overwhelming majority (94.9%) of the respondents reported that remodeling
of outlet was highly needed activity but was not undertaken by the department. It
is due to the reason that it is the prime responsibility of the irrigation department.
So, the WUAs should put pressure on OFWM Department to approach Irrigation
Department for remodeling of the outlets as per demand and rules.
• An overwhelming majority (91.5%) of the respondents reported that payment of
farmers’ share was a specific reason for dispute among the water users. Therefore,
it is suggested that instead of collecting farmers’ share by the WUAs, the
government should devise a mechanism to collect it though Revenue Department.
• A vast majority (76.5%) of the respondents reported that uprooting of trees was a
specific reason for difference among the water users. So, the up-rooting of trees
on right of way of watercourses should be exercised by the government officials
along with WUAs. Similarly realignment of watercourses should also be taken up

164
by the department as about 70% of the respondents reported it as one of the main
reasons of disputes among water users.
• It was revealed that lack of finance on the part of small poor farmers, lack of
interest on the part of farmers locating at the head, lack of unity and ignorance
among water users were the problems which were rated between medium to high
level. So, it is suggested that prior to start the watercourses improvement work,
department should arrange frequent counseling sessions to motivate the water
users, especially small poor farmers and water users locating at the head of
watercourses, to willingly participate in the activities of watercourses
improvement. First, the government should bear the labor cost (farmers’ share)
and then collect it through Revenue Department along with water fee (‘aabiana’)
in easy installments.
• It was revealed that demolishing of watercourses affects the effective functioning
of WUAs during the improvement of watercourses because crops suffer from lack
of water. So, it is suggested that the activities of watercourses improvement
should be started and completed within the period of canal closure.
• Repairing of lined portion of watercourses after the improvement was perceived
as one of the main problems by the respondents. So, it is recommended that
during budget estimates of watercourses, the repair cost should also be included in
the budget which could be utilized after 2 or 3 years of watercourse improvement.
5.3.4 Recommendations for Future Researchers
• Similar studies should be conducted in other parts of the country as well; this will
help in understanding the problems in a much wider perspective and consequently
suggest measures to further strengthen the WUAs.
• Moreover, further research may be conducted to study the optimal frequency of
watercourse cleaning and the strategies that can be implemented to meet the
optimal frequency of watercourse cleaning.
• The extension workers’ role to ensure the participation of water users for the
improvement and maintenance of watercourses and to minimize the disputes
among farmers can also be the focus of future research.
165
LITERATURE CITED
ADB, 1973. Regional workshop on irrigation water management, Manila.
Abdullah, A. 2004. Farmers’ perceptions about the participatory extension approach
followed by PRSP for effective technology transfer among the farmers of
tehsil Chak Jhumra, district Faisalabad, M.Sc. (Hons.) Thesis, Dept. of
Agri. Ext., Univ. of Agri, Faisalabad.
Agradano, L. and M.G. Bos. 1997. The legal and administrative setting for the use of
water resources in Mendoza, Argentina. Irrigation and Drainage Systems,
Kluwer, Dordrecht, 11 (4) 323-335.
Ahmad, B., and S.A. Bowers. 1978. Improving watercourses, conveyance efficiency
through cleaning and maintenance. Improving irrigation water
management on farm. Annual Technical Report No. 50, Colorado State,
University Fort Collins, pp. 427-438.
Ahmad, D. and I. Kutcher. 1992. Pakistan economic policies institutions and the
environment. The Agricultural and National Resources Division, Country
Department, South Asia Region.
Ahmad, N. 1993. Water resources of Pakistan and their utilization, Lahore, pp. 3.1-3.20.
Ahmed, D. and M. Faruqee. 1995. Pakistan economic policies institutions and the
environment. The Agricultural and National Resources Division, Country
Department, South Asia Region.
Akbar, M. 1986. Impact of leadership on water management. M.Sc. Thesis, Dept. of
Rural Sociology, Univ. of Agri., Faisalabad.
Akhtar, P. 1997. A study of sources of factionalism affecting water management decision
making in selected villages of tehsil Faisalabad, M.Sc. Thesis, Dept. of
Rural Sociology, Univ. of Agri., Faisalabad.
Alam, S.M. 2002. Ground water syndrome. The Dawn, The Internet Edition.
[http://www.dawn.com].
Ali, B. 1983. Optimal watercourses improvement in Pakistan. A mixed integer
programming model. Proceedings of the International Seminar on Water
Resources Management, Lahore (Pakistan) 22-27 Oct. 1983. pp. 64-86.
166
Ali, S.A. 1995. The Muslim world today, National Hijra Council, Islamabad Pakistan,
155-156.
Amir, M. 1978. Water users’ association for irrigated agriculture. Govt. of Pakistan,
Islamabad.
Anderson, D, C. 1984. Enhancing irrigation through water users’ associations: An
historical perspective. Utilities Policy Ecuador and regulation in France:
Agricultural Administration. 16 (2): 55-66.
Andrew, A., J. Keller and M. El-Kady. 1995. Effective irrigation efficiency applied to
Egypt’s Nile System. Working Paper Series No. 5-1, Ministry of Public
Works and Water Resources. Environmental and Natural Resource Policy
and Training Project. Winrock International Institute for Agriculture
Development, U. S. Agency for International Development.
Anonymous, 1996. Pakistan on-farm and command water management and irrigation
system rehabilitation projects. Operations Evaluation Department, Impact
Evaluation Report No. 15863.
Anonymous, 2005. Canal rehabilitation: A boon for small farmers.
[www.asiawaterwire.net].
Anonymous, 2007. Substantial water shortage feared. The Daily Dawn, February 02,
2007, pp.-VI.
Anonymous. 2007. Dams to irrigate one million hectare in Baluchistan. The Nation,
February 28, 2007, pp-VI.
Anwar, S. U. 2011. Issues related to rural development along solutions approach.
Agriculture Water management, 97, 1795-1805.
Arsahd, M. 2004. The Contribution of irrigation conveyance system components to the
recharge potential in Rachna Doab under lined and unlined options. Ph.D.
Thesis, Dept. of Agri. Eng., Univ. of Agri. Faisalabad.
Arshad, A and M. Rafique. 1984. Watercourses improvement program in Thekriwala
Project. Dept. of Rural Sociology, Univ. of Agri., Faisalabad.
Asad, M. 1999. Management of Water Resource, Bulk Water Prices in Brazil. World
Bank Technical Paper.
167
Asghar, C.M., M.A. Bhatti and I.W. Kijne. 1992. Management of salt affected lands for
crop production in the Punjab, Pakistan. Paper presented on strategies for
utilizing salt affected lands, Bangkok, Feb. 17-25.
Ashraf, I. 2008. Analysis of communication interventions of extension field staff with
farmers under decentralized extension in the Punjab, Pakistan. Ph.D
Thesis, Dept. of Agri. Ext., Univ. of Agri., Faisalabad, Pakistan.
Ashraf, M. 1997. Proceedings of seminar on water management for Agriculture,
organized by National Fertilizer Company Limited.
Awan, U.K., C. Conrad and M. Hafeez. 2011. Remote sensing and hydrological
measurements for irrigation performance assessments in water users’
associations in the lower Amu Darya River Basin. Water Resource
Management 25: 2467-2485.
Awan, W.A. and A. Ali. 1980. Agricultural production as affected by watercourses
improvement, workshop held at Islamabad, 6-9 Aug. 1979 PARC
Publications, 255-262.
Bajpai, B.K. 1997. Regional disparities in agricultural productivity: An Outcome Based
Infrastructure in Agriculture. Situations in India, 39(2): 79-82.
Bashir, M.K. 2006. Role of commercial banks in the uplift of the agricultural sector in
Pakistan: A case study of district Faisalabad, M.Sc. (Hons.) Thesis, Dept.
of Agri. Eco., Univ. of Agri., Faisalabad.
Basutro, X. 2007. Policy governance and local institutions for biodiversity conservation
in Costa Rica. Ph.D. dissertation. School of Public Administration and
Policy. Arizona State Univ. USA.
Baxter, I.C. and W.R. Laitos. 1988. Water control and maintenance imperative evidence
from Nepal. Agriculture Water Management, 15 (2): 115-130. Div.
Agriculture, Arizona State Univ., Temp., Az. 85287, USA.
Besterfield, D.H., Besterfield, M.C., Besterfield, G.H. and Besterfield, S.M., 2004. Total
Quality Management. (3rd ed.). Pearson Eduction, (Singapure) Ltd., India.
Bhatt, S. 2012. How does participatory irrigation management work? A study of two
water users’ associations in Anand, district Gujarat. New Delhi:
University Grants Commission.
168
Bhatti, M.T. and M. Latif. 2006. Linkages between canal water deprivation and farmers’
income. Proceeding of international seminar on water and environment. A
looming crisis held on August 20-22, 2006 at Univ. of Agri., Faisalabad.
Bonder M.A. 2001. Water everywhere? Canadian Forces College, Des Forces Candidness
CSC 27/CCEM 27, Exercise New Horizones.
Borg, W. R. and M. D. Gall, 2002. Educational Research (7th ed.). New York: Longman.
Brewer, D. 1984. Improving irrigation management through farmers’ organizations in Sri
Lanka.
Bukhari, M. 2007. Acute irrigation water shortage in southern Punjab. Article in Business
Recorder Lahore. February 03, 2007, pp-IX.
Bustos, R., M. Marre and J. Chambouleyron. 2001. Performance of water users’
associations in the lower Tunuyan area, Argentina, Irrigation and Drainage
Systems 15: 235-246.
Chambouleyron, J. 1989. The organization of water users’ associations in Mendoza,
Argentina. Irrigation and Drainage Systems, Kluwer, Dordrecht,
Netherlands, 3 (I): 81-94.
Charin. A. 1976. Water management of rice fields in Thailand. Tropical Agriculture
Research Series No.9, TARC, pp. 1-6.
Chaudary, K.M. 2006. Analysis of alternative extension approaches to technology
dissemination and its utilization for sustainable agricultural development
in the Punjab, Pakistan. Ph.D. Thesis, Dept. of Agri. Ext., Univ. of Agri.,
Faisalabad.
Chaudhary, M. L. 1984. Sociology, Aziz Publishers, Urdu Bazar, Lahore, pp. 293.
Chaudhary, M. Munir, A, Bashir and M. Siddique. 1977. Methods developed at Mona to
reduce watercourses losses. Seminar on Water Management for
Agriculture, Lahore.
Chaudhry, M.R. 2001. An extension book of irrigation and drainage practices for
agriculture. Study Aid Project, University of Agriculture, Faisalabad.
Cheema, M., Z. Iqbal, M. Hussan, and J. Bandaragoda. 1997. Socio-economic baseline
survey for a pilot project on water users organizations in the Hakra 4-R

169
distributary command area, Punjab Report No. R-37, International
Irrigation Management Institute, Lahore.
Clyma, W. and G.L Corey. 1974. The improvement of farm water management in
Pakistan, Water Management Research, Colorado State University. Pak.
Field Report II.
Clyma, W. and M. Afzal. 1975. In-process seasonal irrigation application efficiency at
watercourses serving tube wells 78 and 56 in Mona Project area. Colorado
State University and Mona Reclamation Project, Lahore, Pakistan.
Cole, J. D. and B. Johnson. 2002. Soil conservation practices on leased land: A two-
state study. Soil and Water Cons. 57(2): 100-105.
Copplestone, J. F. (1985). Pesticide exposure and health in development countries. In
G.J. Turnbull (Ed.), Occupational Hazards of Pesticide Use (pp. 67-77).
Taylor & Francis, London.
Corey, G.L. and W. Clyma. 1977. Improving farm water management alternatives themes
from indigenous irrigation system, Dept. of Rural Sociology, University of
Ithaca, USA.
Corey, G.L. and W. Olyma. 1973. Improving farm water management in Pakistan.
Colorado State University, Water Management Research Pakistan. Field
Report No.1.
Coser, L.A. 1965. Social conflicts and social change; British Journal of Society, 8.
Cosgrove and Rijsberman. 2000. World water vision: making water everybody’s
business, World Water Council, World Water Vision, and Earth scan, pp.
107.
Coward, E.W. 1979. Principles of social organization in an indigenous irrigation system,
Human Organization, Cornell University Press, London. Jr. 38:28-36.
Coward, W.E. 1977. Irrigation management alternatives themes from indigenous
irrigation system, Department of Rural Sociology, Cornel University,
Ithaca, USA.
Delphine, L., V. Alain, S. Martin and J. Daud. 2005. More crop per drop: how to make it
acceptable for farmers. Agriculture Water Management. 76(2): 108-119.

170
Demiryurek, K., H. Erdem, V. Ceyhan, S. Atasever, and O. U. O. Mayis. 2008.
Agricultural information systems and communication networks: the case
of dairy farmers in the Samsun province of Turkey. Information Research
(Online), 13 (2).
DFID .2003. Privatization/transfer of irrigation management in Central Asia. Mott
MacDonald, Final Report. UK. Dilemma: The Political Economy of
Development Aid. Oxford
Dixon, W. and F. Marry. 1957. An introduction of statistical analysis. Mexico McGraw
Hill Book Company, New York.
Dlamini, M. P., S. S. Ngwenya, and B. M. Dlamini. 2004. Reasons girls choose
agriculture or other science and technology programs in Swaziland.
Journal of International Agricultural and Extension Education, 11(3): 69-
77.
Dogar, A.A. 2004. Constraint analysis to improve irrigation efficiency at farm level. A
case study of district Sahiwal. M.Sc. (Hons.) Thesis, Dept. of Rural
Sociology, Univ. of Agri., Faisalabad.
Dono, G., Giraldo, L., and severini, S. (2010). Pricing of irrigation water under
alternative changing methods: Possible shortcomings of a volumetric
approach. Agricultural Water Management, 97, 1975-1805.
Dozina, G. 1983. Organizing farmers for efficient and equitable allocation of water in
irrigation system, Irrigation Water Management Department.
Echert, J. and N. Dimick. 1975. Water management alternatives for Pakistan. A Tentative
Appraisal, Colorado State University, Fort Collins, Colorado.
El Qaarraoun. 2002. Growing sustainability of an integrated village development project,
El Qaraaoun Pilot Village Progress Report (1).
Engelman, P.A. 1993. Create the right policy, institution and market incentives to
increase water-use productivity in agriculture. Enhancing irrigation district
management in the Ebro Valley, entities: the unsung heroines of water
resource management in environment. The Agricultural and National
Resources Division, Country Department, South Asia Region.
171
Ersten, M.W. 2007. The development of irrigation designs schools or how history
structures human action. Irrigation Drain 56:1-19.
Evenson, R.E. and G. Mwabu. 1998. The effects of agricultural extension on farm yields
in Kenya. Center Discussion Paper No. 78. A paper originally presented at
10th Anniversary Conference on Investment, Growth and Risk in Africa at
the Centre for the Study of African Economics, University of Oxford, UK.
FAO, 2001. Guidelines for participatory training and extension in farmers’ water
management (PT & E FWM). Food and Agriculture Organization of the
United Nations AGLW-Water Service of the Land and Water
Development Division Provisional version. April 2001.
FAO, 1997. Information system on water and agriculture in Pakistan. Rome, Italy,
[www.fao.org]
FAO, 2005. Aqua stat information system on water and agriculture, FAO Rome, Italy.
[http://www.sciencedirect.com/science]
Farley, K. A., C. Tague and G.E Grant.2011. Vulnerability of water supply from the
Oregon Cascades to changing climate: Linking science to users and
policy. Global Environmental Change. 21 (1), 110-122.
Fawole, O. P. 2006. Poultry farmers’ utilization of information in Lagelu local
government area, Oyo state of Nigeria. Int. J. Poultry Sci., 5(5): 499-501.
Ferri, J., Martínez-Cob, A., 2007. A database program for computers and electronics in
agriculture, 98 (2013): 121-130.
Freeman, D.M. and W.K. Lowdermilk. 1978. Sociological analysis for irrigation water
management. A perspective and some analytical approaches to assist
decision making and improving water management on farms, Appendix-
34, Annual Technical Report, Colorado State University, USA.
Gao, H., Wang, Y. Jun and L. Zehn. 2003. The connotation and development of
participatory irrigation management (in Chinese). China Rural Water and
Hydropower 8, 27-29.
Garces-Restrepo, C., G. Munoz, and Vermillion. 2007. Irrigation management transfer-
Worldwide Efforts and Results, vol. 32.
172
Gastineau, P., 2006. A water users’ association in Madagascar: Why does it fail?
Building the European Commons: From Open Fields to Open Source-
European Regional Meeting of the International Association for the Study
of Common Property, Brescia, Italy.
Ghassemi, F., A.J. Jakeman, and H.A. Nix. 1995. Salivation of land and water resources;
human causes, management and case studies. UNSW Press, Sydney,
Australia, and CAB International, Wallingford, UK.
Gibson, C., K. Anderson, E. Ostrom and S. Shivakumar. 2005. The Samaritan’s dilemma:
The political economy of development aid. Oxford University Press.
Gill, M.A. and W.K. Twitty. 1977. Watercourses design and improvement under OFWM
project. Seminar on Water Management for Agriculture, Lahore.
Gockowski, J ., C. Asamoah, S. David, G. B. Nkamleu, I, Gyamfi, S. Agordorku, M. A.
Kuti. 2006. An evaluation of farmer field school training on the
livelihoods of cocoa farmers in Atwima district, Ashanti region, Ghana.
The sustainable tree crops program (STCP) Working Papers Series Issue I.
Godden, w. and P. Hatt. 1952. Methods in social research. Mexico McGraw Hill Book
Company, New York.
Good, H. and A. Markel. 1959. Study on social sciences. New Publishers, New York.
Gorton, M., J. Sauer, M.Peshevski, D. Bosev, D. Shekerinov and S. Quarrie. 2009. Water
communities in the Republic of Macedonia: An empirical analysis of
membership satisfaction and payment behavior. World Development 37
(12), 1951-1963.
Govt. of Pakistan, 2006. Agricultural Statistics of Pakistan 2006-2007. Govt. of
Pakistan, Ministry of Food, Agriculture and Livestock (Economic Trade
and Investment Wing) Islamabad.
Govt. of Pakistan, 1987. Cooperatives and Water Users’ Associations and the Ordinance
for the Provinces. Federal Water Management Cell, Islamabad.
Govt. of Pakistan, 1999. District Census Report of Sargodha: Censes Publication No. 36,
Population Census Organization, Statistics Division, Islamabad.
Govt. of Pakistan, 2002. Agriculture Statistics of Pakistan. Economic Wing, Ministry of
Food, Agriculture and Livestock, Islamabad, Pakistan.

173
Govt. of Pakistan, 2004. Agriculture Statistics of Pakistan. Ministry of Food, Agriculture
and Livestock, Islamabad, Pakistan.
Govt. of Pakistan, 2004. National Program for Improvement of Watercourses in Pakistan.
Federal Water Management Cell, Ministry of Food, Agriculture and
Livestock, Islamabad, Pakistan.
Govt. of Pakistan, 2004. National Program for Improvement of Watercourses in Pakistan
(Punjab Component), Lahore, Pakistan.
Govt. of Pakistan, 2005. Third Quarterly Report for Fiscal Year 2005, Ministry of Food,
Agriculture and Livestock, Islamabad, Pakistan.
Govt. of Pakistan, 2007. Economic Survey of Pakistan, 2006-07. Finance Division,
Ministry of Food, Agriculture and Livestock, Islamabad, Pakistan.
Govt. of Pakistan, 2013. Economic Survey of Pakistan, 2012-13. Economic Advisors’
Wing, Finance Division, Islamabad, Pakistan.
Govt. of Punjab, 2004. National Program for Improvement of Watercourses in Pakistan.
Directorate General Agriculture (Water Management), Punjab, Lahore.
Govt. of Punjab, 2005. National Program for Improvement of Watercourses in Pakistan.
Directorate General Agriculture (Water Management), Punjab, Lahore.
Govt. of Punjab, 1999. Information and Procedure Manual for Social Organizers
(Revised Publication). Private Sector Groundwater Development Project
(PPSGDP).
Gulati, A., Meinzen-Dick, R. and Raju, K.V. 2005. Institutional Reforms in Indian
Irrigation. Sage Publications: New Delhi.
Haider, A.S., A.H. Mirza, and M. Illahi. 1979. Organizational structure for effective
watercourses use and maintenance in the Punjab. Dept. of Agri. Eco.,
Univ. of Agri., Faisalabad.
Hammad-ur-Rehman. 2000. The impact of watercourses improvement on farm
production in tehsil Chak Jhumra. M.Sc. (Hons.) Thesis, Dept. of Rural
Sociology, Univ. of Agri., Faisalabad.
Haq, A. 1995. Improving irrigation system performance. Major issues and options. Pak.
J. Water Resources, 1: 54-56.
174
Haq, I. 1968. First West Pakistan water shed management conference, Pakistan Forest
Institute, Peshawar.
Hart, K. and G. A. Wilson. 2000. United Kingdom from agriculture environmental policy
shaper to receiver. In: Buller, H., G. Wilson and A. Hall (eds.) Agriculture
-environmental policy in the European Union, Ashgate, Aldershot, 99-117.
Hassan, A. 1975. Water losses in watercourses. Studies on water losses from
watercourses and their lining measures. Irrigation Research Institute,
Lahore.
Hassan, B. 2006. Saving irrigation water. The Daily Dawn, the Internet Edition, June 12,
2006. [http://www.dawn.com]
Hassan, B. 2007. Wheat yield and food security. The Daily Dawn, February 12, 2007,
pp.-III.
Hassan, M. Z. Y., A. S. Khan and N. H. Malik. 2003. Effect of education of the
respondents on the adoption of recommended chemical control measures
among the rice growers of tehsil Kamokee district Gujranwala-Pakistan.
International Journal of Agriculture, Biol. 5(4): 564-565.
Hassan, M. Z.Y., B. N. Siddiqui and M. N. Irshad. 2002. Effect of socio-economic
aspects of mango growers on the adoption of recommended horticultural
practices. Pak. J. Agriculture. Sci. 39(1): 220-221.
Hassan, R., L. Tellefson, A. El-Gindi and M. Ahmad. 1993. Country and sub-regional
action program, Egypt. International action program on water and
sustainable agricultural development, FAO, Rome, Italy. pp. 18-21.
Healy, S. 1994. PRA and irrigation abstracts. Scotland: IDS.
Hedjazi, Y., and Soltani, S. 2005. Factors effecting on cotton farmers’ tendency to
participate in financing agricultural extension systems, 21(1): 96-106.
Hornby, A. S. 1999. Oxford Advanced Learner’s Dictionary of Current English, (8th ed.).
The English Language Book Society and Oxford Uiversity Press.
Hu, K. 2006. Thinking about the development of water users’ associations (in Chinese).
China Rural Water and Hydropower 5, 8-10.
175
Huang, Q., J. Wang, K.W. Easter and S. Rozelle. 2010. Empirical assessment of water
management institutions in northern China. Agricultural Water
Management, 98 (2), 361-369.
Huang, Q., S. Rozelle, J. Wang and J. Huang. 2009. Water management institutional
reform: A representative look at northern China. Agricultural Water
Management. 96 (2), 215-225.
Huisinga, R. N. 1997. Socio-economic and gender analysis program: Intermediate Level
Handbook. FAO and ILO Publication.
Hussain, M. 2007. Impact of small scale irrigation schemes on poverty alleviation in
marginal areas of Punjab, Pakistan. Ph.D. thesis. Dept. of Agri. Eco.,
Univ. of Agri., Faisalabad.
Idrees, M. 2003. Developing a strategy for mobilizing rural youth for the development of
agriculture in NWFP, Pakistan. Ph.D. Thesis. Dept. of Agri. Eco., Univ. of
Agri., Faisalabad.
IFAD, 2002. Assessment of rural poverty in Asia and the Pacific. International fund for
agricultural development. Rome. [Online] http://www.ifad.org/
poverty/region/ pi /PI partl. pdf
INPIM, 2004. Water saving in India, Indian network on participatory irrigation
management (INDIAPIM). (www.indianpim.org)
Iqbal, S.M. and S.A. Khan, 1991. Benchmark survey of Jabbi and Nikka small dams.
Publication No. 275, Punjab Economic Research Institute, Lahore.
Irrigation system with many smallholders: The case of Chancy-
Lambayeque in Peru .Agricultural Water Management. 98 (4), 705-714.
Irshad, A. 1981. Watercourses rehabilitation, roving seminar on on-farm water
management, Univ. of Agri., Faisalabad.
Isham, J. and S. Kahkonen. 2002. Institutional determinants of the impact of community-
based water services: Evidence from Sri Lanka and India. Economic
Development and Cultural Change, 50, 667-691.
Ishaque, C.M. 1966. Watershed management project, an annual report, WAPDA,
Rawalpindi, 47-51.

176
Jafar, A. 1998. Methods and Techniques of Social Research. Published by Mohiuddin
Ahmed, the university press limited, Dhaka, Bangladesh.
Japan Bank for International Cooperation (JBIC), 2004. Sector study for upgrading the
sustainability of irrigation projects in the kingdom of Thailand, Inception
Report, JBIC Sector Study Series 2003, no. 5, pp. 1.
Javed, T. 1991. Constraints in the formation and functioning of water users associations
in tehsil Toba Tek Singh, M.Sc. Thesis, Dept. of Rural Sociology, Univ.
of Agri., Faisalabad.
Jhangir, W.A. and N. Ali. 1998. The farming system potential for investment and returns
in Sindh. Pak. Report No. R-70-2. Pak. National Program, Irrigation
Management Institute, Lahore.
Johnson, S. H., Svendsen, Mark, Gonzalez and Fernando. 2002. Structural reform plan in
irrigation department. Report on the 6th International Symposium on water
users’ participation in irrigation management.
Johnson, S.H., J. Reuss, and M.K. Lowdermilk. 1977. Improving irrigation water
management in Indus Basin, Proceedings of seminar of water management
for agriculture, Lahore.
Johnson, S.M and J. Stoutjesdijk. 2008. WUA training and support in the Kyrgyz
Republic. Journal of Irrigation and Drainage 57, 311–321.
Kango, 1978. Water users’ associations for irrigated agriculture. Ministry of Food,
Agriculture and Livestock, Islamabad, Pakistan.
Kapoor, S. 1998. Regional productivity difference of rice and wheat in Indian States.
Indian J. Agriculture Eco, 33(2): 1075-1078.
Karatas, B.S., E. Akkuzu, H.B. Unal, S. Asik and M. Avci, 2009. Using satellite remote
sensing to assess irrigation performance of water user associations in the
Lower Gediz Basin, Turkey. Agricultural Water Management, 96 (6), 982-
990
Kausar, B. and M.K. Afzaal. 1982. Structure pre-requisites for the functioning of WUAs
under Cooperative Law, Univ. of Agri., Faisalabad.

177
Kausar, M.B. and M. Afzal. 1980. Organization and testing water users’ associations as
self-sustaining enterprises. (Annual Report 1979-80). Water Management
for Agriculture, Lahore.
Kausar, M.B. and M. Afzal. 1991. Structural pre-requisites for the functioning of water
users’ associations under cooperative law. Univ. of Agri., Faisalabad.
Kemper, W.D. 1980. Watercourses improvement research in Pakistan. Water
Management Technical Report, Colorado State University, USA.
Khan, A., Pervaiz. U., Khan. N. M., Ahmad, S and S. Nigar. 2009. Effectiveness of
demonstration on plots as extension method adopted by AKRSP for
agricultural technology dissemination in district Chitral. Sarhad J. Agric.
25 (2): 313-319.
Khan, M. K. 1991. An analysis of the impact of extension work of hill farming
development project of maize production in tehsil Muzaffarabad, Azad
State of Jammu and Kashmir, M.Sc. Thesis, Dept. of Rural Sociology,
Univ. of Agri., Faisalabad.
Khan, S. B. 2010. Problems in universalization of primary education in Pakistan. Pak. J.
Comer. Soc. Sci. 4(2): 147-155.
Khan, S.R. 2007. The Dawn Economic and Business Review, February 12-18, 2007.
Khan, T. 2005. A lost battle? The Daily Dawn, Lahore, Pakistan March 2. pp.4.
Khin, M.N. 1994. Irrigation water management for sustainable agriculture development
in Myanmar. Report of the expert consultation of the Asian Network on
irrigation/water management, Bangkok, Thailand. RAPA Pub. 1994, 117,
pp. 176.
Kijne. J. W., R. Barker and D. Molden. 2003. Water productivity in agriculture: Limits
and opportunities for improvement, CAB International publishing,
Wallingford, UK.
Kirdwood, C. and G.E. Radoservich, 1975. Organizational alternatives to improve
OWFM in Pakistan, CSU Report No. 36, Fort Collins, USA.
Kloezen, W, H. 1998. Water markets between Mexican water users’ associations. Water
Policy, 1 (4), 437-455.
Kotter, J.P. (1988). The Leadership Factor. NY: Free Press, New York.

178
Kumar. 1977. Economics of water management (a study of field channels). New Delhi;
India: Heritage Publishers. World Agriculture Economics & Rural
Sociology, Abstract. 20(8): 4689:1978.
Kurkalova, L., C. King and J. Zaho. 2003. Green subsidies in agriculture: Estimating the
adoption costs of conservation tillage from observed behavior. Working
Paper 01, Centre for Agriculture and Rural Development, Iowa State
University, USA.
Lassey, W. (1976). Leadership and Social Change. California University Associates.
Latios, W.R. 1983. Social organization, water control and water anarchy: a study of
irrigation in Pakistan & India. Colorado State University, USA.
Leady, P. D. 1989. Practical research planning and designing. Macmillan, New York.
Lecina, S., Neale, C. M. U. Merkley and C.A.A. Dos Santos. 2011. Irrigation evaluation
based on performance analysis and water accounting at the Bear River
Irrigation Project (U.S.A.). Agricultural Water Management, 98 (9), 1349-
1363.
Li, J. 2003. Discussion of the economic and social impacts for evaluation of participatory
irrigation management in irrigation districts in China. China Rural Water
and Hydropower 1, 16-20.
Litwin, M. S. (1995). How to measure survey reliability. California: Sage Publications
Inc.
Lodhi, T.E. 2003. Need for paradigm shift from top-down to participatory extension in
the Punjab, Pakistan: Perception of farmers, change agents and their
supervisory staff. Ph.D. Thesis. Dept. of Agri. Ext., Univ. of Agri.,
Faisalabad, Pakistan.
Lohmar, B., J.Wang, S. Rozelle, J. Huang and D. Dawe. 2003. China’s agricultural water
policy reforms: increasing investment, resolving conflicts, and revising
incentives. Market and Trade Economics Division, Economic Research
Service, U.S. Department of Agriculture. Agric. Inf. Bull. 782.
Lovenbalk, J., D. Hjarne, A. A. Taoutaou, O. Mertz, M. Dirir, P. M. Dyg, K. M. Lassen
and M. Sehested. 2003. Opportunities and constraints for agricultural
intensification in communities adjacent to the Crocker Range National
179
Park Sabah, Malaysia. ASEAN Review of Biodiversity and Environmental
Conservation (ARBEC). P.3.
Lowder Milk Max. K. A.C., Early and D.M. Freeman. 1975. Physical and socio-
economics of watercourses in Pak, Punjab system constraints and farmers
responses. Water and Power Management Technical Report No.42
Colorado State University Fort Collins, Colorado.
Lowder Milk, Max, K., Alan Clearly; and David M. Freeman. 1976. Physical, social and
economic factors affecting irrigation. Water Management Technical
Report No. 45 Colorado State University Fort Collins, Colorado.
Lowermilk, M.K., M.F. David and C.E. Alan. 1978. Farmer irrigation constraints and
farmers responses: 6 volumes. Joint Contribution of Colorado State
University and Directorate of Watercourses, Chak Farming Survey
Project, Lahore: Master Planning and Review Division, (WAPDA).
Luna, B.A. 1973. The irrigation department and its water management problems.
Proceedings of the Seminar on Water Management, Agriculture Research
Council, Lahore: 27-31.
Lynne, G. D., C. F. Casey, A. Hodges, and M. Rahmani. 1995. Conservation technology:
adoption decisions and the theory of planned behavior. J.Econ. Psych.,
16(4): 581-598.
Madrigal, R., F. Alpizar and A. Schulter, A. 2011. Determinants of performance of
community-based drinking water organizations. World Development.
www.elsevier.com/locate/worlddev
Magill, F. N. 1995. International encyclopedia of sociology, Vol.2, Published by
Brannfield, Inc. UK.
Malhotra, S.P., S.K. Rahaja and S. David. 1984. A mythology for monitoring the
performance of large scale irrigation system. A case study of the
warabandi system of North West India: Agricultural Administration Unit.
Overseas Development Institute, Perey Street, London, 10-11.
Malik, N. H. 2005. Education as a significant variable in the application of extension
methods with special reference to demonstration techniques. Pak. J. Agri.
Sci., 28(1): 34-36.
180
Mansuri, G. and V. Rao. 2004. Community-based and driven development: a critical
review. World Bank Res. Observ., 19, 1–39.
Maqbool, A., and Abedullah. 2006. Environmental Hazards. The Daily Dawn, the
Internet Edition, January 30, 2006. [http://www. dawn.com].
Marks, S. J., and Davis, J. (2012). Does users’ participation lead to sense of ownership
for rural water systems? Evidence from Kenya, 40(8): 1569-1576.
Marre, M., R. Bustos, J. Chambouleyron and M.G. Bos. 1998. Irrigation water rates in
Mendoza’s decentralized irrigation administration. In: P.J.M. van
Hofwegen and E. Schultz (Eds.), financial aspects of water management,
Balkema Publishers, Rotterdam, pp. 25-40. Revised edition: Irrigation and
Drainage Systems, Kluwer, Dordrecht, 12(1): 67-83.
Matin, A. K. 1989. Methods of research for business and social science. University
Grants Commission.
Mehari, A., B.V. Koppen, M. McCartney, and B. Lankford. 2009. Unchartered
innovation? Local reforms of national formal water management in the
Mkoji sub-catchment, Tanzania. Physics and Chemistry of the Earth, Parts
A/B/C. 34(4-5): 299-308.
Meinzen-Dick, R. S., M. Mendoza, L. Sadoulet and G. Abiad-Shields. 1997. Sustainable
water users’ associations: lessons from a literature review. In:
Subramanian, A., Jagannathan, N.V., Meinzen-Dick, R.S. (Eds.), User
Organizations for Sustainable Water Services. World Bank, Washington,
DC.
Meinzen-Dick, R., and M. Zwarteveen. 1998. Gendered participation in water
management: Issues and Illustrations from Water Users’ Associations in
South Asia. Agriculture and Human Values 15: 337-345.
Merry, D.J. 1979. Irrigation and honor: Cultural impediments to the improvement of local
level water management in Punjab, Pakistan. Field Report No. 9, Lahore:
Colorado State University, Water Management Research Project in
Pakistan.
Merry, J.D. 1986. Culture impediments to the improvement of local level water
management in Punjab, Pakistan.

181
Merry, J.D. 1987. The local impact of centralized irrigation control in Pakistan. A socio-
economic and perspective.
Miraza, A.H. 1975. A study of village organizational factors affecting water management
decision making in Pakistan Engineering Research Centre, Colorado State
University, Port Collins Colorado, 27-74.
Miraza, A.H. and M.A. Khan. 1990. Procedures and problems of organization of WUAs,
Water Management Research Project, Univ. of Agri., Faisalabad.
Mirza, A.H. 1989. The dilemma of organizing water users association in the Punjab in
societal dynamic and irrigation systems. Council of Research in Water
Resources, Islamabad.
Mirza, A.H. and A.S. Haider. 1979. Organizational structure for effective watercourses
use and maintenance in the Punjab. Dept. of Agri. Eco., Univ. of Agri.,
Faisalabad.
Mirza, A.H. and D.J. Merry. 1979. Organizational problems and their consequences on
improved watercourses in Punjab, Pakistan. Technical Report No.50,
Colorado State University, USA.
Mirza, A.H. and D.J. Merry. 1979. Organizational problems and their consequences on
improved watercourses in Punjab, Pakistan. Technical Report No.55,
Colorado State University, USA.
Mirza, A.H. and D.J. Merry. 1979. The water users association research project: An
interim report, Colorado State University, Water Management, Faisalabad
under United States Agency for International Development Agreement
No. 204-77-3.
Molden. D.J., R. Sakhtivadivel and C.J, Fraiture.1998. Indicators for comparing
performance of irrigated agricultural systems. International Water
Management Institute, Sri-Lanka.
Mu, K, H., Z. Hui and K. Di. 2004. Property rights assurance for Chinese farmers to
participate in irrigation management in China. Economic Theory and
Business Management 12, 61-66.
Muhammad, S., T.E.Lodhi, and G.A. Khan, 2008. An in-depth analysis of the electronic
media for the development of a strategy to enhance their role in
182
agricultural technology transfer in the Punjab, Pakistan. Final Report of
Research Project submitted to Higher Education Commission, Islamabad.
Munir, 2000. Conserving water for sustainable human development. Resource Paper,
University of Zurich, Switzerland.
Munir, S. 2002. Conserving water for sustainable human development. www
jang.com.pk./the news/jul. 2002-week/nos-21-07.2002/ poll.htm # I.
Muro, L. and J. Burchi. 2007. Education and gender inequality: The Flamer Press.
Mustafa, Y. 2002. Scarcity emerging as global threat, The Dawn.
www.dawn.com/2002/01/14/ebr16.htm.
Nachmias, F. and Nachmias, D. (1992). Research Methods in Social Sciences. (4th ed.).
Edward Arnold, London, U. K.
Nagaraj, N. 1999. Institutional management regimes for pricing of irrigation water: the
French Model, lessons for India. Agricultural Systems, 61(3), 191-205.
Natiq, M. and S. Akram, 1979. Organizational structure for effective watercourses use
and maintenance in the Punjab. Dept. Agri. Eco., Univ. of Agri.,
Faisalabad.
Nepal Water Conservation Foundation (NWCF), 1999. Global water worries and local
complexities, Water Nepal Journal, 7(1), Kathmandu, Nepal.
Northouse, G. 1997. Leadership theory and practice, Thousand Oaks, CA: Sage
Publications.
Northouse, G. 2007. Leadership Theory and Practice, (3rd ed.). Thousand Oaks, CA: Sage
Publications.
Office of Agriculture Economics, 2003. Agricultural Statistics of Thailand, crop year
2002/2003, Agricultural Statistics No. 401, pp. 100.
Ofuoku, A.U.G. N. Emah and B.E. Itedjere.2008. Information utilization among rural fish
farmers in central agricultural zone of Delta State, Nigeria. World j. Agri.
Sci., 4(5):558-564.
Ogunlade, I. 2007. Backyard fish farmers’ information needs in Osun state, Nigeria.
Available at; http://www.aaae.africa.org/proceedings 2/002/Ogunlade.pdf

183
Ojeda-Bustamante, W., J. González-Camacho, M. Sifuentes-Ibarra and E.Isidro, E. 2007.
Using spatial information systems to improve water management in
Mexico. Agricultural Water Management, 89 (1-2): 81-88.
Okorley, E. L., M. M. Zinnah, A. O. Mensah and M. Owens. 2004. Women in agro-
processing in Ghana: A case study of the state of women in small scale
fish smoking in the central region of Ghana.
Okwu, O. J., A.A. Kuku, and J.I. Aba, 2007. An assessment of use of radio in agricultural
information dissemination: a case study of radio Benue in Nigeria. African
J. Agri. Res., 2(1): 014-018. [Online] http://www.academicjournals.
Org/AJAR
Omobolanle, O.L.2008.Analysis of extension activities on farmers, productivity in
Southwest, Nigeria. Afr. J. Agric. Res; 3(6):469-476.
Onemolease, E. 2002. Extension needs of women cassava farmers in Idueben and Esan
northern local government areas of Edo State, Nigeria. Africa Dev. Vol.
XXVII (1&2): 116-126.
OWFM, Punjab, 1979-80. On-farm water management development project. Annual
Progress Report 1978-79, and 1979-80, Directorate of OFWM
Development Project, Lahore. Ownership for Rural Water Systems?
Evidence from Kenya, 40(8),
Ozeclik A, H Tanrivermis, E. Gundogmus and A. Turan.1999. The development
opportunities of methods for water pricing on the base of turning-
overprices of schemes to water user associations and cooperatives aimed
for best irrigation management practices in Turkey. Agricultural
Economics Research Institute, Ankara, Turkey.
Patil, R. K. 1987. Economic of farmer participation in irrigation management. Irrigation
Management Network, Overseas Development Institute, UK. International
Irrigation Management Institute, Sri Lanka.
Pattern, M. L. 2004. Understanding Research Methods (4th ed.). Los Angeles: Pyrczak.
Pavan, W., Fraisse, C.W., Peres, N.A., 2011. Development of a web-based disease
forecasting system for strawberries. Compute. Electron. Agric. 75, 169-
175.
184
PCRWR, 2003. Water Management for Efficient Use of Irrigation Water and Resources
(PCRWR), Islamabad.
PDIA, 2004. Institutional Reforms in Punjab, Punjab Irrigation & Drainage Authority
(PIDA) Lahore. [www.punjab.gov.pk/irrigation/ pida].
Pezon, C. 2007. The role of users’ cases in drinking water services development and
regulation in France: A Historical Perspective. Utilities Policy, 15(2007):
110-120.
Playan, E., Cavero, J., Mantero, I., Salvador, R., Lecina, S., Faci, J.M., Andres, J.,
Salvador, V., Cardena, G., Ramon, S., Lacueva, J.L., Tejero, M., Ferri, J.,
Martinez-Cob, A., 2007. A database program for enhancing irrigation
district management in the Ebro Valley, Spain. Agric. Water Manage. 87:
209-216.
Qaisar, 2002. Efficient water use, draft guidelines for the reuse of grey water. The Dawn,
the Internet Edition.
Qaisar, A. 2002. Save the country’s lifeline. The Dawn, the Internet Edition.
[www.dawn.com].
Qiao, G., L. Zhao and K.K Klein. 2009. Water user associations in Inner Mongolia:
Factors that influence farmers to join. Agricultural Water Management.
96: 822-830.
Quraishi, et al. 1991. Official response to the organization of WUA under the WUA
ordinance, 1981. Water Management Research and Training Program,
Univ. of Agri., Faisalabad.
Qurban, A.A. and A.Q. Khurshid. 1984. Training in water management at the Univ. of
Agri., Faisalabad.
Radoservich, G.E. 1975. Water users organizations for improved irrigated agriculture:
Applicability to Pakistan. Water Management Technical Report No.44,
Fort Collions: Colorado State University, USA.
Radosevich, G.E. 1978. Proceedings of seminar on water user’s association for
improving irrigated agriculture, Islamabad, June, 1978.
185
Raju, K.V. 2001. Participatory irrigation management in India (Andhra Pradesh) IMT
cases study. In: International E-mail Conference on Irrigation
Management Transfer.
Rasheed, C. 2005. Lining of the watercourses. The Dawn, The Internet Edition,
[www.dawn.com].
Reddi, G.H. and T.Y. Reddy. 2005. Efficient Use of Irrigation Water, Kalyani Publishers,
New Delhi, India.
Reidinger, R. 2002. Participatory irrigation management reform: self-managing irrigation
and drainage districts in China. In: Sixth International Seminar on
Participatory Irrigation Management, Beijing, China.
Reuss, J.O., V.S. Gaylord, and J.M. Douglas. 1979. Water management program to
improve agricultural productivity in Pakistan: An Appraisal Report No.42,
Water Management Research Project, Lahore, Pakistan, Colorado State
University, USA.
Reuss, Y. and D.J. Merry. 1979. Water management program to improve agricultural
productivity in Pakistan. An appraisal report No.44, Water Management
Research Project, Lahore, Pakistan, and Colorado State University, USA.
Rizwani, A.R. 1964. Adoption of recommended farm practices in the selected rural
communities of New York State. M.Sc. Thesis. Tthaco Cornell University,
New York.
Saeed, I. 1978. Economics of cooperative watercourses improvement in Thekriwala
Project Area. Univ. of Agri., Faisalabad.
Sahu, H. 1982. Test seepage studies in two cancels and test studies of polythene lining in
Bortalai distributary and minor to a canal system, Govt. of India, New
Delhi.
Samma, M.A. 1973. Inaugural address at the seminar on water management, agricultural
research council, Ministry of Food and Agriculture, under Developed
Area, Govt. of Pakistan, Lahore.
Saqib, M. 2006. Objectives of water users associations. The Dawn, The Internet Edition,
[www.dawn.com].
186
Scheumann W and M.Hassan. 2001. Irrigation management transfer: Irrigation.
Associations in the lower Seyhan Plain and the Gediz River Basin
(Turkey), Germany.
Shahid, A. and M. Ashraf, 1989. “Benchmark survey of Mirwal small dam”. Publication
No. 262, Punjab Economic Research Institute, Lahore.
Shahid, A., H. Zahid, S. Asaf, M. Rashida and M. Saleem. 2004. Drought mitigation in
Pakistan; current status and options for future strategies, IWMI, Pakistan
working paper No. 85.
Sheikh, A.D, M.A. Mehmood, A. Bashir, and M. Kashif. 2006. Adoption of rice
technological package by the farmer of irrigated Punjab. J. Agric. Res;
44(4):341-353.
Shinn, E.F.J.R. 1988. The social organization of irrigation in the Niazbeg command area
in the Punjab, Pakistan. Colorado State University, USA.
Shioda, K. and T. Onimaru. 2007. Successful factors and activation theory/concept of
water users’ organizations based on the MWMS project in Thailand.
Paddy Water Environment 5: 15-27
Shoida, K. 2000. Study on water management in the Chao Phraya Delta and
development of flow estimation method for tidal river in Thailand. Doctor
Paper to Kyoto University, P 6 (in Japanese).
Shyamsundar, P., E.Araral, and S. Weeraratne. 2005. Devolution of resource rights,
Poverty, and Natural Resource Management – A Review. The World Bank
No. 104.
Siddiqui, B. N., M. Z. Y. Hassan, F. Asif, S. Iqbal, S. Bajwa, and A. Malik. 2003.
Awareness, adoption and reasons for non-adoption of apple growers with
regard to recommended horticultural practices. Pak. J. Appli. Sci. 3(3):
182-184.
Sidiq, A. 1994. Sustainability of the Indus basin: impact of tertiary salinity/sodicity on
wheat productivity, damage assessment and future public policy.
Silva, N.G.R.D.E. 1981. Farmer participation in water management: The maniple project
in Sri Lanka. Kanday Range Department of Irrigation, Sri Lanka.
187
Sokile, C. S., and Koppen, B. V. (2004). Local water rights and local water user
alternative changing methods: Possible shortcomings of a volumetric
Soto-Garcia, M., Del-Amor-Saavedra, P.,Martin-Gorriz, B.,and Martínez-Alvarez,
Spain. Agric. Water Manage. 87: 209–216.
Svendsen M, and Nott, G. 1999. Irrigation management transfer in Turkey: process and
outcomes. EDI participatory irrigation management case studies series.
Draft paper.
Talebi, K. and M. Tajeddin. 2011. The adoption of new and innovative knowledge by
small and medium enterprises for Iran: Opportunities and Constraints for
Growth. African Journal of Business Management, 5(1): 39-49.
Tanaka, Y and Sato, Y. 2005. Farmers managed irrigation districts in Japan: Assessing
how fairness may contribute to sustainability. Agricultural Water
Management, 77 (1-3): 196-209.
Tariq, J. 1991. Constraints in the formation of functioning of water users’ associations in
tehsil Toba Take Singh. M.Sc. Thesis, Dept. of Rural Sociology, Univ. of
Agri., Faisalabad.
Tariq, M., Javed, A. and M. Ali. 2008. The effect of favor and trickle (drip) ingestion on
the yield of tomatoes . Sarhad J. Agri. 6 (03) : 231-233.
Teasmsuwan, V., and M. Satoh. 2009. Comparative analysis of management of three
water users’ organizations: successful cases in the chao phraya delta,
Thailand. Paddy Water Environ, 7: 227-237.
Thomas, J.T. 1977. Operational conveyance on a tubewell number 81-R watercourses.
CSU in collaboration with Mona Reclamation Experiment Project of
WAPDA.
Thornton, D.S. 1975. Some aspects of the organization of irrigated areas, Barking, UK.
Agriculture Admin. 2(3): 179-194. World Agriculture Economics & Rural
Sociology Abstract, 18(1): 415: 1976
Tufail, M. 2000. Role of water uses associations in relation to watercourses improvement
in district Faisalabad. M.Sc. (Hons.) Thesis, Dept. of Rural Sociology,
Univ. of Agri., Faisalabad.
188
U.N. Report, 2002. Resident coordinator of the United Nations systems and operational
activities for the development in Pakistan. Drought Pakistan, Updated No.
16, September 2002.
U.N. Report, 2002a. Resident coordinator of the United Nations systems and operational
activities for the development in Pakistan. Drought Pakistan, Updated No.
15, July 2002.
U.S. Army, 2007. Military leadership, Field Manual 22-100. U.S. Government Printing
Office. University Press, Washington, DC.
UNSW Press, Sydney, Australia, and CAB International, Wallingford. U.K.
Uphaff, N. 1986. Constructing legal organizational approaches to water management
department in Sri Lanka.
Uysal, O.K and E. Atis. 2010. Assessing the performance of participatory irrigation
management over time: A case study from Turkey. Agricultural Water
Management, 97 (7): 1017-1025.
Vandersypen, 2007. Drainage problems in the rice schemes of the office du Niger (Mali)
in relation to water management. Agricultural Water Management, 89 (1-
2): 153-160.
Vandersypen, K., A.C.T Keita, and C. Jamin. 2007. Formal and informal decision
making on water management at the village level: a case study from the
Office du Niger irrigation scheme (Mali). Water Resources. Res. 43, doi:
10/10/2006WR005132.
Vedeld, T. 2000. Village Politics: Heterogeneity, leadership and collective action. Journal
of Development Studies, 36 (5): 105-134.
Veettil, P. C., S. Speelman, A. Frija, J.Buysse and J. Huylenbroeck, 2011.
Complementarity between water pricing, water rights and local water
governance: A Bayesian analysis of choice behavior of farmers in the
Krishna river basin, India. Ecological Economics, 70 (10): 1756-1766.
Vermillion, D. 2006. Lessons learned and to be learned about irrigation management
transfer. Survival of the Commons: Mounting Challenges and New
Realities: the Eleventh Conference of the International Association for the
Study of Common Property, Bali, Indonesia.

189
Vermillion, D.L. 1997. Impacts of irrigation management transfer: a review of the
evidence, Research Report 11, International Irrigation Management
Institute, Colombo, Sri Lanka.
Vos, J. 2005. Understanding water delivery performance in a large scale irrigation system
in Peru. Irrigation Drain 54: 67-78.
Vos, J. and L. Vincent. 2011. Volumetric water control in a large-scale open canal
irrigation system with many smallholders: The case of Chancay-
Lambayeque in Peru. Agricultural Water Management, 98 (4): 705-714.
Waheed-uz-Zaman, 1998. Impacts of farmer participation for water recourses
management in the Punjab, Pakistan. International Water Management
Institute (IWMI) Pakistan. National Program.
Wajayaratna, C.M. 1985. Involvement of farmers in water management in Gal Oya, Sri
Lanka, Cronel Univ., Ithaca.
Wallen, N. E. and Fraenkel, J. R. 2001. Educational Research: A guide to the process (2nd
ed.). Mahwah, N. J.: LEA Publishers.
Wang, J., Z. Xu, J. Huang and S. Rozelle. 2005. Incentives in water management reform:
assessing the effect on water use, production, and poverty in the Yellow
River Basin, Environ. Dev. Econ. 10: 769-799.
Wang, Jinxia, X. Zhigang, J. Rozelle, Scott. 2006. Incentives to managers of participation
of farmers in China’s Irrigation Systems: which matters most for water
savings, farmer income and poverty? Agricultural Economics, 34 (3): 315-
330.
WAPDA. 1985. Monitoring and evaluation on-farm water management program
(IDA/IFAD Assisted) Vol., 1. Final Report. Planning and Investigation,
Publication WAPDA.
Water Resources Department of Inner Mongolia. 2006. Work summaries for water user
participation in irrigation management in Inner Mongolia: compilations of
summary material on work experiences and exchange meetings of water
user associations in China. The Ministry of Water Resources of China, pp.
34-39.

190
Wellwns, J., M. Nitcheu, F. Traore and B.Tychon. 2013. A public–private partnership
experience in the management of an irrigation scheme using decision-
support tools in Burkina Faso. Agricultural Water Management, 116 (0):
1-11.
Wesseling, C., McConnell, R., Partanen, T., and Hogstedt, C. (1997). Agricultural
pesticide use in developing countries: Health Effects and Research Needs.
Int. J. Health Services, 27:273-308.
World Bank, 1976. Pakistan special agricultural sector review, Vol. III Annex on Water
Management June 28, 1976. Document of the World Bank.
World Bank, 2003. Water user association development in China: participatory
management practice under bank-supported projects and beyond. Social
Development Notes No. 83. World Bank, Washington, DC.
World Bank, 2003a. China–Yangtze basin water resources project: Implementation,
Completion and Results. The World Bank No. 25903.
Xianjun, C. and Yumbi. 1996. Introduction of water saving irrigation scheduling through
improved water delivery, a case study from China. Proceedings of
ICDI/FAO Workshop, Sep. 1995. Rome Water Reports No. 8 FAO,
Rome.
Xie, M., 2007. Global development of farmer water user associations (WUAs): lessons
from South-East Asia. In: Hussain, I., Naseer, Z. (Eds.), Proceedings of
the regional workshop on WUAs development: Water users’ associations’
development in Southeastern European Countries. Bucharest, Romania.
Xu, F. and Z. Liang. 2002. The overview of experience on water users who participated
in irrigation management in China. China Rural Water and Hydropower 6:
10-15.
Xu, Z., 2001. Studying on increasing water use efficiency in China. J. China Water
Resource, pp. 25–26.
Yasar, M. 2008. Role of various information sources in adoption of wheat production
technology in selected villages of district Haripur, NWFP, M. Sc. Thesis,
Agri. Ext. Edu. and Communication Dept; NWFP Agric. Univ. Peshawar,
Pakistan.
191
Yasmeen, F., Z.H. Naqwi, B. Mehmood and A. Basit. 2004. Agriculture-economic and
social impact assessment of improved watercourses by scrap-III. Pakistan
J. Soc. Sci. 2(3): 153-161.
Yercan ., M, Dorsan and M. UI. 2004. Comparative analysis of performance criteria in
irrigation schemes: A Case Study of Gediz River basin in Turkey. Agric.
Water Management, 66: 259-266.
Yercan, M .2003. Management turn-over and participatory management of irrigation
schemes: a case study of the Gediz River Basin in Turkey. Agricultural
Water Management, 63 (3): 205-214.
Yercan, M., E.Atis, and H.E. Salali, H. E. 2009. Assessing irrigation performance in the
Gediz river basin of Turkey: water users’ associations versus cooperatives.
Irrigation Science, (2009) 27: 263-270.
Young, K. 1959. Sociology and social life, American Book Company; 349 New York.
Yousaf, M. 1998. A study into the structure and working of water users associations in
Multan district. M.Sc. Thesis, Dept. of Rural Sociology, Univ. of Agri.,
Faisalabad.
Zafar, S. 2004. Watercourses lining, a popular activity. The Dawn, the Internet Edition.
[www.dawn.com].
Zain-ul-Abideen, G. 2007. The effectiveness of the national program for watercourses
improvement as perceived by farmers of tehsil Faisalabad. M.Sc. Thesis,
Dept. of Agri. Ext., Univ. of Agri., Faisalabad.
Zhang, L., J.Huang and S. Rozelle. 2003. China’s war on poverty: assessing targeting and
the growth impacts of poverty programs. J. Chin. Econ. Bus. Stud.1: 301–
317.
Zhang, Q and H.X. Zhang .2001. Five current important water issues for sustainable
development in China. Water Int. 26: 231-238.

192
APPENDIX-I
INTERVIEW SCHEDULE
PRESENT STATUS AND FUTURE SCOPE OF WATER USERS’
ASSOCIATIONS IN THE PUNJAB, PAKISTAN
RESPONDENTS’ DEMOGRAPHIC ATTRIBUTES
1 General
i. Village/Chak No. _____________________________________
ii. Watercourses No. ______________________________________
iii. Specific location of land with regard to watercourses
Head_______________Middle________________Tail___________
2 Personal
i. Name of the respondent____________________________________
ii. Age (years)______________________________________________
iii. Education (years of schooling)______________________________
iv. Land holding (acres)______________________________________
v. Tenancy status
Owner______ Owner-cum-tenant__________Tenant ____________
3 Occupation
i. Only farming____________________________________________
ii. Farming & business_______________________________________
iii. Farming & service________________________________________
iv. Farming & daily wage labor________________________________
v. Any other (please specify)__________________________________
INFORMATION REGARDING THE PROCESS OF SETTING UP
A WATER USERS’ ASSOCIATION (WUA) 1. Do you hold any position in the Managing Committee of WUA in your
village?
Yes________________No__________________No response___________
If yes, please indicate the specific position held:

193
i. President __________ ii. Vice-President _________ iii. Treasurer______
iv. Secretary _________ v. Member ______________
2. What procedure was adopted for the constitution of Managing Committee of
WUA?
i) Through mutual agreement _____________________
ii) By election _________________________________
iii) Any other (please specify) _____________________
3. Were you present in the meeting when the selection/election of Managing
Committee was held?
Yes_________________No________________No response____________
4. In case the Managing Committee was constituted by selection/election, was the
selection/election transparent?
Yes_________________No________________No response____________
5. Were the results announced on the spot?
Yes_________________ No________________ No response___________
6. Was the agreement signed by at least 51% shareholders on stamp paper?
Yes_________________No________________No response____________
7. Was the WUA registered by the District Officer (OFWM)?
Yes_________________No________________No response____________
8. Was Managing Committees’ representation from all reaches of w/c (head,
middle, tail)?
Yes_________________No________________No response____________
9. Was Managing Committees’ representation from all the briadaries living at the
w/c?
Yes_________________No________________No response____________
10. What type of leadership you got from this process?
Excellent_______ Good_______ Satisfactory______ Fair______ Poor ______
11. What is your level of satisfaction about the process of setting up a WUA?
Very low _____ Low ______Medium _____High _____ Very High _______

194
INFORMATION REGARDING THE CRITERIA USED FOR THE
SELECTION OF MEMBERS OF MANAGING COMMITTEE
Which of the following characteristics are possessed by the members of Managing
Committee?
Characteristics Response
All
Members
Most
members
Average
members
Some
members
None
i. Honest ________ ________ ________ ________ _____
ii. Trustworthy ________ ________ ________ ________ _____
iii. Responsible ________ ________ ________ ________ _____
iv. Social worker ________ ________ ________ ________ _____
v. Cooperative ________ ________ ________ ________ _____
vi. Shareholder (landowner) ________ ________ ________ ________ _____
vii. Leader of biradary ________ ________ ________ ________ _____
viii. Man of commitment ________ ________ ________ ________ _____
ix. Devote time of WUA ________ ________ ________ ________ _____
x. Popular among water users ________ ________ ________ ________ _____
xi. Any other (please specify) ________ ________ ________ ________ _____
INFORMATION REGARDING THE EXTENT OF PARTICIPATION OF
WATER USERS IN THE IMPROVEMENT AND MAINTENANCE OF
WATERCOURSES
1 How did water users’ help in the construction of the w/c?
Provision of:
Cash payment only _______________ Labor only ______________
Both (cash & labor) _______________ Any other (please specify) _____
2 What is your level of satisfaction about the construction of the w/c?
Very low _____ Low _____ Medium ____ High ____ Very high _____
3 Do you clean the w/c?
Yes ___________________________ No__________________________
If yes, please specify the mode:
i. Individually ______________
ii. Joint operation ______________
iii. Both ______________
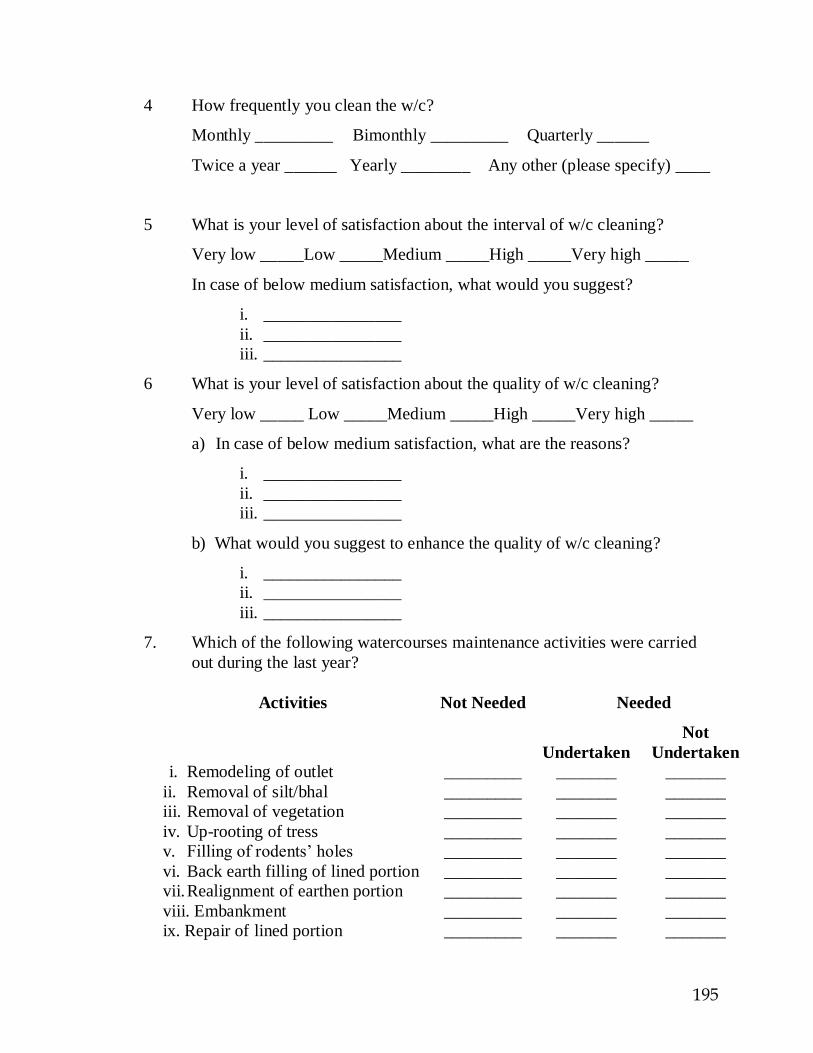
195
4 How frequently you clean the w/c?
Monthly _________ Bimonthly _________ Quarterly ______
Twice a year ______ Yearly ________ Any other (please specify) ____
5 What is your level of satisfaction about the interval of w/c cleaning?
Very low _____Low _____Medium _____High _____Very high _____
In case of below medium satisfaction, what would you suggest?
i. ________________
ii. ________________
iii. ________________
6 What is your level of satisfaction about the quality of w/c cleaning?
Very low _____ Low _____Medium _____High _____Very high _____
a) In case of below medium satisfaction, what are the reasons?
i. ________________
ii. ________________
iii. ________________
b) What would you suggest to enhance the quality of w/c cleaning?
i. ________________
ii. ________________
iii. ________________
7. Which of the following watercourses maintenance activities were carried
out during the last year?
Activities Not Needed Needed
Undertaken
Not
Undertaken i. Remodeling of outlet _________ _______ _______
ii. Removal of silt/bhal _________ _______ _______
iii. Removal of vegetation _________ _______ _______
iv. Up-rooting of tress _________ _______ _______
v. Filling of rodents’ holes _________ _______ _______
vi. Back earth filling of lined portion _________ _______ _______
vii. Realignment of earthen portion _________ _______ _______
viii. Embankment _________ _______ _______
ix. Repair of lined portion _________ _______ _______
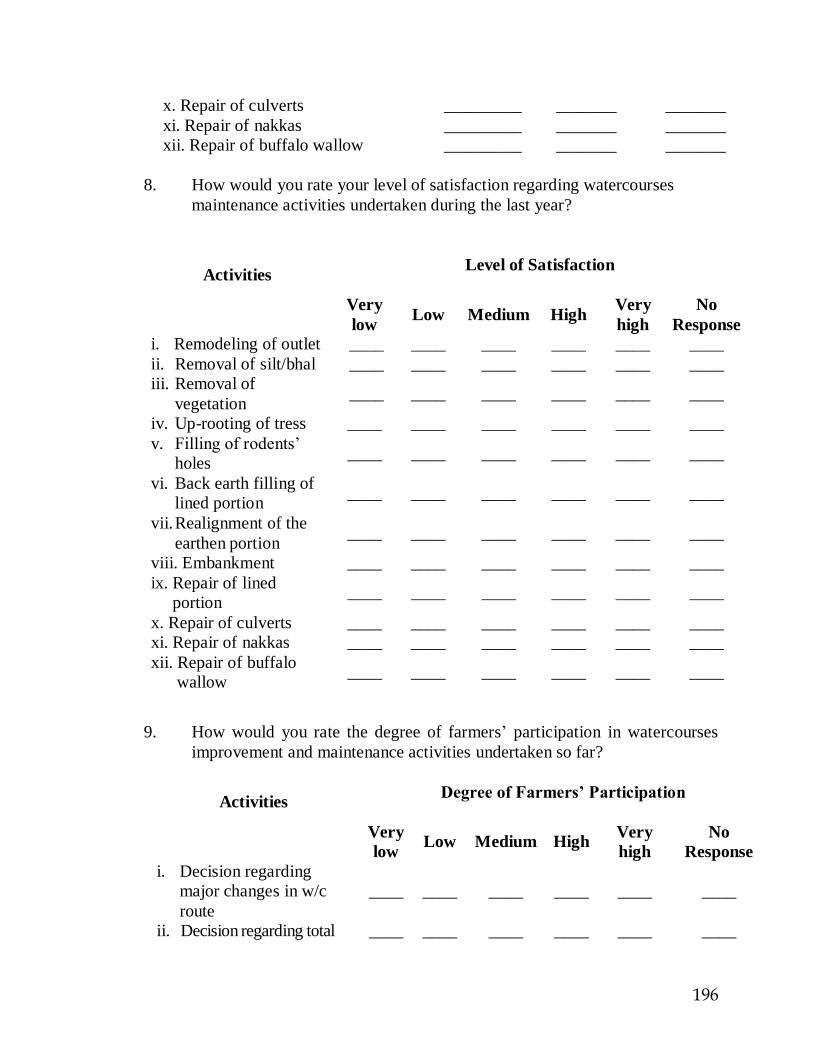
196
x. Repair of culverts _________ _______ _______
xi. Repair of nakkas _________ _______ _______
xii. Repair of buffalo wallow _________ _______ _______
8. How would you rate your level of satisfaction regarding watercourses
maintenance activities undertaken during the last year?
Activities Level of Satisfaction
Very
low Low Medium High
Very
high
No
Response i. Remodeling of outlet ____ ____ ____ ____ ____ ____
ii. Removal of silt/bhal ____ ____ ____ ____ ____ ____
iii. Removal of
vegetation ____ ____ ____ ____ ____ ____
iv. Up-rooting of tress ____ ____ ____ ____ ____ ____
v. Filling of rodents’
holes ____ ____ ____ ____ ____ ____
vi. Back earth filling of
lined portion ____ ____ ____ ____ ____ ____
vii. Realignment of the
earthen portion ____ ____ ____ ____ ____ ____
viii. Embankment ____ ____ ____ ____ ____ ____
ix. Repair of lined
portion ____ ____ ____ ____ ____ ____
x. Repair of culverts ____ ____ ____ ____ ____ ____
xi. Repair of nakkas ____ ____ ____ ____ ____ ____
xii. Repair of buffalo
wallow ____ ____ ____ ____ ____ ____
9. How would you rate the degree of farmers’ participation in watercourses
improvement and maintenance activities undertaken so far?
Activities Degree of Farmers’ Participation
Very
low Low Medium High
Very
high
No
Response
i. Decision regarding
major changes in w/c
route
____ ____ ____ ____ ____ ____
ii. Decision regarding total ____ ____ ____ ____ ____ ____

197
length and specific section
of the w/c to be lined
iii. Provision of labor ____ ____ ____ ____ ____ ____
iv. Provision of farmers’
share ____ ____ ____ ____ ____ ____
v. Provision of material ____ ____ ____ ____ ____ ____
vi. Up-rooting of tress ____ ____ ____ ____ ____ ____
vii. Removal of slit/bhal ____ ____ ____ ____ ____ ____
viii. Removal of vegetation ____ ____ ____ ____ ____ ____
ix. Back earth filling of
lined portion ____ ____ ____ ____ ____ ____
x. Realignment of the
earthen portion ____ ____ ____ ____ ____ ____
xi. Embankment ____ ____ ____ ____ ____ ____
xii. Filling of rodents’ holes ____ ____ ____ ____ ____ ____
xiii. Repair of lined portion ____ ____ ____ ____ ____ ____
xiv. Repair of culverts ____ ____ ____ ____ ____ ____
xv. Repair of nakkas ____ ____ ____ ____ ____ ____
xvi. Repair of buffalo
wallow ____ ____ ____ ____ ____ ____
INFORMATION REGARDING THE DISPUTES BETWEEN THE WATER
USERS AND ROLE PLAYED BY WUAs IN RESOLVING THEM
1. Do you think, there are certain considerable conflicts/disputes on your w/c?
Yes___________ No__________ No Response__________
If yes, what are the main causes of conflicts/disputes?
Causes Response
Yes No No
Response
i. Local polities __________ __________ __________
ii. Religious conflicts __________ __________ __________
iii. Rivalry among two briadaries __________ __________ __________
iv. Rivalry among two families __________ __________ __________
v. Non-cooperative behavior of
some farmers __________ __________ __________
vi. Water thefts __________ __________ __________
vii. Any other (please specify) __________ __________ __________
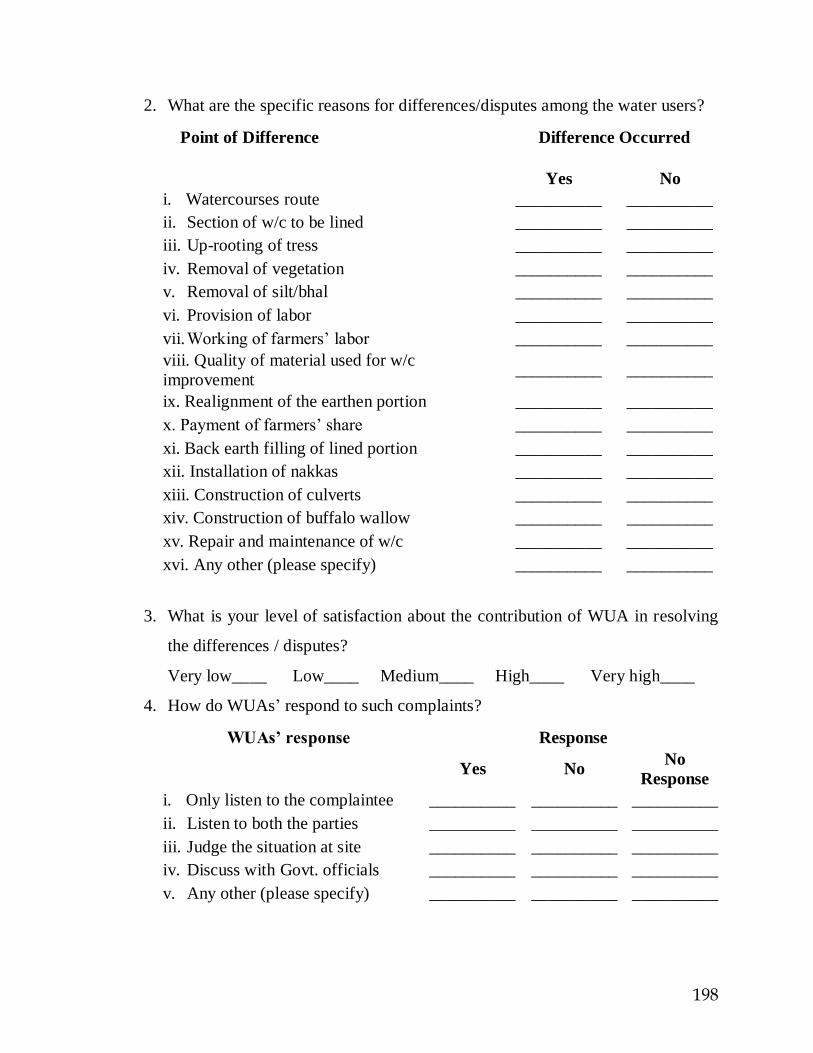
198
2. What are the specific reasons for differences/disputes among the water users?
Point of Difference Difference Occurred
Yes
No
i. Watercourses route __________ __________
ii. Section of w/c to be lined __________ __________
iii. Up-rooting of tress __________ __________
iv. Removal of vegetation __________ __________
v. Removal of silt/bhal __________ __________
vi. Provision of labor __________ __________
vii. Working of farmers’ labor __________ __________
viii. Quality of material used for w/c
improvement __________ __________
ix. Realignment of the earthen portion __________ __________
x. Payment of farmers’ share __________ __________
xi. Back earth filling of lined portion __________ __________
xii. Installation of nakkas __________ __________
xiii. Construction of culverts __________ __________
xiv. Construction of buffalo wallow __________ __________
xv. Repair and maintenance of w/c __________ __________
xvi. Any other (please specify) __________ __________
3. What is your level of satisfaction about the contribution of WUA in resolving
the differences / disputes?
Very low____ Low____ Medium____ High____ Very high____
4. How do WUAs’ respond to such complaints?
WUAs’ response Response
Yes No No
Response
i. Only listen to the complaintee __________ __________ __________
ii. Listen to both the parties __________ __________ __________
iii. Judge the situation at site __________ __________ __________
iv. Discuss with Govt. officials __________ __________ __________
v. Any other (please specify) __________ __________ __________

199
5. What strategy do WUAs adopt to handle the cases of complaints?
WUAs handle complaints
through:
Response
Yes No No
Response
i. Political leaders __________ __________ __________
ii. Biradary heads __________ __________ __________
iii. Govt. officials __________ __________ __________
iv. Any other (please specify) __________ __________ __________
6. How would you rate the effectiveness of WUAs in resolving the disputes?
Very low _____ Low _____ Medium _____ High _____ Very high _____
In case of below medium effectiveness, how can their role be strengthened?
i. ________________
ii. ________________
iii. ________________
INFORMATION REGARDING THE PROBLEMS AND OBSTACLES IN
THE EFFECTIVE FUNCTIONING OF WUAs 1. How would you rate various problems in the effective functioning of
WUAs?
a) Problems before the improvement of watercourses
Problems Rating
Very
low Low Medium High
Very
high
No
Response i. Lack of interest on the
part of big land lords _____ _____ _____ _____ _____ _____
ii. Lack of finance on the
part of small/ poor
farmers
_____ _____ _____ _____ _____ _____
iii. Lack of interest on the
part of water users
locating at the head
_____ _____ _____ _____ _____ _____
iv. Ignorance about the
benefits of w/c
improvement
_____ _____ _____ _____ _____ _____
v. Lack of unity among
the water users _____ _____ _____ _____ _____ _____
vi. Small land holdings _____ _____ _____ _____ _____ _____

200
b) Problems during the improvement of watercourses
Problems relating to:
Rating
Very
low Low Medium High
Very
high
No
Response i. Collection of
farmers’ share _____ _____ _____ _____ _____ _____
ii. Demolishing of w/c _____ _____ _____ _____ _____ _____
iii. Up-rooting of trees _____ _____ _____ _____ _____ _____
iv. W/c alignment _____ _____ _____ _____ _____ _____
v. Decision regarding
w/c route _____ _____ _____ _____ _____ _____
vi. Provision of labor
for katcha
improvement
_____ _____ _____ _____ _____ _____
vii. Acceptance of w/c
design and estimates _____ _____ _____ _____ _____ _____
viii. Acceptance of bed
level of w/c _____ _____ _____ _____ _____ _____
Vix. Provision of
material _____ _____ _____ _____ _____ _____
Vx. Closing of outlet
during pacca w/c
improvement
_____ _____ _____ _____ _____ _____
xvi. Illegal demands for
extra nakkas _____ _____ _____ _____ _____ _____
xvii. Quality of bricks _____ _____ _____ _____ _____ _____
xiii. Quality of cement _____ _____ _____ _____ _____ _____
xiv. Cement-sand ratio _____ _____ _____ _____ _____ _____
xv. Quality of nakkas _____ _____ _____ _____ _____ _____
xvi. Record keeping of
farmers’ share _____ _____ _____ _____ _____ _____
xvii. Record keeping of
materials _____ _____ _____ _____ _____ _____
xviii. Shifting of
material _____ _____ _____ _____ _____ _____
xvix. Non-cooperation
from Irrigation
Department
_____ _____ _____ _____ _____ _____
xvx. Non-cooperation
from Revenue
Department
_____ _____ _____ _____ _____ _____

201
Xvxi. Non-cooperation
from OFWM
Department
_____ _____ _____ _____ _____ _____
c) Problems before the improvement of watercourses
Problems relating to:
Rating
Very
low Low Medium High
Very
high
No
Response i. Removal of silt/bhal _____ _____ _____ _____ _____ _____
ii. Removal of
vegetation _____ _____ _____ _____ _____ _____
iii. Filling of rodents’
holes _____ _____ _____ _____ _____ _____
iv. Provision of labor for
dressing/repair of w/c _____ _____ _____ _____ _____ _____
v. Repair of lined
portion _____ _____ _____ _____ _____ _____
vi. Repair of culverts _____ _____ _____ _____ _____ _____
vii. Repair of nakkas _____ _____ _____ _____ _____ _____
viii. Repair of buffalo
wallow _____ _____ _____ _____ _____ _____
ix. Back earth filling _____ _____ _____ _____ _____ _____
x. Any other (please
specify) _____ _____ _____ _____ _____ _____
INFORMATION REGARDING THE FUTURE SCOPE OF WUAs
1. Keeping in view the existing functioning/performance, how would you rate the
effectiveness of WUAs during future with respect to following?
Aspects
Response
Very
Low Low Medium High
Very
high
i. Procedure for the constitution of
managing committee ____ ___ ____ ____ ____
ii. Selection criteria for the members
of managing committee ____ ___ ____ ____ ____
iii. Type of leadership evolved ____ ___ ____ ____ ____
iv. Participation of water users in
watercourses improvement /
maintenance
____ ___ ____ ____ ____

202
v. Watercourses improvement
activities ____ ___ ____ ____ ____
vi. Watercourses maintenance
activities ____ ___ ____ ____ ____
vii. Minimizing disputes/conflicts
among water users ____ ___ ____ ____ ____
viii. Minimizing cases of water thefts ____ ___ ____ ____ ____
ix. Resolution of disputes/conflicts
through WUAs ____ ___ ____ ____ ____
x. Quality of material used for
watercourses improvement ____ ___ ____ ____ ____
xi. Quality of work during
watercourses improvement ____ ___ ____ ____ ____
xii. Winning the cooperation of
OFWM department ____ ___ ____ ____ ____
2. How would you rate the overall performance of WUAs during future with
respect to following?
Aspects
Response
Very
Low Low Medium High
Very
high i. Attitude of water users towards
watercourses improvement ____ ___ ____ ____ ____
ii. Interest of water users in
watercourses improvement /
maintenance
____ ___ ____ ____ ____
iii. Knowledge of water users about
the benefits of watercourses
improvement
____ ___ ____ ____ ____
iv. Water saving through
watercourses improvement /
maintenance
____ ___ ____ ____ ____
v. Productivity enhancement as a
result of watercourses
improvement/maintenance
____ ___ ____ ____ ____
3. Do you think that WUAs will continue to play effective role in future?
Yes ___________ No_____________ No Response____________

203
APPENDIX-II
Table 1: Distribution of the respondents according to maintenance activities undertaken during last year based on the
satisfaction level of the respondents
Activities N.R. Very low Low Medium High Very high
No. % No. % No. % No. % No. % No. %
Remodeling of outlet 375 100.0 0 0.0 0 0.0 0 0.0 0 0.0 0 0.0
Removal of silt/bhal 0 1.3 0 0.0 0 0.0 18 4.8 220 58.7 137 36.5
Removal of vegetation 0 0.0 0 0.0 0 0.0 18 4.8 220 58.7 137 36.5
Up-rooting of trees 373 98.1 0 0.0 0 0.0 2 100.0 0 0.0 0 0.0
Filling of rodent's holes 8 1.1 0 0.0 6 1.6 112 30.5 210 57.2 39 10.6
Back earth filling of
lined portion 367 62.4 0 0.0 5 62.5 3 37.5 0 0.0 0 0.0
realignment of the
earthen portion 373 67.2 0 0.0 0 0.0 0 0.0 2 100.0 0 0.0
Embankment 337 67.2 0 0.0 20 52.6 12 31.6 6 15.8 0 0.0
Repair of lined portion 341 95.7 0 0.0 8 23.5 18 52.9 8 23.5 0 0.0
Repair of culverts 365 79.5 0 0.0 4 40.0 4 40.0 2 20.0 0 0.0
Repair of nakkas 353 79.5 0 0.0 6 27.3 10 45.5 4 18.2 2 9.1
Repair of buffalo wallow 369 98.7 6 0.0 6 100.0 0 0.0 0 0.0 0 0.0
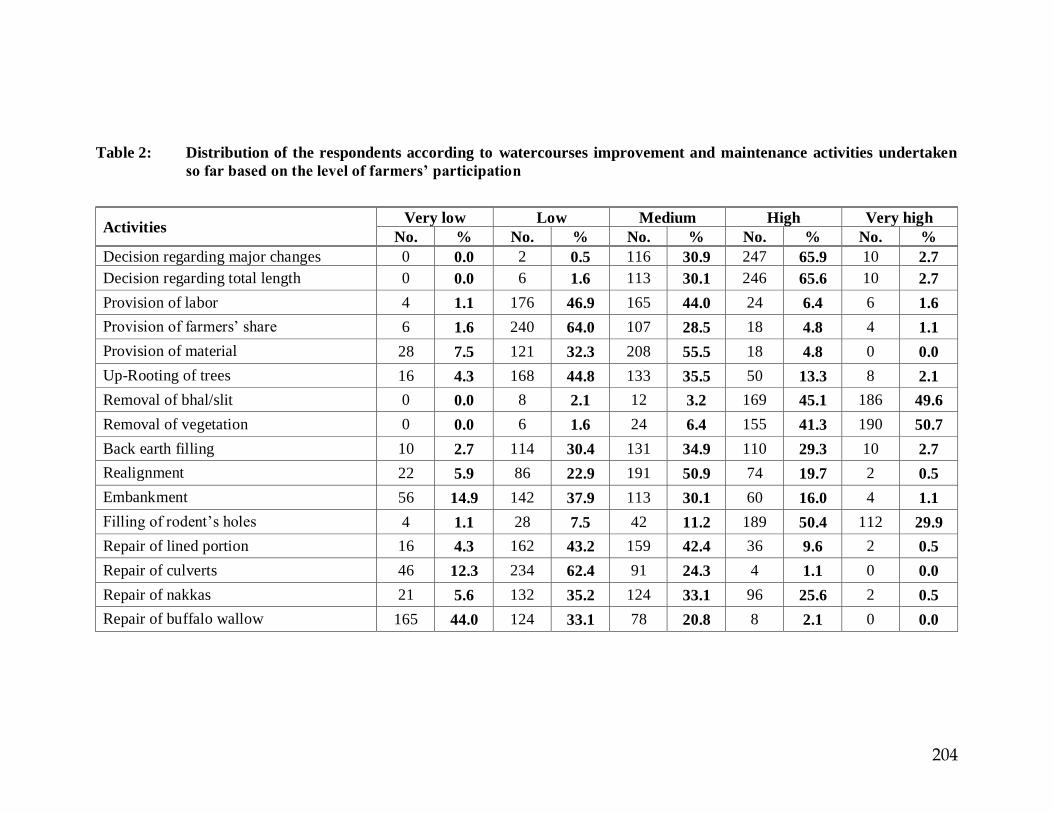
204
Table 2: Distribution of the respondents according to watercourses improvement and maintenance activities undertaken
so far based on the level of farmers’ participation
Activities Very low Low Medium High Very high
No. % No. % No. % No. % No. %
Decision regarding major changes 0 0.0 2 0.5 116 30.9 247 65.9 10 2.7
Decision regarding total length 0 0.0 6 1.6 113 30.1 246 65.6 10 2.7
Provision of labor 4 1.1 176 46.9 165 44.0 24 6.4 6 1.6
Provision of farmers’ share 6 1.6 240 64.0 107 28.5 18 4.8 4 1.1
Provision of material 28 7.5 121 32.3 208 55.5 18 4.8 0 0.0
Up-Rooting of trees 16 4.3 168 44.8 133 35.5 50 13.3 8 2.1
Removal of bhal/slit 0 0.0 8 2.1 12 3.2 169 45.1 186 49.6
Removal of vegetation 0 0.0 6 1.6 24 6.4 155 41.3 190 50.7
Back earth filling 10 2.7 114 30.4 131 34.9 110 29.3 10 2.7
Realignment 22 5.9 86 22.9 191 50.9 74 19.7 2 0.5
Embankment 56 14.9 142 37.9 113 30.1 60 16.0 4 1.1
Filling of rodent’s holes 4 1.1 28 7.5 42 11.2 189 50.4 112 29.9
Repair of lined portion 16 4.3 162 43.2 159 42.4 36 9.6 2 0.5
Repair of culverts 46 12.3 234 62.4 91 24.3 4 1.1 0 0.0
Repair of nakkas 21 5.6 132 35.2 124 33.1 96 25.6 2 0.5
Repair of buffalo wallow 165 44.0 124 33.1 78 20.8 8 2.1 0 0.0

205
Table 3: Distribution of the respondents according to various problems in the effective functioning of WUAs before the
improvement of watercourses
Activities Very low Low Medium High Very high
No. % No. % No. % No. % No. %
Lack of interest on the part of big
land lords 2 0.5 10 2.7 211 56.3 150 40.0 2 0.5
Lack of finance on the part of
small/poor farmers 0 0.0 20 5.3 148 39.5 205 54.7 2 0.5
Lack of interest on the part of water
users locating at the head 0 0.0 88 23.5 153 40.8 126 33.6 8 2.1
Ignorance about the benefits of
watercourses improvement 0 0.0 18 4.8 221 58.9 136 36.3 0 0.0
Lack of unity among the water
users 0 0.0 40 10.7 170 45.3 163 43.5 2 0.5
Small land holdings 2 0.5 132 35.2 115 30.7 124 33.1 2 0.5

206
Table 4: Distribution of the respondents according to various problems in the effective functioning of WUAs during the
improvement of watercourses
Activities Very low Low Medium High Very high
No. % No. % No. % No. % No. %
Collection of farmers’ share 2 0.5 16 4.3 72 19.2 176 46.9 109 29.1
Demolishing of watercourses 2 0.5 12 3.2 108 28.8 143 38.1 110 29.3
Up-rooting of trees 2 0.5 78 20.8 130 34.7 65 17.3 100 26.7
Watercourses alignment 2 0.5 118 31.5 203 54.1 52 13.9 0 0.0
Decision regarding watercourses route 2 0.5 168 44.8 157 41.9 48 12.8 0 0.0
Provision of labor for katcha watercourses improvement 2 0.5 62 16.5 141 37.6 158 42.1 12 3.2
Acceptance of watercourses design and estimates 14 3.7 172 45.9 155 41.3 28 7.5 6 1.6
Acceptance of bed level of watercourses 10 2.7 196 52.3 145 38.7 14 3.7 10 2.7
Provision of material for pacca watercourses
improvement 0 0.0 66 17.6 139 37.1 142 37.9 28 7.5
Closing of outlet during pacca watercourses
improvement 2 0.5 6 1.6 54 14.4 163 43.5 150 40.0
Illegal demands for extra ‘nakkas’(outlets) 0 0.0 6 1.6 43 11.5 246 65.6 80 21.3
Quality of bricks 62 16.5 295 78.7 14 3.7 4 1.1 0 0.0
Quality of cement 68 18.1 285 76.0 12 3.2 10 2.7 0 0.0
Cement-sand ratio 30 8.0 233 62.1 108 28.8 4 1.1 0 0.0
Quality of nakkas 20 5.3 147 39.2 152 40.5 50 13.3 6 1.6
Record keeping of farmers’ share 140 37.3 110 29.3 119 31.7 6 1.6 0 0.0
Record keeping of materials 146 38.9 112 29.9 107 28.5 10 2.7 0 0.0
Shifting of material 72 19.2 70 18.7 175 46.7 58 15.5 0 0.0
Non-cooperation from Irrigation Department 139 37.1 114 30.4 60 16.0 42 11.2 20 5.3
Non-cooperation from Revenue Department 145 38.7 108 28.8 60 16.0 38 10.1 24 6.4
Non-cooperation from OFWM Department 147 39.2 106 28.3 58 15.5 38 10.1 26 6.9
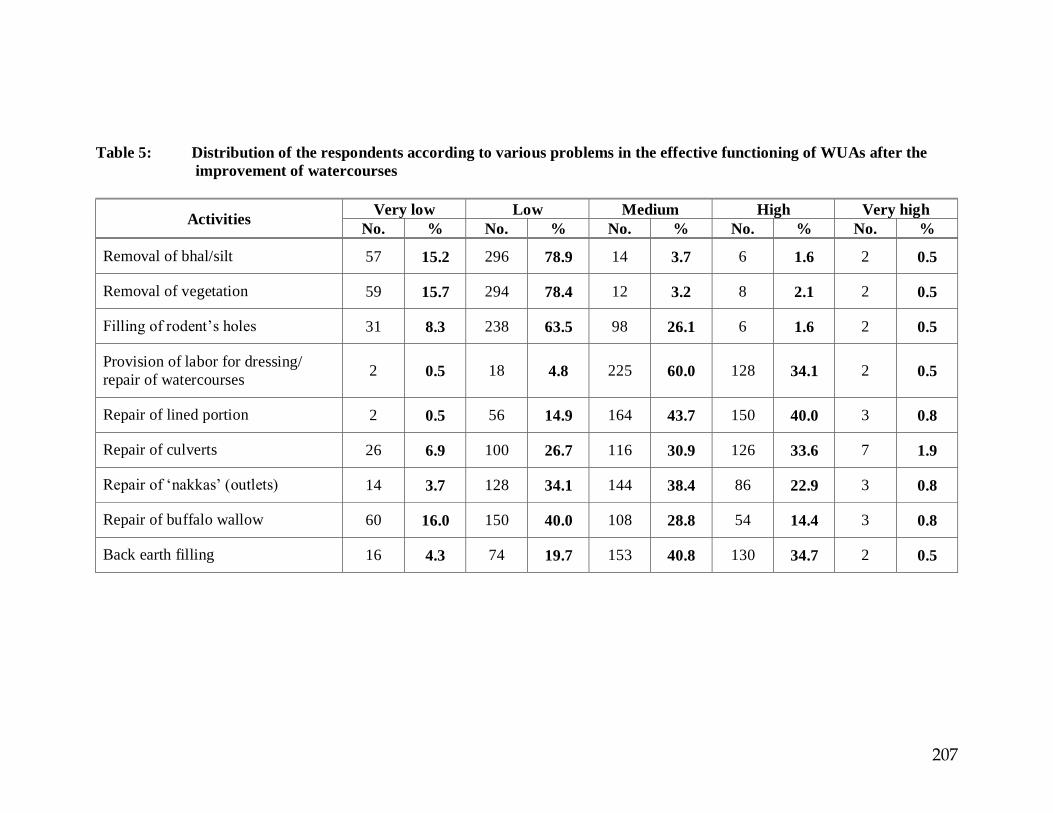
207
Table 5: Distribution of the respondents according to various problems in the effective functioning of WUAs after the
improvement of watercourses
Activities Very low Low Medium High Very high
No. % No. % No. % No. % No. %
Removal of bhal/silt 57 15.2 296 78.9 14 3.7 6 1.6 2 0.5
Removal of vegetation 59 15.7 294 78.4 12 3.2 8 2.1 2 0.5
Filling of rodent’s holes 31 8.3 238 63.5 98 26.1 6 1.6 2 0.5
Provision of labor for dressing/
repair of watercourses 2 0.5 18 4.8 225 60.0 128 34.1 2 0.5
Repair of lined portion 2 0.5 56 14.9 164 43.7 150 40.0 3 0.8
Repair of culverts 26 6.9 100 26.7 116 30.9 126 33.6 7 1.9
Repair of ‘nakkas’ (outlets) 14 3.7 128 34.1 144 38.4 86 22.9 3 0.8
Repair of buffalo wallow 60 16.0 150 40.0 108 28.8 54 14.4 3 0.8
Back earth filling 16 4.3 74 19.7 153 40.8 130 34.7 2 0.5

208
Table 6: Distribution of the respondents according to the expected level of effectiveness of WUAs during future
Aspects Very low Low Medium High Very high
No. % No
.
% No. % No. % No. %
Procedure for the constitution of managing committee 0 0 55 14.7 160 42.7 150 40.0 10 2.7
Selection criteria for the members of managing committee 0 0 25 6.7 180 48.0 165 44.0 5 1.3
Type of leadership evolved 0 0 30 8.0 180 48.0 160 42.7 5 1.3
Participation of water users in w/c improvement/maintenance 0 0 0 0 40 10.7 255 68.0 80 21.3
Watercourses improvement activities 0 0 5 1.3 120 32.0 225 60.0 25 6.7
Watercourses maintenance activities 0 0 55 14.7 280 74.7 40 10.7 0 0
Minimizing disputes /conflicts among water users 0 0 95 25.3 240 64.0 40 10.7 0 0
Minimizing cases of water thefts 0 0
12
5 33.3 215 57.3 35 9.3 0 0
Resolution of disputes/conflicts through WUAs 0 0 15 4.0 90 24.0 245 65.3 25 6.7
Quality of material used for w/c improvement 0 0 0 0 205 54.7 165 44.0 5 1.3
Quality of work during w/c improvement 0 0 0 0 215 57.3 155 41.3 5 1.3
Winning the cooperation of OFWM department 0 0 5 1.3 70 18.7 225 60.0 75 20.0

209
Table 7: Distribution of the respondents according to the expected overall performance of WUAs during future
Activities
Very low Low Medium High Very high
No. % No. % No. % No. % No. %
Interest of water users in watercourses
improvement/maintenance 0 0 0 0 50 13.3 250 66.7 75 20.0
Knowledge of water users about the benefits of
watercourses improvement 0 0 80 21.3 270 72.0 25 6.7 0 0
Attitude of water users towards watercourses
improvement 0 0 0 0 35 9.3 295 78.7 45 12.0
Water saving through watercourses
improvement/maintenance 0 0 0 0 0 0 235 62.7 140 37.3
Productivity enhancement as a result of
watercourses improvement/maintenance 0 0 0 0 10 2.7 205 54.7 160 42.7