Cambodian agriculture in transition
248
Agriculture Public Disclosure Authorized Public Disclosure Authorized Public Disclosure Authorized Public Disclosure Authorized
-
Upload
khangminh22 -
Category
Documents
-
view
3 -
download
0
Transcript of Cambodian agriculture in transition

Agriculture
Pub
lic D
iscl
osur
e A
utho
rized
Pub
lic D
iscl
osur
e A
utho
rized
Pub
lic D
iscl
osur
e A
utho
rized
Pub
lic D
iscl
osur
e A
utho
rized

i
Economic and Sector Work, Report No. 96308-KH
CAMBODIAN AGRICULTURE IN TRANSITION:
OPPORTUNITIES AND RISKS
May 19, 2015
Agriculture Global Practice
East Asia and Pacific Region
________________________________________

ii
© 2015 The International Bank for Reconstruction and Development / The World Bank
1818 H Street, NW, Washington, DC 20433
All rights reserved:
This volume is a product of the staff of the International Bank for Reconstruction and
Development/ The World Bank. The findings, interpretations, and conclusions expressed in this
paper do not necessarily reflect the views of the Executive Directors of The World Bank or the
governments they represent. The World Bank does not guarantee the accuracy of the data
included in this work. The boundaries, colors, denominations, and other information shown on
any map in this work do not imply any judgment on the part of The World Bank concerning the
legal status of any territory or the endorsement or acceptance of such boundaries.
Rights and Permission
The material in this publication is copyrighted. Copying or transmitting any of this work without
permission may be a violation of applicable law. The International Bank for Reconstruction and
Development/The World Bank encourages dissemination of its work and will normally grant
permission to reproduce portions of the work promptly.
For permission to photocopy or reprint any part of this work, please send a request with
complete information to the Copyright Clearance Center, Inc., 222 Rosewood Drive,
Danvers, MA 01923, USA, telephone 978-750-8400, fax 978-750-4470,
www.copyright.com.
All other queries on rights and licenses, including subsidiary rights, should be addressed
to the Office of the Publisher, The World Bank, 1818 H Street NW, Washington, DC
20433, USA, fax 202-522-2422, e-mail [email protected].

iii
Table of Contents
ACRONYMS AND ABBREVIATIONS .................................................................................... X
ACKNOWLEDGMENTS .......................................................................................................... XI
EXECUTIVE SUMMARY ...................................................................................................... XII
1. INTRODUCTION................................................................................................................. 1
2. A DECADE OF AGRICULTURAL TRANSFORMATION IN CAMBODIA .............. 3
2.1. AGRICULTURAL GROWTH ................................................................................................ 3
2.2. AGRIBUSINESS DEVELOPMENT ........................................................................................ 8
2.3. AGRICULTURAL GROWTH AND POVERTY REDUCTION ................................................... 10
2.4. AGRICULTURAL TRANSFORMATION ............................................................................... 13
3. CHANGES IN AGRICULTURE: EVIDENCE FROM THE FIELD ........................... 18
3.1. INTRODUCTION .............................................................................................................. 18
3.2. CROP PRODUCTION ........................................................................................................ 19
3.3. FARMLAND .................................................................................................................... 25
3.4. AGRICULTURAL LABOR FORCE ...................................................................................... 29
3.5. USE OF AGRICULTURAL INPUTS ..................................................................................... 32
3.6. USE OF AGRICULTURAL MACHINERY ............................................................................ 40
3.7. AGRICULTURAL SERVICES ............................................................................................. 42
3.8. FARMERS’ ORGANIZATIONS ........................................................................................... 50
3.9. AGRICULTURAL INFRASTRUCTURE ................................................................................ 52
4. CHANGES IN FARM BUDGETS AND FARM PROFITABILITY ............................ 55
4.1. INTRODUCTION .............................................................................................................. 55
4.2. RESULTS OF THE 2013 SURVEY ...................................................................................... 58
4.3. COMPARISON OF THE 2005 AND 2013 SURVEY RESULTS ............................................... 63
5. COMPETITIVENESS OF CAMBODIAN FARMS ....................................................... 69
5.1. INTRODUCTION .............................................................................................................. 69
5.2. DOMESTIC RESOURCE COST FOR RICE ........................................................................... 70
5.3. DOMESTIC RESOURCE COST FOR CASSAVA AND MAIZE ................................................ 72
5.4. SUMMARY ...................................................................................................................... 73
6. DRIVERS OF PAST GROWTH ....................................................................................... 74
7. DRIVERS OF FUTURE GROWTH ................................................................................. 80
8. A LONG-TERM VISION FOR CAMBODIAN AGRICULTURE ............................... 86
9. OPTIONS FOR SUPPORTING A LONG-TERM VISION FOR AGRICULTURE .. 93

iv
9.1. INTRODUCTION .............................................................................................................. 93
9.2. SCENARIOS FOR ENVIRONMENTAL SUSTAINABILITY ..................................................... 93
9.3. SCENARIOS FOR PRODUCTIVITY GROWTH ...................................................................... 98
9.4. SCENARIOS FOR IMPROVED COMPETITIVENESS ............................................................ 105
9.5. SCENARIOS FOR INCOME GROWTH ............................................................................... 108
9.5 SUMMARY OF SIMULATIONS’ RESULTS ........................................................................ 113
10. POLICY AGENDA TO SUPPORT A LONG-TERM VISION FOR CAMBODIAN
AGRICULTURE....................................................................................................................... 115
10.1. MAINTAINING A PRIVATE SECTOR FRIENDLY AGRICULTURAL POLICY ENVIRONMENT 115
10.2. STRENGTHENING THE ENVIRONMENTAL SUSTAINABILITY ........................................... 117
10.3. IMPROVING THE AGRICULTURAL “PUBLIC GOODS” INVESTMENTS .............................. 118
10.4. HELPING DEVELOP THE AGROPROCESSING AND AGRIBUSINESS INDUSTRY ................. 127
11. CONCLUSIONS AND POLICY RECOMMENDATIONS ..................................... 132
12. REFERENCES .............................................................................................................. 139
ANNEX 1: ANALYTICAL WORK FROM THE WORLD BANK AND AUSAID
PARTNERSHIP ........................................................................................................................ 143
ANNEX 2: METHODOLOGY FOR THE 2013 FARM SURVEY...................................... 144
ANNEX 3: DETAILED FARM BUDGETS BY CROP ........................................................ 152
ANNEX 4: PROJECTION OF SELECTED ECONOMIC INDICATORS, CAMBODIA 184
ANNEX 5: RESULTS OF POLICY SIMULATIONS .......................................................... 186

v
Boxes
Box 1: Rural Population in Cambodia .......................................................................................... 14
Box 2: Rice Yields in Cambodia .................................................................................................. 24
Box 3: Gender Dimensions of Cambodian Agriculture ................................................................ 31
Box 4: Farmers’ Organizations in Cambodia ............................................................................... 51
Box 5: Factor Analysis and Modern versus Traditional Farmers ................................................. 57
Box 6: Gross Margin versus Value Added ................................................................................... 58
Box 7: Driving Forces Underpinning Future Agricultural Transformation in Cambodia ............ 85
Box 8: Indicators of Agricultural Transformation ........................................................................ 87
Box 9: Importance of Fiscal Sustainability for Pro-Poor Agricultural Growth .......................... 119
Box 10: Fertilizer Subsidy in Sri Lanka ..................................................................................... 126
Box 11: Food Safety Investments in Thailand ............................................................................ 128
Box 12: Requirements for an Increase in Cambodian Rice Exports to China ............................ 129
Figures
Figure 1: Agricultural GDP growth (constant prices), Cambodia, 2002-2012 ............................... 3
Figure 2: GDP composition by sector (constant prices), Cambodia, 1995-2012 ........................... 4
Figure 3: GDP composition by sector (current prices), Cambodia, 1995-2012 ............................. 4
Figure 4: Growth of agricultural subsectors (constant prices), Cambodia, 2002-2012 .................. 5
Figure 5: Share of subsectors in agricultural GDP, Cambodia, 2002-2012.................................... 6
Figure 6: Contribution to turnover of different types of agribusinesses, Cambodia, 2011 ............ 9
Figure 7: Poverty rate by region, Cambodia, 2004-2011.............................................................. 11
Figure 8: Drivers of poverty reduction in Cambodia, 2004-2011 ................................................ 12
Figure 9: Crop production and cultivated land areas, Cambodia .................................................. 20
Figure 10: Regional distribution of aromatic paddy production (% of farmers), 2013 ................ 21
Figure 11: Contribution of land and yield to average ag. production growth, 2003-2012 ........... 22
Figure 12: Projections for land expansion and yield changes, Cambodia, 2013 .......................... 25
Figure 13: Private land markets, Cambodia, 2013 ........................................................................ 27
Figure 14: Change in the perception about women’s role in agriculture, Cambodia, 2013 ......... 30
Figure 15: Impact of youth migration on agricultural households, Cambodia, 2013 ................... 31
Figure 16: Access to inputs, Cambodia, 2013 .............................................................................. 33
Figure 17: Access to improved seeds, Cambodia, 2013 ............................................................... 34
Figure 18: Use of manure, Cambodia, 2013 ................................................................................. 36
Figure 19: Use of fertilizers, Cambodia, 2013 .............................................................................. 37
Figure 20: Trends in chemical fertilizer use (kg nutrient/ha), select countries, 2005-2011 ......... 38
Figure 21: Use of pesticides, Cambodia, 2013 ............................................................................. 39
Figure 22: Use of agricultural equipment, Cambodia, 2013 ......................................................... 41
Figure 23: Access to extension services, Cambodia, 2013 ........................................................... 44
Figure 24: Access to financial services, Cambodia, 2013 ............................................................ 47

vi
Figure 25: Access to information, Cambodia, 2013 ..................................................................... 49
Figure 26: Reasons for creation of FOs and their perceived benefits, Cambodia, 2013 .............. 51
Figure 27: Irrigation, Cambodia, 2013 ......................................................................................... 53
Figure 28: Agricultural facilities, Cambodia, 2013 ...................................................................... 54
Figure 29: Average land by farm size and crop, Cambodia, 2013 ............................................... 56
Figure 30: Gross revenues ($/ha) by crop and farm practice, Cambodia, 2013 ........................... 59
Figure 31: Total variable costs ($/ha) by crop and farm practice, Cambodia, 2013 ..................... 60
Figure 32: Breakdown of cost structure by crop, Cambodia, 2013 .............................................. 60
Figure 33: Comparison of nominal gross margins ($/ha), Cambodia, 2005 and 2013 ................. 65
Figure 34: Farm wage, off-farm wage, and returns to agricultural labor ($/day), Cambodia ...... 67
Figure 35: CPI and food price index in Cambodia, 2002-2012 .................................................... 75
Figure 36: Transportation costs in Cambodia and neighboring countries, $/100 km/ton ............. 77
Figure 37: Value of the projected food demand in East Asia, $ billion, 2030.............................. 82
Figure 38: Perspectives on the possibility of change in cultivated areas by crop, Cambodia ...... 94
Figure 39: Labor use in production (days/ha), Cambodia .......................................................... 100
Figure 40: Return to labor ($/day), Cambodia ............................................................................ 100
Figure 41: Shift in land used by traditional and modern farmers, Cambodia ............................. 101
Figure 42: MOWRAM’s projected investments, $ million, 2014-2018 ..................................... 121
Figure 43: Structure of MOWRAM’s projected investments by source .................................... 121
Tables
Table 1: Impact of lower agric. growth on selected agriculture sector indicators, Cambodia .... xvi
Table 2: Summary of the report’s key policy recommendations based on the time of impacts’
realization .................................................................................................................................... xvii
Table 3: Gross agricultural production, annual growth, selected countries, 2002-2012 ................ 5
Table 4: Production, area, yields, and growth of major crops, Cambodia, 2002-2012 .................. 7
Table 5: Irrigated areas, selected countries ..................................................................................... 7
Table 6: Production, area, yield, and export of rubber, Cambodia, 2002-2011 .............................. 8
Table 7: Evolution of formal trade of select commodities, Cambodia, 1996-2011 ........................ 8
Table 8: Agribusiness industry in Cambodia, 2002-2012 .............................................................. 9
Table 9: Rice commodity balance (‘000 tons), Cambodia, 2008-2013 ........................................ 10
Table 10: Growth elasticity of poverty, selected countries in Asia .............................................. 11
Table 11: Indicators of structural transformation, Cambodia, 2004 and 2012 ............................. 13
Table 12: Country groups based on the role of agriculture in the economy ................................. 14
Table 13: Selected economic indicators, Cambodia, 2004 and 2012 ........................................... 15
Table 14: Labor use for rice production in Central Luzon, Philippines, 1966/67-2011/12 .......... 16
Table 15: Diversification in cultivated area, Cambodia, 2002-2011 ............................................ 19
Table 16: Change in farm size, Cambodia, 2008-2012 ................................................................ 23
Table 17: Average crop yields in selected countries (tons/ha), 2010-2013 .................................. 23
Table 18: Wages of labor hired for rice production, selected countries, 2013 ............................. 28
Table 19: Changes in land prices between 2005 and 2013, Cambodia ........................................ 28

vii
Table 20: Use of labor in farm production by crop, Cambodia, 2005 and 2013 .......................... 29
Table 21: Use of labor in dry season paddy production, selected countries, 2013 ....................... 30
Table 22: Illustrative use of fertilizers, Cambodia, 2005 and 2013 .............................................. 38
Table 23: Number of agricultural equipment units, Cambodia, 2006-2010 ................................. 40
Table 24: Average costs of and difficulty finding agricultural machinery, Cambodia, 2013 ...... 42
Table 25: Categorization of farm size by cultivated crop areas, Cambodia ................................. 55
Table 26: Gross margin ($/ha) by crop, technology use, and farm size, Cambodia, 2013 ........... 61
Table 27: Returns to labor ($/day) by crop, technology use, and farm size, Cambodia, 2013 ..... 62
Table 28: Comparison of key farm budget indicators, $/ha, Cambodia, 2005 and 2013 ............. 64
Table 29: Comparison of total crop budgets, Cambodia, 2005 and 2013..................................... 65
Table 30: Changes in crop margins in nominal and real terms, Cambodia, 2005 and 2013 ........ 66
Table 31: Annual changes in crop margins in real terms, Cambodia, 2005 and 2013 ................. 66
Table 32: Changes in returns to labor in nominal and real terms, Cambodia, 2005 and 2013 ..... 67
Table 33: DRCs for selected agricultural crops, Cambodia, 2013 ............................................... 70
Table 34: Sensitivity analysis of impacts of changes of production costs on DRC for rice ......... 71
Table 35: Sensitivity analysis of impacts of changes in prod costs on cassava and maize DRCs 72
Table 36: Sensitivity analysis of impacts of changes in input and output prices on DRCs .......... 73
Table 37: Drivers of agricultural growth during 2002-2012 ........................................................ 74
Table 38: Global agricultural prices, selected commodities, $/ton (in real 2010 prices) ............. 75
Table 39: Selected economic projections, Cambodia, 2012-2030 ................................................ 80
Table 40: Caloric food demand projections, world and selected regions/countries ..................... 81
Table 41: Global rice demand projections (kg per capita) per year .............................................. 82
Table 42: Global agricultural terms of trade, index projections (in real 2010$) .......................... 83
Table 43: Indicators of agricultural transformation at 5 percent agricultural growth ................... 87
Table 44: Changes of indicators of ag transformation at 3 percent comp. with 5 percent growth 88
Table 45: Proposed indicators and targets for a Long-Term Vision for Cambodian Agriculture 91
Table 46: Assumptions about land expansion for Env. Sustainability scenarios L1-L3 .............. 95
Table 47: Simulation results for Weak Environmental Sustainability scenarios L1-L3 .............. 96
Table 48: Simulation results for Strong Environmental Sustainability scenarios L4-L6 ............. 98
Table 49: Assumptions about Productivity Growth scenarios P1-P3 ......................................... 102
Table 50: Simulation results for Productivity Growth scenarios P1-P3 ..................................... 103
Table 51: Simulation results for Productivity Growth scenario P4 ............................................ 104
Table 52: Assumptions about Competitiveness scenarios C1-C6 .............................................. 105
Table 53: Simulation results for the Competitiveness scenarios C1-C6..................................... 107
Table 54: Assumptions about rice variety changes under Income Growth scenarios I1-I2 ....... 109
Table 55: Simulation results for Income Growth scenarios I1-I2 ............................................... 110
Table 56: Assumption about cassava processing under Income Growth scenarios I3-I4 ........... 110
Table 57: Assumptions about Income Growth under scenarios I5-I6 ........................................ 112
Table 58: Summary of the simulations’ results .......................................................................... 114
Table 59: Key issues and options to reform the seed sector in Cambodia ................................. 117

viii
Table 60: Agricultural research intensity .................................................................................... 123
Table 61: Yield response for supplementing nitrogen to soil, Cambodia................................... 125
Table 62: Prices and logistics costs of rice in Cambodia, Vietnam, and Thailand ..................... 130
Table 63: Time and cost in rice export procedures, Cambodia, 2012-2013 ............................... 130
Table 64: Summary of the report’s key policy recommendations by implementing agency ..... 138
Table 65: Product selection for the 2013 field survey ................................................................ 144
Table 66: Selected locations for 2013 field work ....................................................................... 146
Table 67: Matrix of size x technology ........................................................................................ 148
Table 68: List of respondents to 2013 survey ............................................................................. 150
Table 69: Comparison of key indicators across type of commercial cassava ............................. 157
Table 70: Wet season rice farm budget by technology and farm size ........................................ 161
Table 71: Wet season rice farm budget by farm size .................................................................. 162
Table 72: Wet season rice farm budget by technology use ........................................................ 163
Table 73: Wet season rice farm budget by province ................................................................... 164
Table 74: Dry season rice farm budget by technology and farm size ......................................... 165
Table 75: Dry season rice farm budget by farm size .................................................................. 166
Table 76: Dry season rice farm budget by technology use ......................................................... 167
Table 77: Dry season rice farm budget by province ................................................................... 168
Table 78: Cassava farm budget by technology and farm size .................................................... 169
Table 79: Cassava farm budget by farm size .............................................................................. 170
Table 80: Cassava farm budget by technology use ..................................................................... 171
Table 81: Cassava farm budget by province ............................................................................... 172
Table 82: Maize farm budget by technology and farm size ........................................................ 173
Table 83: Maize farm budget by farm size ................................................................................. 174
Table 84: Maize farm budget by technology use ........................................................................ 175
Table 85: Maize farm budget by province .................................................................................. 176
Table 86: Vegetable (mix) farm budget by technology and farm size ....................................... 177
Table 87: Vegetable (mix) farm budget by farm size ................................................................. 178
Table 88: Vegetable (mix) farm budget by technology use ........................................................ 179
Table 89: Vegetable (mix) farm budget by province .................................................................. 180
Table 90: Changes in prices of commodities, Thailand and Cambodia ..................................... 181
Table 91: Change in the prices of inputs, services, and labor, Cambodia .................................. 182
Table 92: Average use of inputs, Cambodia, 2013 ..................................................................... 182
Table 93: Farm budget indicators by crop, farm size, and technology use, Cambodia, 2013 .... 183
Table 94: Results of simulations on land use (baseline) ............................................................. 186
Table 95: Results of simulations on land use (scenario L1) ....................................................... 187
Table 96: Results of simulations on land use (scenario L2) ....................................................... 188
Table 97: Results of simulations on land use (scenario L3) ....................................................... 189
Table 98: Results of simulations on land use (scenario L4) ....................................................... 190
Table 99: Results of simulations on land use (scenario L5) ....................................................... 191

ix
Table 100: Results of simulations on land use (scenario L6) ..................................................... 192
Table 101: Demand for labor for environmental sustainability scenarios .................................. 193
Table 102: Demand for fertilizers for environmental sustainability scenarios ........................... 194
Table 103: Demand and average return to labor ($/day) for scenarios with env sustainability . 195
Table 104: Farm budget data comparing traditional and modern technology users (revenue and
modern inputs) ............................................................................................................................ 196
Table 105: Farm budget data comparing traditional and modern technology users (labor,
services, and gross margins) ....................................................................................................... 197
Table 106: Gross margins and NPV (million $) for TFP scenario (baseline) ............................ 198
Table 107: Gross margins and NPV (million $) for TFP scenario (scenario P1) ....................... 199
Table 108: Gross margins and NPV (million $) for TFP scenario (scenario P2) ....................... 200
Table 109: Gross margins and NPV (million $) for TFP scenario (scenario P3) ....................... 201
Table 110: Summary of gross margins for TFP scenarios .......................................................... 202
Table 111: Examples of costs of irrigation investment (per unit and total investment) ............. 202
Table 112: Demand for labor and return to labor for TFP scenarios .......................................... 203
Table 113: Demand for fertilizers for TFP scenarios ................................................................. 204
Table 114: Cultivated land and gross margins for scenario P4 (TFP through irrigation) ........... 205
Table 115: Gross margins on competitiveness (scenarios C1-C6) ............................................. 206
Table 116: Summary of gross margins and NPV for Competitiveness scenarios (C1-C6) ........ 207
Table 117: Return to labor for Competitiveness scenarios (C1-C6)........................................... 208
Table 118: Demand for labor and demand for fertilizers with Competitiveness scenarios ........ 210
Table 119: Characteristics of rice production: fragrant vs. IRRI ................................................ 211
Table 120: Cultivated land areas for fragrant rice Income Growth scenarios ............................ 212
Table 121: Gross margins for fragrant rice Income Growth scenarios ....................................... 213
Table 122: Summary of gross margins for fragrant rice Income Growth scenarios ................... 214
Table 123: Demand for labor, return to labor and demand for fertilizers for fragrant rice Income
Growth scenarios ........................................................................................................................ 214
Table 124: Cultivated land areas for cassava processing Income Growth scenarios ................. 215
Table 125: Gross margins for cassava processing Income Growth scenarios (million $) .......... 216
Table 126: Comparison between fresh cassava and dry chips production ................................. 217
Table 127: Demand for and return to labor for cassava processing Income Growth scenarios . 218
Table 128: Distribution and farm budget by farm size ............................................................... 219
Table 129: Gross margins with Farm Size Distribution scenario (baseline) .............................. 221
Table 130: Gross margins with Farm Size Distribution scenario (I5) ........................................ 222
Table 131: Gross margins with Farm Size Distribution scenario (I6) ........................................ 223
Table 132: Summary of gross margins from changes on Farm Size Distribution ($ million).... 224
Table 133: Demand for labor and return to labor for Farm Size Distribution scenarios ............ 225

x
ACRONYMS AND ABBREVIATIONS
ADB Asian Development Bank
ASEAN Association of Southeast Asian Nations
CARDI Cambodian Agricultural Research and Development Institute
CCSF Cambodian Community Savings Federation
CDRI Cambodia Development Resource Institute
CICP Cambodian Institute for Cooperation and Peace
CPI Consumer price index
DAP Diammonium phosphate
DRC Domestic resource cost
EBA Everything but Arms
FAO Food and Agriculture Organization of the United Nations
FAOSTAT Food and Agriculture Organization Corporate Statistical Database
FGD Focus group discussion
FO Farmers’ organization
FWUC Farmer Water User Communities
GDP Gross domestic product
ha Hectares
IFC International Finance Corporation
IRR Internal rate of return
MAFF Ministry of Agriculture, Forestry, and Fisheries
MFI Microfinance institution
MOWRAM Ministry of Water Resources and Meteorology
NGO Nongovernmental organization
NIS National Institute of Statistics, Cambodia
NPV Net present value
O&M Operation and maintenance
PDA Provincial Departments of Agriculture
PPP Purchasing power parity
RGC Royal Government of Cambodia
SOWS-REF Secretariat of One Window Service for Rice Export Formality
SNEC Supreme National Economic Council
TFP Total factor productivity
TOT Terms of trade
tph Tons per hour
USAID United States Agency for International Development
WDI World Development Indicators
WRS Warehouse Receipt System

xi
ACKNOWLEDGMENTS
This report was prepared by the World Bank’s Agriculture Global Practice, with financial
support from Australian Aid. The report preparation was initiated by Paavo Eliste (Lead Rural
Development Specialist, GFADR) and completed by Sergiy Zorya (Senior Economist, GFADR).
The team included Mudita Chamroeun (Senior Rural Development Specialist, GFADR) and
Munichan Kung (Rural Development Officer, GSURR). The team was supported by Narya Ou
(Program Assistant, EACSF) in Phnom Penh.
Primary data were collected and background reports were prepared by AgriFood
Consulting International, with the team composed of Francesco Goletti, Jean Claude
Randrianarisoa, and Cheng Vanny.
The report benefited from comments from its peer reviewers: Madhur Gautam (Lead
Economist, GFADR), Enrique Aldaz-Caroll (Senior Economist, GMFDR), and Hendericus
Bastiaan Rozemuller (Operations Officer, CMGSB/IFC). Helpful guidance and supports was also
received from Ulrich Zachau (Country Director, EACTF), Alassane Sow (Country Manager,
Cambodia, EACSF), Louise Scura (Program Leader, EACTF), Nathan Belete (Practice Manager,
GFADR), and Steven Jaffee (Lead Rural Development Specialist, GFADR).
The task team is grateful to H.E. Dr. Hang Chuon Naron, Minister of Education, Youth
and Sports for initiating this analytical work and H.E. Dr. Ouk Rabun, Minister of Agriculture,
Forestry and Fisheries (MAFF) for taking ownership and support; H.E. Ty Sokhun, Secretary of
State, MAFF, and Co-Chair of the Technical Working Group for Agriculture and Water, who
supported and coordinated the consultation process with government agencies and other
stakeholders; H.E. So Khanrithykun, General Director of the MAFF’s General Directorate of
Agriculture, and other MAFF staff for the time they devoted to provide information, discussions,
and support during preparation of the report. We would also like to acknowledge valuable
comments and contributions from government agencies in Phnom Penh and in provinces, from the
donor community, including those received through the joint Government-Donors Technical
Working Groups, and from the many representatives of the private sector, research institutes and
NGOs, who contributed their views and feedback on the initial drafts, background reports, and the
2013 survey. The excellent comments and feedback from the participants of the consultative
workshops held in May 2014, January 2015, and May 2015 in Phnom Penh are particularly
appreciated.
We are grateful to Nicholas Wolf and other Australian Aid staff for support for preparation
of this report provided under the Cambodia Food Crisis Capacity Support Partnership Trust Fund
and the preparation of many other reports produced under this partnership that fed into this
strategic analytical work.
The document was edited by Amy Gautam and Tiina Joosu-Palu assisted with the
preparation of communication materials and dissemination.

xii
EXECUTIVE SUMMARY
This report seeks to understand the
successes, challenges and opportunities of
Cambodia’s agricultural transformation over the
past decade to derive lessons and insights on how to
maintain future agricultural growth, and
particularly on the government’s role in facilitating
it. It is prepared per the request of the Supreme
National Economic Council and the Ministry of
Agriculture Forestry and Fisheries and is based on the
primary farm data surveys from 2005 and 2013, and
the secondary data from various sources. In 2013-
2014, the agricultural growth slowed down to 1 percent from its average of 5.3 percent over 2004-
2012. Is the country in transition to a slower agricultural growth? Cambodia can ill afford it
because agricultural growth will be critical to continued poverty reduction in the country, given its
large size in the economy. Market and private investment friendly policies and targeted public
sector investments in irrigation, extension, and other “public good” agricultural services, as
feasible within the government’s total budget, can help secure continued robust agricultural
growth.
KEY FINDINGS
THE PAST DECADE’S AGRICULTURAL GROWTH IS A STORY OF MANY SUCCESSES
In the last decade, Cambodia’s agriculture sector has undergone significant
structural transformation. Although still playing a large role, the agriculture sector became
relatively less “important” in overall GDP and the total labor force, but more “productive”, i.e.
agricultural land and labor productivity has increased. This transformation was driven by vibrant
and pro-poor agricultural growth.
The agricultural growth in Cambodia was high. During 2004-2012, the annual growth
in agricultural gross production was 8.7 percent. Agricultural value added1 grew by 5.3 percent
during this period. This exceptional growth, among the highest in the world, was driven by crop
production, mainly of paddy rice (annual growth of 9 percent), but also maize (20 percent), cassava
(51 percent), sugarcane (22 percent), and vegetables (10 percent). The growth in livestock and
fisheries was modest.
The agricultural growth was also pro-poor. Cambodia’s poverty headcount declined
from 50 percent in 2007 to 21 percent in 2011, with the number of poor declining from 7 million
to 3 million. Most poverty reduction took place in rural areas. More than 60 percent of the poverty
reduction was attributed to the agriculture sector: higher rice prices stimulated the larger rice
production that increased farm wages. Further poverty reduction will continue to depend on the
success of agriculture for many years to come, due to its large role in the labor force, value added,
and exports, as well as the fact that many farmers are among the poor and vulnerable.
1 The agricultural value added is defined as the value of gross production less the value of intermediate farm inputs.

xiii
Agricultural wages have been converging with nonagricultural wages. Agricultural
wages grew by 206 percent between the surveys conducted in 2005 and 2013, while nonfarm
wages increased by 60 percent. As a result, the ratio between per worker nonagricultural to
agricultural valued added in current prices fell to 2.1 in 2012 from 3.2 in 2004. Returns to farm
labor have been increasing.
The diversification of crop production has started. Although crop production is still
mainly focused on paddy, the crop mix has been
changing, driven by higher profitability of non-rice
crops. In 2013, average farm gross margins (and
returns to labor) were $506/ha ($9.4/day) for
cassava, $303/ha ($8.8/day) for maize, and
$1,393/ha ($7.2/day) for vegetable production,
compared to $245/ha ($4.6/day) for wet season rice
and $296/ha ($9.6/day) for dry season rice. Dry
season rice competes with non-rice crops in terms of
returns to labor but its expansion is constrained by
limited irrigation. The share of total area planted
under paddy declined from 86 percent in 2002 to 74 percent in 2011, while the share of planted
area for maize and cassava production increased significantly.
Even the paddy sector has started to diversify. Triggered by the demand from
modernized rice mills, more farmers grow more profitable aromatic paddy, estimated at 10 percent
of rice cultivated area and 30 percent of total production. Further expansion of farmland under
aromatic paddy is possible with improvements in quality seed supply, agricultural extension, and
irrigation.
Yields increased for most crops. With the annual growth in cultivated land areas at 4.7
percent and agricultural gross production at 8.7 percent, the average growth of yields was 4 percent
during 2004-2012. This growth in yields was triggered by wide adoption of improved technologies,
expanded (yet still limited) irrigation, more use of modern inputs, and better access to mechanized
services, pointing to the advances in commercialization. Farmers also have better access to
markets.
Cambodian farm products remain price competitive at farm gate. A domestic resource
cost analysis of competitiveness shows that despite rising labor costs and prices of farm inputs, the
value added generated by farmers exceeds the costs of domestic factors of production (land, labor,
and capital). This high competitiveness explains the large increase in agricultural exports in the
recent decade. However, the competitiveness of ordinary rice produced during the wet season has

xiv
worsened in recent years and many small farmers producing ordinary rice started to lose their
competitive edge.
Past agricultural growth was driven by several factors. Among the major ones were
open trade and, in general, market-oriented agricultural policy. Cambodia was one of the few
developing countries that did not overact to the 2008 global food price spike but actually saw
higher food prices as an opportunity to leverage agricultural growth. Other net-exporting countries
such as India and Vietnam used export restrictions to limit transmission of the global food price
spike into their markets. Higher agricultural prices in Cambodia made farmland expansion
profitable. In addition, the agriculture sector benefited from: (i) improved access to overseas
markets through the Everything but Arms Agreement with the European Union and open cross-
border trade with neighbors; (ii) better availability and wider use of mechanization services
triggered by the higher cost of rural labor; (iii) better farm access to finance; and (iv) the private
sector investments in rice mills.
BUT THERE ARE CHALLENGES
A large share of the past agricultural growth was driven by farmland expansion. The
average contribution (weighted by crop areas) of land expansion to the change in farm gross
margins in real terms between 2005 and 2013 was about 60 percent. Farmland expanded annually
by 4.7 percent, with very large increases (128 percent) for cassava. This farmland expansion has
contributed to accelerated deforestation, especially in upland areas.
The average increase in per hectare gross
margin2 was good, at 3.4 percent per year. But it
varied between 2.1 percent for dry season rice to 44.5
percent for vegetables. Maize’s per hectare margin
even declined. In many cases, farmers who expanded
their land areas received higher incomes, but farmers
with unchanged land areas were not able to
substantially increase their incomes. The period of
relatively high food prices was largely used to expand
land areas rather than to build a strong foundation
through productivity increases.
While poverty reduced significantly, the number of vulnerable people also increased
significantly. Most people who escaped poverty did so by a small margin. The loss of only 1,200
Riels per day (the cost of two small water bottles) would cause Cambodia’s poverty rate to double
to 40 percent. This high rate of vulnerability is the sign of still modest agricultural productivity
increases. Nutritional security has also lagged behind the reduction in poverty: although the
prevalence of stunting among children under five has declined by 7 percent between 2010 and
2014, it remained at the high rate of 33 percent.
2 Gross margin is defined as gross revenue less intermediate inputs, including hired labor. The farm gross margin
estimated in this report includes major, but not all crops, i.e. rice, cassava, maize, and vegetables.
Changes in farm gross margins, real terms, 2005-2013, %
Change in Cultivated
Area
Change in Gross Margin
per Hectare
Change in Total
Gross Margin
Wet season rice 2.1 2.4 4.5
Dry season rice 6.7 2.1 8.8
Cassava 128.1 15.1 143.2
Maize 17.2 -10.3 6.9
Vegetables 6.4 44.5 50.9
Weighted average 4.7 3.4 8.1
Source: 2005 and 2013 surveys.

xv
Poor are those living below $1.15 per day (poverty line) Near poor or vulnerable are those living above $1.15 per
day, but below $2.30 per day
Vulnerability is greatest among the smallest farms. Small farmers, with land area less
than a hectare, reported finding it difficult to expand and integrate into the emerging modern food
value chains. The share of such farms in total number of rural households owning land was 48
percent in 2011. In the last decade, there has been the trend in Cambodia for large farms (above 3
ha) to become larger and small farms (less than 1 ha) to become smaller.3 The average size of the
interviewed farms4 with less 1 ha declined from 0.99 ha in 2008 to 0.88 ha in 2012, while the
average size of medium farms (between 1 and 3 ha) increased from 1.55 ha to 2.38 ha and the
larger farms (above 3 ha) from 3.61 ha to 7.03 ha. In spite of the productivity improvements of
some small farms in the past, the productivity of most small traditional farms has remained low,
as agricultural extension and other public services have not reached them at a large scale. It appears
that the income increase for this group of farmers in the last decade largely came from higher
production values, driven by high agricultural prices, and the sale of their labor to larger farms at
higher wages, rather than higher land and labor productivity.
Except for rice, the agroprocessing industry has played a limited role in agricultural
growth. Almost all crops were exported to neighboring countries unprocessed. This indicates
serious weaknesses in the value chain, particularly in the post-harvest system of supply chain
management (collection of raw material, storage, finance, logistics, transportation, and
information).
WHAT WORKED IN THE PAST WILL NOT BE SUFFICIENT IN THE FUTURE
With global food prices declining and the land frontier diminishing, Cambodian
agriculture is losing its two major growth drivers. Moreover, agricultural labor is becoming
scarcer and more expensive, adding to production costs. Global agricultural prices are projected to
continue their decline in the next decade, and selling low-quality ordinary rice on domestic and
foreign markets will be less and less profitable. Relying on higher domestic demand driven by the
increase in GDP and higher import demand alone, without more efficient use of resources, will not
be enough to maintain the high rate of past growth. Cambodia would need to find other drivers of
growth to help maintain agricultural growth at or near 5 percent and make it more sustainable.
The recent slowdown in agricultural growth in Cambodia may signal a potential
longer-term decline. As global food prices gradually declined and the global rice market became
more competitive with the reentry of Thailand and Myanmar, rice production in Cambodia stalled.
And with it, total crop value added declined, from 4.9 percent in 2012 to 0.6 percent in 2013. The
3 This change in distribution of farmland is occurring independently of economic land concessions. 4 The farm survey was carried out for this report in 2013, see Annex 2 for details.

xvi
growth in agricultural value added slowed down to 1.6 percent in 2013 after average growth of 5.3
percent between 2004 and 2012.
Returning to a high agricultural growth rate is important. Agriculture still maintains a
large share in GDP, trade, and the labor force, which means that it will remain the key to further
reduction in poverty and vulnerability in the upcoming decade. If Cambodia’s structural
transformation continues, with agricultural growth averaging 5 percent, by 2030 Cambodia will
have relatively smaller but more productive agriculture sector. The agriculture’s share in GDP and
total labor force are projected to go down respectively to 17 percent and 31 percent in 2030, from
26 percent and 51 percent in 2012, while land productivity would increase from $1,300/ha to
$2,700/ha and labor productivity would rise from $1,200/person to $3,700/person (Table 1).
By contrast, the cost of slow agricultural growth would be huge. If average agricultural
growth is only 3 percent between 2012 and 2030, agricultural value added would be 29 percent
lower by 2030 compared with a 5 percent growth scenario, slicing overall GDP by 18 percent,
keeping more people in agriculture, reducing agricultural labor productivity by 34 percent, and
slowing any further income convergence between farmers and nonfarmers. Lower agricultural
growth would also lead to a much slower reduction in poverty.
Table 1: Impact of lower agricultural growth on selected agriculture sector indicators,
Cambodia Indicators 2012 2030
3% Ag GDP growth 5% Ag GDP growth
Share of agriculture in GDP, % 26 15 17
Share of agriculture in labor force, % 51 34 31
Agricultural labor productivity, $/person 1,200 2,450 3,700
Agricultural land productivity, $/ha 1,300 1,900 2,700
Labor productivity ratio of agricultural to
nonagricultural workers
2.1 2.1 1.6
A long-term vision for Cambodian agriculture would need to encompass elements of
sustainability, productivity, competitiveness, and income growth, shifting from still strong
focus on production. Simulation of different scenarios for future agricultural development reveals
that a rise in farm productivity would have the largest positive effect on farm incomes, especially
if the shift from traditional to modern technologies is accompanied by higher efficiency of modern
input use and irrigation. Farmers producing fragrant rice, processing cassava into dry chips, and
undertaking other value addition activities can further increase their incomes, illustrating the
importance of the agroprocessing industry. Lowering production costs through better use of
existing resources (e.g., productivity increase) and minimizing drops in farm output prices through
lower logistics costs are the keys to maintaining farm competitiveness. Continued land expansion
also provides additional income but sustainability considerations will limit large expansions in the
future. This constraint makes agricultural productivity, commercialization, and diversification
even more critical for ensuring future agricultural growth that reduces poverty and boosts shared
prosperity in Cambodia.
RECOMMENDATIONS
Continued rapid agricultural growth and further structural transformation in the
agriculture sector are possible in Cambodia. Four sets of policies together can help support such
continued agricultural growth during the next five years (short-to medium run). The first is

xvii
maintaining a private sector friendly agricultural policy environment, with added attention to lower
the regulatory burden in farm input sectors. The second is strengthening the environmental
sustainability of agricultural production. The third is improving the quality of agricultural public
programs and, as feasible within Cambodia’s total government budget, increasing allocations to
more effective programs. And the fourth is helping develop the agribusiness and agroprocessing
industry.
Investments and policy improvements are needed immediately but not all will show
immediate results. For some of them, more time and effort are required to have an impact on the
ground. Table 2 summarizes key policy recommendations that need to be set in motion
immediately to produce impacts in the short to medium run that would help reverse the recent
slowdown in agricultural growth and help fully utilize the significant potential of Cambodia’s
agriculture.
Table 2: Summary of the report’s key policy recommendations based on the time of
impacts’ realization
Policy recommendations Impacts
realizable
in Short
Run
Impacts
realizable in
Medium-to-
Long Run
Maintaining a private sector friendly agricultural policy environment
Continue the open trade policy and non-distortive agricultural policy X
Reduce the regulatory costs of importation of fertilizers X
Open up seeds sector for private investments through deregulation and
institutional strengthening X
Strengthening the environmental sustainability
Improve land use planning and better enforce land laws/regulations X
Strengthen land tenure security X
Promote sustainable land management practices X
Promote the safe use of agricultural chemicals X
Improving agricultural “public good” investment programs
As feasible within Cambodia’s total government budget, increase the
budget for core agricultural public goods, especially irrigation, applied
research, extension, soil nutrient management, input quality control,
food safety, vocational training, and rural roads
X
In irrigation, pay more attention to upgrades and rehabilitation of
existing systems and participatory management of irrigation
infrastructure
X
Improve the quality of agricultural public programs X
Facilitate integration of small farms into food value chains X
Helping develop agribusiness and agroprocessing industry
Improve access to and reduce electricity costs X
Invest in food safety public infrastructure X
Improve rice trade logistics, including cost reduction X
Remove barriers for introduction of warehouse receipts X

xviii
សេចក្ដីេសខេបរួម
របាយការណ៍ស េះ បា ព្យាយាមស្េែខយលព់្យសីោគជយ័ បញ្ហា ប្បឈម ខិកាលា ុវត្ដភាព្យន បម្លា េប់ដរូក្នខុវេិយ័ក្េកិ្មម សៅក្មពុោ
សៅក្នខុទេវត្សរក៍្ ាខសៅស េះ ស ើមបីទាញ បា ោសមសរៀ ខិគ ំតិ្េំខា ់ៗ េប្ម្លបរ់ក្ាក្សំណើ ក្េកិ្មម នាសព្យលអនាគត្ ោព្យិសេេ
ត្នួាទីរបេ់រដ្ឋា ភបិាល សៅក្នខុការបខកលក្េណៈ ឱ្យម្ល ក្សំណើ ស្បបស េះ។ របាយការណ៍ស េះប្ត្ូវបា សរៀបចំស ើខ សៅតាម ការសេនើេំុរបេ់ឧត្ដមប្ក្ុមប្បឹក្ាសេ ាក្ិចចោត្ ិ ិខប្ក្េួខក្េិក្មម រុកាេ ប្បម្លញ់ ិខស សាទ សដ្ឋយស្អែក្សៅតាមការអសខកត្ប្បមូលទិ ន ័យផ្ទា ល់ព្យីក្េិដ្ឋា ព្យីឆ្ន ២ំ០០៥ ល់២០១៣ ិខទិ ន ័យស្ លបា ព្យីប្បភព្យសអសខៗ។ សៅក្ំ ុខឆ្ន ំ ២០១៣-២០១៤ ក្ំសណើ ក្េិក្មមម្ល ការថមថយមក្សៅប្ត្ឹម ១ភាគរយ
ព្យីក្ំសណើ ោមធ្យម ៥,៣ភាគរយ សៅក្ំ ុខឆ្ន ំ ២០០៤-២០១២។ សត្ើប្បសទេក្មពុោ េថិត្សៅក្នុខអ ដរកាលសៅរក្ក្ំសណើ សេ ាក្ិចចយឺត្ោខមុ ឬ? ប្បសទេក្មពុោមិ អាចបសដដ យឱ្យម្ល បញ្ហា ស្បបស េះ ប ដសក្ើត្ម្ល ស ើខស ើយ សដ្ឋយសេត្ុថាក្ំសណើ ក្នុខវិេ័យក្េិក្មមម្ល សារៈេំខា ់ េប្ម្លប់ប ដការកាត្់ ប ថយភាព្យប្ក្ីប្ក្សៅក្នុខប្បសទេស េះ ិខសដ្ឋយសារស្ត្ក្េិក្មមម្ល េម្លេភាគធ្ំ សៅក្នុខសេ ាក្ិចចរបេ់ប្បសទេក្មពុោ។ សោល សយាបាយ ស្ លបខកភាព្យងាយប្េួល ល់ទីអារ ិខការវិ ិសយាគឯក្ជ ិខការវិ ិសយាគក្នុខវិេ័យសាធារណៈ ស្ លសផ្ទដ ត្ចំសោលសៅ ូចោ
វិេ័យធារាសាស្ដេដ អសព្យែអាយបសចចក្សទេក្េិក្មម ិខ សេវាក្េិក្មមោ “ប្បសយាជ ៍សាធារណៈ” នទសទៀត្ សៅតាមលទធភាព្យស្ លអាចសធ្ែើបា ក្នុខរខែខ់លទធភាព្យថវិកាេរុបរបេ់រដ្ឋា ភិបាល អាច ឹខជួយរក្ាឱ្យវិេ័យក្េិក្មមសៅស្ត្ប ដក្ំសណើ រឹខម្លបំា ។
លទធអលរក្ស ើញេខំា ់ៗ
ក្សំណើ ន វេិយ័ក្េកិ្មមសៅក្នខុទេវត្សរក៍្ ាខសៅ បា បងាា ញព្យីសោគជយ័ោសប្ចើ
សៅក្នខុទេវត្សរច៍ខុសប្កាយស េះ វេិយ័ក្េកិ្មមរបេ់ប្បសទេក្មពោុ បា ឆ្ាខកាត្ប់ម្លា េប់ដូររចនាេមព ័ធេំខា ់ៗ គួរឱ្យក្ត្េ់ម្លា ល។់ សបើសទាេះបីោសៅម្ល ត្ួនាទី ៏ធ្ំយា៉ា ខដក្៏សដ្ឋយ វិេ័យក្េិក្មមមិ េូវម្ល “សារៈេំខា ់” សៅក្នុខ អេេ
ិខក្ម្លា ខំព្យលក្មមេរុបស ើយ ប៉ាុស្ ដម្ល “អលិត្ភាព្យ” ោខមុ សោលគឺអលិត្ភាព្យរបេ់ ីក្េិក្មម ិខក្ម្លា ខំព្យលក្មម ម្ល ការសក្ើ ស ើខ។ បម្លា េ់បដូរស េះប្ត្ូវបា ជប្មុញ សដ្ឋយសារស្ត្ក្ំសណើ ក្នុខវិេ័យក្េិក្មម ស្ លោបំ្ទ ល់ជ ប្ក្ីប្ក្។
ក្សំណើ វេិ័យក្េកិ្មម សៅក្នខុប្បសទេក្មពុោម្ល ក្ប្មតិ្ខ្ពេ។់ ចសនាា េះព្យីឆ្ន ២ំ០០៤ ល់២០១២ ក្ំសណើ ប្បចឆំ្ន នំ អលិត្ក្មមក្េិក្មមេរុបម្ល ៨,៧ភាគរយ។ ត្នមាបស្ ថមរបេ់វិេ័យក្េិក្មម5 ម្ល ការសក្ើ ៥,៣ភាគរយ សៅក្នុខរយៈសព្យលស េះ។ ក្ំសណើ ព្យិសេេ ស្ លេថិត្សៅក្នុខចំសដមក្ំសណើ ខ្ពេ់ោខសគ សៅក្នុខព្យិភព្យសលាក្ស េះ ប្ត្ូវបា ជប្មុញសដ្ឋយអលិត្ក្មម ំដ ំោព្យិសេេប្េូវ (ក្ំសណើ ប្បចឆំ្ន ំ៩ ភាគរយ) ិខសោត្ (២០ ភាគរយ) ំ ូខមី (៥១ ភាគរយ) អំសៅ (២២ ភាគរយ) ិខបស្ ា (១០ ភាគរយ)។ ក្ំសណើ សៅក្នុខវិេ័យបេុេត្ែ ិខស សាទ ម្ល ក្ប្មិត្មធ្យម។
ក្សំណើ ក្នខុវេិយ័ក្េកិ្មមស េះ ក្ោ៏ំប្ទ លប់្បោព្យលរ ាប្ក្បី្ក្អខស្ រ។ អប្តាន ភាព្យប្ក្ីប្ក្របេ់ប្បសទេ ក្មពុោ ម្ល ការថយចុេះព្យី ៥០ភាគរយ សៅក្នុខឆ្ន ២ំ០០៧ មក្សៅ ២១ភាគរយ សៅក្នុខឆ្ន ២ំ០១១ សដ្ឋយចំ ួ ប្បោជ ប្ក្ីប្ក្ថយចុេះព្យី ៧លា នាក្់ មក្សៅ ៣លា នាក្់។ ការកាត្់ប ថយភាព្យប្ក្ីប្ក្ភាគសប្ចើ សក្ើត្ម្ល ស ើខសៅតាមត្ំប ់ជ បទ។ ការកាត្់ប ថយ ភាព្យប្ក្ីប្ក្ោខ ៦០ភាគរយ សក្ើត្ស ើខសដ្ឋយសារវិេ័យក្េិក្មម៖ ត្នមាអខករខ្ពេ់ោខមុ បា ជប្មុញឱ្យអលិត្ក្មមប្េូវ សក្ើ ស ើខ ស្ លជួយបសខកើ ប្បាក្់ចំណូល ល់អនក្ស្ លសធ្ែើស្ប្េ ិខក្េិដ្ឋា ប្េូវនានាស្ រ។ ការកាត្់ប ថយភាព្យប្ក្ីប្ក្បស្ ថមសទៀត្ សៅប ដព្យឹខអាប្េ័យសលើសោគជ័យន វិេ័យក្េិក្មមសប្ចើ ឆ្ន ំសៅមុខ្សទៀត្ សដ្ឋយសារស្ត្ត្ួនាទី ៏ធ្ំរបេ់វិេ័យស េះ ចំសោេះ ក្ម្លា ខំព្យលក្មម ត្នមាបស្ ថម ិខការនាសំចញ
ក្៏ ូចោសដ្ឋយសារស្ត្ក្េិក្រោសប្ចើ េថិត្សៅក្នុខចំសដមអនក្ស្ លប្ក្ីប្ក្ ិខ ងាយរខសប្ោេះោខសគ។
ប្បាក្ឈ់នលួក្នខុវិេយ័ក្េកិ្មម សក្ើ ស ើខសៅសក្ៀក្ ខឹប្បាក្ឈ់នលួក្នខុវេិ័យម ិស្ម ក្េកិ្មម។ ប្បាក្់ឈនួលក្នុខ វិេ័យក្េិក្មមម្ល ការសក្ើ ស ើខ ២០៦ភាគរយ សៅក្នុខការអសខកត្ស្ លសធ្ែើស ើខចសនាា េះ ឆ្ន ២ំ០០៥ ិខ២០១៣ ខ្ណៈសព្យល
ស្ លប្បាក្់ឈនួលក្នុខវិេ័យមិ ស្ម ក្េិក្មម ម្ល ការសក្ើ ស ើខ ៦០ភាគរយ។ ូសចនេះ អលសធ្ៀបរវាខត្នមាបស្ ថម េប្ម្លប់អនក្ សធ្ែើការក្នុខវិេ័យមិ ស្ម ក្េិក្មមម្លន ក្់ សធ្ៀបោមួយ ឹខអនក្សធ្ែើរបរក្េិក្មម គិត្ោត្នមាបចចុបប ន ម្ល ការថយចុេះព្យី ៣,២ សៅក្នុខឆ្ន ២ំ០០៤ មក្ ២,១ សៅក្នុខឆ្ន ២ំ០១២។ ចំណូលស្ លបា មក្ព្យីការសធ្ែើការងារសៅក្នុខក្េិដ្ឋា ម្ល ការសក្ើ ស ើខ។
5 ត្នមាបស្ ថមក្នុខវិេ័យក្េិក្មម ប្តូ្វបា សគកំ្ណត់្ ិយម ័យឱ្យថាោត្នមាេរុបរបេ់អលិត្ក្មម ក្ត្នមាធាតុ្ចូលក្េិក្មមសចញ។

xix
ព្យពិ្យធិ្ភាព្យអលតិ្ក្មម ំដបំា ចប់សអដើម ខិក្ពំ្យខុប ត។ សបើសទាេះបីោអលិត្ក្មម ំដ ំ សផ្ទដ ត្ោចមបខសលើ ំដបំ្េូវក្តី មុខ្ ំដកំ្ំព្យុខម្ល ការស្ប្បប្បួល សដ្ឋយសារស្ត្លទធភាព្យចំសណញ ខ្ពេ់ន ប្បសភទ ំដសំប្ៅព្យីប្េូវ។ សៅឆ្ន ២ំ០១៣ អលចំណូល េរុបគិត្ោមធ្យម (រួមទាខំក្ំនរព្យលក្មម) របេ់ក្េិដ្ឋា រួមម្ល ៥០៦ ុលាា រ/េិចតា (៩,៤ ុលាា រ/នថៃ) េប្ម្លប់ ំ ូខមី, ៣០៣ ុលាា រ/េិចតា
(៨,៨ ុលាា រ/នថៃ) េប្ម្លប់សោត្ ិខ ១៣៩៣ ុលាា រ/េិចតា (៧,២ ុលាា រ/នថៃ) េប្ម្លប់ ំដបំស្ ា សបើសធ្ៀប ោមួយ ឹខ ២៤៥ ុលាា រ/េិចតា (៤,៦ ុលាា រ/នថៃ) េប្ម្លប់ប្េូវ វេា ិខ ២៩៥ ុលាា រ/េិចតា (៩,៦ ុលាា រ/នថៃ) េប្ម្លប់ប្េូវប្បាខំ។ ប្េូវរ ូវប្បាខំប្ត្ូវប្បស្ជខោមួយ ឹខ ំដមំិ ស្ម ប្េូវ នទសទៀត្ សបើគិត្ព្យីចំណូលរបេ់ក្ម្លា ខំព្យលក្មម ប៉ាុស្ ដការព្យប្ខីក្អលិត្ក្មមប្េូវរ ូវប្បាខំប្ត្ូវជួបឧបេគា សដ្ឋយសារស្ត្ ប្បព្យ័ ធធារាសាស្ដេដសៅម្ល ក្ប្មិត្សៅស ើយ។ ភាគរយន នអា ីេរុបស្ លសប្បើប្បាេ់ េប្ម្លប់បខកបសខកើ អលប្េូវ ម្ល ការ ថយចុេះព្យី ៨៦ភាគរយ សៅក្នុខឆ្ន ២ំ០០២ រេូត្ ល ់ ៧៤ភាគរយ សៅក្នុខឆ្ន ំ២០១១ ខ្ណៈសព្យលស្ លភាគរយន នអា ីេប្ម្លប់ដ្ឋសំោត្ ិខ ំ ូខមី ម្ល ការសក្ើ ស ើខគួរឱ្យក្ត្់េម្លា ល់។
េមូបសី្ត្វេិ័យប្េូវក្ច៏ប់សអដើមសធ្ែើព្យពិ្យធិ្ក្មមអខស្ រ។ សដ្ឋយសារស្ត្ម្ល ត្ប្មូវការព្យីសរាខម្ល៉ា េីុ ក្ិ ប្េូវទំស ើប ក្េិក្រ កា ់ស្ត្សប្ចើ ោខមុ នាោំន បសខកើ ការអលិត្ប្េូវប្ក្អូបស្ លអដល់ប្បាក្់ចំសណញខ្ពេ់ោខមុ ប្បម្លណោ១០ភាគរយ ន នអា ី ដ្ឋបំ្េូវេរុប ិខប្បម្លណោ ៣០ភាគរយន អលិត្ក្មមេរុប។ ការព្យប្ខីក្ ីស្ប្េបស្ ថមសទៀត្ េប្ម្លប់ប្េូវប្ក្អូបស េះ គឺអាច សធ្ែើសៅបា ោមួយ ឹខការស្ក្លំអការអាត្់អាខ់ប្ោប់ព្យូជប្បក្បសដ្ឋយគុណភាព្យ ការអសព្យែអាយក្េិក្មម ិខប្បព្យ័ ធធារាសាស្ដេដ។
ទ ិនអលម្ល ការសក្ើ ស ើខ េប្ម្លប ់ដំភំាគសប្ចើ ។ ោមួយ ឹខក្ំសណើ ប្បចឆំ្ន នំ នអា ីដ្ឋ ំុេះ ៤,៧ភាគរយ ិខអលិត្ក្មមក្េិក្មមេរុប ៨,៧ភាគរយ ទិ ន ័យម្ល ក្ំសណើ ោមធ្យមប្បចឆំ្ន ំ ៤ភាគរយ ចសនាា េះព្យីឆ្ន ២ំ០០៤ ល់២០១២។ ក្ំសណើ ទិ នអលទាខំស េះប្ត្ូវបា ជប្មុញ សដ្ឋយការសប្បើប្បាេ់បសចចក្វិទាថមីៗសប្ចើ ោខមុ ការព្យប្ខីក្ប្បព្យ័ ធធារាសាស្ដេដ (សបើសទាេះបីោសៅម្ល ក្ប្មិត្សៅស ើយក្៏សដ្ឋយ) ការសប្បើប្បាេ់ព្យូជ ិខជីរក្េិក្មមលែៗកា ់ស្ត្សប្ចើ ោខមុ ិខលទធភាព្យ ទទួលបា សេវាសប្គឿខយ ដលែប្បសេើរោខមុ ស្ លទាខំស េះេុទធស្ត្បងាា ញព្យីភាព្យសជឿ សលឿ ន ោណិជផូ ីយក្មម។ ក្េិក្រ ក្៏ម្ល លទធភាព្យទទួលបា ទីអារកា ់ស្ត្ប្បសេើរោខមុ អខស្ រ។
ត្នមាអលតិ្អលក្េកិ្មមរបេក់្មពោុសៅម្ល ភាព្យប្បក្តួ្ប្បស្ជខសៅ ខឹក្េិដ្ឋា ផ្ទា ល។់ ការវិភាគសលើភាព្យប្បក្ួត្ ប្បស្ជខន ត្នមាអលិត្អលក្នុខប្េុក្ បងាា ញថាសបើសទាេះបីោត្នមាក្ម្លា ខំព្យលក្មម ិខត្នមាធាត្ុចូលស្ លសប្បើប្បាេ់េប្ម្លប់ដ្ឋ ំុេះ ម្ល ការសក្ើ ស ើខយា៉ា ខដក្តី ត្នមាបស្ ថមស្ លគិត្សដ្ឋយក្េិក្រសៅខ្ពេ់ោខត្នមា ន ក្តាដ អលិត្ក្មមក្នុខប្េុក្ ( ី ព្យលក្មម ិខស ើមទុ )។ ភាព្យប្បក្ួត្ប្បស្ជខខ្ពេ់ស េះ អាចោមូលសេត្ុនាឱំ្យម្ល ការសក្ើ ស ើខការនាំសចញក្េិអល ៏សប្ចើ សៅក្នុខ ទេវត្សរ៍ក្ ាខសៅស េះ។ ប៉ាុស្ ដភាព្យប្បក្ួត្ប្បស្ជខន ប្េូវធ្មមតាស្ លអលិត្សៅរ ូវវេា ម្ល ការថយចុេះក្នុខរយៈប៉ាុនាម ឆ្ន ំចុខសប្កាយស េះ សេើយ ក្េិក្រខាន ត្ត្ូចោសប្ចើ ស្ លអលិត្ប្េូវធ្មមតា បា ចប់សអដើមបាត្់បខ់ភាព្យប្បក្ួត្ប្បស្ជខរបេ់ខ្ាួ ។
ក្សំណើ សៅក្នខុវេិយ័ក្េកិ្មមក្ ាខមក្ ប្ត្វូបា ជប្មុញសដ្ឋយក្តាដ ោសប្ចើ ។ ក្នខុចំសដមក្តាដ ធ្ំៗ រួមម្ល ការ សបើក្ចំេរការសធ្ែើោណិជផក្មម ិខសោល សយាបាយក្េិក្មមសផ្ទដ ត្សលើទីអារោទូសៅ។ ប្បសទេក្មពុោ ោប្បសទេមួយ ក្នុខ ចំសដមប្បសទេក្ំព្យុខអភិវឌ្ឍនានា ស្ លមិ បា ប្បត្ិក្មមប្ជុលខាា ខំសព្យក្សៅ ឹខការសលាត្ ស ើខ ូវត្នមាសេបៀខអាហារ ោេក្លសៅក្នុខឆ្ន ំ២០០៨ ប៉ាុស្ ដចត្់ទុក្ការស ើខនថាសេបៀខអាហារស េះ ថាោឱ្កាេមួយស ើមបីទាញប្បសយាជ ៍ េប្ម្លប់ ក្ំសណើ វិេ័យក្េិក្មម។ ប្បសទេនានាស្ លម្ល ការនាសំចញសប្ចើ ោខការនាចំូល ូចោឥដា ិខសវៀត្ដម ោស ើម បា ដ្ឋក្់ក្ំេិត្សលើការនាសំចញ ស ើមបីទប់ឥទធិព្យលន ការស ើខនថាសេបៀខអាហារោេក្ល មក្សលើទីអាររបេ់ព្យួក្សគ។ ត្នមា អលក្េិក្មមខ្ពេ់សៅក្នុខប្បសទេក្មពុោ
បា សធ្ែើឱ្យការព្យប្ខីក្ ីក្េិក្មម អដល់អលចំណូលមក្វិញខ្ពេ់។ សលើេព្យីស េះ វិេ័យក្េិក្មមបា ទទួលប្បសយាជ ៍ព្យី (i) ការទទួលបា ទីអារសៅបរសទេសប្ចើ ោខមុ តាមរយៈក្ិចចប្ព្យមសប្ព្យៀខទំ ិញប្គប់ស្បបយា៉ា ខសលើក្ស្លខស្ត្អាវុធ្សចញ ោមួយ ឹខេេភាព្យអឺរ ុប ិខការសបើក្ចំេោណិជផក្មមឆ្ាខស្ ោមួយ ឹខប្បសទេ ជិត្ខាខ (ii)ការទទួលបា ិខការសប្បើប្បាេ់យា៉ា ខទូលាយ ូវសេវាសប្គឿខយ ដ ជំ ួេសអាយការចំដយកា ់ស្ត្ខ្ពេ់សលើក្ម្លា ខំព្យលក្មមសៅជ បទ (iii)ការទទួលបា ឥណទា ប្បសេើរោខមុ ិខ (iv)ការវិ ិសយាគរបេ់វិេ័យឯក្ជ សលើម្ល៉ា េីុ ក្ិ ប្េូវខាន ត្ធ្ំ។
បញ្ហា ប្បឈមនានា
ភាគរយ ខ៏្ពេ់ន ក្សំណើ ក្នខុវេិយ័ក្េកិ្មមក្ ាខសៅស េះ ប្ត្វូបា ជប្មញុសដ្ឋយសារស្ត្ការព្យប្ខកី្នអា ីដ្ឋ ំេុះ។ ការរួមចំស្ណក្ោមធ្យម ន ការព្យប្ខីក្នអា ីដ្ឋ ំុេះ ចំសោេះការស្ប្បប្បួលអប្តាចំណូលេរុបរបេ់ក្េិក្មម គិត្ោត្នមាព្យិត្ ចសនាា េះព្យីឆ្ន ២ំ០០៥ ល់២០១៣
គឺប្បស្េលោ ៦០ភាគរយ។ ីក្េិក្មម ប្ត្ូវបា ព្យប្ខីក្ប្បម្លណោ ៤,៧ភាគរយ ក្នុខមួយឆ្ន ំ សដ្ឋយម្ល ការសក្ើ ស ើខយា៉ា ខសប្ចើ (១២៨ភាគរយ) េប្ម្លប់ ំ ូខមី។ ការព្យប្ខីក្ ីក្េិក្មមស្បបស េះ បា រួមចំស្ណក្ សធ្ែើឱ្យម្ល ការបាត្់បខ់នប្ព្យសឈើកា ់ស្ត្សលឿ ោព្យិសេេ
សៅត្ំប ់ខ្ពខ់រាប។
ក្សំណើ ោមធ្យមន អប្តាចំសណញក្នខុមយួេចិតា6 ម្ល ក្ប្មតិ្ លែប្បសេើរ គឺ៣,៤ភាគរយក្នខុមយួឆ្ន ។ំ ប៉ាុស្ ដ វាម្ល ការស្ប្បប្បួលចសនាា េះព្យី ២,១ភាគរយ េប្ម្លប់ប្េូវរ ូវប្បាខំ សៅ៤៤,៥ភាគរយ េប្ម្លប់បស្ ា។ អប្តា ចំសណញេប្ម្លប់សោត្ក្នុខមួយេិចតាម្ល ការថយចុេះ។ សៅក្នុខក្រណីោ សប្ចើ ក្េិក្រស្ លបា ព្យប្ខីក្នអា ីរបេ់ខ្ាួ បា ទទួលប្បាក្់ចំណូលខ្ពេ់ ោខមុ ប៉ាុស្ ដក្េិក្រស្ លរក្ានអា ីដ្ឋ ំុេះ ស្ លមិ អាចបសខកើ ប្បាក្់ចំណូលរបេ់ខ្ាួ ឱ្យបា សប្ចើ ស ើយ។ ក្ំ ុខសព្យលស្ ល ត្នមាសេបៀខស ើខខ្ពេ់ ប្ត្ូវបា ជំរុញសលើការព្យប្ខីក្នអា ី ោោខការក្សាខមូលដ្ឋា រឹខម្លំ តាមរយៈការបសខកើ អលិត្ភាព្យ។
សព្យលស្ លភាព្យប្ក្បី្ក្ម្ល ការថយចេុះគួរឱ្យក្ត្េ់ម្លា ល់ ច ំ ួប្បោជ ស្ លងាយរខសប្ោេះក្ម៏្ល ការសក្ើ ស ើខ សប្ចើ អខស្ រ។ ភាគសប្ចើ ន ប្បោជ ស្ លសខើបសចញព្យីភាព្យប្ក្ីប្ក្ សៅមិ ទា ់សៅអុត្ឆ្ៃ យព្យីវាសៅស ើយ។ ការបាត្់បខ់ ចំណូលប្ត្ឹមស្ត្១២០០សរៀល ក្នុខមួយនថៃ (ត្នមាទឹក្េុទធព្យីរ បត្ូច) ឹខសធ្ែើឱ្យអប្តា ន ភាព្យប្ក្ីប្ក្របេ់ប្បសទេក្មពុោ សក្ើ ស ើខ សទែ ខ ល់៤០ភាគរយ។ អប្តាន ភាព្យងាយរខសប្ោេះ ៏ខ្ពេ់ស្បបស េះ គឺោេញ្ហា ស្ លបងាា ញថា
ក្ំសណើ អលិត្ភាព្យក្េិក្មម សៅម្ល ក្ប្មិត្ត្ិចត្ួចសៅស ើយ។ េ ដិេុខ្អាហារូបត្ថមភ ក្៏សៅម្ល សលបឿ យឺត្ោខការកាត្់ប ថយភាព្យប្ក្ីប្ក្អខស្ រ៖ សទាេះបី ោសប្បវា ខ់ន ភាព្យប្ក្ិ របេ់ក្ុម្លរអាយុសប្កាម៥ឆ្ន ំ បា ថយចុេះ៧ភាគរយ សៅចសនាា េះព្យីឆ្ន ២ំ០១០ ិខ២០១៤ក្តី អប្តា ស េះសៅស្ត្ម្ល ក្ប្មិត្ខ្ពេ់ (៣៣ ភាគរយ)
សៅស ើយ។
6 អប្តាចំណូលេរុប ោចំណូលេរុប ក្ធាតុ្ចូលប្បសយាលសចញ រាប់ទំាខព្យលក្មមស្ លប្តូ្វបា ជួលអខ។ អប្តាចំសណញរបេ់ក្េិដ្ឋា ស្ លប្តូ្វបា បា៉ា ់ប្បម្លណសៅក្នុខរបាយការណ៍ស េះ រាប់បញ្ចូលស្ត្ ំដំេំខា ់ៗ ូចោ ប្េូវ ំ ូខមី សោត្ ិខបស្ ា ោស ើម។
Changes in farm gross margins, real terms, 2005-2013, %
Change in Cultivated
Area
Change in Gross Margin
per Hectare
Change in Total
Gross Margin
Wet season rice 2.1 2.4 4.5
Dry season rice 6.7 2.1 8.8
Cassava 128.1 15.1 143.2
Maize 17.2 -10.3 6.9
Vegetables 6.4 44.5 50.9
Weighted average 4.7 3.4 8.1
Source: 2005 and 2013 surveys.

xx
ប្បោជ ប្កី្ប្ក្ ស្ លកំ្ពុ្យខរេ់សៅសប្កាម ១,១៥ ុលាា រ ក្នុខមួយនថៃ (បនាា ត់្ន ភាព្យប្កី្ប្ក្) ប្បោជ ស្ លសក្ៀក្ប្ក្ ឬងាយរខសប្ោេះ គឺោអនក្ស្ លរេ់ សៅសលើ ១,១៥ ុលាា រ ក្នុខមួយនថៃ ប៉ាុស្ ដសប្កាម ២,៣០ ុលាា រ ក្នុខមួយនថៃ
ភាព្យងាយរខសប្ោេះម្ល ក្ប្មតិ្ខ្ពេោ់ខ ក្នខុចសំដមក្េដិ្ឋា ស្ លម្ល ទេំតំ្ចូៗ។ ក្េិដ្ឋា ត្ូចៗ ស្ លម្ល ទំេំ ី ត្ិចោខ១េិចតា ប្ត្ូវបា រក្ស ើញថាជួប ឹខការលំបាក្ ស ើមបីព្យប្ខីក្ខ្ាួ ិខសធ្ែើេម្លេរណក្មម ចូលសៅក្នុខស្ខ្សេងាែ ក្់ អាត្់អាខ់អាហារស្ លម្ល លក្េណៈទំស ើប។ ន ក្េិដ្ឋា ទាខំស េះ គិត្ោចំ ួ ប្គួសារេរុបស្ លម្ល ីោក្មមេិទធិផ្ទា ល់ខ្ាួ គឺ ៤៨ភាគរយ សៅក្នុខឆ្ន ២ំ០១១។ សៅក្នុខទេវត្សរ៍ចុខសប្កាយស េះ សៅក្នុខប្បសទេក្មពុោ ម្ល ិនាន ការស្ លក្េិដ្ឋា ធ្ំៗ (សលើេ៣េិចតា)កា ់ស្ត្រីក្ធ្ំសៅៗ សេើយក្េិដ្ឋា ត្ូចៗ (ត្ិចោខ១េិចតា)កា ់ស្ត្រួញត្ូចសៅៗ។7 ទំេំមធ្យមរបេ់ក្េិដ្ឋា ខាន ត្ត្ូច8 បា ថយចុេះព្យី០,៩៩េិចតាក្នុខឆ្ន ២ំ០០៨ មក្សៅ០,៨៨េិចតាក្នុខឆ្ន ២ំ០១២ សេើយក្នុខសព្យលោមួយោន សនាេះ ទំេំ ោមធ្យមរបេ់ក្េិដ្ឋា ខាន ត្មធ្យម (ចសនាា េះព្យី១ សៅ៣េិចតា) បា សក្ើ ស ើខព្យី១,៥៥េិចតា ល់២,៣៨េិចតា សេើយក្េិដ្ឋា ធ្ំៗ (សលើេព្យី ៣េិចតា) បា សក្ើ ស ើខព្យី ៣,៦១េិចតា ល់៧,០៣េិចតា។ សបើសទាេះបីោអលិត្ភាព្យរបេ់ក្េិដ្ឋា ត្ូចៗម្ល ការសក្ើ ស ើខខ្ាេះក្តី ក្៏សៅម្ល ក្ំរិត្ទាប សដ្ឋយភាគសប្ចើ ន ក្េិដ្ឋា ត្ូចសៅមិ ទា ់បា ទទួល សេវាអសព្យែអាយ ក្េិក្មម ិខសេវាសាធារណៈ នទសទៀត្ ក្នុខប្ទខ់ប្ទាយធ្ំស ើយ។ ការសក្ើ ស ើខ ូវប្បាក្់ចំណូលរបេ់ក្េិក្រក្នុខប្ក្ុមស េះ សៅក្នុខទេវត្សរ៍ចុខសប្កាយស េះ ហាក្់បី ូចោសក្ើត្ស ើខសដ្ឋយសារស្ត្ត្នមាអលិត្ក្មមខ្ពេ់ោខមុ ិខការលក្់ព្យលក្មមសអាយ ក្េិដ្ឋា ធ្ំៗបា ប្បាក្់ឈនួលខ្ពេ់ោខមុ ោោខសដ្ឋយសារការសក្ើ ស ើខន អលិត្ភាព្យ ី ិខគុណភាព្យព្យលក្មម។
សលើក្ស្លខស្ត្អខករសចញ ឧេាេក្មមស្ក្នចនក្េអិលបា បសំព្យញត្ួនាទតី្ចិត្ចួ សៅក្នខុក្ំសណើ វេិ័យក្េកិ្មម។ ក្េិអលសេាើរស្ត្ទាខំអេ់ប្ត្ូវបា នាសំចញសៅប្បសទេជិត្ខាខ សដ្ឋយព្យុំម្ល ការស្ក្នចន។ ស េះបងាា ញព្យីចំណុចសខ្ាយធ្ៃ ់ធ្ៃរ សៅក្នុខស្ខ្សេងាែ ក្់ត្ំនល
ោព្យិសេេសៅក្នុខប្បព្យ័ ធប្គប់ប្គខស្ខ្សេងាែ ក្់អាត្់អាខ់សប្កាយប្បមូលអល (ការប្បមូលក្េិអល មិ ទា ់ស្ក្នចន ការរក្ាទុក្ ការអដល់េិរញ្ាបបទា ភេដុភារ ការ ឹក្ជញ្ផូ ិខព្យ័ត្៌ម្ល )។
អែសី្ លម្ល ប្បេទិធភាព្យក្ ាខមក្ ខឹម ិប្គបប់្ោ ់ េប្ម្លបអ់នាគត្ស ើយ
ោមួយ ខឹត្នមាសេបៀខអាហារម្ល ការថយចេុះ សេើយនអា ីដ្ឋ ំេុះស្លខសក្ើ ស ើខ វេិ័យក្េកិ្មមសៅក្មពោុ ក្ពំ្យខុ បាត្ប់ខ ់ក្តាដ ជប្មញុក្ំសណើ ធ្ំៗ របេខ់្ា ួច ំ ួព្យរី។ សលើេព្យីស េះ ក្ម្លា ខំព្យលក្មមក្នុខវិេ័យក្េិក្មមកា ់ស្ត្ខ្សត្់សៅៗ ិខម្ល ត្នមាកា ់ស្ត្ខ្ពេ ់
ស្ លនាឱំ្យចំដយនថាស ើមអលិត្ក្មមកា ់ស្ត្សក្ើ ស ើខ។ ត្នមាក្េិអលោេក្ល ប្ត្ូវបា សគព្យាក្រថា ឹខ ប ដថយចុេះសៅក្នុខទេវត្សរ៍ខាខមុខ្ស េះ សេើយការលក្់អខករធ្មមតាស្ លម្ល ត្នមាទាប សៅក្នុខទីអារក្នុខប្បសទេ ិខអ ដរោត្ិ ឹខទទួលបា ចំសណញត្ិចោខមុ ។ ការព្យឹខអាប្េ័យសលើត្ប្មូវការក្នុខប្េុក្ស្ លសក្ើ ស ើខ សដ្ឋយសារស្ត្ក្ំសណើ ន អេេ ិខក្ំសណើ ត្ប្មូវការន ការនាចំូល សដ្ឋយមិ ម្ល ការសប្បើប្បាេ់ធ្ ធា ឱ្យកា ់ស្ត្ម្ល ប្បេិទធភាព្យសទសនាេះ ឹខមិ ប្គប់ប្ោ ់ ស ើមបីរក្ាក្ំសណើ ខ្ពេ់ ូចសព្យលក្ ាខស ើយ។ ប្បសទេក្មពុោចបំាច់ប្ត្ូវស្ត្ស្េែខរក្ ក្ម្លា ខំចលក្រក្ំសណើ សអសខសទៀត្ ស ើមបី ជួយរក្ាក្ំសណើ ក្នុខវិេ័យក្េិក្មមឱ្យបា សេមើ ឬសក្ៀក្ ឹខ៥ភាគរយ ិខសធ្ែើឱ្យក្ំសណើ ស េះម្ល ិរ ដរភាព្យបស្ ថមសទៀត្។
ការថមថយ ូវក្សំណើ ក្នខុវិេយ័ក្េកិ្មមរបេក់្មពោុកាលព្យសីព្យលថមីៗ ស េះ អាចោេញ្ហា បងាា ញព្យកីារថយចេុះ ស្ ល អាចសក្ើត្ស ើខក្នខុរយៈសព្យលស្វខ។ ខ្ណៈសព្យលស្ លត្នមាសេបៀខអាហារម្ល ការថយចុេះោប ដបនាា ប់ សេើយទីអារអខករ េក្សលាក្ កា ់ស្ត្ម្ល ការប្បក្ួត្ប្បស្ជខោមួយ ឹខការចូលមក្ក្នុខទីអារសារោថមីរបេ់ប្បសទេនថ ិខមីយា៉ា ់ម្ល៉ា អលិត្ក្មម ប្េូវសៅក្នុខប្បសទេក្មពុោសៅប្ទឹខ។ ោមួយោន ស េះ ត្នមាបស្ ថមេរុបរបេ់ ំដមំ្ល ការថយចុេះព្យី ៤,៩ភាគរយ សៅក្នុខឆ្ន ំ ២០១២ មក្០,៦ភាគរយ
សៅក្នុខឆ្ន ២ំ០១៣។ ក្ំសណើ ន ត្នមាបស្ ថមរបេ់វិេ័យក្េិក្មមបា ថយមក្សៅ ១,៦ភាគរយ សៅក្នុខឆ្ន ំ២០១៣ សប្កាយសព្យលស្ លម្ល ក្ំសណើ ោមធ្យម ៥,៣ ភាគរយ ចសនាា េះព្យីឆ្ន ំ២០០៤ ល់ ២០១២។
ការវិលប្ត្លបស់ៅរក្អប្តាក្សំណើ ក្េកិ្មមក្ប្មតិ្ខ្ពេ ់ម្ល សារៈេខំា យ់ា៉ា ខខាា ខំ។ វិេ័យក្េិក្មម សៅស្ត្រក្ា ចំស្ណក្មួយ ៏ធ្ំន អេេ ោណិជផក្មម ិខក្ម្លា ខំព្យលក្មម ស្ លម្ល ័យថា វិេ័យស េះសៅស្ត្ម្ល សារៈេំខា ់ចំសោេះ ការកាត្់ប ថយភាព្យប្ក្ីប្ក្ ិខភាព្យងាយរខសប្ោេះ ក្នុខទេវត្សរ៍ខាខមុខ្ស េះ។ ប្បេិ សបើបស្ប្មបប្មួលក្នុខប្បសទេក្មពុោ សៅស្ត្ប ដម្ល សទៀត្ ោមួយ ឹខក្ំសណើ ោមធ្យមក្នុខវិេ័យក្េិក្មម៥ភាគរយ ប្ត្ឹមឆ្ន ២ំ០៣០ ប្បសទេក្មពុោ ឹខម្ល វិេ័យក្េិក្មម ស្ លម្ល ទំេំត្ូចោខស េះ ប៉ាុស្ ដម្ល អលិត្ភាព្យខ្ពេ់ោខមុ ។ ចំស្ណក្ន វិេ័យក្េិក្មម សៅក្នុខ អេេ ិខ ក្ម្លា ខំព្យលក្មមេរុប ប្ត្ូវបា ព្យាក្រថាថយចុេះមក្សៅប្ត្ឹម ១៧ភាគរយ ិខ ៣១ភាគរយ សៅក្នុខឆ្ន ំ២០៣០ ព្យី ២៦ភាគរយ ិខ ៥១ភាគរយ សៅក្នុខឆ្ន ២ំ០១២ ខ្ណៈសព្យលស្ លអលិត្ភាព្យ ីធ្ាី ឹខម្ល ការសក្ើ ស ើខព្យី ១៣០០ ុលាា រ/េិចតា ល់ ២៧០០ ុលាា រ/េិចតា សេើយអលិត្ភាព្យព្យលក្មម ឹខម្ល ការសក្ើ ស ើខព្យី ១២០ ុលាា រ/នាក្់ ល់ ៣៧០០ ុលាា រ/នាក្់ (តារាខ ទី ១)។
អាយុសៅវញិ ការខាត្បខ់សដ្ឋយសារស្ត្ក្ំសណើ ក្េកិ្មមម្ល សលបឿ យតឺ្ ខឹម្ល ទេំធំ្ំសធ្ខ។ ប្បេិ សបើ ក្ំសណើ ោមធ្យមន វិេ័យក្េិក្មមម្ល ប្ត្ឹមស្ត្ ៣ភាគរយ ចសនាា េះព្យីឆ្ន ២ំ០១២ ល់២០៣០ សនាេះត្នមាបស្ ថម ន វិេ័យក្េិក្មម ឹខម្ល ការថយចុេះោខមុ ២៩ភាគរយ សៅឆ្ន ២ំ០៣០ សបើសធ្ៀបោមួយ ឹខសេដរីយ៉ាូ ក្ំសណើ ៥ភាគរយ ស្ លសធ្ែើឱ្យ អេេ ោរួមថយចុេះប្ត្ឹម១៨ភាគរយ សេើយទ ាឹមោន សៅស្ត្រក្ាប្បោោជ សប្ចើ នាក្់សៅក្នុខវិេ័យក្េិក្មម អលិត្ភាព្យព្យលក្មម ក្នុខវិេ័យក្េិក្មមថយចុេះ៣៤ភាគរយ ិខសធ្ែើឱ្យការខ្ិត្មក្ជិត្ោន ន ចំណូលរវាខក្េិក្រ ិខអនក្មិ ប្បក្បរបរក្េិក្មម កា ់ស្ត្ម្ល ភាព្យយឺត្យា៉ា វ។ ក្ំសណើ ក្នុខវិេ័យក្េិក្មមទាបោខមុ ឹខនាឱំ្យការកាត្់ប ថយភាព្យប្ក្ីប្ក្ម្ល សលបឿ យឺត្ខាា ខំ។
តារាខទី ១ ៖ អលប៉ាេះោលន់ ក្ំសណើ ក្េកិ្មមទាបមក្សលើេចូនាក្រវិេយ័ក្េកិ្មមមយួច ំ ួ ប្បសទេក្មពុោ េចូនាក្រ ២០១២ ២០៣០
៣% ន ក្សំណើ អេេ ក្នខុវេិ័យក្េកិ្មម ៥% ន ក្សំណើ អេេ ក្នខុវេិយ័ក្េកិ្មម េម្លេភាគន ក្េិក្មមសៅក្នុខ អេេ គិត្ោ % ២៦ ១៥ ១៧
េម្លេភាគន ក្េិក្មមសៅក្នុខក្ម្លា ំខព្យលក្មម គិត្ោ % ៥១ ៣៤ ៣១
អលិត្ភាព្យក្ម្លា ំខព្យលក្មមក្នុខវិេ័យក្េិក្មម គិត្ោ ុលាា រ/នាក់្ ១២០០ ២៤៥០ ៣៧០០
អលិត្ភាព្យ ីក្េិក្មម គិត្ោ ុលាា រ/េិចតា ១៣០០ ១៩០០ ២៧០០ អលសធ្ៀបន អលិត្ភាព្យក្ម្លា ំខព្យលក្មមរវាខ អនក្សធ្ែើការងារ ក្នុខ វិេ័យក្េិក្មម ោមួយ ឹខអនក្សធ្ែើការងារក្នុខវិេ័យសអសខសទៀត្ ២,១ ២,១ ១,៦
7 ការស្ប្បប្បួលរបាយ ីក្េិក្មមស េះ សក្ើត្ស ើខសដ្ឋយមិ ោក់្ព័្យ ធោមួយ ឹខេមបទា ីសេ ាកិ្ចចស ើយ។
8 ការអសខកត្សលើក្េិដ្ឋា ប្តូ្វបា សធ្ែើស ើខ សៅក្នុខឆ្ន ំ ២០១៣ េប្ម្លប់របាយការណ៍ស េះ។ េូមសមើលឧបេមព័ ធទី ២ េប្ម្លប់ព័្យត៌្ម្ល លំអិត្។

xxi
ចក្េវុិេយ័រយៈសព្យលស្វខេប្ម្លបវ់ិេយ័ក្េកិ្មមសៅក្មពោុ ចំបាចប់្ត្វូសកាដ បសលើេម្លេធាត្ុន ិរ ដរភាព្យ ទ ិនអល ភាព្យប្បក្តួ្ប្បស្ជខ ខិក្សំណើ ប្បាក្ច់ណូំល សដ្ឋយេរំាលព្យកីារសផ្ទដ ត្ខាា ខំសព្យក្ស្ត្សលើអលតិ្ក្មម។ ការគណនាបា៉ា ់សាម តាម សេដរីយ៉ាូសអសខៗ េប្ម្លប់ការអភិវឌ្ឍវិេ័យក្េិក្មមនាសព្យលអនាគត្ បងាា ញថាការសក្ើ ស ើខ ូវអលិត្ភាព្យក្េិក្មម នាសព្យល អនាគត្ ឹខម្ល អលោវិជផម្ល ខាា ខំមក្សលើចំណូលរបេ់ក្េិក្រ ោព្យិសេេ ប្បេិ សបើម្ល ការផ្ទា េ់បដូរព្យីការដ្ឋ ំុេះតាមស្បប ប្បនព្យណី សៅោការសប្បើប្បាេ់បសចចក្វិទាទំស ើប សដ្ឋយអមោមួយ ឹខការសក្ើ ស ើខ ូវប្បព្យ័ ធធារាសាស្ដេដ ិខការសប្បើប្បាេ់ េំភារៈក្េិក្មមថមីៗស្ លម្ល ប្បេិទធភាព្យខ្បេ់។ ក្េិក្រស្ លដ្ឋំប្េូវប្ក្អូប ស្ក្នចន ំ ូខមីោចំណិត្ ំ ូខមីសប្ក្ៀម ិខសធ្ែើ ការបស្ ថមត្នមាសអសខសទៀត្សលើក្េិអល ឹខអាចទទួលបា ចំណូលខ្ពេ់ោខមុ ិខបងាា ញចាេព់្យីសារៈេំខា ់ន ការស្ក្នចន ក្េិអល។ ការកាត្់ប ថយចំដយអលិត្ក្មម តាមរយៈការសប្បើប្បាេ់ឱ្យបា ប្បសេើរោខមុ ូវធ្ ធា ស្ លម្ល ប្សាប់ (តាមរយៈការបសខកើ ទិ នអល) ិខការកាត្់ប ថយការធាា ក្់ចុេះត្នមាក្េិអល តាមរយៈការកាត្់ប ថយត្នមា ឹក្ជញ្ជូ គឺោគ ាឹេះ េប្ម្លប់រក្ាភាព្យប្បក្ួត្ប្បស្ជខន ក្េអិលនានា។ ការប ដព្យប្ខីក្នអា ី ក្៏អដល់ ូវចំណូលបស្ ថមអខស្ រ ប៉ាុស្ ដភាព្យក្ំណត្់ន ធ្ ធា ី ឹខកាត្់ប ថយការព្យប្ខីក្ ីក្នុខប្ទខ់ប្ទាយធ្ំនាសព្យលអនាគត្។ បញ្ហា ប្បឈមស េះ សធ្ែើឱ្យការបសខកើ ទិ នអលក្េិក្មម ោណិជផូប ីយក្មម ិខការសធ្ែើព្យិព្យិធ្ក្មម រឹត្ស្ត្ម្ល សារៈេំខា ់ខាា ខំស ើខ ក្នុខការធានាឱ្យម្ល ក្ំសណើ ក្េិក្មម កាត្់ប ថយភាព្យ ប្ក្ីប្ក្ ិខសលើក្ក្មពេ់វិបុលភាព្យរួម សៅក្នុខប្បសទេក្មពុោ នាសព្យលអនាគត្។
អនុសាសន៍ ការប ដក្សំណើ ក្េកិ្មមយា៉ា ខសលឿ ខិការផ្ទា េប់ដូររចនាេមព ័ធន វេិ័យក្េកិ្មមបស្ ថមសទៀត្ គអឺាចសធ្ែើសៅបា េរំាបប់្បសទេក្មពោុ។ េំណុំសោល សយាបាយរួមោន ចំ ួ ៤ អាចជួយអដល់ការោបំ្ទ ល់ការប ដក្ំសណើ ក្េិក្មមស្បបស េះ
សៅក្នុខរយៈសព្យល៥ឆ្ន ខំាខមុខ្ (រយៈសព្យលខ្ាី ិខមធ្យម)។ ទី១ គឺប្ត្ូវរក្ាបរិយាកាេសោល សយាបាយក្េិក្មម ស្ លបខកភាព្យ ងាយប្េួល ល់វិេ័យឯក្ជ សដ្ឋយសផ្ទដ ត្ការយក្ចិត្ដទុក្ដ្ឋក្់បស្ ថមសលើការកាត្់ប ថយប ាុក្ស្អនក្ ិត្ិក្មម សៅក្នុខវិេ័យ េំភារៈក្េិក្មម។ ទី២
គឺការព្យប្ខឹខ ិរ ដរភាព្យបរិសាថ េប្ម្លប់អលិត្ក្មមក្េិក្មម។ ទី៣ គឺការបសខកើ គុណភាព្យ ក្មមវិធ្ី អសព្យែអាយក្េិក្មមសាធារណៈ ិខវិភាជ ៍ថវិកាបស្ ថម ល់ក្មមវិធ្ីទាខំឡាយស្ លម្ល ប្បេិទធភាព្យខ្ពេ់ សៅតាមលទធភាព្យ ន ថវិកាេរុបរបេ់រដ្ឋា ភិបាលក្មពុោ។ ទី៤ គឺការជួយអភិវឌ្ឍវិេ័យក្េិោណិជផក្មម ិខឧេាេក្មមស្ក្នចនក្េអិល។
ការបសខកើ ទ ុវ ិសិយាគ ខិស្ក្លអំសោល សយាបាយ ចំបាចប់្ត្វូសធ្ែើោបនាា ់ ប៉ាសុ្ ដ ខឹម ិបា ស ើញលទធអល ភាា មៗស ើយ។ េប្ម្លប់ការស្ក្លំអមួយចំ ួ ចបំាច់ប្ត្ូវម្ល ការចំដយសព្យល ិខក្ិចចប្បឹខស្ប្បខបស្ ថមសទៀត្ ស ើមបីឱ្យស ើញ
អលោក្់ស្េដខសៅ ឹខមូលដ្ឋា ។ តារាខទី២ េសខេបព្យីអ ុសាេ ៍សោល សយាបាយេំខា ់ៗ ស្ លចបំាច់ប្ត្ូវអ ុវត្ដភាា មៗ ស ើមបីបា ទទួលលទធអលក្នុខរយៈសព្យលខ្ាីសៅមធ្យម សេើយស្ ល ឹខជួយទប់ ិនាន ការថយចុេះ ន ក្ំសណើ វិេ័យក្េិក្មម បចចុបប នស េះ ប្ព្យមទាខំជួយសប្បើប្បាេ់េកាដ ុព្យលន វិេ័យក្េិក្មមរបេ់ប្បសទេក្មពុោឱ្យបា សព្យញសលញ។
តារាខទ២ី៖ េសខេបអ សុាេ ៍េខំា ់ៗ ន របាយការណ ៍សដ្ឋយស្អែក្សៅតាមសព្យលសវលា ស ើមបីេសប្មចលទធអល
អ ុសាេ ស៍ោល សយាបាយ លទធអលស្ ល េសប្មចបា
ក្នខុរយៈសព្យល ខ្ា ីលទធអលស្ ល េសប្មចបា ក្នខុរយៈសព្យលព្យី
មធ្យម សៅស្វខ រក្ា វូបរយិាកាេសោល សយាបាយក្េកិ្មម ស្ លបខកភាព្យងាយប្េលួ លវ់េិយ័ឯក្ជ ប ដសោល សយាបាយោណិជផក្មមសបើក្ចំេរ ិខសោល សយាបាយក្េិក្មមស្ លមិ នំាឱ្យខូ្ចប្ទខ់ប្ទាយរបេ់វិេ័យ X កាត់្ប ថយចំដយសលើស្បបបទការនំាចូលជីក្េិក្មម X សបើក្ចំេរវិេ័យប្ោប់ពូ្យជ េប្ម្លប់ការវិ ិសយាគពី្យវិេ័យឯក្ជ តាមរយៈការសធ្ែើ ប ិបបញ្ាត្ដិក្មម ិខការព្យប្ខឹខសាថ ប័ X ព្យប្ខឹខ រិ ដរភាព្យបរសិាថ ស្ក្លំអការសរៀបចំស្អ ការសប្បើប្បាេ់ ីធ្ាី បសខកើ ប្បេិទធភាព្យការុេះ ុវត្តចាប់ ីធ្ាី ិខបទដ្ឋា គតិ្យុត្ដិោក់្ព័្យ ធនានា X ព្យប្ខឹខេិទធិកា ់កាប់ ីធ្ាី X សលើក្ក្មពេ់ការប្គប់ប្គខ ីធ្ាីប្បក្បសដ្ឋយ ិរ ដរភាព្យ X សលើក្ក្មពេ់ការសប្បើប្បាេ់ជី ិខថាន ំគីមីក្េិក្មមប្បក្បសដ្ឋយេុវត្ថិភាព្យ X ស្ក្លអំក្មមវធិ្វីិ សិយាគសលើ “ប្ទព្យយសាធារណៈ” ន វេិយ័ក្េកិ្មម
បសខកើ ថវិកាេប្ម្លប់ប្ទព្យយសាធារណៈក្េិក្មមេំខា ់ៗ សៅតាមលទធភាព្យថវិកា របេ់រដ្ឋា ភិបាល ោពិ្យសេេ សលើប្បព័្យ ធធារាសាស្ដេដ ការេិក្ាប្សាវប្ោវ ការអសព្យែអាយ ការប្គប់ប្គខជីោតិ្ ី ការប្តួ្ត្ពិ្យ ិត្យគុណភាព្យេំភារៈក្េិក្មម េុវត្ថិភាព្យចំណីអាហារ ការបណដុ េះបដដ លវិោផ ជីវៈ ិខអាូវជ បទ។
X
េប្ម្លប់វិេ័យធារាសាស្ដេដ សផ្ទដ ត្ការយក្ចិត្ដទុក្ដ្ឋក់្ឱ្យបា កា ់ស្ត្សប្ចើ ោខមុ សលើការស្ក្លំអ ិខការសាដ រប្បព័្យ ធស្ លម្ល ប្សាប់ ិខការប្គប់ប្គខសេដ្ឋា រចនាេមព័ ធធារាសាស្ដេដ សដ្ឋយម្ល ការចូលរួម។ X បសខកើ គុណភាព្យន ក្មមវិធី្ក្េិក្មមសាធារណៈ X េប្មបេប្មួលការសធ្ែើេម្លេរណក្មមក្េិដ្ឋា តូ្ចៗ ចូលសៅក្នុខស្ខ្សេងាែ ក់្តំ្នលន សេបៀខ X ជយួអភវិឌ្ឍក្េោិណជិផក្មម ិខឧេាេក្មមស្ក្នចនក្េអិល បសខកើ លទធភាព្យទទួលបា អគាិេ ីសប្បើប្បាេ់ ិខកាត់្ប ថយចំដយសលើការសប្បើប្បាេ់អគាិេ ី X វិ ិសយាគសលើសេដ្ឋា រចនាេមព័ ធសាធារណៈ ស្ លោក់្ព័្យ ធោមួយ ឹខេុវត្ថិភាព្យចំណីអាហារ X សធ្ែើឱ្យកា ់ស្ត្ប្បសេើរ ូវសេវា ឹក្ជញ្ជូ ន ជំ ួញប្េូវអខករ រួមទំាខកាត់្ប ថយចំដយ X លុបសចលរបំាខនានា ស ើមបីដ្ឋក់្ឱ្យសប្បើប្បាេ់ ូវប្បព័្យ ធទទួលយក្ទំ ិញក្នុខឃ្ា ំខោវត្ថបុញ្ហច ំ (warehouse receipts) X

1
1. INTRODUCTION
1. Cambodian agriculture is in the midst of a rapid transformation. Its annual production
growth during 2002-2012 averaged 9.6 percent, far exceeding agricultural production growth in
Asia and around the world. This high agricultural growth has greatly contributed to poverty
reduction, exports, agribusiness development, and farm commercialization in the last decade.
While the Royal Government of Cambodia (RGC)’s agricultural policy focus has mainly been on
rice production and exports, it is increasingly recognized that the current rice-based traditional
agriculture would need to transform into modern, diversified agriculture to generate the returns
necessary to keep farming an attractive source of income and a contributor to economic
development. Cambodian agriculture is still a long way from being an economic activity
indistinguishable from other sectors, at least in terms of productivity of labor and capital or in the
location of poverty, which would be the final outcome of a structural transformation. The
agricultural growth has recently slowed down to about 1 percent, from 5.3 percent during 2004-
2012. Still, the last decade has seen significant positive changes.
2. How can Cambodia build on this positive development? While there is a wealth of
literature on smallholder farming systems in Cambodia and sectoral information from the national
accounts, the existing analytical work lacks a systematic analysis of changes in farming systems.
Combined with the lack of information on related changes in farm versus nonfarm incomes, this
has limited Cambodia’s ability to have an informed agricultural policymaking process and has
hampered efforts to compare and contrast the impacts and effectiveness of alternative policies and
programs for long-term agricultural development.
3. Further, little empirical knowledge has been generated about past and future sources
of agricultural growth and the government’s role in facilitating growth. Why did agriculture
grow so rapidly and will this growth last? What made that growth pro-poor and how can Cambodia
keep its strong pro-poor impact? How would farming systems need to look to ensure continuation
of the 5 percent growth in agricultural value added? What forces will shape an enabling
environment for agriculture in the future and how different will they be from those that drove
development in the past? And how can the government facilitate future growth, helping farmers
overcome challenges and capitalize on opportunities?
4. This report addresses this knowledge gap. It was requested by the Supreme National
Economic Council (SNEC) and the Ministry of Agriculture Forestry and Fisheries (MAFF). The
report uses primary data on farming systems collected in 2013, and compares them to comparable
data from 2005. It also uses evidence from interviews with villages and experts, discussions with
government staff, and analytical work carried out by the World Bank Group and other development
partners in the recent decade, including the analytical work resulting from the five-year
collaboration between the World Bank and Australian Aid under the Cambodia Food Crisis
Capacity Support Partnership Trust Fund (Annex 1).
5. The report covers the main crops with the largest changes in the past decade and
focuses on smallholders, including small farms (up to 1 hectare), medium farms (from 1 to 3
hectares), and large farms (above 3 hectares). It does not cover the livestock and fisheries sector,
nor does it cover in detail economic land concessions.
6. The remaining report is organized as follows. Chapter 2 presents key facts about
Cambodia’s recent agricultural development using data from national accounts and various

2
reports. Chapter 3 provides evidence from the field that explains the changes observed in the
national accounts. Chapter 4 illustrates developments in farming systems, farm budgets, and farm
incomes compared to nonfarm incomes. Chapter 5 presents a farm competitiveness analysis.
Chapter 6 discusses the sources of past growth and their limitations and presents an analysis of
(likely) future sources of agricultural growth. Chapter 7 presents a long-term vision for the sector,
while Chapter 8 simulates policies and the changes in farm incomes needed to realize this vision.
Chapter 9 discusses the policy agenda, with implementation details based on national and global
experiences. Chapter 10 concludes with a summary of the report and policy recommendations.
Annexes present the methodology of the 2013 farm survey, detailed farm budgets by crop,
projections of selected indicators, and results of the policy simulations.

3
2. A DECADE OF AGRICULTURAL TRANSFORMATION IN CAMBODIA
7. The story of agriculture in Cambodia over the past decade is one of rapid growth and
of the profound transformation of a rural society. The sector has been growing in absolute
terms but its relative share in the economy is on the decline, giving room to manufacturing and
services. Agricultural exports have increased. Agricultural labor has been migrating to other
sectors and outside of the country and is becoming increasingly scarce. Farmers use more inputs
and more modern machinery to substitute for scarcer labor and respond to market incentives.
8. Agricultural policy has in general been conducive for non-distortive growth, i.e., there
are no output and input subsidies and no significant market distortions. However, in addition
to the high costs of doing business in the country overall, regulatory weaknesses exist, especially
in the seed industry, which deters private investments. The weak land tenure security and poor
land administration and governance deter private investments further and lead to unsustainable
land use and farmland expansion. Yet, in spite of these issues, the rural poverty declined in the
past decade and agricultural growth played the key role in that poverty reduction.
9. The structural transformation is still occurring, and Cambodian agriculture is in the
midst of rapidly transitioning from a traditional subsistence to a modern commercial sector.
This Chapter summarizes the key facts of this transformation using information from MAFF, the
Cambodian National Institute of Statistics (NIS), the World Development Indicators (WDI), World
Bank reports, the Corporate Statistical Database of the UN’s Food and Agriculture Organization
(FAOSTAT), and other sources.
2.1. Agricultural Growth
10. Cambodian agriculture’s growth over the past decade is impressive. Real agricultural
GDP grew by 5.1 percent annually between 2002 and 2012 (Figure 1). The average annual growth
was 5.3 percent during 2004-2012, the period mostly analyzed in this report. Agricultural value
added per worker grew from $700 in 2004 to $1,210 in 2012 (Table 13). The ratio of value added
per worker in nonagriculture to agriculture fell from 3.2 in 2004 to 2.1 in 2012, implying a
narrowing income gap between agriculture and the rest of the economy.
Figure 1: Agricultural GDP growth (constant prices), Cambodia, 2002-2012
Source: World Bank 2014c.
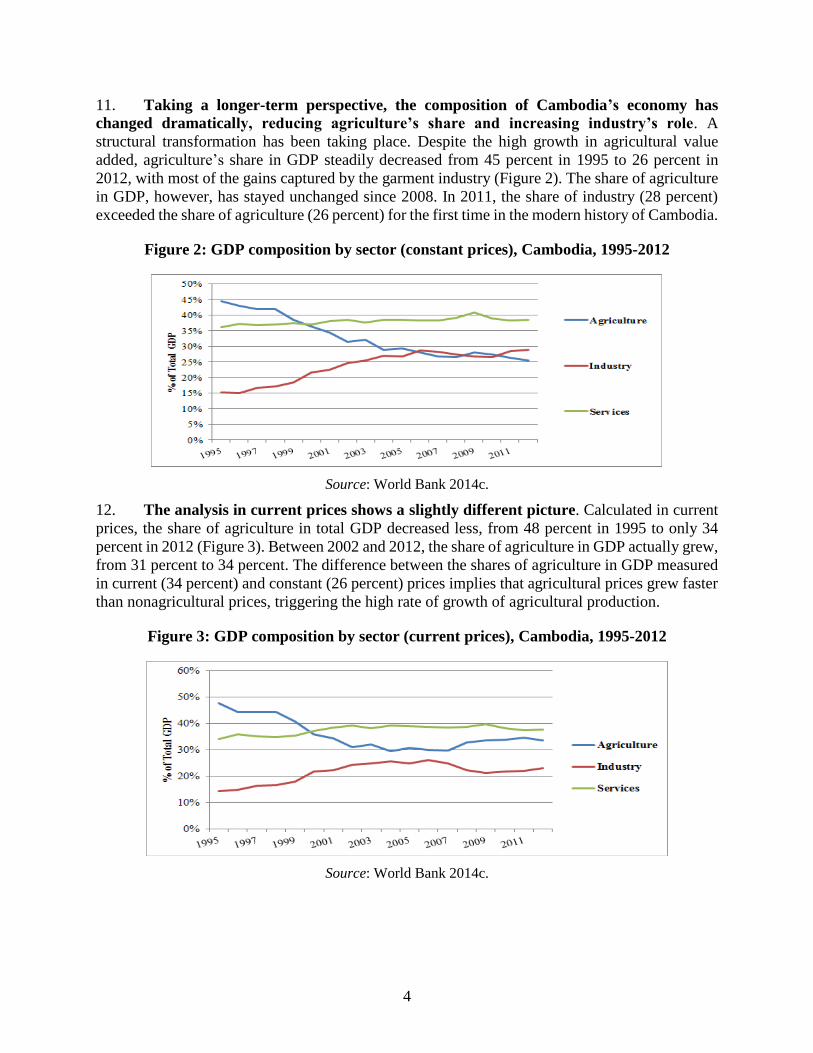
4
11. Taking a longer-term perspective, the composition of Cambodia’s economy has
changed dramatically, reducing agriculture’s share and increasing industry’s role. A
structural transformation has been taking place. Despite the high growth in agricultural value
added, agriculture’s share in GDP steadily decreased from 45 percent in 1995 to 26 percent in
2012, with most of the gains captured by the garment industry (Figure 2). The share of agriculture
in GDP, however, has stayed unchanged since 2008. In 2011, the share of industry (28 percent)
exceeded the share of agriculture (26 percent) for the first time in the modern history of Cambodia.
Figure 2: GDP composition by sector (constant prices), Cambodia, 1995-2012
Source: World Bank 2014c.
12. The analysis in current prices shows a slightly different picture. Calculated in current
prices, the share of agriculture in total GDP decreased less, from 48 percent in 1995 to only 34
percent in 2012 (Figure 3). Between 2002 and 2012, the share of agriculture in GDP actually grew,
from 31 percent to 34 percent. The difference between the shares of agriculture in GDP measured
in current (34 percent) and constant (26 percent) prices implies that agricultural prices grew faster
than nonagricultural prices, triggering the high rate of growth of agricultural production.
Figure 3: GDP composition by sector (current prices), Cambodia, 1995-2012
Source: World Bank 2014c.

5
13. This high growth in agricultural production is shown in Table 3. During 2002-2012,
the rate of gross agricultural production growth in Cambodia was 10 percent per year, one of the
highest in the world. Gross per capita agricultural production growth was 8 percent, also among
the highest.
Table 3: Gross agricultural production, annual growth, selected countries, 2002-2012
Country/Region Average Annual Growth (%)
Bangladesh 2.0
Thailand 2.6
China 3.5
Vietnam 4.1
India 4.3
Indonesia 4.4
Lao PDR 5.3
Cambodia 9.6
Asia 3.4
European Union -0.3
World 2.5
Source: FAOSTAT 2014.
14. Cambodia’s agricultural growth was driven by crops, which are dominated by paddy
rice. The average growth of crops’ value added was 7.8 percent (Figure 4). Livestock’s value
added increased by 3.6 percent per year. The average growth in the fisheries and forestry
subsectors was 3.7 percent and 0.7 percent, respectively.
Figure 4: Growth of agricultural subsectors (constant prices), Cambodia, 2002-2012
Source: NIS 2014.
15. Crops remain the major agricultural subsector. Due to their high rate of growth, the
share of crops in agricultural value added increased from 43 percent in 2002 to 54 percent in 2012
(Figure 5). Cereals, especially paddy rice, accounted for the majority of the crop production value,

6
but the production of non-cereals grew faster than paddy in the last decade (Table 4). The
importance of livestock production in agricultural value added declined from 17 percent in 2002
to 14 percent in 2012. Because of its dominance in agricultural value added, this report focuses on
crop production.
Figure 5: Share of subsectors in agricultural GDP, Cambodia, 2002-2012
Source: NIS 2014.
16. Over the past 10 years, rice production more than doubled through a combination of
land expansion and yield increase. In 2002, paddy production was 3.8 million tons (Table 4). In
2012, it reached 9.3 million tons. The annual growth rate was 9.3 percent. The wet season accounts
for 75 percent of total paddy production. As just 8 percent of Cambodia’s arable land is estimated
to be irrigated during the dry season (the lowest rate in Asia; see Table 5), the country’s agriculture
is still largely dependent on rainfall and quite vulnerable to climatic events.9
9 The share of dry season output, however, has been steadily growing, driven by irrigation investments. In 2008, the
planting area for the dry season crop accounted for 13 percent of total planting rice area. In 2013, it increased to 17
percent.

7
Table 4: Production, area, yields, and growth of major crops, Cambodia, 2002-2012
2002 2012 Annual Average Growth Rate (%)
Crop
Production
(ton)
Cultivated
Area (ha)
Yield
(ton/ha)
Production
(ton)
Cultivated
Area (ha)
Yield
(ton/ha)
Production
(ton)
Cultivated
Area (ha)
Yield
(ton/ha)
Rice 3,822,509 1,994,645 1.916 9,290,940 2,980,297 3.117 9.3% 4.1% 5.0%
Maize 148,897 80,470 1.850 950,909 215,442 4.414 20.4% 10.3% 9.1%
Cassava 122,014 19,563 6.237 7,613,697 337,800 22.539 51.2% 33.0% 13.7%
Vegetables 163,175 34,433 4.739 411,435 54,155 7.597 9.7% 4.6% 4.8%
Soybean 38,661 33,438 1.156 120,165 70,972 1.693 12.0% 7.8% 3.9%
Sugarcane 173,105 9,581 18.068 1,220,255 36,722 33.230 21.6% 14.4% 6.3%
Source: MAFF 2014b.
Table 5: Irrigated areas, selected countries
Country Actually Irrigated Areas
(ha)
2011-2012
Arable Land
(ha)
2011
Share of Irrigated Areas
in Arable Land (%)
Cambodia 317,225 4,000,000 7.9
China 54,218,976 111,598,500 48.6
Indonesia* 6,722,299 23,500,000 28.6
Malaysia* 340,717 1,800,000 18.9
Myanmar* 2,083,000 10,786,000 19.3
Philippines* 1,879,084 5,400,000 34.8
South Korea 880,400 1,492,000 59.0
Thailand 5,059,914 15,760,000 32.1
Vietnam* 4,585,500 6,500,000 70.5
Note: *Equipped full control irrigation areas as data on actually irrigated areas are not available.
Source: World Bank 2014g for data on arable land and World Bank 2014c for data on irrigated areas.
17. Growth in the crops subsector was not limited to rice. Production of several other
important crops increased even more than that of rice (Table 4). The most spectacular cases are
cassava, sugarcane, and maize, which have all grown more than 20 percent per year. This growth
is the result of both area and yield increases. Current yields are still low but their annual growth
over the last 10 years was steady, varying between 3.9 percent for soybeans to 13.7 percent for
cassava.
18. The rubber subsector has also witnessed remarkable growth. Planted areas increased
by 16 percent annually (Table 6) and when these areas go into production, rubber output will likely
triple over the next 10 years.

8
Table 6: Production, area, yield, and export of rubber, Cambodia, 2002-2011
Year
Total
Planted
Area (ha)
Immature
(ha)
Mature
(ha)
Production
(tons)
Yield
(kg/ha)
Export
(tons)
2002 55,582 18,809 36,773 32,384 880 36,774
2003 53,527 19,831 33,696 32,382 960 32,764
2004 54,209 22,619 31,590 33,770 1,060 33,558
2005 60,406 30,004 30,402 29,464 960 29,950
2006 69,994 37,604 32,390 32,077 990 31,184
2007 82,059 51,568 30,491 32,975 1,080 33,121
2008 108,510 74,197 34,313 37,050 1,080 36,000
2009 129,920 95,785 34,135 37,380 1,095 36,500
2010 181,433 143,027 38,406 42,466 1,100 45,000
2011 213,104 167,942 45,162 51,339 1,137 44,969
Annual growth (%) 16% 28% 2% 5% 3% 2%
Source: MAFF 2014b.
19. Most crop products are exported. Rice, cassava, and other cereals are the major
agricultural export items. In 2011, formal cereal exports were estimated at 180,300 tons, a five-
fold increase compared to 2006 (Table 7). The largest increase in exports was for rice. But the
informality of cross-border trade does not allow estimation of the true extent of agricultural
exports. In 2013, for example, the formal export of rice was 378,850 tons (Table 9). At the same
time, informal cross-border trade of rice is estimated to have been 1,536,000 tons, or five times
larger. Most exports of cassava, maize, and vegetables also take place via cross-border trade.
Official statistics do not properly capture this information, including imports of vegetables in
apparently large volumes.
Table 7: Evolution of formal trade of select commodities, Cambodia, 1996-2011
Quantity (‘000 tons) Annual Growth Rate (%)
Commodity 1996 2001 2006 2011 1996-2001 2001-2006 2006-2011
Cereals exports 10.4 7.1 38.0 180.3 -7.4 39.9 36.5
Rice exports 5.6 7.0 5.2 174.0 4.6 -5.8 101.8
Coarse grain exports 4.8 0.0 32.6 6.3 -100.0 n/a -28.0
Cereals imports 41.8 59.8 65.2 44.4 7.4 1.7 -7.4
Source: NIS 2014 based on FAOSTAT 2014.
2.2. Agribusiness Development
20. Despite this impressive growth of the primary agriculture, Cambodia’s agribusiness
remains weak. Agroindustry is basic and most commodities (paddy, cassava, maize, cashews,
cattle, and soy bean) are exported in raw form. A modern agroindustry is emerging for rice, but
this is a very recent phenomenon, stimulated by the RGC’s “Promotion of Paddy Production and
Rice Export” policy in 2010 and favorable world rice price trends.

9
21. Agribusiness covers several industries. It includes food, beverages, tobacco, and rubber
plants. Transport and trade sectors also generate some income from moving/trading agricultural
products, estimated at 50 percent and 30 percent of the sectoral value added respectively.10 When
added, the agribusiness accounted for 10 percent of GDP and 31 percent of agricultural GDP in
2002 (Table 8). In 2012, these shares were 9 percent and 27 percent.11
Table 8: Agribusiness industry in Cambodia, 2002-2012
2002 2012
Agribusiness GDP (billion Riels, current prices) 5,224 19,000
Share of agribusiness in agricultural GDP (%) 30.8 27.4
Share of agribusiness in total GDP (%) 9.6 9.2
Source: World Bank 2014c.
22. The agribusiness sector consists mostly of small traders and informal agro-
enterprises (Figure 6). Even though a modern sector is emerging (e.g., processors, input suppliers,
and machinery suppliers), less than half of the agroenterprises have some degree of formality (e.g.,
registration and accounting systems).
Figure 6: Contribution to turnover of different types of agribusinesses, Cambodia, 2011
Source: World Bank and AusAid 2013.
23. The recent expansion of the rice milling industry has been exemplary. In 2010, the
RGC issued a policy on “Promotion of Paddy Production and Rice Export,” aiming to export one
million ton of milled rice by 2015. Major features of that policy are a strong commitment to open
trade,12 reduction of costs of doing business, and protection of foreign investors’ rights. As a result,
formal exports of milled rice increased from 12,600 tons in 2009 to over 205,000 tons in 2012,
and 378,850 tons by the end of 2013 (Table 9). The “One Window Service” (or one-stop service)
10 There are no official estimates of these shares for Cambodia. These estimates are based on the experiences of the
team producing this report. 11 These data are presented in nominal prices, which are not very different from the results in constant prices. 12 Before 2010, only 9 companies had export licenses. The 2010 Rice Policy liberalized exports, and in 2014, 86
companies were already exporting milled rice from Cambodia. Most export is still paddy, across the border to
Thailand and Vietnam, but the export of milled rice picked up significantly after the removal of the export licensing
restriction.

10
was established in November 2011 to reduce bureaucratic obstacles and export costs to process
export documents (such as sanitary and phytosanitary certificates, customs documents, and
CAMCONTROL quantity and quality certificates). This reduced the export approval period from
10 days in 2011 to 4-5 days in 2013 (World Bank 2014b). In 2013, 378,850 tons of milled rice
were exported to over 50 countries, 91 percent of which went to the EU and Asian countries. About
half of formal milled rice exports consist of high-value fragrant rice. The Federation of Cambodian
Rice Exporters was created and the industry is becoming increasingly organized.
Table 9: Rice commodity balance (‘000 tons), Cambodia, 2008-2013
2008 2009 2010 2011 2012 2013
Total rice production, in paddy 7,175 7,586 8,250 8,779 9,291 9,389
Total rice production, in milled equivalent 4,305 4,552 4,950 5,267 5,575 5,633
Domestic utilization13 2,862 2,937 3,039 3,126 3,212 3,256
Total rice surplus 1,443 1,614 1,911 2,142 2,368 2,378
Total formal export of milled rice 1.5 12.61 105.26 201.89 205.71 378.85
Estimated informal paddy export in milled
equivalent
100 200 350 1,472 1,600 1,536
Source: World Bank 2014b .
24. New actors in the milling industry have emerged since 2010. In 2009, only two rice
milling companies existed with a capacity of 20 tons per hour (tph). By mid-2012, milling capacity
had increased to 322 tph (paddy), and to over 700 tph in 2013 (World Bank 2014b). The polishing
capacity of mills also jumped, from 72 tph in 2009 to 520 tph in 2013. Additionally, three rice
polishing factories have a combined capacity of 44 tph. This increase in polishing capacity enabled
low-quality milled rice from thousands of small mills14 to be upgraded for export. Most new mills
are equipped with modern milling and drying facilities, polishing equipment with color sorters,
and large warehouses for storing paddy at harvest time (Slayton and Muniroth 2009; 2012).
25. But even this success story has its limits. Most rice is still exported in the form of paddy
to Vietnam and Thailand. In 2013, informal export volumes were estimated at 1.7 million tons of
paddy to Vietnam and 250,000 tons of paddy and 450,000 of milled rice to Thailand, compared to
only 379,000 tons of formal rice exports (Table 9). Most mills continue to have low capacity
utilization as a result of underdeveloped supply chain management, poor access to skilled labor,
food safety-related services, proper business management and working capital, and infrastructure
and logistics weaknesses. They operate on one shift per day, for a limited number of days per year.
Consequently, Cambodian mills are less profitable than Vietnamese and Thai mills, where two to
three shifts per day and almost a full year of operating days are the norm.
2.3. Agricultural Growth and Poverty Reduction
26. The impressive agricultural growth in the last decade has contributed to significant
poverty reduction in Cambodia.15 From 2007 to 2011, the overall poverty headcount fell from
13 Domestic food consumption and other utilization on estimated basis. 14 According to the Ministry of Industry, there were 28,474 rice mills in Cambodia in 2011, of which 16,326 run with less than
$3,000 capital.
15 This section is based on World Bank (2013b).

11
50.1 percent to 20.5 percent. During this period, most of the poverty reduction came from
improving rural households’ conditions. From all poverty reduction, 3.6 percent was in Phnom
Penh, 8.1 percent was in other urban areas, and the remaining 88.3 percent was in rural Cambodia
(Figure 7). Furthermore, most of the poverty reduction (80.0 percent) occurred between 2007 and
2009.
Figure 7: Poverty rate by region, Cambodia, 2004-2011
Source: World Bank 2013b.
27. The growth elasticity of poverty in Cambodia was among the largest in Asia. Measured
in the 2005 purchasing parity power (PPP) for the poverty at $1.25 a day, the growth elasticity of
poverty was 5.2, implying that for every 1 percent increase in GDP per capita, poverty fell by 5.2
percent. Among selected countries presented in Table 10, for which most recent poverty data is
available, only Thailand had the larger impact of economic growth on poverty.
Table 10: Growth elasticity of poverty, selected countries in Asia
Country Poverty rate (PPP
2005 $1.25/day)
Growth elasticity of poverty
(PPP 2005 $1.25/day)
Annualized per capita
GDP growth rate
Lao PDR 28.8 0.5 5.9
Philippines 17.8 0.8 4.2
Indonesia 9.7 2.4 4.5
Vietnam 2.9 3.5 4.6
Cambodia 7.2 5.2 3.3
Thailand 0.1 7.5 1.4
Source: World Bank 2013g.
28. The first factor explaining the reduction in rural poverty is the price of rice. There are
more net sellers of rice than net buyers in Cambodia (Ivanich and Martin 2014). The global rice
price spike in 2008 was permitted to fully pass through to local prices in Cambodia. As a result,
many households improved their income, most of them smallholders. Better prices had two direct
effects on household income. First, the value per unit of production increased. And second, total
production increased due to more planted area and increased use of inputs (Figure 8).
29. The second factor explaining the reduction in poverty is higher agricultural wages.
Because of data limitations, it was not possible to differentiate the sources of wages from different

12
agricultural activities, but there is no doubt that an important share of the wage increases was
related to rice production. For example, rice represents about 80 percent of the total planted area
in Cambodia (Table 4), and about 80 percent of rural households reported growing rice. Moreover,
rice experienced the highest price increase (39 percent) from 2007 to 2009 compared to all other
locally produced food products: beef – 25 percent, chicken –24 percent, fish and seafood – 24
percent, fresh eggs – 14 percent, fresh fruits – 27 percent, and vegetables – 22 percent. From 2004
to 2009, agricultural income from wage labor increased 49 percent.
Figure 8: Drivers of poverty reduction in Cambodia, 2004-2011
Source: World Bank 2013b.
30. Overall, the direct impact of higher rice prices and the increase in rice production
were responsible for almost half of the reduction in poverty. Agricultural wages – also closely
related to rice – contributed to 16 percent of total reduction in poverty. At the same time, improved
income from nonfarm business was responsible for one-fifth of all poverty reduction. Increases in
salaried employment in urban areas accounted for 4 percent of the decline in poverty. Finally, the
remaining 14 percent of the reduction was unexplained and occurred mainly between 2009 and
2011 (Figure 8).
31. Despite the significant reduction in poverty headcounts, the vulnerability or the risk
of sliding back into poverty remains high in Cambodia. The recent poverty reduction was
augmented substantially by the high concentration of people just below the poverty line in 2004
and people just above the poverty line in 2011. Most people who escaped poverty did so by a small
margin. It is estimated that a loss of only 1,200 Riels ($0.30) per day would cause Cambodia’s
poverty rate to double to 40 percent. Continuation of agricultural and nonagricultural growth and
their higher resilience to shocks are needed to reduce that vulnerability in the future.
32. Nutritional security has also lagged behind the progress in poverty reduction. The
prevalence of stunting of children under five in 2005 was 44 percent, according to the World Bank.
In 2010, it declined to 40 percent and in 2014 to 33 percent, according to the results of the
Cambodian Demographic and Health Survey 2014, but it remains high in regional comparison.16
Stunting remained above 40 percent in four provinces: Kampong Chhnang, Kompong Speu, Preah
Vihear, and Stung Treng. Stunting is caused not only by lack of food intake but also poor sanitation
16 In Vietnam, the stunting of children under five was 23 percent in 2011. In Thailand, it was 16 percent in 2012.

13
and health care. Yet, irrespective of the multidimensional nature of malnutrition, agriculture can
do more to address it.
2.4. Agricultural Transformation
33. Structural transformation is a defining characteristic of the development process,
both the cause and effect of economic growth. According to Timmer and Akkus (2008), four
quite relentless and interrelated processes define structural transformation: (i) a declining share of
agriculture in GDP and employment; (ii) migration from rural to urban areas and a rapid process
of urbanization; (iii) the rise of a modern industrial and service economy; and (iv) a demographic
transition from high rates of birth and death (common in underserved rural areas) to low rates of
birth and death (associated with better health standards in urban areas). The final outcome of
structural transformation, already visible on the horizon in rich countries, is an economy and
society where agriculture as an economic activity has no distinguishing characteristics from other
sectors, at least in terms of the productivity of labor and capital or the location of poverty.
34. Structural transformation clearly took place in Cambodia over the last decade. The
share of agriculture in GDP measured in constant prices declined from 28.8 percent in 2004 to
25.6 percent in 2012, while the share of industry in total GDP increased from 26.9 percent to 29.0
percent (Table 11).17 The agricultural labor force decreased by 6 percentage points.18 Both birth
and death rates declined, and the urbanization process started. Urbanization has been very slow,
however; in 2012, 78 percent of Cambodians still lived in rural areas (Error! Reference source
ot found.).
Table 11: Indicators of structural transformation, Cambodia, 2004 and 2012
Indicators 2004 2012
Agricultural GDP as % of total GDP 28.8 25.6
Ag. employment as % of total labor force 57.4 51.0
Industrial GDP as % of total GDP 26.9 29.0
Rural population as % of total population 81.0 78.0
Birth rate, crude (per 1,000 people) 26.6 25.9
Death rate, crude (per 1,000 people) 7.8 6.0
Source: NIS 2014 for GDP, employment, and populationand WDI 2014 for birth and death rates.
17 Reliable labor statistics starts only from 2004, collected through the Social Economic Surveys by NIS. This is
why the indicators of transformation also start with the year 2004 not 2002 as in the earlier analysis. 18 According to MAFF, the share of agricultural labor in the total labor force increased from 60 percent in 2004 to
71 percent in 2012. This increase contradicts the evidence-based analysis carried out in this report and the results of
the NIS Socioeconomic Surveys, which are considered the most accurate and up-to-date in Cambodia. The report
uses the NIS data on labor statistics. The ADB also used the NIS labor statistics in its reports prepared in 2014.

14
Box 1: Rural Population in Cambodia
In 2012, Cambodia’s rural population was 11.1 million people, or 78 percent of the total
population. At the same time, the agricultural labor force accounted for 51 percent of the total labor
force. How does the “low” 51 percent agricultural labor share reconcile with the “high” 78 percent
of the rural population? What do rural people do if not farming? The answer is that there is a
difference between population and labor force, as the latter does not include children, seniors, and
the unemployed. According to the socioeconomic surveys of the NIS, in 2012 about 62 percent of
the rural population was of working age; i.e., the remaining 38 percent were children younger than
15 years and seniors older than 65 years. The labor participation rate of the rural population was
86 percent, with 91 percent for men and 80 percent for women. And the share of agricultural labor
in the total rural labor force was 66 percent. Out of 2,393 rural households in 2012, 1,877 were
recorded as farming households in the 2013 Agricultural Census of Cambodia. This means that not
all rural households are agricultural and not all members of households participate in the labor
market.
35. Where does Cambodia stand in the process of structural transformation in a global
comparison? Countries can be divided into groups by their dependence on the role of agriculture.
One such grouping was done by the agribusiness team of the World Bank Group (World Bank
2014a), using the framework developed by the 2008 World Development Report. Countries were
divided into five groups, from agri-based to most developed (Table 12). In 1980, 41 countries were
considered agri-based economies and only 18 countries were considered developed. By 2012, the
number of agri-based economies declined to 28 while the number of developed economies
increased to 50.
Table 12: Country groups based on the role of agriculture in the economy
Indicators Agri-
Based
Pre-
Transitioning Transitioning Urbanizing Developed
Ag. value added as % of total
GDP 40% 11% 12% 9% 2%
Ag. employment as % of total
labor force 72% 59% 40% 19% 4%
Ag. value added per capita, in
PPP $ 387 521 514 682 519
Non-ag. value added per
capita, in PPP $ 588 4,369 3,836 6,577 27,467
Total GDP per capita,
in PPP $ 975 4,879 4,350 7,256 27,986
Ag. value added per ag.
worker, in PPP $ 1,236 1,727 2,868 8,770 30,588
Ag. capital stock per ag.
worker, in PPP $ 715 658 1,408 5,436 37,711
% people below the $2
international poverty line 36% 32% 14% 6% 0%
Source: World Bank 2014a.

15
36. In 2012, Cambodia was still an agri-based economy, but it came close to being a pre-
transitioning country. Considering the share of agricultural labor in its total labor force and its
poverty rates, Cambodia is rapidly approaching the status of a pre-transitioning country (Table
13). The agricultural value added in purchasing power parity (PPP) actually exceeds the average
for this group of countries. But for other indicators, such as the share of agriculture in GDP and
nonfarm incomes, Cambodia is still very much an agri-based economy.
37. The process of structural transformation in Cambodia will continue. Agriculture is
likely to play a larger role in Cambodian economic growth and job creation than it does in
neighboring countries at the same stage of development given the agriculture sector’s strong
comparative advantages. Agricultural growth can provide excellent opportunities for income
generation and poverty reduction for many years to come.
38. Yet future transformation may take different pathways depending on which policy
decisions are made now. Cambodia may follow the positive example of Thailand.19 In this
neighboring country, agricultural growth during 1960s and 1970s was driven largely through
expansion of the land frontier and cheap labor, similar to the current Cambodian situation.
Agricultural land per worker increased steadily, which was subsequently converted into
productivity improvements through farm mechanization and public spending on infrastructure and
human capital. In turn, all of these contributed to significant farm productivity increases, critical
for the production of exportable surpluses. Farming systems during that period were largely
dominated by traditional smallholders and the export was raw materials of lower-value product
segments. But the end of this period also saw the emergence of sophisticated private sector value-
added processing.
Table 13: Selected economic indicators, Cambodia, 2004 and 2012
Indicators 2004 2012
Ag. value added as % of total GDP 28.8 25.6
Ag. employment as % of total labor force 57.4 51.0
Ag. value added per capita, current $ 120 318
Ag. value added per capita, in PPP $ 447 955
Non-ag. value added per capita, in PPP $ 1,074 1,896
Total GDP per capita, in PPP $ 1,516 2,839
Ag. value added per ag. worker, in PPP $ 1,672 3,600
% people below the $2 international poverty line 60.5 32.6
Source: NIS 2014, WDI 2014, and East Asia Poverty Portal, the World Bank.
39. Thai agriculture lost its competitiveness in the late 1980s due to underinvestment in
agricultural public goods and worsening agricultural terms of trade (TOT).20 Exhaustion of
the land frontier and an increasing farm population led to a period of declining agricultural land
per worker, while the competitiveness of agricultural exports was affected by an overvalued
national currency caused by the influx of short-term capital and maintenance of a fixed exchange
rate. By the beginning of the early 1990s, Thai farmers were experiencing rising labor costs and
shortages of family labor due to increasing rural-urban migration of young agricultural workers to
19 The analysis of the structural transformation of the Thai agriculture is based on Nippon (2013). 20 Agricultural TOT is defined as the ratio of prices of agricultural commodities to the prices of farm inputs.

16
the urban-based manufacturing and service sectors. Average annual agriculture growth rates
hovered just over 4 percent throughout the 1980s, dropping to 3.1 percent during 1990-1996.
40. The government and private sector responded to that economic decline. In the 1990s,
they invested in productive infrastructure and a system of food quality standards, which triggered
the next wave of structural transformation. These investments, coupled with more open
agricultural trade policy, made an important contribution to the shift towards mechanized farming
and higher-value food processing and exports during this period. Labor use per hectare in rice
cultivation declined from 58 person-days in 1987 to just 8-10 person-days according to Isvilanonda
et al. (2000) and Bordey et al. (2014). Thai food exports shifted from commodities to higher-value,
processed or final products. Between 1992 and 2011, the share of processed food and agricultural
products in total agricultural exports increased from 20 percent to 26 percent. For example, most
fishery products are now exported in the form of processed products, while that of rice and cereal
are exported as small, packaged, uncooked rice and cereal-based finished products, rather than in
100 kg bags. Among rice products, there have been increasing exports of fragrant rice (Hom Mali)
and parboiled rice, as opposed to lower-value white rice. The share of processed cassava exports
(i.e., starch and modified starch) jumped from 20 percent to 60 percent in the same period. This
implies that Thailand is able to obtain more value added from agricultural and food exports as its
composition has shifted to more high-value products, supporting further transformation of its
agriculture sector.21
41. Yet there are also examples of less successful agricultural transformation in Asia. In
the Philippines, for example, the structure of agricultural production and farm labor use have
hardly changed over many decades, with traditional low-value crops continuing to dominate. Rice
accounted for 16 percent of agricultural value added in 2005, slightly more than in 1980-1990. Its
share in total agricultural production has not changed in recent years. The importance of bananas,
mango, pineapple, and other tropical crops, in which the Philippines has strong comparative
advantage and which are major agricultural export items, has hardly changed over three decades
(World Bank 2007). Rice production continues to be labor intensive, with the same labor use in
Central Luzon in 2011/12 as was seen in 1966/67, especially for wet season rice (Table 14). The
limited dynamism and innovation in the sector hamper agricultural transformation.
Table 14: Labor use for rice production in Central Luzon, Philippines (man-days/ha),
1966/67-2011/12
1966/67 1970/71 1974/75 1986/87 1990/91 1994/95 2003/04 2007/08 2011/12
Wet season 69 68 85 71 74 71 61 66 71
Dry season 70 76 98 67 59 68 52 53 57
Source: Central Luzon Loop Survey, 19960-2012, IRRI.
42. Many reasons explain such divergent performance between Thai and Philippine
agriculture, but the main ones related to land, farm protection, and the quality of public
expenditures. Farmland tenure security is strong in Thailand, while the Philippines’ farmland
market is paralyzed by very slow implementation of its land redistribution program (the
21 In the 2010s, however, Thai agricultural policy has become less conducive to structural change. The controversial
rice pledge scheme has led to a large budget drain, neglected spending on core public goods, and significant economic
distortions on the rice market. This policy has heavily slowed down the successful agricultural transformation. To
avoid this trap, Cambodia should not follow this example.

17
Comprehensive Agrarian Reform Program). Delays and legal uncertainties over program
implementation have led to disinvestment in the sector, especially in capital-intensive tropical
crops and mechanization, thereby promoting farmers’ investments into less profitable, annual
crops such as rice. The Philippines also carries out highly protectionist farm policy, in contrast to
Thailand, where farm protection is a recent phenomenon. In the Philippines, the agricultural sector
has been subject to high import protection and domestic monopolies for decades. Prices of rice,
maize, sugar, and poultry are among the highest in the world. This protection keeps many farmers
inefficient, allowing them to maintain their incomes at the expense of consumers. Poor quality of
agricultural public expenditure and their bias towards the provision of subsidies and other private
goods instead of public goods have further hampered agricultural transformation in the Philippines
(World Bank 2007).
43. This brief dive into international experience is an important reminder for Cambodia.
Future agricultural transformation depends on policy decisions made today. For Cambodia to
shape its policy agenda and move to the next level of agricultural transformation, a thorough
analysis is required of the past development of the agricultures sector, the drivers of past growth,
and the potential drivers of future growth, complemented by lessons from global successes and
failures. This analytical work contributes to this analysis.

18
3. CHANGES IN AGRICULTURE: EVIDENCE FROM THE FIELD
3.1. Introduction
44. The agricultural growth of the last decade represented in the national accounts (as
presented in Chapter 2) is also evident in the field. Significant changes have occurred in the
structure of Cambodia’s farming systems, as revealed through a combination of primary data
collection, key informant interviews, and focus group discussions (FGDs). In 2013, 36 FGDs were
conducted in 24 villages and interviews held with 179 farmers in 6 provinces and 12 districts, 12
commune councils, and dozens of representatives from MAFF and the Ministry of Land at the
district and regional levels.22
45. To ensure the robustness of the results, information from different sources was
triangulated. In other words, data from FGDs and individual farm surveys, as well as information
collected from farm budgets, were used together to assess the status of agricultural production in
Cambodia and to elicit the perspectives of sector stakeholders. This approach allowed better
verification and cross-checking of data for farm enterprises and drivers of change. The details of
the methodology for primary data collection and interviews are provided in Annex 2 and described
briefly below.
46. Rice, cassava, maize, and vegetables best characterize the changes in Cambodia’s
farming systems since the mid-2000s. In addition to significant changes in production growth
over the past 10 years, each product had specific defining characteristics: (i) rice is the most
important crop in terms of GDP contribution, employment, food security, and exports; (ii) maize
is characterized by its rapid adoption of improved seeds and integration with the feed industry;
(iii) cassava growth is exceptional but its development is subject to intense discussion related to
sustainability and biodiversity conservation; and (iv) vegetables are related to nutrition and food
safety, and are a good candidate for import substitution.
47. Qualitative methods were used to collect data for the 2013 survey,23 including key
informant interviews and FGDs, complemented by quantitative data collection on farm
budgets. Data were collected at the national, provincial, district, commune, village, and individual
farm level. Structured survey tools were used to gather data from individual farmers for the
financial analysis of farm enterprises. A brief discussion of the 2013 survey follows.
48. Provinces, districts, and communes for the 2013 survey were selected based on their
contribution to the production of the four commodities. Those visited in the 2005 survey were
included in the sample if they fit the purpose of the current research questions. The selection
sequence was: (i) selection of provinces; (ii) selection of two districts within each province; (iii)
selection of one commune within each district; and (iv) selection of one village within each
commune. The six sampled provinces accounted for 46 percent of the national production of rice
in 2013,24 83 percent of maize production, 57 percent of cassava production, and 60 percent of
vegetable production.
49. At the national, provincial, district, and commune level, key informant interviews
were conducted with experts in the field of agriculture, rural development, and land
22 The survey for the World Bank was designed and implemented by Agrifood Consulting International. 23 The survey covered the 2012 wet season and the 2013 dry season, or the 2012/13 marketing season. 24 Broken down by 44 percent of wet season rice production and 53 percent of dry season rice production.

19
management, using: (i) purposive sampling based on information from initial meetings with MEF,
SNEC, and MAFF and an initial identification of respondents; and (ii) snowball sampling, which
consists of interviewing key informants identified by the respondents themselves. Information was
elicited from key informants on: (i) changes in the past 10 years in the agriculture sector, their
driving forces, key constraints to improved productivity, and stakeholders’ perspectives for the
next five years; and (ii) prices, farmers’ use of inputs including land, and agricultural production.
50. At the village level, one FGD was conducted for each selected crop. The FGD
questionnaire elicited: (i) the same information collected from key informants but at the village
and farm level, and the impact of changes on farm activities; and (ii) more detailed questions on
prices, yields, and use of inputs for agricultural production. At the farm level, data were collected
from individual farmers on: farm budgets for the selected crops; qualitative information on changes
observed by farmers in the past 10 years on their farms; their perspectives for the next five years;
and farm and farmers’ characteristics.
3.2. Crop Production
51. Cambodia’s agricultural landscape diversified over the past 10 years. The cultivated
crop area under paddy increased from 2.14 million ha in 2002 and 2.97 million in 2011 (Table 15).
But the cultivated area under other crops, especially cassava, increased even more (recall Table 4),
resulting in the relative decline of the area under paddy in total cultivated area, from 86 percent in
2002 to 74 percent in 2011 (Table 15).25 Thus, increasingly more farmers are growing non-rice
crops compared to the situation 10 years ago.
Table 15: Diversification in cultivated area, Cambodia, 2002-2011
Indicators 2002 2003 2004 2005 2006 2007 2008 2009 2010 2011
Cultivated crop area
(‘000 ha) 2,473 2,718 2,823 2,939 3,111 3,199 3,321 3,519 3,730 3,990
Cultivated area
under paddy (‘000
ha)
2,137 2,314 2,374 2,444 2,541 2,586 2,616 2,719 2,796 2,969
Share of paddy in
total cultivated area
(%)
86 85 84 83 82 81 79 77 75 74
Source: MAFF 2014b.
52. More generally, there is strong evidence that Cambodian agriculture is both
specializing and diversifying. As Figure 5 shows, agricultural GDP is increasingly dominated by
crops. At the same time, within crops there is diversification away from paddy towards other crops.
The FGDs reported that the number of wet season rice producers had reduced in 5 villages among
the 36 visited (Figure 9.1). Non-paddy crops grew faster than paddy. A shift toward vegetables
and upland crops such as maize and cassava was reported by several villages. In one case, a
vegetable crop grown 10 years ago was abandoned by farmers.
25 Note that FAOSTAT reports a larger cultivated area in 2002 and a much lower rate of land expansion. Total
cultivated area in 2002 was 3,700,000 ha and it grew to 4,000,000 ha in 2011, according to FAOSTAT.

20
Figure 9: Crop production and cultivated land areas, Cambodia
1. Likelihood of changing crops produced in
each village
2. Change in the average cultivated area, 2008-
2012
Source: FGDs. Source: Individual farmers’ surveys.
3. Change in the area of cultivated land and
average farm size
4. Reasons for the change in cultivated land
area
Source: FGDs.
53. Farmers diversify towards different crops because of higher profitability, existence
of a stable market, cultural reasons, and ripple effects. Indeed, farmers’ reasons for diversifying
depend on the type of crop. For example, two out of three farmers chose to grow vegetable and
cassava and, to a lesser extent, maize because they were profitable. This finding is supported by
the results of the farm budget analysis: farmers had gross margins of up to $505/ha for cassava,
$303/ha for maize, and $1,393/ha for vegetable production compared to $295/ha for dry season
rice and $245/ha for wet season rice (Table 26). According to the FGD results, more than 80
percent of farmers grew rice for cultural reasons: they were used to doing it and their parents grew
rice. Ripple effects were also identified as a reason to diversify to other crops or to adopt new
technologies such as improved varieties. Analysis of the data from the FGD shows that regardless
of farm size and level of technology use, the reasons to diversify remained similar.
54. Farmers are increasingly moving from the production of nonaromatic to aromatic
rice. The 2013 Agricultural Census estimates that one out of ten farmers in Cambodia plants
his/her land with aromatic paddy rice. Yet several years ago this share was much smaller.
Geographically, aromatic paddy is mostly produced in the Tonle Sap, Plain, and Plateau regions

21
(Figure 10). Meanwhile, traders and MAFF officials estimate that about 30 percent of the wet and
dry season crops are of fragrant rice.
Figure 10: Regional distribution of aromatic paddy production (% of farmers), 2013
Source: NIS 2014.
55. An important source of growth in agricultural production, irrespective of crop, is
land expansion.26 According to MAFF, land expansion contributed to 42 percent of the increase
in rice production from 2003 to 2012 (Figure 11). The contribution of land expansion for
vegetables, maize, and cassava was 37 percent, 76 percent, and 84 percent, respectively. Cultivated
maize areas grew two-fold, from 93,000 ha to 215,000 ha, and production increased three-fold,
from 314,000 tons to 950,000 tons. The changes were even more spectacular for cassava: its
cultivated areas multiplied by 13 times, from 25,000 ha to more than 337,000 ha, corresponding
to a 23-fold increase in production, from 330,000 tons to more than 7.65 million tons.
56. This large agricultural land expansion shown in the national statistics is confirmed
by the 2013 farm survey. It indicates that cultivated areas especially increased for upland crops
(cassava and maize) (Figure 9.2). This result, combined with the change in the proportion of
farmers growing non-rice crops, led to a boost in upland production.
57. There are also indications that the distribution of farm size is becoming more
unequal. Figure 9.3 indicates that about half of the FGDs experienced an increase in land area in
the past 10 years, regardless of the type of land (irrigated and upland). Respondents reported an
increase in average farm size, mostly for medium-size and large farms. On the other hand, half of
the respondents reported a reduction or at least stagnation in farm size, especially for small farms.
58. Individual farmer interviews indicated an increase in average farm size over the past
five years (Table 16). In many cases, farmers expanded their cultivated upland crops. Areas under
maize and cassava increased about two-fold. FGD participants identified RGC policies in
expanding infrastructure such as feeder roads and social land concessions as the main contributing
factor to upland expansion (Figure 9.4). Improving access to low-population density regions
increased the availability of land for agricultural production. Expansion of rice and vegetable
26 Even in the short run, total agricultural area (arable and permanent crop) increased from 3.81 million ha in 2010 to
4.50 million ha in 2013, according to MAFF.

22
cultivated areas as shown in Table 16 was relatively modest, reportedly due to the constraints in
availability of good land for vegetable production, technical complexity and labor requirements
for vegetable production, and limited irrigation expansion.
Figure 11: Contribution of land and yield to average agricultural production growth, 2003-
2012
Source: MAFF 2014b.
59. Higher agricultural prices and better access to credit provided strong incentives for
farmers to expand their cultivated land areas. Between 2005 and 2013, the farm-gate price of
maize increased by 64 percent, from $140/ton to $230/ton; and even more staggeringly, fresh
cassava prices skyrocketed 200 percent, from $20/ton to $59/ton between the two years (Table
90).27 Similar increases were observed for rice, whose prices went up by 90 percent, from $124/ton
to $237/ton. These higher prices acted as incentives for farmers to increase their cultivated land.
RGC’s policies to spread microfinance institutions and improve access to credit also contributed
to the expansion of cultivated land areas.
60. Crop yields increased significantly in the past 10 years as well (Figure 11). Among the
four selected crops, maize had the highest change (58 percent), from 2.8 tons/ha to 4.4 tons/ha;
cassava yield increased by 44 percent, from 15.1 tons/ha to 21.7 tons/ha, according to the
Production Statistics of MAFF. The same positive changes were observed for wet and dry season
rice, from 1.9 tons/ha to 2.9 tons/ha for wet season rice and 3.2 tons/ha to 4.4 tons/ha for dry season
rice. In the 2010-2013 FAOSTAT data on yields, Cambodia (with Indonesia) had the highest
27 According to 2005 survey and 2013 FGDs.

23
regional yield for cassava, reaching 22 tons/ha (Table 17). On the contrary, it had the lowest
average rice paddy yield at 3.0 tons/ha, 80 percent lower than yields in Vietnam and lower than in
Thailand (Box 2). Maize yields were comparable to the regional average. Most of FGDs and
interviewed experts concurred with the statement that crop yields have increased in the past 10
years.
Table 16: Change in farm size, Cambodia, 2008-2012
Average Size of Individual Farms (ha)
By Province 2008 2009 2010 2011 2012
Kampong Cham 1.28 1.47 2.18 2.61 3.38
Kandal 0.78 0.86 0.98 0.95 0.96
Takeo 0.63 0.67 0.82 0.83 0.85
Kampot 0.68 0.63 0.64 0.63 0.64
Battambang 3.00 3.37 3.65 4.38 4.84
Bantey Meanchey 5.17 4.80 4.17 5.69 7.92
By Crop
Paddy/ Rice 1.89 1.96 1.95 2.06 2.11
Cassava 3.92 3.75 4.33 5.92 7.72
Maize 2.57 2.80 2.88 3.65 4.84
Vegetables 0.60 0.61 0.65 0.62 0.70
By Farm Size
Small 0.99 0.73 0.84 0.87 0.88
Medium 1.55 1.83 1.77 2.10 2.38
Large 3.61 3.78 4.14 5.29 7.03
By Technology
Modern 2.97 2.85 2.81 3.63 4.65
Traditional 1.02 1.21 1.48 1.61 1.85
Total/ Overall 1.94 1.99 2.11 2.57 3.18
Source: Individual farmers’ survey.
Table 17: Average crop yields in selected countries (tons/ha), 2010-2013
Country Cassava Maize Rice Paddy Population
Density*
Cambodia 22.0 4.1 3.0 256
Indonesia 21.1 4.7 5.0 444
Philippines 10.2 2.8 3.8 782
Thailand 20.5 4.3 3.0 316
Vietnam 17.7 4.3 5.5 809
Note: *Population density is defined as number of people per km2 of agricultural land in 2010-2011.
Source: FAOSTAT 2014 data for yields and WDI 2014 data for population density.

24
61. While Cambodia lags behind in rice yield, its average yields for other crops are high
in a regional comparison. This is a very positive outcome of the last decade of agricultural
transformation given Cambodia’s relatively low population density (see the last column in
Table 17). Countries with high population density tend to have higher yields due to constraints on
land expansion. Cambodian farmers, however, have managed to achieve yields comparable to
those of much more populated countries.
Box 2: Rice Yields in Cambodia
How large is the rice “yield gap” in Cambodia? Its average yield looks similar to that in Thailand,
so the yield gap may seem small. Yet national averages can be deceiving. A large proportion of
Thailand’s rice production is of high-value jasmine and glutinous varieties, which inherently have
lower yields than conventional varieties. In the Northeast of Thailand (where nearly all jasmine rice
is grown, along with glutinous varieties), the average yield of the main crop is 2.3 tons/ha. The more
suitable comparator with Cambodia is the wet season crop in Thailand’s Central region, where
conventional varieties dominate. Average yield there was 3.8 tons/ha over the 2011-2013 period.
This would imply a yield gap of about 30 percent.
But what about productivity on Cambodia’s best paddy fields? Does that match the situation
among peers and competitors? The answer seems to be “no.” Even in the best managed irrigation
schemes in Cambodia, yield may reach 4 tons/ha, rarely more than that. For comparison, in the better
growing areas of Thailand Central Region, farmers get 5.7 tons/ha in dry season (Bordey et al.,
2014). In Vietnam’s Mekong Delta, average yield at a provincial level is between 6-7 tons/ha and
some smallholder farmers obtain yields well above this. These high-yielding provinces account for
most of Thailand’s and Vietnam’s rice exports. This situation implies a very large yield gap, even
at the top end of Cambodia’s production.
62. The majority of farmers interviewed in 2013 believed that there is scope for further
improvement in crop yields More than half of the interviewed farmers believed that an increase
in yield is likely, especially for rice and vegetables, and somewhat less likely for cassava and maize
(Figure 12.1 and Figure 12.2). Their expectations about the change in cultivated land areas in the
next five years, however, were more conservative. More than half of interviewed farmers expected
no change in the area of cultivated land for vegetables and maize (Figure 12.3). About 10 percent
predicted a decrease, and one out of three anticipated an increase. Cassava showed a peculiar
pattern: almost equal numbers of farmers expected an increase, no change, or a decrease in
cultivated area. The response was determined by location – respondents in the Tonle Sap and
Mekong regions were not positive about the possibility of increasing cultivated land. In other
regions, the option of land expansion is still open, especially for upland crops. Interviews with
different stakeholders revealed that many people were aware of the encroachment of cassava crop
cultivation into forest land; this is a relatively easy way to increase agricultural land but is receiving
increasing attention from policy makers since it puts more stress on already fragile ecosystems.
For rice, the overall expectation was “no change,” although more than 20 percent of respondents
expected a decrease in cultivated area.
63. Most farmers, particularly small ones, were concerned about the impact of limited
land expansion on their agricultural production. More than half of the interviewed individual
farmers thought that limited land expansion would have a major negative impact on their
production, and as expected, small farms worried most, with two-thirds of them identifying the
difficulty of expanding agricultural landholding as a major concern (Figure 12.4). Most of these

25
were rice and vegetable growers. The issue was assessed as not critical by cassava and maize
farmers.
Figure 12: Projections for land expansion and yield changes, Cambodia, 2013
1. Perspectives on changes in crop yield at the
village level (# of FGDs)
2. Perspectives on changes in yield by crop at
the farm level
Source: FGDs. Source: Individual ffarmers’ surveys.
3. Perspectives on the possibility of change in
cultivated areas by crop
4. Perspectives on the impact of limited land
expansion on production
Source: Individual farmers’ surveys.
64. To address the constraints and reduce the negative impact of limited access to land,
respondents made several suggestions:
Increase public investment in infrastructure, especially irrigation and feeder roads.
Investment in irrigation would allow farmers to have more control over the agricultural
production cycle, thus intensifying the crop cycle, which would increase cultivated areas.
The feeder roads would unlock access to available agricultural land in remote areas, thus
increasing the possibility of land expansion. These suggestions were made mostly by
farmers in Takeo and Kampot provinces.
Strengthen technical assistance to farmers, either through the government or private agents.
Limited land expansion may be compensated for by intensification on existing agricultural
land. Farmers may produce a similar total quantity by intensification, land expansion, or a
combination of both. Better extension service would support farmers to attain higher
productivity.

26
Continue and expand the RGC social land concession policy to small farms. This third
suggestion focused on changing the policy to ensure that even smallholder farmers can
benefit from it and increase their landholding. Respondents identified the suggestion as
possible but it needs policy support to be actionable. This response was quite common from
respondents in Kampong Cham, Battambang, and Bantey Meanchey provinces.
3.3. Farmland
Private land transactions
65. Private land markets were very active over the past 10 years. Results from the FGDs
indicate that farmers bought and sold land for a number of reasons, including family needs and
external incentives (Figure 13). Transactions were fueled by the higher agricultural prices received
by farmers, better access to credit, and the development of public investment in infrastructure.
Higher agricultural prices gave farmers higher incentive to invest in land as this is the main asset
for agriculture. With better access to financial services over the years, farmers were able to spread
land investments across several years through medium-term loans. Government investment in
agricultural infrastructure such as irrigation and rural roads was also identified by farmers as a
factor that helped boost agricultural land transactions (Figure 13.1).
66. In most cases, farmers who sold land faced social and economic distress (Figure 13.2).
Two out of three FGDs reported that farmers who sold land were in default in reimbursing loans
from microfinance institutions (MFIs) and banks; about half reported death or serious illness of
family members as a reason for selling land. About one-third identified other reasons, such as the
need for cash for family obligations (e.g., marriage) and change of activities (e.g., family moving
out of agricultural production).
67. People who bought land were farmers expanding their farm size. Almost all FGDs
reported that other farmers were the main buyers of land, either to expand their own agriculture or
with the expectation of leaving more agricultural land to their offspring (Figure 13.3). In some
cases, farmers from other villages were the buyers. The RGC policy on land distribution has
improved the access to land to some landless and very small land owners. For example, the Land
Allocation for Social and Economic Development Project supported by the World Bank targets
poor landless individuals and allocates about 0.1 ha for housing and 2-5 ha for agricultural
production. Yet many farmers already established in rural areas are not reached by these
operations.
68. The observed agricultural land transactions are likely to result in: (i) increased average
farm size; (ii) lower labor/land ratios; and (iii) an increased gap between small and large farmers:
a. In the long term, because of their agricultural land transaction strategies, large farmers
would accumulate more land with better land quality. According to the FGDs, such farmers
sold small plots and those with poor soil fertility and subsequently bought larger and better
quality plots for the sake of building up their farm asset. Sellers of these lands often become
landless or subsequently owned farms with fragmented land (which may face more difficult
farm management) or poor soil fertility (which will result in lower agricultural
profitability).
b. A further consequence is the increase in the extremes: at one end of the spectrum, there are
more very small farms struggling to make an agricultural livelihood economically viable,

27
while at the other end, there are more large farms with better quality assets, able to benefit
from new technologies for their agricultural production. “Large” includes farms with
agricultural landholding exceeding 3-5 ha, but excludes industrial producers with hundreds
to thousands of hectares of cultivated land. Even so, this results in a wider gap between
small and large landholder households in rural areas.
c. An agricultural landscape dominated by large farms would have the capacity to rapidly
move to commercial and productive agriculture from the current agrarian structure.
Because of their relatively high volume of production, larger farms can be more easily
linked to markets, have lower constraints in terms of access to finance, and are able to make
profitable the use of agricultural machines.
Figure 13: Private land markets, Cambodia, 2013
1. Reasons for intensive private land markets (# FGDs)
2. Reasons for selling land (# FGDs) 3. Reasons for buying land (# FGDs)
Source: FGDs.
69. Landless or marginally landless rural households’ coping strategies include different
options. People who sell their land often become farm laborers, move to off-farm activities in rural
and urban Cambodia, or migrate to neighboring countries. The decision is determined by several
factors, including their level of education and the overall economic environment in Cambodia,
especially the capacity of nonfarm sectors to absorb labor from agriculture. The FGD findings
indicate that agricultural transformation (the process by which agriculture engages less people and
substitutes labor for capital) is taking place in Cambodia. On average, hired labor income on farm
activities increased by 2.7 times from 2005 to 2013, from $1.25/day to $4.56/day, or $109/month
for 24 days of work per month. In spite of the past growth, the average farm wage in Cambodia
remains low in the regional comparison (Table 18). Off-farm wage, represented by prevailing
monthly salaries at garment factories, averaged $159/month based on the FGDs, or 45 percent
higher than agricultural labor income. More than 80 percent of FGD respondents reported that

28
hired labor is increasingly difficult to find, thus the expectation was that rural wages would
continue to increase, and farmers must take that into account in their agricultural production
operations. Competition from neighboring countries also fuels the exodus of rural laborers. In
2013, the minimum off-farm wage in Thailand was around $10.30/day, very similar to the rate in
Malaysia ($9.80/day) and the Philippines (ranging from $6.80/day to $11.10/day depending on
location).
Table 18: Wages of labor hired for rice production, selected countries, 2013 Country Daily wage, US$
China 19.3
Thailand 16.5
Vietnam 8.9
Philippines 7.6
Cambodia 4.5
India 4.2
Myanmar 2.4
Note: Dry season rice production.
Source: Bordey at al. 2014; data for Myanmar are from the World Bank.
Land prices and rentals
70. Irrigation adds value to land. Between 2005 and 2013, increases in land prices showed
significant variation across land types. The price of irrigated land increased by 7 times, up from
$1,136/ha to $8,182/ha, while prices of rainfed lowland and upland were up more than 2.5 times,
from $888/ha to $3,294/ha for rainfed lowland and $945/ha to $3,294/ha for upland. These figures
were obtained from commune council interview respondents (Table 19). The higher price of
irrigated land was related to its location, particularly in those irrigated schemes where the
government concentrated other investments, such as in roads and energy. Irrigated land also
offered the option of growing multiple crops over the year, resulting in higher land productivity.
Table 19: Changes in land prices between 2005 and 2013, Cambodia
2005
($/ha)
2013
($/ha)
Change in Price
(%)
Purchase price of 1 ha of land
Irrigated land 1,136.4 8,182.0 620
Rainfed land 888.7 3,294.0 271
Upland 945.2 3,294.0 248
Rental price for 1 ha of land
Irrigated land 73.5 225.0 206
Rainfed land 63.8 187.0 193
Source: 2005 survey and 2013 commune council interviews.
71. Rental prices of land did not follow the same pattern of high increase as the sale prices
of land. Between 2005 and 2013, rental costs for irrigated land increased 200 percent, from an
average $73.5/ha to $255/ha. The rental price for rainfed land followed the same pattern. If
agricultural production was profitable, then only farmers who faced significant constraints would

29
rent out their land. The rental prices were below the gross margins calculated in the farm budget
analysis. For example, with irrigation, modern farmers got up to $442/ha growing dry season rice,
a margin that represented almost twice the rental costs for irrigated land ($225/ha). For rainfed
rice, farmers got up to $399/ha, again more than twice the income received if rainfed land was
rented out at $187/ha. The difference in rental prices and returns to land may be caused by the
difference in land quality. Farmers may only rent out low fertility land or land with difficult access,
resulting in increased transportation and transaction costs.
3.4. Agricultural Labor Force
72. Cambodia continues to have too many people engaged in agricultural activities, but
the last decade witnessed a significant reduction in the agricultural labor force. According to
the Social Economic Surveys of NIS, 51 percent of Cambodia’s labor force worked in agriculture
in 2012, representing 3.9 million workers out of 7.7 million in the total labor force. In 2004, it was
57 percent.
73. The field evidence confirms that farm labor is being replaced by mechanization
services. In 2005, one hectare of wet season rice production required 73 working days. In 2013,
labor use declined to 48 days, or by 34 percent (Table 20). Labor use also declined for maize and
dry season rice, but increased for vegetable production, which in principle is hard to mechanize.
Table 20: Use of labor in farm production by crop, Cambodia, 2005 and 2013
2005
(days/ha)
2013
(days/ha) Change
(%) Family Hired Total Total
Paddy (wet season) 30.30 42.70 73.00 48.29 -34
Paddy (dry season) 24.60 48.70 73.30 27.75 -52
Cassava 13.20 35.20 48.40 48.80 +1
Maize 15.60 26.20 41.80 31.33 -25
Vegetables (mix) 79.80 60.10 139.90 169.85 +21
Source: 2005 and 2013 surveys.
74. There is the scope for further labor use reduction in Cambodia. While its farmers used
less labor than in the Philippines, India, and Myanmar, in China and Thailand dry season rice
production in the main producing areas requires 10-11 man-days/ha, almost 5 times less than in
Cambodia (Table 21). In Vietnam, dry season paddy production requires half of Cambodia’s labor
requirement. The lower use of labor in these countries is driven by their higher wages (Table 18),
which in turn accelerate mechanization. Mechanization has also begun in Cambodia, and as the
experience of other countries shows, the rate of labor replacement by capital will accelerate with
further wage increases.

30
Table 21: Use of labor in dry season paddy production, selected countries, 2013
Country Man-days/ha
Thailand 10
China 11
Vietnam 23
Cambodia 48
Philippines 69
India 78
Myanmar 110
Source: Bordey et al. 2014 and World Bank estimates for Cambodia and Myanmar.
75. Mechanization and migration affected the structure of rural labor, especially that of
women, for both family and available hired labor. Results from the FGDs indicate that women
historically played a critical role in agriculture but this role will be less important in the future
(Figure 14). The anticipated change is not significant but conveys households’ concern about the
increasing difficulty associated with the availability of labor. Two factors are in play: (i) the
migration of young women to work in garment factories and young men to work in the construction
sector; and (ii) the shift of some agricultural operations from manual to mechanized.
Figure 14: Change in the perception about women’s role in agriculture, Cambodia, 2013
Source: FGDs.
76. Young women are attracted to the relatively high, regular pay from garment
factories. From the FGD results, the average monthly wage at factories was about $162.5/month,
50 percent higher than the calculated monthly salary for hired workers at $4.56/day, and equivalent
to $109/month based on 24 days of work. In addition, garment workers have the convenience of
regular and continuous monthly wages. Young men are attracted to construction work, often
located in urban areas. Data from the 2013 key informant discussions and the 2005 survey suggest
a wage increase of 67 percent, from $72/month in 2005 to $120/month in 2013. Though lower than
the wage received by most women working at garment factories, this was still about 10 percent
above the agricultural wage. The gap between the agricultural and construction wages, however,
declined: in 2005, the ratio was about 1 to 3 in favor of construction. Nonetheless, both agricultural
and construction work often require daily tasks, implying that employers do not comply with

31
current labor law, because this kind of wage is not determined under Cambodian labor law. The
wage is made by an agreement between the service provider and the employer. Mechanization also
contributes to the anticipated decline in the role of women in agriculture. Harvest and post-harvest
activities, which previously often involved tasks directed towards women, are currently executed
using machinery with male drivers (Box 3).
Box 3: Gender Dimensions of Cambodian Agriculture
As Cambodian women are increasingly finding alternative employment in the garment sector
and other nonfarm sectors, there is increased demand from women for new services in rural
areas such as a savings market for remittances and child care options. For women staying in
agriculture, access to extension and other agricultural services remains a large constraint to
increased productivity, much larger than for men. Women’s needs are often neglected,
partially due to the low number of female extension workers and the lack of training and
information tailored to women. Mechanization also creates new challenges as female-headed
households have less ability to control providers of mechanized services. And hazardous
weather events disproportionally impact female-headed households, as their exposure to
trainings and programs for disaster risk management remains limited.
Source: World Bank 2015.
77. Almost all FGD respondents agreed that migration of young rural workers would
continue and the subsequent lack of labor force would negatively affect future farm
production and farm budgets. Rural youth leave farms and rural areas for other employment
opportunities (Figure 15). However, FGD participants believed that households would benefit
from migration through an increase in remittances. Increases in working capital and investment in
agriculture and off-farm activities are examples of positive impacts of migration. Nevertheless,
respondents did not agree with the statement that young workers leaving the rural households may
become a source of good practices and useful information on nutrition and health of children. The
same pattern was true for the perceived capability of returning migrants to provide advice on
agricultural techniques or commercialization of agricultural products.

32
Figure 15: Impact of youth migration on agricultural households, Cambodia, 2013
Source: FGDs.
3.5. Use of Agricultural Inputs
78. Most farmers seemed to be aware of the type of inputs that could boost agricultural
productivity. Improved seeds, urea, insecticides, and herbicides were adopted by more than 50
percent of farmers in several villages (Figure 16.1). Manure, compost, and other fertilizers such as
DAP and NPK had lower levels of adoption.
79. High agricultural prices were the main driving force behind the high adoption of
modern inputs. In order of importance, the reasons driving the high adoption of modern
technologies were identified as: the high prices of agricultural products; better infrastructure; and
better access to finance (Figure 16.2). The private sector is very active in supplying inputs in all
parts of the country. Farmers adopt new technologies based on their profitability expectations,
which take into account the perceived production and price risks. Data from the 2005 and 2013
surveys show that cassava prices increased 200 percent, from $19.79/ton to $59.38/ton; maize
prices increased 64 percent, from $140/ton to $230/ton; wet season rice prices rose from $124/ton
to $237/ton and dry season rice prices from $118/ton to $210/ton; and vegetable prices increased
60-233 percent depending on the type of crop. The expectation of higher prices for the following
agricultural year led more farmers to adopt modern technologies targeting higher yields.
Additional use of modern inputs was also a result of higher application rates. Initiatives from
private firms are discussed in Section 3.7 (extension services), and were undoubtedly a reason for
higher use of modern inputs. Better access to finance resolves farms’ financial gap during the
plantation season. Often, the lean season coincides with the cultivation period, which in the
absence of adequate financing would result in lower use of agricultural inputs.
80. Farmers identified high price of inputs as the main constraint to adoption of modern
inputs. From 2006 to 2013, prices of urea increased by 86 percent (from $0.17/kg to $0.66/kg)
and prices of DAP increased by 96 percent ($0.18/kg to $0.74/kg). The most significant increases
were observed for improved seeds: around four-fold for rice (from $0.16/kg to $0.66/kg) and
around six- to seven-fold for maize (from $0.6/kg to $4.0/kg). For common fertilizers, a valid
assumption is that these prices are for the same quality of products (urea, DAP). However for

33
improved seeds, the very high price increases are likely the result of both a change in commodity
prices and a change in seed quality.
Figure 16: Access to inputs, Cambodia, 2013
1. Importance of type of inputs by technology
adopters
2. Reasons for use of agricultural inputs
Source: FGDs.
81. Given the simultaneous increase in input and output prices, using higher quantities
of modern inputs to get higher yields does not automatically result in higher gross margins
per hectare. Indeed, modern inputs, farm assets, and farmers’ skill together constitute a package
for higher yield, and the absence of any one of them precludes attainment of the expected results.
For example, an adequate rate of chemical fertilizer application would not lead to the expected
increase in yield if farmers did not have a minimum level of irrigation control. Similarly, poor
weed control would preclude farmers from getting higher yields even with the use of fertilizers. A
few cases identified from the farm budgets collected during this survey illustrate the situation
where modern farmers with a higher use of inputs had a lower gross margin. For example, a
modern wet season rice producer spent $132/ha on fertilizers and reported gross revenue of
$499/ha and a gross margin of $132/ha. In contrast, traditional wet season rice farmers spent
$39/ha on fertilizers and reported an average gross revenue of $474/ha with a gross margin of
$152/ha.
Seeds
82. Individual farmers’ use of improved seeds increased over the past 10 years. For the
four selected crops, farmers’ use of improved seeds increased continuously at a relatively high
growth rate (Figure 17.1). Indeed, improved seeds are often one of the most cost-effective
technologies to boost productivity. Cambodia can take advantage of the research results in
neighboring countries with similar agro-ecological characteristics and the same market
preferences. For example, several new rice varieties developed in Vietnam or Thailand can be
grown in Cambodia without huge investments in research or seed multiplication.28 The same
applies to other crops such as cassava and maize. However, Cambodia needs more adequate border
control and effective quarantine to ensure safe introduction of new varieties of crops and
28 Although this might be the source of intellectual property rights litigation in the case of use of seeds developed by
companies in Thailand or Vietnam.

34
compliance with intellectual property rights and plant variety protection (World Bank 2011 and
IFC 2014).
Figure 17: Access to improved seeds, Cambodia, 2013
1. Change in the use of improved seeds by crop 2. Sources of information on improved seeds
3. Perceived impact of improved seeds on
agricultural productivity
4. Perspectives on the use of improved seeds by
crop
Source: Individual farmers’ survey.
83. Farmer-to-farmer was the most frequently used source of information about adoption
of improved seeds. About two-thirds of interviewed individual farmers reported adoption after
discussion with and/or seeing the impact of improved seeds on other farmers’ plots (Figure 17.2).
Extension agents from different sources (RGC, NGOs, and private suppliers) occupied the second
position, with many of them using a farmer-to-farmer approach to increase outreach. Extension
services need to provide more support in the future because few farmers were aware of the
existence of new crop varieties on their own.
84. Cambodian farmers seem to have started using higher seed quality. The increasing use
of improved seeds and the amount spent by farmers to buy seeds seem to contradict the conclusions
from technicians that farmers still face limited availability of good quality seeds (ADB 2014a;
World Bank 2011). For example, in 2013, cassava producers spent $228/ha on cuttings; maize
producers spent $76/ha on seeds; and on average, dry season rice producers spent $108/ha on
seeds. However, because farmer-to-farmer is the preferred way to adopt seeds, the quality of some
seeds is indeed not high because it is often obtained from relatives and other villagers, or used
from the previous harvest for planting the following year.

35
85. About half of the surveyed farmers believed that the use of improved seeds would
increase productivity by more than 20 percent (major impact); the other half believed that
the use of improved seeds would increase productivity between 10-20 percent (moderate
impact). The trends were similar for rice, cassava, and vegetables, with slightly less than half of
farmers expecting a major impact and the rest anticipating a moderate impact (Figure 17.3).
However for maize, two out of three farmers were quite confident about the productivity impact
of using improved seeds. Stakeholders reported that the use of hybrid seeds was common for maize
farmers. The supply chain has the advantage of support from large importers, who provide a
minimum level of technical advice on the use of hybrid maize seeds.
86. Farmers were very positive about the continued use of improved seeds over the next
five years. Two out of three interviewed individual farmers claimed they would continue to use
them; the remaining claimed they were likely to use improved seeds in the next five years (Figure
17.4). However, a small group of cassava farmers was unsure whether they would use improved
seeds. Farmers suggested that the RGC should increase access to improved seeds through
strengthening of technical assistance from MAFF and provide quality seeds at a reasonable price.
Manure/Compost
87. Manure and compost use did not change significantly over the past 10 years. The
trends were similar for all four selected crops (Figure 18.1). Often, farmers reserved the use of
organic fertilizers for vegetables (almost all farms used manure or compost) and rice production
(above half). Non-reconstitution of organic matter on upland cultivation, especially cassava, was
a big concern. With land expansion, cassava is cultivated from massive clearings of forest land,
which in most cases is still rich in organic matter, reducing the need for manure or compost.
Cassava can grow in different types of soil even with little or no additional fertilizer. However, in
the medium-to-long term, Cambodia could face productivity issues linked to soil fertility
depletion.
88. Availability of manure may be a challenge in the future. Farm budgets collected in 2013
show that farmers bought manure for agricultural production and that expenditures were as high
as $300/ha for vegetable producers, representing about 17 percent of their total variable costs. The
share went as high as 25 percent for small modern watermelon producers. The drive towards
mechanization might further contribute to reducing the stock of cattle used for land preparation
and as a source of manure.

36
Figure 18: Use of manure, Cambodia, 2013
1. Change in the use of manure/compost by crop 2. Sources of information on the use of
manure and compost
3. Perceived impact of manure and compost on agricultural productivity
Source: Individual farmers’ survey.
Chemical fertilizers
89. Most farmers used fertilizer for rice and vegetable production. The FGDs reported an
increase of about 30 percent in the number of users of urea for rice production over the past five
years. The change was relatively lower for vegetables and maize, and farmers barely used chemical
fertilizers for cassava production (Figure 19.2). The average expenditures from the 2013 farm
budget data show that farmers used 153 kg/ha of fertilizers for dry season rice, 66 kg/ha for wet
season rice, and 193 kg/ha for vegetables. The results also display that farmers barely used
chemical fertilizers on maize (30 kg/ha in 2013) and almost none on cassava (8 kg/ha).
90. Over time, the use of fertilizers per hectare increased. For example, for dry season rice
production, the rate of use of chemical fertilizers increased 50 percent for medium-size farms (89
kg/ha to 127 kg/ha) and four-fold for large farms (40 kg/ha to 192 kg/ha). Other types of fertilizers
such as DAP received increasingly more attention from farmers. The FGD results show a steep
increase in the number of villages where farmers used DAP. A breakdown by crop shows that
farmers used fertilizers mostly for rice and vegetable production (Figure 19.3 and Figure 19.4).

37
Figure 19: Use of fertilizers, Cambodia, 2013
1. Sources of information on the use of
chemical fertilizers
2. Overall trends in fertilizer use
3. Change in the use of urea 4. Change in the use of DAP
5. Perspectives on the number of users of
chemical fertilizers
6. Perspectives on the intensity of use of
fertilizers (quantity per hectare)
Source: Individual farmers’ survey.
91. The rates of use of fertilizer for dry season rice, cassava, and maize production
increased. Fertilizer use for wet season rice, however, did not show a similar increase. Table 22
illustrates the changes in the use of chemical fertilizers between the 200529 and 2013 surveys.
29 The 2005 survey was conducted by the Agribusiness Institute of Cambodia (ABiC), which was used for the World
Bank’s Cambodia Agrarian Structure Study and is used in this report for comparisons with the 2013 survey.

38
Table 22: Illustrative use of fertilizers, Cambodia, 2005 and 2013
2005 2013
Farm Size Farm Size
Crop Small Medium Large Small Medium Large
Wet season rice (kg/ha) 53 94 93 72 65 63
Dry season rice (kg/ha) 133 89 40 133 127 192
Cassava (kg/ha) - - - 12 - 8
Maize (kg/ha) 35 - - 74 7 9
Source: 2005 and 2013 surveys.
92. In spite of the increased use, the rate of fertilizer use in Cambodia is still below the
regional average. From FAOSTAT data, average fertilizer nutrient consumption for Cambodia
was about 15 kg/ha30 in 2011, low compared to Vietnam’s 160 kg/ha and Thailand’s 126 kg/ha
(Figure 20). More recent surveys indicate a higher use of chemical fertilizers in Cambodia, but
still below the level of regional neighbors.31
Figure 20: Trends in chemical fertilizer use (kg nutrient/ha), select countries, 2005-2011
Source: FAOSTAT 2014.
93. In addition to unfavorable input/output prices and lack of knowledge, the low average
level of application may be caused by farmers’ adverse selection due to a high risk of
obtaining tainted, low-quality fertilizers in the marketplace. Based on their past purchases,
farmers may not be willing to pay the market price for the perceived low-quality fertilizers
available in the market. While there are cases of low-quality and sometimes fake fertilizers sold in
Cambodia, it does not seem to be a major issue (IFDC 2010). The trend is increasing both in the
number of farmers using chemical fertilizers and the amount of fertilizers used per hectare. About
three out of four rice and vegetable farmers expected the number of farmers using chemical
30 Calculated as kg of fertilizers per ha of arable land. 31 Field data from a recent (2013) feasibility study conducted by CelAgrid for ADB (TA7833) reported that the
average application of chemical fertilizer is 122 kg/ha, 96 kg/ha, and 98 kg/ha, respectively, in rice, vegetable, and
corn fields.

39
fertilizer to increase in the next five years, and about half anticipated an increase in the dose per
hectare (Figure 19.3 and Figure 19.4). Although only less than half of cassava farmers expected to
use chemical fertilizers, the amount used per hectare is expected to increase. The most remarkable
changes were anticipated for maize: more than half of the respondents anticipated an increase in
the number of farmers using fertilizer and more than two out of three anticipated an increase in the
quantity used per hectare.
Other chemicals
94. The use of insecticides is increasing in Cambodia. Vegetable production requires higher
use of pesticides; the proportion of users topped at nine out of ten farmers. For maize and rice, the
number of users also increased but at a lower magnitude: one-third of respondents used
insecticides. For cassava, less than 20 percent of interviewed individual farmers used insecticides
(Figure 21.1). Farmers anticipated that the number of insecticide users would increase mostly for
vegetable and maize production. In 2013, farmers spent up to $82/ha on insecticides, with
vegetables having the highest expenditure. The figures were much lower for dry season rice
($12/ha), and very low for cassava, wet season rice, and maize (less than $4/ha). However, farmers
expected the number of pesticide users to continue to increase and remain high for vegetable
production. This situation raises concerns of food safety in areas where farmers are not fully aware
of the dangers linked to pesticide use and due to improper handling by traders.
Figure 21: Use of pesticides, Cambodia, 2013
1. Change in the number of insecticide users 2. Change in the number of herbicide users
3. Perspectives on the number of insecticide
users
4. Perspectives on the number of herbicide
users
Source: Individual farmers’ survey.

40
95. The use of herbicides is also increasing, especially for upland crops. Cassava and maize
farmers were the most prominent users of herbicides (Figure 21.2). Weed infestation was a major
constraint in large-scale upland production; with the increasing difficulty in finding rural workers
and the increase in cultivated land areas, farmers tended to use herbicides. The figure depicts a
sharp increase in the use of herbicides in the last five years, a trend expected to continue for the
next five years, especially for cassava and maize (Figure 21.3 and Figure 21.4). For irrigated rice,
manual rotary weed control equipment allows for good weed control and has the advantage of
requiring only a few days of labor per hectare. In the farm budgets collected in 2013, expenditures
on herbicides ranged from a low of $4.6/ha for wet season rice production to $33.8/ha for cassava.
Expenditures on herbicides for maize ($20/ha) and dry season rice ($12.2/ha) were in between.
3.6. Use of Agricultural Machinery
96. The past 10 years witnessed a spectacular increase in the use of agricultural
machinery in Cambodia. Changes were observed in land preparation, planting, and harvesting.
Data from the Department of Agricultural Mechanization show that the number of combine
harvesters increased three-fold from 2006 to 2010, and the number of threshers increased two-fold
(Table 23). The 2013 survey shows that increasingly more farmers used tractors (both 4WD
tractors and hand power tillers) for land preparation for upland crops (i.e., cassava and maize) and
they expected to continue to use this equipment in the next five years (Figure 22.3, Figure 22.4,
Figure 22.5, and Figure 22.6). For rice and vegetables, their current use was relatively low (10-20
percent) but farmers indicated that their use would increase. However, the use of agricultural
machinery may be constrained by the low purchasing power of smallholders, the high cost of
agricultural equipment, and the lack of well-trained operators and mechanics for agricultural
machinery.
Table 23: Number of agricultural equipment units, Cambodia, 2006-2010
Equipment 2006 2007 2008 2009 2010
Combines 325 399 430 836 947
Tractors 4,247 4,475 4,611 5,495 6,200
Threshers 7,795 8,036 8,237 13,798 14,390
Power tillers 29,706 34,639 38,912 53,220 66,548
Irrigation pumps 127,610 131,702 136,061 164,974 166,633
Source: Department of Agricultural Mechanization.
97. Farmers use different sets of equipment based on their farm size, their agricultural
assets and equipment levels, and the availability of services. Manual tractors will continue to
be common in rice and vegetable production despite the uptake of regular tractor use. Manual
tractors are an intermediate technology between draught animals and tractors, and are highly
effective for puddling, preparatory tillage, and seed bed preparation for rice production. They are
also the most efficient form of mechanization for fragmented and small land plots. However,
farmers thought that the level of use of power tillers would decrease, except in vegetable
production. In terms of costs, 2013 data collected from FGDs show that tractor rental for land
preparation cost about $60/ha and two out of three FGDs reported the service as relatively easy to
find; animal traction cost a bit more, at $71/ha, and only one out of three FGDs said that service

41
providers were easily available. For harvest and post-harvest operations, some services were still
hard to get. About half of the FGDs reported having difficulty getting combines to their fields. On
the contrary, rice reapers and threshers were relatively more available, with only one out of four
FGDs stating difficulty in getting them.
Figure 22: Use of agricultural equipment, Cambodia, 2013
1. Number of FGDs reporting the use of
agricultural equipment in their villages
2. Main reasons driving the use of agricultural
equipment
Source: FGDs. Source: Individual farmers’ survey.
3. Change in the use of and perspectives on
tractors for land preparation
4. Change in the use of and perspectives on
power tillers
5. Change in the use of and perspectives on
drum seeders (rice and maize)
6. Change in the use of and perspectives on
other equipment for rice production
Source: Individual farmers’ survey.
98. Data collected from the FGDs are in line with the increasing trend in the use of
agricultural equipment shown by official statistics. Irrigation pumps and manual tractors were
among the earliest equipment adopted by Cambodian farmers. The uptake of manual tractor use
started about 10 years ago, and increased until late 2010 (Figure 22.1). Irrigation is the key to rice

42
production and power tillers are versatile enough to work on muddy plots. The use of tractors,
adapted to medium-size to large farms, also started to increase in the last 10 years. The economic
land distribution policy and the expansion of agricultural land, resulting in higher average farm
size, will contribute to this continued growth. The trends for harvest and post-harvest equipment
use show a typical pattern: rice farmers first move from labor-intensive tasks to intermediate
mechanization using rice reapers for harvest and threshers for post-harvest; ultimately they move
to a highly capital-intensive approach using combine harvesters. The result is a plateau in the
number of threshers and rice reapers and an increase in the number of combines (as illustrated in
Figure 22 and Table 23).
99. Combines were often rented by farmers from business entrepreneurs, and the use of
combines has taken off. The high purchase price of the machines makes renting the preferred
option for small and medium-size farms. Several FGDs reported having access to such services,
with an average payment of $95/ha, 10-15 percent higher compared to the use of reapers and
threshers for harvest and post-harvest activities (Table 24). However, some farmers complained
about the quality of rented combines and reported that their use brought additional work. With
poor-quality harvesters and/or unskilled drivers, the harvested paddy grain is mixed with a lot of
broken straw, requiring further cleaning processes. Others criticized the extra costs incurred due
to inexperienced drivers, who spend too much time maneuvering at the end of the field while
farmers pay for the equipment by the hour.
Table 24: Average costs of and difficulty finding agricultural machinery, Cambodia, 2013
Tasks $/hectare
% of FGDs Reporting
Difficulty Finding Equipment
(if rental)
Land preparation by animal 76.5 68
Land preparation by power tiller 59.8 33
Land preparation by tractor 74.3 20
Rice reaping 43.0 27
Rice threshing using mechanical thresher 40.3 8
Combine harvester 95.5 46
Source: FGDs.
3.7. Agricultural Services
Extension services
Availability and access
100. In the past 10 years, RGC and NGO extension agents provided technical advice in
two out of three villages visited during the FGDs. Commercial firms were also present, but to a
lesser extent, in one out of three villages. Technical advice is a source of information on
recommended and proven scientific farming techniques. Agricultural extension encompasses
several dimensions, including: economic dimensions such as increases in farming income,
agricultural productivity, farm financial management, and food preservation, and social
dimensions such as improvement in the health of family members, and leadership. Farmers may
get technical advice from several sources, comprising government employees, NGOs, and the

43
private sector. More than 10 years ago, the proportion of villages receiving extension services was
less than 10 percent on average for all four crops (Figure 23.1). Services from the RGC and NGOs
rapidly increased to cover more than half of these villages and then slowed down in the last five
years to around 70 percent (25 FGDs out of 36). At the opposite end of the spectrum, private
extension services grew at a slower pace in the early 2000s before rising to a higher and more
regular level, currently reaching about half of the interviewed villages.
101. Specific crops such as rice and vegetables received more attention from RGC and
NGO extension agents. About half of the interviewed farmers reported receiving technical advice
on these two crops (Figure 23.2 and Figure 23.3). The RGC agents mostly focused on rice and
vegetables and neglected other crops such as maize and cassava, for which extension services were
available in only one out of ten villages. NGOs’ extension services also targeted mostly rice and
vegetables, but they started to add cassava and maize about five years ago. Private commercial
advisors were mostly interested in developing vegetable production and had reached about one out
of three interviewed villages (Figure 23.4).
Satisfaction, perception of impacts, and perspectives
102. Farmers considered RGC and NGOs’ agricultural extension services more
satisfactory than services from private companies. About nine out of ten FGDs32 expressed
satisfaction with the extension services from RGC and NGOs (Figure 23.5). On the contrary,
services from private commercial advisors were perceived by one out of three FGDs as
unsatisfactory. The main complaints were about:
a. Difficulty acquiring the inputs required. For example, advice promoting the advantage of
a specific new variety of crops was not followed by activities to make the promoted seeds
available.
b. The insufficient number of visits conducted by extension agents. More frequent visits
would help farmers, as they mentioned gradual improvements in their knowledge and skills
from repeated discussions with agricultural extension agents. Farmers wanted extension
agents to follow-up and monitor their progress after the initial visit.
c. Confusion regarding commercial activities and dissemination of technical messages.
Complaints were on the type of messages, which in some cases are too focused on selling
products. Some respondents even reported that they felt obliged to buy the product after
meeting with these agents. Some farmers suggested that the government should intervene
when the performance of products sold by extension agents is not as effective as advertised.
32 FGDs with valid responses.

44
Figure 23: Access to extension services, Cambodia, 2013
1. Number of FGDs reporting access to
extension services by type of provider
2. Development of extension service from RGC
agents
Source: FGDs. Source: Individual farmers’ survey.
3. Development of extension service from NGO
agents
4. Development of extension service from the
private sector
Source: Individual farmers’ survey. Source: Individual farmers’ survey.
5. Satisfaction with the quality of extension
service received (# of FGDs)
6. Impact of lack of access to technical advice
on agricultural production
Source: FGDs. Source: Individual farmers’ survey.
103. Farmers reported that extension would be more effective if technical agents had a
better understanding of farm characteristics. Respondents reported that in some cases,
innovations proposed by technical agents did not correspond to the existing reality on the farm.
For example, agents promoted techniques requiring good water control to farmers who did not
have irrigated land; or disseminated technical packages that would not be profitable because of
high initial investments. Farmers wanted extension agents to ultimately discuss adoption based on
the specific assets, soil quality, and fertility associated with their farms. In an ideal situation, such
tailored advice would be provided to farmers, but this approach may face high costs of intervention

45
and may only be possible for medium-size and large farms, excluding the more numerous small
farmers. In other countries, producers’ organizations are an effective way to alleviate the unit costs
of intervention. They have the advantage of focusing on limited types of crops, if not one crop;
and can tackle similar problems encountered by most farmers within the area of interventions.
However, the effectiveness of farmers’ organizations in Cambodia has been limited so far (see
Chapter 3.8).
104. Relatively few farmers were aware of the impacts of the lack of access to technical
advice on their agricultural production. Several individual farmers did not provide answers to
this question. Depending on the type of extension service received, the rates of nonresponse were
about two out of five respondents for those dealing with private firms, and about half for farmers
working with RGC or NGO extension agents. There was also a difference across crops. For rice,
maize, and vegetables, nine out of ten farmers identified the lack of extension services as having
a moderate to major impact on their agricultural activities. Cassava growers, on the other hand,
did not see the lack of extension services as a major issue in their agricultural production (Figure
23.6). A consequence of such lack of awareness is farmers’ low willingness to pay for technical
advice. This will be an issue if the RGC decides to privatize agricultural extension.
Credit
Availability and use
105. Financial services from several sources comprising commercial banks, MFIs,
community saving groups, and money lenders were increasingly available to farmers. In the
past 10 years, increased availability of financial services from MFIs was one of the main changes
in rural Cambodia, with the proportion of villages having access to credit increasing from 25
percent to above 90 percent (Figure 24.1).
106. In addition, the types of service providers have diversified with the establishment of
commercial banks in small towns and community savings and loans institutions in villages (World Bank and AusAid 2013). For FGD participants, the availability of commercial banks and
community savings and loans services increased 10-fold compared to the situation 10 years ago.
However, improved access was not strong enough to satisfy all needs; hence, the continued use of
financial services from money lenders.
107. Farmers’ choices of financial service provider varied according to the size of their
farm and the type of crop produced. Maize and cassava growers used financial services from
commercial banks and MFIs. More than half of the interviewed farmers growing cassava and
maize reported access to MFIs’ financial services; and one out of three used financial services
from commercial banks (Figure 24.2 and Figure 24.3). Most of these farmers were located in
Kampong Cham and Takeo. Commercial banks were not used much in the other four visited
provinces. On the other hand, commercial banks were barely used by rice and vegetable growers:
the proportion of users remained below 10 percent over the past 10 years. These farms, often small,
preferred working with community savings and loans institutions. In sum, respondents were almost
unanimous in identifying MFIs as the most available and accessible financial service for farmers.
For example, ACLEDA, which currently has commercial bank status, started as a microfinance
provider and has been the largest microfinance institution in Cambodia for over a decade.
108. Community savings and loans institutions are being implemented in more and more
villages, but to date, few farmers have had access to their services. Slightly more than half of

46
the visited villages reported receiving financial services from community savings and loans
institutions, most of them in the past five years (Figure 24.1). However, very few interviewed
farmers reported using services from this type of local institution, which was supposed to serve
farmers’ needs (Figure 24.4). Most users were: rice and vegetable growers; located in Battambang,
Takeo, and Kampot provinces; and modern technology users. The Cambodian Community Savings
Federation has provided financial and nonfinancial services to low-income families, especially
women since early 2000. Cambodian Community Savings Federation is currently working in
Battambang and Bantey Meanchey provinces and provides services to more than 3,000 farmers.
109. Despite the existence of numerous formal financial service providers, farmers still
take loans from money lenders, presumably because money lenders do not require collateral
and higher risk loans can be obtained. Individual farmers receiving services from money lenders
increased from 10-15 percent about six years ago to 20-50 percent in 2013. Cassava and maize
farmers appeared to rely more on money lenders than did other producers (Figure 24.5). These
upland crop growers, however, showed higher access to commercial banks and MFIs.
Satisfaction, perception of impacts, and perspectives
110. About nine out of ten FGDs viewed community savings and loans institutions as
providing the most satisfactory quality services. MFIs came in second place, with two out of
three responses “very satisfied” or “satisfied.” Commercial banks and money lenders occupied the
last place, with less than half of respondents reporting satisfaction.33 Satisfaction encompasses
several aspects, but the most important constraints often cited by farmers were the high interest
rate, the excessive delay between time of application and availability of loans, and the required
collateral. For community savings and loans institutions, some farmers criticized the constraints
linked to the “social organization,” such as frequent meetings and the limited amount that can be
borrowed by each member (Figure 24.6). For several respondents,34 lack of access to credit would
negatively impact farm production, regardless of the type of crop, size of farms, or region
(Figure 24.7).
111. Only a handful of farmers reported no impact from the unavailability of MFIs and
money lenders. However, there were a large number of nonresponses, varying from half of
respondents regarding MFIs to about 80 percent regarding commercial banks. In general,
nonrespondent farmers could be categorized as those who did not use financial services, either by
choice or because of nonavailability of such services.
33 These proportions excluded nonresponses, which in some cases may be large (30 percent nonresponse for extension
service from RGC, and 50 percent for extension services from private commercial firms). Responses may be missing
because respondents did not receive the services, or respondents did not know the answers even if they had received
services. 34 Information based on individual farmer interviews.

47
Figure 24: Access to financial services, Cambodia, 2013
1. Change in the availability of financial services
at the village level
2. % of farmers receiving financial services from
commercial banks
Source: FGDs. Source: Individual farmers’ survey.
3. % of farmers using financial services from
MFIs
4. % of farmers using financial services from
community savings and loans institutions
Source: Individual farmers’ survey. Source: Individual farmers’ survey.
5. % of farmers using financial services from
money lenders
6. Satisfaction with the quality of financial
services received
Source: Individual farmer’s survey. Source: FGDs.

48
7. Perception of the impact of lack of credit on agricultural production
Source: Individual farmers’ survey.
Access to other services for agriculture
Price information
112. Over the past 10 years, the RGC made significant efforts to provide regular price
information to farmers. The RGC uses two main ways of information dissemination: mass media,
including public radio and TV; and interpersonal communication using extension agents. For the
past five years, increasingly more villages have been able to receive information on prices, often
from RGC programs (Figure 25.1). These government programs focus on rice and to a lesser extent
on upland crops. In addition, dissemination of price information by private businesses became
more common in about half of the villages visited during the FGDs. They were more focused on
diffusion of information related to vegetables, even though the increase in the number of people
getting information slacked off in the past two years.
113. Despite the increased access to information, farmers were not satisfied with the
quality of service received. Only a handful of FGDs reported “very satisfied” and “satisfied”
perceptions; the majority reported “not satisfied” (Figure 25.2). The most common reason was
discrepancies between the announced prices on TV and the real prices at the market place.
Government agents do not conduct their assessment carefully so disseminated prices are often
higher than the actual selling prices, resulting in disappointment when farmers face buyers.
Ultimately, the businessman/buyer has the last word. Farmers feel cheated and do not know what
to do or where to get advice. On the other hand, farmers are frustrated when the announced prices
are low, unduly below the production costs for some commodities. The system is then judged not
useful since it is the bearer of bad news. Some farmers suggested that the government pass laws
to control the price of agricultural products and disseminate information through the system.
Indeed, the inadequate quality of prices disseminated through official media was reported by the
Cambodian Institute for Cooperation and Peace in 2011: “Cambodian farmers do not get access to
updated accurate market price data for their products.”

49
Figure 25: Access to information, Cambodia, 2013
1. Number of FGDs reporting access to
information by type of provider
2. Satisfaction with the quality of information
received
Source: FGDs.
3. % of farmers receiving price information
from RGC activities
4. % of farmers receiving price information
from other value chain actors
Source: Individual farmers’ survey.
114. Use of mobile technology has started to improve access to information. In 2013, 95
percent of the interviewed farmers owned a mobile phone. About a quarter reported using their
mobile phone to request information, mostly on price and commercialization; most of these were
located in Takeo and Kampot provinces. The use of mobile phones to get technical advice on
technologies is still at the early stages, with only very few cases in Kampong Cham, Kandal,
Battambang, and Bantey Meanchey provinces. These communications were often between private
actors (farmers, sellers, suppliers); the percentage of farmers receiving calls or SMSs related to
agriculture (price or techniques) from the RGC and NGOs remained below 10 percent.
Business development services and contract farming
115. Services providing support to farmers with respect to business planning and contract
farming are not yet developed in rural Cambodia. Only a handful of villages reported having
these services available to them. For example in the past two years, only three villages in Takeo,
Kampot, and Battambang provinces reported having the opportunity to work with business
development service providers. The services provided focused on vegetables and upland crops,
excluding rice. However, the quality of the support received from business development service
providers was disappointing, as reported by several FGDs.

50
116. Contract farming in Cambodia is still limited. Only 6 out of the 36 FGDs provided an
answer to the question related to contract farming. Groups that provided an answer were satisfied
with the quality of services offered by the contractor. Contract farming is appreciated because it
provides farmers with an easy way to sell their products, although some farmers complained about
cases where other buyers offered higher prices. Among the individual farmers interviewed in 2013,
only a handful of rice and vegetables producers in Takeo were involved in contract schemes.
117. Farmers with contracts were able to get higher prices and higher gross margins. The
2005 survey shows that contract farmers had a higher gross margin on rice ($478/ha versus
$229/ha) and tobacco ($682/ha versus $132/ha). Even under harsh climate conditions such as
drought, contract farmers had higher productivity due to better management practices. The 2013
survey did not specifically look at farmers with contracts. However, data collected on farm budgets
show that the few farmers with contracts producing wet season rice had higher yield compared to
noncontract farmers (3.5 tons/ha versus 2.84 tons/ha), received higher output prices ($325/ton
versus $284/ton); and subsequently had a higher gross margin ($330/ha versus $236/ha). However,
they had less cultivated land area, with an average of 0.8 ha versus 1.9 ha for noncontract farmers.
Overall, the survey data showed no huge difference between the cost structures of farmers involved
in contract farming and those of other farmers. Note that these averages should be treated with
caution since they are from very small samples and are not statistically representative (i.e., 3
individual contract farms out of 33 rice farms interviewed in 2013).35
3.8. Farmers’ Organizations
118. Most farmers are not yet engaged in farmers’ organizations (FOs). FGD participants
were not able to report the main reasons for using FOs, resulting in low response rates. This could
indicate either a lack of awareness or an unsuccessful past experience in participating in an FO. In
the selected FGDs, there was no report of creating cooperative FOs. In some cases, being a member
of FOs has a direct advantage. For example, most farmers should be willing to be part of a water
users association to get the benefits of irrigation and drainage. The low response rate (1 out of 36
FGDs) may be caused by the lack of irrigation infrastructure in the sampled villages. Similarly, a
credit group is a valuable tool available to smallholders, alleviating the barrier to access to credit.
In this sample, 4 out of 36 FGDs reported having such a group in their village even though there
is an overall assessment that access to credit increased for farmers in the past years. On the other
hand, higher numbers of FGDs reported having FOs focused on input supplies (6 cases including
equipment supply) and production (10 cases) (Figure 26). The move toward mechanization and
intensification of agricultural production would entice producers to be more interested in FOs
(CDRI 2012). The practice depicted by the current study shows the emergence of private
mechanized service providers. Having production groups would reduce the costs and improve the
quality of the work for FOs based on machinery and would reduce the transaction costs with higher
assurance on the quality for FOs based on inputs supply (seeds, fertilizers).
119. The governance and capacity of existing FOs need to be improved so that farmers
appreciate the benefits of membership. About half of the FGDs recognized that FOs are very
helpful; a quarter reported that they received very little benefit from FOs; and another quarter
stated that FOs can do better. Suggestions on improvement from the FGDs included more
education and awareness raising for farmers, more technical training to empower farmers to
35 The 2013 sampling method did not use contract farming as selection criteria.

51
bargain with other value chain actors, and formalization. Although Cambodia has a variety of FOs
(Box 4), most of them are not operational. The RGC is trying to promote the formation of
agricultural cooperatives that could lead to sustainable business models. Cambodia’s experience
with cooperatives so far is still limited and it is too early to fully assess their success.
Figure 26: Reasons for creation of FOs and their perceived benefits, Cambodia, 2013
Source: FGDs.
Box 4: Farmers’ Organizations in Cambodia
In Cambodia, five classes of FOs exist, as follows: (i) Farmers’ groups, with 5-15 members; (ii) Farmers’
associations, with > 15 members; (iii) Farmer Communities, for users of natural resources like forests,
fisheries, and Water Users Groups; (iv) Federations, where different groups form an overarching common
group; and (v) Cooperatives, called either farmer coops or agricultural coops, established at either the
village or commune level
MAFF’s current focus is on forming coops because they are supposed to lead to a more sustainable business
model than farmers’ groups. Cooperatives are subject to a Royal Decree (“Compilation of legal framework
for agricultural cooperatives 2012”) that includes a model statute for each cooperative to follow in setting
its operating rules. There must be a minimum of 30 members to form a coop. Any one member can have a
maximum of 20 percent of the coop’s shares. Each member has an equal vote, regardless of his/her number
of shares. Activities of cooperatives can be many and varied, but must be limited to agricultural activities
(e.g., input supply, marketing, production, credit provision, and money savings).
The Royal Decree follows seven international principles of cooperatives, as identified by the International
Cooperative Alliance. The Royal Decree is currently in the process of being upgraded to a law (i.e., by
passing through the National Assembly).
There is a prescribed five-step process for establishing a coop. The formation of a coop must be voluntary
rather than forced upon farmers. Five pilot coops were established in five provinces in 2003. The Royal
Decree makes provision for formation of coops, to be registered by MAFF, normally via the relevant
Provincial Department of Agriculture (PDA). It is estimated that there are currently 360-370 cooperatives
in Cambodia.
The PDA is responsible for taking farmers through the five steps of forming a coop, and the PDA Director
signs for registration of a coop once the steps are completed. MAFF provides its Coops Unit with a budget
to help farmers obtain the training they require and covers the legal costs of establishing coops. Sometimes
project donors contribute toward the costs of establishing coops, but farmer members need to cover their
running costs. The PDA cannot interfere with the internal workings of a coop. However, each coop must
hold an Annual General Meeting every year and send a report to the PDA.

52
3.9. Agricultural Infrastructure
Irrigation
120. In addition to the RGC’s investment in irrigation infrastructure, some farmers are
making individual investments in irrigation. Wokker et al. (2014) show that the elasticity36 of
water irrigation in Cambodia may vary from 6 percent for the wet season to 12 percent for the dry
season, measured in terms of rice production. This relatively low return does not stop Cambodian
farmers from paying for and investing in irrigation (Figure 27.1). Sales of irrigation pumps rose
30 percent in the last five years, and the RGC’s Rectangular Strategy aimed to increase irrigated
land by 120,000 ha from 2008 to 2013. For the 2013 dry season rice production, farmers spent an
average $53/ha for irrigation, with the cost peaking at $115/ha for farmers in Takeo province.
121. Farmers stressed the importance of irrigation in their assessment of the impacts of
flooding and drought on agricultural production. However, farmers were more concerned
about drought than flooding. About half of the FGDs assessed flooding as having a major impact
on their activities, while three out of four said the same for drought. Indeed, these natural shocks
affect farmers differently depending on whether their landholdings are lowland or upland and on
the agricultural season (wet or dry) (Figure 27.2 and Figure 27.3). Fear about the impact of drought
led dry season rice producers to invest in small pumps and to allocate 11-20 percent of their total
variable costs to irrigation. Indeed, the additional cost of water irrigation from the use of individual
water pump equipment resulted in adequate yield and higher gross revenue but negatively affected
farms’ gross margins. In general, farms using individual irrigation equipment received 50-150
percent lower gross margins than similar size farms with no irrigation costs. For modern farmers,
regardless of farm size, irrigation expenditures constituted 18-20 percent of total variable costs
(see Table 74 - Table 77 in Annex 3).
122. Aside from irrigation pumps, individual investment in water control is still
underdeveloped. Irrigation pumps were very popular in several villages. Farmers identified
pumps as an efficient way to overcome the lack of hard irrigation infrastructure such as a dam,
while simultaneously reducing the likelihood of production lost due to drought and in some cases
flooding. Pumps are used to drain water from flooded fields. Farmers also used pumps during the
dry season, thus increasing the possible number of harvests per year as well as crop productivity.
On the other hand, farmers were not using more modern irrigation technologies such as drip
irrigation and greenhouses, often used for vegetable production in other countries, except in a few
isolated cases.
36 Defined as the percentage change in production due to a percentage change in irrigated water.

53
Figure 27: Irrigation, Cambodia, 2013
1. Change in the use of and perspectives on pump irrigation
Source: Individual farmers’ survey.
2. Perceived impacts of flooding (L) and drought (R) on agricultural productivity
Source: FGDs.
Other agricultural facilities
123. Expansion of cultivated areas and mechanized agricultural production increased the
need for drying and storage facilities. Results from the FGDs show that about one in three
villages was concerned with drying and storage facilities (Figure 28.1 and Figure 28.2), a
constraint that mostly affected medium-size to large farms. The increased need for storage and
drying facilities was directly caused by the mechanization of harvest and post-harvest activities.
With mechanization, farmers face a high volume of wet products within a short period of time. To
reduce losses and preserve product quality, farmers need to have adequate storage and drying
facilities. Drying facilities became a priority for some villages in the past two years. During the
FGDs, farmers complained about the low prices offered by middlemen and crop collectors for wet
products. Without adequate drying and storage facilities, farmers were obliged to sell at the
prevailing prices, often determined by the buyers.
124. Farmers were also concerned about the lack of social infrastructure, especially
sanitation and potable water (Figure 28.3 and Figure 28.4). In its Rectangular Strategy, the RGC
states that “water supply and sanitation” is a critical element of rural development. The government

54
planned to increase access to sanitation from 23 percent of the rural population in 2008 to 33
percent in 2013, and access to drinking water from 40 percent in 2008 to 50 percent in 2015. The
overall health of farmers’ family members will be improved by greater use of adequate sanitation
facilities and better access to drinking water. This will indirectly increase agricultural labor
productivity by reducing the number of days of illness, for example. The entire value chain may
benefit from this infrastructure due to greater prevention of contamination of fresh fruits and
vegetables. Regulations in importing countries sometimes require a minimum level of
infrastructure in sanitation and access to drinking water at production and processing units before
products are eligible for export.
Figure 28: Agricultural facilities, Cambodia, 2013
1. Change in the use of agricultural facilities 2. Perceived impact of lack of storage facilities
on agricultural production
3. Perceived impact of lack of adequate sanitation facilities (L) and water distribution (R) on
agricultural production
Source: FGDs.

55
4. CHANGES IN FARM BUDGETS AND FARM PROFITABILITY
4.1. Introduction
126. Chapter 3 described the transformational changes taking place in Cambodian
agriculture. Over the last decade, farmers have gotten better access to modern inputs and finance,
and they get extension advice from various sources. They use more inputs as a result, and labor is
being replaced by mechanized services. Farmers have better access to markets. All these
improvements have increased the adoption of yield-increasing technologies. On the other hand,
the quality of public programs has not been satisfactory. Farmers want more and better agricultural
extension, combined with public and private delivery mechanisms. They want better price and
market information. They seek to gain benefits from collective action. And they also want lower
production and marketing costs to be achieved through better quality of irrigation and other
infrastructure investments. This hints at the issues related to total factor productivity (TFP).
Farmers use more inputs to maximize gross revenues but do not necessarily receive adequate
public agricultural services to use these inputs as efficiently as possible to maximize incomes.
127. The 2013 survey collected detailed farm production information to understand the
impact of the above changes in the agriculture sector on farm incomes. This information
includes revenues, variable and fixed costs, gross margins, and returns to labor for each farm
budget model. Surveyed farmers were selected based on their crops, their level of use of modern
technology, and the area of cultivated land allocated to specified crops. Wet season rice, dry season
rice, cassava, maize, and vegetables were chosen for study as they best characterize the changes
in Cambodia’s farming systems since the mid-2000s.
128. Farms were characterized as small, medium or large. This categorization varies by the
crop (Table 25). For cassava, small is a farm cultivating less than 5 ha, medium is between 5 ha
and 10 ha, and large is over 10 ha. For maize and rice, small is below 1 ha, medium is between 1
ha and 3 ha, and large is over 3 ha. Vegetables are quite difficult to categorize because most farms
would be considered small. It was decided to categorize farmers with less than 0.3 ha as small,
between 0.3 and 0.5 ha as medium, and over 0.5 ha as large. The purpose of the categorization was
to assess the likely impact of farm size on farm productivity and profitability.
Table 25: Categorization of farm size by cultivated crop areas, Cambodia
Farm Size
Commodity Small Medium Large
Wet season rice Less than 1 ha Between 1 and 3 ha More than 3 ha
Dry season rice Less than 1 ha Between 1 and 3 ha More than 3 ha
Cassava Less than 5 ha Between 5 and 10 ha More than 10 ha
Maize Less than 1 ha Between 1 and 3 ha More than 3 ha
Vegetables Less than 0.3 ha Between 0.3 and 0.5 ha More than 0.5 ha
129. Figure 29 presents the average farm size of the individual farmers interviewed in the
2013 survey. The average size was: 1.80 ha for wet season rice farmers; 4.15 ha for dry season
rice producers; 8.25 ha for cassava farmers; 4.82 ha for maize farmers; and 0.41 ha for vegetable
farmers. The average size of large cassava farms, for example, was above 17 ha, while for large

56
vegetable producers, the average farm size was only 2.37 ha. Average farm size by crop for the
current study may differ from the national figures37 because of the use of purposive sampling for
the selection of farms. This survey selected similar numbers of farms (one to two) using the criteria
of farm size and level of technology use.
Figure 29: Average land by farm size and crop, Cambodia, 2013
Source: 2013 survey.
130. In addition to the grouping by size, farmers were grouped into two categories of
technology use: traditional and modern. This grouping was based on initial criteria (such as use
of improved seeds, use of fertilizers and chemicals, mechanization, and irrigation) that were then
used to carry out a factor analysis to identify similar farmers. An example of factor analysis output
is presented in Box 5. For the data collection and analysis, two to three farmers were selected
within each category as defined by crop, farm size, and technology use. This sample selection
process selected a possible range of farmers who may not be statistically representative.
37 Overall, 48 percent of rural households in Cambodia hold less than 1 ha of agricultural land, though the difference between
provinces can be significant according to the MAFF crop data assessments of 2003 and 2004.

57
Box 5: Factor Analysis and Modern versus Traditional Farmers
The decision to categorize farmers as using traditional or modern technologies is not
straightforward. No clear separation exists between users and nonusers of modern technologies
in agriculture. Most farmers adopt at least one modern technology, and in practice, farmers are
in a continuum of use for each technology. For example, very few farmers do not adopt chemical
fertilizers, but for those who do the quantity applied varies from very little to very high.
In this analysis, principal components factor analysis was used to reduce the optimal
combination of several independent variables into one score index that ranks farmers along one
dimension. The goal is to characterize farmers as modern or traditional based on their level of
use of modern inputs, labor, and services. The following factors were retained for the analysis:
use of modern inputs (improved seeds, fertilizers, and pesticides), use of agricultural services
(land preparation, harvest, post-harvest, irrigation), and use of labor (modern farms have lower
use). These variables were used to compute the rank of each farm into one latent variable, the
projection of each farm from a multi-dimensional to a one-dimensional space. The analysis was
conducted by crop.
131. The main elements of a farm budget are gross revenue, variable costs, gross margins,
and returns to labor, defined as follows:
a. “Gross revenue” is the amount received by farmers assuming that the entire production is
sold at the farm gate price determined by farmers. Additional revenues obtained through
the sale of byproducts are also taken into account. For example, in the case of paddy, gross
revenue includes sales of straw for paddy rice.
b. “Variable costs” are the amount spent by households for the production of the crop,
excluding the costs of family members’ labor or the use of households’ agricultural assets
for agricultural production. Total variable costs do not take into account the depreciation
of households’ agricultural equipment. In general, variable costs include: input
expenditures (improved seeds, manure, fertilizers, and chemicals – herbicides and
insecticides); expenditures on hired labor (land preparation, sowing, plantation, and
transplantation, weed control, crop management, labor for irrigation, manual harvest and
post-harvest tasks); and costs of services (land preparation, plantation, irrigation, harvest
and post-harvest, and transportation).
c. “Gross margin” is gross revenue minus variable costs (Box 6). It is the remuneration of
farmland, labor, and capital, as well as the profit received by farmers from production
activities. Given that very few farmers rent land and own machinery, gross margin in
Cambodia can be considered a remuneration to labor and farm management, which allows
the calculation of the returns to own labor, the next indicator.
d. “Returns to labor” is the gross margin divided by man-hours of own farm household labor
spent on the production of specific crops.

58
Box 6: Gross Margin versus Value Added
The concept of farm gross margin is similar to the concept of value added
but it is not identical. The difference is in the treatment of hired labor.
Value added is defined as gross revenue less intermediate inputs, while
gross margin is gross revenue less intermediate inputs and hired labor.
Depending on changes in the cost of hired labor, value added can differ
from gross margins, sometimes significantly.
132. The results of the 2013 survey were compared with the 2005 study,38 which combined
primary data with data from secondary sources, including the 1992/93 and 1997/98 NIS
socioeconomic surveys’ datasets, market price data collected by Marketing Office/MAFF,
and various studies undertaken in Cambodia. The primary data sources comprise focus
discussions with key informants at the district level in representative agro-ecological zones. The
list of key informants included local NGOs working in agriculture, forestry, and livestock
development, a sample of producers (small, medium, and large) of major commodities, marketing
agents, processors, and representatives from government agencies based at the district level.
133. Change over time was assessed by comparing data from the 2005 and 2013 surveys.
These changes are presented in nominal and real terms. The GDP deflator was used to obtain real
term results. The cumulative GDP deflator between 2005 and 2013 was 35 percent, according to
the International Monetary Fund (IMF). Price data were converted into US$, using the exchange
rate of Riels 4,000 to 1 US$.
4.2. Results of the 2013 Survey
134. Farmers got the highest total revenue per hectare from vegetable production
($2,843/ha), followed by cassava ($1,297/ha) and dry season rice ($992/ha). Wet season rice
($756/ha) and maize ($744/ha) were in between. Modern farms tend to generate larger revenues
per hectare than traditional farms for all crops; the largest difference is for vegetables and the
smallest is for dry season rice (Figure 30). Annex 3 presents detailed farm budgets for each crop
and farm type.
38 The 2005 survey was conducted as a part of the World Bank’s Cambodia Agrarian Structure Study (2008). The
2005 survey collected 2004 wet season and 2005 dry season data (the 2004/05 marketing season), and the 2013
survey collected 2012 wet season and 2013 dry season data (the 2012/13 marketing season).

59
Figure 30: Gross revenues ($/ha) by crop and farm practice, Cambodia, 2013
Note: The revenue from vegetables for modern farms does not fit into the scale of this figure, and thus is
not shown.
Source: 2013 survey.
135. In general, farmers using modern technologies had higher yields and often sold their
products at higher prices. The price of paddy for wet season modern producers was $242/ton
versus $235/ton for traditional farmers; modern maize farmers received 21 percent more ($235/ton
versus $195/ton); and cassava producers got slightly higher prices at $161/ton versus $157/ton.
The combination of higher yield and higher prices of outputs resulted in higher gross revenue for
modern farmers.
136. Similar to revenues, total variable costs were highest for vegetable producers. They
averaged $1,481/ha. Total variable cost for maize was $440/ha, wet season rice $510/ha, dry
season rice $696/ha, and cassava $791/ha, with differences between traditional and modern farms
(Figure 31). Total variable costs are a critical element in determining the choice of crops, the
cultivated areas, and the production strategy. If finance is a constraint for upland farmers, then
maize would be the best choice because it requires less upfront operational costs compared to
cassava. Similarly, growing dry season rice on irrigated land is less financially demanding than
growing vegetables, assuming the same cultivated area. High production costs of vegetables
explain the slow uptake in vegetable production in Cambodia.

60
Figure 31: Total variable costs ($/ha) by crop and farm practice, Cambodia, 2013
Note: The costs for vegetables for modern farms do not fit into the scale of this figure, and are thus not
shown.
Source: 2013 survey.
137. Variable costs are influenced by many factors, including farmers’ financial position,
technology choices, and input prices. Hired labor accounted for the largest share of total variable
costs for wet season rice and vegetable producers (Figure 32). Inputs and mechanized services
were important for all crops, except vegetables. On average, expenditures of modern farmers
exceeded those of traditional farmers, with the magnitude varying by type of crop: 10 percent for
cassava, 40 percent for maize, 20 percent for dry season rice, and more than 200 percent for
vegetables (Annex 3). These costs were mostly related to purchase of modern inputs and hiring
labor.
Figure 32: Breakdown of cost structure by crop, Cambodia, 2013
Source: 2013 survey.
138. In 2013, farmers producing vegetables got the highest nominal gross margins per
hectare. For one hectare under cultivation, farmers had a gross margin of $1,394 for vegetables,
$506 for cassava, $296 for dry season rice, $304 for maize, and $245 for wet season rice (Table
26). Gross margins were much higher for farmers using modern technologies, except for dry

61
season rice, while the impact of farm size on gross margins was not uniform (see more discussion
on economies of scale below).
Table 26: Gross margin ($/ha) by crop, technology use, and farm size, Cambodia, 2013
Farm Size
Commodity Small Medium Large Total
Overall Sample ($/ha)
Wet season rice 207 270 240 245
Dry season rice 307 283 297 296
Cassava 544 438 512 506
Maize 244 336 330 304
Vegetables 1,575 747 306 1,394
Users of Modern Technologies ($/ha)
Wet season rice 522 415 341 400
Dry season rice 276 174 283 255
Cassava 774 788 609 695
Maize 282 504 522 396
Vegetables 2,239 - -292 2,155
Users of Traditional Technologies ($/ha)
Wet season rice 117 236 71 178
Dry season rice 312 349 415 336
Cassava 493 298 416 422
Maize 119 192 253 212
Vegetables 611 747 505 633
Source: 2013 survey.
139. Returns to labor varied from $4.62/day to $9.58/day, depending on the crop (Table
27). The returns to labor were well above the prevailing wages paid to hired labor in 2013,
averaging $4.5/day. Overall, one day spent working on cassava production yielded $9.43 in return.
For wet season rice, the return was $4.62/day, slightly higher than the daily cost of hired labor for
medium-size wet season rice farms, but there was a huge difference between modern farmers
($12.67/day) and traditional farmers ($2.86/day). Dry season rice provided the highest returns to
labor ($9.58/day), because of the very low share of labor in its cost composition, especially for
large farms. Other crops showed a pattern similar to that observed for wet season rice: higher
returns to labor when farmers used modern technologies.

62
Table 27: Returns to labor ($/day) by crop, technology use, and farm size, Cambodia, 2013
Farm Size
Commodity Small Medium Large Total
Overall Sample ($/day)
Wet season rice 2.99 4.83 8.2 4.62
Dry season rice 6.15 8.27 22.83 9.58
Cassava 10.71 6.82 10.62 9.43
Maize 5.89 9.51 12.12 8.83
Vegetables 7.1 12.88 3.8 7.21
Users of Modern Technologies ($/day)
Wet season rice 8.73 9.24 27.98 12.67
Dry season rice 90.61 74.36 55.3 60.04
Cassava 13.75 8.58 12.17 11.2
Maize 6.32 12.09 38.1 10.56
Vegetables 7.54 - - 7.54
Users of Traditional Technologies ($/day)
Wet season rice 1.62 4.05 1.23 2.86
Dry season rice 5.4 6.54 5.43 5.85
Cassava 9.95 5.6 8.94 8.45
Maize 3.83 6.42 7.81 6.75
Vegetables 5.42 12.88 6.31 6.53
Source: 2013 survey.
140. In most cases, small farms generated similar gross margins per hectare as larger
farms. Only maize production and, to a limited extent, dry season rice production for traditional
technology adopters showed higher returns as farm size increased (i.e., economies of scale). In
these two cases, large farms had higher gross margins per hectare compared to medium-size and
small farms (Table 26). For maize production, large farms using modern technologies had about
twice the gross margins of small farms ($522/ha versus $281/ha) and medium farms about three-
fourths higher ($504/ha versus $281/ha). Similar trends were observed for farmers practicing
traditional techniques, with $253/ha, $191/ha, and $118/ha for large, medium-size, and small
farms, respectively.
141. For vegetable production and modern farmers growing wet season rice, gross
margins per hectare were higher for small farms. Small vegetable farms had the highest gross
margin per hectare, with an average of $2,239/ha when adopting modern technologies. Even for
farmers using traditional techniques, gross margins calculated from small farms’ budgets were 17
percent higher than large farms’ gross margins. Lower returns for larger farms may be due to
several factors. The theory of indivisibility of assets does not hold for most agricultural tasks. For
example, during land preparation farmers have a choice between using draught oxen and ox-plows,
power tillers, and small mechanized equipment, and tractors that are available in different sizes
and powers. For harvest, farmers’ options range from the use of manpower to the use of combines;
reapers and threshers lie in between. Farmers may adopt specific strategies depending on

63
household endowment to maximize either production (for food-insecure households) or profit (for
commercial smallholders). Decreasing economies of scale may also be the consequence of small
farms’ higher efficiency compared to large farms. For farmers with low literacy, management
difficulties in addition to increased risks may reduce efficiency as scale expands. For example, a
large farm that cultivated 3 ha of watermelon in Battambang ended up with a total gross loss of
$876 ($292/ha). Indeed, vegetable production is prone to several critical phases that require timely
and adequate management decisions. Poor management of frequent pest attacks, lack of irrigation
water during the growing period, or issues of product perishability during harvest and post-harvest
periods will reduce the efficiency in vegetable production. Under these constraints, farmers are
more vulnerable to production and price risks.
142. Yet the analysis of the returns to labor shows clearly increasing returns as farm size
increases. Returns to a day of labor for wet season rice production increased from $2.86/day for
small farms to $12.67/day for large farms (Table 27). The average return for wet season rice was
$4.83/day. Maize production showed very similar trends: medium-size farms exhibited 61 percent
higher returns to labor compared to small farms and large farms twice as high, at $12.19/day. Dry
season rice production showed the highest impact of farm size on returns to labor with $6.15,
$8.27, and $22.83 for small, medium-size, and large farms, respectively. For cassava, the size of
farms seemed not to affect returns to labor. Returns to labor for large farms seem to benefit from
the reduced labor for management and crop monitoring. It may also benefit from better access to
capital, resulting in higher use of labor-saving equipment. Large farms may also have lower costs
of transactions and transportation, both for inputs (consolidation of purchase) and
commercialization, which would affect assembly costs (consolidation of sales).
143. The returns to labor for small farms producing rice during the wet season were below
the prevailing wage rate. This has a direct impact on tackling poverty reduction because wet
season rice still constitutes 83 percent of total cultivated rice land, comprising most smallholder
farmers. This is critical for poverty reduction policy because returns to labor determine farmers’
wealth, and rice cultivation occupies more farmers in Cambodia than any other crop.
144. A higher level of technology use enhances returns to labor. Farmers using a higher level
of technology had much higher returns to labor, regardless of farm size (Table 27). The ratio was
about 1 to 2 for maize, 1 to 10 for dry season rice, and 1 to 4 for wet season rice. Vegetable and
cassava producers had the least impact of technology use on returns to labor, although modern
cassava farmers had a 30-50 percent higher return than traditional farmers.
4.3. Comparison of the 2005 and 2013 Survey Results
145. In nominal terms, all 2013 gross margins were above the 2005 values, except for maize (Table 28 and Figure 33). A comparison of the gross margins between the two periods shows that
vegetable producers got five times more than the $284/ha received in 2005; the gross margin for
cassava increased 2.5 times from $198/ha; and dry season rice doubled from $195/ha. However,
maize was reduced by 50 percent, from $574/ha to $304/ha.

64
Table 28: Comparison of key farm budget indicators, $/ha, Cambodia, 2005 and 2013
Total Revenue
2005
($/ha)
2013
($/ha)
Change
(%)
Cassava 375 1,297 246
Maize 708 744 5
Wet season rice 345 756 119
Dry season rice 398 992 150
Vegetables 433 2,843 556
Total Variable Costs
Cassava 178 791 346
Maize 134 440 229
Wet season rice 186 510 174
Dry season rice 202 697 245
Vegetables 149 1,449 893
Gross Margins
Cassava 198 506 156
Maize 577 304 -47
Wet season rice 159 245 55
Dry season rice 195 296 51
Vegetables 284 1,394 380
Source: 2005 and 2013 surveys.
146. These changes were driven by changes in yields and prices of outputs and inputs.
From 2005 to 2013 (survey data), cassava prices increased by 200 percent, paddy rice prices by 90
percent, maize prices by 64 percent, and vegetable prices from 60 percent (eggplant) to 233 percent
(watermelon). During the same period, prices of inputs almost tripled for seeds and labor ($1.2/day
to $4.5/day), and doubled for fertilizers (urea from $0.30/kg to $0.56/kg and DAP from $0.35/kg
to $0.68/kg).
147. The structure of costs, especially for the use of labor, also showed radical changes,
with sharp declines of 20 percent (maize) to 70 percent (dry season rice). The lower labor use was
a response to rising wages and availability of mechanization services in rural areas. The exception
was vegetables, where the labor use increased five-fold, from 38 days/ha to 176 days/ha. Since the
2005 survey included a mix of vegetables while the 2013 survey focused on four main vegetable
crops,39 this huge shift may be due to the change in the types of vegetables produced.
148. In 2013, farmers used more modern inputs per hectare, especially improved seeds
and fertilizers. In 2005, surveyed farmers applied an average 100 kg/ha of fertilizers (all
combined) for dry season rice production. This quantity was 2.5 times higher in 2013, reaching
250 kg/ha. The same pattern was observed for vegetables, with an increase from 110 kg/ha to 295
kg/ha. The rates of application for wet season rice (120 kg/ha) and maize (50 kg/ha) did not change
much. However, the rate of application decreased for cassava from an average 30 kg/ha to 10 kg/ha
in 2013.
39 Cucumber, mustard, eggplant, and watermelon.

65
Figure 33: Comparison of nominal gross margins ($/ha), Cambodia, 2005 and 2013
Source: 2005 and 2013 surveys.
149. In nominal terms, the sum of gross margins for all selected crops more than doubled,
from $469 million in 2005 to $1,067 million in 2013. The cumulative increase was 103 percent,
or 13 percent per year. This increase was driven by both the expansion in land area (37 percent)
and the per hectare gross margins (63 percent) (Table 29). The smallest increase in total margin
was observed for maize: 90 percent from 2005 to 2013; the largest increase was observed for
cassava: 1,180 percent.
Table 29: Comparison of total crop budgets, Cambodia, 2005 and 2013
2005 2013
Crop Unit
Margin
($/ha)
Cultivated
Land
(ha)
Total
Margin
($ million)
Unit
Margin
($/ha)
Cultivated
Land*
(ha)
Total
Margin
($ million)
Wet season rice 159 2,121,591 337 245 2,484,832 609
Dry season rice 195 321,939 63 296 495,465 147
Cassava 198 30,032 6 506 337,800 171
Maize 577 90,732 52 304 215,442 65
Vegetables 284 35,762 10 1,394 54,155 75
Total 180 2,600,056 469 298 3,587,694 1,067
Note: * Land area is used for the year 2012.
Source: 2005 and 2013 surveys.
150. In real terms, however, the growth in total gross margins was smaller. It rose by 68
percent during 2005-2013, or 9 percent a year (Table 30). This increase was due to the 38 percent
change in cultivated crop land and 30 percent increase in per hectare gross margin. Unit margins
increased for all crops except maize.

66
Table 30: Changes in crop margins in nominal and real terms, Cambodia, 2005 and 2013
Crop
Change in
Unit Margins
Between 2005
and 2013 (%)
Change in
Cultivated
Land
Between 2005
and 2013 (%)
Change in
Total
Margins
Between 2005
and 2013 (%)
Change in
Unit Margins
in Real
Terms (%)
Change in
Total
Margins in
Real Terms
(%)
Wet season rice 54 17 71 19 36
Dry season rice 52 54 106 17 71
Cassava 156 1,025 1,180 121 1,145
Maize -47 137 90 -82 55
Vegetables 391 51 442 356 407
Total 65 38 103 30 68
Note: The cumulative GDP deflator from 2005 to 2013 was 35 percent.
Source: 2005 and 2013 surveys.
151. There are differences in the sources of growth across crops. Although cassava’s per
hectare profitability grew annually by 15 percent, the most growth in total gross margin came from
land expansion (Table 31). The problem with that growth is that land expansion in cassava is
unsustainable, since it is carried out through exploitation of soils that were previously forest land.
Most growth in maize and dry season rice also came from land expansion. But in the case of wet
season rice and especially vegetables, the increase in total gross margin was mostly due to the
increase in per hectare profitability. On average, the total gross margin for all crops considered
increased 8.2 percent per year, due to 4.7 percent land expansion and 3.4 percent in per hectare
margins.
Table 31: Annual changes in crop margins in real terms, Cambodia, 2005 and 2013
Change in cultivated
area between 2005 and
2013 (%)
Change in unit gross
margin between 2005
and 2013 (%)
Change in total gross
margin between 2005 and
2013 (%)
Wet season rice 2.1 2.4 4.5
Dry season rice 6.7 2.1 8.8
Cassava 128.1 15.1 143.2
Maize 17.2 -10.3 6.9
Vegetables 6.4 44.5 50.9
Weighted
average 4.7 3.4 8.2
Source: 2005 and 2013 surveys.
152. The increase in agricultural production and farm profitability has led to an increase
in the returns to own farm household labor. The returns to labor in real terms increased by 84
percent for wet season rice, 254 percent for cassava, and 278 percent for dry season rice

67
(Table 32).40 But the returns to labor fell for maize and vegetables. The significant increase in the
returns to labor for rice and cassava was a result not only of higher total gross margins but also of
the reductions in labor used in production. The reduction in labor used ranged from 19 percent for
maize to 69 percent for dry season rice (i.e., the structural transformation in action). Vegetables
were the only crop where labor use increased over the observed period. This led to the decline in
returns to labor in both nominal and real terms. Labor is being increasingly replaced by mechanized
services in Cambodia.
Table 32: Changes in returns to labor in nominal and real terms, Cambodia, 2005 and 2013
Labor ($/ha) 2005 2013
Change in
Nominal Terms
(%)
Change in
Real Terms
(%)
Cassava 104.81 227.40 117 54
Maize 46.49 142.85 207 144
Wet season rice 101.81 220.21 116 53
Dry season rice 107.88 126.50 17 -46
Vegetables 45.83 802.10 1,650 1,587
Labor (days/ha)
Cassava 87.34 49.87 -43
Maize 38.74 31.33 -19
Wet season rice 84.84 48.29 -43
Dry season rice 89.90 27.74 -69
Vegetables 38.19 175.90 361
Returns to labor ($/day)
Cassava 2.26 9.43 317 254
Maize 14.82 8.83 -40 -103
Wet season rice 1.87 4.62 147 84
Dry season rice 2.17 9.58 341 278
Vegetables 7.43 7.21 -3 -66
Note: The cumulative increase in the consumer price index between 2005 and 2013 was 63 percent.
Source: 2005 and 2013 surveys.
153. As a result of increasing returns to labor, agricultural wages in general rose,
converging with nonfarm wages. Agricultural wages grew by a factor of almost three between
the 2005 and 2013 surveys (Error! Not a valid bookmark self-reference.).41 Over the same
40 The adjustment factor for converting the returns to labor from nominal to real terms is the consumer price index
(inflation), which includes prices of both food and non-food items. This index shows changes in the purchasing
power of farmers, and is higher than the GDP deflator used to deflate gross margins. The GDP deflator includes only
intermediate inputs used for production. 41 This agricultural wage increase between 2005 and 2013 surveys is much higher than the 48 percent agricultural
wage increase from 2007 to 2009 reported in the 2013 poverty assessment. There are several reasons for this
difference. First, the surveys have different household coverage. Second, the poverty assessment does not include
the 2005-2007 and 2009-2013 time periods. The increase was especially rapid between 2011 and 2013 when wages
grew again after the slowdown during 2009-2011 in the aftermath of the global financial crisis.

68
period, nonfarm wages increased by only 60 percent. As a result, the gap between farm and
nonfarm sector wages declined. Thus agriculture appears to have provided excellent income-
earning opportunities in Cambodia over the last decade.
Figure 34: Farm wage, off-farm wage, and returns to agricultural labor ($/day), Cambodia
Source: 2005 and 2013 surveys.

69
5. COMPETITIVENESS OF CAMBODIAN FARMS
5.1. Introduction
154. Chapter 4 described the farm income situation in Cambodia. One of the findings is the
rising production costs, especially for maize and rice. In most cases, the rise in production costs is
compensated by higher revenues. The question, however, is how the increase in production costs
affects farm competitiveness.
155. Farm competitiveness in Cambodia is analyzed using the Domestic Resource Cost
(DRC) approach developed by Tsakok (1990). DRC measures a country’s efficiency in using
domestic resources to produce specific goods. The key question DRC answers is whether a country
has a comparative advantage in producing a certain good or if import is a better option so that
domestic resources may be used to produce other commodities that result in higher profit. A DRC
less than one suggests comparative advantage and efficiency in production: the domestic
opportunity costs of producing the selected good are less than the domestic value added generated
by the production process. Conversely, a DRC greater than one implies that production is
inefficient and that foreign exchange would be better spent importing the product rather than
producing it domestically.
156. The DRC is computed based on the following assumptions:
a. The foreign exchange premium is set to zero. In Cambodia, the foreign exchange rate is
not a source of distortion because of the dollarization of the economy (i.e., US dollars and
Riel are freely interchangeable within the country).
b. The capital recovery costs of agricultural equipment are not computed. The rental costs of
equipment paid by farmers, including for irrigation using pumps, are split 80:20 percent,
where 20 percent represents the cost of fuel, a tradable commodity. For transportation and
irrigation, the estimated ratio is 60 percent nontradable and 40 percent tradable. The
assumption is that the opportunity cost of equipment can be approximated by the rental fee
because of the existence of a competitive market for agricultural equipment rental.
c. Land price is set to zero so that the social profit includes returns to land and to management.
d. A first set of DRCs is computed using average distances of 70-100 km from the production
site to the export location for agricultural outputs, and conversely, from the off-load port
to input suppliers’ stores. This is the average distance between Battambang, Kandal, or
Bantey Meanchey to the nearest border. Transportation cost is assumed to be Riel
32,000/ton ($8/ton). One to two provinces per crop were selected to compute the DRCs,
taking into account the specificity of farm budgets in each region.
e. The reference international prices used in the analysis are those of Thailand Hom Mali
grade A rice, Thailand Bangkok 5 percent broken rice, maize yellow grain, and dried
cassava chips.
157. The computed DRCs illustrate Cambodia’s high comparative advantage in
agricultural production. The country has an advantage in producing most agricultural products.
All of the DRCs are below one, with some very low, such as those for maize and cassava
production, revealing a strong advantage in using domestic resources (Table 33). Least competitive

70
is wet season paddy production, the costs of which should be monitored closely to avoid losing its
comparative advantage in the future.
Table 33: DRCs for selected agricultural crops, Cambodia, 2013
Commodity DRC
Dry season rice (paddy) Kandal 0.69
Dry season rice fragrant (paddy) Kandal 0.43
Dry season rice (paddy) Bantey Meanchey 0.61
Milled rice (IRRI 5% broken) 0.54
Wet season rice (paddy) Takeo 0.78
Wet season rice (paddy) Bantey Meanchey 0.54
Wet season rice (paddy) Kampot 0.86
Wet season rice fragrant (paddy) Kampot 0.61
Milled rice fragrant Kampot 0.39
Cassava (dried chips) All 0.39
Cassava (dried chips) Battambang 0.35
Maize (grain) All 0.35
Maize (grain) Bantey Meanchey 0.35
Maize (grain) Kampong Cham 0.22
Source: Own estimates based on the 2013 survey data.
5.2. Domestic Resource Cost for Rice
158. Comparative advantage depends on the variety of cultivated rice but, overall, rice is
produced competitively across the country. Wet season rice production for IRRI varieties in
Takeo has a DRC of 0.78 (yield of 2.88 tons/ha), the closest of Cambodia’s computed DRCs to
inefficient use of domestic resources (i.e., a DRC greater than one). However, farmers producing
fragrant rice have a greater comparative advantage, with a DRC of 0.61 in Kampot (yield of 2.5
tons/ha). Despite the lower yield for fragrant rice, the main difference in DRCs is due to the prices
of these varieties. The same pattern is observed for dry season rice. IRRI varieties have a DRC of
0.61-0.69 (yield of 4.8 tons/ha), more than 50 percent higher compared to fragrant variety rice with
a DRC of 0.43 (yield of 4.0 tons/ha).
159. How large is the reserve in comparative advantage? In other words, how sensitive is it
to future changes in costs, prices, and types of technology use? For dry season rice, for example,
a 50 percent decrease in the cost of agricultural services would result in a 29 percent decrease in
the DRC, from 0.60 to 0.43; i.e., Cambodian dry season rice would enjoy a relatively higher
comparative advantage. This simulation is based on farmers using water pump irrigation; a
different DRC would arise in the presence of public investment in adequate irrigation. An increase
in the price of modern inputs (seeds, fertilizers, and other chemicals) would worsen the
comparative advantage of dry season rice production (DRC increases from 0.60 to 0.79). In all of

71
the sensitivity analyses, the simulated DRCs change but remain below the threshold of one,
indicating Cambodia’s advantage in producing rice (Table 34).
160. By location, Bantey Meanchey province has a greater comparative advantage in
producing dry season rice (DRC=0.61) than Kandal province (DRC=0.69). The ratio of
tradable components to variable costs in these two provinces differs significantly (26 percent of
tradable components for Kandal and 44 percent for Bantey Meanchey). In fact, farmers from
Bantey Meanchey allocate more chemical fertilizers and less labor for dry season rice production,
resulting in a higher dependence on tradable inputs. Access to and cost of irrigation water,
however, may change the DRC for Bantey Meanchey, as farmers spent close to 19 percent of total
variable costs on irrigation compared to less than 3 percent for farmers in Kandal.
Table 34: Sensitivity analysis of impacts of changes of production costs on DRC for rice
Dry Season Rice Decrease in the Cost of Services Increase in the Cost of Inputs
% change in the factors 0% 10% 20% 50% 0% 10% 20% 50%
DRC 0.60 0.56 0.53 0.43 0.60 0.63 0.67 0.79
% change in DRC 0% -7% -13% -29% 0% 5% 10% 30%
Wet Season Rice Decrease in the Cost of Services Increase in Yield
% change in the factors 0% 10% 20% 50% 0% 10% 20% 50%
Simulated yield (kg/ha) 2,880 3,168 3,456 4,320
DRC 0.98 0.95 0.91 0.80 0.98 0.88 0.79 0.61
% change in DRC 0% -4% -8% -19% 0% -11% -19% -38%
Source: Own estimates based on 2013 survey data.
161. Wet season rice production’s sensitivity analysis was conducted using the price for
IRRI high-yielding varieties, a pathway Cambodia may take to improve its rice value chain.
A 10 percent increase in rice yield (from actual 2.88 tons/ha to 3.17 tons/ha) corresponds to an 11
percent decrease in the DRC (DRC=0.88), making the country more competitive in producing
high-yielding rice varieties. A 50 percent increase in yield (4.3 tons/ha) results in a 38 percent
decrease in the DRC (DRC=0.61). The decrease in the DRC is not linear; for example, doubling
average rice yield to 5.76 tons/ha would only result in about a 50 percent decrease in the DRC,
and this sensitivity analysis does not take into account the additional cost of inputs required to
attain this high level of productivity. Still, even with a 20 percent increase in yield (DRC=0.79),
the DRC for high-yielding varieties remains above the DRC for fragrant rice (DRC=0.61),
indicating that it is advantageous for Cambodia to focus on fragrant rice. To get to similar DRCs
with fragrant rice production, the yield for IRRI varieties would need to increase by about 50
percent, from 2.88 tons/ha to 4.3 tons/ha (Table 34), an increase that would require additional
costs.
162. Takeo (DRC=0.78) shows an advantage over Kampot (DRC=0.86). Takeo’s DRC is 15
percent lower, as its farmers use slightly more modern inputs than their peers in Kampot, and thus
were able to get higher yield (20 percent more at 3.1 tons/ha). Again in this case, the comparative
advantage is driven by the difference in yield.

72
5.3. Domestic Resource Cost for Cassava and Maize
163. For non-rice crops, Cambodia’s highest comparative advantage is in maize
production (DRC=0.35), followed by cassava production (DRC=0.39). For cassava,
nontradable costs represent more than 87 percent of total variable costs, indicating that few policy
adjustments related to tradable inputs are available to improve the comparative advantage of this
crop (Table 33). However, cassava production still uses relatively high amounts of labor, so
changes in labor cost may affect cassava’s comparative advantage. A sensitivity analysis showing
the effect of change in labor cost is presented in Table 35. Every 10 percent increase in the cost of
hired labor would result in an increase of cassava’s DRC by 3-4 percent; a 50 percent increase
would lead to a loss of about 17 percent in Cambodian cassava production’s comparative
advantage. Labor cost is likely to increase in the near future if Cambodia continues its path toward
agricultural transformation, stimulating more competition between labor available for agricultural
versus nonagricultural work.
164. Battambang province has a better-than-average DRC (0.35 versus 0.39). Cassava yield
is slightly higher in this province compared to the average (20.4 tons/ha versus 18.4 tons/ha).
Cassava production is also less dependent on changes in the prices of tradable inputs (fertilizers,
pesticides). A 10 percent increase in the world prices of these inputs will only increase cassava’s
DRC by 1 percent.
Table 35: Sensitivity analysis of impacts of changes in production costs on cassava and
maize DRCs
Cassava Decrease in Yield Increase in the Cost of Labor
% change in the factors 0% 10% 20% 50% 0% 10% 20% 50%
Simulated yield (kg/ha) 18,650 16,785 14,920 9,325
DRC 0.39 0.43 0.49 0.81 0.39 0.40 0.41 0.45
% change in DRC 0% 12% 27% 111% 0% 3% 7% 17%
Maize Increase in the Cost of Inputs Increase in Yield
% change in the factors 0% 10% 20% 50% -50% -20% 20% 50%
Simulated yield (kg/ha) 1,970 3,152 4,728 5,910
DRC 0.35 0.36 0.37 0.40 0.89 0.46 0.28 0.22
% change in DRC 0% 2% 5% 14% 154% 31% -20% -38%
Source: Own estimates based on 2013 survey data.
165. Cambodian farmers use relatively high amounts of modern inputs for maize
production. About 40 percent of the production costs for maize are tradable commodities,
implying that the comparative advantage of Cambodia for this crop closely depends on the world
market behavior. Overall, doubling the price of modern inputs (seeds, fertilizers, and chemicals)
would result in a 14 percent increase in maize’s DRC (0.40); i.e., Cambodia still has a strong
comparative advantage in producing maize.
166. To keep maize’s comparative advantage, the focus needs to be on maintaining its
relatively higher yield (3.9 tons/ha), which is currently not far from the average yields in
neighboring countries. A 20 percent decrease in average yield would result in a loss of 31 percent
of maize’s comparative advantage (DRC=0.46); and a 50 percent decrease (to 1,970 kg/ha) would

73
cause the country to lose most of its comparative advantage (DRC=0.88). On the other hand, any
increase in yield is expected to improve its advantage in producing maize (DRC= 0.22 with a 50
percent increase in yield, to 5.9 tons/ha).
167. Bantey Meanchey province has the least comparative advantage in maize production
(DRC=0.35), while Kampong Cham province has the highest comparative advantage
(DRC=0.22). The ratio 1:1.6 of the comparative advantage is partially related to the observed
yields in these provinces: 3.9 tons/ha versus 5.3 tons/ha for Bantey Meanchey and Kampong
Cham, respectively.
5.4. Summary
168. All commodities analyzed indicate Cambodia’s comparative advantage in
agricultural production. The comparative advantage is the strongest for fragrant rice, maize, and
cassava. However, wet season rice production has an almost neutral advantage. Fragrant rice has
a much higher comparative advantage than high-yielding IRRI varieties, and dry season rice has a
comparative advantage relative to wet season rice.
169. The advantage of agricultural production is strongly affected by price variation in the
world market. A 20 percent decrease in rice prices or a 20 percent increase in tradable input prices
would make wet season rice production uncompetitive (Table 36). Other crops have more room to
accommodate rising costs and falling prices, however, indicating a strong foundation for continued
strong agricultural growth in Cambodia for many years to come.
Table 36: Sensitivity analysis of impacts of changes in tradable input and output prices on
DRCs of all crops (except vegetables)
Scenario
Dry Season
Rice
Wet
Season
Rice
Cassava Maize
Current status DRC 0.60 0.98 0.39 0.35
10% increase in world price of
commodities
DRC 0.53 0.87 0.35 0.31
Change -11% -11% -9% -10%
20% decrease in world price of
commodities
DRC 0.83 1.32 0.49 0.46
Change 39% 35% 27% 33%
20% increase in world price of tradable
inputs
DRC 0.66 1.01 0.39 0.36
Change 10% 3% 1% 4%
Source: Own estimates based on 2013 survey data.

74
6. DRIVERS OF PAST GROWTH
170. Cambodia’s agricultural growth of the past decade can be interpreted as the outcome
of a number of factors. These positive factors or drivers can be divided into policy, connectivity
and investments, and incentives (Table 37). This list is not exclusive but it includes most important
drivers.
Table 37: Drivers of agricultural growth during 2002-2012
Policy Connectivity and Investment Incentives
(Food Prices and Wages)
• Market-oriented agricultural
and trade policies conducive
for private sector investments
• Trade integration with the
global economy and in
particular with ASEAN
countries
• Improved connectivity to
markets, technology, and
finance
• Private sector investments,
including FDI
• Higher food prices
originating from world
market structural changes
• Expansion of domestic
market due to the economic
growth
• Increase in labor cost
originating from migration of
labor out of agriculture
Source: Own assessment.
171. The most powerful factor behind the past agricultural growth was private sector
performance in Cambodia. It was the energy, resources, and entrepreneurship of farmers, traders,
and other businesses that made the growth possible. Cambodia’s agricultural and trade policy has
been generally market oriented and conducive to private sector development. Although the costs
of doing business in Cambodia are still high (World Bank 2014e), they would have been much
higher had the RGC introduced farm output or input subsidies or restricted exports at the time of
the food price spikes in 2007-2009. The market-oriented policy allowed farmers and entrepreneurs
to make undistorted decisions about production and trade and to respond to incentives. It allowed
the higher global rice prices that prevailed in the past decade to pass through to local markets. It
helped trigger a strong farm supply response to higher demand for agricultural commodities such
as rubber, cashews, and beef originating from neighboring countries, and facilitated farmers’
diversification towards upland crops such as cassava and maize in response to higher prices.
172. In the last decade, global agricultural markets experienced structural changes. Due
to a combination of factors that resulted in global demand for food exceeding global supply, global
food prices significantly increased after 2007-2008. The World Bank Food Price Index in real
terms increased by 43 percent between 2003-2006 and 2009-2013 (Table 38). The world market
prices of cereals, coffee, and rubber increased the most. The price increase in global markets has
passed through to Cambodia. As a result, in recent years the food CPI consistently exceeded non-
food CPI in spite of the rising agricultural production (Figure 35), pointing to the external factors
of food inflation in Cambodia.

75
Table 38: Global agricultural prices, selected commodities, $/ton (in real 2010 prices)
2003-2006 2009-2013 Change (%)
Maize, Yellow, US Gulf 128 230 80
Rice, 5% Thai 298 513 72
Wheat, Hard Wheat, US Gulf 190 266 40
Rubber, Asia, TSR 20 1,720 3,170 84
Coffee, Robusta, New York 1,220 1,940 59
Beef, Australia/New Zealand 2,810 3,500 25
World Bank Food Price Index 71.22 102.17 43
Source: World Bank Pink Sheets.
Figure 35: CPI and food price index in Cambodia, 2002-2012
Source: NIS 2014.
173. Located in the heart of the Greater Mekong subregion, Cambodia benefits from
connectivity and trade with its regional partners. Most surplus paddy, cashew nuts, sesame
seeds, cassava, and cattle find a market in neighboring Vietnam and Thailand. However, most of
this trade is informal and consists of unprocessed products. An estimated 9 million tons of cassava,
3 million tons of paddy, 1 million tons of sugarcane, and perhaps another million tons of
agricultural, livestock, and fishery products move across borders, representing about 1 ton of
agricultural export per capita. At the same, time considerable volumes of pigs, vegetables, and oil
are imported.
174. The formal exports of rice mainly go to the EU. Cambodia primarily exports quality rice
to European countries, benefiting from access to the EBA, which provides price benefits to
Cambodia relative to competitors India, Vietnam, and Thailand. Vietnam and Thailand, two major
rice exporters, are highly diversified globally in terms of their destination markets. In the group,
only Vietnam lags behind in terms of quality rice exported. India and Thailand are renowned for
their fragrant rice (Basmati and Jasmine) and Cambodia also now produces and exports high-
quality fragrant rice. However, Vietnam recently started producing and exporting quality fragrant
rice and its share of fragrant rice in total rice exports is expected to increase rapidly in the years to
come.

76
175. Among these four countries, Cambodia has the most clearly formulated rice policy.
The RGC has set clear targets for exports and is promoting development of transportation (by
upgrading the Sihanoukville port) and power infrastructure. At the same, time it is promoting
investment in rice milling and in a number of programs to support better seeds and irrigation. As
a result, formal rice exports increased from 1,500 tons in 2008 to 378,000 tons in 2013 (recall
Table 9).
176. Due to private investments, Cambodia’s rice milling capacity increased remarkably
in recent years. Cambodia’s modern rice milling (i.e., the larger mills) capacity increased
sevenfold, from 96 tph in 2009 to over 700 tph in late 2013. The polishing capacity of mills also
jumped, from 72 tph in 2009 to 564 tph in 2013, with an average milling rate of 64 percent. All of
the investment in large mills came from the private sector, at least 35 percent of which was from
joint ventures with foreign investors. In theory, the existing milling capacity could process almost
the entire paddy surplus in Cambodia. However, the high cost of fuel and electricity renders
Cambodia’s average milling cost about 30 percent higher than that of Thailand and Vietnam.
Moreover, rice mills lack the working capital to purchase and store paddy.
177. Cambodia’s rapid economic growth since the mid-1990s has led to significant changes
in the country’s labor market especially in terms of increased employment, shift in
employment structure, and improved outcomes for workers. Agriculture employed about 81.4
percent of the labor force in 1995, but this share had shrunk to 51 percent by 2012 (recall Table
11). Employment in the industry sector increased from 3 percent of the total employed workforce
in 1995 to 19 percent in 2012, while employment in the services sector doubled from 16 percent
to 32 percent. Labor market outcomes improved more or less in parallel with the growing trend
towards labor migration. In 2008 there were 2.5 million recorded internal migrant workers, 89,545
migrants registered as working abroad officially and an estimated 180,000 working abroad
unofficially.
178. The options for labor in Cambodia, particularly youth labor, are to migrate from
agriculture to nonfarm activities, to migrate from rural areas to urban areas (for example,
to garment factories for young women and construction work for young men), or even to
migrate out of the country. These options result in increased choices for job seekers in rural areas
in addition to agricultural work. As a result, agricultural wages have increased by a factor of four
over the past 10 years (As a result of increasing returns to labor, agricultural wages in general
rose, converging with nonfarm wages. Agricultural wages grew by a factor of almost three
between the 2005 and 2013 surveys (Error! Not a valid bookmark self-reference.). Over the
same period, nonfarm wages increased by only 60 percent. As a result, the gap between farm and
nonfarm sector wages declined. Thus agriculture appears to have provided excellent income-
earning opportunities in Cambodia over the last decade.
179. Figure 34). This has pushed farmers towards increased adoption of mechanization.
180. Outside of the agriculture sector, connectivity has improved in terms of both
communication and roads. With a population of 14.6 million, Cambodia had 19 million mobile
phone subscribers in 2012. Currently transportation costs for rice and other agricultural
commodities are around $10-13/100 km/ton (Figure 36). Compared to an estimated
$15/100 km/ton in 2009 (ADI 2009), transportation costs decreased due to road improvements,
more trucks available, and more competition amongst local transport companies. Yet transport
costs in Cambodia are still higher than in neighboring countries such as Vietnam, where it is about

77
$7/100 km/ton and Thailand where it is around $5/100 km/ton. Costs are also higher on rural roads
due to the underinvestment. The ADB survey of 18 communes in Battambang, Kampong Thom,
and Takeo provinces in 2013 found only one to have an asphalt road (ADB 2014a). It should be
noted that both Vietnam and Thailand rely significantly on river transport for moving rice and
other crops, which is significantly cheaper. Using its waterways, Vietnamese transport costs are
only $3/ton compared to $15-17/ton to move the same distance by truck in Cambodia.42
Figure 36: Transportation costs in Cambodia and neighboring countries, $/100 km/ton
Source: Own estimates and ARPEC.
181. While past agricultural growth in Cambodia resulted in an impressive increase in
production and exportable surplus of a number of commodities, it had limitations. To
promote future growth, limitations that need to be addressed include: (i) the reliance on crop land
expansion; (ii) the increase in the number of very small farms; (iii) the slow job creation outside
agriculture; (iv) relatively low productivity growth; and (v) weak development of agroprocessing
and other agribusinesses.
182. First, the large share of the past growth was achieved through the expansion of
cultivated land. This expansion was stimulated by the sharp increase in agricultural prices and
the improved market opportunities. Between 2008 and 2011, cultivated rice area grew 4.5 percent
annually. After agricultural prices leveled and even began declining, land expansion slowed down.
In 2012, cultivated paddy area grew only 0.4 percent and in 2013 even declined 0.4 percent (World
Bank 2014b). Without increasing farm profitability through higher productivity, it will be very
hard to increase agricultural profits in the future.
183. Even at higher farm profitability, repeating the past land expansion in the future is
not feasible given the RGC’s plans to revert deforestation. The target is to have 60 percent of
land area forested, from the current 57 percent (World Bank 2014e).Thus growth of cultivated land
in the future is likely to be just a fraction of what it was in the past. This is good news, because
past land expansion seemed to have contributed to land degradation. Degradation has been
especially high in the upland areas used for cassava production, for which little fertilizer has been
applied to maintain soil nutrients. Land degradation can be defined as the persistent reduction or
42 The Phnom Penh Post “Waterways May Reduce Export Costs,” March 12, 2013, quoting the Alliance of Rice
Producers and Exporters of Cambodia (ARPEC).

78
loss of land ecosystem services. Using global information on the changes in the normalized
difference vegetation index between 1982 and 2006, which serves as a proxy for land degradation,
Cambodia was found to be among the countries with the largest share of land degradation hotspots.
About 55 percent of its crop land and 42 percent of its total land are estimated to have degraded in
terms of net productivity and vegetation cover (Le et al. 2014). About 60 percent of Cambodians
are estimated to reside in land degradation hotspots, and human-induced activities are the source
of most degradation.
184. Second, the past growth was accompanied by an increase in the average farm size and
an increasingly unequal agricultural land distribution. Large farms are becoming larger and
small farms are becoming smaller.43 This change in distribution of farmland occurred
independently of economic land concessions. The increasing disparity is accompanied by land
consolidation and more commercial farming. Even though no general economies of scale in land
use are found in Cambodia, economies of scale in returns to labor have increased as a result of
mechanization, and larger farms seem to be integrated more easily into modern food value chains.
185. Thus, the main concern is that the returns to labor for these small farms will remain
low. For example, the returns to labor in small farms producing rice during the wet season are
estimated to be below the prevailing wage rate. The returns to a day of labor for wet season rice
production increase from $2.86/day for small farms to $12.67/day for large farms. Dry season rice
production has the highest impact of farm size on returns to labor, at $6.15, $8.27, and $22.83 for
small, medium-sized, and large farms, respectively. This has a direct impact on the ability to attack
poverty, because wet season rice still constitutes 83 percent of total cultivated rice land, comprising
most smallholder farmers. Very small farms are less willing and able to mechanize production
processes, falling behind larger farms in income generation.
186. Another concern is that while farm size increases, landlessness may increase. If
landlessness is the result of rural households moving out of agriculture into other profitable
employment opportunities, then landlessness is not a major issue. Yet when landlessness is
associated with poverty and vulnerability, future growth strategies need to address the impact of
increasing landlessness on poor and vulnerable households through a combination of measures
including safety nets, insurance, and capacity building.
187. Third, one of the most worrying aspects of the past growth of agriculture in Cambodia
is that, despite growing yields and production, per hectare profitability of farming has
increased slowly. The average gross margin per hectare in real terms increased by only 3.4 percent
between 2005 and 2013, due to the increase in yields and the gradual shift of production to more
diverse mix of crops more profitable than wet season paddy. Yet there is more room to increase
yields, especially of paddy, which would need to come from more efficient use of resources rather
than just higher use of intermediate inputs, labor, and machinery. For farming to be attractive, the
increase in revenue needs to exceed the increase in costs. In the situation with limited potential for
farmland expansion, this puts emphasis on productivity, profitability, and competitiveness to
underpin future growth.
188. Achieving higher agricultural productivity depends on many factors, with
investments in the delivery of core public goods and good quality of public programs among
the key factors. But most productivity-enhancing public programs such as agricultural extension,
43 It should be noted that even though farm size can increase over the next decade or so, the vast majority of
Cambodian farms will remain less than 5 ha in size.

79
agricultural research, vocational training, and input quality control are underfunded in Cambodia.
Farmers rely mainly on extension advice from the private sector and NGOs, which are often limited
to specific commercial products. Some inputs are fake and their quality control by public agencies
is not adequate or present at all, reducing farmers’ willingness to purchase more inputs. Other
programs such as irrigation receive sufficient funds but are mostly used to construct primary
structures making Cambodia’s irrigation coverage the lowest in Asia (recall Table 5). The
effectiveness of these investments and impacts on farm incomes appears to be very low.
189. Fourth, during the past 10 years, the cost of labor has increased tremendously,
creating a number of adjustments in production, including accelerated mechanization,
reduction of labor use, and adoption of labor-saving technologies. This is consistent with the
key patterns of agricultural transformation from a traditional to a modern agriculture sector.
However, if continued, the increasing cost of labor will also imply that agriculture will not be able
to absorb the increasing labor force and therefore new sources of labor demand have to be
identified not only in urban areas and outside of the country (the two traditional “solutions” for
surplus labor in agriculture), but in the rural nonfarm sector as well. Outside the garment and
footwear industry and construction sectors, nonfarm job creation has been slow.
190. Finally, the past growth of agriculture was mostly related to the production sector;
very little value added was generated by agriculture and in fact an enormous surplus of
commodities was exported in raw form. The RGC has made a concerted effort to change this
situation in the case of rice, but the objective of one million tons export by 2015 is not likely to be
achieved. Contract farming and productive partnerships between farmers and agroenterprises are
very limited; sustainable farmer organizations are few despite the promotion of agricultural
cooperatives. Yet the development of agribusiness and, more generally, of an agri-based rural,
nonfarm economy must be an indispensable element of any future growth strategy.

80
7. DRIVERS OF FUTURE GROWTH
191. Some drivers underpinning future agricultural growth in Cambodia will be similar
to those of the past. For example, GDP growth will increase domestic demand for more diverse
food and encourage further outmigration of labor from agriculture. According to the World Bank
(2013a), Cambodia’s GDP will continue to expand rapidly up to 2030, though at a slower pace
(slightly over 7 percent) than over 2000-2010 (8.2 percent). GDP is expected to increase in real
terms from its present value of $13 billion to $23 billion by 2020, and to nearly quadruple to $50
billion by 2030 (Table 39). With population growth expected to decline from 1.4 percent to 1.1
percent over this projection period, real GDP per capita would increase from $957 in 2012 to
$2,733 by 2030.
Table 39: Selected economic projections, Cambodia, 2012-2030
Indicator Future
Growth
rate (%)
2012
(Baseline)
2015 (Short-
term
Projections)
2020
(Medium-
term
Projections)
2030 (Long-
term
Projections)
Real GDP, $ billion 7.2 14.2 17.5 24.7 49.5
Population, million 1.1 14.8 15.3 16.2 18.0
Real GDP/capita, $ 6.1 957 1,140 1,526 2,733
Urban population,
million
5.1 3.3 3.8 4.8 8.0
% of urban population 4.0 22 25 30 45
Source: Own estimate based on World Bank 2013a.
192. Rising global and regional demand for food will continue to provide markets for
increased Cambodian exports (Table 40), which will be facilitated by the continuation of market-
oriented agricultural and trade policies. Public investments will help continue to reduce the costs
of doing business and attract private investments to create jobs.
193. Yet there will be important differences. First, it is expected that future economic
growth in Cambodia will be accompanied by accelerated urbanization. Total population will
rise from 14.8 million in 2012 to 18.0 million by 2030; assuming an urban population growth rate
of 5.1 percent (consistent with the past decade’s growth), the urban population will more than
double from 3.3 million to 8 million over the projection period. This implies Cambodia’s rapid
urbanization rate increase from 22 percent to 45 percent (Table 39).
194. Rapid urban population growth has a number of implications for Cambodia’s agri-
food system. An increasingly urban population will need to be fed by a relatively smaller rural
population. While in 2012, Cambodia needed one agricultural worker on average to feed 2.8
persons, in 2030, each agricultural worker will need to feed 4.5 persons. For the urban population,
the food consumed will be richer in protein and micronutrients and will require more stringent
quality standard; consumers will want food that is more convenient to prepare and consume.
Increasing urbanization also implies more pressure on agricultural land in peri-urban areas, often
the most fertile land. Food distribution systems appropriate for urban areas need improved
marketing and distribution infrastructure. An increasing amount of food will be distributed via
modern outlets and supermarkets, will be more processed, and will be sold in a variety of packaged
forms. This will put pressure on very small farms, which often find it difficult to integrate into

81
modern value chains. Agroindustry will also need to develop to provide enhanced features such as
storability, convenience, improved packaging, and more diversified products.
Table 40: Caloric food demand projections, world and selected regions/countries
Region/Country 2009 2030 Annual growth rate
Actual Projections %
World 2,831 3,050 0.4
East Asia 2,694 3,190 0.9
East Asia (less China) 2,663 2,965 0.5
China 3,036 3,739 1.0
Cambodia 2,382 2,667 0.5
Japan 2,723 2,613 -0.2
Lao PDR 2,377 2,662 0.5
Malaysia 2,902 3,249 0.5
Mongolia 2,434 2,725 0.5
Myanmar 2,493 2,792 0.5
Philippines 2,580 2,889 0.5
South Korea 3,200 3,583 0.5
Thailand 2,862 3,205 0.5
Vietnam 2,690 3,012 0.5
Note: Caloric food demand refers to the amount of food expressed in kilocalories (kcal) per day, available
for each individual during the reference period.
Source: Jamora 2014 using FAOSTAT.
195. Due to increasing income and urbanization, diets will be more diversified, and richer
in protein and micronutrients. Not only in Cambodia but also in East Asia and the world as a
whole, more animal and fish products and more processed foods will be consumed (Figure 37).
More people will be aware of health issues related to nutrition and food safety (cholesterol,
diabetes, allergies, chemical residues, antibiotics in animal feeding, etc.). Rice consumption per
capita in Cambodia will likely remain high but lower than its current level, implying an increasing
availability of rice for export. Rice quality will have to increase not only for export markets but
for domestic and urban markets as well.
196. Rising ASEAN and global demand for food will offer market outlets for Cambodian
exporters, but penetrating foreign markets will be more challenging. The further increase in
cross-border trade will require Cambodia to have an adequate capacity and network of agreements
in place with major trading partners (especially China) for food safety and quality standards,
phytosanitary and quarantine, double tax agreements, transit, and harmonized trade and commerce
legislation (e.g., anti-dumping, labeling, trademark protection). Cambodia’s agri-food industries
must become competitive with those of neighboring countries. Adequate physical and institutional
infrastructure is needed to achieve such competitiveness, including more stable and cheaper access
to energy, improved transportation network and logistics systems, highly effective information and
communication systems, and financial institutions to support trade and investment.

82
Figure 37: Value of the projected food demand in East Asia, $ billion, 2030
Source: Jamora 2014 using data from IMPACT/IFPRI model and OECD.
197. Exporting much more rice, especially of low quality, will be difficult. Total per capita
consumption of rice is projected to decline by 2030 due to global income growth and substitution
effects (Table 41). Future global consumption rates are heavily affected by future rice consumption
in China and India, but consumers are projected to demand more higher-quality rice (Slayton and
Muniroth 2012b). Structural changes in diets will continue to reduce the relative importance of
rice in favor of meat, fruits, vegetables, fish, and milk (Alexandratos and Bruinsma 2012; Sharma
2014).
Table 41: Global rice demand projections (kg per capita) per year
Sources/assumptions 2020 2025 2030
FAPRI 2005 65 62 61
FAO 2003 63 62 61
Abdullah et al. 2008
Scenario 1: China -0.33%/India -0.93% 59 58 57
Scenario 2: China -1.77%/India -1.44% 54 51 48
Scenario 3: China -3.55%/India -3.03% 49 46 43
Source: Jamora 2014.
198. Future agricultural TOT is projected to be less favorable than in the last decade. As
shown in Table 38, global food prices increased significantly in the past decade. In the future,
however, prices of most agricultural products are projected to decline (Table 42). Prices of grains
are projected to decline 12 percent in real terms between 2010 and 2025, with rice prices in 2025
projected to decline by 20 percent compared to 2015. On the other hand, energy prices are expected
to keep increasing, though fertilizer prices are expected to fall in the future. Overall agricultural
TOT, defined as the ratio of prices of agricultural outputs to prices of inputs for agricultural
production proxied by the simple average of fertilizers and energy, is projected to decline. Rising
costs of energy will drive up costs of irrigation and mechanization, while declining agricultural
prices will put pressure on profits and competitiveness. In this context, profitable farming systems
will depend on access to modern knowledge and technologies and the efficient use of more

83
expensive inputs, along with resilience to weather variations and climate shocks. In other words,
high attention will need to be paid to TFP.
Table 42: Global agricultural terms of trade, index projections (in real 2010$)44
2010 2015 2020 2025
Agricultural prices 100 97.4 90.1 83.1
inc. Food 100 102.2 93.1 84.3
Fats and oils 100 106.4 96.1 86.2
Grains 100 104.3 96.0 87.9
Other food 100 94.9 86.5 78.4
inc. Beverages 100 87.5 77.2 67.9
inc. Raw materials 100 78.7 75.2 71.6
Fertilizer prices 100 89.4 81.2 73.3
Energy prices 100 120.0 113.5 108.9
Agricultural TOT 1.00 0.930 0.926 0.912
Source: World Bank Commodity Price Forecast, July 2014.
199. Future agricultural growth will depend less on land expansion. Reaching the RGC
target of 60 percent of land under forest requires afforestation programs, strict compliance with
land and forest protection laws and regulations, attention to sustainable management of natural
resources, and improvements in the land tenure system. The sustainability of environmental
resources such as land and forests has been neglected in the past decade of growth in Cambodia.
Further depleting natural resources for sustained growth is not a good option. Failing to take into
account the environment, even at the early stages of growth, can be a big mistake, and one that is
extremely expensive to fix in the future (World Bank 2013a). Cambodia is endowed with rich
environmental resources that have benefited its economy and people greatly, and it is important to
ensure that this remains the case in the future.
200. The agricultural labor force will continue to decline, while agricultural wages
increase. As in other countries, Cambodia’s rural youth are increasingly choosing employment in
sectors other than agriculture. Labor shortage provides incentives for increased mechanization.
Outmigration might also accelerate the process of increasing farm size. As the agriculture sector
transforms to a more commercial and competitive industry, it will attract more investment and
support more semi-skilled and higher-paid employment. Yet without strengthening land tenure
security and reducing the cost of capital, adoption of farm mechanization in Cambodia will be
slow, putting upward pressure on farm production costs. Modern farm machinery and new farming
technologies, such as precision farming, are increasingly available to Cambodian farmers, but they
can be more efficiently used on larger farms. The existing land tenure insecurity precludes this
from evolving at a natural pace, as it creates distortions in the land tenancy market that constrain
small absentee land owners from renting their land to capable and entrepreneurial farmers.
44 Agricultural price index is the sum of food, beverages and raw materials. Fats and oils include coconut oil, copra,
groundnuts, palm oil, palm kernel oil, soybeans, soybean meals, and soybean oil. Grains include barley, maize, rice,
sorghum and wheat. Other food includes bananas, oranges, sugar, meats, and fish. Beverages include cocoa, coffee,
and tea. Raw materials include cotton, rubber and tobacco. Fertilizers include DAP, urea, TSP, potassium, and
phosphate rock. Energy includes coal, crude oil, and natural gas.

84
However, land speculation, which could be caused by low land taxes stemming from outdated land
valuation prices, is another potential motivation for increasing farm size.
201. More budget resources will be available to spend on agricultural programs in
Cambodia but more resources will also be required for other purposes to sustain growth and
boost shared prosperity. Competition for public funds will motivate ministries to use funds more
efficiently; those doing so will receive and spend more on their programs. Fiscal discipline will
require clearly definition of what to finance (public goods) and what not to (private goods) from
the budget. Except irrigation, many critical agricultural programs (such as research, extension,
food safety, input quality control, etc.) are underfunded. Improvements in the quality of
agricultural programs and the ability to attribute their impacts on agriculture sector outcomes
through impact evaluations will determine the funding that MAFF and Ministry of Water
Resources and Meteorology (MOWRAM) receive from the national budget and donors to support
further agricultural development.
202. Finally, more attention needs to be paid to implementation. Most of the messages above
are not new to Cambodia and are rightly identified in the RGC’s new five-year Rectangular
Strategy III. The key challenge for Cambodia is implementation, which will require increased
inter-ministerial coordination, leadership, and most importantly, monitoring of specific targets
linked to those reforms. Successful implementation of the reforms could help Cambodia reach a
GDP growth path of 8 percent and sustain its successful agricultural transformation. The driving
forces discussed in this chapter and their impacts on future agricultural growth are summarized in
Box 7.

85
Box 7: Driving Forces Underpinning Future Agricultural Transformation in Cambodia
1. Economic growth in Cambodia
a. Stimulate more demand for food
b. Pull labor out of agriculture
c. Increase labor costs
d. Lower cost of capital and increase farm demand for mechanization
e. Create a larger fiscal space for public investments in agriculture
2. Urbanization in Cambodia
a. Put pressure on land available to agriculture, converting land to urban purposes
b. Lead to declining per capita rice consumption
c. Create higher demand for more diversified (change of diet) and processed foods
d. Require more attention to food safety and quality
e. Create challenges to integrate small farms into value chains
f. Increase demand for farm labor force
3. Rising ASEAN and global demand for food
a. Lead to declining per capita rice consumption of low-quality rice
b. Create more demand for higher-value, better processed and marketed rice
c. Raise demand for higher-value, processed foodstuff
d. Require high attention to safety and quality to comply with the rules of buyers and avoid non-
tariff barriers
4. Declining global agricultural TOT
a. Without increasing TFP, lower farm prices will reduce farm profits and incomes
b. Call for more and better spending on core agricultural public goods
5. Deceleration of agricultural land expansion in Cambodia
a. Increase pressure for sustainable management of natural resources (land, water, forests)
b. Bring more attention and urgency to reduced land degradation
c. Call for building institutions and clear rules for natural resource management
d. Bring urgency to raise agricultural productivity to sustain farm incomes
6. Fiscal discipline
a. Despite a larger fiscal space due to continued economic growth, more budget resources will
be required for various purposes. Public in general would also require better transparency
and accountability on the use of funds. This would lead to stronger fiscal discipline.
b. Define the role of government and key public investments to support agricultural
transformation under fiscal constraints

86
8. A LONG-TERM VISION FOR CAMBODIAN AGRICULTURE
203. The RGC’s long-term vision, including a 2030 vision for the country, is focused on
rapid development that is resilient, inclusive, and sustainable. Continuing its strong economic
performance will be a central pillar to achieve the country’s aspirations. With the appropriate
policies, Cambodia’s economy can more than triple in size by 2030. Beyond economic growth,
the aspirations for Cambodia’s progress towards 2030 are threefold: (i) for progress to be resilient
to shocks such as economic crises and natural disasters; (ii) for progress to be inclusive, ensuring
continued poverty reduction, shared prosperity with an expanding middle class, and social
cohesion; and (iii) for progress to be environmentally sustainable, securing future benefits from
the country’s rich land, forest, and water resources for future generations. Overall, the RGC’s long-
term vision mentioned in the strategic documents consists of seizing opportunities to make
Cambodia a more prosperous, inclusive and successful nation (World Bank 2013a).
204. Agricultural transformation is the key to realizing a 2030 Vision. The agriculture sector
was instrumental in stimulating growth, reducing poverty and boosting shared prosperity in the
past and it remains a powerful source of pro-poor growth in the future, given its large share in the
economy, labor force, and exports. The sector also has an important role in achieving
environmental sustainability and resilience objectives as it is the largest user of land, water, and
other natural resources and is the most vulnerable to climate change. The Agricultural Sector
Strategic Development Plan 2014-2018 prepared by MAFF aims to continue the past growth in
agricultural value added at 5 percent in the future. Achieving the 5 percent growth is possible but
challenging as can be judged from the recent growth slowdown. In 2013, the growth in agricultural
value added was only 1.6 percent and it is expected to be even smaller in 2014.
205. Four lessons from agricultural transformation around the world are relevant to the
formulation of Cambodia’s vision:
a. At early stages of development, agricultural growth is the main engine of poverty
reduction because most of the poor are in rural areas.
b. TFP growth is a main source of long-term agricultural growth. TFP requires not only
land, labor, and capital accumulation, but also technology, innovation, efficiency,
human resource capacity, and governance. TFP growth contributed 40-70 percent of
agricultural output growth in Asia over the last 50 years (Fuglie 2010).
c. Increasing urbanization presents challenges foe which traditional farming systems are
not well prepared. Helping small farmers integrate into modern value chains is a
feasible response for governments to these urbanization challenges.
d. As an economy moves closer to middle-income status, development of the rural
nonfarm sector (including agri-food manufacturing, services, marketing, and logistics)
becomes increasingly important in closing the gap between rural and urban incomes.
206. Cambodian agriculture will need to use these lessons to continue its successful
transformation. As the country moves to middle-income status, it will continue to experience
agricultural transformation, whereby the economic structure of its society will change from one
based on agriculture to one based on agribusiness, industry, and services. During this process,
agriculture’s importance in the economy, as measured by its share of labor and GDP, will decline
(Box 8). At the same time, agriculture will become more productive: returns to agricultural labor
and land will increase and agricultural GDP will grow in the absolute terms.

87
Box 8: Indicators of Agricultural Transformation
Agriculture becomes less “important” in the economy
Declining share of agriculture in labor
Declining share of agriculture in GDP
Agriculture becomes more productive
Increasing agricultural labor income
Increasing agricultural GDP per unit of labor and land
207. By 2030, Cambodia’s agriculture needs to become “less important” but “more
productive.” The challenge is to continue the past agricultural growth of 5 percent per year via
higher resource use efficiency rather than cultivated land expansion. With 5 percent annual
agricultural growth by 2030, the share of agriculture in GDP is projected to decline to 23 percent
in current prices and 17 percent in real prices (Table 43). The labor share in agriculture will decline
to 32 percent compared to 51 percent in 2012. Cambodia may reach the status of a “transitioning
economy” based on the framework presented in Table 12. More productive agriculture (land and
labor productivity) would not only increase farm incomes in absolute terms, but would also
significantly reduce the income gap in current prices between agriculture and non-agriculture to
1.6 by 2030, starting from a high ratio of 2.1 in 2012.
Table 43: Indicators of agricultural transformation at 5 percent agricultural growth
Indicator Unit Past
Growth
Rate
(%)
Future
Growth
Rate
(%)
2012
(Baseline)
2015
(Short
term)
2020
(Medium
term)
2030
(Long
term)
Agriculture as a share
in GDP (in current
prices)
% 1.3 -2.1 34% 32% 28% 23%
Agriculture as a share
in GDP (in real prices)
% -1.9 -2.1 26% 24% 22% 17%
Labor share in
agriculture
% -1.5 -2.6 51% 47% 41% 32%
Agricultural
GDP/agricultural labor
force
$/capita 4.5 6.5 1,210 1,460 2,000 3,700
Agricultural
GDP/cultivated land
area
$/ha 0.3 3.9 1,325 1,485 1,800 2,640
Ratio of nonfarm
GDP/nonfarm labor and
agricultural GDP/farm
labor
Ratio -1.2 -1.6 2.1 1.9 1.8 1.6
Notes: Based on assumptions indicated in Annex 4.
Source: Own estimates.

88
208. A 5 percent agricultural GDP growth is not assured, however. Future growth may well
be only 3 percent, especially if needed policy actions and investments are not made (“doing
nothing”). The costs of doing nothing would be very high for Cambodians. For illustration
purposes only, it is estimated that the 3 percent growth in agricultural value added would reduce
overall GDP,45 make agriculture less productive sector, keep more people in the sector,46 and, most
importantly, increase the income gap between farm and nonfarm workers (Table 44). The
cumulative reduction in agricultural value added by 2030 can reach 29 percent, and the income
gap between agriculture and non-agriculture can stay the same, at 2.1, compared to 1.6 at the 5
percent growth in agricultural GDP. Thus, achieving the 5 percent agricultural growth is important.
Table 44: Changes of indicators of agricultural transformation at 3 percent compared with
5 percent growth
Selected indicators Future Growth Rate 2020 (Medium
Term) (%)
2030 (Long-
Term) (%) 5% 3%
GDP growth 7.2 6.0 -8.6 -18.3
Agricultural GDP growth 5.0 3.0 -14.3 -29.3
Agriculture as a share of GDP -2.2 -3.0 -6.4 -13.7
Agriculture as a share of total
labor force -2.7 -2.3 3.3 7.7
Agricultural GDP/ agricultural
labor 6.4 4.0 -16.7 -33.7
Ratio of nonfarm GDP/nonfarm
labor and agricultural GDP/farm
labor
-1.54 -0.02 15.0 32.7
Source: Own estimates.
209. A long-term vision for Cambodian agriculture would need to aim to continue higher
growth but with more emphasis on intensification and farm income convergence and lower
costs to the environment. The proposed vision statement can be the following: “A sustainable
and competitive agriculture sector that fosters productivity growth and contributes to increased
farm and nonfarm incomes.”
210. This vision statement is largely in line with the policy goal of the Agricultural Strategy
Development Plan for 2014-2018, which is “enhanced agricultural productivity, diversification
and commercialization, thereby contributing to reduced poverty and accelerated economic growth
while, at the same time, ensuring environmental protection and sustainable natural resource
management.” The additional point emphasized by the proposed vision statement is the increase
45 In 2013, the share of agricultural GDP in total GDP was 24 percent. Thus, in the short run a 2 percent reduction in
agricultural GDP would lead to a 0.48 percent reduction in overall GDP. The longer-run effect is likely to be much
higher given the strong links between agriculture and trade, transportation, and food processing sectors in
Cambodia. For the hypothetical calculations of the implications of the 3 percent growth in agricultural GDP, the
long-term GDP growth is reduced from 7.2 percent to 6.0 percent. 46 The impact of lower agricultural growth on agricultural labor is not known. It is, however, likely that lower
growth in the long-term agricultural GDP would keep more people in the sector than 5 percent growth. At 3 percent
agricultural growth, the agricultural labor force is assumed to decline by 1 percent annually, compared to 1.4 percent
at 5 percent agricultural growth.

89
in farm incomes and their convergence with nonfarm incomes, which would indicate successful
structural transformation.
211. The key elements of the proposed Vision are sustainability, competitiveness,
productivity, and income growth:
a. Sustainability: Sustainable agriculture includes many dimensions, including
environmental sustainability. Progress in achieving environmental sustainability will be
judged by the success in securing future benefits from the country’s rich land, forest, and
water resources for future generations. It implies reversing the expansion of cultivated land
at the expense of forest and other environmentally sensitive land, increasing soil organic
matter, reversing land degradation through good agricultural practices and climate-smart
agriculture, and increasing agricultural water productivity.
b. Competitiveness: Having farms able to produce at competitive prices will not be enough
to maintain high agricultural growth rates and increase farm incomes. Even future farm
competitiveness is at risk if policy actions do not address pertinent constraints, including
poor infrastructure, weak governance, weak quality and safety control, low technology,
limited capacity and human resources, and difficulty in accessing credit and doing
business. These constraints harm not only farms but also agribusinesses. Competitiveness
implies a production and distribution system oriented towards the market and meeting
consumers’ demand effectively by providing higher value. Competitive products are not
necessarily cheaper, but meet the preferences and budgets of consumers, using efficient
value chains. Competitiveness is based on comparative advantage, productivity, and
profitability, but goes one step further: rather than focusing only on cheaper costs, it looks
at higher value added, quality, and safety.
c. Productivity growth: Consistent with the insights of agricultural transformation, a more
dynamic agriculture is accompanied by higher productivity growth. The agricultural land
expansion that took place in previous decades is not a viable option in the future.
Productivity growth needs to become a central element of agricultural development in the
country. Growth of agricultural-based activities will have rural nonfarm effects and imply
nonfarm employment. Higher economic growth in the agriculture sector will in turn
contribute to higher GDP. Combined with a reduced population growth rate and reduced
growth of agricultural labor, higher GDP per capita in agriculture will reduce poverty and
improve living standards in rural areas.
d. Income growth: A desirable agricultural transformation implies growing incomes for
farmers and improved integration with the rest of the economy, primarily through strong
linkages with the agribusiness sector, reflected in growing returns to agricultural labor. As
a result of labor migration from agriculture to other sectors, overall productivity growth,
and a more diversified (profitable) mix of agricultural products, the gap between
agricultural and non-agricultural incomes will decline. The growth of agricultural income
will increasingly depend on the development of agroprocessing, storage, trade, food
service, production services, and agri-tourism. The income growth of the smallest farms
may lag behind that of larger farms, calling for special attention to this group of farmers.
212. The key elements of the proposed vision require indicators and targets for
agricultural transformation. Targets indicate what is intended and possible to achieve as a result
of the agricultural strategy’s implementation. The proposed indicators and targets are presented in

90
Table 45. They are based on the underlying data summarized in Annex 4. Targets are listed for the
short term (3 years), medium term (8 years), and long term (18 years). Each target is accompanied
by indicators that allow progress (or lack thereof) toward the target to be measured.

91
Table 45: Proposed indicators and targets for a Long-Term Vision for Cambodian Agriculture
Vision’s
Elements Indicator
Annual Growth
Rate
2012 2015 2020 2030
Comments Unit Past
(2004-
2012)
Future Baseline Short
Term
Medium
Term
Long
Term
Sustainability
Forest cover % of land -1.1% 0.4% 56% 57% 58% 60% The 2012 baseline and the 2030
target are from NDSP. Past growth
rate is from MAFF.
Degraded
land
million ha NA -3.8% 7.8 6.9 5.7 3.9 Baseline data based on Sovuthy
Pheav, Director, Department of Ag
Land Resources Management.
Targets to be achieved through soil
conservation, reforestation, and soil
nutrient management programs.
Soil organic
matter
% NA 8.0% 1.0% 1.3% 1.9% 4.0% Baseline data from Rice Production
in Cambodia edited by Harry J.
Nesbitt SRI. Targets to be achieved
by no tillage, intercropping, organic
fertilizer, and other methods.
Water
productivity
liters / kg
rice
NA -1.2% 2,500 2,409 2,264 2,000 Baseline based on Wokker et al.
2014. Targets to be achieved by
more efficient use of irrigation.
Competitiveness
Agricultural
Exports
$ million 19% 14% 400 587 1,113 4,000 Past growth is based on
stat.wto.org.
Agribusiness
GDP
% of Ag.
GDP
6.4 9.7% 27.4% 31.3% 38.9% 60.3% For agribusiness to grow from 30%
to 60% of agricultural GDP, growth
of agribusiness GDP has to be 9.7
% (if agricultural GDP grows at
5%).
Capital-ag
land ratio
$/ha NA 3.9% 1,000 1,122 1,361 2,000 Baseline based on FAOSTAT.
Productivity Ag land
productivity
Ag. GDP
/cultivate
0.3% 3.9% 1,325 1,485 1,800 2,640 Baseline based on data from WDI.
Target derived from assumption on

92
Vision’s
Elements Indicator
Annual Growth
Rate
2012 2015 2020 2030
Comments Unit Past
(2004-
2012)
Future Baseline Short
Term
Medium
Term
Long
Term
d area,
$/ha
ag GDP growth of 5% and a
moderate increase in cultivated
land of 1% per year.
Agricultural
labor
productivity
Ag. GDP/
ag labor
force,
$/person
4.5% 6.5% 1,210 1,460 2,000 3,755 Baseline based on data from WDI
and NIS. Target derived from
assumption on ag GDP growth of
5% and decrease in ag labor by
1.4%.
Income
Returns to
agricultural
labor
$/day 12.0%
6.3% 6.0 7.2 9.8 18.0 Baseline based on data from the
2013 survey. Target derived from
the conservative assumption of
future growth to be only a half of
the past growth.
Gap between
nonfarm per
capita income
and farm per
capita income
Ratio -1.2%
-1.6% 2.1 1.9 1.8 1.5 Derived from the assumptions on
ag GDP growth, ag labor growth,
non-ag GDP growth, and non-ag
labor growth.

93
9. OPTIONS FOR SUPPORTING A LONG-TERM VISION FOR AGRICULTURE
9.1. Introduction
213. Realizing the Long-Tem Vision for Cambodian Agriculture requires a conducive
policy environment and high-quality public programs. These policies and programs must take
into account the factors underpinning future agricultural development described in Chapter 7. A
number of priority areas exist, as well as trade-offs. Analysis of the farm budget and profitability
database for Cambodian agriculture offers a useful platform to compare policies and programs in
terms of their impact on farm gross margins, net present value (NPV), returns to agricultural labor
and extra demand for labor, demand for fertilizers, and impacts on competitiveness.
214. Four sets of policy scenarios are developed to support Cambodia’s agricultural
transformation over the next twenty years and movement toward a Vision 2030:
a. Environmental sustainability: Ensuring sustainable land expansion through land use
planning; reverting agricultural land to forest, aiming to reach the country’s target of
60 percent forest cover by 2030; and maintaining soil fertility through optimal use of
available land and use of fertilizer and organic matter.
b. Productivity growth: Increasing adoption of improved technologies through extension
services and use of more and better quality inputs; and investing in effective irrigation
by ensuring strong linkages with extension programs and enforcement of operations
and maintenance guidelines.
c. Competitiveness: Analyzing the effect of price changes of inputs and outputs and
making adjustments to maintain competitiveness of Cambodian agriculture.
d. Income growth: Increasing farm households’ income through land consolidation (i.e.,
higher total available income per capita because of larger assets), higher productivity,
and better informed choice of higher-value crops and technologies.
9.2. Scenarios for Environmental Sustainability
215. Land expansion has been a major factor of agricultural growth in Cambodia. Over
2002-2012, cultivated land for crops covered by the survey (rice, maize, cassava, and vegetables)
increased by 50 percent. The growth in upland crops was even more dramatic: cultivated land
increased by a factor of 2 for maize and 13 for cassava. Even for rice, where the increase in land
was more modest than the average, the contribution of cultivated land to rice production growth
was over 40 percent.
216. For upland crops, especially cassava, FGDs and expert interviews revealed that
cultivated land expansion comes at the expense of forest land. Moreover, as soil nutrients are
mined and not replenished, land expansion results in soil fertility degradation. In other areas of the
country, cultivated land expansion puts pressure on water resources and may encroach on pasture
land. This consideration, in line with any biodiversity conservation program that Cambodia may
have, would argue against continuing a development strategy based on land expansion.
217. The majority of farmers interviewed during the 2013 survey believed that their total
cultivated land area will not change. Farmers were relatively conservative regarding their
expectation of cultivated land areas in the next five years. More than half of interviewed farmers

94
expected no change in the area of land cultivated with vegetables and maize (Figure 38). About 10
percent predicted a decrease, and one out of three anticipated an increase. Cassava showed a
peculiar pattern, with almost equal numbers of farmers expecting an increase, no change or a
decrease in cultivated areas.
Figure 38: Perspectives on the possibility of change in cultivated areas by crop, Cambodia
Source: 2013 survey.
218. The response was determined by location. Respondents in the Tonle Sap and Mekong
regions were not positive regarding the possibility of increasing cultivated land. In other regions,
the option of land expansion is still open, especially for upland crops. During interviews with
different stakeholders, many people were aware of the encroachment of cassava crop cultivation
into forest land. This is a relatively easy way to expand agricultural land, but its practice is
receiving increasingly more attention from policy makers since it puts more stress on already
fragile ecosystems. For rice, the trend was “no change,” although more than 20 percent of
respondents were pessimistic, expecting a decrease in area cultivated.
219. As land expansion cannot play the same role in production growth in the future,
alternative growth strategies such as yield increase, crop and technology choices, and
competitive market advantage will have to play a more important role. The analysis of
environmental sustainability is divided into two types: (i) “weak environmental sustainability,”
whereby the increase in cultivated area for agricultural production continues but at a slower pace,
and (ii) “strong environmental sustainability,” whereby cultivated land area stays the same or
decreases over time.
Weak environmental sustainability
220. Three scenarios (L1, L2, and L3) are developed. They consider a slower cultivated land
expansion growth rate compared to past trends and calculate the resulting total production, gross
margins, and demand for inputs. Except land, all other factors are held constant at their 2013
observed values. To make the simulation results comparable, the overall increase in cultivated land
for the selected crops is set at about 450,000 ha by 2030. This leads to a total cultivated land area
of 4.01 million ha in 2030, an increase of 11-12 percent depending on the scenario, compared to
3.58 million ha for the selected crops in 2012.

95
221. The scenarios’ assumptions are summarized in Table 46. Scenario L1 considers
maintaining upland crops and vegetables’ areas constant at their 2013 levels and the land area
under rice growing at 25 percent of its past growth rate. This scenario focuses on rice production,
reinforcing its role in the economy at the expense of diversification. Scenario L2 assumes a land
expansion of about one-tenth of its past growth rate for all crops. This scenario treats all crops
equally. Scenario L3 sets upland crops and vegetables’ cultivated land expansion at slightly less
than 14 percent of their past growth and keeps cultivated rice land at its current level. The policy
then emphasizes diversification toward expansion of upland crops, which may present an
environmental challenge.
Table 46: Assumptions about land expansion for Environmental Sustainability scenarios
L1-L3
Baseline L1 L2 L3
Cassava 0.0% 0.0% 10.0% 14.0%
Maize 0.0% 0.0% 10.0% 14.0%
Wet season rice 0.0% 25.0% 10.0% 0.0%
Dry season rice 0.0% 25.0% 10.0% 0.0%
Vegetables 0.0% 0.0% 10.0% 14.0%
Source: Own estimates.
222. In scenario L1, rice production increases by 17 percent from the baseline of 9.6
million tons to 11.2 million tons. This is the result of land expansion for rice by one-fourth of its
past growth rate. Gross margins for rice increase by 15.8 percent, from $756 million to $876
million (Table 95A47). The overall gross margin for the combined five crops increases by 11.2
percent, from $1.02 to $1.19 billion (Table 47).
223. In scenario L2, the assumption is that land expansion for all crops continues at 10
percent of past growth rates. Rice production increases by 6.4 percent from the baseline 9.6
million tons to 10.17 million tons (Table 96A). Assuming cassava maintain its level of
productivity, a strong assumption due to the low use of organic and chemical fertilizer for this
crop, cassava production increases by 74 percent, from 6.3 million tons to 10.96 million tons;
maize production increases from 849,000 tons to 1 million tons (17.8 percent increase). Rice is
still the most important crop in terms of gross margins even through its share falls by 7 percent,
from its 71 percent baseline. The overall gross margins for the five crops increase by 18.2 percent
(Table 47), reaching $1.26 billion by 2030.
224. In scenario L3, which focuses on upland crops and vegetables production, rice
production remains similar to the baseline at 9.6 million tons. Cassava production is more than
twice the baseline, rising from 6.3 million tons to 13.6 million tons; and maize production increases
by 25.8 percent, from 0.85 million tons to 1.07 million tons (Table 97A). The share of upland crops
and vegetables in overall gross margins increases from 29 percent to 42 percent, reaching $542
million. The share of gross margins from rice drops by 13 percentage points, from 71 percent to
58 percent. Overall gross margins increase by 21.6 percent (Table 47), reaching $1.30 billion, the
highest among the three weak environmental sustainability scenarios.
47 Table numbers with “A” are presented in Annex 4.

96
Table 47: Simulation results for Weak Environmental Sustainability scenarios L1-L3
Simulation Change
in Gross
Margin,
$ million
(%)
NPV
($
million)
Returns
to Ag.
Labor
($/day)
Change in
Demand
for Ag.
Labor
million
days (%)
Change in
Demand
for
Fertilizers,
tons/year
(%)
Likely
Effect on
Competiti
veness
(DRC)
Baseline 1,023 10,220 6.41 166.5 464,861
L1 Rice areas
increase by
25% of past
land expansion
11.2% 10,644 6.42 11.2% 17.1% Neutral
L2 Equal increase
of all cultivated
land by 10%
18.2 10,882 6.70 13.1% 8.2% Neutral
L3 Increase of
upland areas by
14%
21.6 10,958 6.86 13.7% 2.6% Neutral
Source: Own estimates.
225. These simulations suggest that the policy toward crop diversification (scenario L3)
results in the highest gross margin and NPVs. Moreover, diversification toward upland crops
favors more regionally-balanced development. However at the same time, there is a serious danger
of soil degradation and forest land loss because of its focus on upland crops, particularly for
cassava plantation (more than 400,000 ha of new upland brought into agricultural production). The
scenario focusing only on rice (scenario L1), at the current level of per-hectare gross margins,
results in the worst economic outcome.
226. For each of the three scenarios, demand for labor is roughly comparable, 11-14
percent higher than the baseline. On average, 20 million days of additional demand for labor are
generated, which is related to the increase in cultivated land area. By 2030, the total demand for
labor in scenario L1 is expected to reach 185 million days; the demand in scenario L2 is higher at
188 million days; and the demand in scenario L3 is 189 million days due to the labor requirement
for cassava production (Table 101A). The average returns to labor do not change much and remain
close to $6.5 per day (Table 103A).
227. The policy focusing on rice requires the highest amount of chemical fertilizers. It
results in a 17 percent increase, from 465,000 tons to 544,000 tons; i.e., an additional demand of
80,000 tons (Table 102A). Scenario L3 leads to the lowest increase in demand for chemical
fertilizers (2.6 percent at 476,000 tons) while scenario L2 results in an additional demand of about
40,000 tons for chemical fertilizer reaching 477,000 tons. These demands were estimated assuming
the status-quo application and adoption rates of chemical fertilizers as in 2013.
Strong environmental sustainability
228. Under the strong environmental sustainability group, three scenarios were developed.
Two scenarios (L4 and L6) maintain the same agricultural land area until 2030 and one scenario
(L5) reduces the agricultural land available.

97
229. Scenario L4 keeps the current land use for agriculture but assumes a decrease in
cassava yield. Assuming that current farm practices are maintained, characterized by low-to-no
use of organic and low use of inorganic fertilizers for cassava, a drop in yield is likely. It is
estimated that cassava yield can be as low as 12.6 tons/ha when cultivated on low fertility soil. It
is assumed under this scenario that such a low yield will be attained by 2030, corresponding to an
annual decrease in cassava yield of 2.4 percent from 2013 to 2030.
230. The RGC’s objective is for 60 percent of land to be forested by 2030, up from its
current 56 percent. To meet that goal, scenario L5 takes back land from agriculture through
reforestation. This policy target results in about 710,000 ha of non-forest land converted into forest,
increasing forest areas to 10.83 million ha from the current 10.12 million ha. Scenario L5 assumes
that 25 percent of the required increase comes from cultivated agricultural land in upland areas
and the remainder from barren, non-cultivated land. This corresponds to an annual increase of
40,000 ha of forest cover, with about 10,000 ha converted from agriculture.
231. Scenario L6 assumes status quo in the area of agricultural land but simulates the
impact of nutrient restitution by putting upland fields into fallow one out of every three
years. This practice is expected to restore organic matter and maintain soil fertility at an acceptable
level, allowing for the possibility of increased yields. The required yield level is estimated to
maintain the current agriculture sector performance with reduced land under cultivation.
232. Soil depletion on upland crops (simulated on cassava production) reduces the annual
cassava gross margin by 31 percent (Table 98A). This decline is the direct effect of lower yield,
from 18.65 tons/ha in 2012 to 12.80 tons/ha in 2030, corresponding to a production of 4.3 million
tons in 2030 compared to the current 6.3 million tons. Overall gross margin for the five crops drops
by 5 percent, resulting in an NPV loss of $213 million by 2030 (Table 48).
233. Reducing agricultural land to contribute to the country’s target of 60 percent forest
cover in 2030 (scenario L5) also reduces the gross margin. The overall gross margin and NPV
decline by 7.5 percent and 4.7 percent in 2030, respectively (Table 48). This decline is the direct
effect of lower cultivated land areas for cassava and maize (Table 99A). Because the hypothesis is
reduced upland cultivated areas, the share of cassava and maize in total gross margin decreases
from 22 percent to 17 percent; the gross margins from rice and vegetables do not change because
of the initial assumption. The results show that reducing upland areas harms the agriculture sector
in the absence of options to increase agricultural productivity and profitability.
234. In scenario L6, the cultivated upland area is decreased by allocating one-third of the
current area to fallow to restore soil fertility. With this assumption, the results show the
possibility of maintaining the 2013 level of productivity level until 2030 even with the decrease in
cultivated land area. Under scenario L6, overall gross margin remains stable at $1.02 billion
despite the lower areas under cassava and maize. The total annual cultivated land declines by 5.2
percent but this amount of land (about 187,000 ha in 2030) becomes fallow and is not reforested
(Table 100A). The annual cultivated area under cassava drops by one-third, from 337,800 ha to
223,515 ha, and area under maize drops by the same proportion, from the current 215,442 ha to
142,553 ha. A better production system putting into fallow one-third of the available upland area
results in improved soil fertility, optimal pest management and likely higher productivity.
235. However, scenario L6 makes a strong assumption about yield growth. To overcome
the impact of lower cultivated areas, farmers need to efficiently manage crop production and adopt
agricultural techniques that will result in increased yield. The unchanged gross margin obtained

98
with this scenario requires an increase in cassava yield of 50 percent, from its current 18.65 tons/ha
to 25.91 tons/ha, and a similar increase for maize yield from 3.94 tons/ha to 5.90 tons/ha (Table
100A).
Table 48: Simulation results for Strong Environmental Sustainability scenarios L4-L6
Simulation Change
in Gross
Margin,
$ million
(%)
NPV
($
million)
Returns
to Ag.
Labor
($/day)
Change in
Demand
for Ag.
Labor
million
days (%)
Change in
Demand
for
Fertilizers,
tons/year
(%)
Likely
Effect on
Competitiv
eness
(DRC)
Baseline 1,023 10,220 6.41 166.5 464,861
L4 Loss of soil
fertility -5.0% 10,007 6.09 0.0% 0.0%
Worsened/
DRC
increased
L5 Decrease of
upland crop
area by 2.4% a
year
-7.5% 9,901 6.23 -4.7% -1.2% Neutral
L6 Fallow 1/3 of
upland crop
area
-0.2% 10,211 6.72 -4.7% -1.2%
Improved/
DRC
decreased
Source: Own estimates.
9.3. Scenarios for Productivity Growth
236. Considerable technological change has occurred in crop production in the past ten
years. A lot of this technological change has the typical features of the green revolution (improved
seeds, use of inorganic fertilizers and other chemicals, and irrigation), but there is also an
increasing reliance on mechanization, driven by higher labor costs and scarcity of available rural
labor.
237. Cambodian farmers are aware of the importance of improved and higher-quality
seeds. They think that seeds have a high impact on productivity. Farmer-to-farmer communication
is the main source for adoption of new and improved seeds: according to farmers, it was even more
important than information obtained from technical agents of the extension system. Farmers are
positive about the continuous improvement in seeds. This is not necessarily because of the effort
of related institutions such as the research and extension organizations in Cambodia, the public
extension system, NGOs or private companies. A key role in improved seed dissemination and
adoption is played by contact with farmers and traders in neighboring countries. In practice, many
of the improved seeds in Cambodia originated from research and development systems of Vietnam
and Thailand. While access to this research and development effort is a positive externality for
Cambodia, the seed trade remains largely uncontrolled and issues of intellectual property rights
are not addressed.
238. Chemical inputs are increasingly used. But Cambodian farmers use much less chemical
inputs than neighboring countries. This lag in adoption of chemical inputs might have some
positive effects in terms of reducing environmental impact and chemical residues on food.

99
However, the lower use of chemicals in Cambodia appears to be less the result of a conscious
choice inspired by environmental or food safety concerns than the outcome of a poorly functioning
input distribution system characterized by high input prices and often inputs of dubious quality. In
some cases, most notably cassava and to a lower extent maize, the very low use of fertilizer
(whether chemical or organic) has serious negative impacts on soil fertility and sustainability.
239. The increasing use of inputs, however, does not appear to have significantly increased
farm profits. In other words, improved technology use has not been accompanied by efficiency
improvements or increased TFP. Over the past decade, the overall profitability of agriculture
(measured by gross margins per ha in real terms) has not increased for the majority of farmers.
The profitability of those engaged in rice might have been stagnant or declining in spite of the
noted changes in output prices and use of modern technology. For cassava, the increase in output
prices was higher than the increase in the unit cost of production. The problem is that the land
expansion in cassava is itself unsustainable, since it is carried out through exploitation of soils that
were previously forest land.
240. Labor competition is increasing and labor costs are mounting. Wages for basic
agricultural tasks have increased by a factor of three over the past decade, implying changes in
production techniques and production cost structure. Farmers are using more services (e.g.,
mechanization), more modern inputs, and less labor. This movement favors larger farmers who
have access to capital and penalizes small farmers for whom labor is a main asset. Migration of
youth and women to nonfarm rural sector and urban sector employment continues unabated. The
subsequent lack of labor in rural areas puts pressure on rural wages, which has a negative impact
on the cost of production; at the same time, it accelerates mechanization.
241. According to the surveys’ findings, rural wages increased tremendously over the past
decade, from $1.25/day in 2005 to $4.56/day in 2013. The estimated monthly salary for rural
labor is about 70-80 percent of the industrial wage, depending on the season. The most dramatic
changes in the production system regard labor use in cassava and dry season rice production, where
mechanization has contributed to labor substitution in operations such as land preparation, weed
control, harvesting, and threshing. The increasing use of labor in vegetables production might be
associated with the need to provide better care, the use of more intensive practices such as several
cycles over the year, and the trend toward more labor-intensive vegetables such as broccoli, lettuce,
and cucumber.
242. As a result, labor use is decreasing, except in vegetables production (Figure 39), while
returns to labor are increasing for all crops, with the exception of maize (Figure 40). Perhaps
in the case of maize, early adopters of hybrids were rewarded with higher margins. Figure 39 also
shows the higher variability of the returns to labor in 2005, ranging from $1.87/day (wet season
rice) to $14.82/day (maize). The gap across crops become less acute in 2013 (between $5.08/day
and $10.65/day), indicating improved allocation of available labor in rural areas.
243. It is important to note that the share of service in the cost of production is indicative
of a new type of farming emerging in Cambodia, namely one better integrated with the
nonfarm service sector. The idea of a self-sufficient farmer is changing. Even though a farmer
might be able to produce more than what s/he consumes (at least for some specific commodities),
s/he is highly dependent on labor and services provided outside of her/his household. The trend is
for the Cambodian farmer to become a farm manager, namely somebody who in the effort to
maximize profitability out of land will use inputs, services, and knowledge more than her/his own

100
labor. The implicit concern in all these major changes in the cost and use of labor in agriculture is
that neither agriculture nor other sectors of the economy will be able to absorb the increasing labor
force.
244. To simulate the effect of factors that could improve TFP, four scenarios are
developed. The first scenario (P1) simulates technical change (moving the farm technology
frontier up). The second scenario (P2) is about technical efficiency (reducing the productivity gap
by shifting farms from traditional to modern practices). The third scenario (P3) combines technical
change and technical efficiency. The fourth scenario (P4) simulates the effects of irrigation on
TFP.
Figure 39: Labor use in production
(days/ha), Cambodia
Figure 40: Return to labor ($/day),
Cambodia
Source: 2005 and 2013 surveys.
Increased adoption of modern farm technologies
245. Scenarios P1 through P3 assume that increasingly more farmers will become modern
technology adopters, resulting in fewer farmers using traditional practices. In these
simulations, the level of chemical fertilizer application, the use of improved seeds, and labor
allocation in the farm budgets are used as measure for modern technology adoption and contribute
both to the higher adoption of new technologies (technical change) and to a larger share of farms
using existing improved technologies (technical efficiency), thereby increasing an overall TFP.
The basis for the simulation is an annual 4 percent shift from traditional to modern farming until
2030.
246. As the initial distribution of farms by technology use is not known with precision, the
information collected during the FGDs was used to make assumptions. Modern technology
adopters appear to account for 35-40 percent of total farms in Cambodia. Details of modern input
use and the distribution of farms by level of technology use are presented in Table 104A and Table
105A. The projected trend in the number of modern and traditional farms is presented in Figure
41 and shows that by 2030 at least 75 percent of farmers will be categorized as users of modern
technologies. This requires at least a 4 percent shift per year from traditional to modern farming in

101
terms of cultivated land. The simulation shows that by 2019, the total area cultivated by modern
farmers exceeds that cultivated with traditional techniques; by 2030, there is a clear dominance of
farmers using modern technologies in Cambodia.
Figure 41: Shift in land used by traditional and modern farmers, Cambodia
Source: 2013 survey.
247. Modern farmers differ from traditional ones in the following manner. For rice and
cassava, modern farmers use about twice the amount of chemical fertilizers that traditional farmers
do (Table 104A). Maize production presents the largest gap (2.6 kg/ha versus 104 kg/ha), and
vegetable production a ratio of about 1 to 3.5 (traditional versus modern). The table shows different
levels of adoption of improved seeds between modern farmers and those using traditional varieties:
the difference is largest for rice and vegetables, with modern farmers using a higher amount of
improved seeds per hectare. Table 105 details the level of labor use per hectare across farms using
traditional and modern technologies, the wage rate assumed as in 2013. It is assumed that every
year, 4 percent of farmers practicing traditional technology shift to modern technology. The
breakdown of modern farmers by crop is as follows: 35 percent for cassava, 40 percent for maize
and rice, and 40 percent for vegetable production. With the retained growth rate of 4 percent, the
overall proportion of farms adopting modern technologies reaches 75 percent in 2030, an increase
of 35 percentage points from the current average of 40 percent.
248. Farmers using modern technologies are more productive and profitable. In the
baseline, modern cassava producers generate 65 percent more in gross margins compared to
traditional farmers; for maize, the gap is higher, at 87 percent. For dry season rice production, the
gross margins between modern and traditional farmers are quite close, at $387/ha versus $336/ha.
For wet season rice and vegetables, the differences are huge: 124 percent for rice and 240 percent
for vegetables. In scenarios P1-P3, it is assumed that modern farmers do not incur additional
irrigation costs.
249. Scenario P1 consists of keeping the farm distribution by technology use at 2013 status.
However, due to access to better input quality and extension services, modern farmers have higher
efficiency, which translates into productivity growth twice as high as that of traditional farmers by
2030 (Table 49).

102
250. Scenario P2 simulates the effects of an annual shift of 4 percent of land cultivated
with traditional techniques to land cultivated with modern techniques. However, there is no
additional efficiency gain; i.e., the productivity gap between traditional and modern farmers
remains the same as the level recorded during the 2013 baseline.
251. Scenario P3 combines the effect of an annual 4 percent shift on land cultivated with
improved efficiency of modern technology users by using a productivity gap twice the
baseline. This means that modern farmers should be able to get higher gains from the use of any
inputs through better crop production systems, improved knowledge and skills, and better
information on the quality of inputs.
Table 49: Assumptions about Productivity Growth scenarios P1-P3
Baseline P1 P2 P3
% decrease in no. of traditional
farms
0.0% 0.0% 4.0% 4.0%
% increase in no. of modern farms 0.0% 0.0% 4.0% 4.0%
Increase in yield to ensure effectiveness of modern farms
Cassava 0.0% 1.1% 0.0% 1.1%
Maize 0.0% 1.1% 0.0% 1.1%
Wet season rice 0.0% 1.0% 0.0% 1.0%
Dry season rice 0.0% 0.4% 0.0% 0.4%
Vegetables 0.0% 2.3% 0.0% 2.3%
Source: Own estimates.
252. The results simulated with scenario P1 show positive outcomes for the agriculture
sector. The gross margins for modern farmers increase by 19.9 percent from $636 million to $764
million in 2030 (Table 107A). This corresponds to an additional NPV of $450 million, 7.3 percent
higher compared to the baseline. The total gross margin for the five crops and total NPV increase
by 11.1 percent and 4.1 percent, respectively (Table 50). The share of modern farms in total gross
margin in 2030 reaches 60 percent.
253. Scenario P2 simulates an annual shift of 4 percent of traditional to modern farming,
but without improved productivity. This growth rate leads to three-fourths of farmers adopting
modern technologies by 2030. The additional NPV generated by the shift corresponds to $887
million by 2030, 8.6 percent higher than the 2012 NPV (Table 108A). The gross margins for the
five crops increase by 25.8 percent (Table 50), including for modern farms by 94.8 percent. This
is the direct effect of more traditional farmers adopting modern technologies. Since the assumption
is to keep the total cultivated land unchanged, the projected gains in gross margin and NPV exceed
losses from potential agricultural land conversion into forest land simulated in the previous section.
Moreover, the gain in gross margins for modern farms outweighs the loss in gross margin for
traditional farms.
254. Scenario P3 presents more efficient farm production in combination with an annual
4 percent shift in the use of traditional versus modern technologies. The overall gross margins
and NPV for the five crops increase by 47.4 percent and 14.9 percent, respectively (Table 50 and
Table 109A), with 88 percent of the increased NPV provided by modern farms, which cultivate 77
percent of the total area.

103
Table 50: Simulation results for Productivity Growth scenarios P1-P3
Simulation Change
in Gross
Margin,
$ million
(%)
NPV
($
million)
Returns
to Ag.
Labor
($/day)
Change in
Demand
for Ag.
Labor
million
days (%)
Change in
Demand
for
Fertilizers,
tons/year
(%)
Likely
Effect on
Competitiv
eness
(DRC)
Baseline 1,023 10,220 6.41 166.5 464,861
P1 More efficient
modern farms 11.1% 10,640 7.14 -19.9% 26.6%
Improved/
DRC
decreased
P2 Shift from
traditional to
modern farms
25.8% 11,107 10.10 0.0% 0.0%
Improved/
DRC
decreased
P3 Combined
effects of shift
and efficiency
47.4% 11,749 11.84 -19.9% 26.6%
Improved/
DRC
decreased
Source: Own estimates.
255. The results of three scenarios show that the best economic outcome is achieved by a
simultaneous increase in the number of farmers adopting modern technologies and more
efficient use of production factors. Scenario P3, combining both the technology shift and higher
efficiency, leads to the highest gross margins, the largest NPV, and the highest returns to
agricultural labor, which is the proxy for farm incomes (Table 50 and Table 110A). The returns to
labor are projected to increase to $11.84/day, 86 percent above the 2012 baseline. This high return,
however, remains below the long-term Vision’s target as stated in Table 45 ($9/day in 2020 and
$18/day in 2030), requiring high attention to additional sources of income growth (e.g., irrigation
and diversification).
256. Modern farmers are associated with higher gross margins and higher costs because
of the use of more modern inputs. The demand for chemical fertilizers peaks at 598,600 tons in
2030; i.e., an additional 125,000 tons or 26.6 percent higher compared to the baseline (Table
113A). The average application rate for cassava increases by 32 percent, from 14 kg/ha to 19 kg/ha.
Chemical fertilizer use on maize increases by 89 percent, from 43 kg/ha to 82 kg/ha. Rice growers
apply 158 kg/ha for wet season rice and 317 kg/ha for dry season rice, up by 25 percent and 23
percent, respectively, compared with the baseline. The increase chemical fertilizer use for
vegetables is 52 percent, from 303 kg/ha to 460 kg/ha.
257. But modern farms will use less labor, freeing it for other nonfarm uses. With P2 and
P3 scenarios, the demand for labor decreases by 19.9 percent in 2030, corresponding to 33 million
fewer days (Table 112A) compared to the 2012 baseline. This overall decrease from 166 million
to 133 million days, keeping area cultivated the same, comes mainly from reduced demand for rice
production. Yet rice producers remain main users of labor, even though their share goes down
from 80 percent in 2013 to 72 percent in 2030. Labor demand for other crops increases (7 percent
for cassava, 4 percent for maize, and 28 percent for vegetables) but these higher needs are offset
by the decreased demand from rice production. Post-harvest activities related to higher
productivity generate higher demand for labor for cassava and maize production while for
vegetables the increase in labor demand is linked to the overall vegetable production system.

104
Improved irrigation
258. A critical element for increased productivity is the availability and quality of
irrigation water. Irrigation increases the likelihood of success when using modern inputs such as
improved seeds and fertilizers. It also allows increasing crop intensity through multiple crop cycles
per year and provides a system of water control and disaster risk reduction. In this simulation, the
assumption is that irrigated land is cultivated twice a year and produces a higher yield (the dry
season rice yield observed in the 2013 survey). Foregone revenues and costs are those related to
the wet season rice production system, based on data from the 2013 survey. It is assumed that the
land used to grow wet season rice receives irrigation and thus reaches the performance of dry
season rice productivity. And lastly, all costs are held the same, with the exception of irrigation
costs for dry season rice.
259. Scenario P4 focuses on the investment in irrigation. The assumption is that every year
about 2 percent of nonirrigated land receives water irrigation infrastructure. If so, land productivity
and profitability become similar to dry season rice production. If the rice field is irrigated, the
expected yield is 4.34 tons/ha versus 2.78 tons/ha for rainfed rice. From the 2013 farm budgets,
the unit price for paddy is $228/ton during the dry season and $262/ton during the wet season.
Lastly, the gross margin for dry season rice is $370/ha (excluding irrigation costs) and $245/ha for
wet season rice.
260. The NPV from investment in irrigation amounts to $11.98 billion, about 17 percent
above the 2012 baseline. This increase comes from about 450,000 hectares of new land with
irrigation, with the possibility of two crops per year. Table 51 presents the simulation results from
irrigation investment.
Table 51: Simulation results for Productivity Growth scenario P4
Simulation Change
in Gross
Margin,
$ million
(%)
NPV
($
million)
Returns
to Ag.
Labor
($/day)
Change in
Demand
for Ag.
Labor
million
days (%)
Change in
Demand
for
Fertilizers,
tons/year
(%)
Likely
Effect on
Competitiv
eness
(DRC)
Baseline 1,023 10,220 6.41 166.5 464,861
P4 Expansion of
irrigation
coverage
32.4% 11,984 8.52 3.1% 66.7%
Improved/
DRC
decreased
Source: Own estimates.
261. Irrigation requires a large amount of upfront investment. Table 111A presents some
costs observed in South and Eastern Asia that range from $1,400/ha to $4,000/ha. With these levels
of prices, the total amount required for scenario P4 range between $636 million and $1.8 billion.
The average cost for this scenario is assumed at $2,500/ha, which implies a need for $1.13 billion
over the next 10 years to provide irrigation schemes for more than 450,000 ha. With a cost of
irrigation of $4,000/ha, the computed internal rate of return (IRR) until 2030 is as low as 7 percent;
at $2,500/ha, the IRR is 17 percent. However, if Cambodia manages to get reasonable irrigation
investment costs of $1,400, comparable to costs in South Asia, then irrigation is a good candidate
for agricultural development, with an IRR reaching 34 percent.

105
9.4. Scenarios for Improved Competitiveness
262. Over the past decade, the overall cost of production for important crops such as rice
and maize increased more than the overall revenues from production, implying a decline in
profitability per unit of land for farmers engaged in those activities. The concern is then
whether the cost of production will continue to increase for key agricultural commodities and/or
if profitability (as measured by gross margins per hectare) will decrease. Better linkages between
farmers and enterprises and other value chain actors might be a solution to improving farm
profitability. Improved linkages could result in higher output prices and lower prices of inputs due
to lower transaction and transportation costs from better supply chain management and sales and
marketing organization.
263. The DRC analysis showed that agricultural production in Cambodia has a high
comparative advantage, with most DRCs less than 1. However, the DRC ratio is closely linked
with the level of prices and thus any changes in prices will affect the advantage of the country
producing the goods. Price changes for both outputs and inputs are simulated in scenarios C1-C6.
264. The scenarios’ assumptions are summarized in Table 52. Scenarios C1 and C2
hypothesize an increase in output prices by quarter of their past growth rate, and simulate the effect
of changes on input prices (scenario C1: identical to the percentage change in output prices;
scenario C2: double the change in output prices). In both scenarios C3 and C4, output prices remain
stable, but in scenario 3 the wage rate increases by half of its past growth rate, while in scenario
C4 the cost of services increases by a quarter of its growth rate. Scenario C5 assesses the impact
of lower output prices (15 percent less than current prices in 2030 in nominal terms); in scenario
C6, the opposite occurs, such that output prices have a growth rate of 15 percent.
Table 52: Assumptions about Competitiveness scenarios C1-C6
Increase/decrease in Baseline C1 C2 C3 C4 C5 C6
Price of outputs 0.0% 25.0% 25.0% 0.0% 0.0% -15.0% 15%
Price of seeds 0.0% 25.0% 50.0% 0.0% 0.0% 0.0% 0.0%
Price of fertilizers 0.0% 25.0% 50.0% 0.0% 0.0% 0.0% 0.0%
Price of other inputs 0.0% 25.0% 50.0% 0.0% 0.0% 0.0% 0.0%
Wage rate 0.0% 25.0% 50.0% 50.0% 0.0% 0.0% 0.0%
Service costs 0.0% 25.0% 50.0% 0.0% 25.0% 0.0% 0.0%
Source: Own estimates.
265. Scenario C1 assumes equal increases in output and input prices. From 2005 to 2013,
the annual increases in output prices were spectacular in nominal terms: 17 percent for cassava, 13
percent for vegetables, 7-9 percent for rice, and 4 percent for maize. For a more conservative
assumption, the simulation uses one-quarter of the past trends for the calculation. All production
costs are also assumed to increase at a quarter of their past growth rate.
266. Scenario C2 focuses on the effect of input prices increasing at twice the rate of output
prices. The simulation assumes a growth rate increase of one-quarter of the past rate for outputs,
and double the rate for the cost of inputs. Indeed, a comparison of the 2005 and 2013 farm budgets
shows a decrease in the gross margin in real terms, partly due to the rapid increase of input costs
relative to output prices. This scenario tests the strength of the gross margins with respect to
different price trends.

106
267. Scenario C3 simulates the effect of status quo output prices and a 50 percent increase
in the wage rate. The analysis simulates the impact of increased wages on key profitability
indicators. Cultivated land and labor requirements are expected to remain at the 2013 level to
isolate the effect of an increased wage rate. For the simulation, the target of $18/day of returns to
labor is used to estimate the annual wage rate growth. An additional assumption is that labor use
is inelastic to the wage rate (i.e., it does not change as the wage rate increases).
268. Scenario C4 is similar to C3 but simulates a moderate increase in the cost of services
compared to its past growth rate. The cost of services, mainly mechanization, increases by 25
percent, with prices of other inputs assumed constant.
269. Scenario C5 looks at the effect of a reduction of output prices of 15 percent of the past
growth rate by 2030. Scenario C6 assesses the impact of an increase in output prices of the same
magnitude of 15 percent. Other factors’ costs remain constant.
270. The economic results of the scenarios are summarized in Table 53. A balanced increase
of prices of outputs and inputs (scenario C1) results in an NPV gain of $766 million (7.5 percent
increase). Price of outputs may increase due to an increase in world market prices or lower
marketing costs along with a stronger domestic agroprocessing industry offering higher prices.
The nominal yearly gross margin increases by 16.5 percent, from $1.02 billion in 2013 to $1.24
billion in 2030 (Table 116A). The overall growth, however, hides huge discrepancies across crops.
Cassava, wet season rice, and vegetables benefit most from these balanced price increases. The
NPVs for dry season rice and maize are 9 percent and 27 percent below the 2012 baseline,
respectively.
271. Scenario C2 assumes that the prices of inputs (seeds, fertilizers, and other inputs),
labor, and services increase at half the rate of their past trends and that output prices
increase at one-fourth their past rate. This scenario’s effects harm the profitability of agriculture
in Cambodia. The overall NPV is $6.5 billion less than that of the scenario without price changes
($3.76 billion versus $10.2 billion). The NPVs for all crops are lower, with proportional changes
ranging from an 18 percent loss for vegetables to a 94 percent loss for maize.
272. If output prices remain stable but the daily wage rate grows at half of its past trend
until 2030, Cambodia’s agricultural sector will collapse. The NPV for scenario C3 is only $3.76
billion by 2030, corresponding to a loss of $7.3 billion, the highest among the five competitiveness
scenarios (Table 53). This $7.3 billion shortfall is the result of the wage rate increasing at an annual
rate of 8.8 percent (half of the past growth rate), from $4.56/day in 2013 to $19.1/day in 2030,
comparable to a long-term Vision’s target in Table 45. The largest drop in NPV is for wet season
rice (82 percent reduction) due to the relatively low gross margin per hectare ($245/ha) combined
with relatively higher labor use (48 days/ha); the smallest reduction is for maize (a 22 percent
reduction).

107
Table 53: Simulation results for the Competitiveness scenarios C1-C6
Simulation Change
in Gross
Margin,
$ million
(%)
NPV
($
million)
Returns
to Ag.
Labor
($/day)
Change in
Demand
for Ag.
Labor
million
days (%)
Change in
Demand
for
Fertilizers,
tons/year
(%)
Likely
Effect on
Competitiv
eness
(DRC)
Baseline 1,023 10,220 6.41 166.5 464,861
C1 Equal increase
in output and
input prices
(25%)
16.5% 10,986 7.09 0.0% 0.0%
Improved/
DRC
decreased
C2 Input prices
increase twice
that of output
prices
-247.7% 3,761 -10.92 0.0% 0.0%
Worsened/
DRC
increased
C3 Wages
increase by
50% -226.2% 3,655 -7.84 0.0% 0.0%
Worsened/
DRC
increased
C4 Cost of
services
increases by
25%
-25.2% 9,290 4.85 0.0% 0.0%
Worsened/
DRC
increased
C5 Output prices
decrease by
15% -66.5% 7,499 2.36 0.0% 0.0%
Worsened/
DRC
increased
C6 Output prices
increase by
15%
182.8% 16,739 19.48 0.0% 0.0%
Improved/
DRC
decreased
Source: Own estimates.
273. In scenario C4, a moderate increase in the cost of services (a quarter of the past
growth rate, at 1.9 percent per year) affects the overall gross margin less than the wage rate
increase does. The NPV is only by $930 million less (9 percent lower) compared to the baseline
scenario. The nominal gross margins in 2030 decline by 25.2 percent (Table 53). Vegetables
production remains stable with an NPV of $717 million; other crops’ NPV losses range from 7
percent (maize) to 13 percent (dry season rice). The scenario of a moderate increase in the cost of
services is more plausible because more competition across small enterprises providing
agricultural services may happen in the near future, and would keep the increase in the cost of
services at a lower growth rate.
274. Scenario C5 considers the impact of reduced output prices on overall agricultural
productivity. By 2030, the gross margins from the five crops decline by $3.5 billion and the annual
gross margins are 66 percent lower compared to the baseline, decreasing from $1.02 billion to
$357 million.

108
275. An increase in output prices as illustrated in scenario C6 results in higher gross
margins and makes agricultural production profitable for farmers in Cambodia. The NPV
increases by 64 percent, from $10.2 billion to $16.7 billion. The gains are between 64-80 percent,
with the exception of vegetables (26 percent). The nominal gross margin in 2030 is 182 percent
higher than the margin in 2012 ($3.02 billion versus 1.02 billion).
276. Ranking the impact of the five scenarios on gross margins with unchanged or reduced
output prices, moderate increases in the cost of services result in the least negative impact.
This is either compared to the changes due to a higher wage rate (half the past growth rate) or to
unequal increases in the cost of inputs versus output prices with a ratio 2 to 1. The changes in gross
margins and the level of the demand for labor both affect returns to labor. If the wage rate increases
by 8.8 percent a year, which corresponds to a wage rate of $19.1/day in 2030 (scenario C3), and
output prices remain the same as in 2013, returns to labor are negative by 2024 (Table 117A). By
2018, agricultural activities under that scenario do not provide incentives to farm given an average
return of $4.28/day, below the prevailing 2013 wage rate of $4.56/day. The simulations show very
similar results for scenarios C2 and C4 in terms of returns to labor. In these three scenarios,
agriculture is not competitive since the simulated returns to labor tend to go below the prevailing
wages and even plummet below zero. Farmers would not be willing to stay in agricultural
production, and would instead seek other opportunities to earn income. Any increase in the costs
of inputs, keeping the price of output constant, is a significant threat for the agriculture sector
because in a competitive economy, farmers would choose to leave farming and become wage
earners.
277. Scenarios C1 and C6 result in highest returns to labor. In scenario C1, returns to labor
increase but only by 7.14 percent, from $6.41/day to $7.09/day. On the other hand, returns to labor
increase quite substantially in scenario C6. The average returns to labor reach the expected
$19.5/day in 2030. In scenario C6, returns to labor for cassava, maize and dry season rice, ranging
between $30/day and $33/day, are highly attractive (Table 117A). Because the wage rate is
assumed to not affect the demand for labor, the labor needs remain at 166.5 million days per year.
The demand for fertilizer also remains stable, at 474,000 tons because of the zero price-elasticity
assumption (Table 118A).
9.5. Scenarios for Income Growth
278. The convergence of farm and nonfarm incomes is the ultimate objective of
agricultural transformation. In the past decade, the high growth in agricultural incomes led to a
significant reduction in the gap between farm and nonfarm incomes. The ratio of non-agricultural
GDP per nonfarm worker to agricultural GDP per farm worker fell from 3.2 in 2002 to 2.1 in 2012.
The wages of agricultural workers grew much faster than the wages of unskilled workers employed
in the construction and garment industries (recall As a result of increasing returns to labor,
agricultural wages in general rose, converging with nonfarm wages. Agricultural wages grew
by a factor of almost three between the 2005 and 2013 surveys (Error! Not a valid bookmark
self-reference.). Over the same period, nonfarm wages increased by only 60 percent. As a result,
the gap between farm and nonfarm sector wages declined. Thus agriculture appears to have
provided excellent income-earning opportunities in Cambodia over the last decade.
279. Figure 34), causing the farm wage gap to fall from 0.35 in 2005 to 0.75 in 2013.

109
280. Growth in future farm incomes depends on many factors, but it is imperative for
agriculture to grow faster than the rest of the economy on a per capita basis to continue the
farm income convergence. The productivity growth analyzed in Chapter 9.3 is a powerful driver
of future growth. A declining agricultural labor force will also help increase per capita income.
Additional sources of income growth, simulated in this chapter, are: (i) a change in the variety of
cultivated crops (for example, to fragrant rice); (ii) the addition of processing to increase the value
added of crop production (for example, cassava); and (iii) a change in land distribution by farm
size, which affects farmers’ per-capita income.
281. Hardest to support is the income convergence of the smallest farms. During the past
decade, small farms became smaller while large farmers grew larger. Farms with less than 1 ha
producing annual crops, except vegetables, have smaller incomes on average. They are less likely
to adopt modern technologies and integrate into modern value chains. Special attention is needed
for this group of farm households, as they will continue to account for the largest share of farm
households in Cambodia.
Fragrant rice production
282. The DRC analysis showed that producing fragrant rice instead of the IRRI rice would
give Cambodia a higher comparative advantage relative to neighboring countries. One
consequence of switching to fragrant rice production is the reduction in production volumes
(fragrant rice has a lower yield than IRRI rice), but this is compensated by the higher price for
fragrant paddy.
283. Two scenarios assess the impact of farmers switching varieties of rice from high-
yielding IRRI to fragrant. Scenario I1 assumes a 4.2 percent annual shift from IRRI to fragrant
rice, combined with a 75 percent price difference in the output (difference based on the 2013
survey). Scenario I2 looks at a further annual shift (9.9 percent), keeping the same price difference
between fragrant rice and high-yielding IRRI rice varieties (Table 54). The growth rate of areas
cultivated with fragrant rice is based on a hypothetical 10 percent and 25 percent of all rice area in
Cambodia adopting fragrant rice by 2030. To reach these targets, the annual growth rates must be
4.2 percent and 9.9 percent, respectively, with initial land area producing fragrant rice estimated
at 5 percent.
Table 54: Assumptions about rice variety changes under Income Growth scenarios I1-I2
Scenario Baseline I1 I2
Land area under fragrant rice, annual change 0.0% 4.2% 9.9%
Land area for other crops, annual change 0.0% -4.2% -9.9%
Source: Own estimate.
284. Unser scenario I1, the areas cultivated with fragrant rice doubles by 2030. Gross
margins for rice show an annual 6.2 percent increase, from $762 million in 2013 to $808 million
in 2030 (Table 121A). These gains are the effect of a higher price for fragrant rice that compensates
for the lower yields. It is assumed that the wet season rice yield gap is 16 percent (2.89 tons/ha for
other varieties versus 2.5 tons/ha for fragrant rice), and the dry season rice gap is 37 percent (4.80
tons/ha versus 3.50 tons/ha for fragrant rice). Labor and fertilizer demand are held constant. The
NPV gains 2.1 percent, from $7.29 billion to $7.44 billion (Table 55). The returns to agricultural
labor from producing rice increase by 6.2 percent.

110
Table 55: Simulation results for Income Growth scenarios I1-I2
Simulation Change
in Gross
Margin, $
million
(%)
NPV
($
million)
Returns
to Ag.
Labor
($/day)
Change in
Demand
for Ag.
Labor
million
days (%)
Change in
Demand
for
Fertilizers,
tons/year
(%)
Likely
Effect on
Competitiv
eness
(DRC)
Baseline 762.04 7,293 5.68 134.08 430,134
I1 Fragrant rice
area
increases to
10% of total
rice area
6.2% 7,443 6.03 0.0% 0.0%
Improved/
DRC
decreased
I2 Fragrant rice
area
increases to
25% of total
rice area
24.2% 7,744 7.06 0.0% 0.0%
Improved/
DRC
decreased
Source: Own estimate.
285. If the 2030 target is expanded to 25 percent of total rice land cultivated with fragrant
rice, the gains on gross margins rise by 24.2 percent (scenario I2). This corresponds to an
increase of the NPV to $481 million over the next 17 years. Returns to labor increase by 24 percent,
reaching $7.06/day in 2030 (Table 55).
Processing cassava into dry chips
286. The second group of scenarios assesses the effects of domestic value addition on farm
incomes. Data on cassava from the 2013 survey are used to compare the gains from selling fresh
cassava to those from selling dry chips processed from cassava. The loss in product weight is about
50 percent after drying but the gain in price could reach 50 percent or higher (Table 126). The
assumed annual growth rates are a hypothetical 10 percent (scenario I3) and 25 percent (scenario
I4) of total cassava area used for production of cassava for processing and selling as dried chips
by 2030. Scenario I3 looks at the likely changes due to an annual 4.2 percent increase in the area
processing cassava before sales (Table 56), corresponding to the hypothetical 10 percent of total
area with processing by 2030. Scenario I2 assesses the changes resulting from a further shift from
fresh to processed, with annual growth rate of 9.9 percent, aiming to have 25 percent of land selling
processed cassava by 2030.
Table 56: Assumption about cassava processing under Income Growth scenarios I3-I4
Scenarios Baseline I3 I4
Land area for cassava processing, annual change 0.0% 4.2% 9.9%
Other cassava land area, annual change 0.0% -4.2% -9.9%
Source: Own estimate.
287. Processing cassava into dry chips incurs additional costs, but the cost increase is offset
by the gains from better output prices. Under scenario I3, the 2030 gross margin shows a slight
increase of 2.2 percent, from $155.5 million to $158.9 million (Table 125). The changes are quite
small because of the relatively lower starting point (5 percent of production processed). Scenario

111
I4 further simulates the shift to be around 9.9 percent a year, aiming at 25 percent production
processed in 2030. With that hypothesis, cassava gross margins increase by 8.6 percent, from
$155.5 million in 2013 to $168.9 million in 2030. As a consequence, the returns to labor increase
by 8 percent, from $10.61/day to $11.49/day in nominal terms (Table 127A). As per the initial
assumption, the demand for fertilizers is not affected by processing but the demand for labor is
slightly altered because of the additional manual tasks required for cassava drying. For scenario
I4, total demand for labor increases from 14.66 million to 15.01 million days per year by 2030.
Farm size distribution
288. Agricultural land markets are already very active in Cambodia, and are likely to
become more so in the future as the result of improved property rights and agricultural
transformation. The latter might imply a number of situations whereby small and marginal
farmers sell their land to larger farmers, commercial farmers consolidate their landholdings in
contiguous plots, and new lands are opened up as a result of improved connectivity. The
transformation of land size distribution is likely to be in the direction of larger farm size.
289. The 2013 survey indicates that farm size distribution is becoming more unequal. Large
farms are becoming larger; small farms are becoming smaller; and the number of landless or
marginally landless rural households is increasing. Sophal (2008) reported that about 21 percent
of rural households are involuntarily landless, while a further 45 percent are land-poor owning no
more than 1 ha per household. This process is fueled by an active land market that farmers use to
either sell or buy land. Generally, young married couples are most affected.
290. In the current analysis, “large” is a relative term. For rice and maize production, large
refers to farms with cultivated rice land of more than 3 ha. For cassava, the benchmark is 5 ha; and
for vegetables, large farms have more than 1 ha of land. Therefore, even though the trend is towards
larger farms, the agricultural farmland distribution over the next decade will continue to be
dominated by farmers who have farms less than 5 ha.
291. The farm budget analysis in Chapter 4 showed that in general there are no economies
of scale in Cambodian crop agriculture. The situation is very complex and varies from crop to
crop and with different farm sizes and technologies. For some crops and some types of crop
cultivation (e.g., vegetables production and modern wet season rice) there were indications of
decreasing economies to scale; for maize, there was an indication of increasing economies of scale;
and for cassava and dry season rice, there was no indication of economies of scale (either
increasing or decreasing).
292. Given these findings, the current trend towards increasing inequality in farm size
distribution might have either positive or negative implications in terms of overall
profitability of the sector. The outcome is an empirical one that is not preordained a priori. Small
farmers may be negatively affected by the trends toward agricultural transformation, becoming
landless or near-landless. The initial distribution of farm size is not known with precision, so
information collected during FGDS is used to estimate the proportion of farm by size. Though
very rough, these data allow simulating the impact of the move toward larger farm sizes. On
average, small farms account for 47-75 percent of total farms; medium-size farms for about 21-41
percent; and large farms for less than 10 percent, with the exception of maize (12 percent). Details
of the farm size distribution used in the analysis are presented in Table 128A.

112
293. Two scenarios simulate the effect of a change in land distribution by farm size on
gross margins and returns to labor. If the land holding per household increases, overall income
per capita shall also increase. The initial data about unit margin by crop and by farm size allow
derivation of the distribution of overall margins (reported in Table 128A). To compare the
simulated effect of farm size distribution on key indicators, overall cultivated land is held constant
at its 2013 level of 3.58 million ha for the five crops.
294. Scenario I5 assumes an annual decrease of 1 percent of land under small farms,
holding the total cultivated land and average landholding by farm constant. This scenario
assumes that half of the land area from small farms goes to medium-size and half goes to large
farms (Table 57). It implies a decreasing number of small farms and inversely, an increasing
number of medium-size and large farms, and an overall lower number of agricultural farms but
with higher average farm size.
295. Scenario I6 assumes the same farm distribution as in scenario I5, but more efficient
large and medium-size farms such that their gross margins are higher than in the 2012
baseline. For the simulation, the increase in efficiency is set at an annual 5 percent. This efficiency
may, for instance, come from better farm management.
Table 57: Assumptions about Income Growth under scenarios I5-I6
Scenarios Baseline I5 I6
% decrease in small farms 0.0% 1.0% 1.0%
% increase in medium farms 0.0% 0.5% 0.5%
% increase in large farms 0.0% 0.5% 0.5%
Effectiveness of large farms 0.0% 0.0% 5.0%
Source: Own estimate.
296. Using the parameters for scenario I5 over the 2030 horizon, total land cultivated by
small farms decreases by 15.7 percent, from 2.10 million ha to 1.78 million ha. Land for
medium-size farms increases by 14.6 percent, from 1.14 million ha to 1.31 million ha; and large
farms cultivate 52 percent more land, from 319,000 ha to 486,000 ha. The resulting farm
distributions are the same for both scenarios.
297. Changes in farm size distribution do not lead to any increase in the profitability per
capita and per hectare farm production. Focusing only on land distribution, scenario I5 results
in a tiny increase of 0.1 percent of the NPV, from $9,799 to $9,811 million (Table 132A).
However, there are changes within each crop related to the area cultivated by farm size. For
example, increases in gross margins for medium-size farms range from 9 percent for maize to 28
percent for vegetables under scenario I5. For large farms, the increases are more significant, from
30.8 percent (maize) to 147 percent (vegetables). These increases are proportional to per hectare
gross margins and offset the decreases in gross margins for small farms (an average 16 percent
reduction). Because the data on farm budgets do not show clear economies of scales, the impact
on the overall gross margins is very marginal. Under scenario I5, simulating only shifts from small
to medium-size and large farms, the gross margins from small farms still dominate the industry,
capturing 49 percent of the overall gross margins, albeit down from the 58 percent 2013 baseline.
298. A more detailed analysis of the results of the changes in farm size distribution is
presented in Table 130A. It shows that small farms cannot rely solely on agricultural revenue for

113
their livelihood. By 2030, the average total landholding for small farms is around 1 ha, which
provides $0.14 gross margin per capita per day, assuming an average household size of 4.5. This
per capita gross margin is 16 percent lower than the 2013 baseline. Even for medium-size farms,
the daily agricultural gross margins are around $0.48, making these households vulnerable, yet
they get 16 percent higher gross margin per capita gains. Only large farms with an average
landholding of 15 ha benefit from agricultural production, with a daily per capita gross margin of
$2.31, 51 percent higher than the 2013 baseline. This simulation demonstrates the challenge of
small farms relying only on agriculture for their livelihoods.
299. To ensure that the agriculture sector economy benefits from increasing farm size,
larger farms have to become more efficient, the main hypothesis in scenario I6. Higher
efficiency may be a result of better farm management, lower prices of inputs through consolidation
of purchases, or higher prices of outputs through better coordination with traders. To keep costs
constant, there is no assumption on increased use of inputs, and the farm size distribution remains
similar to scenario I5. With a 5 percent increase in gross margin for large and medium-size farms,
gross margins for medium-size farm increase by 162 percent, from a total $342 million to $899
million (Table 130A), and gross margins for large farms by 250 percent, from $88 million to $308
million (Table 131A). On the other hand, the share of gross margins for small farms drops to 29
percent. Medium-size farms provide 53 percent and large farms 18 percent of the overall gross
margins.
300. Demand for labor and fertilizers are barely affected by the changes in farm size
distribution. Labor demand slightly decreases by 4 percent because large and medium-size farms
use less labor for their agricultural activities. Similarly, demand for inorganic fertilizers stay
practically, decreasing slightly from 438,000 tons to 429,000 tons per year. Overall, there is
however a gain in efficiency because with lower labor and fertilizers demand, and the same amount
of land, scenario I6 results in slightly higher gross margins.
9.5 Summary of Simulations’ Results
301. Table 58 presents the summary of the main results of all scenarios. A rise in
agricultural productivity has the largest positive effect on farm incomes, especially if the shift from
traditional to modern technologies is accompanied by higher efficiency of modern input use.
Farmers producing fragrant rice, processing cassava into dry chips, and undertaking other value
addition activities can further increase their incomes. Lowering production costs through better
use of existing resources (e.g., productivity increase) and minimizing drops in farm output prices
through lower logistics costs are the keys to maintaining farm competitiveness. The continuation
of land expansion also provides additional income but sustainability considerations limit large
expansions in the future. This constraint makes agricultural productivity, commercialization, and
diversification even more critical for ensuring future agricultural growth that reduces poverty and
boosts shared prosperity in Cambodia.

114
Table 58: Summary of the simulations’ results
Simulations Effect on
Gross
Margin (%)
NPV ($
million)
Effect on
Returns to
Labor ($/day)
Effect on Demand
for Labor
(mill. days)
Effect on Demand for
Fertilizers (tons/year)
Likely Effect on DRC
(Competitiveness)
Sustainability
Baseline 1,023 10,220 6.41 166.51 464,861
L1 Rice area increased by 25% 11.2% 10,646 6.42 11.1% 17.1% Neutral
L2 Equal increase of cultivated land by 10% 18.2% 10,882 6.70 13.1% 8.2% Neutral
L3 Upland area expansion by 14% 21.6% 10,958 6.86 13.7% 2.6% Neutral
L4 Loss of soil fertility -5.0% 10,007 6.09 0.0% 0.0% Higher: Disadvantage
L5 Decrease of upland areas by 2.4% a year -7.5% 9,901 6.23 -4.7% -1.2% Neutral
L6 Put into fallow one third of upland areas -0.2% 10,211 6.72 -4.7% -1.2% Lower: Increased advantage
Productivity
Baseline 1,023 10,220 6.41 166.51 464,861
P1 More efficient modern farms 11.1% 10,640 7.14 -19.9% 26.6% Lower: Increased advantage
P2 Shift from traditional to modern farms 25.8% 11,107 10.10 0.0% 0.0% Unknown: depends on costs
P3 Combination of P1 and P2 scenarios 47.4% 11,749 11.84 -19.9% 26.6% Lower: Increased advantage
P4 Irrigation 32.4% 11,984 8.52 3.1% 66.7% Lower: Increased advantage
Competitiveness
Baseline 1,023 10,220 6.41 166.51 464,861
C1 Equal increase of all prices by 25% 16.5% 10,986 7.09 0.0% 0.0% Lower: Increased advantage
C2 Input prices increase twice output prices -247.7% 3,761 -10.92 0.0% 0.0% Higher: Disadvantage
C3 50% increase of wages -226.2% 3,665 -7.84 0.0% 0.0% Higher: Disadvantage
C4 25% increase of costs of machine services -25.2% 9,290 4.85 0.0% 0.0% Higher: Disadvantage
C5 15% decrease of output prices -66.5% 7,449 2.36 0.0% 0.0% Higher: Disadvantage
C6 15% increase of output prices 182.8% 16,379 19.48 0.0% 0.0% Lower: Increased advantage
Income Growth
Baseline 7,293 5.68 134.08 430,130
I1 Fragrant rice 10% of rice area in 2030 6.2% 7,443 6.03 0.0% 0.0% Lower: Increased advantage
I2 Fragrant rice 25% of rice area in 2030 24.2% 7,744 7.06 0.0% 0.0% Lower: Increased advantage
Baseline 1,488 10.54 14.66 4,577
I3 Cassava chips 10% of total in 2030 2.2% 1,499 10.78 0.6% 0.0% Lower: Increased advantage
I4 Cassava chips 25% of total in 2030 8.6% 1,523 11.45 2.4% 0.0% Lower: Increased advantage
Baseline 9,799 6.20 166.00 464,861
I5 Small farms shift land to medium and large 0.3% 9,811 6.40 -4.0% 0.0% Unknown: depends on costs
I6 Farm distr. shift + large farms more efficient 6.8% 11,793 10.70 -4.0% -2.1% Lower: Increased advantage

115
10. POLICY AGENDA TO SUPPORT A LONG-TERM VISION FOR CAMBODIAN
AGRICULTURE
302. Agriculture can and should continue to make a large contribution to economic growth
and poverty reduction in Cambodia. Realization of a Long-Term Vision for Cambodian
Agriculture can build on the transformative changes of the past decade and the strength of
Cambodian farmers to respond quickly should market opportunities arise. However, it should be
noted that despite the significant reduction in poverty in the past, vulnerability of the poor to shocks
is still high, and any slowdown in agricultural and non-agricultural growth could push many people
back into poverty. Further reforms are required to support future growth and to get closer to the
final outcome of structural transformation where agriculture as an economic activity has no
distinguishing characteristics from other sectors (in terms of the productivity of labor and capital,
or the location of poverty). The main challenge is to move from extensive agricultural growth to
intensive one. The past agricultural growth in Cambodia was largely achieved by farmland
expansion and higher use of inputs in light of rising agricultural prices. With the land frontier
closing and inputs getting more expensive relative to outputs, future growth depends on other
driving forces and policy actions.
303. The medium-term policy agenda to support realization of a Long-Term Vision for
Cambodian Agriculture needs to include “old” policies that helped drive past growth and
“new” policies that were previously either ineffectively implemented or less relevant. Based
on the analysis carried out in the previous chapters, the priority areas include: (i) maintaining a
private sector friendly agricultural policy environment; (ii) strengthening the environmental
sustainability of agricultural production; (iii) increasing the quality of and budgets for agricultural
public programs, without undermining the fiscal sustainability; and (iv) helping develop the
agribusiness and agroprocessing industry. These priority areas are important in the next five-year
horizon period, and each broad priority area includes three to four critical actions presented below.
10.1. Maintaining a Private Sector Friendly Agricultural Policy Environment
304. Cambodia’s market-oriented agricultural and trade policy helped achieve the high
past rates of agricultural growth. The private sector has benefited from minimal, if any,
interventions in farm output and input pricing, from the strong commitment to open trade,
including across the border, and from the reduction of export costs and time for export processing.
This has created conditions for the private sector to invest and generate profits. These open trade
and market-oriented agricultural policies remain critical to future growth, and need to be protected
by all means. Some proposals being discussed in the country may undermine the past
achievements, however, such as:
a. Redirecting paddy and other raw commodities from exports to domestic processing or
storage through the use of export restrictions would be a mistake. Restricting paddy
exports in the face of high processing and storage costs in Cambodia would result in
lower farm prices and thereby lower farm incomes. Farmers need to remain free in their
production and trade choices.
b. Promotion of agricultural diversification requires better rural infrastructure,
investments in agricultural innovation systems (agricultural research, extension,
education, training), and programs related to integrated pest management, food safety,

116
wholesale markets, and input market development. On the other hand, supply-driven
promotion of diversification including through land zoning by allocating farmland to
specific crops such as vegetables or subsidies to specific crops would not lead to
sustainable, market-driven diversification.
c. Slower agricultural growth and worsening agricultural TOT may lead to the calls to
introduce direct farm support measures. This happens in countries where farm incomes
do not converge quickly enough with nonfarm incomes (China and Thailand, for
example), and this may well happen in Cambodia. Introducing direct farm protection
measures can slow down agricultural growth and hamper structural transformation as
is the case in other countries with high farm protection (see Chapter 2.4). Cambodia
can use agriculture for poverty reduction for many years to come, if it avoids the farm
subsidy trap seen in other countries.
305. In regard to the new policies, attention needs to be paid to improving efficiency in
farm input industries, especially seeds. The removal of burdensome regulations and the state
monopoly in the seed sector would provide further incentives for intensification,
commercialization, and diversification, all needed to maintain high agricultural growth in the
future. Access to high-quality seeds is essential to achieve the growth targets as discussed in
Chapter 9. Without quality seeds, farmers’ investments in fertilizers and machinery bring lower
rates of return. It is estimated that the current supply of improved rice seed varieties meets only 22
percent of farmers’ demand (IFC 2014). The main reason for this undersupply of rice seeds is the
monopoly of the Cambodia Agricultural Research and Development Institute (CARDI) in
production of the foundation seeds required for further multiplication to certified seeds. CARDI
also produces and sells certified seeds, competing with seed companies, which is unusual for a
research institution. The trial and release of imported varieties are not clearly defined and import
of seeds for trials, production, and commercialization has proved to be difficult and expensive.
Overall, the legislative and institutional environment for development of the seed sector is absent.
306. The seed industry requires urgent reform. The reform agenda is challenging but the
costs of doing nothing are very high. Table 59 summarizes the key issues and recommendations
for the seed sector reform developed by the International Finance Corporation, the World Bank
Group (IFC 2014).
307. Regulatory improvements are also required for other inputs such as fertilizers to
reduce costs to farmers. Regulatory burden is mainly related to simplification of importation
procedures. If they are simplified and streamlined, farmers will be able to access cheaper
fertilizers. Potential measures to improve regulations include the approval of import licenses on
the basis of product suitability only and allowing all importers to import any quantity of registered
fertilizers, without the need to receive license/approvals for each new import lot.

117
Table 59: Key issues and options to reform the seed sector in Cambodia
Issues Options/Recommendations
Lack of a framework for long-term
development of the seed sector, which
reduces confidence of investors
Finalize and approve the National Seed Policy
Begin work on a separate Prakas to implement Chapter
2 of the 2008 Seed Law which relates to Plant Breeders
Rights
Lack of clear procedures on variety
testing/registration and seed quality
control
Approve the Prakas to implement the seed management
part of the 2008 Seed Law and prepare two manuals for
technical procedures
Define and simplify the procedures for variety testing
and registration, taking into account different needs of
different crop groups, esp. rice, maize, and vegetables
Lack of transparency in seed sector
regulations Prepare and update regularly the National List of
varieties that recognizes new varieties within the
country so they can be subject to proper regulations
Publish the scale of fees for all government services,
maximum periods for processing requests, and clear
mandatory requirements
Inadequate supply of seeds For rice varieties bred in Cambodia, increase the supply
of foundation seed and explore alternative schemes to
complement government resources
For varieties bred elsewhere, a company registered in
Cambodia could be designated by the breeder as the
maintainer and be responsible for foundation seed
production, provided they can demonstrate the
necessary competence
Facilitate imports of seed by streamlining and setting
transparent and clear procedures, especially seed
intended for trial purposes
Coordinate and strengthen the many small local seed
producers by improving the quality of their product and
facilitating market access, for example by linking them
to rice mills
Poor systems to ensure quality of seeds Establish a single office to handle all official matters
relating to seeds and varieties; this is consistent with the
proposal now under consideration by the General
Directorate of Agriculture of MAF to establish a ‘Seed
Secretariat’
Establish the key elements of official quality control
including a certification scheme and a Seed Testing
Laboratory, based within the National Agricultural
Laboratory of General Directorate of Agriculture
Source: IFC 2014.
10.2. Strengthening the Environmental Sustainability
308. Sustainability would need to be more strongly embedded in agricultural policy. Past
agricultural growth in upland areas was largely driven by rapid land expansion. Especially for

118
cassava, the FGDs and expert interviews revealed that some cultivated land expansion comes at
the cost of forest land. Moreover, as soil nutrients are mined and not replenished due to low use of
fertilizers for cassava production, this land expansion resulted in some land degradation. In other
areas of the country, cultivated land expansion puts pressure on water resources and might also
encroach on pasture land. This consideration, in line with any biodiversity conservation program
that Cambodia may have, would argue against continuing a development strategy based on land
expansion. And to reach the 60 percent target for forest land, such an expansion is not a feasible
option in Cambodia.
309. The main policy implication is then the formulation of land use planning and its
enforcement at the local level to prevent loss of forest land. This needs to be accompanied by
other measures such as a program to raise awareness about loss of soil fertility and incentives to
use good practices in soil nutrient management. Extension workers can work with farmers and the
cassava processing industry to ensure sustainable supplies of raw material. The program could lead
to the emergence of a domestic cassava processing industry rather than the current situation
whereby Cambodian farmers sell raw material primarily to Thai cassava plants, and by doing so,
they mine Cambodian soil nutrients.
310. In addition to protecting forest land, strengthening land tenure security would make
agricultural growth in Cambodia more sustainable. Farm intensification and diversification
require investments; more will be invested when land is secure. Yet 30 percent of farmers in
Cambodia still operate on land without legal titles, according to ADB (2014a). This reduces
investments in agriculture and creates risks of land degradation.
311. Promotion of sustainable land management practices is also needed. The slower
expansion in farmland considered in Chapters 8 and 9 would reduce some farmers’ income but is
necessary to avoid further soil degradation and loss of valuable forest resources. Short-term
income losses of farmers can be compensated by longer-term benefits from higher soil fertility and
more efficient management of available resources. Promotion of putting land on fallow to
regenerate soil fertility (recall scenario L6 from Chapter 9), the use of crop mixes such as
alternating pulses with maize to enhance nitrogen rates, and other sustainable land management
practices can further enhance environmental sustainability (FAO 2014). The international
experience shows that the most effective way to promote such practices is to combine the
enforcement of natural resource protection with agricultural extension and other public programs
that increase land users’ awareness of the longer-term costs and benefits and promote adoption of
modern technologies.
312. With more farmers using chemicals for vegetable and other crop production, the
government is recommended to strengthen public health regulations related to their safe use
and promote alternative programs that ensure safe, effective and environmentally sound pest
management. These alternative programs include integrated pest management, where pest
population is controlled through biological controls, cultural practices and the development and
use of crop varieties that are resistant or tolerant to the pest.
10.3. Improving the Agricultural “Public Goods” Investments
313. The quality of future agricultural growth will depend on the RGC’s success in
spending more and better on agriculture with the ultimate objective of helping farmers raise
their incomes. The higher spending on agriculture, therefore, would need to be considered within

119
the feasibility of total government budget so not to undermine fiscal sustainability (Box 9). The
rising land and labor constraints call for closing yield gaps (intensification), more effective use of
modern technologies (commercialization), better use of labor-saving technologies
(mechanization), and faster response to the evolving market opportunities (diversification). The
analysis in the previous chapters shows that these processes have already begun and that farms
using modern technologies are more capable of overcoming these constraints than traditional
farms. Converting more traditional farms into commercial ones offers a very powerful source of
agricultural productivity growth in the upcoming decade in Cambodia. This in turn requires more
and better public spending on productive infrastructure and human capital.
Box 9: Importance of Fiscal Sustainability for Pro-Poor Agricultural
Growth
Sustainable macroeconomic environment is a necessary pre-condition for translating
public expenditures into pro-poor agricultural growth. Public expenditure policy is a
form of direct economic intervention. Like other interventions, public spending on
agriculture should be part of a market-friendly approach to economic policy, and
supportive of development and adjustment goals. Excessive agricultural public spending
can lead to high or rising budget deficits that can result in different types of
macroeconomic imbalances (e.g., higher inflation and misaligned exchange rate),
causing lower economic growth and weaker demand for farm products. By investigating
the underlying factors in agricultural growth Gardner (2005) found macroeconomic
stability and real income growth in the non-agriculture economy among the most
important factor explaining agricultural growth in 85 developing countries during 1960-
2001. That’s why public spending on agriculture should remain consistent with the
aggregate fiscal discipline.
314. It is important to have a view of productivity growth broader than a narrow emphasis
on yield growth. Yield growth could be accomplished without an increase in profitability; in fact,
this is exactly what seems to have happened over the past decade for most crops in Cambodia.
Farmers use more inputs but fail to translate this into much higher profits. The emphasis on
profitability forces researchers, extension agents, farmers, and the private sector to look at the
combination of inputs and outputs, prices, and technologies that make a certain production activity
more profitable over time. If profitability could be increased, given the same natural resources and
same amount of labor, then a real gain in productivity is achieved.
315. Future public programs for agriculture need to take into account the impacts of
climate change. Cambodia is significantly exposed to weather shocks, mainly shorter rainy
seasons and longer and drier dry seasons (World Bank and AusAid 2011; Thomas et al. 2013).
High dependence on rainfall for agriculture makes Cambodia, and particularly the poorest farmers
in Cambodia, vulnerable. Farmers already report the negatives impacts of more frequent drought
spells, and to lesser degree, floods (see Chapter 3.9, Figure 27). Climate change leads to more
variable growing seasons and water deficits, which require investments in water storage,
development of new crop varieties and farming techniques that are more resilient to unpredictable
growing seasons, and better weather forecasting. In other words, a move to the climate-smart

120
agriculture is required.48 As programs related to water management, agricultural research, and
advisory services offer a triple win (by simultaneously helping Cambodian farmers raise
productivity, mitigate the impacts of climate change, and support adaptation to climate change),
they would need to be prioritized.
316. All these have implications for the selection and design of agricultural programs (e.g., agricultural public expenditures). Agricultural public spending does not seem to have played
much of a role in past agricultural growth. Public investments in connectivity (i.e., roads, ports,
and ICT), and private investments in rice mills, played the larger role as discussed in Chapter 6.
One reason for the low impact in the past is the underfunding of agricultural programs. During
2007-2009, the total budget of three agriculture-related ministries, e.g., MAFF (agricultural
innovation systems), MOWRAM (irrigation), and Ministry of Rural Development (rural roads),
was only 1.4 percent of GDP (World Bank and AusAid 2011). In 2014, the agricultural budget has
hardly changed in relation to GDP, except for higher spending on irrigation. Another reason is the
low quality of agricultural programs. Going forward, both the level and quality of funding need
to be addressed.
317. Investments in irrigation are critical to support future agricultural growth. But
spending more on irrigation alone does not guarantee successful outcomes in Cambodia. Past
irrigation investments have so far failed to improve farmers’ access to water in the dry season, due
to the excessive focus on primary irrigation structures, small operation and maintenance (O&M)
budgets, disempowered farmer water user communities (FWUCs), and the lack of river basin
management institutions. These problems were described in the World Bank and AusAid report in
2011, and according to the ADB (2014b), they still prevail in 2014. In spite of the relatively large
irrigation investments, the actual irrigated area in the country is only about 350,000 ha, or 8 percent
of arable land, the lowest irrigation coverage in Asia (Table 5).
318. During 2014-2018, MOWRAM is projected to invest $250-300 million annually
(Figure 42). This will be a significant increase compared to past years: in 2009, MOWRAM’s
budget was about $60 million. Only 12 percent of the project future budget is national funding,
with the remainder provided by development partners (Figure 43). China provides about half,
Korea about a quarter, and the remainder from a number of other partners. This sizable investment
means that substantial areas of new and rehabilitated irrigation areas will come on line in the
coming years, highlighting the need to address these problems:
a. To increase the effectiveness of irrigation investments, public funds need to be
extended to secondary canals and associated infrastructure. Rehabilitation of
tertiary canals using public funds is also justified, provided that it includes
arrangements for O&M costs to be recovered from end users. In a 2011 survey carried
out for the World Bank and AusAid, 85 percent of farmers reported the lack of water,
mainly due to the lack of distribution canals. In the 2013 survey conducted for this
report, most farms using irrigation reported using pumps rather than gravity irrigation.
Farmers spend 11-20 percent of total variable costs on pump irrigation for dry season
rice. Future irrigation investments, therefore, need to focus on improving farmers’
48 Climate-smart agriculture seeks to increase productivity in an environmentally and socially sustainable way,
strengthen farmers’ resilience to climate change, and reduce agriculture’s contribution to climate change by reducing
greenhouse gas emissions and increasing carbon storage in farmland.

121
access to gravity irrigation to reduce farm production costs and maintain their
competitiveness rather than investing in new dams and primary irrigation structures.
b. FWUCs need to be empowered. They still play a very nominal role as they are not
authorized to collect irrigation service fees and have little say in system management
decisions. The FWCU subdecree that would assign appropriate responsibilities and
rights for irrigation infrastructure to respective FWUCs and allow them to collect
irrigation service fees remains unapproved. The CDTA/ADB provides technical
assistance to MOWRAM to find flexible solutions for fee collection, and the subdecree
needs to be approved soon to underpin the sustainability of large future irrigation
investments (ADB 2014b).
c. Capacity for O&M of irrigation schemes needs to be strengthened. In addition to a
lack of financial resources49, fundamental problems exist with organizational systems,
planning processes, assessment of O&M needs and priority, and capacity of staff. A
2014 study on the economics of O&M in irrigation schemes demonstrated that the lack
of O&M results not only in suboptimal return on investment but also negative returns
(CDTA 2014). Until recently, MOWRAM allocated almost nothing for O&M, and the
Provincial Departments of Water Resources and Meteorology have limited capacity to
maintain their assets, too.
Figure 42: MOWRAM’s projected
investments, $ million, 2014-2018
Figure 43: Structure of MOWRAM’s
projected investments by source
Source: ADB 2014b.
319. Investments in irrigation need to be accompanied by improved water use efficiency.
This will allow achievement of one of the sustainability targets from Table 45. However, water
efficiency may be low and irrigation investments may not be profitable if yields are not boosted
or the production costs are high. Using the data from the 2013 survey it is estimated that at a unit
49 In 2009, only $1 million, or 14 percent of total recurrent budget of MOWRAM, was allocated to O&M versus the
international best practice of allocating 33 percent of total investments on O&M (equivalent to $17 million in
Cambodia).

122
cost of investment of $2,500/ha, an increase of 1.5 percent per year of dry season rice yield would
lead to a 4.2 percentage point increase in the irrigation IRR.
320. Agricultural innovation systems that include agricultural research, extension,
education, and training have an important role to play to raise yields and more importantly
productivity. Research needs to produce new technologies and knowledge relevant to farmers.
Extension is tasked with bringing these technologies and knowledge to farmers and helping them
with adoption and improvement of their management skills. Education creates knowledge, while
training helps youth and adults improve their vocational skills. Working together for these four
elements is the key to bringing innovation to agriculture and accelerating long-term agricultural
productivity.
321. Cambodian agricultural research has underperformed in the past decade. The main
reasons include overall underfinancing, limited operational budgets, and project-based financing.
Problems to resolve to increase public agricultural research’s contribution to future agricultural
growth include:
a. Too little is spent on agricultural research in Cambodia. In 2009, agricultural public
research spending was only 0.1 percent of agricultural GDP, or $0.10 per $100 of
agricultural GDP (Table 60). This is a very small amount compared to the countries
with competitive agriculture sectors. Thailand, for example, spends 0.5 percent of
agricultural GDP on public agricultural research (Nippon 2013). Other agricultural
exporters spend even more, with more successful ones spending 1-2 percent of
agricultural GDP.
b. Especially little is allocated to operational expenses. Researchers are constrained in
going to the field to talk to farmers and extension officers. The demand responsiveness
of agricultural research programs is therefore very low. This also results in the weak
link to agricultural extension services.
c. Allocation of the majority of the agricultural research budget is largely short-term
project-based. There are few large long-term research programs, which makes it
difficult to ensure synergies between various small research projects as researchers are
not able to work together under the same program to attain overarching strategic
research objectives which would lead to knowledge accumulation and innovation. It
also limits the ability to hire better quality research staff. Funds are provided mainly by
donors.
d. Project-based research funding should be complemented by core funding. The
international experience shows that project-based funding approaches, often based on
contestable funding mechanisms, while showing good results in some large research
systems with strong research capacity, could have severe limitations as they tend to
undermine long-term strategic planning. The longer-term nature of agricultural
research (i.e., development of new crop varieties or a system to manage animal disease)
raises the question of the ability of project-based research funding system to respond
to the needs of agriculture as opposed to allocating resources through longer-term core
funding commitments relative to the priority needs of the agriculture sector.

123
Table 60: Agricultural research intensity (public research spending in $ per $100 in
agricultural GDP)
Location 2000 2008
Developed countries 2.40 3.07
Developing countries 0.53 0.54
Asia 0.41 0.42
Cambodia n/a 0.10
Source: IFPRI 2012 and World Bank and AusAid 2011 for Cambodian data.
322. Public agricultural extension is very important in countries with many small farms,
such as Cambodia. Agricultural extension encompasses several dimensions: the economic
dimension focuses on increasing farm income, agricultural productivity, farm financial
management, and food preservation and nutrition; the social dimension includes improvement in
the health of family members, and leadership. Despite the recent increase in coverage (recall Figure
23.1), many farmers do not receive extension services of high quality. They value more highly
services received from the public sector and NGOs than those from private companies (recall
Figure 23.5).
323. Numerous problems weaken public agricultural extension in Cambodia. These include
low funding, lack of trained manpower, poor communication skills of extension workers,
unavailability of appropriate technologies for smallholder farmers, little attention to market
linkages, and poor collaboration between research and extension. These problems are well
recognized in the country, which led to the preparation of the Agricultural Extension Policy, to be
completed early 2015. A number of strategic policy decisions are needed to operationalize this
policy. Among many, these include sustainable financing, farmers’ outreach, service delivery
models, and the evolving role of public extension:
a. Similar to agricultural research, public agricultural extension is underfinanced.
In 2009, the budget for agricultural extension was $6.7 million, 0.2 percent of
agricultural GDP. Most funds come from donors. While continued funds from donors
can be expected, more resources should also come from the RGC given the high
importance of agricultural extension to future agricultural growth. Commercialization
of some services may bring additional revenue, but it is probably unrealistic to expect
large income flows in the near term. The 2013 survey showed farmers’ low willingness
to pay for extension services.
b. Many farmers are not reached out by extension services. At present, there are 1,103
public agricultural extension officers. An estimated additional 696 commune extension
workers, 8,794 village extension workers, and 14,607 village animal health workers
work through donor-funded projects, NGOs, and the private sector (MAFF 2014a).
Considering public officers only, one officer has to reach out to 1,700 farm households
and cover 4,100 ha of agricultural land to serve all farm households.50 This is a very
low outreach rate. But with all extension workers included, except animal health
workers, the outreach rate falls to 177 farm households and 425 ha, a reasonably good
ratio. To maintain this outreach rate and even increase it, will MAFF seek to increase
50 According to the 2013 Agricultural Census, the total number of farm households in Cambodia is 1,875,712. Total
agricultural area consisting of arable land and land under permanent crops is 4.5 million ha.

124
the number of public officers to replace the private agents? Or will it try to utilize the
existing network of extension agents pursuing public private partnerships? The latter
may be a preferred option from the perspectives of demand responsiveness and fiscal
sustainability.
c. How to deliver extension services? Many different extension service providers
operate in Cambodia, and the pluralism is well recognized in the upcoming Agricultural
Extension Policy. The key question is how to further promote it in a coordinated
manner. The international experience suggests that matching grants to the private sector
on a competitive basis or vouchers given to farmers to procure services of private
extension providers are effective ways to deliver services to farmers. Recipients of such
grants must be able to demonstrate improved service delivery based on expressed
demand and the specific local needs of farmers for training and technology transfer.
The public sector would play an important role in setting up the funding mechanisms,
criteria to access funds, monitoring, and quality controls. ICT needs to be used to
monitor delivery of services by the private sector and increase extension outreach at
low costs.
d. The focus of extension services would need to shift. It is necessary for extension to
move away from supply-driven advice to support of technology adoption, market
orientation, competitiveness, and sustainability. Extension services have a large role to
play in achieving the targets presented in Chapter 8 and the successful outcomes
presented in Chapter 9. It can do more to link farmers, especially smaller-scale ones,
into value chains, through promotion of input purchase and marketing farm groups,
contract farming, and productive partnerships. The trend in Cambodia is for small
farms to become smaller, and these farms often face the biggest challenges integrating
into food value chains. Extension can also do more to promote export of agricultural
products. In collaboration with other departments, it can help increase buyers’ trust in
the quality and safety of Cambodian products through better surveillance of pests,
monitoring the use of agricultural inputs in production areas, and promoting good
agricultural practices. Along with food safety actions at other segments of the value
chains, these public programs are the key to promoting agricultural exports, including
to China, the largest market in the world.
324. Investing in human development though education and vocational training would also
help raise agricultural productivity. Farming is a knowledge-intensive industry with changing
requirements, not least because of climate change. The recent movement towards more
mechanized agriculture, for example, requires many workers with skills to operate tractors and
other farm machines. This in turn would require more spending on vocational training for youth
and continuous education programs for adult farmers. Yet public investment in vocational training
and agricultural education remains very low. This needs to change to allow farmers to translate the
use of machinery into higher profits, not just higher production volumes as has happened so far.
325. The public sector has other roles to play and services to deliver to raise agricultural
productivity. The full list of such services cannot be made in this report. But the critical point for
public programs is to identify and address the underlying roots of the problems, without crowding
out the private sector. Examples for fertilizers and agricultural finance follow.

125
326. It is a fact that losses in yields from climate change can be compensated by increases
availability of nitrogen in the soil. The research on the impact of climate change on Cambodian
agriculture conducted by Thomas et al. (2013) shows that applying more fertilizers can help
maintain crop yields (Table 61).
Table 61: Yield response for supplementing nitrogen to soil, Cambodia
Nitrogen Used for
High-Fertilizer
Scenario (kg N/ha)
% Change in Yield for Each Additional
10 kg N/ha
2000 2050
Rainfed wet season rice 90 7.2 5.5
Irrigated dry season rice 90 6.7 5.5
Rainfed maize 90 4.3 3.4
Irrigated maize 90 4.8 3.7
Rainfed taro 90 3.7 3.1
Irrigated taro 90 5.4 4.5
Source: Thomas et al. 2013.
327. In recent years fertilizers use in Cambodia has increased. The FGDs in the 2013 survey
showed a 30 percent increase in the number of urea users for rice production. According to ADB
(2014a), 86 percent of rice farmers in Battambang, Kampong Thom, and Takeo use inorganic
fertilizers. In contrast, fertilizer use for cassava and maize production remains limited. As a result,
average fertilizer nutrient consumption remains low, at 15 kg/ha in 2011, according to FAOSTAT.
Fertilizers are increasingly available on local markets, but their low consumption is explained by
high prices, low quality, and poor knowledge of soil-specific requirements. The public sector has
an important role to play in correcting these market failures:
a. Fertilizer prices in Cambodia can be reduced. For example, import licenses can be
approved on the basis of product suitability only, and all importers be allowed to import
any quantity of registered fertilizer products.
b. No reliable soil maps in Cambodia exist to allow the development of soil- specific
fertilizer recommendations. Extension workers give blunt recommendations. As a
result, many farmers apply too much, too little, or even the wrong fertilizer to trigger a
profitable supply response. Production of such soil maps and fertilizer
recommendations are core functions of public research and extension.
c. The existence of fake fertilizers reduces their use by farmers. While the true extent
of fraudulence is probably lower than perceived, this perception is strong enough to
affect fertilizer adoption. MAFF estimated that in 2008 about 30 percent of fertilizers
were fraudulent or of low quality. The rapid assessment in 2010 found a much smaller
share of fraudulent fertilizers (IFDC 2010). To reduce this negative perception, it is
essential that the Department of Agricultural Legislation in Cambodia and the field
inspectors have access to reliable and fast fertilizer analytical services as visual
inspections cannot detect product adulteration or below-guarantee analysis. In the field,
inspectors can use a simple pill cutter to cut DAP and APS granules in half to check
their consistency. It was recommended to MAFF to ask for independent quality
assurance certificates of analysis from accredited organizations for all imported
fertilizers, particularly those with multi-nutrient content, either NP or NPK.

126
d. Applying nitrogen fertilizers is not the only way to get more nitrogen into the soil
for plant use. Another approach is to improve soil fertility management by using
animal manure, cover crops, crop rotation, and crop or agroforestry residue. This is
another important role for agricultural research and extension to play in helping farmers
gain knowledge about these technologies and adopt them.
328. Cambodia does not need subsidy programs to promote fertilizer use. There are many
examples of huge failures of such programs in Asia, ranging from Indonesia and India to Sri Lanka,
and around the world. The example from Sri Lanka is presented in Box 10. Fertilizers are available
on the market in Cambodia in all locations, even for the smallest farmers. The public role is to
increase their sustainable use through extension, quality and safety controls, and investments in
infrastructure, not through subsidies.
329. Another government role is to improve farmers’ access to affordable and suitable
agrifinance products. As described in Chapter 3.7, financial services from several sources
comprising commercial banks, MFIs, community saving groups, and money lenders are
increasingly available to farmers in Cambodia. Access to finance can be further improved.
330. Subsidizing interest rates or providing concessional credits to agriculture are not
recommended, due to their low sustainability and high economic distortions, including
crowding out rural MFIs. There are innovative ways to improve access to finance in a sustainable
manner at low cost. Cambodia’s financial sector needs institutions, markets, and products tailored
to farmers and agribusinesses’ needs. One example of such products is agricultural loans tailored
to farming practices, seasonality, and cash flow projections.
Box 10: Fertilizer Subsidy in Sri Lanka
Sri Lanka has subsidized fertilizer costs for many years, spending a large part of its agricultural
budget on these subsidies. Its total agricultural budget share is large, accounting for 12 percent
of agricultural GDP over 2008-2012. Yet these high subsidies have failed to induce strong
growth. Since 2000, average growth in agricultural GDP has been 3.2 percent. A recent study
analyzing the effectiveness of the fertilizer subsidy found that although fertilizer use positively
and significantly explains paddy productivity in Sri Lanka, the marginal returns to fertilizer
progressively declines with higher application rates (Gautam and Kar 2014). A majority of farms
in irrigated areas, while behaving rationally in terms of profitability, tend to use fertilizer way
above the level recommended by the Department of Agriculture. The lack of proper education
in efficient fertilizer practices (like balanced use of nutrients) and existing inefficient practices
result in lower private and social economic returns from fertilizer use.
The study also found that despite the higher intensity of fertilizer use in Sri Lanka than in most
South Asian countries, yields are modest and have not grown significantly since 2000.
Improvements in the composition of public spending for agriculture could have greater impact
on the sector’s productivity by targeting fertilizer subsidy benefits and investing in other
production inputs. Investments on agricultural public goods such as research and extension
services would also result in more efficient fertilizer use.

127
331. Amret, with the support of the World Bank/AgriFin project, helped develop and
introduce such a loan product in Cambodia. Agricultural loans are provided for both
agricultural activities (agricultural loans) and agriculture combined with other businesses (hybrid
loans). In contrast to Amret’s existing credit products, agricultural loans’ repayment terms are
flexible. They are aligned with individual clients’ seasonality of income and cash flow projections.
The interest rates for agricultural loans are on par with Amret’s existing individual loan products
and there are no penalties for early repayment.
332. Agricultural loans are reportedly popular with farmers. They also turned out to be
more profitable for Amret compared to traditional loans in rural areas, which do not take into
account farm business characteristics. An agricultural credit officer reaches break-even costs in
month five with these loans (compared with month eight for traditional loans), and on average all
costs of agricultural loans’ set up and provision are covered in eight months. As a result, the share
of agricultural loans in Amret’s total loan portfolio increased from 0.6 percent in December 2013
to 2.8 percent in June 2014.
333. The RGC can increase awareness about such products and promote their wider
adoption by other banks and MFIs. This would be a much more cost-efficient and sustainable
way to improve access to agricultural finance in Cambodia.
10.4. Helping Develop the Agroprocessing and Agribusiness Industry
334. The growth of the agribusiness and agroprocessing industry is critical to future
agricultural growth, job creation, farm income convergence, and structural transformation
in Cambodia. Yet the country seriously lags behind in this respect, as presented in Chapter 2.2,
in spite of the growing raw material base. The main trigger for a stronger industry is an
improvement in the business environment, addressing the following main constraints (World Bank
2014e):
a. The high cost of electricity (Cambodia has the second highest price per kilowatt in the
Southeast Asia after Singapore).
b. Informal payments and burdensome regulations. Cambodia’s ranking in the overall
ease of doing business in the Doing Business 2014 report has fallen over the past ten
years; it is now 137 out of 189 economies. It also ranks 162/189 for contract
enforcement because of an unreliable conflict resolution system.
c. Weak capacity and inefficiencies in transport systems resulting in high transport costs,
long transport durations, and unreliable delivery.
d. The undeveloped financial system, high informality, and predominantly fixed asset
collateral-based lending limit private sector lending from banks and increase financing
costs.
335. There are no substitutes for reforms and investments to improve a business climate
that would facilitate private sector investments. However, particular policy actions that would
have the strongest impact on agribusiness development in Cambodia in the upcoming decade
include improvements related to: (i) food safety and sanitary and phytosanitary (SPS) measures;
(ii) rice trade logistics; and (iii) access to finance.
336. Difficulty complying with food safety and SPS measures of importing countries is
among the major constraints for agribusinesses in Cambodia. While there are positive changes

128
in rice industry in this respect,51 the majority of rice mills and other firms do not have good
facilities and personnel to meet demanding market segment requirements and to supply high-end
markets. The country does not have a good diagnostic capability for food safety/SPS testing, and
the SPS implementation capacity in terms of human skills, technical capacity and operational
funding is weak (van der Meer and Samrith 2014). Transaction costs for the private sector are high
and awareness of the high impact of transaction costs on trade among SPS agencies is very low.
The situation in Cambodia contrasts with the situation in Thailand, for example, where food safety
standards are not a major constraint for agri-food exports (Box 11 and van der Meer 2014).
Box 11: Food Safety Investments in Thailand
Thailand was among the first group of emerging countries to invest in food safety
infrastructure and has developed the capability to export safe food since the mid-1990s.
For example, when Thai exports of shrimp and chicken faced stricter SPS measures in
the EU in 1996 and the early 2000s, the Thai private sector quickly responded
(Nidhiprabha and Chamchan 2005). It introduced bio-safety farms that use fewer
chemicals and lobbied the government to invest in food-safety infrastructure and to
legislate new food safety laws. Some large exporters have established brand names for
hygienic products of high food safety standards. Consequently these actions make Thai
exporters more competitive vis-a-vis their competitors in the region, though many small-
scale exporters still have problems complying with the strict standards, and foods sold
in domestic markets are not as safe as exported foods.
337. Even for rice, Cambodia needs new markets outside the EU.52 To fine them the RGC
would need to: (i) assist rice mills with complying with food safety standards of different countries;
(ii) foster technical upgrades; (iii) promote rice specifications and a strong brand identity for
Cambodian rice; and (iv) facilitate trade with more information, building for example on the IFC’s
Rice Sector Support Project.53 China is a particularly important market as the largest importer of
rice in the last few years, but it is very strict with respect to food safety requirements for imports.
The RGC can do many things to help its exporters sell more rice and other products to China (Box
12).
51 The Cambodian private sector has made significant progress in this area, including with the support from the IFC
Rice Sector Support Project, which helped seven rice mills certify for the Hazard Analysis and Critical Control
Points during 2014. More mills are in pipeline for such a food safety certification. This certification is critical in
terms of accessing export markets such as the EU and the United States. 52 The major export market for Cambodian rice is the EU under the EBA. Cambodia enjoys the zero import tariff,
which gives it a $240/ton cost advantage compared to other exporters. An EU safeguard may be triggered when
imports under EBA exceed by 25 percent the volume imported the previous year. In 2014, Cambodia was close to
this 25 percent ceiling, calling for identification of new outlets for expanded exports. 53 The IFC project was launched in 2012 to support the development of the Cambodian rice industry, aiming to
increase farmers' access to improved inbred rice seed and increase their yields, increase milling efficiency and
product quality, develop and implement a strategy to increase Cambodian rice exports, and reduce the price
differential between Thai and Cambodian rice.

129
Box 12: Requirements for an Increase in Cambodian Rice Exports to
China
A 2014 rice marketing study (Agland Investment Services 2014) identified key
constraints for Cambodia to access the growing Chinese rice import market. A
selection of the recommended actions includes:
Focus on improved packaging and labelling on consumer packs.
Establish contacts at the government-to-government level with Chinese trade
authorities who control the level of imports and quotas; understand the quota
system54 and ensure that exporters comply with it.
Support the role of China Certification and Inspection Co. Ltd in Cambodia for
inspections.
Improve storage and logistics to lower marketing costs. Cool storage may
improve quality especially for the preferred new crop rice.
Establish the “White Gold” emblem as a quality design factor of genuine
Cambodian rice.
Ensure compliance with buyer requirements.
338. Improving rice export logistics is another priority area to develop agribusiness.
Currently, Cambodian rice export’s competitiveness is significantly affected by high logistics costs
and unreliable timelines. Average logistics costs from rice mills to the Sihanoukville port in
Cambodia are twice as high as similar costs in Vietnam and Thailand (Table 62). It also costs more
in Cambodia to move paddy from farm gate to rice mills. Moreover, Cambodia’s logistics
performance indicators on timelines have worsened since 2007, unlike in neighboring countries,
damaging Cambodia’s image as a reliable partner for buyers (World Bank 2014d). This reduces
the profitability not only of farmers but also of rice mills and traders, thereby hindering investment
in the agroprocessing and post-harvest handling.
339. An important reason for the high logistics costs in Cambodia is cumbersome and
expensive export procedures. Cambodia’s export procedures have improved recently both in
terms of processing time and associated costs, but still largely fall behind its neighbors. The
SOWS-REF was set up in the compound of the Council for Development of Cambodia. While all
services related to rice export have yet to be included in the SOWS-REF,55 rice exporters note that
the time and cost to obtain all necessary approvals have reduced remarkably. On average in 2013,
export procedures cost $14/ton and took four days to process; i.e., the costs declined by 30 percent
compared to 2012 and the processing time fell by one-half (Table 63). Yet these procedures are
reported to be highly bureaucratic and loaded with informal costs. Despite the reduced export
procedure cost per ton, it is still high compared to Thailand ($0.10/ton), Vietnam ($0.05/ton), and
even Myanmar ($8.50/ton) (World Bank 2014f). Further reduction is therefore needed.
54 The tariff rate quota for import of rice to China is divided into 2.26 million tons each for long grain rice and
medium grain rice. While the tariff rate quota for long grade rice was largely exhausted in each of 2012 and 2013,
very little - if any - of the medium grain rice quota was utilized. This may provide an opening up for Cambodia (see
Slayton and Muniroth 2012b). 55 The Certificate of Origin and Phyto-Sanitary Certificate are in the SOWS-REF but not the Quality Certificate
(CamControl) and Custom Certificate.

130
Table 62: Prices and logistics costs of rice in Cambodia, Vietnam, and Thailand
Farm-gate
price
Costs from farm
to rice mill
Rice mill
price
Costs from rice
mill to port
FOB
price
Cambodia 247 163 410 50 460
Vietnam 253 122 375 23 398
Thailand 339 126 465 25 490
Note: Prices of white rice per ton in 2013.
Source: World Bank 2014d.
340. In addition to export procedures, container-based exports increase costs. In
Cambodia, most aromatic and non-aromatic rice is shipped in containers. But in the rest of the
world, most rice is transported as break bulk cargo. Break bulk is cheaper and easier to handle, but
it has hardly been tried in Cambodia. The Sihanoukville and Phnom Penh Port drafts limit break
bulk to ocean destinations only, not Asian destinations. Possibilities exist to export rice in bulk for
intra-Asian trade from Sihanoukville Port if key constraints are tackled (World Bank 2014d),
including: (i) lack of a suitable hygienic rice warehouse; (ii) lack of professional stevedoring; (iii)
a combination of high port and National Shipping Agency and Brokerage charges; and (iv) the
missing link between railway station and port quay. Improving logistics requires actions across
several ministries, agencies, and the private sector.
Table 63: Time and cost in rice export procedures, Cambodia, 2012-2013
Services Processing Costs Processing Time
2012 2013 2012 2013
SPS Certificate $150/case $35/case 2 days 1 day
Fumigation Certificate $20/container $35/container 1 day 1 day
Certificate of Origin $250/case $141/case 1 day 1 day
Custom Certificate $25/container $6.50/container 2 days ½ day
CamControl Certificate $25/container $52.50/ container 2 days ½ day
GMO Certificate $150/sample $80/sample 3-4 days 2-3 days
Average total* $20/ton $14/ton 8 days 4 days
Note: *The average services fee per ton is lower for the larger export size.
Source: World Bank team’s estimates based on information from key rice exporters and SOWS-REF.
341. Improving access to finance is necessary to support development of a strong
agroprocessing industry in Cambodia. There are opportunities to introduce a warehouse receipt
system (WRS), starting with rice. Currently, there is too little working capital in the rice milling
sector (similar constraints have been reported in other agricultural processing sectors, such as
cassava). Most mills use their land, buildings, and equipment (i.e., long-term fixed assets) to secure
loans that they use for short-term working capital needs. These loans tend to fall far short of their
actual working capital needs, and furthermore, using long-term assets for working capital needs
reduces millers’ ability to upgrade their storage and production capacity (and thus to invest in the
needed expansion of rice export capacity).
342. In Cambodia, paddy or rice are not yet used as collateral for working capital loans.
Yet many of the conditions for such loans are present (Rutten 2014). Rice is a seasonal crop that
has to be stored over a prolonged period so that it can be processed throughout the year – thus,

131
during many months large physical stocks exist in the country. The rice produced in Cambodia is
far from uniform, but rice millers and traders categorize it into three varieties (fragrant, mixed and
white), with the actual paddy and rice traded being priced at a discount or premium to a reference
price for that variety – so for bankers who wish to finance against rice inventory, there is a
reference price against which to determine its value. Rice production is fairly concentrated. Four
of the country’s 24 provinces produce almost half of the total, permitting financiers to get access,
at least in principle, to large paddy stocks without having to cover too large a geographical region.
The potential market is attractive in size as one million tons of rice may require as much as $300
million in working capital finance, and rice for the domestic market also needs to be financed.
343. Rice mills are potential clients for banks. Rice mills maintain large inventories and have
an incentive to continue doing so, not just to ensure that they have enough raw materials to keep
their mills operating the longest time possible, but also to meet client demands for specific kinds
of white rice. Expanding financing for mills would lead to improved financing for the whole rice
sector: rice millers act as financiers both upstream (pre-financing traders and at times, even
providing inputs on credit to farmers) and downstream (selling on credit to wholesalers and
exporters, permitting the latter to sell on deferred payment terms to international buyers).
344. Even in the short run, the potential benefits of providing more working capital
finance to the rice sector are large enough to promise profits to those who take the initiative
to build its necessary institutional infrastructure. While many of the required activities are most
logically undertaken by the private sector, support from the RGC, including in conceptualizing
strategies and coordinating efforts, will help in realizing the possibilities outlined before. The RGC
has an important role to play in creating a conducive environment for a WRS (Rutten 2014). The
first important step is to remove discrepancies in the Secured Transaction Law and the Civil Code
on the access to movable assets in case of default. Other steps include improving the collateral
registry, strengthening lenders’ capacity and awareness, and providing insurance guarantees for a
WRS. Pro-active support can be given to pilots before scaling up nation-wide. Avoiding credit
subsidization and supply-driven investments in warehouse construction is also an important step
for the RGC. Support for a WRS will create a financing system that can measure up to the
government’s aspirations for its rice sector, and will lay the foundation for more sustainable,
balanced growth.

132
11. CONCLUSIONS AND POLICY RECOMMENDATIONS
345. This report seeks to understand the successes, challenges and opportunities of
Cambodia’s agricultural transformation over the past decade to derive lessons and insights
on how to maintain future agricultural growth, and particularly on the government’s role in
facilitating it. In 2013-2014, the agricultural growth slowed down to 1 percent from its average
of 5.3 percent over 2004-2012. Is the country in transition to a slower agricultural growth?
Cambodia can ill afford it because agricultural growth will be critical to continued poverty
reduction in the country, given its large size in the economy. Market and private investment
friendly policies and targeted public sector investments in irrigation, extension, and other “public
good” agricultural services, as feasible within the government’s total budget, can help secure
continued robust agricultural growth.
Key Findings
346. In the last decade, the agricultural sector in Cambodia has gone through significant
structural transformation. Although still playing a large role, the agriculture sector became
relatively less “important” in the economy in terms of its share in GDP and labor force, but more
“productive” in terms of land and labor productivity. This transformation was driven by high and
pro-poor agricultural growth.
347. The agricultural growth in Cambodia was high. During 2004-2012, the annual growth
in agricultural gross production was 8.7 percent. The agricultural value added grew by 5.3 during
this period. This exceptional growth, among the highest in the world, was driven by crop
production, mainly paddy rice (annual growth of 9 percent) but also spectacular growth in other
crops, particularly maize (20 percent), cassava (51 percent), sugarcane (22 percent), and vegetables
(10 percent). The growth in livestock and fisheries was modest at around?
348. The agricultural growth was also pro-poor. Cambodia’s poverty headcount declined
from 50 percent in 2007 to 21 percent in 2011, with the number of poor declined from 7 to 3
million. Most poverty reduction took place in rural areas. More than 60 percent of the poverty
reduction was attributed to the agriculture sector: higher rice prices stimulated the larger rice
production that increased farm wages. Yet, in 2011, 91 percent of the poor still lived in rural areas.
Thus, further poverty reduction will continue to depend on the success of agriculture for many
years to come, due to its large role in labor force, value added, and exports.
349. Due to the high agricultural growth, agricultural wages have been converging with
nonagricultural wages. Agricultural wages grew by 2.6 times between the surveys conducted in
2005 and 2013, while the nonfarm wages increased by 60 percent. As a result, the ratio between
per worker nonagricultural to agricultural valued added in current prices fell to 2.1 in 2012 from
3.2 in 2004. Returns to farm labor have been increasing.
350. The crop diversification has started. Although crop production is still mainly focused on
paddy, the crop mix has been changing driven by higher profitability of non-rice crops. In 2013,
average farm gross margins (and returns to labor) were $506/ha ($9.4/day) for cassava, $303/ha
($8.8/day) for maize, and $1,393/ha ($7.2/day) for vegetable production, compared to $245/ha
($4.6/day) for wet season rice and $296/ha ($9.6/day) for dry season rice. Dry season rice competes
with non-rice crops in terms of returns to labor but its expansion is constrained by limited
irrigation. The share of total area planted under paddy declined from 86 percent in 2002 to 74

133
percent in 2011, while the share of planted area for maize and cassava production increased
significantly, by 1.7 and 8 times, respectively.
351. Even the paddy sector has started to diversify. Triggered by the demand from
modernized rice mills, more farmers grow more profitable aromatic paddy, estimated at 10 percent
of rice cultivated area and 30 percent of total production. Thought aromatic yields tent to be lower?
Further expansion of farmland under aromatic paddy is possible with improvements in quality seed
supply, agricultural extension, and irrigation.
352. Yields increased for most crops. With the annual growth in cultivated land areas at 4.7
percent and agricultural gross production at 8.7 percent, the average growth of yields was 4 percent
during 2004-2012. This growth in yields was triggered by a wide adoption of improved
technologies, expanded (yet still limited) irrigation, more use of modern inputs, and better access
to mechanized services, pointing to the advances in commercialization. Farmers also have better
access to markets.
353. Cambodian farm products remain price competitive at farm gate. A domestic resource
cost analysis of competitiveness shows that despite rising labor costs and prices of farm inputs, the
value added generated by farmers exceeds the costs of domestic factors of production (land, labor,
and capital). This high competitiveness explains the large increase in agricultural exports in the
recent decade. However, the competitiveness of ordinary rice produced during the wet season has
worsened in recent years due to the increase in labor costs and weak knowledge/skills of most
farmers in using modern inputs. Many small farmers start losing a competitive edge.
354. The past agricultural growth was driven by several factors. Among the major was open
trade and, in general, market-oriented agricultural policy. Cambodia was one of the few developing
countries that did not overact to the 2008 global food price spike but actually saw higher food
prices as an opportunity to induce agricultural growth. Other net-exporting countries such as India,
Lao PDR, and Vietnam used export restrictions to limit transmission of the global food price spike
into their markets. Higher agricultural prices in Cambodia made farmland expansion profitable. In
addition, the agriculture sector benefited from: (i) improved access to overseas markets through
the Everything but Arms Agreement with the European Union and open cross-border trade with
neighbors; (ii) better availability and wider use of mechanization services triggered by the higher
cost of rural labor; (iii) better farm access to finance; and (iv) private investments in rice mills.
355. But there have also been challenges. The large share of the past agricultural growth was
driven by farmland expansion. The average contribution (weighted by crop areas) of land
expansion to the change in farm gross margins in real terms between 2005 and 2013 was about 60
percent. Farmland expanded annually by 4.7 percent, with very large increases (128 percent) for
cassava. This farmland expansion has contributed to the accelerated deforestation, especially in
the upland areas.
356. The average increase in per hectare gross margin was good, at 3.4 percent per year.
But it varied between 2.1 percent for dry season rice to 44.5 percent for vegetables. The per hectare
maize’s margin even declined. In many cases, farmers expanding their land areas received higher
incomes, but farmers with land areas unchanged or reduced were not able to substantially increase
their incomes. The period of relatively high food prices was largely used to expand land areas
rather than build a strong foundation to productivity increases.

134
357. While poverty was reduced significantly, the number of vulnerable people has
increased. Most people who escaped poverty did so by a small margin. The loss of only 1,200
Riels per day (the cost of 2 small water bottles) would cause Cambodia’s poverty rate to double to
40 percent. This high rate of vulnerability is the sign of still modest productivity increases in the
agricultural sector.
358. Vulnerability is largest among smallest farms. Small farmers with the land area less than
a hectare, who still account for 48 percent of all farmers, reported to find it difficult to expand and
get integrated into the emerging modern food supply chains. The larger farms are becoming larger
and smaller farms are becoming smaller in Cambodia. This change in distribution of farmland
occurs independently of economic land concessions. The average size of the interviewed farms
with less 1 ha declined from 0.99 ha in 2008 to 0.88 ha in 2012, while the average size of medium
farms (between 1 and 3 ha) increased from 1.55 ha to 2.38 ha and the larger farms (above 3 ha)
from 3.61 ha to 7.03 ha. Productivity of small, traditional farms also hardly improved, as
agricultural extension and other public services have not reached them at a large scale. It appears
that the income increase for this group of farmers in the past decade largely came from higher
production values, driven by high agricultural prices, and the sale of their labor to larger farms at
higher wages.
359. Except for rice, the agroprocessing industry has played a limited role in agricultural
growth. Almost all crops were exported to neighboring countries unprocessed. This indicates
serious weakness in the value chain, particularly in the post-harvest system of supply chain
management (collection of raw material, storage, finance, logistics, transportation, and
information).
360. Addressing weaknesses of the past growth is a good strategy for maintaining a future
agricultural growth at 5 percent. With the global food prices declining and land frontier closing
down, the Cambodian agriculture has been losing its two major growth drivers. On top of that,
agricultural labor continues to decline and become more expensive adding to production costs.
Global agricultural prices are projected to continue their decline in the next decade, and selling
low-quality ordinary rice on domestic and foreign markets will be less and less profitable. Relying
on higher domestic demand driven by the increase in GDP and higher import demand alone,
without more efficient use of resources, will not be enough to maintain the past growth.
361. The recent slowdown in agricultural growth in Cambodia is worrisome. As global
food prices gradually declined, Thailand returned to the rice market after several years of quasi
isolation due to its distortive rice pledging scheme and the re-entry of Myanmar into global rice
market, the rice (especially dry season) production in Cambodia has stalled. And with it, total crop
value added declined, from 4.9 percent in 2012 to 0.6 percent in 2013. The growth in agricultural
value added slowed down to 1.6 percent in 2013 after the 5.3 percent average growth between
2004 and 2012.
362. Returning to a 5 percent growth is important. Agriculture maintains a large share in
GDP, trade, and labor force, which means that it stays the key to further reduce poverty and
vulnerability in the upcoming decade. If Cambodia’s structural transformation continues, with
agricultural growth averaging 5 percent, by 2030 Cambodian agriculture will be less significant in
the economy but more productive. Its share in GDP (and total labor force) is projected to go down
to 17 percent (31 percent) in 2030, from 26 percent (51 percent) in 2012, while land productivity
would increase from $1,300 to $2,700 and labor productivity rise from $1,200 to $3,700.

135
363. By contrast, the cost of slow agricultural growth would be huge. If average agricultural
growth is only 3 percent between 2012 and 2030, the end agricultural value added would be 29
percent lower by 2030 compared with the 5 percent growth scenario, slicing overall GDP by 18
percent, keeping more people in agriculture, reducing agricultural labor productivity by 34 percent
and stopping any income convergence between farmers and nonfarmers. A lower agricultural
growth will also lead to a slower reduction in poverty.
Policy Recommendations
364. A long-term vision for Cambodian agriculture includes elements of sustainability,
productivity, competitiveness, and income growth, beyond a focus on production. Simulation
of different scenarios for future agricultural development reveals that a rise in farm productivity
would have the largest positive effect on farm incomes, especially if the shift from traditional to
modern technologies is accompanied by higher efficiency of modern input use and irrigation.
Farmers producing fragrant rice, processing cassava into dry chips, and undertaking other value
addition activities can further increase their incomes, illustrating the importance of the
agroprocessing industry. Lowering production costs through better use of existing resources (e.g.,
productivity increase) and minimizing drops in farm output prices through lower logistics costs
are the keys to maintaining farm competitiveness. Continued land expansion also provides
additional income but sustainability considerations will limit large expansions in the future. This
constraint makes agricultural productivity, commercialization, and diversification even more
critical for ensuring future agricultural growth that reduces poverty and boosts shared prosperity
in Cambodia.
365. Continued rapid agricultural growth and further structural transformation in the
agriculture sector are possible in Cambodia. Four sets of policies together will help support
such continued agricultural growth during the next five years (short-to medium run). The first is
maintaining a private sector friendly agricultural policy environment, with added attention to lower
the regulatory burden in farm input sectors. The second is strengthening the environmental
sustainability of agricultural production. The third is improving the quality of agricultural public
programs and as feasible within total government budget, increasing allocations to more effective
programs. And the fourth is helping develop the agribusiness and agroprocessing industry. Table
64 presents the key policy recommendations of the report by implementing agency.
Maintaining a Private Sector Friendly Agricultural Policy Environment
366. Cambodia’s market-oriented agricultural and open trade policy helped achieve the
high past rates of agricultural growth. The private sector has benefited from minimal, if any,
interventions in farm output and input pricing, from the strong commitment to open trade,
including across the border, and from the reduction of export costs and time for export processing.
This has created conditions for farmers and other players to invest and generate profits. These open
trade and market-oriented agricultural policies remain critical to future growth and need to be
protected by all means.
367. In addition to maintaining a non-distortive agricultural policy, reforms in the seed
sector can make an important contribution to agricultural growth. Insufficient supply of seeds
and their poor quality in Cambodia have been among main reasons for the relatively slow
productivity improvements, putting significant constraint on future agricultural growth mainly
because investments in fertilizers and machinery pay off only when combined with the use of
improved seeds. Many policy distortions exist in the seed sector, ranging from the state monopoly

136
on the supply of foundation seeds to the lack of clear and conducive regulations for trials, releases,
production, and import of seeds. The regulatory and legislative bottlenecks in the seed sector need
to be addressed in the upcoming years.
368. Regulations for inputs such as fertilizers can also be improved to reduce costs to
farmers. Cambodia has in place the burdensome requirements to importers of fertilizers to register
products and apply for import license for each imported lot. The procedures can be simplified
through approval of import licenses on the basis of product suitability only, and once received all
importers can be allowed to import any quantity of these registered inputs.
Strengthening the Environmental Sustainability
369. Embedding environmental sustainability in agricultural policy will become
increasingly important. This implies more sustainable expansion of cultivated land though better
land use planning, strengthened land tenure security, and maintenance of soil fertility through
better use of available land and promotion of sustainable land management practices. International
experience shows that the most effective way to promote such practices is to combine the
enforcement of natural resource protection with agricultural extension and other public programs
that increase land users’ awareness of the longer-term costs and benefits and promote adoption of
modern technologies.
370. With more farmers using agricultural chemicals for vegetable and other crop
production, the government may wish to strengthen public health regulations related to their
safe use and promote alternative programs that ensure safe, effective and environmentally
sound pest management. These alternative programs include integrated pest management, where
the pest population is controlled through biological controls, cultural practices and the
development and use of crop varieties that are pest resistant or tolerant.
Improving the Agricultural “Public Goods” Investments
371. Future growth will likely come from productivity improvements, commercialization,
and diversification, all of which strongly depend on effective “public goods” investments in
agriculture. The relatively small size of most farms in Cambodia and their large numbers require
more resources for service provisions than in countries with large farms and few farmers. Public
programs proven worldwide to contribute to long-term agricultural growth include those for
irrigation, research, extension, education, vocational training, food safety, and provision of market
information. While these programs are also critical to Cambodia’s future growth and continued
structural transformation, they have little to show in terms of their contribution to past agricultural
growth. The main reason is their low efficiency and effectiveness. Many programs have poor
design and weak implementation record. Most expenditure goes to capital and wages, with little
spent on operation and maintenance. Relatively low funding levels are another reason for the weak
record of some of these programs in Cambodia.
372. Agricultural programs, especially extension, can become more gender sensitive.
Female-headed households and women in male-headed households have different needs than men
due to the different roles they play in agricultural production, and given women’s time constraints
and limited mobility which affects their access to training. Hiring and training of more female
extension workers, the use of varied information and communication technologies to improve
extension outreach, and promotion of more active participation of women in farmer extension

137
groups, as well as nutrition and disaster risk management trainings are all measures that would
empower women and bring economic benefits.
373. Irrigation investments deserve special attention. Without reliable access to affordable
water in a tropical country such as Cambodia, it is hard to expect intensification and
commercialization. Farmers’ access to water in the dry season, when it is mostly needed, has
improved only marginally. Irrigation coverage in Cambodia is among the lowest in Asia, in spite
of the fact that most resources allocated to irrigation investments have been spent on primary
infrastructure. While irrigation coverage needs to be further expanded, this expansion needs to go
hand-in-hand with the extension of secondary canals, rehabilitation and upgrade of the existing
systems, investments in participatory management of irrigation and drainage infrastructure and
better coordination of irrigation/flood management with the delivery of other agricultural public
services.
374. Higher attention is also merited to the integration of small farms into modern food
value chains. Public extension services are especially important for these farms because they are
unlikely to receive sufficient extension services from the private sector, while without improved
farm management skills and information they will stay poor and vulnerable, disconnected from
economic transformation processes. Small farms, including households participating in social land
concessions, can be supported through public services to facilitate stronger links with the
agroprocessing and agribusiness industry through productive partnerships (e.g., contract farming
and farmer organizations), training in business and other skills, and provision of market
information.
Helping Develop the Agribusiness and Agroprocessing Industry
375. Future agricultural growth in Cambodia depends on the extent of development of
agribusiness and agroprocessing industry. A more developed industry would absorb the
increased supply of raw materials, bring more stability to farm prices, create value added, and
create nonfarm jobs in rural areas. Alternatively, with no changes to the current situation, urban
Cambodians will increasingly eat imported processed foods while the country continues to export
raw commodities.
376. Although development of the agribusiness and agroprocessing industry is to be
considered part of the improvement in the overall business environment in Cambodia,
several areas with a strong impact on agribusiness development will involve government
action. They include investments in: (i) increased access to and reduced costs of electricity, to
increase profit margins in the processing industry and stimulate private investments; (ii) better
food safety and sanitary and phytosanitary capacity, to help Cambodian firms meet importers’
requirements and capture foreign markets and help them compete with the increasing food imports
triggered by Cambodians’ rising incomes and demand for more diversified diets; (iii) export
logistics, to reduce transaction costs; and (iv) improved access to finance, including through WRS,
to create new investment opportunities for the processing and trade industry.
377. Future agricultural growth at its past speed and further structural transformation
are possible in Cambodia. A slower growth cannot become a new normal. More attention to
sustainability, the quality of public services, an enabling policy environment, and implementation
would turn these possibilities into reality. It is worth well trying.

138
Table 64: Summary of the report’s key policy recommendations by implementing agency
Policy recommendations Implementing agencies
Maintaining a private sector friendly agricultural policy environment Continue the open trade policy and non-distortive
agricultural policy
Ministry of Commerce (MOC), Ministry of
Economy and Finance (MEF), Ministry of
Agriculture, Forestry and Fisheries (MAFF)
Open up seed sector for private investments through
deregulation and institutional strengthening, and reduce the
costs of importation of fertilizers
MAFF, Cambodia Agricultural Research and
Development Institute (CARDI)
Strengthening the environmental sustainability Improve land use planning and better enforce land
laws/regulations
MAFF, Ministry of Land Management, Urban
Planning and Construction (MLMUC)
Strengthen land tenure security MLMUC
Promote sustainable land management practices MAFF (CARDI and Extension)
Promote the safe use of agricultural chemicals MAFF
Improving the agricultural “public goods” investments
As feasible within total government budget, increase the
budget for core agricultural public goods, especially
irrigation, applied research, extension, soil nutrient
management, input quality control, food safety, vocational
training, and rural roads
MAFF, SNEC, MEF, Ministry of Labor and
Vocational Training
In irrigation, pay more attention to upgrades and
rehabilitation of existing systems and participatory
management of irrigation infrastructure
MOWRAM, MAFF
Improve the quality of agricultural public programs MAFF, MOWRAM
Facilitate integration of small farms into food value chains MAFF, MOC
Helping develop the agribusiness and agroprocessing industry Improve access to and reduce electricity costs Ministry of Mines and Energy
Invest in food safety public infrastructure CARD, Ministry of Health
Improve rice trade logistics, including cost reduction Ministry of Public Works and Transport, MOC
Remove barriers for introduction of warehouse receipts MEF, National Bank of Cambodia

139
12. REFERENCES
Abdullah, A., H. Kobayashi, I. Matsumura and S. Ito. 2008. “World Rice Demand Towards 2050:
Impact of Decreasing Demand of Per Capita Rice Consumption for China and India.” Japan
and East Asian Regionalism.
ADB. 2014a. “Improving Rice Production and Commercialization in Cambodia: Findings from
the Farm Investment Climate Assessment.” Asian Development Bank, Manila.
ADB. 2014b. “Water Resource Management Sector Development Program, Ninth Quarterly
Progress Report (February 1-April 31, 2014).” Asian Development Bank, Phnom Penh.
ADI. 2009. “Rice Sector Profile.” Agriculture Development International, Phnom Penh.
Agland Investment Services. 2014. “Cambodia International Rice Marketing Study for Six
Countries: China, Cote Divoire, France, Germany, Singapore and USA.” Report sponsored
by IFC and Agence Francaise Development, Phnom Penh.
Alexandratos, N., and J. Bruinsma. 2012. “World Agriculture: Towards 2030/2050.” UN Food and
Agriculture Organization, ESA Working Paper, Rome.
Bordey, F., P. Moya, J. Betran, C. Launio, A. Litonjua, R. Manalili, A. Mataia, J. Besenio, F.
Macalinta, R. Malasa, E. Marciano, M. Milanes, S. Paran, G. Redondo, R. Relado, M. San
Valentin, I. Tanzo, E. Tulay, S. Valencia, C. Viray, and C. Yusongco. 2014.
“Benchmarking The Cost and Profitability of Paddy Production in Selected Asian Rice
Bowls.” Philippine Rice Research Institute, International Rice Research Institute, Benguet
State University, and Philippine Council for Agriculture and Fisheries.
CDRI. 2012. “Impact Assessment of Farmer Organization on Food Security for Rural Poor.”
Report commissioned by the World Bank and AusAID under the Cambodia Food Crisis
Capacity Support Partnership Trust Fund funded by AusAID, Phnom Penh.
CDTA. 2014. “Economics of O&M of Irrigation Systems in Cambodia.” Capacity Development
Technical Assistance Project, Phnom Penh.
FAO. 2003. “World Agriculture: Towards 2015/2030.” Food and Agriculture Organization of the
United Nations, ESA Working Paper, Rome.
FAO. 2014. “A Regional Rice Strategy for Sustainable Food Security in Asia and the Pacific.”
RAP Publication 2014/05, Food and Agriculture Organization of the United Nations,
Regional Office for Asia and Pacific, Bangkok.
FAOSTAT. 2014. FAO Statistics: http://faostat.fao.org/default.aspx (accessed November 20,
2014).
Fuglie, K. 2010. “Total Factor Productivity in the Global Agricultural Economy: Evidence from
FAO Data.” USDA, Washington, DC.
Gardner, B. 2005. “Causes of Rural Economic Development.” College of Agriculture and Natural
Resources, University of Maryland, College Park, MD, USA.
Gautam, M., and A. Kar. 2014. “Public Expenditure Priorities for Competitiveness. Farm Level
Evidence on the Effectiveness of Subsidies in Sri Lanka.” World Bank, mimeo.

140
IFC. 2014. “Preliminary Assessment of the Rice Seed Sector in Cambodia: Policy
Recommendations to Overcome Regulatory Constraints.” Investment Climate Business
Line, Phnom Penh, Cambodia.
IFDC. 2010. “Rapid Apparaisal of Fertilizer Quality in Cambodia.” International Fertilizer
Development Center. Report commissioned by the World Bank and AusAID under the
Cambodia Food Crisis Capacity Support Partnership Trust Fund funded by AusAID,
Phnom Penh.
IFPRI. 2012. ASTI Global Assessment of Agricultural R&D Spending: Developing Countries
Accelerate Investments. Washington, DC.
http://ifpri.org/sites/default/files/publications/astiglobalassessment.pdf.
Isvilanonda, S., A. Ahmed, and M. Hossain. 2000. “Recent Changes in Thailand’s Rural Economy:
Evidence from Six Villages.” Econ. Polit. Weekly 35: 4650-4656.
Ivanich, M., and W. Martin. 2014. “Short and Long-Run Impacts of Food Price Changes on
Poverty.” Policy Research Working Paper 7011, World Bank, Washington, DC.
Jamora, N. 2014. “Food Demand Trends and Prospects in East Asia.” Report prepared for the
World Bank, Washington, DC.
Le, Q., E. Nkonya, and A. Mirzabaev. 2014. “Biomass Productivity-Based Mapping of Global
Land Degradation Hotspots.” ZEF-Discussion Paper on Development Policy No. 193,
Bonn.
MAFF. 2014a. “Agricultural Extension Policy in Cambodia. Second Draft.” Ministry of
Agriculture, Forestry and Fisheries, Phnom Penh, October 30, 2014.
MAFF. 2014b. “Agricutural Statistics.” Ministry of Agriculture, Forestry and Fisheries, Phnom
Penh.
Nidhiprabha, B., and C. Chamchan. 2005. “SPS and Thailand’s Exports of Processed Food. Food
Safety Regulation Concerns: The Developing Country Perspective." Edited by Rajesh
Mehtha and J. George. Delhi: Macmillan India.
Nippon. 2013. “Sustaining Competitiveness of the Thai Agriculture." Report prepared for the
World Bank, Bangkok.
NIS. 2014. Cambodian Statistics. The National Institue of Statistics.
http://www.nis.gov.kh/index.php/en (accessed November 20, 2014).
Rutten, L. 2014. “Review of Potential Constraints for Warehouse Receipts Financing in Cambodia
with a Focus on Rice.” Report commissioned by the World Bank and AusAID under the
Cambodia Food Crisis Capacity Support Partnership Trust Fund funded by AusAID,
Phnom Penh.
Sharma, R. 2014. “Outlook for Rice Demand, Supply and Trade.” In Dawe, D., S. Jaffe and N.
Santos (eds.) Rice in the Shadow of Skyscrapers: Policy Choices in a Dynamic East and
Southeast Asian Settings. Food and Agricultural Organization, International Rice Research
Institute, and World Bank.

141
Slayton, T., and S. Muniroth. 2009. “A Road Map for Cambodian Rice Exports.” Report
commissioned by the World Bank and AusAID under the Cambodia Food Crisis Capacity
Support Partnership Trust Fund funded by AusAID, Phnom Penh.
Slayton, T., and S. Muniroth. 2012a. “A More Detailed Roadmap for Cambodian Rice Exports.”
Report commissioned by the World Bank and AusAID under the Cambodia Food Crisis
Capacity Support Partnership Trust Fund funded by AusAID, Phnom Penh.
Slayton, T., and S. Muniroth. 2012b. “Turning Rice into ‘White Gold.” Report commissioned by
the World Bank and AusAID under the Cambodia Food Crisis Capacity Support
Partnership Trust Fund funded by AusAID, Phnom Penh.
Sophal, C. 2008. “Impact of High Food Prices in Cambodia.” CDRI Policy Brief No. 2, Phnom
Pehn.
Thomas, T., T. Ponlok, R. Bansok, T. De Lopez, C. Chiang, N. Phirun, and C. Chhun. 2013.
“Cambodian Agriculture: Adaptation to Climate Change Impact.” IFPRI Discussion Paper
1285, Washington, DC.
Timmer, P. and S. Akkus. 2008. “The Structural Transformation as a Pathway out of Poverty:
Analytics, Empirics, and Politics.” Centre for Global Development Working Paper 150,
www.cgdev.org.
Tsakok, I. 1990. Agricultural Price Policy: Practitioner's Guide to Partial-Equilibrium Analysis.
Cornell University Press: New York.
van der Meer, K. 2014. “Implemeting SPS Measures to Facilitate Safe Trade. Principles and
Practice in Cambodia, Lao PDR, Philippines, and Thailand.” Study conducted for the
Standards and Trade Development Facility.
van der Meer, K., and S. Samrith. 2014. “Implemeting SPS Measures to Facilitate Safe Trade in
Cambodia.” Country study conducted for the Standards and Trade Development Facility.
Wokker, C., P. Santos, and R. Bansok. 2014. “Irrigation Water Productivity in Cambodian Rice
Systems.” Agricultural Economics 45: 1-10.
World Bank. 2007. “Philippines: Agriculture Public Expenditure Review.” Technical Working
Paper, World Bank, Manila and Washington, DC.
World Bank. 2008. “Cambodia Agrarian Structure Study.” World Bank, Washington, DC.
World Bank. 2011. “Cambodia Seed Sector Overview.” Report commissioned by the World Bank
and AusAID under the Cambodia Food Crisis Capacity Support Partnership Trust Fund
funded by AusAID, Phnom Penh.
World Bank. 2013a. “Cambodia Vision 2030: Input Papers.” World Bank, Phnom Penh.
World Bank. 2013b. “Where Have All the Poor Gone? Cambodia Poverty Assessment 2013.”
World Bank, Washington, DC.
World Bank. 2014a. “The Agricultural Transformation Matrix.” Presentation, Agriculture Global
Practice, World Bank, Washington, DC.
World Bank. 2014b. “Cambodia Rice Sector Monitoring Note 2013.” Technical Assistance Report
ACS8955, World Bank, Washington, DC.

142
World Bank. 2014c. “Cambodia: National Accounts Data.” World Bank, Phnom Penh.
World Bank. 2014d. “Improving Rice Trade Logistics to Help Reach 1 Million Tons Export
Target.” Presentation on the Trade Seminar organized by the Ministry of Commerce on
September 2, 2014, Phnom Penh.
World Bank. 2014e. “Input Notes for Rectangular Strategy III and National Strategic Development
Plan 2014-2018 based on the World Bank Investment Climate Assessment 2014.” World
Bank, Phnom Penh.
World Bank. 2014f. “Myanmar: Capitalizing on Rice Export Opportunities.” Economic and Sector
Work Report No. 85804, World Bank, Washington, DC.
World Bank. 2014g. “What Does Recent Evidence Tell Us About Poverty in Lao PDR?” Lao PDR
Poverty Brief, December 2014, World Bank, Washington, DC.
World Bank. 2015. “Cambodia Gender in Agriculture Assessment.” Draft Technical Assistance
Note, Phnom Penh.
World Bank and AusAid. 2011. “Agriculture, Irrigation, and Rural Roads Sectors: Integrated
Fiduciary Assessment and Public Expenditure Review for Cambodia.” Report
commissioned by the World Bank and AusAID under the Cambodia Food Crisis Capacity
Support Partnership Trust Fund funded by AusAID, Phnom Penh.
World Bank and AusAid. 2013. “Study on Access to Financial Services for Small and Medium
Enterprises in Cambodia.” Technical Working Paper No. 82585-KH. Prepared by Agrifood
Consulting International, Kensington, Maryland. Report commissioned by the World Bank
and AusAID under the Cambodia Food Crisis Capacity Support Partnership Trust Fund
funded by AusAID, Phnom Penh.
WDI. 2014. World Development Indicators. World Bank: http://databank.worldbank.org/data
(accessed November 20, 2014).

143
ANNEX 1: ANALYTICAL WORK FROM THE WORLD BANK AND AUSAID
PARTNERSHIP
1. The World Bank and Australian Aid signed an agreement in 2009 to produce a series of
analytical reports to underpin the efforts of the government and donors to improve food security
and promote smallholder-driven agricultural growth in Cambodia. Eight reports were produced on
topics ranging from input markets and rice sector development to access to finance, all of which
feed into this large report on agricultural transformation, which is also supported through the
partnership.
2. These reports are the following:
Rapid Appraisal of Fertilizer Quality in Cambodia prepared in 2010 by the International
Fertilizer Development Center.
Seed Sector Overview prepared in 2011 by a team led by M. Chamroeun, the World
Bank.
Impact Assessment of Farmer Organizations on Food Security for Rural Poor prepared in
2012 by CDRI.
Roadmap for Cambodian Rice Exports prepared in 2009 and updated in 2012 by T.
Slayton and S. Muniroth.
Turning Rice into “White Gold” prepared in 2012 by T. Slayton and S. Muniroth.
The Agriculture, Irrigation, and Rural Roads Sectors: Public Expenditure Review,
prepared in 2011 by a team led by P. Eliste, the World Bank.
Study on Access to Financial Services for Small and Medium Agribusiness Enterprises in
Cambodia prepared in 2013 by a team led by P. Eliste, the World Bank.
Review of Potential and Constraints for Warehouse Receipts Financing in Cambodia
with a Focus on Rice Sector, prepared in 2014 by L. Rutten.

144
ANNEX 2: METHODOLOGY FOR THE 2013 FARM SURVEY
1. This survey investigated the main changes in Cambodia’s agriculture sector over the past
10 years, the key drivers of those changes, and stakeholders’ medium- and long-term perspectives
about the future of the agriculture sector. Based on the information from agricultural experts in
Cambodia, supported by data gathered from farmers, the findings from this assessment will
provide insights to help shape the RGC’s agriculture sector strategies.
2. The survey team used qualitative methods to collect data for this assignment, including key
informant interviews and FGDs, complemented by quantitative data collection on farm budgets.
The project team collected data at the national, provincial, district, commune, village, and
individual farm level. Individual interviews are typically the preferred approach, but FGDs were
determined to be more effective for talking with farmers. The survey team also used structured
survey tools to gather data from individual farmers for the financial analysis of farm enterprises.
Selection of Products
3. The commodities selected for this analysis were chosen because they best characterized
the changes in Cambodia’s farming system since the mid-2000s. The team first selected four
products that had significant changes in production growth over the past 10 years. In addition, each
of these products had specific defining characteristics: (i) rice is the most important crop in terms
of GDP contribution, employment, food security, and exports; (ii) maize is characterized by its
rapid adoption of improved seeds and integration with the feed industry; (iii) cassava growth is
exceptional but its development is subject to intense discussion related to sustainability and
biodiversity conservation; and (iv) vegetables are related to nutrition and food safety, and are a
good candidate for import substitution.
4. The survey team discussed the selection of these crops during a stakeholder meeting held
in Phnom Penh on September 18, 2013. Table 65 summarizes the characteristics of the four
selected commodities.
Table 65: Product selection for the 2013 field survey
Product Justification Related Policies Region and
Province
Wet season
rice
* Staple food
* Large domestic and international
demand
* RGC focus
* High economic impact
* Contribution to food security
* 2013 production: 7.14 million tons
* Land
* Export promotion
* Food security
TONLE SAP:
* Battambang
* Bantey
Meanchey
COASTAL:
* Kampot
MEKONG:
* Takeo
* Kampong
Cham
* Kandal

145
Dry season rice * Staple food
* Large domestic and international
demand
* RGC focus
* High economic impact
* Contribution to food security
* 2013 production: 2.15 million tons
* Land
* Irrigation
* Food security
* Export promotion
TONLE SAP:
* Battambang
MEKONG:
* Takeo
* Kampong
Cham
Cassava * Subsidiary crop with relatively
reliable demand (starch, animal feed,
ethanol) thus ensuring relatively
stable incomes for upland farms
* Drastic increase of production from
2004 to 2013
* Valorization of upland
* 2013 production: 7.61 million tons
* Land
* Environmental
sustainability
* Export promotion
* Agribusiness
Promotion
TONLE SAP:
* Battambang
* Bantey
Meanchey
MEKONG:
* Kampong
Cham
Maize * Production increased 20 percent a
year from 2003 to 2012
* Existence of demand (animal feed)
thus ensuring relatively stable
incomes for upland farms
* Farmers tend to adopt new
technologies (e.g., hybrid seeds)
* 2013 production: 0.95 million tons
* Seed production
* Agribusiness
promotion
TONLE SAP:
* Battambang
* Bantey
Meanchey
MEKONG:
* Kampong
Cham
* Kandal
Vegetables * Production increased 10 percent a
year from 2003 to 2012
* Import substitution
* Contributes to improve nutrition
* Improved food safety
* From ADB 2009: vegetable
production provides highest gross
margin per ha
* 2013 production: 0.41 million tons
* Food safety
* Pesticide management
* Seed production
MEKONG:
* Takeo
* Kandal
* Kampong
Cham
COASTAL:
* Kampot
TONLE SAP:
* Battambang
* Bantey
Meanchey
Selection of Sites
5. The team selected the provinces, districts, and communes for the field work based on their
contribution to the production of the selected products. The team used data from MAFF and
information from various experts in Phnom Penh. In addition, provinces, districts, and communes
visited in the 2005 survey were included in the sample if they fit the purpose of the current research
questions. In some cases, villages or communes had altered their farming systems, shifting to
commodities not part of the survey list; in these cases, a new, more appropriate site selection for
the four commodities was decided through discussion with the District of Agriculture Office Chief.
6. At the commune level, the team requested the commune council to provide a list of villages
where many farmers produced the selected commodities. The team chose one village from the list
proposed by commune leaders.

146
Table 66: Selected locations for 2013 field work
Zone (3) Province (6) District (12) Crop (4) Commune (12) Visited
in 2005
Mekong Kampong
Cham
Memot Maize/Cassava Dar - Memot Yes
SreySnathor Rice/Maize Prey Poh -
PrekDamboke
Yes
Kandal Sa Ang Vegetable/Maize PrekAmbel No
KandalStoeng Rice/Vegetable Siem Reap No
Takeo
Batti Rice/Vegetable Champei No
Tram Kok Rice/Vegetable Tram Kak No
Coastal Kampot Chhouk Rice/Vegetable Meanchey -
TrapeangPhleang
Yes
Kampong Bay Rice/Vegetable TraeyKoh - Andong
Khmer
Yes
Tonle Sap Battambang Ek Phnom Rice/Vegetable PrekKhpop-
PrekNorin
Yes
Banan Cassava/Maize Kanty 2 - Chheuteal Yes
Bantey
Meanchey
Malai Maize/Cassava OuSampou No
MongkolBorei Rice/Cassava RohatTouk No
7. In summary, the selection sequence was: (i) selection of provinces; (ii) selection of two
districts within each province; (iii) selection of one commune within each district; and (iv)
selection of one village within each commune.
8. The six sampled provinces accounted for 46 percent of the national production of rice in
201356; 83 percent of maize production, 57 percent of cassava production, and 60 percent of
vegetable production.
56 Broken down by 44 percent of wet season rice production and 53 percent of dry season rice production.

147
Selection of Respondents
A. Provinces, districts, and communes
9. At the national, provincial, district, and commune level, the project team conducted key
informant interviews with experts in the field of agriculture, rural development, and land
management. The list included senior officers at the Ministry of Economy and Finance; the
Supreme National Economic Council; the Ministry of Agriculture, Forestry, and Fisheries; the
Ministry of Land Management, Urban Planning, and Construction; and responsible staff members
of development projects and NGOs working in Cambodia. During the fieldwork, the team
interviewed provincial department and district office representatives of the two ministries (MAFF
and MLMUPC), as well as the responsible person for agricultural development at the commune
level.
10. The survey team used two different sampling methods for key informant interviews: (i)
purposive sampling based on the information from initial meetings with MEF, SNEC, and MAFF
and the initial identification of respondents by the project team; and (ii) snowball sampling, which
consists of interviewing key informants identified by the respondents themselves.
11. The interview guide57 for key informants had two sections, aimed at eliciting information
on: (i) changes that happened in the past 10 years in the agriculture sector, their driving forces, and
stakeholders’ perspectives for the next five years; and (ii) prices, farmers’ use of inputs including
land, and agricultural production.
12. For the first section, interviewers ensured that all possible changes and their causes were
discussed during the interview. Topics included:
a. Land use and land availability;
b. Awareness and use of improved varieties and use of good (certified) seed;
c. Awareness and use of other modern inputs such as fertilizer and pesticides;
d. Access to agricultural services such as finance, extension, and information on prices;
e. Extent of mechanization and types of farm machinery used;
f. Use of family and hired labor and dynamics of hired labor costs across geographic
locations, and the overall availability of labor;
g. Role of women in agriculture; and
h. Importance (or not) of farmers’ organizations.
13. In addition, interviewers asked questions about the key constraints to improved
productivity and farmers’ perspectives about the agriculture sector over the next five years.
B. Villages
14. At the village level, the team used FGDs to get information from farmers. For each village,
one FGD was conducted separately for each selected crop for the sake of homogeneity of
respondents. The FGD questionnaire had two sections: the first captured the same information
collected from key informants but at the village and farm level, and the impact of changes on farm
57 The detailed field tools are listed in the Inception Report.

148
activities; the second section included more detailed questions on prices, yields, and use of inputs
for agricultural production.
15. The team again used a purposive approach to sample FGD participants. Focus groups
consisted of 10 to 12 farmers, and ideally included different farmers growing the selected crop in
three categories of cultivated areas (by size) and two levels of use of modern technologies. The
team asked village leaders to identify farmers who met the criteria for farm size (small, medium,
and large cultivated areas) and level of use of modern technologies (use of improved seeds,
fertilizers and pesticides, agricultural machineries, and irrigation).
16. To assess the level of modern technology use, the project team initially characterized
farmers as traditional or modern based on the following: for each category of technology
(improved seeds, fertilizers and pesticides, machineries, and irrigation), the farm was rated 2 in
case of use and 1 for no use. The maximum attainable score was thus 8 for a farm using improved
seeds, modern inputs (fertilizers or pesticides), agricultural machineries (e.g., harvester or power
tiller for land preparation), and irrigation. At the other end of the spectrum, a completely traditional
farmer was given a score of 4. Farmers’ scores thus ranged from 4 to 8. Farmers scoring less than
6 were qualified as traditional and those scoring 6 or more were categorized as modern. During
the analysis, the project team used a statistical method (factor analysis) to distinguish between
farmers adopting more modern technologies and farmers using more traditional practices for
agricultural production.
17. In summary, a FGD included at least one farmer satisfying the criteria for each cell of the
following matrix:
Table 67: Matrix of size x technology
Cultivated Area (farm size)
Small Medium Large
Level of use of
modern
technologies
Low Cell 1 Cell 2 Cell 3
High Cell 4 Cell 5 Cell 6
C. Farms
18. At the farm level, the survey team collected data on farm budgets for the selected crops,
qualitative information on changes observed by farmers in the past 10 years on their farms, and
their perspectives for the next five years.
19. Data on farm budgets for the financial analysis of farm enterprises were collected from
individual farmers. In every village, the survey team visited one to two households within each of
the six cells in Table 67 (matrix of 3 sizes and 2 levels of technology use). However, not all cells
existed in every village; for example, there were not always farmers growing vegetables on large
areas (> 0.5 ha). Although information for each cell per village was not always available, the
project team ensured that within each agro-ecological zone, each cell contained at least one
sampled farmer.
20. The farm budget model was then defined by the four following parameters:

149
Model = M(c, s, l; z)
where c is the commodity, s is farm size, l is the level of modernization, and z is the agro-ecological
zone. In total, the project produced: (i) 29 budget models of crop production based on five crops
(including wet season and dry season rice), three categories of farm size (small, medium, and
large), and two levels of technology adoption (low and high), with one category missing (medium-
size modern vegetable producers); and (ii) 23 models based on location. The project highlighted
any sub-regional differences existing within each agro-ecological zone.
21. The individual farm survey contained three sections:
Section 1: Farm budget
Section 2: Information related to the past 10 years on:
o Production trends
o Trade trends
o Changes in the use of inputs, machineries, and access to agricultural services
o Changes in the use of labor and the impact of migration
o Changes in marketing
o Dynamics of landholdings over the past decade
o Source of change in landholdings
Section 3: Data on farms’ and farmers’ characteristics
D. Summary of the type and number of respondents
22. Table 68 presents a list of respondents for the survey.
Process for Setting Up the Tools for Data Collection
23. The assignment required the use of five different data collection tools:
a. Interview guide for provincial and district staff of MAFF
b. Interview guide for provincial and district staff of MLMUPC
c. Interview guide for key person responsible for agriculture in commune
d. FGD guide for groups of farmers
e. Questionnaire for individual farmer survey, including farm budget sheet
24. The survey team pretested the FGD guide and the individual farmer questionnaire with
farmers in Takeo province. The objectives were to check for consistency and flow, to identify other
relevant responses to each question in the guide, and to determine the timing of the interview and
FGD.
25. The questionnaire was translated into Khmer before the field staff training. The training
lasted for five days, including a second pretest of the revised questionnaires in the field, and
another session to update the tools based on feedback from the field.
26. After the stakeholder consultations held on September 18, 2013, additional questions were
added on gender, changes in the role of women in agriculture, the impact of migration on
agricultural labor, and households’ consumption. Questions about who led the changes were also
added.

150
Table 68: List of respondents to 2013 survey
Categories of Respondents Objectives Location
Executive Senior Staff at MEF,
MAFF, SNEC members
Information on the project
Guidance
Phnom Penh
World Bank Guidance
Administrative
Expectations
Phnom Penh
Technical staff at CDRI, FAO,
CAVAC, HARVEST/USAID,
IDE, LASED
Statistical information
Documents
Experience
Lessons learned
Suggestions
Phnom Penh
Provincial Department and
District Office of MLMPC
Guidance
Policy information
Data validation
In each of the 6 selected
provinces and 12 districts
Provincial Department and
District Office of MAFF
Guidance
Statistical information
Find out other actors to talk to
In each of the selected 6
provinces and 12 districts
Commune Authority (Council) Guidance
Data validation
Suggestions on names of
villages
In each of the 12 selected
communes
Group of Farmers (FGD) Information
Data validation
Suggestions on names of
farmers by size, technology use
In each of the 12 selected
villages
Individual farmers representing
the cell (crop x farm size x level
of technology use)
Information
Data validation
Farm budget model
1 to 2 in each of the 12 selected
villages (if possible), for each
selected crop, farm size, and
level of technology use
Quality Control
27. The survey team consolidated the information received from key informants and FGDs
every day. Each completed interview was signed by the interviewer, and controlled and signed by
the supervisor. For each questionnaire, the team:
a. Checked the consistency of the gathered information;
b. Checked its completeness; and
c. Checked the reliability and accuracy of answers.
28. In addition, the supervisor of each field team communicated to the field survey manager
on a daily basis the work progress, any encountered issues, and major findings worth sharing with
the other teams.
Data Analysis
29. The team used qualitative data gathered from key informants to explain why and how
Cambodia has attained such a remarkable improvement in agricultural production in the past 10

151
years, and to identify opportunities and threats for the future of the agriculture sector. The ultimate
goal was to recommend policies to ensure that the agriculture sector remains central to Cambodia’s
overall economic development.
30. For each key question (such as land use and land availability; use of inputs and machinery;
issues of labor; access to agricultural services; constraints to agricultural production; and
perspectives about the sector), the project team produced tables summarizing the findings by agro-
ecological zone and by farm size.
31. The team used farm-level data to compute financial indicators of farmers’ costs and
profitability, including gross margins, net profit per hectare, and total production, as well as gross
profit per day of family labor and net profit per day of total labor. The team also estimated the
financial rates of return: gross margin over variable cost and net profit over total variable cost.
32. For the analysis of returns to labor, the project team compared the indicators of returns to
labor from various farm enterprise models to prevailing nonfarm returns to unskilled labor in key
economic sectors (manufacturing, construction, and services).
33. The team also conducted a trend analysis explaining trends in cost structures, profitability,
and cash flows, and use of labor and machinery between the 2005 and 2013 farm enterprise models.
Information from key informant interviews and the qualitative data were used to compare the factor
dynamics between 2005 and 2013 in farming systems and to identify the causes of these changes.
34. The team benchmarked the cost of production and input uses against available farm
enterprise data from other ASEAN countries and financial and returns to labor indicators from the
above farm enterprise models. The team assessed the comparative advantage of Cambodia’s
agricultural products relative to other countries in the region, using available data on comparative
advantage indicators from recent analytical work and economic literature. To that end, the project
team computed:
a. Comparative advantage indicators using financial farm enterprise models as a starting
point; economic prices (shadow prices) for internationally traded outputs and inputs; and
other economic prices (such as for labor) that are adjusted for public transfers (subsidies
and taxes);
b. Indicators of social profitability, to measure the comparative advantage of various farm
enterprise variations; and
c. The DRC indicator to assess Cambodia’s comparative advantage in producing agricultural
commodities relative to its neighbors.

152
ANNEX 3: DETAILED FARM BUDGETS BY CROP
1 Farm Budget for Wet Season Rice
1. From 2005 to 2013, the nominal gross margin on wet season rice production increased by
55 percent, from $158/ha to $245/ha. In real terms this increase was close to zero. Within the same
period, gross revenue increased by 1.2 times and total variable costs by 1.7 times. In real terms,
using the GDP deflator from 2005 to 2013 as an adjustment factor,58 the increase was much
smaller.
2. The changes in gross revenues were mostly driven by prices. From 2005 to 2013, wet
season paddy rice prices increased 98 percent in Cambodia, rising to $247 per ton from $125 per
ton. For reference, FAOSTAT reported a similar trend in Thailand, with an increase of 144 percent
over the same period, 50 percent higher than in Cambodia, but the Thai prices might have been
altered by the policy of subsidizing rice farmers. On average, this variation in prices should lead
to a doubling of the nominal values of production, thus significantly affecting nominal gross
margins, assuming no or only slight changes in productivity.
3. Wet season rice producers used increasingly more modern inputs. A comparison of the cost
structure between 2005 and 2013 shows that farmers used more fertilizers for wet season rice
production. In 2013, traditional farmers spent on average $49/ha (75kg/ha) to purchase chemical
fertilizers, up from almost no expenditures in 2005. For modern users, the amount spent increased
two-fold, from $30-$40/ha (100-133 kg/ha) to over $80/ha (125kg/ha). However, between 2005
and 2013, the price of urea and DAP also increased almost two-fold, from $0.35/kg to $0.68/kg,
an increase that may partially explain the increase in chemical fertilizer expenditures. Wet season
rice producers also used more pesticides and herbicides as farm size increased. This expenditure
amounted to $4/ha for small, $6/ha for medium, and $12/ha for large farms. Expenditures on
herbicides, an alternative to manual weed control, constituted the main part of the costs of
chemicals (other than fertilizers).
4. The relative share of costs allocated to hired labor decreased as farm size increased. For
small farms, the relative share of labor in the partial farm budget represented more than half of
total variable costs. The percentage decreased slightly below 50 percent for medium-size farms
and dropped further to a quarter for large farms. Indeed, results from the FGDs and the interviews
with MAFF and Ministry of Land in the regions and districts show that it is increasingly difficult
to find agricultural workers in rural areas. In addition, the daily cost of hired labor increased four-
fold, from $1.0-1.2/day to $4.5/day between 2006 and 2013, according to the survey data. These
factors forced medium-size and large farms to find better alternatives and more cost-efficient
approaches to substitute for the use of hired labor.
5. On the other hand, the cost structure shows the relative importance of expenditures on
services for large farms. In 2013, 45 percent of the total production costs for large wet season rice
producers were allocated to services. This proportion was 27 percent for medium-size farms and
22 percent for small farms. On a per hectare basis, large farms spent 35 percent and 25 percent
more on services than small and medium-size farms, respectively. Most of these costs were related
to harvest and post-harvest operations, as large farms sought services from businesses renting
combines. According to the FGD results, farmers in Cambodia expected an increasing shift of
58 The cumulative change of the GDP deflator between 2005 and 2013 was 35 percent.

153
harvest and post-harvest operations from manual labor to the use of mechanized agricultural
equipment.
6. Each province has its own specific cost composition for producing wet season rice
depending on the cost of labor, technology, and connectivity to urban and industrial zones. Farmers
in Takeo (65 percent) and Kampot (50 percent) allocated a larger percentage of their total variable
costs to labor. In contrast, farmers in Battambang had the lowest share of labor costs (6 percent).
Expenditures on services ranged between 17 percent (Kampot) and 47 percent (Battambang), and
close to 40 percent in Kandal, Kampong Cham, and Bantey Meanchey. In most provinces, rice
farmers spent an average of 16-22 percent of their costs on the purchase of fertilizers, with the
exception of Kampong Cham, where the share was about 6 percent ($29/ha). These differences in
cost composition illustrate the diversity of the techniques used by farmers to produce wet season
rice. For example, direct seedlings are more commonly used in Battambang and Bantey Meanchey.
They are also an indication of the cost and availability of agricultural inputs within each province.
Farmers located farther away from urban centers and/or borders with neighboring countries might
opt for a more labor-oriented approach, favoring the use of family and hired labor. Farmers closer
to urban centers and economic industrial zones might adopt a more capital-oriented approach –
e.g., greater use of herbicides, and use of combines for harvest and post-harvest operations.
7. The choice of technology is a critical component of profitability in wet season rice
production: the gross margins of modern farmers were more than twice those of traditional farmers
($399/ha versus $178/ha). Modern technology users were characterized by higher expenditures on
fertilizers ($99/ha) and lower expenditures on labor ($130/ha) compared to traditional farmers,
who allocated about $5/ha for fertilizers and $259/ha for labor. These differences should allow
modern farmers to reach higher yields, and indeed, modern farmers had a 25 percent higher yield
compared to farmers using traditional practices.
8. According to MAFF statistics, average yields for wet season rice have slightly increased
since 2006, to 2.9 tons/ha in 2012. In 2013, data collected by the project team for the purposively
selected farmers showed an average yield of 2.6 tons/ha, varying from 2.4 tons/ha for farms using
traditional technologies to 3.0 tons/ha for farms using modern technology. Although the current
study did not intend to measure average yield, it is reassuring to find these data in the range of
official figures.
2 Farm Budget for Dry Season Rice
9. The data show that on average, farmers earned higher gross margins per hectare in nominal
terms in 2013 than in 2005, regardless of farm size. The magnitudes of the change were higher as
farm size increased. In 2005, gross margins for small dry season rice producers ranged from
$200/ha to $391/ha; in 2013, they ranged from $276/ha to $311/ha. For medium-size farms, the
changes were higher, with an average $283/ha, almost 1.5 times the 2005 gross margin for this
size category. Large farms showed the largest increase, with the 2013 gross margin on average
three times the recorded 2005 gross margin due to higher use of inputs, which resulted in higher
productivity.
10. On average from 2005 to 2013, dry season rice yields also increased, from an average 3.0
tons/ha to 4.8 tons/ha for the surveyed farms. Over the same period, statistics from MAFF show
the yield increase of 500 kg, reaching 4.4 tons/ha in 2012 from 3.9 tons/ha in 2005. Data collected
by the project team show the average 2013 farm gate price higher by 75 percent in nominal terms

154
compared to the 2005 situation; the price rose from $118.5/ton in 2005 to $206/ton in 2013. This
increase was moderate compared to the paddy price changes in Thailand, which increased 144
percent from $172/ton in 2006, but was comparable to the farm gate prices in the Vietnam Mekong
region at $240/ton. This difference in prices makes profitable the informal export of paddy from
Cambodia to Vietnam and Thailand.
11. Dry season rice producers’ revenue increased less than their costs; the total increase in their
margins, however, was still positive. Data collected by the project team in 2005 and 2013 show a
150 percent increase in gross returns, attributable to the combination of higher price and higher
yield. However, the much higher increase in total variable costs (218 percent) resulted in an
increase of only 79 percent in the gross margin (in nominal terms). This difference varied across
type of farm, level of technology use, and location.
12. Use of modern technology is no guarantee of higher gross margins. In a few cases, dry
season rice producers using modern technologies received lower gross margins compared to
farmers using traditional practices. Besides the use of modern technologies, other factors such as
soil quality, labor skills, and quality of seeds are important. In some cases, the expected returns to
intensive use of chemicals, improved seeds, and irrigation are offset by gaps in these other factors.
If all conditions were the same, modern technology would clearly be better than traditional
methods. But all conditions are not the same, particularly when isolated observations are
compared, as in this study. This finding seems to be counterintuitive and goes against the
conventional wisdom about the advantage of modern technologies. Indeed, the distinction between
modern and traditional is very qualitative, based on the level of use of factors such as irrigation,
improved seeds, fertilizers, chemicals, and mechanization. Modern farms are expected to spend
more on these inputs; e.g., modern small farms spent $228/ha on fertilizers versus $117/ha for
traditional small farms; medium-size farms showed similar patterns ($168/ha versus $102/ha) and
so did modern large farms ($203/ha versus $100/ha). The same disproportions were observed for
herbicides and seed expenditures; this latter may reflect the use of high-quality improved seeds.
Modern farms are also characterized by lower expenditures on hired labor regardless of their size:
$113/ha for small traditional versus $32/ha for small modern farms; $98/ha for traditional medium-
size versus $29/ha for medium-size modern farms; and $96/ha for large traditional versus $42/ha
for large modern farms. The costs of harvest were very similar for both types of farms. The most
striking difference was in expenditures on irrigation. Overall, the field interviews found that gross
margins for modern farms ($255/ha) were lower than those of traditional farms ($336/ha). In
summary, increasing yield is not enough if it comes at the cost of margins or sustainability.
13. Dry season rice producers adapt their production strategies to maximize their profit
according to their assets: labor cost shares decrease and services cost shares increase with farm
size. The analysis shows that regardless of farm size, gross margins remained similar, ranging from
$283/ha for large farms to $306/ha for small farms. As with modern versus traditional farms, the
structure of costs for different sizes of farms was quite different, especially in the use of labor-
alternative technologies. For example, large farms used increasingly less manual labor (e.g., on
weed control), using chemicals as substitute, and reapers and threshers or combines for harvest
and postharvest. This resulted in lower costs for labor as farm size increased. In dry season rice
farm budgets, expenditures on labor amounted to $53/ha, $140/ha, and $204/ha for large, medium,
and small farms, respectively. On the other hand, larger farms reported higher expenditures for
herbicides ($21/ha for large versus $9/ha for small farms).

155
14. The gross returns to dry rice production were similar for all provinces; however, the
production costs showed huge disparities. Takeo, the province with the highest dry season rice
production (460,000 tons in 2012, 21 percent of total production – Source: MAFF), also had the
highest gross margin, $384/ha. The farm budget in Takeo was characterized by the absence of
irrigation costs, which may denote the existence of good public irrigation infrastructure. The cost
of labor in Takeo was the highest of all four provinces in this analysis, at $192/ha. The dry season
rice farm budget in Battambang had a gross margin of $334/ha, slightly less than that in Takeo,
but Battambang is “penalized” by high expenditures on irrigation ($132/ha). It also had high
expenditures on chemical fertilizers ($186/ha). The combination of these investments brought
about a higher yield, above 5.1 tons/ha, thus generating the highest gross return, at $1,047/ha. If
farmers in Battambang did not pay as much for irrigation, their gross margin would be closer to
farmers in Takeo. The total dry season rice production in Battambang was around 100,000 tons in
2013 (MAFF). Kandal was in third place with a gross margin of $288/ha. The province produced
about 270,000 tons of dry season paddy (12 percent of total production) in 2012. It has the
disadvantage of lower gross returns, a direct consequence of lower yield (4.3 tons/ha versus 4.9
tons/ha for Takeo for surveyed farmers). Bantey Meanchey’s gross margin was the lowest of the
four provinces, at $175/ha. Its farmers’ expenditures on seeds were almost double those of Takeo’s
farmers; they also had the highest expenditures on fertilizers ($207/ha) and the highest cost of
irrigation ($150/ha). Their yield was similar to yields in Takeo and Battambang, but because of
the relatively lower prices of products (gross return of $970/ha) and the high costs previously
mentioned, their gross margin fell to $175/ha.
3 Farm Budget for Cassava
15. Overall, for all farm sizes and regardless of the level of technology use, the gross margins
per hectare for cassava significantly increased in nominal terms between 2005 and 2013, varying
from 86 percent for medium-size farms using traditional practices to 300 percent for small farms
adopting modern technologies. In real terms, the increase in per hectare gross margins was more
modest, varying from 51 percent to 265 percent for the two categories of cassava farmers
previously mentioned. These changes were mostly driven by prices. From 2005 to 2013, fresh
cassava prices increased 200 percent in Cambodia, rising to $59.4/ton from $19.8/ton. For
reference, FAOSTAT reported a similar trend in Thailand, with an increase of 166 percent over
the same period. The RGC policy on feeder roads rehabilitation in the past 10 years might have
contributed to higher changes in farm gate prices.
16. Use of modern technologies is positively correlated to an increase in gross margin per
hectare. Overall, cassava farmers using more modern technologies had a 65 percent higher gross
margin per hectare compared to farmers using traditional practices. The difference was lower for
large farms compared to medium-size and small farms. In the 2013 survey, modern technology
adopters recorded a gross margin of $695/ha, about 64 percent higher than that of their traditional
counterparts, at $422/ha. This difference is partly explained by the difference in yields: 21.9
tons/ha versus 17.2 tons/ha for modern and traditional technology users, respectively. For cassava,
use of modern technologies seems to be limited to the adoption of high-productivity varieties,
which may account for a productivity increase of 24 percent, and better crop management
practices. Chemical and organic fertilizers are barely used by farmers, and represent only about 1
percent of total variable costs (slightly less than $2) for the surveyed cassava producers. The 2013
survey did not shows significant differences between the recorded average farm gate prices for the

156
two groups of producers. Traditional farmers sold fresh cassava at $71/ton, very similar to the
$73/ton received by modern farmers.
17. According to MAFF statistics, average yield for cassava fluctuated between 2006 and
2012, with a reported yield of 22.5 tons/ha in 2012. Data collected by the project team show a
lower average yield of 18.9 tons/ha, varying from 14 tons/ha for medium-size farms using
traditional technologies to 27 tons/ha for farms using modern technology. Although the current
study did not intend to measure average yield, it is reassuring to find the survey data in the range
of official figures. Further analysis by category of farm size shows a slight inverse relationship
between productivity and farm size: larger farms tended to have lower productivity per hectare
compared to small farms. The difference was mostly between the small and other farm sizes, with
a gap of close to 10 percent.
18. The most commonly observed changes in the cost structure were an increase in the relative
cost of cassava cuttings and a decrease in the relative cost of services. The share of cutting costs
out of total variable costs increased from 2-3 percent to 20-30 percent for farmers using traditional
methods between the two periods. In 2013, the gap in the relative costs of cassava cuttings
decreased between the levels of technology use. Overall, traditional farmers spent about 17 percent
less than modern farmers on cassava cuttings. Indeed, use of improved varieties is one of the most
cost-efficient technologies to improve productivity. Farmers expanding cassava plantation, in
some cases to lower fertility land, would get higher productivity if they adopted more modern
varieties of cassava. Modern farmers were also characterized by lower costs of services ($253/ha
versus $314/ha), higher costs of labor ($257/ha versus $207/ha), and higher use of fertilizers and
chemicals although in lower magnitude.
19. Low use of fertilizers, including organic fertilizers is a concern for the sustainability of
cassava production. The cassava farm budgets showed that for any category of farm size, the
amount spent on fertilizers remained very low, on average less than 1 percent of total variable
costs. Out of the 26 observations, no farmers reported using manure or compost, one out of 5 used
urea, and only one used DAP. The rates of use were around 50 kg/ha for urea (for users only) and
25 kg/ha for DAP (one case).
20. The analysis did not find significant differences across provinces. The magnitudes of
revenue and total variable costs remained very similar across surveyed farm budgets in three of
the six provinces surveyed. The ratios of gross margins to revenue per hectare were quite similar,
ranging from 35-42 percent. In addition, the structures of total variable costs were not dissimilar.
21. About half of the interviewed cassava farmers dried their products before
commercialization. Farmers who opted to sell chips received higher gross margins ($505/ha versus
$452/ha). Their total variable costs were also higher by 4 percent, including a 12 percent increase
on labor expenditures, but these costs were offset by a 19 percent higher final product price. The
12 percent gain on gross margin was mostly due to the difference in average yield (18.3 tons/ha
versus 16.9 tons/ha) and the 10 percent value added to price from processing.

157
Table 69: Comparison of key indicators across type of commercial cassava (chips vs. fresh)
Processing
Total
Revenue
($/ha)
Total
Variable
Costs
($/ha)
Labor
Costs
($/ha)
Gross
Margin
($/ha)
Yield
(tons/ha)
Unit Price
(Riel/ton)
No 1,224 772 197 452 16.9 72.3
Yes 1,306 801 220 505 18.3 79.3
% Change 7% 4% 12% 12% 8% 10%
4 Farm Budget for Maize
22. The trend between 2005 and 2013 for maize indicates a reduction in the gross margin per
hectare received by farmers in real terms. In general, the gross margin per hectare is affected by
the prices of outputs and inputs and crop yields. Over this period, recorded prices for maize grain
increased from an average $140/ton to $230/ton (i.e., 64 percent, according to data recorded by the
project team). For reference, between 2006 and 2011, farm gate prices for maize in Thailand
increased 110 percent, from $119/ton to $250/ton (FAOSTAT). If the costs of production follow
the same increase as the price of products, then the change in yields will determine the direction
of the nominal change in gross margins. Maize yield over the period increased 25 percent
according to MAFF statistics. On the other hand, input prices increased at a higher rate; e.g., the
price of nitrogen fertilizers in 2012 was about three times higher than in 2006 (FAOSTAT). Based
on these facts, it can be assumed that there was a decrease in real terms in the level of gross margins
received by maize farmers. Information collected in 2005 and the results of the survey conducted
by the project team in 2013 support this assumption. In 2005, maize farms received an average
gross margin of $574/ha with a yield of 6.0 tons; this margin is 90 percent more than the same
measure calculated from a similar farm budget in 2013 ($304/tons). The trend is even more
negative in real terms.
23. Maize production is responsive to the use of modern inputs such as fertilizers, chemicals,
and improved seeds. Farmers using modern inputs to produce maize are more likely to have a
higher gross margin, and the gain increases as farm size decreases. In 2013, the overall gross
margin for modern farmers was $396/ha and $211/ha for traditional farmers. There were large
disparities across farm size: small farms using modern technologies had twice the margin of
farmers practicing traditional technologies ($282/ton versus $118/ton). The same advantages of
modern farmers were observed, albeit at lower magnitude, for large farms ($522/ton versus
$253/ton). The budgets provided by maize producers showed that users of modern technologies
spent about $83/ha on improved seeds versus $71/ha for traditional farmers; their expenditures on
fertilizers and chemical amounted to 20 percent of total variable costs versus 5 percent for users
of traditional practices. Modern farmers had 15 percent higher yields across all size categories.
24. According to MAFF statistics, the average yield for maize fluctuated between 2006 and
2012, with a reported yield of 4.4 tons/ha in 2012. For the last four years, average yield moved up
and down around 4 tons/ha. Data collected by the project team show lower average yield (3.94
tons/ha), varying from 0.8 tons/ha to 10 tons/ha, with a median of 3.5 tons/ha. Although the current
study did not intend to measure average yield, it is reassuring to find these data in the range of
official figures.

158
25. Analysis of the cost structures showed that the cost of improved seeds was the most
important budget line item, regardless of farm size and level of technology adoption. This cost
represented between 16 percent (for small modern farms) and 24 percent (large modern farms) of
total variable costs. The enthusiasm for using improved maize seeds, particularly hybrid seeds,
was often highlighted by respondents during the expert interviews and FGDs. However, this does
not automatically mean that yield will be higher. Many farmers complained of the existence of
fraudulent seed suppliers. The second most significant expenditures were for land preparation.
Depending on the type of farm, this cost ranged between 16 percent (small traditional) to 34
percent (medium-size traditional) of total variable costs. Note that this partial budget did not take
into account the cost of family labor or that of work by farmers for their own agricultural
production. Modern farmers were also characterized by a high percentage of cost allocated to
fertilizers and chemicals, ranging from 9 percent for medium-size farms to 21 percent for small
and large farms. These values contrast with the lower percentages for traditional farmers, which
ranged from 4-5 percent of total variable costs.
26. The analysis found significant differences across provinces in the gross margin, total
variable costs, total revenue, and cost structure. The magnitudes of revenue and total variable costs
were quite different. Farmers in Bantey Meanchey and Kandal had higher revenues ($839/ha and
$1,133/ha, respectively), while revenues in Kampot and Battambang were quite low (around
$370/ha to $402/ha). Kandal exhibited the highest total variable costs at $634/ha, comprising
$85/ha for improved seeds, $105/ha for fertilizers and chemicals, and $177/ha for land preparation.
This province also had the highest gross margin, at $500/ha.
5 Farm Budget for Vegetables
27. Data from 2005 and 2013 show that the nominal gross margins per hectare for small farms
growing vegetables decreased by about one-fifth. Medium-size farms exhibited an increase of
more than 50 percent and large farms doubled their gross margins compared to 2005. Gross
margins for small farmers in 2005 ranged from $415/ha (cucumber production in Battambang) to
$1,775/ha (watermelon production in Kampot); for medium-size farms, the highest gross margin
($1,100/ha) was observed in Pursat for cucumber production and the lowest ($77/ha) in Sihanouk
region for watermelon production. In 2013, a similar spread of gross margins per hectare was
observed, especially for small farms, with values ranging from $164/ha for watermelon production
in Bantey Meanchey to $3,450/ha for eggplant production in Kampot. For medium-size farms, the
range was quite narrow: from $635/ha for mustard production in Kampong Cham to $1,302/ha for
watermelon production in Battambang. Data for large farms were scarce and thus very difficult to
interpret. The only case reported in 2005 was a large cucumber producer in Pursat with gross
margin of $134/ha. In 2013, one large farm was observed producing watermelon and cucumber in
Battambang. From these pieces of information, nominal gross margins for small vegetable
producing farms appeared to decrease; the changes were more favorable for medium-size and large
producers. In real terms, the trend was negative for small farms, stagnant for medium-size farms,
and positive for large farms. One complication is that these data related to numerous types of
vegetables from different provinces, making comparisons difficult. For example, in 2013, the
project team analyzed several farm budgets for cucumber, mustard, watermelon, and eggplant
producers in Battambang, Kampot, Kampong Cham, Bantey Meanchey, and Kandal provinces. In
2005, the data were collected in Pursat, Battambang, and Sihanouk provinces for cucumber and
watermelon production.

159
28. Prices of vegetables in nominal terms increased one- to three-fold between 2005 and 2013,
depending on the type of vegetable. The price of watermelon tripled from 2005 to 2013, reaching
$277/ton versus $84/ton in 2005; cucumber prices more than doubled, from $86/ton to $187/ton.
The price of eggplant did not change much compared to other vegetables, rising to $200/ton from
$125/ton. In real terms, the increases were more modest: double for watermelon and about one-
third for cucumber, while eggplant prices remained the same. Comparable figures from Thailand
increased within these ranges but exhibited different patterns, with watermelon prices the least
increased. Thai cucumber prices had very similar increases to Cambodian farm gate prices. On the
other hand, statistics from MAFF show a steady increase in average yield and production of
vegetables in the past four years. Based on these two data sets, farmers’ total revenue increased on
average but the change in gross margin ultimately depends on the increase in production costs.
29. From 2006 to 2013, average total revenue increased three-fold, from $836/ha to $2,842/ha.
This is the result of a combination of increases in yields and prices. However, during the same
time, total variable costs increased eight- to nine-fold, from $161/ha to $1,481/ha. The increase in
costs was attributable to an increase in input prices, the higher rate of use of modern inputs, and
the higher amount of hired labor. For example in 2005, vegetable farmers spent about $23/ha for
seeds, the same for fertilizers, and $4/ha for chemicals. In 2013, the figures were $141/ha for seeds,
$341/ha for fertilizers (half of it manure), and $130 for pesticides (two-thirds for insecticides). In
addition to an increase in the price, the four-fold increase in expenditures on seeds could be due to
the use of higher-quality varieties to better respond to market demand. Expenditures on labor
skyrocketed to $802/ha, an increase of about 16 times compared to the $50/ha in 2005. Again, this
is the combination of an increase in the cost of labor (1 to 4 based on the 2013 data) and the shift
to more labor-intensive activities, requiring greater use of hired labor. For the future, this could
become a constraint to further development of vegetable production.
30. In 2013, the cost structures show the dominance of labor costs (54 percent), followed by
the cost of inputs (41 percent). The share of services is very low, especially for small and medium-
size farms. Despite the constraints linked to hiring rural laborers, vegetable farmers still relied
heavily on manual labor, which represented about two-thirds of total variable costs. The ratios
were lowest in Kampot, Takeo, and Kampong Cham provinces but still remained around 50
percent of total variable costs. Indeed, these variations were directly related to the type of
vegetables grown in these provinces. Cucumber production required the highest amount of labor
(72 percent of total variable costs), followed by eggplant production (64 percent), and mustard (50
percent). The lowest share was for watermelon production (42 percent), which also had the lowest
average total production costs of $592/ha. In general, the share of labor decreased and share of
services increased as farm size increased.
31. As expected, vegetable farmers adopting modern technologies used a high amount of inputs
including manure, chemical fertilizers, pesticides, and seeds. Input expenditures for modern
farmers represented five times the expenditures of traditional farmers, but there was variability
across the type of vegetables and farm size. For example, small modern cucumber producers spent
$728/ha versus $155/ha for traditional farmers; the figures were $920/ha versus $378/ha for
mustard; and $636/ha versus $250/ha for eggplant producers. The variations were more difficult
to assess for medium-size and large farms since very few of them were characterized as modern
in the 2013 survey. In general, modern farmers allocated about 45 percent of their costs to inputs
versus 30 percent for traditional vegetable producers.

160
32. Vegetable production is also characterized by intensive use of organic fertilizers. The use
of manure or compost represented on average 9 percent of the total variable costs for vegetables.
The share was highest in Takeo (17 percent) and lowest in Battambang and Bantey Meanchey (3-
4 percent). Modern and small farms were also the most intensive users of organic fertilizers, with
expenditures reaching $150/ha.
33. Intensification does not always mean higher gross margins for vegetable production, as
already reported for the case of dry season rice production. Besides modern inputs, other factors
such as irrigation system, commercialization, type of vegetable crop and varieties, and crop
management may enter into consideration. For cucumber production, small farms allocating
$728/ha for inputs reported a gross margin $650/ha, 3.7 times higher than the gross margin of
small traditional farmers. However, for mustard and eggplant production, modern small farms
received a lower gross margin compared to their traditional peers: $760/ha versus $983/ha for
mustard and $689/ha versus $1,107/ha for eggplant, despite the two- to three-fold greater
expenditure on modern inputs.
34. Access to and use of services remained insignificant for vegetable production. Only large
and medium-size farms required substantial expenditures on services as part of their cost
structures. In most cases, there were no reported expenditures. Either farmers supplied these
services using family assets, which are very plausible because of the relatively small cultivated
areas, or the services were not available to or known by farmers. For the future, the farm budget
for vegetables should include a substantial amount for irrigation, a critical element for reaching
high and sustained productivity. During the interviews and FGDs, very few respondents were
aware of the possibility of using drip irrigation or greenhouses to improve vegetable production
and quality or to lower dependency on uncontrolled factors such as rainfall.

161
Table 70: Wet season rice farm budget by technology and farm size
Level of Technology Use and Farm Size
Modern
Small
Traditional
Small
Modern
Medium
Traditional
Medium
Modern
Large
Traditional
Large
Average cultivated area
(ha)
0.60 0.54 1.33 1.27 3.80 5.00
Yield (tons/ha) 3.38 2.48 3.25 2.81 3.33 2.77
Inputs ($/ha)
Seeds 42.50 19.81 30.42 17.13 49.69 19.84
Manure 22.50 41.59 8.17 23.70 13.08 1.67
Chemical fertilizers 173.27 43.28 81.88 60.82 79.08 36.13
Herbicides - 0.47 6.27 1.31 7.03 12.33
Insecticides 2.68 0.67 4.17 0.43 1.21 0.83
Subtotal inputs 240.95 105.82 130.90 103.38 150.09 70.80
Labor ($/ha)
Land preparation - - - - - -
Plantation, transplantation 156.25 124.72 148.75 90.04 26.75 117.92
Weed control 23.04 30.61 6.92 26.50 14.05 2.50
Crop management 63.57 119.27 29.17 100.85 6.04 114.00
Harvest - 11.36 - 10.26 - -
Post-harvest 5.08 12.86 1.67 14.54 3.77 5.00
Subtotal labor 247.93 298.82 186.50 242.19 50.61 239.42
Services ($/ha)
Land preparation 85.00 98.65 118.33 92.00 144.80 158.33
Plantation, transplantation - - - 4.04 - -
Harvest 25.00 - 100.00 7.50 81.25 -
Post-harvest 37.14 32.53 48.96 31.74 19.85 56.25
Subtotal services 147.14 131.18 267.29 135.27 245.90 214.58
Total variable costs ($/ha) 636.02 535.82 584.69 480.85 446.60 524.80
Total revenue ($/ha) 1,157.86 652.68 1,000.00 717.05 787.80 595.83
Gross margin ($/ha) 521.84 116.86 415.31 236.20 341.20 71.04
Returns to labor ($/day) 8.73 1.62 9.24 4.05 27.98 1.23

162
Table 71: Wet season rice farm budget by farm size
Size
Small Medium Large Total
Average cultivated area (ha) 0.56 1.28 4.25 1.80
Yield (tons/ha) 2.68 2.89 3.12 2.89
Inputs ($/ha)
Seeds 24.85 19.62 38.50 25.62
Manure 37.35 20.79 8.80 22.40
Chemical fertilizers 72.17 64.77 62.98 66.35
Herbicides 0.36 2.24 9.02 3.37
Insecticides 1.12 1.13 1.06 1.11
Subtotal inputs 135.85 108.54 120.36 118.85
Labor ($/ha)
Land preparation - - - -
Plantation, transplantation 131.73 101.05 60.94 99.69
Weed control 28.93 22.83 9.72 21.31
Crop management 106.89 87.41 46.53 82.81
Harvest 8.83 8.33 - 6.45
Post-harvest 11.13 12.12 4.23 9.94
Subtotal labor 287.51 231.75 121.41 220.21
Services ($/ha)
Land preparation 95.62 96.94 149.88 109.41
Plantation, transplantation - 3.28 - 1.59
Harvest 5.56 24.84 50.78 25.87
Post-harvest 33.56 34.97 33.50 34.23
Subtotal services 134.73 160.03 234.16 171.10
Total variable costs ($/ha) 558.09 500.32 475.93 510.16
Total revenue ($/ha) 764.94 770.10 715.82 755.53
Gross margin ($/ha) 206.85 269.79 239.89 245.37
Returns to labor ($/day) 2.99 4.83 8.20 4.62

163
Table 72: Wet season rice farm budget by technology use
Level of Technology Use
Modern Traditional Total
Average cultivated area (ha) 2.42 1.53 1.80
Yield (tons/ha) 3.32 2.70 2.89
Inputs ($/ha)
Seeds 42.47 18.30 25.62
Manure 13.49 26.27 22.40
Chemical fertilizers 98.76 52.26 66.35
Herbicides 5.40 2.49 3.37
Insecticides 2.39 0.56 1.11
Subtotal inputs 162.50 99.87 118.85
Labor ($/ha)
Land preparation - - -
Plantation, transplantation 89.25 104.23 99.69
Weed control 13.71 24.62 21.31
Crop management 24.49 108.17 82.81
Harvest - 9.25 6.45
Post-harvest 3.40 12.78 9.94
Subtotal labor 130.84 259.06 220.21
Services ($/ha)
Land preparation 124.90 102.68 109.41
Plantation, transplantation - 2.28 1.59
Harvest 75.63 4.24 25.87
Post-harvest 32.04 35.18 34.23
Subtotal services 232.57 144.37 171.10
Total variable costs ($/ha) 525.91 503.31 510.16
Total revenue ($/ha) 925.47 681.65 755.53
Gross margin ($/ha) 399.56 178.34 245.37
Returns to labor ($/day) 12.67 2.86 4.62

164
Table 73: Wet season rice farm budget by province
Province
Kampong
Cham
Kandal Takeo Kampot Battambang Bantey
Meanchey
Average cultivated area
(ha)
4.17 2.00 1.12 0.88 5 3
Yield (tons/ha) 3.12 3.23 3.08 2.54 3.30 2.65
Inputs ($/ha)
Seeds 16.25 35.83 28.27 12.53 74.75 30.32
Manure 1.67 7.06 33.62 26.99 23.13 -
Chemical fertilizers 13.47 73.96 91.84 55.21 64.56 60.18
Herbicides 13.58 6.94 1.00 0.16 8.91 6.39
Insecticides 0.77 1.33 2.56 - 0.42 0.46
Subtotal inputs 45.73 125.12 157.29 94.90 171.76 97.35
Labor ($/ha)
Land preparation - - - - - -
Plantation, transplantation 129.17 115.42 118.40 111.27 5.00 6.58
Weed control - 13.53 27.29 31.10 3.13 4.72
Crop management 114.17 30.28 80.47 108.45 4.69 70.67
Harvest - - - 17.68 - 6.13
Post-harvest - - 11.91 11.14 9.42 18.54
Subtotal labor 243.33 159.22 238.07 279.64 22.23 106.64
Services ($/ha)
Land preparation 150.00 174.17 98.98 94.25 127.25 86.00
Plantation, transplantation - - - 4.77 - -
Harvest - 100.00 23.86 8.86 45.50 34.25
Post-harvest 72.50 44.79 45.48 21.67 - 13.02
Subtotal services 222.50 318.96 168.32 129.55 172.75 133.27
Total variable costs ($/ha) 511.57 603.30 563.68 504.09 366.74 337.26
Total revenue ($/ha) 662.50 991.67 895.75 654.66 734.25 482.40
Gross margin ($/ha) 150.93 388.37 332.07 150.57 367.51 145.14
Returns to labor ($/day) 2.57 10.12 5.79 2.23 68.61 5.65

165
Table 74: Dry season rice farm budget by technology and farm size
Level of Technology Use and Farm Size
Modern
Small
Traditional
Small
Modern
Medium
Traditional
Medium
Modern
Large
Traditional
Large
Average cultivated area
(ha)
1.00 0.67 2.67 2.04 9.13 3.50
Yield (tons/ha) 5.00 4.64 4.50 4.46 5.19 5.14
Inputs ($/ha)
Seeds 115.00 107.20 134.29 82.43 119.91 61.71
Manure - 16.67 - - - -
Chemical fertilizers 228.75 117.38 168.13 102.96 203.59 100.71
Herbicides 20.00 4.91 19.00 2.33 21.18 5.71
Insecticides 7.50 11.14 7.44 13.61 10.99 19.64
Subtotal inputs 371.25 257.30 328.85 201.33 355.66 187.79
Labor ($/ha)
Land preparation - 62.50 - 36.50 - 92.50
Plantation, transplantation 12.50 16.55 9.58 14.15 20.97 14.29
Weed control - 29.84 - 19.00 - 30.00
Crop management - 27.07 - 24.20 - 38.57
Irrigation - - - - - -
Harvest - 7.32 - 6.16 - 12.86
Post-harvest - 93.33 - 119.00 - 125.00
Subtotal labor 12.50 236.61 9.58 219.01 20.97 313.21
Services ($/ha)
Land preparation 132.50 29.17 129.17 55.00 114.84 -
Plantation, transplantation - - - - - -
Harvest 100.00 98.33 105.83 96.50 105.16 112.50
Post-harvest 20.00 33.19 19.42 35.29 20.56 -
Subtotal services 252.50 160.69 254.42 186.79 240.56 112.50
Cost of irrigation services 150.00 16.67 150.00 - 136.56 -
Total variable costs ($/ha) 786.25 671.27 742.85 607.14 753.76 613.50
Total revenue ($/ha) 1,062.50 983.19 916.67 956.42 1,036.56 1,028.57
Gross margin ($/ha) 276.25 311.92 173.81 349.28 282.81 415.07
Returns to labor ($/day) 90.61 5.40 74.36 6.54 55.30 5.43

166
Table 75: Dry season rice farm budget by farm size
Size
Small Medium Large Total
Average cultivated area (ha) 0.71 2.28 8.50 4.15
Yield (tons/ha) 4.70 4.48 5.18 4.80
Inputs ($/ha)
Seeds 108.31 101.88 113.44 108.09
Manure 14.29 - - 4.17
Chemical fertilizers 133.29 127.40 192.16 153.40
Herbicides 7.07 8.58 19.46 12.22
Insecticides 10.62 11.29 11.95 11.34
Subtotal inputs 273.58 249.15 337.01 289.22
Labor ($/ha)
Land preparation 53.57 22.81 10.28 27.08
Plantation, transplantation 15.97 12.44 20.22 16.39
Weed control 25.58 11.88 3.33 12.67
Crop management 23.21 15.13 4.29 13.42
Irrigation - - - -
Harvest 6.27 3.85 1.43 3.65
Post-harvest 80.00 74.38 13.89 53.33
Subtotal labor 204.60 140.48 53.44 126.54
Services ($/ha)
Land preparation 43.93 82.81 102.08 78.70
Plantation, transplantation - - - -
Harvest 98.57 100.00 105.97 101.82
Post-harvest 31.31 29.34 18.28 25.77
Subtotal services 173.81 212.15 226.33 206.29
Cost of irrigation services 35.71 56.25 121.39 74.69
Total variable costs ($/ha) 687.70 658.03 738.17 696.74
Total revenue ($/ha) 994.52 941.51 1,035.68 992.28
Gross margin ($/ha) 306.83 283.48 297.50 295.55
Returns to labor ($/day) 6.15 8.27 22.83 9.58

167
Table 76: Dry season rice farm budget by technology use
Level of Technology Use
Modern Traditional Total
Average cultivated area (ha) 6.83 1.48 4.15
Yield (tons/ha) 5.00 4.61 4.80
Inputs ($/ha)
Seeds 123.09 93.09 108.09
Manure - 8.33 4.17
Chemical fertilizers 196.82 109.98 153.40
Herbicides 20.54 3.90 12.22
Insecticides 9.81 12.88 11.34
Subtotal inputs 350.26 228.19 289.22
Labor ($/ha)
Land preparation - 54.17 27.08
Plantation, transplantation 17.41 15.36 16.39
Weed control - 25.34 12.67
Crop management - 26.83 13.42
Irrigation - - -
Harvest - 7.30 3.65
Post-harvest - 106.67 53.33
Subtotal labor 17.41 235.66 126.54
Services ($/ha)
Land preparation 119.90 37.50 78.70
Plantation, transplantation - - -
Harvest 104.90 98.75 101.82
Post-harvest 20.23 31.30 25.77
Subtotal services 245.02 167.55 206.29
Cost of irrigation services 141.04 8.33 74.69
Total variable costs ($/ha) 753.74 639.73 696.74
Total revenue ($/ha) 1,008.75 975.82 992.28
Gross margin ($/ha) 255.01 336.08 295.55
Returns to labor ($/day) 60.04 5.85 9.58

168
Table 77: Dry season rice farm budget by province
Province
Bantey Meanchey Battambang Kandal Takeo Total
Average cultivated area (ha) 7.83 5.83 1.25 1.70 4.154
Yield (tons/ha) 4.92 5.08 4.31 4.91 4.81
Inputs ($/ha)
Seeds 144.02 102.17 111.47 74.71 108.09
Manure - - 16.67 - 4.17
Chemical fertilizers 207.68 185.96 96.53 123.43 153.40
Herbicides 16.71 24.37 - 7.81 12.22
Insecticides 8.98 10.64 10.23 15.53 11.34
Subtotal inputs 377.39 323.13 234.90 221.47 289.22
Labor ($/ha)
Land preparation - - 14.58 93.75 27.08
Plantation, transplantation 9.54 25.29 18.46 12.26 16.39
Weed control - - 17.22 33.45 12.67
Crop management - - 15.93 37.74 13.42
Irrigation - - - - -
Harvest - - - 14.59 3.65
Post-harvest - - 97.92 115.42 53.33
Subtotal labor 9.54 25.29 164.11 307.21 126.54
Services ($/ha)
Land preparation 130.83 108.96 75.00 - 78.70
Plantation, transplantation - - - - -
Harvest 106.04 103.75 110.42 87.08 101.82
Post-harvest 20.48 19.98 42.19 20.42 25.77
Subtotal services 257.35 232.69 227.60 107.50 206.29
Cost of irrigation services 150.00 132.08 16.67 - 74.69
Total variable costs ($/ha) 794.28 713.19 643.28 636.18 696.74
Total revenue ($/ha) 970.21 1,047.29 931.60 1,020.04 992.28
Gross margin ($/ha) 175.93 334.10 288.31 383.86 295.55
Returns to labor ($/day) 75.65 54.15 7.20 5.12 9.58

169
Table 78: Cassava farm budget by technology and farm size
Level of Technology Use and Farm Size
Modern
Small
Traditional
Small
Modern
Medium
Traditional
Medium
Modern
Large
Traditional
Large
Average cultivated area
(ha)
3.25 2.50 6.25 6.70 19.50 15.38
Yield (tons/ha) 21.11 19.32 27.85 14.16 19.32 16.27
Inputs ($/ha)
Seeds 200.63 244.51 317.50 153.17 250.31 235.00
Manure - - - - - -
Chemical fertilizers 18.75 10.49 - - 16.34 -
Herbicides 75.35 20.27 60.10 17.94 62.61 21.56
Insecticides - 5.93 - 3.53 - 2.81
Subtotal inputs 294.72 281.20 377.60 174.63 329.26 259.37
Labor ($/ha)
Land preparation - - - - - -
Plantation, transplantation 12.50 42.99 43.75 35.08 45.49 36.47
Weed control 45.00 37.96 11.79 38.28 45.57 30.39
Crop management 69.44 62.93 5.96 62.68 91.53 83.72
Harvest - 19.44 146.63 4.25 - -
Post-harvest 106.50 42.47 172.88 80.36 25.00 42.19
Subtotal labor 233.44 205.79 381.03 220.66 207.59 192.77
Services ($/ha)
Land preparation 87.50 110.53 118.75 166.16 75.94 136.63
Plantation, transplantation 21.25 10.00 - 10.00 10.63 9.38
Harvest 31.25 51.50 - 41.52 22.34 12.81
Post-harvest 77.78 181.14 - 52.45 229.08 122.25
Subtotal services 217.78 353.17 118.75 270.13 337.99 281.06
Total variable costs ($/ha) 745.94 840.17 877.37 665.42 874.83 733.20
Total revenue ($/ha) 1,519.44 1,333.33 1,665.06 963.15 1,483.81 1,148.67
Gross margin ($/ha) 773.50 493.17 787.69 297.73 608.97 415.48
Returns to labor ($/day) 13.75 9.95 8.58 5.60 12.17 8.94

170
Table 79: Cassava farm budget by farm size
Size
Small Medium Large Total
Average cultivated area (ha) 2.64 6.57 17.44 8.25
Yield (tons/ha) 19.65 18.07 17.79 18.65
Inputs ($/ha)
Seeds 236.53 200.12 242.66 228.61
Manure - - - -
Chemical fertilizers 11.99 - 8.17 7.59
Herbicides 30.29 29.99 42.09 33.84
Insecticides 4.85 2.52 1.41 3.16
Subtotal inputs 283.66 232.62 294.32 273.20
Labor ($/ha)
Land preparation - - - -
Plantation, transplantation 37.45 37.56 40.98 38.56
Weed control 39.24 30.72 37.98 36.56
Crop management 64.11 46.48 87.63 66.60
Harvest 15.91 44.93 - 18.83
Post-harvest 54.11 106.80 33.59 61.98
Subtotal labor 210.82 266.48 200.18 222.53
Services ($/ha)
Land preparation 106.35 152.61 106.28 118.78
Plantation, transplantation 12.05 7.14 10.00 10.10
Harvest 47.82 29.66 17.58 33.62
Post-harvest 162.35 37.46 175.66 132.82
Subtotal services 328.56 226.88 309.52 295.32
Total variable costs ($/ha) 823.03 725.98 804.01 791.05
Total revenue ($/ha) 1,367.17 1,163.69 1,316.24 1,296.72
Gross margin ($/ha) 544.14 437.72 512.23 505.67
Returns to labor ($/day) 10.71 6.82 10.62 9.43

171
Table 80: Cassava farm budget by technology use
Level of Technology Use
Modern Traditional Total
Average cultivated area (ha) 12.13 6.53 8.25
Yield (tons/ha) 21.90 17.21 18.65
Inputs ($/ha)
Seeds 254.69 217.03 228.61
Manure - - -
Chemical fertilizers 12.86 5.24 7.59
Herbicides 65.17 19.91 33.84
Insecticides - 4.57 3.16
Subtotal inputs 332.71 246.75 273.20
Labor ($/ha)
Land preparation - - -
Plantation, transplantation 36.81 39.34 38.56
Weed control 36.98 36.37 36.56
Crop management 64.62 67.48 66.60
Harvest 36.66 10.90 18.83
Post-harvest 82.35 52.93 61.98
Subtotal labor 257.41 207.03 222.53
Services ($/ha)
Land preparation 89.53 131.78 118.78
Plantation, transplantation 10.63 9.86 10.10
Harvest 18.98 40.13 33.62
Post-harvest 133.98 132.30 132.82
Subtotal services 253.12 314.08 295.32
Total variable costs ($/ha) 843.25 767.85 791.05
Total revenue ($/ha) 1,538.03 1,189.47 1,296.72
Gross margin ($/ha) 694.79 421.61 505.67
Returns to labor ($/day) 11.20 8.45 9.43

172
Table 81: Cassava farm budget by province
Province
Bantey Meanchey Battambang Kampong Cham Total
Average cultivated area (ha) 10.67 8.42 6.19 8.25
Yield (tons/ha) 20.30 20.44 17.75 18.65
Inputs ($/ha)
Seeds 225.45 228.85 230.63 228.61
Manure - - - -
Chemical fertilizers - 14.11 3.48 7.59
Herbicides 23.57 33.30 42.34 33.84
Insecticides 2.44 5.10 0.79 3.16
Subtotal inputs 251.46 281.37 277.24 273.20
Labor ($/ha)
Land preparation - - - -
Plantation, transplantation 43.13 27.30 52.02 38.56
Weed control 19.72 17.22 78.18 36.56
Crop management 56.67 48.02 101.92 66.60
Harvest 3.54 39.02 - 18.83
Post-harvest 64.15 102.22 - 61.98
Subtotal labor 187.21 233.79 232.13 222.53
Services ($/ha)
Land preparation 144.48 143.98 61.72 118.78
Plantation, transplantation - 17.71 6.25 10.10
Harvest 44.45 40.73 14.84 33.62
Post-harvest 163.33 60.04 219.11 132.82
Subtotal services 352.26 262.46 301.92 295.32
Total variable costs ($/ha) 790.93 777.63 811.28 791.05
Total revenue ($/ha) 1,219.56 1,352.28 1,271.24 1,296.72
Gross margin ($/ha) 428.64 574.65 459.96 505.67
Returns to labor ($/day) 9.50 10.20 8.22 9.43

173
Table 82: Maize farm budget by technology and farm size
Level of Technology Use and Farm Size
Modern
Small
Traditional
Small
Modern
Medium
Traditional
Medium
Modern
Large
Traditional
Large
Average cultivated area
(ha)
0.67 1.00 2.10 2.54 9.75 11.40
Yield (tons/ha) 3.98 2.91 4.15 3.38 5.70 3.77
Inputs ($/ha)
Seeds 79.17 50.58 88.28 68.20 87.75 76.41
Manure 12.17 - 12.25 0.03 9.66 -
Chemical fertilizers 93.40 10.00 16.76 - 32.94 -
Herbicides 29.88 10.78 16.78 16.37 26.41 14.93
Insecticides 5.12 - 8.06 0.38 8.44 2.16
Subtotal inputs 219.75 71.36 142.13 84.98 165.19 93.49
Labor ($/ha)
Land preparation - - - - - -
Plantation, transplantation 40.43 34.12 29.90 26.73 13.35 19.98
Weed control 26.35 22.09 16.75 12.92 11.56 15.71
Crop management 71.40 66.24 56.77 65.08 28.21 69.01
Harvest 41.91 6.25 68.82 19.21 3.75 29.81
Post-harvest 4.86 - 0.83 - - -
Subtotal labor 184.96 128.70 173.07 123.93 56.88 134.51
Services ($/ha)
Land preparation 150.90 65.83 112.08 132.05 60.03 94.56
Plantation, transplantation 4.00 - 8.94 6.43 12.82 14.66
Harvest 4.00 - - 9.46 37.50 -
Post-harvest 52.69 24.23 13.03 35.42 38.61 26.51
Subtotal services 211.59 90.06 134.06 183.36 148.96 135.73
Total variable costs ($/ha) 616.30 290.11 449.26 392.27 371.03 363.73
Total revenue ($/ha) 897.77 408.74 953.31 584.07 893.13 616.83
Gross margin ($/ha) 281.47 118.62 504.06 191.80 522.10 253.10
Returns to labor ($/day) 6.32 3.83 12.09 6.42 38.10 7.81

174
Table 83: Maize farm budget by farm size
Size
Small Medium Large Total
Average cultivated area (ha) 0.75 2.34 10.93 4.83
Yield (tons/ha) 3.73 3.73 4.32 3.94
Inputs ($/ha)
Seeds 72.57 77.47 79.65 76.64
Manure 9.36 5.67 2.76 5.85
Chemical fertilizers 74.16 7.74 9.41 29.91
Herbicides 25.48 16.56 18.21 20.03
Insecticides 3.94 3.93 3.95 3.94
Subtotal inputs 185.50 111.36 113.98 136.37
Labor ($/ha)
Land preparation - - - -
Plantation, transplantation 38.97 28.19 18.09 28.16
Weed control 25.37 14.68 14.52 18.10
Crop management 70.21 61.25 57.36 62.80
Harvest 33.68 42.11 22.36 32.46
Post-harvest 3.74 0.38 - 1.34
Subtotal labor 171.98 146.61 112.33 142.85
Services ($/ha)
Land preparation 131.27 122.83 84.70 112.23
Plantation, transplantation 3.08 7.59 14.13 8.41
Harvest 3.08 5.10 10.71 6.41
Post-harvest 46.12 25.09 29.97 33.63
Subtotal services 183.54 160.60 139.51 160.68
Total variable costs ($/ha) 541.03 418.57 365.82 439.90
Total revenue ($/ha) 784.91 754.49 695.77 743.83
Gross margin ($/ha) 243.89 335.92 329.95 303.92
Returns to labor ($/day) 5.89 9.51 12.19 8.83

175
Table 84: Maize farm budget by technology use
Level of Technology Use
Modern Traditional Total
Average cultivated area (ha) 2.91 6.74 4.83
Yield (tons/ha) 4.38 3.50 3.94
Inputs ($/ha)
Seeds 83.62 69.66 76.64
Manure 11.69 0.01 5.85
Chemical fertilizers 58.32 1.50 29.91
Herbicides 25.26 14.81 20.03
Insecticides 6.67 1.21 3.94
Subtotal inputs 185.55 87.19 136.37
Labor ($/ha)
Land preparation - - -
Plantation, transplantation 31.85 24.46 28.16
Weed control 20.51 15.69 18.10
Crop management 58.37 67.22 62.80
Harvest 42.35 22.56 32.46
Post-harvest 2.68 - 1.34
Subtotal labor 155.78 129.93 142.85
Services ($/ha)
Land preparation 121.08 103.37 112.23
Plantation, transplantation 7.25 9.58 8.41
Harvest 9.50 3.31 6.41
Post-harvest 37.98 29.28 33.63
Subtotal services 175.80 145.55 160.68
Total variable costs ($/ha) 517.13 362.68 439.90
Total revenue ($/ha) 913.50 574.15 743.83
Gross margin ($/ha) 396.37 211.47 303.92
Returns to labor ($/day) 10.56 6.75 8.83

176
Table 85: Maize farm budget by province
Province
Bantey
Meanchey
Battambang Kampong
Cham
Kandal Total
Average cultivated area
(ha)
11.08 2.10 3.25 1.12 4.83
Yield (tons/ha) 5.31 2.72 2.56 4.35 3.94
Inputs ($/ha)
Seeds 91.05 67.08 57.03 84.18 76.64
Manure 1.14 5.00 - 16.29 5.85
Chemical fertilizers 5.48 46.53 - 74.83 29.91
Herbicides 15.44 19.53 18.25 26.48 20.03
Insecticides 7.18 2.94 0.99 3.81 3.94
Subtotal inputs 120.29 141.07 76.28 205.58 136.37
Labor ($/ha)
Land preparation - - - - 0
Plantation, transplantation 3.51 36.85 37.73 40.41 28.16
Weed control 7.50 14.50 21.47 27.11 18.10
Crop management 63.97 45.88 61.04 70.29 62.80
Harvest 41.83 25.75 5.86 50.26 32.46
Post-harvest - 1.00 - 4.05 1.34
Subtotal labor 116.82 123.98 126.10 192.12 142.85
Services ($/ha)
Land preparation 88.72 75.50 83.59 177.29 112.23
Plantation, transplantation 24.71 - - 3.33 8.41
Harvest 12.50 - 6.02 3.33 6.41
Post-harvest 30.48 - 31.92 52.37 33.63
Subtotal services 156.40 75.50 121.53 236.33 160.68
Total variable costs ($/ha) 393.51 340.54 323.91 634.03 439.90
Total revenue ($/ha) 838.98 401.50 370.36 1,133.65 743.83
Gross margin ($/ha) 445.47 60.96 46.46 499.62 303.92
Returns to labor ($/day) 15.83 2.04 1.53 10.79 8.83

177
Table 86: Vegetable (mix) farm budget by technology and farm size
Level of Technology Use and Farm Size
Modern
Small
Traditional
Small
Modern
Medium
Traditional
Medium
Modern
Large
Traditional
Large
Average cultivated area
(ha)
0.12 0.30 0.84 3.00 2.17
Yield (tons/ha) 12.32 6.00 6.00 1.67 8.33
Inputs ($/ha)
Seeds 238.31 36.15 28.07 243.00 127.97
Manure 260.99 57.28 10.12 20.83 24.57
Chemical fertilizers 315.42 86.92 52.21 108.75 69.58
Herbicides 31.57 1.64 3.65 - 5.56
Insecticides 142.97 27.03 18.01 78.75 16.39
Subtotal inputs 989.26 209.02 112.07 451.33 244.06
Labor ($/ha)
Land preparation 229.04 100.28 45.93 207.50 164.58
Plantation, transplantation 151.47 67.70 40.78 50.00 44.44
Weed control 151.29 49.47 55.11 50.00 21.11
Crop management 541.73 219.71 68.65 33.33 46.53
Harvest 158.57 31.32 30.42 - 55.56
Post-harvest - - - - -
Subtotal labor 1,232.11 468.49 240.89 340.83 332.22
Services ($/ha)
Land preparation 38.45 41.07 29.42 - 175.56
Plantation, transplantation - 0.76 5.33 - -
Harvest - 4.55 17.06 - 6.67
Post-harvest 32.00 1.50 10.98 - -
Subtotal services 70.45 47.88 62.79 - 182.22
Total variable costs ($/ha) 2,291.82 725.39 415.74 792.17 758.51
Total revenue ($/ha) 4,530.73 1,336.84 1,163.16 500.00 1,263.89
Gross margin ($/ha) 2,238.92 611.45 747.41 (292.17) 505.38
Returns to labor ($/day) 7.54 5.42 12.88 (3.56) 6.31

178
Table 87: Vegetable (mix) farm budget by farm size
Size
Small Medium Large Total
Average cultivated area (ha) 0.19 0.84 2.38 0.41
Yield (tons/ha) 9.74 6.00 6.67 9.10
Inputs ($/ha)
Seeds 155.80 28.07 156.73 140.96
Manure 177.85 10.12 23.63 148.00
Chemical fertilizers 222.15 52.21 79.38 192.81
Herbicides 19.36 3.65 4.17 16.51
Insecticides 95.65 18.01 31.98 82.34
Subtotal inputs 670.80 112.07 295.88 580.62
Labor ($/ha)
Land preparation 176.49 45.93 175.31 161.18
Plantation, transplantation 117.28 40.78 45.83 103.59
Weed control 109.73 55.11 28.33 97.93
Crop management 410.29 68.65 43.23 345.96
Harvest 106.63 30.42 41.67 93.41
Post-harvest - - - -
Subtotal labor 920.43 240.89 334.38 802.08
Services ($/ha)
Land preparation 39.52 29.42 131.67 44.48
Plantation, transplantation 0.31 5.33 - 0.87
Harvest 1.86 17.06 5.00 3.84
Post-harvest 19.55 10.98 - 17.25
Subtotal services 61.24 62.79 136.67 66.45
Total variable costs ($/ha) 1,652.46 415.74 766.92 1,449.14
Total revenue ($/ha) 3,227.10 1,163.16 1,072.92 2,842.70
Gross margin ($/ha) 1,574.64 747.41 305.99 1,393.56
Returns to labor ($/day) 7.10 12.88 3.80 7.21

179
Table 88: Vegetable (mix) farm budget by technology use
Level of Technology Use
Modern Traditional Total
Average cultivated area (ha) 0.21 0.61 0.41
Yield (tons/ha) 11.96 6.24 9.10
Inputs ($/ha)
Seeds 238.47 43.45 140.96
Manure 252.99 43.01 148.00
Chemical fertilizers 308.53 77.09 192.81
Herbicides 30.52 2.50 16.51
Insecticides 140.83 23.86 82.34
Subtotal inputs 971.33 189.90 580.62
Labor ($/ha)
Land preparation 228.33 94.03 161.18
Plantation, transplantation 148.09 59.09 103.59
Weed control 147.91 47.95 97.93
Crop management 524.78 167.14 345.96
Harvest 153.29 33.54 93.41
Post-harvest - - -
Subtotal labor 1,202.40 401.76 802.08
Services ($/ha)
Land preparation 37.17 51.80 44.48
Plantation, transplantation - 1.75 0.87
Harvest - 7.68 3.84
Post-harvest 30.93 3.56 17.25
Subtotal services 68.10 64.79 66.45
Total variable costs ($/ha) 2,241.83 656.45 1,449.14
Total revenue ($/ha) 4,396.37 1,289.02 2,842.70
Gross margin ($/ha) 2,154.55 632.57 1,393.56
Returns to labor ($/day) 7.44 6.53 7.21

180
Table 89: Vegetable (mix) farm budget by province
Province
Kampong
Cham
Kandal Takeo Kampot Battambang Bantey
Meanchey
Average cultivated area (ha) 0.33 0.18 0.20 0.22 1.833 0.511
Yield (tons/ha) 6.77 9.78 10.67 10.15 6.11 5.89
Inputs ($/ha)
Seeds 125.50 460.13 153.24 72.87 114.94 30.68
Manure 49.90 234.18 262.81 123.95 20.34 15.25
Chemical fertilizers 176.66 320.41 211.27 217.95 67.42 75.92
Herbicides 70.41 32.06 5.90 13.10 2.78 2.87
Insecticides 25.85 87.70 165.05 43.34 29.65 55.05
Subtotal inputs 448.32 1,134.47 798.28 471.22 235.13 179.76
Labor ($/ha)
Land preparation 63.65 229.17 179.07 210.66 129.38 20.40
Plantation, transplantation 161.98 283.40 91.07 85.07 43.06 19.07
Weed control 51.55 227.06 104.23 109.35 18.89 41.09
Crop management 219.80 637.71 313.30 485.26 66.32 140.09
Harvest 40.19 105.56 32.83 200.83 40.28 47.10
Post-harvest - - - - - -
Subtotal labor 537.17 1,482.89 720.51 1,091.18 297.92 267.75
Services ($/ha)
Land preparation 57.29 78.33 17.78 24.31 96.22 86.76
Plantation, transplantation - - - - - 8.74
Harvest - - - - 3.33 35.05
Post-harvest 7.81 125.69 11.32 1.67 - -
Subtotal services 65.10 204.03 29.10 25.97 99.55 130.55
Total variable costs ($/ha) 1,050.59 2,821.39 1,547.88 1,588.37 632.59 578.06
Total revenue ($/ha) 1,878.19 7,080.85 3,579.70 2,169.37 1,090.28 1,130.44
Gross margin ($/ha) 827.60 4,259.46 2,031.81 581.00 457.68 552.37
Returns to labor ($/day) 6.39 11.92 11.70 2.21 6.38 8.56
Detailed farm budgets by crop

181
Table 90: Changes in prices of commodities, Thailand and Cambodia
Thailand
(Farm gate price $/ton)
2005
($/ton)
2011
($/ton)
% Change from
2005 to 2011
Cassava 33.00 87.90 166
Rice 172.20 419.80 144
Maize 118.90 250.20 110
Eggplant 211.00 413.20 96
Cucumber 160.40 367.00 129
Watermelon 138.40 243.60 76
Cambodia
(Farm gate price $/ton)
2005
($/ton)
2013
($/ton)
% Change from
2005 to 2013
Cassava 19.79 59.38 200
Paddy (wet season) 124.79 237.50 90
Paddy (dry season) 118.50 209.98 77
Maize 140.43 230.39 64
Mustard N/A 297.50
Eggplant 125.00 200.00 60
Cucumber 86.16 187.50 118
Watermelon 83.44 277.50 233
Source: Thailand prices from FAOSTAT; Cambodia prices from 2005 and 2013 surveys.

182
Table 91: Change in the prices of inputs, services, and labor, Cambodia
Operations and Inputs 2005 2013
% Change from
2005 to 2013
Services
Land preparation (tractor $/ha) 38.21 61.48 61
Land preparation (animal $/ha) 26.96 76.58 184
Combine harvester ($/ha) 95.67
Fertilizers
Urea ($/kg) 0.30 0.56 86
DAP ($/kg) 0.35 0.68 96
Seeds
Paddy (wet season $/kg) 0.17 0.66 293
Paddy (dry season $/kg) 0.18 0.74 323
Cassava ($/kg) 0.02 0.10 542
Maize ($/kg) 0.61 4.06 563
Eggplant ($/kg) 4.75 11.60 144
Cucumber ($/kg) 8.52 18.00 111
Watermelon ($/kg) 10.63 53.91 407
Labor
Dry season ($/day) 1.20 4.50 275
Wet season ($/day) 1.25 4.56 265
Unskilled labor (garment $/month) 50.00 159.00 218
Source: 2005 and 2013 surveys.
Table 92: Average use of inputs, Cambodia, 2013
Seeds
(kg/ha)
Urea
(kg/ha)
DAP
(kg/ha)
Herbicides
($/ha)
Insecticides
($/ha)
Cassava 9.5 0.8 33.8 3.16
Maize 22.58 27.91 16.36 20.03 3.94
Wet season rice 60.07 49.49 58.34 3.37 1.11
Dry season rice 111.28 139.12 12.22 11.34
Vegetables 158.2 137.25 20.65 49.28
Source: 2013 survey.

183
Table 93: Farm budget indicators by crop, farm size, and technology use, Cambodia, 2013
Farm Size
Level of
Technology Use
Labor Use ($/ha) Small Medium Large Modern Traditional Overall
Cassava 211 284 200 257 214 227
Maize 212 183 131 200 147 174
Wet season rice 288 232 121 131 259 220
Dry season rice 125 66 40 17 129 73
Vegetables 921 241 334 1,190 415 802
Services ($/ha)
Cassava 329 209 310 253 307 290
Maize 144 125 121 129 130 130
Wet season rice 135 160 234 233 144 171
Dry season rice 174 212 226 245 168 206
Vegetables 61 63 137 77 56 66
Returns to Labor ($/day)
Cassava 10.71 6.82 10.62 11.20 8.45 9.43
Maize 5.89 9.51 12.19 10.56 6.75 8.83
Wet season rice 2.99 4.83 8.20 12.67 2.86 4.62
Dry season rice 6.15 8.27 22.83 60.04 5.85 9.58
Vegetables 7.10 12.88 3.80 7.44 6.53 7.21
Source: 2013 survey.

184
ANNEX 4: PROJECTION OF SELECTED ECONOMIC INDICATORS, CAMBODIA
Indicator Unit Future
Growth
Rate
2012
(Baseline)
2015
(Short
term)
2020
(Medium
term)
2030
(Long
term)
Comments
1 GDP $ billion 7.2% 14.17 17.46 24.71 49.53 Baseline data is from the World Bank 2014c. The assumption
of future growth is from the Cambodia Vision 2030.
2 Ag GDP $ billion 5.0% 4.75 5.50 7.00 11.40 Baseline data is from the World Bank 2014c. Future growth is
assumed to be slightly below the past rate (2004-2012).
3 Share of
agriculture in
GDP
% -2.1% 34 31 28 23
Indicator #2 divided by Indicator #1
4 Agribusiness
GDP
$ billion 9.7% 1.30 1.72 2.73 6.89 Baseline data is from the World Bank 2014c. The assumption
of future growth is based on the target to double the ratio of
agribusiness GDP to agricultural GDP.
5 Population Million 1.1% 14.4 14.9 15.7 17.5 Baseline data is from the NIS Social Economic Surveys. The
assumption of future growth is from the Cambodia Vision
2030.
6 GDP per capita $ 6.1% 986 1,180 1,600 2,900 Indicator #1 divided by Indicator #5
7 Urban
population
Million 5.1% 3.1 3.6 4.7 7.7 Baseline data is from the NIS Social Economic Surveys. The
assumption of future growth is from the UN population
projections.
8 Rural population Million -0.8% 11.2 11.2 11.0 9.8 Baseline data is from the NIS Social Economic Surveys. The
assumption of future growth is from the UN population
projections.
9 Urbanization % 4.0% 28 31 38 56 The assumption of future growth is from the Cambodia
Vision 2030.
10 Total labor force Million 1.26% 7.7 8.0 8.5 9.7 Baseline data is from the NIS Social Economic Surveys. The
assumption of future growth is from the UN population
projections.
11 Agricultural
labor force
Million -1.4% 3.9 3.8 3.5 3.0 Baseline data is from the NIS Social Economic Surveys. The
assumption of future growth is from the UN population
projections.

185
12 Labor share in
agriculture
% -2.7% 51 47 41 31 Indicator #11 divided by Indicator #10
13 GDP/labor $/capita 5.9% 1,840 2,190 2,920 5,200 Indicator #1 divided by Indicator #10
14 Ag GDP/Ag
labor
$/capita 6.4% 1,210 1,460 2,000 3,700 Indicator #2 divided by Indicator #11
15 Non-Ag
GDP/Non-Ag
labor
$/capita 4.2% 2,500 2,800 3,500 5,780 (Indicator #1-Indicator #2)/ (Indicator #10-Indicator #11)
divided by Indicator #2/Indicator #11.

186
ANNEX 5: RESULTS OF POLICY SIMULATIONS
Table 94: Results of simulations on land use (baseline)
Baseline 2013 2014 2015 2016 2017 2018 2019 2020 2021 2022 2023 2024 2025 2026 2027 2028 2029 2030
Cultivated Areas (Ha) 0 1 2 3 4 5 6 7 8 9 10 11 12 13 14 15 16 17
Cassava 337,800 337,800 337,800 337,800 337,800 337,800 337,800 337,800 337,800 337,800 337,800 337,800 337,800 337,800 337,800 337,800 337,800 337,800
Maize 215,442 215,442 215,442 215,442 215,442 215,442 215,442 215,442 215,442 215,442 215,442 215,442 215,442 215,442 215,442 215,442 215,442 215,442
Wet Season Rice 2,484,832 2,484,832 2,484,832 2,484,832 2,484,832 2,484,832 2,484,832 2,484,832 2,484,832 2,484,832 2,484,832 2,484,832 2,484,832 2,484,832 2,484,832 2,484,832 2,484,832 2,484,832
Dry Season Rice 495,465 495,465 495,465 495,465 495,465 495,465 495,465 495,465 495,465 495,465 495,465 495,465 495,465 495,465 495,465 495,465 495,465 495,465
Vegetables 54,155 54,155 54,155 54,155 54,155 54,155 54,155 54,155 54,155 54,155 54,155 54,155 54,155 54,155 54,155 54,155 54,155 54,155
Total 5 products 3,587,694 3,587,694 3,587,694 3,587,694 3,587,694 3,587,694 3,587,694 3,587,694 3,587,694 3,587,694 3,587,694 3,587,694 3,587,694 3,587,694 3,587,694 3,587,694 3,587,694 3,587,694
- 0.0% 0.0% 0.0% 0.0% 0.0% 0.0% 0.0% 0.0% 0.0% 0.0% 0.0% 0.0% 0.0% 0.0% 0.0% 0.0% 0.0%
Total Rice 2,980,297 2,980,297 2,980,297 2,980,297 2,980,297 2,980,297 2,980,297 2,980,297 2,980,297 2,980,297 2,980,297 2,980,297 2,980,297 2,980,297 2,980,297 2,980,297 2,980,297 2,980,297
0.0% 0.0% 0.0% 0.0% 0.0% 0.0% 0.0% 0.0% 0.0% 0.0% 0.0% 0.0% 0.0% 0.0% 0.0% 0.0% 0.0%
PRODUCTION (tons) 0 1 2 3 4 5 6 7 8 9 10 11 12 13 14 15 16 17
Cassava 6,299,970 6,299,970 6,299,970 6,299,970 6,299,970 6,299,970 6,299,970 6,299,970 6,299,970 6,299,970 6,299,970 6,299,970 6,299,970 6,299,970 6,299,970 6,299,970 6,299,970 6,299,970
Maize 848,841 848,841 848,841 848,841 848,841 848,841 848,841 848,841 848,841 848,841 848,841 848,841 848,841 848,841 848,841 848,841 848,841 848,841
Wet Season Rice 7,181,164 7,181,164 7,181,164 7,181,164 7,181,164 7,181,164 7,181,164 7,181,164 7,181,164 7,181,164 7,181,164 7,181,164 7,181,164 7,181,164 7,181,164 7,181,164 7,181,164 7,181,164
Dry Season Rice 2,378,232 2,378,232 2,378,232 2,378,232 2,378,232 2,378,232 2,378,232 2,378,232 2,378,232 2,378,232 2,378,232 2,378,232 2,378,232 2,378,232 2,378,232 2,378,232 2,378,232 2,378,232
Vegetables 492,811 492,811 492,811 492,811 492,811 492,811 492,811 492,811 492,811 492,811 492,811 492,811 492,811 492,811 492,811 492,811 492,811 492,811
Total Rice 9,559,396 9,559,396 9,559,396 9,559,396 9,559,396 9,559,396 9,559,396 9,559,396 9,559,396 9,559,396 9,559,396 9,559,396 9,559,396 9,559,396 9,559,396 9,559,396 9,559,396 9,559,396
- 0.0% 0.0% 0.0% 0.0% 0.0% 0.0% 0.0% 0.0% 0.0% 0.0% 0.0% 0.0% 0.0% 0.0% 0.0% 0.0% 0.0%
GROSS MARGINS (Million $) 0 1 2 3 4 5 6 7 8 9 10 11 12 13 14 15 16 17
Cassava 170.82 170.82 170.82 170.82 170.82 170.82 170.82 170.82 170.82 170.82 170.82 170.82 170.82 170.82 170.82 170.82 170.82 170.82
Maize 65.48 65.48 65.48 65.48 65.48 65.48 65.48 65.48 65.48 65.48 65.48 65.48 65.48 65.48 65.48 65.48 65.48 65.48
Wet Season Rice 609.70 609.70 609.70 609.70 609.70 609.70 609.70 609.70 609.70 609.70 609.70 609.70 609.70 609.70 609.70 609.70 609.70 609.70
Dry Season Rice 146.43 146.43 146.43 146.43 146.43 146.43 146.43 146.43 146.43 146.43 146.43 146.43 146.43 146.43 146.43 146.43 146.43 146.43
Vegetables 75.47 75.47 75.47 75.47 75.47 75.47 75.47 75.47 75.47 75.47 75.47 75.47 75.47 75.47 75.47 75.47 75.47 75.47
Total 5 products 1,067.90 1,067.90 1,067.90 1,067.90 1,067.90 1,067.90 1,067.90 1,067.90 1,067.90 1,067.90 1,067.90 1,067.90 1,067.90 1,067.90 1,067.90 1,067.90 1,067.90 1,067.90
- 0.0% 0.0% 0.0% 0.0% 0.0% 0.0% 0.0% 0.0% 0.0% 0.0% 0.0% 0.0% 0.0% 0.0% 0.0% 0.0% 0.0%
Total Rice 756.13 756.13 756.13 756.13 756.13 756.13 756.13 756.13 756.13 756.13 756.13 756.13 756.13 756.13 756.13 756.13 756.13 756.13
Share of Rice 0.71 0.71 0.71 0.71 0.71 0.71 0.71 0.71 0.71 0.71 0.71 0.71 0.71 0.71 0.71 0.71 0.71 0.71

187
Table 95: Results of simulations on land use (scenario L1)
Scenario L1 2013 2014 2015 2016 2017 2018 2019 2020 2021 2022 2023 2024 2025 2026 2027 2028 2029 2030
Cultivated Areas (Ha) 0 1 2 3 4 5 6 7 8 9 10 11 12 13 14 15 16 17
Cassava 337,800 337,800 337,800 337,800 337,800 337,800 337,800 337,800 337,800 337,800 337,800 337,800 337,800 337,800 337,800 337,800 337,800 337,800
Maize 215,442 215,442 215,442 215,442 215,442 215,442 215,442 215,442 215,442 215,442 215,442 215,442 215,442 215,442 215,442 215,442 215,442 215,442
Wet Season Rice 2,484,832 2,500,983 2,517,240 2,533,602 2,550,070 2,566,646 2,583,329 2,600,121 2,617,021 2,634,032 2,651,153 2,668,386 2,685,730 2,703,187 2,720,758 2,738,443 2,756,243 2,774,159
Dry Season Rice 495,465 503,888 512,454 521,166 530,026 539,036 548,200 557,519 566,997 576,636 586,439 596,408 606,547 616,858 627,345 638,010 648,856 659,886
Vegetables 54,155 54,155 54,155 54,155 54,155 54,155 54,155 54,155 54,155 54,155 54,155 54,155 54,155 54,155 54,155 54,155 54,155 54,155
3,587,694 3,612,268 3,637,091 3,662,165 3,687,493 3,713,079 3,738,926 3,765,037 3,791,415 3,818,065 3,844,989 3,872,191 3,899,674 3,927,443 3,955,500 3,983,850 4,012,496 4,041,442
- 0.7% 1.4% 2.1% 2.8% 3.5% 4.2% 4.9% 5.7% 6.4% 7.2% 7.9% 8.7% 9.5% 10.3% 11.0% 11.8% 12.6%
Total Rice 2,980,297 3,004,871 3,029,694 3,054,768 3,080,096 3,105,682 3,131,529 3,157,640 3,184,018 3,210,668 3,237,592 3,264,794 3,292,277 3,320,046 3,348,103 3,376,453 3,405,099 3,434,045
0.8% 1.7% 2.5% 3.3% 4.2% 5.1% 6.0% 6.8% 7.7% 8.6% 9.5% 10.5% 11.4% 12.3% 13.3% 14.3% 15.2%
PRODUCTION (tons) 0 1 2 3 4 5 6 7 8 9
Cassava 6,299,970 6,299,970 6,299,970 6,299,970 6,299,970 6,299,970 6,299,970 6,299,970 6,299,970 6,299,970 6,299,970 6,299,970 6,299,970 6,299,970 6,299,970 6,299,970 6,299,970 6,299,970
Maize 848,841 848,841 848,841 848,841 848,841 848,841 848,841 848,841 848,841 848,841 848,841 848,841 848,841 848,841 848,841 848,841 848,841 848,841
Wet Season Rice 7,181,164 7,227,842 7,274,823 7,322,109 7,369,703 7,417,606 7,465,821 7,514,348 7,563,192 7,612,352 7,661,833 7,711,635 7,761,760 7,812,212 7,862,991 7,914,101 7,965,542 8,017,318
Dry Season Rice 2,378,232 2,418,662 2,459,779 2,501,595 2,544,123 2,587,373 2,631,358 2,676,091 2,721,585 2,767,852 2,814,905 2,862,758 2,911,425 2,960,920 3,011,255 3,062,447 3,114,508 3,167,455
Vegetables 492,811 492,811 492,811 492,811 492,811 492,811 492,811 492,811 492,811 492,811 492,811 492,811 492,811 492,811 492,811 492,811 492,811 492,811
Total Rice 9,559,396 9,646,504 9,734,602 9,823,705 9,913,826 10,004,979 10,097,179 10,190,439 10,284,776 10,380,204 10,476,738 10,574,393 10,673,186 10,773,131 10,874,246 10,976,547 11,080,050 11,184,773
- 0.9% 1.8% 2.8% 3.7% 4.7% 5.6% 6.6% 7.6% 8.6% 9.6% 10.6% 11.7% 12.7% 13.8% 14.8% 15.9% 17.0%
GROSS MARGINS (Million $) 0 1 2 3 4 5 6 7 8 9
Cassava 170.82 170.82 170.82 170.82 170.82 170.82 170.82 170.82 170.82 170.82 170.82 170.82 170.82 170.82 170.82 170.82 170.82 170.82
Maize 65.48 65.48 65.48 65.48 65.48 65.48 65.48 65.48 65.48 65.48 65.48 65.48 65.48 65.48 65.48 65.48 65.48 65.48
Wet Season Rice 609.70 613.67 617.66 621.67 625.71 629.78 633.87 637.99 642.14 646.31 650.51 654.74 659.00 663.28 667.59 671.93 676.30 680.70
Dry Season Rice 146.43 148.92 151.45 154.03 156.64 159.31 162.01 164.77 167.57 170.42 173.32 176.26 179.26 182.31 185.41 188.56 191.76 195.02
Vegetables 75.47 75.47 75.47 75.47 75.47 75.47 75.47 75.47 75.47 75.47 75.47 75.47 75.47 75.47 75.47 75.47 75.47 75.47
Total 5 Products 1,067.90 1,074.35 1,080.87 1,087.46 1,094.12 1,100.85 1,107.65 1,114.52 1,121.47 1,128.49 1,135.59 1,142.77 1,150.02 1,157.35 1,164.76 1,172.25 1,179.82 1,187.48
- 0.6% 1.2% 1.8% 2.5% 3.1% 3.7% 4.4% 5.0% 5.7% 6.3% 7.0% 7.7% 8.4% 9.1% 9.8% 10.5% 11.2%
Total Rice 756.13 762.59 769.11 775.70 782.35 789.08 795.89 802.76 809.71 816.73 823.83 831.00 838.26 845.59 853.00 860.49 868.06 875.72
- 0.9% 1.7% 2.6% 3.5% 4.4% 5.3% 6.2% 7.1% 8.0% 9.0% 9.9% 10.9% 11.8% 12.8% 13.8% 14.8% 15.8%
Share of Rice 0.71 0.71 0.71 0.71 0.72 0.72 0.72 0.72 0.72 0.72 0.73 0.73 0.73 0.73 0.73 0.73 0.74 0.74

188
Table 96: Results of simulations on land use (scenario L2)
Scenario L2 2013 2014 2015 2016 2017 2018 2019 2020 2021 2022 2023 2024 2025 2026 2027 2028 2029 2030
Cultivated Areas (Ha) 0 1 2 3 4 5 6 7 8 9 10 11 12 13 14 15 16 17
Cassava 337,800 348,981 360,532 372,466 384,795 397,531 410,690 424,284 438,327 452,836 467,825 483,310 499,307 515,834 532,909 550,548 568,771 587,597
Maize 215,442 217,532 219,642 221,772 223,924 226,096 228,289 230,503 232,739 234,997 237,276 239,578 241,902 244,248 246,617 249,009 251,425 253,864
Wet Season Rice 2,484,832 2,491,293 2,497,770 2,504,264 2,510,775 2,517,303 2,523,848 2,530,410 2,536,989 2,543,585 2,550,199 2,556,829 2,563,477 2,570,142 2,576,824 2,583,524 2,590,241 2,596,976
Dry Season Rice 495,465 498,834 502,226 505,641 509,080 512,541 516,027 519,536 523,069 526,625 530,207 533,812 537,442 541,096 544,776 548,480 552,210 555,965
Vegetables 54,155 54,577 55,003 55,432 55,865 56,300 56,739 57,182 57,628 58,077 58,530 58,987 59,447 59,911 60,378 60,849 61,324 61,802
Total 5 Products 3,587,694 3,611,217 3,635,174 3,659,576 3,684,438 3,709,772 3,735,593 3,761,915 3,788,752 3,816,121 3,844,037 3,872,516 3,901,575 3,931,232 3,961,504 3,992,411 4,023,971 4,056,204
- 0.7% 1.3% 2.0% 2.7% 3.4% 4.1% 4.9% 5.6% 6.4% 7.1% 7.9% 8.7% 9.6% 10.4% 11.3% 12.2% 13.1%
Total Rice 2,980,297 2,990,127 2,999,996 3,009,905 3,019,855 3,029,845 3,039,875 3,049,946 3,060,058 3,070,211 3,080,405 3,090,641 3,100,919 3,111,239 3,121,600 3,132,005 3,142,451 3,152,941
0.3% 0.7% 1.0% 1.3% 1.7% 2.0% 2.3% 2.7% 3.0% 3.4% 3.7% 4.0% 4.4% 4.7% 5.1% 5.4% 5.8%
PRODUCTION (tons) 0 1 2 3 4 5 6 7 8 9
Cassava 6,299,970 6,508,499 6,723,930 6,946,492 7,176,421 7,413,961 7,659,363 7,912,888 8,174,804 8,445,390 8,724,933 9,013,728 9,312,083 9,620,313 9,938,745 10,267,717 10,607,579 10,958,690
Maize 848,841 857,075 865,389 873,783 882,259 890,817 899,458 908,182 916,992 925,887 934,868 943,936 953,092 962,337 971,672 981,097 990,614 1,000,223
Wet Season Rice 7,181,164 7,199,836 7,218,555 7,237,323 7,256,140 7,275,006 7,293,921 7,312,886 7,331,899 7,350,962 7,370,074 7,389,237 7,408,449 7,427,711 7,447,023 7,466,385 7,485,798 7,505,261
Dry Season Rice 2,378,232 2,394,404 2,410,686 2,427,079 2,443,583 2,460,199 2,476,928 2,493,772 2,510,729 2,527,802 2,544,991 2,562,297 2,579,721 2,597,263 2,614,924 2,632,706 2,650,608 2,668,632
Vegetables 492,811 496,654 500,528 504,432 508,367 512,332 516,328 520,356 524,415 528,505 532,627 536,782 540,969 545,188 549,441 553,726 558,046 562,398
Total Rice 9,559,396 9,594,239 9,629,241 9,664,402 9,699,723 9,735,205 9,770,850 9,806,657 9,842,628 9,878,764 9,915,066 9,951,534 9,988,169 10,024,974 10,061,947 10,099,091 10,136,406 10,173,893
- 0.4% 0.7% 1.1% 1.5% 1.8% 2.2% 2.6% 3.0% 3.3% 3.7% 4.1% 4.5% 4.9% 5.3% 5.6% 6.0% 6.4%
GROSS MARGINS (Million $) 0 1 2 3 4 5 6 7 8 9
Cassava 170.82 176.47 182.31 188.34 194.58 201.02 207.67 214.55 221.65 228.99 236.56 244.40 252.48 260.84 269.48 278.40 287.61 297.13
Maize 65.48 66.11 66.76 67.40 68.06 68.72 69.38 70.06 70.74 71.42 72.12 72.81 73.52 74.23 74.95 75.68 76.42 77.16
Wet Season Rice 609.70 611.29 612.88 614.47 616.07 617.67 619.28 620.89 622.50 624.12 625.74 627.37 629.00 630.64 632.28 633.92 635.57 637.22
Dry Season Rice 146.43 147.43 148.43 149.44 150.45 151.48 152.51 153.54 154.59 155.64 156.70 157.76 158.84 159.92 161.00 162.10 163.20 164.31
Vegetables 75.47 76.06 76.65 77.25 77.85 78.46 79.07 79.69 80.31 80.93 81.57 82.20 82.84 83.49 84.14 84.80 85.46 86.12
Total 5 Products 1,067.90 1,077.35 1,087.02 1,096.90 1,107.01 1,117.34 1,127.91 1,138.72 1,149.78 1,161.10 1,172.68 1,184.54 1,196.68 1,209.12 1,221.85 1,234.89 1,248.25 1,261.94
- 0.9% 1.8% 2.7% 3.7% 4.6% 5.6% 6.6% 7.7% 8.7% 9.8% 10.9% 12.1% 13.2% 14.4% 15.6% 16.9% 18.2%
Total Rice 756.13 758.71 761.31 763.91 766.52 769.15 771.78 774.43 777.09 779.76 782.44 785.13 787.84 790.55 793.28 796.02 798.77 801.53
- 0.3% 0.7% 1.0% 1.4% 1.7% 2.1% 2.4% 2.8% 3.1% 3.5% 3.8% 4.2% 4.6% 4.9% 5.3% 5.6% 6.0%
Share of Rice 0.71 0.70 0.70 0.70 0.69 0.69 0.68 0.68 0.68 0.67 0.67 0.66 0.66 0.65 0.65 0.64 0.64 0.64

189
Table 97: Results of simulations on land use (scenario L3)
Scenario L3 2013 2014 2015 2016 2017 2018 2019 2020 2021 2022 2023 2024 2025 2026 2027 2028 2029 2030
Cassava 0 1 2 3 4 5 6 7 8 9
Cassava 337,800 353,454 369,833 386,971 404,903 423,666 443,299 463,841 485,336 507,826 531,359 555,982 581,746 608,704 636,912 666,426 697,308 729,622
Maize 215,442 218,368 221,333 224,339 227,385 230,473 233,603 236,775 239,991 243,250 246,553 249,901 253,295 256,735 260,221 263,755 267,337 270,967
Wet Season Rice 2,484,832 2,484,832 2,484,832 2,484,832 2,484,832 2,484,832 2,484,832 2,484,832 2,484,832 2,484,832 2,484,832 2,484,832 2,484,832 2,484,832 2,484,832 2,484,832 2,484,832 2,484,832
Dry Season Rice 495,465 495,465 495,465 495,465 495,465 495,465 495,465 495,465 495,465 495,465 495,465 495,465 495,465 495,465 495,465 495,465 495,465 495,465
Vegetables 54,155 54,746 55,344 55,949 56,560 57,177 57,802 58,433 59,071 59,716 60,368 61,027 61,694 62,367 63,048 63,737 64,433 65,136
Total 5 Products 3,587,694 3,606,865 3,626,807 3,647,555 3,669,145 3,691,614 3,715,000 3,739,346 3,764,694 3,791,089 3,818,577 3,847,208 3,877,032 3,908,103 3,940,478 3,974,215 4,009,375 4,046,022
- 0.5% 1.1% 1.7% 2.3% 2.9% 3.5% 4.2% 4.9% 5.7% 6.4% 7.2% 8.1% 8.9% 9.8% 10.8% 11.8% 12.8%
PRODUCTION (tons) 0 1 2 3 4 5 6 7 8 9
Cassava 6,299,970 6,591,911 6,897,380 7,217,004 7,551,440 7,901,374 8,267,524 8,650,641 9,051,511 9,470,959 9,909,843 10,369,065 10,849,567 11,352,336 11,878,404 12,428,849 13,004,802 13,607,444
Maize 848,841 860,369 872,053 883,895 895,898 908,065 920,396 932,895 945,564 958,405 971,420 984,612 997,983 1,011,535 1,025,272 1,039,195 1,053,307 1,067,611
Wet Season Rice 7,181,164 7,181,164 7,181,164 7,181,164 7,181,164 7,181,164 7,181,164 7,181,164 7,181,164 7,181,164 7,181,164 7,181,164 7,181,164 7,181,164 7,181,164 7,181,164 7,181,164 7,181,164
Dry Season Rice 2,378,232 2,378,232 2,378,232 2,378,232 2,378,232 2,378,232 2,378,232 2,378,232 2,378,232 2,378,232 2,378,232 2,378,232 2,378,232 2,378,232 2,378,232 2,378,232 2,378,232 2,378,232
Vegetables 492,811 498,192 503,632 509,132 514,692 520,312 525,994 531,738 537,544 543,414 549,348 555,347 561,412 567,542 573,740 580,005 586,339 592,742
Total Rice 9,559,396 9,559,396 9,559,396 9,559,396 9,559,396 9,559,396 9,559,396 9,559,396 9,559,396 9,559,396 9,559,396 9,559,396 9,559,396 9,559,396 9,559,396 9,559,396 9,559,396 9,559,396
- 0.0% 0.0% 0.0% 0.0% 0.0% 0.0% 0.0% 0.0% 0.0% 0.0% 0.0% 0.0% 0.0% 0.0% 0.0% 0.0% 0.0%
GROSS MARGINS (Million $) 0 1 2 3 4 5 6 7 8 9
Cassava 170.82 178.73 187.01 195.68 204.75 214.24 224.16 234.55 245.42 256.79 268.69 281.14 294.17 307.80 322.07 336.99 352.61 368.95
Maize 65.48 66.37 67.27 68.18 69.11 70.05 71.00 71.96 72.94 73.93 74.93 75.95 76.98 78.03 79.09 80.16 81.25 82.36
Wet Season Rice 609.70 609.70 609.70 609.70 609.70 609.70 609.70 609.70 609.70 609.70 609.70 609.70 609.70 609.70 609.70 609.70 609.70 609.70
Dry Season Rice 146.43 146.43 146.43 146.43 146.43 146.43 146.43 146.43 146.43 146.43 146.43 146.43 146.43 146.43 146.43 146.43 146.43 146.43
Vegetables 75.47 76.29 77.12 77.97 78.82 79.68 80.55 81.43 82.32 83.22 84.13 85.04 85.97 86.91 87.86 88.82 89.79 90.77
Total 5 Products 1,067.90 1,077.52 1,087.54 1,097.96 1,108.81 1,120.10 1,131.84 1,144.08 1,156.81 1,170.07 1,183.89 1,198.27 1,213.26 1,228.88 1,245.15 1,262.11 1,279.78 1,298.21
- 0.9% 1.8% 2.8% 3.8% 4.9% 6.0% 7.1% 8.3% 9.6% 10.9% 12.2% 13.6% 15.1% 16.6% 18.2% 19.8% 21.6%
Total Rice 756.13 756.13 756.13 756.13 756.13 756.13 756.13 756.13 756.13 756.13 756.13 756.13 756.13 756.13 756.13 756.13 756.13 756.13
- 0.0% 0.0% 0.0% 0.0% 0.0% 0.0% 0.0% 0.0% 0.0% 0.0% 0.0% 0.0% 0.0% 0.0% 0.0% 0.0% 0.0%
Share of Rice 0.71 0.70 0.70 0.69 0.68 0.68 0.67 0.66 0.65 0.65 0.64 0.63 0.62 0.62 0.61 0.60 0.59 0.58

190
Table 98: Results of simulations on land use (scenario L4)
Scenario L4 2013 2014 2015 2016 2017 2018 2019 2020 2021 2022 2023 2024 2025 2026 2027 2028 2029 2030
Cassava 0 1 2 3 4 5 6 7 8 9
Cassava 337,800 337,800 337,800 337,800 337,800 337,800 337,800 337,800 337,800 337,800 337,800 337,800 337,800 337,800 337,800 337,800 337,800 337,800
Maize 215,442 215,442 215,442 215,442 215,442 215,442 215,442 215,442 215,442 215,442 215,442 215,442 215,442 215,442 215,442 215,442 215,442 215,442
Wet Season Rice 2,484,832 2,484,832 2,484,832 2,484,832 2,484,832 2,484,832 2,484,832 2,484,832 2,484,832 2,484,832 2,484,832 2,484,832 2,484,832 2,484,832 2,484,832 2,484,832 2,484,832 2,484,832
Dry Season Rice 495,465 495,465 495,465 495,465 495,465 495,465 495,465 495,465 495,465 495,465 495,465 495,465 495,465 495,465 495,465 495,465 495,465 495,465
Vegetables 54,155 54,155 54,155 54,155 54,155 54,155 54,155 54,155 54,155 54,155 54,155 54,155 54,155 54,155 54,155 54,155 54,155 54,155
Total 5 Products 3,587,694 3,587,694 3,587,694 3,587,694 3,587,694 3,587,694 3,587,694 3,587,694 3,587,694 3,587,694 3,587,694 3,587,694 3,587,694 3,587,694 3,587,694 3,587,694 3,587,694 3,587,694
- 0.0% 0.0% 0.0% 0.0% 0.0% 0.0% 0.0% 0.0% 0.0% 0.0% 0.0% 0.0% 0.0% 0.0% 0.0% 0.0% 0.0%
PRODUCTION (tons) 0 1 2 3 4 5 6 7 8 9
Cassava 6,299,970 6,161,873 6,026,803 5,894,694 5,765,481 5,639,100 5,515,490 5,394,589 5,276,338 5,160,679 5,047,556 4,936,912 4,828,694 4,722,848 4,619,322 4,518,065 4,419,028 4,322,161
Maize 848,841 848,841 848,841 848,841 848,841 848,841 848,841 848,841 848,841 848,841 848,841 848,841 848,841 848,841 848,841 848,841 848,841 848,841
Wet Season Rice 7,181,164 7,181,164 7,181,164 7,181,164 7,181,164 7,181,164 7,181,164 7,181,164 7,181,164 7,181,164 7,181,164 7,181,164 7,181,164 7,181,164 7,181,164 7,181,164 7,181,164 7,181,164
Dry Season Rice 2,378,232 2,378,232 2,378,232 2,378,232 2,378,232 2,378,232 2,378,232 2,378,232 2,378,232 2,378,232 2,378,232 2,378,232 2,378,232 2,378,232 2,378,232 2,378,232 2,378,232 2,378,232
Vegetables 492,811 492,811 492,811 492,811 492,811 492,811 492,811 492,811 492,811 492,811 492,811 492,811 492,811 492,811 492,811 492,811 492,811 492,811
Total Rice 9,559,396 9,559,396 9,559,396 9,559,396 9,559,396 9,559,396 9,559,396 9,559,396 9,559,396 9,559,396 9,559,396 9,559,396 9,559,396 9,559,396 9,559,396 9,559,396 9,559,396 9,559,396
- 0.0% 0.0% 0.0% 0.0% 0.0% 0.0% 0.0% 0.0% 0.0% 0.0% 0.0% 0.0% 0.0% 0.0% 0.0% 0.0% 0.0%
GROSS MARGINS (Million $) 0 1 2 3 4 5 6 7 8 9
Cassava 170.82 167.07 163.41 159.83 156.32 152.90 149.55 146.27 143.06 139.92 136.86 133.86 130.92 128.05 125.25 122.50 119.82 117.19
Maize 65.48 65.48 65.48 65.48 65.48 65.48 65.48 65.48 65.48 65.48 65.48 65.48 65.48 65.48 65.48 65.48 65.48 65.48
Wet Season Rice 609.70 609.70 609.70 609.70 609.70 609.70 609.70 609.70 609.70 609.70 609.70 609.70 609.70 609.70 609.70 609.70 609.70 609.70
Dry Season Rice 146.43 146.43 146.43 146.43 146.43 146.43 146.43 146.43 146.43 146.43 146.43 146.43 146.43 146.43 146.43 146.43 146.43 146.43
Vegetables 75.47 75.47 75.47 75.47 75.47 75.47 75.47 75.47 75.47 75.47 75.47 75.47 75.47 75.47 75.47 75.47 75.47 75.47
Total 5 Products 1,067.90 1,064.15 1,060.49 1,056.91 1,053.40 1,049.98 1,046.63 1,043.35 1,040.14 1,037.00 1,033.94 1,030.94 1,028.00 1,025.13 1,022.33 1,019.58 1,016.90 1,014.27
- -0.4% -0.7% -1.0% -1.4% -1.7% -2.0% -2.3% -2.6% -2.9% -3.2% -3.5% -3.7% -4.0% -4.3% -4.5% -4.8% -5.0%
Total Rice 756.13 756.13 756.13 756.13 756.13 756.13 756.13 756.13 756.13 756.13 756.13 756.13 756.13 756.13 756.13 756.13 756.13 756.13
- 0.0% 0.0% 0.0% 0.0% 0.0% 0.0% 0.0% 0.0% 0.0% 0.0% 0.0% 0.0% 0.0% 0.0% 0.0% 0.0% 0.0%
Share of Rice 0.71 0.71 0.71 0.72 0.72 0.72 0.72 0.72 0.73 0.73 0.73 0.73 0.74 0.74 0.74 0.74 0.74 0.75
Cassava yield with L4 18.65 18.24 17.84 17.45 17.07 16.69 16.33 15.97 15.62 15.28 14.94 14.61 14.29 13.98 13.67 13.37 13.08 12.80
-2% -4% -6% -8% -10% -12% -14% -16% -18% -20% -22% -23% -25% -27% -28% -30% -31%

191
Table 99: Results of simulations on land use (scenario L5)
Scenario L5 2013 2014 2015 2016 2017 2018 2019 2020 2021 2022 2023 2024 2025 2026 2027 2028 2029 2030
Cassava 0 1 2 3 4 5 6 7 8 9
Cassava 337,800 329,693 321,780 314,057 306,520 299,164 291,984 284,976 278,137 271,461 264,946 258,588 252,381 246,324 240,413 234,643 229,011 223,515
Maize 215,442 210,271 205,225 200,299 195,492 190,800 186,221 181,752 177,390 173,133 168,977 164,922 160,964 157,101 153,330 149,650 146,059 142,553
Wet Season Rice 2,484,832 2,484,832 2,484,832 2,484,832 2,484,832 2,484,832 2,484,832 2,484,832 2,484,832 2,484,832 2,484,832 2,484,832 2,484,832 2,484,832 2,484,832 2,484,832 2,484,832 2,484,832
Dry Season Rice 495,465 495,465 495,465 495,465 495,465 495,465 495,465 495,465 495,465 495,465 495,465 495,465 495,465 495,465 495,465 495,465 495,465 495,465
Vegetables 54,155 54,155 54,155 54,155 54,155 54,155 54,155 54,155 54,155 54,155 54,155 54,155 54,155 54,155 54,155 54,155 54,155 54,155
Total 5 Products 3,587,694 3,574,416 3,561,457 3,548,809 3,536,464 3,524,416 3,512,657 3,501,180 3,489,979 3,479,046 3,468,376 3,457,961 3,447,797 3,437,877 3,428,195 3,418,745 3,409,522 3,400,520
- -0.4% -0.7% -1.1% -1.4% -1.8% -2.1% -2.4% -2.7% -3.0% -3.3% -3.6% -3.9% -4.2% -4.4% -4.7% -5.0% -5.2%
PRODUCTION (tons) 0 1 2 3 4 5 6 7 8 9
Cassava 6,299,970 6,148,771 6,001,200 5,857,171 5,716,599 5,579,401 5,445,495 5,314,803 5,187,248 5,062,754 4,941,248 4,822,658 4,706,914 4,593,948 4,483,694 4,376,085 4,271,059 4,168,554
Maize 848,841 828,469 808,586 789,180 770,240 751,754 733,712 716,103 698,916 682,142 665,771 649,792 634,197 618,977 604,121 589,622 575,471 561,660
Wet Season Rice 7,181,164 7,181,164 7,181,164 7,181,164 7,181,164 7,181,164 7,181,164 7,181,164 7,181,164 7,181,164 7,181,164 7,181,164 7,181,164 7,181,164 7,181,164 7,181,164 7,181,164 7,181,164
Dry Season Rice 2,378,232 2,378,232 2,378,232 2,378,232 2,378,232 2,378,232 2,378,232 2,378,232 2,378,232 2,378,232 2,378,232 2,378,232 2,378,232 2,378,232 2,378,232 2,378,232 2,378,232 2,378,232
Vegetables 492,811 492,811 492,811 492,811 492,811 492,811 492,811 492,811 492,811 492,811 492,811 492,811 492,811 492,811 492,811 492,811 492,811 492,811
Total Rice 9,559,396 9,559,396 9,559,396 9,559,396 9,559,396 9,559,396 9,559,396 9,559,396 9,559,396 9,559,396 9,559,396 9,559,396 9,559,396 9,559,396 9,559,396 9,559,396 9,559,396 9,559,396
- 0.0% 0.0% 0.0% 0.0% 0.0% 0.0% 0.0% 0.0% 0.0% 0.0% 0.0% 0.0% 0.0% 0.0% 0.0% 0.0% 0.0%
GROSS MARGINS (Million $) 0 1 2 3 4 5 6 7 8 9
Cassava 170.82 166.72 162.71 158.81 155.00 151.28 147.65 144.10 140.65 137.27 133.98 130.76 127.62 124.56 121.57 118.65 115.80 113.02
Maize 65.48 63.91 62.37 60.88 59.42 57.99 56.60 55.24 53.91 52.62 51.36 50.12 48.92 47.75 46.60 45.48 44.39 43.33
Wet Season Rice 609.70 609.70 609.70 609.70 609.70 609.70 609.70 609.70 609.70 609.70 609.70 609.70 609.70 609.70 609.70 609.70 609.70 609.70
Dry Season Rice 146.43 146.43 146.43 146.43 146.43 146.43 146.43 146.43 146.43 146.43 146.43 146.43 146.43 146.43 146.43 146.43 146.43 146.43
Vegetables 75.47 75.47 75.47 75.47 75.47 75.47 75.47 75.47 75.47 75.47 75.47 75.47 75.47 75.47 75.47 75.47 75.47 75.47
Total 5 Products 1,067.90 1,062.22 1,056.69 1,051.29 1,046.01 1,040.87 1,035.85 1,030.94 1,026.16 1,021.49 1,016.93 1,012.49 1,008.14 1,003.91 999.77 995.74 991.80 987.95
- -0.5% -1.0% -1.6% -2.0% -2.5% -3.0% -3.5% -3.9% -4.3% -4.8% -5.2% -5.6% -6.0% -6.4% -6.8% -7.1% -7.5%
Total Rice 756.13 756.13 756.13 756.13 756.13 756.13 756.13 756.13 756.13 756.13 756.13 756.13 756.13 756.13 756.13 756.13 756.13 756.13
- 0.0% 0.0% 0.0% 0.0% 0.0% 0.0% 0.0% 0.0% 0.0% 0.0% 0.0% 0.0% 0.0% 0.0% 0.0% 0.0% 0.0%
Share of Rice 0.71 0.71 0.72 0.72 0.72 0.73 0.73 0.73 0.74 0.74 0.74 0.75 0.75 0.75 0.76 0.76 0.76 0.77
Cassava yield with L5 18.65 18.65 18.65 18.65 18.65 18.65 18.65 18.65 18.65 18.65 18.65 18.65 18.65 18.65 18.65 18.65 18.65 18.65
Maize Yield with L5 3.94 3.94 3.94 3.94 3.94 3.94 3.94 3.94 3.94 3.94 3.94 3.94 3.94 3.94 3.94 3.94 3.94 3.94

192
Table 100: Results of simulations on land use (scenario L6)
Scenario L6 2013 2014 2015 2016 2017 2018 2019 2020 2021 2022 2023 2024 2025 2026 2027 2028 2029 2030
Cassava 0 1 2 3 4 5 6 7 8 9 10 11 12 13 14 15 16 17
Cassava 337,800 329,693 321,780 314,057 306,520 299,164 291,984 284,976 278,137 271,461 264,946 258,588 252,381 246,324 240,413 234,643 229,011 223,515
Maize 215,442 210,271 205,225 200,299 195,492 190,800 186,221 181,752 177,390 173,133 168,977 164,922 160,964 157,101 153,330 149,650 146,059 142,553
Wet Season Rice 2,484,832 2,484,832 2,484,832 2,484,832 2,484,832 2,484,832 2,484,832 2,484,832 2,484,832 2,484,832 2,484,832 2,484,832 2,484,832 2,484,832 2,484,832 2,484,832 2,484,832 2,484,832
Dry Season Rice 495,465 495,465 495,465 495,465 495,465 495,465 495,465 495,465 495,465 495,465 495,465 495,465 495,465 495,465 495,465 495,465 495,465 495,465
Vegetables 54,155 54,155 54,155 54,155 54,155 54,155 54,155 54,155 54,155 54,155 54,155 54,155 54,155 54,155 54,155 54,155 54,155 54,155
Total 5 Products 3,587,694 3,574,416 3,561,457 3,548,809 3,536,464 3,524,416 3,512,657 3,501,180 3,489,979 3,479,046 3,468,376 3,457,961 3,447,797 3,437,877 3,428,195 3,418,745 3,409,522 3,400,520
- -0.4% -0.7% -1.1% -1.4% -1.8% -2.1% -2.4% -2.7% -3.0% -3.3% -3.6% -3.9% -4.2% -4.4% -4.7% -5.0% -5.2%
PRODUCTION (tons) 0 1 2 3 4 5 6 7 8 9
Cassava 6,299,970 6,296,341 6,292,715 6,289,090 6,285,467 6,281,847 6,278,229 6,274,612 6,270,998 6,267,386 6,263,776 6,260,168 6,256,562 6,252,959 6,249,357 6,245,757 6,242,160 6,238,564
Maize 848,841 848,353 847,864 847,376 846,887 846,400 845,912 845,425 844,938 844,451 843,965 843,479 842,993 842,507 842,022 841,537 841,052 840,568
Wet Season Rice 7,181,164 7,181,164 7,181,164 7,181,164 7,181,164 7,181,164 7,181,164 7,181,164 7,181,164 7,181,164 7,181,164 7,181,164 7,181,164 7,181,164 7,181,164 7,181,164 7,181,164 7,181,164
Dry Season Rice 2,378,232 2,378,232 2,378,232 2,378,232 2,378,232 2,378,232 2,378,232 2,378,232 2,378,232 2,378,232 2,378,232 2,378,232 2,378,232 2,378,232 2,378,232 2,378,232 2,378,232 2,378,232
Vegetables 492,811 492,811 492,811 492,811 492,811 492,811 492,811 492,811 492,811 492,811 492,811 492,811 492,811 492,811 492,811 492,811 492,811 492,811
Total Rice 9,559,396 9,559,396 9,559,396 9,559,396 9,559,396 9,559,396 9,559,396 9,559,396 9,559,396 9,559,396 9,559,396 9,559,396 9,559,396 9,559,396 9,559,396 9,559,396 9,559,396 9,559,396
- 0.0% 0.0% 0.0% 0.0% 0.0% 0.0% 0.0% 0.0% 0.0% 0.0% 0.0% 0.0% 0.0% 0.0% 0.0% 0.0% 0.0%
GROSS MARGINS (Million $) 0 1 2 3 4 5 6 7 8 9
Cassava 170.82 170.72 170.62 170.52 170.42 170.32 170.23 170.13 170.03 169.93 169.83 169.74 169.64 169.54 169.44 169.35 169.25 169.15
Maize 65.48 65.44 65.40 65.37 65.33 65.29 65.25 65.22 65.18 65.14 65.10 65.07 65.03 64.99 64.95 64.92 64.88 64.84
Wet Season Rice 609.70 609.70 609.70 609.70 609.70 609.70 609.70 609.70 609.70 609.70 609.70 609.70 609.70 609.70 609.70 609.70 609.70 609.70
Dry Season Rice 146.43 146.43 146.43 146.43 146.43 146.43 146.43 146.43 146.43 146.43 146.43 146.43 146.43 146.43 146.43 146.43 146.43 146.43
Vegetables 75.47 75.47 75.47 75.47 75.47 75.47 75.47 75.47 75.47 75.47 75.47 75.47 75.47 75.47 75.47 75.47 75.47 75.47
Total 5 Products 1,067.90 1,067.76 1,067.62 1,067.49 1,067.35 1,067.22 1,067.08 1,066.94 1,066.81 1,066.67 1,066.54 1,066.40 1,066.27 1,066.13 1,066.00 1,065.86 1,065.73 1,065.59
- 0.0% 0.0% 0.0% -0.1% -0.1% -0.1% -0.1% -0.1% -0.1% -0.1% -0.1% -0.2% -0.2% -0.2% -0.2% -0.2% -0.2%
Total Rice 756.13 756.13 756.13 756.13 756.13 756.13 756.13 756.13 756.13 756.13 756.13 756.13 756.13 756.13 756.13 756.13 756.13 756.13
- 0.0% 0.0% 0.0% 0.0% 0.0% 0.0% 0.0% 0.0% 0.0% 0.0% 0.0% 0.0% 0.0% 0.0% 0.0% 0.0% 0.0%
Share of Rice 0.71 0.71 0.71 0.71 0.71 0.71 0.71 0.71 0.71 0.71 0.71 0.71 0.71 0.71 0.71 0.71 0.71 0.71
Cassava yield with L6 18.65 19.10 19.56 20.03 20.51 21.00 21.50 22.02 22.55 23.09 23.64 24.21 24.79 25.39 25.99 26.62 27.26 27.91
2% 5% 7% 10% 13% 15% 18% 21% 24% 27% 30% 33% 36% 39% 43% 46% 50%
Maize Yield with L6 3.94 4.03 4.13 4.23 4.33 4.44 4.54 4.65 4.76 4.88 4.99 5.11 5.24 5.36 5.49 5.62 5.76 5.90
2% 5% 7% 10% 13% 15% 18% 21% 24% 27% 30% 33% 36% 39% 43% 46% 50%

193
Table 101: Demand for labor for environmental sustainability scenarios
DEMAND FOR LABOR (Million DAYS)
2013 2014 2015 2016 2017 2018 2019 2020 2021 2022 2023 2024 2025 2026 2027 2028 2029 2030
Scenario L1
Cassava 16.48 16.48 16.48 16.48 16.48 16.48 16.48 16.48 16.48 16.48 16.48 16.48 16.48 16.48 16.48 16.48 16.48 16.48
Maize 6.75 6.75 6.75 6.75 6.75 6.75 6.75 6.75 6.75 6.75 6.75 6.75 6.75 6.75 6.75 6.75 6.75 6.75
Wet Season Rice 120.00 120.78 121.56 122.35 123.15 123.95 124.75 125.56 126.38 127.20 128.03 128.86 129.70 130.54 131.39 132.24 133.10 133.97
Dry Season Rice 13.75 13.98 14.22 14.46 14.71 14.96 15.21 15.47 15.73 16.00 16.27 16.55 16.83 17.12 17.41 17.70 18.01 18.31
Vegetables 9.53 9.53 9.53 9.53 9.53 9.53 9.53 9.53 9.53 9.53 9.53 9.53 9.53 9.53 9.53 9.53 9.53 9.53
166.51 167.52 168.54 169.57 170.61 171.67 172.73 173.79 174.87 175.96 177.06 178.17 179.29 180.42 181.56 182.71 183.87 185.04
- 0.6% 1.2% 1.8% 2.5% 3.1% 3.7% 4.4% 5.0% 5.7% 6.3% 7.0% 7.7% 8.4% 9.0% 9.7% 10.4% 11.1%
Scenario L2
Cassava 16.48 17.03 17.59 18.18 18.78 19.40 20.04 20.71 21.39 22.10 22.83 23.59 24.37 25.17 26.01 26.87 27.76 28.68
Maize 6.75 6.81 6.88 6.95 7.01 7.08 7.15 7.22 7.29 7.36 7.43 7.51 7.58 7.65 7.73 7.80 7.88 7.95
Wet Season Rice 120.00 120.31 120.62 120.94 121.25 121.56 121.88 122.20 122.52 122.83 123.15 123.47 123.79 124.12 124.44 124.76 125.09 125.41
Dry Season Rice 13.75 13.84 13.94 14.03 14.13 14.22 14.32 14.42 14.52 14.61 14.71 14.81 14.91 15.02 15.12 15.22 15.32 15.43
Vegetables 9.53 9.60 9.67 9.75 9.83 9.90 9.98 10.06 10.14 10.22 10.30 10.38 10.46 10.54 10.62 10.70 10.79 10.87
166.51 167.60 168.71 169.84 171.00 172.17 173.37 174.60 175.85 177.12 178.42 179.75 181.11 182.49 183.91 185.35 186.83 188.34
- 0.7% 1.3% 2.0% 2.7% 3.4% 4.1% 4.9% 5.6% 6.4% 7.2% 8.0% 8.8% 9.6% 10.5% 11.3% 12.2% 13.1%
Scenario L3
Cassava 16.48 17.25 18.05 18.88 19.76 20.68 21.63 22.64 23.68 24.78 25.93 27.13 28.39 29.71 31.08 32.52 34.03 35.61
Maize 6.75 6.84 6.93 7.03 7.12 7.22 7.32 7.42 7.52 7.62 7.72 7.83 7.93 8.04 8.15 8.26 8.37 8.49
Wet Season Rice 120.00 120.00 120.00 120.00 120.00 120.00 120.00 120.00 120.00 120.00 120.00 120.00 120.00 120.00 120.00 120.00 120.00 120.00
Dry Season Rice 13.75 13.75 13.75 13.75 13.75 13.75 13.75 13.75 13.75 13.75 13.75 13.75 13.75 13.75 13.75 13.75 13.75 13.75
Vegetables 9.53 9.63 9.73 9.84 9.95 10.06 10.17 10.28 10.39 10.50 10.62 10.73 10.85 10.97 11.09 11.21 11.33 11.46
166.51 167.46 168.46 169.50 170.58 171.70 172.86 174.08 175.34 176.65 178.02 179.44 180.92 182.46 184.07 185.74 187.48 189.30
- 0.6% 1.2% 1.8% 2.4% 3.1% 3.8% 4.5% 5.3% 6.1% 6.9% 7.8% 8.7% 9.6% 10.5% 11.6% 12.6% 13.7%
Scenario L4
Cassava 16.48 16.48 16.48 16.48 16.48 16.48 16.48 16.48 16.48 16.48 16.48 16.48 16.48 16.48 16.48 16.48 16.48 16.48
Maize 6.75 6.75 6.75 6.75 6.75 6.75 6.75 6.75 6.75 6.75 6.75 6.75 6.75 6.75 6.75 6.75 6.75 6.75
Wet Season Rice 120.00 120.00 120.00 120.00 120.00 120.00 120.00 120.00 120.00 120.00 120.00 120.00 120.00 120.00 120.00 120.00 120.00 120.00
Dry Season Rice 13.75 13.75 13.75 13.75 13.75 13.75 13.75 13.75 13.75 13.75 13.75 13.75 13.75 13.75 13.75 13.75 13.75 13.75
Vegetables 9.53 9.53 9.53 9.53 9.53 9.53 9.53 9.53 9.53 9.53 9.53 9.53 9.53 9.53 9.53 9.53 9.53 9.53
166.51 166.51 166.51 166.51 166.51 166.51 166.51 166.51 166.51 166.51 166.51 166.51 166.51 166.51 166.51 166.51 166.51 166.51
- 0.0% 0.0% 0.0% 0.0% 0.0% 0.0% 0.0% 0.0% 0.0% 0.0% 0.0% 0.0% 0.0% 0.0% 0.0% 0.0% 0.0%
Scenario L5
Cassava 16.48 16.09 15.70 15.33 14.96 14.60 14.25 13.91 13.57 13.25 12.93 12.62 12.32 12.02 11.73 11.45 11.18 10.91
Maize 6.75 6.59 6.43 6.27 6.12 5.98 5.83 5.69 5.56 5.42 5.29 5.17 5.04 4.92 4.80 4.69 4.58 4.47
Wet Season Rice 120.00 120.00 120.00 120.00 120.00 120.00 120.00 120.00 120.00 120.00 120.00 120.00 120.00 120.00 120.00 120.00 120.00 120.00
Dry Season Rice 13.75 13.75 13.75 13.75 13.75 13.75 13.75 13.75 13.75 13.75 13.75 13.75 13.75 13.75 13.75 13.75 13.75 13.75
Vegetables 9.53 9.53 9.53 9.53 9.53 9.53 9.53 9.53 9.53 9.53 9.53 9.53 9.53 9.53 9.53 9.53 9.53 9.53
166.51 165.95 165.40 164.87 164.35 163.85 163.35 162.87 162.40 161.94 161.49 161.06 160.63 160.21 159.81 159.41 159.02 158.64
- -0.3% -0.7% -1.0% -1.3% -1.6% -1.9% -2.2% -2.5% -2.7% -3.0% -3.3% -3.5% -3.8% -4.0% -4.3% -4.5% -4.7%
Scenario L6
Cassava 16.48 16.09 15.70 15.33 14.96 14.60 14.25 13.91 13.57 13.25 12.93 12.62 12.32 12.02 11.73 11.45 11.18 10.91
Maize 6.75 6.59 6.43 6.27 6.12 5.98 5.83 5.69 5.56 5.42 5.29 5.17 5.04 4.92 4.80 4.69 4.58 4.47
Wet Season Rice 120.00 120.00 120.00 120.00 120.00 120.00 120.00 120.00 120.00 120.00 120.00 120.00 120.00 120.00 120.00 120.00 120.00 120.00
Dry Season Rice 13.75 13.75 13.75 13.75 13.75 13.75 13.75 13.75 13.75 13.75 13.75 13.75 13.75 13.75 13.75 13.75 13.75 13.75
Vegetables 9.53 9.53 9.53 9.53 9.53 9.53 9.53 9.53 9.53 9.53 9.53 9.53 9.53 9.53 9.53 9.53 9.53 9.53
166.51 165.95 165.40 164.87 164.35 163.85 163.35 162.87 162.40 161.94 161.49 161.06 160.63 160.21 159.81 159.41 159.02 158.64
- -0.3% -0.7% -1.0% -1.3% -1.6% -1.9% -2.2% -2.5% -2.7% -3.0% -3.3% -3.5% -3.8% -4.0% -4.3% -4.5% -4.7%

194
Table 102: Demand for fertilizers for environmental sustainability scenarios
DEMAND FOR FERTILIZERS (TONS)
2013 2014 2015 2016 2017 2018 2019 2020 2021 2022 2023 2024 2025 2026 2027 2028 2029 2030
Scenario L1
Cassava 4,578 4,578 4,578 4,578 4,578 4,578 4,578 4,578 4,578 4,578 4,578 4,578 4,578 4,578 4,578 4,578 4,578 4,578
Maize 11,507 11,507 11,507 11,507 11,507 11,507 11,507 11,507 11,507 11,507 11,507 11,507 11,507 11,507 11,507 11,507 11,507 11,507
Wet Season Rice 294,408 296,322 298,248 300,187 302,138 304,102 306,078 308,068 310,070 312,086 314,114 316,156 318,211 320,279 322,361 324,457 326,566 328,688
Dry Season Rice 135,722 138,029 140,376 142,762 145,189 147,657 150,168 152,720 155,317 157,957 160,642 163,373 166,151 168,975 171,848 174,769 177,740 180,762
Vegetables 18,646 18,646 18,646 18,646 18,646 18,646 18,646 18,646 18,646 18,646 18,646 18,646 18,646 18,646 18,646 18,646 18,646 18,646
464,861 469,082 473,355 477,680 482,058 486,490 490,977 495,519 500,118 504,774 509,488 514,260 519,093 523,986 528,940 533,957 539,037 544,181
- 0.9% 1.8% 2.8% 3.7% 4.7% 5.6% 6.6% 7.6% 8.6% 9.6% 10.6% 11.7% 12.7% 13.8% 14.9% 16.0% 17.1%
Scenario L2
Cassava 4,578 4,730 4,887 5,048 5,215 5,388 5,566 5,751 5,941 6,138 6,341 6,551 6,767 6,991 7,223 7,462 7,709 7,964
Maize 11,507 11,619 11,731 11,845 11,960 12,076 12,193 12,311 12,431 12,551 12,673 12,796 12,920 13,045 13,172 13,300 13,429 13,559
Wet Season Rice 294,408 295,174 295,941 296,711 297,482 298,255 299,031 299,808 300,588 301,369 302,153 302,939 303,726 304,516 305,308 306,101 306,897 307,695
Dry Season Rice 135,722 136,645 137,574 138,510 139,451 140,400 141,354 142,316 143,283 144,258 145,239 146,226 147,221 148,222 149,230 150,244 151,266 152,295
Vegetables 18,646 18,791 18,938 19,085 19,234 19,384 19,536 19,688 19,842 19,996 20,152 20,309 20,468 20,628 20,788 20,951 21,114 21,279
464,861 466,958 469,071 471,199 473,343 475,504 477,680 479,874 482,085 484,312 486,558 488,821 491,102 493,402 495,721 498,058 500,415 502,792
- 0.5% 0.9% 1.4% 1.8% 2.3% 2.8% 3.2% 3.7% 4.2% 4.7% 5.2% 5.6% 6.1% 6.6% 7.1% 7.6% 8.2%
Scenario L3
Cassava 4,578 4,791 5,013 5,245 5,488 5,742 6,008 6,287 6,578 6,883 7,202 7,536 7,885 8,250 8,632 9,032 9,451 9,889
Maize 11,507 11,663 11,822 11,982 12,145 12,310 12,477 12,646 12,818 12,992 13,169 13,347 13,529 13,712 13,899 14,087 14,279 14,473
Wet Season Rice 294,408 294,408 294,408 294,408 294,408 294,408 294,408 294,408 294,408 294,408 294,408 294,408 294,408 294,408 294,408 294,408 294,408 294,408
Dry Season Rice 135,722 135,722 135,722 135,722 135,722 135,722 135,722 135,722 135,722 135,722 135,722 135,722 135,722 135,722 135,722 135,722 135,722 135,722
Vegetables 18,646 18,849 19,055 19,263 19,474 19,686 19,901 20,119 20,338 20,560 20,785 21,012 21,241 21,473 21,708 21,945 22,184 22,427
464,861 465,433 466,020 466,620 467,237 467,868 468,517 469,182 469,865 470,566 471,286 472,025 472,785 473,566 474,369 475,195 476,044 476,918
- 0.1% 0.2% 0.4% 0.5% 0.6% 0.8% 0.9% 1.1% 1.2% 1.4% 1.5% 1.7% 1.9% 2.0% 2.2% 2.4% 2.6%
Scenario L4
Cassava 4,578 4,578 4,578 4,578 4,578 4,578 4,578 4,578 4,578 4,578 4,578 4,578 4,578 4,578 4,578 4,578 4,578 4,578
Maize 11,507 11,507 11,507 11,507 11,507 11,507 11,507 11,507 11,507 11,507 11,507 11,507 11,507 11,507 11,507 11,507 11,507 11,507
Wet Season Rice 294,408 294,408 294,408 294,408 294,408 294,408 294,408 294,408 294,408 294,408 294,408 294,408 294,408 294,408 294,408 294,408 294,408 294,408
Dry Season Rice 135,722 135,722 135,722 135,722 135,722 135,722 135,722 135,722 135,722 135,722 135,722 135,722 135,722 135,722 135,722 135,722 135,722 135,722
Vegetables 18,646 18,646 18,646 18,646 18,646 18,646 18,646 18,646 18,646 18,646 18,646 18,646 18,646 18,646 18,646 18,646 18,646 18,646
464,861 464,861 464,861 464,861 464,861 464,861 464,861 464,861 464,861 464,861 464,861 464,861 464,861 464,861 464,861 464,861 464,861 464,861
- 0.0% 0.0% 0.0% 0.0% 0.0% 0.0% 0.0% 0.0% 0.0% 0.0% 0.0% 0.0% 0.0% 0.0% 0.0% 0.0% 0.0%
Scenario L5
Cassava 4,578 4,469 4,361 4,257 4,154 4,055 3,957 3,862 3,770 3,679 3,591 3,505 3,421 3,339 3,258 3,180 3,104 3,029
Maize 11,507 11,231 10,961 10,698 10,441 10,191 9,946 9,708 9,475 9,247 9,025 8,809 8,597 8,391 8,189 7,993 7,801 7,614
Wet Season Rice 294,408 294,408 294,408 294,408 294,408 294,408 294,408 294,408 294,408 294,408 294,408 294,408 294,408 294,408 294,408 294,408 294,408 294,408
Dry Season Rice 135,722 135,722 135,722 135,722 135,722 135,722 135,722 135,722 135,722 135,722 135,722 135,722 135,722 135,722 135,722 135,722 135,722 135,722
Vegetables 18,646 18,646 18,646 18,646 18,646 18,646 18,646 18,646 18,646 18,646 18,646 18,646 18,646 18,646 18,646 18,646 18,646 18,646
464,861 464,475 464,098 463,731 463,372 463,022 462,680 462,346 462,020 461,702 461,392 461,089 460,794 460,505 460,224 459,949 459,681 459,419
- -0.1% -0.2% -0.2% -0.3% -0.4% -0.5% -0.5% -0.6% -0.7% -0.7% -0.8% -0.9% -0.9% -1.0% -1.1% -1.1% -1.2%
Scenario L6
Cassava 4,578 4,469 4,361 4,257 4,154 4,055 3,957 3,862 3,770 3,679 3,591 3,505 3,421 3,339 3,258 3,180 3,104 3,029
Maize 11,507 11,231 10,961 10,698 10,441 10,191 9,946 9,708 9,475 9,247 9,025 8,809 8,597 8,391 8,189 7,993 7,801 7,614
Wet Season Rice 294,408 294,408 294,408 294,408 294,408 294,408 294,408 294,408 294,408 294,408 294,408 294,408 294,408 294,408 294,408 294,408 294,408 294,408
Dry Season Rice 135,722 135,722 135,722 135,722 135,722 135,722 135,722 135,722 135,722 135,722 135,722 135,722 135,722 135,722 135,722 135,722 135,722 135,722
Vegetables 18,646 18,646 18,646 18,646 18,646 18,646 18,646 18,646 18,646 18,646 18,646 18,646 18,646 18,646 18,646 18,646 18,646 18,646
464,861 464,475 464,098 463,731 463,372 463,022 462,680 462,346 462,020 461,702 461,392 461,089 460,794 460,505 460,224 459,949 459,681 459,419
- -0.1% -0.2% -0.2% -0.3% -0.4% -0.5% -0.5% -0.6% -0.7% -0.7% -0.8% -0.9% -0.9% -1.0% -1.1% -1.1% -1.2%

195
Table 103: Total demand and average return to labor ($/day) for scenarios with environmental sustainability
DEMAND FOR LABOR (Million DAYS)
2013 2014 2015 2016 2017 2018 2019 2020 2021 2022 2023 2024 2025 2026 2027 2028 2029 2030
Baseline 166.51 166.51 166.51 166.51 166.51 166.51 166.51 166.51 166.51 166.51 166.51 166.51 166.51 166.51 166.51 166.51 166.51 166.51
Scenario L1 166.51 167.52 168.54 169.57 170.61 171.67 172.73 173.79 174.87 175.96 177.06 178.17 179.29 180.42 181.56 182.71 183.87 185.04
Scenario L2 166.51 167.60 168.71 169.84 171.00 172.17 173.37 174.60 175.85 177.12 178.42 179.75 181.11 182.49 183.91 185.35 186.83 188.34
Scenario L3 166.51 167.46 168.46 169.50 170.58 171.70 172.86 174.08 175.34 176.65 178.02 179.44 180.92 182.46 184.07 185.74 187.48 189.30
Scenario L4 166.51 166.51 166.51 166.51 166.51 166.51 166.51 166.51 166.51 166.51 166.51 166.51 166.51 166.51 166.51 166.51 166.51 166.51
Scenario L5 166.51 165.95 165.40 164.87 164.35 163.85 163.35 162.87 162.40 161.94 161.49 161.06 160.63 160.21 159.81 159.41 159.02 158.64
Scenario L6 166.51 165.95 165.40 164.87 164.35 163.85 163.35 162.87 162.40 161.94 161.49 161.06 160.63 160.21 159.81 159.41 159.02 158.64
RETURN TO LABOR ($/day)
2013 2014 2015 2016 2017 2018 2019 2020 2021 2022 2023 2024 2025 2026 2027 2028 2029 2030
Baseline 6.41 6.41 6.41 6.41 6.41 6.41 6.41 6.41 6.41 6.41 6.41 6.41 6.41 6.41 6.41 6.41 6.41 6.41
Scenario L1 6.41 6.41 6.41 6.41 6.41 6.41 6.41 6.41 6.41 6.41 6.41 6.41 6.41 6.41 6.42 6.42 6.42 6.42
Scenario L2 6.41 6.43 6.44 6.46 6.47 6.49 6.51 6.52 6.54 6.56 6.57 6.59 6.61 6.63 6.64 6.66 6.68 6.70
Scenario L3 6.41 6.43 6.46 6.48 6.50 6.52 6.55 6.57 6.60 6.62 6.65 6.68 6.71 6.73 6.76 6.79 6.83 6.86
Scenario L4 6.41 6.39 6.37 6.35 6.33 6.31 6.29 6.27 6.25 6.23 6.21 6.19 6.17 6.16 6.14 6.12 6.11 6.09
Scenario L5 6.41 6.40 6.39 6.38 6.36 6.35 6.34 6.33 6.32 6.31 6.30 6.29 6.28 6.27 6.26 6.25 6.24 6.23
Scenario L6 6.41 6.43 6.45 6.47 6.49 6.51 6.53 6.55 6.57 6.59 6.60 6.62 6.64 6.65 6.67 6.69 6.70 6.72

196
Table 104: Farm budget data comparing traditional and modern technology users (revenue and modern inputs)
Revenue
MODERN TRADITIONAL TOTAL MODERN TRADITIONAL TOTAL MODERN TRADITIONAL TOTAL
Cassava 21.90 17.21 18.65 70.23 69.12 69.53 1,538.03 1,189.47 1,296.72
Maize 4.38 3.50 3.94 208.56 164.04 188.79 913.50 574.15 743.83
Wet Season Rice 3.32 2.70 2.89 278.76 252.46 261.43 925.47 681.65 755.53
Dry Season Rice 5.00 4.61 4.80 201.75 211.67 206.73 1,008.75 975.82 992.28
Vegetables 11.96 6.24 9.10 367.59 206.57 312.38 4,396.37 1,289.02 2,842.70
Seeds
MODERN TRADITIONAL TOTAL MODERN TRADITIONAL TOTAL MODERN TRADITIONAL TOTAL
Cassava 25,469.00 21,703.00 22,861.00 0.01 0.01 0.01 254.69 217.03 228.61
Maize 20.60 17.16 18.88 4.06 4.06 4.06 83.62 69.66 76.64
Wet Season Rice 64.35 27.73 38.82 0.66 0.66 0.66 42.47 18.30 25.62
Dry Season Rice 166.34 125.80 146.07 0.74 0.74 0.74 123.09 93.09 108.09
Vegetables 20.56 3.75 12.15 11.60 11.60 11.60 238.47 43.45 140.96
Fertilizer
MODERN TRADITIONAL TOTAL TOTAL MODERN TRADITIONAL TOTAL
Cassava 22.96 9.36 13.55 0.56 0.56 0.56 12.86 5.24 7.59
Maize 104.14 2.68 53.41 0.56 0.56 0.56 58.32 1.50 29.91
Wet Season Rice 176.36 93.32 118.48 0.56 0.56 0.56 98.76 52.26 66.35
Dry Season Rice 351.46 196.39 273.93 0.56 0.56 0.56 196.82 109.98 153.40
Vegetables 550.95 137.66 344.30 0.56 0.56 0.56 308.53 77.09 192.81
Other Inputs
Cassava 65.16 24.48 37.00
Maize 43.61 16.03 29.82
Wet Season Rice 21.27 29.31 26.88
Dry Season Rice 30.35 25.12 27.73
Vegetables 424.30 69.36 246.85
Other input Costs ($/ha)
Seeds by farm size (unit/ha)
Revenue by technology use and total
($/ha)Output Prices by technology use ($/ton)Yield by technology use (tons/ha)
Costs of fertil izers by farm size and total Fertil izer Prices by farm size ($/kg)Fertil izer use by farm size (kg/ha)
Seed Prices by farm size ($/unit) Costs of seeds by farm size and total

197
Table 105: Farm budget data comparing traditional and modern technology users (labor, services, and gross margins)
Labor
MODERN TRADITIONAL TOTAL MODERN TRADITIONAL TOTAL MODERN TRADITIONAL TOTAL
Cassava 56.45 45.40 48.80 4.56 4.56 4.56 257.41 207.03 222.53
Maize 34.16 30.49 31.33 4.56 4.26 4.56 155.78 129.93 142.85
Wet Season Rice 28.69 58.81 48.29 4.56 4.41 4.56 130.84 259.06 220.21
Dry Season Rice 3.82 51.68 27.75 4.56 4.56 4.56 17.41 235.66 126.54
Vegetables 263.68 128.11 175.89 4.56 3.14 4.56 1,202.40 401.76 802.08
Services
MODERN TRADITIONAL TOTAL
Cassava 253.12 314.08 295.32
Maize 175.80 145.55 160.68
Wet Season Rice 232.57 144.37 171.10
Dry Season Rice 245.02 167.55 206.29
Vegetables 68.10 64.79 66.45
Irrigation
MODERN TRADITIONAL TOTAL
Cassava
Maize
Wet Season Rice
Dry Season Rice 141.04 8.33 74.69
Vegetables
Gross Margins
MODERN TRADITIONAL TOTAL
Cassava 694.79 421.61 505.67
Maize 396.37 211.48 303.93
Wet Season Rice 399.56 178.35 245.37
Dry Season Rice 255.02 336.09 295.54
Vegetables 2,154.57 632.57 1,393.55
Irrigation Costs ($/ha)
Gross Margins ($/ha)
Labor use by technology (days/ha) Wage rate by technology ($/day) Costs of labor by technology and total
Service Costs ($/ha)

198
Table 106: Gross margins and NPV (million $) for TFP scenario (baseline)
GROSS MARGINS (million $) --->
Baseline 2013 2014 2015 2016 2017 2018 2019 2020 2021 2022 2023 2024 2025 2026 2027 2028 2029 2030 NPV
Gross Margins: MODERN 0 1 2 3 4 5 6 7 8 9 10 11 12 13 14 15 16 17
Cassava 82.15 82.15 82.15 82.15 82.15 82.15 82.15 82.15 82.15 82.15 82.15 82.15 82.15 82.15 82.15 82.15 82.15 82.15 $786
Maize 34.16 34.16 34.16 34.16 34.16 34.16 34.16 34.16 34.16 34.16 34.16 34.16 34.16 34.16 34.16 34.16 34.16 34.16 $327
Wet Season Rice 397.14 397.14 397.14 397.14 397.14 397.14 397.14 397.14 397.14 397.14 397.14 397.14 397.14 397.14 397.14 397.14 397.14 397.14 $3,801
Dry Season Rice 76.84 76.84 76.84 76.84 76.84 76.84 76.84 76.84 76.84 76.84 76.84 76.84 76.84 76.84 76.84 76.84 76.84 76.84 $735
Vegetables 46.67 46.67 46.67 46.67 46.67 46.67 46.67 46.67 46.67 46.67 46.67 46.67 46.67 46.67 46.67 46.67 46.67 46.67 $447
636.95 636.95 636.95 636.95 636.95 636.95 636.95 636.95 636.95 636.95 636.95 636.95 636.95 636.95 636.95 636.95 636.95 636.95 $6,096
Gross Margins: TRADITIONAL
Cassava 92.57 92.57 92.57 92.57 92.57 92.57 92.57 92.57 92.57 92.57 92.57 92.57 92.57 92.57 92.57 92.57 92.57 92.57 $886
Maize 27.34 27.34 27.34 27.34 27.34 27.34 27.34 27.34 27.34 27.34 27.34 27.34 27.34 27.34 27.34 27.34 27.34 27.34 $262
Wet Season Rice 265.90 265.90 265.90 265.90 265.90 265.90 265.90 265.90 265.90 265.90 265.90 265.90 265.90 265.90 265.90 265.90 265.90 265.90 $2,545
Dry Season Rice 99.91 99.91 99.91 99.91 99.91 99.91 99.91 99.91 99.91 99.91 99.91 99.91 99.91 99.91 99.91 99.91 99.91 99.91 $956
Vegetables 20.55 20.55 20.55 20.55 20.55 20.55 20.55 20.55 20.55 20.55 20.55 20.55 20.55 20.55 20.55 20.55 20.55 20.55 $197
506.28 506.28 506.28 506.28 506.28 506.28 506.28 506.28 506.28 506.28 506.28 506.28 506.28 506.28 506.28 506.28 506.28 506.28 $4,845
Gross Margins: TOTAL
Cassava 174.72 174.72 174.72 174.72 174.72 174.72 174.72 174.72 174.72 174.72 174.72 174.72 174.72 174.72 174.72 174.72 174.72 174.72 $1,672
Maize 61.49 61.49 61.49 61.49 61.49 61.49 61.49 61.49 61.49 61.49 61.49 61.49 61.49 61.49 61.49 61.49 61.49 61.49 $589
Wet Season Rice 663.04 663.04 663.04 663.04 663.04 663.04 663.04 663.04 663.04 663.04 663.04 663.04 663.04 663.04 663.04 663.04 663.04 663.04 $6,345
Dry Season Rice 176.76 176.76 176.76 176.76 176.76 176.76 176.76 176.76 176.76 176.76 176.76 176.76 176.76 176.76 176.76 176.76 176.76 176.76 $1,692
Vegetables 67.23 67.23 67.23 67.23 67.23 67.23 67.23 67.23 67.23 67.23 67.23 67.23 67.23 67.23 67.23 67.23 67.23 67.23 $643
1,143.23 1,143.23 1,143.23 1,143.23 1,143.23 1,143.23 1,143.23 1,143.23 1,143.23 1,143.23 1,143.23 1,143.23 1,143.23 1,143.23 1,143.23 1,143.23 1,143.23 1,143.23 $10,941
93.4% 1,067.90 1,067.90 1,067.90 1,067.90 1,067.90 1,067.90 1,067.90 1,067.90 1,067.90 1,067.90 1,067.90 1,067.90 1,067.90 1,067.90 1,067.90 1,067.90 1,067.90 1,067.90 $10,220
Share of Modern 0.56 0.56 0.56 0.56 0.56 0.56 0.56 0.56 0.56 0.56 0.56 0.56 0.56 0.56 0.56 0.56 0.56 0.56

199
Table 107: Gross margins and NPV (million $) for TFP scenario (scenario P1)
GROSS MARGINS (million $) --->
Scenario T1 2013 2014 2015 2016 2017 2018 2019 2020 2021 2022 2023 2024 2025 2026 2027 2028 2029 2030 NPV
MODERN 0 1 2 3 4 5 6 7 8 9
Cassava 82.15 83.09 84.04 85.01 85.98 86.97 87.97 88.98 90.00 91.03 92.08 93.13 94.20 95.29 96.38 97.49 98.60 99.74 $849
Maize 34.16 34.53 34.90 35.28 35.66 36.05 36.44 36.83 37.23 37.63 38.04 38.45 38.87 39.29 39.72 40.15 40.58 41.02 $351
Wet Season Rice 397.14 401.16 405.22 409.32 413.46 417.65 421.87 426.14 430.46 434.82 439.22 443.66 448.15 452.69 457.27 461.90 466.58 471.30 $4,065
Dry Season Rice 76.84 77.18 77.52 77.87 78.21 78.56 78.91 79.26 79.61 79.96 80.31 80.67 81.03 81.39 81.75 82.11 82.47 82.84 $757
Vegetables 46.67 47.76 48.87 50.01 51.17 52.36 53.58 54.82 56.10 57.40 58.74 60.10 61.50 62.93 64.40 65.89 67.43 68.99 $523
636.95 643.71 650.55 657.48 664.49 671.58 678.76 686.03 693.39 700.84 708.39 716.02 723.76 731.58 739.51 747.53 755.66 763.89 $6,545
- 1.1% 2.1% 3.2% 4.3% 5.4% 6.6% 7.7% 8.9% 10.0% 11.2% 12.4% 13.6% 14.9% 16.1% 17.4% 18.6% 19.9%
TRADITIONAL
Cassava 92.57 92.57 92.57 92.57 92.57 92.57 92.57 92.57 92.57 92.57 92.57 92.57 92.57 92.57 92.57 92.57 92.57 92.57 $886
Maize 27.34 27.34 27.34 27.34 27.34 27.34 27.34 27.34 27.34 27.34 27.34 27.34 27.34 27.34 27.34 27.34 27.34 27.34 $262
Wet Season Rice 265.90 265.90 265.90 265.90 265.90 265.90 265.90 265.90 265.90 265.90 265.90 265.90 265.90 265.90 265.90 265.90 265.90 265.90 $2,545
Dry Season Rice 99.91 99.91 99.91 99.91 99.91 99.91 99.91 99.91 99.91 99.91 99.91 99.91 99.91 99.91 99.91 99.91 99.91 99.91 $956
Vegetables 20.55 20.55 20.55 20.55 20.55 20.55 20.55 20.55 20.55 20.55 20.55 20.55 20.55 20.55 20.55 20.55 20.55 20.55 $197
506.28 506.28 506.28 506.28 506.28 506.28 506.28 506.28 506.28 506.28 506.28 506.28 506.28 506.28 506.28 506.28 506.28 506.28 $4,845
- 0.0% 0.0% 0.0% 0.0% 0.0% 0.0% 0.0% 0.0% 0.0% 0.0% 0.0% 0.0% 0.0% 0.0% 0.0% 0.0% 0.0%
TOTAL
Cassava 174.72 175.66 176.61 177.58 178.56 179.54 180.54 181.55 182.57 183.61 184.65 185.71 186.78 187.86 188.95 190.06 191.18 192.31 $1,735
Maize 61.49 61.86 62.24 62.62 63.00 63.38 63.77 64.17 64.57 64.97 65.38 65.79 66.21 66.63 67.05 67.48 67.92 68.36 $613
Wet Season Rice 663.04 667.06 671.12 675.22 679.36 683.55 687.78 692.05 696.36 700.72 705.12 709.56 714.06 718.59 723.17 727.80 732.48 737.20 $6,610
Dry Season Rice 176.76 177.10 177.44 177.78 178.13 178.47 178.82 179.17 179.52 179.87 180.23 180.58 180.94 181.30 181.66 182.02 182.38 182.75 $1,713
Vegetables 67.23 68.31 69.42 70.56 71.72 72.91 74.13 75.38 76.65 77.96 79.29 80.66 82.06 83.49 84.95 86.45 87.98 89.55 $720
1,143.23 1,149.99 1,156.83 1,163.76 1,170.76 1,177.86 1,185.04 1,192.31 1,199.67 1,207.12 1,214.67 1,222.30 1,230.03 1,237.86 1,245.79 1,253.81 1,261.94 1,270.17 $11,391
- 0.6% 1.2% 1.8% 2.4% 3.0% 3.7% 4.3% 4.9% 5.6% 6.2% 6.9% 7.6% 8.3% 9.0% 9.7% 10.4% 11.1%
93.4% 1,067.90 1,074.21 1,080.60 1,087.07 1,093.62 1,100.25 1,106.95 1,113.75 1,120.62 1,127.58 1,134.63 1,141.76 1,148.98 1,156.29 1,163.70 1,171.19 1,178.78 1,186.47 $10,640
Share of Modern 0.56 0.56 0.56 0.56 0.57 0.57 0.57 0.58 0.58 0.58 0.58 0.59 0.59 0.59 0.59 0.60 0.60 0.60

200
Table 108: Gross margins and NPV (million $) for TFP scenario (scenario P2)
GROSS MARGINS (million $) --->
Scenario T2 2013 2014 2015 2016 2017 2018 2019 2020 2021 2022 2023 2024 2025 2026 2027 2028 2029 2030 NPV
MODERN
Cassava 82.15 85.43 88.85 92.40 96.10 99.94 103.94 108.10 112.42 116.92 121.59 126.46 131.52 136.78 142.25 147.94 153.86 160.01 $1,037
Maize 34.16 35.52 36.95 38.42 39.96 41.56 43.22 44.95 46.75 48.62 50.56 52.58 54.69 56.88 59.15 61.52 63.98 66.54 $431
Wet Season Rice 397.14 413.02 429.54 446.72 464.59 483.18 502.50 522.60 543.51 565.25 587.86 611.37 635.83 661.26 687.71 715.22 743.83 773.58 $5,013
Dry Season Rice 76.84 79.92 83.11 86.44 89.90 93.49 97.23 101.12 105.16 109.37 113.75 118.30 123.03 127.95 133.07 138.39 143.92 149.68 $970
Vegetables 46.67 48.54 50.48 52.50 54.60 56.78 59.06 61.42 63.87 66.43 69.09 71.85 74.72 77.71 80.82 84.05 87.42 90.91 $589
636.95 662.43 688.93 716.49 745.15 774.95 805.95 838.19 871.72 906.58 942.85 980.56 1,019.78 1,060.57 1,103.00 1,147.12 1,193.00 1,240.72 $8,040
- 4.0% 8.2% 12.5% 17.0% 21.7% 26.5% 31.6% 36.9% 42.3% 48.0% 53.9% 60.1% 66.5% 73.2% 80.1% 87.3% 94.8%
TRADITIONAL
Cassava 92.57 90.58 88.51 86.35 84.11 81.77 79.35 76.82 74.20 71.47 68.63 65.68 62.61 59.42 56.10 52.65 49.06 45.32 $734
Maize 27.34 26.61 25.85 25.06 24.24 23.39 22.50 21.58 20.62 19.62 18.58 17.51 16.38 15.22 14.00 12.74 11.43 10.06 $206
Wet Season Rice 265.90 258.81 251.44 243.77 235.79 227.50 218.87 209.90 200.57 190.86 180.77 170.27 159.36 148.01 136.20 123.92 111.15 97.87 $2,004
Dry Season Rice 99.91 97.25 94.48 91.60 88.60 85.48 82.24 78.87 75.36 71.72 67.92 63.98 59.88 55.61 51.18 46.56 41.76 36.77 $753
Vegetables 20.55 20.01 19.44 18.84 18.23 17.59 16.92 16.22 15.50 14.75 13.97 13.16 12.32 11.44 10.53 9.58 8.59 7.57 $155
506.28 493.25 479.71 465.62 450.96 435.73 419.88 403.40 386.25 368.43 349.89 330.60 310.55 289.70 268.01 245.45 221.99 197.59 $3,851
- -2.6% -5.2% -8.0% -10.9% -13.9% -17.1% -20.3% -23.7% -27.2% -30.9% -34.7% -38.7% -42.8% -47.1% -51.5% -56.2% -61.0%
TOTAL
Cassava 174.72 176.01 177.35 178.75 180.20 181.72 183.29 184.92 186.62 188.39 190.23 192.14 194.13 196.20 198.35 200.59 202.91 205.33 $1,771
Maize 61.49 62.13 62.80 63.48 64.20 64.95 65.72 66.53 67.37 68.24 69.15 70.09 71.07 72.09 73.15 74.26 75.40 76.60 $637
Wet Season Rice 663.04 671.83 680.98 690.49 700.38 710.67 721.37 732.50 744.07 756.11 768.63 781.65 795.19 809.27 823.91 839.14 854.98 871.45 $7,016
Dry Season Rice 176.76 177.16 177.59 178.03 178.49 178.97 179.47 179.99 180.53 181.09 181.67 182.28 182.91 183.56 184.24 184.95 185.69 186.46 $1,723
Vegetables 67.23 68.55 69.92 71.34 72.83 74.37 75.97 77.64 79.38 81.18 83.06 85.01 87.04 89.15 91.35 93.63 96.01 98.48 $744
1,143.23 1,155.68 1,168.63 1,182.10 1,196.11 1,210.68 1,225.83 1,241.58 1,257.97 1,275.01 1,292.73 1,311.17 1,330.34 1,350.27 1,371.01 1,392.57 1,414.99 1,438.32 $11,891
- 1.1% 2.2% 3.4% 4.6% 5.9% 7.2% 8.6% 10.0% 11.5% 13.1% 14.7% 16.4% 18.1% 19.9% 21.8% 23.8% 25.8%
93.4% 1,067.90 1,079.53 1,091.63 1,104.21 1,117.29 1,130.90 1,145.05 1,159.77 1,175.08 1,190.99 1,207.55 1,224.77 1,242.67 1,261.30 1,280.66 1,300.81 1,321.75 1,343.54 $11,107
Share of Modern 0.56 0.57 0.59 0.61 0.62 0.64 0.66 0.68 0.69 0.71 0.73 0.75 0.77 0.79 0.80 0.82 0.84 0.86

201
Table 109: Gross margins and NPV (million $) for TFP scenario (scenario P3)
GROSS MARGINS (million $) --->
Scenario T3 2013 2014 2015 2016 2017 2018 2019 2020 2021 2022 2023 2024 2025 2026 2027 2028 2029 2030 NPV
MODERN
Cassava 82.15 86.41 90.90 95.62 100.59 105.81 111.31 117.09 123.17 129.57 136.30 143.38 150.82 158.66 166.90 175.57 184.68 194.28 $1,132
Maize 34.16 35.91 37.75 39.68 41.72 43.86 46.11 48.47 50.95 53.57 56.31 59.20 62.23 65.42 68.78 72.30 76.01 79.90 $468
Wet Season Rice 397.14 417.20 438.28 460.43 483.69 508.13 533.81 560.78 589.11 618.88 650.15 683.00 717.51 753.76 791.85 831.86 873.89 918.04 $5,417
Dry Season Rice 76.84 80.27 83.85 87.59 91.50 95.58 99.84 104.30 108.95 113.81 118.88 124.19 129.73 135.51 141.56 147.87 154.47 161.36 $1,003
Vegetables 46.67 49.67 52.86 56.25 59.86 63.70 67.79 72.14 76.77 81.70 86.95 92.53 98.47 104.79 111.51 118.67 126.29 134.39 $706
636.95 669.46 703.64 739.57 777.36 817.08 858.85 902.77 948.96 997.52 1,048.59 1,102.29 1,158.76 1,218.14 1,280.59 1,346.27 1,415.34 1,487.98 $8,727
- 5.1% 10.5% 16.1% 22.0% 28.3% 34.8% 41.7% 49.0% 56.6% 64.6% 73.1% 81.9% 91.2% 101.0% 111.4% 122.2% 133.6%
TRADITIONAL
Cassava 92.57 90.58 88.51 86.35 84.11 81.77 79.35 76.82 74.20 71.47 68.63 65.68 62.61 59.42 56.10 52.65 49.06 45.32 $734
Maize 27.34 26.61 25.85 25.06 24.24 23.39 22.50 21.58 20.62 19.62 18.58 17.51 16.38 15.22 14.00 12.74 11.43 10.06 $206
Wet Season Rice 265.90 258.81 251.44 243.77 235.79 227.50 218.87 209.90 200.57 190.86 180.77 170.27 159.36 148.01 136.20 123.92 111.15 97.87 $2,004
Dry Season Rice 99.91 97.25 94.48 91.60 88.60 85.48 82.24 78.87 75.36 71.72 67.92 63.98 59.88 55.61 51.18 46.56 41.76 36.77 $753
Vegetables 20.55 20.01 19.44 18.84 18.23 17.59 16.92 16.22 15.50 14.75 13.97 13.16 12.32 11.44 10.53 9.58 8.59 7.57 $155
506.28 493.25 479.71 465.62 450.96 435.73 419.88 403.40 386.25 368.43 349.89 330.60 310.55 289.70 268.01 245.45 221.99 197.59 $3,851
- -2.6% -5.2% -8.0% -10.9% -13.9% -17.1% -20.3% -23.7% -27.2% -30.9% -34.7% -38.7% -42.8% -47.1% -51.5% -56.2% -61.0%
TOTAL
Cassava 174.72 176.99 179.41 181.97 184.69 187.59 190.66 193.91 197.37 201.04 204.93 209.06 213.44 218.08 223.00 228.21 233.74 239.60 $1,866
Maize 61.49 62.52 63.60 64.75 65.96 67.25 68.61 70.05 71.57 73.19 74.90 76.70 78.62 80.64 82.78 85.04 87.44 89.97 $674
Wet Season Rice 663.04 676.01 689.72 704.19 719.48 735.63 752.67 770.67 789.68 809.74 830.92 853.27 876.87 901.77 928.05 955.78 985.04 1,015.91 $7,420
Dry Season Rice 176.76 177.52 178.33 179.19 180.10 181.06 182.08 183.16 184.31 185.52 186.81 188.17 189.60 191.13 192.73 194.43 196.23 198.13 $1,756
Vegetables 67.23 69.67 72.29 75.09 78.09 81.29 84.71 88.37 92.28 96.45 100.92 105.69 110.78 116.23 122.04 128.25 134.88 141.96 $861
1,143.23 1,162.71 1,183.34 1,205.19 1,228.32 1,252.81 1,278.73 1,306.17 1,335.21 1,365.95 1,398.47 1,432.89 1,469.31 1,507.84 1,548.60 1,591.72 1,637.33 1,685.57 $12,578
1.7% 3.5% 5.4% 7.4% 9.6% 11.9% 14.3% 16.8% 19.5% 22.3% 25.3% 28.5% 31.9% 35.5% 39.2% 43.2% 47.4%
93.4% 1,067.90 1,086.10 1,105.37 1,125.77 1,147.38 1,170.25 1,194.47 1,220.10 1,247.23 1,275.94 1,306.32 1,338.47 1,372.49 1,408.48 1,446.56 1,486.83 1,529.44 1,574.50 $11,749
Share of Modern 0.56 0.58 0.59 0.61 0.63 0.65 0.67 0.69 0.71 0.73 0.75 0.77 0.79 0.81 0.83 0.85 0.86 0.88

202
Table 110: Summary of gross margins for TFP scenarios
Gross Margins in
2013 ($ million)
Gross Margins in 2030 ($
Million)
NPV at CPI ($
Million) % Change NPV
Baseline 1,067.90 1,067.90 10,220
No Move + Efficiency 1,067.90 1,186.47 10,640 4.1%
Move from Traditional to
Modern 1,067.90 1,343.54 11,107 8.7%
Move + Efficiency 1,067.90 1,574.50 11,749 15.0%
Table 111: Examples of costs of irrigation investment (per unit and total investment)
Examples of irrigation costs Cost in
$/ha
Newly Irrigated Areas (ha) Total Investment (Million $) with Scenario T4
South Asia 1,400 454,543 636.36
Average 2,500 454,543 1,136.36
East Asia 4,000 454,543 1,818.17

203
Table 112: Demand for labor and return to labor for TFP scenarios

204
Table 113: Demand for fertilizers for TFP scenarios

205
Table 114: Cultivated land and gross margins for scenario P4 (TFP through irrigation)
Baseline 2013 2014 2015 2016 2017 2018 2019 2020 2021 2022 2023 2024 2025 2026 2027 2028 2029 2030
Cultivated Areas 0 1 2 3 4 5 6 7 8 9 10 11 12 13 14 15 16 17
Cassava 337,800 337,800 337,800 337,800 337,800 337,800 337,800 337,800 337,800 337,800 337,800 337,800 337,800 337,800 337,800 337,800 337,800 337,800
Maize 215,442 215,442 215,442 215,442 215,442 215,442 215,442 215,442 215,442 215,442 215,442 215,442 215,442 215,442 215,442 215,442 215,442 215,442
Wet Season Rice 2,484,832 2,484,832 2,484,832 2,484,832 2,484,832 2,484,832 2,484,832 2,484,832 2,484,832 2,484,832 2,484,832 2,484,832 2,484,832 2,484,832 2,484,832 2,484,832 2,484,832 2,484,832
Dry Season Rice 495,465 495,465 495,465 495,465 495,465 495,465 495,465 495,465 495,465 495,465 495,465 495,465 495,465 495,465 495,465 495,465 495,465 495,465
Vegetables 54,155 54,155 54,155 54,155 54,155 54,155 54,155 54,155 54,155 54,155 54,155 54,155 54,155 54,155 54,155 54,155 54,155 54,155
3,587,694 3,587,694 3,587,694 3,587,694 3,587,694 3,587,694 3,587,694 3,587,694 3,587,694 3,587,694 3,587,694 3,587,694 3,587,694 3,587,694 3,587,694 3,587,694 3,587,694 3,587,694
Cultivated Land - 0.0% 0.0% 0.0% 0.0% 0.0% 0.0% 0.0% 0.0% 0.0% 0.0% 0.0% 0.0% 0.0% 0.0% 0.0% 0.0% 0.0%
Scenario T4 0 1 2 3 4 5 6 7 8 9 10 11 12 13 14 15 16 17
Cassava 337,800 337,800 337,800 337,800 337,800 337,800 337,800 337,800 337,800 337,800 337,800 337,800 337,800 337,800 337,800 337,800 337,800 337,800
Maize 215,442 215,442 215,442 215,442 215,442 215,442 215,442 215,442 215,442 215,442 215,442 215,442 215,442 215,442 215,442 215,442 215,442 215,442
Wet Season Rice 2,484,832 2,435,135 2,386,433 2,338,704 2,291,930 2,246,091 2,201,169 2,157,146 2,114,003 2,071,723 2,030,289 1,989,683 1,949,889 1,910,891 1,872,674 1,835,220 1,798,516 1,762,545
Dry Season Rice 495,465 594,858 692,264 787,721 881,269 972,946 1,062,790 1,150,837 1,237,123 1,321,683 1,404,552 1,485,763 1,565,351 1,643,346 1,719,782 1,794,689 1,868,098 1,940,038
Vegetables 54,155 54,155 54,155 54,155 54,155 54,155 54,155 54,155 54,155 54,155 54,155 54,155 54,155 54,155 54,155 54,155 54,155 54,155
3,587,694 3,637,391 3,686,093 3,733,822 3,780,596 3,826,435 3,871,357 3,915,380 3,958,523 4,000,803 4,042,237 4,082,843 4,122,637 4,161,635 4,199,852 4,237,306 4,274,010 4,309,981
Gross Margins 2013 2014 2015 2016 2017 2018 2019 2020 2021 2022 2023 2024 2025 2026 2027 2028 2029 2030
Scenario T4 0 1 2 3 4 5 6 7 8 9 10 11 12 13 14 15 16 17
Cassava 170.82 170.82 170.82 170.82 170.82 170.82 170.82 170.82 170.82 170.82 170.82 170.82 170.82 170.82 170.82 170.82 170.82 170.82
Maize 65.48 65.48 65.48 65.48 65.48 65.48 65.48 65.48 65.48 65.48 65.48 65.48 65.48 65.48 65.48 65.48 65.48 65.48
Wet Season Rice 609.70 597.51 585.56 573.85 562.37 551.12 540.10 529.30 518.71 508.34 498.17 488.21 478.44 468.88 459.50 450.31 441.30 432.48
Dry Season Rice 183.44 220.23 256.30 291.64 326.27 360.21 393.48 426.07 458.02 489.33 520.01 550.07 579.54 608.42 636.71 664.45 691.63 718.26
Vegetables 75.47 75.47 75.47 75.47 75.47 75.47 75.47 75.47 75.47 75.47 75.47 75.47 75.47 75.47 75.47 75.47 75.47 75.47
1,104.90 1,129.51 1,153.62 1,177.25 1,200.41 1,223.10 1,245.34 1,267.14 1,288.50 1,309.43 1,329.94 1,350.04 1,369.75 1,389.05 1,407.98 1,426.52 1,444.69 1,462.50
0.0% 2.2% 4.4% 6.5% 8.6% 10.7% 12.7% 14.7% 16.6% 18.5% 20.4% 22.2% 24.0% 25.7% 27.4% 29.1% 30.8% 32.4%
GROSS MARGINS (million $)

206
Table 115: Gross margins on competitiveness (scenarios C1 through C6)

207
Continued…
Table 116: Summary of gross margins and NPV for Competitiveness scenarios (C1 through C6)
Gross Margins 2019
(million $)
Gross Margins 2030
(million $)
NPV at CPI
(million $) NPV Changes
Baseline 1,068 1,068 10,220
C1: Equal Increase 1,147 1,244 10,986 7.5%
C2:↑ Output price half of ↑ inputs 629 (1,577) 3,761 -63.2%
C3: Wage Rate ↑ 50% 569 (1,348) 3,655 -64.2%
C4: Cost of Services ↑ 25% 983 799 9,290 -9.1%
C5: Output price ↓ 15% 794 358 7,449 -27.1%
C6: Output price ↑ 15% 1,650 3,020 16,739 63.8%

208
Table 117: Return to labor for Competitiveness scenarios (C1 through C6)

209
Continued…

210
Table 118: Demand for labor and demand for fertilizers with Competitiveness scenarios
Assumptions: Price change will not affect demand for labor (Inelastic demand) - Changes are due to change on cultivated areas
DEMAND FOR LABOR (Million days)
All Scenarii 2013 2014 2015 2016 2017 2018 2019 2020 2021 2022 2023 2024 2025 2026 2027 2028 2029 2030
DEMAND FOR LABOR (Million days) 0 1 2 3 4 5 6 7 8 9 9 9 9 9 9 9 9 9
Cassava 16.48 16.48 16.48 16.48 16.48 16.48 16.48 16.48 16.48 16.48 16.48 16.48 16.48 16.48 16.48 16.48 16.48 16.48
Maize 6.75 6.75 6.75 6.75 6.75 6.75 6.75 6.75 6.75 6.75 6.75 6.75 6.75 6.75 6.75 6.75 6.75 6.75
Wet Season Rice 120.00 120.00 120.00 120.00 120.00 120.00 120.00 120.00 120.00 120.00 120.00 120.00 120.00 120.00 120.00 120.00 120.00 120.00
Dry Season Rice 13.75 13.75 13.75 13.75 13.75 13.75 13.75 13.75 13.75 13.75 13.75 13.75 13.75 13.75 13.75 13.75 13.75 13.75
Vegetables 9.53 9.53 9.53 9.53 9.53 9.53 9.53 9.53 9.53 9.53 9.53 9.53 9.53 9.53 9.53 9.53 9.53 9.53
166.51 166.51 166.51 166.51 166.51 166.51 166.51 166.51 166.51 166.51 166.51 166.51 166.51 166.51 166.51 166.51 166.51 166.51
- 0.0% 0.0% 0.0% 0.0% 0.0% 0.0% 0.0% 0.0% 0.0% 0.0% 0.0% 0.0% 0.0% 0.0% 0.0% 0.0% 0.0%
Assumptions: Price change will not affect demand for fertil izers (Inelastic demand) - Changes are due to change on cultivated areas
DEMAND FOR FERTILIZERS (tons)
All Scenarii 2013 2014 2015 2016 2017 2018 2019 2020 2021 2022 2023 2024 2025 2026 2027 2028 2029 2030
DEMAND FOR FERTILIZERS (tons) 0 1 2 3 4 5 6 7 8 9 9 9 9 9 9 9 9 9
Cassava 4,578 4,578 4,578 4,578 4,578 4,578 4,578 4,578 4,578 4,578 4,578 4,578 4,578 4,578 4,578 4,578 4,578 4,578
Maize 11,507 11,507 11,507 11,507 11,507 11,507 11,507 11,507 11,507 11,507 11,507 11,507 11,507 11,507 11,507 11,507 11,507 11,507
Wet Season Rice 294,408 294,408 294,408 294,408 294,408 294,408 294,408 294,408 294,408 294,408 294,408 294,408 294,408 294,408 294,408 294,408 294,408 294,408
Dry Season Rice 135,722 135,722 135,722 135,722 135,722 135,722 135,722 135,722 135,722 135,722 135,722 135,722 135,722 135,722 135,722 135,722 135,722 135,722
Vegetables 18,646 18,646 18,646 18,646 18,646 18,646 18,646 18,646 18,646 18,646 18,646 18,646 18,646 18,646 18,646 18,646 18,646 18,646
464,861 464,861 464,861 464,861 464,861 464,861 464,861 464,861 464,861 464,861 464,861 464,861 464,861 464,861 464,861 464,861 464,861 464,861
- 0.0% 0.0% 0.0% 0.0% 0.0% 0.0% 0.0% 0.0% 0.0% 0.0% 0.0% 0.0% 0.0% 0.0% 0.0% 0.0% 0.0%

211
Table 119: Characteristics of rice production: fragrant vs. IRRI
Revenue 150%
FRAGRANT OTHER TOTAL FRAGRANT OTHER TOTAL FRAGRANT OTHER TOTAL FRAGRANT
Wet Season Rice 2.50 2.91 2.89 444.52 254.01 261.43 1,111.29 739.30 757.90 1,587.56
Dry Season Rice 3.50 4.87 4.80 352.14 201.22 206.73 1,232.47 979.62 992.27 1,760.68
Seeds
FRAGRANT OTHER TOTAL FRAGRANT OTHER TOTAL FRAGRANT OTHER TOTAL FRAGRANT
Wet Season Rice 38.82 38.82 38.82 1.32 0.63 0.66 51.24 24.26 25.61 51.24
Dry Season Rice 146.07 146.07 146.07 1.48 0.70 0.74 216.18 102.40 108.08 216.18
Fertilizer
FRAGRANT IRRI TOTAL FRAGRANT IRRI TOTAL FRAGRANT IRRI TOTAL FRAGRANT
Wet Season Rice 118.48 118.48 118.48 0.56 0.56 0.56 66.35 66.35 66.35 66.35
Dry Season Rice 273.93 273.93 273.93 0.56 0.56 0.56 153.40 153.40 153.40 153.40
Other Inputs
FRAGRANT IRRI TOTAL FRAGRANT
Wet Season Rice 26.88 26.88 26.88 26.88
Dry Season Rice 27.73 27.73 27.73 27.73
Labor
FRAGRANT IRRI TOTAL FRAGRANT IRRI TOTAL FRAGRANT IRRI TOTAL FRAGRANT
Wet Season Rice 48.29 48.29 48.29 4.56 4.56 4.56 220.21 220.21 220.21 220.21
Dry Season Rice 27.75 27.75 27.75 4.56 4.56 4.56 126.54 126.54 126.54 126.54
Services
FRAGRANT IRRI TOTAL FRAGRANT
Wet Season Rice 171.10 171.10 171.10 171.10
Dry Season Rice 206.29 206.29 206.29 206.29
Irrigation
FRAGRANT IRRI TOTAL FRAGRANT
Wet Season Rice -
Dry Season Rice 74.69 74.69 74.69 74.69
Gross Margins
FRAGRANT IRRI TOTAL FRAGRANT
Wet Season Rice 575.51 230.50 247.75 1,051.78
Dry Season Rice 427.64 288.58 295.53 955.84
Labor use by technology (days/ha) Wage rate by technology ($/day) Costs of labor by technology and total
Yield by technology use (tons/ha) Output Prices by technology use ($/ton) Revenue by technology use and total
Seeds by farm size (unit/ha) Seed Prices by farm size ($/unit) Costs of seeds by farm size and total
Fertil izer use by farm size (kg/ha) Fertil izer Prices by farm size ($/kg) Costs of fertil izers by farm size and total
Other input Costs ($/ha)
Service Costs ($/ha)
Irrigation Costs ($/ha)
Gross Margins ($/ha)

212
Table 120: Cultivated land areas for fragrant rice Income Growth scenarios

213
Table 121: Gross margins for fragrant rice Income Growth scenarios

214
Table 122: Summary of gross margins for fragrant rice Income Growth scenarios
Gross Margins 2014
(million $)
Gross Margins 2030
(million $)
NPV at CPI
(million $) % Change NPV
Baseline 762.04 762.04 7,293
Fragrant 10%, Price 100% 763.99 808.94 7,443 2.1%
Fragrant 25%, price 100% 766.63 946.21 7,774 6.6%
Table 123: Demand for labor, return to labor and demand for fertilizers for fragrant rice Income Growth scenarios
Baseline 2013 2014 2015 2016 2017 2018 2019 2020 2021 2022 2023 2024 2025 2026 2027 2028 2029 2030
Scenario R1 0 1 2 3 4 5 6 7 8 9 10 11 12 13 14 15 16 17
Wet Season Rice 120.30 120.30 120.30 120.30 120.30 120.30 120.30 120.30 120.30 120.30 120.30 120.30 120.30 120.30 120.30 120.30 120.30 120.30
Dry Season Rice 13.78 13.78 13.78 13.78 13.78 13.78 13.78 13.78 13.78 13.78 13.78 13.78 13.78 13.78 13.78 13.78 13.78 13.78
134.08 134.08 134.08 134.08 134.08 134.08 134.08 134.08 134.08 134.08 134.08 134.08 134.08 134.08 134.08 134.08 134.08 134.08
2013 2014 2015 2016 2017 2018 2019 2020 2021 2022 2023 2024 2025 2026 2027 2028 2029 2030
Baseline 5.68 5.68 5.68 5.68 5.68 5.68 5.68 5.68 5.68 5.68 5.68 5.68 5.68 5.68 5.68 5.68 5.68 5.68
Fragrant 10%, Price 100% 5.68 5.70 5.71 5.73 5.75 5.76 5.78 5.80 5.82 5.84 5.86 5.88 5.90 5.93 5.95 5.98 6.01 6.03
Fragrant 25%, price 100% 5.68 5.72 5.76 5.80 5.84 5.89 5.95 6.01 6.07 6.15 6.23 6.31 6.41 6.52 6.63 6.76 6.90 7.06
Baseline 2013 2014 2015 2016 2017 2018 2019 2020 2021 2022 2023 2024 2025 2026 2027 2028 2029 2030
0 1 2 3 4 5 6 7 8 9 10 11 12 13 14 15 16 17
Wet Season Rice 294,408 294,408 294,408 294,408 294,408 294,408 294,408 294,408 294,408 294,408 294,408 294,408 294,408 294,408 294,408 294,408 294,408 294,408
Dry Season Rice 135,722 135,722 135,722 135,722 135,722 135,722 135,722 135,722 135,722 135,722 135,722 135,722 135,722 135,722 135,722 135,722 135,722 135,722
430,130 430,130 430,130 430,130 430,130 430,130 430,130 430,130 430,130 430,130 430,130 430,130 430,130 430,130 430,130 430,130 430,130 430,130
Land under Cultivation (Ha)
2013 2014 2015 2016 2017 2018 2019 2020 2021 2022 2023 2024 2025 2026 2027 2028 2029 2030
Fragrant (10%) 149,015 149,015 155,273 161,795 168,590 175,671 183,049 190,737 198,748 207,096 215,794 224,857 234,301 244,142 254,396 265,080 276,214 287,815
Other (90%) 2,831,282 2,831,282 2,825,024 2,818,502 2,811,707 2,804,626 2,797,248 2,789,560 2,781,549 2,773,201 2,764,503 2,755,440 2,745,996 2,736,155 2,725,901 2,715,217 2,704,083 2,692,482
Fragrant (25%) 149,015 163,767 179,980 197,798 217,380 238,901 262,552 288,545 317,111 348,505 383,007 420,924 462,596 508,393 558,724 614,038 674,827 741,635
Other (75%) 2,831,282 2,816,530 2,800,317 2,782,499 2,762,917 2,741,396 2,717,745 2,691,752 2,663,186 2,631,792 2,597,290 2,559,373 2,517,701 2,471,904 2,421,573 2,366,259 2,305,470 2,238,662
AVERAGE RETURN TO LABOR ($/DAY)
DEMAND FOR FERTILIZERS (Tons)
DEMAND FOR LABOR (Million days)

215
Table 124: Cultivated land areas for cassava processing Income Growth scenarios

216
Table 125: Gross margins for cassava processing Income Growth scenarios (million $)

217
Table 126: Comparison between fresh cassava and dry chips production
Cultivated land areas
2013 Level
(Ha) % Processed
Cassava 337,800 5%
Revenue
PROCESSED OTHER PROCESSED OTHER TOTAL PROCESSED OTHER TOTAL
Cassava 9.15 16.90 158.60 72.32 1,451.19 1,222.21
Costs w/o labor
PROCESSED OTHER TOTAL PROCESSED OTHER TOTAL PROCESSED OTHER TOTAL
Cassava 581.00 575.00 1.00 1.00 581.00 575.00
Labor Costs
PROCESSED OTHER TOTAL PROCESSED OTHER TOTAL PROCESSED OTHER TOTAL
Cassava 220.00 196.78 1.00 1.00 220.00 196.78
Gross Margins
PROCESSED OTHER TOTAL
Cassava 650.19 450.43
Yield by technology use (tons/ha) Output Prices by technology use ($/ton) Revenue by technology use and total
Gross Margins ($/ha)

218
Table 127: Demand for labor and return to labor for cassava processing Income Growth scenarios
Baseline 2013 2014 2015 2016 2017 2018 2019 2020 2021 2022 2023 2024 2025 2026 2027 2028 2029 2030
Baseline 14.66 14.66 14.66 14.66 14.66 14.66 14.66 14.66 14.66 14.66 14.66 14.66 14.66 14.66 14.66 14.66 14.66 14.66
Processed 5%, Price 50% higher 14.66 14.67 14.67 14.67 14.68 14.68 14.69 14.69 14.70 14.70 14.71 14.71 14.72 14.72 14.73 14.74 14.74 14.75
Processed 10%, Price 50% higher 14.66 14.67 14.68 14.69 14.70 14.72 14.73 14.74 14.76 14.78 14.80 14.82 14.84 14.87 14.90 14.93 14.97 15.01
2013 2014 2015 2016 2017 2018 2019 2020 2021 2022 2023 2024 2025 2026 2027 2028 2029 2030
Baseline 10.61 10.60 10.60 10.60 10.60 10.59 10.59 10.59 10.58 10.58 10.58 10.57 10.57 10.56 10.56 10.55 10.55 10.54
Processed 5%, Price 50% higher 10.61 10.61 10.62 10.63 10.64 10.64 10.65 10.66 10.67 10.68 10.69 10.70 10.71 10.72 10.74 10.75 10.76 10.78
Processed 10%, Price 50% higher 10.61 10.63 10.65 10.67 10.70 10.73 10.76 10.80 10.84 10.89 10.94 10.99 11.05 11.12 11.19 11.27 11.36 11.45
Land under Cultivation (Ha)
2013 2014 2015 2016 2017 2018 2019 2020 2021 2022 2023 2024 2025 2026 2027 2028 2029 2030
Cultivated land: PROCESSED 10% 16,890 17,599 18,339 19,109 19,911 20,748 21,619 22,527 23,473 24,459 25,486 26,557 27,672 28,834 30,045 31,307 32,622 33,992
Cultivated land: OTHER 90% 320,910 320,201 319,461 318,691 317,889 317,052 316,181 315,273 314,327 313,341 312,314 311,243 310,128 308,966 307,755 306,493 305,178 303,808
5.3% 5.5% 5.7% 6.0% 6.3% 6.5% 6.8% 7.1% 7.5% 7.8% 8.2% 8.5% 8.9% 9.3% 9.8% 10.2% 10.7% 11.2%
Cultivated land: PROCESSED 25% 16,890 18,562 20,400 22,419 24,639 27,078 29,759 32,705 35,943 39,501 43,412 47,709 52,433 57,624 63,328 69,598 76,488 84,060
Cultivated land: OTHER 75% 320,910 319,238 317,400 315,381 313,161 310,722 308,041 305,095 301,857 298,299 294,388 290,091 285,367 280,176 274,472 268,202 261,312 253,740
5.3% 5.8% 6.4% 7.1% 7.9% 8.7% 9.7% 10.7% 11.9% 13.2% 14.7% 16.4% 18.4% 20.6% 23.1% 25.9% 29.3% 33.1%
AVERAGE RETURN TO LABOR ($/DAY)
DEMAND FOR LABOR (Million days)

219
Table 128: Distribution and farm budget by farm size
Cultivated Areas Past growth Rate
SMALL MEDIUM LARGE TOTAL SMALL MEDIUM LARGE
Cassava 57% 36% 7% 100% 192,546 121,608 23,646 337,800 33.1% 2.64 6.57
Maize 47% 41% 12% 100% 101,258 88,331 25,853 215,442 9.7% 0.75 2.34
Wet Season Rice 60% 31% 9% 100% 1,490,899 770,298 223,635 2,484,832 2.6% 0.56 1.28
Dry Season Rice 60% 31% 9% 100% 297,279 153,594 44,592 495,465 6.8% 0.71 2.28
Vegetables 75% 21% 4% 100% 40,616 11,373 2,166 54,155 7.8% 0.19 0.84 2,122,598 1,145,204 319,892 3,587,694 1.0 5
Revenue
SMALL MEDIUM LARGE AVERAGE SMALL MEDIUM LARGE AVERAGE SMALL MEDIUM LARGE TOTAL
Cassava 19.65 18.07 17.79 18.95 69.58 64.40 73.99 68.02 1,367.17 1,163.69 1,316.24 1,290.35
Maize 3.73 3.73 4.32 3.80 210.43 202.28 161.06 201.16 784.91 754.49 695.77 761.74
Wet Season Rice 2.68 2.89 3.12 2.78 285.43 266.47 229.43 274.51 764.94 770.10 715.82 762.12
Dry Season Rice 4.70 4.48 5.18 4.68 211.60 210.16 199.94 210.10 994.52 941.51 1,035.68 981.79
Vegetables 9.74 6.00 6.67 8.83 331.28 193.75 160.94 295.58 3,226.66 1,162.48 1,073.45 2,707.06
Seeds
SMALL MEDIUM LARGE AVERAGE SMALL MEDIUM LARGE AVERAGE SMALL MEDIUM LARGE TOTAL
Cassava 2,614.55 1,832.86 2,506.25 2,325.56 0.09 0.11 0.10 0.10 236.53 200.12 242.66 223.85
Maize 23.82 23.52 20.57 23.31 3.05 3.29 3.87 3.25 72.57 77.47 79.65 75.43
Wet Season Rice 53.37 40.46 106.83 54.18 0.47 0.48 0.36 0.46 24.85 19.62 38.50 24.46
Dry Season Rice 261.29 233.13 226.19 249.40 0.41 0.44 0.50 0.43 108.31 101.88 113.44 106.78
Vegetables 12.53 1.78 2.51 9.87 12.43 15.80 62.48 15.14 155.80 28.07 156.73 129.01
Fertilizer
SMALL MEDIUM LARGE AVERAGE SMALL MEDIUM LARGE AVERAGE SMALL MEDIUM LARGE TOTAL
Cassava 15.91 - 11.93 9.90 0.75 0.68 0.48 11.99 - 8.17 7.41
Maize 107.91 12.97 14.29 57.75 0.69 0.60 0.66 0.65 74.16 7.74 9.41 39.15
Wet Season Rice 126.75 106.42 89.42 117.08 0.57 0.61 0.70 0.59 72.17 64.77 62.98 69.04
Dry Season Rice 235.92 212.29 295.29 233.94 0.56 0.60 0.65 0.58 133.29 127.40 192.16 136.76
Vegetables 357.87 88.61 112.50 291.51 0.63 0.62 0.70 0.63 224.39 54.52 78.75 182.89
Other Inputs
SMALL MEDIUM LARGE AVERAGE
Cassava 35.14 32.50 43.49 34.77
Maize 38.77 26.15 24.92 31.93
Wet Season Rice 38.83 24.15 18.88 32.48
Dry Season Rice 31.98 19.87 31.41 28.17
Vegetables 292.85 31.79 59.77 228.70
Other input Costs ($/ha)
Seed Prices by farm size ($/unit) Costs of seeds by farm size and total ($/ha)Seeds by farm size (unit/ha)
Fertil izer use by farm size (kg/ha) Fertil izer Prices by farm size ($/kg) Costs of fertil izers by farm size and total ($/ha)
Revenue by farm size and total ($/ha)
% of land cultivated by farm size Total cultivated land by farm size (ha)2012
Cultivated
land (ha)
Yield by farm size (tons/ha) Output Prices by farm size ($/ton)

220
Continued…
Labor
SMALL MEDIUM LARGE AVERAGE SMALL MEDIUM LARGE AVERAGE SMALL MEDIUM LARGE TOTAL
Cassava 46.23 58.44 43.90 50.46 4.56 4.56 4.56 4.56 210.82 266.48 200.18 230.1128
Maize 37.71 32.15 24.63 33.86 4.56 4.56 4.56 4.56 171.98 146.61 112.33 154.4203
Wet Season Rice 63.05 50.82 26.63 55.98 4.56 4.56 4.56 4.56 287.51 231.75 121.41 255.2754
Dry Season Rice 44.87 30.81 11.72 37.53 4.56 4.56 4.56 4.56 204.60 140.48 53.44 171.1184
Vegetables 201.85 52.83 73.33 165.41 4.56 4.56 4.56 4.56 920.43 240.89 334.38 754.2846
Services
SMALL MEDIUM LARGE AVERAGE
Cassava 328.56 226.88 309.52 295.32
Maize 183.54 160.60 139.51 160.68
Wet Season Rice 134.73 160.03 234.16 171.10
Dry Season Rice 173.81 212.15 226.33 206.29
Vegetables 61.24 62.79 136.67 66.45
Gross Margins
SMALL MEDIUM LARGE AVERAGE
Cassava 544.13 437.71 512.23 498.89
Maize 243.90 335.92 329.95 300.13
Wet Season Rice 206.85 269.79 239.89 209.76
Dry Season Rice 306.82 283.48 297.51 283.57
Vegetables 1,571.96 744.42 307.16 1,345.72
Labor use by farm size (days/ha) Wage rate by farm size ($/day) Costs of labor by farm size and total ($/ha)
Gross Margins ($/ha)
Service Costs ($/ha)

221
Table 129: Gross margins with Farm Size Distribution scenario (baseline)
GROSS MARGINS (million $)
Baseline 2013 2014 2015 2016 2017 2018 2019 2020 2021 2022 2023 2024 2025 2026 2027 2028 2029 2030
SMALL 0 1 2 3 4 5 6 7 8 9 10 11 12 13 14 15 16 17
Cassava 104.77 104.77 104.77 104.77 104.77 104.77 104.77 104.77 104.77 104.77 104.77 104.77 104.77 104.77 104.77 104.77 104.77 104.77
Maize 24.70 24.70 24.70 24.70 24.70 24.70 24.70 24.70 24.70 24.70 24.70 24.70 24.70 24.70 24.70 24.70 24.70 24.70
Wet Season Rice 308.40 308.40 308.40 308.40 308.40 308.40 308.40 308.40 308.40 308.40 308.40 308.40 308.40 308.40 308.40 308.40 308.40 308.40
Dry Season Rice 91.21 91.21 91.21 91.21 91.21 91.21 91.21 91.21 91.21 91.21 91.21 91.21 91.21 91.21 91.21 91.21 91.21 91.21
Vegetables 63.85 63.85 63.85 63.85 63.85 63.85 63.85 63.85 63.85 63.85 63.85 63.85 63.85 63.85 63.85 63.85 63.85 63.85
592.92 592.92 592.92 592.92 592.92 592.92 592.92 592.92 592.92 592.92 592.92 592.92 592.92 592.92 592.92 592.92 592.92 592.92
- 0.0% 0.0% 0.0% 0.0% 0.0% 0.0% 0.0% 0.0% 0.0% 0.0% 0.0% 0.0% 0.0% 0.0% 0.0% 0.0% 0.0%
MEDIUM
Cassava 53.23 53.23 53.23 53.23 53.23 53.23 53.23 53.23 53.23 53.23 53.23 53.23 53.23 53.23 53.23 53.23 53.23 53.23
Maize 29.67 29.67 29.67 29.67 29.67 29.67 29.67 29.67 29.67 29.67 29.67 29.67 29.67 29.67 29.67 29.67 29.67 29.67
Wet Season Rice 207.82 207.82 207.82 207.82 207.82 207.82 207.82 207.82 207.82 207.82 207.82 207.82 207.82 207.82 207.82 207.82 207.82 207.82
Dry Season Rice 43.54 43.54 43.54 43.54 43.54 43.54 43.54 43.54 43.54 43.54 43.54 43.54 43.54 43.54 43.54 43.54 43.54 43.54
Vegetables 8.47 8.47 8.47 8.47 8.47 8.47 8.47 8.47 8.47 8.47 8.47 8.47 8.47 8.47 8.47 8.47 8.47 8.47
342.73 342.73 342.73 342.73 342.73 342.73 342.73 342.73 342.73 342.73 342.73 342.73 342.73 342.73 342.73 342.73 342.73 342.73
- 0.0% 0.0% 0.0% 0.0% 0.0% 0.0% 0.0% 0.0% 0.0% 0.0% 0.0% 0.0% 0.0% 0.0% 0.0% 0.0% 0.0%
LARGE
Cassava 12.11 12.11 12.11 12.11 12.11 12.11 12.11 12.11 12.11 12.11 12.11 12.11 12.11 12.11 12.11 12.11 12.11 12.11
Maize 8.53 8.53 8.53 8.53 8.53 8.53 8.53 8.53 8.53 8.53 8.53 8.53 8.53 8.53 8.53 8.53 8.53 8.53
Wet Season Rice 53.65 53.65 53.65 53.65 53.65 53.65 53.65 53.65 53.65 53.65 53.65 53.65 53.65 53.65 53.65 53.65 53.65 53.65
Dry Season Rice 13.27 13.27 13.27 13.27 13.27 13.27 13.27 13.27 13.27 13.27 13.27 13.27 13.27 13.27 13.27 13.27 13.27 13.27
Vegetables 0.67 0.67 0.67 0.67 0.67 0.67 0.67 0.67 0.67 0.67 0.67 0.67 0.67 0.67 0.67 0.67 0.67 0.67
88.22 88.22 88.22 88.22 88.22 88.22 88.22 88.22 88.22 88.22 88.22 88.22 88.22 88.22 88.22 88.22 88.22 88.22
- 0.0% 0.0% 0.0% 0.0% 0.0% 0.0% 0.0% 0.0% 0.0% 0.0% 0.0% 0.0% 0.0% 0.0% 0.0% 0.0% 0.0%
Gross Margins: OVERALL
Cassava 170.11 170.11 170.11 170.11 170.11 170.11 170.11 170.11 170.11 170.11 170.11 170.11 170.11 170.11 170.11 170.11 170.11 170.11
Maize 62.90 62.90 62.90 62.90 62.90 62.90 62.90 62.90 62.90 62.90 62.90 62.90 62.90 62.90 62.90 62.90 62.90 62.90
Wet Season Rice 569.86 569.86 569.86 569.86 569.86 569.86 569.86 569.86 569.86 569.86 569.86 569.86 569.86 569.86 569.86 569.86 569.86 569.86
Dry Season Rice 148.02 148.02 148.02 148.02 148.02 148.02 148.02 148.02 148.02 148.02 148.02 148.02 148.02 148.02 148.02 148.02 148.02 148.02
Vegetables 72.98 72.98 72.98 72.98 72.98 72.98 72.98 72.98 72.98 72.98 72.98 72.98 72.98 72.98 72.98 72.98 72.98 72.98
1,023.87 1,023.87 1,023.87 1,023.87 1,023.87 1,023.87 1,023.87 1,023.87 1,023.87 1,023.87 1,023.87 1,023.87 1,023.87 1,023.87 1,023.87 1,023.87 1,023.87 1,023.87
- 0.0% 0.0% 0.0% 0.0% 0.0% 0.0% 0.0% 0.0% 0.0% 0.0% 0.0% 0.0% 0.0% 0.0% 0.0% 0.0% 0.0%

222
Table 130: Gross margins with Farm Size Distribution scenario (I5)

223
Table 131: Gross margins with Farm Size Distribution scenario (I6)

224
Table 132: Summary of gross margins from changes on Farm Size Distribution ($ million)
Farm Size
Gross Margins in
2013 (Million $)
Gross Margins in
2030 (Million $) % Change NPV Change NPV
Baseline Small 592.92 592.92 5,674
Scenario I5 Small 592.92 499.80 -15.7% 5,319 -6.3%
Scenario I6 Small 592.92 499.80 -15.7% 5,319 -6.3%
Baseline Medium 342.73 342.73 3,280
Scenario I5 Medium 342.73 392.60 14.6% 3,470 5.8%
Scenario I6 Medium 342.73 899.84 162.6% 4,977 51.7%
Baseline Large 88.22 88.22 844
Scenario I5 Large 88.22 134.60 52.6% 1,021 21.0%
Scenario I6 Large 88.22 308.51 249.7% 1,497 77.3%
Baseline Total 1,023.87 1,023.87 9,799
Scenario I5 Total 1,023.87 1,027.00 0.3% 9,811 0.1%
Scenario I6 Total 1,023.87 1,708.15 66.8% 11,793 20.4%

225
Table 133: Demand for labor and return to labor for Farm Size Distribution scenarios