Is Microcredit Targeted to Poor People? Evidences From a Cambodian Microfinance Institution *
14
Chinese Business Review, ISSN 1537-1506 February2012, VoI. Il , No.2 , 153-166 Is Microcredit Targeted to Poor People? Evidences From a Cambodian Microfinance Institution * Alberto Lanzavecchia University ofPadova, Padova, ltaly This study extends research on the social performance of microfinance institutions. The research methodology is based on Grameen Progress out of Poverty Index™ (PPFM) for Cambodia applied to a sample of borrowers randomly extracted from a Cambodian microfinance institution's loan portfolio. Dataset has been directly collected through in-house interviews. Main questions discussed here are: (1) Is microcredit targeted to poor people? (2) Has the poverty rate of the sample changed in last six months? and (3) What percentage of male vs. female c1ients is poor? We found an average poverty likelihood of about 8.1 %, estimated at the day ofthe interview, steady over a peri od of six months and not statistically different between male and female borrowers. This evidence might be related to business geographicallocation or targeting. Actually, PPI too much relies on asset ownership rather than on cash flows and saving capacity. Despite the generai wisdom microcredit is targeted to the "poorest among the poor people", this is utterly consistent with a sound and safe (micro)banking activity, aimed at sustainable results. Here comes a cali for a triple bottom line performance evaluation on microfrnance institutions: economie, social and environrnental effects of their activities. Keywords: microcredit, soci al performance, poverty index, case study, Cambodia Introduction Since the seminai work of Hossain (1988), for more than ten years microfinance has been depicted as an effective pathway out ofpoverty (Pitt & Khandker, 1998) and its eradication (Yunus, 2007). Access to [mancial services is clairned to be a key driver to reach sustainable development goals as long as improvements in • Acknowledgement: The author is grateful to Consorzio Etimos for have introduced the author to Maxima, and in particular to its director Francesca Lo Re for her enthusiasm on sharing ideas and practice in microcredit. The author is highly indebt with Maxima CEO Mr. Uong Kimseng for his strong commitment and logistic supporto A special thank goes to Ponnak Kiry, Ear Sokry, and ali Maxima's staff who kindly guided us through the fields and into the Cambodian culture. A special acknowledgement go es to Lorenzo Rocco for his valuable support and insights in data analysis. Finally, the author would like to thank participants and discussants at EBES 2011 Annual Conference held in Istanbul and an anonymous referee for helpful comments on an earlier draft . Ali errors, opinions, and views expressed are the author's own. Project supported by University of Padova "Azioni di cooperazione universitaria- anno 2010 Program" and by Associazione Emanuela Morelli via a grant to Martina Caneri who shared with the author the task of collecting data trough the fields (her assistance is gratefully acknowledged). Both sponsors did not make any other influences on aim, scope, data, methodology, results and conclusions of this research. Alberto Lanzavecchia, Ph.D., MSc, assistant professor, School of Economics and Business Administration, Department of Economie Sciences, Urnversity of Padova (Italy). Correspondence concerning this article should be addressed to Alberto Lanzavecchia, Department of Economie Sciences, University of Padova, Italy. E-mai! : [email protected].
Transcript of Is Microcredit Targeted to Poor People? Evidences From a Cambodian Microfinance Institution *

Chinese Business Review, ISSN 1537-1506 February2012, VoI. Il , No.2, 153-166
Is Microcredit Targeted to Poor People? Evidences
From a Cambodian Microfinance Institution *
Alberto Lanzavecchia
University ofPadova, Padova, ltaly
This study extends research on the social performance of microfinance institutions. The research methodology is
based on Grameen Progress out of Poverty Index™ (PPFM) for Cambodia applied to a sample of borrowers
randomly extracted from a Cambodian microfinance institution's loan portfolio. Dataset has been directly collected
through in-house interviews. Main questions discussed here are: (1) Is microcredit targeted to poor people? (2) Has
the poverty rate of the sample changed in last six months? and (3) What percentage of male vs. female c1ients is
poor? We found an average poverty likelihood of about 8.1 %, estimated at the day ofthe interview, steady over a
peri od of six months and not statistically different between male and female borrowers. This evidence might be
related to business geographicallocation or targeting. Actually, PPI too much relies on asset ownership rather than
on cash flows and saving capacity. Despite the generai wisdom microcredit is targeted to the "poorest among the
poor people", this is utterly consistent with a sound and safe (micro)banking activity, aimed at sustainable results.
Here comes a cali for a triple bottom line performance evaluation on microfrnance institutions: economie, social
and environrnental effects of their activities.
Keywords: microcredit, soci al performance, poverty index, case study, Cambodia
Introduction
Since the seminai work of Hossain (1988), for more than ten years microfinance has been depicted as an
effective pathway out ofpoverty (Pitt & Khandker, 1998) and its eradication (Yunus, 2007). Access to [mancial
services is clairned to be a key driver to reach sustainable development goals as long as improvements in
• Acknowledgement: The author is grateful to Consorzio Etimos for have introduced the author to Maxima, and in particular to its director Francesca Lo Re for her enthusiasm on sharing ideas and practice in microcredit. The author is highly indebt with Maxima CEO Mr. Uong Kimseng for his strong commitment and logistic supporto A special thank goes to Ponnak Kiry, Ear Sokry, and ali Maxima' s staff who kindly guided us through the fields and into the Cambodian culture. A special acknowledgement go es to Lorenzo Rocco for his valuable support and insights in data analysis. Finally, the author would like to thank participants and discussants at EBES 2011 Annual Conference held in Istanbul and an anonymous referee for helpful comments on an earlier draft . Ali errors, opinions, and views expressed are the author's own.
Project supported by University of Padova "Azioni di cooperazione universitaria- anno 2010 Program" and by Associazione Emanuela Morelli via a grant to Martina Caneri who shared with the author the task of collecting data trough the fields (her assistance is gratefully acknowledged). Both sponsors did not make any other influences on aim, scope, data, methodology, results and conclusions of this research.
Alberto Lanzavecchia, Ph.D., MSc, assistant professor, School of Economics and Business Administration, Department of Economie Sciences, Urnversity of Padova (Italy). Correspondence concerning this article should be addressed to Alberto Lanzavecchia, Department of Economie Sciences,
University of Padova, Italy. E-mai! : [email protected].

154 IS MICROCREDIT TARGETED TO POOR PEOPLE?
healthcare, nutritional advice and education can be sustained only whenever households have increased income,
consumption and greater contro l on financial resources (Littlefield, Morduch, & Hashemi, 2003; Khandker, 2005;
Morduch, 1999). Microfinance Institutions (MFIs) should consequently be supported by govemment (Hardy,
Holden, & Prokopenko, 2002) and investors since they contribute to develop the financial sector and the rural
economy (Holden & Propenko, 2001) by addressing capitai flows to people exc1uded by the commerciai banking.
Nonetheless, the impact of credit on people poverty depends on several factors, such as the credit use, the
type of microenterprise and the skills of the bOITower (Karnani, 2007). The measurement of how poor people
lives would have changed had the microcredit not been granted, is a tough challenge of assessment. Roodman
and Morduch (2009), Goldberg (2005), and Duvendack, Palmer-Jones, Copestake, Hooper, Loke, and Rao
(2011), among the others, reviewed several studies in microcredit impact evaluation, but the picture they draw
is still inconc1usive. Overall, unchallenged statistical proof of the impact of microfinance on outcomes such as
poverty, women's empowerment, health, and education remains elusive, mainly due to difficulties in creating
randomized controlled experiments that are free ofbias (Karlan & Goldberg, 2006).
While impact of microfinance has been questioned, donors and investors experienced great concerns that
MFIs might be leaving their social missions behind the quest for profits. As a matter of fact, microcredit industry
is becoming quickly an asset c1ass suitable to generate adequate and growing return on capitai (Dieckmann, 2007).
This trend requires MFIs to be increasingly transparent about the achievements oftheir dec1ared objectives.
As a result, a call for new specific indicators to measure and track over time the social performance of MFIs
activities is emerging-whether or not microfinance is the determinant of people's welfare. 1 Poverty outreach
(e.g., poverty levels of c1ients at entry and their movement out ofpoverty over time) is one ofthem. The objective
of poverty assessment is twofold: poverty assessment and poverty targeting. The former intends to determine
whether the program reached relatively poor people (within a community or region), the latter to identify in
advance poorer households in order to deliver services to them rather than to the relatively better-off or non-poor.
Poverty mightbe measured in alternative ways either by using existing secondary data or through field
research that collects primary data on household's welfare (Zeller, 2004). Grameen Progress out of Poverty
Index™ (PPJTM) and USAID Poverty Assessment Tool (PAT) are two examples ofscorecards that are gaining
credits in the microfinance industry (Ford Foundation, CGAP, & Social Performance Taskforce, 2010). Since
these scorecards differ across countries2 and use different algorithms, an MFI could get a different estimate of
poverty depending on the methodology applied.
While a large body of literature has been addressed to impact evaluation, monitoring poverty level in MFIs
bOITowers and, broadly, its social performance is a relatively less explored issue. A growing number of
organizations around the world are supposed to monitor poverty outreach and to track changes on poverty leve l
over time. However, in the author's best knowledge there is little evidence on these results3•
I The Social Performance Task Force (SPTF), an association between more than 850 members among practitioners, donors and investors, academics and researchers, has been charged with clearly defining soci al performance and addressing questions about measuring and managing soci al performance. The STPF is currently working to create a common reporting framework for MFIs which would include standardized social performance indicators. 2 Currently, 34 and 30 countries are available for PPI and PAT scorecard respectively. 3 As of today only four MFIs get the PPI certification released by the Grameen Foundation. Retrieved September I, 2011, from http://www.progressoutofjJOverty.org/certification.

IS MICROCREDIT TARGETED TO POOR PEOPLE? 155
Should MFIs target the marginally poor or the extremely poor? Morduch (1999, p. 1592) suggests that a
dollar increase in income for the very poor borrower has a five times greater impact than the same dollar for the
marginally poor borrower. Hence, in terrns of poverty alleviation, MFIs should focus on the poorest borrowers
first. Nonetheless, as MFIs seek to become fmancially independent, they would target only the marginally poor
(Sengupta & Aubuchon, 2008, p. 21).
In this study we extend the research on MFI's social performance through a case study. This article shows
the results of an empirical application of the standards use of the PPFM for Cambodia within a sample of clients
of an MFI. Main questions discussed here are: Is microcredit targeted to poor people? Has the poverty rate of
the sample changed in last six months? What percentage ofmale vs. female clients is poor?
The article is structured as follows: Section 2 will describe the Cambodian economic background and its
microcredit sector; Section 3 will introduce the MFI case-study; Section 4 will describe the survey design, data,
and methodology of this study; Section 5 will show and discuss the main fmdings; The last section will conclude
with consideration on microfmance practice in the broader context of the Cambodian economie development.
The Case Study Background: Cambodian Economy and Microcredit Sector
A brief summary of Cambodian economic data and trends is shown in Table 1. While the incidence of poverty
has declined from 47.0% in 1994 to 30.1 % in 2007, it remains higher in countryside and almost absent (lower than
5%) in Phnom Penh (World Bank, 2006). Thus, policy-makers are faced with a clear challenge as some 77.8% of
Cambodians live in the countryside and fostering urbanization will in part transfer the issue to cities.
Economie growth (narrowly concentrated on garrnent production, tourism, and construction industries) is
urban-focused, with limited linkages to the rural economy. This has led to a rapid increase in inequality over the
past decade: Gini index in 2007 reached the value of 44.2% (38.3% in 1994)4. There is a pressing need to
diversify the economy to enable the rural poor to contribute to, and benefit from economic growth.
Table l
Selected Key Data on Cambodia
2004 2005 2006 2007 2008 2009
Population (mln) 13.6 13.9 14.1 14.3 14.6 14.8
GDP (current US$, mln) 5,510.3 6,454.5 7,293.5 8,357.5 9,430.4 9,872.2
GDP growth (annual %, LCU) 10.34 13.25 10.77 10.21 6.69 (1.87)
GDP per capita (current US$) 403 .8 465.5 517.6 583 .5 647.6 666.8
GlNllndex (%, O perfect equality, 100 perfect inequality) 41.9 44.2
Literacy rate, adult total (% ofpeople ages 15 and above) 73 .6 77.6
Poverty headcount ratio at national poverty line (% of population) 34.7 30.1
Poverty headcount ratio at rural poverty line (% of rural population) 39.2 34.7
Official exchange rate (LCU per US$, period average) 4,016 4,093 4,103 4,056 4,054 4,153
Note. Source: World Bank.
Microfinance in Cambodia emerged from non-profit microcredit projects initiated by international donors,
NGOs, and institutions in the early 1990s to filI the institutional void left by the virtualIy nonexistent banking
4 Higher than, as a comparison, a 37.8% recorded in Vietnam in 2006.
156 IS MICROCREDIT TARGETED TO POOR PEOPLE?
sector. The "Law on Banking and Financial Institutions", enacted in November 1999, and the govemment decree
for implementation (Prakas), enacted in early 2000, recognizes three categories ofbanking institutions:
(1) Commerciai banks;
(2) Specialized banks;
(3) Microfinance institutions.
Both registered5 and licensed6 MFIs must adhere to a strict set of reserve requirements and accounting
practices, most ofwhich depend on deposit base and loan portfolio size. In 2007 the National Bank ofCambodia
issued new regulations that allowed more freedom in taking deposits from the public. 7 However, capitaI
requirement has proven difficult to meet for most ofCambodia's existing MFIs, and as ofDecember 2010, only
13 institutions have obtained licenses.
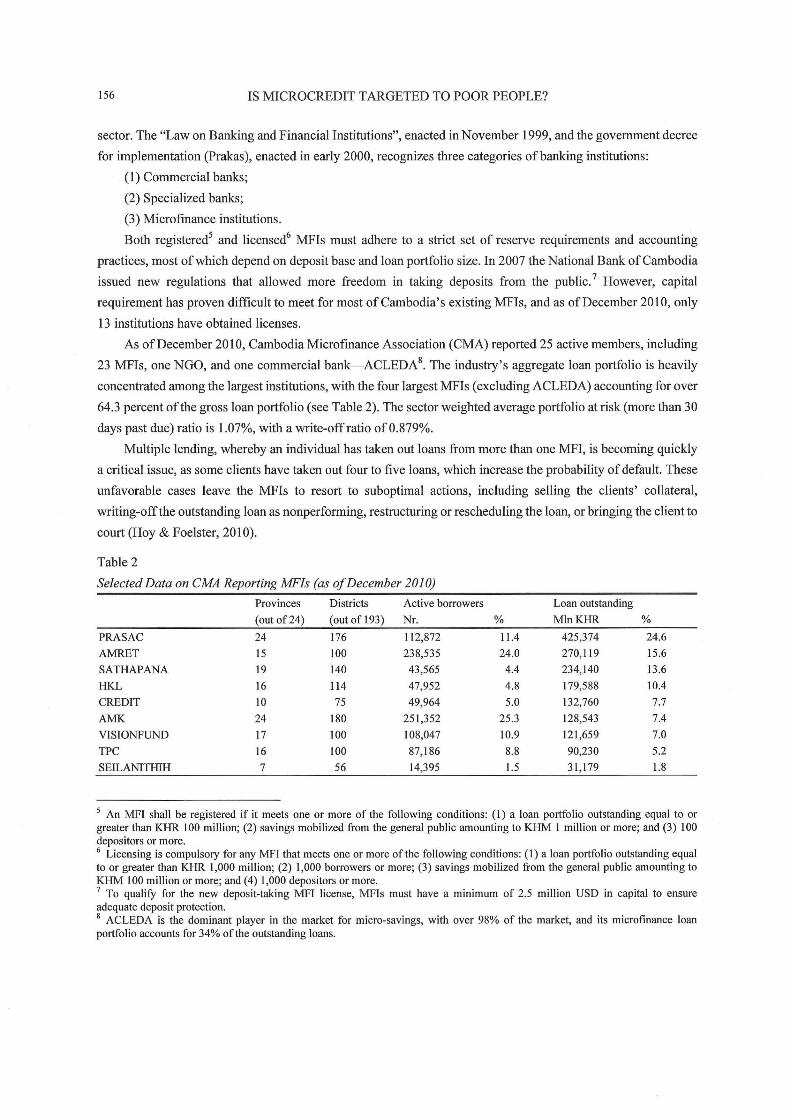
As ofDecember 2010, Cambodia Microfrnance Association (CMA) reported 25 active members, including
23 MFIs, one NGO, and one commerciai bank-ACLEDA8. The industry's aggregate loan portfolio is heavily
concentrated among the largest institutions, with the four largest MFIs (excluding ACLEDA) accounting for over
64.3 percent ofthe gross loan portfolio (see Table 2). The sector weighted average portfolio at risk (more than 30
days past due) ratio is 1.07%, with a write-offratio ofO.879%.
Multiple lending, whereby an individuai has taken out loans from more than one MFI, is becoming quickly
a criticai issue, as some clients have taken out four to five loans, which increase the probability of default. These
unfavorable cases leave the MFIs to resort to suboptimal actions, including selling the clients' collateral,
writing-offthe outstanding loan as nonperforming, restructuring or rescheduling the loan, or bringing the client to
court (Hoy & Foelster, 2010).
Table 2
Selected Data on CMA Reporting MFIs (as ofDecember 2010)
Provinces Districts Active bOITowers Loan outstanding
(out of24) (out of 193) Nr. % MlnKHR %
PRASAC 24 176 112,872 11.4 425,374 24.6
AMRET 15 100 238,535 24.0 270,119 15.6
SATHAPANA 19 140 43,565 4.4 234,140 13.6
HKL 16 114 47,952 4.8 179,588 10.4
CREDIT IO 75 49,964 5.0 132,760 7.7
AMK 24 180 251,352 25.3 128,543 7.4
VISTONFUND 17 100 108,047 10.9 121,659 7.0
TPC 16 100 87,186 8.8 90,230 5.2
SETLANTTffiH 7 56 14,395 1.5 31,179 1.8
5 An MFI shall be registered if it meets one or more of the following conditions: (I) a loan portfolio outstanding equal to or greater than KHR 100 million; (2) savings mobilized from the generai public amounting to KHM 1 million or more; and (3) 100 depositors or more. 6 Licensing is compulsory for any MFI that meets one or more ofthe following conditions: (I) a loan portfolio outstanding equal to or greater than KHR 1,000 million; (2) 1,000 bOITowers or more; (3) savings mobilized from the generai public amounting to KHM 100 million or more; and (4) 1,000 depositors or more. 7 To qualifY for the new deposit-taking MFI license, MFIs must have a minimum of 2.5 million USD in capitai to ensure adequate deposi t protection. 8 ACLEDA is the dominant player in the market for micro-savings, with over 98% of the market, and its microfmance loan portfolio accounts for 34% ofthe outstanding loans.
IS MICROCREDIT TARGETED TO POOR PEOPLE? 157
~Table 2 continuedì
Provinces Districts Active borrowers Loan outstanding
(out of24) (out of 193) Nr. % MlnKHR %
SAMlC 7 30 10,410 1.0 24,547 lA
CAMCAPITAL 2 11 266 0.0 19,459 1.1
IPR 6 22 3,578 004 14,173 0.8
GCMF 8 1,411 0.1 Il ,537 0.7
FIRSTFINANCE 2 12 157 0.0 8,305 0.5
MAXIMA 2 15 2,587 0.3 8,293 0.5
EAP 7 19 193 0.0 7,668 004
CHAMROEUN (NGO) 7 37 14,936 1.5 6,802 004
CSIRD 5 20 2,220 0.2 5,199 0.3
FUDF 4 4 2,545 0.3 4,471 0.3
FARMERFINANCE 5 161 0.0 1,119 0.1
YCP 2 9 120 0.0 1,090 0.1
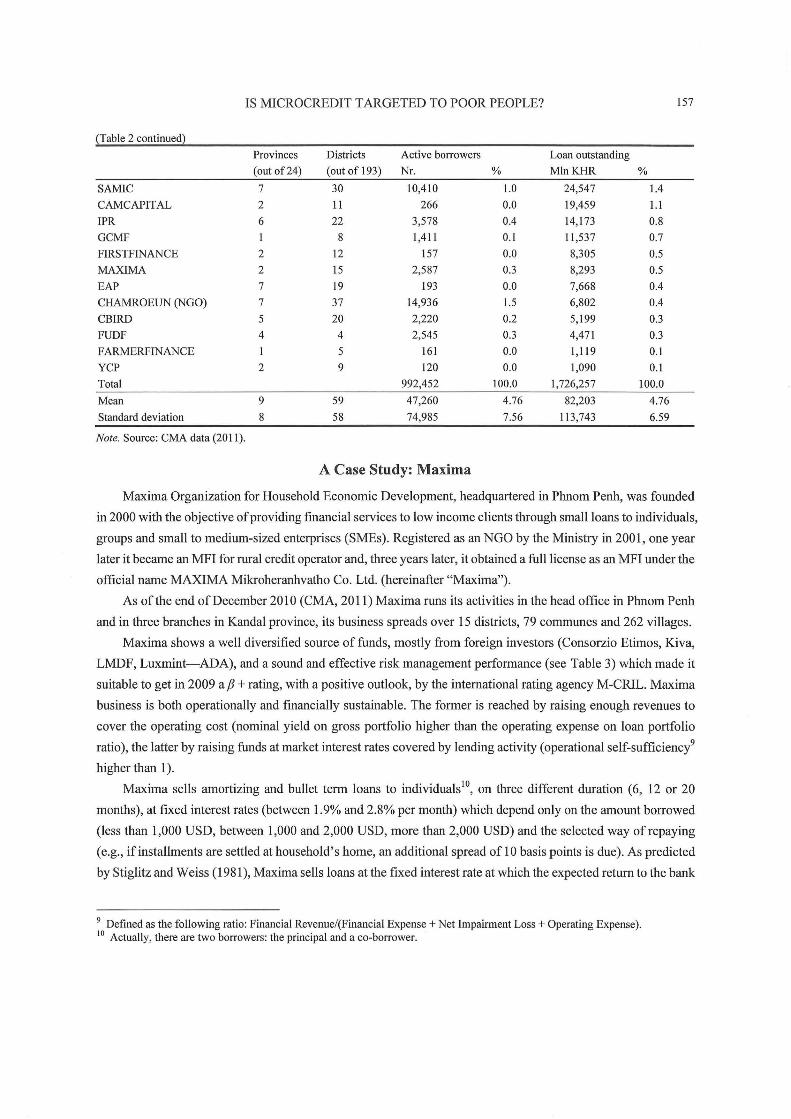
Total 992,452 100.0 1,726,257 100.0
Mean 9 59 47,260 4.76 82,203 4.76
Standard deviation 8 58 74,985 7.56 113,743 6.59
Note. Source: CMA data (201 l) .
A Case Study: Maxima
Maxima Organization for Household Economie Development, headquartered in Phnom Penh, was founded
in 2000 with the objective of providing financial services to low income clients through smallioans to individuals,
groups and small to medium-sized enterprises (SMEs). Registered as an NGO by the Ministry in 2001, one year
later it became an MFI for rural credit operator and, three years later, it obtained a fulllicense as an MFI under the
official name MAXIMA Mikroheranhvatho Co. Ud. (hereinafter "Maxima").
As of the end of December 2010 (CMA, 20 Il) Maxima runs its activities in the head office in Phnom Penh
and in three branches in Kandal province, its business spreads over 15 districts, 79 communes and 262 villages.
Maxima shows a well diversified source of funds, mostly from foreign investors (Consorzio Etimos, Kiva,
LMDF, Luxmint-ADA), and a sound and effective risk management performance (see Table 3) which made it
suitable to get in 2009 a fJ + rating, with a positive outlook, by the intemational rating agency M-CRIL. Maxima
business is both operationally and fmancially sustainable. The former is reached by raising enough revenues to
cover the operating cost (nominai yield on gross portfolio higher than the operating expense on loan portfolio
ratio), the latter by raising funds at market interest rates covered by lending activity (operational self-sufficiencl
higher than l) .
Maxima sells amortizing and bullet term loans to individuals lO, on three different duration (6, 12 or 20
months), at fixed interest rates (between 1.9% and 2.8% per month) which depend only on the amount borrowed
(less than 1,000 USD, between 1,000 and 2,000 USD, more than 2,000 USD) and the selected way ofrepaying
(e.g., ifinstallments are settled at household' s home, an additional spread of lO basis points is due). As predicted
by Stiglitz and Weiss (1981), Maxima sells loans at the fixed interest rate at which the expected retum to the bank
9 Defined as the following ratio: Financial Revenue/(Financial Expense + Net Impainnent Loss + Operating Expense). lO Actually, there are two borrowers: the principal and a co-borrower.
158 IS MICROCREDIT T ARGETED TO POOR PEOPLE?
is rnaxirnized. Unsatisfied borrowers would offer to pay a higher interest rate (or greater collaterals) to the bank,
however the bank would not lend to those people, as, from its perspective, such loan is likely to be a worse risk
than the average loan at the fixed interest rate.
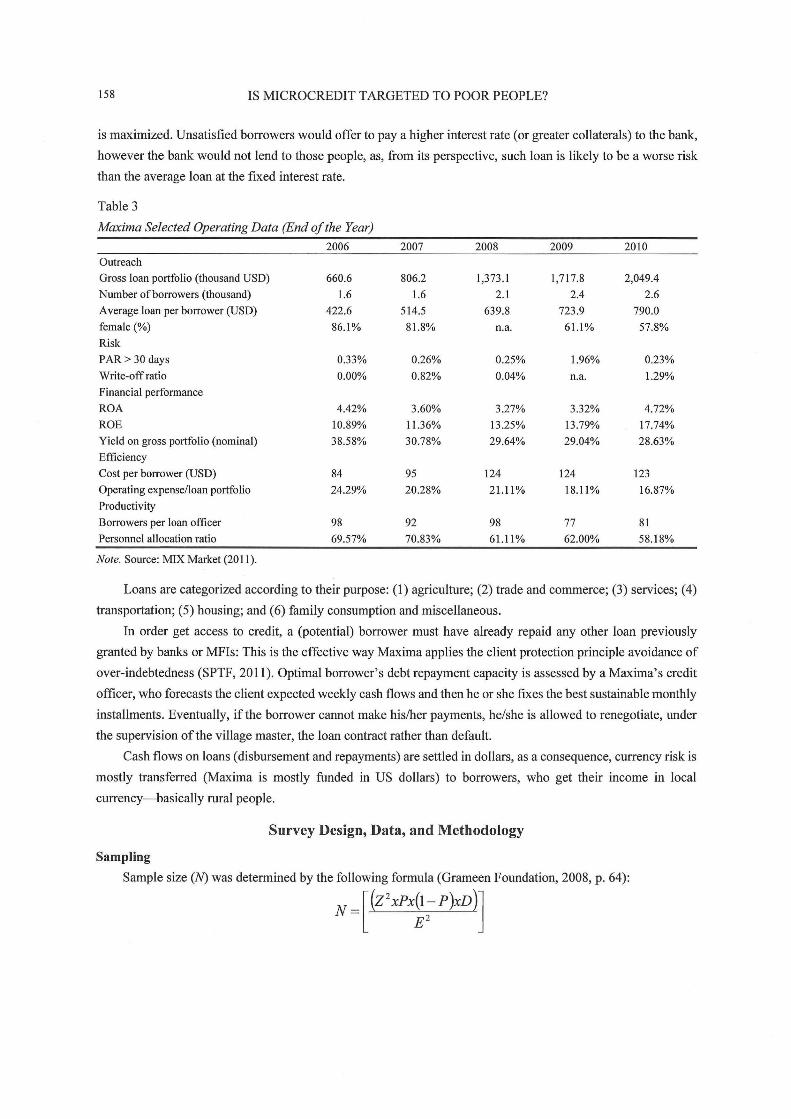
Table 3
Maxima Selected Operating Data (End ofthe Year)
2006 2007 2008 2009 2010 Outreach
Gross loan portfolio (thousand USD) 660.6 806.2 1,373.1 1,717.8 2,049.4
Number ofborrowers (thousand) 1.6 1.6 2.1 2.4 2.6
A verage loan per borrower (USD) 422.6 514.5 639.8 723.9 790.0
female (%) 86.1% 81.8% n.a. 61.1% 57.8%
Risk
PAR> 30 days 0.33% 0.26% 0.25% 1.96% 0.23%
Write-off ratio 0.00% 0.82% 0.04% n.a. 1.29%
Financial performance
ROA 4.42% 3.60% 3.27% 3.32% 4.72%
ROE 10.89% 11.36% 13.25% 13.79% 17.74%
Yield on gross portfolio (nominaI) 38.58% 30.78% 29.64% 29.04% 28.63%
Efficiency
Cost per borrower (USD) 84 95 124 124 123
Operating expense/loan portfolio 24.29% 20.28% 21.11 % 18.11% 16.87%
Productivity
Borrowers per loan officer 98 92 98 77 81
Personnel allocation ratio 69.57% 70.83% 61.11 % 62.00% 58.18%
Note. Source: MIX Market (20 Il).
Loans are categorized according to their purpose: (1) agriculture; (2) trade and cornrnerce; (3) services; (4)
transportation; (5) housing; and (6) farnily consurnption and rniscellaneous.
In order get access to credit, a (potential) borrower rnust have already repaid any other loan previously
granted by banks or MFIs: This is the effective way Maxirna applies the c\ient protection principle avoidance of
over-indebtedness (SPTF, 2011). Optimal borrower's debt repayment capacity is assessed by a Maxirna's credi t
officer, who forecasts the c\ient expected weekly cash flows and then he or she fixes the best sustainable rnonthly
installments. Eventually, if the borrower cannot rnake his/her payrnents, he/she is allowed to renegotiate, under
the supervision ofthe village rnaster, the loan contract rather than default.
Cash flows on loans (disbursernent and repayments) are settled in dollars, as a consequence, currency risk is
rnostly transferred (Maxirna is mostly funded in US dollars) to borrowers, who get their incorne in local
currency- basically rural people.
Survey Design, Data, and Methodology
Sampling
Sample size (N) was detennined by the following fonnula (Grameen Foundation, 2008, p. 64):
N ~ [(z' xPxZ: P)xv l]

IS MICROCREDIT TARGETED TO POOR PEOPLE? 159
Where:
Z: is the z-score is derived from the desired confidence interval;
P: is a guess value for the proportion ofthe population that it is anticipated will be measured;
D: (in a range of 1-10) is a design effect, the extent to which the sample deviates from random sampling11;
E · h . f 12 : IS t e margm o error.
In order to provide at least a 95% confidence level for a population of2,500 active borrowers (P = 10%) with
a precision of 5%, and D = 1.5, a target sample size of 207 was fixed. 13
We then randomly extract borrowers in a two-stage sampling technique ("strata sampling"): we first
randomly selected nine out of 15 districts covered by Maxima and then randomly select borrowers within the
selected districts. We excluded from the pick-up list borrowers who ended the relationship with Maxima more
than six months before.
Data Collection
Data used in this study were directly collected from October 11 to November lO, 2010 by in-house
interviewing14 random selected borrowers.
In case borrowers were unavailable15 we phoned from site to Maxima head office asking to randomly
extract a new borrower living in the same village to be interviewed on the same day ("random walk" method), if
any. If no other extracted borrowers were available to be interviewed on the same day, we would randomly
extract a new borrower to be added in the interview list for the following days (lRlS Center, 2011).
At the end ofthe scheduled interview peri od we got 230 interviews, ofwhich 216 with full data. Descriptive
statistics on sample clients are shown in Tables 4 and 5.
Table 4
Sample Descriptive Statistics
Gender Age Literacy Real estate value Cycle Amount borrowed Household members
Valid 230 229 223 225 225 225 230 Nr.
Missing O 7 5 5 5 O
Mean 43 0.76 8,005 2.71 1,111.33 5.8
Standard deviation II 0.43 6,082 1.85 743.11 2.1
Minimum 18 O 400 l 100 2
Maximum 67 50,000 9 4,500 17
"Literacy" is the borrower capacity ofreading and writing: on average 76% ofborrowers are able to. This is
consistent with the average nationalliteracy rate.
Il D = 1 means that the sample is a random sample, while D = lO means that the sample is intentionally non-random.
12 A 5% margin of error combined with a 95% confidence level means that 95 times out of 100 you expect the score to be accurate within +1- 5% ofthe true value.
13 A sample size of333 would have been fixed according to IRIS Center (2007) methodology. 14 Each interviewer was accompanied by a Maxima's credit officer, who introduced him/her to the borrower and translated the survey in the 10cal language. An interview would take from lOto 20 minutes. We are aware of the potenti al risk of "translation bias": Different results could depend on the translator' s personality and the way he/she addressed the questions into the Cambodian culture. However, we hired ten different credi t officers, as a consequence the marginai impact, ifany, oftranslation bias is weak.
15 All people we met accepted to be interviewed (e.g., no refusal was recorded).
160 IS MICROCREDIT TARGETED TO POOR PEOPLE?
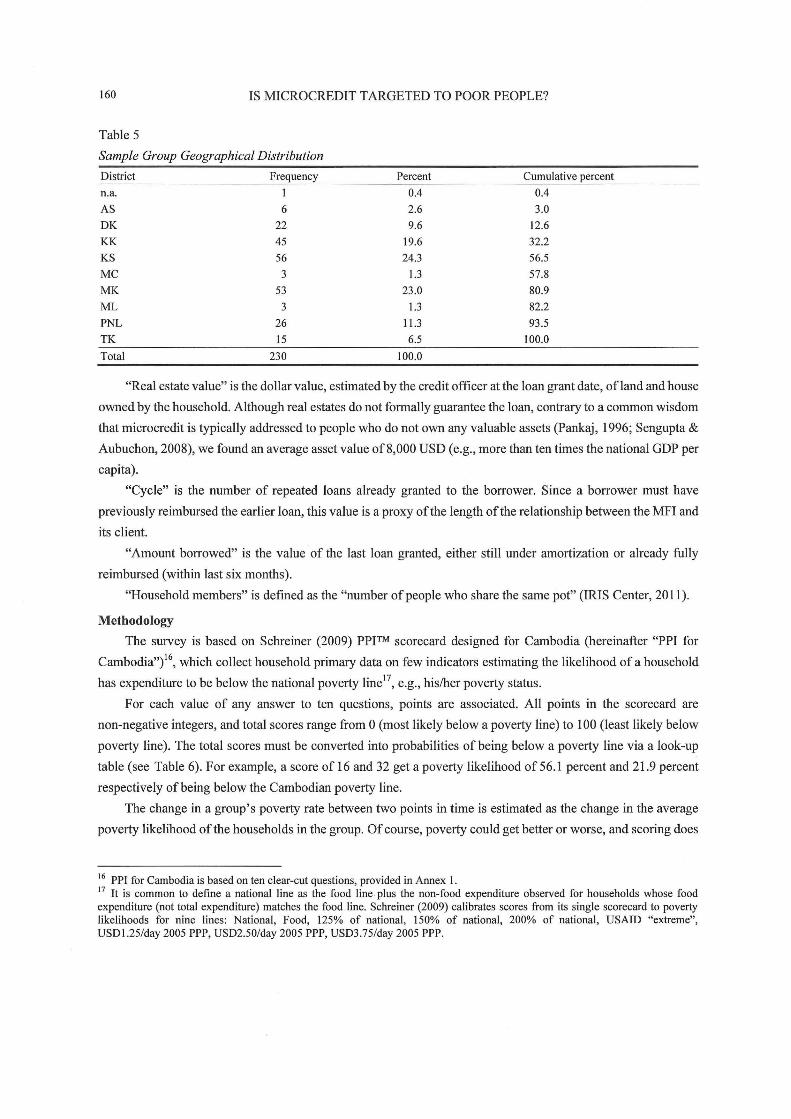
Table 5
Sample Group Geographical Distribution
District Frequency Percent Cumulative percent
n.a. l 0.4 0.4
AS 6 2.6 3.0
DK 22 9.6 12.6
KK 45 19.6 32.2
KS 56 24.3 56.5
MC 3 1.3 57.8
MK 53 23.0 80.9
ML 3 1.3 82.2
PNL 26 11.3 93 .5
TK 15 6.5 100.0
Total 230 100.0
"Real estate value" is the dollar value, estimated by the credit officer at the loan grant date, of land and house
owned by the household. Although real estates do not formally guarantee the loan, contrary to a common wisdom
that microcredit is typically addressed to people who do not own any valuable assets (Pankaj, 1996; Sengupta &
Aubuchon, 2008), we found an average asset value of8,000 USD (e.g., more than ten times the national GDP per
capita).
"Cyc\e" is the number of repeated loans already granted to the borrower. Since a borrower must have
previously reimbursed the earlier loan, this value is a proxy ofthe length ofthe relationship between the MFI and
its c\ient.
"Amount borrowed" is the value of the last loan granted, either still under amortization or already fully
reimbursed (within last six months).
"Household members" is defined as the "number ofpeople who share the same pot" (IRIS Center, 201 t).
Methodology
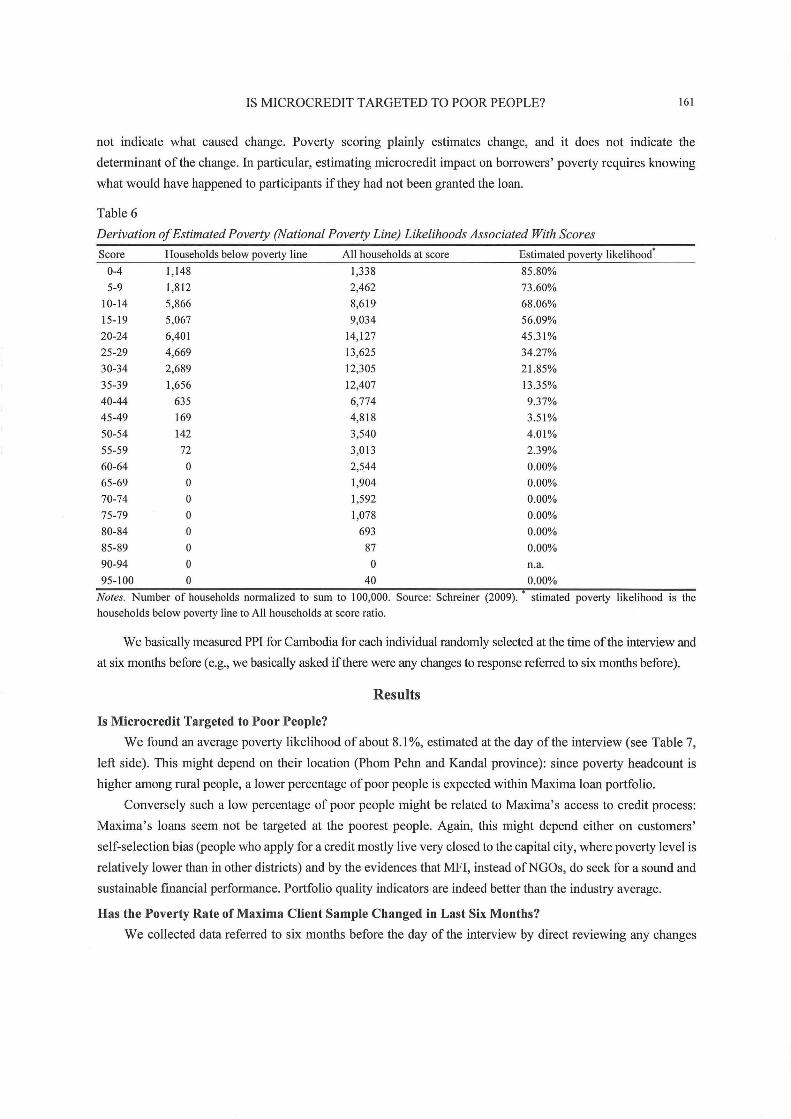
The survey is based on Schreiner (2009) PPJTM scorecard designed for Cambodia (hereinafter "PPI for
Cambodia,,/6, which collect household primary data on few indicators estimating the likelihood of a household
has expenditure to be below the national poverty line l7, e.g., his/her poverty status.
For each value of any answer to ten questions, points are associated. Ali points in the scorecard are
non-negative integers, and total scores range from O (most likely below a poverty line) to 100 (least likely below
poverty line). The total scores must be converted into probabilities ofbeing below a poverty line via a look-up
table (see Table 6). For example, a score of 16 and 32 get a poverty likelihood of 56.1 percent and 21.9 percent
respectively ofbeing below the Cambodian poverty line.
The change in a group's poverty rate between two points in time is estimated as the change in the average
poverty likelihood ofthe households in the group. Of course, poverty could get betler or worse, and scoring does
16 PPI for Cambodia is based on ten clear-cut questions, provided in Annex 1. 17 It is common to define a national line as the food line . plus the non-food expenditure observed for households whose food expenditure (not total expenditure) matches the food line. Schreiner (2009) calibrates scores from its single scorecard to poverty likelihoods for nine lines: National, Food, 125% of national, 150% of national, 200% of national, USAID "extreme", USD1.25/day 2005 PPP, USD2.50/day 2005 PPP, USD3.75/day 2005 PPP.
IS MICROCREDIT TARGETED TO POOR PEOPLE? 161
not indicate what caused change. Poverty scoring plainly estimates change, and it do es not indicate the
determinant ofthe change. In particular, estimating microcredit impact on borrowers' poverty requires knowing
what would have happened to participants if they had not been granted the loan.
Table 6
Derivation oJ Estimated Poverty (National Poverty Line) Likelihoods Associated With Scores
Seore Households below poverty line Ali households at seore Estimated poverty likelihool
0-4 1,148 1,338 85.80%
5-9 1,812 2,462 73.60%
10-14 5,866 8,619 68.06%
15-19 5,067 9,034 56.09%
20-24 6,401 14,127 45.31%
25-29 4,669 13,625 34.27%
30-34 2,689 12,305 21.85%
35-39 1,656 12,407 13.35%
40-44 635 6,774 9.37%
45-49 169 4,818 3.51%
50-54 142 3,540 4.01%
55-59 72 3,013 2.39%
60-64 O 2,544 0.00%
65-69 O 1,904 0.00%
70-74 O 1,592 0.00%
75-79 O 1,078 0.00%
80-84 O 693 0.00%
85-89 O 87 0.00%
90-94 O O n.a.
95-100 O 40 0.00%
Notes. Number of households normalized to sum to 100,000. Souree: Sehreiner (2009). • stimated poverty Iike1ihood is the
households below poverty line to Ali households at seore ratio.
We basically measured PPI for Cambodia for each individuai randomly selected at the time ofthe interview and
at six months before (e.g., we basically asked ifthere were any changes to response referred to six months before).
Results
Is Microcredit Targeted to Poor People?
We found an average poverty likelihood ofabout 8.1%, estimated at the day ofthe interview (see Table 7,
left side). This might depend on their location (Phom Pehn and Kandal province): since poverty headcount is
higher among rural people, a lower percentage ofpoor people is expected within Maxima loan portfolio.
Conversely such a low percentage of poor people might be related to Maxima' s access to credit process:
Maxima's loans seem not be targeted at the poorest people. Again, this might depend either on customers'
self-selection bias (people who apply for a credit mostIy live very cIosed to the capitai city, where poverty level is
relatively lower than in other districts) and by the evidences that MFI, instead ofNGOs, do seek for a sound and
sustainable financial performance. Portfolio quality indicators are indeed better than the industry average.
Has the Poverty Rate of Maxima Client Sample Changed in Last Six Months?
We collected data referred to six months before the day of the interview by direct reviewing any changes

162 IS MICROCREDIT T ARGETED TO POOR PEOPLE?
in the value ofthe ten PPI for Cambodia questions. At a first glance, a little improvement is recorded during six
months: sample average poverty likelihood moves from 9.42% to 8.07% (see Table 7, right side).
Table 7
Results
At the day of the interview At six months before the interview
Frequency x Estimated poverty Frequency x Estimated poverty PPFM Frequency likelihood
PPITM Frequency likelihood
Missing 4 n. a. Missing 5 n. a.
00-04 O 00-04 O 05-09 0.7360 05-09 0.7360
10-14 0.6806 10-14 0.6806
15-19 3 1.6826 15-19 5 2.8044
20-24 7 3.1717 20-24 8 3.6248
25-29 8 2.7414 25-29 8 2.7414
30-34 7 1.5297 30-34 lO 2.1853
35-39 18 2.4025 35-39 24 3.2034
40-44 21 1.9686 40-44 22 2.0623
45-49 27 0.9471 45-49 24 0.8418
50-54 47 1.8853 50-54 43 1.7249
55-59 21 0.5018 55-59 25 0.5974
60-64 28 60-64 26
65-69 14 65-69 9
70-74 lO 70-74 9
75-79 7 75-79 5
80-84 3 80-84 4
85-89 3 85-89
Total 230 18.2474 Total 230 21.2023
Average poverty Iikelihood 0.0807 Average poverty likelihood 0.0942
Standard deviation 0.1302 Standard deviation 0.1397
T-value -1.06088
P(T <= t) one-tailed 0.14466
This difference might depend on an effective poverty reduction or on the standard deviation in the sample
mean, e.g., by chance. Hence, to check the robustness of this evidence, we run a one-tailed T-test on the two
sample mean. However, our findings are not statical1y significant: there is a probability lower than 14.47% (e.g.,
well higher than 10%) that this difference is due to chance (e.g., there are too weak evidences against the null
hypothesis that two sample are equa!).
Even if loans granted by MFIs fall due within 12 months, changes at poverty level should be accounted
over a longer peri od (Berhane & Gardebroek, 2011).
What Percentage of Male vs. Female Clients Is Poor?
Because microcredit programs targeted to poor women have gained prominence, it might appear that
women's access to credit is more extensive than the reality suggests. 18
18 However, in African countries, women stili receive less than 10% of ali credit reaching small farmers and only 1% of the total credit reaching the agricultural sector (Blackden & Bhanu, 1999).
IS MICROCREDIT TARGETED TO POORPEOPLE? 163
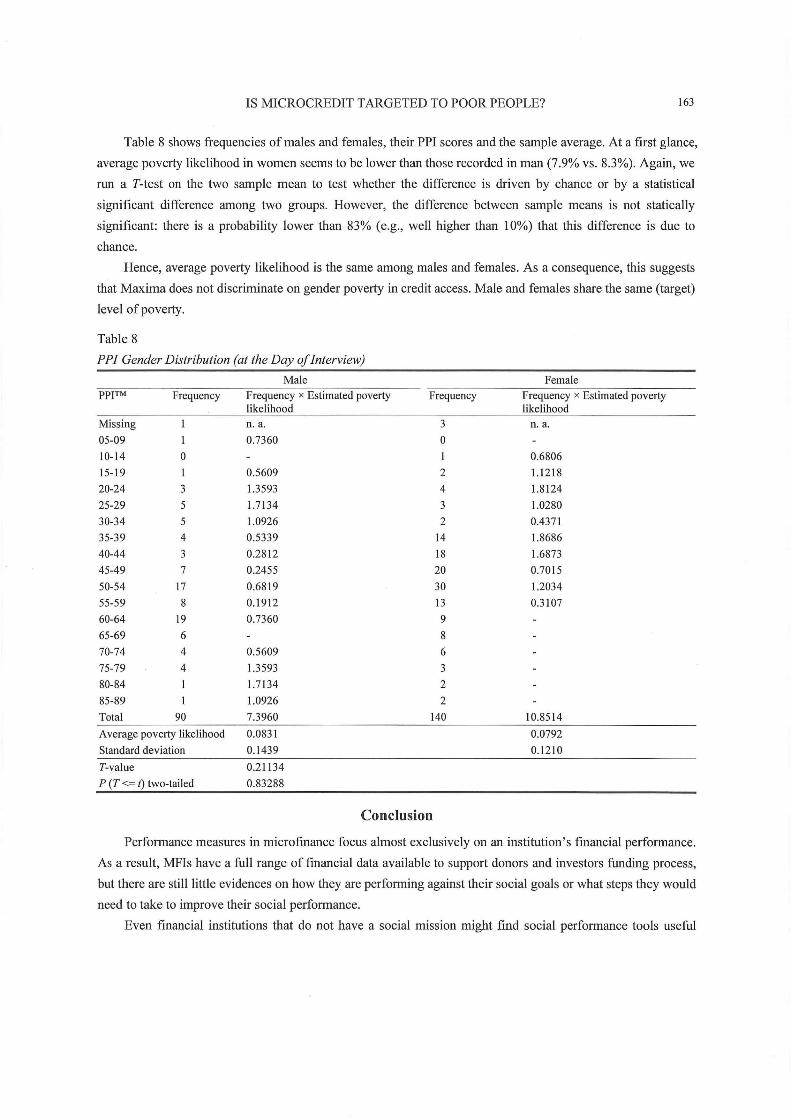
Table 8 shows frequencies of males and females, their PPI scores and the sample average. At a first glance,
average poverty likelihood in women seems to be lower than those recorded in man (7.9% vs. 8.3%). Again, we
run a T-test on the two sample mean to test whether the difference is driven by chance or by a statistical
significant difference among two groups. However, the difference between sample means is not statically
significant: there is a probability lower than 83% (e.g., well higher than 10%) that this difference is due to
chance.
Hence, average poverty likelihood is the same among males and females. As a consequence, this suggests
that Maxima does not discriminate on gender poverty in credit accesso Male and females share the same (target)
level of poverty.
Table 8
PPI Gender Distribution (at the Day oflnterview)
Male PPITM Frequency Frequency x Estimated poverty Frequency
likelihood
Missing n. a. 3
05-09 0.7360 O
10-14 O
15-19 0.5609 2
20-24 3 1.3593 4
25-29 5 I. 7134 3
30-34 5 1.0926 2
35-39 4 0.5339 14
40-44 3 0.2812 18
45-49 7 0.2455 20
50-54 17 0.6819 30
55-59 8 0.1912 13
60-64 19 0.7360 9
65-69 6 8
70-74 4 0.5609 6
75-79 4 1.3593 3
80-84 1.7134 2
85-89 1.0926 2
Total 90 7.3960 140
A verage poverty likelihood 0.0831
Standard deviation 0.1439
T-value 0.21134
p (T <= t) two-tailed 0.83288
Conclusion
Female Frequency x Estimated poverty likelihood
n. a.
0.6806
1.1218
1.8124
1.0280
0.4371
1.8686
1.6873
0.7015
1.2034
0.3107
10.8514
0.0792
0.1210
Performance measures in microfmance focus almost exclusively on an institution's financial performance.
As a result, MFIs have a full range of financial data available to support donors and investors funding process,
but there are stilllittie evidences on how they are performing against their social goals or what steps they would
need to take to improve their soci al performance.
Even financial institutions that do not have a social mission might fmd social performance tools useful

164 IS MICROCREDIT TARGETED TO POOR PEOPLE?
indeed. In particular, client protection principle "do no hann to c1ients" is a non-negotiable aspect of social
performance that any financial service provider should respect (SPTF, 2011).
Ihis paper enlarges knowledge on microcredit activities by exploring social performance and, namely,
poverty outreach.
Ihis study is based on the Progress out of Poverty Index™ for Cambodia (Schreiner, 2009), applied to a
sample ofborrowers from a Cambodian MFI shows. We found an average poverty likelihood (to be below the
national poverty line) of about 8.1 %, estimated at the day of the interview, steady over a period of six months
and not statistically different between male and female borrowers. This might be related to business
geographical location or a self-selection bias or to access to credit internaI procedures (e.g., loans are not
targeted at the "poorest among the poor people").
Actually, there might be a third methodological explanation: PPI is a misleading methodology as it is too
slow to track poverty predicting indicators over time (e.g., scores and parameters do not change over time). In
fast developing countries this is even more problematic since people might suddenly own new assets or items
which do not predict correctly the poverty level (e.g., mobile phones or motorbike). From a more generaI point
of view, we found that PPI too much relies on asset ownership rather than on cash flows and saving capacity.
As a consequence, it fails to track backward movements at an effective poverty level (since assets still remain
even if free cash flow tends to vanish).
Ihe author's modest opinion is that saving capacity is the ultimate measure to track steps taken in a
pathway out of poverty. We encourage future researches about it and on head-to-head comparison of poverty
level estimates (i.e., PPI vs. PAT) over time within the same sample clients of an MFI, to check for errors in
predicting poverty.
Despite the generaI wisdom that microcredit is targeted to the "poorest among the poor people", our
findings are fully consistent with a sound and safety (micro) banking activity, aimed at sustainable results (such
as those accounted in Maxima financial reports).
However, here comes a call for a triple bottom line MFl's performance evaluation: economic, soci al and
environmental effects of their activities.
Maxima case study shows that low-income markets can be served on a "sustainable" basis, that is, with
full cost recovery and a market return, without subsidy. As a result, in Cambodia the formaI financial sector
should start to take notice and to servi ce these traditionally marginalized sectors.
References
Berhane, G., & Gardebroek, C. (2011). Does microfinance reduce rural poverty? Evidence based on household panel data from
northem Ethiopia. American Journal of Agricultural Economics, 93(1), 43-55.
Deutsche Bank Research. (2007). Microfinance: An emerging investment opportunity. Uniting social investment and financial
returns. Frankfurt am Main, DE: Dieckmann, R.
Duvendack, M., Palmer-Jones, R., Copestake, J. G., Hooper, L., Loke, Y., & Rao, N. (2011). What is the evidence ofthe impact of
microfinance on the well-being of poor people? London, UK: EPPI-Centre, Social Science Research Unit, Institute of
Education, University ofLondon.
Ford Foundation, CGAP, & Social Performance Taskforce. (20 I O). Poverty targeting and measuremenl lools in microfinance:
Progress aut of poverty index and Ihe poverty assessmenl 1001. Retrieved from http://www.microfinancegateway.org
Goldberg, N. (2005). Measuring the impact ofmicrofinance: Taking stock ofwhat we know. Grameen Foundation USA Publica/ion
IS MICROCREDIT T ARGETED TO POOR PEOPLE? 165
Series. Washington, D.C.: Grameen Foundation.
Grameen Foundation. (2008). Progress out of poverty index™. PP1 Pilot Training. PPI Participant Guide. Retrieved from
http://www . progressoutofpoverty .org
Grameen Foundation. (2011). PPI Certified MF1s. Retrieved from http://progressoutofpoverty.orglcertification
Hardy, D. C., Holden, P., & Prokopenko, V. (2002). Microfinance 1nstitutions and Public Policy. lMF working paper, No. 159.
Washington, D.C.: 1nternational Monetary Fund.
Holden, P., & Prokopenko, V. (200 I). Financial development and poverty alleviation: lssues and policy implications for developing
and transition countries. IMF working paper, No. 160. Washington, D.C.: 1nternational Monetary Fund.
Hossain, M. (1988). Credit for alleviation ofrural poverty: The Grameen Bank in Bangladesh. Research reports from lnternational
Food Policy Research 1nstitute, No. 65. Washington, D.C.: 1nternational Food Policy Research lnstitute.
Hoy, S., & Foelster, J. (20 I O). Cambodian microfinance. Industry update. Retrieved trom http://www.bwtp.org
IRIS Center. (2007). Introduction to sampling for the implementation of PATs. Retrieved from
http://www.povertytools.orgltraining_ documents/Sampl ingllntroduction _ Sampling. ppt
IRIS Center. (2011). Manual for the ùnplementation of USAID poverty assessment tools. Retrieved from
http://www.povertytools.orglimplementation.html
Karlan, D., & Goldberg, N. (2006). The impact ofmicrofmance: A review ofmethodological issues. Working papers. New York,
N .Y.: Financial Access lnitiative, NYU Wagner Graduate School.
Karnani, A. G. (2007). Employment, not microcredit, is the solution. Ross School of Business Paper No. 1065. Retrieved from
http://ssrn.com/abstract=962941
Khandker, S. R. (2005). Microfinance and poverty: Evidence using pane I data from Bangladesh. World Bank Economie Review,
19(2), 263-286.
Littlefield, E., Morduch, J., & Hashemi S. (2003). 1s microfinance an effective strategy to reach the millennium development goals?
FocusNote No. 24, Washington, D.C.: CGAP.
Morduch, J. (1999). The microfinance promise. Journal ofEconomic Literature, 37(4), 1569-1614.
Pankaj, S. J. (1996). Managing credit for the rural poor: Lessons from the Grameen Bank. World Development, 24(1),79-89.
Pitt, M., & Khandker, S. (1998). The impact of group-based credit programs on poor households in Bangladesh: Does the gender of
participants matter? Journal ofPolitical Economy, 106(5),958-996.
Roodman, D. M., & Morduch, J. (2009). The impact ofmicrocredit on the poor in Bangladesh: Revisiting the evidence. Working
papers No. 174. Washington, D.C.: Center for Global Development.
Schreiner, M. (2009). A simple poverty scorecard for Cambodia. Retrieved from http://www.progressoutofpoverty.orglcambodia
Sengupta, R., & Aubuchon, C. (2008). The microfinance revolution: An overview. Federai Reserve Bank ofSt. Louis Review, 90(1),
9-30.
Social Performance Task Force. (2011). Declaration ofprinciples. Retrieved from http://sptf.info
Stiglitz, J. E., & Weiss, A. (1981). Credit rationing in markets with imperfect information, American Economie Review, 71(3),
393-410.
World Bank. (2006). Cambodia: Halving poverty by 2015? Poverty assessment 2006. Washington, D.C.: World Bank.
Yunus, M. (2007). Creating a world without poverty: Sodal business and the future of capitalismo New Y ork, N. Y.: PublicAffairs.
Zeller, M. (2004). Review ofpoverty assessment tools. Working papero Maryland: The IRIS Center, University ofMaryland.

166 IS MICROCREDIT TARGETED TO POOR PEOPLE?
Appendix: Progress out ofPoverty Index™ for Cambodia Entity: Name: ID: Date (DDIMMIYY):
Member: Joined: Loan officer: Today: Branch: Household size:
Indicator Value Points Score
A. Eight or more O
B. Seven 2
C. Six 6
IO l. How many members does D. Five thehouseholdhave? r------------------------------------------------------t-----1-----1
E. Four 14
F. Three 19
G. One ortwo 27
O 2. How many children ages 7 f-A_._N_o_t_a_ll ________________________________________________ +-____ +-____ -1 to 15 attend school? B. All, or no children ages 7 to 15 4
O 3. What is the primary A. Bamboo or thatch, makeshift, salvaged, or improvised materials, other, or no construction material of thej-'d"'a"'ta"---__________________________ -+ ___ I-_---l outer wall ofthe dwelling unit B. Wood or logs, plywood, galvanized iron or aluminum, or fibrous cement 2
occupied by the household? C. Concrete, brick, or stone 14
A. Firewood or other O
4. What type of fuel does the B. Charcoal, fuewood and charcoal, liquefied
household main1y use for petroleum gas, kerosene, public\y-provided electricity, gas and electricity, 6 cooking? privately
~~~L--------------------------+_--~--~
generated electricity, or none/does not cook
A. Open land O
5 Wh ·1 f: ·1· d h B. None 4 . at tOI et aCI Ity oes t ef-:----,--,----,---,---,-------------,-----,-,------+_--~--~ household have? C. Pit latrine, septic tank, other without septic tank, public toilet, shared toilet, 6
or other
D. Connected to sewerage 13
A. No bicyc\es, and no motorcycles O
6. How many bicyc\es and B. One bicyc\e, and no motorcyc\es 4
7
11
motorcyc\es does the C. Two bicycles, and no motorcyc\es household own? D. Three or more bicyc\es, and no motorcycles
E. One or more motorcyc\es (regardless ofbicyc\es) 13
7. Does the household own a A. No O I-----------------------------+---~--~
bed set? B. Yes 4
8. Does the household own a A. No O f-------------------------------------------------+-----~---1
wardrobe or cabinet? B. Yes 8
9 . Does the household own a A. No O f-------------------------------------------------+-----~---1
water pump? B. Yes 5
IO. Does the household own a A. No O f-------------------------------------------------+-----~---1
television? B. Yes 6
Total score
Note. Thls PPI was updated In December, 2009. For up-to-date PPIs and other InfOrmatlOn on the Progress out ofPoverty Index™
for Cambodia and other countries go to www.progressoutofpoverty.org.