
Université Pierre et Marie Curie Propriétés spectroscopiques ...
250
Université Pierre et Marie Curie Thèse de doctorat présentée par : Vincent Vercamer Pour obtenir le grade de : DOCTEUR de l’UNIVERSITÉ PIERRE ET MARIE CURIE (PARIS) Spécialité : Physique et chimie des matériaux Propriétés spectroscopiques et structurales du fer dans les verres silicatés Soutenue le 5 février 2016 devant le jury composé de : Dr Yusuke Arai AGC Research Center Examinateur Pr Paul Bingham Sheffield Hallam University Rapporteur Dr Maurits Haverkort Max Planck Institute Examinateur Dr Philippe Legrand AGC Invité Dr Gérald Lelong Université Pierre et Marie-Curie Directeur de thèse Pr Pierre Levitz Université Pierre et Marie-Curie Président du jury Pr Akira Takada University College London Rapporteur École doctorale Physique et chimie des matériaux – ED 397 Institut de Minéralogie, de Physique des Matériaux et de Cosmochimie – UMR 7590 cbnd
-
Upload
khangminh22 -
Category
Documents
-
view
3 -
download
0
Transcript of Université Pierre et Marie Curie Propriétés spectroscopiques ...

Université Pierre et Marie Curie
Thèse de doctorat présentée par :
Vincent Vercamer
Pour obtenir le grade de :
DOCTEUR de l’UNIVERSITÉ PIERRE ET MARIE CURIE (PARIS)
Spécialité : Physique et chimie des matériaux
Propriétés spectroscopiques et structuralesdu
fer dans les verres silicatés
Soutenue le 5 février 2016 devant le jury composé de :
Dr Yusuke Arai AGC Research Center Examinateur
Pr Paul Bingham Sheffield Hallam University Rapporteur
Dr Maurits Haverkort Max Planck Institute Examinateur
Dr Philippe Legrand AGC Invité
Dr Gérald Lelong Université Pierre et Marie-Curie Directeur de thèse
Pr Pierre Levitz Université Pierre et Marie-Curie Président du jury
Pr Akira Takada University College London Rapporteur
École doctorale Physique et chimie des matériaux – ED 397
Institut de Minéralogie, de Physique des Matériaux et de Cosmochimie – UMR 7590
c b n d


Spectroscopic and Structural Propertiesof
Iron in Silicate Glasses


RemerciementsAcknowledgements
Cette thèse est issue de la collaboration entre l’équipe PALM (Propriétés des Amorphes,Liquides et Minéraux) de l’IMPMC (Institut de minéralogie, de physique des matériaux etde cosmochimie) et l’entreprise AGC. Elle a en partie été financée grâce à l’AssociationNationale de la Recherche et de la Technologie (ANRT) par la convention industrielle deformation par la recherche (CIFRE) n°2012/0640. Je remercie AGC pour avoir financé cettethèse et pour les nombreux échanges constructifs que nous avons eus autour de ce travail.Je remercie l’IMPMC au travers de ses deux directeurs, Bernard Capelle et GuillaumeFiquet, pour leur accueil bienveillant, leur écoute et leurs conseils.
Je remercie tous les membres du jury d’avoir examiné ce travail. En particulier, PierreLevitz pour avoir présidé le jury, ainsi que Paul Bingham et Akira Takada qui m’ont faitle plaisir de relire attentivement mon manuscrit et d’accepter d’en être les rapporteurs.J’ai été très heureux de pouvoir bénéficier de leur expertise, de leurs remarques et de leursréflexions. Je remercie vivement, Yusuke Arai, Maurits Haverkort et Philippe Legrand dem’avoir fait l’honneur de juger mon travail.
Mes remerciements infinis s’adressent ensuite à mon directeur de thèse, Gérald Lelong, quia magnifiquement dirigé cette recherche et qui m’a guidé tout au long de mon travail. Mercipour les bilans intermédiaires et réguliers qui m’ont permis de me remettre en question etd’améliorer mes méthodes de travail. Merci pour ta bienveillance, ton immense pédagogie,mais aussi pour ta disponibilité, la confiance et l’autonomie que tu m’as accordées et quim’ont permis de présenter mon travail lors de nombreuses conférences. Merci pour cesdiscussions entrecoupées de contradictions et de rires. Tu as été un génial capitaine quim’a bien remonté le moral quand il m’arrivait de me retrouver au creux de la vague afin demieux surfer dessus.
Je remercie les membres d’AGC qui ont grandement contribué au succès de cette recherche:
本研究を進めるにあたり、旭硝子株式会社の多くの方々にお世話になりました。ま
た、2012年には旭硝子中央研究所に研究生としてお招き頂きました。美しい日本
で過ごした貴重な時間は、生涯に渡り忘れ得ぬものとなりました。ここに深く感謝の
意を表します。
研究活動全般に渡り、格別なるご指導とご高配を賜りました、旭硝子中央研究所の
近藤裕己氏、中島哲也氏に甚大なる謝意を表します。
本論文をご精読頂き、様々に有用なコメントを頂き、また博士論文最終審査会には
審査員としても参加して下さった、高田章氏に深く感謝致します。
旭硝子中央研究所の荒井雄介氏には、研究指導およびディスカッションのために多
大なる時間を割いていただきました。博士論文最終審査会に日本よりお越しくださ

8
り、質疑応答においては、そのコメントに大いなる刺激とご厚意を頂きました。心よ
り感謝申し上げます。
また、同研究所の土屋博之氏、藤田早苗氏には本研究の要である硝子実験に際し
て、多大なるご協力を頂きました。両氏の実験資料や計算結果のご提供、ならびに
種々のご助言、またその好意に対し最大の感謝を致します。
研究活動費の調達および共同研究を円滑に進めるために、貴社、横塚俊亮氏、船津
志郎氏ならびに留野暁氏に多大なるご援助を頂きました。深く感謝申し上げます。
Je remercie aussi Bérangère Joumel d’AGC pour le formidable suivi administratif demon dossier tout au long de cette thèse.
Un immense merci aux MIAM (mangeurs insatiables et anticonformistes de multiplet) :Marie-Anne Arrio, Amélie Juhin, Christian Brouder qui m’ont fait découvrir le mondeenivrant des calcools (un mélange de calculs, de cool et d’alcool ?). Merci pour votrepatience et votre disponibilité, pour le temps passé à m’expliquer les différents codes decalculs multiplet et pour vos réponses à mes nombreuses questions quantiques. Merci dem’avoir permis d’aller apprendre à utiliser le code de DFT ORCA au Wigner ResearchCenter à Budapest.
Je remercie grandement les personnes de l’équipe PALM : Georges Calas, LaurenceGaloisy, Laurent Cormier pour les discussions et réunions régulières que nous avons euestout au long de cette thèse.
J’adresse un remerciement spécial à Jean-Louis Robert pour son aide à la synthèsedes phosphates de fer, pour la relecture minutieuse qu’il a faite de ma prose et pour sesnombreux conseils qu’il a distillés tout au long de ces trois ans.
J’exprime toute ma gratitude à Jean-Claude Bouillard, François Farges et Didier Nectouxpour les minéraux qu’ils ont donnés afin de réaliser les nombreuses mesures de cette thèseet pour leur expertise inestimable en minéralogie et gemmologie.
I am infinitely grateful to Maurits Haverkort for his revolutionary code Quanty, whichis a 30-year jump forward compared to TTMULT. Thank you for the time spend to explainme how to use this code and implement all sort of new features. I am very thankful toGyörgy Vankó and Mátyás Pápai for their warm welcome at the Wigner Research Centerof Budapest, and thank you for the time spent to train me for using ORCA.
Merci à ma binôme de thèse, Myrtille Hunault, d’avoir supporté mes diverses incursionset perturbations dans son travail, merci pour son infaillible collaboration qui nous a permisde faire converger nos travaux vers de super résultats.
Merci aux experts de l’IMPMC : Maxime Guillaumet pour son aide avec les spectroscopiesoptique et RPE, Guillaume Morin, Étienne Balan et Thierry Allard pour la RPE, AgnèsElmaleh pour le temps qu’elle m’a accordé pour la mesure et l’interprétation des expériencesde magnétisme, Ludovic Delbes et Benoit Baptiste pour la DRX, Jessica Brest et SylvainLocati pour la chimie, Delphine Cabaret, Guillaume Ferlat, Guillaume Radtke et PhilippeSainctavit pour les inestimables discussions sur la théorie et les calculs numériques.
Un très grand merci aux experts qui ne sont pas du laboratoire, mais dont l’aide a ététout aussi précieuse et décisive : Michel Fialin du service CAMPARIS de l’UPMC pour son

9
aide à la microsonde, Dominique Bonnin pour son expertise multi-spectroscopiques et lesfructueuses discussions que nous avons eues et le temps passé à relire mon manuscrit, JürgenVon Bardeleben de l’INSP pour son incroyable savoir-faire et expertise concernant cettedélicate technique qu’est la RPE à basse température, Melanie Escudier et Michelle Jacquetde l’atelier d’optique cristalline de l’INSP pour leur inestimable expertise du polissage desverres, Emrick Briand de l’INSP pour les mesures RBS qu’il a accepté de réaliser à Namur,Pieter Glatzel et Mauro Rovezzi de la ligne ID26 du synchrotron ESRF de Grenoble pour lesupport technique et les discussions scientifiques instructives que nous avons eues, BrigitteLeridon et Armel Descamps Mandine du LPEM de l’ESPCI Paris de m’avoir permis deréaliser des mesures de magnétisme avec un SQUID.
Un grand merci à Marie-Louise Saboungi pour sa bonne humeur et tous ses conseils !
Je souhaite remercier toutes les générations de doctorants, stagiaires et postdocs que j’aicôtoyées et plus particulièrement : Mathieu Chassé, Louisiane Verger, Benjamin Cochain,Flora Boekhout, Lucas Poirier. Merci aussi à mes co-bureaux et co-bagnards respectifs deleur thèse : Nicolas Dupuy, Nith Cam, Thibault Sohier, on a bien rigolé !
Special thanks to Holly Main, Illustrator and Cartoonist, Toronto, Ontario, for the use ofher For Those Who Love Glass A Bit Too Much comic in the dedication. For more comicsand illustrations, visit www.hollymain.com.
Enfin, je souhaite remercier du fond du cœur mes parents ainsi que Cécile et Rémi pourm’avoir encouragé dans cette voie. On oublie trop souvent de remercier les mamies pour lecalme, la quiétude et le soutien logistique qu’elles apportent dans les moments difficiles dela rédaction. . .
Pour finir, je souhaite remercier Judith pour son soutien quotidien et indéfectible durantces quelques années mouvementées.


11
Table of contents
Introduction 17
1 Iron in glass: an heterovalent ion in a complex medium 211.1 What is a glass? . . . . . . . . . . . . . . . . . . . . . . . . . . . . . . . . . 211.2 Iron redox in glass . . . . . . . . . . . . . . . . . . . . . . . . . . . . . . . . 221.3 Iron environment in glass . . . . . . . . . . . . . . . . . . . . . . . . . . . . 23
1.3.1 Fe2+ coordination number in glass . . . . . . . . . . . . . . . . . . . 231.3.2 Fe3+ coordination number in glass . . . . . . . . . . . . . . . . . . . 241.3.3 The question of [5]-fold coordinated iron in glasses . . . . . . . . . . 251.3.4 From iron coordination number to site geometry . . . . . . . . . . . 261.3.5 Group theory to describe the local environment . . . . . . . . . . . . 27
1.4 Conclusion & Thesis statement . . . . . . . . . . . . . . . . . . . . . . . . . 28
2 Samples and experimental methods 292.1 Glasses . . . . . . . . . . . . . . . . . . . . . . . . . . . . . . . . . . . . . . . 29
2.1.1 Choice of the glass set . . . . . . . . . . . . . . . . . . . . . . . . . . 292.1.2 Sample preparation . . . . . . . . . . . . . . . . . . . . . . . . . . . . 302.1.3 Characterization . . . . . . . . . . . . . . . . . . . . . . . . . . . . . 332.1.4 Summary . . . . . . . . . . . . . . . . . . . . . . . . . . . . . . . . . 35
2.2 Optical absorption spectroscopy . . . . . . . . . . . . . . . . . . . . . . . . . 352.2.1 Transmission measurements . . . . . . . . . . . . . . . . . . . . . . . 352.2.2 Background correction . . . . . . . . . . . . . . . . . . . . . . . . . . 36
2.3 X-ray Absorption Spectroscopy (XAS) . . . . . . . . . . . . . . . . . . . . . 392.3.1 Principle . . . . . . . . . . . . . . . . . . . . . . . . . . . . . . . . . . 392.3.2 Experiment . . . . . . . . . . . . . . . . . . . . . . . . . . . . . . . . 402.3.3 Data processing . . . . . . . . . . . . . . . . . . . . . . . . . . . . . . 41
2.4 RIXS and HERFD . . . . . . . . . . . . . . . . . . . . . . . . . . . . . . . . 422.4.1 Principle . . . . . . . . . . . . . . . . . . . . . . . . . . . . . . . . . . 422.4.2 Experiment . . . . . . . . . . . . . . . . . . . . . . . . . . . . . . . . 432.4.3 Data processing . . . . . . . . . . . . . . . . . . . . . . . . . . . . . . 432.4.4 Why HERFD and RIXS can be useful? . . . . . . . . . . . . . . . . 43
2.5 SQUID-VSM . . . . . . . . . . . . . . . . . . . . . . . . . . . . . . . . . . . 442.5.1 Approach . . . . . . . . . . . . . . . . . . . . . . . . . . . . . . . . . 442.5.2 SQUID data acquisition . . . . . . . . . . . . . . . . . . . . . . . . . 45

12
2.6 Electron Paramagnetic Resonance (EPR) . . . . . . . . . . . . . . . . . . . 462.6.1 EPR principles . . . . . . . . . . . . . . . . . . . . . . . . . . . . . . 462.6.2 EPR data acquisition and data processing . . . . . . . . . . . . . . . 482.6.3 EPR example and interpretation elements . . . . . . . . . . . . . . . 49
3 Ligand Field Multiplet Theory applied to the calculation of XAS andoptical absorption spectra 513.1 Historical introduction to Ligand Field Multiplet Theory (LFMT) . . . . . . 513.2 From mono-electronic picture to multiplet states . . . . . . . . . . . . . . . 523.3 Spectroscopic terms and ground state . . . . . . . . . . . . . . . . . . . . . . 523.4 The importance of geometry . . . . . . . . . . . . . . . . . . . . . . . . . . . 533.5 Crystal field parameters . . . . . . . . . . . . . . . . . . . . . . . . . . . . . 543.6 Tanabe-Sugano diagrams . . . . . . . . . . . . . . . . . . . . . . . . . . . . . 563.7 Hamiltonian describing the multielectronic configuration . . . . . . . . . . . 583.8 Intensities – absorption cross-section . . . . . . . . . . . . . . . . . . . . . . 583.9 Transition rules in optics . . . . . . . . . . . . . . . . . . . . . . . . . . . . . 593.10 Quanty – a quantum many body script language . . . . . . . . . . . . . . . 613.11 Summary . . . . . . . . . . . . . . . . . . . . . . . . . . . . . . . . . . . . . 62
4 Investigation of a reference set of crystalline compounds: determinationand interpretation of spectral signatures 634.1 The case of Oh – octahedral [6]Fe2+ in siderite . . . . . . . . . . . . . . . . . 65
4.1.1 XAS . . . . . . . . . . . . . . . . . . . . . . . . . . . . . . . . . . . . 654.1.2 Optical absorption spectroscopy . . . . . . . . . . . . . . . . . . . . . 664.1.3 Effect of the different parameters . . . . . . . . . . . . . . . . . . . . 67
4.1.3.1 Hybridization . . . . . . . . . . . . . . . . . . . . . . . . . . 674.1.3.2 Crystal field . . . . . . . . . . . . . . . . . . . . . . . . . . 694.1.3.3 Nephelauxetic ratio β . . . . . . . . . . . . . . . . . . . . . 704.1.3.4 Spin-orbit coupling on the 3d levels . . . . . . . . . . . . . 71
4.2 The case of Oh – octahedral [6]Fe3+ in andradite . . . . . . . . . . . . . . . 724.2.1 XAS . . . . . . . . . . . . . . . . . . . . . . . . . . . . . . . . . . . . 724.2.2 Optical absorption spectroscopy . . . . . . . . . . . . . . . . . . . . . 734.2.3 Effect of the different parameters . . . . . . . . . . . . . . . . . . . . 74
4.2.3.1 Crystal field . . . . . . . . . . . . . . . . . . . . . . . . . . 744.2.3.2 Nephelauxetic ratio β . . . . . . . . . . . . . . . . . . . . . 764.2.3.3 Spin-orbit coupling on the 3d . . . . . . . . . . . . . . . . . 77
4.3 The case of D4h – square planar [4]Fe2+ in gillespite . . . . . . . . . . . . . . 774.3.1 Model used for the calculation of gillespite . . . . . . . . . . . . . . . 784.3.2 Comparison experimental data/LFM calculation . . . . . . . . . . . 79
4.4 The case of Td – tetrahedral [4]Fe2+ in staurolite . . . . . . . . . . . . . . . 804.4.1 Comparison of experimental spectra/LFM calculation . . . . . . . . 804.4.2 Effect of the different parameters . . . . . . . . . . . . . . . . . . . . 82
4.4.2.1 Crystal field . . . . . . . . . . . . . . . . . . . . . . . . . . 82

13
4.4.2.2 Nephelauxetic ratio β . . . . . . . . . . . . . . . . . . . . . 834.4.2.3 Effect of ground state hybridization . . . . . . . . . . . . . 84
4.5 The case of Td – tetrahedral [4]Fe3+ in ferriorthoclase . . . . . . . . . . . . . 854.5.1 Comparison experimental data/LFM calculation . . . . . . . . . . . 864.5.2 Effect of the different parameters . . . . . . . . . . . . . . . . . . . . 88
4.5.2.1 Crystal field . . . . . . . . . . . . . . . . . . . . . . . . . . 884.5.2.2 Nephelauxetic ratio β . . . . . . . . . . . . . . . . . . . . . 89
4.6 The case of D3h – trigonal bipyramidal [5]Fe2+ in grandidierite . . . . . . . . 894.6.1 XAS . . . . . . . . . . . . . . . . . . . . . . . . . . . . . . . . . . . . 894.6.2 Optical absorption spectroscopy . . . . . . . . . . . . . . . . . . . . . 90
4.7 The case of C3v – trigonal bipyramidal [5]Fe3+ in yoderite . . . . . . . . . . 934.7.1 XAS K pre-edge . . . . . . . . . . . . . . . . . . . . . . . . . . . . . 934.7.2 Optical absorption spectra . . . . . . . . . . . . . . . . . . . . . . . . 94
4.8 Summary . . . . . . . . . . . . . . . . . . . . . . . . . . . . . . . . . . . . . 95
5 Iron local environment in a soda-lime-silicate glass 975.1 Introduction to the optical absorption spectrum of iron in silicate glass . . . 985.2 Structure–spectroscopy analysis of Fe2+ . . . . . . . . . . . . . . . . . . . . 99
5.2.1 Spectroscopic origins of Fe2+ optical bands . . . . . . . . . . . . . . 995.2.2 The contribution of XAS to the analysis of Fe2+ optical bands . . . . 1015.2.3 LFM calculations of Fe2+ spectroscopic signature in glasses . . . . . 1045.2.4 Influence of redox on the Fe2+ local environment . . . . . . . . . . . 1065.2.5 Evidence of Fe2+ spin-forbidden bands in reduced glass . . . . . . . 109
5.3 Structure–spectroscopy analysis of Fe3+ . . . . . . . . . . . . . . . . . . . . 1105.3.1 Study of the OMCT bands in the UV range . . . . . . . . . . . . . . 1105.3.2 Evidence of [5]-fold ferric iron ([5]Fe3+) in glasses . . . . . . . . . . . 1115.3.3 The contribution of XAS experiments and LFM calculations to the
analysis of Fe3+ optical bands . . . . . . . . . . . . . . . . . . . . . . 1155.3.4 Study of the impact of redox on Fe3+ site distortion . . . . . . . . . 116
5.4 Site partitioning: isolated vs. clustered iron . . . . . . . . . . . . . . . . . . 1195.4.1 Introduction . . . . . . . . . . . . . . . . . . . . . . . . . . . . . . . . 1195.4.2 X-ray absorption spectroscopy (XAS) . . . . . . . . . . . . . . . . . 1205.4.3 Electron paramagnetic resonance (EPR) . . . . . . . . . . . . . . . . 1205.4.4 SQUID magnetometry . . . . . . . . . . . . . . . . . . . . . . . . . . 1225.4.5 Conclusions . . . . . . . . . . . . . . . . . . . . . . . . . . . . . . . . 123
6 Influence of chemical composition on iron local environment in glasses 1256.1 Absence of sodium, what are the effects? . . . . . . . . . . . . . . . . . . . . 125
6.1.1 Effects on Fe3+: DIO vs NCS . . . . . . . . . . . . . . . . . . . . . . 1256.1.2 Effects on Fe2+: DIO vs. NCS . . . . . . . . . . . . . . . . . . . . . 128
6.2 Influence of the alkaline earth nature: Ca vs. Mg . . . . . . . . . . . . . . . 1306.2.1 The opposite effect of Ca:Mg ratio on the Fe2+ and Fe3+ UV-edge . 1316.2.2 Ca:Mg effects on ferric iron (Fe3+) optical signatures in glasses . . . 132

14
6.2.3 Evolution of Fe3+ distortion when Mg substitute Ca . . . . . . . . . 1346.2.4 Ca:Mg effects on ferrous iron (Fe2+) optical signatures in glasses . . 1366.2.5 Are there more Fe-clusters in Mg-rich glass? . . . . . . . . . . . . . . 1386.2.6 Calcium or magnesium who is the favorite neighbor? . . . . . . . . . 140
Conclusions and suggestions for future work 143
References 147
Appendix A Crystalline references data 163
Appendix B Optical absorption spectroscopy 203B.1 Perkin-Elmerr Lambda 1050 . . . . . . . . . . . . . . . . . . . . . . . . . . 203B.2 How to convert α to ε . . . . . . . . . . . . . . . . . . . . . . . . . . . . . . 203B.3 Beer lambert verification for reduced glasses . . . . . . . . . . . . . . . . . . 204B.4 Data processing of weak Fe3+ signals . . . . . . . . . . . . . . . . . . . . . . 205
B.4.1 Removing the UV-edge to extract Fe3+ d–d transitions . . . . . . . . 206B.4.2 Separation of Fe2+/Fe3+ . . . . . . . . . . . . . . . . . . . . . . . . . 207B.4.3 Gaussian fit of the Fe3+ bands . . . . . . . . . . . . . . . . . . . . . 209B.4.4 Low-iron glasses . . . . . . . . . . . . . . . . . . . . . . . . . . . . . 209
Appendix C SQUID-VSM 211C.1 Magnetic units . . . . . . . . . . . . . . . . . . . . . . . . . . . . . . . . . . 211C.2 Correction for the diamagnetism of the glassy matrix . . . . . . . . . . . . . 212
Appendix D X-ray absorption spectroscopy 213D.1 Temperature effect - Boltzmann distribution . . . . . . . . . . . . . . . . . . 213D.2 Spectral broadening . . . . . . . . . . . . . . . . . . . . . . . . . . . . . . . 213D.3 Beam damage . . . . . . . . . . . . . . . . . . . . . . . . . . . . . . . . . . . 214D.4 Sum rules . . . . . . . . . . . . . . . . . . . . . . . . . . . . . . . . . . . . . 217
Appendix E Theoretical developments with LFMT 219E.1 Isotropic resonant inelastic X-ray scattering – the powder formula . . . . . . 219E.2 Geometrical factor of the Kramers-Heisenberg formula . . . . . . . . . . . . 221E.3 Angular dependence of RIXS. E1-E2 interference term . . . . . . . . . . . . 223
E.3.1 General expression . . . . . . . . . . . . . . . . . . . . . . . . . . . . 223E.3.2 Angular terms . . . . . . . . . . . . . . . . . . . . . . . . . . . . . . 223E.3.3 Matter tensors . . . . . . . . . . . . . . . . . . . . . . . . . . . . . . 226E.3.4 9j-symbols . . . . . . . . . . . . . . . . . . . . . . . . . . . . . . . . 226E.3.5 Final formulas . . . . . . . . . . . . . . . . . . . . . . . . . . . . . . 227E.3.6 Conclusion . . . . . . . . . . . . . . . . . . . . . . . . . . . . . . . . 228
E.4 The absolute absorption cross-section σ(ω) in Å2 . . . . . . . . . . . . . . . 229E.5 Crystal field Hamiltonian in D3h geometry . . . . . . . . . . . . . . . . . . . 230
Appendix F Curriculum Vitae 233

15
Résumé de la thèse en français 2351 Introduction à la problématique du fer dans les verres : un ion hétérovalent
dans un milieu complexe . . . . . . . . . . . . . . . . . . . . . . . . . . . . . 2351.1 Contexte . . . . . . . . . . . . . . . . . . . . . . . . . . . . . . . . . 2351.2 Redox . . . . . . . . . . . . . . . . . . . . . . . . . . . . . . . . . . . 2351.3 Le verre . . . . . . . . . . . . . . . . . . . . . . . . . . . . . . . . . . 2351.4 Relation structure-propriétés . . . . . . . . . . . . . . . . . . . . . . 2361.5 Intérêt des cristaux pour l’étude des verres . . . . . . . . . . . . . . . 2361.6 L’environnement du fer dans les verres . . . . . . . . . . . . . . . . . 2371.7 La théorie des groupes pour décrire l’environnement local . . . . . . 2371.8 Problématique . . . . . . . . . . . . . . . . . . . . . . . . . . . . . . 238
2 Échantillons et méthodes expérimentales . . . . . . . . . . . . . . . . . . . . 2382.1 Compositions et synthèses . . . . . . . . . . . . . . . . . . . . . . . . 2382.2 Spectroscopie d’absorption optique . . . . . . . . . . . . . . . . . . . 2392.3 Spectroscopie d’absorption des rayons X (XAS) . . . . . . . . . . . . 2392.4 Spectroscopie RIXS et HERFD . . . . . . . . . . . . . . . . . . . . . 2402.5 SQUID . . . . . . . . . . . . . . . . . . . . . . . . . . . . . . . . . . 2412.6 Résonance Paramagnétique Électronique (RPE) . . . . . . . . . . . . 242
3 La théorie des multiplets en champ de ligands appliquée au calcul des spectresd’absorption X et d’absorption optique . . . . . . . . . . . . . . . . . . . . . 242
4 Étude d’un jeu de références cristallines : détermination et interprétationdes signatures spectrales . . . . . . . . . . . . . . . . . . . . . . . . . . . . . 243
5 Environnement local du fer dans un verre sodo-calcique . . . . . . . . . . . 2455.1 Analyse structure-spectroscopie du Fe2+ . . . . . . . . . . . . . . . . 2455.2 Analyse structure-spectroscopie du Fe3+ . . . . . . . . . . . . . . . . 2465.3 Fer en cluster vs. fer isolés . . . . . . . . . . . . . . . . . . . . . . . . 247
6 Conclusions et perspectives . . . . . . . . . . . . . . . . . . . . . . . . . . . 247
Résumé 249
Abstract 250


17
Introduction
Iron is the fourth most abundant element in Earth’s crust (after oxygen, silicon andaluminum); 11 times more abundant than titanium (the second most abundant transitionelement). It is, therefore, present as an impurity in raw materials used by industry tomanufacture millions of metric tonnes of glass each year. Beyond this constant presence,iron impurities play a major role for many advanced applications (e.g. automotive, solarpanels, construction) and can be used to control glass coloration, thermal insulation, andenergy transmission.
These latter properties are all related to optical absorption, which is one of the mainspectroscopic properties considered in the glass industry to improve the technical charac-teristics of glasses. Understanding the influence of Fe on glass properties may then helpto develop innovative functional glasses. For example, the absorption of UV light by ironis an annoying side effect for solar panel applications; high-energy photons are absorbedby the protective glass containing iron instead of being converted into electricity by thephotovoltaic materials. Another problematic consequence of this UV absorbing propertiesis for photolithography during microfabrication of electronic components such as CPU. UVphotons have to pass through several lenses equivalent to one meter of glass without beingabsorbed, in order to etch the billions of transistors present on the chip. On the other hand,the control of UV absorption is useful for glasses manufactured to protect from degradationof plastics inside cars, or the pigments of photos and paintings, but visible light has tobe transmitted. Concerning the infrared range, the control of the absorption is crucial tooptimize solar and heat transfer through glass windows.
In amorphous materials such as glasses, but also in minerals and chemical complexes, ironusually occurs under two oxidation states Fe2+ (ferrous) and Fe3+ (ferric), whose relativeproportion defines the redox state of iron. The redox depends on synthesis conditionssuch as chemical composition, temperature or atmospheric conditions. Ferrous and ferricions are localized in specific environments within the glass structure. They give to dilutedglasses a blue (Fe2+), yellow (Fe3+) or green (mixed oxidation states) color. The amorphouscharacter of glass and the heterovalent nature of iron are two reasons explaining that evenafter 80 years of active scientific research, the comprehension of iron local environment inglass is still partial.
Through spectroscopy, the interactions of radiation with matter can be used to probe thestructure-property relationships in glass. For example, Ultraviolet–Visible–Near-Infrared(UV–Visible–NIR) spectroscopy provides a correlation between the colorimetric properties of

18
glasses containing transition metals, and the redox state and structural surrounding of thesetransition elements. To complete the knowledge brought by optical absorption spectroscopy(OAS), complementary techniques presenting such as X-ray absorption spectroscopy (XAS)and electron paramagnetic resonance (EPR), can be used.
In order to deduce structural properties from spectroscopic analysis, crystalline com-pounds, in which the local structure is known, are useful references. Signatures of tetrahedraland octahedral sites were widely studied and characterized. However, [5]-fold species, espe-cially in the case of iron, are not always considered for the interpretation of the spectralsignature, which is very sensitive to the local geometry and site coordination. Interpreta-tions can be sustained by coupling experimental results with calculations of the electronicstructure and spectroscopy in order to interpret the structure-property relationships. Thecomplex problem of optical spectra simulations of 3d elements can be addressed using grouptheory to describe the local geometry. Thus, the ligand field multiplet (LFM) approach isused to take into account the point group symmetry of the iron site in order to evaluate themulti-eletronic effects of the neighboring atoms on the central transition metal electrons.These simulations help to extract tendencies from the calculation of iron minerals in orderto extrapolate them for the understanding iron in glasses.
Among the infinite possibilities of glass compositions, this thesis focused on soda-lime sili-cates representing 90% of the glass production. Specific glasses with extreme redox, reducedor oxidized, were synthesized to isolate the respective Fe2+ and Fe3+ spectroscopic signa-tures that are usually mixed due to the heterovalent nature of iron. A multi-spectroscopicstudy was performed by coupling experimental measurements with simulations. Therefore,it is possible to cross the results from multiple points of view to improve the comprehensionof the local structure around iron in order to interpret the optical properties of iron inglasses.
The first chapter presents a brief state of the art about the glass material, the ironredox and the local environment of both Fe2+ and Fe3+ in glasses. The thesis statementthat will be developed in the next chapters is presented after this review.
Chapter 2 justifies the choice of glass samples, their preparation and characteriza-tion. The experimental methods used in this work are details (optical absorption spec-troscopy (OAS), X-ray absorption spectroscopy (XAS), Resonant Inelastic X-ray Scattering(RIXS), High-Energy Resolution Fluorescence Detected X-ray Absorption Spectroscopy(HERFD-XAS), Superconducting Quantum Interference Device with a Vibrating SampleMagnetometer (SQUID-VSM) and Electron Paramagnetic Resonance (EPR)).
Chapter 3 presents the ligand field multiplet theory that is used to describe the localenvironment of iron. At the end of this chapter, the implementation of this theory usingQuanty software for the calculation of the spectra of minerals is presented.
Chapter 4 investigates the spectroscopic signature of both Fe2+ and Fe3+, in [4]-, [5]-and [6]-fold geometries using crystalline reference compounds. The aim of this chapteris to improve the understanding of structure-spectroscopy relationships using both opti-cal absorption and X-ray absorption spectroscopies coupled with ligand field multipletcalculations of these two techniques.

19
Chapter 5 studies the structure-spectroscopy links for Fe2+ and Fe3+ in a soda-limeglass as function of the redox state. The tendencies highlighted by calculations for mineralsare transposed to glasses. This chapter is also the occasion to discuss Fe-Fe interaction andthe site partitioning between isolated iron and Fe-clusters.
Chapter 6 develops the analysis of the previous chapter by considering compositionchange of the glassy matrix. The effect of sodium-lack and calcium-magnesium substitutionon glass structure are evaluated using Fe as a local probe using the spectroscopic methoddeveloped in this thesis.


21
Chapter 1
Iron in glass: an heterovalent ion in acomplex medium
1.1 What is a glass?
Glass is a non-crystalline solid, also described by Scholze [1980] as a “frozen supercooledliquid”, according to its usual synthesis process by quenching a melt. Compared to crystals,which show a precise melting temperature, glass exhibits a “glass transition” spanned intemperature (Figure 1.1) [Shelby, 2005]. As opposed to crystals, glasses do not have a long-range order nor periodic atomic arrangements. To schematically describe the complexity ofglass structure, Zachariasen [1932] introduced the random network theory with the notions ofnetwork former and network modifier. This model was later modified by Greaves [1985] thatintroduced percolation path containing mobile alkaline and alkaline earth cations. Despitethe amorphous nature of glass, experimental studies suggest a medium-range (∼15Å) orderwith local inhomogeneities of enriched domains [Neuville et al., 2013].
Enth
alpy
Temperature
Liquid
Liquid
Supe
rcoole
d
Glass Transformation
Range
Fast Cooled Glass
Slow Cooled GlassCrystal
TfSlow TfFast Tm
Figure 1.1 – Temperature effect on the enthalpy of a glass forming melt (based on Shelby [2005]).

22 Chapter 1
The main problem with characterization of glass structure remains in the fact that exper-imental spectroscopies only give an average picture of the heterogeneous local environmentsand do not reflect the variety of sites. Glass is then a complex system in which localenvironment around impurities can vary for a given matrix composition.
1.2 Iron redox in glass
Fe2+ and Fe3+ are the two valence states of iron usually observed in glasses. The partitionof iron in these two valence states is characterized by the redox state, defined as:
R =[Fe2+]
[Fe2+] + [Fe3+](1.1)
R = 0% for a fully oxidized glass and R = 100% for a fully reduced glass. When aniron-bearing glass is reduced, it is also possible to form metallic Fe0 by reducing Fe2+
[Schreiber et al., 1982]. Iron redox depends on several factors [Paul, 1990; Schreiber, 1986],such as:
− oxygen partial pressure [Johnston, 1964]
− temperature [Johnston, 1964; Kress and Carmichael, 1991]
− matrix composition [Duffy, 1996; Schreiber et al., 1994]
− interactions between redox pairs [Chopinet et al., 2002]
− total iron content [Rüssel and Wiedenroth, 2004; Uchino et al., 2000]
− heating rate [Yamashita et al., 2008]
The final bulk redox is an important experimental parameter because of its major effecton the glass mechanical, spectroscopic or structural properties. Among others, glass redoxis correlated to color: reduced glasses with only Fe2+ are blue and oxidized one with onlyFe3+ are yellow [Bamford, 1977]. Thermal properties such as near infrared absorption(NIR) [Sakaguchi and Uchino, 2007] or ultraviolet (UV) absorption [Uchino et al., 2000]also depend on redox, and lead to industrial consequences for NIR/UV protective glassor black-body absorption in furnaces. Redox also plays a role on other properties notstudied in this thesis, but important to keep in mind such as melt viscosity [Mysen andRichet, 2005], nucleation and crystallization processes [Sørensen et al., 2005] or surfaceredox variations within the first microns [Flank et al., 2011].
Another key factor is time, during synthesis, it is crucial to control the redox kinetics inorder to achieve or avoid thermodynamic equilibrium. Time and redox kinetics have beenstudied in several papers [Densem and Turner, 1938], [Paul and Douglas, 1965], [Goldmanand Gupta, 1983], [Pyare and Nath, 1984], [Paul, 1990], [Cochain, 2009], [Pigeonneau andMuller, 2013].

IRON IN GLASS: AN HETEROVALENT ION IN A COMPLEX MEDIUM 23
1.3 Iron environment in glass
The characterization of iron local environment is a crucial question, since it is interrelatedwith spectroscopic and chemical properties. The modification of structure has an effect onthe physical and chemical properties (Figure 1.2). Therefore, the understanding of ironlocal environment can help to interpret, simulate, and predict the optical properties, suchas color or the behavior in UV and NIR domains.
Structural information, such as Fe–O distances or coordination number can be obtainedfrom neutron scattering or extended X-ray absorption fine structure (EXAFS). Othermethods can bring indirect structural information on iron, such as Electron ParamagneticResonance (EPR, only Fe3+ not Fe2+), X-ray Absorption Near Edge Structure (XANES),Mössbauer and optical absorption spectroscopies. These methods do not give directstructural information, however, it is possible to relate spectroscopic signals with site ofspecific coordination number using fingerprint analysis with minerals in which the localenvironment is known [Burns, 1993]. In addition, numerical calculations of glass structurecoupled with experimental data, such as Reverse Monte Carlo (RMC), Empirical PotentialStructure Refinement (EPSR) or Molecular Dynamics (MD) methods, are valuable tools toextract structural information about the local environment [Weigel et al., 2008a].
(composition, redox,prep. conditions...)
chemistry
spectroscopicpropertiesstructure
Figure 1.2 – Schematic relationships between chemical properties, structure and spectroscopicproperties.
1.3.1 Fe2+ coordination number in glass
Within the framework of industrial glass, this study is focused on silicate glasses containingalkali and alkaline earth ions doped with transition metal, more precisely iron. The role offerrous iron is considered as a network-modifier [Goldman and Berg, 1980]. It has beenhistorically described to be exclusively in tetrahedral and octahedral geometries [Bates,1962, p. 245], with less than 15% of [4]Fe2+ and more than 85% of [6]Fe2+ [Calas andPetiau, 1983a], which is in contradiction with optical spectroscopy results estimating the[4]Fe2+ content to be lower than 1% [Nolet, 1980]. More recently, the presence of [5]-foldcoordinated Fe2+ has been evidenced in silicate glasses containing a significant (∼20mol%of FeO) using XAS and magnetic circular dichroism [Brown et al., 1995; Jackson et al.,2005]. Mössbauer studies of CaO–FeO–2SiO2 glass indicate an average coordination numberbetween [4] and [5] and a maximum coordination number lower than [6] [Rossano et al., 1999,

24 Chapter 1
2008]. Using EXAFS, Rossano et al. [2000c] found that the distribution of Fe–O distancesis too wide to only correspond to a simple mix of [4]-fold and [6]-fold, in CaO–FeO–2SiO2
glass. By comparing these experimental EXAFS data with MD calculations, they suggesteda continuous distribution of the O–Fe–O angles between the oxygens of [4]-fold and [5]-foldferrous iron (Figure 1.3). They found 70% of [4]-fold coordinated Fe2+ and 30% of [5]-foldcoordinated Fe2+. It can be noticed the angular distributions are not centered around theangles of the regular polyhedra (tetrahedron or trigonal bipyramid), which demonstrate thepresence of a variety of possible sites. Moreover, concerning the trigonal bipyramid, thereare almost no polyhedra with a 180° Fe–O–Fe angle, which means that the regular trigonalbipyramid with the apical oxygens aligned with the transition metal ion (forming the C3
axis) is not representative of the [5]-fold coordinated irons. In low-iron content glasses, thecombined results, from a multi-spectroscopic study by Jackson et al. [2005], suggest thatFe2+ predominantly occupies [4]-fold and [5]-fold coordinated sites, with ratios differingwith the composition. This study also suggests that small amounts of [6]-fold coordinatedFe2+ are possible.
4×109.5° 6×90°
3×120°
1×180°
(a)
O-Fe-O angle (deg)50 100 150 50 100 150
O-Fe-O angle (deg)
(b)
Figure 1.3 – Angular distribution around central iron in [4]-fold (a) and [5]-fold (b) coordinatedsites for a cut-off radius of 2.6Å. The bars correspond to the distribution expected for a perfecttetrahedron (a) and a regular bipyramid (b). From: Rossano et al. [2000c].
1.3.2 Fe3+ coordination number in glass
Several studies suggested that the largest fraction of Fe3+ (50 to 70%) is present asnetwork forming [4]Fe3+ in tetrahedra and that the remaining Fe3+ are higher coordinatedspecies ([5]-fold or [6]-fold) and plays a network modifying role in the glass matrix [Calasand Petiau, 1983a; Weigel et al., 2008b; Wright et al., 2014].
Weigel et al. [2008b], using neutron diffraction with Fe isotopic substitution combinedwith Empirical Potential Structure Refinement (EPSR) simulations on NaFeSi2O6 witha 22% redox, pointed out the predominance of Fe3+ in tetrahedra (60%), while 36% areFe2+ and Fe3+ in [5]-fold, and only 4% of total iron are [6]-fold coordinated. On theother hand, Wright et al. [2014], proposed that Fe2+ and Fe3+, when present as networkmodifying cations, are predominantly octahedrally coordinated by oxygen atoms, ratherthan in [5]-fold coordination. The difficulty in concluding on the coordination number of

IRON IN GLASS: AN HETEROVALENT ION IN A COMPLEX MEDIUM 25
Fe3+ present as network modifying cations is due to the poor resolution of experimentaldata, highlighting the necessity of numerical simulations [Weigel et al., 2008a]. Nevertheless,from the interatomic distance distribution, both studies concluded that a higher coordinatedFe3+ acting as a network modifier is needed to interpret experimental data.
By combining XANES and MD, Farges et al. [2004] found evidence of [5]Fe3+ in asoda-lime silicate glass doped with 0.2wt% Fe2O3. In addition, a recent study [Binghamet al., 2014], on oxidized silicate glasses doped with ∼1wt% Fe2O3, points out an averageFe3+ coordination number varying from [4] to [6] depending on the nature of the alkaliand alkaline earth used in the glass composition. [4]Fe3+ are stabilized by larger alkali andsmaller alkaline earth, while [5,6]Fe3+ are stabilized by smaller alkali and larger alkalineearth. These opposing effects of alkali and alkaline-earth ions on Fe3+ coordination cannotbe explained with a simple bond-valence model, and the nature and local environment ofall second neighbors of Fe3+ have to be considered.
1.3.3 The question of [5]-fold coordinated iron in glasses
The existence of [5]-fold coordinated iron in glasses, has been debated for the last 20years since the work of Brown et al. [1995]. Despite the average coordination around 5in glasses, its existence was contradicted by the rare presence of [5]-fold coordination incrystals and complexes. Evidence of [5]-fold coordinated transition metals were found inglasses for nickel and titanium. Galoisy and Calas [1991] showed evidence of [5]Ni2+ in atrigonal bipyramidal site, which opened the search of other transition metals in [5]-foldcoordination in glasses. Cormier et al. [1998] confirmed the presence of [5]-fold coordinatedTi within a square-based pyramid in a silicate glass studied by neutron diffraction withisotopic substitution.
Concerning coordination complexes, Ciampolini [1969] reviewed numerous transitionmetals [5]-fold coordinated complexes, including iron. Some silicate minerals also exhibit[5]-fold coordinated Fe2+ in both square-based pyramid or trigonal bipyramid such asgrandidierite, joaquinite [Rossman and Taran, 2001], vesuvianite [Wilke et al., 2001],hibonite, rhodonite, pyroxmangite [Seifert and Olesch, 1977] or eudialyte [Pol’shin et al.,1991]. However, in these exotic minerals, the structural interpretation is challenging becauseonly a part of the total iron is [5]-fold coordinated, and often in a distorted site or 5 + 1,i.e. a strongly deformed octahedron.
As for complex reviewed by Ciampolini [1969], [5]-fold Fe3+ are less frequent than [5]Fe2+
in silicate minerals but exist in yoderite or in non-silicate minerals such as FeAsO4-I, Fe3PO7
(Berthet et al. [1988, 1989]) and Fe2+3 Fe3+4 (AsO4)6 [Weil, 2004].
In addition to the existence of [5]-fold coordinated iron in complexes and minerals andto the presence of other transition metals in glasses, several studies on Fe-bearing glasseslead to confirm the existence of [5]-fold coordinated iron in glass. Rossano et al. [1999] firstshowed evidence of [5]-fold Fe2+ in tektites, natural impact glasses, by Mössbauer, that havebeen enhanced by an EXAFS and MD study in a CaO–FeO–2SiO2 silicate glass Rossanoet al. [2000c]. Complementary to these conclusions, [5]-fold iron was later confirmed byGuillot and Sator [2007] for both valence states by another MD study in high iron-content

26 Chapter 1
silicate melts (Figure 1.4). They found that Fe3+ is mainly [4]-fold (55%) but an importantamount is [5]-fold (30%), while Fe2+ is mainly [5]-fold (35%) and partly [4]-fold and [6]-fold(25% each). The conclusions of these studies on highly Fe-concentrated glasses tend toprove that both Fe2+ and Fe3+ exist in [5]-fold coordinated sites.
Figure 1.4 – Population analysis of Fe2+ and Fe3+ coordination numbers in a mid-ocean ridgebasalt (MORB) from Guillot and Sator [2007].
However, there is no evidence in previous studies that even if the average coordinationof iron is around [5], the majority of iron is [5]-fold coordinated. For example, severalscenarios that give an average value of [5] can be considered: a mix of [4]-fold and [6]-fold;a mix of [4]-fold and [6]-fold with a minority of [5]-fold and a distribution of coordinationnumber centered around [5] with the highest proportion of iron in [5]-fold coordination (suchas in Figure 1.4); a distribution of centered around [5] with the majority of iron [5]-foldcoordinated (more that all other coordination numbers together). It is also important tokeep in mind that there is no unique geometry associated to [5]-fold coordination, andthat several kind of geometries are possible (such as trigonal bipyramid and square-basedpyramid). Moreover, several distortions of the regular geometries can coexist in glasses(as previously detailed with Figure 1.3) leading to a broad variety of [5]-fold sites. Finally,non-bonding oxygens and second neighbors can also influence the spectroscopic signaturesin addition to the coordination number of iron.
1.3.4 From iron coordination number to site geometry
The understanding of iron optical spectra on their interpretation is still a matter ofresearch, despite the knowledge on Fe local environment, the comprehension of the originsof optical band remains complicated. For example, the correlation of the asymmetricalshape of the Fe2+ band in the near infrared with the chemical composition remains hard toexplain. Difficulties are enhanced by the vitreous nature of glasses, the disordered structurenecessary leading to a distribution of the glass environment and indirectly to variations ofthe coordination number.
To interpret the iron spectroscopic signatures, lots of work focused on iron coordinationbut we must go further in the description of iron sites and use angles, distances, coordinationnumber, nature of the second neighbors... Because the optical absorption depends on thelocal geometry, ligand field theory is an adapted tool to study and characterize iron

IRON IN GLASS: AN HETEROVALENT ION IN A COMPLEX MEDIUM 27
coordination local environment, by using group theory to describe the geometry of theligands around iron and parameters to quantify the effect of neighbors.
1.3.5 Group theory to describe the local environment
The coordination number is an interesting parameter but its simplicity overrides the com-plexity of the local environment. The geometry of the site, determined by the surroundingligands, rules the spectroscopic properties. The characterization of the relationships betweenspectroscopic and structural properties brings valuable information to the understanding ofiron behavior in glasses. Group theory∗ is used to describe the site geometry formed by aniron cation and its first coordination shell of oxygens (see Ludwig and Falter [1988] for afull introduction to group theory and Altmann and Herzig [1994] for point group tables).
In general, different coordination numbers lead to different point group symmetries, forexample, an isolated atom will be in the spherical geometry (O3), a regular octahedron isdescribed by the Oh group, and a regular tetrahedron by the Td group. However, there isno bijective relation between coordination number and point group symmetry. For example,a triangular bipyramid ([5]-fold coordination) and a trigonal plane ([3]-fold coordination)have the same point group symmetry D3h (see Figure 1.5-a).
D3h C3v D4h C4v
strain
(a) (b) (c) (d)Figure 1.5 – Coordination polyhedra and their associate point groups. The blue arrows representstrains leading to atomic shifts.
When a polyhedron is strained, the point group symmetry is lowered, which is charac-terized by a lower number of symmetry elements. In a regular tetrahedron or a trigonalbipyramid, when a ligand is moved along a C3 axis from its position in the regular geometry,both sites can be represented in C3v (Figure 1.5-b). D4h can be likewise related to a squareplane or an octahedron compressed or stretched along a C4 axis (Figure 1.5-c). The lastexample is the C4v geometry, which is associated to the square-based pyramidal geometrybut could also be related to a distorted octahedron (Figure 1.5-d). The displacement of thecentral cation along a C4 axis also leads to the C4v geometry. In conclusion, the coordinationnumber is an interesting but incomplete information. On the contrary, a point group can
∗Schönflies notation is preferred to Hermann–Mauguin notation for point group naming (e.g. D4h ispreferred to 4/mmm)

28 Chapter 1
be associated with two or more coordination polyhedra, which can be discerned using thesign and magnitude of the crystal field parameters, as we will see in the Chapter 3.
1.4 Conclusion & Thesis statement
We saw that the study of iron in glass does not come without difficulties. Distortion anddistribution of iron in a broad variety of sites complicate the definition of the environment.Moreover, the complexity of the problem is increased by the presence of iron in two redoxstates Fe2+ and Fe3+, each with a proper distribution into more or less regular/distorted[4]-fold, [5]-fold and [6]-fold coordinated sites that could potentially segregate to formFe-rich clusters instead of being isolated by their random distribution into the glass matrix.
Generally speaking, the links between chemical composition, redox, iron local environment(structure), and spectroscopic properties remain misunderstood. In order to simplify thiscomplex question, we have chosen to study few simple silicate glass compositions, synthesizedunder different redox conditions, and measured with a broad panel of spectroscopic methodsto extract information about the local environment around iron in soda-lime glasses.
Along this manuscript, a special focus is made on crossing and comparing the resultsfrom the different spectroscopies to improve the comprehension of the origins of opticalabsorption bands of iron in glass. A particular attention has been paid to the study of thevalence 3d orbitals of iron, which are involved in the chemical bond with its neighboringligands and, thus, reflecting the Fe local environment.
Optical Absorption Spectroscopy (OAS) is an appropriate method since the energy rangeof optical photons is similar to the energy transitions between the different 3d levels of iron.Electron Paramagnetic Resonance (EPR) has proven to be a sensitive technique to probethe environment of Fe3+ in iron-doped glasses, the absence of Fe2+ resonance is an asset toextract specific information about Fe3+ site-distortion and site-distribution. Results fromX-ray Absorption Spectroscopy (XAS) will be presented such as X-ray Absorption NearEdge Structure (XANES), which is wildly known to be chemically selective to specificallystudy one element (here iron). But other XAS methods that have never been used forglass will bring new grist to the mill: Resonant Inelastic X-ray Scattering (RIXS) and HighEnergy Resolution Fluorescence Detection (HERFD).
Theoretical calculations are powerful complementary tools to interpret spectroscopic data.We used the Ligand Field Multiplet (LFM), which is particularly adapted to the studyof localized final states with multielectronic interactions as in 3d orbitals. Strong effortswere made to improve LFM calculations in order to reproduce and interpret experimentaldata with this multielectronic simulation method, which is particularly adapted to probetransition metal valence d-electrons. LFM brings indirect structural information since it isintimately related to the point group symmetry of the iron site. Emphasis will be done onfinding a unique set of parameters that enables to calculate all spectroscopic data.

29
Chapter 2
Samples and experimental methods
2.1 Glasses
2.1.1 Choice of the glass set
90% of manufactured glass is soda-lime silicate glasses, especially, 40% of the production isfloat glass, mainly used in construction (80%), automotive (15%), and solar (5%) industries∗.In 2009, flat glass production was about 52 million metric tonnes per year†, therefore, everyoptimization of the production has an important economic impact.
Authentic industrial glasses are complex systems using about 10 to 15 oxides in variousproportions depending on the desired application, but the number of glass compositionsis infinite. Nevertheless, for float glass, 98mol% of the constituents are SiO2, MgO, CaOand Na2O. Model compositions, made of these four oxides and close to industrial soda-limeglasses will be studied in details in this manuscript. Their nominal molar compositions are:16Na2O–10RO–74SiO2, where R is an alkaline-earth ion. The absence of magnesium inglass, is empirically known to improve the optical transmission window in the visible, whichis a key property for float glass applications. The amount of silicon and sodium oxides waskept constant in the soda-lime glass and part of the calcium was replaced by magnesium.Particular attention will be devoted to the effect of alkaline earth nature on iron behavior.
To study the effect of sodium, we looked at an alkali-free glass based on diopside mineral(CaMgSi2O6) with the composition: 50SiO2–25CaO–25MgO in molar proportion. Thecorresponding glass exhibits singular properties and iron-doped diopside gives exotic opticalabsorption spectra due to different local environments around iron [Calas and Petiau,1983b].
The total iron content was maximized to optimize the signal to noise ratio from thedifferent analytical methods and spectroscopies, an upper limit of ∼0.5wt% of Fe2O3
(5000ppm) was chosen to stay close to industrial glass compositions and properties.
To limit the side effects on properties due to the presence of other chemical compounds,all the presented glasses are free from aluminum, potassium and boron that are often used
∗http://www.glassforeurope.com/†Pilkington and the Flat Glass Industry 2010, NSG Group
30 Chapter 2
in industrial float glass. These glasses are also free from other coloring elements, especiallyother transition metals that could interact with iron such as titanium [Burns, 1981], [Taranand Koch-Müller, 2011].
2.1.2 Sample preparation
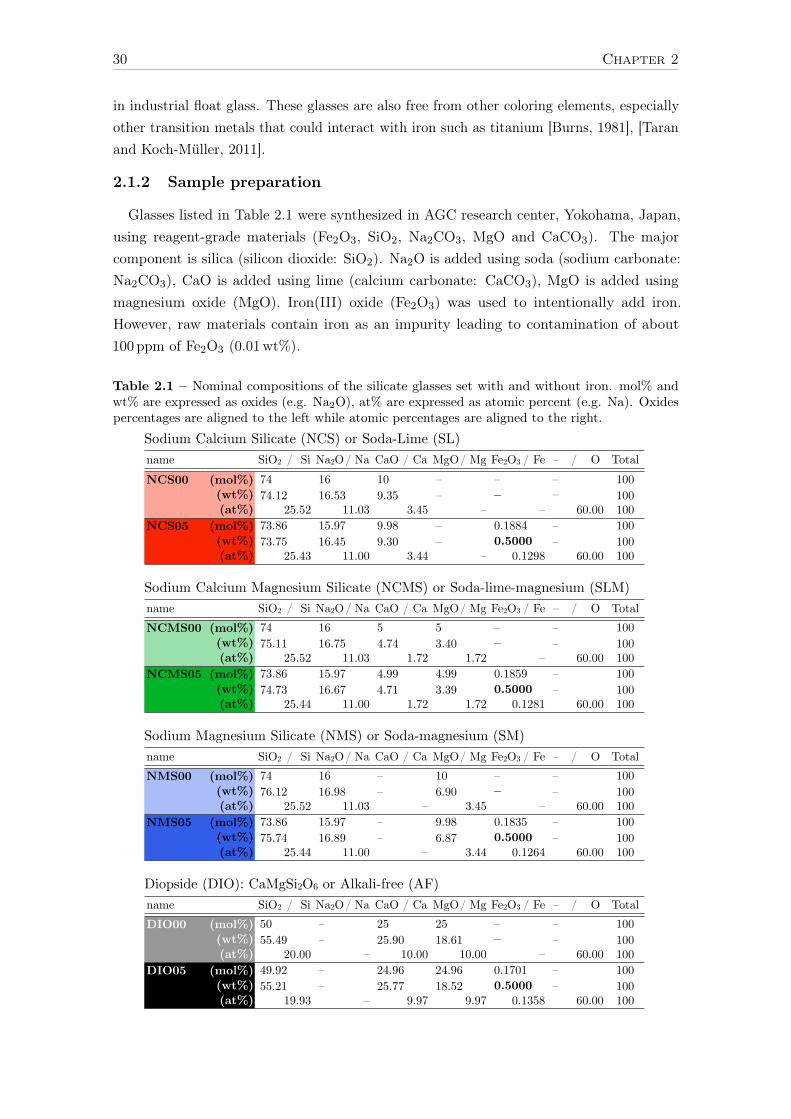
Glasses listed in Table 2.1 were synthesized in AGC research center, Yokohama, Japan,using reagent-grade materials (Fe2O3, SiO2, Na2CO3, MgO and CaCO3). The majorcomponent is silica (silicon dioxide: SiO2). Na2O is added using soda (sodium carbonate:Na2CO3), CaO is added using lime (calcium carbonate: CaCO3), MgO is added usingmagnesium oxide (MgO). Iron(III) oxide (Fe2O3) was used to intentionally add iron.However, raw materials contain iron as an impurity leading to contamination of about100 ppm of Fe2O3 (0.01wt%).
Table 2.1 – Nominal compositions of the silicate glasses set with and without iron. mol% andwt% are expressed as oxides (e.g. Na2O), at% are expressed as atomic percent (e.g. Na). Oxidespercentages are aligned to the left while atomic percentages are aligned to the right.
Sodium Calcium Silicate (NCS) or Soda-Lime (SL)
Sodium Calcium Magnesium Silicate (NCMS) or Soda-lime-magnesium (SLM)
Sodium Magnesium Silicate (NMS) or Soda-magnesium (SM)
Diopside (DIO): CaMgSi2O6 or Alkali-free (AF)
name SiO2 / Si Na2O / Na CaO / Ca MgO / Mg Fe2O3 / Fe – / O TotalNCS00 (mol%) (wt%) (at%)
74 16 10 – – – 10074.12 16.53 9.35 – – – 100
25.52 11.03 3.45 – – 60.00 100NCS05 (mol%) (wt%) (at%)
73.86 15.97 9.98 – 0.1884 – 10073.75 16.45 9.30 – 0.5000 – 100
25.43 11.00 3.44 – 0.1298 60.00 100
name SiO2 / Si Na2O / Na CaO / Ca MgO / Mg Fe2O3 / Fe – / O TotalNCMS00 (mol%) (wt%) (at%)
74 16 5 5 – – 10075.11 16.75 4.74 3.40 – – 100
25.52 11.03 1.72 1.72 – 60.00 100NCMS05 (mol%) (wt%) (at%)
73.86 15.97 4.99 4.99 0.1859 – 10074.73 16.67 4.71 3.39 0.5000 – 100
25.44 11.00 1.72 1.72 0.1281 60.00 100
name SiO2 / Si Na2O / Na CaO / Ca MgO / Mg Fe2O3 / Fe – / O TotalNMS00 (mol%) (wt%) (at%)
74 16 – 10 – – 10076.12 16.98 – 6.90 – – 100
25.52 11.03 – 3.45 – 60.00 100NMS05 (mol%) (wt%) (at%)
73.86 15.97 – 9.98 0.1835 – 10075.74 16.89 – 6.87 0.5000 – 100
25.44 11.00 – 3.44 0.1264 60.00 100
name SiO2 / Si Na2O / Na CaO / Ca MgO / Mg Fe2O3 / Fe – / O TotalDIO00 (mol%) (wt%) (at%)
50 – 25 25 – – 10055.49 – 25.90 18.61 – – 100
20.00 – 10.00 10.00 – 60.00 100DIO05 (mol%) (wt%) (at%)
49.92 – 24.96 24.96 0.1701 – 10055.21 – 25.77 18.52 0.5000 – 100
19.93 – 9.97 9.97 0.1358 60.00 100

SAMPLES AND EXPERIMENTAL METHODS 31
Figure 2.1 shows an example of the total iron content effect in diopside glass. With0.5wt% the coloration is already intense and can be easily studied by optical absorptionspectroscopy.
Figure 2.1 – Effect of iron content on diopside glass at 0.01, 0.1 and 0.5wt% Fe2O3 (size: ∼2 cm,thickness: 5.5mm).
In all protocols, powders were weighted to obtain the desired amount of batch andmechanically mixed without grinding. No decarbonation step was done in order to enhancebubble mixing during melting.
For a given composition, it is possible to adjust the synthesis conditions in order tochange the properties of a glass. The iron redox (R = [Fe2+]
[Fe2+]+[Fe3+]) has a major effect on
the glass properties (see Section 1.2). Figure 2.2 illustrates the impact of redox on color;for glasses with the same soda-lime composition (NCS): the color evolves from yellow (pureferric) to blue (pure ferrous) with intermediate green color for a mixture of both valencestates.
Figure 2.2 – Soda-lime silicate glasses (NCS) at three different redox states (oxidized, airsynthesized, reduced), sample thickness: 2.5mm.
To control the redox state, two parameters were mainly modified, the atmosphericcomposition and the temperature. It is known that oxygen-rich and lower temperaturefavors oxidation of glass [Johnston, 1964; Kress and Carmichael, 1991]. Regarding theseproperties, three synthesis conditions were developed.
− oxidizing conditions, to make “Ox” glasses with a redox R ∼ 5%;− ambient conditions, i.e. under air atmosphere, to make medium “Med” glasses with a
redox R ∼ 25%;− reducing conditions, to make “Red” glasses with a redox R ∼ 99%.
Oxidizing conditions: synthesis under oxygen atmosphere
The aim of this treatment proposed by Johnston [1964] is to make a glass sample withonly ferric iron (0% Fe2+) without using any oxidizing agent, such as arsenic (As2O3),antimony (Sb2O3) or cerium (CeO2) [Stålhandske, 2000].
A tubular furnace under oxygen atmosphere (O2 flux: 1 L/min) set to 1200°C was usedto melt 5 g of batch in a Pt crucible during at least 24 h and up to 72 h. A long melting

32 Chapter 2
time is necessary to reach thermodynamic equilibrium due to the slow oxygen diffusionprocess into the glass matrix [Pigeonneau and Muller, 2013]. The heating was performed at200°C/h and the cooling at 150°C/h. Glasses were not annealed to avoid any reduction.Traces of O–H groups are detected in the samples because the furnace is not isolated fromthe atmosphere containing water.
The oxidized diopside glass was not synthesized due to crystallization problems, thiscomposition does not melt under 1450°C and can easily devitrify. Below 1200°C, glassesare not homogenous and a higher temperature favors reduction process [Paul, 1985]. It wasnot possible to avoid remaining Fe2+, and redox are at least 4% without using a refiningagent such as cerium oxide (CeO2) [Bingham et al., 2014].
Ambient conditions: synthesis under air atmosphere
Glasses synthesized under air atmosphere have an intermediary redox and are thereforenamed “medium” glasses. The furnaces were not air-controlled, the partial pressures ofwater, carbon dioxide and oxygen could slightly vary from one synthesis to another.
400 g of batch was melted in three times to avoid foam overflow, then stirred at 1500°Cfor 1 h in a Pt crucible under air atmosphere. The glass was rapidly cooled by quenchingonto a carbon plate edged with steel, preheated at 120°C to avoid intense thermal shockstress. Right after this cooling, the glass was annealed at 480°C (below Tg, see Table 2.2) for1 h to relieve internal stress. Finally, the glass was slowly cooled down to room temperatureat 1°C/min.
Reducing conditions: synthesis under nitrogen atmosphere
This process was used to obtain 5 g of glass with only ferrous iron (redox state closeto 100% Fe2+). The oven was located in a glove box under nitrogen atmosphere (onlyN2 without additional H2). Samples were melted without stirring in graphite crucibles at1550°C during 1 h, then progressively cooled down to 1200°C in 1 h. At 1200°C, the cruciblewas removed from the oven and cooled down under N2 without quenching. Glasses werenot annealed to avoid any oxidation. No carbon powder or reducing agent was added tothe batch.
For the diopside composition, due to the low viscosity of this glass, all tested meltingtemperatures lead to opaque black glasses. This side-effect of carbon crucibles constrainsthe synthesis of alkali-free glass (AF) in a platinum crucible, thereby the redox of this glassis not so high than soda-lime glasses set (see Table 2.2).

SAMPLES AND EXPERIMENTAL METHODS 33
Sample naming conventions:
The three sodium-silicate glasses are named sodium-calcium-silicate (NCS) or soda-lime(SL), sodium-magnesium-silicate (NMS) or soda-magnesium (SM) and sodium-calcium-magnesium-silicate (NCMS) or soda-lime-magnesium (SLM) regarding their Ca:Mg ratio(respectively 100:0, 0:100 and 50:50). The diopside (DIO) glass is also named alkali-free(AF) due to its lack of sodium.wt% Fe2O3 is used to express the total iron content, and glass samples are named usingthis percentage. For example, the diopside glasses (DIO) with 0.01, 0.1 and 0.5wt% arerespectively named DIO00, DIO01 and DIO05.Samples are named regarding their synthesis conditions, for example, glasses of thesoda-lime composition with 0.5wt% Fe2O3 (NCS05) are respectively named NCS05Ox,NCS05Med and NCS05Red for oxidized (R ∼ 5%), medium (R ∼ 25%) and reduced(R ∼ 99%).
2.1.3 Characterization
This section presents basic properties of glass bulk, i.e. chemical composition, refractiveindex, density and iron redox.
Composition and homogeneity (EMPA, XRD)
Composition and homogeneity were checked using electron microprobe analyzers (EMPA),CAMECA SXFive and SX100, at the Camparis Facility (Université Pierre et Marie Curie,Paris, France). Analyses were performed with a 15 kV accelerating voltage and a 4nA
sample current. All results and nominal compositions were converted in wt% of oxides. Agood agreement was observed between nominal and experimental compositions. With anumber of data points from 10 to 50 with EMPA, low standard deviations suggest a goodsample homogeneity.
X-ray diffraction (XRD) was used to confirm the vitreous nature of the glasses, which donot exhibit any Bragg peaks, characteristic of crystalline phases.
Redox measurement (wet chemistry)
The amount of FeO and total iron was determined by wet chemical analysis based on astandard test method [C14 Committee, 2011]. To summarize, the glass is dissolved withhydrofluoric acid (HF) and Fe2+ forms a complex with o-phenanthroline. The FeO andtotal iron content are estimated using the optical absorption band of the complex at 510 nm
as described in Fortune and Mellon [1938].
Table 2.2 presents the measured redox of the 11 samples. The uncertainty is ±3%.These results will be discussed in light of X-ray absorption spectroscopy, optical absorptionspectroscopy and EPR along Chapter 5 and in Appendix B.4.2 that presents a method,developed during this thesis, to estimate the Fe2+/Fetot ratio using the separation of Fe2+
and Fe3+ optical contributions.

34 Chapter 2
wet c
hem
dens
ityre
fract
ive
optic
alSi
O2
Na 2
OCa
OM
gOFe
2O3
Tota
lre
dox
(%)
(kg/
L)in
dex
basic
ityTg
(°C)
NCS
05M
ed73
.89
(0.7
3)15
.73
(0.3
7)9.
47 (0
.23)
0.01
(0.0
1)0.
52 (0
.02)
99.6
1 (0
.56)
27.8
2.48
881.
519
NCS
05O
x75
.43
(0.5
0)15
.99
(0.4
0)8.
26 (0
.31)
0.00
(0.0
0)0.
54 (0
.004
)10
0.23
(0.4
3)6.
41.
515
NCS
05Re
d74
.32
(0.8
0)15
.61
(0.4
4)9.
35 (0
.33)
0.00
(0.0
0)0.
51 (0
.02)
99.7
9 (0
.58)
96.8
1.51
7N
omin
al73
.75
16.4
59.
30
0.5
100
0.63
9249
5N
CMS0
5Med
75.7
8 (1
.18)
16.0
5 (0
.51)
4.54
(0.2
3)3.
31 (0
.31)
0.52
(0.0
3)10
0.17
(0.8
4)25
.32.
4569
1.51
1N
CMS0
5Ox
77.3
2 (0
.56)
15.8
9 (0
.10)
4.43
(0.1
7)2.
84 (0
.10)
0.52
(0.0
03)
100.
99 (0
.59)
4.9
1.51
0N
CMS0
5Red
74.5
0 (0
.68)
16.3
7 (0
.65)
4.97
(0.1
6)3.
67 (0
.16)
0.55
(0.0
4)10
0.05
(0.6
1)96
.11.
511
Nom
inal
74.7
316
.67
4.71
3.39
0.5
100
0.62
8251
5N
MS0
5Med
75.6
2 (0
.96)
16.7
7 (0
.43)
0.01
(0.0
1)7.
03 (0
.21)
0.51
(0.0
3)99
.93
(0.8
8)23
.92.
4194
1.50
3N
MS0
5Ox
75.6
9 (0
.47)
17.6
1 (0
.28)
0.00
(0.0
0)7.
00 (0
.16)
0.56
(0.0
1)10
0.87
(0.4
6)6.
51.
505
NM
S05R
ed75
.45
(0.9
1)17
.04
(0.3
7)0.
02 (0
.03)
7.19
(0.2
0)0.
52 (0
.02)
100.
19 (0
.88)
96.4
1.50
2N
omin
al75
.74
16.8
90.
06.
870.
510
00.
6172
535
DIO
05M
ed54
.26
(0.5
5)0.
02 (0
.02)
24.9
2 (0
.30)
20.4
5 (0
.46)
0.47
(0.0
1)10
0.17
45.7
2.84
501.
617
DIO
05Re
d55
.25
(0.6
2)0.
00 (0
.00)
25.3
7 (0
.51)
18.5
4 (0
.30)
0.45
(0.0
1)99
.36
79.5
1.61
1N
omin
al55
.21
025
.77
18.5
20.
510
00.
6850
730
Tab
le2.2–EMPA
measurements
(inwt%
)an
dno
minal
compo
sition
(con
verted
inwt%
),stan
dard
deviations
ofeach
elem
entarein
parenthe
sis.
Redox
measurements:Fe
2+/F
e tot
(in%)from
wet
chem
ical
analysis
(incertitude
of3%
).Density
(ρin
kg/L
)weremeasuredforthe3sodium
-silicate
glass,
diop
side
density
istakenfrom
Richetet
al.[1986].Exp
erim
entalrefractiveindexes(n)averaged
forallg
lasses
withthesamecompo
sition
(precision±
0.00
1).Theoretical
opticalb
asicity
arecalculated
accordingto
Duff
yan
dIngram
[1976].Glass
tran
sition
tempe
ratures(T
g)areaveraged
over
measuredvalues
withaTGA-D
SCdevice
andpu
blishedTgvalues.

SAMPLES AND EXPERIMENTAL METHODS 35
Refractive indexes
Refractive indexes were measured at INSP (Université Pierre et Marie Curie, Paris, France)using an Abbe refractometer with diiodomethane CH2I2, a liquid with high refractive index(n = 1.741), at the interfaces with the prisms. Measures were performed with a sodium lampat the wavelength λ = 589.3 nm. There was no significant variation of the refractive indexwithin a set of glasses with the same composition and different small total iron amounts(< 0.5wt%) or redox. Precision of ±0.001 on the refractive index value is estimated fromstandard deviation of the bench of six measures and compared with results from AGCobtained using a V-block refractometer and a prism coupler refractometer.
2.1.4 Summary
Table 2.2 summarized the chemical compositions, redox states, refractive indexes, densitiesand optical basicities of the 11 glasses studied. The present set of samples composed withthree similar sodium-alkaline earth silicate glasses (NCS, NCMS and NMS) and an alkali-free (AF) glass with the diopside (DIO) composition will be used in the next chapters tostudy the influence of composition on the local environments of Fe2+ and Fe3+. Especially,the influence of magnesium and sodium on iron in sodium-silicate glasses. The extremeredox values obtained for these glasses will be helpful for studying the effect of redox state.However, we have to keep in mind that changing synthesis conditions can modify theFe2+:Fe3+ ratio, but could also change the speciation of Fe2+ and Fe3+.
2.2 Optical absorption spectroscopy
Optical properties of iron have been widely studied, especially the coloring properties asexplained in a recent review on the question [Rossman, 2014]. The interpretation of opticalabsorption signatures is related to electronic transitions between d-levels split by the ligandfield. Since the energy splittings of the 3d orbitals by the surrounding ligands have thesame order of magnitude than energies of optical photons, optical absorption spectroscopyis a suitable probe to understand the local environment and speciation of transition metalions.
Optical absorption spectroscopy, also named “UV-Visible∗-NIR” spectroscopy, measuresthe absorption of light as a function of wavelength (λ in nm), wavenumber (ν in cm–1) orelectron-volt (eV)† in the energy range 0.5–6 eV (i.e. 4000–50 000 cm–1).
2.2.1 Transmission measurements
Optical absorption measurements presented here have been carried out on a Perkin-Elmerr Lambda 1050 UV-Visible-NIR spectrophotometer in transmission mode usingthree detectors and two light sources (see Appendix B.1 for more details) to cover a widewavelength (λ) range with a 1nm step. The measured spectral range is spanned fromultraviolet (180 nm) to near-infrared (3300 nm) region.
∗energy range of visible photons: 380–750 nm, 27 000–13 000 cm–1, 3.3–1.6 eV†nm are used for experimental setup, but “energy” unit cm–1 or eV are used for results (1 eV=8066 cm–1)

36 Chapter 2
The experimental transmission T is the ratio between the intensity I passing throughthe sample and the intensity I0 of a reference beam.
T =I
I0(2.1)
Transmittance %T (in %) is related to absorbance by these relations:
%T = 100 · 10−A and A = log10
(100
%T
)(2.2)
Absorbance A is usually preferred to transmittance since it is directly proportional tothe intrinsic capacity of a material to absorb light, characterized by the molar absorptioncoefficient ε in L.mol-1.cm–1. The measured absorbance A is related to ε by the Beer-Lambertlaw:
A(λ) = bkg(λ) + α(λ) · l = bkg(λ) + ε(λ) · c · l (2.3)
where α is the linear absorption coefficient (cm–1), ε the molar absorption coefficient(L.mol-1.cm–1), bkg is the background signal, l the path length (cm) and c the molarconcentration (mol.L-1) of absorbing species in the material. Optical absorption spectrumresulting from light beam passes throughout the transparent sample is the sum of the intrinsicproperties of the sample ε and of the physical phenomena disturbing the measurementbkg(λ).
2.2.2 Background correction
The origin of the optical absorption background in the optical spectrum can be due toseveral physical processes, such as:
− scattering processes
− specular reflection on the surface
− tail of the charge transfer band in the UV
Scattering can be caused by volume defects (bubbles, composition inhomogeneities,impurities...) or surface defects (scratches, polishing imperfections...). To eliminate thescattering defects of bgk(λ), sample homogeneity and surface roughness have been controlledby a careful synthesis and polishing process. In the present study, the particular caredevoted to the sample preparation allowing us to neglect this phenomenon.
However, there is always specular reflection of the beam on the faces r(λ) due to thedifference of refractive index between air and glass. By using parallel faces and normalincidence, the transmission coefficient is given by the following equation:
t(n) = 1− r(n) (2.4)
where t(n) is the transmittance and r(n) is the reflectance. Using Fresnel equations for

SAMPLES AND EXPERIMENTAL METHODS 37
normal incidence, the reflectance is directly linked to the refractive index n(λ):
r(n) =
(n− 1
n+ 1
)2
(2.5)
For a soda-lime silicate glass, the refractive index at λ = 589.3 nm is n = 1.52 (seeTable 2.2), reflection coefficient r is therefore around 4.26% and transmission coefficient tis 95.74%.
Considering a parallel-sided glass plate with multiple internal reflections, total transmit-tance can be expressed as:
%T =t
2− t (2.6)
For a soda-lime silicate glass, the resulting transmitted energy is found equal to 91.83%.Using absorbance scale (Equation 2.2), the fraction of the absorption signal due to reflectionis estimated to be 0.037.
In a first approximation, this constant can be subtracted to the absorption spectra inorder to calculate the molar absorption coefficient. However, following Equation 2.3, glassis a dispersive medium, which means that the refractive index varies with wavelength.
0.5 1 1.5 2 2.5 3x 10⁴
0
0.1
0.2
0.3
0.4
0.5
0.6
0.7
0.8
0.9
1
wavenumber (cm−1)
abso
rban
ce (
a.u)
NCS05Med, 2.5mmNCS05Med, 5.5mmNCS00Med, 5.5mm
Figure 2.3 – Absorbance of NCS05Med and NCS00Med before background subtraction.
Since background correction depends on the wavelength, the following experimentalapproach was used to estimate the absorption background. For each composition (hereresults for soda-lime (NCS) are presented), two glasses were considered, they were of different

38 Chapter 2
thickness (respectively 2.5mm and 5.5mm), from the same piece of glass, NCS05Med,which contains 0.5wt% of Fe2O3 and intermediate redox (Med).
The absorption difference between the two equally doped samples of 2.5 and 5.5mm-thickgives the equivalent spectrum of a 3mm-thick sample corrected from surface defects andpart of the volume defects (see Equation 2.7). If the volume defects such as scatteringphenomena are considered insignificant, the remaining signal corresponds to the reflectionbackground.
y = yNCS05Med2.5mm − (yNCS05Med5.5mm − yNCS05Med2.5mm) ∗ 2.5
3(2.7)
Figure 2.4 shows the optical absorption spectrum of NCS05Med accompanied by theabsorbance of the extracted background in green that was fitted from 15 000 cm–1 to25 000 cm–1 with a linear function of the wavenumber (yellow curve).
wavenumber ( cm -1)0.5 1 1.5 2 2.5 3
abso
rban
ce (
a.u)
0.03
0.035
0.04
0.045
absorption background from 2-thickness NCS05Med constant background from refractive index
linear fit
×104
Figure 2.4 – Background estimation of NCS05Med.
A linear function of the wavenumber with only two parameters is an adequate choice torepresent the spectral background regarding the variability induced by the samples andexperimental setup. This signal (Table 2.3) was subtracted from the three redox samples(Red, Med and Ox) of the same composition.
Table 2.3 – Parameters of the linear function of the wavenumber (y = aν + b) used to correct thebackground of glasses containing 0.5wt%.
Sample a (cm) b (cm–1)
NCS05 2.136 · 10−7 3.416 · 10−2NCMS05 3.256 · 10−7 3.134 · 10−2NMS05 1.279 · 10−7 3.352 · 10−2DIO05 0 4.587 · 10−2

SAMPLES AND EXPERIMENTAL METHODS 39
2.3 X-ray Absorption Spectroscopy (XAS)
2.3.1 Principle
X-ray Absorption Spectroscopy (XAS) is a core-shell spectroscopy used in this thesis atthe Fe K edge to study the 1s→ 3d or 1s→ (3d, 4p) transitions of the absorbing element.This method∗ is chemically selective and can bring information on the local environment(i.e. distances, symmetry, structural disorder, nature and numbers of neighbors in a radiusof 4–5Å) and the electronic structure (i.e. redox state, inter- or intra-site hybridizationbetween p and d orbitals).
The principle is to excite a core-electron (1s) to the first empty states with an incidentX-ray photon of a given energy Ein. Depending on Ein, different physical events lead todifferent structures in the measured absorption spectrum (Figure 2.5).
1.2
1.0
0.8
0.6
0.4
0.2
0.0
Nor
mal
ized
TFY
sig
nal
7250720071507100 Energy (keV)
NCS05Ox
3d
1s
3d
1s
3d
1s
3d
1s
Continuum Continuum Continuum Continuum
(a)
(a) initial state
(b)
(b) XANESpre-edge
(c)
(c) XANESmain edge
(d)
(d) EXAFS
E0
X-ray X-ray X-ray X-ray
multiple scattering
Figure 2.5 – The different regions of a XAS spectrum (here, the Fe K edge spectrum of NCS05Oxglass).
K pre-edgeIn the pre-edge range (Figure 2.5-b), the energy of the incident photon Ein is lower than
the main edge energy (E0 ∼ 7123 eV). However, this energy is sufficient to transfer a 1s
core-electron to the first open shells because the incident photon energy is higher than the1s binding energy (7112 eV for the Fe K edge). 3d levels are localized on the absorbingelement. The pre-edge is essentially described by two phenomena: (i) the local electricquadrupole transitions 1s→ 3d; (ii) the local electric dipole transitions 1s→ 4p, where the4p levels of the absorbing element are hybridized with the empty 3d states [Arrio et al.,2000]. The 3d–4p mixing† is only allowed for a non-centrosymmetric site in absence ofinversion center [Brouder, 1990; Westre et al., 1997] or by the atomic displacement of the∗For a full introduction to XAS, the reader can refer to Calvin [2013].†Do not confuse the local (on-site) electric dipole transitions, 1s→ 4p, with the non-local (off-site) electric

40 Chapter 2
absorbing element induced by vibrations [Cabaret et al., 2010]. Therefore, as in opticalabsorption spectroscopy, these transitions are sensitive to the valence state, coordinationnumber, symmetry and orbital hybridization.
XANES at K edgeThe K edge range or XANES (X-ray Absorption Near Edge Structure) corresponds
to an incident energy in the first 50 eV above the ionization energy E0. A 1s electron isejected to the continuum with a low kinetic energy. Therefore, the mean free path of theelectron is large enough for the electron to be involved in multiple scattering processes withneighboring atoms.
However, to analyze the rich but complex information of XANES spectra the support ofXANES calculation is often needed. In the case of glasses, the extraction of informationfrom the medium-range structure remains a challenging step. In the framework of thisthesis, XANES spectra above the K edge will be interpreted using a simple fingerprintanalysis.
EXAFSThe EXAFS (Extended X-ray Absorption Fine Structure) region corresponds to an
incident energy larger than 50 eV above the edge energy. The core electron is ejected inthe continuum with a large kinetic energy. Therefore, its mean free path is small and theelectron is essentially involved in simple scattering process with neighboring atoms. Theoscillations are visible in this energy range on experimental data due to interferences betweenthe electronic wave from the absorber ion and the waves backscattered by neighboringatoms. The analysis of these EXAFS oscillations allows extracting average informationabout the nature and number of neighbors, the first absorber-neighbors distances andthe structural disorder around the absorber atom in the sample. EXAFS have not beenperformed during this thesis; however, results from previous papers will be used for theinterpretation of spectroscopic data.
2.3.2 Experiment
Measurements have been performed on ID26 beamline at the European SynchrotronRadiation Facility (ESRF) in Grenoble (France), during two sessions of 4 days in February2013 and February 2015.
All the data have been collected with a Si(311) monochromator and detection wasperformed in fluorescence mode with an angle of 90° between incident beam and fluorescencebeam (Figure 2.6). The polarization of the incident beam was always linear and horizontal.
In this thesis, the Total Fluorescence Yield (TFY) is considered equal to the XASmeasured in transmission when the concentration of the absorbing element is low [Jaklevicet al., 1977]∗. Above a threshold of ∼1wt%, samples were ground into a fine powderand mixed with boron nitride or cellulose to reach a ∼1wt% dilution. Otherwise, self-absorption phenomenon can happen in fluorescence mode, which could compress the first
dipole transitions, 1s → p, in which the empty 4p levels of the absorber are mixed with those of thenearest-neighbor metal atoms, via the 2p orbitals of the ligands [Glatzel and Juhin, 2013, p. 126].
∗This assumption, is not true for the L2,3 edges due to the opening of inelastic decay channels as explainedby Kurian et al. [2012] or Tröger et al. [1992].

SAMPLES AND EXPERIMENTAL METHODS 41
XANES oscillations decrease the whiteline intensity leading to a more intense measuredpre-edge intensity than expected (but with the same shape). The absence of self-absorptionphenomenon was verified with ATHENA (fluo package) and PyMca (XAS self-attenuationcorrection). And XANES spectra of crystalline compounds have been compared with resultsfrom Wilke et al. [2001] and Jackson et al. [2005] when available. In this study, none of theglass were ground because they are considered as diluted and only crystalline compoundswere prepared as powders.
Si(311) mono
TFY Samples 45°45°
Scanning Incident Energy
Ω
Figure 2.6 – Setup of XAS experiment.
For each sample, several spectra were measured:
− in the pre-edge region with a 0.05 eV step from 7108 to 7123 eV, 1 minute durationeach (∼60 spectra)
− in the XANES region with a 0.05 eV step from 7105 to 7180 eV, 2 minutes durationeach (2 to 5 spectra)
− in the EXAFS region with a 1 eV step, 7000 to 7550 eV, 1 minute duration each (1 or2 spectra)
2.3.3 Data processing
Spectra were extracted with PyMca software [Solé et al., 2007]. Using Matlabr, all spectraof the same kind were averaged, then the pre-edge spectra were merged onto the XANESand the XANES onto the EXAFS. A Savitzky-Golay noise reduction was applied. Spectrawere then normalized to the edge jump using ATHENA software [Ravel and Newville, 2005].The pre-edge was extracted by subtracting an arctangent function used to fit the edge tail.

42 Chapter 2
2.4 RIXS and HERFD
2.4.1 Principle
In order to improve the XAS measurement and obtained high-resolution data, thefluorescence signal can be monochromatized using analyzer crystals. This method is calledResonant Inelastic X-ray Scattering (RIXS) spectroscopy∗, in which both incident Ω andemitted ω energies are simultaneously scanned. This two-photon process is illustratedin Figure 2.7, and resulting measures are plotted as 3D graph (see an example below,Figure 2.9). There are the two ways to represent RIXS maps: (Ω,ω) or (Ω,Ω− ω), wherethe x-axis is the incident energy, the y-axis is the emitted energy ω or the energy transferΩ − ω, respectively, and the z-axis is the intensity relatively to the number of emittedphotons [Glatzel and Bergmann, 2005]. The representation adopted here, will be the secondone (Ω,Ω− ω).
intermediate state final stateFe2+
= h
= h ’
1s
2p
3p
3d
4p
decay
= h ’decay
absorption
= habsorption
Fe2+
TotalEnergy
Fe2+3d
K pre-edge
K edge
L edge
M edge
UV-Vis6
Kβ
Kα
1s13d7
1s13d64p1
2p53d7
2p53d64p1
3p53d7
3p53d64p1
3d7L3d6
Figure 2.7 – Mono-electronic picture (left) and multi-electronic picture (right) of Fe2+ electronictransitions involved in the RIXS spectroscopy. Ω is the absorption energy, ω the emitted energyand Ω− ω the energy transfer.
A 1D cut of the RIXS plane (at a given emitted energy) is called a High-Energy ResolutionFluorescence Detected X-ray Absorption Spectroscopy (HERFD-XAS or simply HERFD).HERFD-XAS differs from TFY-XAS, i.e. conventional X-ray absorption spectroscopy ofthe total fluorescence yield, because the peak broadening is smaller and the number ofpeaks and the intensity ratios may vary.
∗More information can be found in these reviews: Rovezzi and Glatzel [2014]; de Groot [2001]; Bauer [2014];Rueff and Shukla [2013].
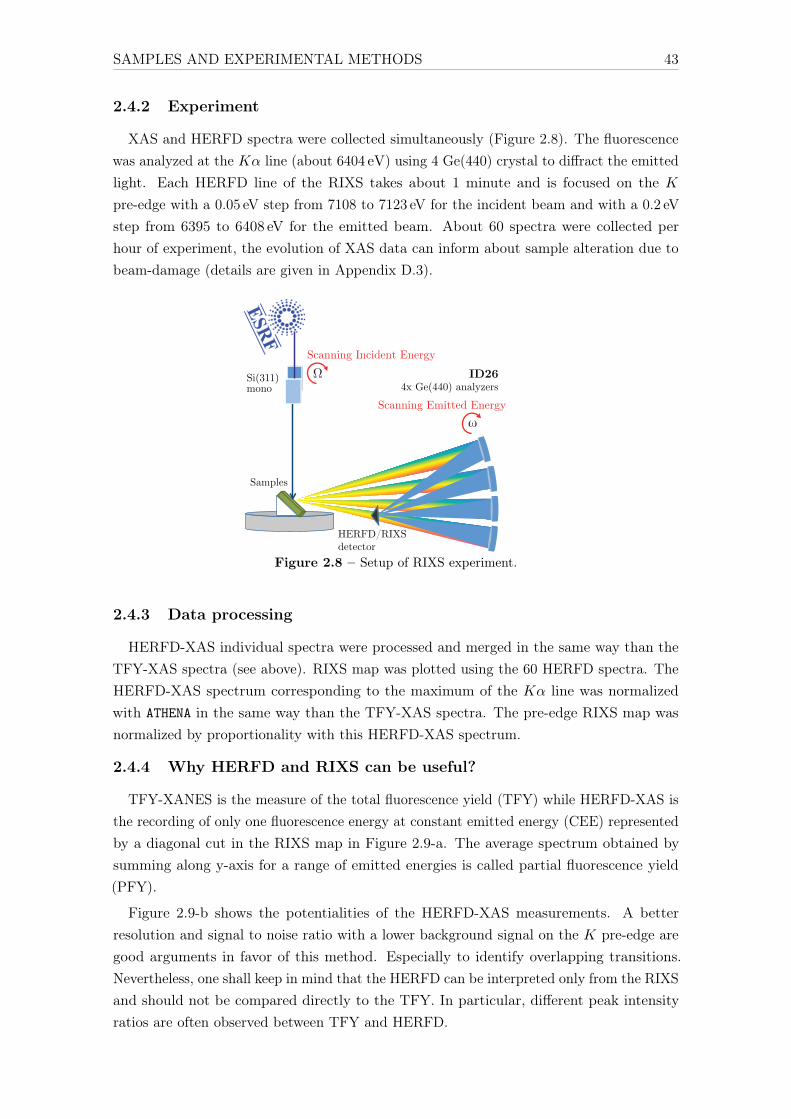
SAMPLES AND EXPERIMENTAL METHODS 43
2.4.2 Experiment
XAS and HERFD spectra were collected simultaneously (Figure 2.8). The fluorescencewas analyzed at the Kα line (about 6404 eV) using 4 Ge(440) crystal to diffract the emittedlight. Each HERFD line of the RIXS takes about 1 minute and is focused on the Kpre-edge with a 0.05 eV step from 7108 to 7123 eV for the incident beam and with a 0.2 eVstep from 6395 to 6408 eV for the emitted beam. About 60 spectra were collected perhour of experiment, the evolution of XAS data can inform about sample alteration due tobeam-damage (details are given in Appendix D.3).
TFY/XASdetector
HERFD/RIXSdetector
Si(311) mono
Samples
Scanning Emitted Energy
Scanning Incident EnergyΩ
ID26 4x Ge(440) analyzers
Figure 2.8 – Setup of RIXS experiment.
2.4.3 Data processing
HERFD-XAS individual spectra were processed and merged in the same way than theTFY-XAS spectra (see above). RIXS map was plotted using the 60 HERFD spectra. TheHERFD-XAS spectrum corresponding to the maximum of the Kα line was normalizedwith ATHENA in the same way than the TFY-XAS spectra. The pre-edge RIXS map wasnormalized by proportionality with this HERFD-XAS spectrum.
2.4.4 Why HERFD and RIXS can be useful?
TFY-XANES is the measure of the total fluorescence yield (TFY) while HERFD-XAS isthe recording of only one fluorescence energy at constant emitted energy (CEE) representedby a diagonal cut in the RIXS map in Figure 2.9-a. The average spectrum obtained bysumming along y-axis for a range of emitted energies is called partial fluorescence yield(PFY).
Figure 2.9-b shows the potentialities of the HERFD-XAS measurements. A betterresolution and signal to noise ratio with a lower background signal on the K pre-edge aregood arguments in favor of this method. Especially to identify overlapping transitions.Nevertheless, one shall keep in mind that the HERFD can be interpreted only from the RIXSand should not be compared directly to the TFY. In particular, different peak intensityratios are often observed between TFY and HERFD.

44 Chapter 2
0
0.05
0.1
0.15
0.2
0.25
0.3
0.35
0.4
Incident Energy [eV] Ω
Ener
gy T
rans
fer
[eV
] Ω–
7110 7115 7120
705
710
715
720
725staurolite[4]Fe2+ CEE
=HERFD
CIE
CET
=PFYΣSp(Ω)
(a)
0.20
0.15
0.10
0.05
0.00
Nor
mal
ized
abs
orba
nce
(arb
. u.)
712071187116711471127110Energy (eV)
staurolite [4]Fe2+ TFY
staurolite [4]Fe2+ HERFD
(b)
Figure 2.9 – (a) Experimental RIXS map of staurolite ([4]Fe2+). The diagonal cut results inthe constant emitted energy (CEE) line plot, which is the HERFD spectrum. The normalizedspectral intensities in the RIXS plane are given in the shaded bar. The peaks present in the EnergyTransfer direction correspond to the multiplet split final states. Horizontal and vertical cuts givethe constant energy transfer (CET) and constant incident energy (CIE) line plots, respectively. (b)Experimental Fe K edge TFY and HERFD spectra of staurolite after normalization to the mainedge.
2.5 SQUID-VSM
2.5.1 Approach
Iron in doped-glasses is usually considered as isolated and paramagnetic species in adiamagnetic matrix∗. When a paramagnetic material is subject to a magnetic field H, themagnetization M (total magnetic moment per unit volume) is given by:
MJ = NgJµBBJ(α), (α = JgµBH/kBT ) (2.8)
where N is the spin number per volume unit, g = 2.0023 is called the Landé g-factor forthe electron, J is the total angular momentum quantum number, µB is the Bohr magnetonand BJ(α) is the Brillouin function. For 3d elements, due to the crystal field the orbitalangular momentum is quenched, therefore L is reduced to 0 and J is approximated by S,thus only the spin contributes to the magnetization process.
For low magnetic field, α 1, M(H) is linear and the first term of the expansion inTaylor series of Equation 2.8 is the Curie law for paramagnetic materials:
χ =M
H=C
T(2.9)
where C = Nµ2eff/3kB is the Curie constant and µeff = g√J(J + 1)µb = g
√S(S + 1)µb is
∗For short introduction to magnetic materials the reader can consult Spaldin [2010] and of course [Kittel,2004] for a detailed introduction

SAMPLES AND EXPERIMENTAL METHODS 45
the effective magnetic moment of the atom. The magnetization M is therefore directlyproportional to the applied magnetic field H, and the magnetic susceptibility χ is a constant(χ > 0 for paramagnetic ions and χ < 0 for diamagnetic ions).
For iron, the calculated g√S(S + 1) and measured µeff values of the effective magnetic
moment, expressed in Bohr magneton, are given in Table 2.4.
Table 2.4 – Effective magnetic moment for iron ions, adapted from Kittel [2004, Chap. 11].
ion configuration total spin g√S(S + 1) µeff
Fe2+ 3d6 S = 2 4.90 5.4Fe3+ 3d5 S = 5/2 5.92 5.9
The purpose of the SQUID-VSM experiment is to measure the static magnetic propertiesof glasses and to look for any deviation from the ideal, paramagnetic behavior. Anydeviation from the ideal could bring to light iron-iron interactions due to iron-clustering.
2.5.2 SQUID data acquisition
Superconducting Quantum Interference Device (SQUID) with a Vibrating Sample Mag-netometer (VSM) measurements were performed on a Quantum Design’s Magnetic PropertyMeasurement System (MPMSr3). Samples are machined to be cylindrical with a diameterof 5.5mm and a 2.5mm thickness, corresponding to a mass m ' 150mg (see Figure 2.10).They are put in a plastic straw fixed on the sample holder. The sample holder is verticallyoscillating along the z-axis in the cavity. Measurement temperatures vary from 2.5K to300K. All measurements with doped iron glass (0.5wt% of Fe2O3) were duplicated withalmost iron-free samples (<100 ppm of Fe2O3) to evaluate the diamagnetic contribution ofthe matrix.
2.5 mm
5.5 mm
straw
glass cylinder no capsule
m = 150 mg
z-axis
Figure 2.10 – Sample shape for SQUID experiments.
In magnetic measurements, the initial state of the system is very important. We performedall the measurements after a zero field cooling, in order to avoid magnetic relaxation effectswhich would occur in the case of a clustering of the iron ions. However, the superconductingmagnet of the MPMS traps magnetic fields in their windings after being charged at highfields. Therefore, we evaluated and canceled the remnant field using palladium as aparamagnetic reference prior to each measurement.
46 Chapter 2
Using the SQUID-VSM, the total magnetic moment of the sample was measured. Themagnetization of the material was then deduced by dividing the moment by the mass∗.
Two kinds of experiments were performed:
Measure of M vs T under low magnetic fields
Objective: estimating the variations of the magnetic susceptibility vs T and check whetheror not it follows the Curie law.
The sample was cooled down from room temperature to 2.5K without applied magneticfield. µ was measured as a function of temperature with a magnetic induction B = 10 mT.In the range, 0-300K, the linearity of M(H) was verified for our glasses, therefore, it ispossible to approximate χ by M/H for this small magnetic field. µ was corrected withthe diamagnetism of the matrix (see Appendix C.2). χmol is calculated with formula C.2.
1
χmolwas fitted with a linear curve a.T + b for different temperature ranges. In the case of
material that follows a Curie’s Law: a = 1/C and b = 0. Instead, if the material presentsmagnetic interaction and becomes ordered below some characteristic temperature θ, it
can follow Curie-Weiss law: χ =C
T − θ , therefore a = 1/C and b = −θ/C where θ is theCurie-Weiss temperature. The effective moment µeff was obtained with equation C.3 forthe same temperature ranges.
Measure of M vs H
Objective: verifying the scaling of M as a function of H/T for different temperature andcompare with the theoretical Brillouin function (Equation 2.8).
The sample was cooled down to 3K without applied magnetic field. µ was measured asa function of magnetic field H from 0 to 7T at different temperature T = 2.5, 5, 10, 20, 35,50, 65, 100, 135, 200 and 300K. No hysteresis was observed for the measured samples.
2.6 Electron Paramagnetic Resonance (EPR)
2.6.1 EPR principles
Since the pioneering work of Castner et al. [1960], Electron Paramagnetic Resonance(EPR), also named Electron Spin Resonance (ESR), has proven to be a sensitive techniqueto probe Fe3+ in glasses. Especially to study clustering, site distortion and to quantify Fe3+
content [Balan et al., 1999, 2000; Griscom, 1980]. The high sensibility of EPR can also beused to confirm the absence of paramagnetic impurities (only those that could be observedwith EPR, such as Mn2+).
EPR is a chemically selective method, and lots of paramagnetic species are silent and donot give any signal. Elvers and Weissmann [2001] list the oxidation states of 3d transitionmetals that can be analyzed by EPR: Ti3RT (d1), V4+
RT (d1), Cr3+/5+RT (d3/d1), Mn2+RT (d5),Fe3+RT (d5), Co2+LT (d7), Ni2+LT (d8), Cu2+RT (d9). The species marked by RT can usually bedetected at room temperature. To analyze the LT-indexed elements, low temperaturemeasurements have to be carried out. For transition metals, an empirical rule (that is notalways true) is that only paramagnetic ions with unpaired electrons give a signal.∗See Appendix C, Table C.1 presents the useful units for magnetism in both CGS and SI systems.

SAMPLES AND EXPERIMENTAL METHODS 47
For the case of ferric and ferrous iron, conventional EPR (magnetic fields B0 ≤ 1.5 T andmicrowave frequencies ν ≤ 35 GHz) is only sensitive to Fe3+ and Fe2+ is a silent species.The short spin-lattice relaxation time and the large zero-field splitting of Fe2+ precludethe direct observation of Fe2+ with conventional EPR in glasses. However, Fe2+ can beobserved with high-frequency EPR, pulse EPR or below helium temperature (4K). It canalso affect the Fe3+ signals with Fe3+–Fe2+ coupling effects.
For a free electron with the energy E0, the spin is s = ±12 . If this electron is in a static
magnetic field H, the energy levels are split in 2s+ 1 levels due to Zeeman effect. Eachlevel is characterized by the magnetic spin quantum number ms (here ms = ±1
2) and theenergy is E0 ±msgµBH, where µB is Bohr magneton and g is the Landé g-factor∗. Theenergy difference between the two levels is ∆E = gµBH. (see Fig 2.11)
Figure 2.11 – Zeeman effect: under a mag-netic field there is a splitting of the levels.
zero field splitting
zero field splitting
crystal field effect magnetic
field effect (Zeeman)
spinS = 5/2
mS = ±1/2
mS = ±3/2
mS = ±5/2
Figure 2.12 – Fine-structure splitting of a d5 ion(Fe3+). Dashed lines represent zero-field splitting dueto crystal field, while plain line indicate the Zeemansplitting due to applied magnetic field. Inspired fromGriscom [1980].
An electromagnetic field with the microwave frequency ν (9.5 GHz for X-band, 34 GHzfor Q-band) is superimposed to this static magnetic field. If the energy hν of a microwavephoton is equal to the level splitting, there is resonance and the photon is absorbed by theelectron. It is the resonance condition:
hν = gµBH (2.10)
The different common g-factor values at X- and Q-band are listed in Table 2.5.
For an ion such as Fe3+ (d5), there are three levels known as Kramers doublets corre-sponding to mS = ±1
2 , ±32 and ±5
2 . They are represented in Figure 2.12 and they arealready split at zero magnetic field by the ligand field or electronic repulsions. This zero-fieldsplitting (ZFS) is characterized in EPR with the fine-structure parameters D and E (orB0
2 = D/3 and B22 = E with Stevens operators). Resonance can be observed between levels
respecting the selection rule ∆mS = ±1
∗The effective g-factor geff, will be simply noted g.
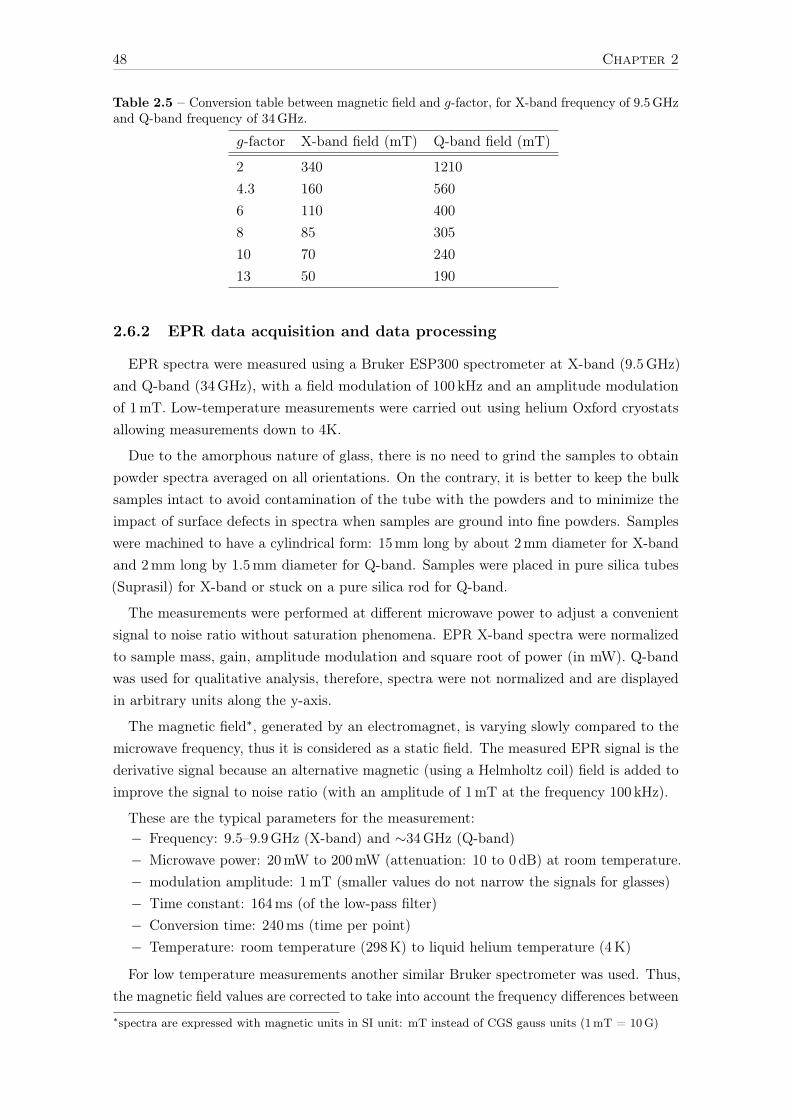
48 Chapter 2
Table 2.5 – Conversion table between magnetic field and g-factor, for X-band frequency of 9.5GHzand Q-band frequency of 34GHz.
g-factor X-band field (mT) Q-band field (mT)
2 340 12104.3 160 5606 110 4008 85 30510 70 24013 50 190
2.6.2 EPR data acquisition and data processing
EPR spectra were measured using a Bruker ESP300 spectrometer at X-band (9.5GHz)and Q-band (34GHz), with a field modulation of 100 kHz and an amplitude modulationof 1mT. Low-temperature measurements were carried out using helium Oxford cryostatsallowing measurements down to 4K.
Due to the amorphous nature of glass, there is no need to grind the samples to obtainpowder spectra averaged on all orientations. On the contrary, it is better to keep the bulksamples intact to avoid contamination of the tube with the powders and to minimize theimpact of surface defects in spectra when samples are ground into fine powders. Sampleswere machined to have a cylindrical form: 15mm long by about 2mm diameter for X-bandand 2mm long by 1.5mm diameter for Q-band. Samples were placed in pure silica tubes(Suprasil) for X-band or stuck on a pure silica rod for Q-band.
The measurements were performed at different microwave power to adjust a convenientsignal to noise ratio without saturation phenomena. EPR X-band spectra were normalizedto sample mass, gain, amplitude modulation and square root of power (in mW). Q-bandwas used for qualitative analysis, therefore, spectra were not normalized and are displayedin arbitrary units along the y-axis.
The magnetic field∗, generated by an electromagnet, is varying slowly compared to themicrowave frequency, thus it is considered as a static field. The measured EPR signal is thederivative signal because an alternative magnetic (using a Helmholtz coil) field is added toimprove the signal to noise ratio (with an amplitude of 1mT at the frequency 100 kHz).
These are the typical parameters for the measurement:− Frequency: 9.5–9.9GHz (X-band) and ∼34GHz (Q-band)− Microwave power: 20mW to 200mW (attenuation: 10 to 0 dB) at room temperature.− modulation amplitude: 1mT (smaller values do not narrow the signals for glasses)− Time constant: 164ms (of the low-pass filter)− Conversion time: 240ms (time per point)− Temperature: room temperature (298K) to liquid helium temperature (4K)
For low temperature measurements another similar Bruker spectrometer was used. Thus,the magnetic field values are corrected to take into account the frequency differences between∗spectra are expressed with magnetic units in SI unit: mT instead of CGS gauss units (1mT = 10G)

SAMPLES AND EXPERIMENTAL METHODS 49
the two spectrometers. Therefore, the x-axis values were divided by the measured frequencyin GHz and multiplied by 9.5GHz.
The cavity signal can be removed, especially for samples with low Fe3+ content. Thecavity was measured without sample, and the signal was subtracted to obtain the flattestsignal around 800mT (where there is no resonance).
2.6.3 EPR example and interpretation elements
1000
800
600
400
200
0
-200
-400
EPR
Sig
nal (
arb.
u.)
4003002001000Magnetic field (mT)
NCS05M
T = 298 K
Ipp (g2)
Hpp(g2)
Hpp(g4.3)
Ipp (g4.3)
g13 g10
g8 g4.3
g2
Figure 2.13 – Example of a typical EPR spectrum (NCS05Med).
Soda-lime-silicate (NCS05Med) glasses with 0.5wt% of Fe2O3 synthesized under atmo-spheric conditions (intermediate redox) gives a typical X-band EPR spectrum of Fe3+-dopedsilicate glasses, presented in Figure 2.13.
The X-band EPR spectrum of Fe3+ in silicate glasses is characterized by an intenseasymmetric signal at g = 4.3, accompanied by two weaker features near g = 8 and g = 2.The resonances at g = 4.3 and g = 8 originate from paramagnetic transitions of isolatedFe3+ ions in rhombic (E/D ∼ 1/3) and axially (E/D ∼ 0) distorted sites, respectively[Dowsing and Gibson, 1969; Kurkjian and Sigety, 1968; Montenero et al., 1986]. This peakis due to the three transitions xx, yy and zz. The more the peak is thin and the morethe site is distorted. If the site is distorted the three bands are superimposed; if the siteis regular, the three bands are separated. The signal at g = 4.3 has been also attributedto tetrahedral or octahedral sites with rhombic distortions [Kurkjian and Sigety, 1968;Montenero et al., 1986]. There are several types of distortions, for example, Figure 2.14shows some distortions of an octahedron.
The attribution of the feature at g = 2 is less clear [Dunaeva et al., 2012]. Differentscenarios have been proposed: (i) a signal due to exchange-coupled pairs or clusters of morethan two atoms [Rüssel, 1993] involving edge- or face-sharing Fe3+ sites [Griscom, 1980;Montenero et al., 1986; Moon et al., 1975]. These clusters could be trimers [Boudalis et al.,2006] up to nano-clusters as in ferritine [Aime et al., 1997], nanoparticles [Koksharov et al.,2000] or obsidian glasses [Calas and Petiau, 1983b; Duttine et al., 2003]; (ii) a paramagnetic

50 Chapter 2
signal due to Fe3+ in axially distorted sites (E/D ∼ 0) [Griscom, 1980], this signal isenhanced by dipole-dipole interactions[Abragam and Bleaney, 1970, §9.8].
1. Regularall distances are equivalent
2. C4 axial distortion a≠b
a
bb
c
c
a
L
L
L
L
LL
L
LL
L
LL M M
3. Rhombic distortion a≠b≠c 4. Trigonal distortion a≠b
a
b
a≠ba
bb
b
b
a
L
L
L
L
LL ML
LL
LL
L M
Figure 2.14 – Distortions of an octahedron
The proportion of these two overlapping contributions depends on glass compositionand Fe-redox state [Elvers and Weissmann, 2001; Montenero et al., 1986]. The g = 2
signal can also be assigned to Fe3+ in regular site with high symmetry, e.g. tetrahedral oroctahedral [Camara, 1982; Kurkjian and Sigety, 1968]. However, the latter interpretationis not coherent with the long tail above 350 mT that goes back to 0 around 600mT.Low-temperature EPR measurements have shown the presence of paramagnetic clusters inFe-doped borate glasses, because small clusters exhibit antiferromagnetic behavior with abroader EPR line, whereas the EPR signal of diluted Fe3+ exhibits paramagnetic behaviorwith a more intense EPR signal[Berger et al., 1995]. Thus, the disappearance of the g = 2
signal when temperature decreases is used as evidence of the presence of Fe3+ containingclusters, as observed in [Aime et al., 1997] or nanoparticles [Koksharov et al., 2000].
The linewidth is the peak to peak value in mT, it is proportional to 1/t (lifetime) andlinked to the dipole-dipole interaction of Fe3+ ions [Elvers and Weissmann, 2001]. InFigure 2.13, the linewidth of the g = 4.3 and g = 2 signals are defined with ∆Hpp(g = 4.3)
and ∆Hpp(g = 2). The intensities of these bands are named Ipp(g = 4.3) and Ipp(g = 2).

51
Chapter 3
Ligand Field Multiplet Theoryapplied to the calculation of XASand optical absorption spectra
This chapter presents Ligand Field Multiplet Theory (LFMT) that is used by Quanty tointerpret the spectroscopic properties, especially optics of iron in cystals and glasses. LFMcalculations performed during this thesis are focused on the interpretation of the iron 3d
orbitals probed by X-ray absorption and optical spectroscopy in order to understand therelationships with Fe local environment.
3.1 Historical introduction to Ligand Field Multiplet Theory(LFMT)
To describe the chemical bond, crystal field theory was developed in the 1930’s by Betheand Van Vleck [Bethe, 1929; Van Vleck and Sherman, 1935]. It was used to interpret thecrystal field potential created by the neighboring atoms and its effects on the electronicstates of the central ion. In coordination chemistry, one of the fundamental questionsis how to describe the chemical bond by considering interactions with the neighboringanions, named ligands. The valence-bond theory, proposed by Pauling in 1929, gave afirst representation of the chemical bonding, with the concepts of electronegativity, bond-length, ionic radius and coordination number. Gibbs et al. [2014] recently revisited thisconcept and the definition of atomic/ionic radii in crystals; the authors underlined thatthe electronic density is highly distorted around atoms and this asphericity shows all thecomplexity to define the ionic radius, which depends on site geometry, nature and numberof ligands and interactions with surrounding atoms. To take into account the chemicalbonding and hybridization with neighbors, crystal field theory was completed by ligandfield theory [Ballhausen, 1962; Jørgensen, 1971]. Tanabe and Sugano [1956] did quantitativecalculations of the electronic levels using Racah parameters to characterize covalency andconsider multielectronic interactions. Ligand Field Multiplet Theory (LFMT) was born.This chapter presents basic notions necessary for the comprehension of this manuscript,

52 Chapter 3
for further details, the reader can refer to these books: Ballhausen [1962]; Bates [1962];Jørgensen [1971]; Cowan [1981]; Lever [1984]; Burns [1993]; Figgis and Hitchman [2000].
3.2 From mono-electronic picture to multiplet states
Electron configurations of ferrous and ferric ions are Fe2+: [Ar]3d6 and Fe3+: [Ar]3d5
respectively, where [Ar] is the electron configuration of argon: 1s22s22p6 3s23p6. The mono-electronic approach, based on hydrogen-like model, predicts five degenerated d orbitalsfor the free ion (dxy, dyz, dxz, dx2−y2 , dz2), each can accept 2 electrons with spin ±1
2 .Thus, with n electrons to put in 10 spin orbitals, there are
(10n
)possible combinations,
corresponding for Fe2+ (d6) to 210 microstates and for Fe3+ (d5) to 256 microstates. Thesimplest scenario would be the absence of electron interactions where all microstates aredegenerated. However, electronic repulsions raise the degeneracy by splitting the electroniclevels. Microstates are not equivalent depending on their fillings, and some arrangementsare energetically more favorable than others. To understand multielectronic effects, thesimple mono-electronic vision is inappropriate to the study of transition metals, and anomenclature using spectroscopic terms is suitable.
3.3 Spectroscopic terms and ground state
Spectroscopic terms are symbols used to describe electronic states. In absence of spinorbit coupling, split levels, named multiplets, are labeled with terms (such as 5D or 6S)regarding their L (total atomic orbital angular momentum) and S (resultant spin quantumnumber) values. They are written as 2S+1L, with L = S, P,D, F,G,H, I (where S = 0,P = 1, D = 2...) The number of microstates is the product of orbital multiplicity (2L+ 1)by the spin multiplicity (2S + 1).
Ground state can be guessed with Hund’s rules (find the term that maximized S, thenmaximized L), which is the one that has the lowest energy by minimizing the repulsions.Other spectroscopic terms representing all excited states are listed in Table 3.1 withoutenergy ordering. For d6 and d5 ions, no excited state has the same spin multiplicity as theground state.
For Fe2+, the ground state is 5D and other spectroscopic terms are triplets (3P , 3D,3F ...) or singlets (1I, 1G, 1F ...). Triplet states are more likely to be involved in a transitionthan the singlets (due to selection rules that will be presented in the next section).
For Fe3+, the ground state is a sextet 6S and other spectroscopic terms are quadruplets(4G, 4P , 4D, 4F ) or doublets (2I, 2H, 2D...). For the same reason as for Fe2+, quadrupletstates of Fe3+ are lead to higher intensity of transition.
Table 3.1 – Spectroscopic terms of ferrous iron (Fe2+) and ferric iron (Fe3+) in spherical geometry(from p. 53 of Burns [1993]).
Configuration Groundstate
Excited states
Fe2+ (d6) 5D 3H, 3G, 3F , 3F , 3D, 3P , 3P , 1I, 1G, 1G, 1F , 1D, 1D, 1S, 1SFe3+ (d5) 6S 4G, 4F , 4D, 4P , 2I, 2H, 2G, 2G, 2F , 2F , 2D, 2D, 2D, 2P , 2S
LFMT APPLIED TO THE CALCULATION OF XAS AND OAS 53
Racah parameters are energies, expressed in cm–1 or eV, used to characterize the strengthof multielectronic repulsions, they are named A, B and C, relatively to the values A0, B0
and C0 of the free ion. In Oh or Td geometries without spin-orbit coupling, all electronicstates energies can be expressed as a linear combination of the Racah parameters (Forexample see Griffith [1961, Table 4.6]). Since A is only related to the average energy ofan electronic configuration, it can be disregarded for comparison of relative energies. Formetal ions surrounded by ligands, electrons of the central metal ion are influenced by theirneighboring atoms. The overlapping of metal orbitals with ligand orbitals, which forms thechemical bond, leads to delocalize the electrons of the metal, thus, Racah parameters haveto be reduced to take this effect into account.
The nephelauxetic ratio β characterizes this reduction, it is defined by β = B/B0 whereB is the Racah parameter of the compound and B0 the value of the free ion. Therefore,β = 1 corresponds to a fully ionic bonding and a lower value of β means that the bondis more covalent. In oxide compounds, such as minerals or glasses studied in this work,bonds are ionocovalent with β commonly about 60∼80% [Arrio et al., 2000; Burns, 1993;de Groot and Kotani, 2008; Lever, 1984; Westre et al., 1997]
For the d-shell, Racah parameters A, B and C are related to Slater-Condon parametersF 0, F 2 and F 4 (direct Slater integrals). The former are often used for experimentalinterpretation of the chemical bond while the later are used to characterize electronicrepulsions. They are related by these relations [Lever, 1984, p. 103]:
A = F 0 − 49
441F 4
B =1
49F 2 − 5
441F 4
C =35
441F 4
(3.1a)
(3.1b)
(3.1c)
3.4 The importance of geometry
The surrounding ligands that determine the site geometry create an electric field, thecrystal field, that raises the degeneracy of the 3d-levels and splits the spectroscopic terms.Split terms are relabeled using group theory regarding the point group geometry of the site.The naming convention is to use small letters for monoelectronic states (e.g. dxy or t2g)and capital letters for multielectronic states (multiplet states coupling all electrons), e.g.5D or 5T2g.
Figure 3.1 shows the high-spin and low-spin states of a Fe3+ ion in the center of aregular octahedron (Oh). In this symmetry, the five mono-electronic 3d orbitals are splitinto t2g and eg which are linear combinations of the atomic 3d orbitals, t2g:(dxy, dyz, dxz)and eg:(dx2−y2 , dz2). In a multielectronic model, the ground state 6S gives 6A1g, and,for example, the excited term 4F is split into 4A2u ⊕4T1u ⊕4T2u. The spin multiplicity4 remains unchanged, and the dimension of the initial state is equal to the sum of splitstates dimensions (here dim(F ) = dim(A2u) + dim(T1u) + dim(T2u) with dim(F ) = 7,dim(A2u) = 1, dim(T1u) = dim(T2u) = 3).

54 Chapter 3
HS OhO3LS Oh
∆ or 10Dq0.6∆
0.4∆
Relativeenergy
Figure 3.1 – Crystal field splitting of Fe3+ 3d orbitals in Oh geometry, Fe3+ is in the center of aregular octahedron. A weak-field leads to a high-spin (HS) ground state and a strong-field leads to alow-spin (LS) ground state. To simplify, only one microstate has been represented. The representedfilling of the degenerated orbitals with spins is a single particle picture of a multielectronic state.
3.5 Crystal field parameters
Crystal field parameters are semi-empirical energies used to quantify the splittings inducedby the crystal field potential. The number of parameters depends on geometry: the morethe geometry is regular, the fewer parameters there are. In the case of Oh geometry, thereis only one parameter, named 10Dq or ∆, in D3h there are 2 parameters (Dµ, Dν) and inD4h there are 3 parameters (Dq, Ds, Dt).
For a strong crystal field (10Dq) compared to electronic repulsions (Racah B parameter),it is better to minimize the energy of the system by having paired electrons than maximizingthe total spin by putting electrons in the eg orbital. Figure 3.1 illustrates the evolution ofthe Fe3+ ground state with increasing crystal field 10Dq, Fe3+ changes from 6A1g high-spin(HS) to 2T2g low-spin (LS) ground state. In oxides and glasses, Fe3+ and Fe2+ are generallyboth in HS state. To summarize:
High-spin = weak-field (10Dq ) with ionic behavior (β → 1)Low-spin = strong-field (10Dq ) with covalent behavior (β < 1)
The crystal field potential has the same symmetry as the site formed by the metal ionand its first neighbors. Usually different coordination numbers lead to different point groupsymmetries, but sometimes two distinct polyhedra with different coordination numbers canhave the same point group geometry. In such case, it can be discerned by the sign andmagnitude of the crystal field parameters.
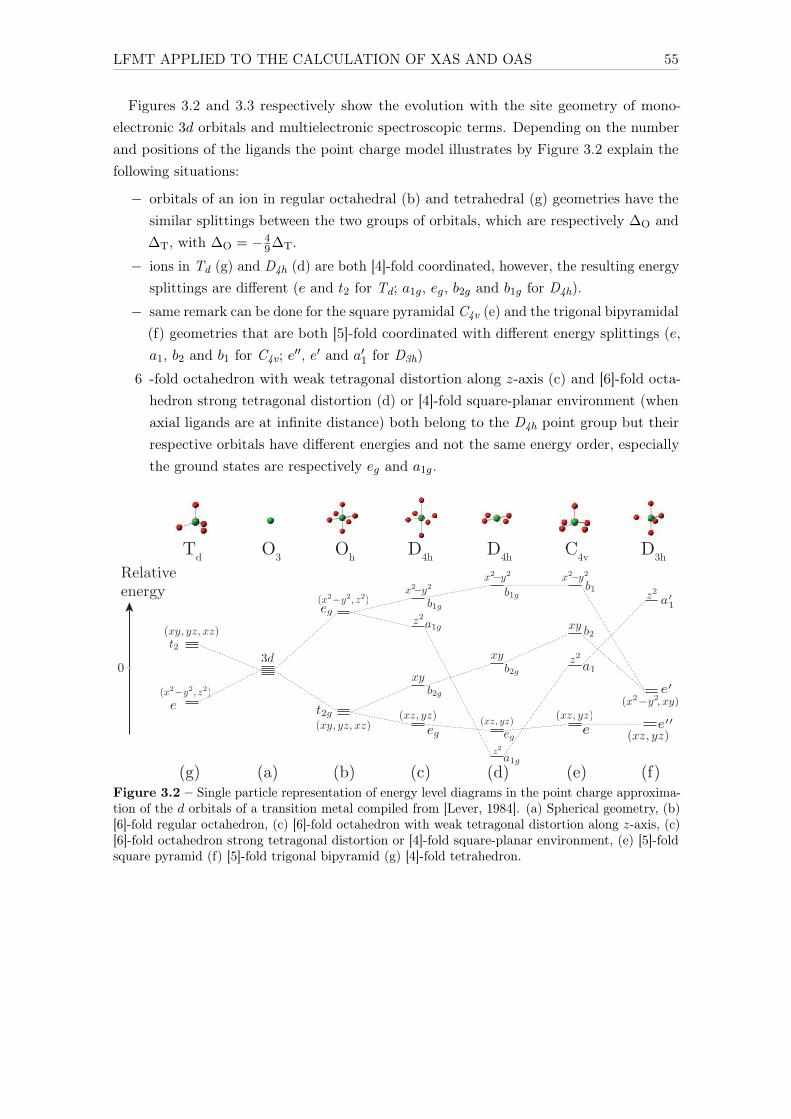
LFMT APPLIED TO THE CALCULATION OF XAS AND OAS 55
Figures 3.2 and 3.3 respectively show the evolution with the site geometry of mono-electronic 3d orbitals and multielectronic spectroscopic terms. Depending on the numberand positions of the ligands the point charge model illustrates by Figure 3.2 explain thefollowing situations:
− orbitals of an ion in regular octahedral (b) and tetrahedral (g) geometries have thesimilar splittings between the two groups of orbitals, which are respectively ∆O and∆T, with ∆O = −4
9∆T.
− ions in Td (g) and D4h (d) are both [4]-fold coordinated, however, the resulting energysplittings are different (e and t2 for Td; a1g, eg, b2g and b1g for D4h).
− same remark can be done for the square pyramidal C4v (e) and the trigonal bipyramidal(f) geometries that are both [5]-fold coordinated with different energy splittings (e,a1, b2 and b1 for C4v; e′′, e′ and a′1 for D3h)
6 -fold octahedron with weak tetragonal distortion along z-axis (c) and [6]-fold octa-hedron strong tetragonal distortion (d) or [4]-fold square-planar environment (whenaxial ligands are at infinite distance) both belong to the D4h point group but theirrespective orbitals have different energies and not the same energy order, especiallythe ground states are respectively eg and a1g.
OhTd D3hD4h D4h C4vO3
(g) (a) (f)(e)(d)(c)(b)
Relativeenergy
Figure 3.2 – Single particle representation of energy level diagrams in the point charge approxima-tion of the d orbitals of a transition metal compiled from [Lever, 1984]. (a) Spherical geometry, (b)[6]-fold regular octahedron, (c) [6]-fold octahedron with weak tetragonal distortion along z-axis, (c)[6]-fold octahedron strong tetragonal distortion or [4]-fold square-planar environment, (e) [5]-foldsquare pyramid (f) [5]-fold trigonal bipyramid (g) [4]-fold tetrahedron.
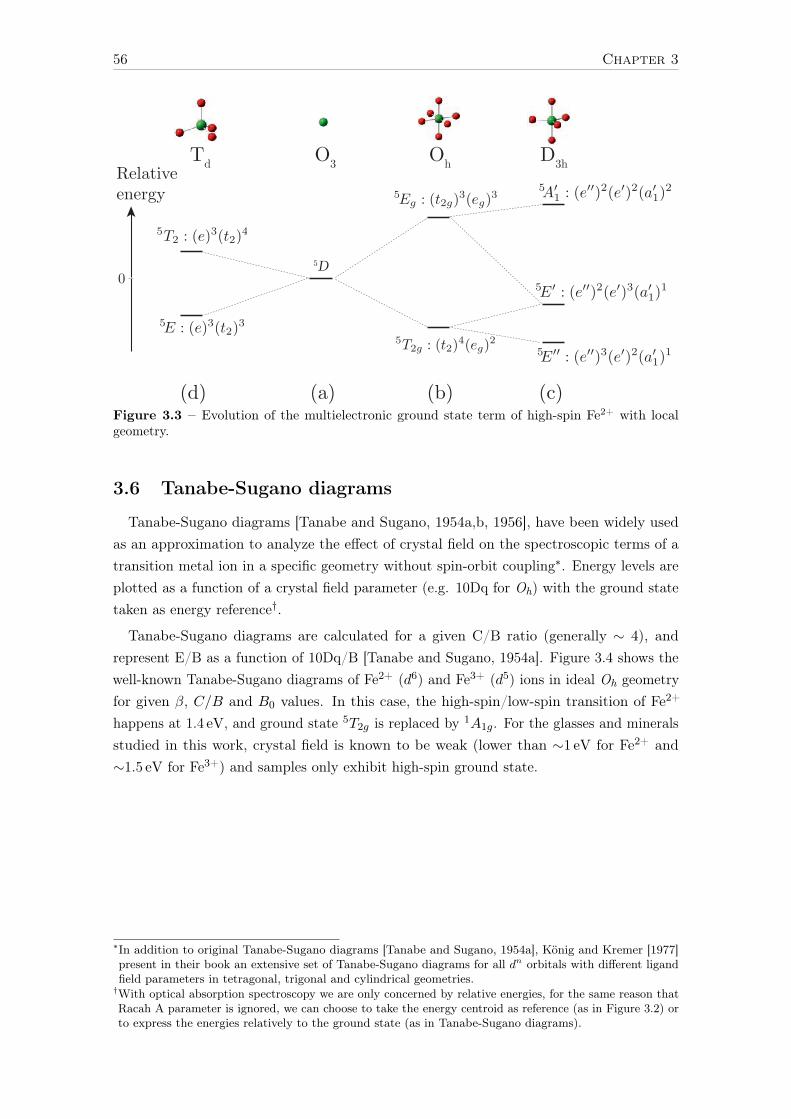
56 Chapter 3
Relativeenergy
OhTd O3
(d) (a) (b)
5D
D3h
(c)Figure 3.3 – Evolution of the multielectronic ground state term of high-spin Fe2+ with localgeometry.
3.6 Tanabe-Sugano diagrams
Tanabe-Sugano diagrams [Tanabe and Sugano, 1954a,b, 1956], have been widely usedas an approximation to analyze the effect of crystal field on the spectroscopic terms of atransition metal ion in a specific geometry without spin-orbit coupling∗. Energy levels areplotted as a function of a crystal field parameter (e.g. 10Dq for Oh) with the ground statetaken as energy reference†.
Tanabe-Sugano diagrams are calculated for a given C/B ratio (generally ∼ 4), andrepresent E/B as a function of 10Dq/B [Tanabe and Sugano, 1954a]. Figure 3.4 shows thewell-known Tanabe-Sugano diagrams of Fe2+ (d6) and Fe3+ (d5) ions in ideal Oh geometryfor given β, C/B and B0 values. In this case, the high-spin/low-spin transition of Fe2+
happens at 1.4 eV, and ground state 5T2g is replaced by 1A1g. For the glasses and mineralsstudied in this work, crystal field is known to be weak (lower than ∼1 eV for Fe2+ and∼1.5 eV for Fe3+) and samples only exhibit high-spin ground state.
∗In addition to original Tanabe-Sugano diagrams [Tanabe and Sugano, 1954a], König and Kremer [1977]present in their book an extensive set of Tanabe-Sugano diagrams for all dn orbitals with different ligandfield parameters in tetragonal, trigonal and cylindrical geometries.
†With optical absorption spectroscopy we are only concerned by relative energies, for the same reason thatRacah A parameter is ignored, we can choose to take the energy centroid as reference (as in Figure 3.2) orto express the energies relatively to the ground state (as in Tanabe-Sugano diagrams).

LFMT APPLIED TO THE CALCULATION OF XAS AND OAS 57
0
1
2
3
4
5
0 0.5 1 1.5 2
Transitio
n e
nergy (
eV
)
10Dq(eV)
HS LS
5D
3H
3P
3F
3G
3D
3P3F
0
5
10
15
20
25
30
35
40
Wavenum
ber (
x10
3 cm
-1)
(a) Fe2+
0
1
2
3
4
5
0 0.5 1 1.5 2Tr
ansit
ion
ener
gy (e
V)
10Dq(eV)
0
5
10
15
20
25
30
35
40
Wav
enum
ber (
x103
cm-1)
6S
4G
4P4D
4F
(b) Fe3+
Figure 3.4 – Tanabe-Sugano diagrams of octahedral Fe2+ and Fe3+ (Oh geometry) as a functionof crystal field parameter 10Dq with β = 0.6 and without spin-orbit coupling. Atomic values ofB0 and C0 are calculated with Cowan’s code, and spectroscopic terms are calculated with Quantysoftware. (a) Fe2+ spectroscopic terms are plotted without singlet states of spin multiplicity 1 withB0 = 1280.4 cm–1 and C/B = 3.69 (b) Fe3+ spectroscopic terms are plotted without doublet statesof spin multiplicity 2 with B0 = 1381.6 cm–1 and C/B=3.73.
Levels are experimentally broadened by several factors, such as sample inhomogeneities.The spectroscopic signals are indeed an average over all iron sites of the structure. Therefore,a repartition of iron into different crystalline sites distributes the crystal field parametersaround average values and leads to level broadening. Ligand field energy dependent levels,which are function of 10Dq (not horizontal in Tanabe-Sugano diagram), yield to broaderspectral bands than levels whose energy is independent of the crystal field, for example,4T2g(G) vs. 4Eg(D) in the Tanabe-Sugano diagram of Fe3+ (d5). The stronger is the slope,the broader is the band. A distribution of bond covalency (Racah B) also leads to levelbroadening.
Spin-orbit coupling is another origin for the broadening effect of d -levels, it is relatedto the magnetic interactions between the spin and the magnetic dipole created by theelectron motion in their orbit [Ballhausen, 1962]. The spin-orbit coupling on the 3d
electrons is denoted ζ3d and is however one or two order of magnitude smaller thanelectronic repulsions. For example, ζ3d(Fe2+) = 0.052 eV, while F 2
3d3d(Fe2+) = 10.966 eV
and F 43d3d(Fe
2+) = 6.815 eV; or ζ3d(Fe3+) = 0.059 eV, while F 23d3d(Fe
3+) = 12.043 eV andF 43d3d(Fe
3+) = 7.535 eV. When added, the degeneracy of the levels is slightly lifted, whichincreases the level broadening and lowers the energy resolution of experimental spectra[Lever, 1984, p. 187].
Jahn-Teller effect also broadens the bands and changes the spectral intensities [Lever,1984, p. 189]. To keep it simple, energy minimization can be achieved by lowering ideal

58 Chapter 3
regular geometries (such as Oh and Td), this distortion spontaneously split the energy levelsto raise the degeneracy, which stabilizes the atom [Burns, 1993]. For the compounds studiedin this work, iron is often in a low symmetry site, which leads to adjust many crystal fieldparameters. However, it is possible to work with higher geometry as an approximation to getsimilar spectral data with fewer parameters. In conclusion, the goal is to find the smallestnumber of parameters in the most regular environment that reproduces the experimentaldata.
3.7 Hamiltonian describing the multielectronic configuration
In term of quantum mechanics formalism the Hamiltonian describing the multielectronicconfiguration of the ion is noted Hion. The initial states |i〉 and final states |f〉 are theeigenvectors of Hion describing the initial and final configurations, respective energies areEi and Ef , eigenvalues of Hion.
Without magnetic field, the Hamiltonian Hion can be written as the sum of several terms:
Hion = Hkin + He−/N + He−/e− + HSO + HCF + Hhybrid (3.2)
where Hkin is the kinetic energy of the electrons, He−/N the electrostatic interaction of theelectrons with the nucleus, He−/e− the electron-electron repulsion, HSO is the spin-orbitcoupling interaction, HCF is the crystal field Hamiltonian, which takes into account thelocal environment around the absorbing atom and Hhybrid is the hybridization Hamiltonian.
Hhybrid describes the on-site 3d–4p mixing. As HCF , it depends on parameters regardingthe site geometry and the point group symmetry [Arrio et al., 2000; Hunault, 2014]. Thepossible off-site transitions from the 3d orbitals of the transition metal to the 2p orbitals ofthe ligands are not taken into account in this work but the effect of the mixing with the 2p
is taken into account through β that characterizes the ionocovalency of the bond (see p. 52).
3.8 Intensities – absorption cross-section
The intensity of absorption bands is ruled by the probability of an absorption processbetween two energy states. The process can be of several natures, for example, electricdipole, electric quadrupole or magnetic dipole transitions. Table 3.2 details the nature ofthe transition depending on the spectroscopic method. In our case, we only have electricdipole and quadrupole transitions.
The intensity is proportional to the absorption cross-section which is given by Fermi’s“Golden rule”:
σ(~ω) = 4π2α~ω∑i,f
1
di|〈f |O|i〉|2δ(Ef − Ei − ~ω) (3.3)
where ~ω is the energy of incident photons, α = e2/4πε0~c the fine structure constant(α ' 7.297 · 10−3) and di the degeneracy of the initial state |i〉. The Dirac functionδ(Ef − Ei − ~ω) ensures the conservation of the energy. O is the transition operator,this Hamiltonian is related to the nature of the transitions. For example, electric dipoleand electric quadrupole transitions operators are respectively defined by: Odip = ε.r and

LFMT APPLIED TO THE CALCULATION OF XAS AND OAS 59
Oquad = ı2(ε.r)(k.r), with ε and k, the unit vectors for polarization of the light and wave
vector, respectively [Brouder, 1990].
Table 3.2 – Nature of the different transitions depending on the spectroscopic method
Spectroscopicmethod
Transition Operatornature
Initialconfiguration
Finalconfiguration
XAS K pre-edge 1s→ 3d quad 3dn 1s13dn+1
XAS K pre-edge 1s→ 4p dip 3dn 1s13dn4p1
XAS L2,3 edge 2p→ 3d dip 3dn 2p53dn+1
Optics (UV-Vis) (3d,4p)↔ (3d,4p) dip (3d,4p)n (3d,4p)n
Kα XES 2p→ 1s dip 1s1(3d,4p)n+1 2p5(3d,4p)n+1
Kβ XES 3p→ 1s dip 1s1(3d,4p)n+1 3p5(3d,4p)n+1
V2C XES* (3d,4p)→ 1s dip+quad 1s1(3d,4p)n+1 (3d,4p)n
*XES V2C: valence to core X-ray emission spectroscopy
Without coupling between the electric dipole and quadrupole terms, σ(~ω) is simply thesum of electric dipole σdip(~ω) and electric quadrupole σquad(~ω) contributions:
σ(~ω) = σdip(~ω) + σquad(~ω) (3.4)
This condition is fulfilled if the system is either centrosymmetric or if, at the same time,the system is nonmagnetic (no net magnetic moment on the absorbing ion) and one usesexclusively linear polarization [Juhin et al., 2008]. This second condition is verified for allXANES measurements. The cross-section calculation is detailed in Appendix E.4.
3.9 Transition rules in optics
The energy of photons used in optical spectroscopy is of the same order of magnitude thanthe energy difference between valence levels. Therefore, optical absorption spectroscopyis a suitable and powerful tool for the study of the chemical bond and local environment.Extensive work has been done to understand the position of energy levels, which is relatedto energy level differences and thus refers to crystal field theory, quantum mechanics andgroup theory.
However, the complexity remains in the understanding of their intensities, its computercalculation requires a fine modeling to reproduce the spectra of this very sensitive andaccurate method. Unfortunately, the interpretation is limited by the absence of a theorythat correctly simulates optical spectra. An interesting preliminary work has been done byRossano et al. [2000a] proving that optical transitions are electric dipole (and not magneticdipole or electric quadrupole) and one of the rare calculated absorption spectra has beenmade by Watanabe et al. [2009] for chromium Cr3+ in ruby (Cr3+:α-Al2O3) and alexandrite(Cr3+:BeAl2O4) .
Due to the parity selection rule (Laporte rule), the so-called “d–d transitions” aretheoretically forbidden because initial and final states have the same parity, whereas p-dor d-f transitions are allowed. However, “d–d transitions” are observed in optics because

60 Chapter 3
Laporte rule is weakened, or relaxed, by several factors. The absence of a center of symmetryallows, for example in a tetrahedral symmetry, the 3d orbitals to mix with the 4p orbitals,which possess opposite parities. Another mechanism by which Laporte-forbidden transitionsmay occur, even in cations located in centrosymmetric sites (e.g. regular octahedron),is through vibronic coupling, which involves coupling of vibrational and electronic wavefunctions with opposite parities [Ballhausen, 1962].
When the spin multiplicity of the initial and final state remains unchanged (∆S = 0),transitions are known as “spin-allowed”. As written in Table 3.1, in absence of ligand fieldpotential, for d5 and d6 ions there is no other state that has the same spin multiplicity asthe ground state (opposite to d2 (V3+), d3 (Cr3+, Mn4+), d7 (Co2+, Ni3+) and d8 (Ni2+)[Burns, 1993, p. 53]). However, for Fe2+ the degenerated ground state 5D can be split byligand field, leading to spin-allowed transitions, while the Fe3+ ground state 6S is a singlet.For example, in the Fe2+ “d–d transitions” 5T2g → 5Eg (octahedral site) or 5E → 5T2
(tetrahedral or trigonal bipyramid sites) cause the broad signals from 4000 to 19 000 cm–1.In the case of Fe3+, transitions are “spin-forbidden” and only sextuplet to quartet transitionsare possible. However, spin-orbit coupling modifies the spin selection rule by allowing themix of states of different spin multiplicities, leading to weak “spin-forbidden” transitions.For example, 6A1g →4Eg,
4A1g(G) occurring around 22 000 cm–1, but intensities for Fe3+
are generally one or two orders of magnitude weaker than the spin-allowed transitions ofFe2+ ions.
In the case of heterovalent compounds with a mix of both Fe2+ and Fe3+ ions, intenseelectronic transitions (100 times higher than d–d transitions), named intervalence chargetransfer (IVCT), can occur between two neighboring metal ions of different valency. Forexample, it commonly happens when they are located in edge-sharing coordination polyhe-dron [Burns, 1993]. For iron doped glasses, bands appear in the range: 11 000∼18 000 cm–1∗
[Amthauer and Rossman, 1984], which indicates clustering of iron ions [Ookawa et al.,1997].
In the UV range (ν > 28 000 cm–1 or λ < 360nm), the intensity is dominated by broadand intense bands, three orders of magnitude higher than the crystal field bands. Thesespin-allowed and Laporte-allowed bands are due to an electronic transition between the 2p
of the nearest-neighbor oxygen ligand and the 3d of the central transition metal ion. Theyare therefore named ligand to metal charge transfer (LMCT) or oxygen to metal chargetransfer (OMCT) in the case of oxides. The diversity of optical transitions is summarizedin Table 3.3.
∗11 000∼18 000 cm–1; 900∼550 nm; 1.4∼2.2 eV

LFMT APPLIED TO THE CALCULATION OF XAS AND OAS 61
Table 3.3 – Selection rules and intensity (ε in L.mol-1.cm–1) of different types of optical absorptionbands [Burns, 1993, p. 72]
Transitions ε Rules
Fe3+ in regular octahedral site
Fe2+ (except 5T2g→5Eg) in regularoctahedral site
<0.1 Laporte-forbidden and spin-forbiddentransitions for a centrosymmetric ion
Fe3+ in tetrahedral site
Fe2+ (except 5T2→5E) in distortedoctahedral site
1 Laporte-forbidden and spin-forbiddentransitions for a non-centrosymmetric ion
Fe2+ (5T2g→5Eg) in regular octahe-dral site
1 Laporte-forbidden but spin-allowed tran-sition for a centrosymmetric ion
Fe2+ (5T2→5E) in distortedoctahedral site
Fe2+ (5T2→5E) in tetrahedral site
10 Laporte-forbidden but spin-allowed tran-sition for a non-centrosymmetric ion
Intervalence Charge Transfer (IVCT)Fe2+ → Fe3+
100 Spin-allowed transitions between two dif-ferent Fe sites
Charge transfer O2−→Fe2+
Charge transfer O2−→Fe3+100010000
Spin- and Laporte allowed transitions ofelectrons from the oxygen ligands
3.10 Quanty – a quantum many body script language
In the case of strongly correlated electronic levels localized on the absorbing atoms,multiplet calculation has proven to be an efficient method to reproduced the XAS K pre-edge and the L2,3 edge [Thole et al., 1985], [Briois et al., 1995], [Westre et al., 1997],[Arrioet al., 2000], [de Groot, 2001], [de Groot et al., 2005], [Vankó et al., 2008], [Haverkort et al.,2012]. The first step uses atomic values from Hartree-Fock calculations of the free ion usingthe code developed by Cowan [1981].
At the beginning of this thesis, we were using Thole’s code TTMULT [Thole et al., 1985] withthe formalism of Butler [1981]. However, problems were limiting the calculations of somesystems. For low symmetries, configuration interaction for Fe3+, which has an unpairednumber of d electrons, led to complex reduced matrix elements when using the sub-programTTRCG. These complex values were not usable by TTRAC to calculated spectra. Moreover,TTRAC was not able to do transitions between level of the same electronic configurationas in optical spectra. Other technical issues, have incited us to use another multipletsoftware. For example, the impossibility to perform parallel computing in order to reducethe calculation time of complicated spectra of iron in a lower geometry than Oh and Td.All these complications were intrinsic to TTMULT development, which started in the 1980’sand was not maintained since 1997.
In the last year of my thesis, a collaboration with Maurits W. Haverkort was initiated.
62 Chapter 3
During two stays in Dresden (Germany), I learned how to use his program Quanty∗ and Ihave implemented the character table of the 32 point groups to use other geometries thanthe ones already implemented.
Quanty is a Lua based script language developed by Maurits W. Haverkort and co-workers.It allows the user to program quantum mechanical problems in second quantization, usingcreation and annihilation operators to describe and analyze quantum many-body systems.This formalism is different but can be related to the one of TTMULT. Cross-section iscalculated as Green function, and the output transitions have therefore a linewidth, whileTTMULT outputs Dirac transitions called sticks. The idea of Quanty is that the user canfocus on the model and its physical or chemical meaning while Quanty takes care of themathematics.
As all Hamiltonian, the crystal field potential is expanded on spherical harmonics. Theidea is that any potential can be written as a sum over spherical harmonics:
V (r, θ, φ) =
∞∑k=0
k∑m=−k
Ak,mCk,m(θ, φ) (3.5)
with the expansion coefficients Ak,m depending on the given symmetry and Ck,m(θ, φ) arethe renormalized spherical harmonics.
Quanty is still in its infancy, but growing fast. The code developed from the need tocalculate core level spectroscopy (X-ray absorption, resonant diffraction, ...) of correlatedtransition metal and rare earth compounds. So these areas are the best developed ordocumented, but many more examples in different fields are regularly added. During thelast year, I was able to reproduce TTMULT K pre-edge and L2,3 calculations of isotropicpowders. Promising results have been obtained with the help of Amélie Juhin, Marie-Anne Arrio and Christian Brouder concerning the calculation of RIXS spectra, but furtherdevelopments are still needed to fully implement RIXS powder formulas of Juhin et al.[2014], which are necessary to extract the HERFD-XAS spectra.
3.11 Summary
Ligand field multiplet theory is interesting to study the valence orbitals with severalspectroscopic methods. We saw that 3p–4d mixing of the transition metal orbitals increasesthe intensity of transitions, nevertheless, to interpret and simulate optical spectra we haveto quantify these intensities. In particular, the intensity of transitions as a function ofsymmetry and their energy dependence with the crystal field needs a deeper understanding.Which transitions are weak or strong? Which species are “silent” and do not absorb light?
A multi-spectroscopic approach is necessary to probe 3d orbitals and extract qualitativeand quantitative information on the structure and the local environment. With such anapproach, different electronic configuration of the same ion can be studied through differentexperimental methods, which increases the accuracy and strengthens the interpretation.
∗http://quanty.org
63
Chapter 4
Investigation of a reference set ofcrystalline compounds:determination and interpretation ofspectral signatures
We saw in the previous chapter that optical absorption spectroscopy (OAS) and X-rayabsorption spectroscopy (XAS) at Fe K pre-edge probe the localized 3d orbitals, whichallows us to extract information on the local environment of transition metals. In orderto determine the relationships between the electronic/crystallographic structure and thespectral signature, I studied, with OAS and XAS, a set of crystalline compounds in thefollowing geometries: Oh, Td, D3h/C3v and D4h. Comparison with the calculated spectralsignatures enables to interpret the experimental evolution of spectra and describes thegeometry as a function of crystal-field and 4p–3d mixing parameters. For this reason, newtheoretical developments, detailed in Appendix E, were needed.
In order to study glasses, we first have to understand what contributions can be expectedfrom the different site geometries. We saw in Section 1.3 that, in glasses, angles anddistances between iron and its ligands are distributed, which complicates the separationof the different contributions. A possible alternative to study the relationships betweenthe structure and the spectroscopic properties is to look at crystals. Differently thanin amorphous materials, there exist crystals in which iron is found to occupy only onecrystallographic site and the local environment around iron can be determined by X-raydiffraction (XRD) or EXAFS. The presence of well-defined crystallographic sites makescrystals an interesting model for the determination of structural-spectroscopic relationships,with the intention of extrapolating the results to glasses.
In the following, I will present in parallel the OAS and XAS K pre-edge spectra obtainedfrom experiments and then calculated data for selected Fe2+- and Fe3+-bearing crystallinereferences: siderite ([6,Oh]Fe3+), andradite ([6,C3i]Fe2+), gillespite ([4,D4h]Fe2+), staurolite([4,Td]Fe2+), ferriorthoclase ([4,Td]Fe3+), grandidierite ([5,C3v]Fe2+) and yoderite ([5,C3v]Fe3+).

64 Chapter 4
Table 4.1 – List of theoretical crystal field and hybridization parameters related to the pointgroup symmetries studied. The ground states for high-spin Fe2+ and Fe3+ ions are listed for theconsidered geometries, with the degeneracy given in parenthesis.
Point groupsymmetry
Crystal fieldparameters
p–d hybridizationparameters
Ground state (dim)d 6 – Fe2+ d 5–Fe3+
Oh 10Dq –
D4h
Dq
Dt Ds
–
Td 10Dq Vpd
C4v Dq
Dt Ds
Vpde
Vpda1
D3h Dµ Dν Vpd
5T2g (15) 6A1g (6)
5A1g (5) 6A1g (6)
5E (10) 6A1 (6)
5E (10) 6A1 (6)
5E ’’ (10) 6A’1 (6)
In order to extract quantitative information from the pre-edge, we performed LFMcalculations using the method developed by Thole et al. [1985] in the framework establishedby Cowan [1981] and Butler [1981]. Here, this approach is implemented in the code Quanty,in which operators are defined using second quantization, and spectra are calculated usingGreen’s functions, as explained in Section 3.10. It takes into account all the 3d–3d and1s–3d electronic Coulomb interactions, as well as the spin-orbit coupling on every openshell of the absorbing atom. For all sites, we applied a reduction factor of β = 0.6 tothe Slater integrals calculated for an isolated ion and spin-orbit coupling is consideredat 100% of its free ion value∗. Iron is considered as an isolated ion and its geometricalenvironment is treated through a parameterized crystal-field potential defined by the pointgroup symmetry of the absorbing site. These parameters, summarized in Table 4.1 werefitted in agreement with the optical spectra of the compounds. For non-centrosymmetricsites, hybridization is allowed between 3d and 4p orbitals of iron and is described by ahybridization Hamiltonian. The p–d hybridization Hamiltonian depends on the energydifference ∆ and ∆′ between the average energies of the two electronic configurations inthe initial and final states, respectively. Figure 4.1 explains the configuration interactionbetween the different electronic configurations involved in the LFM calculation. The ∆ and∆′ values were fixed to the difference between the Hartree-Fock energies of the electronicconfigurations obtained from Cowan’s code “RCN” (atomic). For Fe2+: ∆ = 12.6 eV and∆′ = 13.8 eV; for Fe3+: ∆ = 21.2 eV and ∆′ = 22.9 eV (Figure 4.1). We observe that ∆′ ofthe excited state after a 1s→ 3d transition is about 10% larger than ∆ of the initial state.
∗Slater integrals for Fe2+ free ion: F 23d,3d = 10.966 eV, F 4
3d,3d = 6.815 eV and ζ3d = 0.052 eV and for Fe3+
free ion: F 23d,3d = 12.043 eV, F 4
3d,3d = 7.535 eV and ζ3d = 0.059 eV.

INVESTIGATION OF IRON SPECTRAL SIGNATURES IN CRYSTALS 65
1s13d 74p0
1s23d54p1
1s13d64p1
1s23d64p0Initial State
Final State
Ô
Δ’ = 13.8 eV
Δ = 12.6 eV
1s13d64p0
1s23d44p1
1s13d54p1
1s23d54p0
Ô
Δ’ = 22.9 eV
Δ = 21.2 eV
Fe2+ Fe3+
Figure 4.1 – Scheme of configuration interaction for Fe2+ and Fe3+ that takes into account p–dhybridization in the framework of ligand field multiplet theory (LFMT).
Depending on the symmetry, the hybridization Hamiltonian is described by one (Td andD3h) or two (C4v) Vpd parameters. The hybridization Hamiltonian mixes d and p orbitals ofsame symmetry: t2 for Td, e′ for D3h, a1 and e for C4v. For each point group symmetry, thehybridization parameters were adjusted in order to reproduce the experimental intensity ofthe K pre-edge, which determines the respective contributions of dipole and quadrupoletransitions to the pre-edge (the sum is explained in Appendix E.4). The absolute intensitieswere calculated at T = 300K and the population of the ground-state levels is given bythe Boltzmann law (see Appendix D.1). The use of Green’s function in the calculation(see Appendix E.4) prevents from finding sticks corresponding to Dirac function at theposition of the transitions. However, “sticks” can be approximated by calculating thespectrum with a small Lorentzian broadening (LFWHM = Γ = 0.01 eV) and no Gaussianbroadening. For plotting convenience, the intensities of “sticks” were divided by 100 becausethey were too intense due to the conservation of the area by the convolution. As explainedby Arrio et al. [2000], to obtain the calculated isotropic spectrum of a powder that wecan compare with the experimental data, the sticks were convoluted by a Lorentzian line(full width half maximum, LFWHM = Γ = 2γ = 1.12 eV) and a Gaussian line (GFWHM=2√
2 ln 2σ = 0.35 eV), which respectively account for the 1s core-hole lifetime of Fe andfor the instrumental resolution (see Appendices D.2 and E.4). Finally, the transitions arenormalized by the edge jump at the Fe K edge, calculated for Fe on atom as 3.3 · 10−4Å2
[Gullikson, 2010]. Hence, the calculated spectra can be directly compared to the normalizedexperimental ones. Concerning the calculated optical spectra, they were convoluted by aLorentzian line with LFWHM = 0.01 eV (80 cm–1) and a Gaussian line with GFWHM from0.09 eV (726 cm–1) to 0.15 eV (1210 eV) in order to be compared with experimental opticalspectra.
4.1 The case of Oh – octahedral [6]Fe2+ in siderite
Siderite has a simple chemical formula FeCO3 with 100% of Fe2+/Fetot. Fe2+ ions occupythe center of a regular Oh octahedral site (See Appendix A for more details). In thisparticular case, there is only one crystal field parameter 10Dq and no 3d–4p hybridizationparameter Vpd.
4.1.1 XAS
Figure 4.2 shows the experimental Fe K pre-edge XAS spectrum of siderite. Afterremoving the main edge using an arctangent fit, the pre-edge intensity is only 2% of

66 Chapter 4
the main edge, which is consistent with pure electric quadrupole transitions as expectedin Oh. Quanty was used to calculated the spectrum (quadrupole contribution only),parameters were adjusted to best match the experimental date: 10Dq = 0.98 eV (7900 cm–1)and β = 0.6 (corresponding to Racah parameters B = 0.0879 eV = 709.2 cm–1 andC = 0.3245 eV = 2617.7 cm–1).
0.05
0.04
0.03
0.02
0.01
0.00
Nor
mal
ized
abs
orpt
ion
7116711471127110Energy (eV)
experiment extracted pre-edge calculation
4T1g(F)
4T2g(F)
4T1g(P)
Figure 4.2 – Experimental Fe K pre-edge XAS of siderite before (black dashed line) and after(black solid line) edge subtraction, and the calculated pre-edge (red).
In comparison with the experiment, the ratio of intensities between the first and thesecond peak is slightly different. The tail of the experimental pre-edge is lower thanthe calculated one, which is probably due to the pre-edge extraction. LFM calculationperformed in this thesis does not accurately reproduce the main edge, which is due totransitions to delocalized levels∗. Nevertheless, a good overall agreement is found betweenmultiplet calculations and the experimental data.
From the calculation, the ground state is the high-spin level 5T2g(D), which is conformedto Hund’s rule. 10Dq = 0.98 eV is close to the 10Dq value deduced from OAS experiment inFe-bearing minerals with Oh geometry [Burns, 1993, p. 229-230]. The K pre-edge intensityonly comes from the weak electric quadrupole transitions 1s → 3d, as confirmed by ourcalculation in the absence of p–d mixing. By analogy with the d7 configuration (withoutthe core-hole), the three peaks can be attributed to the transitions 5T2g(D)→4T1g(F ),5T2g(D)→4T2g(F ) and 5T2g(D)→4T1g(P ) because the 1s core-hole has a weak influence onthe 3d [Calas and Petiau, 1983a; Westre et al., 1997].
4.1.2 Optical absorption spectroscopy
For centrosymmetric geometries such as Oh, the difficulty of calculating optical spectraremains in the fact that optical electric dipole transitions between d levels are theoretically
∗For the K edge XANES region, a single particle approach, such as DFT, is more adapted.

INVESTIGATION OF IRON SPECTRAL SIGNATURES IN CRYSTALS 67
forbidden. Due to the presence of an inversion center, the p and d orbitals cannot mixbecause they are not of the same parity: p orbitals are ungerade or odd (e.g. eu, t2u), whiled orbitals are gerade or even (e.g. eg, t2g).
To solve this problem of forbidden transitions, a small hybridization potential has beenadded in order to mix the 3d orbitals with a small fraction of 4p orbitals, allowing thecomputation of transition intensities that are not zero. The C4v potential was used with Vepd= Va1
pd = 0.1 eV, I have verified that the energies of the electronic states remain unchanged.From a physical point of view, the loss of the inversion center can be explained by twoprocesses: the presence of a static distortion, which breaks the regularity of the geometry,or vibrations that are dynamic effects, which temporarily break the geometry.
Experimental and calculated OAS spectra are compared in Figure 4.3. The experimentalspectrum is the combination of a transmission measurement from the GIA gem database∗
(solid line) and a reflectance measurement from this study (dashed line). The spin-forbiddensignals obtained around 15 000 cm–1 and 20 000 cm–1 are 100 times weaker than the spin-allowed transition 5T2g(D)→5Eg(D), as expected by the transitions rules (see Section 3.9,Table 3.3). However, as it can be noticed on the experimental spectrum, the spin-allowedtransition is split in two contributions, which suggests that the Fe site is distorted. ForFe2+ (H2O)6, Burns [1993] explained this splitting by a dynamic Jahn-Teller effect. But alower geometry can indeed explain the splitting of the 5T2g(D)→5Eg(D) transition.
5000 10000 15000 20000 250000
0.25
0.5
0.75
1
Wavenumber (cm−1)
ε (c
m−1 .L
.mol−1 )
experimentcalculation
Figure 4.3 – Experimental optical absorption spectrum (black solid and dashed line) of siderite,and the LFM calculated spectrum (red).
4.1.3 Effect of the different parameters
The purpose of this section is to understand the impact on spectra of the differentphysical parameters considered in the LFM calculation.
4.1.3.1 Hybridization
In order to calculate optical spectra caused by electric dipole transition, a p–d hybridiza-tion was considered in order to get a non-null intensity in the calculated spectra. In the
∗Gemological Institute of America, collection number 35506

68 Chapter 4
case of centrosymmetric geometry such as Oh, a hybridization Hamiltonian of the C4v
sub-group was considered and the p–d mixing was quantified using the parameters Vepd andVa1pd. Figure 4.4 shows the effect of Vepd and Va1
pd on the XAS and optical absorption spectra.
One can note that a slight background growing with increasing wavenumber is visibleon the calculated spectrum. This artifact is due to the use of Green’s functions, sincecalculated transitions are not discrete values but a Lorentzian function with an intrinsiclinewidth. In this case, this background signal is due to the tail of fully authorized 3d→ 4p
electric dipole transitions present above 12 eV (∼ ∆) with an intensity, that is five orders ofmagnitude higher than Laporte-forbidden optical transitions.
If Vpd is smaller than a threshold of around 1 eV, the evolution of intensity is proportionalto the square value of Vpd and the energy positions of transitions are not modified. Abovethis value of 1 eV, the shape of spectra is modified because the mixing between d and plevels results in new multiplet levels with modified energies.
Regarding the iron K pre-edge XAS, if Vpd < 1 eV the pre-edge intensity of a centrosym-metric site is not modified, and the dipole contribution induced by this small hybridizationis negligible when compared to the electric quadrupole intensity. For Vepd = Va1
pd = 0.1 eV,the electric dipole area only represents 1.9% of the total area. Calculations give the numberof p electrons Np = 1.7 · 10−4, which is small compared to the number of d electrons,Np = 5.9998. Therefore, the p-character of the ground state, defined by Np/(Np+Nd), is2.8 · 10−5.
0
10
20
30
40
50
60
70
80
0 5 10 15 20 25
Mol
ar a
bsor
ptio
n co
effic
ient
ε (L
.mol
-1.c
m-1
)
E (x103 cm-1)
Vpda1 = Vpd
e = 0.5 eVaVpd
1 = Vpde = 1 eV
Vpda1 = Vpd
e = 2 eV
Vpda1 = 0.5 eV, Vpd
e = 0 eV×0.25 ×0.5
×1
Vpda1 = 0 eV, Vpd
e = 0.5 eV
Figure 4.4 – Effect of Vpd on the calculated optical spectra of Fe2+ in Oh.

INVESTIGATION OF IRON SPECTRAL SIGNATURES IN CRYSTALS 69
4.1.3.2 Crystal field
In the case of Oh geometry there is only one crystal-field parameter 10Dq, therefore it issimple to represent the effect on spectra as a function of this parameter using a Tanabe-Sugano diagram. Thanks to the p–d mixing, it is now possible to calculate both the positionsand the intensities of optical transitions. A third dimension (color bar) representing theintensity of optical transitions can be added to the conventional Tanabe-Sugano diagramcalculated without spin-orbit coupling and hybridization.
Effect of 10Dq on optical bands
Figure 4.5 (left) is a 3D map composed of multiple optical spectra with 10Dq varyingfrom 0 to 1.4 eV that has been calculated with 100% of the spin-orbit coupling value anda hybridization parameters of 0.5 eV. This color map overlaid with the classical Tanabe-Sugano diagram (black lines) allows the attribution of multiplet levels. Each absorptionband matches with a transition given by the Tanabe-Sugano diagram. Additional bandsrelated to singlet states (not represented on the Tanabe-Sugano diagram) are also visible onthe 3D map. These levels with a spin multiplicity of 1, give optical bands due to spin-orbitcoupling when they are nearby triplet or quintet levels.
The calculated optical spectra for three values of 10Dq, centered on the best 10Dq valuefound in the previous section are shown in Figure 4.5 (right). By increasing 10Dq by 10%,the spin allowed transition is shifted by 10% to higher energies, accompanied by an 10%increase of the molar absorption coefficient.
!"
!#
!$
!%
!&
!'
!" !"(' !# !#(' !$
)*+,-./.0,!1,1*23!4156
#"784156
9: ;:
'!
%"
%#
%$
%%
%!
%#%$
!"
!'
!#"
!#'
!$"
!$'
!%"
!%'
!&"
<+=1,>?@1*!4A#"%! B?
C#6
0
1
0
10
20
30
40
50
5 10 15
Mol
ar a
bsor
ptio
n co
effic
ient
ε (L
.mol
-1.c
m-1
)
E (x103 cm-1)
10Dq = 0.88 eV10Dq = 0.98 eV10Dq = 1.08 eV
Figure 4.5 – (Left) Calculated Tanabe-Sugano diagram (black lines) of Fe2+ in Oh without spin-orbit coupling, singlet levels are not shown, except the low-spin state 1A1g that becomes the groundstate at high 10Dq. The color map shows the respective calculated OAS spectra with spin-orbitcoupling and a small (0.5 eV) hybridization parameter. (Right) Calculated optical absorption bandsfor the three values of 10Dq corresponding to the three lines of the left figure.
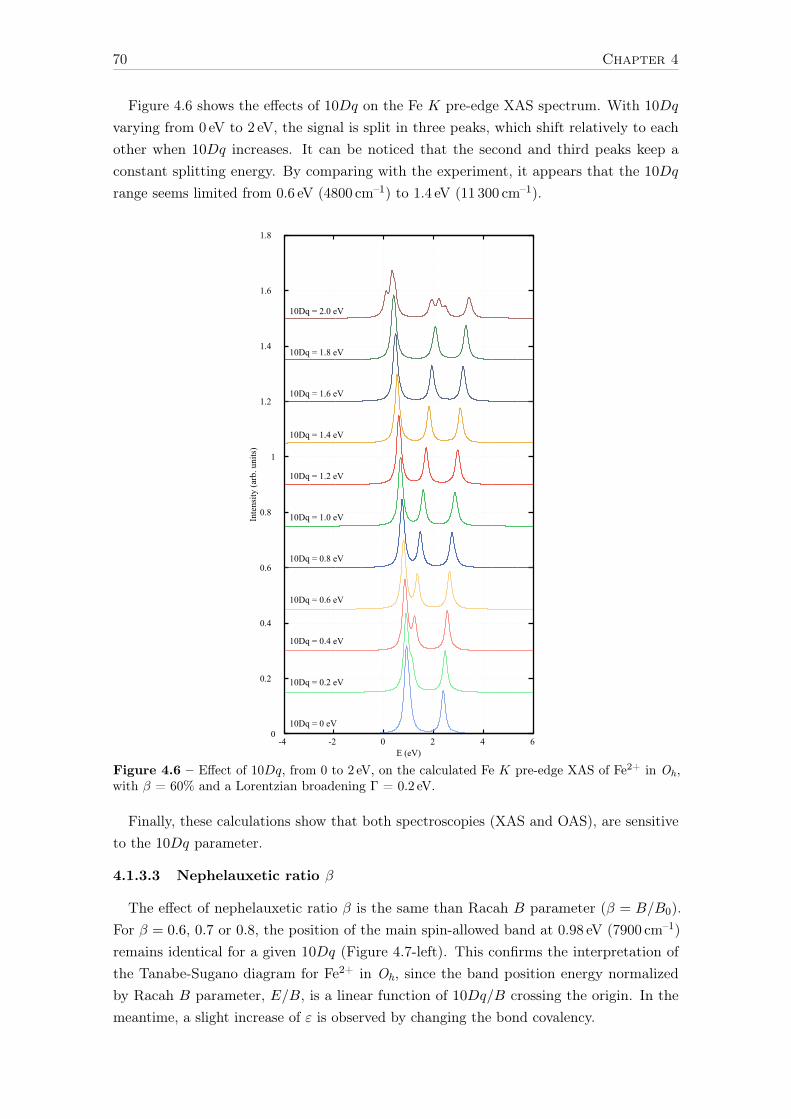
70 Chapter 4
Figure 4.6 shows the effects of 10Dq on the Fe K pre-edge XAS spectrum. With 10Dq
varying from 0 eV to 2 eV, the signal is split in three peaks, which shift relatively to eachother when 10Dq increases. It can be noticed that the second and third peaks keep aconstant splitting energy. By comparing with the experiment, it appears that the 10Dq
range seems limited from 0.6 eV (4800 cm–1) to 1.4 eV (11 300 cm–1).
0
0.2
0.4
0.6
0.8
1
1.2
1.4
1.6
1.8
10Dq = 0 eV
10Dq = 0.4 eV
10Dq = 0.6 eV
10Dq = 0.8 eV
10Dq = 1.0 eV
10Dq = 1.4 eV
10Dq = 1.6 eV
10Dq = 1.8 eV
10Dq = 2.0 eV
10Dq = 1.2 eV
10Dq = 0.2 eV
-4 -2 0 2 4 6
Inte
nsity
(arb
. uni
ts)
E (eV)
Figure 4.6 – Effect of 10Dq, from 0 to 2 eV, on the calculated Fe K pre-edge XAS of Fe2+ in Oh,with β = 60% and a Lorentzian broadening Γ = 0.2 eV.
Finally, these calculations show that both spectroscopies (XAS and OAS), are sensitiveto the 10Dq parameter.
4.1.3.3 Nephelauxetic ratio β
The effect of nephelauxetic ratio β is the same than Racah B parameter (β = B/B0).For β = 0.6, 0.7 or 0.8, the position of the main spin-allowed band at 0.98 eV (7900 cm–1)remains identical for a given 10Dq (Figure 4.7-left). This confirms the interpretation ofthe Tanabe-Sugano diagram for Fe2+ in Oh, since the band position energy normalizedby Racah B parameter, E/B, is a linear function of 10Dq/B crossing the origin. In themeantime, a slight increase of ε is observed by changing the bond covalency.

INVESTIGATION OF IRON SPECTRAL SIGNATURES IN CRYSTALS 71
For β = 0.6, 0.7 or 0.8, modifications of the XAS spectra are noticed on the shouldervisible around 7115 eV (Figure 4.7). The energy splitting remains constant between thefirst and second peak, while the third peak becomes more separated due to a strongerhigh-energy shift.
0
10
20
30
40
50
5 10 15
Mol
ar a
bsor
ptio
n co
effic
ient
ε (L
.mol
-1.c
m-1
)
E (x103 cm-1)
β = 0.6 β = 0.7β = 0.8
0.01
0
0.02
7108 7110 7112 7114 7116
Inte
nsity
(nor
mal
ized
abs
orpt
ion
to th
e m
ain
edge
)
E (eV)
total XAS K pre-edge β = 0.6 β = 0.7β = 0.8
Figure 4.7 – Effect of nephelauxetic ratio β on the calculated OAS (left) and XAS (right) spectrafor Fe2+ in Oh.
4.1.3.4 Spin-orbit coupling on the 3d levels
The spin-orbit coupling slightly splits the levels by removing part of the ground statedegeneracy. This energy splitting is about 0.05 eV which is of the same order of magnitudethan the spin-orbit coupling value (ζ3d = 0.052 eV for Fe2+).
As it can be noticed in Figure 4.8-right, spin-orbit coupling slightly splits the XAStransitions but it has no effect on the convoluted pre-edge. The low-energy resolution ofXAS leads to a signal broadening about 1 eV, which is too large to observe the spin-orbiteffect on the 3d orbitals. Therefore, no change is observed in the relative intensities of thebroadened calculated XAS spectrum.
On the contrary, spin-orbit coupling change the shape of optical bands (Figure 4.8-left)because the energy resolution of optical spectroscopy is of the same order of magnitudethat spin-orbit coupling.
Because spin-orbit coupling does not depend on geometry, the same conclusion can bedone whatever the symmetry. Therefore, spin-orbit coupling on the 3d electron can bedismissed for XAS calculations at K pre-edge but has to be considered for OAS in theUV-Vis-NIR range.

72 Chapter 4
0
100
200
300
400
500
600
700
5 10 15
Mol
ar a
bsor
ptio
n co
effic
ient
ε (L
.mol
-1.c
m-1
)
Wavenumber (x103 cm-1 )
0% SO20% SO40% SO60% SO80% SO
100 % SO
0
0.01
0.02
7108 7110 7112 7114 7116Inte
nsity
(nor
mal
ized
abs
orpt
ion
to th
e m
ain
edge
)
E (eV)
K pre-edge 0% SOK pre-edge 100% SO
Figure 4.8 – Effect of spin-orbit coupling ζ3d on the calculated OAS (Left) and K pre-edge XASspectra (Right) for Fe2+ in Oh.
4.2 The case of Oh – octahedral [6]Fe3+ in andradite
Andradite garnet (Ca3Fe2Si3O12) is a silicate mineral with only ferric iron (d5) in thecenter of a quasi-regular octahedron (all Fe–O distances are equals but the angles are notexactly 90°, see Appendix A for more details). The site geometry is C3i (S6), and will beapproximated to Oh in this study.
4.2.1 XAS
Figure 4.9 shows the experimental Fe K pre-edge XAS spectrum of andradite composedof two bands. After an arctangent fit of the main edge, the pre-edge intensity is only 3% ofthe main edge, which is consistent with pure electric quadrupole transitions. Parameters ofthe calculation were adjusted to best match the experimental spectrum: 10Dq = 1.5 eV(12 100 cm–1) and β = 0.6.
A good overall agreement has been found between multiplet calculations and experiment.The ground state is the high-spin level 6A1g(S), which is conformed to Hund’s rule and thevalue of 10Dq (1.5 eV; 12 100 cm–1) is consistent with the experimental value of andraditefrom OAS [Burns, 1993, p. 224]. By analogy with the d6 configuration, the two peaksat 7113.8 eV and 7115.3 eV can be attributed to the transitions 6A1g(S)→5T2g(D) and6A1g(S)→5Eg(D), respectively [Westre et al., 1997]. In this particular case, the energydifference between the two peaks is equal to 10Dq and does not depend on β [Lever, 1984,p. 126].
The experimental ratio between both intensities is 1.05:1, while the calculated ratio is1.5:1. The first peak represents 0.6 of the total area, which is equal to the value found formore regular octahedral systems [Westre et al., 1997]. The intensity difference, betweenexperimental and calculated spectra, is probably related to some slight differences in the

INVESTIGATION OF IRON SPECTRAL SIGNATURES IN CRYSTALS 73
site geometry, which is not a pure Oh but rather a C3i symmetry. Further adjustment trialsof the calculation parameters (10Dq, β) did not improve significantly the relative intensitybetween both peaks. The point group symmetry has to be lowered to take into account thereal symmetry of the crystal.
0.06
0.05
0.04
0.03
0.02
0.01
0.00
Nor
mal
ized
abs
orpt
ion
(in %
mai
n ed
ge)
711771167115711471137112Energy (eV)
experiment extracted pre-edge calculation
5T2g 5Eg
Figure 4.9 – Experimental Fe K pre-edge XAS of andradite before (black dashed line) and after(black solid line) edge subtraction, and the calculated pre-edge (red).
4.2.2 Optical absorption spectroscopy
Compared to the previous section, where C4v was used for the hybridization Hamiltonianin siderite, the optical intensities were calculated here using a C3 hybridization potential∗
with a small Vpd of 1 eV. C3 is sub-group of both Oh and C3i without inversion center thatconserves the C3 axis characteristic of C3i Fe3+ site in andradite.
Figure 4.10 shows both the experimental spectrum and the calculated one for β = 0.62
and 10Dq = 1.6 eV. It can be noticed that the calculated intensities obtained for the bandaround 12 000 cm–1 and 17 000 cm–1 are stronger than the experimental intensities. This isdue to the choice of the sub-group used for hybridization, which is particularly difficult forcentrosymmetric point groups such as Oh because the geometry has to be lowered into anon-centrosymmetric but several possibilities are available.
The signal around 23 000 cm–1 is too broad meaning that the experimental broadening(GFWHM = 0.15) used in the calculation has been overestimated.
∗The different coefficients for p–d mixing in C3 can be further optimized to improve the relative intensities.

74 Chapter 4
1.5
1.0
0.5
0.0
Mol
ar a
bsor
ptio
n co
effici
ent
of F
e3+ (
L.m
ol-1.c
m-1)
25000200001500010000
wavenumber (cm-1)
calculated experimental
4T1g(G) 4T2g(G)4A1g,
4Eg(G)
4T2g(D)
Figure 4.10 – Calculated and experimental (transmission) optical spectra of andradite. Thecalculated spectrum is done for β = 0.62, 10Dq = 1.6 eV and Gaussian broadening GFWHM = 0.15
4.2.3 Effect of the different parameters
The conclusions on the effects of hybridization on spectra of Fe2+ in Oh symmetry aretransferable to the present case of Fe3+. Below a threshold of about Vpd = 1 eV, there is noeffect on the band positions and the band intensities increase with the square value of Vpd.
4.2.3.1 Crystal field
Figure 4.11 shows both the experimental spectrum and the calculated one for β =
0.62 and an average 10Dq of 1.6 eV without Gaussian broadening. Instead of using aspectral broadening for the optical absorption spectrum, a Gaussian distribution has beenapplied on 10Dq with a FWHM of 0.3 eV. The use of a 10Dq distribution is a method toreproduce the broad value of the two ligand field dependent transitions 6A1g(S)→4T1g(G)
and 6A1g(S)→4T2g(G) around 12 000 cm–1 and 17 000 cm–1. As opposed to the calculatedspectrum of Figure 4.10, with a 10Dq distribution there is no strong broadening of theligand field independent transitions 6A1g(S)→[4A1g, Eg(G)] and 6A1g(S)→4T2g(D) around23 000 cm–1 and 26 000 cm–1.
1.4
1.2
1.0
0.8
0.6
0.4
0.2
0.0
Mol
ar a
bsor
ptio
n co
effici
ent
of F
e3+ (
L.m
ol-1.c
m-1)
25000200001500010000
wavenumber (cm-1)
calculated experimental
4T1g(G) 4T2g(G)4A1g,
4Eg(G)
4T2g(D)
Figure 4.11 – Calculated and experimental (transmission) optical spectra of andradite. Thecalculated spectra was done for β = 0.62, an average 10Dq = 1.6 eV and no gaussian broadening.However, a Gaussian distribution has been applied on 10Dq with a FWHM of 0.3 eV.

INVESTIGATION OF IRON SPECTRAL SIGNATURES IN CRYSTALS 75
Figure 4.12-left shows the 3D map of optical spectra using a C3 hybridization overlaidby the classical Tanabe-Sugano diagram of Fe3+ in Oh. Figure 4.12-right shows three OASspectra for 10Dq values of 1.4, 1.5 and 1.6 eV marked on the 3D map. We see clearly thatthe two first bands are sensitive to Dq and the last three bands are crystal field independent(intensity and position).
0
1
2
3
4
5
0 0.5 1 1.5 2
Tra
nsiti
on e
nerg
y (e
V)
10Dq(eV)
0
5
10
15
20
25
30
35
40
Wav
enum
ber
(x10
3 cm
-1)
6S
4G
4P4D
4F
0
10.06
0.05
0.04
0.03
0.02
0.01
0.00Mol
ar a
bsor
ptio
n co
effici
ent
(L.m
ol-1.c
m-1)
25000200001500010000wavenumber (cm-1)
10Dq = 1.4 eV 10Dq = 1.5 eV 10Dq = 1.6 eV
Figure 4.12 – (Left) Calculated Tanabe-Sugano diagram (black lines) of Fe3+ in Oh without spin-orbit coupling, doublet levels are not shown. The color map shows the respective calculated OASspectra with spin-orbit coupling and a small (1 eV) hybridization parameter. (Right) Calculatedoptical absorption bands for the three values of 10Dq corresponding to the three lines of the leftfigure.
When 10Dq increases the 4T1g(G) and 4T2g(G) bands shift in position to lower energyvalue. In the meantime the intensity of 4T1g(G) is kept unchanged and the intensity of4T2g(G) increases with 10Dq. As we have seen in the previous section for siderite, opticalabsorption is sensitive to site geometry through transition intensity. Therefore, the relativeintensities of the different optical transitions will depend on the non-centrosymmetricsub-group chosen to get intensity in the OAS spectrum (here it is C3 with Vpd = 1 eV).Nevertheless, the present results are already satisfying but the use of a crystal fieldHamiltonian in C3i point group could eventually reproduce the splitting of the [4A1g,4Eg(G)]level.
Figure 4.13 shows the effects of 10Dq on the Fe K pre-edge XAS. For 10Dq varyingfrom 0 eV to 2 eV, the two levels 5T2g and 5Eg are split by an energy of exactly 10Dq, asexpected by theory for a d6 ion [Lever, 1984].

76 Chapter 4
0
0.5
1
1.5
2
2.5
3
-4 -2 0 2 4 6
Inte
nsity
(arb
. uni
ts)
E (eV)
10Dq = 0 eV
10Dq = 0.4 eV
10Dq = 0.6 eV
10Dq = 0.8 eV
10Dq = 1.0 eV
10Dq = 1.4 eV
10Dq = 1.6 eV
10Dq = 1.8 eV
10Dq = 2.0 eV
10Dq = 1.2 eV
10Dq = 0.2 eV
Figure 4.13 – Effect of 10Dq, from 0 to 2 eV, on the calculated Fe K pre-edge XAS of Fe3+ inOh, with β = 60% and a Lorentzian broadening Γ = 0.2 eV.
Finally, these calculations show that both spectroscopies (XAS and OAS), are sensitiveto the 10Dq parameter.
4.2.3.2 Nephelauxetic ratio β
0.08
0.06
0.04
0.02
0.00
Mol
ar a
bsor
ptio
n co
eci
ent
(L.m
ol-1.c
m-1)
3000025000200001500010000
wavenumber (cm-1)
β = 0.60 β = 0.62 β = 0.64
0
0.01
0.02
0.03
0.04
7108 7110 7112 7114 7116Inte
nsity
(nor
mal
ized
abs
orpt
ion
to th
e m
ain
edge
)
E (eV)
β = 0.60β = 0.62β = 0.64
Figure 4.14 – Effect of nephelauxetic ratio β on the calculated OAS (Left) and XAS (Right)spectra for Fe3+ in Oh.
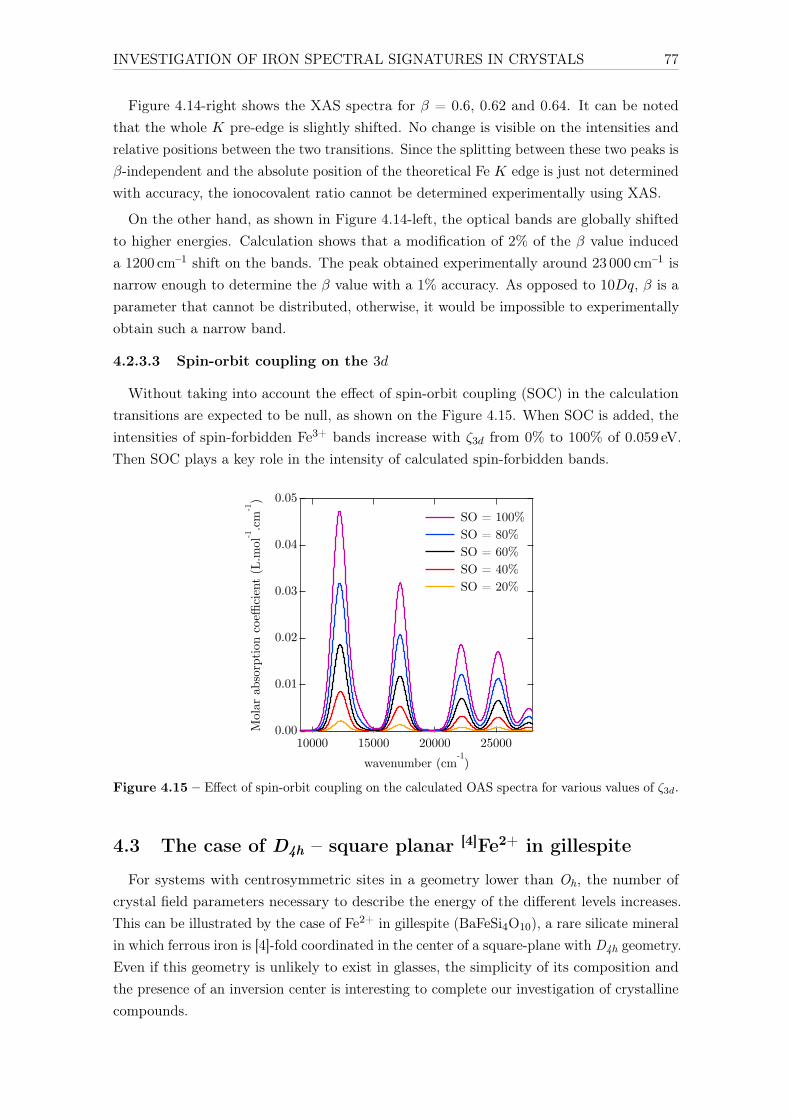
INVESTIGATION OF IRON SPECTRAL SIGNATURES IN CRYSTALS 77
Figure 4.14-right shows the XAS spectra for β = 0.6, 0.62 and 0.64. It can be notedthat the whole K pre-edge is slightly shifted. No change is visible on the intensities andrelative positions between the two transitions. Since the splitting between these two peaks isβ-independent and the absolute position of the theoretical Fe K edge is just not determinedwith accuracy, the ionocovalent ratio cannot be determined experimentally using XAS.
On the other hand, as shown in Figure 4.14-left, the optical bands are globally shiftedto higher energies. Calculation shows that a modification of 2% of the β value induceda 1200 cm–1 shift on the bands. The peak obtained experimentally around 23 000 cm–1 isnarrow enough to determine the β value with a 1% accuracy. As opposed to 10Dq, β is aparameter that cannot be distributed, otherwise, it would be impossible to experimentallyobtain such a narrow band.
4.2.3.3 Spin-orbit coupling on the 3d
Without taking into account the effect of spin-orbit coupling (SOC) in the calculationtransitions are expected to be null, as shown on the Figure 4.15. When SOC is added, theintensities of spin-forbidden Fe3+ bands increase with ζ3d from 0% to 100% of 0.059 eV.Then SOC plays a key role in the intensity of calculated spin-forbidden bands.
0.05
0.04
0.03
0.02
0.01
0.00Mol
ar a
bsor
ptio
n co
effici
ent
(L.m
ol-1.c
m-1)
25000200001500010000wavenumber (cm-1)
SO = 100% SO = 80% SO = 60% SO = 40% SO = 20%
Figure 4.15 – Effect of spin-orbit coupling on the calculated OAS spectra for various values of ζ3d.
4.3 The case of D4h – square planar [4]Fe2+ in gillespite
For systems with centrosymmetric sites in a geometry lower than Oh, the number ofcrystal field parameters necessary to describe the energy of the different levels increases.This can be illustrated by the case of Fe2+ in gillespite (BaFeSi4O10), a rare silicate mineralin which ferrous iron is [4]-fold coordinated in the center of a square-plane with D4h geometry.Even if this geometry is unlikely to exist in glasses, the simplicity of its composition andthe presence of an inversion center is interesting to complete our investigation of crystallinecompounds.

78 Chapter 4
4.3.1 Model used for the calculation of gillespite
Experimentally, resolved optical transitions are observed for gillespite (ε ∼ 5 L.mol−1.cm–1
around 20 000 cm–1), therefore 3d orbitals are necessarily mixed with p orbitals from theneighboring oxygens and/or from the transition metal itself. Vibrations could induce adynamic distortion that generates hybridization. In the present case, we considered the off-plan vibration mode of the central Fe2+ ion along the C4 axis around the centrosymmetricequilibrium position, leading to lower the site geometry to C4v point group (see Figure 4.16).Therefore, a small hybridization of 0.5 eV for both mixing parameters (Vepd and Va1
pd) hasbeen used to allow the calculation of optical transitions in D4h.
C4vD4h
C4 axis C4 axis
Figure 4.16 – Square planar [4]-fold geometry and its off-plan distortion along the C4 axis.
Three crystal field parameters: Dq, Ds and Dt are required to describe the energy ofspectroscopic terms. In the case of a square-planar geometry, the ground state is estimatedto be 5A1g using simple point-charge model (see Figure 3.2).
The ground state of Fe2+ is the same for OAS and XAS, it is therefore described bythe same set of parameters. Because the final state of OAS belongs to the same electronconfiguration (3d, 4p)n, no extra parameters are needed for OAS calculation. On thecontrary, the final states of XAS are described by a different electron configuration within1s1(3d, 4p)n+1 that can be described by a second set of parameters.
In order to get a satisfying calculation of the gillespite XAS spectrum the use of two setsof parameters for the initial and final states of XAS was needed. This can be explained bythe presence of the core-hole in the excited state that modifies the electronic structure of thetransition metal. In comparison with Westre et al. [1997], where the authors systematicallyused ∼80% of the ground state values to describe the XAS excited state, I had to releasethis constraint to adjust the calculation parameters to match with both spectroscopic datasets. For Fe2+ in D4h geometry, the number of parameters of the calculation is one ofthe limits of this semi-empirical ligand field multiplet method; especially, when dissimilarsets of parameters between the ground and excited states are used, the number of fittingparameters is doubled. The risk of over-parameterizing could lead to the possibility foran experimental spectrum to be reproduced by several sets of parameters. However, thecareful attention to reproduce the experimental data from different spectroscopies with acompatible set of parameters gives confidence in our model.
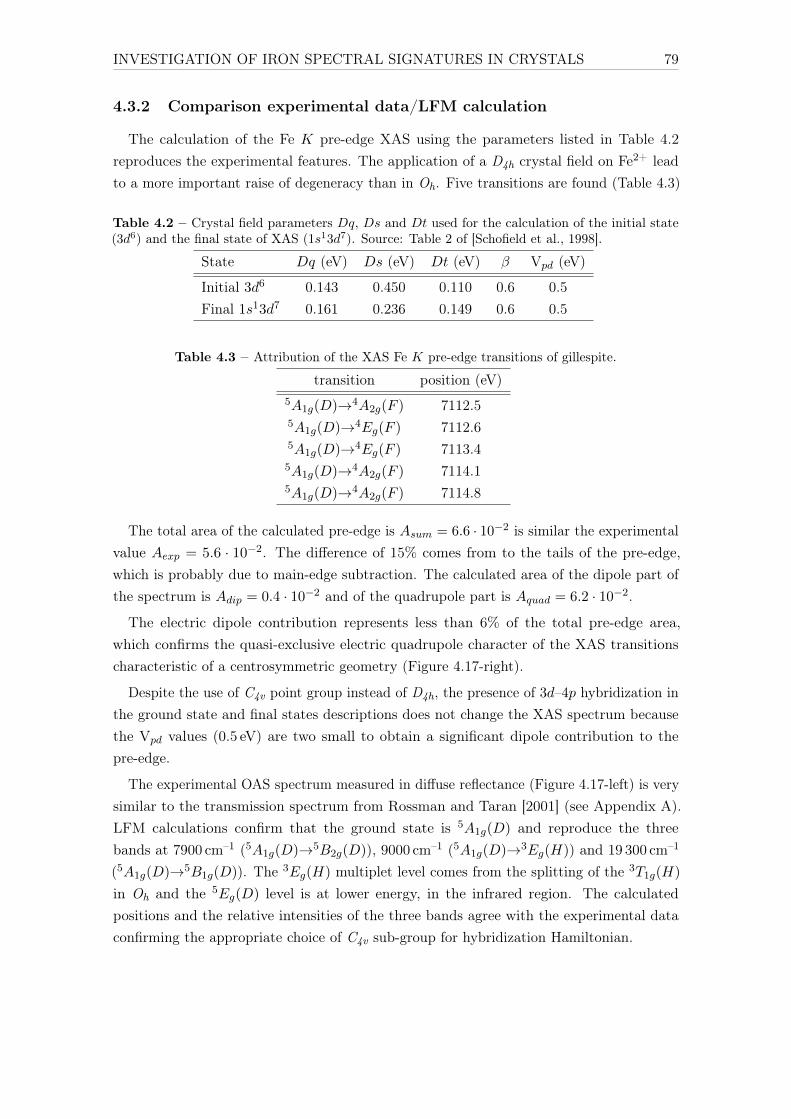
INVESTIGATION OF IRON SPECTRAL SIGNATURES IN CRYSTALS 79
4.3.2 Comparison experimental data/LFM calculation
The calculation of the Fe K pre-edge XAS using the parameters listed in Table 4.2reproduces the experimental features. The application of a D4h crystal field on Fe2+ leadto a more important raise of degeneracy than in Oh. Five transitions are found (Table 4.3)
Table 4.2 – Crystal field parameters Dq, Ds and Dt used for the calculation of the initial state(3d6) and the final state of XAS (1s13d7). Source: Table 2 of [Schofield et al., 1998].
State Dq (eV) Ds (eV) Dt (eV) β Vpd (eV)
Initial 3d6 0.143 0.450 0.110 0.6 0.5Final 1s13d7 0.161 0.236 0.149 0.6 0.5
Table 4.3 – Attribution of the XAS Fe K pre-edge transitions of gillespite.
transition position (eV)5A1g(D)→4A2g(F ) 7112.55A1g(D)→4Eg(F ) 7112.65A1g(D)→4Eg(F ) 7113.45A1g(D)→4A2g(F ) 7114.15A1g(D)→4A2g(F ) 7114.8
The total area of the calculated pre-edge is Asum = 6.6 · 10−2 is similar the experimentalvalue Aexp = 5.6 · 10−2. The difference of 15% comes from to the tails of the pre-edge,which is probably due to main-edge subtraction. The calculated area of the dipole part ofthe spectrum is Adip = 0.4 · 10−2 and of the quadrupole part is Aquad = 6.2 · 10−2.
The electric dipole contribution represents less than 6% of the total pre-edge area,which confirms the quasi-exclusive electric quadrupole character of the XAS transitionscharacteristic of a centrosymmetric geometry (Figure 4.17-right).
Despite the use of C4v point group instead of D4h, the presence of 3d–4p hybridization inthe ground state and final states descriptions does not change the XAS spectrum becausethe Vpd values (0.5 eV) are two small to obtain a significant dipole contribution to thepre-edge.
The experimental OAS spectrum measured in diffuse reflectance (Figure 4.17-left) is verysimilar to the transmission spectrum from Rossman and Taran [2001] (see Appendix A).LFM calculations confirm that the ground state is 5A1g(D) and reproduce the threebands at 7900 cm–1 (5A1g(D)→5B2g(D)), 9000 cm–1 (5A1g(D)→3Eg(H)) and 19 300 cm–1
(5A1g(D)→5B1g(D)). The 3Eg(H) multiplet level comes from the splitting of the 3T1g(H)
in Oh and the 5Eg(D) level is at lower energy, in the infrared region. The calculatedpositions and the relative intensities of the three bands agree with the experimental dataconfirming the appropriate choice of C4v sub-group for hybridization Hamiltonian.

80 Chapter 4
0.4
0.6
0.8
1
1.2
1.4
1.6
1.8
2 1 1.5 2 2.5 3
Abs
orpt
ion
(arb
. u.)
Energy (eV)
CalculationExperiment
14000120001000080006000 22000200001800016000 24000
wavenumber (cm-1)
0.020
0.015
0.010
0.005
0.000
Nor
mal
ized
abs
orpt
ion
7116711471127110Energy (eV)
extracted pre-edge calculation calc quad calc dip
4A2g(F)
4Eg(F)
4Eg(F)4A2g(F)
4A2g(F)
Figure 4.17 – (Left) Calculated and experimental (diffuse reflectance) OAS of gillespite. (Right)Experimental K pre-edge XAS spectrum of gillespite and calculated spectrum of Fe2+ in D4h. Thecalculated spectrum is the sum of the electric quadrupole and the electric dipole contributions.
4.4 The case of Td – tetrahedral [4]Fe2+ in staurolite
Without inversion center, 3d and 4p orbitals can mix, therefore an intense electric dipolecontribution participates in the K pre-edge intensity, in addition to the weak electricquadrupole transitions. As detailed in the previous chapter, electric dipole transitionswithin these multiplet levels are allowed and explain the greater optical intensity of non-centrosymmetric sites as compared to centrosymmetric sites. Here, we will study the case ofFe2+ in staurolite showing a non-regular tetrahedral site (see Appendix A for more details).In the following, the iron site will be approximated to a regular tetrahedron, characterizedby the Td point group symmetry, in which there is one crystal field parameter 10Dq∗ andone p–d mixing parameter Vpd.
4.4.1 Comparison of experimental spectra/LFM calculation
Figure 4.18-right shows the comparison between calculated and experimental XAS spectra.The parameters used for the calculation are listed in Table 4.4. The Fe K pre-edge iscomposed of four peaks at 7111.6 eV, 7112.4 eV, 7113 eV and 7114 eV related to the transitions5E(D)→4A2(F ), 5E(D)→4T2(F ), 5E(D)→4T1(F ) and 5E(D)→4T1(P ), respectively.
The total area of the calculated pre-edge is Asum = 29.4 · 10−2, this value is 26% higherthan the total experimental area Aexp = 23.3 ·10−2 because the second peak around 7114 eV
has a stronger intensity in the calculation than in the measurement. The calculated areaof the dipole part of the spectrum is Adip = 23.6 · 10−2 and of the quadrupole part isAquad = 5.8 · 10−2. Despite the small 4p-character (1.33%), 80% of the pre-edge area is dueto electric dipole transitions, highlighting the importance of the 3d–4p mixing on electronictransitions.
∗In Td and Oh, the Hamiltonian describing the crystal field on 3d orbitals is the same. For 10Dq > 0 thecrystal field is octahedral and for 10Dq < 0 it is tetrahedral. The convention is here to give the absolutevalue |10Dq| in Td, but the value used in the code is negative.

INVESTIGATION OF IRON SPECTRAL SIGNATURES IN CRYSTALS 81
Table 4.4 – Parameters used for the calculation of OAS and XAS spectra of staurolite at 300K
Electronic state 10Dq (eV) Vpd (eV) β 〈Np〉 p-character
Ground state (3d, 4p)6 0.7 3.0 60% 8.6 · 10−3 0.14%Excited state 1s1(3d, 4p)7 1.4 12 60% 9.3 · 10−2 1.33%
The same methodology than Arrio et al. [2000] has been applied for Fe2+ in Td. However,the present values of parameters are different for two reasons. First, our experimental datahave been measured with a better resolution. Second, the supplementary constraints dueto the intention of calculating both OAS and XAS spectra with only one set of parametersimply further adjustments to obtain a satisfying agreement with experimental data. Withthe same parameters than Arrio et al., we reproduced their calculations but the spin-allowedoptical transition (attributed to 5E→5T2) was found below 300 cm–1 instead of 5000 cm–1.The multiplet parameters used in our calculations are of the same order of magnitude, butwith two exceptions: (i) the value of Vpd (used in Quanty) for the ground state is smallerthan for the excited state (3 eV instead of 13 eV), otherwise, the optical intensity is toostrong by several orders of magnitude ; and (ii) the value of 10Dq in the excited state isthe double of 10Dq in the ground state (instead of being the same).
1.81.61.41.21.00.80.6Energy (eV)
30
25
20
15
10
5
0140001200010000800060004000
wavenumber (cm-1)
experiment calculation (rescaled)
Mol
ar a
bsor
ptio
n co
effic
ient
(L.
mol
-1.c
m-1)
0.14
0.12
0.10
0.08
0.06
0.04
0.02
0.00
Nor
mal
ized
abs
orpt
ion
7116711471127110Energy (eV)
experiment extracted pre-edge calculation quad calc dip calc
4A2(F)
4T2(F)
4T1(F)4T1(P)
Figure 4.18 – (Left) Calculated optical absorption spectra for Fe2+ in Td and experimental datafor staurolite from Rossman and Taran [2001]. (Right) Experimental K pre-edge XAS of staurolitebefore (black dashed line) and after (black solid line) edge subtraction, and the calculated broadenedspectrum of Fe2+ in Td (red). The total intensity is the sum of the electric dipole (dashed blue)and the electric quadrupole (dashed green) components.
For the OAS, we found a broad band located around 5000 cm–1 corresponding to the5E(D)→5T2(D) transition. This intense band seems to be in good agreement with theexperimental isotropic spectrum. However, polarized OAS spectra from Rossman andTaran [2001] (see Appendix A) show that the band around 5000 cm–1 is experimentallysplit in three bands located at 3800 cm–1, 4600 cm–1 and 5500 cm–1. By applying 100% ofthe spin-orbit coupling, the 5E(D)→5T2(D) transition is split by 500 cm–1, which is notenough to reproduce the experimental data. Moreover, experimental spectra differ with

82 Chapter 4
polarization, which is not possible for cubic system as Td. Then the Td approximation isprobably too strong, and C2v point group symmetry should be considered in order to takeinto account the distortion of the Fe2+ tetrahedron.
4.4.2 Effect of the different parameters
4.4.2.1 Crystal field
Figure 4.19-left shows the 3D map of optical spectra overlaid by the Tanabe-Suganodiagram of Fe2+ in Td using a Td hybridization parameter of 1 eV. Figure 4.19-right showsthree OAS spectra for 10Dq values of 0.6, 0.7 and 0.8 eV marked on the 3D map. Theoptical spectra are plotted in logarithmic scale to see the effects on the weak spin-forbiddenbands.
0
1
2
3
4
5
0 0.5 1 1.5 2
Tra
nsiti
on e
nerg
y (e
V)
10Dq(eV)
5D
3H3P
3F3G
3D
3P3F
0
5
10
15
20
25
30
35
40
Wav
enum
ber
(x10
3 cm
-1)
0
1
0.01
0.1
1
10
Mol
ar a
bsor
ptio
n co
effici
ent
(L.m
ol-1.c
m-1)
250002000015000100005000wavenumber (cm-1)
10Dq = 0.6 eV 10Dq = 0.7 eV 10Dq = 0.8 eV
Figure 4.19 – (Left) Calculated Tanabe-Sugano diagram (black lines) of Fe2+ in Td withoutspin-orbit coupling, singlet levels are not shown. The color map shows the respective calculated OASspectra with spin-orbit coupling and a small (1 eV) Td hybridization parameter. (Right) CalculatedOAS spectra with absorption in logarithmic scale for the three values of 10Dq corresponding to thethree lines of the left figure.
When 10Dq increases, the intense spin-allowed band 5T1(D) shifts to higher energies andbecomes more intense. The other bands, which are hardly discernible in the experimentalspectrum, remain weak on the simulated spectra, but slightly increase in intensity with 10Dq.However, the variation of their energy positions depend on the spectroscopic term. Forexample, transitions around 15 000 cm–1 are kept unchanged, while those around 20 000 cm–1
and 25 000 cm–1 shift to higher energies.
Figure 4.20 shows the effects of 10Dq on the Fe K pre-edge XAS spectra (sum of dipoleand quadrupole contributions) based on the staurolite parameters of Table 4.4. With 10Dq
of the ground state varying from 0.2 eV to 1.8 eV, it appears that the pre-edge signal is splitin two, three or four three peaks, whose positions and relative intensities depend on 10Dq.By comparing with the experiment, it appears that the 10Dq range seems limited from0.4 eV (3200 cm–1) to 1.2 eV (9700 cm–1).

INVESTIGATION OF IRON SPECTRAL SIGNATURES IN CRYSTALS 83
0
1
2
3
4
5
6
7108 7110 7112 7114 7116
Inte
nsity
(no
rmal
ized
abs
orpt
ion
to t
he m
ain
edge
)
E (eV)
10Dq = 0.4 eV
10Dq = 0.6 eV
10Dq = 0.8 eV
10Dq = 1.0 eV
10Dq = 1.4 eV
10Dq = 1.6 eV
10Dq = 1.8 eV
10Dq = 1.2 eV
10Dq = 0.2 eV
Figure 4.20 – Effect of 10DqGS , from 0 to 2 eV, on the calculated Fe K pre-edge XAS of Fe2+in Td, with V GS
pd = 3 eV and V ESpd = 17 eV, 10DqES = 2 × 10DqGS , β = 60% and a Lorentzian
broadening Γ = 0.2 eV.
4.4.2.2 Nephelauxetic ratio β
For β > 30%, the K pre-edge quadrupole part is composed of four distinct peaks. Byomitting the overall energy shift (which is related to the change in the average energy of theconfiguration), the first three peaks are β-independent. However, the split of the fourth peak(5E(D)→4T1(P )) depends on β (Figure 4.21). As we have previously seen (Figure 4.18),dipole transitions are allowed from the ground state to the three levels of higher energy,only the transition 5E(D)→4A2(F ) is forbidden. Consequently, in the present case of Fe2+
in Td, it is possible to extract β ∼ 60% from XAS data using LFM calculations.

84 Chapter 4
0
0.5
1
1.5
2
2.5
-4 -2 0 2 4 6
Inte
nsity
(arb
. uni
ts)
E (eV)
β = 100 %
β = 90 %
β = 80 %
β = 70 %
β = 60 %
β = 50 %
β = 40 %
β = 30 %
β = 0 %
β = 10 %
β = 20 %
Figure 4.21 – Effect of nephelauxetic ratio β on the calculated Fe K pre-edge XAS of Fe2+ in Td,for β varying from 0% to 100%, 10Dq = 0.7 eV and a Lorentzian broadening Γ = 0.2 eV. Thesecalculations only represent the quadrupole transitions.
4.4.2.3 Effect of ground state hybridization
In tetrahedral geometry, there is only one hybridization parameter, Vpd, mixing the t2levels from 3d-orbitals with the t2 levels from 4p orbitals∗. However, there is a differentdefinition of Vpd between Quanty, used here, and TTMULT, used by Arrio et al.. Quanty usesa development of the Hamiltonian on spherical harmonics while Thole’s code uses a basisadapted to the considered point group symmetry using the formalism of Butler [1981]. Icalculated the relationship between the two definitions of the mixing parameter by using theWigner-Eckart theorem that leads to Vpd (Quanty) = αVpd (TTMULT) with α =
√5×74√3' 0.854.
Same results can be therefore obtained with both Quanty and Thole’code TTMULT.
∗Oh and Td are very similar point groups (both are cubic point groups), except that in Oh the t2g from 3dorbitals and t2u from 4p orbitals cannot mix since they do not have the same symmetry.
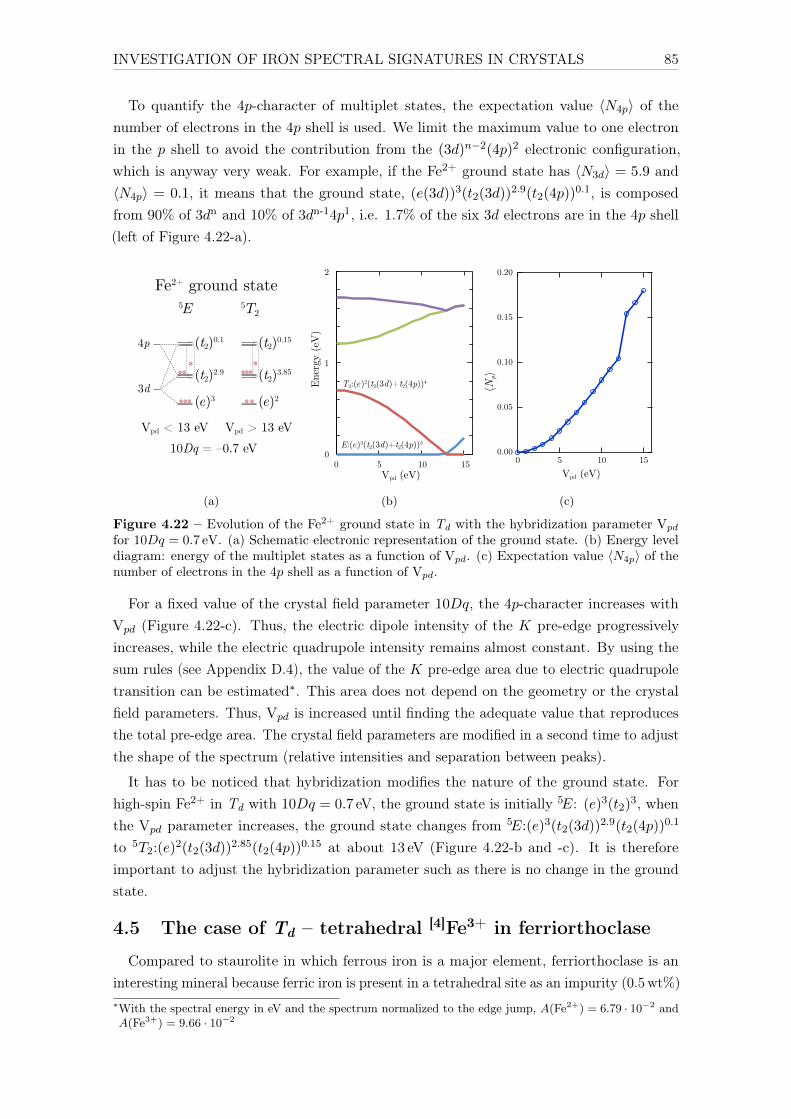
INVESTIGATION OF IRON SPECTRAL SIGNATURES IN CRYSTALS 85
To quantify the 4p-character of multiplet states, the expectation value 〈N4p〉 of thenumber of electrons in the 4p shell is used. We limit the maximum value to one electronin the p shell to avoid the contribution from the (3d)n−2(4p)2 electronic configuration,which is anyway very weak. For example, if the Fe2+ ground state has 〈N3d〉 = 5.9 and〈N4p〉 = 0.1, it means that the ground state, (e(3d))3(t2(3d))2.9(t2(4p))
0.1, is composedfrom 90% of 3dn and 10% of 3dn-14p1, i.e. 1.7% of the six 3d electrons are in the 4p shell(left of Figure 4.22-a).
3d(t2)2.9
(t2)0.1
(e)3
4p
(t2)3.85
(t2)0.15
(e)2
Vpd < 13 eV Vpd > 13 eV
5E 5T2
Fe2+ ground state
10Dq = –0.7 eV
(a)
0
1
2
0 5 10 15
Ener
gy (
eV)
Vpd (eV)
T2:(e)2(t2(3d)+t2(4p))4
E:(e)3(t2(3d)+t2(4p))3
(b)
0.20
0.15
0.10
0.05
0.00
⟨Np⟩
151050Vpd (eV)
(c)
Figure 4.22 – Evolution of the Fe2+ ground state in Td with the hybridization parameter Vpd
for 10Dq = 0.7 eV. (a) Schematic electronic representation of the ground state. (b) Energy leveldiagram: energy of the multiplet states as a function of Vpd. (c) Expectation value 〈N4p〉 of thenumber of electrons in the 4p shell as a function of Vpd.
For a fixed value of the crystal field parameter 10Dq, the 4p-character increases withVpd (Figure 4.22-c). Thus, the electric dipole intensity of the K pre-edge progressivelyincreases, while the electric quadrupole intensity remains almost constant. By using thesum rules (see Appendix D.4), the value of the K pre-edge area due to electric quadrupoletransition can be estimated∗. This area does not depend on the geometry or the crystalfield parameters. Thus, Vpd is increased until finding the adequate value that reproducesthe total pre-edge area. The crystal field parameters are modified in a second time to adjustthe shape of the spectrum (relative intensities and separation between peaks).
It has to be noticed that hybridization modifies the nature of the ground state. Forhigh-spin Fe2+ in Td with 10Dq = 0.7 eV, the ground state is initially 5E: (e)3(t2)
3, whenthe Vpd parameter increases, the ground state changes from 5E:(e)3(t2(3d))2.9(t2(4p))
0.1
to 5T2:(e)2(t2(3d))2.85(t2(4p))0.15 at about 13 eV (Figure 4.22-b and -c). It is therefore
important to adjust the hybridization parameter such as there is no change in the groundstate.
4.5 The case of Td – tetrahedral [4]Fe3+ in ferriorthoclase
Compared to staurolite in which ferrous iron is a major element, ferriorthoclase is aninteresting mineral because ferric iron is present in a tetrahedral site as an impurity (0.5wt%)∗With the spectral energy in eV and the spectrum normalized to the edge jump, A(Fe2+) = 6.79 · 10−2 andA(Fe3+) = 9.66 · 10−2
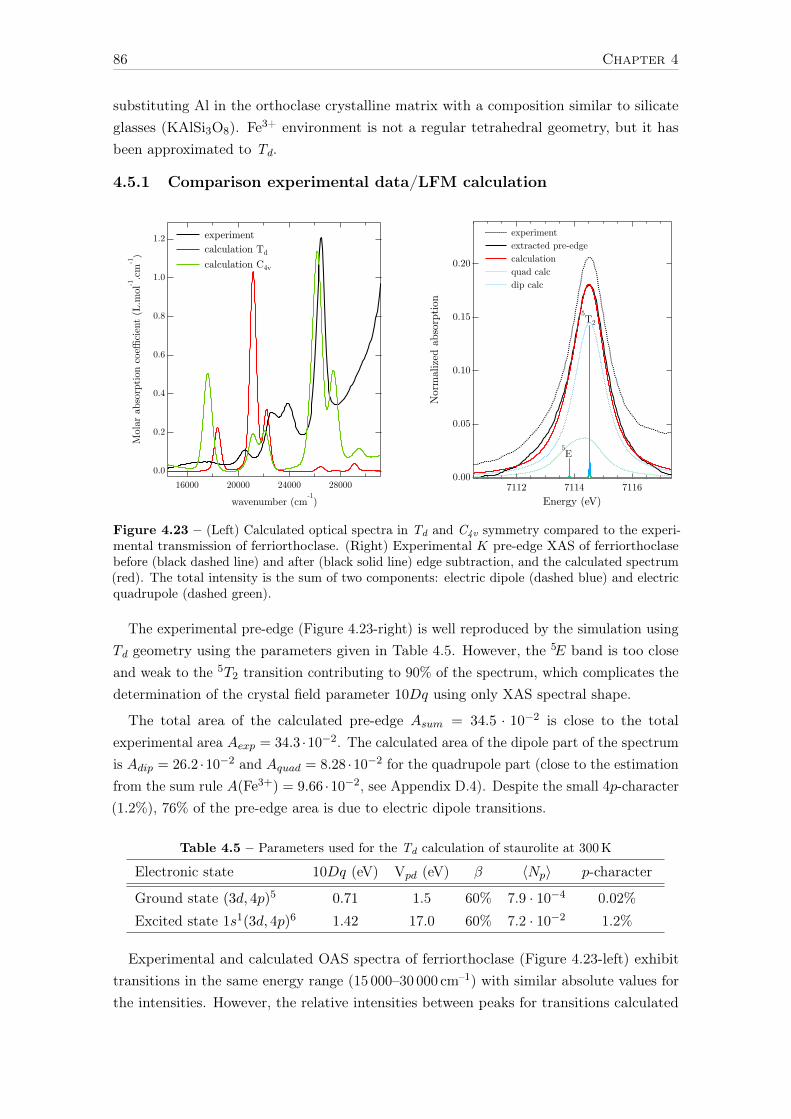
86 Chapter 4
substituting Al in the orthoclase crystalline matrix with a composition similar to silicateglasses (KAlSi3O8). Fe3+ environment is not a regular tetrahedral geometry, but it hasbeen approximated to Td.
4.5.1 Comparison experimental data/LFM calculation
1.2
1.0
0.8
0.6
0.4
0.2
0.0
Mol
ar a
bsor
ptio
n co
effici
ent
(L.m
ol-1.c
m-1)
28000240002000016000
wavenumber (cm-1)
experiment calculation Td
calculation C4v 0.20
0.15
0.10
0.05
0.00
Nor
mal
ized
abs
orpt
ion
711671147112Energy (eV)
experiment extracted pre-edge calculation quad calc dip calc
5E
5T2
Figure 4.23 – (Left) Calculated optical spectra in Td and C4v symmetry compared to the experi-mental transmission of ferriorthoclase. (Right) Experimental K pre-edge XAS of ferriorthoclasebefore (black dashed line) and after (black solid line) edge subtraction, and the calculated spectrum(red). The total intensity is the sum of two components: electric dipole (dashed blue) and electricquadrupole (dashed green).
The experimental pre-edge (Figure 4.23-right) is well reproduced by the simulation usingTd geometry using the parameters given in Table 4.5. However, the 5E band is too closeand weak to the 5T2 transition contributing to 90% of the spectrum, which complicates thedetermination of the crystal field parameter 10Dq using only XAS spectral shape.
The total area of the calculated pre-edge Asum = 34.5 · 10−2 is close to the totalexperimental area Aexp = 34.3 ·10−2. The calculated area of the dipole part of the spectrumis Adip = 26.2 ·10−2 and Aquad = 8.28 ·10−2 for the quadrupole part (close to the estimationfrom the sum rule A(Fe3+) = 9.66 ·10−2, see Appendix D.4). Despite the small 4p-character(1.2%), 76% of the pre-edge area is due to electric dipole transitions.
Table 4.5 – Parameters used for the Td calculation of staurolite at 300K
Electronic state 10Dq (eV) Vpd (eV) β 〈Np〉 p-character
Ground state (3d, 4p)5 0.71 1.5 60% 7.9 · 10−4 0.02%Excited state 1s1(3d, 4p)6 1.42 17.0 60% 7.2 · 10−2 1.2%
Experimental and calculated OAS spectra of ferriorthoclase (Figure 4.23-left) exhibittransitions in the same energy range (15 000–30 000 cm–1) with similar absolute values forthe intensities. However, the relative intensities between peaks for transitions calculated

INVESTIGATION OF IRON SPECTRAL SIGNATURES IN CRYSTALS 87
with a Td hybridization Hamiltonian do not reproduce the experiment. This could suggesta wrong assignment of the classical band attribution in the considered site symmetry.
0
1
2
3
4
5
0 0.5 1 1.5 2
Tra
nsiti
on e
nerg
y (e
V)
10Dq(eV)
0
5
10
15
20
25
30
35
40
Wav
enum
ber
(x10
3 cm
-1)
6S
4G
4P4D
4F
3000
025
000
2000
015
000
1000
050
000
Wav
enum
ber
(cm
-1)
76543210
Molar absorption coe cient of Fe3+
(L.mol-1.cm
-1)
ferriorthoclase ([4]
Fe3+
)
A
12
34
5
1
23
4
5
B
1
23
4
5
C
12
3
4
5
D
1
23
4
5
A : Burns 1993, Manning 1970, Bingham 2014, Volotinen 2008(most common attribution)B : Kurkjian 1968, Faye 1969C : Faye 1969D : Miché 1985
octaocta
octa
Figure 4.24 – Left: optical spectrum of ferriorthoclase ([4]Fe3+). Right: Tanabe-Sugano diagramfor Fe3+ in Td, A, B, C and D are the different possible band attribution for ferriorthoclase.
Figure 4.24 compares the optical spectrum of ferriorthoclase (Left) with the calculatedTanabe-Sugano energy level diagram in the Td symmetry (Right). The attribution marked“A” is commonly used to interpret tetrahedral Fe3+ bands [Bingham et al., 2014; Burns,1993; Volotinen et al., 2008]. However, three other attributions of the same bands havealso been suggested: “B” [Faye, 1969; Kurkjian and Sigety, 1968], “C” [Faye, 1969] and “D”[Miché, 1985].
For a calculation in Td, the attribution marked “A” could not match the experimentbecause the transitions 6A1→4E(D) and 6A1(S)→4T2(D) that should happen around26 300 cm–1 are both very weak and the 6A1(S)→4T2(G) is too intense. The use of C4v
geometry, as an approximation to the C2v geometry (because C2v was not implementedin Quanty) using the same crystal field parameters than in Td (Ds = Dt = 0) and thehybridization Hamiltonian of C4v, Vepd =Va1
pd = 1.5 eV gives the same 〈Np〉 but totallydifferent optical spectra than in Td symmetry (Figure 4.23-left).
Transitions are around the same energies but the relative intensities are different andcloser to the experimental spectrum. However, some discrepancies remain in the intensitiesand positions of bands, for example at 17 000 cm–1 and in the splitting of the bands around24 000 cm–1 and 26 000 cm–1. The results in C4v symmetry are not fully satisfying becausethe calculated spectra do not explain the experimental shape.

88 Chapter 4
One way to solve this problem is to use a lower point group such as C2v, becausewhen the working point group contains too many symmetry elements, some transitionsare symmetry-forbidden. However, as soon as the symmetry is decreased the intensitiesimmediately become of the same order of magnitude than the bands that were alreadyallowed. Unfortunately, the use of a low-symmetry point group implies the adjustment ofseveral crystal field and hybridization parameters explaining the difficulty to reproduceoptical spectra with appropriate positions and intensities.
4.5.2 Effect of the different parameters
4.5.2.1 Crystal field
Figure 4.25-left shows the 3D map of optical spectra overlaid by the Tanabe-Suganodiagram of Fe3+ in Td using a C4v hybridization. Figure 4.25-right shows three OAS spectrafor 10Dq values of 0.6, 0.7 and 0.8 eV marked on the 3D map. We see clearly that thebands 4T1(G), 4T2(G) and 4T2(D) are sensitive to 10Dq and the two bands [4A1,4E(G)]and 4E(D) are crystal field independent (intensity and position).
When 10Dq increases the 4T1(G) and 4T2(G) bands shift in position to lower energyvalue. In the meantime the intensities slightly increase with 10Dq. The use of a crystalfield Hamiltonian in a lower point group such as C2v could eventually split the 4T2(D) orthe [4A1,4E(G)] levels in order to reproduce the experimental splitting of the band around23 000–24 000 cm–1.
0
1
2
3
4
5
0 0.5 1 1.5 2
Tra
nsiti
on e
nerg
y (e
V)
10Dq(eV)
0
5
10
15
20
25
30
35
40
Wav
enum
ber
(x10
3 cm
-1)
6S
4G
4P4D
4F
0
1 0.6
0.5
0.4
0.3
0.2
0.1
0.0Mol
ar a
bsor
ptio
n co
effici
ent
(L.m
ol-1.c
m-1)
28000240002000016000wavenumber (cm-1)
10Dq = 0.6 eV 10Dq = 0.7 eV 10Dq = 0.8 eV
4T1(G)4T2(G)
[4A1,4E1(G)]
4T2(D)
4E(D)
Figure 4.25 – (Left) Calculated Tanabe-Sugano diagram (black lines) of Fe3+ in C4v withoutspin-orbit coupling, 10Dq = 0.7 eV and Ds = Dt = 0 eV, singlet levels are not shown. The colormap shows the respective calculated OAS spectra with spin-orbit coupling and a small hybridizationparameter (Ve
pd = Va1
pd = 1.5 eV in C4v). (Right) Calculated OAS spectra for the three values of10Dq corresponding to the three lines of the left figure.

INVESTIGATION OF IRON SPECTRAL SIGNATURES IN CRYSTALS 89
4.5.2.2 Nephelauxetic ratio β
1.2
1.0
0.8
0.6
0.4
0.2
0.0
Mol
ar a
bsor
ptio
n co
effici
ent
(L.m
ol-1.c
m-1)
300002500020000wavenumber (cm-1)
experiment beta = 0.6 beta = 0.7 0.20
0.15
0.10
0.05
0.00
noitprosba dezilamro
N
711671147112Energy (eV)
extracted pre-edge = 0.6 = 0.7
Figure 4.26 – Effect of the nephelauxetic ratio β for Fe3+ in tetrahedral site on the calculatedOAS (Left) and K pre-edge XAS (Right) spectra. The black lines are experimental spectra.
In the case of Fe3+ in Td geometry, the pre-edge is mainly constituted of one transition,therefore β has no effect on the calculated spectrum (Figure 4.26-b). Using only XAS, it isnot possible to determine β. The optical bands are globally shifted to higher energies andhave weaker intensities, the energy splitting between the transitions is also modified.
4.6 The case of D3h – trigonal bipyramidal [5]Fe2+ in grandi-dierite
This section presents the case of grandidierite, a silicate mineral in which iron is [5]-foldcoordinated in a distorted trigonal bipyramidal geometry (See Appendix A for more details).The site geometry is first approximated by the D3h geometry, characteristic of regulartrigonal bipyramidal [5]-fold coordinated ions. The crystal field of D3h geometry can bedescribed by two parameters Dµ and Dν [König and Kremer, 1977, p. 21].
In D3h, the decomposition of d orbitals into irreducible representation is a′1 ⊕ e′ ⊕ e′′and the decomposition of p orbitals into irreducible representation is a′′2 ⊕ e′. Thus, the 3d
(x2− y2, xy) and 4p (x, y) orbitals belonging to the representation e′ can mix. The intensityof this mixing is described by the parameter Vpd of the D3h hybridization Hamiltonian thatwe theoretically determined and implemented in Quanty (see Appendix E.5).
4.6.1 XAS
The experimental K pre-edge spectrum has been corrected of small self-absorption effects(Figure 4.27). It is partially reproduced by the simulation for the parameters listed inTable 4.6. The total intensity of the experimental pre-edge Aexp = 11.8 · 10−2 is similar tothe calculation (Asum = 11.2 · 10−2). Simulations show that dipole transitions contributeto 45% of the spectrum with Adip = 5.0 · 10−2, and quadrupole transitions contribute to55% with Aquad = 6.2 · 10−2.
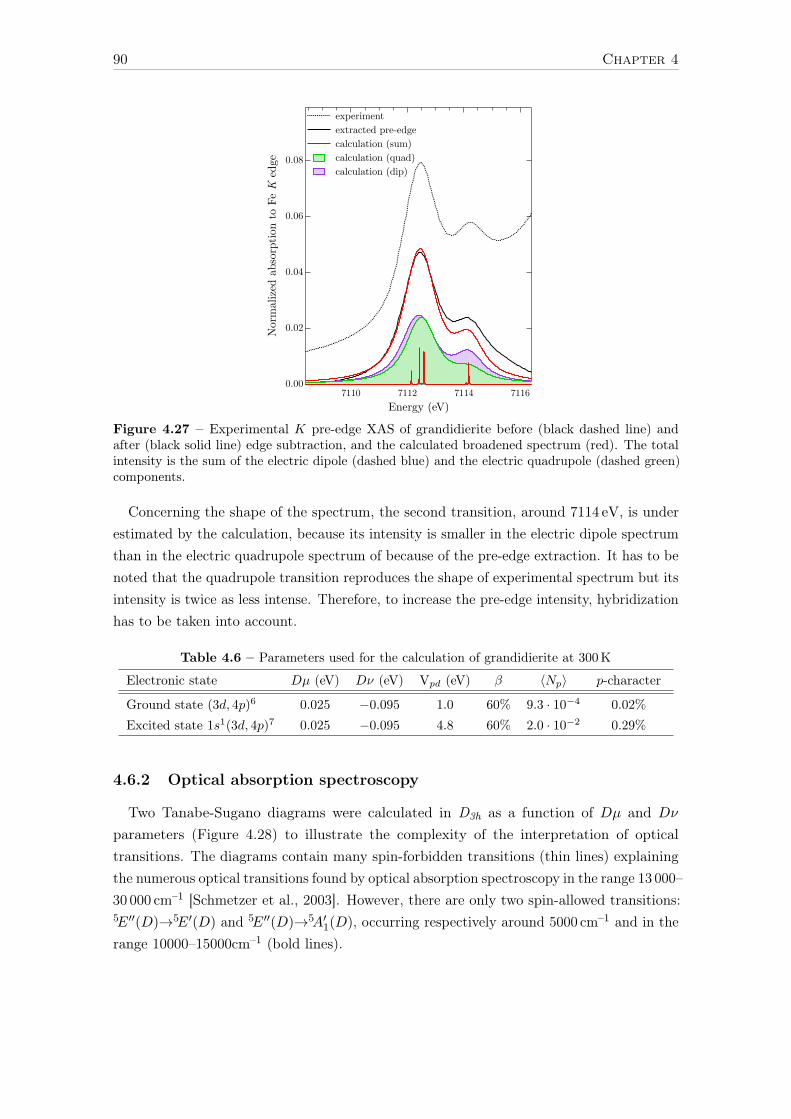
90 Chapter 4
0.08
0.06
0.04
0.02
0.00
Nor
mal
ized
abs
orpt
ion
to F
e K
edg
e
7116711471127110Energy (eV)
experiment extracted pre-edge calculation (sum) calculation (quad) calculation (dip)
Figure 4.27 – Experimental K pre-edge XAS of grandidierite before (black dashed line) andafter (black solid line) edge subtraction, and the calculated broadened spectrum (red). The totalintensity is the sum of the electric dipole (dashed blue) and the electric quadrupole (dashed green)components.
Concerning the shape of the spectrum, the second transition, around 7114 eV, is underestimated by the calculation, because its intensity is smaller in the electric dipole spectrumthan in the electric quadrupole spectrum of because of the pre-edge extraction. It has to benoted that the quadrupole transition reproduces the shape of experimental spectrum but itsintensity is twice as less intense. Therefore, to increase the pre-edge intensity, hybridizationhas to be taken into account.
Table 4.6 – Parameters used for the calculation of grandidierite at 300K
Electronic state Dµ (eV) Dν (eV) Vpd (eV) β 〈Np〉 p-character
Ground state (3d, 4p)6 0.025 −0.095 1.0 60% 9.3 · 10−4 0.02%Excited state 1s1(3d, 4p)7 0.025 −0.095 4.8 60% 2.0 · 10−2 0.29%
4.6.2 Optical absorption spectroscopy
Two Tanabe-Sugano diagrams were calculated in D3h as a function of Dµ and Dν
parameters (Figure 4.28) to illustrate the complexity of the interpretation of opticaltransitions. The diagrams contain many spin-forbidden transitions (thin lines) explainingthe numerous optical transitions found by optical absorption spectroscopy in the range 13 000–30 000 cm–1 [Schmetzer et al., 2003]. However, there are only two spin-allowed transitions:5E′′(D)→5E′(D) and 5E′′(D)→5A′1(D), occurring respectively around 5000 cm–1 and in therange 10000–15000cm–1 (bold lines).

INVESTIGATION OF IRON SPECTRAL SIGNATURES IN CRYSTALS 91
0
1
2
3
4
5T
rans
ition
ene
rgy
(eV
)
(eV)
5D
3H3P3F3G
3D
0
5
10
20
25
30
35
40
Wav
enum
ber
(x10
3 cm
–1)
-0.2 -0.15 -0.1 -0.05 0
(a)
-0.2 -0.15 -0.1 -0.05 0 0.05 0.1 0.15 0.2 0
1
2
3
4
5
Tra
nsiti
on e
nerg
y (e
V)
0
5
10
20
25
15
30
35
40
Wav
enum
ber
(x10
3 cm
–1)
(b)
Figure 4.28 – Calculated Tanabe-Sugano diagram (black lines) of Fe2+ in D3h as a function of Dµ(a) and Dν (b), without spin-orbit coupling. Bold levels have a spin multiplicity of 5 (spin-allowedtransitions), others are singlets or triplets. The dashed line on diagram (a) indicate the startingpoint of diagram (b).
There is no known mineral with Fe in a [5]-fold site with a regular trigonal bipyramidalgeometry, and they are all distorted. Depending on the distortions, the site symmetry isdecreased to C3v, C2v, or even Cs (Figure 4.29). To simplify the calculation of grandidierite([5]Fe2+), the geometry was first approximated to D3h but crystallographic data show thatiron is in a Cs site.
CsC2vC3vD3hFigure 4.29 – Point group of the distorted bipyramid trigonal [5]-fold geometries.
The calculated optical spectrum of Fe2+ in D3h (Figure 4.30-left) shows one of the twospin-allowed transitions at 5000 cm–1. The second transition is symmetry-forbidden in D3h
point group. The hybridization Hamiltonian has to be adapted to allow this transition anda decrease in symmetry is therefore necessary to reproduce the grandidierite data takenfrom Rossman and Taran [2001]. Because Cs and C2v were not implemented in Quanty, theC3v point group was used instead of D3h for Fe2+ in grandidierite. In C3v, the irreducibledecomposition of 3d orbitals is a1 ⊕ 2e and the irreducible decomposition of p orbitals is

92 Chapter 4
a1 ⊕ e. Thus, the 3d (x2 − y2, xy), (xz, yz) and 4p (x, y) orbitals with the representation ecan mix, and the 3d z2 and 4p z orbitals with the representation e1 can mix.
15
10
5
0
Mol
ar a
bsor
ptio
n co
effici
ent
(L.m
ol-1.c
m-1)
2000015000100005000
wavenumber (cm-1)
experiment calculation D3h
5E'(D)
15
10
5
0
Mol
ar a
bsor
ptio
n co
effici
ent
(L.m
ol-1.c
m-1)
2000016000120008000
wavenumber (cm-1)
experiment calc C3v (A) calc C3v (B) calc C3v (C)
5A1(D)
5E(D)
Figure 4.30 – Experimental optical absorption spectrum of grandidierite (from [Rossman andTaran, 2001]) compared to the calculated spectra of Fe2+ in D3h (left) and C3v (right – for threedifferent sets of ligand field parameters: A, B and C).
This effect is illustrated in Figure 4.30-right by an example of calculation using three setsof parameters in the C3v geometry (Table 4.7). The three C3v optical spectra give an opticalband around 5000 cm–1. The use of C3v is more satisfying than D3h geometry, in particular,the second transition to the 5A1 level (5A′1 level in D3h) around 10 000 cm–1–13 000 cm–1 isnow allowed. However, two sets are necessary to reproduce the splitting of the signal of theexperimental spectra around 10 000 cm–1–13 000 cm–1 and a third one for the tail around15 000 cm–1.
Table 4.7 – Sets of parameters used for C3v calculation of grandidierite.
name Dµ (eV) Dν (eV) Vpd (eV) β
A −0.025 −0.120 1.0 60%B −0.06 −0.155 1.0 60%C −0.09 −0.175 1.0 60%
Because this transition around 13 000 cm–1 is due the transition towards level A1, thesplitting cannot be reproduced using only one set of C3v parameters or by decreasingthe symmetry. Two sets representative of two different populations are required and theexistence of multiple, non-equivalent [5]Fe2+ sites in the grandidierite mineral could be atthe origin of these two bands, as suggested by Rossman and Taran [2001]. By lookingclosely at the structural data of grandidierite, the two Fe2+–O distances with apical oxygensare 2.179Å and 2.057Å [Stephenson and Moore, 1968]. An analogy can be done withthe relation ∆ ∝ R−5 between Fe–O distance and crystal field splitting often used bymineralogists [Burns, 1993]. The ratio of the two Fe–O distances at the fifth-power is equalto 1.33, which is not far from the ratio between 13 000 cm–1 and 10 000 cm–1 equal to 1.3.Moreover, the 5A1 levels are related to the z2 orbital, which is orientated in the directionof the apical ligands forming the C3 axis when they are aligned with then central Fe2+.
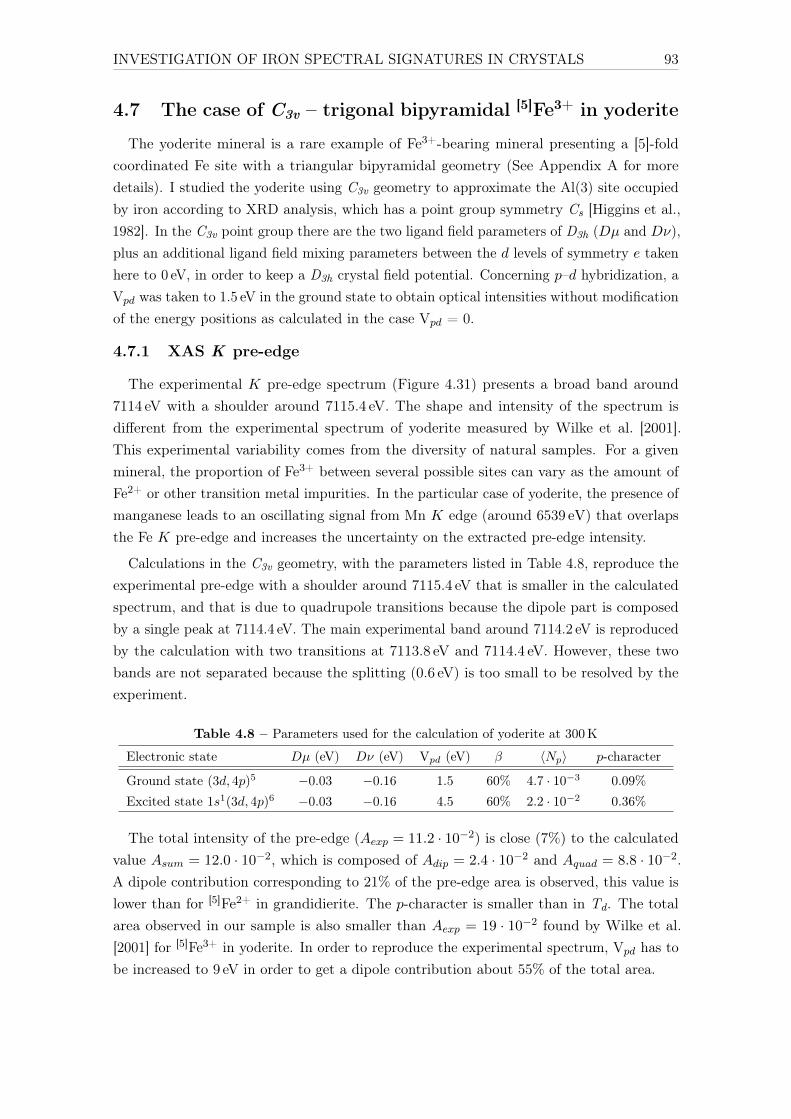
INVESTIGATION OF IRON SPECTRAL SIGNATURES IN CRYSTALS 93
4.7 The case of C3v – trigonal bipyramidal [5]Fe3+ in yoderite
The yoderite mineral is a rare example of Fe3+-bearing mineral presenting a [5]-foldcoordinated Fe site with a triangular bipyramidal geometry (See Appendix A for moredetails). I studied the yoderite using C3v geometry to approximate the Al(3) site occupiedby iron according to XRD analysis, which has a point group symmetry Cs [Higgins et al.,1982]. In the C3v point group there are the two ligand field parameters of D3h (Dµ and Dν),plus an additional ligand field mixing parameters between the d levels of symmetry e takenhere to 0 eV, in order to keep a D3h crystal field potential. Concerning p–d hybridization, aVpd was taken to 1.5 eV in the ground state to obtain optical intensities without modificationof the energy positions as calculated in the case Vpd = 0.
4.7.1 XAS K pre-edge
The experimental K pre-edge spectrum (Figure 4.31) presents a broad band around7114 eV with a shoulder around 7115.4 eV. The shape and intensity of the spectrum isdifferent from the experimental spectrum of yoderite measured by Wilke et al. [2001].This experimental variability comes from the diversity of natural samples. For a givenmineral, the proportion of Fe3+ between several possible sites can vary as the amount ofFe2+ or other transition metal impurities. In the particular case of yoderite, the presence ofmanganese leads to an oscillating signal from Mn K edge (around 6539 eV) that overlapsthe Fe K pre-edge and increases the uncertainty on the extracted pre-edge intensity.
Calculations in the C3v geometry, with the parameters listed in Table 4.8, reproduce theexperimental pre-edge with a shoulder around 7115.4 eV that is smaller in the calculatedspectrum, and that is due to quadrupole transitions because the dipole part is composedby a single peak at 7114.4 eV. The main experimental band around 7114.2 eV is reproducedby the calculation with two transitions at 7113.8 eV and 7114.4 eV. However, these twobands are not separated because the splitting (0.6 eV) is too small to be resolved by theexperiment.
Table 4.8 – Parameters used for the calculation of yoderite at 300K
Electronic state Dµ (eV) Dν (eV) Vpd (eV) β 〈Np〉 p-character
Ground state (3d, 4p)5 −0.03 −0.16 1.5 60% 4.7 · 10−3 0.09%Excited state 1s1(3d, 4p)6 −0.03 −0.16 4.5 60% 2.2 · 10−2 0.36%
The total intensity of the pre-edge (Aexp = 11.2 · 10−2) is close (7%) to the calculatedvalue Asum = 12.0 · 10−2, which is composed of Adip = 2.4 · 10−2 and Aquad = 8.8 · 10−2.A dipole contribution corresponding to 21% of the pre-edge area is observed, this value islower than for [5]Fe2+ in grandidierite. The p-character is smaller than in Td. The totalarea observed in our sample is also smaller than Aexp = 19 · 10−2 found by Wilke et al.[2001] for [5]Fe3+ in yoderite. In order to reproduce the experimental spectrum, Vpd has tobe increased to 9 eV in order to get a dipole contribution about 55% of the total area.
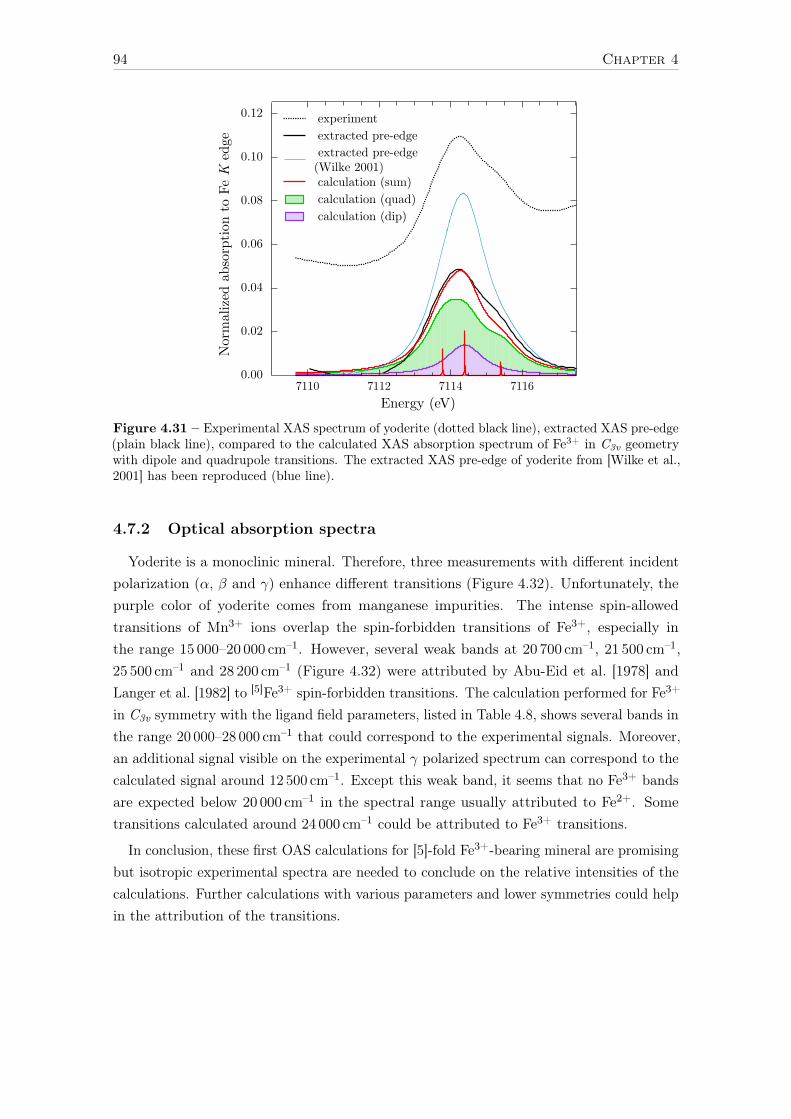
94 Chapter 4
0.12
0.10
0.08
0.06
0.04
0.02
0.00
Nor
mal
ized
abs
orpt
ion
to F
e K
edg
e
7116711471127110Energy (eV)
experiment extracted pre-edge
calculation (sum) calculation (quad) calculation (dip)
extracted pre-edge(Wilke 2001)
Figure 4.31 – Experimental XAS spectrum of yoderite (dotted black line), extracted XAS pre-edge(plain black line), compared to the calculated XAS absorption spectrum of Fe3+ in C3v geometrywith dipole and quadrupole transitions. The extracted XAS pre-edge of yoderite from [Wilke et al.,2001] has been reproduced (blue line).
4.7.2 Optical absorption spectra
Yoderite is a monoclinic mineral. Therefore, three measurements with different incidentpolarization (α, β and γ) enhance different transitions (Figure 4.32). Unfortunately, thepurple color of yoderite comes from manganese impurities. The intense spin-allowedtransitions of Mn3+ ions overlap the spin-forbidden transitions of Fe3+, especially inthe range 15 000–20 000 cm–1. However, several weak bands at 20 700 cm–1, 21 500 cm–1,25 500 cm–1 and 28 200 cm–1 (Figure 4.32) were attributed by Abu-Eid et al. [1978] andLanger et al. [1982] to [5]Fe3+ spin-forbidden transitions. The calculation performed for Fe3+
in C3v symmetry with the ligand field parameters, listed in Table 4.8, shows several bands inthe range 20 000–28 000 cm–1 that could correspond to the experimental signals. Moreover,an additional signal visible on the experimental γ polarized spectrum can correspond to thecalculated signal around 12 500 cm–1. Except this weak band, it seems that no Fe3+ bandsare expected below 20 000 cm–1 in the spectral range usually attributed to Fe2+. Sometransitions calculated around 24 000 cm–1 could be attributed to Fe3+ transitions.
In conclusion, these first OAS calculations for [5]-fold Fe3+-bearing mineral are promisingbut isotropic experimental spectra are needed to conclude on the relative intensities of thecalculations. Further calculations with various parameters and lower symmetries could helpin the attribution of the transitions.

INVESTIGATION OF IRON SPECTRAL SIGNATURES IN CRYSTALS 95
6
5
4
3
2
1
0
).u .bra( noitprosba lacitpO
3000025000200001500010000
wavenumber (cm-1)
experiment α experiment β experiment γ calculation iso
Mn3+
Mn3+
Fe3+
? Fe3+
?
Fe3+
Fe3+
Fe3+
Fe3+
Figure 4.32 – Experimental polarized transmission spectra of yoderite in the UV-Vis range [Langeret al., 1982] compared to the calculated optical absorption spectrum of Fe3+ in C3v geometry. Thecentral part of the spectrum (15 000 cm–1–20 000 cm–1) is dominated by Mn3+ transitions.
4.8 Summary
These results confirm that LFM calculations can reproduce two different spectroscopiesprobing the 3d levels (valence to valence for OAS and core to valence for XAS). The use of acommon set of crystal field parameters for the ground state improved the description of thestudied site. For the first time, optical absorption spectra of iron could be calculated, bytaking into account the 3d–4p mixing, for a wide range of Fe-bearing crystals representativeof various geometries. It proves that the electric dipole contribution are the main originof the optical absorption as suggested by Rossano et al. [2000a]. The Fe K pre-edgeXAS have been interpreted for both centrosymmetric and non-centrosymmetric sites inFe2+- and Fe3+-bearing minerals. Calculations not only reproduce the relative energiesof transitions but also the absolute intensities of the X-ray absorption spectra in mostcompounds. Concerning hybridization, 0.1% of 3d electrons delocalized on the 4p orbitalsare sufficient to obtain optical intensities and a significant dipole contribution to the XASpre-edge.
The proportion of electric dipole and quadrupole contributions to the total K pre-edgeXAS area has been estimated (Table 4.9). Calculations confirmed that electric dipoletransitions can be neglected in the case of centrosymmetric geometries (Oh and D4h). Forboth iron valences (Fe2+ and Fe3+), tetrahedral sites give the strongest pre-edge intensitieswith 80% of the area due to dipole transitions. As intermediary geometries, [5]-foldcompounds give an intermediate value between Oh and Td, which is different for the Fe2+-and Fe3+-bearing minerals. The first one, grandidierite, has an equivalent contributionfrom dipole and quadrupole transitions, while, the pre-edge of yoderite, is mainly due toquadrupole transitions.

96 Chapter 4
Table 4.9 – Normalized integrated intensities of the K pre-edge XAS spectrum from dipole electricand quadrupole electric transitions for different geometries. The areas are multiplied by 100 andcorrespond to the integral of the pre-edge spectrum with energy in eV and its intensity normalizedto the main edge. All the extracted K pre-edge XAS are plotted in the same figure at the end ofAppendix A.
Geometry Mineral LFM calculations ExperimentQuad Dip Total Total
[6]Fe2+ (Oh) siderite6.1
(98%)0.1(2%)
6.2(100%)
5.9
[4]Fe2+ (D4h) gillespite6.2
(94%)0.4(6%)
6.6(100%)
5.6
[5]Fe2+ (D3h) grandidierite6.0
(54%)5.2
(46%)11.2
(100%)11.8
[4]Fe2+ (Td) staurolite5.8
(20%)23.6(80%)
29.4(100%)
23.3
[6]Fe3+ (Oh) andradite8.6
(98%)0.2(2%)
8.8(100%)
9.7
[5]Fe3+ (C3v) yoderite8.8
(79%)2.4
(21%)11.2
(100%)12.0
[4]Fe3+ (Td) ferriorthoclase8.3
(24%)26.2(76%)
34.5(100%)
34.3
More than the possibility of calculating and reproducing an experimental spectrum,calculations shed light on the spectral sensitivity to site geometry and to the differentcrystal field and hybridization parameters used to describe the local environment in a givenpoint group. The different behavior of the two experimental methods in reaction to thevariations of parameters and geometries help to find which parameters are significant andthose that do not affect significantly the shape, intensity or position of transitions in orderto improve the accuracy of crystal field parameters determination.
Thanks to this new kind of calculations, it is now possible to simulate realistic opticalspectra. The sensitivity of optical spectra to the calculation parameters and to thepoint group symmetry combined with the structural knowledge (XRD) of the iron localenvironment in minerals, will be useful to analyze the effects of a distribution of theparameters (10Dq, β...) on the OAS and XAS spectra. Despite that local environment ofiron in crystals is not representative of the one in glasses∗ and that some iron environmentsin crystals are unlikely to exist in glasses†, this approach offers a new method to estimate thedistortion and site distribution of TM in glasses. The study of glass spectroscopic signaturesin order to extract tendencies on the parameters characterizing iron local environment willbe detailed in the next chapter.
∗For example, it has been proven in highly concentrated glasses that many Fe2+ and Fe3+ ions are [5]-foldcoordinated while almost all minerals are [4]- or [6]-fold coordinated [Weigel et al., 2008a, 2006].
†For example, almandine garnet (Ca0.3Fe1.5Mg1.2Al2Si3O12) a pink silicate mineral where iron is present as[8]Fe2+ in an 8-fold coordinated site [Wilke et al., 2001] is not considered as a good candidate to describethe iron environment in glasses.
97
Chapter 5
Iron local environment in asoda-lime-silicate glass
As we have seen in the previous chapter, a broad variety of iron environment exists insilicate minerals. This diversity of iron environment is increased in the case of amorphousmaterials such as glass, as introduced in Section 1.3. The purpose of this chapter is todiscuss the relationships of iron environment and spectroscopic properties of iron in silicateglasses for both existing valences Fe2+ and Fe3+. This chapter is built around opticalabsorption spectroscopy, which is a key property for industrial applications.
I will focus on the case of the sodium-calcium-silicate glass composition (NCS), alsocalled soda-lime silicate, that have been introduced and characterized in Chapter 2. Amongthe different glass compositions studied in this thesis, this one is the most representative ofindustrial float glass. The studied set consists of three NCS glasses (NCS05Ox, NCS05Medand NCS05Red) doped with 0.5wt% of Fe2O3 at three redox ratio (R = Fe2+/Fetot):oxidized (R ∼ 6%), medium (R ∼ 28%) and reduced (R ∼ 99%) glasses, respectively.
The aim is here to cross the optical absorption spectroscopy results with the otherspectroscopic methods presented in Chapter 2: XAS, RIXS, EPR, SQUID-VSM. Eachmethod brings a specific insight on the iron environment by enhancing different aspects of theproblem. The advantage of X-ray absorption spectroscopy has been shown in the previouschapter with the study of several minerals with characteristic Fe sites. The tendencieshighlighted using ligand field multiplet calculation will be extended to the analysis of Fe inglass. The complementary RIXS and HERFD-XAS methods will be used to emphasize thedifferences between glass and mineral environments. EPR will be mainly dedicated here tothe study of Fe3+ distortion and clustering using the interpretation elements of Section 2.6.3.SQUID-VSM will be used at the end of the chapter to investigate the presence of ironclusters in glass.
I will show that a multi-spectroscopic analysis is useful to get new information on theorigins of Fe2+ and Fe3+ optical bands, the distortion of Fe3+ sites and the clustering of iron,in order to have a better understanding of iron speciation and its impact on spectroscopicfeatures as a function of redox state.

98 Chapter 5
5.1 Introduction to the optical absorption spectrum of ironin silicate glass
The optical absorption of iron in the NCS glass will be introduced by energy range usingan experimental optical absorption spectrum of the most common glass sample: NCS05Med(Figure 5.1).
Silicon dioxide (SiO2) is the main component of all the glasses studied in this thesis.Experimentally, the transmission window of pure silica glass (2000 to 50 000 cm–1; 5000 nmto 200 nm) defines an intrinsic limitation of the spectral range.
In the near-infrared (NIR) below 2700 cm–1, the tail of Si–O vibration bands set thelower limit of the optical spectrum. Unfortunately, below 4000 cm–1, the spectral rangeis limited by very intense absorption bands due to O–H vibrations of hydroxyl groups.Adsorption of water by the glass during the synthesis under air atmosphere is at the originof these O–H groups. As we will see later, these bands are not visible on reduced samplessynthesized under nitrogen. The most intense bands are situated below 4000 cm–1, butseveral weak O–H bands can also be found from 4000 to 7200 cm–1 [Boulos et al., 1997;Davis and Tomozawa, 1996; Glebov and Boulos, 1998]. These weak bands, only visible onnon-doped glasses (e.g. NCS00Med, DIO00Med), are negligible for glasses with more than0.1wt% of Fe2O3.
8
6
4
2
0Mol
ar a
bsor
ptio
n co
effici
ent
(L.m
ol-1.c
m-1)
3028262422201816141210864
Wavenumber (x103 cm-1)
3000 2000 1000 900 800 700 600 500 400
NCS05Med
Wavelength (nm)
Fe-doppedNCSglass
Wavenumber (x103 cm-1)30252015105
ε (cm-1.L.mol-1) >10 >5 >1 <1 Fe2+ Fe3+
Figure 5.1 – Top: optical absorption spectrum of the medium sodium-calcium-silicate glass(NCS05Med, Fe2+/Fetot ∼ 28%). Bottom: sticks representing the absorption bands of Fe2+ (blue)and Fe3+ (yellow), molar absorption coefficients in grey scale are calculated separately for Fe2+and Fe3+ (see note p.203).
The upper limit in the UV range, 50 000 cm–1, is determined by the oxygen to siliconcharge transfer. However, in Figure 5.1, the UV-edge happens from ν > 28 000 cm–1
(λ < 360 nm). The UV range above 28 000 cm–1 is in fact dominated by broad and intensetransition metal bands, three orders of magnitude higher than the crystal field bands. These
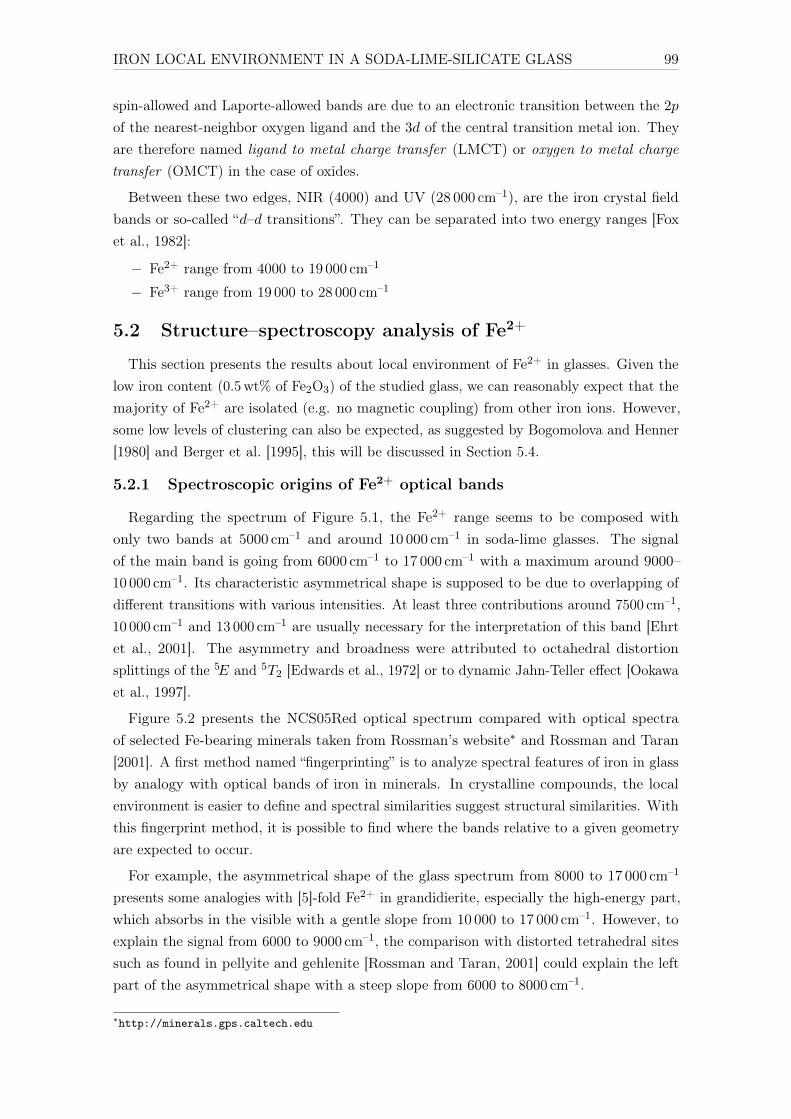
IRON LOCAL ENVIRONMENT IN A SODA-LIME-SILICATE GLASS 99
spin-allowed and Laporte-allowed bands are due to an electronic transition between the 2p
of the nearest-neighbor oxygen ligand and the 3d of the central transition metal ion. Theyare therefore named ligand to metal charge transfer (LMCT) or oxygen to metal chargetransfer (OMCT) in the case of oxides.
Between these two edges, NIR (4000) and UV (28 000 cm–1), are the iron crystal fieldbands or so-called “d–d transitions”. They can be separated into two energy ranges [Foxet al., 1982]:
− Fe2+ range from 4000 to 19 000 cm–1
− Fe3+ range from 19 000 to 28 000 cm–1
5.2 Structure–spectroscopy analysis of Fe2+
This section presents the results about local environment of Fe2+ in glasses. Given thelow iron content (0.5wt% of Fe2O3) of the studied glass, we can reasonably expect that themajority of Fe2+ are isolated (e.g. no magnetic coupling) from other iron ions. However,some low levels of clustering can also be expected, as suggested by Bogomolova and Henner[1980] and Berger et al. [1995], this will be discussed in Section 5.4.
5.2.1 Spectroscopic origins of Fe2+ optical bands
Regarding the spectrum of Figure 5.1, the Fe2+ range seems to be composed withonly two bands at 5000 cm–1 and around 10 000 cm–1 in soda-lime glasses. The signalof the main band is going from 6000 cm–1 to 17 000 cm–1 with a maximum around 9000–10 000 cm–1. Its characteristic asymmetrical shape is supposed to be due to overlapping ofdifferent transitions with various intensities. At least three contributions around 7500 cm–1,10 000 cm–1 and 13 000 cm–1 are usually necessary for the interpretation of this band [Ehrtet al., 2001]. The asymmetry and broadness were attributed to octahedral distortionsplittings of the 5E and 5T2 [Edwards et al., 1972] or to dynamic Jahn-Teller effect [Ookawaet al., 1997].
Figure 5.2 presents the NCS05Red optical spectrum compared with optical spectraof selected Fe-bearing minerals taken from Rossman’s website∗ and Rossman and Taran[2001]. A first method named “fingerprinting” is to analyze spectral features of iron in glassby analogy with optical bands of iron in minerals. In crystalline compounds, the localenvironment is easier to define and spectral similarities suggest structural similarities. Withthis fingerprint method, it is possible to find where the bands relative to a given geometryare expected to occur.
For example, the asymmetrical shape of the glass spectrum from 8000 to 17 000 cm–1
presents some analogies with [5]-fold Fe2+ in grandidierite, especially the high-energy part,which absorbs in the visible with a gentle slope from 10 000 to 17 000 cm–1. However, toexplain the signal from 6000 to 9000 cm–1, the comparison with distorted tetrahedral sitessuch as found in pellyite and gehlenite [Rossman and Taran, 2001] could explain the leftpart of the asymmetrical shape with a steep slope from 6000 to 8000 cm–1.
∗http://minerals.gps.caltech.edu
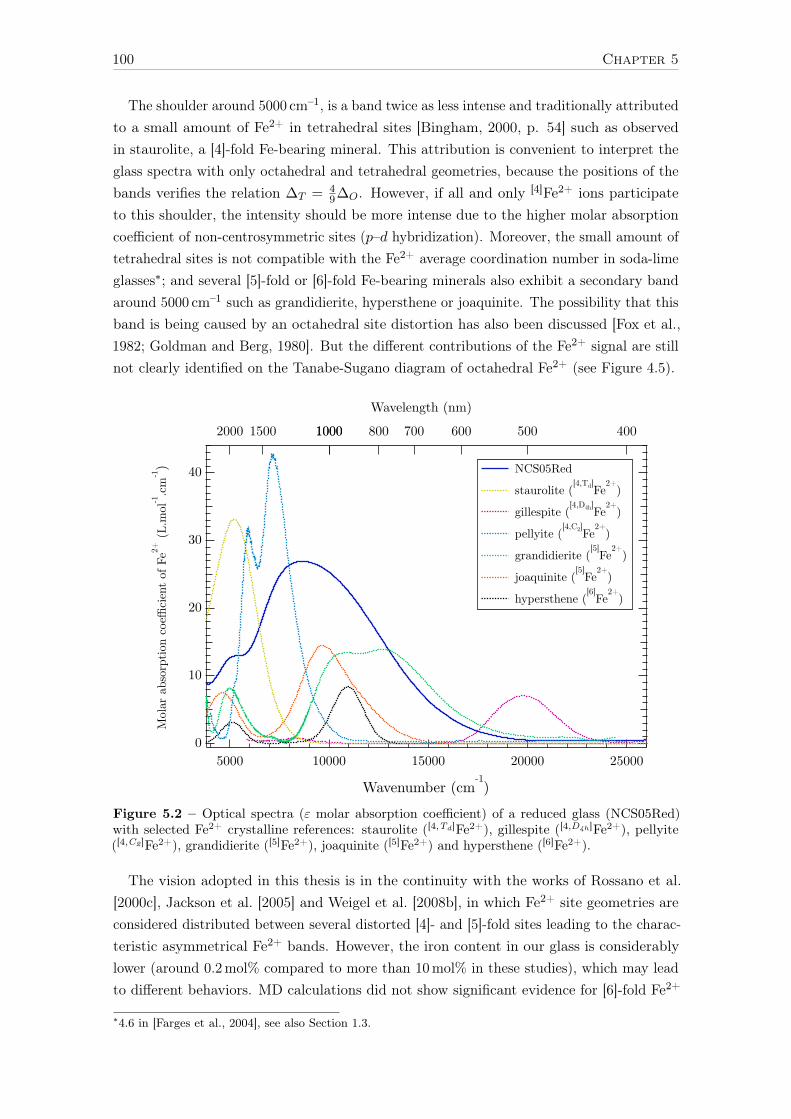
100 Chapter 5
The shoulder around 5000 cm–1, is a band twice as less intense and traditionally attributedto a small amount of Fe2+ in tetrahedral sites [Bingham, 2000, p. 54] such as observedin staurolite, a [4]-fold Fe-bearing mineral. This attribution is convenient to interpret theglass spectra with only octahedral and tetrahedral geometries, because the positions of thebands verifies the relation ∆T = 4
9∆O. However, if all and only [4]Fe2+ ions participateto this shoulder, the intensity should be more intense due to the higher molar absorptioncoefficient of non-centrosymmetric sites (p–d hybridization). Moreover, the small amount oftetrahedral sites is not compatible with the Fe2+ average coordination number in soda-limeglasses∗; and several [5]-fold or [6]-fold Fe-bearing minerals also exhibit a secondary bandaround 5000 cm–1 such as grandidierite, hypersthene or joaquinite. The possibility that thisband is being caused by an octahedral site distortion has also been discussed [Fox et al.,1982; Goldman and Berg, 1980]. But the different contributions of the Fe2+ signal are stillnot clearly identified on the Tanabe-Sugano diagram of octahedral Fe2+ (see Figure 4.5).
40
30
20
10
0
Mol
ar a
bsor
ptio
n co
effici
ent
of F
e2+ (
L.m
ol-1.c
m-1)
250002000015000100005000
Wavenumber (cm-1)
2000 1500 10001000 800 700 600 500 400
Wavelength (nm)
NCS05Red
staurolite ([4,Td]Fe2+)
gillespite ([4,D4h]Fe2+)
pellyite ([4,C2]Fe2+)
grandidierite ([5]Fe2+)
joaquinite ([5]Fe2+)
hypersthene ([6]Fe2+)
Figure 5.2 – Optical spectra (ε molar absorption coefficient) of a reduced glass (NCS05Red)with selected Fe2+ crystalline references: staurolite ([4,Td]Fe2+), gillespite ([4,D4h]Fe2+), pellyite([4,C2]Fe2+), grandidierite ([5]Fe2+), joaquinite ([5]Fe2+) and hypersthene ([6]Fe2+).
The vision adopted in this thesis is in the continuity with the works of Rossano et al.[2000c], Jackson et al. [2005] and Weigel et al. [2008b], in which Fe2+ site geometries areconsidered distributed between several distorted [4]- and [5]-fold sites leading to the charac-teristic asymmetrical Fe2+ bands. However, the iron content in our glass is considerablylower (around 0.2mol% compared to more than 10mol% in these studies), which may leadto different behaviors. MD calculations did not show significant evidence for [6]-fold Fe2+
∗4.6 in [Farges et al., 2004], see also Section 1.3.

IRON LOCAL ENVIRONMENT IN A SODA-LIME-SILICATE GLASS 101
or Fe3+ [Farges et al., 2004]. Anyway, centrosymmetric geometry slightly absorb light andtransitions are weak, therefore octahedra have to be distorted in order to lose their inversioncenter to significantly absorb light.
5.2.2 The contribution of XAS to the analysis of Fe2+ optical bands
To analyze in details the origins of the Fe2+ optical bands in glasses, X-ray absorptionspectroscopy (XAS) in fluorescence-yield detection mode is a chemically selective methodparticularly adapted in the case of low iron-content samples. It is a powerful experimentalmethod giving information on both oxidation state and local environment of iron [Calasand Petiau, 1983a], [Waychunas et al., 1983], [Henderson et al., 1984], [Brown et al.,1995], [Galoisy et al., 2001], [Petit et al., 2001], [Farges et al., 2004], [Jackson et al., 2005],[Henderson et al., 2014].
Compared to these studies, in which the total fluorescence yield was measured, thissection presents the first RIXS and HERFD measurements performed on iron-doped glasses.As explained in Section 2.4, RIXS and HERFD-XAS allow finely analyzing the fluorescencebeam in order to bring new information from the emitted photons.
Incident Energy [eV]
Ener
gy T
rans
fer
[eV
]
7110 7115 7120700
705
710
715
720
725NCS05Red
Incident Energy [eV]
Ener
gy T
rans
fer [
eV]
7110 7115 7120
705
710
715
720
725staurolite[4]Fe2+
Incident Energy [eV]
Ener
gy T
rans
fer [
eV]
7110 7115 7120
705
710
715
720
725grandidierite[5]Fe2+
0
0.05
0.1
0.15
0.2
0.25
0.3
0.35
0.4
Incident Energy [eV]
Ener
gy T
rans
fer [
eV]
7110 7115 7120
705
710
715
720
725hypersthene[6]Fe2+
Incident Energy [eV]
Ener
gy T
rans
fer [
eV]
7110 7115 7120
705
710
715
720
725siderite[6]Fe2+
Figure 5.3 – Normalized RIXS Kα spectra at the Fe K pre-edge for a reduced glass (NCS05Red)and selected [4]-, [5]-, and [6]-coordinated Fe2+ model compounds.

102 Chapter 5
In order to study Fe2+ environment, the RIXS spectrum of the NCS05Red glass iscompared with reference compounds (Figure 5.3). NCS05Red show a similar shape withstaurolite ([4]Fe2+) and grandidierite ([5]Fe2+) compared to other crystalline referencecompounds such as hypersthene or siderite ([6]Fe2+) (RIXS data for all Fe2+- and Fe3+-bearing mineral reference compounds can be found in Appendix A). This assumption wasconfirmed by a linear decomposition of the RIXS pre-edge of NCS05Red as a function ofthe different minerals; staurolite and grandidierite obtained the highest score of similarity.
To confirm this tendency, a cut along the diagonal of the RIXS spectrum, that correspondsto a scan at constant emission energy (CEE) or HERFD spectrum (see Section 2.4.4), isshown in Figure 5.4 for the same five samples. One can notice that it is almost possibleto decompose the glass pre-edge with the staurolite ([4]Fe2+) and grandidierite ([5]Fe2+)minerals. Of course, the XANES oscillations just after the main edge are stronger incrystals than in glass regarding the periodic arrangements of crystals compared to theamorphous nature of glass. Two other details can be shed in light, the first one is thatNCS05Red spectrum also contains features associated to the presence of Fe3+: the pre-edgeis more intense than expected around 7114.5 eV and the main edge is at higher energythan expected. This effect, due to beam damage photooxydation, studied in details inAppendix D.3, changes the redox ratio, Fe2+/Fetot, from 99 to 85% in the glass, leading tothe raise of a Fe3+ component around 7114.5 eV. The other point is the intensity betweenthe pre-edge and the main edge, which is almost zero in the crystalline compounds and notin the glass, this effect is attributed to delocalized states of iron involved in Fe-clusters andwill be detailed later (see Section 5.4).
1.6
1.4
1.2
1.0
0.8
0.6
0.4
0.2
0.0
).u .bra( langis DF
REH
7.207.187.167.147.127.10Energy (keV)
0.15
0.10
0.05
0.007.1207.1187.1167.1147.1127.110
NCS05Red glass
staurolite [4]
Fe2+
grandidierite [5]
Fe2+
hypersthene [6]
Fe2+
siderite [6]
Fe2+
Fe2+ Fe2+ Fe3+
Figure 5.4 – Cut of the RIXS map at constant emitted energy (CEE), i.e. HERFD spectra, forFe K pre-edge spectra of NCS05Red glass and selected [4]-, [5]-, and [6]-coordinated Fe2+ modelcompounds.
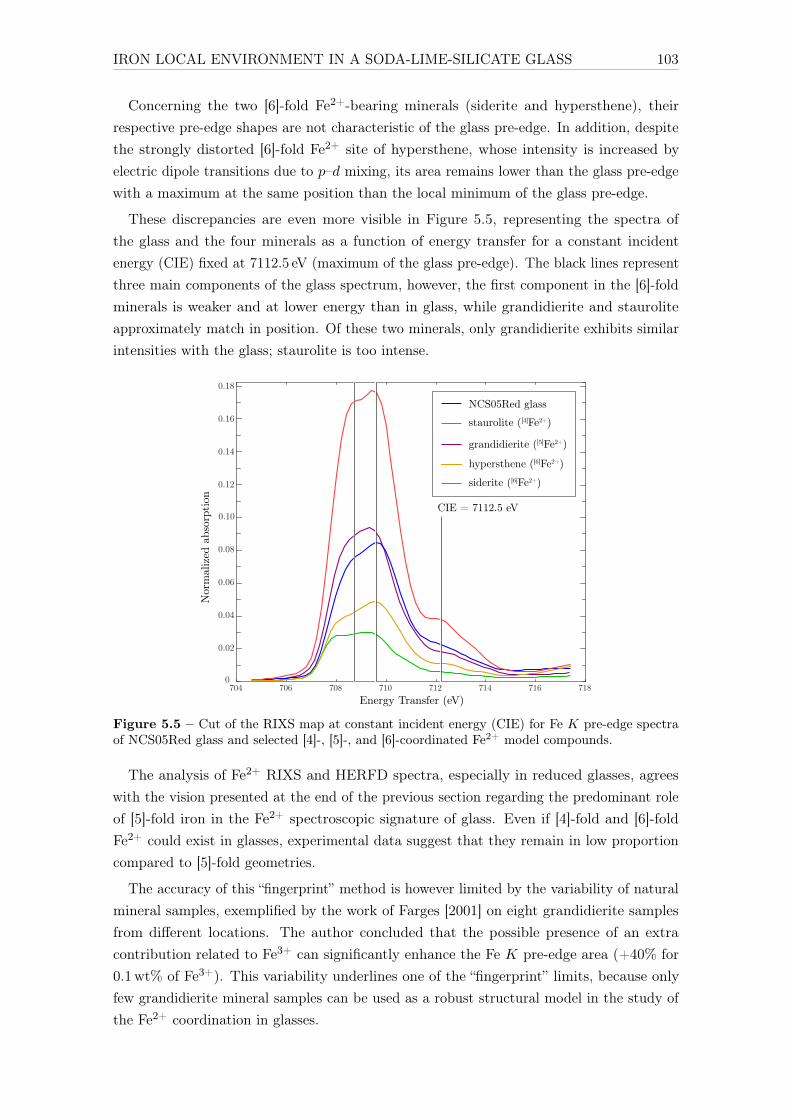
IRON LOCAL ENVIRONMENT IN A SODA-LIME-SILICATE GLASS 103
Concerning the two [6]-fold Fe2+-bearing minerals (siderite and hypersthene), theirrespective pre-edge shapes are not characteristic of the glass pre-edge. In addition, despitethe strongly distorted [6]-fold Fe2+ site of hypersthene, whose intensity is increased byelectric dipole transitions due to p–d mixing, its area remains lower than the glass pre-edgewith a maximum at the same position than the local minimum of the glass pre-edge.
These discrepancies are even more visible in Figure 5.5, representing the spectra ofthe glass and the four minerals as a function of energy transfer for a constant incidentenergy (CIE) fixed at 7112.5 eV (maximum of the glass pre-edge). The black lines representthree main components of the glass spectrum, however, the first component in the [6]-foldminerals is weaker and at lower energy than in glass, while grandidierite and stauroliteapproximately match in position. Of these two minerals, only grandidierite exhibits similarintensities with the glass; staurolite is too intense.
704 706 708 710 712 714 716 7180
0.02
0.04
0.06
0.08
0.10
0.12
0.14
0.16
0.18
CIE = 7112.5 eV
Energy Transfer (eV)
Nor
mal
ized
abs
orpt
ion
staurolite ([4]Fe2+)
siderite ([6]Fe2+)
hypersthene ([6]Fe2+)
grandidierite ([5]Fe2+)
NCS05Red glass
Figure 5.5 – Cut of the RIXS map at constant incident energy (CIE) for Fe K pre-edge spectraof NCS05Red glass and selected [4]-, [5]-, and [6]-coordinated Fe2+ model compounds.
The analysis of Fe2+ RIXS and HERFD spectra, especially in reduced glasses, agreeswith the vision presented at the end of the previous section regarding the predominant roleof [5]-fold iron in the Fe2+ spectroscopic signature of glass. Even if [4]-fold and [6]-foldFe2+ could exist in glasses, experimental data suggest that they remain in low proportioncompared to [5]-fold geometries.
The accuracy of this “fingerprint” method is however limited by the variability of naturalmineral samples, exemplified by the work of Farges [2001] on eight grandidierite samplesfrom different locations. The author concluded that the possible presence of an extracontribution related to Fe3+ can significantly enhance the Fe K pre-edge area (+40% for0.1wt% of Fe3+). This variability underlines one of the “fingerprint” limits, because onlyfew grandidierite mineral samples can be used as a robust structural model in the study ofthe Fe2+ coordination in glasses.

104 Chapter 5
Another issue remains in the differences between the amorphous nature of glass inwhich iron sites are distributed and the crystalline arrangement of minerals. Structuralanalogies between glass and minerals can be done, but the intrinsic differences betweenthese materials exclude the possibility of deconvoluting a glass by directly using selectedminerals characteristic of iron sites in glass.
5.2.3 LFM calculations of Fe2+ spectroscopic signature in glasses
The last chapter shows the potentialities of LFM calculations to the analysis of Fe2+
spectroscopic features of mineral analyzed by optical absorption spectroscopy and X-rayabsorption spectroscopy. During this thesis, several theoretical and software developmentshave been done (see Appendix E) in order to fully calculate the RIXS and HERFD-XASspectra of powders using Quanty and the method described in Chapter 4. In the currentsituation, further developments are still needed but we are confident on the possibility ofreproducing the RIXS and HERFD spectra with the same set of parameters than XAS andOAS spectra.
It is nevertheless possible to use the TFY measurements, which are less resolved thanHERFD but can be reproduced using LFM calculation. With the developments achievedin this work for optical spectroscopy calculations, it is now easier to compare these twocomplementary spectroscopies. It is also possible to extract tendencies from the calculationsin order to study variations of the spectra depending on the point group symmetry repre-senting the Fe absorbing site, crystal field parameters (Dq, Ds, Dt, Dµ, Dν), hybridizationparameters (Vpd), nephelauxetic ratio (β) and spin-orbit (ζ3d).
Concerning staurolite ([4]Fe2+), its optical spectrum of (Figure 5.2) exhibits a bandaround 5000 cm–1 that was reproduced in Section 4.4. The intensities of the optical bandand the pre-edge are too intense compared to the glass, which suggests that Vpd should bedecreased. Unfortunately, with Td geometry it will never be possible of reproducing theoptical features from 9000 cm–1 to 17 000 cm–1, except by taking 10Dq higher than 1 eV,which is not representative of NCS05Red glass regarding the K pre-edge split observed forFe2+ in Td in the previous chapter (Figure 4.20). Therefore, another geometry has to beconsidered in order to interpret the OAS and XAS features of Fe2+ in glass.
On the other hand, it has been shown that grandidierite ([5]Fe2+) and NCS05Red glassexhibit similar OAS (Figure 5.2) and HERFD-XAS (Figure 5.4) spectra. In the case ofNCS05Red, LFM calculations of Fe2+ in C3v shows optical bands in the same spectralrange with coherent intensities (Figure 5.7).
By adapting the previous results of grandidierite, it is possible to obtain two opticalbands at 5000 cm–1 and around 10 000 cm–1 (set A, B and C in Table 5.1). By changingthe values of crystal field parameters Dµ and Dν, it is possible to keep the first band at5000 cm–1 and sweep the second band from 10 000 cm–1 to 17 000 cm–1 (Figure 5.7). Inorder to reproduce the diversity of sites present in the glass, the parameters have to bedistributed around the ones used for grandidierite (Table 4.7). That is why, the use of twoadditional sets of parameters (D and E in in Table 5.1) have permitted to reproduce thesignal between 6000 cm–1 and 9000 cm–1. These calculations show that we could reproduce

IRON LOCAL ENVIRONMENT IN A SODA-LIME-SILICATE GLASS 105
the optical spectrum of Fe2+ in glasses only using the C3v geometry representative of [5]-foldtrigonal bipyramid. The present results show that the key parameter in the interpretationof optical properties of iron in glass is site distribution.
Table 5.1 – Sets of C3v calculation parametersrepresenting the variability of [5]-fold Fe2+ sites.
name Dµ (eV) Dν (eV) Vpd (eV) β
A −0.025 −0.120 0.9 60%B −0.06 −0.155 0.75 60%C −0.09 −0.175 0.5 60%D 0.05 −0.125 1.0 60%E 0.09 −0.12 1.0 60%
A
D
E
B
C
-0.2 -0.1 0
-0.1
0.1
Figure 5.6 – Crystal field parametersrepresenting a trigonal bipyramid geom-etry (white area).
25
20
15
10
5
0
Mol
ar a
bsor
ptio
n co
effici
ent
(L.m
ol-1.c
m-1)
200001800016000140001200010000800060004000
wavenumber (cm-1)
NCS05Red calc C3v (A) calc C3v (B) calc C3v (C) calc C3v (D) calc C3v (E)
5A1(D)
5E(D)
Figure 5.7 – Optical absorption spectra of NCS05Red glass, and five calculated spectra of Fe2+in C3v geometry (A, B, C, D and E).
In any case, the existence of a simple and unique Gaussian distribution of the crystalfield parameters is not probable because at least two sets of parameters were necessary toreproduce the optical spectra of grandidierite (Table 4.7). Therefore, in the eventuality of
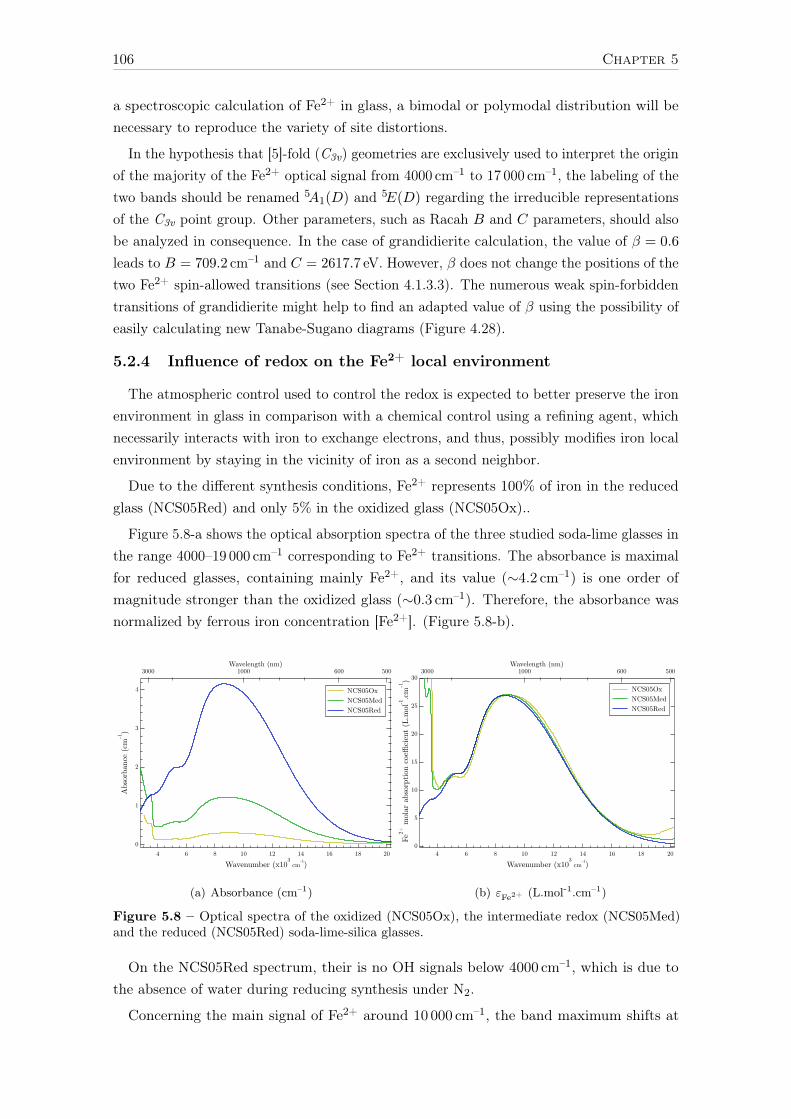
106 Chapter 5
a spectroscopic calculation of Fe2+ in glass, a bimodal or polymodal distribution will benecessary to reproduce the variety of site distortions.
In the hypothesis that [5]-fold (C3v) geometries are exclusively used to interpret the originof the majority of the Fe2+ optical signal from 4000 cm–1 to 17 000 cm–1, the labeling of thetwo bands should be renamed 5A1(D) and 5E(D) regarding the irreducible representationsof the C3v point group. Other parameters, such as Racah B and C parameters, should alsobe analyzed in consequence. In the case of grandidierite calculation, the value of β = 0.6
leads to B = 709.2 cm–1 and C = 2617.7 eV. However, β does not change the positions of thetwo Fe2+ spin-allowed transitions (see Section 4.1.3.3). The numerous weak spin-forbiddentransitions of grandidierite might help to find an adapted value of β using the possibility ofeasily calculating new Tanabe-Sugano diagrams (Figure 4.28).
5.2.4 Influence of redox on the Fe2+ local environment
The atmospheric control used to control the redox is expected to better preserve the ironenvironment in glass in comparison with a chemical control using a refining agent, whichnecessarily interacts with iron to exchange electrons, and thus, possibly modifies iron localenvironment by staying in the vicinity of iron as a second neighbor.
Due to the different synthesis conditions, Fe2+ represents 100% of iron in the reducedglass (NCS05Red) and only 5% in the oxidized glass (NCS05Ox)..
Figure 5.8-a shows the optical absorption spectra of the three studied soda-lime glasses inthe range 4000–19 000 cm–1 corresponding to Fe2+ transitions. The absorbance is maximalfor reduced glasses, containing mainly Fe2+, and its value (∼4.2 cm–1) is one order ofmagnitude stronger than the oxidized glass (∼0.3 cm–1). Therefore, the absorbance wasnormalized by ferrous iron concentration [Fe2+]. (Figure 5.8-b).
4
3
2
1
0
Abs
orba
nce
(cm
-1)
201816141210864
Wavenumber (x103 cm-1)
3000 1000 600 500
NCS05Ox NCS05Med NCS05Red
Wavelength (nm)
(a) Absorbance (cm–1)
30
25
20
15
10
5
0
Fe2+
mol
ar a
bsor
ptio
n co
effici
ent
(L.m
ol-1.c
m-1)
201816141210864
Wavenumber (x103 cm-1)
3000 1000 600 500
NCS05Ox NCS05Med NCS05Red
Wavelength (nm)
(b) εFe2+ (L.mol-1.cm–1)
Figure 5.8 – Optical spectra of the oxidized (NCS05Ox), the intermediate redox (NCS05Med)and the reduced (NCS05Red) soda-lime-silica glasses.
On the NCS05Red spectrum, their is no OH signals below 4000 cm–1, which is due tothe absence of water during reducing synthesis under N2.
Concerning the main signal of Fe2+ around 10 000 cm–1, the band maximum shifts at

IRON LOCAL ENVIRONMENT IN A SODA-LIME-SILICATE GLASS 107
lower energy when Fe2+/Fetot decreases in the glass. This suggests a change of Fe2+ localenvironment, whose proportion of the different sites contributing to the Fe2+ spectrumevolves with redox. Hannant et al. [2008] also found a similar conclusion concerning theenvironment dependence of both ferric and ferrous iron with redox by using Mossbaueranalysis of high iron-content soda-lime silicate glasses with more complex compositionscloser to real industrial glasses.
The band at 5000 cm–1 is more separated from the main band in NCS05Ox than inNCS05Red. In the reduced glass spectrum, this band only shouldered the main band,whereas it presents a local maximum and minimum in the oxidized glass spectrum. Thiscan be analyzed using a Gaussian fit of the Fe2+ contributions from 4000 to 16 000 cm–1.For smaller Fe2+/Fetot values, the fit results shown in Table 5.2 exhibit a shift at lowerenergy of the band #1 (around 4800 cm–1) and a shift at higher energy of the component#2 (around 7800 cm–1).
In conclusion, the analysis of optical absorption spectra, in the energy range attributedto Fe2+, shows a modification of the optical bands suggesting a change of the Fe2+ localenvironment with redox.
Table 5.2 – Fit of Fe2+ bands with 3 Gaussian functions for NCS05Ox, NCS05Med and NCS05Redglasses
Sample name(peak #)
Position(cm–1)
σ
(cm–1)FWHM(cm–1)
Intensity(cm–1)
εFe2+
(L/mol/cm)Area (cm-2)
NCS05Red (R = 99%)#1 4848 492 1159 0.75 4.8 651.6
#2 7812 1277 3007 0.96 6.2 2181.4
#3 9775 3177 7482 3.65 23.7 20 557.5
NCS05Med (R = 28%)#1 4834 470 1107 0.21 4.6 174.3
#2 7856 1155 2720 0.23 5.1 471.3
#3 9711 3104 7310 1.09 24.0 5988.5
NCS05Ox (R = 6%)#1 4818 461 1086 0.05 4.5 39.5
#2 7894 1026 2416 0.05 4.4 86.1
#3 9765 3147 7411 0.27 25.0 1510.2
To complement this analysis, we tried to find the best linear combination of thetwo extreme glasses (NCS05Ox and NCS05Red) that reproduces the RIXS pre-edge ofNCS05Med. The linear fit was performed on the region of interest (ROI): Incident energy:7111 < x < 7116.5 eV; Energy transfer: 707 < y < 716 eV; ∆x = 5.5 eV ; ∆y = 9 eV.
The RIXS spectra of the three glasses are plotted at the top of Figure 5.9. The spectrum ofNCS05Ox is very similar to NCS05Med except that the pre-edge intensity is slightly higher.However, NCS05Red has a different pre-edge shape (lower peak around EI = 7114.5 eV andhigher peaks around 7112.5 eV) and a more intense main-edge (IE > 7116 eV).

108 Chapter 5
The best linear combination (LC), corresponding to Med ' LC = 0.787Ox+ 0.192Red,is plotted at the bottom right of Figure 5.9. This spectrum is very close to the NCS05Medspectrum. The difference spectrum (bottom left of Figure 5.9), corresponding to Resi =
Med−LC, does not show any difference higher than 2% of the NCS05Med intensity in theROI range. However, the main-edge is at higher energy in the LC spectrum (red colorsvalues around EI = 7120 eV) and the area between the pre-edge and the main-edge (bluevalues around EI = 7117 eV) is overestimated (this last point will be discussed in the lastSection 5.4 of this chapter).
The small differences obtained for three glasses of the same composition with differentredox, confirm the observation of optical spectra suggesting some evolution of iron environ-ment with redox. In particular the sum of coefficient (0.979) is almost equal to 1 (idealcase) but this disparity suggest a change of the iron partition between different sites thatdo not have the same X-ray molar absorption coefficient.
Linear combination
Incident energy (eV)7110 7115 7120
Ener
gy T
rans
fer
(eV
)
700
705
710
715
720
725
0
0.05
0.1
0.15
0.2
0.25
0.3
0.35
0.4
0.45
0
0.05
0.1
0.15
0.2
0.25
0.3
0.35
0.4
0.45
NCS05Red
Incident Energy (eV)7110 7115 7120
Ener
gy T
rans
fer
(eV
)
700
705
710
715
720
725
Residuals
Incident energy (eV)7110 7115 7120
Ener
gy T
rans
fer
(eV
)
700
705
710
715
720
725
x10-3
-6
-4
-2
0
2
4
6
NCS05Ox
Incident Energy (eV)7110 7115 7120
NCS05Med
Incident Energy (eV)7110 7115 7120
Figure 5.9 – Top: Fe Kα RIXS pre-edge spectra of three NCS05 glasses (Ox, Red, Med).Bottom-right: best linear combination of Ox and Red to reproduce the Med spectrum (LC =0.787Ox+ 0.192Red), Bottom-left: difference between LC and Med spectra (Resi = LC −Med).

IRON LOCAL ENVIRONMENT IN A SODA-LIME-SILICATE GLASS 109
5.2.5 Evidence of Fe2+ spin-forbidden bands in reduced glass
The spectrum of NCS05Red does not show any trace of the Fe3+ band around 26 300 cm–1.Even after removing the UV edge (see Appendix B.4.1), no “d–d” transitions are discerniblein the spectrum. The absence of Fe3+ bands confirms the high Fe2+/Fetot ratio (R = 99%).In the spectral region of interest for Fe3+, i.e. from 18 000 to 28 000 cm–1, the backgroundis slightly higher than in NCS05Ox and two weak bands are visible around 21 500 cm–1 and23 400 cm–1. By using the extracted absorbance of Fe2+ (See Appendix B.4.2), it appearsin Figure 5.10 that a third band is also visible around 25 200 cm–1.
0.4
0.3
0.2
0.1
0.0
Abs
orba
nce
(cm
-1)
2800026000240002200020000180001600014000wavenumber (cm-1
)
Fe2+
Fe3+
aa
Fe2+
Fe2+
Fe2+
Fe3+Fe3+
Fe3+
Fe3+
Figure 5.10 – Estimated signals for 100% of Fe2+ and 100% of Fe3+ in NCS05 glasses.
The position of these three weak bands are different from the expected values of Fe3+
and their intensities are higher than expected intensities for residual Fe3+ regarding theestimated concentration (∼50 ppm). Since, they can not be ascribable to residual Fe3+, theyca be assigned to the Fe2+ spin-forbidden transitions 5T2(D)→3T1(H) and 5T2(D)→3T2(H)
as suggested in Fe2+(H2O)6 [Burns, 1993] and in a sodium-alkaline earth silicate glass[Glebov et al., 1998]. Grandidierite ([5]Fe2+) shows similar weak features from 20 000 to25 000 cm–1 Rossman [2014] and Schmetzer et al. [2003]. Our measurements suggest that thebackground of the optical spectra of reduced silicate glasses containing iron is constitutedby a succession of poorly resolved bands with low intensities related to Fe2+ spin-forbiddentransitions accordingly to Tanabe-Sugano diagrams. This band superposition could leadto overestimate the background if the minimum of the spectrum around 18 000 cm–1 isconsidered as the background value.
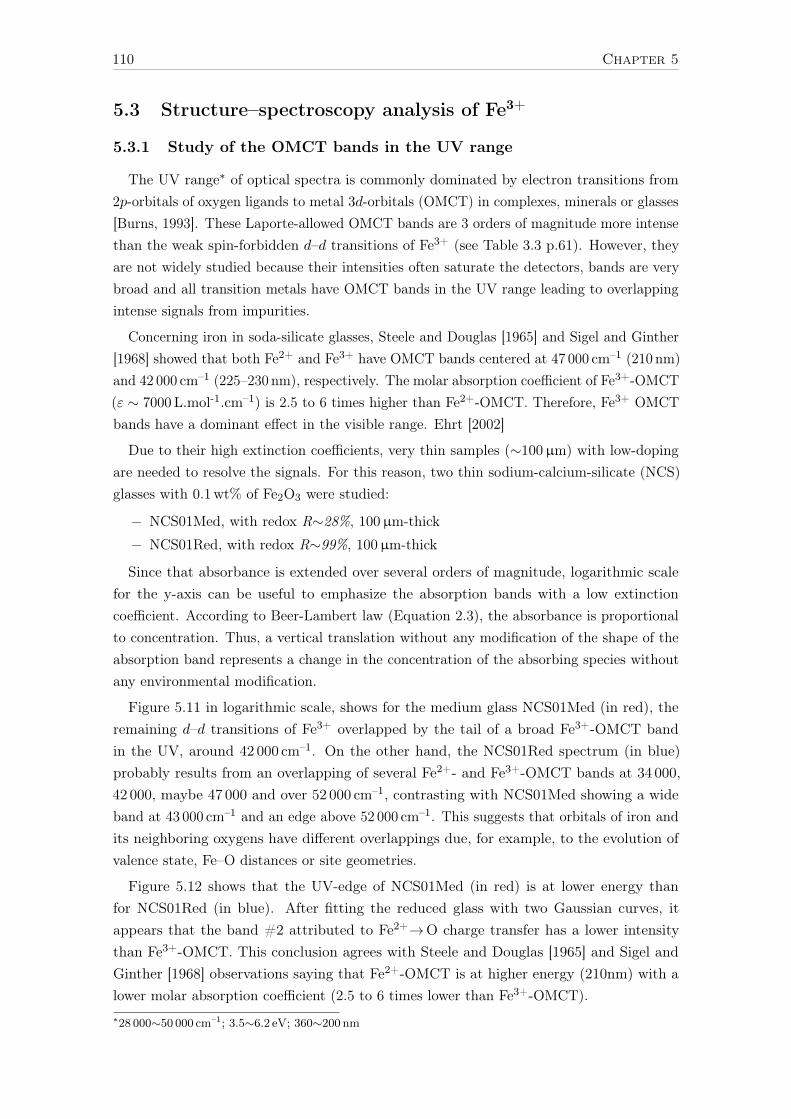
110 Chapter 5
5.3 Structure–spectroscopy analysis of Fe3+
5.3.1 Study of the OMCT bands in the UV range
The UV range∗ of optical spectra is commonly dominated by electron transitions from2p-orbitals of oxygen ligands to metal 3d-orbitals (OMCT) in complexes, minerals or glasses[Burns, 1993]. These Laporte-allowed OMCT bands are 3 orders of magnitude more intensethan the weak spin-forbidden d–d transitions of Fe3+ (see Table 3.3 p.61). However, theyare not widely studied because their intensities often saturate the detectors, bands are verybroad and all transition metals have OMCT bands in the UV range leading to overlappingintense signals from impurities.
Concerning iron in soda-silicate glasses, Steele and Douglas [1965] and Sigel and Ginther[1968] showed that both Fe2+ and Fe3+ have OMCT bands centered at 47 000 cm–1 (210 nm)and 42 000 cm–1 (225–230 nm), respectively. The molar absorption coefficient of Fe3+-OMCT(ε ∼ 7000 L.mol-1.cm–1) is 2.5 to 6 times higher than Fe2+-OMCT. Therefore, Fe3+ OMCTbands have a dominant effect in the visible range. Ehrt [2002]
Due to their high extinction coefficients, very thin samples (∼100µm) with low-dopingare needed to resolve the signals. For this reason, two thin sodium-calcium-silicate (NCS)glasses with 0.1wt% of Fe2O3 were studied:
− NCS01Med, with redox R∼28%, 100µm-thick
− NCS01Red, with redox R∼99%, 100µm-thick
Since that absorbance is extended over several orders of magnitude, logarithmic scalefor the y-axis can be useful to emphasize the absorption bands with a low extinctioncoefficient. According to Beer-Lambert law (Equation 2.3), the absorbance is proportionalto concentration. Thus, a vertical translation without any modification of the shape of theabsorption band represents a change in the concentration of the absorbing species withoutany environmental modification.
Figure 5.11 in logarithmic scale, shows for the medium glass NCS01Med (in red), theremaining d–d transitions of Fe3+ overlapped by the tail of a broad Fe3+-OMCT bandin the UV, around 42 000 cm–1. On the other hand, the NCS01Red spectrum (in blue)probably results from an overlapping of several Fe2+- and Fe3+-OMCT bands at 34 000,42 000, maybe 47 000 and over 52 000 cm–1, contrasting with NCS01Med showing a wideband at 43 000 cm–1 and an edge above 52 000 cm–1. This suggests that orbitals of iron andits neighboring oxygens have different overlappings due, for example, to the evolution ofvalence state, Fe–O distances or site geometries.
Figure 5.12 shows that the UV-edge of NCS01Med (in red) is at lower energy thanfor NCS01Red (in blue). After fitting the reduced glass with two Gaussian curves, itappears that the band #2 attributed to Fe2+→O charge transfer has a lower intensitythan Fe3+-OMCT. This conclusion agrees with Steele and Douglas [1965] and Sigel andGinther [1968] observations saying that Fe2+-OMCT is at higher energy (210nm) with alower molar absorption coefficient (2.5 to 6 times lower than Fe3+-OMCT).∗28 000∼50 000 cm–1; 3.5∼6.2 eV; 360∼200 nm

IRON LOCAL ENVIRONMENT IN A SODA-LIME-SILICATE GLASS 111
0.01
0.1
1
10
100A
bsor
banc
e (c
m-1)
504540353025Wavenumber (x103 cm-1)
400 350 300 270 240 220 200
Medium NCS01Med Reduced NCS01Red
Wavelength (nm)
Figure 5.11 – logarithmic representa-tion of the optical absorption spectra forthe “air” and reduced soda-lime silicateglasses.
0
2
4
6
8
10
25000 30000 35000 40000
NCS01Med experimentNCS01Med UV edge fitNCS01Red experimentNCS01Red UV edge fitNCS01Red UV peak 1NCS01Red UV peak 2
α lin
ear
abso
rptio
n co
effic
ient
(cm
–1)
wavenumber (cm–1)
12
Figure 5.12 – UV-edge fitting of the optical absorptionspectra for the “air” and reduced soda-lime silicate glasses.
The band #1 at 34 000 cm–1 in NCS01Red can be attributed to remaining Fe3+→O chargetransfer that confirms the high redox of reduced glasses close to 100% Fe2+. However, itsshape and position differ from observation of medium glasses, suggesting that the remainingFe3+ are in a different environment than the “common” or “average” Fe3+ observed inmedium glasses which have the same spectral shape than fully oxidized glasses (not shownin Figure 5.11).
5.3.2 Evidence of [5]-fold ferric iron ([5]Fe3+) in glasses
The existence of [5]-fold coordinated Fe3+ in glasses has been suggested by X-rayabsorption spectroscopy, neutron diffraction and numerical simulation studies [Farges et al.,2004; Guillot and Sator, 2007; Jackson et al., 2005; Weigel et al., 2008a], although, theirinfluence on optical absorption spectra in iron-doped glasses is still speculative.
Spin-forbidden transitions of Fe3+ lead to weaker but more numerous bands than Fe2+
[Bingham et al., 2007]. As explained in Section 1.3, Fe3+ is mainly in [4]-fold tetrahedralsite but the average coordination number∗ ([4.6]–[5.0]) suggests the presence of [5]- or[6]-fold coordination. Iron in non-centrosymmetric geometries (such as [5]-fold or distorted[6]-fold) are therefore expected to take part in the optical absorption to a lesser extent.
In silicate glasses, some Fe3+ d–d bands can happen below 19 000 cm–1 and be overlappedby Fe2+ signals, but Fe3+ transitions are mainly apparent in the range 19 000–28 000 cm–1.Band attribution was performed by comparison with Fe3+-bearing mineral references.Figure 5.13 shows experimental data of NCS05Ox glass and the example of three minerals:ferriorthoclase ([4]Fe3+), yoderite ([5]Fe3+) and andradite ([6]Fe3+) that reflects the varietyof signals observed for Fe3+ in silicates.
∗[4.6] in [Farges et al., 2004] and [5.0] in [Bingham et al., 2014], see also Section 1.3.

112 Chapter 5
7
6
5
4
3
2
1
0
Mol
ar a
bsor
ptio
n co
effici
ent
of F
e3+ (
L.m
ol-1.c
m-1)
30000250002000015000Wavenumber (cm-1)
700 600 500 400400 350Wavelength (nm)
NCS05Ox
ferriorthoclase ([4]Fe3+)
andradite ([6]Fe3+)
17000 cm-1
20500 cm-1
22600 cm-1
23900 cm-1
26380 cm-1
26460 cm-1
(a)
Res
cale
d op
tical
abs
orpt
ion
(a.u
.)
30000250002000015000Wavenumber (cm-1)
700 600 500 400400 350Wavelength (nm)
NCS05Ox
ferriorthoclase ([4]Fe3+)
andradite ([6]Fe3+)
yoderite ([5]Fe3+)
17000 cm-1
20500 cm-1
22600 cm-1 23900 cm-1
26380 cm-1
26460 cm-1
25500 cm-1
(b)
Figure 5.13 – Optical spectra comparison of an oxidized glass (NCS05Ox) with three Fe3+crystalline references: ferriorthoclase ([4]Fe3+), yoderite ([5]Fe3+) and andradite ([6]Fe3+). (a) εFe3+molar absorption coefficient of Fe3+ (b) arbitrarily rescaled optical absorption.
Ferriorthoclase and andradite data were measured in transmission mode from naturalsample. Yoderite data have been taken from Langer et al. [1982] (molar absorptioncoefficient was not available). Fe3+ bands have been fitted to remove the intense Mn3+
contribution, however, the signals around 21 000 cm–1 are probably overestimated becauseof this overlapping of Mn3+ and Fe3+.
Ferriorthoclase and NCS05Ox glass have a similar spectral shape attesting the dominanttetrahedral character usually attributed to Fe3+ in glasses. For the mineral, the bands areindeed narrower and the signal is lower between each peaks due to site uniformity. Onthe contrary, the broader bands observed in glass confirm the site distribution and theless defined environment of iron characteristic of amorphous materials. This conclusionis confirmed by the ε values that are 3 times smaller for glasses than for ferriorthoclase,suggesting that, in addition to site distortion and distribution of tetrahedral geometry, partof Fe3+ is not in tetrahedral sites but in higher coordinated sites potentially leading to“silent” species.
After a careful subtraction of the UV-edge and an extraction of the Fe3+ optical signatureusing linear combinations of several spectra from the same glass composition at different Fe-redox, a fit of Fe3+ bands has been done between 19 000 and 28 000 cm–1 (see Appendix B.4for details on Fe3+ data processing).
The shapes and positions of the three main Fe3+ bands, obtained by comparison with Fe3+-bearing crystalline references (Table 5.4), were used to fit the Fe3+ spectrum (Figure 5.14).The bands are near 22 800, 24 000 and 26 300 cm–1, however, the residuals (in dashed grey)are not null and present a Gaussian shape. Thus, three additional contributions at around21 200, 25 500 and 27 200 cm–1 have to be considered to obtain a good fit.

IRON LOCAL ENVIRONMENT IN A SODA-LIME-SILICATE GLASS 113
2.5
2.0
1.5
1.0
0.5
0.0
Fe3+
Mol
ar a
bsor
ptio
n co
effici
ent
(L.m
ol-1.c
m-1)
28272625242322212019Wavenumber (x103 cm-1)
500 450 400 380Wavelength (nm)
32
5 NCS05 Fe3+ signature
fitted spectrum
p2 22700 cm-1
p3 24000 cm-1
p5 26300 cm-1
residuals
Figure 5.14 – Molar absorption coefficient of Fe3+ in the soda-lime oxidized glass (NCS05Ox)after UV-edge removal. Example of Fe3+ bands fitted with 3 Gaussians.
2.5
2.0
1.5
1.0
0.5
0.0
Fe3+
Mol
ar a
bsor
ptio
n co
effici
ent
(L.m
ol-1.c
m-1)
28272625242322212019
Wavenumber (x103 cm-1)
500 450 400 380Wavelength (nm)
13
2 4
5
6
NCS05 Fe3+ signature fitted spectrum
p1 20500 cm-1
p2 22900 cm-1
p3 24000 cm-1
p4 25500 cm-1
p5 26300 cm-1
p6 27300 cm-1
Figure 5.15 – Molar absorption coefficient of Fe3+ in the soda-lime oxidized glass (NCS05Ox)after UV-edge removal. Example of Fe3+ bands fitted with 6 Gaussians.

114 Chapter 5
Table 5.3 – Fitting parameters and corresponding spin forbidden d–d transitions attribution forthe absorbance peaks of Fe3+ ions in the NCS05Med glass.
Peak Position(cm–1)
FWHM(cm–1)
εFe3+
(L.mol–1.cm–1)
Assignments
p6 27 244 ± 50 831 ± 100 0.297 [5,6]Fe3+, 6A1(g)(S)→4E(g)(D)
p5 26 353 ± 10 940 ± 10 2.109 [4]Fe3+, 6A1(S)→4E(D)
p4 25 570 ± 30 1359 ± 75 0.781 [5]Fe3+, 6A1(S)→4T2(D)
p3 24 200 ± 30 1189 ± 100 0.524 [4]Fe3+, 6A1(S)→4T2(D)
p2 22 896 ± 40 1759 ± 70 0.739 [4]Fe3+, 6A1(S)→4A1,4E(G)
p1 20 826 ± 200 2355 ± 300 0.266[4]Fe3+, 6A1(S)→4T2(G)[5]Fe3+, 6A1(S)→4A1,
4E(G)
Table 5.4 – Spin forbidden d–d transitions attribution of the absorbance peaks of 3 Fe-bearingminerals with different site symmetry and coordination number (CN). Ferriorthoclase ([4]Fe3+)[Burns, 1993], yoderite* ([5]Fe3+) [Abu-Eid et al., 1978; Langer et al., 1982] and andradite ([6]Fe3+)[Burns, 1993; Lin, 1981]. The ground state is 6A1(g).
Name CN Geometry 4T1(g)(G) 4T2(g)(G) 4A1(g),4E(g)(G) 4T2(g) (D) 4E(g)(D)
ferriorthoclase [4]Fe3+ Td 17000 20000 22600 23800 26460
yoderite [5]Fe3+ C3v 20700 21500 25500 28200
andradite [6]Fe3+ C3i (S6) 12450 16650 22700 23000 24000 27000
* Yoderite is a [5]-fold Fe3+-bearing mineral with iron in a distorted trigonal bipyramidal site (approximated by a
C3v geometry). The “g” was removed from the name of the energy levels given by Langer et al. [1982], because [5]-
fold coordinated site are necessarily non-centrosymmetric. Fe3+ Band attribution in yoderite was done in literature
by analogy with the octahedral geometry. However, Tanabe-Sugano diagrams are different for trigonal geometries
and parameters are Dµ and Dν instead of 10Dq, therefore spectroscopic terms should not be the same than for
cubic geometries (Td or Oh).
The adjustment performed with these six Gaussians fits the experimental data (Figure 5.15and Table 5.3). According to the transitions observed in crystalline references (Table 5.4),the three resolved bands at around 22 800, 24 000 and 26 300 cm–1 are assigned to tetrahedral[4]Fe3+ [Volotinen et al., 2008]. A weak contribution at around 27 200 cm–1 can hardlybe assigned and can be an artifact due to the edge subtraction. The band at around25500 cm–1, which has a similar absorbance as the bands at 22 800 and 24 000 cm–1, isabsent from optical spectra of ferriorthoclase ([4]Fe3+) or andradite ([6]Fe3+). Moreover, theimportant integrated area indicates a non-centrosymmetric site, such as in [5]Fe3+, which isconsistent with the position and intensity of the 6A1(S)→4T2(G) transition of [5]Fe3+ inyoderite (Table 5.4). The correspondence of this band between glass and mineral supportsthe existence of [5]-fold Fe3+ in glass.

IRON LOCAL ENVIRONMENT IN A SODA-LIME-SILICATE GLASS 115
The weak and broad contribution around 20 500–21 200 cm–1 has been previously assignedto the 6A1(S)→4T2(G) transition of tetrahedral Fe3+ [Manning, 1970]. For the glassesunder investigation, this band is broader than in ferriorthoclase and no decrease in theabsorbance is observed between the local maximums at 20 500 cm–1 and 22 800 cm–1. Thiscan be explained by the overlapping of absorption bands of higher coordinated Fe3+, suchas [5]Fe3+, whose bands at 20 700 and 21 500 cm–1 in yoderite were assigned by Langer et al.[1982] to the transition∗ 6A1(S)→[4A1,
4E(G)]. This optical evidence of [5]Fe3+ in glasspromotes the idea of a Fe3+-site distribution from [4]- to [5]-coordinated sites, as previouslyshown for Fe2+ (see Sections 1.3 and 5.2.1).
Fe3+ in octahedral site has been suggested by the study of minerals such as andradite(Table 5.4), which lead to transitions around 10 000–17 000 cm–1. Therefore, I looked for thetwo bands observed at 11 200 and 15 600 cm–1 in oxidized soda-lime glass by Hannoyer et al.[1992] and attributed to crystal field dependent transitions of [6]Fe3+ (6A1g(S)→4T1g(G)
and 6A1g(S)→4T2g(G). Despite a polynomial fit and a study of the second derivative of theoptical spectrum of the oxidized glass (NCS05Ox), there was no significant contributionsuperimposed to the tail of Fe2+ absorption band in the range 10 000–17 000 cm–1. In therange 20 000–26 000 cm–1, optical absorption bands of [6]-fold Fe3+ should occur at almostthe same positions than [4]- and [5]-fold coordinated Fe3+, but they are expected to be lessintense due to the centrosymmetric geometry of octahedra. In addition, the presence of[4]Fe3+ and [5]Fe3+ was sufficient to account for the visible transitions in this range, and noevidence of [6]-fold coordinated Fe3+ has been found in the investigated glasses by EPR orXAS spectroscopies.
5.3.3 The contribution of XAS experiments and LFM calculations tothe analysis of Fe3+ optical bands
To corroborate these results, the K pre-edge of the oxidized glass can be compared withthe same three mineral references (andradite, yoderite and ferriorthoclase). The normalizedHERFD spectra are shown in Figure 5.16.
As for optical spectra (Figure 5.13-a), [4]-fold Fe3+ in ferriorthoclase is the most intensespecies in the pre-edge range. Despite a similar shape, NCS05Ox has a lower integratedarea. This suggests that non-tetrahedral Fe3+ species with a lower absorption coefficientalso participate to reduce the intensity of this pre-edge.
Regarding the LFM calculations, [4]-fold C2v (ferriorthoclase) and [5]-fold C3v (yoderite)give spectroscopic features that are compatible with Fe3+ signature in glass with bothspectroscopies. A decrease of the Vpd parameter in the [4]Fe3+ calculation could explainboth OAS and XAS smaller integrated areas. However, smaller Vpd values cannot explainthe average coordination number of Fe3+ in soda-lime glasses ∼[4.6] (see Section 1.3.2) anda mixture of at least two site geometries should be considered.
∗The assignations of this paper is ambiguous, since it use the level symmetry of Td and Oh instead of D3h,for example there is no T2 symmetry in D3h but only A′1, A′′1 , A′2, A′′2 , E′ and E′′.

116 Chapter 5
1.4
1.2
1.0
0.8
0.6
0.4
0.2
0.0HER
FD s
igna
l (no
rmliz
ed a
t th
e m
ain
edge
)
720071807160714071207100Energy (eV)
0.4
0.3
0.2
0.1
0.0712071187116711471127110
NCS05Ox ferriorthoclase [4]Fe3+ yoderite [5]Fe3+ andradite [6]Fe3+
Figure 5.16 – HERFD spectra for Fe K pre-edge spectra of NCS05Ox glass and selected [4]-, [5]-,and [6]-coordinated Fe3+ model compounds.
With ligand field multiplet calculations it is not easy to consider a distribution ofgeometries, and only a distribution of calculation parameters can be considered to takeinto account the amorphous nature of glass. Because the optical absorption peak around26 300 cm–1 is relatively well defined, it means that β is not distributed more than ±1% (seeSection 4.5). The broadening of the optical bands, which are less resolved in NCS05Ox glass,can partly be explained by a distribution of 10Dq in a tetrahedral geometry. This supportsthe fact that [5]-fold Fe3+ in C3v should be considered because their optical bands arecalculated to be in the same spectral range with compatible intensities. This hypothesis willbe further developed in the next chapter by studying the effect on spectroscopic propertiesof a substitution of Ca by Mg in the glass formula.
5.3.4 Study of the impact of redox on Fe3+ site distortion
As we have seen for ferrous iron in Section 5.2.4, the redox influences the local environmentof transition metals. This part uses the selectivity of EPR to focus on the distortion offerric iron sites.
The X-band EPR spectra of the three NCS05 glasses with different redox (Ox, Medand Red) are shown in Figure 5.17. The general shape of the EPR spectra depends onthe redox state of the investigated samples. NCS05Med and Ox glasses give typical EPRsignals for a Fe3+-bearing glasss with two main lines at 160mT (g = 4.3) and at 340mT(g = 2) characteristic of two kinds of sites: rhombically distorted isolated sites and sitespresenting Fe–Fe interactions (see Section 2.6.3 for interpretation elements of X-band EPRglass spectra). However, NCS05Red (∼50 ppm Fe3+) gives rise to a peculiar EPR signal(Figure 5.17) with (i) a zero field signal, (ii) a sloping background below 100 mT, (iii) aweak signal at g = 8 (around 80 mT), (iv) appearance of shoulders just before and afterthe g = 4.3 line (at 130 mT and 170 mT), and (v) a split signal at g = 4.3 (see the inset ofthe figure). Moreover, two signals are superimposed at g = 2: a wide signal (marked A)related to clustering of Fe3+ ions and a sharp one at 350 mT (marked B) related to defectstrapped on silicate groups that will not be studied here.

IRON LOCAL ENVIRONMENT IN A SODA-LIME-SILICATE GLASS 117
1000
500
0
-500
165160155
×1×1
×1001000
500
0
-500
).u .bra( langiS RPE
4003002001000Magnetic field (mT)
NCS05Ox NCS05Med NCS05Red
g = 4.3
×1
×100
Temperature 298 K
g = 8(85 mT)
(160 mT)
(340 mT)
(160 mT)Zoom at g = 4.3
split signal
Ipp
A B
A
g = 2
ΔHpp
Figure 5.17 – Room temperature X-band EPR signals of the NCS05 glasses at three differentredox: NCS05Ox (yellow/R = 6%), NCS05Med (green, R = 28%) and NCS05Red (blue, R = 99%).The inset zooms on the g = 4.3 line.
Concerning the signal at g = 4.3, the peak to peak intensity Ipp and peak to peak linewidth∆Hpp are both increasing with the oxidation (i.e. lower Fe2+/Fetot). The enhancementof the NCS05Ox intensity is consistent with the increase of Fe3+ concentration, and theenlargement of the g = 4.3 signal of NCS05Ox, which is larger in Ox glasses than Med thanRed suggests a lower average distortion of Fe3+ sites in oxidized than reduced glasses. Thesplit of the g = 4.3 signal in the reduced sample is due to the separation of the three EPRKramer’s doublet transitions dxx, dyy, dzz, which are not overlapping each other. Thissplitting, rarely observed in glasses, indicates that the distribution of the isolated rhombicFe3+ sites is relatively narrow in NCS05Red and does not include sites with a pure rhombicdistortion. In contrast, in oxidized samples, Fe3+ (> 3500 ppm) there is no splitting ofthe g = 4.3 signal, suggesting a broader distribution among sites with different rhombicdistortions.
To our knowledge, Q-band EPR spectra have not been investigated in silicate glasseseven though higher microwave frequency may help in assessing the rhombic distortionof the Fe3+ site. Q-band (34 GHz) EPR spectra have been investigated for NCS05Medand NCS05Red samples (Figure 5.18). The NCS05Med signal is not constant before andafter the g = 2 line, suggesting the presence of a broad signal (dashed line in Figure 5.18)originating from Fe–Fe interactions and overlapping with the isolated Fe3+ signal at g = 2.The question of Fe-clustering will be discussed in Section 5.4. Regarding the g = 4.3 signalof NCS05Med, there is a weak and split signal.

118 Chapter 5
EPR
Sig
nal (
arb.
u)
150010005000Magnetic field (mT)
NCS05Med NCS05Red
g = 4.3g = 2
T = 20K
estimated signal due to clusters
Figure 5.18 – Low-temperature Q-band EPR signals of NCS05Med (green, R = 28%) andNCS05Red (blue, R = 99%) soda-lime glasses measured at 20 K. The intensities are not normalized.The EPR signal of NCS05Red has been magnified for clarity reasons.
By comparing Q-band to X-band for NCS05Med sample, the intensity proportion betweenthe signals at g = 2 and g = 4.3 are inverted. In Q-band, the dramatic loss of intensity ofthe g = 4.3 signal is compensated by the presence of a sharp and intense signal at g = 2.In term of integrated EPR signal of NCS05Med, the g = 4.3 signal participates in less than10% of the total integrated Q-band signal, while it represents about 60% of the total area inX-band. This change of proportion indicates that rhombic distortions present in the glassesare small relative to the Q-band frequency. As a consequence, the g = 2 signal of isolatedparamagnetic species is increased relatively to X-band spectra. The trend of the g = 2
signal to increase at Q-band relatively to X-band, in which the g = 4.3 signal is dominating,agrees with previous observations on borate glasses [Yahiaoui et al., 1994]. However, inour silicate glasses, the lower intensity of the Q-band signal at g = 4.3 relatively to thesignal at g = 2 suggests a smaller proportion of rhombically distorted Fe3+ sites than inthe lithium-borate glasses studied by Yahiaoui et al. [1994].
The remaining g = 4.3 weak signal in NCS05Med (Figure 5.18) demonstrates the presenceof a small amount of rhombically distorted sites while in the Q-band spectrum of NCS05Red(Figure 5.18), the absence of g = 4.3 signal suggests a less distorted environment for Fe3+
in the reduced than in the medium sample. The numerous Fe3+ peaks between 1000 to1300mT may be related to a lower site distribution in agreement with the splitting observedat g = 4.3 in X-band (inset of Figures 5.17.
The low-field signal (below 500mT) is also detected at X-band (see above). The X-bandEPR spectrum of NCS05Red at 4K (Figure 5.21) shows an intense and broad line centeredon 60 mT (g ∼ 13), which follows Curie law (Ipp is proportional to 1/T). This signal hasbeen attributed by Montenero et al. [1986] to a ferromagnetic resonance due to traces ofmetallic Fe. This attribution has to be confirmed but it is at the origin of the zero field signaland the sloping background observed at room temperature X-band EPR (Figure 5.17).
Figure 5.19 summarizes the three conclusions of the above discussion. The average siteappears more distorted at X-band for NCS05Red than NCS05Med than NCS05Ox because∆Hpp is smaller. NCS05Med presents sites with a stronger rhombic distortion that generate

IRON LOCAL ENVIRONMENT IN A SODA-LIME-SILICATE GLASS 119
a Q-band signal at g = 4.3, while NCS05Red does not present a g = 4.3 signal. This lastpoint agrees with the lower site distribution deduced from the X-band split g = 4.3 signal ofNCS05Red. This confirms that Fe3+ plays a network former role with a limited distributionof the polarization of the oxygens in polymerized glasses and that only a few sites show astrong rhombic distortion [Calas and Petiau, 1983b, p.46].
Fe3+ site distortion
Number of Fe3+ sites
Ox
Average distortion
Maximum distortion
Med Red
Figure 5.19 – Schematic vision of the distortion and distribution of Fe3+ sites in NCS glassdepending on the redox.
5.4 Site partitioning: isolated vs. clustered iron
5.4.1 Introduction
In addition to isolated iron that do not interact with other irons present in the glass.Bingham et al. [1999] have demonstrated, in the case of similar soda-lime-silica glassesthat when the Fe2O3 content is higher than 1mol%, the fraction of the Fe ions involed inFe-clusters becomes significant. This clustering causes magnetic or intervalence interactions.Below this concentration, the influence of clustering trends to be negligible. The possibleclustering was deduced from changes in the optical spectra of the glasses, interpretedby the authors as due to Fe2+–O–Fe3+ and Fe3+–O–Fe3+ interactions. Rossano et al.[2000b] confirmed, by EXAFS and MD simulation, the existence of Fe–Fe distances thatare characteristic of edge-sharing polyhedra in CaFeSi2O6 glass. However, they did notfind evidence for iron to form aggregates and segregate in small particles in the matrix.The number of clusters was conformed to the random distribution of iron in the glassstructure. More recently, using EPSR structural simulations for the same CaFeSi2O6 glasscomposition, Weigel et al. [2008b] found that [5]- and [6]-fold Fe3+ tends to segregate insteadof being randomly distributed as a network-former in tetrahedral sites. The duality of ironpopulations (isolated vs clusterized) was also demonstrated for lower Fe3+ concentrationsby Sakaguchi and Uchino [2007] in alkali alkaline-earth silicate glass system based ona typical float-glass composition, for 0.19mol% of Fe2O3, the authors found clusters ofFe3+ ions (possibly with Fe2+ ions). Here we used a combination of X-ray absorptionspectroscopy, Electron Paramagnetic Resonance and magnetometry to address the questionof iron clustering in soda-lime-silicate glasses containing 0.5wt% of Fe2O3.
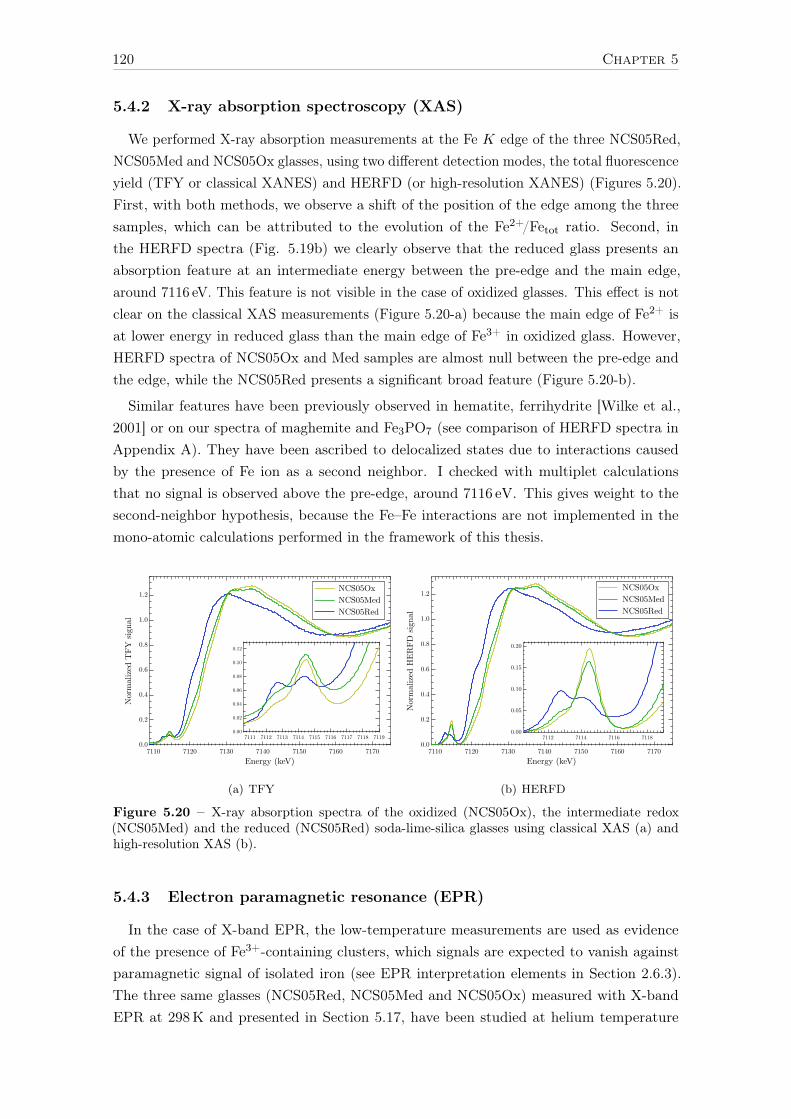
120 Chapter 5
5.4.2 X-ray absorption spectroscopy (XAS)
We performed X-ray absorption measurements at the Fe K edge of the three NCS05Red,NCS05Med and NCS05Ox glasses, using two different detection modes, the total fluorescenceyield (TFY or classical XANES) and HERFD (or high-resolution XANES) (Figures 5.20).First, with both methods, we observe a shift of the position of the edge among the threesamples, which can be attributed to the evolution of the Fe2+/Fetot ratio. Second, inthe HERFD spectra (Fig. 5.19b) we clearly observe that the reduced glass presents anabsorption feature at an intermediate energy between the pre-edge and the main edge,around 7116 eV. This feature is not visible in the case of oxidized glasses. This effect is notclear on the classical XAS measurements (Figure 5.20-a) because the main edge of Fe2+ isat lower energy in reduced glass than the main edge of Fe3+ in oxidized glass. However,HERFD spectra of NCS05Ox and Med samples are almost null between the pre-edge andthe edge, while the NCS05Red presents a significant broad feature (Figure 5.20-b).
Similar features have been previously observed in hematite, ferrihydrite [Wilke et al.,2001] or on our spectra of maghemite and Fe3PO7 (see comparison of HERFD spectra inAppendix A). They have been ascribed to delocalized states due to interactions causedby the presence of Fe ion as a second neighbor. I checked with multiplet calculationsthat no signal is observed above the pre-edge, around 7116 eV. This gives weight to thesecond-neighbor hypothesis, because the Fe–Fe interactions are not implemented in themono-atomic calculations performed in the framework of this thesis.
1.2
1.0
0.8
0.6
0.4
0.2
0.0
Nor
mal
ized
TFY
sig
nal
7170716071507140713071207110Energy (keV)
0.12
0.10
0.08
0.06
0.04
0.02
0.00711971187117711671157114711371127111
NCS05Ox NCS05Med NCS05Red
(a) TFY
1.2
1.0
0.8
0.6
0.4
0.2
0.0
Nor
mal
ized
HER
FD s
igna
l
7170716071507140713071207110Energy (keV)
0.20
0.15
0.10
0.05
0.007118711671147112
NCS05Ox NCS05Med NCS05Red
(b) HERFD
Figure 5.20 – X-ray absorption spectra of the oxidized (NCS05Ox), the intermediate redox(NCS05Med) and the reduced (NCS05Red) soda-lime-silica glasses using classical XAS (a) andhigh-resolution XAS (b).
5.4.3 Electron paramagnetic resonance (EPR)
In the case of X-band EPR, the low-temperature measurements are used as evidenceof the presence of Fe3+-containing clusters, which signals are expected to vanish againstparamagnetic signal of isolated iron (see EPR interpretation elements in Section 2.6.3).The three same glasses (NCS05Red, NCS05Med and NCS05Ox) measured with X-bandEPR at 298K and presented in Section 5.17, have been studied at helium temperature

IRON LOCAL ENVIRONMENT IN A SODA-LIME-SILICATE GLASS 121
(4K) and are plotted in Figure 5.21. The main alteration of the signal shape is observedfor NCS05Red, the g = 2 signal vanished while for both NCS05Med and NCS05Ox, theg = 2 signal keeps the same shape at low temperature but the ratio Ipp(g = 4.3)/Ipp(g = 2)is two times higher than at room temperature. These observations confirm a modificationof the Fe3+ site repartition as a function of the redox state of the glass. As the intensity ofthe signal at g = 2 line disappears on the EPR spectra of NCS05Red when temperatureis lowered to 4K, this signal is assigned to the presence of Fe3+-clusters, with Fe3+–Fe3+
and/or Fe3+–Fe2+ magnetic coupling that becomes insignificant in comparison with theincrease of the at g = 4.3 paramagnetic signal from iron in isolated sites [Sakaguchi andUchino, 2007], [Kurkjian and Sigety, 1968], [Bogomolova and Henner, 1980], [Monteneroet al., 1986], [Dunaeva et al., 2012], [Berger et al., 1995], [Yahiaoui et al., 1994], [Reid et al.,1968], [Bart et al., 1982], [Ardelean et al., 1997, 2003].
-100
-50
0
50
100
165160155
×1
×100
×1
-100
-50
0
50
100
01× .u .bra( langiS RPE
3 )
4003002001000Magnetic field (mT)
NCS05Ox NCS05Med NCS05Red
×1
×100 g = 4.3
g = 2
Temperature 4K
(50 mT)
Zoom at g = 4.3
split signalIpp
∆Hpp
g ~ 13(160 mT)
(160 mT)
(340 mT)
Figure 5.21 – Low-temperature X-band EPR signals of the NCS05 glasses at three different redox:NCS05Ox (yellow/R = 6%), NCS05Med (green, R = 28%) and NCS05Red (blue, R = 99%). Theinset is a zoom on the g = 4.3 line.
In the case of X-band EPR at 298K shown on 5.17. Clustering effects may be evaluatedby the ratio between the intensity of the transitions linked to isolated and clustered Fe3+
at g = 4.3 and g = 2, respectively. The values for the three glasses are: Med = 14.9± 0.7,Ox = 12.4 ± 0.6 and Red = 2.7 ± 1.1 The reduced samples have the lowest Ipp(g =
4.3)/Ipp(g = 2) ratio, suggesting that they contain a higher proportion of Fe3+ involved inclusters than more oxidized samples (Med and Ox). This interpretation is corroboratedby the antiferromagnetic origin of the g = 2 signal in reduced samples (disparition ofthe g = 2 signal in Figure 5.21). The g = 2 line (marked A in Figure 5.17) is wider inNCS05Red (∆Hpp ∼ 60mT) than in NCS05Med and NCS05Ox (∆Hpp ∼ 25mT). Accordingto previous articles studying the effect of total Fe-content in sodium-silicate glasses, the

122 Chapter 5
reduced samples investigated here have a g = 2 signal shape similar to the one observedat higher iron content ([Fe2O3] > 1mol%) [Dunaeva et al., 2012], [Rüssel, 1993]. In thesehigh Fe-glasses, Fe3+-rich clusters have been shown by optical absorption and Mössbauerspectroscopic properties [Bingham et al., 1999] and confirmed by neutron diffraction andnumerical simulations [Weigel et al., 2008b].
5.4.4 SQUID magnetometry
The information on Fe–Fe interactions gained by SQUID magnetometry complements thatof EPR. Indeed, both Fe2+ and Fe3+ contribute to the bulk magnetization. Moreover, thedynamics of magnetization is probed at a different timescale (> s for SQUID, as compared to10−8 s with EPR). Two glasses, NMS05Ox and NMS05Red, containing magnesium insteadof calcium are presented, but we will see in the next chapter that the effect of the alkalineearth nature is negligible compared to the effect of the redox state.
The magnetic susceptibility χ(T ) can be extracted (Figure 5.22-a) from both measurementprotocols presented in Section 2.5.2. Thus, a value of the Curie constant C and the effectivemagnetic moment µeff can be deduced with Equation C.3 (Figure 5.22-b). In the case ofNMS05Red, the effective moment is 5.36µB/at, for NMS05Ox the measure gives 5.95µB/at.These values are close to the expected free spin value: 5.4µB/at for Fe2+ and 5.9µB/at forFe3+ [Kittel, 2004]. Therefore, within our approximations, there is no evidence for a gianteffective moment, which would characterize a superparamagnetic behavior due to isolated,non-interacting, nanoparticles as in ferritine [Kilcoyne and Cywinski, 1995].
T (K)0 50 100 150 200 250 300
mol.T
(m
3 /m
ol.K
)
1
2
2.5
1.5
3
3.5
4
NMS05Ox not correctedNMS05Red not correctedNMS05Ox correctedNMS05Red corrected
(a) 6.0
5.5
5.0
4.5
4.0
µ( B
)ta/
300250200150100500T (K)
µeff
NMS05Ox NMS05Red
(Fe2+)
µeff (Fe3+)
(b)
Figure 5.22 – (a) χ.T ' C Curie constant obtained from M vs T. measured at low field (10mT).
(b) values of χ obtained from M vs. H measured at low field and plotted as 797.8√χSImolT in order
to compare it with the theoretical value µeff of free Fe2+ and Fe3+ (dashed lines).
In the case of NMS05Red, the fit of the magnetic susceptibility with a Curie-Weisslaw (see p. 46) gives θ = −2 K. This Curie-Weiss temperature is very small (dimers,trimers or no more than few atoms) in absolute value and negative, suggesting very weakantiferromagnetic interactions between iron ions and confirm the preponderant paramagneticbehavior. On the other hand, the fit with a Curie-Weiss law of the NMS05Ox gives a nulltemperature confirming Curie law behavior and the paramagnetic nature of the oxidizedglasses. However, for both samples, deviations are observed from the paramagnetic behavior,

IRON LOCAL ENVIRONMENT IN A SODA-LIME-SILICATE GLASS 123
below 10K for NMS05Ox and below 35K for NMS05Red, confirming stronger, but stillweak, interactions in the reduced glass than in its more oxidized counterpart.
A similar conclusion is deduced from the magnetization curves. As shown for NMS05Oxin Figure 5.23-a, the magnetization curves obtained at different temperatures overlap in agraph representing M vs H/T down to 10K. Above 10K, the magnetization curves agreeswith the Brillouin functions of Fe3+ free-spin within 7%. The small deviation from Brillouinfunction below 10K agrees with the susceptibility measurements and suggests a smalldeparture from a paramagnetic behavior. On the other hand, the NMS05Red shown inFigure 5.23-b fits the expected Brillouin function of Fe2+ from 300 to 35K (also 7% moreintense). However, below 35K, the magnetization curves fall clearly below the Brillouincurve for Fe2+ (spin only), strongly than for NMS05Ox (40% instead of 8%), confirming thedeviation from the Curie law observed from susceptibility measurements, and suggestingweak but consistent antiferromagnetic interactions in the material.
H/T (T/K)0 0.1 0.2 0.3 0.4 0.5 0.6 0.7 0.8 0.9 1
Mag
netiz
atio
n M
(em
u/g
i.e. A
.m2 /
kg)
0
0.2
0.4
0.6
0.8
1
1.2
1.4
1.6
1.8
Brillouin MS(Fe2+), S=4, g=2Brillouin MS(Fe3+), S=5/2, g=2NMS05-Ox 2.5K correctedNMS05-Ox 5K correctedNMS05-Ox 10K correctedNMS05-Ox 15K correctedNMS05-Ox 20K correctedNMS05-Ox 35K correctedNMS05-Ox 50K correctedNMS05-Ox 65K correctedNMS05-Ox 100K correctedNMS05-Ox 135K correctedNMS05-Ox 200K correctedNMS05-Ox 300K corrected
(a) NMS05Ox
H/T (T/K)0 0.1 0.2 0.3 0.4 0.5 0.6 0.7 0.8 0.9 1
Mag
netiz
atio
n M
(em
u/g
i.e. A
.m2 /
kg)
0
0.2
0.4
0.6
0.8
1
1.2
1.4
1.6
1.8Brillouin MS(Fe2+), S=4, g=2Brillouin MS(Fe3+), S=5/2, g=2NMS05-Red 2.5K correctedNMS05-Red 5K correctedNMS05-Red 10K correctedNMS05-Red 15K correctedNMS05-Red 20K correctedNMS05-Red 35K correctedNMS05-Red 50K correctedNMS05-Red 65K correctedNMS05-Red 100K correctedNMS05-Red 135K correctedNMS05-Red 200K correctedNMS05-Red 300K corrected
(b) NMS05Red
Figure 5.23 – Magnetization of NMS05Ox and NMS05Red as a function of H/T compared to theBrillouin function of Fe2+ and Fe3+ free spin.
SQUID AC measurements performed at 10Hz, 100Hz and 1000Hz on NMS05Ox andNMS05Red showed null imaginary component χ′′ = 0 and the real component χ wereequivalent to the DC susceptibility. Therefore, if any, clusters are very small and are onlyvisible with the high frequency of EPR (9.5GHz).
5.4.5 Conclusions
With the present study, several arguments point out that there are no large Fe-clusters(such as in ferritin with about 1000 Fe atoms) but that there is still some Fe–Fe antiferro-magnetic interactions in iron-doped soda-lime silicate glasses with a preponderant effectin reduced samples, in which residual Fe3+ tends to be in the vicinity of other irons andinteract with them leading to similar EPR signatures than in concentrated glasses. However,SQUID measurements did not show evidence of Fe nanoparticles with collective magneticeffect such as superparamagnetism.

124 Chapter 5
In minerals, clusters involve [6]Fe3+ cations preferably to [4]Fe3+ [Burns, 1993]. Byanalogy, iron clusters in glasses would be favored by Fe3+ located in [5]-fold or [6]-foldcoordinated sites: this could suggest that reduced glasses contain a higher proportion of[5]Fe3+ and/or [6]Fe3+ than the corresponding oxidized glasses. Indeed, the linkage betweentetrahedral cation sites is energetically unfavored, as predicted by the Lowenstein exclusionrule [Delaye et al., 2001] leading to the formation of oxygen triclusters.
In conclusion, even if very small Fe-clusters exist in diluted glasses with a preponderancein reduced glasses, their presence have little impact on the optical properties.

125
Chapter 6
Influence of chemical composition oniron local environment in glasses
In the previous chapter, local environments of Fe2+ and Fe3+ have been studied in theNCS05 glass as a function of redox state. This chapter presents the results for two kinds ofchemical composition variation of the matrix, using the same iron content (0.5wt%). First,a comparison of NCS with DIO glass, an alkali-free glass of the diopside composition, ispresented to study the impact of the presence or absence of sodium. Second, a comparisonof NCS with NMS glass, in which the Ca has been substituted by Mg, is done to study thefine effect of the alkaline-earth nature on spectroscopic properties.
6.1 Absence of sodium, what are the effects?
To study the effect of sodium, we looked at an alkali-free glass based on diopside mineral(CaMgSi2O6) with the composition: 50SiO2–25CaO–25MgO. This composition is oneof the few simple alkali-free compositions of the SiO2–CaO–MgO system that do notcrystallize. Thus, the matrix considerably differs between the soda-lime (NCS: 74SiO2–10CaO–16Na2O) and alkali-free (DIO: 50SiO2–25CaO–25MgO) glasses, implying a highermelting temperature due to the absence of alkali and a lower viscosity of diopside glass dueto the inferior SiO2 content [Richet et al., 2006]. This diopside glass easily devitrify and itwas therefore impossible to synthesized the DIO05Ox. Concerning, the reduced glasses,the use of a Pt crucible instead of graphite crucible leads to a less reduced DIO05Red(R = 80%) compared to the 99% of NCS05Red. In addition, at the end of the glass synthesisunder air atmosphere, the Fe2+/Fetot ratio is R = 28% for NCS05Med and R = 46% forDIO05Med. Despite these differences, this section details new results and interpretations ofthe iron environment for both Fe2+ and Fe3+ thanks to the comparison of the two glasscompositions.
6.1.1 Effects on Fe3+: DIO vs NCS
The extraction of Fe3+ optical signatures was challenging because the UV-edge ofdiopside glass overlaps the Fe3+ bands and is present at lower energy than in soda-limeglass. Figure 6.1 shows the extracted molar absorption coefficient of Fe3+, relatively to the
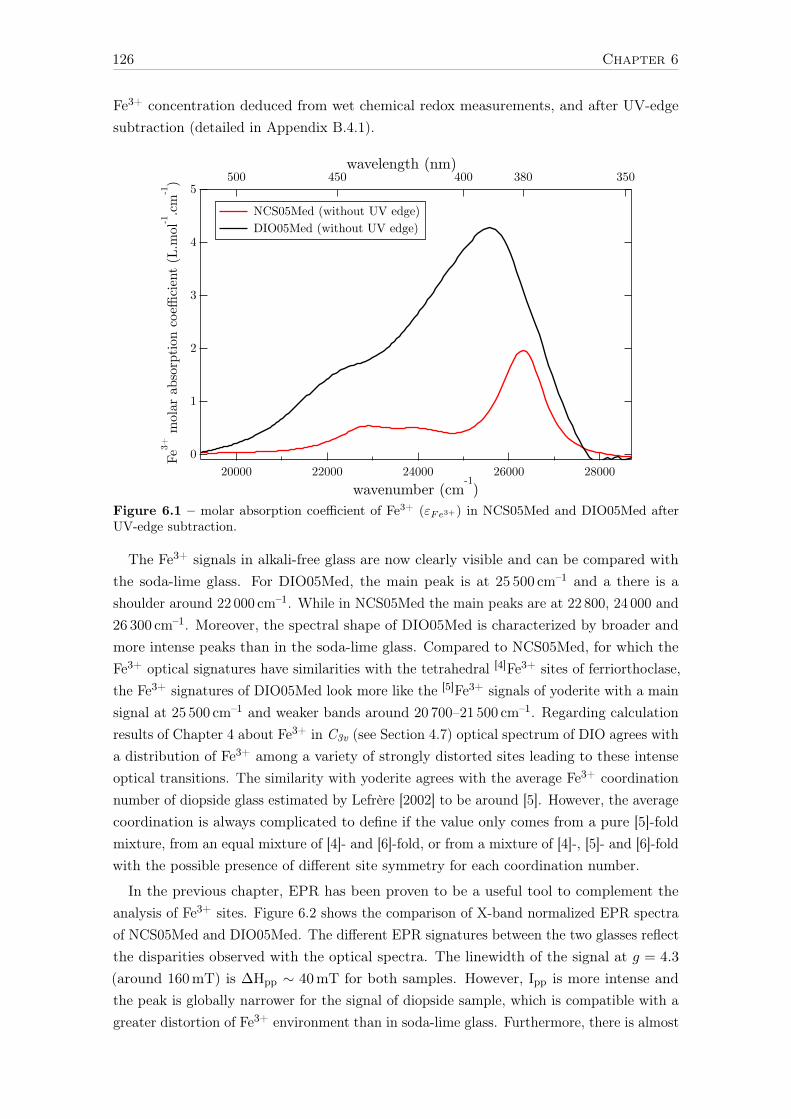
126 Chapter 6
Fe3+ concentration deduced from wet chemical redox measurements, and after UV-edgesubtraction (detailed in Appendix B.4.1).
5
4
3
2
1
0
Fe3+
mol
ar a
bsor
ptio
n co
effici
ent
(L.m
ol-1.c
m-1)
2800026000240002200020000wavenumber (cm-1)
500 450 400 380 350wavelength (nm)
NCS05Med (without UV edge) DIO05Med (without UV edge)
Figure 6.1 – molar absorption coefficient of Fe3+ (εFe3+) in NCS05Med and DIO05Med afterUV-edge subtraction.
The Fe3+ signals in alkali-free glass are now clearly visible and can be compared withthe soda-lime glass. For DIO05Med, the main peak is at 25 500 cm–1 and a there is ashoulder around 22 000 cm–1. While in NCS05Med the main peaks are at 22 800, 24 000 and26 300 cm–1. Moreover, the spectral shape of DIO05Med is characterized by broader andmore intense peaks than in the soda-lime glass. Compared to NCS05Med, for which theFe3+ optical signatures have similarities with the tetrahedral [4]Fe3+ sites of ferriorthoclase,the Fe3+ signatures of DIO05Med look more like the [5]Fe3+ signals of yoderite with a mainsignal at 25 500 cm–1 and weaker bands around 20 700–21 500 cm–1. Regarding calculationresults of Chapter 4 about Fe3+ in C3v (see Section 4.7) optical spectrum of DIO agrees witha distribution of Fe3+ among a variety of strongly distorted sites leading to these intenseoptical transitions. The similarity with yoderite agrees with the average Fe3+ coordinationnumber of diopside glass estimated by Lefrère [2002] to be around [5]. However, the averagecoordination is always complicated to define if the value only comes from a pure [5]-foldmixture, from an equal mixture of [4]- and [6]-fold, or from a mixture of [4]-, [5]- and [6]-foldwith the possible presence of different site symmetry for each coordination number.
In the previous chapter, EPR has been proven to be a useful tool to complement theanalysis of Fe3+ sites. Figure 6.2 shows the comparison of X-band normalized EPR spectraof NCS05Med and DIO05Med. The different EPR signatures between the two glasses reflectthe disparities observed with the optical spectra. The linewidth of the signal at g = 4.3
(around 160mT) is ∆Hpp ∼ 40mT for both samples. However, Ipp is more intense andthe peak is globally narrower for the signal of diopside sample, which is compatible with agreater distortion of Fe3+ environment than in soda-lime glass. Furthermore, there is almost

COMPOSITION DEPENDENCE OF IRON ENVIRONMENT IN GLASSES 127
no g = 2 signal around 340mT suggesting the absence of Fe–Fe interactions in DIO05glass as previously observed by Sakaguchi and Uchino [2007] who found no Fe-clustering inanother alkali-free glass (MgO–Al2O3–SiO2 system).
2000
1500
1000
500
0
-500
-1000
EPR
Sig
nal (
arb.
u.)
4003002001000Magnetic field (mT)
NCS05Med DIO05Med
Temperature 298K
Figure 6.2 – X-band EPR spectra of NCS05Med and DIO05Med measured at room temperature.
The analysis of X-ray absorption data could help to extract information on the localenvironment of iron. Figure 6.3 compares the HERFD spectra of NCS05Med and DIO05Med.The main edge is at lower energy for DIO, and the pre-edge has a similar shape than thesoda-lime glass with a lower intensity of the tetrahedral Fe3+ peak at 7114.5 eV.
1.2
1.0
0.8
0.6
0.4
0.2
0.0
HER
FD s
igna
l (ar
b. u
.)
7170716071507140713071207110Energy (eV)
0.15
0.10
0.05
0.00712071187116711471127110
NCS05Med DIO05Med
Figure 6.3 – HERFD spectra at Fe K edge of NCS05Med and DIO05Med.
The comparison of RIXS maps of NCS05Red and DIO05Med glasses (Figure 6.4), com-plement the HERFD spectra, which are only diagonal cuts of the RIXS maps. NCS05Med
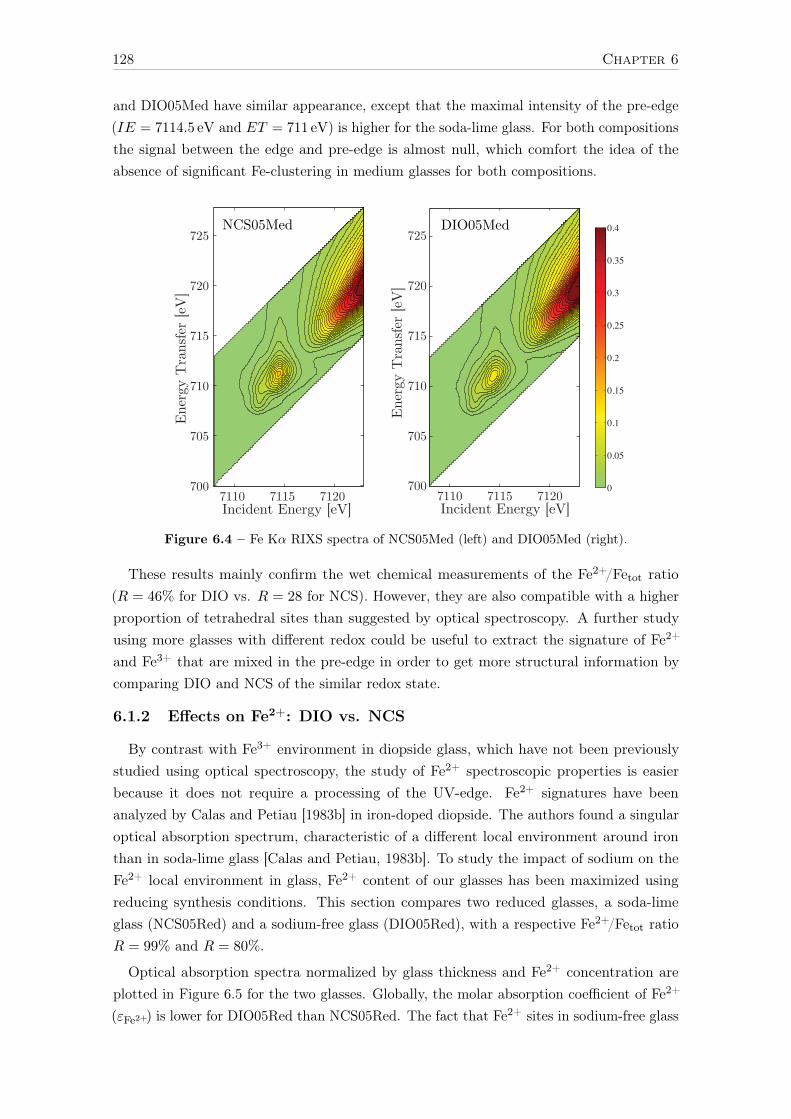
128 Chapter 6
and DIO05Med have similar appearance, except that the maximal intensity of the pre-edge(IE = 7114.5 eV and ET = 711 eV) is higher for the soda-lime glass. For both compositionsthe signal between the edge and pre-edge is almost null, which comfort the idea of theabsence of significant Fe-clustering in medium glasses for both compositions.
Incident Energy [eV]
Ener
gy T
rans
fer
[eV
]
7110 7115 7120700
705
710
715
720
725NCS05Med
Incident Energy [eV]
Ener
gy T
rans
fer
[eV
]
7110 7115 7120
705
710
715
720
725DIO05Med
700 0
0.05
0.1
0.15
0.2
0.25
0.3
0.35
0.4
Figure 6.4 – Fe Kα RIXS spectra of NCS05Med (left) and DIO05Med (right).
These results mainly confirm the wet chemical measurements of the Fe2+/Fetot ratio(R = 46% for DIO vs. R = 28 for NCS). However, they are also compatible with a higherproportion of tetrahedral sites than suggested by optical spectroscopy. A further studyusing more glasses with different redox could be useful to extract the signature of Fe2+
and Fe3+ that are mixed in the pre-edge in order to get more structural information bycomparing DIO and NCS of the similar redox state.
6.1.2 Effects on Fe2+: DIO vs. NCS
By contrast with Fe3+ environment in diopside glass, which have not been previouslystudied using optical spectroscopy, the study of Fe2+ spectroscopic properties is easierbecause it does not require a processing of the UV-edge. Fe2+ signatures have beenanalyzed by Calas and Petiau [1983b] in iron-doped diopside. The authors found a singularoptical absorption spectrum, characteristic of a different local environment around ironthan in soda-lime glass [Calas and Petiau, 1983b]. To study the impact of sodium on theFe2+ local environment in glass, Fe2+ content of our glasses has been maximized usingreducing synthesis conditions. This section compares two reduced glasses, a soda-limeglass (NCS05Red) and a sodium-free glass (DIO05Red), with a respective Fe2+/Fetot ratioR = 99% and R = 80%.
Optical absorption spectra normalized by glass thickness and Fe2+ concentration areplotted in Figure 6.5 for the two glasses. Globally, the molar absorption coefficient of Fe2+
(εFe2+) is lower for DIO05Red than NCS05Red. The fact that Fe2+ sites in sodium-free glass

COMPOSITION DEPENDENCE OF IRON ENVIRONMENT IN GLASSES 129
are less absorbent than in sodium-silicate suggests a smaller p–d mixing and geometriescharacteristic of higher Fe2+ coordination numbers.
Moreover, the more symmetric shape of the band around 10 000 cm–1 in DIO05Red isthe signature of a different Fe2+ local environment than in NCS05Red. The more gentleslope between 6000 and 8000 cm–1 potentially ascribable to the decrease of the absorptionband of distorted tetrahedral sites (see Section 5.2.1) also confirm this theory.
25
20
15
10
5
0Fe2+
Mol
ar a
bsor
ptio
n co
effici
ent
(L.m
ol-1.c
m-1)
1816141210864Wavenumber (x103
cm-1)
2500 2000 1500 1000 900 800 700 600Wavelength (nm)
NCS05Red DIO05Red
Figure 6.5 – Molar absorption coefficient of Fe2+ (εFe2+) in a reduced soda-lime glass (NCS05Red)and in a reduced diopside glass (DIO05Red).
Table 6.1 shows the results of a fit performed on the DIO05Red and NCS05Res opticalspectra between 4000 cm–1 and 16 000 cm–1 using three Gaussian functions. These resultsconfirm the lower molar absorption coefficient and area of Fe2+ in sodium-free glass.The only exception is that the signal around 5000 cm–1 is broader because of the smallcontribution around 8000 cm–1. The three bands are shift at higher energy, which agreeswith a decrease of the proportion of tetrahedral sites.
Table 6.1 – Fit of Fe2+ bands with 3 Gaussian functions for NCS05Red and DIO05Red glasses
Position(cm–1)
σ
(cm–1)FWHM(cm–1)
Intensity(cm–1)
εFe2+
(L/mol/cm)Area (cm–2)
NCS05Red fit3#1 4848 492 1159 0.75 4.8 651.6#2 7812 1277 3007 0.96 6.2 2181.4#3 9775 3177 7482 3.65 23.7 20557.5DIO05Red fit3#1 5135 926 2181 0.84 6.7 1384.4#2 8121 1368 3222 0.42 3.3 1013.5#3 10296 2499 5885 2.13 16.9 9434.8
Differences can also be noticed in the RIXS spectra (Figure 6.6) and the diagonal cut,corresponding to the HERFD spectra, of the two reduced glasses. In the case of diopsideglass, the higher concentration of Fe3+ should lead to higher pre-edge intensity∗. However,
∗Fe3+ features in the pre-edge are generally more intense than Fe2+ in crystalline compounds (see Ap-pendix A) and sum rules (Appendix D.4)

130 Chapter 6
the observed DIO05Red pre-edge intensity is lower than NCS05Red, which agrees with alower amount of Fe2+ in tetrahedral sites for diopside glass.
In addition, the smaller signal between the pre-edge and main-edge for the alkali-freeglass, attributed to a lower amount of Fe-clusters, comforts the previous observations forFe3+.
Incident Energy [eV]
Ener
gy T
rans
fer
[eV
]
7110 7115 7120700
705
710
715
720
725NCS05Red
Incident Energy [eV]
Ener
gy T
rans
fer
[eV
]
7110 7115 7120
705
710
715
720
725DIO05Red
700 0
0.05
0.1
0.15
0.2
0.25
0.3
0.35
0.4
Figure 6.6 – Kα RIXS spectra at Fe of NCS05Red (Right) and DIO05Red (Left)
1.2
1.0
0.8
0.6
0.4
0.2
0.0
HER
FD s
igna
l (ar
b. u
.)
7170716071507140713071207110Energy (eV)
0.15
0.10
0.05
0.00712071187116711471127110
NCS05Red DIO05Red
Figure 6.7 – HERFD spectra at Fe K edge of NCS05Red (blue) and DIO05Red (grey).
6.2 Influence of the alkaline earth nature: Ca vs. Mg
After studying the first order effect of redox in Chapter 5, and the second order effectwith the presence or absence of alkali in the previous section, this part is focused on theanalysis of spectroscopic properties modifications induced by the substitution of Ca by Mg.
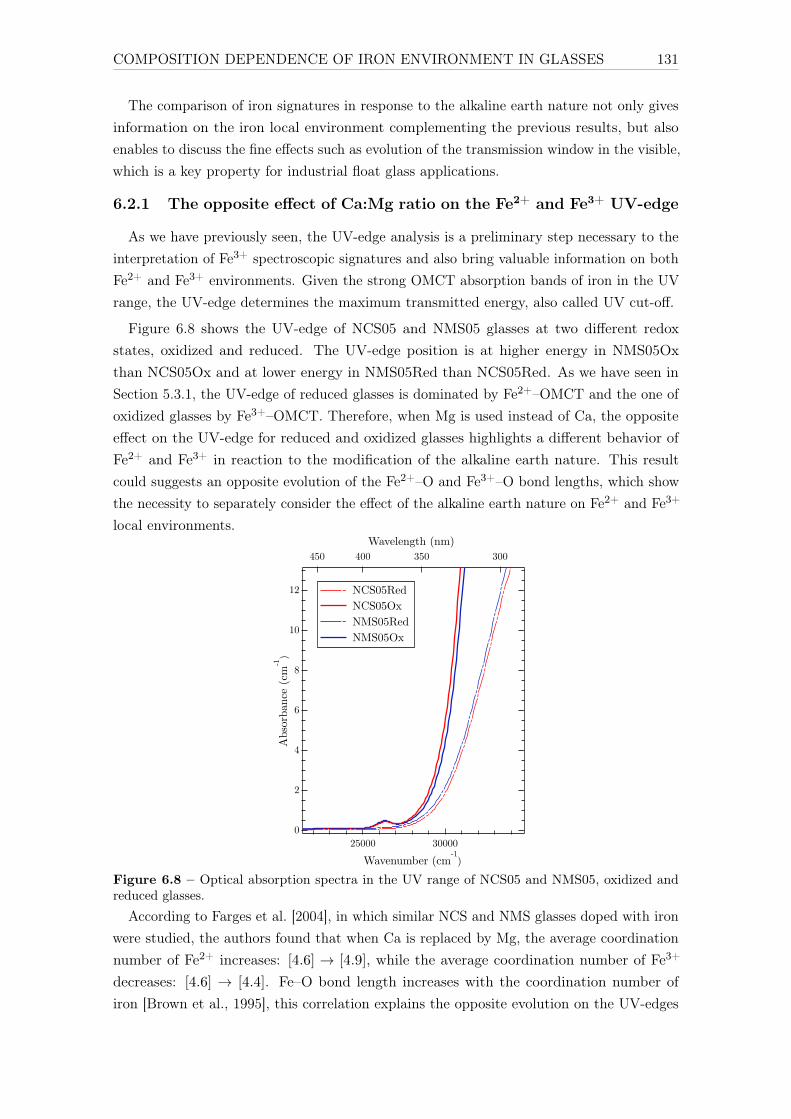
COMPOSITION DEPENDENCE OF IRON ENVIRONMENT IN GLASSES 131
The comparison of iron signatures in response to the alkaline earth nature not only givesinformation on the iron local environment complementing the previous results, but alsoenables to discuss the fine effects such as evolution of the transmission window in the visible,which is a key property for industrial float glass applications.
6.2.1 The opposite effect of Ca:Mg ratio on the Fe2+ and Fe3+ UV-edge
As we have previously seen, the UV-edge analysis is a preliminary step necessary to theinterpretation of Fe3+ spectroscopic signatures and also bring valuable information on bothFe2+ and Fe3+ environments. Given the strong OMCT absorption bands of iron in the UVrange, the UV-edge determines the maximum transmitted energy, also called UV cut-off.
Figure 6.8 shows the UV-edge of NCS05 and NMS05 glasses at two different redoxstates, oxidized and reduced. The UV-edge position is at higher energy in NMS05Oxthan NCS05Ox and at lower energy in NMS05Red than NCS05Red. As we have seen inSection 5.3.1, the UV-edge of reduced glasses is dominated by Fe2+–OMCT and the one ofoxidized glasses by Fe3+–OMCT. Therefore, when Mg is used instead of Ca, the oppositeeffect on the UV-edge for reduced and oxidized glasses highlights a different behavior ofFe2+ and Fe3+ in reaction to the modification of the alkaline earth nature. This resultcould suggests an opposite evolution of the Fe2+–O and Fe3+–O bond lengths, which showthe necessity to separately consider the effect of the alkaline earth nature on Fe2+ and Fe3+
local environments.
12
10
8
6
4
2
0
Abs
orba
nce
(cm
-1)
3000025000Wavenumber (cm-1
)
450 400 350 300Wavelength (nm)
NCS05Red NCS05Ox NMS05Red NMS05Ox
Figure 6.8 – Optical absorption spectra in the UV range of NCS05 and NMS05, oxidized andreduced glasses.
According to Farges et al. [2004], in which similar NCS and NMS glasses doped with ironwere studied, the authors found that when Ca is replaced by Mg, the average coordinationnumber of Fe2+ increases: [4.6] → [4.9], while the average coordination number of Fe3+
decreases: [4.6] → [4.4]. Fe–O bond length increases with the coordination number ofiron [Brown et al., 1995], this correlation explains the opposite evolution on the UV-edges

132 Chapter 6
of Ox and Red glasses. It also agrees with Loeffler et al. [1974] in which the UV-edge of[4]-fold Fe2+ calculated to be at lower energy than [6]-fold Fe2+.
6.2.2 Ca:Mg effects on ferric iron (Fe3+) optical signatures in glasses
The substitution of Ca by Mg acts on the optical spectral signature of Fe3+. This partis focused on the study of the four oxidized and medium glasses, containing the highestamount of Fe3+: NCS05 and NMS05, Med and Ox, in order to bring information regardingthe influence of alkaline-earth nature on the Fe3+ local environment.
The optical absorption spectra for medium and oxidized glasses of the two compositionsNCS05 and NMS05 are shown in Figure 6.9-a. The first thing to notice is that the fourspectra have similar spectral shapes, confirming the fine variations that are studied here. Ata given redox (Ox or Med), a similar trend is observed between NCS and NMS glasses. Inoxidized glasses, the UV-edge is shifted at lower energy due to the higher Fe3+ concentration,which increases the Fe3+–OMCT intensity according to Beer-Lambert law. In the visiblerange, the tail of the Fe2+ main band around 10 000 cm–1 and the small spin-forbiddencontributions overlap the Fe3+ optical bands when the Fe2+/Fetot ratio is higher. These twoside effects are not of the same order of magnitude than fine effects caused by the alkalineearth nature on the weak spin-forbidden Fe3+ bands. Therefore, a necessary processing hasbeen performed using the methodology detailed in Appendix B.4 to extract Fe3+ signaturesfrom d–d transitions and complement this extraction by a Gaussian fit of Fe3+ contributionsparticipating to εFe3+ .
0.8
0.6
0.4
0.2
0.0
Abs
orba
nce
(cm
-1)
2826242220
Wavenumber (x103 cm-1)
500 450 400 380 360Wavelength (nm)
NCS05Ox NMS05Ox NCS05Med NMS05Med
(a)
3
2
1
0
mol
ar a
bsor
ptio
n co
effici
ent
(cm
-1.L
.mol
-1)
2500020000wavenumber (cm-1
)
500 450 400 380wavelength (nm)
NCS05 – Fe3+
NMS05 – Fe3+
NCS05 – Fe2+
NMS05 – Fe2+
(b)
Figure 6.9 – (a) Optical spectra of the two sodium-silicate glasses respectively containing Ca orMg as an alkaline earth network modifier. (b) Extracted molar absorption coefficient of Fe2+ andFe3+ d–d transitions in NCS and NMS glass extracted.
Figure 6.9-b presents the extracted molar absorption coefficient ε of Fe3+ and Fe2+. Thedashed lines represent the separated signal due to Fe2+ that can disturb the analysis of

COMPOSITION DEPENDENCE OF IRON ENVIRONMENT IN GLASSES 133
Fe3+ signatures. The plain lines, corresponding to the signals of interest in this section,present several changes with the alkaline earth nature.
When Mg is added instead of Ca, the extracted Fe3+ spectra keep a similar shape, bytthe main Fe3+ band at 26 300 cm–1 is more intense and narrower, while the signal around25 500 cm–1 becomes weaker. This change of proportion between these two contributionsresults in the optical spectra of Mg-containing glasses by a weaker local minimum around25 000 cm–1 which makes the band at 26 300 cm–1 more defined. The two bands between22 800 and 24 000 cm–1 do not significantly vary, however, the signal width of the 21 000 cm–1
band is narrower and the spectrum from NMS glass is better defined.
If we have a look on the high-resolution X-ray absorption K pre-edge (HERFD), thesubstitution of Ca by Mg results in a slightly more intense peak around 7114.5 eV inFigure 6.10. No other change in the shape could be noted.
The change of proportion of the two optical contributions at 26 300 cm–1 and 25 500 cm–1
becoming respectively more intense and weaker, suggests an increasing proportion of[4]Fe3+ in the Mg-rich samples (NMS) compared to Ca-rich samples (NCS), accordingto the previous chapter, the 25 500 cm–1 contribution was attributed to Fe3+ in [5]-foldcoordination, while the signal at 26 300 cm–1 is mainly due to [4]-fold tetrahedral ferric iron.
0.20
0.15
0.10
0.05
0.00
HER
FD s
igna
l (ar
b. u
.)
71187116711471127110Energy (keV)
NCS05Ox NMS05Ox
Figure 6.10 – HERFD spectra at Fe K edge of NCS05Ox and NMS05Ox.
Due to its broadness, the signal below 22 000 cm–1 was fitted by a single Gaussian, therefinement of this band observed in NMS could signify a smaller variety of Fe3+ sites causinga more restricted number of bands in the range 18 000–22 000 cm–1. In the previous chapter,part of the signal around 21 500 cm–1 was attributed to the presence of weak spin-forbiddenbands possibly due to [5]-fold as in yoderite, while [4]-fold of ferriorthoclase happens around20 500 cm–1.
From the structural point of view, the correlations of the two previous paragraph could
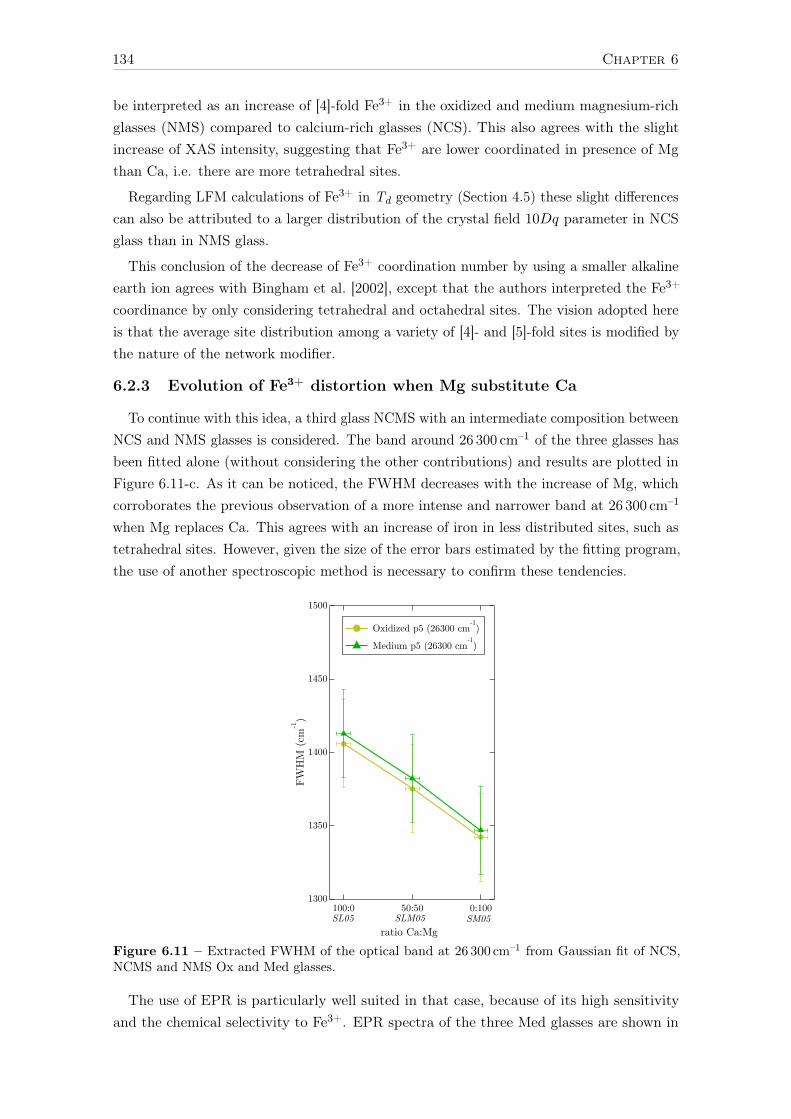
134 Chapter 6
be interpreted as an increase of [4]-fold Fe3+ in the oxidized and medium magnesium-richglasses (NMS) compared to calcium-rich glasses (NCS). This also agrees with the slightincrease of XAS intensity, suggesting that Fe3+ are lower coordinated in presence of Mgthan Ca, i.e. there are more tetrahedral sites.
Regarding LFM calculations of Fe3+ in Td geometry (Section 4.5) these slight differencescan also be attributed to a larger distribution of the crystal field 10Dq parameter in NCSglass than in NMS glass.
This conclusion of the decrease of Fe3+ coordination number by using a smaller alkalineearth ion agrees with Bingham et al. [2002], except that the authors interpreted the Fe3+
coordinance by only considering tetrahedral and octahedral sites. The vision adopted hereis that the average site distribution among a variety of [4]- and [5]-fold sites is modified bythe nature of the network modifier.
6.2.3 Evolution of Fe3+ distortion when Mg substitute Ca
To continue with this idea, a third glass NCMS with an intermediate composition betweenNCS and NMS glasses is considered. The band around 26 300 cm–1 of the three glasses hasbeen fitted alone (without considering the other contributions) and results are plotted inFigure 6.11-c. As it can be noticed, the FWHM decreases with the increase of Mg, whichcorroborates the previous observation of a more intense and narrower band at 26 300 cm–1
when Mg replaces Ca. This agrees with an increase of iron in less distributed sites, such astetrahedral sites. However, given the size of the error bars estimated by the fitting program,the use of another spectroscopic method is necessary to confirm these tendencies.
1500
1450
1400
1350
1300
FWH
M (
cm-1)
100:0 50:50 0:100
ratio Ca:Mg
Oxidized p5 (26300 cm-1)
Medium p5 (26300 cm-1)
SL05 SM05SLM05
Figure 6.11 – Extracted FWHM of the optical band at 26 300 cm–1 from Gaussian fit of NCS,NCMS and NMS Ox and Med glasses.
The use of EPR is particularly well suited in that case, because of its high sensitivityand the chemical selectivity to Fe3+. EPR spectra of the three Med glasses are shown in

COMPOSITION DEPENDENCE OF IRON ENVIRONMENT IN GLASSES 135
Figure 6.12. When Ca2+ is substituted by Mg2+ in the glassy matrix, EPR spectra show(a) an increase of the g = 8 line, (b) a decrease and broadening of the g = 4.3 line and(c) an increase of the g = 2 line. Concerning the signals at g = 4.3, these tendencies aresummarized in Figure 6.13 for the nine glasses (3 redox states times 3 compositions).
80
60
40
20
0
).u .bra( langiS
RP
E
120100806040200Magnetic field (mT)
NCS05-Med NCMS05-Med NMS05-Med
T = 298 K g = 8
a
800
600
400
200
0
-200
-400
-600
).u .bra( langiS
RP
E
170165160155150Magnetic field (mT)
NCS05-Med NCMS05-Med NMS05-Med
T = 298 K g = 4.3
b
Ipp (g4.3)
Hpp(g4.3)
-120
-100
-80
-60
-40
-20
0
).u .bra( langiS
RP
E
420400380360340320Magnetic field (mT)
NCS05-Med NCMS05-Med NMS05-Med
T = 298 K g = 2
c
Ipp (g2)
Hpp(g2)
Figure 6.12 – X-band EPR signals for the three intermediate redox glasses (NCS05Med,NCMS05Med and NMS05Med) at (a) g = 8, (b) g = 4.3 and (c) g = 2.
2000
1500
1000
500
0
I pp (
a.u.
)
100806040200Redox (%)
NCS05 NCMS05 NMS05T = 298K
a
5.5
5.0
4.5
4.0
3.5
3.0
∆Hpp
(mT)
100806040200Redox (%)
NCS05 NCMS05 NMS05T = 298K
b
100x103
80
60
40
20
0
∆Hpp.I pp (
a.u.
)
100806040200Redox (%)
NCS05 NCMS05 NMS05T = 298K
c
Figure 6.13 – (a) g = 4.3 peak-to-peak intensity (Ipp), (b) g = 4.3 peak-to-peak linewidth (∆Hpp)and (c) the product of ∆Hpp and Ipp as a function of redox R = Fe2+/Fetot for the three glasscompositions: NCS, NCMS and NMS. The lines are a guide for the eyes.
The nature of the alkaline earth cations has a smaller effect on Ipp and ∆Hpp than theredox. Nevertheless, Mg-containing samples systematically show a weaker and broader signalat g = 4.3. Whatever the redox, the larger linewidth of the g = 4.3 signal (Figures 6.12-band 6.13-b) for NMS samples compared to NCS samples reflects a decrease of the rhombicdistortion of Fe3+ sites (i.e. lower value of λ = E/D) [Elvers and Weissmann, 2001].This lower rhombic distortion is supported by the increase of the signal associated toaxially distorted sites at g = 8 (Figure 6.12-a) and g = 2 (Figure 6.12-c). Due to smallercoordination numbers, [4]-fold sites are indeed less subject to distortion. This effect isconsistent with the increase of the concentration of tetrahedral sites in Mg-bearing glassescompared to Ca-bearing glasses, with lower average coordination number for Fe3+ in soda-magnesia glasses (∼4.5) than in soda-lime glasses (∼5.0) [Bingham et al., 2014]. Thisis supported by our optical absorption data (Figure 6.9) suggesting an increase of the25 500 cm–1 contribution (attributed to [5]-fold Fe3+) and a decrease of the 26 300 cm–1
contribution (attributed to tetrahedral Fe3+).
Figure 6.13, can be used in addition to the study of the g = 4.3 signal broadening asa function of redox, discussed in Section 5.3.4. The almost linear evolution of Ipp and∆Hpp with redox for a fixed total iron content (0.5wt% of Fe2O3) is similar to the variationobtained by changing the total iron content at a given redox [Elvers and Weissmann, 2001].This indicates a linear variation of the Fe3+ concentration as a function of Fe2+/Fetot. The

136 Chapter 6
quasi-linearity of the product Ipp × ∆Hpp (Figure 6.13-c) confirms the Lorentzian shapeexpected for the g = 4.3 signal of Fe3+ in diluted glasses [Elvers and Weissmann, 2001].Increasing Fe3+ concentration leads to a broadening of this g = 4.3 EPR signal, whichis indicative of a larger distribution including isolated Fe3+ sites with a smaller averagedistortion. On the contrary, at low Fe3+-content, site distribution is smaller (discreteEPR transitions at g = 4.3 compared to oxidized sample without split signal) with apredominance of distorted sites (smaller ∆Hpp).
In the case of iron-dopped silicate glasses, OAS, XAS and EPR spectroscopies suggest alower coordination, distortion and distribution of Fe3+ local environment in Mg-rich glassescompared to Ca-rich glasses. However, as suggested by the study of the optical UV-edge,the substitution of Ca by Mg implies a different behavior on the Fe2+ local environment.
6.2.4 Ca:Mg effects on ferrous iron (Fe2+) optical signatures in glasses
In this section, we focus on the Fe2+ environmental and spectroscopic changes in responseto the modification of the alkaline-earth nature (Ca → Mg) in sodium-silicate glasses.Glasses studied here are the reduced glasses (NCS05Red, NCMS05Red and NMS05Red)that maximized the Fe2+ content.
In glasses, the shape of the main Fe2+ band (around 10 000 cm–1 strongly depends onthe nature of cation modifiers. In the case of alkali modification, the asymmetry increaseswith the alkali radius and can be related to distortion and distribution of site geometries[Bingham, 2000, p. 74–76]. Section 6.1.2 also that the absence of alkali leads to a particularlysymmetric band.
Concerning the effect of the nature of the alkaline-earth, Figure 6.14 shows the opticalmolar absorption coefficients of Fe2+ for the three glasses of interest. The band around10 000 cm–1 is at higher energy for Mg-rich glass but the intensity maximum does notsignificantly change. On the other hand, signals from 4000 cm–1 to 9000 cm–1 are smallerwhen magnesium is added.
In order to help in the interpretation of these change a fit of the optical absorption from4000 cm–1 to 16 000 cm–1 has been performed with 3 Gaussian functions (Table 6.2). Itseems that two simultaneous effects explain the modification of the spectral shape:(i) a shiftat high energy of the bands due to an increase of the crystal field (as studied with LFMcalculation in Chapter 4); (ii) a decrease of the signals from 6000 cm–1 to 9000 cm–1 mirroredby an increase of the signals above 9000. This last point, can be due to a coordinationnumber evolution with less distorted tetrahedral sites and more non-tetrahedral Fe2+ sites.However, there is no significant evolution of the 4800 cm–1 band, except a slight broadeningand shift to lower energies, which could be a possible side effect of the decrease of the8000 cm–1 contribution.

COMPOSITION DEPENDENCE OF IRON ENVIRONMENT IN GLASSES 137
25
20
15
10
5
0Fe2+
Mol
ar a
bsor
ptio
n co
effici
ent
(L.m
ol-1.c
m-1)
1816141210864Wavenumber (x103
cm-1)
2500 2000 1500 1000 900 800 700 600Wavelength (nm)
NCS05Red NCMS05Red NMS05Red
Figure 6.14 – molar absorption coefficient of Fe2+ (εFe2+) for the three sodium-alkaline earthsilicate glasses with a Fe2+/Fetot ratio around 99%: NCS05Red (red), NCMS05Red (green) andNCM05Red (blue).
Table 6.2 – Fit of Fe2+ bands with 3 Gaussian functions for NCS05Red, NCMS05Red andNMS05Red glasses
Sample name Position(cm–1)
σ(cm–1)
FWHM(cm–1)
Intensity(cm–1)
εFe2+
(L/mol/cm) Area (cm–2)
NCS05Red#1 4848 492 1159 0.75 4.8 651.6#2 7812 1277 3007 0.96 6.2 2181.4#3 9775 3177 7482 3.65 23.7 20557.5NCMS05Red#1 4825 511 1203 0.77 4.9 701.9#2 7905 1264 2977 0.82 5.1 1838.9#3 9994 3157 7435 3.96 24.8 22141.8NMS05Red#1 4787 520 1225 0.72 4.8 666.7#2 7944 1287 3031 0.73 4.8 1665.3#3 10129 3144 7404 3.80 25.0 21198.3
To enhance the signal originating from small absorption band, the optical spectra areplotted with a logarithmic scale for the absorbance (Figure 6.15).
There is no evolution of the position of the band around 21 500 cm–1 and 23 500 cm–1
bands that have been attributed in Section 5.2.5 to Fe2+ spin-forbidden transition. Thissignifies that these bands can be due to transitions independent of the crystal field, whichwould explain that they emerge from the absorption background.
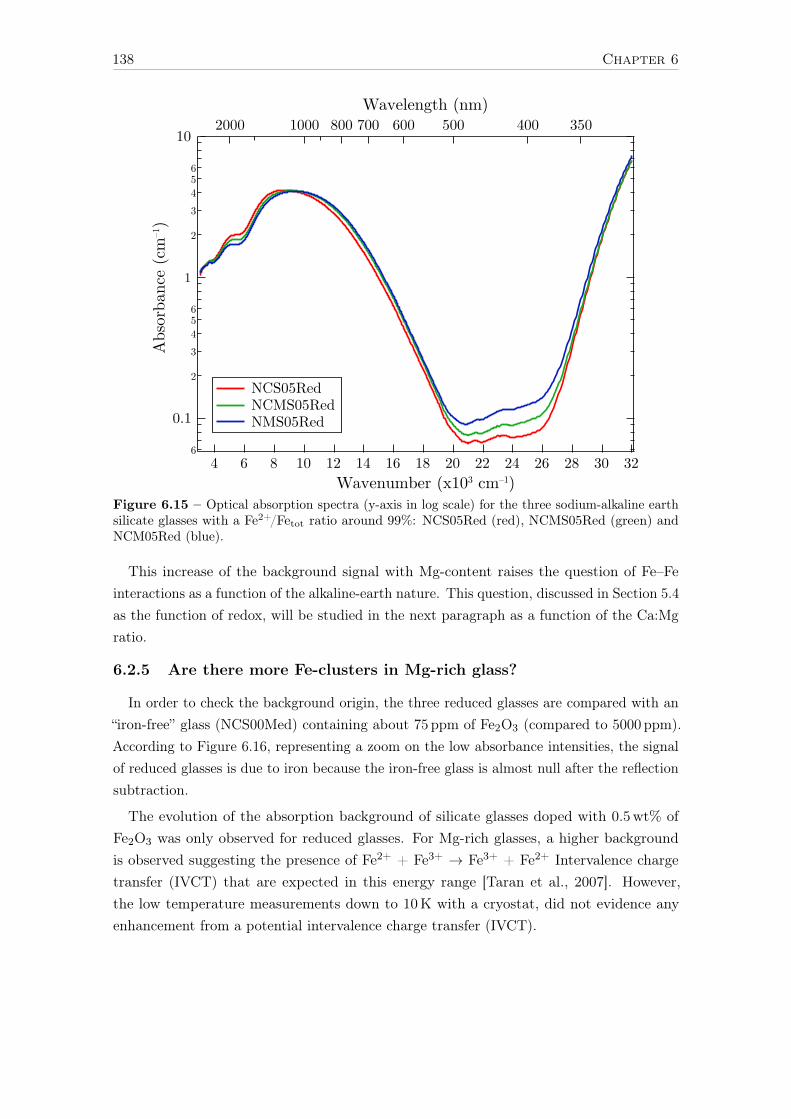
138 Chapter 6
6
0.1
2
3456
1
2
3456
10A
bsor
banc
e (c
m–1)
323028262422201816141210864Wavenumber (x103 cm–1)
2000 1000 800 700 600 500 400 350Wavelength (nm)
NCS05Red NCMS05Red NMS05Red
Figure 6.15 – Optical absorption spectra (y-axis in log scale) for the three sodium-alkaline earthsilicate glasses with a Fe2+/Fetot ratio around 99%: NCS05Red (red), NCMS05Red (green) andNCM05Red (blue).
This increase of the background signal with Mg-content raises the question of Fe–Feinteractions as a function of the alkaline-earth nature. This question, discussed in Section 5.4as the function of redox, will be studied in the next paragraph as a function of the Ca:Mgratio.
6.2.5 Are there more Fe-clusters in Mg-rich glass?
In order to check the background origin, the three reduced glasses are compared with an“iron-free” glass (NCS00Med) containing about 75 ppm of Fe2O3 (compared to 5000 ppm).According to Figure 6.16, representing a zoom on the low absorbance intensities, the signalof reduced glasses is due to iron because the iron-free glass is almost null after the reflectionsubtraction.
The evolution of the absorption background of silicate glasses doped with 0.5wt% ofFe2O3 was only observed for reduced glasses. For Mg-rich glasses, a higher backgroundis observed suggesting the presence of Fe2+ + Fe3+ → Fe3+ + Fe2+ Intervalence chargetransfer (IVCT) that are expected in this energy range [Taran et al., 2007]. However,the low temperature measurements down to 10K with a cryostat, did not evidence anyenhancement from a potential intervalence charge transfer (IVCT).

COMPOSITION DEPENDENCE OF IRON ENVIRONMENT IN GLASSES 139
0.14
0.12
0.10
0.08
0.06
0.04
0.02
0.00
Abs
orba
nce
(cm
–1)
2726252423222120Wavenumber (x103 cm–1)
500 450 400 380Wavelength (nm)
NCS05Red NCMS05Red NMS05Red NCS00Med
Figure 6.16 – Optical absorption spectra in cm–1 for the three sodium-alkaline earth silicateglasses with a Fe2+/Fetot ratio around 99%: NCS05Red (red), NCMS05Red (green) and NCM05Red(blue) and an “iron-free” glass NCS00Med (grey) with an intermediate redox.
In the same way, for XAS measurements, only reduced glasses exhibit a difference withmagnesium content of the signal between the pre-edge and the main edge. The HERFD-XASspectra (Figure 6.17) show an increase of this signal with Mg-content. This signal hasbeen interpreted by Vankó et al. as non-local dipole excitation, due to the presence of aneighboring transition metal via the M(4p)–O–M’(3d) intersite hybridization [Vankó et al.,2008].
0.15
0.10
0.05
0.00
HERF
D no
rmal
ized
sig
nal
7.1187.1167.1147.112Energy (keV)
NCS05Red NCMS05Red NMS05Red NCS05Med
1.2
1.0
0.8
0.6
0.4
0.2
0.0
HERF
D no
rmal
ized
sig
nal
7.227.207.187.167.147.12Energy (keV)
NCS05Red NCMS05Red NMS05Red NCS05Med
Figure 6.17 – HERFD spectra at Fe K edge of the three reduced glasses (NCS05Red, NCMS05Redand NMS05Red) and the NCS05Med glass with an intermediate redox.
Concerning EPR, only the reduced glasses present a complete vanishing of the g = 2
signal at low-temperature EPR (for Med and Ox only a decrease was observed proportionallyto the g = 4.3 signal).
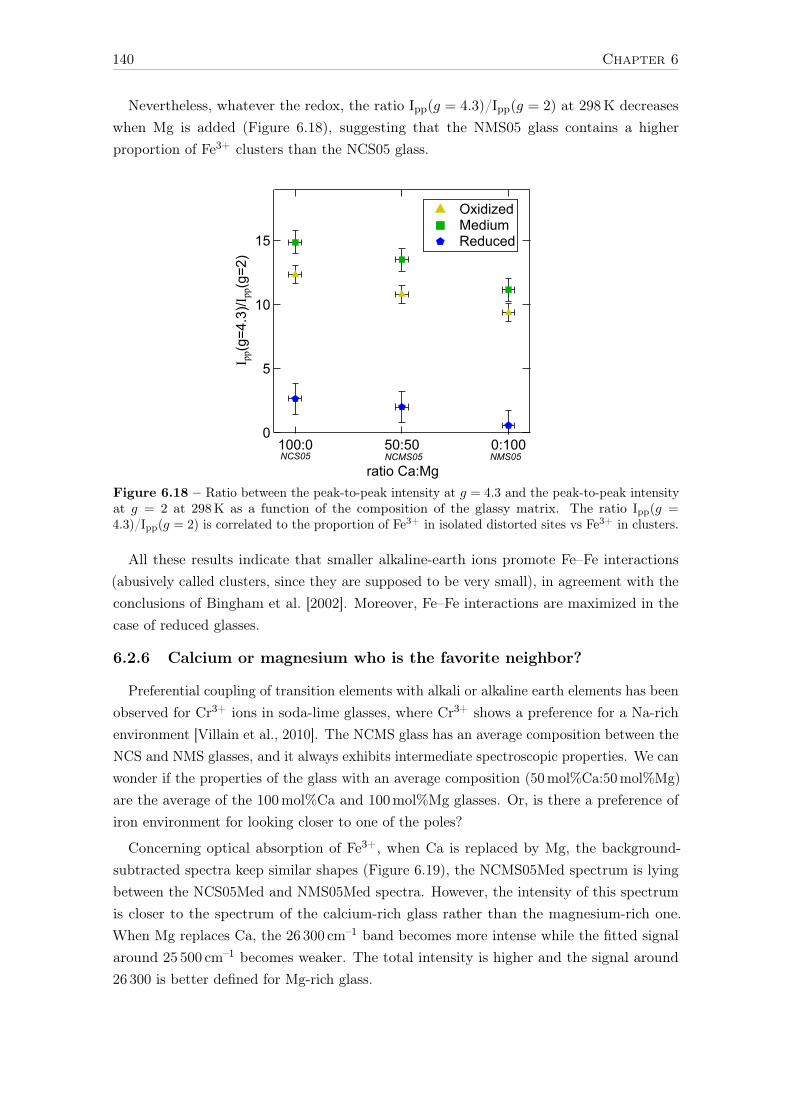
140 Chapter 6
Nevertheless, whatever the redox, the ratio Ipp(g = 4.3)/Ipp(g = 2) at 298K decreaseswhen Mg is added (Figure 6.18), suggesting that the NMS05 glass contains a higherproportion of Fe3+ clusters than the NCS05 glass.
15
10
5
0
I pp(
g=4.
3)/I pp(
g=2)
100:0 50:50 0:100
ratio Ca:Mg
Oxidized Medium Reduced
NCS05 NMS05NCMS05
Figure 6.18 – Ratio between the peak-to-peak intensity at g = 4.3 and the peak-to-peak intensityat g = 2 at 298K as a function of the composition of the glassy matrix. The ratio Ipp(g =4.3)/Ipp(g = 2) is correlated to the proportion of Fe3+ in isolated distorted sites vs Fe3+ in clusters.
All these results indicate that smaller alkaline-earth ions promote Fe–Fe interactions(abusively called clusters, since they are supposed to be very small), in agreement with theconclusions of Bingham et al. [2002]. Moreover, Fe–Fe interactions are maximized in thecase of reduced glasses.
6.2.6 Calcium or magnesium who is the favorite neighbor?
Preferential coupling of transition elements with alkali or alkaline earth elements has beenobserved for Cr3+ ions in soda-lime glasses, where Cr3+ shows a preference for a Na-richenvironment [Villain et al., 2010]. The NCMS glass has an average composition between theNCS and NMS glasses, and it always exhibits intermediate spectroscopic properties. We canwonder if the properties of the glass with an average composition (50mol%Ca:50mol%Mg)are the average of the 100mol%Ca and 100mol%Mg glasses. Or, is there a preference ofiron environment for looking closer to one of the poles?
Concerning optical absorption of Fe3+, when Ca is replaced by Mg, the background-subtracted spectra keep similar shapes (Figure 6.19), the NCMS05Med spectrum is lyingbetween the NCS05Med and NMS05Med spectra. However, the intensity of this spectrumis closer to the spectrum of the calcium-rich glass rather than the magnesium-rich one.When Mg replaces Ca, the 26 300 cm–1 band becomes more intense while the fitted signalaround 25 500 cm–1 becomes weaker. The total intensity is higher and the signal around26 300 is better defined for Mg-rich glass.

COMPOSITION DEPENDENCE OF IRON ENVIRONMENT IN GLASSES 141
2.0
1.5
1.0
0.5
0.0Fe3+
mol
ar a
bsor
ptio
n co
eci
ent
(L.m
ol-1.c
m-1)
282726252423222120Wavenumber (x10
3 cm
-1)
500 480 460 440 420 400 380 360Wavelength (nm)
NCS05Med NCMS05Med NMS05Med
Figure 6.19 – Optical spectra representing the extracted molar absorption coefficient of Fe3+,εFe3+ for the three sodium-silicate glasses NCS05Med, NCMS05Med and NMS05Med, respectivelycontaining Ca, Ca&Mg and Mg as an alkaline earth network modifier.
The EPR results of the previous section, for g = 8, g = 4.3 and g = 2 (Figure 6.12),also show a smilar tendency for Fe3+ in NCMS to look more like Fe3+ in NCS than inNMS. Just as the HERFD and extracted K pre-edge (Figure 6.20), NCMS05Ox pre-edge isalmost identical to the one of NCS05OX.
This situation is less clear for Fe2+ environment, optical absorption spectra of reducedglasses from 4000 cm–1 to 18 000 cm–1 (Figures 6.14 and 6.15) suggest that ferrous iron ofthe 50Mg:50Ca glass is in a similar environment than in the Mg-rich glass. Concerning theXAS (Figures 6.17 and 6.20), below 7113 eV the pre-edge of NCMS is similar to NMS butabove 7113 eV the situation is inverted.
0.20
0.15
0.10
0.05
0.00
HER
FD s
igna
l (ar
b. u
.)
71187116711471127110Energy (eV)
NCS05Red NCMS05Red NMS05Red NCS05Ox NCMS05Ox NMS05Ox
0.10
0.08
0.06
0.04
0.02
0.00TFY
ext
ract
ed p
reed
ge s
igna
l (no
rmed
to
mai
n ed
ge)
71167115711471137112Energy (keV)
NCS05Red NCMS05Red NMS05Red NCS05Ox NCMS05Ox NMS05Ox
Figure 6.20 – (Left) HERFD spectra at Fe K edge of Reduced and Oxidized glasses of the NCS,NCMS and NMS compositions. (Right) Extracted TFY pre-edge spectra at Fe K edge for the samesix glasses.

142 Chapter 6
To help in these comparisons, the different RIXS spectra of glasses has been fitted as afunction of two other spectra. For each redox, the NCMS glass were fitted with NCS andNMS of the corresponding redox. For each composition, Med glasess were fitted with Oxand Red. The results are represented in Figure 6.21, the four corners are occupied by theextreme glasses (blue dots). The more an intermediate glass (red dots) is close to a corner,the more it looks like it.
All medium glasses are mainly oxidized, which totally agrees with their Fe2+/Fetotratio (R ∼ 25%) closer to oxidized glasses (R ∼ 5%) than to reduced glasses (R ∼99%). Concerning NCMS glasses containing a majority of iron in the Fe3+ redox state(NCMS05Ox and NCMS05Med), they are both closer to the Ca-rich glasses, which confirmsthe observations made at the beginning of this section. On the other hand, the situationis less clear for the reduced glass NCMS05Red, containing a majority of iron in the Fe3+
redox state. The linear combination of RIXS suggests that Fe2+ environment in this glassis almost 50% of the one in NCS05Red and 50% of of the one in NMS05Red.
NCS05Ox NCS05Red
NMS05RedNMS05Ox
NCMS05Ox
NCS05Med
NMS05Med
NCMS05RedNCMS05Med
Figure 6.21 – Linear combinations of RIXS pre-edge.
The different behavior of Fe2+ and Fe3+, in response to the substitution of the alkaline-earth, agree with the different nature of the two iron valence (Fe2+ is considered as anetwork modifier and Fe3+ as network former). The environment of Fe3+ in NCMS looksmore like Fe3+ in NCS than in NMS. This indicates that Fe3+ sites are not randomly andhomogeneously distributed into the glass matrix as they are sensing a more calcic thanmagnesian environment. Due to its small ionic radius, Mg coordination number (CN around[4] or [5]) [Trcera et al., 2009] is smaller than Ca (CN around [7]) [Cormier and Neuville,2004]. Because Fe3+ is also a small ion with lot of charge on each neighboring oxygen, theMg–O–Fe3+ bond is be more strained than the Ca–O–Fe3+ bond, which could explain thepreference of Fe3+ for Ca.
Because of the smaller valence of Fe2+, each neighboring oxygen receives a smaller electriccharge than for Fe3+. Therefore, oxygens can manage more easily the vicinity of bothMg and Fe2+ ions. This can explain why the Ca/Mg substitution has a less clear effecton the environment of Fe2+, which do not show a clear preference for Ca-rich or Mg-richenvironments.
143
Conclusions and suggestions forfuture work
The purpose of this thesis was to improve the comprehension of the relationships betweenstructural and spectroscopic properties of Fe2+ and Fe3+ in silicate glasses. To do so,a multi-spectroscopic study coupling experimental methods (OAS, XAS and EPR) withligand field multiplet calculation was achieved.
The first step consisted in the study of Fe-bearing crystalline references with iron inspecific sites defined by the point group symmetries: Oh, D4h, D3h/C3v and Td. Speciationof Fe2+ and Fe3+ was characterized using ligand field theory. New developments allowedus to use one set of parameters to calculate both optical absorption spectra and totalfluorescence yield at Fe K pre-edge. In light of ligand field multiplet calculations, the effectof iron local symmetry on the spectroscopic signatures was investigated through the p–dhybridization. Spectroscopic signatures of [5]-fold coordinated iron in minerals confirmedthe intermediate behavior of these Fe2+ and Fe3+ species between [4]-fold and [6]-foldgeometries.
With this additional understanding of the relationships between local structure andspectroscopic signatures of iron in minerals, we focused on the question of iron localenvironment in silicate glasses. By using the multi-spectroscopic approach in the caseof a simple soda-lime-silicate glass doped with iron, we looked at the dominant effect ofredox. Both ferric and ferrous iron environment are modified by the redox state of the glass.For example, Fe3+ environment in oxidized samples is more regular on average, despitea distribution in a larger number of various sites. The study of the different calculationparameters (crystal field, Racah parameters, Vpd and spin-orbit coupling) on the OAS andXAS spectra of minerals contributed to interpret the evolution of the iron spectroscopicfeatures. In particular, [5]-fold coordination of Fe2+ and Fe3+ are now better characterizedin glasses. In addition, the clustering effects due to Fe-Fe interactions were evidenced to behigher in reduced glasses presenting a segregation of iron ions higher than the statisticaldistribution.
The last step was to project these interpretations of local structure of iron in a globalscenario describing the evolution of iron environment as function of the glassy matrixcomposition. The effect of the absence of sodium were studied as a second order effecton spectroscopic properties compared to the first order effect of redox. Then, slightmodifications of the environment were studied by replacing calcium by magnesium. This
144
third order effect, showed a preference for Fe3+ to be in a Ca-rich environment and thatFe2+ is sensitive to the Ca:Mg ratio but do not show any preference for either alkalineearth. Moreover, magnesium-containing glasses increase the proportion of Fe-Fe interactionscompared to calcium-containing glasses.
Perspectives for future works
First iron population
It is known that for glasses containing large proportion of iron (> 1wt%), the Beer-Lambert law is not any more linear with iron concentration. This is due Fe–Fe interactionsgenerating non-linear effects. However, the behavior of the first iron population is lessknown. I did not have time to detail results on the originality of the first populations ofFe2+ and Fe3+ in diluted glasses containing less than 0.01wt% (100 ppm) of Fe2O3 becauseall the difficulty remains in the distinction of real signal from noise regarding the detectionlimits of spectroscopic methods. However, the high sensitivity of EPR exhibits peculiarFe3+ spectroscopic signatures compared with glasses containing 0.1 or 0.5wt% of Fe2O3.
Characterization of hybridization
For non-centrosymmetric geometries, Vpd takes non-negligible values, and p–d mixingmodifies the intended electronic levels, especially, the ground state. Due to transition rules,a change in the ground state symmetry leads to different relative intensities between thetransitions that modifies the spectral shape. However, the physical meaning of hybridizationin term of structural modification is still poorly understood. In particular, we could wonderif there is a correlation between hybridization and crystal field parameters in response to asite distortion.
Beyond fitting an experimental spectrum with parameters
More than the possibility to reproduce experimental spectra using simulation of iron inspecific sites representative of what is found in minerals, it is possible to access intermediatestates that do not exist in crystals (that eventually represent an important amount of theglassy sites) by changing the calculation parameters in a realistic range considering what isfound in crystals. It is therefore possible to calculate a spectrum from different spectrawith any distribution of the parameters in order to take into account the amorphous natureof glasses.
LFM calculation is an interesting tool to interpret spectroscopic signatures and bringstendencies from the evolution of parameters’ values but it is not a predictive tool regardingthe effect of the structure. For example, we cannot predict what happens if Na is substitutedby K or if the site is distorted in a specific direction.
ab initio calculations could be an interesting preliminary step to the LFM calculationsto avoid excessive parametrization. A potential calculation protocol for simulation of glassspectra would be to use molecular dynamics (MD) to find a distribution of angles anddistances for Fe–O bonds, then use DFT calculations to extract ligand field parameters,energy levels to use them as inputs for LFM calculations to calculate a large number of
145
spectra. To go further, ab initio could provide the wave functions and density of statescalculated describing the electronic state in order to perform spectroscopy and electronictransitions between these levels using LFM calculation. In the end, the spectra could beaveraged regarding their respective proportions estimated by MD calculations.
A similar procedure has been done for NMR by Charpentier et al. [2004] without 3d
elements. However, the presence of diluted 3d elements necessitates large simulation boxeswith lots of atoms and induces very long calculation time.
RIXS calculation of powders
The application of the RIXS cross-section formula to calculate LFM spectra will improvethe comparison with experimental data. Benefits are expected from the better resolution,signal to noise background and the possibility to remove perturbation from other fluorescenceprocesses such as the overlapping signals due to manganese in the iron K pre-edge. Thecalculation of powder spectra is necessary to account for the amorphous nature of glasses.With these calculations, it will also be possible to study the angular dependence of RIXSpowder spectra (dichroism).
Low temperature experiments on crystals
These promising results obtained on gillespite, encourage us to complete the study of thismineral by a temperature dependence study. It could be interesting, in a further study, tomeasure optical transmission of a gillespite crystal at low temperature (10K), and see whathappens to the area of optical transition bands. Lower temperature decreases the effectof vibrations and therefore reduces dynamical distortions induced by thermal agitation.As a consequence, optical bands are narrowed. However, the effect on intensity is lesspredictable, if a decrease in the area of optical transitions is observed, then it could beinterpreted as a decrease of the time spent by the site in a distorted state instead of theregular square-planar D4h geometry reflecting a lower dynamical hybridization.
Optical Magnetic Circular Dichroism (OMCD)
As we have seen, the main problem of Fe2+ optical signature in glasses is that the mainband is very broad due to the overlapping of several contributions from the only spin-allowedtransition of Fe2+ in several different sites. A promising work has been done by Jacksonet al. [2005] who analyzed the Fe2+ bands with optical magnetic circular dichroism (MCD).The authors extracted three transitions at 4500 cm–1, 6700 cm–1 and 8500 cm–1, possiblycorresponding to at least two different sites of coordination number between [4] and [5].However, no correspondence between spectral signature and sites structure has been made;and this method does not explain the optical absorbance measured above 10 000 cm–1.
Using the LFM simulation developments of this thesis concerning optical absorptionspectroscopy, it is possible to take into account the effect of magnetic field in the calculation.For example, in Quanty, the Zeeman splitting, caused by the magnetic field, can be addedto the Hamiltonian describing iron environment in order to analyzed the evolution of opticalbands with the magnetic field.


147
References
Abdelghany, A. M. and ElBatal, H. A. (2014). Gamma-rays interactions on optical, FTIRabsorption and ESR spectra of 3d transition metals-doped sodium silicophosphate glasses.Journal of Molecular Structure 1067, 138–146. (see p. 216)
Abragam, A. and Bleaney, B. (1970). Electron paramagnetic resonance of transition ions.Clarendon P. (see p. 50)
Abu-Eid, R. M., Langer, K. and Seifert, F. (1978). Optical absorption and Mössbauerspectra of purple and green yoderite, a kyanite-related mineral. Physics and Chemistryof Minerals 3, 271–289. (see pp. 94 and 114)
Ades, C., Toganidis, T. and Traverse, J. (1990). High temperature optical spectra ofsoda-lime-silica glasses and modelization in view of energetic applications. Journal ofNon-Crystalline Solids 125, 272–279. (see p. 206)
Aime, S., Bergamasco, B., Biglino, D., Digilio, G., Fasano, M., Giamello, E. and Lopiano, L.(1997). EPR investigations of the iron domain in neuromelanin. Biochimica et BiophysicaActa (BBA) - Molecular Basis of Disease 1361, 49–58. (see pp. 49 and 50)
Altmann, S. L. and Herzig, P. (1994). Point-group theory tables. Clarendon Press. (seep. 27)
Amthauer, G. and Rossman, G. R. (1984). Mixed valence of iron in minerals with cationclusters. Physics and Chemistry of Minerals 11, 37–51. (see p. 60)
Ardelean, I., Peteanu, M., Filip, S., Simon, V. and Gyorffy, G. (1997). EPR and magneticsusceptibility studies of iron ions in 70TeO2–25B2O3–5PbO glass matrix. Solid StateCommunications 102, 341–346. (see p. 121)
Ardelean, I., Păşcuţă, P. and Giurgiu, L. V. (2003). EPR and Magnetic SusceptibilityInvestigations of Fe2O3-B2O3-KCl Glasses. International Journal of Modern Physics B17, 3049–3056. (see p. 121)
Arrio, M.-A., Rossano, S., Brouder, C., Galoisy, L. and Calas, G. (2000). Calculation ofmultipole transitions at the Fe K pre-edge through p-d hybridization in the Ligand FieldMultiplet model. Europhysics Letters 51, 454–460. (see pp. 39, 53, 58, 61, 65 and 81)
Bain, G. A. and Berry, J. F. (2008). Diamagnetic Corrections and Pascal’s Constants.Journal of Chemical Education 85, 532. (see p. 212)

148
Balan, E., Allard, T., Boizot, B., Morin, G. and Muller, J.-P. (1999). Structural Fe3+ innatural kaolinites : new insights from electron paramagnetic resonance spectra fitting atX and Q-band frequencies. Clays and Clay Minerals 47, 605–616. (see pp. 46 and 242)
Balan, E., Allard, T., Boizot, B., Morin, G. and Muller, J.-P. (2000). Quantitativemeasurement of paramagnetic Fe3+ in kaolinite. Clays and Clay Minerals 48, 439–445.(see pp. 46 and 242)
Ballhausen, C. J. (1962). Introduction to ligand field theory. McGraw-Hill. (see pp. 51, 52,57, 60 and 237)
Bamford, C. R. (1977). Colour generation and control in glass. Elsevier Amsterdam. (seep. 22)
Bart, J. C. J., Burriesci, N., Cariati, F., Cavallaro, S., Giordano, N. and Petrera, M. (1982).Nature and distribution of iron in volcanic glasses: Mössbauer and ESR study of Liparipumice. Bull. Mineral 105, 43–50. (see p. 121)
Bates, T. (1962). Ligand field theory and absorption spectra of transition-metal ions inglasses. Modern aspects of the vitreous state 2, 195–254. (see pp. 23 and 52)
Bauer, M. (2014). HERFD-XAS and valence-to-core-XES: new tools to push the limits inresearch with hard X-rays? Physical Chemistry Chemical Physics 16, 13827–13837. (seep. 42)
Berger, R., Kliava, J., Yahiaoui, E.-M., Bissey, J.-C., Zinsou, P. K. and Béziade, P. (1995).Diluted and non-diluted ferric ions in borate glasses studied by electron paramagneticresonance. Journal of Non-Crystalline Solids 180, 151–163. (see pp. 50, 99 and 121)
Berthet, P., Berthon, J. and d’Yvoire, F. (1988). Xanes study of five-fold coordinated iron(III) in Fe3PO7 and FeAsO4-I. Materials Research Bulletin 23, 1501–1508. (see p. 25)
Berthet, P., Berthon, J. and d’Yvoire, F. (1989). EXAFS study of five-fold coordinatediron (III) in Fe3PO7 and FeAsO4-I. Materials Research Bulletin 24, 459–465. (see p. 25)
Bethe, H. (1929). Term splitting in crystals. Annalen der Physik 3, 133–208. (see p. 51)
Bingham, P., Parker, J., Searle, T. and Smith, I. (2007). Local structure and medium rangeordering of tetrahedrally coordinated Fe3+ ions in alkali–alkaline earth–silica glasses.Journal of Non-Crystalline Solids 353, 2479–2494. (see p. 111)
Bingham, P., Parker, J., Searle, T., Williams, J. and Fyles, K. (1999). Redox and clusteringof iron in silicate glasses. Journal of Non-Crystalline Solids 253, 203–209. (see pp. 119,122 and 204)
Bingham, P. A. (2000). The Environment of Iron in Silicate Glasses. PhD thesis, Universityof Sheffield, Department of Engineering Materials. (see pp. 100 and 136)
149
Bingham, P. A., Hannant, O. M., Reeves-McLaren, N., Stennett, M. C. and Hand, R. J.(2014). Selective behaviour of dilute Fe3+ ions in silicate glasses: an Fe K-edge EXAFSand XANES study. Journal of Non-Crystalline Solids 387, 47–56. (see pp. 25, 32, 87,111 and 135)
Bingham, P. A., Parker, J. M., Searle, T., Williams, J. M. and Smith, I. (2002). Novelstructural behaviour of iron in alkali–alkaline-earth–silica glasses. Comptes RendusChimie 5, 787–796. (see pp. 134 and 140)
Bogomolova, L. and Henner, E. (1980). The effects of cluster formation of the Fe3+ ions insilicate glasses. Journal of Magnetic Resonance (1969) 41, 422–431. (see pp. 99 and 121)
Boizot, B., Petite, G., Ghaleb, D., Pellerin, N., Fayon, F., Reynard, B. and Calas, G.(2000). Migration and segregation of sodium under β-irradiation in nuclear glasses.Nuclear Instruments and Methods in Physics Research Section B: Beam Interactionswith Materials and Atoms 166–167, 500–504. (see p. 215)
Boudalis, A. K., Sanakis, Y., Dahan, F., Hendrich, M. and Tuchagues, J.-P. (2006).An Octanuclear Complex Containing the Fe3O7+ Metal Core: Structural, Magnetic,Mössbauer, and Electron Paramagnetic Resonance Studies. Inorganic Chemistry 45,443–453. (see p. 49)
Boulos, E., Glebov, L. and Smirnova, T. (1997). Absorption of iron and water in theNa2O–CaO–MgO–SiO2 glasses. I. Separation of ferrous and hydroxyl spectra in the nearIR region. Journal of Non-Crystalline Solids 221, 213–221. (see p. 98)
Briois, V., dit Moulin, C. C., Sainctavit, P., Brouder, C. and Flank, A.-M. (1995). Fullmultiple scattering and crystal field multiplet calculations performed on the spin transitionFeII (phen) 2 (NCS) 2 complex at the iron K and L2,3 X-ray absorption edges. Journalof the American Chemical Society 117, 1019–1026. (see p. 61)
Brouder, C. (1990). Angular dependence of X-ray absorption spectra. Journal of Physics:Condensed Matter 2, 701–738. (see pp. 39, 59 and 242)
Brown, G. E., Farges, F. and Calas, G. (1995). X-ray scattering and X-ray spectroscopystudies of silicate melts. Reviews in Mineralogy and Geochemistry 32, 317–410. (seepp. 23, 25, 101, 131 and 237)
Burns, R. G. (1981). Intervalence Transitions in Mixed Valence Minerals of Iron andTitanium. Annual Review of Earth and Planetary Sciences 9, 345–383. (see p. 30)
Burns, R. G. (1993). Mineralogical applications of crystal field theory. Cambridge UniversityPress. (see pp. 23, 52, 53, 58, 60, 61, 66, 67, 72, 87, 92, 109, 110, 114, 124 and 236)
Butler, P. H. (1981). Point group symmetry applications: methods and tables. PlenumPress. (see pp. 61, 64, 84 and 231)
C14 Committee (2011). Test Methods for Chemical Analysis of Soda-Lime and BorosilicateGlass. Technical report ASTM International. (see p. 33)
150
Cabaret, D., Bordage, A., Juhin, A., Arfaoui, M. and Gaudry, E. (2010). First-principlescalculations of X-ray absorption spectra at the K-edge of 3d transition metals: anelectronic structure analysis of the pre-edge. Physical Chemistry Chemical Physics 12,5619. (see p. 40)
Calas, G. and Petiau, J. (1983a). Coordination of iron in oxide glasses through high-resolution K-edge spectra: Information from the pre-edge. Solid State Communications48, 625–629. (see pp. 23, 24, 66, 101 and 237)
Calas, G. and Petiau, J. (1983b). Structure of oxide glasses: Spectroscopic studies of localorder and crystallochemistry. Geochemical implications. Bulletin de Minéralogie 106,33–55. (see pp. 29, 49, 119 and 128)
Calvin, S. (2013). XAFS for Everyone. CRC Press. (see p. 39)
Camara, B. (1982). ESR study of the structure of Fe (III) in silicate glasses of differentbasicities. Le Journal de Physique Colloques 43, C9–165–C9–168. (see p. 50)
Castner, T., Newell, G. S., Holton, W. C. and Slichter, C. P. (1960). Note on theParamagnetic Resonance of Iron in Glass. The Journal of Chemical Physics 32, 668–673.(see p. 46)
Charpentier, T., Ispas, S., Profeta, M., Mauri, F. and Pickard, C. J. (2004). First-PrinciplesCalculation of 17O, 29Si, and 23Na NMR Spectra of Sodium Silicate Crystals and Glasses.The Journal of Physical Chemistry B 108, 4147–4161. (see p. 145)
Chopinet, M.-H., Lizarazu, D. and Rocanière, C. (2002). L’importance des phénomènesd’oxydo-réduction dans le verre. Comptes Rendus Chimie 5, 939–949. (see p. 22)
Ciampolini, M. (1969). Spectra of 3d five-coordinate complexes. In Structure and Bonding,(Jørgensen, C. K., Neilands, J. B., Nyholm, R. S., Reinen, D. and Williams, R. J. P., eds),vol. 6, pp. 52–93. Springer Berlin Heidelberg Berlin, Heidelberg. (see pp. 25 and 236)
Cochain, B. (2009). Cinétique et mécanismes d’oxydoréduction dans les silicates fondus :études expérimentales de verres nucléaires simplifiés et d’échantillons naturels. Thèse dedoctorat Paris VI - UPMC Paris, France. (see p. 22)
Cormier, L., Gaskell, P. H., Calas, G. and Soper, A. K. (1998). Medium-range order aroundtitanium in a silicate glass studied by neutron diffraction with isotopic substitution.Physical Review B 58, 11322–11330. (see p. 25)
Cormier, L. and Neuville, D. R. (2004). Ca and Na environments in Na2O–CaO–Al2O3–SiO2 glasses: influence of cation mixing and cation-network interactions. ChemicalGeology 213, 103–113. (see p. 142)
Cowan, R. D. (1981). The Theory of Atomic Structure and Spectra. University of CaliforniaPress. (see pp. 52, 61, 64, 229 and 230)

151
Davis, K. and Tomozawa, M. (1996). An infrared spectroscopic study of water-relatedspecies in silica glasses. Journal of Non-Crystalline Solids 201, 177–198. (see p. 98)
de Groot, F. (2001). High-resolution X-ray emission and X-ray absorption spectroscopy.Chemical Reviews 101, 1779–1808. (see pp. 42 and 61)
de Groot, F. M. F., Glatzel, P., Bergmann, U., van Aken, P. A., Barrea, R. A., Klemme, S.,Hävecker, M., Knop-Gericke, A., Heijboer, W. M. and Weckhuysen, B. M. (2005). 1s2presonant inelastic X-ray scattering of iron oxides. The journal of physical chemistry. B109, 20751–20762. (see pp. 61 and 219)
de Groot, F. M. F. and Kotani, A. (2008). Core Level Spectroscopy of Solids. CRC Press.(see p. 53)
Delaye, J. M., Cormier, L., Ghaleb, D. and Calas, G. (2001). Investigation of multicomponentsilicate glasses by coupling WAXS and molecular dynamics. Journal of Non-CrystallineSolids 293–295, 290–296. (see p. 124)
Densem, N. E. and Turner, W. E. S. (1938). The equilibrium between ferrous and ferricoxides in glasses. J. Soc. Glass Technol 22, 372–89. (see p. 22)
Dowsing, R. D. and Gibson, J. F. (1969). Electron Spin Resonance of High-Spin d5 Systems.The Journal of Chemical Physics 50, 294–303. (see p. 49)
Duffy, J. and Ingram, M. (1976). An interpretation of glass chemistry in terms of theoptical basicity concept. Journal of Non-Crystalline Solids 21, 373–410. (see p. 34)
Duffy, J. A. (1996). Redox equilibria in glass. Journal of Non-Crystalline Solids 196, 45–50.(see p. 22)
Dunaeva, E., Uspenskaya, I., Pokholok, K., Minin, V., Efimov, N., Ugolkova, E. and Brunet,E. (2012). Coordination and RedOx ratio of iron in sodium-silicate glasses. Journal ofNon-Crystalline Solids 358, 3089–3095. (see pp. 49, 121 and 122)
Duttine, M., Villeneuve, G., Poupeau, G., Rossi, A. M. and Scorzelli, R. B. (2003). Electronspin resonance of Fe3+ ion in obsidians from Mediterranean islands. Application toprovenance studies. Journal of Non-Crystalline Solids 323, 193–199. (see p. 49)
Edwards, R. J., Paul, A. and Douglas, R. W. (1972). Spectroscopy and Oxidation-Reductionof Iron in MO-P2O5 Glasses. Physics and Chemistry of Glasses 13, 137–143. (see p. 99)
Ehrt, D. (2002). UV-absorption and radiation effects in different glasses doped with ironand tin in the ppm range. Comptes Rendus Chimie 5, 679–692. (see p. 110)
Ehrt, D., Leister, M. and Matthai, A. (2001). Polyvalent elements iron, tin and titanium insilicate, phosphate and fluoride glasses and melts. Physics and Chemistry of Glasses 42,231–239. (see p. 99)
Elvers, A. and Weissmann, R. (2001). ESR spectroscopy : an analytical tool for the glassindustry. Glass science and technology 74, 32–38. (see pp. 46, 50, 135 and 136)

152
Farges, F. (2001). Crystal chemistry of iron in natural grandidierites: an X-ray absorptionfine-structure spectroscopy study. Physics and Chemistry of Minerals 28, 619–629. (seep. 103)
Farges, F., Lefrère, Y., Rossano, S., Berthereau, A., Calas, G. and Brown Jr., G. E. (2004).The effect of redox state on the local structural environment of iron in silicate glasses: acombined XAFS spectroscopy, molecular dynamics, and bond valence study. Journal ofNon-Crystalline Solids 344, 176–188. (see pp. 25, 100, 101, 111 and 131)
Faye, G. H. (1969). The Optical Absorption Spectrum of Tetrahedrally Bonded Fe3+ inOrthoclase. The Canadian Mineralogist 10, 112–117. (see p. 87)
Figgis, B. N. and Hitchman, M. A. (2000). Ligand field theory and its applications.Wiley-VCH. (see p. 52)
Flank, A.-M., Lagarde, P., Jupille, J. and Montigaud, H. (2011). Redox profile of the glasssurface. Journal of Non-Crystalline Solids 357, 3200–3206. (see p. 22)
Fortune, W. B. and Mellon, M. G. (1938). Determination of Iron with o-Phenanthroline: ASpectrophotometric Study. Industrial & Engineering Chemistry Analytical Edition 10,60–64. (see p. 33)
Fox, K. E., Furukawa, T. and White, W. B. (1982). Transition-metal ions in silicate melts:II, Iron in sodium silicate glasses. Physics and Chemistry of Glasses 23, 169–178. (seepp. 99, 100 and 207)
Galoisy, L. and Calas, G. (1991). Spectroscopic evidence for five-coordinated Ni in CaNiSi2O6
glass. American Mineralogist 76, 1777–1780. (see p. 25)
Galoisy, L., Calas, G. and Arrio, M. A. (2001). High-resolution XANES spectra of iron inminerals and glasses: structural information from the pre-edge region. Chemical Geology174, 307–319. (see p. 101)
Gibbs, G. V., Ross, N. L., Cox, D. F. and Rosso, K. M. (2014). Insights into the crystalchemistry of Earth materials rendered by electron density distributions: Pauling’s rulesrevisited. American Mineralogist 99, 1071–1084. (see p. 51)
Glatzel, P. and Bergmann, U. (2005). High resolution 1s core hole X-ray spectroscopyin 3d transition metal complexes—electronic and structural information. Coordinationchemistry reviews 249, 65–95. (see pp. 42 and 240)
Glatzel, P. and Juhin, A. (2013). X-ray Absorption and Emission Spectroscopy. In LocalStructural Characterisation, (Bruce, D. W., O’Hare, D. and Walton, R. I., eds), pp.89–171. John Wiley & Sons, Ltd. (see p. 40)
Glebov, L. and Boulos, E. (1998). Absorption of iron and water in the Na2O–CaO–MgO–SiO2 glasses. II. Selection of intrinsic, ferric, and ferrous spectra in the visible and UVregions. Journal of Non-Crystalline Solids 242, 49–62. (see p. 98)
153
Glebov, L., Boulos, E., Glebova, L. and Smirnova, T. (1998). Intrinsic UV absorption andcoloration of the Na2O-CaO-MgO-SiO2 glass by different form or iron. In Proceedings of18th International Congress on Glass pp. 71–76„ San Francisco, USA. (see p. 109)
Goldman, D. S. and Berg, J. I. (1980). Spectral study of ferrous iron in Ca-Al-borosilicateglass at room and melt temperatures. Journal of Non-Crystalline Solids 38–39, Part 1,183–188. (see pp. 23 and 100)
Goldman, D. S. and Gupta, P. K. (1983). Diffusion-Controlled Redox Kinetics in a Glassmelt.Journal of the American Ceramic Society 66, 188–190. (see p. 22)
Gonçalves Ferreira, P., de Ligny, D., Lazzari, O., Jean, A., Cintora Gonzalez, O. andNeuville, D. (2013). Photoreduction of iron by a synchrotron X-ray beam in low ironcontent soda-lime silicate glasses. Chemical Geology 346, 106–112. (see pp. 215 and 216)
Greaves, G. (1985). EXAFS and the structure of glass. Journal of Non-Crystalline Solids71, 203–217. (see p. 21)
Griffith, J. S. (1961). The Theory of Transition-Metal Ions. Cambridge University Press.(see p. 53)
Griscom, D. L. (1980). Electron spin resonance in glasses. Journal of Non-Crystalline Solids40, 211–272. (see pp. 46, 47, 49, 50 and 242)
Guillot, B. and Sator, N. (2007). A computer simulation study of natural silicate melts.Part I: Low pressure properties. Geochimica et Cosmochimica Acta 71, 1249–1265. (seepp. 25, 26, 111 and 237)
Gullikson, E. M. (2010). X-ray interactions with matter, CXRO, http://www.cxro.lbl.gov.(see p. 65)
Hannant, O. M., Bingham, P. A., Hand, R. J. and Forder, S. D. (2008). The structuralproperties of iron in vitrified toxic waste ashes. Glass Technology - European Journal ofGlass Science and Technology Part A 49, 27–32. (see p. 107)
Hannoyer, B., Lenglet, M., Dürr, J. and Cortes, R. (1992). Spectroscopic evidence ofoctahedral iron (III) in soda-lime silicate glasses. Journal of Non-Crystalline Solids 151,209–216. (see p. 115)
Haverkort, M. W., Zwierzycki, M. and Andersen, O. K. (2012). Multiplet ligand-field theoryusing Wannier orbitals. Physical Review B 85, 165113. (see p. 61)
Henderson, G. S., de Groot, F. M. F. and Moulton, B. J. A. (2014). X-ray AbsorptionNear-Edge Structure (XANES) Spectroscopy. Reviews in Mineralogy and Geochemistry78, 75–138. (see p. 101)
Henderson, G. S., Fleet, M. E. and Bancroft, G. M. (1984). An X-ray scattering studyof vitreous KFeSi3O8 and NaFeSi3O8 and reinvestigation of vitreous SiO2 using quasi-crystalline modelling. Journal of Non-Crystalline Solids 68, 333–349. (see p. 101)
154
Higgins, J. B., Ribbe, P. H. and Nakajima, Y. (1982). An ordering model for the com-mensurate antiphase structure of yoderite. American Mineralogist 67, 76–84. (seep. 93)
Hunault, M. (2014). Rôle des éléments de transition (Co, Cu) dans la coloration des verres: application aux vitraux du moyen âge. PhD thesis, Paris 6. (see pp. 58 and 231)
Jackson, W. E., Farges, F., Yeager, M., Mabrouk, P. A., Rossano, S., Waychunas, G. A.,Solomon, E. I. and Brown Jr, G. E. (2005). Multi-spectroscopic study of Fe(II) insilicate glasses: Implications for the coordination environment of Fe(II) in silicate melts.Geochimica et Cosmochimica Acta 69, 4315–4332. (see pp. 23, 24, 41, 100, 101, 111and 145)
Jaklevic, J., Kirby, J., Klein, M., Robertson, A., Brown, G. and Eisenberger, P. (1977).Fluorescence detection of exafs: Sensitivity enhancement for dilute species and thin films.Solid State Communications 23, 679–682. (see p. 40)
Johnston, W. (1964). Oxidation-Reduction Equilibria in Iron-Containing Glass. Journal ofthe American Ceramic Society 47, 198–201. (see pp. 22 and 31)
Juhin, A., Brouder, C., Arrio, M.-A., Cabaret, D., Sainctavit, P., Balan, E., Bordage, A.,Seitsonen, A. P., Calas, G., Eeckhout, S. G. and Glatzel, P. (2008). X-ray linear dichroismin cubic compounds: The case of Cr3+ in MgAl2O4. Physical Review B 78, 195103. (seepp. 59 and 243)
Juhin, A., Brouder, C. and de Groot, F. M. F. (2014). Angular dependence of resonantinelastic x-ray scattering: a spherical tensor expansion. Central European Journal ofPhysics 12, 323–340. (see pp. 62, 219, 220 and 223)
Jørgensen, C. K. (1971). Modern aspects of ligand field theory. North-Holland Amsterdam.(see pp. 51 and 52)
Jørgensen, C. K., de Verdier, C.-H., Glomset, J. and Sörensen, N. A. (1954). Studies ofAbsorption Spectra. III. Absorption Bands as Gaussian Error Curves. Acta ChemicaScandinavica 8, 1495–1501. (see p. 209)
Kilcoyne, S. H. and Cywinski, R. (1995). Ferritin: a model superparamagnet. Journal ofMagnetism and Magnetic Materials 140–144, Part 2, 1466–1467. (see p. 122)
Kittel, C. (2004). Introduction to Solid State Physics. Wiley. (see pp. 44, 45 and 122)
Koksharov, Y. A., Gubin, S. P., Kosobudsky, I. D., Beltran, M., Khodorkovsky, Y. andTishin, A. M. (2000). Low temperature electron paramagnetic resonance anomalies inFe-based nanoparticles. Journal of Applied Physics 88, 1587. (see pp. 49 and 50)
Krause, M. O. and Oliver, J. H. (1979). Natural widths of atomic K and L levels, Kα X-raylines and several KLL Auger lines. Journal of Physical and Chemical Reference Data 8,329–338. (see p. 213)

155
Kress, V. and Carmichael, I. (1991). The compressibility of silicate liquids containing Fe2O3
and the effect of composition, temperature, oxygen fugacity and pressure on their redoxstates. Contributions to Mineralogy and Petrology 108, 82–92. (see pp. 22 and 31)
Kurian, R., Kunnus, K., Wernet, P., Butorin, S. M., Glatzel, P. and Groot, F. M. F. d.(2012). Intrinsic deviations in fluorescence yield detected x-ray absorption spectroscopy:the case of the transition metal L 2,3 edges. Journal of Physics: Condensed Matter 24,452201. (see p. 40)
Kurkjian, C. R. and Sigety, E. A. (1968). Co-ordination of Fe3+ in glass. Physics andChemistry of Glasses 9, 73–83. (see pp. 49, 50, 87 and 121)
König, E. and Kremer, S. (1977). Ligand field energy diagrams. Plenum Press. (see pp. 56,89 and 231)
Langer, K., Smith, G. and Hålenius, U. (1982). Reassignment of the absorption spectra ofpurple yoderite. Physics and Chemistry of Minerals 8, 143–145. (see pp. 94, 95, 112,114 and 115)
Lefrère, Y. (2002). Propriétés d’absorption optique du Fe2+ et du Fe3+ dans des verresd’intérêt industriel : mesure, modélisation et implications structurales. Thèse doctoratParis VII - Diderot Paris, France. (see p. 126)
Lever, A. B. P. (1984). Inorganic electronic spectroscopy. Elsevier. (see pp. 52, 53, 55, 57,72, 75, 231, 232 and 237)
Lin, C. (1981). Optical absorption spectra of Fe2+ and Fe3+ in garnets. Bull Mineral 104,218–222. (see p. 114)
Loeffler, B. M., Burns, R. G., Johnson, K. H., Tossell, J. A. and Vaughan, D. J. (1974).Charge transfer in lunar materials - Interpretation of ultraviolet-visible spectral propertiesof the moon. Proceedings of the Fifth Lunar Conference 5, 3007–3016. (see p. 132)
Ludwig, W. and Falter, C. (1988). Symmetries in Physics, vol. 64, of Springer Series inSolid-State Sciences. Springer Berlin Heidelberg, Berlin, Heidelberg. (see p. 27)
Manning, P. G. (1970). Racah parameters and their relationship to lengths and covalenciesof Mn2+- and Fe3+-oxygen bonds in silicates. The Canadian Mineralogist 10, 677–688.(see p. 115)
Miché, C. (1985). Équilibres rédox du fer dans le système Na2O-Al2O3-SiO2 / Iron redoxequilibria in the Na2O-Al2O3-SiO2 system. PhD thesis, Paris 7 Paris, France. (see p. 87)
Montenero, A., Friggeri, M., Giori, D. C., Belkhiria, N. and Pye, L. D. (1986). Iron-soda-silica glasses: Preparation, properties, structure. Journal of Non-Crystalline Solids 84,45–60. (see pp. 49, 50, 118 and 121)
Moon, D. W., Aitken, J. M., MacCrone, R. K. and Cieloszyk, G. S. (1975). Magnetic-properties and structure of xFe2O3,(1-x)[BaO,4B2O3] glasses. Physics and Chemistry ofGlasses 16, 91–102. (see p. 49)

156
Morgan, G. B. and London, D. (2005). Effect of current density on the electron microprobeanalysis of alkali aluminosilicate glasses. American Mineralogist 90, 1131–1138. (seep. 215)
Mysen, B. O. and Richet, P. (2005). Silicate Glasses and Melts: Properties and Structure.Elsevier. (see p. 22)
Nesbitt, H. W. and Bancroft, G. M. (2014). High Resolution Core- and Valence-Level XPSStudies of the Properties (Structural, Chemical and Bonding) of Silicate Minerals andGlasses. Reviews in Mineralogy and Geochemistry 78, 271–329. (see p. 215)
Neuville, D. R., Cormier, L. and Caurant, D. (2013). Du verre au cristal: Nucléation,croissance et démixtion, de la recherche aux applications. EDP Sciences. (see p. 21)
Nolet, D. A. (1980). Optical absorption and Mössbauer spectra of Fe, Ti silicate glasses.Journal of Non-Crystalline Solids 37, 99–110. (see p. 23)
Ookawa, M., Sakurai, T., Mogi, S. and Yokokawa, T. (1997). Optical spectroscopic studyof lead silicate glasses doped heavily with iron oxide. Materials transactions-JIM 38,220–225. (see pp. 60 and 99)
Paul, A. (1985). Effect of thermal stabilization on redox equilibria and colour of glass.Journal of Non-Crystalline Solids 71, 269–278. (see p. 32)
Paul, A. (1990). Oxidation-reduction equilibrium in glass. Journal of Non-Crystalline Solids123, 354–362. (see p. 22)
Paul, A. and Douglas, R. W. (1965). Ferrous-ferric equilibrium in binary alkali silicateglasses. Physics and Chemistry of Glasses 6, 207. (see p. 22)
Petit, P.-E., Farges, F., Wilke, M. and Solé, V. A. (2001). Determination of the ironoxidation state in Earth materials using XANES pre-edge information. Journal ofSynchrotron Radiation 8, 952–954. (see p. 101)
Pigeonneau, F. and Muller, S. (2013). The impact of iron content in oxidation front in soda-lime silicate glasses: An experimental and comparative study. Journal of Non-CrystallineSolids 380, 86–94. (see pp. 22 and 32)
Pol’shin, E. V., Platonov, A. N., Borutzky, B. E., Taran, M. N. and Rastsvetaeva, R. K.(1991). Optical and mössbauer study of minerals of the eudialyte group. Physics andChemistry of Minerals 18, 117–125. (see p. 25)
Pyare, R. and Nath, P. (1984). Kinetics and thermodynamics of ferrous-ferric equilibriumin sodium aluminoborate glasses. Journal of Non-Crystalline Solids 69, 59–67. (see p. 22)
Ravel, B. and Newville, M. (2005). ATHENA, ARTEMIS, HEPHAESTUS : data analysisfor X-ray absorption spectroscopy using IFEFFIT. Journal of Synchrotron Radiation12, 537–541. (see p. 41)
157
Reid, A. F., Perkins, H. K. and Sienko, M. J. (1968). Magnetic, electron spin resonance,optical, and structural studies of the isomorphous series Na(Sc,Fe)TiO4. InorganicChemistry 7, 119–126. (see p. 121)
Richet, P., Robie, R. A. and Hemingway, B. S. (1986). Low-temperature heat capacity ofdiopside glass (CaMgSi2O6): A calorimetric test of the configurational-entropy theoryapplied to the viscosity of liquid silicates. Geochimica et Cosmochimica Acta 50,1521–1533. (see p. 34)
Richet, P., Roskosz, M. and Roux, J. (2006). Glass formation in silicates: Insights fromcomposition. Chemical geology 225, 388–401. (see p. 125)
Rossano, S., Balan, E., Morin, G., Bauer, J.-P., Calas, G. and Brouder, C. (1999). 57FeMössbauer spectroscopy of tektites. Physics and Chemistry of Minerals 26, 530–538.(see pp. 23, 25 and 237)
Rossano, S., Behrens, H. and Wilke, M. (2008). Advanced analyses of (57)Fe Mossbauerdata of alumino-silicate glasses. Physics and Chemistry of Minerals 35, 77–93. (seep. 24)
Rossano, S., Brouder, C., Alouani, M. and Arrio, M. A. (2000a). Calculated opticalabsorption spectra of Ni2+-bearing compounds. Physics and Chemistry of Minerals 27,170–178. (see pp. 59, 95 and 242)
Rossano, S., Ramos, A. and Delaye, J.-M. (2000b). Environment of ferrous iron in CaFeSi2O6
glass; contributions of EXAFS and molecular dynamics. Journal of Non-CrystallineSolids 273, 48–52. (see p. 119)
Rossano, S., Ramos, A., Delaye, J.-M., Creux, S., Filipponi, A., Brouder, C. and Calas, G.(2000c). EXAFS and Molecular Dynamics combined study of CaO-FeO-2SiO2 glass. Newinsight into site significance in silicate glasses. EPL (Europhysics Letters) 49, 597. (seepp. 24, 25, 100 and 237)
Rossman, G. R. (2014). Optical Spectroscopy. Reviews in Mineralogy and Geochemistry78, 371–398. (see pp. 35, 109 and 239)
Rossman, G. R. and Taran, M. N. (2001). Spectroscopic standards for four- and fivefold-coordinated Fe2+ in oxygen-based minerals. American Mineralogist 86, 896–903. (seepp. 25, 79, 81, 91, 92, 99 and 236)
Rovezzi, M. and Glatzel, P. (2014). Hard x-ray emission spectroscopy: a powerful tool forthe characterization of magnetic semiconductors. Semiconductor Science and Technology29, 023002. (see p. 42)
Rueff, J. and Shukla, A. (2013). A RIXS cookbook: Five recipes for successful RIXSapplications. Journal of Electron Spectroscopy and Related Phenomena 188, 10–16. (seep. 42)

158
Rüssel, C. (1993). Iron Oxide-Doped Alkali Lime Silica Glasses. 1. EPR Investigations.Glastechnische Berichte-Glass Science and Technology 66, 68–75. (see pp. 49 and 122)
Rüssel, C. and Wiedenroth, A. (2004). The effect of glass composition on the thermodynam-ics of the Fe2+/Fe3+ equilibrium and the iron diffusivity in Na2O/MgO/CaO/Al2O3/SiO2
melts. Chemical Geology 213, 125–135. (see p. 22)
Sakaguchi, K. and Uchino, T. (2007). Compositional dependence of infrared absorptionof iron-doped silicate glasses. Journal of Non-Crystalline Solids 353, 4753–4761. (seepp. 22, 119, 121, 127 and 235)
Schmetzer, K., Burford, M., Kiefert, L. and Bernhardt, H. J. (2003). The first transparentfaceted grandidierite, from Sri Lanka. Gems & Gemology 39, 32–37. (see pp. 90 and 109)
Schofield, P. F., Van Der Laan, G., Henderson, C. M. B. and Cressey, G. (1998). A singlecrystal, linearly polarized Fe 2p X-ray absorption study of gillespite. MineralogicalMagazine 62, 65–75. (see p. 79)
Scholze, H. (1980). Le Verre : nature, structure et propriétés. Institut du Verre. (see p. 21)
Schreiber, H. D. (1986). Redox processes in glass-forming melts. Journal of Non-CrystallineSolids 84, 129–141. (see p. 22)
Schreiber, H. D., Balazs, G. B., Shaffer, A. P. and Jamison, P. L. (1982). Iron metalproduction in silicate melts through the direct reduction of Fe(II) by Ti(III), Cr(II), andEu(II). Geochimica et Cosmochimica Acta 46, 1891–1901. (see p. 22)
Schreiber, H. D., Kochanowski, B. K., Schreiber, C. W., Morgan, A. B., Coolbaugh, M. andDunlap, T. G. (1994). Compositional dependence of redox equilibria in sodium silicateglasses. Journal of Non-Crystalline Solids 177, 340–346. (see p. 22)
Seifert, F. and Olesch, M. (1977). Mössbauer spectroscopy of grandidierite,(Mg,Fe)Al3BSiO9. American Mineralogist 62, 547–553. (see p. 25)
Shelby, J. E. (2005). Introduction to Glass Science and Technology. Royal Society ofChemistry. (see p. 21)
Sigel, G. H. and Ginther, R. J. (1968). The effect of iron on the ultraviolet absorption ofhigh purity soda-silica glass. Glass Technology 9, 66–69. (see p. 110)
Solé, V. A., Papillon, E., Cotte, M., Walter, P. and Susini, J. (2007). A multiplatform codefor the analysis of energy-dispersive X-ray fluorescence spectra. Spectrochimica ActaPart B: Atomic Spectroscopy 62, 63–68. (see p. 41)
Spaldin, N. A. (2010). Magnetic Materials: Fundamentals and Applications. CambridgeUniversity Press. (see p. 44)
Steele, F. N. and Douglas, R. W. (1965). Some observations on the absorption of ironin silicate and borate glasses. Physics and Chemistry of Glasses 6, 246. (see pp. 110and 206)
159
Stephenson, D. A. and Moore, P. B. (1968). The crystal structure of grandidierite,(Mg,Fe)Al3SiBO9. Acta Crystallographica Section B Structural Crystallography andCrystal Chemistry 24, 1518–1522. (see p. 92)
Stålhandske, C. (2000). The impact of refining agents on glass colour. Glasteknisk Tidskrift55, 65–71. (see p. 31)
Sørensen, P. M., Pind, M., Yue, Y. Z., Rawlings, R. D., Boccaccini, A. R. and Nielsen, E. R.(2005). Effect of the redox state and concentration of iron on the crystallization behaviorof iron-rich aluminosilicate glasses. Journal of Non-Crystalline Solids 351, 1246–1253.(see p. 22)
Tanabe, Y. and Sugano, S. (1954a). On the Absorption Spectra of Complex Ions II. Journalof the Physical Society of Japan 9, 766. (see p. 56)
Tanabe, Y. and Sugano, S. (1954b). On the Absorption Spectra of Complex Ions. I. Journalof the Physical Society of Japan 9, 753. (see p. 56)
Tanabe, Y. and Sugano, S. (1956). On the Absorption Spectra of Complex Ions, III TheCalculation of the Crystalline Field Strength. Journal of the Physical Society of Japan11, 864–877. (see pp. 51 and 56)
Taran, M. N., Dyar, M. D. and Matsyuk, S. S. (2007). Optical Absorption Study of NaturalGarnets of Almandine-Skiagite Composition Showing Intervalence Fe2+ + Fe3+ → Fe3+
+ Fe2+ Charge-Transfer Transition. American Mineralogist 92, 753–760. (see p. 138)
Taran, M. N. and Koch-Müller, M. (2011). Optical absorption of electronic Fe–Ti charge-transfer transition in natural andalusite: the thermal stability of the charge-transfer band.Physics and Chemistry of Minerals 38, 215–222. (see p. 30)
Thole, B. T. and van der Laan, G. (1988). Linear relation between x-ray absorptionbranching ratio and valence-band spin-orbit expectation value. Physical Review A 38,1943–1947. (see p. 217)
Thole, B. T., van der Laan, G., Fuggle, J. C., Sawatzky, G. A., Karnatak, R. C. and Esteva,J.-M. (1985). 3d x-ray-absorption lines and the 3d94fn+1 multiplets of the lanthanides.Physical Review B 32, 5107–5118. (see pp. 61 and 64)
Trcera, N., Cabaret, D., Rossano, S., Farges, F., Flank, A.-M. and Lagarde, P. (2009).Experimental and theoretical study of the structural environment of magnesium inminerals and silicate glasses using X-ray absorption near-edge structure. Physics andChemistry of Minerals 36, 241–257. (see p. 142)
Tröger, L., Arvanitis, D., Baberschke, K., Michaelis, H., Grimm, U. and Zschech, E. (1992).Full correction of the self-absorption in soft-fluorescence extended x-ray-absorption finestructure. Physical Review B 46, 3283–3289. (see p. 40)

160
Uchino, T., Nakaguchi, K., Nagashima, Y. and Kondo, T. (2000). Prediction of opticalproperties of commercial soda–lime-silicate glasses containing iron. Journal of Non-Crystalline Solids 261, 72–78. (see pp. 22 and 235)
Van Vleck, J. H. and Sherman, A. (1935). The Quantum Theory of Valence. Reviews ofModern Physics 7, 167–228. (see p. 51)
Vankó, G., de Groot, F. M. F., Huotari, S., Cava, R. J., Lorenz, T. and Reuther, M. (2008).Intersite 4p-3d hybridization in cobalt oxides: a resonant x-ray emission spectroscopystudy. arXiv:0802.2744 –. (see pp. 61 and 139)
Varshalovich, D. A., Moskalev, A. N. and Khersonskii, V. K. (1988). Quantum theory ofangular momentum. World Scientific Pub., Singapore, Teaneck, NJ, USA. (see pp. 224and 225)
Villain, O., Galoisy, L. and Calas, G. (2010). Spectroscopic and structural properties ofCr3+ in silicate glasses: Cr3+ does not probe the average glass structure. Journal ofNon-Crystalline Solids 356, 2228–2234. (see p. 140)
Volotinen, T., Parker, J. and Bingham, P. (2008). Concentrations and site partitioning ofFe2+ and Fe3+ ions in a sodalimesilica glass obtained by optical absorbance spectroscopy.Physics and Chemistry of Glasses - European Journal of Glass Science and TechnologyPart B 49, 258–270. (see pp. 87, 114 and 209)
Watanabe, S., Sasaki, T., Taniguchi, R., Ishii, T. and Ogasawara, K. (2009). First-principlescalculation of ground and excited-state absorption spectra of ruby and alexandriteconsidering lattice relaxation. Physical Review B 79, 075109. (see p. 59)
Waychunas, G. A., Apted, M. J. and Jr, G. E. B. (1983). X-ray K-edge absorption spectraof Fe minerals and model compounds: Near-edge structure. Physics and Chemistry ofMinerals 10, 1–9. (see p. 101)
Weigel, C., Cormier, L., Calas, G., Galoisy, L. and Bowron, D. T. (2008a). Intermediate-range order in the silicate network glasses NaFexAl1-xSi2O6 (x=0, 0.5, 0.8, 1): A neutrondiffraction and empirical potential structure refinement modeling investigation. PhysicalReview B 78. (see pp. 23, 25, 96 and 111)
Weigel, C., Cormier, L., Calas, G., Galoisy, L. and Bowron, D. T. (2008b). Nature anddistribution of iron sites in a sodium silicate glass investigated by neutron diffractionand EPSR simulation. Journal of Non-Crystalline Solids 354, 5378–5385. (see pp. 24,100, 119, 122 and 237)
Weigel, C., Cormier, L., Galoisy, L., Calas, G., Bowron, D. and Beuneu, B. (2006).Determination of Fe3+ sites in a NaFeSi2O6 glass by neutron diffraction with isotopicsubstitution coupled with numerical simulation. Applied Physics Letters 89. (see p. 96)
Weil, M. (2004). FeII3FeIII4(AsO4)6, the first arsenate adopting the Fe7(PO4)6 structuretype. Acta Crystallographica Section E Structure Reports Online 60, i139–i141. (seep. 25)
161
Westre, T. E., Kennepohl, P., DeWitt, J. G., Hedman, B., Hodgson, K. O. and Solomon,E. I. (1997). A Multiplet Analysis of Fe K-Edge 1s → 3d Pre-Edge Features of IronComplexes. Journal of the American Chemical Society 119, 6297–6314. (see pp. 39, 53,61, 66, 72 and 78)
Wilke, M., Farges, F., Petit, P.-E., Brown, G. E. and Martin, F. (2001). Oxidation stateand coordination of Fe in minerals: An Fe K-XANES spectroscopic study. AmericanMineralogist 86, 714–730. (see pp. 25, 41, 93, 94, 96 and 120)
Wright, A. C., Clarke, S. J., Howard, C. K., Bingham, P. A., Forder, S. D., Holland, D.,Martlew, D. and Fischer, H. E. (2014). The environment of Fe2+/Fe3+ cations in asoda–lime–silica glass. Physics and Chemistry of Glasses 55, 243–252. (see p. 24)
Yahiaoui, E., Berger, R., Servant, Y., Kliava, J., Dugunov, L. and Mednis, A. (1994).Electron-Paramagnetic-Resonance of Fe3+ Ions in Borate Glass - Computer-Simulations.Journal of Physics-Condensed Matter 6, 9415–9428. (see pp. 118 and 121)
Yamashita, M., Akai, T., Sawa, R., Abe, J. and Matsumura, M. (2008). Effect of preparationprocedure on redox states of iron in soda-lime silicate glass. Journal of Non-CrystallineSolids 354, 4534–4538. (see p. 22)
Zachariasen, W. H. (1932). The atomic arrangement in glass. Journal of the AmericanChemical Society 54, 3841–3851. (see p. 21)
Zhang, J. and Sheng, J. (2013). Metastable defects induced by X-ray irradiation in Fe-dopedsoda-lime silicate glass. Optical Materials 35, 1138–1140. (see p. 216)


163
Appendix A
Crystalline references data
This section presents a brief overview of the 14 crystalline reference compounds used tointerpret the spectroscopic signatures of glasses. The spectroscopic methods were presentedin Chapter 2, for each reference, there are additional data from literature (site geometry,distances, redox, cell setting...). In the wide possibility of minerals, few iron crystallinereferences representative of the studied glasses were selected. When it was possible, silicateminerals with iron in one valence state were favored in order to simplify the interpretationof spectroscopic signatures due to their close compositions and similar signatures for ironenvironments. Some references present Fe-clusters (corner-sharing, edge-sharing...) withpotential Fe–Fe magnetic interactions.
Gillespite ([4,SP]Fe2+)
Pink phyllosilicate mineral (BaFeSi4O10) from Incline, California, with15.43wt% FeO. Iron is present as [4]Fe2+ with a square-planar geometry.There are no Fe–O–Fe clusters (Fe2+ are isolated). The pink colorsuggests that this environment is not present in glasses, nevertheless,gillespite composition and environment is simple and interesting tocompare with glasses.
Staurolite ([4,Td]Fe2+)
Dark orthosilicate mineral (Fe4Al18Si8O46(OH)2) from Brittany,France, with 12.4wt% FeO. Iron is present as [4]Fe2+ in a distortedtetrahedral site T2 due to different ligands (2 O and 2 OH). Tetrahedrashare a face with an empty octahedral site (occupancy of the M4 site<1%), thus tetrahedral site containing iron are considered isolated.
Chromite ([4,Td]Fe2+)
Black chromium based spinel (Fe2+Cr3+2 O4) from an unknown locality,our natural sample had Fe substituted by Mg and Cr substituted by Al(EMPA: Fe0.3Mg0.7Cr0.8Al1.2O4 and 12.87wt% FeO). Stoichiometrygives a redox of 97%. Iron is mainly present as [4]Fe2+ in isolatedtetrahedral sites, but impurities of Fe3+ in octahedral sites may exist.

164 Appendix A
Grandidierite ([5]Fe2+)
Blue-green orthosilicate mineral ((Mg,Fe)Al3(BO4)(SiO4)O) from Am-pamatoa, Madagascar, with 5.0wt% FeO and an exceptional redoxclose to 99%. One of the rare minerals with ferrous iron substitutingMg2+ in [5]-fold coordinated isolated distorted triangular bipyramid.We kept only the blue-green crystals (grandidierite) and removed mica(black) and quartz (white).
Siderite-FeCO3 ([6]Fe2+)
Yellow-brown carbonate mineral (FeCO3) from an unknown locality,with 62 wt% FeO. Iron is present as [6]Fe2+ in a slightly distorted,almost regular octahedral site sharing all corners with other octahedra.
Hypersthene ([6]Fe2+)
Orthopyroxene silicate ((Fe2+,Mg)2Si2O6), similar to bronzite, froman unknown locality contains 31 wt% FeO. Fe substitutes Al in theenstatite mineral, iron is present as [6]Fe2+ in an isolated distortedoctahedron site (M2). Despite the high amount of iron there is nocluster.
Diopside ([6]Fe2+)
Silicate mineral (CaMg0.9Fe0.1Si2O6) from Pakistan, with 1.66 wt%FeO that gave a pale green color. Iron is present as [6]Fe2+ in anisolated almost regular octahedron.
FePO4 ([4]Fe3+)
Yellow-brown synthetic phosphate (FePO4) also named Fe-berlinite hasseveral polymorphs such as rodolicoite, heterosite. Iron is present with53wt% Fe2O3 as [4]Fe3+ in slightly distorted tetrahedra. Despite thehigh amount of iron, iron is consider are isolated because Fe-tetrahedrado not share oxygen atoms.
Ferriorthoclase ([4]Fe3+)
Transparent yellow silicate feldspar (Fe : KAlSi3O8) from Itrongay,Madagascar, Fe3+ is an impurity substituting Al3+. Iron is presentwith 0.5∼1wt% Fe2O3 as [4]Fe3+ in slightly distorted tetrahedronwithout Fe–Fe interactions.

CRYSTALLINE REFERENCES DATA 165
Yoderite ([5]Fe3+)
Purple orthosilicate mineral ((Mg,Al,[5]Fe)8Si4(O,OH)20) probablyfrom Mautia Hills, Tanzania, with 6.1wt% Fe2O3. The purple color isdue to Mn impurities. Yoderite also exists in green (not studied here).One of the rare samples containing [5]-fold coordinated ferric iron inisolated distorted triangular bipyramid (crystallographic site M3).
Fe3PO7
Red-brown synthetic phosphate with 77wt% Fe2O3. Iron is presentas [5]Fe3+ in groups of 3 edge-sharing distorted trigonal bipyramids([5]-fold) linked to other Fe by corners.
Andradite ([6]Fe3+)
Transparent green silicate (Ca3Fe2Si3O12), this garnet from Val Ma-lenco, Italy, contains 31wt% Fe2O3 where iron is present as [6]Fe3+
in an almost regular isolated octahedron distorted along the C3 axis.Samples contain some Cr impurity resulting in this shiny green color.
Acmite ([6]Fe3+)
This black silicate mineral is a pyroxen also named aegirine(NaFeSi2O6) from Mont Saint Hilaire, Quebec, with 34.6wt% Fe2O3.Iron is present as [6]Fe3+ in edge-sharing distorted octahedron.
Maghemite γ-Fe2O3 ([4,6]Fe3+)
This polymorph of iron (III) oxide Fe2O3 with a red-brown color has aspinel structure where iron is present in both [4]Fe3+ and [6]Fe3+. Theformula is: (FeIII8 )Td
[FeIII40/38/3]OhO32. represents a vacancy, Td a
tetrahedral site and Oh an octahedral site. Octahedra are linked toeach other by the edges and to tetrahedra by corners.
Table A.1 compiles the studied crystalline references presented below. They are de-tailed with structural representations, spectroscopic data and bibliographic references inAppendix A .

166 Appendix A
Table A.1 – Summary of studied crystalline references. Densities are expressed in 103 · kg/m3.
name ironsite
site geometry(point group)
concentration density clusters
gillespite [4]Fe2+ square planar (D4h) 15.4wt% FeO 3.33 no
staurolite [4]Fe2+ distorted tetrahedron(C2v)
12.4wt% FeO 3.71 no
chromite [4]Fe2+ regular tetrahedron (Td) 12.9wt% FeO 4.6 no
grandidierite [5]Fe2+ distorted triangularbipyramid (Cs)
5.0wt% FeO 2.99 no
siderite [6]Fe2+ regular octahedron (Oh) 62wt% FeO 3.96 corner-sharing
hypersthene [6]Fe2+ distorted octahedron(C2v)
31wt% FeO 3.55 no
diopside [6]Fe2+ almost regularoctahedron (Oh)
1.7wt% FeO 3.3 no
FePO4[4]Fe3+ slightly distorted
tetrahedron (Td)53wt% Fe2O3 3.07 no
ferriorthoclase [4]Fe3+ tetrahedron (Td) 1wt% Fe2O3 2.56 no
yoderite [5]Fe3+ distorted triangularbipyramid (C3v)
6.1wt% Fe2O3 3.39 no
Fe3PO7[5]Fe3+ distorted triangular
bipyramid (Cs)77wt% Fe2O3 4.07 groups of 3 edge-sharing
sites, groups are linked toeach-other by corners
andradite [6]Fe3+ almost regularoctahedron (C3i = S6)
31wt% Fe2O3 3.9 no
acmite [6]Fe3+ distorted octahedron(C2)
34.6wt% Fe2O3 3.52 edge-sharing
maghemite [4,6]Fe3+ almost regularoctahedron (Td and Oh)
100wt% Fe2O3 4.9 edge-sharing octahedralinked to tetrahedra bycorners
For each crystalline reference, the following data from XES Kβ main, XES Kβ satellite(i.e. V2C: Valence to Core), RIXS Kα, HERFD and TFY are experimental results.
X-ray emission spectroscopy (XES) is a 2-step process obtained by (1) putting an electronof the core shell 1s into the continuum with the X-ray beam, (2) measuring the fluorescencephoton resulting of the decay of the iron atom. Kα lines result of the transition 2p→ 1s,Kβ main lines result of the transition 3p→ 1s, Kβ satellite lines result of the transitionvalence electron to 1s level.
The isotropic optical absorption spectra are calculated from εx+εy+εz3 , with x, y and z are
any perpendicular directions. In this document, we approximate α, β and γ (lattice system)as perpendicular axis (but is not necessary the case). True for: orthorhombique, tetragonal,cubic systems. False for: triclinic, monoclinic, rhombohedral, hexagonal systems.
Geometry, distances and the 2 figures of the sites are taken from mineral databases (XRDreferences at the bottom of each page)For more details, see http://rruff.geo.arizona.edu/AMS/amcsd.php

Table of contents
Gillespite ([4]Fe2+) 2
Staurolite ([4]Fe2+) 4
Chromite ([4]Fe2+) 6
Grandidierite ([5]Fe2+) 8
Siderite-FeCO3 ([6]Fe2+) 10
Hypersthene ([6]Fe2+) 12
Diopside ([6]Fe2+) 14
FePO4 ([4]Fe3+) 16
Ferriorthoclase ([4]Fe3+) 18
Yoderite ([5]Fe3+) 20
Fe3PO7 ([5]Fe3+) 22
Andradite ([6]Fe3+) 24
Acmite ([6]Fe3+) 26
Maghemite-γ-Fe2O3 ([4,6]Fe3+) 28
RIXS Kα Fe2+ 30
RIXS Kα Fe3+ 31
all HERFD spectra 32
all TFY spectra 33
all TFY spectra - pre-edge without main edge 34
all XES Kβsat spectra 35
all optical sticks 36
1
CRYSTALLINE REFERENCES DATA 167
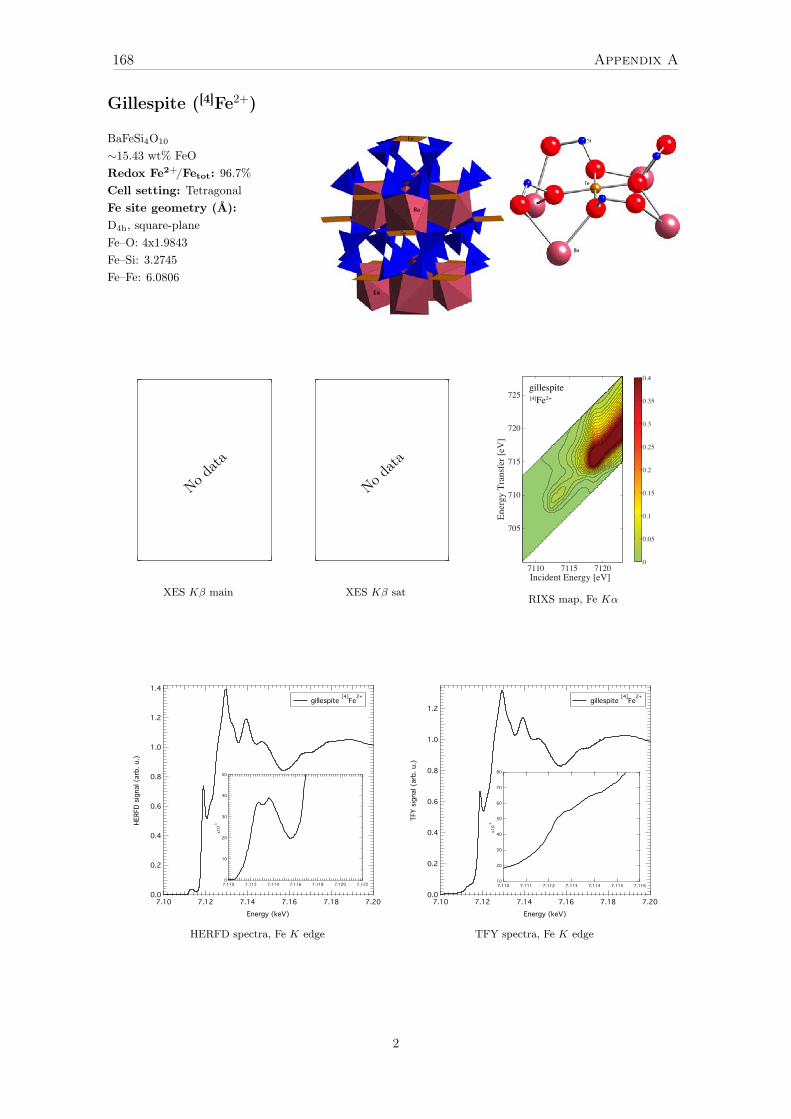
Gillespite ([4]Fe2+)
BaFeSi4O10
∼15.43 wt% FeORedox Fe2+/Fetot: 96.7%Cell setting: TetragonalFe site geometry (Å):D4h, square-planeFe–O: 4x1.9843Fe–Si: 3.2745Fe–Fe: 6.0806
No data
XES Kβ main
No data
XES Kβ satIncident Energy [eV]
Ener
gy T
rans
fer [
eV]
7110 7115 7120
705
710
715
720
725gillespite[4]Fe2+
0
0.05
0.1
0.15
0.2
0.25
0.3
0.35
0.4
RIXS map, Fe Kα
1.4
1.2
1.0
0.8
0.6
0.4
0.2
0.0
HERFD
sig
nal (arb. u.)
7.207.187.167.147.127.10
Energy (keV)
gillespite [4]
Fe2+
50
40
30
20
10
0
x1
0-3
7.1227.1207.1187.1167.1147.1127.110
HERFD spectra, Fe K edge
1.2
1.0
0.8
0.6
0.4
0.2
0.0
TFY
signa
l (ar
b. u
.)
7.207.187.167.147.127.10Energy (keV)
gillespite [4]Fe2+
80
70
60
50
40
30
20
10
x10-3
7.1167.1157.1147.1137.1127.1117.110
TFY spectra, Fe K edge
2
168 Appendix A

0
2
4
6
8Polarized optical absorption spectra of gillespite (from Rossman and Taran 2001)
ε, (
cm−
1 .L.m
ol−
1 )
E perp cbackgroundpeak perp c 1peak perp c 2fit
5000 10000 15000 20000 25000 300000
5
10
15
20
Wavenumber (cm−1)
ε, (
cm−
1 .L.m
ol−
1 )
E parallel cbackgroundpeak parallel c 1peak parallel c 2fit
5000 10000 15000 20000 25000 300000
2
4
6
8
Wavenumber (cm−1)
ε, (
cm−
1 .L.m
ol−
1 )
Isotropic optical absorption spectra of gillespite (from Rossman and Taran 2001)
isotrope spectrum (mean x,y,z) from fitisotrope spectrum (mean x,y,z) from data
Wavenumber (x103 cm-1)
ground state:
30252015105
5E(D)
ε (cm-1.L.mol-1) >10 >5 >1 <1
[4]Fe2+D4h
ReferencesR. H. Hazen, L. W. Finger, American Mineralogist, 68 (1983) 595-603G. A. Waychunas, and G. E. Brown Jr. Physics and Chemistry of Minerals, 17 (1990) 420-430. (EXAFS)G.R. Rossman, M.N. Taran, American Mineralogist, 86 (2001) 896-903 (optical absorption spectroscopy)
3
CRYSTALLINE REFERENCES DATA 169

Staurolite ([4]Fe2+)
Fe4Al18Si8O46(OH)2
∼12.4 wt% FeORedox Fe2+/Fetot: 97%Cell setting: MonoclinicFe site geometry (Å):Td (and M4), two face-sharing tetrahe-dra linked by an empty octahedral site(M4) (occupancy <1%)Fe–FeM4: 1x1.6100Fe–Fe: 1x3.2201Fe–O: 2x1.9679, 1x1.9956, 1x2.0227
140
120
100
80
60
40
20
0
XES
signa
l (ar
b. u
.)
7.087.077.067.057.047.03Energy (keV)
staurolite [4]Fe2+
XES Kβ main
1.4
1.2
1.0
0.8
0.6
0.4
0.2
0.0
XES
signa
l (ar
b. u
.)
7.137.127.117.107.097.08Energy (keV)
staurolite [4]Fe2+
XES Kβ satIncident Energy [eV]
Ener
gy T
rans
fer [
eV]
7110 7115 7120
705
710
715
720
725staurolite[4]Fe2+
0
0.05
0.1
0.15
0.2
0.25
0.3
0.35
0.4
RIXS map, Fe Kα
1.4
1.2
1.0
0.8
0.6
0.4
0.2
0.0
HERFD
sig
nal (arb. u.)
7.207.187.167.147.127.10
Energy (keV)
staurolite [4]
Fe2+
0.15
0.10
0.05
0.00
7.1227.1207.1187.1167.1147.1127.110
HERFD spectra, Fe K edge
1.2
1.0
0.8
0.6
0.4
0.2
0.0
TFY
signa
l (ar
b. u
.)
7.207.187.167.147.127.10Energy (keV)
staurolite [4]Fe2+
0.14
0.12
0.10
0.08
0.06
0.04
0.027.1227.1207.1187.1167.1147.1127.110
TFY spectra, Fe K edge
4
170 Appendix A

0
10
20
30
40
Polarized optical absorption spectra of staurolite (from Rossman and Taran 2001)
ε, (
cm−
1 .L.m
ol−
1 )
αbackgroundpeak a1fit
0
10
20
30
40
ε, (
cm−
1 .L.m
ol−
1 )
βbackgroundpeak b1fit
5000 10000 15000 20000 25000 300000
10
20
30
40
Wavenumber (cm−1)
ε, (
cm−
1 .L.m
ol−
1 )
γbackgroundpeak g1fit
5000 10000 15000 20000 25000 300000
10
20
30
40
Wavenumber (cm−1)
ε, (
cm−
1 .L.m
ol−
1 )
Isotropic optical absorption spectra of staurolite (from Rossman and Taran 2001)
isotrope spectrum (mean x,y,z) from fitisotrope spectrum (mean x,y,z) from data
[4]Fe2+Td
Wavenumber (x103 cm-1)
ground state:
30252015105
5E(D)
ε (cm-1.L.mol-1) >10 >5 >1 <1
4T2(G)
ReferencesR. Oberti, F.C. Hawthorne, A. Zanetti, L. Ottolini, The Canadian Mineralogist, 34 (1996) 1051-1057G.R. Rossman, M.N. Taran, American Mineralogist, 86 (2001) 896-903 (optical absorption spectroscopy)R. G. Burns, Mineralogical applications of crystal field theory, Cambridge University Press, 1993, p100 (optical absorptionspectroscopy)
5
CRYSTALLINE REFERENCES DATA 171

Chromite ([4]Fe2+)
Fe2+Cr3+2 O4
∼12.87 wt% FeORedox Fe2+/Fetot: 97%Cell setting: cubicFe site geometry (Å):Td, isolated regular tetrahedron, possi-ble presence of octahedral sitesFe–O: 4x 1.9722Fe–Cr,Fe–Mg: 3.4519Fe–Fe: 3.6054
140
120
100
80
60
40
20
0
XES
signa
l (ar
b. u
.)
7.087.077.067.057.047.03Energy (keV)
chromite [4]Fe2+
XES Kβ main
1.6
1.4
1.2
1.0
0.8
0.6
0.4
0.2
0.0
XES
signa
l (ar
b. u
.)
7.137.127.117.107.097.08Energy (keV)
chromite [4]Fe2+
XES Kβ sat
45_chromite_Ka_MDfci_normed.mat
Incident Energy [eV]
Ener
gy T
rans
fer [
eV]
7110 7115 7120
705
710
715
720
725chromite[4]Fe2+
0
0.05
0.1
0.15
0.2
0.25
0.3
0.35
0.4
RIXS map, Fe Kα
1.4
1.2
1.0
0.8
0.6
0.4
0.2
0.0
HER
FD s
igna
l (ar
b. u
.)
7.207.187.167.147.127.10Energy (keV)
chromite [4]Fe2+
0.12
0.10
0.08
0.06
0.04
0.02
0.007.1227.1207.1187.1167.1147.1127.110
HERFD spectra, Fe K edge
1.4
1.2
1.0
0.8
0.6
0.4
0.2
0.0
TFY
sign
al (a
rb. u
.)
7.207.187.167.147.127.10Energy (keV)
chromite [4]Fe2+
0.10
0.08
0.06
0.04
0.02
0.007.1227.1207.1187.1167.1147.1127.110
TFY spectra, Fe K edge
6
172 Appendix A

5
4
3
2
1
0
Kub
elka
-Mun
k re
miss
ion
func
tion
30000250002000015000100005000Wavenumber (cm
-1)
Fe2+
Cr3+
Optical spectrum of chromite from reflectivity measurements
ReferencesD. Lenaz, A.M. Logvinova, F. Princivalle, N.V. Sobolev, American Mineralogist, 94 (2009) 1067-1070 (XRD)H.K. Mao, P.M. Bell, Geochimica et Cosmochimica Acta, 39 (1975) 865-866 (optical absorption spectroscopy)
7
CRYSTALLINE REFERENCES DATA 173

Grandidierite ([5]Fe2+)
(Mg,Fe)Al3(BO4)(SiO4)O
∼5.0 wt% FeORedox Fe2+/Fetot: 99%Cell setting: OrthorhombicFe site geometry (Å):C3v,D3h, Isolated distorted triangularbipyramid, substitution of MgFe–O: 2x1.9651, 1x2.0356, 1x2.0568,1x2.1784Fe–Al: 1x2.8645,2x2.9617
140
120
100
80
60
40
20
0
XES
signa
l (ar
b. u
.)
7.087.077.067.057.047.03Energy (keV)
grandidierite [5]Fe2+
XES Kβ main
1.4
1.2
1.0
0.8
0.6
0.4
0.2
0.0
XES
signa
l (ar
b. u
.)
7.137.127.117.107.097.08Energy (keV)
grandidierite [5]Fe2+
XES Kβ satIncident Energy [eV]
Ener
gy T
rans
fer [
eV]
7110 7115 7120
705
710
715
720
725grandidierite[5]Fe2+
0
0.05
0.1
0.15
0.2
0.25
0.3
0.35
0.4
RIXS map, Fe Kα
1.4
1.2
1.0
0.8
0.6
0.4
0.2
0.0
HER
FD s
igna
l (ar
b. u
.)
7.207.187.167.147.127.10Energy (keV)
grandidierite [5]Fe2+
0.10
0.08
0.06
0.04
0.02
0.007.1227.1207.1187.1167.1147.1127.110
Energy (keV)
HERFD spectra, Fe K edge
1.4
1.2
1.0
0.8
0.6
0.4
0.2
0.0
TFY
sign
al (a
rb. u
.)
7.207.187.167.147.127.10Energy (keV)
grandidierite [5]Fe2+
0.08
0.06
0.04
0.02
0.007.1227.1207.1187.1167.1147.1127.110
TFY spectra, Fe K edge
8
174 Appendix A
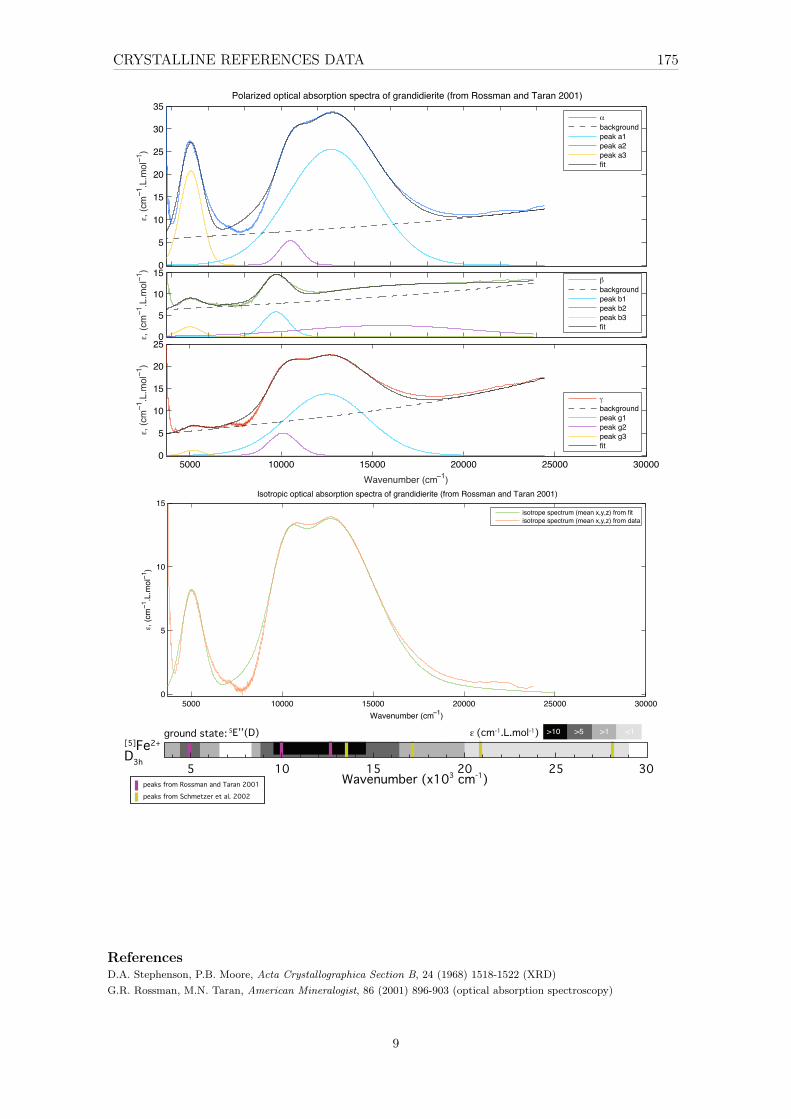
0
5
10
15
20
25
30
35
ε, (c
m−1
.L.m
ol−1
)
Polarized optical absorption spectra of grandidierite (from Rossman and Taran 2001)
αbackgroundpeak a1peak a2peak a3fit
0
5
10
15
ε, (c
m−1
.L.m
ol−1
)
βbackgroundpeak b1peak b2peak b3fit
5000 10000 15000 20000 25000 300000
5
10
15
20
25
Wavenumber (cm−1)
ε, (c
m−1
.L.m
ol−1
)
γbackgroundpeak g1peak g2peak g3fit
5000 10000 15000 20000 25000 300000
5
10
15
Wavenumber (cm−1)
ε, (c
m−1
.L.m
ol−1
)
Isotropic optical absorption spectra of grandidierite (from Rossman and Taran 2001)
isotrope spectrum (mean x,y,z) from fitisotrope spectrum (mean x,y,z) from data
Wavenumber (x103 cm-1)
ground state:
30252015105
5E’’(D) ε (cm-1.L.mol-1) >10 >5 >1 <1[5]Fe2+D3h
peaks from Schmetzer et al. 2002peaks from Rossman and Taran 2001
ReferencesD.A. Stephenson, P.B. Moore, Acta Crystallographica Section B, 24 (1968) 1518-1522 (XRD)G.R. Rossman, M.N. Taran, American Mineralogist, 86 (2001) 896-903 (optical absorption spectroscopy)
9
CRYSTALLINE REFERENCES DATA 175
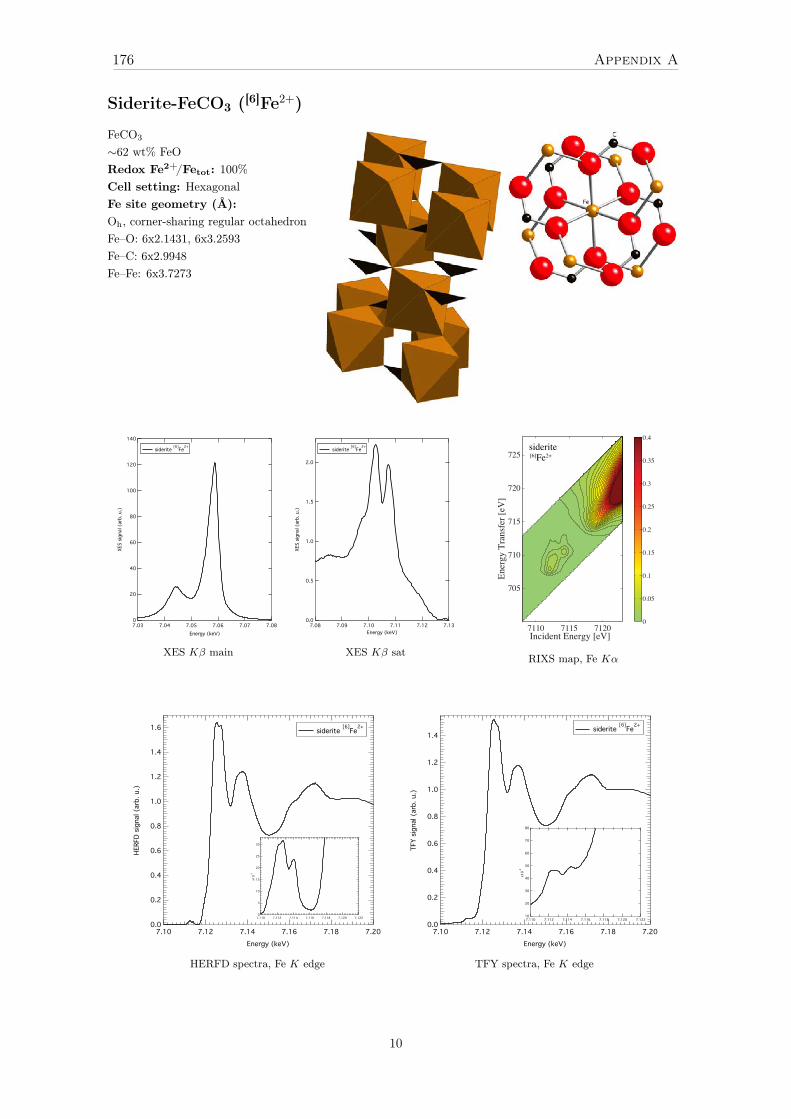
Siderite-FeCO3 ([6]Fe2+)
FeCO3
∼62 wt% FeORedox Fe2+/Fetot: 100%Cell setting: HexagonalFe site geometry (Å):Oh, corner-sharing regular octahedronFe–O: 6x2.1431, 6x3.2593Fe–C: 6x2.9948Fe–Fe: 6x3.7273
140
120
100
80
60
40
20
0
XES
signa
l (ar
b. u
.)
7.087.077.067.057.047.03Energy (keV)
siderite [6]Fe2+
XES Kβ main
2.0
1.5
1.0
0.5
0.0
XES
signa
l (ar
b. u
.)
7.137.127.117.107.097.08Energy (keV)
siderite [6]Fe2+
XES Kβ satIncident Energy [eV]
Ener
gy T
rans
fer [
eV]
7110 7115 7120
705
710
715
720
725siderite[6]Fe2+
0
0.05
0.1
0.15
0.2
0.25
0.3
0.35
0.4
RIXS map, Fe Kα
1.6
1.4
1.2
1.0
0.8
0.6
0.4
0.2
0.0
).u .
br
a( l
an
gis
DF
RE
H
7.207.187.167.147.127.10
Energy (keV)
siderite [6]
Fe2+
30
25
20
15
10
5
0
01
x-3
7.1227.1207.1187.1167.1147.1127.110
HERFD spectra, Fe K edge
1.4
1.2
1.0
0.8
0.6
0.4
0.2
0.0
).u .bra( langis YFT
7.207.187.167.147.127.10Energy (keV)
siderite [6]Fe2+
80
70
60
50
40
30
20
10
01x3-
7.1227.1207.1187.1167.1147.1127.110
TFY spectra, Fe K edge
10
176 Appendix A
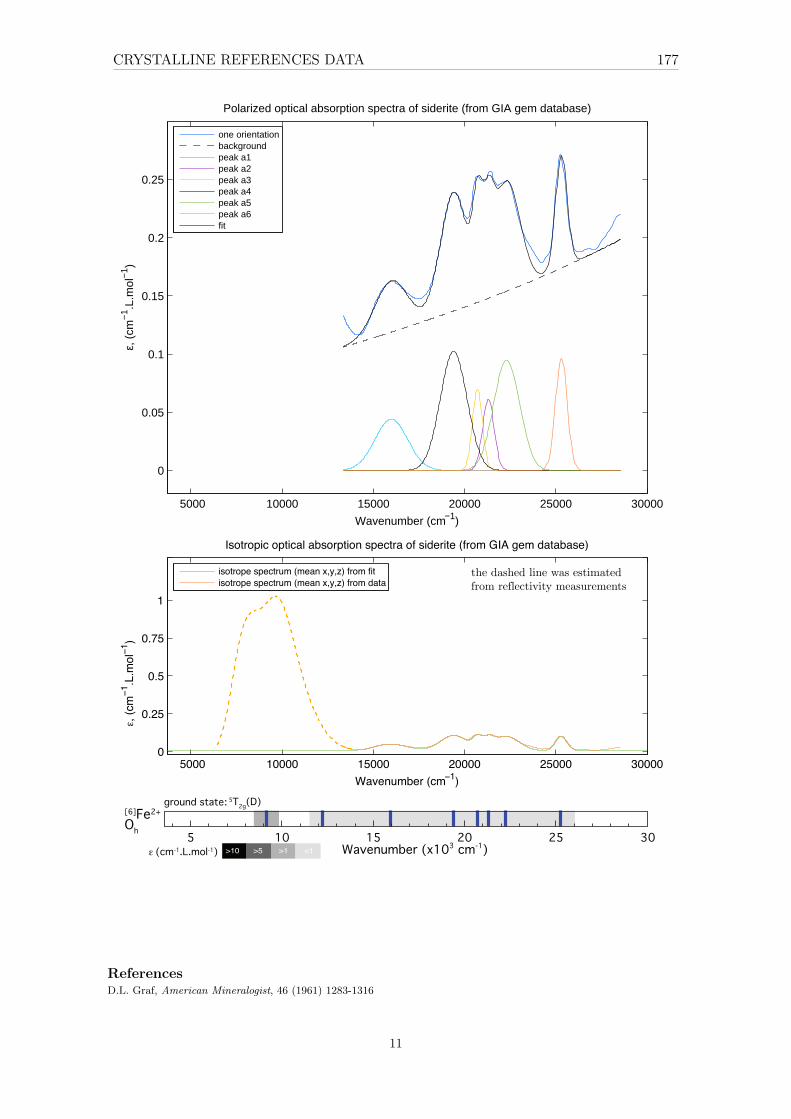
5000 10000 15000 20000 25000 30000
0
0.05
0.1
0.15
0.2
0.25
Polarized optical absorption spectra of siderite (from GIA gem database)
Wavenumber (cm−1)
ε, (
cm−
1 .L.m
ol−
1 )
one orientationbackgroundpeak a1peak a2peak a3peak a4peak a5peak a6fit
5000 10000 15000 20000 25000 300000
0.25
0.5
0.75
1
Wavenumber (cm−1)
ε, (c
m−1
.L.m
ol−1
)
Isotropic optical absorption spectra of siderite (from GIA gem database)
isotrope spectrum (mean x,y,z) from fitisotrope spectrum (mean x,y,z) from data
the dashed line was estimated from reflectivity measurements
Wavenumber (x103 cm-1)
ground state:
30252015105ε (cm-1.L.mol-1) >10 >5 >1 <1
5T2g(D)[6]Fe2+
Oh
ReferencesD.L. Graf, American Mineralogist, 46 (1961) 1283-1316
11
CRYSTALLINE REFERENCES DATA 177
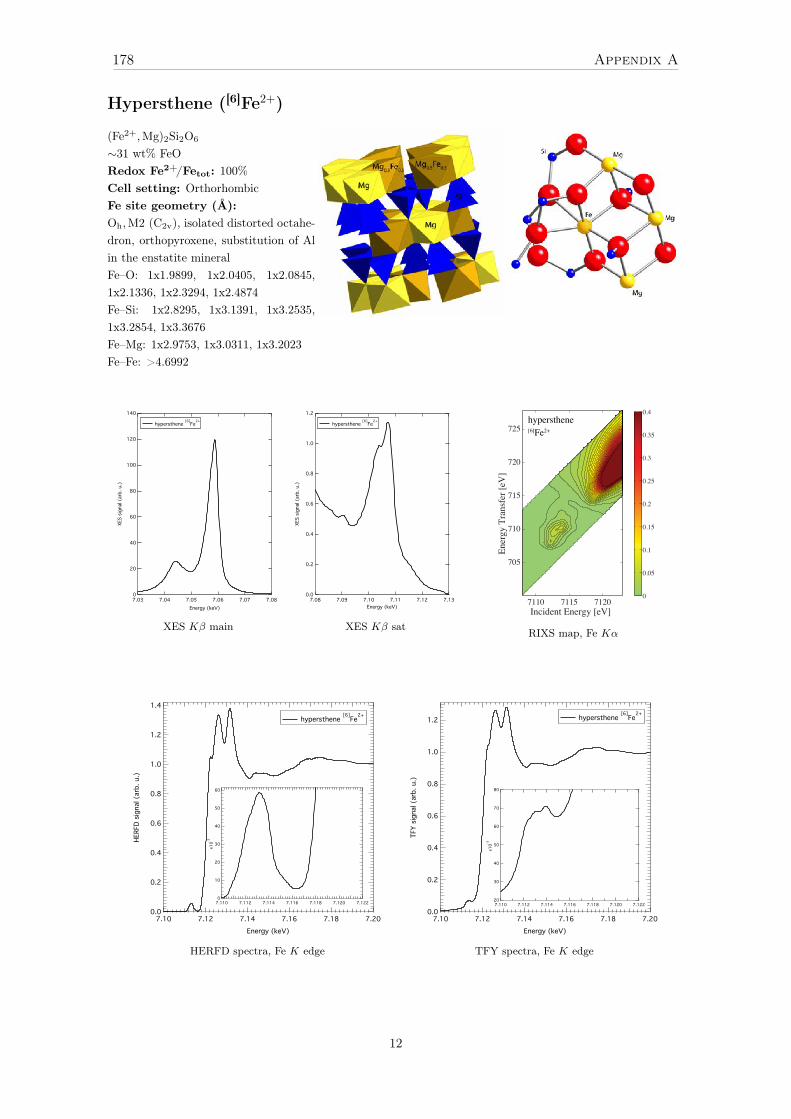
Hypersthene ([6]Fe2+)
(Fe2+,Mg)2Si2O6
∼31 wt% FeORedox Fe2+/Fetot: 100%Cell setting: OrthorhombicFe site geometry (Å):Oh,M2 (C2v), isolated distorted octahe-dron, orthopyroxene, substitution of Alin the enstatite mineralFe–O: 1x1.9899, 1x2.0405, 1x2.0845,1x2.1336, 1x2.3294, 1x2.4874Fe–Si: 1x2.8295, 1x3.1391, 1x3.2535,1x3.2854, 1x3.3676Fe–Mg: 1x2.9753, 1x3.0311, 1x3.2023Fe–Fe: >4.6992
140
120
100
80
60
40
20
0
XES
signa
l (ar
b. u
.)
7.087.077.067.057.047.03Energy (keV)
hypersthene [6]Fe2+
XES Kβ main
1.2
1.0
0.8
0.6
0.4
0.2
0.0
XES
signa
l (ar
b. u
.)
7.137.127.117.107.097.08Energy (keV)
hypersthene [6]Fe2+
XES Kβ satIncident Energy [eV]
Ener
gy T
rans
fer [
eV]
7110 7115 7120
705
710
715
720
725hypersthene[6]Fe2+
0
0.05
0.1
0.15
0.2
0.25
0.3
0.35
0.4
RIXS map, Fe Kα
1.4
1.2
1.0
0.8
0.6
0.4
0.2
0.0
HERFD
sig
nal (arb. u.)
7.207.187.167.147.127.10
Energy (keV)
hypersthene [6]
Fe2+
60
50
40
30
20
10
0
x10
-3
7.1227.1207.1187.1167.1147.1127.110
HERFD spectra, Fe K edge
1.2
1.0
0.8
0.6
0.4
0.2
0.0
TFY
signa
l (ar
b. u
.)
7.207.187.167.147.127.10Energy (keV)
hypersthene [6]Fe2+
80
70
60
50
40
30
20
x10-3
7.1227.1207.1187.1167.1147.1127.110
TFY spectra, Fe K edge
12
178 Appendix A

0
1
2
3
4
5
6
7Polarized optical absorption spectra of hypersthene (from Rossman website)
ε, (
cm−
1 .L.m
ol−
1 )
αbackgroundpeak a1peak a2fit
0
2
4
6
ε, (
cm−
1 .L.m
ol−
1 )
βbackgroundpeak b1peak b2fit
5000 10000 15000 20000 25000 300000
2
4
Wavenumber (cm−1)
ε, (
cm−
1 .L.m
ol−
1 )
γbackgroundpeak g1peak g2peak g3fit
x=11000 cm−1 y=20 cm−1.L.mol−1
5000 10000 15000 20000 25000 300000
2
4
6
8
10
Wavenumber (cm−1)
ε, (
cm−
1 .L.m
ol−
1 )
Isotropic optical absorption spectra of hypersthene (from Rossman website)
isotrope spectrum (mean x,y,z) from fitisotrope spectrum (mean x,y,z) from data
Wavenumber (x103 cm
-1)
ground state:
30252015105
5A1(D)
ε (cm-1.L.mol-1) >10 >5 >1 <1
[6]Fe2+
Oh
ReferencesD.S. Goldman, G.R. Rossman, American Mineralogist, 62 (1977) 151-157 (Optical absorption)H. Yang, S. Ghose, American Mineralogist, 80 (1995) 9-20 (XRD)G.Y.V. Victor, D. Ghosh, S. Ghose, Physical Review B, 64 (2001) (Correlation of magnetic susceptibility, mössbauer,and optical absorption spectroscopy)
13
CRYSTALLINE REFERENCES DATA 179
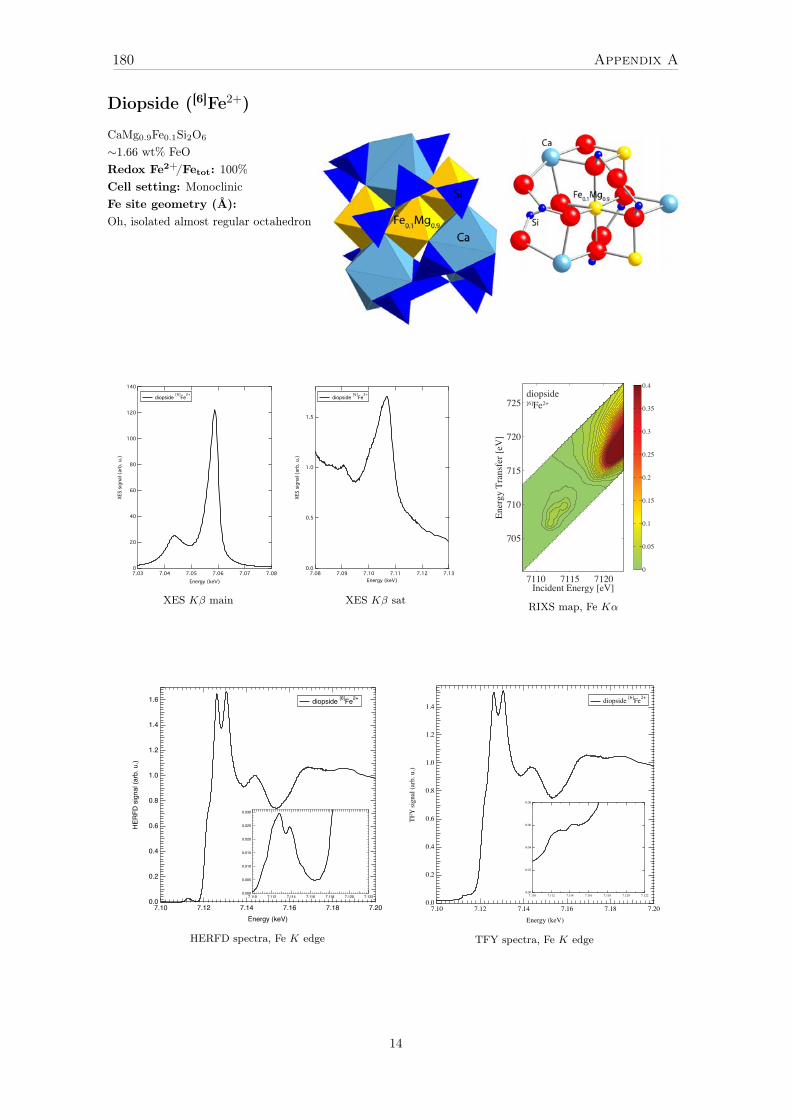
Diopside ([6]Fe2+)
CaMg0.9Fe0.1Si2O6
∼1.66 wt% FeORedox Fe2+/Fetot: 100%Cell setting: MonoclinicFe site geometry (Å):Oh, isolated almost regular octahedron
140
120
100
80
60
40
20
0
XES
signa
l (ar
b. u
.)
7.087.077.067.057.047.03Energy (keV)
diopside [6]Fe2+
XES Kβ main
1.5
1.0
0.5
0.0
XES
signa
l (ar
b. u
.)
7.137.127.117.107.097.08Energy (keV)
diopside [6]Fe2+
XES Kβ satIncident Energy [eV]
Ener
gy T
rans
fer [
eV]
7110 7115 7120
705
710
715
720
725diopside[6]Fe2+
0
0.05
0.1
0.15
0.2
0.25
0.3
0.35
0.4
RIXS map, Fe Kα
1.6
1.4
1.2
1.0
0.8
0.6
0.4
0.2
0.0
HER
FD s
igna
l (ar
b. u
.)
7.207.187.167.147.127.10Energy (keV)
diopside [6]Fe2+
0.030
0.025
0.020
0.015
0.010
0.005
0.0007.1227.1207.1187.1167.1147.1127.110
HERFD spectra, Fe K edge
1.4
1.2
1.0
0.8
0.6
0.4
0.2
0.0
TFY
sign
al (a
rb. u
.)
7.207.187.167.147.127.10Energy (keV)
diopside [6]Fe2+
0.08
0.06
0.04
0.02
0.007.1227.1207.1187.1167.1147.1127.110
TFY spectra, Fe K edge
14
180 Appendix A

no optical absorption spectra
ReferencesS. Carbonin, G. Salviulol, R. Munno, M. Desiderio, A.D. Negro, Mineralogy and Petrology, 41 (1989) 1-10 (XRD)W.B. White, K.L. Keester, American Mineralogist, 51 (1966) 774-791 (optical absorption spectroscopy)M. Wilke, F. Farges, P.-E. Petit, G.E. Brown, F. Martin, American Mineralogist, 86 (2001) 714-730 (XANES)
15
CRYSTALLINE REFERENCES DATA 181

FePO4 ([4]Fe3+)
FePO4
∼53 wt% Fe2O3
Redox Fe2+/Fetot: 0%Cell setting: HexagonalFe site geometry (Å):Td, isolated slightly distorted tetrahe-dronFe–O: 2x 1.8246, 2x1.8664Fe–P: 2x3.1481, 2x 3.1738Fe–Fe: 4x4.5353
140
120
100
80
60
40
20
0
XES
signa
l (ar
b. u
.)
7.087.077.067.057.047.03Energy (keV)
FePO4 [4]Fe3+
XES Kβ main
1.6
1.4
1.2
1.0
0.8
0.6
0.4
0.2
0.0
XES
signa
l (ar
b. u
.)
7.137.127.117.107.097.08Energy (keV)
FePO4 [4]Fe3+
XES Kβ satIncident Energy [eV]
En
erg
y T
ran
sfe
r [e
V]
7110 7115 7120
705
710
715
720
725
FePO4
[4]Fe3+
0
0.05
0.1
0.15
0.2
0.25
0.3
0.35
0.4
RIXS map, Fe Kα
1.4
1.2
1.0
0.8
0.6
0.4
0.2
0.0
HERF
D sig
nal (
arb.
u.)
7.207.187.167.147.127.10Energy (keV)
FePO4 [4]Fe3+
0.35
0.30
0.25
0.20
0.15
0.10
0.05
0.007.1227.1207.1187.1167.1147.1127.110
HERFD spectra, Fe K edge
1.2
1.0
0.8
0.6
0.4
0.2
0.0
TFY s
ignal (arb
. u.)
7.207.187.167.147.127.10
Energy (keV)
FePO4 [4]
Fe3+
0.20
0.15
0.10
0.05
0.00
7.1227.1207.1187.1167.1147.1127.110
TFY spectra, Fe K edge
16
182 Appendix A

no optical absorption spectra
ReferencesG.J. Long, A.K. Cheetham, P.D. Battle, Inorganic Chemistry, 22 (1983) 3012-3016Combes, J.M., A. Manceau, G. Calas, et J.Y. Bottero. Geochimica et Cosmochimica Acta, 53 (1989) 583-94 (X-rayabsorption spectroscopy)
17
CRYSTALLINE REFERENCES DATA 183

Ferriorthoclase ([4]Fe3+)
Fe:KAlSi3O8
∼0.5 wt% Fe2O3
Redox Fe2+/Fetot: 0%Cell setting: MonoclinicFe site geometry (Å):Td, slightly distorted tetrahedron, sub-stitution of Al (feldspar)Fe–O: 4x1.83a or 1.87b,(Si,Al)–O: 2x1.6630, 2x1.6720,Al–Si: 1x2.9929, 1x3.1029, 1x3.1720,1x3.1773Al–K: 1x3.5903, 1x3.6189
aCochain unpublished EXAFS databBrown 1978 Prog Abstr Ann Mtg Geol
Soc Am p 373 (Abstract)
140
120
100
80
60
40
20
0
XES
signa
l (ar
b. u
.)
7.087.077.067.057.047.03Energy (keV)
ferriorthoclase [4]Fe3+
XES Kβ main
2.5
2.0
1.5
1.0
0.5
0.0
XES
signa
l (ar
b. u
.)
7.137.127.117.107.097.08Energy (keV)
ferriorthoclase [4]Fe3+
XES Kβ satIncident Energy [eV]
Ener
gy T
rans
fer [
eV]
7110 7115 7120
705
710
715
720
725ferriorthoclase[4]Fe3+
0
0.05
0.1
0.15
0.2
0.25
0.3
0.35
0.4
RIXS map, Fe Kα
1.4
1.2
1.0
0.8
0.6
0.4
0.2
0.0
HERF
D sig
nal (
arb.
u.)
7.207.187.167.147.127.10Energy (keV)
ferriorthoclase [4]Fe3+
0.4
0.3
0.2
0.1
0.07.1227.1207.1187.1167.1147.1127.110
HERFD spectra, Fe K edge
1.2
1.0
0.8
0.6
0.4
0.2
0.0
TFY
signa
l (ar
b. u
.)
7.207.187.167.147.127.10Energy (keV)
ferriorthoclase [4]Fe3+
0.20
0.15
0.10
0.05
0.007.1227.1207.1187.1167.1147.1127.110
TFY spectra, Fe K edge
18
184 Appendix A
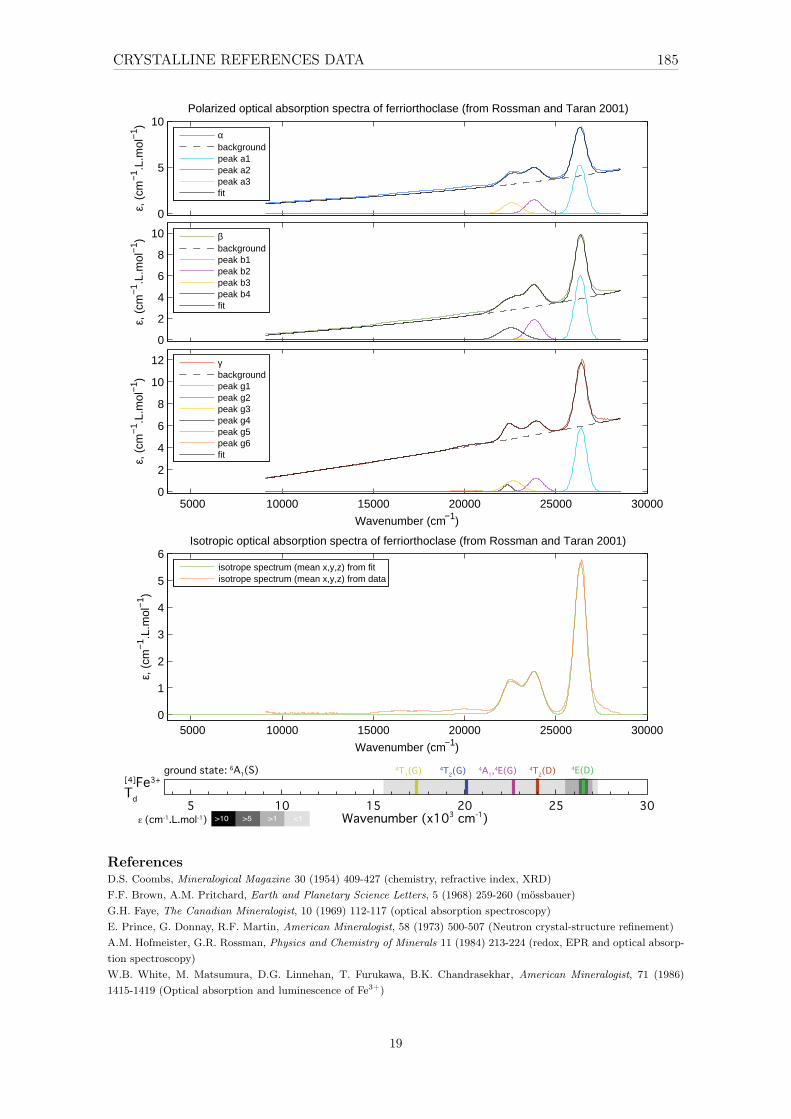
0
5
10Polarized optical absorption spectra of ferriorthoclase (from Rossman and Taran 2001)
ε, (
cm−
1 .L.m
ol−
1 )
αbackgroundpeak a1peak a2peak a3fit
0
2
4
6
8
10
ε, (
cm−
1 .L.m
ol−
1 )
βbackgroundpeak b1peak b2peak b3peak b4fit
5000 10000 15000 20000 25000 300000
2
4
6
8
10
12
Wavenumber (cm−1)
ε, (
cm−
1 .L.m
ol−
1 )
γbackgroundpeak g1peak g2peak g3peak g4peak g5peak g6fit
5000 10000 15000 20000 25000 300000
1
2
3
4
5
6
Wavenumber (cm−1)
ε, (
cm−
1 .L.m
ol−
1 )
Isotropic optical absorption spectra of ferriorthoclase (from Rossman and Taran 2001)
isotrope spectrum (mean x,y,z) from fitisotrope spectrum (mean x,y,z) from data
[4]Fe3+Td
Wavenumber (x103 cm-1)
ground state:
30252015105ε (cm-1.L.mol-1) >10 >5 >1 <1
6A1(S) 4A1,4E(G) 4E(D)4T2(D)4T2(G)4T1(G)
ReferencesD.S. Coombs, Mineralogical Magazine 30 (1954) 409-427 (chemistry, refractive index, XRD)F.F. Brown, A.M. Pritchard, Earth and Planetary Science Letters, 5 (1968) 259-260 (mössbauer)G.H. Faye, The Canadian Mineralogist, 10 (1969) 112-117 (optical absorption spectroscopy)E. Prince, G. Donnay, R.F. Martin, American Mineralogist, 58 (1973) 500-507 (Neutron crystal-structure refinement)A.M. Hofmeister, G.R. Rossman, Physics and Chemistry of Minerals 11 (1984) 213-224 (redox, EPR and optical absorp-tion spectroscopy)W.B. White, M. Matsumura, D.G. Linnehan, T. Furukawa, B.K. Chandrasekhar, American Mineralogist, 71 (1986)1415-1419 (Optical absorption and luminescence of Fe3+)
19
CRYSTALLINE REFERENCES DATA 185
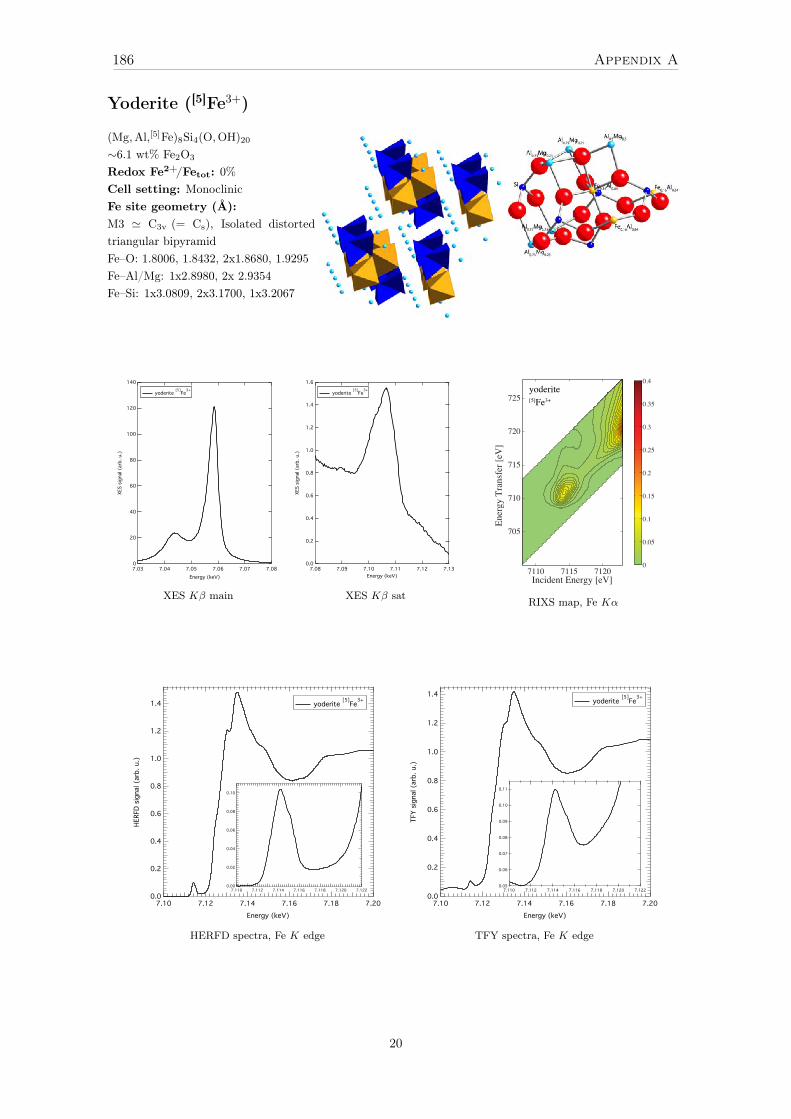
Yoderite ([5]Fe3+)
(Mg,Al,[5]Fe)8Si4(O,OH)20
∼6.1 wt% Fe2O3
Redox Fe2+/Fetot: 0%Cell setting: MonoclinicFe site geometry (Å):M3 ' C3v (= Cs), Isolated distortedtriangular bipyramidFe–O: 1.8006, 1.8432, 2x1.8680, 1.9295Fe–Al/Mg: 1x2.8980, 2x 2.9354Fe–Si: 1x3.0809, 2x3.1700, 1x3.2067
140
120
100
80
60
40
20
0
XES
signa
l (ar
b. u
.)
7.087.077.067.057.047.03Energy (keV)
yoderite [5]Fe3+
XES Kβ main
1.6
1.4
1.2
1.0
0.8
0.6
0.4
0.2
0.0
XES
signa
l (ar
b. u
.)
7.137.127.117.107.097.08Energy (keV)
yoderite [5]Fe3+
XES Kβ satIncident Energy [eV]
Ener
gy T
rans
fer [
eV]
7110 7115 7120
705
710
715
720
725yoderite[5]Fe3+
0
0.05
0.1
0.15
0.2
0.25
0.3
0.35
0.4
RIXS map, Fe Kα
1.4
1.2
1.0
0.8
0.6
0.4
0.2
0.0
HERFD
sig
nal (arb. u.)
7.207.187.167.147.127.10
Energy (keV)
yoderite [5]
Fe3+
0.10
0.08
0.06
0.04
0.02
0.00
7.1227.1207.1187.1167.1147.1127.110
HERFD spectra, Fe K edge
1.4
1.2
1.0
0.8
0.6
0.4
0.2
0.0
TFY
signa
l (ar
b. u
.)
7.207.187.167.147.127.10Energy (keV)
yoderite [5]Fe3+
0.11
0.10
0.09
0.08
0.07
0.06
0.057.1227.1207.1187.1167.1147.1127.110
TFY spectra, Fe K edge
20
186 Appendix A

0
1
2
3
4
5
6
7Polarized optical absorption spectra of yoderite (from Langer 1982)
ε, (
cm−
1 .L.m
ol−
1 )
αbackgroundpeak a1fit
0
1
2
3
4
5
ε, (
cm−
1 .L.m
ol−
1 )
βbackgroundpeak b1fit
5000 10000 15000 20000 25000 300000
1
2
3
Wavenumber (cm−1)
ε, (
cm−
1 .L.m
ol−
1 )
γbackgroundpeak g1peak g2fit
5000 10000 15000 20000 25000 300000
1
2
3
4
Wavenumber (cm−1)
ε, (c
m−1
.L.m
ol−1
)
Isotropic optical absorption spectra of yoderite (from Langer 1982)
isotrope spectrum (mean x,y,z) from fitisotrope spectrum (mean x,y,z) from data
Mn3+
[5]Fe3+D3h
Wavenumber (x103 cm-1)
ground state:
30252015105ε (cm-1.L.mol-1) >10 >5 >1 <1
6A1(S) 4A1g,4Eg(G) 4Eg(D)4T2g(D)4T1g(G)IVCT
ReferencesJ.B. Higgins, P.H. Ribbe, Y. Nakajima, American Mineralogist, 67 (1982) 76-84 (XRD)R.M. Abu-Eid, K. Langer, F. Seifert, Physics and Chemistry of Minerals, 3 (1978) 271-289 (mössbauer and opticalabsorption spectroscopy)K. Langer, G. Smith, U. Hålenius, Phys Chem Minerals 8 (1982) 143-145 (optical absorption spectroscopy)C. McCammon, in: T.J. Ahrens (Ed.), AGU Reference Shelf, American Geophysical Union, Washington, D. C., 1995:pp. 332-347 (mössbauer)
21
CRYSTALLINE REFERENCES DATA 187

Fe3PO7 ([5]Fe3+)
Fe3PO7
∼77 wt% Fe2O3
Redox Fe2+/Fetot: 0%Cell setting: TrigonalFe site geometry (Å):Cs (C3v,D3h), groups of 3 edge-sharingdistorted trigonal bipyramids (5-fold)linked to other Fe by cornersFe–O: 1x1.8917, 1x1.9164, 2x1.9198,1x2.1901, 2x3.1645Fe–Fe: 2x3.1302Fe–P: 1x3.3235, 1x3.3393
140
120
100
80
60
40
20
0
XES
signa
l (ar
b. u
.)
7.087.077.067.057.047.03Energy (keV)
Fe3PO7 [5]Fe3+
XES Kβ main
2.5
2.0
1.5
1.0
0.5
0.0
XES
signa
l (ar
b. u
.)
7.137.127.117.107.097.08Energy (keV)
Fe3PO7 [5]Fe3+
XES Kβ satIncident Energy [eV]
Ener
gy T
rans
fer [
eV]
7110 7115 7120
705
710
715
720
725Fe3PO7[5]Fe3+
0
0.05
0.1
0.15
0.2
0.25
0.3
0.35
0.4
RIXS map, Fe Kα
1.4
1.2
1.0
0.8
0.6
0.4
0.2
0.0
HERF
D sig
nal (
arb.
u.)
7.207.187.167.147.127.10Energy (keV)
Fe3PO7 [5]Fe3+
0.35
0.30
0.25
0.20
0.15
0.10
0.05
0.007.1227.1207.1187.1167.1147.1127.110
HERFD spectra, Fe K edge
1.2
1.0
0.8
0.6
0.4
0.2
0.0
TFY s
ignal (arb
. u.)
7.207.187.167.147.127.10
Energy (keV)
Fe3PO7 [5]
Fe3+
0.25
0.20
0.15
0.10
0.05
0.00
7.1227.1207.1187.1167.1147.1127.110
TFY spectra, Fe K edge
22
188 Appendix A

no optical absorption spectra
ReferencesA. Modaressi, A. Courtois, R. Gerardin, B. Malaman, C. Gleitzer, Journal of Solid State Chemistry, 47 (1983) 245-255(XRD and magnetism)P. Berthet, J. Berthon, F. d’Yvoire, Materials Research Bulletin, 23 (1988) 1501-1508 (XANES)P. Berthet, J. Berthon, F. d’Yvoire, Materials Research Bulletin, 24 (1989) 459-465 (EXAFS)Q. Shi, L. Zhang, M.E. Schlesinger, J. Boerio-Goates, B.F. Woodfield, The Journal of Chemical Thermodynamics, 62(2013) 86-91 (heat capacity)
23
CRYSTALLINE REFERENCES DATA 189

Andradite ([6]Fe3+)
Ca3Fe2Si3O12
∼31 wt% Fe2O3
Redox Fe2+/Fetot: 0%Cell setting: CubicFe site geometry (Å):C3i (S6), almost regular isolated octahe-dron (garnet)Fe–O: 6x2.0206Fe–Si: 6x3.3720Fe–Ca: 6x3.3720
140
120
100
80
60
40
20
0
XES
signa
l (ar
b. u
.)
7.087.077.067.057.047.03Energy (keV)
andradite [6]Fe3+
XES Kβ main
1.5
1.0
0.5
0.0
XES
signa
l (ar
b. u
.)
7.137.127.117.107.097.08Energy (keV)
andradite [6]Fe3+
XES Kβ satIncident Energy [eV]
Ener
gy T
rans
fer [
eV]
7110 7115 7120
705
710
715
720
725andradite[6]Fe3+
0
0.05
0.1
0.15
0.2
0.25
0.3
0.35
0.4
RIXS map, Fe Kα
1.4
1.2
1.0
0.8
0.6
0.4
0.2
0.0
HERFD
sig
nal (arb. u.)
7.207.187.167.147.127.10
Energy (keV)
andradite [6]
Fe3+
60
50
40
30
20
10
0
x1
0-3
7.1227.1207.1187.1167.1147.1127.110
HERFD spectra, Fe K edge
1.4
1.2
1.0
0.8
0.6
0.4
0.2
0.0
TFY
signa
l (ar
b. u
.)
7.207.187.167.147.127.10Energy (keV)
andradite [6]Fe3+
60
50
40
30
20
10
0
x10-3
7.1227.1207.1187.1167.1147.1127.110
TFY spectra, Fe K edge
24
190 Appendix A

5000 10000 15000 20000 25000 30000
0, (
cm-1
.L.m
ol-1
)
0
0.5
1
1.5Polarized optical absorption spectra of andradite (from Rossman website)
cubicbackgroundpeak a1peak a2peak a3peak a4peak a5peak a6fit
Wavenumber (cm-1) 5000 10000 15000 20000 25000 30000
0, (
cm-1
.L.m
ol-1
)
0
0.5
1
1.5Isotropic optical absorption spectra of andradite (from Rossman website)
isotrope spectrum (mean x,y,z) from fitisotrope spectrum (mean x,y,z) from data
Wavenumber (x103 cm
-1)
ground state:
30252015105
ε (cm-1.L.mol-1) >10 >5 >1 <1
6A1g
(S)
[6]Fe3+
Oh
4T2g
(G)4T1g
(G) 4A1g
,4Eg(G) 4E
g(D)4T
2g(D)
ReferencesT. Pilati, F. Demartin, C.M. Gramaccioli, Acta Crystallographica, B52 (1996) 239-250
25
CRYSTALLINE REFERENCES DATA 191
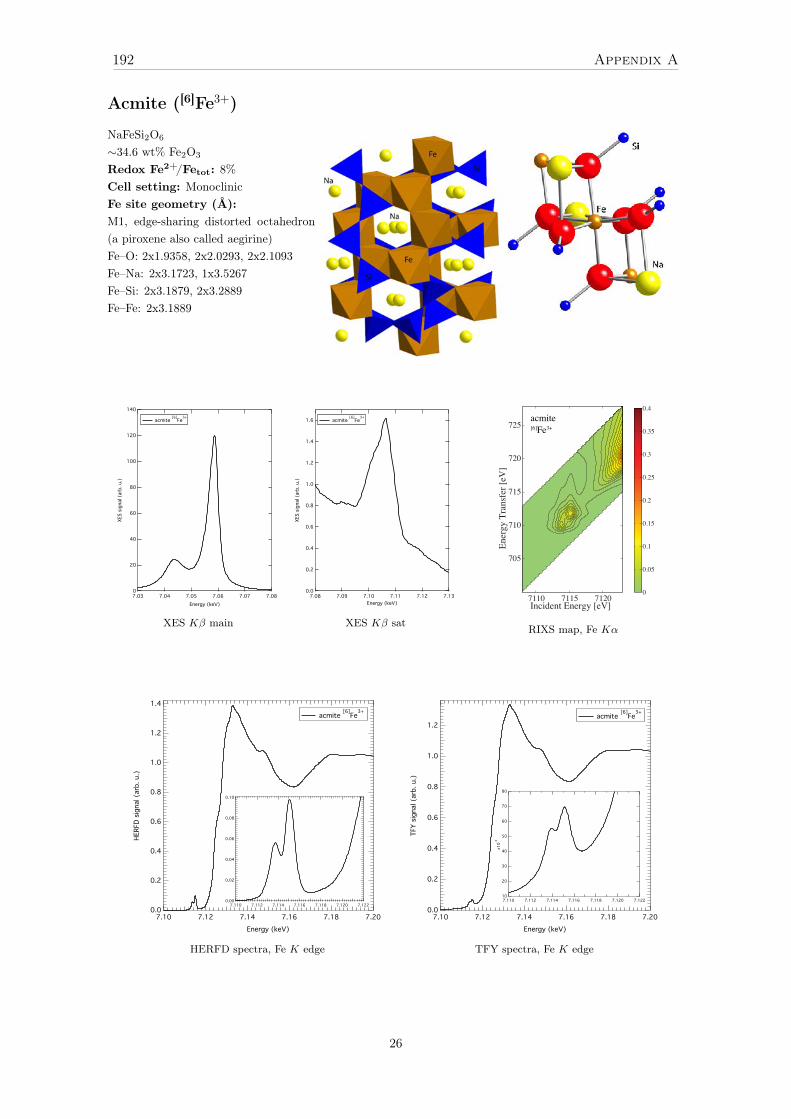
Acmite ([6]Fe3+)
NaFeSi2O6
∼34.6 wt% Fe2O3
Redox Fe2+/Fetot: 8%Cell setting: MonoclinicFe site geometry (Å):M1, edge-sharing distorted octahedron(a piroxene also called aegirine)Fe–O: 2x1.9358, 2x2.0293, 2x2.1093Fe–Na: 2x3.1723, 1x3.5267Fe–Si: 2x3.1879, 2x3.2889Fe–Fe: 2x3.1889
140
120
100
80
60
40
20
0
XES
signa
l (ar
b. u
.)
7.087.077.067.057.047.03Energy (keV)
acmite [6]Fe3+
XES Kβ main
1.6
1.4
1.2
1.0
0.8
0.6
0.4
0.2
0.0
XES
signa
l (ar
b. u
.)
7.137.127.117.107.097.08Energy (keV)
acmite [6]Fe3+
XES Kβ sat
Incident Energy [eV]
Ener
gy T
rans
fer [
eV]
7110 7115 7120
705
710
715
720
725acmite[6]Fe3+
0
0.05
0.1
0.15
0.2
0.25
0.3
0.35
0.4
RIXS map, Fe Kα
1.4
1.2
1.0
0.8
0.6
0.4
0.2
0.0
).u .bra( langis DFREH
7.207.187.167.147.127.10Energy (keV)
acmite [6]Fe3+
0.10
0.08
0.06
0.04
0.02
0.007.1227.1207.1187.1167.1147.1127.110
HERFD spectra, Fe K edge
1.2
1.0
0.8
0.6
0.4
0.2
0.0
).u .bra( langis YFT
7.207.187.167.147.127.10Energy (keV)
acmite [6]Fe3+
80
70
60
50
40
30
20
10
01x3-
7.1227.1207.1187.1167.1147.1127.110
TFY spectra, Fe K edge
26
192 Appendix A
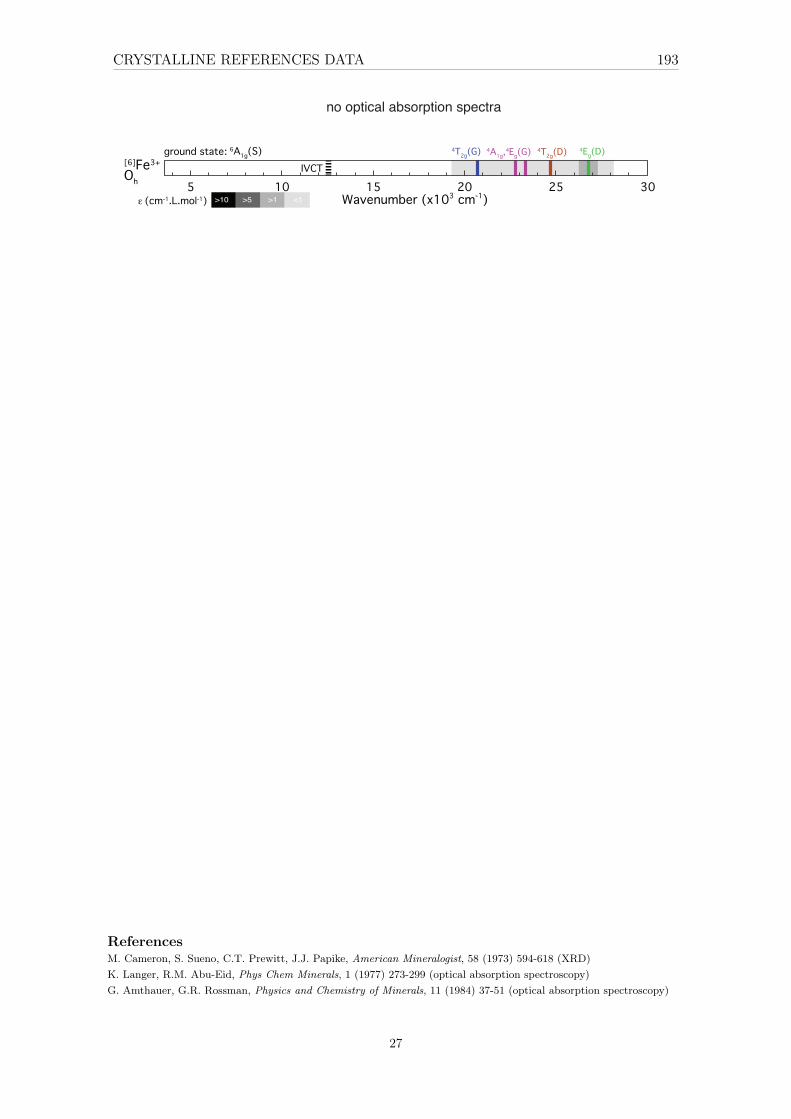
no optical absorption spectra
Wavenumber (x103 cm
-1)
ground state:
30252015105
ε (cm-1.L.mol-1) >10 >5 >1 <1
6A1g
(S)
[6]Fe3+
Oh
4T2g
(G) 4A1g
,4Eg(G) 4E
g(D)4T
2g(D)
IVCT
ReferencesM. Cameron, S. Sueno, C.T. Prewitt, J.J. Papike, American Mineralogist, 58 (1973) 594-618 (XRD)K. Langer, R.M. Abu-Eid, Phys Chem Minerals, 1 (1977) 273-299 (optical absorption spectroscopy)G. Amthauer, G.R. Rossman, Physics and Chemistry of Minerals, 11 (1984) 37-51 (optical absorption spectroscopy)
27
CRYSTALLINE REFERENCES DATA 193

Maghemite-γ-Fe2O3 ([4,6]Fe3+)
γ−Fe2O3
∼100 wt% Fe2O3
Redox Fe2+/Fetot: 0%Cell setting: CubicFe site geometry (Å):Td and Oh, (Fe8)Td
[Fe40/38/3]OhO32
(spinel). represents a vacancy, Td atetrahedral site and Oh an octahedralsite. Octahedra are linked each other bythe edges and to tetrahedra by corners
140
120
100
80
60
40
20
0
XES s
ignal (arb
. u.)
7.087.077.067.057.047.03
Energy (keV)
γ-Fe2O3 [4,6]
Fe3+
XES Kβ main
2.0
1.5
1.0
0.5
0.0
XES s
ignal (arb
. u.)
7.137.127.117.107.097.08
Energy (keV)
γ-Fe2O3 [4,6]
Fe3+
XES Kβ satIncident Energy [eV]
En
erg
y T
ran
sfe
r [e
V]
7110 7115 7120
705
710
715
720
725
γ-Fe2O
3
[4,6]Fe3+
0
0.05
0.1
0.15
0.2
0.25
0.3
0.35
0.4
RIXS map, Fe Kα
1.4
1.2
1.0
0.8
0.6
0.4
0.2
0.0
).u .bra( langis DFREH
7.207.187.167.147.127.10Energy (keV)
[6]Fe3+ _end [6]Fe3+
0.20
0.15
0.10
0.05
0.007.1227.1207.1187.1167.1147.1127.110
γ-Fe2O3
γ-Fe2O3
HERFD spectra, Fe K edge
1.2
1.0
0.8
0.6
0.4
0.2
0.0
).u .bra( langis YFT
7.207.187.167.147.127.10Energy (keV)
[6]Fe3+
0.14
0.12
0.10
0.08
0.06
0.04
0.02
0.007.1227.1207.1187.1167.1147.1127.110
γ-Fe2O3
TFY spectra, Fe K edge
28
194 Appendix A

no optical absorption spectra
ReferencesC. Pecharroman, T. Gonzalez-Carreno, J.E. Iglesias, Physics and Chemistry of Minerals, 22 (1995) 21-29 (XRD, IR)Nadeem, K., L. Ali, I. Gul, S. Rizwan, et M. Mumtaz. Journal of Non-Crystalline Solids 404 (2014): 72-77 (XRD,optical absorption spectroscopy, magnetic)
29
CRYSTALLINE REFERENCES DATA 195

RIXS Kα Fe2+
Incident Energy [eV]7110 7115 7120
705
710
715
720
725siderite[6]Fe2+
Incident Energy [eV]7110 7115 7120
705
710
715
720
725diopside[6]Fe2+
Incident Energy [eV]
Ener
gy T
rans
fer [
eV]
7110 7115 7120
705
710
715
720
725hypersthene[6]Fe2+
Incident Energy [eV]
Ener
gy T
rans
fer [
eV]
7110 7115 7120
705
710
715
720
725grandidierite[5]Fe2+
Incident Energy [eV]En
ergy
Tra
nsfe
r [eV
]7110 7115 7120
705
710
715
720
725chromite[4]Fe2+
Incident Energy [eV]7110 7115 7120
705
710
715
720
725staurolite[4]Fe2+
Incident Energy [eV]
Ener
gy T
rans
fer [
eV]
7110 7115 7120
705
710
715
720
725gillespite[4]Fe2+
0
0.05
0.1
0.15
0.2
0.25
0.3
0.35
0.4
RIXS Kα of Fe2+-bearing crystals normed with HERFD spectra and printed with the same scale
30
196 Appendix A

RIXS Kα Fe3+
Incident Energy [eV]7110 7115 7120
705
710
715
720
725Fe3PO7[5]Fe3+
Incident Energy [eV]
Ener
gy T
rans
fer [
eV]
7110 7115 7120
705
710
715
720
725γ-Fe2O3[4,6]Fe3+
Incident Energy [eV]En
ergy
Tra
nsfe
r [eV
]7110 7115 7120
705
710
715
720
725yoderite[5]Fe3+
Incident Energy [eV]7110 7115 7120
705
710
715
720
725acmite[6]Fe3+
Incident Energy [eV]
Ener
gy T
rans
fer [
eV]
7110 7115 7120
705
710
715
720
725ferriorthoclase[4]Fe3+
Incident Energy [eV]
Ener
gy T
rans
fer [
eV]
7110 7115 7120
705
710
715
720
725andradite[6]Fe3+
Incident Energy [eV]
Ener
gy T
rans
fer [
eV]
7110 7115 7120
705
710
715
720
725FePO4[4]Fe3+
0
0.05
0.1
0.15
0.2
0.25
0.3
0.35
0.4
RIXS Kα of Fe3+-bearing crystals normed with HERFD spectra and printed with the same scale
31
CRYSTALLINE REFERENCES DATA 197

all HERFD spectra
1.6
1.4
1.2
1.0
0.8
0.6
0.4
0.2
0.0
HER
FD s
igna
l (ar
b. u
.)
7.207.187.167.147.127.10Energy (keV)
0.15
0.10
0.05
0.007.1207.1187.1167.1147.1127.110
staurolite [4]Fe2+ chromite [4]Fe2+ gillespite [4]Fe2+ grandidierite [5]Fe2+ hypersthene [6]Fe2+ siderite [6]Fe2+
diopside [6]Fe2+
HERFD spectra of ferrous iron crystalline references (Fe2+)
1.4
1.2
1.0
0.8
0.6
0.4
0.2
0.0
HER
FD s
igna
l (ar
b. u
.)
7.207.187.167.147.127.10Energy (keV)
0.4
0.3
0.2
0.1
0.07.1207.1187.1167.1147.1127.110
ferriorthoclase [4]Fe3+ FePO4
[4]Fe3+ Fe3PO7
[5]Fe3+ yoderite [5]Fe3+ andradite [6]Fe3+ acmite [6]Fe3+ g-Fe2O3
[4,6]Fe3+
HERFD spectra of ferric iron crystalline references (Fe3+)
32
198 Appendix A

all TFY spectra
1.4
1.2
1.0
0.8
0.6
0.4
0.2
0.0
TFY
sign
al (n
orm
ed to
mai
n ed
ge)
7.207.187.167.147.127.10Energy (keV)
0.14
0.12
0.10
0.08
0.06
0.04
0.02
0.007.1207.1187.1167.1147.1127.110
staurolite [4]Fe2+
chromite [4]Fe2+ gillespite [4]Fe2+
grandidierite [5]Fe2+ hypersthene [6]Fe2+ siderite [6]Fe2+
diopside [6]Fe2+
TFY spectra of ferrous iron crystalline references (Fe2+)
1.4
1.2
1.0
0.8
0.6
0.4
0.2
0.0
TFY
sign
al (n
orm
ed to
mai
n ed
ge)
7.207.187.167.147.127.10Energy (keV)
0.20
0.15
0.10
0.05
0.007.1207.1187.1167.1147.1127.110
ferriorthoclase [4]Fe3+ FePO4
[4]Fe3+ Fe3PO7
[5]Fe3+ yoderite [5]Fe3+ andradite [6]Fe3+ acmite [6]Fe3+ g-Fe2O3
[4,6]Fe3+
TFY spectra of ferric iron crystalline references (Fe3+)
33
CRYSTALLINE REFERENCES DATA 199

all TFY spectra - pre-edge without main edge
0.12
0.10
0.08
0.06
0.04
0.02
0.00
TFY
pree
dge
signa
l (no
rmed
to
mai
n ed
ge)
7.1207.1187.1167.1147.1127.110Energy (keV)
staurolite [4]Fe2+
chromite [4]Fe2+ gillespite [4]Fe2+
grandidierite [5]Fe2+ hypersthene [6]Fe2+ siderite [6]Fe2+
diopside [6]Fe2+
TFY pre-edge without main edge of ferrous iron crystalline references (Fe2+)Area (×105): chromite [4]Fe2+: 18.8, staurolite [4]Fe2+: 23.3, gillespite [4]Fe2+: 5.6, grandidierite [5]Fe2+: 15.4,
hypersthene [6]Fe2+: 10.3, siderite [6]Fe2+: 5.9, diopside [6]Fe2+: 7.7
0.15
0.10
0.05
0.00
TFY
pree
dge
signa
l (no
rmed
to
mai
n ed
ge)
7.1207.1187.1167.1147.1127.110Energy (keV)
ferriorthoclase [4]Fe3+ FePO4
[4]Fe3+
Fe3PO7 [5]Fe3+
yoderite [5]Fe3+ andradite [6]Fe3+ acmite [6]Fe3+ g-Fe2O3
[4,6]Fe3+
TFY pre-edge without main edge of ferric iron crystalline references (Fe3+)Area (×105): ferriorthoclase [4]Fe3+: 34.3, FePO4
[4]Fe3+: 34.2, Fe3PO7[5]Fe3+: 44.1, yoderite [5]Fe3+: 12.0,
andradite [6]Fe3+: 9.7, acmite [6]Fe3+: 10.9, γ-Fe2O3[4,6]Fe3+: 24.9
34
200 Appendix A
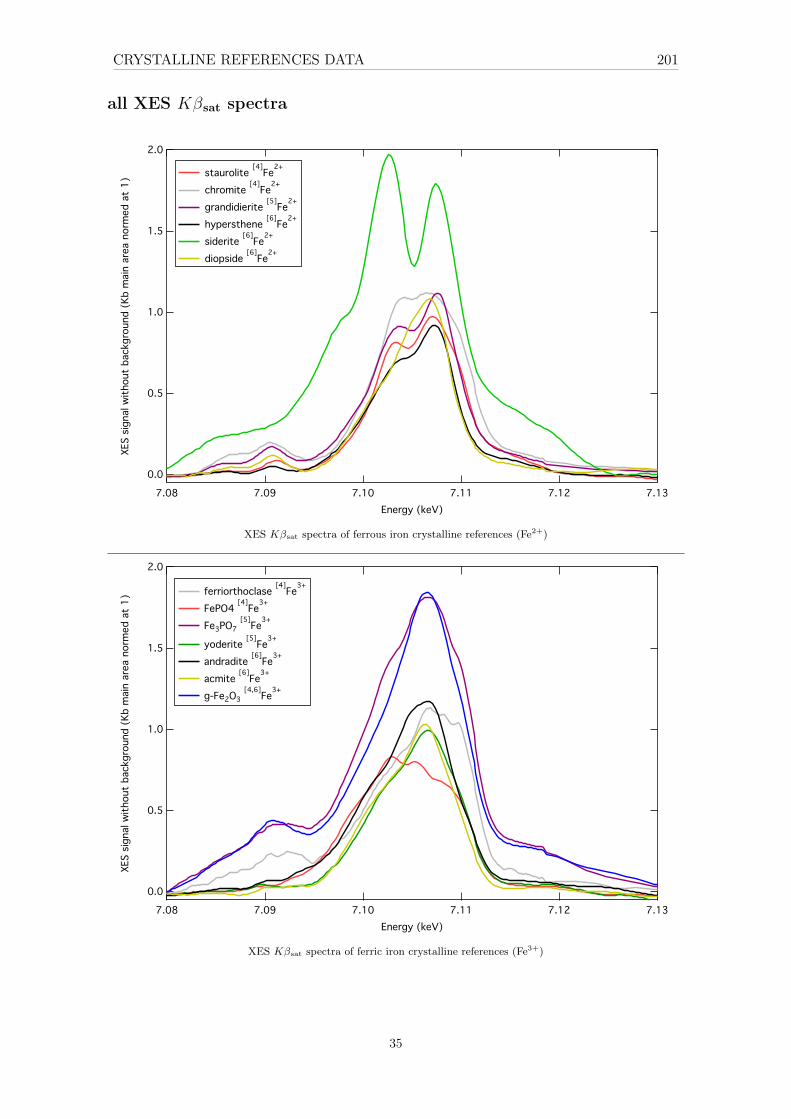
all XES Kβsat spectra
2.0
1.5
1.0
0.5
0.0
XES
signa
l with
out
back
grou
nd (
Kb m
ain
area
nor
med
at
1)
7.137.127.117.107.097.08Energy (keV)
staurolite [4]Fe2+
chromite [4]Fe2+
grandidierite [5]Fe2+ hypersthene [6]Fe2+ siderite [6]Fe2+
diopside [6]Fe2+
XES Kβsat spectra of ferrous iron crystalline references (Fe2+)
2.0
1.5
1.0
0.5
0.0
XES
signa
l with
out
back
grou
nd (
Kb m
ain
area
nor
med
at
1)
7.137.127.117.107.097.08Energy (keV)
ferriorthoclase [4]Fe3+ FePO4 [4]Fe3+
Fe3PO7 [5]Fe3+
yoderite [5]Fe3+
andradite [6]Fe3+
acmite [6]Fe3+
g-Fe2O3 [4,6]Fe3+
XES Kβsat spectra of ferric iron crystalline references (Fe3+)
35
CRYSTALLINE REFERENCES DATA 201

all optical sticks
30252015105
[4]Fe3+: Td[5]Fe3+: D3h
[6]Fe3+: Oh
Ferriorthoclase: mesured & Burns 1993, Rossman website
Yoderite: Langer 1982 & Abu-Eid 1978
Andradite: mesured & Lin 1969 & Burns 1993 & Rossman
Wavenumber (x103 cm-1)
groundstate
Staurolite: Rossman and Taran 2001
Grandidierite: Rossman and Taran 2001, Schmetzer et al. 2002
Siderite: GIA Gem Databasea, Min-Guang and Mao-Lu 1983
Acmite: Amthauer and Rossman 1984, Langer and Abu-Eid 1977
Hypersthene: Rossman website
5E’’(D)
5A1(D)
5E(D)5E(D)
ε (cm-1.L.mol-1)>10 >5 >1 <1
[4]Fe2+: Td
[5]Fe2+: D3h
[6]Fe2+: Oh
5T2g(D)[6]Fe2+: Oh
[4]Fe2+: D4h Gillespite: Rossman and Taran 2001
6A1(S)6A1(S)
6A1g(S)[6]Fe3+: Oh
6A1g(S)
4A1(g),4E(g)(G) 4E(g)(D)4T2(g)(D)4T2(g)(G)4T1(g)(G)
4T2(g)(G)
IVCTIVCT
Sticks form optical spectra iron crystalline references
36
202 Appendix A

203
Appendix B
Optical absorption spectroscopy
B.1 Perkin-Elmerr Lambda 1050
The spectral range covered by this instrument spans from ultraviolet (180 nm) to near-infrared (3300nm). For transparent materials, like glasses, absorption is measured bytransmission of a normal incident light beam on polished sample (to avoid surface scatteringcaused by roughness) with parallel faces (to avoid beam deviation).
Optical measurements presented here have been performed with a Perkin-Elmerr Lambda1050 UV-Visible-NIR spectrophotometer in transmission mode using three detectors andtwo lamps to cover a wide wavelength (λ) range with 1 nm step.
Lamps Lambda 1050 spectrometer has two light sources:
− A deuterium lamp for UV wavelength range (λ from 200 to 319.2 nm), a low-pressuregas-discharge light source.
− A tungsten-halogen for Visible-NIR range (from 319.2 to 3300 nm), an incandescentlamp.
Detectors Lambda 1050 spectrometer has three detectors:
− A photomultiplier R6872 for high energies in the entire UV/Vis wavelength range(from 200 to 860.8 nm), the gain is auto and the response is 0.2 s.
− A high-performance Peltier-cooled InGaAs detector (from 860.8 to 2500nm), the gainis 6.75 and the response is 0.2 s.
− A Peltier-cooled PbS detector (from 2500 to np[nm]3300), the gain is 0.2 and theresponse is 0.2 s.
B.2 How to convert α to ε
For mglass = 1 g of glass dopped 0.5wt% of Fe2O3 there is 0.005 g of Fe2O3, that leads tothe amount of iron nFe:
nFe = 2mFe2O3
MFe2O3
= 2mglass × wt%Fe2O3
MFe2O3
(B.1)
where MFe2O3 = 159.69 g/mol, is the molar mass of Fe2O3.
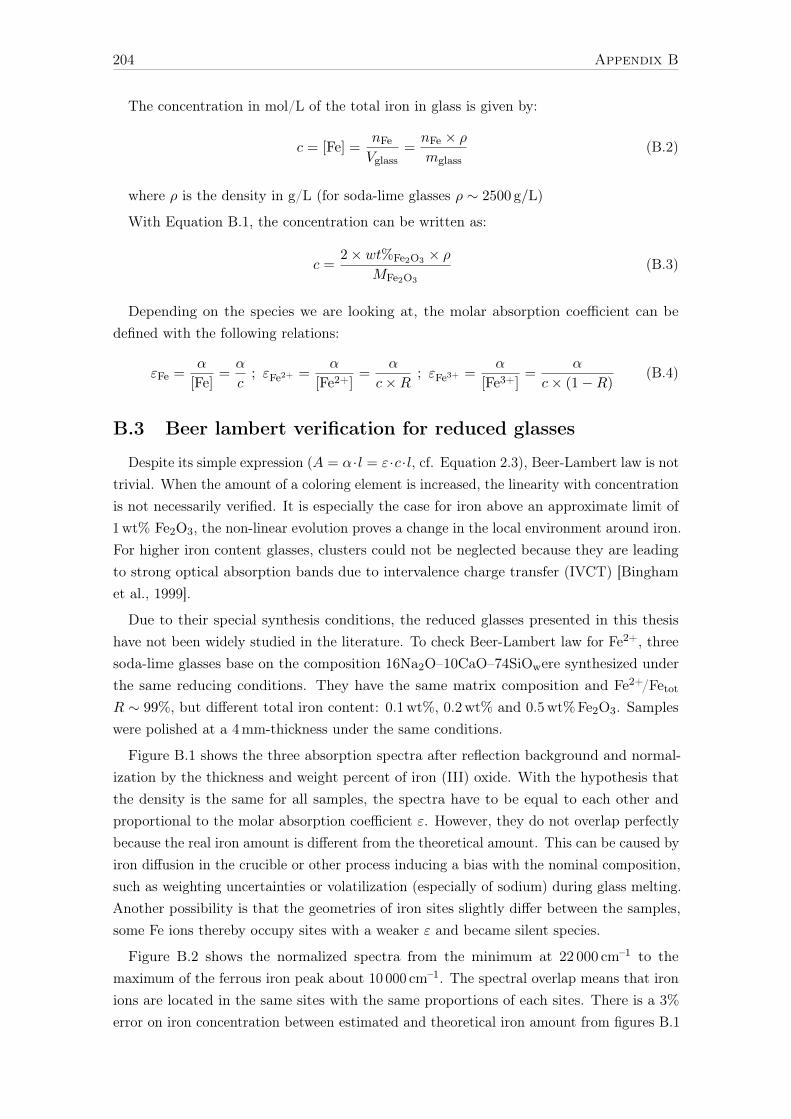
204 Appendix B
The concentration in mol/L of the total iron in glass is given by:
c = [Fe] =nFeVglass
=nFe × ρmglass
(B.2)
where ρ is the density in g/L (for soda-lime glasses ρ ∼ 2500 g/L)
With Equation B.1, the concentration can be written as:
c =2× wt%Fe2O3 × ρ
MFe2O3
(B.3)
Depending on the species we are looking at, the molar absorption coefficient can bedefined with the following relations:
εFe =α
[Fe]=α
c; εFe2+ =
α
[Fe2+]=
α
c×R ; εFe3+ =α
[Fe3+]=
α
c× (1−R)(B.4)
B.3 Beer lambert verification for reduced glasses
Despite its simple expression (A = α·l = ε·c·l, cf. Equation 2.3), Beer-Lambert law is nottrivial. When the amount of a coloring element is increased, the linearity with concentrationis not necessarily verified. It is especially the case for iron above an approximate limit of1wt% Fe2O3, the non-linear evolution proves a change in the local environment around iron.For higher iron content glasses, clusters could not be neglected because they are leadingto strong optical absorption bands due to intervalence charge transfer (IVCT) [Binghamet al., 1999].
Due to their special synthesis conditions, the reduced glasses presented in this thesishave not been widely studied in the literature. To check Beer-Lambert law for Fe2+, threesoda-lime glasses base on the composition 16Na2O–10CaO–74SiOwere synthesized underthe same reducing conditions. They have the same matrix composition and Fe2+/FetotR ∼ 99%, but different total iron content: 0.1wt%, 0.2wt% and 0.5wt%Fe2O3. Sampleswere polished at a 4mm-thickness under the same conditions.
Figure B.1 shows the three absorption spectra after reflection background and normal-ization by the thickness and weight percent of iron (III) oxide. With the hypothesis thatthe density is the same for all samples, the spectra have to be equal to each other andproportional to the molar absorption coefficient ε. However, they do not overlap perfectlybecause the real iron amount is different from the theoretical amount. This can be caused byiron diffusion in the crucible or other process inducing a bias with the nominal composition,such as weighting uncertainties or volatilization (especially of sodium) during glass melting.Another possibility is that the geometries of iron sites slightly differ between the samples,some Fe ions thereby occupy sites with a weaker ε and became silent species.
Figure B.2 shows the normalized spectra from the minimum at 22 000 cm–1 to themaximum of the ferrous iron peak about 10 000 cm–1. The spectral overlap means that ironions are located in the same sites with the same proportions of each sites. There is a 3%error on iron concentration between estimated and theoretical iron amount from figures B.1

OPTICAL ABSORPTION SPECTROSCOPY 205
and B.2. For glasses with 0.1wt%Fe2O3 (1000 ppm) that means a 30 ppm error, whichcorresponds to electron microprobe analysis (EMPA) resolution.
0
2
4
6
8
4000 8000 12000 16000 20000 24000 28000 32000
soda lime reduced SL-R-0.5Fe2O3
soda lime reduced SL-R-0.2Fe2O3
soda lime reduced SL-R-0.1Fe2O3
α lin
ear a
bsob
ance
coe
ffici
ent d
ivid
ed b
y w
t% (w
t%-1 .c
m-1
)
wavenumber (cm-1)
Figure B.1 – Corrected optical absorptionspectra divided by the iron content of threereduced soda-lime silicate glasses with differentiron content (0.1; 0.2 and 0.5 wt%)
0
0.2
0.4
0.6
0.8
1
4000 8000 12000 16000 20000 24000 28000 32000
soda lime reduced SL-R-0.5Fe2O3
soda lime reduced SL-R-0.2Fe2O3
soda lime reduced SL-R-0.1Fe2O3
Norm
alized a
bsorb
ance (
a.u
.)
wavenumber (cm-1)
Figure B.2 – Normalized absorption spectraby the maximum of the ferrous iron peak of threereduced soda-lime silicate (SL) glasses with dif-ferent iron content (0.1; 0.2 and 0.5 wt%)
Figure B.3 shows linear regression of the absorbance (in cm–1) at few fixed wavelengthwithout reflection background subtraction. The regression coefficients are close to 1, thus,the proportionality of the absorbance versus concentration in Beer-Lambert law is verified.
0
1
2
3
4
5
0 0.1 0.2 0.3 0.4 0.5 0.6
5200 cm-16800 cm-18600 cm-110800 cm-112500 cm-131500 cm-1
y = 0.118 + 3.8x R= 0.99998 y = 0.138 + 5.7x R= 0.99999 y = 0.150 + 7.9x R= 0.99999 y = 0.140 + 6.7x R= 1 y = 0.126 + 4.70 R= 0.99999 y = 0.137 + 9.4x R= 1
alph
a lin
ear a
bsor
ptio
n co
effic
ient
(cm
-1)
iron content (wt%)Figure B.3 – Evolution of linear absorption coefficient with the iron content for several arbitrarywavenumbers in the UV-visible-NIR range
B.4 Data processing of weak Fe3+ signals
As we have seen before, the weak Fe3+ “d–d transitions” are weak and overlapped byOMCT and Fe2+ signals. Further data processing is therefore needed to analyze the effectof composition on Fe3+ spectra.

206 Appendix B
B.4.1 Removing the UV-edge to extract Fe3+ d–d transitions
The necessity to remove the UV-edge, especially for alkali-free glasses is illustrated inFigure B.4. The position of the alkali-free UV-edge is lower than for soda-lime glasses andthe weak Fe3+ d–d bands are overlapped by the intense OMCT.
Using results from the study of the UV-range (see Section 5.3.1), the UV-edge was fittedwith two Gaussian curves, then subtracted to the spectrum. Up to 32 000 cm–1, Urbach lawor Gaussian curve give similar results [Ades et al., 1990]. However, the fitting range canbe wider when a Gaussian curve is used, the Gaussian function is parabolic in logarithmicscale while the exponential function is linear in logarithmic scale. Therefore, in Figure B.6,plotted in logarithmic scale, the tail respects Urbach law up to 32 000 cm–1, as observed bySteele and Douglas [1965], but above 32 000 cm–1 the band has a parabolic shape confirmingthe preference for a Gaussian model.
After the UV-edge subtraction, the Fe3+ signals in the alkali-free glass are clearly visiblein Figure B.5 and can be compared with the soda-lime. The contrast between these twokinds of glass and interpretation of the broader DIO peaks is detailed in Section 6.1.1.
2.5
2.0
1.5
1.0
0.5
0.0
line
ar a
bsor
ptio
n co
effici
ent
(cm
-1)
2800026000240002200020000
wavenumber (cm-1)
500 450 400 350wavelength (nm)
NCS05Med UV-edge (NCS) DIO05Med UV-edge (DIO)
Figure B.4 – UV edge fitting of the NCS05Medglass with one Gaussian
5
4
3
2
1
0
Fe3+
mol
ar a
bsor
ptio
n co
effici
ent
(L.m
ol-1.c
m-1)
2800026000240002200020000wavenumber (cm-1)
500 450 400 380 350wavelength (nm)
NCS05Med (without UV-edge) DIO05Med (without UV-edge)
Figure B.5 – main Fe3+ peak fitting with oneGaussian
0.01
0.1
1
10
100
Abs
orba
nce
(cm
-1)
5040302010Wavenumber (x103 cm-1)
2000 1000 700 600 500 400 300 250 200
NCS01Med NCS01Red DIO01Med
Wavelength (nm)
Figure B.6 – Optical absorption spectra of for the Med and Red soda-lime silicate and Meddiopside glasses. The absorbance is in logarithmic scale.

OPTICAL ABSORPTION SPECTROSCOPY 207
B.4.2 Separation of Fe2+/Fe3+
Optical signals of Fe2+ and Fe3+ overlapped each other in the UV-Vis-NIR spectra.Nevertheless, Fe2+ predominates in the range 4000 cm–1 to 19 000 cm–1 and Fe3+ in therange 19 000 cm–1 to 30 000 cm–1[Fox et al., 1982]. In order to separate the two contributions,the following method needs at least two glasses of the same composition with differentredox.
In this example three soda-lime (NCS) samples with different redox are considered:NCS05Red, NCS05Med and NCS05Ox (same protocol is applied for NCMS and NMSglasses).
After subtraction of background and UV-edge (fitted from 27 500 cm–1 to 30 000 cm–1),the energy range is limited from 4048.6 cm–1 (2470nm) to 30 303 cm–1 (330nm). 4048.6 cm–1
to ignore OH bands and 30 303 cm–1 because only artifacts remain in the UV after chargetransfer removal.
Fe2+ and Fe3+ spectra are extracted using linear combinations of two of the 3 spectra.This system of 3 equations with 2 unknowns functions: εFe2+(λ) and εFe3+(λ) is resolved 3times using Cramer’s rule for every wavelength and the 3 couples of 2 equations: (Red,Med),(Red,Ox) and (Med,Ox).
εRed(λ) = aεFe2+(λ) + (1− a)εFe3+(λ) (Red)
εMed(λ) = bεFe2+(λ) + (1− b)εFe3+(λ) (Med)
εOx(λ) = cεFe2+(λ) + (1− c)εFe3+(λ) (Ox)
with a the redox of Red glass, b the redox of Med glass, c the redox of Ox glass. Theredox parameters a, b and c of the three samples are automatically adjusted (using excelsolver and GRG method) with the following restrictions:
− Minimization of∑ε2Fe3+ in the range 4050 cm–1 to 19 000 cm–1
− Minimization of∑ε2Fe2+ in the range 19 000 cm–1 to 30 000 cm–1
This adaptation of least squares method, by minimizing ε2 in the range where they arenot predominant, gives the possibility to extract redox instead of using fixed redox, guessedfrom another method such as wet chemistry. However, in this model, molar absorptioncoefficients are supposed to be independent of the glass redox state.
Table B.1 shows the results of estimated redox compared to redox from wet chemistrylisted in Table B.2. The calculated values are within the wet chemistry error. Thus, thesmall errors on estimated redox values confirm the validity of this methodology.
Table B.1 – Calculated redox in % deducedfrom the optimization of the linear combina-tion of optical spectraname Ox Med RedNCS05 7.3 29.2 98.4NCSM05 7.2 24.7 99.9NMS05 9.7 25.2 99.9
Table B.2 – Experimental redox in % ob-tained with wet chemistry (±3%))name Ox Med RedNCS05 6.4 27.8 96.8NCMS05 4.9 25.3 96.1NMS05 6.5 23.9 96.4

208 Appendix B
Results are shown in Figures B.7(a), B.7(b) and B.8. As expected regarding the selectionrules, spin-allowed transitions of Fe2+ are 10 times higher than Fe3+ spin-forbidden ones.It explains that for oxidized glasses, since Fe3+ is the major redox species (∼ 5% Fe2+),the Fe3+ signal has the same order of magnitude than the small amount of remaining Fe2+.
Fe2+ is dominating the range from 4000 to 19 000 cm–1, and there is no Fe3+ band ableto significantly influence the optical spectrum of Fe2+ in this range. On the Fe2+ spectrum,signals from 20 000 to 28 000 cm–1 (Figure B.7(b)) are 2 times weaker than Fe3+ bands.These bands could have been neglected at first in oxidized and medium glasses with redoxinferior to ∼ 25%, but become be a major issue for the study of Fe3+ bands in glasses withR > 70%. The interpretation of these weak signals apparently related to Fe2+ are discussedin Section 5.2.5.
4
3
2
1
0
Abso
rban
ce (
cm-1
)
30000250002000015000100005000wavenumber (cm-1
)
Fe2+
Fe3+
(a) zoom Fe2+
0.4
0.3
0.2
0.1
0.0
Abso
rban
ce (
cm-1
)
30000250002000015000100005000wavenumber (cm-1
)
Fe2+
Fe3+
(b) zoom Fe3+
Figure B.7 – Extracted linear absorption coefficient αFe2+ and αFe3+
25
20
15
10
5
0mol
ar a
bsor
ptio
n co
effici
ent
(cm
-1.L
.mol
-1)
30000250002000015000100005000wavenumber (cm-1)
2000 10001000 800 700 600 500 400 340wavelength (nm)
Fe2+
Fe3+
x10
Figure B.8 – Estimated molar absorption coefficient εFe2+ and εFe3+ in NCS05 glasses. Fe3+ hasbeen magnified by a factor 10.
OPTICAL ABSORPTION SPECTROSCOPY 209
When extracting the Fe3+ optical signature, the spectrum takes negative values from5000 to 9000 cm–1 (see Figure B.7-b). This artifact in the Fe2+ range due to a shift of themain Fe2+ band with the redox. These changes of shape and position of Fe2+ bands withredox is related to the evolution of Fe2+ environment and could be a limiting issue to thisdeconvolution method.
The removing of the Fe2+ tail could be useful for the analysis of weak bands from 17 000to 21 000 cm–1. For example, the weak signal around 17 000 cm–1 on Fe3+ spectrum couldcorresponds to the transition 6A1 →4T1 observed in minerals (Figure 4.24). However, thisband is in the transition zone between Fe2+ and Fe3+ ranges, and its extraction could beinfluenced by the shift of the main Fe2+ with redox.
In conclusion, this separation of overlapping Fe2+ and Fe3+ optical signatures usinglinear combination of spectra gives a coherent estimation (without a priori) of the redoxvalues, and is especially useful for the study of Fe3+ environment. In addition, for thehighly oxidized (R ∼ 5%) or reduced (R ∼ 95%) glasses studied in this thesis, the overlapcan be neglected in the regions of interest.
B.4.3 Gaussian fit of the Fe3+ bands
In order to extract the different Fe3+ contributions from the glass spectra, a Gaussian fithas been performed, based on the work of Volotinen et al. [2008] and references therein.Jørgensen et al. [1954] showed that optical absorption bands of transition metals can beapproximated by Gaussian functions of the wavenumber as independent variable with goodresults on the residual error. For a fit with three Gaussian functions, the fitting range wasrestricted to 22 400–24 500 cm–1 and 26 000–26 700 cm–1, nearby the three main bands ofFe3+ at 22 900, 24 000 and 26 300 cm–1. For a fit with six Gaussian functions the fittingrange 20 000–28 000 cm–1 was considered.
B.4.4 Low-iron glasses
Glasses of the same matrix composition without added iron were synthesized in order toknow the properties of the matrix such as refractive index, reflection coefficient, diamag-netism. Because EMPA precision is not adapted to this threshold, this part explains how toestimate the iron content in these glasses using optical spectroscopy: For the example, twoglasses were considered, NCS00Med, a thick sample without added-iron and synthesized inthe same conditions than the medium glass, NCS01Med, containing 0.1wt% of Fe2O3, inboth samples the Fe2+/Fetot ratio is approximately R ∼ 25%).
Optical spectra are plotted in logarithmic scale for the y-axis (Figure B.9). The twoglasses synthesized under air atmosphere, NCS01Med and NCS00Med, exhibit the sameshape except that NCS00Med signal is about 13 times weaker. This vertical translationconfirms the previous Beer-Lambert law results. This proportionality of the linear absorptioncoefficient (in cm–1) gives an estimation of the remaining iron content in these “iron-free”glasses. Results for the four studied composition of this thesis are compared in Table B.3with experimental values of EMPA. Both analyses agree with a remaining iron contentaround 70∼100 ppm of Fe2O3.

210 Appendix B
0.001
0.01
0.1
1
10
100A
bsor
banc
e (c
m-1)
5040302010Wavenumber (x103 cm-1)
3000 1000 600 500 400 300 270 250 200
NCS01Med NCS00Med
Wavelength (nm)
Figure B.9 – logarithmic representation of the optical absorption spectra for the soda-lime silicatemedium glasses with no added iron (NCS00Med) and 0.1wt% of Fe2O3 (NCS01Med).
Table B.3 – Iron content (in ppm Fe2O3) of the no added-iron glasses: estimated by EMPA andby optical absorption (comparison of UV range with 0.5wt% glasses)
iron content (ppm)sample EMPA OPTNCS00Med 76 70NCSM00Med 100 96NMS00Med 70 80DIO00Med 77 73
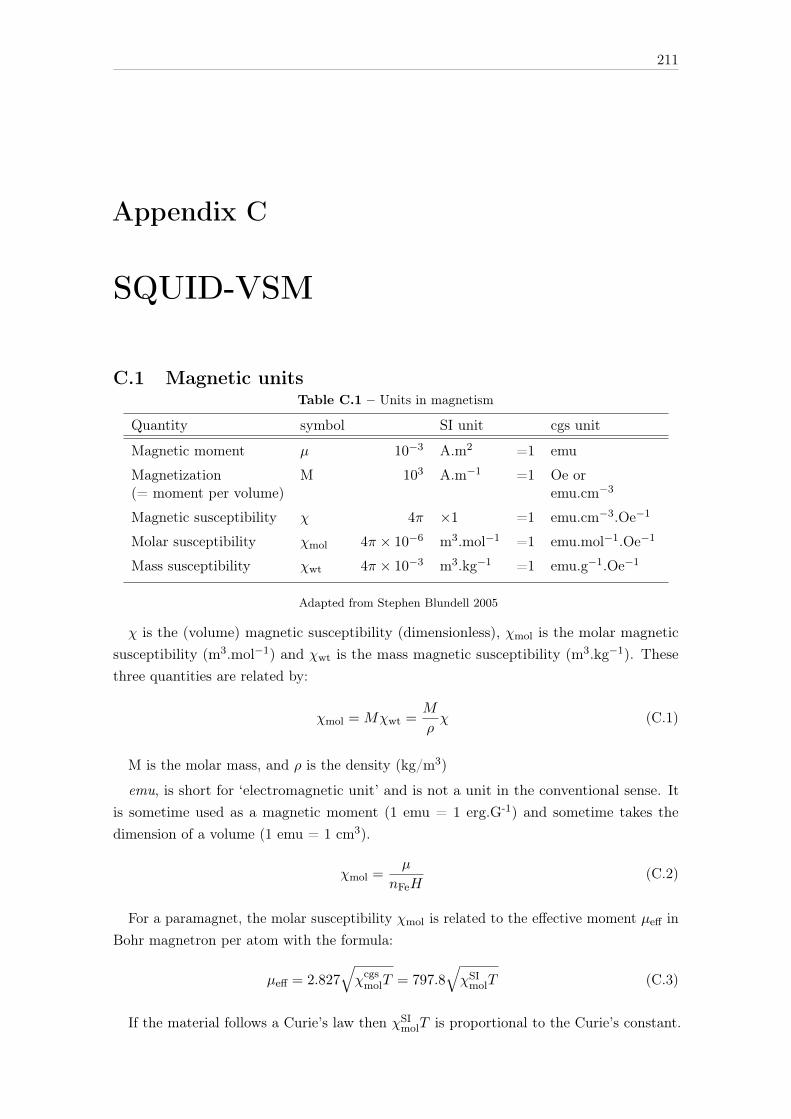
211
Appendix C
SQUID-VSM
C.1 Magnetic unitsTable C.1 – Units in magnetism
Quantity symbol SI unit cgs unit
Magnetic moment µ 10−3 A.m2 =1 emu
Magnetization M 103 A.m−1 =1 Oe or(= moment per volume) emu.cm−3
Magnetic susceptibility χ 4π ×1 =1 emu.cm−3.Oe−1
Molar susceptibility χmol 4π × 10−6 m3.mol−1 =1 emu.mol−1.Oe−1
Mass susceptibility χwt 4π × 10−3 m3.kg−1 =1 emu.g−1.Oe−1
Adapted from Stephen Blundell 2005
χ is the (volume) magnetic susceptibility (dimensionless), χmol is the molar magneticsusceptibility (m3.mol−1) and χwt is the mass magnetic susceptibility (m3.kg−1). Thesethree quantities are related by:
χmol = Mχwt =M
ρχ (C.1)
M is the molar mass, and ρ is the density (kg/m3)
emu, is short for ‘electromagnetic unit’ and is not a unit in the conventional sense. Itis sometime used as a magnetic moment (1 emu = 1 erg.G-1) and sometime takes thedimension of a volume (1 emu = 1 cm3).
χmol =µ
nFeH(C.2)
For a paramagnet, the molar susceptibility χmol is related to the effective moment µeff inBohr magnetron per atom with the formula:
µeff = 2.827√χcgsmolT = 797.8
√χSImolT (C.3)
If the material follows a Curie’s law then χSImolT is proportional to the Curie’s constant.
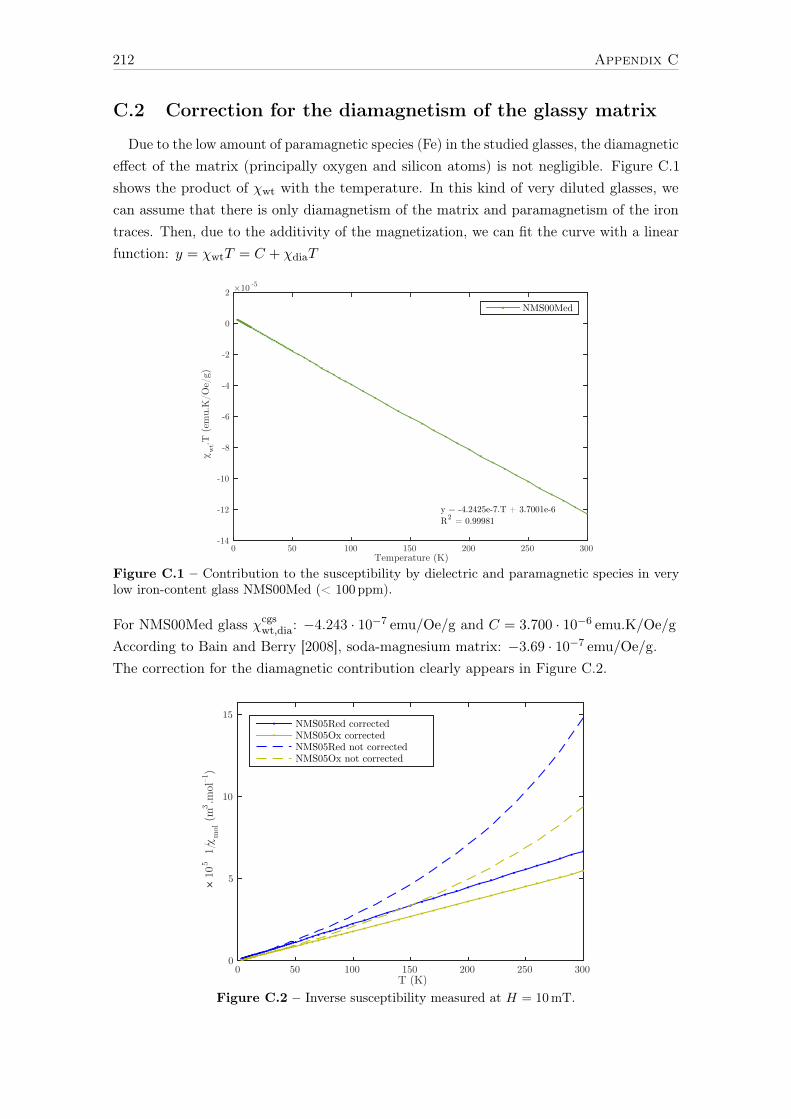
212 Appendix C
C.2 Correction for the diamagnetism of the glassy matrix
Due to the low amount of paramagnetic species (Fe) in the studied glasses, the diamagneticeffect of the matrix (principally oxygen and silicon atoms) is not negligible. Figure C.1shows the product of χwt with the temperature. In this kind of very diluted glasses, wecan assume that there is only diamagnetism of the matrix and paramagnetism of the irontraces. Then, due to the additivity of the magnetization, we can fit the curve with a linearfunction: y = χwtT = C + χdiaT
Temperature (K)0 50 100 150 200 250 300
wt.T
(em
u.K
/Oe/
g)
×10 -5
-14
-12
-10
-8
-6
-4
-2
0
2
NMS00Med
y = -4.2425e-7.T + 3.7001e-6R2 = 0.99981
Figure C.1 – Contribution to the susceptibility by dielectric and paramagnetic species in verylow iron-content glass NMS00Med (< 100ppm).
For NMS00Med glass χcgswt,dia: −4.243 · 10−7 emu/Oe/g and C = 3.700 · 10−6 emu.K/Oe/g
According to Bain and Berry [2008], soda-magnesium matrix: −3.69 · 10−7 emu/Oe/g.The correction for the diamagnetic contribution clearly appears in Figure C.2.
T (K)0 50 100 150 200 250 300
× 10
5 1
/m
ol (
m3 .
mol
–1)
0
5
10
15NMS05Red correctedNMS05Ox correctedNMS05Red not correctedNMS05Ox not corrected
Figure C.2 – Inverse susceptibility measured at H = 10 mT.

213
Appendix D
X-ray absorption spectroscopy
D.1 Temperature effect - Boltzmann distribution
The population P of the different multiplet levels depends on the temperature, T > 0K,following a Boltzmann distribution:
P ∝ e−∆EkT , with ∆E = Ei − Eground (D.1)
If the temperature is equal to the absolute zero, T = 0 K, then, only the ground state(the one with the lowest energy) is filled and involved in the electronic transitions. Thisground state can be degenerated, thus several levels have the same energy and are equallyfilled.
At room temperature, T = 300 K, kT = 4.14 · 10−21 J = 26meV = 210 cm–1. Therefore,if ∆E ≥ 0.12 eV then e−
∆EkT < 0.01, the filling of the higher state is only 1% of the ground
state. Likewise, if ∆E ≥ 0.24 eV then e−∆EkT < 0.001, the weight of the i-th state is only
1% of the ground state.
D.2 Spectral broadening
The width of spectral bands are broaden by two kinds of spectral broadenings: one is aLorentzian (Equation D.2) broadening due to the material and related to core-hole lifetime,the second is a Gaussian (Equation D.3) broadening due to the experimental setup andrelated to monochromators and analyzers. They are characterized by their full width athalf maximum (FWHM).
L(x, γ) =γ
π(γ2 + x2)=
Γ/2
π((Γ/2)2 + x2)(D.2)
G(x, σ) =1
σ√
2πe−x2
2σ2 (D.3)
The Lorentzian broadening is estimated with the core-hole lifetime calculated in Krauseand Oliver [1979] (for iron: FWHM = Γ = 2γ = 1.25 eV), in this thesis Γ was reduced to1.12 eV because the value from Krause gave larger spectra than the experiment.
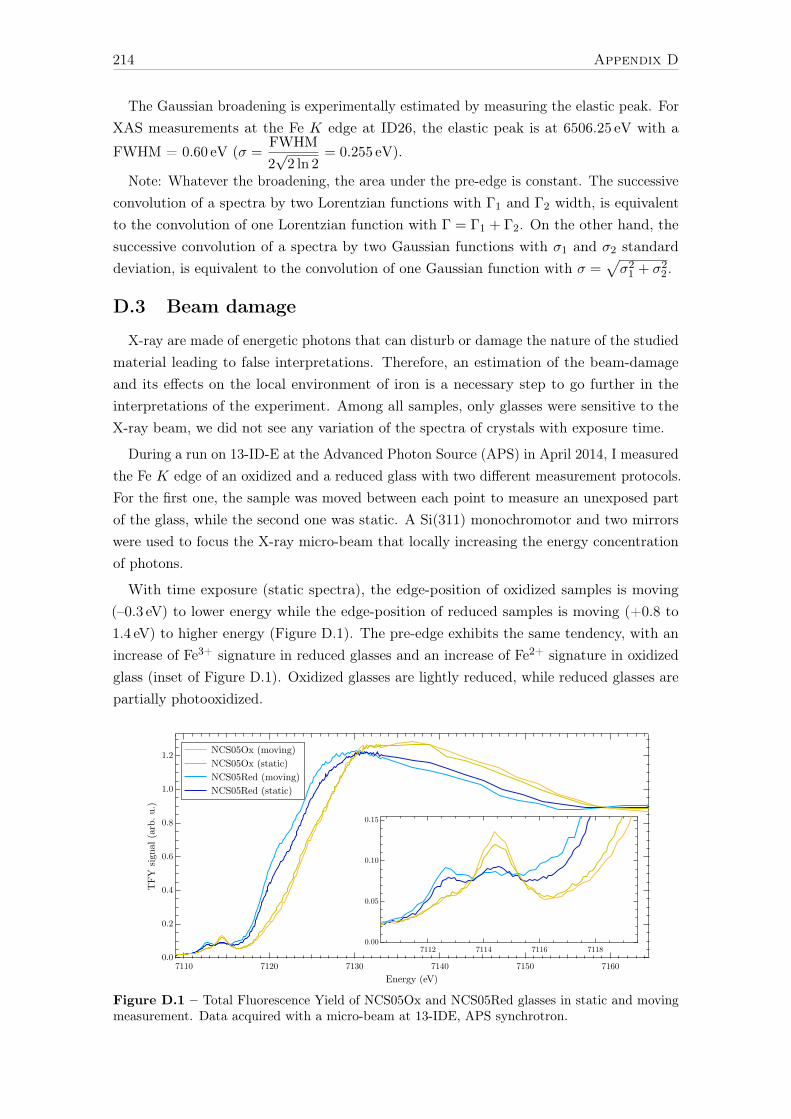
214 Appendix D
The Gaussian broadening is experimentally estimated by measuring the elastic peak. ForXAS measurements at the Fe K edge at ID26, the elastic peak is at 6506.25 eV with a
FWHM = 0.60 eV (σ =FWHM
2√
2 ln 2= 0.255 eV).
Note: Whatever the broadening, the area under the pre-edge is constant. The successiveconvolution of a spectra by two Lorentzian functions with Γ1 and Γ2 width, is equivalentto the convolution of one Lorentzian function with Γ = Γ1 + Γ2. On the other hand, thesuccessive convolution of a spectra by two Gaussian functions with σ1 and σ2 standarddeviation, is equivalent to the convolution of one Gaussian function with σ =
√σ21 + σ22.
D.3 Beam damage
X-ray are made of energetic photons that can disturb or damage the nature of the studiedmaterial leading to false interpretations. Therefore, an estimation of the beam-damageand its effects on the local environment of iron is a necessary step to go further in theinterpretations of the experiment. Among all samples, only glasses were sensitive to theX-ray beam, we did not see any variation of the spectra of crystals with exposure time.
During a run on 13-ID-E at the Advanced Photon Source (APS) in April 2014, I measuredthe Fe K edge of an oxidized and a reduced glass with two different measurement protocols.For the first one, the sample was moved between each point to measure an unexposed partof the glass, while the second one was static. A Si(311) monochromotor and two mirrorswere used to focus the X-ray micro-beam that locally increasing the energy concentrationof photons.
With time exposure (static spectra), the edge-position of oxidized samples is moving(–0.3 eV) to lower energy while the edge-position of reduced samples is moving (+0.8 to1.4 eV) to higher energy (Figure D.1). The pre-edge exhibits the same tendency, with anincrease of Fe3+ signature in reduced glasses and an increase of Fe2+ signature in oxidizedglass (inset of Figure D.1). Oxidized glasses are lightly reduced, while reduced glasses arepartially photooxidized.
1.2
1.0
0.8
0.6
0.4
0.2
0.0
TFY
sig
nal (
arb.
u.)
716071507140713071207110Energy (eV)
0.15
0.10
0.05
0.007118711671147112
NCS05Ox (moving) NCS05Ox (static) NCS05Red (moving) NCS05Red (static)
Figure D.1 – Total Fluorescence Yield of NCS05Ox and NCS05Red glasses in static and movingmeasurement. Data acquired with a micro-beam at 13-IDE, APS synchrotron.

X-RAY ABSORPTION SPECTROSCOPY 215
To estimate the kinetic of these effects on the sample, the beam was moved, at t = 0, toa sample zone that has not been previously exposed, the intensity of the fluorescence at agiven incident and emitted energy (here 7123 eV and 6403.9 eV) was measured as a functionof time (Figure D.2-b). It is also possible to measure XAS spectra in a fast acquisitionmode (every 10 seconds) to see if there is a spectral shape evolution. However, this lastmethod gives data with a poor signal to noise ratio.
In Figure D.2-a, spectra are measured after 400 s under the X-ray beam. The K edgeposition of the oxidized glass is at about +2.5 to +3.3 eV compared to the reduced sample.Using the kinetic curve (Figure D.2-b) with the assumption that the shape of the edge donot significantly change between t = 0 and t = 7min it is possible to estimate the shift ofthe edge during the first minutes of exposure: +0.44 eV for NCS05Red and −0.33 eV forNCS05Ox. A quick evolution is observed during the first 2 minutes, then the evolution isslower and seems to be linear with the time (observation up to 1 h). The time constant isapproximately the same for both samples (about 30 s). Interestingly, we observe that reducedglasses were photooxidized, while oxidized glasses were photoreduced. The estimated redoxare R = 80–87% for NCS05Red instead of 99%, R = 13–17% for NCS05Ox instead of 5%.NCS05Med was also photoreduced with R ' 38% instead of 28%.
1.2
1.0
0.8
0.6
0.4
0.2
0.0
HER
FD in
tens
ity (
norm
aliz
ed t
o ed
ge)
7170716071507140713071207110Energy (eV)
NCS05Red NCS05Ox
Eout = 6403.9 eV
(a)
0.8
0.7
0.6
0.5
0.4
HER
FD in
tens
ity (
norm
ed t
o ed
ge)
3002001000time (s)
NCS05Ox NCS05Red
Ein = 7123 eVEout = 6403.9 eV
(b)
Figure D.2 – NCS05Red and NCS05Ox glasses. a: HERFD spectra with Eout = 6403.9 eV. b:kinetic curve, intensity at Ein = 7123 eV and Eout = 6403.9 eV as a function of time. Measured atID26, ESRF synchrotron.
Photoreduction of similar Fe-doped oxidized silicate glasses have been observed byGonçalves Ferreira et al. [2013]. In this paper, the authors argued that the coordinationnumber does not change during the photoreduction process that has been interpreted asionic vacancy created by the interaction of the X-ray beam with the matrix associated withcationic displacement (see also Nesbitt and Bancroft [2014, p. 305]). This phenomenon issimilar to the sodium migration observed under the electron beam of the microprobe [Morganand London, 2005] or with β-irradiation [Boizot et al., 2000]. The excess of electrons createdby the lack of sodium cations is captured by Fe3+, which is reduced to Fe2+. However, thisinterpretation do not explain the photooxidation of reduced glasses.

216 Appendix D
One has to remember that our glasses were synthesized under specific redox conditions,and that they are frozen in a thermodynamically unstable but kinetically blocked state.The release of Auger electrons (in particular for low atomic number such as Na, Ca, Mg, Siand O) or photoelectrons by the material, due to the interaction with X-ray, can damagethe chemical bonds. These broken bonds can be reformed differently, especially in view ofthe amorphous structure of glass, which is not ideal. This phenomenon can be consideredas a local relaxation of the strains, or photoannealing, of the creation of new defects, orphotoalteration, that could both generate a redox reaction explaining the photooxidation.
However, electronic defects or free radicals remain in the matrix several weeks after theexperiments and can be observed with EPR (Figure D.3). The difference (bottom spectrum)shows a slight change at g = 4.3 and principally a modification at g = 2, which is a typical ofirradiation defects that have already been observed in silicate glasses using EPR and opticalabsorption spectroscopy [Abdelghany and ElBatal, 2014; Zhang and Sheng, 2013]. Thebeam mark is visible with the eye and is smaller than 2 by 0.3mm and probably less than100µm in depth (penetration of the beam). It represents about 1% or less of the samplevolume (15mm height and 2mm diameter). An interesting thing to note, is that eventhought the small irradiated volume compared to the size of the total sample used for EPRmeasurement, defects induced by the X-ray beam clearly appear on EPR spectra. After 2years, the defects are still visible with EPR, but after an annealing of 1 hour at 450°C, theEPR spectrum is identical to the one before X-ray exposure, confirming the observation ofGonçalves Ferreira et al. [2013] that defect are not stable at high-temperature.
1500
1000
500
0
-500
-1000
EPR
Sign
al (
arb.
u.)
4003002001000
Magnetic field (mT)
-150
-100
-50
0
50
100
150
EPR
Sign
al (
arb.
u.)
2013012430-SLM05O (before), Mass=100.7mg, Temp=298K 2013061403-SLM05O (after), Mass=100.7mg, Temp=298K
Effect of the synchrotron irradiation on SLM05O sample by EPR
SLM05O difference (after - before)
g = 2
g = 4.3
Figure D.3 – EPR spectra of NCMS05Med glass before and after synchrotron measurement.
The good homogeneity of glass at the size of the beam spot allow measuring the samplein movement, thereby limiting the photo damage of the glass. This cannot be done withpowders, due to the granularity, any beam displacement during the measurement changethe intensity.

X-RAY ABSORPTION SPECTROSCOPY 217
D.4 Sum rules
Sum rules refer to theoretical estimation of the spectral area related to the nature ofthe transition operator (electric dipole et quadrupole) and the electron configuration ofthe initial state [Thole and van der Laan, 1988]. They are useful to check absorptionspectrum area of an element at a given edge with initially n electrons in the destinationshell regarding the considered transition. The interesting thing is that sum rules do notdepend on crystal field parameters, Slater integrals, nephelauxetic ratio β or broadening.
For X-ray absorption spectroscopy at K and L2,3 edge, the useful sum rules are:
K pre-edge due to electric quadrupole transition (1s→ 3d):4`+ 2− nd15(2`+ 1)
=10− nd
75
K pre-edge due to electric dipole transition (1s→ 4p):∑i,f
|〈f |T |i〉|2δ(Ef − Ei − ~ω) =4`+ 2− np3(2`+ 1)
=6− np
9
L2,3 electric dipole transition (2p→ 3d):4`+ 2− nd3(2`+ 1)
=10− nd
15
with `, the orbital momentum of the destination shell for the transition. For example,` = 1 for 1s→ 4p and ` = 2 1s→ 3d.
For a transition metal in a centrosymmetric site, there is no 3d–4p mixing, the K pre-edgearea is only due to electric quadrupole transition. Moreover, the total intensity of thespectrum is proportional to the number of valence holes. It is possible to compare thenormalized absorption of an experimental spectrum with the sum rule value A(Fe2+) =
6.79 · 10−2 and A(Fe3+) = 9.66 · 10−2 (with energy is in eV for spectral integration).


219
Appendix E
Theoretical developments withLFMT
This appendix details some theoretical developments necessary to the calculation ofexperimental spectra with ligand field multiplet theory.
E.1 Isotropic resonant inelastic X-ray scattering – the pow-der formula
Considering a powder, with one iron site but oriented in a random direction, what iscalculated spectra averaged over all directions, for a given experimental setup (polarizationand wave vector of the incident beam)? Usually, the RIXS spectrum is calculated byaveraging on the different absorption and emission polarizations (or branchings) [de Grootet al., 2005]. However, this approximation omits the interference terms between electricdipole and quadrupole contributions when coupling each photon to itself. The Kramers-Heisenberg formula has been recently developed in Juhin et al. [2014] in order to calculatethe real powder RIXS spectrum, and that I have implemented with Matlabr for C 1 andC3 geometries. Further developments are needed to calculate the spectrum in geometrywhere not all of the branching are of dimension 1 (e.g. Td or Oh).
The scattering of light by a quantum system is described by an equation derived byKramers and Heisenberg before the advent of quantum theory. The multipole scatteringcross-section is [Juhin et al., 2014, Equation 1]:
σscat(~ωi, ~ωs) = r2eωsωi
∑f
∣∣∣∣ ε∗s.ε〈f |eı(ki−ks).r|i〉 (E.1)
+1
me
∑n
〈f |~ε∗s.Pe−ıks.r|n〉〈n|~εi.Peıki.r|i〉Ei − En + ~ωi + ıΓn
(E.2)
+1
me
∑n
〈f |~εi.Peıki.r|n〉〈n|~ε∗s.Pe−ıks.r|i〉Ei − En − ~ωs + ıΓn
∣∣∣∣2 (E.3)
δ(Ef + ~ωs − Ei − ~ωi) (E.4)
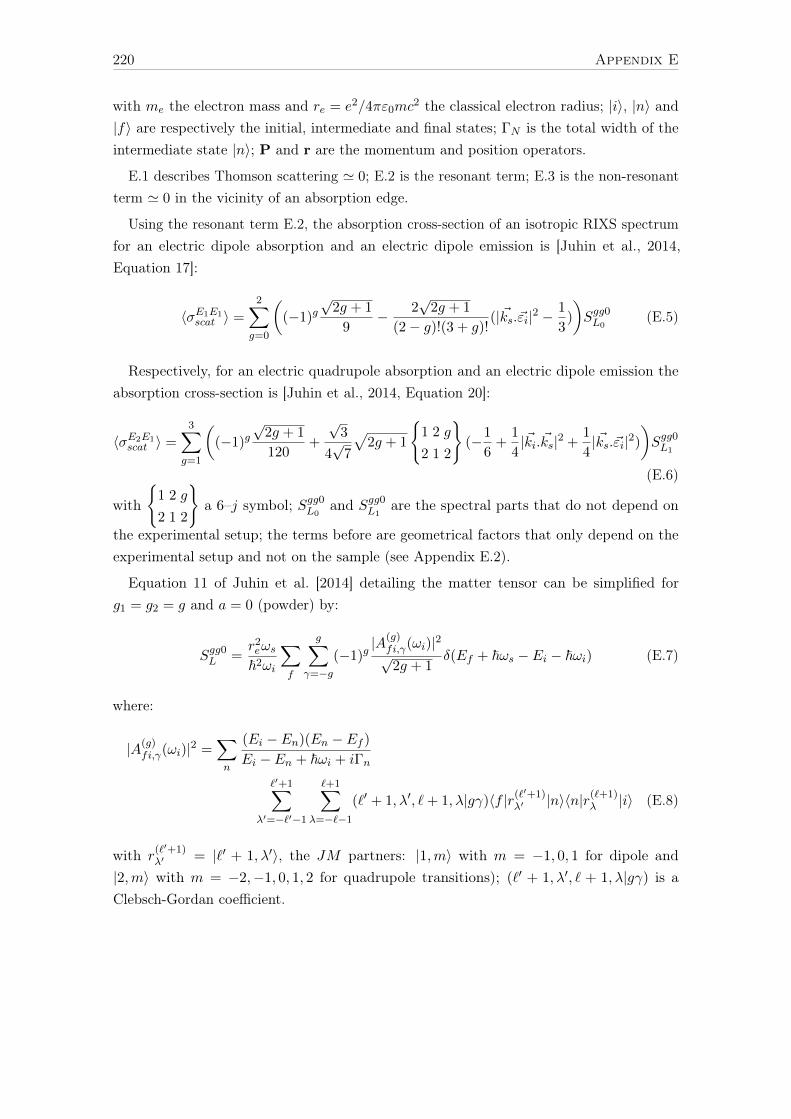
220 Appendix E
with me the electron mass and re = e2/4πε0mc2 the classical electron radius; |i〉, |n〉 and
|f〉 are respectively the initial, intermediate and final states; ΓN is the total width of theintermediate state |n〉; P and r are the momentum and position operators.
E.1 describes Thomson scattering ' 0; E.2 is the resonant term; E.3 is the non-resonantterm ' 0 in the vicinity of an absorption edge.
Using the resonant term E.2, the absorption cross-section of an isotropic RIXS spectrumfor an electric dipole absorption and an electric dipole emission is [Juhin et al., 2014,Equation 17]:
〈σE1E1scat 〉 =
2∑g=0
((−1)g
√2g + 1
9− 2
√2g + 1
(2− g)!(3 + g)!(|~ks.~εi|2 −
1
3)
)Sgg0L0
(E.5)
Respectively, for an electric quadrupole absorption and an electric dipole emission theabsorption cross-section is [Juhin et al., 2014, Equation 20]:
〈σE2E1scat 〉 =
3∑g=1
((−1)g
√2g + 1
120+
√3
4√
7
√2g + 1
1 2 g
2 1 2
(−1
6+
1
4|~ki. ~ks|2 +
1
4|~ks.~εi|2)
)Sgg0L1
(E.6)
with
1 2 g
2 1 2
a 6–j symbol; Sgg0L0
and Sgg0L1are the spectral parts that do not depend on
the experimental setup; the terms before are geometrical factors that only depend on theexperimental setup and not on the sample (see Appendix E.2).
Equation 11 of Juhin et al. [2014] detailing the matter tensor can be simplified forg1 = g2 = g and a = 0 (powder) by:
Sgg0L =r2eωs~2ωi
∑f
g∑γ=−g
(−1)g|A(g)
fi,γ(ωi)|2√2g + 1
δ(Ef + ~ωs − Ei − ~ωi) (E.7)
where:
|A(g)fi,γ(ωi)|2 =
∑n
(Ei − En)(En − Ef )
Ei − En + ~ωi + iΓn
`′+1∑λ′=−`′−1
`+1∑λ=−`−1
(`′ + 1, λ′, `+ 1, λ|gγ)〈f |r(`′+1)
λ′ |n〉〈n|r(`+1)λ |i〉 (E.8)
with r(`′+1)λ′ = |`′ + 1, λ′〉, the JM partners: |1,m〉 with m = −1, 0, 1 for dipole and
|2,m〉 with m = −2,−1, 0, 1, 2 for quadrupole transitions); (`′ + 1, λ′, ` + 1, λ|gγ) is aClebsch-Gordan coefficient.

THEORETICAL DEVELOPMENTS WITH LFMT 221
E.2 Geometrical factor of the Kramers-Heisenberg formula
The geometrical factors are the terms that only depend on the experimental setup,in contrast to Sgg0L describing the sample in Equations E.5 and E.6. They describe thedirection and polarization of the incident and scattered beams. Their study can suggestexperimental setups that cancel some terms in the sum of the KH formula. In the case ofour experiment, the incident light is taken linearly polarized with ~εi fixed along the y-axisand the propagation vector ~ki fixed along the x-axis; the observation direction relative to~ks can take any angle (Figure E.1). In the case of plane waves in a homogeneous isotropicnon-attenuating medium (air or helium), the polarization is perpendicular to the wavevector: ~εi.~ki = 0 and ~εs.~ks = 0; all vectors are unit vectors: |~εi| = |~ki| = |~εs| = |~ks| = 1.The following figures are plotted for a varying observation direction ~ks.
Sample
x
z
y
εi
θ
φ
ki
εs ks
Detector
Beam
Figure E.1 – Experimental setup of fluorescence measurement with a linearly polarized x-raybeam. The incident beam is directed by ~ki along the x-axis and the scattered beam is directed by~ks.
0.05
0.1
0.15
0.2
30
210
60
240
90
270
120
300
150
330
180 0
geometrical factor for σE1E1 (dip−dip)
φ = π/2g = 0g = 1g = 2
kiBeam
0.005
0.01
0.015
30
210
60
240
90
270
120
300
150
330
180 0
geometrical factor for σE2E1 (quad−dip)
φ = π/2g = 1g = 2g = 3
kiBeam
Figure E.2 – Magnitude of the geometrical factors of the Kramers-Heisenberg formula (Equa-tions E.6 and E.6) in the horizontal plane of the experiment (φ = π/2).
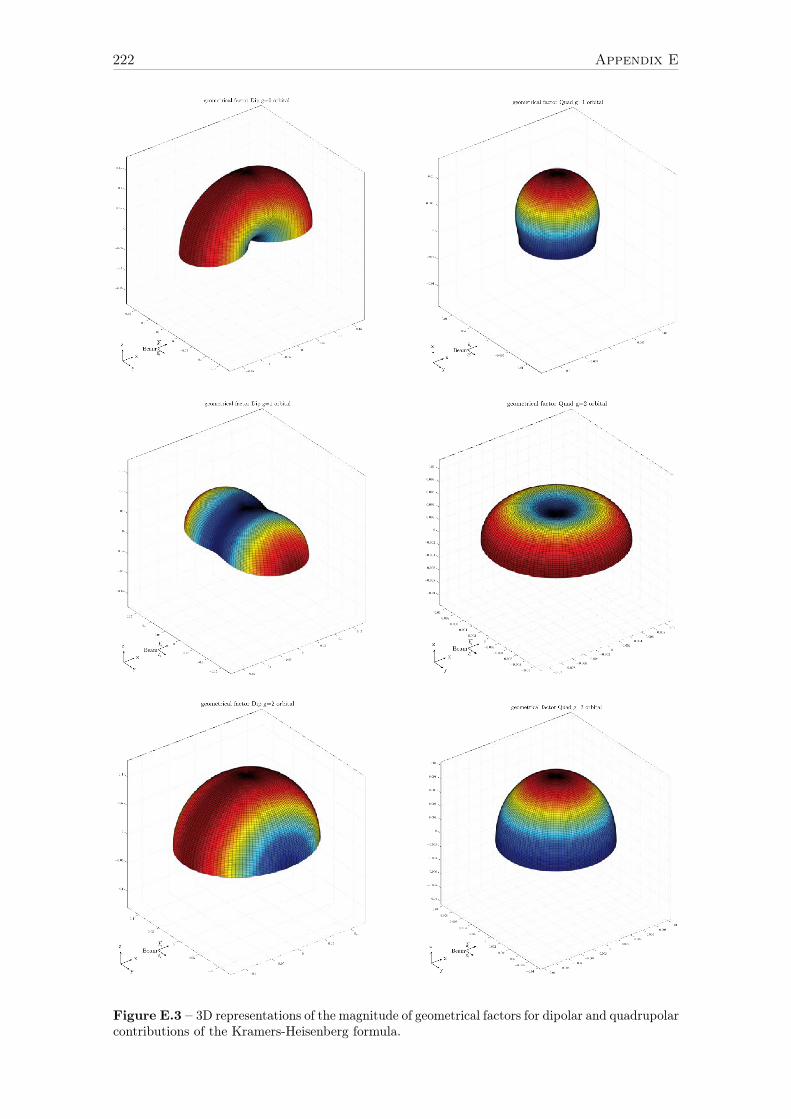
222 Appendix E
Figure E.3 – 3D representations of the magnitude of geometrical factors for dipolar and quadrupolarcontributions of the Kramers-Heisenberg formula.
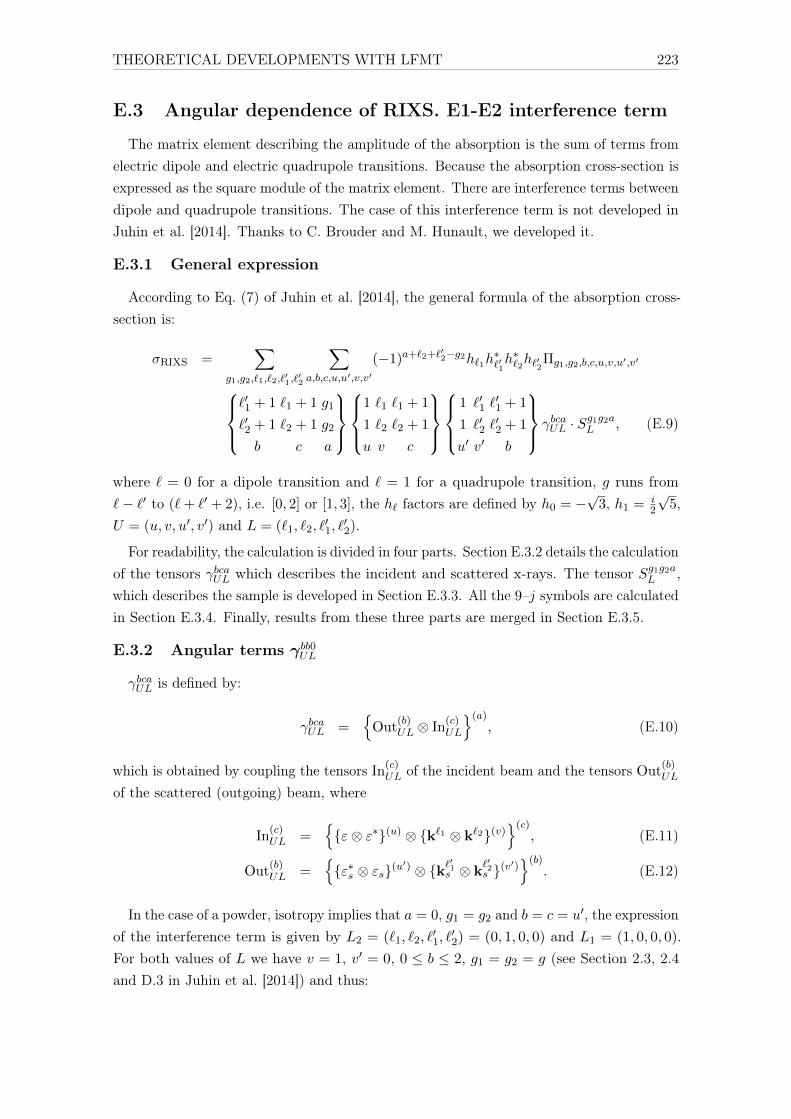
THEORETICAL DEVELOPMENTS WITH LFMT 223
E.3 Angular dependence of RIXS. E1-E2 interference term
The matrix element describing the amplitude of the absorption is the sum of terms fromelectric dipole and electric quadrupole transitions. Because the absorption cross-section isexpressed as the square module of the matrix element. There are interference terms betweendipole and quadrupole transitions. The case of this interference term is not developed inJuhin et al. [2014]. Thanks to C. Brouder and M. Hunault, we developed it.
E.3.1 General expression
According to Eq. (7) of Juhin et al. [2014], the general formula of the absorption cross-section is:
σRIXS =∑
g1,g2,`1,`2,`′1,`′2
∑a,b,c,u,u′,v,v′
(−1)a+`2+`′2−g2h`1h
∗`′1h∗`2h`′2Πg1,g2,b,c,u,v,u′,v′
`′1 + 1 `1 + 1 g1
`′2 + 1 `2 + 1 g2
b c a
1 `1 `1 + 1
1 `2 `2 + 1
u v c
1 `′1 `′1 + 1
1 `′2 `′2 + 1
u′ v′ b
γbcaUL · Sg1g2aL , (E.9)
where ` = 0 for a dipole transition and ` = 1 for a quadrupole transition, g runs from`− `′ to (`+ `′ + 2), i.e. [0, 2] or [1, 3], the h` factors are defined by h0 = −
√3, h1 = i
2
√5,
U = (u, v, u′, v′) and L = (`1, `2, `′1, `′2).
For readability, the calculation is divided in four parts. Section E.3.2 details the calculationof the tensors γbcaUL which describes the incident and scattered x-rays. The tensor Sg1g2a
L ,which describes the sample is developed in Section E.3.3. All the 9–j symbols are calculatedin Section E.3.4. Finally, results from these three parts are merged in Section E.3.5.
E.3.2 Angular terms γbb0UL
γbcaUL is defined by:
γbcaUL =
Out(b)UL ⊗ In
(c)UL
(a), (E.10)
which is obtained by coupling the tensors In(c)UL of the incident beam and the tensors Out
(b)UL
of the scattered (outgoing) beam, where
In(c)UL =
ε⊗ ε∗(u) ⊗ k`1 ⊗ k`2(v)
(c), (E.11)
Out(b)UL =
ε∗s ⊗ εs(u
′) ⊗ k`′1s ⊗ k
`′2s (v
′)(b)
. (E.12)
In the case of a powder, isotropy implies that a = 0, g1 = g2 and b = c = u′, the expressionof the interference term is given by L2 = (`1, `2, `
′1, `′2) = (0, 1, 0, 0) and L1 = (1, 0, 0, 0).
For both values of L we have v = 1, v′ = 0, 0 ≤ b ≤ 2, g1 = g2 = g (see Section 2.3, 2.4and D.3 in Juhin et al. [2014]) and thus:

224 Appendix E
In(b)UL =
ε⊗ ε∗(u) ⊗ k
(b), (E.13)
Out(b)UL = ε∗s ⊗ εs(b), (E.14)
γbb0UL =ε⊗ ε∗(u) ⊗ k
(b) ⊗ ε∗s ⊗ εs(b)(0). (E.15)
We calculated γbb0UL for all relevant values of u and b.
Case b = 0
In the case b = 0, the first factor of Equation E.15 implies u = 1, because ε⊗ ε∗ hasto be of the same rank than k, i.e. 1, to get a tensor of rank b = 0. Then,
γ000UL =ε⊗ ε∗(1) ⊗ k
(0) ⊗ ε∗s ⊗ εs(0)(0)=
i
3√
2εs · ε∗s (ε× ε∗) · k (E.16)
= − Pc
3√
2,
where we used Eq. (2) of [Varshalovich et al., 1988, p. 65] and Eq. (9) of [Varshalovichet al., 1988, p. 66].
Case b = 1
Three values of u are possible:
− u = 0:
γ110UL =ε⊗ ε∗(0) ⊗ k
(1) ⊗ ε∗s ⊗ εs(1)(0)(E.17)
= − 1√3ε · ε∗
k⊗ ε∗s ⊗ εs(1)
(0)=
i
3√
2(ε∗s × εs) · k =
Pcs
3√
2k · ks
− u = 1:
γ110UL =ε⊗ ε∗(1) ⊗ k
(1) ⊗ ε∗s ⊗ εs(1)(0)(E.18)
= − 1√3
ε⊗ ε∗(1) ⊗ k
(1) · ε∗s ⊗ εs(1)= − i
2√
6
((ε∗ · k) ε · (ε∗s × εs)− (ε · k) ε∗ · (ε∗s × εs)
)= 0
− u = 2:
γ110UL =ε⊗ ε∗(2) ⊗ k
(1) ⊗ ε∗s ⊗ εs(1)(0)(E.19)
= − 1√3
ε⊗ ε∗(2) ⊗ k
(1) · ε∗s ⊗ εs(1)= − i√
10
(1
3(ε · ε∗)k · (ε∗s × εs)−
1
2(ε∗ · k) ε · (ε∗s × εs)−
1
2(ε · k) ε∗ · (ε∗s × εs)
)= − i
3√
10k · (ε∗s × εs) = − Pcs
3√
10k · ks

THEORETICAL DEVELOPMENTS WITH LFMT 225
Where we used Eq. (2) of [Varshalovich et al., 1988, p. 65] and Eq. (9) of [Varshalovichet al., 1988, p. 66] for u = 0; Eqs. (4) and (10) of [Varshalovich et al., 1988, p. 66] andε · k = 0 for u = 1; Eqs. (4) and (11) of [Varshalovich et al., 1988, p. 66] and ε · k = 0 foru = 2.
Case b = 2
Two values of u are possible:
− u = 1:
γ220UL =ε⊗ ε∗(1) ⊗ k
(2) ⊗ ε∗s ⊗ εs(2)(0)(E.20)
=i√2
(ε× ε∗)⊗ k(2) ⊗ ε∗s ⊗ εs(2)
(0)=
i√10
(1
2(ε× ε∗) · ε∗s k · εs +
1
2(ε× ε∗) · εs k · ε∗s −
1
3(ε× ε∗) · k εs · ε∗s
)=
Pc√10
(1
3− |k · εs|2
)− u = 2:
γ220UL =ε⊗ ε∗(2) ⊗ k
(2) ⊗ ε∗s ⊗ εs(2)(0)(E.21)
where we used Eq. (18) of [Varshalovich et al., 1988, p. 67] for u = 1.
Then,
γ220UL =ε∗s ⊗ εs(2) ⊗
ε⊗ ε∗(2) ⊗ k
(2)(0). (E.22)
By using Eq. (35) of [Varshalovich et al., 1988, p. 65] and Eq. (27) of [Varshalovich et al.,1988, p. 64] we find
γ220UL = − 1√5
k⊗ ε⊗ ε∗(2)
(2) · ε∗s ⊗ εs(2). (E.23)
Then, by Eq. (2) of [Varshalovich et al., 1988, p. 69],
γ220UL =1√3k ·ε⊗ ε∗(2) ⊗ ε∗s ⊗ εs(2)
(1). (E.24)
Then, by Eq. (20) of [Varshalovich et al., 1988, p. 67],
γ220UL = − i
2√
30
(ε · ε∗s (ε∗ × εs) · k + ε · εs (ε∗ × ε∗s) · k + ε∗ · ε∗s (ε× εs) · k
+ ε∗ · εs (ε× ε∗s) · k). (E.25)

226 Appendix E
If the polarization of the scattered beam is not measured we use the relation 〈ε∗s ⊗εs(2)〉 = −k(2)/2. This gives us:
〈γ220UL 〉 =i
2√
30
(ε · ks (ε∗ × ks) · k + ε∗ · ks (ε× ks) · k
). (E.26)
E.3.3 Matter tensors Sgg0L
The matter tensors are, for L2 = (`1, `2, `′1, `′2) = (0, 1, 0, 0)
Sgg0L2=
r2eωs~2ω
∑F
A
(g)FI(0, 0)⊗A(g)
IF (1, 0)(0)
δ(EF + ~ωs − EI − ~ω), (E.27)
and for the matter tensors are, for L1 = (`1, `2, `′1, `′2) = (1, 0, 0, 0)
Sgg0L1=
r2eωs~2ω
∑F
A
(g)FI(1, 0)⊗A(g)
IF (0, 0)(0)
δ(EF + ~ωs − EI − ~ω). (E.28)
To derive a relation between Sgg0L1and Sgg0L2
, we define X =A
(g)FI(1, 0)⊗A(g)
IF (0, 0)(0)
and calculate its complex conjugate:
X∗ =∑γ
(gγg − γ|00)(A
(g)FI,γ(1, 0)A
(g)IF,−γ(0, 0)
)∗(E.29)
=∑γ
(gγg − γ|00)A(g)IF,−γ(1, 0)A
(g)FI,γ(0, 0)
=A
(g)FI(0, 0)⊗A(g)
IF (1, 0)(0)
In other words,
(Sgg0L1
)∗= Sgg0L2
. (E.30)
E.3.4 9j-symbols
For a = 0 1 `1 + 1 g
1 `2 + 1 g
b b 0
=(−1)`1+b+g√
(2b+ 1)(2g + 1)
1 `1 + 1 g
`2 + 1 1 b
. (E.31)
`1 = 0 and `2 = 1, v = 1, c = b1 `1 `1 + 1
1 `2 `2 + 1
u v c
=
1 0 1
1 1 2
u 1 b
=(−1)b+1
3
2 b 1
u 1 1
. (E.32)

THEORETICAL DEVELOPMENTS WITH LFMT 227
`1 = 1 and `2 = 0, v = 1, c = b1 `1 `1 + 1
1 `2 `2 + 1
u v c
=
1 1 2
1 0 1
u 1 b
=(−1)u
3
2 b 1
u 1 1
. (E.33)
`′1 = `′2 = 0, u′ = b, v′ = 01 `′1 `
′1 + 1
1 `′2 `′2 + 1
u′ v′ b
=
1 0 1
1 0 1
b 0 b
=1
3√
2b+ 1. (E.34)
Therefore, the product of factors gives us, for L1:
i√
5
2(−1)b+u
√(2b+ 1)(2g + 1)(2u+ 1)
1 1 g
2 1 b
2 b 1
u 1 1
. (E.35)
For L2 we have the same expression, up to a factor of (−1)b+u.
E.3.5 Final formulas
Using the results of Sections E.3.2, E.3.3 and E.3.4, the isotropic term is
σKH =∑u,b,g
i√
5
2
√(2b+ 1)(2g + 1)(2u+ 1)
1 1 g
2 1 b
2 b 1
u 1 1
γbb0UL1
((Sgg0L1
)∗+(−1)b+uSgg0L1
).
(E.36)
We write now the cross-section as a sum of contributions σKH =∑
b,u σKH(b, u) and wegive their explicit expressions. If b+ u is odd, we have
σoddKH =∑u,b,g
√5(2b+ 1)(2g + 1)(2u+ 1)
1 1 g
2 1 b
2 b 1
u 1 1
γbb0UL1
Im(Sgg0L1). (E.37)
If b+ u is even, we have
σevenKH =∑u,b,g
i√
5(2b+ 1)(2g + 1)(2u+ 1)
1 1 g
2 1 b
2 b 1
u 1 1
γbb0UL1
Re(Sgg0L1). (E.38)
Time-reversal even term (non magnetic)
Only u = 2 and b = 2 gives a time-reversal even contribution, i.e. for which the sign isunchanged by the time-reversal transformation (t 7→ −t):
σKH(2, 2) =1
8√
30Re(√
3S110L1
+ S220L1
)(ε · ε∗s (ε∗ × εs) · k + ε · εs (ε∗ × ε∗s) · k + ε∗ · ε∗s (ε× εs) · k + ε∗ · εs (ε× ε∗s) · k
). (E.39)

228 Appendix E
Time-reversal odd terms
The time-reversal odd terms take the opposite sign by the time-reversal transformation(t 7→ −t). They depend on Pcs: the rate of circular polarization of the scattered beam.
In the case b = 1 and u = 0:
σKH(1, 0) = −Pcsk · ks√
5
6√
6Im(S220L1− 1√
3S110L1
). (E.40)
In the case b = 1 and u = 2:
σKH(1, 2) = +Pcsk · ks1
12√
30Im(S220L1− 1√
3S110L1
). (E.41)
Their sum is
σKH(1, 0) + σKH(1, 2) = Pcsk · ks√
3
4√
10Im(S220L1− 1√
3S110L1
). (E.42)
In the case b = 2 and u = 1:
σKH(2, 1) = Pc(|k · εs|2 −
1
3
) √3
4√
10Im(S220L1
+1√3S110L1
). (E.43)
Average over the scattered beam
If the polarization of the scattered beam is not measured, we have only two non-zeroterms. A time-reversal odd term depends on the rate of polarization of the incident beamand therefore vanishes with linearly polarized incident x-rays:
〈σKH(2, 1)〉 = Pc(1
3− |k · ks|2
) √3
8√
10Im(S220L1
+1√3S110L1
), (E.44)
and a time-reversal even term that can be observed with linearly polarized x-rays:
〈σKH(2, 2)〉 = −(ε ·ks (ε∗×ks) ·k+ ε∗ ·ks (ε×ks) ·k
) 1
8√
30Re(√
3S110L1
+S220L1
). (E.45)
E.3.6 Conclusion
With the experimental setup described in Section 2.4.2, the polarization is linear and ks
is collinear to ε, therefore 〈σKH(2, 2)〉 is null. The interference term calculated here doesnot influence the experimental measurement with this setup.

THEORETICAL DEVELOPMENTS WITH LFMT 229
E.4 The absolute absorption cross-section σ(ω) in Å2
In Quanty, spectra are implemented by calculating the Green’s function. The complexenergy dependent quantity is calculated for the i-th initial state using the formula:
Gi(ω) = 〈ψi|T †1
ω − H + ıΓ/2T |ψi〉 (E.46)
with T and H operators given in second quantization and ψi a many-particle wavefunction.T is the transition operator, H is the Hamiltonian of the final state system and ψi are theeigenstates of the Hamiltonian of the initial state. There is no degeneracy in Quanty, itthe ground state is 5 times degenerated, there are 5 wave function with the ground stateenergy. To include at the same time the degeneracy and the effect of temperature, we sumover the i-th states (see Appendix D.1):
G(ω) =1
Z
∑i
Gi(ω) · e−∆EkT (E.47)
with Z, the canonical partition function:
Z =∑i
e−∆EkT (E.48)
For linear polarization, the angular part of the isotropic spectrum:
S =−Im(G(ω))
π(E.49)
For electric dipole, the isotropic spectrum from the different polarization is:
SDiso =1
3(Sx + Sy + Sz) (E.50)
For electric quadrupole:
SQiso =
1
15(Sxy + Syz + Sxz + Sx2−y2 + Sz2) (E.51)
The electric dipole absorption cross-section for K pre-edge in Å2 is:
σdip(ω) = 4π2~ωα · a20(P (1)1s,4p)
2 · SDiso (E.52)
with P (k)`,`′ = 〈n`||r(k)||n`′〉 the monoelectronic radial matrix element (unitless), k = 1 for
dipole operator and k = 2 for quadrupole operator [Cowan, 1981]. P (1)1s,4p is replaced by
P(1)2p,3d for L2,3 edge, and by P (1)
3d,4p for optical transitions. The electric quadrupole absorptioncross-section for K pre-edge in Å2 is:
σquad(ω) = 4π2~ωα ·(a20~ω2~c
)2
(P(2)1s,3d)
2 · SQiso (E.53)

230 Appendix E
where a0 = 0.529 177 1Å, the Bohr radius; α = 0.007 297 351, the fine structure constant(dimensionless); ~3d6.582 173·10−16 eV.s, the Planck constant and c = 2.997 924 58·1018Å/s,the light speed.
Note: For optical absorption spectroscopy σ is in Å2 and can be converted to molarabsorption coefficient ε in L.mol-1.cm–1 with the following relationship:
ε = σ · 10−19
ln 10.NA ' σ · 2.615 · 104 (E.54)
where NA = 6.022 · 1023 mol−1, the Avogadro’s number.
E.5 Crystal field Hamiltonian in D3h geometry
Figure E.4 – Energy level diagram for D3h
The crystal field is decomposed as:
V (r, θ, ϕ) =∞∑k=0
m=k∑m=−k
Bmk r
kY mk (θ, ϕ) =
∞∑k=0
m=k∑m=−k
Ak,mrkCmk (θ, ϕ) (E.55)
Where Y mk are spherical harmonics, Cmk are normalized spherical harmonics and Bm
k ,Amk are coefficients. According to Cowan [1981, p. 146]:
Cmk (θ, ϕ) =
√4π
2k + 1Y mk (θ, ϕ) (E.56)
then we can take the expectation value over the radial equations to get
〈R(r)|V |R(r)〉 =∑k,m
Ak,mCmk (θ, ϕ) (E.57)
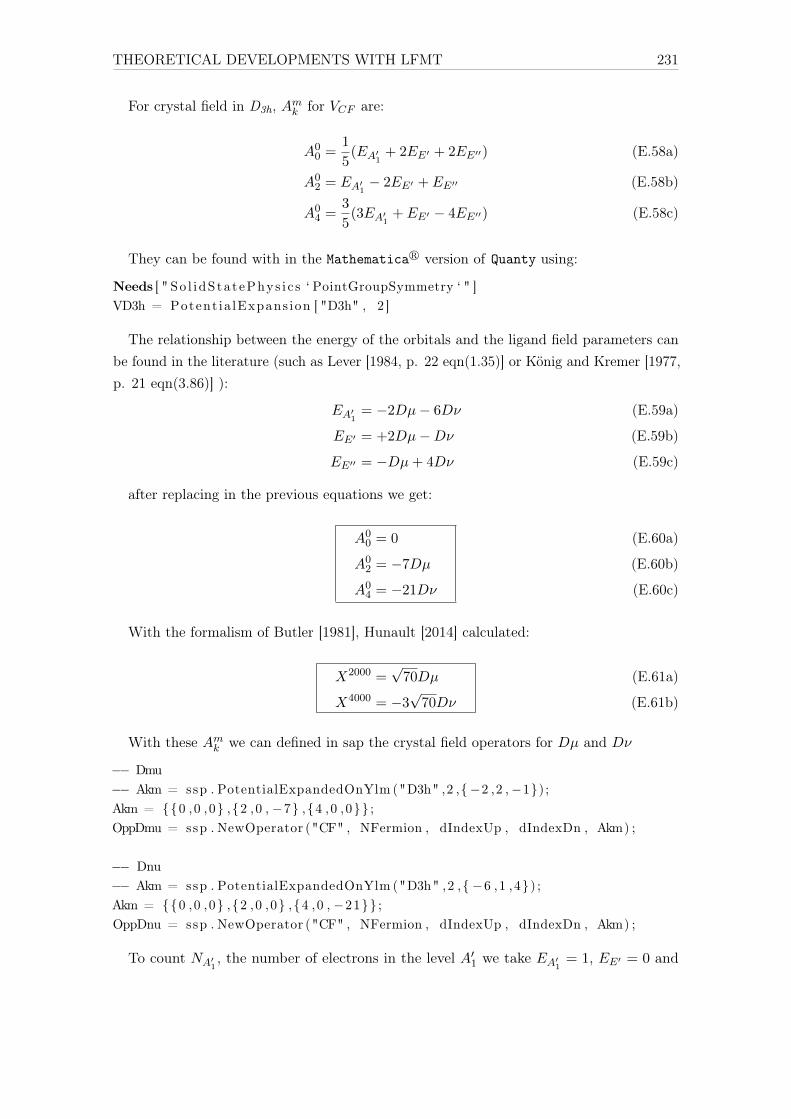
THEORETICAL DEVELOPMENTS WITH LFMT 231
For crystal field in D3h, Amk for VCF are:
A00 =
1
5(EA′1 + 2EE′ + 2EE′′)
A02 = EA′1 − 2EE′ + EE′′
A04 =
3
5(3EA′1 + EE′ − 4EE′′)
(E.58a)
(E.58b)
(E.58c)
They can be found with in the Mathematicar version of Quanty using:
Needs [ " So l idSta tePhys i c s ‘ PointGroupSymmetry ‘ " ]VD3h = Potent ia lExpans ion [ "D3h" , 2 ]
The relationship between the energy of the orbitals and the ligand field parameters canbe found in the literature (such as Lever [1984, p. 22 eqn(1.35)] or König and Kremer [1977,p. 21 eqn(3.86)] ):
EA′1 = −2Dµ− 6Dν
EE′ = +2Dµ−DνEE′′ = −Dµ+ 4Dν
(E.59a)
(E.59b)
(E.59c)
after replacing in the previous equations we get:
A00 = 0
A02 = −7Dµ
A04 = −21Dν
(E.60a)
(E.60b)
(E.60c)
With the formalism of Butler [1981], Hunault [2014] calculated:
X2000 =√
70Dµ
X4000 = −3√
70Dν
(E.61a)
(E.61b)
With these Amk we can defined in sap the crystal field operators for Dµ and Dν
−− Dmu−− Akm = ssp . PotentialExpandedOnYlm ("D3h" ,2 ,−2 ,2 ,−1);Akm = 0 ,0 ,0 ,2 ,0 , −7 ,4 ,0 ,0 ;OppDmu = ssp . NewOperator ("CF" , NFermion , dIndexUp , dIndexDn , Akm) ;
−− Dnu−− Akm = ssp . PotentialExpandedOnYlm ("D3h" ,2 ,−6 ,1 ,4) ;Akm = 0 ,0 ,0 ,2 ,0 ,0 ,4 ,0 , −21 ;OppDnu = ssp . NewOperator ("CF" , NFermion , dIndexUp , dIndexDn , Akm) ;
To count NA′1, the number of electrons in the level A′1 we take EA′1 = 1, EE′ = 0 and

232 Appendix E
EE′′ = 0 to calculate the following Amk :
A00 =
1
5
A02 = 1
A04 =
9
5
(E.62a)
(E.62b)
(E.62c)
Finally, we found:
Table E.1 – Amk coefficients for D3h
Amk VDµ VDν VNA′1VNE′ VNE′′
A00 0 0
1
5
2
5
2
5
A02 −7 0 1 −2 1
A04 0 −21
9
5
3
5
−12
5
For a trigonal bipyramid, with principal axis along z, the expected order of the orbitalsis Ee′′ < Ee′ < Ea′1 Lever [1984, p. 25] then 3Dµ > 5Dν and 4Dµ < −5Dν (see Figure E.5)
-1 0 1
-1
1
Figure E.5 – Values of crystal field parameters representing a trigonal bipyramid

233
Appendix F
Curriculum Vitae
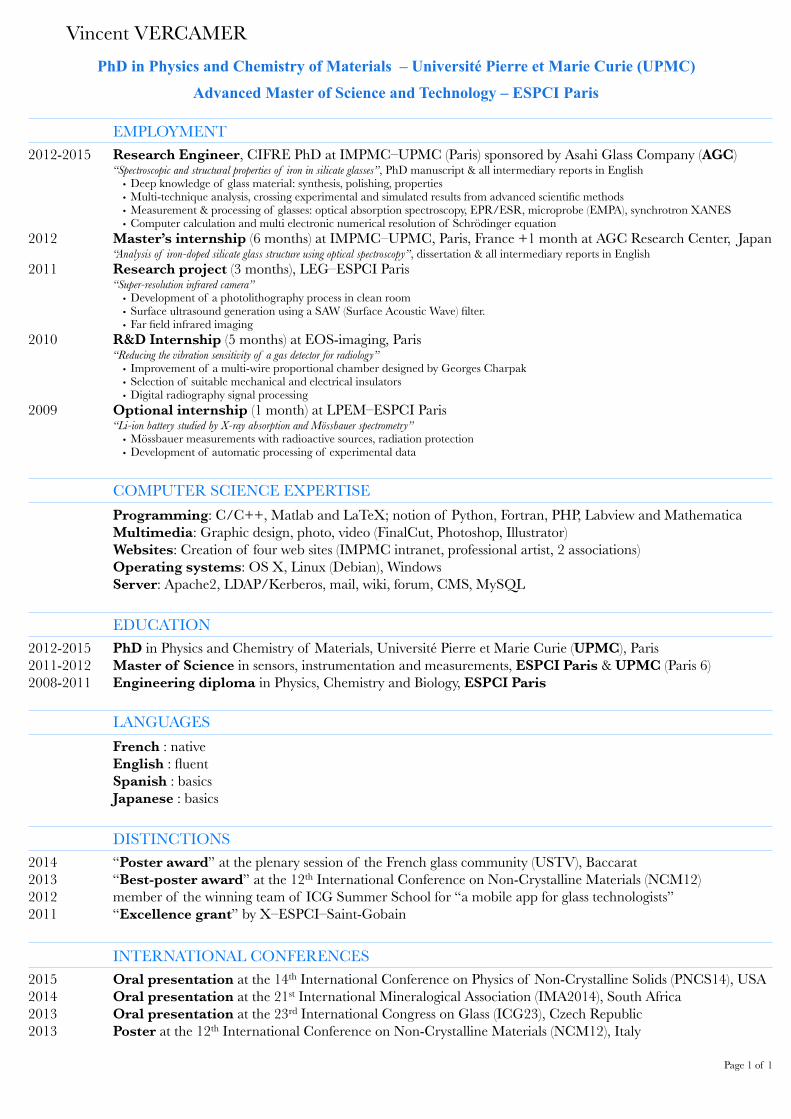
Vincent VERCAMER PhD in Physics and Chemistry of Materials – Université Pierre et Marie Curie (UPMC)
Advanced Master of Science and Technology – ESPCI Paris
EMPLOYMENT 2012-2015 Research Engineer, CIFRE PhD at IMPMC–UPMC (Paris) sponsored by Asahi Glass Company (AGC)
“Spectroscopic and structural properties of iron in silicate glasses”, PhD manuscript & all intermediary reports in English • Deep knowledge of glass material: synthesis, polishing, properties • Multi-technique analysis, crossing experimental and simulated results from advanced scientific methods • Measurement & processing of glasses: optical absorption spectroscopy, EPR/ESR, microprobe (EMPA), synchrotron XANES • Computer calculation and multi electronic numerical resolution of Schrödinger equation
2012 Master’s internship (6 months) at IMPMC–UPMC, Paris, France +1 month at AGC Research Center, Japan “Analysis of iron-doped silicate glass structure using optical spectroscopy”, dissertation & all intermediary reports in English
2011 Research project (3 months), LEG–ESPCI Paris “Super-resolution infrared camera”
• Development of a photolithography process in clean room • Surface ultrasound generation using a SAW (Surface Acoustic Wave) filter. • Far field infrared imaging
2010 R&D Internship (5 months) at EOS-imaging, Paris “Reducing the vibration sensitivity of a gas detector for radiology”
• Improvement of a multi-wire proportional chamber designed by Georges Charpak • Selection of suitable mechanical and electrical insulators • Digital radiography signal processing
2009 Optional internship (1 month) at LPEM–ESPCI Paris “Li-ion battery studied by X-ray absorption and Mössbauer spectrometry”
• Mössbauer measurements with radioactive sources, radiation protection • Development of automatic processing of experimental data
COMPUTER SCIENCE EXPERTISE Programming: C/C++, Matlab and LaTeX; notion of Python, Fortran, PHP, Labview and Mathematica Multimedia: Graphic design, photo, video (FinalCut, Photoshop, Illustrator) Websites: Creation of four web sites (IMPMC intranet, professional artist, 2 associations) Operating systems: OS X, Linux (Debian), Windows Server: Apache2, LDAP/Kerberos, mail, wiki, forum, CMS, MySQL
EDUCATION 2012-2015 PhD in Physics and Chemistry of Materials, Université Pierre et Marie Curie (UPMC), Paris 2011-2012 Master of Science in sensors, instrumentation and measurements, ESPCI Paris & UPMC (Paris 6) 2008-2011 Engineering diploma in Physics, Chemistry and Biology, ESPCI Paris
LANGUAGES French : native English : fluent Spanish : basics Japanese : basics
DISTINCTIONS 2014 “Poster award” at the plenary session of the French glass community (USTV), Baccarat 2013 “Best-poster award” at the 12th International Conference on Non-Crystalline Materials (NCM12) 2012 member of the winning team of ICG Summer School for “a mobile app for glass technologists” 2011 “Excellence grant” by X–ESPCI–Saint-Gobain
INTERNATIONAL CONFERENCES 2015 Oral presentation at the 14th International Conference on Physics of Non-Crystalline Solids (PNCS14), USA 2014 Oral presentation at the 21st International Mineralogical Association (IMA2014), South Africa 2013 Oral presentation at the 23rd International Congress on Glass (ICG23), Czech Republic 2013 Poster at the 12th International Conference on Non-Crystalline Materials (NCM12), Italy
Page " of "1 1

235
Résumé de la thèse en français
1 Introduction à la problématique du fer dans les verres : union hétérovalent dans un milieu complexe
1.1 Contexte
L’objectif de cette thèse est d’étudier les propriétés spectroscopiques du fer dans desverres silicatés d’intérêt industriel ainsi que le lien entre ces propriétés et l’environnementlocal autour du fer. Le fer est de loin l’élément de transitions le plus abondant dansla croute terrestre. Il se retrouve donc systématiquement dans les matières premièresutilisées par l’industrie pour la fabrication des millions de tonnes de verres produites chaqueannée. Le fer en impureté est entre autres utilisé pour contrôler les propriétés optiques(coloration, isolation thermique, transmission énergétique, etc.) du verre dans de nombreusesapplications industrielles (par exemple l’automobile, le bâtiment ou les panneaux solaires).Une compréhension de l’influence du fer sur les propriétés optiques permettrait de maitriseret d’améliorer les caractéristiques techniques des verres.
1.2 Redox
Dans les matériaux amorphes comme le verre, ou encore les minéraux et les complexesde coordinations, le fer est le plus souvent présent sous forme de fer ferreux (Fe2+) ou defer ferrique (Fe3+), dont les proportions relatives définissent le redox :
R =[Fe2+]
[Fe2+] + [Fe3+]
Le redox dépend des conditions de synthèse comme la composition chimique, la températureou les conditions atmosphériques (pression partielle en oxygène). Les ions ferreux et ferriquesdonnent aux verres une coloration bleue (Fe2+), jaune (Fe3+) ou verte (présence d’ionsdes deux degrés d’oxydation). Ils influencent aussi les propriétés thermiques en raison del’impact sur l’absorption de la lumière dans le proche infrarouge [Sakaguchi and Uchino,2007] ou l’ultraviolet [Uchino et al., 2000].
1.3 Le verre
Les verres sont des matériaux amorphes qui ne possèdent pas d’ordre à longue distance.Néanmoins, un ordre local est observé à courte distance, la répartition des atomes dansles premières sphères de coordinences n’est pas aléatoire. Par exemple, les atomes de fer

236
sont localisés dans des environnements spécifiques, dépendant, entre autres, du redox. Lesatomes de fer d’un même degré d’oxydation se répartissent statistiquement entre plusieurssites possibles, ayant chacun des caractéristiques et une influence sur les propriétés finales(moyenne de la distribution dans les différents sites) du verre différentes. Le caractèreamorphe des verres et la nature hétérovalente du fer sont deux raisons expliquant lesdifficultés de compréhension de l’environnement du fer dans les verres malgré l’intenserecherche scientifique des 80 dernières années dans ce domaine.
1.4 Relation structure-propriétés
L’étude de l’environnement local du fer est une question cruciale car la structure estreliée aux propriétés chimiques et spectroscopiques (Figure 1). L’interprétation des relationsentre l’environnement local du fer et les propriétés spectroscopiques permet de relier lesdifférentes méthodes d’analyse à la structure atomique et électronique dans le matériauconsidéré. L’utilisation de la spectroscopie, au travers des interactions rayonnement-matière,sonde les relations structure-propriétés dans le verre. Elle permet entre autres de suivrel’effet d’un changement de la composition chimique d’un verre sur l’environnement local dufer par l’impact observé sur les propriétés spectroscopiques. Par exemple, l’utilisation de laspectroscopie d’absorption optique UV–Visible–proche infrarouge permet de corréler lespropriétés colorimétriques des verres contenant des métaux de transitions avec l’état redoxet l’environnement structural de ces éléments de transitions. Des méthodes complémentairesde la spectroscopie d’absorption optique, comme l’absorption des rayons X ou la résonanceparamagnétique électronique (RPE), peuvent être utilisées.
synthèse(composition, redox,conditions exp., etc.)
spectroscopiestructure
Figure 1 – Schéma des relations entre propriétés structurales, chimiques et spectroscopiques.
1.5 Intérêt des cristaux pour l’étude des verres
Dans le but de déterminer les propriétés structurales à partir de l’analyse spectroscopique,les composés cristallins sont des références utiles. En effet, leur composition structuraleest connue, et les signatures spectroscopiques observées sont très sensibles à la géométrielocale et à la coordinence. Les signatures spectroscopiques de différents environnementstétraédriques ou octaédriques dans les minéraux ont été largement étudiées et caractérisées[Burns, 1993]. Dans une moindre mesure, la présence de fer dans des sites de coordinence[5] (comme la bipyramide trigonale ou la pyramide à base carrée) a été étudiée dans descomplexes [Ciampolini, 1969] ou des minéraux [Rossman and Taran, 2001].

237
1.6 L’environnement du fer dans les verres
L’information structurale, comme les distances Fe–O ou la coordinence, peut être obtenuepar la diffraction de neutrons ou la spectroscopie EXAFS (extended X-ray absorptionfine structure). D’autres méthodes expérimentales, comme les spectroscopies d’absorptionoptique, absorption des rayons X ou RPE, permettent d’obtenir de l’information structuralede façon indirecte en comparant, par exemple, les signatures obtenue dans des minérauxpour des sites bien définis. Toutes ces méthodes peuvent aussi être couplées avec dessimulations numériques (e.g. reverse Monte Carlo (RMC), empirical potential structurerefinement (EPSR) or molecular dynamics (MD)).
Il est montré que la coordinence du fer dans les verres est majoritairement comprise entre[4] et [6] [Calas and Petiau, 1983a]. La présence de Fe2+ en coordinence [5] a été mise enévidence dans les verres silicatés par Brown et al. [1995] et confirmé par plusieurs étudesGuillot and Sator [2007]; Rossano et al. [1999, 2000c]; Weigel et al. [2008b]. Cependant, lessites de coordinence [5] ne sont pas systématiquement considérés par les auteurs lors del’interprétation des signatures spectroscopiques du fer dans les verres.
1.7 La théorie des groupes pour décrire l’environnement local
Le nombre de coordinence est un paramètre intéressant mais sa simplicité ne tient pascompte de la complexité des environnements locaux. En effet, la position des ligands etla géométrie locale du site formé par le fer et ses premiers voisins oxygène influencent lespropriétés spectroscopiques [Ballhausen, 1962; Lever, 1984].
En général, des coordinences différentes signifient des groupes ponctuels de symétriedifférents. Néanmoins, il n’y pas de relation univoque entre ces deux notions. Cette notionest illustrée par la Figure 2 sur laquelle sont tracé plusieurs polyèdres de coordinationcorrespondant à un même groupe de symétrie. En revanche, la coordinence d’un site peutêtre déterminée par la connaissance du groupe ponctuel de symétrie et des valeurs desparamètres de champ cristallin utilisés pour le décrire.
D3h C3v D4h C4v
contrainte
(a) (b) (c) (d)Figure 2 – Polyèdres de coordination et leurs groupes ponctuels de symétrie associés. Les flèchesbleues représente des contraintes liées à des déplacements atomiques.
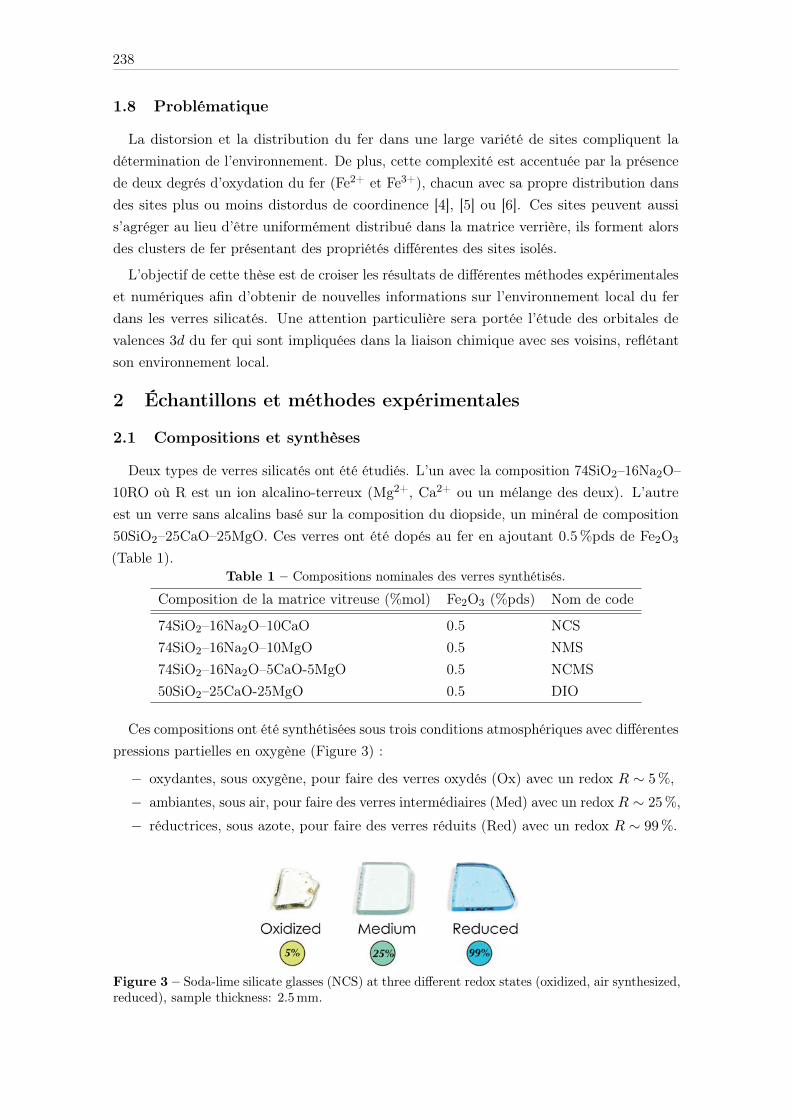
238
1.8 Problématique
La distorsion et la distribution du fer dans une large variété de sites compliquent ladétermination de l’environnement. De plus, cette complexité est accentuée par la présencede deux degrés d’oxydation du fer (Fe2+ et Fe3+), chacun avec sa propre distribution dansdes sites plus ou moins distordus de coordinence [4], [5] ou [6]. Ces sites peuvent aussis’agréger au lieu d’être uniformément distribué dans la matrice verrière, ils forment alorsdes clusters de fer présentant des propriétés différentes des sites isolés.
L’objectif de cette thèse est de croiser les résultats de différentes méthodes expérimentaleset numériques afin d’obtenir de nouvelles informations sur l’environnement local du ferdans les verres silicatés. Une attention particulière sera portée l’étude des orbitales devalences 3d du fer qui sont impliquées dans la liaison chimique avec ses voisins, reflétantson environnement local.
2 Échantillons et méthodes expérimentales
2.1 Compositions et synthèses
Deux types de verres silicatés ont été étudiés. L’un avec la composition 74SiO2–16Na2O–10RO où R est un ion alcalino-terreux (Mg2+, Ca2+ ou un mélange des deux). L’autreest un verre sans alcalins basé sur la composition du diopside, un minéral de composition50SiO2–25CaO–25MgO. Ces verres ont été dopés au fer en ajoutant 0.5%pds de Fe2O3
(Table 1).Table 1 – Compositions nominales des verres synthétisés.
Composition de la matrice vitreuse (%mol) Fe2O3 (%pds) Nom de code
74SiO2–16Na2O–10CaO 0.5 NCS74SiO2–16Na2O–10MgO 0.5 NMS74SiO2–16Na2O–5CaO-5MgO 0.5 NCMS50SiO2–25CaO-25MgO 0.5 DIO
Ces compositions ont été synthétisées sous trois conditions atmosphériques avec différentespressions partielles en oxygène (Figure 3) :
− oxydantes, sous oxygène, pour faire des verres oxydés (Ox) avec un redox R ∼ 5 %,
− ambiantes, sous air, pour faire des verres intermédiaires (Med) avec un redox R ∼ 25 %,
− réductrices, sous azote, pour faire des verres réduits (Red) avec un redox R ∼ 99 %.
Figure 3 – Soda-lime silicate glasses (NCS) at three different redox states (oxidized, air synthesized,reduced), sample thickness: 2.5mm.

239
2.2 Spectroscopie d’absorption optique
La spectroscopie d’absorption optique est une méthode très utilisée qui a l’avantage d’êtresimple à mettre en œuvre et d’être particulièrement adaptée à l’étude de la couleur et despropriétés optiques dans l’infrarouge et l’ultraviolet. Sa bonne résolution énergétique permetde distinguer de faible levée de dégénérescence des niveaux 3d de l’ordre du centième d’eV[Rossman, 2014]. Cette levée de dégénérescence causée par l’effet du champ de ligands créépar les voisins justifie que cette spectroscopie est particulièrement sensible à la géométrielocale des atomes absorbeurs.
Les mesures d’absorption optiques ont été réalisées en transmission sur des échantillonspolis et plans d’épaisseur 2,5mm et 5,5mm. L’énergie des photons utilisés est comprisedans la gamme 0,5–6 eV (i.e. 4000–50 000 cm–1 ou 2500–200 nm)
2.3 Spectroscopie d’absorption des rayons X (XAS)
La spectroscopie d’absorption des rayons X est un outil puissant pour l’étude de lastructure électronique et cristallographique d’une impureté dans une structure-hôte. Ellea le double avantage d’être sélective chimiquement et orbitalairement. On peut en effetsélectionner l’élément étudié grâce à l’énergie des rayons X incidents, chaque élément ayantune énergie bien définie. De même, on peut choisir dans quelle couche l’électron est excitéet donc quels états vides sont sondés. On parle de seuils K si l’électron excité provient de lacouche 1s. Toutes les expériences réalisées au cours de cette thèse ont été faites au seuil Kdu fer (situé à 7112 eV). En fonction de l’énergie incidente, différents événements peuventse produire (Figure 4).
1.2
1.0
0.8
0.6
0.4
0.2
0.0
Nor
mal
ized
TFY
sig
nal
7250720071507100 Energy (keV)
NCS05Ox
3d
1s
3d
1s
3d
1s
3d
1s
Continuum Continuum Continuum Continuum
(a)
(a) initial state
(b)
(b) XANESpre-edge
(c)
(c) XANESmain edge
(d)
(d) EXAFS
E0
X-ray X-ray X-ray X-ray
multiple scattering
Figure 4 – Les différentes régions du spectre XAS (ici, le seuil K du fer pour l’échantillon de verreNCS05Ox).

240
Cette thèse s’intéresse particulièrement au préseuil K (Figure 4-b), pour lequel l’énergieincidente est plus faible que l’énergie du seuil mais reste suffisante pour transférer unélectron 1s dans la première orbitale non pleine. Il permet de sonder les niveaux 3d localiséssur l’atome absorbeur. Le préseuil est essentiellement décrit par deux phénomènes : (i) unetransition locale quadrupolaire électrique 1s→ 3d; une transition locale dipolaire électrique1s → 4p. Dans le cas d’un site centrosymétrique seules les transitions quadrupolairesélectriques sont à l’origine du signal du préseuil.
Les mesures de XAS ont été réalisées sur la ligne de lumière ID26 de l’ESRF à Grenoble(France). Toutes les données ont été collectées en utilisant un monochromateur Si(311) etune détection en fluorescence avec un angle de 90° entre le faisceau incident et le faisceaudiffusé (Figure 5). La polarisation du faisceau incident est prise horizontale et linéaire.
Si(311) mono
TFY Samples 45°45°
Scanning Incident Energy
Ω
Figure 5 – Principe de la mesure de XAS.
2.4 Spectroscopie RIXS et HERFD
Afin d’améliorer les résultats obtenus avec la méthode XAS, décrite au paragrapheprécédent, des mesures hautes-résolution utilisant les technique Resonant Inelastic X-rayScattering (RIXS) et High-Energy Resolution Fluorescence Detected X-ray AbsorptionSpectroscopy (HERFD-XAS ou simplement HERFD).
Le principe de cette méthode qui met en jeu un processus à deux photons, illustré sur laFigure 6. Les mesures sont tracées sur un graph 3D (appelé “plan RIXS”) en fonction de(Ω,ω) ou (Ω,Ω− ω) pour les axes (x,y) et l’intensité relative au nombre de photons émis esttracée selon l’axe z [Glatzel and Bergmann, 2005].

241
intermediate state final stateFe2+
= h
= h ’
1s
2p
3p
3d
4p
decay
= h ’decay
absorption
= habsorption
Fe2+
TotalEnergy
Fe2+3d
K pre-edge
K edge
L edge
M edge
UV-Vis6
Kβ
Kα
1s13d7
1s13d64p1
2p53d7
2p53d64p1
3p53d7
3p53d64p1
3d7L3d6
Figure 6 – Vision monoélectronique (gauche) et vision multiélectronique (droite) des transitionsélectroniques du Fe2+ impliquées en RIXS spectroscopy. Ω est l’énergie d’absorption incident, ωl’énergie de fluorescence émise et Ω− ω l’énergie de transfert.
Ces mesures ont été réalisées simultanément aux mesures XAS sur la ligne ID26 del’ESRF. La Figure 5 illustre le montage expérimental, dont le principe consiste à analyserla fluorescence de l’échantillon en utilisant des cristaux analyseurs. Dans le cas présent lafluorescence Kα (6404 eV) a été analysée avec quatre cristaux de Ge(440) pour diffracterles rayons X émis. Pour une énergie de fluorescence fixée la méthode est appelée HERFD.
TFY/XASdetector
HERFD/RIXSdetector
Si(311) mono
Samples
Scanning Emitted Energy
Scanning Incident EnergyΩ
ID26 4x Ge(440) analyzers
Figure 7 – Principe de la mesure de RIXS.
2.5 SQUID
Des mesures de susceptibilité magnétique ont été réalisées afin de vérifier que le comporte-ment paramagnétique des échantillons de verres dopé au fer. Le comportement attenduest paramagnétique (avec une matrice de verre légèrement diamagnétique) mais un écartpourrait suggérer des interactions Fe–Fe dus à un effet de clustering. Ces mesures de ont été

242
faite avec un système MPMSr3 (Magnetic Property Measurement System) de QuantumDesign. Il s’agit d’un système SQUID-VSM (Superconducting Quantum Interference Deviceavec Vibrating Sample Magnetometer) dans lequel un échantillon d’environ 150mg est fixédans une paille oscillant selon l’axe vertical dans une cavité à des températures entre 2.5Ket 300K et un champ magnétique entre –7T et 7T. Des mesures de l’aimantation M onété réalisées en fonction du champ magnétique H et de la température T .
2.6 Résonance Paramagnétique Électronique (RPE)
La Résonance Paramagnétique Électronique (RPE) est une méthode très utilisé pourl’étude du clustering, de la distorsion de site et de la quantification du Fe3+ [Balan et al.,1999, 2000; Griscom, 1980]. En pratique, aux fréquences utilisées (bande X et bande Q)et aux températures utilisées (supérieures à 4K) seul le Fe3+ produit un signal RPE ; lesautres ions (Fe2+ et de la matrice vitreuse) étant “silencieux”.
Les mesures ont été réalisées avec un spectromètre Bruker ESP300 en bande X (9,5GHz)et en bande Q (34GHz) la fréquence de modulation utilisée est de 100 kHz et l’amplitudede modulation de 1mT. Des mesures basses températures ont été réalisées entre 300K etjusqu’à 4K avec un cryostat Oxford.
3 La théorie des multiplets en champ de ligands appliquée aucalcul des spectres d’absorption X et d’absorption optique
L’approche théorique utilisée dans cette thèse afin de reproduire les spectres expéri-mentaux est une approche multiélectronique basée sur la théorie des multiplets en champde ligands (Ligand Field Multiplet, LFM). Cette approche semi-empirique, dédiée auxsystèmes avec de fortes interaction électroniques. Elle consiste à calculer la section efficaced’absorption :
σ(~ω) = 4π2α~ω∑i,f
1
di|〈f |O|i〉|2δ(Ef − Ei − ~ω)
où ~ω est l’énergie des photons incidents, α = e2/4πε0~c la constante de structure fine(α ' 7.297 · 10−3) et di la dégénérescence de l’état initial |i〉. La fonction de Diracδ(Ef −Ei − ~ω) permet d’assurer la conservation de l’énergie. L’opérateur de transition Opermet de relier l’état initial |i〉 d’énergie Ei à l’état final 〈f | d’énergie Ef . Cet Hamiltonienest relié à la nature de la transition. Par exemple, les opérateurs de transition dipolaireet quadrupolaire sont respectivement défini par Odip = ε.r et Oquad = ı
2(ε.r)(k.r), avec εet k, qui sont respectivement le vecteur unitaire de polarisation et le vecteur d’onde de lalumière [Brouder, 1990].
Dans le cas d’une transition optique seules les transitions dipolaires sont considéréesRossano et al. [2000a]. Dans le cas de l’absorption X il est possible de calculer les préseuilsK en réalisant la somme des contributions dipolaire et quadrupolaires, la section efficaced’absorption totale est alors :
σ(~ω) = σdip(~ω) + σquad(~ω)
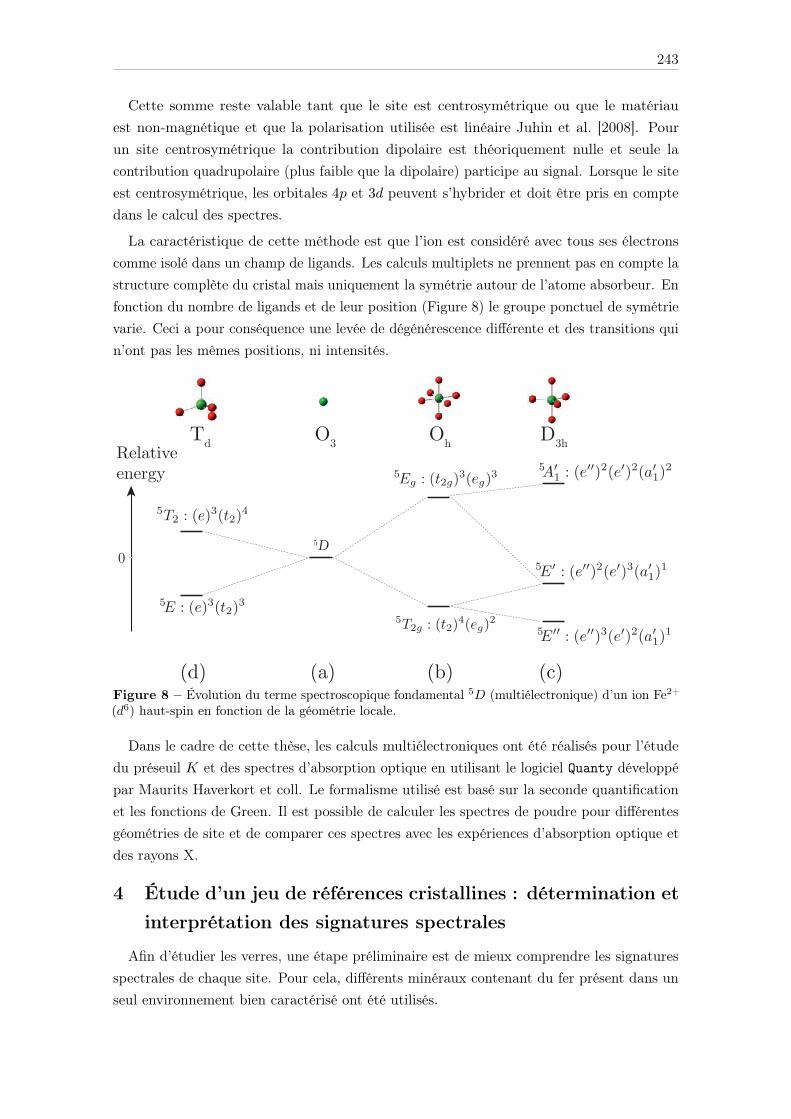
243
Cette somme reste valable tant que le site est centrosymétrique ou que le matériauest non-magnétique et que la polarisation utilisée est linéaire Juhin et al. [2008]. Pourun site centrosymétrique la contribution dipolaire est théoriquement nulle et seule lacontribution quadrupolaire (plus faible que la dipolaire) participe au signal. Lorsque le siteest centrosymétrique, les orbitales 4p et 3d peuvent s’hybrider et doit être pris en comptedans le calcul des spectres.
La caractéristique de cette méthode est que l’ion est considéré avec tous ses électronscomme isolé dans un champ de ligands. Les calculs multiplets ne prennent pas en compte lastructure complète du cristal mais uniquement la symétrie autour de l’atome absorbeur. Enfonction du nombre de ligands et de leur position (Figure 8) le groupe ponctuel de symétrievarie. Ceci a pour conséquence une levée de dégénérescence différente et des transitions quin’ont pas les mêmes positions, ni intensités.
Relativeenergy
OhTd O3
(d) (a) (b)
5D
D3h
(c)Figure 8 – Évolution du terme spectroscopique fondamental 5D (multiélectronique) d’un ion Fe2+(d6) haut-spin en fonction de la géométrie locale.
Dans le cadre de cette thèse, les calculs multiélectroniques ont été réalisés pour l’étudedu préseuil K et des spectres d’absorption optique en utilisant le logiciel Quanty développépar Maurits Haverkort et coll. Le formalisme utilisé est basé sur la seconde quantificationet les fonctions de Green. Il est possible de calculer les spectres de poudre pour différentesgéométries de site et de comparer ces spectres avec les expériences d’absorption optique etdes rayons X.
4 Étude d’un jeu de références cristallines : détermination etinterprétation des signatures spectrales
Afin d’étudier les verres, une étape préliminaire est de mieux comprendre les signaturesspectrales de chaque site. Pour cela, différents minéraux contenant du fer présent dans unseul environnement bien caractérisé ont été utilisés.

244
La description de l’effet des ligands et des niveaux électroniques dépendent de la géométrielocale. Le groupe ponctuel de symétrie et le nombre de paramètres nécessaires associé àchaque groupe étudié sont résumé dans la Table 2.
Table 2 – Liste des paramètres de champ cristallin et d’hybridation en fonction du groupe ponctuelde symétrie étudiée. L’état fondamental pour des ions Fe2+ et Fe3+ haut-spin sont donnée avecleur dégénérescence entre parenthèses.
Point groupsymmetry
Crystal fieldparameters
p–d hybridizationparameters
Ground state (dim)d 6 – Fe2+ d 5–Fe3+
Oh 10Dq –
D4h
Dq
Dt Ds
–
Td 10Dq Vpd
C4v Dq
Dt Ds
Vpde
Vpda1
D3h Dµ Dν Vpd
5T2g (15) 6A1g (6)
5A1g (5) 6A1g (6)
5E (10) 6A1 (6)
5E (10) 6A1 (6)
5E ’’ (10) 6A’1 (6)
L’Hamiltonien d’hybridation p–d dépend, pour l’état initial, de la différence d’énergie ∆
entre les configurations électroniques 3dn4p0 et 3dn−14p1 (Figure 9. Pour l’état final, lasituation est analogue et la différence d’énergie est nommée ∆′. En plus de cette différenced’énergie, l’intensité de l’hybridation est paramétrée par le coefficient Vpd (en eV).
1s13d 74p0
1s23d54p1
1s13d64p1
1s23d64p0Initial State
Final State
Ô
Δ’ = 13.8 eV
Δ = 12.6 eV
1s13d64p0
1s23d44p1
1s13d54p1
1s23d54p0
Ô
Δ’ = 22.9 eV
Δ = 21.2 eV
Fe2+ Fe3+
Figure 9 – Schéma de l’interaction de configuration pour le Fe2+ et le Fe3+ tenant compte del’hybridation p–d dans le cadre de la théorie des multiplets en champ de ligands LFMT).
Dans le cadre de cette thèse, les références cristallines suivantes ont été étudiées :siderite ([6,Oh]Fe3+), andradite ([6,C3i]Fe2+), gillespite ([4,D4h]Fe2+), staurolite ([4,Td]Fe2+),ferriorthoclase ([4,Td]Fe3+), grandidierite ([5,C3v]Fe2+) et yoderite ([5,C3v]Fe3+). Dans chacundes cas, les paramètres des spectres d’absorption optique et des rayons X ont été reproduits,en ajustant au mieux les paramètres du calcul. L’effet des différents paramètres a été étudié
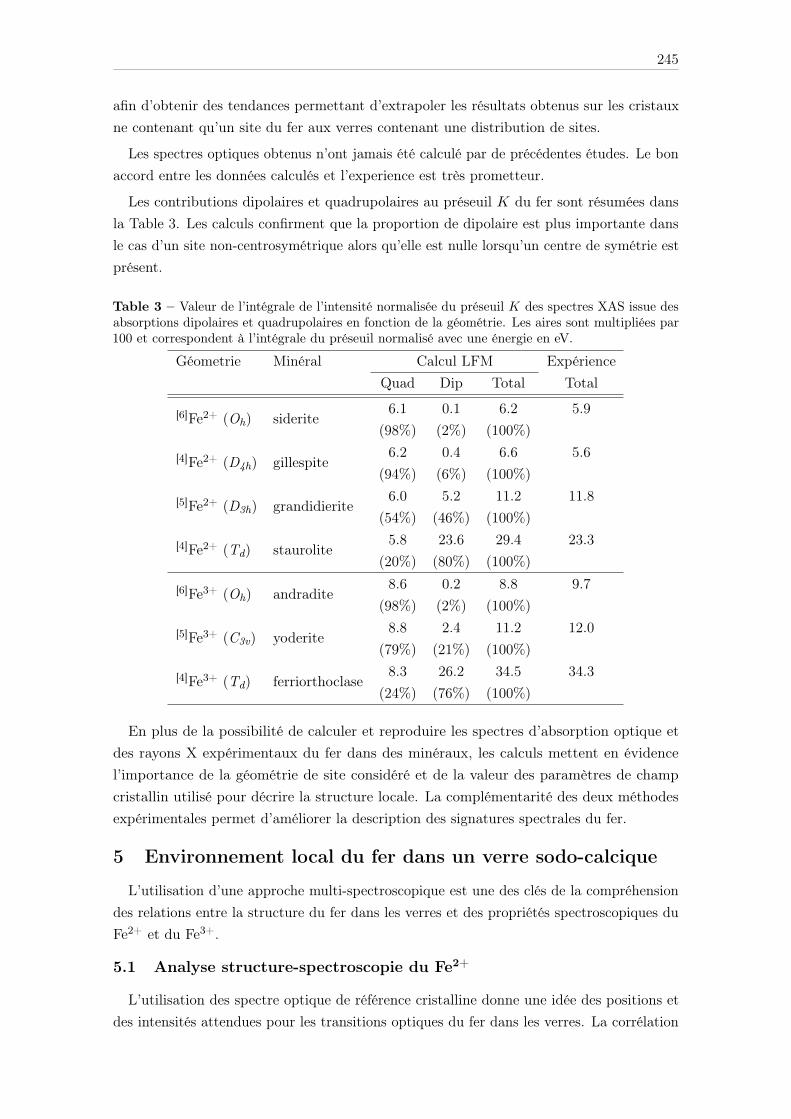
245
afin d’obtenir des tendances permettant d’extrapoler les résultats obtenus sur les cristauxne contenant qu’un site du fer aux verres contenant une distribution de sites.
Les spectres optiques obtenus n’ont jamais été calculé par de précédentes études. Le bonaccord entre les données calculés et l’experience est très prometteur.
Les contributions dipolaires et quadrupolaires au préseuil K du fer sont résumées dansla Table 3. Les calculs confirment que la proportion de dipolaire est plus importante dansle cas d’un site non-centrosymétrique alors qu’elle est nulle lorsqu’un centre de symétrie estprésent.
Table 3 – Valeur de l’intégrale de l’intensité normalisée du préseuil K des spectres XAS issue desabsorptions dipolaires et quadrupolaires en fonction de la géométrie. Les aires sont multipliées par100 et correspondent à l’intégrale du préseuil normalisé avec une énergie en eV.
Géometrie Minéral Calcul LFM ExpérienceQuad Dip Total Total
[6]Fe2+ (Oh) siderite6.1
(98%)0.1(2%)
6.2(100%)
5.9
[4]Fe2+ (D4h) gillespite6.2
(94%)0.4(6%)
6.6(100%)
5.6
[5]Fe2+ (D3h) grandidierite6.0
(54%)5.2
(46%)11.2
(100%)11.8
[4]Fe2+ (Td) staurolite5.8
(20%)23.6(80%)
29.4(100%)
23.3
[6]Fe3+ (Oh) andradite8.6
(98%)0.2(2%)
8.8(100%)
9.7
[5]Fe3+ (C3v) yoderite8.8
(79%)2.4
(21%)11.2
(100%)12.0
[4]Fe3+ (Td) ferriorthoclase8.3
(24%)26.2(76%)
34.5(100%)
34.3
En plus de la possibilité de calculer et reproduire les spectres d’absorption optique etdes rayons X expérimentaux du fer dans des minéraux, les calculs mettent en évidencel’importance de la géométrie de site considéré et de la valeur des paramètres de champcristallin utilisé pour décrire la structure locale. La complémentarité des deux méthodesexpérimentales permet d’améliorer la description des signatures spectrales du fer.
5 Environnement local du fer dans un verre sodo-calcique
L’utilisation d’une approche multi-spectroscopique est une des clés de la compréhensiondes relations entre la structure du fer dans les verres et des propriétés spectroscopiques duFe2+ et du Fe3+.
5.1 Analyse structure-spectroscopie du Fe2+
L’utilisation des spectre optique de référence cristalline donne une idée des positions etdes intensités attendues pour les transitions optiques du fer dans les verres. La corrélation

246
avec ces références a aussi été réalisé en comparant les spectres d’absorption X des verres etminéraux. Les données confirment l’importance de considérer la coordinence [5] du Fe2+.
Afin de mieux comprendre cette influence de la coordinence [5], plusieurs spectres optiquesdu Fe2+ en C3v ont été calculés afin de représenter différents environnement de coordinence[5] possibles. Ces spectres optiques calculés sont tracés sur la Figure 10. L’informationprincipale apportée par ce calcul est la possibilité de reproduire l’ensemble du signal optiqueexpérimental en ne modifiant que les paramètres de champ cristallin d’une coordinence [5]en géométrie C3v. Il est donc important de considérer ce type de géométrie en plus desgéométrie tétraédriques (coordinence 4) et octaédriques (coordinence 6) habituellementconsidérées.
25
20
15
10
5
0
Mol
ar a
bsor
ptio
n co
effici
ent
(L.m
ol-1.c
m-1)
200001800016000140001200010000800060004000
wavenumber (cm-1)
NCS05Red calc C3v (A) calc C3v (B) calc C3v (C) calc C3v (D) calc C3v (E)
5A1(D)
5E(D)
Figure 10 – Spectres d’absorption optique du fer dans le verre NCS05Red, ainsi que les spectrescalculés pour du Fe2+ en géométrie C3 (A,B, C D et E).
5.2 Analyse structure-spectroscopie du Fe3+
L’étude croisée des différentes spectroscopies a permis de mettre en évidence la présencede Fe3+ en coordinence 5. L’utilisation de la RPE donne aussi une information sur ladistortion et la distribution des sites du Fe3+ dans la matrice verrière. La Figure 11 permetainsi de montré que malgré la diminution du nombre de Fe3+ lorsqu’un verre est réduit lesFe3+ restant sont plus distordus. En revanche, les Fe3+ restant sont moins distribués etsont donc présents dans des sites plus semblables les uns aux autres. Par comparaison, lesverres oxydées présente une plus grandes variétés de sites du Fe3+ qui sont globalementplus réguliers que dans les verres réduits.

247
Fe3+ site distortion
Number of Fe3+ sites
Ox
Average distortion
Maximum distortion
Med Red
Figure 11 – Représentation schématique de la distribution et de la distorsion du Fe3+ dans lesverres NCS en fonction du redox.
5.3 Fer en cluster vs. fer isolés
Les mesures de SQUID-VSM et de RPE croisées avec les données d’absorption optiqueet des rayons X montrent que des effets de clustering dues à des interactions Fe–Fe sontvisible dans les verres contenant seulement 0.5%pds de Fe2O3. Ces interactions sont plusimportantes dans le cas des verres réduits dans lesquels il est montré que les Fe3+ résiduelsont tendance à se trouver dans le voisinage d’autres ions fer. Cependant, les mesures deSQUID ont démontré l’absence de nanoparticules de fer. Ainsi, même si des effets declustering sont visible en RPE et absorption X, ils restent minoritaires dans le signal etleur effet sur les propriétés optiques sont limités.
6 Conclusions et perspectives
L’objectif de cette thèse était d’améliorer la compréhension des relations structure-propriétés du Fe2+ et du Fe3+ dans les verres silicatés. Pour ce faire une étude multi-spectroscopique a été réalisée en couplant les méthodes d’absorption optique, absorption desrayons X (XAS, RIXS et HERFD) et la résonance paramagnétique électronique (RPE). Lesdonnées expérimentales ont été comparées avec des résultats de calculs multiplet permettantde reproduire les signaux des préseuil K du fer et les spectres d’absorption optique.
L’étude de plusieurs références cristallines contenant du fer dans différentes géométriesa permis de caractériser l’environnement du fer dans des sites spécifiques en utilisant lathéorie du champ de ligand. Les nouveaux développements ont permis de reproduire lesspectres d’absorption optique et des rayons X. Les effets de la géométrie locale ont été priscompte à travers les paramètres de champ cristallin et les paramètres d’hybridation, quiont permis de reproduire les positions et intensités des spectres.
L’utilisation de ces signatures spectroscopiques couplées aux tendances obtenues enfaisant varier les paramètres de calculs permet d’extrapoler les résultats aux verres. Enparticulier, l’étude de références cristallines avec du fer en coordinence [5] permet de mieuxcaractériser ce type d’environnement dans les verres. D’autre part, des modifications de lacomposition des verres a permis d’étudier les variations spectroscopiques associées au redoxdu verre, à la présence ou absence de sodium et au ratio calcium/magnésium.


Résumé
Parmi l’infinité de compositions verrières, les silicates représentent 90% de la productionmondiale de verre et sont utilisés pour de nombreuses applications industrielles (par exemplel’automobile, le bâtiment ou les panneaux solaires). Des verres silicatés dopés avec 0.5%pdsde Fe2O3 ont été spécifiquement synthétisés dans des conditions d’oxydoréduction extrêmes,réductrices ou oxydantes. L’objectif étant d’isoler les signatures spectroscopiques respectivesdu Fe2+ et du Fe3+ qui sont habituellement mélangés en raison de la nature hétérovalentedu fer.
Cependant, les conditions de synthèse ne permettent pas d’isoler des environnementsspécifiques du fer qui reste distribué dans les verres. Par conséquent, des minérauxcontenant du Fe2+ et du Fe3+ dans des environnements bien définis ont été sélectionnés.La compréhension des relations structure-spectroscopie dans ces références cristallines estdonc une étape préliminaire à l’interprétation des signatures spectroscopiques du fer dansles verres.
Une étude multi-spectroscopique a été réalisée sur les verres et minéraux en combinantdes méthodes expérimentales (absorption optique, absorption des rayons X au seuil K dufer, résonance paramagnétique électronique) et théoriques (calculs multiélectroniques dansl’approche en champ de ligand pour reproduire les spectres de pré-seuils K et de spectresoptiques) pour mieux comprendre l’environnement local du fer dans les verres.
L’étude des références cristallines a permis de montrer l’influence de la symétrie locale(Oh, Td, D4h/C4v et D3h/C3v) du site du fer et de l’hybridation p–d sur sa signaturespectroscopique. Concernant l’étude des verres silicatés réduits, une majorité du Fe2+
est présent en coordinance 5, il est montré que cette dernière permet de reproduire etd’expliquer la signature du fer par une distribution des paramètres de champ cristallinrendant compte de la nature amorphe du verre. L’analyse des verres oxydés a permisd’appuyer l’existence de Fe3+ en coordinance 5 dans les verres sodo-calciques, dont la priseen compte est nécessaire pour l’interprétation des spectres optiques en complément descoordinances tétraédriques. Cette étude apporte un éclairage nouveau sur les variationsstructurales et spectroscopiques du fer en réaction à une substitution du calcium par dumagnésium ou à l’absence d’alcalin dans la composition de la matrice verrière.
Mots-clés:
impureté, absorption optique, XANES, RPE, redox du fer, silicates, champ cristallin.

Abstract
Among the infinite possibilities of glass compositions, soda-lime silicates represent of90% of the glass production and are widely used for many industrial applications (e.g.automotive, solar panels, construction). Specific glasses silicate containing 0.5wt% of Fe2O3
were synthesized with extreme redox. The use of reducing and oxidizing conditions allowsto isolate the respective Fe2+ and Fe3+ spectroscopic signatures that are usually mixed dueto the heterovalent nature of iron.
However, synthesis conditions do not allow to isolate specific iron environment thatremains distributed in glasses. Thus, Fe2+- and Fe3+-bearing minerals containing iron inwell defined environments were selected. The comprehension of structure-spectroscopyrelationships in these crystalline references is a preliminary step to the interpretation ofiron spectroscopic signature in glasses.
A multi-spectroscopic study was performed on glasses and minerals by combining experi-mental (optical absorption, X-ray absorption at the iron K edge, and electron paramagneticresonance) and theoretical (multielectronic calculations using ligand field multiplet approachto reproduce the K pre-edge and optical absorption spectra) methods.
The study of crystalline references evidenced the influence of local symmetry (Oh, Td,D4h/C4v et D3h/C3v) on iron sites and of p–d hybridization on iron spectroscopic signatures.Concerning the study of reduced silicate glasses, the majority of Fe2+ is present in [5]-fold coordination, this speciation can reproduce and explain the iron signature by using adistribution of the crystal field parameters to take into account the amorphous nature of glass.The analysis of oxidized glasses supports the existence of Fe3+ in [5]-fold coordination. Thesespecies need to be considered, in addition to tetrahedral geometries, for the interpretation ofoptical spectra. This study shed light on structural and spectroscopic variations of iron dueto the substitution of calcium by magnesium or by the absence of alkali in the compositionof the glass matrix.
Keywords:
impurity, optical absorption, XANES, EPR, iron redox, silicates, crystal field.