università degli studi di milano - CORE
188
UNIVERSITÀ DEGLI STUDI DI MILANO PhD Course in Molecular and Cellular Biology XXIX Cycle TESTING THE EFFICACY OF BRAIN CHOLESTEROL SUPPLEMENTATION AS A POSSIBLE THERAPEUTIC APPROACH FOR HUNTINGTON’S DISEASE Eleonora Di Paolo PhD Thesis Scientific tutor: Elena Cattaneo Academic year: 2015-2016 SSD: BIO/14 Thesis performed at University of Milan; Department of Biosciences; Elena Cattaneo’s Laboratory
-
Upload
khangminh22 -
Category
Documents
-
view
4 -
download
0
Transcript of università degli studi di milano - CORE
UNIVERSITÀ DEGLI STUDI DI MILANO PhD Course in Molecular and Cellular Biology
XXIX Cycle
TESTING THE EFFICACY OF BRAIN CHOLESTEROL
SUPPLEMENTATION AS A POSSIBLE THERAPEUTIC
APPROACH FOR HUNTINGTON’S DISEASE
Eleonora Di Paolo PhD Thesis
Scientific tutor: Elena Cattaneo
Academic year: 2015-2016
SSD: BIO/14
Thesis performed at University of Milan; Department of Biosciences;
Elena Cattaneo’s Laboratory

Contents
Contents
Part I
Abstract ................................................................................................................................................ 1
Introduction .......................................................................................................................................... 2
Aim of the Project .............................................................................................................................. 39
Results ................................................................................................................................................ 41
Discussion .......................................................................................................................................... 69
General Conclusions and Prospects ............................................................................................... 74
Material and Methods ........................................................................................................................ 75
References .......................................................................................................................................... 79
Part II Published papers .............................................................................................................................. 118
− Paper_1: Shankaran, M., Di Paolo E., Leoni V., Caccia C., Ferrari Bardile C., Mohammed
H., Di Donato S., Kwak S., Marchionini D., Turner S., Cattaneo E., Valenza M. (2017)
Early and brain region-specific decrease of de novo cholesterol biosynthesis in Huntington’s
disease: A cross-validation study in Q175 knock-in mice. Neurobiology of Disease.
− Paper_2: Valenza M.*, Chen J.Y.*, Di Paolo E.§, Ruozi B.§, Belletti D., Ferrari Bardile C.,
Leoni V., Caccia C., Brilli E., Di Donato S., Boido M.M., Vercelli A., Vandelli M.A., Forni
F., Cepeda C., Levine M.S., Tosi G., Cattaneo E. (2015) Cholesterol-loaded nanoparticles
ameliorate synaptic and cognitive function in Huntington’s disease mice. EMBO Molecular
Medicine.
− Paper_3: Valenza M.*, Marullo M.*, Di Paolo E., Cesana E., Zuccato C., Biella G.,
Cattaneo E. (2015) Disruption of astrocyte-neuron cholesterol cross talk affects neuronal
function in Huntington's disease. Cell Death Differ. *co-first authors, §co-second authors


Abstract
1
Abstract Huntington's disease (HD) is a progressive, fatal, adult-onset, neurodegenerative disorder caused by
an expanded CAG repeat in the huntingtin gene, which encodes an abnormally long polyglutamine
repeat in the huntingtin protein. Clinical features of Huntington's disease include progressive motor
dysfunction, cognitive decline, and psychiatric disturbance. Currently, the available drugs are used
only for symptomatic management of Huntington's disease, but there is no effective therapy.
Several studies indicate that brain cholesterol biosynthesis is reduced in several HD rodent models
(Valenza et al. 2005) (Valenza et al. 2007) (Valenza et al. 2010) and data from HD patients also
suggested a similar reduction (Leoni et al. 2008) (Leoni et al. 2013).
This dysfunction may be detrimental for neuronal cells, especially given that locally synthesized
cholesterol is implicated in neurite outgrowth, synapses formation and maintenance, synaptic
activity and integrity, and optimal neurotransmitter release (Pfrieger et al. 2003).
Based on these evidences, we supposed that in vivo supplying of exogenous cholesterol could
rescue aspects of neuronal dysfunction. To verify our hypothesis we used different approaches to
deliver exogenous cholesterol to the brain of R6/2 mice (Mangiarini et al. 1996), since peripheral
cholesterol is not able to cross the blood brain barrier (BBB).
In our first study, the delivery of cholesterol via brain-permeable polymeric nanoparticles (g7-NPs-
Chol) rescued synaptic communication, protected from cognitive decline and partially improved
global activity in HD mice (Valenza et al. 2015). In a second study we tested the efficacy of
increasing doses of cholesterol directly infused into mouse brain by osmotic minipumps. Results
demonstrated that high amounts of cholesterol have to be delivered to observe both cognitive and
motor functional recovery in R6/2 mice. More recently, we started to investigate a third innovative
non-invasive strategy based on intranasal delivery of cholesterol and preliminary results will be
discussed.

Introduction
2
Introduction
Introduction
3
1. HUNTINGTON’S DISEASE 1.1 Huntington’s disease history
Huntington’s disease (HD) is a fatal neurodegenerative disorder characterized by psychiatric,
cognitive and motor disorders. HD was first recognized as an inherited disorder in 1872 when
George Huntington, an American doctor, wrote a paper called “On Chorea”. The paper was
published in the Medical and Surgical Reporter of Philadelphia and gave the first complete
description of the disease based on studies of several generations of one family who exhibited
similar symptoms.
"Chorea" comes from the Latin and Greek words meaning chorus or a group of dances. The term
was given to many so-called "dancing disorders" that became noticed in the Middle Ages. In those
days it was believed that people with chorea, like the involuntary muscle jerks and twitches
characteristic of HD, were possessed by devils.
In 1968, Dr. Milton Wexler, a psychoanalyst and clinical psychologist, created the Hereditary
Disease Foundation (HDF) to find treatments and cures for HD, after his wife Leonore was
diagnosed with the disease. Later years a research team guided by their daughter, the geneticist
Nancy Wexler, identified a region of Venezuela where the disease was prevalent. Thus, a twenty-
year-long study started in 1979, which allowed to collect over 4,000 blood samples and documented
18,000 different individuals to work out a common pedigree.
The collected samples were useful in a collaborative research project of the HDF, together with the
National Institute of Neurological Disorders and Stroke (NIH) to locate the gene that causes the
disease. In 1983, the gene was located near the telomere of chromosome 4 and a test to identify
carriers of HD was developed (Gusella et al. 1983).
From 1983, the HDF organized and funded a decade-long international collaboration of over 100
scientists named “The Gene Hunters” to find the HD gene itself and finally, in 1993, the HD gene
mutation was discovered.
HD was the first genetic disorder to be mapped to a specific locus in the chromosome without prior
knowledge of the gene location and one of the first diseases to have prenatal genetic testing made
available.
1.2 The genetics of HD
The human HD gene (also called IT15) is located on chromosome 4p16.3 and encodes the protein
huntingtin, whose proposed functions will be discussed later. The genetic alteration, which causes
the disease, is an increase of the number of repetitions of three nucleic acids (C, A, and G) in the

Introduction
4
coding region of the first exon of the HD gene. This results in an expanded polyglutamine tract in
N-terminus of huntingtin protein (Htt) (Zuccato, Valenza, and Cattaneo 2010).
The distribution of CAG “triplet” repeats for Huntington’s disease may be divided into four
categories. Repeats of 26 or fewer are normal. Repeats between 27 and 35 are rare and are not
associated with the expression of the disease. Repeats between 36 and 39 are associated with
reduced penetrance whereby some individuals will develop HD at an advanced age and others will
not. Repeats of 40 or larger are always associated with the expression of HD (Myers 2004).
Merritt et al. first observed that a disproportionate number of cases with juvenile onset HD (before
the age of 21) had inherited the HD gene from affected fathers (Merritt, Conneally, and Rahman
1969). This phenomenon termed “anticipation”, is typical of trinucleotide repeat disorders, and is
explained by the meiotic instability of the HD repeat. Although meiotic instability may occur in
both maternal and paternal transmission, in paternal transmission there is a propensity toward larger
repeat expansion.
A recent study completed a systematic review of the literature on the prevalence of HD. Overall
worldwide prevalence of HD was estimated at 2.71 per 100,000. The study has also revealed that
HD prevalence is higher in North America, Europe, and Australia (5.70 per 100,000), compared to
Asia and Africa (0.40 per 100,000) (Pringsheim et al. 2012). This difference can be, at least partly,
explained by differences in CAG tract size and HTT haplotypes. In fact it is known that the average
CAG tract size in European populations is larger than that in Asian and African populations
(Squitieri et al. 1994).
Interestingly, genetic variations correlated with onset of motor signs, were recently identified by the
genome-wide association (GWAS) study (Modifiers of Huntingtons Disease Consortium 2015).
Two genetic loci on chromosomes 15 and 8 were found. In particular, the region on chromosome
15, harbors two independent modifier association signals in the HD population: one that anticipates
and the other that delays age of onset. The region on chromosome 8 carries a modification signal
that delays onset. The study also suggested a role of MLH1 gene, involved in mismatch DNA
repair, in modifying the onset of disease due to an effect on somatic HTT CAG repeat instability.
1.3 Clinical manifestations of HD
One of the main focuses in HD research is the development of new therapeutic strategies, as
currently there is no treatment to delay or prevent the progression of the disease. Neuronal
dysfunction and death observed in HD are caused by a combination of many pathogenic processes
that lead to motor, cognitive and psychiatric symptoms. Other less well-known, but prevalent
features of HD include weight loss, sleep- and circadian rhythm disturbances and autonomic
Introduction
5
nervous system dysfunction. The mean age at onset is between 30 and 50 years, with a range of 2 to
85 years. The mean duration of the disease is 17-20 years and most common cause of death is
pneumonia.
Motor symptoms and signs
When HD was first discovered it was called Huntington’s chorea, due to the uncontrollable, dance-
like movement that is common among patients. The unwanted movements, which initially occur in
the distal extremities and in small facial muscles, gradually spread to all other muscles. Choreatic
movements are always present when the patient is awake, so that even walking becomes unstable.
However, the pattern of motor symptoms tends to change over time: while chorea declines, dystonia
(sustained or repetitive muscle contractions that result in twisting and repetitive movements or
abnormal fixed postures), rigidity and akinesia (inability to initiate movement) becomes more
marked leading to bradykinesia (slowness of movement). Also dysarthria (a motor speech disorder)
and dysphagia (difficulty in swallowing) become very prominent during the course of the disease.
Behavior and psychiatric symptoms and signs
Psychiatric symptoms very frequently appear in the early stage of the disease, and can even
anticipate the onset of motor symptoms. These symptoms and signs have a highly negative impact
on family daily life (Wheelock et al. 2003). The most frequently signs are depression and anxiety.
Obsessions and compulsions are also common and lead to irritability and aggression. Furthermore,
HD patients manifest apathy and increasing passive behavior with the progression of the disease.
Psychosis most frequently appears in the later stages and is accompanied by cognitive decline. The
complete clinical picture is comparable to schizophrenia with paranoid and acoustic hallucinations.
An additional aspect of the disease is the higher risk of suicide, frequently associated to the genetic
test and the loss of independence in daily life.
The cognitive impairment
Although the clinical diagnosis of HD relies on the onset of motor abnormalities, patients manifest
the first signs of cognitive impairments at least 15 years prior, in parallel with volume loss detected
by MRI (Paulsen et al. 2004) (Aylward et al. 2011). Cognitive decline in HD is mostly due to
cortico-striatal and hyppocampal dysfunctions. Patient’s actions and behaviors are not more goal-
directed or planned. Furthermore, HD patients are not able to distinguish what is relevant from what
can be ignored and are no longer able to organize or plan their life. HD patients have difficulty in
learning new information or recall previously learned information (Sadek et al. 2004) (Montoya et

Introduction
6
al. 2006). The implicit memory, that includes those coordinated movements and skills that allow to
ride a bike, play a musical instrument and even the ability to chew and swallow without choking, is
compromised.
More in detail, at pre-symptomatic stages one of the most common cognitive deficits affects tasks
requiring a shift in strategy (Lawrence et al. 1998) (Ho et al. 2003). Executive functions, verbal
fluency (Hahn-Barma et al. 1998) (Paulsen et al. 2001), procedural learning, planning, and explicit
motor learning result impaired (Lawrence et al. 1998) (Rosenberg et al. 1995) (Schneider et al.
2010). The execution of ordinary mental tasks is more tiring and requires more time.
At early symptomatic stages, HD patients show a significant deficit in discrimination and reversal
learning (Lawrence et al. 1999). Moreover, attention, acquisition of psychomotor skills, planning
and executive functions progressively decline (Watkins et al. 2000) (Ho et al. 2003). In early
symptomatic HD patients, there are alterations in associative learning, pattern and spatial short-term
memory, in spatial working memory (Lawrence et al. 2000), and there are deficits in recall and
recognition memory (Montoya et al. 2006).
Middle symptomatic stage is characterized by a widespread worsening in executive function, verbal
fluency, perceptual speed and reasoning (Bäckman et al. 1997) (Lemiere et al. 2004). In this stage
HD patients show episodic memory and spatial memory deficits (Bäckman et al. 1997) (Lemiere et
al. 2004).
Finally, at more advanced symptomatic stages, patients manifest a sub-cortical dementia with
alterations in cognitive functions involving slow information processing, decreased motivation,
depression, apathy and personality changes (Paulsen et al. 1995) (Zakzanis 1998). Thus, tasks
relying on hippocampal and cortico-temporal integrity (declarative memories: visuospatial, spatial
working memory and object and spatial perception/recognition) are altered in HD patients also if to
a lesser extent than those dependent on cortico-striatal integrity (procedural learning). Finally,
different findings have suggested that HD lead to alterations in the perception of time and the
production of timed output (Hinton et al. 2007) (Rowe et al. 2010).
Secondary symptoms and signs
In addition to motor, psychiatric and cognitive symptoms, there are other important symptoms in
HD, including weight loss, sleep disturbances and autonomic disturbances. From early on, weight
loss has been reported in all patients. A recent study have described a relationship between the
weight loss and the CAG tract size (Aziz et al. 2008). This can be also ascribed to decreased
appetite, difficulty handling food and swallowing. An additional causative factor is hypothalamic
neuronal loss (Aziz et al. 2007).

Introduction
7
Recently, attention has been focused also on sleep and circadian rhythm disturbances of patients
with HD. The first description of these type of abnormalities in HD patients came from the study of
Morton (2005) showing as HD patients exhibit abnormal night-day ratios, although interestingly
they do not report any major sleep difficulties. A delayed sleep phase and an increased REM
latency together with circadian changes in melatonin have been reported in HD (Aziz et al. 2010).
Melatonin synthesis is directly regulated by the SCN and it plays a major role in the regulation of
sleep and other circadian rhythms. HD patients report insomnia and increased daytime somnolence
(Goodman & Barker 2010), besides impaired quality of sleep, reduced sleep efficiency (Silvestri et
al. 1995) (Mena-Segovia et al. 2002) and reduced sleep time (Silvestri et al. 1995). The
progressively worsening sleep disorder appeared to be independent of CAG repeat length (Arnulf et
al. 2008)
Also the autonomic symptoms are highly prevalent in patients with HD. These symptoms are
related to functional disability and depression and may precede the onset of motor signs. 44% of
patients, even at early stages of the disease, manifest autonomic dysfunction whereby both the
sympathetic and parasympathetic system are affected (Andrich et al. 2002). Different autonomic
disturbances, such as hyperhydrosis, sexual dysfunction, swallowing difficulties and dysphagia,
have been reported in HD patients (Aziz et al. 2010). The origin of autonomic dysfunction is found
in alterations of the central autonomic network that includes the hypothalamic region and its
connections to the cortex, limbic system, brainstem, and spinal cord (Benarroch 1993). Indeed,
hypothalamic damage has been found in HD patients (Aziz et al. 2007) (Politis et al. 2008).
1.4 Neuropathological features of HD
HD brain is characterized by a variable pattern of neuropathological changes (Vonsattel and
DiFiglia 1998) that reflect the highly variable symptomatology of HD even among comparing cases
with the same number of CAG repeats (Friedman et al. 2005) (Gómez-Esteban et al. 2006) (Tippett
et al. 2006). The most affected brain area is the neostriatum, which includes the caudate nucleus and
putamen, but, especially in more severe cases, also other brain regions are involved. Gross
examination of postmortem HD human brains highlights a characteristic bilateral atrophy of the
striatum (Vonsattel and DiFiglia 1998) (Vonsattel, Keller, and Pilar Amaya 2008). In particular, the
putamen had an average 64% cross-sectional area loss compared with a 57% cross-sectional area
loss in the caudate nucleus (de la Monte et al. 1988).
In 1985, JP Vonsattel developed a neuropathological grading system for HD based on the pattern of
striatal neurodegeneration observed in a wide sample of HD brains (Vonsattel et al. 1985). Grade 0
comprises HD brains that show indistinguishable features from control brains. However, 30–40%

Introduction
8
neuronal loss has been revealed in the head of the caudate nucleus upon histological examination.
Grade 1 comprises HD brains in which the body of caudate nucleus shows atrophy, neuronal loss,
and astrogliosis. Gross striatal atrophy is described mild to moderate in grade 2 and severe in grade
3. In Grade 4, the striatum is severely atrophic with a strong neuronal loss of about 95%.
Furthermore, in Grades 1 and 2, non-striatal structures of the brain are apparently normal, or show
only mild atrophy. In grades 3 and 4 also other brain regions as globus pallidus, neocortex,
thalamus, subthalamic nucleus, substantia nigra, and cerebellum are smaller than normally
expected.
The most affected neuronal populations in the HD striatum are the medium-sized spiny projection
neurons (MSNs) that constitute 90–95% of the total striatal neuronal population. The MSNs
degeneration is associated with increasing HD grade (Vonsattel et al. 1985) (Vonsattel and DiFiglia
1998) and leads to the disruption of important striatal pathways. Immunohistochemical studies also
revealed differential loss of striatal projection neurons in HD. In particular, in early and middle
stages of the disease, enkephalin-containing neurons, projecting to the external segment of the
globus pallidus, results much more affected than substance P-containing neurons projecting to the
internal pallidal segment. Furthermore, substance P-containing neurons projecting to the substantia
nigra pars reticulata results more affected than those projecting to the substantia nigra pars
compacta. At later stages of the disease, projections to all striatal target areas are significantly
reduced, with the exception of some apparent sparing of the striatal projection to the substantia
nigra pars compacta (Reiner et al. 1988). However, in most severe HD cases the extreme striatal
atrophy and loss of neurons observed indicate that even the striatal interneurons are affected (Reiner
et al. 2013). Cortical atrophy is another hallmark of HD brains, especially at advanced stages of the
disease. Many studies highlight volume loss, cortical thinning, and neuronal loss in HD cerebral
cortex (Macdonald & Halliday 2002) (Rosas et al. 2002) (Thu et al. 2010). In particular, the cortical
volume loss was demonstrated to correlate with the degree of striatal atrophy and the number of
CAG repeats, suggesting a relation between disease processes occurring into striatum and cortex.
Neurodegeneration of cortical pyramidal neurons is also observed but in a smaller degree respect to
that of MSNs (Vonsattel et al. 1985) (Hedreen et al. 1991). An additional neuropathalogical feature of HD is the reactive gliosis, especially in the dorsal
striatum (Myers et al. 1991). Gliosis involves the proliferation or hypertrophy of several types of
glial cells, including astrocytes, microglia, and oligodendrocytes and form part of the inflammatory
response of the diseased brain. Interestingly, activated microglia correlated with neuronal loss in the
neostriatum, globus pallidus, cerebral cortex, and white matter (Sapp et al. 2001). Furthermore,
astrocytes in the white matter of HD brain display intranuclear inclusions (Shin et al. 2005),

Introduction
9
especially in advanced stages. This phenomenon may contribute to the overall metabolic
dysfunctions of the HD brain.
Another HD pathological hallmark consists in the presence of intracellular aggregates of mutant
Htt. Mutant Htt shows a similar expression level and regional distribution to the wild-type Htt in the
brain (Aronin et al. 1995), but abnormal accumulation of its N-terminal fragments gives rise to
typical aggregates/inclusions in the nucleus, cytoplasm, and dystrophic neurites in HD brains
(DiFiglia et al. 1997). These protein aggregates are thought to be formed by associations of
polyglutamine (polyQ) regions, which act as a “polar zipper” (Perutz 1996). The
immunohistochemical analyses of postmortem human HD brain have demonstrated the presence of
aggregates that can form neuronal intranuclear inclusions (NIIs) or cytoplasmic and neuropil
extranuclear inclusions (NEIs), and Htt aggregates also form in axons and dendritic spines. The
inclusions are already evident in the HD human brain before onset of symptoms and can be found
throughout the cortex, but less frequently in the striatum (Gutekunst et al. 1999) (Maat-Schieman et
al. 1999) (Herndon et al. 2009).
Finally, white matter changes have been reported in HD brains, although detailed systematic studies
have not been carried out. Earlier studies measured 29–34% changes in overall white matter area in
slices through HD brains (de la Monte et al. 1988). More recent studies based on neuroimaging
techniques show changes in the white matter even at pre-symptomatic phase of HD, in different
brain regions (Rosas et al. 2006) (Rosas et al. 2010).
1.5 Normal Htt distribution and functions
Cellular and tissue distribution
Htt is expressed ubiquitously in humans and rodents, but reaches the highest expression levels in
the neuronal cells within the central nervous system (CNS) (DiFiglia et al. 1995) (Ferrante et al.
1997). Htt is particularly enriched in cortical pyramidal neurons in the layers III and V that project
to the striatal neurons (Fusco et al. 1999). Within cells, mammalian Htt is associated with different
organelles, including the nucleus, endoplasmic reticulum, Golgi complex, and mitochondrion
(Hilditch-Maguire et al. 2000) (Kegel et al. 2002) (Panov et al. 2002) (Strehlow et al. 2006). In
particular, in neuronal cells, Htt localize within neuritis and at synapses, where it associates with
various vesicular structures such as clathrin-coated vesicles, endosomal compartments or caveolae
and microtubules (DiFiglia et al. 1995) (Velier et al. 1998) (Hilditch-Maguire et al. 2000).
Htt interacts with proteins involved in different cellular functions including clathrin-mediated
endocytosis, apoptosis, vesicle transport, cell signaling, morphogenesis, and transcriptional
regulation (Li and Li 2004). Htt binds also to proteins of the synaptic complex such as protein

Introduction
10
kinase C, casein kinase substrate in neurons 1 (PACSIN-1) and postsynaptic density 95 (PSD95),
thus participating in the regulation of synaptic activity (Sun et al. 2001) (Smith et al. 2005).
Htt functions
There are solid evidence showing the critical role of Htt for embryonic development. Generation of
nullizygous Htt mice (Hdh−/−) causes embryonic death between day 8.5 and 10.5 (Zeitlin et al.
1995). The same study found that a single wt HTT allele is sufficient to carry out the developmental
function of Htt in mice. Furthermore, with the progression of embryonic development, Htt levels
lowering to below 50% leads to defects in the epiblast and severe cortical and striatal architectural
anomalies (White et al. 1997) (Auerbach et al. 2001). Wild-type Htt plays also a critical role in
brain maturation, especially in establishing and maintaining cortical and striatal neuronal identity
(Reiner et al. 2001).
Interestingly, also mHtt can carry out this developmental role. In fact HD patients are born normally
and the onset of symptoms occurs several years after birth. Even homozygosity for CAG mutation
does not results in evident developmental defects in HD patients (Wexler et al. 1987). In addition,
expression of human Htt with a pathological polyglutamine expansion (72 CAG repeats) rescues
Hdh−/− mice from embryonic lethality (Leavitt et al. 2001).
All these evidence suggest that, despite the mutation, Htt can perform its physiological function
during development.
However, more recent findings (Molero et al. 2009) suggest that developmental abnormalities occur
in a knock-in mouse model of HD (HdhQ111) compared with a knock-in mouse expressing 18
CAG (HdhQ18). In particular, the striatum of HdhQ111 embryos at E17.5, show impairment in the
acquisition of the cytoarchitecture of striatal subcompartments, suggesting abnormal specification
and maturation of MSN.
Htt has an important prosurvival role as demonstrated by different in vitro and in vivo studies. The
first in vitro experiment was performed using ST14A striatal cells, transfected with wild-type htt
(Rigamonti et al. 2000). They found that cells expressing high levels of exogenous wt Htt protein
were protected from death. On the contrary, the same cells transfected with mHtt showed a fastern
viability decline, indicating that the mHtt is not able to act as a neuroprotective protein.
Additional studies confirmed the antiapoptotic role of Htt. Primary striatal neurons derived from
YAC18 transgenic mice overexpressing full-length wild-type human Htt were protected from
apoptosis compared with cultured striatal neurons from nontransgenic littermates or from YAC72
mice expressing human mHtt (Leavitt et al. 2006).

Introduction
11
Different studies clarified some of the mechanisms by which wild-type Htt protects cells from
apoptosis. Wild-type Htt is able to prevent the formation of a functional apoptosome complex and
the consequent activation of caspase-3 and caspase-9 (Rigamonti et al. 2000) (Rigamonti et al.
2001). Furthermore, wild-type Htt physically interacting with active caspase-3, blocks its
proteolytic activity and interferes with procaspase-8 activation (Hackam et al. 2000). A pro-survival
role for Htt has also been demonstrated in vivo. Overexpression of full-length wild-type Htt in yeast
artificial chromosome (YAC18) transgenic mice conferred protection against apoptosis triggered by
NMDA receptor induced excitotoxicity (Leavitt et al. 2006). Moreover, it has been found that levels
of endogenous Htt are reduced following ischemic injury through a caspase mediated process, while
overexpression of wild-type Htt in mice protects against ischemic injury in a dose-dependent
manner (Zhang et al. 2003).
WT Htt is also linked to Brain-derived neurotrophic factor (BDNF), a neurotrophin particularly
important for the survival of striatal neurons and for the activity of the cortico-striatal synapses
(Zuccato and Cattaneo 2007). Most of striatal BDNF is anterogradely transported from the cortex to
striatum (Altar et al. 1997) via the cortico-striatal afferents (Fusco et al. 1999) in which Htt and
BDNF colocalize. YAC18 mice overexpressing wild-type Htt showed a significant increase in
cortical production and striatal levels of BDNF (Zuccato et al. 2001) compared with control
littermates. On the contrary, reduced BDNF mRNA levels were found in brain samples from wild-
type Htt-depleted mice as well as in heterozygous Htt knock-out mice (Zuccato et al. 2003). Wild-
type Htt promotes cortico-striatal BDNF expression by enhancing transcription of exon II of the
BDNF gene (Zuccato et al. 2001). This function is exclusive to wild-type Htt, indeed mice
overexpressing mHtt show a decrease of BDNF levels compared with controls (Zuccato et al.
2001).
Wt Htt is also involved in BDNF vesicle trafficking along microtubules, through its interaction with
the molecular motors dynein/dynactin and kinesin (Caviston et al. 2007). BDNF vesicle trafficking
is enhanced in the presence of wild-type Htt and conversely reduced either in the presence of mHtt
or when the levels of wild-type Htt are reduced by RNA interference (Gauthier et al. 2004).
Besides the BDNF vesicles, Htt transports synaptic precursor vesicles (Zala et al. 2013), v-SNARE
VAMP7 protein containing vesicles (Colin et al. 2008), autophagosomes (Y. C. Wong & Holzbaur
2014), endosomes and lysosomes (Liot et al. 2013). Htt mediates the transport of organelles, in both
the anterograde and retrograde directions, and in axons and dendrites within neurons.
Furthermore, Htt is also involved in endocytosis, vesicle recycling and endosomal trafficking
(Waelter et al. 2001) (Harjes & Wanker 2003) (Kaltenbach et al. 2007) (Moreira Sousa et al. 2013).

Introduction
12
Wild-type Htt can affect gene transcription in many different ways. Indeed it interacts with
numerous transcription factors, as the cAMP-response element (CREB)-binding protein (CBP)
(Steffan et al. 2000) and the nuclear factor-kB (NF-kB) (Takano & Gusella 2002). Htt also binds
transcriptional activators and repressors as the Gln-Ala repeat transcriptional activator CA150
(Holbert et al. 2001) and the repressor element-1 transcription factor/neuron restrictive silencer
factor (REST/NRSF) (Zuccato et al. 2003). Further target of Htt are nuclear receptors, including
LXRa and peroxisome proliferator-activated receptor-g (PPARg) (Futter et al. 2009). Htt also
activates the transcription of genes containing a conserved repressor element 1 sequence (RE1, also
named the neuron-restrictive silencer element NRSE) (Zuccato et al. 2003), recognized by REST
transcriptional silencer. One of the most important NRSF-regulated genes is the BDNF gene
(Zuccato et al. 2001). Htt may also act as a transcriptional cofactor itself (Benn et al. 2008) and a
chromatin remodeling factor (Seong et al. 2009). Finally, Htt may mediate the transport to the
nucleus of transcription factors and regulators (Marcora et al. 2003).
Htt is involved in autophagy cellular process. Through its scaffolding function of the
dynein/dynactin/HAP1 complex, Htt regulates the retrograde transport of autophagosomes along
axons (Wong & Holzbaur 2014). Htt also participates in the clathrin coated-mediated post-Golgi
trafficking to lysosomes through its interaction with optineurin/Rab8 (del Toro et al. 2009). An
essential role for Htt in p62-dependent cargo recognition, required for correct sequestration of cargo
into autophagosomes, has been recently identified (Rui et al. 2015). This autophagy regulatory
function of HTT is conserved from flies to humans (Rui et al. 2015).
Finally, Htt play also an essential role in mitotic spindle positioning in mammary stem cells (Elias
et al. 2014) and it is required for correct ciliogenesis (Keryer et al. 2011).
1.6 Molecular dysfunctions in HD
Many pathogenic mechanisms have been identified in HD including proteolysis and aggregation of
mutant Htt (mHtt) (Vonsattel et al. 1985) (Poirier et al. 2002) (Legleiter et al. 2010), mitochondrial
dysfunction (Gu et al. 1996) (Panov et al. 2002) (Chen et al. 2007) (Browne 2008), impaired protein
degradation pathways (Bennett et al. 2007) (Martinez-Vicente et al. 2010), reduction of striatal
BDNF (Gauthier et al. 2004) (Zuccato et al. 2008) (Zuccato and Cattaneo 2009).
In this introduction HD mechanisms related to altered transcriptional dysregulation, synaptic
alterations and glial dysfunctions will be considered.

Introduction
13
Transcriptional dysregulation
A large number of studies have provided evidence for transcriptional abnormalities in HD, even
before the onset of symptoms (Cha 2007). These include changes in mRNA levels, direct
interactions between Htt and proteins of the transcriptional machinery, and inhibition of enzymes
involved in chromatin remodeling.
A whole-genome analysis, based on a microarray platform, revealed that the variety of altered
genes increased with the progression of the disease (Chan et al. 2002) (Luthi-Carter et al. 2002)
(Sipione et al. 2002). In particular, the altered genes were associated with transcriptional processes,
neurotransmitter receptors, synaptic transmission, cytoskeletal and structural proteins, intracellular
signaling, and calcium homeostasis.
In 2006, Luthi-Carter completed a gene expression profile of HD patients (Hodges et al. 2006),
showing gene expression changes in the caudate and motor cortex and confirming the set of down-
regulated genes previously identified in HD transgenic mice (Luthi-Carter et al. 2002). Gene
expression profile studies revealed that transcriptional abnormalities occurred also in the skeletal
muscles (Luthi-Carter et al. 2002) (Strand et al. 2005). It was also found that mHtt itself can repress
transcription of genes binding their specific transcriptional factors (Zhai et al. 2005) (Benn et al.
2008). Indeed TFIID, TFIIF, and TAFII130, which are components of the core transcriptional
machinery, are direct targets of mHtt (Shimohata et al. 2000) (Dunah et al. 2002) (Zhai et al. 2005).
One of the main transcriptional abnormalities described in HD concerns the neuronal gene
repression mediated by the transcription factor REST/NRSF (Zuccato et al. 2007). REST/NRSF
represses a large cohort of neuronal-specific genes, among the BDNF gene, through recruitment of
the DNA regulatory motif RE1/NRSE (Ooi & Wood 2007). RE1/NRSE silencing activity is
inhibited in the presence of wild-type Htt, on the contrary protein mutation induces the activation of
RE1/NRSE leading to a significant decrease of BDNF levels (Zuccato et al. 2003) (Zuccato et al.
2007). By using a microarray-based survey of gene expression in a large cohort of HD patients and
matched controls (Hodges et al. 2006), most of REST/NRSF target genes were found down
regulated in the HD caudate (Johnson & Buckley 2009). Transcriptional dysregulation in HD was
also linked to energy defects since Htt inhibits expression of PGC-1α, the main transcription
coactivator involved in the regulation of cellular energy metabolism (Cui et al. 2006). Mutant Htt
may interfere with gene expression also by inducing modifications in chromatin structure. The
expanded polyQ can indeed directly bind CREB binding protein (CBP) and p300/CBP associated
factor (P/CAF), blocking their acetyltransferase activity (Steffan et al. 2001). This results in a
condensed chromatin state and reduced gene transcription.
Introduction
14
Synaptic alterations
Survival and activity of striatal neurons, the most affected neuronal population in HD, depend on
glutamate release from the cortical afferents. An increased glutamate release from cortical afferents
in parallel with reduced uptake of glutamate by glial cells may contribute to the excessive activation
of glutamate receptors observed in HD. Impaired clearance of glutamate from the synaptic cleft
may also contribute to enhance excitotoxic neurodegeneration in HD. In some HD mouse models
(R6/2 and R6/1 lines), the Na+-dependent glial transporter of glutamate GLT1 is down-regulated
and appears responsible for decreased striatal glutamate uptake (Liévens et al. 2001) (Estrada-
Sánchez et al. 2009). Decreased GLT1 mRNA and deficient glutamate uptake has also been
reported in post mortem brain tissues taken from HD patients (Arzberger et al. 1997) (Hassel et al.
2008). Results from electrophysiological experiments also confirmed the excitotoxic hypothesis.
Enhanced NMDA receptors sensitivity to NMDA and increased NMDA evoked currents have been
described in striatal neurons from full-length HD mouse models (Fan & Raymond 2007).
Furthermore, altered information processing in the prefrontal cortex of HD mouse models and
dysregulation of coordinated neuronal firing patterns in striatum (Miller et al. 2008) (Walker et al.
2008) suggest that the loss of connectivity between the cortex and striatum may participate in the
excitotoxic process and contribute to the development of the HD phenotype.
Mutant Htt causes also the over activation (Song et al. 2003) and the trafficking impairment of
NMDA receptors (Fan et al. 2007). Also changes in NMDA receptors protein level or subunits have
been proposed as possible mechanisms responsible for aberrant NMDA receptors activity in HD
(Cepeda et al. 2001) (Ali & Levine 2006) (Fan et al. 2007). The R6/2 transgenic mouse model
displays a deficiency in metabotropic glutamate receptor mGluR2 that could lead to glutamate-
mediated overstimulation of the postsynaptic striatal neurons (Cha et al. 1998) (Cha et al. 1999)
(Luthi-Carter et al. 2000) (Luthi-Carter et al. 2003). Other mechanisms can contribute to
excitotoxicity in HD. The polyglutamine expansion alters the interaction between Htt and post-
synaptic density 95 (PSD95) scaffolding protein, resulting in the sensitization of NMDA receptors
(Sun et al. 2001). In HD patients, a significant decrease in NMDA receptor (NMDAR) binding at
pre- and early symptomatic stages has been detected (London et al. 1980) (Young et al. 1988)
(Albin et al. 1990) (DiFiglia 1990).
Contrary to all these studies, a recent paper has shown that glutamate clearance in the striatum of
R6/2 mice is normal or even accelerated (Parsons et al. 2016). Indeed, thanks to an innovative
approach based on a real-time imaging technique using a fluorescent reporter as glutamate sensor
(iGluSnFR) it was possible to quantify real-time glutamate dynamics in R6/2 mouse models. This

Introduction
15
evidence supports the hypothesis that glutamate clearance is not the major contributor to excitotoxic
cell death in HD.
Other neurotransmitter systems, controlling the activity of the corticostriatal synapse, result
compromised in HD, contributing to striatal excitotoxicity. Evidence of aberrant Adenosine 2A
receptor function (Tarditi et al. 2006) as well as downregulation of the dopamine transporter and D1
and D2 receptors has also been reported in HD brains (Augood et al. 1997) (Cha et al. 1998) (Cha et
al. 1999).
Glial dysfunctions
Astroglia represent the major cellular component of the CNS and their dysfunction contributes to
the pathogenesis of most neurological diseases. Glial cells expressing mutant HTT are characterized
by compromised morphology and function that can exacerbate neurological symptoms in HD (Hebb
et al. 1999) (Shin et al. 2005). Accordingly, transgenic mice that express N-terminal mHtt under the
control of GFAP promoter, display age-dependent neurological phenotype and accumulation of
mutant protein in astrocytes (Bradford et al. 2009).
Many studies demonstrate that one of the most important astrocyte-mediated mechanisms altered in
HD is the glutamate uptake for preventing neuronal excitotoxicity.
Indeed, in vitro experiments have shown that the expression of mHtt in HD astrocytes results in a
decreased expression of GLT-1 and GLAST glutamate transporters (Shin et al. 2005). Time-
dependent reduced expression of both GLT-1 and GLAST was observed in striatal specimens from
HD subjects and in an HD animal model expressing short N-terminal fragment of mHtt selectively
into striatal astrocytes (Faideau et al. 2010). The same results emerged by analyzing the levels of
these glutamate transporters in the R6/2 transgenic mice (Behrens et al. 2002) (Estrada-Sánchez et
al. 2009). In addition to glutamate transporters abnormalities, a defect in Ca(2+)-dependent
glutamate exocytosis has also been demonstrated in HD astrocytes (Lee et al. 2013).
Another well-known astrocytic homoeostatic function is to regulate extracellular potassium. A
recent study found that symptom onset in R6/2 and Q175 HD mouse models was associated with
decreased expression of striatal astrocytes Kir4.1 K+ channel, leading to elevated striatal
extracellular K+ in vivo. Interestingly, restoration of Kir4.1 function normalized extracellular K+,
ameliorated aspects of MSN dysfunction, prolonged survival and attenuated some motor
phenotypes in R6/2 mice (Tong et al. 2014). These results were recently confirmed by a new study
showing early-onset astrocytes loss of Kir4.1- and Glt1-mediated homeostatic functions in R6/2
mice, which may in turn contribute to altered MSNs in the striatum (Jiang et al. 2016).

Introduction
16
All these findings suggest that the presence of mutant Htt in astrocytes impairs glial glutamate
potassium and calcium homeostasis leading to excitotoxicity that may contribute to HD
pathogenesis.
Normally, astrocytes are also an important source of BDNF in the brain (Miyamoto et al. 2015) but
the expression of mHtt inhibits BDNF exocytosis from these cells (Hong et al. 2016).
As described later in a dedicated paragraph, another important function of astrocytes consists in
supplying cholesterol to neuronal cells by ApoE-containing lipoproteins (Lahiri 2004). A paper
from our lab has shown that astrocytes bearing the Htt protein containing increasing CAG repeats
secreted less apoE-lipoprotein-bound cholesterol in the medium (Valenza et al. 2015). Furthermore,
conditioned media from HD astrocytes was detrimental in a neurite outgrowth assay and did not
support synaptic activity in HD neurons, compared with conditioned media from wild-type (wt)
astrocytes (Valenza et al. 2015).
A recent work have further investigated the role of glial cells in HD, by neonatally engrafting
immunodeficient mice with mutant Htt (mHTT)-expressing human glial progenitor cells (hGPCs)
(Benraiss et al. 2016). It was found that while mHTT glia impaired behavioral phenotype of healthy
mice, normal glia engraftment was able to ameliorate aspects of the disease in transgenic HD mice.
All the described dysfunctions represent potential therapeutic target for HD treatment. However, the
discovery of genetic cause of HD have offered the opportunity to develop genetic approaches aimed
at inhibiting mutant Htt expression, which are currently considered among the most promising
emerging therapeutics for HD (Garriga-Canut et al. 2012) (Magen & Hornstein 2014). The use of
antisense oligonucleotides (ASOs) have been found to reduce mutant Htt-associated abnormalities
in animal models of HD (Kordasiewicz et al. 2012) (Skotte et al. 2014). Ionis Pharmaceuticals, has
initiated a clinical study with this “Htt lowering” strategy.
2. MOUSE MODELS OF HD There are a variety of mouse models available for the study of HD that recapitulate many of the
features of the human disease. HD animal models can be divided into two broad categories,
nongenetic and genetic. Nongenetic models are easy to generate and use, and basically induce cell
death by excitotoxic mechanisms or by alteration of mitochondrial metabolism.
Genetic models differ in their CAG repeat numbers (and stability of the stretch), size and species of
origin (mouse or human) of the Htt protein, promoters driving the protein expression and their

Introduction
17
background strain. As a consequence, each model exhibits a different characteristic phenotype.
Genetic models can be grouped into:
- N-terminal transgenic animals, carrying the 5’ portion of the human mutant HTT gene, including
exon 1 that contains the CAG repeat region.
- Full-length transgenic models, expressing full-length mutant HTT.
- Knock-in models, carrying an expanded polyglutamine stretch within the mouse HTT protein.
2.1 The R6/2 transgenic model
The R6/2 is the most widely studied transgenic mouse model of HD. It allows a depth and relatively
rapid evaluation of the efficacy of pre-clinical therapeutic strategies, for this reason R6/2 model is
been chosen for our in vivo studies.
This animal model was generated by random insertion into the mouse genome of exon 1 from the 5’
end of the human HTT gene, with approximately 150 CAG repeats (Mangiarini et al. 1996). In
these mice the transgene expression is driven by the human Htt promoter and reach 75% of the level
of the endogenous gene in all cells (Mangiarini et al. 1996). This model is characterized by a very
aggressive, rapidly progressing phenotype, similar to the juvenile form of HD in humans. Most of
the behavioral symptoms appear around 8-9 weeks of age and average life expectancy is around 14
weeks.
During the progression of the disease, R6/2 mice develop both motor and cognitive dysfunctions.
Motor symptoms include resting tremor, chorea-like movements, stereotypic involuntary grooming
movements and clasping behavior (Mangiarini et al. 1996) (Stack et al. 2005). Starting from 3
weeks of age, mice display locomotor hyperactivity (Lüesse et al. 2001), while around 8 weeks of
age they become hypoactive (Carter et al. 1999) (Stack et al. 2005). In the same period, R6/2 begin
to show an abnormal paw clasping response, recognizable by dystonia of the limbs when suspended
by the tail. Around 8 weeks of age, other gradual changes in motor function, such as stereotypical
hindlimb grooming and involuntary movements appear. As a result, R6/2 motor coordination,
assessed by the Rotarod test, progressively deteriorates by 8–12 weeks of age (Carter et al. 1999)
(Lüesse et al. 2001). R6/2 mice exhibit severe cognitive abnormalities before the onset of motor
defects (Lione et al. 1999). At 3.5 weeks their performance in the hippocampal dependent Morris
water maze spatial learning task is impaired. Furthermore, at around 8 weeks of age, these animals
completely lose the ability to learn the task, partly for the worsening in swimming ability (Lione et
al. 1999) (Murphy et al. 2000). R6/2 mice also demonstrate difficulty in reversing pre-learned tasks
in the two-choice swim T-maze (Lione et al. 1999). This particular test requires correct functioning
of the frontostriatal circuitry that allows to subjects to replace of a previously learned strategy
Introduction
18
(Goldberg et al. 1990) (Van Raamsdonk et al. 2005). It is known that the impairment of these neural
pathways results in loss in executive function, procedural memory and psychomotor skills in HD
patients (Heindel et al. 1988) (Bylsma et al. 1990) (Lange et al. 1995), therefore deficits in the T-
maze may be more closely related to those seen in HD. Finally, R6/2 mice display impaired long-
term memory (LTM) during disease progression (Giralt et al. 2011) as assessed by the Novel Object
Recognition test (NORT), based on the spontaneous tendency of rodents to spend more time
exploring a novel object than a familiar one (Antunes & Biala 2012).
R6/2 mice are also characterized by many neuropathological signs. In particular, this animal model
demonstrate robust brain atrophy (about 20% brain weight loss at 12 weeks) (Davies et al. 1997)
but only moderate cerebral cell death. Since only a small number of cortical and striatal neurons
undergo “dark cell degeneration” (Turmaine et al. 2000), probably the significant reduction in brain
volume is the result of atrophy of individual neurons and massive decrease in neuropil. Indeed, the
cell bodies of striatal medium-sized spiny neurons have been described to shrink by around 20% in
surface area and the size of their dendritic fields is also reduced (Klapstein et al. 2001). Another
frequently used pathological endpoint in R6/2 mice is the presence of mutant Htt-containing nuclear
inclusions (NIs) and neuropil aggregates (NAs) in different brain regions. Aggregates and
inclusions first appear in the striatum and the cortex around 3–4 weeks of age and progressively
increase until late symptomatic phase in which around 98% of the striatal projection neurons
(calbindin positive) exhibit Htt inclusions (Meade et al. 2002). Glial cells do not appear to develop
these protein inclusions (Davies et al. 1997). In R6/2 mouse model an alteration in gene expression
is also evident. Within the striatum, the levels of mRNAs encoding components of the
neurotransmitter, calcium and retinoid signaling pathways are decreased at both early and late
symptomatic time points (6 and 12 weeks of age). Conversely some genes associated with cell
stress and inflammation appear to be upregulated in striatum but also in cerebellum and in
peripheral tissues of R6/2 mice (Luthi-Carter et al. 2000) (Luthi-Carter et al. 2002). In addition,
increases in markers for oxidative damage to DNA (Bogdanov et al. 2001) and mitochondrial
dysfunctions (Tabrizi et al. 2000) have been found in R6/2 striatum.
Different studies revealed an abnormal neurotransmission in R6/2 mice that may account for striatal
neuronal vulnerability. Starting from 8 weeks of age, to advanced stages of the disease, cortico-
striatal LTP results impaired in R6/2 mice (Kung et al. 2007). Striatal neurons exhibit more
depolarized resting potentials (Levine et al. 1999) and increased intracellular calcium levels
(Hansson et al. 2001). Furthermore, alterations in the firing patterns of cortico-striatal fibers have
been demonstrated in the brains of R6/2 mice (Cepeda et al. 2003) together with changes in
neurotransmitter release (Behrens et al. 2002). At specific stages of the disease R6/2 mice show
Introduction
19
reduced synthesis of neurotransmitters such as dopamine (Hickey et al. 2002) (Johnson et al. 2006)
and serotonin (Reynolds et al. 1999) (Yohrling IV et al. 2002), but also severe alterations in the
levels of synaptic proteins (Morton et al. 2001) and deficits in glial glutamate uptake (Liévens et al.
2001). At the postsynaptic sites R6/2 mice display a progressive reduction in dopamine and
glutamate receptors expression (Cha et al. 1998) (Cha et al. 1999) (Zucker et al. 2005).
R6/2 mice also suffer from epileptic seizures and spontaneous shuddering movements. Starting
from 9weeks of age their body weight progressively decline and at the end of their life is
approximately 70% less than their wild-type littermates (Mangiarini et al. 1996).
3. BRAIN CHOLESTEROL 3.1 Brain cholesterol in physiologic condition
The brain is the most cholesterol-rich organ, with about 25% of the whole body’s cholesterol
(Bjorkhem 2004) (Dietschy 2004). The content of cholesterol within the brain is 15–30 mg/g tissue,
whereas the average in other tissues is at 2–3 mg/g tissue (Dietschy 2009). Essentially all brain
cholesterol (>99.5%) is unesterified, but small amounts of desmosterol and cholesteryl ester are also
present. Brain cholesterol is a basic component of myelin sheaths and plasma membranes of both
astrocytes and neurons (Dietschy and Turley 2001). Moreover, brain cholesterol is a necessary
precursor of neurosteroids (Zwain & Yen 1999).
All brain cholesterol is de novo locally synthetized, since the blood–brain barrier (BBB) efficiently
prevents exchange with circulating lipoprotein cholesterol. This allows to keep constant the levels
of cholesterol within the brain. Overall, brain cholesterol homeostasis is maintained by the dynamic
equilibrium among de novo synthesis, transport, storage, removal and recycle.
The larger pool (about 70%–80%) of brain cholesterol is produced by oligodendrocytes, with a very
slow turnover (half-life of approximately 5 years) (Russell et al. 2009), to form myelin sheaths, an
electrically insulating layer surrounding neuronal cells. Indeed, during the period of active
myelination the rate of cholesterol synthesis reaches the highest levels. With the conclusion of brain
maturation and myelin formation phases, the production of cholesterol drops by 90%. Brain
cholesterol half-life has been estimated to be at least 5 years in humans and 4-6 months in mice
(Björkhem et al. 1998) (Dietschy and Turley 2001).
While in the developing brain a minor pool of cholesterol is synthesized by neurons (Saito et al.
2009), in adulthood neurons completely rely on glia-derived cholesterol (Nieweg et al. 2009). This
strategy allows to avoid costly cholesterol synthesis. Indeed, more than 100 mol of ATP are
required for the synthesis of one mole of cholesterol (Poirier et al. 1993).

Introduction
20
As it will be described in a more detailed paragraph, brain cholesterol actively contributes to
synapse formation and synaptic transmission.
Cholesterol synthesis in the brain
The first step of de novo brain cholesterol biosynthesis consists in the conversion of acetyl-CoA
into 3-hydroxyl-3-methylglutaryl-CoA, catalyzed by HMG-CoA synthetase. Then 3-hydroxyl-3-
methylglutaryl-CoA is converted into mevalonate by HMG-CoA reductase. The HMG-CoA
reductase-catalyzed reaction is considered an irreversible and rate-limiting step of cholesterol
biosynthesis.
There are two cholesterologenic pathways in the brain (Fig. 1): the Kandutsch-Russel cholesterol
synthetic pathway, and the Bloch pathway typical of neurons and astrocytes respectively (Leoni and
Caccia 2015).
The intracellular machinery for cholesterol synthesis is located in the endoplasmic reticulum (ER).
Transcriptional regulation of cholesterol synthesis and uptake depends on sterol regulatory element
binding proteins (SREBPs) (Ye & DeBose-Boyd 2011), a class of transcription factors of the basic
helix–loop–helix leucine zipper (bHLH-Zip) family. Three distinct SREBP isoforms have been
identified: -1a, -1c and -2. SREBP-1a is constitutively expressed in the cell as a ‘low-specificity’
regulator, targeting all genes containing sterol response elements (SRE) (Eberlé et al. 2004). By
contrast, the inducible SREBP-1c and SREBP-2 promote the expression of genes involved in fatty-
acid and cholesterol metabolism respectively (Eberlé et al. 2004). In particular, the SREBP-2
transcription factor directly interacts with the cholesterol sensor SREBP cleavage-activating protein
(SCAP). In conditions of high cholesterol concentrations, the SREBP-2/SCAP complex is retained
in the ER membranes by the retention insulin-induced proteins 1 and 2 (INSIG-1 and -2). On the
contrary, cholesterol depletion results in the loss of interaction between the INSIG retention
complex and SREBP-2/SCAP, allowing SCAP to escort SREBP-2 to the Golgi compartment.
Within the Golgi apparatus, SCAP releases the N-terminal domain of SREBP-2, which can
translocate to the nucleus and bind to the sterol regulatory elements (SRE) in the promoter regions
of target genes involved in cholesterol biosynthesis (Dietschy 2009) (Leoni and Caccia 2015).
The critical role of SCAP is confirmed by evidences of a substantial (30–40%) reduction in brain
cholesterol synthesis, with deleterious effects on synaptic transmission and cognitive function, in
SCAP knockout mice (Suzuki et al. 2013). Furthermore, mice in which SCAP is mutated in
schwann cells exhibit congenital hypomyelination and neuropathy-related behavior, tremor and
abnormal gait (Verheijen et al. 2009).

Introduction
21
Figure 1. Schematic representation of the Bloch and Kandutsch-Russel pathways for cholesterol synthesis. Broken arrows indicate potential sites of crossover from the Bloch to Kandutsch-Russel pathway. (From: Mitsche, Matthew et al. 2015. “Flux Analysis of Cholesterol Biosynthesis in Vivo Reveals Multiple Tissue and Cell-Type Specific Pathways.” eLife 4.) Brain cholesterol storage
Typically, esterified cholesterol represents ~1% of the total cholesterol pool. The enzyme
responsible for cholesterol esterification is acylcoenzyme A: cholesterol acyltransferase 1
(ACAT1/SOAT1). ACAT1/SOAT1 is located in ER and is upregulated in response to intracellular
high cholesterol levels that induce cholesterol movement from the plasma membrane to the ER
(Cheng et al. 1995) (Chang et al. 1997). ACAT1/SOAT1 is generally more active in neurons than in
glial cells (Sakashita et al. 2000) although, following impaired cholesterol efflux or exogenous
cholesterol surplus, the astrocytic enzyme become more active (Karten, Robert B. Campenot, et al.
2006).

Introduction
22
Regulators of intercellular and intracellular cholesterol trafficking
In adult brain, astrocytes represent the major producers of cholesterol, which is transported to
neurons via apolipoproteins and lipids. Astrocytes are also the major source of apolipoprotein E
(ApoE) (Mahley et al. 2006), a key apolipoprotein required for extracellular transport of cholesterol
and other lipids between astrocytes and neurons or oligodendrocytes (Lahiri 2004). The synthesis of
ApoE by glial cells increase up to 150 fold in case of nerve injury (Boyles et al. 1990). The stability
of ApoE in the brain depends from the association with lipids. In particular, lipidation and secretion
of ApoE are mediated by one or several ATP-binding cassette transporters (ABC), such as ABCA1,
ABCG1, and ABCG4 (Hayashi 2011). The major classes in the brain are ABCA and ABCG,
critical transporters for lipid homeostasis (Dean et al. 2001) (Puglielli et al. 2003). The initial
transfer of lipids into lipid-free apolipoproteins, including ApoE, is catalyzed by ABCA1 whereas
ABCG1 mediates lipidation in a second phase (Vaughan & Oram 2006). ABCA1 is expressed in
both neurons and glial cells (Wellington et al. 2002).
In ABCA1 knockout mice a significant decrease of ApoE lipidation, with consequent decline of
cholesterol and ApoE levels, are observed in brain and cerebrospinal fluid (CSF) (Hirsch-
Reinshagen et al. 2004) (Wahrle et al. 2004). These mice exhibit also cortical astrogliosis, increased
inflammatory gene expression, altered synaptic transmission and sensomotor behavior (Karasinska
et al. 2013).
The Low-Density Lipoprotein receptor (LDLR) and the Low Density Lipoprotein Receptor-related
Protein 1 (LRP1) are the main receptors responsible for the uptake of ApoE-containing lipoproteins
in the brain. In particular LDLR is highly expressed in glial cells than in neurons, on the contrary
LRP1 is mainly found in neurons (Rebeck et al. 1993) and transports ApoE in a more efficiently
way, due to the elevated rates of endocytic recycling (Li et al. 2001). The interaction between
ApoE-particles and these receptors activate signaling pathways essential for neuronal survival and
correct activity (Hayashi 2011) (Lane-Donovan et al. 2015). The crucial role of LRP1 is confirmed
by the evidence that its ablation in neuronal cells leads to global impairment of cholesterol
homeostasis and neurodegeneration (Liu et al. 2010).
Externally uptaken low-density lipoproteins are rapidly transported to late endosomal/lysosomal
compartments where they are hydrolyzed. Consequently free cholesterol can reach subcellular
membrane compartments whereas lipoproteins are recycled to the plasma membrane (Rensen et al.
2000) (Soccio 2004).
Cholesterol intracellular movement can be vesicle-dependent or vesicle-independent (Maxfield &
Wüstner 2002). Cholesterol vesicle-mediated trafficking, along cytoskeletal tracks, involves ATP-
dependent proteases. Conversely, non-vesicular transport can be mediated by diffusible carrier

Introduction
23
proteins characterized by hydrophobic cavities for cholesterol binding and transport across the
aqueous cytosol. A key player of non-vesicular trafficking is the cholesterol transport protein
steroidogenic acute regulatory protein (StAR) (Alpy 2005). The intracellular trafficking of
cholesterol is also related to Niemann-Pick type C1 (NPC1) and C2 (NPC2) proteins, expressed in
both neurons and glial cells (Prasad et al. 2000) (German et al. 2002). In particular, NPC1 is a
transmembrane protein with a sterol-sensitive domain (Carstea et al. 1997) and NPC2 is an
intralumenal component that binds cholesterol (Soccio 2004). Both these proteins are essential to
avoid unesterified cholesterol accumulation in the late endosome/lysosome, condition that could
leads to pathologic changes in neurons and glial cells (Baudry et al. 2003) (Reid et al. 2004).
Cholesterol efflux from the brain
As cholesterol-recycling mechanisms are not sufficient to maintain steady state within the brain,
excess cholesterol needs to be removed.
A minor mechanism for cholesterol removal consists in ApoE-bound cholesterol excretion through
the CSF (Pitas et al. 1987). According to the CSF cholesterol content and the rate of CSF renewal,
this mechanism allows to eliminate about 1-2 mg of cholesterol per day.
However, the most important removal mechanism is based on cholesterol conversion into 24S-
hydroxycholesterol (24OHC), catalyzed by cholesterol 24-hydroxylase (encoded by CYP46A1, a
member of the cytochrome p450 family). CYP46A1 is normally expressed in neuronal cells bodies
and dendrites (large pyramidal cells of cortical areas, hippocampal cells, amygdale cells, putamen
cells, thalamic cells, Purkinje cells), suggesting that a strict regulation of cholesterol content is
required in these cells (Russell et al. 2009). Conversely, only a little expression of CYP46A1 was
observed in glial cells (Ramirez et al. 2008).
Contrary to cholesterol, 24-OHC is able to cross the blood–brain barrier (Lütjohann et al. 1996)
(Björkhem et al. 1997) (Björkhem et al. 1998).
The rapid transfer of 24-OHC, over lipophilic membranes, is due to an energetically favorable
reordering of membrane phospholipids in parallel with an increase in the membrane surface area,
induced by the hydroxyl group in the side chain (Kessel et al. 2001) (Meaney et al. 2002). The
direction of the net flux across the membrane is probably influenced by oxysterol concentration
gradient. The estimated amount of 24-OHC moving from the brain into the circulation is 6-7 mg per
day (Lütjohann et al. 1996) (Björkhem et al. 1998). Interestingly, CYP46 knockout mice showed a
dramatic decrease (about 64%) in sterol export from the brain in parallel to a reduction (about 40%)
in cholesterol synthesis, suggesting a close relation between synthesis and metabolism of
Introduction
24
cholesterol within the brain (Lund et al. 2003). Once in the circulation, 24-OHC binds to LDL, is
taken up by hepatocytes and finally excreted in bile salts (Russell et al. 2009).
Whereas in mice, 24-OHC production has been reported also in the liver, human 24-OHC is
exclusively of cerebral origin (Lund et al. 1999) (Lund et al. 2003). Consequently, 24-OHC can
represent a useful marker of brain cholesterol homeostasis in humans. In different neurological
diseases an alteration of plasma levels of 24-OHC is observed (Lütjohann et al. 2000) (Leoni et al.
2002) (Leoni et al. 2013).
The brain-derived cholesterol metabolite 24-OHC, as other oxysterols, can activate the nuclear
liver-X receptors (LXR), ligand-activated transcription factors, recognized as master regulators of
cholesterol homeostasis in the CNS (Janowski et al. 1996) (Lehmann et al. 1997) (Edwards et al.
2002). LXRs, directly interact with the retinoid X receptors (RXRs), forming heterodimers that
regulate the expression of target genes, by binding to LXR-response elements within genes
regulatory regions. There are two isoforms of LXRs: LXRα, prominently expressed in the liver,
kidney and other peripheral tissues, and LXRβ, expressed in the brain and liver (Zhao & Dahlman-
Wright 2010).
LXRs are considered key cholesterol sensors. Following excessive increase of cholesterol, cellular
oxysterols, including 24-OHC, accumulate, activating LXR. Consequently, LXR positively regulate
ApoE transcription in astrocytes and increase the expression of its lipidating transporters ABCA1
and ABCG1, in neurons and glia, protecting cells from cholesterol overload (Fukumoto et al. 2002)
(Pfrieger and Ungerer 2011) (Vitali et al. 2014).
LXRs are also involved in cellular cholesterol uptake, downregulating lipoprotein receptor cell
surface expression through the inducible degrader of LDLR (IDOL) pathway (Zelcer et al. 2009).
The complex mechanism of cholesterol homeostasis within the brain is summarized in Fig. 2.

Introduction
25
Figure 2. Schematic representation of brain cholesterol metabolism. (From: Courtney, Rebecca, and Gary E. Landreth. 2016. “LXR Regulation of Brain Cholesterol: From Development to Disease.” Trends in Endocrinology and Metabolism.) Cholesterol and synaptic transmission
Cholesterol is an essential component of cells membranes, able to affect their biophysical properties
(Yeagle 1985). Cholesterol is particularly enriched in the cytosolic leaflet of the plasma membranes
(Mondal et al. 2008), within micro-domains named “lipid rafts”. Lipid rafts are considered highly
dynamic scaffolding regions, which connect multiple signal transduction pathways (Martens et al.
2004) (Lingwood & Simons 2010) involving ion channels, transporters and receptors (Burger et al.
2000). Notably, in neuronal cells, lipid rafts and their enclosed cholesterol play a crucial role in
both pre- and postsynaptic terminals (Gil et al. 2006) (Allen et al. 2007). Brain cholesterol regulates
multiple processes, important for the maintenance of synapse organization, synaptogenesis, and
synaptic vesicles recycling (Mauch et al. 2001) (Hering et al. 2003) (Pfrieger 2003) (Rohrbough &
Broadie 2005). In particular, at presynaptic site, cholesterol is the major component of vesicle
membranes. It is required for synaptic vesicle fusion, since it ensures the appropriate membrane
curvature during the process (Chen & Rand 1997). Furthermore, cholesterol promotes membrane
fusion by interacting with the synaptic vesicles integral membrane protein synaptophysin (Thiele et
al. 2000), and by concentrating, at fusion-competent sites, other integral membrane proteins named

Introduction
26
SNAREs (Lang et al. 2001) (Chamberlain & Gould 2002). Different studies reveal fusion
inhibition, and impaired synaptic vesicle exocytosis and transmission, following cholesterol
removal from membranes (Lang et al. 2001) (Linetti et al. 2010).
At postsynaptic site cholesterol is involved in composition, localization and
trafficking/internalization of neurotransmitter receptors (Burger et al. 2000) (Sooksawate &
Simmonds 2001), mediating learning and memory processes (Bliss & Collingridge 1993) (Plant et
al. 2006). Poor availability of cholesterol results in impaired lateral mobility and endocytosis of
AMPA receptors that accumulate in neuronal lipid rafts (Martin et al. 2014). Cholesterol depletion
also prevents NMDA-dependent Ca2+ influx in neuronal cells (Frank et al. 2004) and inhibits
NMDA-induced hippocampal long-term potentiation (LTP) (Frank et al. 2008). Accordingly, age-
dependent decrease in hippocampal cholesterol content, leads to deficits in glutamate receptor
internalization and consequent long-term depression (LTD) impairment, through a mechanism
mediated by PI3K/Akt. Intracerebral infusion of cholesterol rescues age-related hippocampal LTD
decrease and improves hippocampal-related learning and memory processes in aging animals
(Martin et al. 2014). This study has further confirmed the crucial role of cholesterol in neuronal
function.
3.2 Brain cholesterol defect in HD
Evidences in animal models and patients
The first evidence of brain cholesterol dysfunction in HD emerges from a microarray study of
immortalized murine striatal cell lines, characterized by an inducible expression of mutant Htt N-
terminal fragment. In this inducible cellular model of HD, a downregulation of genes related to
cholesterol biosynthesis was observed in presence of mHtt (Sipione et al. 2002). A subsequent
study performed in R6/2 mice, an HD animal model expressing exon 1 of human mutant HTT
(Mangiarini et al. 1996), confirmed the transcriptional deregulation of cholesterogenic genes within
mice striatum and cortex and highlighted a significant decrease in brain sterol content (Valenza et
al. 2005). The decrease in cerebral cholesterol content was also found in other HD animal models
(Valenza et al. 2010) such as yeast artificial chromosome (YAC) transgenic mice, expressing full
length human mutant HTT (Hodgson et al. 1999), with progressively increased CAG repeats
(YAC46, YAC72, YAC128), and HdhQ111 knock-in mice, carrying an expanded CAG tract within
the mouse HD protein (Menalled 2005). Other studies in these animal models described brain
cholesterol accumulation (Trushina et al. 2006) (Del Toro et al. 2010). This discrepancy was due to
the low sensitive, colorimetric and enzymatic, methods used for cholesterol content detection,

Introduction
27
instead of more reliable analytical method such as gas chromatography-mass spectrometry (Marullo
et al. 2012).
Importantly, reduced levels of brain cholesterol biosynthesis were also observed in four different
HD rodent models (R6/2 mice, YAC mice, HdhQ111 knock-in mice and transgenic HD rats)
(Valenza et al. 2007) (Valenza et al. 2010). These studies revealed reduced activity of HMGCoAR,
the rate-controlling enzyme of cholesterol biosynthesis pathway, together with reduced levels of
cholesterol precursors (Valenza et al. 2007 a, b). These molecular abnormalities worsened in YAC
mice carrying progressively increased CAG repeats (Valenza et al. 2010), whereas HMGCoAR
activity and levels of cholesterol and its precursors increased in brain of YAC18 mice,
overexpressing normal HTT (Valenza et al. 2010) (Valenza et al. 2007).
In R6/2 and YAC128 mice brain cholesterol biosynthesis dysfunction is evident even before the
onset of behavioral symptoms, conversely significant reductions in cholesterol content are
measurable only in advanced symptomatic stages (Valenza et al. 2007) (Valenza et al. 2010).
Furthermore, a new study in heterozygous knock-in Q175 mice (Menalled et al. 2012) quantified
the rate of de novo brain cholesterol biosynthesis, by heavy water (2H2O) labeling method. From
early stages of the disease, the striatal daily synthesis rate of cholesterol was found significantly
reduced. Additionally, isotope mass spectrometry analysis revealed an inverse correlation between
the levels of lathosterol, the direct precursor of cholesterol, and the CAG size in an allelic series of
knock-in mice (Q7, Q20, Q80, Q111, Q175), at symptomatic stages. A significant correlation
between the fractional synthesis rates of total cholesterol and 24OHC in brain of wt and Q175 mice
was also observed, supporting the evidence that plasma 24OHC may reflect cholesterol synthesis in
the adult brain (Shankaran et al. 2017).
All these studies performed in multiple HD animal models reinforce the potential relevance of brain
cholesterol dysfunction to human pathology.
There are evidences of potential alterations in cholesterol biosynthetic pathway also in human HD
patients. Initial studies performed on post-mortem caudate specimens from human HD patients and
on patients-derived fibroblasts indicated reduced expression of cholesterogenic genes, compared to
controls (Valenza et al. 2005).
Additional evidence in HD patients revealed that total plasma cholesterol levels decline (Markianos
et al. 2008) according to disease progression (Leoni et al. 2008). A recent study confirmed these
findings in both pre-manifest and manifest HD subjects (Wang et al. 2014). Also two cholesterol
precursors, lanosterol and lathosterol, and the cholesterol metabolites 27OHC and 24OHC,
respectively of cerebral and peripheral origin, are lower in plasma from HD patients respect to
controls, at any disease stage (Leoni et al. 2011). These data suggest that whole body cholesterol

Introduction
28
homeostasis is disturbed in HD patients. In particular, the decrease in plasma 24OHC, an indirect
marker of metabolically active brain neurons (Lütjohann & von Bergmann 2003), was proportional
to the degree of caudate atrophy (measured as reduction of caudate volume at MRI) and to the
motor impairment in HD patients (Leoni et al. 2008). Finally, an additional study, revealed a
definitive correlation between decreasing concentration of 24OHC and the progression of striatum
atrophy and striatal volumes reduction at MRI (Leoni et al. 2013).
Molecular mechanisms of cholesterol dysfunction in HD
One of the possible mechanisms underlying cholesterol metabolism defect in HD is the reduction of
SREBP activity, linked to mHtt expression. Indeed, in HD cellular models and in R6/2 mice striata
a reduced nuclear translocation of SREBP is observed (Valenza et al. 2005).
Brain cholesterol homeostasis could be also impaired due to mutant Htt inability to bind some
nuclear receptors involved in lipid metabolism such as LXRs (Futter et al. 2009a).
A further potential interconnection exists between cholesterol dysfunction, BDNF signaling and
synaptic transmission alterations in HD. BDNF signaling in neuronal cells leads to the activation
cholesterol synthetic pathway, increases the cholesterol content in lipid rafts and facilitates the
development of a readily releasable pool of presynaptic vesicles (Suzuki et al. 2007). Mutant Htt,
by affecting both BDNF transport and release (Zuccato, Valenza, and Cattaneo 2010), could inhibit
neuronal cholesterol synthesis.
An additional key mechanism is the cross-talk between neurons and astrocytes. In adulthood
astrocytes produce and secrete cholesterol bound to ApoE lipoproteins, which is available to
neurons, but this process is altered in HD. Indeed, the expression of cholesterol biosynthesis genes
is reduced in primary astrocytes cultured from two HD mouse models (R6/2 and YAC128)
compared to control littermates (Valenza et al. 2010). Primary astrocytes from YAC128 mice also
displayed reduced mRNA levels of ABCA1, ATP binding cassette sub-family G member 4 (another
ATP binding cassette transporter highly expressed in the brain) and ApoE compared with controls
(Valenza et al. 2010). Furthemore, ApoE was predominantly associated with smaller lipoprotein
particles in CSF from HD mice (Valenza et al. 2010). These findings suggest that reduced
cholesterol biosynthesis and efflux occur in HD astrocytes, along with reduced transport in the HD
brain (Valenza et al. 2010). Accordingly, a recent study confirmed that astrocytes derived from both
neural stem knock-in cells, carrying increasing CAG repeats, and from R6/2 mice secrete lower
levels of cholesterol bound to ApoE in the culture medium, leading to a reduced availability of
cholesterol to HD neurons (Valenza et al. 2015). Glia-conditioned medium (GCM) from wt
astrocytes is able to rescue neurite outgrowth defect in NS-derived HD neurons, as well as

Introduction
29
cholesterol administration. This beneficial effect of wt GCM is abolished following silencing of
ABCA1 or SREBP2 in wt astrocytes (Valenza et al. 2015). Conversely, GCM derived from HD
astrocytes fails to support neurite outgrowth in NS-derived HD neurons. However, the induced
ABCA1 or SREBP2 N-terminal fragment over-expression in HD astrocytes makes the relative
GCM able to promote efficient neurite outgrowth in HD neurons (Valenza et al. 2015). The same
study proved that a reduced supply of glial-derived cholesterol from HD astrocytes affects synaptic
related activities (number of synapses, synaptic proteins, electrophysiological parameters) in
primary neurons cultured from R6/2 mice but this condition may be reversed by cholesterol or wt
GCM supplementation (Valenza et al. 2015).
Taken together, these observations suggest that in HD there is a reduced ApoE mediated cholesterol
transport and supply from astrocytes to neurons that might be due to a combination of reduced
activity of LXRs and a reduced SREBP activation.
Other mechanisms that can concur to perturb brain cholesterol homeostasis are the deficiency of
metabolic intermediates for cholesterol biosynthesis associated with HD mitochondrial dysfunction
(Leoni and Caccia 2015) and the alteration of membrane properties and fluidity (Muratore 2013)
that can contribute to affect the transfer of cholesterol between cells.
3.3 Brain cholesterol alterations in other neurodegenerative diseases
Dysregulation of brain cholesterol homeostasis is being linked to different chronic
neurodegenerative disorders over HD, including Niemann-Pick type C (NPC) disease, Smith-Lemli
Opitz syndrome (SLOS) and Alzheimer’s disease (AD).
Cholesterol and NPC disease
NPC is a fatal, autosomal, recessive, inherited disorder characterized be massive loss of neurons,
often accompanied by hepatosplenomegaly and lung disease (Vanier & Millat 2003). NPC disease
is directly related to cholesterol metabolism impairment, since it is caused by mutations in either the
NPC1 or NPC2 gene resulting in unesterified cholesterol and glycosphingolipids sequestration and
accumulation within the endocitic pathway (Karten et al. 2002) (Karten et al. 2005). Consequently,
a deficiency in the intracellular trafficking of cholesterol towards plasma membrane and
endoplasmic reticulum is observed. NPC1 and NPC2 are involved in recycling endosomes in
presynaptic nerve terminals thus synaptic vesicle morphology and composition are also impaired by
NPC1 dysfunction (Karten et al. 2006).
There is currently no definitive cure for NPC, but treatments based on cyclodextrin gave
encouraging results (Rosenbaum et al. 2010) (Aqul et al. 2011) (Peake & Vance 2012).
Introduction
30
Cholesterol and SLOS
SLOS is an, autosomal recessive, neurodegenerative and developmental disease caused by
mutations in the gene encoding for 7-dehydrocholesterol reductase, the enzyme that catalyzes the
final step in the cholesterol biosynthetic pathway. This condition leads to increased levels of 7-
dehydrocholesterol in parallel with a dramatic decrease in cholesterol amounts within the cells,
plasma and the brain (Porter 2006) (Porter and Herman 2011). It remains unclear whether these
disease-related processes are caused by the low level of cholesterol in the brain or by the abnormal
accumulation of the potentially toxic cholesterol precursor, 7-dehydrocholesterol. The
developmental abnormalities observed in SLOS patients might also be caused by reduced activity of
the sonic hedgehog (SHH) linked to alterations in cholesterol metabolism. Indeed SHH signaling
pathway is involved in embryonic development of the CNS, limbs and facial features (Maity et al.
2005). SHH correct activity is only ensured by the covalent attachment of a cholesterol molecule to
the protein (Porter, Young, and Beachy 1996) (Mann & Beachy 2000).
Cholesterol and AD
AD is a progressive neurodegenerative disorder that leads to memory loss and cognitive decline.
The brains of individuals affected by AD are characterized by the presence of extracellular deposits
of β-amyloid (Aβ) plaques, as well as intracellular neurofibrillary tangles that contain
hyperphosphorylated tau, a microtubule-associated protein. The accumulation of Aβ plaques and
the loss of neurons play a critical role in the development of AD (Selkoe 2002).
Although, on the contrary of NPC and SLOS disorders, a direct causal relationship has not been
found, different experimental evidences have indicated that alterations in brain cholesterol
metabolism might contribute to the pathogenesis of AD (Simons et al. 1998).
Interestingly, the secretases responsible for the generation of the Aβ peptides from the amyloid
precursor protein (APP) are located in cholesterol-enriched microdomains of the plasma membranes
(Simons et al. 1998) (Ehehalt et al. 2003). Moreover, intracellular cholesterol levels can influence
the production of the Aβ peptides (Bodovitz & Klein 1996) (Simons et al. 1998).
APOE associates with Aβ peptides, facilitating their degradation (Sanan et al. 1994). A recent study
performed in a mouse model of AD demonstrated that the induced increased production of APOE
enhanced Aβ degradation reducing Aβ plaque area within the brain (Cramer et al. 2012). Other
contrasting data have suggested that low APOE levels are associated with reduced amount of Aβ in
the brain (Bien-Ly et al. 2012). These differences could be due to the expression of different
isoforms of ApoE. The most common isoform allele is APOE3. The less widespread allele in the
human population is APOE4 whose inheritance is recognized as the strongest genetic risk factor for

Introduction
31
the development of late-onset AD (Corder et al. 1993). In contrast, inheritance of the APOE2 allele
seems to protect against AD (Corder et al. 1994).
Finally, evidences in AD mice show that ABCA1 deficiency can lead to increased amyloid
deposition (Wahrle et al. 2005), while its overexpression have the opposite effect (Wahrle et al.
2008).
4. OUR THREE SELECTED STRATEGIES FOR CHOLESTEROL
DELIVERY TO THE BRAIN Considered the critical role of brain cholesterol for correct synaptic transmission (described in
paragraph 3.1), we hypothesized that HD synaptic dysfunction could be, at least in part, due to
reduced brain cholesterol production and availability, described in different animal models
(Valenza et al. 2007) (Valenza et al. 2010) (Shankaran et al. 2017). We were interested in
investigating the therapeutic potential of brain cholesterol supply in R6/2 mice. To this end, we
tested three drug delivery strategies that allowed to overcome the obstacle of the blood-brain barrier
(BBB) in different ways.
4.1 Surface-Modified Poly(lactic-co-glycolic acid) (PLGA) Nanoparticles (NPs) (Strategy 1)
PLGA is one of the most successfully used synthetic polymers in biomedical devices. Indeed, it has
been approved by the US Food and Drug Administration (FDA) and European Medicine Agency
(EMA) due to its high biodegradability (Mundargi et al. 2008). Once in the body, PLGA is
degraded by non-enzymatic hydrolysis leading to the formation of lactic acid (LA), glycolic acid
(GA), CO2 and H2O (Yoo et al. 2005).
The biomedical and therapeutic applications of PLGA NPs as drug delivery devices were deeply
investigated for vaccines (des Rieux et al. 2006), neurological disorders (Tosi et al. 2008) (Tosi,
Ruozi, and Belletti 2012) and cancer (Bala et al. 2004) (Taurin et al. 2012). NPs biodistribution and
interaction with living cells, tissues, organs or blood constituents depend on their chemico-physical
features (shape, size, surface properties) (Alexis et al. 2008) (Minchin 2008).
Recent studies performed in rodents revealed that surface engineering with a glycosylated hepta-
peptide, called g7, confers to PLGA NPs the ability to cross the BBB at a concentration of up to
10% of the injected dose (Costantino et al. 2005) (Tosi et al. 2007) (Tosi et al. 2011a) (Tosi et al.
2011b). Conversely to un-modified PLGA NPs, systemically administered peptide-conjugated NPs
(g7-NPs) are able to cross the BBB and reach the brain bypassing the hepatic uptake (Costantino et

Introduction
32
al. 2005) (Tosi et al. 2005). Further studies investigated the g7-NPs ability to act as drug carriers. In
particular, Loperamide, an opioid drug generally not able to cross the BBB, was loaded into
systemically administered NPs inducing antinociceptive effects in treated rats (Tosi et al. 2007).
The ability of g7-NPs to reach the brain following different routes of administration
(intraperitoneal, intravenous, nasal, oral) was also confirmed by other in vivo studies (Tosi et al.
2013).
Endocytosis mechanism of NPs
In order to understand the mechanism of BBB crossing, it is important to consider that g7 peptide
derives from the native opioid peptide MMP-2200 (Polt & Palian 2001). Consequently, g7 peptide
ability to cross the BBB could be related to the mechanism used by the β-endorphines. These
peptides maintain helical amphipathic conformation in presence of BBB luminal wall lipid bilayers,
for which they have a high affinity (Dhanasekaran et al. 2005). More in general, rigid proteins
stabilize the membrane curvature inserting their amphipathic moieties or helices between the polar
head-groups of lipid molecules (Zimmerberg & Kozlov 2006). g7-NPs could elicit the same BBB
membrane curvature, since they are characterized by a rigid polymeric matrix structure conjugated
to an amphiphatic glycopeptides (g7), having a helix-like conformation. Following in vivo systemic
administration, a clear interaction between g7-NPs and BBB was highlighted (Tosi et al. 2011b). In
particular, electron photomicrographs proved that g7-NPs ability to reach the brain is related to the
peculiar amphipathic character of g7-peptide that promote endocytosis at BBB level mediating NPs
translocation to the CNS and macropinocytotic processes (Tosi et al. 2011b). Taken together, these
evidences suggest that BBB crossing of g7-NPs is a consequence of multiple pathways, mainly
membrane–membrane interaction and macropinocytosis-like mechanisms.
g7-NPs Trafficking inside the CNS
Very recently, cellular and intracellular destiny of g7-NPs was analyzed (Tosi et al. 2014) (Vilella
et al. 2014). Once crossed the BBB, g7-NPs can target specific cell populations within the brain.
Evidence clearly show that g7-NPs are transported intra- and inter-cellularly within vesicles, after
vesicular internalization. Moreover, in vitro studies indicate that g7-NPs cell-to-cell transport is
mediated by tunneling-nanotube (TNT)-like structures, in glial and neuronal cells. This transport is
dependent on F-actin.

Introduction
33
4.2 Intrastriatal administration via Alzet osmotic pumps (Strategy 2)
Alzet osmotic pumps were developed in the seventies (Theeuwes and Yum 1976) and are
considered today one of the most important examples of miniature pumps operating without need of
electric energy. They are commercially available by DURECT Corp., Cupertino, CA, USA. Alzet
osmotic pumps can be surgically implanted subcutaneous, intraperitoneally, intravenous or used for
brain infusion, in multiple species of laboratory animals. These rate-controlled release systems
ensure continuous and constant pumping rate of drugs or test agents, over prolonged periods,
without the need of external connections. ALZET osmotic pumps are cylindrically shaped and
comprise different components (Fig. 3).
Figure 3. Schematic representation of Alzet osmotic minipumps. The inner, collapsible, reservoir is made of impermeable thermoplastic hydrocarbon elastomer (4) and is surrounded by a coating layer of osmotic driving agent (2). The semi-permeable membrane (3) that covers the osmotic layer is based on a cellulose ester blend and forms the outer surface of the pump. Finally, a cannula working as flow moderator (5) is inserted into the drug-filled pump (1). (www.alzet.com)
Osmotic minipumps geometry together with the presence of a flow moderator hinders diffusive
release and prevents accidental spill of drug content. In particular, ALZET pumps operate because
of the osmotic pressure generated by inflowing water from tissue environment in which the pump is
implanted. As the water enters it compresses the flexible reservoir, displacing the test solution from
the pump at a controlled, predetermined rate. Because the compressed reservoir cannot be refilled,
the pumps are designed for single-use only. The rate of delivery by an Alzet pump is regulated by
the water permeability of the pump’s outer membrane while is independent from the drug
formulation or its physical and chemical properties. The Alzet pumps are available with three

Introduction
34
different reservoir capacities of 100 µL, 200 µL, and 2 mL with, delivery rates ranging from 0.11
µL/h to 10 µL/h. Depending on the chosen pump model and the delivery rate, these devices can
operate from 1 day to 6 weeks. Since many agents do not cross the BBB, direct intracerebral
infusion of drugs or compounds could be required. The Alzet brain infusion kits (Fig. 4) have been
specifically designed for a targeted delivery to the CNS. In particular, brain infusion kits can be
used for:
- Infusion into the cerebral ventricles resulting in infusate diffusion in multiple brain regions, via
the cerebrospinal fluid.
- Direct microperfusion of discrete brain structures resulting in localized distribution of infusate.
The commercially available brain infusion kit models (www.Alzet.com) can differ for the
maximum depth reached by their intracerebral inserted cannula.
Figure 4. Representation of the brain infusion kit. Brain infusion kits are composed by a brain infusion cannula (1) connected to the osmotic minipump through a catheter (2). Appropriate spacers (3) allow to adjust the cannula length, to target desired brain regions. (www.alzet.com)
Overall, despite being considered an invasive method due to required surgery for their implantation,
Alzet osmotic minipumps represent a reliable, rate-controlled, delivery strategy that avoids animal’s
frequent handling.
4.3 Intranasal route of administration (Strategy 3)
Intranasal transport is the direct transport of therapeutic agents from the nasal cavity to the brain. It
mainly relies on extracellular and transcellular transport mechanisms, involving the olfactory and

Introduction
35
respiratory regions of the nasal cavity. Traditionally, the nasal route has been exploited for delivery
of drugs for the treatment of local diseases like nasal allergy, sinusitis and nasal congestion. In the
last few decades, the nasal route emerged as a reliable, safe, non-invasive and convenient route to
accomplish faster and higher levels of drug absorption (Pardeshi et al. 2012). Importantly, this non-
invasive method facilitates patient compliance and comfort compared with other route of
administration.
Macroscopical anatomy of the nasal cavity
The nasal cavity consists in three functionally regions: the vestibular, the respiratory and the
olfactory regions (Graziadei 1970). Generally the nasal vestibule is covered in stratified squamous
epithelium and is located at the opening of the nasal passages. The vestibular area contains hairs for
filtering airborne particles. Largest of the three regions in humans is the respiratory area containing
an epithelium made up of ciliated cells, whose function is to remove particles deposited in the
mucous layer. The olfactory mucosa is located at the most dorsal and caudal region of the nasal
cavity and contains a surface area of highly convoluted turbinates. Structurally, it is composed of
the olfactory epithelium on the luminal side of the basal lamina and an underlying lamina propria.
Different pathways connecting the nasal passages to the brain and spinal cord have been identified.
Pathways relevant for nose-to-brain transport
Following intranasal administration, therapeutics can reach the CNS, from the nasal cavity, along
olfactory nerve pathways. Olfactory nerve pathways represent the major component of intranasal
delivery, as illustrated by fluorescent tracers-based studies (Jansson & Björk 2002). Olfactory
pathways originate in the olfactory region, a modified columnar, pseudo-stratified epithelium,
containing olfactory receptor neurons (ORNs). The olfactory epithelium is located at the top of the
mammalian nasal cavity, under the cribriform plate of the ethmoid bone, which divides cranial and
nasal cavities. Beneath the epithelium of the olfactory region, is located the lamina propria that
contains mucus secreting Bowman’s glands, axons, blood vessels, lymphatic vessels, and
connective tissue. ORNs are surrounded by supporting cells, microvillar cells and basal cells (Fig.
5A) and their principal function is to mediate the sense of smell (Hadley et al. 2004). ORNs are
bipolar neurons extending their dendrites into the mucous layer of the olfactory epithelium.
Conversely, ORNs axons reach the subarachnoid space containing CSF and terminate on mitral
cells in the olfactory bulbs, passing through the lamina propria and the cribriform plate of the
ethmoid bone (Fig. 5A). From the olfactory bulbs, neural projections extend to multiple brain
regions including the olfactory tract, anterior olfactory nucleus, piriform cortex, amygdala, and

Introduction
36
hypothalamus (Carmichael et al. 1994) (Kandel et al. 2000). Due to the direct contact with toxins in
the external environment, ORNs regenerate in few weeks from basal cells residing in the olfactory
epithelium (Whitman & Greer 2009). Special Schwann cell-like cells called olfactory ensheathing
cells (OECs) envelope ORNs axons of and play a key role in axonal regeneration, regrowth, and
remyelination (Field et al. 2003). In addition to ORNs, chemosensory neurons located in the nasal
cavity in the Grueneberg ganglion lead into the olfactory bulbs (Koos & Fraser 2005). Intranasally
administered therapeutics can reach the CNS via extracellular or intracellular mechanisms of
transport along olfactory nerves. Extracellular transport mechanisms are relatively rapid and
involve the movement of molecules between cells in the nasal epithelium. It has been proved that
within 30 minutes intranasally administered drug reach the olfactory bulbs and other brain areas
(Balin et al. 1986), probably through bulk flow mechanisms (Thorne et al. 2004). Intracellular
transport mechanisms involve the uptake of molecules into ORNs by passive diffusion, receptor-
mediated or adsorptive endocytosis. In this case, a slower axonal transport, requiring several hours
to days for drug delivery to CNS is observed (Baker & Spencer 1986).
Another important pathway connecting nasal passages to the CNS involves the trigeminal nerve,
which innervates the respiratory epithelium (Schuenke, Schulte, and Schumacher 2010) (Chapman
et al. 2013). The nasal respiratory epithelium represents approximately 50% of the nasal cavity in
rats and 80–90% in humans. It is a pseudostratified columnar secretory epithelium, which warms
and humidifies inspired air in addition to removing particulates, microorganisms, and allergens. The
human respiratory epithelium is comprised of goblet cells, ciliated cells distributed among mucus
secreting goblet cells, (Fig. 5B) intermediate cells, and basal cells (Jafek 1983). Basal cells function
as progenitors to the other cell types in the nasal respiratory epithelium. The trigeminal nerve
conveys sensory information from the nasal cavity, the oral cavity, the eyelids, and the cornea, to
the CNS via the ophthalmic division (ophthalmic nerve, V1), the maxillary division (maxillary
nerve, V2), or the mandibular division (mandibular nerve, V3) of the trigeminal nerve (Standring
2009). The three branches of the trigeminal nerve come together at the trigeminal ganglion and
ramify centrally to enter the brain at the level of the pons, terminating in the spinal trigeminal nuclei
in the brainstem. A unique feature of the trigeminal nerve is that it enters the brain from the
respiratory epithelium of the nasal passages at two sites: (1) through the anterior lacerated foramen
near the pons and (2) through the cribriform plate near the olfactory bulbs, creating entry points into
both caudal and rostral brain areas following intranasal administration (Schaefer et al. 2002).

Introduction
37
Figure 5. Schematic representation of the olfactory (A) and respiratory (B) regions of the nasal cavities. (From: van Woensel, Matthias et al. 2013. “Formulations for Intranasal Delivery of Pharmacological Agents to Combat Brain Disease: A New Opportunity to Tackle GBM?” Cancers.)
The vascular pathway provides a further connection between the nose and the brain. The olfactory
and respiratory mucosa receives blood supply from small branches of the ophthalmic artery and
from arterial branch of the maxillary artery, respectively (Coulston & DeSesso 1993). The
vasculature in the respiratory region contains a mix of continuous and fenestrated endothelia,
(Grevers & Herrmann 1987) allowing both small and large molecules to enter the systemic
circulation following nasal administration. This pathway preferentially facilitates small, lipophilic
drugs delivery to the CNS. Increasing evidence is emerging suggesting that perivascular channels,
are involved in intranasal drug delivery to the CNS (Thorne et al. 2008) (Dhuria et al. 2009).
Perivascular spaces surround perforating arterioles and venules (Kwee & Kwee 2007) and represent
an important drainage conduit for cerebral interstitial fluid (Weller et al. 1992) (Abbott 2004). They
do not have a direct connection with the subarachnoid space. Perivascular transport is not only due
to diffusion but also to bulk flow mechanisms (Groothuis et al. 2007). Furthermore, arterial
pulsations are considered a driving force for perivascular transport (Rennels et al. 1990). The
resulting ‘‘perivascular pump’’ can account for the rapid distribution of therapeutics throughout the
brain (Hadaczek et al. 2006). Perivascular transport mechanisms are also responsible for the
widespread distribution within the CNS of intranasally applied drugs (Thorne et al. 2004). Direct
transport from the nasal cavity to the cerebrospinal fluid (CSF) has also been reported (Johnston et
al. 2004) (Walter et al. 2006). Finally, absorption of the intranasally applied substance in the
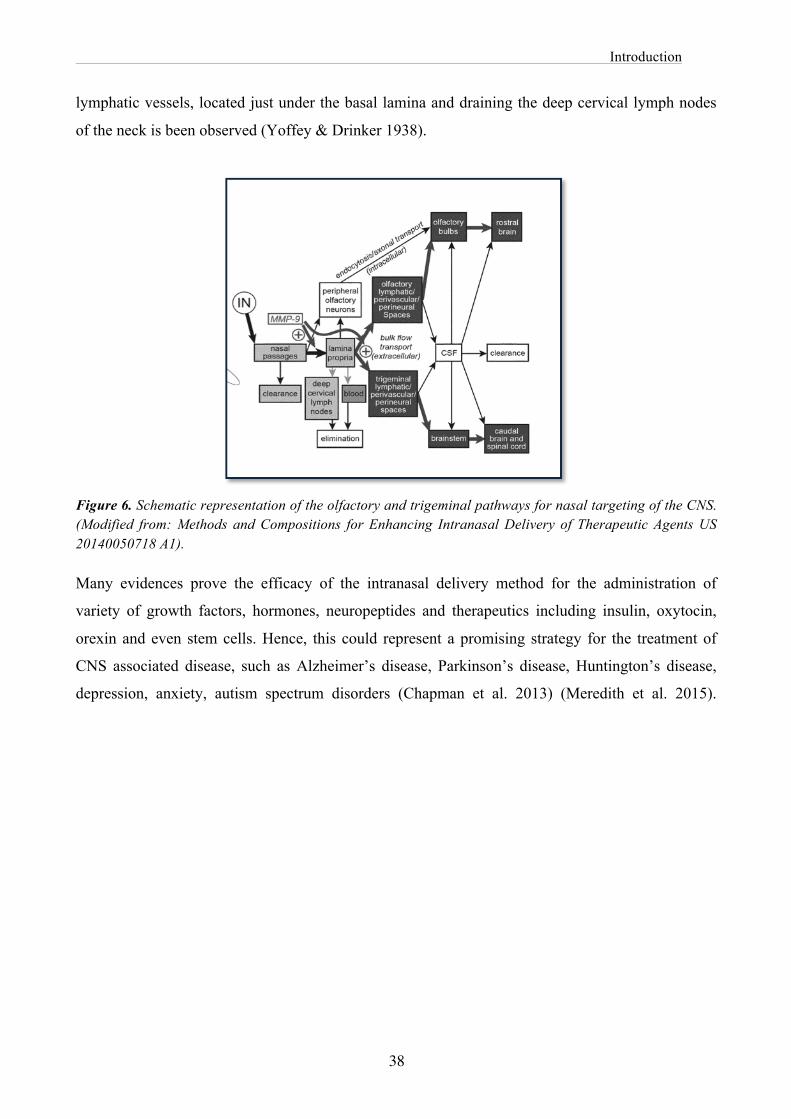
Introduction
38
lymphatic vessels, located just under the basal lamina and draining the deep cervical lymph nodes
of the neck is been observed (Yoffey & Drinker 1938).
Figure 6. Schematic representation of the olfactory and trigeminal pathways for nasal targeting of the CNS. (Modified from: Methods and Compositions for Enhancing Intranasal Delivery of Therapeutic Agents US 20140050718 A1).
Many evidences prove the efficacy of the intranasal delivery method for the administration of
variety of growth factors, hormones, neuropeptides and therapeutics including insulin, oxytocin,
orexin and even stem cells. Hence, this could represent a promising strategy for the treatment of
CNS associated disease, such as Alzheimer’s disease, Parkinson’s disease, Huntington’s disease,
depression, anxiety, autism spectrum disorders (Chapman et al. 2013) (Meredith et al. 2015).

Aim of the Project
39
Aim of the Project

Aim of the Project
40
The aim of our study is to explore whether cholesterol administration to the HD brain is able to
rescue neurobehavioral and synaptic defects in a transgenic mouse model of the disease.
This study will also allow to further understanding the relevance of cholesterol defects in HD.
Locally synthesized brain cholesterol plays a critical role in synapse formation, synaptic activity
and integrity (Pfrieger 2003). Many evidences show that brain cholesterol biosynthesis is reduced in
several HD rodent models (Valenza et al. 2005) (Valenza et al. 2007) (Valenza et al. 2010). These
data were recently confirmed in Q175 knock-in mice, in which consistent decrease in daily
synthesis rate of cholesterol (by 2H2O labeling) and reduced lathosterol and cholesterol levels were
found (Shankaran et al. 2017). Due to the blood-brain barrier (BBB), brain cholesterol metabolism
is independent from that in peripheral tissues (Dietschy & Turley 2004). As a consequence,
eventual brain cholesterol dysfunction cannot be compensated by diet.
We decided to exploit alternative routes for cholesterol delivery to the brain of R6/2 transgenic
mouse model of HD (Mangiarini et al. 1996), each one presenting different advantages and
limitations:
(i) Systemic injection of biodegradable polymeric nanoparticles, loaded with cholesterol, and
modified with specific glycopeptides to cross the BBB (Strategy 1 - Polymeric g7-NPs-Chol).
(ii) Osmotic minipumps, attached to a stereotaxically implanted brain cannula, to infuse increasing
doses of cholesterol at continuous and controlled rates, directly in the striatum (Strategy 2 -
Osmotic minipumps).
(iii) Intranasal administration of cholesterol-containing liposome formulations (Strategy 3 -
Intranasal rout of administration).
A combination of neurobehavioral tests, biochemical and functional assays will allow to assess how
such treatments influence neuronal activity and neurobehavioral anomalies in HD mice.

Results
41
Results

Results
42
Strategy 1 – Surface-Modified PLGA NPs With this first series of studies, we tested the therapeutic potential of brain cholesterol
supplementation, via polymeric NPs, in R6/2 mice. Table 1 summarizes the features of the
unloaded (u) and cholesterol (chol) loaded Polymeric Poly(lactic-co-glycolic acid)-nanoparticles
(PLGA-NPs) used in this work, provided and characterized by G. Tosi (University of Modena and
Reggio Emilia) (Tosi et al. 2005) (Tosi et al. 2007) (Tosi et al. 2011). We decided to use g7-PLGA-
NPs for their multiple attractive properties: (i) biodegradability and biocompatibility; (ii) protection
of drug from degradation; (iii) successful brain targeting (due to the conjugation with the glyco-
heptapetide (g7), 10% of g7-NPs reach the brain once systemically injected in rodents (Costantino
et al. 2005) (Tosi et al. 2007); (iv) PLGA is approved by FDA and EMA as drug delivery system
for parenteral administration in humans (Mundargi et al. 2008).
Table 1. Chemical-physical properties of g7-PLGA-NPs used in the study. Z-Average value (nm) indicates the dimensions of samples; Polydispersity Index (PDI) indicates homogeneity of the samples; Di (nm) indicates intensity distribution; ζ‐pot (mV) expresses surface charge; %PVA expresses as percentage the polyvinyl alcohol residual; mg of Chol per 100 mg of formulation (LC%) and percentage of encapsulation efficiency (EE%) represent drug loading values. Standard Deviation is reported as SD.
Characterization of g7-NPs distribution in vivo
First of all, we performed immunohistochemical analysis to investigate g7-NPs distribution
following a single intraperitoneal injection into both R6/2 and wild-type (wt) mice, at 8 weeks of
age. Results showed both rhodamine-labeled control (unmodified) NPs (C-NPs) and g7-NPs
signals, in the liver (Fig. 1A) and in other peripheral tissues (data not shown) of mice sacrificed few
hours after the injection. On the contrary, only the g7-NPs signal was detected in the brain (Fig.
1B). Successive quantification of g7-NPs, determined normalizing the red spots on the mean size of
NPs, yielded an approximate ratio of ~10:1 in liver compared to striatum and cortex of wt mice
(Fig. 1C). The same quantification was also performed in R6/2 mice revealing reduced propensity
of g7-NPs to reach the brain despite greater liver accumulation, compared to the wt. These results
suggest an influence of HD-related mechanism in g7-NPs BBB crossing. Interestingly, g7-NPs
signal was still present into mice brain 24 h and 2 weeks after a single (Fig. 1D) or multiple
!

Results
43
intraperitoneal injections performed in the same week (Fig. 1E). Further analysis performed on
high-magnification confocal images indicated the presence of g7-NPs in different brain regions and
in different cells types such as IBA1 immunoreactive microglial cells (Fig. 1F), GFAP positive
astrocytes (Fig. 1G) and calbindin (Fig. 1H) and DARPP-32 (Fig. 1I) positive neurons.
!

Results
44
Figure 1. g7-NPs localize within different cells types in R6/2 mice brain. (A, B) Representative confocal images of liver (A) and brain (B) slices from R6/2 mice intraperitoneally injected with C-NPs (left) or with g7-NPs (right) and sacrificed after 4 h. (C) Quantification of g7-NPs localized in the liver, striatum, and cortex of wt (n = 3) and R6/2 mice (n = 3). Data are expressed as the number of g7-NPs for 100 µm2 ± SEM. Statistics: *P < 0.05 was determined by Student’s t-test. (D, E) g7-NPs in brain slices from R6/2 mice 24 h (D, left) or 2 weeks (D, right) after a single intraperitoneal injection and 1 week (E) after multiple injections. (F-I) Representative confocal images of IBA1 (F), GFAP (G), calbindin (H), and DARPP-32 (I) positive cells, on brain coronal sections from R6/2 mice intraperitoneally injected with g7-NPs and sacrificed at indicated time points. White arrowheads indicate g7-NPs within different cells types. DAPI (A, B, D) or Hoechst 33258 (Ho) (F–I) was used to counterstain nuclei. Scale bars: 20 µm (A); 10 µm (B, D, E); 5 µm (F–I).
Delivery and release of cholesterol by g7-NPs in the R6/2 brain
To track cholesterol delivery and intracellular release by g7-NPs, we performed specific
experiments using rhodamine-labeled g7-NPs (Vergoni et al. 2009) loaded with the fluorescent
analog NBD cholesterol (g7-NPs-NBD-Chol). NBD cholesterol closely resembles the structure of
native cholesterol, localizes in the membrane's interior and is commonly used to study lipid
transport processes as well lipid-protein interactions (Gimpl & Gehrig-Burger 2007). Accordingly,
NBD cholesterol, stereotaxically injected into mice brain ventricles, co-localized with the plasma
membrane Ca2+ ATPase (PMCA), confirming that exogenous cholesterol is incorporated on brain
cells’ membranes in vivo (Fig. 2).
!

Results
45 !
Figure 2. Co-localization of NBD-Cholesterol with PMCA in vivo. Representative confocal images of brain slice from wt mice stereotaxically injected in the lateral ventricle with NBD-Cholesterol (10ug) and sacrificed after 7 h. (A, B) low-magnification images of brain slices from mice injected with NBD-Cholesterol (A) or with saline (B) (see arrows). (C) Representative 63x confocal image of co-localization (yellow signal) between NBD-Cholesterol (green signal) and the plasma membrane marker PMCA (red signal), in brain slices of injected wt mice (scale bar: 10µm). The Hoechst 33342 dye (Ho; blue) was used to counterstain nuclei.
We next monitored g7-NPs degradation and consequent NBD cholesterol release following the red
spots and the green signal respectively. 12 and 24 h after a single intraperitoneal injection of g7-
NPs-NBD-Chol, g7-NPs and NBD cholesterol signals co-localized in brain cells as indicated by the
scatterplot of red and green pixel intensities (Figs. 3A and B). However, successive analysis
performed 7 days (not shown) and 14 days after the injection highlighted a separation between g7-
NPs and NBD-Chol signals (Fig. 3C). These findings demonstrated a release of NBD-Chol from
NPs starting from 1–2 weeks after injection, in parallel with a reduction in g7-NPs signal, probably
due to their degradation. g7-NPs quantification in brain slices from injected mice confirmed a
decrease in the number of NPs over time (Fig. 3D).

Results
46
Figure 3. Cholesterol delivery and release in the R6/2 brain. (A) Representative confocal image (crop) of brain slices from R6/2 mice 12 h after the intraperitoneal injection of rhodamine-labeled g7-NPs-NBD-Chol, showing co-localization of NBD-Chol (green signal) and rhodamine (NPs, red signal). Scale bar: 5 µm. (B, C) Representative confocal image (low magnification) of brain slices from R6/2 mice treated with g7-NPs-NBD-Chol and sacrificed after 24 h (B) or 2 weeks (C), with the relative, decreasing, co-localization (yellow signal) of NBD-Cholesterol and g7-NPs. Scale bar: 10 µm. (D) g7-NPs quantification in brain slices at the same time points in (B, C). Data are expressed as number of g7-NPs (evaluated based their size) for 100 µm2 ± SEM. Statistics: **P < 0.01 (48 h vs. 7 days; 7 days vs. 14 days), ***P < 0.001 (24 h vs. 7 days; 7 days vs. 14 days) was determined by one-way ANOVA followed by Newman–Keuls multiple comparison test. DAPI was used to counterstain nuclei.
g7-NPs-Chol rescue synaptic activity in R6/2 mice
As R6/2 mice typically show alterations in striatal medium spiny neurons (MSNs) synaptic
transmission with disease progression (Cepeda et al. 2003) (Cepeda et al. 2004), we next explored
whether cholesterol supplementation to the brain, via systemic injection of g7-NPs-Chol, was able
to ameliorate synaptic parameters in HD mice. Pilot experiments in R6/2 animals treated only with
1 or 2 injections of g7-NPs-Chol did not show any significant modifications in electrophysiological
properties (data not shown). We therefore redesigned the experimental paradigm in order to provide
sustained and prolonged delivery of cholesterol to the HD brain (Fig. 4).
Figure 4. Scheme of the experimental paradigm. Saline solution or g7-NPs were intraperitoneally injected, twice a week, from pre-symptomatic stage (5 weeks of age) to late-symptomatic stage (9 weeks of age), delivering an estimated dose of 15µg of cholesterol in g7-NPs-Chol treated mice.
R6/2 mice were treated starting from pre-symptomatic stage (5 weeks of age) to the symptomatic
stage (9 weeks of age). 0.15 mg of g7-NPs per gram body weight were intraperitoneally injected
twice a week, delivering approximately 15 µg of cholesterol to HD brain. We compared: wt and
R6/2 mice treated with saline (referred to as wt and R6/2 respectively), R6/2 mice injected with
empty g7-NPs (referred to as R6/2-emp) and R6/2 mice injected with g7-NPs-Chol (referred to as
R6/2-Chol). In different HD animal models, robust defects have been described in striatal MSNs,
!!
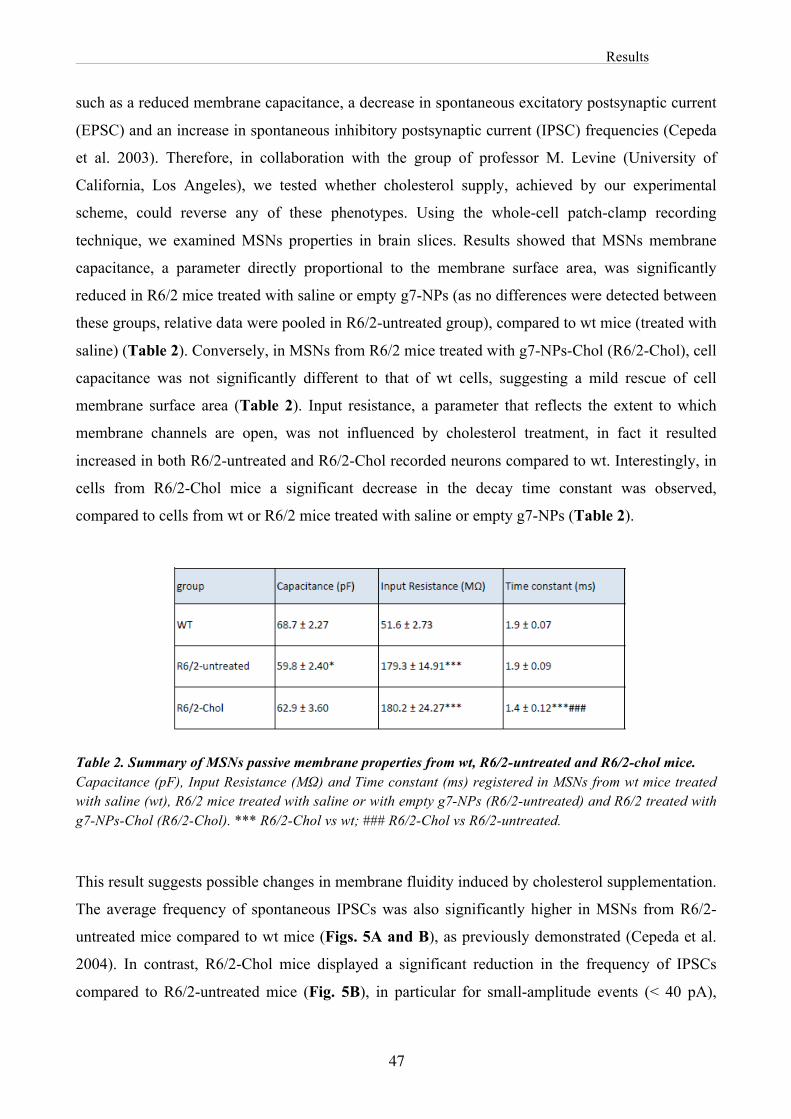
Results
47
such as a reduced membrane capacitance, a decrease in spontaneous excitatory postsynaptic current
(EPSC) and an increase in spontaneous inhibitory postsynaptic current (IPSC) frequencies (Cepeda
et al. 2003). Therefore, in collaboration with the group of professor M. Levine (University of
California, Los Angeles), we tested whether cholesterol supply, achieved by our experimental
scheme, could reverse any of these phenotypes. Using the whole-cell patch-clamp recording
technique, we examined MSNs properties in brain slices. Results showed that MSNs membrane
capacitance, a parameter directly proportional to the membrane surface area, was significantly
reduced in R6/2 mice treated with saline or empty g7-NPs (as no differences were detected between
these groups, relative data were pooled in R6/2-untreated group), compared to wt mice (treated with
saline) (Table 2). Conversely, in MSNs from R6/2 mice treated with g7-NPs-Chol (R6/2-Chol), cell
capacitance was not significantly different to that of wt cells, suggesting a mild rescue of cell
membrane surface area (Table 2). Input resistance, a parameter that reflects the extent to which
membrane channels are open, was not influenced by cholesterol treatment, in fact it resulted
increased in both R6/2-untreated and R6/2-Chol recorded neurons compared to wt. Interestingly, in
cells from R6/2-Chol mice a significant decrease in the decay time constant was observed,
compared to cells from wt or R6/2 mice treated with saline or empty g7-NPs (Table 2).
Table 2. Summary of MSNs passive membrane properties from wt, R6/2-untreated and R6/2-chol mice. Capacitance (pF), Input Resistance (MΩ) and Time constant (ms) registered in MSNs from wt mice treated with saline (wt), R6/2 mice treated with saline or with empty g7-NPs (R6/2-untreated) and R6/2 treated with g7-NPs-Chol (R6/2-Chol). *** R6/2-Chol vs wt; ### R6/2-Chol vs R6/2-untreated.
This result suggests possible changes in membrane fluidity induced by cholesterol supplementation.
The average frequency of spontaneous IPSCs was also significantly higher in MSNs from R6/2-
untreated mice compared to wt mice (Figs. 5A and B), as previously demonstrated (Cepeda et al.
2004). In contrast, R6/2-Chol mice displayed a significant reduction in the frequency of IPSCs
compared to R6/2-untreated mice (Fig. 5B), in particular for small-amplitude events (< 40 pA),
!

Results
48
while the cumulative inter-event interval histogram showed a decreased release probability in R6/2-
Chol compared to R6/2-untreated cells (Fig. 5C). We analyzed also the frequency of spontaneous
excitatory postsynaptic currents (EPSCs) (Fig. 5D) that was significantly reduced in R6/2-untreated
mice compared to wt mice (Fig. 5E). Although the decrease in the average frequency of EPSCs was
not significantly rescued in R6/2-Chol mice, the cumulative inter-event interval indicated a
significantly increased release probability in R6/2-Chol cells versus R6/2-untreated cells (Fig. 5F).
Altogether, these findings demonstrate that cholesterol supplementation through g7-NPs strategy
resulted in a rescue of specific membrane and synaptic parameters typically altered in MSNs of HD
mice.
!

Results
49
Figure 5. Systemic injections of g7-NPs-Chol rescue synaptic deficits in R6/2 mice. (A) Spontaneous IPSCs were recorded from striatal MSNs (wt = 52; R6/2-untreated = 27; R6/2-Chol = 29) at a holding potential of +10 mV. Data from R6/2 mice treated with saline (R6/2) or with empty g7-NPs (R6/2-emp) were pooled, as no differences were found. (B) Amplitude–frequency histogram and average frequency (inset) of IPSCs from R6/2-Chol, R6/2-untreated, and wt mice MSNs. (C) Cumulative inter-event histogram showing the release probability of IPSCs in all the experimental groups. (D) Spontaneous EPSCs were recorded from striatal MSNs (wt = 52; R6/2-untreated = 27; R6/2-Chol = 29) at a holding potential of -70 mV. Data from R6/2 mice treated with saline (R6/2) or with empty g7-NPs (R6/2-emp) were pooled, as no differences were found. (E) Amplitude–frequency histogram and average frequency (inset) of EPSCs from R6/2-Chol, R6/2-untreated, and wt MSNs. (F) Cumulative inter-event histogram showing the release probability of EPSCs in all the experimental groups. Data information: (B, D–F) Data represent mean ± SEM. P < 0.05 was calculated by one-way ANOVA followed by Newman–Keuls multiple comparison tests (#P < 0.05, ##P < 0.01, ###P < 0.001 R6/2-untreated mice vs. R6/2-Chol mice; *P < 0.05, **P < 0.01, ***P < 0.001 WT mice vs R6/2-untreated or R6/2-Chol mice).
g7-NPs-Chol rescue cognitive dysfunction in R6/2 mice
R6/2 mice develop a progressive neurological phenotype characterized by cognitive and motor
symptoms resembling those seen in HD (Carter et al. 1999) (Murphy et al. 2000) (Lüesse et al.
2001) (Giralt et al. 2011). For this reason, we investigated the impact of cholesterol
supplementation on behavioral abnormalities in that HD mouse model by using standard motor and
cognitive tasks. The experimental paradigm employed in these behavioral studies is shown in Fig.
4. To evaluate mice motor skills, we performed both rotarod and activity cage tests. We chose
rotarod test since is widely used to evaluate motor coordination in rodents. Mice are first trained to
walk on a rotating bar at constant speed and their motor performance is then evaluated in
accelerating speed. In the rotarod test, R6/2 mice treated with saline or empty g7-NPs exhibited
typical impaired motor coordination compared to wt mice, as indicated by the significantly shorter
latency to fall (Fig. 6A). This deficit was not improved in R6/2-Chol mice (Fig. 6A).
Activity Cage test determines global activity, locomotion activity and exploration habits and is
often used to assess motor abilities in rodent models of central nervous system (CNS) disorders.
Animals are placed in the center of the testing arena and allowed to freely move while being tracked
by an automated tracking system. In the activity cage, reduced rearing activity, a form of vertical
exploration, was not rescued by cholesterol supplementation at 10 weeks of age (Fig. 6B). At the
same time point, the hypokinetic phenotype (indicated by reduced global activity in the activity
cage) was less dramatic in R6/2-Chol mice (Fig. 6C) in comparison to R6/2-untreated mice,
suggesting that cholesterol supplementation partially ameliorates locomotion-related behavior in a
novel environment.

Results
50
Figure 6. Motor phenotype assessment in R6/2 untreated and cholesterol treated mice. (A) Fall latency from an accelerating rotarod for 5- to 11-week-old wt and R6/2 mice (wt = 17; R6/2-untreated = 21; R6/2-Chol = 13). (B) Rearing episodes in the activity cage at 10 weeks of age (wt = 14; R6/2-untreated = 21; R6/2-Chol = 15). (C) Global activity in the activity cage test at 10 weeks of age (wt = 14; R6/2-untreated = 21; R6/2-Chol = 15). Data information: data are from three independent trials and represent mean ± SEM. P < 0.05 was calculated by one-way ANOVA followed by Newmann–Keuls multiple comparison tests (#P < 0.05, ##P < 0.01, ###P < 0.001 R6/2-untreated mice vs. R6/2-Chol mice; *P < 0.05, **P < 0.01, ***P < 0.001 wt mice vs. R6/2-untreated or R6/2-Chol mice).
!

Results
51
Finally, we evaluated cognitive tasks in HD mice after cholesterol supplementation, since changes
in cholesterol synthesis/levels are associated with cognitive decline (Suzuki et al. 2013). To
evaluate cognitive performance, we used the novel object recognition test (NORT), a low-stress
task aimed at evaluating recognition memory. This is a cognitive test particularly attractive also
because it requires no external motivation, reward, or punishment. NORT is based on the
spontaneous tendency of rodents to spend more time exploring a novel object than a familiar one.
The choice to explore the novel object reflects the learning and recognition memory. Importantly,
object memory is impaired in patients with HD (Lawrence et al. 1996) (Lawrence et al. 2000).
Behavioral analysis showed a progressive inability to discriminate novel from familiar objects in
R6/2-untreated mice, from 8 weeks of age (Fig. 7). On the contrary, R6/2-Chol mice performance
was absolutely comparable to that of wt mice, indicating that cholesterol supplementation is
sufficient to complete rescue memory defect (Fig. 7). Importantly, this beneficial effect on
recognition memory was observed at all the time points tested, even at 12 weeks of age, that is 3
weeks after the last injection (Fig. 7).
Figure 7. Cognitive phenotype assessment in R6/2 untreated and cholesterol treated mice. Index of discrimination (%) in wt, R6/2-untreated, and R6/2-Chol mice, at 8 weeks of age (wt = 24; R6/2-untreated = 36; R6/2-Chol = 21), at 10 weeks of age (wt = 25; R6/2-untreated = 35; R6/2-Chol = 20), and at 12 weeks of age (wt = 24; R6/2-untreated = 30; R6/2-Chol = 19). A DI above zero indicates a preference for the novel object; on the contrary the index below zero indicates a preference for the familiar object. Data from R6/2 mice treated with saline (R6/2) or with empty g7-NPs (R6/2-emp) were pooled, as no differences were found. Data information: data are from three independent trials and represent mean ± SEM. P < 0.05 was calculated by one-way ANOVA followed by Newmann–Keuls multiple comparison tests (#P < 0.05, ##P < 0.01, ###P < 0.001 R6/2-untreated mice vs. R6/2-Chol mice; *P < 0.05, **P < 0.01, ***P < 0.001 wt mice vs. R6/2-untreated or R6/2-Chol mice).
!

Results
52
Cholesterol supplementation influences the protein levels of synaptic machinery
To determine whether the cognitive improvement observed in R6/2 mice after cholesterol
supplementation was related to a positive modulation of synaptic protein machinery, we purified
synaptic protein enriched triton-insoluble fractions (TIF) from the brain of wt, R6/2-untreated and
R6/2-Chol mice. Next, we performed semiquantitative Western blotting for scaffolding proteins
such as PSD95 and gephyrin and NMDA receptor subunits (GluN1 and GluN2B) (Fig. 8A).
Reduced PSD95, as well as a reduction in GluN1 and GluN2B, were found in R6/2-untreated mice
compared to wt mice, as expected (Fig. 8B). Importantly, cholesterol supplementation normalized
or increased the levels of these proteins (Fig. 8B), suggesting a rescue of the molecular composition
of the synaptic machinery contributing to synaptic structure.
!!

Results
53
!
Figure 8. Systemic injections of g7-NPs-Chol increase the levels of synaptic machinery proteins. Protein levels (A) and relative densitometry quantification (B) of several synaptic proteins analyzed in triton-insoluble (synaptic enriched) fractions purified from total brains from wt (n = 5), R6/2-untreated (n = 5) and R6/2-Chol (n = 3) mice. Cholesterol supplementation rescued the levels of PSD95 and NMDA receptor subunits GluN1 and GluN2B in R6/2 mice. Data information: Data in B represent mean ± SEM. P < 0.05 was determined by one-way ANOVA followed by Newman–Keuls multiple comparison tests (§P < 0.05, §§P < 0.01, §§§P < 0.001 R6/2-untreated mice vs. R6/2-Chol mice; *P < 0.05, **P < 0.01, ***P < 0.001 wt mice vs. R6/2-untreated or R6/2-Chol mice).
Anatomical examination of R6/2 brains revealed several age-related alterations in brain morphology
such as progressive reduction in striatal volume and increase in ventricular volume, compared with
controls (Stack et al. 2005). To investigate whether cholesterol supplementation was able to
ameliorate neuropathological deficits in R6/2 mice, we performed unbiased stereological analyses
at 12 weeks of age, in collaboration with Marina Boido (Neuroscience institute Cavalieri
Ottolenghi, Torino). A significant enlargement of ventricles was observed in R6/2 mice treated with
saline (R6/2) compared to wt mice (Fig. 9A), as already reported in the literature. Surprisingly,
systematic injections of both empty g7-NPs and g7-NPs-Chol led to a reduction of the ventricular
volume (Fig. 9B). We hypothesized that the effect induced by both types of NPs could be related to
degradation of PLGA in lactic and glycolic acids. Altogether, these findings suggest that cholesterol
supplementation via g7-NPs is not sufficient to contrast brain atrophy in R6/2 mice, at least with
this experimental paradigm, although it does restore the physiological levels of specific synaptic
proteins altered in HD mice.
!
!!

Results
54
Figure 9. Systemic injections of g7-NPs-Chol do not rescue a typical neuropathological feature of R6/2 mice. Representative images of Nissl staining (A) and ventricle volume analyzed using Neurolucida 3D reconstruction software, at 12 weeks of age (B) in wt (n = 7), R6/2 (n = 7), R6/2-emp (n = 6), and R6/2-Chol (n = 8) mice. Data information: Data in B represent mean± SEM. P < 0.05 was determined by one-way ANOVA followed by Newman–Keuls multiple comparison tests (#P < 0.05, ##P < 0.01, ###P < 0.001 R6/2-untreated mice vs. R6/2-Chol mice; *P < 0.05, **P < 0.01, ***P < 0.001 wt mice vs. R6/2-untreated or R6/2-Chol mice).
Safety evaluation of g7-NPs in R6/2 mice
It is known that cholesterol supplementation to the brain might lead to a further reduction in
cholesterol synthesis, already compromised in R6/2 mice (Valenza et al. 2007b). We therefore
analyzed by MS the levels of cholesterol precursors and the brain-specific cholesterol catabolite
24OHC in the brain of treated mice, at 12 weeks of age. Lathosterol, a marker of cholesterol
synthesis, was found equally reduced in both R6/2-untreated and R6/2-Chol mice compared to wt
mice (Fig. 10A), suggesting that exogenous cholesterol supplemented via g7-NPs does not further
decrease the endogenous biosynthetic pathway. Similarly, 24OHC, an indicator of brain cholesterol
catabolism that usually mirrors cholesterol biosynthesis in brain (Lund et al. 2003), was found
similarly reduced in both R6/2 groups compared to wt mice (Fig. 10B). Furthermore, we also
measured mRNA levels of cholesterol biosynthetic genes (hmgcr and fdft1) in liver and lung of
R6/2 mice to verify if the injected NPs that localized in periphery altered endogenous cholesterol
metabolism. The mRNA expression of both cholesterol genes was similar in both tissues in all
groups, even in the presence of g7-NPs-Chol (Figs. 10C and D). All these results suggest that the
exogenous cholesterol delivered to the brain or accumulated in peripheral tissues does not lead to
significant alterations of endogenous cholesterol homeostasis in the time frame analyzed in this
study. Although the PLGA NPs employed in this study are considered biocompatible and
biodegradable, an immunogenicity study of these NPs in vivo is missing. PLGA, released after
degradation of empty or cholesterol-loaded g7-NPs, and cholesterol itself might influence immune
responses. Therefore, we analyzed mRNA levels of two pro-inflammation genes encoding for
Tumor Necrosis Factor (TNF)-alpha and interleukin-6 (IL-6), in peripheral tissues from our cohorts.
As shown in Figs. 10E and F, TNF-alpha and Il6 mRNA levels were significantly increased in the
liver and in lung of R6/2 mice treated with saline (R6/2) compared to wt mice, supporting the
available evidence that peripheral inflammation is associated with HD (Trager et al. 2014). Similar
results were found in R6/2-emp and R6/2-Chol mice, suggesting that multiple administrations of
g7-NPs (empty or loaded with cholesterol) per se do not affect peripheral inflammation in R6/2
mice.

Results
55
!
Figure 10. Exogenous cholesterol or g7-NPs per se do not affect endogenous cholesterol biosynthesis or inflammatory genes expression. Lathosterol (A) and 24OHC (B) measured by MS in the brain of wt (n = 6), R6/2-untreated (n = 7) and R6/2-Chol (n = 5) mice. mRNA levels of hmgcr and fdft1 in liver (C) and lung (D) of wt (n = 7), R6/2-untreated (n = 8) and R6/2-Chol (n = 4) mice. Data from R6/2 mice treated with saline (R6/2) or with empty g7-NPs (R6/2-emp) were pooled, as no differences were found. mRNA levels of inflammatory genes in liver (E) and lung (F) of wt (n = 7), R6/2 (n = 4), R6/2-emp (n = 4) and R6/2-Chol (n = 5) mice. Data information: Data in (A–F) represent mean ± SEM. *P < 0.05, **P < 0.01, ***P < 0.001 was determined by one-way ANOVA followed by Newman–Keuls multiple comparison tests.
All these data have been published in: Valenza M.*, Chen J.Y.*, Di Paolo E.§, Ruozi B.§, Belletti D.,
Ferrari Bardile C., Leoni V., Caccia C., Brilli E., Di Donato S., Boido M.M., Vercelli A., Vandelli
M.A., Forni F., Cepeda C., Levine M.S., Tosi G., Cattaneo E. (2015) Cholesterol-loaded
nanoparticles ameliorate synaptic and cognitive function in Huntington’s disease mice. EMBO
Molecular Medicine, 7(12), 1547–1564. http://doi.org/10.15252/emmm.201505413. *co-first
authors, §co-second authors.

Results
56
Strategy 2 – Alzet Osmotic Minipumps
To define the most efficacious dose of cholesterol in contrasting neurobehavioral defects in R6/2
mice and to avoid potential confounding effects from peripheral administration and limited blood–
brain barrier permeability, we performed a second series of studies employing osmotic minipumps
(Alzet). Conversely to g7-NPs, this second strategy allowed us to investigate the effects of chronic,
unilateral, infusion of increasing doses cholesterol into mice striatum. This is of great importance
given that the striatum is one of the most affected brain areas in HD, in which cholesterol
dysfunction is higher and more precocious respect to other areas (Valenza et al. 2005) (Valenza et
al. 2007). In all the trials performed, the animals were treated with the same experimental paradigm
showed in Fig. 11.
Figure 11. Scheme of the experimental paradigm. Minipumps were surgically implanted in 7 weeks old mice and a battery of behavioral tests is performed before and after surgery, to assess motor and cognitive abilities of mice.
Cholesterol levels increase in the brain of wt animals, after minipump infusion
To verify if the delivery of exogenous cholesterol, via osmotic minipumps, led to a detectable
variation in the amount of brain cholesterol, we performed initial MS studies in collaboration with
the Carlo Besta Neurological Institute of Milan. Analysis of MS data, from wt mice intrastriatally
infused with 500µg of cholesterol, indicated a significant increase in total cholesterol levels into
both infused (right) and contralateral (left) striata of cholesterol treated wt mice, respect to controls
(untreated or ACSF infused wt mice) (Fig. 12A). Interestingly, a detectable increase in cholesterol
levels was also found into cortex of both right and left hemispheres from cholesterol treated mice,
indicating cholesterol diffusion into the surrounding brain areas from the site of infusion (Fig. 12B).
!

Results
57
Figure 12. Intrastriatal infusion of exogenous cholesterol induces an increase in brain cholesterol levels. Cholesterol levels measured by MS in striatum (A) and cortex (B) of wt mice at 11 weeks of age, after 4 weeks of continuous infusion (pumping rate 0.11 µl/h). Data information: data in (A–B) represent the mean from n = 2 untreated, n = 3 ACSF treated and n = 4 cholesterol treated mice ± SEM. *P < 0.05, **P < 0.01, ***P < 0.001 was determined by one-way ANOVA followed by Newman–Keuls multiple comparison tests. All data are normalized above weight tissue.
Surgical implantation of osmotic minipumps per se does not influence behavioral phenoytpe in
healthy mice
In a first trial, wt mice were subjected to surgical implantation of artificial cerebrospinal fluid
(ACSF)-containing minipumps and compared to untreated (unoperated) mice, in order to
investigate possible side effects associated with the procedure. Animal’s behavioral phenotype was
evaluated before (6 weeks of age) and after surgery (8-11 weeks of age) by using the same motor
!
!
!

Results
58
and cognitive test described before. At each time point tested, both motor (Fig. 13) and cognitive
(Fig. 14) performances of ACSF infused mice were comparable to that of unoperated (control) wt
mice. Assessment of post-operative pain and distress was performed using a specific table for pain
scoring based on behavioral indicators of well-being and monitoring mice body weight (Lloyd and
Wofenshohn 1998). To obtain reliable results in the following cognitive and motor tests it was
necessary to avoid any kind of bias based on potential mice suffering. No obvious signs of pain or
distress or significant changes in body weight were detected in all the animals over the infusion
period (data not shown).
Overall these data indicate that minipumps implantation does not influence the behavioral
phenotype of healthy mice, consequently the experimental group of ACSF treated wt mice was not
included in the successive trials.
Figure 13. Motor phenotype assessment in operated and unoperated wt mice. (A) Fall latency from an accelerating rotarod for 5- to 10-week-old wt mice. (B) Global activity in the activity cage test for 6- to 11-week-old wt mice. Data information: data in (A–B) represent the mean from n = 5 untreated and n = 6 ACSF treated wt mice ± SEM.
!
!
!
A
B
Glo
bal A
ctiv
ity
!
!
!
A
B G
loba
l Act
ivity

Results
59
Figure 14. Cognitive phenotype assessment in operated and unoperated control wt mice. Index of discrimination (%) for 6- to 11-week-old wt mice. Data information: data represent the mean from n = 5 untreated and n = 6 ACSF treated wt mice ± SEM.
Intrastriatal infusion of cholesterol leads to a dose-dependent rescue of motor and cognitive deficits
in R6/2 mice
To provide definitive evidence of the therapeutic potential of brain cholesterol supplementation and
identify the most efficacious dose in contrasting HD neurobehavioral defects, we implanted osmotic
minipumps in R6/2 mice. Five independent in vivo trials were completed comparing:
- unoperated wt mice
- unoperated R6/2 mice
- R6/2 mice + ACSF loaded minipumps
- R6/2 mice + ACSF-cyclodextrin loaded minipumps
- R6/2 mice + 20µg-cholesterol loaded minipumps (low dose, near to the amount delivered with g7-
NPs-Chol treatment)
- R6/2 mice + 250µg-cholesterol loaded minipumps (intermediate dose)
- R6/2 mice + 500µg-cholesterol loaded minipumps (high dose)
In each trial, the animals were tested following the same experimental paradigm shown in Fig. 11.
As expected, untreated and ACSF treated R6/2 mice showed a progressive deterioration in fine
motor coordination assessed by an accelerating rotarod test, from pre-symptomatic stage (5 weeks
of age) (Fig. 15A) to symptomatic stage (10 weeks of age) (Fig. 15B). All the administered doses
!

Results
60
of cholesterol failed to induce a significant amelioration in rotarod performance of R6/2 mice at 8
weeks of age (data not shown) and 10 weeks of age (Fig. 15B).
Figure 15. Motor coordination assessment in cholesterol infused R6/2 mice. Fall latency from an accelerating rotarod at pre-symptomatic time point (5 weeks of age) (A) and at symptomatic time point (10 weeks of age) (B) in R6/2 mice. Data information: data represent the mean ± SEM. The number of animals analyzed is reported under each column group. *P < 0.05, **P < 0.01, ***P < 0.001 was determined by one-way ANOVA followed by Newman–Keuls multiple comparison tests.
To evaluate mice motor abilities, we performed also the activity cage test at 6 (Fig. 16A), 9 (data
not shown) and 11 weeks of age (Fig. 16B). In this test R6/2 mice typically exhibit a severe
hypokinetic phenotype with disease progression (Luesse et al. 2001), as confirmed in our
experiments (Fig. 16A and B). Only the intrastriatal infusion of the high dose of cholesterol
(500µg) resulted also in a rescue of spontaneous locomotor activity, that remained comparable to
!

Results
61
that of wt mice at all the time points tested (Fig. 16A and B). A beneficial effect on spontaneous
locomotor activity was also observed after cholesterol supplementation via g7-NPs, but in that case
R6/2 mice displayed only a partial rescue at 10 weeks of age (Valenza et al. 2015).
!
Time%point%before%surgery%%
6"ws"
Time%point%a2er%surgery%%
11"ws"
23% 12% 35% 12% 22% 12% 19%
Activity cage - Global 6ws (III + IV + V + VI + VII Trials)
glob
al a
ctiv
ity
WT N
T (N=2
3)
R6/2 N
T (N
=12)
R6/2 ac
sf mini
pump (
N=35)
R6/2 ac
sf- cy
clode
xtrin
(N=1
2)
R6/2 ch
ol 20
ug m
inipu
mp (N=2
2)
R6/2 ch
ol 25
0ug m
inipu
mp(N=1
2)
R6/2 ch
ol 50
0ug m
inipu
mp(N=1
9)0
2000
4000
6000
8000
10000**
***
glob
al a
ctiv
ity
WT N
T (N=2
8)
R6/2 N
T (N
=15)
R6/2 ac
sf mini
pump (
N=30)
R6/2 ac
sf- cy
clode
xtrin
(N=8
)
R6/2 ch
ol 20
ug m
inipu
mp (N=1
3)
R6/2 ch
ol 25
0ug m
inipu
mp (N=7
)
R6/2 ch
ol 50
0ug m
inipu
mp(N=1
7)0
5000
10000
15000
Activity cage - Global 11ws (III + IV + V + VI + VII Trials)
**
**
*****
***
**
****
28% 15% 30% 8% 13% 7% 17%Nort 6ws (III + IV + V + VI + VII Trials)
ID (
%)
WT N
T (N=2
1)
R6/2 N
T (N=1
2)
R6/2 ac
sf mini
pump (
N=34)
R6/2 ac
sf-cy
clode
xtrin
(N=1
2)
R6/2 ch
ol 20
ug m
inipu
mp (N=2
2)
R6/2 ch
ol 25
0ug m
inipu
mp(N=1
1)
R6/2 ch
ol 50
0ug m
inipu
mp(N=1
9)0
10
20
30
40
50
WT untreatedR6/2 untreatedR6/2 acsf minipump
R6/2 chol 20ug minipump R6/2 chol 250ug minipumpR6/2 chol 500ug minipump
R6/2 acsf-cyclodextrin
A B
Figure 16. Spontaneous global activity assessment in cholesterol infused R6/2 mice. Global activity in the activity cage test at pre-symptomatic time point (6 weeks of age) (A) and at late-symptomatic time point (11 weeks of age) (B) in R6/2 mice. Spontaneous locomotor activity of 11 weeks-old R6/2 mice infused with 500µg of cholesterol was comparable to that of age-matched wt mice (B). Data information: data represent the mean ± SEM. The number of animals analyzed is reported under each column group. *P < 0.05, **P < 0.01, ***P < 0.001 was determined by one-way ANOVA followed by Newman–Keuls multiple comparison tests.

Results
62
To assess mice cognitive abilities we performed the novel object recognition test (NORT), as
previously done in Valenza et al. 2015. Untreated and ACSF treated R6/2 mice cognitive abilities
declined during disease progression, with a marked inability to discriminate the novel object from
the familiar one evident at symptomatic time points of 9 (data not shown) and 11 weeks of age (Fig.
17B), but not at 6 weeks of age (Fig. 17A). R6/2 mice treated with all doses of cholesterol
performed as well as wt mice at 11 weeks of age (Fig. 17B), indicating that cholesterol infusion into
the striatum completely prevents memory deficits in HD mice, as previously observed with chol-g7-
NPs administration (Valenza et al. 2015).
Figure 17. Cognitive phenotype assessment in cholesterol infused R6/2 mice. Index of discrimination (%) in NOR test at pre-symptomatic time point (6 weeks of age) (A) and at late-symptomatic time point (11 weeks of age) (B) in R6/2 mice. ID is significantly increased in R6/2 mice treated with three different doses of cholesterol at 11 weeks of age (B). Data information: data represent the mean ± SEM. The number of animals analyzed is reported under each column group. *P < 0.05, **P < 0.01, ***P < 0.001 was determined by one-way ANOVA followed by Newman–Keuls multiple comparison tests.
!
Time%point%before%surgery%%
6"ws"
Time%point%a2er%surgery%%
11"ws"
21% 6% 34% 12% 22% 11% 19%
Nort 6ws (III + IV + V + VI + VII Trials)
ID (
%)
WT N
T (N=2
1)
R6/2 N
T (N=1
2)
R6/2 ac
sf mini
pump (
N=34)
R6/2 ac
sf-cy
clode
xtrin
(N=1
2)
R6/2 ch
ol 20
ug m
inipu
mp (N=2
2)
R6/2 ch
ol 25
0ug m
inipu
mp(N=1
1)
R6/2 ch
ol 50
0ug m
inipu
mp(N=1
9)0
10
20
30
40
50
WT untreatedR6/2 untreatedR6/2 acsf minipump
R6/2 chol 20ug minipump R6/2 chol 250ug minipumpR6/2 chol 500ug minipump
R6/2 acsf-cyclodextrin
Nort 11ws (III + IV + V + VI + VII Trials)
ID (
%)
WT
NT (N
=27)
R6/2 N
T (N
=15)
R6/2 ac
sf mini
pump (
N=30)
R6/2 ac
sf- cy
clode
xtrin
(N=8
)
R6/2 ch
ol 20
ug m
inipu
mp (N=1
3)
R6/2 ch
ol 25
0ug m
inipu
mp (N=7
)
R6/2 ch
ol 50
0ug m
inipu
mp(N=1
6)0
20
40
60
***
*****
***
**
27% 15% 30% 8% 13% 7% 16%Nort 6ws (III + IV + V + VI + VII Trials)
ID (
%)
WT N
T (N=2
1)
R6/2 N
T (N=1
2)
R6/2 ac
sf mini
pump (
N=34)
R6/2 ac
sf-cy
clode
xtrin
(N=12
)
R6/2 ch
ol 20
ug m
inipu
mp (N=2
2)
R6/2 ch
ol 25
0ug m
inipu
mp(N=1
1)
R6/2 ch
ol 50
0ug m
inipu
mp(N=1
9)0
10
20
30
40
50
WT untreatedR6/2 untreatedR6/2 acsf minipump
R6/2 chol 20ug minipump R6/2 chol 250ug minipumpR6/2 chol 500ug minipump
R6/2 acsf-cyclodextrin
A B

Results
63
All these results confirm that low doses of cholesterol are already sufficient to totally contrast
cognitive decline in R6/2 mice. On the contrary, highest doses of cholesterol are required to
ameliorate motor performances of HD mice.
Since in these experiments we used Methyl-β-cyclodextrin (MBCD)-balanced water-soluble
cholesterol dissolved in ACSF (see material and methods), an additional control group of R6/2 mice
treated with MBCD cyclodestrin (ACSF-cyclodestrin) was tested. However, the behavioral
phenotype of this R6/2 group was comparable to that of untreated and ACSF treated R6/2 mice
(Figs. 15, 16, 17B).
Preliminary analysis of EPSC in MSNs from R6/2 mice infused with high dose of cholesterol
Also in this case we investigated whether changes in synaptic-transmission parameters, typically
altered in MSNs of HD mice, were implicated in the behavioral recovery observed in cholesterol
treated mice.
In collaboration with the group of professor G. Biella (University of Pavia), we compared EPSC
frequency in MSNs from R6/2 mice, following ACSF or cholesterol (500µg) infusion. It is known
that the frequency of spontaneous EPSCs progressively decreases in MSNs of R6/2 mice (Cepeda et
al. 2003) (Cepeda et al. 2004), however intrastriatal infusion of cholesterol partially restored this
synaptic defect (Fig. 18).
Figure 18. Intrastriatal infusion of cholesterol led to a significant increase in the frequency of EPSCs. Spontaneous EPSCs recorded from striatal MSNs (R6/2 ACSF minipumps = 5; R6/2 chol 500µg minipumps = 5) at a holding potential of -70 mV. Data represent mean ± SEM. Statistics: *P < 0.05 was determined by Student’s t-test.
!
12 ws
R6/2 ac
sf mini
pump
R6/2 ch
ol 50
0ug m
inipu
mp0.0
0.5
1.0
1.5
2.0
2.5
Freq
uenc
y (H
z)
R6/2 acsf minipump R6/2 chol 500ug minipump
*
Nort 6ws (III + IV + V + VI + VII Trials)
ID (
%)
WT N
T (N=2
1)
R6/2 N
T (N=1
2)
R6/2 ac
sf mini
pump (
N=34)
R6/2 ac
sf- cy
clode
xtrin
(N=12
)
R6/2 ch
ol 20
ug m
inipu
mp (N=2
2)
R6/2 ch
ol 25
0ug m
inipu
mp(N=1
1)
R6/2 ch
ol 50
0ug m
inipu
mp(N=1
9)0
10
20
30
40
50
WT untreatedR6/2 untreatedR6/2 acsf minipump R6/2 acsf- cyclodextrin R6/2 chol 20ug minipump R6/2 chol 250ug minipumpR6/2 chol 500ug minipump
****
*
*
Time%point%a+er%surgery%%
12#ws#

Results
64
Strategy 3 – Intranasal rout of administration In a third approach we attempted to deliver exogenous cholesterol to mice brain using intranasally
administered liposomes. We were interested in this route of administration since it has recently
emerged as a non-invasive, promising, approach for drug delivery to the brain (Meredith et al.
2015). Intranasally applied drugs are rapidly transported into the central nervous system by the
peripheral olfactory and trigeminal systems. In collaboration with M. Salmona (Mario Negri
Institute), we performed preliminary in vivo experiments in order to verify the validity of this
further strategy for cholesterol delivery to the brain. To supply exogenous cholesterol to the mice
brain through the intranasal rout, we chose to employ liposomes based formulations. Liposomes are
spherical, self-closed structures formed by one or several concentric lipid bilayers with an aqueous
phase inside, which were first proposed and tested as a drug delivery system in the early 1970s.
Since then, they have been adopted as vehicle for drug delivery and targeting, due to their very
unique and attractive biological and physical chemical properties. Liposomes are biocompatible and
can both entrap and protect water-soluble (hydrophilic) molecules in their internal water
compartment and water-insoluble (hydrophobic) into their membranes. Moreover, they provide a
unique opportunity to deliver pharmaceuticals into cells or even inside individual cellular
compartments (Bozzuto & Molinari 2015).
Intranasally administered D6-cholesterol is detectable into mice brain after 6 and 24 hours, but
chronic intranasal administration of unlabeled cholesterol containing liposomes leads to
undetectable variation in brain cholesterol levels
We performed a first experiment using unilamellar liposomes containing deuterated (D6)
cholesterol in 6 weeks old wt and R6/2 mice. To avoid the use of any anesthesia, mice were
acclimated to handling for a period of two weeks before the onset of intranasal dosing (Hanson et
al. 2013). This procedure helps ensure a correct body position and avoid anxiety reaction for
maximum effectiveness of awake intranasal drug delivery. All the animals received a single
intranasal administration and then were sacrificed at different time points (1h, 3h, 6h, 24h; n = 2
mice/genotype/time point) (Fig. 19).

Results
65
Figure 19. Scheme of the experimental paradigm. 6 weeks old animals received a single intranasal administration after hyaluronidase pretreatment. Mice were then sacrificed at different time points (1h, 3h, 6h, 24h; n = 2 mice/genotype/time point).
Subsequently, the group coordinated by Prof M. Salmona performed liquid chromatography–mass
spectrometry on brain tissues isolated from treated mice. Collected data revealed that D6-
cholesterol (distinguishable from the native one) reached measurable, increasing, levels in the
olfactory bulb and in the brain, respectively after 6 and 24 hours (Fig. 20), suggesting the validity
of the strategy in both wt and R6/2 mice.
!
!

Results
66
Figure 20. Deuterated cholesterol (D6-chol) levels in mice plasma, olfactory bulbs and brain. D6-chol signal was determined in plasma 1h after intranasal administration (A) and decreased overtime from 3h to 24h (B). Detectable levels of D6-chol were found in olfactory bulbs and brain after 3h and 6h respectively (A) and increased overtime (B).
The successive trial performed in wt mice had different aims: (i) to test if repeated intranasal
administrations of liposomes containing native cholesterol resulted in an increased content of
cholesterol in the brain; (ii) to evaluate the effectiveness of different liposome based cholesterol
formulations. On the basis of their size and number of bilayers, liposomes can also be classified into
multilamellar vesicles (MLVs) and unilamellar vesicles (ULVs). In unilamellar liposomes, the
vesicle has a single phospholipid bilayer sphere enclosing the aqueous solution, while in
multilamellar liposomes, vesicles have an onion structure. ULVs and MLVs have different release
kinetics due overall to the number of phospholipid. We compared ULVs (n = 18 wt mice) and
MLVs (n = 18 wt mice) containing native hydrophobic cholesterol and cholesteryl hemisuccinate
(CHEMS) within their lipid membranes and their aqueous core, respectively. In particular, CHEMS
consists of succinic acid esterified to the beta-hydroxyl group of cholesterol. This chemical
modification results in the ability of CHEMS to adopt a lamellar assembly in suitable aqueous
media.
Following a 14-day acclimation period (Hanson et al. 2013), 6 weeks-old mice were treated three
times weekly until 12ws when the animals were sacrificed to collect brain tissues (Fig. 21).
!

Results
67
!
Figure 21. Scheme of the experimental paradigm followed in the first intranasal trial in wt mice. After two weeks of acclimation to handling, wt mice were intranasally treated three times a week from 6 to 11 weeks of age. Each treatment consisted in three sequential administrations of 6µl of liposomes for a total of 18µl/nostril.
Unfortunately, we didn’t find a detectable increase in the total amount of cholesterol, measured by
MS, in brain tissues of treated mice respect to controls (Fig. 22). Probably the total amount of
cholesterol delivered by DRV and MLV liposomes, with this experimental paradigm, was too low
to detect an increase in the total content of cholesterol.
Figure 22. Total cholesterol levels measured in striatum and resting brain areas. Total cholesterol levels measured by MS in cerebral tissues collected from wt mice sacrificed ad different time points (4h, 24h, 48h) after the last intranasal administration. All data were normalized above weight tissue.
!

Results
68
Finally, during my PhD, I had also the opportunity to contribute to two recently published papers:
• Valenza M., Marullo M., Di Paolo E., Cesana E., Zuccato C., Biella G., Cattaneo E.
“Disruption of Astrocyte-Neuron Cholesterol Cross Talk Affects Neuronal Function in
Huntington’s Disease.” Cell Death and Differentiation. 2015.
• Shankaran M., Di Paolo E., Leoni V., Caccia C., Ferrari Bardile C., Mohammed H., Di
Donato S., Kwak S., Marchionini D., Turner S., Cattaneo E.*, Valenza M.* 2017. “Early
and brain region-specific decrease of de novo cholesterol biosynthesis in Huntington’s
disease: a cross-validation study in zQ175 knock-in mice.” Neurobiology of Disease. 2017.
*corresponding authors.

Discussion
69
Discussion

Discussion
70
Brain cholesterol homeostasis appears severely compromised in HD.
Data from our previously published papers reveal a reduction in cholesterol biosynthesis,
cholesterol precursors and cholesterol levels within the brain of different HD rodent models
(Valenza et al. 2005) (Valenza et al. 2007) (Valenza et al. 2010). Recently, by measuring the rate of
de novo brain cholesterol biosynthesis in the Q175 knock-in model we further confirmed this
reduction (Shankaran et al. 2017). Furthermore, the decreased plasma levels of the brain-specific
cholesterol catabolite 24OHC suggest a similar dysfunction in HD patients (Leoni et al. 2008)
(Leoni et al. 2013). However, others studies, performed in some of these HD models, show brain
cholesterol accumulation (Thrushina et al. 2006) (Del Toro et al. 2010) (Boussicault et al. 2016). It
has already been demonstrated that these opposite results might be attributable to the different
methods used for sample preparation and cholesterol measurement. In particular, saline perfusion
prior to tissue dissection is essential to avoid any contamination of blood-derived cholesterol (Liu et
al. 2010) as well as the use of reliable analytical method such as gas chromatography-mass
spectrometry is necessary to properly quantify cholesterol content (Marullo et al. 2012).
Cerebral cholesterol is fundamental for neurite outgrowth, synapses formation and maintenance,
synaptic activity and integrity and optimal neurotransmitter release (Pfrieger 2003), so its
deficiency may be injurious especially for neuronal cells. Given that peripheral cholesterol does not
pass the BBB, we tested different strategies to deliver exogenous cholesterol to the HD brain.
Results from our studies using g7-NPs and Alzet osmotic minipumps highlight the therapeutic
potential of brain cholesterol supplementation in contrasting disease-related neurobehavioral
impairments in the most widely used transgenic mouse model of HD.
Our findings from g7-NPs study demonstrate for the first time that cholesterol supplementation is
able to completely prevent cognitive decline and to partially rescue hypokinetic phenotype in R6/2
mice. The improvement in animal’s behavioral phenotype was correlated with increased levels of
scaffold synaptic proteins and ameliorations in synaptic transmission abnormalities in striatal MSNs
of R6/2 mice, confirming the critical role of cholesterol in synaptic integrity and neuronal function
(Pfrieger 2003). We also found that the beneficial effect of exogenous cholesterol is dose-
dependent, indeed higher doses of cholesterol are required to observe a significant functional
recovery of both cognitive and motor abilities. Even at late-symptomatic stages (11 weeks of age),
R6/2 mice intrastriatally infused with 500µg of cholesterol performed similarly to age-matched
nontransgenic wt mice in NORT and activity cage tests. In contrast, we did not observe a significant
amelioration in rotarod performance. We believe that these contrasting results obtained from

Discussion
71
rotarod and activity cage can be ascribed to the different nature of these motor tests. While the first
one is based on forced motor activity and measures primarily mice coordination, the second one
assesses spontaneous, global, motor activity.
NORT results indicate that low doses of cholesterol are sufficient to promote the formation of long-
term memory for the familiar object in R6/2 mice, normally impaired in this HD model starting
from 8 weeks of age (Giralt et al. 2011). Other works analyzed this memory aspect in R6/2 mice
using the NORT, but not at advanced time points (Bissonnette et al. 2013). In particular, the group
of Bissonnette et al. observed a significant increase in short- but not in long-term memory in 8
weeks old-R6/2 mice, in parallel with a partial rescue of spontaneous locomotor activity after
striatal overexpression of pre-enkephalin (pENK).
Our preliminary electrophysiological analysis also suggest that behavioral recovery observed in
R6/2 mice following intrastriatal cholesterol infusion mediated by osmotic minipumps, may be
related to an improvement in synaptic transmission, as previously observed in our g7-NPs studies.
The encouraging results from g7-NPs and minipumps strategies, prompted us to investigate also the
intranasal route of administration as an alternative, non–invasive, strategy for cholesterol delivery
to the HD brain (in collaboration with M. Salmona, Mario Negri Institute). Because of their
biocompatibility, biodegradability and low toxicity features, we used liposomal formulations as
cholesterol-delivery vehicles in these experiments. However in our experimental conditions,
measurable variations in brain cholesterol levels were not observed after repeated intranasal
administrations of both DRV and MLV liposomes containing unlabeled cholesterol. Ongoing
investigations are aimed at understanding the percentage of intranasally administered cholesterol
that effectively reaches the brain.
Thinking to a possible clinical translation of the therapeutic approach based on brain cholesterol
supplementation, other studies are necessary to better characterize and optimize g7-NPs and
intranasal non-invasive strategies. g7-PLGA-NPs used in this study already present many
interesting advantages. First, PLGA has been approved by FDA and EMA for drug delivery,
diagnostics and clinical applications (Mundargi et al. 2008). PLGA NPs are totally biodegradable,
since their physiological hydrolysis into the body produce lactic acid and glycolic acid, which are
easily metabolized via the Krebs cycle (Yoo et al. 2005). A significant toxicity associated to PLGA
has not been described (Athanasiou, Niederauer, and Agrawal 1996) and our studies confirmed this
result as our NPs do not induce any inflammatory response in peripheral tissues in which they
preferentially accumulate (liver and lung). PLGA NPs are able to sustain the release of the
encapsulated therapeutic agent over a period of days to several weeks (Panyam and Labhasetwar

Discussion
72
2003), protecting them from the body excretion and metabolism. Furthermore, due to their sub-
micron size, NPs delivery systems are taken up efficiently by the cells (Vinogradov, Bronich, and
Kabanov 2002).
Despite all these advantages, NPs based strategies present some limitations. Their small size and
large surface area can result in particle aggregation and allow limited drug loading. Indeed, g7-NPs
formulations used in this study only achieve 1% drug loading. Consequently, with our experimental
paradigm we delivered only about 15 µg of cholesterol to the mouse brain, without the possibility to
test the effects of higher doses of cholesterol.
In collaboration with G. Tosi (University of Modena) our future efforts will be orientated to
optimize this promising, non invasive, CNS delivery system, with the goal of increasing the amount
of cholesterol loaded into g7‐NPs, without affecting their chemical–physical properties. This will
also allow to reduce the number of injections/week in order to minimize handling stress in mice.
Additional experimental investigations are also required to optimize the intranasal strategy.
Currently, the main limiting factors associated with nasal drug delivery are the limited capacity of
the nasal cavity along with the rapid mucociliary clearance that hinders complete drug absorption
(Soane et al. 1999). Furthermore, nasal mucosa contains a number of enzymes responsible for the
degradation of intranasally applied drugs (Chung and Donovan 1996).
Common utilized approaches to improve nasal drug absorption include the use of protease and
peptidase inhibitors (Bernkop-Schnürch 1998). Moreover, to enhance the retention of liposomes
containing cholesterol on nasal mucosal surface, mucoadhesive polymers can be used. Owing to
their properties, in situ gelling formulations undergo gelation upon contact with the nasal cavity, as
they respond to physiological stimuli like nasal temperature and mucous pH (Chonkar, Nayak, and
Udupa 2015). These “smart” polymers not only are able to enhance the retention of the drug in
nasal cavity but also provide controlled release, ease of administration, enhanced permeation and
protection of the drug from mucosal enzymes. Liposomes in situ gelling system (LIGS) have also
been developed and characterized (Tiwari et al. 2009) and could represent a valid formulation for
intranasal cholesterol delivery.
Although it is considered an invasive delivery system, osmotic minipumps allowed us to test the
therapeutic potential of increasing doses of cholesterol directly administered into mice striatum,
overcoming current limitations of g7-NPs strategy. Furthermore, a clinical translation of this brain
targeting drug delivery system should not be excluded, considering that the Company Medtronic is
developing these devices for human application. Indeed Alnylam Pharmaceuticals and the CHDI
Foundation started a collaboration with Medtronic, to develop implantable infusion system for CNS

Discussion
73
delivery of RNAi therapeutics targeting huntingtin (“Industry Update, The Latest Developments in
Therapeutic Delivery” 2011).
Finally, an additional strategy to counteract the reduction in cholesterol available for synaptic
function and neurotransmission consists in promoting its endogenous synthesis and efflux in
astrocytes, which emerged to be defective in the HD brain (Valenza et al. 2010) (Valenza et al.
2015). Our in vitro data indicate that stimulation of endogenous biosynthesis in astrocytes results in
increased availability of newly synthetized cholesterol for neuronal activities (Valenza et al. 2015).
Based on this evidence, our ongoing in vivo studies aim to directly enhance endogenous cholesterol
biosynthesis in striatal astrocytes relies on the overexpression of the active form of SREBP2,
through glia-targeted viral vectors, in HD mice. More recently, an alternative indirect approach has
been adopted in Boussicault et al. 2016. In this study, the viral-induced overexpression of
CYP46A1 in the striatum of R6/2 mice stimulated the production of 24OHC and led to increased
levels of lanosterol and desmosterol, indirect indicators of brain cholesterol biosynthesis in neurons
and astrocytes respectively (Nieweg et al. 2009). The increase of 24OHC likely activates LXR-
dependent cholesterol efflux from astrocytes to neuronal cells (Abildayeva et al. 2006) and
indirectly glial cholesterol synthesis (i.e. increase of desmosterol), resulting in a rescue of some HD
phenotypes (Boussicault et al. 2016).
Our findings together with data from Boussicault et al. (2016) highlight the beneficial effect of
strategies able to stimulate endogenous biosynthesis both directly (Valenza et al. 2015) and
indirectly (Boussicault et al. 2016) or, alternatively, aimed at supplying exogenous cholesterol to
the HD brain (data herein described). All these studies pave the way for clinical translation and
develop new possible therapeutic strategies for HD patients.

Discussion
74
General Conclusions and Prospects
All these studies have provided clear evidence that cholesterol administration to the brain represents
a promising therapeutic approach for HD.
Our future primary goals will be to better analyze the cognitive rescue promoted by cholesterol
supplementation and to deepen our understanding of mechanisms underlying cholesterol-mediated
behavioral recovery (Valenza et al. 2015). To reach these goals, additional cognitive tests will be
performed on treated mice to investigate different aspects of learning and memory (i.e. fear
conditioning test). Furthermore, molecular (RNA sequencing), biochemical, electrophysiological
and neuropathological analyses will be completed on the tissues collected from mice implanted with
minipumps.
Since our findings revealed that high doses of exogenous cholesterol are required to observe a
significant recovery of both cognitive and motor functions in R6/2 mice, we will work to increase
cholesterol encapsulation efficacy of g7-NPs and, on the other hand, we will attempt to identify
more efficacious formulations for cholesterol intranasal delivery.
Moreover, pharmacokinetic and biodistribution studies will be performed, using D6-cholesterol, in
order to quantify the amount and cellular localization of exogenous cholesterol delivered in the
different brain regions with our non-invasive delivery systems.
Finally the potential validity of brain cholesterol supplementation–based therapeutic approach will
be evaluated in another HD animal model, chosen among them that closely mimic the genetic
context of patients with HD.

Material and Methods
75
Material and Methods

Material and Methods
76
Colony management
All the in vivo experiments were carried out in accordance with Italian Governing Law (D.lgs
26/2014; Authorisation n.324/2015-PR issued May 6, 2015 by Ministry of Health); the NIH Guide
for the Care and Use of Laboratory Animals (2011 edition) and EU directives and guidelines (EEC
Council Directive 2010/63/UE).
Our R6/2 colony lifespan was approximately of 13 weeks and it was maintained through the male
line exclusively (Mangiarini et al. 1996). Transgenic R6/2 male were paired with non-carrier
females (B6CBAF1/J, supplied by Charles River). Mice were weaned and then genotyped at 3
weeks of age (+/- 3 days). R6/2 colony was continually monitored for any changes that could affect
strain productivity, general behavior, litter size, pup survival, genotype frequency, phenotype and
other strain characteristics.
Mice were housed under standard conditions (22 ± 1°C, 60% relative humidity, 12 hour light/dark
schedule, 3–4 mice/cage, with free access to food and water).
After PCR genotyping, by method of Mangiarini et al. (1996), animals were randomly divided into
experimental groups. Male and female mice will be included and matched in experimental groups.
Animal treatments
- NPs injections: mice were treated with two intraperitoneal injections at week, from 5 to 9 weeks
of age, receiving 0.15 mg g7-NPs/g body weight in each injection (NPs stock concentration was
12.5 mg/ml; 0.7 mg in 100 mg of NPs).
- Surgical implantation of osmotic minipumps: mice were anesthetized with Avertin 2.5%. Avertin
100% was prepared diluting 5 g of 2,2,2-Tribromoethanol (Sigma Aldrich, #T48402-25G) in 5
mL of 2-methyl-2-butanol (Sigma Aldrich, #240486). 16 µL of Avertin 2.5% per gram of weight
was used to anesthetize mice. Once responses to tail/toe pinches and intactness of the ocular
reflex were assessed, scalp was shaved and mice were placed into a stereotaxic apparatus (2-
Biological Instrument). After disinfecting the scalp with iodine tincture, a midline sagittal
incision about 2.5 cm long was made, starting slightly behind the eyes. A subcutaneous pocket
was made on the back of the animals, in the midscapular area, to insert the osmotic pump. The
brain infusion microcannula, connected to the pump through a catheter, cannula (brain infusion
kit n°3, Alzet, #0008851) was stereotaxically implanted into mice right striatum (stereotaxic
coordinates 1.75 mm mediolateral, 0.5 mm anteroposterior, 3 mm dorsoventral; from Paxinos G
and Watson C. The Rat Brain in Stereotaxic Coordinates. Academic Press, San Diego). Loctite
454 instant adhesive gel (Alzet, #0008670) was spread on the base of the cannula in order to fix
it to the skull. Once the skull surface was dried, the cannula and the entre implantation site were
Material and Methods
77
covered with dental cement (Heraeus, #647079) and the scalp was closed with sutures (bLife,
#668H). Following surgery mice were removed from the stereotaxic apparatus and placed on a
warm cover to awaken from anesthesia. In each trial animals were operated at 7 weeks of age to
implant minipumps (Alzet, pump model 1004, #0009922) loaded with artificial cerebrospinal
fluid (ACSF), with methyl-β-cyclodextrin (Sigma Aldrich, #M7439-1G) diluted in ACSF, or
with water-soluble cholesterol (Sigma Aldrich, #C4951-30MG) supplemented with 5µM free
cholesterol diluted in ACSF. ACSF was prepared mixing two solutions (A and B) in a 1:1 ratio.
Solution A was prepared by diluting 8,66 g of NaCl (Sigma Aldrich, #53014), 0,224 g of KCl
(Sigma Aldrich, #P9333), 0,206 g of CaCl2 2H2O (Sigma Aldrich, #C3881) and 0,163 g of
MgCl2 6H2O (Sigma Aldrich, #M9272) in 500 mL of sigma water. Solution B was prepared by
diluting 0,214 g of Na2HPO4 7H2O (Sigma Aldrich, #59390) and 0,027 g of NaH2PO4 H2O
(Sigma Aldrich, #59638) in 500 mL of sigma water.
- Intranasal administrations: animals were treated as described in Hanson et al. 2013.
Methods relative to g7-NPs studies and behavioral analysis
Please for detailed description of this part see material and methods in the paper in attached
(Valenza et al. 2015).
Electrophysiological analysis relative to osmotic minipumps studies
Experiments were performed on submerged brain slices obtained from R6/2 adult mice (12 weeks
of postnatal life) treated with ACSF or cholesterol (500µg) in the 4 weeks preceding the
experiment. Animals were dissected using the standard procedure preceded by the intracardiac
perfusion of a saline solution containing (mM): Sucrose 70; NaCl 80; KCl 2.5; NaHCO3 26;
Glucose 15; MgCl2 7; CaCl2 1; NaH2PO4 1.25. The intracardiac perfusion was necessary to
preserve the vitality of brain tissue in adult mice. Coronal slices (300 µm- thickness) containing the
striatum were collected from the hemisphere ipsilateral to the insertion site and were kept for 1 h in
a saline solution containing (mM): NaCl 125; KCl 2.5; NaHCO3 26; Glucose 15; MgCl2 1.3;
CaCl2 2.3; NaH2PO4 1.25. After the recovery, slices were transferred to a submerged-style
recording chamber at room temperature (23-25°C) for the electrophysiological analysis.
Experiments were performed on striatal projection medium spiny neurons (MSNs). The cell
selected for recording was approached with a glass patch pipette filled with a solution iso-osmotic
with cytosol and containing (mM): Cs-methanesulphonate 120; KCl 5; CaCl2 1; MgCl2 2; EGTA
10; Na2ATP 4; Na3GTP 0.3; lidocaine N-ethylbromide 5; Hepes 8 (pH adjusted to 7.3 with KOH).
During the approach, the tip of the pipette was brought in close proximity to the neuron in order to

Material and Methods
78
create a very high resistance seal (1 GΩ or more - ‘giga seal’): this configuration is called ‘cell-
attached’. After the application of brief strong suctions inside the pipette, the small patch under the
tip was broken: in this used configuration (called ‘whole-cell’) the interior of the pipette becomes
continuous with the cytoplasm of the cell, allowing the measurement of electrical potentials and
currents flowing through the entire cell membrane.
Statistics
Prism 5 (GraphPad software) was used to perform all statistical analyses. Data are presented as
means ± standard error of the mean (SEM). Grubbs’ test was applied to identify outliers. Each set of
data was normally distributed consequently we used parametric statistical tests. Differences were
considered statistically if the p-value was less than 0.05. The specific statistical test used is
indicated in the legend of all results figures. No statistical methods were used to pre-determine
sample sizes, but our sample sizes are similar to those reported in the literature.

References
79
References

References
80
Abbott, N.J., 2004. Evidence for bulk flow of brain interstitial fluid: Significance for physiology
and pathology. Neurochemistry International, 45(4), pp.545–552.
Abildayeva, K., P. J. Jansen, V. Hirsch-Reinshagen, V. W. Bloks, A. H. F. Bakker, F. C. S.
Ramaekers, and others, ‘24(S)-Hydroxycholesterol Participates in a Liver X Receptor-
Controlled Pathway in Astrocytes That Regulates Apolipoprotein E-Mediated Cholesterol
Efflux’, Journal of Biological Chemistry, 281 (2006), 12799–808
<https://doi.org/10.1074/jbc.M601019200>
Albin, R.L. et al., 1990. Abnormalities of Striatal Projection Neurons and N-Methyl-D-Aspartate
Receptors in Presymptomatic Huntington’s Disease. New England Journal of Medicine,
322(18), pp.1293–1298. Available at:
http://dx.doi.org/10.1056/NEJM199005033221807\nhttp://www.nejm.org/doi/full/10.1056/NE
JM199005033221807\nhttp://www.nejm.org/doi/pdf/10.1056/NEJM199005033221807.
Alexis, F. et al., 2008. Factors affecting the clearance and biodistribution of polymeric
nanoparticles. In Molecular Pharmaceutics. pp. 505–515.
Ali, N.J. & Levine, M.S., 2006. Changes in Expression of N-Methyl-<i>D</i>-
Aspartate Receptor Subunits Occur Early in the R6/2 Mouse Model of Huntington’s Disease.
Developmental Neuroscience, 28(3), pp.230–238. Available at:
http://www.ncbi.nlm.nih.gov/pubmed/16679770 [Accessed December 28, 2016].
Allen, J. a, Halverson-Tamboli, R. a & Rasenick, M.M., 2007. Lipid raft microdomains and
neurotransmitter signalling. Nature reviews. Neuroscience, 8(2), pp.128–140.
Alpy, F., 2005. Give lipids a START: the StAR-related lipid transfer (START) domain in
mammals. Journal of Cell Science, 118(13), pp.2791–2801. Available at:
http://jcs.biologists.org/cgi/doi/10.1242/jcs.02485 [Accessed November 7, 2016].
Altar, C. a et al., 1997. Anterograde transport of brain-derived neurotrophic factor and its role in the
brain. Nature, 389(6653), pp.856–860.
Andrich, J. et al., 2002. Autonomic nervous system function in Huntington’s disease. Journal of
neurology, neurosurgery, and psychiatry, 72(6), pp.726–31. Available at:
http://www.ncbi.nlm.nih.gov/pubmed/12023413 [Accessed October 23, 2016].
Anon, 2011. Industry Update The latest developments in therapeutic delivery. Therapeutic
Delivery, 2(1), pp.9–14.
Antunes, M. & Biala, G., 2012. The novel object recognition memory: neurobiology, test
procedure, and its modifications. Cognitive Processing, 13(2), pp.93–110. Available at:
http://link.springer.com/10.1007/s10339-011-0430-z [Accessed November 21, 2016].
Aqul, A. et al., 2011. Unesterified Cholesterol Accumulation in Late Endosomes/Lysosomes

References
81
Causes Neurodegeneration and Is Prevented by Driving Cholesterol Export from This
Compartment. Journal of Neuroscience, 31(25), pp.9404–9413. Available at:
http://www.jneurosci.org/cgi/doi/10.1523/JNEUROSCI.1317-11.2011 [Accessed November
14, 2016].
Arnulf, I. et al., 2008. Rapid Eye Movement Sleep Disturbances in Huntington Disease. Archives of
Neurology, 65(4), p.482. Available at:
http://archneur.jamanetwork.com/article.aspx?doi=10.1001/archneur.65.4.482 [Accessed
November 2, 2016].
Aronin, N. et al., 1995. CAG expansion affects the expression of mutant Huntingtin in the
Huntington’s disease brain. Neuron, 15(5), pp.1193–201. Available at:
http://www.ncbi.nlm.nih.gov/pubmed/7576661 [Accessed November 2, 2016].
Arzberger, T. et al., 1997. Changes of NMDA receptor subunit (NR1, NR2B) and glutamate
transporter (GLT1) mRNA expression in Huntington’s disease--an in situ hybridization study.
Journal of Neuropathology and Experimental Neurology, 56(4), pp.440–454. Available at:
http://www.ncbi.nlm.nih.gov/entrez/query.fcgi?cmd=Retrieve&db=PubMed&dopt=Citation&l
ist_uids=9100675.
Athanasiou, K.A., Niederauer, G.G. & Agrawal, C.M., 1996. Sterilization, toxicity,
biocompatibility and clinical applications of polylactic acid/ polyglycolic acid copolymers.
Biomaterials, 17(2), pp.93–102.
Auerbach, W. et al., 2001. The HD mutation causes progressive lethal neurological disease in mice
expressing reduced levels of huntingtin. Human molecular genetics, 10(22), pp.2515–2523.
Augood, S.J., Faull, R.L. & Emson, P.C., 1997. Dopamine D1 and D2 receptor gene expression in
the striatum in Huntington’s disease. Annals of neurology, 42(2), pp.215–21. Available at:
http://www.ncbi.nlm.nih.gov/pubmed/9266732.
Aylward, E.H. et al., 2011. Longitudinal change in regional brain volumes in prodromal Huntington
disease. Journal of neurology, neurosurgery, and psychiatry, 82(4), pp.405–10. Available at:
http://www.ncbi.nlm.nih.gov/pubmed/20884680 [Accessed October 23, 2016].
Aziz, N.A. et al., 2010. Autonomic symptoms in patients and pre-manifest mutation carriers of
Huntington’s disease. European journal of neurology, 17(8), pp.1068–74. Available at:
http://www.ncbi.nlm.nih.gov/pubmed/20192977 [Accessed October 23, 2016].
Aziz, N.A. et al., 2007. Hypothalamic dysfunction and neuroendocrine and metabolic alterations in
Huntington’s disease: clinical consequences and therapeutic implications. Reviews in the
neurosciences, 18(3–4), pp.223–51. Available at:
http://www.ncbi.nlm.nih.gov/pubmed/18019608 [Accessed October 23, 2016].

References
82
Aziz, N.A. et al., 2010. Sleep and circadian rhythm alterations correlate with depression and
cognitive impairment in Huntington’s disease. Parkinsonism & Related Disorders, 16(5),
pp.345–350. Available at: http://linkinghub.elsevier.com/retrieve/pii/S1353802010000477
[Accessed November 2, 2016].
Aziz, N.A. et al., 2008. Weight loss in Huntington disease increases with higher CAG repeat
number. Neurology, 71(19), pp.1506–1513. Available at:
http://www.neurology.org/cgi/doi/10.1212/01.wnl.0000334276.09729.0e [Accessed November
2, 2016].
Bäckman, L. et al., 1997. Cognitive deficits in Huntington’s disease are predicted by dopaminergic
PET markers and brain volumes. Brain : a journal of neurology, pp.2207–17. Available at:
http://www.ncbi.nlm.nih.gov/pubmed/9448576 [Accessed November 2, 2016].
Baker, H. & Spencer, R.F., 1986. Transneuronal transport of peroxidase-conjugated wheat germ
agglutinin (WGA-HRP) from the olfactory epithelium to the brain of the adult rat.
Experimental brain research, 63(3), pp.461–73. Available at:
http://www.ncbi.nlm.nih.gov/pubmed/3758265.
Bala, I., Hariharan, S. & Kumar, M.N., 2004. PLGA nanoparticles in drug delivery: the state of the
art. Crit Rev Ther Drug Carrier Syst, 21(5), pp.387–422. Available at:
http://ukpmc.ac.uk/abstract/MED/15719481.
Balin, B.J. et al., 1986. Avenues for entry of peripherally administered protein to the central
nervous system in mouse, rat, and squirrel monkey. The Journal of comparative neurology,
251(2), pp.260–80. Available at: http://www.ncbi.nlm.nih.gov/pubmed/3782501 [Accessed
November 30, 2016].
Baudry, M. et al., 2003. Postnatal development of inflammation in a murine model of Niemann-
Pick type C disease: Immunohistochemical observations of microglia and astroglia.
Experimental Neurology, 184(2), pp.887–903.
Behrens, P.F. et al., 2002. Impaired glutamate transport and glutamate-glutamine cycling:
downstream effects of the Huntington mutation. Brain : a journal of neurology, 125(Pt 8),
pp.1908–22. Available at: http://www.ncbi.nlm.nih.gov/pubmed/12135980 [Accessed
November 21, 2016].
Benarroch, E.E., 1993. The central autonomic network: functional organization, dysfunction, and
perspective. Mayo Clinic proceedings, 68(10), pp.988–1001. Available at:
http://www.ncbi.nlm.nih.gov/pubmed/8412366 [Accessed October 23, 2016].
Benn, C.L. et al., 2008. Huntingtin Modulates Transcription, Occupies Gene Promoters In Vivo,
and Binds Directly to DNA in a Polyglutamine-Dependent Manner. Journal of Neuroscience,

References
83
28(42).
Bennett, E.J. et al., 2007. Global changes to the ubiquitin system in Huntington’s disease
(suplementary info). Nature, 448(7154), pp.704–8. Available at:
http://www.ncbi.nlm.nih.gov/pubmed/17687326.
Benraiss, A. et al., 2016. Human glia can both induce and rescue aspects of disease phenotype in
Huntington disease. Nature Communications, 7, p.11758. Available at:
http://www.ncbi.nlm.nih.gov/pubmed/27273432 [Accessed December 27, 2016].
Bernkop-Schnürch, A., 1998. The use of inhibitory agents to overcome the enzymatic barrier to
perorally administered therapeutic peptides and proteins. Journal of Controlled Release, 52(1–
2), pp.1–16.
Bien-Ly, N. et al., 2012. Reducing human apolipoprotein E levels attenuates age-dependent Abeta
accumulation in mutant human amyloid precursor protein transgenic mice. J Neurosci, 32(14),
pp.4803–4811. Available at:
http://www.ncbi.nlm.nih.gov/pubmed/22492035\nhttp://www.jneurosci.org/content/32/14/480
3.full.pdf.
Bjorkhem, I., 2004. Brain Cholesterol: Long Secret Life Behind a Barrier. Arteriosclerosis,
Thrombosis, and Vascular Biology, 24(5), pp.806–815. Available at:
http://atvb.ahajournals.org/cgi/doi/10.1161/01.ATV.0000120374.59826.1b [Accessed
November 5, 2016].
Björkhem, I. et al., 1998. Cholesterol homeostasis in human brain: turnover of 24S-
hydroxycholesterol and evidence for a cerebral origin of most of this oxysterol in the
circulation. Journal of lipid research, 39(8), pp.1594–1600.
Björkhem I, Lütjohann D, Breuer O, Sakinis A, W.A., 1997. Importance of a Novel Oxidative
Mechanism for Elimination of. Journal of Biological Chemistry, 272(48), pp.30178–30184.
Bliss, T. V & Collingridge, G.L., 1993. A synaptic model of memory: long-term potentiation in the
hippocampus. Nature, 361(6407), pp.31–39.
Bodovitz, S. & Klein, W.L., 1996. Cholesterol modulates alpha-secretase cleavage of amyloid
precursor protein. The Journal of biological chemistry, 271(8), pp.4436–40. Available at:
http://www.ncbi.nlm.nih.gov/pubmed/8626795 [Accessed November 14, 2016].
Bogdanov, M.B. et al., 2001. Increased oxidative damage to DNA in a transgenic mouse model of
Huntington’s disease. Journal of neurochemistry, 79(6), pp.1246–9. Available at:
http://www.ncbi.nlm.nih.gov/pubmed/11752065 [Accessed November 21, 2016].
Boussicault, Lydie, Sandro Alves, Antonin Lamazière, Anabelle Planques, Nicolas Heck, Lara
Moumné, and others, ‘CYP46A1, the Rate-Limiting Enzyme for Cholesterol Degradation, Is

References
84
Neuroprotective in Huntington’s Disease.’, Brain : A Journal of Neurology, 139 (2016), 953–
70 <https://doi.org/10.1093/brain/awv384>
Boyles, J.K., Notterpek, L.M. & Anderson, L.J., 1990. Accumulation of apolipoproteins in the
regenerating and remyelinating mammalian peripheral nerve. Identification of apolipoprotein
D, apolipoprotein A-IV, apolipoprotein E, and apolipoprotein A-I. The Journal of biological
chemistry, 265(29), pp.17805–15. Available at: http://www.ncbi.nlm.nih.gov/pubmed/2120218
[Accessed November 6, 2016].
Bozzuto, G. & Molinari, A., 2015. Liposomes as nanomedical devices. International journal of
nanomedicine, 10, pp.975–99. Available at: http://www.ncbi.nlm.nih.gov/pubmed/25678787
[Accessed December 5, 2016].
Bradford, J. et al., 2009. Expression of mutant huntingtin in mouse brain astrocytes causes age-
dependent neurological symptoms. Proceedings of the National Academy of Sciences of the
United States of America, 106(52), pp.22480–5. Available at:
http://www.ncbi.nlm.nih.gov/pubmed/20018729 [Accessed December 26, 2016].
Browne, S.E., 2008. Mitochondria and Huntington’s disease pathogenesis: Insight from genetic and
chemical models. In Annals of the New York Academy of Sciences. pp. 358–382.
Burger, K., Gimpl, G. & Fahrenholz, F., 2000. Regulation of receptor function by cholesterol.
Cellular and molecular life sciences : CMLS, 57, pp.1577–1592.
Bylsma, F.W., Brandt, J. & Strauss, M.E., 1990. Aspects of procedural memory are differentially
impaired in huntington’s disease. Archives of Clinical Neuropsychology, 5(3), pp.287–297.
Carmichael, S.T., Clugnet, M.C. & Price, J.L., 1994. Central olfactory connections in the macaque
monkey. Journal of Comparative Neurology, 346(3), pp.403–434.
Carstea, E.D. et al., 1997. Niemann-Pick C1 disease gene: homology to mediators of cholesterol
homeostasis. Science (New York, N.Y.), 277(5323), pp.228–31. Available at:
http://www.ncbi.nlm.nih.gov/pubmed/9211849.
Carter, R.J. et al., 1999. Characterization of progressive motor deficits in mice transgenic for the
human Huntington’s disease mutation. The Journal of neuroscience : the official journal of the
Society for Neuroscience, 19(8), pp.3248–57. Available at:
http://www.ncbi.nlm.nih.gov/pubmed/10191337 [Accessed November 19, 2016].
Caviston, J.P. et al., 2007. Huntingtin facilitates dynein/dynactin-mediated vesicle transport.
Proceedings of the National Academy of Sciences of the United States of America, 104(24),
pp.10045–50. Available at: http://www.ncbi.nlm.nih.gov/pubmed/17548833 [Accessed
December 19, 2016].
Cepeda, C. et al., 2004. Increased GABAergic function in mouse models of Huntington’s disease:

References
85
Reversal by BDNF. Journal of Neuroscience Research, 78(6), pp.855–867. Available at:
http://www.ncbi.nlm.nih.gov/pubmed/15505789 [Accessed December 3, 2016].
Cepeda, C. et al., 2003. Transient and progressive electrophysiological alterations in the
corticostriatal pathway in a mouse model of Huntington’s disease. The Journal of
neuroscience : the official journal of the Society for Neuroscience, 23(3), pp.961–9. Available
at: http://www.ncbi.nlm.nih.gov/pubmed/12574425 [Accessed November 21, 2016].
Cha, J.H. et al., 1998. Altered brain neurotransmitter receptors in transgenic mice expressing a
portion of an abnormal human huntington disease gene. Proceedings of the National Academy
of Sciences of the United States of America, 95(11), pp.6480–5. Available at:
http://www.ncbi.nlm.nih.gov/pubmed/9600992 [Accessed November 21, 2016].
Cha, J.H. et al., 1999a. Altered neurotransmitter receptor expression in transgenic mouse models of
Huntington’s disease. Philosophical transactions of the Royal Society of London. Series B,
Biological sciences, 354(1386), pp.981–9. Available at:
http://www.pubmedcentral.nih.gov/articlerender.fcgi?artid=1692608&tool=pmcentrez&render
type=abstract.
Cha, J.H. et al., 1999b. Altered neurotransmitter receptor expression in transgenic mouse models of
Huntington’s disease. Philosophical transactions of the Royal Society of London. Series B,
Biological sciences, 354(1386), pp.981–9. Available at:
http://www.ncbi.nlm.nih.gov/pubmed/10434296 [Accessed November 21, 2016].
Cha, J.H.J., 2007. Transcriptional signatures in Huntington’s disease. Progress in Neurobiology,
83(4), pp.228–248.
Chamberlain, L.H. & Gould, G.W., 2002. The vesicle- and target-SNARE proteins that mediate
Glut4 vesicle fusion are localized in detergent-insoluble lipid rafts present on distinct
intracellular membranes. Journal of Biological Chemistry, 277(51), pp.49750–49754.
Chan, E.Y.W. et al., 2002. Increased huntingtin protein length reduces the number of
polyglutamine-induced gene expression changes in mouse models of Huntington’s disease.
Human molecular genetics, 11(17), pp.1939–51. Available at:
http://www.ncbi.nlm.nih.gov/pubmed/12165556 [Accessed December 28, 2016].
Chang, T.Y., Chang, C.C.Y. & Cheng, D., 1997. ACYL-COENZYME A : CHOLESTEROL.
Chapman, C.D. et al., 2013. Intranasal treatment of central nervous system dysfunction in humans.
Pharmaceutical research, 30(10), pp.2475–84. Available at:
http://www.ncbi.nlm.nih.gov/pubmed/23135822 [Accessed November 30, 2016].
Chen, C.-M. et al., 2007. Increased oxidative damage and mitochondrial abnormalities in the
peripheral blood of Huntington’s disease patients. Biochemical and biophysical research

References
86
communications, 359(2), pp.335–40. Available at:
http://www.ncbi.nlm.nih.gov/pubmed/17543886.
Chen, Z. & Rand, R.P., 1997. The influence of cholesterol on phospholipid membrane curvature
and bending elasticity. Biophysical journal, 73(1), pp.267–276.
Cheng, D. et al., 1995. Activation of acyl-coenzyme A:cholesterol acyltransferase by cholesterol or
by oxysterol in a cell-free system. Journal of Biological Chemistry, 270(2), pp.685–695.
Chonkar, A., Nayak, U. & Udupa, N., 2015. Smart Polymers in Nasal Drug Delivery. Indian
journal of pharmaceutical sciences, 77(4), pp.367–375.
Chung, F.Y. & Donovan, M.D., 1996. Nasal pre-systemic metabolism of peptide drugs: Substance
P metabolism in the sheep nasal cavity. International Journal of Pharmaceutics, 128(1–2),
pp.229–237.
Colin, E. et al., 2008. Huntingtin phosphorylation acts as a molecular switch for
anterograde/retrograde transport in neurons. The EMBO journal, 27(15), pp.2124–34.
Available at: http://www.ncbi.nlm.nih.gov/pubmed/18615096 [Accessed December 19, 2016].
Corder, E.H. et al., 1993. Gene dose of apolipoprotein E type 4 allele and the risk of Alzheimer’s
disease in late onset families. Science (New York, N.Y.), 261(5123), pp.921–3. Available at:
http://www.ncbi.nlm.nih.gov/pubmed/8346443 [Accessed November 14, 2016].
Corder, E.H. et al., 1994. Protective effect of apolipoprotein E type 2 allele for late onset Alzheimer
disease. Nature Genetics, 7(2), pp.180–184. Available at:
http://www.nature.com/doifinder/10.1038/ng0694-180 [Accessed November 14, 2016].
Costantino, L. et al., 2005. Peptide-derivatized biodegradable nanoparticles able to cross the blood–
brain barrier. Journal of Controlled Release, 108(1), pp.84–96. Available at:
http://www.ncbi.nlm.nih.gov/pubmed/16154222 [Accessed December 2, 2016].
Coulston, F. & DeSesso, J.M., 1993. The relevance to humans of animal models for inhalation
studies of cancer in the nose and upper airways. Quality assurance (San Diego, Calif.), 2(3),
pp.211–212.
Courtney, R. & Landreth, G. E. LXR Regulation of Brain Cholesterol: From Development to
Disease. Trends Endocrinol. Metab. 27, 404–414 (2016).
Cramer, P.E. et al., 2012. ApoE-Directed Therapeutics Rapidly Clear -Amyloid and Reverse
Deficits in AD Mouse Models. Science, 335(6075), pp.1503–1506. Available at:
http://www.sciencemag.org/cgi/doi/10.1126/science.1217697 [Accessed November 14, 2016].
Cui, L. et al., 2006. Transcriptional repression of PGC-1alpha by mutant huntingtin leads to
mitochondrial dysfunction and neurodegeneration. Cell, 127(1), pp.59–69. Available at:
http://www.ncbi.nlm.nih.gov/pubmed/17018277.

References
87
Davies, S.W. et al., 1997. Formation of neuronal intranuclear inclusions underlies the neurological
dysfunction in mice transgenic for the HD mutation. Cell, 90(3), pp.537–548.
Dean, M., Hamon, Y. & Chimini, G., 2001. The human ATP-binding cassette (ABC) transporter
superfamily. Journal of lipid research, 42(7), pp.1007–17. Available at:
http://www.ncbi.nlm.nih.gov/pubmed/11441126 [Accessed November 6, 2016].
Dhanasekaran, M. et al., 2005. Glycopeptides related to beta-endorphin adopt helical amphipathic
conformations in the presence of lipid bilayers. Journal of the American Chemical Society,
127(15), pp.5435–5448.
Dhuria, S. V, Hanson, L.R. & Frey, W.H., 2009. Novel vasoconstrictor formulation to enhance
intranasal targeting of neuropeptide therapeutics to the central nervous system. The Journal of
pharmacology and experimental therapeutics, 328(1), pp.312–320.
Dietschy, J.M., 2009. Central nervous system: cholesterol turnover, brain development and
neurodegeneration. Biological Chemistry, 390(4). Available at:
http://www.degruyter.com/view/j/bchm.2009.390.issue-4/bc.2009.035/bc.2009.035.xml
[Accessed November 5, 2016].
Dietschy, J.M., 2004. Thematic review series: Brain Lipids. Cholesterol metabolism in the central
nervous system during early development and in the mature animal. The Journal of Lipid
Research, 45(8), pp.1375–1397. Available at: http://www.jlr.org/cgi/doi/10.1194/jlr.R400004-
JLR200 [Accessed November 5, 2016].
Dietschy, J.M. & Turley, S.D., 2001. Cholesterol metabolism in the brain. Current opinion in
lipidology, 12, pp.105–112.
DiFiglia, M. et al., 1997. Aggregation of huntingtin in neuronal intranuclear inclusions and
dystrophic neurites in brain. Science (New York, N.Y.), 277(5334), pp.1990–3. Available at:
http://www.ncbi.nlm.nih.gov/pubmed/9302293 [Accessed November 2, 2016].
DiFiglia, M., 1990. Excitotoxic injury of the neostriatum: a model for Huntington’s disease. Trends
in Neurosciences, 13(7), pp.286–289.
DiFiglia, M. et al., 1995. Huntingtin is a cytoplasmic protein associated with vesicles in human and
rat brain neurons. Neuron, 14(5), pp.1075–81. Available at:
http://www.ncbi.nlm.nih.gov/pubmed/7748555 [Accessed November 2, 2016].
Dunah, A.W. et al., 2002. Sp1 and TAFII130 transcriptional activity disrupted in early Huntington’s
disease. Science (New York, N.Y.), 296(5576), pp.2238–2243.
Eberlé, D. et al., 2004. SREBP transcription factors: master regulators of lipid homeostasis.
Biochimie, 86(11), pp.839–848. Available at:
http://linkinghub.elsevier.com/retrieve/pii/S0300908404001658 [Accessed November 7,

References
88
2016].
Edwards, P.A., Kennedy, M.A. & Mak, P.A., 2002. LXRs;: Oxysterol-activated nuclear receptors
that regulate genes controlling lipid homeostasis. Vascular Pharmacology, 38(4), pp.249–256.
Ehehalt, R. et al., 2003. Amyloidogenic processing of the Alzheimer β-amyloid precursor protein
depends on lipid rafts. The Journal of Cell Biology, 160(1), pp.113–123. Available at:
http://www.jcb.org/lookup/doi/10.1083/jcb.200207113 [Accessed November 14, 2016].
Elias, S. et al., 2014. Huntingtin regulates mammary stem cell division and differentiation. Stem
Cell Reports, 2(4), pp.491–506.
Estrada-Sánchez, A.M. et al., 2009. Glutamate toxicity in the striatum of the R6/2 Huntington’s
disease transgenic mice is age-dependent and correlates with decreased levels of glutamate
transporters. Neurobiology of Disease, 34(1), pp.78–86. Available at:
http://www.ncbi.nlm.nih.gov/pubmed/19168136 [Accessed December 20, 2016].
Faideau, M. et al., 2010. In vivo expression of polyglutamine-expanded huntingtin by mouse striatal
astrocytes impairs glutamate transport: a correlation with Huntington’s disease subjects.
Human Molecular Genetics, 19(15), pp.3053–3067. Available at:
http://www.ncbi.nlm.nih.gov/pubmed/20494921 [Accessed December 22, 2016].
Fan, M.M.Y. et al., 2007. Altered NMDA receptor trafficking in a yeast artificial chromosome
transgenic mouse model of Huntington’s disease. The Journal of neuroscience : the official
journal of the Society for Neuroscience, 27(14), pp.3768–3779.
Fan, M.M.Y. & Raymond, L.A., 2007. N-Methyl-d-aspartate (NMDA) receptor function and
excitotoxicity in Huntington’s disease. Progress in Neurobiology, 81(5–6), pp.272–293.
Ferrante, R.J. et al., 1997. Heterogeneous topographic and cellular distribution of huntingtin
expression in the normal human neostriatum. The Journal of neuroscience : the official journal
of the Society for Neuroscience, 17(9), pp.3052–3063.
Field, P.M., Li, Y. & Raisman, G., 2003. Ensheathment of the olfactory nerves in the adult rat.
Journal of Neurocytology, 32(3), pp.317–324.
Frank, C. et al., 2008. Cholesterol depletion inhibits synaptic transmission and synaptic plasticity in
rat hippocampus. Experimental Neurology, 212(2), pp.407–414.
Frank, C. et al., 2004. Cholesterol perturbing agents inhibit NMDA-dependent calcium influx in rat
hippocampal primary culture. FEBS Letters, 566(1–3), pp.25–29.
Friedman, J.H. et al., 2005. Monozygotic Twins Discordant for Huntington Disease After 7 Years.
Archives of Neurology, 62(6). Available at:
http://archneur.jamanetwork.com/article.aspx?doi=10.1001/archneur.62.6.995 [Accessed
November 2, 2016].
References
89
Fukumoto, H. et al., 2002. Induction of the cholesterol transporter ABCA1 in central nervous
system cells by liver X receptor agonists increases secreted A?? levels. Journal of Biological
Chemistry, 277(50), pp.48508–48513.
Fusco, F.R. et al., 1999. Cellular localization of huntingtin in striatal and cortical neurons in rats:
lack of correlation with neuronal vulnerability in Huntington’s disease. The Journal of
neuroscience : the official journal of the Society for Neuroscience, 19(4), pp.1189–202.
Available at: http://www.ncbi.nlm.nih.gov/pubmed/9952397 [Accessed December 19, 2016].
Futter, M. et al., 2009a. Wild-type but not mutant huntingtin modulates the transcriptional activity
of liver X receptors. Journal of Medical Genetics, 46(7), pp.438–446. Available at:
http://jmg.bmj.com/cgi/doi/10.1136/jmg.2009.066399 [Accessed November 13, 2016].
Futter, M. et al., 2009b. Wild-type but not mutant huntingtin modulates the transcriptional activity
of liver X receptors. Journal of medical genetics, 46(7), pp.438–46. Available at:
http://jmg.bmj.com/content/46/7/438.abstract.
Garriga-Canut, M. et al., 2012. Synthetic zinc finger repressors reduce mutant huntingtin expression
in the brain of R6/2 mice. Proceedings of the National Academy of Sciences, 109(45),
pp.E3136–E3145. Available at: http://www.ncbi.nlm.nih.gov/pubmed/23054839 [Accessed
December 29, 2016].
Gauthier, L.R. et al., 2004. Huntingtin Controls Neurotrophic Support and Survival of Neurons by
Enhancing BDNF Vesicular Transport along Microtubules. Cell, 118(1), pp.127–138.
Available at: http://www.ncbi.nlm.nih.gov/pubmed/15242649 [Accessed December 19, 2016].
German, D.C. et al., 2002. Neurodegeneration in the Niemann-Pick C mouse: Glial involvement.
Neuroscience, 109(3), pp.437–450.
Gil, C. et al., 2006. Synaptic proteins associate with a sub-set of lipid rafts when isolated from
nerve endings at physiological temperature. Biochemical and Biophysical Research
Communications, 348(4), pp.1334–1342.
Gimpl, G. & Gehrig-Burger, K., 2007. Cholesterol reporter molecules. Bioscience Reports, 27(6),
pp.335–358.
Giralt, A. et al., 2011. Increased PKA signaling disrupts recognition memory and spatial memory:
role in Huntington’s disease. Human Molecular Genetics, 20(21), pp.4232–4247. Available at:
http://www.hmg.oxfordjournals.org/cgi/doi/10.1093/hmg/ddr351 [Accessed November 20,
2016].
Goldberg, T.E. et al., 1990. Regional cerebral blood flow and cognitive function in Huntington’s
disease and schizophrenia. A comparison of patients matched for performance on a prefrontal-
type task. Arch Neurol, 47, pp.418–422.

References
90
Gómez-Esteban, J.C. et al., 2006. Monozygotic Twins Suffering from Huntington’s Disease Show
Different Cognitive and Behavioural Symptoms. European Neurology, 57(1), pp.26–30.
Available at: http://www.karger.com/?doi=10.1159/000097006 [Accessed November 2, 2016].
Goodman, A.O.G. & Barker, R.A., 2010. How vital is sleep in Huntington’s disease? Journal of
Neurology, 257(6), pp.882–897. Available at: http://link.springer.com/10.1007/s00415-010-
5517-4 [Accessed November 2, 2016].
Graziadei, P.P., 1970. The mucous membranes of the nose. The Annals of otology, rhinology, and
laryngology, 79(3), pp.433–42. Available at: http://www.ncbi.nlm.nih.gov/pubmed/5426874
[Accessed December 2, 2016].
Grevers, G. & Herrmann, U., 1987. Fenestrated endothelia in vessels of the nasal mucosa. Archives
of Oto-Rhino-Laryngology, 244(1), pp.55–60. Available at:
http://link.springer.com/10.1007/BF00453492 [Accessed December 2, 2016].
Groothuis, D.R. et al., 2007. Efflux of drugs and solutes from brain: the interactive roles of
diffusional transcapillary transport, bulk flow and capillary transporters. Journal of cerebral
blood flow and metabolism : official journal of the International Society of Cerebral Blood
Flow and Metabolism, 27(1), pp.43–56.
Gu, M. et al., 1996. Mitochondrial defect in Huntington’s disease caudate nucleus. Annals of
Neurology, 39(3), pp.385–389.
Gusella, J.F. et al., 1983. A polymorphic DNA marker genetically linked to Huntington’s disease.
Nature, 306(5940), pp.234–238.
Gutekunst, C.A. et al., 1999. Nuclear and neuropil aggregates in Huntington’s disease: relationship
to neuropathology. The Journal of neuroscience : the official journal of the Society for
Neuroscience, 19(7), pp.2522–34. Available at:
http://www.ncbi.nlm.nih.gov/pubmed/10087066 [Accessed November 2, 2016].
Hackam, A.S. et al., 2000. Huntingtin interacting protein 1 induces apoptosis via a novel caspase-
dependent death effector domain. Journal of Biological Chemistry, 275(52), pp.41299–41308.
Hadaczek, P. et al., 2006. The “Perivascular Pump” Driven by Arterial Pulsation Is a Powerful
Mechanism for the Distribution of Therapeutic Molecules within the Brain. Molecular
Therapy, 14(1), pp.69–78.
Hadley, K., Orlandi, R.R. & Fong, K.J., 2004. Basic anatomy and physiology of olfaction and taste.
Otolaryngologic Clinics of North America, 37(6 SPEC.ISS.), pp.1115–1126.
Hahn-Barma, V. et al., 1998. Are cognitive changes the first symptoms of Huntington’s disease? A
study of gene carriers. Journal of neurology, neurosurgery, and psychiatry, 64(2), pp.172–7.
Available at: http://www.ncbi.nlm.nih.gov/pubmed/9489526 [Accessed November 2, 2016].
References
91
Hanson, L.R. et al., 2013. Intranasal Administration of CNS Therapeutics to Awake Mice. Journal
of Visualized Experiments, (74), pp.e4440–e4440. Available at:
http://www.jove.com/video/4440/intranasal-administration-of-cns-therapeutics-to-awake-mice
[Accessed December 5, 2016].
Hansson, O. et al., 2001. Resistance to NMDA toxicity correlates with appearance of nuclear
inclusions, behavioural deficits and changes in calcium homeostasis in mice transgenic for
exon 1 of the huntington gene. The European journal of neuroscience, 14(9), pp.1492–504.
Available at: http://www.ncbi.nlm.nih.gov/pubmed/11722611 [Accessed November 21, 2016].
Harjes, P. & Wanker, E.E., 2003. The hunt for huntingtin function: interaction partners tell many
different stories. Trends in Biochemical Sciences, 28(8), pp.425–433. Available at:
http://www.ncbi.nlm.nih.gov/pubmed/12932731 [Accessed December 28, 2016].
Hassel, B. et al., 2008. Glutamate uptake is reduced in prefrontal cortex in Huntington’s disease.
Neurochemical Research, 33(2), pp.232–237.
Hayashi, H., 2011. Lipid metabolism and glial lipoproteins in the central nervous system.
Biological & pharmaceutical bulletin, 34(4), pp.453–61. Available at:
http://www.ncbi.nlm.nih.gov/pubmed/21467629 [Accessed November 6, 2016].
Hebb, M.O., Denovan-Wright, E.M. & Robertson, H.A., 1999. Expression of the Huntington’s
disease gene is regulated in astrocytes in the arcuate nucleus of the hypothalamus of
postpartum rats. FASEB journal : official publication of the Federation of American Societies
for Experimental Biology, 13(9), pp.1099–106. Available at:
http://www.ncbi.nlm.nih.gov/pubmed/10336893 [Accessed December 26, 2016].
Hedreen, J.C. et al., 1991. Neuronal loss in layers V and VI of cerebral cortex in Huntington’s
disease. Neuroscience letters, 133(2), pp.257–61. Available at:
http://www.ncbi.nlm.nih.gov/pubmed/1840078 [Accessed November 2, 2016].
Heindel, W.C., Butters, N. & Salmon, D.P., 1988. Impaired learning of a motor skill in patients
with Huntington’s disease. Behav Neurosci, 102(1), pp.141–147. Available at:
http://www.ncbi.nlm.nih.gov/entrez/query.fcgi?cmd=Retrieve&db=PubMed&dopt=Citation&l
ist_uids=2965592.
Hering, H., Lin, C. & Sheng, M., 2003. Lipid rafts in the maintenance of synapses, dendritic spines,
and surface AMPA receptor stability. The Journal of neuroscience : the official journal of the
Society for Neuroscience, 23(8), pp.3262–3271.
Herndon, E.S. et al., 2009. Neuroanatomic profile of polyglutamine immunoreactivity in
Huntington disease brains. Journal of neuropathology and experimental neurology, 68(3),
pp.250–61. Available at: http://www.ncbi.nlm.nih.gov/pubmed/19225411 [Accessed

References
92
November 2, 2016].
Hickey, M.A., Reynolds, G.P. & Morton, A.J., 2002. The role of dopamine in motor symptoms in
the R6/2 transgenic mouse model of Huntington’s disease. Journal of neurochemistry, 81(1),
pp.46–59. Available at: http://www.ncbi.nlm.nih.gov/pubmed/12067237 [Accessed November
21, 2016].
Hilditch-Maguire, P. et al., 2000. Huntingtin: an iron-regulated protein essential for normal nuclear
and perinuclear organelles. Human Molecular Genetics, 9(19), pp.2789–2797. Available at:
http://eutils.ncbi.nlm.nih.gov/entrez/eutils/elink.fcgi?dbfrom=pubmed&id=11092755&retmod
e=ref&cmd=prlinks\npapers2://publication/uuid/BA6DB0F9-3AA5-4A1A-9066-
89B6B16E18EE.
Hinton, S.C. et al., 2007. Motor timing variability increases in preclinical Huntington’s disease
patients as estimated onset of motor symptoms approaches. Journal of the International
Neuropsychological Society : JINS, 13(3), pp.539–43. Available at:
http://www.ncbi.nlm.nih.gov/pubmed/17445303 [Accessed August 29, 2016].
Hirsch-Reinshagen, V. et al., 2004. Deficiency of ABCA1 Impairs Apolipoprotein E Metabolism in
Brain. Journal of Biological Chemistry, 279(39), pp.41197–41207. Available at:
http://www.jbc.org/lookup/doi/10.1074/jbc.M407962200 [Accessed November 6, 2016].
Ho, A.K. et al., 2003. Profile of cognitive progression in early Huntington’s disease. Neurology,
61(12), pp.1702–6. Available at: http://www.ncbi.nlm.nih.gov/pubmed/14694033 [Accessed
November 2, 2016].
Hodges, A. et al., 2006. Regional and cellular gene expression changes in human Huntington’s
disease brain. Hum Mol Genet, 15(6), pp.965–977. Available at:
http://www.ncbi.nlm.nih.gov/pubmed/16467349.
Hodgson, J.G. et al., 1999. A YAC mouse model for Huntington’s disease with full-length mutant
huntingtin, cytoplasmic toxicity, and selective striatal neurodegeneration. Neuron, 23(1),
pp.181–92. Available at: http://www.ncbi.nlm.nih.gov/pubmed/10402204 [Accessed
November 11, 2016].
Holbert, S. et al., 2001. The Gln-Ala repeat transcriptional activator CA150 interacts with
huntingtin: Neuropathologic and genetic evidence for a role in Huntington’s disease
pathogenesis. Proceedings of the National Academy of Sciences, 98(4), pp.1811–1816.
Available at: http://www.ncbi.nlm.nih.gov/pubmed/11172033 [Accessed December 28, 2016].
Hong, Y. et al., 2016. Mutant Huntingtin Impairs BDNF Release from Astrocytes by Disrupting
Conversion of Rab3a-GTP into Rab3a-GDP. The Journal of Neuroscience , 36(34), pp.8790–
8801. Available at: http://www.jneurosci.org/content/36/34/8790.abstract.

References
93
Jafek, B.W., 1983. Ultrastructure of human nasal mucosa. The Laryngoscope, 93(12), pp.1576–
1599. Available at: http://dx.doi.org/10.1288/00005537-198312000-00011.
Janowski, B.A. et al., 1996. An oxysterol signalling pathway mediated by the nuclear receptor
LXR[alpha]. Nature, 383(6602), pp.728–731. Available at:
http://dx.doi.org/10.1038/383728a0.
Jansson, B. & Björk, E., 2002. Visualization of in vivo olfactory uptake and transfer using
fluorescein dextran. Journal of drug targeting, 10(5), pp.379–86. Available at:
http://www.tandfonline.com/doi/abs/10.1080/1061186021000001823.
Jiang, R. et al., 2016. Dysfunctional Calcium and Glutamate Signaling in Striatal Astrocytes from
Huntington’s Disease Model Mice. Journal of Neuroscience, 36(12), pp.3453–3470. Available
at: http://www.ncbi.nlm.nih.gov/pubmed/27013675 [Accessed December 22, 2016].
Johnson, M.A. et al., 2006. Dopamine release is severely compromised in the R6/2 mouse model of
Huntington’s disease. Journal of neurochemistry, 97(3), pp.737–46. Available at:
http://www.ncbi.nlm.nih.gov/pubmed/16573654 [Accessed November 21, 2016].
Johnson, R. & Buckley, N.J., 2009. Gene Dysregulation in Huntington’s Disease: REST,
MicroRNAs and Beyond. NeuroMolecular Medicine, pp.1–17.
Johnston, M. et al., 2004. Evidence of connections between cerebrospinal fluid and nasal lymphatic
vessels in humans, non-human primates and other mammalian species. Cerebrospinal fluid
research, 1(1), p.2. Available at: http://www.ncbi.nlm.nih.gov/pubmed/15679948 [Accessed
December 2, 2016].
Kaltenbach, L.S. et al., 2007. Huntingtin Interacting Proteins Are Genetic Modifiers of
Neurodegeneration. PLoS Genetics, 3(5), p.e82. Available at:
http://dx.plos.org/10.1371/journal.pgen.0030082 [Accessed December 28, 2016].
Kandel, E.R., Schwartz, J.H. & Jessell, T.M., 2000. Principles of Neural Science,
Karasinska, J.M. et al., 2013. ABCA1 influences neuroinflammation and neuronal death.
Neurobiology of Disease, 54, pp.445–455. Available at:
http://linkinghub.elsevier.com/retrieve/pii/S0969996113000429 [Accessed November 6,
2016].
Karten, B. et al., 2002. Cholesterol accumulates in cell bodies, but is decreased in distal axons, of
Niemann-Pick C1-deficient neurons. Journal of neurochemistry, 83(5), pp.1154–63. Available
at: http://www.ncbi.nlm.nih.gov/pubmed/12437586 [Accessed November 14, 2016].
Karten, B., Campenot, R.B., et al., 2006. Expression of ABCG1, but not ABCA1, correlates with
cholesterol release by cerebellar astroglia. Journal of Biological Chemistry, 281(7), pp.4049–
4057.

References
94
Karten, B. et al., 2005. Generation and function of astroglial lipoproteins from Niemann-Pick type
C1-deficient mice. The Biochemical journal, 387(Pt 3), pp.779–88. Available at:
http://www.ncbi.nlm.nih.gov/pubmed/15544574 [Accessed November 14, 2016].
Karten, B., Campenot, R.B., et al., 2006. The Niemann-Pick C1 protein in recycling endosomes of
presynaptic nerve terminals. Journal of lipid research, 47(3), pp.504–14. Available at:
http://www.ncbi.nlm.nih.gov/pubmed/16340014 [Accessed November 14, 2016].
Kegel, K.B. et al., 2002. Huntingtin Is Present in the Nucleus, Interacts with the Transcriptional
Corepressor C-terminal Binding Protein, and Represses Transcription. Journal of Biological
Chemistry, 277(9), pp.7466–7476. Available at:
http://www.ncbi.nlm.nih.gov/pubmed/11739372 [Accessed December 19, 2016].
Keryer, G. et al., 2011. Ciliogenesis is regulated by a huntingtin-HAP1-PCM1 pathway and is
altered in Huntington disease. The Journal of clinical investigation, 121(11), pp.4372–82.
Available at: http://www.ncbi.nlm.nih.gov/pubmed/21985783 [Accessed December 28, 2016].
Kessel, a, Ben-Tal, N. & May, S., 2001. Interactions of cholesterol with lipid bilayers: the preferred
configuration and fluctuations. Biophysical journal, 81(2), pp.643–658.
Klapstein, G.J. et al., 2001. Electrophysiological and morphological changes in striatal spiny
neurons in R6/2 Huntington’s disease transgenic mice. Journal of neurophysiology, 86(6),
pp.2667–77. Available at: http://www.ncbi.nlm.nih.gov/pubmed/11731527 [Accessed
November 20, 2016].
Koos, D.S. & Fraser, S.E., 2005. The Grueneberg ganglion projects to the olfactory bulb.
Neuroreport, 16(17), pp.1929–1932.
Kordasiewicz, H.B. et al., 2012. Sustained Therapeutic Reversal of Huntington’s Disease by
Transient Repression of Huntingtin Synthesis. Neuron, 74(6), pp.1031–1044. Available at:
http://www.ncbi.nlm.nih.gov/pubmed/22726834 [Accessed December 28, 2016].
Kung, V.W.S. et al., 2007. Dopamine-dependent long term potentiation in the dorsal striatum is
reduced in the R6/2 mouse model of Huntington’s disease. Neuroscience, 146(4), pp.1571–
1580. Available at: http://linkinghub.elsevier.com/retrieve/pii/S0306452207003600 [Accessed
November 21, 2016].
Kwee, R.M. & Kwee, T.C., 2007. Virchow-Robin spaces at MR imaging. Radiographics : a review
publication of the Radiological Society of North America, Inc, 27(4), pp.1071–1086. Available
at: papers3://publication/doi/10.1148/rg.274065722.
de la Monte, S.M., Vonsattel, J.P. & Richardson, E.P., 1988. Morphometric demonstration of
atrophic changes in the cerebral cortex, white matter, and neostriatum in Huntington’s disease.
Journal of neuropathology and experimental neurology, 47(5), pp.516–25. Available at:

References
95
http://www.ncbi.nlm.nih.gov/pubmed/2971785 [Accessed November 2, 2016].
Lahiri, D.K., 2004. Apolipoprotein E as a Target for Developing New Therapeutics for Alzheimer’s
Disease Based on Studies From Protein, RNA, and Regulatory Region of the Gene. Journal of
Molecular Neuroscience, 23(3), pp.225–234. Available at:
http://link.springer.com/10.1385/JMN:23:3:225 [Accessed November 6, 2016].
Lane-Donovan, C.E., Philips, G.T. & Herz, J., 2015. More Than Cholesterol Transporters :
Lipoprotein Receptors in. , 83(4), pp.771–787.
Lang, T. et al., 2001. SNAREs are concentrated in cholesterol-dependent clusters that define
docking and fusion sites for exocytosis. EMBO Journal, 20(9), pp.2202–2213.
Lange, K.W. et al., 1995. Comparison of executive and visuospatial memory function in
Huntington’s disease and dementia of Alzheimer type matched for degree of dementia. Journal
of neurology, neurosurgery, and psychiatry, 58(5), pp.598–606.
Lawrence, A.D. et al., 1999. Discrimination, reversal, and shift learning in Huntington’s disease:
mechanisms of impaired response selection. Neuropsychologia, 37(12), pp.1359–74. Available
at: http://www.ncbi.nlm.nih.gov/pubmed/10606011 [Accessed November 2, 2016].
Lawrence, A.D. et al., 1996. Executive and mnemonic functions in early Huntington’s disease.
Brain : a journal of neurology, pp.1633–45. Available at:
http://www.ncbi.nlm.nih.gov/pubmed/8931586 [Accessed December 3, 2016].
Lawrence, A.D. et al., 1998. The relationship between striatal dopamine receptor binding and
cognitive performance in Huntington’s disease. Brain : a journal of neurology, pp.1343–55.
Available at: http://www.ncbi.nlm.nih.gov/pubmed/9679785 [Accessed November 2, 2016].
Lawrence, A.D. et al., 2000. Visual object and visuospatial cognition in Huntington’s disease:
implications for information processing in corticostriatal circuits. Brain : a journal of
neurology, pp.1349–64. Available at: http://www.ncbi.nlm.nih.gov/pubmed/10869048
[Accessed November 2, 2016].
Leavitt, B.R. et al., 2006. Wild-type huntingtin protects neurons from excitotoxicity. Journal of
Neurochemistry, 96(4), pp.1121–1129.
Leavitt, B.R. et al., 2001. Wild-type huntingtin reduces the cellular toxicity of mutant huntingtin in
vivo. American journal of human genetics, 68(2), pp.313–324.
Lee, W. et al., 2013. Enhanced Ca2+-dependent glutamate release from astrocytes of the BACHD
Huntington’s disease mouse model. Neurobiology of Disease, 58, pp.192–199. Available at:
http://www.ncbi.nlm.nih.gov/pubmed/23756199 [Accessed December 26, 2016].
Legleiter, J. et al., 2010. Mutant huntingtin fragments form oligomers in a polyglutamine length-
dependent manner in vitro and in vivo. The Journal of biological chemistry, 285(19),

References
96
pp.14777–90. Available at: http://www.ncbi.nlm.nih.gov/pubmed/20220138 [Accessed
December 28, 2016].
Lehmann, J.M. et al., 1997. Activation of the nuclear receptor LXR by oxysterols defines a new
hormone response pathway. J Biol Chem, 272(6), pp.3137–3140. Available at:
http://www.ncbi.nlm.nih.gov/pubmed/9013544.
Lemiere, J. et al., 2004. Cognitive changes in patients with Huntington’s disease (HD) and
asymptomatic carriers of the HD mutation--a longitudinal follow-up study. Journal of
neurology, 251(8), pp.935–42. Available at: http://www.ncbi.nlm.nih.gov/pubmed/15316797
[Accessed November 2, 2016].
Leoni, V. et al., 2002. Changes in human plasma levels of the brain specific oxysterol 24S-
hydroxycholesterol during progression of multiple sclerosis. Neuroscience letters, 331(3),
pp.163–166.
Leoni, V. et al., 2008. Plasma 24S-hydroxycholesterol and caudate MRI in pre-manifest and early
Huntington’s disease. Brain, 131(11), pp.2851–2859. Available at:
http://www.brain.oxfordjournals.org/cgi/doi/10.1093/brain/awn212 [Accessed November 11,
2016].
Leoni, V. et al., 2013. Plasma 24S-hydroxycholesterol correlation with markers of Huntington
disease progression. Neurobiology of Disease, 55, pp.37–43.
Leoni, V. et al., 2011. Whole body cholesterol metabolism is impaired in Huntington’s disease.
Neuroscience Letters, 494(3), pp.245–249. Available at:
http://linkinghub.elsevier.com/retrieve/pii/S030439401100317X [Accessed November 12,
2016].
Leoni, V. & Caccia, C., 2015. The impairment of cholesterol metabolism in Huntington disease.
Biochimica et Biophysica Acta (BBA) - Molecular and Cell Biology of Lipids, 1851(8),
pp.1095–1105. Available at: http://linkinghub.elsevier.com/retrieve/pii/S1388198115000037
[Accessed November 6, 2016].
Levine, M.S. et al., 1999. Enhanced sensitivity to N-methyl-D-aspartate receptor activation in
transgenic and knockin mouse models of Huntington’s disease. Journal of neuroscience
research, 58(4), pp.515–32. Available at: http://www.ncbi.nlm.nih.gov/pubmed/10533044
[Accessed November 21, 2016].
Li, S.-H. & Li, X.-J., 2004. Huntingtin–protein interactions and the pathogenesis of Huntington’s
disease. Trends in Genetics, 20(3), pp.146–154. Available at:
http://www.ncbi.nlm.nih.gov/pubmed/15036808 [Accessed December 19, 2016].
Li, Y. et al., 2001. Differential Functions of Members of the Low Density Lipoprotein Receptor

References
97
Family Suggested by their Distinct Endocytosis Rates. Journal of Biological Chemistry,
276(21), pp.18000–18006.
Liévens, J.C. et al., 2001. Impaired glutamate uptake in the R6 Huntington’s disease transgenic
mice. Neurobiology of disease, 8(5), pp.807–821.
Liévens, J.-C. et al., 2001. Impaired Glutamate Uptake in the R6 Huntington’s Disease Transgenic
Mice. Neurobiology of Disease, 8(5), pp.807–821. Available at:
http://linkinghub.elsevier.com/retrieve/pii/S0969996101904309 [Accessed November 21,
2016].
Linetti, a. et al., 2010. Cholesterol reduction impairs exocytosis of synaptic vesicles. Journal of
Cell Science, 123(4), pp.595–605. Available at:
http://jcs.biologists.org/cgi/doi/10.1242/jcs.060681.
Lingwood, D. & Simons, K., 2010. Lipid Rafts As a Membrane-Organizing Principle. Science,
327(5961), pp.46–50. Available at:
http://www.sciencemag.org/cgi/doi/10.1126/science.1174621 [Accessed November 8, 2016].
Lione, L.A. et al., 1999. Selective discrimination learning impairments in mice expressing the
human Huntington’s disease mutation. The Journal of neuroscience : the official journal of the
Society for Neuroscience, 19(23), pp.10428–37. Available at:
http://www.ncbi.nlm.nih.gov/pubmed/10575040 [Accessed November 19, 2016].
Liot, G. et al., 2013. Mutant Huntingtin alters retrograde transport of TrkB receptors in striatal
dendrites. The Journal of neuroscience : the official journal of the Society for Neuroscience,
33(15), pp.6298–309. Available at:
http://www.jneurosci.org/cgi/doi/10.1523/JNEUROSCI.2033-12.2013 [Accessed December
28, 2016].
Liu, Q. et al., 2010. Neuronal LRP1 Knockout in Adult Mice Leads to Impaired Brain Lipid
Metabolism and Progressive, Age-Dependent Synapse Loss and Neurodegeneration. Journal
of Neuroscience, 30(50), pp.17068–17078. Available at:
http://www.jneurosci.org/cgi/doi/10.1523/JNEUROSCI.4067-10.2010 [Accessed November 7,
2016].
Lloyd M.H. and Wofenshohn S.E. (1998) Practical use of distress scoring systems in the application
of humane endpoints. In: Humane Endpoints in Animal Experiments for Biomedical Research,
Proceedings of the International Conference. November 22-25 1998, Zeist, The Netherlands
(Hendriksen C.F.M. and Moron D.B., eds). London UK: Royal Society of Medicine Press,
pp.48-53.
London, E.D., Klemm, N. & Coyle, J.T., 1980. Phylogenetic distribution of [3H]kainic acid

References
98
receptor binding sites in neuronal tissue. Brain Research, 192(2), pp.463–476.
Lüesse, H.G. et al., 2001. Evaluation of R6/2 HD transgenic mice for therapeutic studies in
Huntington’s disease: behavioral testing and impact of diabetes mellitus. Behavioural brain
research, 126(1–2), pp.185–95. Available at: http://www.ncbi.nlm.nih.gov/pubmed/11704263
[Accessed November 19, 2016].
Lund, E.G. et al., 2003. Knockout of the cholesterol 24-hydroxylase gene in mice reveals a brain-
specific mechanism of cholesterol turnover. Journal of Biological Chemistry, 278(25),
pp.22980–22988.
Lund, E.G., Guileyardo, J.M. & Russell, D.W., 1999. cDNA cloning of cholesterol 24-hydroxylase,
a mediator of cholesterol homeostasis in the brain. Proceedings of the National Academy of
Sciences of the United States of America, 96(13), pp.7238–7243.
Luthi-Carter, R. et al., 2003. Complex alteration of NMDA receptors in transgenic Huntington’s
disease mouse brain: Analysis of mRNA and protein expression, plasma membrane
association, interacting proteins, and phosphorylation. Neurobiology of Disease, 14(3),
pp.624–636.
Luthi-Carter, R. et al., 2000. Decreased expression of striatal signaling genes in a mouse model of
Huntington’s disease. Human molecular genetics, 9(9), pp.1259–71. Available at:
http://www.ncbi.nlm.nih.gov/pubmed/10814708 [Accessed November 21, 2016].
Luthi-Carter, R. et al., 2002. Dysregulation of gene expression in the R6/2 model of polyglutamine
disease: parallel changes in muscle and brain. Human molecular genetics, 11(17), pp.1911–26.
Available at: http://www.ncbi.nlm.nih.gov/pubmed/12165554 [Accessed November 21, 2016].
Lütjohann, D. et al., 1996. Cholesterol homeostasis in human brain: evidence for an age-dependent
flux of 24S-hydroxycholesterol from the brain into the circulation. Proceedings of the National
Academy of Sciences of the United States of America, 93(18), pp.9799–9804.
Lütjohann, D. et al., 2000. Plasma 24S-hydroxycholesterol (cerebrosterol) is increased in Alzheimer
and vascular demented patients. Journal of Lipid Research, 41(2), pp.195–8.
Lütjohann, D. & von Bergmann, K., 2003. 24S-hydroxycholesterol: a marker of brain cholesterol
metabolism. Pharmacopsychiatry, 36 Suppl 2, pp.S102-6. Available at:
http://www.ncbi.nlm.nih.gov/pubmed/14574622 [Accessed November 13, 2016].
Maat-Schieman, M.L. et al., 1999. Distribution of inclusions in neuronal nuclei and dystrophic
neurites in Huntington disease brain. Journal of neuropathology and experimental neurology,
58(2), pp.129–37. Available at: http://www.ncbi.nlm.nih.gov/pubmed/10029096 [Accessed
November 2, 2016].
Macdonald, V. & Halliday, G., 2002. Pyramidal cell loss in motor cortices in Huntington’s disease.

References
99
Neurobiology of disease, 10(3), pp.378–86. Available at:
http://www.ncbi.nlm.nih.gov/pubmed/12270698 [Accessed November 2, 2016].
Magen, I. & Hornstein, E., 2014. Oligonucleotide-based therapy for neurodegenerative diseases.
Brain Research, 1584, pp.116–128.
Mahley, R.W., Weisgraber, K.H. & Huang, Y., 2006. Apolipoprotein E4: A causative factor and
therapeutic target in neuropathology, including Alzheimer’s disease. Proceedings of the
National Academy of Sciences, 103(15), pp.5644–5651. Available at:
http://www.pnas.org/cgi/doi/10.1073/pnas.0600549103 [Accessed November 6, 2016].
Maity, T., Fuse, N. & Beachy, P. a, 2005. Molecular mechanisms of Sonic hedgehog mutant effects
in holoprosencephaly. Proceedings of the National Academy of Sciences of the United States of
America, 102(47), pp.17026–17031.
Mangiarini, L. et al., 1996. Exon 1 of the HD Gene with an Expanded CAG Repeat Is Sufficient to
Cause a Progressive Neurological Phenotype in Transgenic Mice. Cell, 87(3), pp.493–506.
Mann, R.K. & Beachy, P.A., 2000. Cholesterol modification of proteins. Biochimica et Biophysica
Acta - Molecular and Cell Biology of Lipids, 1529(1–3), pp.188–202.
Marcora, E., Gowan, K. & Lee, J.E., 2003. Stimulation of NeuroD activity by huntingtin and
huntingtin-associated proteins HAP1 and MLK2. Proceedings of the National Academy of
Sciences of the United States of America, 100(16), pp.9578–83. Available at:
http://www.ncbi.nlm.nih.gov/pubmed/12881483 [Accessed December 28, 2016].
Markianos, M. et al., 2008. Low plasma total cholesterol in patients with Huntington’s disease and
first-degree relatives. Mol Genet Metab, 93(3), pp.341–346.
Martens, J.R., O’Connell, K. & Tamkun, M., 2004. Targeting of ion channels to membrane
microdomains: localization of KV channels to lipid rafts. Trends in Pharmacological Sciences,
25(1), pp.16–21. Available at: http://linkinghub.elsevier.com/retrieve/pii/S0165614703003559
[Accessed November 8, 2016].
Martin, M.G. et al., 2014. Constitutive hippocampal cholesterol loss underlies poor cognition in old
rodents. EMBO Molecular Medicine, 6(7), pp.902–917. Available at:
http://www.pubmedcentral.nih.gov/articlerender.fcgi?artid=4119354&tool=pmcentrez&render
type=abstract.
Martinez-Vicente, M. et al., 2010. Cargo recognition failure is responsible for inefficient autophagy
in Huntington’s disease. Nature Neuroscience, 13(5), pp.567–576. Available at:
http://www.pubmedcentral.nih.gov/articlerender.fcgi?artid=2860687&tool=pmcentrez&render
type=abstract.
Marullo, M. et al., 2012. Pitfalls in the detection of cholesterol in Huntington’s disease models.

References
100
PLoS Currents. Available at: http://currents.plos.org/hd/?p=6263 [Accessed November 11,
2016].
Mauch, D.H. et al., 2001. CNS synaptogenesis promoted by glia-derived cholesterol. Science (New
York, N.Y.), 294(5545), pp.1354–1357.
Maxfield, F.R. & Wüstner, D., 2002. Intracellular cholesterol transport. Journal of Clinical
Investigation, 110(7), pp.891–898. Available at: http://www.jci.org/articles/view/16500
[Accessed November 7, 2016].
Meade, C.A. et al., 2002. Cellular localization and development of neuronal intranuclear inclusions
in striatal and cortical neurons in R6/2 transgenic mice. The Journal of comparative neurology,
449(3), pp.241–69. Available at: http://www.ncbi.nlm.nih.gov/pubmed/12115678 [Accessed
November 20, 2016].
Meaney, S. et al., 2002. On the rate of translocation in vitro and kinetics in vivo of the major
oxysterols in human circulation: critical importance of the position of the oxygen function.
Journal of lipid research, 43(26), pp.2130–2135.
Menalled, L.B. et al., 2012. Comprehensive Behavioral and Molecular Characterization of a New
Knock-In Mouse Model of Huntington’s Disease: zQ175 H. Okazawa, ed. PLoS ONE, 7(12),
p.e49838. Available at: http://dx.plos.org/10.1371/journal.pone.0049838 [Accessed November
11, 2016].
Menalled, L.B., 2005. Knock-in mouse models of Huntington’s disease. NeuroRx : the journal of
the American Society for Experimental NeuroTherapeutics, 2(3), pp.465–70. Available at:
http://www.ncbi.nlm.nih.gov/pubmed/16389309 [Accessed November 11, 2016].
Mena-Segovia, J. et al., 2002. Changes in sleep-waking cycle after striatal excitotoxic lesions.
Behavioural brain research, 136(2), pp.475–81. Available at:
http://www.ncbi.nlm.nih.gov/pubmed/12429410 [Accessed November 2, 2016].
Meredith, M.E., Salameh, T.S. & Banks, W. a, 2015. Intranasal Delivery of Proteins and Peptides in
the Treatment of Neurodegenerative Diseases. The AAPS journal, 17(11), pp.780–787.
Available at: http://www.ncbi.nlm.nih.gov/pubmed/25801717.
Merritt AD, Conneally PM, Rahman NF, D. AL, 1969. Juvenile Huntington’s chorea A. Barbeau &
T. Brunette, eds., Amsterdam: Excerpta Medica Foundation.
Miller, B.R. et al., 2008. Dysregulated information processing by medium spiny neurons in striatum
of freely behaving mouse models of Huntington’s disease. Journal of neurophysiology, 100(4),
pp.2205–16. Available at: http://www.ncbi.nlm.nih.gov/pubmed/18667541 [Accessed
December 20, 2016].
Minchin, R., 2008. Nanomedicine: sizing up targets with nanoparticles. Nature nanotechnology,

References
101
3(1), pp.12–13.
Mitsche, M. A., McDonald, J. G., Hobbs, H. H. & Cohen, J. C. Flux analysis of cholesterol
biosynthesis in vivo reveals multiple tissue and cell-type specific pathways. Elife 4, 1–21
(2015).
Miyamoto, N. et al., 2015. Astrocytes Promote Oligodendrogenesis after White Matter Damage via
Brain-Derived Neurotrophic Factor. The Journal of neuroscience : the official journal of the
Society for Neuroscience, 35(41), pp.14002–8. Available at:
http://www.ncbi.nlm.nih.gov/pubmed/26468200\nhttp://www.pubmedcentral.nih.gov/articlere
nder.fcgi?artid=PMC4604233.
Modifiers of Huntingtons Disease Consortium, G. et al., 2015. Identification of Genetic Factors that
Modify Clinical Onset of Huntington’s Disease. Cell, 162, pp.516–526.
Molero, A.E. et al., 2009. Impairment of developmental stem cell-mediated striatal neurogenesis
and pluripotency genes in a knock-in model of Huntington’s disease. Proceedings of the
National Academy of Sciences, 106(51), pp.21900–21905. Available at:
http://www.ncbi.nlm.nih.gov/pubmed/19955426 [Accessed December 19, 2016].
Mondal, M. et al., 2008. Sterols Are Mainly in the Cytoplasmic Leaflet of the Plasma Membrane
and the Endocytic Recycling Compartment in CHO Cells. Molecular Biology of the Cell,
20(2), pp.581–588. Available at: http://www.molbiolcell.org/cgi/doi/10.1091/mbc.E08-07-
0785 [Accessed November 8, 2016].
Montoya, A. et al., 2006. Episodic memory impairment in Huntington’s disease: a meta-analysis.
Neuropsychologia, 44(10), pp.1984–94. Available at:
http://www.ncbi.nlm.nih.gov/pubmed/16797615 [Accessed November 2, 2016].
Moreira Sousa, C. et al., 2013. The Huntington disease protein accelerates breast tumour
development and metastasis through ErbB2/HER2 signalling. EMBO Molecular Medicine,
5(2), pp.309–325. Available at: http://www.ncbi.nlm.nih.gov/pubmed/23300147 [Accessed
December 28, 2016].
Morton, A.J., 2005. Disintegration of the Sleep-Wake Cycle and Circadian Timing in Huntington’s
Disease. Journal of Neuroscience, 25(1), pp.157–163. Available at:
http://www.jneurosci.org/cgi/doi/10.1523/JNEUROSCI.3842-04.2005 [Accessed November 2,
2016].
Morton, A.J., Faull, R.L. & Edwardson, J.M., 2001. Abnormalities in the synaptic vesicle fusion
machinery in Huntington’s disease. Brain research bulletin, 56(2), pp.111–7. Available at:
http://www.ncbi.nlm.nih.gov/pubmed/11704347 [Accessed November 21, 2016].
Mundargi, R.C. et al., 2008. Nano/micro technologies for delivering macromolecular therapeutics

References
102
using poly(d,l-lactide-co-glycolide) and its derivatives. Journal of Controlled Release, 125(3),
pp.193–209. Available at: http://www.ncbi.nlm.nih.gov/pubmed/18083265 [Accessed
December 3, 2016].
Muratore, M., 2013. Raman spectroscopy and partial least squares analysis in discrimination of
peripheral cells affected by Huntington’s disease. Analytica Chimica Acta, 793, pp.1–10.
Available at: http://linkinghub.elsevier.com/retrieve/pii/S0003267013008350 [Accessed
November 13, 2016].
Murphy, K.P. et al., 2000. Abnormal synaptic plasticity and impaired spatial cognition in mice
transgenic for exon 1 of the human Huntington’s disease mutation. The Journal of
neuroscience : the official journal of the Society for Neuroscience, 20(13), pp.5115–23.
Available at: http://www.ncbi.nlm.nih.gov/pubmed/10864968 [Accessed November 20, 2016].
Myers, R., 2004. Huntington’s disease genetics. NeuroRx : the journal of the American Society for
Experimental NeuroTherapeutics, 1(2), pp.255–262. Available at:
http://www.ncbi.nlm.nih.gov/entrez/query.fcgi?db=pubmed&cmd=Retrieve&dopt=AbstractPl
us&list_uids=15717026.
Myers, R.H. et al., 1991. Decreased neuronal and increased oligodendroglial densities in
Huntington’s disease caudate nucleus. Journal of neuropathology and experimental neurology,
50(6), pp.729–42. Available at: http://www.ncbi.nlm.nih.gov/pubmed/1836225 [Accessed
November 2, 2016].
Nieweg, K., Schaller, H. & Pfrieger, F.W., 2009. Marked differences in cholesterol synthesis
between neurons and glial cells from postnatal rats. Journal of neurochemistry, 109(1),
pp.125–34. Available at: http://doi.wiley.com/10.1111/j.1471-4159.2009.05917.x [Accessed
December 6, 2016].
Ooi, L. & Wood, I.C., 2007. Chromatin crosstalk in development and disease: lessons from REST.
Nature reviews. Genetics, 8(7), pp.544–54. Available at: http://dx.doi.org/10.1038/nrg2100.
Panov, a V et al., 2002. Early mitochondrial calcium defects in Huntington’s disease are a direct
effect of polyglutamines. Nat Neurosci, 5(8), pp.731–736. Available at:
http://www.nature.com/neuro/journal/v5/n8/pdf/nn884.pdf.
Panyam, J. & Labhasetwar, V., 2003. Biodegradable nanoparticles for drug and gene delivery to
cells and tissue. Advanced Drug Delivery Reviews, 55(3), pp.329–347.
Pardeshi, C. V. et al., 2012. Formulation, optimization and evaluation of spray-dried mucoadhesive
microspheres as intranasal carriers for Valsartan. Journal of Microencapsulation, 29(2),
pp.103–114.
Parsons, M.P. et al., 2016. Real-time imaging of glutamate clearance reveals normal striatal uptake

References
103
in Huntington disease mouse models. Nature Communications, 7, p.11251. Available at:
http://www.ncbi.nlm.nih.gov/pubmed/27052848 [Accessed December 26, 2016].
Paulsen, J.S. et al., 2001. Clinical markers of early disease in persons near onset of Huntington’s
disease. Neurology, 57(4), pp.658–62. Available at:
http://www.ncbi.nlm.nih.gov/pubmed/11524475 [Accessed November 2, 2016].
Paulsen, J.S. et al., 1995. Distinct cognitive profiles of cortical and subcortical dementia in
advanced illness. Neurology, 45(5), pp.951–6. Available at:
http://www.ncbi.nlm.nih.gov/pubmed/7746413 [Accessed November 2, 2016].
Paulsen, J.S. et al., fMRI biomarker of early neuronal dysfunction in presymptomatic Huntington’s
Disease. AJNR. American journal of neuroradiology, 25(10), pp.1715–21. Available at:
http://www.ncbi.nlm.nih.gov/pubmed/15569736 [Accessed October 23, 2016].
Peake, K.B. & Vance, J.E., 2012. Normalization of Cholesterol Homeostasis by 2-Hydroxypropyl- -
cyclodextrin in Neurons and Glia from Niemann-Pick C1 (NPC1)-deficient Mice. Journal of
Biological Chemistry, 287(12), pp.9290–9298. Available at:
http://www.jbc.org/cgi/doi/10.1074/jbc.M111.326405 [Accessed November 14, 2016].
Perutz, M.F., 1996. Glutamine repeats and inherited neurodegenerative diseases: molecular aspects.
Current opinion in structural biology, 6(6), pp.848–58. Available at:
http://www.ncbi.nlm.nih.gov/pubmed/8994886 [Accessed November 2, 2016].
Pfrieger, F.W., 2003. Cholesterol homeostasis and function in neurons of the central nervous
system. Cellular and molecular life sciences : CMLS, 60(6), pp.1158–71. Available at:
http://www.ncbi.nlm.nih.gov/pubmed/12861382.
Pfrieger, F.W. & Ungerer, N., 2011. Cholesterol metabolism in neurons and astrocytes. Progress in
Lipid Research, 50(4), pp.357–371. Available at:
http://dx.doi.org/10.1016/j.plipres.2011.06.002.
Pitas, R.E. et al., 1987. Astrocytes synthesize apolipoprotein E and metabolize apolipoprotein E-
containing lipoproteins. Biochimica et Biophysica Acta (BBA) - Lipids and Lipid Metabolism,
917(1), pp.148–161.
Plant, K. et al., 2006. Transient incorporation of native GluR2-lacking AMPA receptors during
hippocampal long-term potentiation. Nature neuroscience, 9(5), pp.602–604.
Poirier, J. et al., 1993. Cholesterol synthesis and lipoprotein reuptake during synaptic remodelling
in hippocampus in adult rats. Neuroscience, 55(1), pp.81–90.
Poirier, M.A. et al., 2002. Huntingtin spheroids and protofibrils as precursors in polyglutamine
fibrilization. Journal of Biological Chemistry, 277(43), pp.41032–41037.
Politis, M. et al., 2008. Hypothalamic involvement in Huntington’s disease: an in vivo PET study.

References
104
Brain : a journal of neurology, 131(Pt 11), pp.2860–9. Available at:
http://www.ncbi.nlm.nih.gov/pubmed/18829696 [Accessed October 23, 2016].
Polt, D.R. & Palian, M.M., 2001. Glycopeptide analgesics. Drugs of the Future, 26(6), p.561.
Available at:
http://journals.prous.com/journals/servlet/xmlxsl/pk_journals.xml_summary_pr?p_JournalId=2
&p_RefId=668342&p_IsPs=N [Accessed December 2, 2016].
Porter, F.D., 2006. Cholesterol precursors and facial clefting. Journal of Clinical Investigation,
116(9), pp.2322–2325. Available at: http://www.jci.org/articles/view/29872 [Accessed
November 14, 2016].
Porter, F.D. & Herman, G.E., 2011. Malformation syndromes caused by disorders of cholesterol
synthesis. The Journal of Lipid Research, 52(1), pp.6–34. Available at:
http://www.jlr.org/cgi/doi/10.1194/jlr.R009548 [Accessed November 14, 2016].
Porter, J. a, Young, K.E. & Beachy, P. a, 1996. Cholesterol modification of hedgehog signaling
proteins in animal development. Science (New York, N.Y.), 274(5285), pp.255–259.
Prasad, A. et al., 2000. Regional and developmental expression of the Npc1 mRNA in the mouse
brain. Journal of Neurochemistry, 75(3), pp.1250–1257.
Pringsheim, T. et al., 2012. The incidence and prevalence of Huntington’s disease: A systematic
review and meta-analysis. Movement Disorders, 27(9), pp.1083–1091.
Puglielli, L., Tanzi, R.E. & Kovacs, D.M., 2003. Alzheimer’s disease: the cholesterol connection.
Nature Neuroscience, 6(4), pp.345–351. Available at:
http://www.nature.com/doifinder/10.1038/nn0403-345 [Accessed November 6, 2016].
Van Raamsdonk, J.M. et al., 2005. Cognitive dysfunction precedes neuropathology and motor
abnormalities in the YAC128 mouse model of Huntington’s disease. The Journal of
neuroscience : the official journal of the Society for Neuroscience, 25(16), pp.4169–80.
Available at: http://www.ncbi.nlm.nih.gov/pubmed/15843620.
Ramirez, D.M.O., Andersson, S. & Russell, D.W., 2008. Neuronal expression and subcellular
localization of cholesterol 24-hydroxylase in the mouse brain. The Journal of comparative
neurology, 507(5), pp.1676–93. Available at:
http://www.pubmedcentral.nih.gov/articlerender.fcgi?artid=4015140&tool=pmcentrez&render
type=abstract.
Rebeck, G.W. et al., 1993. Apolipoprotein E in sporadic Alzheimer’s disease: allelic variation and
receptor interactions. Neuron, 11(4), pp.575–80. Available at:
http://www.ncbi.nlm.nih.gov/pubmed/8398148 [Accessed November 6, 2016].
Reid, P.C. et al., 2004. A novel cholesterol stain reveals early neuronal cholesterol accumulation in

References
105
the Niemann-Pick type C1 mouse brain. Journal of lipid research, 45(3), pp.582–591.
Reiner, A. et al., 1988. Differential loss of striatal projection neurons in Huntington disease.
Proceedings of the National Academy of Sciences of the United States of America, 85(15),
pp.5733–7. Available at: http://www.ncbi.nlm.nih.gov/pubmed/2456581 [Accessed November
2, 2016].
Reiner, A. et al., 2001. Neurons lacking huntingtin differentially colonize brain and survive in
chimeric mice. The Journal of neuroscience : the official journal of the Society for
Neuroscience, 21(19), pp.7608–19. Available at:
http://www.ncbi.nlm.nih.gov/pubmed/11567051.
Reiner, A. et al., 2013. Striatal parvalbuminergic neurons are lost in Huntington’s disease:
implications for dystonia. Movement disorders : official journal of the Movement Disorder
Society, 28(12), pp.1691–9. Available at: http://www.ncbi.nlm.nih.gov/pubmed/24014043
[Accessed November 2, 2016].
Rennels, M.L., Blaumanis, O.R. & Grady, P.A., 1990. Rapid solute transport throughout the brain
via paravascular fluid pathways. Adv.Neurol., 52:431-9., pp.431–439.
Rensen, P.C.N. et al., 2000. Apolipoprotein E is resistant to intracellular degradation in vitro and in
vivo. Evidence for retroendocytosis. Journal of Biological Chemistry, 275(12), pp.8564–8571.
Reynolds, G.P. et al., 1999. Brain neurotransmitter deficits in mice transgenic for the Huntington’s
disease mutation. Journal of neurochemistry, 72(4), pp.1773–6. Available at:
http://www.ncbi.nlm.nih.gov/pubmed/10098889 [Accessed November 21, 2016].
des Rieux, A. et al., 2006. Nanoparticles as potential oral delivery systems of proteins and vaccines:
A mechanistic approach. Journal of Controlled Release, 116(1), pp.1–27. Available at:
http://www.ncbi.nlm.nih.gov/pubmed/17050027 [Accessed December 2, 2016].
Rigamonti, D. et al., 2001. Huntingtin’s Neuroprotective Activity Occurs via Inhibition of
Procaspase-9 Processing. Journal of Biological Chemistry, 276(18), pp.14545–14548.
Rigamonti, D. et al., 2000. Wild-type huntingtin protects from apoptosis upstream of caspase-3. The
Journal of neuroscience : the official journal of the Society for Neuroscience, 20(10), pp.3705–
13. Available at: http://www.ncbi.nlm.nih.gov/pubmed/10804212.
Rohrbough, J. & Broadie, K., 2005. Lipid regulation of the synaptic vesicle cycle. Nature reviews.
Neuroscience, 6(2), pp.139–150.
Rosas, H.D. et al., 2010. Altered white matter microstructure in the corpus callosum in
Huntington’s disease: Implications for cortical “disconnection.” NeuroImage, 49(4), pp.2995–
3004. Available at: http://linkinghub.elsevier.com/retrieve/pii/S1053811909010866 [Accessed
November 2, 2016].

References
106
Rosas, H.D. et al., 2006. Diffusion tensor imaging in presymptomatic and early Huntington’s
disease: Selective white matter pathology and its relationship to clinical measures. Movement
Disorders, 21(9), pp.1317–1325. Available at: http://doi.wiley.com/10.1002/mds.20979
[Accessed November 2, 2016].
Rosas, H.D. et al., 2002. Regional and progressive thinning of the cortical ribbon in Huntington’s
disease. Neurology, 58(5), pp.695–701. Available at:
http://www.ncbi.nlm.nih.gov/pubmed/11889230 [Accessed November 2, 2016].
Rosenbaum, A.I. et al., 2010. Endocytosis of beta-cyclodextrins is responsible for cholesterol
reduction in Niemann-Pick type C mutant cells. Proceedings of the National Academy of
Sciences, 107(12), pp.5477–5482. Available at:
http://www.pnas.org/cgi/doi/10.1073/pnas.0914309107 [Accessed November 14, 2016].
Rosenberg, N.K., Sørensen, S.A. & Christensen, A.L., 1995. Neuropsychological characteristics of
Huntington’s disease carriers: a double blind study. Journal of medical genetics, 32(8),
pp.600–4. Available at: http://www.ncbi.nlm.nih.gov/pubmed/7473650 [Accessed November
2, 2016].
Rowe, K.C. et al., 2010. Self-paced timing detects and tracks change in prodromal Huntington
disease. Neuropsychology, 24(4), pp.435–42. Available at:
http://www.ncbi.nlm.nih.gov/pubmed/20604618 [Accessed August 29, 2016].
Rui, Y.-N. et al., 2015. Huntingtin functions as a scaffold for selective macroautophagy. Nature
Cell Biology, 17(3), pp.262–275. Available at:
http://www.pubmedcentral.nih.gov/articlerender.fcgi?artid=4344873&tool=pmcentrez&render
type=abstract.
Russell, D.W. et al., 2009. Cholesterol 24-Hydroxylase: An Enzyme of Cholesterol Turnover in the
Brain. Annual Review of Biochemistry, 78(1), pp.1017–1040. Available at:
http://www.annualreviews.org/doi/10.1146/annurev.biochem.78.072407.103859 [Accessed
November 5, 2016].
Sadek, J.R. et al., 2004. Retrograde amnesia in dementia: comparison of HIV-associated dementia,
Alzheimer’s disease, and Huntington’s disease. Neuropsychology, 18(4), pp.692–9. Available
at: http://www.ncbi.nlm.nih.gov/pubmed/15506837 [Accessed November 2, 2016].
Saito, K. et al., 2009. Ablation of cholesterol biosynthesis in neural stem cells increases their VEGF
expression and angiogenesis but causes neuron apoptosis. Proceedings of the National
Academy of Sciences of the United States of America, 106(20), pp.8350–5. Available at:
http://www.pubmedcentral.nih.gov/articlerender.fcgi?artid=2688855&tool=pmcentrez&render
type=abstract.

References
107
Sakashita, N. et al., 2000. Localization of human acyl-coenzyme A:cholesterol acyltransferase-1
(ACAT-1) in macrophages and in various tissues. The American Journal of Pathology, 156(1),
pp.227–236. Available at: http://dx.doi.org/10.1016/S0002-9440(10)64723-2.
Sanan, D.A. et al., 1994. Apolipoprotein E associates with beta amyloid peptide of Alzheimer’s
disease to form novel monofibrils. Isoform apoE4 associates more efficiently than apoE3.
Journal of Clinical Investigation, 94(2), pp.860–869. Available at:
http://www.jci.org/articles/view/117407 [Accessed November 14, 2016].
Sapp, E. et al., 2001. Early and progressive accumulation of reactive microglia in the Huntington
disease brain. Journal of neuropathology and experimental neurology, 60(2), pp.161–72.
Available at: http://www.ncbi.nlm.nih.gov/pubmed/11273004 [Accessed November 2, 2016].
Schaefer, M.L. et al., 2002. Trigeminal collaterals in the nasal epithelium and olfactory bulb: A
potential route for direct modulation of olfactory information by trigeminal stimuli. Journal of
Comparative Neurology, 444(3), pp.221–226.
Schneider, S.A. et al., 2010. Abnormal explicit but normal implicit sequence learning in
premanifest and early Huntington’s disease. Movement disorders : official journal of the
Movement Disorder Society, 25(10), pp.1343–9. Available at:
http://www.ncbi.nlm.nih.gov/pubmed/20544716 [Accessed November 2, 2016].
Selkoe, D.J., 2002. Alzheimer’s Disease Is a Synaptic Failure. Science, 298(5594), pp.789–791.
Available at: http://www.sciencemag.org/cgi/doi/10.1126/science.1074069 [Accessed
November 14, 2016].
Seong, I.S. et al., 2009. Huntingtin facilitates polycomb repressive complex 2. Human Molecular
Genetics, 19(4), pp.573–583.
Shankaran, M. et al., 2017. Early and brain region-specific decrease of de novo cholesterol
biosynthesis in Huntington’s disease: A cross-validation study in Q175 knock-in mice.
Neurobiology of Disease, 98, pp.66–76. Available at:
http://www.ncbi.nlm.nih.gov/pubmed/27913290 [Accessed December 19, 2016].
Shimohata, T. et al., 2000. Expanded polyglutamine stretches interact with TAFII130, interfering
with CREB-dependent transcription. Nature genetics, 26(1), pp.29–36.
Shin, J.-Y. et al., 2005. Expression of mutant huntingtin in glial cells contributes to neuronal
excitotoxicity. The Journal of cell biology, 171(6), pp.1001–12. Available at:
http://www.ncbi.nlm.nih.gov/pubmed/16365166 [Accessed November 2, 2016].
Silvestri, R. et al., 1995. Sleep features in Tourette’s syndrome, neuroacanthocytosis and
Huntington’s chorea. Neurophysiologie Clinique/Clinical Neurophysiology, 25(2), pp.66–77.
Available at: http://linkinghub.elsevier.com/retrieve/pii/0987705396810343 [Accessed

References
108
November 2, 2016].
Simons, M. et al., 1998. Cholesterol depletion inhibits the generation of beta-amyloid in
hippocampal neurons. Proceedings of the National Academy of Sciences of the United States of
America, 95(11), pp.6460–4. Available at: http://www.ncbi.nlm.nih.gov/pubmed/9600988
[Accessed November 14, 2016].
Sipione, S. et al., 2002. Early transcriptional profiles in huntingtin-inducible striatal cells by
microarray analyses. Human molecular genetics, 11(17), pp.1953–65. Available at:
http://www.ncbi.nlm.nih.gov/pubmed/12165557.
Skotte, N.H. et al., 2014. Allele-Specific Suppression of Mutant Huntingtin Using Antisense
Oligonucleotides: Providing a Therapeutic Option for All Huntington Disease Patients J. C.
Glorioso, ed. PLoS ONE, 9(9), p.e107434. Available at:
http://dx.plos.org/10.1371/journal.pone.0107434 [Accessed December 29, 2016].
Smith, R., Brundin, P. & Li, J.Y., 2005. Synaptic dysfunction in Huntington’s disease: a new
perspective. Cell Mol Life Sci, 62(17), pp.1901–1912. Available at:
http://www.ncbi.nlm.nih.gov/entrez/query.fcgi?cmd=Retrieve&db=PubMed&dopt=Citation&l
ist_uids=15968465.
Soane, R.J. et al., 1999. Evaluation of the clearance characteristics of bioadhesive systems in
humans. International Journal of Pharmaceutics, 178(1), pp.55–65.
Soccio, R.E., 2004. Intracellular Cholesterol Transport. Arteriosclerosis, Thrombosis, and Vascular
Biology, 24(7), pp.1150–1160. Available at:
http://atvb.ahajournals.org/cgi/doi/10.1161/01.ATV.0000131264.66417.d5.
Song, C. et al., 2003. Expression of polyglutamine-expanded huntingtin induces tyrosine
phosphorylation of N-methyl-D-aspartate receptors. Journal of Biological Chemistry, 278(35),
pp.33364–33369.
Sooksawate, T. & Simmonds, M.A., 2001. Effects of membrane cholesterol on the sensitivity of the
GABA A receptor to GABA in acutely dissociated rat hippocampal neurones. , 40, pp.178–
184.
Squitieri, F. et al., 1994. DNA haplotype analysis of huntington disease reveals clues to the origins
and mechanisms of CAG expansion and reasons for geographic variations of prevalence.
Human Molecular Genetics, 3(12), pp.2103–2114. Available at:
http://www.ncbi.nlm.nih.gov/pubmed/7881406 [Accessed August 28, 2016].
Stack, E.C. et al., 2005. Chronology of behavioral symptoms and neuropathological sequela in R6/2
Huntington’s disease transgenic mice. The Journal of Comparative Neurology, 490(4),
pp.354–370. Available at: http://doi.wiley.com/10.1002/cne.20680 [Accessed November 19,

References
109
2016].
Steffan, J.S. et al., 2001. Histone deacetylase inhibitors arrest polyglutamine-dependent
neurodegeneration in Drosophila. Nature, 413(6857), pp.739–743.
Steffan, J.S. et al., 2000. The Huntington’s disease protein interacts with p53 and CREB-binding
protein and represses transcription. Proc Natl Acad Sci U S A, 97(12), pp.6763–6768.
Available at:
http://www.pubmedcentral.nih.gov/articlerender.fcgi?artid=18731&tool=pmcentrez&renderty
pe=abstract\nhttp://www.ncbi.nlm.nih.gov/entrez/query.fcgi?cmd=Retrieve&db=PubMed&do
pt=Citation&list_uids=10823891.
Strand, A.D. et al., 2005. Gene expression in Huntington’s disease skeletal muscle: A potential
biomarker. Human Molecular Genetics, 14(13), pp.1863–1876.
Strehlow, A.N.T., Li, J.Z. & Myers, R.M., 2006. Wild-type huntingtin participates in protein
trafficking between the Golgi and the extracellular space. Human Molecular Genetics, 16(4),
pp.391–409. Available at: http://www.ncbi.nlm.nih.gov/pubmed/17189290 [Accessed
December 19, 2016].
Sun, Y. et al., 2001. Polyglutamine-expanded Huntingtin Promotes Sensitization of N-Methyl-D-
aspartate Receptors via Post-synaptic Density 95. Journal of Biological Chemistry, 276(27),
pp.24713–24718. Available at: http://www.ncbi.nlm.nih.gov/pubmed/11319238 [Accessed
December 19, 2016].
Susan Standring, PhD, Ds., 2009. Gray’s Anatomy 40th edition. Churchill Livingstone, pp.196–
200. Available at: http://www.us.elsevierhealth.com/anatomy/gray-anatomy-expert-
consult/9780443066849/.
Suzuki, R. et al., 2013. Reduction of the Cholesterol Sensor SCAP in the Brains of Mice Causes
Impaired Synaptic Transmission and Altered Cognitive Function S. O’Rahilly, ed. PLoS
Biology, 11(4), p.e1001532. Available at: http://dx.plos.org/10.1371/journal.pbio.1001532
[Accessed November 6, 2016].
Suzuki, S. et al., 2007. Brain-Derived Neurotrophic Factor Regulates Cholesterol Metabolism for
Synapse Development. Journal of Neuroscience, 27(24).
Tabrizi, S.J. et al., 2000. Mitochondrial dysfunction and free radical damage in the Huntington R6/2
transgenic mouse. Annals of neurology, 47(1), pp.80–6. Available at:
http://www.ncbi.nlm.nih.gov/pubmed/10632104 [Accessed November 21, 2016].
Takano, H. & Gusella, J.F., 2002. The predominantly HEAT-like motif structure of huntingtin and
its association and coincident nuclear entry with dorsal, an NF-kB/Rel/dorsal family
transcription factor. BMC neuroscience, 3, p.15. Available at:
References
110
http://www.ncbi.nlm.nih.gov/pubmed/12379151 [Accessed December 28, 2016].
Tarditi, A. et al., 2006. Early and transient alteration of adenosine A2A receptor signaling in a
mouse model of Huntington disease. Neurobiology of disease, 23(1), pp.44–53.
Taurin, S., Nehoff, H. & Greish, K., 2012. Anticancer nanomedicine and tumor vascular
permeability; Where is the missing link? In Journal of Controlled Release. pp. 265–275.
Theeuwes F and Yum SI., 1976. Principles of the design and operation of generic osmotic pumps
for the delivery of semisolid or liquid drug ormulations. Ann Biomed Eng, 4(4), pp.343–353.
Thiele, C. et al., 2000. Cholesterol binds to synaptophysin and is required for biogenesis of synaptic
vesicles. Nature cell biology, 2(1), pp.42–49. Available at: http://dx.doi.org/10.1038/71366.
Thorne, R.G. et al., 2004. Delivery of insulin-like growth factor-I to the rat brain and spinal cord
along olfactory and trigeminal pathways following intranasal administration. Neuroscience,
127(2), pp.481–96. Available at: http://www.ncbi.nlm.nih.gov/pubmed/15262337 [Accessed
November 30, 2016].
Thorne, R.G. et al., 2008. Delivery of interferon-b to the monkey nervous system following
intranasal administration. Neuroscience, 152(3), pp.785–797.
Thu, D.C. V et al., 2010. Cell loss in the motor and cingulate cortex correlates with
symptomatology in Huntington’s disease. Brain : a journal of neurology, 133(Pt 4), pp.1094–
110. Available at: http://www.ncbi.nlm.nih.gov/pubmed/20375136 [Accessed November 2,
2016].
Tippett, L.J. et al., 2006. Striosomes and mood dysfunction in Huntington’s disease. Brain, 130(1),
pp.206–221. Available at: http://www.brain.oxfordjournals.org/cgi/doi/10.1093/brain/awl243
[Accessed November 2, 2016].
Tiwari, S. et al., 2009. Liposome in situ gelling system: Novel carrier based vaccine adjuvant for
intranasal delivery of recombinant protein vaccine. Procedia in Vaccinology, 1(1), pp.148–
163.
Tong, X. et al., 2014. Astrocyte Kir4.1 ion channel deficits contribute to neuronal dysfunction in
Huntington’s disease model mice. Nature neuroscience, 17(5), pp.694–703. Available at:
http://www.ncbi.nlm.nih.gov/pubmed/24686787.
Del Toro, D. et al., 2010. Altered cholesterol homeostasis contributes to enhanced excitotoxicity in
Huntington’s disease. Journal of Neurochemistry, 115(1), pp.153–167. Available at:
http://doi.wiley.com/10.1111/j.1471-4159.2010.06912.x [Accessed November 11, 2016].
del Toro, D. et al., 2009. Mutant huntingtin impairs post-Golgi trafficking to lysosomes by
delocalizing optineurin/Rab8 complex from the Golgi apparatus. Molecular biology of the cell,
20(5), pp.1478–92. Available at: http://www.ncbi.nlm.nih.gov/pubmed/19144827 [Accessed
References
111
December 28, 2016].
Tosi, Giovanni, Barbara Ruozi, Daniela Belletti, Antonietta Vilella, Michele Zoli, Maria Angela
Vandelli, and F.F., 2013. Brain-targeted polymeric nanoparticles: in vivo evidences of
different routes of administration in rodents. Nanomedicine, 8, pp.1373–1383.
Tosi, G. et al., 2005. Conjugated poly(D,L-lactide-co-glycolide) for the preparation of in vivo
detectable nanoparticles. Biomaterials, 26(19), pp.4189–95. Available at:
http://www.ncbi.nlm.nih.gov/pubmed/15664646 [Accessed December 2, 2016].
Tosi, G. et al., 2014. Insight on the fate of CNS-targeted nanoparticles. Part II: Intercellular
neuronal cell-to-cell transport. Journal of Controlled Release, 177, pp.96–107. Available at:
http://www.ncbi.nlm.nih.gov/pubmed/24417968 [Accessed December 2, 2016].
Tosi, G. et al., 2011. Investigation on mechanisms of glycopeptide nanoparticles for drug delivery
across the blood-brain barrier. Nanomedicine (London, England), 6(3), pp.423–36. Available
at: http://www.futuremedicine.com/doi/10.2217/nnm.11.11 [Accessed December 2, 2016].
Tosi, G. et al., 2011. NIR-labeled nanoparticles engineered for brain targeting: in vivo optical
imaging application and fluorescent microscopy evidences. Journal of Neural Transmission,
118(1), pp.145–153. Available at: http://www.ncbi.nlm.nih.gov/pubmed/20931242 [Accessed
December 2, 2016].
Tosi, G. et al., 2008. Polymeric nanoparticles for the drug delivery to the central nervous system.
Expert opinion on drug delivery, 5(2), pp.155–174.
Tosi, G. et al., 2007. Targeting the central nervous system: In vivo experiments with peptide-
derivatized nanoparticles loaded with Loperamide and Rhodamine-123. Journal of Controlled
Release, 122(1), pp.1–9.
Tosi, G., Ruozi, B. & Belletti, D., 2012. Nanomedicine: the future for advancing medicine and
neuroscience. Nanomedicine, 7(8), pp.1113–1116. Available at:
http://www.futuremedicine.com/doi/10.2217/nnm.12.90 [Accessed December 2, 2016].
Trager, U. et al., 2014. Characterisation of immune cell function in fragment and full-length
Huntington’s disease mouse models. Neurobiol Dis, 73C, pp.388–398. Available at:
http://www.ncbi.nlm.nih.gov/pubmed/25447230.
Trushina, E. et al., 2006. Mutant huntingtin inhibits clathrin-independent endocytosis and causes
accumulation of cholesterol in vitro and in vivo. Human Molecular Genetics, 15(24), pp.3578–
3591. Available at: http://www.hmg.oxfordjournals.org/cgi/doi/10.1093/hmg/ddl434
[Accessed November 11, 2016].
Turmaine, M. et al., 2000. Nonapoptotic neurodegeneration in a transgenic mouse model of
Huntington’s disease. Proc Nat Acad Sci Usa, 97(14), pp.8093–8097.

References
112
Valenza, M. et al., 2007. Cholesterol biosynthesis pathway is disturbed in YAC128 mice and is
modulated by huntingtin mutation. Human Molecular Genetics, 16(18), pp.2187–2198.
Available at: http://www.hmg.oxfordjournals.org/cgi/doi/10.1093/hmg/ddm170 [Accessed
November 11, 2016].
Valenza, M. et al., 2010. Cholesterol defect is marked across multiple rodent models of
Huntington’s disease and is manifest in astrocytes. The Journal of neuroscience : the official
journal of the Society for Neuroscience, 30(32), pp.10844–50. Available at:
http://www.pubmedcentral.nih.gov/articlerender.fcgi?artid=3842469&tool=pmcentrez&render
type=abstract.
Valenza, M. et al., 2015. Disruption of astrocyte-neuron cholesterol cross talk affects neuronal
function in Huntington’s disease. Cell Death and Differentiation, 22(4), pp.690–702. Available
at: http://www.nature.com/doifinder/10.1038/cdd.2014.162 [Accessed November 14, 2016].
Valenza, M. et al., 2005. Dysfunction of the cholesterol biosynthetic pathway in Huntington’s
disease. The Journal of neuroscience : the official journal of the Society for Neuroscience,
25(43), pp.9932–9. Available at: http://www.jneurosci.org/content/25/43/9932.short.
Valenza, M. et al., 2007. Progressive dysfunction of the cholesterol biosynthesis pathway in the
R6/2 mouse model of Huntington’s disease. Neurobiology of Disease, 28(1), pp.133–142.
Available at: http://linkinghub.elsevier.com/retrieve/pii/S096999610700143X [Accessed
November 11, 2016].
van Woensel, M. et al. Formulations for Intranasal Delivery of Pharmacological Agents to Combat
Brain Disease: A New Opportunity to Tackle GBM? Cancers (Basel). 5, 1020–48 (2013).
Vanier, M.T. & Millat, G., 2003. Niemann-Pick disease type C. Clinical genetics, 64(4), pp.269–81.
Available at: http://www.ncbi.nlm.nih.gov/pubmed/12974729 [Accessed November 14, 2016].
Vaughan, A.M. & Oram, J.F., 2006. ABCA1 and ABCG1 or ABCG4 act sequentially to remove
cellular cholesterol and generate cholesterol-rich HDL. The Journal of Lipid Research, 47(11),
pp.2433–2443. Available at: http://www.jlr.org/cgi/doi/10.1194/jlr.M600218-JLR200
[Accessed November 6, 2016].
Velier, J. et al., 1998. Wild-type and mutant huntingtins function in vesicle trafficking in the
secretory and endocytic pathways. Experimental neurology, 152(1), pp.34–40.
Vergoni, A.V. et al., 2009. Nanoparticles as drug delivery agents specific for CNS: in vivo
biodistribution. Nanomedicine: Nanotechnology, Biology, and Medicine, 5(4), pp.369–377.
Verheijen, M.H.G. et al., 2009. SCAP is required for timely and proper myelin membrane
synthesis. Proceedings of the National Academy of Sciences, 106(50), pp.21383–21388.
Available at: http://www.pnas.org/lookup/doi/10.1073/pnas.0905633106 [Accessed November
References
113
6, 2016].
Vilella, A. et al., 2014. Insight on the fate of CNS-targeted nanoparticles. Part I: Rab5-dependent
cell-specific uptake and distribution. Journal of Controlled Release, 174, pp.195–201.
Available at: http://www.ncbi.nlm.nih.gov/pubmed/24316476 [Accessed December 2, 2016].
Vinogradov, S. V., Bronich, T.K. & Kabanov, A. V., 2002. Nanosized cationic hydrogels for drug
delivery: Preparation, properties and interactions with cells. Advanced Drug Delivery Reviews,
54(1), pp.135–147.
Vitali, C., Wellington, C.L. & Calabresi, L., 2014. HDL and cholesterol handling in the brain.
Cardiovascular Research, 103(3), pp.405–413.
Vonsattel, J.P. et al., 1985. Neuropathological classification of Huntington’s disease. Journal of
neuropathology and experimental neurology, 44(6), pp.559–77. Available at:
http://www.ncbi.nlm.nih.gov/pubmed/2932539 [Accessed November 2, 2016].
Vonsattel, J.P. & DiFiglia, M., 1998. Huntington disease. Journal of neuropathology and
experimental neurology, 57(5), pp.369–84. Available at:
http://www.ncbi.nlm.nih.gov/pubmed/9596408 [Accessed November 2, 2016].
Vonsattel, J.P.G., Keller, C. & Pilar Amaya, M. del, 2008. Neuropathology of Huntington’s
Disease. In pp. 599–618. Available at:
http://linkinghub.elsevier.com/retrieve/pii/S0072975207012560 [Accessed November 2,
2016].
Waelter, S. et al., 2001. The huntingtin interacting protein HIP1 is a clathrin and alpha-adaptin-
binding protein involved in receptor-mediated endocytosis. Hum.Mol.Genet., 10(17), pp.1807–
1817.
Wahrle, S.E. et al., 2004. ABCA1 Is Required for Normal Central Nervous System ApoE Levels
and for Lipidation of Astrocyte-secreted apoE. Journal of Biological Chemistry, 279(39),
pp.40987–40993. Available at: http://www.jbc.org/lookup/doi/10.1074/jbc.M407963200
[Accessed November 6, 2016].
Wahrle, S.E. et al., 2005. Deletion of Abca1 increases Abeta deposition in the PDAPP transgenic
mouse model of Alzheimer disease. The Journal of biological chemistry, 280(52), pp.43236–
42. Available at: http://www.ncbi.nlm.nih.gov/pubmed/16207708 [Accessed November 14,
2016].
Wahrle, S.E. et al., 2008. Overexpression of ABCA1 reduces amyloid deposition in the PDAPP
mouse model of Alzheimer disease. Journal of Clinical Investigation. Available at:
http://content.the-jci.org/articles/view/33622 [Accessed November 14, 2016].
Walker, A.G. et al., 2008. Altered information processing in the prefrontal cortex of Huntington’s

References
114
disease mouse models. The Journal of neuroscience : the official journal of the Society for
Neuroscience, 28(36), pp.8973–82. Available at:
http://www.pubmedcentral.nih.gov/articlerender.fcgi?artid=2597399&tool=pmcentrez&render
type=abstract.
Walter, B.A. et al., 2006. The olfactory route for cerebrospinal fluid drainage into the peripheral
lymphatic system. Neuropathology and Applied Neurobiology, 32(4), pp.388–396. Available
at: http://www.ncbi.nlm.nih.gov/pubmed/16866984 [Accessed December 2, 2016].
Wang, R. et al., 2014. Metabolic and hormonal signatures in pre-manifest and manifest
Huntington’s disease patients. Frontiers in physiology, 5, p.231. Available at:
http://www.ncbi.nlm.nih.gov/pubmed/25002850 [Accessed November 13, 2016].
Watkins, L.H. et al., 2000. Impaired planning but intact decision making in early Huntington’s
disease: implications for specific fronto-striatal pathology. Neuropsychologia, 38(8), pp.1112–
25. Available at: http://www.ncbi.nlm.nih.gov/pubmed/10838146 [Accessed November 2,
2016].
Weller, R.O., Kida, S. & Zhang, E.T., 1992. Pathways of fluid drainage from the brain--
morphological aspects and immunological significance in rat and man. Brain pathology
(Zurich, Switzerland), 2(4), pp.277–284.
Wellington, C.L. et al., 2002. ABCA1 mRNA and protein distribution patterns predict multiple
different roles and levels of regulation. Laboratory investigation; a journal of technical
methods and pathology, 82(3), pp.273–83. Available at:
http://www.ncbi.nlm.nih.gov/pubmed/11896206 [Accessed November 6, 2016].
Wexler, N.S. et al., 1987. Homozygotes for Huntington’s disease. Nature, 326(6109), pp.194–7.
Available at: http://dx.doi.org/10.1038/326194a0.
Wheelock, V.L. et al., 2003. Predictors of nursing home placement in Huntington disease.
Neurology, 60(6), pp.998–1001. Available at: http://www.ncbi.nlm.nih.gov/pubmed/12654967
[Accessed November 2, 2016].
White, J.K. et al., 1997. Huntingtin is required for neurogenesis and is not impaired by the
Huntington’s disease CAG expansion. Nature genetics, 17(4), pp.404–10. Available at:
http://dx.doi.org/10.1038/ng1297-404.
Whitman, M.C. & Greer, C.A., 2009. Adult neurogenesis and the olfactory system. Progress in
Neurobiology, 89(2), pp.162–175.
Wong, Y.C. & Holzbaur, E.L.F., 2014. The Regulation of Autophagosome Dynamics by Huntingtin
and HAP1 Is Disrupted by Expression of Mutant Huntingtin, Leading to Defective Cargo
Degradation. Journal of Neuroscience, 34(4), pp.1293–1305. Available at:
References
115
http://www.ncbi.nlm.nih.gov/pubmed/24453320 [Accessed December 28, 2016].
Wong, Y.C. & Holzbaur, E.L.F., 2014. The regulation of autophagosome dynamics by huntingtin
and HAP1 is disrupted by expression of mutant huntingtin, leading to defective cargo
degradation. The Journal of neuroscience : the official journal of the Society for Neuroscience,
34(4), pp.1293–305. Available at:
http://www.pubmedcentral.nih.gov/articlerender.fcgi?artid=3898289&tool=pmcentrez&render
type=abstract.
Ye, J. & DeBose-Boyd, R.A., 2011. Regulation of Cholesterol and Fatty Acid Synthesis. Cold
Spring Harbor Perspectives in Biology, 3(7), pp.a004754–a004754. Available at:
http://cshperspectives.cshlp.org/lookup/doi/10.1101/cshperspect.a004754 [Accessed
November 7, 2016].
Yeagle, P.L., 1985. Cholesterol and the cell membrane. Biochimica et biophysica acta, 822(3–4),
pp.267–87. Available at: http://www.ncbi.nlm.nih.gov/pubmed/3904832 [Accessed November
9, 2016].
Yoffey, J.M. & Drinker, C.K., 1938. THE LYMPHATIC PATHWAY FROM THE NOSE AND
PHARYNX : THE ABSORPTION OF DYES. The Journal of experimental medicine, 68(4),
pp.629–40. Available at: http://www.ncbi.nlm.nih.gov/pubmed/19870807 [Accessed
December 2, 2016].
Yohrling IV, G.J. et al., 2002. Inhibition of tryptophan hydroxylase activity and decreased 5-HT1A
receptor binding in a mouse model of Huntington’s disease. Journal of neurochemistry, 82(6),
pp.1416–23. Available at: http://www.ncbi.nlm.nih.gov/pubmed/12354289 [Accessed
November 21, 2016].
Yoo, J.Y. et al., 2005. Characterization of degradation behavior for PLGA in various pH condition
by simple liquid chromatography method. Bio-medical materials and engineering, 15(4),
pp.279–88. Available at: http://www.ncbi.nlm.nih.gov/pubmed/16010036.
Young, A.B. et al., 1988. NMDA receptor losses in putamen from patients with Huntington’s
disease. Science (New York, N.Y.), 241(4868), pp.981–3. Available at:
http://www.ncbi.nlm.nih.gov/pubmed/2841762 [Accessed November 2, 2016].
Zakzanis, K.K., 1998. The Subcortical Dementia of Huntington’s Disease. Journal of Clinical and
Experimental Neuropsychology (Neuropsychology, Development and Cognition: Section A),
20(4), pp.565–578. Available at:
http://www.tandfonline.com/doi/abs/10.1076/jcen.20.4.565.1468 [Accessed November 2,
2016].
Zala, D. et al., 2013. Huntingtin’s Function in Axonal Transport Is Conserved in Drosophila

References
116
melanogaster A. Bergmann, ed. PLoS ONE, 8(3), p.e60162. Available at:
http://dx.plos.org/10.1371/journal.pone.0060162 [Accessed December 28, 2016].
Zeitlin, S. et al., 1995. Increased apoptosis and early embryonic lethality in mice nullizygous for the
Huntington’s disease gene homologue. Nature Genetics, 11, pp.155–163.
Zelcer, N. et al., 2009. LXR regulates cholesterol uptake through Idol-dependent ubiquitination of
the LDL receptor. Science (New York, N.Y.), 325(5936), pp.100–4. Available at:
http://www.pubmedcentral.nih.gov/articlerender.fcgi?artid=2777523&tool=pmcentrez&render
type=abstract.
Zhai, W. et al., 2005. In vitro analysis of huntingtin-mediated transcriptional repression reveals
multiple transcription factor targets. Cell, 123(7), pp.1241–1253.
Zhang, Y. et al., 2003. Depletion of wild-type huntingtin in mouse models of neurologic diseases.
Journal of Neurochemistry, 87(1), pp.101–106.
Zhao, C. & Dahlman-Wright, K., 2010. Liver X receptor in cholesterol metabolism. Journal of
Endocrinology, 204(3), pp.233–240.
Zimmerberg, J. & Kozlov, M.M., 2006. How proteins produce cellular membrane curvature. Nature
reviews. Molecular cell biology, 7(1), pp.9–19. Available at:
http://www.ncbi.nlm.nih.gov/pubmed/16365634.
Zuccato, C. et al., 2003. Huntingtin interacts with REST/NRSF to modulate the transcription of
NRSE-controlled neuronal genes. Nature Genetics, 35(1), pp.76–83. Available at:
http://www.ncbi.nlm.nih.gov/pubmed/12881722 [Accessed December 19, 2016].
Zuccato, C. et al., 2001. Loss of huntingtin-mediated BDNF gene transcription in Huntington’s
disease. Science, 293(5529), pp.493–498.
Zuccato, C. et al., 2008. Systematic assessment of BDNF and its receptor levels in human cortices
affected by Huntington’s disease. Brain Pathology, 18(2), pp.225–238.
Zuccato, C. et al., 2007. Widespread Disruption of Repressor Element-1 Silencing Transcription
Factor/Neuron-Restrictive Silencer Factor Occupancy at Its Target Genes in Huntington’s
Disease. Journal of Neuroscience, 27(26), pp.6972–6983. Available at:
http://www.ncbi.nlm.nih.gov/pubmed/17596446 [Accessed December 19, 2016].
Zuccato, C. & Cattaneo, E., 2009. Brain-derived neurotrophic factor in neurodegenerative diseases.
Nature reviews. Neurology, 5(6), pp.311–322. Available at:
http://dx.doi.org/10.1038/nrneurol.2009.54.
Zuccato, C. & Cattaneo, E., 2007. Role of brain-derived neurotrophic factor in Huntington’s
disease. Prog Neurobiol, 81(5–6), pp.294–330. Available at:
http://www.ncbi.nlm.nih.gov/pubmed/17379385.

References
117
Zuccato, C., Valenza, M. & Cattaneo, E., 2010. Molecular Mechanisms and Potential Therapeutical
Targets in Huntington ’ s Disease. Physiol Rev, 90(3), pp.905–981.
Zucker, B. et al., 2005. Transcriptional dysregulation in striatal projection- and interneurons in a
mouse model of Huntington’s disease: neuronal selectivity and potential neuroprotective role
of HAP1. Human molecular genetics, 14(2), pp.179–89. Available at:
http://www.ncbi.nlm.nih.gov/pubmed/15548548 [Accessed November 21, 2016].
Zwain, I.H. & Yen, S.S.C., 1999. Neurosteroidogenesis in astrocytes, oligodendrocytes, and
neurons of cerebral cortex of rat brain. Endocrinology, 140(8), pp.3843–3852.

118
Published papers
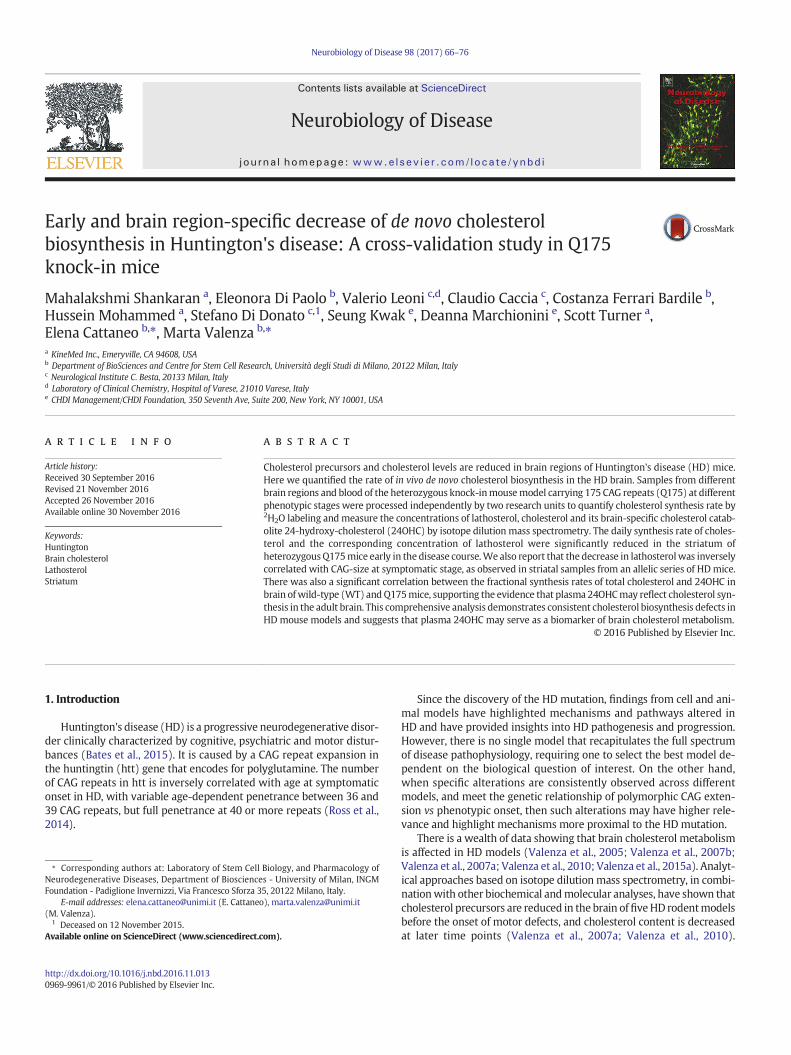
Early and brain region-specific decrease of de novo cholesterolbiosynthesis in Huntington's disease: A cross-validation study in Q175knock-in mice
Mahalakshmi Shankaran a, Eleonora Di Paolo b, Valerio Leoni c,d, Claudio Caccia c, Costanza Ferrari Bardile b,Hussein Mohammed a, Stefano Di Donato c,1, Seung Kwak e, Deanna Marchionini e, Scott Turner a,Elena Cattaneo b,⁎, Marta Valenza b,⁎a KineMed Inc., Emeryville, CA 94608, USAb Department of BioSciences and Centre for Stem Cell Research, Università degli Studi di Milano, 20122 Milan, Italyc Neurological Institute C. Besta, 20133 Milan, Italyd Laboratory of Clinical Chemistry, Hospital of Varese, 21010 Varese, Italye CHDI Management/CHDI Foundation, 350 Seventh Ave, Suite 200, New York, NY 10001, USA
a b s t r a c ta r t i c l e i n f o
Article history:Received 30 September 2016Revised 21 November 2016Accepted 26 November 2016Available online 30 November 2016
Cholesterol precursors and cholesterol levels are reduced in brain regions of Huntington's disease (HD) mice.Here we quantified the rate of in vivo de novo cholesterol biosynthesis in the HD brain. Samples from differentbrain regions and blood of the heterozygous knock-inmousemodel carrying 175 CAG repeats (Q175) at differentphenotypic stages were processed independently by two research units to quantify cholesterol synthesis rate by2H2O labeling andmeasure the concentrations of lathosterol, cholesterol and its brain-specific cholesterol catab-olite 24-hydroxy-cholesterol (24OHC) by isotope dilution mass spectrometry. The daily synthesis rate of choles-terol and the corresponding concentration of lathosterol were significantly reduced in the striatum ofheterozygousQ175mice early in the disease course.We also report that the decrease in lathosterolwas inverselycorrelated with CAG-size at symptomatic stage, as observed in striatal samples from an allelic series of HDmice.There was also a significant correlation between the fractional synthesis rates of total cholesterol and 24OHC inbrain ofwild-type (WT) andQ175mice, supporting the evidence that plasma 24OHCmay reflect cholesterol syn-thesis in the adult brain. This comprehensive analysis demonstrates consistent cholesterol biosynthesis defects inHD mouse models and suggests that plasma 24OHC may serve as a biomarker of brain cholesterol metabolism.
© 2016 Published by Elsevier Inc.
Keywords:HuntingtonBrain cholesterolLathosterolStriatum
1. Introduction
Huntington's disease (HD) is a progressive neurodegenerative disor-der clinically characterized by cognitive, psychiatric and motor distur-bances (Bates et al., 2015). It is caused by a CAG repeat expansion inthe huntingtin (htt) gene that encodes for polyglutamine. The numberof CAG repeats in htt is inversely correlated with age at symptomaticonset in HD, with variable age-dependent penetrance between 36 and39 CAG repeats, but full penetrance at 40 or more repeats (Ross et al.,2014).
Since the discovery of the HD mutation, findings from cell and ani-mal models have highlighted mechanisms and pathways altered inHD and have provided insights into HD pathogenesis and progression.However, there is no single model that recapitulates the full spectrumof disease pathophysiology, requiring one to select the best model de-pendent on the biological question of interest. On the other hand,when specific alterations are consistently observed across differentmodels, and meet the genetic relationship of polymorphic CAG exten-sion vs phenotypic onset, then such alterations may have higher rele-vance and highlight mechanisms more proximal to the HD mutation.
There is a wealth of data showing that brain cholesterol metabolismis affected in HD models (Valenza et al., 2005; Valenza et al., 2007b;Valenza et al., 2007a; Valenza et al., 2010; Valenza et al., 2015a). Analyt-ical approaches based on isotope dilutionmass spectrometry, in combi-nationwith other biochemical andmolecular analyses, have shown thatcholesterol precursors are reduced in the brain of fiveHD rodentmodelsbefore the onset of motor defects, and cholesterol content is decreasedat later time points (Valenza et al., 2007a; Valenza et al., 2010).
Neurobiology of Disease 98 (2017) 66–76
⁎ Corresponding authors at: Laboratory of Stem Cell Biology, and Pharmacology ofNeurodegenerative Diseases, Department of Biosciences - University of Milan, INGMFoundation - Padiglione Invernizzi, Via Francesco Sforza 35, 20122 Milano, Italy.
E-mail addresses: [email protected] (E. Cattaneo), [email protected](M. Valenza).
1 Deceased on 12 November 2015.Available online on ScienceDirect (www.sciencedirect.com).
http://dx.doi.org/10.1016/j.nbd.2016.11.0130969-9961/© 2016 Published by Elsevier Inc.
Contents lists available at ScienceDirect
Neurobiology of Disease
j ourna l homepage: www.e lsev ie r .com/ locate /ynbd i

Cholesterol homeostasis may also be affected in HD patients early inthe disease as the reduced levels of plasma 24-hydroxycholesterol(24OHC), the brain-specific catabolite of cholesterol, parallels the largedecrease in caudate volume in gene-positive subjects frompre-manifesttoHD stage (Leoni et al., 2008; Leoni et al., 2013). This suggests that cho-lesterol dysfunction may be linked to the HD mutation and might berelevant in the disease pathogenesis. First, a quarter of the cholesterolin humans is found in the brain and is produced locally becausethe blood-brain barrier (BBB) prevents its uptake from circulation(Dietschy and Turley, 2004). Secondly, although the rate of cholesterolsynthesis decreases after myelination (Dietschy, 1984; Jurevics andMorell, 1995), the very small amount produced by everyday cholesterolsynthesis in adulthood plays a role in neuronal function (Camargo et al.,2009). Third, the half-life of brain cholesterol is estimated to 5 years inhumans (Bjorkhem et al., 1998; Saher and Simons, 2010), consistentwith a late-onset disease. Fourth, to develop and maintain synapses,neurons have a high demand of cholesterol, which is supplied by astro-cytes (Mauch et al., 2001; Valenza et al., 2007b; Nieweg et al., 2009;Valenza et al., 2015a). Finally, first attempts at delivering cholesterol(Valenza et al., 2015b) or at modulating cholesterol catabolism(Boussicault et al., 2016) in the mouse HD brain have been proven bebeneficial. However, to date there are no direct measurements of cho-lesterol biosynthesis in the adult mouse HD brain and evidence of CAGlength–dependence is missing.
Here we performed a cross-validation study aimed at measuringcholesterol biosynthesis in vivo in the adult mouse brain by indepen-dent methods. The tissue concentration of the cholesterol precursor,lathosterol, was compared to the fractional synthesis rate of cholesterol,and brain and plasma24OHCmeasured by isotope labelingwith deuter-ated water (Lee et al., 1994) themeasures of cholesterol synthesis werethen compared to the concentration of cholesterol andbrain andplasma24OHC, determined by isotope dilution mass spectrometry (Cohen etal., 1980). Control and heterozygous knock-in mice carrying 175 CAGrepeats (herein referred as Q175; (Menalled et al., 2012) as well asmice carrying 20, 80, 111 CAG repeats were included in the study.The Q175 mouse model exhibits progressive and early-onset HD-related alterations, while the shorter repeat genotypes developsymptoms late in life or not at all; these mice enabled us to testwhether any of the parameters measured were CAG dependent atdifferent stages of disease. Additionally, we investigated whetherthe fraction of newly synthesized cholesterol, which is metabolizedinto 24OHC and can be measured in the blood, faithfully representsnewly synthesized cholesterol in the brain, thus making this measure-ment potentially useful as a clinical biomarker for CNS cholesterolbiosynthesis.
2. Material and methods
2.1. Deuterated water labeling and tissue collection in c57bl/6 mice
For deuterated water labeling, 4-months old animals received apriming intraperitoneal (i.p.) bolus of 49 mL/kg 0.9% NaCl in 99.9%2H2O and were maintained on 8% 2H2O in drinking water for twoweeks until sacrifice. This regimen results in steady state values ofabout 5% excess 2H enrichment of bodywater. At the end of the labelingperiod, mice were euthanized and blood drawn by cardiac puncture.Samples from 5 mice were pooled and centrifuged to separate plasmaand stored at −80 °C. Brain was removed and dissected into striatum,cortex and cerebellum and frozen on dry ice. Samples from 5 micewere pooled by brain region and stored at−80 °C.
2.2. Deuterated water labeling and tissue collection in WT and Q175 mice
Given that homozygosity is very rare in humans, all the analyseswere performed in the heterozygous Q175mice. Striatum, cortex, cere-bellum, and blood fromall animals have beenprovided by PsychoGenics
(USA). 5 weeks old animals were labeled with 2H2O for one weekwhereas 6-months and 12-months old mice were labeled for twoweeks with 2H2O as described above. Animals were food deprived for4 h and perfused with saline prior to tissue collection. The number ofhemizygous and age-matchedWT littermates used for the experimentswere indicated in the figure legends.
2.3. Myelin isolation
Individual brain region from 20 mice (tissue from 5 mice werepooled per sample for n = 4 samples per group) was weighed and ho-mogenized with tissue homogenizer (Fastprep®24-MP Biomedical) in10 mL of 30% sucrose solution. 10 mL of 10% sucrose solution was lay-ered over 10 mL of brain homogenate in polycarbonate ultracentrifugetube and centrifuged at 25000RPM for 30 min in SW-17 rotor. The my-elin layer at the interface of the two sucrose solutions was collectedwith a Pasteur pipette and the pellet constituted the ‘myelin-depletedfraction’. The procedurewas repeated twice to further deplete the pelletof myelin by resolubilizing the pellet with 2.5 mL of 30% sucrose andlayering with 1.9 mL of 10% sucrose solution in 4 mL tubes. The tubeswere centrifuged at 2500RPM for 30 min in Ti 50.4 and the myelin atthe interface was extracted with 2 mL pasture pipette. For further puri-fication of isolated myelin, the combined myelin extract washed withwater (1:1, v/v), resuspended in 2.5mL of 30% sucrose solution and lay-ered with 1.9 mL of 10% sucrose. The tubes were centrifuged at25000RPM for 30 min in Ti50.4 rotor, the myelin at the interface ofthe two solutions removed andwashedwithwater. The purifiedmyelinand the myelin-depleted fraction were reconstituted in 500ul of waterand stored at−20 °C.
2.4. Brain sterols (lathosterol, desmosterol cholesterol and 24OHC) synthe-sis rates
Lipid was extracted in 2:1 chloroform methanol from myelin-enriched and myelin-depleted fractions of each brain region. 125 μg ofbutylated hydroxytoluene (BHT)was added to 75 μL lipid extract and al-kaline hydrolysis was performed with 2 mL of NaOH in 90% ethanol for2 h at 50 °C. The sterols were extracted three times with 4 mL of cyclo-hexane and evaporated under streamof nitrogen. The dried samplewasacetylated for subsequent analysis by GC/MS as described previously(Lee et al., 1994) on an Agilent Technologies GC6890N equipped withDB-17MS column (30m× 0.25mm× 0.25 µm) and 5973Nmass detec-tor operated in selected ion-monitoring mode. The selected ions corre-sponding to M0 & M1 mass isotopomers for cholesterol were m/z 368and 369, for 24OHC were m/z 426 and 427, for lathosterol were m/z428 and 429, and for desmosterol werem/z 366 and 367. For each ana-lyte, fractional synthesis was calculated as described below.
2.5. Calculation of fractional synthesis
Cholesterol and 24OHC synthesis rate are expressed as fractionalsynthesis (%) over the duration of label. The fractional synthesis (f)was calculated on the basis of the precursor-product, or rise-to-plateau,approach, f = EM1/A∞, where EM1 represents the mass + 1-labeledspecies in excess of natural abundance, and A∞ represents the theoreti-cal plateau or asymptotic value for fully labeled moiety. The theoreticalplateau or asymptotic value A∞ during 2H2O labelingwas determined bymass isotomer distribution analysis (MIDA) of the combinatorial label-ing pattern based on precursor 2H–enrichment (Hellerstein andNeese, 1992). When the duration of label was different for differentage-groups, data for cholesterol and 24OHC are represented as synthe-sis rate per day, calculated as –ln(1-f)/t, where (f) is fractional synthesisand (t) the duration in days of label.
67M. Shankaran et al. / Neurobiology of Disease 98 (2017) 66–76

2.6. Plasma 24OHC and cholesterol synthesis rates
For analysis of cholesterol, 125 μg of BHT added to 1.5 mL plasma(pooled from5miceper sample in the samemanner as for brain tissues)and hydrolyzed with 2 mL of 1 M NaOH in 90% ethanol for 2 h at 50 °C.1 mL of water added and the unsaponiable part was extracted threetimes with 4 mL of cyclohexane. The combined top organic phase wasdried with stream of nitrogen. For analysis of 24-hydroxy cholesterol,the lipid extract were dissolved in 2 mL of toluene and loaded to500 mg/3 mL strata Sl-1 SPE column (Phenomenex) preconditionedwith methanol and hexane. The columnwas washed with hexane, cho-lesterol was eluted with 0.5% isopropanol in hexane, and 24-hydroxysterol and other oxysterolswere elutedwith 30% isopropanol in hexane.Each fractionwasdried under streamof nitrogen and acetylated for sub-sequent analysis by GC/MS as described above.
2.7. Isotope dilution mass spectrometry
Tissue homogenates were prepared in PBS. The weight of each sam-ple was used to normalize raw data. Fifty microliters of homogenateswere added to a screw-capped vial sealed with a Teflon-lined septum,together with 100 ng of 5a–cholest-7-en-3b-ol-1,2,5a,6a-d4 (D4-lathosterol; CDN Isotopes), 200 ng of D324S–hydroxycholesterol, and5 μg of (D6) cholesterol internal standards. To prevent self-oxidation,25 μL of butylated hydroxytoluene (BHT) (5 g/L) and 25 μL of EDTA(10 g/L) were added to each vial, and argon was flushed through to re-move air. Alkaline hydrolysis was allowed to proceed at room tempera-ture (22 °C) for 1 h in the presence of 1 M ethanolic potassiumhydroxide solution undermagnetic stirring. After hydrolysis, the neutralsterols (cholesterol, lathosterol, lanosterol and desmosterol; herein onlylathosterol has been shown and oxysterol (24OHC) were extractedthree times with 5 mL of cyclohexane. The organic solvents were evap-orated under a gentle stream of argon, and converted into trimethylsilylethers with N,O-Bis(trimethylsilyl)trifluoroacetamide (BSTFA) at 70 °Cfor 30min. Gas chromatography–mass spectrometry (GC–MS) to quan-tify single components was performed as described by Valenza et al.(2007a, 2007b).
2.8. Western blot analysis
Protein lysates from a small aliquot (2 μL) of the same homogenatesused for in vivo labeling studies were prepared by adding 50 μL of RIPAbuffer supplemented with PMSF (1:250; Sigma-Aldrich) and proteaseinhibitors (1:100; Sigma-Aldrich). Proteins were separated by SDS-polyacrylamide gel electrophoresis and then transferred to a nitrocellu-lose membrane using a Trans-Blot Turbo System (Bio-Rad). The mem-branes were next probed with mouse anti-MBP (1:500; Chemicon),mouse anti-SNAP25 (1:1000; Becton Dickinson), mouse anti-GFAP(1:500; Becton Dickinson) and mouse anti-α-tubulin (1:5000; Sigma-Aldrich), followed by washing, and probing with horseradish peroxi-dase-conjugated secondary antibodies (1:3000; Bio-Rad). Bands werevisualized with enhanced chemoluminescence (Pierce) and imagedwith the ChemiDoc MP Imaging System (Bio-Rad).
2.9. Real time PCR
Total RNA from tissues was isolated with TRIzol Reagent (Life Tech-nologies). Total RNA (0.5 μg)was reverse-transcribed to single-strandedcDNA using the iScript cDNA synthesis kit (Bio-Rad). For each reverse-transcribed product, three real-time PCR analyses were performed induplicate for each of the analyzed genes. Real time PCR was performedon an iCycler Thermal Cycler with a Multicolor Real-time PCR DetectionSystem (Bio-Rad) using TaqMan 2× Master Mix (Bio-Rad). Taqmanprimer/probe sets were designed in collaboration with Bio-Rad techni-cal service and are available upon request. Relative gene expressionwas determined usingΔΔCtmethod, normalizing to b-actin and Gapdh.
2.10. Statistics
No statisticalmethodswere used to predetermine sample sizes. Datawere expressed asmean± S.E. M or±S.D. as indicated. Statistical anal-ysis was performed by two-tail Student's t-test, one-way ANOVA withNewman–Keuls Multiple Comparison post-hoc test or two-wayANOVA with Holm-Sidak's multiple comparison test, as indicated. Nor-mality of the data was assessed using the Shapiro-Wilk test. Differencesfor which p was b0.05 were considered to be significant.
3. Results
3.1. Cholesterol, lathosterol and 24-hydroxycholesterol synthesis rates inwild-type mice
To determine the fractional synthetic rate of cholesterol, we utilizedin vivo stable isotope labeling and Isotope Dilution mass spectrometry(ID/MS) analysis (Lee et al., 1994).Malemicewere labeledwith deuter-ated water (8% 2H2O) for 2 weeks added in the drinkingwater (see ma-terial and methods). Deuterium incorporated into newly madecholesterol and the 2H enrichment in cholesterol and its precursor,lathosterol, as well its catabolite, 24OHC, were measured by mass spec-trometry. Since labeled water freely and rapidly penetrates all tissues inthe body and deuterium enrichments can be easilymaintained at a con-stant level for days or weeks, the synthesis rate of very slowly turningover pools of cholesterol can be accurately determined.
Cholesterol biosynthesis rates were first measured in 4-month-oldlittermate wild-type (WT) mice. We purified myelin-enriched and my-elin-depleted fractions (Zoller et al., 2008) from striatum, cortex andcerebellum of the labeled mice to characterize the contribution of denovo cholesterol synthesis in these two potentially distinct pools of cho-lesterol in the brain. To check for the efficiency of purification, we mea-sured the levels of MBP (a marker of myelin), GFAP (a marker ofastrocytes, which are regarded as the cells that producemost of the cho-lesterol in the adult brain; (Mauch et al., 2001)) and SNAP25 (a markerof neurons) in myelin-depleted and myelin-enriched fractions. Bothpreparations contained neuronal cells and astrocytes (as detected bySNAP25 and GFAP, respectively) but the myelin-depleted fractionswereMBPnegative, indicating thatmeasures of cholesterol biosynthesisrates in myelin-depleted fractions had limited myelin contamination(Fig. 1A). Cholesterol synthesis rate, expressed as cholesterol fractionalsynthesis % for the duration of 2 weeks of label (see methods), was ingeneral lower inmyelin-enriched fractions compared tomyelin-deplet-ed fractions (Fig. 1B), consistent with the notion that myelin lipids turnover more slowly than other brain lipid pools (Aggarwal et al., 2011). Inboth fractions, cholesterol synthesis rate was highest in cortex with re-spect to striatum and the lowest rate of synthesis was found in cerebel-lum (Fig. 1B). The synthesis rate of lathosterol was also measured andfound to be fully turned over in both myelin and myelin-depleted frac-tions in all brain regions (data not shown).
In order to maintain homeostasis in brain, cholesterol synthesis anddegradation are equilibrated through its oxidation to 24OHC, which iscatalyzed by cholesterol-24-hydroxylase (CYP46a1), a supposedly neu-ronal-specific enzyme prevalent in striatum and cortex (Lund et al.,1999; Ramirez et al., 2008). 24OHC, in contrast to cholesterol, crossesthe blood-brain barrier (BBB) and is exported into the circulation to pre-vent excess accumulation of cholesterol in brain. The synthesis rate of24OHC in the present study refers to the de novo synthesis of 24OHCfrom Acetyl CoA. Accordingly, the measure of 2H enrichment in24OHC reflects the proportion of newly synthesized cholesterol thatwas catabolized into 24OHC; this is based on the assumption that bothnon-labeled and labeled cholesterol contribute to 24OHC formation. Ifthe enrichment in 24OHC and cholesterol in brain is equal, then the syn-thesis rate of 24OHC can be used as a surrogate for whole brain choles-terol synthesis ((Bjorkhem et al., 1998; Meaney et al., 2000). As shownin Fig. 1C, the 24OHC fractional synthesis in adult mice mirrored the
68 M. Shankaran et al. / Neurobiology of Disease 98 (2017) 66–76

cholesterol fractional synthesis in all the brain regions tested both inmyelin-enriched and myelin-depleted fractions, suggesting that24OHC is formed from cholesterol locally and there is no bias towardconversion of newly made cholesterol into 24OHC. Cholesterol synthe-sis rate (Fig. 1B) and new cholesterol present in 24OHC (Fig. 1C) werealso highly correlated as shown in Fig. 1D (values represent average ofmyelin and myelin-depleted fractions by brain region).
3.2. Cholesterol biosynthesis in the striatum of Q175 mice
The striatum is among thebrain regionsmost affected inHD. Of note,the content of cholesterol in the striatummeasured by mass spectrom-etry is the highest compared to other brain regions ((Runquist et al.,1995; Zhang et al., 1996; Dietschy and Turley, 2004) likely due to itsrichness in interconnections and synapses that require high cholesterolcontent.We firstmeasured lathosterol content by isotopic dilutionmassspectrometry in the striatumofWTand heterozygousQ175miceduringphenotype progression (n= 10 animals/genotype for each time point).As shown in Fig. 2A, lathosterol levels were significantly reduced in thestriatum of Q175 mice since the age prior to motor deficits (5 weeks ofage)with respect toWTmice, with the difference beingmore evident atages with emerging motor deficits (25 weeks) and significant motordeficits (54 weeks). In agreement with what has already been reportedfor other HDmousemodels (Valenza et al., 2007b; Valenza et al., 2007a;Valenza et al., 2010), our data here suggests that cholesterol precursorlevel is affected early in the Q175 mouse model.
To attribute decrease in precursor level to decreased cholesterol bio-synthesis, we measured the in vivo cholesterol biosynthesis rate withdeuterated water in the samemouse lines and at the same time points.We performed evaluations for both myelin-enriched and myelin-de-pleted fractions from different brain tissues ofWT andQ175mice. How-ever, as the contribution of oligodendrocytes to cholesterol productionin the adult brain is limited (Dietschy and Turley, 2004), we showdata only from myelin-depleted fractions. As expected, lathosterol wascompletely turned over in both genotypes at all time points (data notshown). The cholesterol fractional synthesis rate, expressed as rate perday since mice of different ages had different durations of label (seemethods) was reduced in the striatum of Q175 mice compared to WTmice at all ages examined, which were statistically significant at 25and 54 weeks (10–18% reduction, Fig. 2B). Taken together, the reducedcholesterol concentration and fractional synthesis, suggest that the ab-solute production of cholesterol is reduced at early time points in thestriatum of Q175 mice. Of note, in agreement with the notion that cho-lesterol biosynthesis is high during postnatal stage (up to 4 weeks ofage) and low (albeit measurable) in the adult brain, we report thatboth lathosterol levels (Fig. 2A) and cholesterol synthesis rates (Fig.2B) were highest in young mice but decreased in older mice, regardlessof the genotype.
We next asked if reduced cholesterol synthesis rate might lead to adecrease in cholesterol content in the striatum of Q175 mice. In agree-ment with the literature (Jurevics and Morell, 1995; Dietschy andTurley, 2004), cholesterol levels increased steadily with age in the WTbrain. In contrast, Q175 mice did not accumulate cholesterol in the
Fig. 1. Synthesis rate of brain cholesterol and 24OHC in c57bl/6 mice. (A) Representative western blot analysis for GFAP (marker of astrocytes), SNAP25 (marker of neurons) and MBP(marker of oligodendrocytes) in myelin-depleted and –enriched fractions purified from a subset of cortical and cerebellar samples, in which cholesterol biosynthesis rates weremeasured. Alpha-tubulin was used as loading control. (B–C) Synthesis rate of cholesterol (B), and 24OHC (C) in myelin-depleted (left) and in myelin-enriched fraction (right) fromdifferent brain regions (cortex, CTX; striatum, STR; cerebellum, CRB) in 4 month-old c57bl/6 mice. Synthesis rate is expressed as fractional synthesis % for the duration of 2 weeks oflabel. (D) Correlation between % new cholesterol and 24OHC synthesis in striatum of 4-month-old c57bl/6 mice. The values are the average of data obtained for myelin-enriched andmyelin-depleted fractions by brain regions (black, CTX; dark grey, STR; grey, CRB) shown in Fig 1B and C. The graphs in (B, C) show the mean ± SD of fractional synthesis (%) of n = 4samples per group, each sample was tissue pooled from 5 mice (all males). Statistics: 2-way ANOVA with post-hoc Holm-Sidak comparisons. ****p b 0.0001 for each brain region.
69M. Shankaran et al. / Neurobiology of Disease 98 (2017) 66–76

Fig. 2. Brain cholesterol homeostasis in Q175 het mice during disease progression. Lathosterol (A), cholesterol (C) and 24OHC (E) levels measured by ID-MS in striatum ofWT and Q175mice at 5, 25 and 54weeks of age. Cholesterol synthesis rate per day (B) and 24OHC synthesis rate per day (D) in striatum ofWT and Q175mice at 5, 25 and 54weeks of age. The 24OHCsynthesis rate per day indicates the % of new cholesterol that is catabolized into 24OHC. (F) Correlation between % of new cholesterol and 24OHC synthesis inWT (white circle) and Q175(black circle) mice in striatum at different ages. The graphs in (A, C, D) show themean from n=10mice (5males and 5 females) per group± SEM. The graphs in (B, C, F) show themeanfrom 4 samples per group, each sample was tissue pooled from 5 mice (all males) per group ± SD. Statistics: two-tailed unpaired t-test with age-matched WT. *p b 0.05; **p b 0.01,***p b 0.001, ****p b 0.0001.
Table 1Concentration of lathosterol, cholesterol and 24OHC in females andmales ofWT and Q175 mice. Statistics. Unpaired t-test WT vs Q175, within the same age and gender group, *p b 0.05;**p b 0.01, ***p b 0.001.
Gender Females Males
Age 5 weeks 25 weeks 54 weeks 5 weeks 25 weeks 54 weeksGenotype(n = 5/group)a
wt Q175 wt Q175 wt Q175 wt Q175 wt Q175 wt Q175
Lathosterol(ng/mg ww)
52,34± 2,48
43,66± 2.28*
17,84± 1,23
8,33± 0,675***
13,40± 0,87
7,77± 0.57***
46,11± 0,80
45,89± 1,49
16,16± 1,77
7,72± 0.77**
13,75± 1,74
7,12± 1.01*
Cholesterol(μg/mg ww)
11,65± 0,33
10,07± 0.44*
12,57± 0,28
10,85± 0.48**
14,61± 1,59
12,47± 0.54*
11,04± 0,25
10,95± 0,47
13,13± 0,37
12,69± 0,53
15,11± 0,81
11,16± 0.67**
24OHC(ng/mg ww)
48,39± 1,70
40,64± 2.60*
59,61± 2,27
50,75± 2.76*
63,20± 2,87
52,72± 0.90**
46,07± 0,97
46,69± 1,36
56,75± 1,34
49,36± 1.55**
58,67± 2,57
47,65± 3.93*
a Unpaired t-test wt vs Q175 (within the same age and gender groups).
70 M. Shankaran et al. / Neurobiology of Disease 98 (2017) 66–76

brain with age; an overall reduced cholesterol content was found in theQ175 striatum, compared to WT mice, at 54 weeks of age (Fig. 2C). Wealso noted a gender effect as female Q175 mice showed a reduction inlathosterol and cholesterol at earlier time points (from 5 weeks ofage) compared to males (from 25 to 54 weeks of age) (Table 1).
The findings of reduced cholesterol biosynthesis (at early ages; Fig.2A,B) and cholesterol content (at ages where the mice exhibit motordeficits; Fig. 2C), together with the lack of evidence of cholesterol accu-mulation at any of the timepoints analyzed, reinforce the notion of a de-fect in cholesterol production in Q175 mice, and support previousfindings in R6/2, YAC46, YAC72, YAC128, Q111 knock-in mice andtgHD rats carrying 51 CAG (Valenza et al., 2007b; Valenza et al., 2010).This cross-validation analysis conducted in parallel by two independentresearch units on the same samples supports the hypothesis that re-duced cholesterol biosynthesis is the primary event that leads to a de-crease in cholesterol content in mouse HD brain.
3.3. Cholesterol catabolism in the striatum of Q175 mice
To explore whether reduction rate of cholesterol synthesis can alsoreflected in a reduction of 24OHC production in HDmice, we measured2H enrichment in 24OHC in the striatum of WT and Q175 mice after invivo stable isotope tracking experiments. As shown in Fig. 2D, a 10–14% significant reduction of 24OHC synthesis rate per daywas observedstarting from 25 weeks in the striatum of Q175 mice compared to WTmice. Accordingly, 24OHC level, measured by isotope dilution massspectrometry, was reduced at 25 and 54 weeks of age in the striatumof Q175 mice compared to WT mice (Fig. 2E), an event that occurslater with respect to reduction of lathosterol level (Fig. 2A). All togetherthese results suggest that the reduced concentration of 24OHC is reflec-tive of reduced cholesterol synthesis, not for example, reduced forma-tion or increased clearance of 24OHC.
Importantly, there was a significant correlation between the frac-tional synthesis rates of total cholesterol and 24OHC in the striatum(but also in other brain regions, see Fig. 4E,F) of both genotypes (Fig.2F) suggesting that 24OHC can be used to track cholesterol synthesisin the brain.
3.4. Cholesterol biosynthesis and removal in other brain regions of Q175mice
We next explored whether cholesterol biosynthesis and catabolismare also reduced in cortex and cerebellum of Q175 mice. To better ap-preciate differences between the brain regions tested, the striatal datafrom Fig. 2 were re-plotted in Fig. 3. In contrast to the early reductionin lathosterol found in the Q175 striatum, lathosterol levels were re-duced in the cortex and cerebellum of Q175 mice only at 54 weeks(Fig. 3A–C). Similar levels of cholesterol were found in cortex and cere-bellum of WT and Q175 mice at all the time points (Fig. 3D–F), while24OHC mirrored lathosterol, with a significant decrease in both cortexand cerebellum only at 54 weeks (Fig. 3G–I).
In vivomeasurement of cholesterol, lathosterol and 24OHC synthesisrates in the same brain regions and at the same time points revealedsimilar and coherent findings with respect to the isotope dilutionmass spectrometry data. Similar to striatum, lathosterol was fullyturned over (fractional synthesis ~100%) in cortex and cerebellum inboth WT and Q175 mice (data not shown). Cholesterol synthesis rateswere similar in young Q175 mice andWTmice, but there was a signifi-cant 7–10% reduction in cortex and 7–17% in cerebellum in 25- and 54-week-old Q175 mice, respectively, compared to WT mice (Fig. 4A,B).24OHC synthesis rate in cortex and cerebellum alsomirrored cholester-ol with a 8–9% (in cortex) and 21–24% (in cerebellum) reduction inQ175 mice, respectively, compared to WT mice (Fig. 4C,D). Similarlyto striatum, a significant correlation between the fractional synthesisrates of total cholesterol and 24OHC was found in the cortex and cere-bellum from WT and Q175 mice (Fig. 4E, F).
All these findings indicate that a reduction in steady-statelathosterol and 24OHC, and cholesterol synthesis rates, in the absenceof changes in cholesterol content in the CTX and CRB of Q175, suggeststhat these brain regions are more efficient in their compensatory re-sponses to maintain cholesterol homeostasis, in comparison to thestriatum.
3.5. SREBP-dependent cholesterol biosynthesis genes in the striatum andcortex from Q175 mice
Nearly all genes involved in cholesterol biosynthesis are transcrip-tionally regulated by SREBP2 (Jeon and Osborne, 2012). SREBP activitywas reduced in an inducible cell model of HD, brain and primary astro-cytes from the R6/2 mouse model (Valenza et al., 2005; Valenza et al.,2015a), in N171-82Q mice (Lee et al., 2015) and in postmortem HDbrain (Valenza et al., 2005; Hodges et al., 2006). Here we analyzedmRNA levels of hydroxyl-methyl-glutaryil-CoA-reductase (hmgcr) andfarnesyl-diphosphate farnesyltransferase 1 (fdft1) in the striatum andcortex of WT and Q175 mice. mRNA level of Fdft1, encoding for thefirst enzyme catalyzing the metabolic step in cholesterol biosynthesisthat is exclusively committed to sterol biosynthesis, was reduced of ~20–30% in the striatum and in cortex from Q175 mice (0.82 ± 0,045and 0.69 ± 0,064 respectively) compared to control mice (1.00 ±0,028 and 1.00 ± 0,027 respectively). Also the mRNA level of Hmgcr,encoding for the rate-controlling enzyme of the upstream mevalonatepathway that produces cholesterol and other isoprenoids, was reducedof ~20% in the striatum and cortex of Q175 mice (0.81 ± 0,041 and0.80 ± 0,025) at 54 weeks of age compared to control mice (1.00 ±0,021 and 1.00 ± 0,020).
All these data support the hypothesis that impaired SREBP2 activa-tion in the presence ofmutant htt contributes to cholesterol dysfunctionin HD.
3.6. Cholesterol related parameters in striatumand cortex from allelic seriesof knock-in HD mice
To test whether cholesterol dysfunction is CAG length dependent,we measured cholesterol, cholesterol precursors and 24OHC in the stri-atum and cortex from amouse allelic series (Q20, Q80, Q111, Q175 – allHETs -versusWT control). In this experiment, samples fromWT (hereindefined as Q7) and Q175 mice were re-analyzed and plotted in thegraphs together with the other samples. Fig. 5A shows that lathosterollevel in 54-week-old striata correlates strongly (R2 = 0.96,252) withCAG length with its level being Q175 b Q111 b Q80 b Q20 b Q7, whilein 54-week-old cortical samples, we found a CAG-dependent reductionof lathosterol only in animals with Q111 and Q175 (Fig. 5B). Conversely,cholesterol content (Fig. 5C) and 24OHC level (Fig. 5E) were reduced inexpanded Q striatal samples (Q80, Q111, Q175) compared to controlstriata (Q7 andQ20) independent from the polyQ expansion. Significantchanges were observed for cholesterol (Fig. 5D) in expanded Q mice –however with the Q111 samples that did not reach significance - anda decrease of 24OHC level was found in cortical tissues of expanded Qmice (Fig. 5F) independent from the length of CAG expansion.
All together, these data suggest that lathosterol, a precursor of cho-lesterol biosynthesis, correlates strongly with CAG expansion in thestriatal samples.
3.7. Plasma 24OHC as a marker of brain cholesterol synthesis in HD
We next asked whether 24OHC in blood might reflect brain choles-terol metabolism in Q175 and allelic series mice. Steady-state level ofplasma 24OHC was similar among all samples at 5 weeks of age (Fig.6A). However, at 54 weeks of age, there was a significant reduction inplasma 24OHC in Q80, Q111 and Q175 samples, compared to Q7(WT)samples (Fig. 6B), mirroring the levels of brain 24OHC in the samemice. In parallel, a statistically significant reduction in the plasma
71M. Shankaran et al. / Neurobiology of Disease 98 (2017) 66–76

24OHC synthesis rate was detected in Q175mice at 25weeks of age, al-though no significant changes were observed in other time points (Fig.6C). Plasma cholesterol synthesis rate, which reflects peripheral choles-terol, was not altered in Q175 mice at all time points (Fig. 6D) suggest-ing that whole body de novo cholesterol metabolism is not affected inHD mice.
We conclude that circulating 24OHC is reduced inHDmousemodelswith high CAG expansion (N80Q), mirroring the brain levels, and thatplasma 24OHC should be explored further for its utility as a biomarker.
4. Discussion
Our study provides a clear demonstration that a reduction in choles-terol biosynthesis is associatedwithHDmousemodels. In particular, the
uniqueness of the approach,multi-platform, isotope dilutionmass spec-trometry and deuterium incorporation analyses combined with in vivolabeling based measurements of cholesterol synthesis, in the samebrain regions and time points by two independent research units, pro-vided a rigorous cross-validation study with the best available technol-ogies in at least one mouse model (i.e. Q175). Furthermore, theinclusion of brain samples from a knock-in mouse series carrying 20,80, 111 CAG in the isotopic-dilution mass spectrometry analyses pro-vided solid evidence of a CAG length dependence of the lathosterollevel that robustly mirrors cholesterol biosynthesis rate in mouse brain.
Our previous in vitro and in vivo data have proposed that mutanthuntingtin moderates the cholesterol biosynthetic pathway in thebrain (Karasinska and Hayden, 2011; Valenza and Cattaneo, 2011).This is based on mass spectrometry data showing reduced level of the
Fig. 3. Lathosterol, cholesterol and 24OHC levels in different brain regions of Q175 het mice during disease progression. Lathosterol (A-B-C), cholesterol (D-E-F) and 24OHC (G-H-I) levelsmeasured by ID-MS in striatum, cortex and cerebellumofWT andQ175mice at 5weeks, 25weeks and 54weeks of age. The graphs show themean fromn=10 animals/genotype±SEM.The raw data for striatum are the same shown in Fig. 2. Statistics: two-tailed unpaired t-test with WT by region. *p b 0.05; **p b 0.01, ***p b 0.001.
72 M. Shankaran et al. / Neurobiology of Disease 98 (2017) 66–76

cholesterol precursor lathosterol at stages prior to onset of motor phe-notypes in the brain regions from R6/2 and YAC128 mice and reducedcholesterol content at more advanced stages. However, lathosterollevel is only an indirect measure of cholesterol biosynthesis (Kempenet al., 1988). Furthermore, the measure of cholesterol content in a spe-cific tissue reflects all cholesterol present in the brain and not the poolof newly synthetized cholesterol. On the contrary, an in vivo labeling ap-proach allows us to directly address questions related to synthesis rate/day of a specific metabolite. By combining indirect and direct measure-ments, in this report we show that cholesterol biosynthesis is signifi-cantly reduced in the striatum (and other brain regions) of the Q175mouse model.
The cross-validation analyses performed at different time points,from young ages prior to phenotypic deficits to ages with emergingand significant phenotypic deficits, allowed us to define the timing ofcholesterol dysregulation in the Q175 mouse model. Mass spectrome-try data show that lathosterol levels are reduced in the striatum ofQ175 mice by 5 weeks of age, followed by a decrease in 24OHC levelsat 25 weeks of age. As cholesterol biosynthesis is reduced, there islikely a compensatory response to reduce cholesterol catabolism
into 24OHC in order to maintain cholesterol levels in the brain.However, at 54 weeks of age, the equilibrium between synthesisand catabolism is compromised, leading to a reduced total cholester-ol content compared to WT mice. In vivo labeling experiments are inagreement with the mass spectrometry data, indicating that reducedcholesterol biosynthesis is a primary event in the Q175 mice and isnot a consequence of cholesterol catabolism. Therefore, upstreaminterventional strategies (i.e. at cholesterol synthesis) might bemore impactful in HD systems. Of note, the low daily synthesis rateof cholesterol in different brain regions in Q175 mice supports thehypothesis that the availability of newly synthesized cholesterol –a small pool dedicated to synaptic transmission - is reduced in HDmouse models and might further compromise neuronal functionalduring disease progression. Additionally, Q175 striatum is affectedat an earlier time point than cortex and other brain regions, suggest-ing a specific need of continuous production and/or availability ofcholesterol. Accordingly, the rodent and bovine striatum has beendescribed to contain higher levels of cholesterol compared to otherregions (Jurevics and Morell, 1995; Zhang et al., 1996), which mayaccount for its particular anatomical/functional properties.
Fig. 4. Cholesterol and 24OHC synthesis rates in different brain regions of Q175 het mice during disease progression. Cholesterol synthesis rate (A–B) and percentage of new cholesterolinto 24OHC (C–D) in cortex and cerebellum ofWT andQ175mice at 5weeks, 25weeks and 54weeks of age. The graphs show themean± SD, n=4 samples per group, each sample wastissue pooled from 5 mice (all males). Statistics: two-tailed unpaired t-test with age-matchedWT. *p b 0.05; **p b 0.01, ***p b 0.001.
73M. Shankaran et al. / Neurobiology of Disease 98 (2017) 66–76
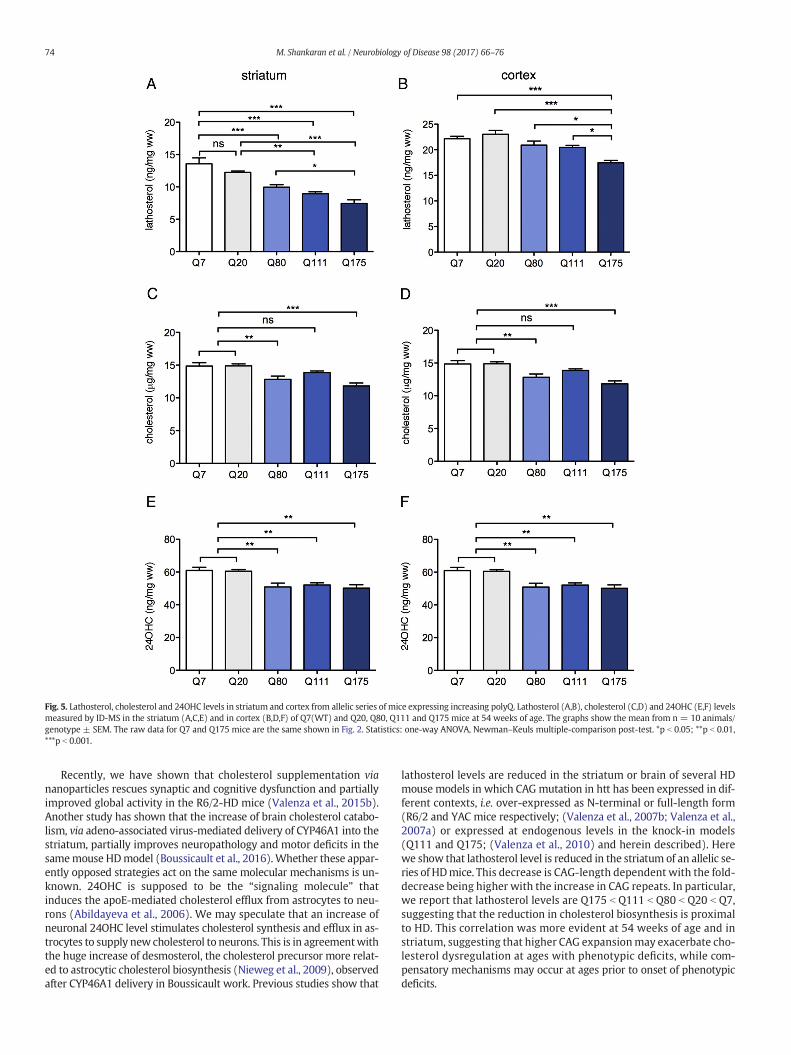
Recently, we have shown that cholesterol supplementation viananoparticles rescues synaptic and cognitive dysfunction and partiallyimproved global activity in the R6/2-HD mice (Valenza et al., 2015b).Another study has shown that the increase of brain cholesterol catabo-lism, via adeno-associated virus-mediated delivery of CYP46A1 into thestriatum, partially improves neuropathology and motor deficits in thesamemouse HDmodel (Boussicault et al., 2016).Whether these appar-ently opposed strategies act on the same molecular mechanisms is un-known. 24OHC is supposed to be the “signaling molecule” thatinduces the apoE-mediated cholesterol efflux from astrocytes to neu-rons (Abildayeva et al., 2006). We may speculate that an increase ofneuronal 24OHC level stimulates cholesterol synthesis and efflux in as-trocytes to supply new cholesterol to neurons. This is in agreementwiththe huge increase of desmosterol, the cholesterol precursor more relat-ed to astrocytic cholesterol biosynthesis (Nieweg et al., 2009), observedafter CYP46A1 delivery in Boussicault work. Previous studies show that
lathosterol levels are reduced in the striatum or brain of several HDmouse models in which CAGmutation in htt has been expressed in dif-ferent contexts, i.e. over-expressed as N-terminal or full-length form(R6/2 and YAC mice respectively; (Valenza et al., 2007b; Valenza et al.,2007a) or expressed at endogenous levels in the knock-in models(Q111 and Q175; (Valenza et al., 2010) and herein described). Herewe show that lathosterol level is reduced in the striatum of an allelic se-ries of HDmice. This decrease is CAG-length dependent with the fold-decrease being higher with the increase in CAG repeats. In particular,we report that lathosterol levels are Q175 b Q111 b Q80 b Q20 b Q7,suggesting that the reduction in cholesterol biosynthesis is proximalto HD. This correlation was more evident at 54 weeks of age and instriatum, suggesting that higher CAG expansionmay exacerbate cho-lesterol dysregulation at ages with phenotypic deficits, while com-pensatory mechanisms may occur at ages prior to onset of phenotypicdeficits.
Fig. 5. Lathosterol, cholesterol and 24OHC levels in striatum and cortex from allelic series of mice expressing increasing polyQ. Lathosterol (A,B), cholesterol (C,D) and 24OHC (E,F) levelsmeasured by ID-MS in the striatum (A,C,E) and in cortex (B,D,F) of Q7(WT) and Q20, Q80, Q111 and Q175 mice at 54 weeks of age. The graphs show the mean from n = 10 animals/genotype ± SEM. The raw data for Q7 and Q175 mice are the same shown in Fig. 2. Statistics: one-way ANOVA, Newman–Keuls multiple-comparison post-test. *p b 0.05; **p b 0.01,***p b 0.001.
74 M. Shankaran et al. / Neurobiology of Disease 98 (2017) 66–76

We previously proposed that reduced cholesterol biosynthesis mayresult as a consequence of reduced SREBP activity. Here we found thattwo SREBP2-dependent cholesterol genes are reduced in the striatumand cortex of Q175 mice, compared to control mice. Reduced transloca-tion of the active form of SREBP2, rather than its sequestration intomuHtt aggregates, might occur in the presence of CAG expansion, aspreviously suggested (Valenza et al., 2005; Valenza et al., 2015a). How-ever, differently from that observed in the R6/2 mice (Valenza et al.,2005), we found a significant decrease of mRNA of these genes at alater time point compared to reduced lathosterol levels. Further invitro and in vivo studies in which expression of cholesterol and lipidgenes are experimentallymanipulatedwill help to elucidatewhich cho-lesterol related genes are more proximal to mutant htt in order to iden-tify targets of intervention to restore cholesterol biosynthesis in HD.
We also previously explored the potential of circulating 24OHC ascandidate biomarker in HD mouse models and patients.
In humans, 24OHC is of cerebral origin and there is a continuous netflux of this oxysterol across the BBB from brain into the circulation(Lutjohann et al., 1996; Bjorkhemet al., 1998). In YAC128mice, circulat-ing 24OHC levels are reduced reflecting what is observed in the brain(Valenza et al., 2007b), while its level in plasma from HD patientsmimic HD onset and progression (Leoni et al., 2008; Leoni et al., 2011;Leoni et al., 2013). Notably, 24OHC plasma level is significantly reducedin pre-manifest HD gene positive subjects and can further distinguishbetweenpre-manifest and patientswith overtmotor disease.Moreover,this measure has suggested to be second only to striatal volume in itsstability to distinguish among progression groups (Leoni et al., 2013).Level of circulating 24OHC is linked to brain cholesterol synthesis, butalso increased clearance or reduced formation. The decrease in circulat-ing 24OHC that we observed in mice carrying NQ80 suggests that24OHC can be used in HD models to trace a defect in brain cholesterolbiosynthesis and, eventually, a neurodegenerative process. We should
consider that previous reports suggested only 50% of circulating24OHC is of cerebral origin in mice (Meaney et al., 2000) and that thepower of this measure in mice might be lower than in humans, inwhich almost all the 24OHC is of cerebral origin (Bjorkhem et al.,1998). A longitudinal study for 24OHCwill be required to definewheth-er 24OHC is a candidate biomarker in human HD. Using stable isotopelabeling we also demonstrate for the first time the use of deuteratedwater labeling in plasma 24OHC as a surrogate, noninvasive measure-ment of in vivo brain cholesterol synthesis.
In conclusion, we demonstrate that reduced cholesterol synthesis isa biological pathway that is proximal to mutant huntingtin in mousemodels and future studies should examine perturbations of this path-way with an eye toward therapeutic interventions in appropriate cells.Importantly, the in vivo labeling study conducted in mice in this studyis fully translational and similar experiments could be conducted inhumans. Measurement of 24OHC in the plasma of HD patients after2H2O labeling will help evaluate the relevance of 24OHC as a potentialbiomarker in HD onset and progression.
Conflict of interest
No conflicts of interest, financial or otherwise, are declared by theauthor(s).
Acknowledgments
This work was supported by CHDI Foundation/CHDI Management,USA to EC (no. A-5086) and to KineMed (A-5142); and by Ministerodella Salute under 40 (GR-2008) to V.L. and M.V. We thank IgnacioMunoz-Sanjuan for critical reading of themanuscript. This paper is ded-icated to the memory of our dear colleague, devoted scientist and wellknown neurologist Stefano Di Donato.
Fig. 6. Circulating 24OHC from allelic series and Q175 het mice during disease progression. (A–B) 24OHC level measured by ID-MS in blood fromWT and allelic series of mice at 5 weeksand 54weeks of age. The graphs show themean-min-max from n=10 animals/genotype± SEM. (C) Cholesterol synthesis rate per day and percentage of new cholesterol into 24OHC inblood from WT and Q175 mice. The graph shows mean ± SEM of n = 4 samples per group, each sample was blood plasma pooled from 5 mice (all males). Statistics: one-way ANOVA,Newman–Keuls multiple-comparison post-test (in A–B) and two tail impaired t-test in (C). *p b 0.05; **p b 0.01, ***p b 0.001.
75M. Shankaran et al. / Neurobiology of Disease 98 (2017) 66–76

References
Abildayeva, K., Jansen, P.J., Hirsch-Reinshagen, V., Bloks, V.W., Bakker, A.H., Ramaekers,F.C., de Vente, J., Groen, A.K., Wellington, C.L., Kuipers, F., Mulder, M., 2006. 24(S)-hydroxycholesterol participates in a liver X receptor-controlled pathway in astro-cytes that regulates apolipoprotein E-mediated cholesterol efflux. J. Biol. Chem. 281,12799–12808.
Aggarwal, S., Yurlova, L., Simons, M., 2011. Central nervous systemmyelin: structure, syn-thesis and assembly. Trends Cell Biol. 21, 585–593.
Bates, G.P., Dorsey, R., Gusella, J.F., Hayden, M.R., Kay, C., Leavitt, B.R., Nance, M., Ross, C.A.,Scahill, R.I., Wetzel, R., Wild, E.J., Tabrizi, S.J., 2015. Huntington disease. Nature Rev.Dis. Primers 1, 15005.
Bjorkhem, I., Lutjohann, D., Diczfalusy, U., Stahle, L., Ahlborg, G., Wahren, J., 1998. Choles-terol homeostasis in human brain: turnover of 24S-hydroxycholesterol and evidencefor a cerebral origin of most of this oxysterol in the circulation. J. Lipid Res. 39,1594–1600.
Boussicault, L., Alves, S., Lamaziere, A., Planques, A., Heck, N., Moumne, L., Despres, G.,Bolte, S., Hu, A., Pages, C., Galvan, L., Piguet, F., Aubourg, P., Cartier, N., Caboche, J.,Betuing, S., 2016. CYP46A1, the rate-limiting enzyme for cholesterol degradation, isneuroprotective in Huntington's disease. Brain J. Neurol. 139, 953–970.
Camargo, N., Smit, A.B., Verheijen, M.H., 2009. SREBPs: SREBP function in glia-neuron in-teractions. FEBS J. 276, 628–636.
Cohen, A., Hertz, H.S., Mandel, J., Paule, R.C., Schaffer, R., Sniegoski, L.T., Sun, T., Welch, M.J.,White, E., 1980. Total serum cholesterol by isotope dilution/mass spectrometry: acandidate definitive method. Clin. Chem. 26, 854–860.
Dietschy, J.M., 1984. Regulation of cholesterol metabolism in man and in other species.Klin. Wochenschr. 62, 338–345.
Dietschy, J.M., Turley, S.D., 2004. Thematic review series: brain lipids. Cholesterol metab-olism in the central nervous system during early development and in the mature an-imal. J. Lipid Res. 45, 1375–1397.
Hellerstein,M.K., Neese, R.A., 1992.Mass isotopomer distribution analysis: a technique formeasuring biosynthesis and turnover of polymers. Am. J. Phys. 263, E988–1001.
Hodges, A., et al., 2006. Regional and cellular gene expression changes in humanHuntington's disease brain. Hum. Mol. Genet. 15, 965–977.
Jeon, T.I., Osborne, T.F., 2012. SREBPs: metabolic integrators in physiology and metabo-lism. Trends Endocrinol. Metab. 23, 65–72.
Jurevics, H., Morell, P., 1995. Cholesterol for synthesis of myelin is made locally, notimported into brain. J. Neurochem. 64, 895–901.
Karasinska, J.M., Hayden, M.R., 2011. Cholesterol metabolism in Huntington disease. Nat.Rev. Neurol. 7, 561–572.
Kempen, H.J., Glatz, J.F., Gevers Leuven, J.A., van der Voort, H.A., Katan, M.B., 1988. Serumlathosterol concentration is an indicator of whole-body cholesterol synthesis inhumans. J. Lipid Res. 29, 1149–1155.
Lee, W.N., Bassilian, S., Guo, Z., Schoeller, D., Edmond, J., Bergner, E.A., Byerley, L.O., 1994.Measurement of fractional lipid synthesis using deuterated water (2H2O) and massisotopomer analysis. Am. J. Phys. 266, E372–E383.
Lee, J.H., Tecedor, L., Chen, Y.H., Monteys, A.M., Sowada, M.J., Thompson, L.M., Davidson,B.L., 2015. Reinstating aberrant mTORC1 activity in Huntington's disease mice im-proves disease phenotypes. Neuron 85, 303–315.
Leoni, V., Mariotti, C., Tabrizi, S.J., Valenza, M., Wild, E.J., Henley, S.M., Hobbs, N.Z.,Mandelli, M.L., Grisoli, M., Bjorkhem, I., Cattaneo, E., Di Donato, S., 2008. Plasma24S-hydroxycholesterol and caudate MRI in pre-manifest and early Huntington's dis-ease. Brain J. Neurol. 131, 2851–2859.
Leoni, V., Mariotti, C., Nanetti, L., Salvatore, E., Squitieri, F., Bentivoglio, A.R., Bandettini diPoggio, M., Piacentini, S., Monza, D., Valenza, M., Cattaneo, E., Di Donato, S., 2011.Whole body cholesterol metabolism is impaired in Huntington's disease. Neurosci.Lett. 494, 245–249.
Leoni, V., Long, J.D., Mills, J.A., Di Donato, S., Paulsen, J.S., group P-Hs, 2013. Plasma 24S-hydroxycholesterol correlation with markers of Huntington disease progression.Neurobiol. Dis. 55, 37–43.
Lund, E.G., Guileyardo, J.M., Russell, D.W., 1999. cDNA cloning of cholesterol 24-hydroxy-lase, a mediator of cholesterol homeostasis in the brain. Proc. Natl. Acad. Sci. U. S. A.96, 7238–7243.
Lutjohann, D., Breuer, O., Ahlborg, G., Nennesmo, I., Siden, A., Diczfalusy, U., Bjorkhem, I.,1996. Cholesterol homeostasis in human brain: evidence for an age-dependent fluxof 24S-hydroxycholesterol from the brain into the circulation. Proc. Natl. Acad. Sci.U. S. A. 93, 9799–9804.
Mauch, D.H., Nagler, K., Schumacher, S., Goritz, C., Muller, E.C., Otto, A., Pfrieger, F.W.,2001. CNS synaptogenesis promoted by glia-derived cholesterol. Science 294,1354–1357.
Meaney, S., Lutjohann, D., Diczfalusy, U., Bjorkhem, I., 2000. Formation of oxysterols fromdifferent pools of cholesterol as studied by stable isotope technique: cerebral origin ofmost circulating 24S-hydroxycholesterol in rats, but not in mice. Biochim. Biophys.Acta 1486, 293–298.
Menalled, L.B., Kudwa, A.E., Miller, S., Fitzpatrick, J., Watson-Johnson, J., Keating, N., Ruiz,M., Mushlin, R., Alosio, W., McConnell, K., Connor, D., Murphy, C., Oakeshott, S., Kwan,M., Beltran, J., Ghavami, A., Brunner, D., Park, L.C., Ramboz, S., Howland, D., 2012.Comprehensive behavioral and molecular characterization of a new knock-inmouse model of Huntington's disease: zQ175. PLoS One 7, e49838.
Nieweg, K., Schaller, H., Pfrieger, F.W., 2009. Marked differences in cholesterol synthesisbetween neurons and glial cells from postnatal rats. J. Neurochem. 109, 125–134.
Ramirez, D.M., Andersson, S., Russell, D.W., 2008. Neuronal expression and subcellular lo-calization of cholesterol 24-hydroxylase in the mouse brain. J. Comp. Neurol. 507,1676–1693.
Ross, C.A., Aylward, E.H., Wild, E.J., Langbehn, D.R., Long, J.D., Warner, J.H., Scahill, R.I.,Leavitt, B.R., Stout, J.C., Paulsen, J.S., Reilmann, R., Unschuld, P.G., Wexler, A.,Margolis, R.L., Tabrizi, S.J., 2014. Huntington disease: natural history, biomarkersand prospects for therapeutics. Nat. Rev. Neurol. 10, 204–216.
Runquist, M., Parmryd, I., Thelin, A., Chojnacki, T., Dallner, G., 1995. Distribution of branchpoint prenyltransferases in regions of bovine brain. J. Neurochem. 65, 2299–2306.
Saher, G., Simons, M., 2010. Cholesterol and myelin biogenesis. Subcell. Biochem. 51,489–508.
Valenza, M., Cattaneo, E., 2011. Emerging roles for cholesterol in Huntington's disease.Trends Neurosci. 34, 474–486.
Valenza, M., Rigamonti, D., Goffredo, D., Zuccato, C., Fenu, S., Jamot, L., Strand, A., Tarditi,A., Woodman, B., Racchi, M., Mariotti, C., Di Donato, S., Corsini, A., Bates, G., Pruss,R., Olson, J.M., Sipione, S., Tartari, M., Cattaneo, E., 2005. Dysfunction of the cholesterolbiosynthetic pathway in Huntington's disease. J. Neurosci. 25, 9932–9939.
Valenza, M., Leoni, V., Tarditi, A., Mariotti, C., Bjorkhem, I., Di Donato, S., Cattaneo, E.,2007a. Progressive dysfunction of the cholesterol biosynthesis pathway in the R6/2mouse model of Huntington's disease. Neurobiol. Dis. 28, 133–142.
Valenza, M., Carroll, J.B., Leoni, V., Bertram, L.N., Bjorkhem, I., Singaraja, R.R., Di Donato, S.,Lutjohann, D., Hayden, M.R., Cattaneo, E., 2007b. Cholesterol biosynthesis pathway isdisturbed in YAC128 mice and is modulated by huntingtin mutation. Hum. Mol.Genet. 16, 2187–2198.
Valenza, M., Leoni, V., Karasinska, J.M., Petricca, L., Fan, J., Carroll, J., Pouladi, M.A., Fossale,E., Nguyen, H.P., Riess, O., MacDonald, M., Wellington, C., DiDonato, S., Hayden, M.,Cattaneo, E., 2010. Cholesterol defect is marked across multiple rodent models ofHuntington's disease and is manifest in astrocytes. J. Neurosci. 30, 10844–10850.
Valenza, M., Marullo, M., Di Paolo, E., Cesana, E., Zuccato, C., Biella, G., Cattaneo, E., 2015a.Disruption of astrocyte-neuron cholesterol cross talk affects neuronal function inHuntington's disease. Cell Death Differ. 22, 690–702.
Valenza, M., Chen, J.Y., Di Paolo, E., Ruozi, B., Belletti, D., Ferrari Bardile, C., Leoni, V., Caccia,C., Brilli, E., Di Donato, S., Boido, M.M., Vercelli, A., Vandelli, M.A., Forni, F., Cepeda, C.,Levine, M.S., Tosi, G., Cattaneo, E., 2015b. Cholesterol-loaded nanoparticles amelioratesynaptic and cognitive function in Huntington's disease mice. EMBO Mol. Med. 7,1547–1564.
Zhang, Y., Appelkvist, E.L., Kristensson, K., Dallner, G., 1996. The lipid compositions of dif-ferent regions of rat brain during development and aging. Neurobiol. Aging 17,869–875.
Zoller, I., Meixner, M., Hartmann, D., Bussow, H., Meyer, R., Gieselmann, V., Eckhardt, M.,2008. Absence of 2-hydroxylated sphingolipids is compatible with normal neural de-velopment but causes late-onset axon and myelin sheath degeneration. J. Neurosci.28, 9741–9754.
76 M. Shankaran et al. / Neurobiology of Disease 98 (2017) 66–76

Research Article
Cholesterol-loaded nanoparticles amelioratesynaptic and cognitive function in Huntington’sdisease miceMarta Valenza1,†, Jane Y Chen2,†, Eleonora Di Paolo1,‡, Barbara Ruozi3,‡, Daniela Belletti3,
Costanza Ferrari Bardile1, Valerio Leoni4,5, Claudio Caccia4, Elisa Brilli1, Stefano Di Donato4,§,
Marina M Boido6, Alessandro Vercelli6, Maria A Vandelli3, Flavio Forni3, Carlos Cepeda2,
Michael S Levine2, Giovanni Tosi3 & Elena Cattaneo1,*
Abstract
Brain cholesterol biosynthesis and cholesterol levels are reduced inmouse models of Huntington’s disease (HD), suggesting that locallysynthesized, newly formed cholesterol is less available to neurons.This may be detrimental for neuronal function, especially giventhat locally synthesized cholesterol is implicated in synapse integ-rity and remodeling. Here, we used biodegradable and biocompati-ble polymeric nanoparticles (NPs) modified with glycopeptides (g7)and loaded with cholesterol (g7-NPs-Chol), which per se is notblood–brain barrier (BBB) permeable, to obtain high-rate choles-terol delivery into the brain after intraperitoneal injection in HDmice. We report that g7-NPs, in contrast to unmodified NPs, effi-ciently crossed the BBB and localized in glial and neuronal cells indifferent brain regions. We also found that repeated systemicdelivery of g7-NPs-Chol rescued synaptic and cognitive dysfunctionand partially improved global activity in HD mice. These resultsdemonstrate that cholesterol supplementation to the HD brainreverses functional alterations associated with HD and highlightthe potential of this new drug-administration route to thediseased brain.
Keywords cholesterol; cognition; Huntington’s disease; nanoparticles;
synapses
Subject Categories Metabolism; Neuroscience
DOI 10.15252/emmm.201505413 | Received 6 May 2015 | Revised 20 October
2015 | Accepted 21 October 2015 | Published online 20 November 2015
EMBO Mol Med (2015) 7: 1547–1564
Introduction
Huntington’s disease (HD) is a genetic neurological disorder caused
by a CAG expansion in the gene encoding the huntingtin (HTT)
protein (HDCRG, 1993). Clinically, HD is characterized by motor,
cognitive, and psychiatric disturbances (Ross et al, 2014) and is
associated with neuronal dysfunction, atrophy of the striatum and
other brain regions, and progressive loss of striatal medium-sized
spiny neurons (MSNs) and of cortical pyramidal neurons (Vonsattel
& DiFiglia, 1998). Several molecular and cellular dysfunctions have
been identified (Zuccato et al, 2010), and one affected pathway
implicates brain cholesterol.
The brain is the most cholesterol-rich organ in the body, with
almost all of the cholesterol produced in situ, as circulating choles-
terol is not able to cross the BBB (Dietschy & Turley, 2004). A large
majority of cholesterol (> 70% of brain cholesterol mass) is present
in myelin sheaths. Indeed, the rate of cholesterol synthesis is highest
during post-natal stage to build myelin scaffolding. Cholesterol is
also a structural component of glial and neuronal membranes and is
concentrated in lipid rafts, specialized membrane microdomains
that initiate, propagate, and maintain signal transduction events
(Paratcha & Ibanez, 2002). Newly synthesized cholesterol is also
required for vesicle assembly and fusion (Huttner & Zimmerberg,
2001; Lang et al, 2001), synapse formation, integrity, remodeling
(Pfrieger, 2003), and neurotransmitter release (Thiele et al, 2000;
Mauch et al, 2001). Accordingly, a breakdown of cholesterol synthe-
sis causes brain malformations and impaired cognitive functions
(Valenza & Cattaneo, 2006).
1 Department of BioSciences, Centre for Stem Cell Research, Università degli Studi di Milano, Milan, Italy2 Intellectual and Developmental Disabilities Research Center, Semel Institute for Neuroscience, Brain Research Institute, David Geffen School of Medicine, University of
California Los Angeles, Los Angeles, CA, USA3 Department of Life Sciences, University of Modena and Reggio Emilia, Modena, Italy4 Neurological Institute C. Besta, Milan, Italy5 Laboratory of Clinical Chemistry, Ospedale di Circolo e Fondazione Macchi, Varese, Italy6 Neuroscience Institute Cavalieri Ottolenghi, Neuroscience Institute of Turin, Orbassano, Turin, Italy
*Corresponding author. Tel: +39 02 50325842; E-mail: [email protected]†These authors share first authorship‡These authors share second authorship§Deceased on 12 November 2015
ª 2015 The Authors. Published under the terms of the CC BY 4.0 license EMBO Molecular Medicine Vol 7 | No 12 | 2015 1547

HD is characterized by abnormal brain cholesterol homeostasis.
Patients with HD show altered cholesterol homeostasis since pre-
and early stages of disease as judged by the plasmatic measure of
24S-hydroxy-cholesterol (24OHC), the brain-specific catabolite of
cholesterol able to cross the blood–brain barrier (BBB) (Leoni et al,
2008, 2013). Reduced cholesterol biosynthesis and levels are also
found in the brain of several HD mouse models (Valenza et al,
2007a,b, 2010). On the contrary, others reported an increased accu-
mulation of free cholesterol in brain tissues of HD mouse models
(Trushina et al, 2006; del Toro et al, 2010) likely due to different
sample preparation and less sensitive methods (colorimetric and
enzymatic assays) to detect and quantify cholesterol compared to
mass spectrometry (Marullo et al, 2012). Of note, more recently,
some of the same groups have reported a decrease of lathosterol
and cholesterol levels in the striatum of a HD mouse model by
means of mass spectrometry (Trushina et al, 2014). Cholesterol
dysregulation occurs in astrocytes (Valenza et al, 2015) and is
linked to a specific action of mutant HTT on sterol regulatory-
element-binding proteins (SREBPs) and its target genes, whose
reduced transcription leads to less brain cholesterol produced and
released and available to be uptaken by neurons (Valenza et al,
2005).
Accordingly, an early decrease of cholesterol production in the
HD brain might be detrimental for neuronal activities. Abnormalities
in synaptic communication within the striatum and between the
cortex and striatum occur long before, or in the absence of, cell
death in HD animal models (Milnerwood & Raymond, 2010) and
cognitive disturbances have been observed decades before predicted
clinical diagnosis in HD gene carriers (Levine et al, 2004; Paulsen &
Long, 2014). Similarly, brain cholesterol biosynthesis is significantly
reduced before the onset of motor symptoms in all the HD animal
models analyzed so far (Valenza et al, 2007a,b) and synaptosomes
—a compartment dedicated to impulse transmission and neuro-
transmitter release—carry suboptimal levels of sterols in the early
stages of HD in one mouse model (Valenza et al, 2010). However, a
link between the reduced level of cholesterol and neuronal dysfunc-
tion in vivo in HD is still missing.
Here, we explored the effects of cholesterol supplementation on
synaptic communication and machinery, motor and cognitive
behaviors, and neuropathology in the R6/2 mouse model, a well-
established early onset transgenic mouse model of HD (Mangiarini
et al, 1996). Since cholesterol does not cross the BBB, cholesterol
was delivered using a new technology for drug administration in the
brain (Vergoni et al, 2009; Tosi et al, 2010), that is, via biodegrad-
able polymeric (polylactide-co-glycolide, PLGA) nanoparticles (NPs)
modified with a glycopeptide (g-7) able to cross the BBB upon
systemic injection in mice (Costantino et al, 2005; Tosi et al, 2007,
2011b). The development of new strategies to enhance brain
delivery based on colloidal carriers is of great importance, since
nanocarriers can protect drugs and deliver them across the BBB to
target brain cells in a non-invasive way (Tosi et al, 2008). Notably,
both FDA and EMA have approved PLGA in various drug delivery
systems in humans (Mundargi et al, 2008), as confirmed by a
number of market products (i.e., Lupron Depot�, Nutropin
Depot �).
We report that, in contrast to unmodified NPs, g7-NPs efficiently
crossed the BBB and within a few hours after systemic injection
reached glial and neuronal cells in different brain regions.
Importantly, repeated systemic delivery of g7-NPs-Chol rescued
synaptic communication, protected from cognitive decline and
partially improved global activity in HD mice.
Results
Chemical–physical and technological optimization of unloadedand cholesterol-loaded Nanoparticles
The chemical formulation and features of unloaded NPs (u-NPs)
herein employed have been largely described (Vergoni et al, 2009;
Tosi et al, 2011a, 2014; Vilella et al, 2014). To optimize the produc-
tion of NPs loaded with cholesterol (NPs-Chol), we first prepared
u-NPs and NPs loaded with different amounts of cholesterol (1, 5,
and 10 mg of Chol per 100 mg of polymer; herein defined as NPs-
Chol1, NPs-Chol2 and NPs-Chol3, respectively) according to the
nanoprecipitation procedure (Minost et al, 2012) (see Materials and
Methods). The composition of different NPs is described in
Appendix Table S1, and details about their optimization and charac-
terization are described in the Appendix.
NPs were characterized by their chemical–physical properties,
summarized in Appendix Table S2. The average diameter
(Z-average) of u-NPs ranged from 170 to 192 nm. Z-average for
NPs-Chol1 and NPs-Chol2 was lower than 210 nm, while size of
NPs-Chol3 ranged between 200 nm and 300 nm. The polydispersity
index (PDI value), a measure of the heterogeneity of NPs, was
0.08 � 0.01 for u-NPs, suggesting a homogeneous and monomodal
distribution population around the mean size. NPs-Chol1 and NPs-
Chol2 showed a PDI value of 0.09 � 0.01 and 0.11 � 0.02, respec-
tively, and a narrow dimension distribution, indicating that they are
monomodal and monodisperse systems. On the contrary, NPs-Chol3
was characterized by a PDI value close to 0.3, accounting for a
marked increase in sample heterogeneity. Zeta-potential (f-pot), afunction of particle surface charges that influences cell interaction,
was negative for all the NPs-Chol samples and similar to those of
u-NPs. Moreover, f-pot of NPs-Chol3 displayed higher standard
deviation (�12 � 10 mV) with respect to those of NPs-Chol1
(�9 � 4 mV) and NPs-Chol2 (�8 � 4 mV), further highlighting the
higher heterogeneity of this sample.
To evaluate whether and how the incorporation of cholesterol
influences the morphology, architecture and surface properties of
NPs, atomic force microscopy (AFM) and transmission electron
microscopy (TEM) analyses were performed on u-NPs and NPs-
Chol (Fig 1A–C). In agreement with the chemical–physical proper-
ties (Appendix Table S2), the “height” AFM image (Fig 1A, left
column), 3D reconstruction (Fig 1A, middle column), and TEM
micrograph (Fig 1A, right column) of u-NPs highlighted well
compact and defined spherical structures (Belletti et al, 2012). The
AFM analysis for NPs-Chol1 confirmed the spherical shape, but
shape and size were less homogeneous if compared with those of
u-NPs (Fig 1B). Particles adopted an irregular frame, evident in
the AFM 3D reconstruction, supporting the hypothesis that alter-
ation of polymer organization and intimate interplay between
cholesterol and PLGA occurred when cholesterol was added to the
formulation. The greater complexity of these samples was con-
firmed by TEM microphotographs (right columns) emphasizing the
less dense and compact structures of NPs-Chol1 with respect to
EMBO Molecular Medicine Vol 7 | No 12 | 2015 ª 2015 The Authors
EMBO Molecular Medicine Cholesterol delivery to the brain is beneficial in HD Marta Valenza et al
1548

u-NPs. NPs-Chol2 showed similar morphology and architecture of
NPs-Chol1 (data not shown). Instead, the AFM images of NPs-
Chol3 showed the presence of irregular structures and unformed
material and a remarkable tendency to aggregate (Fig 1C). With
respect to u-NPs and NPs-Chol1, NPs-Chol3 seemed to promote
the formation of disorganized clusters characterized by heteroge-
neous dimensions (242 � 52 nm) and by a roughness surface with
evident fissuring. Similarly, TEM microphotographs showed the
complexity of NPs-Chol3 that appeared with abundant adsorbed
unformed material (likely unloaded cholesterol) and modified NPs’
morphology.
We also evaluated the content of cholesterol into NPs (loading
capacity, LC%) and the encapsulation efficiency (EE%)
(Appendix Table S2). About 0.7 � 0.1 mg/100 mg of formulation,
corresponding to an EE of 68%, were loaded in the NPs-Chol1, indi-
cating that an important fraction of the initial cholesterol was stably
incorporated into the NPs-Chol1. On the contrary, a decrease in EE
value was observed as the amount of cholesterol used in the prepa-
ration increased. In NPs-Chol2 and NPs-Chol3, the EE remarkably
decreased (about 20%) although the highest value of drug loading
was observed in NPs-Chol3 (2.5 mg of Chol/100 mg of NPs).
However, as previously pointed out, cholesterol in NPs-Chol3 was
A
B
C
D E
Figure 1. Characterization of NPs loaded with different concentrations of cholesterol.
A–C AFM and TEM analysis of unloaded (u-NPs) and cholesterol-loaded NPs (NPs-Chol). AFM “height” images (left column), 3D reconstruction (middle column), andTEM micrograph (right column) of u-NPs (A), NPs-Chol1 (B), and NPs-Chol3 (C).
D Release profile in water of cholesterol (continuous line, —) and NBD-Chol (dotted line, - - -) from NPs-Chol1 and NPs-NBD-Chol1, respectively. The graphrepresents mean ± SEM. Data are from three independent experiments.
E In vitro release of NBD-Chol from NPs at different time intervals in NS cells. Data in the graph represent mean (lg) � SEM of total NBD-Chol (embedded into andreleased from NPs; red columns) and NBD-Chol released after NPs degradation (purple columns) present in the homogenates of NS cells treated with NPs-NBD-Chol1. Data obtained from four independent experiments. N.T.: not treated cells.
ª 2015 The Authors EMBO Molecular Medicine Vol 7 | No 12 | 2015
Marta Valenza et al Cholesterol delivery to the brain is beneficial in HD EMBO Molecular Medicine
1549

not completely embedded, but a remarkable fraction was absorbed
onto the surface. Based on these analyses, NPs-Chol1 formulation
was used in all experiments.
Controlled release of cholesterol from NPs in physiologicalconditions and in vitro
To explore the ability of the system to release cholesterol, we first
carried out release studies in deionized water for 10 days (Fig 1D).
The release profile of cholesterol from NPs-Chol1 (hereafter referred
as NPs-Chol; solid line) showed an initial “burst release” (< 8%)
during the first 3 days, followed by a second slow release phase.
Chol release was detected close to values of 18% over 10 days
owing to the poor water solubility of cholesterol (estimated to be
2 lg/ml). Moreover, during the second phase, the slow linear
release kinetic of Chol from NPs-Chol between day 5 and day 10
could be ascribed to NPs degradation.
In specific experiments, we also adopted a lead formulation
prepared by replacing cholesterol with the fluorescent cholesterol
derivative NBD-Chol to discriminate between endogenous
and exogenous cholesterol released from NPs. We therefore
characterized also the NBD-Chol-loaded NPs (NPs-NBD-Chol) in
terms of their chemical–physical and technological properties
(Appendix Table S2) and morphological features (Appendix Fig S1).
The release of NBD-Chol from NPs in water showed a slow kinetic
profile (Fig 1D, dotted line) similar to that observed for native
cholesterol (Fig 1D, solid line). Similar findings were observed
when the kinetic profile of drug release was evaluated in experi-
ments conducted in cultured cells (Fig 1E). Spectrophotometric
quantification of NBD-Chol in neural stem (NS) cells treated with
3 lg of NPs-NBD-Chol revealed that only 20% of the total NBD-
Chol taken by the cells was released after 24 h (0.05 lg vs. 0.23 lg;Fig 1E, seventh and fourth columns, respectively). At 72 h, the
amount of NBD-Chol released increased to about 35% of the total
NBD-Chol taken up by cells (0.14 lg vs. 0.39 lg; Fig 1E, ninth and
sixth columns, respectively), confirming the slow kinetic profile of
cholesterol release from NPs.
g7-NPs distribution in HD cells and brain
The g7-NPs used in this study are designed to cross the BBB,
and previous studies indicated that about 10% are estimated to
penetrate the brain (Costantino et al, 2005; Tosi et al, 2007,
2011a,b, 2014). To verify that g7-NPs could penetrate HD cells,
primary neurons from R6/2 mice and neurons and astrocytes
from mouse NS cells carrying 140 CAG repeats (NS Q140/7)
were exposed to g7-NPs labeled with rhodamine to allow their
detection with fluorescence microscopy. Appendix Fig S2 shows
that g7-NPs are taken up in vitro by different brain cells express-
ing mutant Htt. Importantly, 4 h after a single intraperitoneal
(ip) injection into 8-week-old R6/2 mice and wild-type (WT)
littermates, both control (unmodified) NPs (C-NPs) and g7-NPs
were detected in the liver (Fig 2A) and in other peripheral
tissues (Appendix Fig S3), but only g7-NPs were detected in the
brain (Fig 2B). Quantification of g7-NPs yielded an approximate
ratio of ~10:1 in the WT liver compared to striatum and cortex
(Fig 2C). This quantification also revealed a reduced propensity
of g7-NPs to reach the R6/2 brain compared to the WT brain,
while g7-NPs were more prevalent in R6/2 liver compared to
WT liver, suggesting that HD-related mechanisms may influence
the BBB crossing of g7-NPs. g7-NPs were also found 24 h and
2 weeks after a single (Fig 2D) or multiple ip injections
performed in the same week (Fig 2E). High-magnification confo-
cal images indicated the presence of g7-NPs in different brain
regions and in IBA1 immunoreactive microglial cells (Fig 2F)
and in GFAP positive astrocytes (Fig 2G). Notably, g7-NPs were
also detected in neuronal cells, as demonstrated by immunostain-
ing against calbindin (Fig 2H; Appendix Fig S4) and DARPP-32
(Fig 2I).
Delivery and release of cholesterol in vivo in the R6/2 brain
To track the delivery and intracellular release of cholesterol from
g7-NPs, we employed rhodamine-labeled g7-NPs (Vergoni et al,
2009) loaded with the fluorescent cholesterol derivative NBD-
Chol (g7-NPs-NBD-Chol). NBD-Chol closely resembles the struc-
ture of native cholesterol and is normally used to study choles-
terol trafficking (Gimpl & Gehrig-Burger, 2007). Accordingly,
NBD-Chol, injected into brain ventricles of mice, co-localizes
with PMCA ATPase, a marker of plasma membrane, suggesting
that exogenous cholesterol is incorporated on brain cells’
membranes in vivo (Appendix Fig S5). We next monitored the
distribution of g7-NPs as red spots and the distribution of
released NBD-Chol as green signal. In vivo, at 12 and 24 h after
a single ip injection of g7-NPs-NBD-Chol, g7-NPs and NBD-Chol
co-localized in brain cells (Fig 3A and B). In particular, Fig 3B
shows the distribution of g7-NPs (red signal) and NBD-Chol
(green signal) in a brain section of a R6/2 mouse injected ip
with g7-NPs-NBD-Chol and sacrificed 24 h later. Both g7-NPs
and NBD-Chol signals co-localized as indicated by the scatterplot
of red and green pixel intensities. However, g7-NPs and NBD-
Chol were no longer co-localized after 14 days as demonstrated
in Fig 3C. Similar results were found at 7 days after ip injection
(data not shown). These findings indicate that NBD-Chol was
partially released from NPs 1–2 weeks after injection, in parallel
with a reduction in the signal from g7-NPs, probably due to
their degradation. Quantification of g7-NPs in brain slices from
injected mice confirmed a decreased number of NPs over time
as determined after normalizing the red spots on the mean size
of NPs (Fig 3D). In the liver, the kinetics of NBD-Chol release
and g7-NPs degradation was faster (< 24 h) than in brain
(Appendix Fig S6).
g7-NPs-Chol rescue synaptic activity in HD mice
As synaptic transmission in striatal MSNs is altered in R6/2 mice
during disease progression (Cepeda et al, 2003, 2004), we next
explored whether cholesterol supplementation to the brain via
systemic injection of g7-NPs-Chol restored synaptic parameters in
HD mice. Pilot experiments with R6/2 animals that received only
1 or 2 injections of g7-NPs-Chol did not show any significant
modifications in electrophysiological properties (data not shown).
We therefore designed our trials in order to provide sustained
and prolonged delivery of cholesterol to the HD brain. Treatment
started at the pre-symptomatic stage (5 weeks of age) and
continued until the symptomatic stage (9 weeks of age) under
EMBO Molecular Medicine Vol 7 | No 12 | 2015 ª 2015 The Authors
EMBO Molecular Medicine Cholesterol delivery to the brain is beneficial in HD Marta Valenza et al
1550

A
B
D
F G H I
E
C
Figure 2. g7-NPs reach different brain cells and release cholesterol in R6/2 mice.
A, B Representative confocal images of liver (A) and brain (B) slices from R6/2 mice ip injected with C-NPs (left) or with g7-NPs (right) and sacrificed after 4 h.C Quantification of g7-NPs localized in the liver, striatum, and cortex of WT (n = 3) and R6/2 mice (n = 3). Data are expressed as the number of g7-NPs for
100 lm2 � SEM. Statistics: *P < 0.05 determined by Student’s t-test.D, E g7-NPs in brain slices from R6/2 mice administered with a single ip injection and sacrificed after 24 h (D, left) or 2 weeks (D, right) and after multiple ip injections
within 1 week (E).F–I Representative confocal images of immunostaining against IBA1 (F), GFAP (G), calbindin (H), and DARPP-32 (I) on coronal sections of brains isolated from R6/2 mice
ip injected with g7-NPs and sacrificed at the indicated time points. White arrowheads indicate intracellular g7-NPs.
Data information: DAPI (A, B, D) or Hoechst 33258 (Ho) (F–I) was used to counterstain nuclei. Scale bars: 20 lm (A); 10 lm (B, D, E); 5 lm (F–I).
ª 2015 The Authors EMBO Molecular Medicine Vol 7 | No 12 | 2015
Marta Valenza et al Cholesterol delivery to the brain is beneficial in HD EMBO Molecular Medicine
1551

two experimental regimens. One group of R6/2 mice and WT
littermates were administered 0.15 mg g7-NPs/g body weight for
each injection, once every two weeks (three injections total)
while the second experimental group was injected twice a week
(ten injections total) accounting for a total estimated amount of
6.3 lg or 21 lg of cholesterol injected, respectively. Four groups
were compared: WT mice administered with saline (referred to
as WT), R6/2 mice administered with saline (referred to as R6/
2), R6/2 injected with empty g7-NPs (referred to as R6/2-emp),
and R6/2 mice receiving three or ten injections (referred to as
R6/2-Chol). At sacrifice, the presence of g7-NPs was analyzed by
fluorescence microscopy in liver sections from each animal and
in cortical samples taken from the brains before the
electrophysiological recordings (Appendix Fig S7). At the end of
the analyses, data from the two experimental paradigms were
pooled together as no significant differences were found.
HD mouse models have been extensively analyzed for their basic
striatal electrophysiological phenotypes. Similar and robust defects
have been described in striatal MSNs, namely a reduced membrane
capacitance, a decrease in spontaneous excitatory postsynaptic
current (EPSC), and an increase in spontaneous inhibitory post-
synaptic current (IPSC) frequencies (Cepeda et al, 2003). The consis-
tency of these phenotypes across different HD mouse models
suggests that these changes are a result of the mutant huntingtin
gene. We therefore tested whether our experimental scheme for
cholesterol supplementation could reverse any of these phenotypes.
Our whole-cell patch-clamp recordings of MSNs in brain slices
showed that membrane capacitance, a reflection of membrane area,
was significantly reduced in R6/2 mice treated with saline or empty
g7-NPs (R6/2-untreated; data were pooled as no differences were
found), compared to WT mice (WT, treated with saline)
(Appendix Table S3). In contrast, in neurons from R6/2 mice
treated with g7-NPs-Chol (R6/2-Chol), cell capacitance was not
significantly reduced compared to WT cells, suggesting a mild
rescue of cell membrane area (Appendix Table S3). Input resistance
was found increased in both R6/2-untreated and R6/2-Chol neurons
compared to WT neurons. Additionally, a significant decrease in
the decay time constant in cells from R6/2-Chol mice compared
with cells from WT or R6/2 mice treated with saline or empty
g7-NPs was observed (Appendix Table S3). This effect may be
attributed to changes in membrane fluidity induced by cholesterol
supplementation.
The average frequency of spontaneous IPSCs was also signifi-
cantly higher in MSNs from R6/2-untreated mice compared to WT
mice (Fig 4A and B, inset), as previously observed (Cepeda et al,
2004). In contrast, R6/2-Chol mice displayed a significant reduc-
tion in the frequency of IPSCs compared to R6/2-untreated
(Fig 4B, inset), in particular for small-amplitude events (< 40 pA;
Fig 4B), while the cumulative inter-event interval histogram
showed a decreased release probability in R6/2-Chol compared to
R6/2-untreated cells (Fig 4C). Similar to MSNs from R6/2-
untreated mice, IPSCs from R6/2-Chol mice had faster kinetics
than cells from WT mice as judged by shorter decay time and
half-amplitude duration of the current events compared to WTs
(Appendix Table S4A).
The frequency of spontaneous excitatory postsynaptic currents
(EPSCs) (Fig 4D) was significantly reduced in R6/2-untreated mice
compared to WT mice (Fig 4E, inset). Although the decrease in
the average frequency of EPSCs was not significantly rescued in
R6/2-Chol mice, the cumulative inter-event interval indicated a
significantly increased release probability in R6/2-Chol cells
versus R6/2-untreated cells (Fig 4F). EPSC kinetics was similar
among groups, except for half-amplitude duration, which was
significantly shorter in R6/2-chol cells than in WT cells
(Appendix Table S4B). Altogether, these findings indicate that
specific membrane and synaptic alterations observed in MSNs
from R6/2 mice can be rescued by in vivo cholesterol supplemen-
tation through g7-NPs.
Cholesterol supplementation ameliorates cognitivedysfunction in HD
We next assessed the impact of cholesterol supplementation on
the behavior of HD mice by using motor and cognitive tasks.
The injections regimen used in the behavioral studies, described
in Fig 5A, is the same employed for electrophysiological studies.
In the rotarod test, R6/2 mice treated with saline or empty g7-
NPs exhibited typical impaired coordination compared to WT
mice, as indicated by a shorter latency to fall from an accelerat-
ing rotarod. This deficit was not improved in R6/2-Chol mice
(Fig 5B). Similarly, in the open field test, reduced rearing activ-
ity, which is a form of vertical exploration, was not rescued by
cholesterol supplementation at 10 weeks of age (Fig 5C). At the
same age, the hypokinetic phenotype shown in R6/2 mice (mea-
sured as global activity in the open field) was still apparent in
R6/2-Chol, but the phenotype was less dramatic compared to
R6/2-untreated mice and significance reached P < 0.05 (Fig 5D),
suggesting that cholesterol supplementation partially ameliorates
locomotion-related behavior in a novel environment. Other
parameters (stereotyped movements, locomotion, resting time,
mean velocity) showed similar changes (Appendix Fig S8A).
Accordingly, R6/2-untreated mice worsened over time more than
R6/2-Chol mice (Appendix Fig S8B) as indicated by the signifi-
cant difference reached at later time points when the two groups
were compared at 8 and 10 weeks of age. These findings suggest
that sustained and repeated cholesterol supplementation might
slow the disease progression.
As changes in cholesterol synthesis/levels are associated with
cognitive decline (Suzuki et al, 2013), we next evaluated cognitive
tasks in HD mice after cholesterol supplementation. To evaluate
cognitive performance, we used the novel object recognition test, a
low-stress task aimed at evaluating recognition memory. Impor-
tantly, object memory is impaired in patients with HD. In a pattern
recognition task, subjects have to remember and touch the abstract
patterns they are shown during training and that are paired with a
novel pattern during testing. Early HD patients and clinically symp-
tomatic subjects performed significantly worse than control subjects
(Lawrence et al, 1996, 2000). R6/2-untreated mice showed a
pronounced inability to discriminate novel from familiar objects
from 8 weeks of age and worsened over time (Fig 5E). Notably,
R6/2-Chol mice performed as well as WT mice, indicating that
cholesterol supplementation rescued memory deficits at all time
points (Fig 5E). Importantly, the time-course analysis also revealed
that the benefit on recognition memory in R6/2-Chol mice was still
present at 12 weeks of age, that is, 3 weeks after the last injection
(Fig 5E).
EMBO Molecular Medicine Vol 7 | No 12 | 2015 ª 2015 The Authors
EMBO Molecular Medicine Cholesterol delivery to the brain is beneficial in HD Marta Valenza et al
1552

Cholesterol supplementation restores levels of synapticcomponents but not neuropathology
To determine whether cholesterol supplementation modulates
synaptic protein machinery, we used biochemically purified
triton-insoluble fractions (TIF) from the brain of WT (n = 5),
R6/2-untreated (n = 6) and R6/2-Chol (n = 3) mice and performed
semiquantitative Western blotting for scaffolding proteins such as
PSD95 and gephyrin and NMDA receptor subunits (GluN1 and
GluN2B) (Fig 6A). Reduced PSD95, as well as a reduction in GluN1
and GluN2B, were found in R6/2-untreated mice compared to WTs,
as expected (Fig 6B). Importantly, cholesterol supplementation
A
B
D
C
Figure 3. Cholesterol delivery and release in vivo in the R6/2 brain.
A Representative confocal image (crop) of brain slices from R6/2 mice ip injected with rhodamine-labeled g7-NPs-NBD-Chol and sacrificed after 12 h, showing co-localization of NBD-Chol (green) and rhodamine (NPs, red). Scale bar: 5 lm.
B, C Representative confocal image (low magnification) of brain slices from R6/2 mice ip injected with g7-NPs-NBD-Chol and sacrificed after 24 h (B) or 2 weeks (C) andrelative co-localization of NBD-Chol and g7-NPs. Scale bar: 10 lm.
D g7-NPs quantification in brain slices at the same time points in (B, C). Data are expressed as number of g7-NPs (evaluated based their size) for 100 lm2 � SEM.Statistics: **P < 0.01 (48 h vs. 7 days; 7 days vs. 14 days), ***P < 0.001 (24 h vs. 7 days; 7 days vs. 14 days) determined by one-way ANOVA followed by Newman–Keuls multiple comparison test.
Data information: DAPI was used to counterstain nuclei.
ª 2015 The Authors EMBO Molecular Medicine Vol 7 | No 12 | 2015
Marta Valenza et al Cholesterol delivery to the brain is beneficial in HD EMBO Molecular Medicine
1553
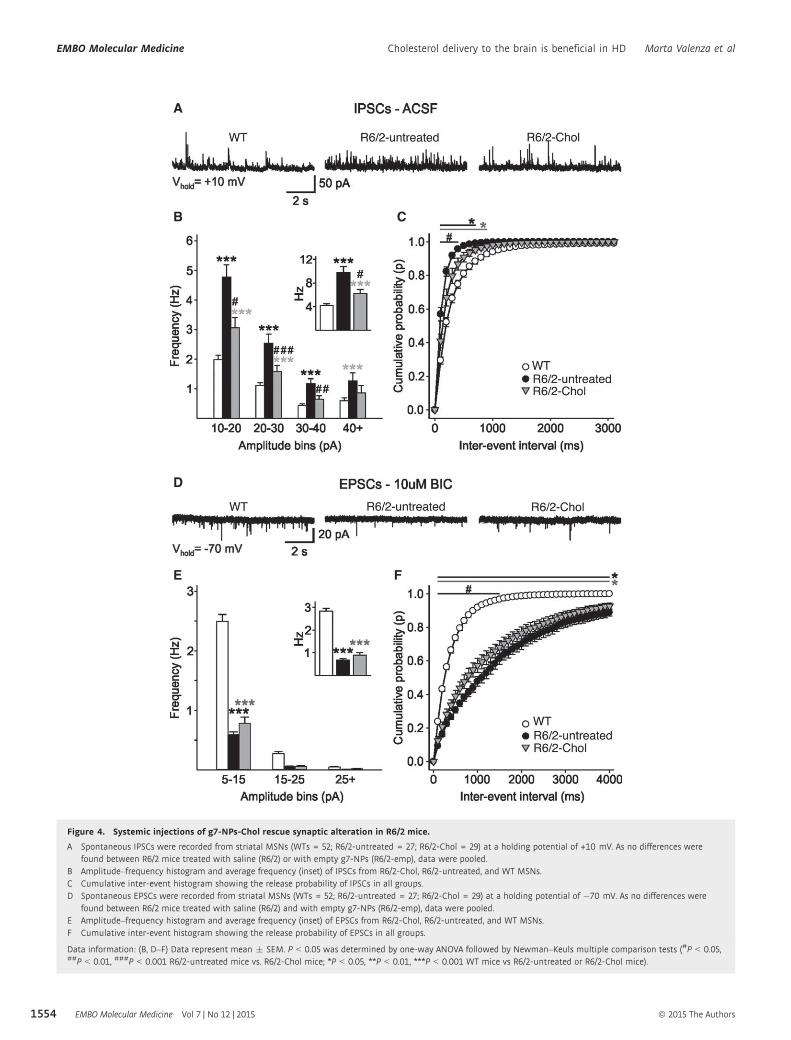
A
B
D
E F
C
Figure 4. Systemic injections of g7-NPs-Chol rescue synaptic alteration in R6/2 mice.
A Spontaneous IPSCs were recorded from striatal MSNs (WTs = 52; R6/2-untreated = 27; R6/2-Chol = 29) at a holding potential of +10 mV. As no differences werefound between R6/2 mice treated with saline (R6/2) or with empty g7-NPs (R6/2-emp), data were pooled.
B Amplitude–frequency histogram and average frequency (inset) of IPSCs from R6/2-Chol, R6/2-untreated, and WT MSNs.C Cumulative inter-event histogram showing the release probability of IPSCs in all groups.D Spontaneous EPSCs were recorded from striatal MSNs (WTs = 52; R6/2-untreated = 27; R6/2-Chol = 29) at a holding potential of �70 mV. As no differences were
found between R6/2 mice treated with saline (R6/2) and with empty g7-NPs (R6/2-emp), data were pooled.E Amplitude–frequency histogram and average frequency (inset) of EPSCs from R6/2-Chol, R6/2-untreated, and WT MSNs.F Cumulative inter-event histogram showing the release probability of EPSCs in all groups.
Data information: (B, D–F) Data represent mean � SEM. P < 0.05 was determined by one-way ANOVA followed by Newman–Keuls multiple comparison tests (#P < 0.05,##P < 0.01, ###P < 0.001 R6/2-untreated mice vs. R6/2-Chol mice; *P < 0.05, **P < 0.01, ***P < 0.001 WT mice vs R6/2-untreated or R6/2-Chol mice).
EMBO Molecular Medicine Vol 7 | No 12 | 2015 ª 2015 The Authors
EMBO Molecular Medicine Cholesterol delivery to the brain is beneficial in HD Marta Valenza et al
1554

normalized or increased the levels of these proteins (Fig 6B),
suggesting a rescue of the molecular composition of the synaptic
machinery contributing to synaptic structure.
To evaluate whether cholesterol supplementation also influences
the expression of synaptic genes, we performed qRT–PCR for a
panel of synaptic genes known to be reduced in HD. BDNF mRNA is
reduced in brain of several HD mice and is considered a critical hall-
mark in HD (Zuccato and Cattaneo (2014). Unpaired t-test between
R6/2-untreated and R6/2-Chol groups revealed a slight but signifi-
cant increase of bdnf expression in HD cortex after cholesterol
supplementation (Fig 6C). We also evaluated the expression of
snap25 and complexin II (Fig 6D and E), the latter being a gene
encoding for a presynaptic protein involved in neurotransmitter
release (Reim et al, 2001). Similarly to bdnf, mRNA levels of snap25
were significantly increased in cortex of HD mice after cholesterol
supplementation (Fig 6D). mRNA level of complexin II was strongly
reduced in cortex, hippocampus, and striatum of R6/2-untreated
mice compared to WTs. Cholesterol supplementation significantly
increased complexin II expression in hippocampus and striatum
from R6/2-Chol mice compared to R6/2-untreated mice (Fig 6E).
These findings suggest that cholesterol supplementation partially
ameliorates transcriptional abnormalities in the synaptic machinery
in HD mice.
We also quantified mRNA levels of genes considered to be MSN
markers, that is, darpp32, dopamine receptor D2 (drd2), and
muscarinic acetylcholine receptor M4 (chmr4). As expected, all
these genes were reduced in the striatum from R6/2-untreated mice
compared to WTs, but cholesterol supplementation did not signifi-
cantly influence their expression (Appendix Fig S9).
To investigate whether cholesterol supplementation counteracts
striatal atrophy and MSN degeneration, we performed unbiased
stereological analyses at 12 weeks of age. Reduced striatal volume
and enlargement of ventricles, both measures of striatal atrophy,
were observed in R6/2 mice treated with saline (R6/2) compared to
WTs (Appendix Fig S10; Fig 6F), as already reported in the litera-
ture. The administration of empty g7-NPs or g7-NPs-Chol did not
influence striatal volume in R6/2 mice (Appendix Fig S10). A statis-
tically significant reduction in ventricular volume was evident in
R6/2-Chol in comparison with R6/2 mice, similar to that observed
in WTs (Fig 6F). However, R6/2 mice treated with empty g7-NPs
(R6/2-emp) also showed a similar rescue, suggesting that the
administration of g7-NPs per se, likely due to degradation of PLGA
in lactic and glycolic acids, might influence this neuropathological
parameter.
Altogether, these findings suggest that cholesterol supplementa-
tion via g7-NPs is not sufficient to counteract brain atrophy and
neurodegeneration in R6/2 mice, at least with this experimental
paradigm, although it does increase the expression of specific genes
and synaptic proteins.
In vivo evaluation of safety of g7-NPs in HD mice
Cholesterol supplementation to the brain might lead to a further
reduction in cholesterol synthesis, already compromised in R6/2
mice (Valenza et al, 2007b). We therefore measured cholesterol
precursors and the brain-specific cholesterol catabolite 24OHC in
the brain of the treated mice at 12 weeks of age. Lathosterol, a
marker of cholesterol synthesis, was equally reduced in both
R6/2-untreated and R6/2-Chol mice compared to WTs (Fig 7A),
suggesting that exogenous cholesterol supplemented via g7-NPs
does not further decrease the endogenous biosynthetic pathway.
Similarly, 24OHC, an indicator of brain cholesterol catabolism that
usually mirrors cholesterol biosynthesis in brain (Lund et al, 2003),
was found similarly reduced in both R6/2 groups compared to WTs
(Fig 7B).
As it is known that most of the NPs (90%) localize in periph-
ery, we also measured mRNA levels of cholesterol biosynthetic
genes (hmgcr and fdft1) in liver and lung. The mRNA expression
of both cholesterol genes was similar in both tissues in all groups,
even in the presence of g7-NPs-Chol (Fig 7C and D). All these
results suggest that the exogenous cholesterol delivered to the
brain or accumulated in peripheral tissues does not lead to
alterations of endogenous cholesterol homeostasis in the time
frame analyzed in this study.
Although the NPs employed in this study are considered
biocompatible and biodegradable as made of PLGA, which is
approved by the FDA and EMA, an immunogenicity study of
these NPs in vivo is missing. Both PLGA, released after degrada-
tion of empty or cholesterol-loaded g7-NPs, and cholesterol itself
might influence immune responses. Therefore, we analyzed
mRNA levels of two pro-inflammation genes encoding for TNF-
alpha and IL6, in peripheral tissues from our cohorts. As shown
in Fig 7E and F, Tnf-alpha and Il6 mRNA levels were signifi-
cantly increased in the liver and in lung of R6/2 mice treated
with saline (R6/2) compared to WTs, supporting the available
evidence that peripheral inflammation is associated with HD
condition (Trager et al, 2014; Chang et al, 2015). Similar activa-
tion of inflammatory genes was also observed in R6/2 mice
treated with empty g7-NPs (R6/2-emp) or g7-NPs-Chol (R6/2-
Chol), suggesting that multiple administrations of g7-NPs (empty
or loaded with cholesterol) do not affect per se peripheral
inflammation in R6/2 mice.
Discussion
Synaptic dysfunction is an attractive target for possible HD therapies
as it occurs early in the disease process when cell death in HD
models is not obvious (Cepeda et al, 2004; Cummings et al, 2006;
Joshi et al, 2009; Milnerwood et al, 2010) and paralleling the
evidence that cognitive disturbances in patients with HD occur long
before onset of overt motor manifestations (Levine et al, 2004;
Paulsen et al, 2008; Schippling et al, 2009; Orth et al, 2010). We
show that exogenous cholesterol supplementation to the HD mouse
brain restores normal synaptic communication and protects mice
from cognitive decline. This study provides the missing link
between the reduction in brain cholesterol in the mouse HD brain
and some of the neuronal abnormalities in the disease state. The
data herein reported are in line with our recent in vitro studies,
suggesting that strategies aimed at supplying cholesterol to HD
neurons can ameliorate neuronal and synaptic dysfunction (Valenza
et al, 2015).
Cholesterol supplementation via ip injection of cholesterol-
loaded NPs normalizes GABAergic and, partially, glutamatergic
synaptic activity in striatal MSNs of R6/2 mice (Fig 4), supporting
the relevance of cholesterol in synaptic integrity and neuronal
ª 2015 The Authors EMBO Molecular Medicine Vol 7 | No 12 | 2015
Marta Valenza et al Cholesterol delivery to the brain is beneficial in HD EMBO Molecular Medicine
1555

function (Pfrieger, 2003). Cholesterol supplementation also protects
R6/2 mice from cognitive decline as measured by recognition
memory recovery (Fig 5E). Novel object preference has been often
associated with the hippocampus; however, it also depends on
functional interaction between hippocampus and cortex (Barker &
Warburton, 2011) and, more recently, it has been linked to the
striatum (Darvas & Palmiter, 2009). Consistently, reduction of the
cholesterol sensor SCAP in the brains of mice leads to a decrease
in brain cholesterol synthesis and causes impaired synaptic trans-
mission and altered cognitive function assessed by novel object
recognition test (Suzuki et al, 2013). Of note, cognitive decline has
been recently associated with hippocampal cholesterol loss and
cholesterol infusion in aged mice improved learning and memory in
aged rodents (Martin et al, 2014a).
Several in vitro findings indicate that synaptic transmission is
sensitive to cholesterol levels both at pre-synaptic and post-
synaptic levels. Indeed, cholesterol depletion affects vesicle recy-
cling and fusion (Thiele et al, 2000; Dason et al, 2010, 2014;
Linetti et al, 2010), AMPARs mobility (Hering et al, 2003; Renner
et al, 2009; Martin et al, 2014b), and the distribution and
A
B C
D E
Figure 5. Systemic injections of g7-NPs-Chol ameliorate cognitive defects in R6/2 mice.
A Experimental paradigm performed in all the trials.B Fall latency from an accelerating rotarod for 5- to 11-week-old WT and R6/2 mice during cholesterol supplementation (WT = 17; R6/2-untreated = 21;
R6/2-Chol = 13).C Rearing activity in open field at 10 weeks of age (WT = 14; R6/2-untreated = 21; R6/2-Chol = 15).D Global activity in the open field test at 10 weeks of age (WT = 14; R6/2-untreated = 21; R6/2-Chol = 15).E Index of discrimination (%) in WT, R6/2-untreated, and R6/2-Chol mice during disease progression, at 8 weeks of age (WT = 24; R6/2-untreated = 36; R6/2-Chol = 21),
at 10 weeks of age (WT = 25; R6/2-untreated = 35; R6/2-Chol = 20), and at 12 weeks of age (WT = 24; R6/2-untreated = 30; R6/2-Chol = 19); the index above zeroindicates a preference for the novel object; the index below zero indicates a preference for the familiar object. As no differences were found between R6/2 micetreated with saline (R6/2) or treated with empty g7-NPs (R6/2-emp), data were pooled.
Data information: Data in (B–E) are from three independent trials and represent mean � SEM. P < 0.05 was determined by two-way ANOVA (in B, C) and by one-wayANOVA (in D, E) followed by Newmann–Keuls multiple comparison tests (#P < 0.05, ##P < 0.01, ###P < 0.001 R6/2-untreated mice vs. R6/2-Chol mice; *P < 0.05,**P < 0.01, ***P < 0.001 WT mice vs. R6/2-untreated or R6/2-Chol mice).
EMBO Molecular Medicine Vol 7 | No 12 | 2015 ª 2015 The Authors
EMBO Molecular Medicine Cholesterol delivery to the brain is beneficial in HD Marta Valenza et al
1556

function of NMDAR (Frank et al, 2004, 2008). Accordingly, we
found that cholesterol supplementation increases the levels of
the scaffold synaptic protein PSD95 and NMDARs in synaptic
protein-enriched fractions of HD mice (Fig 6A and B), suggesting
that in vivo delivery of cholesterol contributes to preserve the
structure and integrity of the synaptic machinery. In agreement
with the biochemical findings, the partial but significant increase
of mRNA levels of bdnf, snap25, and complexin II (all involved
in synaptic transmission) in different brain regions of HD mice
after cholesterol supplementation (Fig 6C–E) suggests that choles-
terol may act at different levels in improving synaptic and cogni-
tive functions. In particular, mRNA levels of complexin II, a key
player in the mechanisms underlying cognitive processes (Reim
et al, 2001; Glynn et al, 2003), are reduced in R6/2 mice and in
human HD striatum and cortex (Morton & Edwardson, 2001;
Freeman & Morton, 2004) and complexin II knockout mice show
selective cognitive deficits that reflect those seen in R6/2 mice
(Glynn et al, 2003). The cognitive benefits might be also related to
an effect of exogenous cholesterol on hormone steroids (Hara et al,
2015), but further studies are needed to address this issue.
Cholesterol is also required to establish proper membrane perme-
ability, fluidity, and thickness, and it stabilizes membranes and
provides order to membranes. The partial rescue of membrane
capacitance and the decrease in the decay time constant that we
have observed in striatal MSNs from R6/2 mice treated with g7-NPs-
Chol (Appendix Table S4) suggest that cholesterol supplementation
A
C
F G
D E
B
Figure 6. Systemic injections of g7-NPs-Chol positively influence synaptic protein network but not neuropathology.
A, B Protein levels (A) and relative densitometry quantification (B) of several synaptic proteins in triton-insoluble (synaptic enriched) fractions purified from total brainsfrom WT (n = 5), R6/2-untreated (n = 5) and R6/2-Chol (n = 3). Levels of PSD95 and NMDA receptor subunits GluN1 and GluN2B are rescued in R6/2 mice bycholesterol supplementation.
C–E mRNA levels for Bdnf (C), and Snap25 (D) in cortex and hippocampus; Complexin II (E) in cortex, hippocampus, and striatum from a subset of WT (n = 4), R6/2-untreated (n = 7), and R6/2-chol animals (n = 3). As no differences were found between R6/2 mice treated with saline or treated with empty g7-NPs, data werepooled.
F, G Representative images of Nissl staining (F) and ventricle volume revealed by Neurolucida analysis at 12 weeks of age in WT (n = 7), R6/2 (n = 7), R6/2-emp (n = 6),and R6/2-Chol (n = 8) mice.
Data information: Data in (B–E, G) represent mean � SEM. P < 0.05 was determined by one-way ANOVA followed by Newman–Keuls multiple comparison tests (in B, E)and by Student’s t-test between R6/2-untreated and R6/2-Chol (in C, D) (#P < 0.05, ##P < 0.01, ###P < 0.001 R6/2-untreated mice vs. R6/2-Chol mice; *P < 0.05,**P < 0.01, ***P < 0.001 WT mice vs. R6/2-untreated or R6/2-Chol mice).Source data are available online for this figure.
ª 2015 The Authors EMBO Molecular Medicine Vol 7 | No 12 | 2015
Marta Valenza et al Cholesterol delivery to the brain is beneficial in HD EMBO Molecular Medicine
1557

induces changes in membrane fluidity. However, other than show-
ing its incorporation into the membrane (Appendix Fig S5), we were
not able to establish where exactly the exogenous cholesterol, once
released by g7-NPs, localizes in brain cells, and more refined
methods to visualize exogenous cholesterol at subcellular levels are
needed.
We also reported that cholesterol supplementation does not
rescue motor defects and restores only partially the global activity of
HD mice (Fig 5B and D). The dichotomy that we observed in rescu-
ing cognitive but not motor functions might be associated with
specific roles of cholesterol in neuronal function. Similarly,
neuropathological hallmarks such as striatal volume and MSN
markers (Appendix Figs S9 and S10) do not significantly change
after cholesterol supplementation in R6/2 mice, suggesting that
cholesterol alone, at least within this experimental paradigm, is not
sufficient to prevent brain atrophy or to improve neuropathology.
Of note, both empty g7-NPs and g7-NPs-Chol seem to counteract the
enlargement of ventricle volume observed in R6/2 mice (Fig 6F and G)
likely due to degradation of PLGA in lactic and glycolic acids that
might influence metabolic pathways related to energy. However, the
significance of this effect is unknown and cannot be ascribed to
cholesterol. We should also consider that the content of cholesterol
delivered to the brain through g7-NPs is estimated to be 21 lg (for
the ten injections) and, although we started the treatment at
5 weeks of age, cholesterol was released after 1–2 weeks as shown
by the co-localization studies (Fig 3). Both low dose and slow
timing of cholesterol release might not be sufficient to reverse motor
performance and brain atrophy in HD mice. Further studies, by
A B
C D
E F
Figure 7. Exogenous cholesterol or g7-NPs per se do not influence endogenous cholesterol synthesis or induce inflammatory response.
A, B Lathosterol and 24OHC measured by mass spectrometry in the brain of WT (n = 6), R6/2-untreated (n = 7) and R6/2-Chol (n = 5) mice.C, D mRNA levels of hmgcr and fdft1 in liver and lung of WT (n = 7), R6/2-untreated (n = 8) and R6/2-Chol (n = 4) mice. As no differences were found between R6/2
mice treated with saline or treated with empty g7-NPs, data were pooled.E, F mRNA levels of inflammatory genes in liver and lung of the of WT (n = 7), R6/2 (n = 4), R6/2-emp (n = 4) and R6/2-Chol (n = 5) mice.
Data information: Data in (A–F) represent mean � SEM. *P < 0.05, **P < 0.01, ***P < 0.001 was determined by one-way ANOVA followed by Newman–Keuls multiplecomparison tests.
EMBO Molecular Medicine Vol 7 | No 12 | 2015 ª 2015 The Authors
EMBO Molecular Medicine Cholesterol delivery to the brain is beneficial in HD Marta Valenza et al
1558

employing mini-pump-based strategies for early and continuous
delivery of well-defined concentrations of cholesterol, will allow to
gain more information about the possible impact of cholesterol
delivery on motor defects.
Recent advances in nanotechnology and growing needs in
biochemical applications have driven the development of multifunc-
tional nanoparticles. Nanodrugs in liposome- or albumin-based
formulations are already used in the clinic for some forms of cancers
(Barenholz, 2012; Sethi et al, 2013; Von Hoff et al, 2013), and
others are being tested in pre-clinical trials (Tasciotti et al, 2008;
Shen et al, 2013). This is the first study in which g7-NPs have been
applied to a disease model for CNS targeting of molecules that are
not able to cross the BBB (such as cholesterol). g7-NPs reach
different brain regions 2–4 h after a single systemic injection and
localize in different brain cells, including striatal neurons (Figs 1
and 2). Previous pharmacological and biodistribution studies esti-
mated that the percentage of g7-NPs that reaches the brain is > 10%
of the injected dose (Tosi et al, 2007) and that multiple non-
receptor-mediated mechanisms are implicated (Tosi et al, 2011b).
Other NPs carrying ligands, antibodies, or peptides for specific
receptors that enter into the brain by receptor-mediated endocytosis
usually reach the brain compartment as maximum level values
ranging from 0.1 to 1% of the injected dose (Gabathuler, 2010; Tosi
et al, 2012; Gosk et al, 2004) owing to a possible saturation of the
receptor or by the competiveness of endogenous ligands. Therefore,
g7-NPs may represent a novel tool that can be used for brain deliv-
ery of several molecules. However, from a therapeutic prospective,
we are conscious that additional quantitative studies of g7-NPs
alone and loaded with cholesterol are needed to increase the knowl-
edge about biodistribution and pharmacokinetics.
The polymeric NPs used in this study are made of PLGA, a
copolymer approved by the FDA as drug delivery system for parent-
eral administration (Danhier et al, 2012). PLGA is considered
biodegradable and biocompatible as it degrades completely into its
original monomers, lactic and glycolic acid, which are easily metab-
olized in the body via the Krebs cycle and then eliminated (Shive &
Anderson, 1997). However, specific studies concerning immune
reactivity of g7-NPs are missing. Similarly, depending on the mole-
cule delivered, specific studies should be performed in order to
exclude any immune reaction or other side effects in different
tissues. Our studies suggest that g7-NPs and cholesterol itself do not
induce inflammatory response in liver and lungs, where almost all
g7-NPs are localized. A more extensive biochemical study to evalu-
ate the impact of g7-NPs degradation (and of the molecule released)
is needed to accelerate preclinical testing and translational develop-
ments of these NPs.
A limitation of g7-NPs in this current study is the low drug
loading (1%) that does not allow the delivery of elevated
amounts of cholesterol. Presumably, a high amount of choles-
terol, its strong affinity for hydrophobic interactions, and the
rigidity of the sterane ring lead to the disruption of the PLGA
organization as observed for NPs-Chol3 formation (Fig 1), with a
marked increase in sample heterogeneity and low quality of
nanoparticles. The identification of strategies aimed at increasing
the amount of cholesterol encapsulated into g7-NPs without
affecting chemical–physical properties of NPs will allow to
reduce the number of injections/week while increasing the
amount of cholesterol that reaches the brain cells. From another
prospective, the low content and the slow release of cholesterol
by g7-NPs might be advantageous as cholesterol accumulation is
dangerous for the brain. Further studies are needed to identify
the threshold of cholesterol increase that is beneficial for HD
brain/neurons and beyond which negative effects may occur.
The very low dose of exogenous cholesterol delivered in the
brain of HD mice in our experimental paradigm (21 lg) does
not allow to discriminate it from the large content of endogenous
cholesterol even by mass spectrometry. However, the demonstra-
tion of a rescue in specific electrophysiological and behavioral
phenotypes support the notion that the exogenous cholesterol
delivered to the adult brain is sufficient to ameliorate neuronal
dysfunction in HD. A similar concentration of cholesterol infused
via osmotic pumps in aged mice has recently been able to
improve learning and memory in aged rodents (Martin et al,
2014a).
In conclusion, these results emphasize the beneficial effects of
cholesterol supplementation in reversing synaptic alterations and
delaying cognitive defects in the HD mouse brain. Additionally, this
study demonstrates the validity of a new technology based on
g7-NPs to administer drugs (besides cholesterol) to the HD brain
and lays the ground for future therapeutic approaches.
Materials and Methods
NPs formulation and characterization
Gly-L-Phe-D-Thr-Gly-L-Phe-L-Leu-L-Ser(O-b-D-Glucose)-CONH2 (g7)
was prepared as previously described (Tosi et al, 2011b) and conju-
gated with PLGA to obtain g7-PLGA. PLGA derivatization yields
were confirmed by nuclear magnetic resonance to be 30–40 lmol
peptide/g of polymer. PLGA conjugated with rhodamine (Sigma-
Aldrich) was prepared as previously described (Costantino et al,
2005; Tosi et al, 2005). In all NPs, a fraction of polyvinyl alcohol
(PVA) (about 12.5 mg PVA/100 mg NPs) remains stably associated
with the NPs despite the repeated purification. The residual PVA
forms a connected network with the PLGA chains becoming a
“secondary” constituent of the NPs and partially masking the
exposed acidic groups of the polymer. This explanation justifies the
less negative values of f-pot with respect to those of the NPs
prepared in the absence of PVA. Details related to the production
and characterization of NPs and related to Fig 1 are listed in the
Appendix Supplementary Methods.
Cell culture and glial and neuronal differentiation
Neural stem (NS) cells carrying normal (Q7/7) or mutant htt
(Q140/7) employed in this study and protocols for their differentia-
tion were previously described (Conforti et al, 2013; Valenza et al,
2015). Primary neuronal cultures were prepared from the cortex of
R6/2 mice embryos (day 18 of gestation) as previously described
(Valenza et al, 2015).
Animals and treatments
Experiments at the University of Milan were carried out in
accordance with the European Communities Council Directive
ª 2015 The Authors EMBO Molecular Medicine Vol 7 | No 12 | 2015
Marta Valenza et al Cholesterol delivery to the brain is beneficial in HD EMBO Molecular Medicine
1559

2010/63/EU revising Directive 86/609/EEC regarding the care and
use of animals for experimental procedures. All procedures at
UCLA were performed in accordance with the U.S. Public Health
Service Guide for Care and Use of Laboratory Animals and were
approved by the Institutional Animal Care and Use Committee at
UCLA. Genotyping of R6/2 mouse colonies (~150 CAG repeats)
was performed by PCR of DNA obtained from tail samples, once
at weaning and again following sacrifice for verification. The
lifespan of this R6/2 mouse colony is approximately 12–14 weeks,
with HD-like phenotypes evident from 8 weeks of age. All the
mice have been randomly assigned to experimental groups, and
the investigators have been blinded to the sample group alloca-
tion during the treatments and experiments. For each injection,
the mice were administered 0.15 mg g7-NPs/g body weight (NPs
stock concentration is 12.5 mg/ml; 0.7 mg in 100 mg of NPs),
which corresponds to 1 lg of cholesterol/g. The chemical–
physical characterization and drug content in the g7-NPs used in
the pre-clinical trials is summarized in Appendix Table S5. The
complete list of WT and R6/2 animals used for each experiment
is described in Appendix Table S6. An initial trial was performed
in WT and R6/2 mice treated with control NPs loaded with
cholesterol (without g7, i.e., not able to cross the BBB). No
changes were found in terms of behavioral tasks and molecular
signature (Appendix Fig S11). Therefore, we decided to not
include these groups in subsequent trials with g7-NPs-Chol.
Immunohistochemistry
The animals were deeply anesthetized and transcardially perfused
with 4% PFA. When only NPs were detected, cells or tissues were
fixed in cold methanol at �20°C for 10 min, since fixation with
paraformaldehyde reduced rhodamine-related NP fluorescence.
Immunohistochemistry was performed on 15–30 lm coronal
sections with the following primary antibodies: rabbit anti-IBA1
(1:500; Wako), rabbit anti-GFAP (1:250; Dako), rabbit anti-
calbindin28 kDa (1:100; Swant), mouse anti-DARPP32 or rabbit
anti-DARPP32 (1:100, Epitomics; S. Cruz), and mouse anti-PMCA
ATPase (clone 5F10, 1:500; Thermo Scientific). Alexa Fluor 488-
conjugated goat secondary antibodies (1:1,000; Invitrogen) were
used for detection. Sections were counterstained with the nuclear
dye Hoechst 33258 or 40,6-diamidino-2-phenylindole (DAPI) (Invitro-
gen). Confocal images were acquired with a ZEISS LSM 510 or a
LEICA SP5 laser scanning confocal microscopes.
NPs quantification
To quantify NPs in different tissues, we used ImageJ software to
measure the fluorescence derived from the rhodamine used to label
the NPs. NPs were counted in 10 images for each tissue taken from
three WT and three R6/2 mice. Images were divided into three color
channels to set a threshold for the red produced by the NPs, and we
calculated the percentage of red signal for each image. Knowing the
total area of the field and the size of the NPs, we calculated the
approximate number of NPs in the selected area. The count of NPs
in the liver and in the brain was made at 20× and 60×, respectively,
and the data were normalized to compare the results. Ten images
for each animal/condition were analyzed. The images were
acquired with a Leica AF6000LX microscope.
Electrophysiology
At 10–11 weeks of age, mice were anesthetized with isoflurane and
decapitated, and the brain was rapidly removed to ice-cold dissec-
tion artificial cerebrospinal fluid (ACSF) containing 130 mM NaCl,
3 mM KCl, 26 mM NaHCO3, 1.25 mM NaHPO4, 10 mM glucose,
5 mM MgCl2, and 1 mM CaCl2 oxygenated with 95% O2/5% CO2
(pH 7.2–7.4, osmolality 290–310 mOsm/l). Coronal slices (300 lm)
of the striatum were cut with a microtome (Model VT 1000S, Leica
Microsystems) and transferred to an incubating chamber containing
oxygenated standard ACSF (with 2 mM CaCl2 and 2 mM MgCl2) for
1 h before electrophysiological recordings.
Whole-cell patch-clamp recordings were obtained from MSNs
visualized in slices with the aid of infrared video microscopy and
identified by somatic size and basic membrane properties (mem-
brane capacitance, input resistance, and time constant). The patch
pipette (3–5 MO) was filled with solution containing 125 mM
Cs-methanesulfonate, 4 mM NaCl, 3 mM KCl, 1 mM MgCl2, 9 mM
EGTA, 8 mM HEPES, 5 mM MgATP, 1 mM Tris-GTP, 10 mM
disodium phosphocreatine, and 0.1 mM leupeptin (pH 7.2, osmolality
270–280 mOsm/l).
Spontaneous postsynaptic currents were recorded in standard
ACSF. The membrane current was filtered at 1 kHz and digitized at
100–200 ls using Clampex 10.2 (gap-free mode). Cells were volt-
age-clamped at �70 mV to assess basic membrane properties.
Membranes were stepped to a holding potential of +10 mV to assess
GABAA receptor-mediated IPSCs. Bicuculline methiodide (10 lM)
was added to block GABAA receptor-mediated currents, and sponta-
neous glutamate receptor-mediated EPSCs were recorded at a hold-
ing potential of �70 mV. Spontaneous synaptic currents and event
kinetics were analyzed offline using the automatic detection proto-
col within the MiniAnalysis Program (Synaptosoft) and checked
manually for accuracy. Event counts were performed blind to geno-
type and treatment. The threshold amplitude for the detection of an
event (5 pA for glutamatergic currents and 10 pA for GABAergic
currents) was set above the root mean square background noise
level (1–2 pA at Vhold = �70 mV and 2–3 pA at Vhold = +10 mV).
Amplitude–frequency and inter-event interval distributions were
constructed to evaluate differences in events at each amplitude and
interval.
Behavioral characterization
Rotarod: Mice were first trained at a fixed speed of 4 rpm on the
apparatus (model 47600, Ugo Basile). After 1 h, the mice were
tested in an accelerating task (from 4 to 40 rpm) over 5 min, for
three trials per day for three consecutive days with an inter-trial
interval of 30 min. Latency to fall was recorded for each trial and
averaged. Open Field: The animals were placed individually into the
center of a transparent, square, activity-cage arena (45 cm × 45 cm)
(2Biological Instrument). Both horizontal and vertical activities
were assessed, monitoring mice allowed to freely move for 60 min
using the Actitrack software (2Biological Instrument) connected to
infrared sensors placed all around the square cage. Novel Object
Recognition Test: The device consisted of a Plexiglass square arena
(dimensions: 40 × 40 × 40 cm). All phases of the test were
conducted in the presence of low-intensity light. Mice were first
habituated to the arena in the absence of objects for 15 min (on one
EMBO Molecular Medicine Vol 7 | No 12 | 2015 ª 2015 The Authors
EMBO Molecular Medicine Cholesterol delivery to the brain is beneficial in HD Marta Valenza et al
1560
day, in the morning). On the same day, in the afternoon, two similar
objects were presented to each mouse for 10 min (A0 and A″), after
which the mice were returned to their home cage. Twenty-four
hours later, the same animals were tested for 10 min in the arena
with a familiar object (A″) and a new object (B). The index of
discrimination was calculated as (time exploring the novel
object � time exploring the familiar object) / (time exploring both
objects) × 100. Object preference was measured as (time exploring
each object) / (time exploring both objects) × 100. All experiments
were done blind to genotypes.
Triton-insoluble protein fraction preparation and Western blot
Triton-insoluble fractions of the brain were prepared as described in
the study by Gardoni et al (2009), separated on SDS–PAGE and
probed with specific antibodies. Antibodies used in these
experiments include anti-PSD-95 (1:1,000; #124011 SySy), NMDAR1
(GluN1) (1:500; #AB9864, Millipore), NMDAR2B (GluN2B) (1:500;
#MAB57578, Millipore), gephyrin (1:1,000; #147111, SySy), synap-
tophysin (1:1,000, S. Cruz), and beta-3-tubulin (1:3,000; #G7121,
Promega). Horseradish peroxidase-conjugated secondary antibodies
were then used (1:3,000; Bio-Rad). Bands were visualized with
enhanced chemoluminescence (Pierce) and imaged with the
ChemiDoc MP Imaging System (Bio-Rad). The bands were densito-
metrically quantified (Image Lab, Bio-Rad) and normalized for
Coomassie staining. Beta-3-tubulin was used as an additional loading
control.
RNA isolation, retrotranscription, and real-time quantitative PCR
Total RNA from tissues was isolated with TRIzol reagent (Life Tech-
nologies). Total RNA (0.25–1 lg) was reverse-transcribed to single-
stranded cDNA using the iScript cDNA synthesis kit (Bio-Rad). For
each reverse-transcribed product, three real-time PCR analyses were
performed in duplicate for each of the analyzed genes. An iCycler
thermal cycler with a Multicolor Real-time PCR Detection System
(Bio-Rad) was used to evaluate gene expressions. Taqman probes
with a FAM dye label (for cholesterol genes) or EVA Green Super-
mix (for inflammatory genes) was used, as previously described
(Valenza et al, 2015).
Nissl staining and Neurolucida analysis
Animals were perfused and brains dissected, frozen and serially cut
(30 lm-thick coronal sections) on the cryostat. One 30-lm-thick
section every five was stained with cresyl violet (Nissl staining).
Briefly, sections were dried overnight. Then, they were dehydrated
with a scale alcoholic of ethanol and xylene, than rehydrated, and
immersed in 1% cresyl violet and 1% glacial acetic acid aqueous
solution for 5 min. The staining was followed by a new dehydration
in ascending ethanol and xylene. Sections were cover-slipped with
Leica CV mounting media (Cat#14046430011). Brain, ventricle, and
striatum perimeters (relative to one hemisphere) were reconstructed
in a cerebral segment included between plates 19 and 39 of the
Franklin K. and Paxinos G. atlas (Paxinos & Franklin, 2008). They
were drawn at 40× at a microscope with a motorized stage inter-
faced to the computer, using the Neurolucida software (Microbright-
field Inc., VT, USA). The obtained volumes were analyzed with the
Neuroexplorer software (Microbrightfield Inc.) using the Cavalieri
formula for volume reconstruction.
Measurement of sterols
Samples were prepared and analyzed by isotopic dilution mass spec-
trometry as previously described (Valenza et al, 2010).
Statistics
SigmaPlot 12.3 (Systat software) or Prism 5 (GraphPad software)
was used to perform all statistical analyses. Data are presented as
means � standard error of the mean (SEM). Grubbs’ test was
applied to identify outliers. For each set of data to be compared, we
determined in Prism whether data were normally distributed or not.
As they were all normally distributed, we used parametric tests.
The paper explained
ProblemHuntington’s disease is a genetic neurodegenerative disorder charac-terized by progressive motor, cognitive, and psychiatric disturbances.Cholesterol biosynthesis and content are reduced in the brain ofmultiple animal models of HD. This dysfunction—of cerebral origin—is measurable in blood of patients with HD since pre-symptomaticstages of disease. However, a link between reduced synthesis/level ofcholesterol and neuronal dysfunction in vivo in HD is missing. Ascirculating or dietary cholesterol is not able to cross the blood–brainbarrier (BBB) and cholesterol in the brain depends largely on endoge-nous biosynthesis, this dysfunction may be detrimental for neuronalfunction especially given that locally synthesized cholesterol is impli-cated in synapses formation, integrity, and remodeling.
ResultsTo address the relationship between cholesterol dysfunction andsynaptic and cognitive deficits in HD mouse models, we deliveredcholesterol into the brain by using a novel technology based oncholesterol-loaded polymeric nanoparticles further modified with apeptide (g7) to cross the BBB after systemic injection in the mice. Weshowed that these nanoparticles (g7-NPs) reach different brainregions and different brain cells and gradually release cholesterol aftertheir degradation. We also showed that repeated systemic administra-tion of cholesterol-loaded g7-NPs in HD mice: (i) rescues synapticcommunication in striatal medium-sized spiny neurons, (ii) preventscognitive decline and partially improves global activity, and (iii)restores the levels of proteins that compose the synaptic machinery.
ImpactNeuronal and synaptic dysfunction is an attractive target for possibleHD therapies because it occurs long before cell death in mousemodels and in humans with HD. An intervention at this stage could,in theory, slow or stop neuron loss before it starts. Our conclusionshighlight the relevance of cholesterol deficits in cognitive impairmentassociated with HD and the benefits of cholesterol supplementationwith a broad impact for other brain disorders.In parallel, the evidence that g7-NPs can be used as vectors for thedelivery of therapeutic molecules (besides cholesterol) to the brainopens new and medically very relevant scenarios for the treatmentof several CNS disorders. Importantly, the nanoparticles employedare made of PLGA, which is approved by FDA in various drugdelivery systems in humans as it is considered biodegradable andbiocompatible.
ª 2015 The Authors EMBO Molecular Medicine Vol 7 | No 12 | 2015
Marta Valenza et al Cholesterol delivery to the brain is beneficial in HD EMBO Molecular Medicine
1561

Indeed, differences between group means were assessed with an
unpaired Student’s t-test, and two-way or one-way ANOVA followed
by Bonferroni or Newman–Keuls post hoc tests, as indicated in the
text. Differences were considered statistically significant if P < 0.05.
No statistical methods were used to pre-determine sample sizes, but
our sample sizes are similar to those reported in the literature. For
details, see also Appendix Table S7 showing statistical analyses and
P-values for the main figures.
Expanded View for this article is available online.
AcknowledgementsWe thank Luca Pignata and Chiara Orciani for technical assistance and Elisa
Battaglia for help with the behavioral tests. We also thank Miriam Ascagni
(CIMA, an advanced microscopy facility established by Università degli Studi
Milano, Milan), Valeria Berno and Silvia Tartari (Imaging Facility in INGM,
Milan), and Centro Grandi Strumenti (University of Modena and Reggio
Emilia) for technical assistance and support with confocal analysis. This work
was partially supported by Neuromics European grant (305121) to E.C. and
by Ministero della Salute under 40 (GR-2008-1145270) to M.V and V.L.. The
electrophysiology studies were supported by USPHS NS41574, HD004612,
and NS081335 to M.S.L. and C.C. The Hereditary Disease Foundation (to M.L.
and G.T.) supported the preparation of g7-NPs for the electrophysiological
studies.
This paper is dedicated to the memory of our dear colleague, devoted
scientist and well known neurologist Stefano Di Donato.
Author contributionsEC and MV developed the study, conceived the experimental plans, and
analyzed the data. JYC, CCe, and MSL developed and performed the electro-
physiological experiments and analyzed the data. GT, BR, DB, MAV, and FF
developed the NP-based strategy, produced, and characterized all NPs used in
this work. MV, EB, and GT performed the immunostaining experiments and
provided most of the confocal images. MV performed biochemical analyses
and with CFB all the molecular analyses; MV, EDP, and CFB performed the
behavioral tests. VL, CCa and SDD performed all the mass spectrometry analy-
ses. MMB and AV performed all reconstruction analyses with Neurolucida. MV,
GT, BR, and EC interpreted the data and wrote the manuscript. All authors
read and edited the manuscript. EC supervised the entire work and gave final
approval of the manuscript version to be published.
Conflict of interestThe authors declare that they have no conflict of interest.
References
Barenholz Y (2012) Doxil(R)–the first FDA-approved nano-drug: lessons
learned. J Control Release 160: 117 – 134
Barker GR, Warburton EC (2011) When is the hippocampus involved in
recognition memory? J Neurosci 31: 10721 – 10731
Belletti D, Tosi G, Forni F, Gamberini MC, Baraldi C, Vandelli MA, Ruozi B
(2012) Chemico-physical investigation of tenofovir loaded polymeric
nanoparticles. Int J Pharm 436: 753 – 763
Cepeda C, Hurst RS, Calvert CR, Hernandez-Echeagaray E, Nguyen OK, Jocoy
E, Christian LJ, Ariano MA, Levine MS (2003) Transient and progressive
electrophysiological alterations in the corticostriatal pathway in a mouse
model of Huntington’s disease. J Neurosci 23: 961 – 969
Cepeda C, Starling AJ, Wu N, Nguyen OK, Uzgil B, Soda T, Andre VM, Ariano
MA, Levine MS (2004) Increased GABAergic function in mouse models of
Huntington’s disease: reversal by BDNF. J Neurosci Res 78: 855 – 867
Chang KH, Wu YR, Chen YC, Chen CM (2015) Plasma inflammatory
biomarkers for Huntington’s disease patients and mouse model. Brain
Behav Immun 44: 121 – 127
Conforti P, Camnasio S, Mutti C, Valenza M, Thompson M, Fossale E, Zeitlin
S, MacDonald ME, Zuccato C, Cattaneo E (2013) Lack of huntingtin
promotes neural stem cells differentiation into glial cells while neurons
expressing huntingtin with expanded polyglutamine tracts undergo cell
death. Neurobiol Dis 50: 160 – 170
Costantino L, Gandolfi F, Tosi G, Rivasi F, Vandelli MA, Forni F (2005) Peptide-
derivatized biodegradable nanoparticles able to cross the blood-brain
barrier. J Control Release 108: 84 – 96
Cummings DM, Milnerwood AJ, Dallerac GM, Waights V, Brown JY, Vatsavayai
SC, Hirst MC, Murphy KP (2006) Aberrant cortical synaptic plasticity and
dopaminergic dysfunction in a mouse model of Huntington’s disease. Hum
Mol Genet 15: 2856 – 2868
Danhier F, Ansorena E, Silva JM, Coco R, Le Breton A, Preat V (2012) PLGA-
based nanoparticles: an overview of biomedical applications. J Control
Release 161: 505 – 522
Darvas M, Palmiter RD (2009) Restriction of dopamine signaling to the
dorsolateral striatum is sufficient for many cognitive behaviors. Proc Natl
Acad Sci USA 106: 14664 – 14669
Dason JS, Smith AJ, Marin L, Charlton MP (2010) Vesicular sterols are
essential for synaptic vesicle cycling. J Neurosci 30: 15856 – 15865
Dason JS, Smith AJ, Marin L, Charlton MP (2014) Cholesterol and F-actin are
required for clustering of recycling synaptic vesicle proteins in the
presynaptic plasma membrane. J Physiol 592: 621 – 633
Dietschy JM, Turley SD (2004) Thematic review series: brain Lipids.
Cholesterol metabolism in the central nervous system during early
development and in the mature animal. J Lipid Res 45: 1375 – 1397
Frank C, Giammarioli AM, Pepponi R, Fiorentini C, Rufini S (2004) Cholesterol
perturbing agents inhibit NMDA-dependent calcium influx in rat
hippocampal primary culture. FEBS Lett 566: 25 – 29
Frank C, Rufini S, Tancredi V, Forcina R, Grossi D, D’Arcangelo G (2008)
Cholesterol depletion inhibits synaptic transmission and synaptic plasticity
in rat hippocampus. Exp Neurol 212: 407 – 414
Freeman W, Morton AJ (2004) Regional and progressive changes in brain
expression of complexin II in a mouse transgenic for the Huntington’s
disease mutation. Brain Res Bull 63: 45 – 55
Gabathuler R (2010) Approaches to transport therapeutic drugs across the
blood-brain barrier to treat brain diseases. Neurobiol Dis 37: 48 – 57
Gardoni F, Mauceri D, Malinverno M, Polli F, Costa C, Tozzi A, Siliquini S,
Picconi B, Cattabeni F, Calabresi P et al (2009) Decreased NR2B subunit
synaptic levels cause impaired long-term potentiation but not long-term
depression. J Neurosci 29: 669 – 677
Gimpl G, Gehrig-Burger K (2007) Cholesterol reporter molecules. Biosci Rep 27:
335 – 358
Glynn D, Bortnick RA, Morton AJ (2003) Complexin II is essential for normal
neurological function in mice. Hum Mol Genet 12: 2431 – 2448
Gosk S, Vermehren C, Storm G, Moos T (2004) Targeting anti-transferrin
receptor antibody (OX26) and OX26-conjugated liposomes to brain
capillary endothelial cells using in situ perfusion. J Cereb Blood Flow Metab
24: 1193 – 1204
Hara Y, Waters EM, McEwen BS, Morrison JH (2015) Estrogen Effects on
Cognitive and Synaptic Health Over the Lifecourse. Physiol Rev 95:
785 – 807
EMBO Molecular Medicine Vol 7 | No 12 | 2015 ª 2015 The Authors
EMBO Molecular Medicine Cholesterol delivery to the brain is beneficial in HD Marta Valenza et al
1562
HDCRG (1993) A novel gene containing a trinucleotide repeat that is
expanded and unstable on Huntington’s disease chromosomes. The
Huntington’s Disease Collaborative Research Group. Cell 72: 971 – 983
Hering H, Lin CC, Sheng M (2003) Lipid rafts in the maintenance of synapses,
dendritic spines, and surface AMPA receptor stability. J Neurosci 23:
3262 – 3271
Huttner WB, Zimmerberg J (2001) Implications of lipid microdomains for
membrane curvature, budding and fission. Curr Opin Cell Biol 13:
478 – 484
Joshi PR, Wu NP, Andre VM, Cummings DM, Cepeda C, Joyce JA, Carroll JB,
Leavitt BR, Hayden MR, Levine MS et al (2009) Age-dependent alterations
of corticostriatal activity in the YAC128 mouse model of Huntington
disease. J Neurosci 29: 2414 – 2427
Lang T, Bruns D, Wenzel D, Riedel D, Holroyd P, Thiele C, Jahn R (2001)
SNAREs are concentrated in cholesterol-dependent clusters that define
docking and fusion sites for exocytosis. EMBO J 20: 2202 – 2213
Lawrence AD, Sahakian BJ, Hodges JR, Rosser AE, Lange KW, Robbins TW
(1996) Executive and mnemonic functions in early Huntington’s disease.
Brain 119(Pt 5): 1633 – 1645
Lawrence AD, Watkins LH, Sahakian BJ, Hodges JR, Robbins TW (2000) Visual
object and visuospatial cognition in Huntington’s disease: implications for
information processing in corticostriatal circuits. Brain 123(Pt 7):
1349 – 1364
Leoni V, Mariotti C, Tabrizi SJ, Valenza M, Wild EJ, Henley SM, Hobbs NZ,
Mandelli ML, Grisoli M, Bjorkhem I et al (2008) Plasma 24S-
hydroxycholesterol and caudate MRI in pre-manifest and early
Huntington’s disease. Brain 131: 2851 – 2859
Leoni V, Long JD, Mills JA, Di Donato S, Paulsen JS, Group P-Hs (2013) Plasma
24S-hydroxycholesterol correlation with markers of Huntington disease
progression. Neurobiol Dis 55: 37 – 43
Levine MS, Cepeda C, Hickey MA, Fleming SM, Chesselet MF (2004) Genetic
mouse models of Huntington’s and Parkinson’s diseases: illuminating but
imperfect. Trends Neurosci 27: 691 – 697
Linetti A, Fratangeli A, Taverna E, Valnegri P, Francolini M, Cappello V,
Matteoli M, Passafaro M, Rosa P (2010) Cholesterol reduction impairs
exocytosis of synaptic vesicles. J Cell Sci 123: 595 – 605
Lund EG, Xie C, Kotti T, Turley SD, Dietschy JM, Russell DW (2003) Knockout
of the cholesterol 24-hydroxylase gene in mice reveals a brain-specific
mechanism of cholesterol turnover. J Biol Chem 278: 22980 – 22988
Mangiarini L, Sathasivam K, Seller M, Cozens B, Harper A, Hetherington C,
Lawton M, Trottier Y, Lehrach H, Davies SW et al (1996) Exon 1 of the HD
gene with an expanded CAG repeat is sufficient to cause a progressive
neurological phenotype in transgenic mice. Cell 87: 493 – 506
Martin MG, Ahmed T, Korovaichuk A, Venero C, Menchon SA, Salas I, Munck
S, Herreras O, Balschun D, Dotti CG (2014a) Constitutive hippocampal
cholesterol loss underlies poor cognition in old rodents. EMBO Mol Med 6:
902 – 917
Martin MG, Pfrieger F, Dotti CG (2014b) Cholesterol in brain disease: sometimes
determinant and frequently implicated. EMBO Rep 15: 1036 – 1052
Marullo M, Valenza M, Leoni V, Caccia C, Scarlatti C, De MA, Zuccato C, Di
Donato S, Carafoli E, Cattaneo E (2012) Pitfalls in the detection of
cholesterol in Huntington’s disease models. PLoS Curr 4:
e505886e505889a501968
Mauch DH, Nagler K, Schumacher S, Goritz C, Muller EC, Otto A, Pfrieger FW
(2001) CNS synaptogenesis promoted by glia-derived cholesterol. Science
294: 1354 – 1357
Milnerwood AJ, Gladding CM, Pouladi MA, Kaufman AM, Hines RM, Boyd JD,
Ko RW, Vasuta OC, Graham RK, Hayden MR et al (2010) Early increase in
extrasynaptic NMDA receptor signaling and expression contributes to
phenotype onset in Huntington’s disease mice. Neuron 65: 178 – 190
Milnerwood AJ, Raymond LA (2010) Early synaptic pathophysiology in
neurodegeneration: insights from Huntington’s disease. Trends Neurosci 33:
513 – 523
Minost A, Delaveau J, Bolzinger MA, Fessi H, Elaissari A (2012) Nanoparticles
via nanoprecipitation process. Recent Pat Drug Deliv Formul 6: 250 – 258
Morton AJ, Edwardson JM (2001) Progressive depletion of complexin II in a
transgenic mouse model of Huntington’s disease. J Neurochem 76:
166 – 172
Mundargi RC, Babu VR, Rangaswamy V, Patel P, Aminabhavi TM (2008)
Nano/micro technologies for delivering macromolecular therapeutics using
poly(D, L-lactide-co-glycolide) and its derivatives. J Control Release 125:
193 – 209
Orth M, Schippling S, Schneider SA, Bhatia KP, Talelli P, Tabrizi SJ, Rothwell JC
(2010) Abnormal motor cortex plasticity in premanifest and very early
manifest Huntington disease. J Neurol Neurosurg Psychiatry 81:
267 – 270
Paratcha G, Ibanez CF (2002) Lipid rafts and the control of neurotrophic
factor signaling in the nervous system: variations on a theme. Curr Opin
Neurobiol 12: 542 – 549
Paulsen JS, Langbehn DR, Stout JC, Aylward E, Ross CA, Nance M, Guttman M,
Johnson S, MacDonald M, Beglinger LJ et al (2008) Detection of
Huntington’s disease decades before diagnosis: the Predict-HD study. J
Neurol Neurosurg Psychiatry 79: 874 – 880
Paulsen JS, Long JD (2014) Onset of Huntington’s disease: can it be purely
cognitive? Mov Disord 29: 1342 – 1350
Paxinos G, Franklin KBJ (2008) Paxinos and Franklin’s the Mouse Brain in
Stereotaxic Coordinates, 3rd edn. Waltham, MA: Academic Press
Pfrieger FW (2003) Role of cholesterol in synapse formation and function.
Biochim Biophys Acta 1610: 271 – 280
Reim K, Mansour M, Varoqueaux F, McMahon HT, Sudhof TC, Brose N,
Rosenmund C (2001) Complexins regulate a late step in Ca2 + -
dependent neurotransmitter release. Cell 104: 71 – 81
Renner M, Choquet D, Triller A (2009) Control of the postsynaptic membrane
viscosity. J Neurosci 29: 2926 – 2937
Ross CA, Aylward EH, Wild EJ, Langbehn DR, Long JD, Warner JH, Scahill RI,
Leavitt BR, Stout JC, Paulsen JS et al (2014) Huntington disease: natural
history, biomarkers and prospects for therapeutics. Nat Rev Neurol 10:
204 – 216
Schippling S, Schneider SA, Bhatia KP, Munchau A, Rothwell JC, Tabrizi SJ,
Orth M (2009) Abnormal motor cortex excitability in preclinical and very
early Huntington’s disease. Biol Psychiatry 65: 959 – 965
Sethi A, Sher M, Akram MR, Karim S, Khiljee S, Sajjad A, Shah SN, Murtaza G
(2013) Albumin as a drug delivery and diagnostic tool and its market
approved products. Acta Pol Pharm 70: 597 – 600
Shen H, Rodriguez-Aguayo C, Xu R, Gonzalez-Villasana V, Mai J, Huang Y,
Zhang G, Guo X, Bai L, Qin G et al (2013) Enhancing chemotherapy
response with sustained EphA2 silencing using multistage vector delivery.
Clin Cancer Res 19: 1806 – 1815
Shive MS, Anderson JM (1997) Biodegradation and biocompatibility of PLA
and PLGA microspheres. Adv Drug Deliv Rev 28: 5 – 24
Suzuki R, Ferris HA, Chee MJ, Maratos-Flier E, Kahn CR (2013) Reduction of
the cholesterol sensor SCAP in the brains of mice causes impaired
synaptic transmission and altered cognitive function. PLoS Biol 11:
e1001532
Tasciotti E, Liu X, Bhavane R, Plant K, Leonard AD, Price BK, Cheng MM,
Decuzzi P, Tour JM, Robertson F et al (2008) Mesoporous silicon particles
ª 2015 The Authors EMBO Molecular Medicine Vol 7 | No 12 | 2015
Marta Valenza et al Cholesterol delivery to the brain is beneficial in HD EMBO Molecular Medicine
1563

as a multistage delivery system for imaging and therapeutic applications.
Nat Nanotechnol 3: 151 – 157
Thiele C, Hannah MJ, Fahrenholz F, Huttner WB (2000) Cholesterol binds to
synaptophysin and is required for biogenesis of synaptic vesicles. Nat Cell
Biol 2: 42 – 49
del Toro D, Xifro X, Pol A, Humbert S, Saudou F, Canals JM, Alberch J (2010)
Altered cholesterol homeostasis contributes to enhanced excitotoxicity in
Huntington’s disease. J Neurochem 115: 153 – 167
Tosi G, Rivasi F, Gandolfi F, Costantino L, Vandelli MA, Forni F (2005)
Conjugated poly(D, L-lactide-co-glycolide) for the preparation of in vivo
detectable nanoparticles. Biomaterials 26: 4189 – 4195
Tosi G, Costantino L, Rivasi F, Ruozi B, Leo E, Vergoni AV, Tacchi R,
Bertolini A, Vandelli MA, Forni F (2007) Targeting the central nervous
system: in vivo experiments with peptide-derivatized nanoparticles
loaded with Loperamide and Rhodamine-123. J Control Release 122:
1 – 9
Tosi G, Costantino L, Ruozi B, Forni F, Vandelli MA (2008) Polymeric
nanoparticles for the drug delivery to the central nervous system. Expert
Opin Drug Deliv 5: 155 – 174
Tosi G, Vergoni AV, Ruozi B, Bondioli L, Badiali L, Rivasi F, Costantino L, Forni F,
Vandelli MA (2010) Sialic acid and glycopeptides conjugated PLGA
nanoparticles for central nervous system targeting: in vivo pharmacological
evidence and biodistribution. J Control Release 145: 49 – 57
Tosi G, Bondioli L, Ruozi B, Badiali L, Severini GM, Biffi S, De Vita A, Bortot B,
Dolcetta D, Forni F et al (2011a) NIR-labeled nanoparticles engineered for
brain targeting: in vivo optical imaging application and fluorescent
microscopy evidences. J Neural Transm 118: 145 – 153
Tosi G, Fano RA, Bondioli L, Badiali L, Benassi R, Rivasi F, Ruozi B, Forni F,
Vandelli MA (2011b) Investigation on mechanisms of glycopeptide
nanoparticles for drug delivery across the blood-brain barrier.
Nanomedicine 6: 423 – 436
Tosi G, Badiali L, Ruozi B, Vergoni AV, Bondioli L, Ferrari A, Rivasi F, Forni F,
Vandelli MA (2012) Can leptin-derived sequence-modified nanoparticles be
suitable tools for brain delivery? Nanomedicine 7: 365 – 382
Tosi G, Vilella A, Chhabra R, Schmeisser MJ, Boeckers TM, Ruozi B, Vandelli
MA, Forni F, Zoli M, Grabrucker AM (2014) Insight on the fate of CNS-
targeted nanoparticles. Part II: intercellular neuronal cell-to-cell transport.
J Control Release 177: 96 – 107
Trager U, Andre R, Magnusson-Lind A, Miller JR, Connolly C, Weiss A,
Grueninger S, Silajdzic E, Smith DL, Leavitt BR et al (2014)
Characterisation of immune cell function in fragment and full-length
Huntington’s disease mouse models. Neurobiol Dis 73C: 388 – 398
Trushina E, Singh RD, Dyer RB, Cao S, Shah VH, Parton RG, Pagano RE,
McMurray CT (2006) Mutant huntingtin inhibits clathrin-independent
endocytosis and causes accumulation of cholesterol in vitro and in vivo.
Hum Mol Genet 15: 3578 – 3591
Trushina E, Canaria CA, Lee DY, McMurray CT (2014) Loss of caveolin-1
expression in knock-in mouse model of Huntington’s disease suppresses
pathophysiology in vivo. Hum Mol Genet 23: 129 – 144
Valenza M, Rigamonti D, Goffredo D, Zuccato C, Fenu S, Jamot L, Strand A,
Tarditi A, Woodman B, Racchi M et al (2005) Dysfunction of the cholesterol
biosynthetic pathway in Huntington’s disease. J Neurosci 25: 9932 – 9939
Valenza M, Cattaneo E (2006) Cholesterol dysfunction in neurodegenerative
diseases: is Huntington’s disease in the list? Prog Neurobiol 80: 165 – 176
Valenza M, Carroll JB, Leoni V, Bertram LN, Bjorkhem I, Singaraja RR, Di
Donato S, Lutjohann D, Hayden MR, Cattaneo E (2007a) Cholesterol
biosynthesis pathway is disturbed in YAC128 mice and is modulated by
huntingtin mutation. Hum Mol Genet 16: 2187 – 2198
Valenza M, Leoni V, Tarditi A, Mariotti C, Bjorkhem I, Di Donato S,
Cattaneo E (2007b) Progressive dysfunction of the cholesterol
biosynthesis pathway in the R6/2 mouse model of Huntington’s disease.
Neurobiol Dis 28: 133 – 142
Valenza M, Leoni V, Karasinska JM, Petricca L, Fan J, Carroll J, Pouladi MA,
Fossale E, Nguyen HP, Riess O et al (2010) Cholesterol defect is marked
across multiple rodent models of Huntington’s disease and is manifest in
astrocytes. J Neurosci 30: 10844 – 10850
Valenza M, Marullo M, Di Paolo E, Cesana E, Zuccato C, Biella G, Cattaneo E
(2015) Disruption of astrocyte-neuron cholesterol cross talk affects
neuronal function in Huntington’s disease. Cell Death Differ 22: 690 – 702
Vergoni AV, Tosi G, Tacchi R, Vandelli MA, Bertolini A, Costantino L (2009)
Nanoparticles as drug delivery agents specific for CNS: in vivo
biodistribution. Nanomedicine 5: 369 – 377
Vilella A, Tosi G, Grabrucker AM, Ruozi B, Belletti D, Vandelli MA, Boeckers TM,
Forni F, Zoli M (2014) Insight on the fate of CNS-targeted nanoparticles.
Part I: Rab5-dependent cell-specific uptake and distribution. J Control
Release 174: 195 – 201
Von Hoff DD, Ervin T, Arena FP, Chiorean EG, Infante J, Moore M, Seay T,
Tjulandin SA, Ma WW, Saleh MN et al (2013) Increased survival in
pancreatic cancer with nab-paclitaxel plus gemcitabine. N Engl J Med 369:
1691 – 1703
Vonsattel JP, DiFiglia M (1998) Huntington disease. J Neuropathol Exp Neurol
57: 369 – 384
Zuccato C, Valenza M, Cattaneo E (2010) Molecular mechanisms and potential
therapeutical targets in Huntington’s disease. Physiol Rev 90: 905 – 981
Zuccato C, Cattaneo E (2014) Huntington’s disease. Handb Exp Pharmacol
220: 357 – 409
License: This is an open access article under the
terms of the Creative Commons Attribution 4.0
License, which permits use, distribution and reproduc-
tion in any medium, provided the original work is
properly cited.
EMBO Molecular Medicine Vol 7 | No 12 | 2015 ª 2015 The Authors
EMBO Molecular Medicine Cholesterol delivery to the brain is beneficial in HD Marta Valenza et al
1564

Appendix PDF
Cholesterol-loaded nanoparticles ameliorate synaptic and cognitive function in Huntington’s disease mice
Marta Valenza1§, Jane Y. Chen2§, Eleonora Di Paolo1¶, Barbara Ruozi3¶, Daniela Belletti3, Costanza Ferrari Bardile1, Valerio Leoni4,5, Claudio Caccia4, Elisa Brilli1, Stefano Di
Donato4, Marina M. Boido6, Alessandro Vercelli6, Maria A. Vandelli3, Flavio Forni3, Carlos Cepeda2, Michael S. Levine2 , Giovanni Tosi3, Elena Cattaneo1
1Department of BioSciences and Centre for Stem Cell Research, Università degli Studi di Milano,
Milan, Italy; 2Intellectual and Developmental Disabilities Research Center, Semel Institute for Neuroscience, Brain Research Institute, David Geffen School of Medicine, University of California Los Angeles, Los Angeles, CA; 3Department of Life Sciences, University of Modena and Reggio
Emilia, Modena, Italy. 4Neurological Institute C. Besta, Milan, Italy. 5Laboratory of Clinical Chemistry, Ospedale di Circolo e Fondazione Macchi, Varese, Italy. 6Neuroscience Institute
Cavalieri Ottolenghi Neuroscience Institute of Turin, Orbassano (Turin), Italy. §co-first authors. ¶co-second authors
Content:
Appendix Figures S1-S11 Appendix Tables S1-S7
Appendix Methods

Appendix Figure S1
Appendix Figure S1. AFM analysis (3D elaboration) of Rhodamine Samples (Rhod-NPs, Rhod-g7-NPs, Rhod-g7-NPs-NBD-Chol1). The chemico-physical properties have been described in Appendix Table 2.
Rhod-g7-NPs-NBD-Chol1 Rhod-g7-NPs Rhod-NPs
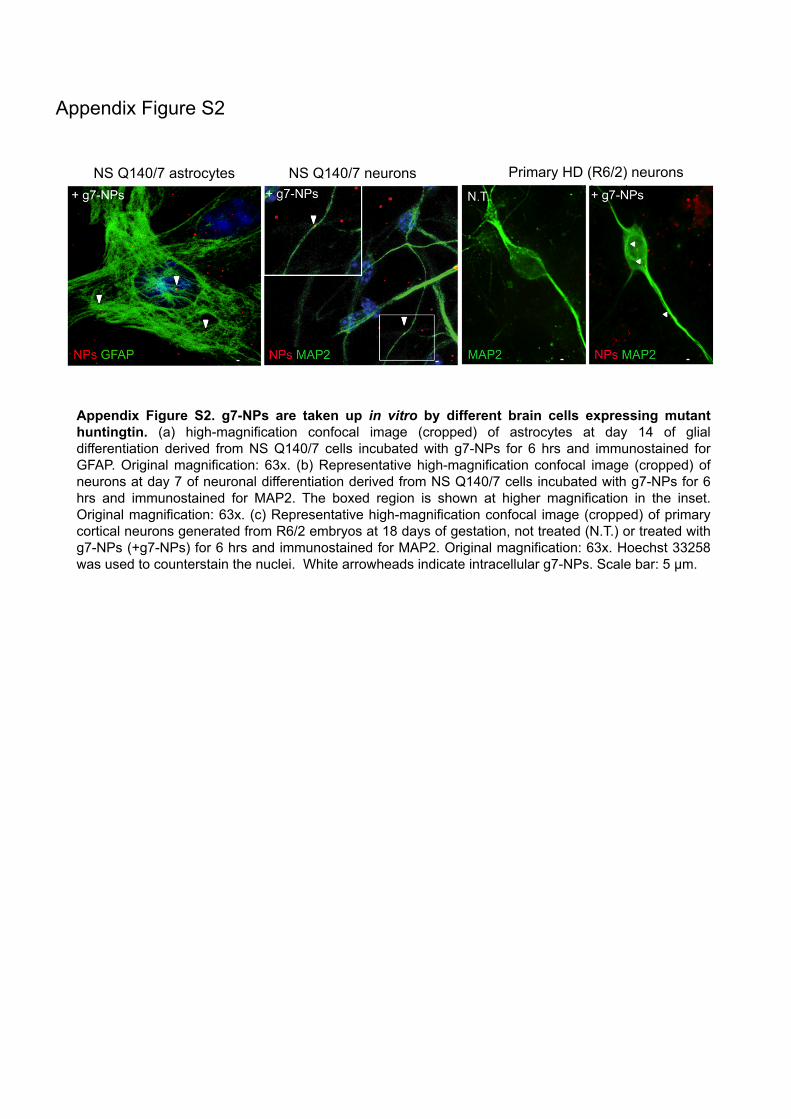
Appendix Figure S2. g7-NPs are taken up in vitro by different brain cells expressing mutant huntingtin. (a) high-magnification confocal image (cropped) of astrocytes at day 14 of glial differentiation derived from NS Q140/7 cells incubated with g7-NPs for 6 hrs and immunostained for GFAP. Original magnification: 63x. (b) Representative high-magnification confocal image (cropped) of neurons at day 7 of neuronal differentiation derived from NS Q140/7 cells incubated with g7-NPs for 6 hrs and immunostained for MAP2. The boxed region is shown at higher magnification in the inset. Original magnification: 63x. (c) Representative high-magnification confocal image (cropped) of primary cortical neurons generated from R6/2 embryos at 18 days of gestation, not treated (N.T.) or treated with g7-NPs (+g7-NPs) for 6 hrs and immunostained for MAP2. Original magnification: 63x. Hoechst 33258 was used to counterstain the nuclei. White arrowheads indicate intracellular g7-NPs. Scale bar: 5 µm.
Appendix Figure S2
NS Q140/7 astrocytes NS Q140/7 neurons Primary HD (R6/2) neurons
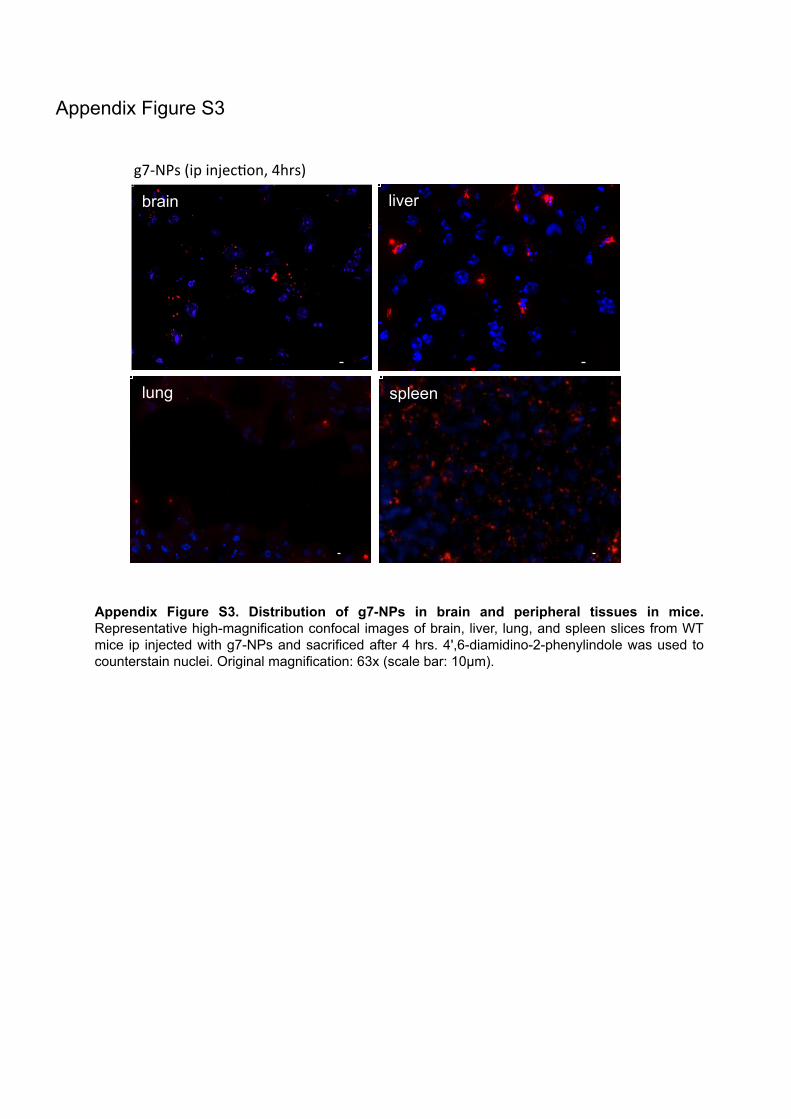
60x
60x
g7-‐NPs (ip injec2on, 4hrs)
60x
e f
g
Appendix Figure S3. Distribution of g7-NPs in brain and peripheral tissues in mice. Representative high-magnification confocal images of brain, liver, lung, and spleen slices from WT mice ip injected with g7-NPs and sacrificed after 4 hrs. 4',6-diamidino-2-phenylindole was used to counterstain nuclei. Original magnification: 63x (scale bar: 10µm).
Appendix Figure S3
brain liver
lung spleen

Appendix Figure S4
NPs Calbindin Ho
Hippocampus, 24h post-injection – low magnification
Appendix Figure S4. Distribution of g7-NPs in calbindin-positive neurons in hyppocampus. Representative confocal image of brain slice from R6/2 mice ip injected with g7-NPs and sacrificed after 24 hrs. 4',6-diamidino-2-phenylindole was used to counterstain nuclei. Scale bar: 5 µm.

Appendix Figure S5
Appendix Figure S5. Co-localization of NBD-Chol with PMCA ATPase in vivo. Representative confocal images of brain slice from WT mice injected with NBD-Chol (10ug) into the brain ventricles and sacrificed after 7 hrs. A-B) low-magnification images of brain slices of mice injected with NBD-Chol (A) or with saline (B) into the ventricle (see arrows). C) Representative 63x confocal image of brain slices of WT mice injected with NBD-Chol (green) and immunostained against PMCA ATPase (red), a marker for plasma membrane (scale bar: 10µm). In the crops, it is possible to appreciate the distribution of NBD-Chol into brain cells’ membrane (yellow signal). The Hoechst 33342 dye (Ho; blue) was used to counterstain nuclei.
NBD-Chol PMCA-ATPase Ho
Ab II (neg. Control)
5x
A B
C
NBD-Chol saline

liver, 24h Liver, 14 days
liver, 24h Liver, 14 days
g7-NPs DAPI g7-NPs DAPI
g7-NPs NBD g7-NPs NBD
Appendix Figure S6. Kinetics of g7-NPs in the brain and liver. (a-b) Representative confocal images of brain slices (a) and of liver slices (b) from R6/2 mice ip injected with NBD-chol-g7-NPs and sacrificed after 7 days (a) or after 24 hrs or 14 days (in b; the same experiment described in Fig. 1i-l). (c) Confocal images of liver slices from WT mice after a single or multiple injections of g7-NPs and sacrificed after 1 week. Scale bars: 10 µm (in a), 50 µm (in b), and 10-20 µm (in c). All images suggest a faster degradation of g7-NPs in the liver than in the brain. 4',6-diamidino-2-phenylindole (DAPI) was used to counterstain nuclei.
Liver, ip, 1 injec2on week
Liver, ip, 2 injec2ons Liver, ip, 3 injec2ons B
10 µm 20 µm 20 µm
A
Appendix Figure S6

WT, saline WT, g7-NPs-Chol
R6/2, g7-NPs-Chol
WT, g7-NPs
R6/2, g7-NPs R6/2, saline
Ip, 2 injec2ons/week (for 5 weeks)
Appendix Figure S7. Distribution of g7-NPs-Chol or empty g7-NPs in the brain and liver of WT and HD mice in which electrophysiological parameters were analyzed. The presence of g7-NPs was analyzed by fluorescent microscopy in the liver and in cortical pieces taken from brains before electrophysiological analysis. 4',6-diamidino-2-phenylindole was used to counterstain nuclei. Scale bars: 10µm (brain) and 50µm (liver).
LIV
ER
B
RA
IN
LIV
ER
B
RA
IN
Appendix Figure S7

Appendix Figure S8. A) Open field parameters in WT (n=14), R6/2-untreated (n=22) and R6/2-Chol (n=15) mice. Stereotyped moviments, locomotion, total distance travelled, resting time, mean velocity, slow moviments and fast moviments at 10 weeks of age. B) Global activity, distance, resting time in R6/2-untreated (n=22) and R6/2-Chol mice (n=15). Data were combined to highlight the differences between R6/2 groups at each time points. All data are presented as mean ± s.e.m.; P<0.05 was determined by one-way ANOVA followed by Newmann-Keuls multiple comparison test or t-student test .
Appendix Figure S8
A
B
WT R6/2-untreated R6/2-Chol
R6/2-untreated R6/2-Chol
v v

Appendix Figure S9. mRNA levels of striatal genes considered hallmarks of Medium Spiny Neurons (MSNs), such as darpp32, drd2 and chrm4. Data are presented as mean ± s.e.m.; WT (n=4), R6/2-untreated (n=7) and R6/2-Chol animals (n=3) at 12 weeks of age. P<0.05 was determined by one-way ANOVA followed by Newmann-Keuls multiple comparison tests.
Appendix Figure S9
darpp32 drd2 chrm4
WT
R6/2-untreated
R6/2-Chol
gene
/act
in %
MSN genes

Appendix Figure S10. Striatal volume was evaluated by Neurolucida Analysis at 12 weeks of age in WT (n= 7), R6/2 (n=7), R6/2-emp (n=6), R6/2-Chol (n=8). Data represent mean ± SEM. P<0.05 was determined by one-way ANOVA followed by Newmann-Keuls multiple comparison tests.
Appendix Figure S10
WT
R6/2
R6/2-Chol R6/2-emp

Appendix Figure S11. Initial trial performed in WT and R6/2 mice treated with unmodified control NPs (not able to cross the BBB) loaded with cholesterol (C-NPs-Chol) (n=4/genotype) or with empty C-NPs (n=4/genotype) according to the same experimental paradigm shown in Figure 5. A) mRNA levels of BDNF, a brain-specific hallmark of HD, were found reduced in the brain of R6/2 mice independently from the treatment, suggesting that peripheral cholesterol supplementation did not influence BDNF expression in the HD brain, differently from that observed in R6/2 mice treated with g7-NPs-Chol (Figure 6C). B) behavioral performance, as measured by rotarod test, was not improved in R6/2 treated with C-NPs-Chol compared to WTs; similarly, peripheral cholesterol supplementation via C-NPs-Chol injection did not influence rotarod performance in R6/2 mice (see R6/2+C-NPs-Chol line versus R6/2+ empty C-NPs). Data represent mean ± SEM. P<0.05 was determined by one-way ANOVA followed by Newmann-Keuls multiple comparison tests. On this basis, the unmodified control NPs loaded with cholesterol (C-NPs-Chol) group was no longer included in subsequent trials with g7-NPs-Chol.
Appendix Figure S11
WT + empty C-NPs WT+ C-NPs-Chol R6/2 + empty C-NPs
R6/2+ C-NPs-Chol
A
WT + empty C-NPs WT+ C-NPs-Chol R6/2 + empty C-NPs
R6/2+ C-NPs-Chol
bdnf in brain
B
bdnf
/b-a
ctin
Rotarod
* * * *
Fall
late
ncy
(sec
)

Appendix Table S1. Composition of NPs involved in the study.
Sample description defined in the text as PLGA503H (mg)
Rhod-‐PLGA502H (mg)
g7-‐PLGA503H (mg)
Chol (mg)
NBD-‐Chol (mg)
u-‐NPs unloaded (empty) NPs u-‐NPs 100
NPs-‐Chol1 NPs loaded with 1mg Chol NPs-‐Chol1 100 1
NPs-‐Chol2 NPs loaded with 5mg Chol NPs-‐Chol2 100 5
NPs-‐Chol3 NPs loaded with 10mg Chol NPs-‐Chol3 100 10
NPs-‐NBD-‐Chol1 NPs loaded with 1mg NBD-‐Chol NPs-‐NBD-‐Chol 100 1
Rhod-‐u-‐NPs unloaded (empty) NPs labelled with Rhodamine (used in vivo experiments)
C-‐NPs 80 20
Rhod-‐g7-‐NPsunloaded (empty) NPs modified with g7
and labelled with Rhodamine (used in vivo experiments)
g7-‐NPs 70 10 20
Rhod-‐g7-‐NPs-‐Chol1NPs modified with g7, labelled with
Rhodamine and loaded with NBD-‐chol (used in vivo experiments)
g7-‐NPs-‐NBD-‐Chol 70 10 20 1
Rhod-‐g7-‐NPs-‐NBDChol1NPs modified with g7, labelled with
Rhodamine and loaded with NBD-‐chol (used in vivo experiments)
g7-‐NPs-‐Chol 70 10 20 1
The amounts (mg) of polymers (PLGA503H; Rhod-‐PLGA502H; g7-‐PLGA), of cholesterol (Chol) and of labeled cholesterol (NDB-‐Chol) used as starting materials are reported for each formulation.

Appendix Table S2. chemical-‐physical properties of NPs involved in the study
Sample Chol/PLGA (mg/mg)Z-‐Average nm (± S.D.)
PDI value (± S.D.)
D(i)10 nm (± S.D.)
D(i)50 nm (± S.D.)
D(i)90 nm (± S.D.)
ζ-‐pot mV (± S.D.)
% PVA residual (± S.D.)
mg Chol/100 mg form. LC% EE%
u-‐NPs 181±11 0.08±0.01 139±12 187±12 205±12 -‐12±3 4.8±1.2
NPs-‐Chol1 1:100 192±15 0.09±0.01 136±11 195±12 283±23 -‐9±4 5.1±0.4 0.7±0.1 68±5
NPs-‐Chol2 5:100 187±17 0.11±0.02 118±13 177±15 269±28 -‐8±4 4.5±1.8 0.8±0.03 17±1
NPs-‐Chol3 10:100 242±52 0.28±0.03 111±21 256±76 378±78 -‐12±10 5.8±1.0 2.4±0.3 24±3
NPs-‐NBD-‐Chol1 1:100 178±19 0.07±0.02 125±3 186±10 280±7 -‐6±3 5.7±0.2 0.4±0.1 44±1
Dimensions of samples is expressed with Z-‐Average values (nm); Homegeneity of the samples is expressed as Polydispersity Index (PDI); intensitydistribution is expressed as Di (nm); surface charge is expressed as ζ-‐pot (mV); percentage of polyvynyl alchol residual is expressed as percentage as %PVA; drug loading is expressed as mg of Chol per 100 mg of formulation (LC%) and as percentual encapsulation efficiency (EE%). Standard Deviation is reported as SD.

Appendix Table S3 -‐ passive membrane properties of MSNs from WT, R6/2-‐untreated and R6/2-‐chol mice
group Capacitance (pF) Input Resistance (MΩ) Time constant (ms)
WT 68.7 ± 2.27 51.6 ± 2.73 1.9 ± 0.07
R6/2-‐untreated 59.8 ± 2.40* 179.3 ± 14.91*** 1.9 ± 0.09
R6/2-‐Chol 62.9 ± 3.60 180.2 ± 24.27*** 1.4 ± 0.12***###
***R6/2-‐Chol vs WT; ### R6/2-‐chol vs R6/2-‐untreated
Capacitance (pF), Input Resistance (MΩ) and Time constant (ms) registered in MSNs from WT mice treated with saline (WT), R6/2 mice treated with saline or with empty g7-‐NPs (R6/2-‐untreated) and R6/2 treated with g7-‐NPs-‐Chol (R6/2-‐Chol).

Appendix Table S4 -‐ kinetics of IPSCs (A) and of EPSCs (B) in MSNs from WT, R6/2-‐untreated and R6/2-‐chol mice
A. IPSC event kinetics
group Rise time (ms) Decay time (ms) Half-‐amplitude duration (ms)
WT-‐sal 3.1 ± 0.09 19.0 ± 0.62 18.3 ± 0.42
R6/2-‐untreated 2.7 ± 0.12 16.1 ± 0.82* 15.8 ± 0.5***
R6/2-‐Chol 2.5 ± 0.14*** 14.2 ± 1.09*** 14.7 ± 0.73***
B. EPSC event kinetics
group Rise time (ms) Decay time (ms) Half-‐amplitude duration (ms)
WT-‐sal 1.0 ± 0.03 3.5 ± 0.08 4.9 ± 0.12
R6/2-‐untreated 1.1 ± 0.06 3.5 ± 0.15 4.7 ± 0.17
R6/2-‐Chol 1.0 ± 0.06 3.3 ± 0.14 4.4 ± 0.22*
***R6/2-‐Chol or R6/2-‐untreated vs WT

Appendix Table S5 -‐ chemico-‐physical characterization and drug content in the NPs in the preclinical trials
NPs tyoe of experiments Rhod g7 Chol administered (mg/g) Size (nm) (PDI) Z-‐potential (mV)
g7-‐NPs ✓ ✓ -‐ 192 (0.06) -‐11.7
g7-‐NPs-‐Chol ✓ ✓ 0,7 199 (0.06) -‐12.5
g7-‐NPs ✓ ✓ -‐ 176 (0.09) -‐12.2
g7-‐NPs-‐Chol ✓ ✓ 0,7 174 (0.08) -‐9.1
g7-‐NPs ✓ ✓ -‐ 210 (0.11) -‐5.7
g7-‐NPs-‐Chol ✓ ✓ 0,7 190 (0.08) -‐9.2
g7-‐NPs ✓ ✓ -‐ 187 (0.09) -‐6.4
g7-‐NPs-‐Chol ✓ ✓ 0,7 210 (0.12) -‐7.3
g7-‐NPs ✓ ✓ -‐ 147 (0.09) -‐16.4
g7-‐NPs-‐Chol ✓ ✓ 0,7 151 (0.10) -‐17.3
fifth preclinical trial (behaviour)
first pre-‐clinical trial (electrophysiology)
second pre-‐clinical trial (electrophysiology)
third preclinical trial (behaviour)
fourth preclinical trial (behaviour)

Appendix Table S6 -‐ summary all animals used in this study
n° exp date Nps n° WT mice n° R6/2 mice injection n° injections sacrifice after first injection
1 28/04/10 g7-‐NPs 2 iv 1 2 hrsg7-‐NPs 4 iv 1 4 hrsg7-‐NPs 3 iv 1 12 hrsC-‐NPs 2 iv 1 2 hrsC-‐NPs 2 iv 1 4 hrsg7-‐NPs 2 ip 1 4 hrsg7-‐NPs 2 ip 1 12 hrs
2 07/06/10 g7-‐NPs-‐NBD-‐Chol 3 ip 1 4 hrsg7-‐NPs-‐NBD-‐Chol 3 ip 1 24 hrsg7-‐NPs-‐NBD-‐Chol 3 ip 1 48 hrsg7-‐NPs-‐NBD-‐Chol 3 ip 1 1 weekg7-‐NPs-‐NBD-‐Chol 2 2 ip 2 48 hrsg7-‐NPs-‐NBD-‐Chol 2 2 ip 3 1 weeksaline 2 2 ip 1 48 hrssaline 2 2 ip 3 1 week
3 12/07/10 g7-‐NPs-‐NBD-‐Chol 1 3 ip 1 1 weekg7-‐NPs-‐NBD-‐Chol 3 ip 1 2 weeksg7-‐NPs-‐NBD-‐Chol 3 ip 1 3 weekssaline 1 3 ip 1 3 weeksg7-‐NPs-‐NBD-‐Chol 1 3 ip 2 2 weeksg7-‐NPs-‐NBD-‐Chol 1 3 ip 3 3 weekssaline 1 3 ip 3 3 weeksg7-‐NPs-‐NBD-‐Chol 1 ip 1 5 months
4 08/07/12 g7-‐NPs 3 3 ip 1 4 hrs
5 01/07/12 empty-‐C-‐NPs 4 4 ip 2/week 5 weeksC-‐NPs-‐Chol 4 4 ip 2/week 5 weeks
6 01/08/12 g7-‐NPs-‐NBD-‐Chol 3 ip 1 24 hrsg7-‐NPs-‐NBD-‐Chol 3 ip 1 48 hrsg7-‐NPs-‐NBD-‐Chol 3 ip 1 7 daysg7-‐NPs-‐NBD-‐Chol 3 ip 1 14 days
7 28/05/13 g7-‐NPs 2 ip 1 24 hrsg7-‐NPs-‐NBD-‐Chol 2 ip 1 24 hrs, 1 weeksaline 2 2 ip 1 24 hrs
8 01/10/10 g7-‐NPs 4 4 ip 3 5 weeksg7-‐NPs-‐Chol 10 10 ip 3 5 weeks
9 01/05/11 g7-‐NPs 5 5 ip 2/week 5 weeksg7-‐NPs-‐Chol 5 5 ip 2/week 5 weekssaline 5 5 ip 2/week 5 weeks
10 01/07/13 g7-‐NPs 3 ip 2/week 5 weeksg7-‐NPs-‐Chol 6 ip 2/week 5 weekssaline 8 7 ip 2/week 5 weeks
11 01/11/13 g7-‐NPs 4 ip 2/week 5 weeksg7-‐NPs-‐Chol 8 ip 2/week 5 weekssaline 8 8 ip 2/week 5 weeks
12 01/06/14 g7-‐NPs 6 ip 2/week 5 weeksg7-‐NPs-‐Chol 8 ip 2/week 5 weeks
saline 8 8 ip 2/week 5 weeks
pre-
clin
ical
trial
s
first pilot study (UCLA), electrophysiological studies; rotarod test
second pilot study (UCLA), for electrophysiological studies
third pilot study (UNIMI), for behavioral tests (rotarod and NORT); neurophatology, biochemestry
forth pilot study (UNIMI), for behavioral tests (rotarod, NORT, open field); neurophatology, biochemestry
fifth pilot study (UNIMI), for behavioral tests (NORT, open field); neurophatology, biochemestry, qRTPCR (injections until 11 ws)
char
acte
riza
tion
and
dist
ribu
tion
of g
7-N
Ps
ip vs. iv injectionNps kinetics in the mouse brain
NPs kinetics in the mouse brainNBD and g7-NPs co-localizationIHC different brain cells
NPs kinetics in the mouse brainfirst co-localization study
IHC different brain cellsg7-NPs counts in liver, striatum and cortex
effect of cholesterol supplementation only in periphery
IHC different brain cells; second co-localization study; g7-NPs counts in brain
IHC different brain cells

Appendix Table S7 -‐ summary of statistics for the main figuresFigure Statistical AnalysisFigure 2C unpaired t test
WT liver vs R6/2 liverP value 0,0104P value summary *Are means signif. different? (P < 0.05) YesOne-‐ or two-‐tailed P value? Two-‐tailedt, df t=2.859 df=18
WT cortex vs R6/2 cortexP value < 0.0001P value summary ***Are means signif. different? (P < 0.05) YesOne-‐ or two-‐tailed P value? Two-‐tailedt, df t=9.559 df=18
WT striatum vs R6/2 striatumP value < 0.0001P value summary ***Are means signif. different? (P < 0.05) YesOne-‐ or two-‐tailed P value? Two-‐tailedt, df t=8.309 df=18
Figure 3D One-‐way analysis of varianceP value < 0.0001P value summary ***Are means signif. different? (P < 0.05) YesNumber of groups 4F 12,34R squared 0,5069
Bonferroni's Multiple Comparison Test Mean Diff. t Significant? P < 0.05? Summarybrain 24h vs brain 48h 34,06 0,6415 No nsbrain 24h vs brain 7d 255,0 4,804 Yes ***brain 24h vs brain 14d 232,1 4,371 Yes ***brain 48h vs brain 7d 221,0 4,162 Yes **brain 48h vs brain 14d 198,0 3,730 Yes **brain 7d vs brain 14d -‐22,97 0,4326 No ns
Figure 4B One-‐way analysis of varianceP value < 0.0001P value summary ***Are means signif. different? (P < 0.05) YesNumber of groups 3F 39,46R squared 0,4315
Newman-‐Keuls Multiple Comparison Test Mean Diff. q Significant? P < 0.05? SummaryWT (n=52) vs R6/2-‐untreated (n=27) -‐6,793 12,39 Yes ***WT (n=52) vs R6/2-‐Chol (n=29) -‐3,396 6,338 Yes ***R6/2-‐untreated (n=27) vs R6/2-‐Chol (n=29) -‐3,397 5,514 Yes *
Figure 4E One-‐way analysis of varianceP value < 0.0001P value summary ***Are means signif. different? (P < 0.05) YesNumber of groups 3F 78,23R squared 0,6197
Newman-‐Keuls Multiple Comparison Test Mean Diff. q Significant? P < 0.05? SummaryWT (n=52) vs R6/2-‐untreated (n=27) -‐1,990 15,37 Yes ***WT (n=52) vs R6/2-‐Chol (n=29) -‐0,1656 1,047 No nsR6/2-‐untreated (n=27) vs R6/2-‐Chol (n=29) -‐1,824 13,09 Yes ***
Figure 5B two-‐way ANOVA testWT vs R6/2-‐untreated time Difference t P value Summary5 ws -‐22,27 1,107 P > 0.05 ns7 ws -‐70,36 3,496 P<0.01 **9 ws -‐95,94 4,768 P<0.001 ***11 ws -‐169,9 8,030 P<0.001 ***WT vs R6/2-‐Choltime Difference t P value Summary5 ws -‐29,99 1,320 P > 0.05 ns7 ws -‐79,95 3,518 P<0.01 **9 ws -‐119,7 5,268 P<0.001 ***11 ws -‐179,0 7,878 P<0.001 ***
Figure 5C two-‐way ANOVA testWT vs R6/2-‐untreated treatment Difference t P value Summary 5 -‐39,91 5,890 P<0.001 *** 10 -‐36,07 5,324 P<0.001 *** 15 -‐35,53 5,244 P<0.001 *** 20 -‐36,26 5,352 P<0.001 *** 25 -‐36,77 5,426 P<0.001 *** 30 -‐39,44 5,821 P<0.001 *** 35 -‐30,75 4,538 P<0.001 *** 40 -‐33,94 5,009 P<0.001 *** 45 -‐40,27 5,944 P<0.001 *** 50 -‐31,47 4,645 P<0.001 *** 55 -‐35,39 5,223 P<0.001 *** 60 -‐33,13 4,890 P<0.001 ***

WT vs R6/2-‐Choltreatment Difference t P value Summary 5 -‐39,08 5,241 P<0.001 *** 10 -‐27,82 3,732 P<0.01 ** 15 -‐29,22 3,919 P<0.01 ** 20 -‐30,65 4,111 P<0.001 *** 25 -‐33,11 4,441 P<0.001 *** 30 -‐36,49 4,895 P<0.001 *** 35 -‐29,34 3,935 P<0.01 ** 40 -‐31,36 4,207 P<0.001 *** 45 -‐38,03 5,101 P<0.001 *** 50 -‐27,25 3,655 P<0.01 ** 55 -‐31,71 4,254 P<0.001 *** 60 -‐28,32 3,798 P<0.01 **
Figure 5D one-‐way ANOVA testP value < 0.0001P value summary ***Are means signif. different? (P < 0.05) YesNumber of groups 3F 32,65R squared 0,5763
Newman-‐Keuls Multiple Comparison Test Mean Diff. q Significant? P < 0.05? SummaryR6/2-‐untreated vs WT -‐3890 11,36 Yes ***R6/2-‐untreated vs R6/2-‐Chol -‐1133 3,379 Yes *R6/2-‐Chol vs WT -‐2757 7,408 Yes ***
Figure 5ENORT -‐ 8 weeks One-‐way analysis of variance
P value < 0.0001P value summary ****Are means signif. different? (P < 0.05) YesNumber of groups 3F 17,42R square 0,3087
Newman-‐Keuls Multiple Comparison Test Mean Diff. q Significant? P < 0.05? SummaryR6/2-‐untreated vs WT -‐38,54 8,271 Yes ***R6/2-‐untreated vs R6/2-‐Chol -‐20,46 4,213 Yes **R6/2-‐Chol vs WT -‐18,09 3,423 Yes *
NORT -‐ 10 weeks One-‐way analysis of varianceP value < 0.0001P value summary ****Are means signif. different? (P < 0.05) YesNumber of groups 3F 22,32R square 0,3669
Newman-‐Keuls Multiple Comparison Test Mean Diff. q Significant? P < 0.05? SummaryR6/2-‐untreated vs WT -‐48,29 8,904 Yes ***R6/2-‐untreated vs R6/2-‐Chol -‐37,02 6,377 Yes ***R6/2-‐Chol vs WT -‐11,27 1,813 No ns
NORT -‐ 12 weeks One-‐way analysis of varianceP value < 0.0001P value summary ****Are means signif. different? (P < 0.05) YesNumber of groups 3F 18,27R square 0,3430
Newman-‐Keuls Multiple Comparison Test Mean Diff. q Significant? P < 0.05? SummaryR6/2-‐untreated vs WT -‐48,22 8,299 Yes ***R6/2-‐untreated vs R6/2-‐Chol -‐33,04 5,311 Yes ***R6/2-‐Chol vs WT -‐15,18 2,330 No ns
Figure 6APSD95 One-‐way analysis of variance
P value < 0.0001P value summary ***Are means signif. different? (P < 0.05) YesNumber of groups 3F 36,39R squared 0,5740
Newman-‐Keuls Multiple Comparison Test Mean Diff. q Significant? P < 0.05? SummaryR62-‐untreated vsWT -‐0,2700 11,60 Yes ***R62-‐untreated vs R6/2-‐Chol -‐0,1973 7,916 Yes ***R6/2-‐Chol vs WT -‐0,07268 2,802 No ns
Gephryin One-‐way analysis of varianceP value 0,0739P value summary nsAre means signif. different? (P < 0.05) NoNumber of groups 3F 2,873R squared 0,1755
Newman-‐Keuls Multiple Comparison Test Mean Diff. q Significant? P < 0.05? SummaryR62-‐untreated vsWT -‐0,1670 3,161 No nsR62-‐untreated vs R6/2-‐Chol -‐0,1409 -‐-‐-‐ No nsR6/2-‐Chol vs WT -‐0,02604 -‐-‐-‐ No ns

GluN1 One-‐way analysis of varianceP value < 0.0001P value summary ***Are means signif. different? (P < 0.05) YesNumber of groups 3F 16,54R squared 0,5416
Newman-‐Keuls Multiple Comparison Test Mean Diff. q Significant? P < 0.05? SummaryR62-‐untreated vsWT -‐0,6375 8,111 Yes ***R62-‐untreated vs R6/2-‐Chol -‐0,2169 2,760 No nsR6/2-‐Chol vs WT -‐0,4206 4,923 Yes **
GluN2B One-‐way analysis of varianceP value 0,0028P value summary **Are means signif. different? (P < 0.05) YesNumber of groups 3F 7,188R squared 0,3240
Newman-‐Keuls Multiple Comparison Test Mean Diff. q Significant? P < 0.05? SummaryR62-‐untreated vs R6/2-‐Chol -‐0,3574 4,921 Yes **R62-‐untreated vsWT -‐0,2780 4,051 Yes **R6/2-‐Chol vs WT -‐0,07939 1,055 No ns
beta-‐3-‐tub One-‐way analysis of varianceP value 0,1550P value summary nsAre means signif. different? (P < 0.05) NoNumber of groups 3F 1,956R squared 0,09117
Newman-‐Keuls Multiple Comparison Test Mean Diff. q Significant? P < 0.05? SummaryR62-‐untreated vsWT -‐0,1177 2,796 No nsR62-‐untreated vs R6/2-‐Chol -‐0,05825 -‐-‐-‐ No nsR6/2-‐Chol vs WT -‐0,05946 -‐-‐-‐ No ns
Figure 6C R6/2-‐Chol vs R6/2-‐untreated bdnf cortexUnpaired t testP value 0,0001P value summary ***Are means signif. different? (P < 0.05) YesOne-‐ or two-‐tailed P value? Two-‐tailedt, df t=4.475 df=25
bdnf hippocampusUnpaired t testP value 0,1607P value summary nsAre means signif. different? (P < 0.05) NoOne-‐ or two-‐tailed P value? Two-‐tailedt, df t=1.441 df=28
Figure 6D snap25 cortexUnpaired t testP value 0,0092P value summary **Are means signif. different? (P < 0.05) YesOne-‐ or two-‐tailed P value? Two-‐tailedt, df t=2.920 df=18
snap25 hippocampusUnpaired t testP value 0,0729P value summary nsAre means signif. different? (P < 0.05) NoOne-‐ or two-‐tailed P value? Two-‐tailedt, df t=1.905 df=18
Figure 6E complexin cortexUnpaired t testP value 0,1774P value summary nsAre means signif. different? (P < 0.05) NoOne-‐ or two-‐tailed P value? Two-‐tailedt, df t=1.404 df=18
complexin hippocampusUnpaired t testP value 0,0169P value summary *Are means signif. different? (P < 0.05) YesOne-‐ or two-‐tailed P value? Two-‐tailedt, df t=2.666 df=16
complexin striatumUnpaired t testP value 0,0151P value summary *Are means signif. different? (P < 0.05) YesOne-‐ or two-‐tailed P value? Two-‐tailedt, df t=2.687 df=18

Figure 6G One-‐way analysis of varianceP value 0,0180P value summary *Are means signif. different? (P < 0.05) YesNumber of groups 4F 4,071R squared 0,3372
Newman-‐Keuls Multiple Comparison Test Mean Diff. q Significant? P < 0.05? SummaryR6/2-‐emp vs R6/2 -‐541900000 4,141 Yes *R6/2-‐emp vs R6/2-‐Chol -‐92100000 0,7250 No nsR6/2-‐emp vs WT -‐18000000 -‐-‐-‐ No nsWT vsR6/2-‐Chol -‐74100000 -‐-‐-‐ No nsR6/2-‐Chol vs R6/2 -‐449800000 3,695 Yes *
Figure 7A One-‐way analysis of varianceP value < 0.0001P value summary ***Are means signif. different? (P < 0.05) YesNumber of groups 3F 79,31R squared 0,9243
Newman-‐Keuls Multiple Comparison Test Mean Diff. q Significant? P < 0.05? Summaryr62 chol vs wt saline -‐21,12 13,53 Yes ***r62 chol vs r62 saline -‐1,197 0,7860 No nsr62 saline vs wt saline -‐19,92 16,22 Yes ***
Figure 7B One-‐way analysis of varianceP value 0,0016P value summary **Are means signif. different? (P < 0.05) YesNumber of groups 3F 11,02R squared 0,6290
Newman-‐Keuls Multiple Comparison Test Mean Diff. q Significant? P < 0.05? SummaryR6/2-‐Chol vs WT -‐4,237 5,916 Yes **R6/2-‐Chol vs R6/2 -‐0,3880 0,5187 No nsR6/2 vs WT -‐3,849 5,374 Yes **
Figure 7E One-‐way analysis of varianceP value < 0.0001P value summary ***Are means signif. different? (P < 0.05) YesNumber of groups 4F 24,89R squared 0,5586
Newman-‐Keuls Multiple Comparison Test Mean Diff. q Significant? P < 0.05? SummaryTNF-‐alpha WT vs R6/2-‐emp -‐3,087 9,294 Yes ***
WT vs R6/2-‐Chol -‐2,386 8,344 Yes ***WT vs R6/2 -‐2,339 8,820 Yes ***
IL6 WT vs R6/2-‐emp -‐0,7488 2,064 No nsWT vs R6/2-‐Chol -‐0,04721 -‐-‐-‐ No nsWT vs R6/2 -‐0,7016 -‐-‐-‐ No ns
Figure 7F One-‐way analysis of varianceP value < 0.0001P value summary ***Are means signif. different? (P < 0.05) YesNumber of groups 4F 11,98R squared 0,3786
Newman-‐Keuls Multiple Comparison Test Mean Diff. q Significant? P < 0.05? SummaryTNF-‐alpha WT vs R6/2 -‐1,049 7,972 Yes ***
WT vs R62-‐emp -‐0,8024 4,866 Yes **WT vs R6/2-‐Chol -‐0,5491 3,869 Yes **
IL6 R6/2-‐Chol vs R6/2 -‐0,5000 3,139 No nsR6/2-‐Chol vs R62-‐emp -‐0,2533 -‐-‐-‐ No nsR62-‐emp vs R6/2 -‐0,2467 -‐-‐-‐ No ns

Appendix Methods Details about formulation and characterization of NPs employed in this study are herein described.
Purification and collection of the NPs
To purify the loaded NPs from the unloaded Chol, NBD-Chol and PVA residuals, all the samples were
centrifuged at 17,000 rpm for 10 min (Sorvall RC28S, Dupont, Brussels, Belgium), washed several times with water and
re-suspended in water. The purified NP suspensions were freeze-dried (-60°C, 1.10-3 mm/Hg, for 48 h; LyoLab 3000,
Heto-Holten, Allerod, Denmark) using trehalose as cryoprotectant (1:0.5 w:w polymer/trehalose ratio). After the
liophylisation process, all the samples were stored at 4°C in N2 atmosphere. The yield of NPs (Yield %) was calculated
as the percentage of NPs recovered after the freeze-drying procedure compared to the weight of PLGA and Chol used for
the preparation as follows: Yield (%) = (NPs recovered after the freeze-dried process – anidre trehalose - PVA residual)
weight x100/ (PLGA+Chol) weight. Before their use, freeze-dried NPs were weighed, re-suspended in water at the
concentration of 10 mg/mL by bath sonication for 3 min at r.t.
Determination of the amount of PVA residual
As the residual PVA associated with the NPs could affect the physical properties and the uptake by cells, the residual
PVA was determined by a colorimetric method based on the formation of the colored complex between two adjacent
hydroxyl groups of PVA and an iodine molecule. Briefly, freeze-dried NPs (5 mg) were solubilized in dichloromethane
(1 mL). Then, water (2 mL) was added and the organic solvent was evaporated at r.t. under stirring (2 h). The suspension
was filtered (cellulose nitrate filter, porosity 0.45 µm, Sartorius, Florence, Italy) to remove the polymeric residue and the
aqueous solution (1 mL) was treated with 0.5 M NaOH (2 mL) for 15 min at 60°C. The solution was neutralized with 1 N
HCl (900 µL) and the volume adjusted to 5 mL with water. Then, a solution of I2/KI (0.5 mL) (0.05 M/0.15 M) and water
(1.5 mL) was added to a solution of boric acid (0.65 M; 3 mL). PVA concentration was determined measuring the
absorbance at 690 nm after 15 min of incubation at r.t. in comparison with a standard plot of PVA prepared under the
same experimental conditions.
Chemico-physical characterization
The surface morphology of both unloaded and loaded NPs was evaluated by means of the atomic force
microscope (AFM, Park Instruments, Sunnyvale, CA, USA) analysis at r.t. (about 25°C) operating in air and in non-
contact mode using triangular silicon tips. The resonant frequencies of the cantilever were found to be about 160 kHz.
Before the analysis, a drop (20 µL) of a water-diluted suspension of the NPs (about 0.01 mg/mL) was applied on a small
mica disk (1 cm × 1 cm); after 2 min, the excess of water was removed using paper filter. The topographical images
obtained, also called “height” images, were flattened using second-order fitting to remove sample tilt.
Architecture and internal structure of NPs was studied by using the transmission electron microscope (TEM) operating at
an acceleration voltage of 200 KV (model JEM 2010; JEOL, Oxford Instruments, Abingdon, England). Briefly, a drop of
a water-diluted suspension of the samples (about 0.03 mg/mL) was placed on a 200-mesh copper grid (TABB
Laboratories Equipment, Berks, UK), allowed to adsorb and the suspension surplus was removed by filter paper.
Mean particle size (Z-Average) and polydispersivity index (PDI) of the NPs (in distilled water) were determined at 25°C
by PCS using a Zetasizer Nano ZS (Malvern, UK; Laser 4 mW He–Ne, 633 nm, Laser attenuator Automatic,
transmission 100–0.0003%, Detector Avalanche photodiode, Q.E. > 50% at 633 nm, T = 25 ◦C). The results were
normalized with respect to a polystirene standard suspension. The zeta potential (ζ-pot) was measured by using the same

equipment with a combination of laser Doppler velocimetry and phase analysis light scattering (PALS). All the data are
expressed as means of at least three determinations carried out for each preparation lot (three lots for each sample).
Drug entrapment efficiency (EE%) and loading capacity (LC%)
To quantify the amount of Chol loaded into NPs, an exact amount of loaded NPs (5 mg) was dissolved in
chloroform (0.5 mL). Then, isopropyl alcohol (1mL) (in which Chol, but not PLGA, is soluble) was added. The mixture
was then vortexed (15 Hz for 1 min; ZX3, VelpScientifica, Usmate, Italy) to promote the precipitation of the polymer
and then filtered (polytetrafluoroethylene filter, porosity 0.20 µm, Sartorius). The amount of Chol loaded in the NPs was
quantified by RP-HPLC. The HPLC apparatus (JASCO Europe, Cremella, Italy) comprised a Model PU980 pump
provided with an injection valve with a 50 µL sample loop (Jasco, Model 7725i) and the UV detector (Jasco UV975).
Chromatography separation was carried out on a Syncronics C18 (250x4.6 mm; porosity 5 µm; Thermo Fisher Scientific,
Waltham, MA, USA) at r.t., flow rate of 1.2 mL/min, by operating in an isocratic mode using 50:50 v/v
acetonitrile:ethanol as mobile phase. Before the use, mobile phase eluents were filtered through a 0.45 µm hydrophilic
polypropylene membrane filters (Sartorius). The eluent absorbance was monitored at 220 nm using the UV detector
(Jasco UV975). Chromatographic peak area of the standard solution were collected and used for the generation of
calibration curve. Linearity was assumed in the range of 18-300 µg/mL (r2=0.995).
The entrapment efficiency (EE) and the loading capacity (LC), expressed as percentage, were calculated using the
following formula: EE%= D/Td×100; LC%= D/W×100 where D is the amount of Chol loaded in the NPs, Td is the
amount of drug used for the preparation and W is the weight of the NPs (polymer + drug). All the data are expressed as
the mean of at least three determinations.
Release of Chol and NBD-Chol from loaded NPs under simulated conditions
Figure 1D shows the % of Chol and NBD-Chol released in water. The initial “burst effect” can be attributed to
the fraction of Chol adsorbed or in close contact with the surface of the NPs. This surface Chol fraction dissolved into the
surrounding liquid, leading to the fast initial release profile. Moreover, during the second phase, Chol embedded in the
NPs could significantly delay the in vitro release. The slow linear release kinetic of Chol from NPs-Chol between day 5
and day 10 could be ascribed to NPs degradation. While hydrophilic drugs with high solubility could increase the rate of
water diffusion into the biodegradable matrix, accelerating the release and the (bulk) erosion, hydrophobic molecules
with low water solubility (as Chol) may hinder water diffusion into the matrix, slowing the release rate as the
consequence of the NPs surface erosion with a consequent release.
An exact amount of lyophilized NPs-Chol1 or NPs-NBD-Chol1 (0.5 mg) were suspended in water under perfect
sink conditions (6 mL) into a well closed glass vial that was incubated into a water bath at 37±0.2°C under magnetic
stirring (250 rpm). At fixed time intervals, the loaded NPs were centrifuged (40,000 rpm for 30 min at 10°C) and the
surnatant (1 mL) was collected to be lyophilized (-60°C, 1.10-3 mm/Hg, for 48 h; LyoLab 3000, Heto-Holten). To
evaluate the amount of Chol released from NPs-Chol1, the freeze dried residual was dissolved in water and derivatized
with 50 µL of N,O-bis(trimethylsilyl) trifluoroacetamide/trimethylchlorosilane (BSTFA/TMCS) (Sigma–Aldrich).The
mixture was heated at 60°C for 30 min. Then, the sample was equilibrated at 25°C and diluted with n-exane. The
quantification of the derivatized-Chol was performed by gas chromatography (GC) with selected ion monitoring mass
spectrometric (SIM-MSD) using Agilent (Santa Clara, CA, USA) 7890A gas chromatography interfaced with an 5975C
Series GC/MSD with Triple-Axis HED-EM Detector and equipped with an Agilent 190915-433 column
(30m*250µm*0.25µm). The chromatographic conditions were as follow: initial oven temperature 240°C which was

increased by 15°C/min to 315°C. The temperature of the injector was set at 280°C. Helium was used as the carrier gas in
a splitless mode injection (3 µL). In selected ion monitoring (SIM) mode three characteristic ions were analyzed (329,
353 and 368 m/z) and the most representative 329 m/z was used for the calibration.
Calibration was achieved starting from stock solution of Chol (1mg/mL) properly diluted with chloroform, evaporated to
dryness and analyzed in the manner previously described. Linearity was assured in the range 0.1-2.7 ppm (r2=0.998).
To evaluate the amount of NBD-Chol released from NPs-NBD-Chol1, the lyophilized residual was solubilized in 1:5 v/v
chloroform:isopropyl alcohol mixture and injected in a chromatographic system. The HPLC apparatus (Jasco, Model PU
2089 pump, injection valve model 7725i with a 20 µl sample loop) was correlated with a fluorimetric detector (Jasco FP
2020). Chromatographic separation was carried out on a Syncronis C18 column (250*4.6 µm; 5µm; ThermoScientific) at
30°C and at a flow-rate of l mL/min. Elution was performed in an isocratic mode using as mobile phase a 90:10 v/v
acetonitrile:isopropyl alcohol mixture. Mobile phase eluents were filtered through a 0.45 µm of hydrophilic
polypropylene membrane filters (Sartorius) before the use. The fluorescence of the eluent was monitored by excitation at
484 nm detecting the emission at 539 nm. A calibration curve was done by analyzing standard solution assuring linearity
in the range 0.4-16 µg/ml (r2=0.995).
In vitro release studies and NBD-Chol quantification
For quantitative studies, NS cells were plated in proliferation medium in 6-mwell plates at 300,000 cells/well.
Cells were treated for different time points (24-48-72 h) with 165 µL NPs-NBD-Chol1 suspension (4 mg/mL, 440 µg
NBD-Chol/100mg NPs) to receive 3 µg NBD-Chol. After the treatment, the cells were washed with PBS, collected in
tubes and centrifuged for 5 min at 1000xg. The centrifuged cell pellets were re-suspended in 400 µl of Lysis Buffer [10
mM TRIS HCl pH 7.5, 150 mM NaCl, 5 mM EDTA, supplemented with PMSF (phenylmethylsulfonyl fluoride) 1:200
and Protease inhibitor 1:100] to obtain a homogenate containing total NBD-Chol (released and still encapsulated into
NPs). A fraction of the homogenate (200 µL) was centrifuged for 15 min at 19000xg to separate NBD-Chol still
encapsulated into NPs (pellet) from NBD-Chol released after NPs degradation (surnatant). NBD-Chol was quantified in
duplicate in both fractions (pellet and surnatant) and in total homogenate by spectrophotometry at 488 nm. NBD-Chol
release was calculated by subtracting the NBD fluorescence detected in the pellet (containing the intact NPs) to NBD
fluorescence detected in the homogenate (total NBD-Chol present into cells).

Disruption of astrocyte-neuron cholesterol cross talkaffects neuronal function in Huntington’s disease
M Valenza1,3, M Marullo1,3, E Di Paolo1, E Cesana2, C Zuccato1, G Biella2 and E Cattaneo*,1
In the adult brain, neurons require local cholesterol production, which is supplied by astrocytes through apoE-containinglipoproteins. In Huntington’s disease (HD), such cholesterol biosynthesis in the brain is severely reduced. Here we show that thisdefect, occurring in astrocytes, is detrimental for HD neurons. Astrocytes bearing the huntingtin protein containing increasingCAG repeats secreted less apoE-lipoprotein-bound cholesterol in the medium. Conditioned media from HD astrocytes andlipoprotein-depleted conditioned media from wild-type (wt) astrocytes were equally detrimental in a neurite outgrowth assay anddid not support synaptic activity in HD neurons, compared with conditions of cholesterol supplementation or conditioned mediafrom wt astrocytes. Molecular perturbation of cholesterol biosynthesis and efflux in astrocytes caused similarly altered astrocyte–neuron cross talk, whereas enhancement of glial SREBP2 and ABCA1 function reversed the aspects of neuronal dysfunction in HD.These findings indicate that astrocyte-mediated cholesterol homeostasis could be a potential therapeutic target to ameliorateneuronal dysfunction in HD.Cell Death and Differentiation (2015) 22, 690–702; doi:10.1038/cdd.2014.162; published online 10 October 2014
Huntington's disease (HD) is an adult-onset neurodegenera-tive disorder characterized by cell loss mainly in the striatumand cortex. Its pathophysiology is linked to an expanded CAGrepeat in the IT-15 gene, which leads to an elongated polyQtract in huntingtin (HTT) protein. No disease-modifyingtreatment is available for HD and novel pathophysiologicalinsights and therapeutic strategies are needed.1
Lipids are vital to brain health and function. Accordingly, thebrain has a local source of cholesterol,2 and a breakdown ofcholesterol synthesis causes brain malformations andimpaired cognitive function.3,4 Cholesterol metabolism isdisrupted in HD5,6 as revealed by transcriptional, biochemical,andmass spectrometry analyses in HD rodent models.7,8 Thisdysregulation is linked to a specific action of mutant HTT onsterol-regulatory-element-binding proteins (SREBPs) and onits target genes, whose reduced transcription leads to lowerbrain cholesterol levels.7 In HD humans, brain cholesterolhomeostasis is affected since pre-symptomatic stages, asdetermined by measurement of the brain-specific cholesterolcatabolite 24-S-hydroxy-cholesterol (24OHC).9,10 However, itremains unclear how reduced brain cholesterol would becomepathological for HD neurons.In adulthood, astrocytes produce cholesterol, which is
secreted as a complex with apolipoprotein (apo) E lipoproteinsand delivered to neurons.11,12 Mutant HTT is expressed in glialcells,13,14 and transgenic mice overexpressing mutant HTT inastrocytes show age-dependent neurological symptoms.15,16
Additionally, primary astrocytes overexpressing full-length
human mutant HTT show reduced mRNA levels of cholesterolbiosynthetic genes, along with impaired cellular productionand secretion of apoE.8
Here we employed molecular and cellular tools to test theimpact of cholesterol perturbation between astrocytes andneurons in HD. Reduced secretion of cholesterol bound toapoE lipoproteins by HD astrocytes negatively influencedneurite outgrowth and neuronal synaptic properties. Further-more, gain-of-function experiments revealed that this non-cell-autonomousmechanism can be overridden throughmolecularenhancement of cholesterol biosynthesis in HD astrocytes.
Results
Astrocytes bearing mutant HTT protein display choles-terol dysfunction. To test whether and how cholesteroldysfunction in HD astrocytes impacted neuronal function, wetook advantage of neural stem (NS) cells that are capable ofdifferentiating into neurons or astrocytes depending onculture conditions17 (Supplementary Figures 1a and e).We first found that mRNA levels of hydroxyl-methyl-glutaryl-CoA reductase (hmgcr) were similar between wild-type (wt)and HD NS cells under self-renewal conditions, but wereseverely reduced in GFAP+ NS-derived astrocytes carryingmutant HTT with 140 CAG repeats (Q140/7 astrocytes)compared with wt NS-derived astrocytes (Q7/7 astrocytes)(Figure 1a). Accordingly, following 6–8 h of pre-incubationwith serum-free medium, the Q140/7 astrocytes secreted less
1Department of Biosciences and Centre for Stem Cell Research, Università degli Studi di Milano, Milano, Italy and 2Department of Biology and Biotechnology, Universitàdegli Studi di Pavia, Pavia, Italy*Corresponding author: E Cattaneo, Department of Biosciences and Centre for Stem Cell Research, Università degli Studi di Milano, Via Viotti 3/5, Milan, 20133, Italy.Tel: +39 02 50325830; Fax: +39 02 50325843; E-mail: [email protected] authors contributed equally to this work
Received 20.5.14; revised 13.8.14; accepted 03.9.14; Edited by M Piacentini; published online 10.10.14
Abbreviations: 24OHC, 24-S-hydroxy-cholesterol; Bsn, Bassoon; CAG, cytosine-adenine-guanine; fdft1, farnesyl-diphosphate farnesyltransferase; GCM, glial-conditioned medium; HD, Huntington’s disease; Hmgcr, hydroxyl-methyl-glutaryl-CoA reductase; HTT, huntingtin; LRP1, LDL receptor-related protein; NS, neural stem;SRE, sterol regulatory element; SREBPs, sterol regulatory element-binding proteins; Wt, wild-type
Cell Death and Differentiation (2015) 22, 690–702& 2015 Macmillan Publishers Limited All rights reserved 1350-9047/15
www.nature.com/cdd

apoE in the media compared with Q7/7 astrocytes (Figure 1b).ApoE level was also significantly decreased in the media froman allelic series of Hdh CAG knock-in NS cells carrying50 or 111 CAG repeats (Q50/7 and Q111/7 astrocytes) ina CAG length-dependent manner (Q7/74Q50/74Q111/7)(Figure 1c).17 HTT-depleted astrocytes displayed the samereduction in apoE level as in Q111/7 (Figure 1c), supportingthe hypothesis that normal HTT has a role in cholesterolsynthesis.18 Furthermore, primary astrocytes from a trans-genic HD mouse model (R6/2; Supplementary Figure 1f)secreted lower apoE levels compared with primary wtastrocytes (Figure 1d). Quantitative assays confirmed thatconcentrations of apoE (Figure 1e) and cholesterol(Figure 1f) were significantly reduced in conditioned mediafrom Q140/7 astrocytes and from primary R6/2 astrocytescompared with their respective controls. The impairment inapoE release is likely due to reduced synthesis of intracellularapoE as indicated by reduced mRNA and protein levels inYAC128 astrocytes8 and in R6/2 and HD NS-derivedastrocytes (Supplementary Figure 1g).Although apoE level was reduced in the media from R6/2
astrocytes, the sizes of apoE lipoproteins, as judged by non-denaturing gel electrophoresis, were similar in the media fromthe control and HD cultures (Figure 1g). This finding suggeststhat the total content of cholesterol bound to apoE lipoproteinssecreted by HD astrocytes was lower because of reducedapoE level and not as a consequence of inefficient lipoproteinlipidation. Together, these results indicate that HD astrocytesproduce and secrete less cholesterol bound to apoElipoproteins in vitro, with possible consequences for neuronalfunction.
Neurite outgrowth is reduced in HD neurons and isrescued by exogenous cholesterol. Upon exposure to apan-neuronal differentiation protocol, NS cells can beconverted into generic MAP2+ neurons.17,19 Here, we firstdifferentiated wt and HD NS cell lines towards neurons, andafter 7 days, the cells were fixed and immunostained with ananti-MAP2 antibody to visualize the neurites. Not surprisingly,neurite outgrowth was reduced in Q140/7 neurons comparedwith Q7/7 neurons, as shown by MAP2 staining (Figure 1h)and relative quantification using an automated neurite tracing(NeuriteTracer20) (Figure 1i). Flow cytometric analysis alsoshowed a reduced number of MAP2-positive cells inQ140/7 (28.3%) compared with Q7/7 neurons (44.1%;Supplementary Figure 2a). Notably, addition of cholesterolimproved neurite outgrowth in Q140/7 neurons (Figures 1hand i) with maximal effect at 7–10 μg/ml (Figure 1j). Abovethis concentration, cholesterol failed to promote neuriteoutgrowth, as depicted by the bell-shaped curves forQ140/7 neurons (Figure 1j) and, to a lesser extent, forQ7/7 neurons (Supplementary Figure 2b). In the sameexperimental paradigm, cholesterol treatment did not influ-ence cell survival/proliferation in control or HD neurons(Supplementary Figure 2c). Overall, these results highlight arelationship between neurite outgrowth and cholesteroladministration, demonstrating that exogenous cholesterolapplication is beneficial to HD neurons in vitro.
Glial-conditioned medium from HD astrocytes does notsupport neurite outgrowth in HD neurons. To test whetherglial-conditioned media (GCM) influenced HD neurons, wequantified neurite outgrowth following exposure to GCM fromwt and HD astrocytes. First, GCM from primary and NS-derived astrocytes were prepared (see Method section) andused to supplement the regular growth medium of Q140/7neurons, starting from day 4 of neuronal differentiation. Asobserved for exogenous cholesterol administration, GCMfrom primary wt astrocytes (GCM wt) or from Q7/7 astrocytes(GCM Q7/7) promoted neurite outgrowth in Q140/7 neuronswith respect to the cells under glial-free condition (not treated,NT) (Figures 2a and b). Conversely, GCM from primaryastrocytes generated from R6/2 mice (GCM R6/2), or fromQ50/7 or Q140/7 astrocytes (GCM Q50/7 and GCM Q140/7),did not promote neurite outgrowth (Figures 2a and b). Notsurprisingly, all GCMs (except for R6/2) performed better thanNT, although the difference was not significant, suggestingthat other glial components, not affected in the HD condition,contribute to neurite outgrowth.To test whether lipoproteins in the GCM were responsible
for promoting neurite outgrowth, we cultured Q140/7neurons with lipoprotein-depleted GCM from wt astrocytes(GCMwtdelip) or GCM from primary astrocytes generatedfrom apoE knock-out mice (GCM apoE− /−). NeitherGCM stimulated neurite outgrowth in Q140/7 neurons(Supplementary Figure 3a,b). Notably, neither GCM con-tained a detectable apoE level (Supplementary Figure 3c)whereas GCM apoE− /− contained higher levels of apoD(Supplementary Figure 3d), another lipoprotein expressed inthe brain, which is increased in apoE− /− mice to carry outsome of the apoE-dependent functions.21 These dataindicate that apoE lipoproteins in GCM are key factors instimulating neurite outgrowth by supplying cholesterolto HD neurons.
Genetic perturbation of astrocytic cholesterol productionand release influences neurite outgrowth in HD neurons.To further test the impact of cholesterol perturbation onneurite outgrowth in HD neurons, we performed gain- andloss-of-function experiments. We first silenced abca1, thegene encoding ATP-binding cassette transporter ABCA1, themajor regulator of cellular cholesterol homeostasis. Transfec-tion of wt primary astrocytes with small interfering RNAs(siRNA) against abca reduced the level of abca1 mRNA(abca-i) by 40% compared with wt astrocytes transfected withthe scrambled siRNA control (scrambled) (Figure 3a). Thisled to a 50% decrease of apoE levels secreted in the GCM(GCMwtabca-i) compared with GCM from scrambled astro-cytes (GCMwtscrambled) (Figure 3b). Importantly, neuriteoutgrowth was severely impaired when Q140/7 neurons werecultured with GCMwtabca-i, but not with GCMwtscrambled(Figures 3c and d). Overexpression of ABCA1 in R6/2astrocytes (Figure 3e) did not lead to increased apoElevel in the GCM (GCMR6/2ABCA1) compared withGCMR6/2pcDNA (Figure 3f, left), in agreement with theevidence that greater than sixfold overexpression of ABCA1in the mouse brain is required to alter apoE levels.22
However, ABCA1 overexpression stimulated R6/2 astrocytesto release larger apoE lipoproteins into the medium
Glial cholesterol and neuronal function in HDM Valenza et al
691
Cell Death and Differentiation

(Figure 3f, right, arrows), suggesting increased lipidation.When HD neurons were cultured with GCM from R6/2astrocytes overexpressing ABCA1 (GCMR6/2ABCA1), we
observed stimulated neurite outgrowth compared withuntreated HD neurons or treated with GCMR6/2 pcDNA(Figures 3g and h).
Glial cholesterol and neuronal function in HDM Valenza et al
692
Cell Death and Differentiation
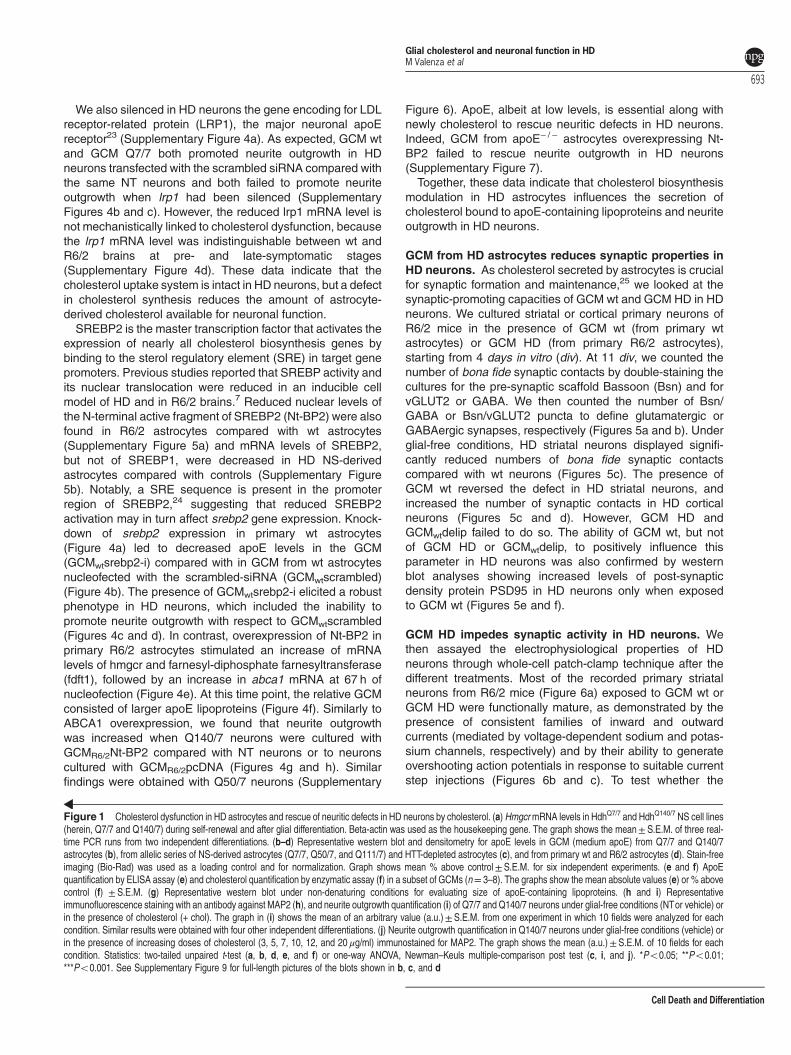
We also silenced in HD neurons the gene encoding for LDLreceptor-related protein (LRP1), the major neuronal apoEreceptor23 (Supplementary Figure 4a). As expected, GCM wtand GCM Q7/7 both promoted neurite outgrowth in HDneurons transfected with the scrambled siRNA compared withthe same NT neurons and both failed to promote neuriteoutgrowth when lrp1 had been silenced (SupplementaryFigures 4b and c). However, the reduced lrp1 mRNA level isnot mechanistically linked to cholesterol dysfunction, becausethe lrp1 mRNA level was indistinguishable between wt andR6/2 brains at pre- and late-symptomatic stages(Supplementary Figure 4d). These data indicate that thecholesterol uptake system is intact in HD neurons, but a defectin cholesterol synthesis reduces the amount of astrocyte-derived cholesterol available for neuronal function.SREBP2 is the master transcription factor that activates the
expression of nearly all cholesterol biosynthesis genes bybinding to the sterol regulatory element (SRE) in target genepromoters. Previous studies reported that SREBP activity andits nuclear translocation were reduced in an inducible cellmodel of HD and in R6/2 brains.7 Reduced nuclear levels ofthe N-terminal active fragment of SREBP2 (Nt-BP2) were alsofound in R6/2 astrocytes compared with wt astrocytes(Supplementary Figure 5a) and mRNA levels of SREBP2,but not of SREBP1, were decreased in HD NS-derivedastrocytes compared with controls (Supplementary Figure5b). Notably, a SRE sequence is present in the promoterregion of SREBP2,24 suggesting that reduced SREBP2activation may in turn affect srebp2 gene expression. Knock-down of srebp2 expression in primary wt astrocytes(Figure 4a) led to decreased apoE levels in the GCM(GCMwtsrebp2-i) compared with in GCM from wt astrocytesnucleofected with the scrambled-siRNA (GCMwtscrambled)(Figure 4b). The presence of GCMwtsrebp2-i elicited a robustphenotype in HD neurons, which included the inability topromote neurite outgrowth with respect to GCMwtscrambled(Figures 4c and d). In contrast, overexpression of Nt-BP2 inprimary R6/2 astrocytes stimulated an increase of mRNAlevels of hmgcr and farnesyl-diphosphate farnesyltransferase(fdft1), followed by an increase in abca1 mRNA at 67 h ofnucleofection (Figure 4e). At this time point, the relative GCMconsisted of larger apoE lipoproteins (Figure 4f). Similarly toABCA1 overexpression, we found that neurite outgrowthwas increased when Q140/7 neurons were cultured withGCMR6/2Nt-BP2 compared with NT neurons or to neuronscultured with GCMR6/2pcDNA (Figures 4g and h). Similarfindings were obtained with Q50/7 neurons (Supplementary
Figure 6). ApoE, albeit at low levels, is essential along withnewly cholesterol to rescue neuritic defects in HD neurons.Indeed, GCM from apoE− /− astrocytes overexpressing Nt-BP2 failed to rescue neurite outgrowth in HD neurons(Supplementary Figure 7).Together, these data indicate that cholesterol biosynthesis
modulation in HD astrocytes influences the secretion ofcholesterol bound to apoE-containing lipoproteins and neuriteoutgrowth in HD neurons.
GCM from HD astrocytes reduces synaptic properties inHD neurons. As cholesterol secreted by astrocytes is crucialfor synaptic formation and maintenance,25 we looked at thesynaptic-promoting capacities of GCM wt and GCM HD in HDneurons. We cultured striatal or cortical primary neurons ofR6/2 mice in the presence of GCM wt (from primary wtastrocytes) or GCM HD (from primary R6/2 astrocytes),starting from 4 days in vitro (div). At 11 div, we counted thenumber of bona fide synaptic contacts by double-staining thecultures for the pre-synaptic scaffold Bassoon (Bsn) and forvGLUT2 or GABA. We then counted the number of Bsn/GABA or Bsn/vGLUT2 puncta to define glutamatergic orGABAergic synapses, respectively (Figures 5a and b). Underglial-free conditions, HD striatal neurons displayed signifi-cantly reduced numbers of bona fide synaptic contactscompared with wt neurons (Figures 5c). The presence ofGCM wt reversed the defect in HD striatal neurons, andincreased the number of synaptic contacts in HD corticalneurons (Figures 5c and d). However, GCM HD andGCMwtdelip failed to do so. The ability of GCM wt, but notof GCM HD or GCMwtdelip, to positively influence thisparameter in HD neurons was also confirmed by westernblot analyses showing increased levels of post-synapticdensity protein PSD95 in HD neurons only when exposedto GCM wt (Figures 5e and f).
GCM HD impedes synaptic activity in HD neurons. Wethen assayed the electrophysiological properties of HDneurons through whole-cell patch-clamp technique after thedifferent treatments. Most of the recorded primary striatalneurons from R6/2 mice (Figure 6a) exposed to GCM wt orGCM HD were functionally mature, as demonstrated by thepresence of consistent families of inward and outwardcurrents (mediated by voltage-dependent sodium and potas-sium channels, respectively) and by their ability to generateovershooting action potentials in response to suitable currentstep injections (Figures 6b and c). To test whether the
Figure 1 Cholesterol dysfunction in HD astrocytes and rescue of neuritic defects in HD neurons by cholesterol. (a) HmgcrmRNA levels in HdhQ7/7 and HdhQ140/7 NS cell lines(herein, Q7/7 and Q140/7) during self-renewal and after glial differentiation. Beta-actin was used as the housekeeping gene. The graph shows the mean± S.E.M. of three real-time PCR runs from two independent differentiations. (b–d) Representative western blot and densitometry for apoE levels in GCM (medium apoE) from Q7/7 and Q140/7astrocytes (b), from allelic series of NS-derived astrocytes (Q7/7, Q50/7, and Q111/7) and HTT-depleted astrocytes (c), and from primary wt and R6/2 astrocytes (d). Stain-freeimaging (Bio-Rad) was used as a loading control and for normalization. Graph shows mean % above control± S.E.M. for six independent experiments. (e and f) ApoEquantification by ELISA assay (e) and cholesterol quantification by enzymatic assay (f) in a subset of GCMs (n= 3–8). The graphs show the mean absolute values (e) or % abovecontrol (f) ± S.E.M. (g) Representative western blot under non-denaturing conditions for evaluating size of apoE-containing lipoproteins. (h and i) Representativeimmunofluorescence staining with an antibody against MAP2 (h), and neurite outgrowth quantification (i) of Q7/7 and Q140/7 neurons under glial-free conditions (NTor vehicle) orin the presence of cholesterol (+ chol). The graph in (i) shows the mean of an arbitrary value (a.u.)± S.E.M. from one experiment in which 10 fields were analyzed for eachcondition. Similar results were obtained with four other independent differentiations. (j) Neurite outgrowth quantification in Q140/7 neurons under glial-free conditions (vehicle) orin the presence of increasing doses of cholesterol (3, 5, 7, 10, 12, and 20 μg/ml) immunostained for MAP2. The graph shows the mean (a.u.)± S.E.M. of 10 fields for eachcondition. Statistics: two-tailed unpaired t-test (a, b, d, e, and f) or one-way ANOVA, Newman–Keuls multiple-comparison post test (c, i, and j). *Po0.05; **Po0.01;***Po0.001. See Supplementary Figure 9 for full-length pictures of the blots shown in b, c, and d
Glial cholesterol and neuronal function in HDM Valenza et al
693
Cell Death and Differentiation

reduced cholesterol complexed to apoE lipoproteins in GCMHD had an impact on synaptic activity in HD neurons, weperformed whole-cell recordings at 9–12 div, followingincubation with GCM wt or GCM HD for 5–6 days. HD striatalneurons exhibited increased input resistance (Rin) underglial-free conditions compared with wt neurons. Importantly,exogenous cholesterol administration in the presence ofGCM HD restored Rin in HD neurons to wt level (Figures 6d).Although the difference between HD and wt neurons in basalconditions was not statistically significant, application ofneither GCM wt or GCM HD in HD neurons led to asignificant increase in the membrane capacitance (Cm), aparameter directly correlated with cell size (Figure 6e). Theseresults suggest that exogenous cholesterol may influenceinput resistance, but that other glial-derived molecules mightinfluence the charge storing in HD neurons.Finally, we tested the capability of the cells to develop in vitro
a functional synaptic network, by analyzing post-synapticactivity (Figures 6f and i). Under NT conditions, only 4 out of 27HD neurons (14.8%) produced post-synaptic currents com-pared with 10 out of 22 wt neurons (45.4%), suggesting thatHD neurons had lower spontaneous activity (Figure 6g),consistently with a loss of synaptic contacts and a reducedpost-synaptic expression. Notably, 15 out of 22 (68.2%) of HDneurons showed spontaneous synaptic activity in the pre-sence of GCM wt, and 9 out of 28 (32.1%) in the presence ofGCM HD. Cholesterol administration to HD neurons, even inthe presence of GCMHD, stimulated spontaneous activity in 7out of 10 (70%) of the recorded cells (Figure 6g), even with ahigher mean frequency (2.475±0.99 Hz) compared withuntreated HD cells (0.42± 0.15 Hz; P= 0.0238) or in the
presence of GCM HD (0.29±0.06 Hz; P=0.002) (Figure 6h).Additionally, themean amplitudewas significantly increased inthe presence of GCM wt compared with GCM HD (34.7± 4.7pA versus 17.30±4.47 pA;P=0.017), even in the presence ofexogenous cholesterol (20.93±4.1 pA) (Figure 6i), suggest-ing that other glial molecules might influence this parameter inHD neurons. These findings indicate that a reduced supplyof glial-derived cholesterol affects synaptic activity in HDneurons and this may be reversed by cholesterolsupplementation.
Discussion
Astrocytes, the major cellular component of the CNS,26 supplyneurons with energy metabolites, growth factors, neurotrans-mitter recycling functions, and structural support. Cholesteroland glial-conditioned medium have a well-documented role inpromoting axonal outgrowth in vitro under physiologicalconditions. Glial-derived lipoproteins containing cholesterolstimulate axon growth27 and transcription of genes involved indendrite and synapse development28 in primary rat retinalganglion cells; their co-culture with glial cells enhancessynaptic activity and neurite outgrowth and branching inPurkinje neurons,29 and cholesterol deficiency inhibits den-drite outgrowth in primary cortical and hippocampalneurons.30 Impairments in astrocytic function are increasinglyrecognized as a culprit in neuronal dysfunction in neurode-generative diseases,31 such as amyotrophic lateralsclerosis,32 Rett’s syndrome,33,34 lysosomal disorders,35
Alzheimer’s disease,36 and HD.16 Accordingly, astrocytekir4.1 ion channel deficits contribute to neuronal dysfunction in
Figure 2 GCM from R6/2 astrocytes does not promote neurite outgrowth in HD NS-derived neurons. (a) Representative immunofluorescence staining for MAP2 in Q140/7neurons under glial-free conditions (NT) or in the presence of GCM from primary astrocytes from wt mice (+GCM wt) or from R6/2 mice (+GCM R6/2), or GCM from Q7/7 (+GCMQ7/7), Q50/7 (+GCM Q50/7), and Q140/7 (+GCM Q140/7) NS-derived astrocytes. Scale bars: 25 μm. (b) Relative neurite outgrowth quantification. The graph shows the mean(a.u.)± S.E.M. of one experiment in which 10 fields were analyzed for each condition. Similar results were obtained in two other independent differentiations. Statistics: one-wayANOVA, Newman–Keuls multiple-comparison post test (b). *Po0.05; **Po0.01; ***Po0.001
Glial cholesterol and neuronal function in HDM Valenza et al
694
Cell Death and Differentiation

Figure 3 Genetic modulation of ABCA1 in astrocytes influences neurite outgrowth in HD neurons. (a) mRNA levels of abca1 in primary wt astrocytes after transfection withsiRNA against abca1 (abca-i) compared with the same cells transfected with scramble siRNA as a control (scrambled). (b) ApoE levels released in the corresponding GCMs.(c) Representative immunofluorescence staining for MAP2 in Q140/7 neurons under glial-free conditions (NT), in the presence of GCMwtscrambled, and in the presence ofGCMwtabca-i. (d) Relative neurite outgrowth quantification. (e) Western blot analysis for ABCA1 in primary R6/2 astrocytes after overexpression of ABCA1 (+ABCA1) or an emptyvector (pcDNA). (f) Relative apoE levels (left) and sizes (right) in the corresponding GCM. (g) Representative immunofluorescence staining for MAP2 in Q140/7 neurons underglial-free conditions (NT), in the presence of GCMR6/2 pcDNA, and in the presence of GCMR6/2 ABCA1. (h) Relative neurite outgrowth quantification. Graphs in a, b, e, and f showthe mean % above relative controls± S.E.M. Scale bars: 25 μm. Graphs in d and h show the mean (a.u.)±S.E.M. of one experiment in which 10 fields were analyzed for eachcondition. Similar results were obtained in two (d) and three (h) other independent differentiations. Statistics: two-tailed unpaired t-test (a and b) or one-way ANOVA withNewman–Keuls multiple-comparison post test (d and h). *Po0.05; **Po0.01; ***Po0.001. The samples in b were run together with GCMwtsrebp2-i shown in Figure 4b. Thecontrol sample (GCMwtscrambled) shown in b and in Figure 4b is the same. See Supplementary Figure 9 for full-length pictures of the blots shown in b, e, and f
Glial cholesterol and neuronal function in HDM Valenza et al
695
Cell Death and Differentiation

Figure 4 Genetic modulation of SREBP2 in astrocytes influences neurite outgrowth in HD neurons. (a) mRNA levels of srebp2 in wt primary astrocytes after transfection withsiRNA against srebp2 (srebp2-i) compared with the same cells transfected with a scramble as control (scrambled) and (b) apoE levels released in the corresponding GCMs.(c) Representative immunofluorescence staining for MAP2 in Q140/7 neurons in glial-free condition (NT), in the presence of GCMwt scrambled or in the presence GCMwt srebp2-iand (d) relative neurite outgrowth quantification. Scale bars: 25 μm. (e) mRNA levels of hmgcr, fdft1, and abca1 in primary R6/2 astrocytes overexpressing the N-terminalfragment of SREBP2 (Nt-BP2) or an empty vector (pcDNA) at different time points from the nucleofection. (f) ApoE-containing lipoproteins size in non-denaturing condition in thecorresponding GCM from R6/2 astrocytes overexpressing an empty vector (pcDNA) or Nt-BP2. (g) Representative immunofluorescence staining for MAP2 in Q140/7 neurons inglial-free condition (NT), in the presence of GCMR6/2pcDNA and in the presence GCMR6/2Nt-BP2, and (h) relative neurite outgrowth quantification. Graphs in a, b, and e showmean as % above relative controls± S.E.M. Graphs in d and h show the mean (a.u.)± S.E.M. for one experiment in which 10 fields were analyzed for each condition. Similarresults were obtained in other two independent differentiations. Statistics: two-tailed, unpaired t test (a, b, and e) or one-way ANOVA with Newman–Keuls multiple-comparisonpost test (d and h). *Po0.05; **Po0.01; ***Po0.001. The samples in b were run together with GCMwtabca-i shown in Figure 3b. The control sample (GCMwtscrambled) shownin b and in Figure 3b is the same. See Supplementary Figure 9 for full-length pictures of the blots shown in b
Glial cholesterol and neuronal function in HDM Valenza et al
696
Cell Death and Differentiation
HD,37 highlighting that some electrophysiological features ofstriatal dysfunction in HD can be secondary to glial dis-turbances. Here, we demonstrate that HD astrocytes affectneuronal function through their reduced synthesis andsecretion of cholesterol bound to apoE lipoproteins.We found that HD NS-derived neurons displayed neurite
outgrowth defects at day 7 of neuronal differentiation whencompared with control neurons. Conditioned media from wtastrocytes, but not from HD astrocytes, rescued the neuriticdefect, suggesting that cholesterol dysfunction in glial cellsmay contribute to neuritic morphology defects, therebycompromising neuron function. Although several glial-derived factors may contribute to neurite outgrowth in culturedneurons,38 we demonstrated a direct link between glialcholesterol and neurite outgrowth in HD neurons. First, weshowed that cholesterol administration rescued neuriticdefects in HD neurons during early stages of differentiation.This effect was specifically observed with cholesterol con-centrations of 7–10 μg/ml, suggesting that HD neuronsdepend on exogenous cholesterol for their activities and thatcholesterol concentration is critical for this effect. Notably, thisis the same concentration at which cholesterol is found inGCM.11 Second, we found that lipoprotein-depletedGCM fromwt astrocytes did not support neurite outgrowth and synapticproperties in HD neurons, pointing out a role of lipoproteins inneuronal function. Third, media conditioned by primaryastrocytes from apoE− /− mice did not improve neuronalproperties in HD neurons, despite the presence of higherlevels of apoD, supporting the unique role of cholesterol boundto apoE lipoproteins present in GCM. Finally, abca1 silencingin wt astrocytes negatively influenced neurite outgrowth in HDneurons, whereas its overexpression in HD astrocytes had theopposite effect. This is in agreement with the critical role ofABCA1 in brain cholesterol metabolism and neuronalfunction.39 The evidence that lrp1 mRNA levels are similar inwt and R6/2 brains also confirms that HD astrocytes are themediators of cholesterol dysfunction in HD. Modulation ofcholesterol efflux might be an alternative strategy for targetingcholesterol-dependent neuronal defects in HD. Agonists ofliver-X receptors induced transcription of ABCA1 and apoE,reduced amyloid-β levels and improved cognition in Alzhei-mer’s disease,40 and may reduce neuroinflammation.41 More-over, an liver-X receptor agonist partially rescued HTTknockdown phenotypes in Zebrafish.42 However, furtherstudies are needed to evaluate the potential of these drugsin HD and to develop more brain-specific liver-X receptoragonists.Our findings suggest a prominent role of glial SREBP2 in
neuronal function. SREBP2 is expressed in glial cells and itsactivity likely controls the synthesis of lipids involved in variousglia–neuron interactions, thereby affecting a range of neuronalfunctions.43–45 SREBP1 and SREBP2 activities are reducedin the presence of mutant HTT, both in vitro and in vivo.7
Although the details of the underlying molecular mechanismare unknown, mutant HTT likely interferes with the Golgi-to-nucleus translocation of the active SREBP.7 The effects onneurite outgrowth in HD neurons following the silencing oroverexpression of active SREBP2 in astrocytes demonstrate alink between cholesterol synthesis in astrocytes and subse-quent efflux likely under the regulating effect of oxysterols,
such as 24OHC.46 Reduced levels of 24OHC in HD8–10 maytherefore exacerbate cholesterol unbalance between astro-cytes and neurons.In the absence of cell death, HD animal models exhibit
abnormalities in synaptic communication47,48 and neuronaldysfunction precedes cell death by many years in HDhumans.49 Similarly, cholesterol biosynthesis disruption inHD animal models and patients occurs before the onset ofmotor defect.9,10,18,50 Additionally, synaptosomes carry sub-optimal levels of sterols in early R6/2 model.8 Here, weshowed that a non-cell autonomous cholesterol-handlingdefect in astrocytes affects cholesterol shuttling betweenastrocytes and neurons, which has a reversible detrimentaleffect on synaptic-related parameters in HD neurons.How does reduced glial cholesterol contribute to neuronal
dysfunction in HD? Cholesterol promotes different aspects ofsynapse development and maintenance, including dendritedifferentiation, synaptic vesicle formation and release, andreceptor clustering and stability.12–53 Of note, proteome-widemapping of cholesterol-interacting proteins in mammaliancells reveals that most of these proteins are linked toneurological disorders.54 Neurons produce cholesterol lessefficiently than glial cells55 and the appearance of mostsynapses in the developing brain is temporally and spatiallycoincident with astrocyte development, suggesting thatsynapse formation may depend on astrocytes-derivedcholesterol.56 Changes in cholesterol pathways and in apoEexpression have been also associated to NMDA-mediatedexcitotoxicity.57–59 Of note, 24OHC is a potent and specificmodulator of NMDA receptors.60 Although cholesterol home-ostasis has been reported to contribute to enhancedexcitotoxicity in HD,61 however, further studies are needed toaddress this relationship.In conclusion, our results indicate that HD astrocytes are
responsible for cholesterol dysfunction in the HD brain, bysupplying less cholesterol to the surrounding neurons. GlialSREBP2 might be a candidate target for in vivo approachesaiming to explore the contribution of glial cholesterol dysfunc-tion in HD. Its enhancement may contribute to attenuatingneurite degeneration and synaptic defects in HD neurons.
Materials and MethodsNeural stem cell lines and neuronal differentiation. The NS cell linesemployed in this study were grown and differentiated towards neurons for 7 days, aspreviously described.17
Primary cultures of neurons. We used primary neurons to measuresynaptic properties because NS-derived neurons did not reach complete functionalmaturation in vitro (data not shown). Primary cultures of striatal neurons weregenerated from transgenic R6/2 mice that overexpress exon 1 of the human HTTgene containing 150 CAG repeats. At embryonic day (E) 16.5, tails from eachembryo were used to extract genomic DNA and to perform PCR for genotypedetermination. Next, the brain was dissected and tissue was placed into ice-coldHIBERNATE MEDIA (Life Technologies Italia, Monza, Italy). Cells were obtained firstthrough an enzymatic disaggregation with 0.5 mg/ml papain (Worthingtonbiochemical Corporation, Lakewood, NJ, USA) for 15 min at 37 °C, and then bymechanical dissociation. The dissociated cells were resuspended in DMEM(Invitrogen, Life Tecnhologies Italia) supplemented with 10% fetal bovine serum,0.5 mM L-glutamine (Invitrogen), and 100 U/ml of penicillin-streptomycin (Invitrogen).They were then seeded at a density of 400 000 cells per well in 12-well plates or1 000 000 cells per well in 6-well plates. After 1 div, the medium was totally replacedwith DMEM/F12 supplemented with B27 1 × (Life Technologies), 0.5 mM
Glial cholesterol and neuronal function in HDM Valenza et al
697
Cell Death and Differentiation

L-glutamine (Invitrogen), and 100 U/ml of penicillin-streptomycin (Invitrogen). Cellswere cultured for 11 div with multiple medium changes.
Glial-conditioned medium preparation. NS-derived astrocytes wereobtained by plating NS cells on uncoated 25-cm2 flasks, and exposing them to
Glasgow Minimum Essential Medium (Celbio, Euroclone S.p.a., Milan, Italy) inthe presence of 10% fetal bovine serum, 0.5 mM L-glutamine (Invitrogen), and100 U/ml of penicillin-streptomycin (Invitrogen) for 14 days, with the mediumchanged every 3 days. Primary astrocytes were generated from postnatal day 1pups as previously described.8 Astrocytes were seeded in six-well plates
Figure 5 GCM HD does not promote synaptic properties in HD neurons. (a and b) Fluorescence images of primary cortical and striatal neurons under glial-free conditions(NT) or in the presence of GCM wt, GCM R6/2, or GCM delip, double-immunostained with Bassoon (red, middle panels) and either VGLUT-2 or GABA (green, bottom panels),along with the relative co-localization (merge; col.). (c and d) Quantification of puncta that are double-positive for Bassoon and either VGLUT-2 or GABA to identify glutamatergicand GABAergic bona-fide synapses, respectively. Scale bars: 5 μm. (e and f) Western blot analysis for PSD95 in protein lysates from primary R6/2 (HD) striatal and corticalneurons under glia-free conditions (NT) or in the presence of GCM wt, GCM R6/2, or GCM delip. (c and d) Graphs show the mean % above relative controls±S.E.M. from 10fields each for three independent experiments. Statistics: one-way ANOVA with Newman–Keuls multiple-comparison post test. *Po0.05; **Po0.01; ***Po0.001. SeeSupplementary Figure 9 for full-length pictures of the blots shown in e and f
Glial cholesterol and neuronal function in HDM Valenza et al
698
Cell Death and Differentiation

(1 600 000/well) and, 24 h later, were exposed to serum-free DMEM/F12 (Invitrogen)for 6–8 h. Conditioned medium was collected, centrifuged at 1000 × g for 4 min, andthen concentrated 10-fold using Amicon Ultra-4 filter devices (Millipore, Billerica,MA, USA). Lipoprotein-depleted GCM was prepared by mixing 5 ml of GCM with
50 mg of colloidal silica that avidly binds lipoproteins (Cab-o-sil, Sigma-Aldrich,St Louis, MO, USA). After 30 min of mixing, the Cab-o-sil (which contained boundlipoproteins) was removed from the medium by centrifugation for 5 min at 1000 × g.Immunoblotting showed that the Cab-o-sil-treated GCM contained no detectable
Figure 6 GCM wt, but not GCM HD, stimulates synaptic activity in HD neurons. (a) Representative fluorescent image of a recorded primary striatal neuron immunostained forbiocytin and GABA. (b and c) Family of fast inward (negative) and outward (positive) currents, reflecting the presence of sodium (Na+) and potassium (K+) channels, respectively,recorded in response to depolarizing 10 mV voltage step (from − 90 to +50 mV) and sample traces of repetitive action potentials in primary R6/2 (HD) striatal neurons recorded inresponse to increasing current step injection from a holding potential of − 70 mV in the presence of GCM wt or GCM HD. (d and e) Histograms showing the input resistance (Rin)(d) and the membrane capacitance (Cm) (e) in primary wt and HD striatal neurons under different medium conditions. (f) Sample current traces of spontaneous synaptic activityrecorded in voltage-clamp at− 70 mV. (g–i) Histograms showing the % of neurons able to produce spontaneous PSCs (g), the mean frequency (h), and the mean amplitude (i) ofsynaptic events. Data in d, e, g, h, and i are shown as mean± S.E.M. Numbers inside the columns represent the number of recorded cells (d and e) or recorded cells showingPSCs (h). P values were determined by non-parametric Mann–Whitney test. *Po0.05; **Po0.01; ***Po0.001; ns= not statistically significant
Glial cholesterol and neuronal function in HDM Valenza et al
699
Cell Death and Differentiation

apoE. Each stock of GCMs used for subsequent experiments was first checked forapoE levels.
Medium apoE analysis. Equal volumes of concentrated media were resolvedon Criterion TGX Stain-Free Gels (Bio-Rad, Hercules, CA, USA) with SDS. Thesestain-free gels contain proprietary trihalo compounds that react with tryptophanresidues, producing fluorescent light through an ultraviolet light-induced reaction.Stain-free imaging of the gels and membranes, corresponding to proteins in thesamples, was used as loading control and for normalization.62 Proteins weretransferred to a nitrocellulose membrane using a Trans-Blot Turbo system (Bio-Rad). They were then probed with a polyclonal goat anti-apoE antibody (1 : 800;AB947, Millipore), washed, and probed with HRP-conjugated horse anti-goat IgG(1 : 3000; Bio-Rad). Bands were visualized with enhanced chemoluminescence(Pierce, Thermo Scientific, Rockford, IL, USA) and imaged with ChemiDoc MPImaging System (Bio-Rad).
Nondenaturing gradient gel electrophoresis. GCM samples weremixed 1 : 1 with native sample buffer (Bio-Rad) and electrophoresed onCriterion TGX Stain-Free 4–15% Gels (Bio-Rad). Proteins were transferred to anitrocellulose membrane and probed with apoE antibody as described above.Proteins with known hydrated diameters were used as size standards(GE Healthcare, Buckinghamshire, UK).
ApoE ELISA. For in vitro quantitative determination of mouse apoEconcentration in GCMs, we used the Mouse apoE ELISA Kit (MyBioSource, SanDiego, CA, USA) following the manufacturer’s procedures. Only fresh media wereused for the analyses.
Measurement of total cholesterol. Total cholesterol content wasevaluated in 10-fold concentrated GCMs. A colorimetric assay was performedusing the Cholesterol Kit (Amplex Red Cholesterol Assay Kit, Invitrogen) followingthe manufacturer’s instructions.
Immunofluorescence. Cells were fixed in 4% paraformaldehyde for 15 min atroom temperature, and washed three times with PBS. The cells were permeabilizedwith Triton 0.5% (Sigma) and blocked with 5% fetal bovine serum (Euroclone S.p.a.)for 1 h at room temperature. Cells were then incubated overnight at 4 °C with one ofthe following primary antibodies: mouse anti-MAP2 (1 : 500; Becton Dicknson,Franklin Lakes, NJ, USA), rabbit anti-VGLUT2 (1 : 500; Synaptic Systems GmbH,Goettinger, Germany), rabbit anti-GABA (1 : 500; Sigma-Aldrich), mouse anti-GFAP(1 : 500; Becton Dickinson), and rabbit anti-S100β (1 : 200; Sigma-Aldrich). Next,the cells were washed three times with PBS, followed by a 1-h incubation at roomtemperature with the appropriate secondary antibodies conjugated to 488 or 568Alexa-fluorophores (Molecular Probes, Life Technologies). Finally, the cells werewashed three times with PBS, and the nuclei were stained with Hoechst 33258(5 mg/ml; Molecular Probes, Life Technologies). Images were acquired with a LeicaDMI 6000B microscope (Leica microsystems, Wetzlar, Germany) with × 10 and × 20objectives, using LAS-AF imaging software (Leica microsystems). Adobe PhotoshopCS3 (Adobe Systems Incorporated, San Jose, CA, USA) was used to increase theimage quality by applying the same values of luminosity and contrast to all imagesbeing compared.
Neurite outgrowth quantification. Total neurite length was estimatedusing the ImageJ plugin Neurite Tracer20 in combination with a modified macro forcounting neuronal nuclei that was developed in the lab. The analysis was performedblind to the experimental conditions. In the main figures, the data are represented asthe mean (a.u.)±S.E.M. of one experiment in which 10 fields were analyzed foreach condition. Graphs showing neurite outgrowth quantification expressed as %above the relative controls, as mean of all the independent experiments performedin this work have been showed in Supplementary Figure 8.
Flow cytometry. Detached cells were fixed in 0.1% paraformaldehyde,permeabilized for 15 min in a 0.2% Tween20 solution, and resuspended in fetalbovine serum. We then added a solution containing primary antibodies (anti-MAP2,1 : 500, Becton Dickinson; anti-GFAP, 1 : 500, Becton Dickinson; anti-S100β, 1 : 200,Sigma-Aldrich). After washing, appropriate Alexa488- and 647-conjugatedsecondary antibodies were used (1 : 1000). Primary isotypic antibodies were usedas controls. Analyses were performed using a FACS Canto II analyzer (BD
Biosciences, San Jose, CA, USA) and BD FACSDiva v6.1.3 software. For eachcondition, 10 000 cells were analyzed.
Cell proliferation assays. On day 3 of neuronal differentiation, NS cells wereplated on laminin-coated (3 μg/ml for 3–5 h at 37 °C) 96-well microplates, at30 × 103 cells/well. The CyQuant NF Cell Proliferation Assay Kit (Molecular Probes,Invitrogen) was used to assay cell viability after treatment of the cells for 24, 48, 72,and 96 h with different doses of cholesterol, following the manufacturer’sprocedures.
Nucleofection. The Amaxa Cell Line Optimization Nucleofector Kit (Lonza,Basel, Switzerland) was used to modulate gene expressions in different cell lines.Electroporation was performed using pre-set programs: T-020 for the nucleofectionof primary astrocytes, and A-033 for NS-derived neurons. The following constructswere used: specific siRNA for abca, srebp2 and lrp1 (Santa Cruz Biotechnology,Inc., Santa Cruz, CA, USA), plasmid overexpressing ABCA1 (gift by S. Calandra,University of Modena) and plasmid overexpressing the active fragment of SREBP2(as described previously6).
RNA isolation, retrotranscription, and real-time PCR for geneexpression. Total RNA from cell cultures was isolated with TRIZOL Reagent(Invitrogen). Total RNA (0.25–0.5 μg) was reverse-transcribed to single-strandedcDNA using the iScript cDNA synthesis kit (Bio-Rad). For each reverse-transcribedproduct, three real-time PCR analyses were performed in duplicate for each of theanalyzed genes. An iCycler Thermal Cycler with a Multicolor Real-time PCRDetection System (Bio-Rad) was used to evaluate gene expressions. All reactionswere performed in a total volume of 15 μl, containing 60 ng cDNA, 50 mM KCl,20 mM Tris-HCl (pH 8.4), 0.2 mM dNTPs, 25 U/ml iTaq DNA polymerase, 3 mMMgCl2, SYBR Green I, 10 nM fluorescein, stabilizers (iQ EVA Green Supermix; Bio-Rad), and 0.2 μM forward and reverse primers. Amplification cycles consisted of aninitial denaturing cycle at 95 °C for 3 min, followed by 45 cycles of 30 s at 95 °C,30 s at 60 °C (for all analyzed genes), and 30 s at 72 °C. Fluorescence wasquantified during the annealing step, primer specificity and product formation wereconfirmed by melting curve analysis (55–94 °C), and the amounts of target genemRNA were normalized to β-actin as reference gene and by using the calibrationcurve method. The following primer sequences were used: Hmgcr fwd,GGAGCATAGGCGGCTACA; Hmgcr rev, ACCACCCACGGTTCCTATCT; Fdft fwd,ACTCAGCAGCAGCTTGAAGACC; Fdft rev, TGTCATCCTCCACTGTATCCAG;Abca1 fwd, GTCAGCTGTTACTGGAAGTGG; Abca1 rev, CGCCGGGAGTTGGATAACGG; lrp1 fwd, AGGCCACCTCTGCAGCTGT; lrp1 rev, GCTGCGGATCTCGTTGTCATC; Actin fwd, AGTGTGACGTTGACATCCGTA; Actin rev, GCCAGAGCAGTAATCTCCTTCT; Srebp2 fwd, GCCTCTCCTTTAACCCCTTG; and Srebp2 rev,CCAGTCAAACCAGCCCCCAG.
Quantification of bona fide synapses. Following the above-describedprocedures, we performed standard immunofluorescence on primary neuronalcultures with a mouse anti-Bassoon antibody (1 : 400; Stressgen Biotechnologies,Collegeville, PA, USA) and with the specific neuronal markers v-GLUT2 and GABA.Confocal images were acquired with a Zeiss LSM 510 laser-scanning confocalmicroscope with AIM4.2 software (Zeiss, Oberkochen, Germany). The number ofco-localizations was quantified using the ‘Red and Green Puncta Colocalization’macro under the ImageJ analysis software platform (U.S. National Institutes ofHealth, Bethesda, MD, USA).
Western blot analysis. Cells were lysed by adding 50 μl of RIPA buffersupplemented with PMSF (1 : 250; Sigma-Aldrich) and protease inhibitors (1 : 100;Sigma-Aldrich). After centrifugation at 10 000 × g for 5 min, the supernatant wascollected and the protein concentration was determined by BCA assay (ThermoScientific). Nuclear extracts to evaluate the active form of SREBP2 were preparedas previously described.7 Proteins were separated by SDS-polyacrylamide gelelectrophoresis and then transferred to a nitrocellulose membrane using a Trans-Blot Turbo System (Bio-Rad). The membranes were next probed with mouse anti-PSD95 (1 : 1000; Synaptic Systems), rabbit anti-ABCA1 (1 : 500; gift fromM. Hayden), goat anti-apoE (1 : 800; AB947, Millipore), mouse anti-α-tubulin(1 : 5000; Sigma-Aldrich), rabbit anti-SREBP2 (1 : 200; Abcam, Cambridge, MA,USA) followed by washing, and probing with horseradish peroxidase-conjugatedsecondary antibodies (1 : 3000; Bio-Rad). Bands were visualized with enhancedchemoluminescence (Pierce) and imaged with the ChemiDoc MP Imaging System(Bio-Rad).
Glial cholesterol and neuronal function in HDM Valenza et al
700
Cell Death and Differentiation
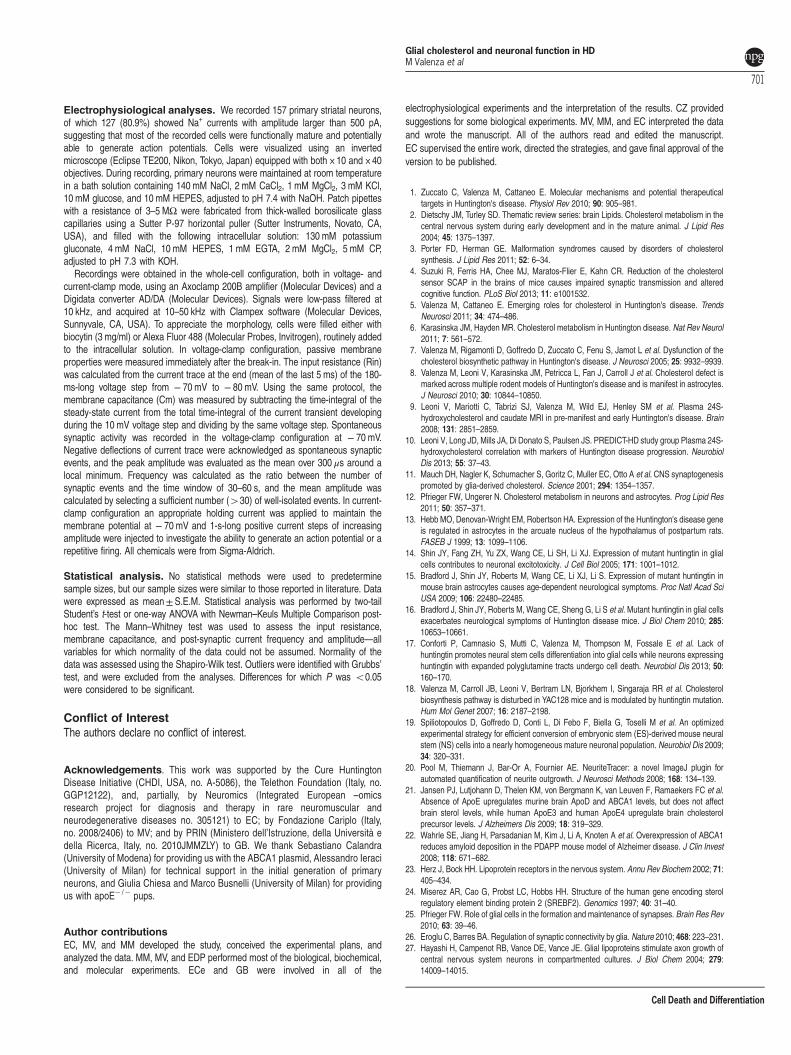
Electrophysiological analyses. We recorded 157 primary striatal neurons,of which 127 (80.9%) showed Na+ currents with amplitude larger than 500 pA,suggesting that most of the recorded cells were functionally mature and potentiallyable to generate action potentials. Cells were visualized using an invertedmicroscope (Eclipse TE200, Nikon, Tokyo, Japan) equipped with both × 10 and × 40objectives. During recording, primary neurons were maintained at room temperaturein a bath solution containing 140 mM NaCl, 2 mM CaCl2, 1 mM MgCl2, 3 mM KCl,10 mM glucose, and 10 mM HEPES, adjusted to pH 7.4 with NaOH. Patch pipetteswith a resistance of 3–5 MΩ were fabricated from thick-walled borosilicate glasscapillaries using a Sutter P-97 horizontal puller (Sutter Instruments, Novato, CA,USA), and filled with the following intracellular solution: 130 mM potassiumgluconate, 4 mM NaCl, 10 mM HEPES, 1 mM EGTA, 2 mM MgCl2, 5 mM CP,adjusted to pH 7.3 with KOH.Recordings were obtained in the whole-cell configuration, both in voltage- and
current-clamp mode, using an Axoclamp 200B amplifier (Molecular Devices) and aDigidata converter AD/DA (Molecular Devices). Signals were low-pass filtered at10 kHz, and acquired at 10–50 kHz with Clampex software (Molecular Devices,Sunnyvale, CA, USA). To appreciate the morphology, cells were filled either withbiocytin (3 mg/ml) or Alexa Fluor 488 (Molecular Probes, Invitrogen), routinely addedto the intracellular solution. In voltage-clamp configuration, passive membraneproperties were measured immediately after the break-in. The input resistance (Rin)was calculated from the current trace at the end (mean of the last 5 ms) of the 180-ms-long voltage step from − 70 mV to − 80 mV. Using the same protocol, themembrane capacitance (Cm) was measured by subtracting the time-integral of thesteady-state current from the total time-integral of the current transient developingduring the 10 mV voltage step and dividing by the same voltage step. Spontaneoussynaptic activity was recorded in the voltage-clamp configuration at − 70 mV.Negative deflections of current trace were acknowledged as spontaneous synapticevents, and the peak amplitude was evaluated as the mean over 300 μs around alocal minimum. Frequency was calculated as the ratio between the number ofsynaptic events and the time window of 30–60 s, and the mean amplitude wascalculated by selecting a sufficient number (430) of well-isolated events. In current-clamp configuration an appropriate holding current was applied to maintain themembrane potential at − 70 mV and 1-s-long positive current steps of increasingamplitude were injected to investigate the ability to generate an action potential or arepetitive firing. All chemicals were from Sigma-Aldrich.
Statistical analysis. No statistical methods were used to predeterminesample sizes, but our sample sizes were similar to those reported in literature. Datawere expressed as mean±S.E.M. Statistical analysis was performed by two-tailStudent’s t-test or one-way ANOVA with Newman–Keuls Multiple Comparison post-hoc test. The Mann–Whitney test was used to assess the input resistance,membrane capacitance, and post-synaptic current frequency and amplitude—allvariables for which normality of the data could not be assumed. Normality of thedata was assessed using the Shapiro-Wilk test. Outliers were identified with Grubbs’test, and were excluded from the analyses. Differences for which P was o0.05were considered to be significant.
Conflict of InterestThe authors declare no conflict of interest.
Acknowledgements. This work was supported by the Cure HuntingtonDisease Initiative (CHDI, USA, no. A-5086), the Telethon Foundation (Italy, no.GGP12122), and, partially, by Neuromics (Integrated European –omicsresearch project for diagnosis and therapy in rare neuromuscular andneurodegenerative diseases no. 305121) to EC; by Fondazione Cariplo (Italy,no. 2008/2406) to MV; and by PRIN (Ministero dell’Istruzione, della Università edella Ricerca, Italy, no. 2010JMMZLY) to GB. We thank Sebastiano Calandra(University of Modena) for providing us with the ABCA1 plasmid, Alessandro Ieraci(University of Milan) for technical support in the initial generation of primaryneurons, and Giulia Chiesa and Marco Busnelli (University of Milan) for providingus with apoE− /− pups.
Author contributionsEC, MV, and MM developed the study, conceived the experimental plans, andanalyzed the data. MM, MV, and EDP performed most of the biological, biochemical,and molecular experiments. ECe and GB were involved in all of the
electrophysiological experiments and the interpretation of the results. CZ providedsuggestions for some biological experiments. MV, MM, and EC interpreted the dataand wrote the manuscript. All of the authors read and edited the manuscript.EC supervised the entire work, directed the strategies, and gave final approval of theversion to be published.
1. Zuccato C, Valenza M, Cattaneo E. Molecular mechanisms and potential therapeuticaltargets in Huntington's disease. Physiol Rev 2010; 90: 905–981.
2. Dietschy JM, Turley SD. Thematic review series: brain Lipids. Cholesterol metabolism in thecentral nervous system during early development and in the mature animal. J Lipid Res2004; 45: 1375–1397.
3. Porter FD, Herman GE. Malformation syndromes caused by disorders of cholesterolsynthesis. J Lipid Res 2011; 52: 6–34.
4. Suzuki R, Ferris HA, Chee MJ, Maratos-Flier E, Kahn CR. Reduction of the cholesterolsensor SCAP in the brains of mice causes impaired synaptic transmission and alteredcognitive function. PLoS Biol 2013; 11: e1001532.
5. Valenza M, Cattaneo E. Emerging roles for cholesterol in Huntington's disease. TrendsNeurosci 2011; 34: 474–486.
6. Karasinska JM, Hayden MR. Cholesterol metabolism in Huntington disease. Nat Rev Neurol2011; 7: 561–572.
7. Valenza M, Rigamonti D, Goffredo D, Zuccato C, Fenu S, Jamot L et al. Dysfunction of thecholesterol biosynthetic pathway in Huntington's disease. J Neurosci 2005; 25: 9932–9939.
8. Valenza M, Leoni V, Karasinska JM, Petricca L, Fan J, Carroll J et al. Cholesterol defect ismarked across multiple rodent models of Huntington's disease and is manifest in astrocytes.J Neurosci 2010; 30: 10844–10850.
9. Leoni V, Mariotti C, Tabrizi SJ, Valenza M, Wild EJ, Henley SM et al. Plasma 24S-hydroxycholesterol and caudate MRI in pre-manifest and early Huntington's disease. Brain2008; 131: 2851–2859.
10. Leoni V, Long JD, Mills JA, Di Donato S, Paulsen JS. PREDICT-HD study group Plasma 24S-hydroxycholesterol correlation with markers of Huntington disease progression. NeurobiolDis 2013; 55: 37–43.
11. Mauch DH, Nagler K, Schumacher S, Goritz C, Muller EC, Otto A et al. CNS synaptogenesispromoted by glia-derived cholesterol. Science 2001; 294: 1354–1357.
12. Pfrieger FW, Ungerer N. Cholesterol metabolism in neurons and astrocytes. Prog Lipid Res2011; 50: 357–371.
13. Hebb MO, Denovan-Wright EM, Robertson HA. Expression of the Huntington's disease geneis regulated in astrocytes in the arcuate nucleus of the hypothalamus of postpartum rats.FASEB J 1999; 13: 1099–1106.
14. Shin JY, Fang ZH, Yu ZX, Wang CE, Li SH, Li XJ. Expression of mutant huntingtin in glialcells contributes to neuronal excitotoxicity. J Cell Biol 2005; 171: 1001–1012.
15. Bradford J, Shin JY, Roberts M, Wang CE, Li XJ, Li S. Expression of mutant huntingtin inmouse brain astrocytes causes age-dependent neurological symptoms. Proc Natl Acad SciUSA 2009; 106: 22480–22485.
16. Bradford J, Shin JY, Roberts M, Wang CE, Sheng G, Li S et al.Mutant huntingtin in glial cellsexacerbates neurological symptoms of Huntington disease mice. J Biol Chem 2010; 285:10653–10661.
17. Conforti P, Camnasio S, Mutti C, Valenza M, Thompson M, Fossale E et al. Lack ofhuntingtin promotes neural stem cells differentiation into glial cells while neurons expressinghuntingtin with expanded polyglutamine tracts undergo cell death. Neurobiol Dis 2013; 50:160–170.
18. Valenza M, Carroll JB, Leoni V, Bertram LN, Bjorkhem I, Singaraja RR et al. Cholesterolbiosynthesis pathway is disturbed in YAC128 mice and is modulated by huntingtin mutation.Hum Mol Genet 2007; 16: 2187–2198.
19. Spiliotopoulos D, Goffredo D, Conti L, Di Febo F, Biella G, Toselli M et al. An optimizedexperimental strategy for efficient conversion of embryonic stem (ES)-derived mouse neuralstem (NS) cells into a nearly homogeneous mature neuronal population. Neurobiol Dis 2009;34: 320–331.
20. Pool M, Thiemann J, Bar-Or A, Fournier AE. NeuriteTracer: a novel ImageJ plugin forautomated quantification of neurite outgrowth. J Neurosci Methods 2008; 168: 134–139.
21. Jansen PJ, Lutjohann D, Thelen KM, von Bergmann K, van Leuven F, Ramaekers FC et al.Absence of ApoE upregulates murine brain ApoD and ABCA1 levels, but does not affectbrain sterol levels, while human ApoE3 and human ApoE4 upregulate brain cholesterolprecursor levels. J Alzheimers Dis 2009; 18: 319–329.
22. Wahrle SE, Jiang H, Parsadanian M, Kim J, Li A, Knoten A et al. Overexpression of ABCA1reduces amyloid deposition in the PDAPP mouse model of Alzheimer disease. J Clin Invest2008; 118: 671–682.
23. Herz J, Bock HH. Lipoprotein receptors in the nervous system. Annu Rev Biochem 2002; 71:405–434.
24. Miserez AR, Cao G, Probst LC, Hobbs HH. Structure of the human gene encoding sterolregulatory element binding protein 2 (SREBF2). Genomics 1997; 40: 31–40.
25. Pfrieger FW. Role of glial cells in the formation and maintenance of synapses. Brain Res Rev2010; 63: 39–46.
26. Eroglu C, Barres BA. Regulation of synaptic connectivity by glia. Nature 2010; 468: 223–231.27. Hayashi H, Campenot RB, Vance DE, Vance JE. Glial lipoproteins stimulate axon growth of
central nervous system neurons in compartmented cultures. J Biol Chem 2004; 279:14009–14015.
Glial cholesterol and neuronal function in HDM Valenza et al
701
Cell Death and Differentiation
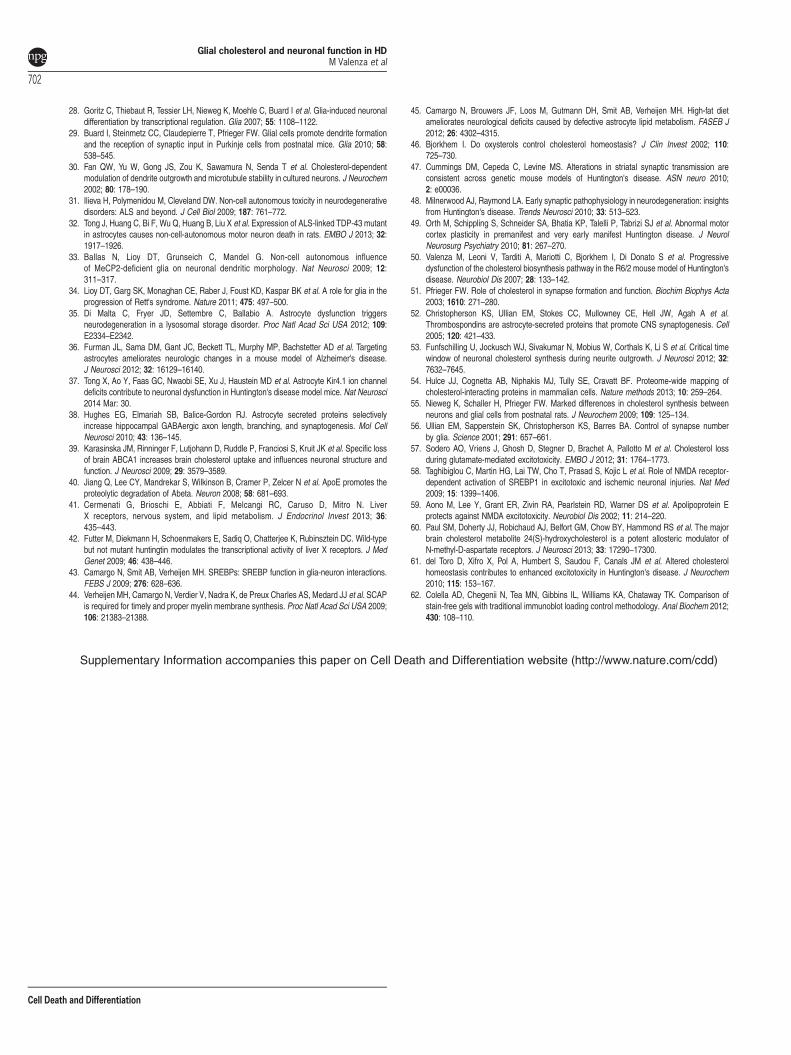
28. Goritz C, Thiebaut R, Tessier LH, Nieweg K, Moehle C, Buard I et al. Glia-induced neuronaldifferentiation by transcriptional regulation. Glia 2007; 55: 1108–1122.
29. Buard I, Steinmetz CC, Claudepierre T, Pfrieger FW. Glial cells promote dendrite formationand the reception of synaptic input in Purkinje cells from postnatal mice. Glia 2010; 58:538–545.
30. Fan QW, Yu W, Gong JS, Zou K, Sawamura N, Senda T et al. Cholesterol-dependentmodulation of dendrite outgrowth and microtubule stability in cultured neurons. J Neurochem2002; 80: 178–190.
31. Ilieva H, Polymenidou M, Cleveland DW. Non-cell autonomous toxicity in neurodegenerativedisorders: ALS and beyond. J Cell Biol 2009; 187: 761–772.
32. Tong J, Huang C, Bi F, Wu Q, Huang B, Liu X et al. Expression of ALS-linked TDP-43 mutantin astrocytes causes non-cell-autonomous motor neuron death in rats. EMBO J 2013; 32:1917–1926.
33. Ballas N, Lioy DT, Grunseich C, Mandel G. Non-cell autonomous influenceof MeCP2-deficient glia on neuronal dendritic morphology. Nat Neurosci 2009; 12:311–317.
34. Lioy DT, Garg SK, Monaghan CE, Raber J, Foust KD, Kaspar BK et al. A role for glia in theprogression of Rett's syndrome. Nature 2011; 475: 497–500.
35. Di Malta C, Fryer JD, Settembre C, Ballabio A. Astrocyte dysfunction triggersneurodegeneration in a lysosomal storage disorder. Proc Natl Acad Sci USA 2012; 109:E2334–E2342.
36. Furman JL, Sama DM, Gant JC, Beckett TL, Murphy MP, Bachstetter AD et al. Targetingastrocytes ameliorates neurologic changes in a mouse model of Alzheimer's disease.J Neurosci 2012; 32: 16129–16140.
37. Tong X, Ao Y, Faas GC, Nwaobi SE, Xu J, Haustein MD et al. Astrocyte Kir4.1 ion channeldeficits contribute to neuronal dysfunction in Huntington's disease model mice. Nat Neurosci2014 Mar: 30.
38. Hughes EG, Elmariah SB, Balice-Gordon RJ. Astrocyte secreted proteins selectivelyincrease hippocampal GABAergic axon length, branching, and synaptogenesis. Mol CellNeurosci 2010; 43: 136–145.
39. Karasinska JM, Rinninger F, Lutjohann D, Ruddle P, Franciosi S, Kruit JK et al. Specific lossof brain ABCA1 increases brain cholesterol uptake and influences neuronal structure andfunction. J Neurosci 2009; 29: 3579–3589.
40. Jiang Q, Lee CY, Mandrekar S, Wilkinson B, Cramer P, Zelcer N et al. ApoE promotes theproteolytic degradation of Abeta. Neuron 2008; 58: 681–693.
41. Cermenati G, Brioschi E, Abbiati F, Melcangi RC, Caruso D, Mitro N. LiverX receptors, nervous system, and lipid metabolism. J Endocrinol Invest 2013; 36:435–443.
42. Futter M, Diekmann H, Schoenmakers E, Sadiq O, Chatterjee K, Rubinsztein DC. Wild-typebut not mutant huntingtin modulates the transcriptional activity of liver X receptors. J MedGenet 2009; 46: 438–446.
43. Camargo N, Smit AB, Verheijen MH. SREBPs: SREBP function in glia-neuron interactions.FEBS J 2009; 276: 628–636.
44. Verheijen MH, Camargo N, Verdier V, Nadra K, de Preux Charles AS, Medard JJ et al. SCAPis required for timely and proper myelin membrane synthesis. Proc Natl Acad Sci USA 2009;106: 21383–21388.
45. Camargo N, Brouwers JF, Loos M, Gutmann DH, Smit AB, Verheijen MH. High-fat dietameliorates neurological deficits caused by defective astrocyte lipid metabolism. FASEB J2012; 26: 4302–4315.
46. Bjorkhem I. Do oxysterols control cholesterol homeostasis? J Clin Invest 2002; 110:725–730.
47. Cummings DM, Cepeda C, Levine MS. Alterations in striatal synaptic transmission areconsistent across genetic mouse models of Huntington's disease. ASN neuro 2010;2: e00036.
48. Milnerwood AJ, Raymond LA. Early synaptic pathophysiology in neurodegeneration: insightsfrom Huntington's disease. Trends Neurosci 2010; 33: 513–523.
49. Orth M, Schippling S, Schneider SA, Bhatia KP, Talelli P, Tabrizi SJ et al. Abnormal motorcortex plasticity in premanifest and very early manifest Huntington disease. J NeurolNeurosurg Psychiatry 2010; 81: 267–270.
50. Valenza M, Leoni V, Tarditi A, Mariotti C, Bjorkhem I, Di Donato S et al. Progressivedysfunction of the cholesterol biosynthesis pathway in the R6/2 mouse model of Huntington'sdisease. Neurobiol Dis 2007; 28: 133–142.
51. Pfrieger FW. Role of cholesterol in synapse formation and function. Biochim Biophys Acta2003; 1610: 271–280.
52. Christopherson KS, Ullian EM, Stokes CC, Mullowney CE, Hell JW, Agah A et al.Thrombospondins are astrocyte-secreted proteins that promote CNS synaptogenesis. Cell2005; 120: 421–433.
53. Funfschilling U, Jockusch WJ, Sivakumar N, Mobius W, Corthals K, Li S et al. Critical timewindow of neuronal cholesterol synthesis during neurite outgrowth. J Neurosci 2012; 32:7632–7645.
54. Hulce JJ, Cognetta AB, Niphakis MJ, Tully SE, Cravatt BF. Proteome-wide mapping ofcholesterol-interacting proteins in mammalian cells. Nature methods 2013; 10: 259–264.
55. Nieweg K, Schaller H, Pfrieger FW. Marked differences in cholesterol synthesis betweenneurons and glial cells from postnatal rats. J Neurochem 2009; 109: 125–134.
56. Ullian EM, Sapperstein SK, Christopherson KS, Barres BA. Control of synapse numberby glia. Science 2001; 291: 657–661.
57. Sodero AO, Vriens J, Ghosh D, Stegner D, Brachet A, Pallotto M et al. Cholesterol lossduring glutamate-mediated excitotoxicity. EMBO J 2012; 31: 1764–1773.
58. Taghibiglou C, Martin HG, Lai TW, Cho T, Prasad S, Kojic L et al. Role of NMDA receptor-dependent activation of SREBP1 in excitotoxic and ischemic neuronal injuries. Nat Med2009; 15: 1399–1406.
59. Aono M, Lee Y, Grant ER, Zivin RA, Pearlstein RD, Warner DS et al. Apolipoprotein Eprotects against NMDA excitotoxicity. Neurobiol Dis 2002; 11: 214–220.
60. Paul SM, Doherty JJ, Robichaud AJ, Belfort GM, Chow BY, Hammond RS et al. The majorbrain cholesterol metabolite 24(S)-hydroxycholesterol is a potent allosteric modulator ofN-methyl-D-aspartate receptors. J Neurosci 2013; 33: 17290–17300.
61. del Toro D, Xifro X, Pol A, Humbert S, Saudou F, Canals JM et al. Altered cholesterolhomeostasis contributes to enhanced excitotoxicity in Huntington's disease. J Neurochem2010; 115: 153–167.
62. Colella AD, Chegenii N, Tea MN, Gibbins IL, Williams KA, Chataway TK. Comparison ofstain-free gels with traditional immunoblot loading control methodology. Anal Biochem 2012;430: 108–110.
Supplementary Information accompanies this paper on Cell Death and Differentiation website (http://www.nature.com/cdd)
Glial cholesterol and neuronal function in HDM Valenza et al
702
Cell Death and Differentiation