Universal Robina Corporation and Subsidiaries
188
- 44 - *SGVFS035342* C O V E R S H E E T for AUDITED FINANCIAL STATEMENTS SEC Registration Number 9 1 7 0 C O M P A N Y N A M E U N I V E R S A L R O B I N A C O R P O R A T I O N A N D S U B S I D I A R I E S PRINCIPAL OFFICE ( No. / Street / Barangay / City / Town / Province ) 8 t h F l o o r , T e r a T o w e r , B r i d g e t o w n e , E . R o d r i g u e z , J r . A v e n u e ( C 5 R o a d ) , U g o n g N o r t e , Q u e z o n C i t y , M e t r o M a n i l a Form Type Department requiring the report Secondary License Type, If Applicable 1 7 - A C O M P A N Y I N F O R M A T I O N Company’s Email Address Company’s Telephone Number Mobile Number N/A 516-9888 N/A No. of Stockholders Annual Meeting (Month / Day) Fiscal Year (Month / Day) 1,012 Last Wednesday of May 12/31 CONTACT PERSON INFORMATION The designated contact person MUST be an Officer of the Corporation Name of Contact Person Email Address Telephone Number/s Mobile Number Mr. Francisco Del Mundo [email protected] (02) 516-9822 +63 998 840 0429 CONTACT PERSON’s ADDRESS 10 th Floor, Tera Tower, Bridgetowne, E. Rodriguez Jr. Avenue (C5 Road), Ugong Norte, Quezon City, Metro Manila NOTE 1 : In case of death, resignation or cessation of office of the officer designated as contact person, such incident shall be reported to the Commission within thirty (30) calendar days from the occurrence thereof with information and complete contact details of the new contact person designated. 2 : All Boxes must be properly and completely filled-up. Failure to do so shall cause the delay in updating the corporation’s records with the Commission and/or non-receipt of Notice of Deficiencies. Further, non-receipt of Notice of Deficiencies shall not excuse the corporation from liability for its deficiencies.
-
Upload
khangminh22 -
Category
Documents
-
view
0 -
download
0
Transcript of Universal Robina Corporation and Subsidiaries

- 44 -
*SGVFS035342*
C O V E R S H E E Tfor
AUDITED FINANCIAL STATEMENTS
SEC Registration Number
9 1 7 0
C O M P A N Y N A M E
U N I V E R S A L R O B I N A C O R P O R A T I O N A
N D S U B S I D I A R I E S
PRINCIPAL OFFICE ( No. / Street / Barangay / City / Town / Province )
8 t h F l o o r , T e r a T o w e r , B r i d g e t
o w n e , E . R o d r i g u e z , J r . A v e n u e
( C 5 R o a d ) , U g o n g N o r t e , Q u e z o
n C i t y , M e t r o M a n i l a
Form Type Department requiring the report Secondary License Type, If Applicable
1 7 - A
C O M P A N Y I N F O R M A T I O N
Company’s Email Address Company’s Telephone Number Mobile Number
N/A 516-9888 N/A
No. of Stockholders Annual Meeting (Month / Day) Fiscal Year (Month / Day)
1,012 Last Wednesday of May 12/31
CONTACT PERSON INFORMATION
The designated contact person MUST be an Officer of the Corporation
Name of Contact Person Email Address Telephone Number/s Mobile Number
Mr. Francisco Del Mundo [email protected] (02) 516-9822 +63 998 840 0429
CONTACT PERSON’s ADDRESS
10th Floor, Tera Tower, Bridgetowne, E. Rodriguez Jr. Avenue (C5 Road), Ugong Norte, Quezon City,Metro Manila
NOTE 1 : In case of death, resignation or cessation of office of the officer designated as contact person, such incident shall be reported to the Commission withinthirty (30) calendar days from the occurrence thereof with information and complete contact details of the new contact person designated.
2 : All Boxes must be properly and completely filled-up. Failure to do so shall cause the delay in updating the corporation’s records with the Commissionand/or non-receipt of Notice of Deficiencies. Further, non-receipt of Notice of Deficiencies shall not excuse the corporation from liability for its deficiencies.

SECURITIES AND EXCHANGE COMMISSION
SEC FORM 17-A
ANNUAL REPORT PURSUANT TO SECTION 17OF THE SECURITIES REGULATION CODE AND SECTION 141
OF THE CORPORATION CODE OF THE PHILIPPINES
1. For the year ended December 31, 2018
2. SEC Identification Number 9170
3. BIR Tax Identification No. 000-400-016-000
4. Exact name of issuer as specified in its charter Universal Robina Corporation
5. Quezon City, Philippines Province, Country or other jurisdiction of incorporation or organization
6. Industry Classification Code: (SEC Use Only)
7. 8th Floor, Tera Tower, Bridgetowne, E. Rodriguez, Jr. Avenue(C5 Road), Ugong Norte, Quezon City, Metro Manila 1110
Address of principal office Postal Code
8. (632) 633-7631 to 40 / (632) 516-9888 Issuer's telephone number, including area code
9. Not Applicable Former name, former address, and former fiscal year, if changed since last report.
10. Securities registered pursuant to Sections 8 and 12 of the SRC, or Sec. 4 and 8 of the RSA
Title of Each ClassNumber of Shares of Common StockOutstanding and Amount of Debt
Common Shares, P1.00 Par value 2,204,161,868 shares
11. Are any or all of these securities listed on the Philippine Stock Exchange.
Yes [ / ] No [ ]

- 2 -
12. Check whether the issuer:
a) has filed all reports required to be filed by Section 17 of the SRC and SRC Rule 17 thereunderor Section 11 of the RSA and RSA Rule 11(a)-1 thereunder, and Sections 26 and 141 of TheCorporation Code of the Philippines during the preceding twelve (12) months (or for such shorterperiod that the registrant was required to file such reports);
Yes [ / ] No [ ]
b) has been subject to such filing requirements for the past ninety (90) days.
Yes [ / ] No [ ]
13. State the aggregate market value of the voting stock held by non-affiliates of the registrant.
The aggregate market value of the voting stock held by non-affiliates is P=123,384,423,284.
APPLICABLE ONLY TO ISSUERS INVOLVED ININSOLVENCY/SUSPENSION OF PAYMENTS PROCEEDINGS
DURING THE PRECEDING FIVE YEARS:
14. Check whether the issuer has filed all documents and reports required to be filed by Section 17 of theCode subsequent to the distribution of securities under a plan confirmed by a court or theCommission.
Not Applicable
DOCUMENTS INCORPORATED BY REFERENCE
If any of the following documents are incorporated by reference, briefly describe them and identifythe part of SEC Form 17-A into which the document is incorporated:
a) Any annual report to security holders; None
b) Any proxy or information statement filed pursuant to SRC Rule 20 and 17.1(b); None
c) Any prospectus filed pursuant to SRC Rule 8.1-1 None

TABLE OF CONTENTS
Page No.
PART I - BUSINESS AND GENERAL INFORMATIONItem 1 Business 1Item 2 Properties 9Item 3 Legal Proceedings 10Item 4 Submission of Matters to a Vote of Security Holders 10
PART II - OPERATIONAL AND FINANCIAL INFORMATIONItem 5 Market for Registrant’s Common Equity and
Related Stockholder Matters 11Item 6 Management’s Discussion and Analysis or
Plan of Operation 13Item 7 Financial Statements 26Item 8 Changes in and Disagreements with Accountants and
Financial Disclosure 26Item 9 Independent Public Accountant and Audit Related Fees 27
PART III - CONTROL AND COMPENSATION INFORMATIONItem 10 Directors and Executive Officers of the Registrant 28Item 11 Executive Compensation 34Item 12 Security Ownership of Certain Beneficial Owners
and Management 35Item 13 Certain Relationships and Related Transactions 37
PART IV - EXHIBITS AND SCHEDULESItem 14 (a) Exhibits 38
(b) Reports on SEC Form 17-C (Current Report) 39
SIGNATURES 40
INDEX TO FINANCIAL STATEMENTS AND SUPPLEMENTARY SCHEDULES 42

PART I - BUSINESS AND GENERAL INFORMATION
Item 1. Business
Universal Robina Corporation (URC or the Company) is one of the largest branded food productcompanies in the Philippines, with the distinction of being called the country’s first “PhilippineMultinational”. URC has established a strong presence in ASEAN and has further expanded its reach tothe Oceania region. URC was founded in 1954 when Mr. John Gokongwei, Jr. established UniversalCorn Products, Inc., a cornstarch manufacturing plant in Pasig. The Company is involved in a wide rangeof food-related businesses, including the manufacture and distribution of branded consumer foods,production of hogs and poultry, manufacture of animal feeds and veterinary products, flour milling, andsugar milling and refining. URC has also ventured in the renewables business for sustainability throughDistillery and Cogeneration divisions. In the Philippines, URC is a dominant player with leading marketshares in Snacks, Candies and Chocolates, and is a significant player in Biscuits. URC is also the largestplayer in the Ready-to-Drink (RTD) Tea market and Cup Noodles, and is a competitive 3rd player in theCoffee business. With six mills operating as of December 31, 2018, URC Sugar division remains to bethe largest producer in the country based on capacity.
No material reclassifications, merger, consolidation, or purchase or sale of significant amount of assets(not ordinary) were made in the past three years (2016-2018) except those mentioned in the succeedingparagraphs. The Company’s financial condition has remained solid in the said period.
The Company operates its food business through operating divisions and wholly-owned or majority-owned subsidiaries that are organized into three business segments: branded consumer foods, agro-industrial products and commodity food products.
Branded consumer foods (BCF) segment, including packaging division, is the Company’s largest segmentcontributing about 80.2% of revenues for the year ended December 31, 2018. Established in the 1960s,the Company’s branded consumer foods segment manufactures and distributes a diverse mix of saltysnacks, chocolates, candies, biscuits, packaged cakes, beverages and instant noodles. The manufacture,distribution, sales, and marketing activities of BCF group are carried out mainly through the Company’sbranded consumer foods division consisting of snack foods, beverage, and noodles, although theCompany conducts some of its branded consumer foods operations through its majority-ownedsubsidiaries and joint venture companies. The Company established URC BOPP Packaging and URCFlexible Packaging divisions to engage in the manufacture of bi-axially oriented polypropylene (BOPP)films for packaging companies and flexible packaging materials to cater various URC branded products.Both manufacturing facilities are located in Simlong, Batangas and are ISO 9001:2008 certified forQuality Management Systems.
Majority of URC’s consumer foods business is conducted in the Philippines but has expanded moreaggressively into other ASEAN markets, primarily through its wholly-owned subsidiary, URCInternational. In 2014, URC has expanded its reach to the Oceania region through the acquisition ofGriffin’s Foods Limited, a leading snacks player in New Zealand, which owns many established brandssuch as Griffin’s, Cookie Bear, Eta, Huntley & Palmer’s, and Nice & Natural. In 2016, URC completedthe acquisition of Consolidated Snacks Pty Ltd., which trades under Snacks Brand Australia (SBA), thesecond largest salty snacks player in Australia with a wide range of chips including the iconic brands likeKettle, Thins, CC’s and Cheezels. The international operations contributed about 33.8% of theCompany’s revenues for the year ended December 31, 2018.
The Company’s agro-industrial products segment operates four segments: (1) Robina Farm-Hogs, (2)Robina Farm-Poultry, (3) the manufacturing and distribution of animal feeds (URC Feeds), and (4) theproduction and distribution of animal health products (URC Veterinary Drugs). This segment contributedapproximately 9.2% of sale of goods and services in 2018.

- 2 -
The Company’s commodity food products segment operates three divisions: (1) sugar milling andrefining through Sugar division, (2) flour milling and pasta manufacturing through Flour division, and (3)renewable energy development through Distillery and Cogeneration divisions. This segment contributedapproximately 10.6% of aggregate sale of goods and services in 2018.
The Company is a core subsidiary of JG Summit Holdings, Inc. (JGSHI), one of the largest and mostdiversified conglomerates in the Philippines. JGSHI has substantial business interests in airtransportation, property development and hotel management, banking and financial services, andpetrochemicals (JG Summit owns the only naphtha cracker complex in the country). It also has non-controlling minority stakes in the country’s leading telecommunications, power generation and electricitydistribution companies, as well as in a leading Singapore property company.
The percentage contribution to the Company’s revenues for each of the three periods endedDecember 31, 2016 (three months), December 31, 2017 (one year) and December 31, 2018 (one year) byeach of the Company’s principal business segments is as follows:
December 31, 2016(Three Months)
December 31, 2017(One Year)
December 31, 2018(One Year)
Branded Consumer Foods Group 83.1% 82.5% 80.2%Agro-Industrial Group 7.7% 8.1% 9.2%Commodity Foods Group 9.2% 9.4% 10.6%
100.00% 100.00% 100.00%
The geographic percentage distribution of the Company’s revenues for each of the three periodsDecember 31, 2016 (three months), December 31, 2017 (one year) and December 31, 20187 (one year) isas follows:
December 31, 2016(Three Months)
December 31, 2017(One Year)
December 31, 2018(One Year)
Philippines 65.8% 65.7% 66.2%International 34.2% 34.3% 33.8%
100.00% 100.00% 100.00%
Customers
None of the Company’s businesses is dependent upon a single customer or a few customers that a loss ofanyone of them would have a material adverse effect on the Company. The Company has no singlecustomer that, based upon existing orders, will account for 20.0% or more of the Company’s total sale ofgoods and services.
Distribution, Sales and Marketing
The Company has developed an effective nationwide distribution chain and sales network that it believesprovide its competitive advantage. The Company sells its branded food products primarily tosupermarkets, as well as directly to top wholesalers, large convenience stores, large scale tradingcompanies and regional distributors, which in turn sell its products to other small retailers and down linemarkets. The Company’s branded consumer food products are distributed to approximately 120,000outlets in the Philippines and sold through its direct sales force and regional distributors. URC intends toenlarge its distribution network coverage in the Philippines by increasing the number of retail outlets thatits sales force and distributors directly service.

- 3 -
The branded consumer food products are generally sold by the Company from salesmen to wholesalers orsupermarkets, and regional distributors to small retail outlets. 15 to 30-day credit terms are extended towholesalers, supermarkets and regional distributors.
The Company believes that its emphasis on marketing, product innovation and quality, and strong brandequity has played a key role in its success in achieving leading market shares in the different categorieswhere it competes. In particular, URC launched “Jack ‘n Jill” as a master umbrella brand for all its snackfood products in order to enhance customer recognition. URC devotes significant expenditures to supportadvertising and branding to differentiate its products and further expand market share both in thePhilippines and in its overseas markets, including funding for advertising campaigns such as televisioncommercials and radio and print advertisements, as well as trade and consumer promotions.
For URC agro-industrial group (AIG), both piggery and poultry farms have been accredited as GAHP(Good Animal Husbandry Practice), 100% compliant to Good Manufacturing Practices (GMP) and itsmeats and eggs have been certified as No Hormone, and Antibiotic residue free. This has allowed AIG toaggressively capture the quality conscious meat segment of the country as embodied by the Robina Farmsbrand with its key positioning of Robina raised, Family safe products. Similarly, the Feeds businessheaded by their brand champions such as Uno+, Supremo Gamefowl, and Top Breed Dog mealsincreased its distribution network supported by the Kabalikat Farm Program covering Hog and Gamefowlraisers.
Competition
The BCF business is highly competitive and competition varies by country and product category. TheCompany believes that the principal competitive factors include price, taste, quality, convenience, brandrecognition and awareness, advertising and marketing, availability of products and ability to get itsproduct widely distributed. Generally, the Company faces competition from both local and multinationalcompanies in all of its markets. In the Philippines, major competitors in the market segments in which itcompetes include Liwayway Marketing Corporation, Monde M.Y. San Corporation, Columbia FoodsInternational, Republic Biscuit Corporation, Suncrest Foods Inc., Del Monte Phil. Inc., Monde NissinCorporation, Nestle Philippines Inc., San Miguel Pure Foods Company Inc. and Kraft Foods Inc.Internationally, major competitors include Procter & Gamble, Effem Foods/Mars Inc., Lotte Group,Perfetti Van Melle Group, Mayora Inda PT, Apollo Food, Frito-Lay, Nestlé S.A., PepsiCo, Inc., CadburySchweppes PLC and Kraft Foods International.
URC AIG has four major segments namely: Commercial Feeds, Commercial Drugs, Robina Farm-Hogs,and Robina Farm-Poultry. The market for AIG is highly fragmented, very competitive, cyclical andprincipally domestic. The Company is focused and known in providing Total Agri-Solution and farmmanagement expertise including state of the art diagnostic capability.
The Company’s commercial feeds segment principal competitive factors are quality, brand equity, creditterm and price. It faces competition from local, multinational companies, and even foreign companies inall of its markets. Since the business is highly fragmented, it also faces increasing speed of change in themarket particularly customer preferences and lifestyle. The Company’s principal competitors are SanMiguel Corporation (B-Meg and Integra), UNAHCO (Sarimanok, Thunderbird, GMP and Pigrolac), andAboitiz Inc. (Pilmico). The market for commercial drugs is composed of both local and multinationalcompanies. Furthermore, URC AIG is one of the only few Philippine companies in this market. TheCompany’s principal competitors are UNAHCO (Univet), Novartis, and Excellence Poultry andLivestock Specialist.
The Company believes that the principal competitive factors for hogs are quality, reliability of supply,price, and proximity to market. The Company’s principal competitors are San Miguel Corp. (Monterey),

- 4 -
Aboitiz Inc. (Pilmico) and Foremost Farms, Inc. The Company considers quality, price, egg productivity,and disease resistance as the principal competitive factors of its poultry business. The Company’sprincipal competitors are Bounty Farms, Inc., Foremost Farms, Inc., Brookdale Farms, and Heritage VetCorp. for layer chicks.
Enhancement and Development of New Products
The Company intends to continuously introduce innovative new products, product variants and lineextensions in the snackfoods (snacks, biscuits, candies, chocolates and bakery), beverage, and grocery(instant noodles and tomato-based) products. This year alone, the Company’s Branded Consumer FoodsPhilippines has introduced 22 new products, which contributed 1.61% to its total sales.
The Company supports the rapid growth of the business through line expansion, construction andacquisition of plants.
Raw Materials
A wide variety of raw materials are required in the manufacture of the Company’s food products,including corn, wheat, flour, sugar, robusta coffee beans, palm oil and cocoa powder. Some of which arepurchased domestically and some of which are imported. The Company also obtains a major portion ofits raw materials from its commodity food products segments, such as flour and sugar, and flexiblepackaging materials from its packaging segment. A portion of flexible packaging material requirementsis also purchased both locally and from abroad (Vietnam and Indonesia), while aseptic packaging ispurchased entirely from China.
For its feeds segment, the Company requires a variety of raw materials, including corn grains, soya beansand meals, feed-wheat grains, wheat bran, wheat pollard, soya seeds, rice bran, copra meal and fish meal.The Company purchases corn locally from corn traders and imports feed-wheat from suppliers in NorthAmerica, Europe and China. Likewise, soya seeds are imported by the Company from the USA. For itsanimal health products, the Company requires a variety of antibiotics and vitamins, which it acquiresfrom suppliers in Europe and Asia. The Company maintains approximately two months physicalinventory and one month in-transit inventory for its imported raw materials.
For its hogs business, the Company requires a variety of raw materials, primarily close-herd breedingstocks. For its poultry business, the Company purchases the parent stock for its layer chicks from Dekalbfrom Europe. Robina Farms obtains all of the feeds it requires from its Commercial Feeds segment andsubstantially all of the minerals and antibiotics from its Commercial Drugs division as part of its verticalintegration. The Company purchases vaccines, medications and nutritional products from a variety ofsuppliers based on the values of their products.
The Company obtains sugar cane from local farmers. Competition for sugar cane supply is very intenseand is a critical success factor for its sugar business. Additional material requirements for the sugar canemilling process are either purchased locally or imported.
The Company generally purchases wheat, the principal raw material for its flour milling and pastabusiness, from suppliers in the United States, Canada and Australia.
The Company’s policy is to maintain a number of suppliers for its raw and packaging materials to ensurea steady supply of quality materials at competitive prices. However, the prices paid for raw materialsgenerally reflect external factors such as weather conditions, commodity market fluctuations, currencyfluctuations and the effects of government agricultural programs. The Company believes that alternative

- 5 -
sources of supply of the raw materials that it uses are readily available. The Company’s policy is tomaintain approximately 30 to 90 days of inventory.
Patents, Trademarks, Licenses, Franchises, Concessions or Labor Contract
The Company owns a substantial number of trademarks registered with the Bureau of Trademarks subjectto the provisions of RA 8293 also known as the Intellectual Property Code of the Philippines (IP Code)and recorded with the Intellectual Property Office of the Philippines (IPPHL). In addition, certaintrademarks have been strategically registered in other countries in which it operates. These trademarksare important in the aggregate because brand name recognition is a key factor in the success of many ofthe Company’s product lines. Trademark registration is a means to protect these brand names fromcounterfeiting and infringement.
Trademarks registered under RA 166, also known as the Trademark Law, are registered for twenty (20)years. Upon renewal, these trademarks become subject to the IP Code having a registration period of ten(10) years and renewable thereafter. In general, trademarks in other countries have a ten-year registrationwhich are renewable as well, allowing relatively a lifetime of territorial and limited trademarkregistration.
The Company also uses brand names under licenses from third parties. These licensing arrangements aregenerally renewable based on mutual agreement. The Company’s licensed brands include Nissin CupNoodles, Nissin Yakisoba Instant Noodles and Nissin Pasta Express, Vitasoy, Calbee and B’lue, amongothers.
Licensing Agreements are voluntarily registered with the Documentation, Information and TechnologyTransfer Bureau of the IPPHL.
Regulatory Overview
As manufacturer of consumer food and commodity food products, the Company is required to guaranteethat the products are pure and safe for human consumption, and that the Company conforms to standardsand quality measures prescribed by the Bureau of Food and Drugs (BFAD).
The Company’s sugar mills are licensed to operate by the Sugar Regulatory Administration (SRA) andrenew its sugar milling licenses at the start of every crop year. The Company is also registered with theDepartment of Energy as a manufacturer of bio-ethanol and as a renewable energy developer.
All of the Company’s livestock and feed products have been registered with and approved by the Bureauof Animal Industry, an agency of the Department of Agriculture which prescribes standards, conductsquality control test of feed samples, and provides technical assistance to farmers and feed millers.
Some of the Company’s projects, such as the sugar mill and refinery, bioethanol production, biomasspower cogeneration and hog and poultry farm operations are registered with the Board of Investments(BOI) which allows the Company certain fiscal and non-fiscal incentives.
Effects of Existing or Probable Governmental Regulations on the Business
The Company operates its businesses in a highly regulated environment. These businesses depend uponlicenses issued by government authorities or agencies for their operations. The suspension or revocationof such licenses could materially and adversely affect the operation of these businesses.

- 6 -
Research and Development
The Company develops new products and variants of existing product lines, researches new processes andtests new equipment on a regular basis in order to maintain and improve the quality of the Company’sfood products. In Philippine operations alone, about P=52 million was spent for research and developmentactivities in 2018 and approximately P=91 million and P=32 million in 2017 and in three-month periodended December 31, 2016, respectively.
The Company has research and development staff for its branded consumer foods and packagingdivisions located in its research and development facility in Metro Manila and in each of itsmanufacturing facilities. In addition, the Company hires experts from all over the world to assist itsresearch and development staff. The Company conducts extensive research and development for newproducts, line extensions for existing products and for improved production, quality control andpackaging as well as customizing products to meet the local needs and tastes in the international markets.The Company’s commodity foods segment also utilizes this research and development facility to improvetheir production and quality control. The Company also strives to capitalize on its existing joint venturesto effect technology transfers.
The Company has a dedicated research and development team for its agro-industrial business thatcontinually explores advancements in feeds, breeding and farming technology. The Company regularlyconducts market research and farm-test for all of its products. As a policy, no commercial product isreleased if it was not tested and used in Robina Farms.
Transactions with Related Parties
The largest shareholder, JG Summit Holdings, Inc. (JG Summit or JGSHI), is one of the largest and mostdiversified conglomerates listed on the Philippine Stock Exchange. JG Summit provides the Companywith certain corporate center services including finance, strategy and development, government affairs,governance and management systems, internal audit, procurement, human resources, general counsel,information technology, digital transformation office, and advertising and public relations. JG Summitalso provides the Company with valuable market expertise in the Philippines as well as intra-groupsynergies. See Note 34 to Consolidated Financial Statements for Related Party Transactions.
Costs and Effects of Compliance with Environmental Laws
The operations of the Company are subject to various laws and regulations enacted for the protection ofthe environment, including Philippine Clean Water Act (R.A. No. 9275), Clean Air Act (R.A. No. 8749),Ecological Solid Waste Management Act (R.A. No. 9003), Toxic Substances and Hazardous and NuclearWastes Control Act (R.A. No. 6969), Pollution Control Law (R.A. No. 3931, as amended by P.D. 984),the Environmental Impact Statement System (P.D. 1586), the Laguna Lake Development Authority(LLDA) Act of 1966 (R.A. No. 4850), Renewable Energy Act (R.A. No. 9513), Electric Power IndustryReform Act (R.A. No. 9136) and Environmental Compliance Certificates (ECCs) requirements of P.D.No. 1586, in accordance with DENR Administrative Order No. 2003-30. The Company believes that ithas complied with all applicable environmental laws and regulations, an example of which is theinstallation of wastewater treatment systems in its various facilities. Compliance with such laws does nothave, and in the Company’s opinion, is not expected to have, a material effect upon the Company’scapital expenditures, earnings or competitive position. As of December 31, 2018, the Company hasinvested about P=227 million in wastewater treatment in its facilities in the Philippines.

- 7 -
Employees and Labor
As of December 31, 2018, the number of permanent full-time employees engaged in the Company’srespective businesses is 14,239 and are deployed as follows:
Business Company or Division Number
Branded consumer foodsBCF, Packaging Division, CCPI, URCI,URCCCL, NURC, HURC, CURC and DURBI 10,277
Agro-industrial products Robina Farms, UCP & Robichem 1,272Commodity food products:
Sugar Sugar 1,021Flour & pasta Flour 384Bio-ethanol & renewable energy Distillery and Cogeneration 488
Corporate 79714,239
For most of the companies and operating divisions, collective bargaining agreements between the relevantrepresentatives of the employees’ union and the subsidiary or divisions are in effect. The collectivebargaining agreements generally cover a five-year term with a right to renegotiate the economicprovisions of the agreement after three years, and contain provisions for annual salary increases, healthand insurance benefits, and closed-shop arrangements. The collective bargaining agreements are with 26different unions. For the year 2018, 7 collective bargaining agreements were signed and concluded withthe labor unions which are as follows: URC BCFG Rosario & Bagong Ilog (Consolidated Workers Union(CWU)), URC Indonesia (Federation of Indonesia Metal Workers Union (FSPMI)), URC SURE BalayanR&F (URC SURE Balayan Labor Union Chapter - NACUSIP), URC BCFG ESMO (United Labor Unionof URC ESMO Plant), URC BCFG Pampanga (Cebu Industrial Management Corporation EmployeesUnion – Workers’ Solidarity Network (CIMCEU-WSN)), URC BCFG Canlubang (URC Canlubang PlantEmployees Union – Organized Labor Organization in Line Industries and Agriculture (CPEU-OLALIA))and URC BCFG MCD (MCD Monthly Independent Union (MIU)). The Company believes that goodlabor relations generally exist throughout the Company’s subsidiaries and operating divisions.
The Company has a funded, noncontributory defined benefit retirement plan covering all of the regularemployees of URC. The plan provides retirement, separation, disability and death benefits to itsmembers. The Company, however, reserves the right to change the rate and amounts of its contribution atany time on account of business necessity or adverse economic conditions. The funds of the plan areadministered and managed by the trustees. Retirement cost charged to operations, including net interestcost, amounted to P=185 million, P=176 million and P=48 million in 2018, 2017 and three-month periodended December 31, 2016, respectively.
Risks
The major business risks facing the Company and its subsidiaries are as follows:
1) Competition
The Company and its subsidiaries face competition in all segments of its businesses both in the Philippinemarket and in international markets where it operates. The Philippine food industry in general is highlycompetitive. Although the degree of competition and principal competitive factors vary among thedifferent food industry segments in which the Company participates, the Company believes that theprincipal competitive factors include price, product quality, brand awareness and loyalty, distributionnetwork, proximity of distribution outlets to customers, product variations and new product introductions.(See page 3, Competition, for more details)

- 8 -
The Company’s ability to compete effectively is due to continuous efforts in sales and marketing of itsexisting products, development of new products and cost rationalization.
2) Financial Market
The Company has foreign exchange exposure primarily associated with fluctuations in the value of thePhilippine Peso against the U.S. dollar and other foreign currencies. Majority of the Company’s revenuesis denominated in Pesos, while certain of its expenses, including debt services and raw material costs, aredenominated in U.S. dollars or based on prices determined in U.S. dollars. In addition, the majority of theCompany’s debt is denominated in foreign currencies. Prudent fund management is employed tominimize effects of fluctuations in interest and currency rates.
3) Raw Materials
The Company’s production operations depend upon obtaining adequate supplies of raw materials on atimely basis. In addition, its profitability depends in part on the prices of raw materials since a portion ofthe Company’s raw material requirements is imported including packaging materials. To mitigate theserisks, alternative sources of raw materials are used in the Company’s operations.(See page 4, Raw Materials, for more details)
4) Food Safety Concerns
The Company’s business could be adversely affected by the actual or alleged contamination ordeterioration of certain of its flagship products, or of similar products produced by third parties. A risk ofcontamination or deterioration of its food products exists at each stage of the production cycle, includingthe purchase and delivery of food raw materials, the processing and packaging of food products, thestocking and delivery of the finished products to its customers, and the storage and display of finishedproducts at the points of final sale. The Company conducts extensive research and development for newproducts, line extensions for existing products and for improved production, quality control andpackaging as well as customizing products to meet the local needs and tastes in the international marketsfor its food business. For its agro-industrial business, its researchers are continually exploringadvancements in breeding and farming technology. The Company regularly conducts market researchand farm-test for all of its products. Moreover, the Company ensures that the products are safe for humanconsumption, and that the Company conforms to standards and quality measures prescribed by regulatorybodies such as BFAD, SRA, Bureau of Animal Industry, and Department of Agriculture.
5) Mortalities
The Company’s agro-industrial business is subject to risks of outbreaks of various diseases. TheCompany faces the risk of outbreaks of foot and mouth disease, which is highly contagious anddestructive to susceptible livestock such as hogs, and avian influenza or bird flu for its chicken farmingbusiness. These diseases and many other types could result to mortality losses. Disease control measuresare adopted by the Company to minimize and manage this risk.
6) Intellectual Property Rights
Approximately 80.2% of the Company’s sale of goods and services in 2018 were from its brandedconsumer foods segment. The Company has put considerable efforts to protect the portfolio ofintellectual property rights, including trademark registrations. Security measures are continuously takento protect its patents, licenses and proprietary formulae against infringement and misappropriation.

- 9 -
7) Weather and Catastrophe
Severe weather condition may have an impact on some aspects of the Company’s business, such as itssugar cane milling operations due to reduced availability of sugar cane. Weather condition may alsoaffect the Company’s ability to obtain raw materials and the cost of those raw materials. Moreover,Philippines have experienced a number of major natural catastrophes over the years including typhoons,droughts, volcanic eruptions, and earthquakes. The Company and its subsidiaries continually maintainsufficient inventory level to neutralize any shortfall of raw materials from major suppliers whether localor imported.
8) Environmental Laws and Other Regulations
The Company is subject to numerous environmental laws and regulations relating to the protection of theenvironment and human health and safety, among others. The nature of the Company’s operations willcontinue to subject it to increasingly stringent environmental laws and regulations that may increase thecosts of operating its facilities above currently projected levels and may require future capitalexpenditures. The Company is continually complying with environmental laws and regulations, such asthe wastewater treatment plants as required by the Department of Environment and Natural Resources, tolessen the effect of these risks.
The Company shall continue to adopt what it considers conservative financial and operational policiesand controls to manage the various business risks it faces.
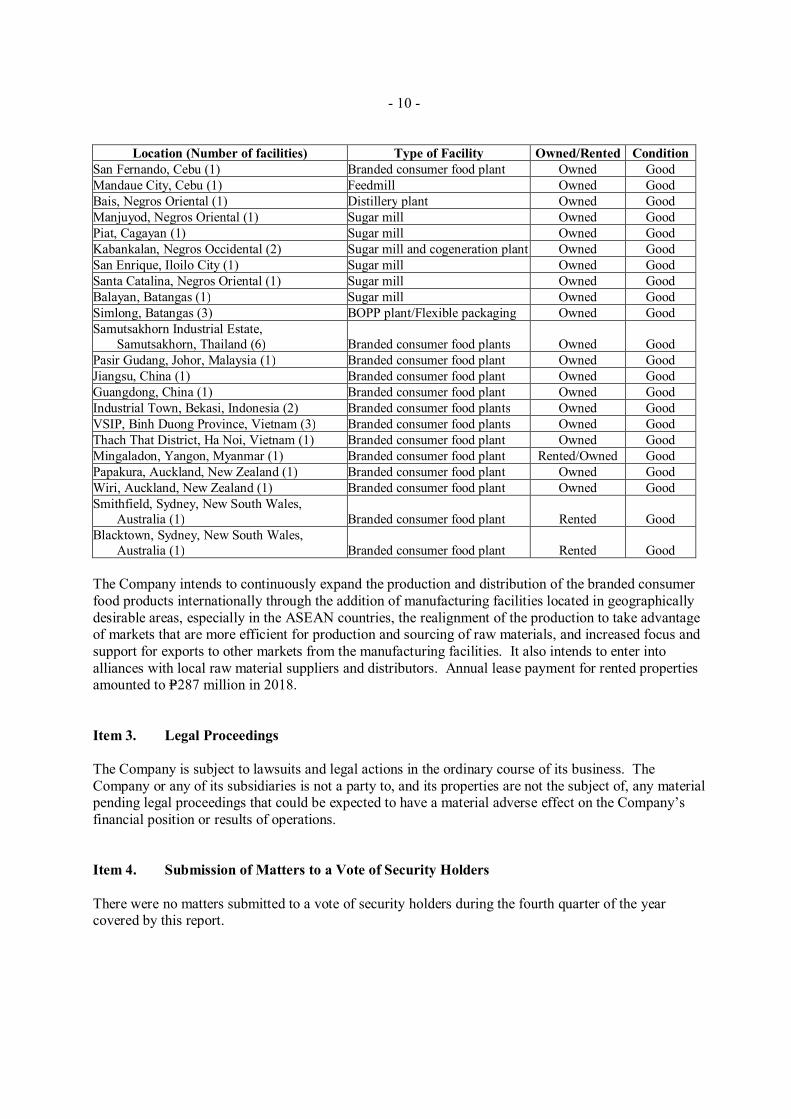
Item 2. Properties
The Company operates the manufacturing/farm facilities located in the following:
Location (Number of facilities) Type of Facility Owned/Rented Condition
Pasig City (5)Branded consumer food plants,feedmills and flourmill Rented/Owned Good
Libis, Quezon City (1) Branded consumer food plant Owned GoodCabuyao, Laguna (1) Branded consumer food plant Owned GoodLuisita, Tarlac (1) Branded consumer food plant Rented/Owned GoodSan Fernando, Pampanga (1) Branded consumer food plant Rented/Owned GoodDasmariñas, Cavite (2) Branded consumer food plants Owned GoodCagayan de Oro (1) Branded consumer food plant Owned GoodSan Pedro, Laguna (2) Branded consumer food plants Owned GoodCalamba, Laguna (1) Branded consumer food plant Rented/Owned GoodSan Pablo, Laguna (1) Branded consumer food plant Owned GoodBinan, Laguna (1) Branded consumer food plant Owned Good
Antipolo, Rizal (4)Poultry and piggery farms andslaughterhouse Rented/Owned Good
Taytay, Rizal (1) Poultry farm Rented/Owned GoodNaic, Cavite (1) Poultry farm Owned GoodSan Miguel, Bulacan (2) Piggery and poultry farms Owned GoodBustos, Bulacan (1) Piggery farm Owned GoodPandi, Bulacan (1) Piggery farm Rented/Owned GoodNovaliches, Quezon City (1) Piggery farm Owned GoodRosario, Batangas (1) Piggery farm Owned GoodMagalang, Pampanga (1) Piggery farm Rented/Owned GoodDavao City, Davao (1) Flourmill Owned GoodTabok City, Cebu (1) Branded consumer food plant Owned Good
- 10 -
Location (Number of facilities) Type of Facility Owned/Rented ConditionSan Fernando, Cebu (1) Branded consumer food plant Owned GoodMandaue City, Cebu (1) Feedmill Owned GoodBais, Negros Oriental (1) Distillery plant Owned GoodManjuyod, Negros Oriental (1) Sugar mill Owned GoodPiat, Cagayan (1) Sugar mill Owned GoodKabankalan, Negros Occidental (2) Sugar mill and cogeneration plant Owned GoodSan Enrique, Iloilo City (1) Sugar mill Owned GoodSanta Catalina, Negros Oriental (1) Sugar mill Owned GoodBalayan, Batangas (1) Sugar mill Owned GoodSimlong, Batangas (3) BOPP plant/Flexible packaging Owned GoodSamutsakhorn Industrial Estate,
Samutsakhorn, Thailand (6) Branded consumer food plants Owned GoodPasir Gudang, Johor, Malaysia (1) Branded consumer food plant Owned GoodJiangsu, China (1) Branded consumer food plant Owned GoodGuangdong, China (1) Branded consumer food plant Owned GoodIndustrial Town, Bekasi, Indonesia (2) Branded consumer food plants Owned GoodVSIP, Binh Duong Province, Vietnam (3) Branded consumer food plants Owned GoodThach That District, Ha Noi, Vietnam (1) Branded consumer food plant Owned GoodMingaladon, Yangon, Myanmar (1) Branded consumer food plant Rented/Owned GoodPapakura, Auckland, New Zealand (1) Branded consumer food plant Owned GoodWiri, Auckland, New Zealand (1) Branded consumer food plant Owned GoodSmithfield, Sydney, New South Wales,
Australia (1) Branded consumer food plant Rented GoodBlacktown, Sydney, New South Wales,
Australia (1) Branded consumer food plant Rented Good
The Company intends to continuously expand the production and distribution of the branded consumerfood products internationally through the addition of manufacturing facilities located in geographicallydesirable areas, especially in the ASEAN countries, the realignment of the production to take advantageof markets that are more efficient for production and sourcing of raw materials, and increased focus andsupport for exports to other markets from the manufacturing facilities. It also intends to enter intoalliances with local raw material suppliers and distributors. Annual lease payment for rented propertiesamounted to P=287 million in 2018.
Item 3. Legal Proceedings
The Company is subject to lawsuits and legal actions in the ordinary course of its business. TheCompany or any of its subsidiaries is not a party to, and its properties are not the subject of, any materialpending legal proceedings that could be expected to have a material adverse effect on the Company’sfinancial position or results of operations.
Item 4. Submission of Matters to a Vote of Security Holders
There were no matters submitted to a vote of security holders during the fourth quarter of the yearcovered by this report.

PART II - OPERATIONAL AND FINANCIAL INFORMATION
Item 5. Market for Registrant’s Common Equity and Related Stockholder Matters
Market Information
The principal market for URC’s common equity is the Philippine Stock Exchange. Sales prices of thecommon stock follow:
High LowCalendar Year 2018
January to March 2018 P=174.00 P=140.00April to June 2018 152.00 111.30July to September 2018 153.40 119.00October to December 2018 148.00 121.20
Calendar Year 2017January to March 2017 P=176.10 P=157.10April to June 2017 185.30 157.50July to September 2017 165.40 135.20October to December 2017 155.00 131.00
Three Month PeriodOctober to December 2016 P=186.00 P=150.00
As of April 5, 2019, the latest trading date prior to the completion of this annual report, sales price of thecommon stock is at P=151.60.
The number of shareholders of record as of December 31, 2018 was approximately 1,012. Commonshares outstanding as of December 31, 2018 were 2,204,161,868.

- 12 -
List of Top 20 Stockholders of RecordDecember 31, 2018
Name of StockholdersNumber of
Shares Held
Percent toTotal
Outstanding1 JG Summit Holdings, Inc. 1,215,223,061 55.13%2 PCD Nominee Corporation (Non-Filipino) 704,513,078 31.96%3 PCD Nominee Corporation (Filipino) 249,650,620 11.33%4 Toccata Securities Pty. Ltd (Account 1) 5,035,541 0.23%4 Toccata Securities Pty. Ltd (Account 2) 5,035,541 0.23%4 Toccata Securities Pty. Ltd (Account 3) 5,035,541 0.23%5 Elizabeth Y. Gokongwei and/or John Gokongwei, Jr. 2,479,400 0.11%6 Litton Mills, Inc. 2,237,434 0.10%7 Hopkins Securities Pty. Ltd. (Account 1) 1,888,328 0.09%7 Hopkins Securities Pty. Ltd. (Account 2) 1,888,328 0.09%7 Hopkins Securities Pty. Ltd. (Account 3) 1,888,328 0.09%7 Hopkins Securities Pty. Ltd. (Account 4) 1,888,328 0.09%8 Lisa Yu Gokongwei and/or Elizabeth Gokongwei 575,000 0.03%8 Faith Gokongwei Ong and/or Elizabeth Gokongwei 575,000 0.03%8 Robina Gokongwei Pe and/or Elizabeth Gokongwei 575,000 0.03%8 Marcia Gokongwei Sy and/or Elizabeth Gokongwei 575,000 0.03%8 Hope Gokongwei Tang and/or Elizabeth Gokongwei 575,000 0.03%9 Quality Investments & Sec Corp 400,143 0.02%10 Flora Ng Siu Kheng 379,500 0.02%11 Consolidated Robina Capital Corporation 253,000 0.01%12 Gilbert U. Du and/or Fe Socorro R. Du 188,485 0.01%13 JG Summit Capital Services Corporation 127,765 0.01%14 Pedro Sen 75,900 0.00%15 Phimco Industries Provident Fund 72,864 0.00%16 Joseph Estrada 72,105 0.00%17 Gilbert Du 63,250 0.00%18 Abacus Securities Corporation 51,100 0.00%19 Patrick Y. Tong 46,299 0.00%20 Patrick Henry C. Go 45,540 0.00%20 Vincent Henry C. Go 45,540 0.00%
OTHERS 2,701,849 0.12%TOTAL 2,204,161,868 100.00%
Recent Sales of Unregistered Securities
Not applicable. All shares of the Company are listed on the Philippine Stock Exchange.
Dividends
The Company paid dividends as follows:
In 2018, a regular cash dividend of P=1.65 per share and a special cash dividend of P=1.50 per share weredeclared to all stockholders of record as of February 26, 2018 and paid on March 22, 2018.

- 13 -
In 2017, a regular cash dividend of P=1.65 per share and a special cash dividend of P=1.50 per share weredeclared to all stockholders of record as of March 1, 2017 and paid on March 27, 2017.
In 2016, a regular cash dividend of P=1.65 per share and a special cash dividend of P=1.50 per share weredeclared to all stockholders of record as of February 29, 2016 and paid on March 28, 2016.
Item 6. Management’s Discussion and Analysis or Plan of Operation
The following discussion should be read in conjunction with the accompanying consolidated financialstatements and notes thereto, which form part of this Report. The consolidated financial statements andnotes thereto have been prepared in accordance with the Philippine Financial Reporting Standards(PFRS).
Results of Operations
(in thousand pesos)Calendar Year
ended 2018Calendar Year
ended 2017Calendar Year
ended 2016*Fiscal Yearended 2016
Sale of goods and services P=127,769,949 P=125,007,824 P= 112,611,970 P=111,631,793Cost of sales 90,332,569 85,693,355 76,403,954 75,090,959Gross profit 37,437,380 39,314,469 36,208,016 36,540,834Selling and distribution costs (18,719,559) (19,250,876) (16,274,639) (15,828,046)General and administrative expenses (5,337,208) (5,111,426) (4,173,860) (3,902,175)Operating income 13,380,613 14,952,167 15,759,517 16,810,613Finance costs (1,661,700) (1,427,330) (927,122) (897,221)Finance revenue 359,281 225,583 182,335 213,044Net foreign exchange gains (losses) (174,659) 154,191 1,308,789 1,877,597Equity in net loss of joint ventures (132,408) (280,533) (166,719) (233,999)Impairment losses (45,002) (21,423) (185,595) (181,097)Market valuation gain (loss) on
financial assets and liabilities at fairvalue through profit or loss (35,424) 71,016 107,383 855,085
Other income (expense) – net (145,821) 276,736 220,628 353,483Income before income tax 11,544,880 13,950,407 16,299,216 18,797,505Provision for income tax 2,082,094 2,797,486 3,216,342 3,441,533Net income P=9,462,786 P=11,152,921 P=13,082,874 P=15,355,972*Unaudited
Calendar Year 2018 Compared to Calendar Year 2017
URC generated a consolidated sale of goods and services of P=127.770 billion for the year endedDecember 31, 2018, a 2.2% sales growth over last year. Excluding PFRS 15 impact, net sales grew by3.6%. Sale of goods and services performance by business segment follows:
∂ Sale of goods and services in URC’s branded consumer foods segment (BCFG), excluding packagingdivision, slightly decreased by P=806 million or 0.8% to P=101.014 billion in 2018 fromP=101.820 billion registered in 2017. BCFG domestic operations’ net sales declined from P=58.950billion in 2017 to P=57.811 billion in 2018, due to lower volumes and unfavorable mix in the coffeecategory, that slowed down the sustained growth performance in snacks and noodles, and recovery ofRTD beverages.
BCFG international sales increased by P=333 million to P=43.203 billion in 2018 against P=42.870billion in 2017 driven by continuous recovery in Vietnam and sustained momentum in Australia.

- 14 -
Vietnam is still on track on its path to recovery as sales continue to grow from its drive to recovernumeric distribution, as well as from additional sales from new products such as milk tea. Australiamaintained its growth attributed to very strong sales of both branded and private labels.
Sale of goods and services of BCFG, excluding packaging division, accounted for 79.1% of totalURC consolidated sale of goods and services for 2018.
Sale of goods and services in URC’s packaging division increased by 19.4% to P=1.524 billion in 2018from P=1.276 billion recorded in 2017.
∂ Sale of goods and services in URC’s agro-industrial segment (AIG) amounted to P=11.693 billion in2018, a 15.7% increase from P=10.111 billion recorded in 2017. Feeds business grew by 27.6% due tohigher sales volume and improved selling prices across all feed categories. Farms business also grewby 2.2% due to favorable sales mix and better average selling prices of hogs, slightly offset by lowersales of poultry products due to decline in production of day-old pullets.
∂ Sale of goods and services in URC’s commodity foods segment (CFG) amounted to P=13.539 billionin 2018 or up by 14.7% from P=11.801 billion reported in 2017. Sugar and renewables businessesgrew by 15.8% and 12.3%, respectively, on the account of higher volume and selling prices of rawsugar and molasses. Flour business also posted higher sales by 14.5% due to higher volume.
URC’s cost of sales consists primarily of raw and packaging materials costs, manufacturing costs anddirect labor costs. Cost of sales increased by P=4.639 billion, or 5.4%, to P=90.332 billion in 2018 fromP=85.693 billion recorded in 2017 due to higher sales and higher costs of commodities and other raw andpackaging materials.
URC’s gross profit for 2018 amounted to P=37.437 billion, down by P=1.877 billion or 4.8% from P=39.314billion reported in 2017. Gross profit margin decreased by 215 basis points from 31.4% in 2017 to 29.3%in 2018.
URC’s selling and distribution costs, and general and administrative expenses consist primarily ofcompensation benefits, advertising and promotion costs, freight and other selling expenses, depreciation,repairs and maintenance expenses and other administrative expenses. Selling and distribution costs, andgeneral and administrative expenses slightly declined by P=306 million or 1.3% to P=24.057 billion in 2018from P=24.362 billion registered in 2017 primarily due to decline in freight and delivery costs as a result ofdistribution restructuring in Myanmar and Cambodia.
As a result of the above factors, operating income decreased by P=1.572 billion, or 10.5% to P=13.381billion in 2018 from P=14.952 billion reported in 2017. URC’s operating income by segment was asfollows:
∂ Operating income in URC’s branded consumer foods segment, excluding packaging division,decreased by P=1.191 billion or 9.9% to P=10.889 billion in 2018 from P=12.081 billion in 2017. URC’sdomestic operations went down by 20.0% to P=7.143 billion in 2018 from P=8.927 billion in 2017 dueto decline in sales volume and lower margins as a result of higher input costs, forex devaluation andunfavorable product mix driven by coffee category. International operations posted a P=3.746 billionoperating income, 18.8% higher than P=3.154 billion posted in 2017. In constant US dollar terms,international operations posted an operating income of US$71 million, a 14.1% increase from lastyear due to complete turnaround of Vietnam and consistent contribution of New Zealand, partiallyoffset by lower operating income from other markets.

- 15 -
URC’s packaging division reported an operating income of P=29 million in 2018 from P=48 millionreported in 2017 due to lower margins coming from higher material cost, negating the impact ofhigher average selling prices, as well as due to higher repairs and maintenance costs.
∂ Operating income in URC’s agro-industrial segment decreased by P=962 million to P=818 million in2018 from P=1.780 billion in 2017 as a result of the impact of avian flu coupled with higher cost ofinput materials in feeds and hogs, and higher operating expenses in farms.
∂ Operating income in URC’s commodity foods segment increased by P=622 million or 21.3% toP=3.539 billion in 2018 from P=2.917 billion in 2017. Flour business declined by 13.5% despite highervolumes due to lower margins as a result of higher wheat costs. Sugar business, on the other hand,grew by 31.8% due to higher average selling prices and volume while renewable energy business alsogrew by 57.0% from last year driven by higher sales.
URC’s finance costs consist mainly of interest expense which increased by P=234 million or 16.4%, toP=1.662 billion in 2018 from P=1.427 billion recorded in 2017 due to higher level of trust receipts payableand short-term debt, coupled with higher interest rates.
URC’s finance revenue consists of interest income from investments in financial instruments, moneymarket placements, savings and dollar deposits and dividend income from investment in equity securities.Finance revenue increased by P=134 million to P=359 million in 2018 from P=226 million in 2017 due tohigher level of financial assets during the year.
Equity in net losses of joint ventures decreased to P=132 million in 2018 from the P=281 million in 2017due to lower net losses of domestic joint ventures coupled with the higher net income of Proper Snacks inNew Zealand.
Net foreign exchange loss amounted to P=175 million in 2018 from the P=154 million gain reported in 2017due to the combined effects of appreciation of international subsidiaries’ local currencies against USdollar, particularly NZD, and depreciation of Philippine peso against US dollar.
Market valuation loss on financial instruments at fair value through profit or loss of P=35 million reportedin 2018 was lower than the P=71 million gain reported in 2017 due to decrease in market values of equityinvestments.
Impairment losses increased to P=45 million in 2018 from P=21 million in 2017 due to this year’simpairment of goodwill of Advanson.
Other income (expenses) - net consists of gain (loss) on sale of fixed assets, amortization of bond issuecosts, rental income, and miscellaneous income and expenses. Other expense - net amounted toP=146 million in 2018 while other income - net of P=277 million was reported in 2017 due to last year’shigher gain on sale of fixed assets.
URC recognized consolidated provision for income tax of P=2.082 billion in 2018, a 25.6% decrease fromP=2.797 billion in 2017 due to lower taxable income and recognition of lower deferred tax liabilities.
URC’s consolidated net income for 2018 amounted to P=9.463 billion, lower by P=1.690 billion or 15.2%from P=11.153 billion in 2017 due to lower operating income, higher net finance costs and foreignexchange losses.

- 16 -
URC’s core earnings before tax (operating profit after equity earnings, net finance costs and otherexpenses - net) in 2018 amounted to P=11.799 billion, a decline of 13.6% from P=13.656 billion recorded in2017.
Net income attributable to equity holders of the parent decreased by P=1.684 billion or 15.5% to P=9.204billion in 2018 from P=10.888 billion in 2017 as a result of the factors discussed above.
Non-controlling interest (NCI) represents primarily the share in the net income (loss) attributable to non-controlling interest of Nissin-URC, URC’s 51.0%-owned subsidiary. NCI in net income of subsidiariesdecreased from P=265 million in 2017 to P=258 million in 2018.
URC reported an EBITDA (operating income plus depreciation and amortization) of P=19.750 billion in2018, 6.2% lower than P=21.056 billion posted in 2017.
Calendar Year 2017 Compared to Calendar Year 2016
URC generated a consolidated sale of goods and services of P=125.008 billion for the year endedDecember 31, 2017, an 11.0% sales growth over last year. Sale of goods and services performance bybusiness segment follows:
∂ Sale of goods and services in URC’s branded consumer foods segment (BCFG), excluding packagingdivision, increased by P=9.684 billion or 10.5% to P=101.820 billion in 2017 from P=92.136 billionregistered in 2016. BCFG domestic operations’ net sales slightly declined from P=59.188 billion in2016 to P=58.950 billion in 2017, which was mainly driven by the lower volume and unfavorable mixin the coffee category, that dragged down the sustained growth performance in snacks and recoveryof RTD beverages.
BCFG international sales increased by 30.1% to P=42.870 billion in 2017 against P=32.948 billion in2016. In constant US dollar (US$) terms, sales improved by 21.2% to US$851 million in 2017against last year due to full year consolidation of SBA as well as growth from Thailand and Malaysia,partly offset by Vietnam’s slower than expected recovery. Malaysia grew by 7.8% on the back ofpositive performances from snacks, wafer and chocolates while Thailand increased by 6.1% due tocontinuous growth with wafer and snack categories reaching their highest market shares to date.Vietnam’s steady recovery was driven by renewed campaign of C2 brand plus growing snackfoodsbusiness.
Sale of goods and services of BCFG, excluding packaging division, accounted for 81.5% of totalURC consolidated sale of goods and services in 2017.
Sale of goods and services in URC’s packaging division increased by 16.4% to P=1.276 billion in 2017from P=1.095 billion recorded in 2016.
∂ Sale of goods and services in URC’s agro-industrial segment (AIG) amounted to P=10.111 billion in2017, a 9.9% increase from P=9.201 billion recorded in 2016. Feeds business grew by 4.6% due toincrease in volumes while farms business increased by 16.4% due to higher volumes and averageselling prices of value added hogs.

- 17 -
∂ Sale of goods and services in URC’s commodity foods segment (CFG) amounted to P=11.801 billionin 2017 or up by 15.9% from P=10.180 billion reported in 2016. Sugar and renewables businessesgrew by 33.6% and 15.5%, respectively, on the account of higher volumes. On the other hand, flourbusiness declined by 3.8% due to lower volume and average selling price.
URC’s cost of sales consists primarily of raw and packaging materials costs, manufacturing costs anddirect labor costs. Cost of sales increased by P=9.289 billion, or 12.2%, to P=85.693 billion in 2017 fromP=76.404 billion recorded in 2016 mainly coming from the effect of SBA full year consolidation.
URC’s gross profit in 2017 amounted to P=39.314 billion, up by P=3.106 billion or 8.6% from P=36.208billion reported in 2016. Gross profit margin decreased by 70 basis points from 32.2% in 2016 to 31.5%in 2017.
URC’s selling and distribution costs, and general and administrative expenses consist primarily ofcompensation benefits, advertising and promotion costs, freight and other selling expenses, depreciation,repairs and maintenance expenses and other administrative expenses. Selling and distribution costs, andgeneral and administrative expenses rose by P=3.914 billion or 19.1% to P=24.362 billion in 2017 fromP=20.448 billion registered in 2016. This increase resulted primarily from the following factors:
∂ 23.5% or P=1.004 billion increase in compensation and benefits to P=5.279 billion in 2017 from P=4.275billion in 2016 due to SBA full year consolidation, increase in headcount and annual salaryadjustments.
∂ 24.7% or P=1.355 billion increase in freight and delivery charges to P=6.846 billion in 2017 fromP=5.491 billion in 2016 due to SBA full year consolidation and increase in trucking and shipping costsas a result of increased volume.
∂ 10.3% or P=713 million increase in advertising and promotion costs to P=7.603 billion in 2017 fromP=6.890 billion in 2016 due to promotion programs with key accounts and wholesalers, and newproduct launches.
∂ 49.3% or P=253 million increase in contracted services to P=766 million in 2017 from P=513 million in2016 due to additional conso warehouses and increase in shared services charges.
As a result of the above factors, operating income decreased by P=807 million, or 5.1% to P=14.952 billionin 2017 from P=15.760 billion reported in 2016. URC’s operating income by segment was as follows:
∂ Operating income in URC’s branded consumer foods segment, excluding packaging division,decreased by P=1.010 billion or 7.7% to P=12.081 billion in 2017 from P=13.091 billion in 2016. URC’sdomestic operations went down by 14.9% to P=8.927 billion in 2017 from P=10.493 billion in 2016 dueto decline in sales volume and lower margins as a result of higher input costs, forex devaluation andunfavorable product mix driven by coffee category. International operations posted a P=3.154 billionoperating income, 21.4% higher than P=2.598 billion posted in 2016. In constant US dollar terms,international operations posted an operating income of US$63 million, a 11.7% increase from lastyear due to SBA full year consolidation, offset by Vietnam’s slower than expected recovery.
URC’s packaging division reported an operating income of P=48 million in 2017 from P=65 millionreported in 2016 due to lower margins.

- 18 -
∂ Operating income in URC’s agro-industrial segment increased by P=847 million to P=1.780 billion in2017 from P=934 million in 2016 due to higher volumes coupled with favorable prices of hogs andlower raw materials costs of feeds.
∂ Operating income in URC’s commodity foods segment decreased by P=440 million or 13.1% toP=2.917 billion in 2017 from P=3.357 billion in 2016. Flour business declined by 13.9% due to lowerselling prices and volume in addition to higher wheat costs. Sugar business dropped by 22.1% due tolower selling prices notwithstanding higher volumes and higher freight costs. Renewable energybusiness grew by 12.6% from last year driven by higher sales.
URC’s finance costs consist mainly of interest expense which increased by P=500 million or 54.0%, toP=1.427 billion in 2017 from P=927 million recorded in 2016 due to higher level of long-term debt, whichwas used to finance the acquisition of SBA.
URC’s finance revenue consists of interest income from investments in financial instruments, moneymarket placements, savings and dollar deposits and dividend income from investment in equity securities.Finance revenue increased by P=43 million to P=225 million in 2017 from P=182 million in 2016 due tohigher level of financial assets during the year.
Equity in net losses of joint ventures amounted to P=281 million in 2017 as against P=167 million in 2016due to equity share in the net losses of newly created joint venture, Vitasoy-URC.
Net foreign exchange gain decreased to P=154 million in 2017 from P=1.309 billion reported in 2016 due tothe combined effects of appreciation of international subsidiaries’ local currencies against US dollar,particularly NZD, and depreciation of Philippine peso against US dollar.
Market valuation gain on financial instruments at fair value through profit or loss of P=71 million reportedin 2017 was lower than the P=107 million in 2016 due to increase in market values of equity investments,offset by unfavorable fair value changes of derivative instruments.
Impairment losses decreased to P=21 million in 2017 from P=186 million in 2016 due to last year’s higherinventory write-offs resulting from issues encountered in Vietnam.
Other income (expenses) - net consists of gain (loss) on sale of fixed assets, amortization of bondissue costs, rental income, and miscellaneous income and expenses. Other income-net increased toP=277 million in 2017 from P=221 million in 2016 due to higher gain on sale of fixed assets.
URC recognized consolidated provision for income tax of P=2.797 billion in 2017, a 13.0% decrease fromP=3.216 billion in 2016 due to lower taxable income and utilization of deferred tax assets on realizedforeign exchanges losses and tax credits.
URC’s consolidated net income in 2017 amounted to P=11.153 billion, lower by P=1.930 billion or 14.8%from P=13.083 billion in 2016, due to lower operating income, lower net foreign exchange gains andhigher net finance costs.
URC’s core earnings before tax (operating profit after equity earnings, net finance costs and otherexpenses - net) in 2017 amounted to P=13.656 billion, a decline of 9.6% from P=14.944 billion recorded in2016.
Net income attributable to equity holders of the parent decreased by P=1.984 billion or 15.4% to P=10.888billion in 2017 from P=12.872 billion in 2016 as a result of the factors discussed above.

- 19 -
Non-controlling interest (NCI) represents primarily the share in the net income (loss) attributable to non-controlling interest of Nissin-URC, URC’s 51.0%-owned subsidiary. NCI in net income of subsidiariesincreased from P=211 million in 2016 to P=265 million in 2017.
URC reported an EBITDA (operating income plus depreciation and amortization) of P=21.056 billion forin 2017, 1.6% lower than the P=21.405 billion posted in 2016.
Fiscal Year 2016 Compared to Fiscal Year 2015
URC generated a consolidated sale of goods and services of P=111.632 billion for the fiscal year endedSeptember 30, 2016, a 2.4% sales growth over last year. Sale of goods and services performance bybusiness segment follows:
∂ Sale of goods and services in URC’s branded consumer foods segment (BCFG), excluding packagingdivision, increased by P=643 million to P=91.376 billion in 2016, slightly up from P=90.733 billionregistered in 2015. BCFG domestic operations posted an increase of 4.0% in net sales fromP=57.600 billion in 2015 to P=59.923 billion in 2016, which was mainly driven by RTD beverages,chocolates and noodles with double-digit growths. Sales was muted due to decline in coffee categoryas a result of intense competition in the saturated coffee market. Snackfoods category was flattishdue to the aggressive low-priced players affecting corn chips and pelletized snacks.
BCFG international sales decreased by 5.1% to P=31.453 billion in 2016 against P=33.133 billion in2015. In constant US dollar (US$) terms, sales declined by 4.8% to US$670 million in 2016 againstlast year due to regulatory issues encountered in Vietnam despite the growth from Indonesia,Thailand and Malaysia. Indonesia was up by 25.3% driven by the growth in modern trade andsustained sales momentum from favorable results in all categories. Malaysia grew by 7.0% on theback of positive performances from chocolates and wafers while Thailand increased by 3.0% asconsumer confidence has started to recover in the country. New Zealand was flat against last year butwith improvements as Griffin’s business have started stabilizing through improved pricing strategiesand new product developments.
Sale of goods and services of BCFG, excluding packaging division, accounted for 81.9% of totalURC consolidated sale of goods and services in 2016.
Sale of goods and services in URC’s packaging division was flat at P=1.139 billion in 2016 fromP=1.128 billion recorded in 2015.
∂ Sale of goods and services in URC’s agro-industrial segment (AIG) amounted to P=9.114 billion in2016, a 2.0% increase from P=8.931 billion recorded in 2015. Feeds business grew by 21.3% due toincrease in sales volume as a result of aggressive sales and marketing strategies while farms businessdeclined by 14.8% due to lower average selling price of live hogs.
∂ Sale of goods and services in URC’s commodity foods segment (CFG) amounted to P=10.003 billionin 2016 or up by 21.1% from P=8.259 billion reported in 2015. Sugar business grew by 20.0% due toincremental sales from the recently acquired Balayan sugar mill and higher prices of raw and refinedsugar. On the other hand, flour business declined by 2.3% despite higher volume due to loweraverage selling price. Sales contribution from renewable energy businesses amounted toP=2.003 billion in 2016, compared to P=824 million last year.

- 20 -
URC’s cost of sales consists primarily of raw and packaging materials costs, manufacturing costs anddirect labor costs. Cost of sales increased by P=1.290 billion, or 1.7%, to P=75.091 billion in 2016 fromP=73.801 billion recorded in 2015 due to increase in sales volume.
URC’s gross profit in 2016 amounted to P=36.541 billion, up by P=1.291 billion or 3.7% from P=35.250billion reported in 2015. Gross profit margin increased by 41 basis points from 32.3% in 2015 to 32.7%in 2016.
URC’s selling and distribution costs, and general and administrative expenses consist primarily ofcompensation benefits, advertising and promotion costs, freight and other selling expenses, depreciation,repairs and maintenance expenses and other administrative expenses. Selling and distribution costs, andgeneral and administrative expenses rose by P=1.854 billion or 10.4% to P=19.730 billion in 2016 fromP=17.876 billion registered in 2015. This increase resulted primarily from the following factors:
∂ 17.5% or P=603 million increase in compensation and benefits to P=4.047 billion in 2016 fromP=3.444 billion in 2015 due to increase in headcount and annual salary adjustments.
∂ 9.1% or P=576 million increase in advertising and promotion costs to P=6.888 billion in 2016 fromP=6.312 billion in 2015 due to promotion programs with key accounts and wholesalers, and newproduct launches.
∂ 7.9% or P=381 million increase in freight and delivery charges to P=5.227 billion in 2016 fromP=4.846 billion in 2015 due to increase in trucking and shipping costs as a result of increased volume.
∂ 62.0% or P=292 million increase in rent expense to P=764 million in 2016 from P=471 million in 2015 asa result of business expansion.
As a result of the above factors, operating income decreased by P=563 million, or 3.2% to P=16.811 billionin 2016 from P=17.373 billion reported in 2015. URC’s operating income by segment was as follows:
∂ Operating income in URC’s branded consumer foods segment, excluding packaging division,decreased by P=540 million or 3.7% to P=13.975 billion in 2016 from P=14.515 billion in 2015. URC’sdomestic operations went up by 3.1% to P=11.003 billion in 2016 from P=10.676 billion in 2015 due togrowth in sales volume, net of slightly lower margins as a result of change in product mix and higherkey input costs. International operations posted a P=2.973 billion operating income, 22.6% lower thanP=3.839 billion posted in 2015. In constant US dollar terms, international operations posted anoperating income of US$63 million, a 23.1% drop from last year due to Vietnam issues, decline inNew Zealand and losses from Indonesia and Myanmar as a result of brand building and distribution.
URC’s packaging division reported an operating income of P=75 million in 2016 from P=30 millionoperating loss reported in 2015 due to improved sales mix and margins.
∂ Operating income in URC’s agro-industrial segment decreased by P=119 million to P=1.051 billion in2016 from P=1.170 billion in 2015 due to lower prices and volumes of hogs, net of strong performanceby feeds business.
∂ Operating income in URC’s commodity foods segment increased by P=201 million or 6.4% toP=3.340 billion in 2016 from P=3.139 billion in 2015, mainly coming from the additional contributionof renewable energy businesses. Flour business slightly increased by 1.7% due to better wheat priceswhile sugar business declined by 18.4% due to higher freight costs notwithstanding higher salesvolume and price.

- 21 -
Market valuation gain on financial instruments at fair value through profit or loss of P=855 million wasreported in 2016 against the P=215 million market valuation loss in 2015 due to fair value changes ofderivative instruments and lower decline in market values of equity investments.
URC’s finance revenue consists of interest income from investments in financial instruments, moneymarket placements, savings and dollar deposits and dividend income from investment in equity securities.Finance revenue decreased by P=64 million to P=213 million in 2016 from P=277 million in 2015 due todecline in level of financial assets.
URC’s finance costs consist mainly of interest expense which decreased by P=380 million or 29.8%, toP=897 million in 2016 from P=1.278 billion recorded in 2015 due to lower level of financial debt resultingfrom prepayment of a long-term debt.
Net foreign exchange gain amounted to P=1.878 billion in 2016 from P=265 million net foreign exchangeloss reported in 2015 due to the combined effects of appreciation of international subsidiaries’ localcurrencies against US dollar, particularly IDR and NZD, and depreciation of Philippine peso against USdollar.
Impairment losses increased to P=181 million in 2016 from P=110 million in 2015 due to higher inventorywrite-offs resulting from issues encountered in Vietnam.
Equity in net losses of joint ventures amounted to P=234 million in 2016 as against P=206 million in 2015due to higher net losses of DURBI as a result of continuous brand building.
Other income (expenses) - net consists of gain (loss) on sale of fixed assets, amortization of bondissue costs, rental income, and miscellaneous income and expenses. Other income-net increased toP=353 million in 2016 from P=180 million in 2015 mainly coming from gain on sale of a property located inChina.
URC recognized consolidated provision for income tax of P=3.442 billion in 2016, a 5.8% increase fromP=3.252 billion in 2015 due to recognition of higher deferred tax liabilities, net of lower taxable income.
URC’s consolidated net income in 2016 amounted to P=15.356 billion, higher by P=2.851 billion or 22.8%from P=12.505 billion in 2015, due to market valuation gain on financial assets and net foreign exchangegains.
URC’s core earnings before tax (operating profit after equity earnings, net finance costs and otherexpenses - net) in 2016 amounted to P=15.904 billion, a decline of 2.7% from P=16.346 billion recorded in2015.
Net income attributable to equity holders of the parent increased by P=2.757 billion or 22.3% to P=15.140billion in 2016 from P=12.383 billion in 2015 as a result of the factors discussed above.
Non-controlling interest (NCI) represents primarily the share in the net income (loss) attributable to non-controlling interest of Nissin-URC, URC’s 51.0%-owned subsidiary. NCI in net income of subsidiariesincreased from P=122 million in 2015 to P=216 million in 2016.
URC reported an EBITDA (operating income plus depreciation and amortization) of P=22.280 billion for2016, slightly higher than P=22.083 billion posted in 2015.

- 22 -
Financial Condition
URC’s financial position remains healthy with strong cash levels. The Company has a current ratio of1.70:1 as of December 31, 2018, lower than the 1.92:1 as of December 31, 2017. Financial debt to equityratio of 0.48:1 as of December 31, 2018 is within comfortable level. The Company is in a net debtposition of P=26.445 billion this year against P=23.391 billion last year.
Total assets amounted to P=151.936 billion as of December 31, 2018, higher than P=147.641 billion as ofDecember 31, 2017. Book value per share increased to P=38.02 as of December 31, 2018 from P=36.93 asof December 31, 2017.
The Company’s cash requirements have been sourced through cash flow from operations. The net cashflow provided by operating activities in 2018 amounted to P=14.658 billion. Net cash used in investingactivities amounted to P=8.680 billion which were substantially used for fixed asset acquisitions. Net cashused in financing activities amounted to P=7.452 billion due to dividend payment and net loan repayment.
The capital expenditures amounting to P=8.642 billion include site development, building constructionsand rehabilitation/upgrade of beverage and snacks facilities in the Philippines; improvements inpackaging facility in Vietnam; new warehouse and improvements in biscuit, snacks and candy lines inThailand; potato chips and kettle plant upgrade in New Zealand; various capacity upgrades and buildingmanagement improvements in New Zealand and Australia; and construction of new factory building andconbar line in Malaysia.
The Company budgeted about P=9.144 billion for capital expenditures (including maintenance capex) andinvestments for 2019, which substantially consists of the following:
∂ P=7.309 billion for capacity expansions and improvement of information systems, handling,distribution, safety, quality control and operational efficiencies throughout the branded consumersfoods group.
∂ P=1.254 billion for commodity foods group for flourmill and pasta manufacturing, sugar businessexpansion, improvement and maintenance capital expenditures.
∂ P=581 million for agro-industrial group maintenance capex, packaging business facilities improvementand machine rehabilitation.
No assurance can be given that the Company’s capital expenditures plan will not change or that theamount of capital expenditures for any project or as a whole will not change in future years from currentexpectations.
As of December 31, 2018, the Company is not aware of any events that will trigger direct or contingentfinancial obligation that is material to the Company, including any default or acceleration of anobligation.

- 23 -
Financial Ratios
The following are the major financial ratios that the Group uses. Analyses are employed by comparisonsand measurements based on the financial information of the current year against last year.
December 31, 2018 December 31, 2017Liquidity:
Current ratio 1.70:1 1.92:1Solvency:
Gearing ratio 0.48:1 0.47:1Debt to equity ratio 0.81 0.81:1Asset to equity ratio 1.81 1.81:1
Year 2018 Year 2017Profitability:
Operating margin 10.5% 12.0%Earnings per share 4.18 4.94
Leverage:Interest rate coverage ratio 11.89 14.75
The Group calculates the ratios as follows:
Financial Ratios FormulaCurrent ratio Current assets
Current liabilities
Gearing ratioTotal financial debt (short-term debt, trust receipts payable
and long-term debt including current portion)Total equity (equity holders + non-controlling interests)
Debt to equity ratio Total liabilities (current + noncurrent)Total equity (equity holders + non-controlling interests)
Asset to equity ratio Total assets (current + noncurrent)Total equity (equity holders + non-controlling interests)
Operating margin Operating IncomeSale of goods and services
Earnings per share Net income attributable to equity holders of the parentWeighted average number of common shares
Interest rate coverage ratio Operating income plus depreciation and amortizationFinance costs

- 24 -
Material Changes in the 2018 Financial Statements(Increase/Decrease of 5% or more versus 2017)
Income statements – Year ended December 31, 2018 versus Year ended December 31, 2017
5.4% increase in cost of salesDue to higher input costs, including forex impact on imported raw materials
16.4% increase in finance costsDue to higher level of trust receipts payable and short-term debt, coupled with higher interest rates
59.3% increase in finance revenueDue to higher level of financial assets during the year
213.3% decrease in net foreign exchange gains (losses)Due to the combined effects of appreciation of international subsidiaries’ local currencies against USdollar, particularly NZ dollar, and depreciation of Philippine peso against US dollar
52.8% decrease in equity in net losses of joint venturesDue to lower net losses of domestic joint ventures coupled with the higher net income of Proper Snacks inNew Zealand
110.1% increase in impairment lossesDue to this year’s impairment of goodwill of Advanson
149.9% decrease in market valuation gain (loss) on financial instruments at FVPLDue to decrease in market values of equity investments
152.7% decrease in other income (loss) - netDue to last year’s higher gain on sale of fixed assets
25.6% decrease in provision for income taxDue to lower taxable income and recognition of lower deferred tax liabilities
Statements of Financial Position – December 31, 2018 versus December 31, 2017
10.2% decrease in cash and cash equivalentsDue to capital expenditure and dividend payment, net of operating cash
7.8% decrease in financial assets at fair value through profit or lossDue to decline in fair values of equity securities
10.6% decrease in receivables - netDue to increase in trade receivables
19.6% increase in inventoriesDue to increases in raw material and finished goods inventories
34.0% decrease in biological assetsDue to decline in headcount and market prices of hogs

- 25 -
25.0% increase in other current assetsDue to increases in input value-added tax and advances to suppliers
7.7%% increase in property, plant and equipmentDue to various plant expansion and improvement projects, net of depreciation
5.7% decrease in investment in joint venturesDue to share in net losses of joint ventures and change in ownership of HURC and CURC from jointventures to wholly-owned subsidiaries, partially offset by the additional investments during the year
12.5% increase in noncurrent assetsDue to increase in security deposits, net of lower deferred input taxes
5.5% increase in accounts payable and other accrued liabilitiesDue to increase in trade payables
22.5% increase in short-term debtDue to loan availments during the year to partially finance the dividend payment
90.8% increase in trust receipts payableDue to increased utilization of trust receipt facilities
43.0% decrease in income tax payableDue to lower income tax provision during the year
5.3% decrease in long-term debtDue to partial repayment of the NZ loan and forex translation impact
38.5% decrease in other noncurrent liabilitiesDue to decline in net pension liability
374.4% increase in other comprehensive incomeDue to significant increase in cumulative translation adjustments
99.2% increase in treasury sharesDue to issuance of shares in relation to CCPI merger with and into the Parent Company, which wereconsequently classified as treasury shares
28.5% decrease in equity attributable to non-controlling interestsDue significantly to the dividends declared by Nissin-URC, net of equity share in net income

- 26 -
The Company’s key performance indicators are employed across all businesses. Comparisons are thenmade against internal target and previous period’s performance. The Company and its significantsubsidiaries’ top five (5) key performance indicators are as follows: (in million PhPs)
Universal Robina Corporation (Consolidated)CY 2018 CY 2017 Index
Revenues 127,770 125,008 102EBIT 13,381 14,952 89EBITDA 19,750 21,056 94Net Income 9,463 11,153 85Total Assets 151,753 147,641 103
URC International Co., Ltd. (Consolidated)CY 2018 CY 2017 Index
Revenues 42,203 42,871 98EBIT 3,944 3,154 125EBITDA 6,756 5,833 116Net Income 1,046 1,855 56Total Assets 89,899 87,739 102
Nissin-URCCY 2018 CY 2017 Index
Revenues 5,815 5,103 114EBIT 845 769 110EBITDA 975 890 110Net Income 603 559 108Total Assets 2,583 2,686 96
Majority of the above key performance indicators were within targeted levels.
Item 7. Financial Statements
The consolidated financial statements and schedules listed in the accompanying Index to FinancialStatements and Supplementary Schedules (page 43) are filed as part of this Form 17-A (pages 44to 172).
Item 8. Changes in and Disagreements with Accountants on Accounting and FinancialDisclosure
None.

- 27 -
Item 9. Independent Public Accountants and Audit Related Fees
Independent Public Accountants
The Company’s independent public accountant is the accounting firm of SyCip Gorres Velayo & Co.The same accounting firm is tabled for reappointment for the current year at the annual meeting ofstockholders. The representatives of the principal accountant have always been present at prior year’smeetings and are expected to be present at the current year’s annual meeting of stockholders. They mayalso make a statement and respond to appropriate questions with respect to matters for which theirservices were engaged.
The current handling partner of SGV & Co. has been engaged by the Company in 2018 and is expected tobe rotated every five (5) years.
Audit-Related Fees
The following table sets out the aggregate fees billed for each of the last three years for professionalservices rendered by SyCip, Gorres, Velayo & Co.
FY 2016 CY 2017 CY 2018Audit and Audit-Related Fees P=9,740,000 P=9,954,000 P=11,206,000Fees for services that are normally provided
by the external auditor in connection withstatutory and regulatory filings orengagements none none 1,100,000Professional fees for due diligence reviewfor bond/shares offering none none none
Tax Fees none none noneOther Fees none none noneTotal P=9,740,000 P=9,954,000 P=12,306,000
Audit Committee’s Approval Policies and Procedures for the Services Rendered by the External Auditors
The Corporate Governance Manual of the Company provides that the Audit Committee shall, among others:1. Evaluate all significant issues reported by the external auditors relating to the adequacy, efficiency, and
effectiveness of policies, controls, processes and activities of the Company.2. Ensure that other non-audit work provided by the external auditors is not in conflict with their functions
as external auditors.3. Ensure the compliance of the Company with acceptable auditing and accounting standards and
regulations.

- 28 -
PART III - CONTROL AND COMPENSATION INFORMATION
Item 10. Directors and Executive Officers of the Registrant
Name Age Position Citizenship
1. John L. Gokongwei, Jr 92Director, Chairman Emeritus andFounder Filipino
2. James L. Go 79 Director, Chairman Emeritus Filipino3. Lance Y. Gokongwei 52 Director, Chairman Filipino4. Irwin C. Lee 54 President and Chief Executive Officer Filipino5. Patrick Henry C. Go 48 Director, Vice President Filipino6. Johnson Robert G. Go, Jr 53 Director Filipino7. Robert G. Coyiuto, Jr 67 Director Filipino8. Wilfrido E. Sanchez 81 Director (Independent) Filipino9. Cesar V. Purisima 59 Director (Independent) Filipino10. Pascual S. Guerzon 81 Member of the Advisory Board Filipino11. Cornelio S. Mapa, Jr. 52 Executive Vice President Filipino12. Bach Johann M. Sebastian 57 Senior Vice President Filipino13. David J. Lim, Jr. 55 Senior Vice President Filipino
14. Francisco M. Del Mundo 48Senior Vice President and ChiefFinancial Officer Filipino
15. Michael P. Liwanag 44 Senior Vice President Filipino16. Chona R. Ferrer 60 First Vice President Filipino17. Ester T. Ang 60 Vice President - Treasurer Filipino18. Teofilo B. Eugenio, Jr. 53 Vice President Filipino19. Vincent Henry C. Go 47 Vice President Filipino20. Ellison Dean C. Lee 61 Vice President Filipino21. Renato P. Cabati 55 Vice President Filipino22. Anne Patricia C. Go 52 Vice President Filipino23. Alan D. Surposa 55 Vice President Filipino24. Rosalinda F. Rivera 48 Corporate Secretary Filipino25. Socorro ML. Banting 64 Assistant Vice President Filipino26. Arlene S. Denzon 50 Compliance Officer Filipino
All of the above directors and officers have served their respective offices since May 30, 2018. There areno directors who resigned or declined to stand for re-election to the board of directors since the date of thelast annual meeting of stockholders for any reason whatsoever.
Messrs. Wilfrido E. Sanchez and Cesar V. Purisima are the independent directors of the Company.
A brief description of the directors and executive officers’ business experience and other directorshipsheld in other reporting companies are provided as follows:
John L. Gokongwei, Jr. founded URC in 1954 and has been the Chairman Emeritus and Founder of URCeffective January 1, 2002. He continues to be a member of URC’s Board and is the Chairman Emeritusand Founder of JGSHI and Robinsons Land Corporation. He is currently the Chairman of the GokongweiBrothers Foundation, Inc., and a director of Cebu Air, Inc., Robinsons Retail Holdings, Inc. and OrientalPetroleum and Minerals Corporation. He was elected a director of Manila Electric Company on March31, 2014. He is also a non-executive director of A. Soriano Corporation. Mr. Gokongwei received a
- 29 -
Masters degree in Business Administration from the De La Salle University and attended the AdvancedManagement Program at Harvard Business School.
James L. Go is the Chairman Emeritus and a member of the Board of Directors of URC. He is theChairman of JGSHI and Oriental Petroleum and Minerals Corporation. He is the Chairman Emeritus ofRobinsons Land Corporation, JG Summit Petrochemical Corporation, and JG Summit OlefinsCorporation. He is the Vice Chairman of Robinsons Retail Holdings, Inc. and a director of Cebu Air,Inc., Marina Center Holdings Private Limited, United Industrial Corporation Limited and Hotel MarinaCity Private Limited. He is also the President and Trustee of the Gokongwei Brothers Foundation, Inc.He has been a director of the Philippine Long Distance Telephone Company (PLDT) since November 3,2011. He is a member of the Technology Strategy Committee and Advisor of the Audit Committee of theBoard of Directors of PLDT. He was elected a director of Manila Electric Company on December 16,2013. Mr. Go received his Bachelor of Science Degree and Master of Science Degree in ChemicalEngineering from Massachusetts Institute of Technology, USA. Mr. James L. Go is a brother of Mr. JohnL. Gokongwei, Jr. and joined URC in 1964.
Lance Y. Gokongwei is the Chairman of URC. He is the President and Chief Executive Officer ofJGSHI. He is the Chairman of Robinsons Retail Holdings, Inc., Robinsons Land Corporation, JG SummitPetrochemical Corporation, JG Summit Olefins Corporation and Robinsons Bank Corporation. He is thePresident and Chief Executive Officer of Cebu Air, Inc. He is a director and Vice Chairman of ManilaElectric Company and a director of Oriental Petroleum and Minerals Corporation and United IndustrialCorporation Limited. He is also a trustee and secretary of the Gokongwei Brothers Foundation, Inc. Hereceived a Bachelor of Science degree in Finance and a Bachelor of Science degree in Applied Sciencefrom the University of Pennsylvania. Mr. Lance Y. Gokongwei is the son of Mr. John L. Gokongwei, Jr.and joined URC in 1988.
Irwin C. Lee is the President and Chief Executive Officer of URC effective May 14, 2018. Heconcurrently handles the Branded Consumer Foods Group of URC. Prior to joining URC, he was theChief Executive Officer of Rustan Supercenters, Inc. and a director of Rose Pharmacy under JardineMatheson’s Dairy Farm Group. He brings with him more than 32 years of work experience in fast-moving consumer foods and retail across Asia, Europe and the US. He started his career at Procter &Gamble (P&G) as a Finance Analyst and rose to key executive finance roles in various countries,including Chief Financial Officer roles in Indonesia, Japan/Korea and Greater China. In 2004, he wasappointed Vice President for P&G Greater China with dual roles as Chief Marketing Officer and asGeneral Manager for the laundry detergent business, which he drove to market leadership. In 2007, hewas appointed Vice President/Managing Director for P&G UK and Ireland, where he delivered profitablegrowth through two recessions and led P&G’s London 2012 Olympics program. In 2014, he rose tobecome P&G’s Regional Head for Northern Europe, leading commercial operations across UK, Ireland,Sweden, Denmark, Norway and Finland, and integrating P&G’s second largest international regionalcluster. While in the UK, he spearheaded industry initiatives for connecting businesses to communitiesand enhancing employee engagement and well-being. After P&G, he served as Global Strategic Advisorfor McKinsey and Co. to consumer and retail sector partners and engagement managers. He also sat asBoard Director and Remuneration Committee Chairman for Wm Morrison Supermarkets Plc (one ofUK’s top 4 grocery retailers). Mr. Irwin Lee graduated with a Bachelor of Science Degree in CommerceMajor in Accounting from the De La Salle University Manila, Summa Cum Laude. He finished third inthe CPA Licensure Exams in 1985.
Patrick Henry C. Go is a director and a Vice President of URC. He also heads the URC Packaging(BOPP) Division and Flexible Packaging Division. He is the President and Chief Executive Officer of JGSummit Petrochemical Corporation and JG Summit Olefins Corporation. He is also a director of JGSHI,Robinsons Land Corporation, and Robinsons Bank Corporation. He is a trustee and treasurer of theGokongwei Brothers Foundation, Inc. He received a Bachelor of Science degree in Management from

- 30 -
the Ateneo de Manila University and attended the General Manager Program at Harvard Business School.Mr. Patrick Henry C. Go is a nephew of Mr. John L. Gokongwei, Jr.
Johnson Robert G. Go, Jr. has been a director of URC since May 5, 2005. He is also a director ofJGSHI, Robinsons Land Corporation, and Robinsons Bank Corporation. He is also a trustee of theGokongwei Brothers Foundation, Inc. He received his Bachelor of Arts degree in InterdisciplinaryStudies (Liberal Arts) from the Ateneo de Manila University. He is a nephew of Mr. John L. Gokongwei,Jr.
Robert G. Coyiuto, Jr. has been a director of URC since 2002. He was appointed Presidential Adviseron Capital Market Development. He is the Chairman of the Board and Chief Executive Officer ofPrudential Guarantee & Assurance, Inc. and of PGA Sompo Insurance Corporation. He is also Chairmanof PGA Cars, Inc., Pioneer Tours Corporation and Coyiuto Foundation. He is the Chairman andPresident of Calaca High Power Corporation and Pacifica 21 Holdings, Inc. He is Vice Chairman andDirector of National Grid Corporation of the Philippines and First Life Financial Co., Inc. He is also thePresident, Chief Operating Officer and Director of Oriental Petroleum and Minerals Corporation. He is adirector of Petrogen Insurance Corporation, and Canon (Philippines) Inc. He is a member of thePhilippine Stock Exchange.
Wilfrido E. Sanchez has been an independent director of URC since 1995. He is a Tax Counsel inQuiason Makalintal Barot Torres Ibarra Sison & Damaso Law Firm. He is also a trustee of theGokongwei Brothers Foundation, Inc. He is a director of Adventure International Tours, Inc., AmonTrading Corporation, Asia Brewery, Inc., Center for Leadership & Change, Inc., EEI Corporation,EMCOR, Inc., Eton Properties Philippines, Inc., House of Investments, Inc., J-DEL Investment andManagement Corporation, JVR Foundation, Inc., Kawasaki Motor Corp., K Servico, Inc., LT Group, Inc.,Magellan Capital Holdings Corporation, Tanduay Distillers, Inc., Transnational Diversified Corporation,Transnational Financial Services, Inc., and Transnational Plans, Inc. He was also appointed as a memberof the Board of Trustees of the Asian Institute of Management on September 8, 2016. He received hisBachelor of Arts degree and Bachelor of Laws degree from the Ateneo de Manila University and aMasters of Law degree from the Yale Law School.
Cesar V. Purisima, has been an independent director of URC effective May 30, 2018. He is an AsiaFellow at the Milken Institute. He is also an independent nonexecutive director of the AIA GroupLimited and Ayala Land, Inc., an Executive-in-Residence of the Asian Institute of Management, and amember of the Board of Trustees of the International School, Manila and De La Salle University. He isalso a member of the International Advisory Council (Phils.) of the Singapore Management Universityand a member of the Global Advisory Council of Sumitomo Mitsui Banking Corporation. He is also anadvisor of the Partners Group AG Life Council. He served in the Philippine government as Secretary ofthe Department of Finance from July 2010 to June 2016 and as Secretary of the Department of Trade andIndustry from January 2004 to February 2005. He also previously served on the boards of a number ofgovernment institutions, including as a member of the Monetary Board of the Bangko Sentral ngPilipinas, Governor of the World Bank Group for the Philippines, Governor of the Asian DevelopmentBank for the Philippines, Alternate Governor of the International Monetary Fund for the Philippines andChairman of the Land Bank of the Philippines. He was conferred the Chevalier dans l’Ordre national dela Légion d’Honneur (Knight of the National Order of the Legion of Honour) by the President of theFrench Republic in 2017, the Order of Lakandula, Rank of Grand Cross (Bayani) by the President of thePhilippines in 2016 and the Chevalier de l’Ordre national du Mérite (Knight of the National Order ofMerit) by the President of the French Republic in 2001. He is a certified public accountant. He hasextensive experience in public accounting both in the Philippines and abroad. He was Chairman andManaging Partner of SyCip Gorres Velayo & Co. (a member firm of Andersen Worldwide until 2002 andbecame member firm of Ernst & Young Global Limited) from 1999 until 2004. During the period, hewas also the Asia-Pacific Area Managing Partner for Assurance and Business Advisory Services of

- 31 -
Andersen Worldwide from 2001 to 2002 and Regional Managing Partner for the ASEAN Practice ofAndersen Worldwide from 2000 to 2001. He obtained his Bachelor of Science in Commerce (Majors inAccounting & Management of Financial Institutions) degree from De La Salle University (Manila) in1979, Master of Management degree from J.L. Kellogg Graduate School of Management, NorthwesternUniversity in 1983 and Doctor of Humanities honoris causa degree from Angeles University Foundationof the Philippines in 2012.
Pascual S. Guerzon is a Member of the Advisory Board of URC effective May 30, 2018. He waspreviously an independent director of URC. He is currently the Principal of Dean Guerzon & Associates(Business Development). He is the Founding Dean of De La Salle Graduate School of Business. He wasalso the former President of the Management Association of the Philippines Agribusiness andCountryside Development Foundation and the Management Association of the Philippines Foundation,MBA Director of the Ateneo de Manila Graduate School of Business, Director of Leverage InternationalConsultants, Deputy Director of Asean Chambers of Commerce and Industry and Section Chief of theBoard of Investments. He is a holder of an MBA in Finance from the University of the Philippines and aPh.D. (N.D) in Management from the University of Santo Tomas.
Cornelio S. Mapa, Jr. is the Executive Vice President for Corporate Strategy of URC. He is the SeniorVice President, Corporate Strategy for Consumer Businesses of JG Summmit Holdings, Inc. He was alsothe Managing Director of the URC Branded Consumer Foods Group. He was the General Manager of theCommercial Centers Division of Robinsons Land Corporation before joining URC in October2010. Prior to joining URC and Robinsons Land Corporation, he was Senior Vice President and ChiefFinancial Officer of the Coca Cola Bottlers Philippines including its subsidiaries, Cosmos Bottling andPhilippine Beverage Partners. He was also formerly Senior Vice President and Chief Financial Officer ofLa Tondeña Distillers, Inc. He earned his Bachelor of Science degrees in Economics and InternationalFinance from New York University and obtained his Masters in Business Administration from IMD inLausanne, Switzerland.
Bach Johann M. Sebastian is the Senior Vice President and Chief Strategist of URC. He is also theSenior Vice President of JGSHI, Corporate Strategy for Digital and Strategic Investments Group. He isalso the Senior Vice President and Chief Strategist of Robinsons Land Corporation. He is also the SeniorVice President, Chief Strategist and Compliance Officer of Cebu Air, Inc., and Robinsons RetailHoldings, Inc. Prior to joining URC in 2002, he was Senior Vice President and Chief CorporateStrategist at RFM Corporation, Swift Foods Inc., Selecta Dairy Products Inc., Cosmos BottlingCorporation, and PSI Technologies Inc. Between 1981 and 1991, he was with the Department of Tradeand Industry as Chief of Economic Research, and Director of Operational Planning. He received hisBachelor of Arts in Economics from the University of the Philippines in 1981 and his Master in BusinessAdministration degree from the Asian Institute of Management in 1986.
David J. Lim, Jr. is the Senior Vice President for Quality, Engineering, Sustainability and TechnicalServices of URC’s Branded Consumer Foods Group Philippines and International. He was the AssistantTechnical Director for JGSHI prior to joining URC in December of 2008. He earned his Bachelor ofScience degree in Aeronautical Engineering from Imperial College, London, England and obtained hisMaster of Science degree in Civil Structural Engineering from the University of California at Beverly,USA as well as his Masters in Engineering from the Massachusetts Institute of Technology, USA.
Michael P. Liwanag is the Senior Vice President and Investor Relations Officer of URC. He isconcurrently the Senior Vice President for Investor Relations and Special Projects for the Office of thePresident & CEO of JGSHI. Prior to his current role in URC, he was the Vice President for CorporateStrategy and Development of URC until May 14, 2018. Before joining URC in 2001, he was exposed todifferent business functions such as Strategic Management & Implementation, CorporateFinance/Mergers & Acquisitions, Program Management, Financial Planning & Analysis and Business

- 32 -
Analytics in Digital Telecommunications Phils., Inc., Global Crossings and Philippine GlobalCommunications, Inc. He studied Engineering at the University of the Philippines, is a CertifiedManagement Accountant (ICMA Australia) and an alumni of the Harvard Business School (AMP).
Francisco M. Del Mundo is the Senior Vice President and Chief Financial Officer of URC. He is alsothe Senior Vice President and Chief Financial Officer of JGSHI. He brings with him 26 years ofexperience in all aspects of the finance career. He has built his career from 17 years of rigorous trainingin Procter & Gamble (P&G) and 3 years in Coca-Cola prior to joining the JG Summit Group. He hasworked in three different markets: Manila, Thailand and Singapore, and has held numerous CFO andRegional Finance Head positions, namely: CFO for ASEAN, Head of Accounting Shared Services forCentral and Eastern Europe, Middle East and Africa, and Asia Hub Manager for Internal Controls forP&G. During his stint with Coca-Cola, he was the CFO for Coca-Cola Bottlers Philippines, Inc. andconcurrently the CEO of Coca-Cola Bottlers Business Services, the company’s global shared servicehandling Philippines, Singapore and Malaysia. In 2013, he joined JGSHI as Vice President for JGSummit and Affiliates Shared Services. He was appointed as CFO of URC International the same year,concurrent with Shared Services role. In 2016, he was appointed CFO of URC and Head of JG SummitEnterprise Risk Management Group, and continues to lead Shared Services as its Vice President. Hegraduated cum laude from the University of the Philippines Diliman with a Bachelor of Science inBusiness Administration degree. He was recognized as the Most Distinguished Alumnus of theUniversity’s College of Business Administration in 2008. He is also a Certified Internal Auditor and hasdone several external talks on shared service and finance transformation in Manila, Malaysia and Dubai.
Chona R. Ferrer is the First Vice President for Corporate Treasury of URC. She is also the DeputyTreasurer of JGSHI. Prior to joining URC in 1983, she was Assistant Treasurer of Guevent IndustrialDevelopment Corporation. She received a Bachelor of Science degree in Business Administration fromthe University of the Philippines.
Ester T. Ang is the Vice President - Treasurer, Treasury Industrial Group. Prior to joining URC in 1987,she worked with Bancom Development Corporation and Union Bank of the Philippines. She received herBachelor of Science degree in Accounting from the Ateneo De Davao University in Davao City.
Teofilo B. Eugenio, Jr. is the Vice President of URC. He is the General Manager of Nissin-UniversalRobina Corporation. He is also the President and General Manager of Hunt-Universal RobinaCorporation. During the time he was Vice President for Snacks Marketing, he also served as GeneralManager of Calbee-URC, Inc. until April 2016. Before handling Snacks, he was the Marketing Directorfor biscuits, cakes and chocolates of the URC Branded Consumer Foods Group and started as GroupProduct Manager of biscuits. Prior to joining URC, he was Senior Product Manager for Ovaltine atNovartis Nutrition Philippines, Inc. He has more than 20 years’ experience in the field of marketing. Heearned his Bachelor of Science degree in Industrial Management Engineering, Minor in MechanicalEngineering, from the De La Salle University, Manila and obtained his Masters in BusinessAdministration from Strathclyde Graduate Business School, Strathclyde University, United Kingdom.
Vincent Henry C. Go is the Vice President of URC, has been the Group General Manager of URC’sAgro-Industrial Group since 2006 and Chairman of the Supplier Selection Committee since 2013. Heserved as General Manager and National Sales Manager of Universal Corn Products in 2002 and 1994,respectively. He obtained his degree in Feed Manufacturing Technology from the Swiss Institute of FeedTechnology in Uzwil, Switzerland. Mr. Vincent Henry C. Go is a nephew of Mr. John L. Gokongwei, Jr.and joined URC in 1992.
Ellison Dean C. Lee is the Vice President of URC and the Business Unit General Manager of URC’sFlour Division. He started his career with the Philippine Appliance Corporation as Manager, SpecialAccounts, under the Office of the Chairman and President. He then moved to PHINMA Group of

- 33 -
Companies and occupied the positions of Assistant Vice President and Vice President for Marketing. Healso joined Inglenook Foods Corporation as Vice President for Sales. Prior to joining URC in 2001, hewas a Vice President of Golden Gate Marketing Corporation, a marketing arm of APO CementCorporation, and Vice President for Sales and Marketing of Blue Circle Philippines, Inc. He graduatedwith a Bachelor of Science in Business Management from the Ateneo De Manila University. He alsoattended the Management Program at the Asian Institute of Management.
Renato P. Cabati is the Vice President of URC and the Business Unit General Manager of URC’sSugar and Renewables Group since 2002. He has held various posts in the sugar business since1989. Prior to joining URC, he practiced public accounting with SyCip, Gorres, Velayo & Co. andprivate accounting with NDC - Guthrie Plantations, Inc. He is a member of the Philippine Institute ofCertified Public Accountants, past President and Chairman of the Philippine Sugar TechnologistsAssociation, Inc., Executive Committee member of the Philippine Sugar Millers Association, MillersSector Representative to the Sugar Tripartite Council of the Department of Labor & Employment andPresident of the Philippine Association of Sugar Refiners, Inc., Chairman of Ethanol ProducersAssociation of the Philippines and a Member of the Board of Trustees of the Philippine Sugar ResearchInstitute. He is a Certified Public Accountant and has obtained his Bachelor of Science degree inCommerce Major in Accounting from the Far Eastern University and attended raw sugar and refinedsugar manufacturing courses at the Nichols State University, Thibodaux, Louisiana, USA.
Anne Patricia C. Go is the Vice President for Advertising and Marketing Services of URC. She alsohandles all Advertising and Public Relations, Consumer Promotions, Special Events and Market Researchrequirements of URC. She is also Vice President for Advertising and Public Relations for the JG Groupand handles all Advertising and Public Relations for the JG Group including Summit Media andRobinsons Retail Group. She joined URC in 1993 as Director of Marketing Services. She began hermore than 20 year-career in Advertising and Communications in Basic/FCB. She was also a freelancebroadcast producer and the Philippine representative of Hong Kong-based Centro Digital Pictures. Shegraduated from Ateneo de Manila University with a degree in Communication Arts. Ms. Anne Patricia C.Go is the niece of Mr. John L. Gokongwei, Jr.
Alan D. Surposa is the Vice President for Procurement of URC Branded Consumer Foods Group -Philippines and International. He had an expanded role as Vice President - Corporate Procurement of JGGroup effective March 18, 2015. He is responsible for ensuring that the procurement processes operatesmoothly and consistently across the group in line with the set procurement policies of the organization.He will synergize procurement policies, procedures and strategies across the different businesses to createa unified procurement group that is efficient, competent and strategically aligned to deliver competitiveadvantage. In his expanded role, he also exercises strong functional oversight over heads/managers in thedifferent countries whose work revolves around procurement to ensure consistent alignment andsynergies across the region. He also handles the Corporate Import Services of JGSHI. He is a memberand formerly a Director of The Purchasing Managers Association of the Philippines. He received hisBachelor of Science degree in Civil Engineering from the Cebu Institute of Technology in Cebu City.
Rosalinda F. Rivera was appointed Corporate Secretary of URC on May 22, 2004 and has been AssistantCorporate Secretary since May 2002. She is also the Corporate Secretary of JGSHI, Robinsons LandCorporation, Cebu Air, Inc., Robinsons Retail Holdings, Inc., JG Summit Olefins Corporation and JGSummit Petrochemical Corporation. Prior to joining URC, she was a Senior Associate at Puno and PunoLaw Offices. She received a Juris Doctor degree from the Ateneo de Manila University School of Lawand a Masters of Law degree in International Banking from the Boston University School of Law. Shewas admitted to the Philippine Bar in 1995.

- 34 -
Socorro ML. Banting is the Assistant Vice President and Assistant Treasurer of URC. She is also anofficer of other related companies of URC. Prior to joining URC in 1986, she worked with StateInvestment House, Inc. and Manila Midtown Hotel. She obtained her Bachelor of Science degree inBusiness Administration from the Ateneo de Davao University.
Arlene S. Denzon is the Compliance Officer of URC and Vice President of the Corporate Governanceand Management Systems (CGMS) of JGSHI. Prior to rejoining URC in February 2013, she was theSenior Vice President in charge of the Enterprise-wide Risk Management Group of Digitel MobilePhilippines, Inc. (DMPI, more popularly known as Sun Cellular) until December 2012. Ms. Denzonstarted her career in the Gokongwei Group in 1991 and performed various roles including AccountingManager of JGSHI until 1997, Assistant Vice President - Special Assistant to the Chairman until 2001,Vice President - Treasurer and Acting Chief Financial Officer of URC International until 2003 before shewas seconded to DMPI in 2004. Prior to JGSHI, Ms. Denzon had three years working experience asexternal auditor in SyCip, Gorres, Velayo & Co. She was a Certified Public Accountant Boardtopnotcher and obtained her Bachelor of Accountancy degree, Magna Cum Laude, from the PolytechnicUniversity of the Philippines.
The members of the Company’s board of directors and executive officers can be reached at the address ofits registered office at 8th Floor, Tera Tower, Bridgetowne, E. Rodriguez Jr. Avenue (C5 Road), UgongNorte, Quezon City, Philippines.
Involvement in Certain Legal Proceedings of Directors and Executive Officers
None of the members of the Board of Directors and Executive Officers of the Company are involved inany criminal, bankruptcy or insolvency investigations or proceedings.
Family Relationships
1. Mr. James L. Go is the brother of Mr. John L. Gokongwei, Jr.2. Mr. Lance Y. Gokongwei is the son of Mr. John L. Gokongwei, Jr.3. Mr. Patrick Henry C. Go is the nephew of Mr. John L. Gokongwei, Jr.4. Mr. Johnson Robert G. Go, Jr. is the nephew of Mr. John L. Gokongwei, Jr.5. Mr. Vincent Henry C. Go is the nephew of Mr. John L. Gokongwei, Jr.6. Ms. Anne Patricia C. Go is the niece of Mr. John L. Gokongwei, Jr.
Item 11. Executive Compensation
The following summarizes certain information regarding compensation paid or accrued during the lasttwo (2) years and to be paid in the ensuing year to the Company’s Directors and Executive Officers:
Estimated - CY2019 ActualSalary Bonus Other Total CY2018 CY2017
CEO and Four (4) mosthighly compensatedexecutive officers P=129,919,492 P=2,000,000 P=1,025,000 P=132,944,492 P=118,747,121 P=115,286,005
All officers and directors as agroup unnamed 187,324,651 3,000,000 1,425,000 191,749,651 172,850,653 146,773,330
The following are the five (5) highest compensated directors and/or executive officers of the Company:1. Director, Chairman Emeritus James L. Go; 2. Director, Chairman Emeritus and Founder - John L.Gokongwei, Jr.; 3. Director, Chairman - Lance Y. Gokongwei; 4. President and Chief Executive President- Irwin C. Lee; and 5. Executive Vice President - Cornelio S. Mapa, Jr.

- 35 -
Standard Arrangements
There are no standard arrangements pursuant to which directors of the Company are compensated, or areto be compensated, directly or indirectly, for any services provided as a director for the last completedyear and the ensuing year.
Other Arrangements
There are no other arrangements pursuant to which directors of the Company are compensated, or are tobe compensated, directly or indirectly, for any services provided as a director for the last completed yearand the ensuing year.
Employment Contracts and Termination of Employment and Change-in-Control Arrangement
There are no special employment contracts between the Corporation and the named executive officers.
There are no compensatory plans or arrangements with respect to a named executive officer.
Warrants and Options Outstanding
There are no outstanding warrants or options held by the Corporation’s CEO, the named executiveofficers and all officers and directors as a group.
Item 12. Security Ownership of Certain Beneficial Owners and Management
(1) Security Ownership of Certain Record and Beneficial Owners
As of December 31, 2018, URC knows no one who beneficially owns in excess of 5% of URC’s commonstock except as set forth in the table below.
Title ofClass
Names and addresses of recordowners and relationship with the
Corporation
Name of beneficialowner and relationship
with record owner Citizenship No. of Shares Held% to Total
OutstandingCommon JGSHI
43/F Robinsons Equitable Tower, ADBAvenue corner Poveda Street, OrtigasCenter, Pasig City(stockholder)
Same as record owner(See Note 1) Filipino 1,215,223,061 55.13%
Common PCD Nominee Corporation(Non-Filipino)G/F Makati Stock Exchange Bldg.6767 Ayala Ave., Makati City(stockholder)
PCD Participants andtheir clients(See Note 2) Non-Filipino
704,513,078(See Note 3) 31.96%
Common PCD Nominee Corporation (Filipino)G/F Makati Stock Exchange Bldg.6767 Ayala Ave., Makati City(stockholder)
PCD Participants andtheir clients(See Note 2) Filipino
249,650,620(See Note 3) 11.33%
_________________________________________________________________________________________________________________
1. The Chairman and the President are both empowered under the By-Laws of JGSHI to vote any and all shares owned by JGSHI, except asotherwise directed by the Board of Directors. The incumbent Chairman and Chief Executive Officer JGSHI are Mr. James L. Go and Mr.Lance Y. Gokongwei, respectively.
2. PCD Nominee Corporation is the registered owner of the shares in the books of the Corporation’s transfer agent. PCD Nominee Corporationis a corporation wholly-owned by Philippine Depository and Trust Corporation, Inc. (formerly the Philippine Central Depository) (“PDTC”),

- 36 -
whose sole purpose is to act as nominee and legal title holder of all shares of stock lodged in the PDTC. PDTC is a private corporationorganized to establish a central depository in the Philippines and introduce scripless or book-entry trading in the Philippines. Under thecurrent system of the PDTC, only participants (brokers and custodians) are recognized by PDTC as the beneficial owners of the lodged shares.Each beneficial owner of shares through his participant is the beneficial owner to the extent of the number of shares held by such participantin the records of the PCD Nominee.
3. Out of the PCD Nominee Corporation account, “The Hongkong and Shanghai Banking Corp. Ltd. - Clients’ Acct.” and “Deutsche BankManila - Clients A/C” hold for various trust accounts the following shares of the Corporation as of December 31, 2018:
No. of shares % to OutstandingThe Hongkong and Shanghai Banking Corp. Ltd. - Clients’ Acct 380,116,928 17.68%Deutsche Bank Manila - Clients A/C 227,940,857 10.34%
Voting instructions may be provided by the beneficial owners of the shares.
(2) Security Ownership of Management
Title ofClass
Name of beneficialOwner Position
Amount &nature ofbeneficial
ownership Citizenship% to Total
Outstanding
Named Executive Officers1
Common 1. John L. Gokongwei, Jr.2 Director, ChairmanEmeritus and Founder
2,479,401 Filipino 0.11%
Common 2. James L. Go Director, ChairmanEmeritus
1 Filipino *
Common 3. Lance Y. Gokongwei Director, Chairman 500,001 Filipino 0.02%- 4. Cornelio S. Mapa, Jr. Executive Vice President - Filipino -
Common 5. Irwin C. Lee Director, President andChief Executive Officer
1 Filipino *
Sub-Total 2,979,404 0.14%
Other Directors, Executive Officers and NomineesCommon 6. Patrick Henry C. Go Director, Vice President 45,540 Filipino *
Common 7. Johnson Robert G. Go, Jr. Director 1 Filipino *
Common 8. Robert G. Coyiuto, Jr. Director 1 Filipino *
Common 9. Wilfrido E. Sanchez Director (Independent) 1 Filipino *
Common 10. Cesar V. Purisima Director (Independent) 1 Filipino *
Common 11. Vincent Henry C. Go Vice President 45,540 Filipino *Common 12. Anne Patricia C. Go Vice President 8,855 Filipino *
Sub-Total 99,939 * 3,079,343 0.14%
__________________________________________________________________________________1. As defined under Part IV (B) (1) (b) of Annex “C” of SRC Rule 12, the “named executive officers” to be listed refer to the Chief Executive
Officer and those that are the four (4) most highly compensated executive officers as of December 31, 2018.2. Sum of shares in the name of “John Gokongwei, Jr.” for one (1) share and “Elizabeth Y. Gokongwei and/or John Gokongwei, Jr.” for
2,479,400 shares.* less than 0.01%
(3) Voting Trust Holders of 5% or more
There are no persons holding more than 5% of a class under a voting trust or similar agreement.

- 37 -
Item 13. Certain Relationships and Related Transactions
The Company, in its regular conduct of business, had engaged in transactions with its major stockholder,JGSHI and its affiliated companies. See Note 34 (Related Party Transactions) of the Notes toConsolidated Financial Statements (page 34) in the accompanying Audited Financial Statements filed aspart of this Form 17-A.

- 38 -
PART IV - EXHIBITS AND SCHEDULES
Item 14. Exhibits and Reports on SEC Form 17-C
(a) Exhibits - See accompanying Index to Exhibits (page 45)
(b) Reports on SEC Form 17-C

- 39 -
UNIVERSAL ROBINA CORPORATIONLIST OF CORPORATE DISCLOSURES/REPLIES TO SEC LETTERS
UNDER SEC FORM 17-CJULY 1, 2018 TO DECEMBER 31, 2018
Date of Disclosure Description
July 30, 2018 Press Release entitled “URC growth accelerates in Q2 driven byInternational and Agro-industrial Commodities Divisions”.
August 13, 2018 Change in designation of an officer
August 17, 2018 Change in number of issued shares
August 23, 2018 Press Release entitled “URC to acquire Roxas Holdings/CentralAzucarera Don Pedro sugar mill in Batangas”.
August 24, 2018 Disclosure on the acquisition of the milling and refinery assets in Brgy.Lumbangan, Nasugbu, Batangas.
September 26, 2018 Acquisition of shares owned by Calbee, Inc. in Calbee-URC, Inc.
September 28, 2018 Acquisition of shares owned by ConAgra Grocery Products Company,LLC in Hunt-Universal Robina Corporation.
October 1, 2018 Acquisition of shares owned by Calbee, Inc. in Calbee-URC, Inc.[Amended-1]
October 18, 2018 Acquisition of shares owned by Calbee, Inc. in Calbee-URC, Inc.[Amended-2]
October 25, 2018 Press Release entitled “URC continue to grow topline amidst a toughermacroenvironment”.
November 12, 2018 Change in designation of an officer


- 41 -
SUBSCRIBED AND SWORN to before me this ____ day of _______, 2019 affiants exhibiting to mehis/their Community Tax Certificates, as follows:
NAMES DOCUMENT NO. DATE OF ISSUEPLACE
OF ISSUE
Irwin C. LeePassport No.P8857404A 09.23.18 Manila
Francisco M. Del MundoPassport No.P9624564A 11.20.18 Manila
Rosalinda F. RiveraSSS ID No.
33-2484959-1
Doc. No. ____;Page No. ____;Book No. ____;Series of 2019.

- 42 -
UNIVERSAL ROBINA CORPORATION AND SUBSIDIARIES
INDEX TO FINANCIAL STATEMENTS AND SUPPLEMENTARY SCHEDULES
FORM 17- A, Item 7
Page No.Consolidated Financial Statements
Statement of Management’s Responsibility for Financial StatementsReport of Independent Auditors
Consolidated Statements of Financial Position as of December 31, 2018 and 2017Consolidated Statements of Income for each of the three years in the period ended
December 31, 2018Consolidated Statements of Comprehensive Income for each of the three years in
the period ended December 31, 2018 Consolidated Statements of Changes in Equity for each of the three years in the period ended December 31, 2018 Consolidated Statements of Cash Flows for each of the three years in the period ended December 31, 2018
Notes to Consolidated Financial Statements
Supplementary ScheduleReport of Independent Auditors on Supplementary SchedulesA. Financial AssetsB. Amounts Receivable from Directors, Officers, Employees, Related Parties and
Principal Stockholders (Other than Related Parties)C. Amounts Receivable from Related Parties which are Eliminated during the
Consolidation of Financial StatementsD. Intangible assets - other assetsE. Long-term DebtF. Indebtedness to Related Parties (Long-term Loans from Related Parties)
Guarantees of Securities of Other IssuersG. Guarantees of Securities and Other IssuersH. Capital Stock
List of PFRS effective as of December 31, 2018Organizational ChartSchedule of Retained Earnings Available for Dividend Declaration
___* Not applicable per section 1(b) (xii), 2(e) and 2 (I) of SRC Rule 68
** These schedules, which are required by Section 4(e) of SRC Rule 68, have beenomitted because they are either not required, not applicable or the information requiredto be presented is included/shown in the related URC & Subsidiaries’ consolidatedfinancial statements or in the notes thereto.
444551
53
54
55
5658
165
166
167168169
170171172
173180184

Universal Robina Corporationand Subsidiaries
Consolidated Financial StatementsAs of December 31, 2018 and 2017and for the years ended December 31, 2018,December 31, 2017 andthree months ended December 31, 2016
and
Independent Auditor’s Report


- 45 -
*SGVFS035342*
- 45 -INDEPENDENT AUDITOR’S REPORT
The Stockholders and the Board of DirectorsUniversal Robina Corporation8th Floor, Tera Tower, BridgetowneE. Rodriguez, Jr. Avenue (C5 Road)Ugong Norte, Quezon City, Metro Manila
Opinion
We have audited the consolidated financial statements of Universal Robina Corporation and itssubsidiaries (the Group), which comprise the consolidated statements of financial position as atDecember 31, 2018 and 2017, and the consolidated statements of income, consolidated statements ofcomprehensive income, consolidated statements of changes in equity and consolidated statements of cashflows for the years ended December 31, 2018 and 2017 and the period October 1, 2016 toDecember 31, 2016, and the notes to the consolidated financial statements, including a summary ofsignificant accounting policies.
In our opinion, the accompanying consolidated financial statements present fairly, in all material respects,the consolidated financial position of the Group as at December 31, 2018 and 2017, and its consolidatedfinancial performance and its consolidated cash flows for the years ended December 31, 2018 and 2017and the period October 1, 2016 to December 31, 2016 in accordance with Philippine Financial ReportingStandards (PFRSs).
Basis for Opinion
We conducted our audits in accordance with Philippine Standards on Auditing (PSAs). Ourresponsibilities under those standards are further described in the Auditor’s Responsibilities for the Auditof the Consolidated Financial Statements section of our report. We are independent of the Group inaccordance with the Code of Ethics for Professional Accountants in the Philippines (Code of Ethics)together with the ethical requirements that are relevant to our audit of the consolidated financialstatements in the Philippines, and we have fulfilled our other ethical responsibilities in accordance withthese requirements and the Code of Ethics. We believe that the audit evidence we have obtained issufficient and appropriate to provide a basis for our opinion.
Key Audit Matters
A key audit matter is one that, in our professional judgment, was of most significance in our audit of theconsolidated financial statements of the current period. The matter below was addressed in the context ofour audit of the consolidated financial statements as a whole, and in forming our opinion thereon, and wedo not provide a separate opinion on this matter. The description of how our audit addressed the matter isprovided in that context.
A member firm of Ernst & Young Global Limited
SyCip Gorres Velayo & Co.6760 Ayala Avenue1226 Makati CityPhilippines
Tel: (632) 891 0307Fax: (632) 819 0872ey.com/ph
BOA/PRC Reg. No. 0001, October 4, 2018, valid until August 24, 2021SEC Accreditation No. 0012-FR-5 (Group A), November 6, 2018, valid until November 5, 2021
A member firm of Ernst & Young Global Limited

- 46 -
*SGVFS035342*
We have fulfilled the responsibilities described in the Auditor’s Responsibilities for the Audit of theConsolidated Financial Statements section of our report, including in relation to these matters.Accordingly, our audit included the performance of procedures designed to respond to our assessment ofthe risks of material misstatement of the consolidated financial statements. The results of our auditprocedures, including the procedures performed to address the matters below, provide the basis for ouraudit opinion on the accompanying consolidated financial statements.
Recoverability of Goodwill and Intangible Assets
As of December 31, 2018, the Group’s goodwill attributable to the acquisition of Consolidated Snacks,Pty. Ltd., Griffin’s Food Limited and other acquired entities amounted to P=31.2 billion. The Group’sintangible assets with indefinite useful lives pertaining to trademarks and product formulation amountedto P=9.4 billion and P=0.4 billion, respectively. These items are significant to the consolidated financialstatements. Under PFRS, the Group is required to test annually the amount of goodwill and intangibleassets with indefinite useful lives for impairment. Accordingly, management has performed animpairment test on its goodwill and other intangible assets with indefinite useful lives. In addition,management’s assessment process requires significant judgment and is based on assumptions, specificallyrevenue growth rate, discount rate and the long-term growth rate.
The Group’s disclosures about goodwill and intangible assets are included in Notes 3 and 15 to theconsolidated financial statements.
Audit response
We reviewed the value in use calculation prepared by management. We involved our internal specialistin evaluating the methodologies and the assumptions used. These assumptions include revenue growthrate, discount rate and the long-term growth rate. We compared the key assumptions used, such asrevenue growth rate against the historical performance of the cash generating unit (CGU),industry/market outlook and other relevant external data. We tested the parameters used in thedetermination of the discount rate against market data. We also reviewed the Group’s disclosures aboutthose assumptions to which the outcome of the impairment test is most sensitive, specifically those thathave the most significant effect on the determination of the recoverable amount of goodwill andintangible assets with indefinite useful lives.
Adoption of PFRS 15, Revenue from Contracts with Customers
Effective January 1, 2018, the Group adopted the new revenue recognition standard, PFRS 15, Revenuefrom Contracts with Customers, under the modified retrospective approach. The adoption of PFRS 15resulted in significant changes in the Group’s revenue recognition policies, process, and procedures. Theadoption of PFRS 15 is significant to our audit because this involves application of significantmanagement judgment and estimation in the: (1) identification of the contract for sale of goods that wouldmeet the requirements of PFRS 15; (2) assessment of performance obligation and the probability that theentity will collect the consideration from the buyer; (3) determining method to estimate variableconsideration and assessing the constraint; and (4) recognition of revenue as the Group satisfies theperformance obligation.
Refer to Notes 2 and 3 of the consolidated financial statements for the disclosure in relation to theadoption of PFRS 15.
A member firm of Ernst & Young Global Limited

- 47 -
*SGVFS035342*
Audit response
We obtained an understanding of the Group’s process in implementing the new revenue recognitionstandard. We reviewed the PFRS 15 adoption papers and accounting policies prepared by management,including revenue streams identification and scoping, and contract analysis.
For significant revenue streams, we obtained sample contracts and reviewed whether the accountingpolicies appropriately considered the five-step model and cost requirements of PFRS 15.
In addition, we reviewed sample contracts and checked whether management has identified and estimatedall components of the transaction price (variable consideration and consideration payable to a customer)and applied the constraint on variable consideration. We evaluated management’s assumptions (historicaltrend of volume discounts and rights of return) by comparing the historical experience of the Group withthe assumptions used in its estimates as it relates to variable consideration.
We also reviewed the application of the accounting policy in relation to the adoption of the new standard.We also reviewed the disclosures related to the transition adjustments based on the requirements ofPFRS 15.
Estimation of fair value of biological assets
The Group’s biological assets consist of hog and poultry livestock which are carried at fair value less costto sell. The Group determines fair value based on the current market prices of livestock of similar age,breed and genetic merit. As of December 31, 2018, the Group has biological assets amounting toP=1.11 billion, with fair value changes amounting to P=0.47 billion in the same year. This matter issignificant to our audit because the determination of fair value of biological assets involves significantestimation.
Refer to Notes 2 and 3 of the consolidated financial statements for the relevant accounting policy and adiscussion of significant estimates, and Note 14 for the disclosure about the fair value of biological assets.
Audit responseWe obtained an understanding of management’s fair value measurement methodology and their processin valuing the biological assets. We tested the key assumptions used in the valuation, which include futuregrowing costs, estimated volume of production and gross margin, by comparing them to both externaldata such as selling prices in the principal market and to historical information. We assessed thecomposition of costs to sell and tested the reasonableness of allocations. We also assessed themethodology used in estimating the fair value.
We also assessed the adequacy of the related disclosures on the assumptions underlying the measurementof these biological assets.
Other Information
Management is responsible for the other information. The other information comprises theSEC Form 17-A for the year ended December 31, 2018 (but does not include the consolidated financialstatements and our auditor’s report thereon), which we obtained prior to the date of this auditor’s report,and the SEC Form 20-IS (Definitive Information Statement) and Annual Report for the year endedDecember 31, 2018, which are expected to be made available to us after that date.
A member firm of Ernst & Young Global Limited

- 48 -
*SGVFS035342*
Our opinion on the consolidated financial statements does not cover the other information and we do notand will not express any form of assurance conclusion thereon.
In connection with our audits of the consolidated financial statements, our responsibility is to read theother information identified above and, in doing so, consider whether the other information is materiallyinconsistent with the consolidated financial statements or our knowledge obtained in the audits, orotherwise appears to be materially misstated.
If, based on the work we have performed on the other information that we obtained prior to the date ofthis auditor’s report, we conclude that there is a material misstatement of this other information, we arerequired to report that fact. We have nothing to report in this regard.
Responsibilities of Management and Those Charged with Governance for the ConsolidatedFinancial Statements
Management is responsible for the preparation and fair presentation of the consolidated financialstatements in accordance with PFRSs, and for such internal control as management determines isnecessary to enable the preparation of consolidated financial statements that are free from materialmisstatement, whether due to fraud or error.
In preparing the consolidated financial statements, management is responsible for assessing the Group’sability to continue as a going concern, disclosing, as applicable, matters related to going concern andusing the going concern basis of accounting unless management either intends to liquidate the Group or tocease operations, or has no realistic alternative but to do so.
Those charged with governance are responsible for overseeing the Group’s financial reporting process.
Auditor’s Responsibilities for the Audit of the Consolidated Financial Statements
Our objectives are to obtain reasonable assurance about whether the consolidated financial statements as awhole are free from material misstatement, whether due to fraud or error, and to issue an auditor’s reportthat includes our opinion. Reasonable assurance is a high level of assurance, but is not a guarantee that anaudit conducted in accordance with PSAs will always detect a material misstatement when it exists.Misstatements can arise from fraud or error and are considered material if, individually or in theaggregate, they could reasonably be expected to influence the economic decisions of users taken on thebasis of these consolidated financial statements.
As part of an audit in accordance with PSAs, we exercise professional judgment and maintainprofessional skepticism throughout the audit. We also:
∂ Identify and assess the risks of material misstatement of the consolidated financial statements,whether due to fraud or error, design and perform audit procedures responsive to those risks, andobtain audit evidence that is sufficient and appropriate to provide a basis for our opinion. The risk ofnot detecting a material misstatement resulting from fraud is higher than for one resulting from error,as fraud may involve collusion, forgery, intentional omissions, misrepresentations, or the override ofinternal control.
A member firm of Ernst & Young Global Limited

- 49 -
*SGVFS035342*
∂ Obtain an understanding of internal control relevant to the audit in order to design audit proceduresthat are appropriate in the circumstances, but not for the purpose of expressing an opinion on theeffectiveness of the Group’s internal control.
∂ Evaluate the appropriateness of accounting policies used and the reasonableness of accountingestimates and related disclosures made by management.
∂ Conclude on the appropriateness of management’s use of the going concern basis of accounting and,based on the audit evidence obtained, whether a material uncertainty exists related to events orconditions that may cast significant doubt on the Group’s ability to continue as a going concern. Ifwe conclude that a material uncertainty exists, we are required to draw attention in our auditor’sreport to the related disclosures in the consolidated financial statements or, if such disclosures areinadequate, to modify our opinion. Our conclusions are based on the audit evidence obtained up tothe date of our auditor’s report. However, future events or conditions may cause the Group to ceaseto continue as a going concern.
∂ Evaluate the overall presentation, structure and content of the consolidated financial statements,including the disclosures, and whether the consolidated financial statements represent the underlyingtransactions and events in a manner that achieves fair presentation.
∂ Obtain sufficient appropriate audit evidence regarding the financial information of the entities orbusiness activities within the Group to express an opinion on the consolidated financial statements.We are responsible for the direction, supervision and performance of the audit. We remain solelyresponsible for our audit opinion.
We communicate with those charged with governance regarding, among other matters, the planned scopeand timing of the audit and significant audit findings, including any significant deficiencies in internalcontrol that we identify during our audit.
We also provide those charged with governance with a statement that we have complied with relevantethical requirements regarding independence, and to communicate with them all relationships and othermatters that may reasonably be thought to bear on our independence, and where applicable, relatedsafeguards.
A member firm of Ernst & Young Global Limited

- 50 -
*SGVFS035342*
From the matters communicated with those charged with governance, we determine those matters thatwere of most significance in the audit of the consolidated financial statements of the current period andare therefore the key audit matters. We describe these matters in our auditor’s report unless law orregulation precludes public disclosure about the matter or when, in extremely rare circumstances, wedetermine that a matter should not be communicated in our report because the adverse consequences ofdoing so would reasonably be expected to outweigh the public interest benefits of such communication.
The engagement partner on the audit resulting in this independent auditor’s report is Miguel U. Ballelos, Jr.
SYCIP GORRES VELAYO & CO.
Miguel U. Ballelos, Jr.PartnerCPA Certificate No. 109950SEC Accreditation No. 1566-AR-1 (Group A), April 3, 2019, valid until April 2, 2022Tax Identification No. 241-031-088BIR Accreditation No. 08-001998-114-2019, January 28, 2019, valid until January 27, 2022PTR No. 7332525, January 3, 2019, Makati City
April 5, 2019
A member firm of Ernst & Young Global Limited

- 51 -
*SGVFS035342*
UNIVERSAL ROBINA CORPORATION AND SUBSIDIARIESCONSOLIDATED STATEMENTS OF FINANCIAL POSITION
December 312018 2017
ASSETS
Current AssetsCash and cash equivalents (Note 7) P=13,023,101,912 P=14,497,517,791Financial assets at fair value through profit or loss (Note 8) 420,153,416 455,577,705Receivables (Note 10) 14,405,323,971 16,116,493,339Inventories (Note 11) 22,085,770,041 18,465,363,440Biological assets (Note 14) 741,719,637 1,180,266,509Other current assets (Note 12) 3,733,665,505 2,987,386,097
54,409,734,482 53,702,604,881
Noncurrent AssetsProperty, plant and equipment (Note 13) 51,950,316,266 48,254,128,303Biological assets (Note 14) 366,184,414 498,309,880Goodwill (Note 15) 31,194,495,817 31,212,075,404Intangible assets (Note 15) 11,730,260,354 11,810,036,032Investments in joint ventures (Note 16) 520,917,509 552,226,288Deferred income tax assets (Note 32) 195,485,985 216,916,334Other noncurrent assets (Note 17) 1,568,318,583 1,394,502,377
97,525,978,928 93,938,194,618
TOTAL ASSETS P=151,935,713,410 P=147,640,799,499
LIABILITIES AND EQUITY
Current LiabilitiesAccounts payable and other accrued liabilities (Note 19) P=22,766,759,527 P=21,571,118,556Short-term debts (Notes 18 and 22) 2,461,385,106 2,009,317,911Trust receipts payable (Notes 11 and 22) 6,019,613,469 3,155,187,680Income tax payable 720,742,396 1,263,938,251
31,968,500,498 27,999,562,398
Noncurrent LiabilitiesLong-term debts (Notes 20 and 22) 31,457,123,882 33,225,962,388Deferred tax liabilities (Note 32) 4,228,752,279 4,261,515,625Other noncurrent liabilities (Notes 16 and 21) 287,857,481 467,746,491
35,973,733,642 37,955,224,50467,942,234,140 65,954,786,902
(Forward)

- 52 -
*SGVFS035342*
December 312018 2017
EquityEquity attributable to equity holders of the parent
Paid-up capital (Note 22) P=23,422,134,732 P=23,083,782,043Retained earnings (Note 22) 63,789,482,388 63,243,842,044Other comprehensive income (Note 23) 2,334,566,528 492,151,622Equity reserve (Note 22) (5,075,466,405) (5,075,466,405)Treasury shares (Note 22) (679,489,868) (341,137,179)
83,791,227,375 81,403,172,125Equity attributable to non-controlling interest (Notes 16 and 22) 202,251,895 282,840,472
83,993,479,270 81,686,012,597
TOTAL LIABILITIES AND EQUITY P=151,935,713,410 P=147,640,799,499
See accompanying Notes to Consolidated Financial Statements.

- 53 -
*SGVFS035342*
UNIVERSAL ROBINA CORPORATION AND SUBSIDIARIESCONSOLIDATED STATEMENTS OF INCOME
December 31, 2018
(One Year)
December 31,2017
(One Year)
December 31,2016
(Three Months -Note 2)
SALE OF GOODS AND SERVICES (Notes 24 and 34) P=127,769,949,329 P=125,007,824,013 P=30,940,237,745COST OF SALES (Notes 24 and 34) 90,332,569,341 85,693,355,234 21,143,380,393
GROSS PROFIT 37,437,379,988 39,314,468,779 9,796,857,352Selling and distribution costs (Note 25) (18,719,558,853) (19,250,876,212) (4,541,783,127)General and administrative expenses (Note 26) (5,337,208,345) (5,111,425,807) (1,169,103,846)
OPERATING INCOME 13,380,612,790 14,952,166,760 4,085,970,379Finance costs (Note 30) (1,661,700,393) (1,427,329,826) (338,591,320)Finance revenue (Note 29) 359,281,191 225,582,853 49,947,558Net foreign exchange gains (losses) (174,658,640) 154,190,672 (433,863,058)Equity in net losses of joint ventures (Note 16) (132,407,965) (280,533,323) (49,411,584)Provision for credit and impairment losses (Notes 10, 11 and 15) (45,001,536) (21,423,202) (2,773,188)Market valuation gain (loss) on financial assets and liabilities at
fair value through profit or loss - net (Note 8) (35,424,289) 71,016,151 (4,514,684)Other income (loss) - net (Notes 13, 16, 17 and 19) (145,821,109) 276,737,549 (89,650,692)
INCOME BEFORE INCOME TAX 11,544,880,049 13,950,407,634 3,217,113,411
PROVISION FOR INCOME TAX (Note 32) 2,082,093,827 2,797,486,301 767,495,099
NET INCOME P=9,462,786,222 P=11,152,921,333 P=2,449,618,312
NET INCOME ATTRIBUTABLE TO:
Equity holders of the parent (Note 33) P=9,204,306,540 P=10,888,080,693 P=2,402,116,084Non-controlling interests (Note 16) 258,479,682 264,840,640 47,502,228
P=9,462,786,222 P=11,152,921,333 P=2,449,618,312
EARNINGS PER SHARE (Note 33)Basic/diluted, for income attributable to equity
holders of the parent P=4.18 P=4.94 P=1.09
See accompanying Notes to Consolidated Financial Statements.

- 54 -
*SGVFS035342*
UNIVERSAL ROBINA CORPORATION AND SUBSIDIARIESCONSOLIDATED STATEMENTS OF COMPREHENSIVE INCOME
December 31, 2018
(One Year)
December 31,2017
(One Year)
December 31,2016
(Three Months -Note 2)
NET INCOME P=9,462,786,222 P=11,152,921,333 P=2,449,618,312
OTHER COMPREHENSIVE INCOME (LOSS)Items to be reclassified to profit or loss in subsequent periods, net of tax:
Cumulative translation adjustments (Note 23) 1,630,309,574 (1,392,324,892) 1,200,565,078Unrealized loss on cash flow hedge (Notes 9 and 23) (3,336,554) (11,359,659) 19,196,810Unrealized gain on available-for-sale financial assets
(Notes 17 and 23) − 2,950,000 1,200,0001,626,973,020 (1,400,734,551) 1,220,961,888
Item not to be reclassified to profit or loss in subsequentperiods:
Remeasurement gains on defined benefitplans (Notes 23 and 31) 300,219,467 39,544,208 192,095,316
Income tax effect (90,065,840) (11,863,262) (57,628,595)Unrealized gain on financial assets at fair value through
other comprehensive income (Notes 17 and 23) 4,320,000 − −214,473,627 27,680,946 134,466,721
OTHER COMPREHENSIVE INCOME (LOSS) 1,841,446,647 (1,373,053,605) 1,355,428,609
TOTAL COMPREHENSIVE INCOME P=11,304,232,869 P=9,779,867,728 P=3,805,046,921
TOTAL COMPREHENSIVE INCOME ATTRIBUTABLE TO:Equity holders of the parent P=11,046,721,446 P=9,512,498,099 P=3,757,544,693Non-controlling interests 257,511,423 267,369,629 47,502,228
P=11,304,232,869 P=9,779,867,728 P=3,805,046,921
See accompanying Notes to Consolidated Financial Statements.

- 55 -
*SGVFS035342*
UNIVERSAL ROBINA CORPORATION AND SUBSIDIARIESCONSOLIDATED STATEMENTS OF CHANGES IN EQUITY
Attributable to Equity Holders of the ParentPaid-up Capital (Note 22) Retained Earnings (Note 22) Other Comprehensive Income (Loss) (Note 23)
CapitalStock
AdditionalPaid-inCapital
TotalPaid-upCapital
UnappropriatedRetainedEarnings
AppropriatedRetainedEarnings
TotalRetainedEarnings
CumulativeTranslation
Adjustments
Net UnrealizedGain on
Financial Assetsat FVOCI/
AFS Investment(Note 17)
UnrealizedGain (Loss) on
Cash FlowHedge
(Note 9)
RemeasurementLosses
on DefinedBenefit Plans
Total OtherComprehensive
Income
EquityReserve
(Note 22)
TreasuryShares
(Note 22) Total
EquityAttributable to
Non-controllingInterest
(Notes 16, 22and 23) Total Equity
Balances as at January 1, 2018, as previouslystated P=2,227,638,933 P=20,856,143,110 P=23,083,782,043 P=58,743,842,044 P=4,500,000,000 P=63,243,842,044 P=850,642,705 P=24,260,000 P=7,936,673 (P=390,687,756) P=492,151,622 (P=5,075,466,405) (P=341,137,179)P=81,403,172,125 P=282,840,472 P=81,686,012,597
Effect of adoption of new accounting standard –PFRS 9 (Note 2) – – – (1,715,556,312) – (1,715,556,312) – – – – – – – (1,715,556,312) – (1,715,556,312)
Balances as at January 1, 2018, as restated 2,227,638,933 20,856,143,110 23,083,782,043 57,028,285,732 4,500,000,000 61,528,285,732 850,642,705 24,260,000 7,936,673 (390,687,756) 492,151,622 (5,075,466,405) (341,137,179) 79,687,615,813 282,840,472 79,970,456,285Net income for the year – – – 9,204,306,540 – 9,204,306,540 – – − – – – – 9,204,306,540 258,479,682 9,462,786,222Other comprehensive income (loss) – – – – – – 1,630,309,574 4,320,000 (3,336,554) 211,121,886 1,842,414,906 – – 1,842,414,906 (968,259) 1,841,446,647Total comprehensive income – – – 9,204,306,540 – 9,204,306,540 1,630,309,574 4,320,000 (3,336,554) 211,121,886 1,842,414,906 – – 11,046,721,446 257,511,423 11,304,232,869Cash dividends (Note 22) – – – (6,943,109,884) – (6,943,109,884) – – – − – – – (6,943,109,884) (338,100,000) (7,281,209,884)Issuance of shares (purchase of treasury shares)
(Note 22) 2,521,257 335,831,432 338,352,689 – – – – – – – – – (338,352,689) − – --Reversal of appropriation of retained earnings
(Note 22) – – – 2,500,000,000 (2,500,000,000) − – – – – – – – – – –Balances as at December 31, 2018 P=2,230,160,190 P=21,191,974,542 P=23,422,134,732 P=61,789,482,388 P=2,000,000,000 P=63,789,482,388 P=2,480,952,279 P=28,580,000 P=4,600,119 (P=179,565,870) P=2,334,566,528 (P=5,075,466,405) (P=679,489,868)P=83,791,227,375 P=202,251,895 P=83,993,479,270
Balances as at January 1, 2017 P=2,227,638,933 P=20,856,143,110 P=23,083,782,043 P=56,298,871,235 P=3,000,000,000 P=59,298,871,235 P=2,242,967,597 P=21,310,000 P=19,296,332 (P=415,839,713) P=1,867,734,216 (P=5,075,466,405) (P=341,137,179)P=78,833,783,910 P=15,470,843 P=78,849,254,753Net income for the year – – – 10,888,080,693 – 10,888,080,693 – – − – – – – 10,888,080,693 264,840,640 11,152,921,333Other comprehensive income (loss) – – – – – – (1,392,324,892) 2,950,000 (11,359,659) 25,151,957 (1,375,582,594) – – (1,375,582,594) 2,528,989 (1,373,053,605)Total comprehensive income – – – 10,888,080,693 – 10,888,080,693 (1,392,324,892) 2,950,000 (11,359,659) 25,151,957 (1,375,582,594) – – 9,512,498,099 267,369,629 9,779,867,728Cash dividends (Note 22) – – – (6,943,109,884) – (6,943,109,884) – – – − – – – (6,943,109,884) – (6,943,109,884)Appropriation of retained earnings (Note 22) – – – (1,500,000,000) 1,500,000,000 − – – – – – – – – – –Balances as at December 31, 2017 P=2,227,638,933 P=20,856,143,110 P=23,083,782,043 P=58,743,842,044 P=4,500,000,000 P=63,243,842,044 P=850,642,705 P=24,260,000 P=7,936,673 (P=390,687,756) P=492,151,622 (P=5,075,466,405) (P=341,137,179)P=81,403,172,125 P=282,840,472 P=81,686,012,597
Balances as at October 1, 2016 P=2,227,638,933 P=20,856,143,110 P=23,083,782,043 P=53,896,755,151 P=3,000,000,000 P=56,896,755,151 P=1,042,402,519 P=20,110,000 P=99,522 (P=550,306,434) P=512,305,607 (P=5,075,466,405) (P=341,137,179)P=75,076,239,217 P=195,818,615 P=75,272,057,832Net income for the period – – – 2,402,116,084 – 2,402,116,084 – – − – – – – 2,402,116,084 47,502,228 2,449,618,312Other comprehensive income (loss) – – – – – – 1,200,565,078 1,200,000 19,196,810 134,466,721 1,355,428,609 – – 1,355,428,609 − 1,355,428,609Total comprehensive income – – – 2,402,116,084 – 2,402,116,084 1,200,565,078 1,200,000 19,196,810 134,466,721 1,355,428,609 – – 3,757,544,693 47,502,228 3,805,046,921Cash dividends (Note 22) – – – − – − – – – − – – – − (227,850,000) (227,850,000)Balances as at December 31, 2016 P=2,227,638,933 P=20,856,143,110 P=23,083,782,043 P=56,298,871,235 P=3,000,000,000 P=59,298,871,235 P=2,242,967,597 P=21,310,000 P=19,296,332 (P=415,839,713) P=1,867,734,216 (P=5,075,466,405) (P=341,137,179)P=78,833,783,910 P=15,470,843 P=78,849,254,753
See accompanying Notes to Consolidated Financial Statements.

- 56 -
*SGVFS035342*
UNIVERSAL ROBINA CORPORATION AND SUBSIDIARIESCONSOLIDATED STATEMENTS OF CASH FLOWS
December 31, 2018
(One Year)
December 31,2017
(One Year)
December 31,2016
(Three Months -Note 2)
CASH FLOWS FROM OPERATING ACTIVITIESIncome before income tax P=11,544,880,049 P=13,950,407,634 P=3,217,113,411Adjustments for:
Depreciation and amortization (Note 27) 6,369,775,844 6,104,063,359 1,506,918,564 Finance costs (Note 30) 1,600,072,501 1,427,329,826 338,591,320
Gain on sale/disposals of property, plant and equipment(Note 13) (629,392,076) (239,361,566) (1,444,132)
Loss (gain) arising from changes in fair value lessestimated costs to sell of biological assets(Note 14) 467,471,975 (118,841,072) 104,648,602
Finance revenue (Note 29) (359,281,191) (225,582,853) (49,947,558)Net foreign exchange losses (gains) 174,658,640 (154,190,672) 433,863,058
Equity in net loss of joint ventures (Note 16) 132,407,965 280,533,323 49,411,584 Unamortized debt issue costs recognized as expense on
pretermination of long-term debt (Notes 20 and 30) 61,627,892 − −Provision for credit and impairment losses
(Notes 10, 11 and 15) 45,001,536 21,423,202 2,773,188 Market valuation loss (gain) on financial assets at fair
value through profit or loss (Note 8) 35,424,289 (71,016,151) 4,514,684Operating income before working capital changes 19,442,647,424 20,974,765,030 5,606,442,721
Decrease (increase) in:Receivables (921,314,586) (933,282,952) (681,674,910)Inventories (3,704,007,347) 185,447,755 (138,455,495)Biological assets (272,030) (262,992,645) 6,113,503Other current assets (634,703,473) (874,122,137) (104,245,020)
Increase (decrease) in:Accounts payable and other accrued liabilities 1,443,040,708 1,090,362,231 1,663,345,144
Trust receipts payable 2,758,725,897 (1,390,608,195) (144,187,482)Net cash generated from operations 18,384,116,593 18,789,569,087 6,207,338,461Income taxes paid (2,558,923,595) (3,458,322,291) (237,863,655)Interest paid (1,527,185,331) (1,308,340,934) (317,125,531)Interest received 359,587,480 230,671,556 9,377,116Net cash provided by operating activities 14,657,595,147 14,253,577,418 5,661,726,391
CASH FLOWS FROM INVESTING ACTIVITIESAcquisitions of:
Property, plant and equipment (Note 13) (8,641,730,098) (8,129,671,952) (2,132,474,840)Intangible assets (Note 15) (11,234,200) (4,475,330) (12,651,126)Derivatives designated as accounting hedge (Note 9) − − (7,470,393)
Financial assets at fair value throughprofit or loss − (8,285) −
Investments in joint ventures (Note 16) (406,841,074) (349,776,367) (5,000,000) Subsidiary, net of cash acquired (Note 16) (173,995,570) − −Proceeds from:
Sale/disposals of property, plant and equipment 691,614,716 269,369,636 5,962,080Settlement of derivatives (Note 9) − 4,595,140 −
Decrease (increase) in other noncurrent assets (170,240,967) (216,545,822) 106,550,609Dividends received (Notes 8 and 16) 32,302,870 18,500,000 −Net cash used in investing activities (8,680,124,323) (8,408,012,980) (2,045,083,670)
(Forward)

- 57 -
*SGVFS035342*
December 31, 2018
(One Year)
December 31,2017
(One Year)
December 31,2016
(Three Months)
CASH FLOWS FROM FINANCING ACTIVITIESRepayments of:
Short-term debts (Note 37) (P=4,050,000,000) (P=3,850,000,000) (P=4,438,588,016)Long-term debts (Note 37) (15,356,761,921) − −
Proceeds from availments of:Short-term debts 4,650,000,000 4,284,475,807 −Long-term debt 14,226,028,915 − −
Cash dividends paid (Note 22) (6,943,109,884) (7,170,959,884) −Increase in other noncurrent liabilities 21,956,187 40,735,510 50,620,673Net cash used in financing activities (7,451,886,703) (6,695,748,567) (4,387,967,343)
NET DECREASE IN CASH ANDCASH EQUIVALENTS (1,474,415,879) (850,184,129) (771,324,622)
CASH AND CASH EQUIVALENTS ATBEGINNING OF PERIOD 14,497,517,791 15,347,701,920 16,119,026,542
CASH AND CASH EQUIVALENTS ATEND OF PERIOD P=13,023,101,912 P=14,497,517,791 P=15,347,701,920
See accompanying Notes to Consolidated Financial Statements.

- 58 -
*SGVFS035342*
UNIVERSAL ROBINA CORPORATION AND SUBSIDIARIESNOTES TO CONSOLIDATED FINANCIAL STATEMENTS
1. Corporate Information
Universal Robina Corporation (hereinafter referred to as “the Parent Company” or “URC”) wasincorporated on September 28, 1954 and domiciled in the Republic of the Philippines, and is listed inthe Philippine Stock Exchange. On October 28, 2002, the Parent Company’s corporate life wasextended for another 50 years or until September 28, 2054. The registered office address of theParent Company is at 8th Floor Tera Tower, Bridgetowne, E. Rodriguez, Jr. Avenue (C5 Road),Ugong Norte, Quezon City, Metro Manila.
The Parent Company is a majority owned subsidiary of JGSHI (“the Ultimate Parent Company” or“JGSHI”).
The Parent Company and its subsidiaries (hereinafter referred to as “the Group”) is one of the largestbranded food products companies in the Philippines and has a strong presence in ASEAN markets.The Group is involved in a wide range of food-related businesses which are organized into three(3) business segments: (a) the branded consumer food segment which manufactures and distributes adiverse mix of salty snacks, chocolates, candies, biscuits, packed cakes, beverages, instant noodlesand pasta; (b) the agro-industrial segment which engages in hog and poultry farming, production anddistribution of animal health products and manufacture and distribution of animal feeds, glucose andsoya bean products; and (c) the commodity food segment which engages in sugar milling andrefining, flour milling and pasta manufacturing and renewable energy development. The ParentCompany also engages in the manufacture of bi-axially oriented polypropylene (BOPP) films forpackaging companies and flexible packaging materials to cater various URC branded products. TheParent Company’s packaging business is included in the branded consumer food segment.
On April 29, 2016, the Board of Directors (BOD) approved the Parent Company’s change inaccounting period from “Fiscal Year which begins on the first day of October and ends on the last dayof September of the following year” to “Calendar Year which shall begin on the first day of Januaryand end on the last day of December of the same year” to be implemented effective January 1, 2017.The Parent Company filed its amended by-laws with the Philippine Securities and ExchangeCommission (SEC) in connection with the change in accounting period, which was approved by thePhilippine SEC on June 20, 2016 (see Note 2). The Parent Company, likewise, filed the request forchange in accounting period with the Bureau of Internal Revenue (BIR), which was approved by theBIR on December 5, 2016.
On January 15, 2016 and March 9, 2016, the BOD and the Stockholders of the Parent Company,respectively, approved the amendment to the Articles of Incorporation (AOI) of the Parent Companyto change the principal office address of the Parent Company from 110 E. Rodriguez Avenue,Bagumbayan, Quezon City, Metro Manila to 8th Floor, Tera Tower, Bridgetowne, E. Rodriguez, Jr.Avenue (C5 Road), Ugong Norte, Quezon City, Metro Manila. On May 16, 2016, the Philippine SECapproved the amendment to the principal office address.
The operations of certain subsidiaries are registered with the Board of Investments (BOI) as preferredpioneer and nonpioneer activities. Under the terms of the registrations and subject to certainrequirements, the Parent Company and certain subsidiaries are entitled to certain fiscal and non-fiscalincentives, including among others, an income tax holiday (ITH) for a period of three (3) years toseven (7) years from respective start dates of commercial operations (see Note 35).

- 59 -
*SGVFS035342*
The Group is also subject to certain regulations with respect to, among others, product composition,packaging, labeling, advertising and safety.
The principal activities of the Group are further described in Note 6.
2. Summary of Significant Accounting Policies
Basis of PreparationThe accompanying consolidated financial statements of the Group have been prepared on a historicalcost basis, except for financial assets at fair value through profit or loss (FVTPL), available-for-sale(AFS) financial assets/financial assets at fair value through other comprehensive income (FVOCI)and derivative financial instruments that have been measured at fair value, inventories that have beenmeasured at lower of cost and net realizable value (NRV) and biological assets and agriculturalproduce that have been measured at fair value less estimated costs to sell.
The consolidated financial statements of the Group are presented in Philippine Peso. The functionaland presentation currency of the Parent Company and its Philippine subsidiaries is the PhilippinePeso. All values are rounded to the nearest peso except when otherwise stated.
The functional currencies of the Group’s consolidated foreign subsidiaries follow:
Country of FunctionalSubsidiaries Incorporation Currency
URC Asean Brands Co. Ltd. (UABCL) British Virgin Islands US Dollar -Hong Kong China Foods Co. Ltd. (HCFCL) - do - - do -URC International Co. Ltd. (URCICL) - do - - do -URC Oceania Co. Ltd. (URC Oceania) - do - - do -Shanghai Peggy Foods Co., Ltd.
(Shanghai Peggy) China Chinese RenminbiURC China Commercial Co. Ltd. (URCCCL) - do - - do -Xiamen Tongan Pacific Food Co., Ltd. - do - - do -Guangzhou Peggy Foods Co., Ltd. - do - - do -Shantou SEZ Shanfu Foods Co., Ltd. - do - - do -Jiangsu Acesfood Industrial Co., Ltd. - do - - do -Shantou Peggy Co. Ltd. - do - - do -URC Hong Kong Company Limited Hong Kong Hong Kong DollarPT URC Indonesia Indonesia Indonesian RupiahURC Snack Foods (Malaysia) Sdn. Bhd.
(URC Malaysia) Malaysia Malaysian RinggitRicellent Sdn. Bhd. - do - - do -URC Foods (Singapore) Pte. Ltd. Singapore Singapore DollarAcesfood Network Pte. Ltd. - do - - do -Acesfood Holdings Pte. Ltd. - do - - do -Acesfood Distributors Pte. Ltd. - do - - do -Advanson International Pte. Ltd. (Advanson) - do - - do -URC (Thailand) Co., Ltd. Thailand Thai BahtSiam Pattanasin Co., Ltd. - do - - do -URC (Myanmar) Co. Ltd. Myanmar Myanmar KyatURC Vietnam Co., Ltd. Vietnam Vietnam DongURC Hanoi Company Limited - do - - do -URC Central Co. Ltd. - do - - do -URC New Zealand Holding Co. Ltd.
(URC NZ HoldCo) New Zealand New Zealand Dollar

- 60 -
*SGVFS035342*
Country of FunctionalSubsidiaries Incorporation Currency
URC New Zealand Finance Co. Ltd.(URC NZ FinCo) New Zealand New Zealand Dollar
Griffin’s Food Limited (Griffin’s) - do - - do -Nice and Natural Limited - do - - do -URC Australia Holding Company Ltd.
(URC AU HoldCo) Australia Australian DollarURC Australia Finance Company Ltd.
(URC AU FinCo) - do - - do -Consolidated Snacks Pty Ltd. (CSPL) - do - - do -Snack Brands Australia Partnership - do - - do -
The consolidated financial statements as at December 31, 2016 and for the period October 1 toDecember 31, 2016 were prepared because of the change in the Group’s accounting period(see Note 1).
The amounts presented for the period October 1 to December 31, 2016 in the consolidated statementsof income, consolidated statements of comprehensive income, consolidated statements of changes inequity and consolidated statements of cash flows and the related notes are for the three months, andaccordingly, are not comparable to the calendar years ended December 31, 2018 and 2017.
Statement of ComplianceThe consolidated financial statements of the Group have been prepared in compliance with PhilippineFinancial Reporting Standards (PFRSs).
Basis of ConsolidationThe consolidated financial statements include the financial statements of the Parent Company and thefollowing wholly and majority owned subsidiaries as of December 31, 2018 and 2017.
Place of Effective Percentages of OwnershipSubsidiaries Incorporation 2018 2017CFC Corporation Philippines 100.00 100.00Bio-Resource Power Generation Corporation and a
Subsidiary (BRPGC) - do - 100.00 100.00Calbee – URC, Inc. (CURCI)* - do - 100.00 50.00Hunt – URC (HURC)* - do - 100.00 50.00Nissin – URC (NURC) - do - 51.00 51.00CFC Clubhouse Property, Inc. (CCPI) - do - − 100.00URC Philippines, Ltd. (URCPL) British Virgin Islands 100.00 100.00URCICL and Subsidiaries** - do - 100.00 100.00Universal Robina (Cayman), Ltd. (URCL) Cayman Islands 100.00 100.00URCCCL China 100.00 100.00* Accounted for as joint ventures under equity method until September 30, 2018** Subsidiaries are located in Thailand, Singapore, Malaysia, Vietnam, Indonesia, China, Hong Kong, Myanmar, New Zealand and Australia.
Acquisition of CURCIIn September 2018, the Parent Company entered into a share purchase agreement with its jointventure partner, Calbee, Inc., to purchase the latter’s 50% equity interest in CURCI. As a result ofthe sale, CURCI became a wholly-owned subsidiary of URC (see Note 16).

- 61 -
*SGVFS035342*
Acquisition of HURCIn September 2018, the Parent Company entered into a share purchase agreement with its jointventure partner, ConAgra Grocery Products Company, LLC., to purchase the latter’s 50% equityinterest in HURC. As a result of the sale, HURC became a wholly-owned subsidiary of URC(see Note 16).
Merger of CCPIOn March 10, 2015 and May 27, 2015, the BOD and stockholders of the Parent Company,respectively, approved the plan to merge CCPI with the Parent Company. On April 25, 2017 andJune 28, 2017, the BOD and stockholders of the Parent Company approved the revised Plan ofMerger and Articles of Merger between the Company and the Parent Company. On April 24, 2018,the SEC approved the merger (see Notes 16 and 22).
ControlControl is achieved when the Group is exposed, or has rights to variable returns from its involvementwith the investee and has the ability to affect those returns through its power over the investee.Specifically, the Group controls an investee if and only if the Group has:
∂ Power over the investee (i.e., existing rights that give it the current ability to direct the relevantactivities of the investee);
∂ Exposure, or rights, to variable returns from its involvement with the investee; and∂ The ability to use its power over the investee to affect its returns.
When the Group has less than a majority of the voting or similar rights of an investee, the Groupconsiders all relevant facts and circumstances in assessing whether it has power over an investee,including:
∂ The contractual arrangement with the other vote holders of the investee;∂ Rights arising from other contractual arrangements; and∂ The Group’s voting rights and potential voting rights.
The Group re-assesses whether or not it controls an investee if facts and circumstances indicate thatthere are changes to one or more of the three elements of control. Consolidation of a subsidiarybegins when the Parent Company obtains control over the subsidiary and ceases when the ParentCompany loses control of the subsidiary. Assets, liabilities, income and expenses of a subsidiaryacquired or disposed of during the year are included in the consolidated statement of comprehensiveincome from the date the Parent Company gains control until the date it ceases to control thesubsidiary.
Profit or loss and each component of other comprehensive income (OCI) are attributed to the equityholders of the Parent of the Group and to the non-controlling interests, even if this results in the non-controlling interest having deficit balance. When necessary, adjustments are made to the financialstatements of subsidiaries to bring the accounting policies used in line with those used by the Group.
All intragroup transactions, balances, income and expenses are eliminated in the consolidation.Non-controlling interests in the net assets of consolidated subsidiaries are identified separately fromthe Group’s equity therein. The interest of non-controlling shareholders may be initially measured atfair value or at the non-controlling interest’s proportionate share of the acquiree’s identifiable netassets. The choice of measurement basis is made on an acquisition-by-acquisition basis. Subsequentto acquisition, non-controlling interests consist of the amount attributed to such interests at initialrecognition and the non-controlling interest’s share of changes in equity since the date of the

- 62 -
*SGVFS035342*
combination.
Changes in the Group’s ownership interest in subsidiary that do not result in a loss of control areaccounted for as equity transactions. Any difference between the amount by which the non-controlling interests are adjusted and the fair value of the consideration paid or received is recognizeddirectly in equity and attributed to the equity holders of the Parent Company.
If the Group loses control over a subsidiary, it:
∂ derecognizes the assets (including goodwill) and liabilities of the subsidiary;∂ derecognizes the carrying amount of any non-controlling interest;∂ derecognizes the related other comprehensive income recorded in equity and recycles the same to
profit or loss or retained earnings;∂ recognizes the fair value of the consideration received;∂ recognizes the fair value of any investment retained;∂ recognizes any surplus or deficit in the consolidated statement of income; and∂ reclassifies the Parent Company’s share of components previously recognized in other
comprehensive income to profit or loss or retained earnings, as appropriate, as would be requiredif the Group had directly disposed of the related assets or liabilities.
The financial statements of the subsidiaries are prepared for the same reporting period as the ParentCompany, using consistent accounting policies. Some of the Group's subsidiaries have a localstatutory accounting reference date of September 30. These are consolidated using managementprepared information on a basis coterminous with the Group's accounting reference date.
Below are the subsidiaries with a different accounting reference date from that of the ParentCompany:
Subsidiaries* Year-endBio-resource Power Generation Corporation September 30Southern Negros Development Corporation -do-*Dormant/non-operating subsidiaries
Business CombinationsBusiness combinations are accounted for using the acquisition method. The cost of an acquisition ismeasured at the aggregate of the fair values, at the date of exchange, of assets given, liabilitiesincurred or assumed, and equity instruments issued by the Group in exchange for control of theacquiree. This policy also covers purchase of assets that constitutes acquisition of a business. Foreach business combination, the Group elects whether to measure the non-controlling interests in theacquiree at fair value or at the proportionate share of the acquiree’s identifiable net assets.Acquisition-related costs are recognized in profit or loss in the consolidated statement of income asincurred.
Where appropriate, the cost of acquisition includes any asset or liability resulting from a contingentconsideration arrangement, measured at its acquisition-date fair value. Subsequent changes in suchfair values are adjusted against the cost of acquisition where they qualify as measurement periodadjustments. All other subsequent changes in the fair value of contingent consideration classified asan asset or liability are accounted for in accordance with relevant PFRSs. Changes in the fair value ofcontingent consideration classified as equity are not recognized.

- 63 -
*SGVFS035342*
If the initial accounting for a business combination is incomplete by the end of the reporting period inwhich the combination occurs, the Group reports provisional amounts for the items for which theaccounting is incomplete. Those provisional amounts are adjusted during the measurement period, oradditional assets or liabilities are recognized, to reflect new information obtained about facts andcircumstances that existed as of the acquisition date that if known, would have affected the amountsrecognized as of that date. The measurement period is the period from the date of acquisition to thedate the Group receives complete information about facts and circumstances that existed as of theacquisition date and is subject to a maximum period of one year.
If the business combination is achieved in stages, the Group’s previously-held interests in theacquired entity are remeasured to fair value at the acquisition date (the date the Group attains control)and the resulting gain or loss, if any, is recognized in the consolidated statement of income. Amountsarising from interests in the acquiree prior to the acquisition date that have previously beenrecognized in other comprehensive income are reclassified to profit or loss, where such treatmentwould be appropriate if that interest were disposed of.
Combinations of Entities Under Common ControlWhere there are business combinations involving entities that are ultimately controlled by the sameultimate parent (i.e., Controlling Shareholders) before and after the business combination and that thecontrol is not transitory (“business combinations under common control”), the Group accounts forsuch business combinations in accordance with the guidance provided by the PhilippineInterpretations Committee Q&A No. 2011-02, PFRS 3.2 - Common Control Business Combinations.The purchase method of accounting is used, if the transaction was deemed to have substance from theperspective of the reporting entity. In determining whether the business combination has substance,factors such as the underlying purpose of the business combination and the involvement of partiesother than the combining entities such as the non-controlling interest, shall be considered. In caseswhere the transaction has no commercial substance, the business combination is accounted for usingthe pooling of interest method.
In applying the pooling-of-interests method, the Group follows the Philippine InterpretationsCommittee Q&A No. 2012-01, PFRS 3.2 - Application of the Pooling of Interest Method for BusinessCombinations of Entities under Common Control in Consolidated Financial Statements, whichprovides the following guidance:
∂ The assets and liabilities of the combining entities are reflected in the consolidated financialstatements at their carrying amounts. No adjustments are made to reflect fair values, or recognizeany new assets or liabilities, at the date of the combination. The only adjustments that are madeare those adjustments to harmonize accounting policies.
∂ No new goodwill is recognized as a result of the combination. The only goodwill that isrecognized is any existing goodwill relating to either of the combining entities. Any differencebetween the consideration paid or transferred and the equity acquired is reflected within equity asother equity reserve, i.e., either contribution or distribution of equity.
∂ The consolidated statement of income reflects the results of the combining entities for the fullyear, irrespective of when the combination took place.
GoodwillGoodwill arising on the acquisition of a subsidiary is recognized as an asset at the date the control isacquired (the acquisition date). Goodwill is measured as the excess of the sum of the considerationtransferred, the amount of any non-controlling interest in the acquiree and the fair value of theacquirer’s previously-held interest, if any, in the entity over the net fair value of the identifiable netassets recognized.

- 64 -
*SGVFS035342*
If after reassessment, the Group’s interest in the net fair value of the acquiree’s identifiable net assetsexceeds the sum of consideration transferred, the amount of any non-controlling interest in theacquiree and the fair value of the acquirer’s previously-held equity interest, if any, the excess isrecognized immediately in the consolidated statement of income as a gain on bargain purchase.
After initial recognition, goodwill is measured at cost less accumulated impairment losses. Goodwillis not amortized, but is reviewed for impairment at least annually. Any impairment loss is recognizedimmediately in profit or loss and is not subsequently reversed.
On disposal of a subsidiary, the attributable amount of goodwill is included in the determination ofthe profit or loss on disposal.
Changes in Accounting Policies and DisclosuresThe accounting policies adopted are consistent with those of the previous financial years, except thatthe Group has adopted the following PFRSs and Philippine Accounting Standards (PAS) andPhilippine Interpretations beginning January 1, 2018. The adoption of the new and amendedstandards and interpretations did not have any impact on the consolidated financial statements of theGroup unless otherwise indicated.
∂ Amendments to PFRS 2, Share-based Payment, Classification and Measurement of Share-basedPayment TransactionsThe amendments to PFRS 2 address three main areas: the effects of vesting conditions on themeasurement of a cash-settled share-based payment transaction; the classification of a share-based payment transaction with net settlement features for withholding tax obligations; and theaccounting where a modification to the terms and conditions of a share-based paymenttransaction changes its classification from cash-settled to equity-settled. Entities are required toapply the amendments to: (1) share-based payment transactions that are unvested or vested butunexercised as of January 1, 2018, (2) share-based payment transactions granted on or afterJanuary 1, 2018 and to (3) modifications of share-based payments that occurred on or afterJanuary 1, 2018. Retrospective application is permitted if elected for all three amendments and ifit is possible to do so without hindsight.
∂ PFRS 9, Financial InstrumentsPFRS 9 replaces PAS 39, Financial Instruments: Recognition and Measurement, for annualperiods beginning on or after January 1, 2018, bringing together all three aspects of theaccounting for financial instruments: classification and measurement; impairment; and hedgeaccounting.
The Group applied PFRS 9 using the modified retrospective approach, with an initial applicationdated January 1, 2018. The Group has not restated the comparative information, which continuesto be reported under PAS 39. Restatements and differences in the carrying amounts of financialinstruments arising from the adoption of PFRS 9 have been recognized in the 2018 openingbalances of retained earnings as if the Group had always applied PFRS 9.

- 65 -
*SGVFS035342*
The Group adopted the classification and measurement, impairment and hedge accountingrequirements of the standard as follows:
Classification and measurementFinancial assets are measured at FVTPL unless these are measured at FVOCI or at amortizedcost. The classification and measurement provisions of PFRS 9 require that all debt financialassets that do not meet the “solely payment of principal and interest” (SPPI) test, including thosethat contain embedded derivatives, be classified at initial recognition as financial assets atFVTPL. The intent of the SPPI test is to ensure that debt instruments that contain non-basiclending features, such as conversion options and equity linked pay-outs, are measured as financialassets at FVTPL. Subsequent measurement of instruments classified as financial assets atFVTPL under PFRS 9 operates in a similar manner to financial instruments held for trading underPAS 39.
All equity financial assets are required to be classified at initial recognition as at FVTPL unlessan irrevocable designation is made to classify the instrument as financial asset at FVOCI forequities. Unlike AFS for equity securities under PAS 39, the FVOCI for equities category resultsin all realized and unrealized gains and losses being recognized in the consolidated statement ofcomprehensive income with no recycling to profit or loss. Only dividends will continue to berecognized in the consolidated statement of income.
As at January 1, 2018, the Group has reviewed and assessed all of its existing financialinstruments. The following table shows the Group’s financial instruments from their previousclassification and measurement category in accordance with PAS 39 to their new classificationand measurement categories upon transition to PFRS 9 on January 1, 2018:
Financial AssetsClassification and Measurement
Under PAS 39 Under PFRS 9Cash and cash equivalents Loans and receivables Amortized costReceivables Loans and receivables Amortized costEquity instruments at FVTPL Financial assets at FVPL Financial assets at FVTPLEquity instruments at OCI AFS investments Financial assets at FVOCIDerivatives under hedge accounting FVOCI FVOCI
ImpairmentPFRS 9 requires recording of expected credit losses (ECL) for all debt securities not classified asat FVPL, together with receivables. ECL represents credit losses that reflect an unbiased andprobability-weighted amount which is determined by evaluating a range of possible outcomes, thetime value of money and reasonable and supportable information about past events, currentconditions and forecasts of future economic conditions. In comparison, the incurred loss modelunder PAS 39 recognizes lifetime credit losses only when there is objective evidence ofimpairment. The ECL model eliminates the loss event required under the incurred loss model,and lifetime ECL is recognized earlier under PFRS 9.
PFRS 9 provides some operational simplifications for receivables, by introducing an alternativesimplified approach. Under the simplified approach, there is no more requirement to determine atreporting date whether a credit exposure has significantly increased in credit risk or not. Creditexposures under the simplified approach will be subject only to lifetime ECL. In addition,PFRS 9 allows the use of a provision matrix approach or a loss rate approach as a practicalexpedient when measuring ECL for certain short-term financial assets, so long as thesemethodologies reflects a probability-weighted outcome, the time value of money and reasonable

- 66 -
*SGVFS035342*
and supportable information that is available without undue cost or effort at the reporting date,about past events, current conditions and forecasts of future economic conditions.
Under PFRS 9, the level of provision for credit and impairment losses has generally increaseddue to the incorporation of a more forward-looking approach in determining provisions. Further,since the implementation of PFRS 9, all financial assets except those measured at FVTPL andequity instruments at FVOCI, are assessed for at least 12-month ECL and the population offinancial assets to which the lifetime ECL applies is larger than the population for which there isobjective evidence of impairment in accordance with PAS 39.
The adoption of PFRS 9 changed the Group’s accounting for impairment losses for receivables toECL approach. The adoption of PFRS 9 as at January 1, 2018 resulted in a reduction of retainedearnings and receivables by P=1.7 billion.
Hedge accountingThe new hedge accounting model under PFRS 9 aims to simplify hedge accounting, align theaccounting for hedge relationships more closely with an entity’s risk management activities andpermit hedge accounting to be applied more broadly to a greater variety of hedging instrumentsand risks eligible for hedge accounting.
∂ Amendments to PFRS 4, Applying PFRS 9 Financial Instruments with PFRS 4 InsuranceContractsThe amendments address concerns arising from implementing PFRS 9, the new financialinstruments standard before implementing the new insurance contracts standard. Theamendments introduce two options for entities issuing insurance contracts: a temporaryexemption from applying PFRS 9 and an overlay approach. The temporary exemption is firstapplied for reporting periods beginning on or after January 1, 2018. An entity may elect theoverlay approach when it first applies PFRS 9 and apply that approach retrospectively to financialassets designated on transition to PFRS 9. The entity restates comparative information reflectingthe overlay approach if, and only if, the entity restates comparative information when applyingPFRS 9.
∂ PFRS 15, Revenue from Contracts with CustomersPFRS 15 supersedes PAS 11, Construction Contracts, PAS 18, Revenue, and relatedinterpretations and it applies to all revenue arising from contracts with customers, unless thosecontracts are in the scope of other standards. PFRS 15 establishes a five-step model that willapply to revenue arising from contracts with customers. The five-step model is as follows:
∂ Identify the contract(s) with a customer;∂ Identify the performance obligations in the contract;∂ Determine the transaction price;∂ Allocate the transaction price to the performance obligations in the contract; and∂ Recognize revenue when (or as) the entity satisfies a performance obligation.
Under PFRS 15, revenue is recognized at an amount that reflects the consideration to which anentity expects to be entitled in exchange for transferring goods or services to a customer. Thestandard requires entities to exercise judgment, taking into consideration all of the relevant factsand circumstances when applying each step of the model to contracts with customers. Thestandard also specifies the accounting for the incremental costs of obtaining a contract and thecosts directly related to fulfilling a contract.

- 67 -
*SGVFS035342*
With the effectivity of PFRS 15 on January 1, 2018, as approved by the Financial ReportingStandards Council (FRSC), the Philippine Interpretations Committee (PIC) issued PIC Q&A2019-3, Revenue Recognition Guidance for Sugar Millers, to assist the companies operating inthe sugar industry in the adoption of PFRS 15. The interpretation states that a miller shouldrecognize revenue arising from its sugar milling operation under either an output sharingagreement or cane purchase agreement, and that providing free storage constitutes a separateperformance obligation in the case of an output sharing agreement.
In response to concerns raised by the sugar industry on the implementation and adoption of thePIC Q&A, the SEC issued MC No. 06 on April 4, 2019, deferring the application of theprovisions of the above-mentioned PIC Q&A for a period of one (1) year.
Effective January 1, 2019, the Philippine sugar millers will adopt PIC Q&A No. 2019-3 and anysubsequent amendments thereto retrospectively or as the SEC will later prescribe.
The Group availed of the deferral of adoption of the above specific provisions. Had theseprovisions been adopted, it would have affected retained earnings as at January 1, 2018 andrevenue from milling, cost of sales, cost of milling and raw sugar inventories for 2018.Currently, revenue is recognized upon sale of raw sugar arising from the output sharingagreements.
With the deferral of the implementation of certain provisions of PIC Q&A 2019-3, the adoptionof PFRS 15 for sugar milling did not have any significant impact to the consolidated financialstatements.
The Group adopted PFRS 15 using the modified retrospective method of adoption with the dateof initial application of January 1, 2018. Under this method, the standard can be applied either toall contracts at the date of initial application or only to contracts that are not completed at thisdate. The Group elected to apply the standard to all contracts that are not completed as at the dateof initial application.
Set out below are the amounts by which each financial statement line item is affected as at andfor the year ended December 31, 2018 as a result of the adoption of PFRS 15. The adoption ofPFRS 15 did not have an impact on the Group’s other comprehensive income or on its operating,investing and financing cash flows. There were no adjustments recognized to the openingbalances of retained earnings as at January 1, 2018 upon the adoption of PFRS 15.
(in thousands) Under PAS 18 Adjustment Under PFRS 15Revenue from contracts with
customersSale of goods and services P=129,515,091 (P=1,745,142) P=127,769,949Selling and distribution expense 20,464,701 (1,745,142) 18,719,559
The nature of the adjustment as at January 1, 2018 and the reasons for the significant changes inthe consolidated statement of income for the year ended December 31, 2018 as presented in theabove table are described below:
a) The Group has determined that, except in the case of milling revenue, all contracts underPAS 18 still qualify as contracts under PFRS 15. Under PAS 18, milling contracts enteredinto by the Group with the planters for the conversion of the planters’ sugar cane into rawsugar through an output-sharing arrangement is not considered as a revenue contract, but is

- 68 -
*SGVFS035342*
now within the scope of PFRS 15. Planters are considered customers under this arrangementand the Group provides service to the planters in the form of conversion processes ofsugar cane to raw sugar.
b) Other than the sale of goods and services, no other performance obligations were identifiedexcept in the case of milling revenue discussed in the preceding paragraph.
c) The Group pays various consideration payable to customers and accounts for each type ofconsideration separately either treated as contra-revenue (discount) or an expense under theold revenue standard. Under PFRS 15, the Group shall account for a consideration payable tocustomer as a reduction in revenue unless the payment to the customer is in exchange for adistinct good or service that the customer transfer to the entity wherein the considerationpayable to the customer shall be treated as an expense. As a result, certain expenses werereclassified as contra-revenue amounting to P=1.7 billion for the year endedDecember 31, 2018.
∂ Amendments to PAS 28, Investments in Associates and Joint Ventures, Measuring an Associateor Joint Venture at Fair Value (Part of Annual Improvements to PFRSs 2014 - 2016 Cycle)The amendments clarify that an entity that is a venture capital organization, or other qualifyingentity, may elect, at initial recognition on an investment-by-investment basis, to measure itsinvestments in associates and joint ventures at fair value through profit or loss. They also clarifythat if an entity that is not itself an investment entity has an interest in an associate or jointventure that is an investment entity, the entity may, when applying the equity method, elect toretain the fair value measurement applied by that investment entity associate or joint venture tothe investment entity associate’s or joint venture’s interests in subsidiaries. This election is madeseparately for each investment entity associate or joint venture, at the later of the date on which(a) the investment entity associate or joint venture is initially recognized; (b) the associate or jointventure becomes an investment entity; and (c) the investment entity associate or joint venture firstbecomes a parent. Retrospective application is required.
∂ Amendments to PAS 40, Investment Property, Transfers of Investment PropertyThe amendments clarify when an entity should transfer property, including property underconstruction or development into, or out of investment property. The amendments state that achange in use occurs when the property meets, or ceases to meet, the definition of investmentproperty and there is evidence of the change in use. A mere change in management’s intentionsfor the use of a property does not provide evidence of a change in use. Retrospective applicationof the amendments is not required and is only permitted if this is possible without the use ofhindsight.
∂ Philippine Interpretation IFRIC-22, Foreign Currency Transactions and Advance ConsiderationThe interpretation clarifies that, in determining the spot exchange rate to use on initial recognitionof the related asset, expense or income (or part of it) on the derecognition of a non-monetary assetor non-monetary liability relating to advance consideration, the date of the transaction is the dateon which an entity initially recognizes the nonmonetary asset or non-monetary liability arisingfrom the advance consideration. If there are multiple payments or receipts in advance, then theentity must determine the date of the transaction for each payment or receipt of advanceconsideration. Retrospective application of this interpretation is not required.
Since the Group’s current practice is in line with the clarifications issued, these do not have anyimpact on the Group’s consolidated financial statements.

- 69 -
*SGVFS035342*
Significant Accounting Policies
Current versus Noncurrent ClassificationThe Group presents assets and liabilities in the consolidated statement of financial position based oncurrent or noncurrent classification.
An asset is current when it is:∂ Expected to be realized or intended to be sold or consumed in normal operating cycle;∂ Held primarily for the purpose of trading;∂ Expected to be realized within twelve months after the reporting period; or∂ Cash or cash equivalents, unless restricted from being exchanged or used to settle a liability for at
least twelve months after the reporting period.
All other assets are classified as noncurrent.
A liability is current when:∂ It is expected to be settled in normal operating cycle;∂ It is held primarily for the purpose of trading;∂ It is due to be settled within twelve months after the reporting period; or∂ There is no unconditional right to defer the settlement of the liability for at least twelve months
after the reporting period.
All other liabilities are classified as noncurrent.
Deferred tax assets and liabilities are classified as noncurrent assets and liabilities.
Fair Value MeasurementThe Group measures certain financial instruments and nonfinancial assets at fair value at eachreporting date. Fair values of financial instruments measured at amortized cost and investmentproperties carried at cost are disclosed in Note 5.
Fair value is the price that would be received to sell an asset or paid to transfer a liability in an orderlytransaction between market participants at the measurement date. The fair value measurement isbased on the presumption that the transaction to sell the asset or transfer the liability takes placeeither:
∂ In the principal market for the asset or liability, or∂ In the absence of a principal market, in the most advantageous market for the asset or liability
The principal or the most advantageous market must be accessible to the Group.
The fair value of an asset or a liability is measured using the assumptions that market participantswould use when pricing the asset or liability, assuming that market participants act in their economicbest interest.
A fair value measurement of a non-financial asset takes into account a market participant’s ability togenerate economic benefits by using the asset in its highest and best use or by selling it to anothermarket participant that would use the asset in its highest and best use.

- 70 -
*SGVFS035342*
The Group uses valuation techniques that are appropriate in the circumstances and for whichsufficient data are available to measure fair value, maximizing the use of relevant observable inputsand minimizing the use of unobservable inputs.
All assets and liabilities for which fair value is measured or disclosed in the financial statements arecategorized within the fair value hierarchy, described as follows, based on the lowest level input thatis significant to the fair value measurement as a whole:
∂ Level 1 - Quoted (unadjusted) market prices in active markets for identical assets or liabilities∂ Level 2 - Valuation techniques for which the lowest level input that is significant to the fair
value measurement is directly or indirectly observable∂ Level 3 - Valuation techniques for which the lowest level input that is significant to the fair
value measurement is unobservable.
For assets and liabilities that are recognized in the financial statements on a recurring basis, the Groupdetermines whether transfers have occurred between levels in the hierarchy by re-assessingcategorization (based on the lowest level input that is significant to the fair value measurement as awhole) at the end of each reporting date.
Cash and Cash EquivalentsCash includes cash on hand and in banks. Cash equivalents are short-term, highly liquid investmentsthat are readily convertible to known amounts of cash with original maturities of three months or lessfrom dates of placement, and that are subject to insignificant risk of changes in value.
Financial Instruments (Upon Adoption of PFRS 9 beginning January 1, 2018)A financial instrument is any contract that gives rise to a financial asset of one entity and a financialliability or equity instrument of another entity.
a) Financial assetsInitial recognition and measurementFinancial assets are classified at fair value at initial recognition and subsequently measured atamortized cost, FVOCI, and FVTPL.
The classification of financial assets at initial recognition depends on the financial asset’s contractualcash flow characteristics and the Group’s business model for managing them. With the exception oftrade receivables that do not contain a significant financing component or for which the Group hasapplied the practical expedient, the Group initially measures a financial asset at its fair value plus, inthe case of a financial asset not at FVTPL, transaction costs. Trade receivables that do not contain asignificant financing component or for which the Group has applied the practical expedient aremeasured at the transaction price determined under PFRS 15.
In order for a financial asset to be classified and measured at amortized cost or FVOCI, it needs togive rise to cash flows that are ‘solely payments of principal and interest (SPPI)’ on the principalamount outstanding. This assessment is referred to as the SPPI test and is performed at aninstrument level.
The Group’s business model for managing financial assets refers to how it manages its financialassets in order to generate cash flows. The business model determines whether cash flows will resultfrom collecting contractual cash flows, selling the financial assets, or both.

- 71 -
*SGVFS035342*
Purchases or sales of financial assets that require delivery of assets within a time frame establishedby regulation or convention in the market place (regular way trades) are recognized on the trade date,i.e., the date that the Group commits to purchase or sell the asset.
Subsequent measurementFor purposes of subsequent measurement, financial assets are classified in four categories:∂ Financial assets at amortized cost (debt instruments)∂ Financial assets at FVOCI with recycling of cumulative gains and losses (debt instruments)∂ Financial assets designated at FVOCI with no recycling of cumulative gains and losses upon
derecognition (equity instruments)∂ Financial assets at FVTPL
The financial assets of the Group as of December 31, 2018 consist of financial assets at amortizedcost, financial assets designated at FVOCI with no recycling of cumulative gains and losses uponderecognition (equity instruments), derivative assets at FVOCI and financial assets at FVTPL(equity instruments).
Financial assets at amortized cost (debt instruments)The Group measures financial assets at amortized cost if both of the following conditions are met:∂ The financial asset is held within a business model with the objective to hold financial assets in
order to collect contractual cash flows; and∂ The contractual terms of the financial asset give rise on specified dates to cash flows that are
solely payments of principal and interest on the principal amount outstanding.
Financial assets at amortized cost are subsequently measured using the effective interest (EIR)method and are subject to impairment. Gains and losses are recognized in profit or loss when theasset is derecognized, modified or impaired.
The Group’s financial assets at amortized cost include cash and cash equivalents and receivables.
Financial assets designated at FVOCI (equity instruments)Upon initial recognition, the Group can elect to classify irrevocably its equity investments as equityinstruments designated at FVOCI when they meet the definition of equity under PAS 32, FinancialInstruments: Presentation, and are not held for trading. The classification is determined on aninstrument-by-instrument basis.
Gains and losses on these financial assets are never recycled to profit or loss. Dividends arerecognized as other income in the consolidated statements of income when the right of payment hasbeen established, except when the Group benefits from such proceeds as a recovery of part of thecost of the financial asset, in which case, such gains are recorded in OCI. Equity instrumentsdesignated at FVOCI are not subject to impairment assessment.
The Group elected to classify irrevocably its investments in club shares under this category.
Financial assets at FVTPL (equity instruments)Financial assets at FVTPL include financial assets held for trading, financial assets designated uponinitial recognition at FVTPL, or financial assets mandatorily required to be measured at fair value.Financial assets are classified as held for trading if they are acquired for the purpose of selling orrepurchasing in the near term. Derivatives, including separated embedded derivatives, are alsoclassified as held for trading unless they are designated as effective hedging instruments. Financialassets with cash flows that are not solely payments of principal and interest are classified and

- 72 -
*SGVFS035342*
measured at FVTPL, irrespective of the business model. Notwithstanding the criteria for debtinstruments to be classified at amortized cost or at FVOCI, as described above, debt instruments maybe designated at FVTPL on initial recognition if doing so eliminates, or significantly reduces, anaccounting mismatch.
Financial assets at FVTPL are carried in the consolidated statements of financial position at fair valuewith net changes in fair value recognized in the consolidated statements of income.
This category includes equity instruments held for trading and currency options.
A derivative embedded in a hybrid contract, with a financial liability or non-financial host, isseparated from the host and accounted for as a separate derivative if: the economic characteristics andrisks are not closely related to the host; a separate instrument with the same terms as the embeddedderivative would meet the definition of a derivative; and the hybrid contract is not measured at fairvalue through profit or loss. Embedded derivatives are measured at fair value with changes in fairvalue recognized in profit or loss. Reassessment only occurs if there is either a change in the terms ofthe contract that significantly modifies the cash flows that would otherwise be required or areclassification of a financial asset out of the fair value through profit or loss category.
DerecognitionA financial asset (or, where applicable, a part of a financial asset or part of a group of similarfinancial assets) is primarily derecognized (i.e., removed from the Group’s consolidated statement offinancial position) when:
∂ The rights to receive cash flows from the asset have expired, or∂ The Group has transferred its rights to receive cash flows from the asset or has assumed an
obligation to pay the received cash flows in full without material delay to a third party under a‘pass-through’ arrangement; and either (a) the Group has transferred substantially all the risks andrewards of the asset, or (b) the Group has neither transferred nor retained substantially all therisks and rewards of the asset, but has transferred control of the asset.
When the Group has transferred its rights to receive cash flows from an asset or has entered into apass-through arrangement, it evaluates if, and to what extent, it has retained the risks and rewards ofownership. When it has neither transferred nor retained substantially all of the risks and rewards ofthe asset, nor transferred control of the asset, the Group continues to recognize the transferred asset tothe extent of its continuing involvement. In that case, the Group also recognizes an associatedliability. The transferred asset and the associated liability are measured on a basis that reflects therights and obligations that the Group has retained.
Continuing involvement that takes the form of a guarantee over the transferred asset is measured atthe lower of the original carrying amount of the asset and the maximum amount of consideration thatthe Group could be required to repay.
Impairment of financial assetsThe Group recognizes an allowance for ECLs for all debt instruments not held at FVTPL. ECLrepresents credit losses that reflect an unbiased and probability-weighted amount which is determinedby evaluating a range of possible outcomes, the time value of money and reasonable and supportableinformation about past events, current conditions and forecasts of future economic conditions. TheECL allowance is based on the credit losses expected to arise over the life of the asset (the lifetimeECL), unless there has been no significant increase in credit risk since origination, in which case, theallowance is based on the 12-month ECL. The 12-month ECL is the portion of lifetime ECL thatresults from default events on a financial instrument that are possible within the 12 months after the

- 73 -
*SGVFS035342*
reporting date. Lifetime ECL are credit losses that results from all possible default events over theexpected life of a financial instrument.
For trade receivables, installment contracts receivable and contract assets, the Group applies asimplified approach in calculating ECLs. Therefore, the Group does not track changes in credit risk,but instead recognizes a loss allowance based on lifetime ECLs at each reporting date. The Grouphas established a provision matrix that is based on historical credit loss experience, adjusted forforward-looking factors specific to the debtors and the economic environment.
For other financial assets such nontrade receivable, loans receivable, due from related parties andother receivables, ECLs are recognized in two stages. For credit exposures for which there has notbeen a significant increase in credit risk since initial recognition, ECLs are provided for credit lossesthat result from default events that are possible within the next 12-months (a 12-month ECL). Forthose credit exposures for which there has been a significant increase in credit risk (SICR) sinceinitial recognition, a loss allowance is required for credit losses expected over the remaining life ofthe exposure, irrespective of the timing of the default (a lifetime ECL).
For cash and cash equivalents and short-term investments, the Group applies the low credit risksimplification. The probability of default and loss given defaults are publicly available and areconsidered to be low credit risk investments. It is the Group’s policy to measure ECLs on suchinstruments on a 12-month basis. However, when there has been a significant increase in credit risksince origination, the allowance will be based on the lifetime ECL. The Group uses the ratings fromreputable credit rating agencies to determine whether the debt instrument has SICR and to estimateECLs.
The Group considers a debt investment security to have low credit risk when its credit risk rating isequivalent to the globally understood definition of ‘investment grade’.
The key inputs in the model include the Group’s definition of default and historical data of three yearsfor the origination, maturity date and default date. The Group considers trade receivables andcontract assets in default when contractual payment are 90 days past due, except for certaincircumstances when the reason for being past due is due to reconciliation with customers of paymentrecords which are administrative in nature which may extend the definition of default. However, incertain cases, the Group may also consider a financial asset to be in default when internal or externalinformation indicates that the Group is unlikely to receive the outstanding contractual amounts in fullbefore taking into account any credit enhancements held by the Group.
Determining the stage for impairmentAt each reporting date, the Group assesses whether there has been a SICR for financial assets sinceinitial recognition by comparing the risk of default occurring over the expected life between thereporting date and the date of initial recognition. The Group considers reasonable and supportableinformation that is relevant and available without undue cost or effort for this purpose. This includesquantitative and qualitative information and forward-looking analysis.
An exposure will migrate through the ECL stages as asset quality deteriorates. If, in a subsequentperiod, asset quality improves and also reverses any previously assessed SICR since origination, thenthe loss allowance measurement reverts from lifetime ECL to 12-months ECL.

- 74 -
*SGVFS035342*
b) Financial liabilitiesInitial recognition and measurementFinancial liabilities are classified, at initial recognition, as financial liabilities at FVTPL, loans andborrowings, payables, or as derivatives designated as hedging instruments in an effective hedge, asappropriate.
All financial liabilities are recognized initially at fair value and, in the case of loans and borrowingsand payables, net of directly attributable transaction costs.
Subsequent measurementThe measurement of financial liabilities depends on their classification, as described below:
Financial liabilities at FVTPLFinancial liabilities at FVTPL include financial liabilities held for trading and financial liabilitiesdesignated upon initial recognition as at FVTPL.
Financial liabilities are classified as held for trading if they are incurred for the purpose ofrepurchasing in the near term. This category also includes derivative financial instruments enteredinto by the Group that are not designated as hedging instruments in hedge relationships as defined byPFRS 9. Separated embedded derivatives are also classified as held for trading unless they aredesignated as effective hedging instruments.
Gains or losses on liabilities held for trading are recognized in the consolidated statements of income.
Financial liabilities designated upon initial recognition at FVTPL are designated at the initial date ofrecognition, and only if the criteria in PFRS 9 are satisfied.
The Group does not have financial liabilities at FVTPL as of December 31, 2018.
Other financial liabilitiesThis category pertains to financial liabilities that are not held for trading or not designated as atFVTPL upon the inception of the liability. These include liabilities arising from operations andborrowings.
After initial measurement, other financial liabilities are measured at amortized cost using the EIRmethod. Amortized cost is calculated by taking into account any discount or premium on theacquisition and fees or costs that are an integral part of the EIR. Gains and losses are recognized inprofit or loss when other financial liabilities are derecognized, as well as through the EIRamortization process.
This category applies to the Group’s accounts payable and accrued expenses (excluding advancesfrom customers, advances from third parties, statutory and taxes payables), short-term debt and trustreceipts payable and long-term debt.
DerecognitionA financial liability is derecognized when the obligation under the liability is discharged or cancelledor expires. When an existing financial liability is replaced by another from the same lender onsubstantially different terms, or the terms of an existing liability are substantially modified, such anexchange or modification is treated as the derecognition of the original liability and the recognition ofa new liability. The difference in the respective carrying amounts is recognized in profit or loss.

- 75 -
*SGVFS035342*
c) Offsetting of financial instrumentsFinancial assets and financial liabilities are offset and the net amount is reported in the consolidatedstatements of financial position if there is a currently enforceable legal right to offset the recognizedamounts and there is an intention to settle on a net basis, to realize the assets and settle the liabilitiessimultaneously.
Financial Instruments (Prior to Adoption of PFRS 9)
Date of recognitionThe Group recognizes a financial asset or a financial liability in the consolidated statement offinancial position when the Group becomes a party to the contractual provisions of the instrument.Purchases or sales of financial assets that require delivery of assets within the time frame establishedby regulation or convention in the marketplace are recognized on the settlement date. Derivatives arerecognized on a trade date basis.
Initial recognition of financial instrumentsAll financial instruments are recognized initially at fair value. Except for financial instrumentsvalued at FVPL, the initial measurement of financial assets includes transaction costs. The Groupclassifies its financial assets into the following categories: financial assets at FVPL, held-to-maturity(HTM) investments, AFS financial assets, loans and receivables or as derivatives designated ashedging instruments in effective hedge, as appropriate. The Group classifies its financial liabilitiesinto financial liabilities at FVPL and other financial liabilities at amortized cost.
The classification depends on the purpose for which the investments were acquired and whether theyare quoted in an active market. Management determines the classification of its investments at initialrecognition and, where allowed and appropriate, re-evaluates such designation at every reportingdate.
As of December 31, 2017, the Group has no HTM investments and financial liabilities at FVPL.
‘Day 1’ differenceWhere the transaction price in a non-active market is different from the fair value based on otherobservable current market transactions in the same instrument or based on a valuation techniquewhose variables include only data from an observable market, the Group recognizes the differencebetween the transaction price and fair value (a ‘Day 1’ difference) in profit or loss in the consolidatedstatement of income. In cases where variables used are made of data which is not observable, thedifference between the transaction price and model value is only recognized in the consolidatedstatement of income when the inputs become observable or when the instrument is derecognized.For each transaction, the Group determines the appropriate method of recognizing the ‘Day 1’difference amount.
Financial assets and financial liabilities at FVPLFinancial assets and financial liabilities at FVPL include financial assets and financial liabilities heldfor trading purposes, derivative financial instruments, or those designated upon initial recognition atFVPL when any of the following criteria are met:
a. Financial assets and liabilities are classified as held for trading if they are acquired for thepurpose of selling and repurchasing in the near term.
b. Derivatives, including separate embedded derivatives, are also classified under financial assets orliabilities at FVPL, unless they are designated as hedging instruments in an effective hedge
c. Financial assets or liabilities may be designated by management on initial recognition as at FVPLwhen any of the following criteria are met:

- 76 -
*SGVFS035342*
∂ the designation eliminates or significantly reduces the inconsistent treatment that wouldotherwise arise from measuring the assets or liabilities or recognizing gains or losses on themon a different basis;
∂ the assets and liabilities are part of a group of financial assets, financial liabilities or bothwhich are managed and their performance are evaluated on a fair value basis, in accordancewith a documented risk management or investment strategy; or
∂ the financial instrument contains an embedded derivative, unless the embedded derivativedoes not significantly modify the cash flows or it is clear, with little or no analysis, that itwould not be separately recorded.
Financial assets and financial liabilities at FVPL are recorded in the consolidated statement offinancial position at fair value. Changes in fair value are reflected in profit or loss in the consolidatedstatement of income. Interest earned or incurred is recorded in interest income or expense,respectively, while dividend income is recorded in other operating income according to the terms ofthe contract, or when the right of the payment has been established.
The Group’s financial assets at FVPL consist of equity securities and currency options (see Note 8and 9).
Derivatives classified as FVPLThe Group uses derivative financial instruments such as currency forwards and currency options tohedge the risks associated with foreign currency and interest rate fluctuations. Such derivativefinancial instruments are initially recorded at fair value on the date at which the derivative contract isentered into and are subsequently remeasured at fair value. Any gains or losses arising from changesin fair values of derivatives (except those accounted for as accounting hedges) are taken directly inthe consolidated statement of income. Derivatives are carried as assets when the fair value is positiveand as liabilities when the fair value is negative.
The fair values of the Group’s derivative instruments are calculated using certain standard valuationmethodologies.
Derivatives designated as accounting hedgesFor the purpose of hedge accounting, hedges are classified primarily as either: (a) a hedge of the fairvalue of an asset, liability or a firm commitment (fair value hedge); (b) a hedge of the exposure tovariability in cash flows attributable to an asset or liability or a forecasted transaction (cash flowhedge); or (c) a hedge of a net investment in a foreign operation (net investment hedge). Hedgeaccounting is applied to derivatives designated as hedging instruments in a fair value, cash flow or netinvestment hedge provided certain criteria are met.
Hedge accountingAt the inception of a hedging relationship, the Group formally designates and documents the hedgerelationship to which the Group wishes to apply hedge accounting and risk management objective andits strategy for undertaking the hedge. The documentation includes identification of the hedginginstrument, the hedged item or transaction, the nature of the risk being hedged and how the entity willassess the hedging instrument’s effectiveness in offsetting the exposure to changes in the hedgeditem’s fair value or cash flows attributable to the hedged risk. Such hedges are expected to be highlyeffective in achieving offsetting changes in fair value or cash flows and are assessed on an ongoingbasis that they actually have been highly effective throughout the financial reporting periods forwhich they were designated.

- 77 -
*SGVFS035342*
Cash flow hedgeCash flow hedges are hedges of the exposure to variability in cash flows that are attributable to aparticular risk associated with a recognized asset, liability or a highly probable forecast transactionand could affect the profit or loss. The effective portion of changes in the fair value of derivativesthat are designated and qualified as cash flow hedges is recognized as ‘Unrealized gains (losses) oncash flow hedge’ in other comprehensive income. Any gain or loss in fair value relating to anineffective portion is recognized immediately in profit or loss.
Amounts accumulated in other comprehensive income are recycled to profit or loss in the periods inwhich the hedged item will affect profit or loss.
When a hedging instrument expires or is sold, or when a hedge no longer meets the criteria for hedgeaccounting, any cumulative gain or loss recognized in other comprehensive income is eventuallyrecycled in profit or loss.
Hedge effectiveness testingTo qualify for hedge accounting, the Group is required that at the inception of the hedge andthroughout its life, each hedge must be expected to be highly effective (prospective effectiveness),and demonstrate actual effectiveness (retrospective effectiveness) on an ongoing basis.
The documentation of each hedging relationship sets out how the effectiveness of the hedge isassessed. The method that the Group adopts for assessing hedge effectiveness will depend on its riskmanagement strategy.
For prospective effectiveness, the hedging instrument must be expected to be highly effective inoffsetting changes in fair value or cash flows attributable to the hedged risk during the period forwhich the hedge is designated. The Group applies the dollar-offset method using hypotheticalderivatives in performing hedge effectiveness testing. For actual effectiveness to be achieved, thechanges in fair value or cash flows must offset each other in the range of 80 to 125 percent. Anyhedge ineffectiveness is recognized in profit or loss.
Embedded derivativesAn embedded derivative is separated from the host contract and accounted for as a derivative if all ofthe following conditions are met: a) the economic characteristics and risks of the embedded derivativeare not closely related to the economic characteristics and risks of the host contract; b) a separateinstrument with the same terms as the embedded derivative would meet the definition of a derivative;and c) the hybrid or combined instrument is not recognized at FVPL.
Subsequent reassessment is prohibited unless there is a change in the terms of the contract thatsignificantly modifies the cash flows that otherwise would be required under the contract, in whichcase reassessment is required. The Group determines whether a modification to cash flows issignificant by considering the extent to which the expected future cash flows associated with theembedded derivative, the host contract or both have changed and whether the change is significantrelative to the previously expected cash flow on the contract.
Current versus noncurrent classificationDerivative instruments that are not designated as effective hedging instruments are classified ascurrent or noncurrent or separated into a current and noncurrent portion based on an assessment of thefacts and circumstances (i.e., the underlying contracted cash flows).
∂ Where the Group will hold a derivative as an economic hedge (and does not apply hedgeaccounting) for a period beyond 12 months after the reporting date, the derivative is classified as

- 78 -
*SGVFS035342*
noncurrent (or separated into current and noncurrent portions) consistent with the classification ofthe underlying item.
∂ Embedded derivatives that are not closely related to the host contract are classified consistentwith the cash flows of the host contract.Derivative instruments that are designated as, and are effective hedging instruments, are classifiedconsistently with the classification of the underlying hedged item. The derivative instrument isseparated into a current portion and a noncurrent portion only if a reliable allocation can be made.
Loans and receivablesLoans and receivables are nonderivative financial assets with fixed or determinable payments andfixed maturities that are not quoted in an active market. After initial measurement, loans andreceivables are subsequently carried at amortized cost using the effective interest rate (EIR) methodless any allowance for impairment. Amortized cost is calculated taking into account any discount orpremium on acquisition and includes fees that are an integral part of the EIR and transaction costs.The amortization is included under ‘Finance revenue’ in the consolidated statement of income. Gainsand losses are recognized in profit or loss in the consolidated statement of income when the loans andreceivables are derecognized or impaired, as well as through the amortization process. Loans andreceivables are included in current assets if maturity is within 12 months from the reporting date.Otherwise, these are classified as noncurrent assets.
This accounting policy applies primarily to the Group’s cash and cash equivalents and receivables(see Notes 7 and 10).
AFS financial assetsAFS financial assets are those nonderivative investments which are designated as such or do notqualify to be classified or designated as financial assets at FVPL, held-to-maturity investments orloans and receivables. They are purchased and held indefinitely, and may be sold in response toliquidity requirements or changes in market conditions.
After initial measurement, AFS financial assets are subsequently measured at fair value. Theunrealized gains and losses arising from the fair valuation of AFS financial assets are excluded fromreported earnings and are reported under the ‘Unrealized gain on AFS financial assets’ section of theconsolidated statement of comprehensive income.
When the security is disposed of, the cumulative gain or loss previously recognized in equity isrecognized in profit or loss in the consolidated statement of income. Interest earned on holding AFSfinancial assets are reported as interest income using the EIR method. Where the Group holds morethan one investment in the same security, these are deemed to be disposed of on a first-in, first-outbasis.
Dividends earned on holding AFS financial assets are recognized in the consolidated statement ofincome, when the right to receive payment has been established. The losses arising from impairmentof such investments are recognized under ‘Provision for Credit and impairment losses’ in theconsolidated statement of income.
Other financial liabilitiesIssued financial instruments or their components, which are not designated at FVPL are classified asother financial liabilities where the substance of the contractual arrangement results in the Grouphaving an obligation either to deliver cash or another financial asset to the holder, or to satisfy theobligation other than by the exchange of a fixed amount of cash or another financial asset for a fixednumber of own equity shares.

- 79 -
*SGVFS035342*
All loans and borrowings are initially recognized at the fair value of the consideration received lessdirectly attributable debt issuance costs. Debt issuance costs are amortized using the EIR method andunamortized debt issuance costs are offset against the related carrying value of the loan in theconsolidated statement of financial position.
After initial measurement, other financial liabilities are subsequently measured at amortized costusing the EIR method. Amortized cost is calculated by taking into account any discount or premiumon the issue and fees that are an integral part of the EIR.
When a loan is paid, the related unamortized debt issuance costs at the date of repayment are chargedagainst current operations. Gains and losses are recognized in the consolidated statement of incomewhen the liabilities are derecognized or impaired, as well as through the amortization process.
This accounting policy applies primarily to the Group’s short-term (see Note 18) and long-term debts(see Note 20), accounts payable and other accrued liabilities (see Note 19) and other obligations thatmeet the above definition (other than liabilities covered by other accounting standards, such aspension liabilities or income tax payable).
Debt Issuance CostsDebt issuance costs are amortized using EIR method and unamortized debt issuance costs areincluded in the measurement of the related carrying value of the loan in the consolidated statement offinancial position. When the loan is repaid, the related unamortized debt issuance costs at the date ofrepayment are charged to the consolidated statement of income.
Classification of Financial Instruments Between Debt and EquityA financial instrument is classified as debt if it provides for a contractual obligation to:
∂ deliver cash or another financial asset to another entity; or∂ exchange financial assets or financial liabilities with another entity under conditions that are
potentially unfavorable to the Group; or∂ satisfy the obligation other than by the exchange of a fixed amount of cash or another financial
asset for a fixed number of own equity shares.
If the Group does not have an unconditional right to avoid delivering cash or another financial assetto settle its contractual obligation, the obligation meets the definition of a financial liability.
The components of issued financial instruments that contain both liability and equity elements areaccounted for separately, with the equity component being assigned the residual amount afterdeducting from the instrument as a whole the amount separately determined as the fair value of theliability component on the date of issue.
Reclassification of Financial AssetsA financial asset is reclassified out of the FVPL category when the following conditions are met:
∂ the financial asset is no longer held for the purpose of selling or repurchasing it in the near term;and
∂ there is a rare circumstance.
A financial asset that is reclassified out of the FVPL category is reclassified at its fair value on thedate of reclassification. Any gain or loss already recognized in the consolidated statement of incomeis not reversed. The fair value of the financial asset on the date of reclassification becomes its newcost or amortized cost, as applicable.

- 80 -
*SGVFS035342*
The Group evaluates its AFS investments whether the ability and intention to sell them in the nearterm is still appropriate. When the Group is unable to trade these financial assets due to inactivemarkets and management’s intention to do so significantly changes in the foreseeable future, theGroup may elect to reclassify these financial assets in rare circumstances. Reclassification to loansand receivables is permitted when the financial assets meet the definition of loans and receivables andthe Group has the ability and intention to hold these assets for the foreseeable future or until maturity.Reclassification to the HTM category is permitted only when the entity has the ability and intention tohold the financial asset to maturity.
For a financial asset reclassified out of the AFS category, any previous gain or loss on that asset thathas been recognized in equity is amortized to profit or loss over the remaining life of the investmentusing the effective interest method. Any difference between the new amortized cost and the expectedcash flows is also amortized over the remaining life of the asset using the effective interest method.If the asset is subsequently determined to be impaired, then the amount recorded in equity isreclassified to profit or loss.
Impairment of Financial AssetsThe Group assesses at each reporting date whether there is objective evidence that a financial asset orgroup of financial assets is impaired. A financial asset or a group of financial assets is deemed to beimpaired if, and only if, there is objective evidence of impairment as a result of one or more eventsthat has occurred after the initial recognition of the asset (an incurred ‘loss event’) and that loss event(or events) has an impact on the estimated future cash flows of the financial asset or the group offinancial assets that can be reliably estimated. Evidence of impairment may include indications thatthe borrower or a group of borrowers is experiencing significant financial difficulty, default ordelinquency in interest or principal payments, the probability that they will enter bankruptcy or otherfinancial reorganization and where observable data indicate that there is a measurable decrease in theestimated future cash flows, such as changes in arrears or economic conditions that correlate withdefaults.
Financial assets carried at amortized costThe Group first assesses whether objective evidence of impairment exists individually for financialassets that are individually significant, or collectively for financial assets that are not individuallysignificant. If there is objective evidence that an impairment loss on financial assets carried atamortized cost (i.e., receivables) has been incurred, the amount of the loss is measured as thedifference between the asset’s carrying amount and the present value of estimated future cash flowsdiscounted at the asset’s original EIR. The carrying amount of the asset is reduced through the use ofan allowance account. The loss is recognized in the consolidated statement of income as ‘Provisionfor credit and impairment losses’. The asset, together with the associated allowance accounts, iswritten off when there is no realistic prospect of future recovery.
If it is determined that no objective evidence of impairment exists for an individually assessedfinancial asset, whether significant or not, the asset is included in a group of financial assets withsimilar credit risk characteristics and that group of financial assets is collectively assessed forimpairment. Those characteristics are relevant to the estimation of future cash flows for groups ofsuch assets by being indicative of the debtor’s ability to pay all amounts due according to thecontractual terms of the assets being evaluated. Assets that are individually assessed for impairmentand for which an impairment loss is or continues to be recognized are not included in a collectiveassessment of impairment.

- 81 -
*SGVFS035342*
If, in a subsequent period, the amount of the impairment loss decreases and the decrease can berelated objectively to an event occurring after the impairment was recognized, the previouslyrecognized impairment loss is reversed. Any subsequent reversal of an impairment loss is recognizedin the consolidated statement of income to the extent that the carrying value of the asset does notexceed its amortized cost at the reversal date.
The Group performs a regular review of the age and status of its trade and other receivables, designedto identify receivables with objective evidence of impairment and provide the appropriate allowancefor impairment loss. The review is accomplished using a combination of specific and collectiveassessment approaches, with the impairment loss being determined for each risk grouping identifiedby the Group (see Note 10).
AFS financial assetsThe Group assesses at each reporting date whether there is objective evidence that a financial asset orgroup of financial assets is impaired.
In the case of equity investments classified as AFS financial assets, objective evidence would includea significant or prolonged decline in the fair value of the investments below its cost. Thedetermination of what is significant and prolonged is subject to judgment. ‘Significant’ is to beevaluated against the original cost of the investment and ‘Prolonged’ against the period in which thefair value has been below its original cost. The Group treats ‘significant’ generally as 20% and‘prolonged’ as greater than 12 months for quoted equity instruments. Where there is evidence ofimpairment, the cumulative loss - measured as the difference between the acquisition cost and thecurrent fair value, less any impairment loss on that financial asset previously recognized in theconsolidated statement of income - is removed from equity and recognized in the consolidatedstatement of income. Impairment losses on equity investments are not reversed through theconsolidated statement of income. Increases in fair value after impairment are recognized directly aspart of other comprehensive income.
In the case of debt instruments classified as AFS financial assets, impairment is assessed based on thesame criteria as financial assets carried at amortized cost. Future interest income is based on thereduced carrying amount and is accrued based on the rate of interest used to discount future cashflows for the purpose of measuring impairment loss. Such accrual is recorded under interest incomein the consolidated statement of income. If, in subsequent year, the fair value of a debt instrumentincreases, and the increase can be objectively related to an event occurring after the impairment losswas recognized in the consolidated statement of income, the impairment loss is reversed in theconsolidated statement of income.
Financial guarantee contractsFinancial guarantee contracts issued by the Group are those contracts that require a payment to bemade to reimburse the holder for a loss it incurs because the specified debtor fails to make a paymentwhen due in accordance with the terms of a debt instrument. Financial guarantee contracts arerecognized initially as a liability at fair value, adjusted for transaction costs that are directlyattributable to the issuance of the guarantee. Subsequently, the liability is measured at the higher ofthe best estimate of the expenditure required to settle the present obligation at the reporting date andthe amount recognized less cumulative amortization.

- 82 -
*SGVFS035342*
Derecognition of Financial InstrumentsFinancial assetsA financial asset (or, where applicable a part of a financial asset or part of a group of financial assets)is derecognized when:
∂ the rights to receive cash flows from the asset have expired;∂ the Group retains the right to receive cash flows from the asset, but has assumed an obligation to
pay them in full without material delay to a third party under a “pass-through” arrangement; or∂ the Group has transferred its rights to receive cash flows from the asset and either (a) has
transferred substantially all the risks and rewards of ownership and retained control of the asset,or (b) has neither transferred nor retained the risk and rewards of the asset but has transferred thecontrol of the asset.
Where the Group has transferred its rights to receive cash flows from an asset or has entered into apass-through arrangement, and has neither transferred nor retained substantially all the risks andrewards of the asset nor transferred control of the asset, the asset is recognized to the extent of theGroup’s continuing involvement in the asset. Continuing involvement that takes the form of aguarantee over the transferred asset is measured at the lower of original carrying amount of the assetand the maximum amount of consideration that the Group could be required to repay.
Financial liabilitiesA financial liability is derecognized when the obligation under the liability is discharged or cancelledor has expired. Where an existing financial liability is replaced by another from the same lender onsubstantially different terms, or the terms of an existing liability are substantially modified, such anexchange or modification is treated as a derecognition of the original liability and the recognition of anew liability, and the difference in the respective carrying amounts is recognized in the consolidatedstatement of income.
Offsetting Financial InstrumentsFinancial assets and financial liabilities are offset and the net amount reported in the consolidatedstatement of financial position if, and only if, there is a currently enforceable legal right to offset therecognized amounts and there is an intention to settle on a net basis, or to realize the asset and settlethe liability simultaneously. The Group assesses that it has a currently enforceable right of offset ifthe right is not contingent on a future event, and is legally enforceable in the normal course ofbusiness, event of default, and event of insolvency or bankruptcy of the Group and all of thecounterparties.
InventoriesInventories, including goods-in-process, are valued at the lower of cost and NRV. NRV is theestimated selling price in the ordinary course of business, less estimated costs of completion and theestimated costs necessary to make the sale. NRV for materials, spare parts and other suppliesrepresents the related replacement costs.
When the inventories are sold, the carrying amounts of those inventories are recognized under ‘Costof sales’ in the consolidated statement of income in the period when the related revenue isrecognized.
Costs incurred in bringing each product to its present location and conditions are accounted for asfollows:

- 83 -
*SGVFS035342*
Finished goods, goods-in-process, raw materials, containers and packaging materials, and spareparts and suppliesCost is determined using the weighted average method. Finished goods and goods-in-process includedirect materials and labor, and a proportion of manufacturing overhead costs based on actual goodsprocessed and produced, but excluding borrowing costs.
Materials in-transitCost is determined using the specific identification basis.
Biological AssetsThe biological assets of the Group are divided into two major categories with sub-categories asfollows:
Swine livestock - Breeders (livestock bearer)- Sucklings (breeders’ offspring)- Weanlings (comes from sucklings intended to be breeders or to be sold
as fatteners)- Fatteners/finishers (comes from weanlings unfit to become breeders;
intended for the production of meat)
Poultry livestock - Breeders (livestock bearer)- Chicks (breeders’ offspring intended to be sold as breeders)
Biological assets are measured on initial recognition and at each reporting date at its fair value lessestimated costs to sell. The fair values are determined based on current market prices of livestock ofsimilar age, breed and genetic merit. Costs to sell include commissions to brokers and dealers,nonrefundable transfer taxes and duties. Costs to sell exclude transport and other costs necessary toget the biological assets to the market.
Agricultural produce is the harvested product of the Group’s biological assets. A harvest occurswhen agricultural produce is either detached from the bearer biological asset or when a biologicalasset’s life processes cease. A gain or loss arising on initial recognition of agricultural produce at fairvalue less estimated costs to sell is recognized in the consolidated statement of income in the periodin which it arises. The agricultural produce in swine livestock is the suckling that transforms intoweanling then into fatteners/finishers and meats, while the agricultural produce in poultry livestock isthe hatched chick and table eggs.
A gain or loss on initial recognition of a biological asset at fair value less estimated costs to sell andfrom a change in fair value less estimated costs to sell of a biological asset are included in theconsolidated statement of income in the period in which it arises.
Property, Plant and EquipmentProperty, plant and equipment, except land, are carried at cost less accumulated depreciation andamortization and impairment losses, if any.
The initial cost of an item of property, plant and equipment comprises its purchase price and any costattributable in bringing the asset to its intended location and working condition. Cost also includes:
(a) interest and other financing charges on borrowed funds used to finance the acquisition ofproperty, plant and equipment to the extent incurred during the period of installation andconstruction; and

- 84 -
*SGVFS035342*
(b) asset retirement obligation relating to property, plant and equipment installed/constructed onleased properties, if any, for the corresponding liability.
Land is stated at cost less any impairment in value.
Subsequent costs are capitalized as part of the ‘Property, plant and equipment’ in the consolidatedstatement of financial position, only when it is probable that future economic benefits associated withthe item will flow to the Group and the cost of the item can be measured reliably. Cost of repairs andmaintenance are expensed when incurred.
Foreign exchange differentials arising from foreign currency borrowings used for the acquisition ofproperty, plant and equipment are capitalized to the extent that these are regarded as adjustments tointerest costs.
Depreciation and amortization of property, plant and equipment commence once the property, plantand equipment are available for use and are computed using the straight-line method over theestimated useful life (EUL) of the assets regardless of utilization.
The EUL of property, plant and equipment of the Group follow:
YearsLand improvements 5 to 10Buildings and improvements 10 to 30Machinery and equipment 10Transportation equipment 5Furniture, fixtures and equipment 5
Leasehold improvements are amortized over the shorter of their EUL or the corresponding leaseterms. The residual values, useful lives and methods of depreciation and amortization of property,plant and equipment are reviewed periodically and adjusted, if appropriate, at each reporting date toensure that the method and period of depreciation and amortization are consistent with the expectedpattern of economic benefits from items of property, plant and equipment. Any change in theexpected residual values, useful lives and methods of depreciation are adjusted prospectively from thetime the change was determined necessary.
Construction-in-progress and equipment in transit are stated at cost. This includes the cost ofconstruction and other direct costs. Borrowing costs that are directly attributable to the constructionof property, plant and equipment are capitalized during the construction period. Construction in-progress and equipment in transit are not depreciated until such time as the relevant assets arecompleted and put into operational use.
Construction in-progress and equipment in transit are transferred to the related ‘Property, plant andequipment’ in the consolidated statement of financial position when the construction or installationand related activities necessary to prepare the property, plant and equipment for their intended use arecompleted, and the property, plant and equipment are ready for service.
Major spare parts and stand-by equipment items that the Group expects to use over more than oneperiod and can be used only in connection with an item of property, plant and equipment areaccounted for as property, plant and equipment. Depreciation and amortization on these major spareparts and stand-by equipment commence once these have become available for use (i.e., when it is inthe location and condition necessary for it to be capable of operating in the manner intended by theGroup).

- 85 -
*SGVFS035342*
An item of property, plant and equipment is derecognized upon disposal or when no future economicbenefits are expected to arise from the continued use of the asset. Any gain or loss arising onderecognition of the property, plant and equipment (calculated as the difference between the netdisposal proceeds and the carrying amount of the item) is included in the consolidated statement ofincome, in the period the item is derecognized.
Fully depreciated property, plant and equipment are retained in the accounts until these are no longerin use.
Investment PropertiesInvestment properties consist of properties that are held to earn rentals or for capital appreciation orboth, and those which are not occupied by entities in the Group. Investment properties, except forland, are carried at cost less accumulated depreciation and any impairment loss, if any. Land iscarried at cost less any impairment loss, if any. The carrying amount includes the cost of replacingpart of an existing investment property at the time that cost is incurred if the recognition criteria aremet, and excludes the cost of day-to-day servicing of an investment property.
Investment properties are measured initially at cost, including transaction costs. Transaction costsrepresent nonrefundable taxes such as capital gains tax and documentary stamp tax that are for theaccount of the Group. An investment property acquired through an exchange transaction is measuredat fair value of the asset acquired unless the fair value of such an asset cannot be measured, in whichcase, the investment property acquired is measured at the carrying amount of asset given up.
The Group’s investment properties consists solely of buildings and building improvements and aredepreciated using the straight-line method over their EUL ranging from 10 to 30 years (see Note 17).
The depreciation and amortization method and useful life are reviewed periodically to ensure that themethod and period of depreciation and amortization are consistent with the expected pattern ofeconomic useful benefits from items of investment properties.
Investment properties are derecognized when either they have been disposed of or when they arepermanently withdrawn from use and no future economic benefit is expected from their disposal.Any gains or losses on the retirement or disposal of investment properties are recognized in theconsolidated statement of income in the year of retirement or disposal.
Transfers are made to investment property when, and only when, there is a change in use, evidencedby the end of owner occupation, commencement of an operating lease to another party or by the endof construction or development. Transfers are made from investment property when, and only when,there is a change in use, evidenced by commencement of owner occupation or commencement ofdevelopment with a view to sale.
For a transfer from investment property to owner-occupied property or inventories, the cost ofproperty for subsequent accounting is its carrying amount at the date of change in use. If the propertyoccupied by the Group as an owner-occupied property becomes an investment property, the Groupaccounts for such property in accordance with the policy stated under Property, plant and equipmentaccount up to the date of change in use.
GoodwillGoodwill represents the excess of the cost of the acquisition over the fair value of identifiable netassets of the investee at the date of acquisition which is not identifiable to specific assets.

- 86 -
*SGVFS035342*
Goodwill acquired in a business combination from the acquisition date is allocated to each of theGroup’s cash-generating units, or groups of cash-generating units that are expected to benefit fromthe synergies of the combination, irrespective of whether other assets or liabilities of the Group areassigned to those units or groups of units.
Each unit or group of units to which the goodwill is allocated:∂ represents the lowest level within the Group at which the goodwill is monitored for internal
management purposes; and∂ is not larger than a segment based on the Group’s operating segments as determined in
accordance with PFRS 8, Operating Segments.
Following initial recognition, goodwill is measured at cost, less any accumulated impairment losses,if any. Goodwill is reviewed for impairment annually or more frequently, if events or changes incircumstances indicate that the carrying value may be impaired (see further discussion underImpairment of nonfinancial assets).
Where goodwill forms part of a cash-generating unit and part of the operation within that unit isdisposed of, the goodwill associated with the operation disposed of is included in the carrying amountof the operation when determining the gain or loss on disposal of the operation. Goodwill disposed ofin this circumstance is measured based on the relative values of the operation disposed of and theportion of the cash-generating unit retained.
Intangible AssetsIntangible assets (other than goodwill) acquired separately are measured on initial recognition at cost.The cost of intangible asset acquired in a business combination is its fair value as at the acquisitiondate. Following initial recognition, intangible assets are measured at cost less any accumulatedamortization and impairment losses, if any. Internally generated intangibles, excluding capitalizeddevelopment costs, are not capitalized and the related expenditure is reflected in profit or loss in theperiod in which the expenditure is incurred.
The EUL of intangible assets are assessed to be either finite or indefinite.
The useful lives of intangible assets with a finite life are assessed at the individual asset level.Intangible assets with finite lives are amortized on a straight line basis over the asset’s EUL andassessed for impairment, whenever there is an indication that the intangible assets may be impaired.The amortization period and the amortization method for an intangible asset with a finite useful lifeare reviewed at least at each reporting date.
Changes in the EUL or the expected pattern of consumption of future economic benefits embodied inthe asset is accounted for by changing the amortization period or method, as appropriate, and treatedas changes in accounting estimates. The amortization expense on intangible assets with finite usefullives is recognized in the consolidated statement of income in the expense category consistent withthe function of the intangible asset.
Intangible assets with indefinite useful lives are tested for impairment annually, either individually orat the cash-generating unit level (see further discussion under Impairment of nonfinancial assets).Such intangibles are not amortized. The useful life of an intangible asset with an indefinite useful lifeis reviewed annually to determine whether indefinite life assessment continues to be supportable. Ifnot, the change in the useful life assessment from indefinite to finite is made on a prospective basis.

- 87 -
*SGVFS035342*
A gain or loss arising from derecognition of an intangible asset is measured as the difference betweenthe net disposal proceeds and the carrying amount of the asset and is recognized in the consolidatedstatement of income when the asset is derecognized.
A summary of the policies applied to the Group’s intangible assets follows:
EUL Amortization method usedInternally generated
or acquiredProduct Formulation Indefinite No amortization AcquiredTrademarks/Brands Indefinite No amortization AcquiredTrademarks Finite (4 years) Straight line amortization AcquiredSoftware Costs Finite (10 years) Straight line amortization AcquiredCustomer Relationship Finite (35 years) Straight line amortization Acquired
Investment in Joint VenturesThe Group has interests in joint ventures. A joint venture is a contractual arrangement whereby twoor more parties who have joint control over the arrangement have rights to the net assets of thearrangements.
The Group’s investment in joint venture is accounted for using the equity method of accounting.Under the equity method, the investment in a joint venture is carried in the consolidated statement offinancial position at cost plus post-acquisition changes in the Group’s share in the net assets of thejoint venture. The consolidated statement of income reflects the Group’s share in the results ofoperations of the joint venture. Where there has been a change recognized directly in the investees’equity, the Group recognizes its share of any changes and discloses this, when applicable, in the othercomprehensive income in the consolidated statement of changes in equity. Profits and losses arisingfrom transactions between the Group and the joint ventures are eliminated to the extent of the interestin the joint ventures.
The Group discontinues applying the equity method when its investments in investee companies arereduced to zero. Accordingly, additional losses are not recognized unless the Group has guaranteedcertain obligations of the associates or joint venture. When the investees subsequently report netincome, the Group will resume applying the equity method but only after its equity in the net incomeequals the equity in net losses of associates and joint venture not recognized during the period theequity method was suspended.
The investee company’s accounting policies conform to those used by the Group for like transactionsand events in similar circumstances.
Impairment of Nonfinancial AssetsThis accounting policy applies primarily to the Group’s property, plant and equipment (see Note 13),investment properties (see Note 17), investment in joint ventures (see Note 16), goodwill andintangible assets (see Note 15).
Except for goodwill and intangible assets with indefinite useful lives which are tested for impairmentannually, the Group assesses at each reporting date whether there is an indication that its nonfinancialassets may be impaired. When an indicator of impairment exists or when an annual impairmenttesting for an asset is required, the Group makes a formal estimate of recoverable amount.Recoverable amount is the higher of an asset’s (or cash-generating unit’s) fair value less costs to selland its value in use and is determined for an individual asset, unless the asset does not generate cashinflows that are largely independent of those from other assets or groups of assets, in which case therecoverable amount is assessed as part of the cash-generating unit to which it belongs. Where the

- 88 -
*SGVFS035342*
carrying amount of an asset (or cash generating unit) exceeds its recoverable amount, the asset (orcash-generating unit) is considered impaired and is written-down to its recoverable amount.
In assessing value in use, the estimated future cash flows are discounted to their present value using apre-tax discount rate that reflects current market assessments of the time value of money and the risksspecific to the asset (or cash-generating unit).
Impairment losses are recognized under ‘Provision for credit and impairment losses’ in theconsolidated statement of income.
The following criteria are also applied in assessing impairment of specific assets:
Property, plant and equipment, investment properties, intangible assets with definite useful livesFor property, plant and equipment, investment properties, intangible assets with definite useful lives,an assessment is made at each reporting date as to whether there is any indication that previouslyrecognized impairment losses may no longer exist or may have decreased. If such indication exists,the recoverable amount is estimated. A previously recognized impairment loss is reversed only ifthere has been a change in the estimates used to determine the asset’s recoverable amount since thelast impairment loss was recognized. If that is the case, the carrying amount of the asset is increasedto its recoverable amount. That increased amount cannot exceed the carrying amount that would havebeen determined, net of depreciation and amortization, had no impairment loss been recognized forthe asset in prior years. Such reversal is recognized in the consolidated statement of income. Aftersuch a reversal, the depreciation and amortization expense is adjusted in future years to allocate theasset’s revised carrying amount, less any residual value, on a systematic basis over its remaininguseful life.
GoodwillGoodwill is reviewed for impairment, annually or more frequently, if events or changes incircumstances indicate that the carrying value may be impaired.
Impairment is determined by assessing the recoverable amount of the cash-generating unit (or groupof cash-generating units) to which the goodwill relates. Where the recoverable amount of the cash-generating unit (or group of cash-generating units) is less than the carrying amount to which goodwillhas been allocated, an impairment loss is recognized. Where goodwill forms part of a cash-generating unit (or group of cash-generating units) and part of the operations within that unit isdisposed of, the goodwill associated with the operation disposed of is included in the carrying amountof the operation when determining the gain or loss on disposal of the operation. Goodwill disposed ofin this circumstance is measured on the basis of the relative fair values of the operation disposed ofand the portion of the cash-generating unit retained.
Impairment losses relating to goodwill cannot be reversed in future periods.
Intangible assets with indefinite useful livesIntangible assets with indefinite useful lives are tested for impairment annually as of reporting dateeither individually or at the cash-generating unit level, as appropriate.
Investments in joint venturesAfter application of the equity method, the Group determines whether it is necessary to recognizeadditional impairment losses on the Group’s investments in joint ventures. If this is the case, theGroup calculates the amount of impairment as being the difference between the fair value of the jointventures and the acquisition cost and recognizes the amount under ‘Provision for credit andimpairment losses’ in the consolidated statement of income.

- 89 -
*SGVFS035342*
Revenue Recognition (Upon adoption of PFRS 15 beginning January 1, 2018)Revenue from contracts with customers is recognized when control of the goods or services aretransferred to the customer at an amount that reflects the consideration to which the Group expects tobe entitled in exchange for those goods or services. The Group has concluded that it is the principalin its revenue arrangements because it controls the goods or services before transferring them to thecustomer.
Sale of goods and servicesRevenue from sale of goods and services is recognized at the point in time when control of the assetis transferred to the customer, generally on delivery of the goods and services. The Group considerswhether there are other promises in the contract that are separate performance obligations to which aportion of the transaction price needs to be allocated. In determining the transaction price for the saleof goods and services, the Group considers the effects of variable consideration, the existence ofsignificant financing components, noncash consideration, and consideration payable to the customer,if any.
Sale of sugarSale of raw sugar is recognized upon (a) endorsement and transfer of quedans for quedan-based salesand (b) shipment or delivery and acceptance by the customers for physical sugar sales. Sale ofrefined sugar and alcohol is recognized upon shipment of delivery and acceptance by the customers.Sale of molasses warehouse receipts, which represents ownership title over the molasses inventories.
Rendering of tolling servicesRevenue derived from tolling activities is recognized as revenue at the point in time when the relatedservices have been rendered.
Revenue Recognition (Prior to adoption of PFRS 15)Revenue is recognized to the extent that it is probable that the economic benefits will flow to theGroup and the revenue can be reliably measured. Revenue is measured at the fair value of theconsideration received, excluding discounts, rebates and other sales taxes or duties. The Groupassesses its revenue arrangements against specific criteria in order to determine if it is acting asprincipal or agent. The Group has concluded that it is acting as principal in all of its revenuearrangements.
Sale of goodsRevenue from sale of goods is recognized upon delivery, when the significant risks and rewards ofownership of the goods have passed to the buyer and the amount of revenue can be measured reliably.Revenue is measured at the fair value of the consideration received or receivable, net of any tradediscounts, prompt payment discounts and volume rebates.
Rendering of tolling servicesRevenue derived from tolling activities is recognized as revenue when the related services have beenrendered.
Revenue outside the scope of PFRS 15:Dividend incomeDividend income is recognized when the shareholder’s right to receive the payment is established.
Rent incomeRent income arising on investment properties is accounted for on a straight-line basis over the leaseterm on ongoing leases.

- 90 -
*SGVFS035342*
Interest incomeInterest income is recognized as it accrues using the EIR method under which interest income isrecognized at the rate that exactly discounts estimated future cash receipts through the expected life ofthe financial instrument to the net carrying amount of the financial asset.
ProvisionsProvisions are recognized when: (a) the Group has a present obligation (legal or constructive) as aresult of a past event; (b) it is probable (i.e., more likely than not) that an outflow of resourcesembodying economic benefits will be required to settle the obligation; and (c) a reliable estimate canbe made of the amount of the obligation. Provisions are reviewed at each reporting date and adjustedto reflect the current best estimate. If the effect of the time value of money is material, provisions aredetermined by discounting the expected future cash flows at a pre-tax rate that reflects current marketassessment of the time value of money and, where appropriate, the risks specific to the liability.Where discounting is used, the increase in the provision due to the passage of time is recognized asinterest expense under ‘Finance cost’ in the consolidated statement of income. Where the Groupexpects a provision to be reimbursed, the reimbursement is recognized as a separate asset but onlywhen the reimbursement is probable.
ContingenciesContingent liabilities are not recognized in the consolidated financial statements but disclosed in thenotes to the consolidated financial statements unless the possibility of an outflow of resourcesembodying economic benefits is remote.
Contingent assets are not recognized in the consolidated financial statements but disclosed in thenotes to the consolidated financial statements when an inflow of economic benefits is probable.
Pension CostsThe net defined benefit liability or asset is the aggregate of the present value of the defined benefitobligation at the end of the reporting period reduced by the fair value of plan assets, if any, adjustedfor any effect of limiting a net defined benefit asset to the asset ceiling. The asset ceiling is thepresent value of any economic benefits available in the form of refunds from the plan or reductions infuture contributions to the plan.
The cost of providing benefits under the defined benefit plans is actuarially determined using theprojected unit credit method.
Defined benefit costs comprise the following:∂ Current service cost∂ Net interest on the net defined benefit liability or asset∂ Remeasurements of net defined benefit liability or asset
Service costs which include current service costs, past service costs and gains or losses on non-routine settlements are recognized as expense in profit or loss.Past service costs are recognized when plan amendment or curtailment occurs. These amounts arecalculated periodically by independent qualified actuaries.
Net interest on the net defined benefit liability or asset is the change during the period in the netdefined benefit liability or asset that arises from the passage of time which is determined by applyingthe discount rate based on government bonds to the net defined benefit liability or asset.

- 91 -
*SGVFS035342*
Net interest on the net defined benefit liability or asset is recognized as expense or income in theconsolidated statement of income.
Remeasurements comprising actuarial gains and losses, return on plan assets and any change in theeffect of the asset ceiling (excluding net interest on defined benefit liability) are recognizedimmediately in other comprehensive income in the period in which they arise. Remeasurements arenot reclassified to consolidated statement of income in subsequent periods.
Plan assets are assets that are held by a long-term employee benefit fund or qualifying insurancepolicies. Plan assets are not available to the creditors of the Group, nor can they be paid directly tothe Group. Fair value of plan assets is based on market price information. When no market price isavailable, the fair value of plan assets is estimated by discounting expected future cash flows using adiscount rate that reflects both the risk associated with the plan assets and the maturity or expecteddisposal date of those assets (or, if they have no maturity, the expected period until the settlement ofthe related obligations). If the fair value of the plan assets is higher than the present value of thedefined benefit obligation, the measurement of the resulting defined benefit asset is limited to thepresent value of economic benefits available in the form of refunds from the plan or reductions infuture contributions to the plan.
The Group’s right to be reimbursed of some or all of the expenditure required to settle a definedbenefit obligation is recognized as a separate asset at fair value when and only when reimbursement isvirtually certain.
Termination benefitTermination benefits are employee benefits provided in exchange for the termination of anemployee’s employment as a result of either an entity’s decision to terminate an employee’semployment before the normal retirement date or an employee’s decision to accept an offer ofbenefits in exchange for the termination of employment.
A liability and expense for a termination benefit is recognized at the earlier of when the entity can nolonger withdraw the offer of those benefits and when the entity recognizes related restructuring costs.Initial recognition and subsequent changes to termination benefits are measured in accordance withthe nature of the employee benefit, as either post-employment benefits, short-term employee benefits,or other long-term employee benefits.
Employee leave entitlementEmployee entitlements to annual leave are recognized as a liability when they are accrued to theemployees. The undiscounted liability for leave expected to be settled wholly before twelve monthsafter the end of the annual reporting period is recognized for services rendered by employees up tothe end of the reporting period.
Income TaxesCurrent taxCurrent tax assets and liabilities for the current and prior periods are measured at the amount expectedto be recovered from or paid to the taxation authorities.The tax rates and tax laws used to compute the amount are those that are enacted or substantivelyenacted at the reporting date.
Deferred taxDeferred tax is provided using the balance sheet liability method on all temporary differences, withcertain exceptions, at the reporting date between the tax bases of assets and liabilities and theircarrying amounts for financial reporting purposes.

- 92 -
*SGVFS035342*
Deferred tax liabilities are recognized for all taxable temporary differences, except:
∂ When the deferred tax liability arises from the initial recognition of goodwill or an asset orliability in a transaction that is not a business combination and, at the time of the transaction,affects neither the accounting profit nor taxable profit or loss; and
∂ In respect of taxable temporary differences associated with investments in subsidiaries, associatesand interests in joint ventures, where the timing of the reversal of the temporary differences canbe controlled and it is probable that the temporary differences will not reverse in the foreseeablefuture.
Deferred tax assets are recognized for all deductible temporary differences, carryforward benefits ofunused tax credits from unused minimum corporate income tax (MCIT) over the regular corporateincome tax (RCIT) and unused net operating loss carryover (NOLCO), to the extent that it is probablethat future taxable income will be available against which the deductible temporary differences, andthe carryforward benefits of unused tax credits from excess MCIT and unused NOLCO can beutilized, except:
∂ Where the deferred tax asset relating to the deductible temporary difference arises from the initialrecognition of an asset or liability in a transaction that is not a business combination and, at thetime of the transaction, affects neither the accounting profit nor future taxable profit or loss; and
∂ In respect of deductible temporary differences associated with investments in subsidiaries,associates and interests in joint ventures, deferred tax assets are recognized only to the extent thatit is probable that the temporary differences will reverse in the foreseeable future and futuretaxable profit will be available against which the temporary differences can be utilized.
The carrying amounts of deferred tax assets are reviewed at each reporting date and reduced to theextent that it is no longer probable that sufficient taxable income will be available to allow all or partof the deferred tax assets to be utilized. Unrecognized deferred tax assets are reassessed at eachreporting date, and are recognized to the extent that it has become probable that future taxable incomewill allow the deferred tax assets to be recognized.
Deferred tax relating to items recognized outside profit or loss is recognized outside profit or loss inthe consolidated statement of comprehensive income. Deferred tax items are recognized incorrelation to the underlying transaction either in other comprehensive income or directly in equity.
Deferred tax assets and liabilities are measured at the tax rate that is expected to apply to the periodwhen the asset is realized or the liability is settled, based on tax rates (and tax laws) that have beenenacted or substantively enacted as of the reporting date.
Deferred tax assets and deferred tax liabilities are offset if a legally enforceable right exists to set offcurrent tax assets against current tax liabilities and the deferred taxes relate to the same taxable entityand the same taxation authority.
Value-added Tax (VAT)Revenues, expenses, and assets are recognized net of the amount of VAT, if applicable.
When VAT from sale of goods and/or services (output VAT) exceeds VAT passed on from purchasesof goods or services (input VAT), the excess is recognized as payable in the consolidated statement offinancial position. When VAT passed on from purchases of goods or services (input VAT) exceedsVAT from sale of goods and/or services (output VAT), the excess is recognized as an asset in theconsolidated statement financial position to the extent of the recoverable amount.

- 93 -
*SGVFS035342*
The net amount of VAT recoverable from, or payable to, the taxation authority is included as part of“Other current assets” or “Accounts payable and other accrued liabilities” in the consolidated statementof financial position.
Borrowing CostsInterest and other finance costs incurred during the construction period on borrowings used to financeproperty development are capitalized to the appropriate asset accounts. Capitalization of borrowingcosts commences when the activities to prepare the asset are in progress, and expenditures andborrowing costs are being incurred. The capitalization of these borrowing costs ceases whensubstantially all the activities necessary to prepare the asset for sale or its intended use are complete.If the carrying amount of the asset exceeds its recoverable amount, an impairment loss is recorded.Capitalized borrowing cost is based on the applicable weighted average borrowing rate. Borrowingcosts which do not qualify for capitalization are expensed as incurred.
Interest expense on loans is recognized using the EIR method over the term of the loans.
LeasesThe determination of whether an arrangement is, or contains a lease, is based on the substance of thearrangement at inception date, and requires an assessment of whether the fulfillment of thearrangement is dependent on the use of a specific asset or assets and the arrangement conveys a rightto use the asset or assets, even if that right is not explicitly specified in an arrangement.
A reassessment is made after inception of the lease only if one of the following applies:
a) there is a change in contractual terms, other than a renewal or extension of the arrangement;b) a renewal option is exercised or an extension granted, unless that term of the renewal or extension
was initially included in the lease term;c) there is a change in the determination of whether fulfillment is dependent on a specified asset; ord) there is a substantial change to the asset.
Where a reassessment is made, lease accounting shall commence or cease from the date when thechange in circumstances gave rise to the reassessment for scenarios a, c or d above, and at the date ofrenewal or extension period for scenario b.
Group as a lesseeA lease is classified at the inception date as finance lease or an operating lease.
Finance leases, which transfer to the Group substantially all the risks and benefits incidental toownership of the leased item, are capitalized at the commencement of the lease at the fair value of theleased property or, if lower, at the present value of the minimum lease payments. Lease payments areapportioned between finance charges and reduction of the lease liability so as to achieve a constantrate of interest on the remaining balance of the liability. Finance charges are recognized in ‘Financecosts’ in the consolidated statement of income.
A leased asset is depreciated over the EUL of the asset. However, if there is no reasonable certaintythat the Group will obtain ownership by the end of the lease term, the asset is depreciated over theshorter of the EUL of the asset and the lease term.
Leases where the lessor retains substantially all the risks and benefits of ownership of the asset areclassified as operating leases. Operating lease payments are recognized as an expense in theconsolidated statement of income on a straight-line basis over the lease term.

- 94 -
*SGVFS035342*
Group as a lessorLeases where the Group does not transfer substantially all the risks and benefits of ownership of theassets are classified as operating leases. Initial direct costs incurred in negotiating operating leasesare added to the carrying amount of the leased asset and recognized over the lease term on the samebasis as the rental income. Contingent rents are recognized as revenue in the period in which they areearned.
Cost and ExpensesCost and expenses are decreases in economic benefits during the accounting period in the form ofoutflows or decrease of assets or incurrence of liabilities that result in decreases in equity, other thanthose relating to distributions to equity participants. Cost and expenses are recognized when incurred.
Foreign Currency Translation/TransactionsThe functional and presentation currency of the Parent Company and its Philippine subsidiaries is thePhilippine Peso. Each entity in the Group determines its own functional currency and items includedin the consolidated financial statements of each entity are measured using that functional currency.
Transactions and balancesTransactions in foreign currencies are initially recorded in the functional currency rate prevailing atthe date of the transaction. Monetary assets and liabilities denominated in foreign currencies areretranslated at the functional currency rate of exchange prevailing at the reporting date. Alldifferences are taken to the consolidated statement of income. Tax charges and credits attributable toexchange differences on those borrowings are also dealt with in statement of income. Nonmonetaryitems that are measured in terms of historical cost in a foreign currency are translated using theexchange rate as at the date of initial transaction. Nonmonetary items measured at fair value in aforeign currency are translated using the exchange rates at the date when the fair value wasdetermined.
Group companiesAs of reporting date, the assets and liabilities of the subsidiaries are translated into the presentationcurrency of the Group at the rate of exchange prevailing at reporting date and their respectivestatements of income are translated at the weighted average exchange rates for the year. Theexchange differences arising on the translation are taken directly to a separate component of equity as‘Cumulative translation adjustments’ under ‘Other comprehensive income’. On disposal of a foreignentity, the deferred cumulative amount recognized in equity relating to that particular foreignoperation shall be recognized in the consolidated statement of income.
Common StockCapital stocks are classified as equity and are recorded at par. Proceeds in excess of par value arerecorded as ‘Additional paid-in capital’ in the consolidated statement of changes in equity.
Incremental costs directly attributable to the issue of new shares or options are shown in equity as adeduction, net of tax, from the proceeds.
Retained EarningsRetained earnings represent the cumulative balance of periodic net income (loss), dividenddistributions, prior period adjustments and effect of changes in accounting policy and capitaladjustments.

- 95 -
*SGVFS035342*
Other Comprehensive IncomeOther comprehensive income comprises items of income and expenses (including items previouslypresented under the consolidated statements of changes in equity) that are not recognized in theconsolidated statement of income for the year in accordance with PFRSs.
Treasury SharesTreasury shares are recorded at cost and are presented as a deduction from equity. Any considerationpaid or received in connection with treasury shares are recognized directly in equity.
When the shares are retired, the capital stock account is reduced by its par value. The excess of costover par value upon retirement is debited to the following accounts in the order given: (a) additionalpaid-in capital to the extent of the specific or average additional paid-in capital when the shares wereissued, and (b) retained earnings. When shares are sold, the treasury share account is credited andreduced by the weighted average cost of the shares sold. The excess of any consideration over thecost is credited to additional paid-in capital.
Transaction costs incurred such as registration and other regulatory fees, amounts paid to legal,accounting and other professional advisers, printing costs and stamp duties (net of any related incometax benefit) in relation to issuing or acquiring the treasury shares are accounted for as reduction fromequity, which is disclosed separately.
No gain or loss is recognized in the consolidated statement of income on the purchase, sale, issue orcancellation of the Group’s own equity instruments.
Dividends on Common StocksDividends on common shares are recognized as a liability and deducted from equity when approvedby BOD of the Parent Company in the case of cash dividends, and the BOD and shareholders of theParent Company in the case of stock dividends.
Earnings Per Share (EPS)Basic EPS is computed by dividing consolidated net income attributable to equity holders of theParent Company (consolidated net income less dividends on preferred shares) by the weightedaverage number of common stocks issued and outstanding during the year, adjusted for anysubsequent stock dividends declared.
Diluted EPS amounts are calculated by dividing the consolidated net income attributable to equityholders of the Parent Company by the weighted average number of ordinary shares outstandingduring the year plus the weighted average number of ordinary shares that would be issued on theconversion of all the dilutive potential ordinary shares into ordinary shares.
Segment ReportingThe Group’s operating businesses are organized and managed separately according to the nature ofthe products and services provided, with each segment representing a strategic business unit thatoffers different products and serves different markets. Financial information on business segments ispresented in Note 6 to the consolidated financial statements.
Events after Reporting DateAny post year-end event up to the date of approval of the BOD of the consolidated financialstatements that provides additional information about the Group’s position at reporting date (adjustingevent) is reflected in the consolidated financial statements. Any post year-end event that is not anadjusting event is disclosed in the notes to the consolidated financial statements, when material.

- 96 -
*SGVFS035342*
Standards Issued but not yet EffectivePronouncements issued but not yet effective are listed below. Unless otherwise indicated, the Groupdoes not expect that the future adoption of the said pronouncements will have a significant impact onits consolidated financial statements. The Group intends to adopt the following pronouncementswhen they become effective.
Effective beginning on or after January 1, 2019∂ Amendments to PFRS 9, Prepayment Features with Negative Compensation
Under PFRS 9, a debt instrument can be measured at amortized cost or at fair value through othercomprehensive income, provided that the contractual cash flows are ‘solely payments of principaland interest on the principal amount outstanding’ (the SPPI criterion) and the instrument is heldwithin the appropriate business model for that classification. The amendments to PFRS 9 clarifythat a financial asset passes the SPPI criterion regardless of the event or circumstance that causesthe early termination of the contract and irrespective of which party pays or receives reasonablecompensation for the early termination of the contract. The amendments should be appliedretrospectively and are effective from January 1, 2019, with earlier application permitted.
∂ PFRS 16, LeasesPFRS 16 sets out the principles for the recognition, measurement, presentation and disclosure ofleases and requires lessees to account for all leases under a single on-balance sheet model similarto the accounting for finance leases under PAS 17, Leases. The standard includes tworecognition exemptions for lessees – leases of ’low-value’ assets (e.g., personal computers) andshort-term leases (i.e., leases with a lease term of 12 months or less). At the commencement dateof a lease, a lessee will recognize a liability to make lease payments (i.e., the lease liability) andan asset representing the right to use the underlying asset during the lease term (i.e., the right-of-use asset). Lessees will be required to separately recognize the interest expense on the leaseliability and the depreciation expense on the right-of-use asset.
Lessees will be also required to remeasure the lease liability upon the occurrence of certain events(e.g., a change in the lease term, a change in future lease payments resulting from a change in anindex or rate used to determine those payments). The lessee will generally recognize the amountof the remeasurement of the lease liability as an adjustment to the right-of-use asset.
Lessor accounting under PFRS 16 is substantially unchanged from today’s accounting underPAS 17. Lessors will continue to classify all leases using the same classification principle as inPAS 17 and distinguish between two types of leases: operating and finance leases.
PFRS 16 also requires lessees and lessors to make more extensive disclosures than under PAS 17.A lessee can choose to apply the standard using either a full retrospective or a modifiedretrospective approach. The standard’s transition provisions permit certain reliefs.
The Group is currently assessing the impact of adopting PFRS 16.
∂ Amendments to PAS 19, Employee Benefits, Plan Amendment, Curtailment or SettlementThe amendments to PAS 19 address the accounting when a plan amendment, curtailment orsettlement occurs during a reporting period. The amendments specify that when a planamendment, curtailment or settlement occurs during the annual reporting period, an entity isrequired to:
∂ Determine current service cost for the remainder of the period after the plan amendment,curtailment or settlement, using the actuarial assumptions used to remeasure the netdefined benefit liability (asset) reflecting the benefits offered under the plan and the planassets after that event.

- 97 -
*SGVFS035342*
∂ Determine net interest for the remainder of the period after the plan amendment,curtailment or settlement using: the net defined benefit liability (asset) reflecting thebenefits offered under the plan and the plan assets after that event; and the discount rateused to remeasure that net defined benefit liability (asset).
The amendments also clarify that an entity first determines any past service cost, or a gain or losson settlement, without considering the effect of the asset ceiling. This amount is recognized inprofit or loss. An entity then determines the effect of the asset ceiling after the plan amendment,curtailment or settlement. Any change in that effect, excluding amounts included in the netinterest, is recognized in other comprehensive income.
The amendments apply to plan amendments, curtailments, or settlements occurring on or after thebeginning of the first annual reporting period that begins on or after January 1, 2019, with earlyapplication permitted. These amendments will apply only to any future plan amendments,curtailments, or settlements of the Group.
∂ Amendments to PAS 28, Long-term Interests in Associates and Joint VenturesThe amendments clarify that an entity applies PFRS 9 to long-term interests in an associate orjoint venture to which the equity method is not applied but that, in substance, form part of the netinvestment in the associate or joint venture (long-term interests). This clarification is relevantbecause it implies that the ECL model in PFRS 9 applies to such long-term interests.
The amendments also clarified that, in applying PFRS 9, an entity does not take account of anylosses of the associate or joint venture, or any impairment losses on the net investment,recognized as adjustments to the net investment in the associate or joint venture that arise fromapplying PAS 28, Investments in Associates and Joint Ventures.
The amendments should be applied retrospectively and are effective from January 1, 2019, withearly application permitted. Since the Group does not have such long-term interests in itsassociate and joint venture, the amendments will not have an impact on its consolidated financialstatements.
∂ Philippine Interpretation IFRIC-23, Uncertainty over Income Tax TreatmentsThe interpretation addresses the accounting for income taxes when tax treatments involveuncertainty that affects the application of PAS 12, Income Taxes, and does not apply to taxes orlevies outside the scope of PAS 12, nor does it specifically include requirements relating tointerest and penalties associated with uncertain tax treatments.
The interpretation specifically addresses the following:∂ Whether an entity considers uncertain tax treatments separately∂ The assumptions an entity makes about the examination of tax treatments by taxation
authorities∂ How an entity determines taxable profit (tax loss), tax bases, unused tax losses, unused
tax credits and tax rates∂ How an entity considers changes in facts and circumstances
An entity must determine whether to consider each uncertain tax treatment separately or togetherwith one or more other uncertain tax treatments. The approach that better predicts the resolutionof the uncertainty should be followed.

- 98 -
*SGVFS035342*
Annual Improvements to PFRSs 2015-2017 Cycle∂ Amendments to PFRS 3, Business Combinations, and PFRS 11, Joint Arrangements,
Previously Held Interest in a Joint OperationThe amendments clarify that, when an entity obtains control of a business that is a jointoperation, it applies the requirements for a business combination achieved in stages,including remeasuring previously held interests in the assets and liabilities of the jointoperation at fair value. In doing so, the acquirer remeasures its entire previously held interestin the joint operation.
A party that participates in, but does not have joint control of, a joint operation might obtainjoint control of the joint operation in which the activity of the joint operation constitutes abusiness as defined in PFRS 3. The amendments clarify that the previously held interests inthat joint operation are not remeasured.
An entity applies those amendments to business combinations for which the acquisition dateis on or after the beginning of the first annual reporting period beginning on or afterJanuary 1, 2019 and to transactions in which it obtains joint control on or after the beginningof the first annual reporting period beginning on or after January 1, 2019, with earlyapplication permitted. These amendments are currently not applicable to the Group but mayapply to future transactions.
∂ Amendments to PAS 12, Income Tax Consequences of Payments on Financial InstrumentsClassified as EquityThe amendments clarify that the income tax consequences of dividends are linked moredirectly to past transactions or events that generated distributable profits than to distributionsto owners. Therefore, an entity recognizes the income tax consequences of dividends inprofit or loss, other comprehensive income or equity according to where the entity originallyrecognized those past transactions or events.
An entity applies those amendments for annual reporting periods beginning on or afterJanuary 1, 2019, with early application is permitted. These amendments are not relevant tothe Group because dividends declared by the Group do not give rise to tax obligations underthe current tax laws.
∂ Amendments to PAS 23, Borrowing Costs, Borrowing Costs Eligible for CapitalizationThe amendments clarify that an entity treats as part of general borrowings any borrowingoriginally made to develop a qualifying asset when substantially all of the activities necessaryto prepare that asset for its intended use or sale are complete.
An entity applies those amendments to borrowing costs incurred on or after the beginning ofthe annual reporting period in which the entity first applies those amendments. An entityapplies those amendments for annual reporting periods beginning on or after January 1, 2019,with early application permitted.

- 99 -
*SGVFS035342*
Effective beginning on or after January 1, 2020∂ Amendments to PFRS 3, Definition of a Business
The amendments to PFRS 3 clarify the minimum requirements to be a business, remove theassessment of a market participant’s ability to replace missing elements, and narrow thedefinition of outputs. The amendments also add guidance to assess whether an acquired processis substantive and add illustrative examples. An optional fair value concentration test isintroduced which permits a simplified assessment of whether an acquired set of activities andassets is not a business.
An entity applies those amendments prospectively for annual reporting periods beginning on orafter January 1, 2020, with earlier application permitted.
These amendments will apply on future business combinations of the Group.
∂ Amendments to PAS 1, Presentation of Financial Statements, and PAS 8, Accounting Policies,Changes in Accounting Estimates and Errors, Definition of MaterialThe amendments refine the definition of material in PAS 1 and align the definitions used acrossPFRSs and other pronouncements. They are intended to improve the understanding of theexisting requirements rather than to significantly impact an entity’s materiality judgements.An entity applies those amendments prospectively for annual reporting periods beginning on orafter January 1, 2020, with earlier application permitted.
Effective beginning on or after January 1, 2021∂ PFRS 17, Insurance Contracts
PFRS 17 is a comprehensive new accounting standard for insurance contracts coveringrecognition and measurement, presentation and disclosure. Once effective, PFRS 17 will replacePFRS 4, Insurance Contracts. This new standard on insurance contracts applies to all types ofinsurance contracts (i.e., life, non-life, direct insurance and re-insurance), regardless of the type ofentities that issue them, as well as to certain guarantees and financial instruments withdiscretionary participation features. A few scope exceptions will apply.
The overall objective of PFRS 17 is to provide an accounting model for insurance contracts thatis more useful and consistent for insurers. In contrast to the requirements in PFRS 4, which arelargely based on grandfathering previous local accounting policies, PFRS 17 provides acomprehensive model for insurance contracts, covering all relevant accounting aspects. The coreof PFRS 17 is the general model, supplemented by:
∂ A specific adaptation for contracts with direct participation features (the variable feeapproach)
∂ A simplified approach (the premium allocation approach) mainly for short-durationcontracts
PFRS 17 is effective for reporting periods beginning on or after January 1, 2021, withcomparative figures required. Early application is permitted.

- 100 -
*SGVFS035342*
Deferred effectivity∂ Amendments to PFRS 10, Consolidated Financial Statements, and PAS 28, Sale or Contribution
of Assets between an Investor and its Associate or Joint VentureThe amendments address the conflict between PFRS 10 and PAS 28 in dealing with the loss ofcontrol of a subsidiary that is sold or contributed to an associate or joint venture. Theamendments clarify that a full gain or loss is recognized when a transfer to an associate or jointventure involves a business as defined in PFRS 3. Any gain or loss resulting from the sale orcontribution of assets that does not constitute a business, however, is recognized only to theextent of unrelated investors’ interests in the associate or joint venture.
On January 13, 2016, the Financial Reporting Standards Council deferred the original effectivedate of January 1, 2016 of the said amendments until the International Accounting StandardsBoard (IASB) completes its broader review of the research project on equity accounting that mayresult in the simplification of accounting for such transactions and of other aspects of accountingfor associates and joint ventures.
3. Significant Accounting Judgments and Estimates
The preparation of the consolidated financial statements in compliance with PFRSs requires theGroup to make estimates and assumptions that affect the reported amounts of assets, liabilities,income and expenses and disclosure of contingent assets and contingent liabilities. Future eventsmay occur which will cause the assumptions used in arriving at the estimates to change. The effectsof any change in estimates are reflected in the consolidated financial statements as they becomereasonably determinable.
Judgments and estimates are continually evaluated and are based on historical experience and otherfactors, including expectations of future events that are believed to be reasonable under thecircumstances.
JudgmentsIn the process of applying the Group’s accounting policies, management has made the followingjudgments, apart from those involving estimations, which have the most significant effect on theamounts recognized in the consolidated financial statements:
a. Revenue recognition on sale of goods and servicesRevenue recognition under PFRS 15 involves the application of significant judgment andestimation in the: (a) identification of the contract for sale of goods that would meet therequirements of PFRS 15; (b) assessment of performance obligation and the probability that theentity will collect the consideration from the buyer; (c) determining method to estimate variableconsideration and assessing the constraint; and (d) recognition of revenue as the Group satisfiesthe performance obligation.
i. Existence of a contractThe Group enters into a contract with customer through an approved purchase order whichconstitutes a valid contract as specific details such as the quantity, price, contract termsand their respective obligations are clearly identified. In the case of sales to key accountsand distributors, the combined approved purchase order and trading termsagreement/exclusive distributorship agreement constitute a valid contract. In addition,part of the assessment process of the Group before revenue recognition is to assess theprobability that the Group will collect the consideration to which it will be entitled inexchange for the goods sold that will be transferred to the customer.

- 101 -
*SGVFS035342*
ii. Identifying performance obligationThe Group identifies performance obligations by considering whether the promised goodsor services in the contract are distinct goods or services. A good or service is distinctwhen the customer can benefit from the good or service on its own or together with otherresources that are readily available to the customer and the Group’s promise to transfer thegood or service to the customer is separately identifiable from the other promises in thecontract.
Based on management assessment, other than the sale of goods and services, no otherperformance obligations were identified except in the case of milling revenue.
iii. Recognition of revenue as the Group satisfies the performance obligationThe Group recognizes its revenue for all revenue streams at a point in time, when thegoods are sold and delivered and when services are already rendered.
b. ContingenciesThe Group is currently involved in various legal proceedings. The estimate of the probable costsfor the resolution of these claims has been developed in consultation with outside counselhandling the defense in these matters and is based upon an analysis of potential results. TheGroup currently does not believe these proceedings will have a material effect on the Group’sfinancial position. It is possible, however, that future results of operations could be materiallyaffected by changes in the estimates or in the effectiveness of the strategies relating to theseproceedings.
EstimatesThe key assumptions concerning the future and other sources of estimation uncertainty at thefinancial position date that have a significant risk of causing a material adjustment to the carryingamounts of assets and liabilities within the next financial year are discussed below.
a. Assessment for ECL on trade receivablesThe Group, applying the simplified approach in the computation of ECL, initially uses aprovision matrix based on historical default rates for trade receivables. The provision matrixspecifies provision rates depending on the number of days that a trade receivable is past due. TheGroup also uses appropriate groupings if its historical credit loss experience show significantlydifferent loss patterns for different customer segments. The Group then adjusts the historicalcredit loss experience with forward-looking information on the basis of current observable dataaffecting each customer segment to reflect the effects of current and forecasted economicconditions.
The Group adjusts historical default rates to forward-looking default rate by determining theclosely related economic factor affecting each customer segment. The Group regularly reviewsthe methodology and assumptions used for estimating ECL to reduce any differences betweenestimates and actual credit loss experience.
The determination of the relationship between historical default rates and forecasted economicconditions is a significant accounting estimate. Accordingly, the provision for ECL on tradereceivables is sensitive to changes in assumptions about forecasted economic conditions.
The Group has assessed that the ECL on trade receivables is not material because substantialamount of receivables are normally collected within one year. The carrying amount of tradereceivables is P=12.1 billion and P=13.7 billion as at December 31, 2018 and 2017, respectively(see Note 10).

- 102 -
*SGVFS035342*
b. Assessment for ECL on Other Financial Assets at Amortized CostThe Group determines the allowance for ECL using general approach based on the probability-weighted estimate of the present value of all cash shortfalls over the expected life of financialassets at amortized cost. ECL is provided for credit losses that result from possible default eventswithin the next 12-months unless there has been a significant increase in credit risk since initialrecognition in which case ECL is provided based on lifetime ECL.
When determining if there has been a significant increase in credit risk, the Group considersreasonable and supportable information that is available without undue cost or effort and that isrelevant for the particular financial instrument being assessed such as, but not limited to, thefollowing factors:
∂ Actual or expected external and internal credit rating downgrade;∂ Existing or forecasted adverse changes in business, financial or economic conditions; and,∂ Actual or expected significant adverse changes in the operating results of the borrower.
The Group also considers financial assets that are more than 90 days past due to be the latestpoint at which lifetime ECL should be recognized unless it can demonstrate that this does notrepresent a significant risk in credit risk such as when non-payment was an administrativeoversight rather than resulting from financial difficulty of the borrower.
The Group has assessed that the ECL on other financial assets at amortized cost is not materialbecause the transactions with respect to these financial assets were entered into by the Group onlywith reputable banks and companies with good credit standing and relatively low risk of defaults.Accordingly, no provision for ECL on other financial assets at amortized cost was recognized in2018.
c. Determination of fair values less estimated costs to sell of biological assetsThe fair values of biological assets are determined based on current market prices of livestock ofsimilar age, breed and genetic merit. Costs to sell include commissions to brokers and dealers,nonrefundable transfer taxes and duties. Costs to sell exclude transport and other costs necessaryto get the biological assets to the market. The fair values are reviewed and updated ifexpectations differ from previous estimates due to changes brought by both physical change andprice changes in the market. It is possible that future results of operations could be materiallyaffected by changes in these estimates brought about by the changes in factors mentioned.
As of December 31, 2018 and 2017, the Group’s biological assets carried at fair values lessestimated costs to sell amounted to P=1.1 billion and P=1.7 billion, respectively (see Note 14). Forthe years ended December 31, 2018 and 2017, the Group recognized changes in the fair value lesscosts to sell of biological assets amounting to P=467.5 million loss and P=118.8 million gain,respectively. For the three-month period ended December 31, 2016, the Group recognized lossesfrom fair value changes of P=104.6 million (see Note 14). Changes in fair value of biologicalassets are recognized in the consolidated statement of income.
d. Impairment of goodwill and intangible assets with indefinite useful livesThe Group performed its annual impairment test on its goodwill and other intangible assets withindefinite useful lives as of reporting date. The recoverable amounts of the intangible assets weredetermined based on value in use calculations using cash flow projections from financial budgetsapproved by management covering a five-year period. The pre-tax discount rates applied to cashflow projections range from 7.80% to 10.80% and 3.40% to 12.67% for the years ended

- 103 -
*SGVFS035342*
December 31, 2018 and 2017, respectively. The following assumptions were also used incomputing value in use:
Growth rate estimates - growth rates include long-term and terminal growth rates that are basedon experiences and strategies developed for the various subsidiaries. The prospect for theindustry was also considered in estimating the growth rates.
Discount rates - discount rates were estimated based on the industry weighted average cost ofcapital, which includes the cost of equity and debt after considering the gearing ratio.
Value-in-use is most sensitive to changes in discount rate and growth rate.
As of December 31, 2018 and 2017, the balance of the Group’s goodwill and intangible assets withindefinite useful lives, net of accumulated depreciation, amortization and impairment loss follow:
2018 2017Goodwill (Note 15) P=31,194,495,817 P=31,212,075,404Intangible assets (Note 15) 9,787,936,671 9,787,936,671
e. Assessment of impairment of nonfinancial assetsThe Group assesses the impairment of its nonfinancial assets (i.e., property, plant and equipment,investment properties, investment in joint venture and intangible assets with finite useful lives)whenever events or changes in circumstances indicate that the carrying amount of an asset maynot be recoverable.
The factors that the Group considers important which could trigger an impairment review includethe following:
∂ Market interest rates or other market rates of return on investments have increased during theperiod, and those increases are likely to affect the discount rate used in calculating the asset’svalue in use and decrease the asset’s recoverable amount materially;
∂ Significant underperformance relative to expected historical or projected future operatingresults;
∂ Significant changes in the manner of use of the acquired assets or the strategy for overallbusiness; and
∂ Significant negative industry or economic trends.
The Group determines an impairment loss whenever the carrying amount of an asset exceeds itsrecoverable amount, which is the higher of its fair value less costs to sell and its value in use.The fair value less costs to sell calculation is based on available data from binding salestransactions in an arm’s length transaction of similar assets or observable market prices lessincremental costs for disposing of the asset. The value in use calculation is based on a discountedcash flow model. The cash flows are derived from the budget for the next five years and do notinclude restructuring activities that the Group is not yet committed to or significant futureinvestments that will enhance the asset base of the cash-generating unit being tested. Therecoverable amount is most sensitive to the discount rate used for the discounted cash flow modelas well as the expected future cash inflows and the growth rate used for extrapolation purposes.
For the year ended December 31, 2018, the Group recognized impairment losses on its goodwilland property, plant and equipment amounting to P=17.6 million and P=1.7 million, respectively. Noimpairment was recognized for its investment property and other intangibles. For the year ended

- 104 -
*SGVFS035342*
December 31, 2017 and the three-month period ended December 31, 2016, the Group did notrecognize any impairment losses on its property, plant and equipment (see Note 13), investmentproperties (Note 17), goodwill and its other intangible assets (see Note 15).
As of December 31, 2018 and 2017, the balances of the Group’s nonfinancial assets with finiteuseful lives, excluding biological assets, net of accumulated depreciation, amortization andimpairment losses follow:
2018 2017Property, plant and equipment (Note 13) P=51,950,316,266 P=48,254,128,303Intangible assets (Note 15) 1,942,323,683 2,022,099,361Investment in joint ventures (Note 16) 520,917,509 552,226,288Investment properties (Note 17) 36,384,879 45,288,139
f. Determination of the fair value of intangible assets and property, plant and equipment acquiredin a business combinationThe Group measures the identifiable assets and liabilities acquired in a business combination atfair value at the date of acquisition.
The fair value of the intangible assets acquired in a business combination is determined based onthe net sales forecast attributable to the intangible assets, growth rate estimates and royalty ratesusing comparable license agreements. Royalty rates are based on the estimated arm’s lengthroyalty rate that would be paid for the use of the intangible assets. Growth rate estimate includeslong-term growth rate and terminal growth rate applied to future cash flows beyond the projectionperiod.
The fair value of property, plant and equipment acquired in a business combination is determinedbased on comparable properties after adjustments for various factors such as location, size andshape of the property. Cost information and current prices of comparable equipment are alsoutilized to determine the fair value of equipment.
The Group’s acquisitions are discussed in Note 15 to the consolidated financial statements.
g. Estimation of pension and other benefits costsThe determination of the obligation and cost of pension and other employee benefits is dependenton the selection of certain assumptions used in calculating such amounts. Those assumptionsinclude, among others, discount rates and salary increase rates (see Note 31). Actual results thatdiffer from the Group’s assumptions are accumulated and amortized over future periods andtherefore, generally affect the recognized expense and recorded obligation in such future periods.
The present value of the defined benefit obligation is determined by discounting the estimatedfuture cash outflows using interest rates of Philippine government bonds with terms consistentwith the expected employee benefit payout as of reporting date.
The mortality rate is based on publicly available mortality tables for the specific country and ismodified accordingly with estimates of mortality improvements. Future salary increases andpension increases are based on expected future inflation rates for the specific country.
As of December 31, 2018 and 2017, the balance of the Group’s present value of defined benefitobligations and other benefits is shown in Note 31 to the consolidated financial statements.

- 105 -
*SGVFS035342*
h. Recognition of deferred income tax assetsThe Group reviews the carrying amounts of its deferred income taxes at each reporting date andreduces the deferred tax assets to the extent that it is no longer probable that sufficient taxableincome will be available to allow all or part of the deferred tax assets to be utilized. However,there is no assurance that the Group will generate sufficient taxable income to allow all or part ofthe deferred tax assets to be utilized.
As of December 31, 2018 and 2017, the Group recognized net deferred tax assets amounting toP=195.5 million and P=216.9 million, respectively (see Note 32), as the Group believes sufficienttaxable income will allow these deferred tax assets to be utilized.
Net deferred tax liabilities amounted to P=4.2 billion and P=4.3 billion as of December 31, 2018 and2017, respectively (see Note 32).
As of December 31, 2018 and 2017, the Group has certain subsidiaries which are under ITH. Assuch, no deferred tax assets were set up on certain gross deductible temporary differences that areexpected to reverse or expire within the ITH period (see Note 35).
The recognized and unrecognized deferred tax assets for the Group are disclosed in Note 32.
4. Financial Risk Management Objectives and Policies
The Group’s principal financial instruments, other than derivative financial instruments, comprisecash and cash equivalents, financial assets at FVTPL, financial assets at FVOCI/AFS financial assets,and interest-bearing loans and other borrowings. The main purpose of these financial instruments isto finance the Group’s operations and related capital expenditures. The Group has various otherfinancial assets and financial liabilities, such as trade receivables and payables which arise directlyfrom its operations. One of the Group’s subsidiaries is a counterparty to derivative contracts. Thesederivatives are entered into as a means of reducing or managing their respective foreign exchange andinterest rate exposures.
The BOD of the Parent Company and its subsidiaries review and approve policies for managing eachof these risks and they are summarized below, together with the related risk management structure.
Risk Management StructureThe Group’s risk management structure is closely aligned with that of the Ultimate Parent Company.The BOD of the Parent Company and the respective BODs of each subsidiary are ultimatelyresponsible for the oversight of the Group’s risk management processes that involve identifying,measuring, analyzing, monitoring and controlling risks.
The risk management framework encompasses environmental scanning, the identification andassessment of business risks, development of risk management strategies, design and implementationof risk management capabilities and appropriate responses, monitoring risks and risk managementperformance, and identification of areas and opportunities for improvement in the risk managementprocess.
The BOD has created the board-level Audit Committee (AC) to spearhead the managing andmonitoring of risks.
ACThe AC shall assist the Group’s BOD in its fiduciary responsibility for the over-all effectiveness of

- 106 -
*SGVFS035342*
risk management systems, and both the internal and external audit functions of the Group.Furthermore, it is also the AC’s purpose to lead in the general evaluation and to provide assistance inthe continuous improvements of risk management, control and governance processes.
The AC also aims to ensure that:
a. financial reports comply with established internal policies and procedures, pertinent accountingand auditing standards and other regulatory requirements;
b. risks are properly identified, evaluated and managed, specifically in the areas of managing credit,market, liquidity, operational, legal and other risks, and crisis management;
c. audit activities of internal and external auditors are done based on plan and deviations areexplained through the performance of direct interface functions with the internal and externalauditors; and
d. the Group’s BOD is properly assisted in the development of policies that would enhance the riskmanagement and control systems.
Enterprise Risk Management Group (ERMG)The ERMG was created to be primarily responsible for the execution of the enterprise riskmanagement framework. The ERMG’s main concerns include:
a. recommending risk policies, strategies, principles, framework and limits;b. managing fundamental risk issues and monitoring of relevant risk decisions;c. providing support to management in implementing the risk policies and strategies; andd. developing a risk awareness program.
Corporate Governance Compliance OfficerCompliance with the principles of good corporate governance is also one of the primary objectives ofthe BOD. To assist the BOD in achieving this purpose, the BOD has designated a ComplianceOfficer who shall be responsible for monitoring the actual compliance with the provisions andrequirements of the Corporate Governance Manual and other requirements on good corporategovernance, identifying and monitoring control compliance risks, determining violations andrecommending penalties on such infringements for further review and approval of the BOD, amongothers.
Day-to-day risk management functionsAt the business unit or company level, the day-to-day risk management functions are handled byfour (4) different groups, namely:
a. Risk-taking personnel. This group includes line personnel who initiate and are directlyaccountable for all risks taken.
b. Risk control and compliance. This group includes middle management personnel who performthe day-to-day compliance check to approved risk policies and risk mitigation decisions.
c. Support. This group includes back office personnel who support the line personnel.d. Risk management. This group pertains to the business unit’s Management Committee which
makes risk mitigating decisions within the enterprise-wide risk management framework.
Enterprise Resource Management (ERM) FrameworkThe Parent Company’s BOD is also responsible for establishing and maintaining a sound riskmanagement framework and is accountable for risks taken by the Parent Company. The ParentCompany’s BOD also shares the responsibility with the ERMG in promoting the risk awarenessprogram enterprise-wide.

- 107 -
*SGVFS035342*
The ERM framework revolves around the following eight interrelated risk management approaches:
a. Internal Environmental Scanning. It involves the review of the overall prevailing risk profile ofthe business unit to determine how risks are viewed and addressed by management. This ispresented during the strategic planning, annual budgeting and mid-year performance reviews ofthe Group.
b. Objective Setting. The Group’s BOD mandates the business unit’s management to set the overallannual targets through strategic planning activities, in order to ensure that management has aprocess in place to set objectives which are aligned with the Group’s goals.
c. Event Identification. It identifies both internal and external events affecting the Group’s settargets, distinguishing between risks and opportunities.
d. Risk Assessment. The identified risks are analyzed relative to the probability and severity ofpotential loss which serves as a basis for determining how the risks should be managed. Therisks are further assessed as to which risks are controllable and uncontrollable, risks that requiremanagement’s attention, and risks which may materially weaken the Group’s earnings andcapital.
e. Risk Response. The Group’s BOD, through the oversight role of the ERMG, approves thebusiness unit’s responses to mitigate risks, either to avoid, self-insure, reduce, transfer or sharerisk.
f. Control Activities. Policies and procedures are established and approved by the Group’s BODand implemented to ensure that the risk responses are effectively carried out enterprise-wide.
g. Information and Communication. Relevant risk management information are identified, capturedand communicated in form and substance that enable all personnel to perform their riskmanagement roles.
h. Monitoring. The ERMG, Internal Audit Group, Compliance Office and Business AssessmentTeam constantly monitor the management of risks through risk limits, audit reviews, compliancechecks, revalidation of risk strategies and performance reviews.
Risk management support groupsThe Group’s BOD created the following departments within the Group to support the riskmanagement activities of the Parent Company and the other business units:
a. Corporate Security and Safety Board (CSSB). Under the supervision of ERMG, the CSSBadministers enterprise-wide policies affecting physical security of assets exposed to various formsof risks.
b. Corporate Supplier Accreditation Team (CORPSAT). Under the supervision of ERMG, theCORPSAT administers enterprise-wide procurement policies to ensure availability of suppliesand services of high quality and standards to all business units.
c. Corporate Management Services (CMS). The CMS is responsible for the formulation ofenterprise-wide policies and procedures.
d. Corporate Planning (CORPLAN). The CORPLAN is responsible for the administration ofstrategic planning, budgeting and performance review processes of business units.
e. Corporate Insurance Department (CID). The CID is responsible for the administration of theinsurance program of business units concerning property, public liability, businessinterruption, money and fidelity, and employer compensation insurances, as well as, in theprocurement of performance bonds.

- 108 -
*SGVFS035342*
Risk Management PoliciesThe main risks arising from the use of financial instruments are credit risk, liquidity risk and marketrisks such as foreign currency risk, equity price risk and interest rate risk. The Group’s policies formanaging the aforementioned risks are summarized below.
Credit riskCredit risk is the risk that one party to a financial instrument will fail to discharge an obligation andcause the other party to incur a financial loss. The Group trades only with recognized andcreditworthy third parties. It is the Group’s policy that all customers who wish to trade on creditterms are subject to credit verification procedures. The Credit Management Division (CMD) of theGroup continuously provides credit notification and implements various credit actions, depending onassessed risks, to minimize credit exposure. Receivable balances of trade customers are beingmonitored on a regular basis and appropriate credit treatments are executed for overdue accounts.Likewise, other receivable balances are also being monitored and subjected to appropriate actions tomanage credit risk.
With respect to credit risk arising from the other financial assets of the Group, which comprise cashand cash equivalents, financial assets at FVTPL, financial assets at FVOCI/AFS financial assets andcertain derivative financial instruments, the Group’s exposure to credit risk arises from default of thecounterparty with a maximum exposure equal to the carrying amount of these instruments.
a. Credit risk exposure
With respect to credit risk arising from financial assets of the Group, which comprise cash andcash equivalents, receivables, financial assets at FVTPL and financial assets at FVOCI/AFSfinancial assets, the Group’s maximum exposure to credit risk is equal to its carrying amount asof December 31, 2018 and 2017, except for the Group’s trade receivables as of as ofDecember 31, 2018 and 2017 with carrying value of P=12.1 billion and P=13.7 billion, respectively,and collateral with fair value amounting to P=2.8 billion as of both dates, resulting to net exposureof P=9.3 billion and P=10.9 billion, respectively.
The collateral securities related to the Group’s trade receivables consist of standby letters ofcredit. The Group holds no other collateral or guarantee that would reduce the maximumexposure to credit risk.
b. Risk concentrations of the maximum exposure to credit risk
Concentrations arise when a number of counterparties are engaged in similar business activitiesor activities in the same geographic region or have similar economic features that would causetheir ability to meet contractual obligations to be similarly affected by changes in economic,political or other conditions. Concentrations indicate the relative sensitivity of the Group’sperformance to developments affecting a particular industry or geographical location. Such creditrisk concentrations, if not properly managed, may cause significant losses that could threaten theGroup's financial strength and undermine public confidence.
In order to avoid excessive concentrations of risk, identified concentrations of credit risks arecontrolled and managed accordingly.

- 109 -
*SGVFS035342*
i. Concentration by geographical location
The Group’s credit risk exposures as of December 31, 2018 and 2017 before taking intoaccount any collateral held or other credit enhancements are categorized by geographiclocation follows:
2018Philippines Asia New Zealand Australia United States Others Total
Amortized cost: Cash and cash equivalents*
(Note 7) P=6,778,173,501 P=3,485,633,654 P=1,518,874,359 P=1,164,705,153 P=– P=– P=12,947,386,667Receivables (Note 10):
Trade receivables 4,092,400,288 4,919,980,265 1,110,640,137 1,900,543,956 20,255,518 40,568,500 12,084,388,664 Due from related
parties 716,143,819 129,657,810 – – – – 845,801,629 Advances to officers
and employees 130,111,597 15,033,683 – – – – 145,145,280Interest receivable 9,690,349 – – – – – 9,690,349
Non-trade and otherreceivables 1,097,107,751 205,845,576 17,344,722 – – – 1,320,298,049
Total financial assets atamortized cost 12,823,627,305 8,756,150,988 2,646,859,218 3,065,249,109 20,255,518 40,568,500 27,352,710,638
Financial assets at FVTPL:Equity securities (Note 8) 420,153,416 – – – – – 420,153,416
Derivative assets designated asaccounting hedge (Note 12) – – 6,389,048 – – – 6,389,048
Financial assets at FVOCI:Equity securities (Note 17) 50,300,000 – – – – – 50,300,000
P=13,294,080,721 P=8,756,150,988 P=2,653,248,266 P=3,065,249,109 P=20,255,518 P=40,568,500 P=27,829,553,102* Excludes cash on hand
2017Philippines Asia New Zealand Australia United States Others Total
Loans and receivables: Cash and cash equivalents*
(Note 7) P=8,349,277,554 P=3,496,585,008 P=1,442,324,015 P=1,106,004,723 P=– P=− P=14,394,191,300Receivables (Note 10):
Trade receivables 6,214,144,707 4,548,383,778 1,069,665,700 1,804,757,697 21,092,431 25,609,047 13,683,653,360 Due from related
parties 309,779,040 611,414,576 − − − 475,046,014 1,396,239,630 Advances to officers
and employees 99,243,981 15,086,141 − − − − 114,330,122Interest receivable 42,299,508 − − − − − 42,299,508
Non-trade and otherreceivables 742,625,821 120,874,339 16,470,559 − − − 879,970,719
Total loans and receivable 15,757,370,611 8,792,343,842 2,528,460,274 2,910,762,420 21,092,431 500,655,061 30,510,684,639Financial assets at FVPL:
Equity securities (Note 8) 455,577,705 − − − − − 455,577,705Derivative assets designated as
accounting hedge (Note 12) − − 11,023,146 − − − 11,023,146AFS financial assets:
Equity securities (Note 17) 45,980,000 − − − − − 45,980,000P=16,258,928,316 P=8,792,343,842 P=2,539,483,420 P=2,910,762,420 P=21,092,431 P=500,655,061 P=31,023,265,490
* Excludes cash on hand

- 110 -
*SGVFS035342*
ii. Concentration by industry
The tables below show the industry sector analysis of the Group’s financial assets as ofDecember 31, 2018 and 2017 before taking into account any collateral held or other creditenhancements.
2018
ManufacturingFinancial
Intermediaries PetrochemicalsTele-
Communication Others* TotalAmortized cost: Cash and cash equivalents**
(Note 7) P=– P=12,947,386,667 P=– P=– P=– P=12,947,386,667Receivables (Note 10):
Trade receivables 11,791,998,739 – 316,057 – 292,073,868 12,084,388,664Due from related parties 44,910,646 28,646,754 – – 772,244,229 845,801,629
Advances to officers andemployees 125,797,555 – – – 19,347,725 145,145,280
Interest receivable – 9,690,349 – – – 9,690,349Non-trade and other receivables 1,068,474,296 21,576,156 7,884,799 19,046,448 203,316,350 1,320,298,049
Total financial assets at amortized cost 13,031,181,236 13,007,299,926 8,200,856 19,046,448 1,286,982,172 27,352,710,638Financial assets at FVTPL:
Equity securities (Note 8) – – – – 420,153,416 420,153,416Derivative assets designated as accounting
hedge (Note 12) 6,389,048 – – – – 6,389,048Financial assets at FVOCI:
Equity securities (Note 17) – – – – 50,300,000 50,300,000P=13,037,570,284 P=13,007,299,926 P=8,200,856 P=19,046,448 P=1,757,435,588 P=27,829,548,6122
*Includes real estate, agriculture, automotive, mining and electrical industries.**Excludes cash on hand
2017
ManufacturingFinancial
Intermediaries PetrochemicalsTele-
Communication Others* TotalLoans and receivables: Cash and cash equivalents**
(Note 7) P=− P=14,394,191,300 P=− P=− P=− P=14,394,191,300Receivables (Note 10):
Trade receivables 13,394,985,650 − , − 288,667,710 13,683,653,360Due from related parties 585,335,992 39,861,018 − − 771,042,620 1,396,239,630
Advances to officers andemployees 88,505,126 − − − 25,824,996 114,330,122
Interest receivable 35,189,797 7,109,711 − − − 42,299,508Non-trade and other receivables 534,611,441 30,477,362 12,221,888 19,548,753 283,111,275 879,970,719
Total loans and receivables 14,638,628,006 14,471,639,391 12,221,888 19,548,753 1,368,646,601 30,510,684,639Financial assets at FVPL:
Equity securities (Note 8) − − − − 455,577,705 455,577,705Derivative assets designated as accounting
hedge (Note 12) 11,023,146 − − − − 11,023,146AFS financial assets:
Equity securities (Note 17) − − − − 45,980,000 45,980,000P=14,649,651,152 P=14,471,639,391 P=12,221,888 P=19,548,753 P=1,870,204,306 P=31,023,265,490
*Includes real state, agriculture, automotive, mining and electrical industries.**Excludes cash on hand
c. Credit quality per class of financial assets
The tables below show the credit quality by class of financial assets as of December 31, 2018 and2017, gross of allowance for credit losses:
2018Neither Past Due Nor Impaired Past Due or
High Grade Standard GradeSubstandard
GradeIndividually
Impaired TotalAmortized cost:
Cash and cash equivalents* (Note 7) P=12,947,386,667 P=− P=− P=− P=12,947,386,667Receivables (Note 10):
Trade receivables 9,501,989,205 − − 2,728,573,462 12,230,562,667Due from related parties 845,801,629 − − − 845,801,629Advances to officers and employees 12,472,463 36,386,918 7,194,732 108,737,849 164,791,962Interest receivable 9,541,911 148,438 9,690,349
Non-trade and other receivables 737,541,761 303,517,633 − 468,562,349 1,509,621,743Total financial assets at amortized cost 24,054,733,636 339,904,551 7,194,732 3,306,022,098 27,707,855,017Financial assets at FVTPL (Note 8):
Equity securities 420,153,416 − − − 420,153,416Derivative assets designated as accounting hedge
(Note 12) 6,389,048 − − − 6,389,048Financial assets at FVOCI:
Equity securities (Note 17) 50,300,000 − − − 50,300,000P=24,531,576,100 P=339,904,551 P=7,194,732 P=3,306,022,098 P=28,184,697,481
*Excludes cash on hand

- 111 -
*SGVFS035342*
2017Neither Past Due Nor Impaired Past Due or
High Grade Standard GradeSubstandard
GradeIndividually
Impaired TotalLoans and receivables: Cash and cash equivalents* (Note 7) P=14,394,191,300 P=− P=− P=− P=14,394,191,300
Receivables (Note 10):Trade receivables 11,564,013,104 − − 2,287,192,070 13,851,205,174Due from related parties 1,396,239,630 − − − 1,396,239,630Advances to officers and employees 12,140,446 89,948,384 1,253,952 30,634,022 133,976,804Interest receivable 7,109,711 – – 35,189,797 42,299,508Non-trade and other receivables 458,963,605 126,302,166 – 484,028,642 1,069,294,413
Total loans and receivables 27,832,657,796 216,250,550 1,253,952 2,837,044,531 30,887,206,829Financial assets at FVPL (Note 8):
Equity securities 455,577,705 − − − 455,577,705Derivative assets designated as accounting hedge
(Note 12) 11,023,146 − − − 11,023,146AFS financial assets:
Equity securities (Note 17) 45,980,000 − − − 45,980,000P=28,345,238,647 P=216,250,550 P=1,253,952 P=2,837,044,531 P=31,399,787,680
*Excludes cash on hand
High grade cash and cash equivalents are short-term placements and working cash fund placed,invested, or deposited in foreign and local banks belonging to the top ten (10) banks, including anaffiliated bank, in the Philippines in terms of resources and profitability.
Other high grade accounts are accounts considered to be high value. The counterparties have avery remote likelihood of default and have consistently exhibited good paying habits.
Standard grade accounts are active accounts with minimal to regular instances of paymentdefault, due to ordinary/common collection issues. These accounts are typically not impaired asthe counterparties generally respond to credit actions and update their payments accordingly.
Substandard grade accounts are accounts which have probability of impairment based onhistorical trend. These accounts show propensity to default in payment despite regular follow-upactions and extended payment terms.
d. Aging analysis
An aging analysis of the Group’s past due or individually impaired receivables as ofDecember 31, 2018 and 2017 are as follows:
2018Past Due But Not Impaired Impaired
Less than 30 to 60 60 to 90 Over 90 Financial30 Days Days Days Days Assets Total
Trade receivables P=1,696,079,869 P=204,326,180 P=116,597,861 P=565,395,549 P=146,174,003 P=2,728,573,462Advances to officers and employees 3,788,295 130,182 1,659,548 83,513,142 19,646,682 108,737,849Others 231,517,066 6,950,793 2,038,714 38,880,520 189,323,694 468,710,787Balances at end of year P=1,931,385,230 P=211,407,155 P=120,296,123 P=687,789,211 P=355,144,379 P=3,306,022,098
2017Past Due But Not Impaired Impaired
Less than 30 to 60 60 to 90 Over 90 Financial30 Days Days Days Days Assets Total
Trade receivables P=1,276,951,666 P=184,160,218 P=43,328,542 P=615,199,830 P=167,551,814 P=2,287,192,070Advances to officers and employees 2,209,641 385,001 1,604,516 6,788,182 19,646,682 30,634,022Others 248,823,866 3,790,310 3,531,426 73,749,143 189,323,694 519,218,439Balances at end of year P=1,527,985,173 P=188,335,529 P=48,464,484 P=695,737,155 P=376,522,190 P=2,837,044,531

- 112 -
*SGVFS035342*
Liquidity riskLiquidity risk is the risk of not being able to meet funding obligation such as the repayment ofliabilities or payment of asset purchases as they fall due. The Group’s liquidity management involvesmaintaining funding capacity to finance capital expenditures and service maturing debts, and toaccommodate any fluctuations in asset and liability levels due to changes in the Group’s businessoperations or unanticipated events created by customer behavior or capital market conditions. TheGroup maintains a level of cash and cash equivalents deemed sufficient to finance its operations. Italso maintains a portfolio of highly marketable and diverse financial assets that assumed to be easilyliquidated in the event of an unforeseen interruption of cash flow. The Group also has committedlines of credit that it can access to meet liquidity needs. As part of its liquidity risk management, theGroup regularly evaluates its projected and actual cash flows. It also continuously assessesconditions in the financial markets for opportunities to pursue fund raising activities. Fund raisingactivities may include obtaining bank loans and capital market issues both onshore and offshore.
Maturity Profile of Financial LiabilitiesThe tables below summarize the maturity profile of the Group’s financial liabilities as ofDecember 31, 2018 and 2017 based on the remaining undiscounted contractual cash flows.
2018
On Demand1 to 3
Months3 to 12
Months1 to 5Years Total
Financial liabilities at amortized cost: Accounts payable and other accrued
liabilities: Trade payable and accrued
expenses** P=7,555,767,195 P=14,483,455,869 P=389,153,647 P=− P=22,428,376,711Due to related parties 164,624,582 − − − 164,624,582
Short-term debts* − 2,464,651,336 − − 2,464,651,336Trust receipts payable* − 6,038,711,014 − − 6,038,711,014Long-term debts* − 261,685,556 785,056,667 34,675,088,951 35,721,831,174
P=7,720,391,777 P=23,248,503,775 P=1,174,210,314 P=34,675,088,951 P=66,818,194,817*Includes future interest**Excludes statutory liabilities
2017
On Demand1 to 3
Months3 to 12
Months1 to 5Years Total
Financial liabilities at amortized cost: Accounts payable and other accrued
liabilities: Trade payable and accrued
expenses** P=7,130,314,295 P=13,051,428,395 P=419,532,782 P=− P=20,601,275,472Due to related parties 106,452,798 − − − 106,452,798
Short-term debts* − − 2,010,859,525 − 2,010,859,525Trust receipts payable* − 3,158,622,472 − − 3,158,622,472Long-term debts* − 277,235,968 831,707,904 35,707,074,219 36,816,018,091
P=7,236,767,093 P=16,487,286,835 P=3,262,100,211 P=35,707,074,219 P=62,693,228,358*Includes future interest**Excludes statutory liabilities
Market riskMarket risk is the risk of loss to future earnings, to fair value or future cash flows of a financialinstrument as a result of changes in its price, in turn caused by changes in interest rates, foreigncurrency exchange rates, equity prices and other market factors.
Foreign currency riskForeign currency risk arises on financial instruments that are denominated in a foreign currency otherthan the functional currency in which they are measured.
The Group has transactional currency exposures. Such exposures arise from sales and purchases incurrencies other than the entities’ functional currency. For the years ended December 31, 2018 and2017, and the three-month period ended December 31, 2016, approximately 34.8%, 34.3% and 34.2%of the Group’s total sales, respectively, are denominated in currencies other than the functional

- 113 -
*SGVFS035342*
currency. In addition, 3.0% and 4.3% of the Group’s debt is denominated in US Dollars as ofDecember 31, 2018 and 2017, respectively.
The Group estimates a reasonably possible change of +5.00 in the US Dollar to Philippine Pesoexchange rate would have an impact of approximately P=81.4 million and P=161.3 million on incomebefore income tax for the years ended December 31, 2018 and 2017, respectively. An equal changein the opposite direction would have decreased income before income tax by the same amount.
The impact of the range of reasonably possible changes in the exchange rates of the other currenciesagainst the Philippine Peso on the Group’s income before income tax as of December 31, 2018 and2017 are deemed immaterial.
The exchange rates used to restate the US dollar-denominated financial assets and liabilities wereP=52.58 to US$1.00 and P=49.93 to US$1.00 as of December 31, 2018 and 2017, respectively.
Equity price riskEquity price risk is the risk that the fair values of equities will change as a result of changes in thelevels of equity indices and the value of individual stocks.
The table below shows the effect on equity as a result of a change in the fair value of equityinstruments held as financial assets at FVPL investments due to reasonably possible changes in equityindices:
2018 2017Changes in PSEi 21.20% (21.20%) 12.33% (12.33%)Change in trading gain (loss) at equity portfolio P=59,232,482 (P=59,232,482) P=21,906,081 (P=21,906,081)As a percentage of the Parent Company’s trading
gain for the year (59.81%) 59.81% (324.18%) 324.18%
The Group’s investment in golf shares designated as financial assets at FVOCI/AFS financial assetsare susceptible to market price risk arising from uncertainties about future values of the investmentsecurity. The Group’s estimates an increase of 1.00% would have an impact of approximatelyP=0.5 million on equity for the year ended December 31, 2018 and 2017. An equal change in theopposite direction would have decreased equity by the same amount.
Interest rate riskThe Group’s exposure to market risk for changes in interest rates relates primarily to the subsidiaries’long-term debt obligations which are subject to floating rate. The Group’s policy is to manage itsinterest cost using a mix of fixed and variable rate debt.

- 114 -
*SGVFS035342*
The following tables show information about the Group’s financial instruments that are exposed to interest rate risk and presented by maturity profile:
2018
<1 year >1-<2 years >2-<3 years >3-<4 years >4-<5 years Total
Total(in Philippine
Peso)
DebtIssuance
Costs(in Philippine
Peso)
Carrying Value(in Philippine
Peso)Liabilities: Foreign currencies:
Floating rate Australian Dollar loan AU$13,625,723 AU$13,700,180 AU$494,387,449 AU$– AU$– AU$521,713,352 P=17,922,355,336 P=179,697,514 P=17,742,657,822 Interest rate:
BBSY Bid+1.25% New Zealand Dollar loans NZ$12,753,563 NZ$12,580,750 NZ$12,649,875 NZ$12,615,313 NZ$407,511,625 NZ$458,111,126 13,924,974,927 210,508,867 13,714,466,060 Interest rate:
NZ BKBM+1.10% P=31,847,330,263 P=390,206,381 P=31,457,123,882
2017
<1 year >1-<2 years >2-<3 years >3-<4 years >4-<5 years Total
Total(in Philippine
Peso)
DebtIssuance Costs(in Philippine
Peso)
Carrying Value(in Philippine
Peso)Liabilities: Foreign currencies:
Floating rate Australian Dollar loan AU$13,251,758 AU$13,179,542 AU$13,215,650 AU$494,081,575 AU$, AU$533,728,525 P=18,772,656,535 P=250,622,686 P=18,522,033,849 Interest rate:
BBSY Bid+1.25%New Zealand Dollar loans NZ$16,205,992 NZ$435,180,958 NZ$, NZ$, NZ$, NZ$451,386,950 14,808,699,804 104,771,265 14,703,928,539
Interest rate:NZ BKBM+1.60%
P=33,581,356,339 P=355,393,951 P=33,225,962,388

- 115 -
*SGVFS035342*
The following table demonstrates the sensitivity to a reasonably possible change in interest rates onthe long-term debts. With all other variables held constant, the Group’s income before tax is affectedthrough the impact on floating rate borrowings, as follows:
Change in basis pointsEffect on income
before tax2018 +100 (P=320,970,394)
-100 320,970,3942017 +100 (P=323,797,776)
-100 323,797,776
5. Fair Value Measurement
The following methods and assumptions were used to estimate the fair value of each asset andliability for which it is practicable to estimate such value:
Cash and cash equivalents, receivables (except amounts due from and due to related parties),accounts payable and other accrued liabilities, short-term debts and trust receipts payable.Carrying amounts approximate their fair values due to the relatively short-term maturities of theseinstruments.
Amounts due from and due to related partiesCarrying amounts of due from and due to related parties which are payable and due on demandapproximate their fair values.
Financial assets at FVTPL, derivatives and financial assets at FVOCI/AFS investmentsFair values of quoted equity securities are based on quoted prices published in markets.
Biological assetsBiological assets are measured at their fair values less costs to sell. The fair values of Level 2biological assets are determined based on current market prices of livestock of similar age, breed andgenetic merit while Level 3 are determined based on adjusted commercial farmgate prices. Costs tosell include commissions to brokers and dealers, nonrefundable transfer taxes and duties. Costs tosell exclude transport and other costs necessary to get the biological assets to the market.
The Group has determined that the highest and best use of the sucklings and weanlings is finisherswhile for other biological assets is their current use.
Investment propertiesFair value of investment properties is based on market data (or direct sales comparison) approach.This approach relies on the comparison of recent sale transactions or offerings of similar propertieswhich have occurred and/or offered with close proximity to the subject property.
The fair values of the Group’s investment properties have been determined by appraisers in 2017,including independent external appraisers, on the basis of the recent sales of similar properties in thesame areas as the investment properties and taking into account the economic conditions prevailing atthe time of the valuations are made.
The Group has determined that the highest and best use of the property used for the land and buildingis its current use.
Long-term debts

- 116 -
*SGVFS035342*
The fair value of long-term debts are based on the discounted value of future cash flows (interests andprincipal) using market rates plus a certain spread.
Fair Value Measurement Hierarchy for Assets and Liabilities
December 31, 2018Carrying Value Level 1 Level 2 Level 3 Total Fair value
Assets measured at fair valueFinancial assetsFinancial assets at FVTPL
(Note 8):Quoted equity securities P=420,153,416 P=420,153,416 P=− P=− P=420,153,416
Derivative assets designated asaccounting hedge (Note 12) 6,389,048 6,389,048 − − 6,389,048
Financial assets at FVOCIQuoted equity securities
(Note 17) 50,300,000 − 50,300,000 − 50,300,000P=476,842,464 P=426,542,464 P=50,300,000 P=− P=476,842,464
Non-financial assetsBiological assets (Note 14) P=1,107,904,051 P=− P=137,522,046 P=970,382,005 P=1,107,904,051Assets for which fair values are
disclosedInvestment properties
(Note 17) P=36,384,879 P=− P=− P=324,572,000 P=324,572,000Liabilities for which fair values
are disclosedLong-term debts (Note 20) P=31,457,123,882 P=− P=− P=31,585,901,825 P=31,585,901,825
December 31, 2017Carrying Value Level 1 Level 2 Level 3 Total Fair value
Assets measured at fair valueFinancial assetsFinancial assets at FVPL (Note 8):
Quoted equity securities P=455,577,705 P=455,577,705 P=− P=− P=455,577,705Derivative assets designated as
accounting hedge (Note 12) 11,023,146 11,023,146 − − 11,023,146AFS financial assets
Quoted equity securities(Note 17) 45,980,000 − 45,980,000 − 45,980,000
P=512,580,851 P=466,600,851 P=45,980,000 P=− P=512,580,851Non-financial assetsBiological assets (Note 14) P=1,678,576,389 P=− P=477,232,582 P=1,201,343,807 P=1,678,576,389Assets for which fair values are
disclosedInvestment properties
(Note 17) P=45,288,139 P=– P=– P=337,579,000 P=337,579,000Liabilities for which fair values
are disclosedLong-term debts (Note 20) P=33,225,962,388 P=– P=− P=33,402,588,509 P=33,402,588,509
For the years ended December 31, 2018 and 2017, there were no transfers between Level 1 andLevel 2 fair value measurements. Non-financial assets determined under Level 3 include investmentproperties and biological assets. No transfers between any level of the fair value hierarchy took placein the equivalent comparative period.

- 117 -
*SGVFS035342*
Descriptions of significant unobservable inputs to valuation of biological assets and investmentproperties under level 3 of the fair value category follow:
Account Valuation TechniqueSignificant UnobservableInputs
Biological assets Adjusted commercial farmgateprices
Commercial farmgate prices
Investment properties Market data approach andCost approach
Price per square meter, size,shape, location, time element,replacement cost anddepreciation for improvements
Significant increases (decreases) in reasonable profit margin applied would result in a significantlyhigher (lower) fair value of the biological assets.
Significant unobservable inputs
Size Size of lot in terms of area. Evaluate if the lot size of propertyor comparable conforms to the average cut of the lots in the areaand estimate the impact of the lot size differences on land value.
Shape Particular form or configuration of the lot. A highly irregularshape limits the usable area whereas an ideal lot configurationmaximizes the usable area of the lot which is associated indesigning an improvement which conforms with the highest andbest use of the property.
Location Location of comparative properties whether on a main road, orsecondary road. Road width could also be a consideration ifdata is available. As a rule, properties located along a mainroad are superior to properties located along a secondary road.
Time element An adjustment for market conditions is made if general propertyvalues have appreciated or depreciated since the transactiondates due to inflation or deflation or a change in investor’sperceptions of the market over time. In which case, the currentdata is superior to historic data.
Replacement cost Estimated amount of money needed to replace in like kind andin new condition an asset or group of assets, taking intoconsideration current prices of materials, labor, contractor’soverhead, profit and fees, and all other attendant costsassociated with its acquisition and installation in place withoutprovision for overtime or bonuses for labor, and premiums formaterials.
Depreciation Depreciation as evidenced by the observed condition incomparison with new units of like kind tempered byconsideration given to extent, character, and utility of theproperty which is to be continued in its present use as part of agoing concern but without specific relations to earnings.
Adjusted commercialfarmgate prices
Fair value based on commercial farmgate prices, adjusted byconsidering the age, breed and genetic merit

- 118 -
*SGVFS035342*
6. Business Segment Information
The Group’s operating segments are organized and managed separately according to the nature of theproducts and services provided, with each segment representing a strategic business unit that offersdifferent products and serves different markets. The Group has four (4) reportable operatingsegments as follows:
∂ The branded consumer food products segment manufactures and distributes a diverse mix of saltysnacks, chocolates, candies, biscuits, bakery products, beverages, instant noodles and pasta. Thissegment also includes the packaging division, which manufactures BOPP films primarily used inpackaging; and its subsidiary, which manufactures flexible packaging materials for the packagingrequirements of various branded food products. Its revenues are in their peak during the openingof classes in June and Christmas season.
∂ The agro-industrial products segment engages in hog and poultry farming, manufacturing anddistribution of animal feeds, glucose and soya products, and production and distribution of animalhealth products. Its peak season is during summer and before Christmas season.
∂ The commodity food products segment engages in sugar milling and refining, and flour millingand pasta manufacturing and renewable energy. The peak season for sugar is during its cropseason, which normally starts in November and ends in April while flour and pasta’s peak seasonis before and during the Christmas season.
∂ The corporate business segment engages in bonds and securities investment and fund sourcingactivities.
No operating segments have been aggregated to form the above reportable operating businesssegments.
Management monitors the operating results of business segments separately for the purpose ofmaking decisions about resource allocation and performance assessment. The measure presented tomanage segment performance is the segment operating income (loss). Segment operating income(loss) is based on the same accounting policies as consolidated operating income (loss) except thatintersegment revenues are eliminated only at the consolidation level. Group financing (includingfinance costs and revenues), market valuation gain and loss, foreign exchange gains or losses, otherrevenues and expenses and income taxes are managed on a group basis and are not allocated tooperating segments. Transfer prices between operating segments are on an arm’s length basis in amanner similar to transactions with third parties.
The following tables present the financial information of each of the operating segments inaccordance with PFRSs except for Earnings before interest, income taxes and depreciation/amortization (EBITDA) and Earnings before interest and income taxes (EBIT) as of and for the yearsended December 31, 2018 and 2017, and the three-month period ended December 31, 2016.

- 119 -
*SGVFS035342*
The Group’s business segment information follows (amounts in thousands):
As of and for the year ended December 31, 2018Branded
Consumer Food Agro-IndustrialCommodity
FoodCorporate
Business Eliminations TotalSale of Goods and ServicesThird party P=102,537,877 P=11,693,453 P=13,538,619 P=– P=– P=127,769,949Inter-segment 17,266,362 63,901 5,353,541 – (22,683,804) –
P=119,804,239 P=11,757,354 P=18,892,160 P=– (P=22,683,804) P=127,769,949ResultEarnings before interest, income taxes and depreciation/amortization (EBITDA) P=15,674,743 P=1,237,539 P=4,487,433 (P=1,649,326) P=– P=19,750,389Depreciation and amortization (Note 27) (4,756,491) (419,526) (948,368) (245,391) – (6,369,776)Earnings before interest and income tax (EBIT) P=10,918,252 P=818,013 P=3,539,065 (P=1,894,717) P=– 13,380,613Finance revenue (Note 29) P=208,796 P=102 P=23,931 P=126,452 P=– 359,281Finance costs (Note 30) (P=1,419,134) (P=66,536) (P=84,784) (P=91,246) P=– (1,661,700)Equity in net loss of joint ventures (Note 16) P=– P=– P=– (P=132,408) P=– (132,408)Market valuation gain on financial assets and liabilities at FVTPL (Note 8) P=– P=– P=– (P=35,424) P=– (35,424)Provision for credit and impairment losses (Notes 10, 11 and 15) (P=45,002) P=– P=– P=– P=– (45,002)Other expenses* (320,480)Income before income tax 11,544,880Provision for income tax (Note 32) (2,082,094)Net income P=9,462,786Other InformationTotal assets P=117,089,788 P=7,846,913 P=21,713,667 P=5,285,345 P=– P=151,935,713Total liabilities P=59,813,702 P=4,598,732 P=5,882,522 (P=2,352,722) P=– P=67,942,234Capital expenditures P=5,468,991 P=696,640 P=2,191,679 P=284,420 P=– P=8,641,730Non-cash expenses other than depreciation and amortization:
Credit and impairment losses on:Receivables (Note 10) (P=17,774) P=– P= P=– P=– (P=17,774)Property, plant and equipment (1,700) – – – – (1,700)Goodwill (Note 15) (17,580) – – – – (17,580)Inventories (Note 11) (7,948) – – – – (7,948)
(P=45,002) P=– P=– P=– P=– (P=45,002)* Include net foreign exchange losses and other revenues (expenses).

- 120 -
*SGVFS035342*
As of and for the year ended December 31, 2017Branded
Consumer Food Agro-IndustrialCommodity
FoodCorporateBusiness Eliminations Total
Sale of Goods and ServicesThird party P=103,095,968 P=10,110,653 P=11,801,203 P=− P=− P=125,007,824Inter-segment 15,303,639 122,304 6,189,868 − (21,615,811) −
P=118,399,607 P=10,232,957 P=17,991,071 P=− (P=21,615,811) P=125,007,824ResultEarnings before interest, income taxes and depreciation/amortization (EBITDA) P=16,608,493 P=2,178,990 P=3,930,971 (P=1,662,224) P=− P=21,056,230Depreciation and amortization (Note 27) (4,480,403) (398,721) (1,014,338) (210,601) − (6,104,063)Earnings before interest and income tax (EBIT) P=12,128,090 P=1,780,269 P=2,916,633 (P=1,872,825) P=− 14,952,167Finance revenue (Note 29) P=108,162 P=179 P=11,469 P=105,773 P=− 225,583Finance costs (Note 30) (P=1,298,675) (P=44,056) (P=51,249) (P=33,350) P=− (1,427,330)Equity in net loss of joint ventures (Note 16) P=− P=− P=− (P=280,533) P=− (280,533)Market valuation gain on financial assets and liabilities at FVPL (Note 8) P=− P=− P=− P=71,016 P=− 71,016Provision for credit and impairment losses (Notes 10 and 11) (P=21,423) P=− P=− P=− P=− (21,423)Other expenses* 430,927Income before income tax 13,950,407Provision for income tax (Note 32) (2,797,486)Net income P=11,152,921Other InformationTotal assets P=112,007,686 P=6,558,891 P=18,536,399 P=10,537,823 P=− P=147,640,799Total liabilities P=57,021,889 P=3,225,428 P=4,420,186 P=1,287,284 P=− P=65,954,787Capital expenditures P=4,436,763 P=761,141 P=2,630,024 P=301,744 P=− P=8,129,672Non-cash expenses other than depreciation and amortization:
Credit and impairment losses on:Receivables (Note 10) (P=18,553) P=− P=− P=− P=− (P=18,553)Inventories (Note 11) (2,870) − − − − (2,870)
(P=21,423) P=− P=− P=− P=− (P=21,423)* Include net foreign exchange losses and other revenues (expenses).

- 121 -
*SGVFS035342*
As of and for the three-month period ended December 31, 2016Branded
Consumer Food Agro-IndustrialCommodity
FoodCorporateBusiness Eliminations Total
Sale of Goods and ServicesThird party P=25,725,086 P=2,373,929 P=2,841,223 P=− P=− P=30,940,238Inter-segment 3,958,902 30,504 1,535,214 − (5,524,620) −
P=29,683,988 P=2,404,433 P=4,376,437 P=− (P=5,524,620) P=30,940,238ResultEarnings before interest, income taxes and depreciation/amortization (EBITDA) P=4,565,914 P=284,008 P=1,176,762 (P=433,796) P=− P=5,592,888Depreciation and amortization (Note 27) (1,092,811) (101,319) (256,427) (56,361) − (1,506,918)Earnings before interest and income tax (EBIT) P=3,473,103 P=182,689 P=920,335 (P=490,157) P=− 4,085,970Finance revenue (Note 29) P=17,690 P=65 P=16 P=32,177 P=− 49,948Finance costs (Note 30) (P=316,702) (P=7,809) (P=10,305) (P=3,775) P=− (338,591)Equity in net loss of joint ventures (Note 16) P=− P=− P=− (P=49,412) P=− (49,412)Market valuation gain on financial assets and liabilities at FVPL (Note 8) P=− P=− P=− (P=4,515) P=− (4,515)Provision for credit and impairment losses (Notes 10 and 11) (P=2,773) P=− P=− P=− P=− (2,773)Other expenses (523,514)Income before income tax 3,217,113Provision for income tax (Note 32) (767,495)Net income P=2,449,618Other InformationTotal assets P=107,420,050 P=5,484,690 P=16,888,975 P=12,871,692 P=− P=142,665,407Total liabilities P=54,849,692 P=3,528,691 P=4,192,196 P=1,245,573 P=− P=63,816,152Capital expenditures P=1,752,007 P=105,356 P=245,653 P=29,459 P=− P=2,132,475Non-cash expenses other than depreciation and amortization:
Credit and impairment losses on:Receivables (Note 10) P=2,102 P=− P=− P=− P=− P=2,102Inventories (Note 11) 671 − − − − 671
P=2,773 P=− P=− P=− P=− P=2,773

- 122 -
*SGVFS035342*
Inter-segment RevenuesInter-segment revenues are eliminated at the consolidation level.
Segment ResultsSegment results pertain to the net income (loss) of each of the operating segments excluding theamounts of market valuation gains and losses on financial assets at FVPL, foreign exchange gains andlosses and other revenues and expenses which are not allocated to operating segments.
Segment AssetsSegment assets are resources owned by each of the operating segments excluding significantinter-segment transactions.
Segment LiabilitiesSegment liabilities are obligations incurred by each of the operating segments excluding significantinter-segment transactions. The Group also reports to the chief operating decision maker thebreakdown of the short-term and long-term debts of each of the operating segments.
Capital ExpendituresThe components of capital expenditures reported to the chief operating decision maker are theadditions to investment property and property plant and equipment during the period.
Geographic InformationThe Group operates in the Philippines, Thailand, Malaysia, Indonesia, China, Hong Kong, Singapore,Vietnam, Myanmar, New Zealand and Australia.
The following table shows the distribution of the Group’s consolidated revenues to externalcustomers by geographical market, regardless of where the goods were produced:
December 31, 2018(One Year)
December 31, 2017(One Year)
December 31, 2016(Three Months)
(In Thousands)Domestic P=84,566,692 P=82,137,541 P=20,372,269Foreign 43,203,257 42,870,283 10,567,969
P=127,769,949 P=125,007,824 P=30,940,238
The Group has no customer which contributes 10% or more of the consolidated revenues of theGroup.
The table below shows the Group’s carrying amounts of noncurrent assets per geographic locationexcluding noncurrent financial assets, deferred tax assets and pension assets:
December 31, 2018 December 31, 2017 December 31, 2016(In Thousands)
Domestic P=33,507,048 P=30,500,080 P=27,795,757Foreign 63,757,555 63,175,218 62,227,710
P=97,264,603 P=93,675,298 P=90,023,467

- 123 -
*SGVFS035342*
7. Cash and Cash Equivalents
This account consists of:
2018 2017Cash on hand P=75,715,245 P=103,326,491Cash in banks (Note 34) 3,895,390,938 3,948,475,487Short-term investments (Note 34) 9,051,995,729 10,445,715,813
P=13,023,101,912 P=14,497,517,791
Cash in banks earn interest at the prevailing bank deposit rates. Short-term investments representmoney market placements that are made for varying periods depending on the immediate cashrequirements of the Group and earn interest ranging from 0.05% to 6.80%, from 0.05% to 6.50% andfrom 0.01% to 6.50% for foreign currency-denominated money market placements for the yearsended December 31, 2018 and 2017, and the three-month period ended December 31, 2016,respectively. Peso-denominated money market placements, on the other hand, earn interest rangingfrom 1.50% to 5.50%, from 1.20% to 3.40% and from 1.10% to 2.75% for the years endedDecember 31, 2018 and 2017, and the three-month period ended December 31, 2016.
Interest earned on cash and cash equivalents amounted to P=327.0 million, P=212.7 million andP=49.9 million for the years ended December 31, 2018 and 2017, and the three-month period endedDecember 31, 2016, respectively (see Note 29).
8. Financial Assets at Fair Value Through Profit or Loss
This account consists of investments held-for-trading amounting to P=420.2 million andP=455.6 million as of December 31, 2018 and 2017, respectively. Investments held-for-trading consistof quoted equity securities issued by certain domestic entities.
Market valuation on financial instruments at fair value though profit and loss amounted toP=35.4 million loss, P=71.0 million gain and P=4.5 million loss for the years ended December 31, 2018and 2017 and the three-month period ended December 31, 2016, respectively.
The Group received dividends from its quoted equity securities amounting to P=32.3 million,P=12.9 million and nil for the years ended December 31, 2018 and 2017 and for the three-monthperiod ended December 31, 2016, respectively (see Note 29).
9. Derivative Financial Instruments
Derivatives designated as accounting hedgeAs part of its asset and liability management, the Group uses derivatives, particularly currency option,as cash flow hedges in order to reduce its exposure to market risks.
The Group entered into currency options with a total notional amount of NZ$28.2 million and initialfair value of P=7.5 million. The Group recognized unrealized loss (presented under ‘Othercomprehensive income’) amounting to P=3.3 million and P=11.4 million for the years endedDecember 31, 2018 and 2017, and unrealized gain of P=19.2 million for the three-month period endedDecember 31, 2016 (see Note 23). The Group made a settlement of P=4.6 million in 2017 for therelated derivatives.

- 124 -
*SGVFS035342*
The Group’s currency options have a positive fair value of P=6.4 million and P=11.0 million as ofDecember 31, 2018 and 2017, respectively (see Note 12).
10. Receivables
This account consists of:
2018 2017Trade receivables (Note 34) P=12,230,562,667 P=13,851,205,174Non-trade receivables 980,754,057 871,056,230Due from related parties (Note 34) 845,801,629 1,396,239,630Advances to officers and employees 164,791,962 133,976,804Interest receivable (Note 34) 9,690,349 42,299,508Others 528,867,686 198,238,183
14,760,468,350 16,493,015,529Less allowance for credit losses 355,144,379 376,522,190
P=14,405,323,971 P=16,116,493,339
Allowance for Credit Losses on ReceivablesChanges in allowance for impairment losses on receivables follow:
2018
Individual AssessmentCollective
AssessmentTrade
ReceivablesOther
ReceivablesTrade
Receivables TotalBalances at beginning of the period P=153,990,523 P=208,970,376 P=13,561,291 P=376,522,190Provision for credit losses 12,194,872 − 5,579,236 17,774,108Others (39,151,919) – − (39,151,919)Balances at end of the period P=127,033,476 P=208,970,376 P=19,140,527 P=355,144,379
2017
Individual AssessmentCollective
AssessmentTrade
ReceivablesOther
ReceivablesTrade
Receivables TotalBalances at beginning of the period P=157,563,135 P=188,697,554 P=13,561,291 P=359,821,980Provision for credit losses 18,553,155 − − 18,553,155Others (22,125,767) 20,272,822 − (1,852,945)Balances at end of the period P=153,990,523 P=208,970,376 P=13,561,291 P=376,522,190
Allowance for credit losses on other receivables includes credit losses on nontrade receivables,advances to officers and employees and other receivables. Allowance for credit losses on advances toofficers and employees amounted to P=19.6 million as of December 31, 2018 and 2017. Allowancefor credit losses on other receivables amounted to P=189.3 million as of December 31, 2018 and 2017.

- 125 -
*SGVFS035342*
11. Inventories
This account consists of inventories at cost as follows:
2018 2017Raw materials P=8,573,783,243 P=6,639,193,504Finished goods 6,153,119,351 5,247,036,948Spare parts and supplies 4,140,804,017 3,720,707,970Containers and packaging materials 2,111,369,788 1,969,926,603Goods in-process 1,106,693,642 888,498,415
P=22,085,770,041 P=18,465,363,440
Under the terms of the agreements covering liabilities under trust receipts totaling P=6.0 billion andP=3.2 billion as of December 31, 2018 and 2017, respectively, certain inventories which approximatethe trust receipts payable, have been released to the Group under trust receipt agreement with thebanks. The Group is accountable to these banks for the trusteed merchandise or their sales proceeds.
Inventory obsolescence included in ‘Cost of sales’, amounted to P=749.0 million, P=638.4 million andP=185.2 million for the years ended December 31, 2018 and 2017, and the three-month period endedDecember 31, 2016, respectively.
The Group recognized impairment losses on its inventories amounting to P=7.9 million, P=2.9 millionand P=0.7 million for the years ended December 31, 2018 and 2017, and the three-month period endedDecember 31, 2016, respectively.
12. Other Current Assets
This account consists of:
2018 2017Input value-added tax (VAT) P=1,599,204,239 P=1,249,413,458Advances to suppliers 1,517,145,432 1,266,652,930Prepaid insurance 262,671,126 204,878,838Prepaid taxes 147,684,689 85,055,881Prepaid rent 42,096,258 51,421,481Derivatives designated as accounting hedge
(Note 9) 6,389,048 11,023,146Other prepaid expenses 158,474,713 118,940,363
P=3,733,665,505 P=2,987,386,097
Advances to suppliers include advance payments for the acquisition of raw materials, spare parts,packaging materials and other supplies. Also included in the account are advances made tocontractors related to construction activities. These are applied against progress billings which occurwithin one year from the date the advances arose.
Other prepaid expenses include prepayments of advertising and office supplies.

- 126 -
*SGVFS035342*
13. Property, Plant and Equipment
The rollforward of this account follows:
As of and for the year ended December 31, 2018
LandLand
ImprovementsBuildings and
ImprovementsMachinery and
Equipment Sub-totalCostBalance at beginning of year P=3,727,711,355 P=1,704,819,183 P=16,605,754,803 P=69,703,010,941 P=91,741,296,282Additions − 127,631,305 1,671,216,410 3,356,378,331 5,155,226,046Additions from acquisition of subsidiaries (Note 16) − − − 115,275,827 115,275,827Disposals, reclassifications and other adjustments 20,382,166 188,477,584 31,975,458 12,513,461 253,348,669Balance at end of year 3,748,093,521 2,020,928,072 18,308,946,671 73,187,178,560 97,265,146,824Accumulated Depreciation and AmortizationBalance at beginning of year − 670,717,018 7,516,009,094 46,464,498,911 54,651,225,023Depreciation and amortization (Note 27) − 84,943,231 806,054,484 4,610,183,001 5,501,180,716Disposals, reclassifications and other adjustments − (1,091,293) 55,980,784 (169,586,394) (114,696,903)Balance at end of year − 754,568,956 8,378,044,362 50,905,095,518 60,037,708,836Net Book Value P=3,748,093,521 P=1,266,359,116 P=9,930,902,309 P=22,282,083,042 P=37,227,437,988
As of and for the year ended December 31, 2018
TransportationEquipment
Furniture, Fixturesand Equipment
ConstructionIn-progress
EquipmentIn-transit Total
CostBalance at beginning of year P=2,476,588,603 P=4,868,933,076 P=5,882,128,787 P=3,169,822,628 P=108,138,769,376Additions 181,992,862 573,199,933 1,770,790,472 960,520,785 8,641,730,098Additions from acquisition of subsidiaries (Note 16) 2,021,293 274,742 55,718 − 117,627,580Disposals, reclassifications and other adjustments (15,587,527) (138,688,771) 179,648,506 739,815,612 1,018,536,489Balance at end of the year 2,645,015,231 5,303,718,980 7,832,623,483 4,870,159,025 117,916,663,543Accumulated Depreciation and AmortizationBalance at beginning of year 1,831,800,835 3,401,615,215 , , 59,884,641,073Depreciation and amortization (Note 27) 209,519,017 455,481,200 − − 6,166,180,933Disposals, reclassifications and other adjustments 20,166,049 10,056,125 − − (84,474,729)Balance at end of year 2,061,485,901 3,867,152,540 − − 65,966,347,277Net Book Value P=583,529,330 P=1,436,566,440 P=7,832,623,483 P=4,870,159,025 P=51,950,316,266

- 127 -
*SGVFS035342*
As of and for the year ended December 31, 2017
LandLand
ImprovementsBuildings andImprovements
Machinery andEquipment Sub-total
CostBalance at beginning of period P=3,431,016,024 P=1,640,367,292 P=15,715,575,721 P=66,093,113,234 P=86,880,072,271Additions 214,731,551 49,404,956 471,575,891 2,131,770,696 2,867,483,094Disposals, reclassifications and other adjustments 81,963,780 15,046,935 418,603,191 1,478,127,011 1,993,740,917Balance at end of period 3,727,711,355 1,704,819,183 16,605,754,803 69,703,010,941 91,741,296,282Accumulated Depreciation and AmortizationBalance at beginning of period − 578,902,619 6,514,023,632 42,194,166,937 49,287,093,188Depreciation and amortization (Note 27) − 84,419,460 751,947,125 4,408,672,415 5,245,039,000Disposals, reclassifications and other adjustments − 7,394,939 250,038,337 (138,340,441) 119,092,835Balance at end of period − 670,717,018 7,516,009,094 46,464,498,911 54,651,225,023Net Book Value P=3,727,711,355 P=1,034,102,165 P=9,089,745,709 P=23,238,512,030 P=37,090,071,259
As of and for the year ended December 31, 2017
TransportationEquipment
Furniture, Fixturesand Equipment
ConstructionIn-progress
EquipmentIn-transit Total
CostBalance at beginning of period P=2,370,685,859 P=4,089,123,064 P=3,504,041,899 P=1,794,350,119 P=98,638,273,212Additions 134,481,808 691,914,896 2,785,889,642 1,531,857,139 8,011,626,579Disposals, reclassifications and other adjustments (28,579,064) 87,895,116 (407,802,754) (156,384,630) 1,488,869,585Balance at end of the period 2,476,588,603 4,868,933,076 5,882,128,787 3,169,822,628 108,138,769,376Accumulated Depreciation and AmortizationBalance at beginning of period 1,637,136,526 2,706,625,749 , , 53,630,855,463Depreciation and amortization (Note 27) 196,356,912 475,586,168 , , 5,916,982,080Disposals, reclassifications and other adjustments (1,692,603) 219,403,298 − − 336,803,530Balance at end of period 1,831,800,835 3,401,615,215 − − 59,884,641,073Net Book Value P=644,787,768 P=1,467,317,861 P=5,882,128,787 P=3,169,822,628 P=48,254,128,303

- 128 -
*SGVFS035342*
In July 2018, CFC Corporation executed a Memorandum of Agreement and Deed of Absolute Salewith a related party, selling its parcel of land costing P=3.4 million at P=584.9 million sellingprice. Gain on disposal attributable to sale was P=581.5 million, which was recognized under ‘Otherincome (loss) - net’ in the consolidated statements of income.
In May 2017, Century Pacific Food Inc. (CNPF) entered into an asset purchase agreement with theParent Company to purchase the machineries and equipment used in manufacturing the Hunt’sbranded products for a total consideration of P=145.1 million, net of tax. As of date of sale, the netbook value of these assets amounted to P=28.1 million. The Group recognized gain on disposalamounting to P=117.0 million, under ‘Other income (loss) - net’ in the consolidated statements ofincome. The sale was completed on August 31, 2017.
CNPF also entered into a Compensation Agreement with the Parent Company to acquire theexclusive right to manufacture and sell Hunt’s branded products amounting to P=214.2 million whichthe Group recognized in the consolidated statements of income.
In January 2017, the Parent Company executed a Memorandum of Agreement and Deed of AbsoluteSale with a related party, selling its three parcels of land costing P=1.0 million for a total considerationof P=111.3 million. Gain on disposal attributable to the sale amounted to P=110.3 million, which wasrecognized under ‘Other income (loss) - net’ in the consolidated statements of income.
Borrowing CostsFor the years ended December 31, 2018 and 2017, and the three-month period endedDecember 31, 2016, no borrowing costs have been incurred related to property, plant and equipmentunder construction.
DepreciationThe breakdown of consolidated depreciation and amortization of property, plant and equipmentfollows:
December 31,2018
(One Year)
December 31,2017
(One Year)
December 31,2016
(Three Months)Cost of sales (Note 24) P=5,444,705,459 P=5,270,962,412 P=1,300,783,837Selling and distribution costs
(Note 25) 219,016,116 162,600,854 37,436,876General and administrative expenses
(Note 26) 502,459,358 483,418,814 116,437,087P=6,166,180,933 P=5,916,982,080 P=1,454,657,800
CollateralAs of December 31, 2018 and 2017, the Group has no property and equipment that are pledged ascollateral.

- 129 -
*SGVFS035342*
14. Biological Assets
Total biological assets shown in the consolidated statements of financial position follow:
2018 2017Current portion P=741,719,637 P=1,180,266,509Noncurrent portion 366,184,414 498,309,880
P=1,107,904,051 P=1,678,576,389
These biological assets consist of:
2018 2017Swine livestock
Commercial P=709,045,374 P=1,137,959,568Breeder 278,316,362 435,698,306
Poultry livestockCommercial 32,674,263 42,306,941Breeder 87,868,052 62,611,574
P=1,107,904,051 P=1,678,576,389
The rollforward analysis of this account follows:
2018 2017Balance at beginning of year P=1,678,576,389 P=1,383,379,248Additions 3,200,666,651 3,115,220,274Disposals (3,303,867,014) (2,938,864,205)Gain (loss) arising from changes in fair value
less estimated costs to sell (467,471,975) 118,841,072Balance at end of year P=1,107,904,051 P=1,678,576,389
The Group has 232,724 and 239,438 heads of swine livestock and 731,177 and 435,946 heads ofpoultry livestock as of December 31, 2018 and 2017, respectively.
15. Goodwill and Intangible Assets
The movements of goodwill follow:
2018 2017CostBalance at beginning and end of year P=31,460,215,108 P=31,460,215,108Accumulated impairment lossesBalance at beginning of year 248,139,704 248,139,704Additional impairment during the year 17,579,587 −Balance at end of year 265,719,291 248,139,704Net book value at end of year P=31,194,495,817 P=31,212,075,404

- 130 -
*SGVFS035342*
The Group’s goodwill pertains to the following:
2018 2017Acquisition of CSPL in September 2016 P=16,492,854,332 P=16,492,854,332Acquisition of NZSFHL in November 2014 13,913,396,261 13,913,396,261The excess of the acquisition cost over the
fair values of the net assets acquired byUABCL in 2000 775,835,598 775,835,598
Acquisition of Balayan Sugar Mill inFebruary 2016 12,409,626 12,409,626
Acquisition of Advanson in December 2007 − 17,579,587P=31,194,495,817 P=31,212,075,404
As of December 31, 2018, the goodwill from the acquisition of Advanson amounting to P=17.6 millionwas fully impaired.
The composition and movements of intangible assets follow:
As of and for the year ended December 31, 2018Trademarks/
BrandsProduct
FormulationSoftware
CostsCustomer
Relationship TotalCostBalances at beginning of period P=9,564,461,252 P=425,000,000 P=79,955,581 P=2,201,281,173 P=12,270,698,006Additions − − 11,234,200 − 11,234,200Disposal/others − − (12,411) − (12,411)
9,564,461,252 425,000,000 91,177,370 2,201,281,173 12,281,919,795Accumulated Amortization and
Impairment LossesBalances at beginning of period 201,524,581 − 60,900,396 198,236,997 460,661,974Amortization during the period
(Note 27) – – 17,973,401 78,862,555 96,835,956Disposal/others − − (626,217) (5,212,272) (5,838,489)
201,524,581 – 78,247,580 271,887,280 551,659,441Net Book Value at End of Period P=9,362,936,671 P=425,000,000 P=12,929,790 P=1,929,393,893 P=11,730,260,354
As of and for the year ended December 31, 2017Trademarks/
BrandsProduct
FormulationSoftware
CostsCustomer
Relationship TotalCostBalances at beginning of year P=9,564,461,252 P=425,000,000 P=73,812,234 P=2,201,281,173 P=12,264,554,659Additions − − 4,475,330 − 4,475,330Disposal/others − − 1,668,017 − 1,668,017
9,564,461,252 425,000,000 79,955,581 2,201,281,173 12,270,698,006Accumulated Amortization and
Impairment LossesBalances at beginning of year 201,524,581 − 40,904,256 118,520,921 360,949,758Amortization during the period
(Note 27) – – 19,404,935 77,381,982 96,786,917Disposal/others − − 591,205 2,334,094 2,925,299
201,524,581 – 60,900,396 198,236,997 460,661,974Net Book Value at End of Year P=9,362,936,671 P=425,000,000 P=19,055,185 P=2,003,044,176 P=11,810,036,032
Trademarks and product formulation were acquired from General Milling Corporation in 2008.Total intangible assets acquired from the acquisition of CSPL and NZSFHL in 2016 and 2014 werecomposed of brands of P=9.3 billion, customer relationships of P=2.2 billion and software costs ofP=56.3 million.

- 131 -
*SGVFS035342*
The Group performed its annual impairment test on its goodwill and other intangible assets withindefinite useful lives as of December 31, 2018 and 2017. The recoverable amounts of goodwill andother intangible assets were determined based on value in use calculations using cash flow projectionsfrom financial budgets approved by management covering a five-year period. The pre-tax discountrates applied to cash flow projections range from 7.80% to 10.80% and from 3.40% to 12.67% for theyears ended December 31, 2018 and 2017, respectively. The following assumptions were also usedin computing value in use:
Growth rate estimates - growth rates include long-term and terminal growth rates that are based onexperiences and strategies developed for the various subsidiaries. The prospect for the industry wasalso considered in estimating the growth rates. Growth rates used in computing the projected futurecash flows ranged from 2.0% to 12.1% as of December 31, 2018 and 2017.
Discount rates - discount rates were estimated based on the industry weighted average cost of capital,which includes the cost of equity and debt after considering the gearing ratio.
Management believes that no reasonably possible changes in any of the above key assumptions wouldcause the carrying values of goodwill and intangible assets arising from the Group’s acquisitions tomaterially exceed their recoverable amounts.
16. Investments in Joint Ventures
The rollforward analysis of this account follows:
2018 2017Acquisition CostBalance at beginning of year P=1,147,543,071 P=746,250,000Additional investments 324,341,074 401,293,071Reclassification to investment in subsidiaries
due to step-up acquisition (328,250,000) –Balance at end of year 1,143,634,145 1,147,543,071Accumulated Equity in Net EarningsBalance at beginning of year (596,122,551) (444,667,941)Equity in net losses during the year (132,407,965) (132,954,610)Dividends received – (18,500,000)Reclassification to investment in subsidiaries
due to step-up acquisition 105,478,327 −Balance at end of year (623,052,189) (596,122,551)Cumulative Translation Adjustments 335,553 805,768Net Book Value at End of Year P=520,917,509 P=552,226,288
Proper Snack Foods Ltd.On June 30, 2017, Griffins purchased 50.1% of the shares in Proper Snack Foods Ltd. (PSFL) (aNelson based business with the 49.9% shareholder being an individual) for a total consideration ofapproximately NZ$7.8 million (P=275.3 million), which includes deferred consideration amounting toNZ$1.5 million (P=51.5 million) recorded in the consolidated statement of financial position.

- 132 -
*SGVFS035342*
Vitasoy-URC, Inc.On October 4, 2016, the Parent Company entered into a joint venture agreement with VitaInternational Holdings Limited, a corporation duly organized in Hong Kong to form Vitasoy - URC(VURCI), a corporation duly incorporated and organized in the Philippines to manufacture anddistribute food products under the “Vitasoy” brand name, which is under exclusive license to VURCIin the Philippines.
On January 31, 2018, the Parent Company made an additional subscription to the unissued authorizedcapital stock of VURCI consisting of 29,000,000 common shares for a total cost of P=290.0 million.
On May 31, 2017, the Parent Company made additional subscriptions to the unissued authorizedcapital stock of VURCI consisting of 12,600,000 common shares for a total cost of P=126.0 million.
Danone Universal Robina Beverages, Inc.On May 23, 2014, the Parent Company entered into a joint venture agreement with Danone AsiaHoldings Pte. Ltd., a corporation duly organized in the Republic of Singapore to form DanoneUniversal Robina Beverages, Inc. (DURBI), a corporation duly incorporated and organized in thePhilippines to manufacture and distribute food products under the “B’lue” brand name, which isunder exclusive license to DURBI in the Philippines.
In 2018, the Parent Company made additional subscriptions to the unissued authorized capital stockof DURBI consisting of 5,000,000 common shares for a total cost of P=82.5 million. The capitalinfusion was not presented as additional investment but was applied to the 2017 excess of the share innet loss over the investment.
Equity in net losses in the 2017 consolidated statement of income amounting to P=280.5 millionincludes the excess of the share in net loss over the investment in DURBI amounting toP=147.6 million presented in ‘Other noncurrent liabilities.’
Calbee-URC, Inc.On January 17, 2014, the Parent Company entered into a joint venture agreement with Calbee, Inc., acorporation duly organized in Japan to form Calbee-URC, Inc. (CURCI), a corporation dulyincorporated and organized in the Philippines to manufacture and distribute food products under the“Calbee Jack ‘n Jill” brand name, which is under exclusive license to CURCI in the Philippines.
In September 2018, the Parent Company entered into a share purchase agreement with its jointventure partner, Calbee, Inc., to sell the latter’s 50% equity interest in CURCI for a totalconsideration of P=171.0 million, which approximates the fair values of identifiable net assetsacquired. The purchase of the additional 50% shares will allow the Parent Company to have fullcontrol of CURCI, consistent with its agenda of driving an aligned and scalable snacking categorygrowth. As a result of the sale, CURCI became a wholly-owned subsidiary of the Parent Company.
Calbee-URC MalaysiaOn August 23, 2017, URC Malaysia entered into a joint venture agreement with Calbee, Inc., acorporation duly organized in Japan to form Calbee-URC Malaysia Sdn Bhd (CURM), a corporationregistered with the Companies Commission of Malaysia organized to manufacture savoury snackproducts. Total consideration amounted to MYR2.7 million (P=34.3 million).

- 133 -
*SGVFS035342*
Hunt-Universal Robina CorporationThe Parent Company has an equity interest in Hunt-Universal Robina Corporation (HURC), adomestic joint venture which is a jointly controlled entity. HURC manufactures and distributes foodproducts under the “Hunt’s” brand name, which is under exclusive license to HURC in thePhilippines.
In 2017, the Parent Company entered into certain agreements with CNPF to sell its rights, title andinterest in the assets used in manufacturing the hunt’s business, as well as pre-termination of the rightto manufacture, sell and distribute Hunt’s products (see Note 13). Subsequent to the sale, HURCremains to exist as a jointly controlled entity.
On January 11, 2017, HURC’s BOD declared cash dividends amounting to P=13.20 per share tostockholders of record as of September 30, 2016. Total dividends declared amounted toP=37.0 million, which was paid on the third quarter of calendar year 2017.
In September 2018, the Parent Company entered into a share purchase agreement with its jointventure partner, ConAgra Grocery Products Company, LLC., to sell the latter’s 50% equity interest inHURC for a total consideration of P=3.2 million, which approximates the fair values of identifiable netassets acquired. A loss of P=55.6 million was recognized under “Other income (loss) - net” account inthe 2018 consolidated statement of income as a result of the remeasurement of the 50% previouslyheld interest in HURC. The acquisition of the HURC shares of ConAgra will result in the ParentCompany having full control of HURC and will allow URC to integrate and simplify its businessoperations as part of its Philippine business portfolio. As a result of the sale, HURC became awholly-owned subsidiary of URC.
As of December 31, 2018 and 2017, the Parent Company has the following percentage of ownershipof shares in its joint ventures and its related equity in the net assets are summarized below:
Place ofBusiness
Percentage of Ownership Equity in Net Assets (in MM)2018 2017 2018 2017
VURCI Philippines 50.00 50.00 P=199.0 P=31.6DURBI -do- 50.00 50.00 − −PSFL New Zealand 50.10 50.10 293.3 279.6CURM Malaysia 50.00 50.00 34.7 −HURC* Philippines 100.00 50.00 − 56.8CURCI* -do- 100.00 50.00 − 184.2
* No 2018 equity in net assets presented as both HURC and CURCI are subsidiaries of the Parent Company as of December 31, 2018
Summarized financial information in respect of the Group’s joint ventures as of December 31, 2018and 2017 are presented below (in thousands).
CURM DURBI VURCI PSFL HURC* CURCI*2018 2017 2018 2017 2018 2017 2018 2017 2017 2017
Current assets P=120,611 P=− P=427,870 P=248,267 P=577,131 P=255,324 P=113,092 P=83,147 P=326,815 P=513,301Noncurrent assets 9,637 − 10,940 13,022 550,599 3,692 586,249 563,253 7,221 141,918Current liabilities 60,946 − 789,169 555,490 729,019 195,816 79,672 46,160 218,504 285,425Noncurrent liabilities − − 3,440 2,271 − − 33,103 41,028 1,932 1,394Revenue 64,080 − 466,261 665,620 242,359 203,453 413,870 261,343 406,496 227,322Costs and expenses 63,837 − 717,032 904,293 496,388 403,949 387,001 240,617 444,998 330,374Net income (loss) (5,092) − (222,791) (239,234) (243,806) (198,798) 26,868 11,998 (36,159) (93,891)* No 2018 financial information presented as both HURC and CURCI are subsidiaries of the Parent Company as of December 31, 2018
The summarized financial information presented above represents amounts shown in the jointventures’ financial statements prepared in accordance with PFRSs.

- 134 -
*SGVFS035342*
The joint venture companies are private companies and there are no quoted prices available for theirshares.
The Group received dividends from its joint ventures amounting to P=18.5 million for the year endedDecember 31, 2017. No dividends were declared and received for the year ended December 31, 2018and for the three-month period ended December 31, 2016.
As of December 31, 2018 and 2017, there were no agreements entered into by the joint ventures thatmay restrict dividends and other capital distributions to be paid, or loans and advances to be made orrepaid to or from the Group. In addition, the Group has no share on commitments and contingenciesof its joint ventures.
Investments in SubsidiariesThe summarized financial information (before inter-company eliminations) of NURC, a subsidiarywith material non-controlling interest follows (in thousands):
2018 2017Current assets P=1,388,075 P=1,712,589Noncurrent assets 1,193,411 973,148Current liabilities 1,769,632 1,789,532Noncurrent liabilities 20,512 14,488Revenue 5,755,858 5,102,875Costs and expenses 4,935,042 4,334,291Net income 601,600 559,264
The equity interest held by non-controlling interest in NURC, a subsidiary with material non-controlling interest is 49.0% as of December 31, 2018 and 2017.
The accumulated non-controlling interest as of December 31, 2018 and 2017 amounted toP=202.3 million and P=282.8 million, respectively.
The profit allocated to non-controlling interest for the years ended December 31, 2018 and 2017, andthe three-month period ended December 31, 2016 amounted to P=258.5 million, P=264.8 million andP=47.5 million, respectively.
17. Other Noncurrent Assets
This account consists of:
2018 2017Deposits P=766,539,097 P=576,377,057Input VAT 634,328,645 666,011,121Financial assets at FVOCI 50,300,000 −AFS financial assets − 45,980,000Investment properties 36,384,879 45,288,139Pension asset (Note 31) 15,589,696 –Others 65,176,266 60,846,060
P=1,568,318,583 P=1,394,502,377

- 135 -
*SGVFS035342*
DepositsDeposits pertain to the Group’s deposits made in connection with the installation of power watermeters, deposits on returnable containers and security deposits for operating leases of plants,warehouses and office buildings.
Input VATInput tax pertains to VAT from purchases and/or importations of various parts, supplies, equipment,machineries and or capital goods, which will be claimed as credit against output tax liabilities in amanner prescribed by pertinent revenue regulations.
Financial Assets at FVOCI/AFS Financial AssetsAs of December 31, 2018 and 2017, financial assets at FVOCI/AFS financial assets consists of equitysecurities with the following movement:
2018 2017Balance at beginning of period P=45,980,000 P=43,030,000Changes in fair value during the period 4,320,000 2,950,000Balance at end of period P=50,300,000 P=45,980,000
Fair value changes of financial assets at FVOCI/AFS financial assets are presented as components of‘Other comprehensive income’ in Equity (see Note 23).
Investment PropertiesThe rollforward analysis of investment properties follows:
2018 2017CostBalance at beginning of period P=107,947,364 P=107,947,364Reclassification to property, plant and equipment (13,392,698) −Balance at end of period 94,554,666 107,947,364Accumulated depreciationBalance at beginning of period 62,659,225 59,001,439Depreciation (Notes 26 and 27) 3,286,562 3,657,786Reclassification to property, plant and equipment (7,776,000) −Balance at end of period 58,169,787 62,659,225Net book value at end of period P=36,384,879 P=45,288,139
The investment properties consist of buildings and building improvements which are leased out torelated and third parties (see Notes 34 and 36).
Total rental income earned from investment properties (included under ‘Other income (loss) - net’ inthe consolidated statements of income) amounted to P=61.2 million, P=57.9 million and P=19.2 millionfor years ended December 31, 2018 and 2017 and the three-month period ended December 31, 2016,respectively.
Direct operating expenses (included under ‘General and administrative expenses’ in the consolidatedstatements of income) arising from investment properties amounted to P=0.8 million for the yearsended December 31, 2018 and 2017, and nil for the three-month period ended December 31, 2016.

- 136 -
*SGVFS035342*
CollateralAs of December 31, 2018 and 2017, the Group has no investment properties that are pledged ascollateral.
18. Short-term Debts
This account consists of:
2018 2017Thai Baht denominated loans - unsecured with
interest ranging from 2.16% to 2.40% andfrom 2.10% to 2.25% for the years endedDecember 31, 2018 and 2017, respectively P=1,467,098,720 P=1,629,389,107
Peso-denominated loan - unsecured with interestof 5.55% 600,000,000 –
Malaysian Ringgit denominated loan -unsecured with interest at 4.62% and 4.43%for the years ended December 31, 2018 and2017, respectively 394,286,386 379,928,804
P=2,461,385,106 P=2,009,317,911
Accrued interest payable on the Group’s short-term debts (included under ‘Accounts payable andother accrued liabilities’ in the consolidated statements of financial position) amounted toP=5.7 million and P=2.4 million as of December 31, 2018 and 2017, respectively. Interest expense fromthe short-term debts amounted to P=134.9 million, P=66.6 million and P=14.0 million for the years endedDecember 31, 2018 and 2017, and the three-month period ended December 31, 2016, respectively(see Note 30).
19. Accounts Payable and Other Accrued Liabilities
This account consists of:
2018 2017Trade payables (Note 34) P=13,531,720,134 P=12,344,609,082Accrued expenses 7,159,227,021 7,532,671,219VAT payable 758,822,733 680,883,835Customers’ deposits 496,197,812 398,004,745Advances from stockholders (Note 34) 247,216,898 243,600,509Withholding taxes payable 236,709,093 186,762,222Due to related parties (Note 34) 164,624,582 106,452,798Others 172,241,254 78,134,146
P=22,766,759,527 P=21,571,118,556
Trade payables are noninterest-bearing and are normally settled on 30-60 day terms. Trade payablesarise from purchases of inventories which include raw materials and indirect materials(i.e., packaging materials) and supplies, for use in manufacturing and other operations.
Customers’ deposits represent downpayments for the sale of goods or performance of services whichwill be applied against accounts receivables upon delivery of goods or rendering of services.

- 137 -
*SGVFS035342*
The accrued expenses account consists of:
2018 2017Advertising and promotions P=3,988,888,494 P=4,656,850,277Personnel costs 958,392,371 1,006,743,561Freight and handling costs 341,656,474 251,248,221Utilities 335,649,820 296,217,865Contracted services 278,581,376 384,401,569Rent 252,144,351 366,344,003Professional and legal fees 121,959,369 9,056,533Others 881,954,766 561,809,190
P=7,159,227,021 P=7,532,671,219
Customers’ deposits represent downpayments for the sale of goods or performance of services whichwill be applied against accounts receivables upon delivery of goods or rendering of services.
Accrued professional and legal fees include fees or services rendered by third party consultants forthe review of the Group's brand portfolio in 2018. The related expense recognized under 'Otherincome (expense) - net' in the 2018 consolidated statement of income amounted to P=341.5 million.
Others include accruals for taxes and licenses, interest expense and other benefits.
20. Long-term Debts
This account consists of:
2018 2017
Principal
Unamortizeddebt issuance
cost Net Principal
Unamortizeddebt issuance
cost NetURC AU FinCo Loan P=17,922,355,336 P=179,697,514 P=17,742,657,822 P=18,772,656,535 P=250,622,686 P=18,522,033,849URC NZ FinCo Loan 13,924,974,927 210,508,867 13,714,466,060 14,808,699,804 104,771,265 14,703,928,539
P=31,847,330,263 P=390,206,381 P=31,457,123,882 P=33,581,356,339 P=355,393,951 P=33,225,962,388
URC AU FinCo Loan due 2021On September 30, 2016, URC AU FinCo entered into a syndicated term loan facility agreementguaranteed by the Parent Company payable in five years, amounting to AU$484.2 million(P=17.9 billion), with various banks for payment of acquisition costs and to refinance certainindebtedness of an acquired company, CSPL. The loan obtained bears a market interest rate plus acertain spread, payable quarterly, maturing on September 30, 2021.
URC NZ FinCo NZ$395 Million Term Loan due 2023On October 22, 2018, URC NZ FinCo entered into a term loan facility agreement guaranteed by theParent Company payable in five years, amounting to NZ$395.0 million (P=14.4 billion), with variousbanks for payment of the NZ$420 million term loan due in 2019. The loan obtained bears a marketinterest rate plus a certain spread, payable quarterly, and maturing on October 22, 2023.
URC NZ FinCo NZ$420 Million Term Loan due 2019On November 13, 2014, URC NZ FinCo entered into a term loan facility agreement guaranteed bythe Parent Company payable in five years, amounting to NZ$420.0 million (P=12.6 billion), withvarious banks for payment of acquisition costs and to refinance certain indebtedness of an acquired

- 138 -
*SGVFS035342*
company, NZSFHL. The loan obtained bears a market interest rate plus a certain spread, payablequarterly, and maturing on November 13, 2019.
In October 2018, URC NZ FinCo prepaid its 5-year term loan under Clause 7.1 of the underlyingFacility Agreement at face value plus accrued interest. Total payment amounted to NZ$423.8 million(approximately P=15.5 billion), which includes accrued interest. The prepayment resulted in therecognition of the unamortized debt issue costs of US$1.7 million (approximately P=61.6 million) asexpense presented under ‘Finance costs’ which represents the difference between the settlementamount and the carrying value of the loan at the time of settlement (see Note 30).
These long-term loans have no collateral but are all guaranteed by the Parent Company.
For the URC NZ FinCo and URC AU FinCo loans, the Group is required to maintain consolidateddebt to equity ratio of not greater than 2.5 to 1.0. The Group has complied with all of its debtcovenants as of December 31, 2018 and 2017.
21. Other Noncurrent Liabilities
This account consists of:
2018 2017Net pension liability (Note 31) P=21,967,651 P=170,807,825Miscellaneous (Note 16) 265,889,830 296,938,666
P=287,857,481 P=467,746,491
Miscellaneous includes asset retirement obligation and other noncurrent liabilities.
Asset retirement obligation arises from obligations to restore the leased manufacturing sites,warehouses and offices of CSPL at the end of the respective lease terms. These provisions arecalculated as the present value of the estimated expenditures required to remove any leaseholdimprovements. These costs are currently capitalized as part of the cost of the plant and equipmentand are amortized over the shorter of the lease term and the useful life of assets.
As of December 31, 2018 and 2017, the carrying value of asset retirement obligation amounted toP=91.3 million and P=94.7 million, respectively. The amortization of this asset retirement obligation(included under ‘Finance costs’ in the consolidated statement of income) amounted to P=3.5 million,P=3.4 million and P=0.5 million for the years ended December 31, 2018 and 2017, and the three monthsperiod ended December 31, 2016, respectively (see Note 30).

- 139 -
*SGVFS035342*
22. Equity
The details of the Parent Company’s common stock as of December 31, 2018 and 2017 follows:
2018 2017Authorized shares 2,998,000,000 2,998,000,000Par value per share P=1.00 P=1.00Issued shares:
Balance at beginning of year 2,227,638,933 2,227,638,933Issuance during the year 2,521,257 −Balance at end of year 2,230,160,190 2,227,638,933
Outstanding shares 2,204,161,868 2,204,161,868
The paid-up capital of the Parent Company consists of the following:
2018 2017Common stock P=2,230,160,190 P=2,227,638,933Additional paid-in capital 21,191,974,542 20,856,143,110Total paid-up capital P=23,422,134,732 P=23,083,782,043
Capital ManagementThe primary objective of the Group’s capital management is to ensure that it maintains healthy capitalratios in order to support its business and maximize shareholder value. The Group manages itscapital structure and makes adjustments to these ratios in light of changes in economic conditions andthe risk characteristics of its activities. In order to maintain or adjust the capital structure, the Groupmay adjust the amount of dividend payment to shareholders, return capital structure or issue capitalsecurities. No changes have been made in the objective, policies and processes as they have beenapplied in previous years.
The Group monitors its use of capital structure using a debt-to-capital ratio which is gross debtdivided by total capital. The Group includes within gross debt all interest-bearing loans andborrowings, while capital represents total equity.
Following is a computation of the Group’s debt-to-capital ratio:
December 31,2018
December 31,2017
December 31,2016
(a) Short-term debts (Note 18) P=2,461,385,106 P=2,009,317,911 P=1,431,890,655Trust receipts payable (Note 11) 6,019,613,469 3,155,187,680 4,554,101,456Long-term debts (Note 20) 31,457,123,882 33,225,962,388 31,366,592,785
P=39,938,122,457 P=38,390,467,979 P=37,352,584,896(b) Capital P=83,993,479,270 P=81,686,012,597 P=78,849,254,753(c) Debt-to-capital ratio (a/b) 0.48:1 0.47:1 0.47:1
The Group’s policy is to not exceed a debt-to-capital ratio of 2:1. The Group considers its totalequity as capital.

- 140 -
*SGVFS035342*
Cumulative Redeemable Preferred SharesThe Group’s authorized preferred shares of stock are 12.00% cumulative, nonparticipating, andnonvoting. In case of dissolution and liquidation of the Parent Company, the holders of the preferredshares shall be entitled to be paid an amount equal to the par value of the shares or ratably insofar asthe assets of the Parent Company may warrant, plus accrued and unpaid dividends thereon, if any,before the holders of the common shares of stock can be paid their liquidating dividends. Theauthorized preferred stock is 2,000,000 shares at par value of P=1.00 per share. There have been noissuances of preferred stock as of December 31, 2018 and 2017.
Retained EarningsAccumulated equity in net earnings of the subsidiariesA portion of the Group’s retained earnings corresponding to the undistributed net earnings of thesubsidiaries and joint ventures amounting to P=53.2 billion and P=49.9 billion as of December 31, 2018and 2017, respectively, is not available for dividend declaration. This becomes available for dividenddeclaration upon dividend distribution by the investees.
DividendsDetails of the Group’s dividend declarations follow:
Parent Company
Year Date of declarationDividendper share Total dividends Date of record Date of payment
2018 February 5, 2018 P=3.15 P=6.9 billion February 26, 2018 March 22, 20182017 February 15, 2017 P=3.15 P=6.9 billion March 1, 2017 March 27, 20172016 February 9, 2016 P=3.15 P=6.9 billion February 29, 2016 March 28, 2016
On February 28, 2019, the Parent Company’s BOD declared regular cash dividends amounting toP=1.50 per share to stockholders of record as of March 14, 2019. On the same date, the ParentCompany’s BOD declared special cash dividends amounting to P=1.65 per share to stockholders ofrecord as of July 1, 2019. Total dividends declared amounted to P=6.9 billion. On March 28, 2019,the regular cash dividend was paid amounting to P=3.3 billion.
NURCOn March 23, 2018, NURC’s BOD approved the declaration of cash dividends amounting toP=690.00 million (P=3.65 per share) to stockholders of record as of December 31, 2017 payable on orbefore September 30, 2018.
There were no dividend declarations and dividend payments to stockholders of NURC for the yearended December 31, 2017. For the year ended December 31, 2016:
Year Date of declarationDividendper share Total dividends Date of record Date of payment
2016 December 22, 2016 P=1.06 P=200.0 million September 30, 2016 March 30, 20172016 December 22, 2016 P=1.40 P=265.0 million September 30, 2016 September 30, 2017
The Group intends to maintain an annual cash dividend payment ratio of 50.0% of the Group’sconsolidated net income from the preceding fiscal year, subject to the requirements of the applicablelaws and regulations and the absence of circumstances which may restrict the payment of suchdividends. The BOD may, at any time, modify such dividend payment ratio.

- 141 -
*SGVFS035342*
Appropriation of retained earningsOn December 18, 2018, the BOD approved the reversal of the appropriation of retained earnings inthe aggregate amount of P=2.5 billion, which was approved by the BOD in its resolutions adopted onSeptember 27, 2016 and December 15, 2017.
On December 15, 2017, the BOD approved the additional appropriation of retained earningsamounting to P=1.5 billion for capital expenditure commitments to expand capacities in the snackfoods and beverage businesses across branded consumer food operations, which are expected to becompleted within the next two years.
On September 27, 2016, the BOD approved the reversal of appropriated retained earnings amountingto P=1.0 billion, which was used to fund the completion of various snack foods and beverage businessprojects across branded foods group. On the same date, the BOD approved the additionalappropriation of retained earnings amounting to P=2.0 billion for capital expenditure commitments toexpand capacities across branded consumer and commodity foods businesses, which are expected tobe completed within the next two years.
Treasury SharesUnder the Articles and Plan of Merger of CCPI with and into the Parent Company which wasapproved by the SEC on April 24, 2018, the Parent Company has issued 2,521,257 common shares tothe stockholders of CCPI. Since CCPI is a wholly-owned subsidiary of URC, these issued shareswere consequently classified as treasury shares amounting to P=338.4 million.
On September 27, 2016, the Parent Company’s BOD approved the sale of 22.7 million commonshares previously held as treasury shares by way of block sale at a selling price of P=193.45 per share,with a total gross selling proceeds amounting to P=4.4 billion. The net cash proceeds amounting toP=4.4 billion is net of transaction costs incurred amounting to P=27.2 million. The proceeds of the saidsale was used in relation to the acquisition of CSPL. The excess of the total consideration receivedover the cost amounting to P=4.1 billion was treated as additional paid-in capital.
The Parent Company has outstanding treasury shares of 26.0 million shares (P=679.5 million) and23.5 million shares (P=341.1 million) as of December 31, 2018 and 2017, respectively, restricting theParent Company from declaring an equivalent amount from unappropriated retained earnings asdividends.
Equity ReserveIn December 2014, URC entered into a share purchase agreement with Nissin Foods (Asia) Pte. Ltd.to sell 14.0% of its equity interest in NURC for a total consideration of P=506.7 million. As a result ofthe sale, the equity interest of URC changed from 65.0% to 51.0%. The excess of the considerationreceived over the carrying amount of the equity transferred to NCI amounting to P=481.1 million ispresented under “Equity reserve” in the consolidated statements of financial position.
In August 2012, the Parent Company acquired 23.0 million common shares of URCICL fromInternational Horizons Investment Ltd for P=7.2 billion. The acquisition of shares represented theremaining 23.00% interest in URCICL. As a result of the acquisition, the Parent Company now holds100.00% interest in URCICL. The Group charged equity reserve from the acquisition amounting toabout P=5.6 billion presented under “Equity reserve” in the consolidated statements of financialposition.

- 142 -
*SGVFS035342*
Record of Registration of Securities with SECSummarized below is the Parent Company’s track record of registration of securities under the Securities Registration Code:
Authorized Issued andNo. of shares Par Offer number of Outstanding
Date of offering Type of offering offered value price shares Shares
February 17, 1994 Registration of authorized capital stock – P=1.00 P=–1,998,000,000
common shares –2,000,000
preferred shares
February 23, 1994 Initial public offeringSubscribed and fully paid common 929,890,908 1.00 1.00 – 929,890,908
sharesNew common shares 309,963,636 1.00 21.06 – 309,963,636
July 21, 1995 20.00% stock dividend 247,970,907 – – – 247,970,907
October 15, 2001 10.00% stock dividend 148,782,542 – – – 148,782,542
June 20, 2003 Property-for-share swap [theParent Company shares inexchange for property ofRobinsons SupermarketCorporation (RSC)] 49,871,556 – – – 49,871,556
December 16, 2005 Increase in authorized capital stock – – – 1,000,000,000 252,971,932(payment by way of 15.00% common sharesstock dividend)
(Forward)

- 143 -
*SGVFS035342*
Authorized Issued andNo. of shares Par Offer number of Outstanding
Date of offering Type of offering offered value price shares SharesFebruary 7, 2006 New share offering for common
shares:a. Primary shares 282,400,000 P=1.00 P=17.00 – 282,400,000b. Secondary shares 352,382,600c. Over-allotment shares 95,217,400
November 14, 2007 Acquisition of Parent Company’s – – – – (75,104,200)to October 20, 2008 shares under the share buy-back
program
April 21, 2009 Issuance of shares to JGSHI – – – – 5,787,452
December 8, 2009 Acquisition of Parent Company’sto January 27, 2011 shares under the share buy-back
program – – – – (91,032,800)
June 14, 2012 Sale of treasury shares – – – – 120,000,000
September 30, 2016 Sale of treasury shares , , , , 22,659,935
April 24, 2018 Issuance of shares to stockholders – – – – 2,521,257
April 24, 2018 Re-purchase of shares issued to stockholders – – – – (2,521,257)
2,204,161,868

- 144 -
*SGVFS035342*
The table below provides information regarding the number of stockholders of the Parent Company:
December 31,2018
December 31,2017
December 31,2016
Common shares 1,012 1,017 1,026
23. Components of Other Comprehensive Income
The breakdown and movement of other comprehensive income attributable to equity holders of theParent Company follows:
December 31, 2018(One Year)
December 31, 2017(One Year)
December 31, 2016(Three Months)
Items to be reclassified to profit or loss in subsequentperiods, net of tax:Cumulative translation adjustments P=2,480,952,279 P=850,642,705 P=2,242,967,597
Net unrealized gain on AFS financial assetsBalance at beginning of period 24,260,000 21,310,000 20,110,000Reclassification due to PFRS 9 (24,260,000) − −
Change in fair value during the period (Note 17) − 2,950,000 1,200,000
Balance at end of period − 24,260,000 21,310,000Net unrealized gain (loss) on cash flow hedges:
Balance at beginning of period 7,936,673 19,296,332 99,522Change in fair value during the period
(Note 9) (3,336,554) (11,359,659) 19,196,810Balance at end of period 4,600,119 7,936,673 19,296,332
2,485,552,398 882,839,378 2,283,573,929Item not to be reclassified to profit or loss in
subsequent periods:Net unrealized gain on financial assets at FVOCI
Reclassification due to PFRS 9 24,260,000 − − Change in fair value during the period
(Note 17) 4,320,000 − −Balance at end of period 28,580,000 − −
Remeasurement losses on defined benefitPlans, gross of tax:
Balance at beginning of period (558,125,366) (594,056,733) (786,152,049) Remeasurement gains on defined
benefit plans during the period (Note 31) 301,602,694 35,931,367 192,095,316Balance at end of period (256,522,672) (558,125,366) (594,056,733)Income tax effect 76,956,802 167,437,610 178,217,020Balance at end of period (179,565,870) (390,687,756) (415,839,713)
(150,985,870) (390,687,756) (415,839,713)P=2,334,566,528 P=492,151,622 P=1,867,734,216
The Group does not recognize income tax on cumulative translation adjustments.

- 145 -
*SGVFS035342*
The breakdown and movement of other comprehensive income attributable to non-controllinginterests follows:
December 31, 2018(One Year)
December 31, 2017(One Year)
December 31, 2016(Three Months)
Item not to be reclassified to profit or loss insubsequent periods:
Remeasurement losses on defined benefitPlans, gross of tax:Balance at beginning of period (P=953,725) (P=4,566,566) (P=4,566,566)
Remeasurement gain on definedbenefit plans during the period (Note 31) (1,383,227) 3,612,841 –
Balance at end of period (2,336,952) (953,725) (4,566,566)Income tax effect 701,086 286,118 1,369,970
(P=1,635,866) (P=667,607) (P=3,196,596)
24. Sale of Goods and Services/Cost of Sales
Sale of goods and services include revenue from tolling services amounting to P=241.8 million,P=179.8 million and P=35.6 million for the years ended December 31, 2018 and 2017, and the three-month period ended December 31, 2016, respectively.
Cost of sales account consists of:
December 31, 2018(One Year)
December 31, 2017(One Year)
December 31, 2016(Three Months)
Raw materials used P=61,935,144,153 P=58,991,536,243 P=14,179,507,687Direct labor 6,229,393,398 5,788,350,160 1,298,162,777Overhead costs 23,292,309,420 20,862,774,466 5,495,527,685Total manufacturing costs 91,456,846,971 85,642,660,869 20,973,198,149Goods in-process (218,195,227) 3,638,910 25,170,993Cost of goods manufactured 91,238,651,744 85,646,299,779 20,998,369,142Finished goods (906,082,403) 47,055,455 145,011,251
P=90,332,569,341 P=85,693,355,234 P=21,143,380,393
The Group’s raw materials used include raw materials and container and packaging materialsinventory.
Overhead costs are broken down as follows:
December 31, 2018(One Year)
December 31, 2017(One Year)
December 31, 2016(Three Months)
Utilities P=7,898,234,689 P=7,576,345,534 P=2,143,711,872Depreciation and amortization (Note 27) 5,548,177,852 5,377,003,923 1,333,371,293Personnel expenses (Note 28) 3,344,085,895 3,112,919,756 693,833,436Repairs and maintenance 2,943,488,316 2,548,246,214 767,279,515Security and other contracted services 722,503,684 649,866,606 152,542,298Rental expense 523,104,472 513,373,944 123,876,139Insurance 192,985,628 198,832,730 53,887,701Handling and delivery charges 176,880,414 185,825,028 43,430,837Research and development 86,766,264 82,323,639 23,745,975Others 1,856,082,206 618,037,092 159,848,619
P=23,292,309,420 P=20,862,774,466 P=5,495,527,685
Others include excise taxes amounting to P=1.2 billion for the year ended December 31, 2018 and nilfor the year ended December 31, 2017 and three-month period ended December 31, 2016.

- 146 -
*SGVFS035342*
25. Selling and Distribution Costs
This account consists of:
December 31, 2018(One Year)
December 31, 2017(One Year)
December 31, 2016(Three Months)
Freight and other selling expenses P=8,640,063,341 P=8,836,677,237 P=2,030,121,733Advertising and promotions 7,105,834,748 7,602,693,478 1,793,559,907Personnel expenses (Note 28) 2,475,786,677 2,333,202,923 593,189,775Depreciation and amortization (Note 27) 219,016,116 239,982,836 56,195,739Repairs and maintenance 131,244,077 96,269,637 28,527,609Others 147,613,894 142,050,101 40,188,364
P=18,719,558,853 P=19,250,876,212 P=4,541,783,127
26. General and Administrative Expenses
This account consists of:
December 31, 2018(One Year)
December 31, 2017(One Year)
December 31, 2016(Three Months)
Personnel expenses (Note 28) P=2,882,430,173 P=2,946,018,579 P=626,564,581Depreciation and amortization (Note 27) 602,581,876 487,076,600 117,351,532Security and contractual services 285,204,116 263,010,037 30,137,131Taxes, licenses and fees 256,080,911 245,171,407 30,797,104Repairs and maintenance 243,392,263 142,522,762 51,275,075Rental expense (Note 36) 236,787,812 214,483,196 68,745,299Professional and legal fees 217,085,528 201,415,585 93,634,485Travel and transportation 150,412,629 160,850,872 35,127,969Communication 122,195,855 140,911,147 25,701,864Utilities 60,836,183 57,251,993 17,512,494Stationery and office supplies 30,784,674 29,591,597 8,955,946Donations and contributions 29,603,765 7,233,729 2,009,503Others 219,812,560 215,888,303 61,290,863
P=5,337,208,345 P=5,111,425,807 P=1,169,103,846
Others expenses include insurance, memberships, and representation and entertainment related togeneral and administrative functions.
27. Depreciation and Amortization
The breakdown of consolidated depreciation and amortization follows:
December 31, 2018(One Year)
December 31, 2017(One Year)
December 31, 2016(Three Months)
Cost of sales (Notes 13 and 24) P=5,548,177,852 P=5,377,003,923 P=1,333,371,293Selling and distribution costs
(Notes 13 and 25) 219,016,116 239,982,836 56,195,739General and administrative expenses
(Notes 13, 15, 17 and 26) 602,581,876 487,076,600 117,351,532P=6,369,775,844 P=6,104,063,359 P=1,506,918,564

- 147 -
*SGVFS035342*
28. Personnel Expenses
This account consists of:
December 31, 2018(One Year)
December 31, 2017(One Year)
December 31, 2016(Three Months)
Salaries and wages P=6,278,052,294 P=5,902,127,792 P=1,391,539,768Other employee benefits 2,247,665,666 2,322,941,873 476,834,683Pension expense (Note 31) 176,584,785 167,071,593 45,213,341
P=8,702,302,745 P=8,392,141,258 P=1,913,587,792
The breakdown of personnel expenses follows:
December 31, 2018(One Year)
December 31, 2017(One Year)
December 31, 2016(Three Months)
Cost of sales (Note 24) P=3,344,085,895 P=3,112,919,756 P=693,833,436Selling and distribution costs (Note 25) 2,475,786,677 2,333,202,923 593,189,775General and administrative expenses (Note 26) 2,882,430,173 2,946,018,579 626,564,581
P=8,702,302,745 P=8,392,141,258 P=1,913,587,792
29. Finance Revenue
This account consists of:
December 31, 2018(One Year)
December 31, 2017(One Year)
December 31, 2016(Three Months)
Bank interest income (Note 7) P=326,978,321 P=212,661,705 P=49,947,558Dividend income (Note 8) 32,302,870 12,921,148 −
P=359,281,191 P=225,582,853 P=49,947,558
30. Finance Costs
This account consists of finance costs arising from:
December 31, 2018(One Year)
December 31, 2017(One Year)
December 31, 2016(Three Months)
Long-term debts (Note 20) P=1,354,936,980 P=1,239,928,198 P=274,309,463Short-term debts (Note 18) 134,922,658 66,560,687 13,967,106Net interest on net pension liability
(Note 31) 8,751,555 9,068,871 3,285,987Others (Notes 20 and 21) 163,089,200 111,772,070 47,028,764
P=1,661,700,393 P=1,427,329,826 P=338,591,320
Others include unamortized debt issue costs recognized as expense on pretermination of NZD loan,interests incurred on liabilities under trust receipts, amortization of asset retirement obligation andother financing charges.

- 148 -
*SGVFS035342*
31. Pension Costs
The Group has a funded, noncontributory defined benefit retirement plan covering all its employees.The pension funds are being administered and managed through JG Summit Multi-EmployerRetirement Plan, with Robinsons Bank Corporation (RBC) as Trustee. The plan provides forretirement, separation, disability and death benefits to its members. The Group, however, reservesthe right to discontinue, suspend or change the rates and amounts of its contributions at any time onaccount of business necessity or adverse economic conditions. The retirement plan has an ExecutiveRetirement Committee that is mandated to approve the plan, trust agreement, investment plan,including any amendments or modifications thereto, and other activities of the Plan. Certainmembers of the BOD of the Ultimate Parent Company are represented in the Executive RetirementCommittee. RBC manages the funds based on the mandate as defined in the trust agreement.
Under the existing regulatory framework, Republic Act (RA) 7641, the Philippine Retirement PayLaw, requires a provision for retirement pay to qualified private sector employees in the absence ofany retirement plan in the entity, provided however that the employee’s retirement benefits under anycollective bargaining and other agreements shall not be less than those provided under law. The lawdoes not require minimum funding of the plan. The Parent Company and all of its subsidiaries meetthe minimum retirement benefit under RA 7641.
Net pension asset (liability) included in the consolidated statements of financial position follow:
2018 2017Pension asset (Note 17) P=15,589,696 P=–Pension liability (Note 21) (21,967,651) (170,807,825)
(P=6,377,955) (P=170,807,825)

- 149 -
*SGVFS035342*
Changes in net defined benefit liability of funded funds of the Group are as follows:
2018Net benefit cost in consolidated statements of income Remeasurements in other comprehensive income
January 1,2018
Currentservice cost
(Note 28)Finance cost
(Note 30) Subtotal Benefits paid
Return onplan assets(excluding
amountincluded innet interest
cost)
Actuarialchanges
arising fromchanges inexperience
adjustments
Actuarialchanges
arising fromdemographicassumptions
Actuarialchanges
arising fromchanges in
financialassumptions Subtotal Contributions
Asset andLiabilitiesAcquired
December 31,2018
Present value of definedbenefit obligation P=2,250,032,759 P=176,584,785 P=121,634,967 P=298,219,752 (P=145,747,035) P=− (P=62,574,266) P=466,322 (P=283,129,138) (P=345,237,082) (P=213,268) P=3,551,880 P=2,060,607,006
Fair value of plan assets (2,079,224,934) – (112,883,412) (112,883,412) 145,747,035 45,017,615 – – – 45,017,615 (51,363,797) (1,521,558) (2,054,229,051)P=170,807,825 P=176,584,785 P=8,751,555 P=185,336,340 P=− P=45,017,615 (P=62,574,266) P=466,322 (P=283,129,138) (P=300,219,467) (P=51,577,065) P=2,030,322 P=6,377,955
2017Net benefit cost in consolidated statements of income Remeasurements in other comprehensive income
January 1,2017
Currentservice cost
(Note 28)Finance cost
(Note 30) Subtotal Benefits paid
Return onplan assets(excluding
amountincluded innet interest
cost)
Actuarialchanges
arising fromchanges inexperience
adjustments
Actuarialchanges
arising fromdemographicassumptions
Actuarialchanges
arising fromchanges in
financialassumptions Subtotal Contributions
Asset andLiabilitiesAcquired
December 31,2017
Present value of definedbenefit obligation P=2,268,007,023 P=167,071,593 P=114,314,355 P=281,385,948 (P=269,870,853) P=− P=30,095,758 P=29,621,518 (P=89,206,635) (P=29,489,359) P=− P=– P=2,250,032,759
Fair value of plan assets (2,100,343,966) − (105,245,484) (105,245,484) 269,870,853 (10,054,849) − − − (10,054,849) (133,451,488) – (2,079,224,934)P=167,663,057 P=167,071,593 P=9,068,871 P=176,140,464 P=− (P=10,054,849) P=30,095,758 P=29,621,518 (P=89,206,635) (P=39,544,208) (P=133,451,488) P=– P=170,807,825

- 150 -
*SGVFS035342*
The fair value of net plan assets of the Group by each classes as at the end of the reporting period areas follows:
2018 2017AssetsCash and cash equivalents (Note 34) P=445,167,836 P=661,849,930Loans receivable 240,570,000 −Financial assets at FVOCI 872,101,658 –AFS investments – 379,861,432Investments at amortized cost 336,285,640 −HTM investments − 887,146,600Interest receivable 16,307,541 7,135,297Prepaid taxes 759,980 197,391Land 143,201,000 143,201,000
2,054,393,655 2,079,391,650LiabilitiesAccrued trust and management fees 164,603 166,716
P=2,054,229,052 P=2,079,224,934
The costs of defined benefit pension plan as well as the present value of the pension obligation aredetermined using actuarial valuations. The actuarial valuation involves making various assumptions.The principal assumptions used in determining pension for defined benefit plans are as follows:
Parent Company NURC HURC CCPI2018 2017 2018 2017 2018 2017 2018 2017
Discount rate 7.33% 5.71% 7.31% 5.76% 7.40% – – 5.23%Salary increase 5.70% 5.70% 5.70% 5.70% 5.70% – – 5.70%
The overall expected rate of return on assets is determined based on the market expectation prevailingon that date, applicable to the period over which the obligation is to be settled.
The sensitivity analysis below has been determined based on reasonably possible changes of eachsignificant assumption on the defined benefit obligation as of the reporting period, assuming all otherassumptions were held constant:
Parent Company NURC HURC CCPIIncrease
(Decrease) 2018 2017 2018 2017 2018 2017 2018 2017Discount rate 1.00% (P=143,013,836) (P=167,993,526) (P=2,452,824) (P=2,635,011) (P=328,428) P=– P=– (P=2,836,472)
(1.00%) 163,812,150 194,071,843 2,798,885 3,078,561 390,430 – – 3,446,967
Salary increase 1.00% 177,988,158 206,528,263 3,022,258 3,246,644 419,502 – – 3,564,423(1.00%) (157,768,850) (181,862,773) (2,688,918) (2,824,060) (357,295) – – (2,982,661)
The Group expects to contribute P=170.5 million in the pension fund in 2019.
Shown below is the maturity analysis of the Group’s expected (undiscounted) benefit payments:
2018 2017Less than one year P=172,255,639 P=200,075,413More than one year to five years 947,528,189 815,130,976More than five years to 10 years 1,409,906,313 1,452,708,067More than 10 years to 15 years 1,711,149,123 1,523,945,706More than 15 years to 20 years 1,814,430,836 1,662,775,069More than 20 years 5,100,579,845 4,718,097,211

- 151 -
*SGVFS035342*
Shown below is the average duration of the defined benefit obligation at the end of the reportingperiod:
2018 2017(Years)
Parent Company 18 18NURC 17 17HURC 21 –CCPI – 23
32. Income Taxes
Provision for income tax consists of:
December 31, 2018(One Year)
December 31, 2017(One Year)
December 31, 2016(Three Months)
Current P=2,004,462,439 P=2,584,562,832 P=533,905,331Deferred 77,631,388 212,923,469 233,589,768
P=2,082,093,827 P=2,797,486,301 P=767,495,099
Components of the Group’s net deferred tax assets and liabilities follow:
Net deferred tax assets Net deferred tax liabilities2018 2017 2018 2017
Deferred tax assets on:Net unrealized foreign
exchange loss P=– P=21,534,393 P=– P=− Pension liabilities 79,085,718 67,546,081 144,652,177 128,290,055
Nondeductible accruals – − 214,771,891 219,029,961 Leases 147,408 , 11,525,815 13,857,605 Impairment losses on trade
receivables and propertyand equipment 100,852,134 100,852,134 – −
Past service cost – 75,505,520 – −Inventory write-downs 27,377,429 27,377,429 5,961,639 4,634,232Foreign subsidiaries 100,068,558 33,866,361 – 15,900,394Unearned revenue – , 22,726,694 22,726,694NOLCO 36,499,802 41,745,235 – −MCIT 34,312 – – –Others – 4,242,256 – 12,083,956
344,065,361 372,669,409 399,638,216 416,522,897Deferred tax liabilities on: Gain arising from changes in
fair value less estimated point-of-sale costs of swine stocks 10,973,879 151,215,472 – −Borrowing costs 1,977,244 4,537,603 – −Accelerated depreciation – − 506,773,573 543,986,501Intangibles – − 2,965,938,522 2,987,529,285
Undistributed income offoreign subsidiaries – − 708,771,887 651,315,255
Foreign subsidiaries 468,328 − 446,906,513 495,207,481Net unrealized foreign
exchange gain 135,159,925 – – –148,579,376 155,753,075 4,628,390,495 4,678,038,522
Net deferred tax assets (liabilities) P=195,485,985 P=216,916,334 (P=4,228,752,279) (P=4,261,515,625)

- 152 -
*SGVFS035342*
As of December 31, 2018 and 2017, the Group’s subsidiaries did not recognize deferred tax assetsamounting to P=231.6 million and P=434.6 million, respectively, since management believes that futuretaxable income will not be available to allow all or part of the deferred tax assets to be utilized.
Reconciliation between the Group’s statutory income tax rate and the effective income tax ratefollows:
December 31, 2018(One Year)
December 31, 2017(One Year)
December 31, 2016(Three Months)
Statutory income tax rate 30.00% 30.00% 30.00%Increase (decrease) in tax rate resulting from
Income exempt from tax (2.64) (1.42) (1.96)Interest income subjected to final tax (0.31) (0.23) (0.30)Nondeductible interest expense 0.13 0.09 0.12Equity in net income of a joint venture (0.34) (0.60) (0.46)
Net income of subsidiaries withdifferent tax rate (8.26) (8.95) (5.57)
Change in value of financial assetsat FVPL 0.09 (0.15) 0.04
Others (0.64) 1.31 1.99Effective income tax rate 18.03% 20.05% 23.86%
Under Philippine tax laws, the Group is subject to income taxes, as well as other taxes (presented as‘Taxes and licenses’ in the consolidated statements of income). Other taxes paid consist principallyof documentary stamp taxes, real estate taxes and municipal taxes.
Income taxes include the minimum corporate income tax (MCIT), regular corporate income tax(RCIT), final tax paid at the rate of 20.0% for peso deposits and 7.5% for foreign currency depositson gross interest income from bank deposits and short-term investments.
Current tax regulations provide that the RCIT rate shall be 30.0% and interest allowed as a deductibleexpense is reduced by 33.0% of interest income subjected to final tax beginning January 1, 2009.
Current tax regulations also provide for rules on the imposition of a 2.0% MCIT on the gross incomeas of the end of the taxable year beginning on the fourth taxable year immediately following thetaxable year in which the Group commenced its business operations. Any excess MCIT over theRCIT can be carried forward on an annual basis and credited against the RCIT for the threeimmediately succeeding taxable years. In addition, NOLCO is allowed as a deduction from taxableincome in the next three years from the date of inception.
Current tax regulations further provides that an OSD equivalent to 40.0% of gross income may beclaimed as an alternative deduction in computing for the RCIT. For the years endedDecember 31, 2018 and 2017, and the three-month period ended December 31, 2016, the Group didnot claim the OSD in lieu of the itemized deductions.
Entertainment, Amusement and Recreation (EAR) ExpensesCurrent tax regulations define expenses to be classified as EAR expenses and set a limit for theamount that is deductible for tax purposes. EAR expenses are limited to 0.5% of net sales for sellersof goods or properties or 1.0% of net revenue for sellers of services. For sellers of both goods orproperties and services, an apportionment formula is used in determining the ceiling on suchexpenses. The Group recognized EAR expenses (included under ‘General and administrativeexpenses’ in the consolidated statements of income) amounting to P=57.5 million, P=61.9 million andP=15.0 million for the years ended December 31, 2018 and 2017, and the three-month period endedDecember 31, 2016, respectively.

- 153 -
*SGVFS035342*
MCITAn MCIT of 2.0% on modified gross income is computed and compared with the RCIT. Any excessof the MCIT over RCIT is deferred and can be used as a tax credit against future income tax liabilityfor the next three years.
33. Earnings Per Share
The following reflects the income and share data used in the basic/dilutive EPS computations:
December 31, 2018(One Year)
December 31, 2017(One Year)
December 31, 2016(Three Months)
Net income attributable toequity holders of the parent P=9,204,306,540 P=10,888,080,693 P=2,402,116,084
Weighted average numberof common shares 2,204,161,868 2,204,161,868 2,204,161,868
Basic/dilutive EPS P=4.18 P=4.94 P=1.09
The weighted average number of common shares excludes the treasury shares acquired during theyear. There have been no other transactions involving ordinary shares or potential ordinary sharesbetween the reporting date and the date of completion of these consolidated financial statements.
There were no potential dilutive shares for the years ended December 31, 2018 and 2017, and thethree-month period ended December 31, 2016.
34. Related Party Transactions
The Group, in the regular conduct of its business, has entered into transactions with JGSHI, itsultimate parent, and other related parties principally consisting of sales, purchases, advances andreimbursement of expenses, regular banking transactions, leases and, management and administrativeservice agreements. Transactions with related parties are generally settled in cash.

- 154 -
*SGVFS035342*
Intercompany transactions with subsidiaries are eliminated in the accompanying consolidated financial statements. Details of related party transactions are as follows:
December 31, 2018
Related Party Category/TransactionAmount/Volume
Cash andCash Equivalents
(Note 7)
TradeReceivable
(Payable) - net(Notes 10
and 19)
Non-tradeReceivable
(Payable) - net(Notes 10
and 19) Terms ConditionsUltimate Parent Company Advances P=− P=− P=− P=298,465,468 On demand;
non-interest bearingUnsecured;
no impairmentRental expense 191,681,600 − − −
Entity under common controlDue from related parties Advances − − − 547,336,161 On demand;
non-interest bearingUnsecured;
no impairmentSales 1,120,358,698 − 103,086,078 −
On demand;non-interest bearing
Unsecured;no impairment
Rental income 37,327,677 − − −Engineering services 12,918,430 − − −Contracted services 116,083,484 − − −
Due to related parties − − − (164,624,582) On demand Unsecured
Cash and cash equivalents Cash in bank 145,020,946 335,598,449 − − Interest-bearing atprevailing market rate;
due and demandable
Unsecured;no impairment
Money market placements (1,832,041,774) 2,216,003,012 − − Interest-bearing atprevailing market rate;
due from 7 to 90 days; withinterest ranging from
1.5% to 5.5%
Unsecured;no impairment
Interest income 75,013,989 − 3,616,138 − Due from 7 to 90 days Unsecured;no impairment
Subsidiaries −Due from related parties Sales 819,324,713 − 124,600,418 − On demand; Unsecured;
Rental income 20,934,624 − − − non-interest bearing no impairment−
Due to related parties Purchases 5,927,521,672 − (583,395,154) − On demand Unsecured−
Joint Venture Purchases 1,045,752,811 − (82,456,142) − 1 to 30 days; UnsecuredSales 47,496,986 − 7,316,815 − non-interest bearingRental income 917,280 − − −

- 155 -
*SGVFS035342*
December 31, 2017
Related Party Category/TransactionAmount/Volume
Cash andCash Equivalents
(Note 7)
TradeReceivable
(Payable) - net(Notes 10
and 19)
Non-tradeReceivable
(Payable) - net(Notes 10
and 19) Terms ConditionsUltimate Parent Company Advances P=− P=− P=− P=439,409,131 On demand;
non-interest bearingUnsecured;
no impairmentRental expense 177,081,208 − − −
Entity under common controlDue from related parties Advances − − − 956,830,499 On demand;
non-interest bearingUnsecured;
no impairmentSales 995,485,756 − 77,348,339 − On demand;
non-interest bearingUnsecured;
no impairmentRental income 37,966,278 − − −Engineering services 17,420,461 − − −Contracted services 103,675,870 − − −
Due to related parties , − − (106,452,798) On demand Unsecured
Cash and cash equivalents Cash in bank (205,215,801) 190,577,503 − − Interest-bearing atprevailing market rate;
due and demandable
Unsecured;no impairment
Money market placements 1,512,724,554 4,048,044,786 − − Interest-bearing atprevailing market rate;
due from 2 to 40 days; withinterest ranging from
1.2% to 3.4%
Unsecured;no impairment
Interest income 30,148,933 , 3,401,689 , Due from 2 to 40 days Unsecured;no impairment
SubsidiariesDue from related parties Sales 630,964,853 − 30,023,194 − On demand; Unsecured;
Rental income 17,126,605 − − − non-interest bearing no impairment
Due to related parties Purchases 5,102,874,725 − (339,334,405) − On demand Unsecured
Joint Venture Purchases 1,384,805,724 − (69,986,122) − 1 to 30 days; UnsecuredSales 158,109,871 − 187,398,912 − non-interest bearing

- 156 -
*SGVFS035342*
December 31, 2016
Related Party Category/TransactionAmount/Volume
Cash andCash Equivalents
(Note 7)
TradeReceivable
(Payable) - net(Notes 10
and 19)
Non-tradeReceivable
(Payable) - net(Notes 10
and 19) Terms ConditionsUltimate Parent Company Advances P=− P=− P=− P=833,498,102 On demand;
non-interest bearingUnsecured;
no impairmentRental expense 43,019,661 − − −
Entity under common controlDue from related parties Advances − − − 720,463,444 On demand;
non-interest bearingUnsecured;
no impairmentSales 172,923,852 − 154,694,305 − On demand;
non-interest bearingUnsecured;
no impairmentRental income 6,349,804 − − −Engineering services 3,354,945 − − −
Due to related parties , − − (75,161,893) On demand Unsecured
Cash and cash equivalents Cash in bank 206,671,389 395,793,304 − − Interest-bearing atprevailing market rate;
due and demandable
Unsecured;no impairment
Money market placements 1,952,052,684 2,535,320,232 − − Interest-bearing atprevailing market rate;
due from 3 to 87 days; withinterest ranging from
1.5% to 2.0%
Unsecured;no impairment
Interest receivable 2,524,928 , 3,254,609 , Due from 3 to 87 days Unsecured;no impairment
SubsidiariesDue from related parties Sales 172,923,852 − 69,830,184 − On demand; Unsecured;
Dividend income 237,150,000 − 237,150,000 − non-interest bearing no impairmentRental income 3,973,435 − −
Due to related parties Purchases 1,231,915,708 − − (310,594,994) On demand Unsecured
Joint Venture Purchases 1,474,555,268 − − (249,252,030) 1 to 30 days; UnsecuredSales 176,928,503 − 347,307,329 − non-interest bearing

- 157 -
*SGVFS035342*
The Group maintains savings and current accounts and time deposits with an entity under commoncontrol which is a local commercial bank. Cash and cash equivalents earns interest at the prevailingbank deposit rates.
As of December 31, 2018 and 2017, the Group has advances from stockholders amounting toP=247.2 million and P=243.6 million, respectively (see Note 19). These advances are non-interestbearing and payable on demand.
Transactions with the retirement planThe Parent Company entered into an agreement to lease the land of the retirement plan for a period ofone (1) year, renewable annually. Rentals incurred amounted to P=25.3 million and P=25.3 million forthe years ended December 31, 2018 and 2017, respectively. Terms are unsecured, noninterest-bearing and payable on demand.
Included in the Parent Company’s retirement plan assets are special savings deposits with RBC.In December 31, 2018 and 2017, special savings deposit with RBC amounting to P=445.2 millionand P=657.5 million bears annual interest rates ranging from 1.5% to 5.8% and 10.0% to 3.5%,respectively.
Compensation of Key Management PersonnelThe compensation of the Group’s key management personnel by benefit type follows:
December 31, 2018(One Year)
December 31, 2017(One Year)
December 31, 2016(Three Months)
Short-term employee benefits P=291,597,774 P=256,914,335 P=55,934,152Post-employment benefits 81,989,490 70,445,960 17,611,490
P=373,587,264 P=327,360,295 P=73,545,642
There are no agreements between the Group and any of its directors and key officers providing forbenefits upon termination of employment, except for such benefits to which they may be entitledunder the Group’s pension plans.
35. Registration with the BOI
Certain operations of the Parent Company are registered with the BOI as preferred pioneer andnonpioneer activities. As registered enterprises, these entities are subject to some requirements andare entitled to certain tax and non-tax incentives which are considered in the computation of theprovision for income tax.
Sugar Millsite - TolongOn January 14, 2015, Sugar Millsite Tolong was registered with the BOI as an expanding producer ofraw sugar.
Under the terms of the registration and subject to certain requirements, Parent Company is entitled tothe following fiscal and non-fiscal incentives: (a) ITH for a period of three (3) years from February2015 (as an expanding producer raw sugar) or actual start of commercial operations, whichever isearlier but in case earlier than the date of registration; (b) importation of capital equipment, spareparts and accessories at zero (0) duty from the date of effectivity of Executive Order (EO) No. 70 andits implementing rules and regulations for a period of five (5) years reckoned from the date itsregistration or until the expiration of EO No. 70 whichever is earlier; (c) additional deduction fromtaxable income of fifty percent (50%) of the wages corresponding to the increment in number of

- 158 -
*SGVFS035342*
direct labor for skilled and unskilled workers in the year of availment as against the previous year, ifthe project meets the prescribed ratio of capital equipment to the number of workers set by the Board.This may be availed of for the first five (5) year from date of registration but not simultaneously withITH; (d) importation of consigned equipment for a period of ten (10) years from the date ofregistration, subject to posting of re-export bond; (e) tax credit equivalent to national internal revenuetaxes and duties paid on raw materials and supplies and semi-manufactured products used inproducing its export product and forming part thereof for a period of ten (10) years from start ofcommercial operations; (f) exemption from wharfage dues, and any export tax, duty, impost and feefor period of ten (10) years from the date of registration; (g) employment of foreign nationals; (h)simplifications of customs procedures for the importation of equipment, spare parts, raw materialsand supplies.
The ITH entitlement has ended last February 14, 2018.
Sugar Millsite - SonedcoOn June 29, 2018, Sugar Millsite Sonedco was registered with the BOI as an expanding producer ofrefined sugar and its by-product (molasses).
Under the terms of the registration and subject to certain requirements, Parent Company is entitled tothe following fiscal and non-fiscal incentives: (a) ITH for a period of three (3) years from September2018 (as an expanding producer of refined sugar and its by-product) or actual start of commercialoperation, whichever is earlier but availment shall in no case be earlier than the data of registration;(b) importation of capital equipment, spare parts and accessories at zero (0) duty under EO No. 22and its implementing rules; (c) exemption from taxes and duties on imported spare parts andconsumable supplies for export producers with Customs Bonded Manufacturing Warehouse (CBMW)exporting at least seventy percent (70%) of production; (d) additional deduction for labor expense fora period of five (5) years from registration an amount equivalent to fifty percent (50%) of the wagescorresponding to the increment in number of direct labor for skilled and unskilled workers in the yearof availment as against the previous year, if the project meets the prescribed ratio of capitalequipment to the number of workers set by the Board. This may be availed of for the first five (5)years from the date of registration but not simultaneously with ITH; (e) importation of consignedequipment for a period of ten (10) years from date of registration, subject to posting of re-exportbond; (f) employment of foreign nationals; (g) simplification of customs procedures for theimportation of equipment, spare parts, raw materials and supplies; (h) exemption from wharfage dues,and export tax duty, impost and fee for a period of ten (10) years from the data of registration; (i)access to CBMW subject to the BOC rules and regulations, and additional deduction from taxableincome equivalent to 100% of expenses incurred in the development of necessary and majorinfrastructure facilities.
The said expansion started commercial operation on November 27, 2018.
Sugar Millsite - BalayanOn September 8, 2017, Sugar Millsite Balayan was registered with the BOI as an expanding producerof raw sugar and its by-product (molasses).
Under the terms of the registration and subject to certain requirements, Parent Company is entitled tothe following fiscal and non-fiscal incentives: (a) ITH for a period of three (3) years from November2018 (as an expanding producer of raw sugar and its by-product) or actual start of commercialoperation, whichever is earlier but in no case be earlier than the data of registration; (b) importation ofcapital equipment, spare parts and accessories at zero (0) duty under EO No. 22 and its implementingrules. Only equipment directly needed and exclusively use in its operation shall be entitled to capitalequipment incentives; (c) additional deduction from taxable income of fifty percent (50%) of the

- 159 -
*SGVFS035342*
wages corresponding to the increment in number of direct labor for skilled and unskilled workers inthe year of availment as against the previous year, if the project meets the prescribed ratio of capitalequipment to the number of workers set by the Board. This may be availed of for the first five (5)years from the date of registration but not simultaneously with ITH; (d) importation of consignedequipment for a period of ten (10) years from date of registration, subject to posting of re-exportbond; (e) employment of foreign nationals; and (f) simplification of customs procedures for theimportation of equipment, spare parts, raw materials and supplies. The said expansion will startcommercial operation early of 2019.
CogenerationOn September 26, 2014, Cogeneration was registered with the BOI as a Renewable Energy (RE)developer of Bagasse-fired power plant.
Under the terms of the registration and subject to certain requirements, the Parent Company is entitledto the following fiscal and non-fiscal incentives: (a) ITH for a period of seven (7) years at which theRE plant generated the first kilowatt-hour energy after commissioning or testing, or two months fromdate of commissioning, whichever is earlier; (b) duty-free importation of RE machinery, equipment,and materials including control and communication equipment; (c) tax exemption of carbon credits;(d) special realty tax rates on equipment and machinery, (e) NOLCO during the first three years fromthe start of commercial operation shall be carried over as a deduction from the gross income asdefined in the National Internal Revenue Code (NIRC) for the next seven (7) years immediatelyfollowing the year of such loss; (f) after availment of the ITH, the enterprise shall pay a corporate taxof 10% on its taxable income as defined in the NIRC, provided that it shall pass on the savings to theend users in the form of lower power rates; (g) the plant, machinery, and equipment that arereasonably needed and actually used for the exploration, development, and utilization of RE resourcesmay be depreciated using a rate not exceeding twice the rate which would have been used had theannual allowance been computed in accordance with the rules and regulations prescribed by theDepartment of Finance and the provisions of the NIRC; (h) the sale of fuel or power generated by theenterprise from renewable sources of energy such as biomass as well as its purchases of local supplyof goods, properties, and services needed for the development, construction, and installation of itsplant facilities, and the whole process of exploration and development of RE sources up to itsconversion into power shall be subject to zero percent VAT pursuant to NIRC; (i) tax creditequivalent to 100% of the value of VAT and custom duties that would have been paid on the purchaseof RE machinery, equipment, materials and parts had these items been imported shall be given to theenterprise that purchases machinery, equipment, materials and parts from a domestic manufacturer.
DistilleryOn August 28, 2013, Distillery was registered with the BOI as a manufacturer of bio-ethanol (fuelgrade ethanol).
Under the terms of the registration and subject to certain requirements, the Parent Company isentitled to the following fiscal and non-fiscal incentives: (a) ITH for a period of seven (7) years fromMarch 2014 or date of commissioning, whichever is earlier; (b) duty-free importation of REmachinery, equipment, and materials including control and communication equipment; (c) taxexemption of carbon credits; (d) special realty tax rates on equipment and machinery (e) NOLCOduring the first three years from the start of commercial operation shall be carried over as a deductionfrom the gross income as defined in the NIRC for the next seven (7) years immediately following theyear of such loss; (f) after availment of the ITH, the enterprise shall pay a corporate tax of 10.0% onits taxable income as defined in the NIRC, provided that it shall pass on the savings to the end usersin the form of lower power rates; (g) the plant, machinery, and equipment that are reasonably neededand actually used for the exploration, development, and utilization of RE resources may bedepreciated using a rate not exceeding twice the rate which would have been used had the annual

- 160 -
*SGVFS035342*
allowance been computed in accordance with the rules and regulations prescribed by the Departmentof Finance and the provisions of the NIRC. The enterprise that applies for accelerated depreciationshall no longer be eligible to avail of the ITH; (h) the sale of fuel or power generated by theenterprise from renewable sources of energy such as biomass as well as its purchases of local supplyof goods, properties, and services needed for the development, construction, and installation of itsplant facilities, and the whole process of exploration and development of RE sources up to itsconversion into power shall be subject to zero percent VAT pursuant to NIRC; (i) tax creditequivalent to 100.0% of the value of VAT and custom duties that would have been paid on thepurchase of RE machinery, equipment, materials and parts had these items been imported shall begiven to the enterprise that purchases machinery, equipment, materials and parts from a domesticmanufacturer.
Robina Farms (RF) - PoultryOn July 23, 2018, RF - Poultry was registered as an expanding producer of table eggs for the newcommercial layer houses, with a non-pioneer status.
RF- Poultry is eligible to the grant of the following incentives: (a) ITH for three (3) years from July2018 or actual start of commercial operations, whichever is earlier but shall not be earlier than thedate of registration. Income qualified for ITH shall be limited to the income directly attributable tothe eligible revenue generated from registered project; (b) exemption from taxes and duties onimported spare parts and consumable supplies with Customs Bonded Manufacturing Warehouse(CBMW) exporting at least seventy percent (70%) of production; (c) additional deduction for aperiod of five (5) years from registration an amount equivalent to fifty percent (50%) of wagescorresponding to the increment in number of direct labor for skilled and unskilled workers in the yearof availment as against the previous year; (d) importation of consigned equipment for a period of ten(10) years from date of registration subject to posting of re-export bond; (e) employment of foreignnationals; (f) simplification of customs procedures for the importation of equipment, spare parts, rawmaterials and supplies; (g) exemption from wharfage dues, and any export tax, duty, impost and feefor a period of ten years from date of registration; (h) access to CBMW subject to customs rules andregulations; and (i) additional deduction from taxable income equivalent to 100% of expensesincurred in the development of necessary and major infrastructure facilities.
On January 30, 2008, RF - Poultry was registered with the BOI as an expanding producer of parentstock day-old chicks. On June 4 of the same year, it was registered as a new producer of table eggsand its by-products. Both activities are on a nonpioneer status.
Under the terms of the registration and subject to certain requirements, RF - Poultry is entitled to thefollowing fiscal and non-fiscal incentives: (a) ITH for a period of three (3) years from October 2008(as an expanding producer of parent stock day-old chicks) and for a period of four (4) years fromOctober 2009 (as a new producer of table eggs and its by-products); (b) additional deduction fromtaxable income on wages subject to certain terms and conditions; (c) employment of foreignnationals; (d) tax credit equivalent to the national internal revenue taxes and duties paid on rawmaterials and supplies and semi-manufactured products used in producing its export product andforming part thereof for a period of ten (10) years from start of commercial operations;(e) simplification of customs procedures for the importation of equipment, spare parts, raw materialsand supplies; (f) access to CBMW subject to Custom rules and regulations, provided firm exports atleast 70.0% of production output; (g) exemption from wharfage dues, any export tax, duty, impostand fees for a period of ten (10) years from date of registration; (h) importation of consignedequipment for a period of ten (10) years from the date of registration, subject to the posting of re-export bond; (i) exemption from taxes and duties on imported spare parts and consumable suppliesfor export producers with CBMW exporting at least 70.0% of production; (j) tax and duty exemptionon the imported breeding stocks and genetic materials within ten (10) years from the date of

- 161 -
*SGVFS035342*
registration; and (k) tax credit on tax and duty portion of domestic breeding stocks and geneticmaterials within ten (10) years from the date of registration.
Robina Farms (RF) - HogsOn January 30, 2008, RF - Hogs was registered with the BOI as an expanding producer of finisherhogs in RF 11, Antipolo City and RF 12, Bulacan on a nonpioneer status. Under the terms of theregistration and subject to certain requirements, RF - Hogs is entitled to the following fiscal and non-fiscal incentives: (a) ITH for a period of three (3) years from October 2009 but only from the salesgenerated from the registered projects; (b) additional deduction from taxable income on wagessubject to certain terms and conditions; (c) employment of foreign nationals; (d) tax credit equivalentto the national internal revenue taxes and duties paid on raw materials and supplies and semi-manufactured products used in producing its export product and forming part thereof for a period often (10) years from start of commercial operations; (e) simplification of customs procedures for theimportation of equipment, spare parts, raw materials and supplies; (f) access to Customs BondedManufacturing Warehouse (CBMW) subject to Custom rules and regulations, provided firm exportsat least 70% of production output; (g) exemption from wharfage dues, any export tax, duty, impostand fees for a period of ten (10) years from date of registration; (h) importation of consignedequipment for a period of ten (10) years from the date of registration, subject to the posting of re-export bond; (i) exemption from taxes and duties on imported spare parts and consumable suppliesfor export producers with CBMW exporting at least 70% of production; (j) tax and duty exemption onthe imported breeding stocks and genetic materials within ten (10) years from the date of registration;and (k) tax credit on tax and duty portion of domestic breeding stocks and genetic materials withinten (10) years from the date of registration.
36. Commitments and Contingencies
Milling ContractsMilling contracts with various planters provide for a 60%-70% share to the planters (including relatedparties) and 30%-40% share to the Group of sugar and molasses produced from sugar canesmilled. The Sugar Industry Development Act of 2015 provides that, to ensure the immediatepayment of farmers and secure their income from sugarcane, farmers may enter into any paymentmethod with the sugar mill.
Sugar under Custody but not ownedAs of December 31, 2018 and 2017, the Group has in its custody sugar owned by several quedanholders with volume of 502,051 Lkg and 460,835 Lkg, respectively. The said volume of sugar is notreflected in the statement of financial position since this is not owned by the Group. The Group isaccountable to both quedan holders and sugar traders for the value of these trusteed sugar or theirsales proceeds.
Operating Lease Commitments - Group as a LessorThe Group has entered into (1) one-year renewable, noncancellable leases with various related partiescovering certain land and buildings where office spaces are located. Future minimum rentalsreceivable under noncancellable operating leases amounted to P=73.3 million, P=63.7 million andP=76.7 million for the years ended December 31, 2018 and 2017, and the three-month period endedDecember 31, 2016, respectively.

- 162 -
*SGVFS035342*
Operating Lease Commitments - Group as a LesseeThe Group leases land where certain of its facilities are located. The operating lease agreements arefor periods ranging from one to five years from the date of the contracts and are renewable undercertain terms and conditions. The Group’s rentals incurred on these leases (included under ‘Sellingand distribution costs’ and ‘General and administrative expenses’ in the consolidated statements ofincome) amounted to P=937.6 million, P=976.1 million and P=228.5 million for the years endedDecember 31, 2018 and 2017, and the three-month period ended December 31, 2016, respectively.
Future minimum rentals payable under noncancellable operating leases follow:
December 31, 2018(One Year)
December 31, 2017(One Year)
December 31, 2016(Three Months)
Within one year P=752,048,217 P=792,639,232 P=283,789,390After one year but not more than
five years 1,362,757,872 1,708,022,477 1,010,214,435Five (5) years or more 464,770,770 506,731,716 436,059,899
P=2,579,576,859 P=3,007,393,425 P=1,730,063,724
Finance Lease Commitments - Group as a LesseeSome of the Group’s subsidiaries were granted land usage rights from private entities. The landusage right represents the prepaid amount of land lease payments. The right is currently beingamortized by the Group on a straight-line basis over the term of the right ranging from 30 to 50 years.The amortization on these leases (included under ‘General and administrative expenses’ in theconsolidated statements of income) amounted to P=2.5 million, P=2.4 million and P=0.6 million for theyears ended December 31, 2018 and 2017, and the three-month period ended December 31, 2016,respectively.
OthersThe Group has various contingent liabilities arising in the ordinary conduct of business which areeither pending decision by the courts, under arbitration or being contested, the outcome of which arenot presently determinable. In the opinion of management and its legal counsel, the eventual liabilityunder these lawsuits or claims, if any, will not have a material or adverse effect on the Group’sfinancial position and results of operations. The information usually required by PAS 37, Provisions,Contingent Liabilities and Contingent Assets, is not disclosed on the grounds that it can be expectedto prejudice the outcome of these lawsuits, claims, arbitration and assessments.
37. Supplemental Disclosure to Cash Flow Statements
The Group’s noncash activities are as follows:
December 31, 2018(One Year)
December 31, 2017(One Year)
December 31, 2016(Three Months)
Cumulative translation adjustment (Note 23) P=1,630,309,574 (P=1,392,324,892) P=1,200,565,078Accrued earn-out of PSFL (Note 16) − (51,516,704) −
Reclassifications between accounts considered in the preparation of cash flow statement for the yearended December 31, 2018 include: (a) from investment properties to property, plant and equipmentwith book value of P=5.6 million (see Note 17); and (b) from investment in joint ventures toinvestment in subsidiaries amounting to P=222.8 million (see Note 16).

- 163 -
*SGVFS035342*
The table below provides for the changes in liabilities arising from financing activities:
Short-term debt Long-term debtTotal liabilities from
financing activitiesJanuary 1, 2018 P=2,009,317,911 P=33,225,962,388 P=35,235,280,299Cash flows from availment 4,650,000,000 14,226,028,915 20,476,028,915Cash flows from settlement (4,050,000,000) (15,356,761,921) (21,006,761,921)Foreign exchange movement/CTA (147,932,805) (462,062,230) (609,995,035)Others – (176,043,270) (176,043,270)December 31, 2018 P=2,461,385,106 P=31,457,123,882 P=33,918,508,988
38. Approval for the Release of the Financial Statements
The accompanying consolidated financial statements of the Group were authorized for issue by theAC and the BOD on April 5, 2019.
- 164 -
*SGVFS035342*
INDEPENDENT AUDITORS’ REPORTON SUPPLEMENTARY SCHEDULE
The Stockholders and the Board of DirectorsUniversal Robina Corporation8th Floor, Tera Tower, BridgetowneE. Rodriguez, Jr. Avenue (C5 Road)Ugong Norte, Quezon City, Metro Manila
We have audited, in accordance with Philippine Standards on Auditing, the consolidated financialstatements of Universal Robina Corporation and Subsidiaries (the Group) as at December 31, 2018 and2017, for the years ended December 31, 2018 and 2017 and for the period October 1, 2016 toDecember 31, 2016, included in this Form 17-A and have issued our report thereon dated April 5, 2019.Our audits were made for the purpose of forming an opinion on the basic consolidated financialstatements taken as a whole. The schedules listed in the Index to Consolidated Financial Statements andSupplementary Schedules are the responsibility of the Group’s management. These schedules arepresented for purposes of complying with Securities Regulation Code Rule 68, As Amended (2011) andare not part of the basic consolidated financial statements. These schedules have been subjected to theauditing procedures applied in the audit of the basic consolidated financial statements and, in our opinion,fairly state, in all material respects, the information required to be set forth therein in relation to the basicconsolidated financial statements taken as a whole.
SYCIP GORRES VELAYO & CO.
Miguel U. Ballelos, Jr.PartnerCPA Certificate No. 109950SEC Accreditation No. 1566-AR-1 (Group A), April 3, 2019, valid until April 2, 2022Tax Identification No. 241-031-088BIR Accreditation No. 08-001998-114-2019, January 28, 2019, valid until January 27, 2022PTR No. 7332525, January 3, 2019, Makati City
April 5, 2019
A member firm of Ernst & Young Global Limited
SyCip Gorres Velayo & Co.6760 Ayala Avenue1226 Makati CityPhilippines
Tel: (632) 891 0307Fax: (632) 819 0872ey.com/ph
BOA/PRC Reg. No. 0001, October 4, 2018, valid until August 24, 2021SEC Accreditation No. 0012-FR-5 (Group A), November 6, 2018, valid until November 5, 2021
A member firm of Ernst & Young Global Limited

- 165 -
*SGVFS035342*
Universal Robina Corporation and SubsidiariesSchedule A - Financial Assets
December 31, 2018
Name of Issuing Entity and Number of Shares or Amount Shown in Valued Based on Income Received andDescription of Each Issue Principal Amount of the Balance Sheet/ Market Quotations at Accrued (including
Bonds and Notes Notes Balance Sheet Date Dividends Received)
Various/Equity Securities P=470,453,416 P=470,453,416 P=32,302,870
See Note 8 of the Consolidated Financial Statements.

- 166 -
*SGVFS035342*
Universal Robina Corporation and SubsidiariesSchedule B - Amounts Receivable from Directors, Officers, Employees, Related Parties
and Principal Stockholders (Other than Related Parties)December 31, 2018
Balance at Balance at End of PeriodName of Debtor Beginning of Additions Collections Current Non-Current Total
Period
Advances to officers andemployees P=110,231,826 P=31,975,041 P=– P=142,206,867 P=– P=142,206,867
See Note 10 of the Consolidated Financial Statements.

- 167 -
*SGVFS035342*
Universal Robina Corporation and SubsidiariesSchedule C - Amounts Receivable from Related Parties Which are Eliminated
During the Consolidation of Financial StatementsDecember 31, 2018
Name and Balance at Amounts Amounts Balance at End of PeriodDesignation of Debtor Beginning of Additions Collected Others Written Off Current Non-Current Total
Period
Calbee URC P=– P=661,281 P=– P=– P=– P=661,281 P=– P=661,281Hunt-Universal Robina
Corporation – – (341,878,993) – – (341,878,993)–
(341,878,993)CFC Corporation 171,199,593 – (13,194,081) – – 158,005,512 – 158,005,512CFC ClubhouseProperty, Inc. (249,973,452) – – 249,973,452 – – – –URC International Company, Ltd. and
its Subsidiaries 3,609,052,525 270,634,171 – – – 3,879,686,696 – 3,879,686,696Nissin - Universal
Robina Corporation 144,522,794 32,522,295 – – – 177,045,089 – 177,045,089P=3,674,801,460 P=303,817,747 (P=355,073,074) P=249,973,452 P=– P=3,873,519,585 P=– P=3,873,519,585

- 168 -
*SGVFS035342*
Universal Robina Corporation and SubsidiariesSchedule D - Intangible Assets - Other Assets
December 31, 2018
Deductions/Amortizations Other Charges–Description Beginning Additions Charged to cost Charged to Additions Ending
Balance at Cost and Expenses Other Accounts (Deductions) Balance
Goodwill P=31,212,075,404 P=– (P=17,579,587) P=– P=– P=31,194,495,817Trademark 9,362,936,671 – – – 9,362,936,671Customer relationship 2,003,044,176 – (78,862,555) – 5,212,272 1,929,393,893Product formulation 425,000,000 – – 425,000,000Software costs 19,055,185 11,234,200 (17,973,401) – 613,806 12,929,790Intangible Assets P=43,022,111,436 P=11,234,200 (P=114,415,543) P=− P=5,826,078 P=42,924,756,171
See Note 15 of the Consolidated Financial Statements.

- 169 -
*SGVFS035342*
Universal Robina Corporation and SubsidiariesSchedule E - Long-Term Debt
December 31, 2018
Name of Issuer and Amount Authorized Amount Shown Amount ShownType of Obligation By Indenture as Current as Long-term Total
Various foreign banks Not applicable P= P=31,457,123,882 P=31,457,123,882
See Note 20 of the Consolidated Financial Statements

- 170 -
*SGVFS035342*
Universal Robina Corporation and SubsidiariesSchedule F - Indebtedness to Related Parties (Long-Term Loans from Related Companies)
December 31, 2018
Name of Related Party Balance at Beginning of Period Balance at End of Period
NONE TO REPORT

- 171 -
*SGVFS035342*
Universal Robina Corporation and SubsidiariesSchedule G - Guarantees of Securities and Other Issuers
December 31, 2018
Name of Issuing Entity of Title of Issue of Total Amount Amount Owned bySecurities Guaranteed by the Company Each Class of Guaranteed and Person for which this Nature of
for which this Statement is Filed Securities Guaranteed Outstanding Statement is Filed Guarantee
NONE TO REPORT

- 172 -
*SGVFS035342*
Universal Robina Corporation and SubsidiariesSchedule H - Capital Stock
December 31, 2018
Number of Shares Number of SharesNumber of Issued and Reserved for Number of Shares Held by
Title of Issue Shares Outstanding Options,Warrants,
Directors,
Authorized (Net of Treasury Conversions and Affiliates Officers and OthersShares) Other Rights Employees
Preferred stock- P=1 par value 2,000,000 None – – – –
Common stock- P=1 par value 2,998,000,000 2,204,161,868 – 1,217,841,260 14,779,343 971,541,265
See Note 22 of the Consolidated Financial Statements.

- 173 -
SCHEDULE OF ALL THE EFFECTIVE STANDARDSUNDER PFRS IN COMPLIANCE WITH SRC RULE 68, AS AMENDED
DECEMBER 31, 2018
List of Philippine Financial Reporting Standards (PFRS) [which consist of PFRSs and PhilippineAccounting Standards (PAS)] effective as of December 31, 2018:
PHILIPPINE FINANCIAL REPORTING STANDARDS ANDINTERPRETATIONSEffective as of December 31, 2018
Adopted Not EarlyAdopted
NotApplicable
Framework for the Preparation and Presentation of FinancialStatementsConceptual Framework Phase A: Objectives and qualitative characteristics
PFRS Practice Statement Management Commentary
Philippine Financial Reporting Standards
PFRS 1(Revised)
First-time Adoption of Philippine Financial ReportingStandards
Amendments to PFRS 1 and PAS 27: Cost of anInvestment in a Subsidiary, Jointly Controlled Entity orAssociate
Amendments to PFRS 1: Additional Exemptions for First-time Adopters
Amendment to PFRS 1: Limited Exemption fromComparative PFRS 7 Disclosures for First-time Adopters
Amendments to PFRS 1: Severe Hyperinflation andRemoval of Fixed Date for First-time Adopters
Amendments to PFRS 1: Government Loans
PFRS 2 Share-based Payment
Amendments to PFRS 2: Vesting Conditions andCancellations
Amendments to PFRS 2: Group Cash-settled Share-basedPayment Transactions
Amendments to PFRS 2: Definition of Vesting Condition
Amendments to PFRS 2: Share-based Payment,Classification and Measurement of Share-based PaymentTransactions
PFRS 3(Revised)
Business Combinations
Amendment to PFRS 3: Accounting for ContingentConsideration in a Business Combination
Amendment to PFRS 3: Scope Exceptions for JointArrangements

- 174 -
PHILIPPINE FINANCIAL REPORTING STANDARDS ANDINTERPRETATIONSEffective as of December 31, 2018
Adopted Not EarlyAdopted
NotApplicable
PFRS 4 Insurance Contracts
Amendments to PAS 39 and PFRS 4: Financial GuaranteeContracts
Amendments to PFRS 4: Insurance Contracts, ApplyingPFRS 9, Financial Instruments, with PFRS 4
PFRS 5 Non-current Assets Held for Sale and DiscontinuedOperations
Amendments to PFRS 5: Changes in Methods of Disposal
PFRS 6 Exploration for and Evaluation of Mineral Resources
PFRS 7 Financial Instruments: Disclosures
Amendments to PAS 39 and PFRS 7: Reclassification ofFinancial Assets
Amendments to PAS 39 and PFRS 7: Reclassification ofFinancial Assets - Effective Date and Transition
Amendments to PFRS 7: Improving Disclosures aboutFinancial Instruments
Amendments to PFRS 7: Disclosures - Transfers ofFinancial Assets
Amendments to PFRS 7: Disclosures - Offsetting FinancialAssets and Financial Liabilities
Amendments to PFRS 7: Mandatory Effective Date ofPFRS 9 and Transition Disclosures
Amendments to PFRS 7: Additional hedge accountingdisclosures (and consequential amendments) resulting fromthe introduction of the hedge accounting chapter in PFRS 9
Amendments to PFRS 7: Applicability of the Amendmentsto PFRS 7 to Condensed Interim Financial Statements
Amendments to PFRS 7: Disclosures - Servicing Contracts
PFRS 8 Operating Segments
Amendments to PFRS 8: Aggregation of OperatingSegments and Reconciliation of the Total of theReportable Segments Assets to the Entity’s Assets
PFRS 9 PFRS 9, Financial Instruments
Amendments to PFRS 9, Prepayment Features withNegative Compensation
PFRS 10 Consolidated Financial Statements
Amendments to PFRS 10: Transition Guidance
Amendments to PFRS 10: Investment Entities

- 175 -
PHILIPPINE FINANCIAL REPORTING STANDARDS ANDINTERPRETATIONSEffective as of December 31, 2018
Adopted Not EarlyAdopted
NotApplicable
PFRS 10(cont’d)
Amendments to PFRS 10 and PAS 28: Sale orContribution of Assets Between an Investor and itsAssociate or Joint Venture
Amendments to PFRS 10, PFRS 12 and PAS 28Investment Entities: Applying the Consolidation Exception
PFRS 11 Joint Arrangements
Amendments to PFRS 11: Investment Entities
Amendments to PFRS 11: Joint Arrangements -Accounting for Acquisitions of Interests in JointOperations
PFRS 12 Disclosure of Interests in Other Entities
Amendments to PFRS 12: Investment Entities
Amendments to PFRS 12: Transition Guidance
Amendment to PFRS 12, Clarification of the Scope of theStandard
PFRS 13 Fair Value Measurement (2013 Version)
Amendment to PFRS 13: Short-term Receivables andPayables
Amendment to PFRS 13: Portfolio Exception
PFRS 14 Regulatory Deferral Accounts
PFRS 15 Revenue from Contracts with Customers
PFRS 16 Leases
Philippine Accounting Standards
PAS 1(Revised)
Presentation of Financial Statements
Amendments to PAS 32 and PAS 1: Puttable FinancialInstruments and Obligations Arising on Liquidation
Amendments to PAS 1: Presentation of Items of OtherComprehensive Income
Amendment to PAS 1: Presentation of FinancialStatements – Disclosure Initiative
PAS 2 Inventories
PAS 7 Statement of Cash Flows
Amendment to PAS 7: Disclosure Initiative
PAS 8 Accounting Policies, Changes in Accounting Estimates andErrors
PAS 10 Events after the Reporting Date
PAS 11 Construction Contracts

- 176 -
PHILIPPINE FINANCIAL REPORTING STANDARDS ANDINTERPRETATIONSEffective as of December 31, 2018
Adopted Not EarlyAdopted
NotApplicable
PAS 12 Income Taxes
Amendment to PAS 12 - Deferred Tax: Recovery ofUnderlying Assets
Amendment to PAS 12: Recognition of Deferred TaxAssets for Unrealized Losses
PAS 16 Property, Plant and Equipment
Amendment to PAS 16: Revaluation Method -Proportionate Restatement of Accumulated Depreciation
Amendments to PAS 16 and PAS 38: Clarification ofAcceptable Methods of Depreciation and Amortization
Amendments to PAS 16 and PAS 41: Bearer Plants
PAS 17 Leases
PAS 19(Revised)
Employee Benefits
Amendments to PAS 19: Defined Benefit Plans:Employee Contributions
Regional Market Issue regarding Discount Rate
PAS 20 Accounting for Government Grants and Disclosure ofGovernment Assistance
PAS 21 The Effects of Changes in Foreign Exchange Rates
Amendment: Net Investment in a Foreign Operation
PAS 23(Revised)
Borrowing Costs
PAS 24(Revised)
Related Party Disclosures
Amendments to PAS 24: Key Management Personnel
PAS 26 Accounting and Reporting by Retirement Benefit Plans
PAS 27(Amended)
Separate Financial Statements
Amendments to PAS 27: Investment Entities
Amendments to PAS 27: Equity Method in SeparateFinancial Statements
PAS 28(Amended)
Investments in Associates and Joint Ventures
Amendments to PFRS 10, PFRS 12 and PAS 28Investment Entities: Applying the Consolidation Exception
Amendments to PFRS 10 and PAS 28: Sale orContribution of Assets Between an Investor and itsAssociate or Joint Venture
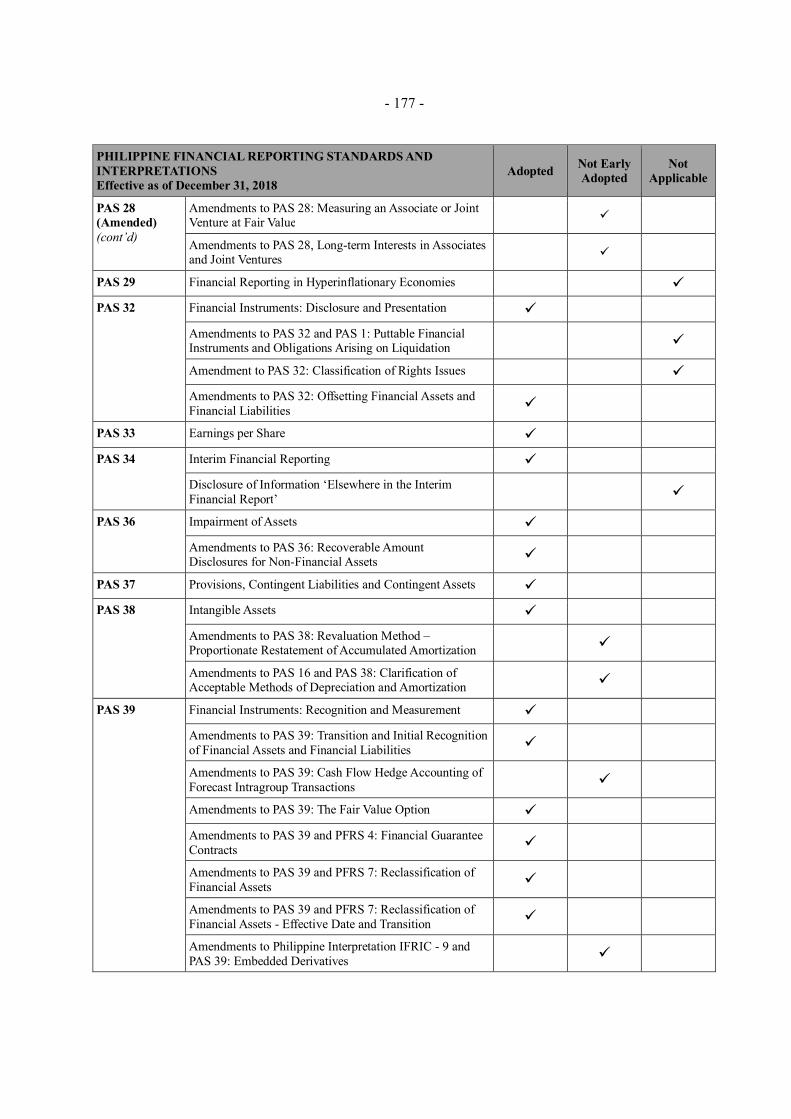
- 177 -
PHILIPPINE FINANCIAL REPORTING STANDARDS ANDINTERPRETATIONSEffective as of December 31, 2018
Adopted Not EarlyAdopted
NotApplicable
PAS 28(Amended)(cont’d)
Amendments to PAS 28: Measuring an Associate or JointVenture at Fair Value
Amendments to PAS 28, Long-term Interests in Associatesand Joint Ventures
PAS 29 Financial Reporting in Hyperinflationary Economies
PAS 32 Financial Instruments: Disclosure and Presentation
Amendments to PAS 32 and PAS 1: Puttable FinancialInstruments and Obligations Arising on Liquidation
Amendment to PAS 32: Classification of Rights Issues
Amendments to PAS 32: Offsetting Financial Assets andFinancial Liabilities
PAS 33 Earnings per Share
PAS 34 Interim Financial Reporting
Disclosure of Information ‘Elsewhere in the InterimFinancial Report’
PAS 36 Impairment of Assets
Amendments to PAS 36: Recoverable AmountDisclosures for Non-Financial Assets
PAS 37 Provisions, Contingent Liabilities and Contingent Assets
PAS 38 Intangible Assets
Amendments to PAS 38: Revaluation Method –Proportionate Restatement of Accumulated Amortization
Amendments to PAS 16 and PAS 38: Clarification ofAcceptable Methods of Depreciation and Amortization
PAS 39 Financial Instruments: Recognition and Measurement
Amendments to PAS 39: Transition and Initial Recognitionof Financial Assets and Financial Liabilities
Amendments to PAS 39: Cash Flow Hedge Accounting ofForecast Intragroup Transactions
Amendments to PAS 39: The Fair Value Option
Amendments to PAS 39 and PFRS 4: Financial GuaranteeContracts
Amendments to PAS 39 and PFRS 7: Reclassification ofFinancial Assets
Amendments to PAS 39 and PFRS 7: Reclassification ofFinancial Assets - Effective Date and Transition
Amendments to Philippine Interpretation IFRIC - 9 andPAS 39: Embedded Derivatives

- 178 -
PHILIPPINE FINANCIAL REPORTING STANDARDS ANDINTERPRETATIONSEffective as of December 31, 2018
Adopted Not EarlyAdopted
NotApplicable
PAS 39(cont’d)
Amendment to PAS 39: Eligible Hedged Items
Amendment to PAS 39: Novation of Derivatives andContinuation of Hedge Accounting
PAS 40 Investment Property
Amendment to PAS 40: Investment Property: Clarifyingthe relationship between PFRS 3 and PAS 40 whenclassifying property as investment property or owner-occupied property
Amendments to PAS 40: Investment Property, Transfers ofInvestment Property
PAS 41 Agriculture
Amendment to PAS 16 and PAS 41: Bearer Plants
Philippine Interpretations
IFRIC 1 Changes in Existing Decommissioning, Restoration andSimilar Liabilities
IFRIC 2 Members' Share in Co-operative Entities and SimilarInstruments
IFRIC 4 Determining Whether an Arrangement Contains a Lease
IFRIC 5 Rights to Interests arising from Decommissioning,Restoration and Environmental Rehabilitation Funds
IFRIC 6 Liabilities arising from Participating in a Specific Market -Waste Electrical and Electronic Equipment
IFRIC 7 Applying the Restatement Approach under PAS 29Financial Reporting in Hyperinflationary Economies
IFRIC 8 Scope of PFRS 2
IFRIC 9 Reassessment of Embedded Derivatives
Amendments to Philippine Interpretation IFRIC - 9 andPAS 39: Embedded Derivatives
IFRIC 10 Interim Financial Reporting and Impairment
IFRIC 11 PFRS 2- Group and Treasury Share Transactions
IFRIC 12 Service Concession Arrangements
IFRIC 13 Customer Loyalty Programmes
IFRIC 14 The Limit on a Defined Benefit Asset, Minimum FundingRequirements and their Interaction
Amendments to Philippine Interpretations IFRIC- 14,Prepayments of a Minimum Funding Requirement
IFRIC 15 Agreements for the Construction of Real Estate
IFRIC 16 Hedges of a Net Investment in a Foreign Operation
IFRIC 17 Distributions of Non-cash Assets to Owners
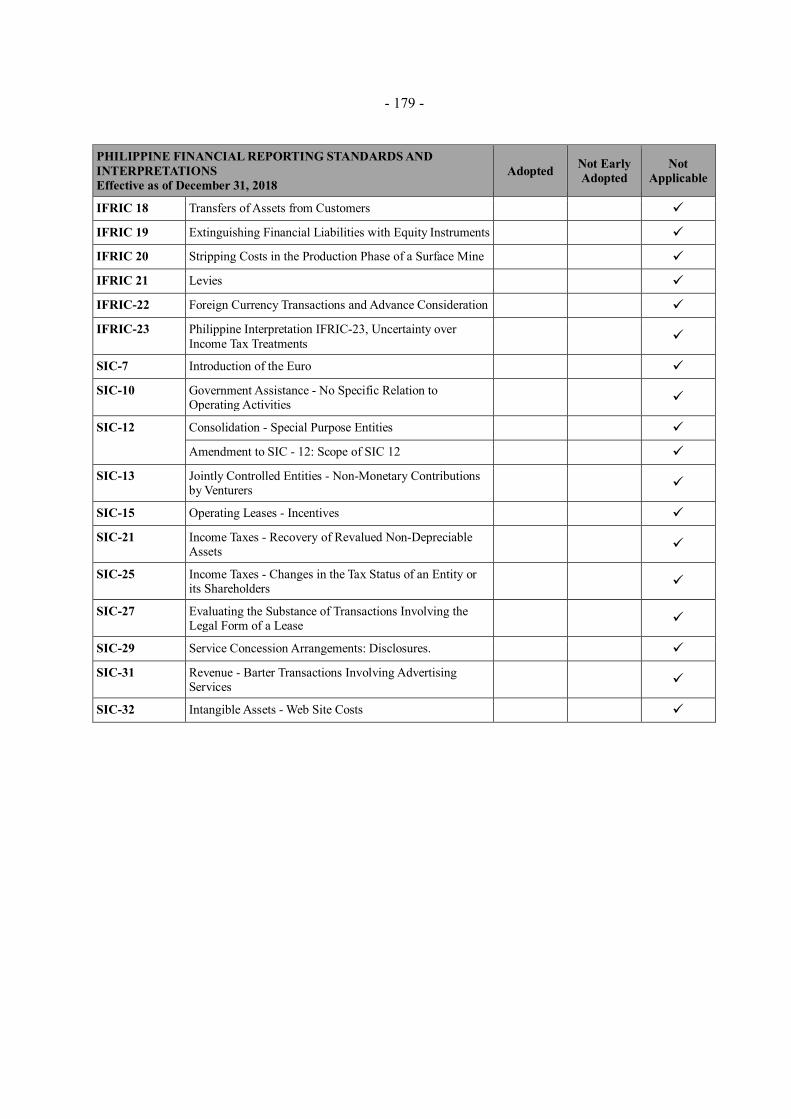
- 179 -
PHILIPPINE FINANCIAL REPORTING STANDARDS ANDINTERPRETATIONSEffective as of December 31, 2018
Adopted Not EarlyAdopted
NotApplicable
IFRIC 18 Transfers of Assets from Customers
IFRIC 19 Extinguishing Financial Liabilities with Equity Instruments
IFRIC 20 Stripping Costs in the Production Phase of a Surface Mine
IFRIC 21 Levies
IFRIC-22 Foreign Currency Transactions and Advance Consideration
IFRIC-23 Philippine Interpretation IFRIC-23, Uncertainty overIncome Tax Treatments
SIC-7 Introduction of the Euro
SIC-10 Government Assistance - No Specific Relation toOperating Activities
SIC-12 Consolidation - Special Purpose Entities
Amendment to SIC - 12: Scope of SIC 12
SIC-13 Jointly Controlled Entities - Non-Monetary Contributionsby Venturers
SIC-15 Operating Leases - Incentives
SIC-21 Income Taxes - Recovery of Revalued Non-DepreciableAssets
SIC-25 Income Taxes - Changes in the Tax Status of an Entity orits Shareholders
SIC-27 Evaluating the Substance of Transactions Involving theLegal Form of a Lease
SIC-29 Service Concession Arrangements: Disclosures.
SIC-31 Revenue - Barter Transactions Involving AdvertisingServices
SIC-32 Intangible Assets - Web Site Costs

- 180 -
NOTE: Please see separate sheets for the organizational structures of the various consolidation groups.
LEGEND:SubsidiaryAssociateJoint Venture
JG SUMMIT HOLDINGS,INC. (Parent)
MAP OF THE RELATIONSHIPS OF THE COMPANIES WITHIN THE GROUP
JG SUMMIT HOLDINGS,INC. & SUBSIDIARIES
100%
Universal RobinaCorporation &Subsidiaries
Robinsons LandCorporation &Subsidiaries
CP Air Holdings, Inc. &Subsidiaries
JG SummitPhilippines, Ltd. &
Subsidiaries
Express Holdings, Inc.& Subsidiaries
JG Summit (Cayman),Ltd.
JG PetrochemicalCorporation
JG Summit OlefinsCorporation Merbau Corporation Unicon Insurance Brokers
Corporation
55.25% 60.97% 100.00% 100% 100% 100% 100% 100% 100% 100%
JG Summit Capital ServicesCorporation & Subsidiaries
Batangas Agro-IndustrialDevelopment Corporation &
Subsidiaries
JG Summit InfrastructureHoldings Corporation
100%
Global BusinessPower Corporation
Manila ElectricCompany
Oriental Petroleumand Minerals Corp.
30.00% 29.56% 19.40%
100% 100%

- 181 -
LEGEND:SubsidiaryAssociateJoint Venture
50%
DanoneUniversal
Robina50%
MAP OF THE RELATIONSHIPS OF THE COMPANIES WITHIN THE GROUP
AdvansonInternationa
l Pte. Ltd.
JiangsuAces
100% 100%
100% 100% 100% 100% 90% 100%
Hong Kong ChinaFoods (Parent)
URC HongKong Co.,
Ltd
XiamenTonganPacific
ShanghaiPeggy
Foods Co.,
GuangzhouPeggy
Foods Co.,
AdvansonInternational
Pte. Ltd &
96.08% 100.00%
A B C
AcesfoodNetwork Pte
Ltd. &
URC OceaniaCompany Ltd.
and Subsidiaries100% 100% 100% 100%
100% 100% 94% 100%
ShantouPeggy Co.
Ltd.
Hong Kong -China Foods Co.,
Ltd and
URCInternational
Co., Ltd (Parent)
URC AseanBrands Co., Ltd.& Subsidiaries
Vitasoy-URC, Inc.
100% 100%
Universal RobinaCorporation
(Parent)
URC ChinaCommercial
Co., Ltd.
SouthernNegros
Development
URCInternational
Co., Ltd &
51%100%
CFCCorporation
Bio-ResourcePower
Generation
UniversalRobina
(Cayman),100% 100% 100%
Universal RobinaCorporation &Subsidiaries
URCPhilippines,
Ltd.
NissinUniversal
Robina
HuntUniversal
Robina
Calbee-URC,Inc.

- 182 -
LEGEND:SubsidiaryAssociateJoint Venture
Calbee-URCMalaysiaSdn Bhd
50%
100% 100%
B
100% 100% 100%
AcesfoodDistributors
Pte Ltd.
AcesfoodHoldingsPte Ltd.
95%
Acesfood Network PteLtd & Subsidiaries
100.00%
AcesfoodHoldingsPte Ltd
AcesfoodNetwork Pte
Ltd.
ShantouSEZ ShanfuFoods Co.
49%
URC(Thailand)Co., Ltd.
URC HanoiCo., Ltd.
PT URCIndonesia
100% 100%
URCMyanmarCo., Ltd.
SiamPattanasin
Co. LTd
URC CentralCo., Ltd.
100% 100% 100% 53.49% 91.52% 100% 100%
A
URC Asean Brands Co.,Ltd. & Subsidiaries
100%
URC AseanBrands Co.,
Ltd.
URCVietnamCo., Ltd.
URC Foods(Singapore)
Pte. Ltd.
RicellentSdn. Bhd
URC SnackFoods
(Malaysia)

- 183 -
LEGEND:SubsidiaryAssociateJoint Venture
100% 100%
Snack Brands Industries Pty Ltd. Snack Brands Foods Pty Ltd.
100% 100%
The Kettle Chip Co., Pty Ltd.The Real McCoy Snackfood Co.,
Pty Ltd.100% 100%
Lips Chips Pty Ltd.Australian Natural Snack
Company
Snack Foods Pty Ltd.Consolidated Snacks Finance Pty
Ltd.Windsor Chips Pty Ltd.
100%100% 100% 100% 100%
Griffin's Food Limited Consolidated Snacks Pty Ltd.
100% 100%
Nice and Natural LimitedSnack Foods Pty Ltd.
Proper Snack Foods Ltd.
50.10%
100% 100%
URC New Zealand Finance
Company Ltd.
URC Australia Finance Company
Pty Ltd.
100% 100%
URC New Zealand Holding
Company Ltd.
URC Australia Holding Company
Pty Ltd.
C
URC Oceania Company Ltd. and
Subsidiaries
100.00%
URC Oceania Company Ltd.
(Parent)
100%

- 184 -
UNIVERSAL ROBINA CORPORATIONSUPPLEMENTARY SCHEDULE OF RETAINED EARNINGSAVAILABLE FOR DIVIDEND DECLARATION
The table below present the retained earnings available for dividend declaration as atDecember 31, 2018:
Unappropriated retained earnings as at December 31, 2017 P=8,829,542,786Adjustments:
Transition impact of adopting new accounting standard –PFRS 9 (P=417,785,935)
Fair value adjustment on financial assets at FVTPL (390,912,159)Fair value less estimated cost to sell adjustment on biological
assets (118,841,072)Deferred tax assets, excluding those arising from
remeasurements 68,189,238 (859,349,928)Unappropriated retained earnings, as adjusted as at
December 31, 2017 7,970,192,858Net income actually earned/realized during the period
Net income during the period 4,646,572,833Add: Non-actual/unrealized loss
Loss arising from changes in fair value lessestimated costs to sell of swine stocks 467,471,975
Movements of deferred tax assets, excluding thosearising from remeasurements 11,406,181 5,125,450,989
Sub-total 13,095,643,847Less: Dividend declarations during the year (6,943,109,884)
Reversal of appropriations during the year 2,500,000,000Treasury shares (679,489,868)
Total retained earnings available for dividend declaration as atDecember 31, 2018 P=7,973,044,095