
Universal 2019 Document Registration
488
Universal 2019 Document Registration ANNUAL FINANCIAL REPORT 9
-
Upload
khangminh22 -
Category
Documents
-
view
1 -
download
0
Transcript of Universal 2019 Document Registration

Universal
2019Document
Registration
ANNUAL FINANCIAL REPORT
9

CO
NT
EN
TS
1
2
3
4
5
6
7
A
CERTAIN PRELIMINARY INFORMATION ABOUT THIS ANNUAL REPORT 1
Chairman’s Message 4Chief Executive Off icer’s Message 5
THE AXA GROUP 13
1.1 Key figures 141.2 History 191.3 Business overview 21
ACTIVITY REPORT AND CAPITAL MANAGEMENT 29
2.1 Market Environment 302.2 Operating Highlights 352.3 Activity report 402.4 Liquidity and capital resources 822.5 Events subsequent to December 31, 2019 892.6 Outlook 90
CORPORATE GOVERNANCE 91
3.1 Corporate governance structure 923.2 Executive compensation and share ownership 1203.3 Corporate Governance Code of Reference 1523.4 Related-party transactions 153
RISK FACTORS AND RISK MANAGEMENT 157
4.1 Risk factors 1584.2 Internal Control and Risk Management 1764.3 Market risks 1904.4 Credit risk 1974.5 Liquidity risk 2014.6 Insurance risks 2024.7 Operational risk 2064.8 Other material risks 207
CONSOLIDATED FINANCIAL STATEMENTS 209
5.1 Consolidated statement of financial position 2105.2 Consolidated statement of income 2125.3 Consolidated statement of comprehensive income 2135.4 Consolidated statement of changes in equity 2145.5 Consolidated statement of cash flows 2185.6 Notes to the Consolidated Financial Statements 2205.7 Report of the Statutory Auditors on the consolidated financial statements 366
SHARES, SHARE CAPITAL AND GENERAL INFORMATION 373
6.1 AXA shares 3746.2 Share capital 3756.3 General Information 380
CORPORATE RESPONSIBILITY 393
7.1 Introduction 3947.2 Social information 4017.3 Climate change and biodiversity 4117.4 Inclusive insurer 4217.5 Business behaviour 4267.6 Vigilance plan 433
APPENDICES 439
Appendix I Management’s annual evaluation of internal control over financial reporting 440Appendix II Statement of the person responsible for the Universal Registration Document 443Appendix III AXA parent company financial statements 444Appendix IV Group Embedded Value and Solvency II Own Funds 470Appendix V Glossary 471Appendix VI Board of Directors’ report – Cross-reference table 476Appendix VII Corporate governance report – Cross-reference table 477Appendix VIII Commission delegated regulation (EU) 2019/980 of March 14, 2019 –
Cross-reference table 478Appendix IX Annual Financial Report – Cross-reference table 482

1I UNIVERSAL REGISTRATION DOCUMENT - ANNUAL REPORT 2019 - AXA I
This Universal Registration Document (which we also refer to as our “Annual Report”) includes (i) all the components of the
Annual Financial Report (Rapport Financier Annuel) referred to in paragraph I of Article L.451-1-2 of the French Monetary
and Financial Code (Code monétaire et financier) as well as in Article 222-3 of the AMF General Regulation (Règlement
Général de l’AMF) (please refer to the cross-reference table on page 482 of this Universal Registration Document which
indicates the relevant sections of this Universal Registration Document corresponding to the items referred to in Article
222-3 of the AMF General Regulation), (ii) all disclosure matters required to be included in the Board of Directors’ Report
to AXA’s Shareholders’ Meeting to be held on April 30, 2020, established pursuant to Articles L.225-100 et seq. of the French
Commercial Code (Code de commerce) (the relevant sections of this Universal Registration Document corresponding to
such required disclosures have been approved by AXA’s Board of Directors and are referred to in the cross-reference table
on page 476 of this Universal Registration Document), and (iii) all the elements required to be included in the corporate
governance report established pursuant to Articles L.225-37 et seq. of the French Commercial Code (Code de commerce)
(the relevant sections of this Universal Registration Document corresponding to such required disclosures have been
approved by AXA’s Board of Directors and are referred to in the cross reference table on page 477 of this Universal
Registration Document). The cross-reference table on page 478 of this Universal Registration Document indicates the
items of Annexes 1 and 2 of Delegated Regulation (EU) 2019/980 to which the information contained herein corresponds.
UNIVERSAL REGISTRATION
DOCUMENTANNUAL REPORT 2019
This Universal Registration Document has been filed on March 19, 2020 with the Autorité des Marchés Financiers (the
“AMF”) as the competent authority under Regulation (EU) 2017/1129, without prior approval pursuant to Article 9
of Regulation (EU) 2017/1129.
This Universal Registration Document may be used for the purposes of an off er to the public of securities or admission
of securities to trading on a regulated market if approved by the AMF together with any amendments, if applicable,
and a securities note and summary approved in accordance with Regulation (EU) 2017/1129.
CERTAIN PRELIMINARY INFORMATION ABOUT THIS ANNUAL REPORT
In this Annual Report, unless provided otherwise, (i) the
“Company”, “AXA” and “AXA SA” refer to AXA, a société anonyme
(a public limited company) organized under the laws of France,
which is the publicly traded parent company of the AXA Group,
and (ii) the “AXA Group”, the “Group” and “we” refer to AXA SA
together with its direct and indirect consolidated subsidiaries.
The Company’s ordinary shares are referred to in this Annual
Report as “shares”, “ordinary shares”, “AXA shares” or “AXA
ordinary shares”. The principal trading market for AXA’s ordinary
shares is the regulated market Euronext in Paris (Compartment A),
which we refer to in this Annual Report as “Euronext Paris”.
The Group’s consolidated financial statements and related notes
are prepared in accordance with International Financial Reporting
Standards (IFRS) (the “Consolidated Financial Statements”) and
published in Euro (“Euro”, “euro”, “EUR” or “€”). Unless otherwise
stated, all amounts in this Annual Report are (i) expressed in Euro,
with applicable foreign exchange rates presented on page 31 of
this Annual Report, and (ii) presented in millions for convenience.
Such amounts may have been rounded. Rounding diff erences
may exist, including for percentages.
Where reference is made to a website in this Universal
Registration Document, the contents of such website do not form
part of this Universal Registration Document. No information,
document or material from the website of the Company
(www.axa.com) or any other source shall form part of this
Universal Registration Document, unless such information,
document or material is expressly incorporated by reference
into this Universal Registration Document.

2 I UNIVERSAL REGISTRATION DOCUMENT - ANNUAL REPORT 2019 - AXA I
This page was intentionally left blank.

3I UNIVERSAL REGISTRATION DOCUMENT - ANNUAL REPORT 2019 - AXA I
Cautionary statement regarding forward-looking statements and the use of non-gaap fi nancial measures
This Annual Report may include statements with respect to
future events, trends, plans, expectations or objectives and
other forward-looking statements relating to the Group’s future
business, financial condition, results of operations, performance,
and strategy. Forward-looking statements are not statements of
historical fact and may contain the terms “may”, “will”, “should”,
“continue”, “aims”, “estimates”, “projects”, “believes”, “intends”,
“expects”, “plans”, “seeks” or “anticipates”, or words of similar
meaning. Such statements are based on Management’s current
views and assumptions and, by nature, involve known and
unknown risks and uncertainties; therefore, undue reliance
should not be placed on them. Actual financial condition, results
of operations, performance or events may diff er materially from
those expressed or implied in such forward-looking statements,
due to a number of factors including, without limitation, general
economic and political conditions and competitive situation;
future financial market performance and conditions, including
fluctuations in exchange and interest rates; frequency and
severity of insured loss events, and increases in loss expenses;
mortality and morbidity levels and trends; persistency levels;
changes in laws, regulations and standards; the impact of
acquisitions and disposal, including related integration issues,
and reorganization measures; and general competitive factors,
in each case on a local, regional, national and/or global basis.
Many of these factors may be more likely to occur, or more
pronounced, as a result of catastrophic events, including
weather-related catastrophic events, pandemic events or
terrorist-related incidents. Please refer to Part 4 – “Risk factors
and risk management” of this Annual Report for a description of
certain important factors, risks and uncertainties that may aff ect
AXA’s business and/or results of operations. AXA undertakes no
obligation to publicly update or revise any of these forward-
looking statements, whether to reflect new information, future
events or circumstances or otherwise, except as required by
applicable laws and regulations.
In addition to the Consolidated Financial Statements, this
Annual Report refers to certain non-GAAP financial measures,
or alternative performance measures, used by Management in
analyzing the Group’s operating trends, financial performance
and financial position and providing investors with additional
information that Management believes to be useful and
relevant regarding the Group’s results. These non-GAAP financial
measures generally have no standardized meaning and therefore
may not be comparable to similarly labelled measures used by
other companies. As a result, none of these non-GAAP financial
measures should be considered in isolation from, or as a
substitute for, the Consolidated Financial Statements included
in Part 5 – “Consolidated Financial Statements” of this Annual
Report. The non-GAAP financial measures used by the Group
are defined in the Glossary set forth in Appendix V to this Annual
Report.
The results of our U.S. segment are presented on the basis of IFRS
and are not, and should not be relied upon as representing, the
U.S. GAAP results of Equitable Holdings, Inc. (“EQH”)(1) (including
AB), which, as a U.S. public company, reports in U.S. GAAP in
accordance with the rules of the U.S. Securities and Exchange
Commission (“SEC”). For further information on EQH’s financial
results and other public reports please consult the SEC website
at www.sec.gov.
(1) Formerly known as AXA Equitable Holdings, Inc.

4 I UNIVERSAL REGISTRATION DOCUMENT - ANNUAL REPORT 2019 - AXA I
Chairman’s MessageIn 2019, AXA demonstrated its capacity to deliver on its operational
targets, while completing major transformative moves, in
accordance with its Ambition 2020 strategic plan.
AXA achieved outstanding operational performance during the
year. The Group’s revenues grew +5% organically, supported by
the dynamism of its preferred segments, P&C C ommercial lines,
Health and Protection. This was delivered while securing strong
technical profitability.
At the same time, AXA progressed significantly on its
transformation journey. The sell-down of our US Life and Asset
Management operations is now complete. The Group has now
full control over its P&C business in China – a market in which
we are now the largest foreign actor. AXA further simplified
its footprint, notably divesting from insurance operations in
Ukraine and banking activities in Belgium. AXA XL’s integration
within the Group has been p rogressing quickly. In early 2020,
AXA announced the sale of its insurance and asset management
operations in Central and Eastern Europe (Poland, Czech Republic
and Slovakia).
As a result of those eff orts, AXA is well on track to achieve its
Ambition 2020 targets.
I am especially satisfied that while delivering this strong business
performance, AXA was able to confirm its leadership on societal
issues.
To further contribute to the fight against climate change, a major
risk for insurers, AXA doubled its green investment target to €24bn,
launched transition bonds as a new asset class and tightened
its policies regarding coal, both as an investor and an insurer.
As curbing climate change is a collective challenge, AXA joined
coalitions, such as the Net Zero Asset Owner Alliance, and forged
new partnerships, for instance with the C40, a group of the world’s
largest cities.
With a growing consensus that insurance is a condition for growth
and prosperity, AXA now provides insurance to 18.6 million
emerging customers across nine developing countries, almost
doubling from last year. In mature markets, AXA develops leading
protection solutions for digital economy workers.
AXA’s score in the Dow Jones Sustainability Index reached 83% in
2019, increasing by four points from last year, with improvements
in all of the indices of the ranking. Accordingly, AXA was ranked
third most responsible insurer, up two places.
Finally, I would like to send my warmest thanks to all AXA’s
employees, agents and partners for their commitment to our
company and for their engagement throughout 2019. On my
behalf as well on all Board members’, I express our trust in
Thomas Buberl and the Management Committee members to
deliver the Ambition 2020 plan and prepare AXA’s future.
Denis Duverne
Chairman of the Board of Directors

5I UNIVERSAL REGISTRATION DOCUMENT - ANNUAL REPORT 2019 - AXA I
Chief Executive Offi cer’s Message
As uncertainty grows across the world, generating, increasing and
changing protection needs, I am convinced that our role as insurer
is becoming ever more relevant. In the face of shift ing threats
and concerning trends, our mission is to be a stabiliser, helping
individuals and organisations overcome hardship, and acting as
a force for collective good.
In 2019, our Group continued its transformation journey to be
prepared for what tomorrow holds and enhance our ability to
help our customers in all circumstances. We have grown across
our preferred segments (Health, Protection and P&C commercial
lines) which are precisely areas where we have the opportunity
to tackle these growing needs. We completely divested from our
US Life and Asset Management businesses, thus completing a
shift in our risk profile, moving away from financial risks towards
technical risks. At the same time, we made significant progress in
the operational integration of AXA XL, strengthening our position
as the world’s leading P&C commercial lines insurer, protecting
companies of all sizes, anywhere, and against all types of risks.
We also continued to simplify the Group’s footprint, notably by
divesting from insurance operations in Ukraine and banking
activities in Belgium as well as announcing the disposal of our
operations in Central and Eastern Europe, while pursuing the
focus on our prominent geographies, such as France and Europe,
where we are strengthening our positions, as well as Asia and the
US. For instance, we completed the acquisition of the remaining
50% stake in AXA Tianping to accelerate our growth in China, thus
becoming the number one foreign P&C insurer. We also pursued
our innovation eff orts in the healthcare space by partnering with
clinics networks to off er integrated insurance and primary care
delivery in emerging countries. In partnership with ING, we also
launched an innovative digital platform to off er simpler insurance
solutions to our customers and best address their needs.
Finally, AXA continued acting as an architect of solutions designed
to meet the major challenges facing our societies. In 2019, we
have further leveraged our expertise and economic strength to
contribute to the fight against climate change by taking a series of
new commitments to accelerate our contribution to a low-carbon
and more resilient economy.
To summarise, our Focus and Transform strategy is bearing
fruit, resulting in improved customer satisfaction (75% of AXA
businesses at or above local market average NPS(1) in 2019,
versus 54% in 2018) and a strong operating performance. Our
underlying earnings increased, including in our key geographies
and segments, reaching a record €6.5 billion.
Year after year, our organic growth dynamic continues: our
gross revenues increased by 5% to €104 billion. With underlying
earnings per share up 5%, adjusted return of equity at 16%,
operating free cash flows at €6.3 billion and a solvency ratio up
5 points to 198% despite low interest rates, we have delivered
on our financial targets, confirming our trajectory to achieve our
strategic plan Ambition 2020.
I would like to sincerely thank our customers for their trust: they
are at the heart of what we do, their satisfaction is both our
objective and our reward, and standing by them day by day is
our pride.
I would also like to extend my gratitude to all the AXA teams,
agents, and partners who have delivered these great results. I
am delighted that employee satisfaction, as measured by the
e-NPS(2), increased in 2019. I measure and appreciate their
unwavering dedication, eff orts and commitment. Together, we
are transforming AXA to make it a simpler and more customer-
focused leader of the insurance industry.
Thomas Buberl
Chief Executive Off icer
(1) Net Promoter Score.
(2) Employee Net Promoter Score.
“2019: strong strategy execution and solid
operational performance”

6 I UNIVERSAL REGISTRATION DOCUMENT - ANNUAL REPORT 2019 - AXA I
AXA Today
■ AXA protects people and businesses worldwide and creates value
analyzing, pooling and managing a wide range of risks.
■ The Group started as a local French company and became a global
insurance leader in just 30 years.
■ Recently, AXA has transformed its risk profile, from financial to
insurance risks, by completing the disposal of its US Life & Savings
and Asset Management entity and acquiring the XL Group. AXA is
accelerating on Property & Casualty, Health and Protection, which
are less sensitive to financial markets.
■ AXA is a responsible leader and has launched in 2019 a new phase
in its climate strategy to accelerate its contribution to the transition
towards a low-carbon and resilient economy.
■ The Group has a proven track record in delivering sustained earnings
and dividend growth to its shareholders.

7I UNIVERSAL REGISTRATION DOCUMENT - ANNUAL REPORT 2019 - AXA I
I Growth across preferred segments (1)
(1) Percentages excluding the contribution of the United States segment.
I And all main geographies (1 )
ASIA &
INTERNATIONAL
17%of
revenues
+ 5%
ASIA &
INTERNATIONAL
€1. 7bn
AXA XL
19%of
revenues
+ 10%
AXA XL
€0. 5bn
FRANCE
26%of
revenues
+ 4%
FRANCE
€1. 7bn
PROTECTION
16%of
revenues
+ 4%
EUROPE
35%of
revenues
+ 4%
EUROPE
€2. 5bn
HEALTH
14%of
revenues
+ 6%
P&C
COMMERCIAL
32%of
revenues
+ 7%
Revenues
€104bn + 5%
Underlying
Earnings
€6. 5bn

8 I UNIVERSAL REGISTRATION DOCUMENT - ANNUAL REPORT 2019 - AXA I
Strategic orientations
Several underlying trends have impacted the insurance industry
over the last few years: a low interest rates environment
challenging the Life & Savings and Protection businesses,
increasing competition from non-insurance companies,
hardening of legislation & regulation and shifting customer
behaviors & expectations. The nature, the frequency and the
volatility of risks are also evolving, notably driven by climate
change and natural catastrophes, the evolution of technology
and the global interconnection of businesses increasing supply
chain risk and business interruption.
To respond to these developments and seize new opportunities,
AXA is constantly rethinking and expanding its products, services
and business models with the ambition to become a true partner
for its clients. Moving from an approach based on risk coverage
to a logic relying on ecosystems, the Group is progressively
diversifying toward a world of services where, by offering
complementary services in addition to insurance coverage, the
Group enables clients to gain more from their relationship with
AXA and better understand and mitigate their risks.
Following the transformation initiated in 2018 with the
rebalancing of its portfolio towards more technical risks with the
acquisition of XL Group, AXA has continued delivering on the bold
moves it made: the Group reduced its exposure to financial risks
by completing its exit from the US Life & Savings market through
the full disposal of its remaining stake in Equitable Holdings, Inc.
in 2019, and it progressed on the integration of AXA XL. In line
with the strategic priorities of Ambition 2020, AXA continues to
focus on its preferred segments, i.e. P&C Commercial lines, Health
and Protection, where it further developed ‘beyond Insurance’
services to expand in the Healthcare ecosystem, including the
launch of primary care clinics in Mexico through a joint venture
with Keralty and in Egypt where AXA owns diagnostic centers
and primary care centers.
In Asia, AXA completed the acquisition of the remaining 50% stake
in AXA Tianping in China and started building the foundations
to roll-out its Chinese health strategy through the recruitment
of Chinese health experts, the creation of a new portfolio of
products and services and the development of a comprehensive
distribution plan. Apart from China, the Group focused on driving
growth in its current strongholds (Japan and Hong Kong) and
high potentials (Indonesia, Thailand and Philippines) through
transforming agency distribution and enhancing insurance and
service propositions.
Customer satisfaction remains a key pillar of AXA’s strategy and
the Group accelerated its eff orts in implementing a customer-
centric culture. Entities have designed wide-ranging action plans
with impact on customer satisfaction expected beyond 2019 (e.g.
customer journey redesign, claims management), and more
short-term/tactical actions, encompassing adjusting business
processes and tools to enhance immediately customers’
experience.
The Group confirmed its Ambition 2020 financial targets, with
an adjusted ROE target between 14%-16%, a dividend payout
range of 50%-60% of adjusted earnings, as well as a Solvency
II ratio target range from 170% to 220% and a 3-7% UEPS 2015-
2020 CAGR.
In parallel, AXA has undertaken a series of initiatives to address
social and environmental challenges not only for its clients
and partners, employees and shareholders, but for society as
a whole. Believing in combining societal and business impact
while being relevant for customers and employees, the Group
continues to promote its objectives of diversity and inclusion,
and its ambitious Corporate Social Responsibility policy.

9I UNIVERSAL REGISTRATION DOCUMENT - ANNUAL REPORT 2019 - AXA I
Sustainable value creation
WE CREATE
PRODUCTS AND
SERVICES
THAT ENABLE
OUR CLIENTS
TO TRANSFER
THEIR RISKS.
WE IDENTIFY, ASSESS
AND POOL RISKS
RELATED TO PEOPLE
AND BUSINESSES FOR
A MORE STABLE
WORLD. WE HELP OUR
CUSTOMERS MANAGE
THEIR RISKS.
WE INVEST
RESPONSIBLY OUR
ASSETS ON BEHALF
OF BOTH OUR
CUSTOMERS AND
OUR SHAREHOLDERS.
WE COMMIT TO
CUSTOMERS,
PARTNERS
AND INVESTORS,
AND REINVEST PART
OF OUR PROFITS IN OUR
BUSINESS, IN OUR
HUMAN RESOURCES AND
IN OUR COMMUNITIES.
AXA
As
se
t
ma
na
ge
me
nt
Sa
vin
gs
Property &
Casualty
Protection
He
alt
h
Pro
d
uct d
esig
n
Actu
arial i
nsi
ghts/ D
ata science
Distribu
tion
Advice/ Supp
ort
Fin
an
cia
l m
ark
et
exp
ert
ise
Ass
et lia
bilit
y m
an
ag
em
en
t/
Inv
es
tm
en
ts
Customer service/ Payments/ Assistance Operations
Ad
dit
ion
al s
er
vic
es
Inn
ova
tio
n/P
art
ne
rsh
ips
Ris
k m
anagement/

10 I UNIVERSAL REGISTRATION DOCUMENT - ANNUAL REPORT 2019 - AXA I
2019 Full Year Earnings
Dividend (In euro per share)
2016 2017 2018 2019
1.161.26 1.34
1.43 (1)
32%29%
I Shareholders’ equity I Debt gearing
2018 2019
€69. 9 bn€62. 4 bn
(1) Proposed dividend, submitted for approval at the annual shareholders meeting on April 30, 2020.
Combined ratio
PROTECTION
Combined ratio
HEALTH
Combined ratio
P&C
Financial strength
Profi tability
52%50% - 60%
Target range
Distribution rate
20192018
93. 2%94. 1%96. 4%
+7%2019 versus 2018

11I UNIVERSAL REGISTRATION DOCUMENT - ANNUAL REPORT 2019 - AXA I
2016 2017 2018 2019
€25 bnCumulative 2016-2019
28 - 32 Euro billionCumulative FCF 2016-2020
170% - 220%Target range
2016 2017 2018 2019
197% 205%193% 198%
3% - 7%UEPS CAGR
(1)
2015 2016 2017 2018 2019
2.16€ 2.24€2.40€ 2.48€ 2.59€
+ 5%2015-2019 CAGR
(1)
2016 2017 2018 2019
13.5%14.5% 14.4%
16.0%
14% - 16%Target range
Ambition 2020Underlying earnings per share
Free cash fl ows
Solvency II ratioAdjusted return on equity
(1) Compound annual growth rate, on a reported basis.

12 I UNIVERSAL REGISTRATION DOCUMENT - ANNUAL REPORT 2019 - AXA I
This page was intentionally left blank.
13I UNIVERSAL REGISTRATION DOCUMENT - ANNUAL REPORT 2019 - AXA I
1THE AXA GROUP
1.1 KEY FIGURES 14
IFRS indicators 14
Activity and Earnings indicators 15
Assets under management 15
Dividends and dividend policy 16
Ratings 17
1.2 HISTORY 19
1.3 BUSINESS OVERVIEW 21
France 22
Europe 23
Asia 24
AXA XL 26
International 27
Transversal & Central Holdings 28

14 I UNIVERSAL REGISTRATION DOCUMENT - ANNUAL REPORT 2019 - AXA I
THE AXA GROUP 1 1.1 KEY FIGURES
AXA SA is the holding company of AXA Group, a worldwide leader in insurance, with total assets of €781 billion for the year ended
December 31, 2019.
AXA operates primarily in five geographies: France, Europe, Asia, AXA XL and International (including Middle East, Latin America and Africa).
The main operating activities are Life & Savings, Property & Casualty, Health and Asset Management. In addition, the Group is composed
of various companies conducting certain non-operating and banking activities.
1.1 KEY FIGURES
I IFRS indicators
IFRS indicators presented below are derived from the Consolidated Financial Statements for the year ended December 31, 2019.
The table set out below is only a summary. You should read it in conjunction with the Consolidated Financial Statements for the year
ended December 31, 2019 included in Part 5 – “Consolidated Financial Statements” of this Annual Report.
(in Euro million) 2019 2018 2017
Incom e Statement Data
Revenues 103,532 102,874 98,549
Net consolidated income - Group Share 3,857 2,140 6,209
(in Euro million except per share data) 2019 2018 2017
Balance Sheet Data
Total assets 780,878 930,695 870,128
Shareholders’ equity - Group share 69,897 62,428 69,611
Shareholders’ equity per share (a) 26.6 23.4 26.1
Dividend per share (b) 1.43 1.34 1.26
(a) Shareholders’ equity per share is calculated based on the actual number of outstanding shares at each period-end presented. Shares held by AXA and its subsidiaries (i.e. treasury shares) are deducted for the calculation of outstanding shares. Undated debt is excluded from shareholders’ equity for this calculation.
(b) An annual dividend is generally paid each year in respect of the prior year aft er the Annual Shareholders’ Meeting (customarily held in April or May) and before September of that year. Dividends are presented in this table in the year to which they relate and not in the year in which they are declared and paid. A dividend of €1.43 per share will be proposed at AXA’s Shareholders’ Meeting that will be held on April 30, 2020. Subject to the Shareholders’ Meeting approval, the dividend will be paid out on May 13, 2020, with an ex-dividend date of May 11, 2020.

15I UNIVERSAL REGISTRATION DOCUMENT - ANNUAL REPORT 2019 - AXA I
THE AXA GROUP
1
1.1 KEY FIGURES
I Activity and Earnings indicators
The table set out below presents the key activity and earnings indicators. You should read it in conjunction with Section 2.3 “Activity
R eport” and the Glossary set forth in Appendix V to this Annual Report.
(in Euro million, except percentages) 2019 2018 2017
Property & Casualty Gross Revenues 48,817 35,320 31,763
Property & Casualty Combined Ratio (a) 96.4% 97.0% 96.3%
Health Gross Revenues 14,000 13,056 12,403
Health Combined Ratio (a) (b) 94.1% 94.4% 94.7%
Annual Premium Equivalent (APE) 6,029 6,631 6,470
New Business Value (NBV) 2,542 2,607 2,787
Underlying earnings Group share (a) 6,451 6,182 6,002
Adjusted earnings Group share (a) 6,844 6,489 6,457
(a) Alternative Performance Measures. For further information, refer to Section 2.3 Activity R eport and the Glossary set forth in Appendix V of this Annual Report.
(b) As a consequence of the deconsolidation of Equitable Holdings, Inc. (“EQH”) as of March 31, 2019, EQH contribution was excluded from Health Combined Ratio calculation in 2019.
I Assets under management
The table below sets forth the total assets managed by AXA’s subsidiaries, including assets managed on behalf of third parties:
(in Euro million)
At December 31,
2019 2018 2017
AXA
General Account assets 576,183 633,854 612,606
Assets backing contracts with financial risk borne by policyholders (Unit-Linked) 72,660 160,176 175,003
Subtotal 648,843 794,030 787,609
Managed on behalf of third parties (a) 320,517 629,814 650,923
TOTAL ASSETS UNDER MANAGEMENT 969,360 1,423,844 1,438,532
(a) Include assets managed on behalf of Mutuelles AXA.
The decrease in Assets under Management in 2019 versus 2018
was driven by the disposal of Equitable Holdings, Inc., including
its asset management subsidiary (AB).
For additional information on AXA’s revenues by segment, see
Note 21 “Information by segment” in Part 5 - “Consolidated
Financial Statements” of this Annual Report.
For additional information on AXA’s segments, see Section 2.3
“Activity R eport” and Note 3 “Consolidated statement of income
by segment” in Part 5 - “Consolidated Financial Statements” of
this Annual Report.

16 I UNIVERSAL REGISTRATION DOCUMENT - ANNUAL REPORT 2019 - AXA I
THE AXA GROUP 1 1.1 KEY FIGURES
The following table sets forth information on the dividends declared and paid in respect of the last five fiscal years:
Fiscal year
Distribution
(in Euro million)
Number of shares
(on December 31)
Net dividend
per share
(in Euro)
Dividend per
share eligible for
a tax relief
(in Euro)
Gross dividend
per share
(in Euro)
2015 2,669 2,426,458,242 1.10 (b) 1.10 (b) 1.10 (b)
2016 2,813 2,425,149,130 1.16 (c) 1.16 (c) 1.16 (c)
2017 3,056 2,425,235,751 1.26 (d) 1.26 (d) 1.26 (d)
2018 3,249 2,424,916,626 1.34 (e) 1.34 (e) 1.34 (e)
2019 3,457 (a) 2,417,695,123 1.43 (f) 1.43 (f) 1.43 (f)
(a) Proposal to be submitted to the Shareholders’ Meeting to be held on April 30, 2020.
(b) Individual shareholders who were residents of France for tax purposes were eligible for a tax relief of 40% on the dividend, i.e. €0.44 per share for fiscal year 2015.
(c) Individual shareholders who were residents of France for tax purposes were eligible for a tax relief of 40% on the dividend, i.e. €0.46 per share for fiscal year 2016.
(d) The gross amount of dividends was subject to a unique withholding tax liquidated at an overall rate of 30%, unless in case of option for the progressive scale on income tax which then applied to all capital income paid in 2018. The option for the progressive scale gave right to the 40% tax relief pursuant to paragraph 2° of Article 158.3 of the French General Tax Code, i.e. €0.50 per share for fiscal year 2017.
(e) The gross amount of dividends will be subject to a unique withholding tax liquidated at an overall rate of 30%, unless in case of express and irrevocable option for the progressive scale on income tax which would then apply to all capital income paid in 2019. The option for the progressive scale would give right to the 40% tax relief pursuant to paragraph 2° of Article 158.3 of the French General Tax Code, i.e. €0.54 per share for fiscal year 2018.
(f) Proposal to be submitted to the Shareholders’ Meeting to be held on April 30, 2020. The gross amount of dividends will be subject to a unique withholding tax liquidated at an overall rate of 30%, unless in case of express and irrevocable option for the progressive scale on income tax which would then apply to all capital income paid in 2020. The option for the progressive scale would give right to the 40% tax relief pursuant to paragraph 2° of Article 158.3 of the French General Tax Code, i.e. €0.57 per share for fiscal year 2019.
I Dividends and dividend policy
The Company pays dividends in Euro. Future dividends will depend
on a variety of factors including AXA’s earnings, consolidated
financial condition, applicable capital and solvency requirements,
prevailing financial market conditions and the general economic
environment. Proposals for dividend payments are made at the
discretion of the Board of Directors and are submitted for approval
to the Shareholders’ Meeting.
AXA determines its dividend policy on the basis of its adjusted
earnings net of its outstanding undated debt interest charges.
Since 2018, AXA targets to pay aggregate dividends in a general
range of 50% to 60% of this amount (representing an increase
from the prior indicative range of 45% to 55%). The dividend
proposed by the Board of Directors in any particular year may
vary considerably depending on a variety of factors (as noted
above) which may have an impact on this target from one year
to another. In assessing the dividend to be paid in any given year,
Management tries to strike the appropriate balance between
(i) prudent capital management, (ii) reinvestment of previous
results to support business development, and (iii) an attractive
dividend for shareholders.
A dividend of €1.43 per share for the 2019 fiscal year will be
proposed to the Shareholders’ Meeting to be held on April 30, 2020.
Dividends not claimed within five years aft er the payout date become the property of the French Public Treasury.
For further information on AXA’s dividend, see Note 29.4 “Other items: Restriction on dividend payments to shareholders” in Part 5 –
“Consolidated Financial Statements” and Section 6.3 “General information – Bylaws - Dividends” of this Annual Report.

17I UNIVERSAL REGISTRATION DOCUMENT - ANNUAL REPORT 2019 - AXA I
THE AXA GROUP
1
1.1 KEY FIGURES
I Ratings
The financial strength, debt or performance of the Company and
certain of its insurance subsidiaries is rated by recognized rating
agencies. The ratings set forth below are subject to revision or
withdrawal at any time by the assigning rating agency in its sole
discretion. Credit ratings are intended to reflect the ability of AXA
to meet its payment obligations and may not reflect the potential
impact of all risks on the value of AXA’s securities. A rating is
not a recommendation to buy, sell or hold securities. None of
these ratings should be construed as an indication or forecast
of the historical or potential performance of AXA’s securities nor
should any such rating be relied upon for the purpose of making
an investment decision with respect to any of the Company’s
securities. The Company does not undertake to maintain its
ratings, nor in any event shall the Company be responsible for
the accuracy or reliability of any of the ratings set forth below.
The significance and the meaning of individual ratings vary from
agency to agency.
INSURER FINANCIAL STRENGTH & COUNTERPARTY CREDIT RATINGS
At the date of this Annual Report, the relevant ratings for the Company and its principal insurance subsidiaries were as follows:
Agency Date of last review
Insurer financial strength ratings Counterparty credit ratings
AXA’s principal
insurance
subsidiaries Outlook
Senior debt of
the Company Outlook
Short term debt
of the Company
S&P Global
Ratings
July 24, 2019 AA- Stable A Stable A-1
Fitch Ratings December 10, 2019 AA- Positive A Positive F1
Moody’s Investors
Service
April 5, 2019 Aa3 Stable A2 Stable P-1
SOCIALLY RESPONSIBLE INVESTMENT
(SRI) RATINGS
AXA’s social, societal, environmental and governance performance
is rated by a number of specialists, including investors, brokers
and rating agencies that focus specifically on the SRI market, as
well as specialist organizations focused on single sustainability
themes. The Group generally ranks amongst the top performers
in its industry and is also included in the main international
sustainability indices:
■ DJSI World and DJSI Europe (based on Standard & Poor’s study);
■ Euronext Vigeo, World 120, Eurozone 120 and France 20 (based
on Vigeo Eiris research);
■ FTSE4GOOD (based on FTSE Russell research).
The AXA Group’s main SRI ratings are listed below (not all ratings are updated annually):
Agency/Organisation Scores & ratings
Standard & Poor’s
“Dow Jones Sustainability Index” (a)
83/100 – Sector average: 47/100
Percentile ranking: 97th
Vigeo Eiris 69/100 – Sector leader
FTSE ESG 4. 3/5
Sustainalytics 86/100 – Rank 2/145 in sector
CDP A-
MSCI AAA
UN Principles for Responsible Investment A+
(a) Note: The Dow Jones Sustainability Index is a reference performance indicator for AXA, its methodology serves as the basis for the Group’s internal sustainability evaluation tool since 2010, and is one of the performance metrics used to calculate long- term incentives (Performance Shares) since 2016.

18 I UNIVERSAL REGISTRATION DOCUMENT - ANNUAL REPORT 2019 - AXA I
THE AXA GROUP 1 1.1 KEY FIGURES
FURTHER INFORMATION REGARDING EXTRA-FINANCIAL RATINGS PROVIDERS
Standard & Poor’s. Since this year, RobecoSAM teams have
joined Standard & Poor’s. As an investment specialist focused
on “Sustainability Investing”, it assesses each year over
4,500 companies using criteria that are both industry-specific
and financially material. www.robecosam.com/csa/
Note: the Dow Jones Sustainability Index is a reference
performance indicator for AXA: its methodology serves as the
basis for the Group’s internal sustainability evaluation tool since
2010, and is one of the performance metrics used to calculate
long- term incentives (Performance Shares) since 2016.
Vigeo Eiris is an ESG (Environmental, Social and Governance)
rating agency. Its methodology leverages a number of sustainability
criteria based on international standards. http://www.vigeo-eiris.
com/about-us/methodology-quality-assurance/
FTSE Russell is a provider of benchmarks, analytics, and data
solutions across asset classes. Each year FTSE Russell rates over
4,000 companies, measuring their exposure to and management
of ESG issues. https://www.ft se.com/products/indices/esg
Sustainalytics is an ESG (Environmental, Social and Governance)
rating agency covering 9,000 companies. The agency focuses on
corporate governance, material ESG issues, and controversies.
https://www.sustainalytics.com/esg-ratings/
The CDP (formerly known as the Carbon Disclosure Project) runs
a global disclosure system that enables companies, cities, states
and regions to report on their environmental impacts. The CDP
also transforms this data into analysis on critical environmental
risks, opportunities and impacts. https://www.cdp.net/fr
MSCI is an independent provider of research and data for
institutional investors. MSCI’s research analysts assess thousands
of data points across 37 ESG issues, focusing on both risks and
opportunities. https://www.msci.com/esg-ratings
UN Principles for Responsible Investment (Transparency
R eport). The six Principles for Responsible Investment are a
voluntary and aspirational set of investment principles that
encourage the incorporation of ESG issues into investment
practices. PRI signatories are required to report publicly on their
responsible investment activities each year, using asset-specific
modules in the UN PRI reporting system. Answers are then assessed
and results are compiled into an annual Assessment report.
https://www.unpri.org/signatories/about-pri-assessment

19I UNIVERSAL REGISTRATION DOCUMENT - ANNUAL REPORT 2019 - AXA I
THE AXA GROUP
1
1.2 HISTORY
1.2 HISTORY
AXA originated from several French regional mutual insurance
companies: “Les Mutuelles Unies ”.
1982
Takeover of Groupe Drouot.
1986
Acquisition of Groupe Présence.
1988
Transfer of the insurance businesses to Compagnie du Midi (which
subsequently changed its name to AXA Midi and then AXA).
1992
Acquisition of a controlling interest in The Equitable Companies
Incorporated (United States), which subsequently changed its
name to AXA Financial, Inc. (“AXA Financial”).
1995
Acquisition of a majority interest in National Mutual Holdings
(Australia), which subsequently changed its name to AXA Asia
Pacific Holdings Ltd. (“AXA APH”).
1997
Merger with Compagnie UAP.
2000
Acquisition of (i) Sanford C. Bernstein (United States) by AXA’s asset
management subsidiary Alliance Capital, which subsequently
changed its name to AllianceBernstein (now AB); (ii) the minority
interest in AXA Financial; and (iii) Japanese life insurance company,
Nippon Dantaï Life Insurance Company; and
Sale of Donaldson, Lufkin & Jenrette (United States) to Credit
Suisse Group.
2004
Acquisition of the American insurance group MONY.
2005
FINAXA (AXA’s principal shareholder at that date) merged into AXA.
2006
Acquisition of Winterthur Group.
2008
Acquisition of Seguros ING (Mexico).
2010
Voluntary delisting of AXA SA from the New York Stock Exchange
and deregistration with the Securities and Exchange Commission
(SEC); and
Sale by AXA UK of its traditional Life and Pensions businesses
to Resolution Ltd.
2011
Sale of (i) AXA’s Australian and New Zealand Life & Savings
operations and acquisition of the AXA APH Life & Savings
operations in Asia; and (ii) AXA Canada to the Canadian insurance
group Intact.
2012
Launch of ICBC-AXA Life, a Life insurance joint venture in China
with ICBC; and
Acquisition of HSBC’s Property & Casualty operations in Hong
Kong and Singapore.
2013
Acquisition of HSBC’s Property & Casualty operations in Mexico;
and
Sale by (i) AXA Investment Managers of a majority stake in AXA
Private Equity; and (ii) AXA Financial of a MONY portfolio.
2014
Acquisition of (i) 50% of Tianp ing, a Chinese Property & Casualty
insurance company; (ii) 51% of Grupo Mercantil Colpatria’s
insurance operations in Colombia; and (iii) 77% of Mansard
Insurance plc in Nigeria.
2015
Acquisition of (i) 7% of African Reinsurance Corporation (“Africa
Re”); (ii) BRE Insurance, mBank’s Property & Casualty subsidiary in
Poland; (iii) the P&C large commercial risks insurance subsidiary
of SulAmérica in Brazil; (iv) Commercial International Life, the
Life & Savings joint-venture between Commercial International
Bank (“CIB”) and Legal & General in Egypt and conclusion of an
exclusive Life & Savings distribution partnership with CIB; and
(v) Genworth Lifestyle Protection Insurance;
Launch of (i) AXA Strategic Ventures, a venture capital fund
dedicated to emerging strategic innovations in insurance and
financial services; and (ii) Kamet, an InsurTech incubator dedicated
to conceptualizing, launching and accompanying disruptive
InsurTech products and services; and
Sale of Hong Kong’s mandatory retirement schemes business to
The Principal Financial Group.

20 I UNIVERSAL REGISTRATION DOCUMENT - ANNUAL REPORT 2019 - AXA I
THE AXA GROUP 1 1.2 HISTORY
2016
Acquisition of (i) Charter Ping An Insurance Co.; and (ii) the Polish
Property & Casualty operations of Liberty Ubezpieczenia from
Liberty Mutual Insurance Group; and
Sale of AXA’s (i) Portuguese operations to Ageas; (ii) UK off shore
investment bonds business based in the Isle of Man to Life
Company Consolidation Group; (iii) UK (non-platform) investment
and pensions businesses and its direct protection businesses to
Phoenix Group Holdings; (iv) UK wrap platform business Elevate to
Standard Life plc; (v) Hungarian banking operations to OTP bank
plc.; and (vi) Life & Savings and Property & Casualty operations in
Serbia to Vienna Insurance Group and exit from the Serbian market.
2017
Announcement of the intention to list a minority stake of AXA’s US
operations (expected to consist of its US Life & Savings business
and AXA Group’s interest in AB) subject to market conditions, a
strategic decision to create significant additional financial flexibility
to accelerate AXA’s transformation, in line with Ambition 2020;
Launch of AXA Global Parametrics, a new entity dedicated to
accelerate the development of parametric insurance solutions,
broaden the range of solutions to better serve existing customers
and expand its scope to SMEs and individuals; and
Sale of (i) the Property & Casualty commercial broker in the UK,
Bluefin Insurance Group Ltd, to Marsh; (ii) the Life & Savings
insurance operations in Romania to Vienna Insurance Group; and
(iii) AXA Life Europe Limited’s off shore investment bonds business
to Harcourt Life International dac (recently renamed to Utmost
Ireland dac), a subsidiary of the Life Company Consolidation
Group.
2018
Acquisition of (i) the XL Group, creating the #1 global P&C
Commercial lines insurance platform; and (ii) Maestro Health, a
US health benefit administration digital company;
Initial public off ering (“IPO”) of the US subsidiary, Equitable
Holdings, Inc. (1), on the New York Stock Exchange;
Exclusivity agreement entered into with Cinven for the potential
disposal of AXA Life Europe (2) (“ALE”), a specialized platform which
designed, manufactured and distributed AXA’s Variable Annuity
products across Europe; and
Signing of a digital partnership with ING to build a global insurance
platform.
2019
Launch of the new global brand positioning: “Know you can”;
Finalization of the sale of the Ukrainian operations;
Sale of AXA Bank Belgium and conclusion of a long-term insurance
distribution partnership with Crelan Bank (2) ;
Sale of AXA’s remaining stake in Equitable Holdings, Inc. (EQH) (3);
and
Finalization of the acquisition of the remaining 50% stake in
AXA Tianping.
For further information concerning Group subsidiaries (including
the Group’s equity interest and voting rights percentages), please
see Note 2 “Scope of consolidation” in Part 5 – “Consolidated
Financial Statements” of this Annual Report.
(1) Formerly known as AXA Equitable Holdings, Inc.
(2) The completion of the transaction is subject to customary closing conditions, including the receipt of regulatory approvals.
(3) Excluding shares of common stock of EQH, primarily related to the EQH shares to be delivered on redemption of the AXA SA bonds mandatorily exchangeable into EQH shares, maturing in May 2021.

21I UNIVERSAL REGISTRATION DOCUMENT - ANNUAL REPORT 2019 - AXA I
THE AXA GROUP
1
1.3 BUSINESS OVERVIEW
1.3 BUSINESS OVERVIEW
AXA operates in seven segments (France, Europe, Asia, AXA XL, the
United States, International and Transversal & Central Holdings)
and off ers a broad range of Life & Savings, Property & Casualty,
Health, Asset Management and Banking products and expertise.
The nature and level of competition vary among the countries
where AXA operates. AXA competes with insurance companies
and also with banks, asset management companies, investment
advisers and other financial institutions.
The principal competitive factors are as follows:
■ size, strength and quality of the distribution channels, in
particular the quality of advisors;
■ range of product lines and product quality, feature functionality
and innovation;
■ price;
■ quality of service;
■ investment management performance;
■ historical level of bonuses with respect to participating contracts;
■ crediting rates on General Account products;
■ reputation, visibility and recognition of brand; and
■ ratings for financial strength and claims-paying ability.
For additional information on markets, see Section 2.1 “Market
environment – Market conditions” of this Annual Report.
The table set out below presents AXA gross revenues (aft er inter-
segment eliminations) by line of business:
(in Euro million)
Gross revenues (a)
Life & Savings
Property &
Casualty Health
Asset
Management Banking Total
Years ended December 31,
2019
2018
restated (b)
2019 2018 2019 2018 2019 2018 2019 2018 2019
2018
restated (b)
France 14,325 13,542 7,059 7,061 4,619 4,356 - - 179 215 26,182 25,175
Europe 12,268 15,450 16,645 15,760 5,477 5,258 - - 25 41 34,415 36,508
Asia 6,350 5,780 1,353 1,245 2,156 1,947 - - - - 9,860 8,973
AXA XL 188 45 18,553 6,241 - - - - - - 18,741 6,287
United States (c) 3,629 13,723 - - 14 54 654 2,706 - - 4,297 16,483
International 1,328 1,285 3,888 3,722 1,550 1,295 - - 313 233 7,078 6,535
Transversal & Central
Holdings 230 234 1,319 1,290 184 146 1,225 1,243 - - 2,959 2,913
TOTAL 38,318 50,059 48,817 35,320 14,000 13,056 1,879 3,950 517 490 103,532 102,874
(a) Net of intercompany eliminations.
(b) Restated: reclassification of German and Japanese activities of AXA Life Europe (previously reported as part of Germany and Japan respectively) into AXA Life Europe (included in Transversal & Central Holdings).
(c) The contribution of the United States in 2019 includes 3 months of operations, until the date of the deconsolidation (March 31).

22 I UNIVERSAL REGISTRATION DOCUMENT - ANNUAL REPORT 2019 - AXA I
THE AXA GROUP 1 1.3 BUSINESS OVERVIEW
The tables below summarize AXA gross revenues (aft er inter-segment eliminations) by segment for the indicated periods:
I France
GROSS REVENUES
(in Euro million, except percentages)
Gross revenues (a)
Years ended December 31,
2019 2018
TOTAL 26,182 25,175
Of which:
Gross written premiums 26,002 24,958
(a) Net of intercompany eliminations.
PRODUCTS AND SERVICES
AXA off ers in France a full range of insurance products, including
Life & Savings, Property & Casualty and Health. Its off ering covers
a broad range of products including motor, household, property
and general liability insurance, banking, savings vehicles and
other investment-based products for both Personal/Individual
and Commercial/Group customers, as well as health, protection
and retirement products for individual or professional customers.
In addition, leveraging on its product and distribution expertise,
AXA France is developing an Employee Benefit proposition
internationally to individuals, corporates and other institutions.
NEW PRODUCT INITIATIVES
In line with both the “Payer-to-Partner” and Ambition 2020 strategic
orientations, AXA France has launched several new product
initiatives in 2019 spread across Life & Savings and Property &
Casualty segments.
In Life & Savings, AXA France has commercialized a new
pension savings product called P lan d’E pargne R etraite (PER) to
comply with the “PACTE” law (P lan d’A ction pour la C roissance
et la T ransformation de l’E ntreprise) that came into force in
October 2019.
The latter off ers transparency and flexibility, especially the
availability of funds before retirement and the choice between
cash or annuity settlement.
In Property & Casualty, AXA France created a legal protection
website - “dailydroits.fr” - on which customers can get legal
advice. For simple matters, advice is provided, free-of-charge, by
a chatbot nurtured by AXA Protection Juridique’s legal experts.
As for more complex cases, the website off ers direct access to a
legal expert for personalized advice. Additionally, it off ers access
to real estate experts and debt recovery assistance.
In household and in partnership with AXA Partners, AXA France
has launched a service platform called “Mes Travaux” where retail
clients can seek help from AXA’s network of professionals in order
to accomplish various types of house reparations or renovations.
Amongst other benefits, the platform off ers customers negotiated
tariff s, as well as guaranteed 24/7 support.
AXA France also redesigned its motor product renamed Mon
Auto. A modular and flexible off ering has been put in place,
spread across a set of packages and options. The latter reflects
the ability to meet customers’ needs while maintaining attractive
and agile pricing.
AXA Partners is collaborating with the Swedish Public Employment
Service (Arbetsförmedlingen) and the start-up Stratumn to deliver
a blockchain-based solution to accelerate and simplify payment
protection in case of involuntary unemployment.
DISTRIBUTION CHANNELS
AXA France distribu tes its insurance prod ucts through exclusive
and non-exclusive channels, including exclusive agents, salaried
sales forces, direct sales, banks, as well as brokers, independent
financial advisors, aligned distributors or wholesale distributors
and partnerships.

23I UNIVERSAL REGISTRATION DOCUMENT - ANNUAL REPORT 2019 - AXA I
THE AXA GROUP
1
1.3 BUSINESS OVERVIEW
I Europe
In Europe (excluding France), AXA operates in seven countries (Switzerland, Germany, Belgium, the United Kingdom & Ireland, Spain
and Italy).
GROSS REVENUES
(in Euro million, except percentages)
Gross revenues (a)
Years ended December 31,
2019 2018 restated (b)
Switzerland 5,992 17% 9,531 26%
Germany 10,862 32% 10,509 29%
Belgium 3,405 10% 3,359 9%
United Kingdom & Ireland 5,367 16% 5,166 14%
Spain 2,686 8% 2,525 7%
Italy 6,104 18% 5,418 15%
TOTAL 34,415 100% 36,508 100%
Of which:
Gross written premiums 33,985 36,132
(a) Net of intercompany eliminations.
(b) Restated: reclassification of German activities of AXA Life Europe (previously reported as part of Germany) into AXA Life Europe (included in Transversal & Central Holdings).
PRODUCTS AND SERVICES
Except for the United Kingdom and Ireland (where AXA operates
only in Property & Casualty and Health), AXA off ers in Europe a full
range of insurance products, including Life & Savings, Property
& Casualty and Health. In each country, its off ering covers a
broad range of products including motor, household, property
and general liability insurance, term life, whole life, universal
life, endowment, deferred annuities, immediate annuities, and
other investment-based products for both Personal/Individual
and Commercial/Group customers.
Types and specificities of the products off ered by AXA vary from
market to market.
NEW PRODUCT INITIATIVES
The transformation from Payer to Partner continues in European
markets, with the objective of becoming a full-fledged and
innovative partner for their customers before, during and aft er
claims.
In Health, several initiatives have been launched in a consistent
aspiration to enlarge the off er and service portfolio for the benefit
of customers and further strengthen AXA’s position as a leading
health provider in Europe:
■ in Germany, the new full-cover health product ActiveMe was
launched, gaining a very positive response from the market and
agents. These core insurance solutions with services beyond
underwriting and claims are off ered seamlessly through Meine
Gesundheit, AXA Germany’s online health portal, with a number
of active customers which increased to 132,000 users in one year;
■ in the United Kingdom, over 500,000 customers have access to
Doctor@Hand, a leading virtual General Practitioners service
in the country;
■ in Italy, AXA has made a big step towards its vertical integration
strategy with the acquisition of a majority stake in CIDIMU Group
diagnostic center, with a view to integrate into a seamless
customer journey, teleconsultation and insurance protection
capacities. AXA Italy has also accelerated its momentum on
Soluzioni Salute with 37,000 services sold;
■ in Belgium, a teleconsultation pilot was successfully launched
with AXA Partners, and now also includes the collective
hospitalization schemes at AXA Assistance representing
approximately 300,000 customers.

24 I UNIVERSAL REGISTRATION DOCUMENT - ANNUAL REPORT 2019 - AXA I
THE AXA GROUP 1 1.3 BUSINESS OVERVIEW
In SME, new enriched off erings and various partnerships were
completed to provide customers a holistic off er with the aim of
empowering SMEs to have ease of doing business:
■ in Italy, the SME Cyber risk service Protezione Business was
launched, which includes vulnerability assessment, monitoring
and remote support;
■ in Switzerland, partnerships with 3 start-ups that provide payroll,
accounting, fringe benefits and legal services (Accounto, Swibeco
& Silenccio) were concluded successfully, with integration
projects underway into a common ecosystem and several
pilots with SME customers kicked-off ;
■ in Germany, the first three services were launched: whole-book
factoring, purely digital factoring and leasing.
Switzerland further strengthened its mobility ecosystem with
its Upto business (fleet management services for corporate and
car rental for retail) and in Belgium, the partnership with Fixico
has progressed, providing the customers a fully-digital damage
handling proposition aimed at improving convenience whether
or not customers are covered by the insurance contract, reducing
costs and time and, therefore increasing satisfaction.
DISTRIBUTION CHANNELS
AXA distributes its insurance products through exclusive and non-
exclusive channels that vary from country to country, including
exclusive agents, salaried sales forces, direct sales, banks and other
partnerships (e.g. car dealers), brokers, independent financial
advisors and aligned distributors or wholesale distributors.
I Asia
Asia market includes AXA’s operations in seven countries (Japan, Hong Kong, Thailand, Indonesia, China, the Philippines and South Korea).
GROSS REVENUES
(in Euro million, except percentages)
Gross revenues (a)
Years ended December 31,
2019 2018 restated (b)
Japan 4,850 49% 4,564 51%
Hong Kong 3,829 39% 3,305 37%
Asia High Potentials 163 2% 153 2%
Asia - Direct 1,018 10% 950 11%
TOTAL 9,860 100% 8,973 100%
Of which:
Gross written premiums 9,820 8,935
(a) Net of intercompany eliminations.
(b) Restated: reclassification of Japanese activities of AXA Life Europe (previously reported as part of Japan) into AXA Life Europe (included in Transversal & Central Holdings).
Asia High Potentials include (i) the Property & Casualty subsidiary
in Thailand and the non-bancassurance Life & Savings subsidiary
in Indonesia which are fully consolidated, (ii) the Property &
Casualty subsidiary in China (AXA Tianping) which has been fully
consolidated as at December 31, 2019, and (iii) the Joint-Ventures
in China, the Philippines, Thailand, and Indonesia which are
consolidated under the equity method.
PRODUCTS AND SERVICES
AXA operates in Asia primarily in Life & Savings and Health
activities. Although recent years have seen the emergence of
pan-Asian franchises, competition remains driven by local players
in most of the countries.

25I UNIVERSAL REGISTRATION DOCUMENT - ANNUAL REPORT 2019 - AXA I
THE AXA GROUP
1
1.3 BUSINESS OVERVIEW
AXA off ers a full range of insurance products, including Life
& Savings, Property & Casualty as well as Health. Types and
specificities of the products off ered by AXA vary depending on
geographies:
■ in Japan, AXA primarily off ers protection, health and savings
products, including notably medical whole life and medical
term insurance as well as protection with unit-linked products;
■ in Hong Kong, AXA off ers individual life insurance (notably
traditional whole life and to a lesser extent investment-linked),
as well as protection and health products. In Property & Casualty,
product off er includes traditional general insurance products
such as motor, household and travel, as well as Commercial
insurance;
■ in Asia High Potentials:
• in Thailand, Indonesia and the Philippines, AXA off ers a
broad range of both (i) Life & Savings and Health products
including whole life, endowment, unit-linked, group term
insurance, critical illness and hospital cash products, as well
as (ii) traditional Property & Casualty off ers on both Personal
and Commercial lines,
• in China, AXA off ers a whole range of general insurance
products with both Personal, including motor and health,
and Commercial lines, as well as the whole range of Life &
Savings products;
■ in Asia - Direct, Direct business focuses on motor insurance
as well as casualty insurance in South Korea and on motor
insurance as well as other personal insurance products in Japan.
NEW PRODUCT INITIATIVES
As in other geographies, AXA aims to become a partner for its
customers, by considering the specificities of the respective
markets in which it operates:
■ in Japan, AXA has further enhanced its Health off ering through
the launch of a new cancer therapy product which not only
covers customer needs of lump sum benefit for cancer
diagnosis/hospitalization, but also provides access to a wide
range of services including hotline, second opinion, as well as
appearance and work support. On the protection side, AXA has
widened its protection unit-linked off er by launching a long-term
care product to support customers with nursing care needs;
■ in Hong Kong, AXA has launched new Health solutions certified
under the Voluntary Health Insurance Scheme (“VHIS”), as well
as deferred annuity product, both supported by government
tax deduction incentives. Other significant product initiatives
included the rejuvenation of a flagship protection with savings
products;
■ in Asia High Potentials:
• in the Philippines, AXA launched a simple and aff ordable
family critical illness plan, as well as a value-added service
that provides customers with free access to expert medical
advice for cancer and cardiovascular diseases. AXA also
enhanced its protection with savings off ers. An innovative
“Payer-to-Partner” service, AXA Rescue Line, was also launched
which provides users with free access to emergency services,
• in Thailand, AXA launched a range of new protection and
health products,
• in China, AXA enhanced its off ering on Health side through
the launch of in-patient medical reimbursement products,
as well the launch of new cancer off ers;
■ in Asia – Direct, AXA Direct Japan introduced new customer-
oriented innovative services such as multi-language claims
related communication with clients, garages counterparts
and lawyers, as well as 24/7 phone access to a veterinarian
for pet insurance policies, while AXA Direct Korea launched
new protection products and a partnership with C-trip, a travel
company, for overseas travel insurance.
DISTRIBUTION CHANNELS
AXA distributes its products through different distribution
channels, in particular exclusive and non-exclusive agents,
brokers and partnerships. AXA also has strong bancassurance
partnerships, including joint-ventures, with large international
and local financial institutions in the region.
26 I UNIVERSAL REGISTRATION DOCUMENT - ANNUAL REPORT 2019 - AXA I
THE AXA GROUP 1 1.3 BUSINESS OVERVIEW
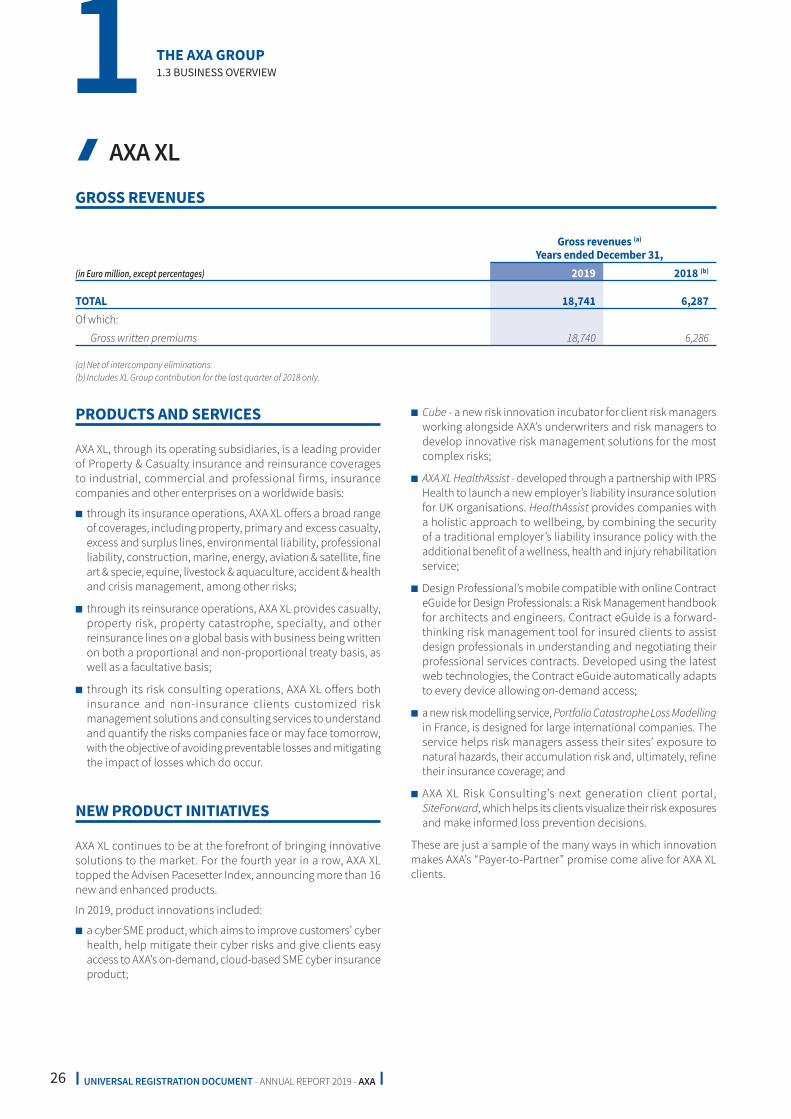
I AXA XL
GROSS REVENUES
(in Euro million, except percentages)
Gross revenues (a)
Years ended December 31,
2019 2018 (b)
TOTAL 18,741 6,287
Of which:
Gross written premiums 18,740 6,286
(a) Net of intercompany eliminations.
(b) Includes XL Group contribution for the last quarter of 2018 only.
PRODUCTS AND SERVICES
AXA XL, through its operating subsidiaries, is a leading provider
of Property & Casualty insurance and reinsurance coverages
to industrial, commercial and professional firms, insurance
companies and other enterprises on a worldwide basis:
■ through its insurance operations, AXA XL off ers a broad range
of coverages, including property, primary and excess casualty,
excess and surplus lines, environmental liability, professional
liability, construction, marine, energy, aviation & satellite, fine
art & specie, equine, livestock & aquaculture, accident & health
and crisis management, among other risks;
■ through its reinsurance operations, AXA XL provides casualty,
property risk, property catastrophe, specialty, and other
reinsurance lines on a global basis with business being written
on both a proportional and non-proportional treaty basis, as
well as a facultative basis;
■ through its risk consulting operations, AXA XL off ers both
insurance and non-insurance clients customized r isk
m anagement solutions and consulting services to understand
and quantify the risks companies face or may face tomorrow,
with the objective of avoiding preventable losses and mitigating
the impact of losses which do occur.
NEW PRODUCT INITIATIVES
AXA XL continues to be at the forefront of bringing innovative
solutions to the market. For the fourth year in a row, AXA XL
topped the Advisen Pacesetter Index, announcing more than 16
new and enhanced products.
In 2019, product innovations included:
■ a cyber SME product, which aims to improve customers’ cyber
health, help mitigate their cyber risks and give clients easy
access to AXA’s on-demand, cloud-based SME cyber insurance
product;
■ Cube - a new risk innovation incubator for client risk managers
working alongside AXA’s underwriters and risk managers to
develop innovative r isk m anagement solutions for the most
complex risks;
■ AXA XL HealthAssist - developed through a partnership with IPRS
Health to launch a new employer’s liability insurance solution
for UK organisations. HealthAssist provides companies with
a holistic approach to wellbeing, by combining the security
of a traditional employer’s liability insurance policy with the
additional benefit of a wellness, health and injury rehabilitation
service;
■ Design Professional’s mobile compatible with online Contract
eGuide for Design Professionals: a Risk Management handbook
for architects and engineers. Contract eGuide is a forward-
thinking r isk m anagement tool for insured clients to assist
design professionals in understanding and negotiating their
professional services contracts. Developed using the latest
web technologies, the Contract eGuide automatically adapts
to every device allowing on-demand access;
■ a new risk modelling service, Portfolio Catastrophe Loss Modelling
in France, is designed for large international companies. The
service helps risk managers assess their sites’ exposure to
natural hazards, their accumulation risk and, ultimately, refine
their insurance coverage; and
■ AXA XL Risk Consulting’s next generation client portal,
SiteForward, which helps its clients visualize their risk exposures
and make informed loss prevention decisions.
These are just a sample of the many ways in which innovation
makes AXA’s “Payer-to-Partner” promise come alive for AXA XL
clients.
27I UNIVERSAL REGISTRATION DOCUMENT - ANNUAL REPORT 2019 - AXA I
THE AXA GROUP
1
1.3 BUSINESS OVERVIEW
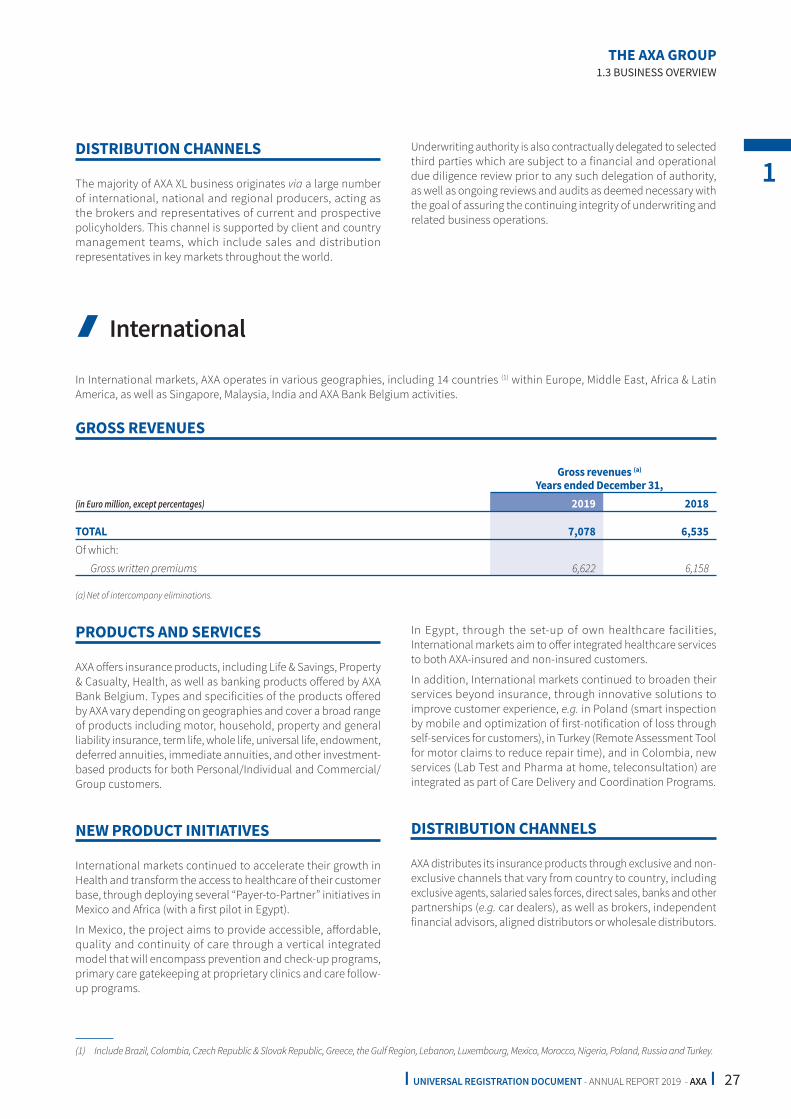
DISTRIBUTION CHANNELS
The majority of AXA XL business originates via a large number
of international, national and regional producers, acting as
the brokers and representatives of current and prospective
policyholders. This channel is supported by client and country
management teams, which include sales and distribution
representatives in key markets throughout the world.
Underwriting authority is also contractually delegated to selected
third parties which are subject to a financial and operational
due diligence review prior to any such delegation of authority,
as well as ongoing reviews and audits as deemed necessary with
the goal of assuring the continuing integrity of underwriting and
related business operations.
I International
In International markets, AXA operates in various geographies, including 14 countries (1) within Europe, Middle East, Africa & Latin
America, as well as Singapore, Malaysia, India and AXA Bank Belgium activities.
(1) Include Brazil, Colombia, Czech Republic & Slovak Republic, Greece, the Gulf Region, Lebanon, Luxembourg, Mexico, Morocco, Nigeria, Poland, Russia and Turkey.
GROSS REVENUES
(in Euro million, except percentages)
Gross revenues (a)
Years ended December 31,
2019 2018
TOTAL 7,078 6,535
Of which:
Gross written premiums 6,622 6,158
(a) Net of intercompany eliminations.
PRODUCTS AND SERVICES
AXA off ers insurance products, including Life & Savings, Property
& Casualty, Health, as well as banking products off ered by AXA
Bank Belgium. Types and specificities of the products off ered
by AXA vary depending on geographies and cover a broad range
of products including motor, household, property and general
liability insurance, term life, whole life, universal life, endowment,
deferred annuities, immediate annuities, and other investment-
based products for both Personal/Individual and Commercial/
Group customers.
NEW PRODUCT INITIATIVES
International markets continued to accelerate their growth in
Health and transform the access to healthcare of their customer
base, through deploying several “Payer-to-Partner” initiatives in
Mexico and Africa (with a first pilot in Egypt).
In Mexico, the project aims to provide accessible, aff ordable,
quality and continuity of care through a vertical integrated
model that will encompass prevention and check-up programs,
primary care gatekeeping at proprietary clinics and care follow-
up programs.
In Egypt, through the set-up of own healthcare facilities,
International markets aim to off er integrated healthcare services
to both AXA-insured and non-insured customers.
In addition, International markets continued to broaden their
services beyond insurance, through innovative solutions to
improve customer experience, e.g. in Poland (smart inspection
by mobile and optimization of first-notification of loss through
self-services for customers), in Turkey (Remote Assessment Tool
for motor claims to reduce repair time), and in Colombia, new
services (Lab Test and Pharma at home, teleconsultation) are
integrated as part of Care Delivery and Coordination Programs.
DISTRIBUTION CHANNELS
AXA distributes its insurance products through exclusive and non-
exclusive channels that vary from country to country, including
exclusive agents, salaried sales forces, direct sales, banks and other
partnerships (e.g. car dealers), as well as brokers, independent
financial advisors, aligned distributors or wholesale distributors.

28 I UNIVERSAL REGISTRATION DOCUMENT - ANNUAL REPORT 2019 - AXA I
THE AXA GROUP 1 1.3 BUSINESS OVERVIEW
I Transversal & Central Holdings
This segment includes the main transversal entities and the non-operating activities conducted by the central holding companies
within the Group.
GROSS REVENUES
(in Euro million, except percentages)
Gross revenues (a)
Years ended December 31,
2019 2018 restated (b)
AXA Investment Managers 1,225 41% 1,243 43%
AXA Assistance 1,415 48% 1,331 46%
Others (c) 319 11% 339 12%
TOTAL 2,959 100% 2,913 100%
Of which:
Gross written premiums 1,363 1,332
Other revenues (d) 1,596 1,582
(a) Net of intercompany eliminations.
(b) Restated: reclassification of German and Japanese activities of AXA Life Europe (previously reported as part of Germany and Japan respectively) into AXA Life Europe.
(c) Include AXA Liabilities Managers, AXA Global Re and AXA Life Europe.
(d) Include fees and charges related to investment contracts with no participating features and revenues from other activities.
Through its operating entities located in more than 20 countries,
AXA Investment Managers (“AXA IM”) provides its clients with
a wide range of global products and expertise, in the Asset
Management area, principally via Mutual funds and dedicated
portfolios. AXA IM’s clients include (i) institutional investors,
(ii) individual investors to whom Mutual funds are distributed
through AXA and external distribution networks, and (iii) AXA’s
insurance subsidiaries both for main fund and unit-linked fund
backing insurance products. AXA IM’s expertise includes (i) Fixed
Income, (ii) Framlington and Rosenberg equities, (iii) Multi-Asset
client solutions, (iv) Structured Finance, (v) Real Assets, and
(vi) absolute return strategy managed by Chorus.
AXA IM has continued to add innovative Mutual funds to its off ering
in 2019, including but not limited to specialty investment strategies
encompassing a broad range of asset classes (AXA WF Framlington
All China Evolving Trends, AXA WF Chorus Systematic Macro, AXA IM
WAVe Framlington Biotech), and the expansion of its Responsible
Investment off ering all across the spectrum as well as its Private
Markets Impact suite of products.
AXA Assistance is the Group subsidiary providing its customers
with assistance services in emergencies and everyday situations.
AXA Assistance operates through six business lines (vehicle, travel,
health, home, consumer electronics and legal protection) to off er
customer focused services.
In 2019, AXA Assistance launched several innovating digital
products. The main ones are:
■ on Demand products in motor and home assistance allowing
non covered final clients who face an emergency to benefit
from AXA’s network and expertise in assistance services at
their own financial burden;
■ E-rescue on motor assistance, a self-service digital application
that is live in the United Kingdom, Spain, France, Belgium, and
soon in Germany;
■ Pleeze, developed by the travel business line, is a mobile
application concierge service allowing to proactively anticipate
the customer’s needs through usage of artificial intelligence
and international network experience;
■ BeLive, in health business line, is a dedicated unique off er for
customers diagnosed with tumors, off ered in partnership with
Roche Foundation Medicine launched in Italy.

29I UNIVERSAL REGISTRATION DOCUMENT - ANNUAL REPORT 2019 - AXA I
2ACTIVITY REPORT AND
CAPITAL MANAGEMENT
2.1 MARKET ENVIRONMENT 30
Financial Market Conditions 30
Market Conditions 31
2.2 OPERATING HIGHLIGHTS 35
2.3 ACTIVITY REPORT 40
Activity and Earnings Indicators 40
Underlying Earnings, Adjusted Earnings and Net Income Group share 44
Alternative Performance Measures 46
Commentary on Group Earnings 47
Shareholders’ equity Group share 50
Solvency information 50
Shareholder value 51
Segment information 52
2.4 LIQUIDITY AND CAPITAL RESOURCES 82
Liquidity, sources and needs for Group operating subsidiaries 83
Liquidity position 84
Uses of funds 85
Impact of regulatory requirements 86
Subsequent events aft er December 31, 2019 impacting AXA’s liquidity 88
2.5 EVENTS SUBSEQUENT TO DECEMBER 31, 2019 89
2.6 OUTLOOK 90

30 I UNIVERSAL REGISTRATION DOCUMENT - ANNUAL REPORT 2019 - AXA I
ACTIVITY REPORT AND CAPITAL MANAGEMENT 2 2.1 MARKET ENVIRONMENT
2.1 MARKET ENVIRONMENT
I Financial Market Conditions
In 2019, trade tensions between the United States and China,
combined with weak activity indicators worldwide, led Central
Banks to send a strong accommodative signal by both loosening
their monetary policies and cutting interest rates. Interest rates
quickly spiralled downwards to new historically low levels in the
summer, with 10-year Government yields turning negative in
several large countries. The combined eff ect of accommodative
Central Banks policies and the temporary relief on trade tensions
propelled equity markets to new all-time highs, while Government
bond yields bounced back during the second half of the year.
In Europe, the stark dependency of some countries to international
trade continued to weigh on economic activity and resulted in a
weak manufacturing output across the Eurozone. The European
Central Bank (ECB) eased its monetary policy in the third quarter
in reaction to a weakening growth outlook, thus sending bond
yields to historically low levels in the summer, followed by a
slight recovery at the end of the year. Aft er depreciating sharply
against the US Dollar until the end of September, the Euro reversed
most of its losses in the fourth quarter of 2019, thus limiting its
depreciation to 2% over the year.
France fared better than the remainder of the Eurozone, posting
a GDP growth of 1.3% in 2019 as its relatively domestic-oriented
economy showed a stronger resilience to global trade threats. In
the third quarter, international tensions cast a shadow on future
economic growth, thus resulting in volatile equity indexes. As
some of the concerns vanished in the fourth quarter, French equity
markets posted solid gains with the CAC 40 posting a 26% gain
over the year, its best annual performance since 1999. Following
accommodative announcements made by the ECB, the French
government 10-year bond yield reached a historically low level
of -0.45% in August, before recovering to 0.12% at year-end.
In the United Kingdom, Brexit-related uncertainties mounted
as successive Prime Ministers first postponed the withdrawal
from the European Union initially expected on March 31, 2019
then threatened of a hard “no deal” Brexit on October 31, 2019
and finally called for a General Election in December. British
voters elected a large Conservative majority that set a clearer
path to leaving the European Union in 2020, though areas of
uncertainty remain. As a result, the United Kingdom equity markets
significantly underperformed both European and American
markets, with the FTSE 100 rising by 12% over the year. In parallel,
the Sterling rallied over the period, up 4% vs. the US Dollar and
6% vs. the Euro.
In the United States, GDP growth came in at 2.1% and
unemployment reached its lowest level in decades. However,
concerns emerged around the prospects of a trade-war with
China which weighed on the economy. As a result, the Federal
Reserve quickly reacted by accommodating its monetary policy,
successively cutting three times its rate by increments of 0.25%
from 2.5% to 1.75% by the end of October. Despite uncertainties
on the international stage, the robust health of the domestic
economy led to equity markets posting sharp gains in 2019, with
the S&P 500 index rising by 29% reaching new all-time highs.
In Asia, growth suff ered from both mounting trade tensions
and weakening foreign demand in a context of slowing global
economic growth. Japan posted stronger-than-expected GDP
growth in the first quarter of 2019 (+0.6%), benefiting mostly
from government support, but gains reversed in the second part
of the year as the economy took a toll from both the increase of
the consumption tax and the damages from typhoon Hagibis,
bringing annual GDP growth to 0.5%. In China, growth finally
stabilized following a period of deceleration. Recent activity was
supported by both monetary and fiscal measures but remained
vulnerable to a slowdown in manufacturing activity and trade
tensions. Asian stocks rose sharply in the first semester, recovering
from the strong decline of the last quarter of 2018, and rose further
throughout the rest of the year. As observed in other financial
markets around the world, monetary policies were overall eased
across Asian emerging markets.
STOCK MARKETS
The MSCI World Index increased by 24.9%. The MSCI G7 index
increased by 25.6% and the MSCI Emerging index increased by
15.1%.
The Dow Jones Industrial Average index increased by 22.3% and
the S&P 500 index increased by 28.9%. Equity markets in Europe
and Japan posted gains in 2019: the EUROSTOXX 50 index in the
Eurozone increased by 24.8%, the Nikkei index in Tokyo increased
by 18.2%, and the FTSE 100 index in London increased by 12.1%.
The S&P 500 implied volatility index (VIX) decreased from 25.4%
on December 31, 2018, to 13.8% on December 31, 2019.

31I UNIVERSAL REGISTRATION DOCUMENT - ANNUAL REPORT 2019 - AXA I
ACTIVITY REPORT AND CAPITAL MANAGEMENT
2
2.1 MARKET ENVIRONMENT
BOND MARKETS
Government bond yields decreased since December 31, 2018,
in mature economies, with the lowest point reached around
September 2019, and slightly increased in the last quarter of the
year in most markets: the 10-year US T-bond yield decreased by
77 bps to 1.92%, its lowest point being reached in September
at 1.43%, the 10-year German Bund yield decreased by 43 bps
to -0.19%, its all-time minimum being reached in September at
-0.74%, the French 10-year government bond yield decreased
by 59 bps to 0.12%, aft er reaching its all-time lowest point at
-0.45% in August, the 10-year Belgium government bond yield
decreased by 67 bps to 0.1%, with reaching its all-time lowest
point at -0.4% in August, the UK 10-year government bond yield
decreased by 44 bps to 0.83%, the 10-year Swiss government
bond yield decreased by 30 bps to -0.47%, and the 10-year Japan
government bond yield decreased by 2 bps to -0.02%.
In the Eurozone peripheral countries, the 10-year government
bond yields decreased as well: -293 bps to 1.46% in Greece,
-135 bps to 1.43% in Italy, -128 bps to 0.45% in Portugal, -95 bps
to 0.47% in Spain, and -79 bps to 0.12% in Ireland.
In Europe, the iTraxx Main spreads decreased by 44 bps to 44 bps
compared to December 31, 2018, and the iTraxx Crossover
decreased by 147 bps to 206 bps. In the United States, the CDX
Main spread Index decreased by 43 bps to 45 bps.
The Euro interest rates implied volatility index (based on 10x10
Euro swaptions) increased from 46.5% as of December 31, 2018,
to 133.9% as of December 31, 2019.
EXCHANGE RATES
End of Period Exchange rate Average Exchange rate
December 31,
2019
December 31,
2018
December 31,
2019
December 31,
2018
(for €1) (for €1) (for €1) (for €1)
US Dollar 1.12 1.14 1.12 1.18
Japanese Yen 122 125 122 130
British Sterling Pound 0.85 0.90 0.88 0.88
Swiss Franc 1.09 1.13 1.11 1.16
I Market Conditions
INSURANCE ACTIVITIES
Current Engines
In 2019, the French Savings insurance market grew by 4% to reach
€145 billion premiums, of which Unit-Linked contracts represented
27%. However, Unit-Linked volumes decreased, as policyholders
continued to favor investments into G/A products. In a context of
low rate environment, insurers face both persistent reinvestment
yield and capital strain headwinds. Insurance companies have
taken actions to mitigate the impact, notably by adjusting
policyholder bonus, thus resulting in an all-time low average
return on G/A contracts (-0.40 point from 2018 at approximately
1.40% for 2019), or through incentivizing policyholders to invest
into other types of funds. In 2019, the “Loi Pacte” (Action Plan for
Business Growth and Transformation) has been enacted with a
dual objective to simplify and bring more flexibility to pension
savings, notably through the introduction of a single Pension
Savings Products (PER). The law also enhances the features of
“Eurocroissance” funds, which will help insurance companies to
boost sales of capital-light products while granting policyholders
both a capital guarantee at maturity and a higher yield. The French
Protection & complementary Health insurance market grew by
5% to reach €25 billion in 2019. Following the implementation
of substantial regulatory reforms over the past few years, the
French government has enacted a 100% Health regulation (“100%
Santé”), which will provide free eye care, dentures and hearing aids
without co-payment. Following the standardization of contracts
as a consequence of the introduction of the “Accord National
Interprofessionnel” law, insurance companies are now developing
new and diff erentiated ad hoc services, such as telemedicine,
prevention or processes digitalization.

32 I UNIVERSAL REGISTRATION DOCUMENT - ANNUAL REPORT 2019 - AXA I
ACTIVITY REPORT AND CAPITAL MANAGEMENT 2 2.1 MARKET ENVIRONMENT
The French Property & Casualty insurance market continued
to grow steadily in 2019. 2019 was marked by a series of natural
events, especially in the fourth quarter of 2019 notably with
floods recorded in the south of France. Excluding natural events,
2019 did not see the emergence of new loss trends, although
frequency remained at significant levels, thus leading to selective
underwriting actions and tariff increases in most lines of business,
especially in Motor and Casualty.
In Europe, political climate and trade tensions resulted in a slow
economic environment, constraining Property & Casualty turnover
growth. Profitability was impacted by severe natural events such
as the storm Eberhard, striking the United Kingdom, Germany
and Belgium, as well as Dana floods in Spain. In a context of
competitive markets, European insurance players continued to
undertake diff erentiating actions including customer satisfaction
initiatives and underwriting discipline measures, in particular in
the Motor market. In the United Kingdom, the “Ogden” discount
rate for personal injury lump sum was raised below industry
expectations, resulting in profit pressure and causing Motor
insurance prices to increase. In Life & Savings, the drop in interest
rates pulled down sales and deteriorated profitability in G/A
Savings, expediting the industry shift to Unit-Linked products.
As governments are playing a less important role in providing
pensions and health services, insurers are seizing the opportunity
to expand their off erings in a context of ageing population and
rising customer expectations.
In Japan, aft er the slight recovery observed in 2018, the Life &
Savings insurance market was negatively impacted by the tax
rule revision in February 2019 on tax-eff icient Savings products,
aff ecting notably the SME market in all lines of business (including
the Health market), and by lower sales of foreign-denominated
Savings products in a low interest rates environment. The
Property & Casualty insurance market grew by 3.6% and remained
dominated by Motor business thanks to the expansion of the
scope of coverage off ers despite low prices.
In Hong Kong, the Life & Savings insurance market continued
to grow, boosted by the launch of tax incentives on annuity
products. The Property & Casualty insurance market recorded
the highest year-over-year increase in the past six years driven by
the hardening of coverage and pricing conditions following the
recent large losses incurred from typhoons and social unrest. The
Health insurance market continued to grow, benefiting from the
launch of tax-deductible voluntary health insurance certified plans.
In the United States, the severity of claims incurred by Commercial
insurance companies worldwide over the past few years led in
2019 to an acceleration of the price-firming cycle, with several
lines of business experiencing double digits price increases.
The United States Property sector saw carriers take measures
in 2019 to restore profitability in a sector that has been, over the
past years, impacted by significant natural events and man-made
large losses. Property Insurance leaders have therefore continued
to increase pricing while also adjusting coverage and deploying
capacity selectively. The United States Casualty sector saw a
higher severity of claims driven by social inflation over the past
year, first in Commercial through bodily injury then in other
US Casualty lines of business. The “Directors & Off icers” sector
continues to become more complex with increased regulation
and emerging technologies. Third party litigation funding and
higher settlement expectations continue to attract litigation in
the form of securities class actions.
High Potentials
In Asia High Potentials, the insurance market remained
challenged by economic and industry environments. In China,
Life & Savings premiums grew moderately following insurers’
decision to increase the focus on regular Protection products.
The Property & Casualty market experienced another year of
double-digit growth mainly supported by Non-Motor business. In
Thailand, the Life & Savings market grew strongly, driven by higher
sales of G/A Savings and Unit-Linked products, while the Health
market and the Motor Property & Casualty market continued to
grow. In Indonesia, the Life & Savings market increased moderately
thanks to good agency performance. In the Philippines, the Life
& Savings market experienced a decrease reflecting unfavorable
financial markets.
In International markets, the Property & Casualty business
continued to grow in Mexico, with positive trend in Non-Motor.
The Health and the Life & Savings insurance businesses both
experienced a strong growth in Mexico and Brazil.

33I UNIVERSAL REGISTRATION DOCUMENT - ANNUAL REPORT 2019 - AXA I
ACTIVITY REPORT AND CAPITAL MANAGEMENT
2
2.1 MARKET ENVIRONMENT
Rankings and Market shares
Please find below AXA’s rankings and market shares in the main countries where it operates:
Property & Casualty Life & Savings
SourcesRanking
Market
share
( %) Ranking
Market
share
( %)
Cu
rre
nt
En
gin
es
France 2 13.2 3 8.8 FFA as of December 31, 2019.
Switzerland 1 13.0 4 10.0 SIA (Swiss Insurance Association) Market sha re based
on statutory premiums and market estimations by the
SIA as of January 30, 2020.
Germany 5 4.9 8 4.3 GDV (German association of Insurance companies) as of
December 31, 2018.
Belgium 1 19.6 6 7.7 Assuralia (Belgium Professional Union of Insurance
companies) based on gross written premium as of
September 30, 2019.
United Kingdom 2 8.1 n/a n/a UK General Insurance: Competitor Analytics 2019, Global
Data, as of December 31, 2019.
Ireland 1 27.1 n/a n/a Insurance Ireland P&C Statistics 2018 as of December 31,
2018.
Spain 5 6.2 11 2.7 Spanish Association of Insurance Companies. ICEA as of
December 31, 2019.
Italy 5 5.7 6 4.3 Associazione Nazionale Imprese Assicuratrici (ANIA) as of December 31, 2018.
Japan n/a n/a 13 2.9 Disclosed financial reports (excluding Kampo Life) for the
12 months ended September 30, 2019.
Hong Kong 1 7.7 7 4.9 Insurance Authority statistics based on gross written
premiums as of September 30, 2019.
XL (Lloyd’ s) 1 7.1 n/a n/a Lloyd’s Annual Report 2018 as of December 31, 2018.
XL Reinsurance 9 2.6 n/a n/a AM Best 2018 as of December 31, 2018.
Hig
h P
ote
nti
als
Thailand 28 1.1 4 9.4 TLAA (Thai Life Assurance Association) statistics report
and TGIA (Thai General Insurance Association) as of
December 31, 2019.
Indonesia n/a n/a 4 6.6 AAJI Statistic measured on Weighted New Business
Premium as of September 30, 2019.
Philippines n/a n/a 5 11.1 Insurance Commission measured on total premium
income as of September 30, 2019.
China 18 0.5 11 1.8 CBIRC (China Banking and Insurance Regulatory
Commission) as of December 31, 2019.
Mexico 4 8.2 10 2.1 AMIS (Asociacion Mexicana de Instituciones de Seguros) as of September 30, 2019.
Brazil 9 3.1 n/a n/a SUSEP (Superintendência de Seguros Privados) as of October 31, 2019.

34 I UNIVERSAL REGISTRATION DOCUMENT - ANNUAL REPORT 2019 - AXA I
ACTIVITY REPORT AND CAPITAL MANAGEMENT 2 2.1 MARKET ENVIRONMENT
ASSET MANAGEMENT
Asset managers benefitted from favorable market conditions in
2019 as both low interest rates and strong equity markets increased
assets under management, thus driving both management and
performance fees up across the industry. However, the year was
split into two distinct periods as the first half of the year saw
investors retreat from volatile markets into safe havens, while
accommodative monetary policies combined with equity markets
at an all-time high saw investors return into riskier asset classes
in the second half of the year.
2019 also saw management fee bps remain under pressure
across the industry with high competitive pressure amongst
players, combined with the continued shift from active to passive
investing that resulted in further compression of the fees charged
to clients in liquid asset classes.
As a result, both institutional investors and asset managers continued
to work together to explore alternative investments forms including
structured products, real estate etc., mainly in the hunt for yields in
a depressed economic environment. However, appetite remains
somehow restrained by capital constraints on investors sides as well
as by the stringent regulatory environment on the asset managers
side.
Separately, asset managers continued to mirror the evolution
of societal trends notably by widening and expanding their
Environmental, Social and Governance (ESG) investments off ers,
or by re-assessing their off er in certain asset classes and industries
(including firearms, coal, tobacco, fossil fuels, etc.).

35I UNIVERSAL REGISTRATION DOCUMENT - ANNUAL REPORT 2019 - AXA I
ACTIVITY REPORT AND CAPITAL MANAGEMENT
2
2.2 OPERATING HIGHLIGHTS
2.2 OPERATING HIGHLIGHTS
GOVERNANCE
Re-appointment of Mr. Jean-Pierre Clamadieu
as director, and ratification of the cooptation
of Mrs. Elaine Sarsynski as director
On April 24, 2019, AXA’s Shareholders’ Meeting approved the
reappointment of Mr. Jean-Pierre Clamadieu as director for
a four-year term. The Board of Directors held following the
Shareholders’ Meeting confirmed his appointment as Chairman
of the Compensation & Governance Committee and Senior
Independent Director. AXA’s Shareholders’ Meeting also ratified the
cooptation of Mrs. Elaine Sarsynski as director for the remainder
of her predecessor’s term of off ice, i.e. until the close of the
Shareholders’ Meeting called in 2021 to approve the financial
statements of the preceding fiscal year.
Étienne Bouas-Laurent was appointed
Group CFO starting from January 1,
2020. Étienne Bouas-Laurent, Karima
Silvent and Georges Desvaux joined
AXA’s Management Committee
On June 20, 2019, AXA announced that Étienne Bouas-Laurent,
previously CEO of AXA Hong Kong, would become D eputy C hief
Financial Off icer and a Member of AXA’s Management Committee
as of September 1, 2019, and would replace Gérald Harlin as Group
Chief Financial Off icer as of January 1, 2020. Étienne joined the
Group in 1997 and has held several financial and operational
roles throughout his career at AXA.
Alban de Mailly Nesle, Chief Risk Off icer, Head of Insurance Off ice,
and a Member of the Management Committee, became Chief
Risk and Investment Off icer, taking the additional responsibility
of overseeing the Group Investment Department, in addition to
Group Risk Management and Ceded Reinsurance.
Georges Desvaux, previously Senior Partner at McKinsey
& Company, was appointed Chief Strategy and Business
Development Officer of AXA and joined AXA’s Management
Committee as of September 1, 2019.
Karima Silvent, Chief Human Resources Off icer, joined AXA’s
Management Committee as of September 1, 2019.
AXA announced changes in AXA IM’s leadership
to prepare a new phase of its development
On October 14, 2019, AXA announced that Gérald Harlin, Group
Deputy CEO and Group CFO, was appointed Executive Chairman
of AXA IM, eff ective on December 1, 2019, to implement the
next phase of AXA IM’s strategy with the aim of accelerating the
company’s development. Gérald continues to report to Thomas
Buberl, CEO of AXA, in this role.
Andrea Rossi, who led AXA IM since 2013, decided to step
down from his role as CEO and became a strategic advisor to
Gérald Harlin on December 1, 2019. All members of the AXA
IM Management Board have been reporting to Gérald Harlin
from then on. Christof Kutscher, who has been Chairman of AXA
IM’s Board of Directors since 2014, stepped down from his role.
Gérald Harlin assumes the role of Chairman of the Board since
October 14, 2019.
Gérald Harlin remains Group Deputy CEO following the transition
of his Group CFO responsibilities to Étienne Bouas-Laurent at
year-end 2019.
Matthieu Bébéar and Guillaume Borie took
new positions. Benoît Claveranne assumed
oversight of AXA Next
On November 15, 2019, AXA announced that Matthieu Bébéar,
previously Deputy CEO of AXA France and CEO of AXA Particuliers
& IARD Entreprises, was appointed Chief Business Off icer of AXA
International & New Markets and Strategic Development Off icer
for Latin America. He reports to Benoît Claveranne, CEO of AXA
International & New Markets and a member of the AXA Group
Management Committee.
Guillaume Borie, previously Group Chief Innovation Off icer and
CEO of AXA Next, became Deputy CEO of AXA France and CEO
of AXA Particuliers & IARD Entreprises. He reports to Jacques de
Peretti, Chairman and CEO of AXA France and a member of the
AXA Group Management Committee.
At the AXA Group Management Committee level, Benoît Claveranne,
in addition to his current role, now assumes oversight of our
innovation ecosystem and pursues the development of new
business models in healthcare across the Group. As a result, the
CEO of AXA Next now reports to him.
These appointments were eff ective on January 1, 2020.

36 I UNIVERSAL REGISTRATION DOCUMENT - ANNUAL REPORT 2019 - AXA I
ACTIVITY REPORT AND CAPITAL MANAGEMENT 2 2.2 OPERATING HIGHLIGHTS
Delphine Maisonneuve was appointed CEO of
AXA Next and Group Chief Innovation Off icer
On December 4, 2019, AXA announced that Delphine Maisonneuve,
previously CEO of AXA Brazil, was appointed CEO of AXA Next
and Group Chief Innovation Off icer, eff ective January 1, 2020.
She reports to Benoît Claveranne, CEO of AXA International & New
Markets and a member of the AXA Group Management Committee,
and replaces Guillaume Borie who was appointed Deputy CEO
of AXA France and CEO of AXA Particuliers & IARD Entreprises.
In her new position, Delphine Maisonneuve will further pursue
the endeavors of AXA to design, pilot and implement innovative
insurance and service proposals across the Group to serve the
Payer to Partner strategy. She will also build on and leverage the
innovation ecosystem across the Group in close cooperation
with the business.
Scott Gunter was appointed CEO of AXA XL
On February 20, 2020, AXA announced the appointment of Scott
Gunter, previously Senior Vice-President of Chubb Group and
President of Chubb’s North America Commercial Insurance
division, as CEO of AXA XL. He replaced Greg Hendrick and joined
AXA’s Management Committee, reporting to Thomas Buberl,
CEO of AXA.
These changes were eff ective immediately, subject to any required
regulatory approval.
SIGNIFICANT ACQUISITIONS
AXA has completed the acquisition of
the remaining 50% stake in AXA Tianping
On December 13, 2019, AXA announced that it has completed
the acquisition of the remaining 50% stake (1) in AXA Tianping
Property & Casualty Insurance Company Ltd. (“AXA Tianping”)
from its domestic shareholders (2), becoming the largest 100%
foreign-owned P&C insurer in the Chinese market.
Total cash consideration for the acquisition of the 50% stake
amounted to RMB 4.6 billion (3) (or €590 million (4)).
The completion of the transaction follows the fulfilment of
customary closing conditions, including the receipt of regulatory
approvals.
AXA Tianping has been fully consolidated in AXA Group’s financial
statements as at December 31, 2019.
SIGNIFICANT DISPOSALS
AXA completed the sale of its Ukrainian
operations
On February 14, 2019, AXA announced that it had completed the
sale of both its non-life entity (AXA Insurance (5)) and life entity (AXA
Insurance Life) in Ukraine to Fairfax Financial Holdings Limited (6).
Termination of the sale agreement related to
AXA MBask Insurance Company in Azerbaijan
On April 4, 2019, AXA announced that the agreement with Mr. Elkhan
Garibli to sell AXA’s non-life entity in Azerbaijan (AXA MBask
Insurance Company OJSC), announced on February 21, 2018,
lapsed.
AXA Mbask Insurance Company ceased underwriting new
insurance business and will exclusively administer the in-force
portfolio with the purpose of terminating its insurance activities in
Azerbaijan as soon as practicable, while preserving the interests
of its existing clients in Azerbaijan.
AXA to sell AXA Bank Belgium, and enter into
a long-term insurance distribution partnership
with Crelan Bank
On October 25, 2019, AXA announced that it has entered into
an agreement to sell its Belgian banking operations, AXA Bank
Belgium, to Crelan Bank (“Crelan”).
Under the terms of the agreement, AXA will sell 100% of AXA
Bank Belgium to Crelan for a total consideration of €620 million,
comprised of (i) a total cash consideration of €540 million (7),
and (ii) the transfer to AXA Belgium of 100% of Crelan Insurance
(valued at €80 million), the insurance company of Crelan, providing
protection insurance linked to loans originated by Crelan.
In addition, AXA and Crelan have agreed to enter into a long-
term P&C and Protection (8) insurance distribution partnership,
extending the existing partnership between AXA Bank Belgium
and AXA Belgium to the entire Crelan network.
(1) AXA acquired the initial 50% stake in AXA Tianping in February 2014.
(2) Ningbo Yi Ke Joint Venture Co., Ltd., Ningbo Hua Ge Industrial Investment Co., Ltd., Tian Mao Industrial Group Joint Stock Corporation, Ningbo Lu Da Sheng Technology Co., Ltd., Ningbo Rixingkang Biology Engineering Co., Ltd.
(3) This includes an immediate cash consideration of RMB 3.5 billion, and a payment of RMB 1.1 billion deferred by 12 months from completion. The deferred payment replaces the capital reduction of AXA Tianping (RMB 1.5 billion) communicated at the time of the signing of the transaction.
(4) EUR 1 = RMB 7.8009 as of December 12, 2019 (Source: Bloomberg).
(5) AXA Insurance in Ukraine was a joint venture between AXA (50% shareholding) and Ukrsibbank.
(6) Through its subsidiary FFHL Group Ltd.
(7) Subject to price adjustment at closing.
(8) Insurance linked to mortgages, consumer and professional loans.

37I UNIVERSAL REGISTRATION DOCUMENT - ANNUAL REPORT 2019 - AXA I
ACTIVITY REPORT AND CAPITAL MANAGEMENT
2
2.2 OPERATING HIGHLIGHTS
Financial impacts are the following:
■ this transaction is expected to result in a positive impact on
AXA Group’s Solvency II ratio of ca. 4 points;
■ it resulted in a one-time negative net income impact (1) of
approximately €0.6 billion in AXA Group’s 2019 consolidated
financial statements;
■ underlying earnings generated by AXA Bank Belgium were
€47 million (2) in 2018.
In addition, AXA Belgium will take a 9.9% minority equity
stake (3) in Crelan NV (4) and AXA Bank Belgium, investing a total
of €90 million, which will be fully financed by the purchase by
Crelan, for €90 million, of the contingent convertible bonds
previously issued by AXA Bank Belgium to AXA Group.
Completion of the transaction is subject to customary closing
conditions, including the receipt of regulatory approvals, and is
expected to be finalized in the second quarter of 2020.
PARTNERSHIPS AND INNOVATION
AXA expands its Payer-to-Partner strategy
in emerging markets through innovative
healthcare delivery systems
On July 17, 2019, AXA announced the expansion of its Payer-
to-Partner strategy in emerging markets. AXA is creating a
digital and physical health care ecosystem by launching its own
medical centers, linked directly to its health insurance services.
By combining, in one off er, services that are normally delivered
by diff erent providers, AXA aims to simplify the healthcare journey
of its customers.
AXA’s target is to open up to 50 medical clinics which would serve
as many as 1.5 million clients across emerging markets by 2023,
starting with Mexico in Latin America and Egypt in Africa, to be
followed by other key emerging markets.
These centers will provide access to advanced diagnostics,
laboratory equipment and medical consultations in key specialties,
thereby bringing to its customers an aff ordable, high-quality
and seamless patient experience, in markets where access to
economical and quality care still remains a challenge for many
individuals and families.
In Mexico, AXA announced the launch of a joint venture with Keralty,
to develop a vertically integrated health system incorporating
quality day-to-day healthcare delivery. Keralty is the leading
health insurer and services provider in Colombia, with significant
presence in the United States and Brazil. Concurrently in Egypt,
AXA will open diagnostic centers and primary care centers, owned
100% by AXA, with the support of World Health Management as
its technical partner, with expertise in designing and setting up
healthcare facilities.
These initiatives fully embody AXA’s strategy to provide healthcare
solutions in emerging markets, where the existing health system
oft en results in high non-reimbursable medical care spending
for the population.
AXA launches a new phase in its climate
strategy to accelerate its contribution to a low-
carbon and more resilient economy
On November 27, 2019, AXA announced the launch of a new phase
in its climate strategy, which aims to accelerate its contribution
to the transition towards a more sustainable and less carbon-
intensive economy by 2050, in line with the objectives of the Paris
Agreement. This announcement was made during the “AXA Climate
Impact Day”, an event organized by AXA in collaboration with the
United Nations Principles for Sustainable Insurance (UN PSI).
To succeed in this new phase, AXA will use all its levers as a global
investor, insurer and cooperation enabler:
AS A GLOBAL INVESTOR
AXA targets to contain the “warming potential” (5 ) of its investments
to below 1.5°C by 2050. As part of this objective, the Group will
double its green investment objective to reach €24 billion by 2023.
AXA will also invest in “transition bonds”, an innovative asset class
conceptualized by AXA Investment Managers to support companies
shift ing towards less carbon-intensive business models. This
tool notably complements Green Bonds which are designed to
finance projects that are already “green”.
Aft er full exit from coal companies with coal-based business
model, AXA sets a new ambition towards a 0% coal energy world.
AXA will therefore reinforce its divestment policy to completely
exit the coal industry by 2030 in the OECD and EU countries,
then in the rest of the world by 2040. In the shorter term, existing
investment thresholds will be strengthened, with a particularly
stringent focus on companies developing new coal capacities.
(1) The net income impact is based on the cash consideration and the value of Crelan Insurance only and does not take into account any value for the insurance distribution partnership with AXA Bank Belgium, and its extension to Crelan.
(2) Excluding favorable non-recurring impacts of €36 million.
(3) Crelan has a call option to purchase the Crelan NV and AXA Bank Belgium shares held by AXA.
(4) Crelan NV is Crelan’s banking subsidiary.
(5) AXA tested the “investment temperature” concept in its 2019 Climate report as an institutional investor’s response to the Paris Agreement.

38 I UNIVERSAL REGISTRATION DOCUMENT - ANNUAL REPORT 2019 - AXA I
ACTIVITY REPORT AND CAPITAL MANAGEMENT 2 2.2 OPERATING HIGHLIGHTS
AS A GLOBAL INSURER
AXA will leverage its climate expertise and innovative technologies
to provide new protection services to its customers and society.
The Group, through AXA Climate, will notably launch FastCat, a
new parametric assistance service, in December. It off ers weather
alerting solutions and 24/7 real-time assessment through satellite
imagery and drones, to support communities and corporations
facing natural disasters such as floods, earthquakes, cyclones
and wildfires.
AXA’s coal underwriting policy will also be strengthened. The
Group will notably ban any insurance business (except Employee
Benefits) with clients developing new coal projects that exceed
300 MW in capacity, as well as further restrict underwriting services
with coal-related businesses.
AS A COOPERATION ENABLER
Our conviction has always been that the fight against climate
change requires cooperation between all stakeholders to drive
collective action.
This is why AXA has decided to join the recently launched “Net
Zero Asset Owner Alliance”, a coalition of institutional investors
committed to transitioning their investments to “net-zero”
greenhouse gas emissions by 2050 to align their portfolios with
a 1.5°C scenario. AXA will notably contribute to this initiative
by sharing its expertise on climate finance methodology tools,
which are key to eff ectively finance the transition to a green
economy eff ectively.
AXA is also joining forces with the C40 network, a coalition of the
biggest cities gathering 1 out of 12 inhabitants in the world, to
make metropolitan areas more resilient to natural catastrophes.
The first AXA-C40 resilient cities report was unveiled today, with
recommendations and use cases to drive multi-stakeholder
cooperation and mitigate the eff ects of natural catastrophes on
urban networks.
CAPITAL/DEBT OPERATIONS/OTHER
AXA Ratings
On April 5, 2019, Moody’s Investors Service aff irmed the “Aa3”
insurance financial strength rating of AXA’s principal insurance
subsidiaries, changing the outlook from negative to stable.
On July 24, 2019, S&P Global Ratings aff irmed the long-term
financial strength rating of AXA’s core operating subsidiaries at
“AA-” with a stable outlook.
On December 10, 2019, Fitch Ratings aff irmed the financial strength
rating of AXA’s core operating subsidiaries at “AA-”, changing the
outlook from stable to positive.
AXA Group unveiled its new global brand
positioning: “Know you can”
On February 1, 2019, AXA unveiled its new tagline, which will be
rolled out across all its markets in the next year: “Know you can”.
This positioning symbolizes AXA’s new promise to its customers,
that of being the encouraging partner who helps them feel more
confident to achieve their goals and go further. This new promise
plays an integral role in the deployment of AXA’s strategic ambition
to transition from payer to partner to its customers.
The new tagline has been deployed with a global campaign
featuring one of history’s greatest tennis champions Serena
Williams. Embodying success and self-belief, this campaign
symbolizes AXA’s values and ambition. The films with
Serena Williams have been at the heart of a comprehensive
communications campaign also featuring Liverpool Football
Club players (1) and AXA’s strategic business segments, Health,
Protection and Commercial lines insurance, and local market
proofs illustrating the Group’s commitment to its customers.
AXA announced the successful completion
of a Secondary Common Stock Off ering
of Equitable Holdings, Inc. (2)
and related
Share Buyback
On March 25, 2019, AXA announced that it had successfully
completed a secondary public off ering of 40,000,000 shares (the
“Off ering”), at a public off ering price of USD 20.50 per share, of
its U.S. subsidiary, Equitable Holdings, Inc. (“EQH”) and the sale
to EQH of 30,000,000 shares (the “Share Buyback”) at the per
share price paid by the underwriters in the Off ering. In addition,
the underwriters exercised in full the over-allotment option to
purchase an additional 6,000,000 EQH shares.
Net proceeds (3) amounted to USD 1.5 billion or €1.3 billion (4),
corresponding to the sale of 76,000,000 EQH shares in the Off ering,
the full exercise of the over-allotment option granted to the
underwriters, and the Share Buyback. Following this sale, AXA’s
ownership in EQH decreased from 60.1% (5) (6) to 48.3% (6).
Following the successful completion of the Off ering and the
Share Buyback, the retained non-controlling minority stake in
EQH was deconsolidated and subsequently accounted for using
the equity method.
(1) AXA is the Global Insurance Partner of Liverpool Football Club.
(2) Formerly known as AXA Equitable Holdings, Inc.
(3) Net of underwriting discounts and commissions.
(4) EUR 1 = USD 1.1297 as of March 22, 2019 (Source: Bloomberg).
(5) EQH’s issued and outstanding common stock as of March 7, 2019, was comprised of 521,051,204 shares.
(6) Including the shares to be delivered on redemption of the bonds mandatorily exchangeable into EQH shares, issued by AXA in May 2018.

39I UNIVERSAL REGISTRATION DOCUMENT - ANNUAL REPORT 2019 - AXA I
ACTIVITY REPORT AND CAPITAL MANAGEMENT
2
2.2 OPERATING HIGHLIGHTS
The Off ering and the Share Buyback resulted in a negative net
income impact of €-0.6 billion. This impact reflected the diff erence
between the Off ering price and the consolidated book value (1) of
(i) the EQH shares sold in the transaction, and (ii) AXA’s remaining
48.3% (2) stake in EQH (i.e. the loss required to be taken upon
deconsolidation).
The transaction contributed to the reduction of AXA’s Debt
Gearing (3) by 1.0 point (4).
AXA announced the successful completion
of a Secondary Off ering of Equitable Holdings,
Inc. (5 )
Common Stock
On June 7, 2019, AXA announced that it had successfully completed
a secondary public off ering of a further 40,000,000 shares of
EQH’s common stock.
Net proceeds (5) to AXA, corresponding to the sale of 40,000,000 EQH
shares, amounted to USD 834 million or €739 million (6) (7). Following
this sale, AXA’s ownership in EQH decreased from 48.3% (2 ) (9) to
40.1% (2 ) (9 ). In addition, AXA granted the underwriters a 30-day
option to purchase up to an additional 6,000,000 EQH shares.
On July 8, 2019, AXA announced that the underwriters in the
secondary off ering of shares of common stock (the “Off ering”) of
EQH, completed on June 7, 2019, had fully exercised their option
to purchase an additional 6,000,000 shares of EQH’s common
stock from AXA, subject to the same terms and conditions as
the Off ering.
Net proceeds (6 ) to AXA from the exercise of the underwriters’ option
amounted to USD 125 million or €112 million (10), corresponding
to a net price (6 ) of USD 20.85 per share. Following the sale of
these additional shares, AXA’s ownership in EQH decreased from
40.1% (2 ) (9 ) to 38.9% (2 ) (9 ).
AXA announced the successful completion
of the sale of its remaining stake
in Equitable Holdings, Inc. (11)
On November 13, 2019, AXA announced that it had successfully
completed the secondary public off ering of 144,000,000 shares
of EQH’s common stock. The completion of the Off ering has
resulted in net proceeds (6 ) to AXA of approximately USD 3.1 billion
or approximately €2.9 billion (12), corresponding to a net price (6 ) of
USD 21.80 per share. Subsequently, in December 2019, 3 million
shares of EQH’s common stock was sold.
Shareplan 2019
On December 2, 2019, AXA announced the results of the AXA
Group employee share off ering (“Shareplan 2019”), a capital
increase reserved to its employees worldwide, which had been
launched on August 26, 2019. Approximately 26,000 employees in
40 countries, representing nearly 24% of the eligible employees,
subscribed to Shareplan 2019.
The aggregate proceeds from the offering amount to over
€375 million, for a total of approximately 18 million newly-issued
shares, subscribed at a price of €18.30 for the classic plan and
€21.73 for the leveraged plan. The new shares are created with
full rights as of January 1, 2019.
Following Shareplan 2019, on December 31, 2019, AXA’s employees
held 4.28% of the share capital and 6.09% of the voting rights.
The total number of outstanding AXA shares amounted to
2,417,695,123 on December 31, 2019.
Share Repurchase Program
In order to meet its obligation to deliver shares and to eliminate
the dilutive eff ect of certain share-based compensation schemes (13)
or employee share off erings (14), as of December 31, 2019, AXA had
bought back 26,420,747 shares. These shares will be delivered
to the beneficiaries of share-based compensation schemes or
cancelled, all in accordance with the share repurchase program (15).
(1) Including the recycling of related currency translation adjustment, and other comprehensive income.
(2 ) Including the shares to be delivered on redemption of the bonds mandatorily exchangeable into EQH shares, issued by AXA in May 2018.
(3) Following the deconsolidation of EQH and its subsequent accounting under the equity method, the Mandatory Exchangeable Bonds (“MEB”) issued by AXA in May 2018 were excluded from the Debt Gearing. Debt Gearing is an alternative performance measure and is defined in the Glossary set forth in Appendix V of this Annual Report.
(4) This reflects the eff ect of the deconsolidation of EQH but does not reflect the intended use of the proceeds to reduce of AXA’s Debt Gearing towards the targeted range of 25%-28% by 2020.
(5) Formerly known as AXA Equitable Holdings, Inc.
(6 ) Net of underwriting discounts and commissions.
(7 ) EUR 1 = USD 1.1293 as of June 6, 2019 (Source: Bloomberg).
(8 ) Not including the proceeds from the exercise of the 30-day over-allotment option granted to the underwriters to purchase 6,000,000 EQH shares.
(9) EQH’s issued and outstanding common stock as of May 9, 2019 comprised 491,138,042 shares.
(10) EUR 1 = USD 1.1219 as of July 5, 2019 (Source: Bloomberg).
(11) Excluding the 44,162,500 shares of common stock of EQH, primarily related to the EQH shares to be delivered on redemption of the AXA SA bonds mandatorily exchangeable into EQH shares, maturing in May 2021.
(12) EUR 1 = USD 1.1011 as of November 12, 2019 (Source: Bloomberg).
(13) Stock-options plans and performance shares plans.
(14) Employee share off ering “Shareplan 2019”.
(15) AXA share repurchase program was authorized by the Shareholder’s Meeting of April 24, 2019.

40 I UNIVERSAL REGISTRATION DOCUMENT - ANNUAL REPORT 2019 - AXA I
ACTIVITY REPORT AND CAPITAL MANAGEMENT 2 2.3 ACTIVITY REPORT
2.3 ACTIVITY REPORT
I Activity and Earnings Indicators
On March 25, 2019, AXA completed a further sell down of its
shareholding in EQH, bringing AXA’s ownership in Equitable
Holdings, Inc. (“EQH”), from 60.1% to 48.3%. The reduction of
its voting rights below 50% combined with the reduction of its
Board membership to a minority share led to the loss of control
of AXA over EQH, while continuing to retain a significant influence
over EQH. As a result, AXA:
■ deconsolidated EQH on March 31, 2019, and recorded a negative
net income impact of €-0.6 billion (including the recycling of
related other comprehensive income and currency translation
reserve) corresponding to the diff erence between the fair value
and the consolidated carrying value of EQH at the date of the
deconsolidation;
■ from April 1, 2019, to November 13, 2019, accounted for
its remaining ownership in EQH using the equity method
and reclassified the equity component of the Mandatory
Exchangeable Bonds (“MEB”) from non-controlling interests
to financial liability.
Between November 13, 2019, and December 31, 2019, AXA
completed the sale of its remaining stake in EQH, excluding
44,162,500 shares of common stock of EQH, primarily
corresponding to the number of EQH shares to be delivered on
redemption of the AXA SA bonds mandatorily exchangeable in
May 2021. This sale brought AXA’s remaining participation below
10%. As a result, AXA deconsolidated its remaining ownership in
EQH that was accounted for using equity method, and accounted
for its remaining ownership in EQH as an AFS OCI asset, under
IAS 39.
As a consequence, in this A ctivity R eport, the United States Gross
revenues contribution included 3 months of operations, until the
date of the deconsolidation (March 31, 2019).
Nevertheless, the United States contribution in 2019 for APE and
NBV included operations up to November 13, 2019, on Group share
basis, until the loss of the significant influence of AXA over EQH.
Furthermore, the United States Underlying earnings contribution
in 2019 included operations up to November 13, 2019, and was
fully reported in Income from aff iliates and associates. As a result,
EQH contribution was excluded from Health and Protection
Combined Ratio calculation in 2019.
ACTIVITY INDICATORS
(in Euro million, except percentages)
December 31,
2019
December 31,
2018 restated (a)
December 31, 2019/
December 31, 2018
restated (a) & (b)
Gross revenues (c)
103,532 102,874 5.1%
France 26,182 25,175 3.9%
Europe 34,415 36,508 4.1%
Asia 9,860 8,973 3.8%
AXA XL 18,741 6,287 10.2%
United States 4,297 16,483 4.8%
International 7,078 6,535 6.0%
Transversal & Central Holdings 2,959 2,913 2.0%
APE (d)
6,029 6,631 (0.4%)
NBV Margin (e)
42.2% 39.3% 0.7 pt
(a) Restated: reclassification of German and Japanese activities of AXA Life Europe (previously reported as part of Germany and Japan respectively) into AXA Life Europe (included in Transversal & Central Holdings).
(b) Changes are on comparable basis.
(c) Net of intercompany eliminations.
(d) Annual Premium Equivalent (APE) represents 100% of new regular premiums plus 10% of single premiums, in line with EEV methodology. APE is Group share.
(e) New Business Value (NBV) Margin is the ratio of (i) New Business Value representing the value of newly issued contracts during the current year to (ii) APE.

41I UNIVERSAL REGISTRATION DOCUMENT - ANNUAL REPORT 2019 - AXA I
ACTIVITY REPORT AND CAPITAL MANAGEMENT
2
2.3 ACTIVITY REPORT
Consolidated Gross revenues amounted to €103,532 million as
of December 31, 2019, up 0.6% on a reported basis and up 5.1%
on a comparable basis compared to December 31, 2018.
The comparable basis mainly includes the following adjustments:
(i) the exclusion of United States contribution of the last three
quarters of 2018 following the deconsolidation of Equitable
Holdings, Inc. (€-12.5 billion or +13.0 points), (ii) the exclusion of
the Savings portion of 2018 premiums related to the transformed
in-force Group Life business in Switzerland (€-3.8 billion or
+4.0 points), and (iii) the inclusion of XL Group contribution
from January 1, 2018 to September 30, 2018 (€+9.9 billion or
-10.3 points).
Also, the 2019 comparable basis includes the foreign exchange
rate movements mainly due to the depreciation of average Euro
exchange rate against major currencies (€-1.9 billion or +1.9 points).
GROSS REVENUES
Gross revenues were up 1% on a reported basis and up 5% on
a comparable basis to €103,532 million.
France gross revenues were up 4% (or €+972 million) on a
comparable basis to €26,182 million:
■ Life & Savings (€+655 million or +5%) to €14,325 million mainly
driven by (i) Individual Savings (€+672 million) due to strong
sales of G/A capital light products through the bancassurance
channel and higher sales of Eurocroissance products through the
proprietary channel, as well as by (ii) Protection (€+198 million)
mainly from growth of in-force on both Individual and Group
businesses;
■ Property & Casualty (€+17 million or 0%) to €7,059 million
mainly driven by (i) domestic Commercial lines (€+111 million)
supported by volumes and tariff increases in Motor, Property
and Construction, partly off set by (ii) continued selectivity in
Credit and Lifestyle Protection business (€-83 million);
■ Health (€+263 million or +6%) to €4,619 million driven by higher
volumes in Group business (€+233 million) in both international
and domestic markets;
■ Other (€+37 million or +26%) to €179 million driven by AXA
Banque France mainly due to higher volumes in residential
mortgages.
Europe gross revenues were up 4% (or €+1,334 million) on a
comparable basis to €34,415 million:
■ Switzerland (€+53 million or +1%) to €5,992 million mainly from
(i) Property & Casualty (+1%) driven by Commercial lines due to
higher volumes and tariff increases in Workers’ Compensation,
while (ii) Life & Savings remained stable;
■ Germany (€+226 million or +2%) to €10,862 million from
(i) Health (+4%) mainly due to the continued growth in the civil
servants segment and tariff increases in full benefit insurance,
(ii) Property & Casualty (+2%) driven by Commercial Non-Motor
mainly from new business and higher average premium in
Property and Liability, and by Personal Non-Motor from tariff
increases in Household and Legal Protection, and (iii) Life &
Savings (+1%) mainly due to new business in G/A capital light
products, partly off set by Protection with Savings and traditional
G/A Savings, in line with the strategy;
■ Belgium (€+46 million or +1%) to €3,405 million primarily from
Property & Casualty (+2%) driven by Commercial lines in Mid-
Market segments, notably in the Public sector and SMEs, driven
by new business and tariff increases as well as by Personal
Household mainly following tariff increases;
■ The United Kingdom & Ireland (€+163 million or +3%) to
€5,367 million from (i) Property & Casualty (+4%) in Personal
Motor reflecting higher new business and tariff increases, in
Commercial Property mainly due to higher new business, and
in Commercial Motor driven by tariff increases, as well as from
(ii) Health (+2%) mainly driven by volume growth notably due
to a new partnership in international business;
■ Spain (€+160 million or +6%) to €2,686 million from (i) Property
& Casualty (+5%) driven by a strong growth in Commercial lines
mainly in Liability and Property as well as in Personal Motor
driven by higher volumes, (ii) Life & Savings (+10%) driven by
Unit-Linked and Protection sales, as well as (iii) Health (+8%)
driven by higher volumes and tariff increases;
■ Italy (€+686 million or +13%) to €6,104 million from (i) Life &
Savings (+17%) mainly in G/A Savings and Unit-Linked from
the sale of hybrid products and Protected Unit-Linked, and
(ii) Property & Casualty (+3%) driven by higher new business
and renewals in both Personal and Commercial lines.
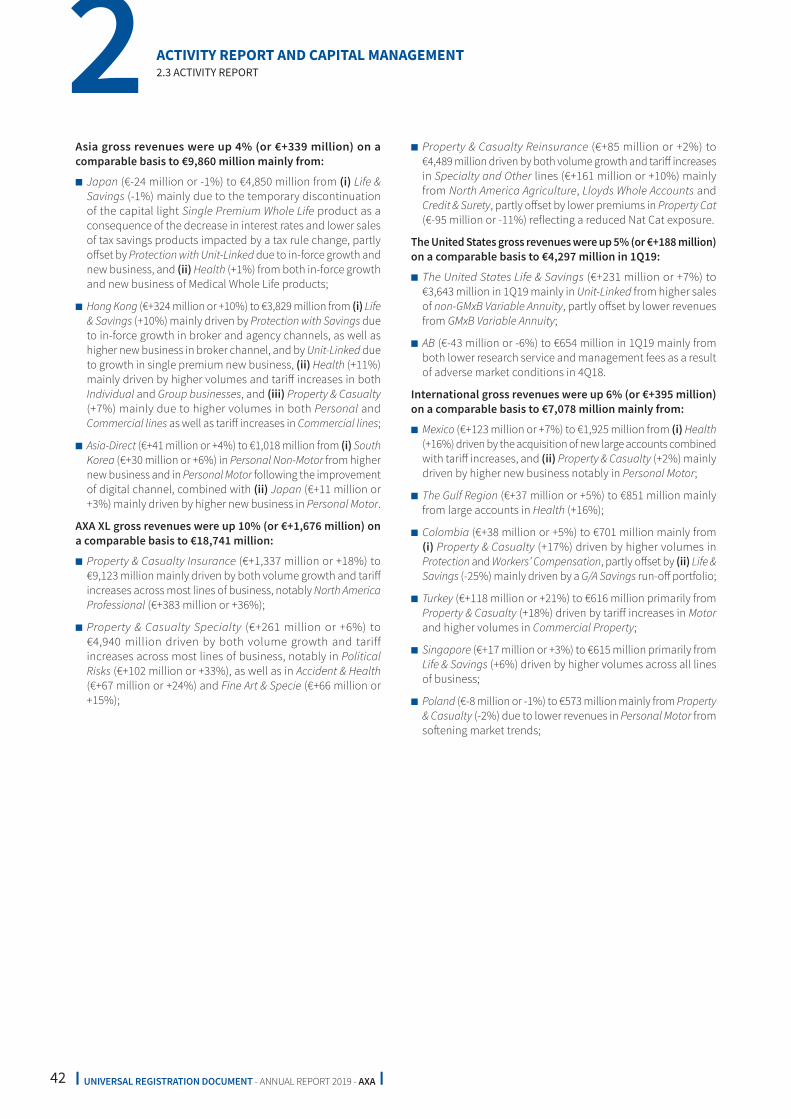
42 I UNIVERSAL REGISTRATION DOCUMENT - ANNUAL REPORT 2019 - AXA I
ACTIVITY REPORT AND CAPITAL MANAGEMENT 2 2.3 ACTIVITY REPORT
Asia gross revenues were up 4% (or €+339 million) on a
comparable basis to €9,860 million mainly from:
■ Japan (€-24 million or -1%) to €4,850 million from (i) Life &
Savings (-1%) mainly due to the temporary discontinuation
of the capital light Single Premium Whole Life product as a
consequence of the decrease in interest rates and lower sales
of tax savings products impacted by a tax rule change, partly
off set by Protection with Unit-Linked due to in-force growth and
new business, and (ii) Health (+1%) from both in-force growth
and new business of Medical Whole Life products;
■ Hong Kong (€+324 million or +10%) to €3,829 million from (i) Life
& Savings (+10%) mainly driven by Protection with Savings due
to in-force growth in broker and agency channels, as well as
higher new business in broker channel, and by Unit-Linked due
to growth in single premium new business, (ii) Health (+11%)
mainly driven by higher volumes and tariff increases in both
Individual and Group businesses, and (iii) Property & Casualty
(+7%) mainly due to higher volumes in both Personal and
Commercial lines as well as tariff increases in Commercial lines;
■ Asia-Direct (€+41 million or +4%) to €1,018 million from (i) South
Korea (€+30 million or +6%) in Personal Non-Motor from higher
new business and in Personal Motor following the improvement
of digital channel, combined with (ii) Japan (€+11 million or
+3%) mainly driven by higher new business in Personal Motor.
AXA XL gross revenues were up 10% (or €+1,676 million) on
a comparable basis to €18,741 million:
■ Property & Casualty Insurance (€+1,337 million or +18%) to
€9,123 million mainly driven by both volume growth and tariff
increases across most lines of business, notably North America
Professional (€+383 million or +36%);
■ Property & Casualty Specialty (€+261 million or +6%) to
€4,940 million driven by both volume growth and tariff
increases across most lines of business, notably in Political
Risks (€+102 million or +33%), as well as in Accident & Health
(€+67 million or +24%) and Fine Art & Specie (€+66 million or
+15%);
■ Property & Casualty Reinsurance (€+85 million or +2%) to
€4,489 million driven by both volume growth and tariff increases
in Specialty and Other lines (€+161 million or +10%) mainly
from North America Agriculture, Lloyds Whole Accounts and
Credit & Surety, partly off set by lower premiums in Property Cat
(€-95 million or -11%) reflecting a reduced Nat Cat exposure.
The United States gross revenues were up 5% (or €+188 million)
on a comparable basis to €4,297 million in 1Q19:
■ The United States Life & Savings (€+231 million or +7%) to
€3,643 million in 1Q19 mainly in Unit-Linked from higher sales
of non-GMxB Variable Annuity, partly off set by lower revenues
from GMxB Variable Annuity;
■ AB (€-43 million or -6%) to €654 million in 1Q19 mainly from
both lower research service and management fees as a result
of adverse market conditions in 4Q18.
International gross revenues were up 6% (or €+395 million)
on a comparable basis to €7,078 million mainly from:
■ Mexico (€+123 million or +7%) to €1,925 million from (i) Health
(+16%) driven by the acquisition of new large accounts combined
with tariff increases, and (ii) Property & Casualty (+2%) mainly
driven by higher new business notably in Personal Motor;
■ The Gulf Region (€+37 million or +5%) to €851 million mainly
from large accounts in Health (+16%);
■ Colombia (€+38 million or +5%) to €701 million mainly from
(i) Property & Casualty (+17%) driven by higher volumes in
Protection and Workers’ Compensation, partly off set by (ii) Life &
Savings (-25%) mainly driven by a G/A Savings run-off portfolio;
■ Turkey (€+118 million or +21%) to €616 million primarily from
Property & Casualty (+18%) driven by tariff increases in Motor
and higher volumes in Commercial Property;
■ Singapore (€+17 million or +3%) to €615 million primarily from
Life & Savings (+6%) driven by higher volumes across all lines
of business;
■ Poland (€-8 million or -1%) to €573 million mainly from Property
& Casualty (-2%) due to lower revenues in Personal Motor from
soft ening market trends;

43I UNIVERSAL REGISTRATION DOCUMENT - ANNUAL REPORT 2019 - AXA I
ACTIVITY REPORT AND CAPITAL MANAGEMENT
2
2.3 ACTIVITY REPORT
■ Morocco (€+38 million or +10%) to €425 million notably from
Property & Casualty (+9%) mainly due to higher new business
in Personal Motor;
■ Malaysia (€-23 million or -7%) to €286 million mostly from
Property & Casualty (-7%) mainly due to lower sales reflecting
strong market competition.
Transversal gross revenues were up 2% (or €+59 million) on
a comparable basis to €2,959 million mainly from:
■ AXA Assistance (€+93 million or +7%) to €1,415 million from
(i) Property & Casualty (+5%) driven by higher volumes in both
Non-Motor, notably in Travel and Consumer Electronics, and
Motor, as well as (ii) Health (+25%) mainly driven by higher
new business;
■ AXA Investment Managers (€-27 million or -2%) to €1,225 million
mainly driven by lower realized carried interest, performance
fees and distribution fees, partly off set by higher transaction fees.
NEW BUSINESS ANNUAL PREMIUM
EQUIVALENT (1)
New business APE was down 9% on a reported basis and
remained stable on a comparable basis to €6,029 million driven
by France and International, partly off set by Europe, the United
States and Asia.
France (€2,077 million, 34% of total) down €168 million (-7%)
on a comparable basis mainly stemming from Group Health
(€- 296 million) due to the non-repeat of exceptional sales in Group
International business, partly off set by Savings (€+87 million) and
Protection (€+38 million) mainly reflecting higher sales in Group
International business.
Europe (€1,267 million, 21% of total) up €111 million (+10%)
on a comparable basis in (i) Italy (€+53 million) mainly from G/A
Savings and Unit-Linked from the sales of hybrid products as well
as from Protected Unit-Linked, (ii) Belgium (€+37 million) mainly
driven by two large Group pension contracts in both Protection
with Savings and Unit-Linked, (iii) Germany (€+26 million) mainly
due to higher new business in G/A capital light and Pure Protection
following the launch of a new disability product as well as in
Health in civil and private servants segments, and (iv) Spain
(€+15 million) mainly driven by a strong growth in Unit-Linked,
partly off set by (v) Switzerland (€-20 million) in the context of the
transformation of the in-force Group Life business, partly off set
by higher new business in Individual Life.
Asia (€1,614 million, 27% of total) up €10 million (+1%) on a
comparable basis mainly driven by (i) China (€+68 million) due
to strong sales of G/A Savings products during the Chinese New
Year, and (ii) Hong Kong (€+4 million) driven by strong sales in
Protection with Savings, partly off set by lower sales in G/A Savings
and Group Health, partly off set by (iii) Japan (€-49 million) mainly
driven by lower sales of tax savings products impacted by a tax
rule change, partly off set by Protection with Unit-Linked and
Health, and (iv) Thailand (€-11 million) mainly driven by lower
sales in Unit-Linked.
The United States (€817 million, 14% of total) up €36 million
(+5%) on a comparable basis mostly driven by higher sales of
non-GMxB Variable Annuity, partly off set by lower sales of GMxB
Variable Annuity and lower advisory sales in Mutual funds.
International (€254 million, 4% of total) down €13 million (-5%)
on a comparable basis mainly in Singapore (€-15 million) from
strong market competition.
NEW BUSINESS VALUE MARGIN (2)
New Business Value Margin stood at 42.2%, increasing by 2.8
points. On a comparable basis, restated mainly for the decrease
of AXA’s ownership in EQH, New Business Value Margin increased
by 0.7 point mainly driven by a favorable product mix towards
Health and Protection with Unit-Linked in Japan, as well as an
assumption update in Protection combined with a favorable
business mix in France, partly off set by lower interest rates mainly
in France and Asia.
(1) New business Annual Premium Equivalent (APE) represents 100% of new regular premiums plus 10% of single premiums, in line with EEV methodology. APE is Group share.
(2) New Business Value (NBV) Margin is the ratio of (i) New Business Value representing the value of newly issued contracts during the current year to (ii) APE.

44 I UNIVERSAL REGISTRATION DOCUMENT - ANNUAL REPORT 2019 - AXA I
ACTIVITY REPORT AND CAPITAL MANAGEMENT 2 2.3 ACTIVITY REPORT
I Underlying Earnings, Adjusted Earnings and Net Income
Group share
(in Euro million, except percentages)
December 31,
2019 (a)
France Europe Asia AXA XL United States (a)
International
Transversal
& Central
Holdings
Investment margin 4,855 1,682 1,662 44 990 - 394 84
Fees & revenues 6,063 2,258 1,204 2,182 - - 363 55
Net technical margin 17,587 3,100 6,847 901 4,288 - 1,666 785
Expenses (19,989) (4,671) (6,286) (1,810) (4,554) - (1,900) (767)
Amortization of value of purchased
life business in-force (88) - (60) (26) - - (3) -
Underlying earnings before
tax from insurance activities 8,427 2,369 3,366 1,291 725 - 520 157
Underlying earnings before
tax from other activities (818) (1) 48 (12) (91) - 58 (819)
Income tax expenses/benefits (1,748) (660) (774) (256) (125) - (153) 219
Income from aff iliates and associates 766 11 - 188 (2) 444 103 21
Minority interests (175) (4) (96) (7) 0 - (61) (7)
Underlying earnings Group share 6,451 1,715 2,544 1,204 507 444 466 (429)
Net capital gains or losses
attributable to shareholders net
of income tax 393 168 162 14 78 (3) (9) (16)
Adjusted earnings Group share 6,844 1,882 2,706 1,218 585 441 457 (445)
Profit or loss on financial
assets (under fair value option)
and derivatives (791) 83 (259) (20) (16) 30 12 (621)
Exceptional operations
(including discontinued operations) (1,634) 5 (38) 24 (51) (145) (599) (831)
Goodwill and other related
intangible impacts (114) - (37) (15) (39) (0) (23) (1)
Integration and restructuring costs (449) (30) (54) (3) (307) (5) (16) (35)
NET INCOME GROUP SHARE 3,857 1,940 2,318 1,204 173 321 (169) (1,932)
Property & Casualty Combined Ratio 96.4% 90.7% 93.2% 97.0% 101.5% - 97.2% 98.5%
Health Combined Ratio 94.1% 98.7% 95.1% 76.7% - - 99.3% 102.8%
Protection Combined Ratio 93.2% 95.3% 94.8% 88.9% 105.4% - 99.1% -
(a) As a consequence of the deconsolidation of Equitable Holdings, Inc. (“EQH”) as of March 31, 2019, the United States underlying earnings contribution was reported in income from aff iliates and associates for the period January 1, 2019, to November 13, 2019, until its subsequent accounting as financial investment available for sale. As a result, EQH contribution was excluded from Health and Protection Combined Ratio calculation in 2019.

45I UNIVERSAL REGISTRATION DOCUMENT - ANNUAL REPORT 2019 - AXA I
ACTIVITY REPORT AND CAPITAL MANAGEMENT
2
2.3 ACTIVITY REPORT
(in Euro million, except percentages)
December 31,
2018 France Europe (a)
Asia (a)
AXA XL United States International
Transversal
& Central
Holdings (a)
Investment margin 4,864 1,604 1,747 40 349 641 410 75
Fees & revenues 8,434 2,105 1,119 2,009 - 2,781 361 58
Net technical margin 12,990 3,034 6,361 791 944 (385) 1,421 824
Expenses (17,686) (4,430) (5,984) (1,651) (1,462) (1,635) (1,792) (732)
Amortization of value of purchased
life business in-force (55) - (23) (29) - (1) (3) -
Underlying earnings before
tax from insurance activities 8,547 2,313 3,219 1,160 (168) 1,400 397 225
Underlying earnings before
tax from other activities (43) (0) 108 (3) (10) 496 39 (673)
Income tax expenses/benefits (2,004) (755) (750) (219) (70) (272) (92) 154
Income from aff iliates and associates 315 20 2 171 (3) - 104 20
Minority interests (632) (5) (84) (7) 18 (500) (47) (8)
Underlying earnings Group share 6,182 1,573 2,496 1,102 (233) 1,125 400 (282)
Net capital gains or losses
attributable to shareholders net
of income tax 307 131 266 (34) (27) (11) (4) (14)
Adjusted earnings Group share 6,489 1,704 2,762 1,068 (260) 1,114 396 (295)
Profit or loss on financial assets
(under fair value option) and
derivatives (463) (91) (134) (55) (63) (82) 39 (77)
Exceptional operations
(including discontinued operations) (451) 40 (376) 4 (29) 16 (17) (91)
Goodwill and other related
intangible impacts (3,102) - (39) (18) (10) (3,006) (29) (1)
Integration and restructuring costs (332) (19) (107) (13) (67) (27) (35) (64)
NET INCOME GROUP SHARE 2,140 1,635 2,106 986 (428) (1,986) 355 (527)
Property & Casualty Combined Ratio 97.0% 92.3% 94.5% 97.1% 108.6% - 100.6% 89.9%
Health Combined Ratio 94.4% 97.9% 94.8% 78.8% - 169.6% 99.6% 110.4%
Protection Combined Ratio 95.6% 95.0% 96.7% 86.8% 89.2% 106.2% 98.8% -
(a) Reclassification of German and Japanese activities of AXA Life Europe (previously reported as part of Germany and Japan respectively) into AXA Life Europe (included in Transversal & Central Holdings).

46 I UNIVERSAL REGISTRATION DOCUMENT - ANNUAL REPORT 2019 - AXA I
ACTIVITY REPORT AND CAPITAL MANAGEMENT 2 2.3 ACTIVITY REPORT
I Alternative Performance Measures
Adjusted Earnings, Underlying Earnings, Adjusted Return on
Equity, Underlying Earnings per share, Underlying Combined
Ratio and Debt Gearing are Alternative Performance Measures
(“APMs”) as defined in ESMA’s guidelines and the AMF’s related
position statement issued in 2015. A reconciliation from Adjusted
Earnings, Underlying Earnings and Underlying Combined Ratio
to the most directly reconcilable line item, subtotal or total in
the financial statements of the corresponding period is provided
in the above tables. Adjusted Return on Equity and Underlying
Earnings per share are reconciled to the financial statements in
the table set forth on page 51 of this Annual Report, and Debt
Gearing calculation methodology based on the information
available in the financial statements is defined on page 47 of
this Annual Report.
For further information on any of the above-mentioned APMs,
see the Glossary set forth in Appendix V to this Annual Report.
ADJUSTED EARNINGS
Adjusted Earnings represent the net income (Group share) as
disclosed in the above tables, before the impact of the following
items net of policyholder participation, deferred acquisition costs,
VBI, taxes and minority interests:
■ integration, amortization and impairments costs related to
material newly-acquired companies as well as restructuring
and associated costs related to productivity improvement plans;
■ goodwill and other related intangibles;
■ exceptional operations (primarily changes in scope and
discontinued operations); and
■ profit or loss on financial assets accounted for under fair value
option (excluding assets backing liabilities for which the financial
risk is borne by the policyholder), foreign exchange impacts
on assets and liabilities, and derivatives related to invested
assets and liabilities.
UNDERLYING EARNINGS
Underlying Earnings correspond to Adjusted Earnings without
the following elements, net of policyholder participation, deferred
acquisition costs, VBI, taxes and minority interests:
■ realized gains and losses and change in impairment valuation
allowance (on assets not designated under fair value option
or trading assets); and
■ cost at inception, intrinsic value and pay-off of derivatives used
for the economic hedging of realized gains and impairments of
equity securities backing General Account and shareholders’
funds.
ADJUSTED RETURN ON EQUITY
The Adjusted Return on Equity (“Adjusted RoE”) is calculated
as adjusted earnings net of financial charges related to undated
subordinated debt, preferred shares and mandatory exchangeable
bonds up to the date of deconsolidation of EQH (recorded through
shareholders’ equity as disclosed in Part 5.4 - “Consolidated
statement of changes in equity” and financial debt as disclosed in
Part 5.6 - Note 17 “Financing debt” of this Annual Report) divided
by the weighted average shareholders’ equity. The weighted
average shareholders’ equity:
■ is based on opening shareholders’ equity adjusted for weighted
average impacts of capital flows (including dividends);
■ without reserves relating to change in fair value of financial
investments available for sale as disclosed in Part 5.4 -
“Consolidated Statement of Changes in Equity” of the Annual
Report;
■ without undated subordinated debt as disclosed in Part 5.4 -
“Consolidated statement of changes in equity” of the Annual
Report.
UNDERLYING EARNINGS PER SHARE
Underlying Earnings per share corresponds to Group Share
Underlying Earnings net of financial charges related to undated
subordinated debts recorded through shareholders’ equity – Group
share, and preferred shares and mandatory exchangeable bonds
up to the date of deconsolidation of EQH (recorded through
shareholders’ equity as disclosed in Part 5.4 - “Consolidated
Statement of Changes in Equity” and financial debt as disclosed in
Part 5.6 - Note 17 “Financing debt” of this Annual Report), divided
by the weighted average number of outstanding ordinary shares.
UNDERLYING COMBINED RATIO
(APPLICABLE FOR PROPERTY & CASUALTY,
HEALTH AND PROTECTION)
The Underlying Combined Ratio is the sum of the all accident
year loss ratio and the underlying expense ratio.
■ All accident year loss ratio net of reinsurance is the ratio of:
• all accident years claims charge gross of reinsurance +
claims handling costs + result of reinsurance ceded on all
accident years excluding unwind of the discount rate used
in calculating technical reserves; to
• earned revenues gross of reinsurance.

47I UNIVERSAL REGISTRATION DOCUMENT - ANNUAL REPORT 2019 - AXA I
ACTIVITY REPORT AND CAPITAL MANAGEMENT
2
2.3 ACTIVITY REPORT
■ Underlying expense ratio is the ratio of:
• underlying expenses (excluding claims handling costs,
including changes in VBI amortization); to
• earned revenues gross of reinsurance.
DEBT GEARING
Debt Gearing refers to the level of a company’s debt related to its
equity capital, usually expressed as a percentage. Debt Gearing
is used by Management to measure the financial leverage of
the Group and the extent to which its operations are funded
by creditors as opposed to shareholders. AXA’s Debt Gearing is
calculated by dividing the gross debt (financing debt as disclosed
in Part 5.6 - Note 17 “Financing debt” and undated subordinated
debt as disclosed in Note 13 “Shareholders’ equity and minority
interests” of this Annual Report) by total capital employed
(shareholders’ equity excluding undated subordinated debt
and reserves relating to the change in the fair value of financial
instruments and of hedge accounting derivatives plus gross debt).
Furthermore, following the deconsolidation of EQH, mandatory
exchangeable bonds issued by AXA in May 2018 were excluded
from the Debt Gearing.
I Commentary on Group Earnings
UNDERLYING EARNINGS
Underlying earnings amounted to €6,451 million, up €269 million
(+4%) versus 2018 on a reported basis. On a constant exchange
rate basis, underlying earnings increased by €123 million (+2%),
broken down as follows:
■ €+720 million at AXA XL as 2018 underlying earnings (€-
233 million) corresponding only to the fourth quarter of 2018
activity compared to a contribution of €507 million for 12
months of operations in 2019;
■ €-703 million at Equitable Holdings, Inc. mainly corresponding
to the progressive dilution of AXA’s ownership following the
subsequent Secondary Off erings;
■ €+106 million increase (+2%) to €5,500 million for the remainder
of the Group.
Underlying earnings excluding AXA XL
and the United States
Underlying earnings before tax from insurance activities
increased by €273 million (+4%) on a constant exchange rate
basis to €7,702 million:
■ lower investment margin (€-18 million or 0%) driven by
(i) Europe (€-95 million) due to lower distribution from
investment funds combined with lower reinvestment yields
as well as a decrease in the asset base in Switzerland following
the transformation of the in-force Group Life business model
to a semi-autonomous model, partly off set by (ii) France
(€+78 million) from lower profit-sharing;
■ higher fees & revenues (€+260 million or +5%) driven by
(i) France (€+152 million) mainly from higher loadings on
premiums in Protection, (ii) Europe (€+71 million) driven by
higher loadings on premium in Germany (€+15 million) and
Italy (€+15 million), and higher Unit-Linked management fees
(€+28 million) reflecting the growth of the portfolio in Italy, and
(iii) Asia (€+43 million) mainly in Japan (€+20 million) due to
in-force growth in Protection with Unit-Linked;
■ higher net technical margin (€+734 million or +6%) mainly
driven by (i) Europe (€+417 million) from Property & Casualty
(€+436 million) due to an improved current year loss ratio
(-0.5 point) driven by lower attritional losses (-0.7 point) in
Switzerland, Germany, the United Kingdom & Ireland and Italy,
despite higher Nat Cat charges (+0.4 point) mainly in Italy and
Switzerland, combined with more favorable prior year reserve
developments (-0.9 point) mainly in Switzerland and the United
Kingdom & Ireland, partly off set by Life & Savings (€-42 million)
mainly in Switzerland (€-43 million) in Group Life business due
to the non-repeat of a particularly low profit sharing in 2018,
(ii) International (€+227 million) primarily from Property &
Casualty (€+202 million) driven by Turkey (€+62 million) and
Morocco (€+48 million) mainly due to a positive impact from
prior year reserve developments, Colombia (€+38 million) due to
volume eff ects and Brazil (€+28 million) due to a more favorable
claims experience, as well as from Health (€+34 million) driven
by Mexico (€+17 million) due to volume eff ects, and (iii) France
(€+67 million) mainly from Property & Casualty (€+90 million) due
to higher favorable prior year reserve developments and lower
attritional losses mostly from lower frequency in Personal lines;

48 I UNIVERSAL REGISTRATION DOCUMENT - ANNUAL REPORT 2019 - AXA I
ACTIVITY REPORT AND CAPITAL MANAGEMENT 2 2.3 ACTIVITY REPORT
■ higher expenses (€-671 million or +5%) primarily in (i) Europe
(€-249 million) mainly from Germany (€-150 million) due to the
full consolidation of a newly acquired Legal Protection company
(Roland Rechtsschutz) starting from October 1, 2018, and higher
commissions linked to volume growth in Life & Savings, the
United Kingdom & Ireland (€-54 million) due to higher volumes
and Italy (€-49 million) in line with volume growth in Life &
Savings, (ii) France (€-241 million) in line with volume growth
in Life & Savings, (iii) International (€-89 million) in line with
volume growth in Colombia (€-30 million), Turkey (€-28 million)
and Mexico (€-25 million), and (iv) Transversal & Central Holdings
(€-35 million) mainly at AXA Assistance (€-44 million) driven by
higher commissions from a change in business mix towards
large partnerships, notably in Home;
■ higher VBI amortization (€-31 million or +57%) driven by Europe
(€-35 million) mainly from lower interest rates assumptions in
Switzerland (€-27 million) and Germany (€-11 million).
Underlying earnings before tax from other activities decreased
by €200 million on a constant exchange rate basis to €-727 million
mainly driven by (i) Transversal & Central Holdings (€-149 million
or -22%) mainly at AXA SA (€-144 million) due to temporary higher
financial charges, notably in the context of the acquisition of XL
Group, and the change in the accounting methodology of the
mandatory exchangeable bonds triggered by the deconsolidation
of Equitable Holdings, Inc., and (ii) Europe (€-60 million) mainly
in Germany Holding due to the non-repeat of an exceptional
distribution from an investment fund and higher pensions costs.
Income tax expenses decreased by €62 million (-4%) on a constant
exchange rate basis to €-1,623 million mainly from (i) France
(€+95 million) mainly driven by the non-repeat of negative tax
one-off s in 2018, and (ii) AXA SA (€+37 million) from lower pre-
tax underlying earnings, partly off set by (iii) the non-repeat of
favorable tax one-off s in 2018 in Asia and International, combined
with (iv) higher pre-tax underlying earnings in International.
Income from affiliates & associates decreased by €6 million
(-2%) on a constant exchange rate basis to €323 million mainly
driven by France (€-9 million) due to the disposal of Natio in 2018.
Minority interests increased by €24 million (+16%) on a constant
exchange rate basis to €-176 million driven by (i) International
(€-13 million) from Colombia and the Gulf Region, as well as
(ii) Europe (€-12 million) mainly from Italy (€-10 million) as a result
of the increase of AXA MPS underlying earnings.
AXA XL Underlying earnings
Underlying earnings before tax from insurance and reinsurance
activities were €725 million, mainly driven by a strong net
investment income and the emergence of expense synergies
related to the integration within AXA. This was partly off set by
current year catastrophe losses in excess of the normalized
level in 2H19 (€-0.4 billion), notably from Typhoons Hagibis (€-
0.2 billion) and Faxai (€-0.1 billion) in Japan and Hurricane Dorian
(€-0.1 billion) in the Bahamas and in the United States, as well
as elevated levels of large non-catastrophe losses and a higher
current year loss ratio primarily in long-tail lines of business
reflecting an update in assumptions related to claims inflation.
Underlying earnings before tax from other activities were
€-91 million mainly driven by interest expenses on financing debt.
Income tax expenses were €-125 million reflecting positive pre-
tax underlying earnings.
Combined Ratios
The Property & Casualty Combined Ratio improved by 0.6
point to 96.4%. On a constant exchange rate basis and excluding
the contribution of AXA XL, the Property & Casualty Combined
Ratio improved by 1.1 points to 93.5% driven by more favorable
prior year reserve developments (-0.7 point) and an improved
current year loss ratio (-0.5 point) mainly from lower attritional
losses (-0.6 point) as well as lower large losses (-0.1 point).
AXA XL Property & Casualty Combined Ratio stood at 101.5%
due to current year catastrophe losses, higher levels of individual
large non-catastrophe losses, and higher current year loss ratio
primarily in long-tail lines of business.
The Health Combined Ratio improved by 0.3 point to 94.1%. On a
constant exchange rate basis and excluding the contribution of AXA
XL and the United States, the Health Combined Ratio increased
by 0.1 point mainly driven by France and the United Kingdom.
The Protection Combined Ratio improved by 2.3 points to
93.2%. On a constant exchange rate basis and excluding the
contribution of the United States, the Protection Combined
Ratio improved by 0.7 point mainly from Switzerland (-3.3 points)
driven by the transformation of the in-force Group Life business
to a semi-autonomous model.

49I UNIVERSAL REGISTRATION DOCUMENT - ANNUAL REPORT 2019 - AXA I
ACTIVITY REPORT AND CAPITAL MANAGEMENT
2
2.3 ACTIVITY REPORT
ADJUSTED EARNINGS TO NET INCOME
Net realized capital gains and losses attributable to
shareholders amounted to €393 million. On a constant exchange
rate basis, net realized capital gains and losses attributable
to shareholders increased by €83 million due to:
■ €+217 million lower impairments to €-227 million mainly
driven by equity securities (€+167 million to €-98 million) from
the strong equity market performance in 2019 versus the late
2018 turmoil, as well as alternative investments (€+61 million to
€-53 million) and fixed income assets (€+26 million to €-7 million),
partly off set by real estate (€-37 million to €-69 million);
■ €-99 million lower net realized capital gains to €752 million
mainly driven by equity securities (€-390 million to €233 million)
mainly from Germany (€-130 million) due to the non-repeat
of the impact of the derisking strategy from the US market in
2018, partly off set by real estate (€+174 million to €350 million)
mainly from an exceptional transaction in Belgium, fixed income
assets (€+71 million to €79 million), and alternative investments
(€+46 million to €90 million);
■ €-36 million unfavorable change in intrinsic value to
€-131 million related to equity hedging derivatives due to the
strong equity market performance in 2019 combined with the
non-repeat of late 2018 equity market turmoil.
As a result, adjusted earnings amounted to €6,844 million, up
€355 million (+5%). On a constant exchange rate basis, adjusted
earnings increased by €206 million (+3%).
Net income amounted to €3,857 million, up €1,716 million (+80%).
On a constant exchange rate basis, net income increased by
€1,610 million (+75%) due to:
■ higher adjusted earnings (€+206 million);
■ lower impact of goodwill and other related intangibles up
€2,992 million to €-114 million mainly from the non-repeat of
the United States goodwill impairment of Equitable Holdings,
Inc. in 2018 (€-3,006 million);
■ a positive change in the fair value of assets accounted for
under fair value option, up €492 million to €169 million, driven
by the decrease in interest rates and the strong recovery of
the equity market in 2019, combined with lower distribution
from funds;
partly off set by:
■ higher impact from exceptional and discontinued operations
(€-1,162 million) to €-1,634 million mainly due to (i) the expected
loss on the upcoming disposals of AXA Bank Belgium (€-
590 million) and AXA Life Europe (€-89 million), the negative
impact linked to the deconsolidation of Equitable Holdings,
Inc. (€-590 million), combined with the impairment of the
participation in non-consolidated subsidiaries (€-245 million),
partly off set by (ii) the non-repeat of the transformation of
the in-force Group Life business model to a semi-autonomous
model in Switzerland (€+421 million);
■ an unfavorable change in the fair value of derivatives net of
foreign exchange impacts, down 816 million to €-960 million
driven by:
• the change in the fair value of equity, interest rates and credit
derivatives not eligible for hedge accounting under IAS 39,
down €615 million to €-754 million, mainly driven by equity
hedging derivatives (€-525 million) in a context of strong
equity market recovery during the year and the impact of
the decrease in interest rates on swaps hedging the financial
debt at AXA SA (€-129 million),
• the change in the fair value of foreign exchange derivatives
not eligible for hedge accounting under IAS 39 net of
foreign exchange rate movements on assets and liabilities
denominated in foreign currencies, down €201 million to
€-206 million, driven by the appreciation of main currencies
against Euro;
■ higher integration and restructuring costs (€-103 million)
to €-449 million mainly due to XL Group integration costs (€-
227 million), partly off set by the decrease of the costs of voluntary
leave and pre-retirement plans in AXA Investment Managers
(€+36 million), Belgium (€+30 million), Italy (€+20 million),
Spain (€+20 million), and the non-repeat of restructuring costs
in the context of the IPO of Equitable Holdings, Inc. completed
in May 2018 in the United States (€+23 million).

50 I UNIVERSAL REGISTRATION DOCUMENT - ANNUAL REPORT 2019 - AXA I
ACTIVITY REPORT AND CAPITAL MANAGEMENT 2 2.3 ACTIVITY REPORT
I Shareholders’ equity Group share
(in Euro million)
Shareholders’
equity Group share
At December 31, 2018 62,428
Share Capital (17)
Capital in excess of nominal value (227)
Equity-share based compensation 40
Treasury shares sold or bought in open market 286
Change in equity component of compound financial instruments -
Deeply subordinated debt (including accumulated interests charges) (447)
Fair value recorded in shareholders’ equity 7,656
Impact of currency fluctuations 457
Payment of N-1 dividend (3,189)
Other (255)
Net income for the period 3,857
Actuarial gains and losses on pension benefits (679)
Reserves relating to changes in fair value of financial liabilities measured at fair value through profit and loss
that are attributable to changes in own credit risk (13)
At December 31, 2019 69,897
I Solvency information (1)
(1) Prudential information related to solvency, including the Solvency II ratio and the Eligible Own Funds (“EOF”) disclosed in the note and the table below, will be detailed in the Group’s 2019 SFCR that is expected to be published at a later stage and for which Group’s auditors will issue a report.
As of December 31, 2019, the Group’s Eligible Own Funds (“EOF”) amounted to €59.4 billion and the Solvency II ratio to 198%, compared
to €58.1 billion and 193% as of December 31, 2018.
(in Euro billion)
L&S EOF
December 31, 2019
Group EOF
December 31, 2019
Group EOF
December 31, 2018
Previous Closing 43.0 58.1 57.8
Modeling changes and opening adjustments (3.7) (0.7) (1.7)
Opening 39.3 57.4 56.1
Expected existing business contribution 3.2 4.6 4.4
Value of new premiums 1.8 2.2 2.0
Operating variance and change in assumptions 0.2 0.8 1.9
Operating return 5.3 7.7 8.3
Economic variance (2.9) (2.4) (3.7)
Total return 2.3 5.3 4.6
Exchange rate impact 0.5 1.1 0.8
Dividend to be paid in year N+1 - (3.5) (3.2)
Subordinated debts and others (a) (2.7) (1.0) (0.1)
Closing 39.5 59.4 58.1
(a) Including subordinated debts, capital movements, internal dividends paid in 2018 and others.
As of December 31, 2019, Shareholders’ equity Group share totaled €69.9 billion. The movements in Shareholders’ equity Group share
since December 31, 2018, are presented in the table below:

51I UNIVERSAL REGISTRATION DOCUMENT - ANNUAL REPORT 2019 - AXA I
ACTIVITY REPORT AND CAPITAL MANAGEMENT
2
2.3 ACTIVITY REPORT
I Shareholder value
EARNINGS PER SHARE (“EPS”)
(in Euro, except ordinary shares in million)
December 31, 2019 December 31, 2018
December 31, 2019/
December 31, 2018
Basic Fully diluted Basic Fully diluted Basic Fully diluted
Weighted average number of shares 2,383 2,389 2,383 2,389
Net income (Euro per ordinary share) 1.51 1.51 0.79 0.79 91.8% 91.9%
Adjusted earnings (Euro per ordinary share) 2.77 2.76 2.61 2.61 5.8% 5.9%
Underlying earnings (Euro per ordinary share) 2.60 2.59 2.48 2.48 4.7% 4.7%
RETURN ON EQUITY (“ROE”)
(in Euro million, except percentages) December 31, 2019 December 31, 2018
December 31, 2019/
December 31, 2018
ROE 6.1% 3.3% 2.7 pts
Net income 3,857 2,140
Average shareholders’ equity 63,578 64,419
Adjusted ROE 16.0% 14.4% 1.6 pts
Adjusted earnings (a) 6,591 6,227
Average shareholders’ equity (b) 41,215 43,390
Underlying ROE 15.0% 13.6% 1.4 pts
Underlying earnings (a) 6,198 5,920
Average shareholders’ equity (b) 41,215 43,390
(a) Including adjustment to reflect net financial charges related to undated subordinated debt (recorded through shareholders’ equity) and preferred shares. Following the deconsolidation of Equitable Holdings Inc. (“EQH”), it includes an adjustment to reflect financial charges for only the first three months of the year 2019 related to the equity component of mandatory exchangeable bonds into shares of EQH.
(b) Excluding fair value of invested assets and derivatives and undated subordinated debt (both recorded through shareholders’ equity).

52 I UNIVERSAL REGISTRATION DOCUMENT - ANNUAL REPORT 2019 - AXA I
ACTIVITY REPORT AND CAPITAL MANAGEMENT 2 2.3 ACTIVITY REPORT
I Segment information
FRANCE
(in Euro million, except percentages)
December 31,
2019
December 31,
2018
Gross revenues (a)
26,182 25,175
Life & Savings 14,325 13,542
Property & Casualty 7,059 7,061
Health 4,619 4,356
Other (b) 179 215
New business
APE 2,077 2,232
NBV Margin 31.5% 29.5%
Underlying earnings before tax 2,368 2,313
Life & Savings 1,106 1,143
Property & Casualty 1,140 1,022
Health 123 149
Other (c) (1) (0)
Income tax expenses/benefits (660) (755)
Minority interests (4) (5)
Income from aff iliates and associates 11 20
Underlying earnings Group share 1,715 1,573
Net capital gains or losses attributable to shareholders net of income tax 168 131
Adjusted earnings Group share 1,882 1,704
Profit or loss on financial assets (under fair value option) and derivatives 83 (91)
Exceptional operations (including discontinued operations) 5 40
Goodwill and other related intangible impacts - -
Integration and restructuring costs (30) (19)
NET INCOME GROUP SHARE 1,940 1,635
Property & Casualty Combined Ratio 90.7% 92.3%
Health Combined Ratio 98.7% 97.9%
Protection Combined Ratio 95.3% 95.0%
(a) Net of intercompany eliminations.
(b) Other corresponds to banking activities.
(c) Other corresponds to banking activities and holding.
Gross revenues increased by €1,008 million (+4%) to
€26,182 million. On a comparable basis, gross revenues increased
by €972 million (+4%):
■ Life & Savings (€+655 million or +5%) to €14,325 million, mainly
driven by strong sales of G/A capital light products through the
bancassurance channel and higher sales of Eurocroissance
products (€+76 million or +61%) through the proprietary
channel. Unit-Linked gross revenues contributed to 38% (1) of
total Individual Savings compared to 27% (1) on average for the
market. Protection revenues increased by €198 million (+5%)
from growth of in-force on both Individual and Group businesses;
■ Property & Casualty (€+17 million or 0%) to €7,059 million,
mainly driven by Commercial lines (€+28 million or +1%)
supported by volumes and tariff increases mainly in Motor,
Property and Construction, partly off set by continued selectivity
in the Credit and Lifestyle Protection business, while Personal
lines revenues remained in line with previous year (€-11 million
or 0%);
(1) Including Eurocroissance.

53I UNIVERSAL REGISTRATION DOCUMENT - ANNUAL REPORT 2019 - AXA I
ACTIVITY REPORT AND CAPITAL MANAGEMENT
2
2.3 ACTIVITY REPORT
■ Health (€+263 million or +6%) to €4,619 million, driven by
higher volumes in Group business (€+233 million or +6%) in both
international and domestic markets, as well as in Individual
business (€+30 million or +5%);
■ Other (€+37 million or +26%) to €179 million at AXA Banque
France, mainly due to higher volumes in residential mortgages
and loans.
APE (€-155 million or -7%) to €2,077 million. On a comparable
basis, APE decreased by €168 million (-7%) mainly driven by
Group Health (€-296 million or -38%) due to the non-repeat of
exceptional sales in Group International business in 2018, partly
off set by Savings (€+87 million or +9%) and Protection (€+38 million
or +9%) due to higher sales in Group International business.
NBV Margin increased by 2.0 points to 31.5%. On a comparable
basis, NBV Margin increased by 2.2 points driven by an assumption
update in Protection and a favorable business mix, partly off set
by lower interest rates and higher expenses.
Underlying earnings before tax increased by €55 million (+2%)
to €2,368 million:
■ Property & Casualty (€+118 million or +12%) to €1,140 million,
mainly driven by a higher net technical margin (€+90 million)
due to higher prior year reserve developments and lower
attritional losses mostly from lower frequency in Personal lines
as well as lower expenses;
■ Life & Savings (€-37 million or -3%) to €1,106 million, mainly
due to higher commissions and general expenses from business
growth, partly off set by an increase in loadings on premiums
mainly from Protection as well as a higher investment margin
from continued discipline on crediting rates;
■ Health (€-26 million or -17%) to €123 million, mainly driven by
less favorable claims experience in Group International business;
■ Other (€-1 million) to €-1 million.
Income tax expenses decreased by €95 million (-13%) to
€-660 million mainly driven by the non-repeat of negative
tax one-off s in 2018 (€+61 million), the favorable eff ect of the
upcoming decrease in corporate tax rate as well as higher dividend
distributions on investment funds benefiting from lower taxation,
partly off set by higher pre-tax underlying earnings.
Underlying earnings increased by €141 million (+9%) to
€1,715 million.
Adjusted earnings increased by €178 million (+10%) to
€1,882 million driven by higher underlying earnings and higher
net realized capital gains.
Net income increased by €306 million (+19%) to €1,940 million
driven by higher adjusted earnings and a favorable change in
the fair value of both Mutual funds and derivatives not eligible
to hedge accounting, partly off set by the non-repeat of the gain
relating to the discontinuation of the partnership with BNP Paribas
(Natio) in 2018.

54 I UNIVERSAL REGISTRATION DOCUMENT - ANNUAL REPORT 2019 - AXA I
ACTIVITY REPORT AND CAPITAL MANAGEMENT 2 2.3 ACTIVITY REPORT
EUROPE
(in Euro million, except percentages)
December 31,
2019
December 31,
2018 restated (a)
Gross revenues (b)
34,415 36,508
Life & Savings 12,268 15,450
Property & Casualty 16,645 15,760
Health 5,477 5,258
Other (c) 25 41
New business
APE 1,267 1,146
NBV Margin 46.9% 49.6%
Underlying earnings before tax 3,414 3,327
Life & Savings 1,016 1,077
Property & Casualty 2,054 1,834
Health 297 308
Other (d) 48 108
Income tax expenses/benefits (774) (750)
Minority interests (96) (84)
Income from aff iliates and associates - 2
Underlying earnings Group share 2,544 2,496
Net capital gains or losses attributable to shareholders net of income tax 162 266
Adjusted earnings Group share 2,706 2,762
Profit or loss on financial assets (under fair value option) and derivatives (259) (134)
Exceptional operations (including discontinued operations) (38) (376)
Goodwill and other related intangible impacts (37) (39)
Integration and restructuring costs (54) (107)
NET INCOME GROUP SHARE 2,318 2,106
Property & Casualty Combined Ratio 93.2% 94.5%
Health Combined Ratio 95.1% 94.8%
Protection Combined Ratio 94.8% 96.7%
(a) Restated: reclassification of German activities of AXA Life Europe (previously reported as part of Germany) into AXA Life Europe (included in Transversal & Central Holdings).
(b) Net of intercompany eliminations.
(c) Other corresponds to banking activities.
(d) Other corresponds to banking activities and holding.

55I UNIVERSAL REGISTRATION DOCUMENT - ANNUAL REPORT 2019 - AXA I
ACTIVITY REPORT AND CAPITAL MANAGEMENT
2
2.3 ACTIVITY REPORT
EUROPE - SWITZERLAND
(in Euro million, except percentages)
December 31,
2019
December 31,
2018
Gross revenues (a)
5,992 9,531
Life & Savings 2,824 6,534
Property & Casualty 3,152 2,992
Health 16 5
New business
APE 320 340
NBV Margin 46.7% 53.0%
Underlying earnings before tax 961 943
Life & Savings 285 404
Property & Casualty 693 555
Health (16) (16)
Income tax expenses/benefits (159) (177)
Minority interests (4) (4)
Income from aff iliates and associates - -
Underlying earnings Group share 798 762
Net capital gains or losses attributable to shareholders net of income tax 6 81
Adjusted earnings Group share 803 843
Profit or loss on financial assets (under fair value option) and derivatives 1 (5)
Exceptional operations (including discontinued operations) (24) (421)
Goodwill and other related intangible impacts (25) (26)
Integration and restructuring costs - -
NET INCOME GROUP SHARE 755 391
Property & Casualty Combined Ratio 82.8% 87.0%
Health Combined Ratio n/a n/a
Protection Combined Ratio 93.7% 97.0%
Average exchange rate: €1.00 = Swiss Franc 1.11 1.16
(a) Net of intercompany eliminations.
On January 1, 2019, AXA Switzerland transformed its main
occupational benefits foundations from full insurance to semi-
autonomous. As a result, the change in gross revenues on a
comparable basis excludes the savings portion of the 2018
premiums related to the transformed in-force Group Life business.
Gross revenues decreased by €3,539 million (-37%) to
€5,992 million. On a comparable basis, gross revenues increased
by €53 million (+1%):
■ Property & Casualty (€+43 million or +1%) to €3,152 million,
mainly driven by Commercial lines (€+41 million or +3%) due to
higher volumes and tariff increases in Workers’ Compensation;
■ Life & Savings (€-1 million or 0%) to €2,824 million, linked to the
transformation of the Group Life business which was compensated
by higher revenues from semi-autonomous activities;
■ Health (€+10 million) to €16 million.
APE decreased by €20 million (-6%) to €320 million. On a
comparable basis, APE decreased by €20 million (-6%) in the
context of the transformation of the in-force Group Life business,
partly off set by higher new business in Individual Life driven by a
new hybrid product launched in 2019.
NBV Margin decreased by 6.3 points to 46.7%. On a comparable
basis, restated for the impact of the transformation of the in-force
Group Life business, NBV margin decreased by 8.1 points mainly
driven by lower interest rates and an adverse business mix due
to a lower share of Group Life business.

56 I UNIVERSAL REGISTRATION DOCUMENT - ANNUAL REPORT 2019 - AXA I
ACTIVITY REPORT AND CAPITAL MANAGEMENT 2 2.3 ACTIVITY REPORT
Underlying earnings before tax increased by €18 million (+2%)
to €961 million. On a constant exchange rate basis, underlying
earnings before tax decreased by €18 million (-2%):
■ Property & Casualty (€+112 million or +20%) to €693 million,
as a result of an improvement in the current year combined
ratio (-2.5 points) due to both lower attritional and large losses
as well as a decrease of claims handling costs combined with
more favorable prior year reserve developments (-1.7 points),
partly off set by a lower net investment income (€-21 million);
■ Life & Savings (€-130 million or -32%) to €285 million, mainly
due to the non-repeat of the particularly low policyholder
bonus in 2018 in Group Life, higher VBI amortization resulting
from lower interest rates assumptions, the impact of the
transformation of the in-force Group Life business as well as a
decrease in the investment margin in Individual Life;
■ Health remained stable at €-16 million.
Income tax expenses decreased by €18 million (-10%) to
€-159 million. On a constant exchange rate basis, income tax
expenses decreased by €24 million (-13%) mainly due to lower
pre-tax underlying earnings combined with the impact of the
reduction of the net deferred tax liability position due to the
decrease in the corporate tax rate from 20% to 18.5% voted in
2019 and eff ective in 2020.
Underlying earnings increased by €36 million (+5%) to
€798 million. On a constant exchange rate basis, underlying
earnings increased by €6 million (+1%).
Adjusted earnings decreased by €39 million (-5%) to €803 million.
On a constant exchange rate basis, adjusted earnings decreased
by €69 million (-8%) as higher underlying earnings were more
than off set by lower net realized capital gains.
Net income increased by €364 million (+93%) to €755 million. On a
constant exchange rate basis, net income increased by €337 million
(+86%) as lower adjusted earnings were more than off set by the
non-repeat of the negative impact linked to the transformation
of the in-force Group Life business in 2018 (€+421 million).

57I UNIVERSAL REGISTRATION DOCUMENT - ANNUAL REPORT 2019 - AXA I
ACTIVITY REPORT AND CAPITAL MANAGEMENT
2
2.3 ACTIVITY REPORT
EUROPE - GERMANY
(in Euro million, except percentages)
December 31,
2019
December 31,
2018 restated (a)
Gross revenues (b)
10,862 10,509
Life & Savings 3,187 3,330
Property & Casualty 4,392 4,006
Health 3,259 3,131
Other (c) 25 41
New business
APE 375 340
NBV Margin 55.5% 53.0%
Underlying earnings before tax 834 811
Life & Savings 174 150
Property & Casualty 489 438
Health 133 117
Other (d) 38 107
Income tax expenses/benefits (255) (233)
Minority interests (6) (4)
Income from aff iliates and associates - 2
Underlying earnings Group share 573 576
Net capital gains or losses attributable to shareholders net of income tax 1 127
Adjusted earnings Group share 574 703
Profit or loss on financial assets (under fair value option) and derivatives (83) (50)
Exceptional operations (including discontinued operations) (3) 27
Goodwill and other related intangible impacts (4) (4)
Integration and restructuring costs (6) (4)
NET INCOME GROUP SHARE 479 672
Property & Casualty Combined Ratio 94.7% 95.6%
Health Combined Ratio 95.9% 96.3%
Protection Combined Ratio 98.1% 97.6%
(a) Restated: reclassification of German activities of AXA Life Europe (previously reported as part of Germany) into AXA Life Europe (included in Transversal & Central Holdings).
(b) Net of intercompany eliminations.
(c) Other corresponds to banking activities.
(d) Other corresponds to banking activities and holding.
On October 1, 2018, AXA Germany increased its ownership in
Roland Rechtsschutz from 41% to 60%. As a result, Roland
Rechtsschutz has been fully consolidated starting from October 1,
2018. Property & Casualty comparable basis has been adjusted to
include Roland Rechtsschutz gross revenues from January 1, 2018.
On October 31, 2018, AXA Germany completed the disposal
of a part of its occupational pension business. Life & Savings
comparable basis in Gross revenues, APE and NBV have been
adjusted accordingly to exclude the contribution of this business
in 2018.
Gross revenues increased by €354 million (+3%) to €10,862 million.
On a comparable basis, gross revenues increased by €226 million
(+2%):
■ Property & Casualty (€+81 million or +2%) to €4,392 million,
driven by (i) Commercial Non-Motor (€+52 million) mainly due
to new business as well as higher average premium in Property
and Liability, and (ii) Personal Non-Motor (€+47 million) due to
tariff increases in Household and Legal Protection;
■ Health (€+127 million or +4%) to €3,259 million, mainly due to
the continued growth in the civil servants segment and tariff
increases in full benefit insurance;

58 I UNIVERSAL REGISTRATION DOCUMENT - ANNUAL REPORT 2019 - AXA I
ACTIVITY REPORT AND CAPITAL MANAGEMENT 2 2.3 ACTIVITY REPORT
■ Life & Savings (€+28 million or +1%) to €3,187 million, mainly
due to new business in G/A capital light products (€+113 million)
and Pure Protection (€+29 million) following the launch of a
new disability product, partly off set by Protection with Savings
(€-69 million) and traditional G/A Savings (€-21 million) in line
with our strategy, and in Unit-Linked (€-19 million) due to lower
sales of single premium products.
APE increased by €35 million (+10%) to €375 million. On a
comparable basis, APE increased by €26 million (+7%) mainly due
to higher new business in G/A capital light products (€+18 million)
and Pure Protection (€+6 million) following the launch of a new
disability product, as well as in Health (€+5 million) from full benefit
insurance both in civil servants segment and in private segment.
NBV Margin increased by 2.5 points to 55.5% mainly reflecting a
positive impact in Health from the update of financial assumptions.
Underlying earnings before tax increased by €23 million (+3%)
to €834 million:
■ Property & Casualty (€+52 million or +12%) to €489 million,
driven by an improved current year combined ratio (-0.8 point)
due to lower attritional losses mainly in Personal Motor from
improved pricing and claims management and in Mid-Markets
due to lower claims frequency;
■ Life & Savings (€+24 million or +16%) to €174 million, mainly
due to a higher investment margin from lower policyholders’
participation, partly off set by higher VBI amortization reflecting
the decrease in interest rates assumptions;
■ Health (€+16 million or +14%) to €133 million, driven by both
higher volumes and a lower combined ratio (-0.3 point) due
to lower profit sharing;
■ Other (€-69 million or -65%) to €38 million, from Holding (€-
70 million) mainly due to the non-repeat of an exceptional
distribution from an investment fund and higher pension costs.
Income tax expenses increased by €22 million (+10%) to
€-255 million driven by higher pre-tax underlying earnings and
lower positive tax one-off s (€-6 million).
Income from affiliates and associates decreased by €2 million
to €0 million.
Underlying earnings decreased by €3 million (-1%) to €573 million.
Adjusted earnings decreased by €129 million (-18%) to
€574 million driven by lower underlying earnings and lower net
realized capital gains mainly from equities.
Net income decreased by €193 million (-29%) to €479 million
driven by lower adjusted earnings and an unfavorable change in
the fair value of interest rates and foreign exchange derivatives
not eligible for hedge accounting, as well as from the non-repeat
of the positive impact in 2018 related to the disposal of a part of
the occupational pension business.

59I UNIVERSAL REGISTRATION DOCUMENT - ANNUAL REPORT 2019 - AXA I
ACTIVITY REPORT AND CAPITAL MANAGEMENT
2
2.3 ACTIVITY REPORT
EUROPE - BELGIUM
(in Euro million, except percentages)
December 31,
2019
December 31,
2018
Gross revenues (a)
3,405 3,359
Life & Savings 1,201 1,195
Property & Casualty 2,100 2,061
Health 103 103
New business
APE 101 64
NBV Margin 52.4% 66.5%
Underlying earnings before tax 516 528
Life & Savings 292 281
Property & Casualty 224 246
Health 2 0
Other (b) (2) 1
Income tax expenses/benefits (134) (125)
Minority interests (0) (0)
Income from aff iliates and associates - -
Underlying earnings Group share 381 403
Net capital gains or losses attributable to shareholders net of income tax 145 50
Adjusted earnings Group share 526 454
Profit or loss on financial assets (under fair value option) and derivatives (97) (42)
Exceptional operations (including discontinued operations) 4 3
Goodwill and other related intangible impacts (2) (2)
Integration and restructuring costs (10) (40)
NET INCOME GROUP SHARE 420 373
Property & Casualty Combined Ratio 96.3% 95.7%
Health Combined Ratio 100.8% 102.1%
Protection Combined Ratio 96.2% 96.0%
(a) Net of intercompany eliminations.
(b) Other corresponds to holding.
Gross revenues increased by €46 million (+1%) to €3,405 million.
On a comparable basis, gross revenues increased by €46 million
(+1%):
■ Property & Casualty (€+39 million or +2%) to €2,100 million,
primarily from Commercial lines (€+28 million or +3%) in Mid-
Market segments, notably in the Public sector, and SMEs due
to new business and tariff increases, as well as from Personal
lines (€+11 million or +1%) in Household mainly due to tariff
increases;
■ Life & Savings (€+6 million or +1%) to €1,201 million, from
Unit-Linked and G/A Savings pension products, partly off set by
the decrease in Protection with Savings and Pure G/A Savings
products, in line with the strategy to exit Individual Savings
market;
■ Health stable at €103 million.
APE increased by €37 million (+58%) to €101 million. On a
comparable basis, APE increased by €37 million (+58%) mainly
driven by two large Group pension contracts.
NBV Margin decreased by 14.1 points to 52.4% mainly driven by
lower interest rates and large Group pension contracts, partly
off set by lower expenses following eff iciency gains.

60 I UNIVERSAL REGISTRATION DOCUMENT - ANNUAL REPORT 2019 - AXA I
ACTIVITY REPORT AND CAPITAL MANAGEMENT 2 2.3 ACTIVITY REPORT
Underlying earnings before tax decreased by €12 million (-2%)
to €516 million:
■ Life & Savings (€+11 million or +4%) to €292 million, driven
by lower general expenses (€+9 million) mainly resulting from
the cost savings program and lower deferred acquisition costs
amortization due to the update of economic assumptions
(€+10 million), partly off set by lower net technical margin
(€-7 million) due to the non-repeat of favorable prior year
reserve developments;
■ Property & Casualty (€-22 million or -9%) to €224 million,
mainly driven by a lower investment income (€-11 million) and
a higher current year combined ratio (+0.8 point) due to higher
attritional losses in Personal Motor driven by the increase in
average claims costs and in Workers’ Compensation combined
with higher large losses and an exceptional negative impact
on prior year premiums, partly off set by a lower expense ratio
resulting from the cost savings program;
■ Health (€+1 million) to €2 million;
■ Other (€-3 million) to €-2 million.
Income tax expenses increased by €10 million (+8%) to
€-134 million mainly driven by the non-repeat of a positive tax
one-off in 2018 (€-14 million).
Underlying earnings decreased by €22 million (-5%) to
€381 million.
Adjusted earnings increased by €72 million (+16%) to €526 million
as lower underlying earnings were more than off set by higher net
realized capital gains (€+94 million) mainly due to the exceptional
sale of a building (€+85 million).
Net income increased by €47 million (+13%) to €420 million
driven by higher adjusted earnings and lower restructuring costs,
partly off set by an unfavorable change in the fair value of equity
derivatives not eligible for hedge accounting.
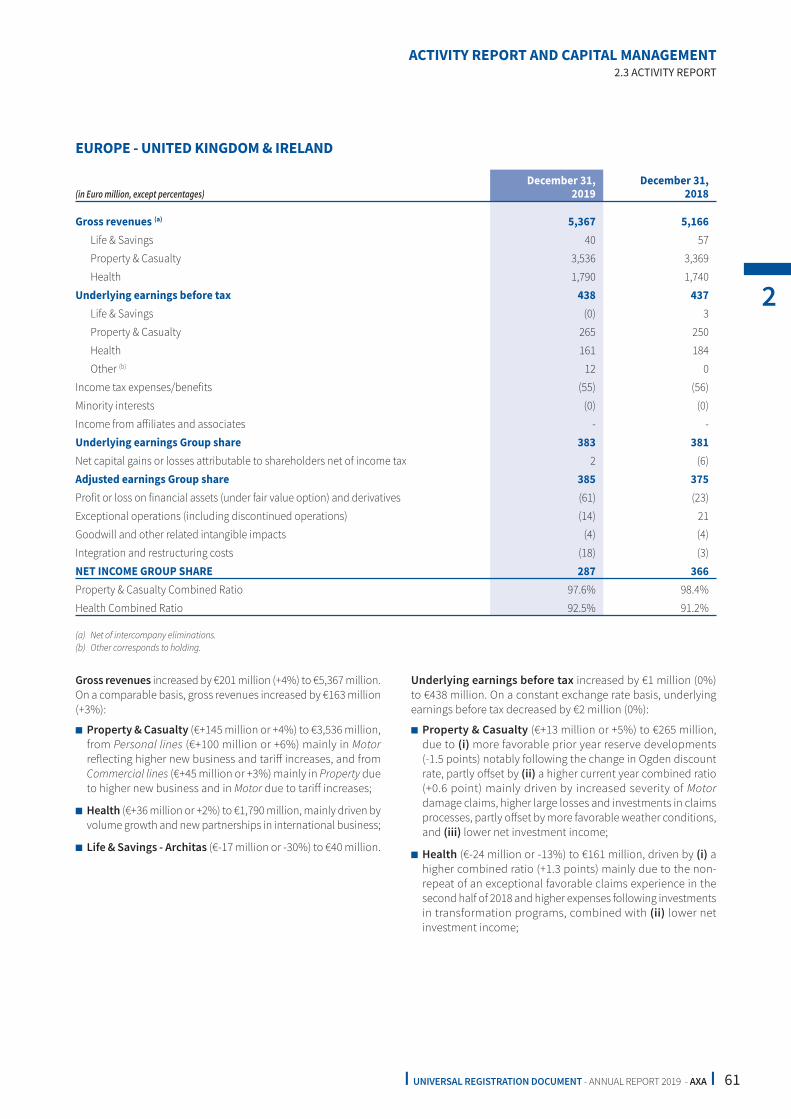
61I UNIVERSAL REGISTRATION DOCUMENT - ANNUAL REPORT 2019 - AXA I
ACTIVITY REPORT AND CAPITAL MANAGEMENT
2
2.3 ACTIVITY REPORT
EUROPE - UNITED KINGDOM & IRELAND
(in Euro million, except percentages)
December 31,
2019
December 31,
2018
Gross revenues (a)
5,367 5,166
Life & Savings 40 57
Property & Casualty 3,536 3,369
Health 1,790 1,740
Underlying earnings before tax 438 437
Life & Savings (0) 3
Property & Casualty 265 250
Health 161 184
Other (b) 12 0
Income tax expenses/benefits (55) (56)
Minority interests (0) (0)
Income from aff iliates and associates - -
Underlying earnings Group share 383 381
Net capital gains or losses attributable to shareholders net of income tax 2 (6)
Adjusted earnings Group share 385 375
Profit or loss on financial assets (under fair value option) and derivatives (61) (23)
Exceptional operations (including discontinued operations) (14) 21
Goodwill and other related intangible impacts (4) (4)
Integration and restructuring costs (18) (3)
NET INCOME GROUP SHARE 287 366
Property & Casualty Combined Ratio 97.6% 98.4%
Health Combined Ratio 92.5% 91.2%
(a) Net of intercompany eliminations.
(b) Other corresponds to holding.
Gross revenues increased by €201 million (+4%) to €5,367 million.
On a comparable basis, gross revenues increased by €163 million
(+3%):
■ Property & Casualty (€+145 million or +4%) to €3,536 million,
from Personal lines (€+100 million or +6%) mainly in Motor
reflecting higher new business and tariff increases, and from
Commercial lines (€+45 million or +3%) mainly in Property due
to higher new business and in Motor due to tariff increases;
■ Health (€+36 million or +2%) to €1,790 million, mainly driven by
volume growth and new partnerships in international business;
■ Life & Savings - Architas (€-17 million or -30%) to €40 million.
Underlying earnings before tax increased by €1 million (0%)
to €438 million. On a constant exchange rate basis, underlying
earnings before tax decreased by €2 million (0%):
■ Property & Casualty (€+13 million or +5%) to €265 million,
due to (i) more favorable prior year reserve developments
(-1.5 points) notably following the change in Ogden discount
rate, partly off set by (ii) a higher current year combined ratio
(+0.6 point) mainly driven by increased severity of Motor
damage claims, higher large losses and investments in claims
processes, partly off set by more favorable weather conditions,
and (iii) lower net investment income;
■ Health (€-24 million or -13%) to €161 million, driven by (i) a
higher combined ratio (+1.3 points) mainly due to the non-
repeat of an exceptional favorable claims experience in the
second half of 2018 and higher expenses following investments
in transformation programs, combined with (ii) lower net
investment income;

62 I UNIVERSAL REGISTRATION DOCUMENT - ANNUAL REPORT 2019 - AXA I
ACTIVITY REPORT AND CAPITAL MANAGEMENT 2 2.3 ACTIVITY REPORT
■ Other (€+11 million) to €12 million, mainly due to lower interest
charges resulting from lower financing debt;
■ Life & Savings - Architas (€-3 million) to €0 million.
Income tax expenses decreased by €1 million (-1%) to €-55 million.
On a constant exchange rate basis, income tax expenses decreased
by €1 million (-2%) due to lower pre-tax underlying earnings and
higher positive tax one-off s (€+9 million).
Underlying earnings increased by €2 million (+1%) to €383 million.
On a constant exchange rate basis, underlying earnings remained
stable.
Adjusted earnings increased by €10 million (+3%) to €385 million.
On a constant exchange rate basis, adjusted earnings increased
by €7 million (+2%) driven by higher net realized capital gains.
Net income decreased by €79 million (-21%) to €287 million. On a
constant exchange rate basis, net income decreased by €80 million
(-22%) as higher adjusted earnings were more than off set by
(i) a loss relating to the early redemption of a financing debt (€-
37 million) and the non-repeat of the realized gain relating to the
sale of a non-consolidated subsidiary, (ii) an unfavorable change
in the fair value of both equity and interest rate derivatives not
eligible to hedge accounting, and (iii) higher restructuring costs.

63I UNIVERSAL REGISTRATION DOCUMENT - ANNUAL REPORT 2019 - AXA I
ACTIVITY REPORT AND CAPITAL MANAGEMENT
2
2.3 ACTIVITY REPORT
EUROPE - SPAIN
(in Euro million, except percentages)
December 31,
2019
December 31,
2018
Gross revenues (a)
2,686 2,525
Life & Savings 750 680
Property & Casualty 1,719 1,644
Health 217 202
New business
APE 103 88
NBV Margin 60.3% 79.5%
Underlying earnings before tax 264 245
Life & Savings 75 71
Property & Casualty 175 152
Health 14 22
Income tax expenses/benefits (62) (59)
Minority interests (0) (0)
Income from aff iliates and associates - -
Underlying earnings Group share 202 186
Net capital gains or losses attributable to shareholders net of income tax (2) 6
Adjusted earnings Group share 200 192
Profit or loss on financial assets (under fair value option) and derivatives (12) (5)
Exceptional operations (including discontinued operations) - -
Goodwill and other related intangible impacts (3) (3)
Integration and restructuring costs (16) (36)
NET INCOME GROUP SHARE 169 147
Property & Casualty Combined Ratio 95.4% 96.4%
Health Combined Ratio 94.0% 89.5%
Protection Combined Ratio 92.9% 94.0%
(a) Net of intercompany eliminations.
Gross revenues increased by €160 million (+6%) to €2,686 million.
On a comparable basis, gross revenues increased by €160 million
(+6%):
■ Property & Casualty (€+75 million or +5%) to €1,719 million,
driven by a strong growth in Commercial lines (€+42 million or
+11%) mainly in Liability and Property, as well as in Personal
lines (€+33 million or +3%) mainly from higher volumes in Motor;
■ Life & Savings (€+70 million or +10%) to €750 million, mainly
driven by strong sales in Unit-Linked (€+60 million or +21%)
and Protection (€+13 million or +7%);
■ Health (€+15 million or +8%) to €217 million, driven by higher
volumes and tariff increases.
APE increased by €15 million (+18%) to €103 million. On a
comparable basis, APE increased by €15 million (+18%) mainly
driven by a strong growth in Unit-Linked (€+9 million or +27%).
NBV Margin decreased by 19.2 points to 60.3% mainly in Protection
driven by actuarial assumptions update on contract duration.
Underlying earnings before tax increased by €19 million (+8%)
to €264 million:
■ Property & Casualty (€+22 million or +15%) to €175 million,
mainly driven by strong volumes growth combined with cost
containment initiatives, more favorable prior year reserve
developments and a higher investment income, partly off set by
an increase in Personal Motor Bodily Injury average claims costs;

64 I UNIVERSAL REGISTRATION DOCUMENT - ANNUAL REPORT 2019 - AXA I
ACTIVITY REPORT AND CAPITAL MANAGEMENT 2 2.3 ACTIVITY REPORT
■ Life & Savings (€+5 million or +7%) to €75 million, mainly driven
by both higher Unit-Linked management fees and loadings
on premiums in Protection, in line with higher volumes, partly
off set by a lower investment margin;
■ Health (€-8 million or -36%) to €14 million, mainly due to a
less favorable current year profitability.
Income tax expenses increased by €3 million (+5%) to €-62 million
in line with higher pre-tax underlying earnings.
Underlying earnings increased by €16 million (+9%) to
€202 million.
Adjusted earnings increased by €8 million (+4%) to €200 million
driven by higher underlying earnings, partly off set by lower net
realized capital gains.
Net income increased by €22 million (+15%) to €169 million mainly
driven by higher adjusted earnings as well as lower restructuring
costs.

65I UNIVERSAL REGISTRATION DOCUMENT - ANNUAL REPORT 2019 - AXA I
ACTIVITY REPORT AND CAPITAL MANAGEMENT
2
2.3 ACTIVITY REPORT
EUROPE - ITALY
(in Euro million, except percentages)
December 31,
2019
December 31,
2018
Gross revenues (a)
6,104 5,418
Life & Savings 4,266 3,653
Property & Casualty 1,746 1,688
Health 92 77
New business
APE 368 315
NBV Margin 33.2% 30.7%
Underlying earnings before tax 401 364
Life & Savings 190 169
Property & Casualty 209 193
Health 3 1
Other (b) - 0
Income tax expenses/benefits (109) (101)
Minority interests (85) (75)
Income from aff iliates and associates - -
Underlying earnings Group share 207 188
Net capital gains or losses attributable to shareholders net of income tax 11 8
Adjusted earnings Group share 218 196
Profit or loss on financial assets (under fair value option) and derivatives (6) (9)
Exceptional operations (including discontinued operations) - (5)
Goodwill and other related intangible impacts - -
Integration and restructuring costs (4) (24)
NET INCOME GROUP SHARE 208 158
Property & Casualty Combined Ratio 93.3% 94.4%
Health Combined Ratio 99.2% 101.0%
Protection Combined Ratio 79.6% 80.8%
(a) Net of intercompany eliminations.
(b) Other corresponds to holding.
Gross revenues increased by €686 million (+13%) to €6,104 million.
On a comparable basis, gross revenues increased by €686 million
(+13%):
■ Life & Savings (€+612 million or +17%) to €4,266 million,
mainly in G/A Savings (€+391 million or +16%) and Unit-Linked
(€+185 million or +21%) mainly from the sales of hybrid and
Protected Unit-Linked products, as well as in Protection
(€+36 million or +11%);
■ Property & Casualty (€+58 million or +3%) to €1,746 million,
from higher new business and renewals in both Personal
lines (€+36 million or +3%) mainly in Motor and Property, and
Commercial lines (€+22 million or +4%) mainly in Property
and Liability;
■ Health (€+15 million or +20%) to €92 million, as a result of a
strong commercial focus and the good performance of a new
product launched at AXA MPS in 2018.
APE increased by €53 million (+17%) to €368 million. On a
comparable basis, APE increased by €53 million (+17%) mainly
from G/A Savings (€+37 million or +26%), and Unit-Linked
(€+14 million or +11%) from the sales of hybrid and Protected
Unit-Linked products.
NBV Margin increase d by 2.5 points to 33.2% mainly due to an
improved product mix with higher share of hybrid products and
the tightening of spreads of Italian government bonds.

66 I UNIVERSAL REGISTRATION DOCUMENT - ANNUAL REPORT 2019 - AXA I
ACTIVITY REPORT AND CAPITAL MANAGEMENT 2 2.3 ACTIVITY REPORT
Underlying earnings before tax increased by €38 million (+10%)
to €401 million:
■ Life & Savings (€+21 million or +12%) to €190 million, mainly
due to higher Unit-Linked management fees (€+22 million)
in line with volume growth, and a higher investment margin
(€+6 million) driven by in-force growth and lower minimum
guaranteed rates;
■ Property & Casualty (€+15 million or +8%) to €209 million,
mainly due to favorable prior year reserve developments (-0.8
point) as well as an improved expense ratio (-0.2 point) driven
by higher volumes combined with cost containment initiatives,
partly off set by a lower net investment income;
■ Health (€+2 million) to €3 million, mainly driven by volume
growth.
Income tax expenses increased by €8 million (+8%) to
€-109 million driven by higher pre-tax underlying earnings, partly
off set by positive tax one-off s.
Minority interests increased by €10 million (+14%) to €-85 million
as a result of the increase of AXA MPS underlying earnings.
Underlying earnings increased by €19 million (+10%) to
€207 million.
Adjusted earnings increased by €22 million (+11%) to €218 million
mainly driven by higher underlying earnings.
Net income increased by €50 million (+32%) to €208 million
driven by higher adjusted earnings and lower restructuring costs
resulting from pre-retirement plans.

67I UNIVERSAL REGISTRATION DOCUMENT - ANNUAL REPORT 2019 - AXA I
ACTIVITY REPORT AND CAPITAL MANAGEMENT
2
2.3 ACTIVITY REPORT
ASIA
(in Euro million, except percentages)
December 31,
2019
December 31,
2018 restated (a)
Gross revenues (b)
9,860 8,973
Life & Savings 6,350 5,780
Property & Casualty 1,353 1,245
Health 2,156 1,947
New business
APE 1,614 1,520
NBV Margin 63.1% 62.2%
Underlying earnings before tax 1,278 1,157
Life & Savings 687 667
Property & Casualty 75 68
Health 529 426
Other (c) (12) (3)
Income tax expenses/benefits (256) (219)
Minority interests (7) (7)
Income from aff iliates and associates 188 171
Underlying earnings Group share 1,204 1,102
Net capital gains or losses attributable to shareholders net of income tax 14 (34)
Adjusted earnings Group share 1,218 1,068
Profit or loss on financial assets (under fair value option) and derivatives (20) (55)
Exceptional operations (including discontinued operations) 24 4
Goodwill and other related intangible impacts (15) (18)
Integration and restructuring costs (3) (13)
NET INCOME GROUP SHARE 1,204 986
Property & Casualty Combined Ratio 97.0% 97.1%
Health Combined Ratio 76.7% 78.8%
Protection Combined Ratio 88.9% 86.8%
(a) Restated: reclassification of Japanese activities of AXA Life Europe (previously reported as part of Japan) into AXA Life Europe (included in Transversal & Central Holdings).
(b) Net of intercompany eliminations.
(c) Other corresponds to holding.

68 I UNIVERSAL REGISTRATION DOCUMENT - ANNUAL REPORT 2019 - AXA I
ACTIVITY REPORT AND CAPITAL MANAGEMENT 2 2.3 ACTIVITY REPORT
ASIA - JAPAN
(in Euro million, except percentages)
December 31,
2019
December 31,
2018 restated (a)
Gross revenues (b)
4,850 4,564
Life & Savings 3,378 3,203
Health 1,472 1,361
New business
APE 531 546
NBV Margin 120.3% 97.8%
Underlying earnings before tax 761 696
Life & Savings 290 301
Health 484 395
Other (c) (12) -
Income tax expenses/benefits (215) (189)
Minority interests (7) (7)
Income from aff iliates and associates - -
Underlying earnings Group share 540 500
Net capital gains or losses attributable to shareholders net of income tax 4 8
Adjusted earnings Group share 543 508
Profit or loss on financial assets (under fair value option) and derivatives (25) (42)
Exceptional operations (including discontinued operations) - 4
Goodwill and other related intangible impacts - -
Integration and restructuring costs - -
NET INCOME GROUP SHARE 518 469
Health Combined Ratio 69.3% 72.0%
Protection Combined Ratio 90.3% 87.7%
Average exchange rate: €1.00 = Japanese Yen 122 130
(a) Restated: reclassification of Japanese activities of AXA Life Europe (previously reported as part of Japan) into AXA Life Europe (included in Transversal & Central Holdings).
(b) Net of intercompany eliminations.
(c) Other corresponds to holding.
Gross revenues increased by €285 million (+6%) to €4,850 million.
On a comparable basis, gross revenues decreased by €24 million
(-1%):
■ Life & Savings (€-41 million or -1%) to €3,378 million, mainly
due to the temporary discontinuation of the capital light
Single Premium Whole Life product (€-149 million or -41%)
as a consequence of the decrease in interest rates and lower
sales of tax savings products impacted by a tax rule change
(€-59 million or -4%), partly off set by Protection with Unit-Linked
(€+171 million or +31%) from in-force growth and new business;
■ Health (€+17 million or +1%) to €1,472 million, mainly due
to both in-force growth and new business of Medical Whole
Life products, partly off set by lower new business of Medical
Term products.
APE decrea sed by €16 million (-3%) to €531 million. On a
comparable basis, APE decreased by €49 million (-9%) mainly
driven by lower sales of tax savings products impacted by a
tax rule change (€-132 million or -61%) and the temporary
discontinuation of the capital light Single Premium Whole Life
product (€-14 million or -41%), partly off set by Protection with
Unit-Linked (€+81 million or +50%) and Health (€+17 million or
+16%). Excluding the decrease in sales of tax savings products,
APE increased by €83 million (+25%).
NBV Margin increased by 22.5 points to 120.3% mainly driven
by a favorable product mix towards Health and Protection with
Unit-Linked.

69I UNIVERSAL REGISTRATION DOCUMENT - ANNUAL REPORT 2019 - AXA I
ACTIVITY REPORT AND CAPITAL MANAGEMENT
2
2.3 ACTIVITY REPORT
Underlying earnings before tax increased by €65 million (+9%)
to €761 million. On a constant exchange rate basis, underlying
earnings before tax increased by €17 million (+2%):
■ Health (€+58 million or +15%) to €484 million. Excluding the
impact of a refinement of investment and expense margins
allocation between Health and Life & Savings, Health underlying
earnings before tax increased by €11 million (+3%) mainly due
to an improved morbidity experience in Medical Whole Life
products (€+7 million) and higher volumes;
■ Life & Savings (€-29 million or -10%) to €290 million. Excluding
the impact of a refinement of investment and expense margins
allocation between Health and Life & Savings, Life & Savings
underlying earnings before tax increased by €17 million (+6%)
mainly due to an improved net technical margin;
■ Other (€-11 million or 0%) to €-12 million, mainly due to the
registration tax costs linked to the establishment of a holding
company (€-5 million).
Income tax expenses increased by €25 million (+13%) to
€-215 million. On a constant exchange rate basis, income tax
expenses increased by €11 million (+6%) mainly driven by higher
pre-tax underlying earnings combined with lower positive tax
one-off s (€-15 million).
Underlying earnings increased by €40 million (+8%) to
€540 million. On a constant exchange rate basis, underlying
earnings increased by €6 million (+1%).
Adjusted earnings increased by €35 million (+7%) to €543 million.
On a constant exchange rate basis, adjusted earnings increased
by €1 million (0%) mainly driven by higher underlying earnings.
Net income increased by €49 million (+10%) to €518 million.
On a constant exchange rate basis, net income increased by
€16 million (+3%) mainly driven by a less unfavorable change
in the fair value of derivatives not eligible for hedge accounting.

70 I UNIVERSAL REGISTRATION DOCUMENT - ANNUAL REPORT 2019 - AXA I
ACTIVITY REPORT AND CAPITAL MANAGEMENT 2 2.3 ACTIVITY REPORT
ASIA - HONG KONG
(in Euro million, except percentages)
December 31,
2019
December 31,
2018
Gross revenues (a)
3,829 3,305
Life & Savings 2,917 2,521
Property & Casualty 271 240
Health 640 545
New business
APE 486 456
NBV Margin 44.4% 47.2%
Underlying earnings before tax 463 404
Life & Savings 393 358
Property & Casualty 29 22
Health 41 25
Income tax expenses/benefits (29) (13)
Minority interests (0) -
Income from aff iliates and associates - -
Underlying earnings Group share 434 391
Net capital gains or losses attributable to shareholders net of income tax 1 (2)
Adjusted earnings Group share 435 389
Profit or loss on financial assets (under fair value option) and derivatives 7 (5)
Exceptional operations (including discontinued operations) (14) -
Goodwill and other related intangible impacts (14) (15)
Integration and restructuring costs (1) (13)
NET INCOME GROUP SHARE 413 357
Property & Casualty Combined Ratio 94.7% 95.5%
Health Combined Ratio 93.6% 95.6%
Protection Combined Ratio 86.8% 85.4%
Average exchange rate: €1.00 = Hong Kong Dollar 8.77 9.26
(a) Net of intercompany eliminations.
Gross revenues increased by €524 million (+16%) to €3,829 million.
On a comparable basis, gross revenues increased by €324 million
(+10%):
■ Life & Savings (€+244 million or +10%) to €2,917 million, mainly
in Protection with Savings (€+219 million or +12%) driven by in-
force growth in broker and agency channels, as well as higher
new business in broker channel, and Unit-Linked (€+41 million
or +27%) due to growth in single premium new business;
■ Health (€+62 million or +11%) to €640 million, mainly driven
by higher volumes and tariff increases in both Individual and
Group businesses;
■ Property & Casualty (€+18 million or +7%) to €271 million,
mainly due to higher volumes in both Personal and Commercial
lines as well as tariff increases in Commercial lines.
APE increased by €30 million (+7%) to €486 million. On a
comparable basis, APE increased by €4 million (+1%) driven by
strong sales in Protection with Savings (€+67 million or +23%),
partly off set by lower sales in G/A Savings (€-46 million or -56%)
and Group Health (€-14 million or -58%).
NBV Margin decreased by 2.8 points to 44.4% mainly driven by
a change in distribution mix combined with low interest rates.

71I UNIVERSAL REGISTRATION DOCUMENT - ANNUAL REPORT 2019 - AXA I
ACTIVITY REPORT AND CAPITAL MANAGEMENT
2
2.3 ACTIVITY REPORT
Underlying earnings before tax increased by €59 million (+15%)
to €463 million. On a constant exchange rate basis, underlying
earnings before tax increased by €35 million (+9%):
■ Life & Savings (€+15 million or +4%) to €393 million, mainly
due to volume growth;
■ Health (€+15 million or +59%) to €41 million, mainly driven
by a better claims experience combined with volume growth;
■ Property & Casualty (€+6 million or +26%) to €29 million,
mainly due to volume growth in both Personal and Commercial
lines, and pricing actions mostly in Workers’ Compensation.
Income tax expenses increased by €17 million (+130%) to
€-29 million. On a constant exchange rate basis, income tax
expenses increased by €15 million (+118%) driven by higher
pre-tax underlying earnings combined with lower positive tax
one-off s (€-7 million).
Underlying earnings increased by €43 million (+11%) to
€434 million. On a constant exchange rate basis, underlying
earnings increased by €20 million (+5%).
Adjusted earnings increased by €46 million (+12%) to €435 million.
On a constant exchange rate basis, adjusted earnings increased
by €23 million (+6%) mainly driven by higher underlying earnings.
Net income increased by €56 million (+16%) to €413 million.
On a constant exchange rate basis, net income increased by
€35 million (+10%) mainly driven by higher adjusted earnings
and lower restructuring costs.

72 I UNIVERSAL REGISTRATION DOCUMENT - ANNUAL REPORT 2019 - AXA I
ACTIVITY REPORT AND CAPITAL MANAGEMENT 2 2.3 ACTIVITY REPORT
ASIA - HIGH POTENTIALS
(in Euro million, except percentages)
December 31,
2019
December 31,
2018
Gross revenues (a)
163 153
Life & Savings 55 56
Property & Casualty 67 58
Health 41 39
New business
APE 598 517
NBV Margin 27.5% 37.9%
Underlying earnings before tax 7 6
Life & Savings 4 8
Property & Casualty (0) (8)
Health 3 6
Income tax expenses/benefits 2 (2)
Minority interests 0 0
Income from aff iliates and associates 188 171
Underlying earnings Group share 197 176
Net capital gains or losses attributable to shareholders net of income tax 11 (40)
Adjusted earnings Group share 208 136
Profit or loss on financial assets (under fair value option) and derivatives (7) (8)
Exceptional operations (including discontinued operations) 38 -
Goodwill and other related intangible impacts 0 (2)
Integration and restructuring costs (2) -
NET INCOME GROUP SHARE 238 126
Property & Casualty Combined Ratio 102.9% 114.3%
Health Combined Ratio 95.0% 90.1%
Protection Combined Ratio 111.0% 103.9%
(a) Net of intercompany eliminations.
Scope: (i) The Property & Casualty subsidiary in Thailand and
the non-bancassurance Life & Savings subsidiary in Indonesia are
fully consolidated; (ii) the Property & Casualty subsidiary in China
(AXA Tianping) has been fully consolidated as at December 31,
2019, and therefore contributes only to the underlying earnings,
adjusted earnings and net income; (iii) the Joint-Ventures in
China, the Philippines, Thailand, and Indonesia are consolidated
under the equity method and contribute only to the non-GAAP
financial measures and net income.
Gross revenues increased by €10 million (+7%) to €163 million. On
a comparable basis, gross revenues decreased by €2 million (-1%):
■ Property & Casualty (€+3 million or +5%) to €67 million, in
Thailand mainly from Personal Motor (€+5 million or +22%),
partly off set by pruning actions in Commercial lines (€-2 million
or -8%) mainly in Property;
■ Life & Savings (€-4 million or -8%) to €55 million, in Indonesia
driven by Protection with Savings (€-6 million or -16%) reflecting
lower volumes in the agency channel;
■ Health remained stable at €41 million, as lower revenues in
Thailand (€-3 million or -26%) due to the loss of a large contract
were off set by higher volumes in Indonesia (€+3 million or +11%)
mainly driven by higher new business as well as renewals from
the agency channel.

73I UNIVERSAL REGISTRATION DOCUMENT - ANNUAL REPORT 2019 - AXA I
ACTIVITY REPORT AND CAPITAL MANAGEMENT
2
2.3 ACTIVITY REPORT
APE increased by €81 million (+16%) to €598 million. On a
comparable basis, APE increased by €55 million (+11%):
■ China (€+68 million or +32%) to €286 million, due to strong
sales of G/A Savings products during the Chinese New Year
(€+69 million or +48%);
■ Thailand (€-11 million or -8%) to €141 million, mainly driven
by lower sales of Unit-Linked products (€-10 million or -95%);
■ Indonesia remained stable at €118 million;
■ The Philippines (€-3 million or -5%) to €53 million, in Protection
with Savings (€-6 million or -13%) due to lower sales in the
bancassurance channel.
NBV Margin decreased by 10.3 points to 27.5%. On a comparable
basis, NBV Margin decreased by 10.2 points mainly driven by
strong sales of low-margin G/A Savings products in China during
the Chinese New Year as well as lower interest rates in Thailand.
Underlying earnings before tax increased by €1 million (+24%)
to €7 million. On a constant exchange rate basis, underlying
earnings before tax increased by €1 million (+16%):
■ Life & Savings (€-4 million or -54%) to €4 million, in Indonesia
mainly driven by lower volumes;
■ Health (€-3 million or -49%) to €3 million, primarily in Indonesia
(€-2 million) mainly driven by higher marketing expenses;
■ Property & Casualty (€+8 million) to €0 million, in Thailand
mainly driven by the favorable impact of pruning actions in
Commercial lines.
Income tax expenses decreased by €4 million to €2 million. On
a constant exchange rate basis, income tax expenses decreased
by €3 million mainly driven by lower pre-tax underlying earnings
in Indonesia, partly off set by higher pre-tax underlying earnings
in Thailand.
Income from affiliates and associates increased by €17 million
(+10%) to €188 million. On a constant exchange rate basis, income
from aff iliates and associates increased by €5 million (+3%):
■ Thailand (€+23 million or +42%) to €84 million, mainly due to a
higher net investment income as well as lower expenses in Life
& Savings combined with a better claims experience following
pruning actions in Health;
■ Indonesia (€0 million or +1%) to €42 million, mainly driven by
higher volumes from a new product launched in Health, partly
off set by higher expenses in Life & Savings;
■ The Philippines (€+6 million or +28%) to €30 million, mainly
driven by a favorable change in business mix;
■ China (€-25 million or -44%) to €32 million, mainly driven by
higher acquisition expenses, a lower net investment margin
and a negative impact of financial assumptions update, partly
off set by favorable tax impa cts.
Underlying earnings increased by €22 million (+12%) to
€197 million. On a constant exchange rate basis, underlying
earnings increased by €9 million (+5%).
Adjusted earnings increased by €72 million (+53%) to €208 million.
On a constant exchange rate basis, adjusted earnings increased
by €59 million (+44%) driven by higher underlying earnings and
the non-repeat of net realized capital losses in China due to the
negative equity market performance in 2H18 .
Net income increased by €111 million (+88%) to €238 million. On a
constant exchange rate basis, net income increased by €100 million
(+79%) driven by higher adjusted earnings combined with the
positive accounting impact related to the full consolidation of
AXA Tianping.

74 I UNIVERSAL REGISTRATION DOCUMENT - ANNUAL REPORT 2019 - AXA I
ACTIVITY REPORT AND CAPITAL MANAGEMENT 2 2.3 ACTIVITY REPORT
AXA XL
(in Euro million, except percentages)
December 31,
2019
December 31,
2018
Gross revenues (a)
18,741 6,287
Life & Savings 188 45
Property & Casualty Insurance 9,123 3,354
Property & Casualty Specialty 4,940 1,794
Property & Casualty Reinsurance 4,489 1,093
Underlying earnings before tax 634 (178)
Life & Savings 13 5
Property & Casualty Insurance & Specialty 382 103
Property & Casualty Reinsurance 330 (277)
Other (b) (91) (10)
Income tax expenses/benefits (125) (70)
Minority interests 0 18
Income from aff iliates and associates (2) (3)
Underlying earnings Group share 507 (233)
Net capital gains or losses attributable to shareholders net of income tax 78 (27)
Adjusted earnings Group share 585 (260)
Profit or loss on financial assets (under fair value option) and derivatives (16) (63)
Exceptional operations (including discontinued operations) (51) (29)
Goodwill and other related intangible impacts (39) (10)
Integration and restructuring costs (307) (67)
NET INCOME GROUP SHARE 173 (428)
Property & Casualty Combined Ratio 101.5% 108.6%
Protection Combined Ratio 105.4% 89.2%
(a) Net of intercompany eliminations.
(b) Other corresponds to holding.
The comparable basis includes XL Group contribution to Gross
revenues from January 1, 2018, to September 30, 2018. AXA
Corporate Solutions Assurance and AXA Art contributions were
not adjusted, as they were fully included in 2018 reported figures.
Gross revenues increased by €12,454 million to €18,741 million.
On a comparable basis, gross revenues increased by €1,676 million
(+10%):
■ Property & Casualty Insurance (€+1,337 million or +18%) to
€9,123 million, mainly driven by both volume growth and tariff
increases across most lines of business, notably North America
Professional (€+383 million or +36%), including a new significant
multi-year contract written in the first quarter, International
Property (€+198 million or +15%), and North America Property
(€+145 million or +32%);
■ Property & Casualty Specialty (€+261 million or +6%) to
€4,940 million, driven by both volume growth and tariff
increases across most lines of business, notably in Political
Risks (€+102 million or +33%), as well as in Accident & Health
(€+67 million or +24%) and Fine Art & Specie (€+66 million or
+15%);
■ Property & Casualty Reinsurance (€+85 million or +2%) to
€4,489 million, driven by both volume growth and tariff increases
in Specialty and Other lines (€+161 million or +10%) mainly
from North America Agriculture, Lloyds Whole Accounts and
Credit & Surety, partly off set by lower premiums in Property Cat
(€-95 million or -11%) reflecting a reduced Nat Cat exposure;
■ Life & Savings remained stable at €188 million, as the underlying
business is in run-off .
Underlying earnings before tax reported were €634 million:
■ Property & Casualty reported earnings were €711 million
mainly driven by a strong net investment income and the
emergence of expense synergies related to the integration
within AXA. This was partly off set by current year catastrophe

75I UNIVERSAL REGISTRATION DOCUMENT - ANNUAL REPORT 2019 - AXA I
ACTIVITY REPORT AND CAPITAL MANAGEMENT
2
2.3 ACTIVITY REPORT
losses in excess of the normalized level in 2H19 (€-0.4 billion),
notably from Typhoons Hagibis (€-0.2 billion) and Faxai (€-
0.1 billion) in Japan and Hurricane Dorian (€-0.1 billion) in the
Bahamas and in the United States, as well as elevated levels
of large non-catastrophe losses and a higher current year loss
ratio primarily in long-tail lines of business reflecting an update
in assumptions related to claims inflation;
■ Life & Savings reported earnings were €13 million;
■ Other reported earnings were €-91 million mainly driven by
interest expenses on financing debt.
Income tax expenses reported were €-125 million reflecting
positive pre-tax underlying earnings.
Underlying earnings reported were €507 million.
Adjusted earnings reported were €585 million reflecting
underlying earnings (€507 million) as well as net realized capital
gains mainly on fixed-income assets and equity instruments.
Net income reported was €173 million reflecting adjusted
earnings (€585 million), integration and restructuring costs (€-
307 million) linked to the integration within AXA, exceptional
operations (€-51 million) due to the repurchase of financing
debt, and amortization of intangible assets (€-39 million) related
to distribution networks.

76 I UNIVERSAL REGISTRATION DOCUMENT - ANNUAL REPORT 2019 - AXA I
ACTIVITY REPORT AND CAPITAL MANAGEMENT 2 2.3 ACTIVITY REPORT
INTERNATIONAL
(in Euro million, except percentages)
December 31,
2019
December 31,
2018
Gross revenues (a)
7,078 6,535
Life & Savings 1,328 1,285
Property & Casualty 3,888 3,722
Health 1,550 1,295
Other (b) 313 233
New business
APE 254 262
NBV Margin 43.9% 36.5%
Underlying earnings before tax 577 435
Life & Savings 78 67
Property & Casualty 410 305
Health 32 25
Other (c) 58 39
Income tax expenses/benefits (153) (92)
Minority interests (61) (47)
Income from aff iliates and associates 103 104
Underlying earnings Group share 466 400
Net capital gains or losses attributable to shareholders net of income tax (9) (4)
Adjusted earnings Group share 457 396
Profit or loss on financial assets (under fair value option) and derivatives 12 39
Exceptional operations (including discontinued operations) (599) (17)
Goodwill and other related intangible impacts (23) (29)
Integration and restructuring costs (16) (35)
NET INCOME GROUP SHARE (169) 355
Property & Casualty Combined Ratio 97.2% 100.6%
Health Combined Ratio 99.3% 99.6%
Protection Combined Ratio 99.1% 98.8%
(a) Net of intercompany eliminations.
(b) Other corresponds to banking activities.
(c) Other corresponds to banking activities and holding.
Scope: (i) Mexico, the Gulf Region, Colombia, Singapore, Turkey,
Poland, Morocco, AXA Bank Belgium, Malaysia Property & Casualty,
Luxembourg, the Czech Republic Life & Savings, the Slovak
Republic Life & Savings, Greece and Brazil are fully consolidated;
(ii) Russia (Reso), India, Nigeria and Lebanon are consolidated
under the equity method and contribute only to the underlying
earnings, adjusted earnings and net income.
Gross revenues increased by €543 million (+8%) to €7,078 million.
On a comparable basis, gross revenues increased by €395 million
(+6%):
■ Property & Casualty (€+174 million or +5%) to €3,888 million
driven by:
• Mexico (€+16 million or +2%) to €867 million, mainly driven
by higher new business mainly in Personal Motor,
• Turkey (€+95 million or +18%) to €551 million, mainly from
tariff increases in Motor and higher volumes in Commercial
Property,
• Colombia (€+77 million or +17%) to €517 million, driven by
higher volumes in Protection and Workers’ Compensation,
• The Gulf Region (€-13 million or -3%) to €466 million, in
Commercial lines mainly driven by a further reduction of the
size of a large Motor fleet, partly off set by higher volumes in
Property and Protection,
• Poland (€-9 million or -2%) to €427 million, mainly due to
lower revenues in Personal Motor from soft ening market
trends, partly off set by higher sales in Commercial lines,

77I UNIVERSAL REGISTRATION DOCUMENT - ANNUAL REPORT 2019 - AXA I
ACTIVITY REPORT AND CAPITAL MANAGEMENT
2
2.3 ACTIVITY REPORT
• Morocco (€+24 million or +9%) to €289 million, mainly due
to higher new business in Personal Motor,
• Malaysia (€-18 million or -7%) to €241 million, mainly due to
lower sales reflecting strong market competition;
■ Health (€+186 million or +14%) to €1,550 million, mainly in
(i) Mexico (€+104 million or +16%) to €801 million from the
acquisition of several new large accounts and tariff increases,
(ii) the Gulf Region (€+50 million or +16%) to €385 million mainly
from large accounts, and (iii) Turkey (€+23 million or +51%)
to €61 million from tariff increases and higher new business;
■ Life & Savings (€+33 million or €+3%) to €1,328 million, mainly
driven by (i) Singapore (€+15 million or +6%) to €293 million
from higher volumes across all lines of business, (ii) Luxembourg
(€+30 million or +23%) to €160 million driven by a large account
in Unit-Linked, partly off set by a decrease in (iii) Colombia (€-
44 million or -25%) to €121 million mostly due to G/A Savings
run-off portfolio;
■ Other (€+2 million or +1%) to €313 million, at AXA Bank Belgium.
APE decreased by €8 million (-3%) to €254 million. On a
comparable basis, APE decreased by €13 million (-5%) mainly
driven by (i) Singapore (€-15 million or -15%) to €88 million from
strong market competition mainly in Unit-Linked, partly off set
by (ii) India (€+2 million or +6%) to €41 million and (iii) Poland
(€+3 million or +8%) to €35 million both from Protection.
NBV Margin increased by 7.5 points to 43.9%. On a comparable
basis, NBV Margin increased by 7.6 points mainly in Poland from
a more favorable business mix towards Protection and lower
expenses.
Underlying earnings before tax increased by €142 million (+33%)
to €577 million. On a constant exchange rate basis, underlying
earnings before tax increased by €140 million (+32%):
■ Property & Casualty (€+105 million or +34%) to €410 million,
mainly driven by (i) Morocco (€+40 million) from higher prior
year reserve developments, (ii) Brazil (€+23 million) from a more
favorable claims experience, (iii) Mexico (€+22 million) from an
improved net technical margin mainly in Motor and a higher
net investment income, (iv) Poland (€+17 million) from higher
prior year reserve developments mainly in Motor and a higher
net investment income, and (v) Colombia (€+7 million) from an
improved net technical margin mainly in Workers’ Compensation.
This was partly off set by (vi) Singapore (€-8 million) from lower
prior year reserve developments, partly off set by a more
favorable claims experience;
■ Life & Savings (€+10 million or +15%) to €78 million, mainly
driven by lower expenses (€+17 million);
■ Other (€+19 million or +49%) to €58 million, from AXA Bank
Belgium (€+10 million) mainly driven by higher fees and lower
expenses, and Holdings (€+9 million);
■ Health (€+6 million or +24%) to €32 million, mainly driven by
business growth.
Income tax expenses increased by €60 million (+65%) to
€-153 million. On a constant exchange rate basis, income tax
expenses increased by €60 million (+65%) mainly driven by higher
pre-tax underlying earnings combined with negative impact of tax
one-off s (€-14 million in 2019 vs. €+11 million in 2018).
Minority interests increased by €14 million (+30%) to €-61 million.
On a constant exchange rate basis, minority interests increased
by €13 million (+29%) as a result of higher underlying earnings
in the Gulf Region and Colombia.
Income from affiliates and associates decreased by €2 million
(-2%) to €103 million. On a constant exchange rate basis, income
from aff iliates and associates remained stable.
Underlying earnings increased by €66 million (+16%) to
€466 million. On a constant exchange rate basis, underlying
earnings increased by €66 million (+17%).
Adjusted earnings increased by €61 million (+15%) to €457 million.
On a constant exchange rate basis, adjusted earnings increased by
€61 million (+15%) mainly driven by higher underlying earnings.
Net income decreased by €524 million (-147%) to €-169 million.
On a constant exchange rate basis, net income decreased by
€521 million (-147%) as higher adjusted earnings were more
than off set by the negative impact related to the expected loss
on the upcoming disposal of AXA Bank Belgium (€-590 million).

78 I UNIVERSAL REGISTRATION DOCUMENT - ANNUAL REPORT 2019 - AXA I
ACTIVITY REPORT AND CAPITAL MANAGEMENT 2 2.3 ACTIVITY REPORT
TRANSVERSAL & CENTRAL HOLDINGS
(in Euro million, except percentages)
December 31,
2019
December 31,
2018 restated (a)
Gross revenues (b)
2,959 2,913
Life & Savings 230 234
Property & Casualty 1,319 1,290
Health 184 146
Other (c) 1,225 1,243
Underlying earnings before tax (662) (448)
Life & Savings 71 34
Property & Casualty 91 208
Health (6) (17)
Other (d) (819) (673)
Income tax expenses/benefits 219 154
Minority interests (7) (8)
Income from aff iliates and associates 21 20
Underlying earnings Group share (429) (282)
Net capital gains or losses attributable to shareholders net of income tax (16) (14)
Adjusted earnings Group share (445) (295)
Profit or loss on financial assets (under fair value option) and derivatives (621) (77)
Exceptional operations (including discontinued operations) (831) (91)
Goodwill and other related intangible impacts (1) (1)
Integration and restructuring costs (35) (64)
NET INCOME GROUP SHARE (1,932) (527)
Property & Casualty Combined Ratio 98.5% 89.9%
Health Combined Ratio 102.8% 110.4%
(a) Restated: reclassification of German and Japanese activities of AXA Life Europe (previously reported as part of Germany and Japan respectively) into AXA Life Europe.
(b) Net of intercompany eliminations.
(c) Other corresponds to asset management activities.
(d) Other corresponds to asset management activities and holding.

79I UNIVERSAL REGISTRATION DOCUMENT - ANNUAL REPORT 2019 - AXA I
ACTIVITY REPORT AND CAPITAL MANAGEMENT
2
2.3 ACTIVITY REPORT
AXA INVESTMENT MANAGERS (“AXA IM”)
(in Euro million, except percentages)
December 31,
2019
December 31,
2018
Gross revenues (a)
1,225 1,243
Underlying earnings before tax 348 343
Income tax expenses/benefits (97) (85)
Minority interests (7) (8)
Income from aff iliates and associates 20 19
Underlying earnings Group share 264 270
Net capital gains or losses attributable to shareholders net of income tax - -
Adjusted earnings Group share 264 270
Profit or loss on financial assets (under Fair Value option) and derivatives (15) (1)
Exceptional operations (including discontinued operations) 1 (53)
Goodwill and other related intangibles impacts (1) (1)
Integration and restructuring costs (4) (40)
NET INCOME GROUP SHARE 245 175
Average Assets under Management (in Euro billion) 673 642
Asset management fee bps 16.5 17.1
Underlying cost income ratio 72.0% 72.1%
(a) Net of intercompany eliminations. Gross Revenues amounted to €1,547 million before intercompany eliminations as of December 31, 2019.
Assets under Management (“AUM”) increased by €71 billion from
December 31, 2018, to €801 billion at the end of December 31,
2019, driven by €+58 billion positive market eff ects from both
lower interest rates and favorable foreign exchange rate impact,
and €+13 billion net inflows from (i) Main Fund (€+18 billion) of
which €+8 billion linked to the ongoing integration of XL Group,
and (ii) Third-Party clients (€+4 billion), partly off set by (iii) net
outflows from Asian joint ventures (€-9 billion) mainly from the
China subsidiary due to changes in regulatory requirements.
Management fee bps decreased by 0.5 bps to 16.5 bps. On a
constant exchange rate basis, management fee bps decreased
by 0.7 bps mainly due to an unfavorable change in product mix.
Gross revenues decreased by €19 million (-1%) to €1,225 million.
On a comparable basis, gross revenues decreased by €27 million
(-2%) mainly driven by lower performance fees including realized
carried interests (€-24 million) and distribution fees (€-7 million),
partly off set by higher transaction fees (€+7 million).
Underlying earnings before tax increased by €4 million (+1%)
to €348 million. On a constant exchange rate basis, underlying
earnings before tax increased by €2 million (+1%) as a result of
lower expenses from eff iciency initiatives, partly off set by lower
gross revenues.
The underlying cost income ratio remained stable at 72.0%.
On a constant exchange rate basis, the underlying cost income
ratio decreased by 0.2 point.
Income tax expenses increased by €12 million (+14%) to
€-97 million. On a constant exchange rate basis, income tax
expenses increased by €11 million (+13%) mainly driven by the
non-repeat of the impact of a low tax regime on realized carried
interests.
Income from affiliates and associates increased by €2 million
(+8%) to €20 million. On a constant exchange rate basis, income
from aff iliates and associates increased by €1 million (+8%).
Underlying earnings and adjusted earnings decreased by
€6 million (-2%) to €264 million. On a constant exchange rate
basis, underlying earnings and adjusted earnings decreased by
€8 million (-3%).
Net income increased by €70 million (+40%) to €245 million.
On a constant exchange rate basis, net income increased by
€68 million (+39%) mainly driven by the non-repeat of an
exceptional tax charge related to the transfer of AB shares to
Equitable Holdings, Inc. in the context of its IPO completed in
2018 and lower restructuring costs.

80 I UNIVERSAL REGISTRATION DOCUMENT - ANNUAL REPORT 2019 - AXA I
ACTIVITY REPORT AND CAPITAL MANAGEMENT 2 2.3 ACTIVITY REPORT
AXA ASSISTANCE
(in Euro million, except percentages)
December 31,
2019
December 31,
2018
Gross revenues (a)
1,415 1,331
Property & Casualty 1,231 1,185
Health 184 146
Underlying earnings before tax 6 20
Property & Casualty 12 36
Health (6) (17)
Income tax expenses/benefits (9) (16)
Minority interests (0) (0)
Income from aff iliates and associates 1 1
Underlying earnings Group share (2) 4
Net capital gains or losses attributable to shareholders net of income tax 0 (2)
Adjusted earnings Group share (2) 2
Profit or loss on financial assets (under fair value option) and derivatives (4) (7)
Exceptional operations (including discontinued operations) (10) 2
Goodwill and other related intangible impacts - -
Integration and restructuring costs (5) (8)
NET INCOME GROUP SHARE (21) (11)
Property & Casualty Combined Ratio 99.5% 97.8%
Health Combined Ratio 102.8% 110.4%
(a) Net of intercompany eliminations.
Gross revenues increased by €84 million (+6%) to €1,415 million.
On a comparable basis, gross revenues increased by €93 million
(+7%):
■ Property & Casualty (€+57 million or +5%) to €1,231 million,
from higher volumes in both Non-Motor (€+47 million or
+7%) notably in Travel and Consumer Electronics, and Motor
(€+11 million or +2%);
■ Health (€+36 million or +25%) to €184 million, mainly due to
higher new business.
Underlying earnings before tax decreased by €13 million (-69%)
to €6 million:
■ Property & Casualty (€-24 million or -67%) to €12 million,
mainly driven by higher commissions from a change in business
mix, notably in Home, as well as higher investments to improve
customer experience and simplification, partly off set by lower
attritional losses in Home and Motor;
■ Health (€+11 million or +65%) to €-6 million, mainly from
higher volumes combined with lower expenses, partly off set
by higher attritional losses due to an increase in service usage.
Income tax expenses decreased by €7 million (-42%) to €-9 million
driven by lower pre-tax underlying earnings and a favorable
change in country mix.
Underlying earnings decreased by €6 million to €-2 million.
Adjusted earnings decreased by €4 million to €-2 million.
Net income decreased by €11 million to €-21 million driven by
lower adjusted earnings combined with higher restructuring costs
and losses on exceptional operations.

81I UNIVERSAL REGISTRATION DOCUMENT - ANNUAL REPORT 2019 - AXA I
ACTIVITY REPORT AND CAPITAL MANAGEMENT
2
2.3 ACTIVITY REPORT
AXA SA
(in Euro million, except percentages)
December 31,
2019
December 31,
2018
Underlying earnings Group share (810) (703)
Net capital gains or losses attributable to shareholders net of income tax 36 (23)
Adjusted earnings Group share (774) (726)
Profit or loss on financial assets (under fair value option) and derivatives (587) (68)
Exceptional operations (including discontinued operations) (556) (16)
Goodwill and other related intangible impacts - -
Integration and restructuring costs (11) (9)
NET INCOME GROUP SHARE (1,928) (819)
Underlying earnings decreased by €107 million to €-810 million
mainly driven by (i) temporary higher financial charges, notably
in the context of the acquisition of XL Group and the change in the
accounting methodology of the mandatory exchangeable bonds
triggered by the deconsolidation of Equitable Holdings, Inc., as
well as (ii) tax paid on higher dividends received from subsidiaries.
Adjusted earnings decreased by €48 million to €-774 million
mainly driven by lower underlying earnings, partly off set by
the positive impact of derivatives set up to reduce the Group
exposure to equities.
Net income decreased by €1,108 million to €-1,928 million mainly
due to (i) an unfavorable change in the fair value of derivatives
not eligible for hedge accounting, (ii) the negative impact linked
to the deconsolidation of Equitable Holdings, Inc., and (iii) the
non-repeat of the 2018 one-off benefit from the reimbursement
of the tax paid on dividends received from European subsidiaries
held for more than 95% following the decision from the European
Court of Justice.

82 I UNIVERSAL REGISTRATION DOCUMENT - ANNUAL REPORT 2019 - AXA I
ACTIVITY REPORT AND CAPITAL MANAGEMENT 2 2.4 LIQUIDITY AND CAPITAL RESOURCES
2.4 LIQUIDITY AND CAPITAL RESOURCES
Information in this section should be read in conjunction with
Note 4 - “Financial and insurance Risk Management” in Part 5 -
“Consolidated Financial Statements” of this Annual Report. The
report of the Statutory Auditors on the Consolidated Financial
Statements covers only the information included in Note 4.
Liquidity management is a core part of the Group’s financial
planning and includes debt profile scheduling and, more generally,
the Group’s capital allocation process. Liquidity resources result
mainly from Insurance and Asset Management operations, as well
as from capital raising activities and committed bank credit lines.
Over the past several years, the Group has expanded its core
operations ((re)insurance and Asset Management) through
a combination of organic growth, direct investments and
acquisitions. This expansion has been funded primarily through a
combination of (i) dividends received from operating subsidiaries,
(ii) proceeds from debt instruments issuance (mainly subordinated
debt) and internal borrowings, (iii) the issuance of ordinary
shares and (iv) proceeds from the sale of non-core businesses
and assets, including equity participations.
Each of the major operating subsidiaries of the Group is responsible
for managing its own liquidity position, in coordination with the
Company. The Company, as the holding company of the AXA
Group, coordinates funding and liquidity management and, in
this role, participates in financing the operations of certain of its
subsidiaries. Certain of AXA’s subsidiaries, including XL Group
Limited, AXA Konzern AG, AXA UK Plc. and AXA Mediterranean
Holding SA, are also holding companies and consequently, depend
on dividends received from their own subsidiaries to meet their
obligations. The Group’s operating (re)insurance companies are
required to meet multiple regulatory constraints, in particular, a
minimum solvency ratio. The level of internal dividends paid by
operating subsidiaries must therefore take into account these
constraints. Cash positions also fluctuate as a result of cash-
settled margin calls from counterparties related to collateral
agreements on derivatives. The Company’s statutory results
may be significantly impacted by unrealized gains and losses
on derivatives used to hedge, in particular, currency and interest
rate risks. In the context of the regular review of its exchange rate
hedging strategy and its eff ectiveness, the Company has adjusted
in 2020 the protection of its net foreign-currency investments in
its main subsidiaries outside the Eurozone to focus it on near
term expected cash flows.
The Company anticipates that cash dividends received from its
operating subsidiaries and other financing sources available to the
Company will continue to cover its operating expenses (including
interest payments on its outstanding debt and borrowings)
and dividend payments until the end of the strategic plan. AXA
expects that anticipated investments in subsidiaries and existing
operations, future acquisitions and strategic investments will
be funded from available cash flow remaining aft er payments
of dividends and operating expenses, proceeds from the sale of
non-strategic assets and businesses as well as future issuance
of debt and/or equity instruments.
As a holding company, AXA is not subject to legal restrictions on
dividend payments, provided that its accumulated profits are
suff icient to cover distributions. However, many subsidiaries,
particularly insurance subsidiaries, are subject to local regulatory
restrictions on the amount of dividends they can pay to their
shareholders. For more information on these restrictions, see
Note 29.4 “Other items: restrictions on dividend payments to
shareholders” in Part 5 - “Consolidated Financial Statements”
and paragraph “The Group’s or its insurance subsidiaries’ failure
to meet their solvency and capital adequacy requirements could
have a material adverse eff ect on our business, liquidity, ratings,
results of operations and financial position” in Section 4.1 “Risk
Factors” (1) o f this Annual Report.
(1) The information provided in this Section 4.1 is not required under IFRS and as such is not part of the Consolidated Financial Statements.

83I UNIVERSAL REGISTRATION DOCUMENT - ANNUAL REPORT 2019 - AXA I
ACTIVITY REPORT AND CAPITAL MANAGEMENT
2
2.4 LIQUIDITY AND CAPITAL RESOURCES
I Liquidity, sources and needs for Group
operating subsidiaries
The principal sources of liquidity for the Group’s insurance
subsidiaries are premiums, investment income and proceeds
from sales of invested assets. These funds are mainly used to
pay policyholder benefits, claims and claims expenses, policy
surrenders and other operating expenses and to purchase financial
assets and meet potential collateral exchange obligations in
relation to derivatives. The liquidity of the Group’s insurance
operations is aff ected by, among other things, the overall quality
of the Group’s investments and the Group’s ability to liquidate
its financial assets in a timely manner and to meet policyholder
benefits and insurance claims as they fall due. The Group regularly
reviews the quality of its assets to ensure adequate liquidity in
stress scenarios.
Information on projected payments and surrenders related to
Life & Savings and Property & Casualty insurance contracts are
disclosed in Note 14.10.1 - “Payment and surrender projections” in
Part 5 - “Consolidated Financial Statements” of this Annual Report.
PROPERTY & CASUALTY (INCLUDING
REINSURANCE AND HEALTH)
Liquidity needs of Property & Casualty subsidiaries can be aff ected
by actual claims experience. Property & Casualty Insurance’s net
cash flows are generally positive. They can be negative in the
case of exceptional loss events, such as natural or man-made
catastrophe events. A portion of these cash flows is invested in
liquid, short-term bonds and other listed securities in order to
manage the liquidity risk that may arise from such events.
LIFE & SAVINGS (INCLUDING HEALTH)
Liquidity needs of Life & Savings subsidiaries can be aff ected by a
number of factors including fluctuations in the level of surrenders,
withdrawals, maturities and guarantees to policyholders including
guarantees in the form of minimum income benefits or death
benefits, particularly in the Variable Annuity business.
The investment strategy of AXA’s Life & Savings subsidiaries
is designed to match the investment returns and estimated
maturities of their investments with expected cash flows on their
insurance contracts. Entities regularly monitor the valuation
and duration of their investments and the performance of their
financial assets. Financial market performance may aff ect the
level of surrenders and withdrawals on life insurance policies, as
well as immediate and projected long-term cash needs. Group
operating entities seek to adjust their investment portfolios to
reflect such considerations and react in a targeted manner.
ASSET MANAGEMENT AND BANKING
The principal sources of liquidity for AXA’s Asset Management
and Banking subsidiaries are operating cash flows, repurchase
agreements, borrowings from credit institutions, banking clients,
drawings on credit facilities, proceeds from the issuance of
ordinary shares (where applicable).
The financing needs of Asset Management subsidiaries arise
principally from their activities, which require working capital,
in particular to finance prepaid commissions on some mutual
fund-type products at AB or to constitute seed money for new
funds at both AB (1) and AXA Investment Managers.
(1) Deconsolidated in 2019 (please refer to Note 3 - “Consolidated statement of income by segment”- Part 5 - “C onsolidated F inancial S tatements” of this Annual Report).

84 I UNIVERSAL REGISTRATION DOCUMENT - ANNUAL REPORT 2019 - AXA I
ACTIVITY REPORT AND CAPITAL MANAGEMENT 2 2.4 LIQUIDITY AND CAPITAL RESOURCES
I Liquidity position
In 2019, AXA continued to follow a prudent approach to manage
its liquidity risk. At year-end 2019, AXA had:
■ a large cash position across all business lines (information
on cash flows from operations is provided in Note 12 “Cash
and cash equivalents” in Part 5 - “Consolidated Financial
Statements” of this Annual Report). As of December 31, 2019,
AXA’s consolidated statement of financial position included cash
and cash equivalents of €21.3 billion, net of bank overdraft s
of €0.7 billion.
■ broad access to various markets via standardized debt programs:
for example, at the end of 2019, this included a maximum
capacity of €6.0 billion of French commercial paper, $2.0 billion
of US commercial paper, €18.0 billion under a Euro Medium
Term Note (“EMTN”) program (of which €15.3 billion have
already been issued) and €1.5 billion of French titres négociables
à moyen terme;
■ a debt profile characterized by debt that is mostly subordinated,
with a long maturity profile. In 2019, AXA SA reimbursed €1.8 (1)
billion of debts and we stand at €19.9 (2) billion at year-end 2019.
This resulted in a decrease in debt gearing (3) (28.8% at year-end
2019, versus 32.1% at year-end 2018). The interest coverage (4)
has slightly increased (10.5x at year-end 2019, versus 10.4x at
year-end 2018).
AXA has put in place a robust liquidity Risk Management framework
which is reviewed on a regular basis through a quarterly monitoring
of liquidity and solvency requirements in stressed environments
both at local and Group level. For additional information, please
refer to Section 4.2 “Internal control and Risk Management” (5) and
Section 4.5 “Liquidity risk” (6) of this Annual Report.
At year-end 2019, Group entities held, in the aggregate, more
than €241 billion of government and related bonds of which
€150 billion issued by Eurozone countries, which enables them
to address local liquidity needs through highly liquid assets. AXA
SA also reduced its credit lines to €8.5 billion at year-end 2019
(€12.3 billion in 2018). AXA has its own liquidity requirements
resulting mainly from solvency needs of entities under severe
stress scenarios and collateralized derivatives held by AXA SA.
The derivatives book is monitored and managed on a daily basis
by the Treasury Department.
In addition, as part of its risk control framework, the Company
remains vigilant regarding contractual provisions, such as
rating triggers or restrictive covenants in financing and other
documentation that may give lenders, security holders or other
counterparties, the right to accelerate repayment, demand
collateral or seek other similar remedies under circumstances that
could have a material adverse eff ect on the Group’s consolidated
financial position. At year-end 2019, AXA had no rating triggers
and no financial covenants in its credit facilities.
SUBORDINATED DEBT
On a consolidated basis, subordinated debt that qualifies as
financing debt (excluding derivative instruments) amounted
to €11,393 million as of December 31, 2019 (€11,294 million
including derivatives) aft er taking into account all intra-group
eliminations and excluding undated subordinated debt that
qualifies as equity (TSS/TSDI, which are included in shareholders’
equity, as described in Note 1.13.2 “Undated subordinated debt”
in Part 5 - “Consolidated Financial Statements” of this Annual
Report), compared to €11,200 million as of December 31, 2018
(€10,876 million including derivatives), thus showing an increase of
€193 million mainly driven by the FX impact of debts denominated
in foreign currencies.
The Group’s subordinated debt is described in Note 17 “Financing
debt” in Part 5 - “Consolidated Financial Statements” of this
Annual Report.
(1) Including preference shares and undated debt.
(2) Includes Mandatory Exchangeable Bonds.
(3) Debt gearing is defined in the Glossary set forth in Appendix V hereto.
(4) Including interest charge on undated subordinated debt, preference shares and Mandatory Exchangeable Bonds until deconsolidation of Equitable Holding, Inc. (please refer to Note 3 – “Consolidated statement of income by segment”- Part 5 “C onsolidated F inancial S tatements” of this Annual Report).
(5) Only information contained in Section 4.2 “Internal control and risk management” of this Annual Report and referred to in Note 4 “Financial and insurance risk management” in Part 5 – “Consolidated Financial Statements” of this Annual Report is covered by the report of the Statutory Auditors on the Consolidated Financial Statements.
(6) This information is not required under IFRS and as such is not part of the Consolidated Financial Statements. Therefore, it is not covered by the report of the Statutory Auditors on the Consolidated Financial Statements.

85I UNIVERSAL REGISTRATION DOCUMENT - ANNUAL REPORT 2019 - AXA I
ACTIVITY REPORT AND CAPITAL MANAGEMENT
2
2.4 LIQUIDITY AND CAPITAL RESOURCES
FINANCING DEBT INSTRUMENTS ISSUED
On a consolidated basis, AXA’s total outstanding financing
debt excluding derivatives amounted to €1,038 million (1) at
December 31, 2019 (no derivatives associated), a decrease of
€4,058 million from €5,096 million at the end of 2018 (€5,096 million
including derivatives) mainly driven by the deconsolidation of
Equitable Holdings Inc. debts (€3,594 million), the repayment of
AXA XL debt (€322 million) and the repayment Guaradian Royal
Exchange senior debt (€168 millions).
Financing debt instruments issued are described in Note 17
“Financing debt” in Part 5 - “Consolidated Financial Statements”
of this Annual Report.
FINANCING DEBT OWED TO CREDIT
INSTITUTIONS
At December 31, 2019, the Group did not owe any financing debt
to credit institutions.
OTHER DEBT (OTHER THAN FINANCING DEBT)
Other debt instruments issued
At December 31, 2019, other debt instruments amounted to
€93 million (down from €505 million at the end of 2018). The
decrease of €412 million mainly related to the loss of control of
AXA Group over Equitable Holding, Inc.
Debt instruments (other than financing debt) issued by Group
entities are described in Note 18 “Payables” in Part 5 - “Consolidated
Financial Statements” of this Annual Report.
Other debt owed to credit institutions
(including bank overdraft s)
At December 31, 2019, other debt owed to credit institutions
amounted to €2,541 million (including €679 million of bank
overdraft s), an increase of €308 million compared to €2,233 million
at the end of 2018 (including €773 million of bank overdraft s).
Debt (other than financing debt) owed to credit institutions is
described in Note 18 “Payables” in Part 5 - “Consolidated Financial
Statements” of this Annual Report.
ISSUANCE OF ORDINARY SHARES
For several years, the AXA Group has off ered to its employees,
in and outside France, the opportunity to subscribe for shares
issued through a capital increase reserved for employees. In
2019, approximately 17.8 million new shares were issued for a
total amount of €375 million. To eliminate the dilutive impact
of the newly issued shares, AXA bought back the equivalent
number of shares.
Newly issued shares arising from long term incentive plans (stock
options) amounted to 4.2 million shares in 2019. To eliminate the
dilutive impact of the newly issued shares, AXA bought back the
equivalent number of such shares.
DIVIDENDS RECEIVED FROM GROUP
SUBSIDIARIES
Dividends received by the Company from its subsidiaries
amounted to €5,865 million in 2019 (€3,973 million in 2018), of
which €2,821 million were denominated in currencies other than
Euro (€796 million in 2018).
(1) Excluding Mandatory Exchangeable bonds.
I Uses of funds
Interest paid by the Company in 2019 amounted to €1,097 million
(€1,049 million in 2018), of which interests on undated subordinated
debt of €301 million (€338 million in 2018).
Dividends paid to AXA SA’s shareholders in 2019 in respect of the
2018 financial year amounted to €3,189 million, or €1.34 per share,
versus €1.26 per share paid in 2018 in respect of the 2017 financial
year (€2,998 million in total). Those dividends were paid in cash.
For additional information, please refer to Appendix III “AXA parent
company financial statements” of this Annual Report.

86 I UNIVERSAL REGISTRATION DOCUMENT - ANNUAL REPORT 2019 - AXA I
ACTIVITY REPORT AND CAPITAL MANAGEMENT 2 2.4 LIQUIDITY AND CAPITAL RESOURCES
I Impact of regulatory requirements
The Group’s operations are subject to a wide variety of insurance
and other laws and regulations in the jurisdictions in which it
operates, including regulatory capital and solvency requirements.
For additional information, please refer to Section 6.3 “General
Information—Regulation and Supervision” (1) of this Annual Report.
REGULATORY CAPITAL REQUIREMENTS
The Group’s operating (re)insurance subsidiaries are subject
to local regulatory capital requirements which are designed to
protect policyholders and to monitor capital adequacy.
In the event that the Group or any of its (re)insurance subsidiaries
fails to meet minimum regulatory capital requirements, insurance
regulators would have broad authority to require or take various
regulatory actions. A failure of the Group and/or any of its (re)
insurance subsidiaries to meet its regulatory capital requirements
and/or a deterioration of its solvency position may also result in the
need for significant amounts of new capital, which could adversely
aff ect the Group’s liquidity position. For additional information,
see paragraph “The Group’s or its insurance subsidiaries’ failure
to meet their solvency and capital adequacy requirements could
have a material adverse eff ect on our business, liquidity, ratings,
results of operations and financial position” in Section 4.1 - “Risk
Factors” (2) of this Annual Report.
The Group was in compliance with the applicable solvency
requirements as of December 31, 2019 and monitors compliance
with such requirements on a continuous basis.
CAPITAL MANAGEMENT OBJECTIVES
The AXA Group defined a clear framework for its capital
management policy around a central regulatory Solvency II
ratio target range:
■ the central target range is between 170% and 220%. Within this
central range, AXA intends to (i) pay dividends for an amount
representing a pay-out (3) ratio within 50% to 60% target range;
(ii) buy back shares to neutralize at least dilution resulting
from employee share off erings and stock options exercise;
(iii) maintain investments in business growth; and (iv) maintain
current investment risk appetite;
■ above 220% and as solvency increases, excess capital could
be returned to our shareholders, used to add flexibility within
the dividend pay-out range, to invest in business growth or
increase its appetite for investment risk;
■ below 170%, the AXA Group may become more conservative
gradually, selectively de-risking the investment portfolio,
increasing selectivity in growth initiatives, allowing for dilution
resulting from employee shares off ering and stock options
exercise; and potentially having more flexibility in the dividend
pay-out ratio;
■ below 140%, the AXA Group may restrict its growth initiatives,
further reduce its appetite for investment risk and reduce the
dividend pay-out ratio below its target range.
The AXA Group has defined and implemented capital management
standards in order to ensure that the Company and its subsidiaries
are well positioned from a competitive point of view and
maintain an adequate solvency ratio in accordance with local
regulation requirements. The Management has developed various
contingency plans. These plans may involve use of reinsurance,
sales of investment portfolios and/or other assets, measures to
reduce capital strain of new business or other measures. There
can be no assurance, however, that these plans will be eff ective
and achieve their objectives.
TIERING ANALYSIS OF CAPITAL
Resources under Solvency II Eligible Own Funds (“EOF”) to the
Company before the impact of any tiering eligibility restrictions
and aft er consideration of the potential non-availability of certain
elements of capital.
Eligible Own Funds are split into three diff erent tiers, based
on the quality of each component as defined under Solvency
II regulations. The classification depends upon the extent to
which the own fund item is immediately available to absorb
losses including in case of a winding-up (permanent availability)
and subordinated to all other obligations including towards
policyholders and beneficiaries. Capital elements of the highest
quality are classified in Tier 1. Eligibility limits apply to these
components to cover the Solvency Capital Requirement (“SCR”).
For compliance with the SCR, the following quantitative limits
apply: (a) the eligible amount of Tier 1 items must be at least one
half of the SCR; (b) the eligible amount of Tier 3 items must be
less than 15% of the SCR; (c) the sum of the eligible amounts of
Tier 2 and Tier 3 items must not exceed 50% of the SCR.
Hybrid debt instruments eligible for Tier 1 must not exceed 20%
of the total amount of Tier 1 capital.
(1) This information is not required under IFRS and as such is not part of the Consolidated Financial Statements. Therefore, it is not covered by the report of the Statutory Auditors on the Consolidated Financial Statements.
(2) The information provided in this Section 4.1 is not required under IFRS and as such is not part of the Consolidated Financial Statements. Therefore, it is not covered by the report of the Statutory Auditors on the Consolidated Financial Statements.
(3) Pay out ratio range: 50% - 60% of Adjusted Earnings net of undated debt interest charges, preferred shares and equity components of mandatory exchangeable bonds into shares of Equitable Holdings, Inc.

87I UNIVERSAL REGISTRATION DOCUMENT - ANNUAL REPORT 2019 - AXA I
ACTIVITY REPORT AND CAPITAL MANAGEMENT
2
2.4 LIQUIDITY AND CAPITAL RESOURCES
DATED AND UNDATED SUBORDINATED
DEBT DESCRIPTION
Dated and undated subordinated notes issued by the Company
qualify as eligible own funds.
Subordinated notes issued by the Company since January 18, 2015
have been structured to be eligible as own funds regulatory capital
under Solvency II regulations. Subordinated notes issued prior
January 17, 2015 mostly benefit from the transitional provisions
set forth in Directive 2014/51/EU (Omnibus II) , which amended
the Solvency II Directive, as they were previously eligible under
the Solvency I regime and were issued prior to the entry into
force of Delegated Regulation EU 2015/35 of October 10, 2014.
The Company has issued dated subordinated notes (“TSR”),
undated subordinated notes (“TSDI”) and undated deeply
subordinated notes (“TSS”), which include provisions designed
to allow the Company to ensure the continuity of its activities in
the event its financial position deteriorates.
Certain TSR include clauses which permit or force the Company
to defer interest payments. In addition, redemption at maturity
is subject to (i) the prior approval by the Autorité de C ontrôle
P rudentiel et de R ésolution (the“ACPR”), (ii) the absence of any
event (a) making the own funds of the Company and/or the
Group insuff icient to cover its regulatory capital requirements,
or (b) pursuant to which the Company would have to take
specified action in relation to payments under the notes due
to its financial condition, or (c) having an adverse eff ect on its
insurance subsidiaries claim payments ability.
Pursuant to the terms and conditions of AXA’s TSDI, the Company
may, at its option, under certain circumstances and shall, in
other circumstances, defer interest payment (e.g. no dividend
declared or paid in the preceding Annual Shareholders’ Meeting
or receipt by the Company or by certain of its principal insurance
subsidiaries of a regulatory demand to restore their solvency
position). Payment of deferred interest may become due in certain
specified cases (e.g. payment of a dividend, notification of the
end of a regulatory demand to restore solvency, liquidation of
the Company or redemption of the TSDI).
In particular, most of the Company’s TSS include loss absorption
mechanisms which provide that under certain circumstances where
the Company does not meet its regulatory capital requirements,
the principal amount of each of the relevant TSS will be written
down. In such event, interest will become payable on the reduced
principal amount only. The principal may be reinstated when the
Company returns to financial health, as defined under the terms
and conditions of the TSS.
In addition, for most of the Company’s TSS, upon the occurrence
of certain events relating to the Company’s consolidated net
earnings and shareholders’ equity, the Company is required to
defer payment of interest. In such events, the Company may
choose to pay such deferred interest by way of alternative coupon
settlement mechanisms within five years (such as, issuance of
new shares or other securities including TSS or preference shares,
sale of treasury shares, or an increase in the principal amount of
the relevant notes, subject to applicable limits), failing which the
interest is forfeited. However, the settlement of deferred interest
becomes due, on a best eff orts basis, in certain circumstances
including redemption of the notes, liquidation of the Company,
payment of a dividend or interest on any other TSS, any share
buyback outside the Company’s buy-back program, or any
redemption or repurchase of other TSS.
Finally, under its TSS, the Company has an option to cancel
payments of interest upon the deterioration of its financial
position, unless certain events have occurred in the preceding
year (e.g. a dividend payment or interest payment on any TSS,
any share buy-back outside the Group share buy-back program
or a repurchase or redemption of any TSS).
FUNGIBILITY OF CAPITAL
In assessing whether certain fungibility restrictions on capital
held by AXA subsidiaries may limit the cover of the Group SCR,
the Group considers the following elements:
■ whether the own funds items are subject to legal or regulatory
requirements that restrict the ability of such items to absorb
all types of losses wherever they arise in the Group;
■ whether there are legal or regulatory requirements that restrict
the transferability of assets to another insurance or reinsurance
undertaking; and
■ whether making those own funds available for covering
the Group SCR would not be possible within a maximum of
9 months.
Finally, own funds which cannot be deemed available at Group
level are included in the Group’s own funds as long as they are
eligible for covering the SCR of the entity which holds them.
The ACPR currently considers that AXA SA is not subject to
requirements relating to financial conglomerates.
For additional information on regulation and capital requirements,
please refer to Section 6.3 “General Information Regulation and
Supervision – Regulatory Capital and Solvency Requirements”
of this Annual Report (1) .
(1) This information is not required under IFRS and as such is not part of the Consolidated Financial Statements. Therefore, it is not covered by the report of the statutory Auditors on the Consolidated Financial Statements.

88 I UNIVERSAL REGISTRATION DOCUMENT - ANNUAL REPORT 2019 - AXA I
ACTIVITY REPORT AND CAPITAL MANAGEMENT 2 2.4 LIQUIDITY AND CAPITAL RESOURCES
I Subsequent events aft er December 31, 2019
impacting AXA’s liquidity
A dividend per share of €1.43 will be proposed to the Shareholders’
Meeting to be held on April 30, 2020. Subject to the Shareholders’
Meeting approval, the dividend will be payable on May 13, 2020
with an ex-dividend date of May 11, 2020.
For other subsequent events, please refer to Note 32 “Subsequent
events” in Part 5 - “Consolidated Financial Statements” of this
Annual Report.

89I UNIVERSAL REGISTRATION DOCUMENT - ANNUAL REPORT 2019 - AXA I
ACTIVITY REPORT AND CAPITAL MANAGEMENT
2
2.5 EVENTS SUBSEQUENT TO DECEMBER 31, 2019
2.5 EVENTS SUBSEQUENT TO DECEMBER 31, 2019
AXA to sell its operations in Central
and Eastern Europe (1)
for €1.0 billion
On February 7, 2020, AXA announced that it has entered into an
agreement with UNIQA Insurance Group AG (“UNIQA”) to sell its
operations in Poland, Czech Republic and Slovakia.
Under the terms of the agreement, AXA would sell 100% of its
Life & Savings, Property & Casualty and Pension businesses in
Central and Eastern Europe for a total cash consideration of
€1,002 million, representing an implied 12.4x 2019 P/E multiple (2).
The completion of the transaction is expected to result in a
positive impact on AXA Group’s Solvency II ratio of ca. 2 points.
No significant net income impact is expected.
Completion of the transaction is subject to customary closing
conditions, including the receipt of regulatory approvals, and is
expected during the fourth quarter of 2020.
COVID -2019 outbreak
Since December 2019, a significant number of cases of pneumonia
associated with the Coronavirus, now called COVID-19 by the
World Health Organization (“WHO”), has been reported worldwide.
Initially reported in the province of Hubei in the People’s Republic
of China, it has spread across other countries, resulting in
reported infections and deaths in numerous countries, including
South Korea, Iran, Italy, France, the United Kingdom and the
United States, and new cases and fatalities are reported daily.
Furthermore, it is currently not possible to know or to predict
the extent to which the current levels of reported cases reflect
the actual transmission of the virus within populations, and
accordingly the scale of the pandemic may be significantly larger
than is presently recorded.
The spread of COVID-19 has resulted globally in governmental
authorities imposing quarantines and travel restrictions of varying
scope; has led to significant disruptions in the global travel and
hospitality industries, and in global trade and supply chains more
broadly; has resulted in decreased economic activity and lowered
estimates for future economic growth; has created severe strains
on local, national and supra-national medical and healthcare
systems and institutions; and has caused global financial markets
to experience significant volatility and the worst downturn since
the 2008 financial crisis.
AXA and each of its regulated entities has or is in the process of
establishing plans to address how it will manage the eff ects of the
outbreak, and assess disruptions and other risks to its operations.
These include the protection of employees, sustaining our services
to clients and other stakeholders and ensuring eff ective processes
are in place to communicate and execute such plans.
Although no material claims have been reported at this stage,
AXA is closely monitoring the Group’s exposure, including (i) the
operational impact on its business, (ii) the consequences of a
deterioration in macroeconomic conditions or of a slowdown in
the flow of people, goods and services, especially on new business
volumes, (iii) the extent of insurance coverage impacted, including
Life, Health, Protection and Property & Casualty insurance and
reinsurance cover (following, for example, increased business
interruptions, travel and event cancellations and higher medical
costs), and (iv) change in asset prices and financial conditions
(including interest rates).
Information in this section should be read in conjunction with
the paragraph “Pricing and Underwriting-related risks” in Section
4.1 “Risk Factors” of this Annual Report.
(1) Includes AXA Ubezpieczenia Towarzystwo Ubezpieczeń i Reasekuracji S.A. (P&C business), AXA Życie Towarzystwo Ubezpieczeń S.A. (L&S business) and AXA Powszechne Towarzystwo Emerytalne S.A. (Pension business) in Poland, and AXA pojišťovna a.s. (P&C business), AXA životni pojišťovna a.s (L&S business) and AXA penzijni společnost a.s. (Pension business) in Czech Republic, together with their subsidiaries and branches in Slovakia. AXA XL’s and AXA Partners’ operations in the three countries are not within the scope of this transaction.
(2) Price/2019 IFRS Net income (including the 2019 IFRS Net income of Czech Republic and Slovakia P&C operations which are not consolidated in AXA Group’s financial statements).

90 I UNIVERSAL REGISTRATION DOCUMENT - ANNUAL REPORT 2019 - AXA I
ACTIVITY REPORT AND CAPITAL MANAGEMENT 2 2.6 OUTLOOK
2.6 OUTLOOK
Anticipating the rapidly evolving needs of its customers, AXA’s
strategy is articulated around its preferred segments (P&C
Commercial lines, Health and Protection) and a focus on
partnerships and innovation, seizing opportunities arising from
new technologies to off er products and services beyond insurance
and becoming a trusted partner for its customers.
AXA is resolutely focused on the delivery of its Ambition 2020
plan and the successful integration of XL Group, solidifying AXA’s
position as the #1 global P&C Commercial lines insurer.
With the full disposal of Equitable Holdings, Inc., successfully
achieved in 2019, the Group’s profile has changed significantly,
with a higher proportion of technical margin earnings and a
reduced sensitivity to financial markets.
AXA’s Solvency II position and free cash generation should remain
strong and resilient to external shocks due to robust underwriting
and reinsurance policies, a high quality asset portfolio and
disciplined capital management.
With its clear strategy, a simplified organization designed to foster
growth across its preferred segments, a significant shift in strategic
profile and a strong balance sheet with financial flexibility, AXA
is well positioned to create lasting shareholder value and off er
an attractive return.

91I UNIVERSAL REGISTRATION DOCUMENT - ANNUAL REPORT 2019 - AXA I
3CORPORATE
GOVERNANCE
3.1 CORPORATE GOVERNANCE STRUCTURE 92
Board of Directors 93
The Board Committees 113
Executive Management 117
Other information 118
3.2 EXECUTIVE COMPENSATION AND SHARE OWNERSHIP 120
Corporate off icers’ and executives’ compensation 121
Performance shares and international performance shares 131
Stock options 137
Share ownership policy for executives of the Group 142
Transactions involving Company securities completed in 2019 by the members of the Board of Directors 144
Commitments made to executive off icers 145
Compensation policy of the Company’s corporate off icers (Ordinary and Extraordinary Shareholders’ Meeting of April 30, 2020) 147
3.3 CORPORATE GOVERNANCE CODE OF REFERENCE 152
3.4 RELATED PARTY TRANSACTIONS 153
Statutory Auditors’ special report on regulated agreements 154

92 I UNIVERSAL REGISTRATION DOCUMENT - ANNUAL REPORT 2019 - AXA I
CORPORATE GOVERNANCE 3 3.1 CORPORATE GOVERNANCE STRUCTURE
3.1 CORPORATE GOVERNANCE STRUCTURE
PRINCIPLES OF GOVERNANCE
Implementing sound corporate governance principles has been a
priority at AXA for many years. In this context, AXA chose to adopt,
in 2008, the Corporate Governance Code for French corporations
(Code de gouvernement d’entreprises des sociétés cotées) published
by the Afep (Association française des entreprises privées) and the
Medef (Mouvement des entreprises de France) (the “Afep-Medef
Code”). The Board of Directors believes that AXA’s corporate
governance practices are in line with the recommendations of the
Afep-Medef Code (revised in January 2020 and available on AXA’s
website – www.axa.com) and its accompanying guide and have
followed the evolution of corporate governance practices in France
and abroad, as well as the recommendations and standards of
shareholders, regulators, the French High Committee for Corporate
Governance (Haut Comité de G ouvernement d’E ntreprise), proxy
advisors, rating agencies and other stakeholders.
PRESENTATION OF AXA’S GOVERNANCE
AXA’s corporate governance framework
Since April 2010, AXA has operated with a unitary Board of
Directors.
The Board is assisted by three specialized Board Committees: the
Audit Committee, the Finance Committee and the Compensation
& Governance Committee.
The Board has adopted internal terms of reference (the “Board’s
Terms of Reference”) which detail in particular the role and
responsibilities of the Board and its Committees, as well as
matters reserved for Board decisions. The Board’s Terms of
Reference include corporate governance requirements which,
in certain instances, go beyond French regulatory requirements
notably in relation to the role of the independent directors on
the Board Committees.
Separation of the positions of Chairman of the
Board of Directors and Chief Executive Off icer
Following Mr. Henri de Castries’ decision to step down from his
positions of Chairman and Chief Executive Off icer announced on
March 21, 2016, the Board of Directors decided to separate the
positions of Chairman and Chief Executive Off icer, appointing
Mr. Denis Duverne, former Deputy Chief Executive Off icer and
member of the Board, as non-executive Chairman and Mr. Thomas
Buberl as Chief Executive Off icer on September 1, 2016.
This decision reflected the Board’s conclusions that splitting the
roles of Chairman and Chief Executive Off icer was consistent with
the interest of the Company at that time. The Board concluded
that the separation of roles would ensure that the Group benefits
from the mix and complementarity of the respective experiences
and skills of Mr. Thomas Buberl and Mr. Denis Duverne and would
lead to a smooth transition.
Following the decision to separate the positions of Chairman and
Chief Executive Off icer, the Board of Directors also decided to
maintain the position of Senior Independent Director for a variety
of reasons including that Mr. Denis Duverne is not considered
independent with regard to the Afep-Medef criteria due to his
former role of Deputy Chief Executive Off icer until August 31, 2016.
AXA’s corporate governance framework is summarized in the
table below.
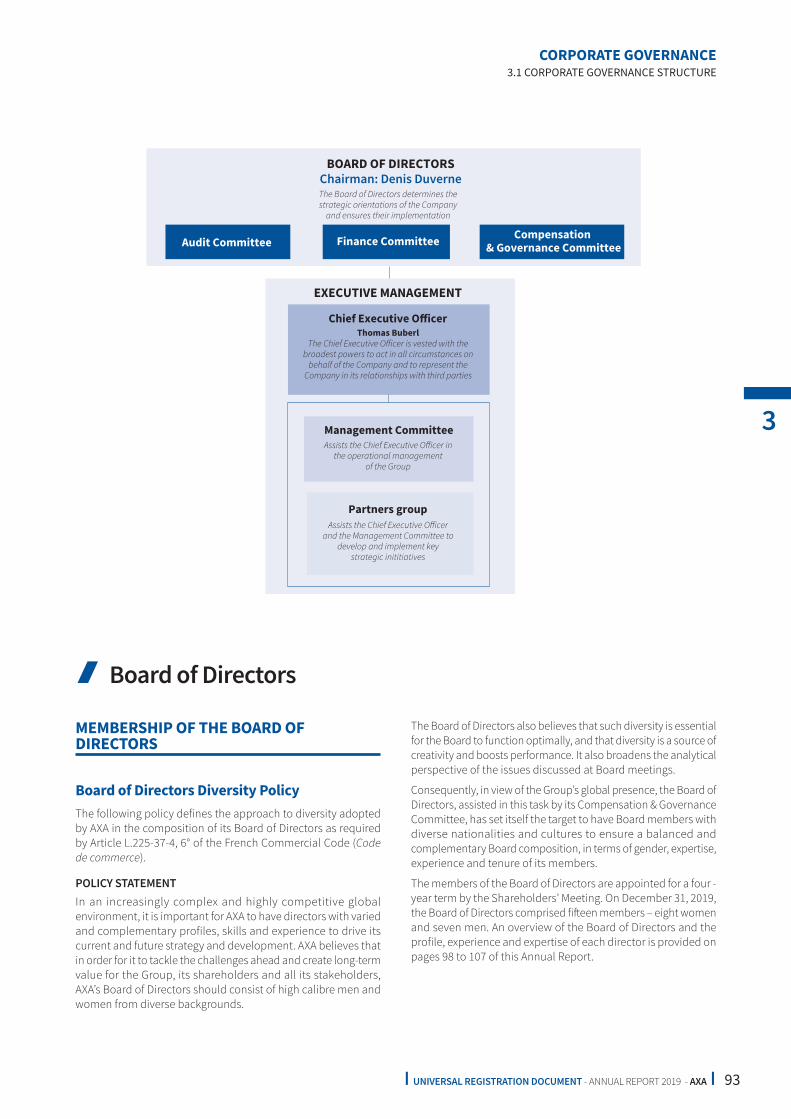
93I UNIVERSAL REGISTRATION DOCUMENT - ANNUAL REPORT 2019 - AXA I
CORPORATE GOVERNANCE
3
3.1 CORPORATE GOVERNANCE STRUCTURE
Finance CommitteeCompensation
& Governance CommitteeAudit Committee
BOARD OF DIRECTORS
Chairman: Denis Duverne
Chief Executive Officer
EXECUTIVE MANAGEMENT
Management Committee
Partners group
Thomas Buberl
The Chief Executive Officer is vested with thebroadest powers to act in all circumstances on
behalf of the Company and to represent theCompany in its relationships with third parties
Assists the Chief Executive Officer inthe operational management
of the Group
The Board of Directors determines thestrategic orientations of the Company
and ensures their implementation
Assists the Chief Executive Officerand the Management Committee to
develop and implement keystrategic inititiatives
I Board of Directors
MEMBERSHIP OF THE BOARD OF
DIRECTORS
Board of Directors Diversity Policy
The following policy defines the approach to diversity adopted
by AXA in the composition of its Board of Directors as required
by Article L.225-37-4, 6° of the French Commercial Code (Code
de commerce).
POLICY STATEMENT
In an increasingly complex and highly competitive global
environment, it is important for AXA to have directors with varied
and complementary profiles, skills and experience to drive its
current and future strategy and development. AXA believes that
in order for it to tackle the challenges ahead and create long-term
value for the Group, its shareholders and all its stakeholders,
AXA’s Board of Directors should consist of high calibre men and
women from diverse backgrounds.
The Board of Directors also believes that such diversity is essential
for the Board to function optimally, and that diversity is a source of
creativity and boosts performance. It also broadens the analytical
perspective of the issues discussed at Board meetings.
Consequently, in view of the Group’s global presence, the Board of
Directors, assisted in this task by its Compensation & Governance
Committee, has set itself the target to have Board members with
diverse nationalities and cultures to ensure a balanced and
complementary Board composition, in terms of gender, expertise,
experience and tenure of its members.
The members of the Board of Directors are appointed for a four -
year term by the Shareholders’ Meeting. On December 31, 2019,
the Board of Directors comprised fift een members – eight women
and seven men. An overview of the Board of Directors and the
profile, experience and expertise of each director is provided on
pages 98 to 107 of this Annual Report.

94 I UNIVERSAL REGISTRATION DOCUMENT - ANNUAL REPORT 2019 - AXA I
CORPORATE GOVERNANCE 3 3.1 CORPORATE GOVERNANCE STRUCTURE
The objective of this diversity policy is to ensure that, over time,
the Board maintains a diverse Board composition to support the
Group’s Management in the development of its strategic plan and
the definition of its long-term objectives.
IMPLEMENTATION AND MONITORING
The Board of Directors and its Compensation & Governance
Committee regularly examine the composition of the Board and
its Committees.
In this context, the Compensation & Governance Committee
regularly calls upon external consultants to assist it in identifying
and interviewing candidates meeting defined selection criteria.
It then submits its recommendations to the Board of Directors.
The implementation of the Board of Directors diversity policy is
monitored and analysed each year as part of the Board’s self-
assessment process. In this respect, the Board notably assesses
the selection process for directors and measures the progress
made against the predefined diversity targets. The results of
this self-assessment are also specifically discussed at a Board
meeting once a year.
RESULTS OBTAINED IN THE PAST YEAR
In 2019, the Board took into account these diversity criteria,
managing to maintain, on the one hand, a gender balance and,
on the other hand, a diversity of profiles and expertise within
the Board.
DIVERSITY POLICY TARGETS OF THE BOARD OF DIRECTORS
C riteria Targets Implementation and results obtained in past years
Gender balance At least 40% of directors
of each gender
(Target met)
Representation of women on the Board:
■ 8 women (stable compared to 2018) and 7 men (1 less than in 2018)
% women
% men
44 43
5056 57
5053
47
20192016 2017 2018
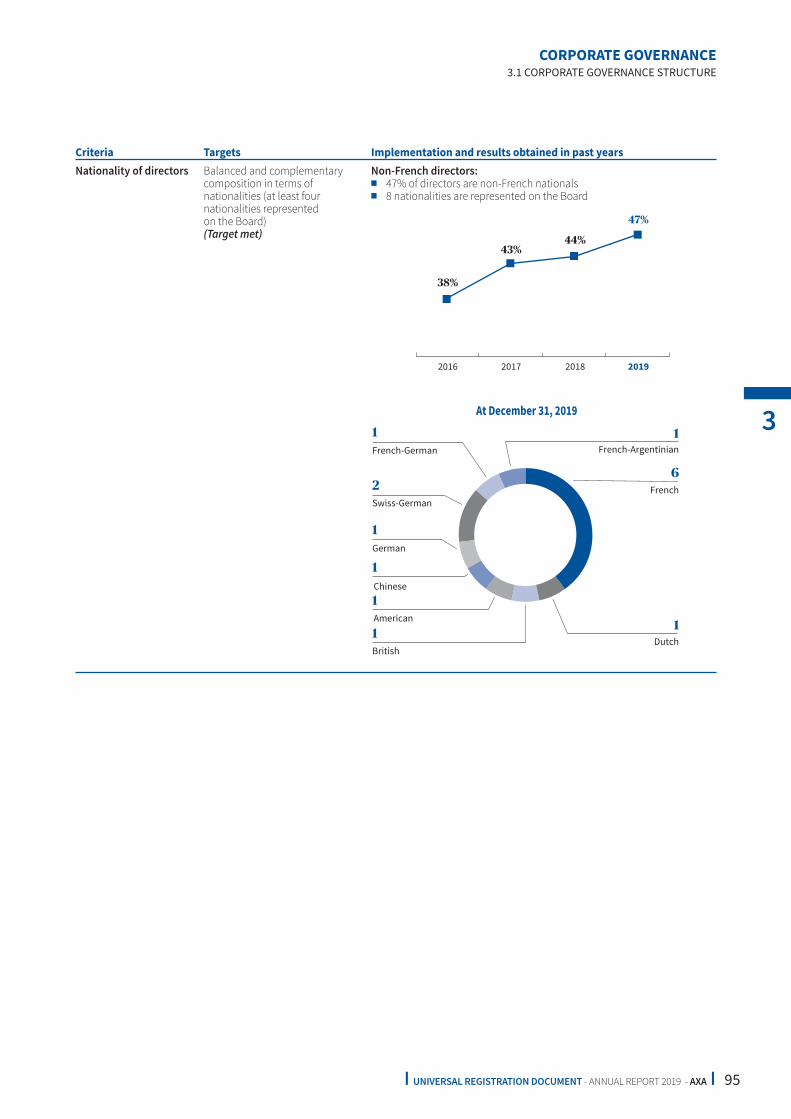
95I UNIVERSAL REGISTRATION DOCUMENT - ANNUAL REPORT 2019 - AXA I
CORPORATE GOVERNANCE
3
3.1 CORPORATE GOVERNANCE STRUCTURE
Criteria Targets Implementation and results obtained in past years
Nationality of directors Balanced and complementary
composition in terms of
nationalities (at least four
nationalities represented
on the Board)
(Target met)
Non-French directors:
■ 47% of directors are non-French nationals
■ 8 nationalities are represented on the Board
2016 2017 2018 2019
38%
43%44%
47%
1
1
1
2
1
1 1
1
6
French-German
Swiss-German
German
Chinese
American
British
French-Argentinian
French
Dutch
������������� �����

96 I UNIVERSAL REGISTRATION DOCUMENT - ANNUAL REPORT 2019 - AXA I
CORPORATE GOVERNANCE 3 3.1 CORPORATE GOVERNANCE STRUCTURE
Criteria Targets Implementation and results obtained in past years
Tenure of directors on
the Board
Balanced and complementary
composition in terms of tenure
on the Board (average tenure
between 4 and 8 years)
(Target met)
Directors’ tenure at December 31, 2019:
■ Less than 4 years: 9 directors (stable compared to 2018)
■ Between 4 and 8 years: 3 directors (stable compared to 2018)
■ Between 8 and 12 years: 3 directors (versus 4 in 2018)
■ Directors’ average tenure on the Board at December 31, 2019: 5 years
56%60%
29%37%
44%50%
19%20%
25%20%
20
18
20
19
20
17
20
16
21%19%
Less than 4 years
Between 4 and 8 years
More than 8 years
Criteria Targets Implementation and results obtained in past years
Age of directors No more than one-third of
directors over the age of 70
(Target met)
■ At December 31, 2019, the directors’ average age was 61 years old
■ No director is over the age of 70 (versus 1 in 2018)
2
12
140-49 years
60-69 years
50-59 years
Criteria Targets Implementation and results obtained in past years
Independence of
directors
At least 50% independent
directors
(Target met)
At December 31, 2019, 9 out of 15 directors were independent, i.e. 60%
of members of the Board of Directors (62.5% at December 31, 2018).
The Chief Executive Off icer, the member of the Board representing
the employee shareholders and the members of the Board representing
the employees (i.e. 4 directors), are by definition not independent.

97I UNIVERSAL REGISTRATION DOCUMENT - ANNUAL REPORT 2019 - AXA I
CORPORATE GOVERNANCE
3
3.1 CORPORATE GOVERNANCE STRUCTURE
Skills and expertise of members of the Board of Directors
The Board of Directors pays special attention, in the selection of its members, to their respective areas of expertise and experience,
including their knowledge of the diff erent regions where the Group is present.
The kills matrix below presents the number of directors with skills and expertise considered critical for AXA’s Board of Directors:
Oversight of sustainabilityand environmental stewardship
Strong leadership and seniormanagement experience
Experience in growingand emerging markets
Extensive experience of customersservices and digital strategies
Financial expertise
Knowledge and experience
Experience in AXAbusinesses and industries 12/15
9/15
11/15
5/15
7/15
9/15
7/15
of regulatory and legal matters
Composition of the Board of Directors at December 31, 2019 (1)
15 60% 53% 617
NUMBER
OF DIRECTORS
INDEPENDENT
DIRECTOR RATIO
9 independent
directors
DIRECTORS’
AVERAGE AGENATIONALITY
GENDER BALANCE
WITHIN THE
BOARD OF DIRECTORS
46% of women,
excluding directors
representing the
employees
directors out of 15 are
non-French nationals –
8 nationalities are
represented on the
Board
(1) For further information on the expertise, experience and directorship of the members of the Board of Directors, please refer to Section “Information on current members of the Board of Directors” below.

98 I UNIVERSAL REGISTRATION DOCUMENT - ANNUAL REPORT 2019 - AXA I
CORPORATE GOVERNANCE 3 3.1 CORPORATE GOVERNANCE STRUCTURE
Name (age) and principal function (a)
Principal business address
Nationality
Position within the
Board of Directors
Number
of AXA
shares (b)
First appointment/
term of off ice
Denis Duverne (66)
Chairman of the Board of Directors of AXA
25, avenue Matignon – 75008 Paris – France
French nationality
Chairman of the Board of Directors 1,558,366 April 2010/2022
Annual Shareholders’
Meeting
Thomas Buberl (46)
Director and Chief Executive Off icer of AXA
25, avenue Matignon – 75008 Paris – France
German and Swiss nationalities
Director and Chief Executive Off icer 320,305 September 2016/2022
Annual Shareholders’
Meeting
Patricia Barbizet (64)
Chairman of Temaris & Associés
40, rue François 1er – 75008 Paris – France
French nationality
Independent director
Member of the Compensation
& Governance Committee
4,570 April 2018/2022
Annual Shareholders’
Meeting
Martine Bièvre (60)
Director of AXA representing the employees
AXA France – 203-205 rue Carnot -
94138 Fontenay-sous-Bois – France
French nationality
Director representing the employees 0 June 2018/2022
Annual Shareholders’
Meeting
Jean-Pierre Clamadieu (61)
Chairman of the Board of Directors of ENGIE
1, place Samuel de Champlain –
92930 Paris la Défense Cedex – France
French nationality
Senior Independent D irector
Chairman of the Compensation
& Governance Committee
9,000 October 2012/2023
Annual Shareholders’
Meeting
Bettina Cramm (56)
Director of AXA representing the employees
AXA Konzern AG – Gustav-Stresemann-Ring 12-16 –
65189 Wiesbaden – Germany
German nationality
Director representing the employees
Member of the Compensation
& Governance Committee
106 June 2018/2022
Annual Shareholders’
Meeting
Irene Dorner (65)
Companies’ director
AXA – 25, avenue Matignon – 75008 Paris – France
British nationality
Independent director
Member of the Audit Committee
6,700 April 2016/2020
Annual Shareholders’
Meeting
Rachel Duan (49)
Senior Vice President of GE and President & Chief
Executive Off icer of GE Global Markets (China)
GE China – 8F 1 Building 1 Huatuo Road – Zhangjiang
High Tech Park – Shanghai 201203 – China
Chinese nationality
Independent director
Member of the Compensation
& Governance Committee
3,950 (c) April 2018/2022
Annual Shareholders’
Meeting
André François-Poncet (60)
Group CEO of Wendel SE
89, rue Taitbout – 75009 Paris – France
French nationality
Independent director
Member of the Compensation
& Governance Committee
Member of the Finance Committee
7,842 December 2016/2022
Annual Shareholders’
Meeting
Angelien Kemna (62)
Companies’ director
AXA – 25, avenue Matignon – 75008 Paris – France
Dutch nationality
Independent director
Member of the Audit Committee
7,250 April 2016/2020
Annual Shareholders’
Meeting
Stefan Lippe (64)
Co-founder and Chairman of the Board of Directors
of yes.com AG (Switzerland) and co-founder
and Vice-Chairman of the Board of Directors
of Acqupart Holding AG (Switzerland)
Baarerstrasse 8 – CH 6300 Zug – Switzerland
German and Swiss nationalities
Independent director
Chairman of the Audit Committee
Member of the Finance Committee
12,000 April 2012/2020
Annual Shareholders’
Meeting
François Martineau (68)
Attorney at Law at Lussan/Société d’avocats
282, boulevard Saint Germain – 75007 Paris – France
French nationality
Director 6,732 April 2008/2020
Annual Shareholders’
Meeting
(a) For further information on the expertise, experience and directorships of the members of the Board of Directors, please refer to Section “Information on current members of the Board of Directors” below.
(b) AXA shares which could be indirectly held through Mutual funds are not taken into account.
(c) On January 17, 2020.

99I UNIVERSAL REGISTRATION DOCUMENT - ANNUAL REPORT 2019 - AXA I
CORPORATE GOVERNANCE
3
3.1 CORPORATE GOVERNANCE STRUCTURE
Name (age) and principal function (a)
Principal business address
Nationality
Position within the
Board of Directors
Number
of AXA
shares (b)
First appointment/
term of off ice
Ramon de Oliveira (65)
Managing Director of Investment Audit Practice, LLC
(United States)
580 Park Avenue – New York – NY 10065 – United States
French and Argentinian nationalities
Independent director
Chairman of the Finance Committee
Member of the Audit Committee
11,300 April 2009/2021
Annual Shareholders’
Meeting
Doina Palici-Chehab (62)
AXA Group Chief Integration Off icer
AXA – 61, rue Mstislav Rostropovitch – 75017 Paris –
France
German and French nationalities
Director representing the employee
shareholders
Member of the Finance Committee
18,079 April 2012/2020
Annual Shareholders’
Meeting
Elaine Sarsynski (64)
Companies’ director
AXA – 25, avenue Matignon – 75008 Paris – France
American nationality
Independent director
Member of the Audit Committee
5,000 (c ) May 2018/2021
Annual Shareholders’
Meeting
(a) For further information on the expertise, experience and directorships of the members of the Board of Directors, please refer to Section “Information on current members of the Board of Directors” below.
(b) AXA shares which could be indirectly held through Mutual funds are not taken into account.
(c) On January 22, 2020.
Changes within the membership of the Board of Directors and its Committees in 2019
Term of off ice Appointment Renewal
Ratification
of cooptation
Board of Directors Jean-Martin Folz
(04/24/2019)- Jean-Pierre Clamadieu
(04/24/2019)Elaine Sarsynski
(04/24/2019)
Audit Committee - - Elaine Sarsynski
(04/24/2019)-
Finance Committee - - - -
Compensation & Governance
Committee
Jean-Martin Folz
(04/24/2019)Patricia Barbizet
(05/22/2019)Rachel Duan
(06/19/2019)
Jean-Pierre Clamadieu
(04/24/2019)-
Changes to the Board at the 2020
Shareholders’ Meeting
The Shareholders’ Meeting to be held on April 30, 2020 will be
asked to vote on (i) the re-appointment of two members of the
Board of Directors whose term of off ice is ending (Mrs. Angelien
Kemna and Mr. Stefan Lippe) and (ii) the appointment of four new
members of the Board of Directors, one of them upon proposal
of the employee shareholders of the AXA Group.
In this context, the Board of Directors proposed, based on the
recommendation of the Compensation & Governance Committee:
■ the appointment of Mrs. Isabel Hudson as director, for a four-
year term, replacing Mrs. Irene Dorner whose term of off ice will
expire at the close of this Shareholders’ Meeting;
■ the appointment of Mr. Antoine Gosset-Grainville as director, for
a four-year term, replacing Mr. François Martineau whose term
of off ice will expire at the close of this Shareholders’ Meeting;
■ the appointment of Mrs. Marie-France Tschudin as director,
for a four-year term; and
■ the appointment of Mrs. Helen Browne, representing the
employee shareholders, for a four-year term, replacing
Mrs. Doina Palici-Chehab, whose term of off ice will expire at
the close of this Shareholders’ Meeting.
Subject to the April 30, 2020 Shareholders’ Meeting approval,
the Board of Directors would therefore be comprised of sixteen
members including nine women (56% (1)) and eleven members
considered independent (69%) by the Board of Directors in
accordance with the Afep-Medef Code criteria.
The composition of the Board Committees will be reviewed
during the Board of Directors’ meeting following the Shareholders’
Meeting of April 30, 2020.
The gender diversity policy applied to the Group’s management
bodies and the objectives of this policy, together with an action
plan and the timeframe within which these actions will be carried
out, are presented in Section 7.2 “Social information” of this
Annual Report.
(1) Or a rate of 46% (higher than the minimum of 40% required by law) of women (excluding the directors representing the employees and the director representing the employee-shareholders) in accordance with legal requirements.

100 I UNIVERSAL REGISTRATION DOCUMENT - ANNUAL REPORT 2019 - AXA I
CORPORATE GOVERNANCE 3 3.1 CORPORATE GOVERNANCE STRUCTURE
Information on current members of the Board of Directors (1)
Expertise and experience
Mr. Denis Duverne is a graduate of the École des Hautes Études Commerciales (HEC). Aft er graduating from the École Nationale d’Administration (ENA), he started his career in 1979 at the
Tax Department of the French Ministry of Finance, and aft er
2 years as commercial counsellor for the French Consulate
General in New York (1984-1986), he became director of
the Corporate Taxes Department and then responsible for
tax policy within the French Ministry of Finance from 1986
to 1991. In 1991, he was appointed Corporate Secretary of
Compagnie Financière IBI. In 1992, he became a member
of the Executive Committee of Banque Colbert, in charge of
operations. In 1995, Mr. Denis Duverne joined the AXA Group
and assumed responsibility for supervision of AXA’s operations
in the US and the UK and managed the reorganization of
AXA companies in Belgium and the United Kingdom. From
February 2003 until December 2009, Mr. Denis Duverne was
the Management Board member in charge of Finance, Control
and Strategy. From January 2010 until April 2010, Mr. Denis
Duverne assumed broader responsibilities as Management
Board member in charge of Finance, Strategy and Operations.
From April 2010 to August 31, 2016, Mr. Denis Duverne was
director and Deputy Chief Executive Off icer of AXA, in charge
of Finance, Strategy and Operations. Mid-2014, Mr. Denis
Duverne became a member of the Private Sector Advisory
Group (PSAG), which brings together international leaders
of the private sector whose shared goal is to help developing
countries improve their corporate governance, co-founded in
1999 by the World Bank and the Organisation for Economic Co-
operation and Development (OECD). Since September 1, 2016,
Mr. Denis Duverne has been non-executive Chairman of the
Board of Directors of AXA. Since September 2018, he has been
Chairman of the Insurance Development Forum (IDF). The IDF
is a public-private partnership led by the insurance industry and
supported by the World Bank and the United Nations, aiming to
enhance the use of insurance to build greater resilience against
disasters and to help achieve the United Nations Global 2030
Agenda.
Directorships held within the AXA Group
Chairman of the Board of Directors: AXA*
Chairman: AXA Millésimes (SAS)
Directorship held outside the AXA Group
None
Directorships held during the last five years
Deputy Chief Executive Officer: AXA
Chairman & Chief Executive Officer: AXA America
Holdings, Inc. (United States)
Chairman of the Board of Directors: AXA Holdings Belgium
(Belgium), AXA Financial, Inc. (United States)
Director or member of the Management Committee: AXA
ASIA (SAS), AllianceBernstein Corporation (United States),
AXA Assicurazioni S.p.A. (Italy), AXA Belgium SA (Belgium),
AXA Equitable Life Insurance Company (United States),
AXA Italia S.p.A. (Italy), AXA MPS Assicurazioni Danni S.p.A.
(Italy), AXA MPS Assicurazioni Vita S.p.A. (Italy), AXA UK plc
(United Kingdom), MONY Life Insurance Company (United
States), MONY Life Insurance Company of America (United
States)
Denis Duverne
Chairman of the Board of Directors of AXA
Born on October 31, 1953
French nationality
Appointed on April 25, 2018
Term expires at the 2022 Shareholders’ Meeting
First appointment on April 29, 2010
Expertise and experience
Mr. Thomas Buberl holds a Master of Economics degree from
WHU Koblenz (Germany), a MBA from Lancaster University
(UK) and a Ph.D. in Economics from the University of St Gallen
(Switzerland). In 2008 he was nominated as a Young Global
Leader by the World Economic Forum. From 2000 to 2005,
Mr. Thomas Buberl worked at the Boston Consulting Group
as a consultant for the banking & insurance sector in Germany
and abroad. From 2005 to 2008, he had worked for the
Winterthur Group as member of the Management Board
of Winterthur in Switzerland, first as Chief Operating Off icer
and then as Chief Marketing and Distribution Off icer. Then,
he joined Zurich Financial Services where he had been Chief
Executive Off icer for Switzerland. From 2012 to April 2016, he
was Chief Executive Off icer of AXA Konzern AG (Germany). In
2012, he has been member of the AXA Executive Committee.
In March 2015, he became Chief Executive Off icer of the Global
Business Line for the Health Business and joined the AXA
Management Committee. In January 2016, Mr. Thomas Buberl
was also appointed Chief Executive Officer of the global
business line Life & Savings. From March 21, 2016 to August 31,
2016, Mr. Thomas Buberl was Deputy Chief Executive Off icer
(Directeur Général Adjoint ) of AXA. Since September 1, 2016,
Mr. Thomas Buberl has been Chief Executive Officer and
director of AXA.
Directorship held within the AXA Group
Director and Chief Executive Officer: AXA*
Directorship held within the AXA Group (2)
Member of the Supervisory Board: Bertelsmann SE & Co.
KGaA (Germany)
Directorships held during the last five years
Chairman of the Management Board: AXA Konzern AG
(Germany), AXA Krankenversicherung AG (Germany), AXA
Lebensversicherung AG (Germany), AXA Versicherung AG
(Germany), DBV Deutsche Beamtenversicherung AG
(Germany)
Chairman of the Board of Directors: AXA Equitable
Holdings, Inc. (United States), AXA Financial, Inc.
(United States), AXA Leben AG (Switzerland), AXA
Versicherungen AG (Switzerland), XL Group Ltd (Bermuda)
Chairman of the Supervisory Board: AXA Konzern AG
(Germany), AXA Krankenversicherung AG (Germany), AXA
Lebensversicherung AG (Germany), AXA Versicherung AG
(Germany), Deutsche Ärzteversicherung AG (Germany)
Deputy Chairman of the Supervisory Board: Roland
Rechtsschutz-Versicherungs-AG (Germany)
Managing Director and Chief Executive Officer: Vinci B.V. (The
Netherlands)
Director or member of the Management Committee or member of the Supervisory Board: AXA ASIA (SAS), AXA
ART Versicherung AG (Germany), AXA Equitable Life
Insurance Company (United States), AXA Life Insurance
Co. Ltd (Japan), MONY Life Insurance Company of
America (United States), Tertia GmbH (Germany)
Thomas Buberl
Member of the Board of Directors and Chief Executive Off icer of AXA
Born on March 24, 1973
German and Swiss nationalities
Appointed on April 25, 2018
Term expires at the 2022 Shareholders’ Meeting
First appointment on September 1, 2016
(1) Current directorships held by members of the Board of Directors within a listed company are indicated by the following symbol: *. Current directorships held by members of the Board of Directors within companies belonging to the same group are indicated by the following symbol: **.
(2) Mr. Thomas Buberl requested the Board of Directors’ approval before accepting new directorships in companies outside the AXA Group.

101I UNIVERSAL REGISTRATION DOCUMENT - ANNUAL REPORT 2019 - AXA I
CORPORATE GOVERNANCE
3
3.1 CORPORATE GOVERNANCE STRUCTURE
Expertise and experience
Mrs. Patricia Barbizet graduated from ESCP-Europe Business
School in 1976. Mrs. Patricia Barbizet started her career as
International Treasurer in Renault Véhicules Industriels, and
then as Chief Financial Off icer of Renault Crédit International.
In 1989, she joined the Groupe Pinault as Chief Financial
Officer. She was Chief Executive Officer of Artémis, the
investment company of the Pinault family, from 1992 to 2018.
She was Chief Executive Off icer and Chairwoman of Christie’s
International from 2014 to 2016. Mrs. Patricia Barbizet is Lead
Independent Director of the Board of Total and Pernod Ricard.
She also served as a qualified independent member on the
Boards of Bouygues, Air France-KLM, Kering and PSA Peugoet-
Citroen as well as Chairwoman of the Fonds Stratégique
d’Investissement Investment Committee from 2008 to 2013.
Since April 2018, Mrs. Patricia Barbizet has been Chairman of
Temaris & Associés.
Directorship held within the AXA Group
Director: AXA*
Directorships held outside the AXA Group
Chairman of the Board of Directors: Cité de la musique
Philharmonie de Paris
Chairman: Temaris & Associés, Zoé SAS
Director: Colombus H olding, Pernod Ricard* (Lead
Independent Director), Total* (Lead Independent
Director)
Directorships held during the last five years
Chief Executive Officer: Artémis
Chairwoman & Chief Executive Officer: Christie’s
International Plc (United Kingdom)
Vice-Chairwoman: Christie’s International Plc (United
Kingdom)
Vice-Chairman of the Board of Directors: Kering
Chief Executive Officer (non-executive) and member of the Supervisory Board: Financière Pinault
Member of the board of managers: Société Civile du
Vignoble de Château Latour
Managing Director and director: Palazzo Grassi (Italy)
Director and member of the Supervisory Board: Air
France-KLM, Artémis, Bouygues, Fonds Stratégique
d’Investissements, Fnac Darty, Peugeot S.A, Ponant,
Société Nouvelle du Théâtre Marigny, TF1, Yves Saint
Laurent, Gucci Group NV (The Netherlands)
Permanent representative of Artémis to the boards of: Agefi, Collection Pinault Paris, Sebdo le Point
Patricia Barbizet
Member of the Board of Directors of AXA (independent)
Chairman of Temaris & Associés
Born on April 17, 1955
French nationality
Appointed on April 25, 2018
Term expires at the 2022 Shareholders’ Meeting
First appointment on April 25, 2018
Member of the AXA Compensation & Governance Committee
Expertise and experience
Mrs. Martine Bièvre graduated with a Master’s degree in
law specialized in insurance law from the University of
Lyon (France). From 1984 to 1988, Mrs. Martine Bièvre
was a damage regulations and civil liability editor at the
UAP branch in Lyon (France). Since 1988, she held various
functions such as claim inspector – adjuster, at the UAP
Rhône-Alpes delegation (from 1988 to 1999), at the UAP
Bassin Parisien Delegation (from 1990 to 1999), at the AXA
Bourgogne Franche-Comté Region (from 1999 to 2004), at
AXA Entreprises – IARD Department (from 2004 to 2011) and
at AXA Particuliers and IARD Entreprises (since 2011). From
2015 to 2018, she was director representing the employees
on the board of directors of AXA France IARD. In June 2018,
Mrs. Martine Bièvre was appointed director representing the
employees on AXA’s Board of Directors.
Directorship held within the AXA Group
Director representing the employees: AXA*
Directorship held outside the AXA Group
Director: Caisse de retraite du personnel de l’UAP (CRUAP)
Directorship held during the last five years
Director representing the employees: AXA France IARD
Martine Bièvre
Member of the Board of Directors of AXA representing the employees
Born on September 4, 1959
French nationality
Appointed on June 13, 2018
Term expires at the 2022 Shareholders’ Meeting
First appointment on June 13, 2018

102 I UNIVERSAL REGISTRATION DOCUMENT - ANNUAL REPORT 2019 - AXA I
CORPORATE GOVERNANCE 3 3.1 CORPORATE GOVERNANCE STRUCTURE
Expertise and experience
Mr. Jean-Pierre Clamadieu is a graduate of the École Nationale Supérieure des Mines of Paris and ingénieur du Corps des Mines . He began his carrier in various positions within the
French Civil Service, in particular for the Ministry of Industry
and as technical adviser in the Ministry of Labour. In 1993, he
joined the Rhône-Poulenc Group and held various executive
positions. In 2003, he was appointed Chief Executive Off icer
of the Rhodia Group and in 2008, Chairman & Chief Executive
Officer. In September 2011, further to the combination
between the groups Rhodia and Solvay, Mr. Jean-Pierre
Clamadieu became Vice-Chairman of the Executive
Committee of Solvay and Chairman of the Board of Directors
of Rhodia. From May 2012 to March 1, 2019, Mr. Jean-Pierre
Clamadieu was Chairman of the Executive Committee and
member of the Board of Directors of Solvay. Since May 18,
2018, Mr. Jean-Pierre Clamadieu has been Chairman of the
Board of Directors of Engie. On April 2019, the AXA Board of
Directors appointed Mr. Jean-Pierre Clamadieu as Senior
Independent Director.
Directorship held within the AXA Group
Director: AXA*
Directorships held outside the AXA Group
Chairman of the Board of Directors: ENGIE*, Opéra
National de Paris
Vice-Chairman of the Executive Committee: World
Business Council for Sustainable Development (WBCSD)
(Switzerland)
Director: Airbus*, France Industries
Directorships held during the last five years
Director and Chairman of the Executive Committee: Solvay (Belgium)
Chairman: Cytec Industries Inc. (United States)
Director: Faurecia, SNCF
Jean-Pierre
Clamadieu
Member of the Board of Directors and Senior Independent Director of AXA
Chairman of the Board of Directors of ENGIE
Born on August 15, 1958
French nationality
Appointed on April 24, 2019
Term expires at the 2023 Shareholders’ Meeting
First appointment on October 10, 2012
Chairman of the AXA Compensation & Governance Committee
Expertise and experience
Mrs. Bettina Cramm is a graduated Medical Educator from
the Martin-Luther University (Halle/Saale – Germany). She
started her career in 1984 as a Medical Technical Assistant
at the German Klinik of Diagnostik of Wiesbaden (Germany).
In 1991, she joined German-Civil-Servants-Insurance (DBV),
known today as AXA Konzern AG. From 1991 to 1994, she
was Power Clerk General Private Health Insurance at DBV
and from 1994 to 2002, Operational Paramedic at DBV-
Winterthur Wiesbaden. From 2002 to 2007, Mrs. Bettina
Cramm was a Healthcare Consultant at DBV-Winterthur. In
1995, she joined the Works Council at DBV-Winterthur and
was a member of the Supervisory Board of DBV-Winterthur
Health Insurance (2006-2008), member of the Supervisory
Board of DBV Vermittlungsgesellschaft für Versicherungen
und Vermögensbildung mbH (2007-2008). From 2008 to 2013,
she was responsible for the prevention and health promotion
at the company medical service at AXA Konzern AG. From
2013 to June 2018, Mrs. Bettina Cramm held various
functions as member of the Works Council, Central Works
Council, European Works Council and their commissions and
member of Supervisory Boards of AXA entities in Germany.
Since May 2017, she has been a member of the Supervisory
Board of AXA Konzern AG. In June 2018, Mrs. Bettina Cramm
was appointed member of the Board of Directors of AXA
representing the employees.
Directorships held within the AXA Group
Director representing the employees: AXA*
Member of the Supervisory Board: AXA Konzern AG
(Germany)
Directorship held outside the AXA Group
None
Directorship held during the last five years
NoneBettina Cramm
Member of the Board of Directors of AXA representing the employees
Born on May 10, 1963
German nationality
Appointed on June 20, 2018
Term expires at the 2022 Shareholders’ Meeting
First appointment on June 20, 2018
Member of the AXA Compensation & Governance Committee
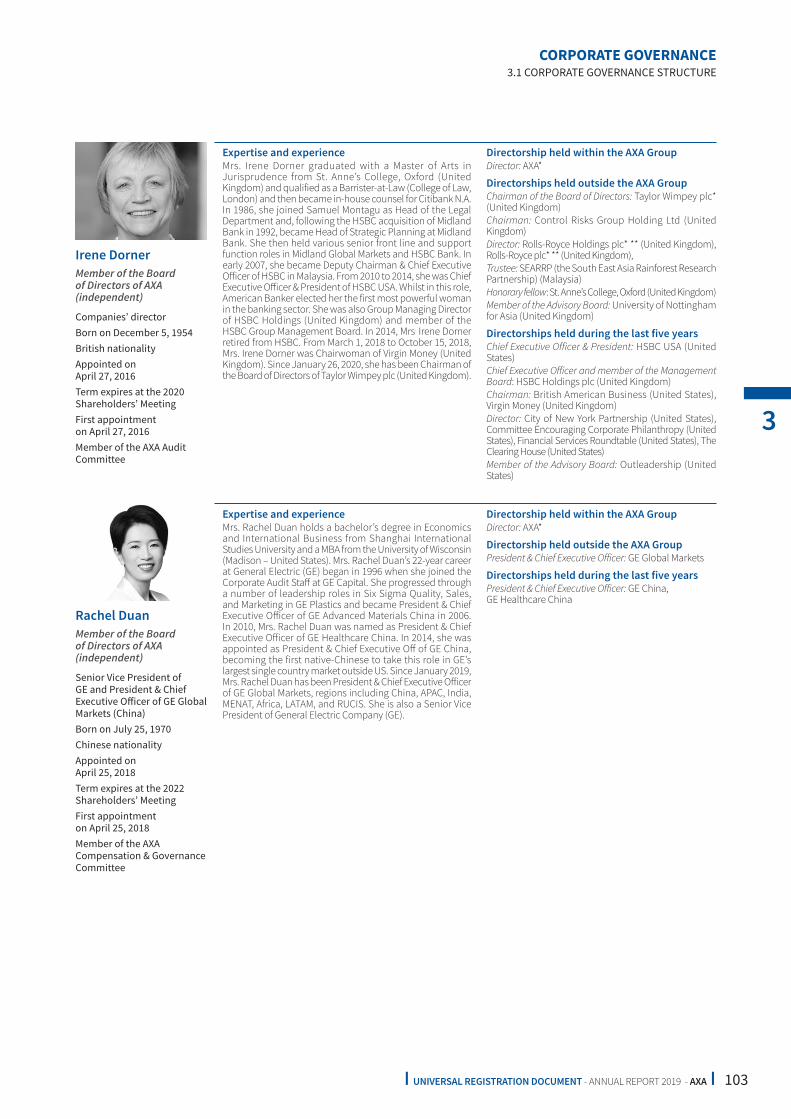
103I UNIVERSAL REGISTRATION DOCUMENT - ANNUAL REPORT 2019 - AXA I
CORPORATE GOVERNANCE
3
3.1 CORPORATE GOVERNANCE STRUCTURE
Expertise and experience
Mrs. Irene Dorner graduated with a Master of Arts in
Jurisprudence from St. Anne’s College, Oxford (United
Kingdom) and qualified as a Barrister-at-Law (College of Law,
London) and then became in-house counsel for Citibank N.A.
In 1986, she joined Samuel Montagu as Head of the Legal
Department and, following the HSBC acquisition of Midland
Bank in 1992, became Head of Strategic Planning at Midland
Bank. She then held various senior front line and support
function roles in Midland Global Markets and HSBC Bank. In
early 2007, she became Deputy Chairman & Chief Executive
Off icer of HSBC in Malaysia. From 2010 to 2014, she was Chief
Executive Off icer & President of HSBC USA. Whilst in this role,
American Banker elected her the first most powerful woman
in the banking sector. She was also Group Managing Director
of HSBC Holdings (United Kingdom) and member of the
HSBC Group Management Board. In 2014, Mrs . Irene Dorner
retired from HSBC. From March 1, 2018 to October 15, 2018,
Mrs. Irene Dorner was Chairwoman of Virgin Money (United
Kingdom). Since January 26, 2020, she has been Chairman of
the Board of Directors of Taylor Wimpey plc (United Kingdom).
Directorship held within the AXA Group
Director: AXA*
Directorships held outside the AXA Group
Chairman of the Board of Directors: Taylor Wimpey plc*
(United Kingdom)
Chairman: Control Risks Group Holding Ltd (United
Kingdom)
Director: Rolls-Royce Holdings plc* ** (United Kingdom),
Rolls-Royce plc* ** (United Kingdom),
Trustee: SEARRP (the South East Asia Rainforest Research
Partnership) (Malaysia)
Honorary fellow: St. Anne’s College, Oxford (United Kingdom)
Member of the Advisory Board: University of Nottingham
for Asia (United Kingdom)
Directorships held during the last five years
Chief Executive Officer & President: HSBC USA (United
States)
Chief Executive Officer and member of the Management Board: HSBC Holdings plc (United Kingdom)
Chairman: British American Business (United States),
Virgin Money (United Kingdom)
Director: City of New York Partnership (United States),
Committee Encouraging Corporate Philanthropy (United
States), Financial Services Roundtable (United States), The
Clearing House (United States)
Member of the Advisory Board: Outleadership (United
States)
Irene Dorner
Member of the Board of Directors of AXA (independent)
Companies’ director
Born on December 5, 1954
British nationality
Appointed on April 27, 2016
Term expires at the 2020 Shareholders’ Meeting
First appointment on April 27, 2016
Member of the AXA Audit Committee
Expertise and experience
Mrs. Rachel Duan holds a bachelor’s degree in Economics
and International Business from Shanghai International
Studies University and a MBA from the University of Wisconsin
(Madison – United States). Mrs. Rachel Duan’s 22-year career
at General Electric (GE) began in 1996 when she joined the
Corporate Audit Staff at GE Capital. She progressed through
a number of leadership roles in Six Sigma Quality, Sales,
and Marketing in GE Plastics and became President & Chief
Executive Off icer of GE Advanced Materials China in 2006.
In 2010, Mrs. Rachel Duan was named as President & Chief
Executive Off icer of GE Healthcare China. In 2014, she was
appointed as President & Chief Executive Off of GE China,
becoming the first native-Chinese to take this role in GE’s
largest single country market outside US. Since January 2019,
Mrs. Rachel Duan has been President & Chief Executive Off icer
of GE Global Markets, regions including China, APAC, India,
MENAT, Africa, LATAM, and RUCIS. She is also a Senior Vice
President of General Electric Company (GE).
Directorship held within the AXA Group
Director: AXA*
Directorship held outside the AXA Group
President & Chief Executive Officer: GE Global Markets
Directorships held during the last five years
President & Chief Executive Officer: GE China,
GE Healthcare China
Rachel Duan
Member of the Board of Directors of AXA (independent)
Senior Vice President of GE and President & Chief Executive Off icer of GE Global Markets (China)
Born on July 25, 1970
Chinese nationality
Appointed on April 25, 2018
Term expires at the 2022 Shareholders’ Meeting
First appointment on April 25, 2018
Member of the AXA Compensation & Governance Committee

104 I UNIVERSAL REGISTRATION DOCUMENT - ANNUAL REPORT 2019 - AXA I
CORPORATE GOVERNANCE 3 3.1 CORPORATE GOVERNANCE STRUCTURE
Expertise and experience
Mr. André François-Poncet graduated from École des Hautes Études Commerciales (HEC) and holds a Master in Business
Administration (MBA) from the Harvard Business School. He
began his career, in 1984, at Morgan Stanley in New York and
then in London and in Paris, where he was in charge of the
opening of Morgan Stanley French off ice. Aft er a sixteen-year
career at Morgan Stanley, he joined, in 2000, BC Partners
(Paris and London) as Managing Partner until December 2014
and then as Senior Advisor until December 2015. From
September 2016 to December 2017, Mr. André François-
Poncet was a Partner at the French asset manager CIAM in
Paris. Since January 1, 2018, Mr. André François-Poncet has
been Group CEO of Wendel SE.
Directorship held within the AXA Group
Director: AXA*
Directorships held outside the AXA Group
Group CEO : Wendel SE* **
Chairman and director: Harvard Business School Club de
France, Trief Corporation** (Luxembourg)
Vice-Chairman of the Board of Directors and director: Bureau Veritas* **
Director: Winvest Conseil** (Luxembourg)
Member of the bureau: Club des Trente
Member of the European Advisory Board: Harvard
Business School
Directorship held during the last five years
Chairman and Chief Executive Officer: LMBO Europe SAS
André François-
Poncet
Member of the Board of Directors of AXA (independent)
Group CEO of Wendel SE
Born on June 6, 1959
French nationality
Appointed on April 25, 2018
Term expires at the 2022 Shareholders’ Meeting
First appointment on December 14, 2016
Member of the AXA Compensation & Governance Committee
Member of the AXA Finance Committee
Expertise and experience
Dr. Angelien Kemna graduated with a Master of Arts in
Econometrics and a Ph.D. in Finance from Erasmus University
Rotterdam (the Netherlands). She has a visiting scholar at the
Sloan School, MIT (United States). Dr. Angelien Kemna began
her career as Associate Professor in Finance at the Erasmus
University from 1988 to 1991. In 1992, she joined Robeco NV
and held various positions, notably Investments and Account
Management Director from 1998 to 2001. During this period,
she was also part-time Professor of Financial Markets at
the University of Maastricht (the Netherlands) (1993–1999).
From 2001 to July 2007, she worked for ING Investment
Management BV (the Netherlands), where she initially
held the position of Global Chief Investment Officer and
subsequently Chief Executive Off icer for the European region.
In the period 2007-2011, Dr. Angelien Kemna was part-time
Professor of Corporate Governance at the Erasmus University
and had also various Non-Executive and advisory positions,
most notably Vice-Chairman of the Supervisory Board of
the Dutch regulatory institution (AFM). In 2009, Dr. Angelien
Kemna joined APG Group N.V. as member of the Executive
Board with the responsibility of Chief Investment Off icer. From
September 2014 to November 2017, Dr. Angelien Kemna was
Chief Finance & Risk Off icer of APG Group (the Netherlands).
Directorships held within the AXA Group
Director: AXA*, AXA Investment Managers
Directorships held outside the AXA Group
Director or member of the Supervisory Board: NIBC* (The
Netherlands), Friesland Campina N.V. (The Netherlands)
Directorships held during the last five years
Chairman of the Supervisory Board: Yellow&Blue
Investment Management B.V. (The Netherlands)
Director or member of the Supervisory Board: Duisenburg
School of Finance (The Netherlands), Railway Pension
Investments Ltd (“RPMI”) (United Kingdom), Stichting
Child and Youth Finance International (The Netherlands)
Angelien Kemna
Member of the Board of Directors of AXA (independent)
Companies’ director
Born on November 3, 1957
Dutch nationality
Appointed on April 27, 2016
Term expires at the 2020 Shareholders’ Meeting
First appointment on April 27, 2016
Member of the AXA Audit Committee

105I UNIVERSAL REGISTRATION DOCUMENT - ANNUAL REPORT 2019 - AXA I
CORPORATE GOVERNANCE
3
3.1 CORPORATE GOVERNANCE STRUCTURE
Expertise and experience
Mr. Stefan Lippe is a graduate in mathematics and business
administration from the University of Mannheim. He obtained
his doctorate in 1982 being awarded the Kurt Hamann
foundation prize for his thesis. In October 1983, he joined
Bavarian Re (a former Swiss Re subsidiary). From 1985, he
was involved in the casualty department’s operations in the
German-speaking area. In 1986, he became Head of the non-
proportional underwriting department. He was appointed
member of the Management Board in 1988 when he assumed
responsibility for the company’s casualty line of business in
the German-speaking area. In 1993, he became Chairman of
the Management Board of Bavarian Re. Mr. Stefan Lippe was
appointed a member of Swiss Re’s Executive Board in 1995,
as Head of the Bavarian Re Group. In 2001, he was assigned
the role of Head of the Property & Casualty Business Group
and appointed a member of Swiss Re’s Executive Committee.
Beginning in 2005, he led Swiss Re’s Property & Casualty and
Life & Health Underwriting activities; and in September 2008,
he took over as Chief Operating Off icer of Swiss Re and was
also appointed Deputy Chief Executive Off icer of Swiss Re.
In 2009, he was appointed Chief Executive Off icer of Swiss
Re and stayed in this function until January 2012. Mr. Stefan
Lippe was named Reinsurance CEO of the year 2011 by the
leading industry publication, Reaction, and he was recognized
at the Worldwide Reinsurance Awards 2013 ceremony with
the “Lifetime Achievement Award”. Aft er nearly 30 years with
Swiss Re, he turned to other activities. In 2011, Mr. Stefan
Lippe co-founded Acqupart Holding AG of which he serves
as Vice-Chairman of the Board of Directors, and Acqufin AG.
In May 2013, he co-founded Paperless Inc. renamed as
yes. com AG in 2018 and currently serves as Chairman of the
Board of Directors of this company. In October 2013, Mr. Stefan
Lippe was elected as Chairman of the Board of Directors of
CelsiusPro AG. From May 2014 to May 2018, Mr. Stefan Lippe
was a member of the Supervisory Board of Commerzbank AG
(Germany).
Directorship held within the AXA Group
Director: AXA*
Directorships held outside the AXA Group
Chairman of the Board of Directors: CelsiusPro AG
(Switzerland), yes.com AG (Switzerland)
Chairman of the Advisory Board: German Insurance
Association for Vocational Training (BWV) (Germany)
Vice-Chairman of the Board of Directors: Acqupart
Holding AG (Switzerland)
Directorships held during the last five years
Vice-Chairman of the Board of Directors: Acqufin AG
(Switzerland)
Director or member of the Supervisory Board: Commerzbank AG (Germany), Extremus Insurance Ltd.
(Germany)
Stefan Lippe
Member of the Board of Directors of AXA (independent)
Co-founder and Chairman of the Board of Directors of yes. com AG (Switzerland) and co-founder and Vice- Chairman of the Board of Directors of Acqupart Holding AG (Switzerland)
Born on October 11, 1955
German and Swiss nationalities
Appointed on April 27, 2016
Term expires at the 2020 Shareholders’ Meeting
First appointment on April 25, 2012
Chairman of the AXA Audit Committee
Member of the AXA Finance Committee
Expertise and experience
Mr. François Martineau is a graduate of the University Paris IV
(Philosophy Degree), University Paris I (Law Master), and of
the Institut d’études politiques of Paris. Mr. François Martineau
has been an attorney since 1976. In 1981, he was Secrétaire de la Conférence. In 1985, he was a lecturer at the University
Paris I (Civil Procedure). In 1995, he was a Professor at the Paris
Bar School (EFB) and since 1998, he is Honorary Professor at
the Law and Political Sciences School of Lima (Peru). In 1996,
he became an Expert at the Council of Europe and fulfilled
various missions in Eastern Europe countries regarding the
reform of the Code of the Judicial Organization, the reform
of the magistrates’ and lawyers’ training and the revision of
the Code of Civil Procedure. He also taught professionals at
the École Nationale de la Magistrature (ENM). Since 1987,
Mr. François Martineau has been a Partner of the law firm
Lussan/Société d’avocats, and co-Managing Partner.
Directorships held within the AXA Group
Director or member of the Management Committee: AXA*,
AXA Millésimes (SAS)
Directorships held outside the AXA Group
Vice-Chairman and member of the Supervisory Board: Associations Mutuelles Le Conservateur**, Assurances
Mutuelles Le Conservateur**
Vice-Chairman and director: Bred Banque Populaire
Co-Managing Partner: Lussan/Société d’avocats
Director: AXA Assurances IARD Mutuelle, Conservateur
Finance**
Directorship held during the last five years
Director: AXA Assurance Vie Mutuelle
François Martineau
Member of the Board of Directors of AXA
Attorney at law
Born on June 11, 1951
French nationality
Appointed on April 27, 2016
Term expires at the 2020 Shareholders’ Meeting
First appointment on April 22, 2008

106 I UNIVERSAL REGISTRATION DOCUMENT - ANNUAL REPORT 2019 - AXA I
CORPORATE GOVERNANCE 3 3.1 CORPORATE GOVERNANCE STRUCTURE
Expertise and experience
Mr. Ramon de Oliveira is a graduate of the University of
Paris and of the Institut d’études politiques (Paris). Starting
in 1977, Mr. Ramon de Oliveira spent 24 years at JP Morgan
& Co. From 1996 to 2001, Mr. Ramon de Oliveira was
Chairman & Chief Executive Off icer of JP Morgan Investment
Management. Mr. Ramon de Oliveira was also a member
of the firm’s Management Committee since its inception
in 1995. Upon the merger with Chase Manhattan Bank in
2001, Mr. Ramon de Oliveira was the only executive from
JP Morgan & Co. asked to join the Executive Committee of
the new firm with operating responsibilities. Between 2002
and 2006, Mr. Ramon de Oliveira was an Adjunct Professor
of Finance at both Columbia University and New York
University. Mr. Ramon de Oliveira is the Managing Director
of the consulting firm Investment Audit Practice, LLC, based
in New York. He is also Chairman of the Board of Directors of
Equitable Holdings (EQH) and AllianceBernstein (AB), both
based also in New York.
Directorship held within the AXA Group
Director: AXA*
Directorships held outside the AXA Group
Managing Director: Investment Audit Practice, LLC
(United States)
Chairman of the Board of Directors: AllianceBernstein
Corporation* (United States), Equitable Holdings, Inc.*
(United States)
Directorships held during the last five years
Chairman of the Board of Directors: Friends of Education
(non-profit organization) (United States)
Trustee and Chairman of the Investment Committee: Fondation Kaufman (United States)
Chairman of the Investment Committee: Fonds de
Dotation du Musée du Louvre
Vice-Chairman: JACCAR Holdings SA (Luxembourg)
Director or member of the Supervisory Board: American
Century Companies Inc. (United States), AXA Equitable
Life Insurance Company (United States), AXA
Financial, Inc. (United States), JP Morgan Switzerland
(Switzerland), MONY Life Insurance Company (United
States), MONY Life Insurance Company of America
(United States), Quilvest (Luxembourg), SunGard Data
Systems (United States), Taittinger-Kobrand USA (United
States)
Member of the Investment Committee: La Croix Rouge
(United States)
Ramon de Oliveira
Member of the Board of Directors of AXA (independent)
Managing Director of Investment Audit Practice, LLC (United States)
Born on September 9, 1954
French and Argentinian nationalities
Appointed on April 26, 2017
Term expires at the 2021 Shareholders’ Meeting
First appointment on April 30, 2009
Chairman of the AXA Finance Committee
Member of the AXA Audit Committee
Expertise and experience
Mrs. Doina Palici-Chehab is a graduate of the University of
Bucarest (Romania) (Magister Artium) and of the Deutsche
Versicherungsakademie of Munich (Germany) (Degree in
insurance management (Versicherungsbetriebswirt (DVA)).
From 1980 to 1983, she was a teacher for foreign languages
in Romania. From 1983 to 1990, she was subject Matter
Expert in AGF (now Allianz) in Cologne (Germany). In 1990,
she joined the AXA Group as Reinsurance Director of AXA
Germany (Germany). In 2000, she became head of Group
Reinsurance of AXA Global P&C in Paris (France). From
2010 to March 2013, she was Chief Executive Off icer of AXA
Business Services in Bangalore (India). From April 2013
to December 2016, she was Chief Executive Off icer of AXA
Insurance Singapore (Singapore) and from July 2016 to
December 2016, Chief Executive Off icer of AXA Life Insurance
Singapore. From January 1, 2017 to June 30, 2017, Mrs. Doina
Palici-Chehab was Chief Executive Off icer of AXA Insurance
Pte Ltd (Singapore) (new entity further to the merger of the
two entities in Singapore). From July 1, 2017 to March 2018,
she served as interim Chief Executive Off icer of AXA Asia. From
April 1, 2018 to December 31, 2019, she was the Executive
Chairman of AXA Corporate Solutions and AXA ART. As
from April 1, 2018, she has been Executive Chairman of
AXA Matrix Risks Consultants and assumes the role of Chief
Integration Off icer following the acquisition of the XL Group.
Since November 2019, Mrs. Doina Palici-Chehab serves on
the Supervisory Board of AXA Konzern AG (Germany). Since
April 2012, Mrs. Doina Palici-Chehab has been the employee
shareholder representative to the AXA Board of Directors.
Directorships held within the AXA Group
Chairman of the Board of Directors: AXA Matrix Risk
Consultants SA
Director representing the employee shareholders: AXA*
Director or member of the Supervisory Board: AXA
Konzern AG (Germany), XL Bermuda Ltd (Bermuda), XL
Group Ltd (Bermuda), XLICSE (Ireland)
Directorship held outside the AXA Group
None
Directorships held during the last five years
Chairman of the Board of Directors: AXA Corporate
Solutions Assurance
Chairman of the Supervisory Board: AXA ART
Versicherung AG (Germany)
Chairman: AXA ASIA (SAS), Chambre de Commerce
Française (Singapore)
Chief Executive Officer: AXA Business Services Pvt. Ltd.
(India), AXA Insurance Singapore Pte Ltd (Singapore),
AXA Life Insurance Singapore (Singapore), Red Switch
Pte. Ltd. (Singapore)
Director: AXA China Region Limited (Bermuda), AXA
China Region Insurance Company (Bermuda) Limited
(Bermuda), AXA China Region Insurance Company
Limited (Hong Kong), AXA Financial Services (Singapore)
Pte Ltd (Singapore), AXA General Insurance Hong Kong
Limited (Hong Kong), AXA Insurance Public Company
Limited (Thailand), AXA Insurance Pte Ltd (Singapore),
AXA Wealth Management (HK) Limited (Hong Kong),
Charter Ping An Insurance Corporation (Philippines),
India Private Limited (India), Krungthai AXA Life Insurance
Public Company Limited (Thailand), Philippine AXA Life
Insurance Company Limited (Philippines), Red Switch
Pte. Ltd. (Singapore), Sayata Labs Ltd (Israel)
Member of the Advisory Board: Singapore Management
University Lee Kong Chian School of Business (Singapore)
Member of the Management Committee of the General Insurance Association of Singapore to the Board of Governors: Singapore College of Insurance (Singapore)
Doina Palici-Chehab
Member of the Board of Directors of AXA representing the employee shareholders
Chief Integration Off icer of AXA and Executive Chairman of AXA Matrix Risk Consultants
Born on November 4, 1957
German and French nationalities
Appointed on April 27, 2016
Term expires at the 2020 Shareholders’ Meeting
First appointment on April 25, 2012
Member of the AXA Finance Committee

107I UNIVERSAL REGISTRATION DOCUMENT - ANNUAL REPORT 2019 - AXA I
CORPORATE GOVERNANCE
3
3.1 CORPORATE GOVERNANCE STRUCTURE
Expertise and experience
Ms. Elaine Sarsynski graduated with a Bachelor of Arts degree
(BA) in Economics from Smith College of Northampton
(United States) and a Master of Business Administration
(MBA) in Accounting and Finance from Columbia Business
School, New York (United States). Ms. Elaine Sarsynski started
her career in 1977 as Real Estate Analyst at Morgan Stanley
(New York, United States). In 1981, she joined Aetna Life and
Casualty (Hartford, United States), where she held various
positions, notably Head of the Corporate Finance Department
(1991-1992), Unit Head of Mortgage Finance (1992-1995) and
Head of the Real Estate Investments Department (1995-1998).
From 1998 to 2001, she worked for Sun Consulting Group, LLC
(Hartford, United States) as Partner and founding principal.
During this period, she was an Economic and Community
Development Director (1999-2001) and became first
Selectman for the town of Suff ield (United States) in 2001. In
2005, Ms. Elaine Sarsynski joined Massachusetts Mutual Life
Insurance Company (Springfield, United States), where she
was Managing Director at Babson Capital Management LLC,
a MassMutual subsidiary. In 2006, she became Executive Vice
President, Chief Administrative Off icer, Chief Executive Off icer
and President of MassMutual International and in 2008,
Executive Vice President, member of the Off ice of the Chief
Executive Off icer and President of MassMutual Retirement
Services as well as Chairwoman of MassMutual International.
In early 2017, Ms. Elaine Sarsynski retired from Massachusetts
Mutual Life Insurance Company.
Directorship held within the AXA Group
Director: AXA*
Directorships held outside the AXA Group
Director: Horizon Technology Finance Corporation*
(United States), TI Fluid Systems Plc* (United Kingdom)
Trustee: Hopkins Academy (United States)
Directorships held during the last five years
Chairman: MassMutual International (United States)
Trustee: MassMutual Fund Boards (United States)Elaine Sarsynski
Member of the Board of Directors of AXA (independent)
Companies’ directors
Born on April 21, 1955
American nationality
Appointed on May 24, 2018
Term expires at the 2021 Shareholders’ Meeting
First appointment on May 24, 2018
Member of the AXA Audit Committee

108 I UNIVERSAL REGISTRATION DOCUMENT - ANNUAL REPORT 2019 - AXA I
CORPORATE GOVERNANCE 3 3.1 CORPORATE GOVERNANCE STRUCTURE
DIRECTORS’ INDEPENDENCE
Each year, the Board of Directors assesses the independence of each of its members on the basis of the recommendations set out in
the Afep-Medef Code.
The following table summarizes the position of each director of the Company with regard to the criteria of the Afep-Medef Code at
December 31, 2019.
Criterion
(the criterion is considered to be met when it is identified by ✓)
Denis
Duverne
Thomas
Buberl
Patricia
Barbizet
Martine
Bièvre
Jean-
Pierre
Clamadieu
1 Not have been an employee or executive off icer of the Company,
or an employee, executive off icer or director of a consolidated
subsidiary within the previous five years
0 0 ✔ 0 ✔
2 Not have cross-directorships ✔ ✔ ✔ ✔ ✔
3 Not have significant business relationships ✔ ✔ ✔ ✔ ✔
4 Not be related by close family ties to a company off icer ✔ ✔ ✔ ✔ ✔
5 Not have been an auditor of the Company within the previous five years ✔ ✔ ✔ ✔ ✔
6 Not have been a director of the Company for more than twelve years ✔ ✔ ✔ ✔ ✔
7 Not represent a major shareholder of the Company (holding more
than 10% of share capital or voting rights)
✔ ✔ ✔ ✔ ✔
Independent director aft er assessing the Afep-Medef criteria 0 0 ✔ 0 ✔

109I UNIVERSAL REGISTRATION DOCUMENT - ANNUAL REPORT 2019 - AXA I
CORPORATE GOVERNANCE
3
3.1 CORPORATE GOVERNANCE STRUCTURE
Bettina
Cramm
Irene
Dorner
Rachel
Duan
André
François-
Poncet
Angelien
Kemna
Stefan
Lippe
François
Martineau
Ramon de
Oliveira
Doina
Palici-
Chehab
Elaine
Sarsynski
0 ✔ ✔ ✔ ✔ ✔ 0* 0* 0 ✔
✔ ✔ ✔ ✔ ✔ ✔ ✔ ✔ ✔ ✔
✔ ✔ ✔ ✔ ✔ ✔ ✔ ✔ ✔ ✔
✔ ✔ ✔ ✔ ✔ ✔ ✔ ✔ ✔ ✔
✔ ✔ ✔ ✔ ✔ ✔ ✔ ✔ ✔ ✔
✔ ✔ ✔ ✔ ✔ ✔ ✔ ✔ ✔ ✔
✔ ✔ ✔ ✔ ✔ ✔ 0** ✔ ✔ ✔
0 ✔ ✔ ✔ ✔ ✔ 0 ✔ 0 ✔
* The Company considers that the fact that certain members of the AXA Board of Directors hold or have held during the last five years non-executive directorships in one or more Group subsidiaries owned, directly or indirectly, by AXA does not automatically (i) place them in a situation of conflict of interest, or (ii) impair their independence in any way. The Board believes that permitting its members to sit on the boards of certain Group subsidiaries is beneficial to the Board’s overall knowledge and appreciation of the Group’s operations, strategy and risk profile. Directors who also serve on the boards of Group subsidiaries, however, are required to abstain from participating in the debates and decisions of the AXA Board which could aff ect the interests of the entity in which they hold a directorship to prevent any conflict of interest or potential independence issues.
** As Mr. François Martineau is Chairman of the AXA Mutuals’ Strategy Coordination Committee, the Board of Directors concluded that he was no longer independent.
On February 19, 2020, the AXA Board of Directors determined
that, at December 31, 2019, nine of the fift een Board members
were independent aft er assessing the criteria of the Afep-Medef
Code: Mmes Patricia Barbizet, Irene Dorner, Rachel Duan, Angelien
Kemna and Elaine Sarsynski and Messrs. Jean-Pierre Clamadieu,
André François-Poncet, Stefan Lippe and Ramon de Oliveira.
One member of the Board of Directors (currently Mrs. Doina
Palici-Chehab) is the AXA employee shareholders’ representative.
This representative is appointed by shareholders every four
years from a list of candidates selected by the Group’s employee
shareholders, following an internal selection process.
In addition, in June 2018, two directors representing the
employees, Mmes Martine Bièvre and Bettina Cramm, were
appointed as members of the AXA Board of Directors.
The Board of Directors does not have any non-voting members
(censors).

110 I UNIVERSAL REGISTRATION DOCUMENT - ANNUAL REPORT 2019 - AXA I
CORPORATE GOVERNANCE 3 3.1 CORPORATE GOVERNANCE STRUCTURE
ROLE AND RESPONSIBILITIES
OF THE BOARD
The Board is collectively responsible for determining the strategic
orientations of the Company, ensuring their implementation
in accordance with its corporate purpose and taking into
consideration the social and environmental challenges of its
activity, and establishing the internal framework for oversight of
Executive Management, subject to relevant laws and regulations
and the Bylaws of the Company. In addition, the Board inter alia:
■ chooses the appropriate corporate governance framework;
■ appoints and dismisses the Chairman, any Vice-Chairman/
Senior Independent Director, the Chief Executive Off icer, any
Deputy Chief Executive Off icer, any dirigeant effectif (executive
who eff ectively runs the Company as required by Solvency II),
and determines their respective compensation;
■ convenes Shareholders’ Meetings;
■ proposes directors for appointment to the Shareholders’
Meeting and/or coopts directors to the Board;
■ reviews and endorses (arrête) the Company’s and the Group’s
half-year and annual financial statements;
■ presents a report on corporate governance to the Shareholders’
Meeting;
■ fulfills all the Board obligations set out in Solvency II;
■ adopts and oversees the general principles of the Group’s
compensation policy;
■ reviews the strategies and the policies on the taking,
management and monitoring of risks as well as the conclusions
of the internal assessment of risks and solvency (ORSA – Own
Risk and Solvency Assessment – report);
■ proposes Statutory Auditors for appointment to the
Shareholders’ Meeting and approves non-audit services.
The Chief Executive Off icer, who is also a Board member, is vested
with the broadest powers to act in all circumstances on behalf of
the Company and to represent the Company in its relationships
with third parties. However, the Board of Directors also reserves
the approval of certain material transactions to itself in its Terms
of Reference, including sales or acquisitions (over €500 million),
significant financing operations and any material transactions
outside the strategy announced by the Company.
To ensure that the personal interests of the members of the Board
of Directors and those of the Company are appropriately aligned,
the Board’s Terms of Reference provide that each member of the
Board of Directors (with the exception of the directors representing
the employees) must hold, within two years following his/her first
appointment, a number of AXA shares with a value at least equal
to the gross annual amount of his/her compensation (director’s
fees) earned in respect of the previous fiscal year (1).
CHAIRMAN OF THE BOARD OF DIRECTORS
In accordance with French law, the Chairman’s role is to organize
and oversee the work of the Board of Directors. In this context, he
sets the agenda of the Board meetings, holds regular discussions
with the Chief Executive Off icer and the directors, requests any
document or information necessary to help the Board of Directors
for the preparation of its meetings, verifies the quality of the
information provided and more generally, ensures that Board
members are in a position to fulfill their role. Prior to each meeting,
Board members receive documentation concerning matters to
be reviewed, generally eight days in advance of Board meetings.
The Chairman convenes the members of the Board without
directors who are members of the Executive Management being
present, in particular to allow debates on the performance and
compensation of the Executive Management and succession
planning.
Following its decision to appoint Mr. Denis Duverne as Chairman,
the Board decided, in light of his experience and expertise and
knowledge of the AXA Group, to extend the role of the Chairman
as follows (2):
■ promote the Company’s values and culture in particular in
relation to corporate responsibility and professional ethics;
■ upon request by the Chief Executive Off icer, represent the
Company in its relations, nationally and internationally with
public bodies, institutions, regulators, shareholders and the
Company’s main strategic partners and stakeholders;
■ consult with the Chief Executive Off icer on major topics and
events relating to the Company (including the Company’s
strategy, major acquisition or divestment projects, significant
financial transactions, major community projects and the
appointment of the most senior executives of the Group);
■ upon invitation of the Chief Executive Off icer, take part in
internal meetings with Group executives and teams to provide
his opinion on strategic issues or projects;
■ assist and advise the Chief Executive Off icer.
In this context, in 2019, the Chairman of the Board of Directors,
notably:
■ represented the Company at various national and international
events attended by certain of the Group’s main partners and
strategic stakeholders;
(1) For this purpose, AXA shares are valued using the closing price of the AXA share on December 31 of the preceding fiscal year.
(2) The role of the Chairman is set out in the Board’s Terms of Reference which are available on AXA’s website.

111I UNIVERSAL REGISTRATION DOCUMENT - ANNUAL REPORT 2019 - AXA I
CORPORATE GOVERNANCE
3
3.1 CORPORATE GOVERNANCE STRUCTURE
■ had discussions with the main institutional shareholders of the
Company, in particular prior to the Shareholders’ Meeting; and
■ at the request of the Chief Executive Off icer, participated
in internal meetings in connection with significant events
concerning the Company (e.g. acquisition and disposal projects).
While the Chairman acts in close collaboration with the Chief
Executive Off icer, his role is contributory in nature and does not
confer any executive power. Under French law, it is the Chief
Executive Off icer who is solely responsible for the Company’s
operational leadership and management.
SENIOR INDEPENDENT DIRECTOR
Following the decision to separate the positions of Chairman and
Chief Executive Off icer, the Board of Directors decided to maintain
the position of Senior Independent Director, in particular due to
the qualification of non-independent director of the Chairman
of the Board of Directors.
The Senior Independent Director (Mr. Jean-Martin Folz until
April 24, 2019 and Mr. Jean-Pierre Clamadieu as of April 24, 2019),
replaces the Chairman of the Board of Directors in the event of
temporary incapacity or death, chairs meetings of the Board in
the absence of the Chairman, acts, if need be, as spokesperson
for the independent directors and informs the Chairman of any
potential conflict of interest identified. The Senior Independent
Director also reviews, with the Chairman of the Board of Directors,
the agenda of Board meetings and the quality of information
provided to the Board.
In addition, the Senior Independent Director may convene
meetings of independent members of the Board, without
the presence of the Chairman and Executive Management, in
particular, to assess the performance of the Chairman, review
his compensation and prepare his succession plan. He may also
request the Chairman to convene the Board on a specific agenda.
The Senior Independent Director reports on his activities to the
Shareholders’ Meeting.
In 2019, the Senior Independent Director, also acting as Chairman
of the Compensation & Governance Committee:
■ maintained regular dialogue with the Chairman of the Board
and with the Executive Management (i.e. the Chief Executive
Off icer and the Deputy Chief Executive Off icers (Directeurs
Généraux Adjoints));
■ was actively involved in the preparation of Board meetings,
working closely with the Chairman of the Board of Directors
and the Executive Management;
■ contributed to the selection process of the future members of
the Board of Directors and its Committees;
■ worked closely with the Chairman of the Board on the
organization of the annual self-assessment of the Board;
■ contributed to the review of all communications made to
shareholders in particular on corporate governance topics
and Executive Management compensation.
He reported on his activities at the Shareholders’ Meeting of
April 24, 2019.
BOARD ACTIVITIES IN 2019
In 2019, the Board of Directors met ten times and held three
executive sessions without the presence of Executive Management.
In 2019, the Board notably focused on the review of the Group’s
strategy, the examination of the 2018 financial statements and
the 2019 half-year financial statements, the review of proposed
significant acquisitions and disposals, the integration of the XL
Group, the review of the Board Committee reports, the review of
the ORSA report and AXA’s Internal Model as well as other written
policies required under Solvency II, the Group’s Pre-emptive
Recovery Plan, the Group’s dividend policy, the i nternal control
and r isk m anagement, the approval of non-audit services, the self-
assessment of the Board of Directors and the re-appointment and
independence of its Board members, the review of the composition
of the Board of Directors and its Committees and the succession
plans of the Chairman of the Board and the Executive Management.
In March 2019, the Board of Directors held its annual two-day
off -site strategy session with presentations by Group senior
executives on a variety of key strategic topics related to the
implementation of the Group’s 2020 Strategic Plan.
In 2019, several training sessions were organized by the Chairman
of the Board of Directors to familiarize the members of the Board
of Directors with the Group’s main activities and challenges.
These sessions particularly focused on the Group’s Financial
Crime Compliance (anti-money laundering, sanctions and anti-
bribery & corruption), reinsurance and Solvency II regulation.
In October 2019, the Board of Directors also visited the Group’s
Security Operations Center (SOC), during which several
presentations on the Group’s IT security were delivered.

112 I UNIVERSAL REGISTRATION DOCUMENT - ANNUAL REPORT 2019 - AXA I
CORPORATE GOVERNANCE 3 3.1 CORPORATE GOVERNANCE STRUCTURE
SELF-ASSESSMENT OF THE BOARD
OF DIRECTORS’ ACTIVITIES
The Board of Directors conducts an annual self-assessment
to review its composition, operating procedures and overall
functioning. The conclusions of this self-assessment are discussed
annually at the Board of Directors.
Since 2013, the Board of Directors, upon recommendation of
its Compensation & Governance Committee, has periodically
entrusted the annual assessment of the Board of Directors to
an external consultant.
In 2018, the Board self-assessment was carried out by a consultant
(SpencerStuart) who collected each of the individual director’s
inputs, views and suggestions on the Board work and its
performance. Each director’s view on other members’ participation
and contribution to the Board work was also collected.
In 2019, the Board self-assessment was conducted internally
and all directors (except the Chairman of the Board) answered
the self-assessment questionnaire and had a meeting with the
Chairman of the Board in order to assess the eff ectiveness of the
Board and each Board member’s contribution. The conclusions
concerning the personal contribution of each director were
then transmitted by the Chairman of the Board who provided
individual feedback during dedicated one-on-one meetings with
each Board member.
Each director also had a meeting with the Chairman of the
Compensation & Governance Committee in order to collect his/
her assessment and suggestions on the personal contribution
of the Chairman of the Board of Directors. The conclusions of
these interviews were then submitted by the Chairman of the
Compensation & Governance Committee to the Chairman of
the Board of Directors.
The Compensation & Governance Committee reviewed in detail
(i) the conclusions of the Board self-assessment, (ii) the principal
areas identified for improvement and (iii) made recommendations
to the Board of Directors which were examined and approved at
the Board meeting of December 18, 2019.
The 2019 Board self-assessment demonstrated that all of the
directors agreed that the functioning of the Board had either
improved or remained unchanged at a high level due to the
maturity of processes and the eff iciency of the team formed by
the Chairman and the Chief Executive Off icer.
The members of the Board of Directors identified the following
areas of improvement:
■ closely monitor the selection of future Board members with
the objective of appointing (i) directors with predefined critical
skills (industry knowledge, digital/IT/technology, HR, customer/
marketing skills), and (ii) an additional seasoned and active or
former Chief Executive Off icer;
■ further involve the entire Board in the selection process of new
directors, in particular the Chairman of any Committee in which
the identified candidates are expected to sit;
■ strengthen the involvement of the entire Board in the process
of setting the objectives of the Chief Executive Off icer, assessing
his performance and discussing his compensation by organizing
two executive sessions prior to final decisions by the entire
Board;
■ closely monitor the selection of any future Chairman of the
Board of Directors and provide the Board with regular updates
on the work performed in this regard; carefully manage the
succession process for the current Chairman of the Finance
Committee in 2021; and regularly discuss with the Board the
succession plan for the Group Chief Executive Off icer and
Management Committee members;
■ find occasions for the Board members to meet with the
directors of the main operating subsidiaries (e.g. during the
Board strategic seminar or during personal trips);
■ provide the Board with post-mortem analysis or follow-up
reports on the main decisions or projects discussed/approved
by the Board;
■ continue to involve the directors in the choice of training
sessions; and
■ continue to provide and improve information sent by the Chief
Executive Off icer to the Board on insurance sector-related news
or reactions to public announcements made by the Company.

113I UNIVERSAL REGISTRATION DOCUMENT - ANNUAL REPORT 2019 - AXA I
CORPORATE GOVERNANCE
3
3.1 CORPORATE GOVERNANCE STRUCTURE
DIRECTORS’ ATTENDANCE AT BOARD AND COMMITTEE MEETINGS IN 2019
In 2019, the Board met ten times and the average attendance rate was 99.35%. Board meetings lasted approximately four hours on
average.
Directors
Board of Directors Audit Committee Finance Committee
Compensation
& Governance Committee
Number of
attendance/
Number of
meetings
Attendance
rate
Number of
attendance/
Number of
meetings
Attendance
rate
Number of
attendance/
Number of
meetings
Attendance
rate
Number of
attendance/
Number of
meetings
Attendance
rate
Denis Duverne 10/10 100% - - - - - -
Thomas Buberl 10/10 100% - - - - - -
Patricia Barbizet 10/10 100% - - - - 4/4 100%
Martine Bièvre 10/10 100% - - - - - -
Jean-Pierre Clamadieu 9/10 90% - - - - 5/5 100%
Bettina Cramm 10/10 100% - - - - 5/5 100%
Irene Dorner 10/10 100% 5/6 83.33% - - - -
Rachel Duan 10/10 100% - - - - 3/3 100%
Jean-Martin Folz 4/4 100% - - - - 1/1 100%
André François-Poncet 10/10 100% - - 5/5 100% 5/5 100%
Angelien Kemna 10/10 100% 6/6 100% - - - -
Stefan Lippe 10/10 100% 6/6 100% 5/5 100% - -
François Martineau 10/10 100% - - - - - -
Ramon de Oliveira 10/10 100% 4/6 66.67% 5/5 100% - -
Doina Palici-Chehab 10/10 100% - - 5/5 100% - -
Elaine Sarsynski 10/10 100% 6/6 100% - - - -
TOTAL ATTENDANCE RATE 99.35% 90% 100% 100%
I The Board Committees
The Board of Directors has established three specialized
Committees: the Audit Committee, the Finance Committee and
the Compensation & Governance Committee.
To ensure a well-balanced governance, the Board’s Terms
of Reference go beyond the requirements of French law and
specifically provide that independent directors have a major
role in all Board Committees, as follows:
■ each of the three Committees is chaired by an independent
director;
■ all members of the Audit Committee are independent directors;
■ all members of the Compensation & Governance Committee
are independent directors, with the exception of the director
representing the employees who sits on the Committee
pursuant to the Afep-Medef recommendations;
■ none of AXA’s corporate officers may be members of the
Committees.
Each Committee issues opinions, proposals or recommendations
to the Board of Directors on matters within the scope of its
responsibilities with each Committee Chairman reporting to
the Board at the following Board meeting. However, under French
law, Board Committees do not have any formal decision-making
power and are advisory only.

114 I UNIVERSAL REGISTRATION DOCUMENT - ANNUAL REPORT 2019 - AXA I
CORPORATE GOVERNANCE 3 3.1 CORPORATE GOVERNANCE STRUCTURE
The Committees may request external consulting expertise if
necessary. They may also invite external participants to attend
their meetings.
All Committees are composed of members with expertise in the
relevant areas, and their composition is regularly reviewed by
the Board of Directors.
The role, organization and responsibilities of each Committee
are set out in the Board’s Terms of Reference and in the Audit
Committee Terms of Reference available on AXA’s website.
AUDIT COMMITTEE IN 2019 (1)
Composition: Stefan Lippe (Chairman) – Irene Dorner – Angelien Kemna – Ramon de Oliveira – Elaine Sarsynski
In accordance with the Afep-Medef recommendations, the Audit Committee members are notably competent in the areas of finance
and/or accounting.
6
MEETINGS
90% 100%
ATTENDANCE
INDEPENDENT
DIRECTORS
Principal responsibilities Principal activities in 2019
The scope of the Audit Committee’s responsibilities is set out in its
Terms of Reference which are reviewed and approved each year by
the Board of Directors.
The principal missions of the Committee are to:
■ monitor the financial reporting process and the integrity of the
publicly reported results and disclosures made in the financial
statements;
■ monitor the adequacy and eff ectiveness of the internal control
and risk management frameworks;
■ form an opinion on the effectiveness, performance and
independence of the Group’s internal auditors;
■ consider the appointment and oversee the process for selecting
Statutory Auditors, monitor the Statutory Auditors’ audits and
review of the Group’s consolidated financial statements, as well
as the auditors’ independence and the breakdown of their fees
and make recommendations to the Board as to the appointment
of the Statutory Auditors to provide non-audit services.
The review of financial statements by the Audit Committee is
accompanied by a report from the Statutory Auditors on the main
results of the statutory audit and the accounting methods chosen
in this regard.
The Committee also receives presentations from the Group Chief
Risk Off icer and the Group Chief Financial Off icer describing the
Company’s principal risk exposures and where applicable the material
off -balance-sheet commitments.
The Committee examines and issues an opinion on documents
required by the Solvency II.
The Committee regularly meets the Statutory Auditors and the Global
Head of Internal Audit during ad hoc sessions.
The Chief Executive Off icer, the Group Deputy Chief Executive Off icer
(Directeur Général Adjoint ) & General Secretary, the Chief Financial
Off icer, the Global Head of Internal Audit, the Group Chief Risk Off icer,
the Group Chief Accounting Off icer, as well as the Statutory Auditors
attend each Audit Committee meeting.
The Committee focused, in particular, on the following issues:
■ the 2018 financial statements;
■ the 2018 Annual Report (Universal Registration Document);
■ the 2019 half-year financial statements;
■ internal control and risk management (reports on the financial and
operational risks, compliance, litigation, Group IT security – cyber
risk, on the Group’s Internal Financial Control (IFC) function, and
the Group’s Standards…);
■ risk management, risk appetite and reporting framework;
■ compliance with the Solvency II regulations and the review of the
ORSA, SFCR and RSR reports;
■ the results of internal and external audit work;
■ the review of Management’s draft response to requests sent by
the ACPR;
■ the review, for recommendation to the Board, of the non-audit
services provided by the Statutory Auditors;
■ the review of the Statutory Auditors’ rotation process; and
■ the internal and external audit plans and resources.
(1) At December 31, 2019.

115I UNIVERSAL REGISTRATION DOCUMENT - ANNUAL REPORT 2019 - AXA I
CORPORATE GOVERNANCE
3
3.1 CORPORATE GOVERNANCE STRUCTURE
FINANCE COMMITTEE IN 2019 (1)
Composition: Ramon de Oliveira (Chairman) – André François-Poncet – Stefan Lippe - Doina Palici-Chehab
5 100 % 75 %
MEETINGS ATTENDANCE
INDEPENDENT
DIRECTORS
Principal responsibilities Principal activities in 2019
The principal missions of the Committee are:
■ to examine and issue an opinion on any plan to sell some or all
ownership interests held by the Company, or any acquisition or
strategic partnership, whatever form they may take, when their
immediate or deferred value exceeds the €500 million threshold;
■ to examine and issue an opinion on any sureties, guarantees,
endorsements and warrantees in favor of third parties which
exceed the delegations of power granted to the Chief Executive
Off icer by the Board of Directors;
■ to examine and issue an opinion on any of the following:
– securities issuances giving a claim, whether directly or indirectly,
to the Company’s share capital,
– share repurchase programs proposed to the Ordinary
Shareholders’ Meeting,
– financing operations that could substantially change the
Company’s financial structure;
■ to examine any plan to perform a financial operation of significant
size for the AXA Group;
■ to examine any subject relating to the financial management of
the AXA Group including:
– the policy on financial risk management,
– the liquidity and financing of the Group,
– solvency and capital management;
■ to examine the impact of the main orientations and limits of
Asset Liability Management policy on the Group’s capital and
solvency; and
■ to review the risk appetite framework developed by the Executive
Management for financial, insurance and operational exposures.
The Group Chief Financial Off icer and the Group Chief Risk Off icer
attend each Finance Committee meeting.
The Chairman of the Board of Directors, as well as the Chief Executive
Off icer, although not members of the Committee, contribute to the
work of the Committee and attend its meetings.
The Committee focused, in particular, on the following issues:
■ macroeconomic environment;
■ capital and solvency;
■ debt and liquidity;
■ financial risk management;
■ risk appetite and asset allocation;
■ review of the 2019 investment strategy;
■ the Pre-emptive Recovery Plan;
■ M&A projects (above €500 million);
■ the impact of low rates environment;
■ review of financial authorizations including guarantees; and
■ review of the proposed capital increase reserved for the employees
of the AXA Group (Shareplan 2019).
(1) At December 31, 2019.

116 I UNIVERSAL REGISTRATION DOCUMENT - ANNUAL REPORT 2019 - AXA I
CORPORATE GOVERNANCE 3 3.1 CORPORATE GOVERNANCE STRUCTURE
COMPENSATION & GOVERNANCE COMMITTEE IN 2019 (1)
Composition: Jean-Pierre Clamadieu (Chairman) – Patricia Barbizet – Bettina Cramm - Rachel Duan – André François-Poncet
5 100% 80%
MEETINGS ATTENDANCE
INDEPENDENT
DIRECTORS (2)
Principal responsibilities Principal activities in 2019
The principal missions of the Committee are:
■ to issue proposals to the Board of Directors on:
– the recommendations to the Shareholders’ Meeting for the
appointment and the re-appointment of the members of the Board
of Directors,
– the composition of the Board Committees,
– the appointment of the Chairman, the Senior Independent Director,
the members of the Executive Management and the persons who
eff ectively run the Company (dirigeants effectifs ) as defined under
the Solvency II.
The Committee also prepares, with the Chairman of the Board
of Directors and the Chief Executive Off icer, the succession of
the Executive Management.
The members of the Committee are also kept informed of the
appointments of the main executives of the Group, and in
particular the members of the Management Committee;
■ to issue proposals to the Board of Directors on:
– the compensation of the Chairman of the Board of Directors and the
Chief Executive Off icer and the preparation of their annual assessment,
– the amount of directors’ fees for the members of the Board of Directors
to be submitted to the Shareholders’ Meeting,
– the number of Company performance shares to be granted to the Chief
Executive Officer and the other members of the Management Committee;
■ to formulate an opinion on the proposals of the Chief Executive Off icer
concerning:
– the principles and conditions for the determination of the
compensation of the main executives of the AXA Group,
– the overall annual allocation of Company performance shares to
employees of the AXA Group;
The Chief Executive Off icer also informs the Committee of the
compensation of the main executives of the AXA Group;
■ in depth analysis of certain Group human resources topics, including
the annual review of the Company’s policy with respect to professional
equality and equal pay;
■ to examine the Group’s strategy on corporate responsibility and other
related issues;
■ in depth analysis certain governance matters relating to the operation
and organization of the Board of Directors and the organization of the
periodic self-assessment of the Board of Directors; and
■ to review the AXA Compliance & Ethics Code.
The Group Deputy Chief Executive Off icer (Directeur Général Adjoint ) & General
Secretary attends each Compensation & Governance Committee meeting.
The Chairman of the Board of Directors, as well as the Chief Executive Off icer,
although not members of the Committee, contribute to the work of the
Committee and attend its meetings, except when their personal situation
is discussed.
The Committee prepares, with the Chairman of the Board of Directors and the
Chief Executive Off icer, the succession of the Executive Management, including
emergency succession, and reports regularly to the Board of Directors. It also
regularly ensures the existence of succession plans, with diff erent time horizons
(short, medium, long), for each member of the Management Committee.
The Committee in particular focused on the following issues:
Compensation issues:
■ the compensations paid to the Chief Executive Off icer, the Company
dirigeants effectifs (as defined under the Solvency II) and the
members of the Management Committee;
■ the 2019 and 2020 equity allocations (performance shares) and
performance conditions;
■ the grant of performance shares relating to retirement;
■ the Group Remuneration policy and its evolution;
■ the ex post and ex ante “say-on-pay” for corporate off icers;
■ the compensation ratios (PACTE law); and
■ the amount and allocation of the directors’ fees.
Governance issues:
■ the selection process for future directors;
■ the composition of the Board and its Committees as well as the
composition of the Management Committee;
■ the independence of the members of the Board;
■ the self-assessment of the Board of Directors; and
■ the succession plan (including the emergency succession plan) of
the Executive Management.
Corporate Responsibility issues:
■ the review of the Company’s Corporate Responsibility strategy and
the Group’s environmental policy; and
■ the Diversity & Inclusion strategy.
(1) At December 31, 2019.
(2) All members of the Compensation & Governance Committee are independent directors, with the exception of the director representing the employees who sits on the Committee pursuant to the Afep-Medef recommendations.

117I UNIVERSAL REGISTRATION DOCUMENT - ANNUAL REPORT 2019 - AXA I
CORPORATE GOVERNANCE
3
3.1 CORPORATE GOVERNANCE STRUCTURE
I Executive Management
The Chief Executive Off icer is assisted in the day-to-day operational
management of the Group by a Management Committee and a
Partners group.
THE CHIEF EXECUTIVE OFFICER
The Chief Executive Off icer is vested with the broadest powers
to act in all circumstances on behalf of the Company and to
represent the Company in its relationships with third parties.
He exercises these powers within the scope of the Company’s
corporate purpose and subject to the powers expressly assigned
by law to the Shareholders’ Meetings and the Board of Directors.
In addition, the Board’s Terms of Reference provide for specific
limitations of the powers of the Chief Executive Off icer and require,
in addition to legal requirements, prior Board approval for certain
significant transactions as indicated in the Section “Board of
Directors” above.
The Chief Executive Off icer reports to the Board on a regular basis
on the Company’s financial condition and all key issues, and
provides regular written updates to the Board between meetings.
THE MANAGEMENT COMMITTEE
The Management Committee’s role is to assist the Chief Executive
Off icer in the operational management of the Group.
The Management Committee meets fortnightly to discuss Group
strategic, financial and operational matters. The Management
Committee has no formal decision-making authority and is
advisory in nature.
COMPOSITION OF THE MANAGEMENT COMMITTEE ON FEBRUARY 20, 2020
Name Principal function within AXA
Thomas Buberl Chief Executive Off icer of AXA
George Stansfield Group Deputy Chief Executive Off icer (Directeur Général Adjoint ) & General Secretary
Gérald Harlin Group Deputy Chief Executive Off icer (Directeur Général Adjoint ) & Executive Chairman of AXA Investment Managers
Etienne Bouas-Laurent Group Chief Financial Off icer
Benoît Claveranne Chief Executive Off icer International & New Markets
Georges Desvaux Chief Strategy and Business Development Off icer
Scott Gunter Chief Executive Off icer of AXA XL
Alban de Mailly Nesle Group Chief Risk and Investment Off icer
Antimo Perretta Chief Executive Off icer Europe
Jacques de Peretti Chief Executive Off icer of AXA France
Karima Silvent Chief Human Resources Off icer
Astrid Stange Chief Operating Off icer
Gordon Watson Chief Executive Off icer Asia
THE PARTNERS GROUP
The Partners group is composed of the members of the
Management Committee and over thirty other senior executives
from across the Group. Its principal role is to assist the Chief
Executive Off icer and the Management Committee in the definition
and implementation of key strategic initiatives in the context of
the strategic plans and to contribute to a permanent strategic
dialogue throughout the Group. It has no formal decision-making
authority and is advisory in nature. The Partners group meets at
least twice a year.
The complete list of the members of the Partners group is available
on the AXA Group website (www.axa.com).

118 I UNIVERSAL REGISTRATION DOCUMENT - ANNUAL REPORT 2019 - AXA I
CORPORATE GOVERNANCE 3 3.1 CORPORATE GOVERNANCE STRUCTURE
I Other information
SERVICE CONTRACTS BETWEEN
THE AXA GROUP AND MEMBERS
OF THE BOARD OF DIRECTORS
Mrs. Doina Palici-Chehab, who is the employee shareholder
representative on AXA’s Board of Directors, is currently an employee
of the GIE AXA (France).
Mrs. Martine Bièvre, who is an employee representative
on AXA’s Board of Directors, is currently an employee of AXA
France IARD, which is one of AXA’s main French subsidiaries.
Mrs. Bettina Cramm, who is also an employee representative
on AXA’s Board of Directors, is currently an employee of AXA
Konzern AG, which is one of AXA’s main German subsidiaries.
FAMILY RELATIONSHIPS
To the best of the Company’s knowledge, there are no family
relationships among the members of the Board of Directors or
with members of the Executive Management.
OTHER INFORMATION ON MEMBERS
OF THE BOARD OF DIRECTORS
Absence of conflicts of interests
According to the Board’s Terms of Reference and the
recommendations of the Afep-Medef Code, each member of
the Board of Directors is required to inform the Chairman of the
Board of Directors and/or the Senior Independent Director of
any situation concerning her/him which may create a conflict of
interest with the Company or the companies of the AXA Group,
and to abstain from voting on any related resolution.
The Chairman of the Board of Directors and the Chief Executive
Off icer do not currently carry out any professional activity or
hold any directorship outside the AXA Group that the Board
believes substantially interfere with or impede in any material way
their availability to focus on the Group and its business. Certain
members of the Board of Directors, however, are corporate off icers
and/or executives of companies that may have agreements or enter
into transactions from time to time with the AXA Group including
furnishing services or goods, providing credit facilities, purchases
of securities (for their own account or for third parties), and/or
underwriting of securities, and/or product and service providing.
These agreements or deals are systematically negotiated and
performed at arm’s length terms and conditions. Consequently,
AXA does not believe that any of these agreements or transactions
give rise to any conflicts of interests between (i) the director’s
duties towards AXA and (ii) their private interests and/other duties.
To the best of the Company’s knowledge, there are no agreements
or arrangements that have been entered into with major
shareholders, customers, suppliers or others pursuant to which
a member of the Board of Directors was selected.
Absence of any conviction in relation
to fraudulent off ences, any off icial
public incrimination and/or sanctions,
or any responsibility in a bankruptcy
for the last five years
To the best of the Company’s knowledge, none of the members
of its Board of Directors have been, during the last five years
(i) subject to any conviction in relation to fraudulent off ences or
to any off icial public incrimination and/or sanction by statutory
or regulatory authorities (including designated professional
bodies), (ii) disqualified by a court from acting as a member of
the administrative, management or supervisory body of an issuer
or from acting in the management or conduct of the aff airs of
any issuer, or (iii) associated as a member of the administrative,
management or supervisory body with any company that has
declared bankruptcy or been put into receivership, liquidation,
or administration provided, however, that AXA has from time to
time sold, discontinued and/or restructured certain business
operations and voluntarily liquidated aff iliated companies in
connection with these or similar transactions and certain members
of AXA’s Board of Directors may have been associated with other
companies that have undertaken similar solvent liquidations.

119I UNIVERSAL REGISTRATION DOCUMENT - ANNUAL REPORT 2019 - AXA I
CORPORATE GOVERNANCE
3
3.1 CORPORATE GOVERNANCE STRUCTURE
EMPLOYEES
The table below sets forth the number of salaried employees of the AXA Group over the past three years broken down by segment:
Salaried employees (Full time equivalent)
At December 31,
2019
At December 31,
2018
At December 31,
2017 restated (a)
France (b)(c)
16,780 16,570 15,926
Europe (including AXA Bank Belgium) 30,311 30,534 29,604
Of which Switzerland 4,110 4,028 3,890
Of which Germany (d) 8,590 8,922 7,969
Of which Belgium (including AXA Bank Belgium) (e)(f) 3,767 3,881 4,019
Of which United Kingdom & Ireland (g) 9,644 9,465 9,345
Of which Spain 2,410 2,467 2,599
Of which Italy 1,790 1,772 1,783
Asia 11,799 8,124 7,965
Of which Japan 2,963 2,874 2,804
Of which Hong Kong 1,701 1,720 1,640
Of which Asia – Direct 2,742 2,771 2,597
Of which China (h) 2,988 - -
Of which Thailand 465 450 537
Of which Indonesia 320 309 387
AXA XL (i)
9,179 9,071 1,544
United States (j) - 7,959 7,636
International (excluding AXA Bank Belgium) (k)
14,164 13,854 13,852
Transversal & Central Holdings 18,229 17,954 19,201
Of which AXA Investment Managers 2,366 2,356 2,399
Of which Group Management Services 938 851 1,086
Of which AXA Group Operations and AXA Business
Services (l) 6,765 6,170 7,061
Of which AXA Assistance (m) 7,792 8,213 8,170
Of which AXA Global Re 145 167 263
TOTAL 99,843 104,065 95,728
Employees of non-consolidated companies or companies accounted for using the equity method are not included in the above table.
(a) Restated: as per the new governance in force since 2018.
(b) A portion of the employees of AXA’s French aff iliates is included in GIEs.
(c) In 2019, the increase by 210 in France was mainly driven by recruitments in both sales platform and call centers in Morocco, as well as business growth.
(d) In 2019, the decrease by 332 in Germany reflected eff iciency programs.
(e) Some employees of AXA Bank Belgium provide common services for both insurance and banking activities and vice versa.
(f) In 2019, the decrease by 114 in Belgium was mainly driven by restructuring measures.
(g) In 2019, the increase by 179 in UK & Ireland was mainly driven by recruitments in compliance and regulatory projects, as well as business growth.
(h) In 2019, the increase by 2,988 in China was driven by the full consolidation of AXA Tianping in AXA Group’s financial statements as at December 31, 2019.
(i) In 2019, the increase by 108 in AXA XL is mainly due to the internal transfer of employees to AXA Art.
(j) In 2019, the decrease by 7,959 in the United States was driven by the deconsolidation of Equitable Holdings, Inc. in AXA Group’s financial statements as at December 31, 2019.
(k) In 2019, the increase by 310 in International (excluding AXA Bank Belgium), was mainly driven by Mexico (+162) due to business growth and higher recruitments related to projects and Colombia (+101 ) due to business growth.
(l) In 2019, the increase by 595 was mainly driven by AXA Group Operations (+485) from internal transfer of employees from GIE AXA to AXA Group Operations, as well as the development of shared services centers in both the Philippines and Malaysia.
(m) In 2019, the decrease by 421 in AXA Assistance was mainly driven by the Americas Region (-389) related to contract cancellations and simplification programs.

120 I UNIVERSAL REGISTRATION DOCUMENT - ANNUAL REPORT 2019 - AXA I
CORPORATE GOVERNANCE 3 3.2 EXECUTIVE COMPENSATION AND SHARE OWNERSHIP
3.2 EXECUTIVE COMPENSATION AND SHARE OWNERSHIP
INTRODUCTION
AXA’s global executive compensation policy is designed to align
the interests of the executives with those of the Company and its
shareholders while establishing a clear and straightforward link
between performance and compensation. In this context, its main
objective is to encourage the achievement of ambitious objectives
and the creation of long-term value by setting challenging
performance criteria.
AXA’s executive compensation structure is based on an in-depth
analysis of market practices in France and abroad, within the
financial services sector (insurance companies, banks, asset
managers, etc.) and of other international groups.
AXA Group’s overall policy on executive compensation focuses
on the variable part of the compensation package, which is the
compensation at risk for beneficiaries. The structure of AXA’s
executive compensation is composed of a variable portion which
represents a significant part of the aggregate compensation. This
is designed to align executive compensation more directly with
the operational strategy of the Group and the interests of the
shareholders while encouraging performance:
■ both on an individual and collective level; and
■ over the short, medium and long term.
Individual
S kills
Individual
Performance
Entity
Performance
AXA Group
Performance
AXA Share
Performance
Performance
Shares
Deferred Variable
Annual Variable
Fixed Salary
CurrentShort term
(1 year)
Medium term
(2 - 3 years)
Medium -
Long term
(3 - 5 years)

121I UNIVERSAL REGISTRATION DOCUMENT - ANNUAL REPORT 2019 - AXA I
CORPORATE GOVERNANCE
3
3.2 EXECUTIVE COMPENSATION AND SHARE OWNERSHIP
I Corporate off icers’ and executives’ compensation (1)
(1) The information in this section is presented in accordance with the recommendation No. 2009-16 of the AMF, as modified on July 25, 2019, and with the recommendations of the Afep-Medef Code.
COMPENSATION OF THE CORPORATE
OFFICERS AND MANAGEMENT COMMITTEE
MEMBERS ON DECEMBER 31, 2019
Governance
The principal mission of the Compensation & Governance
Committee of AXA’s Board of Directors is to formulate propositions
to the Board regarding, in particular, (i) the Company’s
compensation policy and principles, (ii) the determination of the
corporate off icers’ compensation and performance assessment,
and (iii) the grant of AXA performance shares to the Group
Chief Executive Off icer and the other members of the Group
Management Committee.
Most of the members of the Compensation & Governance
Committee are independent. Their independence is assessed
annually by the Board in accordance with the criteria set forth
in the Afep-Medef Code. The Senior Independent Director is the
Chairman of the Committee and presents the compensation
policy of the Company each year at the Shareholders’ Meeting.
The Committee meets frequently with the Group Executives
and the departments of the Company including Group Human
Resources and Group Legal. The Committee is empowered to
undertake or commission specific reviews and to use external
consulting expertise to the extent deemed appropriate. Thus,
during the last few years, the Committee worked several times
with a compensation-consulting firm in order to benefit from
an external technical expertise and an independent overview in
order to compare AXA’s variable compensation practices with
general market practices.
Solvency II Group remuneration policy
Solvency II regulations came into force on January 1, 2016, and
include a number of specific compensation and governance
requirements applicable to European insurers and reinsurers.
In this context, AXA has undertaken a comprehensive review
of its existing compensation policies and practices against the
requirements of Solvency II and has adopted a Remuneration
Policy applicable to all AXA employees as of January 1, 2016. This
Remuneration Policy is designed to support the Group’s long-
term business strategy and to align the interests of its employees
with those of other stakeholders by (i) establishing a clear link
between performance and remuneration over the short, medium
and long term, (ii) ensuring that the Group can off er competitive
compensation arrangements across the multiple markets in which
it operates while avoiding potential conflicts of interest that may
lead to undue risk taking for short-term gain, and (iii) ensuring
compliance with Solvency II regulations and any other applicable
regulatory requirements.
The AXA Group Remuneration Policy is designed to:
■ attract, develop and motivate critical skills and best talents;
■ drive superior performance;
■ align compensation levels with business performance;
■ ensure that employees are not incentivized to take inappropriate
and/or excessive risks and that they operate within AXA’s overall
risk framework; and
■ ensure compliance of the Group’s practices with all applicable
regulatory requirements.
It follows four main guiding principles:
■ competitiveness and market consistency of the remuneration
practices;
■ fairness based on individual and collective performance, in
order to ensure remuneration is reflecting employee’s individual
quantitative and qualitative achievements and impact;
■ internal equity based on remuneration policies and procedures
designed to ensure that employees are paid equitably based on
criteria such as role, skills, contribution or impact, and do not
discriminate on the basis of gender or other irrelevant factors;
■ achievement of the Group’s overall financial and operational
objectives over the short, medium and long term as well as
execution against medium and long-term strategic objectives
as a prerequisite to fund any mid-to-long term award.
The requirements set out in the Group Remuneration Policy
may be supplemented in order to comply with local regulatory
requirements or best practices. The Policy is reviewed and updated
annually to mirror, as the case may be, changes in the internal
organization and the nature, scale and complexity of the risks
inherent to AXA’s business and to reflect exchanges with the
French insurance regulator (Autorité de Contrôle Prudentiel et
de Résolution (ACPR)).
Remuneration structure
AXA applies a pay-for-performance approach which (i) promotes
long-term sustainable performance by incorporating risk
adjustment mechanisms in variable compensation schemes, and
(ii) recognizes employees who bring the greatest value to the firm
on the basis of financial results while demonstrating individual
leadership and behaviours. The intent of this approach is to
attract and retain the best skills and talents, to foster employee
engagement and to strengthen AXA’s leadership.

122 I UNIVERSAL REGISTRATION DOCUMENT - ANNUAL REPORT 2019 - AXA I
CORPORATE GOVERNANCE 3 3.2 EXECUTIVE COMPENSATION AND SHARE OWNERSHIP
The overall remuneration structure is based on the following
components, which are designed to provide balance and avoid
excessive risk taking for short-term financial gain:
■ a fixed component which comprises of a base salary and any
other fixed allowances. Fixed remuneration primarily reflects the
relevant organizational responsibility, professional experience,
technical and leadership skills required of the role, criticality
or scarcity of skills, as well as the individual’s capability to
sustainably perform the duties of the role;
■ a variable component which primarily reflects the business and
individual performance, including performance in excess of that
required to fulfil the role description. It comprises of an upfront
cash element (annual cash bonus) and a deferred element
recognizing the importance of aligning remuneration over long-
term value creation. The deferred element is awarded through
AXA performance shares. This variable component depends
on the AXA Group’s global performance, on the beneficiary’s
operating business performance, and on the achievement of
the executive’s individual objectives including demonstrated
abilities for leadership. The variable portion is designed to
represent a substantial component of the executive’s global
compensation and, where an executive attains or exceeds
the set objectives, to position the compensation levels of AXA
executives between the median and the third quartile (or, in
certain cases, beyond the third quartile) of the market reference.
The target level of the executives’ compensation and the structure
of the elements which compose such compensation are based
on a detailed analysis of market practices as well as potential
applicable national and international regulations, and also take
into consideration various other factors including the equity
principles within the Group and the previous compensation
level of the executive.
Each year, AXA, with the assistance of specialized firms, conducts
compensation reviews in order to ensure the competitiveness
and consistency of executives’ compensation and to measure
the suitability of the global remuneration policies. In this context,
three markets are used as a reference:
■ a first market composed of 12 companies in the French CAC 40
index (companies selected to form the panel, which may vary
from year-to-year, are comparable to AXA in terms of stock
capitalization, revenues, sector, number of employees and/
or geographic coverage);
■ a second market composed exclusively of international financial
companies comparable in size and scope to the AXA Group
(insurance companies and banks) which are principally based
in the main European markets (France, Germany, Italy, the
Netherlands, the United Kingdom, Spain and Switzerland),
and in the United States;
■ a third market composed exclusively of international financial
companies comparable in size and scope to the AXA Group
(insurance companies and banks) which are principally based
in Asia.
Annual cash compensation
TOTAL TARGET COMPENSATION
Total target compensation of the Chief Executive Off icer
The Board of Directors, upon recommendation of its
Compensation & Governance Committee, has decided to maintain
unchanged in 2019 the total annual cash compensation target
of the Chief Executive Off icer, Mr. Thomas Buberl, at €2,900,000.
This total target compensation is composed of a fixed annual
compensation and a target annual variable compensation.
The fixed annual compensation of the Chief Executive Off icer
amounts to €1,450,000 and the variable component of his
compensation is set at €1,450,000, i.e. 100% of his fixed annual
compensation.
The total amount of compensation of the Chief Executive Off icer
and the balance between its diff erent components (fixed and
variable) are mainly based on a study by an external advisory
firm (Willis Towers Watson) on compensation practices for similar
positions within a sample of CAC 40 companies as well as the
main European companies in the financial sector (insurance
companies, banks), and follows the recommendations of the
Afep-Medef Code, the G20, the European Commission and the
Financial Stability Board in terms of compensation.
Total compensation of the Chairman of the Board of Directors
The Board of Directors, upon proposal of its Compensation &
Governance Committee, has decided to maintain unchanged
in 2019 the fixed annual compensation of the Chairman of the
Board, Mr. Denis Duverne, at €1,200,000.
The Board of Directors upon recommendation of its
Compensation & Governance Committee and pursuant to the
recommendations of the Afep-Medef Code considered that the
compensation structure best suited for the Chairman of the
Board of Directors was to limit his compensation to a sole fixed
annual compensation.
In order to determine Mr. Denis Duverne’s fixed compensation,
the Board of Directions consulted an external advisory firm (Willis
Towers Watson) regarding compensation practices for similar
positions within a sample of CAC 40 companies as well as the
main European companies in the financial sector (insurance
companies, banks).
The Board of Directors also took into account the extensive duties
that it entrusted Mr. Denis Duverne with as Chairman of the Board
of Directors as described in Section 3.1 of this Annual Report.
Furthermore, Mr. Denis Duverne, who claimed his rights to pension
as of September 1, 2016, has decided to waive payment, for his
entire term of off ice as Chairman of the Board of Directors, of the
annuities which he would have received as from September 1,
2016, under the complementary pension scheme for Group
executive off icers in France, amounting to circa €750,000 per year.
Mr. Denis Duverne has decided not to receive payment of these
annuities until termination of his term of off ice as Chairman of
the Board without retroactive payment.

123I UNIVERSAL REGISTRATION DOCUMENT - ANNUAL REPORT 2019 - AXA I
CORPORATE GOVERNANCE
3
3.2 EXECUTIVE COMPENSATION AND SHARE OWNERSHIP
Finally, no variable compensation is paid to him, nor does he
receive directors’ fees or performance shares or any other long-
term incentive during his term of off ice.
ANNUAL VARIABLE COMPENSATION AND PERFORMANCE
CONDITIONS
Performance conditions
The variable annual compensation is entirely subject to
performance conditions and no minimum payment is guaranteed.
The determination of the variable compensation to be paid to
the Chief Executive Off icer, Mr. Thomas Buberl, was based in 2019
on the following two metrics:
■ Group performance for 50%. This metric is measured based
on (i) underlying earnings per share, (ii) return on equity
(adjusted Return on Equity – RoE), (iii) gross revenues in both
Commercial Property & Casualty and Health & Protection, and
(iv) Net Promoter Score (customer recommendation index).
The relative weight of each indicator is, respectively, 55%,
15%, 15% and 15%.
The selected indicators to measure the Group performance
reflect objectives widely disclosed internally and externally
with respect to growth, profitability, capital management,
operational eff iciency and proximity with clients. Thus, these
indicators, directly linked to the strategic orientations of the
Group, are both financial and operating criteria and rely on
achievement of a predefined budget and on target figure;
■ Individual performance for 50%, which is evaluated based on
objectives specifically related to strategic initiatives set and
reviewed each year.
The individual performance of the Chief Executive Off icer is
assessed on the basis of various indicators and qualitative and
quantifiable objectives set by the Board of Directors through a
written target letter drawn up at the beginning of each calendar
year. This letter includes detailed objectives about the Group’s
progress in the elaboration of its strategic plan as well as other
performance indicators and objectives designed to assess
the level of achievement of global strategic initiatives and/
or relating to certain geographic areas, and the evolution of
certain investments contributing to the development of the
Group’s operations.
Each of these two metrics is evaluated separately so that overall
variable payout reflects performance against two distinct
components (each capped at a 150% achievement rate) assessed
independently.
The determination of the actual amount of variable compensation
to be paid to the Chief Executive Off icer is based on the following
additive formula: Variable compensation due = Target Variable
compensation x (50% Group Performance + 50% Individual
Performance).
From 2020 performance year onwards, the weight of the Group
Performance within the variable compensation assessment
will increase to 70% leading to a decrease of the Individual
Performance weight to 30%.
With this evolution, the Board of Directors, upon recommendation
from its Compensation & Governance Committee, wished to
strengthen the formulaic/quantitative component of the Chief
Executive Off icer’s variable compensation, in line with market
practices in France and abroad, as well as feedback received
from a number of institutional investors.
MR. THOMAS BUBERL, CHIEF EXECUTIVE
OFFICER
Weighting
Achievement
rate
Group performance based on: 50% 108%
■ Underlying earnings per share 55% 98%
■ Return on equity 15% 112%
■ Gross revenues in Commercial
Property & Casualty and in Health
& Protection
15% 151%
■ Net Promoter Score 15% 93%
Individual performance based on: 50% 114.5%
■ XL integration: Ensure the
integration of AXA XL
25% 90%
■ Innovation: Scale innovation
to support acceleration of Payer
to Partner
15% 100%
■ Simplification: Make further
progress on AXA’s portfolio
transformation
25% 130%
■ Culture: Evolve culture, transform
leadership and develop his own
leadership
15% 130%
■ Execute selected key initiatives 20% 125%
Global performance 111%
In order to evaluate Mr. Thomas Buberl’s individual performance
in 2019, the Board of Directors assessed the achievement of the
following objectives set in his target letter:
■ XL integration:
• Realize the planned synergies of the XL integration,
• Start implementing the new global Commercial L ines
Strategy;
■ Innovation: Scale innovation to support acceleration of Payer
to Partner:
• Accelerate development of new business models in Health
through strategic partnerships and review of potential
acquisitions,
• Develop vertical integration in Health in 1 or 2 emerging
market(s);

124 I UNIVERSAL REGISTRATION DOCUMENT - ANNUAL REPORT 2019 - AXA I
CORPORATE GOVERNANCE 3 3.2 EXECUTIVE COMPENSATION AND SHARE OWNERSHIP
■ Simplification: Make further progress on AXA’s portfolio
transformation:
• Continue the sell down of EQH, if market allows it,
• Achieve relevant steps in deleveraging AXA;
■ Culture: Evolve culture, transform leadership and develop his
own leadership:
• Improve Employee Net Promoter Score (eNPS) by 5 points
on average compared to the December 2018 score,
• Further strengthen diversity by 3 points within the newly
created Global Leadership Network (GLN),
• Manage the succession of the Group CFO;
■ Execute selected key initiatives:
• Progress on the implementation of the China strategy
(complete acquisition of 100% of AXA Tianping…),
• Progress on the implementation of AXA IM’s strategy and
transformation.
The total eff ective variable compensation of the Chief Executive
Off icer may not exceed 150% of his variable target compensation,
i.e. 150% of his fixed annual compensation.
A deferral mechanism applies to 30% of his variable compensation
over a two-year period.
Pursuant to Article L.225-100 III of the French Commercial
Code, the payment of the Chief Executive Off icer’s 2019 variable
compensation is withheld until the approval of the Shareholders’
Meeting on April 30, 2020.
Performance conditions applicable to the other members of the
Management Committee
For the other members of the Management Committee, their
variable compensation is also determined on the basis of an
individual predefined target which is entirely based on the
following formulas.
Management Committee members’ performance with operating
business responsibilities is determined according to the following
metrics: 50%* (50% Entity Score + 50% Group STIC Score) + 50%
Individual Performance Score.
The variable compensation of the members of the Management
Committee with Group responsibilities is determined according
to the following metrics: (50%* Group STIC Score + 50% Individual
Performance Score).
The variable compensation of Management Committee
members who hold Group key functions as defined under the
Solvency II regulations is exclusively determined by the individual
performance.
Group performance is measured by the (i) underlying earnings
per share, (ii) return on equity (adjusted Return on Equity – ROE),
(iii) gross revenues in both Commercial Property & Casualty
and Health & Protection, and (iv) Net Promoter Score (customer
recommendation index). Individual performance is evaluated
considering predetermined objectives specifically deriving from
strategic initiatives.
The performance of operating businesses is determined in
particular on the basis of the following performance indicators:
■ Underlying earnings;
■ Property & Casualty current year combined ratio;
■ Health & Protection current year/all year combined ratio;
■ Commercial Property & Casualty gross revenues;
■ Health & Protection gross revenues;
■ Net Promoter Score.
Performance indicators that measure the Group performance
are defined at the beginning of the year with:
■ a predefined target, aligned with the strategic plan (budget),
the completion of which will result in 100% achievement;
■ a floor (at which the STIC pay-out is 25%), which defines the
threshold below which no variable compensation for that
component will be paid;
■ a cap (at a STIC pay-out of 175%), which defines the threshold
above which the variable compensation for that component
is capped.
Individual performance is assessed both on (i) the achievement
of results for each predetermined individual objective and
(ii) qualitative factors, including leadership skills demonstrated
by the members of the Management Committee measured against
the goals listed below:
■ improving customer satisfaction;
■ rolling-out diff erentiated Payer-to-Partner Services;
■ making AXA XL a success;
■ accelerating simplification;
■ striving to be the most inspiring company to work for and boost
employee engagement.
In the tables of this section, compensation not paid in Euro was
converted into Euro on the basis of the following yearly average
exchange rates for 2019: 1 USD = 0.8933 EUR; 1 HKD = 0.1140 EUR
and 1 CHF = 0.8989 EUR.
The variable compensations paid to the Management Committee
members for 2017, 2018 and 2019 were:

125I UNIVERSAL REGISTRATION DOCUMENT - ANNUAL REPORT 2019 - AXA I
CORPORATE GOVERNANCE
3
3.2 EXECUTIVE COMPENSATION AND SHARE OWNERSHIP
VARIABLE COMPENSATIONS PAID TO MANAGEMENT COMMITTEE MEMBERS
Members of the Management Committee
(in Euro) Country
Variable compensation
for the year 2017
Variable compensation
for the year 2018
Variable compensation
for the year 2019
Target Actual (b)
%
Target Target Actual (b)
%
Target Target Actual
%
Target
Thomas Buberl Chief Executive Off icer France 1,450,000 1,754,500 (a) 121% 1,450,000 1,725,500 (a) 119% 1,450,000 1,609,500 (a) (c) 111%
Total of the other Management
Committee members (d) 5,032,997 6,128,763 122% 8,691,210 10,453,693 120% 9,363,562 8,017,777 99%
(a) This amount includes the part of the variable compensation with respect to 2017, 2018 and 2019 which has been deferred in accordance with the mechanism described on page 125 . The total amount paid will depend on performance conditions and may then vary.
(b) Amount before deduction of 70% of directors’ fees.
(c) Pursuant to Article L.225-100 III of the French Commercial Code, the payment of the Chief Executive Off icer’s 2019 variable compensation is withheld until the approval of the Shareholders’ Meeting on April 30, 2020.
(d) As at December 31, 2019, the Management Committee was comprised of 13 members (compared to 11 as at December 31, 2018).
ANNUAL DEFERRED VARIABLE COMPENSATION
Since 2013, the Board of Directors has implemented a deferral
mechanism for 30% of for the executive officers’ variable
compensation over a two-year period.
Under this mechanism, the Chief Executive Off icer’s deferred
amount of variable compensation for the 2019 fiscal year will be
paid out in two tranches, in 2021 and 2022. The actual amount to
be paid will vary depending on the AXA share price performance
over the deferral period and will be subject to a minimum of 80%
and a cap at 120% of the deferred amount; provided, however
that no deferred variable compensation would be paid in the
event (i) that the Group’s underlying earnings are negative for the
year ending immediately prior to the year of scheduled payout,
or (ii) of resignation or dismissal, for gross or wil ful misconduct
prior to the payout date (clawback provision).
The variable compensation deferral component is subject to a
clawback mechanism which, while not required by law in France,
is designed to further align AXA’s policy with current practices,
laws and regulations on executive compensation in the financial
services sector internationally.
At the end of February 2020, (i) the second tranche of Mr. Thomas
Buberl’s deferred variable compensation for the 2017 fiscal year,
i.e. an amount of €244,125 and (ii) the first tranche of Mr. Thomas
Buberl’s deferred variable compensation for the 2018 fiscal year
i.e. an amount of €260,575 were paid.
These amounts reflect the evolution of the AXA share price and
were set at 93% of the deferred variable compensation granted
in respect of the 2017 fiscal year and at 101% in respect of the
2018 fiscal year.
All the amounts presented in this Section 3.2 are gross amounts
and before taxation.
Long-term incentive (LTI) annual allotment
Each year, LTIs (performance shares) are granted to Group
executives.
These LTIs represent a significant part of their global variable
compensation in order to associate the Group executives to the
creation of long-term value. In this context, the number of LTIs
granted is set so that the executives are between the median
and the 3rd quartile of market references considering the global
amount of the variable part (comprised of one part in cash and
one part in LTIs). The Compensation & Governance Committee
and the Board of Directors however ensure that the performance
shares granted to the Group executives and valued in accordance
with IFRS standards are not disproportionate compared to the
aggregate compensation and shares granted to the said executives.
These performance shares are integrally subject to performance
conditions (please refer to pages 131 and following) and therefore
do not guarantee any grant or minimal gain for the beneficiaries.
The Board of Directors, upon recommendation of its
Compensation & Governance Committee, decided that Mr. Denis
Duverne, as Chairman of the Board of Directors shall not receive
any performance shares or other long-term incentive during his
term of off ice.

126 I UNIVERSAL REGISTRATION DOCUMENT - ANNUAL REPORT 2019 - AXA I
CORPORATE GOVERNANCE 3 3.2 EXECUTIVE COMPENSATION AND SHARE OWNERSHIP
SUM MARY OF COMPENSATION, OPTIONS AND PERFORMANCE SHARES GRANTED
TO MANAGEMENT COMMITTEE MEMBERS
Members of the
Management Committee
(in Euro) Country
Year 2018 Year 2019
Compen-
sation
granted in
respect of
the year
Value of
options
granted
during
the year
Value of
perfor-
mance
shares
granted
during
the year
Value of
interna-
tional per-
formance
shares
granted
during
the year TOTAL
Compen-
sation
granted in
respect of
the year
Value of
options
granted
during
the year
Value of
perfor-
mance
shares
granted
during
the year
Value of
interna-
tional per-
formance
shares
granted
during
the year TOTAL
Thomas
Buberl
Chief Executive
Off icer
France 3,234,959 (a) 229,748 1,577,687 0 5,042,394 3,063,544 (a) 0 2,024,558 0 5,088,102 (b)
Total of the other
Management Committee
members (c) 19,886,304 1,506,333 2,617,521 7,636,604 31,646,763 18,780,436 0 3,814,466 5,609,452 28,204,354
(a) This amount includes the part of the variable compensation with respect to 2018 or 2019 which has been deferred in accordance with the mechanism described on page 125 . The total amount paid will depend on performance conditions and may then vary.
(b) This amount includes the payment of the Chief Executive Off icer’s 2019 variable compensation which will be withheld until the approval of the Shareholders’ Meeting on April 30, 2020.
(c) As at December 31, 2019, the Management Committee was comprised of 13 members (compared to 11 as at December 31, 2018).
On each date of grant, the fair value of stock options and
performance shares is determined in accordance with IFRS
standards. This is a historical value on the date of grant,
calculated for accounting purposes as described in Note 26.3.1
“Share-based compensation instruments issued by the Group”
in Part 5 “Consolidated Financial Statements” of the Annual
Report. This value does not represent a current market value, a
current valuation of these options and performance shares, nor
the actual amounts that may be paid to beneficiaries if and when
the options are exercised or the performance shares are acquired.
On June 27, 2018, the fair value of one option was €1.17 for
options with performance conditions, and the fair value of one
performance share was €14.06.
On June 19, 2019, the fair value of one performance share was
€15.17.
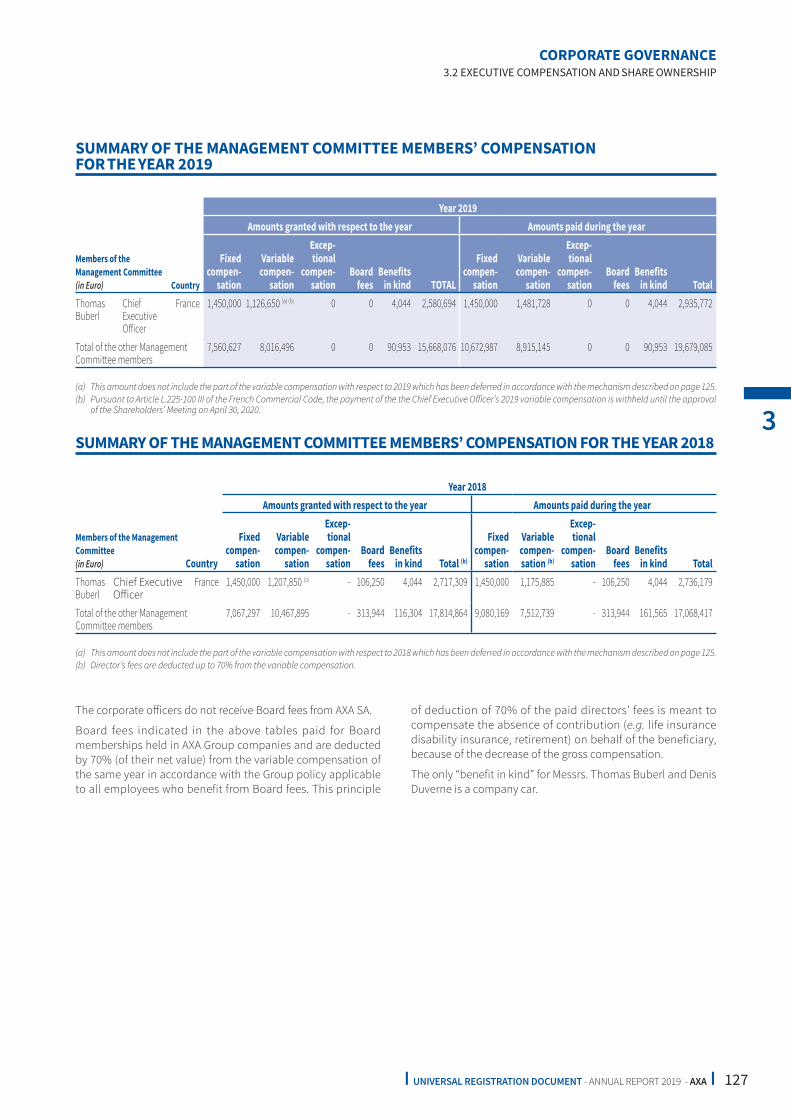
127I UNIVERSAL REGISTRATION DOCUMENT - ANNUAL REPORT 2019 - AXA I
CORPORATE GOVERNANCE
3
3.2 EXECUTIVE COMPENSATION AND SHARE OWNERSHIP
SUMMARY OF THE MANAGEMENT COMMITTEE MEMBERS’ COMPENSATION FOR THE YEAR 2018
Members of the Management
Committee
(in Euro) Country
Year 2018
Amounts granted with respect to the year Amounts paid during the year
Fixed
compen-
sation
Variable
compen-
sation
Excep-
tional
compen-
sation
Board
fees
Benefits
in kind Total (b)
Fixed
compen-
sation
Variable
compen-
sation (b)
Excep-
tional
compen-
sation
Board
fees
Benefits
in kind Total
Thomas
Buberl
Chief Executive
Off icer
France 1,450,000 1,207,850 (a) - 106,250 4,044 2,717,309 1,450,000 1,175,885 - 106,250 4,044 2,736,179
Total of the other Management
Committee members
7,067,297 10,467,895 - 313,944 116,304 17,814,864 9,080,169 7,512,739 - 313,944 161,565 17,068,417
(a) This amount does not include the part of the variable compensation with respect to 2018 which has been deferred in accordance with the mechanism described on page 125 .
(b) Director’s fees are deducted up to 70% from the variable compensation.
The corporate off icers do not receive Board fees from AXA SA.
Board fees indicated in the above tables paid for Board
memberships held in AXA Group companies and are deducted
by 70% (of their net value) from the variable compensation of
the same year in accordance with the Group policy applicable
to all employees who benefit from Board fees. This principle
of deduction of 70% of the paid directors’ fees is meant to
compensate the absence of contribution (e.g. life insurance
disability insurance, retirement) on behalf of the beneficiary,
because of the decrease of the gross compensation.
The only “benefit in kind” for Messrs. Thomas Buberl and Denis
Duverne is a company car.
SUMMARY OF THE MANAGEMENT COMMITTEE MEMBERS’ COMPENSATION
FOR THE YEAR 2019
Members of the
Management Committee
(in Euro) Country
Year 2019
Amounts granted with respect to the year Amounts paid during the year
Fixed
compen-
sation
Variable
compen-
sation
Excep-
tional
compen-
sation
Board
fees
Benefits
in kind TOTAL
Fixed
compen-
sation
Variable
compen-
sation
Excep-
tional
compen-
sation
Board
fees
Benefits
in kind Total
Thomas
Buberl
Chief
Executive
Off icer
France 1,450,000 1,126,650 (a) (b) 0 0 4,044 2,580,694 1,450,000 1,481,728 0 0 4,044 2,935,772
Total of the other Management
Committee members
7,560,627 8,016,496 0 0 90,953 15,668,076 10,672,987 8,915,145 0 0 90,953 19,679,085
(a) This amount does not include the part of the variable compensation with respect to 2019 which has been deferred in accordance with the mechanism described on page 125 .
(b) Pursuant to Article L.225-100 III of the French Commercial Code, the payment of the the Chief Executive Off icer’s 2019 variable compensation is withheld until the approval of the Shareholders’ Meeting on April 30, 2020.

128 I UNIVERSAL REGISTRATION DOCUMENT - ANNUAL REPORT 2019 - AXA I
CORPORATE GOVERNANCE 3 3.2 EXECUTIVE COMPENSATION AND SHARE OWNERSHIP
COMPENSATION RATIOS
As required by the regulation in force and in accordance with the Afep guidelines, the table below sets out the ratios comparing, on the
one hand, the Chief Executive Off icer’s and the Chairman’s compensation paid or granted in 2019 and, on the other hand, the mean
and median 2019 compensation of employees of the holding Company in France (AXA SA) (1) and, on a voluntary basis, of employees
of the Group’s France-based entities (2).
2019 Fiscal Year
(compensation paid or granted during the 2019 fiscal year) (a)
Ratio against
AXA SA’s
employees
mean
compensation
Ratio against
AXA SA’s
employees
median
compensation
Ratio against
employees
of AXA in
France’s mean
compensation
Ratio against
employees
of AXA in
France’s
median
compensation
Chief Executive Off icer’s Compensation 2.26 1.95 70.11 91.85
Chairman’s Compensation 0.51 0.44 15.76 20.64
(a) The elements of compensation selected for the purpose of the table above are: the fixed and variable compensation, LTIs (in IFRS value), Board fees, benefits in kind and collective profit-sharing, paid or granted to each relevant executive or employee during the fiscal year.
(1) Which has less than five employees.
(2) Around 15,000 employees.

129I UNIVERSAL REGISTRATION DOCUMENT - ANNUAL REPORT 2019 - AXA I
CORPORATE GOVERNANCE
3
3.2 EXECUTIVE COMPENSATION AND SHARE OWNERSHIP
As required by the regulation in force, the annual evolutions over the five most recent fiscal years of (i) the E xecutive O ff icers’ compensations
of the Company (AXA SA), (ii) the performance of AXA, (iii) the mean compensation of employees of the Company (AXA SA) and, on a
voluntary basis, (iv) of the employees of the Group’s France-based entities, and (v) the hereinabove mentioned ratios, are disclosed
in the table below.
Evolution
(as %)
between 2015
and 2016
Evolution
(as %)
between 2016
and 2017
Evolution
(as %)
between 2017
and 2018
Evolution
(as %)
between 2018
and 2019
Chairman & CEO’s Compensation (a) -30.08% (b ) N/A N/A N/A
Chief Executive Off icer’s Compensation (CEO) (c ) N/A N/A (d ) +4.44% (e ) +6.70%
Chairman’s Compensation (f) N/A 0.00% (7) 0.00% 0.00%
AXA’s Performance (Underlying Earnings Per Share) +4% +7% +3% +5%
AXA SA employees’ mean compensation -18.49% +16.74% +16.28% -6.05%
AXA entities in France employees’ mean compensation +1.13% +1.75% +3.51% +2.52%
Ratio between AXA SA Chairman & CEO’s compensation
and the mean compensation of AXA SA employees -14.22% (b ) N/A N/A N/A
Ratio between AXA SA CEO’s compensation
and the mean compensation of AXA SA employees N/A N/A (d ) -10.19% (e ) +13.57%
Ratio between AXA SA Chairman’s compensation
and the mean compensation of AXA SA employees N/A -14.35% (g ) -14.01% +6.44%
Ratio between AXA SA Chairman & CEO’s compensation
and the median compensation of AXA SA employees -23.49% (b ) N/A N/A N/A
Ratio between AXA SA CEO’s compensation
and the median compensation of AXA SA employees N/A N/A (d ) -5.73% (e ) +4.51%
Ratio between AXA SA Chairman’s compensation
and the median compensation of AXA SA employees N/A -14.23% (g ) -9.74% -2.06%
Ratio between AXA SA Chairman & CEO’s compensation
and the mean compensation of employees of AXA in France -30.86% (b ) N/A N/A N/A
Ratio between AXA SA CEO’s compensation and the mean
compensation of employees of AXA in France N/A N/A (d ) +0.89% (e ) +4.08%
Ratio between AXA SA Chairman’s compensation
and the mean compensation of employees of AXA in France N/A -1.73% (g ) -3.40% -2.45%
Ratio between AXA SA Chairman & CEO’s compensation
and the median compensation of employees of AXA in France -31.49% (b ) N/A N/A N/A
Ratio between AXA SA CEO’s compensation and the median
compensation of employees of AXA in France N/A N/A (d ) +1.57% (e ) +3.68%
Ratio between AXA SA Chairman’s compensation and
the median compensation of employees of AXA in France N/A -2.27% (g ) -2.75% -2.83%
(a ) The term of off ice of the Chairman & CEO ended on September 1, 2016.
(b ) The cash compensation granted to the Chairman & CEO in 2016 has been annualized for the purpose of the table above. No Long Term Incentives were granted to the Chairman & CEO in 2016 (year of retirement).
(c ) The CEO was appointed on September 1, 2016.
(d ) No variable compensation with respect to the CEO term of off ice was granted during 2016.
(e ) The variable compensation granted to the CEO in 2017 has been annualized for the purpose of the table above.
(f ) The Chairman was appointed on September 1, 2016.
(g ) The compensation granted to the Chairman in 2016 has been annualized for the purpose of the table above.
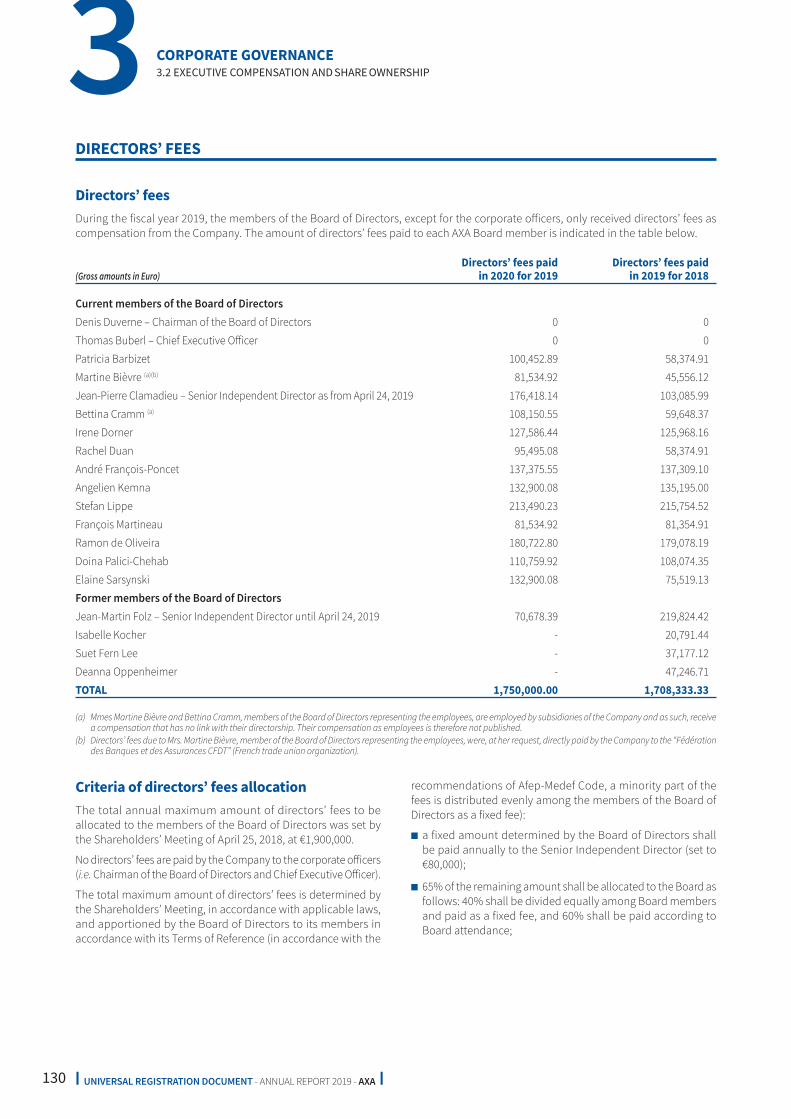
130 I UNIVERSAL REGISTRATION DOCUMENT - ANNUAL REPORT 2019 - AXA I
CORPORATE GOVERNANCE 3 3.2 EXECUTIVE COMPENSATION AND SHARE OWNERSHIP
DIRECTORS’ FEES
Directors’ fees
During the fiscal year 2019, the members of the Board of Directors, except for the corporate off icers, only received directors’ fees as
compensation from the Company. The amount of directors’ fees paid to each AXA Board member is indicated in the table below.
(Gross amounts in Euro)
Directors’ fees paid
in 2020 for 2019
Directors’ fees paid
in 2019 for 2018
Current members of the Board of Directors
Denis Duverne – Chairman of the Board of Directors 0 0
Thomas Buberl – Chief Executive Off icer 0 0
Patricia Barbizet 100,452.89 58,374.91
Martine Bièvre (a )(b ) 81,534.92 45,556.12
Jean-Pierre Clamadieu – Senior Independent Director as from April 24, 2019 176,418.14 103,085.99
Bettina Cramm (a ) 108,150.55 59,648.37
Irene Dorner 127,586.44 125,968.16
Rachel Duan 95,495.08 58,374.91
André François-Poncet 137,375.55 137,309.10
Angelien Kemna 132,900.08 135,195.00
Stefan Lippe 213,490.23 215,754.52
François Martineau 81,534.92 81,354.91
Ramon de Oliveira 180,722.80 179,078.19
Doina Palici-Chehab 110,759.92 108,074.35
Elaine Sarsynski 132,900.08 75,519.13
Former members of the Board of Directors
Jean-Martin Folz – Senior Independent Director until April 24, 2019 70,678.39 219,824.42
Isabelle Kocher - 20,791.44
Suet Fern Lee - 37,177.12
Deanna Oppenheimer - 47,246.71
TOTAL 1,750,000.00 1,708,333.33
(a ) Mmes Martine Bièvre and Bettina Cramm, members of the Board of Directors representing the employees, are employed by subsidiaries of the Company and as such, receive a compensation that has no link with their directorship. Their compensation as employees is therefore not published.
(b ) Directors’ fees due to Mrs. Martine Bièvre, member of the Board of Directors representing the employees, were, at her request, directly paid by the Company to the “Fédération des Banques et des Assurances CFDT” (French trade union organization).
Criteria of directors’ fees allocation
The total annual maximum amount of directors’ fees to be
allocated to the members of the Board of Directors was set by
the Shareholders’ Meeting of April 25, 2018, at €1,900,000.
No directors’ fees are paid by the Company to the corporate off icers
(i.e. Chairman of the Board of Directors and Chief Executive Off icer).
The total maximum amount of directors’ fees is determined by
the Shareholders’ Meeting, in accordance with applicable laws,
and apportioned by the Board of Directors to its members in
accordance with its Terms of Reference (in accordance with the
recommendations of Afep-Medef Code, a minority part of the
fees is distributed evenly among the members of the Board of
Directors as a fixed fee):
■ a fixed amount determined by the Board of Directors shall
be paid annually to the Senior Independent Director (set to
€80,000);
■ 65% of the remaining amount shall be allocated to the Board as
follows: 40% shall be divided equally among Board members
and paid as a fixed fee, and 60% shall be paid according to
Board attendance;

131I UNIVERSAL REGISTRATION DOCUMENT - ANNUAL REPORT 2019 - AXA I
CORPORATE GOVERNANCE
3
3.2 EXECUTIVE COMPENSATION AND SHARE OWNERSHIP
■ the remaining 35% shall be allocated by the Board of
Directors to the Board Committees as follows: 25% to the
Finance Committee, 25% to the Compensation & Governance
Committee, and 50% to the Audit Committee. Each Committee
shall then allocate such amount to its members as follows:
40% shall be divided equally among members and paid as
a fixed fee, and 60% shall be paid according to Committee
attendance, with the Chairman of the Committee receiving in
each case a double fee.
Mrs. Doina Palici-Chehab, member of the Board of Directors
representing the employee shareholders of the AXA Group, received
in 2019 an annual gross cash compensation of €1,579,943 in
connection with her position as Chief Integration Off icer. This
compensation consists of €700,000 of fixed compensation and
€879,943 of variable compensation.
I Performance shares and international performance shares
Performance shares are designed to recognize and motivate the
Group’s best talents and core skills by aligning the individuals’
interests with the overall performance of the AXA Group, and the
corresponding operational Entity/Business Unit as well as with the
stock performance of the AXA share over the medium-long term.
Performance shares generally result in low shareholder dilution
due to the possibility to deliver existing shares, this choice being
the one made up to this date.
Performance shares are usually granted to beneficiaries residing
in France while international performance shares are generally
granted to beneficiaries residing outside of France.
GRANT PROCEDURE
Within the multi-annual cap authorized by the shareholders, the
Board of Directors approves all performance share programs prior
to their implementation.
Each year, the Board of Directors, acting upon recommendation
of its Compensation & Governance Committee, approves a global
performance share pool to be granted.
The recommendations for grants of performance shares are
made by the management of each operating business and by the
Group’s functional department heads. These recommendations
are reviewed by the Executive Management to ensure a global
coherence and respect of the Group’s internal equity principles.
Individual grants of performance shares are then decided by
the Board of Directors, provided that individual grants to the
Chief Executive Off icer and other members of the Management
Committee are preceded by a proposal of the Compensation &
Governance Committee, which takes into consideration their
aggregate compensation elements as well as the market
studies carried out by the Group together with an independent
compensation-consulting firm. Furthermore, the grant to AXA
executive off icers shall depend on the level of achievement of the
strategic objectives previously defined by the Board of Directors.
The Board of Directors also decided that the total number of
performance shares granted to the Company’s executive off icers
each year may not exceed 10% of the aggregate number of
performance shares granted during the same year, to avoid an
excessive concentration of performance shares granted to the
executive off icers.
RULES REGARDING PERFORMANCE
SHARES AND PERFORMANCE CONDITIONS
Each beneficiary receives an initial, preliminary allocation of
performance shares that is used as a reference to calculate the
actual number of shares that will be definitely granted at the end
of a 3-year performance period.
During the performance period, all performance shares initially
granted are integrally subject to performance conditions regardless
of the beneficiary’s status. These criteria measure both the financial
and operational performance of the AXA Group as well as the
beneficiary’s operating business performance, according to pre-
determined targets.
The nature of these criteria as well as the associated targets are
defined and reviewed on a regular basis by the Board of Directors,
depending on the evolution of the Group’s strategic objectives
and aft er consideration of market practices as well as changes
in regulations. Thus, during the last few years, the performance
criteria used for this purpose have been linked to (i) the underlying
earnings and the adjusted earnings to measure the operating
businesses’ performance, and (ii) the adjusted earnings per share
to measure the AXA Group performance.
The achievement rate of the performance indicators (“performance
rate”) is used to determine the number of shares, which will
be definitively acquired by the beneficiaries at the end of the
acquisition period, under the condition that the beneficiary is still
employed by the AXA Group. The number of performance shares
definitively granted shall therefore be equal to the number of
performance shares initially granted multiplied by the performance
rate, which may vary between 0% and 130%.

132 I UNIVERSAL REGISTRATION DOCUMENT - ANNUAL REPORT 2019 - AXA I
CORPORATE GOVERNANCE 3 3.2 EXECUTIVE COMPENSATION AND SHARE OWNERSHIP
The AXA Group performance weighs for 40% performance of the
total performance while the operating business weighs for 50%.
For beneficiaries in Group functions (including AXA executive
off icers) as well as Head of Control Functions, the considered
operating business is the AXA Group.
Since the 2016 grant, two relative performance criteria were
introduced in the calculation of the global performance:
■ one criterion linked to Corporate Responsibility – CR (based on
the Dow Jones Sustainability Index “DJSI”) which weighs for
10% of the global performance rate. Accordingly, the average
of the scores achieved by AXA according to the DJSI during the
acquisition period is compared to the average of the scores
achieved by the other companies included in the DJSI over the
same period. Consequently, under this indicator:
• no share shall be granted if AXA’s score is lower than the
75th percentile (1),
• 80% of the shares shall be granted if AXA’s score is equal to
the 75th percentile,
• 100% of the shares shall be granted if AXA’s score is equal to
the 85th percentile, and
• a maximum of 130% of the shares shall be granted if AXA’s
score is equal or greater than the 95th percentile;
Between these minimal and maximal performance levels, the
number of shares definitely granted are calculated on a linear
basis depending on the performance achieved;
■ one financial criterion of relative performance is meant to
compare the growth of the total return of the AXA share (Total
Shareholder Return – “TSR”) with the growth of the TSR of the
stock reference index of the insurance sector (SXIP (2)) in order
to adjust upwards or downwards within the limit of 5 points the
global performance rate. Thus, AXA’s outperformance (150%
or more) compared to the SXIP index shall trigger a maximum
increase of the global performance rate of 5 points (subject
however to the upper limit of 130% of the global performance
rate) and AXA’s under-performance (75% or less) compared to
the SXIP index shall trigger a maximum decrease of 5 points
of the global performance rate. Between these minimal and
maximal performance levels, the number of shares definitely
granted shall be calculated on a linear basis depending on the
performance achieved.
The global performance rate is therefore calculated as follows: [10%
CR (DJSI) + 40% Group performance (Adjusted earnings per share)
+ 50% operating business performance [average (Adjusted earnings
+ Underlying earnings)]] +/- 5 points of relative performance (TSR)
within the upper limit of 130%.
Since the 2017 grant, the performance target setting is aligned with
the financial targets of the strategic plan over the performance
period (i.e. 3 years).
In the event of 100% achievement of the strategic plan targets
(“target”), the number of shares definitively granted at the end of the
acquisition period would be equal to the number of performance
shares initially granted.
Accordingly, for all beneficiaries except AXA’s executive off icers and
members of the Management Committee, should the performance be:
■ lower than 80% of the performance required to reach the target,
no share would be delivered to the beneficiary at the end of
the acquisition period; consequently the beneficiaries are not
guaranteed a minimal grant/gain;
■ equal to 80% of the performance required to reach the target,
the number of shares definitively granted would be equal to
80% of the number initially granted;
■ equal to 100% of the performance required to reach the target,
the number of shares definitively granted would be equal to
100% of the number initially granted;
■ equal to or higher than 130% of the performance required to
reach the target, the number of shares definitively granted would
be equal to 130% of the number initially granted.
For the executive off icers and members of the Management
Committee, should the performance be:
■ lower than the average cumulated results achieved over the
3 years immediately prior to the grant date, no share would be
delivered to the beneficiary at the end of the acquisition period;
consequently, in the absence of growth, no shares would be
granted, and no potential underperformance would be rewarded;
■ equal to 100% of the average cumulated results achieved over
the 3 years immediately prior to the grant date, the number of
shares definitively granted would be equal to 50% of the number
initially granted (the Board of Directors, upon recommendation
from its Compensation & Governance Committee, has decided
to lower this threshold to 40% from the 2020 grant onwards);
■ equal to 100% of the performance required to reach the target,
the number of shares definitively granted would be equal to
100% of the number initially granted;
■ equal to or higher than 130% of the performance required to
reach the target, the number of shares definitively granted would
be equal to 130% of the number initially granted.
Between the diff erent levels of performance listed above, the
number of shares definitively granted to beneficiaries is calculated
on a linear basis depending on the achieved performance of the
various indicators used.
Furthermore, should no dividend be paid by the AXA Group during
any fiscal year of the acquisition period, the number of shares
definitively granted would be automatically divided by 2.
(1) The percentile represents the percentage of other companies included in the index which obtained a lower score.
(2) SXIP index (STOXX Insurance Index): a capitalization-weighted index, which includes European companies that are involved in the insurance sector. As at December 31, 2019, the index included 35 companies of the sector.

133I UNIVERSAL REGISTRATION DOCUMENT - ANNUAL REPORT 2019 - AXA I
CORPORATE GOVERNANCE
3
3.2 EXECUTIVE COMPENSATION AND SHARE OWNERSHIP
The performance conditions are summarized in the chart below:
Executive off icers & Management Committee Other beneficiaries
For 100% of the shares For 100% of the shares
Performance % granted Performance % granted
Group Performance
(40%)
Adjusted earnings per share
Capped at 130%
Floor 100% of the average
AEPS over the 3 years
immediately prior to
the grant date
50%
(40% from
the 2020 grant
onwards)
Floor 80% of the
performance required
to reach the target
80%
Target AEPS target 100% Target AEPS target 100%
Outperformance 130% of the
performance required
to reach the target
130% Outperformance 130% of the
performance required
to reach the target
130%
Executive off icers & Management Committee Other beneficiaries
For 100% of the shares For 100% of the shares
Performance % granted Performance % granted
Operating Business
Performance (50%)
Average (Adjusted earnings + Underlying earnings)
Capped at 130%
Floor 100% of the average AE
+ UE over the 3 years
immediately prior to
the grant date
50%
(40% from
the 2020 grant
onwards)
Floor 80% of the
performance required
to reach the target
80%
Target AE + UE target 100% Target AE + UE target 100%
Outperformance 130% of the
performance required
to reach the target
130% Outperformance 130% of the
performance required
to reach the target
130%
For all beneficiaries
For 100% of the shares
Performance % granted
CR criterion (10%)
AXA’s score vs DJSI Capped at 130%
Floor AXA’s score = 75th percentile 80%
Target AXA’s score = 85th percentile 100%
Outperformance AXA’s score ≥ 95th percentile 130%
Calculation of the global performance rate = [40% Group Performance + 50% Operating Business Performance + 10% CR criterion]
+/- 5 points according to AXA’s score vs a relative performance criterion (TSR).
Performance rate divided by 2 should no dividend be paid during any of the fiscal years of the acquisition period.
In any event the total number of shares definitely acquired is capped at 130% of the initial grant.

134 I UNIVERSAL REGISTRATION DOCUMENT - ANNUAL REPORT 2019 - AXA I
CORPORATE GOVERNANCE 3 3.2 EXECUTIVE COMPENSATION AND SHARE OWNERSHIP
The Performance Shares and International Performance Shares
granted in 2019 to all beneficiaries (except for the Management
Committee members) were conditioned to a 3-year acquisition
period, corresponding to the performance measurement period
but were not restricted from sale (“holding period”) aft er the
acquisition period.
The Performance Shares granted to the Management Committee
members, including the Chief Executive Off icer, were acquired at
the end of a 3-year acquisition period and restricted from sale
during a 2-year holding period.
The International Performance Shares granted to the Management
Committee members were subject to a 3-year performance period
followed by a 1-year deferred acquisition period.
The amounts corresponding to International Performance Shares
are expensed each year under the variable accounting method.
They do not create any dilution for shareholders since no new
shares are issued. The payment is made in shares. Should this
type of payment not be possible for legal, tax or any other reason,
the payment could be made in cash.
The Performance Shares and International Performance Shares
granted in 2020 to the Management Committee members’
(except for the Chief Executive Off icer) will be acquired aft er a
3-year acquisition period, corresponding to the performance
measurement period, and 50% of the shares acquired will be
subject to a further 2-year holding period. The Performance
Shares granted to the Chief Executive Off icer will remain acquired
at the end of a 3-year acquisition period and restricted from sale
during a 2-year holding period.
PERFORMANCE SHARES PLANS SUMMARY
International Performance Shares plans
Grant date (Board of Directors) 19/06/2015 06/06/2016 21/06/2017 27/06/2018 19/06/2019 12/03/2020
Total number of beneficiaries 5,093 4,968 5,200 4,507 4,279 3,978
Total number of International Performance
Shares granted 5,737,538 6,324,271 5,759,830 4,531,764 4,514,526 6,314,782
from which granted to:
Corporate off icers:
Thomas Buberl 28,727 (a) 40,341 (a) - - - -
Denis Duverne - - - - - -
Doina Palici-Chehab 7,692 8,589 8,700 - - -
Acquisition date of the International Performance Shares 19/06/2019 06/06/2020 21/06/2021 27/06/2022 19/06/2022 (b) 12/03/2023 (d)
Number of International Performance
Shares acquired at 31/12/19 4,801,867 421 (c) 4,748 (c) 837 (c) 0 -
Number of International Performance
Shares cancelled 1,164,783 1,360,183 937,240 415,282 103,836 -
Balance at 31/12/19 0 4,955,919 4,818,938 4,115,838 4,410,690 -
(a) International Performance Shares granted to Mr. Thomas Buberl prior to his appointment as AXA Chief Executive Off icer.
(b) The members of Management Committee have a 1-year deferred acquisition period.
(c) Acquisition by anticipation following death events.
(d) 50% of International Performance Shares of the Management Commitee members have a 2-year holding period.

135I UNIVERSAL REGISTRATION DOCUMENT - ANNUAL REPORT 2019 - AXA I
CORPORATE GOVERNANCE
3
3.2 EXECUTIVE COMPENSATION AND SHARE OWNERSHIP
Performance Shares Plans
Date of the Shareholders’ meeting 23/04/2014 27/04/2016 27/04/2016 27/04/2016 24/04/2019 24/04/2019
Grant date (Board of Directors) 19/06/2015 06/06/2016 21/06/2017 27/06/2018 19/06/2019 12/03/2020
Total number of beneficiaries 2,250 2,342 2,673 2,812 2,793 2,623
Total number of Performance Shares granted 2,459,256 2,358,236 2,486,368 2,979,171 2,961,225 4,020,077
from which granted to:
Corporate off icers:
Thomas Buberl - - 100,526 112,211 133,458 168,648
Denis Duverne 82,603 0 0 0 0 0
Doina Palici-Chehab - - - 18,644 22,440 29,620
Acquisition date of the shares 19/06/2018 06/06/2019 (a) 21/06/2020 (b) 27/06/2021 (c) 19/06/2022 12/03/2023
End of restriction 19/06/2020 06/06/2021 21/06/2022 27/06/2023 19/06/2022 (d) 12/03/2023 (f)
Number of shares acquired at 31/12/19 2,275,750 2,036,436 147 (e) 168 (e) - -
Number of Performance Shares cancelled 190,195 254,447 195,804 98,170 17,105 -
Balance at 31/12/19 0 42,643 2,290,451 2,880,872 2,944,120 -
(a) Eleven employees have chosen the 4+0 vesting calendar (aquisition at June 6, 2020 with no restricted period), based on the plan rules due to moves out of France during the acquisition period.
(b) Three employees have chosen the 4+0 vesting calendar (aquisition at June 21, 2021 with no restricted period), based on the plan rules due to moves out of France during the acquisition period.
(c) Six employees have chosen the 4+0 vesting calendar (aquisition at June 27, 2022 with no restricted period), based on the plan rules due to moves out of France during the acquisition period.
(d) The members of the Management Committee (including the Chief Executive Off icer of AXA) have a 2-year holding period.
(e) Shares acquired by anticipation following death events.
(f) 100% of the Performance Shares for the Chief Executive Off icer of AXA as well as 50% of the Performance Shares for the other members of the Management Committee have a 2-year holding period.
In the table above all dates that are indicated are in the format of day/month/year.
PERFORMANCE SHARES/INTERNATIONAL PERFORMANCE SHARES GRANTED
TO CORPORATE OFFICERS DURING 2019 AND 2020
Corporate off icers Plan date
Nature of
the plan
Number
of shares
granted
% of
capital
Value
(in Euro) Acquisition date
End of
restriction
Performance
conditions
Thomas
Buberl
Chief Executive Off icer 19/06/2019 Performance Shares
133,458 0.006% 2,024,558 19/06/2022 19/06/2024 adjusted earnings
per share
adjusted earnings
underlying
earnings
12/03/2020 Performance Shares
168,648 0.007% 1,548,189 12/03/2023 12/03/2025 adjusted earnings
per share
adjusted earnings
underlying
earnings
Denis
Duverne
Chairman of the Board
of Directors
- - - - - - - -
Doina Palici-
Chehab
Representative of
employee shareholders
to the Board of
Directors
19/06/2019 Performance Shares
22,440 0.001% 367,792 19/06/2022 19/06/2022 adjusted earnings
per share
adjusted earnings
underlying
earnings
12/03/2020 Performance Shares
29,620 0.001% 290,868 12/03/2023 12/03/2023 adjusted earnings
per share
adjusted earnings
underlying
earnings

136 I UNIVERSAL REGISTRATION DOCUMENT - ANNUAL REPORT 2019 - AXA I
CORPORATE GOVERNANCE 3 3.2 EXECUTIVE COMPENSATION AND SHARE OWNERSHIP
In the table above all dates that are indicated are in the format
of day/month/year.
The fair value of performance shares is determined in accordance
with IFRS standards. It corresponds to a historical value at the
date of grant, calculated for accounting purposes as described
in Note 26.3.1 “Share based compensation instruments issued by
the Group” in Part 5 “Consolidated Financial Statements” of this
Annual Report. This value does not represent a current market
value, a current valuation of these performance shares or the
actual proceeds if and when the performance shares are acquired.
Under the AXA Compliance & Ethics Code, all employees (including
the executive off icers of the Company) are prohibited from
engaging in any transaction designed to hedge the value of
equity-based compensation awards (performance shares) granted
under any plan or arrangement maintained by AXA or any of its
subsidiaries. This restriction applies from the date of grant until
such time as the beneficiary receives the securities underlying the
award upon, for example, the lapse of restrictions on performance
shares or similar events. In accordance with the recommendations
of the Afep-Medef Code, the executive off icers of the Company
make a formal commitment to not resort to hedging transactions.
PERFORMANCE SHARES/INTERNATIONAL PERFORMANCE SHARES ACQUIRED
BY CORPORATE OFFICERS DURING 2019
Corporate off icers Plan date
Nature
of the plan
Number
of shares
granted
Acquisition
date
Shares
acquired
during
the year
Performance
rate over the
acquisition
period
End of the
restriction
period
Thomas
Buberl
Chief Executive
Off icer
19/06/2015 International Performance
Shares
28,727 19/06/2019 32,788 114% (a) 19/06/2019
Denis
Duverne
Chairman of the
Board of Directors
- - - - - - -
Doina
Palici-
Chehab
Representative
of employee
shareholders to the
Board of Directors
19/06/2015 International Performance
Shares
7,692 19/06/2019 7,193 94% (b) 19/06/2019
(a) The performance rate of 114% is composed of: 1/3 x 106% (Adjusted earnings per share) + 2/3 x 118% (Adjusted earnings and Underlying earnings).
(b) The performance rate of 94% is composed of: 1/3 x 106% (Adjusted earnings per share) + 2/3 x 87% (Adjusted earnings and Underlying earnings).
In the table above all dates that are indicated are in the format of day/month/year.
PERFORMANCE SHARES/INTERNATIONAL PERFORMANCE SHARES BECOMING
UNRESTRICTED DURING 2019 FOR EACH CORPORATE OFFICER
Corporate off icers Plan date
Number of shares
becoming unrestricted
during the year
Date of
availability
Thomas Buberl Chief Executive Off icer 19/06/2015 32,788 19/06/2019
Denis Duverne Chairman of the Board of Directors 24/03/2014 111,745 24/03/2019
Doina Palici-Chehab Representative of employee shareholders to
the Board of Directors
19/06/2015 7,193 19/06/2019
In the table above all dates that are indicated are in the format of day/month/year.

137I UNIVERSAL REGISTRATION DOCUMENT - ANNUAL REPORT 2019 - AXA I
CORPORATE GOVERNANCE
3
3.2 EXECUTIVE COMPENSATION AND SHARE OWNERSHIP
I Stock options
From 1989 to 2018, AXA granted stock options to its corporate
off icers and its employees in France and abroad. The purpose
of these grants was to associate them with AXA’s share price
performance and encourage their performance over the long
term. In 2019, aft er having progressively reduced the number of
stock options beneficiaries over the past few years, AXA’s Board
of Directors, upon recommendation from its Compensation &
Governance Committee, in order to simplify AXA’s compensation
policy and in line with market practice and feedback received from
a number of institutional investors, decided to cease awarding
stock options to corporate off icers and AXA employees.
Previous plans are still valid until their expiration (maximum
duration period of 10 years). They were granted at market value,
with no discount, and become exercisable by tranches, generally
in thirds between 3 and 5 years following the grant date.
Pursuant to the stock option plan rules, beneficiaries who resign
from the Group lose the right to exercise their options.
On December 31, 2019, more than 2,100 AXA employees held a
total of 15,154,663 outstanding options, representing 0.63% of
the Company’s share capital on the same date.
PERFORMANCE CONDITIONS
All options granted to all members of the Management
Committee until 2018 were subject to performance condition.
This performance condition also applied to the last tranche of
each option grant (i.e. the last third of the options granted) for
all other beneficiaries of options.
Pursuant to this performance condition, the options become
fully exercisable only if the AXA share price performs at least
as well as the stock reference index of the insurance sector (1).
No option submitted to such performance condition can be
exercised as long as this criterion has not been reached. This
external performance condition subjects the acquisition of the
right to exercise the options to the achievement of a fully objective
and public performance and allows to measure the relative
performance of AXA compared to its main European competitors
over a period of at least three years.
If the performance condition has not been met at the expiry
date of the options, these options are automatically cancelled.
Furthermore, the Board of Directors decided that a second
performance condition would apply to the all options granted
in 2017 and 2018, pursuant to which beneficiaries would not be
able to exercise their stock options in the event the net income
of the Group share is negative, and for as long as it remains.
(1) SXIP index (Stoxx Insurance Index): a capitalization-weighted index, which includes European companies that are involved in the insurance sector. As at December 31, 2019, the index included 35 companies of the sector.

138 I UNIVERSAL REGISTRATION DOCUMENT - ANNUAL REPORT 2019 - AXA I
CORPORATE GOVERNANCE 3 3.2 EXECUTIVE COMPENSATION AND SHARE OWNERSHIP
STOCK OPTIONS PLAN SUMMARY
Date of the
Shareholders’ meeting 22/04/2008 22/04/2008 22/04/2008 22/04/2008 22/04/2008 22/04/2008 22/04/2008 22/04/2008 22/04/2008 22/04/2008
Grant date (Board
of Directors or
Management Board) 20/03/2009 20/03/2009 02/04/2009 10/06/2009 10/06/2009 21/09/2009 08/12/2009 08/12/2009 19/03/2010 19/03/2010
Total number of
beneficiaries 4,627 759 28 29 17 16 2 13 5,062 476
Total number of shares
to be subscribed (a)
4,870,844 407,692 114,324 22,291 2,137,462 53,237 3,134 20,890 7,671,540 278,986
or purchased, from
which to be subscribed
or purchased by:
corporate off icers:
Thomas Buberl - - - - - - - - - -
Denis Duverne - - - - 226,398 - - - 264,000 -
Doina Palici-Chehab 3,227 - - - - - - - 3,850 -
The first 10 employees
beneficiaries (b) 293,954 51,018 84,309 20,317 615,165 47,753 - 18,280 742,217 75,035
Start date of exercise 20/03/2011 20/03/2011 02/04/2011 10/06/2013 10/06/2011 21/09/2013 08/12/2011 08/12/2013 19/03/2012 19/03/2012
Expiry date of options 20/03/2019 20/03/2019 02/04/2019 10/06/2019 10/06/2019 21/09/2019 08/12/2019 08/12/2019 19/03/2020 19/03/2020
Subscription or purchase
price of options (a)
9.76 9.76 9.76 13.03 15.47 15.88 16.60 16.60 15.43 15.43
Exercise schedule
of options
33% aft er 2 y
66% aft er 3 y
100% aft er 4 y 100% aft er 4 y
33% aft er 2 y
66% aft er 3 y
100% aft er 4 y 100% aft er 4 y
33% aft er 2 y
66% aft er 3 y
100% aft er 4 y 100% aft er 4 y
33% aft er 2 y
66% aft er 3 y
100% aft er 4 y 100% aft er 4 y
33% aft er 2 y
66% aft er 3 y
100% aft er 4 y 100% aft er 4 y
Number of options
exercised at 31/12/19 3,802,683 254,581 64,216 3,764 1,883,893 40,618 0 4,700 5,868,279 226,040
Options cancelled
at 31/12/19 1,068,161 153,111 50,108 18,527 253,569 12,619 3,134 16,190 1,329,314 43,521
Options outstanding
at 31/12/19 0 0 0 0 0 0 0 0 473,947 9,425
(a) The number of options and exercise prices have been adjusted, pursuant to applicable regulation, as a result of operations on the AXA stock.
(b) “Employees” other than corporate off icers at grant date.
In the table above all dates that are indicated are in the format of day/month/year.

139I UNIVERSAL REGISTRATION DOCUMENT - ANNUAL REPORT 2019 - AXA I
CORPORATE GOVERNANCE
3
3.2 EXECUTIVE COMPENSATION AND SHARE OWNERSHIP
Date of the
Shareholders’ meeting 22/04/2008 22/04/2008 22/04/2008 22/04/2008 22/04/2008 22/04/2008 22/04/2008 22/04/2008 27/04/2011 27/04/2011
Grant date (Board
of Directors or
Management Board) 18/08/2010 18/08/2010 13/10/2010 13/10/2010 22/12/2010 18/03/2011 18/03/2011 04/04/2011 16/03/2012 13/06/2012
Total number of
beneficiaries 3 5 1 17 8 6,372 423 170 467 1
Total number of shares
to be subscribed (a)
or purchased, from
which to be subscribed
or purchased by: 22,846 10,619 4,274 27,772 12,758 8,598,469 154,705 375,988 4,508,380 76,089
corporate off icers:
Thomas Buberl - - - - - - - - - -
Denis Duverne - - - - - 247,500 - - 192,000 -
Doina Palici-Chehab - - - - - 8,750 - - 7,500 -
The first 10 employees
beneficiaries (b) - - - 21,364 - 980,684 21,412 183,500 693,745 -
Start date of exercise 18/08/2012 18/08/2014 13/10/2012 13/10/2014 22/12/2014 18/03/2013 18/03/2015 04/04/2013 16/03/2014 13/06/2014
Expiry date of options 18/08/2020 18/08/2020 13/10/2020 13/10/2020 22/12/2020 18/03/2021 18/03/2021 04/04/2021 16/03/2022 13/06/2022
Subscription or purchase
price of options (a) 13.89 13.89 13.01 13.01 12.22 14.73 14.73 14.73 12.22 9.36
Exercise schedule
of options
33% aft er 2 y
66% aft er 3 y
100% aft er 4 y 100% aft er 4 y
33% aft er 2 y
66% aft er 3 y
100% aft er 4 y 100% aft er 4 y 100% aft er 4 y
33% aft er 2 y
66% aft er 3 y
100% aft er 4 y 100% aft er 4 y
33% aft er 2 y
66% aft er 3 y
100% aft er 4 y
33% aft er 2 y
66% aft er 3 y
100% aft er 4 y
33% aft er 2 y
66% aft er 3 y
100% aft er 4 y
Number of options
exercised at 31/12/19 15,846 6,458 3,274 7,833 5,582 6,027,651 90,243 253,840 3,441,815 76,089
Options cancelled
at 31/12/19 7,000 4,161 0 16,379 6,379 1,454,025 29,670 99,923 552,339 0
Options outstanding
at 31/12/19 0 0 1,000 3,560 797 1,116,793 34,792 22,225 514,226 0
(a) The number of options and exercise prices have been adjusted, pursuant to applicable regulation, as a result of operations on the AXA stock.
(b) “Employees” other than corporate off icers at grant date.
In the table above all dates that are indicated are in the format of day/month/year.

140 I UNIVERSAL REGISTRATION DOCUMENT - ANNUAL REPORT 2019 - AXA I
CORPORATE GOVERNANCE 3 3.2 EXECUTIVE COMPENSATION AND SHARE OWNERSHIP
Date of the Shareholders’ meeting 27/04/2011 27/04/2011 23/04/2014 23/04/2014 26/04/2017 26/04/2017
Grant date (Board of Directors or Management Board) 22/03/2013 24/03/2014 19/06/2015 06/06/2016 21/06/2017 27/06/2018
Total number of beneficiaries 162 158 148 158 144 117
Total number of shares to be subscribed (a)
3,480,637 3,100,000 3,014,469 3,323,259 3,070,397 2,730,217
or purchased, from which to be subscribed
or purchased by:
corporate off icers:
Thomas Buberl - 48,800 (c) 50,272 (c) 70,598 (c) 175,917 196,366
Denis Duverne 169,000 155,000 145,381 0 0 0
Doina Palici-Chehab 14,000 14,110 13,461 15,028 15,224 32,626
The first 10 employees beneficiaries (b) 789,382 661,900 683,100 813,477 787,665 761,168
Start date of exercise 22/03/2015 24/03/2017 19/06/2018 06/06/2019 21/06/2020 27/06/2021
Expiry date of options 22/03/2023 24/03/2024 19/06/2025 06/06/2026 21/06/2027 27/06/2028
Subscription or purchase price of options (a)
13.81 18.68 22.90 21.52 23.92 21.60
Exercise schedule of options
33% aft er
2 y
66% aft er
3 y
100% aft er
4 y
33% aft er
3 y
66% aft er
4 y
100% aft er
5 y
33% aft er
3 y
66% aft er
4 y
100% aft er
5 y
33% aft er
3 y
66% aft er
4 y
100% aft er
5 y
33% aft er
3 y
66% aft er
4 y
100% aft er
5 y
33% aft er
3 y
66% aft er
4 y
100% aft er
5 y
Number of options exercised at 31/12/19 2,507,217 1,106,925 191,693 180,437 76,416 0
Options cancelled at 31/12/19 264,014 299,840 294,989 501,838 255,396 62,316
Options outstanding at 31/12/19 709,406 1,693,235 2,527,787 2,640,984 2,738,585 2,667,901
(a) The number of options and exercise prices have been adjusted, pursuant to applicable regulations, as a result of operations on the AXA stock.
(b) “Employees” other than corporate off icers at grant date.
(c) Options were granted to Mr. Thomas Buberl prior to his appointment as Chief Executive Off icer.
In the table above all dates that are indicated are in the format
of day/month/year.
Under the AXA Group Compliance & Ethics Code, all employees
(including the corporate off icers of the Company) are prohibited
from engaging in any transaction designed to hedge the value
of equity-based compensation awards (stock options and
performance shares) granted under any plan or arrangement
maintained by AXA or any of its subsidiaries. This restriction
applies from the date of grant until such time as the beneficiary
receives the securities underlying the award upon, for example,
the exercise of a stock option or the lapse of restrictions on
performance shares. In accordance with the recommendations of
the Afep-Medef Code, the executive off icers of the Company make
a formal commitment to not resort to such hedging transactions.

141I UNIVERSAL REGISTRATION DOCUMENT - ANNUAL REPORT 2019 - AXA I
CORPORATE GOVERNANCE
3
3.2 EXECUTIVE COMPENSATION AND SHARE OWNERSHIP
STOCK OPTIONS HELD BY CORPORATE OFFICERS THAT BECAME EXERCISABLE
DURING 2019
Corporate off icers Plan date
Nature of
options
Number
of options
that became
exercisable
during the year (a)
Exercise
price
(in Euro)
Expiry date
of options
Performance
conditions
Thomas
Buberl
Chief Executive Off icer 24/03/2014 subscription
or purchase
16,266 18.68 24/03/2024 100% of options:
SXIP index
19/06/2015 subscription
or purchase
33,516 22.90 19/06/2025 100% of options:
SXIP index
06/06/2016 subscription
or purchase
23,533 21.52 06/06/2026 100% of options:
SXIP index
Denis
Duverne
Chairman of the Board of
Directors
24/03/2014 subscription
or purchase
51,666 18.68 24/03/2024 100% of options:
SXIP index
19/06/2015 subscription
or purchase
96,922 22.90 19/06/2025 100% of options:
SXIP index
Doina
Palici-
Chehab
Representative of
employee shareholders
to the Board of Directors
24/03/2014 subscription
or purchase
4,702 18.68 24/03/2024 Last third of options:
SXIP Index
19/06/2015 subscription
or purchase
4,487 22.90 19/06/2025 Last third of options:
SXIP Index
06/06/2016 subscription
or purchase
5,010 21.52 06/06/2026 Last third of options:
SXIP Index
(a) Stock options vested (according to the vesting calendar) for which the performance conditions have been met during the year or no performance condition is applicable.
In the table above all dates that are indicated are in the format of day/month/year.
STOCK OPTIONS EXERCISED BY CORPORATE OFFICERS DURING 2019
Corporate off icers
AXA options ADS AXA options
Date of
grant
Number
of options
exercised
during
the year
Exercise
price
(in Euro)
Date of
exercise
Date
of grant
Number
of options
exercised
during the
year
Exercise
price
(in USD)
Date of
exercise
Thomas
Buberl
Chief Executive
Off icer
24/03/2014 32,533 18.68 23/12/2019 - - - -
19/06/2015 33,516 22.90 20/12/2019 - - - -
06/06/2016 23,533 21.52 23/12/2019 - - - -
Denis
Duverne
Chairman of the
Board of Directors
18/03/2011 142,711 14.73 30/08/2019 - - - -
22/03/2013 59,740 13.81 23/12/2019 - - - -
Doina
Palici-
Chehab
Representative
of employee
shareholders to the
Board of Directors
- - - - - - - -
In the table above all dates that are indicated are in the format of day/month/year.

142 I UNIVERSAL REGISTRATION DOCUMENT - ANNUAL REPORT 2019 - AXA I
CORPORATE GOVERNANCE 3 3.2 EXECUTIVE COMPENSATION AND SHARE OWNERSHIP
STOCK OPTIONS EXERCISED BY THE TOP 10 BENEFICIARIES (OUTSIDE THE CORPORATE
OFFICERS) DURING 2019
Number of options
exercised
Weighted average price
(in Euro)
Stock options of AXA or any eligible AXA Group subsidiaries, exercised during the year
by the ten employees, outside management bodies’ members of the Company or of
eligible AXA Group subsidiaries, who exercised the highest number of stock options
(aggregate information) 679,156 17.55
STOCK OPTIONS HELD BY CORPORATE OFFICERS
(OPTIONS GRANTED BUT NOT EXERCISED AS OF DECEMBER 31, 2019)
Corporate off icers
Balance of options at
December 31, 2019
AXA ADS AXA
Thomas Buberl Chief Executive Off icer 436,104 -
Denis Duverne Chairman of the Board of Directors 409,641 -
Doina Palici-Chehab Representative of employee shareholders to the Board of Directors 85,745 -
I Share ownership policy for executives of the Group
AXA implemented a shareholding policy applicable to the main
senior executives of the Group. This policy imposes that each
executive hold, during the entire duration of his/her functions,
a minimum number of AXA shares (the “Minimum Shareholding
Requirement”) representing a multiple of the annual fixed
compensation received for his/her functions within the Group:
■ the Chief Executive Off icer is required to hold the equivalent
of his annual fixed compensation multiplied by 3;
■ Management Committee members are required to hold the
equivalent of their annual fixed compensation multiplied by 2;
■ Partners Group are required to hold the equivalent of their
annual fixed compensation multiplied by 1.
AXA shares, ADS AXA or shares of listed Group subsidiaries, held
directly or indirectly through Mutual funds or similar investment
vehicles, regardless of their acquisition procedure, are taken into
account for the purposes of calculating this Minimum Shareholding
Requirement.
Each concerned senior executive is required to meet this Minimum
Shareholding Requirement within a period of 5 years as from the
date of her/his first appointment.
Pursuant to Articles L.225-197-1 and L.225-185 of the French
Commercial Code, the Board of Directors has decided that, as
long as the Chief Executive Off icer has not met his Minimum
Shareholding Requirement, all Stock Options and Performance
Shares granted to him will be subject to the following restrictions:
■ upon each exercise of these stock options granted, the Chief
Executive Off icer must continue to hold in registered form a
number of shares obtained upon exercise equal in value to at
least 25% of the pre-tax capital gain realized upon exercise.
These shares shall be held during his entire term of off ice as
Chief Executive Off icer;
■ for Performance Shares granted, the Chief Executive Off icer
must, at every performance share acquisition date, hold in
registered form at least 25% of the Performance Shares acquired
during his entire term of off ice as Chief Executive Off icer.
These restrictions do not apply if the Chief Executive Off icer
complies with his Minimum Shareholding Requirement.

143I UNIVERSAL REGISTRATION DOCUMENT - ANNUAL REPORT 2019 - AXA I
CORPORATE GOVERNANCE
3
3.2 EXECUTIVE COMPENSATION AND SHARE OWNERSHIP
CHIEF EXECUTIVE OFFICER
On December 31, 2019, based on the AXA share value on that date (€25.11), the Chief Executive Off icer meets his Minimum Shareholding
Requirement such as described in the above Section “Share ownership policy for executives of the Group”.
Shareholding requirement Shareholding on 31/12/2019
Fixed compensation
Number
of years Amount
Target
date
Number
of years Amount
AXA
shares
AXA
Share
plan
units
Thomas Buberl €1,450,000 3 €4,350,000 01/09/2021 5.7 €8,265,057 320,305 8,847
MEMBERS OF THE MANAGEMENT COMMITTEE
On December 31, 2019, based on the AXA share value on that date (€25.11), the members of the Management Committee held, on
average, 2.2 times the equivalent of their fixed annual compensation, it being specified that all members of the Management Committee
are still within the 5-year time following their nomination date allowing them to comply with their minimal shareholding requirement.
MEMBERS OF THE BOARD OF DIRECTORS
To the best knowledge of the Company and based on information reported to it, each AXA Board of Directors member held, on
December 31, 2019, the number of AXA shares or ADS AXA indicated in the table below.
Number of shares (a)
owned
on December 31, 2019
AXA Shares ADS AXA
Denis Duverne – Chairman of the Board of Directors 1,558,366 18,734
Thomas Buberl – Chief Executive Off icer 320,305 -
Patricia Barbizet 4,570 -
Martine Bièvre (b) 0 -
Jean-Pierre Clamadieu 9,000 -
Bettina Cramm (b) 106 -
Irene Dorner 6,700 -
Rachel Duan 3,950 (c) -
André François-Poncet 7,842 -
Angelien Kemna 7,250 -
Stefan Lippe 12,000 -
François Martineau 6,732 -
Ramon de Oliveira - 11,300
Doina Palici-Chehab 18,079 -
Elaine Sarsynski - 5,000 (d)
(a) AXA shares which could be indirectly held through Mutual funds are not taken into account.
(b) The holding of AXA shares by directors representing the employees (Mmes Martine Bièvre and Bettina Cramm) is not mandatory.
(c ) On January 17, 2020.
(d ) On January 22, 2020.

144 I UNIVERSAL REGISTRATION DOCUMENT - ANNUAL REPORT 2019 - AXA I
CORPORATE GOVERNANCE 3 3.2 EXECUTIVE COMPENSATION AND SHARE OWNERSHIP
I Transactions involving Company securities completed
in 2019 by the members of the Board of Directors
To the best of the Company’s knowledge and based on the
information reported to it, several members of the Board of
Directors made the following disclosures in the course of 2019
concerning their transactions involving Company securities.
Detailed information about all of these transactions, as well as
individual disclosures filed in accordance with Articles 223-22
and 223-25 of the AMF General Regulations, are published on
the Company’s website (www.axa.com) and on the AMF website
(www.amf-france.org).
Name
Sale
of AXA
shares
(Number)
Purchase
of AXA
ADS
(Number)
Purchase
of AXA
shares
(Number)
Acquisition of
performance
shares (end
of acquisition
period)
(Number)
Automatic
reinvestment
into the
Company
Savings Plan
of dividends
attached to
shares held in
the Company
Savings Plan
(Number
of units)
Options
Subscription
of stock options
Subs-
cription
and sale
of stock
optionsSale of
units of
AXA Group
Mutual
funds
invested in
AXA shares
(Number
of units)
Transfer
of units of
AXA Group
Mutual
funds
invested in
AXA shares
to other
AXA Group
m utual
funds
(Number
of units)
Equity issue
reserved for
employees
(Shareplan)
Sale
of call
options
(Number)
Acquisition
of put
options
(Number)
Options
that
became
exercisable
(Number)
Subscrip-
tion to
AXA shares
(Number)
Subscrip-
tion to
AXA ADS
(Number)
AXA
shares
(Number)
Subscription
to units of
AXA Group
Mutual funds
invested in
AXA shares
(Number
of units)
Thomas
Buberl
12,093 32,788
3,042 (d)
16,266
33,516
23,533
32,533
33,516
23,533
36,516.13
52,847.61
50,406.94
Bettina
Cramm 98.45
Denis
Duverne
27,395 (a)
24,618 (a)
27,395 (a)
24,618 (a)
27,396 (a)
32,000 (a)
32,000 (a)
25,000 (a)(c)
19,775.52 51,666
96,922
142,711 (a)
59,740 (a)(b)
37,285.51 2,986.70 20,468.50
Doina
Palici-
Chehab
1,017 7,193 4,487
4,702
5,494.09
460.19
(a) Transaction performed by an independent financial intermediary pursuant to a discretionary mandate.
(b) AXA shares locked in under the AXA employee-stock purchase plan (plan d’Épargne d’entreprise du Groupe).
(c) Transaction performed by a legal entity linked to Denis Duverne.
(d) Retirement performance shares.
Pursuant to the AXA Group Compliance & Ethics Code, corporate
off icers and other employees of the Company must refrain from
any purchase or sale of AXA securities during specific time periods
(“blackout periods”) prior to the earnings releases. These blackout
periods generally begin about 30 days before its annual or half-
year earnings releases and 15 days before its quarterly financial
information. Depending on the circumstances, these blackout
periods could be declared at other times or be extended.

145I UNIVERSAL REGISTRATION DOCUMENT - ANNUAL REPORT 2019 - AXA I
CORPORATE GOVERNANCE
3
3.2 EXECUTIVE COMPENSATION AND SHARE OWNERSHIP
I Commitments made to executive off icers
PENSION COMMITMENTS
Mr. Denis Duverne as former Deputy Chief Executive Off icer of
the Company participated, as all other executive employees
(directeurs) of AXA Group entities in France, in a mandatory and
collective supplementary pension scheme with defined benefits
on the condition that they terminate their career in the AXA Group
in accordance with the provisions of Article L.137-11 of the French
Social Security Code.
Mr. Denis Duverne, who retired from his position as Deputy Chief
Executive Off icer on August 31, 2016, and was appointed Chairman
of the Board of Directors as of September 1, 2016, claimed his
pension rights according to the collective defined benefit pension
scheme as of September 1, 2016. However, Mr. Denis Duverne
decided to waive payment of the annuities amounting to circa
€750,000 per year before taxes and social security charges, until
termination of his term of off ice as Chairman of the Board without
any retroactive payment.
This collective defined benefits pension scheme has been closed
to any new beneficiary as of December 31, 2016. As a result, no
executive employees (directeurs) or executive off icer appointed
aft er this date shall benefit from it.
The Directive 2014/50/UE/of the European Parliament and of the
Council of April 16, 2014, provides that, as from January 1, 2020,
future pension rights must be portable and consequently can no
longer be acquired in the existing defined benefit pension scheme.
The collective defined benefits pension scheme is currently under
review and amendment to ensure compliance with this directive.
Mr. Thomas Buberl, AXA’s Chief Executive Off icer does not benefit
from the collective defined benefits pension scheme described
above.
The Chief Executive Off icer of the Company. Mr. Thomas Buberl,
as well as all other employees of AXA Group entities in France,
participate in a mandatory and collective supplementary pension
scheme with defined contributions (collective insurance contract –
contrat d’assurance de Groupe as defined in Article L.141-1 of the
French Insurance Code). This AXA pension fund was implemented
in 2011 and benefits to the employees of AXA Group entities in
France falling within the scope of the Collective Agreement of
December 18, 2009. The individual employer contribution rate
is set at 0.75% of the total gross compensation, which is not
capped (the contribution base is the same as the one used for
contributions related to the Social Security General Scheme).
Contributions are subject to 9.7% social charges (9.2% for CSG
and 0.5% for CRDS).
Retirement performance shares
Since December 2016, AXA has implemented a retirement
performance shares plan which benefits to all executive employees
(directeurs) of AXA Group entities in France including for the Chief
Executive Off icer, Mr. Thomas Buberl.
It provides beneficiaries with portable pension benefits until
retirement in line with Directive 2014/50/UE/of the European
Parliament and of the Council of April 16, 2014 on minimum
requirements for enhancing worker mobility between Member
States by improving the acquisition and preservation of
supplementary pension rights.
These performance shares are subject to (i) an acquisition period
of three years, and (ii) an obligation to hold the shares until
retirement, provided that the beneficiaries may sell all or part of
their shares for diversification purposes (following the three-year
acquisition period), as long as the sale proceeds are invested in a
long-term savings plan until the beneficiary’s retirement.
The definitive acquisition of these shares is subject to (i) the
beneficiary’s presence in the AXA Group on December 31 of the
year during which the grant is decided, and (ii) the achievement
of a performance condition related to the average AXA Group
Solvency II ratio calculated during the acquisition period and
subject to diff erent performance levels: to benefit from the totality
of performance shares initially granted, the average AXA Group
Solvency II ratio calculated during the acquisition period must
be greater than or equal to 170%. However, if the average ratio
is 150%, only half of the shares initially granted will be acquired.
No shares will be acquired if the average ratio is below 150%. No
minimum number of shares is guaranteed.
Between these performance levels, the number of shares definitely
acquired will be calculated, on a linear basis depending on the
achieved performance.
No shares will be acquired if the Company does not pay dividends
during any year of the acquisition period.
The Board of Directors also decided that no more than 10% of
the total number of shares granted during any fiscal year should
be granted to AXA’s executive off icers, to avoid an excessive
concentration of retirement performance shares granted to the
executive off icers.
On December 18, 2019, the Board of Directors approved a grant of
retirement performance shares. Accordingly, 571,909 retirement
performance shares were granted to 466 off icers, which represent
0.02% of the outstanding share capital on the date of the grant,
of which 18,947 retirement performance shares were granted to
AXA’s Chief Executive Off icer representing 3.3% of the total grant.
All retirement performance shares granted are subject to the
performance conditions described above and calculated over a
three-year period beginning on January 1, 2019, and ending on
December 31, 2021.

146 I UNIVERSAL REGISTRATION DOCUMENT - ANNUAL REPORT 2019 - AXA I
CORPORATE GOVERNANCE 3 3.2 EXECUTIVE COMPENSATION AND SHARE OWNERSHIP
TERMINATION PROVISIONS
Executive off icers
Employment
contract
Supplementary
pension scheme
Indemnities or
advantages due or
likely to be due upon
termination of functions
Indemnities due for
non-competition
clause
Yes No Yes No Yes No Yes No
Thomas Buberl
Chief Executive Off icer
Beginning of current mandate: 25/04/18
Term of off ice: 2022
X X (a) X X
Denis Duverne
Chairman of the Board of Directors
Beginning of current mandate: 25/04/18
Term of off ice: 2022
X X (b) X X
(a) Mr. Thomas Buberl is a beneficiary of the retirement performance shares plans.
(b) Mr. Denis Duverne decided to waive payment of the annuities he is entitled to under the collective defined benefit pension scheme, until termination of his term of off ice as Chairman of the Board without any retroactive payment. He does not benefit from additional pension schemes as Chairman of the Board.
In accordance with the recommendations of the Afep-Medef Code,
Mr. Thomas Buberl has decided to renounce to his employment
contract as of the date of his appointment as Chief Executive
Off icer.
In connection with this decision, the Board of Directors upon
recommendation of its Compensation & Governance Committee
undertook a review of the consequences of this renunciation
including with respect to the continuity of the social benefits
(health insurance, life insurance, disability insurance, etc.) to
which Mr. Thomas Buberl was entitled as an employee. In this
context, the Board of Directors was concerned that the decision
of Mr. Thomas Buberl to renounce his employment contract in
accordance with the recommendations of the Afep-Medef Code
would jeopardize the continuity of his accrued and future social
benefits.
As a result, on August 2, 2016, the Board of Directors took the
following decisions:
■ the Board of Directors authorized that, following the termination
of his employment contract, Mr. Thomas Buberl would continue
to have social benefits (health insurance, life insurance, disability
insurance, etc.) on terms equivalent to those of all other Group
senior employees of the AXA Group in France;
■ the Board of Directors authorized a contractual severance
benefit for Mr. Thomas Buberl designed to replicate the benefits
to which he would have been entitled as AXA employee
under the 1993 collective agreement covering director-level
employees of the insurance sector, but with the addition of
performance conditions in accordance with the Afep-Medef
recommendations. A severance benefit would be applicable,
except in the case of gross or willful misconduct, solely in
the event of dismissal or non-renewal further to the Board of
Directors’ decision. The payment of the severance benefit would
be subject to the three following performance conditions as
determined by the Board of Directors during its August 2, 2016,
meeting: (1) achievement, for at least 2 of the 3 preceding
fiscal years, of the objectives set for the beneficiary’s variable
compensation and corresponding to the payment of at least
60% of his variable compensation target, (2) evolution of the
AXA share price at least equal to the stock reference index of
the insurance sector (SXIP) (in percentage) over a 3-year period
preceding the termination of the term of off ice, and (3) the
average consolidated adjusted ROE over the 3 preceding years
higher than or equal to 5%.
The amount of severance benefit to be paid to the beneficiary
would be adjusted in accordance with the level of achievement
against these performance conditions: 100% of the severance
benefit will be paid if at least two of the three performance
conditions are met; 40% of the severance benefit will be paid
if only one performance condition is met; and no severance
benefit shall be paid if none of the performance conditions are
met. Notwithstanding the foregoing, if only two of the three
performance conditions are met, the amount of severance benefit
will be reduced by 50% if performance condition (1) above is not
met or if AXA’s consolidated net income for the preceding fiscal
year is negative.
No severance benefit will be paid if the beneficiary is entitled to
a pension scheme within the 6 months following his termination.
The initial amount of the severance benefit is equal to 12 months
of the average compensation (fixed and variable) paid during
the 24-month period preceding termination. One month should
then be added to the initial amount of the severance benefit for
each additional year of future service up to a maximum cap of
24 months.
These commitments were approved by AXA’ Shareholders’ Meeting
of April 25, 2018. They took eff ect upon Mr. Thomas Buberl’s
eff ective renunciation of his employment contract on September 1,
2016, and will continue as such for the duration of his mandate
and under any potential renewed mandates.

147I UNIVERSAL REGISTRATION DOCUMENT - ANNUAL REPORT 2019 - AXA I
CORPORATE GOVERNANCE
3
3.2 EXECUTIVE COMPENSATION AND SHARE OWNERSHIP
I Compensation policy of the Company’s corporate
off icers (Ordinary and Extraordinary Shareholders’ Meeting
of April 30, 2020)
This policy was prepared in accordance with Articles L.225-37-2 and R.225-29-1 of the French Commercial Code and presents the
principles and criteria for determination, distribution and allocation of all elements of compensation of the corporate off icers of
the Company as approved by the Board of Directors during its meeting held on February 19, 2020, upon recommendation of its
Compensation & Governance Committee.
The Compensation & Governance Committee, the role and composition of which are presented in detail in Section 3.1 of this Annual
Report, is responsible for, among others, formulating propositions to the Board of Directors regarding the Company’s principles and
policy on corporate off icers’ compensation.
The Compensation & Governance Committee is mostly composed of independent members who exchange frequently with the
Group’s Management and the departments of the Company including Group Human Resources and Group Legal. The Committee is
also empowered to undertake or commission specific reviews by external experts when deemed appropriate. Such reviews allow the
Committee to benefit from a technical expertise and independent insights in comparing AXA’s compensation practices with general
market practice.
COMPENSATION POLICY FOR THE CHIEF EXECUTIVE OFFICER
Guiding principles of AXA’s compensation policy
AXA’s compensation policy is designed to support the Company’s long-term business strategy and to align the interests of its Management
with those of its shareholders and all other stakeholders by (i) establishing a close relation between performance and compensation
over the short, medium and long term, (ii) ensuring that the Group can off er competitive compensation that is consistent with the
various markets in which it operates while avoiding potential conflicts of interests that may lead to undue risk taking for short-term
gain, and (iii) ensuring compliance of the Company’s practices with all applicable regulatory requirements.
AXA’s compensation policy aims to, among others:
■ attract, develop and motivate unique skills and best talents;
■ incentivize superior performance;
■ align compensation levels with the Company’s results.
Structure and criteria for determination of the Chief Executive Off icer’s compensation
In this context, the compensation policy for the Chief Executive Off icer is based on a pay-for-performance approach which (i) requires
the achievement of challenging financial and operational targets that are defined and aligned with the Group’s strategy, (ii) promotes
long-term sustainable performance while incorporating risk adjustment measures in performance metrics, and (iii) determines the
eff ective amount of the actual individual compensation on the basis of both financial and non-financial results.
Thus, the “at-risk” portion of the Chief Executive Off icer’s total compensation (variable compensation and share-based compensation)
represents a significant component of his compensation structure, with a view to aligning his compensation more directly with the
operational strategy of the Group and the interests of the shareholders.
The diff erent components of the Chief Executive Off icer’s total compensation are presented in detail hereaft er:
FIXED ANNUAL COMPENSATION OF THE CHIEF EXECUTIVE OFFICER
The determination of the amount of the Chief Executive Off icer’s fixed compensation is based on an in-depth analysis of market practices
as well as applicable national and international regulations. It also takes into consideration various other factors such as experience,
skills, as well as criticality and scarcity of such skills, and the Group’s fairness principles or the individual’s compensation history.
The Board of Directors, relying in particular on a study carried out by an external advisory firm (Willis Towers Watson) regarding
compensation practices for similar functions in a sample of CAC 40 companies and in the main European companies in the financial
sector (insurance companies, banks), and upon recommendation of its Compensation & Governance Committee, decided to maintain
unchanged, for 2020, the amount of the Chief Executive Off icer’s fixed annual compensation, at €1.45 million.

148 I UNIVERSAL REGISTRATION DOCUMENT - ANNUAL REPORT 2019 - AXA I
CORPORATE GOVERNANCE 3 3.2 EXECUTIVE COMPENSATION AND SHARE OWNERSHIP
VARIABLE ANNUAL COMPENSATION OF THE CHIEF EXECUTIVE OFFICER
The Chief Executive Off icer’s variable annual compensation is subject in its entirety to challenging performance conditions and closely
aligned with the Group’s strategy. No minimum payment is guaranteed to the Chief Executive Off icer.
In order to determine the Chief Executive Off icer’s target annual variable compensation, the Board of Directors sought to establish a
balanced structure between the fixed part and the variable part of his cash compensation.
Thus, the Board of Directors, upon recommendation of its Compensation & Governance Committee, and following a comparative
review of national, European and industry practices, decided to maintain unchanged, for 2020, the Chief Executive Off icer’s target
annual variable compensation, at €1.45 million, i.e. 100% of the amount of his annual fixed compensation.
The Chief Executive Off icer’s total eff ective variable compensation may not exceed 150% of his variable compensation target, i.e. 150%
of his annual fixed compensation.
The evaluation of the Chief Executive Off icer’s individual performance with respect to the 2020 fiscal year will be based on the following
two components, each of them capped at a 150% achievement rate:
■ the Group’s performance, as assessed based on underlying earnings per share, return on equity (adjusted Return on Equity – ROE),
gross revenues in both Commercial Property & Casualty and in Health & Protection, Net Promoter Score (customer recommendation
index) and non-commission expenses. The relative weight of each indicator is, respectively, 55%, 15%, 10%, 10% and 10%. The
indicators selected to measure the Group’s performance reflect objectives in terms of growth, profitability, capital management,
operational eff iciency and proximity with clients that have been disclosed both internally and externally. Thus, indicators which are
directly linked to the strategic orientations of the Group include both financial and operating indicators and rely on achievement
of a predefined budget or target figure;
■ individual performance, assessed on the basis of various indicators and qualitative and quantifiable objectives determined by the
Board of Directors in a target letter drawn up at the beginning of each relevant year, as well as on the basis of demonstrated leadership
abilities by the Chief Executive Off icer. The target letter includes detailed objectives with regards to the Group’s progress in the
elaboration of its strategic plan as well as other performance indicators and objectives designed to assess the level of achievement
of global strategic initiatives or relating to certain geographic areas, as well as progress on certain investments that are expected to
contribute to the development of the Group’s operations.
Each of these two components will be evaluated separately so that the Chief Executive Off icer’s overall variable pay-out reflects his
performance against two distinct components assessed independently.
With respect to the 2020 fiscal year, the determination of the actual amount of variable compensation to be paid to the Chief Executive
Off icer will therefore be based on the addition of two components: the Group performance for 70% (compared to 50% beforehand)
and the individual performance for 30% (compared to 50% beforehand).
With this evolution, the Board of Directors, upon recommendation from its Compensation & Governance Committee, wished to
strengthen the formulaic/quantitative component of the Chief Executive Off icer’s variable compensation, in line with market practices
in France and abroad, as well as feedback received from a number of institutional investors.
In order to ensure that AXA remains aligned with current market practice and regulations, both in France and abroad, within the
financial industry, the Board of Directors has decided to continue to use a deferral mechanism with respect to the Chief Executive
Off icer’s annual variable compensation.
Under this mechanism, payment of 30% of his actual annual variable compensation will be deferred over the course of two years and
will be subject to performance condition. Thus, the actual deferred amount will vary depending on changes in the AXA share price over
the deferral period, within a minimum of 80% of the deferred amount and a maximum of 120% of the deferred amount. However, no
deferred variable compensation will be paid in the event that the Group’s underlying earnings are negative for the year ending immediately
prior to the year of the scheduled payout, or in case of resignation or dismissal for gross or wi lful misconduct, prior to the payout date.
Should a significant change aff ecting the calculation of the Group’s economic parameters emerge (significant patrimonial transaction
approved by the Board of Directors, change in accounting norms…), the Board will be able to calculate the parameters mutatis mutandis ,
i.e. without taking into account extraordinary external elements.
The Board of Directors also reserves the right to exercise its discretionary power regarding the determination of the Chief Executive
Off icer’s compensation pursuant to Article L.225-47 of the French Commercial Code and in accordance with Articles L.225-37-2 and
L.225-100 of the French Commercial Code, should any particular circumstance arise and justify an exceptional adjustment, either
upwards (within the limit of 150% of the target variable compensation) or downwards, of one or several of the criteria composing the
Chief Executive Off icer’s compensation, to ensure that the application of the abovementioned criteria fairly reflect the Chief Executive
Off icer’s performance as well as that of the Group.
This adjustment may apply to the Chief Executive Off icer’s compensation following a justified decision of the Board of Directors, upon
proposal by its Compensation & Governance Committee.
Payment of the Chief Executive Off icer’s variable cash compensation for 2020 is subject to the approval by the Shareholders’ Meeting to
be held in 2021 of the compensation elements paid during or granted with respect to the 2020 fiscal year to the Chief Executive Off icer.
149I UNIVERSAL REGISTRATION DOCUMENT - ANNUAL REPORT 2019 - AXA I
CORPORATE GOVERNANCE
3
3.2 EXECUTIVE COMPENSATION AND SHARE OWNERSHIP
SHARE-BASED COMPENSATION GRANTED TO THE CHIEF EXECUTIVE OFFICER
Each year, the Board of Directors, upon recommendation of its Compensation & Governance Committee, decides to grant Long-Term
Incentives (LTI) to the Chief Executive Off icer in the form of performance shares.
In order to give the Chief Executive Off icer a stake in long-term value creation, these performance shares represent an important part
of his compensation. Therefore, the value of the allocated performance shares is determined in order to position the Chief Executive
Off icer’s overall compensation (in cash and in shares) between the median and the 3rd quartile of market references.
However, the value of the performance shares granted to the Chief Executive Off icer as determined in accordance with the IFRS standards
may not in any event exceed half of his total compensation.
The Board of Directors has also decided that the number of performance shares allocated to the Company’s corporate off icers may
not exceed 10% of the total number of performance shares granted to all beneficiaries within the Group.
The perfor mance shares granted to the Chief Executive Off icer are entirely subject to demanding internal and external performance
conditions (the details of which are presented in Section 3.2 of this Annual Report), which are assessed over a minimum period of
three years (followed by a two-year holding period), and do not guarantee a minimum grant or gain. Moreover, the performance shares
plan rules provide that in the event the Chief Executive Off icer leaves his position (1 at any time before the end of the performance
period, any performance shares initially granted are irremediably lost, unless otherwise decided by the Board of Directors in a motivated
decision disclosed at the time of the off icer’s departure (in such case, all or part of the performance shares could be maintained and
the vesting calendar and performance conditions of the performance shares set at the grant date would remain unchanged).
Given the principles presented above and following an analysis of practices observed on the market for similar functions in CAC 40
companies of similar size and scope, the Board of Directors, upon proposal of its Compensation & Governance Committee, has decided
that the total value of the performance shares to be granted to the Chief Executive Off icer during 2020, shall not exceed 150% of the
amount of his annual variable compensation target.
EXCEPTIONAL COMPENSATION OF THE CHIEF EXECUTIVE OFFICER
The Board of Directors does not contemplate granting any exceptional compensation to the Chief Executive Off icer.
CHIEF EXECUTIVE OFFICER’S DIRECTORS’ FEES
The Chief Executive Off icer, who also is a member of the Board of Directors of the Company, is not entitled to payment of any directors’
fees from the Company.
BENEFITS IN KIND GRANTED TO THE CHIEF EXECUTIVE OFFICER
The only benefit in kind granted to the Chief Executive Off icer is the use of a company car.
ELEMENTS OF COMPENSATION RELATING TO THE CHIEF EXECUTIVE OFFICER’S RETIREMENT
The Chief Executive Off icer does not participate in any pension schemes with defined benefits.
As all other executives of AXA Group entities in France, he participates in the retirement performance share plan, under which grants
are made on an annual basis.
The performance shares granted under such plan are subject to (i) a vesting period of three years, and (ii) an undertaking not to
transfer the performance shares before the date on which the beneficiary retires, subject to the option off ered to the beneficiaries, for
diversification purposes, to transfer their shares (aft er the end of the acquisition period of three years) as long as the proceeds of such
transfer are invested in a long-term savings plan until the beneficiary retires.
Acquisition of the performance shares is subject to the satisfaction of a performance condition (the details of which are set out in
Section 3.2. of this Annual Report), linked to the average AXA Group Solvency II ratio calculated over the vesting period. Furthermore, no
performance share would be definitely acquired should the Company not pay a dividend during any of the fiscal years of the acquisition
period. Therefore, no minimum grant or gain is guaranteed to the Chief Executive Off icer under this scheme.
The Board of Directors, upon recommendation of its Compensation & Governance Committee, has decided that the total value of the
retirement performance shares to be granted to the Chief Executive Off icer during 2020 shall not exceed 15% of his annual fixed and
cash variable compensation.
REGULATED COMMITMENTS MADE TO THE CHIEF EXECUTIVE OFFICER
The commitments made to the benefit of the Chief Executive Off icer regarding social benefits and unemployment benefits are presented
in more detail in the 2019 Annual Report.
(1) Except in the event of death, invalidity or retirement.

150 I UNIVERSAL REGISTRATION DOCUMENT - ANNUAL REPORT 2019 - AXA I
CORPORATE GOVERNANCE 3 3.2 EXECUTIVE COMPENSATION AND SHARE OWNERSHIP
Appointment of a new Chief Executive Off icer aft er the Shareholder’s Meeting
to be held on April 30, 2020
For purposes of this policy only, and in accordance with applicable regulations, the Board of Directors has also considered the hypothetical
appointment of a new Chief Executive Off icer following the Shareholders’ Meeting to be held on April 30, 2020.
Under such circumstances, the compensation structure applicable to a new Chief Executive Off icer would comply with this policy and
the Board of Directors would perform a comprehensive review of the situation of the relevant executive, provided that:
■ the amount and criteria of his compensation would be determined in accordance with existing practices within the Company by
reference to compensation practices for similar functions in a sample of CAC 40 companies and in the main European companies
in the financial sector; and
■ the experience, skills and individual compensation history of the executive would also be taken into account.
Finally, in the event that the Chief Executive Off icer is recruited externally, the Board of Directors retains the right to grant to the newly
appointed executive a lump sum (in cash and/or in shares) the amount of which, in accordance with the recommendations set forth
in the Afep-Medef Code, may not under any circumstances exceed the amount of the benefits the executive would have had to forgo
by resigning from his previous position.
***
For further information on the Chief Executive Off icer’s compensation, please see Section 3.2 of this Annual Report.
COMPENSATION POLICY FOR THE CHAIRMAN OF THE BOARD OF DIRECTORS
Structure and criteria for determination of the Chairman of the Board of Directors’ compensation
The Board of Directors, upon recommendation of its Compensation & Governance Committee, and in accordance with the recommendations
set forth in the Afep-Medef Code, has considered that the most appropriate compensation structure for the Chairman of the Board of
Directors would be the payment of a sole fixed compensation.
In determining the fixed annual compensation of its Chairman, the Board of Directors has consulted an external advisory firm (Willis
Towers Watson) in order to identify compensation practices for similar functions in a sample of CAC 40 companies and in the main
European companies in the financial sector.
The Board of Directors has also taken into account the extensive role it decided to entrust Mr. Denis Duverne with as Chairman of the
Board of Directors. This role is presented in detail in the Board’s Terms of Reference as well as in Section 3.1 of this Annual Report and
goes beyond the statutory duties of a Chairman under French law.
In addition, the Board of Directors has taken into account the fact that Mr. Denis Duverne, who claimed his pension rights on
September 1, 2016, has decided to waive, for the duration of his term of off ice as Chairman of the Board of Directors, payment of his
benefits (approximately €750,000 per year) under the supplementary pension scheme for executives within the AXA Group in France,
to which he was entitled as from September 1, 2016. Mr. Denis Duverne has decided that he would claim such benefits only aft er the
end of his term of off ice, without application of any retroactive payment.
Accordingly, the Board of Directors has decided, upon recommendation of its Compensation & Governance Committee, to maintain
the amount of the fixed annual compensation of the Chairman of the Board of Directors unchanged, for 2020, i.e. at €1.2 million.
Having considered that the most appropriate compensation structure for the Chairman of the Board of Directors would be fixed
compensation only, the Board of Directors has resolved, as a consequence, that the Chairman of the Board of Directors will not benefit
from any variable compensation, any directors’ fees, any performance shares grants, or of any other long-term compensation elements.
In addition, the Board of Directors does not contemplate granting any exceptional compensation to the Chairman of the Board of
Directors.
Finally, there is no employment contract between the Company and the Chairman of the Board of Directors and the Chairman is not
entitled to any severance benefits or any allowance relating to any non-compete clause in the event that he ceases to be Chairman
of the Board of Directors.
The only benefit in kind granted to the Chairman of the Board of Directors is the use of a company car.
REGULATED COMMITMENTS MADE TO THE CHAIRMAN OF THE BOARD OF DIRECTORS
The commitments made to the benefit of the Chairman of the Board of Directors regarding social benefits are presented in more detail
in the Statutory Auditors’ special report.

151I UNIVERSAL REGISTRATION DOCUMENT - ANNUAL REPORT 2019 - AXA I
CORPORATE GOVERNANCE
3
3.2 EXECUTIVE COMPENSATION AND SHARE OWNERSHIP
Appointment of a new Chairman of the Board of Directors aft er the Shareholders’
Meeting to be held on April 30, 2020
For purposes of this policy only, and in accordance with applicable regulations, the Board of Directors has also considered the
hypothetical appointment of a new Chairman of the Board of Directors following the Shareholders’ Meeting to be held on April 30, 2020.
Under such circumstances, the compensation structure applicable to a new Chairman of the Board of Directors would comply with
this policy and the Board of Directors would perform a comprehensive review of the situation of the relevant executive, provided that:
■ the amount and criteria of his fixed compensation would be determined in accordance with existing practices within the Company
by reference to compensation practices for similar functions in a sample of CAC 40 companies and in the main European companies
in the financial sector; and
■ the experience and skills of the executive as well as the scope of his assignments as defined by the Board of Directors in connection
with his appointment would also be taken into account.
***
For further information on the compensation of the Chairman of the Board of Directors, please see Section 3.2 of this Annual Report.
COMPENSATION POLICY OF THE OTHER MEMBERS OF THE BOARD OF DIRECTORS
The members of the Board of Directors (1) other than the corporate off icers (dirigeants mandataires sociaux) are paid directors’ fees
as sole compensation from the Company.
Criteria for allocation of directors’ fees (compensation in accordance with Article L.225-45,
paragraph 1 of the French Commercial Code)
The total annual maximum amount of directors’ fees is determined by the Shareholders’ Meeting, in accordance with applicable laws,
and apportioned by the Board of Directors to its members in accordance with its Terms of Reference (pursuant to the recommendations
of Afep-Medef Code, a minority part of the fees is distributed evenly among the members of the Board of Directors as a fixed fee):
■ a fixed amount determined by the Board of Directors shall be paid annually to the Senior Independent Director (set at €80,000);
■ 65% of the remaining amount shall be allocated to the Board as follows: 40% shall be divided equally amongst Board members and
paid as a fixed fee and 60% shall be paid depending on Board attendance;
■ the remaining 35% shall be allocated by the Board of Directors to the Board Committees as follows: 25% to the Finance Committee,
25% to the Compensation & Governance Committee, and 50% to the Audit Committee. Each Committee shall then allocate such
amount to its members as follows: 40% shall be divided equally amongst members and paid as a fixed fee and 60% shall be paid
depending on Committee attendance, with the Chairman of the Committee receiving in each case a double fee.
■ The total annual maximum amount of directors’ fees to be allocated to the members of the Board of Directors was set by the
Shareholders’ Meeting of April 25, 2018 at €1,900,000.
No directors’ fees are paid by the Company to the corporate off icers (i.e. Chairman of the Board of Directors and Chief Executive Off icer).
***
For further information on the members of the Board of Directors’ compensation, please see Section 3.2 of this Annual Report.
(1) Who have a four-year term of off ice.

152 I UNIVERSAL REGISTRATION DOCUMENT - ANNUAL REPORT 2019 - AXA I
CORPORATE GOVERNANCE 3 3.3 CORPORATE GOVERNANCE CODE OF REFERENCE
3.3 CORPORATE GOVERNANCE CODE OF REFERENCE
In December 2008, AXA adopted all of the Afep-Medef
recommendations, including the recommendations on the
compensation of corporate officers of October 2008, as its
Corporate Governance Code of reference.
These recommendations were consolidated in a Corporate
Governance Code of Listed Corporations published by the
Afep (Association française des entreprises privées) and the Medef
(Mouvement des entreprises de France) in April 2010 and revised
in January 2020 (hereaft er the “Afep-Medef Code”), which is
available at AXA’s registered off ice or on its website (www.axa.
com) under the “Corporate Governance” Section.
AXA complies with the recommendations of the Afep-Medef Code
that are in line with the long-established corporate governance
principles initiated by the Company. Details are presented in
Sections 3.1 “Corporate governance structure” and 3.2 “Executive
compensation and share ownership” of this Annual Report
describing corporate governance mechanisms and containing
information about executives’ compensation.
The Company implements all the recommendations of the
Afep-Medef Code. However, in order to take into account certain
specificities of its business and governance practices, AXA has
decided, while remaining in line with the principles of the Afep-
Medef Code, to adapt the following provision of the Code:
■ Section 9.5 of the Afep-Medef Code relating to the independence
of parent company directors holding a directorship in a Group
subsidiary: although certain members of the AXA Board of
Directors hold or have held over the last five years a non-
executive directorship in one or more Group subsidiaries
owned, directly or indirectly, by AXA, the Company considers
that this does not automatically (i) place them in a situation
of conflict of interest, or (ii) impair their independence in any
way. The Board believes that permitting its members to sit on
the Boards of certain Group subsidiaries is beneficial to the
Board’s overall knowledge and appreciation of the Group’s
operations, strategy and risk profile. Directors who also serve
on the Boards of Group subsidiaries, however, are required to
abstain from participating in the decisions of the AXA Board
which could aff ect the interests of the entity in which they
hold a directorship to prevent potential independence issues.

153I UNIVERSAL REGISTRATION DOCUMENT - ANNUAL REPORT 2019 - AXA I
CORPORATE GOVERNANCE
3
3.4 RELATED-PARTY TRANSACTIONS
3.4 RELATED- PARTY TRANSACTIONS
For further information concerning related-party transactions,
please see Note 28 “Related-party transactions” included in
Part 5 – “Consolidated Financial Statements” of this Annual Report.
DESCRIPTION OF THE PROCEDURE
FOR ASSESSMENT OF ORDINARY
AGREEMENTS CONCLUDED AT ARM’S
LENGTH TERMS AND CONDITIONS AND ITS
IMPLEMENTATION
At its meeting of February 19, 2020 and in accordance with
Article L.225-39, paragraph 2 of the French Commercial Code,
the Board of Directors adopted a procedure to regularly assess
whether agreements relating to ordinary transactions concluded at
arm’s length terms and conditions actually meet these conditions.
The assessment procedure has been implemented within AXA
since that date.
This procedure provides for the Group Legal Department to be
informed prior to the conclusion, amendment, renewal, extension
or termination of any agreement falling within the scope of
Article L.225-38 of the French Commercial Code, regardless of
the ordinary nature of the transaction or the arm’s length basis
of the agreement. This information enables the Group Legal
Department to carry out a prior review of the agreement in order
to determine whether it should be subject to the “regulated”
agreements procedure provided for under Articles L.225-38 et
seq. of the French Commercial Code or whether it is exempt from
such procedure. To this end, the Group Legal Department may
seek the advice of AXA Group’s other relevant departments and
of the Company’s Statutory Auditors.
In addition, the Group Legal Department annually assesses
whether ordinary agreements concluded at arm’s length terms and
conditions continue to meet the conditions for such qualification,
in cooperation with AXA Group’s relevant departments and the
Company’s Statutory Auditors where necessary. If the Group
Legal Department considers that an agreement initially qualified
as ordinary and concluded at arm’s length terms and conditions
constitutes a “regulated” agreement, the Board of Directors
decides on the qualification of the said agreement and on the
actions to be taken on it according to the qualification adopted.

154 I UNIVERSAL REGISTRATION DOCUMENT - ANNUAL REPORT 2019 - AXA I
CORPORATE GOVERNANCE 3 3.4 RELATED-PARTY TRANSACTIONS
I Statutory Auditors’ special report on regulated agreements
(Shareholders’ Meeting for the approval of the financial statements for the year ended December 31, 2019)
This is a free translation into English of the Statutory Auditors’ report issued in French and is provided solely for the convenience
of English speaking readers. This report should be read in conjunction with, and construed in accordance with, French law and
professional auditing standards applicable in France.
To the Shareholders of AXA SA
25, avenue Matignon
75008 Paris, France
Ladies and Gentlemen,
In our capacity as Statutory Auditors of AXA, we hereby report to you on regulated agreements.
It is our responsibility to report to shareholders, based on the information provided to us, on the main terms and conditions of
agreements that have been disclosed to us or that we may have identified as part of our engagement, as well as the reasons given
as to why they are beneficial for the Company, without commenting on their relevance or substance or identifying any undisclosed
agreements. Under the provisions of Article R.225-31 of the French Commercial Code (Code de commerce), it is your responsibility to
determine whether the agreements are appropriate and should be approved.
Where applicable, it is also our responsibility to provide shareholders with the information required by Article R.225-31 of the French
Commercial Code in relation to the implementation during the year of agreements already approved by the Shareholders’ Meeting.
We performed the procedures that we deemed necessary in accordance with professional standards applicable in France to
such engagements. These standards consisted in the verification of the consistency of the information we received with the basis
documentation from which they are extracted.
AGREEMENTS TO BE APPROVED BY THE SHAREHOLDERS’ MEETING
Agreements authorized and concluded during the year
We hereby inform you that we have not been advised of any agreements authorized and concluded during the year to be submitted
for approval at the Shareholders’ Meeting in accordance with Article L.225-38 of the French Commercial Code.
AGREEMENTS ALREADY APPROVED BY THE SHAREHOLDERS’ MEETING
Agreements approved during prior years
In accordance with Article R.225-30 of the French Commercial Code, we were advised of the following regulated agreements, approved
during previous years, which remained in force during the past year.
Agreement w ith Mr. Thomas Buberl (Chief Executive Off icer)
Nature, purpose, terms and conditions
On August 2, 2016, the Board of Directors acknowledged the eff ective renunciation by Mr. Thomas Buberl, in accordance with the
Afep-Medef recommendations, of his employment contract from September 1, 2016, the date on which he became Chief Executive
Off icer of AXA.
Consequently, the Board of Directors proceeded to a full review of the future social status of Mr. Thomas Buberl, once the renunciation
of his employment contract will be eff ective in accordance with the Afep-Medef recommendations.

155I UNIVERSAL REGISTRATION DOCUMENT - ANNUAL REPORT 2019 - AXA I
CORPORATE GOVERNANCE
3
3.4 RELATED-PARTY TRANSACTIONS
In this context, the Board of Directors, in view of the seniority of Mr. Thomas Buberl in his employee status and from the significance
of his services provided to the Company, confirmed its wish to maintain social benefits (health and disability insurance, etc.), as an
executive director, in the same conditions than the ones applicable to AXA Group director-level employees in France.
Agreement with Mr. Denis Duverne (Chairman of the Board of Directors)
Nature, purpose, terms and conditions
On February 17, 2010, the Supervisory Board acknowledged the eff ective renunciation by Mr. Denis Duverne of his employment
contract as of the Shareholders’ Meeting of April 29, 2010 during which the former dual structure consisting of a Management Board
and a Supervisory Board was replaced by a unitary Board of Directors structure.
The Supervisory Board was concerned that the decision of Mr. Denis Duverne to renounce his employment contract, in accordance
with the Afep-Medef recommendations, would not jeopardize the continuity of his accrued and future social benefits.
Consequently, the Supervisory Board took the following decision:
■ The Supervisory Board authorized the Company to take all appropriate commitments to ensure that, as a corporate off icer, Mr. Denis
Duverne would continue to have social benefits (health and disability insurance, etc.) identical or on terms equivalent to those
applicable to AXA Group director-level employees in France, including by amending Group benefit plans in terms of health and
disability insurance.
Neuilly-sur-Seine and Courbevoie, March 16, 2020
The Statutory Auditors
PricewaterhouseCoopers Audit Mazars
Bénédicte Vignon - Grégory Saugner Jean-Claude Pauly - Maxime Simoen

156 I UNIVERSAL REGISTRATION DOCUMENT - ANNUAL REPORT 2019 - AXA I
CORPORATE GOVERNANCE 3 3.4 RELATED-PARTY TRANSACTIONS
This page was intentionally left blank.

157I UNIVERSAL REGISTRATION DOCUMENT - ANNUAL REPORT 2019 - AXA I
4RISK FACTORS AND
RISK MANAGEMENT
4.1 RISK FACTORS 158
Financial risks 158
Risks related to the Company and its business 163
Risks related to the ownership of the Company’s shares 175
4.2 INTERNAL CONTROL AND RISK MANAGEMENT 176
Governance and Risk Management organization 177
Own Risk and Solvency Assessment (“ORSA”) 184
Internal Model 185
Governance of investment strategy and asset & liability management (ALM) 188
4.3 MARKET RISKS 190
Market risks: definition and exposure 190
Risk control and risk mitigation 191
Focus on main market risks and sensitivity analyses 192
4.4 CREDIT RISK 197
Credit risk: definition and exposure 197
Risk control and risk mitigation 197
4.5 LIQUIDITY RISK 201
4.6 INSURANCE RISKS 202
Insurance risks: definition and exposure 202
Risk control and risk mitigation 203
4.7 OPERATIONAL RISK 206
4.8 OTHER MATERIAL RISKS 207
Strategic risk 207
Reputation risk 207
Emerging risks 208
Regulatory risks 208
Sustainability risks 208

158 I UNIVERSAL REGISTRATION DOCUMENT - ANNUAL REPORT 2019 - AXA I
RISK FACTORS AND RISK MANAGEMENT 4 4.1 RISK FACTORS
4.1 RISK FACTORS
You should carefully consider the following risk factors together
with other information contained in this Annual Report. Any of
these risks could materially aff ect our business, financial condition
or results of operations, cause the trading price of our ordinary
shares to decline materially or our actual results to diff er materially
from those expected or those expressed in any forward looking
statements made by or on behalf of the Company.
The risks described below are not the only risks we face. Additional
risks and uncertainties not currently known to us or that we
currently deem to be immaterial may also materially adversely
aff ect our business, financial condition, results of operations or
cash flows.
The Company’s Risk Management processes, procedures and
controls are described in Section 4.2 “Internal Control and Risk
Management” of this Annual Report, which should be read in
conjunction with this Section 4.1. While M anagement devotes
very substantial resources to Risk Management on an ongoing
basis, the Group’s Risk Management activities, like all control
systems, are subject to inherent limitations and cannot provide
absolute assurance or render the Group immune in any respect
from the risks described in this Part 4 or the losses that may be
incurred in connection with these risks.
Where the risks described in this Section 4.1 have given rise to
quantifiable and material financial impacts and/or material
contingent liabilities, those financial impacts and/or contingent
liabilities are reflected in the Consolidated Financial Statements.
You should also refer to Section 4.3 et seq. of this Annual Report for
quantitative information on the material risks to which the Group
is exposed. For avoidance of doubt, references to “insurance”,
“(re)insurance”, “Property & Casualty” and “Life & Savings” in this
section also refer to “Health” activities as appropriate.
In presenting the risks set forth in this Section 4.1, M anagement
has identified the primary categories and the most material risks
in a manner that corresponds to management’s current view as
to the materiality of such risk factors for the AXA Group, based
on the perceived likelihood of the occurrence of such risks and
the expected magnitude of their negative impact. As more fully
described below, such categories include market-related risks,
credit and liquidity-related risks, pricing and underwriting-related
risks, operational-related risks, regulatory-related risks and risks
related to the ownership of the Company’s shares. Further, there
can be no assurance that M anagement’s assessment of the relative
importance of such risk factors may not change over time, whether
to reflect new information, events, circumstances or otherwise.
I Financial risks
MARKET-RELATED RISKS
Negative developments in economic and
financial market conditions, whether on a
national, continental or global basis, may
materially and adversely aff ect our business
and profitability
Our businesses, financial position and results of operations are
impacted by global financial market fluctuations and economic
conditions generally. While financial market results and economic
conditions were generally favorable in 2019, there remains a wide
variety of factors which could negatively impact economic growth
prospects and contribute to high levels of volatility in financial
markets. These factors include, among others, concerns over a
potential slowdown in economic growth and levels of consumer
confidence generally; current market conditions, including asset
valuations and volatility, that may lead to an abrupt and significant
repricing in financial markets; the strengthening or weakening of
foreign currencies, in particular the US Dollar, against the Euro;
the availability and cost of credit; the stability and solvency of
certain financial institutions and other companies, including
related systemic credit risk concerns; rising trade tensions, “trade
wars”, and other governmental measures, either enacted or being
contemplated relating to tariff s or international trade agreements
and policies; continuing concerns over certain sovereign debt
issuers; inflation or deflation in certain markets; central bank
intervention in the financial markets, such as the recent decision of
the European Central Bank to restart its asset purchase program,
and uncertainty regarding potential central bank intervention
in European and other markets, through quantitative easing
or similar programs or the winding down or cessation of such
programs; changes in reference rates, including reforms to and
potential changes aff ecting Libor, Euribor and other indices;
volatile energy costs; adverse geopolitical events (including acts
of terrorism or military conflicts) and rising geopolitical tensions
in various regions, including Russia, Ukraine, Latin America,
Syria, Iraq or North Korea; recent developments such as the
latest political events in the United Kingdom, Spain, Germany,
Italy and Hong Kong and the European Union; and continuing
political uncertainty regarding the United States.

159I UNIVERSAL REGISTRATION DOCUMENT - ANNUAL REPORT 2019 - AXA I
RISK FACTORS AND RISK MANAGEMENT
4
4.1 RISK FACTORS
In addition, specific concerns regarding the Eurozone, including
the financial condition of certain EU sovereign debt issuers,
uncertainty regarding membership in the European Union,
relationships between European institutions and certain Member
States, potential structural reforms or other changes made to
the Euro, the Eurozone or the European Union, have resulted
in significant disruptions in financial markets in recent years
and could have similar eff ects in the future. In particular, the
decision of the United Kingdom to leave the European Union
in accordance with Article 50 of the Treaty on European Union,
on March 29, 2017 (“Brexit”) and the resulting negotiations
between the United Kingdom and the European Union to reach
a withdrawal agreement, which entered into force on January 31,
2020 (the “Withdrawal Agreement”), have materially impacted
and are likely to continue to materially impact financial markets
and macroeconomic conditions. Pursuant to the Withdrawal
Agreement, most EU rules and regulations will continue to apply
to the United Kingdom until December 31, 2020 (such period,
the “Transition Period”), subject to a one-time extension of up to
two years upon a joint decision of the European Union and the
United Kingdom to be taken before July 1, 2020. The European
Union and the United Kingdom will negotiate the terms of their
new relationship during the Transition Period. Although they have
agreed to a political declaration on the outline of their future
partnership, the exact terms of that future relationship aft er the
expiry of the Transition Period, including those regarding access to
each other’s financial markets and cross-border financial services
generally, remain subject to future negotiation. Such negotiations
could have far-reaching and unpredictable eff ects on financial
markets and macroeconomic conditions. These eff ects could
be amplified by the uncertainty surrounding the terms of the
new relationship between the European Union and the United
Kingdom, if any, the contingency plans at European Union and
Member State levels in case no agreement on such relationship
is reached and, more generally, the United Kingdom’s future
relationship with the European Union. While the Group actively
follows Brexit-related developments and has developed Brexit
contingency plans, there can be no assurance that Brexit and
its related consequences will not have an adverse eff ect on the
Group’s business and financial condition.
These factors and others have had and may continue to have an
adverse eff ect on our revenues and results of operations, in part
because we have a large investment portfolio. Our investment
income is an important part of our profitability, and our sales of
insurance and Asset Management products (as well as the level
of product surrenders and lapses) are dependent upon financial
market performance, customer behavior and confidence as well
as other related factors. Our ability to make a profit on insurance
and investment products, for example, depends in part on the
returns on investments supporting our obligations under those
products, and the value of specific investments may fluctuate
substantially depending on the foregoing conditions. In addition,
certain types of insurance and investment products that we
off er expose us to risks associated with fluctuations in financial
markets, including certain types of interest sensitive or variable
products such as guaranteed annuities or variable annuities,
which have crediting or other guaranteed rates or guaranteed
minimum benefits not necessarily related to prevailing market
interest rates or investment returns on underlying assets. Although
we use hedging techniques to help mitigate our exposure under
certain of these guarantees, not all risks can be eff ectively hedged
against and volatility in the financial markets, combined with
unanticipated policyholder behavior, may increase our cost of
risk and/or negatively aff ect our ability to hedge against certain
of these risks, which may in turn adversely aff ect our profitability.
More generally, to the extent the economic environment in the
jurisdictions in which we do business may become characterized
by higher unemployment, lower family income, lower corporate
earnings, lower business investment and lower consumer
spending, the demand for our financial and insurance products
could be adversely aff ected. In addition, in such circumstances,
we may experience an elevated incidence of lapses or surrenders
on certain types of policies or funds, lower surrender rates than
anticipated on other types of products, and our policyholders
may choose to defer paying insurance premiums or stop paying
insurance premiums altogether. These developments could
accordingly have a material adverse eff ect on our business,
results of operations and financial condition.
Changes in interest rates and credit spreads
may adversely aff ect our business, results of
operations, solvency and financial condition
Our exposure to interest rate risk relates primarily to the market
price and cash flow variability associated with changes in interest
rates. Changes in interest rates may negatively aff ect the value of
our assets (particularly fixed-income investments) and our ability
to realize gains or avoid losses from the sale of those assets, all
of which also ultimately aff ect earnings. In particular, negative
interest rates and low levels of interest rates generally, such as
those experienced in recent years, have and may continue to
negatively impact our net interest income and the profitability
of our Life & Savings business.

160 I UNIVERSAL REGISTRATION DOCUMENT - ANNUAL REPORT 2019 - AXA I
RISK FACTORS AND RISK MANAGEMENT 4 4.1 RISK FACTORS
In-force life insurance and annuity products may become
comparatively more attractive to customers in a declining interest
rate environment, resulting in an increase in our liabilities (in
particular in relation to flexible-premium products), asset-liability
duration mismatches (as more policies and contracts remain
in-force from year-to-year) and an increase in provisions for
guarantees included in life insurance and annuity products.
Accordingly, during a period of declining interest rates or a
prolonged period of low interest rates, our profitability may
suff er as the result of a decrease in the spread between interest
rates credited to insurance policyholders and annuity contract
owners and the rates we are able to earn on our fixed-income
investment portfolio. In addition, certain regulatory capital and
reserve requirements are based on formulas and models that
consider interest rates, such as the Group’s Internal Model, and an
extended period of low interest rates may increase the regulatory
capital we are required to hold and the amount of assets we must
maintain to support our reserves, while decreasing the amount
of our Eligible Own Funds (“EOF”), which could have an adverse
impact on our Solvency II ratio.
Conversely, in periods of increasing interest rates, the estimated
fair value of certain of our fixed-income investments may decrease,
which could negatively impact our Solvency II ratio and net income;
surrenders of life insurance policies and fixed annuity contracts
may accelerate, as policyholders seek higher returns, which may
cause us to accelerate amortization of deferred policy acquisition
costs or to liquidate fixed maturity investments in order to obtain
liquidity to satisfy such obligations, which may result in realized
investment losses; our fee income may decrease due to a decline
in the value of our asset managers’ fixed income assets under
management, which could result in lower management fees and
have an adverse impact on Asset Management net inflows. In
addition, we may be required, as an issuer of securities, to pay
higher interest rates on debt securities, debt and bank facilities,
which may increase our interest expenses.
For a description of the sensitivity of our EOF to changes in interest
rates, please refer to Note 4.2 “Market risks (including sensitivity
analysis)” in Part 5 “Consolidated Financial Statements” of this
Annual Report. For additional information on the sensitivity of
our Solvency II ratio to financial shocks on interest rates, please
refer to the AXA Group’s SFCR, available on AXA’s website (www.
axa.com) (1).
Our exposure to changes in credit spreads primarily relates to
the impact of such changes on market prices and cash flow
variability. A widening of credit spreads will generally reduce
the value of fixed income securities we hold (including credit
derivatives where we assume credit exposure) and increase
our investment income associated with purchases of new fixed
income securities in our investment portfolios; and, as issuer,
we may be facing increased interest expenses. Conversely, credit
spread tightening will generally increase the value of fixed income
securities we hold and reduce our investment income associated
with new purchases of fixed income securities in our investment
portfolios. For additional information on the sensitivity of our
Solvency II ratio to financial shocks on corporate bond spreads,
please refer to the AXA Group’s SFCR, available on AXA’s website
(www.axa.com) (1).
Although we take measures, including hedging through derivative
instruments, to manage the economic risks of investing in a
changing interest rate environment, we may not be able to
mitigate the interest rate risk of our assets relative to our liabilities.
Accordingly, ongoing volatility in interest rates and credit spreads,
individually or in tandem with other factors, could have a material
adverse eff ect on our solvency position, and on our results of
operations, financial position or cash flows through realized losses,
impairments, and changes in unrealized gains and loss positions.
Fluctuations in currency exchange rates may
significantly aff ect our results of operations,
financial position, liquidity and solvency
Due to the geographical diversity of our business, we are subject
to the risk of exchange rate fluctuations since a significant portion
of our shareholdings and investments, revenues and expenses are
denominated in currencies other than Euro, while our Consolidated
Financial Statements are established in Euro. Likewise, the part of
our debt and other obligations denominated in currencies other
than Euro is subject to foreign currency exchange rate fluctuations.
While we seek to manage our exposure to foreign currency
fluctuations through hedging, fluctuations in exchange rates
may have a significant impact on our Euro-denominated results
of operations, cash flows, gearing ratio, shareholders’ equity and
solvency. In addition, the currency hedges we use to manage
foreign exchange rate risk may in themselves significantly impact
our cash and liquidity position.
Inflation or deflation in our principal markets
would have multiple impacts on AXA and may
negatively aff ect our business, solvency
position and results of operations
We are subject to inflation risk in certain of our principal markets,
especially in Europe, through our holdings of fixed interest and
other instruments, and as a result of the potential for claim
payments and expenses to rise faster than anticipated in our
reserving and pricing assumptions.
(1) The AXA Group’s SFCR for the year ended December 31, 2018 is available on AXA’s website, and the AXA Group’s SFCR for the year ended December 31, 2019 is expected to be published on May 14, 2020 on AXA’s website.

161I UNIVERSAL REGISTRATION DOCUMENT - ANNUAL REPORT 2019 - AXA I
RISK FACTORS AND RISK MANAGEMENT
4
4.1 RISK FACTORS
In particular, inflation in relation to medical costs, construction
costs and tort issues impacts the Property & Casualty industry.
The impact of inflation on loss costs could be more pronounced
for those Property & Casualty lines of business that are considered
“long tail” such as general liability, worker’s compensation and
professional liability, and other specialty lines of our AXA XL
business, as they require a relatively long period of time to finalize
and settle claims for a given accident year. Changes in the level
of inflation could also result in an increased level of uncertainty
in our estimation of claims reserves, particularly for long tail
lines of business.
We are also subject to deflation risk, which has materialized in the
Eurozone in recent years. Deflation may erode collateral values
and diminish the quality of certain investment assets, and may
negatively impact customer behavior or otherwise negatively
aff ect our business and results of operations.
Adverse business and market conditions
as well as accounting rules may impact the
amortization of our Deferred Acquisition Costs
(“DAC”), Value of Business In-force (“VBI”)
and other intangibles and/or reduce deferred
tax assets and deferred policyholders
participation assets, which could materially
aff ect our results of operations and financial
statements
Business and market conditions as well as accounting rules may
impact the amount of goodwill we carry in our consolidated
balance sheet, our pattern of DAC, VBI and other intangible
assets amortization and the value of our deferred tax assets
and deferred participation assets. The value of certain of our
businesses is significantly impacted by such factors as the state
of the financial markets, particularly equity markets, and ongoing
operating performance.
Adverse experience relative to the
methodologies, estimations and assumptions
used by M anagement in valuing investments
and determining allowances and impairments
may materially adversely aff ect our results of
operations
Certain of our invested assets, for which there is no active trading
market or other observable market data, are valued using models
and methodologies that involve estimates, assumptions and
significant M anagement judgment. During periods of market
disruption, a larger portion of our investment assets may be
valued using these models and methodologies as a result of less
frequent trading or less observable market data with respect to
certain asset classes that were previously actively traded in liquid
markets. There can be no assurance that our valuations on the
basis of these models and methodologies represent, for example,
the price for which a security may ultimately be sold or sold at
any specific point in time. The choice of models, methodologies
and/or assumptions may have a material impact on the estimated
fair value amounts and could have a material adverse eff ect on
our results of operations and financial condition.
The determination of the amount of allowances and impairments
that we recognize with respect to the invested assets we hold varies
by investment type, and is based upon our periodic evaluation
and assessment of known and inherent risks associated with
the respective asset class. Such evaluations and assessments
are revised as conditions change and new information becomes
available. In considering impairments, M anagement considers
a wide range of factors, including those described in Note 1.8.2
“Financial instruments classification” in Part 5 “Consolidated
Financial Statements” of this Annual Report, and uses its best
judgment in evaluating the cause of the decline in the estimated
fair value of the investment assets and the prospects for near-term
recovery. For certain asset classes, particularly debt instruments,
management’s evaluation involves a variety of assumptions and
estimates about the operations of the issuer of the instrument and
its future earnings potential. Management updates its evaluations
regularly and reflects changes in allowances and impairments as
such evaluations are revised. There can be no assurance, however,
that management has accurately assessed the level of impairments
taken and allowances reflected in our financial statements, and
the need for and timing of any additional impairments and/or
allowances may have a material adverse eff ect on our results of
operations and financial position.
CREDIT AND LIQUIDITY-RELATED RISKS
Adverse capital and credit market conditions
may significantly aff ect our ability to meet
liquidity needs, our access to capital and
increase our cost of capital
In recent years, the capital and credit markets have at times
experienced high levels of volatility and disruption which, during
certain periods, have significantly limited the availability of
additional liquidity in the markets and credit capacity for most
issuers, including AXA.
We need liquidity to pay our operating expenses (including claims
and surrenders), dividends and interests on our debts and to
refinance certain maturing debts and other liabilities. In addition,
we need liquidity in connection with derivatives transactions to
which we are party which require us to transfer cash collateral
and/or subject us to margin calls in certain circumstances. The

162 I UNIVERSAL REGISTRATION DOCUMENT - ANNUAL REPORT 2019 - AXA I
RISK FACTORS AND RISK MANAGEMENT 4 4.1 RISK FACTORS
availability of additional financing to supplement internal liquidity
resources will depend on a variety of factors such as market
conditions, the overall availability of credit to the financial services
industry, our credit ratings and credit capacity, as well as the
possibility that customers or lenders could develop a negative
perception of our long-term or short-term financial prospects if
we incur large investment losses or if the level of our business
activity decreases due to a market downturn. While M anagement
has put in place a liquidity risk management framework that
includes active monitoring of the Group’s liquidity position and
contingency plans for accessing liquidity, liquidity constraints over
a prolonged period may have a material adverse eff ect on our
business, results of operations and consolidated financial position.
Downgrades in our insurer and reinsurer
financial strength and credit ratings could
adversely impact our competitive position
and damage our relationships with creditors
or trading counterparties
Insurer (and reinsurer) financial strength and credit ratings are
important factors used by the market and customers in establishing
the competitive position of insurance and reinsurance companies
and in assessing our claims-paying ability. Rating agencies review
their ratings and rating criteria and methodologies on a recurring
basis, and they may change or withdraw their ratings at any
time, based on relevant factors that may not be entirely within
our control and/or aff ect the insurance and reinsurance industry
generally. Consequently, our current ratings may not be maintained
in the future and no undue reliance should be placed on such
ratings, which should not be considered as recommendations to
purchase, sell or hold any securities we have issued.
A downgrade or the potential for a downgrade in our ratings
could have an adverse eff ect on us, including (i) damaging our
competitive position, (ii) negatively impacting our ability to
underwrite new insurance policies, (iii) increasing the levels
of surrenders and termination rates of our in-force policies,
(iv) increasing our reinsurance cost, (v) triggering termination
provisions or collateral delivery requirements, or requiring
us to return unearned premiums to cedants, under certain of
our reinsurance and retrocessional agreements, (vi) negatively
impacting our ability to obtain financing and/or increasing our
cost of financing, (vii) harming our relationships with creditors
or trading counterparties and/or (viii) adversely aff ecting public
confidence in us. Any of these developments could have a material
adverse eff ect on our business, liquidity position, results of
operations, revenues and financial condition.
The financial condition and conduct of our
counterparties could negatively impact us
We have significant exposure to third parties that owe us money,
securities or other assets and which may fail to perform or
default on their obligations to us due to bankruptcy, insolvency,
lack of liquidity, operational failure, fraud, or other reasons.
Such third parties include private sector and government (or
government-backed) issuers whose securities we hold in our
investment portfolios (including mortgage-backed, asset-backed,
government bonds and other types of securities), borrowers
under mortgages and other loans that we extend, reinsurers
and capital market counterparties to which we have ceded
(directly or indirectly) our insurance risks, customers, ceding
companies, service providers, partners, trading counterparties,
counterparties under swap and other derivative contracts, and
other counterparties including brokers and dealers, commercial
and investment banks, hedge funds, other investment funds,
clearing agents and market exchanges. We may also have
exposures to such counterparties under insurance policies that
we have written, including in respect of D&O, surety and similar
coverages. Moreover, we are exposed to counterparty risk with
respect to certain policies we write that provide coverage to
our policyholders for their credit risk exposures to third parties.
Under our reinsurance and retrocessional arrangements (including
similar protection aff orded through risk transfer transactions
to capital markets), other insurers, reinsurers or capital market
counterparties assume a portion of the losses and related expenses
under policies we issue, although we remain liable as the direct
(re)insurer on all risks reinsured. While we evaluate periodically
the financial condition of our reinsurers, retrocessionaires and
capital market counterparties to minimize our exposure to
significant losses from reinsurer/retrocessionaire/capital market
counterparty insolvencies, such counterparties may become
financially unsound by the time their financial obligations to us
become due and force us to recapture the reinsured or retroceded
business. For information on the ratings of our reinsurers, please
refer to Section 4.4 “Credit risk-Risk control and risk mitigation-
Receivables from reinsurers: rating processes and factors” of
this Annual Report.
There can be no assurance that defaults by the foregoing or other
counterparties would not materially and adversely aff ect our
business, results of operations and financial condition.

163I UNIVERSAL REGISTRATION DOCUMENT - ANNUAL REPORT 2019 - AXA I
RISK FACTORS AND RISK MANAGEMENT
4
4.1 RISK FACTORS
I Risks related to the Company and its business
PRICING AND UNDERWRITING-RELATED RISKS
Adverse experience relative to the
assumptions and judgment used in setting
reserves, developing and pricing products
and calculating industry measures of
value may significantly aff ect our results
of operations or performance indicators,
which may have an adverse impact on
the price of our securities
The profitability of our businesses largely depends on a
variety of factors including social, economic and demographic
trends (including, in the life insurance business, mortality and
morbidity trends), policyholder behavior (including surrender
and persistency rates), court decisions, changes in laws and
regulations, inflation, investment returns and underwriting
expenses. We make assumptions about these factors in estimating
our risk exposures, determining the pricing of our products,
establishing (re)insurance and employee benefits reserves and
reporting capital levels and business results (using such industry
measures of value as NBV or European Embedded Value (“EEV”)).
These assumptions are based on various modeling techniques
(e.g., scenarios, predictive, stochastic and/or forecasting), using
both proprietary and third-party models, data analytics and related
analyses. Model outputs and related analyses are subject to
various assumptions, uncertainties, model errors and the inherent
limitations of any statistical analysis (including availability, use,
accuracy and relevance of historical, internal and industry data)
and incorporate numerous assumptions and forecasts about
market conditions (such as interest rates, inflation and currency
exchange rates), capital requirements, loss frequency and severity,
and policyholder behavior. The use of such models can also be
aff ected by operational risks, including input, data and human
error. Adverse experience relative to such assumptions, use of
and reliance on inaccurate or incomplete models, or inherent
product defects may result in an increase in the pricing of our
insurance products or the need for us to strengthen our product
reserves, which may in turn have an adverse eff ect on our results
of operations and financial position, or lead to litigation.
In our Property & Casualty business, we establish reserves for
claims (either reported or unreported) and claims expenses in
accordance with industry practices and accounting, actuarial
and regulatory requirements. Reserves do not represent an exact
calculation of liability, but instead represent expectations of what
the ultimate settlement and administration of claims will cost
based on our assessment of facts and circumstances then known,
review of historical settlement patterns, estimates of trends in
claims severity and frequency, actuarial experience on past events,
legal liability and other factors. While we continually review the
adequacy of our claims reserves, because the establishment of
claims reserves is an inherently uncertain and complex process
involving numerous estimates, including the impacts of any
regulatory and legislative changes, court interpretations, medical
condition of claimants, emerging trends and theories of liability,
including with respect to environmental, medical and products
liability exposures, and changes in economic conditions (including
inflation changes and discount rates used for evaluation of
settlements), there can be no assurance that ultimate losses
will not materially exceed our claims reserves and have a material
adverse eff ect on our results of operations. The impact of certain
of these factors, such as social inflation, particularly in the U.S.
(increased litigation, expanded theories of liability, higher jury
awards and settlement expectations), as well as mass tort claims
related to exposure to harmful products or substances (e.g.,
asbestos, opioids, talc, glyphosate, lead paint), on our estimation
of claims reserves and ultimate costs for claims is diff icult to
assess and could be material. Our estimation may also be more
diff icult during times of adverse economic conditions due to
unexpected changes in behavior of claimants and policyholders,
including an increase in fraudulent reporting of exposures and/or
losses, reduced maintenance of insured properties or increased
frequency of small claims.
In our Life & Savings business, our earnings depend significantly
upon the extent to which our actual claims experience is
consistent with the assumptions we use in setting the prices
for our products and establishing the liabilities for obligations
for technical provisions and claims. In certain cases, product
features such as minimum guarantees or options to swap between
underlying funds in certain savings products may with time result
in higher realized losses than anticipated in initial assumptions.

164 I UNIVERSAL REGISTRATION DOCUMENT - ANNUAL REPORT 2019 - AXA I
RISK FACTORS AND RISK MANAGEMENT 4 4.1 RISK FACTORS
In particular, assessing the impact of minimum guarantees which
are contained within certain of our Variable Annuity products
and the adequacy test performed on the reserves for life policies
(which encompasses the recoverability of DAC, VBI and deferred
participation assets) involve a significant degree of management
judgment. While we use both our own experience and industry
data to develop products and to estimate future policy benefits,
including information used in pricing the insurance products
and establishing the related actuarial liabilities, there can be no
assurance that actual experience will match these estimates and
that emerging risks would not result in loss experience inconsistent
with our pricing and reserve assumptions.
Furthermore, while our NBV and EEV calculations are done
on a market consistent basis, changes in assumptions used
in calculating these measures may have a material adverse
eff ect on the level of our NBV and/or EEV. For example, our NBV
is sensitive to interest rate movements and, consequently, an
adverse evolution of interest rates relative to our assumptions
may have a significant impact on our NBV and a corresponding
impact on the trading price of our securities.
The occurrence of natural or man-made
disasters, including those resulting from
changing weather patterns, diseases
and climatic conditions, could adversely
aff ect our financial condition, profitability
and cash flows
Catastrophic events are inherently unpredictable. Our exposure to
natural and man-made disasters depends on various factors and
is oft en more pronounced in certain geographic areas, including
major urban centers, with a high concentration of customers,
employees and/or insured property and assets.
Our acquisition of the XL Group in 2018 complemented and
diversified our existing Property & Casualty Commercial lines
portfolio, provided us with additional reinsurance capabilities
and further strengthened our specialty platform and presence in
North and Latin America, Europe, Lloyd’s and Asia-Pacific. AXA XL’s
operations are significantly exposed to natural and man-made
catastrophes and, as a result, our overall exposure to such events
has increased compared to prior years.
Catastrophic events, whether natural or man-made, such as
hurricanes, tornadoes, windstorms, hailstorms, earthquakes,
volcanic eruptions, freezes, floods, explosions, wildfires, pandemic
diseases, terrorist attacks, cyber events, systemic cyber failures,
military actions, and power grid and other core infrastructure
(e.g., telephony or Internet infrastructures) failures could result in
substantial volatility in or adversely aff ect our operations, results,
financial condition, cash flows or solvency position, including as a
result of claims occurring at higher levels or materially earlier than
anticipated; losses resulting from disruptions in our operations
or failures of our counterparties to perform; or declines in value
of our investment portfolio. We monitor the evolution of these
risks closely and generally seek to manage our exposure to them
through individual risk selection, modelling and monitoring
overall exposures and risk accumulation, purchase of third-party
reinsurance and risk transfer transactions to capital markets.
There can be no assurance, however, that we will be able to
adequately anticipate such evolution, as a single catastrophic
event, an accumulation of losses resulting from several events
or an unusual frequency of smaller losses in a particular period
may aff ect multiple geographic areas and lines of business, and
the frequency or severity of catastrophic events could exceed
our estimates. Accounting principles and rules preventing (re)
insurers to reserve for catastrophic events until they occur may
also augment the impact of such events.
The occurrence of catastrophic events may also result in an
increase of our reinsurance/retrocession for own account and
limit or prevent us from obtaining adequate types and amounts of
reinsurance/retrocession (or entering into adequate risk transfer
transactions to capital markets) for certain risks or regions.
While we seek to reduce our exposure to catastrophic events,
through diversification and incremental reinsurance, we have
experienced and could in the future experience material losses
from these types of risks, which may exceed our reinsurance
and retrocessional protection (or similar protection aff orded
through risk transfer transactions to capital markets) or such
protection may otherwise be inadequate to protect us against
losses or uncollectible reinsurance when due. In particular, we
may enter into risk transfer transactions to capital markets that
off er reinsurance protection based on an industry loss index
rather than on our actual incurred losses, which may result in our
residual losses not being covered to the extent they are not fully
correlated with the relevant share of the related industry loss.
Over the past several years, changing weather patterns and
climatic conditions, including as a result of climate change,
have added to the unpredictability of natural disasters and
to the frequency and severity thereof and created additional
uncertainty as to future trends and exposures. In particular, the
consequences of climate change might significantly impact the
insurance and reinsurance industry, including with respect to risk
perception, pricing and modelling assumptions, and the need
for new insurance products, all of which may create unforeseen
risks and costs not currently known to us.
COVID-19 Outbreak. Since December 2019, a significant number
of cases of pneumonia associated with the Coronavirus, now
called COVID-19 by the W orld Health Organization (“WHO”), has
been reported worldwide. Initially reported in the province of
Hubei in the People’s Republic of China, it h as spread across
other countries, resulting in reported infections and deaths in
numerous countries , including South Korea, Iran, Italy, France,
the United Kingdom and the United States , and new cases and
fatalities are reported daily. Furthermore, it is currently not possible
to know or to predict the extent to which the current levels of
reported cases reflect the actual transmission of the virus within
populations, and accordingly the scale of the pandemic may be
significantly larger than is presently recorded.

165I UNIVERSAL REGISTRATION DOCUMENT - ANNUAL REPORT 2019 - AXA I
RISK FACTORS AND RISK MANAGEMENT
4
4.1 RISK FACTORS
The spread of COVID- 19 has resulted globally in governmental
authorities imposing quarantines and travel restrictions of varying
scope; has led to significant disruptions in the global travel and
hospitality industries, and in global trade and supply chains more
broadly; has resulted in decreased economic activity and lowered
estimates for future economic growth; has created severe strains
on local, national and supra-national medical and healthcare
systems and institutions; and has caused global financial markets
to experience significant volatility and the worst downturn since
the 2008 financial crisis. While significant resources have been
mobilized to attempt to find a vaccine or other measures to
achieve containment of COVID- 19, such eff orts are in the early
stages and there can be no assurance that vaccines or other
treatments will be developed in the near term, nor that their
eff icacy and availability will be adequate if and when developed.
Given the very recent emergence of COVID- 19, we are currently
unable to predict the potential impact thereof on our business
in 2020 or future periods. AXA is monitoring potential adverse
eff ects of the spread of COVID- 19 on the Group’s operations
and business activities, in particular, the scope and severity of
any further downturn in global financial markets and the global
economy and consequential impacts on our investment portfolio;
the extent of insurance coverage impacted, including L ife, H ealth,
P rotection and P roperty & C asualty insurance and reinsurance
cover (following, for example, increased business interruptions,
travel and event cancellations and higher medical costs); and
on new business. Depending on the rate of transmission and
related mortality, COVID- 19 may have material adverse eff ects
on our business, operations and financial results.
The Property & Casualty insurance
and reinsurance businesses are cyclical,
which may impact our results
Historically, Property & Casualty insurers and reinsurers have
experienced significant fluctuations in operating results due
to volatile and sometimes unpredictable developments, many
of which are beyond the direct control of the insurer/reinsurer,
including competition, frequency or severity of loss events, levels of
underwriting capacity by region or product line, general economic
conditions and other factors, including the development of
the insurance-linked securities market and other alternatives
to traditional Property & Casualty insurance and reinsurance
products. Changes in customer expectations for appropriate
premium levels, the frequency or severity of claims or other loss
events, including losses incurred by our ceding insurers, or other
factors aff ecting the Property & Casualty insurance business may
have an adverse eff ect on our results of operations and financial
condition.
Our Risk Management programs may be
inadequate to protect us against the full
extent of the exposure or losses we seek
to mitigate and may leave us exposed to
unidentified, unanticipated or incorrectly
quantified risks that could result
in significant losses
We employ a range of risk mitigation strategies, including
reinsurance for own account and capital markets solutions (such as
catastrophe bonds), in order to avoid or limit losses and liabilities.
The failure of any of our Risk Management strategies could result
in significant losses and have a material adverse impact on our
financial condition, results of operations, and cash flows.
We use derivatives (including equity futures, treasury bond futures,
interest rate swaps and swaptions, equity options and variance
swaps) to hedge certain, but not all, risks under guarantees
provided to our clients or stemming from our assets.
In certain cases, however, we may not be able to apply these
techniques to eff ectively hedge our risks as intended or expected
or may choose not to hedge certain risks because the derivative
markets in question may not be of suff icient size or liquidity,
the cost of hedging may be too expensive (as a result of adverse
market conditions or otherwise), the nature of the risk itself may
limit our ability to eff ectively hedge or for other reasons. This may
result in higher realized losses and unanticipated cash needs
to collateralize or settle transactions. Hedging counterparties
may also fail to perform their obligations, resulting in unhedged
exposures and losses on positions that are not collateralized.
Furthermore, the operation of our hedging program is based
on models involving numerous estimates and management
judgments, including, among others, mortality, lapse rates,
election rates, volatility and interest rates and correlation among
various market movements. Our hedging program may change
over time and there can be no assurance that actual experience
will not diff er materially from our assumptions, which could
adversely impact our results of operations and financial condition.

166 I UNIVERSAL REGISTRATION DOCUMENT - ANNUAL REPORT 2019 - AXA I
RISK FACTORS AND RISK MANAGEMENT 4 4.1 RISK FACTORS
OPERATIONAL-RELATED RISKS
Inadequate or failed processes, controls
or systems, human factors or external events
may adversely aff ect our profitability,
reputation or operational eff ectiveness
Operational risk is inherent in our business and can manifest
itself in various ways, including business interruption, poor
vendor performance or default (including under significant
outsourcing arrangements), systems malfunctions or failures,
computer viruses, hacking incidents and/or other unauthorized
access to our websites and/or systems, misappropriation of
sensitive information, corruption of data or operational disruption,
regulatory breaches, human errors, defective products, external
fraud, natural or man-made disasters and terrorist attacks. We
are also exposed to risks arising from potential failures in, or
non-compliance with, Group and entity policies concerning such
matters as internal controls and procedures and financial reporting
policies, as well as from employee misconduct or negligence and
fraud. While we take measures to manage such risk, operational
risk is part of the business environment in which we operate
and we may incur losses from time to time due to these types
of risks, as well as impairments to our liquidity, disruption of our
businesses, legal claims, regulatory sanctions or damage to our
reputation. The risk of operational failure or termination of any of
the clearing agents, exchanges, clearing houses or other financial
intermediaries we use to facilitate our securities transactions
could have similar adverse eff ects.
Our business is highly dependent on the eff ective operation of our
information technology, telecommunications, electronic data and
other operational systems. We rely on these systems to perform
necessary business functions, including providing insurance
quotes, processing applications and claims, providing information
and support to customers and distributors, administering complex
products, conducting actuarial analyses and keeping financial
records. We also use computer systems to store, retrieve, evaluate
and utilize significant amounts of sensitive customer, employee
and company data and information, including proprietary and
confidential information. Some of these systems, in turn, rely on
third-party systems. Systems failures or outages could compromise
our ability to perform necessary business functions in a timely
manner, which could harm our ability to conduct business and
hurt our relationships with our customers and business partners.
In the event of a disruption, our systems may be inaccessible, and
our employees unable to perform their duties, for an extended
period of time.
For additional information on the risks relating to the protection,
processing and transfer of personal data (including customer
and employee data), see the paragraph below “The evolving and
complex regulatory environment surrounding data protection
and transfer in the European Union could increase our costs and
adversely impact our business”.
Cyber attacks or other security breaches
of our computer systems, technologies
or networks, or those of our third-party
providers, could disrupt our businesses,
result in damage to our reputation
or significant financial losses, and expose
us to potential regulatory sanctions
The increasing frequency and sophistication of hacking incidents
and other cyber security threats directed at major financial
institutions and other corporations recently has made clear the
significance of these cyber risks and the damage, both financial
and reputational, they can potentially inflict.
Despite the Group’s implementation of a variety of security
measures, the Group’s computer systems, technologies and
networks, as well as the services we provide or rely on (including
mobile and cloud services), may in the future be subject to
unauthorized intrusions, such as physical or electronic break-
ins, cyber-attacks, unauthorized tampering or other security
breaches. Like other global financial institutions and companies,
the Group has, from time to time, experienced threats to its
data, systems, technologies and networks, including malware
attacks, unauthorized access, systems failures and disruptions.
Management has put in place internal controls and procedures
designed to protect client data as well as the Group’s assets
from hacking or other types of unauthorized intrusions into
the Group’s computer systems, technologies and networks.
There is no absolute guarantee, however, that these controls and
procedures will be suff icient, properly implemented or eff ective,
and prevent all attempted intrusions into the Group’s systems,
technologies and networks. Any such intrusion could result in
operational disruption, financial losses, unauthorized access to
or loss of sensitive personal data and/or proprietary information
and lead to regulatory actions, proceedings or sanctions against
us. In addition, due to our reliance on certain infrastructures and
interconnectivity with third-party providers, exchanges, clearing
houses, financial institutions and other third parties, we could
also be adversely impacted by any successful cyber-attack or
other security event aff ecting any of them.
Interruptions or disruptions of our systems, technologies and
networks, or those of our third-party providers (including third-
party providers deemed critical to our principal activities), or a
failure to maintain the availability, integrity or confidentiality
of sensitive data residing on such systems or technologies, or
transmitted through these networks, could potentially result in
financial loss, impairment to our liquidity, a disruption of our
businesses, legal claims, regulatory sanctions or damage to our
reputation, any of which could materially adversely aff ect our
results of operations or financial condition.

167I UNIVERSAL REGISTRATION DOCUMENT - ANNUAL REPORT 2019 - AXA I
RISK FACTORS AND RISK MANAGEMENT
4
4.1 RISK FACTORS
For additional information on the risks relating to the protection
of personal data, see the paragraph below “The evolving and
complex regulatory environment surrounding data protection
and transfer in the European Union could increase our costs and
adversely impact our business”.
Any failure in managing and implementing
our strategic initiatives could materially
impact our results of operations,
share price, and competitive position
In connection with our “Ambition 2020” strategic plan, we have
recently implemented a number of major initiatives which
have had and can be expected to have a significant impact
on the Group’s business, competitive position, and results
of operations. These initiatives have included, for example,
our acquisition of XL Group in 2018 and the resulting shift of
our business mix further towards Property & Casualty lines,
particularly commercial and specialty lines and reinsurance,
as well as the IPO of EQH in 2018 and additional EQH share
sales in 2018 and 2019. The combined eff ect of the acquisition
of XL Group and the disposal of our remaining stake (1 ) in EQH
resulted in our overall business mix shift ing significantly, with
reduced exposure to life/annuity business lines and significantly
increased exposure to Property & Casualty lines, both in our direct
business and in reinsurance. In addition, we have announced
other major initiatives in the areas of life/health insurance; digital
transformation and “insurtech”; increased exposure to Asian
markets, including through the acquisition of the remaining 50%
stake in AXA Tianping from its domestic shareholders; the sale of
AXA Bank Belgium; and the reorganization of AXA Switzerland’s
operations in 2018 and 2019. All of these initiatives are designed
to focus on operational delivery, reduce our exposure to financial
risks (including market, credit and life risks), bring us closer to
our customers and demonstrate our commitment to sustainable
value creation for our shareholders. There can be no assurance,
however, that any or all of such initiatives will be successful, or
that the process of achieving their implementation will not cause
significant disruption to our business operations, management
and personnel in particular periods. Any failure to properly manage
and successfully implement these strategic initiatives could in
turn materially impact our results of operations, share price, and
competitive position.
We may pursue acquisitions, joint
ventures and other transactions to expand,
complement or reorganize our business,
which could adversely aff ect our business,
future profitability and growth
External growth transactions involve risks that could adversely
aff ect our operating results, including the substantial amount
of management time that may be diverted from operations to
carry out such transactions and related integration eff orts. Such
transactions could also result in new debt or equity issuances,
financing arrangements, and the incurrence of additional costs,
contingent or unforeseen liabilities or risks and impairment and
amortization expenses relating to goodwill and other intangible
assets, and failure to mitigate the risks and uncertainties arising
from such transactions through due diligence and indemnification
provisions, all of which could materially and adversely aff ect our
business, financial condition, results of operations and growth.
Furthermore, we may be exposed from time to time to certain risks
relating to the integration of newly acquired companies, which
include, for instance, XL Group in 2018. Such risks include diff iculty
or delay in integrating such companies, their IT, operations,
employees and areas of expertise in an eff icient and eff ective
manner, which may result in the loss of certain key employees
and/or customers of the acquired companies. As a result, we
may not be able to eff ectively integrate acquired companies
and achieve all of the expected strategic objectives, anticipated
synergies, expected cost savings, impact on solvency capital
requirements (including contributions to the Group’s Solvency II
ratio, if any), innovation, operational eff iciencies and business
development from acquisitions within the forecast periods or at
all, or we may be required to spend additional time and money
on integration, any of which could adversely aff ect our business,
financial condition, results of operations and growth. In case
of adverse developments relating to an acquired company,
modifications to our expected strategy with respect to such
company, or more generally our overall strategy, might have
to be considered. We may also be exposed to liabilities and
risks that were not known or assessed correctly at the time of
the transaction and/or need to address capital, regulatory, tax
or accounting issues that arise aft er transactions have closed,
which may not be covered by, or exceed the amounts of, any
indemnities provided to us by the sellers and could adversely
aff ect our business and results of operations. In particular, we
may be subject to, or engage in, litigation in connection with or
as a result of acquisitions, which could have an adverse eff ect
on our results of operations.
(1 ) Excluding the 44,162,500 shares of EQH’s common stock, primarily related to the EQH shares to be delivered on redemption of the bonds mandatorily exchangeable into EQH’s shares, issued by AXA in May 2018 and maturing in May 2021. For additional information on the selldowns of EQH, please refer to Section 2.2 “Operating Highlights” of this Annual Report.

168 I UNIVERSAL REGISTRATION DOCUMENT - ANNUAL REPORT 2019 - AXA I
RISK FACTORS AND RISK MANAGEMENT 4 4.1 RISK FACTORS
We may also carry out divestitures, such as the announced sales
of AXA Life Europe in 2018, AXA Bank Belgium in 2019 and our
operations in Poland, Czech Republic and Slovakia, announced in
February 2020, or reorganization of existing businesses, including
AXA Switzerland from 2018 to 2019, which may have adverse eff ects
on our business, financial condition or results of operations. Such
divestitures and reorganizations may not be carried out within
the expected timeframe or at all, due to the failure to obtain
regulatory or other approvals or other reasons; the anticipated
profit and/or positive eff ect on our overall risk profile, SCR and
Solvency II ratio may not be realized; or we may incur a loss on
such transactions. Divestments of equity participations we hold
may also be subject to volatility and other market-related risks,
which could impact the carrying value of our remaining stake
in such companies, including related goodwill, and adversely
aff ect our results of operations. For additional information on
the impact of divestitures, acquisitions and other transactions on
goodwill, please refer to Note 5 “Goodwill” in Part 5 “Consolidated
Financial Statements” of this Annual Report.
From time to time, we may also consider acquisitions of or
investments in other companies, including through joint ventures.
Any such acquisition or investment may be subject to approvals
from regulatory authorities in certain countries, including as a
result of foreign investment regulations and controls, which may
lead to the transfer of certain assets or branches of activity and/or
commitments or restrictions aff ecting the conduct of our business.
We conduct businesses in highly competitive
environments with evolving trends that could
adversely impact our results of operations
and financial condition
Our competitors include mutual fund companies, asset
management firms, private equity firms, hedge funds, commercial
and investment banks and other insurance or reinsurance
companies, many of which are regulated diff erently from us and
off er alternative products or more competitive pricing than we do.
The insurance and reinsurance industry faces disruptive
competitive challenges from the emergence of new actors, such
as financial technology companies, or fintech, and insurance
technology companies, or insurtech, which generally benefit
from less extensive regulatory requirements (including less
strict capital requirements) as well as from data synergies or
technological innovation. In addition, development of alternative
distribution channels for certain types of insurance and securities
products, including through the Internet, may result in increasing
competition as well as pressure on margins for certain types
of products. Continued consolidation of the insurance and
reinsurance sector may also result in increased competition.
These competitive pressures could result in increased pricing
pressures on a number of our products and services, particularly
as competitors seek to win market share, and may harm our
ability to maintain or increase our profitability.
The failure to respond eff ectively to various
emerging technological changes may aff ect
our business and profitability
An ongoing challenge we face is the eff ective adaptation to
a constantly changing technological landscape. If we are not
eff ective in anticipating the impact on our business of changing
technologies, such as driverless cars, drones, connected devices,
artificial intelligence or roboadvisors, our ability to successfully
operate our business may be impaired. Technologies that facilitate
ride or home sharing could disrupt the demand for our products
from current customers, create coverage issues or impact the
frequency or severity of losses. These changes could also aff ect
our ability to accurately price our products and might significantly
aff ect our margins in certain lines of business. For example,
the advent of driverless cars, connected devices and usage-
based insurance could materially alter the way that automobile,
health or other p ersonal lines insurance is marketed, priced and
underwritten. In addition, the market for coverage for so-called
“cyber risks” or similar emerging threats is a rapidly evolving one,
and any failure by us to provide innovative products relative to
our competitors or new entrants in the market may result in a
competitive disadvantage.
In addition, the rapid increase in the nature, volume and
availability of data in recent years, whether resulting from
connected customers, so-called “big data”, “blockchain”, cloud
computing, satellite information, personalization of genetic
data, asymmetric information with respect to genetic testing,
artificial intelligence or otherwise, may have unanticipated and
adverse impacts on our business, for example by changing the
nature of insurance underwriting, pricing and claims handling;
by allowing customers and competitors to tailor coverage in ways
that we do not currently off er; or by potentially exposing us to
increased “moral hazard” in business lines where we are unable
for regulatory or other reasons to adjust pricing or coverage to
reflect individual risk profiles. While data-driven changes in the
industry are at an early stage and diff icult to predict, they could
adversely impact our business going forward, including through
the expense and eff ort that we will need to incur in order to ensure
that our employees, systems and processes are able to eff iciently
adapt to and manage such changes as they arise.

169I UNIVERSAL REGISTRATION DOCUMENT - ANNUAL REPORT 2019 - AXA I
RISK FACTORS AND RISK MANAGEMENT
4
4.1 RISK FACTORS
Furthermore, if we are unable to eff ectively use and update or
replace our key technology systems as they become obsolete or
as emerging technology renders them competitively ineff icient, or
if we fail to develop the talent and skills of our human resources
to meet the new technological challenges, and to attract and
assimilate new talents into our Group consistent with our business
goals, our business, prospects, competitive position and financial
condition could be adversely aff ected.
We operate through arrangements with third
parties, including delegation of underwriting
and claims authority, which exposes us to
operational and regulatory risks and could
materially adversely impact our business,
results of operations and financial condition
We have entered into contractual outsourcing arrangements with
third-party service providers for a wide variety of services required
in connection with the day-to-day operation of our insurance,
reinsurance and Asset Management businesses (including policy
administration, claims related services, securities pricing and
other services) and our product distribution. Such arrangements
expose us to operational and regulatory risks incurred by these
third parties, including employee misconduct or negligence, fraud,
internal control failure, contract error, disruption to distribution
arrangements, failures in processing policies and handling claims,
and non-compliance with applicable laws and regulations.
In addition, part of our (re)insurance business is underwritten
by third parties under contractual arrangements, which typically
authorize such third parties to bind us to new policies and to
renew policies, within the terms of our licenses and subject to
various contractual obligations and restrictions. If these third
parties do not abide by the terms of our licenses and breach
their contractual obligations to us, we could be subject to fines,
penalties, injunctions or other similar restrictions for breach of
outsourcing/licensing requirements and be liable under the
policies issued by breaching third parties.
Furthermore, as with other reinsurers, in our reinsurance business
we do not separately evaluate each of the individual risks assumed
under our reinsurance treaties and we largely rely on original
underwriting decisions made by ceding companies. As a result, if
ceding companies did not adequately evaluate the risks insured,
the premiums ceded to us may not compensate us for the risks
we reinsure and the losses we may incur, which may adversely
aff ect our results of operations and financial condition.
We carry out certain of our operations through joint ventures and
other partnership arrangements with third parties that we do
not control. These arrangements expose us, in particular, to the
failure of any of our partners to meets its contractual obligations
or to comply with applicable laws and regulations.
There can be no assurance that any of our contractual
arrangements with third parties will not expose us to operational,
financial and reputational risk, which could materially adversely
impact our business, results of operations and financial condition.
We may also not be fully indemnified for the contractual breaches
of our third parties.
The Group’s or its (re)insurance subsidiaries’
failure to meet their solvency and capital
adequacy requirements could have a material
adverse eff ect on our business, liquidity,
ratings, results of operations and financial
position
We and our subsidiaries are subject to evolving solvency and
capital adequacy requirements, including the Solvency II
framework, which is currently undergoing a review by the European
Commission and the European Insurance and Occupational
Pensions Authority (“EIOPA”), including regarding (re)insurance
group supervision and internal models used by certain (re)insurers,
such as AXA, to calculate their solvency capital requirement. It is
diff icult to predict the ultimate outcome of discussions regarding
changes to these requirements, the impacts of which could include
additional regulatory costs and operational constraints, as well
as changes to our Internal Model, which may significantly and
adversely aff ect our Solvency II ratio and EOF, results of operations,
financial condition and liquidity.
The AXA Group’s Solvency II ratio is sensitive to capital market
conditions (including the level of interest rates, the level of
equity markets and foreign exchange impacts) as well as other
economic factors. For additional information on the sensitivity of
our Solvency II ratio to capital market conditions, please refer to
the AXA Group’s SFCR, available on AXA’s website (www.axa.com) (1 ).
In addition, supervisory authorities may become more conservative
in the interpretation, application and enforcement of relevant
regulations, as a result of which they may, for example, impose
increased reserving requirements for certain types of insurers
or certain types of risks, greater liquidity requirements, higher
discounts/“haircuts” on certain assets or asset classes, more
conservative calculation methodologies or take other similar
(1 ) The AXA Group’s SFCR for the year ended December 31, 2018 is available on AXA’s website, and the AXA Group’s SFCR for the year ended December 31, 2019 is expected to be published on May 14, 2020 on AXA’s website.

170 I UNIVERSAL REGISTRATION DOCUMENT - ANNUAL REPORT 2019 - AXA I
RISK FACTORS AND RISK MANAGEMENT 4 4.1 RISK FACTORS
measures which may significantly increase regulatory capital
requirements. In particular, the ACPR, the French insurance
supervisory authority may impose changes to the Internal Model
we use to calculate our SCR or change its view regarding our
methodologies and/or the integration method of some of our
subsidiaries, which may adversely aff ect our Solvency II ratio. For
additional information on our Internal Model and Solvency II ratio,
please refer to Section 4.2 “Internal Control and Risk Management –
Internal Model” of this Annual Report (1 ).
In the event of a failure by us, the Company or our (re)insurance
subsidiaries to meet applicable regulatory capital requirements,
insurance supervisory authorities have broad authority to require
or take various regulatory actions including limiting or prohibiting
the issuance of new business, prohibiting payment of dividends
or other shareholder distributions, and/or putting a company
into recovery, resolution or insolvency proceedings. In particular,
under the French recovery and resolution framework for the
insurance industry (the “French Resolution Framework”), the ACPR
has broad resolution powers with respect to insurance groups,
insurance holding companies, such as AXA SA, and (re) insurance
companies, including prohibiting payment of dividends and
ordering portfolio transfers.
A failure of the Group and/or any of its (re)insurance subsidiaries
to meet its regulatory capital requirements and/or a deterioration
of its solvency position may also result in the need for significant
amounts of new capital, which could adversely aff ect our liquidity
position, results of operations and financial position.
Regulatory restrictions that inhibit our ability to freely move
excess capital among our subsidiaries or which otherwise restrict
fungibility of the AXA Group’s capital resources may, depending
on the nature and extent of the restrictions, adversely aff ect the
capital position of our operating (re)insurance subsidiaries, which
may have a consequent negative impact on the perception of the
AXA’s Group financial strength.
Additional regulatory developments regarding solvency capital
requirements, including changes to the Solvency II framework,
may adversely aff ect our prudential regime as well as increase
associated costs. There can be no assurance that contingency
plans developed by M anagement will be eff ective to achieve
their objectives and any failure by us and/or our (re)insurance
subsidiaries to meet minimum regulatory capital requirements
and to maintain regulatory capital at competitive levels could
have a material adverse eff ect on our business, liquidity, credit
ratings, results of operations and financial position.
As a holding company, we are dependent
on our subsidiaries to cover our operating
expenses and dividend payments
Our (re)insurance and financial services operations are generally
conducted through direct and indirect subsidiaries. As a holding
company, our principal sources of funds are dividends from
subsidiaries and funds that may be raised from time to time
through the issuance of debt or equity securities or through bank
or other borrowings.
Regulatory and other legal and contractual restrictions may
limit our ability to transfer funds freely, either to or from all our
subsidiaries. In particular, our principal (re)insurance subsidiaries
are subject to restrictions on the amount of dividends and debt
repayments that can be paid to us and our aff iliates. Financial
covenants in letters of credit and revolving credit facilities of
our subsidiaries may also restrict their ability to declare and
pay dividends.
Moreover, our status as an Internationally Active Insurance Group
(“IAIG”) under the Common Framework for the Supervision of IAIGs
(the “ComFrame”) developed by the International Association
of Insurance Supervisors (“IAIS”) could, in case of adoption
of implementing legislation in relevant jurisdictions, result in
the imposition of similar or other restrictions on the transfer
of funds, including intra-group financing arrangements, which
could negatively impact the fungibility of our capital. These
factors may adversely impact our liquidity position and capacity
to pay dividends.
We may have contingent liabilities
from discontinued, divested and run-off
businesses and may incur other off -balance
sheet liabilities that may result in charges
to our income statement
We may, from time to time, retain insurance or reinsurance
obligations and other contingent liabilities in connection with
our divestiture, liquidation or run-off of various businesses. We
may also, from time to time and in the course of our business,
provide guarantees and enter into derivative and other types
of off -balance sheet transactions that could result in income
statement charges.
(1 ) Please also refer to the AXA Group’s SFCR for the year ended December 31, 2019, which is expected to be published on May 14, 2020 on AXA’s website.

171I UNIVERSAL REGISTRATION DOCUMENT - ANNUAL REPORT 2019 - AXA I
RISK FACTORS AND RISK MANAGEMENT
4
4.1 RISK FACTORS
REGULATORY-RELATED RISKS
Our businesses are subject to extensive
regulation and regulatory supervision
in the various jurisdictions in which
we operate
The AXA Group operates in 57 countries around the world
and our operations are subject to a wide variety of insurance
and other laws and regulations. Our regulatory environment
is evolving rapidly and supervisory authorities around the
world are assuming an increasingly active and aggressive role
in interpreting and enforcing regulations in the jurisdictions
in which we do business, resulting in significant compliance
challenges. We have highlighted below some of the more recent
and noteworthy regulatory developments that we anticipate
may impact our business in the coming periods; further details
regarding these and related regulatory and supervisory matters
also appear in Section 6.3 “General Information – Regulation and
Supervision” of this Annual Report. The following summarizes
recent developments impacting our required levels of capital
and surplus; anti-money laundering and related anti-corruption
measures; regulatory pronouncements with respect to interest
rate and other “benchmarks”, as well as climate change-related
initiatives; and potential developments at Lloyds.
Capital Standards. The multiplicity of diff erent regulatory regimes,
capital standards and reporting requirements resulting from work
on new capital standards led by the IAIS such as the Insurance
Capital Standard (the “ICS”), and the development by IAIS of the
ComFrame, which will apply to IAIGs, including AXA, as well as
potential changes to applicable solvency and capital adequacy
requirements, such as the regulatory framework established under
the Solvency II Directive, could increase operational complexity,
regulatory costs and competition. In this regard, a review of
the Solvency II framework by the European Commission and
EIOPA is currently ongoing and could significantly and adversely
aff ect our Internal Model, EOF or Solvency II ratio, in addition
to operational constraints resulting from changes to our group
supervision. For additional information on the risks relating to
the Solvency II review, see the paragraph above “The Group’s or
its (re)insurance subsidiaries’ failure to meet their solvency and
capital adequacy requirements could have a material adverse
eff ect on our business, liquidity, ratings, results of operations
and financial position.”
AML and Compliance Matters. In recent years there also has been
a significant increase in legislative and regulatory initiatives and
enforcement actions in the areas of financial crime compliance,
anti-money laundering (“AML”), international trade sanctions
and anti-bribery laws and regulations (including the US Foreign
Corrupt Practices Act, the UK Bribery Act of 2010, French Law
No. 2016-1691 of December 9, 2016, known as “Sapin II”, and
the various implementing measures of Directive 2015/849 of
May 20, 2015, as amended, including enhanced control on
transactions involving high risk countries and requirements
regarding disclosure of beneficial ownership). In particular,
financial crime compliance programs of financial institutions
(AML, anti-corruption and international sanctions compliance)
continue to be a major focus of regulatory and law enforcement
authorities. In France, the Sapin II Law recently introduced new
requirements for all large French companies and corporate
groups, such as the AXA Group, including the establishment of
internal procedures to prevent and detect acts of corruption
and influence peddling committed in France and abroad, while
establishing a new French anti-corruption agency (Agence française
anticorruption), which was given strengthened supervisory and
enforcement powers. Furthermore, in certain jurisdictions the
relevant AML, anti-corruption and sanctions rules may be enforced
on an extraterritorial basis, which could expose our operations
to additional or conflicting requirements. In addition, increased
cooperation amongst authorities globally may, in the event we
become subject to enforcement proceedings, or are otherwise
found to be non-compliant in this area, result in more severe
sanctions or monetary penalties.
Benchmark Reforms. Regulatory authorities have also proposed
reforms to and potential changes aff ecting interest rate, equity,
foreign exchange rate and other types of indices (also known
as “benchmarks”). In particular, Regulation (EU) 2016/1011
of June 8, 2016 (as amended, the “Benchmark Regulation”),
which entered into force on January 1, 2018, imposed additional
requirements on the provision of financial market-related
benchmarks, the contribution of input data to a benchmark
and the use of benchmarks within the EU. Several interbank
market benchmarks have been designated as critical benchmarks
under the Benchmark Regulation, including Libor, Euribor and
Eonia, and their related benchmark methodologies have been
made subject to review. Certain critical benchmarks might be
discontinued in the future, including, Eonia, which is currently
expected to cease being published on January 3, 2022, and
Libor, as it is likely that contributing banks will cease providing
submissions for the calculation of Libor aft er 2021. We are closely
following industry and regulatory developments with respect
to the potential impacts of future benchmark changes, which
could have implications for our capital models, risk management
eff orts, investment strategies and product design, amongst
others. Implementation of these and any future regulations,
amendments to existing regulations, or future or revised guidance
issued by regulatory authorities (such as the European Securities
and Markets Authority (“ESMA”), EIOPA, the AMF and the FCA)
can be expected to increase our costs in relation to operations,
information systems, legal and compliance, and may also limit
or restrict our ability to do business or expose us to civil, criminal
or regulatory actions, proceedings or sanctions, which may
adversely impact our brand or reputation.

172 I UNIVERSAL REGISTRATION DOCUMENT - ANNUAL REPORT 2019 - AXA I
RISK FACTORS AND RISK MANAGEMENT 4 4.1 RISK FACTORS
Climate Change Initiatives. Regulatory initiatives, including at
French, European Union and international levels, regarding
climate change may aff ect our operations and those of our
counterparties, and potentially limit our investments or aff ect
their value, as certain companies struggle to adapt to these
regulations. These may include: (i) new investment requirements;
(ii) new disclosure requirements, such as the recently adopted
Regulation (EU) 2019/2088 on sustainability-related disclosures
in the financial services sector or Regulation (EU) 2019/2089
amending the Benchmark Regulation as regards EU Climate
Transition Benchmarks, EU Paris-aligned Benchmarks and
sustainability-related disclosures for benchmarks; or (iii) new
requirements relating to the inclusion of environmental, social and
governance considerations into insurance and Asset Management
products and advice. In particular, EIOPA is working towards the
integration of sustainability considerations into the prudential
and conduct framework for (re)insurance undertakings and
insurance distributors. These and similar regulatory requirements,
as well as any further regulations regarding the transition to a
lower-carbon economy, climate change or our energy-related
investments, could increase our legal and compliance costs and
adversely aff ect our business or the value of our investments. For
further information on investment-related climate risk analysis,
please refer to Section 7.3 “Climate change and biodiversity –
Investments” of this Annual Report.
Changes to IFRS. Changes to IFRS, as developed by the International
Accounting Standards Board (“IASB”), could significantly impact
insurers and other financial institutions, including AXA, that prepare
their consolidated financial statements in accordance with IFRS.
In particular, the implementation of IFRS 17 “Insurance Contracts”,
which will replace IFRS 4, and IFRS 9 “Financial Instruments” within
the Group is in progress and M anagement is currently assessing
the impact of their adoption, which may significantly aff ect the
accounting treatment of insurance liabilities and financial assets.
For further information on these two standards, please refer to
“Evolution of Accounting Standards” in Section 6.3 “General
Information – Regulation and Supervision – Other significant
legislative and regulatory frameworks”. The abovementioned
and any other changes to IFRS that may be adopted in the future
could have a material adverse eff ect on our results of operations
and financial position.
Lloyd’s. Following the acquisition of XL Group in 2018, we have
been managing, through Catlin Underwriting Agencies Limited,
Syndicate 2003, one of the Lloyd’s largest underwriting syndicates
and, as a result, are exposed to a variety of Lloyd’s-related
regulatory risks. For instance, the Council of Lloyd’s has wide
discretionary powers to regulate members of Lloyd’s, and may
vary the method by which the capital solvency ratio is calculated,
or impose additional or special levies on members. In addition, if
Lloyd’s fails to satisfy the Financial Conduct Authority (the “FCA”)’s
and the Prudential Regulation Authority’s annual solvency test
in any given year, Syndicate 2003 could be required to cease
or reduce underwriting through Lloyd’s. A downgrading of the
Lloyd’s market could also impair Syndicate 2003’s ability to
trade in certain classes of business at current levels. As a Lloyd’s
syndicate providing coverage to US policyholders and covering US
risks, we could also be required by US regulators to increase the
level of funding required as minimum deposits for the protection
of US policyholders. Any Lloyd’s-related risks could have an
adverse eff ect on our business, financial condition and results
of operations.
We expect the scope and extent of applicable laws and regulations,
as well as regulatory oversight, to continue to increase over the
coming years. While M anagement proactively manages legal and
regulatory risks and has adopted policies and procedures designed
to ensure compliance with applicable laws and regulations in the
various jurisdictions where we do business, we cannot predict
with any certainty the potential eff ects that a change in applicable
laws or regulations, their interpretation or enforcement (or of
the potential eff ects of any new regulation or legislation in the
future), or any determination we make regarding compliance
with conflicting regulations, may have on our business, financial
condition or results of operations. Any failure by us to remain
in compliance with regulations applicable to us could result
in fines, penalties, injunctions or other similar restrictions, any
of which could negatively impact our earnings and reputation.
For a description of the regulations and supervision framework
applicable to the Group, please refer to Section 6.3 “General
Information – Regulation and Supervision” of this Annual Report.
We may also be adversely aff ected by a change in applicable laws
or regulations, their interpretation or enforcement impacting, or
regulatory decisions, authorizations or approvals relating to, third
parties with which we do business. For instance, certain of our
letter of credit facilities for cedants are eff ective only if the banks
issuing the letters of credit are on the list of banks approved by the
National Association of Insurance Commissioners (the “NAIC”). If
some or all of the issuing banks under our credit facilities cease
to be NAIC approved and we are unable to replace them with
NAIC approved banks, our letter of credit facility capacity could
be significantly diminished, especially in situations of adverse
capital and credit market conditions where the cost of replacement
facilities may be significantly increased or prohibitive. See the
paragraph above “Adverse capital and credit market conditions
may significantly aff ect our ability to meet liquidity needs, our
access to capital and increase our cost of capital”.

173I UNIVERSAL REGISTRATION DOCUMENT - ANNUAL REPORT 2019 - AXA I
RISK FACTORS AND RISK MANAGEMENT
4
4.1 RISK FACTORS
As a global business, we are exposed
to various local political, regulatory,
business and financial risks and challenges
The global nature of our business exposes us to a wide variety
of local political, regulatory, business and financial risks and
challenges, which may aff ect the demand for our products and
services, the value of our investment portfolios, the levels of
capital and surplus that we are required to hold, and the credit
quality of our counterparties.
These risks include, for example, political, social or economic
instability in the countries in which we operate, including the risk
of nationalization, expropriation, price controls, capital controls,
restrictions on foreign trade and investment (such as changes to
authorized levels of foreign ownership, which may aff ect our ability
to conduct business in certain countries through joint ventures),
fluctuations in foreign currency exchange rates, credit risks of
our local borrowers and counterparties, lack of local business
experience in certain markets, risks associated with exposure to
insurance industry insolvencies through policyholder guarantee
funds or similar mechanisms and, in certain cases, risks associated
with the potential incompatibility with foreign partners, especially
in countries in which we are conducting business through joint
ventures or other entities that we do not control.
We have been and may become in the
future subject to lawsuits and/or regulatory
investigations which may aff ect our business,
brand, reputation, relations with regulators
and/or results of operations
We have been named as defendants in numerous lawsuits
(both class actions and individual lawsuits) and involved in
various regulatory investigations and examinations, and other
actions arising in the various jurisdictions where we and our
subsidiaries do business. Please refer to Note 31 “Litigation” in
Part 5 “Consolidated Financial Statements” of this Annual Report.
We may be involved in similar proceedings in the future.
Certain of these lawsuits and investigations seek significant or
unspecified amounts of damages, including punitive damages, and
certain of the regulatory authorities involved in these proceedings
have substantial powers over the conduct and operations of our
business. The introduction of a class action system in France
in 2014 and similar developments in certain other European
jurisdictions and at the EU level have increased, and are likely to
continue to increase litigation, risks and costs. Similarly, in the
US there is an increasing trend towards large damage awards
in the consumer class action context, and such trend can be
expected to continue in the future. For additional information,
please refer to Section 6.3 “General Information – Regulation and
Supervision” of this Annual Report.
Due to the nature of certain of these lawsuits and investigations,
we cannot estimate the potential losses or predict with any
certainty the potential impact thereof on our business, brand,
reputation, relations with regulators and/or results of operations.
The evolving and complex regulatory
environment surrounding data protection
and transfer in the European Union could
increase our costs and adversely impact
our business
Collection, transfer and protection of significant amounts of
sensitive data are critical to the operation of our business.
Regulations in this area are quickly evolving in the European
Union, which could adversely aff ect our business if we fail to timely
adapt our rules, internal controls and strategy to the emerging
regulatory environment.
Regulation (EU) 2016/679 of April 27, 2016 on the protection
of natural persons with regard to the processing of personal
data and on the free movement of such data (as amended, the
“GDPR”) entered into force on May 25, 2018. GDPR significantly
modified the EU data protection framework and, in particular,
imposed new restrictions on data usage/processing (including
profiling), disclosure to customers and a stronger enforcement
regime, under which competent data protection authorities will
be able to fine companies which do not comply with EU rules up
to 4% of their global annual turnover. While we have adopted a
global Data Privacy Organization/Governance policy designed to
manage risks related to data protection, there can be no assurance
that our existing or planned data protection rules, including our
privacy-related Group Binding Corporate Rules, and governance
organization will not need to be updated or replaced to comply
with new laws and regulations and regulatory guidance applicable
in the European Union or other jurisdictions where we operate
or may operate in the future.
In addition, there is a risk that data collected by the Group and its
third-party service providers is not processed in accordance with
notifications made to, or obligations imposed by, data subjects,
regulators or other counterparties or in compliance with GDPR and
other applicable law. The Group’s IT and other systems may also
in the future be subject to hacking and unauthorized intrusions,
such as physical or electronic break-ins, unauthorized tampering
or security breaches or other intentional or unintentional acts by
parties acting from within or outside the Group, which could result
in sensitive data (including customer and employee data) being
stolen, lost or misused. Negligence or failure to implement and
follow internal Group policies, in particular regarding encryption
of data, or perform adequate internal data collection/processing
controls may also facilitate hacking and other intrusions and
result in breaches of GDPR and other applicable laws.

174 I UNIVERSAL REGISTRATION DOCUMENT - ANNUAL REPORT 2019 - AXA I
RISK FACTORS AND RISK MANAGEMENT 4 4.1 RISK FACTORS
Any failure to comply with GDPR and other applicable data
protection laws, and data theft , loss or misuse, aff ecting any
Group entity or a third-party service provider, could result in
significant regulatory sanctions, penalties, injunctions or other
similar restrictions, damage to our reputation, need to compensate
customers, customer litigation (including class actions and
individual lawsuits), and consequently have a material adverse
eff ect on our business, results of operations and prospects.
Regarding transfer of data to the United States, following
invalidation in 2015 of the European Commission’s Safe Harbor
Decision by the European Union Court of Justice (the “2015 ECJ
Decision”), which allowed under certain conditions for the transfer
of personal information from EU companies to US companies,
transatlantic data flows between companies continued using
other mechanisms, such as standard contractual clauses with
US companies and binding corporate rules for transfers within a
multinational corporate group. While a new safe harbor, referred
to as the “EU-US Privacy Shield”, was adopted in July 2016, banks
and (re)insurance companies are generally not currently eligible
to register on the EU-US Privacy Shield list and the AXA Group has
accordingly been relying on the above-mentioned mechanisms
to transfer personal data from the Company or its EU-based
aff iliates to its banking and (re)insurance aff iliates based in the
United States. While we currently anticipate that we can continue
using such mechanisms to transfer data into the United States,
there is no guarantee that such mechanisms will not be subject
to challenge or to stricter scrutiny by the competent authorities
or that further changes in the regulation will not potentially
increase our legal and compliance costs, or result in regulatory
sanctions or damage to our brand or reputation.
In addition, Brexit could significantly impact transfers of data to or
from the United Kingdom if no agreement is reached between the
United Kingdom and the European Union, with its consequences
being comparable to those of the 2015 ECJ Decision. EU-UK data
flows between companies would continue, but rely on other
mechanisms than before Brexit, such as standard contractual
clauses with UK companies and binding corporate rules for
transfers within a multinational corporate group. Although we
currently anticipate that we can continue using such mechanisms
to transfer data to or from the United Kingdom, there is no
guarantee that such mechanisms will be fully implemented
in time by all external providers, given the overall uncertainty
surrounding a potential withdrawal agreement, contingency
plans at EU and Member State levels and, more generally, the
United Kingdom’s future relationship with the European Union.
There can be no assurance that such mechanisms will not be
challenged or impeded by competent authorities or as result
of amendments to applicable regulations, or that Brexit and its
related consequences will not increase our legal and compliance
costs, result in regulatory sanctions or damage to our brand or
reputation, or otherwise have an adverse eff ect on the Group’s
business and financial condition.
Changes in tax laws or uncertainties
in the interpretation of certain tax laws
may result in adverse consequences to
our business and our results of operations
As a global company operating in numerous jurisdictions, we are
subject to various tax regimes and regulations. Changes in tax laws
could result in higher tax expenses, payments and compliance
costs. In particular, while we continue to expect the Tax Cuts and
Jobs Act of 2017 (the “US Tax Act”) to have an overall net positive
economic impact on the Group, additional regulatory guidance
under the US Tax Act is expected to be issued and significant
guidance under the US Tax Act remains in proposed form. We
continue to evaluate the implementation of the US Tax Act and
assess the magnitude of the various impacts it may have.
Uncertainties in the interpretation or future developments of
tax regimes, including the development of the US tax system
following the enactment of the US Tax Act, may aff ect our tax
liability, return on investments and business operations. We
have been and may increasingly become exposed to the risk
of tax audits and investigations in the various jurisdictions in
which we operate. The international tax environment continues
to change as a result of actions taken by the OECD, the European
Union and national governments intended to address concerns
over perceived international tax avoidance techniques. We take
tax positions that we believe are correct and reasonable in the
course of our business. However, there is no guarantee that our
tax positions will be upheld by the relevant tax authorities. Our
business operations, results, financial position, liquidity, outlook
or reputation could be materially aff ected if one or more of the
aforementioned risks materialized.

175I UNIVERSAL REGISTRATION DOCUMENT - ANNUAL REPORT 2019 - AXA I
RISK FACTORS AND RISK MANAGEMENT
4
4.1 RISK FACTORS
I Risks related to the ownership of the Company’s shares
In order to raise capital to fund future growth or for solvency
purposes, we may, in the future, off er rights, warrants or similar
securities at prices below the then-current market price which
may adversely aff ect the market price of our ordinary shares and
dilute the positions of existing shareholders.
The Mutuelles AXA, which comprise two French mutual insurance
companies, together held 14.45% of the Company’s outstanding
shares and 24.21% of its voting rights as of December 31, 2019.
The Mutuelles AXA have stated their intention to collectively vote
their shares in AXA and may have interests conflicting with other
shareholders’ interests. For example, even though the Mutuelles
AXA do not hold a majority of the total voting rights in AXA, eff orts
by the Mutuelles AXA to decline or deter a future off er to acquire
control of AXA, which other shareholders may find attractive, may
prevent other shareholders from realizing a premium for their
AXA ordinary shares. The Mutuelles AXA may decide to increase
their ownership interest in AXA or to sell all or a portion of the
ordinary shares they own at some future date.

176 I UNIVERSAL REGISTRATION DOCUMENT - ANNUAL REPORT 2019 - AXA I
RISK FACTORS AND RISK MANAGEMENT 4 4.2 INTERNAL CONTROL AND RISK MANAGEMENT
4.2 INTERNAL CONTROL AND RISK MANAGEMENT
Information in this section should be read in conjunction with
Note 4 “Financial and insurance Risk Management” in Part 5
“Consolidated Financial Statements” of this Annual Report. Only
information referred to in Note 4 is covered by the report of the
Statutory Auditors on the Consolidated Financial Statements.
The AXA Group is engaged in Insurance, Reinsurance, Asset
Management and Banking businesses on a global scale. As such,
it is exposed to a wide variety of risks, including market risks,
credit risk, insurance risks, operational risk and other material
risks, as further described in this Part 4 “Risk factors and Risk
Management” (1) and in Note 31 “Litigation” in Part 5 “Consolidated
Financial Statements” of this Annual Report.
To manage these risks, the Group has put in place a comprehensive
system of internal control and risk management designed to
ensure that executives are informed of significant risks on a
timely basis and can manage these risks, so that the Consolidated
Financial Statements and other market disclosures are accurate.
In addition, the Solvency II regime requires the Group to have
in place an eff ective system of governance which provides for
sound and prudent risk management. This governance system
must be based on a clear separation of responsibilities and must
be proportionate to the nature, extent and complexity of the
Group’s operations.
In this context, AXA has (i) put in place a control framework with
three lines of defense with boundaries between each of them
clearly defined and (ii) established four key functions.
(1) This information is not required under IFRS and as such is not part of the Consolidated Financial Statements. Therefore, it is not covered by the report of the Statutory Auditors on the Consolidated Financial Statements.
The three lines of defense are:
Responsibilities Owners
1st
line of defense responsible for day-to-day risk and control
management and decision-making
Management and staff
2nd line of defense
(independent from the Group’s
business operations)
responsible for developing, facilitating and
monitoring an eff ective risk and control
framework
Risk
Management
Compliance Internal Control
(including Internal
Financial Control)
3rd
line of defense responsible for providing independent assurance
on the eff ectiveness of the overall control
environment
Internal Audit
The four key functions are:
■ the Risk Management function is responsible for coordinating
the second line of defense, ensuring that the risk appetite is
implemented with respect to all risks, and in charge of the
design, implementation and validation of AXA Group economic
capital model which is the basis for the Group Solvency II
internal model (“Internal Model”), the documentation of the
Internal Model and any subsequent changes made to it as
well as the analysis of the performance of this model and the
production of summary reports thereof. The holder of the Risk
Management function, including the internal control function,
at Group level is the Group Chief Risk Off icer;
■ the compliance function is responsible for advising on
compliance with laws, regulations and administrative provisions
regarding insurance, reinsurance, asset management and
banking activities as well as monitoring that compliance is
eff ective. The compliance function holder at Group level is the
Group Chief Compliance Off icer;
■ the internal audit function is responsible for performing an
evaluation of the adequacy and eff ectiveness of the Group’s
internal control system and other elements of the system of
governance. The internal audit function must be objective
and independent from the operational functions. The internal
audit function holder at Group level is the Global Head of
Internal Audit; and

177I UNIVERSAL REGISTRATION DOCUMENT - ANNUAL REPORT 2019 - AXA I
RISK FACTORS AND RISK MANAGEMENT
4
4.2 INTERNAL CONTROL AND RISK MANAGEMENT
■ the actuarial function is responsible for overseeing the
calculation of Solvency II technical provisions (including
ensuring the appropriateness of the methodologies and
underlying models used as well as the assumptions made in
the calculation of technical provisions), assessing the suff iciency
and quality of the data used in this calculation and comparing
best estimates against experience, expressing an opinion on the
overall underwriting policy and on the adequacy of reinsurance
arrangements. The actuarial function holder at Group level is
the Group Actuarial Function Holder. For further information
on the actuarial function, please refer to Section 4.6 “Insurance
Risks” of this Annual Report (1).
The holders of key functions have direct access to the Board of
Directors.
The Group Chief Executive Off icer and the Group Deputy Chief
Executive Officer – Group General Secretary (2), who, under
Solvency II, are deemed to be “persons who eff ectively run” the
Group, and the key functions holders must fulfil the requirements
for a fit and proper assessment, as set in the Group’s internal
policy, adopted in compliance with the requirements of the
Solvency II regulation, both at appointment and on an ongoing
basis. These requirements are:
■ appropriate competence and capability, taking into account
professional qualifications, training, knowledge and relevant
experience including understanding of regulatory requirements
to enable sound and prudent management (fit); and
■ propriety, taking into account reputation, financial soundness
and personal characteristics such as integrity and transparency
(proper).
Furthermore, appointments to any of these positions must be
notified to the French Autorité de contrôle prudentiel et de résolution
(“ACPR”), through a formal process, including submission of a
detailed questionnaire addressing the fitness and propriety of
each person, as well as detailed background information.
(1) Only information contained in Section 4.6 “Insurance risks” of this Annual Report and referred to in Note 4 “Financial and insurance Risk Management” in Part 5 “Consolidated Financial Statements” of this Annual Report is covered by the report of the Statutory Auditors on the Consolidated Financial Statements.
(2) Until December 31, 2019, the Group Deputy Chief Executive Off icer – Group Chief Financial Off icer was also deemed to be a “person who eff ectively runs” the Group.
I Governance and Risk Management organization
GOVERNANCE
MANAGEMENT COMMITTEE
AUDIT, RISK AND COMPLIANCE
COMMITTEE (ARCC)
Operational Risk, Audit
& Compliance
Committee
Solvency II
Committee
Operational risk , includingcompliance risk and other material risks
(strategic, reputation, emerging)
Market, credit, liquidity risks Solvency II frameworkand systemic risk
CHIEF EXECUTIVE OFFICER
Financial Risk
Committee
BOARD OF DIRECTORS AND ITS SPECIALIZED COMMITTEES
(AUDIT COMMITTEE, FINANCE COMMITTEE, COMPENSATION & GOVERNANCE COMMITTEE)

178 I UNIVERSAL REGISTRATION DOCUMENT - ANNUAL REPORT 2019 - AXA I
RISK FACTORS AND RISK MANAGEMENT 4 4.2 INTERNAL CONTROL AND RISK MANAGEMENT
Board of Directors
The Board of Directors is responsible for ensuring that an
appropriate and eff ective system of internal control and Risk
Management is in place across the Group. In this context, it can
undertake all controls and verifications as it deems appropriate.
The Board of Directors has established three Committees to assist
it in fulfilling its responsibilities: an Audit Committee, a Finance
Committee and a Compensation & Governance Committee. All
the Board Committees constitute an important part of the Group’s
overall internal control environment, and play a major role in
reviewing Internal Control and Risk Management related issues.
For more information on the composition and assignments of the
Board of Directors and its Committees, please refer to Section 3.1
“Corporate governance structure” (1) of this Annual Report.
Audit Committee
The Audit Committee (i) considers the Group’s internal control
systems and procedures for Risk Management with a view to
obtaining reasonable assurances as to their eff ectiveness and
consistent application, and (ii) monitors the Group’s major risk
exposures and sensitivities (insurance and operational), the results
of the risk assessments performed, and the steps management
has taken to monitor that such exposures remain within the risk
appetite set by the Group.
The scope of the Audit Committee’s responsibilities is set forth in
the Audit Committee Terms of Reference, approved by the Board
of Directors and available on www.axa.com.
Finance Committee
The Finance Committee examines any subject relating to the
financial management of the Group and in particular the policy
on financial Risk Management (including management of foreign
exchange and interest rates exposure), the issues relating to the
liquidity and financing of the Group, the capital and solvency.
The Finance Committee examines the impact on capital and
solvency at Group level of the main orientations and limits of the
Asset-Liability Management (“ALM”) policy; and reviews the risk
appetite framework developed by the Executive Management
for financial, insurance and operational exposures.
Executive Management
Executive Management oversees the implementation of the
internal control system and the existence and appropriateness of
internal control, as well as Risk Management monitoring systems
within the Group.
For more information about the Executive Management, please
see Section 3.1 “Corporate governance structure” of this Annual
Report (1).
Audit Risk and Compliance Committee (ARCC)
The Audit Risk and Compliance Committee (“ARCC”) was created in
2016 by the Chief Executive Off icer with the view to strengthening
the Group’s overall Risk Management governance and is chaired
by the Group General Counsel with the purpose of reviewing all
material audit, risk and compliance issues faced by the Group.
The scope of the ARCC covers all the Group’s operations and
includes the following:
■ the Group’s overall risk appetite, material breaches of risk limits
and proposed remedial actions, the Group’s risk framework as
well as action plans proposed to reduce or otherwise modify
the Group’s material risk positions when they are beyond
defined limits;
■ the Group’s standards and limits to ensure that they are
consistent with the Group’s defined risk appetite;
■ the Own Risk & Solvency Assessment (“ORSA”) and the other
Solvency II reports (Group Solvency and Financial Condition
report, Group Regular Supervisory Report, Actuarial Function
Holders reports);
■ the systemic documentation (Systemic Risk Management Plan,
Liquidity Risk Management Plan, Recovery Plan);
■ the major findings identified by internal audit; and
■ the Group’s Compliance standards.
The ARCC reports back to the Management Committee on a regular
basis. The ARCC also reviews and discusses the proposed agenda
items for the Audit Committee and Finance Committee with a view
to ensuring that these agendas include the appropriate items.
Reporting to the ARCC, the following Group Risk Committees
cover the main risk categories:
■ for financial risks: the Group Financial Risk Committee is
co-chaired by the Group Chief Financial Off icer and the Group
Chief Risk and Investment Off icer. This Committee determines
the Group ALM policies and ensures that the Group exposures
are within the Group risks limits;
■ for operational, other material risks (strategic, reputation,
emerging) and internal control: the Operational Audit Risk &
Compliance Committee is co-chaired by the Group Chief Risk
and Investment Off icer and the Group Chief Operating Off icer.
Insurance risks are directly managed and monitored at the Group
ARCC level.
The Solvency II Committee, co-chaired by the Group Chief
Risk Off icer and the Group Chief Financial Off icer, is in charge
of (i) steering the overall AXA Group Solvency II framework,
(ii) implementing the governance and validation of the Internal
Model, and (iii) reviewing Solvency II developments.
(1) This information is not required under IFRS and as such is not part of the Consolidated Financial Statements. Therefore, it is not covered by the report of the Statutory Auditors on the Consolidated Financial Statements.

179I UNIVERSAL REGISTRATION DOCUMENT - ANNUAL REPORT 2019 - AXA I
RISK FACTORS AND RISK MANAGEMENT
4
4.2 INTERNAL CONTROL AND RISK MANAGEMENT
The Solvency II Committee is also responsible to monitor current
developments in systemic risk.
Group Risk Committees are supported by local Risk Committees
to ensure consistency in the implementation of the Enterprise
Risk Management (“ERM”) framework.
RISK MANAGEMENT AND INTERNAL
CONTROL ORGANIZATION
The control framework with three lines of defense has been
designed to ensure that the risks that the AXA Group may face
are systematically identified, measured, managed and controlled.
First line of defense: management and staff
Management and staff have primary responsibility for
(i) establishing and maintaining an eff ective control environment,
(ii) identifying and managing the risks inherent in the products,
services and activities in their scope and (iii) designing,
implementing, maintaining, monitoring, evaluating and reporting
on the Group’s internal control system in accordance with the
risk strategy and policies on internal control as approved by the
Board of Directors.
Second line of defense: Group Risk
Management function, including Group
Internal Control function and Group
Compliance function
Group Risk Management (“GRM”) function
GRM is headed by the Group Chief Risk Off icer, who reports to
the Chief Risk and Investment Off icer, with an administrative
reporting line to the Group Chief Executive Off icer.
The role of GRM is to identify, quantify and manage the main risks
to which the Group is exposed. To this end, GRM develops and
deploys a number of risk measurements, monitoring instruments
and methods, including a standardized methodology and
framework for stochastic modelling (through the Internal Model)
including the ORSA required under Solvency II.
When appropriate, this role leads to the implementation of
decisions that aff ect the Group’s risk profile, helping to monitor
the solvency position and manage the volatility of the Group’s
earnings through improved understanding of the risks taken and
optimization of capital allocation.
As an integrated part of all the Group’s business processes, GRM
is also responsible for the definition and implementation of the
ERM framework within the AXA Group.
The ERM framework is based on the following five pillars, cemented by a strong risk culture:
Extensive use
of Internal Model
based on a robust
economic
capital metric
Risk Management
independence &
comprehensiveness
Common
Risk Appetite
Framework
Systematic
2nd
Opinion &
Challenge
Proactive
Risk Management
���������� � ��
�����
5���
�������
1 2 3 4 5
1. Risk Management independence and comprehensiveness:
Chief Risk Off icers are independent from operations (first
line of defense) and Internal Audit department (third line of
defense). The Risk Management Department, together with
the Compliance and Internal Control departments, constitute
the second line of defense, whose objective is to develop,
coordinate and monitor a consistent risk framework across
the Group;
2. Common risk appetite framework: Chief Risk Off icers are
responsible for ensuring that senior management reviews and
approves the risks to which the relevant entity or business
unit is exposed, understands the consequences of an adverse
development in such risks, and have action plans that can
be implemented in case of unfavorable developments;
3. Systematic second opinion on key processes: Chief Risk
Off icers provide a systematic and independent second
opinion on product approval process, reserves, reinsurance,
investments and ALM, and challenge on operational risks
and strategic plan;

180 I UNIVERSAL REGISTRATION DOCUMENT - ANNUAL REPORT 2019 - AXA I
RISK FACTORS AND RISK MANAGEMENT 4 4.2 INTERNAL CONTROL AND RISK MANAGEMENT
4. Extensive use of Internal Model based on a robust
economic capital metric: the Internal Model is intended
to offer a concrete and powerful tool to control and
measure exposure to most risks, in line with the Solvency II
framework. The Internal Model is designed as a consistent and
comprehensive Risk Management tool, which also forms an
important element in the capital management and planning
process;
5. Proactive Risk Management: Chief Risk Officers are
responsible for early detection of risks. This is ensured
through challenge of and constant dialogue with the relevant
business and supported by the AXA Group’s emerging risks
management framework.
GRM oversees the operating entities’ adherence to the ERM,
supported by the local Risk Management teams. It coordinates
Risk Management for the Group, steers the local Risk Management
Departments and strives to develop a risk culture throughout the
Group. Since September 2019, the former Group Insurance Off ice
teams have been fully integrated within GRM. They gather Life &
Savings, Health & Protection, and Property & Casualty business
experts in charge of promoting technical excellence and ensuring
compliance with Group insurance guidelines and standards.
Since September 2019, the newly created Portfolio Management
team is in charge of steering the Group Solvency ratio in
cooperation with Finance, and initiating, supporting or conducting
initiatives aiming at optimizing further AXA Group balance sheet
from a risk and solvency perspective (encompassing both the
assets and the liabilities). The Head of Portfolio Management
reports to the Group Chief Risk and Investment Off icer.
The reinsurance structure in charge of Property & Casualty and
Life & Savings, Health & Protection reinsurance (AXA Global Re)
reports to the Group Chief Risk and Investment Off icer. Its main
mandate is to contribute to the protection of the Group through
the centralization of the Group’s purchase of reinsurance. For
additional information on the reinsurance strategy, please see
Section 4.6 “Insurance Risks” of this Annual Report (1).
Group Compliance function
The Group Compliance function is responsible for advising
Executive Management and the Board of Directors on applicable
compliance laws, regulations and administrative provisions, and
on the impact of regulatory change on AXA Group’s operations.
The Group Compliance function provides expertise, advice and
support to AXA entities to assess significant compliance matters,
analyzes the major compliance risks and contributes to designing
solutions to mitigate the risks to which the Group is exposed. The
Group Compliance function manages a wide range of compliance
related matters including (i) financial crime (which includes
anti-bribery and corruption, anti-money laundering programs
and international sanctions/embargo compliance), (ii) data
privacy, (iii) compliance & ethics, (iv) the monitoring of other
major compliance and regulatory risks, and (v) regular reporting
of significant compliance and regulatory matters to Executive
Management, the Board of Directors and regulators.
The Group Chief Compliance Off icer reports to the Group Deputy
Chief Executive Off icer & Group General Secretary.
The compliance activities within the Group are set out in a number
of standards and policies which set the minimum requirements
expected to be achieved by the entities and their compliance
functions.
The Compliance section of the Group Standards contains standards
and policies on significant risk areas aff ecting compliance activities
and sets out the high-level controls and monitoring principles to
which the entities must adhere. Adherence to the Standards and
Policies (e.g. Compliance Governance, Anti-Money Laundering,
Sanctions, Anti-Bribery…) is mandatory.
The Group Compliance function undertakes an annual Compliance
Risk Assessment exercise via which entities are required to
identify the most significant compliance risks to which they are
exposed. Based on this assessment, an Annual Compliance Plan is
developed for the following year. Based on the same methodology
and to comply with the French extraterritorial law (Sapin II), an
Anti-Bribery and Corruption Risk Assessment has been developed
and rolled out to the entities. This risk assessment enables entities
to identify in a more granular manner risks related to bribery.
The Group Compliance function has implemented a number of
monitoring processes. For example, the Compliance Support and
Development Program (CSDP) which is an ongoing program of
structured on-site Compliance reviews conducted by the Group
Compliance Department to AXA Group Companies worldwide.
The main purpose of these reviews is to measure adherence to
the Group Standards and Policies, to define improvement action
plans, to provide experienced advice and to rate the entity’s
maturity level against other Group companies. This program was
introduced in 2009 using a risk-based approach.
On a regular basis, the Group Compliance function reports
to the Group Audit Risk & Compliance Committee, the Audit
Committee, and the Board of Directors (as required) on significant
compliance matters. These include major regulatory changes
that have compliance implications, results of the Compliance
Risk Assessment, and any other significant issues that require
escalation.
(1) Only information contained in Section 4.6 “Insurance risks” of this Annual Report and referred to in Note 4 “Financial and insurance Risk Management” in Part 5 “Consolidated Financial Statements” of this Annual Report is covered by the report of the Statutory Auditors on the Consolidated Financial Statements.

181I UNIVERSAL REGISTRATION DOCUMENT - ANNUAL REPORT 2019 - AXA I
RISK FACTORS AND RISK MANAGEMENT
4
4.2 INTERNAL CONTROL AND RISK MANAGEMENT
Group Internal Control function
To further strengthen its control environment, the AXA Group
established in 2017 a centralized Internal Control function within
the second line of defense independent from business operations.
Group Head of Internal Control is reporting to the Group Head of
Operational Risk and Internal Control. The Group Internal Control
department is responsible for the development of a standardized
methodology and framework for internal control and for oversight
of its implementation in the AXA Group’s subsidiaries. For more
information on the internal control at local level, please refer to
the paragraph “Risk Management and internal control at local
level” below.
The Internal Control framework of the AXA Group:
■ is based on the principle of proportionality and takes into
account the nature, scale and complexity of the entities
operations;
■ is aligned with the COSO “Internal Control – Integrated
Framework” of the Committee of Sponsoring Organizations
of the Treadway Commission;
■ is an integral part of the Risk Management thus providing the
Executive Management with a view of the risk and control
environment;
■ is underpinned by the Group Internal Control Standard and
Group Solvency II Internal Control Policy, first approved by
the Audit Committee and the Board of Directors of AXA SA in
December 2017;
■ encompasses Internal Financial Control, implemented since
2010 to provide reasonable assurance regarding the reliability
of Internal Control Over Financial Reporting (“ICOFR”), and
extended to Solvency II in 2014 to contribute to the Internal
Model validation process. For more information on Internal
Financial Control, please refer to the paragraphs “Financial
reporting, disclosure, controls and procedures” and “Internal
Model validation” below.
On a regular basis, the Group Internal Control reports to the Group
Operational Audit, Risk and Compliance Committee.
Third line of defense: Group Internal
Audit function
The Group’s Internal Audit function provides the Group Audit
Committee and the Group’s Management Committee with
independent and objective assurance on the eff ectiveness of
the overall control environment across the Group.
The Global Head of Internal Audit reports to the Chairman of the
AXA Group Audit Committee with an administrative reporting line
to the Group Deputy Chief Executive Off icer.
All internal audit teams across the Group report to the Global
Head of Internal Audit whilst also having a direct and unfettered
reporting line to their local Audit Committee Chairman and an
administrative reporting line within their local management
structure.
The Group’s Internal Audit function exists to help the Board
and Executive Management protect the assets, reputation and
sustainability of the organization by providing an independent and
objective assurance activity designed to add value and improve
the organization’s operations. It helps the organization meet
its objectives by bringing a systematic, disciplined approach to
challenge Executive Management and evaluate the eff ectiveness
of Risk Management, control and governance processes.
Group Internal Audit sets an annual plan of work, based on an
assessment of both the inherent risk and the adequacy of controls
as well as consideration of the audit cycle. The plan is formally
approved and its performance formally monitored by the Group
Audit Committee.
Over the audit cycle, all applicable audit universe components for
each entity are expected to be audited. Any exceptions identified
are notified to the Audit Committee for ratification.
A report is issued at the conclusion of each audit assignment to
the relevant senior management. The results of the audits and
resolution status of internal audit issues are presented to the
relevant Audit Committee and Executive Management Committee
on a regular basis.
Risk Management and Internal Control
at local level
Governance: The Group Governance Standards require, among
other things, the Boards of AXA’s main subsidiaries to establish
an Audit Committee. The Audit Committees have a critical role
in reviewing financial results and other financial information
prepared by the management of these subsidiaries, financial
reporting and control processes, critical accounting policies,
specific accounting issues, key risks and systems of internal
control, fraud and similar issues.
In addition, the Group has established Standards that apply to
AXA SA and entities (including Joint Ventures) where AXA has
the majority of the voting rights, or has a minority interest but
exercises control through other means such as management.
They are mandatory for all Group entities within scope unless
otherwise indicated. The Standards focus on critical requirements
and form part of the overall Risk Management framework which
allow the Group to have a clear understanding of risks, both
locally and Group-wide.
Chief Executive Off icers are required to certify annually to the
Group Chief Executive Off icer that to the best of their knowledge
their entities comply with the Standards. Entity Boards must be
formally informed of the Annual Certifications, together with any
material breaches, areas of non-compliance and corresponding
mitigation plans in order to monitor progress of remedial actions.
Risk Management: Risk Management is a local responsibility, in
accordance with GRM standards and guidelines. The roles and
responsibilities of local Risk Management teams are validated
jointly by the Executive Committees of local entities and the
Group Chief Risk Off icer to ensure the alignment of central and
local interests.

182 I UNIVERSAL REGISTRATION DOCUMENT - ANNUAL REPORT 2019 - AXA I
RISK FACTORS AND RISK MANAGEMENT 4 4.2 INTERNAL CONTROL AND RISK MANAGEMENT
The minimum missions required for local Risk Management
teams are:
■ coordinating the second line of defense locally (which covers
among others Compliance, Internal Control, Security) through
a specific system of governance framework;
■ ensuring that the risk appetite is implemented with respect
to all risks consistently with the Group’s risk appetite, with
enhanced reporting, risk limits and decision processes;
■ providing a second opinion on key processes, such as the
definition of characteristics for new products before launch,
reserves, ALM studies & asset allocation and reinsurance
strategies;
■ with respect to the Internal Model, checking the adequacy of
the local risk profile, and implementing, testing and validating
the Internal Model.
Local Chief Risk Off icers head the local Risk Management teams
within each operational entity, and report both to their local Chief
Executive Off icer and to the Group Chief Risk Off icer. They are
independent from operations and Internal Audit departments.
Local Chief Risk Off icers regularly report to the local Board of
Directors (or to a sub-committee) on Risk Management matters.
Their teams are responsible for controlling and managing risks
within Group policies and limits, and for validating investment
or underwriting decisions through local Risk Committees. The
Group Chief Risk Off icer chairs the Chief Risk Off icers’ meeting
composed of the Chief Risk Off icers of AXA’s main subsidiaries,
that meets on a quarterly basis and have monthly calls.
Internal Control: Internal Control is a local responsibility in
accordance with Internal Control Standard and Policy. Entities
are expected to:
■ define and document their controls and control procedures
covering all important risks and processes (First line
responsibility);
■ regularly verify and challenge the eff ectiveness of the control
environment (Second line responsibility);
■ implement a comprehensive monitoring and reporting on
internal control deficiencies at a senior level of the organization
to ensure that these are rectified in an adequate and timely
manner.
Local Heads of Internal Control (or equivalent) are independent
from operations and report preferably to their local Chief Risk
Off icer. Local Heads of Internal Control (or equivalent) regularly
report to the local Executive Committee (or to a sub-committee)
on Internal Control matters.
Compliance: The local Compliance functions are expected to
undertake an annual Compliance Risk Assessment to identify the
major compliance risks to which the business is exposed. Based
on the Compliance Risk Assessment, an Annual Compliance
Plan must be developed at the end of each year for the following
year. The local Compliance function must directly report on a
regular basis to local senior management and the local Audit
Committee (or equivalent body), on significant compliance
matters, including key compliance risks, major regulatory changes
that have compliance implications, the Annual Compliance Plan,
outstanding Compliance Support and Development Program
action points and any other significant issues that require
escalation.
FINANCIAL REPORTING, DISCLOSURE,
CONTROLS AND PROCEDURES
S cope of responsibilities
The PBRC department within the Group Finance department
is responsible for consolidation, management reporting, as
well as actuarial indicators and the economic balance sheet.
These missions are performed for regular closings, forecasts and
strategic plan exercises. PBRC works with local PBR units within
the Finance departments of Group subsidiaries.
The local PBR units are responsible for producing their respective
contribution to the Group Consolidated Financial Statements.
PBRC’s role encompasses the following principal activities:
■ development of both accounting and reporting standards;
■ managing process instructions with the subsidiaries for the
various exercises;
■ managing the Group’s financial consolidation and reporting
systems;
■ producing the Consolidated Financial Statements in accordance
with International Financial Reporting Standards (IFRS) and
analyzing key performance indicators;
■ developing and using management control tools;
■ managing and consolidating the European Embedded Value
processes, related actuarial indicators and the economic
balance sheet;
■ coordinating the production of the Group’s Annual Reports
filed with the AMF;
■ coordinating the production of reports filed with the ACPR
related to Solvency II;
■ liaising with the Statutory Auditors and contributing to Audit
Committee meetings as required; and
■ fostering convergence of accounting and financial reporting
processes, systems and organizations for insurance activities
in Europe.
PBRC has defined and implemented a set of policies and
procedures to ensure that the consolidation process leading to
the consolidated financial statements is timely and accurate. This
consolidation process is based on the following:

183I UNIVERSAL REGISTRATION DOCUMENT - ANNUAL REPORT 2019 - AXA I
RISK FACTORS AND RISK MANAGEMENT
4
4.2 INTERNAL CONTROL AND RISK MANAGEMENT
Definition of standards and use of a centralized
information system
Group accounting standards, which are consistent with accounting
and regulatory principles, are set forth in the “AXA Group
Accounting Manual” and updated regularly by PBRC experts.
These guidelines are submitted to AXA’s Statutory Auditors for
review before being made available to AXA’s subsidiaries.
The Group’s consolidation and reporting processes are based on a
central information system “Magnitude”. This tool is managed and
updated by a dedicated team. This system is also used to deliver
management reporting information and the economic balance
sheet. The process through which this management reporting
information and the economic balance sheet are produced and
validated is the same as the one used to prepare consolidated
financial information.
Operating control mechanisms
At entity level, AXA’s subsidiaries are responsible for recording
and controlling accounting and financial data that comply with
the AXA Group Accounting Manual and reflect consolidation
rules under IFRS accounting standards. In this respect, the Chief
Financial Off icer of each entity signs off on the accuracy of their
respective contribution to the consolidated figures reported
through “Magnitude” and their compliance with both the AXA
Group Accounting Manual and instructions in all frameworks
produced (IFRS, Embedded Value, actuarial indicators and
economic balance sheet) within the internal financial control
program.
At PBRC level, accounting, financial and economic information
reported by entities are analyzed by teams that liaise with
subsidiaries on a full-time basis. In particular, these teams analyze
the compliance with the AXA Group Accounting Manual and
Group actuarial standards.
Internal Control over Financial
Reporting (ICOFR)
The AXA Group’s ICOFR is a process designed under the supervision
of the Group Chief Financial Officer to provide reasonable
assurance regarding the reliability of financial reporting and
the preparation of Consolidated Financial Statements.
In that context, and based on the Group Internal Control Standard,
the Group has implemented a comprehensive program managed
by Group Risk Management, entitled Internal Financial Control
(“IFC”), to ensure that the Group Chief Executive Off icer has a
reasonable basis to conclude that AXA Group’s ICOFR is eff ective
as of the end of each financial year.
The IFC program is based on the Group’s IFC Standard, which is an
internal control and governance standard based on the “Internal
Control – Integrated Framework” issued by the Committee of
Sponsoring Organizations of the Treadway Commission (COSO).
It is designed to ensure consistency and quality in AXA Group’s
financial reporting, and provide an overall framework for the
annual IFC program precising the scope of application and
governance.
The entities in IFC scope are required to document their significant
processes and key controls, as well as the rationale of how the
associated risk of material misstatement due to error or fraud
can be reduced to an acceptable level. This is performed under
the supervision of the Chief Financial Off icer, sponsor of the IFC
program. The independent Internal Financial Control function,
anchored within Risk Management for most entities, is in charge
of testing the design and operational eff ectiveness of those key
controls, and ensuring that identified control deficiencies are
remediated.
At each year-end, the in-scope entities have to perform an
evaluation of their ICOFR as part of an internal certification process,
involving formal sign-off by process owners and with a formal
management report from the entity’s Chief Financial Off icer and
Chief Risk Off icer stating their conclusion as to the eff ectiveness
of the entity’s ICOFR.
Disclosure controls and procedures
The Group has implemented a formal internal review and sign-off
process pursuant to which all Management Committee members,
Chief Financial Off icers and certain other senior executives are
required to certify various matters covered in AXA’s Universal
Registration Document.
This process is based on the following four pillars:
1. Chief Financial Off icer Sign-Off Certificates, which are required
to be submitted by all local Chief Financial Off icers to PBRC,
together with the required subsidiary financial reporting and
consolidation information;
2. IFC Management reports are required to be submitted by
the Chief Financial Off icer or another senior executive of
every in-scope entity, as part of the IFC program dedicated
to ICOFR;
3. Disclosure Controls & Procedures Certificates, which are
required to be submitted by AXA’s Management Committee
members, Chief Financial Off icers and certain other senior
executives pursuant to which each of these executives
is required to review the Group’s Universal Registration
Document and formally certify (i) the accuracy and
completeness of the information in the Annual Report with
respect to the companies under his/her responsibility, and
(ii) the eff ectiveness of disclosure controls and procedures
and ICOFR at companies under his/her responsibility (with
specific disclosure of any significant deficiencies or material
weaknesses). In addition, as part of this “sub-certification”
process, these executives are required to review and comment
on a number of cross-sectional disclosures in the Universal
Registration Document relating to risk and other matters;
4. Chief Financial Off icer Sign-Off Certificates on the notes to
the Consolidated Financial Statements: PBRC provides Chief
Financial Off icers with the contribution of the entities under
their responsibility to the Consolidated Financial Statements
in order to facilitate their certification on the accuracy and
completeness of the information in the Universal Registration
Document of the Group.
For further information, please refer to Appendix I “Management’s
annual evaluation of the internal control over financial reporting”
of this Annual Report.

184 I UNIVERSAL REGISTRATION DOCUMENT - ANNUAL REPORT 2019 - AXA I
RISK FACTORS AND RISK MANAGEMENT 4 4.2 INTERNAL CONTROL AND RISK MANAGEMENT
CONCLUSION
The Group has established a comprehensive system of internal
control procedures and mechanisms that management believes
appropriate and adapted to its business and the global scale of
its operations.
However, all internal control systems, no matter how well
designed, have inherent limitations and cannot provide absolute
certainty or guarantee against the materialization of risks and
control failures. Even systems determined to be eff ective by
the management may not prevent or detect all human errors,
all system malfunctions, all fraud or all misstatements and can
provide only reasonable assurance.
I Own Risk and Solvency Assessment (“ORSA”) (1)
(1) This information is not required under IFRS and as such is not part of the Consolidated Financial Statements. Therefore, it is not covered by the report of the Statutory Auditors on the Consolidated Financial Statements.
POLICY AND GOVERNANCE
Under Solvency II, the Group and certain of its subsidiaries (i.e.
all insurance and reinsurance entities in the European Economic
Area and insurance and reinsurance entities outside the European
Economic Area that are within the scope of the Internal Model)
are each required to produce an ORSA report which is filed with
the applicable national supervisor. At Group level, the Group
Chief Risk Off icer is responsible for developing the ORSA policy,
implementing the ORSA process and coordinating the ORSA
reporting.
The ORSA policy defines minimum standards for assessing
and reporting own risks and solvency to be applied across the
Group. Adherence to this policy is expected to be promoted and
monitored by all entity heads of Risk Management Department
(Chief Risk Off icers).
The Group ORSA report is reviewed annually by the Solvency II
Committee and then presented, first, to the ARCC and the Audit
Committee of the Board of Directors, and finally to the Board of
Directors, which approves the conclusions of the Group ORSA
report and authorizes its filing with the ACPR.
Beyond the annual ORSA report, a quarterly assessment is
performed to update the Group’s risk profile against Risk
Appetite limits and adapt management actions accordingly.
This information is reported to the Finance Committee of the
Board of Directors and to the ARCC which regularly reviews all
material audit, risk and compliance issues faced by the Group.
PURPOSE AND CONTENT
ORSA encompasses processes to identify, assess, monitor, manage
and report the short to medium term risks to which the Group is
exposed and to ensure the adequacy of the level of own funds
within the Group solvency targets, taking into account the Group’s
risk profile, as well as approved risk appetite limits and business
strategy. As an important component of the risk management
system, it is intended to give a comprehensive and complete
vision of the risks embedded in the businesses of the Group on
a continuous basis.
ORSA mainly encompasses Risk Management and financial
activities, which are organized around the following processes:
■ Solvency Capital Requirement (“SCR”) & Eligible Own Funds
(“EOF”) calculation;
■ liquidity risk reporting;
■ strategic planning and financial projections;
■ risk appetite process;
■ stress and scenario testing analysis and monitoring; and
■ risk assessment and review of strategic risk, reputation risk,
regulatory risk and emerging risk.
185I UNIVERSAL REGISTRATION DOCUMENT - ANNUAL REPORT 2019 - AXA I
RISK FACTORS AND RISK MANAGEMENT
4
4.2 INTERNAL CONTROL AND RISK MANAGEMENT
The ORSA report provides an assessment on:
■ the overall solvency needs through the measurement
of quantifiable risks considering risk mitigation actions
implemented in current economic context and approved
business strategy detailed in the 2018-2020 strategic plan
and within approved risk appetite limits. Stress scenario
analyses are performed to ensure adequacy of the economic
capital assessed. This is supported by the Enterprise Risk
Management system, including the identification, monitoring
and management of non-quantifiable risks;
■ the compliance, on a continuous basis, with (i) regulatory capital
requirements, through the assessment of the ability to meet
capital requirements using the approved Internal Model, in
compliance with the Solvency II regulatory standard, as well as
(ii) requirements regarding technical provisions. Stress scenario
analyses are performed to ensure adequacy of the economic
capital assessed. Also, the extensive use of the Internal Model
outputs for key decision-making processes provides a feedback
loop for improving the modelling according to the evolution
of the risk profile;
■ the significance with which the risk profile of the AXA Group
deviates from the assumptions underlying the SCR calculated
on the basis of the Internal Model. Extensive validation tests are
performed to assess the relevance of the Internal Model and the
model error. Limitations of the Internal Model and evolution
plan resulting from the validation activities are presented.
I Internal Model (1)
(1) This information is not required under IFRS and as such is not part of the Consolidated Financial Statements. Therefore, it is not covered by the report of the Statutory Auditors on the Consolidated Financial Statements.
For more information on regulatory capital and solvency
requirements applicable to the Group, including Solvency II,
please refer to Section 6.3 “General Information – Regulation
and Supervision” of this Annual Report.
The Group has developed a robust economic capital model
since 2007. The internal model of the Group (the “Internal Model”)
is used in its risk management systems and decision-making
processes. The ACPR has approved the use by the Group of
its Internal Model to calculate its SCR under Solvency II. The
Internal Model encompasses the use of AXA Group’s economic
capital model on all material entities, except entities that were
part of the XL Group we acquired in 2018 (“XL entities”). The
Solvency capital requirement in respect of the entities that were
part of the XL Group (“XL entities”) as at December 31, 2019 was
calculated in accordance with the Solvency II standard formula,
while December 31, 2018 was relying on the equivalence regime,
based on the Bermudian Standard Formula SCR, plus a 5% add-
on required by the AXA’s lead supervisor (ACPR), as a transitional
measure. Subject to prior approval of the ACPR, the Group intends
as soon as December 31, 2020 to extend its Internal Model to
XL entities.
AXA continues to review regularly the scope, underlying
methodologies and assumptions of the Internal Model and
will adjust its SCR accordingly. In addition, AXA’s Internal Model
has been and may be revised from time to time in accordance
with applicable regulations. However, any major change to the
Internal Model would be subject to the prior approval of the ACPR,
which may require adjustments to the level of SCR. In addition,
the Group monitors EIOPA’s work program which, through its
objectives, is also expected to continue to carry out consistency
reviews of European insurers’ internal models. Such review may
lead to further regulatory changes to increase convergence and to
strengthen oversight of cross-border groups, as well as changes
to internal models and Solvency II capital requirements.
The Group’s main goal in using its Internal Model as opposed to
the Solvency II standard formula is to better reflect the Group’s
risk profile in its SCR. This is reflected through several objectives:
■ taking into account local specificities – The Group is a global
company, and caters to a wide range of insurance markets with
a variety of products off ered targeting certain demographics
and with diff ering risk exposures. It is therefore appropriate,
to the extent possible, to calibrate stresses specific for these
risk profiles and to allow for the benefits of diversification of
risks which arise as a result of being spread over these markets;
■ addressing shortcomings inherent to the standard formula –
based on its expertise, the Group can improve on the approach
of the standard formula (which is naturally constrained by
its general scope and which does not cover all measurable
risks) and have models more appropriate to the scope of the
Group; and

186 I UNIVERSAL REGISTRATION DOCUMENT - ANNUAL REPORT 2019 - AXA I
RISK FACTORS AND RISK MANAGEMENT 4 4.2 INTERNAL CONTROL AND RISK MANAGEMENT
■ allowing for better evolution of the model over time – as the
Group’s experience increases, business expands to new markets
and product innovations create diff erent risks to consider, the
flexibility of an internal model allows the specificities of these
developments to be reflected.
The Internal Model is based on a common definition of risks used
consistently throughout the Group. It aims to ensure that the
Company risk mapping is comprehensive and is followed in a
consistent way across the Company and that eff icient procedures
and reporting are in place so that roles and responsibilities are
allocated to identify, measure, monitor, manage and report key
risks.
The Group risk grid (1) aims to identify all material risks applicable
to the Company’s insurance businesses. The Internal Model
is intended to capture all material risks to which the Group is
exposed from the risk assessment performed at sub-risk level
to the overall aggregation of risk categories.
The underlying methodologies and assumptions used in the
economic capital model are regularly reviewed to ensure that they
accurately reflect the AXA Group’s risk profile and new methods
are developed and integrated regularly (in accordance with the
Internal Model change policy).
The SCR, calculated on the basis of the Internal Model, represents
the value at risk of Group EOF at the 99.5th percentile over a one-
year horizon. In other words, the Solvency Capital Requirement is
the capital needed to sustain an extreme shock likely to occur with
a 0.5% probability (i.e. a 1 in 200 years event). It aims at including
all measurable risks (market, credit, insurance and operational)
and reflecting the Group’s diversified profile.
In addition to the risks that impact the SCR through the Internal
Model calculation, the Group also monitors its liquidity risk,
reputation risk, strategic risk and regulatory risks as well as
emerging threats.
AXA GROUP SOLVENCY II RATIO
In addition to the SCR assessment, which intends to cover all
quantifiable risks to which the Group is exposed (insurance,
financial, and operational risks), the AXA Group performs sensitivity
analyses of its Solvency II ratio to material risks and events.
These analyses quantify, for instance, the potential impact on the
AXA Group’s Solvency II ratio of (i) financial shocks on corporate
bond and sovereign spreads, on interest rates, and on equity and
(ii) a wide range of shocks reflecting historical stress events (such
as the 2008-2009 financial crisis, the 2011 financial crisis, the 1918
Spanish flu and the 1999 Lothar & Martin storms).
These sensitivity analyses do not take into account preemptive
management actions that might be taken to mitigate the eff ects
of the defined shocks, nor indicate a probability of occurrence,
but, are designed:
■ to demonstrate that the AXA Group Solvency ratio is resilient
to a wide range of shocks;
■ to ensure through the risk appetite framework that the
management reviews and acknowledges the risks that arise
in their company, understands the consequences of an adverse
development of these risks, and have action plans that can
be implemented in case of unfavorable developments; and
■ to verify the robustness of the Internal Model.
The Solvency II ratio as of December 31, 2019, published on
February 20, 2020 was estimated at 198% (2), compared to 193%
as of December 31, 2018 and remains within AXA’s target range
of 170%-220%.
(1) The Group risk grid is designed to identify all risks applicable to AXA businesses. Risk categories are further split into sub-risks. The risk assessment is performed at the sub-risk level. The risk grid is regularly reviewed and validated at Group level.
(2) The Solvency II ratio is estimated primarily using AXA’s internal model calibrated based on an adverse 1/200 years shock. In compliance with the ACPR’s decision, from January 1, 2019, entities that were part of the XL Group (“XL entities”) have been fully consolidated for Solvency II purposes (as per the consolidation-based method set forth in the Solvency II Directive) and their contribution to the Group’s solvency capital requirement has been calculated using the Solvency II standard formula. Subject to prior approval of the ACPR, the Group intends to extend its internal model to XL entities as soon as December 31, 2020. For additional information, please refer to Section 4.2 “Internal Control and Risk Management - Internal Model” . The Solvency II ratio will be finalized prior to the publication of the AXA Group’s SFCR currently expected to be on May 14, 2020.

187I UNIVERSAL REGISTRATION DOCUMENT - ANNUAL REPORT 2019 - AXA I
RISK FACTORS AND RISK MANAGEMENT
4
4.2 INTERNAL CONTROL AND RISK MANAGEMENT
INTERNAL MODEL GOVERNANCE
At Group level, the governance bodies involved in the Internal
Model governance are as follows:
■ the Board of Directors reviews the Internal Model, and authorizes
the application to the ACPR for approval of major changes to
the Internal Model;
■ the Audit, Risk and Compliance Committee; and
■ the Solvency II Committee.
At Group level, the Internal Model is reviewed, tested and
approved on an ongoing basis by the Solvency II Committee.
The Solvency II Committee is supported by risk technical working
groups reviewing changes proposed to the Internal Model and
presenting conclusions of these diligences to the Solvency II
Committee. The Solvency II Committee also reviews the Internal
Model validation and model change processes, and liaises with
local governance. It also reviews the conclusions of the regular
validation activities.
INTERNAL MODEL VALIDATION
The Group has implemented and documented a validation
process of its Internal Model to monitor its performance and
continued adequacy. This process and associated governance are
documented in the Group validation policy, endorsed by the ARCC.
The Group validation policy is supplemented by local
validation policies specifying the local validation activities and
responsibilities.
Validation does not only apply to the quantitative aspects of
the model (input data, theory & methodology, parameters &
assumptions, data, results) but also encompasses the qualitative
aspects of the model: expert judgment, documentation, model
governance, use test, systems/IT.
Risk Management performs regular integrated validation activities,
described in the Internal Model validation policy, mostly organized
around:
■ validation of the model structure, modelling choices, parameters
and assumptions; and
■ validation of the Solvency Capital Requirement calculation
and results.
These tasks are performed mostly within the Risk Management
Departments in charge of the model, through controls and
validation activities using validation tools such as sensitivity
tests, back testing, scenario testing, and stability analysis and
any other relevant activity.
These validation procedures are complemented by independent
challenge and validation of assumptions, key parameters and
results through Committees (including assumptions Committees,
calibration Committees and clearance Committees) intended to
provide an adequate level of expertise and seniority.
In particular, Group Risk Management teams provide independent
testing of the local model choices, local parameters, assumptions
or calibration as well as local results.
Apart from this fully integrated validation, sanctioned by the
Group Chief Risk Off icer’s review and sign-off , a comprehensive
independent review process has been defined and implemented
to provide adequate comfort to AXA Group Management and
Board of Directors that the model and its outputs meet a “fit for
purpose” standard.
The independent reviews are performed by the following two
internal teams:
■ IFC teams, at local and Group level, responsible for assessing
the eff ectiveness of internal control framework over Solvency II,
on the basis of the testing of processes and controls over the
EOF and STEC, at least annually; and
■ Internal Model Review (“IMR”) team, a Group team responsible
for the in-depth actuarial review of the model under local
teams’ responsibility, the conception and methodology when
locally developed, and the local implementation of the Group
principles where relevant. IMR controls are performed on a
3-year rolling basis, independently from closing agenda.
Both IMR and IFC are fully independent from the development,
the governance and the processing of the Internal Model.
At the end of the annual validation process, the Board of Directors
is provided with a report summarizing the conclusions of the
internal review by Risk Management and the conclusion of the
independent review by IMR and IFC as well as a review by an
independent third party.

188 I UNIVERSAL REGISTRATION DOCUMENT - ANNUAL REPORT 2019 - AXA I
RISK FACTORS AND RISK MANAGEMENT 4 4.2 INTERNAL CONTROL AND RISK MANAGEMENT
I Governance of investment strategy
and asset & liability management (ALM)
The AXA Group, as an insurance group, follows an investment
strategy mainly driven by Asset & Liability Management (“ALM”).
The overall objectives of all investment decisions made within
the Group are to meet its obligations and commitments to
policyholders, to protect the solvency of the Group’s entities,
and to generate superior return over time.
GROUP AND LOCAL GUIDANCE
ON INVESTMENTS
The Group Chief Investment Off icer (Group CIO) heads the Group-
wide community of local insurance companies CIOs, the central
Investment & ALM department and reports to the Group Chief
Risk and Investment Off icer. His role includes aligning AXA’s
investment strategy with the broader strategy of the Group,
fostering closer cooperation amongst local entities, enhancing
investment expertise and methodology, and steering investment
decisions.
Local investment & ALM activities are steered by local CIOs.
Local CIOs manage local portfolios, aiming at an optimized risk-
return ratio, maintain reporting lines to the Group, and manage
close relationships with asset managers and local stakeholders.
Moreover, they are responsible for the investment performance
and for implementing and executing a sound Asset Liability
Management.
GROUP AND LOCAL GOVERNANCE BODIES
In order to eff iciently coordinate local and global investment
processes, decisions within the Group’s investment community
are taken by two main governance bodies:
■ the Group Investment Committee, which is co-chaired by
the Group Chief Risk and Investment Off icer and the Group
Chief Financial Off icer. This Committee defines the Group’s
investment strategy, steers tactical asset allocation, evaluates
new investment opportunities and monitors the Group’s
investment performance; and
■ the Group Financial Risk Committee is co-chaired by the Group
Chief Financial Off icer and the Group Chief Risk and Investment
Off icer. The Group Chief Investment Off icer is also member of
this Committee (please refer to the paragraph “Audit Risk and
Compliance Committee” above).
At the entity level, each insurance company has a local Investment
and ALM Committee whose terms of reference are approved by
the local Executive Committees.
These committees are responsible for, inter alia, defining the
entity’s Strategic Asset Allocation, approving and monitoring
investments, meeting local compliance obligations and reviewing
the participation in investment proposals syndicated by the
Group, as well as local investment proposals.
ALM STUDIES AND STRATEGIC
ASSET ALLOCATION
ALM aims to match assets with the liabilities generated by the sale
of insurance policies. The objective is to define the optimal asset
allocation so that all liabilities can be met with the highest degree
of confidence while maximizing the expected investment return.
ALM studies are performed by the Investment & ALM department
with the support of internal asset managers when appropriate
and a second opinion is provided by the Risk Management
Department. They use methodologies and modelling tools that
develop deterministic and stochastic scenarios, embedding
policyholders’ behavior considerations for the liabilities, financial
market evolution for the assets and taking into account existing
interaction between the two. This process aims at maximizing
expected returns given a defined level of risk. Furthermore, a
series of additional constraints are taken into account, such as
Solvency II economic capital model considerations, earnings
stability, protection of the solvency margin, preservation of
liquidity, as well as local and consolidated capital adequacy
and requirement.
ALM constraints are also taken into account when new insurance
products are being designed as part of the product approval
process (see Section 4.6 “Insurance risks – Product approval” of
this Annual Report).
At the entity level, the strategic asset allocation issued from the
ALM study must be reviewed by local Risk Management, and
verified against predefined risk appetite limits, before being
approved by the local Investment and ALM Committee.

189I UNIVERSAL REGISTRATION DOCUMENT - ANNUAL REPORT 2019 - AXA I
RISK FACTORS AND RISK MANAGEMENT
4
4.2 INTERNAL CONTROL AND RISK MANAGEMENT
INVESTMENT APPROVAL PROCESS
Investment opportunities, like non-standard investments, new
strategies or new structures, are subject to an Investment Approval
Process (“IAP”) in line with the third pillar of the Group Risk
Management principles which provides for a systematic second
opinion on key processes. The IAP ensures key characteristics of
the investment are analyzed, such as risk and return expectations,
experience and expertise of the investment management teams,
as well as accounting, tax, legal and reputational issues.
The IAP is completed at Group level for any significant investment,
depending on the investment size and the number of entities
participating in it. The successful completion of an IAP is done
aft er the production of a second independent opinion by Group
Risk Management. The IAP is used and completed at local level to
cover local regulatory characteristics (including tax and statutory
accounting).
Local IAP is also run for investments in new asset classes for local
entities under the same principles.
GOVERNANCE FRAMEWORK
FOR DERIVATIVES
Products involving hedging programs based on derivative
instruments are designed with the support of dedicated teams
at AXA Investment Managers and AXA SA. In a similar way, this
set-up ensures that all entities benefit from technical expertise,
legal protection and good execution of such transactions within
the following governance framework for derivatives.
Derivative strategies are reviewed by local Investment and ALM
Committees. In addition, there is a segregation of duties between
those responsible for making investment decisions, executing
transactions, processing trades and instructing the custodian.
This segregation of duties aims in particular at avoiding conflicts
of interest.
The market risks arising from derivatives are regularly monitored
taking into account the Group’s various constraints (such as risk
appetite and Internal Model).
Such monitoring is designed to ensure market risks, arising from
cash or derivative instruments, are properly controlled and remain
within approved limits.
Legal risk is addressed by defining a standardized master
agreement. The Group’s business units may trade derivatives
only if they are covered by legal documentation which complies
with the requirements set out in the Group standards. Any change
to certain mandatory provisions defined in the Group standards
must be approved by GRM.
Additionally, there is a centralized counterparty risk policy. GRM
has established rules on authorized counterparties, minimum
requirements regarding collateral and counterparty exposure
limits.
The operational risk related to derivatives is measured and
managed in the context of the Group’s global operational
risk framework. Furthermore, execution and management of
derivatives are centralized within dedicated teams, reducing the
AXA Group’s operational risk.
Valuation Risk is also addressed through the use of dedicated
teams, within the Group’s asset managers and banks. They
independently counter-valuate the derivatives positions so
as to achieve appropriate accounting, payment and collateral
management. They also challenge the prices proposed by
counterparties in the event that the applicable AXA entity wishes
to initiate, terminate or restructure derivatives. Such capacity in
pricing requires strong expertise, which relies on rigorous market
analysis and the ability to follow the most up-to-date market
developments for new derivatives instruments.
INVESTMENT AND ASSET MANAGEMENT
For a large proportion of its assets, the Group utilizes the services
of asset managers to invest in the market:
■ local AXA companies assign the day-to-day management of
their asset portfolios primarily to AXA’s Asset Management
subsidiaries, i.e. AXA Investment Managers and Architas. Local
CIOs continuously monitor, analyze, and challenge asset
managers’ performances; and
■ in order to benefit from a more asset-specific and/or
geographical expertise, the Group may also decide to invest
through external asset managers. In such event, thorough due
diligence analyses are performed by the Investment and the
Risk Management communities and a continuous monitoring
is implemented at both Group and Local levels.

190 I UNIVERSAL REGISTRATION DOCUMENT - ANNUAL REPORT 2019 - AXA I
RISK FACTORS AND RISK MANAGEMENT 4 4.3 MARKET RISKS
4.3 MARKET RISKS
I Market risks: definition and exposure
Information in this section should be read in conjunction with
Note 4 “Financial and insurance Risk Management” in Part 5
“Consolidated Financial Statements” of this Annual Report. Only
information referred to in Note 4 is covered by the report of the
Statutory Auditors on the Consolidated Financial Statements.
Information in this section should be read in conjunction with
the paragraph “Market-related risks” in Section 4.1 “Risk Factors”
of this Annual Report.
AXA Group is exposed to financial market risks through its core
business of financial protection (i.e. insurance) and through
the financing of its activities as part of its equity and debt
management.
The market risks to which Life & Savings (L&S) and Property &
Casualty (P&C) portfolios are exposed arise from a variety of
factors including:
■ a decline in market returns may cause us to accelerate
amortization of deferred acquisition costs, value of business
in-force and other intangibles;
■ a decline in returns on assets (linked to a sustained fall in yields
on fixed income investments or to lower equity markets) could
reduce investment margins on General Account products or
fees on Unit-Linked contracts and impact the performance of
asset managers;
■ a change in yields on fixed-income investments (linked to
changes in interest rates or in credit spreads) aff ects the market
value of investments and liabilities and could impact adversely
the Group’s solvency position, and increase policyholder’s
surrenders due to competitive pressures;
■ a decline in asset market value (relating, for example, to equity,
real estate, or alternatives, etc.) could adversely impact the
Group’s solvency position, as well as available surplus;
■ a change in foreign-exchange rates would have limited impact
for the operating units since foreign-currency commitments
are matched to a large extent by assets in the same currency or
covered by hedges, but it could aff ect the earnings contribution
in euros;
■ furthermore, Health and Property & Casualty activities are
subject to inflation which may increase the compensation
payable to policyholders, so that the actual payments may
exceed the associated reserves set aside. This risk can be
significant for long-tail businesses but is managed through
regular pricing adjustments or specific protections against
peaks of inflation.
The Group policies implemented to manage these risks are tailored
to each product type and the risks relating to it.
The main market risks to which the AXA Group is exposed are
the following:
■ interest-rate risk, spread risk and equity risk related to the
operating activities of Group subsidiaries;
■ exchange-rate risk related to the operating activities of Group
subsidiaries; and
■ risks relating to the management of holding companies’
exposure to foreign currency exchange rate fluctuations and
debt.
AXA Group’s exposure to market risks is covered by AXA Group’s
Solvency Capital Requirement metric, as detailed in the paragraph
“Internal Model” in Section 4.2 “Internal Control and Risk
Management” of this Annual Report and is taken into account
in AXA’s Liquidity Risk Management framework (please refer to
Section 4.5 “Liquidity Risk” of this Annual Report).

191I UNIVERSAL REGISTRATION DOCUMENT - ANNUAL REPORT 2019 - AXA I
RISK FACTORS AND RISK MANAGEMENT
4
4.3 MARKET RISKS
For more information on the AXA Group’s risk controls and Risk
Management processes, please refer to Section 4.2 “Internal
Control and Risk Management” of this Annual Report.
In addition, AXA Group’s investment strategy, which is mainly
driven by Asset & Liability Management, aims to meet the Group’s
obligations and commitments to policyholders, and to protect
the solvency of the Group and of its entities (please refer to
paragraph “Governance of investment strategy and Asset & Liability
Management (ALM)” in Section 4.2 “Internal Control and Risk
Management” of this Annual Report).
Local operating units have the primary responsibility for managing
their market-related risks, while abiding by the risk framework
defined at Group-level, in terms of limits/thresholds and standards.
This approach aims to allow reacting swift ly in an accurate and
targeted manner to changes in financial markets, political and
economic environments in which the Group operates.
A wide variety of risk management techniques are used to control
and mitigate the market risks to which the Group is exposed. These
techniques, used primarily in all operating subsidiaries, include:
■ local risk appetite governance and processes, including
functional limits on market risks defined locally and approved
by the local Board or Executive Committee;
■ Asset & Liability Management (ALM), i.e. defining an optimal
strategic asset allocation with respect to the liabilities’ structure
in order to reduce the risk to a desired level;
■ a disciplined investment process, requiring for any sophisticated
investment a formal thorough analysis by the Investment
department, and a second opinion by Risk Management;
■ hedging of financial risks when they exceed the tolerance levels
set by the Group. Operational management of derivatives is
based on stringent rules and is mainly performed by AXA SA
for the holding company activities and Group asset managers,
AXA Investment Managers for operating units;
■ a regular monitoring of the financial risks on the Group Solvency
ratio; and
■ reinsurance which also off ers solutions to mitigate certain
financial risks.
As regards the market risks relating to the management of holding
companies’ foreign exchange and interest rates exposure, the
following Risk Management measures have been defined and
implemented.
For the purpose of optimizing the financial management and
control of financial risks linked to AXA SA and its sub-holding
companies, the Group Corporate Finance and Treasury department
has defined a methodology to monitor and assess financial risks.
The policy on the management of holding companies’ interest
rate risk aims at monitoring and limiting the potential medium-
term variation in interest expenses and consequently at partially
protecting future levels of interest expenses against movements in
interest rates. Regarding foreign exchange risk, the implemented
policy’s objective is to limit variations in net foreign currency-
denominated assets resulting from movements in exchange
rates. The purpose of the policy is therefore to protect partially
or in full the value of AXA’s net foreign-currency investments in its
subsidiaries and thus reduce the variability of Group consolidated
shareholders’ equity against currency fluctuations, but also of
other key indicators such as liquidity, gearing and solvency ratio
at Group level. In 2020, the Company has adjusted the protection
of its net foreign-currency investments in its main subsidiaries
outside the Eurozone to focus it on near term expected cash
flows. These adjustments have allowed to maintain a similar
level of protection on key financial indicators.
AXA regularly monitors its exchange rate hedging strategy and
will continue to review its eff ectiveness and the potential need to
adapt it taking into account impacts on earnings, value, solvency,
gearing ratio and liquidity.
The Group Corporate Finance and Treasury department is in
charge of producing reporting data that consolidate interest
rate, foreign exchange and liquidity risk exposures, as well as the
interest expenses of AXA SA and its sub-holdings. This reporting
also includes medium-term forecasts.
Synthetic reports, including information about hedging strategies,
are sent to and reviewed by the Finance Committee of AXA’s Board
of Directors five times a year.
I Risk control and risk mitigation

192 I UNIVERSAL REGISTRATION DOCUMENT - ANNUAL REPORT 2019 - AXA I
RISK FACTORS AND RISK MANAGEMENT 4 4.3 MARKET RISKS
I Focus on main market risks and sensitivity analyses
INTEREST RATES & EQUITY RISKS
RELATED TO THE OPERATING
ACTIVITIES OF GROUP SUBSIDIARIES
AXA Group performs sensitivity analyses to estimate its exposure
to movements in interest rates and equity markets. These analyses
quantify the potential impact on the Group of positive and adverse
changes in financial markets.
AXA Group analyzes sensitivities to movements in interest rates
and equity markets looking at two diff erent measures:
■ sensitivities of the Group Eligible Own Funds (“EOF”), as
described below;
■ sensitivities of Group Solvency ratio (please refer to Section 4.2
“Internal Control and Risk Management” of this Annual Report (1).
Eligible Own Funds represent the amount of economic capital
available to absorb losses under stress events. The EOF are the
surplus of assets over liabilities derived from the Solvency II
balance sheet.
AXA Group Risk Management is monitoring EOF sensitivities and
the EOF is derived from IFRS equity.
(1) Only information contained in Section 4.2 “Internal Control and Risk Management” of this Annual Report and referred to in Note 4 “Financial and Insurance Risks Management” in Part 5 – “Consolidated Financial Statements” of this Annual Report is covered by the report of the Statutory Auditors on the Consolidated Financial Statements.
The following table presents the reconciliation between IFRS S hareholders’ equity to Group EOF:
RECONCILIATION IFRS SHAREHOLDERS’ EQUITY TO GROUP EOF
(in Euro billion) 2019
IFRS SHAREHOLDERS’ EQUITY (a)
69.9
Net unrealized capital gains not included in Shareholders’ e quity 5.6
Elimination TSS/TSDI (6.7)
Elimination Intangibles (32.3)
o/w Goodwill (17.7)
o/w DAC (9.7)
o/w VBI (1.3)
o/w Others (3.7)
IFRS TANGIBLE NET ASSET VALUE (a)
36.5
Dividends to be paid (3.5)
Technical provision adjustments 8.5
o/w Risk Margin (11.8)
o/w BEL adjustment 20.3
Other adjustments (0.7)
UNRESTRICTED TIER 1 40.8
Restricted Tier 1 + Tier 2 18.1
Tier 3 0.5
GROUP ELIGIBLE OWN FUNDS (b)
59.4
(a) Group share.
(b) Including minority interests.

193I UNIVERSAL REGISTRATION DOCUMENT - ANNUAL REPORT 2019 - AXA I
RISK FACTORS AND RISK MANAGEMENT
4
4.3 MARKET RISKS
The main elements of the reconciliation from the €69.9 billion
of IFRS shareholders’ equity to the €36.5 billion of IFRS TNAV
are as follows:
■ addition of €5.6 billion of net unrealized gains and losses on
assets not reflected in IFRS shareholders’ equity;
■ deduction of €6.7 billion of undated deeply subordinated
notes and of undated subordinated notes included in IFRS
shareholders’ equity; and
■ elimination of €32.3 billion of intangible assets net of unearned
revenues and fee reserves, taxes and policyholder bonuses.
IFRS TNAV increased by €11.2 billion mainly driven by (i) higher
IFRS shareholder’s equity and (ii) the disposal of Equitable
Holdings, Inc. This metric however reflects the IFRS accounting
value of liabilities and not their economic value which is better
reflected within Solvency II EOF.
The main elements of the reconciliation between the IFRS TNAV
and the Group EOF Unrestricted Tier 1 are as follows:
■ deduction of €3.5 billion of foreseeable dividends to be paid
to shareholders in 2020;
■ addition of €8.5 billion reflecting the Solvency II technical
provision adjustments corresponding to the adjustment from
IFRS reserves to best estimate liabilities (€+20.3 billion) and
the risk margin (€-11.8 billion); and
■ other adjustments between IFRS TNAV and Group EOF
Unrestricted Tier 1 (€-0.7 billion).
Group EOF are then the sum of Unrestricted Tier 1, Restricted
Tier 1, Tier 2 and Tier 3.
Information on the Group EOF is disclosed in the “Embedded
Value & Solvency II Own Funds Report 2019” which is available
on AXA Group website www.axa.com.
The sensitivities of the EOF to changes in major economic
assumptions were calculated as follows for the 2019 values:
■ upward shift of 50 basis points in reference rates simulates
a sudden shock to the initial conditions. This means changes
to: 1) the current market values of fixed-interest assets, with
related possible changes to projected capital gains/losses and/
or fee revenues, 2) future reinvestment rates for all asset classes,
and 3) discount rates. The change is applied to the reference
interest rates, including the volatility adjuster where applied
in the base case. Inflation rates, the volatility on interest rates
and the Ultimate Forward Rates are not changed;
■ downward shift of 50 basis points in reference rates is the
same as above but with a shift downward;
■ 25% higher value of equity markets simulates a shock to
the initial conditions for equities only. Listed equities and
private equity values including the impact of equity hedges
are shocked. This means changes to current market values of
all these equities excluding hedge funds, with related possible
changes to projected capital gains/losses and/or fee revenues;
■ 25% lower value of equity markets: same methodology as
mentioned above assuming a decrease.
L&S EOF sensitivities
2019 EOF
(in Euro million)
2019 EOF
(in percentage)
Closing amount 39,501 100%
Interest rates +50bps 1,926 5%
Interest rates -50bps (2,549) -6%
Equity markets +25% 2,804 7%
Equity markets -25% (2,897) -7%
P&C EOF sensitivities
2019 EOF
(in Euro million)
2019 EOF
(in percentage)
Closing amount 34,989 100%
Interest rates +50bps (368) -1%
Interest rates -50bps 425 1%
Equity markets +25% 1,238 4%
Equity markets -25% (1,134) -3%

194 I UNIVERSAL REGISTRATION DOCUMENT - ANNUAL REPORT 2019 - AXA I
RISK FACTORS AND RISK MANAGEMENT 4 4.3 MARKET RISKS
All sensitivities are presented net of tax, and where applicable,
net of policyholders’ participation.
2019 interest rate sensitivities for Life & Savings business (% of
L&S EOF) of 5% to upward 50 bps and -6% to downward 50 bps
show an asymmetry mainly driven by guaranteed interest rates
having higher value when interest rates decrease, while higher
reinvestment returns would need to be shared with policyholders
limiting shareholders’ gains in a higher rate environment. However,
this classical pattern is not followed everywhere, as for certain
type of business with significantly low interest rate guarantees,
the EOF behaves more like a portfolio of fixed-income assets. In
addition, higher interest rates aff ect the value both positively
through higher investment rate and negatively through lower
starting value of fixed income assets and higher discount rates
for future profits. For diff erent product types these interactions
produce diff erent results.
2019 interest rate sensitivities for Property & Casualty business
(% of P&C EOF) of -1% to upward 50 bps and 1% to downward
50 bps reflect mainly the impacts on fixed-income assets, off set
by discount on liabilities.
2019 equity market sensitivities for Life & Savings business (%
of L&S EOF) of 7% to 25% higher value and -7% to 25% lower value
reflect mainly the impact of guarantees and profit-sharing rules,
along with some hedging programs to limit potential losses. The
impacts of equity market value changes can come from General
Account exposures or from changing asset balances impacting
future fee revenue on separate account business.
2019 equity market sensitivities for Property & Casualty business
(% of P&C EOF) of 4% to 25% higher value and -3% to 25% lower
value reflect the impacts on equities including derivatives on
equities.
EXCHANGE-RATE RISK RELATED TO THE OPERATING ACTIVITIES OF GROUP SUBSIDIARIES
A 10% change in foreign exchange rate as at December 31, 2019 and December 31, 2018 between euro and main functional currencies
of the Group (USD, JPY and CHF) would have had the following impacts on Shareholders’ equity Group share and underlying earnings
Group share:
2019
(in %) Shareholders’ equity Group share Underlying Earnings Group share
Currency -10% +10% -10% +10%
US Dollar 2% -2% 2% -2%
Japanese Yen 1% -1% 1% -1%
Swiss Franc 1% -1% 1% -1%
2018
(in %) Shareholders’ equity Group share Underlying Earnings Group share
Currency -10% +10% -10% +10%
US Dollar 3% -3% 1% -1%
Japanese Yen 1% -1% 1% -1%
Swiss Franc 1% -1% 1% -1%
In the insurance companies, which accounted for 90% of Group
assets at December 31, 2019 (91% in 2018), assets and liabilities
with foreign currency exposure are generally naturally matched
or hedged.
■ France: 32% of Group assets at the end of 2019 (24% in 2018):
In France, AXA was exposed to exchange-rate risk for a total
amount of €22,994 million at the end of 2019 (€19,424 million in
2018) held both directly and indirectly through investment funds
partly invested in foreign currencies (US Dollar: €18,743 million
versus €16,134 million in 2018, Pound Sterling: €2,618 million
versus €2,781 million in 2018 and Japanese Yen: €1,327 million
versus €248 million in 2018). This exposure allows AXA France to
diversify its investments and enable policyholders to benefit from
the performance of international financial markets. AXA France
off sets its exposure to exchange-rate risk by using foreign exchange
forwards and other derivatives (notional of €20,406 million versus
€15,632 million in 2018).
■ Europe: 34% of Group assets at the end of 2019 (30% in 2018):
Switzerland
In Switzerland, AXA entities are exposed to exchange-rate risk
through their investments in foreign currencies (mainly Euro and
US Dollar) due to limited investment possibilities in the Swiss
market. A major portion of the exposure is hedged back into Swiss
Francs with foreign exchange swaps, options and forwards. At the
end of 2019, Switzerland foreign exchange exposure amounted to
€16,751 million (€24,473 million in 2018) which represented 27% of
total assets (28% of total assets in 2018), of which €11,971 million
were hedged (€21,838 million in 2018).

195I UNIVERSAL REGISTRATION DOCUMENT - ANNUAL REPORT 2019 - AXA I
RISK FACTORS AND RISK MANAGEMENT
4
4.3 MARKET RISKS
Germany
In Germany, AXA held €10,945 million investments denominated
in foreign currencies at the end of 2019 (€9,417 million in 2018)
both directly and indirectly through investment funds with the
aim of diversifying its investments and taking advantage of
foreign markets’ performance. These investments were mainly
denominated in US Dollar (€8,500 million versus €7,363 million in
2018) and in Pound Sterling (€1,242 million versus €1,232 million
in 2018). AXA Germany controls and limits its exchange-rate risk
by using foreign exchange forwards for a notional amount of
€7,059 million (notional €6,701 million in 2018), currency swaps
for a notional amount of €1,003 million (notional €853 million
in 2018), foreign exchange collars for a notional amount of
€1,703 million (notional €1,194 million in 2018) and congruent
coverage (matching assets and liabilities denominated in the
same currency) for €17 million (€29 million in 2018).
Belgium
In Belgium, AXA held inv estments in foreign currency for
€2,875 million in 2019 both directly and indirectly through
physical assets. These investments are mainly in US Dollar
for €1,953 million and in Pounds Sterling for €340 million. The
exchange-rate exposure on Assets is hedged for €2,353 million
using mainly foreign exchange forwards, Cross Currency Swaps
and Collar options strategies.
United Kingdom & Ireland
In the United Kingdom, AXA is exposed to exchange-rate risk
through its AXA Insurance and AXA PPP Healthcare subsidiaries,
which operate in Pound Sterling, and through AXA Ireland which
operates in Euro. It has diversified its investment portfolios
in line with Asset & Liability Management objectives. As at
December 31, 2019, AXA UK held investments denominated
in foreign currencies for €4,209 million (€4,078 million in 2018)
mainly in US Dollar (€2,278 million), with further UK exposure
to the Euro (€1,313 million) and exposure to Pound Sterling
(€303 million) in Ireland. This exposure is held both directly and
indirectly through investment funds (CLO funds, Alternative Credit
funds, Assets Backed Securities, Commercial Real Estate loans
and other investment funds). Of this exposure, €3,728 million
are hedged through foreign exchange forwards, options or cross
currency swaps, with a further €304 million of exposure hedging
liabilities held within the business.
Spain
In Spain, AXA entities held investments in foreign currency for
€913 million in 2019 (€907 million in 2018), directly and indirectly
through physical assets. These investments are mainly in US
Dollar €778 million (€760 million in 2018). Exchange-rate risk
exposure is hedged for a notional amount of €846 million using
mainly foreign exchange forwards, currency swaps and collars.
Italy
In Italy, AXA held investments in foreign currency for €1,234 million
in 2019 (€1,111 million in 2018) both directly and indirectly through
physical assets. These investments are mainly in US Dollar for
€1,018 million (€913 million in 2018). The overall exchange
risk exposure is managed within the FX limits approved in the
correspondent Local Investment Committees. Unhedged FX
exposure amounts to €168 million (€158 million in 2018).
■ United States: 0% of Group assets at the end of 2019 ( 21%
in 2018):
Equitable Holdings, Inc. have been deconsolidated in 2019 (see
Note 3 “Consolidated statement of income by segment” in Part 5
– “Consolidated Financial Statements” of this Annual Report.
■ Asia: 12% of Group assets at the end of 2019 (8% in 2018):
Japan
In Japan, AXA entities may invest when relevant outside the
Japanese market in order to diversify and optimize investments
and enhance returns. At the end of 2019, the total assets
denominated in foreign currencies held both directly and indirectly
through investment funds (mainly US Dollar) represented an
amount of €9,517 million (€9,799 million in 2018) excluding assets
backing unit-linked contracts. The corresponding exchange-rate
risk was fully hedged through the use of derivatives.
Hong Kong
AXA Hong Kong holds investments denominated in foreign
currencies €21,434 million (€14,921 million in 2018), both in
directly and indirectly through investment funds.
These investments are mainly in US Dollar €20,180 million
(€14,064 million in 2018), partly in congruence to the technical
liabilities denominated in US dollar (€8,434 million) and the
remaining in order to take advantage of the US bond market
which is more developed than the HK bond market one notably
in terms of liquidity and available maturities. Exchange-rate
risk exposure is hedged using foreign exchange forwards and
cross currency swap for a notional amount of €8,873 million
(€5,684 million in 2018).
■ International: 6% of Group assets at the end of 2019 (5% in 2018):
AXA entities held investments denominated in foreign currencies
for €3,744 million in 2019 (€3,384 million in 2018) both directly
and indirectly through investment funds which are mainly
denominated in US Dollar €2,281 million (€2,071 million in 2018). In
particular, Mexico has its exchange-rate risk exposure mostly under
congruent coverage, matching assets and liabilities denominated
in the same currency. Besides, Singapore and Colombia have their
exchange-rate risk exposure hedged (through forwards, cross
currency swaps, and forex options for Singapore, and through
forwards for Colombia).

196 I UNIVERSAL REGISTRATION DOCUMENT - ANNUAL REPORT 2019 - AXA I
RISK FACTORS AND RISK MANAGEMENT 4 4.3 MARKET RISKS
■ AXA XL: 8% Group assets at the end of 2019 (7% in 2018):
XL Group
For the majority of XL Group’s business, assets and liabilities are
denominated in US Dollar. For business written in currencies
other than in US Dollar, the risk is managed primarily by matching
assets and liabilities in each currency. Asset positions in certain
currencies, in particular Canadian Dollar and Swiss Franc, are
hedged back to US Dollars using foreign exchange forwards with a
notional amount of €727 million at the end of 2019 (€796 million
in 2018).
AXA Corporate Solutions Assurance
In the course of its business, AXA Corporate Solutions Assurance
carries some insurance liabilities denominated in foreign
currencies, particularly in US Dollar (€1,144 million at the end
of 2019 versus €1,192 million in 2018) and, to a lesser extent,
Pound Sterling (€434 million at the end of 2019 versus €397 million
in 2018). AXA Corporate Solutions Assurance carries assets
denominated in foreign currencies to ensure balance sheet
congruence. The congruence between the Company’s foreign
currency assets and liabilities is regularly adjusted.
■ Transversal and Central Holdings: 8% of Group assets at the
end of 2019 (6% in 2018):
AXA SA & other Central Holdings
Since 2001, AXA SA has adopted a hedging policy on net
investments denominated in foreign currencies, which aims at
protecting the Group’s consolidated shareholders’ equity against
currency fluctuations, using derivatives instruments and foreign
currency debt.
As at December 31, 2019, the main hedging positions of AXA SA were as follows:
Foreign currency hedging
Amount in currency (in billion) Amount in Euro (in billion)
2019 2018 2019 2018
US Dollar 2.8 9.6 2.4 8.4
HK Dollar 11.6 12.4 1.3 1.4
Japanese Yen 96.1 108.5 0.8 0.9
Pound Sterling 1.0 1.0 1.1 1.1
Swiss Franc 4.4 5.8 3.9 5.1
In addition to the foreign exchange rate management performed locally (hedged through Foreign Exchange forward and currency
swaps), the Group Corporate Finance and Treasury department steers the global exposure to foreign exchange risk and reports the
position five times a year to the Finance Committee of the Board of Directors.

197I UNIVERSAL REGISTRATION DOCUMENT - ANNUAL REPORT 2019 - AXA I
RISK FACTORS AND RISK MANAGEMENT
4
4.4 CREDIT RISK
4.4 CREDIT RISK
I Credit risk: definition and exposure
Information in this section should be read in conjunction with
Note 4 “Financial and insurance Risk Management” in Part 5 -
“Consolidated Financial Statements” of this Annual Report. Only
information referred to in Note 4 is covered by the report of the
Statutory Auditors on the Consolidated Financial Statements.
Information in this section should be read in conjunction with the
paragraph “Credit and liquidity-related risks” in the Section 4.1
“Risk factors” of this Annual Report.
Credit risk is defined as the risk that a third party in a transaction
will default on its commitments. Given the nature of its core
business activities, AXA Group monitors three major types of
counterparties, using methods suitable to each type:
■ investment portfolios held by the Group’s insurance operations
(excluding assets backing separate-account products where
the financial risk is borne by policyholders) as well as by banks
and holding companies;
■ receivables from reinsurers resulting from reinsurance ceded
by the AXA Group; and
■ credit and credit-sensitive exposures on third party obligors
stemming from some Group insurance and assumed reinsurance
businesses.
AXA Group’s exposure to credit risk is covered by AXA Group’s
Solvency Capital Requirement metric, except for XL entities, as
detailed in the paragraph “Internal Model” in the Section 4.2
“Internal Control and Risk Management” of this Annual Report
and is taken into account in AXA’s liquidity r isk m anagement
framework (please refer to Section 4.5 “Liquidity risks” of this
Annual Report).
I Risk control and risk mitigation
For more information on the AXA Group’s risk controls and Risk
Management processes, please refer to Section 4.2 “Internal
Control and Risk Management” of this Annual Report.
In addition, AXA Group’s investment strategy, which is mainly
driven by Asset & Liability Management, aims to meet the Group’s
obligations and commitments to policyholders, and to protect
the solvency of the Group and of its entities (please refer to
paragraph “Governance of investment strategy and Asset & Liability
Management (ALM)” in Section 4.2 “Internal Control and Risk
Management” of this Annual Report).
A specific set of limits take into account all AXA Group exposures on
a given ultimate shareholder through debt securities, cash, equity,
derivatives, reinsurance receivables, insurance and assumed
reinsurance commitments. They aim at managing globally the
default risk of a given counterparty.
INVESTED ASSETS: A CENTRAL MONITORING
OF COUNTERPARTY EXPOSURE
AXA Group concentration risk is monitored by diff erent analyses
performed at Group level by issuer and ultimate shareholder,
in addition to local procedures and by a set of Group and local
issuer limits.
These limits aim at managing the default risk of a given issuer,
depending on its rating and on the maturity and seniority of all
bonds issued by the issuer and held by the AXA Group (corporate,
Government agency and sub sovereign).
On sovereign exposures, specific limits have also been defined
on government bonds and government-guaranteed bonds.
Compliance with the limits is ensured by the Group through
defined governance. The Group Credit Risk Committee handles,
on a monthly basis, the issuer exposure breaches to the Group’s
limits and determines coordinated actions for excessive credit
concentrations. A Group Credit Team reporting to the Group
Chief Investment Off icer (Group CIO) provides credit analyses
independently from Group asset managers, in addition to local
CIO teams. The Group Financial Risk Committee is regularly kept
informed of the main credit risks.

198 I UNIVERSAL REGISTRATION DOCUMENT - ANNUAL REPORT 2019 - AXA I
RISK FACTORS AND RISK MANAGEMENT 4 4.4 CREDIT RISK
As at December 31, 2019, the breakdown of the debt security
portfolio (€429 billion) by credit rating category was as follows:
22%
2%
22% 31%
3%
20%
BBB
A
Other
AAA
AA
BB and lower
As at December 31, 2018, the breakdown of the debt security
portfolio (€467 billion) by credit rating was: 20% in AAA, 27% in
AA, 24% in A, 24% in BBB, 2% in BB and lower, and 3% in other.
Credit risk diversification and analysis policies, particularly using
credit ratings, are implemented by Investment Departments and
monitored by Risk Management teams.
As at December 31, 2019, the breakdown of Government and
Government related bonds fair values (€241 billion) by country
was as follows:
Spain
Switzerland
United states
Austria
Supranationals
institutions (a)
Netherlands
Ireland
Belgium
Italy Japan
Other
France
Germany
21%
8%
8%
15%10%
6%
4%
5%
3%
6%
2%
1%
10%
CREDIT DERIVATIVES
The AXA Group, as part of its investment and credit r isk
m anagement activities, uses strategies that involve credit
derivatives (mostly Credit Default Swaps or CDS), which are
mainly used as an alternative to debt security portfolios, when
coupled with government debt securities, but also as a protection
on single corporate names or specific portfolios.
As at December 31, 2019, the nominal amount of positions taken
through credit derivatives was €18.1 billion (1) of CDS (cumulated
notional amounts of €4.0 billion protections bought and of
€14.2 billion protections sold), which can be broken down as
follows:
i. €3.94 billion of CDS protections bought to hedge credit risk
with regard to certain investments, mostly in corporate
bonds;
ii. €0.05 billion of CDS protections bought used to lock the
liquidity premium through purchasing bonds and CDS
protection on the same name (negative basis trade strategy)
mostly in corporate bonds mainly in France (€0.02 billion)
and Hong Kong (€0.02 billion);
iii. €14.2 billion of CDS protections sold as an alternative to
the direct purchase of a corporate bond mainly by holding
government bonds and at the same time selling protection
on very good quality names. This type of ALM strategy is
oft en implemented to compensate for the lack of depth or
liquidity in some markets in order to take synthetic credit
risk.
Limits applied to issuers take into account the credit derivative
positions.
As at December 31, 2019, the breakdown of these CDS’s underlying
debt securities gross exposure by rating was as follows:
6%
44% 34%
2%
BBB
AAA
14%AA
A
High Yield/NR
Credit risk relating to CDOs is monitored separately, depending
on the tranches held, and regardless of the type of assets held
(debt securities or credit derivatives).
(1) This figure represents an accounting view i.e. 100% of assets held directly and in consolidated investment funds “Core Investment Portfolios”, and excluding credit derivatives in non-consolidated investment funds, in line with Note 20 to the Consolidated Financial Statements. The Group holds €21.0 billion (notional amount) of credit derivatives as total exposure including consolidated investment funds “Satellite Investment Portfolios” (€2.6 billion).
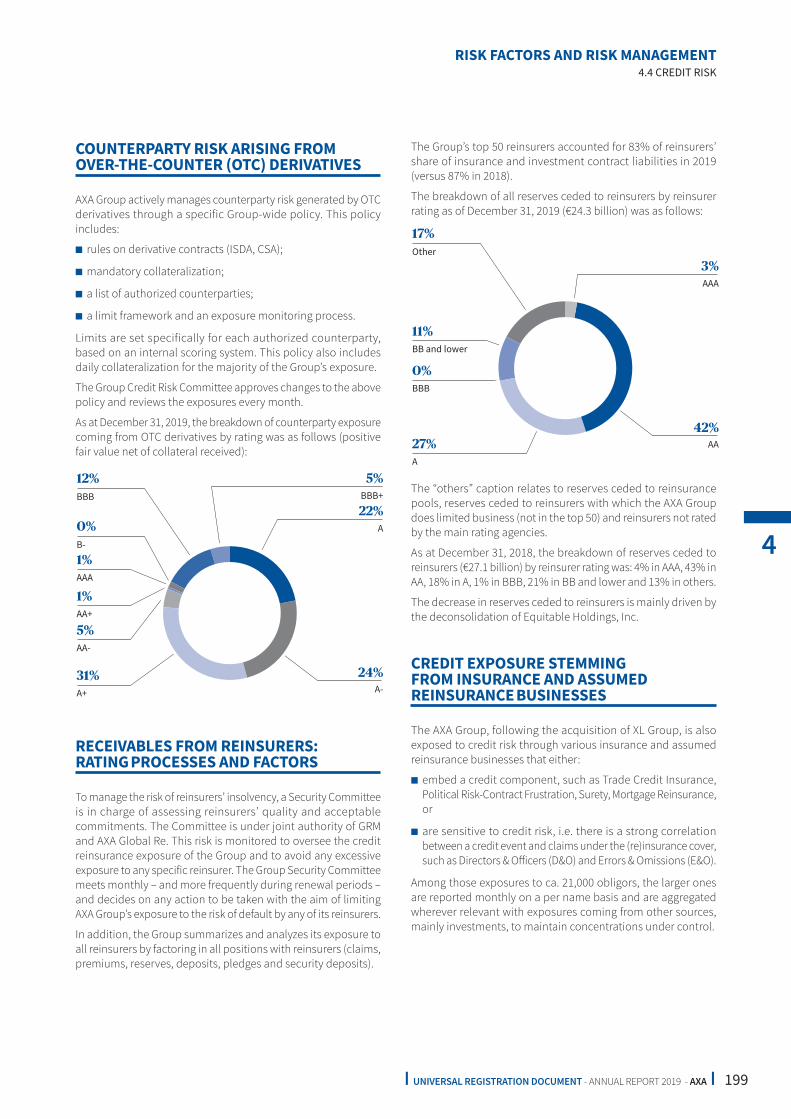
199I UNIVERSAL REGISTRATION DOCUMENT - ANNUAL REPORT 2019 - AXA I
RISK FACTORS AND RISK MANAGEMENT
4
4.4 CREDIT RISK
COUNTERPARTY RISK ARISING FROM
OVER-THE-COUNTER (OTC) DERIVATIVES
AXA Group actively manages counterparty risk generated by OTC
derivatives through a specific Group-wide policy. This policy
includes:
■ rules on derivative contracts (ISDA, CSA);
■ mandatory collateralization;
■ a list of authorized counterparties;
■ a limit framework and an exposure monitoring process.
Limits are set specifically for each authorized counterparty,
based on an internal scoring system. This policy also includes
daily collateralization for the majority of the Group’s exposure.
The Group Credit Risk Committee approves changes to the above
policy and reviews the exposures every month.
As at December 31, 2019, the breakdown of counterparty exposure
coming from OTC derivatives by rating was as follows (positive
fair value net of collateral received):
12%
31% 24%
22%
A+
5%AA-
1%AA+
1%AAA
A
A-
BBB
0%B-
5%BBB+
RECEIVABLES FROM REINSURERS:
RATING PROCESSES AND FACTORS
To manage the risk of reinsurers’ insolvency, a Security Committee
is in charge of assessing reinsurers’ quality and acceptable
commitments. The Committee is u nder joint authority of GRM
and AXA Global Re. This risk is monitored to oversee the credit
reinsurance exposure of the Group and to avoid any excessive
exposure to any specific reinsurer. The Group Security Committee
meets monthly – and more frequently during renewal periods –
and decides on any action to be taken with the aim of limiting
AXA Group’s exposure to the risk of default by any of its reinsurers.
In addition, the Group summarizes and analyzes its exposure to
all reinsurers by factoring in all positions with reinsurers (claims,
premiums, reserves, deposits, pledges and security deposits).
The Group’s top 50 reinsurers accounted for 83% of reinsurers’
share of insurance and investment contract liabilities in 2019
(versus 87% in 2018).
The breakdown of all reserves ceded to reinsurers by reinsurer
rating as of December 31, 2019 (€24.3 billion) was as follows:
17%
27%42%
3%
A
0%BBB
11%BB and lower
AAA
AA
Other
The “others” caption relates to reserves ceded to reinsurance
pools, reserves ceded to reinsurers with which the AXA Group
does limited business (not in the top 50) and reinsurers not rated
by the main rating agencies.
As at December 31, 2018, the breakdown of reserves ceded to
reinsurers (€27.1 billion) by reinsurer rating was: 4% in AAA, 43% in
AA, 18% in A, 1% in BBB, 21% in BB and lower and 13% in others.
The decrease in reserves ceded to reinsurers is mainly driven by
the deconsolidation of Equitable Holdings, Inc.
CREDIT EXPOSURE STEMMING
FROM INSURANCE AND ASSUMED
REINSURANCE BUSINESSES
The AXA Group, following the acquisition of XL Group, is also
exposed to credit risk through various insurance and assumed
reinsurance businesses that either:
■ embed a credit component, such as Trade Credit Insurance,
Political Risk-Contract Frustration, Surety, Mortgage Reinsurance,
or
■ are sensitive to credit risk, i.e. there is a strong correlation
between a credit event and claims under the (re)insurance cover,
such as Directors & Off icers (D&O) and Errors & Omissions (E&O).
Among those exposures to ca. 21,000 obligors, the larger ones
are reported monthly on a per name basis and are aggregated
wherever relevant with exposures coming from other sources,
mainly investments, to maintain concentrations under control.

200 I UNIVERSAL REGISTRATION DOCUMENT - ANNUAL REPORT 2019 - AXA I
RISK FACTORS AND RISK MANAGEMENT 4 4.4 CREDIT RISK
Each month, the Group Credit Risk Committee monitors the
aggregate ultimate shareholder exposures vs. the risk appetite
limits, as well as the contributions of the various credit risk sources
including the split by lines of business, reviews potential breaches
to the Group limits and remediation plans, and when necessary
handles additional capacity requests and allocates capacity
between investments and insurance & reinsurance businesses.
Group Credit team provides the Group Credit Risk Committee
with credit assessments on the biggest exposures or on a case
by case basis when required.
Utilizations of Group limits per name are shared with local r isk
m anagement and business teams, in order to avoid excessive
concentrations and breaches.
In addition, all types of credit exposures whether related to
assets or liabilities, and for the latter including those arising from
a huge number of very small individual exposures (ca. 16,000
obligors with an exposure at risk below USD 10 million), are
captured through a credit risk per event approach. It measures
the impact of defaults, including rating migration, in a 1 in 20 year
credit crisis, and the contribution of each source of credit risk, in
particular stemming from insurance and assumed reinsurance
businesses. The results are shared with the Group Audit, Risk and
Compliance Committee.
The Group Financial Risk Committee is regularly informed of
the main credit risks including those related to (re)insurance
businesses.
BANK CREDIT ACTIVITIES
At December 31, 2019, total invested assets of banking activities
amounted to €14.7 billion (€35.8 billion as at December 31, 2018),
the decrease is mainly driven by AXA Bank Belgium that was
reclassified into held for sale and for which the disposal process
was not finalized at year-end.
AXA Banking operations, based in Belgium, France and Germany,
are mostly limited to retail banking activities, distributing simple
investment and credit products.
As such, AXA banks’ Risk Management policies are based on their
stated risk appetite, with the following key principles:
■ dedicated counterparty and credit risk functions with
appropriate Committees;
■ quality sovereign, international institutions and bank
counterparties portfolio closely monitored;
■ adequacy to Group risk standards; and
■ tightly managed market, asset & liability, foreign exchange and
interest rate risks including a strict collateral policy.
Credit risk in the banks encompasses:
■ retail credit risk, resulting from the commercial activity – sales
of mortgages and other type of loans to retail clients and small
enterprises. Credit Risk Management is done through careful risk
selection (e.g. in Belgium “Internal Rating Based” scoring models
regularly monitored to ensure a risk selection consistent with
each bank’s risk appetite) and a regular monitoring of portfolios
by product management teams and Risk Management teams;
■ other than retail credit risk, resulting from investment activity.
This activity is limited with strong control processes in place.
Credit risks are regularly reviewed by the Management Board of
each bank, and are subject to regulation. For instance AXA Bank
Belgium’s internal capital adequacy assessment and strategic
planning processes take into account capital required to mitigate
all material risks, capital required for expected business growth,
liquidity requirements and stress testing results.
The banks aim to meet all regulatory capital obligations.

201I UNIVERSAL REGISTRATION DOCUMENT - ANNUAL REPORT 2019 - AXA I
RISK FACTORS AND RISK MANAGEMENT
4
4.5 LIQUIDITY RISK
4.5 LIQUIDITY RISK
Information in this section should be read in conjunction with
Section 2.4 “Liquidity and capital resources” of this Annual Report.
The liquidity risk is the uncertainty, emanating from business
operations, investments or financing activities, over whether
AXA SA and/or an AXA entity will have the ability to meet payment
obligations in a full and timely manner, in current or stressed
environments. Liquidity risk concerns assets and liabilities as
well as their interplay.
Liquidity is a key dimension of the Risk Appetite Framework
allowing the AXA Group to ensure that both AXA SA and the local
entities have at all times suff icient liquidity buff er to withstand a
severe shock. The objective is achieved through the monitoring
of the liquidity adequacy across the AXA Group on the basis of a
metric called “Excess Liquidity”, i.e. the diff erence between liquidity
resources and liquidity needs calculated under severe stress
conditions and over diff erent time horizons: 1 week, 1 month,
3 months and 12 months.
For each time horizon, the post-stress liquidity resources available
and the post-stress liquidity needs (i.e. net outflows) to be paid
are projected to measure the excess liquidity. The stressed
conditions are calibrated so as to reflect extreme circumstances
(e.g. distressed financial markets, confidence crisis towards the
Group, natural catastrophes). The approach is prudent as it is
assumed that all events occur simultaneously.

202 I UNIVERSAL REGISTRATION DOCUMENT - ANNUAL REPORT 2019 - AXA I
RISK FACTORS AND RISK MANAGEMENT 4 4.6 INSURANCE RISKS
4.6 INSURANCE RISKS
I Insurance risks: definition and exposure
Information in this section should be read in conjunction with
Note 4 “Financial and insurance risk Management” in Part 5
“Consolidated Financial Statements” of this Annual Report. Only
information referred to in Note 4 is covered by the report Statutory
Auditors on the Consolidated Financial Statements.
Information in this section should be read in conjunction with the
paragraph “Pricing and underwriting-related risks” in Section 4.1
“Risk factors” of this Annual Report.
The Group’s insurance subsidiaries are primarily responsible for
managing their insurance risks linked to underwriting, pricing
and reserving. They are also responsible for taking appropriate
actions in response to changes in insurance cycles and to the
political and economic environments in which they operate.
In the context of its Property & Casualty (P&C) and Protection &
Health businesses operations as described in Section 1.3 “Business
overview” of this Annual Report, the AXA Group is exposed to the
following main insurance risks, which include:
■ premium risk resulting from fluctuations in the timing, frequency
and severity of insured events, and relating to:
• unexpired risks on existing contracts (insuff icient premium
reserves),
• mispricing of policies to be written (including renewals)
during the period, and
• expense payments;
■ reserve risk resulting from fluctuations in the timing and amount
of claim settlements and relating to the insuff iciency of claims
reserves, which includes:
• misestimating claims reserves (average payments), and
• fluctuation of payments around their statistical average;
■ catastrophe risks embedding both natural disasters such as
climatic events (including windstorms, hurricanes, floods or
hailstorms), tectonic ones (earthquakes, volcanoes) and man-
made ones, such as nuclear, liability, cyber, conflagration,
terrorist attacks.
Life risks also include risks related to mortality, longevity, lapses,
disability and pandemics among others. The main risks to which
the Life business is exposed are longevity risk and lapse risk,
which are both sensitive to changes in interest rates, and could
be defined as follows:
■ longevity risk is the risk related to the overestimation of mortality
rates for business contingent on longevity;
■ lapse risk is the risk of experiencing lapses lower (or higher)
than expected on a permanent basis for businesses adversely
sensitive to a decrease (or an increase) in lapses.
AXA Group’s exposure to insurance risks is covered by the AXA
Group’s Solvency Capital Requirement metric, as detailed in the
paragraph “Internal Model” in Section 4.2 “Internal Control and
Risk Management” of this Annual Report and is taken into account
in AXA’s liquidity Risk Management framework (please refer to
Section 4.5 “Liquidity risk” of this Annual Report).

203I UNIVERSAL REGISTRATION DOCUMENT - ANNUAL REPORT 2019 - AXA I
RISK FACTORS AND RISK MANAGEMENT
4
4.6 INSURANCE RISKS
I Risk control and risk mitigation
For more information on the AXA Group’s risk controls and Risk
Management processes, please refer to Section 4.2 “Internal
Control and Risk Management” of this Annual Report.
In addition, AXA Group’s investment strategy, which is mainly
driven by Asset & Liability Management, aims to meet the Group’s
obligations and commitments to policyholders, and to protect
the solvency of the Group and of its entities (please refer to
paragraph “Governance of investment strategy and Asset & Liability
Management (ALM)” in Section 4.2 “Internal Control and Risk
Management” of this Annual Report).
Insurance risks for Life & Savings, Health and Property & Casualty
businesses are covered through 4 major processes, defined at
Group level but performed jointly by central and local teams:
■ implementing a product approval process, which entails risk
controls on new products that complement underwriting rules
and product profitability analyses;
■ optimizing reinsurance strategies in order to limit the Group’s
peak exposures thereby protecting its solvency by reducing
volatility and to mitigate risk within the Group to benefit from
diversification;
■ reviewing technical reserves including a roll forward analysis;
and
■ monitoring emerging risks to share expertise within the
underwriting and risk communities.
PRODUCT APPROVAL
Group Risk Management (GRM) has defined a set of procedures to
approve new products launches. These procedures are adapted
and implemented locally, and aim to foster product innovation
across the Group while maintaining risks under control. The
validation framework relies among others on the results of the
Solvency Capital Requirement’s assessments, based on the AXA
Group’s Internal Model, to ensure that new products undergo a
thorough approval process before they are brought to market.
In Life & Savings, as well as Health, the Product Approval Process
is managed at local level for all traditional products meeting
Group’s minimum requirements, which allows maintaining time-
to-market product launches. For sophisticated products, local
entities require Group’s approval before launch to ensure all
long-term commitments are monitored at Group level and benefit
from the Group expertise on enhanced or specific guarantees.
In Property & Casualty, methods are adapted to the underwriting
of risks, while maintaining the principle of local decision-making
based on a documented approval procedure and using the output
of the internal model. The aim is twofold:
■ for pre-launch business, the aim is to ensure that new risks
underwritten by the Group have been scrutinized before
proposing them to customers;
■ for post-launch business, appropriate profitability and risk
control are performed to verify that the business remains in
line with the Group’s risk framework.
This framework is part of the Group underwriting policy and
ensures that no risks are taken outside the Group tolerances and
that value is created by adequate risk pricing.
EXPOSURE ANALYSIS AND RISK ASSESSMENT
AXA Group reviews regularly its exposure to ensure that the
risks underwritten are diversified geographically and by lines
of business in order to manage risk concentration, and to verify
adequacy of reinsurance.
For Life & Savings, Health and Property & Casualty activities, GRM
has developed and deployed common models and metrics to
consistently measure risks throughout the Group (in particular
via its economic capital framework as detailed in Section 4.2
“Internal Control and Risk Management” of the Annual Report).
This enables the Group to verify that its exposure complies
with consolidated risk appetite limits along the dimensions of
earnings, Eligible Own Funds (“EOF”), solvency and liquidity. These
tools also contribute substantially to monitoring the major risks
(claims frequency deviation, claims severity, reinsurance, pricing
consistency, natural and man-made catastrophes, biometric and
behavior risks deviations).
This framework is included in the governance set out previously
for product development control.
In the Life & Savings, Health businesses, these tools allow for
mortality/longevity risks to be analyzed on a multi-country basis.
The AXA Group regularly monitors its exposure to these risks
(including mortality, longevity and morbidity) and uses the results
of this work to optimize its product design and its reinsurance
coverage. These exposure analyses are supported by expert risk
models in Life & Savings.
Regarding the Property & Casualty exposures, ad hoc concentration
risk models (both internal and external for natural catastrophe
and internal for man-made catastrophe) are developed to ensure
yearly natural catastrophe volatility, coming from events such as
windstorm, earthquake, hurricane or typhoon, or catastrophe
man-made events, such as cyber or liability ones, are not likely
to aff ect the Group above the set tolerance levels.
Since 2015, the Group has strategically developed a strong
in-house expertise of development and validation of natural
catastrophe models to cope with their dynamic nature in the
context of global climate change.

204 I UNIVERSAL REGISTRATION DOCUMENT - ANNUAL REPORT 2019 - AXA I
RISK FACTORS AND RISK MANAGEMENT 4 4.6 INSURANCE RISKS
CEDED REINSURANCE
For the Life & Savings, Health and Property & Casualty operations,
reinsurance programs are set up as follows:
■ Group’s operating entities reinsurance capacity are set in
alignment with Group Standards and with their local risk
appetite limits considering the risk assessment previously
described;
■ their risks are modeled through in-depth actuarial analyses
conducted on each portfolio; specifically, for Property & Casualty
natural catastrophe modelling, via the Group economic capital
model, GRM uses several models both internal and external
for assessing the risk associated with the main natural perils
(storms, floods, earthquakes…).
Reinsurance strategy
Centralization and harmonization of treaty reinsurance purchase is
based on the same procedures for both the Life & Savings, Health
businesses as for the Property & Casualty activities.
In Life & Savings and Health, reinsurance is mainly used to
support local innovation policy for new risks or to cover mass
risks (pandemic, earthquake or terrorism).
In order to build adjusted and optimized protection, the Group’s
operating entities are reinsured by AXA Global Re (“AGRe”). AGRe
can place a variable part of the local treaties on the reinsurance
market, for regulatory reasons for example. A portion of the risk
exposure is retained and mitigated within AGRe through the
internal Group covers (including through a pool mechanism for
Property) and the remaining part is ceded to external reinsurers.
AGRe is responsible for all Group external cessions. Since the
acquisition of the XL Group, AXA XL contributes to placing directly
part of its covers under AGRe’s delegation and control. 2020
Group reinsurance protections ensure reaching risk appetite as
in 2019 and further limit the impacts of volatility (Nat Cat and
man-made) induced by frequency of mid-size events. These
protections consist of major Group covers (CAT covering direct
business and reinsurance business from XL Re, Property Per Risk,
International Liability, Marine, Cyber, Motor Third Party Liability
and Life) and various AXA XL-dedicated covers which contribute
to further decrease the net retention of AXA XL and limit its own
volatility (e.g. Aviation, US Liability, Political risks).
For Group covers, their structures are designed to adequately
protect the Group in compliance with the Group risk appetite
framework. In order to protect the Group, specific covers are
arranged through either the traditional reinsurance market or
the financial one through securitization (cat bonds and Insurance
Linked Securities).
As opposed to the other Group covers where the Group retention
is kept by AXA Global Re, in 2019, 93.9% of the Property Pool
year-end financial result net of external reinsurance protections
is retroceded back to local entities, through a pool mechanism
managed by AGRe on behalf of those local entities.
Finally, in addition to the analyses described above, AGRe
regularly monitors its credit exposure and other AXA entities’
credit exposures to reinsurers, to ensure that consolidated limits
remain within Group risk tolerance (see Section 4.4 “Credit Risk
– Receivables from reinsurers”).
TECHNICAL RESERVES
Operational entities specifically monitor their reserve risks. Claims
reserves are estimated and booked on a file by file basis by the
claims handlers. Additional reserves are also booked by the
local entities.
The additional reserves’ calculations are initially carried out locally
by a two-opinion process, one given by the local Technical or
Financial department, the other one by local Risk Management.
Actuaries in charge of assessing reserves use various statistical
and actuarial methods. Their assumptions are made following
discussions with claims managers, pricing actuaries, underwriters
and other specialized departments.
They notably ensure that:
■ a suff icient number of operating elements have been scrutinized
(including contracts, premiums and claims patterns, claims’
handling, and reinsurance eff ects);
■ enough data is available (such as suff icient claims experience
or granularity) and adequate to achieve the reserving exercise;
■ the technical assumptions and actuarial methodologies are
in line with professional practices and sensitivity analyses are
performed at least for most significant ones;
■ a roll-forward analysis of reserves including merit-rating
(boni-mali) back-tests has been performed, the regulatory
and economic context references are taken into account and
material deviations are explained;
■ the operational losses relating to the reserving process have
been adequately quantified; and
■ the Best Estimate Liabilities have been calculated in accordance
with Articles 75 to 86 of the Solvency II Directive and Group
guidelines.
205I UNIVERSAL REGISTRATION DOCUMENT - ANNUAL REPORT 2019 - AXA I
RISK FACTORS AND RISK MANAGEMENT
4
4.6 INSURANCE RISKS
In addition, the Solvency II regime requires insurance and
reinsurance companies to provide for an eff ective actuarial
function to:
■ coordinate the calculation of technical provisions;
■ ensure the appropriateness of the methodologies and
underlying models used as well as the assumptions made in
the calculation of technical provisions;
■ assess the suff iciency and quality of the data used in the
calculation of technical provisions;
■ compare best estimates against experience;
■ inform the management and the Board of the reliability and
adequacy of the calculation of technical provisions;
■ oversee the calculation of technical provisions;
■ express an opinion on the overall underwriting policy;
■ express an opinion on the adequacy of reinsurance
arrangements; and
■ contribute to the effective implementation of the Risk
Management system, in particular with respect to the risk
modelling underlying the calculation of the capital requirements.
The Group Actuarial Function Holder has been set with a specific
role to monitor the tasks undertaken by the Group actuarial
function stakeholders (notably GRM, PBRC) as well as the local
actuarial functions established in insurance entities across the
Group.
The Group Actuarial Function Holder reports to the Group Chief
Financial Off icer, with an administrative reporting line to the
Group Chief Executive Off icer.
The nomination of the local Actuarial Function Holder must be
agreed in advance by the Group Actuarial Function Holder.
The AXA Group Actuarial Function Holder prepares the actuarial
function report to inform the management and the Board on their
conclusions about the reliability and adequacy of the calculation
of technical provisions. This report also provides an overview of
the activities undertaken by the actuarial function in each of its
areas of responsibility during the reporting period.
The breakdown of the Group’s Property & Casualty technical
reserves by line of business was as follows:
■ 26% at the end of 2019 (26% at the end of 2018) of the Group’s
Property & Casualty reserves cover Motor insurance business;
■ 9% at the end of 2019 (9% at the end of 2018) of the Group’s
Property & Casualty reserves cover Property insurance business;
■ 11% at the end of 2019 (11% at the end of 2018) of the Group’s
Property & Casualty reserves cover Liability insurance business;
■ 7% at the end of 2019 (6% at the end of 2018) of the Group’s
Property & Casualty reserves cover Specialty insurance business;
■ 11% at the end of 2019 (12% at the end of 2018) of the Group’s
Property & Casualty reserves cover Reinsurance business;
■ 36% at the end of 2016 (36% at the end of 2018) cover the
other lines of business.
The breakdown of the Group’s Life & Savings technical insurance
reserves by product type was as follows:
■ 18% at the end of 2019 (20% at the end of 2018) of the Group’s
Life & Savings technical reserves cover separate-account
(Unit-Linked) products that do not materially aff ect AXA’s risk
exposure. On these products, the underlying financial market
performance is mostly passed on to the policyholders. This
category also includes products that may provide a stand-alone
guarantee on invested capital in the event of death. Overall,
they present only a limited market risk for the Group through
reduction of shareholders’ value;
■ 1% at the end of 2019 (11% at the end of 2018) of the Group’s Life
& Savings technical reserves cover separate-account products
with related interest-rate or equity guarantees provided by the
insurance companies, called Variable Annuities.
■ 20% at the end of 2019 (16% at the end of 2018) cover savings
products without guaranteed cash values upon surrender;
■ 24% at the end of 2019 (18% at the end of 2018) are related
to savings products off ering one-year guaranteed rates that
are updated every year. The risks arising from a sustained fall
in interest rates in the financial markets are limited for these
types of products. Hedging programs have been implemented
to cover long-term fixed maturities from the risk of an increase
in interest rates;
■ 35% at the end of 2019 (35% at the end of 2018) cover other
products like Protection. These reserves cover surrender
guarantees and, in some cases, a guaranteed long-term rate.
Related risks are managed in the following ways:
• products that are not surrender-sensitive are usually backed
by fixed-income investments with maturities and interest
rates generally suff icient to cover guaranteed benefits, so
as to reduce as much as possible the reinvestment risk;
• derivatives may be used to hedge the risk of a fall (floor) or
a rise (cap) in interest rates;
• other products are managed with the surplus required to
cover guarantees.
The Group’s Health technical reserves represented 7% of the
Group’s total technical reserves at the end of 2019 (5% at the
end of 2018). Technical reserves for Health Life-like contracts (i.e.
contracts with long-term guarantees or coverage and/or surrender
value) represented 94% of the Group’s Health technical reserves
at the end of 2019 (stable compared to 2018).

206 I UNIVERSAL REGISTRATION DOCUMENT - ANNUAL REPORT 2019 - AXA I
RISK FACTORS AND RISK MANAGEMENT 4 4.7 OPERATIONAL RISK
4.7 OPERATIONAL RISK
Information in this section should be read in conjunction with the
paragraph “Operational and business-related risks” in Section 4.1
“Risk factors” of this Annual Report.
AXA Group has defined a single framework for identifying,
quantifying and monitoring the main operational risks that
may arise from a failure in its organization, systems, processes
and resources or from external events.
Operational risk includes legal risks and excludes risks arising
from strategic decisions, as well as reputation risks.
AXA Group’s Operational risk framework provides for the
deployment of a common system, dedicated operational risk
teams and a common operational risk typology classifying
operational risks into seven risk categories: internal fraud;
external fraud; employment practices and workplace safety;
clients, products and business practices; damages to physical
assets; business disruption; and system failures and execution,
delivery and process management. Its implementation is not
limited to insurance activities. It encompasses all AXA entities,
including insurance companies, banking activities, AXA asset
managers and internal service providers consistent with AXA
policy on operational risk management.
Both quantitative and qualitative requirements are defined:
■ across the Group, the most critical operational risks of
each entity and a set of stress scenarios are identified and
assessed following a forward-looking and expert-opinion
approach. These risk scenarios are then used to estimate
the capital requirement needed to cover operational risks
based on advanced models based on Solvency II principles.
The operational Risk Management process is embedded into
local governance through senior management validation to
ensure that the risk assessment is adequate, appropriate and
comprehensive but also to ensure that adequate corrective
and pre-emptive actions are defined and implemented in
respect of the main risks;
■ in addition, a loss data collection process is in place within most
companies of the Group in order to track and appropriately
mitigate actual operational risk losses. This process is also
used as a valuable source of information to back-test the
assumptions taken in risk assessments.
A key objective of the AXA Group’s operational risk economic
capital model is to understand and reduce losses resulting from
operational failures and to define an appropriate risk response
strategy for major operational risk scenarios. Entities and Group
Operational Risk profiles are presented to local/Group Risk
Committees for decisions and actions to be taken.
In 2019, the Group Operational Risk Profile is reasonably well
spread out with all seven operational risk categories covered
and the main risks being the following:
■ transaction capture, execution and maintenance risk is a top
risk and relates to process error, failure, and/or misperformance;
■ compliance risk due to increases in legislation and regulation
remains a major concern and is under the close monitoring
of Group Compliance;
■ external fraud & system security risk continues also to be a top
priority. AXA Group’s exposure to cyber risk is still high with
more and more new technology into AXA Group’s products
and services. Information on cyber risks should be read in
conjunction with the paragraph “Operational and business-
related risks” in Section 4.1 “Risk factors” of this Annual Report;
AXA Group’s exposure to operational risk is captured in the
AXA Group’s Solvency Capital Requirement as detailed in the
paragraph “Internal Model” in Section 4.2 “Internal Control and
Risk Management” of this Annual Report.
Specific actions are identified at Group and local levels to mitigate
these risks. Also, the implementation of the Internal Control
framework will continue to contribute to better embed controls
in activities and mitigate the risks.
As regards information risks, AXA has built an Information Risk
Management (IRM) practice to enable information risk decisions
to be made consistently across the organization and establish
sustainable Risk Management capabilities that are integrated
with the business.
AXA relies on third-party providers for outsourcing of services at
diff erent stages of the value chain. Although relying on partners is
a strategic advantage, onboarding a vendor into AXA’s organization
requires AXA to assess the risks it might bring, such as regulatory,
compliance, IT security, etc.
To protect both business and customers, AXA has decided to
reinforce its operational controls and its Risk Management
framework of third parties: a dedicated Vendor Risk program was
validated by the Operational Audit Risk Compliance Committee
(OpARCC) and launched in 2018 in order to enhance the existing
AXA control framework. This program is supported by Group
functions (Compliance, Data Privacy, Information Security,
Operational Resilience, Legal, Reputation and Internal Control),
local stakeholders (Chief Risk Off icers, Chief Procurement Off icers
and Insurance Procurement directors) and co-sponsored by Group
Risk Management and Group Procurement.
The Vendor Risk Framework defines a set of requirements for
each relationship, with a risk-based approach, i.e. existing and
potential new contracts. Aft er identification of the criticality
through pre-determined criteria, an appropriate level of due
diligence, minimum requirements and oversight is implemented.
Several waves of deployment, aligned with the Group Internal
Control Program, have been scheduled between 2019 and
beginning of 2021.
For more information on the AXA Group’s risk controls and Risk
Management processes, please refer to Section 4.2 “Internal
Control and Risk Management” of this Annual Report.

207I UNIVERSAL REGISTRATION DOCUMENT - ANNUAL REPORT 2019 - AXA I
RISK FACTORS AND RISK MANAGEMENT
4
4.8 OTHER MATERIAL RISKS
4.8 OTHER MATERIAL RISKS
I Strategic risk
A strategic risk is the risk that a negative impact (current or
prospective) on earnings or capital, material at the Group level,
arises from (a) a lack of responsiveness to industry changes, or
(b) adverse business decisions regarding:
■ significant changes in footprint, including through disposals
or acquisitions;
■ changes in product off ering and client segmentation;
■ changes in distribution model (channel mix including alliances/
partnerships, multi-access and digital distribution).
Given the nature of strategic risks, there is no capital charge
assessment but a strong strategic Risk Management framework
to anticipate and mitigate these risks. Group Risk Management is
involved at early stage in major strategic projects (e.g. large M&A
projects). The Group governance standards require among other
things a risk management second opinion on key processes,
including significant transactions and strategic plans. Furthermore,
the ORSA report provides an assessment on the overall solvency
needs which include the Solvency II ratio projection made until
the strategic plan horizon and in stress scenarios as detailed in
Section 4.2 “Internal Control and Risk Management - Own Risk
and Solvency Assessment (“ORSA”)” of this Annual Report.
I Reputation risk
Reputation risk is the risk that an event, internal or external,
will negatively influence the stakeholders’ perception and trust
of the Company or where there is a gap between stakeholders’
expectation and the Company’s behaviors, attitudes, values,
actions, or inactions.
Given the nature of reputation risks, there is no capital charge
assessment but the AXA Group has defined a global framework
with a two-fold approach to reactively protect and proactively
identify, monitor, manage and mitigate reputational issues to not
only minimize value destruction, but also to build and maintain
brand equity and trust among stakeholders.
AXA Group has a Global Reputation Network whose purpose is
to implement locally a Reputation Risk Management framework.
The objectives of the Reputation Risk Management approach are
in line with AXA’s overall Enterprise Risk Management approach
aiming to develop a reputation risk culture and risk intelligence.
Three main objectives drive the Reputation Risk Management
approach:
■ proactively manage reputation risks, avoid or minimize negative
issues impacting the reputation of AXA and build trust among
all of AXA stakeholders;
■ define accountability for reputation risks across the organization,
at Group and local levels;
■ implement a common reputation Risk Management framework
throughout the organization.
The implementation of the Reputation Risk Framework
encompasses AXA Group activities including insurance, asset
management, banking as well as internal service providers.

208 I UNIVERSAL REGISTRATION DOCUMENT - ANNUAL REPORT 2019 - AXA I
RISK FACTORS AND RISK MANAGEMENT 4 4.8 OTHER MATERIAL RISKS
I Emerging risks
Emerging risks are risks which may develop or which already exist
and are continuously evolving. Emerging risks are marked by a high
degree of uncertainty, as some of them may never even emerge.
Given the nature of emerging risks, there is no capital charge
assessment but the AXA Group has established processes to
qualify emerging risks which could develop over time and become
significant. The emerging risk framework encompasses a network
of circa 100 people within the AXA Group (based in insurance,
bank, asset management and support function entities such
as AXA Group Operations) which allows expertise to be shared
within the business and risk communities and ensures adequate
underwriting policies are defined.
Emerging risks surveillance is organized through a detection
process including watch on scientific publications, court decisions,
etc. Risks are monitored and classified within a risk mapping
constituted of five sub-groups (environmental, societal, regulatory
& political, economic & financial, medical and technological). Aft er
prioritization of the monitored risks or aft er a warning from an
entity, a working group is launched on a yearly basis by GRM to
review a specific risk and its potential impact in terms of insurance.
Since 2015, an annual Emerging Risks Survey is conducted to
collect the views of internal and external stakeholders on the
most significant emerging risks for society at large.
By seeking to develop new solutions, acting as an advisor to Risk
Management and actively contributing to the overall debate about
the issues involved, along with other major market players, AXA
Group intends to promote a better understanding and better
forecasting of the emerging risks and to support sustainable
development.
I Regulatory risks
For further information on the regulatory environment in which AXA Group operates including regulatory risks, please refer to the
paragraph “Regulatory-related risks” in Section 4.1 “Risk factors” of this Annual Report.
I Sustainability risks
For further information on the sustainability risks to which the AXA Group may be exposed, please refer to the paragraph “Sustainability
Risk Assessment” in Section 7.1 “Introduction” of this Annual Report.

209
5.1 CONSOLIDATED STATEMENT OF FINANCIAL POSITION 210
5.2 CONSOLIDATED STATEMENT OF INCOME 212
5.3 CONSOLIDATED STATEMENT OF COMPREHENSIVE INCOME 213
5.4 CONSOLIDATED STATEMENT OF CHANGES IN EQUITY 214
5.5 CONSOLIDATED STATEMENT OF CASH FLOWS 218
5.6 NOTES TO THE CONSOLIDATED FINANCIAL STATEMENTS 220
NOTE 1 Accounting principles 220
NOTE 2 Scope of consolidation 241
NOTE 3 Consolidated statement of income by segment 247
NOTE 4 Financial and insurance Risk Management 252
NOTE 5 Goodwill 253
NOTE 6 Value of purchased business in-force 262
NOTE 7 Deferred acquisition costs and equivalent 263
NOTE 8 Other intangible assets 264
NOTE 9 Investments 266
NOTE 10 Investments accounted for using the equity method 286
NOTE 11 Receivables 291
NOTE 12 Cash and cash equivalents 292
NOTE 13 Shareholders’ equity and minority interests 293
NOTE 14 Liabilities arising from insurance and investment contracts 299
NOTE 15 Liabilities arising from banking activities 312
NOTE 16 Provisions for risks and charges 314
NOTE 17 Financing debt 315
NOTE 18 Payables 317
NOTE 19 Tax 320
NOTE 20 Derivative instruments 325
NOTE 21 Information by segment 333
NOTE 22 Net investment result excluding financing expenses 337
NOTE 23 Net result of reinsurance ceded 339
NOTE 24 Financing debt expenses 340
NOTE 25 Expenses by type 340
NOTE 26 Employees 341
NOTE 27 Net income per ordinary share 355
NOTE 28 Related-party transactions 356
NOTE 29 Contingent assets and liabilities and unrecognized contractual commitments 358
NOTE 30 Fees paid to Statutory Auditors 361
NOTE 31 Litigation 362
NOTE 32 Subsequent events 365
5.7 REPORT OF THE STATUTORY AUDITORS ON THE CONSOLIDATED FINANCIAL
STATEMENTS 366
CONSOLIDATED
FINANCIAL
STATEMENTS 5
I UNIVERSAL REGISTRATION DOCUMENT - ANNUAL REPORT 2019 - AXA I

210 I UNIVERSAL REGISTRATION DOCUMENT - ANNUAL REPORT 2019 - AXA I
CONSOLIDATED FINANCIAL STATEMENTS 5 5.1 CONSOLIDATED STATEMENT OF FINANCIAL POSITION
5.1 CONSOLIDATED STATEMENT OF FINANCIAL POSITION
(in Euro million)
Notes
December 31,
2019
December 31,
2018
5 Goodwill 17,776 16,771
6 Value of purchased business in force 1,520 2,087
7 Deferred acquisition costs and equivalent 16,684 26,415
8 Other intangible assets 4,872 5,041
Intangible assets 40,852 50,313
Investments in real estate properties 23,301 20,939
Financial investments 494,765 525,338
Assets backing contracts where the financial risk is borne by policyholders (a) 72,660 160,176
9 Investments from insurance activities 590,726 706,452
9 Investments from banking and other activities 22,389 41,809
10 Investments accounted for using the equity method 2,437 2,929
14 Reinsurers’ share in insurance and investment contracts liabilities 22,970 25,751
Tangible assets 2,872 1,599
14 Deferred policyholders’ participation assets - 303
19 Deferred tax assets 651 915
Other assets 3,524 2,817
Receivables arising from direct insurance and inward reinsurance operations 27,087 25,259
Receivables arising from outward reinsurance operations 2,074 1,944
Receivables - current tax 949 962
Other receivables 10,329 14,745
11 Receivables 40,439 42,911
5 Assets held for sale (b)
35,593 26,384
12 Cash and cash equivalents 21,948 31,329
TOTAL ASSETS 780,878 930,695
Note: All invested assets are shown net of related derivative instruments impact.
(a) Includes assets backing contracts where the financial risk is borne by policyholders with Guaranteed Minimum features.
(b) As of December 31, 2019, amounts included the assets relating to AXA Bank Belgium, AXA Life Europe and the remaining Group Life portfolio in Switzerland, for which disposal processes were not finalized at year-end. Held for sale classification previously applied for the AXA Wealth Management (HK) Limited portfolio has been unwound.
As of December 31, 2018, amounts included the assets relating to the Group Life portfolio in Switzerland, AXA Life Europe and the AXA Wealth Management (HK) Limited portfolio for which disposal processes were not finalized at year-end.
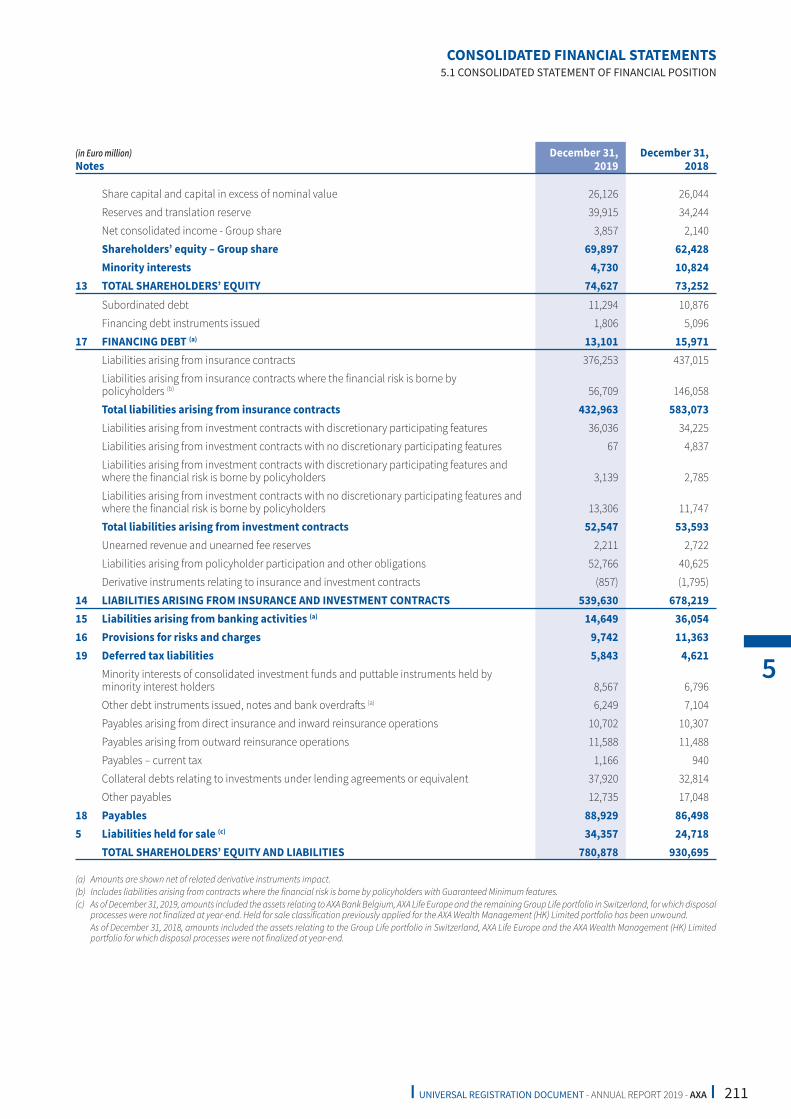
211I UNIVERSAL REGISTRATION DOCUMENT - ANNUAL REPORT 2019 - AXA I
CONSOLIDATED FINANCIAL STATEMENTS
5
5.1 CONSOLIDATED STATEMENT OF FINANCIAL POSITION
(in Euro million)
Notes
December 31,
2019
December 31,
2018
Share capital and capital in excess of nominal value 26,126 26,044
Reserves and translation reserve 39,915 34,244
Net consolidated income - Group share 3,857 2,140
Shareholders’ equity – Group share 69,897 62,428
Minority interests 4,730 10,824
13 TOTAL SHAREHOLDERS’ EQUITY 74,627 73,252
Subordinated debt 11,294 10,876
Financing debt instruments issued 1,806 5,096
17 FINANCING DEBT (a)
13,101 15,971
Liabilities arising from insurance contracts 376,253 437,015
Liabilities arising from insurance contracts where the financial risk is borne by
policyholders (b) 56,709 146,058
Total liabilities arising from insurance contracts 432,963 583,073
Liabilities arising from investment contracts with discretionary participating features 36,036 34,225
Liabilities arising from investment contracts with no discretionary participating features 67 4,837
Liabilities arising from investment contracts with discretionary participating features and
where the financial risk is borne by policyholders 3,139 2,785
Liabilities arising from investment contracts with no discretionary participating features and
where the financial risk is borne by policyholders 13,306 11,747
Total liabilities arising from investment contracts 52,547 53,593
Unearned revenue and unearned fee reserves 2,211 2,722
Liabilities arising from policyholder participation and other obligations 52,766 40,625
Derivative instruments relating to insurance and investment contracts (857) (1,795)
14 LIABILITIES ARISING FROM INSURANCE AND INVESTMENT CONTRACTS 539,630 678,219
15 Liabilities arising from banking activities (a)
14,649 36,054
16 Provisions for risks and charges 9,742 11,363
19 Deferred tax liabilities 5,843 4,621
Minority interests of consolidated investment funds and puttable instruments held by
minority interest holders 8,567 6,796
Other debt instruments issued, notes and bank overdraft s (a) 6,249 7,104
Payables arising from direct insurance and inward reinsurance operations 10,702 10,307
Payables arising from outward reinsurance operations 11,588 11,488
Payables – current tax 1,166 940
Collateral debts relating to investments under lending agreements or equivalent 37,920 32,814
Other payables 12,735 17,048
18 Payables 88,929 86,498
5 Liabilities held for sale (c)
34,357 24,718
TOTAL SHAREHOLDERS’ EQUITY AND LIABILITIES 780,878 930,695
(a) Amounts are shown net of related derivative instruments impact.
(b) Includes liabilities arising from contracts where the financial risk is borne by policyholders with Guaranteed Minimum features.
(c) As of December 31, 2019, amounts included the assets relating to AXA Bank Belgium, AXA Life Europe and the remaining Group Life portfolio in Switzerland, for which disposal processes were not finalized at year-end. Held for sale classification previously applied for the AXA Wealth Management (HK) Limited portfolio has been unwound.
As of December 31, 2018, amounts included the assets relating to the Group Life portfolio in Switzerland, AXA Life Europe and the AXA Wealth Management (HK) Limited portfolio for which disposal processes were not finalized at year-end.

212 I UNIVERSAL REGISTRATION DOCUMENT - ANNUAL REPORT 2019 - AXA I
CONSOLIDATED FINANCIAL STATEMENTS 5 5.2 CONSOLIDATED STATEMENT OF INCOME
5.2 CONSOLIDATED STATEMENT OF INCOME
(in Euro million, except EPS in Euro)
Notes
December 31,
2019
December 31,
2018
Gross written premiums 99,852 96,309
Fees and charges relating to investment contracts with no participating features 244 249
Revenues from insurance activities 100,096 96,558
Net revenues from banking activities 512 484
Revenues from other activities 2,924 5,832
21 Revenues (a)
103,532 102,874
Change in unearned premiums net of unearned revenues and fees (1,543) (653)
Net investment income (b) 12,115 16,597
Net realized gains and losses relating to investments at cost and at fair value through
shareholders’ equity (c) 1,356 1,982
Net realized gains and losses and change in fair value of investments at fair value through
profit and loss (d) 18,475 (13,104)
of which change in fair value of assets with financial risk borne by policyholders (e) 18,286 (10,706)
Change in investments impairments (f) (826) (1,271)
22 Net investment result excluding financing expenses 31,121 4,205
Technical charges relating to insurance activities (e) (101,484) (75,069)
23 Net result from outward reinsurance (1,118) (285)
Bank operating expenses (67) (70)
25 Acquisition costs (12,482) (11,201)
Amortization of the value of purchased business in force (644) (470)
25 Administrative expenses (10,722) (10,976)
Change in goodwill impairment and other intangible assets impairment and amortization (153) (6,441)
Other income and expenses (g) (598) (109)
Other operating income and expenses (127,269) (104,621)
Income from operating activities before tax 5,840 1,805
10 Income (net of impairment) from investment accounted for using the equity method 504 286
24 Financing debts expenses (h) (720) (562)
Net income from operating activities before tax 5,624 1,530
19 Income tax (1,419) (1,474)
Net operating income 4,206 55
Net loss on Group Life portfolio in Switzerland (i) (24) (428)
Net consolidated income aft er tax 4,181 (373)
Split between :
Net consolidated income - Group share 3,857 2,140
Net consolidated income - Minority interests 325 (2,513)
27 Earnings per share 1.51 0.79
Fully diluted earnings per share 1.51 0.79
(a) Gross of reinsurance.
(b) Net of investment management costs and including gains/losses from derivatives hedging variable annuities.
(c) Includes impairment releases on investments sold.
(d) Includes realized and unrealized forex gains and losses relating to investments at cost and at fair value through shareholders’ equity.
(e) Change in fair value of assets with financial risk borne by policyholders is off set by a balancing entry in technical charges relating to insurance activities.
(f) Excludes impairment releases on investments sold.
(g) Include losses related to the disposal processes of AXA Bank Belgium and AXA Life Europe (see Note 5.3).
(h) Includes net balance of income and expenses related to derivatives on financing debt (nonetheless excludes change in fair value of these derivatives).
(i) Mainly related to the VBI impairment related to the Group Life portfolio in Switzerland classified as held for sale.
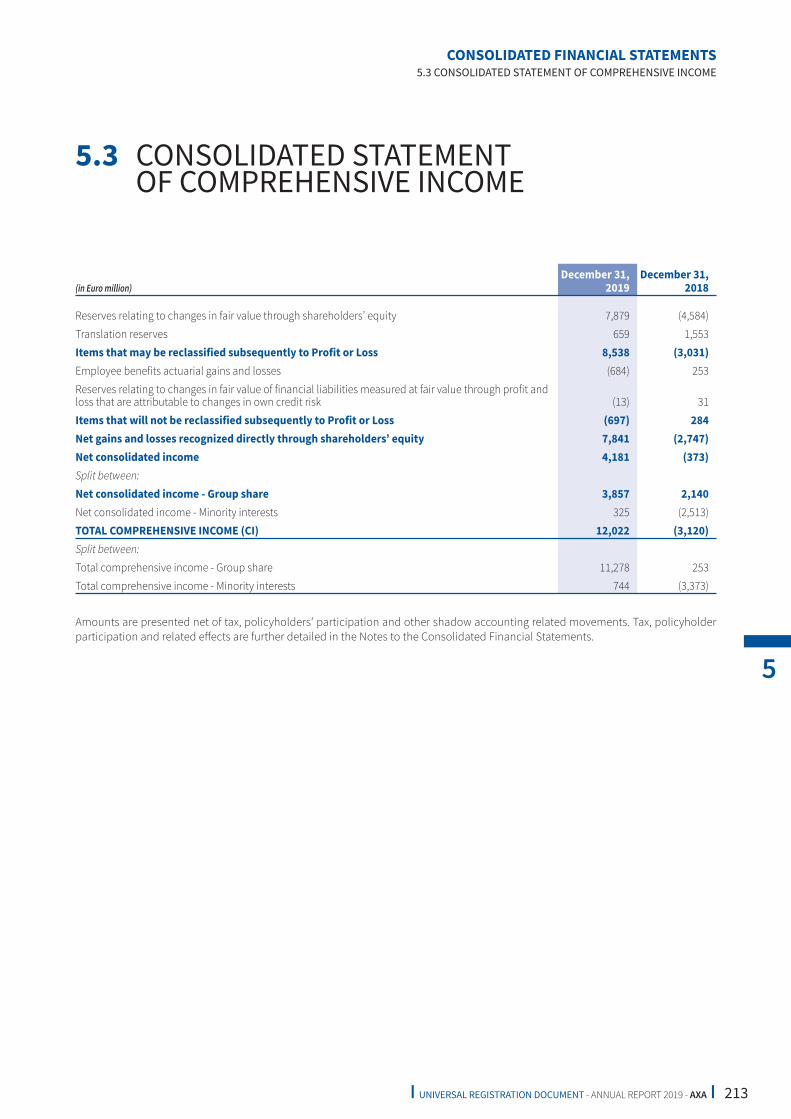
213I UNIVERSAL REGISTRATION DOCUMENT - ANNUAL REPORT 2019 - AXA I
CONSOLIDATED FINANCIAL STATEMENTS
5
5.3 CONSOLIDATED STATEMENT OF COMPREHENSIVE INCOME
5.3 CONSOLIDATED STATEMENT OF COMPREHENSIVE INCOME
(in Euro million)
December 31,
2019
December 31,
2018
Reserves relating to changes in fair value through shareholders’ equity 7,879 (4,584)
Translation reserves 659 1,553
Items that may be reclassified subsequently to Profit or Loss 8,538 (3,031)
Employee benefits actuarial gains and losses (684) 253
Reserves relating to changes in fair value of financial liabilities measured at fair value through profit and
loss that are attributable to changes in own credit risk (13) 31
Items that will not be reclassified subsequently to Profit or Loss (697) 284
Net gains and losses recognized directly through shareholders’ equity 7,841 (2,747)
Net consolidated income 4,181 (373)
Split between:
Net consolidated income - Group share 3,857 2,140
Net consolidated income - Minority interests 325 (2,513)
TOTAL COMPREHENSIVE INCOME (CI) 12,022 (3,120)
Split between:
Total comprehensive income - Group share 11,278 253
Total comprehensive income - Minority interests 744 (3,373)
Amounts are presented net of tax, policyholders’ participation and other shadow accounting related movements. Tax, policyholder
participation and related eff ects are further detailed in the Notes to the Consolidated Financial Statements.

214 I UNIVERSAL REGISTRATION DOCUMENT - ANNUAL REPORT 2019 - AXA I
CONSOLIDATED FINANCIAL STATEMENTS 5 5.4 CONSOLIDATED STATEMENT OF CHANGES IN EQUITY
5.4 CONSOLIDATED STATEMENT OF CHANGES IN EQUITY
(in Euro million, except for number of shares and nominal value)
Share Capital
Number
of shares
(in thousands)
Nominal
value
(in Euro)
Share
Capital
Capital in
excess of
nominal
value
Treasury
shares
Shareholders’ equity opening January 1, 2019 2,424,917 2.29 5,553 21,894 (1,038)
Capital (7,222) 2.29 (17) - -
Capital in excess of nominal value - - - (227) -
Equity - share based compensation - - - 40 -
Treasury shares - - - - 286
Others reserves - transaction on treasury shares - - - - -
Equity component of compound financial instruments - - - - -
Undated subordinated debt - - - - -
Financial expenses - Undated subordinated debt - - - - -
Others (including impact on change in scope) (b) - - - - -
Dividends paid - - - - -
Impact of transactions with shareholders (7,222) 2.29 (17) (187) 286
Reserves relating to changes in fair value through shareholders’ equity - - - - -
Translation reserves - - - - -
Employee benefits actuarial gains and losses - - - - -
Reserves relating to changes in fair value of financial liabilities measured
at fair value through profit and loss that are attributable to changes in
own credit risk - - - - -
Net consolidated income - - - - -
Total Comprehensive Income (CI) - - - - -
Shareholders’ equity closing December 31, 2019 2,417,695 2.29 5,537 21,706 (752)
Note: Amounts are presented net of impacts of shadow accounting and its eff ects on policyholder participation, deferred acquisition costs, and value of business in force.
(a) Mainly undated subordinated debts (TSS, TSDI) (see Note 13.1.1).
(b) Including changes in ownership interest in consolidated subsidiaries.
(c) Includes the first time application impact of IFRS 16 Leases (€-68 million in Group share) and IFRIC 23 Uncertainty over Income Tax Treatments (€-111 million in Group share). AXA has chosen to adopt this standard and this interpretation retrospectively through the cumulative eff ect approach with an adjustment to the opening balance of retained earnings in 2019. Therefore there is no restatement of comparative information for the year 2018.

215I UNIVERSAL REGISTRATION DOCUMENT - ANNUAL REPORT 2019 - AXA I
CONSOLIDATED FINANCIAL STATEMENTS
5
5.4 CONSOLIDATED STATEMENT OF CHANGES IN EQUITY
Attributable to shareholders
Minority
interests
Other reserves
Shareholders’
equity
- Group share
Reserves relating
to the change in fair
value of financial
instruments
available for sale
Reserves relating
to the change in
fair value of hedge
accounting derivatives
(cash flow hedge) Other (a)
Translation
reserves
Undistributed
profits and other
reserves (c)
11,566 302 6,776 (2,395) 19,770 62,428 10,824
- - - - - (17) -
- - - - - (227) -
- - - - - 40 -
- - - - - 286 -
- - 0 - - 0 -
- - - - - - (614)
- - (253) - - (253) -
- - - - (194) (194) -
(0) 0 - (0) (255) (255) (6,224)
- - - - (3,189) (3,189) -
(0) 0 (253) (0) (3,638) (3,809) (6,838)
7,762 (106) - - - 7,656 223
- - 113 344 - 457 202
- - - - (679) (679) (5)
- - - - (13) (13) 0
- - - - 3,857 3,857 325
7,762 (106) 113 344 3,165 11,278 744
19,328 196 6,636 (2,050) 19,297 69,897 4,730

216 I UNIVERSAL REGISTRATION DOCUMENT - ANNUAL REPORT 2019 - AXA I
CONSOLIDATED FINANCIAL STATEMENTS 5 5.4 CONSOLIDATED STATEMENT OF CHANGES IN EQUITY
(in Euro million, except for number of shares and nominal value)
Share Capital
Number
of shares
(in thousands)
Nominal
value
(in Euros)
Share
Capital
Capital in
excess of
nominal
value
Treasury
shares
Shareholders’ equity opening January 1, 2018 2,425,236 2.29 5,554 20,904 (1,060)
Capital (319) 2.29 (1) - -
Capital in excess of nominal value - - - 951 -
Equity - share based compensation - - - 39 -
Treasury shares - - - - 22
Others reserves - transaction on treasury shares - - - - -
Equity component of compound financial instruments - - - - -
Undated subordinated debt - - - - -
Financial expenses - Undated subordinated debt (b) - - - - -
Others (including impact on change in scope) (c) - - - - -
Dividends paid - - - - -
Impact of transactions with shareholders (319) 2.29 (1) 990 22
Reserves relating to changes in fair value through shareholders’ equity - - - - -
Translation reserves - - - - -
Employee benefits actuarial gains and losses - - - - -
Reserves relating to changes in fair value of financial liabilities measured
at fair value through profit and loss that are attributable to changes in
own credit risk - - - - -
Net consolidated income - - - - -
Total Comprehensive Income (CI) - - - - -
Shareholders’ equity closing December 31, 2018 2,424,917 2.29 5,553 21,894 (1,038)
Note: Amounts are presented net of impacts of shadow accounting and its eff ects on policyholder participation, deferred acquisition costs, and value of business in force.
(a) Mainly undated subordinated debts (TSS, TSDI) (see Note 13.1.1).
(b) Including changes in ownership interest in consolidated subsidiaries without losing control.
(c) Includes the first time application impact of IFRS 15 Revenue from Contracts with Customers. AXA has chosen to adopt the new standard through the cumulative eff ect approach meaning the cumulative eff ect was recognised as an adjustment to the opening balance of retained earnings in 2018.

217I UNIVERSAL REGISTRATION DOCUMENT - ANNUAL REPORT 2019 - AXA I
CONSOLIDATED FINANCIAL STATEMENTS
5
5.4 CONSOLIDATED STATEMENT OF CHANGES IN EQUITY
Attributable to shareholders
Minority
interests
Other reserves
Shareholders’
e quity
- Group share
Reserves relating
to the change in fair
value of financial
instruments
available for sale
Reserves relating
to the change in
fair value of hedge
accounting derivatives
(cash flow hedge) Other (a)
Translation
reserves
Undistributed
profits and
other reserves
15,992 272 7,318 (4,142) 24,773 69,611 5,656
- - - - - (1) -
- - - - - 951 -
- - - - - 39 -
- - - - - 22 -
- - (0) - - (0) -
- - - - - - 607
- - (665) - - (665) -
- - - - (222) (222) -
(0) 0 - 0 (4,562) (4,562) 7,935
- - - - (2,998) (2,998) -
(0) 0 (665) 0 (7,783) (7,436) 8,542
(4,426) 30 - - - (4,396) (188)
- - 123 1,747 - 1,869 (317)
- - - - 608 608 (355)
- - - - 31 31 0
- - - - 2,140 2,140 (2,513)
(4,426) 30 123 1,747 2,779 253 (3,373)
11,566 302 6,776 (2,395) 19,770 62,428 10,824

218 I UNIVERSAL REGISTRATION DOCUMENT - ANNUAL REPORT 2019 - AXA I
CONSOLIDATED FINANCIAL STATEMENTS 5 5.5 CONSOLIDATED STATEMENT OF CASH FLOWS
5.5 CONSOLIDATED STATEMENT OF CASH FLOWS
(in Euro million)
December 31,
2019
December 31,
2018
Operating income including discontinued operations before tax 5,624 1,530
Net amortization expense (a)1,376 849
Change in goodwill impairment and other intangible assets impairment (b) 115 6,323
Net change in deferred acquisition costs and equivalent (1,944) (1,738)
Net increase/(write back) in impairment on investments, tangible and other intangible assets 819 1,250
Change in fair value of investments at fair value through profit or loss (19,130) 12,596
Net change in liabilities arising from insurance and investment contracts (c) 22,226 (7,235)
Net increase/(write back) in other provisions (d) 507 (9)
Income (net of impairment) from investment accounted for using the equity method (497) (286)
Adjustment of non cash balances included in the operating income before tax 3,472 11,750
Net realized investment gains and losses (644) (1,384)
Financing debt expenses 706 561
Adjustment for reclassification to investing or financing activities 62 (823)
Dividends recorded in profit or loss during the period (2,993) (3,489)
Investment income & expense recorded in profit or loss during the period (e) (10,117) (13,951)
Adjustment of transactions from accrued to cash basis (13,110) (17,440)
Net cash impact of deposit accounting (98) (374)
Dividends and interim dividends collected 3,411 3,541
Investment income (e) 15,122 18,613
Investment expense
(excluding interests on financing and undated subordinated debts, margin calls and others) (4,214) (4,130)
Net operating cash from banking activities (250) 235
Change in operating receivables and payables 562 (597)
Net cash provided by other assets and liabilities (f) (114) (3,603)
Tax expenses paid (978) (663)
Other operating cash impact and non cash adjustment (627) (405)
Net cash impact of transactions with cash impact not included in the operating income before tax 12,813 12,617
NET CASH PROVIDED/(USED) BY OPERATING ACTIVITIES 8,861 7,634
Purchase of subsidiaries and aff iliated companies, net of cash acquired (242) (9,725)
Disposal of subsidiaries and aff iliated companies, net of cash ceded 293 71
Net cash related to changes in scope of consolidation 51 (9,654)
Sales of debt instruments (f) 49,538 64,654
Sales of equity instruments and non consolidated investment funds (f) (g) 18,498 20,072
Sales of investment properties held directly or not (f) 2,194 2,718
Sales and/or repayment of loans and other assets (f) (h) 20,307 26,105

219I UNIVERSAL REGISTRATION DOCUMENT - ANNUAL REPORT 2019 - AXA I
CONSOLIDATED FINANCIAL STATEMENTS
5
5.5 CONSOLIDATED STATEMENT OF CASH FLOWS
(in Euro million)
December 31,
2019
December 31,
2018
Net cash related to sales and repayments of investments (f)
(g)
(h)
90,537 113,550
Purchases of debt instruments (f) (61,226) (65,577)
Purchases of equity instruments and non consolidated investment funds (f) (g) (20,165 ) (19,250)
Purchases of investment properties held direct or not (f) (4,644) (3,338)
Purchases and/or issues of loans and other assets (g) (h) (19,660) (21,370)
Net cash related to purchases and issuance of investments (f)
(g)
(h)
(105,696 ) (109,535)
Sales of tangible and intangible assets 75 15
Purchases of tangible and intangible assets (462) (462)
Net cash related to sales and purchases of tangible and intangible assets (388) (447)
Increase in collateral payable/Decrease in collateral receivable 187,972 119,885
Decrease in collateral payable/Increase in collateral receivable (183,141) (115,923)
Net cash impact of assets lending/borrowing collateral receivables and payables 4,831 3,962
NET CASH PROVIDED/(USED) BY INVESTING ACTIVITIES (10,665 ) (2,124)
Issuance of equity instruments (62) 957
Repayments of equity instruments (2,045) (530)
Transactions on treasury shares (17) (5)
Dividends payout (3,268) (3,413)
Interests on undated subordinated debts paid (301) (338)
Acquisition/sale of interests in subsidiaries without change in control (51 ) 3,688
Net cash related to transactions with shareholders (6,335 ) 359
Cash provided by financial debts issuance 145 5,685
Cash used for financial debts repayments (781) (1,652)
Interests on financing debt paid (i) (588) (530)
Net interest margin of hedging derivatives on financing debt (9) 56
Net cash related to Group financing (676) 3,560
Other financing cash impact and non cash adjustment - -
NET CASH PROVIDED/(USED) BY FINANCING ACTIVITIES (7,011 ) 3,919
NET CASH PROVIDED BY DISCONTINUED OPERATIONS 0 0
CASH AND CASH EQUIVALENT AS OF JANUARY 1 (j)
30,556 23,196
Net cash provided by operating activities 8,861 7,634
Net cash provided by investing activities (10,665 ) (2,124)
Net cash provided by financing activities (7,011 ) 3,919
Net cash provided by discontinued operations 0 0
Impact of change in consolidation method and of reclassifications as held for sale (k) (943) (4,025)
Net impact of foreign exchange fluctuations and reclassification on cash and cash equivalents 471 1,956
CASH AND CASH EQUIVALENT AS OF DECEMBER 31 (j)
21,269 30,556
(a) Includes premiums/discounts capitalization and relating amortization, amortization of investment and owner occupied properties (held directly).
(b) Includes impairment and amortization of intangible assets booked in the context of business combinations.
(c) Includes impact of reinsurance and change in liabilities arising from contracts where the financial risk is borne by policyholders.
(d) Mainly includes change in provisions for risks & charges, for bad debts/doubtful receivables and change in impairment of assets held for sale.
(e) Includes gains/losses from derivatives hedging variable annuities.
(f) Includes related derivatives.
(g) Includes equity instruments held directly or by consolidated investment funds as well as non consolidated investment funds.
(h) Includes sales/purchases of assets backing insurance & investment contracts where the financial risk is borne by policyholders.
(i) Includes net cash impact of interest margin relating to hedging derivatives on financing debt.
( j) Net of bank overdraft s.
(k) As of December 31, 2019, amounts included the assets relating to AXA Bank Belgium, AXA Life Europe and the remaining Group Life portfolio in Switzerland, for which disposal processes were not finalized at year-end. Held for sale classification previously applied for the AXA Wealth Management (HK) Limited portfolio has been unwound.
As of December 31, 2018, amounts included the assets relating to the Group Life portfolio in Switzerland, AXA Life Europe and the AXA Wealth Management (HK) Limited portfolio for which disposal processes were not finalized at year-end.
Cash and cash equivalents are presented in Note 12.

220 I UNIVERSAL REGISTRATION DOCUMENT - ANNUAL REPORT 2019 - AXA I
CONSOLIDATED FINANCIAL STATEMENTS 5 5.6 NOTES TO THE CONSOLIDATED FINANCIAL STATEMENTS
5.6 NOTES TO THE CONSOLIDATED FINANCIAL STATEMENTS
I Note 1 Accounting principles
1.1 GENERAL INFORMATION
AXA SA, a French société anonyme (the “Company” and together
with its consolidated subsidiaries, “AXA” or the “Group”), is the
holding (parent) company of an international financial services
group focused on financial protection. AXA operates principally
in Europe, the Americas, Asia and Africa. The list of the main
entities included in the scope of AXA’s consolidated financial
statements is provided in Note 2 of the Notes to the consolidated
financial statements.
AXA is listed on Euronext Paris Compartiment A.
These consolidated financial statements including all Notes were
set by the Board of Directors on March 13, 2020.
1.2 GENERAL ACCOUNTING PRINCIPLES
AXA’s consolidated financial statements are prepared as of
December 31.
The consolidated financial statements are prepared in
compliance with IFRS and interpretations of the IFRS
Interpretations Committee that are endorsed by the European
Union before the balance sheet date with a compulsory date of
January 1, 2019. The Group does not use the “carve out” option
allowing not to apply all hedge accounting principles required
by IAS 39.
IFRS REQUIREMENTS ADOPTED ON JANUARY 1, 2019
IFRS 16 – Leases
IFRS 16 – Leases, published on January 13, 2016, sets out the
principles for the recognition, measurement, presentation
and disclosure of leases for both parties to a contract, i.e. the
customer (“lessee”) and the supplier (“lessor”). Under the
previous standard, IAS 17, a lessee had to classify its leases
as operating leases or financial leases. Leases of the Group
were mainly classified as operating leases, meaning leases
payments were accounted for as expenses and off balance sheet
commitments were disclosed. Under the IFRS 16 model, a lessee
is required to recognize (i) assets and liabilities for all leases
and (ii) depreciation of lease assets separately from interest
on lease liabilities in the income statement. Lessors continue
to classify and account for their leases as (i) operating leases
with recognition of the underlying assets; or (ii) finance leases
by derecognizing the underlying asset and recognition of a net
investment, similar to the previous IAS 17 requirements. The
cumulative eff ect of initially applying IFRS 16 totaled €68 million
and was recognized as a negative adjustment to the opening
balance of retained earnings on January 1, 2019. There is no
restatement of comparative data.
Within the Group, this new standard mainly impacts property
leases for off ices. It increased assets by €2.3 billion and liabilities
by €2.4 billion as of January 1, 2019. The diff erence with the
amount of lease commitments given as of December 31, 2018
(€2.6 billion) mainly results from the discount impact, as the
lease liability is calculated as the present value of future lease
payments. At the transition date, discount rates for leases
denominated in Euro range from -0.20% to 2.009% depending
on their duration.
As at December 31, 2019, lease liability and lease asset (called
“right-of-use”) respectively amounted to €1.6 billion and
€1.4 billion. The evolution compared to January 1, 2019 is mainly
explained by the deconsolidation of Equitable Holdings, Inc.
(“EQH”). As permitted by the standard, lease payments related to
short-term leases (i.e leases with a term of less than 12 months)
and low-value assets are directly recognized as an expense.
In December 2019, the IFRIC (IFRS Interpretations Committee)
issued a decision on the determination of the lease term for
some contracts, in particular contracts of indefinite duration, or
concluded for an initial term, and renewable by tacit agreement.
The IFRIC clarified that to determine the enforceable duration of
the lease, an entity must take into account all of the economic
aspects of the contract and not limit the analysis to contractual
termination payments. Within the Group, this decision applies
mainly to some real estate leases located in France and more
particularly to “baux 3-6-9”. The duration of these leases is being
analyzed. The impact of this decision will be accounted for in
2020 but is not expected to be material.
IFRIC 23 – Uncertainty over tax treatment
IFRIC 23 - Uncertainty over tax treatment published on June 7,
2017 clarifies how to account for income tax when it is unclear
whether the tax authority will accept the tax treatment applied in

221I UNIVERSAL REGISTRATION DOCUMENT - ANNUAL REPORT 2019 - AXA I
CONSOLIDATED FINANCIAL STATEMENTS
5
5.6 NOTES TO THE CONSOLIDATED FINANCIAL STATEMENTS
the tax return. The cumulative eff ect of initially applying IFRIC 23
totaled €111 million and was recognized as a negative adjustment
to the opening balance of retained earnings on January 1, 2019.
Moreover, IFRIC 23 requires Uncertain Tax Position (UTP) to be
presented as current and deferred taxes. Therefore, the amount
of UTP existing at January 1, 2019, (€862 million) was reclassified
from provisions for risks and charges to current and deferred
taxes. As at December 31, 2019, UTP amounted to €385 million;
the evolution compared to January 1, 2019, is mainly explained
by the deconsolidation of EQH.
Amendments to IAS 39, IFRS 9 and IFRS 7 related to Phase 1 of
the IBOR reform
Amendments to IAS 39, IFRS 9 and IFRS 7 – Temporary exceptions
from applying specific hedge accounting requirements, related
to Phase 1 of the IBOR reform were issued in September 2019
and endorsed by the European Union on January 15, 2020. They
should be applied for annual periods starting from January 1,
2020, but earlier application as of December 31, 2019 is permitted.
These amendments provide temporary reliefs from applying
specific hedge accounting requirements to hedging relationships
directly aff ected by the IBOR reform and introduce corresponding
disclosure requirements. The reliefs have the eff ect that IBOR
reform should not generally cause hedge accounting to
terminate. However, any hedge ineff ectiveness should continue
to be recorded in the income statement under both IAS 39 and
IFRS 9.
The key reliefs provided by the amendment relate to the
following hedge accounting requirements:
■ risk components remain clearly identifiable for fair value
hedges;
■ “highly probable” requirements remain for cash flow hedges;
■ recycling of the cash flow hedging reserve from other
comprehensive income to profit or loss;
■ prospective assessments (economic relationship or expected
to be ‘highly eff ective’) and IAS 39 retrospective eff ectiveness
test.
AXA has decided to early adopt the amendments to IAS 39 and
IFRS 7 as of December 31, 2019, for hedging relationships directly
impacted by the IBOR reform qualified as fair value hedges and
cash flow hedges to ensure the prospective assessments and
highly probable requirements are still met given the uncertainty
arising from the transition to the new reformed interest rates. The
early adoption of the amendments has no material impact on the
Group’s consolidated financial statements as of December 31,
2019.
Derivative instruments involved in aforementioned hedges are
interest rate derivatives and foreign exchange derivatives like
interest rate swaps, forward interest rate swaps, bond and foreign
exchange forwards and cross currency swaps.
The main interest rate benchmarks used by those hedges are
Euribor, libor USD, libor GBP, libor JPY, hibor HKD, libor CHF.
Nominal amounts of derivative instruments aff ected by the IBOR
reform (i.e. interest rate derivatives and currencies derivatives
involved in fair value hedge accounting relationships and cash
flow hedge accounting relationships under IAS 39) are presented
in Note 20.2.
In 2020, the IBOR project of the IASB enters into Phase 2 with the
objective to provide useful information about the eff ects of the
transition to alternative benchmark rates on an entity’s financial
statements and support preparers in applying the requirements
of the IFRS Standards during IBOR reform. AXA has initiated a
group wide project that covers all areas impacted by the IBOR
reform.
Other amendments and interpretations
The application of the amendments below as of January 1, 2019 had no material impact on the Group’s consolidated financial
statements.
Amendments Publication date Topic
IAS 28 – Long-term Interests in
Associates and Joint Ventures
October 12, 2017 Clarification that a company applies IFRS 9 (IAS 39 for insurers having opted
for IFRS 9 deferral approach) to long-term interests in an associate or joint
venture to which the equity method is not applied but that in substance
form part of the net investment in the associate or joint venture (long-term
interests).
Annual Improvements to IFRS
2015 – 2017 Cycle
December 12, 2017 Collection of amendments to IFRS in response to issues that are not part
of a major project.
IAS 19 – Employee Benefits
Plan Amendment, Curtailment or
Settlement
February 7, 2018 The amendments clarify the accounting when a plan amendment,
curtailment or settlement occurs.
Indeed, if a plan amendment, curtailment or settlement occurs, the current
service cost and the net interest for the period aft er the remeasurement are
determined using the assumptions used for the remeasurement.
Amendments also clarify the eff ect of a plan amendment, curtailment or
settlement on the requirements regarding the asset ceiling.

222 I UNIVERSAL REGISTRATION DOCUMENT - ANNUAL REPORT 2019 - AXA I
CONSOLIDATED FINANCIAL STATEMENTS 5 5.6 NOTES TO THE CONSOLIDATED FINANCIAL STATEMENTS
STANDARDS AND AMENDMENTS PUBLISHED BUT NOT YET
EFFECTIVE
IFRS 17 – Insurance contracts
IFRS 17 – Insurance contracts, published on May 18, 2017,
establishes the principles for the recognition, measurement,
presentation and disclosure of insurance contracts and
supersedes IFRS 4 – Insurance contracts. The new standard
applies to insurance contracts issued, to all reinsurance contracts
and to investment contracts with discretionary participating
features provided the entity also issues insurance contracts. It
requires to separate the following components from insurance
contracts: (i) embedded derivatives, if they meet certain specified
criteria, (ii) distinct investment components, and (iii) distinct
performance obligations to provide non-insurance goods and
services. These components should be accounted for separately
in accordance with the related standards.
The standard defines the level of aggregation to be used for
measuring the insurance contract liabilities and the related
profitability. Indeed, IFRS 17 requires to identify portfolios of
insurance contracts, which comprise contracts that are subject
to similar risks and are managed together. Afterwards, each
portfolio of insurance contracts issued shall be divided into
three groups:
■ contracts that are onerous at initial recognition;
■ contracts that at initial recognition have no significant
possibility of becoming onerous subsequently;
■ and the remaining contracts in the portfolio.
Moreover, contracts that are issued more than one year apart
should not be in the same group.
IFRS 17 requires a current measurement model, where the
general model is based on the following “building blocks”:
■ the fulfilment cash flows (FCF), which comprise:
• probability-weighted estimates of future cash flows,
• an adjustment to reflect the time value of money (i.e.
discounting) and the financial risks associated with those
future cash flows,
• and a risk adjustment for non-financial risk;
■ the Contractual Service Margin (CSM).
The CSM represents the unearned profit for a group of insurance
contracts and will be recognized as the entity provides services
in the future. The CSM cannot be negative at inception; any net
negative amount of the fulfilment cash flows at inception will be
recorded in profit or loss immediately.
At the end of each subsequent reporting period the carrying
amount of a group of insurance contracts is remeasured to be
the sum of:
■ the liability for remaining coverage, which comprises the FCF
related to future services and the CSM of the group at that
date; and
■ the liability for incurred claims, which is measured as the FCF
related to past services allocated to the group at that date.
The CSM is adjusted subsequently for changes in cash flows
related to future services. However, the CSM cannot be negative,
so negative changes in future cash flows that are greater than
the remaining CSM are recognized in profit or loss. Interest is
also accreted on the CSM at rates locked in at initial recognition
of a contract (i.e. discount rate used at inception to determine
the present value of the estimated cash flows). Moreover, the
CSM will be released into profit or loss based on coverage units,
reflecting the quantity of the benefits provided and the expected
coverage duration of the remaining contracts in the Group.
The Variable Fee Approach (VFA) is a mandatory model for
measuring contracts with direct participation features (also
referred to as “direct participating contracts”). A contract has
a direct participation feature if it meets all three requirements
below:
■ the contractual terms specify that the policyholder participates
in a share of a clearly identified pool of underlying items;
■ the entity expects to pay to the policyholder an amount equal
to a substantial share of the fair value returns on the underlying
items;
■ the entity expects a substantial proportion of any change in
the amounts to be paid to the policyholder to vary with the
change in fair value of the underlying items.
This assessment of whether the contract meets these criteria is
made at inception of the contract and not revised subsequently,
except in case of substantial modification of the contract.
For these contracts, the CSM is adjusted (i) for changes in the
variable fee (entity’s share in the change of value of underlying
items that corresponds to the revenue of the insurer), (ii) for the
time value of money, and (iii) for eff ect of changes in financial
risks not arising from underlying items (such as options and
guarantees).
In addition, a simplified Premium Allocation Approach (PAA)
is permitted for the measurement of the liability for remaining
coverage if it provides a measurement that is not materially
diff erent from the general model or if the coverage period is one
year or less. With the PAA, the liability for remaining coverage
corresponds to premiums received at initial recognition less
acquisition costs and amounts already recognized as insurance
revenue at the closing date. However, the general model remains
applicable for the measurement of incurred claims.
In terms of presentation, the amounts recognized in the
statement of financial performance have to be disaggregated
into:
■ an insurance service result, comprising insurance revenue
(corresponding to the insurance service provided over the
period) and insurance service expenses (i.e. incurred claims
and other incurred insurance service expense); and
■ insurance finance income or expenses.
223I UNIVERSAL REGISTRATION DOCUMENT - ANNUAL REPORT 2019 - AXA I
CONSOLIDATED FINANCIAL STATEMENTS
5
5.6 NOTES TO THE CONSOLIDATED FINANCIAL STATEMENTS
In the beginning of March 2020, the Staff of the IASB proposed
to defer the IFRS 17 eff ective date to annual reporting periods
beginning on or aft er January 1, 2023.
The Staff also proposed to extend the expiry date of the
temporary exemption from applying IFRS 9 off ered to qualifying
insurers (see below) to annual periods beginning on or aft er
January 1, 2023. This would mean that qualifying insurers could
apply both standards for the first time simultaneously.
These proposals remain subject to the IASB approval and should
be confirmed through amendments.
The standard has to be applied retrospectively unless
impracticable, in which case two options are possible:
■ either the modified retrospective approach: based on
reasonable and supportable information available without
undue cost and eff ort to the entity, certain modifications of
requirements are applied to the extent their full retrospective
application is not possible, but still with the objective to
achieve the closest outcome to retrospective application
possible; or
■ the fair value approach: the CSM is determined as the positive
diff erence between the fair value determined in accordance
with IFRS 13 and the fulfilment cash flows (any negative
diff erence would be recognized in retained earnings at the
transition date).
The standard has not yet been endorsed by the European
Union. The implementation of IFRS 17 and the assessment
of its potential impact on the Group’s consolidated financial
statements are in progress.
IFRS 9 – Financial instruments
IFRS 9 - Financial instruments, published on July 24, 2014, has
replaced IAS 39. The new standard addresses the following items
related to financial instruments:
■ classification and measurement: IFRS 9 uses a single
approach to determine whether a financial asset is measured
at amortized cost, fair value through other comprehensive
income or fair value through profit or loss. A financial asset is
measured at amortized cost if both i) the asset is held within
a business model whose objective is to hold assets in order
to collect contractual cash flows, and ii) the contractual terms
of the financial asset give rise on specified dates to cash flows
that are solely payments of principal and interest on the
principal amount outstanding (“SPPI”). If both i) the asset is
held within a business model whose objective is to hold assets
in order to collect contractual cash flows and for sale, and
ii) the contractual terms of cash flows are SPPI, the financial
asset is measured at fair value through other comprehensive
income and realized gains or losses would be recycled through
profit or loss upon sale. Assets not fitting either of these
categories are measured at fair value through profit or loss.
Additionally, at initial recognition, an entity can use the option
to designate a financial asset at fair value through profit or loss
if doing so eliminates or significantly reduces an accounting
mismatch. For equity instruments that are not held for trading,
an entity can also make an irrevocable election to present in
other comprehensive income subsequent changes in the fair
value of the instruments (including realized gains and losses),
dividends being recognized in profit or loss. Additionally, for
financial liabilities that are measured as at fair value through
profit or loss, the amount of change in the fair value of the
financial liability that is attributable to changes in the credit
risk of that liability is recognized in other comprehensive
income, unless the recognition of the eff ects of changes in
the liability’s credit risk in other comprehensive income would
create or enlarge an accounting mismatch in profit or loss;
■ impairment: the impairment model under IFRS 9 reflects
expected credit losses, as opposed to incurred credit losses
under IAS 39. Under the IFRS 9 approach, it is no longer
necessary for a credit event to have occurred before credit
losses are recognized. Instead, an entity always accounts for
expected credit losses and changes in those expected credit
losses. The amount of expected credit losses is updated at
each reporting date to reflect changes in credit risk since initial
recognition;
■ hedge accounting: IFRS 9 introduces new requirements for
hedge accounting that align hedge accounting more closely
with Risk Management. The requirements establish a more
principles-based approach to the general hedge accounting
model. The new requirements apply to all hedge accounting
with the exception of portfolio fair value hedges of interest
rate risk (commonly referred to as “fair value macro hedges”).
For these, an entity may continue to apply the hedge
accounting requirements currently in IAS 39. This exception
was granted largely because the IASB is addressing macro
hedge accounting as a separate project.
The implementation of IFRS 9 and the assessment of its potential
impact on the Group’s consolidated financial statements, in
combination with IFRS 17, are in progress.
The published eff ective date of IFRS 9 is January 1, 2018.
However, amendments to IFRS 4 - Insurance Contracts: Applying
IFRS 9 - Financial Instruments with IFRS 4 - Insurance Contracts,
published on September 12, 2016, changes the existing IFRS 4
to allow entities issuing insurance contracts within the scope
of IFRS 4 to mitigate certain eff ects of applying IFRS 9 before
the IASB’s new insurance contract standard (IFRS 17) becomes
eff ective. The amendments introduced two alternative options:
(1 ) apply a temporary exemption from implementing IFRS 9
until the earlier of (i) the eff ective date of IFRS 17; or (ii)
annual reporting periods beginning on or after January
1, 2021. Additional disclosures related to financial assets
are required during the deferral period. This option is only
available to entities whose activities are predominately
connected with insurance and that have not applied IFRS 9
previously; or
(2 ) adopt IFRS 9 but, for designated financial assets, remove
from profit or loss the eff ects of some of the accounting
mismatches that may occur before IFRS 17 is implemented.
During the interim period, additional disclosures are
required.

224 I UNIVERSAL REGISTRATION DOCUMENT - ANNUAL REPORT 2019 - AXA I
CONSOLIDATED FINANCIAL STATEMENTS 5 5.6 NOTES TO THE CONSOLIDATED FINANCIAL STATEMENTS
The Group has determined that it is eligible for the temporary
exemption option (1). The eligibility conclusion is based on an
analysis of the percentage of the total consolidated carrying
amount of liabilities connected with insurance activities
relative to the total consolidated carrying amount of all
liabilities, which indicates AXA’s activities are predominately
connected with insurance. Indeed, the amount of its insurance
liabilities determined as of December 31, 2015 represent more
than 90% of its total consolidated carrying amount of all
liabilities. Consequently, the Group has decided to defer the
implementation of IFRS 9 until the effective date of the new
insurance contracts standard, as mentioned above with the
IASB proposal. The amendments permitting the temporary
exemption are effective for annual periods beginning on or
after January 1, 2018. Disclosures related to financial assets
required during the deferral period are included in the Group’s
consolidated financial statements.
As mentioned above, the IASB, following a recommendation
of its Staff , could decide to extend the expiry of the temporary
exemption from applying IFRS 9 to annual periods beginning on
or aft er January 1, 2023, in order to enable qualifying insurers to
adopt IFRS 9 and IFRS 17 simultaneously.
In addition, amendments to IFRS 9 - Financial instruments:
prepayment features with negative compensation, published on
October 12, 2017, and endorsed by the European Union change
the initial IFRS 9, in regards of the classification of financial
assets with prepayment features that may result in negative
compensation.
Other amendments and interpretations
The following amendments and interpretation are not expected to have a material impact on the Group’s consolidated financial
statements:
Amendments and
interpretations Publication date
Eff ective for annual
periods beginning
on or aft er Topic
Conceptual Framework March 29, 2018 January 1, 2020 * The revised conceptual framework includes:
■ a new chapter on measurement;
■ guidance on reporting financial performance;
■ improved definitions of an asset and a liability, and guidance
supporting these definitions; and
■ clarifications in important areas, such as the roles of
stewardship, prudence and measurement uncertainty in
financial reporting.
IFRS 3 – Business
combination
Definition of business
October 22, 2018 January 1, 2020 * The amendments:
■ confirm that a business must include inputs and a process;
■ narrow the definitions of a business; and
■ add an optional concentration test that permits a simplified
assessment of whether an acquired set of activities and assets
is not a business.
IAS 1 – Presentation of
financial statements & IAS 8 –
Accounting policy changes
Definition of “material”
October 31, 2018 January 1, 2020 * The amendments clarify the definition of “m aterial” and how it has
to be applied by adding in the definition the clarifications that were
included so far in other IFRS standards.
* With earlier application being permitted (subject to conditions in some cases) but not elected by the Group.
PREPARATION OF FINANCIAL STATEMENTS
The preparation of financial statements in accordance with
IFRS requires the use of estimates and assumptions. It requires
a degree of judgment in the application of the Group accounting
principles described below. The main balance sheet captions
concerned are goodwill (in particular impairment tests described
in paragraph 1.7.1), intangible assets acquired in a business
combination, the value of acquired business in force, deferred
acquisition costs and equivalent, certain assets accounted at
fair value, deferred tax assets, liabilities relating to the insurance
business, pension benefit obligations and balances related to
share-based compensation. The principles set out below specify
the measurement methods used for these items. These methods,
along with key assumptions where required, are discussed in
greater depth in the notes relating to the asset and liability items
concerned where meaningful and useful.
As recommended by IAS 1, assets and liabilities are generally
classified globally on the balance sheet in increasing order of

225I UNIVERSAL REGISTRATION DOCUMENT - ANNUAL REPORT 2019 - AXA I
CONSOLIDATED FINANCIAL STATEMENTS
5
5.6 NOTES TO THE CONSOLIDATED FINANCIAL STATEMENTS
liquidity, which is more relevant for financial institutions than
a classification between current and non-current items. As
a standard practice for insurance companies, expenses are
classified by destination in the income statement.
All amounts in the consolidated statement of financial position,
consolidated statement of income, consolidated statement of
comprehensive income, consolidated statement of cash flows,
consolidated statement of changes in equity and in the Notes
are expressed in Euro million.
1.3 CONSOLIDATION
1.3.1 Scope and basis of consolidation
Companies in which AXA exercises control are subsidiaries.
They are fully consolidated from the date on which control is
transferred to AXA. Under IFRS 10, AXA controls an investee
when it is exposed, or has rights, to variable returns from its
involvement with the investee and has the ability to aff ect those
returns through its power over the investee. Only substantive
rights (i.e. the holder must have the practicability to exercise
them) and rights that are not protective shall be considered. AXA
can have power with less than a majority of the voting rights of
an investee, in particular through:
■ the proportion of ownership with regards to the other
investors;
■ potential voting rights;
■ a contractual arrangement between the investor and other
vote holders;
■ rights arising from other contractual arrangements; or
■ a combination of these indicators.
Under IFRS 11, companies over which AXA exercises a joint
controlling influence alongside one or more third parties are
joint ventures and are accounted for under the equity method.
Companies in which AXA exercises significant influence are
accounted for under the equity method. Under IAS 28, significant
influence is presumed when AXA directly or indirectly holds 20%
or more of the voting rights. Significant influence can also be
exercised through an agreement with other shareholders.
Under the equity method, AXA’s share of equity investments’ post-
acquisition profit or loss is recognized in the income statement,
and its share of post-acquisition movements in reserves is stated
under “Other reserves”.
Investment funds and real estate companies are either fully
consolidated or accounted for under the equity method,
depending on which conditions of IFRS 10/IFRS 11/IAS 28
listed above they satisfy. Fees received by asset managers are
also taken into account in the assessment of the exposure to
variability of returns. For fully consolidated investment funds,
minority interests are recognized at fair value and shown as
liabilities in the balance sheet if the companies’ instruments can
be redeemed at any time by the holder at fair value. Investment
funds accounted by equity method are shown under the balance
sheet caption “Financial investments”.
Some companies in which AXA exercises control, a joint
controlling influence or a significant influence are excluded from
the scope of consolidation as they are not material with respect
to the Group’s Consolidated Financial Statements. These are
mainly investment funds.
1.3.2 Business combinations and subsequent
changes in the Group ownership
interest
In accordance with the option made available by IFRS 1 First-time
adoption of IFRS, business combinations prior to 2004 were not
restated with respect to French accounting principles in force
at the time.
VALUATION OF ASSETS ACQUIRED AND LIABILITIES
ASSUMED OF NEWLY ACQUIRED SUBSIDIARIES
AND CONTINGENT LIABILITIES
Upon first consolidation, all assets, liabilities and contingent
liabilities (unless they are not present obligations) of the acquired
company are estimated at their fair value. However, in compliance
with an exemption permitted by IFRS 4, liabilities related to life
insurance contracts or investment contracts with discretionary
participating features are maintained at the carrying value prior
to the acquisition date to the extent that this measurement basis
is consistent with AXA’s accounting principles. The fair value of
acquired business in force relating to life insurance contracts and
investment contracts with discretionary participating features
is recognized as an asset corresponding to the present value of
estimated future profits emerging on acquired business in force
at the date of acquisition (also referred to as value of acquired
business in force or VBI and reflecting the diff erence between
the fair value and the carrying value of the liabilities). The
present value of future profits takes into consideration the cost
of capital and is estimated using actuarial assumptions based
on projections made at purchase date but also using a discount
rate that includes a risk premium.
Investment contracts with no discretionary participating features
do not benefit from the exemption permitted by IFRS 4 in Phase I
of the IASB’s insurance project such as described above, under
which the fair value of acquired liabilities is booked through the
recognition of an asset corresponding to the value of acquired
business in force. Liabilities relating to investment contracts with
no discretionary participating features are measured directly
at fair value. In accordance with IAS 39, the fair value of these
contracts cannot be less than surrender value when they contain
a demand feature.
Other identifiable intangible assets such as the value of customer
relationships should be recognized. The value of customer
relationships intangible represents the value of future cash flows
expected from renewals and the cross-selling of new products to

226 I UNIVERSAL REGISTRATION DOCUMENT - ANNUAL REPORT 2019 - AXA I
CONSOLIDATED FINANCIAL STATEMENTS 5 5.6 NOTES TO THE CONSOLIDATED FINANCIAL STATEMENTS
customers known and identified at the time of the acquisition.
These projections include assumptions regarding claims,
expenses and financial revenues, or they can be estimated on the
basis of the New Business Value. In line with accounting practices
in force before the adoption of IFRS, which may continue to be
applied under IFRS 4, future premiums relating to acquired
business may be recognized in the “Value of acquired business
in force” item.
To the extent that these other intangible assets can be estimated
separately, they can also be measured by looking at the
purchased marketing resources that will allow to generate these
future cash flows. The nature of the intangible assets recognized
is consistent with the valuation methods used when purchasing
the acquired entity.
In the context of a business combination, only restructuring
costs that can be measured reliably and which correspond to an
existing liability of the acquired company prior to the acquisition
date are included in restructuring provisions recognized in the
acquired company’s balance sheet at acquisition date.
The consideration transferred in a business combination is
measured at fair value, which is calculated as the sum of the
acquisition-date fair values of the assets transferred by the
Group, the liabilities incurred by the Group to former owners of
the acquiree and the equity interests issued by the Group.
Purchase consideration includes any contingent element
(adjustment in the acquisition price conditional upon on one
or more events). In the estimate of the contingent element,
attention is paid to use assumptions that are consistent with the
assumptions used for the valuation of intangible assets such as
VBI. For business combinations that occurred before January 1,
2009, any contingent element was included in the cost of the
combination to the extent the adjustment was probable and
could be measured reliably. If the future events do not occur
or the estimate needs to be revised, the cost of the business
combination continues to be adjusted accordingly, taking
account of the impact in terms of additional goodwill and/or
adjustments of the valuation of acquired assets and liabilities.
For business combinations on or after January 1, 2009, any
change to the estimate of the contingent element between the
acquisition date and the amount actually subsequently paid is
recognized in the income statement.
Direct transaction costs related to a business combination are
charged in the income statement when incurred.
In step acquisitions, any previous minority interest held by the
Group is measured at fair value and the resulting adjustment is
recognized through net income. Similarly, when an additional
purchase changes the control from significant influence or
joint control to control, any investment pre-existing in a former
associate/joint venture is re-measured to its fair value with the
gain or loss through net income (consequently also resulting in
a new goodwill).
According to a decision taken for each acquisition, any minority
interest may be measured at fair value or at its proportionate
interest in the acquiree’s identifiable net assets.
GOODWILL
Goodwill is measured as the excess of (i) the aggregate of the
consideration transferred, the amount of any minority interest
in the acquiree and in a business combination achieved in
stages, the acquisition-date fair value of the Group’s previously
held equity interest in the acquiree over (ii) the net of the
acquisition-date amounts of the identifiable assets acquired
and the liabilities assumed.
Goodwill arising from the acquisition of a foreign entity is
recorded in the local currency of the acquired entity and is
translated into Euro at the closing date.
If the cost of acquisition is less than the net of the acquisition-
date amounts of the identifiable assets acquired and the
liabilities assumed, the difference is directly recorded in the
consolidated statement of income.
Adjustments can be made to goodwill within twelve months
of the acquisition date, if new information becomes available
to complete the initial accounting. In this case, comparative
information is presented as if the initial accounting had been
completed from the acquisition date.
If, aft er the period of twelve months, a deferred tax asset, initially
considered as not recoverable, finally meets the recognition
criteria, the corresponding tax benefit is recorded in the
consolidated statement of income without a corresponding
adjustment in goodwill.
Goodwill is allocated to cash generating units corresponding to
(i) the companies acquired or portfolios of business acquired
according to their expected profitability, and (ii) the entities
already within the AXA Group that will benefit from the synergies
of the combination with the activities acquired. This allocation of
goodwill is used both for segment reporting and for impairment
testing.
PURCHASE AND SALE OF MINORITY INTERESTS
IN A CONTROLLED SUBSIDIARY
Purchase and sale transactions of minority interests in a
controlled subsidiary that do not change the conclusion of
control are recorded through shareholders’ equity (including
direct acquisition costs).
If control in a subsidiary is lost, any gain or loss is recognized in
net income. Furthermore, if an investment in the entity is retained
by the Group, it is re-measured to its fair value and any gain or
loss is also recognized in net income.
PUT OVER MINORITY INTERESTS
When control over a subsidiary is acquired, a put option may be
granted to minority shareholders. However, the recognition of
the puttable instruments as a liability depends on the contractual
obligations.
When the contract involves an unconditional commitment
exercisable by the option holder, it is recognized as a liability.
Since the balancing entry to this liability is not specified by
current IFRS, the Group’s method is to (i) reclassify minority

227I UNIVERSAL REGISTRATION DOCUMENT - ANNUAL REPORT 2019 - AXA I
CONSOLIDATED FINANCIAL STATEMENTS
5
5.6 NOTES TO THE CONSOLIDATED FINANCIAL STATEMENTS
interests from equity to liability, (ii) re-measure this liability at
the present value of the option price, and (iii) recognize the
difference either as an increase in goodwill for puts existing
before January 1, 2009, or as a decrease in equity (Group share)
for a put granted aft er January 1, 2009, to the extent there is no
immediate transfer of risks and rewards. Similarly, subsequent
changes in the liability are recorded against goodwill for puts
existing before January 1, 2009, and against equity (Group share)
for puts granted aft er that date.
INTRA-GROUP TRANSACTIONS
Intra-group transactions, including internal dividends, payables/
receivables and gains/losses on intra-group transactions are
eliminated:
■ in full for controlled subsidiaries; and
■ to the extent of AXA’s interest for entities consolidated by
equity method.
The eff ect on net income of transactions between consolidated
entities is always eliminated. However, in case of a loss, an
impairment test is performed, in order to assess whether an
impairment of the underlying item has to be booked.
In the event of an internal sale of an asset that is not intended
to be held on the long term by the Group, deferred tax is
recognized as the current tax calculated on the realized gain or
loss is eliminated. The income statement impact of the potential
policyholders’ participation resulting from this transaction is also
eliminated, and a deferred policyholders’ participation asset or
liability is posted to the statement of financial position.
In addition, the transfer of consolidated shares, between two
consolidated subsidiaries but held with different ownership
percentages, should not impact the Group net income. The
only exception would be any related tax and policyholders’
participation recorded in connection to the transaction, which
are maintained in the consolidated financial statements. These
transfers also have an impact on Group shareholders’ equity
(with a balancing entry recorded in minority interests). This
impact is identified in the “other” changes of the consolidated
statement of shareholders’ equity.
1.4 FOREIGN CURRENCY TRANSLATION
OF FINANCIAL STATEMENTS AND
TRANSACTIONS
The consolidated financial statements are presented in
Euro million, the Euro being the Group’s presentational currency.
The results and financial position of all Group entities that have
a functional currency (i.e. the currency of the primary economic
environment in which the entity operates) diff erent from the
Group presentational currency are translated as follows:
■ assets and liabilities of entities in a functional currency
diff erent from Euro are translated at the closing exchange rate;
■ revenues and expenses are translated at the average exchange
rate over the period;
■ all resulting foreign exchange diff erences are recognized as a
separate component of equity (translation diff erences).
At the local entity level, foreign currency transactions are
translated into the functional currency using the exchange rate
prevailing at the date of the transactions. Foreign exchange gains
and losses resulting from the settlement of such transactions
and from the translation at closing rates of monetary assets and
liabilities denominated in foreign currencies are recognized in
the income statement, except where hedge accounting is applied
as explained in paragraph 1.10.
As mentioned in paragraph 1.3.2, goodwill arising on the
acquisition of a foreign entity is recorded in the local currency of
the acquired entity and is translated into Euro at the closing date.
Foreign exchange diff erences arising from the translation of a
net investment in a foreign subsidiary, borrowings and other
currency instruments qualifying for hedge accounting of
such investment are recorded in shareholders’ equity under
translation diff erences and are recycled in the income statement
as part of the realized gain or loss on disposal of the hedged net
investment.
Foreign exchange diff erences arising from monetary financial
investments available for sale are recognized as income or
expense for the period in respect of the portion corresponding
to amortized cost. The residual translation diff erences relating
to fair value changes are recorded in shareholders’ equity, like
for non-monetary items such as equity securities.
Regarding the cumulative amount of the exchange diff erences
related to disposed business, the Group applies the step-by-step
consolidation method (IFRIC 16).
1.5 FAIR VALUE MEASUREMENT
The Group applies the IFRS 13 fair value hierarchy as described
below for all assets and liabilities where another IFRS requires or
permits fair value measurement or disclosures about fair value
measurement in the Notes. Principles below address mostly
assets given the nature of the activities of the Group.
1.5.1 Active market: quoted price
Fair values of assets and liabilities traded on active markets
are determined using quoted market prices when available. An
instrument is regarded as quoted in an active market if quoted
prices are readily and regularly available from an exchange,

228 I UNIVERSAL REGISTRATION DOCUMENT - ANNUAL REPORT 2019 - AXA I
CONSOLIDATED FINANCIAL STATEMENTS 5 5.6 NOTES TO THE CONSOLIDATED FINANCIAL STATEMENTS
dealer, broker, industry group, pricing service or regulatory
agency and those prices represent actual and regularly occurring
market transactions on an arm’s length basis between a willing
seller and a willing buyer. For financial instruments traded in
active markets, quotes received from external pricing services
represent consensus prices, i.e. using similar models and inputs
resulting in a very limited dispersion.
The fair value amounts of assets and liabilities for which fair value
is determined in whole directly by reference to an active market
are disclosed as level 1 in the Notes to the financial statements.
1.5.2 Active versus inactive markets –
financial instruments
Financial instruments are considered as being quoted in an
active market when:
■ quotes that represent consensus are regularly provided by
external pricing services with limited dispersion; and
■ prices are readily available.
Liquidity may be defined as the possibility to sell or dispose
of the asset in the ordinary course of business within a certain
limited time period at approximately the price at which the
investment is valued. Liquidity for debt instruments is assessed
using a multi-criteria approach including the number of quotes
available, the place of issuance and the evolution of the widening
of bid ask spreads.
A financial instrument is regarded as not quoted in an active
market:
■ if there is little observation of transaction prices as an inherent
characteristic of the instrument;
■ when there is a significant decline in the volume and level of
trading activity;
■ in case of significant illiquidity;
■ if observable prices cannot be considered as representing fair
value because of dislocated market conditions.
Characteristics of inactive markets can therefore be very diff erent
in nature, inherent to the instrument or indicative of a change in
the conditions prevailing in certain markets.
1.5.3 Assets and liabilities not quoted
in an active market
Fair values of assets and liabilities that are not traded in an active
market are estimated using:
■ external and independent pricing services; or
■ valuation techniques.
Fair values of assets and liabilities that are not traded in active
market mainly based on observable market data are disclosed
as level 2 in the Notes to the financial statements. Fair values
mainly not based on observable market data are disclosed as
level 3 in the Notes.
■ No active market: use of external pricing services.
External pricing services may be fund asset managers in the case
of non-consolidated investments in funds or brokers. To the
extent possible, the Group collects quotes from external pricing
providers as inputs to measure fair value. Prices received may
form tight clusters or dispersed quotes which may then lead
to the use of valuation techniques. The dispersion of quotes
received may be an indication of the large range of assumptions
used by external pricing providers given the limited number of
transactions to be observed or reflect the existence of distress
transactions. In addition, given current market conditions since
the financial crisis and the persistency of complete inactivity of
some markets since then, many financial institutions closed their
desks dedicated to structured assets deals and are no longer in
a position to deliver meaningful quotes.
■ No active market: use of valuation techniques.
The objective of valuation techniques is to arrive at the price
at which an orderly transaction would take place between
market participants (a willing buyer and a willing seller) at the
measurement date. Valuation techniques include:
• market approach: the consideration of recent prices and
other relevant information generated by market transactions
involving substantially similar assets or liabilities;
• income approach: use of discounted cash flow analysis,
option pricing models, and other present value techniques
to convert future amounts to a single current (i.e. discounted)
amount;
• cost approach: the consideration of amounts that would
currently be required to construct or replace the service
capacity of an asset.
Valuation techniques are subjective in nature and significant
judgment is involved in establishing fair values. They include
recent arm’s length transactions between knowledgeable
willing parties on similar assets if available and representative
of fair value and involve various assumptions regarding the
underlying price, yield curve, correlations, volatility, default
rates and other factors. Unlisted equity instruments valuation
is based on cross checks using diff erent methodologies such as
discounted cash flows techniques, price earning ratios multiples,
adjusted net asset values, taking into account recent transactions
on instruments which are substantially the same if concluded
at arm’s length between knowledgeable willing parties, if
any. The use of valuation techniques and assumptions could
produce diff erent estimates of fair value. However, valuations
are determined using generally accepted models (discounted
cash flows, Black & Scholes models, etc.) based on quoted
market prices for similar instruments or underlyings (index,

229I UNIVERSAL REGISTRATION DOCUMENT - ANNUAL REPORT 2019 - AXA I
CONSOLIDATED FINANCIAL STATEMENTS
5
5.6 NOTES TO THE CONSOLIDATED FINANCIAL STATEMENTS
credit spread, etc.) whenever such directly observable data are
available and valuations are adjusted for liquidity and credit risk.
Valuation techniques may be used when there is little observation
of transaction prices as an inherent characteristic of the market,
when quotes made available by external pricing providers are
too dispersed or when market conditions are so dislocated that
observed data cannot be used or need significant adjustments.
Internal mark to model valuations are therefore normal market
practices for certain assets and liabilities inherently scarcely
traded or exceptional processes implemented due to specific
market conditions.
■ Use of valuation techniques in dislocated markets.
The dislocation of certain markets may be evidenced by various
factors, such as very large widening of bid ask spreads which
may be helpful indicators in understanding whether market
participants are willing to transact, wide dispersion in the prices
of the small number of current transactions, varying prices over
time or among market participants, inexistence of secondary
markets, disappearance of primary markets, closing down of
dedicated desks in financial institutions, distress and forced
transactions motivated by strong needs of liquidity or other
diff icult financial conditions implying the necessity to dispose
of assets immediately with insuff icient time to market the assets
to be sold, and large bulk sales to exit such markets at all costs
that may involve side arrangements (such as sellers providing
finance for a sale to a buyer).
In such cases, the Group uses valuation techniques including
observable data whenever possible and relevant, adjusted if
needed to develop the best estimate of fair value, including
adequate risk premiums or develops a valuation model based
on unobservable data representing estimates of assumptions
that willing market participants would use when prices are not
current, relevant or available without undue costs and eff orts: in
inactive markets, transactions may be inputs when measuring fair
value, but would likely not be determinative and unobservable
data may be more appropriate than observable inputs.
1.6 SEGMENT REPORTING
The segmental analysis provided in AXA’s Annual Report and
Financial Statements reflects operating business segments. It
is based on six geographies (France, Europe, Asia, AXA XL, the
United States and International) and the seventh segment
comprises transversal entities as well as the Corporate Center
and other central Holdings.
1.7 INTANGIBLE ASSETS
1.7.1 Goodwill and impairment of goodwill
Goodwill is considered to have an indefinite useful life and
is therefore not amortized but subject to a regular test for
impairment. Impairment tests are performed at least annually.
Impairment of goodwill is not reversible.
AXA performs an impairment test of goodwill by cash generating
unit, using valuation approaches that rely on parameters such
as market indicators, market value of assets, market value of
liabilities and future operating profits, derived on the basis of
operational and economic assumptions in order to determine
any significant adverse changes that might lead to the non-
recoverability of the goodwill. Compliant with IAS 36, within
each cash generating unit, a comparison is made between net
book value and the recoverable value (equal to the higher of fair
value less costs to sell and value in use). Value in use consists of
the net assets and the value placed on expected future earnings
from existing and new business. For Life & Savings segment,
the value of future expected earnings is estimated on the basis
of embedded value models or similar calculations for other
activities. Fair value less costs to sell is determined in compliance
with IFRS 13 fair value as described in paragraph 1.5.
An impairment loss is recognized for a cash generating unit if,
and only if, the recoverable amount of the unit or group of units
is less than the carrying amount of the unit or group of units.
Fair value approach is based on risk neutral valuation techniques
taking into account:
■ the current shareholders’ net asset value plus the future
profitability of the business in force:
• the current shareholders’ net asset value is adjusted to
take into account any diff erence between the basis of cash
flows projections used in the value of business in force
calculations and IFRS,
• the profitability of business in force is determined using
the embedded value methodology, which is an industry-
wide and specific valuation approach, consistent with the
principle of discounted earnings, as the value of business
in force is represented by the discounted value of future
earnings from the in-force portfolios. The Group uses
however both market consistent risk neutral approaches,
aligned with fair-value calculations, and traditional
discounted cash flows projections;
■ the profitability of future new business:
• the value of future new business is computed either on the
basis of multiples of a standardized year of new business

230 I UNIVERSAL REGISTRATION DOCUMENT - ANNUAL REPORT 2019 - AXA I
CONSOLIDATED FINANCIAL STATEMENTS 5 5.6 NOTES TO THE CONSOLIDATED FINANCIAL STATEMENTS
contribution (present value of projected future distributable
profits generated from business written in a year) or on a
projection of each of the expected annual future earnings
when multiples are not appropriate. The determination of
the future earnings arising from the new business relies
upon the use of operational and economic assumptions,
both of which are compliant with the requirements of the
diff erent regulatory frameworks.
The recoverable value of the Life & Savings segment is first
assessed on a risk free basis (basic test) and then on the basis
of illustrative investment assumptions suitable for a traditional
embedded value approach if the recoverable value determined
for the basic test is lower than the carrying amount.
The value in use approach is built upon cash flow projections
based on the business plans approved by AXA management
covering up to five years and discounted using a risk adjusted
rate. Cash flows beyond that period are extrapolated using a
steady growth rate and a terminal value.
1.7.2 Value of purchased life insurance
business in force (VBI)
The value of purchased insurance contracts and investment
contracts with discretionary participating features recognized in a
business combination (see paragraph 1.3.2) is amortized as profits
emerge over the life of the contracts’ portfolio. In conjunction with
the liability adequacy test (see paragraph 1.14.2), VBI is subject
to annual recoverability testing based on actual experience and
expected changes in the main assumptions.
1.7.3 Deferred Acquisition Costs (DAC)
relating to insurance contracts
and investment contracts with
discretionary participating features –
rights to future management fees, also
known as deferred origination costs
(DOC) relating to investment contracts
with no discretionary participating
features
The incremental direct costs of acquiring a portfolio of
insurance contracts and investment contracts with discretionary
participating features, primarily related to the selling,
underwriting and initiating the insurance contracts in a portfolio,
are deferred by recognizing an asset, Deferred Acquisition Costs
(DAC). In Property & Casualty segment, DAC are amortized over
the terms of the policies, as premium is earned. For Life & Savings
segment, the asset is amortized based on the estimated gross
profits emerging over the life of the contracts. This asset is tested
for recoverability and any amount above future estimated gross
profits is expensed. DAC are also tested through the liability
adequacy test (see paragraph 1.14.2).
For investment contracts with no discretionary participating
features, a similar asset is recognized, i.e. rights to future
management fees, also known as Deferred Origination Costs
(DOC) (see Note 7) but limited to incremental costs directly
attributable to the provision of investment management services.
This asset is amortized by taking into account projections of fees
collected over the life of the contracts. The amortization of DOC is
reviewed at each closing date to reflect changes in assumptions
and experience. This asset is also tested for recoverability.
DAC and DOC are reported gross of unearned revenues and
fees reserves. These unearned revenues and fees reserves are
separately recognized as liabilities and are amortized over the
contract term using the same amortization approach as the one
used for DAC and DOC.
1.7.4 Unearned revenues reserves
Revenues received at contract inception to cover future services
are deferred and recognized in the income statement using
the same amortization pattern as the one used for deferred
acquisition costs.
1.7.5 Other intangible assets
Other intangible assets include soft ware developed for internal
use for which direct costs are capitalized and amortized on a
straight-line basis over the assets’ estimated useful lives.
They also include customer relationships intangibles as well
as distribution agreements recognized as a result of business
combinations. If these assets have a finite useful life, they are
amortized on a straight-line basis over their estimated life. In
all cases, they are subject to impairment tests, at each closing
for assets with a finite useful life and at least annually for
other assets. In the event of a significant decline in value, an
impairment is booked corresponding to the diff erence between
the value on the balance sheet and the higher of value in use and
fair value less costs to sell.
1.8 INVESTMENTS FROM INSURANCE,
BANKING AND OTHER ACTIVITIES
Investments include investment in real estate properties and
financial instruments including equity instruments, debt
instruments and loans.
1.8.1 Investment in real estate properties
Investment in real estate properties (excluding investment in
real estate properties totally or partially backing liabilities arising
from contracts where the financial risk is borne by policyholders)
is recognized at cost. The properties components are depreciated

231I UNIVERSAL REGISTRATION DOCUMENT - ANNUAL REPORT 2019 - AXA I
CONSOLIDATED FINANCIAL STATEMENTS
5
5.6 NOTES TO THE CONSOLIDATED FINANCIAL STATEMENTS
over their estimated useful lives, also considering their residual
value if it may be reliably estimated.
In case of unrealized loss over 15%, an impairment is recognized
for the diff erence between the net book value of the investment
property and the fair value of the asset based on an independent
valuation. Furthermore, at the level of each reporting entity, if
the cumulated amount of unrealized losses under 15% (without
off setting with unrealized gains) represents more than 10% of the
cumulated net cost of real estate assets, additional impairment
is booked on a line-by-line approach until the 10% threshold
is reached.
If, in subsequent periods, the appraisal value rises to at least
15% more than the net carrying value, previously recorded
impairment is reversed to the extent of the diff erence between
i) the net carrying value and ii) the lower of the appraisal value
and the depreciated cost (before impairment).
Investment in real estate properties that totally or partially backs
liabilities arising from contracts where the financial risk is borne
by policyholders is recognized at fair value with changes in fair
value through profit or loss.
1.8.2 Financial instruments classification
Depending on the intention and ability to hold the invested
assets, financial instruments are classified in the following
categories:
■ assets held to maturity, accounted for at amortized cost;
■ assets held for trading and assets designated as at fair value
with change in fair value through profit or loss;
■ available for sale assets accounted for at fair value with
changes in fair value recognized through shareholders’ equity;
■ loans and receivables (including some debt instruments not
quoted in an active market) accounted for at amortized cost.
At inception, the option to designate financial investments
and liabilities at fair value with change in fair value recognized
through income statement is mainly used by the Group for the
following financial instruments:
■ financial investments when electing the fair value option
allows the Group to solve accounting mismatch, and in
particular:
• assets backing liabilities arising from contracts where the
financial risk is borne by policyholders,
• assets included in hedging strategies set out by the Group for
economical reasons but not eligible for hedge accounting
as defined by IAS 39,
• debt held by structured bond (primarily Collateralized
Debt Obligations) funds controlled and consolidated by
the Group;
■ portfolios of managed financial investments whose
profitability is valued on a fair value basis: mainly securities
held by consolidated investment funds, managed according
to the Group Risk Management policy (“Satellite Investment
Portfolio”, see definition below).
In practice, assets held through consolidated investment funds
are classified:
■ either as assets of the “Core Investment Portfolios” which
include assets backing liabilities arising from insurance and
investment contracts, managed according to AXA’s Assets and
Liabilities strategy; or
■ as assets of the “Satellite Investment Portfolios”, reflecting
the strategic asset allocation based on a dynamic asset
management aimed at maximizing returns.
Underlying financial instruments held in the “Core Investment
Portfolios” are classified as available for sale with change in
fair value through shareholders’ equity unless involved in a
qualifying hedge relationship or more broadly when electing
the fair value option reduces accounting mismatch. As specified
above, the financial instruments held in the “Satellite Investment
Portfolios” are accounted for at fair value with changes in fair
value recognized through income statement.
Assets designated as available for sale, trading assets,
investments designated as at fair value through profit or loss
and all derivatives are measured at fair value, i.e. the amount for
which an asset could be exchanged, between knowledgeable,
willing parties in an arm’s length transaction. The Group applies
the IFRS 13 fair value hierarchy.
Loans which are not designated under the fair value option are
accounted at amortized cost using the eff ective interest rate
method.
IMPAIRMENT OF FINANCIAL INSTRUMENTS
AXA assesses at each balance sheet date whether a financial
asset or a group of financial investments at (amortized) cost or
designated as available for sale should be impaired. A financial
asset or group of financial investments should be impaired when
there is objective evidence of impairment as a result of one or
more events and this event has an impact on the estimated
future cash flows of the assets that can be reliably estimated.
For debt instruments classified as “held to maturity” or “available
for sale”, an impairment based respectively on future cash flows
discounted using the initial eff ective interest rate or on fair value
is recorded through the income statement if future cash flows
may not be fully recoverable due to a credit event relating to the
instrument issuer. A downgrade of an entity’s credit rating is not,
of itself, evidence of impairment. If the credit risk is eliminated or
improves, the impairment may be reversed. The amount of the
reversal is also recognized in the income statement.
For equity instruments classified as available for sale, a significant
or prolonged decline in the fair value below its carrying value
is considered as indication for potential impairment, such as
equity instruments showing unrealized losses over a 6 months
period or more (prior to the closing date), or unrealized losses
in excess of 20% of the net carrying value at the closing date.
If such evidence exists for an available for sale financial asset,
the cumulative loss – measured as the difference between
the acquisition cost and the current fair value, less any
impairment on that financial asset already booked in the
income statement – is removed from shareholders’ equity and
an impairment is recognized through the income statement.

232 I UNIVERSAL REGISTRATION DOCUMENT - ANNUAL REPORT 2019 - AXA I
CONSOLIDATED FINANCIAL STATEMENTS 5 5.6 NOTES TO THE CONSOLIDATED FINANCIAL STATEMENTS
Equity instruments impairment recognized in the income
statement cannot be reversed through the income statement
until the asset is sold or derecognized.
Impairment testing for loans available for sale is based on the
present value of expected future cash flows, discounted at the
loan’s effective interest rate (down to the loan’s observable
market price), or on the fair value of the collateral.
For financial investments accounted for at amortized cost,
including loans and assets classified as “held to maturity” or
assets designated as “Loans and receivables”, the impairment
test is first performed at the asset level. A more global test is then
performed on groups of assets with similar risk profile.
Methods for calculating the net book value of assets sold (average
cost, first-in first-out, etc.) depend on local Assets and Liabilities
Management (ALM) strategies as these strategies have been set
up to take into account specific commitments to policyholders.
These methods may diff er within the Group provided that they
are used consistently at each entity level.
1.8.3 Repurchase agreements and securities
lending
The Group is party to repurchase agreements and securities
lending transactions under which financial assets are sold
to a counterparty, subject to a simultaneous agreement to
repurchase these financial assets at a certain later date, at an
agreed price. Since substantially all of the risks and rewards of
the financial assets remain with the Group over the entire lifetime
of the transaction, the Group does not derecognize the financial
assets. The proceeds of the sale are reported separately. Interest
expense from repurchase and security lending transactions is
accrued over the duration of the agreements.
Additionally, the Group is party to total return swaps under which
financial assets are sold to a counterparty with a corresponding
agreement. Cash flows equal to those of the underlying assets
will be remitted to the Group in exchange for specified payments
taking into account any increase or decline in the fair value of the
assets. This results in substantially all of the risks and rewards of
the financial assets remaining with the Group. As such, the Group
does not derecognize the financial assets.
The Group is also party to reverse repurchase agreements under
which financial assets are purchased from a counterparty, subject
to a simultaneous agreement to return these financial assets at
a certain later date, at an agreed price. If substantially all of the
risks and rewards of the securities remain with the counterparty
over the entire lifetime of the agreement of the transaction, the
securities concerned are not recognized as financial assets of
the Group. The amounts of cash disbursed are recorded under
financial investments, except for transactions arising from
banking activities, which are recorded as separate assets. Interest
income on reverse repurchase agreements is accrued over the
duration of the agreements.
1.9 ASSETS BACKING LIABILITIES
ARISING FROM CONTRACTS WHERE
THE FINANCIAL RISK IS BORNE
BY POLICYHOLDERS
Assets backing liabilities arising from insurance or investment
contracts where the financial risk is borne by policyholders are
presented in a separate aggregate of the balance sheet so that
they are shown in a symmetrical manner to the corresponding
liabilities. This presentation is considered more relevant for the
users and consistent with the liquidity order recommended
by IAS 1 for financial institutions, since the risks are borne by
policyholders, whatever the type of assets backing liabilities
(investment in real estate properties, debt instruments or equity
instruments, etc.). Details of these assets are provided in the
Notes.
1.10 DERIVATIVE INSTRUMENTS
Derivatives are initially recognized at fair value at purchase date
and are subsequently re-measured at their fair value. Unrealized
gains and losses are recognized in the statement of income unless
they relate to a qualifying hedge relationship as described below.
The Group designates certain derivatives as either: (i) hedging
of the fair value of recognized assets or liabilities or of a firm
commitment (fair value hedge), or (ii) hedging of highly probable
expected future transactions (cash flow hedge), or (iii) hedging
of net investments in foreign operations.
The Group documents, at inception, the hedge relationship, as
well as its Risk Management hedging objectives and strategy. The
Group also documents the hedge eff ectiveness, both at inception
and on an ongoing basis, indicating the actual or expected
eff iciency level of the derivatives used in hedging transactions
in off setting changes in the fair values or cash flows of hedged
underlying items.
FAIR VALUE HEDGE
Changes in the fair value of derivatives designated and qualifying
as fair value hedge are recorded in the income statement,
together with any changes in the fair value of the hedged asset
or liability. Therefore, the gain or loss relating to any ineff ective
portion is directly recognized in the income statement.
CASH FLOW HEDGE
The eff ective portion of changes in the fair value of derivatives
designated and qualifying as cash flow hedge is recognized in
shareholders’ equity. The gain or loss relating to any ineff ective
portion is recognized in the income statement. Cumulative gain
or loss in shareholders’ equity is recycled in the income statement
when the hedged underlying item impacts the profit or loss for
the period (for example when the hedged future transaction

233I UNIVERSAL REGISTRATION DOCUMENT - ANNUAL REPORT 2019 - AXA I
CONSOLIDATED FINANCIAL STATEMENTS
5
5.6 NOTES TO THE CONSOLIDATED FINANCIAL STATEMENTS
is recognized). When a hedging instrument reaches its maturity
date or is sold, or when a hedge no longer qualifies for hedge
accounting, the cumulative gains or losses in shareholders’
equity are released in profit or loss when the initially hedged
future transaction ultimately impacts the income statement.
NET INVESTMENT HEDGE
The accounting of net investments in foreign operations hedge
is similar to the accounting of cash flow hedge. Any gain or loss
on the hedging instrument relating to the eff ective portion of
the hedge is recognized in shareholders’ equity; the gain or loss
relating to the ineff ective portion is recognized in the income
statement. Cumulative gains and losses in shareholders’ equity
impact the income statement only on disposal of the foreign
operations.
DERIVATIVES NOT QUALIFYING FOR HEDGE ACCOUNTING
Changes in the fair value of all other derivative instruments that
do not qualify for hedge accounting are recognized in the income
statement. Given IAS 39 constraints, only a few hedges are eligible
to hedge accounting provisions described above. However, most
of the derivatives used by the Group are purchased with a view to
hedge or for example to use such instruments as an alternative
to gain exposure to certain asset classes through “synthetic
positions”. See Note 20.
The Group holds financial investments that also include
embedded derivatives. Such embedded derivatives are
separately recorded and measured at fair value through profit
or loss if the impact is deemed material.
For the statement of financial position, derivatives are presented
alongside the underlying assets or liabilities for which they are
used, regardless of whether these derivatives meet the criteria
for hedge accounting.
The purpose and condition of the use of derivatives within the
Group are detailed in Note 20.
1.11 ASSETS/LIABILITIES HELD FOR SALE
AND ASSETS/LIABILITIES INCLUDING
DISCONTINUED OPERATIONS
These comprise assets, particularly buildings or operations,
intended to be sold or discontinued within twelve months.
Subsidiaries held for sale remain within the scope of
consolidation until the date on which the Group loses eff ective
control. The assets and activities (assets and liabilities)
concerned are measured at the lower of net carrying value and
fair value net of selling costs. They are presented in separate
asset and liability items on the balance sheet. The liabilities
of subsidiaries (excluding shareholders’ equity) held for sale
are entered separately on the liability side of the consolidated
balance sheet, with no netting against assets.
In the event of a discontinuation of operations representing
either a business line, a main and distinct geographical region
or a subsidiary acquired solely with a view to reselling, their
aft er-tax contribution is stated on a separate line of the income
statement. For comparison purposes, the same applies to the
presentation of income statements relating to previous periods
that are included in the financial statements. This separate line
also includes the post-tax gain/loss recognized on the disposal
of the discontinued operation at the date of loss of control.
1.12 CASH AND CASH EQUIVALENTS
Cash comprises cash on hand and demand deposits while cash
equivalents are short-term, liquid investments that are readily
convertible to cash and which are subject to low volatility.
1.13 SHARE CAPITAL
AND SHAREHOLDERS’ EQUITY
1.13.1 Share capital
Ordinary shares are classified in shareholders’ equity when there
is no obligation to transfer cash or other assets to the holders.
Additional costs (net of tax) directly attributable to the issue
of equity instruments are shown in shareholders’ equity as a
deduction to the proceeds.
1.13.2 Undated subordinated debt
Undated subordinated debt and any related interest charges are
classified either in shareholders’ equity (in the “other reserves”
aggregate) or as liabilities depending on contract clauses without
taking into consideration the prospect of redemption under
economic constraints (e.g. step up clauses or shareholders’
expectations).
1.13.3 Compound financial instruments
Any financial instrument issued by the Group with an equity
component (for example certain options granted to convert the
debt instrument into an equity instrument of the Company) and
a liability component (a contractual obligation to deliver cash)
is classified separately on the liability side of the balance sheet
with the equity component reported in Group shareholders’
equity (in the “other reserves” aggregate) and the liability
component reported in financing debt. Gains and losses relating
to redemptions or refinancing of the equity component are
recognized as changes to shareholders’ equity.
1.13.4 Treasury shares
Treasury shares and any directly related costs are recorded as a
deduction to consolidated shareholders’ equity. Where treasury
shares are subsequently sold or reissued, any consideration

234 I UNIVERSAL REGISTRATION DOCUMENT - ANNUAL REPORT 2019 - AXA I
CONSOLIDATED FINANCIAL STATEMENTS 5 5.6 NOTES TO THE CONSOLIDATED FINANCIAL STATEMENTS
received is included in consolidated shareholders’ equity, net
of any directly related costs and tax eff ects.
However, treasury shares held by controlled investment
funds backing contracts where the financial risk is borne by
policyholders are not deducted as all risks and income resulting
from holding these shares are attributable to policyholders.
1.13.5 Preferred shares
Preferred shares issued by the Group are recorded as equity
when there is no contractual obligation to redeem and there is
no contractual obligation to deliver cash or other financial asset.
1.14 LIABILITIES ARISING FROM
INSURANCE AND INVESTMENT
CONTRACTS
1.14.1 Contracts classification
The Group issues contracts that transfer an insurance risk or a
financial risk or both.
Insurance contracts, including assumed reinsurance contracts,
are contracts that carry significant insurance risks. Such contracts
may also transfer financial risk from the policyholders to the
insurer. Investment contracts are contracts that carry financial
risk with no significant insurance risk.
A number of insurance and investment contracts contain
discretionary participating features. These features entitle the
contract holder to receive additional benefits or bonuses on top
of these standard benefits:
■ they are likely to represent a significant portion of the overall
contractual benefits;
■ their amount or timing is contractually at the discretion of
the Group; and
■ they are contractually based on the performance of a group of
contracts, the investment returns of a financial asset portfolio
or the Company profits, a fund or another entity that issues
the contract.
In some insurance or investment contracts, the financial risk is
borne by policyholders. Such contracts are usually Unit-Linked
contracts.
The Group classifies its insurance and investment contracts into
six categories:
■ liabilities arising from insurance contracts;
■ liabilities arising from insurance contracts where the financial
risk is borne by policyholders;
■ liabilities arising from investment contracts with discretionary
participating features;
■ liabilities arising from investment contracts with no
discretionary participating features;
■ liabilities arising from investment contracts with discretionary
participating features where the financial risk is borne by
policyholders; these relate to Unit-Linked contracts or multi-
funds contracts containing a non-Unit-Linked fund with
discretionary participating features; and
■ liabilities arising from investment contracts with no
discretionary participating features where the financial risk is
borne by policyholders.
1.14.2 Insurance contracts and investment
contracts with discretionary
participating features
Except where IAS 39 applies, according to IFRS 4, recognition and
derecognition are based on the AXA accounting policies existing
prior to IFRS and are described below, except for the elimination
of equalization provisions, selective changes as permitted by
IFRS 4 (see below) and the extension of shadow accounting.
The main characteristics of the accounting principles applied
prior to IFRS and retained aft er the conversion to IFRS are as
follows:
■ reserves must be suff icient;
■ life reserves cannot be discounted using a discount rate higher
than prudently estimated expected assets yield;
■ acquisition costs are deferred to the extent recoverable and
amortized based on the estimated gross profits emerging over
the life of the contracts;
■ Property & Casualty claims reserves represent estimated
ultimate costs. Post claims reserves are generally not
discounted, except in limited cases (a detail of discounted
reserves is shown in Note 14.10).
PRE-CLAIMS RESERVES
Unearned premiums reserves of non-life insurance contracts
represent the prorata portion of written premiums that relates
to unexpired risks at the closing date.
For traditional life insurance contracts (that is, contracts with
significant mortality or morbidity risk), the future policy benefits
reserves are calculated on a prospective basis according to each
country’s regulation provided methods used are consistent with
the Group’s policies and using assumptions on investment yields,
morbidity/mortality and expenses.
Changes in reserves are booked if there are impacts caused by
a change in the mortality table.
Future policy benefits reserves relating to investment contracts
with discretionary participation features (previously called
“savings contracts” in AXA’s accounting principles) that carry
low mortality and morbidity risk are generally calculated using
a prospective approach based on discount rates usually set at
inception with reserves similar to the retrospective approach (i.e.
“account balance” methodology).

235I UNIVERSAL REGISTRATION DOCUMENT - ANNUAL REPORT 2019 - AXA I
CONSOLIDATED FINANCIAL STATEMENTS
5
5.6 NOTES TO THE CONSOLIDATED FINANCIAL STATEMENTS
The discount rates used by AXA are less than or equal to the
expected future investment yields (assessed on prudent basis).
Part of the policyholders participation reserve is included in
future policy benefits reserves, according to contractual clauses.
Except when these guarantees are covered by a Risk Management
program using derivative instruments (see next paragraph),
guaranteed minimum benefits reserves relating to contracts
where the financial risk is borne by policyholders (insurance
contracts because they include such guarantees or investment
contracts with discretionary participating features), are built
over the life of the contract based on a prospective approach:
the present value of future benefit obligations to be paid to
policyholders in relation to these guarantees is estimated on
the basis of reasonable scenarios. These scenarios are based
on assumptions including investment returns, volatility,
surrender and mortality rates. This present value of future benefit
obligations is reserved as fees are collected over the life of the
contracts.
Some guaranteed benefits such as Guaranteed Minimum Death
or Income Benefits (GMDB or GMIB), or certain guarantees on
return proposed by reinsurance treaties, are covered by a Risk
Management program using derivative instruments. In order
to minimize the accounting mismatch between liabilities and
hedging derivatives, AXA has chosen to use the option allowed
under IFRS 4.24 to re-measure its provisions: this revaluation is
carried out at each account closing based on guarantee level
projections and considers interest rates and other market
assumptions. The liabilities revaluation impact in the current
period is recognized through income, symmetrically with the
impact of the change in value of hedging derivatives. This
change in accounting principles was adopted on the first time
application of IFRS on January 1, 2004, for contract portfolios
covered by the Risk Management program at that date. Any
additional contract portfolios covered by the Risk Management
program aft er this date are valued on the same terms as those
that applied on the date the program was first applied. These
contracts were mainly subscribed by Equitable Holdings, Inc.
that has no longer been within the consolidation scope of the
Group since November 2019.
POST CLAIMS RESERVES
Claims reserves (life and non-life contracts)
The purpose of claims reserves is to cover the ultimate cost of
settling an insurance claim. Claims reserves are generally not
discounted, except in cases such as disability annuities.
Claims reserves include the claims incurred and reported, claims
incurred but not reported (IBNR) as well as claims handling costs.
Claims reserves are based on historical claims data, current
trends, actual payment patterns for all insurance business lines
as well as expected changes in inflation, regulatory environment
or anything else that could impact amounts to be paid.
Shadow accounting and Deferred policyholders Participation
Asset (DPA) or Liability (DPL)
In compliance with the option in IFRS 4, shadow accounting is
applied to insurance and investment contracts with discretionary
participating features. Shadow accounting includes adjustments
to technical liabilities, policyholders participation, other
obligations, deferred acquisition costs and value of business in
force to take into account unrealized gains or losses on insurance
liabilities or assets in the same way as it is done for a realized
gain or loss of invested assets.
For example, for contracts with discretionary participating
features, shadow accounting consists in recognizing
policyholders participation in unrealized capital gains and
losses. Thus, when an unrealized gain is recognized, a deferred
participating liability (DPL) is recorded. In case of an unrealized
loss, a deferred participating asset (DPA) should be recognized
only to the extent that its recoverability as defined below is
highly probable. Deferred participating liabilities and assets are
calculated using an appropriate long-term participation rate
based on a contractual, regulatory and constructive obligation
to allocate a percentage of gains/losses to policyholders.
Jurisdictions where participating business is significant are
Switzerland (for group insurance policies), Germany and France
where the minimum is set to 90%, 90% and 85% respectively, of a
basis which may include not only financial income but also other
components. Participating business is less prevalent in Japan.
DPL is fully recognized in the liabilities. As a consequence, there
is no component recognized as an equity component and AXA
does not need to ensure the liability recognized for the whole
contract is not less than the amount that would result from
applying IAS 39 to the guaranteed element.
When a net unrealized loss (unrealized change in fair value,
impairment, expense related, …) is accounted, a deferred
participating asset (DPA) may be recognized only to the extent
that it is highly probable that it can be charged to policyholders,
by entity, in the future. This could be the case if the DPA can
be offset against future participation either directly through
deduction of the DPL from future capital gains or the DPL
netted against value of businesses in force or indirectly through
deduction of future fees on premiums or margins.
Unrealized gains and losses on assets classified as trading or
designated at fair value through profit and loss, along with any
other entry impacting the income statement and generating
a timing difference, are accounted for through the income

236 I UNIVERSAL REGISTRATION DOCUMENT - ANNUAL REPORT 2019 - AXA I
CONSOLIDATED FINANCIAL STATEMENTS 5 5.6 NOTES TO THE CONSOLIDATED FINANCIAL STATEMENTS
statement with a corresponding shadow entry adjustment also
in the statement of income. The shadow accounting adjustments
relating to unrealized gains and losses on assets available for sale
(for which change in fair value is taken to shareholders’ equity)
are booked through shareholders’ equity.
Recoverability tests and liability adequacy test (LAT)
Deferred participation
When a net deferred participation asset is recognized, the Group
uses liquidity analyses performed by the entities to assess the
capacity to hold assets showing unrealized loss position, if any,
generating such debits. The Group then performs projections
to compare the value of assets backing policyholders’ contracts
with expected payments to be made to policyholders.
Liability adequacy test
In addition, at each balance sheet date, liability adequacy tests
are performed in each consolidated entity in order to ensure
the adequacy of the contract liabilities net of related DAC and
VBI assets and deferred policyholders’ participation asset. To
perform these tests, entities group contracts together according
to how they have been acquired, are serviced and have their
profitability measured. Entities use current best estimates of
all future contractual cash flows as well as claims handling and
administrative expenses, and take into account guarantees and
investment yields relating to assets backing these contracts:
■ such tests are based on the intention and capacity of entities
to hold financial assets according to various sets of scenarios,
excluding the value of new business;
■ they include projections of future investments sales according
to estimated surrender patterns; and
■ they determine the extent to which resulting gains/losses
may be allocated/charged to policyholders, i.e. profit sharing
between policyholders and shareholders.
These tests therefore measure the capacity to charge estimated
future losses to policyholders on the basis of the assessment of
the holding horizon and potential realization of losses among
unrealized losses existing at closing date.
Contract specific risks directly related to the contracts (insurance
risk, asset return risk, inflation risk, persistency, adverse
selection, etc.) are also considered.
Depending on the type of business, the future investment cash
flows and discounting may be based on a deterministic best
estimate rate, with corresponding participation, or in the case
of Guaranteed Minimum Benefits, stochastic scenarios. Testing
is performed either by a comparison of the reserve booked net of
related assets (DAC, VBI, etc.) directly with discounted cash flows,
or by ensuring that the discounted profit net of participation from
release of the technical provisions exceeds net related assets.
Any identified deficiency is charged to the income statement,
initially by respectively writing off DPA, DAC or VBI, and
subsequently by establishing a LAT provision for losses arising
from the liability adequacy test for any amount in excess of DPA,
DAC and VBI. For non-life insurance contracts, an unexpired risk
provision is recognized for contracts on which the premiums are
expected to be insuff icient to cover expected future claims and
claims expenses.
Embedded derivatives in insurance and investment contracts
with discretionary participating features
Embedded derivatives that meet the definition of an insurance
contract or correspond to options to surrender insurance
contracts for a set amount (or based on a fixed amount and an
interest rate) are not separately measured. All other embedded
derivatives are bifurcated and booked at fair value when material
(with change in fair value recognized through income statement)
if they are not considered as closely related to the host insurance
contract and/or do not meet the definition of an insurance
contract.
Embedded derivatives meeting the definition of an insurance
contract are described in Note 14.11.
1.14.3 Investment contracts with no
discretionary participating features
In accordance with IAS 39, these contracts are accounted
for using “deposit accounting”, which mainly results in not
recognizing the cash flows corresponding to premiums,
benefits and claims in the statement of income (see “Revenue
recognition” paragraph below). These cash flows shall rather be
recognized as deposits and withdrawals.
This category includes mainly Unit-Linked contracts that do
not meet the definition of insurance or investment contracts
with discretionary participating features. For these Unit-Linked
contracts, the liabilities are valued at current unit value, i.e. on
the basis of the fair value of the financial investments backing
those contracts at the balance sheet date together with rights
to future management fees, also known as Deferred Origination
Costs (DOC, described in paragraph 1.7.3).
UNEARNED FEES RESERVES
Fees received at inception of an investment contract with no
discretionary participating features to cover future services are
recognized as liabilities and accounted in the income statement
based on the same amortization pattern as the one used for
deferred origination costs.
1.15 REINSURANCE
The Group assumes and cedes reinsurance in the normal
course of business. Assumed reinsurance refers to the Group’s
acceptance of certain insurance risks that other companies
have underwritten. Ceded reinsurance refers to the transfer
of insurance risk, along with the related premiums, to other
reinsurers who will assume the risks. Indeed, in the normal
course of business, the Group seeks to reduce the potential

237I UNIVERSAL REGISTRATION DOCUMENT - ANNUAL REPORT 2019 - AXA I
CONSOLIDATED FINANCIAL STATEMENTS
5
5.6 NOTES TO THE CONSOLIDATED FINANCIAL STATEMENTS
amount of loss arising from claims events by reinsuring certain
levels of risk assumed in various areas of exposure with other
insurers or reinsurers.
When these contracts meet the insurance contracts classification
requirements, transactions relating to reinsurance are accounted
for in the balance sheet and income statement in a similar way
to direct business transactions in agreement with contractual
clauses. Reinsurance premiums ceded are expensed (and any
commissions recorded thereon are earned) on a monthly pro-
rata basis over the period the reinsurance coverage is provided.
Ceded unearned reinsurance premiums represent the portion of
premiums ceded applicable to the unexpired term of policies in
force. Reinstatement premiums ceded are recognized at the time
a loss event occurs where coverage limits for the remaining life
of the contract are reinstated under pre-defined contract terms
and are fully expensed when recognized. Amounts recoverable
from reinsurers are estimated in a manner consistent with the
claim liability associated with the reinsured policy. Provisions
are made for estimated unrecoverable reinsurance.
If a reinsurance asset is impaired, the Group reduces the carrying
amount accordingly and recognizes that impairment loss in the
income statement. A reinsurance asset is impaired if there is
objective evidence, as a result of an event that occurred aft er
initial recognition of the reinsurance assets, that the Group may
not receive all amounts due to it under the terms of the contract,
and the event has a reliably measurable impact on the amounts
that the Group will receive from the reinsurer.
If the Group determines that reinsurance contracts do not meet
the insurance contracts definition and/or principally transfers
financial risk, the agreement is recorded using the deposit
method of accounting. Deposits received are included in payables
and deposits made are included within receivables. As amounts
are paid or received, consistent with the underlying contracts, the
deposit assets or liabilities are adjusted as appropriate.
1.16 FINANCING DEBT
Financing debt issued to finance the solvency requirements
of operational entities or to acquire a portfolio of contracts is
isolated in a specific aggregate of the statement of financial
position and is accounted for at amortized cost.
1.17 OTHER LIABILITIES
1.17.1 Income taxes
The current income tax expense (benefit) is recorded in the
income statement on the basis of local tax regulations.
Deferred tax assets and liabilities emerge from temporary
diff erences between the accounting and fiscal values of assets
and liabilities, and when applicable from tax loss carry forwards.
Deferred tax assets are recognized to the extent that it is probable
that future taxable profit will be available to off set the temporary
diff erences taking into account the existence of tax groups and
any legal or regulatory requirements on the limits (in terms of
amounts or timing) relating to the carry forwards of unused tax
credits. The recoverability of deferred tax assets recognized in
previous periods is re-assessed at each closing.
In particular, a deferred tax liability is recognized for any
taxable temporary diff erence relating to the value of shares in a
consolidated company held, unless the Group controls at what
date the temporary diff erence will reverse and it is probable
that the temporary diff erence will not reverse in the foreseeable
future. If a Group company decides to sell its stake in another
consolidated entity, the diff erence between the carrying value
and the tax value of these shares for the company that holds
them leads to the recognition of deferred tax (including as part of
a business combination when the Group as the buyer intends to
sell or carry out internal restructuring of the shares following the
acquisition). The same approach applies to dividend payments
that have been voted or deemed likely, to the extent that a tax
on dividends will be due.
Deferred taxes for taxable temporary diff erences relating to tax
deductible goodwill are recognized to the extent they do not arise
from the initial recognition of goodwill. These deferred taxes are
only released if the goodwill is impaired or if the corresponding
consolidated shares are sold.
The measurement of deferred tax liabilities and deferred tax
assets reflects the expected tax impact, at the balance sheet
date. That would follow the way the Group expects to recover
or settle the carrying amount of its assets and liabilities. When
income taxes are calculated at a diff erent rate if dividends are
paid, deferred taxes are measured at the tax rate applicable to
undistributed profits. The income tax consequences of dividends
are only accounted when a liability to pay the dividend is
recognized.
1.17.2 Pensions and other post-retirement
benefits
Pensions and other post-retirement benefits include the
benefits payable to AXA Group employees after they retire
(retirement compensation, additional pension benefit, health
insurance). In order to meet those obligations, some regulatory
frameworks have allowed or enforced the set up of dedicated
funds (plan assets).
Defined contribution plans: payments are made by the
employer to a third party (e.g. pension trusts). These payments
free the employer of any further commitment, and the obligation
to pay acquired benefits to the employees is transferred. The
contributions paid by the employer are recorded as an expense
in the income statement and no liability needs to be recorded
once contributions are made.

238 I UNIVERSAL REGISTRATION DOCUMENT - ANNUAL REPORT 2019 - AXA I
CONSOLIDATED FINANCIAL STATEMENTS 5 5.6 NOTES TO THE CONSOLIDATED FINANCIAL STATEMENTS
Defined benefit plans: an actuarial assessment of the
commitments based on each plan’s internal rules is performed.
The present value of the future benefits paid by the employer,
known as the DBO (Defined Benefit Obligation), is calculated
annually on the basis of long-term projections of rate of salary
increase, inflation rate, mortality, staff turnover, pension
indexation and remaining service lifetime. The amount recorded
in the balance sheet for employee defined benefit plans is the
difference between the present value of the Defined Benefit
Obligation and the market value at the balance sheet date of
the corresponding invested plan assets aft er adjustment for any
minimum funding requirement or any asset ceiling eff ect. If the
net result is positive, a provision is recorded under the provision
for risks and charges heading. If the net result is negative, a
prepaid pension asset is recorded in the balance sheet but not
more than its recoverable amount (asset ceiling). Actuarial gains
and losses arising from experience adjustments and changes in
actuarial assumptions are recognized in shareholders’ equity
(in Other Comprehensive Income) in full in the period in which
they occur. Similarly, the actual return on assets and any change
in asset ceiling, excluding the net interest income on assets, is
recognized in shareholders’ equity. The regular impact in the
income statement mainly relates to the current service cost
(annually accruing employee benefit) and the net interest on
the amount recorded in the opening balance sheet (unwinding
of discount applied to the net liability/asset at start of the annual
period, taking into account contributions and benefits payments
during the period). Past service cost represents the change in the
present value of the defined benefit obligation resulting from
a plan amendment or curtailment to a defined benefit plan. It
is recognized totally and immediately in the income statement
when incurred. Gains and losses on the settlement of a defined
benefit plan also have an impact in the income statement when
the settlement occurs.
It should be noted that, all cumulative past actuarial gains and
losses on all employee benefit plans were recognized in retained
earnings as of January 1, 2004, AXA Group’s transition date.
1.17.3 Share-based compensation plans
The Group’s share-based compensation plans are predominantly
settled in equities.
All equity-settled share-based compensation plans are
accounted for at fair value at the date they were granted and
the fair value is expensed over the vesting period.
Cash-settled share-based compensation plans are recognized
at fair value, which is remeasured at each balance sheet date with
any change in fair value recognized in the statement of income.
The AXA Shareplan issued under a specific French regulatory
framework includes a traditional and a leveraged formula (with
an application subject to specific local regulations within the
Group).
The cost of the traditional formula of Shareplan is valued
according to the specific guidance issued in France by the ANC
(Autorité des N ormes C omptables). The cost of the leveraged
formula plan is valued by taking into account the five-year lock-
up period for the employees (as in the traditional plan) but
adding the value of the advantage granted to the employees by
enabling them to benefit from an institutional derivatives-based
pricing instead of a retail pricing.
1.18 PROVISIONS FOR RISKS, CHARGES
AND CONTINGENT LIABILITIES
1.18.1 Restructuring costs
Restructuring provisions other than those that may be recognized
on the balance sheet of an acquired company on the acquisition
date are recorded when the Group has a present obligation
evidenced by a binding sale agreement or a detailed formal plan
whose main features are announced to those aff ected or to their
representatives.
1.18.2 Other provisions and contingencies
Provisions are recognized when the Group has a present
obligation (legal or constructive) as a result of past events, when
it is probable that an outflow of resources will be required to
settle the obligation, and when the provision can be reliably
estimated.
Provisions are not recognized for future operating losses. The
same applies to contingent liabilities, except if identified at the
time of a business combination (see paragraph 1.3.2).
Provisions are measured at management’s best estimate, at the
balance sheet date, of the expenditure required to settle the
obligation, discounted at the market risk-free rate of return for
long term provisions.
1.19 REVENUE RECOGNITION
1.19.1 Gross written premiums
Gross written premiums correspond to the amount of premiums
written by insurance and reinsurance companies on business
incepted in the year with respect to both insurance contracts
and investment contracts with discretionary participating
features, net of cancellations and gross of reinsurance ceded. For
reinsurance, premiums are recorded on the basis of declarations
made by the ceding company, and may include estimates of
gross written premiums. Any subsequent diff erences arising on
such estimates are recorded in the period they are determined.
For multi-year reinsurance treaties which are payable in annual
installments, generally, only the initial annual installment is
included as premiums written at policy inception due to the
ability of the reinsured to commute or cancel coverage during
the term of the policy. The remaining annual installments are
included as premiums written at each successive anniversary
date within the multi-year term.

239I UNIVERSAL REGISTRATION DOCUMENT - ANNUAL REPORT 2019 - AXA I
CONSOLIDATED FINANCIAL STATEMENTS
5
5.6 NOTES TO THE CONSOLIDATED FINANCIAL STATEMENTS
Reinstatement premiums are recognized at the time a loss event
occurs where coverage limits for the remaining life of the contract
are reinstated under pre-defined contract terms and are fully
earned when recognized.
Retroactive loss portfolio transfer contracts are evaluated
to determine whether they meet the established criteria for
reinsurance accounting, and, if so, at inception, written premiums
are fully earned and corresponding losses and loss expense
recognized. The contracts can cause significant variances in gross
premiums written, net premiums written, net premiums earned,
and net incurred losses in the years in which they are written.
1.19.2 Fees and revenues from investment
contracts with no discretionary
participating features
Amounts collected as premiums from investment contracts
with no discretionary participating features are reported as
deposits net of any loadings and policy fees. Revenues from
these contracts consist of loadings and policy fees relating to
underwriting, investment management, administration and
surrender of the contracts during the period. Front-end fees
collected corresponding to fees for future services are recognized
over the estimated life of the contract (see “Unearned fees
reserves” paragraph 1.14.3).
1.19.3 Deposit accounting
Investment contracts with no discretionary participating features
fall within the scope of IAS 39. Deposit accounting applies to
these contracts, which involves the following:
■ the Group directly recognizes the consideration received (apart
from potential fees) as a deposit financial liability rather than
as revenues;
■ claims paid are recognized as withdrawals with no posting in
the income statement apart from potential fees.
1.19.4 Unbundling
The Group unbundles the deposit component of contracts when
required by IFRS 4, i.e. when both the following conditions are
met:
■ the Group can measure separately the “deposit” component
(including any embedded surrender option, i.e. without taking
into account the “insurance” component);
■ the Group accounting methods do not otherwise require
the recognition of all obligations and rights arising from the
“deposit” component.
No such situation currently exists within the Group. In accordance
with IFRS 4, the Group continues to use the accounting principles
previously applied by AXA to insurance contracts and investment
contracts with discretionary participating features. According to
these principles, all rights and obligations related to contracts
are recognized.
1.19.5 Change in unearned premiums reserves
net of unearned revenues and fees
Changes in unearned premium reserves net of unearned
revenues and fees include both the change in the unearned
premiums reserve reported as a liability (see “Unearned
premiums reserves” in paragraph 1.14.2) and the change in
unearned revenues and fees. Unearned revenues and fees
correspond to upfront charges for future services recognized over
the estimated life of insurance and investment contracts with
discretionary participating features (see “Unearned revenues
reserves” in paragraph 1.14.2) and investment contracts with
no discretionary participating features (see paragraph 1.14.3
“Unearned fees reserves”).
1.19.6 Net revenues from banking activities
Net revenues from banking activities comprise all revenues and
expenses from banking operations, including interest expenses
not related to financing, banking fees, capital gains and losses
on sales of financial assets, changes in the fair value of assets
under the fair value option and related derivatives.
They exclude bank operating expenses and change in bad debt
provisions, doubtful receivables or loans, which are recorded in
“Bank operating expenses”.
1.19.7 Revenues from other activities
Revenues from other activities mainly include:
■ commissions received and fees for services relating to Asset
Management activities;
■ insurance companies revenues from non-insurance activities,
notably commissions received on the sales or distribution of
financial products; and
■ rental income received by real estate management companies.
Revenue is recognized when the Group satisfies a performance
obligation by transferring a service to a customer. In particular,
as asset management entities of the Group deliver investment
management services to their clients, revenue for providing this
service may theoretically occur over-time, with a time-based
measure of progress, which is relevant as the service is provided
continuously over the contract period. However, according to
IFRS 15, revenue is recognized only to the extent that it is highly
probable that a significant reversal in the amount of cumulative
revenue recognized will not occur. As a result, as management
fees and performance fees received by the Group are generally
calculated based on a percentage of assets under management
(AUM), they are considered as variable considerations, which
are subject to market volatility and are recognized only when
uncertainty is resolved.

240 I UNIVERSAL REGISTRATION DOCUMENT - ANNUAL REPORT 2019 - AXA I
CONSOLIDATED FINANCIAL STATEMENTS 5 5.6 NOTES TO THE CONSOLIDATED FINANCIAL STATEMENTS
1.19.8 Net investment result excluding
financing expenses
Net investment result includes:
■ investment income from investments other than from
banking activities, net of depreciation expense on real estate
investments (depreciation expense relating to owner occupied
properties is included in “administrative expenses”); this
item includes interest received calculated using the eff ective
interest method for debt instruments and dividends received
on equity instruments;
■ investment management expenses (excluding financing debt
expenses);
■ realized investment gains and losses net of releases of
impairment following sales;
■ the change in unrealized gains and losses on invested assets
measured at fair value through profit or loss; and
■ the change in impairment of investments (excluding releases
of impairment following sales).
In respect of banking activities, interest income and expenses
are included in the “Net revenue from banking activities” (see
paragraph 1.19.6).
1.20 SUBSEQUENT EVENTS
Subsequent events relate to events that occur between the
balance sheet date and the date when the financial statements
are authorized for issue:
■ such events lead to an adjustment of the Consolidated
Financial Statements if they provide evidence of conditions
that existed at the balance sheet date;
■ such events result in additional disclosures if indicative of
conditions that arose after the balance sheet date, and if
relevant and material.

241I UNIVERSAL REGISTRATION DOCUMENT - ANNUAL REPORT 2019 - AXA I
CONSOLIDATED FINANCIAL STATEMENTS
5
5.6 NOTES TO THE CONSOLIDATED FINANCIAL STATEMENTS
I Note 2 Scope of consolidation
2.1 CONSOLIDATED COMPANIES
2.1.1 Main fully consolidated companies
Change
in scope
December 31, 2019 December 31, 2018
Voting rights
percentage
Group share
of interests
Voting rights
percentage
Group share
of interests
AXA SA and Other Holdings
France
AXA Parent
company
Parent
company
CFP Management 100.00 100.00 100.00 100.00
AXA Group Operations SAS 100.00 100.00 100.00 100.00
Société Beaujon 100.00 100.00 100.00 100.00
AXA China 100.00 100.00 100.00 100.00
AXA Asia 100.00 100.00 100.00 100.00
AXA US Holding Merged with
XL Group - - 100.00 100.00
France
AXA France IARD 99.92 99.92 99.92 99.92
AXA France Vie 99.77 99.77 99.77 99.77
AXA Protection Juridique 98.52 98.44 98.52 98.44
Avanssur 100.00 100.00 100.00 100.00
AXA France Participations 100.00 100.00 100.00 100.00
Genworth Financial European Group Holdings 100.00 100.00 100.00 100.00
Financial Assurance Company Limited (Genworth) Merged with
AXA France Vie - - 100.00 99.77
Financial Insurance Company Limited (Genworth) Merged with
AXA France IARD - - 100.00 99.92
AXA Banque 100.00 99.89 100.00 99.89
AXA Banque Financement 65.00 64.93 65.00 64.93
Europe
Germany
AXA Versicherung AG 100.00 100.00 100.00 100.00
AXA Lebensversicherung AG 100.00 100.00 100.00 100.00
Deutsche Ärzteversicherung 100.00 100.00 100.00 100.00
AXA Krankenversicherung AG 100.00 100.00 100.00 100.00
Kölnische Verwaltungs AG für Versicherungswerte 100.00 100.00 100.00 100.00
AXA Konzern AG 100.00 100.00 100.00 100.00
AXA Bank AG 100.00 100.00 100.00 100.00
Roland Rechtsschutz-Versicherungs-AG 60.00 60.00 60.00 60.00
United Kingdom & Ireland
Guardian Royal Exchange Plc 100.00 99.98 100.00 99.98
AXA UK Plc 100.00 99.98 100.00 99.98

242 I UNIVERSAL REGISTRATION DOCUMENT - ANNUAL REPORT 2019 - AXA I
CONSOLIDATED FINANCIAL STATEMENTS 5 5.6 NOTES TO THE CONSOLIDATED FINANCIAL STATEMENTS
Change
in scope
December 31, 2019 December 31, 2018
Voting rights
percentage
Group share
of interests
Voting rights
percentage
Group share
of interests
AXA Equity & Law Plc 99.96 99.96 99.96 99.96
AXA Insurance UK Plc 100.00 99.98 100.00 99.98
AXA PPP Healthcare Limited 100.00 99.98 100.00 99.98
Architas Multi-Manager Limited 100.00 100.00 100.00 100.00
AXA Insurance Limited 100.00 99.98 100.00 99.98
AXA Life Europe Limited 100.00 100.00 100.00 100.00
Spain
AXA Seguros Generales, S. A. Relution 99.92 99.92 99.90 99.90
AXA Aurora Vida, S.A. de Seguros Relution 99.84 99.84 99.83 99.83
Switzerland
AXA Life 100.00 100.00 100.00 100.00
AXA-ARAG Legal Assistance 66.67 66.67 66.67 66.67
AXA Insurance 100.00 100.00 100.00 100.00
Italy
AXA Assicurazioni e Investimenti 100.00 100.00 100.00 100.00
AXA MPS Vita 50.00
+ 1 voting right 50.00
50.00
+ 1 voting right 50.00
AXA MPS Danni 50.00
+ 1 voting right 50.00
50.00
+ 1 voting right 50.00
AXA MPS Financial 50.00
+ 1 voting right 50.00
50.00
+ 1 voting right 50.00
Belgium
Ardenne Prévoyante 100.00 100.00 100.00 100.00
AXA Belgium SA 100.00 100.00 100.00 100.00
AXA Holdings Belgium 100.00 100.00 100.00 100.00
Yuzzu SA (previously Touring Assurances SA) 100.00 100.00 100.00 100.00
Asia
National Mutual International Pty Ltd. 100.00 100.00 100.00 100.00
Japan
AXA Holdings Japan New company 98.70 98.70 - -
AXA Life Insurance Relution 100.00 98.70 98.69 98.69
AXA Non Life Insurance Co. Ltd. Relution 100.00 98.70 100.00 98.69
Hong Kong
AXA China Region Limited 100.00 100.00 100.00 100.00
AXA General Insurance Hong Kong Ltd. 100.00 100.00 100.00 100.00
China
AXA Tianping From Equity
Method to Full
Consolidation 100.00 100.00 - -
Indonesia
MLC Indonesia 100.00 100.00 100.00 100.00
Thailand
AXA Insurance Public Company Limited 99.47 99.47 99.47 99.47
South Korea
Kyobo AXA General Insurance Co. Ltd. 99.71 99.71 99.71 99.71

243I UNIVERSAL REGISTRATION DOCUMENT - ANNUAL REPORT 2019 - AXA I
CONSOLIDATED FINANCIAL STATEMENTS
5
5.6 NOTES TO THE CONSOLIDATED FINANCIAL STATEMENTS
Change
in scope
December 31, 2019 December 31, 2018
Voting rights
percentage
Group share
of interests
Voting rights
percentage
Group share
of interests
AXA XL
XL Group (a) 100.00 100.00 100.00 100.00
AXA Corporate Solutions Assurance (sub group) Merged with
XL Group - - 98.75 98.75
AXA Art Merged with
XL Group - - 100.00 100.00
United States
Equitable Holdings, Inc. (previously AXA America
Holdings, Inc.) Disposal - - 59.25 59.25
AXA Equitable Life Insurance Company Disposal - - 100.00 59.25
AB (sub group) Disposal - - 65.16 38.61
International
AXA Mediterranean Holding SA 100.00 100.00 100.00 100.00
AXA Bank Belgium (sub group) 100.00 100.00 100.00 100.00
Colombia
AXA Colpatria Seguros 51.00 51.00 51.00 51.00
AXA Colpatria Seguros de vida 51.00 51.00 51.00 51.00
Morocco
AXA Assurance Maroc 100.00 100.00 100.00 100.00
AXA Al Amane Assurance 100.00 100.00 100.00 100.00
AXA Holding Maroc S.A. 100.00 100.00 100.00 100.00
Turkey
AXA Hayat ve Emeklilik A.S. 100.00 100.00 100.00 100.00
AXA Sigorta AS 92.61 92.61 92.61 92.61
AXA Turkey Holding W.L.L 100.00 100.00 100.00 100.00
The Gulf Region
AXA Cooperative Insurance Company 50.00 34.00 50.00 34.00
AXA Insurance B.S.C.c. 50.00 50.00 50.00 50.00
Greece
AXA Insurance A.E. 99.98 99.98 99.98 99.98
Mexico
AXA Seguros S.A. de C.V. 100.00 100.00 100.00 100.00
Luxembourg
AXA Assurances Luxembourg 100.00 100.00 100.00 100.00
AXA Assurances Vie Luxembourg 100.00 100.00 100.00 100.00
AXA Luxembourg SA 100.00 100.00 100.00 100.00
Czech Republic & Slovakia
AXA Czech Republic Pension Funds Relution 100.00 100.00 99.99 99.99
AXA Czech Republic Insurance 100.00 100.00 100.00 100.00
AXA Slovakia 100.00 100.00 100.00 100.00
Poland
AXA Poland 100.00 100.00 100.00 100.00
AXA Poland Pension Funds 100.00 100.00 100.00 100.00
AXA Ubezpieczenia TUIR S.A 100.00 100.00 100.00 100.00
(a) XL Group mainly operates in the United States, the United Kingdom, Bermuda, Switzerland, France, Ireland, Singapore, germany, Australia and Canada.

244 I UNIVERSAL REGISTRATION DOCUMENT - ANNUAL REPORT 2019 - AXA I
CONSOLIDATED FINANCIAL STATEMENTS 5 5.6 NOTES TO THE CONSOLIDATED FINANCIAL STATEMENTS
Change
in scope
December 31, 2019 December 31, 2018
Voting rights
percentage
Group share
of interests
Voting rights
percentage
Group share
of interests
Singapore
AXA Financial Services Singapore pte Ltd. 100.00 100.00 100.00 100.00
AXA Life Insurance Singapore 100.00 100.00 100.00 100.00
AXA Insurance Singapore 100.00 100.00 100.00 100.00
Malaysia
AXA Aff in General Insurance Berhad 50.00 50.00 50.00 50.00
India
AXA India Holding 100.00 100.00 100.00 100.00
Other
AXA Investment Managers (sub group) Dilution 97.58 97.57 97.80 97.73
AXA Global Re 100.00 100.00 100.00 100.00
AXA Assistance SA (sub group) 100.00 100.00 100.00 100.00
Colisée Ré 100.00 100.00 100.00 100.00
Main changes in scope of consolidation are detailed in Note 5.
CONSOLIDATED INVESTMENT FUNDS AND REAL ESTATE
COMPANIES
As of December 31, 2019, investment funds represented a total of
€128,129 million invested assets (€117,337 million at the end of
2018), corresponding to 287 investment funds mainly in France,
Japan, Germany, Switzerland and Belgium.
In most investment funds (particularly open-ended investment
funds), minority interests are presented as liabilities under
“Minority interests of consolidated investment funds”. As
of December 31, 2019, minority interests in consolidated
investment funds amounted to €8,567 million (€6,799 million as
of December 31, 2018). Minority interests related to consolidated
investment funds and real estate companies that are classified
in shareholder’s equity amounted to €2,848 million as of
December 31, 2019 (€3,269 million as of December 31, 2018).
As of December 31, 2019, 26 consolidated real estate companies
corresponded to a total of €17,876 million invested assets
(€12,798 million at the end of 2018) mainly in France, Germany,
Switzerland and Japan.
MAIN SUBSIDIARIES WITH MINORITY INTERESTS
As regards main subsidiaries with minority interests (other than
investment funds and real estate companies):
■ the financial information of Equitable Holdings, Inc. (no
longer consolidated within AXA Group as of December 31,
2019) is available in Part II – Item 8. Financial Statements and
Supplementary Data of its Annual Report for the year ended
December 31, 2019, which is filed with the SEC;
■ summarized financial information of AXA MPS is as follows
(including AXA and external share but excluding goodwill
related to AXA’s holdings and before intercompany eliminations
with other companies of the Group):

245I UNIVERSAL REGISTRATION DOCUMENT - ANNUAL REPORT 2019 - AXA I
CONSOLIDATED FINANCIAL STATEMENTS
5
5.6 NOTES TO THE CONSOLIDATED FINANCIAL STATEMENTS
(in Euro million)
December 31, 2019 December 31, 2018
AXA MPS AXA MPS
Net consolidated income - Minority Interests 89 68
Minority interests 1,190 1,044
Dividends paid to minority interests (19) (84)
Cash and cash equivalents 378 184
Total investments 29,236 25,985
Other assets 1,683 1,780
Total Assets 31,297 27,949
Liabilities arising from insurance & investment contracts 28,018 24,983
Other Liabilities 899 878
Total Liabilities (excluding shareholders’ equity) 28,917 25,861
Total Revenues 3,837 3,312
Net Income 178 136
Other Comprehensive Income 154 (156)
Total Comprehensive Income 332 (20)
Excluding minority interests related to consolidated investment
funds and real estate companies that are classified in
shareholders’ equity, these minority interests represent 49% of
minority interests of the Group as of December 31, 2019 (1% as
of December 31, 2018).
2.1.2 Main investments in companies accounted for using the equity method
Companies accounted for using the equity method listed below exclude investment funds and real estate entities:
Change
in scope
December 31, 2019 December 31, 2018
Voting rights
percentage
Group share
of interests
Voting rights
percentage
Group share
of interests
France
Neuflize Vie 39.98 39.98 39.98 39.98
Asia
Philippines AXA Life Insurance Corporation 45.00 45.00 45.00 45.00
Krungthai AXA Life Insurance Company Ltd. 50.00 50.00 50.00 50.00
ICBC-AXA Life Insurance Co., Ltd. 27.50 27.50 27.50 27.50
PT AXA Mandiri Financial Services 49.00 49.00 49.00 49.00
AXA Tianping From Equity
Method
to Full
Consolidation
- - 50.00 50.00
AXA SPDB Investment Managers Company limited Dilution 39.00 38.05 39.00 38.11
International
Reso Garantia (RGI Holdings S.a.r.l.) (Russia) 39.34 39.34 39.34 39.34
Bharti AXA Life (India) 49.00 49.00 49.00 49.00
Bharti AXA General Insurance Company Limited (India) 49.00 49.00 49.00 49.00
AXA Middle East SAL (Lebanon) Dilution 50.99 50.99 51.00 51.00
AXA Mansard Insurance plc (Nigeria) Dilution 76.48 76.48 77.79 77.79
Other
AXA Investment Managers Asia Holdings Private Limited Dilution 49.00 47.81 49.00 47.89
Kyobo AXA Investment Managers Company Limited Dilution 50.00 48.79 50.00 48.86
Main changes in scope of consolidation are detailed in Note 10.

246 I UNIVERSAL REGISTRATION DOCUMENT - ANNUAL REPORT 2019 - AXA I
CONSOLIDATED FINANCIAL STATEMENTS 5 5.6 NOTES TO THE CONSOLIDATED FINANCIAL STATEMENTS
INVESTMENT FUNDS AND REAL ESTATE ENTITIES
ACCOUNTED FOR USING THE EQUITY METHOD
As of December 31, 2019, real estate companies accounted for
using the equity method amounted to €154 million invested
assets (€157 million at the end of 2018) and investment
funds accounted for using the equity method amounted to
€7,782 million invested assets (€4,979 million at the end of
2018), mainly in the United Kingdom, Ireland, France, Belgium
and Germany.
2.2 UNCONSOLIDATED STRUCTURED
ENTITIES
Structured entities are entities that have been designed so that
voting or similar rights are not the dominant factor in deciding
who controls the entity, such as when relevant activities are
directed by means of contractual arrangements. Structured
entities often have a narrow and well-defined objective or
restricted activities.
The Group does not hold significant interests in unconsolidated
insurance/reinsurance structured entities.
Furthermore, given its insurance business, the Group holds
direct investments in corporates of various sectors, such as debt
instruments, equity securities and loans. These investments are
not designed to be done in structured entities and the whole
Group’s exposure is reflected on the consolidated balance sheet.
In addition, the Group holds interests in investment funds
including real estate companies. Some of these funds are fully
consolidated or accounted for using the equity method (see
Note 2.1.). Other funds are not consolidated because they are
not controlled or under significant influence. By nature, and
notably because of the power of decision usually given to the
asset managers (internal or external to AXA), most of these funds
are structured entities.
As investor, AXA’s interests in unconsolidated funds are limited
to the investments held. These ones are fully recognized in the
consolidated balance sheet. Depending on the nature of its
investment, AXA receives interests or dividends and can realize
capital gains or losses in case of sale. These investments are
subject to impairment testing as any financial asset.
The Group’s asset manager companies also receive fees for the
services they provide when they manage investment funds.
Some unconsolidated funds managed by the Group are partially
or fully held by external investors.
Information on these unconsolidated investment funds are
provided in diff erent sections of this Annual Report:
■ Section 1.1 “Key figures”: AXA’s total assets under management
including assets managed on behalf of third parties;
■ Section 2.3 “Activity report”;
■ Section 5.6 “Notes to the consolidated financial statements”:
• Note 9 “Investments” with the breakdown of investments
and detail on non-consolidated investment funds in
Note 9.8,
• Note 22 “Net investment result excluding financing
expenses”.
247I UNIVERSAL REGISTRATION DOCUMENT - ANNUAL REPORT 2019 - AXA I
CONSOLIDATED FINANCIAL STATEMENTS
5
5.6 NOTES TO THE CONSOLIDATED FINANCIAL STATEMENTS
I Note 3 Consolidated statement of income by segment
AXA’s Chief Executive Off icer (CEO), acting as chief operating
decision maker, is a member of the Board of Directors. He is
assisted by a Management Committee in the operational
management of the Group and by a group of senior executives,
the so-called Partners’ Group, in developing and implementing
any strategic initiatives. The financial information related to
AXA’s business segments and Holding companies reported to the
Board of Directors twice a year is consistent with the presentation
provided in the consolidated financial statements.
The results of operating activities and non-operating activities
are presented on the basis of seven segments: France, Europe,
Asia, AXA XL, the United States, International, and Transversal &
Central Holdings.
As a consequence of the loss of control of AXA Group over
Equitable Holdings, Inc. (“EQH”) as of March 31, 2019, the United
States contribution to the consolidated financial statements was
reported:
■ as fully consolidated from January 1, 2019, to March 31, 2019;
■ in “income from investment accounted for using the equity
method” from April 1, 2019, to November 13, 2019;
■ as financial investment available for sale from November 13,
2019, to December 31, 2019, following the loss of the significant
influence of AXA over EQH.
It includes Life & Savings activities in the United States, Asset
Management services off ered by AB, and US holdings.
As of December 31, 2019, the CEOs supervising the other main
geographies (respectively CEO of AXA France, CEO of AXA in
Europe, CEO of AXA in Asia, CEO of AXA XL, CEO of International)
are members of the Management Committee.
Key transversal entities and Central Holdings are managed
alongside these geographies.
France: The France market consists of Life & Savings and Property
& Casualty activities, AXA Banque France and France holdings.
Europe: The Europe market consists of Life & Savings and
Property & Casualty activities in Switzerland, Germany, Belgium,
United Kingdom & Ireland, Spain and Italy. The German bank and
the holding companies in these countries are also included. The
direct and traditional entities are reported within their respective
countries.
Asia: The Asian market consists of Life & Savings activities in
Japan, Hong Kong and Asia High Potentials (Thailand, Indonesia,
China and the Philippines) as well as Property & Casualty
activities in Hong Kong and Asia High Potentials (Thailand and
China). The Asia-Direct entities (Japan and South Korea) and the
Asia holdings are also included.
AXA XL: The AXA XL market mainly consists of Property & Casualty
activities at XL Group, as well as AXA Corporate Solutions
Assurance and AXA Art. XL holdings are also included.
International: The International market consists of Life &
Savings and Property & Casualty activities in 14 countries
within Europe, Middle East, Africa & Latin America as well as in
Singapore, Malaysia and India. AXA Bank Belgium and holding
companies in these countries are also included.
Transversal & Central Holdings: includes transversal entities
namely AXA Investment Managers, AXA Assistance, AXA Liabilities
Managers, AXA Global Re, AXA Life Europe, as well as AXA SA and
other Central Holdings.
The intersegment eliminations include only operations between
entities from diff erent countries and operating activities. They
mainly relate to reinsurance treaties, assistance guarantees
recharging, asset management fees and interests on loans within
the Group.
In this document, “Insurance” covers the three insurance
activities: Life & Savings, Property & Casualty and Health.

248 I UNIVERSAL REGISTRATION DOCUMENT - ANNUAL REPORT 2019 - AXA I
CONSOLIDATED FINANCIAL STATEMENTS 5 5.6 NOTES TO THE CONSOLIDATED FINANCIAL STATEMENTS
3.1 CONSOLIDATED STATEMENT OF INCOME BY SEGMENT
(in Euro million)
December 31, 2019
France Europe Asia AXA XL
United
States
Interna-
tional
Transversal
& Central
Holdings
Interseg-
ment e li-
minations Total
of which Insurance (a)
Gross written premiums 26,242 34,207 9,849 18,856 3,321 6,644 1,519 (785) 99,852 99,852
Fees and charges relating
to investment contracts
with no participating features 1 128 39 - - 76 - - 244 244
Revenues from insurance
activities 26,243 34,334 9,888 18,856 3,321 6,720 1,519 (785) 100,096 100,096
Net revenues from banking
activities 170 12 - - - 318 - 12 512 -
Revenues from other activities 6 338 - 0 1,007 67 1,967 (461) 2,924 1,040
Revenues 26,419 34,685 9,888 18,856 4,328 7,104 3,486 (1,234) 103,532 101,136
Change in unearned
premiums net of unearned
revenues and fees 34 (188) (39) (1,193) (11) (173) (6) 34 (1,543) (1,543)
Net investment income (b) 4,534 4,996 1,429 1,098 (375) 536 (32) (71) 12,115 10,856
Net realized gains and losses
relating to investments at
cost and at fair value through
shareholders’ equity 561 808 315 120 (9) 8 (449) 2 1,356 1,803
Net realized gains and losses
and change in fair value of other
investments at fair value through
profit or loss (c) 5,094 822 1,219 (112) 11,139 310 0 2 18,475 19,317
of which change in fair value of assets with financial risk borne by policyholders 4,921 1,431 1,293 - 9,926 257 458 1 18,286 18,286
Change in investments
impairment (268) (170) (43) (27) - (10) (308) - (826) (504)
Net investment result
excluding financing expenses 9,920 6,456 2,921 1,078 10,754 845 (788) (66) 31,121 31,473
Technical charges relating to
insurance activities (28,799) (30,644) (9,490) (12,700) (13,600) (4,727) (1,927) 403 (101,484) (101,484)
Net result from outward
reinsurance (132) (347) (124) (801) 93 (266) 132 327 (1,118) (1,118)
Bank operating expenses (15) (5) - - - (47) - - (67) -
Acquisition costs (3,057) (4,001) (1,241) (2,123) (319) (1,316) (521) 96 (12,482) (12,482)
Amortization of the value
of purchased business in force - (60) (24) (557) (0) (3) - - (644) (644)
Administrative expenses (1,657) (2,666) (586) (2,034) (742) (877) (2,655) 494 (10,722) (7,740)
Change in goodwill impairment
and other intangible assets
impairment - (47) (17) (47) (7) (35) (1) - (153) (146)
Other income and expenses (d) (26) (34) (25) (9) (113) (541) 454 (304) (598) (220)
(a) Insurance covers the three insurance activities: Life & Savings, Property & Casualty and Health.
(b) Includes gains/losses from derivatives hedging variable annuities within the Life & Savings activity.
(c) Include net realized and unrealized foreign exchange gains and losses relating to investments at cost and at fair value through shareholders’ equity.
(d) Include losses related to the disposal processes of AXA Bank Belgium and AXA Life Europe (see Note 5.3).
(e) Mainly related to the VBI impairment related to the Group Life portfolio in Switzerland.

249I UNIVERSAL REGISTRATION DOCUMENT - ANNUAL REPORT 2019 - AXA I
CONSOLIDATED FINANCIAL STATEMENTS
5
5.6 NOTES TO THE CONSOLIDATED FINANCIAL STATEMENTS
(in Euro million)
December 31, 2019
France Europe Asia AXA XL
United
States
Interna-
tional
Transversal
& Central
Holdings
Interseg-
ment e li-
minations Total
of which Insurance (a)
Other operating income
and expenses (33,685) (37,804) (11,508) (18,270) (14,689) (7,811) (4,519) 1,016 (127,269) (123,835)
Income from operating
activities before tax 2,688 3,149 1,261 472 382 (34) (1,826) (251) 5,840 7,231
Income (net of impairment)
from investment accounted
for using the equity method 11 - 210 (2) 174 89 22 - 504 425
Financing debt expenses (2) (47) (13) (164) (52) (17) (676) 251 (720) (43)
Net income from operating
activities before tax 2,697 3,101 1,457 306 504 38 (2,480) - 5,624 7,613
Income tax (753) (657) (246) (133) (39) (145) 554 - (1,419) (920)
Net operating income 1,945 2,444 1,211 173 465 (107) (1,926) - 4,206 6,693
Net loss on Group Life porfolio
in Switzerland (e) - (24) - - - - - - (24) (24)
Net consolidated income
aft er tax 1,945 2,420 1,211 173 465 (107) (1,926) - 4,181 6,668
Split between:
Net consolidated income -
Group share 1,940 2,318 1,204 173 321 (169) (1,932) - 3,857 6,408
Net consolidated income -
Minority interests 4 102 7 - 143 62 7 - 325 260
(a) Insurance covers the three insurance activities: Life & Savings, Property & Casualty and Health.
(b) Includes gains/losses from derivatives hedging variable annuities within the Life & Savings activity.
(c) Include net realized and unrealized foreign exchange gains and losses relating to investments at cost and at fair value through shareholders’ equity.
(d) Include losses related to the disposal processes of AXA Bank Belgium and AXA Life Europe (see Note 5.3).
(e) Mainly related to the VBI impairment related to the Group Life portfolio in Switzerland.

250 I UNIVERSAL REGISTRATION DOCUMENT - ANNUAL REPORT 2019 - AXA I
CONSOLIDATED FINANCIAL STATEMENTS 5 5.6 NOTES TO THE CONSOLIDATED FINANCIAL STATEMENTS
(in Euro million)
December 31, 2018 restated (a)
France Europe Asia AXA XL
United
States
Interna-
tional
Transversal
& Central
Holdings
Interseg-
ment eli-
minations Total
of which Insurance (b)
Gross written premiums 25,118 36,288 8,966 6,298 12,508 6,177 1,450 (497) 96,309 96,309
Fees and charges relating
to investment contracts with
no participating features 1 130 36 - - 82 - - 249 249
Revenues from insurance
activities 25,119 36,418 9,002 6,298 12,508 6,259 1,450 (497) 96,558 96,558
Net revenues from banking
activities 124 23 - - - 327 - 11 484 -
Revenues from other activities 6 259 1 - 4,089 62 1,951 (536) 5,832 1,877
Revenues 25,249 36,700 9,003 6,298 16,598 6,648 3,401 (1,023) 102,874 98,435
Change in unearned
premiums net of unearned
revenues and fees (47) (109) (199) (222) 12 (128) 34 6 (653) (653)
Net investment income (c) 4,630 5,851 1,401 396 3,514 556 301 (51) 16,597 15,338
Net realized gains and losses
relating to investments at
cost and at fair value through
shareholders’ equity 579 1,157 142 68 (30) 37 26 3 1,982 1,953
Net realized gains and losses
and change in fair value of
other investments at fair value
through profit or loss (d) (2,872) (1,358) (843) (81) (7,613) (26) (311) (1) (13,104) (12,871)
of which change in fair value of assets with financial risk borne by policyholders (2,558) (942) (785) - (6,109) (29) (280) (2) (10,706) (10,706)
Change in investments
impairment (480) (456) (140) (61) (39) (63) (31) - (1,271) (1,193)
Net investment result
excluding financing expenses 1,857 5,193 560 322 (4,167) 503 (15) (49) 4,205 3,228
Technical charges relating to
insurance activities (20,126) (31,555) (6,449) (4,854) (6,778) (4,281) (1,302) 276 (75,069) (75,069)
Net result from outward
reinsurance (249) (342) (72) 123 7 (228) 276 200 (285) (285)
Bank operating expenses (9) (6) - - - (56) - - (70) -
Acquisition costs (2,919) (3,922) (1,139) (935) (602) (1,237) (483) 35 (11,201) (11,201)
Amortization of the value
of purchased business in force - (23) (35) (408) (1) (3) - - (470) (470)
Administrative expenses (1,421) (2,540) (490) (609) (2,895) (869) (2,588) 436 (10,976) (6,649)
Change in goodwill impairment
and other intangible assets
impairment - (41) (16) (12) (6,335) (37) (1) - (6,441) (1,898)
Other income and expenses (8) (26) (90) (3) (339) 60 479 (181) (109) (194)
Other operating income
and expenses (24,732) (38,456) (8,290) (6,699) (16,942) (6,651) (3,618) 766 (104,621) (95,766)
Income from operating
activities before tax 2,328 3,329 1,074 (300) (4,500) 372 (198) (299) 1,805 5,244
(a) Restated: reclassification of German and Japanese activities of AXA Life Europe (previously reported as part of Germany and Japan respectively) into AXA Life Europe (included in Transversal & Central Holdings).
(b) Insurance covers the three insurance activities: Life & Savings, Property & Casualty and Health.
(c) Includes gains/losses from derivatives hedging variable annuities within the Life & Savings activity.
(d) Includes net realized and unrealized foreign exchange gains and losses relating to investments at cost and at fair value through shareholders’ equity.
(e) Mainly related to the VBI impairment related to the Group Life portfolio in Switzerland.

251I UNIVERSAL REGISTRATION DOCUMENT - ANNUAL REPORT 2019 - AXA I
CONSOLIDATED FINANCIAL STATEMENTS
5
5.6 NOTES TO THE CONSOLIDATED FINANCIAL STATEMENTS
(in Euro million)
December 31, 2018 restated (a)
France Europe Asia AXA XL
United
States
Interna-
tional
Transversal
& Central
Holdings
Interseg-
ment eli-
minations Total
of which Insurance (b)
Income (net of impairment)
from investment accounted
for using the equity method 20 (6) 119 (3) - 137 20 - 286 274
Financing debt expenses 2 (23) - (62) (173) (18) (588) 299 (562) (3)
Net income from operating
activities before tax 2,349 3,301 1,193 (365) (4,673) 492 (766) - 1,530 5,515
Income tax (709) (691) (200) (81) 53 (89) 244 - (1,474) (942)
Net operating income 1,640 2,609 993 (447) (4,620) 402 (522) - 55 4,573
Net loss on Group Life portfolio
in Switzerland (e) - (428) - - - - - - (428) (428)
Net consolidated income
aft er tax 1,640 2,181 993 (447) (4,620) 402 (522) - (373) 4,145
Split between:
Net consolidated income -
Group share 1,635 2,106 986 (428) (1,986) 355 (527) - 2,140 4,549
Net consolidated income -
Minority interests 5 75 7 (18) (2,634) 47 5 - (2,513) (404)
(a) Restated: reclassification of German and Japanese activities of AXA Life Europe (previously reported as part of Germany and Japan respectively) into AXA Life Europe (included in Transversal & Central Holdings).
(b) Insurance covers the three insurance activities: Life & Savings, Property & Casualty and Health.
(c) Includes gains/losses from derivatives hedging variable annuities within the Life & Savings activity.
(d) Includes net realized and unrealized foreign exchange gains and losses relating to investments at cost and at fair value through shareholders’ equity.
(e) Mainly related to the VBI impairment related to the Group Life portfolio in Switzerland.

252 I UNIVERSAL REGISTRATION DOCUMENT - ANNUAL REPORT 2019 - AXA I
CONSOLIDATED FINANCIAL STATEMENTS 5 5.6 NOTES TO THE CONSOLIDATED FINANCIAL STATEMENTS
I Note 4 Financial and insurance Risk Management
All of the following paragraphs form an integral part of the Group
financial statements. They appear in Section 4 “Risk Factors
and Risk Management” and Section 2.4 “Liquidity and capital
Resources” of this Annual Report:
4.1 RISK MANAGEMENT ORGANIZATION
Please refer to pages 179 to 184 of Section 4.2 “Internal control
and Risk Management” subsections “Risk management and
Internal Control Organization”, “Financial reporting, disclosure,
controls and procedures” and “Conclusion”.
4.2 MARKET RISKS (INCLUDING
SENSITIVITY ANALYSIS)
Please refer to pages 192 to 196 of Section 4.3 “Market risks”,
subsections “Interest rates & equity risks related to the operating
activities of Group subsidiaries” and “Exchange-rate risk related
to the operating activities of Group subsidiaries”.
4.3 CREDIT RISK
Please refer to pages 197 to 200 of Section 4.4 “Credit
risk” subsections “Invested assets: A central monitoring of
counterparty exposure”, “Credit derivatives”, “Counterparty risk
arising from over-the-counter (OTC) derivatives”, “Receivables
from reinsurers: rating processes and factors” and “Bank credit
activities”.
4.4 INSURANCE RISK
Please refer to pages 203 to 205 of Section 4.6 “Insurance risks”,
subsections “Product approval”, “Exposure Analysis”, “Ceded
Reinsurance” and “Technical reserves”.
4.5 LIQUIDITY AND CAPITAL RESOURCES
Please refer to pages 83 to 88 of Section 2.4 “Liquidity and capital
resources” subsections “Liquidity, sources and needs for Group
operating subsidiaries”, “Liquidity position”, “Uses of funds”,
“Impact of regulatory requirements” and “Subsequent events
aft er December 31, 2019 impacting AXA’s liquidity”.

253I UNIVERSAL REGISTRATION DOCUMENT - ANNUAL REPORT 2019 - AXA I
CONSOLIDATED FINANCIAL STATEMENTS
5
5.6 NOTES TO THE CONSOLIDATED FINANCIAL STATEMENTS
I Note 5 Goodwill
5.1 GOODWILL
An analysis of goodwill by cash generating unit is presented in the table below:
(in Euro million)
December 31, 2019 December 31, 2018
Gross value
Accumulated
impairment Net value Gross value
Accumulated
impairment Net value
France 225 - 225 225 - 225
France Life & Savings 57 - 57 57 - 57
France Property & Casualty 168 - 168 168 - 168
Europe 5,328 - 5,328 5,148 - 5,148
Germany Life & Savings 190 - 190 147 - 147
Germany Property & Casualty 992 - 992 918 - 918
Spain Life & Savings 393 - 393 393 - 393
Spain Property & Casualty 613 - 613 613 - 613
Switzerland Life & Savings 168 - 168 162 - 162
Switzerland Property & Casualty 225 - 225 217 - 217
Italy Life & Savings 424 - 424 424 - 424
Italy Property & Casualty 356 - 356 356 - 356
Belgium Life & Savings 296 - 296 296 - 296
Belgium Property & Casualty 563 - 563 563 - 563
UK & Ireland Life & Savings 18 - 18 17 - 17
UK & Ireland Property & Casualty 1,090 - 1,090 1,042 - 1,042
Asia 3,530 (79) 3,451 2,784 (77) 2,707
AXA Tianping 662 - 662 - - -
Japan Life & Savings 1,958 (79) 1,879 1,904 (77) 1,827
Hong Kong Life & Savings 571 - 571 547 - 547
Hong Kong Property & Casualty 198 - 198 194 - 194
Others 141 0 141 139 - 139
AXA XL 7,615 - 7,615 7,479 - 7,479
United States - - - 7,682 (7,682) 0
International 717 0 717 780 0 780
Life & Savings 221 - 221 220 - 220
Property & Casualty 497 0 497 492 0 492
AXA Bank Belgium - - - 68 - 68
Others - - - - - -
Transversal & Central Holdings 440 (0) 440 432 (0) 432
AXA Investment Managers 389 - 389 381 - 381
AXA Assistance 51 (0) 51 51 (0) 50
TOTAL 17,855 (79) 17,776 24,529 (7,758) 16,771
Note: Goodwill related to entities accounted for using the equity method is not presented in this table (see Note 10).
The total goodwill Group share amounted to €17,695 million as of
December 31, 2019 and €16,691 million as of December 31, 2018.
Consistent with IAS 36, each unit or group of units to which
the goodwill is allocated represents the lowest level at which
the goodwill is monitored for internal management purposes
within the Group and is never larger than an operating segment
as defined by IFRS 8 such as presented in Note 3.

254 I UNIVERSAL REGISTRATION DOCUMENT - ANNUAL REPORT 2019 - AXA I
CONSOLIDATED FINANCIAL STATEMENTS 5 5.6 NOTES TO THE CONSOLIDATED FINANCIAL STATEMENTS
5.2 CHANGE IN GOODWILL
5.2.1 Goodwill – change in gross value
(in Euro million)
Gross value
January 1, 2019
Acquisitions
during
the period
Disposals
during
the period
Currency
translation
adjustment
Other
changes
Gross value
December 31, 2019
France 225 - - - - 225
Europe (a) 5,148 - - 63 117 5,328
Asia 2,784 665 - 71 10 3,530
AXA XL 7,479 - - 136 - 7,615
United States 7,682 - (7,820) 139 - -
International (b) 780 - - 5 (68) 717
Transversal & Central
Holdings 432 - - 8 - 440
TOTAL 24,529 665 (7,820) 422 59 17,855
(a) Increase in the valuation of a contingent consideration corresponding to a buyout of minorities interest (€+117 million) related to the business combination occurred in 2006 (see Note 31).
(b) Related to AXA Bank Belgium disposal process (see Note 5.3.3).
(in Euro million)
Gross value
January 1, 2018
Acquisitions
during
the period
Disposals
during
the period
Currency
translation
adjustment
Other
changes
Gross value
December 31, 2018
France 225 - - - - 225
Europe 5,143 - - 5 - 5,148
Asia 2,603 - - 181 - 2,784
AXA XL 35 7,354 - 91 - 7,479
United States 7,313 - - 369 - 7,682
International 805 - - (25) - 780
Transversal & Central
Holdings 427 0 - 4 - 432
TOTAL 16,551 7,354 - 624 - 24,529
5.2.2 Goodwill – change in impairment
(in Euro million)
Cumulative
impairment
January 1, 2019
Increase in
Impairment
during
the period
Write back of
impairment
of goodwill
sold during
the period
Currency
translation
adjustment
Other
Changes
Cumulative
impairment
December 31, 2019
France - - - - - -
Europe - - - - - -
Asia 77 - - 2 - 79
AXA XL - - - - - -
United States 7,682 - (7,820) 139 - -
International - - - - - -
Transversal & Central
Holdings 0 - - - - 0
TOTAL 7,758 - (7,820) 141 - 79

255I UNIVERSAL REGISTRATION DOCUMENT - ANNUAL REPORT 2019 - AXA I
CONSOLIDATED FINANCIAL STATEMENTS
5
5.6 NOTES TO THE CONSOLIDATED FINANCIAL STATEMENTS
(in Euro million)
Cumulative
impairment
January 1, 2018
Increase in
Impairment
during
the period
Write back of
impairment
of goodwill
sold during
the period
Currency
translation
adjustment
Other
Changes
Cumulative
impairment
December 31, 2018
France - - - - - -
Europe - - - - - -
Asia 71 - - 6 - 77
AXA XL - - - - - -
United States 1,089 6,329 - 264 - 7,682
International - - - - - -
Transversal & Central
Holdings 0 - - - - 0
TOTAL 1,161 6,329 - 269 - 7,758
METHODOLOGY BY UNIT
For most Life & Savings businesses Cash Generating Units
(“CGUs”) recoverability of goodwill is assessed using a fair value
approach. For AXA Belgium, the recoverability of the goodwill is
assessed using the value in use approach. Both approaches are
described in Note 1.
For the CGUs within the Property & Casualty business segment
recoverability of goodwill is also assessed using the value in
use approach, as described in Note 1. For AXA Investment
Managers (“AXA IM”) the recoverability of the goodwill is based
on a fair value derived from market information, such as the
price to earnings ratio of peers, and the earnings expected for
the year corresponding to the CGU’s scope. The fair value is
then compared to the carrying amount to assess the goodwill
recoverability.
MAIN ASSUMPTIONS
For the cash generating units (CGUs) within the Property &
Casualty business segment, the value in use approach uses
cash flow projections based on business plans approved
by management covering up to three years and discounted
using a risk adjusted rate. Cash flows beyond that period are
extrapolated using sustainable perpetual growth rates assumed
to be achievable over the long term to derive a terminal value.
The earnings included in the business plan of each CGU are
agreed with AXA Management and defined locally considering
best estimate operating assumptions, including expenses and
loss ratios, investment income, economic capital, premium
rates and taxes, all compliant with the various standards and
the requirements of supervisory authorities, when applicable.
The discount rates used for the valuation have been derived
using the Capital Asset Pricing Model (CAPM) which includes
assumptions for risk-free interest rates, equity risk premiums,
insurance activity beta and leverage ratio that are consistent
with the view of AXA’s Management for the specific market(s)
in which the CGU operates. For the main CGUs discount rates
range from 3.0% to 7.4% in 2019, compared to a range of 5.6% to
8.4% in 2018, and growth rates, applied beyond the strategic plan
horizon, where applicable, vary from 0.0% to 4.4%, compared to
a range of 2.4% to 4.2% in 2018.
For Life & Savings CGUs, recoverable amounts are calculated
using a risk neutral approach, relying on European Embedded
Value (EEV) techniques, that are industry specific and widely
used. The EEV represents the excess of the market value of
assets over the market value of liabilities. The market value
of the liabilities is based on best estimate liabilities which are
the probability weighted average of future cash flows adjusted
to allow for the time value of money, using the relevant term
structure of the risk-free interest rates, as well as for deviations
related to the cost of non-hedgeable, i.e. non-financial, risks.
The calculation of the best estimate liabilities involves the
use of operational and economic assumptions. Operational
assumptions include demographic factors, such as mortality,
morbidity and lapse/surrender rates, expenses allowance
and taxes, all compliant with the requirements of supervisory
authorities. Future cash flows are discounted using reference
rates that are compliant with EIOPA specifications of using swap
rates adjusted for credit and volatility risk. The table below shows
the adjustments in basis points by currency:
Reference Yield Curve (in bps) EUR GBP USD JPY CHF HKD
Volatility adjustment (added) 7 15 32 3 6 32
Credit risk adjustment (deducted) 10 11 13 10 10 15

256 I UNIVERSAL REGISTRATION DOCUMENT - ANNUAL REPORT 2019 - AXA I
CONSOLIDATED FINANCIAL STATEMENTS 5 5.6 NOTES TO THE CONSOLIDATED FINANCIAL STATEMENTS
In the case of AXA Belgium, the recoverable value has been
derived using a Traditional Embedded Value (TEV) methodology
equivalent to a real world approach where the risk allowance
is implicit to the discount rate as the projected cash flows are
not risk-adjusted. The discount rate used to determine the
recoverable value of AXA Belgium was 4.5% as opposed to 5.3%
used in 2018 following the drop in interest rates.
ALL CASH-GENERATING UNITS (CGU)
The results of cash flow projections exceed the carrying amount
of each related cash-generating unit or group of units.
For all cash-generating units, to the extent that the valuation
of securities and interest rate levels remain low for prolonged
periods of time, or volatility and other market conditions stagnate
or worsen, new business volumes and profitability together with
the value of the in-force portfolio are likely be negatively aff ected.
In addition, the future cash flow expectations from both the
in-force and new business and other assumptions underlying
management’s current business plans could be negatively
impacted by other risks to which the Group’s business is subject.
For each CGU, sensitivity analyses were performed with regards
to the discount rate: an increase of 0.5% in the discount rate
would not lead to an impairment loss for any of the CGUs as the
recoverable amount for each CGU would still exceed its carrying
value.
However, subsequent impairment tests may be based upon
diff erent assumptions and future cash flow projections, which
may result in an impairment of these assets in the foreseeable
future.
5.3 OTHER INFORMATION RELATING
TO GOODWILL, ACQUISITIONS
AND DISPOSALS OF SUBSIDIARIES
5.3.1 AXA Tianping acquisition
On December 13, 2019, AXA completed the acquisition of the
remaining 50% stake (1) in AXA Tianping Property & Casualty
Insurance Company Ltd. (“AXA Tianping”) from its domestic
shareholders. Total cash consideration amounted to RMB
4.6 billion (2) (or €590 million (3) (4)).
AXA Tianping was accounted for using the equity method until
December 31, 2019, and starting that date the entity is fully
consolidated in AXA Group’s financial statements. The impact
of a full consolidation of AXA Tianping activities between
December 13, 2019, and December 31, 2019, was deemed
immaterial with respect to the AXA Group’s consolidated income.
Therefore, the acquisition balance sheet was prepared on the
basis of December 31, 2019 figures.
Additionally, the result of discontinuing the equity method
participation was €+38 million, corresponding to the recycling
of other comprehensive income and currency translation
adjustment.
Acquired assets and liabilities were adjusted to fair value in
the opening balance sheet and integrated within Consolidated
Financial Statements at year-end based on IFRS accounting
policies. In accordance with IFRS 3 Business combinations,
adjustments can be made within twelve months of the acquisition
date if new information becomes available to complete the initial
accounting.
(1) AXA acquired the initial 50% stake in AXA Tianping in February 2014. At the acquisition date of the remaining stake, the initial participation has a fair value of €541 million.
(2) This includes an immediate cash consideration of RMB 3.5 billion (€450 million), and a payment of RMB 1.1 billion (€146 million) deferred by 12 months from completion. The deferred payment replaces the capital reduction of AXA Tianping RMB 1.5 billion (€193 million) communicated at the time of the signing of the transaction. It does not include a Net Investment Hedge of €36 million which is also considered as part of the total consideration transferred.
(3) EUR 1 = RMB 7.8009 as of December 12, 2019 (Source: Bloomberg).
(4) Total consideration transferred amounted to €1,167 million, including the fair value of the initial participation for €541 million and the costs related to a Net Invesment Hedge costs for €36 million.
ASSETS AND LIABILITIES FAIR VALUED AT THE ACQUISITION DATE:
(in Euro million) At the acquisition date
Deferred acquisition costs and equivalent 141
Other intangible assets 101
Investments 791
Deferred tax asset 28
Other assets 588
TOTAL ASSETS (EXCLUDING GOODWILL) 1,622
Liabilities arising from insurance and investment contracts 812
Other liabilities 308
TOTAL LIABILITIES 1,120
Net asset value before goodwill 502
Goodwill 665
TOTAL CONSIDERATION (4)
1,167

257I UNIVERSAL REGISTRATION DOCUMENT - ANNUAL REPORT 2019 - AXA I
CONSOLIDATED FINANCIAL STATEMENTS
5
5.6 NOTES TO THE CONSOLIDATED FINANCIAL STATEMENTS
AXA Tianping acquisition led to the recognition of a goodwill of
€665 million.
At the date of the acquisition, other intangible assets include
€82 million representing the value of the commercial relationships
built by AXA Tianping with non-exclusive agencies. This value is
estimated based on the expected cash flows generated by the
new customers by considering the average renewal rate of the
existing commercial relationships of non-exclusive agencies and
a market growth rate assumption based on the last 4 years.
These intangible assets are amortized over a useful life expected
to be 15 years.
AXA TIANPING IFRS REVENUES AND NET INCOME FOR 2019
2019 revenues and net income for the acquired AXA Tianping
assuming the acquisition took place as at January 1, 2019
respectively was estimated to be €881 million and €-11 million,
respectively.
These figures are estimates based on IFRS guidelines. This
information is not necessarily indicative of the results that could
have been achieved within the AXA Group if the acquisition
had actually taken place on January 1, 2019. In particular, the
information does not factor in any synergy, nor does provide an
indication of future results.
5.3.2 Equitable Holdings, Inc.
MARCH 25 SECONDARY COMMON STOCK OFFERING OF
EQUITABLE HOLDINGS, INC. AND RELATED SHARE BUYBACK
On March 25, 2019, AXA completed a secondary public off ering
of 40,000,000 shares (the “Off ering”), at a public off ering price of
USD 20.50 per share, of its US subsidiary, Equitable Holdings,
Inc. (“EQH”) and the sale to EQH of 30,000,000 shares at the per
share price paid by the underwriters in the Off ering. In addition,
the underwriters exercised in full the over-allotment option to
purchase an additional 6,000,000 EQH shares.
Net proceeds (1) amounted to USD 1.5 billion or €1.3 billion (2),
corresponding to the sale of 76,000,000 EQH shares in the
Off ering, the full exercise of the over-allotment option granted
to the underwriters and the Share Buyback. Following this sale,
AXA’s ownership in EQH decreased from 60.1% (3) (4) to 48.3% (4 ).
The reduction of its voting rights below 50% combined with the
reduction of its Board membership to a minority share led to
the loss of control of AXA over EQH, while continuing to retain
a significant influence over its residual shareholding of EQH. As
a result, AXA:
■ deconsolidated EQH and accounted for its remaining
ownership in EQH using the equity method; and
■ reclassified the equity component of the Mandatory
Exchangeable Bonds from non-controlling interests to
financial liability (valued at €614 million).
(1) Net of underwriting discounts and commissions.
(2) EUR 1 = USD 1.1297 as of March 22, 2019 (Source: Bloomberg).
(3) EQH’s issued and outstanding common stock as of March 7, 2019, was comprised of 521,051,204 shares.
(4) Including the shares to be delivered on redemption of the mandatory exchangeable bonds into EQH shares, issued by AXA in May 2018.
The Off ering and the Share Buyback resulted in a negative net income impact of €-598 million as detailed in the table below:
(in Euro million)
Net p roceeds 1,341
Fair value of retained stake in EQH 4,330
Total Fair v alue 5,671
Consolidated b ook v alue 6,269
NET LOSS UPON DECONSOLIDATION (598)
of which revaluation at fair value of retained stake (1,165)
of which other comprehensive income recycling 1,232
Employee benefits actuarial losses were reclassified from other comprehensive income to retained earnings for €-512 million.

258 I UNIVERSAL REGISTRATION DOCUMENT - ANNUAL REPORT 2019 - AXA I
CONSOLIDATED FINANCIAL STATEMENTS 5 5.6 NOTES TO THE CONSOLIDATED FINANCIAL STATEMENTS
At the date of the transaction, the retained stake in EQH was adjusted to its fair value. The table below presents the assets and liabilities
on a 100% basis fair valued at this date, resulting in a carrying amount of the EQH under the equity method amounting to €4,330 million:
(in Euro million) At the acquisition date
Intangible assets 9,701
Investments 182,473
Other assets 15,731
TOTAL ASSETS 207,905
Liabilities arising from insurance and investment contracts 180,484
Provisions for risks and charges 1,714
Other liabilities 16,742
TOTAL LIABILITIES 198,940
Net asset value (100%) 8,965
Net asset value - Group share (48.3%) 4,330
JUNE 7 SECONDARY OFFERING OF EQUITABLE HOLDINGS, INC.’S COMMON STOCK (INCLUDING GREEN SHOE)
On June 7, 2019, AXA completed a secondary public off ering
of 40,000,000 shares of EQH’s common stock and further
6,000,000 shares from the full exercise of the over-allotment
option granted to the underwriters.
Net proceeds (1) to AXA, corresponding to the sale of
46,000,000 EQH shares, amounted to USD 959 million or
€850 million (2). Following this transaction, AXA’s ownership in
EQH decreased from 48.3% (3) (4) to 38.9% (3) (4) .
(1) Net of underwriting discounts and commissions.
(2) EUR 1 = USD 1.1293 as of June 6, 2019 (Source: Bloomberg). Greenshoe: EUR 1 = USD 1.1219 as of July 5, 2019 (Source: Bloomberg).
(3) Including the shares to be delivered on redemption of the bonds mandatorily exchangeable into EQH shares, issued by AXA in May 2018.
(4) EQH’s issued and outstanding common stock as of May 9, 2019, comprised 491,138,042 shares.
Intangible assets mainly relate to value of business inforce and are amortized over the life of the portfolio of contracts.
The net gain of the sale amounted to €2 million as detailed below:
(in Euro million)
Net p roceeds 850
Consolidated b ook v alue 848
NET INCOME RESULT 2
of which other comprehensive income recycling 61
Employee benefits actuarial losses were reclassified from other comprehensive income to retained earnings for €-4 million.

259I UNIVERSAL REGISTRATION DOCUMENT - ANNUAL REPORT 2019 - AXA I
CONSOLIDATED FINANCIAL STATEMENTS
5
5.6 NOTES TO THE CONSOLIDATED FINANCIAL STATEMENTS
(in Euro million)
Net p roceeds 2,850
Fair value of retained stake in EQH 934
Total Fair v alue 3,784
Consolidated b ook v alue 3,639
NET GAIN UPON DECONSOLIDATION 145
of which revaluation at fair value of retained stake (105)
of which other comprehensive income recycling 629
NOVEMBER 13 SECONDARY OFFERING OF EQUITABLE HOLDINGS, INC.’S COMMON STOCK
On November 13, 2019, AXA completed the sale of 144,000,000
shares (1) of common stock of EQH to Goldman Sachs, as the
sole underwriter in a registered public off ering of those shares
(the “Off ering”).
As part of the Offering, EQH repurchased 24,000,000 of the
144,000,000 shares of common stock from the underwriter at
the per share purchase price paid by the underwriter to AXA in
the Off ering.
The completion of the Off ering resulted in net proceeds to AXA
of USD 3.1 billion or €2.9 billion (2), corresponding to a net price (3)
of USD 21.80 per share.
At the date of the transaction, the retained stake of EQH was
adjusted to its fair value and classified as equity instruments
available for sale. This remaining stake is mainly related to the
Mandatorily Exchangeable Bonds that will be repaid in 2021.
(1) As of November 5, 2019, EQH’s issued and outstanding common stock comprised 489,329,559 shares.
(2) EUR 1 = USD 1.1011 as of November 12, 2019 (Source: Bloomberg).
(3) Net of underwriting discounts and commissions.
(4) Subject to price adjustment at closing.
(5) Crelan has a call option to purchase the Crelan NV and AXA Bank Belgium shares held by AXA.
(6) Crelan NV is Crelan’s banking subsidiary.
5.3.3 AXA Bank Belgium disposal
On October 25, 2019, AXA entered into an agreement to sell its
Belgian banking operations, AXA Bank Belgium, to Crelan Bank
(“Crelan”).
Under the terms of the agreement, AXA will sell 100% of AXA
Bank Belgium to Crelan for a total consideration of €620 million,
comprised of (i) a total cash consideration of €540 million (4),
and (ii) the transfer to AXA Belgium of 100% of Crelan Insurance
(valued at €80 million), the insurance company of Crelan,
providing protection insurance linked to loans originated by
Crelan.
In addition, AXA Belgium will take a 9.9% minority equity stake (5)
in Crelan NV (6) and AXA Bank Belgium, investing a total of
€90 million, which will be fully funded by the purchase by Crelan,
for €90 million, of the contingent convertible bonds previously
issued by AXA Bank Belgium to AXA Group.
The major classes of assets and liabilities (net of intercompany balances with other AXA entities) presented as held for sale related to:
ASSETS
(in Euro million)
December 31,
2019
Investments 25,243
Other assets 639
Cash and cash equivalents 1,020
TOTAL ASSETS HELD FOR SALE 26,902
Employee benefits actuarial losses were reclassified from other comprehensive income to retained earnings for €15 million.

260 I UNIVERSAL REGISTRATION DOCUMENT - ANNUAL REPORT 2019 - AXA I
CONSOLIDATED FINANCIAL STATEMENTS 5 5.6 NOTES TO THE CONSOLIDATED FINANCIAL STATEMENTS
As such, the major classes of assets and liabilities (net of intercompany balances with other AXA entities) presented as held for sale
related to:
ASSETS
(in Euro million)
December 31,
2019
Investments 2,041
Cash and cash equivalents 262
TOTAL ASSETS HELD FOR SALE 2,303
LIABILITIES
(in Euro million)
December 31,
2019
Liabilities arising from insurance and investment contracts 2,303
TOTAL LIABILITIES HELD FOR SALE 2,303
LIABILITIES
(in Euro million)
December 31,
2019
Financing debt 18
Liabilities arising from banking activities 25,807
Other liabilities 516
TOTAL LIABILITIES HELD FOR SALE 26,341
As of December 31, 2019, the transaction is expected to result
in a loss of €-590 million, some assets were impaired with the
following allocation: goodwill for €-68 million, other intangible
assets for €-17 million and investments for €-505 million. These
impairments are included in the amounts above.
5.3.4 Group life portfolio transformation in
Switzerland
On April 10, 2018, AXA entered into an agreement with its
main occupational benefits foundations (1) to convert their
business model from a full-value insurance (2) model to a semi-
autonomous model (3) . As at December 31, 2018, the operations
affected by these disposals were treated as held for sale in
AXA consolidated financial statements. On January 1, 2019,
AXA Switzerland completed the transformation and most of
the related assets and liabilities have been transferred to the
occupational Foundations during the first half of 2019.
Besides, during 2019, AXA Switzerland entered in agreement
with additional small occupational benefit foundations to
convert their business model from a full insurance value to a
semi-autonomous model on July 1, 2019 and January 1, 2020.
Assets and liabilities were classified as held for sale in AXA’s
Consolidated Financial Statements as of December 31, 2019.
(1) Collective group pensions schemes, which are managed by an independent Board.
(2) Contract covering the whole off er: guaranteed savings and annuity benefits, death and disability benefits, and administration services.
(3) Contract covering death and disability benefits, and administration services.
As of December 31, 2019, the other comprehensive income of invested assets in the scope of the transaction amounted to €+15 million.
As of December 31, 2019, the other comprehensive income of invested assets in the scope of the transaction was nil.
As of December 31, 2019, the consolidated statement of income included an impact of €-24 million.

261I UNIVERSAL REGISTRATION DOCUMENT - ANNUAL REPORT 2019 - AXA I
CONSOLIDATED FINANCIAL STATEMENTS
5
5.6 NOTES TO THE CONSOLIDATED FINANCIAL STATEMENTS
5.3.5 AXA Life Europe disposal
On August 1, 2018, AXA received an irrevocable off er from Cinven for the sale of AXA Life Europe. The sale is expected to take place in
the first semester of 2020. The completion of the transaction is subjected to customary closing conditions, including the regulatory
approvals that were not yet received as of December 31, 2019. Given these circumstances, the held for sale classification was therefore
extended beyond one year.
As of December 31, 2019, the major classes of assets liabilities (net of intercompany balances with other AXA entities) presented as
held for sale related to:
ASSETS
(in Euro million)
December 31,
2019
Other intangible assets 207
Investments 5,606
Other assets 146
Cash and cash equivalents 708
TOTAL ASSETS HELD FOR SALE 6,667
LIABILITIES
(in Euro million)
December 31,
2019
Liabilities arising from insurance and investment contracts 5,241
Other liabilities 468
TOTAL LIABILITIES HELD FOR SALE 5,709
As of December 31, 2019, the other comprehensive income of
invested assets and currency translation adjustment in the scope
of the transaction amounted to €+91 million.
As the transaction is expected to result in a loss of €-89 million,
in addition to the €-18 million recognized as of December 31,
2018, other intangible assets were impaired.

262 I UNIVERSAL REGISTRATION DOCUMENT - ANNUAL REPORT 2019 - AXA I
CONSOLIDATED FINANCIAL STATEMENTS 5 5.6 NOTES TO THE CONSOLIDATED FINANCIAL STATEMENTS
I Note 6 Value of purchased business in-force
6.1 VALUE OF PURCHASED LIFE BUSINESS IN-FORCE
The change in Value of Life Business In-force (“VBI”) was as follows:
(in Euro million) 2019 2018
Gross carrying value as of January 1 6,172 5,926
Accumulated amortization and impairment (4,614) (3,857)
Shadow accounting on VBI (159) (178)
Net carrying value as of January 1 1,399 1,891
Capitalization - -
Capitalized interests 59 70
Amortization and impairment for the period (a) (183) (649)
Changes in VBI amortization, capitalization and impairment (124) (579)
Change in shadow accounting on VBI (3) 27
Currency translation and other changes 26 52
Acquisitions and disposals of subsidiaries and portfolios 76 9
Net carrying value as of December 31 1,376 1,399
Gross carrying value as of December 31 6,199 6,172
Accumulated amortization and impairment (4,656) (4,614)
Shadow accounting on VBI (167) (159)
(a) In 2018, amount mainly related to the VBI impairment related to the Group Life portfolio in Swizterland.
6.2 VALUE OF PURCHASED NON-LIFE BUSINESS IN-FORCE
The change in Value of non-life Business In-force (“VBI”) was as follows:
(in Euro million) 2019 2018
Gross carrying value as of January 1 1,093 -
Accumulated amortization and impairment (405) -
Net carrying value as of January 1 687 -
VBI Capitalization - -
Capitalized interests - -
Changes in amortization excluding impacts of assumptions unlocking (557) (408)
Changes in VBI amortization and capitalized interests (557) (408)
Currency translation 15 12
Acquisitions of subsidiaries (manual consolidation sub group only) - -
Disposal of subsidiaries (manual consolidation sub group only) - -
Acquisitions and disposals of portfolios and other changes - 1,083
Acquisitions and disposals of subsidiaries and portfolios (a)
- 1,083
Net carrying value as of December 31 145 687
Gross carrying value as of December 31 1,113 1,093
Accumulated amortization and impairment (969) (405)
(a) In 2018, amount related to the acquisition of the XL Group.

263I UNIVERSAL REGISTRATION DOCUMENT - ANNUAL REPORT 2019 - AXA I
CONSOLIDATED FINANCIAL STATEMENTS
5
5.6 NOTES TO THE CONSOLIDATED FINANCIAL STATEMENTS
I Note 7 Deferred acquisition costs and equivalent
7.1 BREAKDOWN OF DEFERRED ACQUISITION COSTS (DAC) AND EQUIVALENT
(in Euro million)
December 31,
2019
December 31,
2018
Deferred Acquisition Costs relating to Life & Savings (a) 13,534 23,798
Deferred Origination Costs (b) 592 625
Shadow accounting on DAC (1,227) (488)
Deferred Acquisition Costs and equivalent relating to Life & Savings 12,899 23,934
Deferred Acquisition Costs and equivalent relating to Property & Casualty 3,785 2,481
Deferred Acquisition Costs and equivalent 16,684 26,415
(a) Applicable to Life & Savings insurance contracts and investment contracts with discretionary participation features according to IFRS 4. Amounts are net of accumulated amortization.
(b) Applicable to investment contracts with no discretionary participation features (IAS 39).
7.2 ROLLFORWARD OF DEFERRED ACQUISITION COSTS AND EQUIVALENT
Changes in Deferred Acquisition Costs and equivalent were as follows:
(in Euro million)
December 31, 2019 December 31, 2018
Deferred
Acquisition
Costs (a)
Deferred
Origination
Costs (b)
Deferred
Acquisition
Costs (a)
Deferred
Origination
Costs (b)
Deferred Acquisition Costs and equivalent net carrying value
as of January 1 25,791 625 22,183 698
Amortization and impairment for the period of Life DAC (1,572) (92) (1,700) (140)
Capitalized interests for the period of Life DAC 599 24 916 26
DAC and similar costs capitalization for the period of Life DAC 1,718 25 2,130 26
Change in Non-Life DAC 1,304 464
Changes in amortization, capitalization and impairment 2,049 (43) 1,809 (88)
Change in shadow accounting on DAC (1,020) - 1,300 -
Currency translation and other changes 352 10 803 13
Disposals of subsidiaries and portfolios (c) (11,079) 0 (303) 1
Deferred Acquisition Costs and equivalent net carrying value
as of December 31 16,092 592 25,791 625
of which shadow accounting on DAC (1,227) - (488) -
TOTAL 16,684 26,415
(a) Relating to contracts subject to IFRS 4, i.e. insurance contracts and investment contracts with discretionary participating features.
(b) Applicable to investment contracts with no discretionary participation features (IAS 39).
(c) In 2019, the amount includes the deconsolidation of Equitable Holdings, Inc.
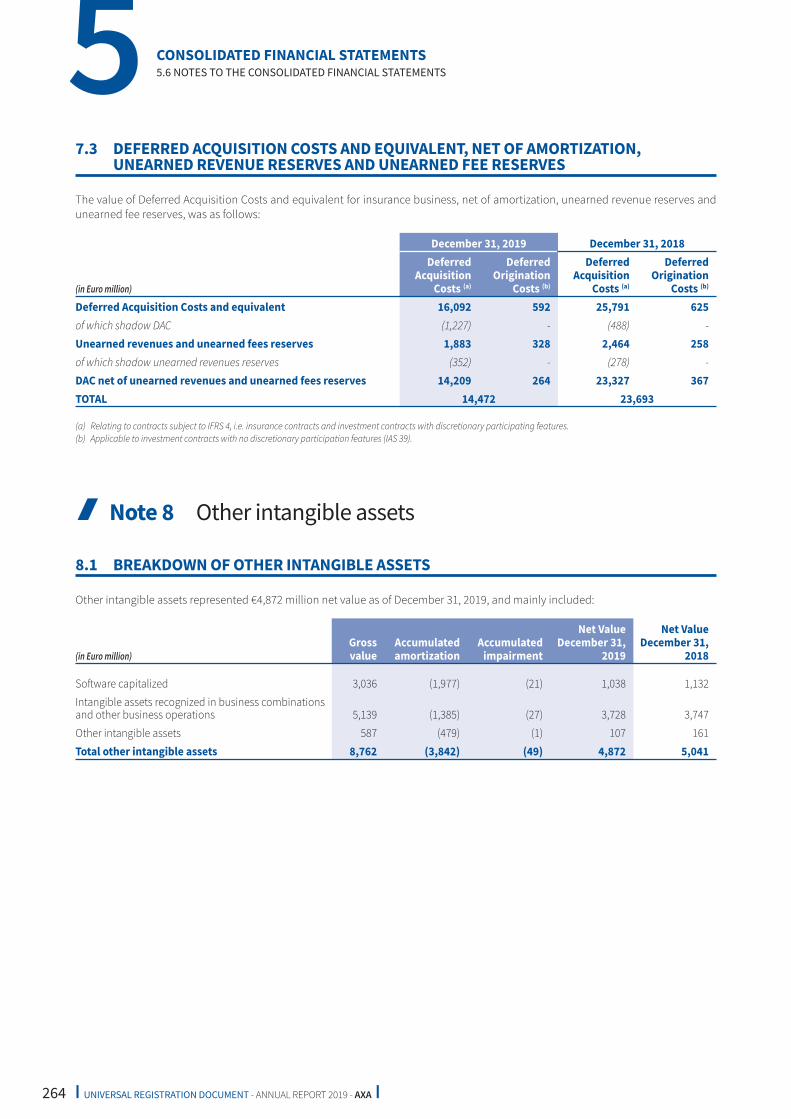
264 I UNIVERSAL REGISTRATION DOCUMENT - ANNUAL REPORT 2019 - AXA I
CONSOLIDATED FINANCIAL STATEMENTS 5 5.6 NOTES TO THE CONSOLIDATED FINANCIAL STATEMENTS
7.3 DEFERRED ACQUISITION COSTS AND EQUIVALENT, NET OF AMORTIZATION,
UNEARNED REVENUE RESERVES AND UNEARNED FEE RESERVES
The value of Deferred Acquisition Costs and equivalent for insurance business, net of amortization, unearned revenue reserves and
unearned fee reserves, was as follows:
(in Euro million)
December 31, 2019 December 31, 2018
Deferred
Acquisition
Costs (a)
Deferred
Origination
Costs (b)
Deferred
Acquisition
Costs (a)
Deferred
Origination
Costs (b)
Deferred Acquisition Costs and equivalent 16,092 592 25,791 625
of which shadow DAC (1,227) - (488) -
Unearned revenues and unearned fees reserves 1,883 328 2,464 258
of which shadow unearned revenues reserves (352) - (278) -
DAC net of unearned revenues and unearned fees reserves 14,209 264 23,327 367
TOTAL 14,472 23,693
(a) Relating to contracts subject to IFRS 4, i.e. insurance contracts and investment contracts with discretionary participating features.
(b) Applicable to investment contracts with no discretionary participation features (IAS 39).
I Note 8 Other intangible assets
8.1 BREAKDOWN OF OTHER INTANGIBLE ASSETS
Other intangible assets represented €4,872 million net value as of December 31, 2019, and mainly included:
(in Euro million)
Gross
value
Accumulated
amortization
Accumulated
impairment
Net Value
December 31,
2019
Net Value
December 31,
2018
Soft ware capitalized 3,036 (1,977) (21) 1,038 1,132
Intangible assets recognized in business combinations
and other business operations 5,139 (1,385) (27) 3,728 3,747
Other intangible assets 587 (479) (1) 107 161
Total other intangible assets 8,762 (3,842) (49) 4,872 5,041

265I UNIVERSAL REGISTRATION DOCUMENT - ANNUAL REPORT 2019 - AXA I
CONSOLIDATED FINANCIAL STATEMENTS
5
5.6 NOTES TO THE CONSOLIDATED FINANCIAL STATEMENTS
8.2 BREAKDOWN OF INTANGIBLE ASSETS RECOGNIZED IN BUSINESS COMBINATIONS
AND OTHER BUSINESS OPERATIONS
(in Euro million)
Transaction
Year
December 31, 2019 December 31, 2018
Gross
value
Accu-
mulated
amortiza-
tion
Accu-
mulated
impair-
ment
Net
carrying
value
Gross
value
Accu-
mulated
amortiza-
tion
Accu-
mulated
impair-
ment
Net
carrying
value
AXA Tianping 2019 82 - - 82 - - - -
XL Group Property & Casualty 2018 1,704 (58) - 1,646 1,659 (11) - 1,647
Poland Property & Casualty 2015 71 (23) - 47 70 (18) - 52
Asia Property & Casualty 2012 166 (119) - 47 162 (100) - 62
Greece Life & Savings 2007 43 (7) (24) 11 43 (6) (24) 12
Greece Property & Casualty 2007 77 (51) - 26 77 (47) - 30
AXA MPS (Italy) Life & Savings 2007 & 2008 592 - - 592 592 - - 592
AXA MPS (Italy) Property &
Casualty 2007 & 2008 347 - - 347 347 - - 347
Switzerland Life & Savings 2006 188 (122) - 66 181 (109) - 72
Switzerland Property & Casualty 2006 625 (458) - 167 603 (420) - 183
Germany Property & Casualty 2006 92 (54) - 38 92 (49) - 43
Belgium Property & Casualty 2006 67 (37) - 30 67 (34) - 33
Spain Property & Casualty 2006 247 (235) - 12 247 (231) - 16
AXA Investment Managers 2005 190 (9) - 181 180 (8) - 172
Others 650 (211) (2) 437 698 (209) (2) 487
TOTAL 5,139 (1,385) (27) 3,728 5,016 (1,242) (27) 3,747
Intangible assets recognized in business combinations mainly
include value of distribution agreements and customer related
intangibles, including €1,936 million (net carrying value) assets
with indefinite useful life.
The amortization period for intangible assets recognized in
business combinations with a finite useful life ranges from 10
to 20 years.
8.3 CHANGE IN INTANGIBLE ASSETS RECOGNIZED IN BUSINESS COMBINATIONS
AND OTHER BUSINESS OPERATIONS
(in Euro million) 2019 2018
Net value as of January 1 3,747 2,184
Acquisition during the period (a) 109 1,672
Amortization allowance (146) (118)
Impairment allowance - (2)
Disposal during the period (0) (8)
Purchase decreases following adjustments - -
Currency impact 53 20
Other changes (34) -
Closing net value as of December 31 3,728 3,747
(a) In 2019, mainly includes €101 million related to the acquisition of AXA Tianping (see Note 5.3.1).
In 2018, mainly includes €1,656 million related to the acquisition of the XL Group.

266 I UNIVERSAL REGISTRATION DOCUMENT - ANNUAL REPORT 2019 - AXA I
CONSOLIDATED FINANCIAL STATEMENTS 5 5.6 NOTES TO THE CONSOLIDATED FINANCIAL STATEMENTS
I Note 9 Investments
9.1 BREAKDOWN OF INVESTMENTS
Each investment item is presented net of the eff ect of related hedging derivatives (IAS 39 qualifying hedges or economic hedges)
except derivatives related to macro-hedges which are shown separately. Detailed eff ects of derivatives are also provided in Note 20.3.
(in Euro million)
Insurance
Fair value Carrying value
% (value
balance sheet)
Investment in real estate properties at amortized cost (a) 31,395 21,679 3.67%
Investment in real estate properties designated as at fair value through profit or loss (b) 1,622 1,622 0.27%
Macro-hedge and other derivatives - - -
Investment in real estate properties 33,017 23,301 3.94%
Debt instruments held to maturity - - -
Debt instruments available for sale 383,232 383,232 64.87%
Debt instruments designated as at fair value through profit or loss (c) 22,274 22,274 3.77%
Debt instruments held for trading 117 117 0.02%
Debt instruments (at cost) that are not quoted in an active market (d) 11,271 10,901 1.85%
Debt instruments 416,894 416,525 70.51%
Equity instruments available for sale 18,400 18,400 3.11%
Equity instruments designated as at fair value through profit or loss (b) 9,563 9,563 1.62%
Equity instruments held for trading 1 1 0.00%
Equity instruments 27,965 27,965 4.73%
Non consolidated investment funds available for sale 8,612 8,612 1.46%
Non consolidated investment funds designated as at fair value through profit or loss (b) 6,286 6,286 1.06%
Non consolidated investment funds held for trading 32 32 0.01%
Non consolidated investment funds 14,930 14,930 2.53%
Other assets designated as at fair value through profit or loss,
held by consolidated investment funds 15,132 15,132 2.56%
Macro-hedge and other derivatives 249 249 0.04%
Sub total Financial instruments (excluding Loans) 475,169 474,800 80.38%
Loans held to maturity - - -
Loans available for sale - - -
Loans designated as at fair value through profit or loss (b) - - -
Loans held for trading - - -
Loans at cost (e) 21,011 19,965 3.38%
Macro-hedge and other derivatives - - -
Loans 21,011 19,965 3.38%
Total Financial instruments 496,180 494,765 83.76%
Assets backing contracts where the financial risk is borne by policyholders 72,660 72,660 12.30%
INVESTMENTS 601,857 590,726 100.00%
Investments (excluding those backing contracts where the financial risk
is borne by policyholders) 529,197 518,066 87.70%
(a) Includes infrastructure and forests investments.
(b) Assets measured at fair value under the fair value option.
(c) Includes assets measured at fair value notably under the fair value option.
(d) Eligible to the IAS 39 Loans and receivables measurement category.
(e) Mainly relates to mortgage loans and policy loans.
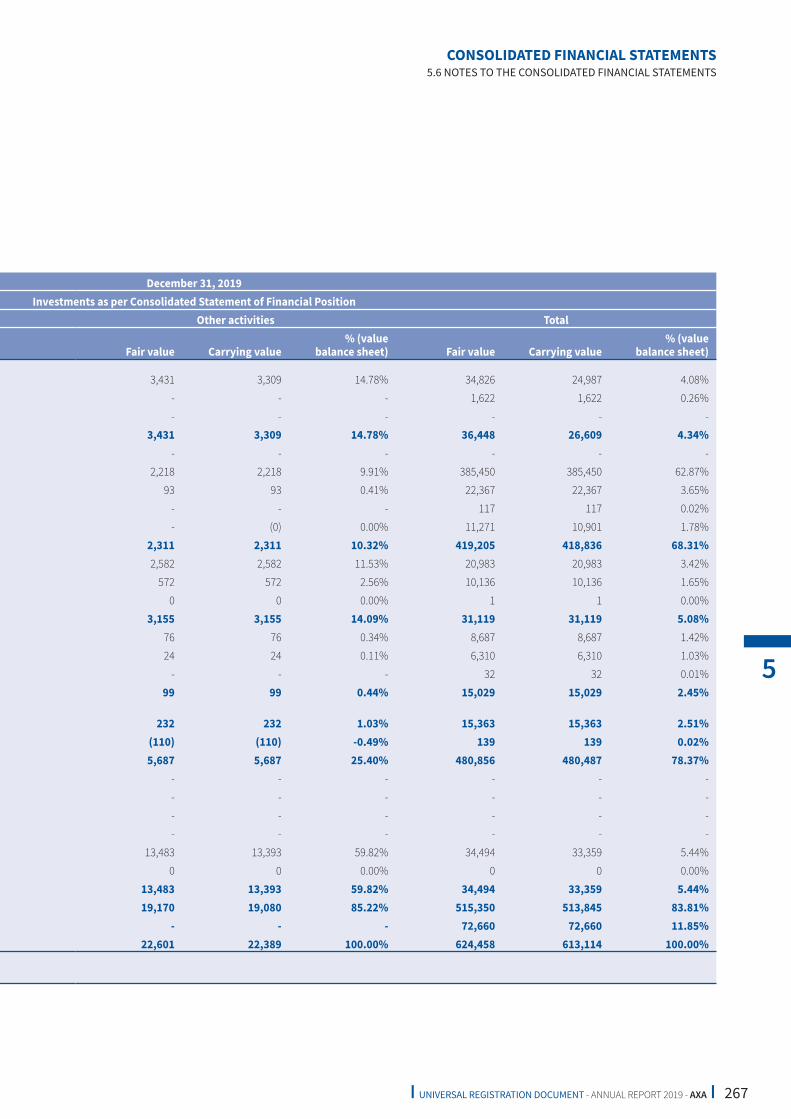
267I UNIVERSAL REGISTRATION DOCUMENT - ANNUAL REPORT 2019 - AXA I
CONSOLIDATED FINANCIAL STATEMENTS
5
5.6 NOTES TO THE CONSOLIDATED FINANCIAL STATEMENTS
December 31, 2019
Investments as per Consolidated Statement of Financial Position
Other activities Total
Fair value Carrying value
% (value
balance sheet) Fair value Carrying value
% (value
balance sheet)
3,431 3,309 14.78% 34,826 24,987 4.08%
- - - 1,622 1,622 0.26%
- - - - - -
3,431 3,309 14.78% 36,448 26,609 4.34%
- - - - - -
2,218 2,218 9.91% 385,450 385,450 62.87%
93 93 0.41% 22,367 22,367 3.65%
- - - 117 117 0.02%
- (0) 0.00% 11,271 10,901 1.78%
2,311 2,311 10.32% 419,205 418,836 68.31%
2,582 2,582 11.53% 20,983 20,983 3.42%
572 572 2.56% 10,136 10,136 1.65%
0 0 0.00% 1 1 0.00%
3,155 3,155 14.09% 31,119 31,119 5.08%
76 76 0.34% 8,687 8,687 1.42%
24 24 0.11% 6,310 6,310 1.03%
- - - 32 32 0.01%
99 99 0.44% 15,029 15,029 2.45%
232 232 1.03% 15,363 15,363 2.51%
(110) (110) -0.49% 139 139 0.02%
5,687 5,687 25.40% 480,856 480,487 78.37%
- - - - - -
- - - - - -
- - - - - -
- - - - - -
13,483 13,393 59.82% 34,494 33,359 5.44%
0 0 0.00% 0 0 0.00%
13,483 13,393 59.82% 34,494 33,359 5.44%
19,170 19,080 85.22% 515,350 513,845 83.81%
- - - 72,660 72,660 11.85%
22,601 22,389 100.00% 624,458 613,114 100.00%

268 I UNIVERSAL REGISTRATION DOCUMENT - ANNUAL REPORT 2019 - AXA I
CONSOLIDATED FINANCIAL STATEMENTS 5 5.6 NOTES TO THE CONSOLIDATED FINANCIAL STATEMENTS
(in Euro million)
Insurance
Fair value Carrying value
% (value
balance sheet)
Investment in real estate properties at amortized cost (a) 28,461 19,504 2.76%
Investment in real estate properties designated as at fair value through profit or loss (b) 1,435 1,435 0.20%
Macro-hedge and other derivatives - - -
Investment in real estate properties 29,896 20,939 2.96%
Debt instruments held to maturity - - -
Debt instruments available for sale 394,649 394,649 55.86%
Debt instruments designated as at fair value through profit or loss (c) 36,059 36,059 5.10%
Debt instruments held for trading 210 210 0.03%
Debt instruments (at cost) that are not quoted in an active market (d) 9,346 9,193 1.30%
Debt instruments 440,264 440,111 62.30%
Equity instruments available for sale 15,131 15,131 2.14%
Equity instruments designated as at fair value through profit or loss (b) 7,815 7,815 1.11%
Equity instruments held for trading 43 43 0.01%
Equity instruments 22,990 22,990 3.25%
Non consolidated investment funds available for sale 7,425 7,425 1.05%
Non consolidated investment funds designated as at fair value through profit or loss (b) 5,361 5,361 0.76%
Non consolidated investment funds held for trading 250 250 0.04%
Non consolidated investment funds 13,036 13,036 1.85%
Other assets designated as at fair value through profit or loss,
held by consolidated investment funds 14,864 14,864 2.10%
Macro-hedge and other derivatives 744 744 0.11%
Sub total Financial instruments (excluding Loans) 491,897 491,745 69.61%
Loans held to maturity - - -
Loans available for sale 0 0 0.00%
Loans designated as at fair value through profit or loss (b) - - -
Loans held for trading - - -
Loans at cost (e) 34,087 33,592 4.76%
Macro-hedge and other derivatives - - -
Loans 34,087 33,593 4.76%
Total Financial instruments 525,985 525,338 74.36%
Assets backing contracts where the financial risk is borne by policyholders 160,176 160,176 22.67%
INVESTMENTS 716,056 706,452 100.00%
Investments (excluding those backing contracts where the financial risk
is borne by policyholders) 555,881 546,276 77.33%
(a) Includes infrastructure investments.
(b) Assets measured at fair value under the fair value option.
(c) Includes assets measured at fair value notably under the fair value option.
(d) Eligible to the IAS 39 Loans and Receivables measurement category.
(e) Mainly relates to mortgage loans and policy loans.

269I UNIVERSAL REGISTRATION DOCUMENT - ANNUAL REPORT 2019 - AXA I
CONSOLIDATED FINANCIAL STATEMENTS
5
5.6 NOTES TO THE CONSOLIDATED FINANCIAL STATEMENTS
December 31, 2018
Investments as per Consolidated Statement of Financial Position
Other activities Total
Fair value Carrying value
% (value
balance sheet) Fair value Carrying value
% (value
balance sheet)
1,581 1,495 3.58% 30,042 20,999 2.81%
- - - 1,435 1,435 0.19%
- - - - - -
1,581 1,495 3.58% 31,477 22,434 3.00%
- - - - - -
4,184 4,184 10.01% 398,833 398,833 53.30%
183 183 0.44% 36,242 36,242 4.84%
343 343 0.82% 553 553 0.07%
938 938 2.24% 10,284 10,131 1.35%
5,648 5,648 13.51% 445,912 445,759 59.57%
1,466 1,466 3.51% 16,597 16,597 2.22%
562 562 1.34% 8,377 8,377 1.12%
19 19 0.05% 62 62 0.01%
2,047 2,047 4.90% 25,036 25,036 3.35%
98 98 0.23% 7,523 7,523 1.01%
311 311 0.74% 5,672 5,672 0.76%
193 193 0.46% 443 443 0.06%
602 602 1.44% 13,639 13,639 1.82%
169 169 0.40% 15,033 15,033 2.01%
59 59 0.14% 803 803 0.11%
8,526 8,526 20.39% 500,423 500,271 66.86%
- - - - - -
- - - 0 0 0.00%
- - - - - -
- - - - - -
33,608 31,789 76.03% 67,696 65,381 8.74%
0 0 0.00% 0 0 0.00%
33,609 31,789 76.03% 67,696 65,381 8.74%
42,134 40,315 96.42% 568,119 565,652 75.60%
- - - 160,176 160,176 21.41%
43,715 41,809 100.00% 759,772 748,261 100.00%

270 I UNIVERSAL REGISTRATION DOCUMENT - ANNUAL REPORT 2019 - AXA I
CONSOLIDATED FINANCIAL STATEMENTS 5 5.6 NOTES TO THE CONSOLIDATED FINANCIAL STATEMENTS
9.2 INVESTMENT IN REAL ESTATE PROPERTIES
Investment in real estate properties includes buildings owned directly and through consolidated real estate entities.
Breakdown of the carrying value and fair value of investment in real estate properties at amortized cost, including the impact of all
derivatives, except derivatives related to macro-hedges which are shown separately, is as follows:
(in Euro million)
December 31, 2019 December 31, 2018
Gross
value
Amorti-
zation Impairment
Carrying
value
Fair
value
Gross
value
Amorti-
zation I mpairment
Carrying
value
Fair
value
Investment in real
estate properties at
amortized cost
Insurance (a) 24,300 (1,536) (981) 21,783 31,499 21,918 (1,624) (752) 19,542 28,499
Other activities 3,309 - (0) 3,309 3,431 1,495 - (0) 1,495 1,581
All activities excluding
derivatives 27,609 (1,536) (981) 25,092 34,930 23,413 (1,624) (752) 21,037 30,080
Impact of Derivatives (104) (104) (38) (38)
Total for all activities
including derivatives 24,987 34,826 20,999 30,042
(a) Includes infrastructure and forests investments.
Change in impairment and amortization of investment in real estate properties at amortized cost (all activities), is as follows:
(in Euro million)
Impairment - Investment
in real estate properties
Amortization - Investment
in real estate properties
2019 2018 2019 2018
Value as of January 1 752 568 1,624 2,114
Increase for the period 373 305 241 170
Write back following sale or repayment (52) (74) (164) (22)
Write back following recovery in value (28) (47) - -
Others (a) (64) (0) (165) (638)
Value as of December 31 981 752 1,536 1,624
(a) Includes changes in the scope of consolidation and the impact of changes in exchange rates.

271I UNIVERSAL REGISTRATION DOCUMENT - ANNUAL REPORT 2019 - AXA I
CONSOLIDATED FINANCIAL STATEMENTS
5
5.6 NOTES TO THE CONSOLIDATED FINANCIAL STATEMENTS
9.3 UNREALIZED GAINS AND LOSSES ON FINANCIAL INVESTMENTS
Including the eff ect of derivatives, unrealized capital gains and losses on financial investments, when not already reflected in the
income statement, are broken down as follows:
INSURANCE
(in Euro million)
December 31, 2019 December 31, 2018
Amortized
cost (a)
Fair
value
Carrying
value (b)
Unrealized
gains
Unrealized
losses
Amortized
cost (a)
Fair
value
Carrying
value (b)
Unrealized
gains
Unrealized
losses
Debt instruments
available for sale 330,522 383,232 383,232 57,208 4,498 360,667 394,649 394,649 41,324 7,342
Debt instruments
(at cost) that are
not quoted in an
active market 10,888 11,271 10,901 445 62 9,192 9,346 9,193 224 71
Equity instruments
available for sale 13,524 18,400 18,400 4,962 86 13,341 15,131 15,131 2,275 485
Non-consolidated
investment funds
available for sale 7,758 8,612 8,612 920 66 6,774 7,425 7,425 741 90
(a) Net of impairment - including premiums/discounts and related accumulated amortization.
(b) Net of impairment.
OTHER ACTIVITIES
(in Euro million)
December 31, 2019 December 31, 2018
Amortized
cost (a)
Fair
value
Carrying
value (b)
Unrealized
gains
Unrealized
losses
Amortized
cost (a)
Fair
value
Carrying
value (b)
Unrealized
gains
Unrealized
losses
Debt instruments
available for sale 2,133 2,218 2,218 89 4 4,228 4,184 4,184 93 137
Debt instruments
(at cost) that are
not quoted in an
active market (0) - (0) 0 - 938 938 938 - 0
Equity instruments
available for sale 1,766 2,582 2,582 819 3 1,030 1,466 1,466 451 15
Non consolidated
investment funds
available for sale 74 76 76 2 0 96 98 98 2 -
(a) Net of impairment - including premiums/discounts and related accumulated amortization.
(b) Net of impairment.

272 I UNIVERSAL REGISTRATION DOCUMENT - ANNUAL REPORT 2019 - AXA I
CONSOLIDATED FINANCIAL STATEMENTS 5 5.6 NOTES TO THE CONSOLIDATED FINANCIAL STATEMENTS
TOTAL
(in Euro million)
December 31, 2019 December 31, 2018
Amortized
cost (a)
Fair
value
Carrying
value (b)
Unrealized
gains
Unrealized
losses
Amortized
cost (a)
Fair
value
Carrying
value (b)
Unrealized
gains
Unrealized
losses
Debt instruments
available for sale 332,655 385,450 385,450 57,297 4,502 364,895 398,833 398,833 41,417 7,479
Debt instruments
(at cost) that are
not quoted in an
active market 10,888 11,271 10,901 445 62 10,131 10,284 10,131 224 71
Equity instruments
available for sale 15,290 20,983 20,983 5,782 89 14,371 16,597 16,597 2,726 500
Non consolidated
investment funds
available for sale 7,832 8,687 8,687 922 66 6,870 7,523 7,523 744 90
(a) Net of impairment - including premiums/discounts and related accumulated amortization.
(b) Net of impairment.
See also Note 9.9.1 “Breakdown of financial investments subject to impairment”.
9.4 DEBT INSTRUMENTS AND LOANS
9.4.1 Debt instruments by type of issuer
The table below sets out the debt instruments portfolio by issuer type, excluding macro-hedging derivatives but including the eff ect
of related hedging derivatives (IAS 39 qualifying hedges or economic hedges). Details of the eff ect of derivatives are also provided in
Note 20.3.
(in Euro million)
December 31, 2019 December 31, 2018
Carrying value Carrying value
Government and government like debt instruments 232,680 231,059
Other debt instruments issued by government related 16,755 17,064
Corporate debt instruments (a) 171,668 199,752
Other debt instruments (b) 178 156
Hedging derivatives and other derivatives (2,445) (2,272)
TOTAL DEBT INSTRUMENTS 418,836 445,759
(a) Includes debt instruments issued by companies in which a State holds interests.
(b) Mainly includes fixed maturity investment funds.
Additional information on the credit risk associated with debt instruments is provided in Note 4 “Financial and insurance Risk Management”.
9.4.2 Loans from activities other than insurance
The table below sets out the loans portfolio other than insurance activities, excluding macro-hedging derivatives but including the
eff ect of related hedging derivatives (IAS 39 qualifying hedges or economic hedges).
(in Euro million)
December 31, 2019 December 31, 2018
Fair value Carrying value Fair value Carrying value
Mortgage loans 10,097 10,013 28,213 26,594
Other loans 3,287 3,281 5,309 5,109
Total Banking loans 13,383 13,293 33,522 31,703
Loans from activities other than insurance and banks 100 100 86 86
Total excluding the impact of derivatives 13,483 13,393 33,608 31,789
Derivatives impact 0 0 0 0
TOTAL 13,483 13,393 33,609 31,789

273I UNIVERSAL REGISTRATION DOCUMENT - ANNUAL REPORT 2019 - AXA I
CONSOLIDATED FINANCIAL STATEMENTS
5
5.6 NOTES TO THE CONSOLIDATED FINANCIAL STATEMENTS
9.5 CONTRACTUAL MATURITIES OF DEBT INSTRUMENTS AND LOANS AND EXPOSURE
TO INTEREST RATE RISK
The table below sets out the contractual maturities of debt
instruments held by the Group. Eff ective maturities may diff er
from those presented, mainly because some assets include
clauses allowing early redemption, with or without penalty
or duration extension features. In some cases, the effect of
derivatives (detailed in Note 20.3) modifies the maturity profile
of assets presented below.
Debt instruments (at cost) that are not quoted in an active market
and loans and debt instruments backing contracts where the
financial risk is borne by policyholders are excluded from the
table below. Most of the debt instruments and loans held by
the Group are fixed-rate instruments (i.e. exposed to fair value
interest rate risk).
(in Euro million)
December 31, 2019
Net carrying amount by maturity
December 31, 2018
Net carrying amount by maturity
12
months
or less
More
than
1 year
up to 5
years
More
than 5
years
Carrying
value
exclu-
ding
deriva-
tives
Impact
of Deri-
vatives
Total
Carrying
value
inclu-
ding
deriva-
tives
12
months
or less
More
than
1 year
up to 5
years
More
than 5
years
Carrying
value
exclu-
ding
deriva-
tives
Impact
of Deri-
vatives
Total
Carrying
value
inclu-
ding
deriva-
tives
Debt instruments 19,948 82,768 307,677 410,393 (2,458) 407,935 27,337 102,793 307,771 437,901 (2,272) 435,628
Loans (a) 5,160 12,029 21,263 38,452 (46) 38,406 7,747 22,759 41,296 71,801 (447) 71,354
Total Financial
investments exposed
to interest rate risk 25,107 94,797 328,940 448,844 (2,504) 446,340 35,083 125,552 349,067 509,702 (2,720) 506,982
Of which Financial investments exposed to fair value interest rate risk 23,701 86,591 309,788 420,080 32,586 112,885 327,949 473,420
(a) Including Summary Consolidated Investment funds - Loans.
9.6 EXPOSURE TO PRICE RISK
Including the eff ect of derivatives (also detailed in Note 20.3) and equity instruments of real estate companies, the breakdown by
industry of equity instruments owned across the Group is as follows:
(in Euro million) Financial
Consu-
mer
goods &
Services Energy
Com-
munica-
tions
Indus-
trial
Basic
Mate-
rials
Techno-
logy Other
Total value
excluding
derivatives
Eff ect of
Derivatives
Total value
including
derivatives
Equity instruments as
of December 31, 2019 11,492 8,240 682 1,455 3,197 1,230 2,202 2,635 31,134 (14) 31,119
Equity instruments as
of December 31, 2018 8,978 6,637 741 1,290 2,550 932 1,453 2,490 25,072 (35) 25,036

274 I UNIVERSAL REGISTRATION DOCUMENT - ANNUAL REPORT 2019 - AXA I
CONSOLIDATED FINANCIAL STATEMENTS 5 5.6 NOTES TO THE CONSOLIDATED FINANCIAL STATEMENTS
9.7 TRANSFERS OF FINANCIAL ASSETS NOT QUALIFYING FOR DERECOGNITION
The Group is part of repurchase agreements and securities
lending transactions under which financial assets are sold
to a counterparty, subject to a simultaneous agreement to
repurchase these financial assets at a certain later date, at an
agreed price. While substantially all of the risks and rewards of
the financial assets remain with the Group over the entire lifetime
of the transaction, the Group does not derecognize the financial
assets. The proceeds of the sale are reported separately. Interest
expense from repurchase and security lending transactions is
accrued over the duration of the agreements.
Additionally, the Group is party to total return swaps where
financial assets are sold to a counterparty with an agreement
in which the Group retains substantially all the risk and rewards
of the financial instruments. Therefore, the Group doesn’t
derecognize the assets.
The breakdown of transferred financial assets/liabilities not qualifying for derecognition was as follows:
(in Euro million)
December 31, 2019 December 31, 2018
Debt
instruments
designated
at fair value
through profit
or loss
Debt
instruments
available for
sale
Debt
instruments
- Loans &
Receivables
Debt
instruments
designated
at fair value
through profit
or loss
Debt
instruments
available for
sale
Debt
instruments
- Loans &
Receivables
Carrying value of assets 10 48,025 48 12 40,772 64
Carrying value of associated
liabilities (a)
- 38,827 50 - 35,658 66
(a) Amounts do not include securities received as collateral to securities lending transactions if such collateral is not recognized under the terms of the agreement because the risks and rewards have not been transferred to the Group (detailed in Note 29).
9.8 NON-CONSOLIDATED INVESTMENT FUNDS
The detail of “non-consolidated” investment funds breakdown was as follows:
(in Euro million)
December 31, 2019 December 31, 2018
Fair value (a)
Fair value (a)
Insurance
Other
activities Total Insurance
Other
activities Total
Non-consolidated investment funds mainly
holding equity securities 2,728 15 2,743 2,605 470 3,075
Non-consolidated investment funds mainly
holding debt instruments 5,628 10 5,638 3,897 41 3,939
Other non-consolidated investment funds 6,541 75 6,616 6,511 90 6,602
Non-consolidated investment at cost - - - - - -
Derivatives related to non-consolidated
investment funds 33 - 33 23 - 23
TOTAL 14,930 99 15,029 13,036 602 13,639
(a) Amounts are presented net of the eff ect of related hedging derivatives (IAS 39 qualifying hedges or economic hedges) except derivatives related to macro-hedges which are shown separately.
The amortized cost of non-consolidated investment funds available for sale was as below:
■ funds mainly holding equity securities: €1,815 million in 2019 compared to €1,566 million in 2018;
■ funds mainly holding debt instruments: €2,986 million in 2019 compared to €2,702 million in 2018;
■ other funds: €3,033 million in 2019 compared to €2,603 million in 2018.

275I UNIVERSAL REGISTRATION DOCUMENT - ANNUAL REPORT 2019 - AXA I
CONSOLIDATED FINANCIAL STATEMENTS
5
5.6 NOTES TO THE CONSOLIDATED FINANCIAL STATEMENTS
9.9 FINANCIAL INVESTMENTS SUBJECT TO IMPAIRMENT
9.9.1 Breakdown of financial investments subject to impairment
Each investment item is presented net of the eff ect of related hedging derivatives (IAS 39 qualifying hedges or economic hedges).
(in Euro million)
December 31, 2019 December 31, 2018
Cost
before
impair-
ment and
reva-
luation
to fair
value (a)
Impair-
ment
Cost
aft er
impair-
ment but
before
reva-
luation
to fair
value (b)
Reva-
luation
to fair
value (c)
Carrying
value
Cost
before
impair-
ment and
reva-
luation
to fair
value (a)
Impair-
ment
Cost
aft er
impair-
ment but
before
reva-
luation
to fair
value (b)
Reva-
luation
to fair
value (c)
Carrying
value
Debt instruments available
for sale 332,674 (19) 332,655 52,795 385,450 364,973 (78) 364,895 33,938 398,833
Debt instruments (at cost)
that are not quoted in an
active market (c) 10,890 (2) 10,888 13 10,901 10,131 (0) 10,131 1 10,131
Debt instruments 343,564 (21) 343,543 52,808 396,351 375,104 (78) 375,025 33,939 408,964
Equity instruments
available for sale 17,856 (2,566) 15,290 5,693 20,983 17,104 (2,733) 14,371 2,226 16,597
Non consolidated
investment funds
available for sale 8,570 (739) 7,832 856 8,687 7,785 (915) 6,870 654 7,523
Loans held to maturity - - - - - - - - - -
Loans available for sale - - - - - 0 - 0 - 0
Loans at cost (d) 33,522 (118) 33,404 (45) 33,359 65,999 (199) 65,800 (419) 65,381
Loans 33,522 (118) 33,404 (45) 33,359 65,999 (199) 65,800 (419) 65,381
TOTAL 403,512 (3,444) 400,069 59,312 459,380 465,991 (3,925) 462,066 36,400 498,466
(a) Asset value including impact of discounts/premiums and accrued interests, but before impairment and revaluation to fair value of assets available for sale.
(b) Asset value including impairment, discounts/premiums and accrued interests, but before revaluation to fair value of assets available for sale.
(c) Revaluation to fair value for instruments at cost related to the application of hedge accounting.
(d) Including policy loans.

276 I UNIVERSAL REGISTRATION DOCUMENT - ANNUAL REPORT 2019 - AXA I
CONSOLIDATED FINANCIAL STATEMENTS 5 5.6 NOTES TO THE CONSOLIDATED FINANCIAL STATEMENTS
9.9.2 Change in impairment on financial investments
(in Euro million)
January 1,
2019
Increase for
the period (a)
Write back
following sale
or repayment
Write back
following
recovery
in value Other (b)
December 31,
2019
Impairment - Debt instruments 78 3 (36) (0) (24) 21
Impairment - Equity instruments 2,733 412 (647) - 69 2,566
Impairment - Non-consolidated
investment funds 915 69 (331) - 85 739
Impairment - Loans 199 46 (14) (49) (64) 118
TOTAL 3,925 529 (1,028) (49) 66 3,444
(a) Includes the impairment of the participation in non-consolidated subsidiaries for €245 million.
(b) Mainly relates to changes in the scope of consolidation and the impact of changes in exchange rates.
(in Euro million)
January 1,
2018
Increase for
the period
Write back
following sale
or repayment
Write back
following
recovery
in value Other (a)
December 31,
2018
Impairment - Debt instruments 243 53 (220) (0) 2 78
Impairment - Equity instruments 2,280 764 (295) - (16) 2,733
Impairment - Non-consolidated
investment funds 1,084 186 (41) - (314) 915
Impairment - Loans 228 49 (3) (60) (16) 199
TOTAL 3,837 1,052 (560) (60) (344) 3,925
(a) Mainly relates to changes in the scope of consolidation and the impact of changes in exchange rates.

277I UNIVERSAL REGISTRATION DOCUMENT - ANNUAL REPORT 2019 - AXA I
CONSOLIDATED FINANCIAL STATEMENTS
5
5.6 NOTES TO THE CONSOLIDATED FINANCIAL STATEMENTS
9.10 FAIR VALUE OF INVESTMENTS
9.10.1 Fair value of Investments recognized at fair value
The breakdown by valuation method of investments recognized at fair value including derivatives (also detailed in Note 20.3 and
Note 20.5), but excluding the assets backing contracts where the financial risk is borne by policyholders is as follows:
(in Euro million)
December 31, 2019 December 31, 2018
Assets quoted
in an active
market
excluding
derivatives
Assets not quoted in
an active market or no
active market excluding
derivatives
Total
excluding
deriva-
tives
Total
including
deriva-
tives
Assets quoted
in an active
market
excluding
derivatives
Assets not quoted in
an active market or no
active market excluding
derivatives
Total
excluding
deriva-
tives
Total
including
deriva-
tives
Fair value
determined
directly by
reference
to active
market
excluding
derivatives
(level 1)
Fair value
mainly
based on
observable
market
data
excluding
derivatives
(level 2)
Fair value
mainly not
based on
observable
market data
excluding
derivatives
(level 3)
Fair value
determined
directly by
reference
to active
market
excluding
derivatives
(level 1)
Fair value
mainly
based on
observable
market
data
excluding
derivatives
(level 2)
Fair value
mainly not
based on
observable
market data
excluding
derivatives
(level 3)
Debt instruments 294,967 92,439 661 388,068 385,450 315,367 84,894 877 401,138 398,833
Equity instruments 16,590 2,129 2,278 20,997 20,983 12,168 1,843 2,624 16,635 16,597
Non-consolidated
investment funds 1,243 5,082 2,345 8,670 8,687 1,272 4,781 1,464 7,517 7,523
Loans - (0) - (0) (0) 0 0 (0) 0 0
Financial investments and
loans available for sale 312,801 99,650 5,284 417,734 415,120 328,807 91,518 4,964 425,290 422,954
Investment in real estate
properties - 1,622 0 1,622 1,622 - 1,435 - 1,435 1,435
Debt instruments 13,355 7,528 1,304 22,187 22,367 26,681 8,262 1,126 36,069 36,242
Equity instruments 3,288 970 5,877 10,136 10,136 2,790 700 4,885 8,375 8,377
Non-consolidated
investment funds 330 3,562 2,402 6,295 6,310 409 3,216 2,031 5,656 5,672
Other assets held by
consolidated investment
funds designated as at fair
value through profit or loss 1,634 6,560 7,181 15,375 15,363 1,135 6,765 7,125 15,025 15,033
Loans - - - - (0) - - - - -
Financial investments and
loans designated as at fair
value through profit or
loss 18,607 20,243 16,764 55,615 55,798 31,014 20,378 15,167 66,560 66,759
Debt instruments 84 54 - 138 117 512 181 0 694 553
Equity instruments 1 - - 1 1 43 - 19 62 62
Non-consolidated
investment funds 0 32 - 32 32 197 245 0 443 443
Loans - 1 - 1 1 - - - - -
Financial investments and
loans held for trading 85 86 1 172 151 753 427 19 1,198 1,059
TOTAL FINANCIAL
INVESTMENTS AND LOANS
ACCOUNTED FOR AT FAIR
VALUE 331,493 119,979 22,049 473,521 471,069 360,574 112,323 20,151 493,048 490,771
Methods applied to determine the fair value of investments measured at fair value in the financial statements are described in Note 1.5.
The Group applies the IFRS 13 fair value hierarchy.

278 I UNIVERSAL REGISTRATION DOCUMENT - ANNUAL REPORT 2019 - AXA I
CONSOLIDATED FINANCIAL STATEMENTS 5 5.6 NOTES TO THE CONSOLIDATED FINANCIAL STATEMENTS
ASSETS CLASSIFICATION
Fair values determined in whole directly by reference to an active
market relate to prices which are readily and regularly available
from an exchange, dealer, broker, industry group, pricing service
or regulatory agency which represent actual and regularly
occurring market transactions on an arm’s length basis, i.e. the
market is still active. Such assets are categorized in the level 1
of the IFRS 13 fair value hierarchy.
Level 2 and 3 assets are investments which are not quoted in an
active market or for which there is no active market. Fair values
for level 2 and 3 assets include:
■ values provided by external parties which:
• are readily available including last transaction prices but
relate to assets for which the market is not always active, or
• are provided at the request of the Group by pricing services
and which are not readily publicly available;
■ assets measured on the basis of valuation techniques
including a varying degree of assumptions supported by
market transactions and observable data.
The common characteristic of level 2 and 3 assets is that their
markets are considered as inactive. Their value is generally
based on mark to market basis, except when there is no market
or when the market is distressed, in which case a mark to model
approach is used. Assets not quoted in an active market which
are marked to market mainly using observable inputs are
classified in level 2. Assets not quoted in an active market for
which fair value determination is not mainly based on observable
inputs are classified as level 3. For all assets not quoted in an
active market/no active market and for which a mark to model
approach is used, the classification between level 2 and level 3
depends on the proportion of assumptions used supported by
market transactions and observable data (market observable
inputs):
■ assumed to be used by pricing services or;
■ used by the Group in the limited cases of application of mark
to model valuations.
a) Fair values determined in whole directly by reference
to an active market (level 1)
Since the 2008 financial crisis, a significant volatility related
to corporate spreads has been observed leading to transfers
between level 1 and 2 with both yield and bid ask spreads
widening and narrowing from one closing to another. Since
2010, this volatility has also been experienced on European
government bonds with yields and bid ask spreads widening
significantly leading to transfers from level 1 to level 2 and then
also subsequent sustained improved market liquidity for certain
government issuers resulting in transfers back to level 1 from
level 2. As of December 31, 2018, Irish, Portuguese and Spanish
government bonds were transferred from level 2 to level 1.
Indeed, a sustained improvement has been observed over
the previous years and current year on the market indicators
especially on bid/ask spreads of these sovereign bonds reflecting
an increased market liquidity of these securities.
As of December 31, 2019, €6,431 million of invested assets
were transferred from level 2 to level 1 and €8,192 million were
transferred from level 1 to level 2, primarily in corporate bonds.
b) Fair values of assets not quoted in an active market –
no active markets (level 2 and level 3)
OVERVIEW OF THE NATURE OF SUCH INVESTMENTS
Amounts presented in level 2 and 3 represent a variety of
circumstances. A financial instrument is regarded as not quoted
in an active market if there is little observation of transaction
prices as an inherent characteristic of the instrument, when there
is a significant decline in the volume and level of trading activity,
in case of significant illiquidity or if observable prices cannot
be considered as representing fair value because of dislocated
market conditions. Characteristics of inactive markets can
therefore be very diff erent in nature, inherent to the instrument
or be indicative of a change in the conditions prevailing in certain
markets.
The identification of level 3 assets among assets not quoted in
an active market involves a significant level of judgment. The
following are considered as observable: inputs provided by
external pricing services, information observable obtained from
specialized data providers, rating agencies, external surveys.
The extent to which such data are external to the Group and not
assessed by internal valuation teams is one of the main criteria
applied in assessing whether data are observable or not. Should
those data be significantly adjusted or would they be outdated
because of the lack of newly available factors, such inputs
would be deemed unobservable. Another area of judgment is
the assessment of the significance of an input against the fair
value measurement in its entirety. As a result, a diff erent cut
between observable and unobservable data and variances in
the weighting of the significance of each input against the fair
value measurement in its entirety could produce a different
categorization.
Assets such as certain unquoted debt instruments, some
instruments issued on private markets such as private equity
instruments or private loans were always considered as not
quoted in active markets as an inherent characteristic of these
investments and were included as assets not quoted in active
markets/no active markets in all periods presented. Valuations
are based either on external pricing providers or internal models
using techniques commonly used by market participants.
Valuation teams make the maximum use of current transaction
prices (if any) and observable data but some of the underlying
sectors to which the investments relate may be so particular that
significant adjustments are performed or unobservable data are
used. Private equity funds of funds are measured on the basis of
the latest net asset values of funds provided to the Group.

279I UNIVERSAL REGISTRATION DOCUMENT - ANNUAL REPORT 2019 - AXA I
CONSOLIDATED FINANCIAL STATEMENTS
5
5.6 NOTES TO THE CONSOLIDATED FINANCIAL STATEMENTS
TRANSFER IN AND OUT OF THE LEVEL 3 CATEGORY AND
OTHER MOVEMENTS
From January 1, 2019 to December 31, 2019, the amount of level 3
assets increased by €1.9 billion to €22.1 billion, representing 4.7%
of the total assets at fair value (4.1% in 2018 or €20.2 billion).
Main movements related to level 3 assets to be noted were the
following:
■ €4.1 billion of new investments;
■ €0.1 billion of change in unrealized gains and losses;
■ €0.8 billion of net asset transfers in and out of level 3 and
foreign exchange fluctuation impact;
■ €-3.2 billion of asset sales, redemptions and settlements
mainly of debt instruments, equity securities and non-
consolidated investment funds accounted as available for
sale and of equity securities, non-consolidated investment
funds, other assets held by controlled investment funds and
debt instruments accounted as fair value through profit or loss.
A majority of assets classified in level 3 corresponds to private
investments, in particular private equity assets.
9.10.2 Fair value of Investments recognized at amortized cost
(in Euro million)
December 31, 2019 December 31, 2018
Assets
quoted in
an active
market
Assets not quoted in an
active market or no active
market
Total
excluding
deriva-
tives
Total
including
deriva-
tives
Assets
quoted in
an active
market
Assets not quoted in an
active market or no active
market
Total
excluding
deriva-
tives
Total
including
deriva-
tives
Fair value
determined
directly by
reference
to active
market
(level 1)
Fair value
mainly
based on
observable
market
data (level
2)
Fair value
mainly not
based on
observable
market
data
(level 3)
Fair value
determined
directly by
reference
to active
market
(level 1)
Fair value
mainly
based on
observable
market
data (level
2)
Fair value
mainly not
based on
observable
market
data (level
3)
Debt instruments held
to maturity - - - - - - - - - -
Loans held to maturity - - - - - - - - - -
Financial investments
and loans held to
maturity - - - - - - - - - -
Investment in real estate
properties at amortized
cost - 34,477 454 34,930 34,826 - 29,660 420 30,080 30,042
Debt instruments at cost
(loans & receivables) 332 6,365 4,560 11,257 11,271 221 7,340 2,722 10,283 10,284
Loans at amortized cost 30 20,365 14,144 34,539 34,493 48 31,214 36,880 68,143 67,696
Financial investments
and loans at
amortized cost 362 61,207 19,158 80,727 80,590 269 68,214 40,022 108,506 108,021
TOTAL FAIR VALUE
OF INVESTED ASSETS
AT AMORTIZED COST 362 61,207 19,158 80,727 80,590 269 68,214 40,022 108,506 108,021
Note: This table excludes assets backing contracts where the financial risk is borne by policyholders with guaranteed minimum features.
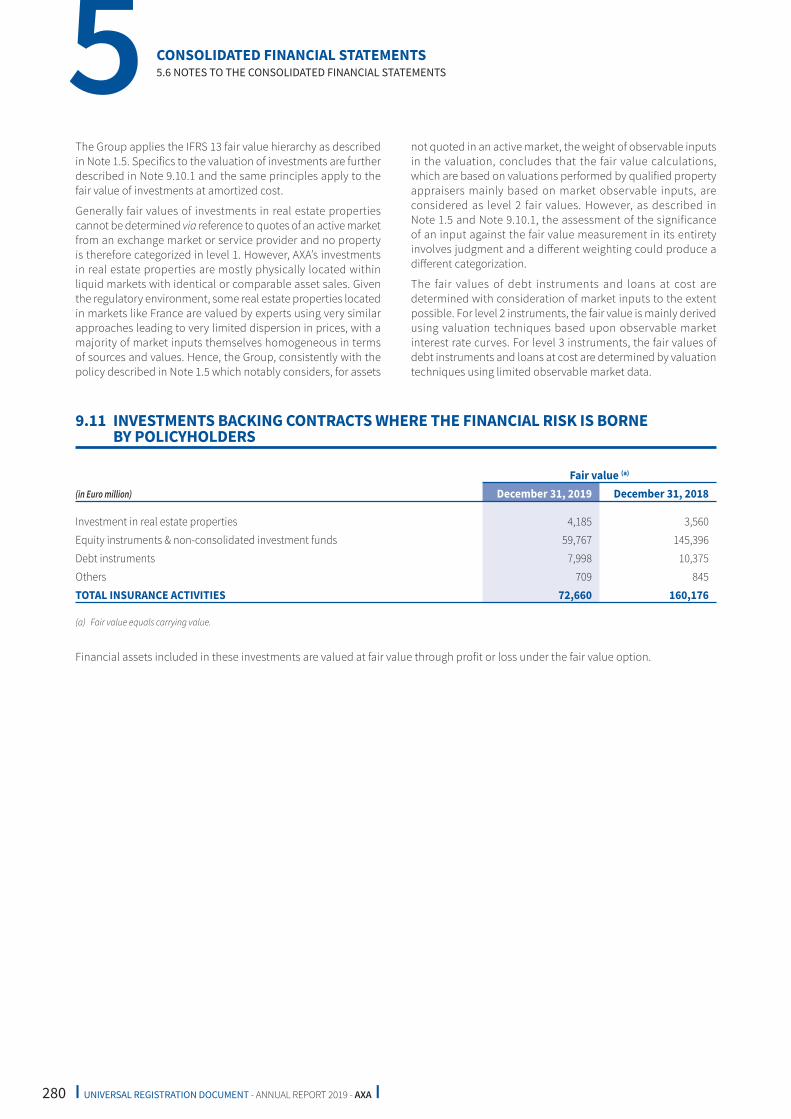
280 I UNIVERSAL REGISTRATION DOCUMENT - ANNUAL REPORT 2019 - AXA I
CONSOLIDATED FINANCIAL STATEMENTS 5 5.6 NOTES TO THE CONSOLIDATED FINANCIAL STATEMENTS
The Group applies the IFRS 13 fair value hierarchy as described
in Note 1.5. Specifics to the valuation of investments are further
described in Note 9.10.1 and the same principles apply to the
fair value of investments at amortized cost.
Generally fair values of investments in real estate properties
cannot be determined via reference to quotes of an active market
from an exchange market or service provider and no property
is therefore categorized in level 1. However, AXA’s investments
in real estate properties are mostly physically located within
liquid markets with identical or comparable asset sales. Given
the regulatory environment, some real estate properties located
in markets like France are valued by experts using very similar
approaches leading to very limited dispersion in prices, with a
majority of market inputs themselves homogeneous in terms
of sources and values. Hence, the Group, consistently with the
policy described in Note 1.5 which notably considers, for assets
not quoted in an active market, the weight of observable inputs
in the valuation, concludes that the fair value calculations,
which are based on valuations performed by qualified property
appraisers mainly based on market observable inputs, are
considered as level 2 fair values. However, as described in
Note 1.5 and Note 9.10.1, the assessment of the significance
of an input against the fair value measurement in its entirety
involves judgment and a diff erent weighting could produce a
diff erent categorization.
The fair values of debt instruments and loans at cost are
determined with consideration of market inputs to the extent
possible. For level 2 instruments, the fair value is mainly derived
using valuation techniques based upon observable market
interest rate curves. For level 3 instruments, the fair values of
debt instruments and loans at cost are determined by valuation
techniques using limited observable market data.
9.11 INVESTMENTS BACKING CONTRACTS WHERE THE FINANCIAL RISK IS BORNE
BY POLICYHOLDERS
(in Euro million)
Fair v alue (a)
December 31, 2019 December 31, 2018
Investment in real estate properties 4,185 3,560
Equity instruments & non-consolidated investment funds 59,767 145,396
Debt instruments 7,998 10,375
Others 709 845
TOTAL INSURANCE ACTIVITIES 72,660 160,176
(a) Fair value equals carrying value.
Financial assets included in these investments are valued at fair value through profit or loss under the fair value option.

281I UNIVERSAL REGISTRATION DOCUMENT - ANNUAL REPORT 2019 - AXA I
CONSOLIDATED FINANCIAL STATEMENTS
5
5.6 NOTES TO THE CONSOLIDATED FINANCIAL STATEMENTS
9.12 DISCLOSURES ABOUT
THE TEMPORARY EXEMPTION
FROM IFRS 9
9.12.1 Solely Payment of Principal
and Interest (SPPI) test
As mentioned in Note 1.2 “General accounting principles”, in the
context of IFRS 9 implementation, the Group has determined that
it is eligible for the temporary exemption option, introduced by
the amendment to IFRS 4 Insurance contracts, until the earlier of
annual reporting periods beginning on or aft er January 1, 2022.
During this deferral period, additional disclosures related to SPPI
criterion and to credit risk exposure are required.
To determine the appropriate classification of financial assets
under IFRS 9, an entity would need to assess the contractual
cash flows characteristics of any financial asset. Indeed, the
contractual terms of the financial asset give rise, on specified
dates, to cash flows that are solely payments of principal and
interest on the principal amount outstanding i.e. cash flows
that are consistent with a basic lending arrangement. In a basic
lending arrangement, consideration for the time value of money
and credit risk are typically the most significant elements of
interest.
IFRS 9 defines the terms “principal” as being the fair value of the
financial asset at initial recognition, and the “interest” as being
compensation for (i) the time value of money, and (ii) the credit
risk associated with the principal amount outstanding during a
particular period of time.
The tables below set out the result of the SPPI test for the assets
not currently designated as at fair value through profit and loss,
with a split between Insurance and Other activities.
Each investment item is presented gross of tax and excluding the
eff ect of related hedging derivatives (IAS 39 qualifying hedges or
economic hedges) and the potential impact resulting from the
application of the future IFRS 17 standard on insurance contracts
that will avoid accounting mismatches in particular for contracts
eligible to the variable fee approach measurement model.
INSURANCE
(in Euro million)
December 31, 2019 December 31, 2018
Fail the SPPI test Pass the SPPI test Fail the SPPI test Pass the SPPI test
Fair
value
Change in
unrealized
gain or loss
in 2019
Fair
value
Change in
unrealized
gain or loss
in 2019
Fair
value
Change in
unrealized
gain or loss
in 2018
Fair
value
Change in
unrealized
gain or loss
in 2018
Debt instruments held to maturity - - - - - - - -
Debt instruments available for sale 3,713 (7) 382,137 18,528 4,782 (179) 392,053 (9,051)
Debt instruments (at cost) not quoted
in an active market 30 - 11,226 208 - - 9,345 (69)
Equity instruments available for sale 18,415 2,887 - - 15,170 (2,564) - -
Non-consolidated investment funds
available for sale 8,594 (99) - - 7,419 (242) - -
Loans held to maturity - - - - - - - -
Loans available for sale - - - - - - - -
Loans at cost 130 - 19,232 220 97 - 28,874 (380)
TOTAL 30,882 2,781 412,595 18,955 27,466 (2,985) 430,272 (9,500)

282 I UNIVERSAL REGISTRATION DOCUMENT - ANNUAL REPORT 2019 - AXA I
CONSOLIDATED FINANCIAL STATEMENTS 5 5.6 NOTES TO THE CONSOLIDATED FINANCIAL STATEMENTS
OTHER ACTIVITIES
(in Euro million)
December 31, 2019 December 31, 2018
Fail the SPPI test Pass the SPPI test Fail the SPPI test Pass the SPPI test
Fair
value
Change in
unrealized
gain or loss
in 2019
Fair
value
Change in
unrealized
gain or loss
in 2019
Fair
value
Change in
unrealized
gain or loss
in 2018
Fair
value
Change in
unrealized
gain or loss
in 2018
Debt instruments held to maturity - - - - - - - -
Debt instruments available for sale 5 - 2,213 49 3 - 4,298 (64)
Debt instruments (at cost) not quoted
in an active market - - - - - - 938 -
Equity instruments available for sale 2,582 403 - - 1,466 228 - -
Non-consolidated investment funds
available for sale 76 - - - 98 (13) - -
Loans held to maturity - - - - - - - -
Loans available for sale - - - - - - - -
Loans at cost 1 - 13,399 8 8 - 33,973 30
TOTAL 2,664 403 15,612 57 1,575 215 39,209 (34)
TOTAL
(in Euro million)
December 31, 2019 December 31, 2018
Fail the SPPI test Pass the SPPI test Fail the SPPI test Pass the SPPI test
Fair
value
Change in
unrealized
gain or loss
in 2019
Fair
value
Change in
unrealized
gain or loss
in 2019
Fair
value
Change in
unrealized
gain or loss
in 2018
Fair
value
Change in
unrealized
gain or loss
in 2018
Debt instruments held to maturity - - - - - - - -
Debt instruments available for sale 3,717 (7) 384,350 18,577 4,786 (179) 396,351 (9,114)
Debt instruments (at cost) not quoted
in an active market 30 - 11,226 208 - - 10,283 (69)
Equity instruments available for sale 20,997 3,290 - - 16,635 (2,337) - -
Non-consolidated investment funds
available for sale 8,670 (100) - - 7,517 (254) - -
Loans held to maturity - - - - - - - -
Loans available for sale - - - - - - - -
Loans at cost 131 - 32,631 227 105 - 62,847 (350)
TOTAL 33,546 3,183 428,207 19,012 29,041 (2,771) 469,481 (9,534)

283I UNIVERSAL REGISTRATION DOCUMENT - ANNUAL REPORT 2019 - AXA I
CONSOLIDATED FINANCIAL STATEMENTS
5
5.6 NOTES TO THE CONSOLIDATED FINANCIAL STATEMENTS
9.12.2 Credit risk exposure
The tables below set out the gross carrying amount and the fair value (excluding the impact of derivatives) information on credit risk
exposure for financial assets that pass the SPPI test:
For debt instruments, the credit risk information is available by rating grades (1).
(in Euro million)
December 31, 2019 December 31, 2018
Gross Carrying Amount of debt instruments
that pass the SPPI test
Gross Carrying Amount of debt instruments
that pass the SPPI test
AAA AA A BBB
BB and
lower Other Total AAA AA A BBB
BB and
lower Other Total
Debt instruments held to
maturity - - - - - - - - - - - - - -
Debt instruments available
for sale 73,072 97,419 76,944 74,530 2,579 5,803 330,346 80,997 98,087 84,834 88,036 4,310 5,535 361,800
Debt instruments (at cost)
not quoted in an active
market 221 2,606 621 3,301 441 3,667 10,858 76 1,699 1,086 2,278 411 4,581 10,131
Total Gross Carrying
amount of Debt
instruments that pass
the SPPI test 73,293 100,025 77,565 77,831 3,020 9,470 341,204 81,073 99,786 85,921 90,313 4,721 10,117 371,931
(1) These are external ratings corresponding to the average of the three main rating agencies, which are S&P, Fitch and Moody’s.
(in Euro million)
December 31, 2019 December 31, 2018
Fair value of debt instruments
that pass the SPPI test
Fair value of debt instruments
that pass the SPPI test
AAA AA A BBB
BB and
lower Other Total AAA AA A BBB
BB and
lower Other Total
Debt instruments held to
maturity - - - - - - - - - - - - - -
Debt instruments available
for sale 82,435 124,004 84,965 84,176 2,611 6,160 384,350 86,520 118,467 89,844 91,777 4,141 5,602 396,351
Debt instruments (at cost)
not quoted in an active
market 226 2,635 638 3,491 454 3,782 11,226 68 1,734 1,101 2,316 414 4,651 10,283
Total Fair value of Debt
instruments that pass
the SPPI test 82,661 126,639 85,603 87,667 3,065 9,941 395,576 86,587 120,201 90,945 94,093 4,555 10,253 406,634
For loans, the credit risk information is available through three categories: rating grades, range of probability of default (range of PD)
and scoring which is issued by AXA banking entities and past due information.

284 I UNIVERSAL REGISTRATION DOCUMENT - ANNUAL REPORT 2019 - AXA I
CONSOLIDATED FINANCIAL STATEMENTS 5 5.6 NOTES TO THE CONSOLIDATED FINANCIAL STATEMENTS
(in Euro million)
December 31, 2019 December 31, 2018
Gross Carrying Amount of loans
that pass the SPPI test
Gross Carrying Amount of loans
that pass the SPPI test
Credit risk
information
is based on
ratings
Credit risk
information
is based
on scoring
(ranges
of PD)
Credit risk
information
is provided
on the basis
of past due
information Total
Credit risk
information
is based on
ratings
Credit risk
information
is based
on scoring
(ranges
of PD)
Credit risk
information
is provided
on the basis
of past due
information Total
Loans held to maturity - - - - - - - -
Loans available for sale - - - - - - - -
Loans at cost 2,842 12,469 16,309 31,619 13,393 31,549 15,796 60,738
Total Gross Carrying
amount of loans that
pass the SPPI test 2,842 12,469 16,309 31,619 13,393 31,549 15,796 60,738
(in Euro million)
December 31, 2019 December 31, 2018
Fair v alue of loans that pass the SPPI test Fair v alue of loans that pass the SPPI test
Credit risk
information
is based on
ratings
Credit risk
information
is based
on scoring
(ranges
of PD)
Credit risk
information
is provided
on the basis
of past due
information Total
Credit risk
information
is based on
ratings
Credit risk
information
is based
on scoring
(ranges
of PD)
Credit risk
information
is provided
on the basis
of past due
information Total
Loans held to maturity - - - - - - - -
Loans available for sale - - - - - - - -
Loans at cost 2,829 12,405 17,397 32,631 13,077 33,175 16,594 62,847
Total Fair value amount
of loans that pass
the SPPI test 2,829 12,405 17,397 32,631 13,077 33,175 16,594 62,847

285I UNIVERSAL REGISTRATION DOCUMENT - ANNUAL REPORT 2019 - AXA I
CONSOLIDATED FINANCIAL STATEMENTS
5
5.6 NOTES TO THE CONSOLIDATED FINANCIAL STATEMENTS
Below are detailed the gross carrying value and the fair value of loans that pass the SPPI test for which the credit risk is based on:
A) RATING GRADES:
Loans at cost
December 31, 2019 December 31, 2018
Gross carrying
value of loans
that pass the
SPPI test
Fair value of
loans that pass
the SPPI test
Gross Carrying
value of loans
that pass
the SPPI test
Fair Value of
loans that pass
the SPPI test
AAA 0 0 2,989 2,893
AA 677 679 7,934 7,739
A 1,103 1,112 1,247 1,255
BBB 1,057 1,034 1,196 1,170
BB and lower 0 0 23 17
Other 4 4 4 4
Total amount of loans that pass the SPPI test and for
which the credit risk information is based on ratings 2,842 2,829 13,393 13,077
B) RANGES OF PROBABILITY OF DEFAULT (1-YEAR PD):
Loans at cost
December 31, 2019 December 31, 2018
Gross Carrying
value of loans
that pass the
SPPI test
Fair Value of
loans that pass
the SPPI test
Gross Carrying
value of loans
that pass
the SPPI test
Fair Value of
loans that pass
the SPPI test
0% < PD < 0.35% 5,577 5,577 21,346 22,694
0.35 < PD < 3.78% 5,551 5,550 8,177 8,524
3.78 < PD < 10.00% 1,020 1,019 1,035 1,077
PD > 10.00% 96 84 485 506
Default 224 174 506 373
Total amount of loans that pass the SPPI test and for
which credit risk information is based on scoring 12,469 12,405 31,549 33,175
C) PAST DUE INFORMATION:
Loans at cost
December 31, 2019 December 31, 2018
Gross Carrying
value of loans
that pass the
SPPI test
Fair Value of
loans that pass
the SPPI test
Gross Carrying
value of loans
that pass the
SPPI test
Fair Value of
loans that pass
the SPPI test
Current 16,225 17,326 15,689 16,498
0-30 days past due 14 13 41 42
31-60 days past due 5 6 5 5
61-89 days past due 2 2 6 6
90 days and more past due 62 50 56 43
Total amount of loans that pass the SPPI test and for
which credit risk is provided on the basis of past due
information 16,309 17,397 15,796 16,594

286 I UNIVERSAL REGISTRATION DOCUMENT - ANNUAL REPORT 2019 - AXA I
CONSOLIDATED FINANCIAL STATEMENTS 5 5.6 NOTES TO THE CONSOLIDATED FINANCIAL STATEMENTS
I Note 10 Investments accounted for using the equity method
10.1 BREAKDOWN OF INVESTMENTS ACCOUNTED FOR USING THE EQUITY METHOD
(in Euro million)
2019
January 1
Acquisitions
& disposals
Contribution
to net
income
Currency
translation
impact
Other
changes (a)
December 31
Neuflize Vie 171 - 11 - (32) 150
Philippine AXA Life Insurance Corporation 83 - 30 5 (3) 114
Krungthai AXA Life Insurance Company Ltd. 224 - 83 27 (0) 334
ICBC-AXA Assurance Co., Ltd. 481 - 59 1 39 579
PT AXA Mandiri Financial Services 67 - 44 4 (15) 100
Bharti AXA Life 116 - (0) (1) 10 125
Bharti AXA General Insurance Company Limited 25 - 1 (0) 13 39
Reso Garantia 553 - 81 46 12 692
Kyobo AXA Investment Managers Company
Limited 34 - 4 (1) (4) 34
AXA SPDB Investments Managers Company
Limited 122 - 16 0 (8) 131
AXA Tianping (b) 542 0 (5) 2 (539) -
AXA Mansard Insurance plc (P&C including
Assur African Holding) 77 - 4 1 3 86
AXA Mansard Insurance plc (L&S) 27 - 2 1 3 33
XL Group 352 - - 7 (360) -
Equitable Holdings, Inc. (c) - 0 174 75 (249) 0
Other 56 (1) 2 0 (38) 20
TOTAL 2,929 (1) 504 169 (1,165) 2,437
(a) Includes increase in capital, dividend distributions, changes in consolidation method, and impacts of revaluation to fair value of financial investments in shareholders’ equity.
(b) From December 31, 2019, AXA Tianping is fully consolidated within AXA Group (see Note 5.3.1).
(c) Includes the initial recognition of the retained stake accounted for using the equity method for €+4,330 million and its deconsolidation for €-4,579 million embedding the residual retained stake reclassified as Avaivable for Sale instruments for €-934 million (see Note 5.3.2).

287I UNIVERSAL REGISTRATION DOCUMENT - ANNUAL REPORT 2019 - AXA I
CONSOLIDATED FINANCIAL STATEMENTS
5
5.6 NOTES TO THE CONSOLIDATED FINANCIAL STATEMENTS
(in Euro million)
2018
January 1
Acquisitions
& disposals
Contribution
to net
income
Currency
translation
impact
Other
changes (a)
December 31
Neuflize Vie 170 - 9 - (8) 171
Philippine AXA Life Insurance Corporation 76 - 20 0 (13) 83
Krungthai AXA Life Insurance Company Ltd. 181 - 32 12 0 224
ICBC-AXA Assurance Co., Ltd. 413 - 41 (2) 30 481
PT AXA Mandiri Financial Services 52 - 35 (0) (21) 67
Bharti AXA Life 105 - 9 (4) 6 116
Bharti AXA General Insurance Company Limited 25 - 1 (1) (0) 25
Reso Garantia 500 - 123 (58) (11) 553
Kyobo AXA Investment Managers Company
Limited 33 - 4 0 (3) 34
AXA SPDB Investments Managers Company
Limited 32 - 15 (1) 75 122
Natio Assurance 45 (54) 10 - (1) -
AXA Tianping 549 - (8) (2) 3 542
AXA Mansard Insurance plc
(P&C including Assur African Holding) 74 - 0 3 (0) 77
AXA Mansard Insurance plc (L&S) 24 - 4 1 (2) 27
Roland Rechtsschutzversicherung 45 (0) 2 - (48) -
XL Group - 450 - 7 (104) 352
Other 56 - (6) 1 4 56
TOTAL 2,381 396 289 (45) (93) 2,929
(a) Includes increase in capital, dividend distributions, changes in consolidation method, and impacts of revaluation to fair value of financial investments in shareholders’ equity.

288 I UNIVERSAL REGISTRATION DOCUMENT - ANNUAL REPORT 2019 - AXA I
CONSOLIDATED FINANCIAL STATEMENTS 5 5.6 NOTES TO THE CONSOLIDATED FINANCIAL STATEMENTS
10.2 MAIN JOINT VENTURES
Financial information for main joint ventures is as follows (including AXA and external share but excluding goodwill related to AXA’s
investment):
(in Euro million)
December 31, 2019 December 31, 2018
Krungthai AXA
Life Insurance
Company Ltd.
AXA
Tianping
Krungthai AXA
Life Insurance
Company Ltd.
AXA
Tianping
Cash and cash equivalents 117 - 108 188
Total assets (including cash and cash equivalents) 10,287 - 7,543 1,407
Financing debts - - - -
Total liabilities (including financing debts but excluding
shareholders’ equity) 9,619 - 7,095 949
Net assets 669 - 448 457
Revenues 1,671 881 1,536 800
Change in unearned premiums net of unearned revenues and fees (7) (40) 1 89
Net investment result excluding financing expenses 1,241 42 43 40
Other operating income and expenses (2,700) (910) (1,503) (941)
Financing debt expenses - - - -
Income tax expense or income (39) 16 (14) (5)
Net income 166 (11) 63 (17)
Other Comprehensive Income 54 - 23 4
Total Comprehensive Income 220 - 87 (12)
Dividends received by AXA from the joint venture - - - -
As of December 31, 2019, the Group share of interest in Krungthai AXA Life Insurance Company Ltd. was 50.0%. Additionally, AXA
Tianping, which was previously held by AXA for 50.0%, is fully consolidated within AXA Group from December 31, 2019 (see Note 5.3.1).
A reconciliation of the summarized financial information to the carrying amount of the joint ventures is as follows:
(in Euro million)
December 31, 2019 December 31, 2018
Krungthai AXA
Life Insurance
Company Ltd.
AXA
Tianping
Krungthai AXA
Life Insurance
Company Ltd.
AXA
Tianping
Net assets as presented above 669 - 448 457
Group share in net assets 334 - 224 229
Goodwill - - - 313
Carrying value 334 - 224 542
Under IAS 39, all financial assets of Krungthai AXA Life Insurance Company Ltd. are accounted for at fair value through profit and loss
and consequently the SPPI test (Solely Payments of Principal and Interest) is not applicable.

289I UNIVERSAL REGISTRATION DOCUMENT - ANNUAL REPORT 2019 - AXA I
CONSOLIDATED FINANCIAL STATEMENTS
5
5.6 NOTES TO THE CONSOLIDATED FINANCIAL STATEMENTS
10.3 MAIN ASSOCIATES
Financial information for main associates is as follows (including AXA and external share but excluding goodwill related to AXA’s
investment):
(in Euro million)
December 31, 2019 December 31, 2018
Reso
Garantia
ICBC-AXA
Assurance
Co., Ltd.
Reso
Garantia
ICBC-AXA
Assurance
Co., Ltd.
Total assets 3,763 20,711 2,745 15,199
Total liabilities (excluding shareholders’ equity) 2,478 18,604 1,780 13,449
Net assets 1,285 2,107 966 1,750
Revenues 1,462 7,014 1,438 4,319
Net income 206 213 312 148
Other Comprehensive Income 113 143 (112) 107
Total Comprehensive Income 318 356 199 255
Dividends received by AXA from the associate - - - -
A reconciliation of the summarized financial information to the carrying amount of the associates is as follows:
(in Euro million)
December 31, 2019 December 31, 2018
Reso
Garantia
ICBC-AXA
Assurance
Co., Ltd.
Reso
Garantia
ICBC-AXA
Assurance
Co., Ltd.
Net assets as presented above 1,285 2,107 966 1,750
Group share of net assets 506 579 380 481
Goodwill 186 - 173 -
Impairment of associate - - - -
Carrying value 692 579 553 481
Reso Garantia already applies IFRS 9.

290 I UNIVERSAL REGISTRATION DOCUMENT - ANNUAL REPORT 2019 - AXA I
CONSOLIDATED FINANCIAL STATEMENTS 5 5.6 NOTES TO THE CONSOLIDATED FINANCIAL STATEMENTS
Disclosures about the temporary exemption from IFRS 9 for ICBC-AXA Assurance Co., Ltd.
The table below sets out the result of the SPPI test (Solely Payment of Principal and Interest) for the assets not currently designated as at
fair value with change in fair value through income statement as of December 31, 2019. The amounts exclude the impact of derivatives.
(in Euro million)
December 31, 2019 December 31, 2018
Fail the SPPI test Pass the SPPI test Fail the SPPI test Pass the SPPI test
Fair
value
Change in
unrealized
gain or loss
in 2019
Fair
value
Change in
unrealized
gain or loss
in 2019
Fair
value
Change in
unrealized
gain or loss
in 2018
Fair
value
Change in
unrealized
gain or loss
in 2018
Debt instruments held to maturity - - - - - - - -
Debt instruments available for sale - - 3,388 28 - - 2,047 213
Debt instruments (at cost) not quoted in
an active market 783 - 1,919 - 888 - 1,992 -
Equity instruments available for sale 941 39 - - 371 (43) - -
Non-consolidated investment funds
available for sale 757 133 - - 1,036 (69) - -
Loans held to maturity - - - - - - - -
Loans available for sale - - - - - - - -
Loans at cost 1,106 - 2,488 - 1,131 - 1,606 -
TOTAL 3,588 172 7,795 28 3,426 (112) 5,645 213
This Note excludes investment funds and real estate companies accounted for using the equity method, which are presented as
financial investments (Note 9).

291I UNIVERSAL REGISTRATION DOCUMENT - ANNUAL REPORT 2019 - AXA I
CONSOLIDATED FINANCIAL STATEMENTS
5
5.6 NOTES TO THE CONSOLIDATED FINANCIAL STATEMENTS
I Note 11 Receivables
(in Euro million)
December 31, 2019 December 31, 2018
Gross
value Impairment
Carrying
value
Fair
value
Gross
value Impairment
Carrying
value
Fair
value
Deposits and guarantees 2,651 (2) 2,650 2,650 3,315 (2) 3,313 3,313
Current accounts receivables from
other Companies 2,369 (8) 2,361 2,361 1,928 (4) 1,923 1,923
Receivables from policyholders,
brokers and general agents 16,349 (512) 15,837 15,837 14,941 (511) 14,431 14,431
Premiums earned not yet written 6,239 - 6,239 6,239 5,592 - 5,592 5,592
Receivables arising from direct
insurance and inward reinsurance
operations 27,608 (521) 27,087 27,087 25,776 (517) 25,259 25,259
Deposits and guarantees 0 - 0 0 5 - 5 5
Receivables from reinsurers 2,141 (67) 2,074 2,074 2,002 (65) 1,937 1,937
Receivables from brokers and general
agents 0 (0) 0 0 5 (3) 3 3
Receivables arising from outward
reinsurance operations 2,141 (67) 2,074 2,074 2,012 (68) 1,944 1,944
Current tax receivables 949 - 949 949 962 - 962 962
Employee benefits & related 1,442 (0) 1,442 1,442 1,507 (0) 1,507 1,507
Other deposits 2,658 - 2,658 2,658 1,845 - 1,845 1,845
Others 6,300 (71) 6,229 6,229 12,226 (833) 11,393 11,393
Other receivables 10,400 (71) 10,329 10,329 15,578 (833) 14,745 14,745
TOTAL RECEIVABLES 41,099 (660) 40,439 40,439 44,328 (1,417) 42,911 42,911

292 I UNIVERSAL REGISTRATION DOCUMENT - ANNUAL REPORT 2019 - AXA I
CONSOLIDATED FINANCIAL STATEMENTS 5 5.6 NOTES TO THE CONSOLIDATED FINANCIAL STATEMENTS
I Note 12 Cash and cash equivalents
(in Euro million)
December 31, 2019 December 31, 2018
Carrying value (a)
Carrying value (a)
Arising from insurance activities 16,427 25,972
Arising from banking activities 1,072 1,220
Arising from other activities 4,450 4,137
Cash and cash equivalents (b)
21,948 31,329
(a) Fair value is assessed as being equal to net carrying value given the nature of such assets.
(b) Including €783 million deposits in the central banks in 2019 and €905 million in 2018.
The table below reconciles assets and liabilities cash and cash equivalent balances with the statement of consolidated cash flows:
(in Euro million)
December 31,
2019
December 31,
2018
Cash and cash equivalents 21,948 31,329
Bank overdraft s (a) (679) (773)
Cash and cash equivalents (b)
21,269 30,556
(a) Included in “Other debt instruments issued and bank overdraft s”.
(b) The “Cash and cash equivalents” item excludes cash backing contracts where the financial risk is borne by policyholders (Unit-Linked contracts).
The tables above exclude cash held by consolidated investment funds in the “Satellite Investment Portfolio”, as defined in Note 1.8.2.
As of December 31, 2019, total consolidated net cash and cash
equivalents amounted to €21,269 million, net of €679 million
bank overdraft s classified under “Other debt instrument issued
and bank overdraft s” in the consolidated statement of financial
position.
Net cash and cash equivalents decreased by €9,287 million
compared to 2018 mainly in:
■ Switzerland (€-5,35 4 million) due to higher surrenders in the
context of Group Life portfolio disposal;
■ the United States (€-4,094 million) due to the deconsolidation
of Equitable Holdings, Inc.;
■ France (€-1,354 million) mainly due to regular insurance
activities (€-1,885 million), partly off set by a temporary cash
position invested in money market funds (€+417 million).
It was partly off set by:
■ AXA SA (€+1,373 million) mainly from the proceeds coming
from the disposal of Equitable Holdings, Inc. shares and
dividends received, partly offset by the dividends paid to
the shareholders, and the repayment of loans made by the
operating entities;
■ Belgium (€+264 million) mainly due to the repayment of an
intra-group loan.
Regarding the consolidated statement of cash flows presented in
the primary financial statements, net cash provided by operating
activities amounted to €+8,861 million in 2019, compared to
€7,634 million in 2018.
Net cash used in investing activities amounted to €-10,665 million
in 2019, mainly reflecting:
■ €-15,158 million of net cash used in purchases and sales of
financial invested assets;
■ €+4,831 million of net cash impact of assets lending/borrowing
collateral receivables and payables.
Net cash used in investing activities amounted to €-2,124 million
in 2018, mainly reflecting:
■ €-9,247 million of net cash used in the acquisition of the XL
Group;
■ €+4,015 million of net cash used in purchases and sales of
financial invested assets;
■ €+3,962 million of net cash impact of assets lending/borrowing
collateral receivables and payables.

293I UNIVERSAL REGISTRATION DOCUMENT - ANNUAL REPORT 2019 - AXA I
CONSOLIDATED FINANCIAL STATEMENTS
5
5.6 NOTES TO THE CONSOLIDATED FINANCIAL STATEMENTS
Net cash relating to financing activities amounted to
€-7,011 million in 2019, mainly driven by:
■ the repayment of preference shares (€-1,086 million) related
to the XL Group;
■ subordinated debt issued (€+145 million) the repayment of
financing debt (€-559 million) and undated subordinated debt
in 2019 (€-253 million);
■ dividends payments of €-3,268 million.
Net cash relating to financing activities amounted to
€+3,919 million in 2018, mainly driven by:
■ the sale of interests in subsidiaries without change in control
(€+4,097 million), mostly related to the partial disposal of
Equitable Holdings, Inc.;
■ subordinated debt issued (€+5,685 million), the repayment of
financing debt (€-1,681 million) and undated subordinated
debt in 2018 (€-665 million);
■ dividends payments of €-3,414 million.
I Note 13 Shareholders’ equity and minority interests
13.1 IMPACT OF TRANSACTIONS
WITH SHAREHOLDERS
The Consolidated Statement of changes in Equity is presented
as a primary financial statement.
13.1.1 Change in shareholders’ equity Group
share in 2019
SHARE CAPITAL AND CAPITAL IN EXCESS OF NOMINAL
VALUE
During 2019, the following transactions had an impact on AXA’s
share capital and capital in excess of nominal value:
■ a capital increase of €375 million from the employee share
off ering of 17.8 million shares in December 2019;
■ a capital increase of €67 million due to the exercise of stock
options;
■ share-based payments for €40 million;
■ a capital decrease of €683 million corresponding to 29.3 million
shares in order to eliminate the dilutive eff ect of employee
share off ering of 17.8 million shares and other share-based
compensation schemes of 11.5 million shares (AXA SA’s stocks
options and performance shares plans).
TREASURY SHARES
As of December 31, 2019, the Company and its subsidiaries
owned 31.3 million AXA shares, representing 1.3% of the
share capital, a decrease of 10.3 million shares compared to
December 31, 2018.
As of December 31, 2019, 1.4 million treasury shares backing
contracts where financial risk is borne by policyholders held
in consolidated investment funds were not deducted from
shareholders’ equity. Their total estimated historical cost was
€18 million and their market value €36 million at the end of
December 2019.
As of December 31, 2019, the carrying value of treasury shares
and related derivatives amounted to €752 million. There was no
AXA shares held by consolidated Mutual funds other than those
backing contracts where financial risk is borne by policyholders.
UNDATED SUBORDINATED DEBT AND RELATED FINANCIAL
EXPENSES
As described in the accounting principles, undated subordinated
debt instruments issued by the Group do not qualify as liabilities
under IFRS.
Undated subordinated debt instruments are classified in
shareholders’ equity and valuated at their historical value or
their closing value as regards exchange rates. The corresponding
foreign exchange differences are cancelled out through the
translation reserve.
In 2019, the following transactions pertaining to undated
subordinated debt had an impact on AXA’s other reserves:
■ €-253 million from repayment of undated subordinated debt;
■ €+113 million from foreign exchange rate fluctuations;
■ €-194 million from interest expenses related to the undated
subordinated debt (net of tax).
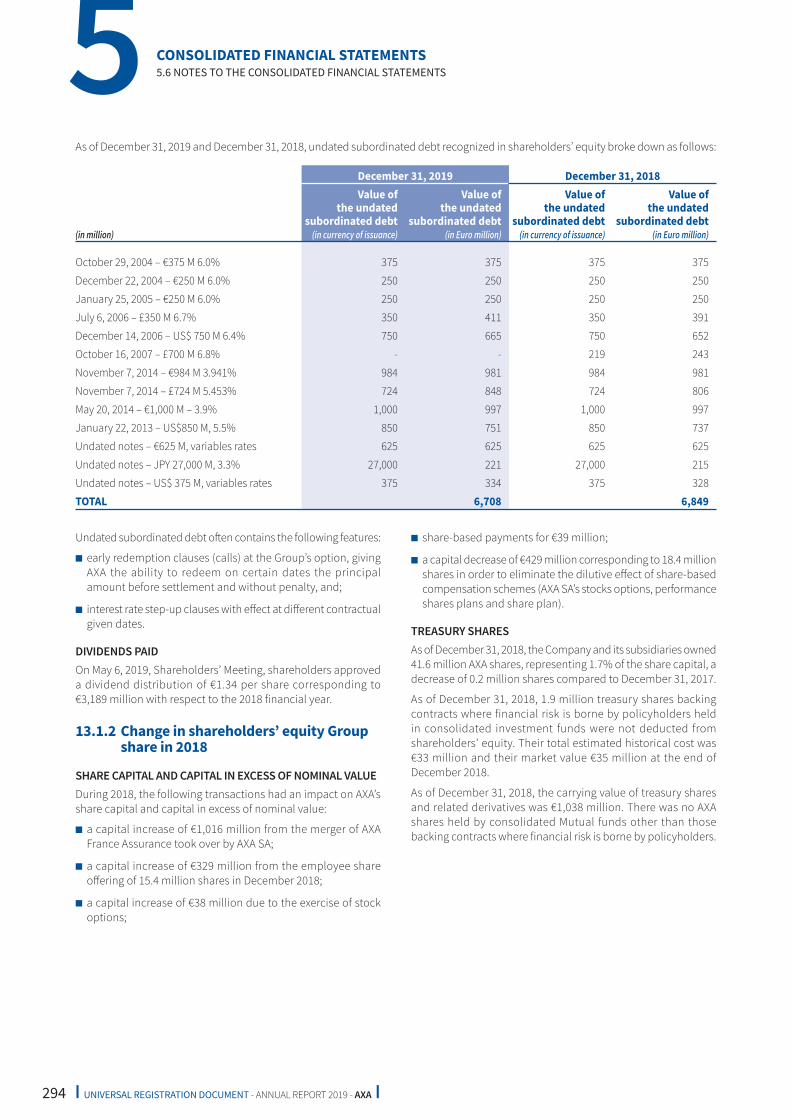
294 I UNIVERSAL REGISTRATION DOCUMENT - ANNUAL REPORT 2019 - AXA I
CONSOLIDATED FINANCIAL STATEMENTS 5 5.6 NOTES TO THE CONSOLIDATED FINANCIAL STATEMENTS
As of December 31, 2019 and December 31, 2018, undated subordinated debt recognized in shareholders’ equity broke down as follows:
(in million)
December 31, 2019 December 31, 2018
Value of
the undated
subordinated debt
(in currency of issuance)
Value of
the undated
subordinated debt
(in Euro million)
Value of
the undated
subordinated debt
(in currency of issuance)
Value of
the undated
subordinated debt
(in Euro million)
October 29, 2004 – €375 M 6.0% 375 375 375 375
December 22, 2004 – €250 M 6.0% 250 250 250 250
January 25, 2005 – €250 M 6.0% 250 250 250 250
July 6, 2006 – £350 M 6.7% 350 411 350 391
December 14, 2006 – US$ 750 M 6.4% 750 665 750 652
October 16, 2007 – £700 M 6.8% - - 219 243
November 7, 2014 – €984 M 3.941% 984 981 984 981
November 7, 2014 – £724 M 5.453% 724 848 724 806
May 20, 2014 – €1,000 M – 3.9% 1,000 997 1,000 997
January 22, 2013 – US$850 M, 5.5% 850 751 850 737
Undated notes – €625 M, variables rates 625 625 625 625
Undated notes – JPY 27,000 M, 3.3% 27,000 221 27,000 215
Undated notes – US$ 375 M, variables rates 375 334 375 328
TOTAL 6,708 6,849
Undated subordinated debt oft en contains the following features:
■ early redemption clauses (calls) at the Group’s option, giving
AXA the ability to redeem on certain dates the principal
amount before settlement and without penalty, and;
■ interest rate step-up clauses with eff ect at diff erent contractual
given dates.
DIVIDENDS PAID
On May 6, 2019, Shareholders’ Meeting, shareholders approved
a dividend distribution of €1.34 per share corresponding to
€3,189 million with respect to the 2018 financial year.
13.1.2 Change in shareholders’ equity Group
share in 2018
SHARE CAPITAL AND CAPITAL IN EXCESS OF NOMINAL VALUE
During 2018, the following transactions had an impact on AXA’s
share capital and capital in excess of nominal value:
■ a capital increase of €1,016 million from the merger of AXA
France Assurance took over by AXA SA;
■ a capital increase of €329 million from the employee share
off ering of 15.4 million shares in December 2018;
■ a capital increase of €38 million due to the exercise of stock
options;
■ share-based payments for €39 million;
■ a capital decrease of €429 million corresponding to 18.4 million
shares in order to eliminate the dilutive eff ect of share-based
compensation schemes (AXA SA’s stocks options, performance
shares plans and share plan).
TREASURY SHARES
As of December 31, 2018, the Company and its subsidiaries owned
41.6 million AXA shares, representing 1.7% of the share capital, a
decrease of 0.2 million shares compared to December 31, 2017.
As of December 31, 2018, 1.9 million treasury shares backing
contracts where financial risk is borne by policyholders held
in consolidated investment funds were not deducted from
shareholders’ equity. Their total estimated historical cost was
€33 million and their market value €35 million at the end of
December 2018.
As of December 31, 2018, the carrying value of treasury shares
and related derivatives was €1,038 million. There was no AXA
shares held by consolidated Mutual funds other than those
backing contracts where financial risk is borne by policyholders.

295I UNIVERSAL REGISTRATION DOCUMENT - ANNUAL REPORT 2019 - AXA I
CONSOLIDATED FINANCIAL STATEMENTS
5
5.6 NOTES TO THE CONSOLIDATED FINANCIAL STATEMENTS
UNDATED SUBORDINATED DEBT AND RELATED FINANCIAL
EXPENSES
In 2018, the following transactions pertaining to undated
subordinated debt had an impact on AXA’s other reserves:
■ €-665 million from repayment of undated subordinated debt;
■ €+123 million from foreign exchange rate fluctuations;
■ €-222 million from interest expenses related to the undated
subordinated debt (net of tax).
DIVIDENDS PAID
On April 26, 2018, Shareholders’ Meeting, shareholders approved
a dividend distribution of €1.26 per share corresponding to
€2,998 million with respect to the 2017 financial year.
13.2 COMPREHENSIVE INCOME
FOR THE PERIOD
The Statement of Comprehensive Income, presented as primary
financial statements, includes net income for the period, the
reserves relating to the change in fair value of available for sale
financial instruments, the translation reserve, and actuarial gains
and losses on employee benefit obligations.
13.2.1 Comprehensive income for 2019
RESERVES RELATED TO CHANGES IN FAIR VALUE
OF AVAILABLE FOR SALE FINANCIAL INSTRUMENTS
INCLUDED IN SHAREHOLDERS’ EQUITY
The increase of gross unrealized gains and losses on assets
available for sale totaled €+22,669 million, of which a
€+18,756 million increase in unrealized capital gains on debt
securities driven by the decrease in interest rates.
The following table shows the reconciliation between gross unrealized gains and losses on available for sale financial assets and the
corresponding reserve recognized in shareholders’ equity:
(in Euro million)
December 31,
2019
December 31,
2018
Gross unrealized gains and losses (a)
61,244 38,575
Less unrealized gains and losses attributable to:
Shadow accounting on policyholder participation and other obligations (34,196) (22,154)
Shadow accounting on Deferred Acquisition Costs (b) (876) (210)
Shadow accounting on Value of purchased Business In force (167) (159)
Unallocated unrealized gains and losses before tax 26,005 16,052
Deferred tax (6,174) (4,189)
Unrealized gains and losses net of tax – assets available for sale 19,831 11,863
Unrealized gains and losses net of tax (100%) – equity accounted companies 56 (32)
UNREALIZED GAINS AND LOSSES (NET OF TAX) – 100% – TOTAL 19,887 11,831
Minority interests’ share in unrealized gains and losses (c)
(255) (42)
Translation reserves (d) (303) (223)
UNREALIZED GAINS AND LOSSES (NET GROUP SHARE) (e)
19,328 11,566
(a) Unrealized gains and losses on total available for sale invested assets including loans and assets held for sale.
(b) Net of shadow accounting on unearned revenues and fees reserves and held for sale activities.
(c) Including foreign exchange impact attributable to minority interests.
(d) Group share.
(e) Including unrealized gains and losses on assets held for sale.
On December 31, 2019, most of the unrealized gains on assets available for sale were related to Life & Savings activities.

296 I UNIVERSAL REGISTRATION DOCUMENT - ANNUAL REPORT 2019 - AXA I
CONSOLIDATED FINANCIAL STATEMENTS 5 5.6 NOTES TO THE CONSOLIDATED FINANCIAL STATEMENTS
In jurisdictions where participating business represents an
important portion of contracts in force and where required
minimum local policyholders’ share in the entities’ results
(limited to investment result or not) are significant, the
reconciliation between gross unrealized gains and losses on
available for sale financial assets and the corresponding net
reserve recognized in shareholders’ equity were as follows as
of December 31, 2019:
The change in reserves related to changes in fair value of available for sale financial instruments included in shareholders’ equity as
of December 31, 2019 and December 31, 2018, broke down as follows:
(in Euro million)
December 31,
2019
December 31,
2018
Unrealized gains and losses (net of tax) 100%, opening 11,831 16,194
Transfer in the income statement on the period (a) (187) (874)
Investments bought in the current accounting period and changes in fair value 8,593 (3,715)
Foreign exchange impact 217 289
Change in scope and other changes (567) (62)
Unrealized gains and losses (net of tax) 100%, closing 19,887 11,831
Minority interests’ share in unrealized gains and losses (b)
(255) (42)
Translation reserves (c)
(303) (223)
UNREALIZED GAINS AND LOSSES (NET GROUP SHARE) (d)
19,328 11,566
(a) Transfer induced by disposal of financial assets, impairment write-back following reevaluation, or transfer of expenses following impairment charge during the period, and debt instruments discount premium impacts.
(b) Including foreign exchange impact attributable to minority interests.
(c) Group share.
(d) Including unrealized gains and losses on assets held for sale operations.
(in Euro million)
December 31, 2019
France Life &
Savings
Germany Life
& Savings
Switzerland
Life &
Savings
Belgium Life
& Savings
Gross unrealized gains and losses (a)
21,095 10,465 3,753 6,307
Less unrealized gains and losses attributable to:
Shadow accounting on policyholders’ participation and other obligations (15,886) (8,984) (2,530) (2,927)
Shadow accounting on Deferred Acquisition Costs (b) (303) - (122) (79)
Shadow accounting on Value of purchased Business In force - - (93) (2)
Unallocated unrealized gains and losses before tax 4,906 1,482 1,008 3,299
Deferred tax (1,253) (474) (186) (760)
Unrealized gains and losses (net of tax) – assets available for sale 3,653 1,008 821 2,540
Unrealized gains and losses net of tax – equity accounted companies 16 - - -
UNREALIZED GAINS AND LOSSES (NET OF TAX) – 100% – TOTAL 3,669 1,008 821 2,540
Minority interests’ share in unrealized gains and losses (c)
(9) 0 - (1)
Translation reserves (d) 0 - (208) (0)
UNREALIZED GAINS AND LOSSES (NET GROUP SHARE) (e)
3,660 1,008 613 2,539
(a) Unrealized gains and losses on total available for sale invested assets including loans and assets held for sale.
(b) Net of shadow accounting on unearned revenues and fees reserves.
(c) Including foreign exchange impact attributable to minority interests.
(d) Group share.
(e) Including unrealized gains and losses on assets held for sale.

297I UNIVERSAL REGISTRATION DOCUMENT - ANNUAL REPORT 2019 - AXA I
CONSOLIDATED FINANCIAL STATEMENTS
5
5.6 NOTES TO THE CONSOLIDATED FINANCIAL STATEMENTS
CURRENCY TRANSLATION RESERVE
The total impact of foreign exchange rate movements was
€+659 million (of which €+457 million from Group share and
€+202 million from minority interests) as at December 31, 2019.
The change in Group share translation reserves €+457 million was
mainly driven by Switzerland (€+391 million), the UK & Ireland
(€+248 million), the United States (€+204 million), Hong Kong
(€+113 million) and International (€+107 million), partly off set by
the deconsolidation of Equitable Holdings, Inc. (€-1,014 million).
EMPLOYEE BENEFITS ACTUARIAL GAINS AND LOSSES
The total impact of employee benefits actuarial gains and
losses amounted to €-684 million (of which Group share was
€-679 million and minority interests were €-5 million) as of
December 31, 2019.
The negative impact in equity arising from employee defined
benefits obligation was mainly explained by an overall decrease
in discount rate assumptions used to value liabilities in the
Eurozone but also in the United Kingdom and Switzerland
partially offset by gains on plan assets backing the defined
benefit obligation mainly in the United Kingdom and Switzerland.
Additional information on pension benefits is provided in
Note 26.2.
13.2.2 Comprehensive income for 2018
RESERVE RELATED TO CHANGES IN FAIR VALUE OF
AVAILABLE FOR SALE FINANCIAL INSTRUMENTS INCLUDED
IN SHAREHOLDERS’ EQUITY
The decrease of gross unrealized gains and losses on assets
available for sale totaling €11,702 million, of which €8,971 million
decrease in unrealized capital gains on debt securities, mainly
driven by corporate spreads widening, and to a lower extent by
interest rates increase in the United States.
CURRENCY TRANSLATION RESERVE
The total impact of foreign exchange rate movements was
€+1,553 million (of which €+1,869 million from Group share and
€-317 million from minority interests) as at December 31, 2018.
The change in Group share translation reserves €1,869 million
was mainly driven by Japan (€+495 million), Switzerland
(€+404 million), the United States (€+368 million), Asia
(€+175 million), partly off set by International (€-79 million).
EMPLOYEE BENEFITS ACTUARIAL GAINS AND LOSSES
The total impact of employee benefits actuarial gains and
losses amounted to €+253 million (of which Group share was
€+608 million and minority interests were €-355 million) as of
December 31, 2018.
The positive impact in equity arising from employee defined
benefits obligation was mainly explained by:
■ an overall increase in discount rate assumptions used to value
liabilities in diff erent countries (an increase in discount rate per
reference to financial conditions entails a decrease in defined
benefit obligation thus, a gain on liabilities);
■ an update of longevity assumptions in Switzerland (adoption
of the latest Continuous Mortality Investigation Projection
Model – CMI);
It was partly off set by:
■ losses on plan assets backing the defined benefit obligation
mainly in the United Kingdom, the United States and
Switzerland.
Additional information on pension benefits is provided in
Note 26.2.
13.3 CHANGE IN MINORITY INTERESTS
Under IFRS, minority interests in most investment funds in
which the Group invests consist of instruments that holders can
redeem at will at fair value, and qualify as a liability rather than
shareholders’ equity item.
13.3.1 Change in minority interests for 2019
The €6,094 million decrease in minority interests to €4,730 million
was driven by transactions with minority interests’ holders and
comprehensive income:
■ the comprehensive income for the period notably included
the following:
• net income attributable to minority interests for
€+325 million,
• employee benefits actuarial gains and losses €-5 million,
• reserves relating to changes in fair value through
shareholders’ equity for €+223 million,
• foreign exchange movements for €+202 million;

298 I UNIVERSAL REGISTRATION DOCUMENT - ANNUAL REPORT 2019 - AXA I
CONSOLIDATED FINANCIAL STATEMENTS 5 5.6 NOTES TO THE CONSOLIDATED FINANCIAL STATEMENTS
■ transactions with minority interests’ holders mainly included:
• decrease in minority interests as a consequence of
the deconsolidation of Equitable Holdings, Inc. for
€-5,172 million (see Note 5.3.2),
• reclassification of the equity component of the Mandatory
Exchangeable Bonds to financing debt for €-614 million (see
Note 5.3.2),
• redemption of AXA XL preferred shares for €-1,086 million,
• dividend payout to minority interests’ holders for
€-156 million,
• minority interests qualified as equity resulting from the
consolidation of a new investment fund and capital addition
to existing consolidated investment funds for €+191 million.
13.3.2 Change in minority interests for 2018
The €5,168 million increase in minority interests to €10,824 million
was driven by transactions with minority interests’ holders and
comprehensive income:
■ the comprehensive income for the period notably included
the following:
• net income attributable to minority interests for
€-2,513 million,
• employee benefits actuarial gains and losses €-355 million,
• reserves relating to changes in fair value through
shareholders’ equity for €-188 million,
• foreign exchange movements for €-317 million;
■ transactions with minority interests’ holders mainly included:
• increase in minority interests following the IPO and
the Second Offering of Equitable Holdings, Inc. for
€+6,463 million,
• equity component of Mandatory Exchangeable Bonds for
€+607 million,
• XL Group preferred shares for €+1,025 million,
• dividend payout to minority interests’ holders for
€-428 million,
• minority interests qualified as equity resulting from the
consolidation of a new investment fund and capital addition
to existing consolidated investment funds for €+532 million.

299I UNIVERSAL REGISTRATION DOCUMENT - ANNUAL REPORT 2019 - AXA I
CONSOLIDATED FINANCIAL STATEMENTS
5
5.6 NOTES TO THE CONSOLIDATED FINANCIAL STATEMENTS
I Note 14 Liabilities arising from insurance and investment contracts
In this Note, Health is not reported separately from Life & Savings and Property & Casualty lines of business.
14.1 BREAKDOWN OF LIABILITIES ARISING FROM INSURANCE AND INVESTMENT
CONTRACTS (GROSS AND REINSURERS’ SHARE)
14.1.1 Segment breakdown of liabilities arising from insurance and investment contracts
(gross and reinsurers’ share)
(in Euro million)
December 31, 2019
France Europe Asia AXA XL
United
States
Interna-
tional
Trans-
versal &
Central
Holdings
Total
Insu-
rance
Insurance liabilities (A) 157,890 150,179 62,721 48,669 - 11,591 1,912 432,963
Investment liabilities (B) 11,960 35,744 2,167 - - 2,677 - 52,547
Other liabilities (C) (a) 19,439 30,287 3,727 0 - 667 (0) 54,120
Total insurance and investment
liabilities (D = A+B+C) 189,290 216,209 68,615 48,669 - 14,935 1,912 539,630
Reinsurers’ share in insurance
and investment contracts’ liabilities (E) 4,975 1,210 707 15,141 - 1,198 (260) 22,970
TOTAL INSURANCE AND INVESTMENT
LIABILITIES NET OF REINSURER’S SHARE
(F = D-E) 184,315 214,999 67,908 33,528 - 13,737 2,172 516,660
(a) Other liabilities comprised unearned revenue and unearned fee reserves, liabilities arising from policyholders’ participation and other obligations, and derivatives instruments relating to insurance and investment contracts.
(in Euro million)
December 31, 2018
France Europe Asia AXA XL
United
States
Interna-
tional
Trans-
versal &
Central
Holdings
Total
Insu-
rance
Insurance liabilities (A) 149,939 153,272 56,141 45,689 165,179 10,917 1,936 583,073
Investment liabilities (B) 10,384 33,982 2,035 864 3,910 2,417 - 53,593
Other liabilities (C) (a) 14,633 23,706 2,863 0 (172) 516 5 41,552
Total insurance and investment
liabilities (D = A+B+C) 174,956 210,961 61,039 46,553 168,917 13,850 1,942 678,219
Reinsurers’ share in insurance
and investment contracts’ liabilities (E) 4,563 1,258 251 13,641 5,251 1,057 (270) 25,751
TOTAL INSURANCE AND INVESTMENT
LIABILITIES NET OF REINSURER’S SHARE
(F = D-E) 170,392 209,703 60,788 32,913 163,667 12,794 2,211 652,468
(a) Other liabilities comprised unearned revenue and unearned fee reserves, liabilities arising from policyholders’ participation and other obligations, and derivatives instruments relating to insurance and investment contracts.

300 I UNIVERSAL REGISTRATION DOCUMENT - ANNUAL REPORT 2019 - AXA I
CONSOLIDATED FINANCIAL STATEMENTS 5 5.6 NOTES TO THE CONSOLIDATED FINANCIAL STATEMENTS
14.1.2 Breakdown of liabilities arising from insurance and investment contracts
(gross and reinsurers’ share)
(in Euro million)
December 31, 2019 December 31, 2018
Life &
Savings
Property &
Casualty
Total
Insurance
Life &
Savings
Property &
Casualty
Total
Insurance
Liabilities arising from insurance contracts 267,454 108,800 376,253 333,688 103,327 437,015
Liabilities arising from insurance contracts
where risk is borne by policyholders 56,709 - 56,709 146,058 - 146,058
Total insurance liabilities (A) 324,163 108,800 432,963 479,746 103,327 583,073
Liabilities arising from investment contracts
with discretionary participating features 36,036 - 36,036 34,225 - 34,225
Liabilities arising from investment contracts
with no discretionary participating features 67 - 67 3,973 864 4,837
Liabilities arising from investment contracts
where the financial risk is borne by
policyholders 16,444 - 16,444 14,532 - 14,532
Total investment liabilities (B) 52,547 - 52,547 52,729 864 53,593
Unearned revenue and unearned fee reserves 2,211 - 2,211 2,711 10 2,722
Liabilities arising from participation 52,465 301 52,766 40,367 259 40,625
Derivative instruments (1,098) 241 (857) (1,984) 189 (1,795)
Other liabilities (C) 53,578 542 54,120 41,094 458 41,552
Total insurance and investment liabilities
(D = A+B+C) 430,288 109,342 539,630 573,569 104,650 678,219
Reinsurers’ share in insurance contracts
liabilities 7,417 15,438 22,855 12,280 13,358 25,637
Reinsurers’ share in insurance contract
liabilities relating to policyholders’
participation 1 18 18 1 22 23
Reinsurers’ share in liabilities arising
from investment contracts 97 - 97 91 - 91
Total reinsurers’ share in insurance
and investment contracts liabilities (E) 7,515 15,456 22,970 12,371 13,380 25,751
TOTAL INSURANCE AND INVESTMENT
LIABILITIES NET OF REINSURERS’ SHARE
(F = D-E) 422,774 93,887 516,660 561,198 91,270 652,468

301I UNIVERSAL REGISTRATION DOCUMENT - ANNUAL REPORT 2019 - AXA I
CONSOLIDATED FINANCIAL STATEMENTS
5
5.6 NOTES TO THE CONSOLIDATED FINANCIAL STATEMENTS
14.2 LIABILITIES ARISING FROM INSURANCE CONTRACTS
(GROSS AND REINSURERS’ SHARE)
Liabilities arising from insurance contracts, including those where the financial risk is borne by policyholders, as disclosed in the total
(A) of Note 14.1.1, were split by as follows:
(in Euro million)
December 31, 2019 December 31, 2018
Life &
Savings
Property &
Casualty
Total
Insurance
Life &
Savings
Property &
Casualty
Total
Insurance
Future policy benefit reserves 245,175 107 245,282 311,915 102 312,017
Unearned premiums reserves 920 21,472 22,392 836 19,091 19,927
Claims reserves (a) 13,948 81,689 95,637 14,054 78,703 92,757
of which IBNR 4,741 30,814 35,554 5,050 29,474 34,524
Liability adequacy test reserves - - - - - -
Other reserves (c) 7,410 5,532 12,942 6,884 5,431 12,315
Liabilities arising from insurance contracts (A) 267,454 108,800 376,253 333,688 103,327 437,015
of which measured at current assumptions (c) 226 - 226 14,123 - 14,123
Future policy benefit reserves 56,608 - 56,608 145,889 - 145,889
Claims reserves (a) 101 - 101 93 - 93
of which IBNR 1 - 1 2 - 2
Other reserves 0 - 0 76 - 76
Liabilities arising from insurance
contracts where the financial risk is borne
by policyholders (B) 56,709 - 56,709 146,058 - 146,058
Sub-total Liabilities arising from insurance
contract (C = A+B) 324,163 108,800 432,963 479,746 103,327 583,073
Reinsurers’ share in future policy benefit reserves 4,689 (7) 4,681 9,525 (6) 9,519
Reinsurers’ share in unearned premiums reserves 50 3,157 3,208 49 2,705 2,754
Reinsurers’ share in claims reserves (a) 1,977 12,277 14,254 2,072 10,670 12,742
of which IBNR 29 5,945 5,975 49 5,143 5,192
Reinsurers’ share in other reserves 702 10 712 633 (11) 622
Reinsurers’ share in liabilities arising
from insurance contracts (D) 7,417 15,438 22,855 12,280 13,358 25,637
Reinsurers’ share in liabilities arising from
insurance contracts where the financial risk
is borne by policyholders (E) 0 - 0 0 - 0
Sub-total Reinsurers’ share in liabilities
(F = D+E) 7,418 15,438 22,855 12,280 13,358 25,638
TOTAL LIABILITIES ARISING FROM INSURANCE
CONTRACTS, NET OF REINSURERS’ SHARE
(G = C-F) 316,745 93,362 410,107 467,466 89,970 557,436
Note: Liabilities relating to unearned revenues and fees (see Note 7.3), to policyholder participation (see Note 14.9), and derivative instruments (see Note 20.4) are excluded from the table above.Reinsurers’ share in insurance contracts liabilities relating to policyholders’ participation (€18 million in 2019 and €23 million in 2018), as well as derivative instruments (none in 2019 and 2018) are excluded from the table above.
(a) Includes reserves for claims handling expenses.
(b) Notably includes non-life annuities mathematical reserves.
(c) See Note 1.14.2 “Reserves measured according to the option off ered by IFRS 4.24” for selective re-measurement of reserves at current market assumptions.

302 I UNIVERSAL REGISTRATION DOCUMENT - ANNUAL REPORT 2019 - AXA I
CONSOLIDATED FINANCIAL STATEMENTS 5 5.6 NOTES TO THE CONSOLIDATED FINANCIAL STATEMENTS
14.3 LIABILITIES ARISING FROM INVESTMENT CONTRACTS
(GROSS AND REINSURERS’ SHARE)
The following table shows a breakdown of liabilities arising from investment contracts including those where the financial risk is borne
by policyholders, as disclosed in the sub total (B) of Note 14.1.1:
(in Euro million)
December 31,
2019
December 31,
2018
Future policy benefit reserves 35,739 33,937
Unearned premiums reserves 0 0
Claims reserves (a) 295 285
Liability adequacy test reserves - -
Other reserves 3 3
Liabilities arising from investment contracts with discretionary participating features (A) 36,036 34,225
of which measured at current assumptions (b) - -
Future policy benefit reserves 57 3,963
Claims reserves (a) 9 10
Other reserves 0 865
Liabilities arising from investment contracts with no discretionary participating features (B) 67 4,837
Future policy benefit reserves 16,434 14,519
Claims reserves (a) 11 13
Other reserves - -
Liabilities arising from investment contracts where the financial risk is borne by policyholders (C) 16,444 14,532
Sub-total liabilities arising from investment contract (D = A+B+C) 52,547 53,593
Reinsurers’ share in liabilities arising from investment contracts with discretionary
participating features (E) 93 88
Reinsurers’ share in liabilities arising from investment contracts with no discretionary
participating features (F) - -
Reinsurers’ share in liabilities arising from investment contracts where the financial risk
is borne by policyholders (G) 3 3
Sub-total Reinsurers’ share (H = E+F+G) 97 91
TOTAL LIABILITIES ARISING FROM INVESTMENT CONTRACTS – NET OF REINSURERS’ SHARE (I = D-H) 52,451 53,502
Note: Liabilities relating to unearned revenues and fees (see Note 7.3), to policyholders’ participation (see Note 14.9), and derivative instruments (see Note 20.4), are excluded from the table above.Reinsurance’s share in investments contracts liabilities relating to policyholders’ participation (none in 2019 and 2018), as well as derivatives instruments (none in 2019 and 2018) are excluded from the table above.
(a) Includes reserves for claims handling expenses.
(b) See Note 1.14.2 “Reserves measured according to the option opened by IFRS 4.24” for selective re-measurement of reserves at current market assumptions.

303I UNIVERSAL REGISTRATION DOCUMENT - ANNUAL REPORT 2019 - AXA I
CONSOLIDATED FINANCIAL STATEMENTS
5
5.6 NOTES TO THE CONSOLIDATED FINANCIAL STATEMENTS
14.4 CHANGE IN CLAIMS RESERVES FOR PROPERTY & CASUALTY (INSURANCE CONTRACTS)
14.4.1 Change in gross of reinsurance claims reserves
The table below gives information on change in reserves in Property & Casualty presented in Note 14.2:
(in Euro million)
2019 2018
Property &
Casualty
Property &
Casualty
Claims reserves as of January 1 75,782 48,445
Claims handling cost reserves as of January 1 2,921 1,396
Gross claims reserve as of January 1 (a)
78,703 49,841
Current year charge 31,850 25,116
Loss reserves development (prior years) (368) (709)
Total claims expenses (b)
31,482 24,407
Claims payments (current year) (19,683) (12,900)
Claims payments (prior years) (10,282) (10,335)
Claim payments (b)
(29,964) (23,235)
Change in scope of consolidation and change in accounting method 500 27,430
Impact of foreign currency fluctuation 967 338
Claims reserves as of December 31 79,129 75,782
Claims handling cost reserves as of December 31 2,559 2,921
Gross claims reserves as of December 31 (a)
81,689 78,703
(a) Excluding “other policy benefits liabilities” (mainly mathematical annuity reserves), which totaled €5.5 billion in 2019 and €5.3 billion in 2018.
(b) Excluding claims handling expense reserves.
14.4.2 Change in reinsurers’ share in claims reserves
The table below gives information on change in reinsurers’ share in claims reserves in Property & Casualty presented in Note 14.2:
(in Euro million)
2019 2018
Property &
Casualty
Property &
Casualty
Reinsurers’ share in claims reserves as of January 1 10,670 3,952
Reinsurers’ share in total claims expenses 5,232 3,109
Reinsurers’ share in claims payments (3,939) (2,536)
Change in scope of consolidation, portfolio transfers, change in accounting principles and other changes 47 6,014
Impact of foreign currency fluctuation 267 138
Reinsurers’ share in claims reserves as of December 31 12,277 10,670

304 I UNIVERSAL REGISTRATION DOCUMENT - ANNUAL REPORT 2019 - AXA I
CONSOLIDATED FINANCIAL STATEMENTS 5 5.6 NOTES TO THE CONSOLIDATED FINANCIAL STATEMENTS
14.5 CHANGE IN LIABILITIES ARISING FROM INSURANCE AND INVESTMENT CONTRACTS –
LIFE & SAVINGS
14.5.1 Change in liabilities arising from insurance and investment contracts – Gross of reinsurance
The table below gives detailed information on change in liabilities arising from insurance and investment contracts in Life and Savings
presented in Note 14.2 (C):
(in Euro million)
2019 2018
Insurance
contracts
Investment
contracts Total
Insurance
contracts
Investment
contracts Total
Technical reserves as of January 1 (a)
479,746 52,729 532,475 494,615 51,995 546,610
Collected premiums net of loadings
on premiums (+) 36,084 7,601 43,684 48,423 5,421 53,844
Surrenders, maturities and other claims and
benefits paid net of charges and penalties (-) (41,002) (5,936) (46,939) (52,390) (5,190) (57,581)
Unit-Linked technical reserves value
adjustment (+/-) 17,047 857 17,903 (10,344) (791) (11,135)
Change in reserves relating to technical
and actuarial items (+/-) (b) 6,341 630 6,971 6,130 880 7,011
Transfers following technical reserves/
contract reclassification (2) 7 5 19 (19) -
Change in scope of consolidation,
portfolio transfers and change
in accounting principles (179,942) (3,547) (183,488) (19,828) 111 (19,717)
Impact of foreign currency fluctuation 5,891 207 6,098 13,121 321 13,442
Technical reserves as of December 31 (a)
324,163 52,547 376,710 479,746 52,729 532,475
(a) Includes: future policy benefit reserves (including shadow accounting reserves), unearned premium reserves, unexpired risk reserves, claims reserves, claims expense reserves, other policy benefit reserves. Excludes: unearned revenue and unearned fee reserves, liabilities from policyholder participation.
(b) Notably includes interests credited and policyholder participation credited to reserves, fees on account balance and investment management fees and change in reserves relating to other technical and actuarial items.
In 2019, the effect of the change in scope of consolidation
amounted to €183,488 million, mainly due to the deconsolidation
of Equitable Holdings, Inc. (€182,152 million) and the
classification as held for sale of additional small occupational
benefit foundations in 2019 in Switzerland (€2,212 million), partly
offset by the unwinding of held for sale classification of AXA
Wealth Management (HK) Limited in Hong Kong (€702 million).
In 2018, the effect of the change in scope of consolidation
amounted to €19,717 million, mainly due to the classification
in held for sale due to the planned sale of Group Life portfolio
in Switzerland (€17,111 million) as well as AXA Life Europe
(€5,108 million), partly off set by the acquisition of the XL Group
(€3,064 million).

305I UNIVERSAL REGISTRATION DOCUMENT - ANNUAL REPORT 2019 - AXA I
CONSOLIDATED FINANCIAL STATEMENTS
5
5.6 NOTES TO THE CONSOLIDATED FINANCIAL STATEMENTS
14.5.2 Change in reinsurers’ share in liabilities arising from insurance and investment contracts
The table below gives detailed information on change in reinsurer’s share in liabilities arising from insurance and investment contracts
in Life & Savings presented in Note 14.2 (F) and Note 14.3 (H).
(in Euro million)
2019 2018
Insurance
contracts
Investment
contracts Total
Insurance
contracts
Investment
contracts Total
Reinsurers’ share in technical reserves
as of January 1 (a)
12,280 91 12,371 8,272 69 8,342
Reinsurers’ share in collected premiums
net of loadings on premiums (+) 1,740 12 1,752 1,110 25 1,135
Reinsurers’ share in surrenders, maturities
and other claims and benefits paid net
of charges and penalties (-) (1,442) (17) (1,459) (872) (17) (889)
Reinsurers’ share in change in reserves
relating to technical and actuarial
items (+/-) (b) (387) 10 (377) 913 12 925
Change in scope of consolidation
and change in accounting principles (c) (4,948) - (4,948) 2,651 - 2,651
Impact of foreign currency fluctuation 175 1 176 206 1 207
Reinsurers’ share in technical
reserves as of December 31 (a)
7,418 97 7,514 12,280 91 12,371
(a) Includes: future policy benefit reserves (including shadow accounting reserves), unearned premium reserves, unexpired risk reserves, claims reserves, claims expense reserves, other policy benefit reserves. Excludes: unearned revenue and unearned fee reserves, liabilities from policyholder participation.
(b) Notably includes interests credited and policyholder participation credited to reserves, fees on account balance and investment management fees and change in reserves relating to other technical and actuarial items.
(c) In 2019, mainly included the deconsolidation of Equitable Holdings, Inc.
In 2018, mainly included the acquisition of the XL Group.
14.6 LIABILITIES ARISING FROM INVESTMENT CONTRACTS BY ACCOUNTING METHOD
The table below gives detailed information on liabilities arising from investment contracts presented in Note 14.3 (D):
(in Euro million)
Carrying value
December 31,
2019
December 31,
2018
(Non Unit-Linked) – Liabilities arising from:
Investment contracts with Discretionary Participation Features measured according to existing
accounting policies (a) (d) 36,036 34,225
Investment contracts with Discretionary Participation Features measured with current assumptions (b) - -
Investment contracts with no Discretionary Participation Features measured according to existing
accounting policies 67 4,837
(Unit-Linked) – Liabilities arising from contracts where financial risk is borne by policyholders:
Investment contracts with Discretionary Participation Features measured according to existing
accounting policies (a) (c) 3,139 2,785
Investment contracts with no Discretionary Participation Features measured at current unit value (d) 13,306 11,747
TOTAL LIABILITIES ARISING FROM INVESTMENT CONTRACTS 52,547 53,593
Note: This information is presented net of the impact of derivatives, which is described in Note 20.4.1.
(a) In accordance with IFRS 4 which allows, under certain conditions, to continue to use a previous accounting policy for liabilities arising from contracts with discretionary participating features.
(b) See Note 1.14.2 “Reserves measured according to IFRS 4.24” option which allows to evaluate certain portfolios with current assumptions.
(c) & (d) As Unit-Linked contracts reserves are measured on the basis of held asset units fair value (“current unit value”). Only the valuation of related assets is diff erent: ■ for Unit-Linked contracts with a discretionary participating feature (c), an asset representing the deferred acquisition costs is recognized in continuity with previous
accounting policies; ■ for Unit-Linked contracts with no discretionary participating feature (d), an asset representing the rights to future management fees is recognized in accordance with
IFRS 15 (Rights to future management fees also known as Deferred Origination Costs “DOC”) – see Note 1.7.3 and Note 7.

306 I UNIVERSAL REGISTRATION DOCUMENT - ANNUAL REPORT 2019 - AXA I
CONSOLIDATED FINANCIAL STATEMENTS 5 5.6 NOTES TO THE CONSOLIDATED FINANCIAL STATEMENTS
The recognition of investment contracts with discretionary
participating features is subject to IFRS 4, which allows, under
certain conditions, the use of accounting principles applied prior
to the adoption of IFRS. However, these contracts must be treated
in accordance with IFRS 7 with regards to the disclosures to be
provided in the Notes to the financial statements. IFRS 7 requires
the disclosure of fair value or value ranges for these contracts,
unless the Group cannot reliably measure the participating
features.
In the context of the current IFRS 4, the IASB acknowledged the
diff iculties involved in the recognition and the measurement
of discretionary participating features included in insurance
or investment contracts. The IASB issued guidance to measure
fair value but with no principles addressing policyholder
participation features. It would therefore be premature to
interpret this definition before the implementation guidance of
the future standard IFRS 17 (see Note 1.2) clarified it.
Therefore, too many uncertainties remain outstanding to define
how to determine the fair value of participating contracts. As a
result, fair value or value ranges for investment contracts with
discretionary participating features cannot be reliably disclosed.
14.7 LOSS RESERVE DEVELOPMENT TABLE
The loss reserve development table shows movements in loss
reserves between 2009 and 2019, based on previously applied
accounting standards. All contracts concerned are insurance
contracts as defined by IFRS.
The first line labelled “Gross reserves for unpaid claims and
claims expenses developed initially at the booking date”
represents the loss reserves developed in the Group’s balance
sheet on the reporting date for the year indicated in the column
heading. For example, the amount of €44,470 million appearing
in the first line of the table in the 2009 column represents all
loss reserves developed in all years of occurrence prior to and
including 2009, recognized on the Group’s balance sheet as of
December 31, 2009.
The second line titled “Gross reserves for unpaid claims and
claims expenses developed in 2019 adjusted for changes in
exchange rates and scope of consolidation” indicates the amount
that would have been developed initially at the booking date,
had the exchange rates for the current year been used (for
reserves recognized by AXA Group entities that do not use the
Euro as their functional currency) and assuming an identical
scope of consolidation to that used for the last diagonal of the
table.
The first section of the table entitled “Cumulative payments”
shows, for a given column N, the cumulative amount of payments
related to years of occurrence prior to and including N, made
since December 31 of year N-1.
The second part of the table entitled “Reserve re-estimated”
shows, for a given column N, an estimate of the final cost of
liabilities carried as of December 31 of year N in respect of all
years of occurrence prior to and including N, at each future period
end. The final cost estimate varies year on year as information
relating to losses still outstanding becomes more reliable.
The surplus (shortfall) of the initial reserve with respect to the
re-estimated (gross) final cost for each year represents, for
a given year N, the diff erence between the amount shown in
the second line (gross reserves for unpaid claims and claims
expenses developed in 2019 adjusted for changes in exchange
rates and scope of consolidation) and the amount shown in the
final diagonal under “Reserve re-estimated”.

307I UNIVERSAL REGISTRATION DOCUMENT - ANNUAL REPORT 2019 - AXA I
CONSOLIDATED FINANCIAL STATEMENTS
5
5.6 NOTES TO THE CONSOLIDATED FINANCIAL STATEMENTS
(in Euro million) 2009 2010 2011 (a)
2012 2013 (b)
2014 2015 (c)
2016 2017 2018 2019
Gross reserves for unpaid
claims and claims expenses
developed initially at
the booking date 44,470 46,367 45,946 46,440 47,031 49,868 51,965 53,286 52,973 82,134 85,201
Gross reserves for unpaid
claims and claims expenses
developed in 2019 adjusted
for changes in exchange rates
and scope of consolidation 46,943 45,201 45,819 46,646 47,768 49,863 51,183 52,771 52,664 83,751 85,201
Cumulative payments at:
One year later 9,483 8,953 9,183 9,361 9,422 10,111 9,621 10,755 10,960 18,402
Two years later 13,360 13,016 12,841 13,315 13,727 13,388 14,871 15,157 14,435
Three years later 16,078 15,330 15,911 16,284 15,299 16,682 17,190 17,776
Four years later 17,684 18,012 18,331 17,000 18,077 18,802 19,894
Five years later 19,741 19,775 18,328 19,505 19,631 20,447
Six years later 20,845 19,305 20,610 20,917 21,362
Seven years later 20,815 21,208 21,812 22,314
Eight years later 21,506 22,527 23,069
Nine years later 23,375 23,673
Ten years later 27,543
Reserve re-estimated at:
One year later 44,814 44,518 44,971 45,394 47,707 49,716 51,097 50,821 51,695 82,665
Two years later 41,973 42,904 43,412 44,479 46,051 46,359 46,773 45,736 47,113
Three years later 41,301 41,782 42,449 43,953 44,106 43,899 43,516 44,269
Four years later 40,250 40,769 42,013 41,813 41,841 41,152 42,404
Five years later 39,653 40,674 40,122 40,308 39,049 40,275
Six years later 39,684 38,907 38,424 37,385 37,744
Seven years later 38,079 37,136 35,974 36,125
Eight years later 35,379 34,917 34,706
Nine years later 33,833 33,497
Ten years later 36,187
Cumulative redundancy
(deficiency) from the initial
gross reserves in excess of
re-estimated gross reserves: (d)
Amount 10,756 11,704 11,113 10,521 10,024 9,588 8,778 8,501 5,552 1,086
Percentages 22.9% 25.9% 24.3% 22.6% 21.0% 19.2% 17.2% 16.1% 10.5% 1.3%
(a) Following the disposal of Canadian operations, amounts in its respect were not reported for the current year while previously disclosed amounts were unchanged.
(b) The comparative information related to previous periods was restated for the implementation of IFRS 10 and 11.
(c) Amounts prior to 2015 contains the Life & Savings entities historically reported in the International Insurance segment.
(d) It is not appropriate to extrapolate future redundancies or future deficiencies based on the loss reserves development presented in the table, as conditions and trends that have aff ected development of the liability in prior periods may not necessarily occur in the future periods. Redundancy or deficiency disclosed includes forex impact between one year and the next.
Loss reserve development table: Property and Casualty
The data prior to 2015 does not present the impact of the new segmentation.

308 I UNIVERSAL REGISTRATION DOCUMENT - ANNUAL REPORT 2019 - AXA I
CONSOLIDATED FINANCIAL STATEMENTS 5 5.6 NOTES TO THE CONSOLIDATED FINANCIAL STATEMENTS
Gross and net of reinsurance loss reserve development table: AXA XL
(in Euro million)
Gross Net
2018 2019 2018 2019
Reserves for unpaid claims and claims expenses developed initially
at the booking date 34,527 36,136 25,613 26,025
Reserves for unpaid claims and claims expenses developed in 2019
adjusted for changes in exchange rates and scope of consolidation 35,327 36,136 26,027 26,025
Cumulative payments at:
One year later 9,288 6,686
Reserve re-estimated at:
One year later 35,933 25,875
Cumulative redundancy (deficiency) from the initial gross reserves
in excess of re-estimated gross reserves:
Amount (606) 153
Percentages (1.7%) 0.6%
Reconciliation between developed reserves and recognized claims reserves
The table below gives a reconciliation between developed reserves and total recognized claims reserves for the claims reserves and
other reserves arising from insurance contracts as disclosed in Note 14.2:
(in Euro million)
December 31, 2019 December 31, 2018
Carrying value Carrying value
Gross claims and other reserves developed
Property & Casualty (a) 85,201 82,134
■ of which future policy benefit annuity reserves 4,943 4,830
■ of which construction reserves (PSNEM) 1,858 1,946
Total G ross claims and other reserves developed 85,201 82,134
Other reserves non developed (b)
2,021 2,000
TOTAL GROSS CLAIMS RESERVES AND OTHER RESERVES FOR PROPERTY & CASUALTY 87,222 84,134
(a) Total gross claims and other reserves developed are presented on the basis of the loss reserves development table.
(b) Includes reserves inward reinsurance (€1,043 million in 2019, €1,033 million in 2018).
14.8 ASBESTOS
AXA continues to receive claims from policies written in prior
years asserting damages from asbestos-related exposures.
There is considerable uncertainty as to the future cost of asbestos
claims. The ultimate cost of claims is very much dependent on
legal factors that are diff icult to predict with any certainty. It is
common to have issues of allocation of responsibility among
parties, as well as involvement of multiple insurers and multiple
policy periods. This causes considerable coverage issues.
AXA actively conducts its exposure to asbestos claims by using
its unit specialized in non-life run-off s: AXA Liabilities Managers.
Claims are managed by dedicated teams of experts who use a
variety of claims payment including settlements, policy buy-
backs and, in certain cases, litigation. In addition, they focus
specifically on final resolutions of exposures, either through
commutations or other solutions.

309I UNIVERSAL REGISTRATION DOCUMENT - ANNUAL REPORT 2019 - AXA I
CONSOLIDATED FINANCIAL STATEMENTS
5
5.6 NOTES TO THE CONSOLIDATED FINANCIAL STATEMENTS
The calculation of reserves for asbestos risks raises specific
diff iculties as conventional reserving techniques cannot be used
for evaluating IBNR. AXA evaluates the future cost of those claims
using a range of specific methods based either on exposure
analysis, frequency/cost projections or reserving benchmarks.
Asbestos reserves are reviewed on a yearly basis to ensure that
they adequately reflect the latest claims experience, as well
as legal and economic developments. Consistent with AXA’s
reserving practices, and despite the particularly long-tail nature
of those risks, reserves for asbestos are undiscounted.
Due to the uncertainty surrounding asbestos claims, it is not
possible to determine their future cost with the same degree of
certainty as for other types of claims. Although AXA considers
its reserves for asbestos claims to be adequate, it is possible
that, under some adverse scenarios, they may turn out to be
insuff icient to cover future losses.
At year-end 2019, key data relating to asbestos claims were as follows:
(in Euro million)
2019 2018
Gross Net Gross Net
Evolutions of reserves
Claims reserves at end of year 515 381 560 432
of which Reported claims 130 96 164 129
of which IBNR claims 385 285 397 303
Reserves adequacy ratios
3-Year survival ratio excluding commutations (a) 16 years 17 years 15 years 15 years
IBNR/Case Reserves 295% 298% 242% 236%
Cumulative Payments to date/Projected Ultimate Cost 74% 73% 71% 69%
(a) Reserves at the end of the year/Average yearly payments over the last 3 years (excluding commutations).
AXA total reserves for asbestos exposure (net of reinsurance)
decreased by 12% to €381 million at year-end 2019. This decrease
was mainly driven by the re-estimation of the ultimate liability on
AXA XL Asbestos following settlement with a large claimant and
a full review of claims with favorable court decisions.
14.9 LIABILITIES AND ASSETS ARISING FROM POLICYHOLDER PARTICIPATION AND OTHER
OBLIGATIONS
The following table shows liabilities and assets arising from policyholder participation and other obligations as of December 31, 2019:
(in Euro million)
December 31,
2019
December 31,
2018
Policyholder participation reserves 9,637 9,421
Policyholder deferred participation liabilities and other obligations 43,128 31,205
TOTAL LIABILITIES ARISING FROM POLICYHOLDER PARTICIPATION AND OTHER OBLIGATIONS 52,766 40,625
Total Assets arising from policyholder participation - (303)
The deferred policyholder participation and other obligations
liabilities and deferred policyholder participation assets include
the impact of shadow accounting (see definition in Note 1.14.2)
mainly in relation to unrealized gains and losses on invested
financial assets available for sale as described in Note 13.2.1, but
also with regard to other temporary diff erences not necessarily
linked to financial assets. Note 13.2.1 also contains a focus on
jurisdictions with significant portions of participating business
and where required minimum local policyholders’ share in the
entities’ results are significant. This Note discloses for such
jurisdictions unrealized gains and losses related to available for
sale investments and related shadow accounting adjustments.
The increase in deferred policyholders’ participation liabilities
mainly relates to an increase in unrealized gains on assets
available for sale in France and Germany.

310 I UNIVERSAL REGISTRATION DOCUMENT - ANNUAL REPORT 2019 - AXA I
CONSOLIDATED FINANCIAL STATEMENTS 5 5.6 NOTES TO THE CONSOLIDATED FINANCIAL STATEMENTS
14.10 PAYMENT, SURRENDER
PROJECTIONS, INSURANCE
AND INVESTMENT CONTRACT
LIABILITIES DISCOUNT RATES
In the tables presented in Note 14.10.1 and 14.10.2, liabilities
arising from Life & Savings and Property & Casualty insurance
contracts and investment contracts exclude contracts where
the financial risk is borne by policyholders. These liabilities
are not exposed to interest rate or duration risk, except Unit-
Linked contracts with performance guarantees. In addition, as
far as liquidity risk is concerned, entities hold Unit-Linked assets
backing the corresponding liabilities arising from these contracts.
Occasional mismatches result mainly from administrative timing
diff erences in the processing of day-to-day operations.
14.10.1 Payment and surrender projections
The table below shows the breakdown of projected payments
and surrenders related to insurance and investment contracts
(excluding contracts where the financial risk is borne by
policyholders). Actual maturities may diff er significantly from the
estimates set out below, mainly because some of the contracts
contain a surrender option controlled by the policyholder that
may reduce their duration.
The projections shown below cannot be compared with the
reserves carried on the balance sheet and are higher than
the published balance sheet figures because they represent
expected cash flows without the impact of discounting. They
are also shown net of inflows of periodical premiums payable
by policyholders.
The figures shown in the first line of the table below represent
estimated undiscounted cash outflows in connection to
death, incapacity and disability claims, surrenders, annuities,
minimum guaranteed benefits for Unit-Linked contracts,
Property & Casualty and Health claims, net of premiums due
from policyholders under contracts in-force. These cash flows
are based on assumptions regarding mortality, incapacity and
disability, surrender and settlement frequency for Property &
Casualty businesses, which are consistent with past experience.
They are gross of reinsurance. Given the strong use of estimates,
it is likely that actual payments will diff er.
(in Euro million)
2019 2018
12 months
or less
More
than
1 year up
to 5 years
More
than
5 years Total
12 months
or less
More
than
1 year up
to 5 years
More
than
5 years Total
Liabilities arising from insurance
and investment contracts 38,210 82,102 456,171 576,483 32,792 87,403 513,163 633,358
of which Life & Savings liabilities relating to contracts including a surrender option with some surrender benefit before maturity 13,727 48,243 295,810 357,780 14,481 57,692 354,384 426,557
14.10.2 Insurance and investment contract
liabilities – discount rates
The table hereaft er and related comments exclude contracts
where the financial risk is borne by policyholders (Unit-Linked
contracts).
The general principles for establishing insurance liabilities are set
out in Note 1 of the consolidated financial statements. Liabilities
are based on estimates, and one of the key assumptions used in
these estimates is the discount rate.
As shown in the table below, as at December 31, 2019: 84% of
Life & Savings reserves (excluding Unit-Linked contracts) were
discounted, of which 11 % were subject to a revision of the
discount rate and 73 % retained the rate set at inception, subject
to the liability adequacy test described in Note 1.
By convention, contracts with zero guaranteed rates are deemed
undiscounted, except for products off ering guaranteed rates
updated annually and for one year: these contracts are presented
in discounted reserves. Reserves for savings contracts with
non-zero guaranteed rates are discounted at the technical
restatements at closing and mainly consist of reserves for
guarantees (Guaranteed Minimum Death Benefits, etc.).
In Property & Casualty business, most reserves (94% as of
December 31, 2019) are not discounted, with the exception of
disability annuities and workers’ compensation liabilities that
are deemed structured settlements and where the discount rate
is revised regularly. Undiscounted reserves are not sensitive to
interest rate risks in the financial statements.
The rates presented in the table below are weighted average
rates for all the portfolios under consideration. For contracts with
guaranteed rates that are revised annually, rates are considered
at the closing date. The risk factors associated with policyholders
contracts are set out in Note 4.
Discount rates are qualified as locked-in when those used in the
first recognition of the technical liabilities remain unchanged
in the subsequent years and are qualified as unlocked when
updated in subsequent years.
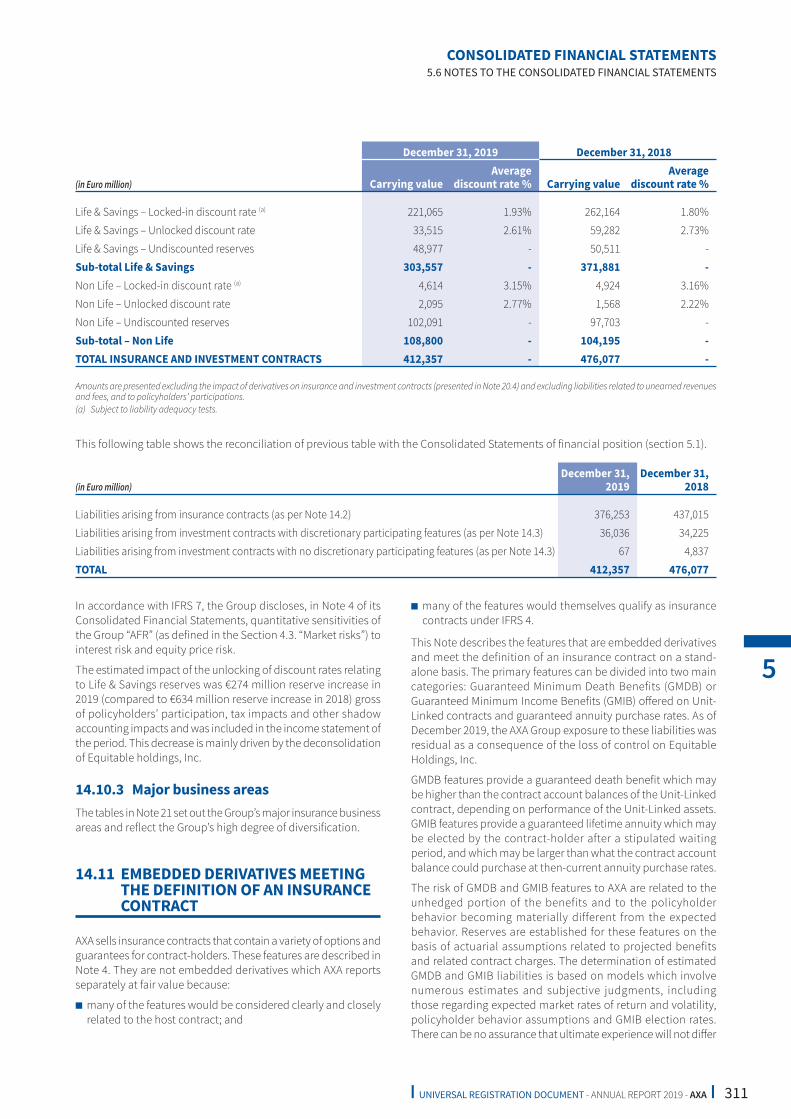
311I UNIVERSAL REGISTRATION DOCUMENT - ANNUAL REPORT 2019 - AXA I
CONSOLIDATED FINANCIAL STATEMENTS
5
5.6 NOTES TO THE CONSOLIDATED FINANCIAL STATEMENTS
(in Euro million)
December 31, 2019 December 31, 2018
Carrying value
Average
discount rate % Carrying value
Average
discount rate %
Life & Savings – Locked-in discount rate (a) 221,065 1.93% 262,164 1.80%
Life & Savings – Unlocked discount rate 33,515 2.61% 59,282 2.73%
Life & Savings – Undiscounted reserves 48,977 - 50,511 -
Sub-total Life & Savings 303,557 - 371,881 -
Non Life – Locked-in discount rate (a) 4,614 3.15% 4,924 3.16%
Non Life – Unlocked discount rate 2,095 2.77% 1,568 2.22%
Non Life – Undiscounted reserves 102,091 - 97,703 -
Sub-total – Non Life 108,800 - 104,195 -
TOTAL INSURANCE AND INVESTMENT CONTRACTS 412,357 - 476,077 -
Amounts are presented excluding the impact of derivatives on insurance and investment contracts (presented in Note 20.4) and excluding liabilities related to unearned revenues and fees, and to policyholders’ participations.
(a) Subject to liability adequacy tests.
This following table shows the reconciliation of previous table with the Consolidated Statements of financial position (section 5.1).
(in Euro million)
December 31,
2019
December 31,
2018
Liabilities arising from insurance contracts (as per Note 14.2) 376,253 437,015
Liabilities arising from investment contracts with discretionary participating features (as per Note 14.3) 36,036 34,225
Liabilities arising from investment contracts with no discretionary participating features (as per Note 14.3) 67 4,837
TOTAL 412,357 476,077
In accordance with IFRS 7, the Group discloses, in Note 4 of its
Consolidated Financial Statements, quantitative sensitivities of
the Group “AFR” (as defined in the Section 4.3. “Market risks”) to
interest risk and equity price risk.
The estimated impact of the unlocking of discount rates relating
to Life & Savings reserves was €274 million reserve increase in
2019 (compared to €634 million reserve increase in 2018) gross
of policyholders’ participation, tax impacts and other shadow
accounting impacts and was included in the income statement of
the period. This decrease is mainly driven by the deconsolidation
of Equitable holdings, Inc.
14.10.3 Major business areas
The tables in Note 21 set out the Group’s major insurance business
areas and reflect the Group’s high degree of diversification.
14.11 EMBEDDED DERIVATIVES MEETING
THE DEFINITION OF AN INSURANCE
CONTRACT
AXA sells insurance contracts that contain a variety of options and
guarantees for contract-holders. These features are described in
Note 4. They are not embedded derivatives which AXA reports
separately at fair value because:
■ many of the features would be considered clearly and closely
related to the host contract; and
■ many of the features would themselves qualify as insurance
contracts under IFRS 4.
This Note describes the features that are embedded derivatives
and meet the definition of an insurance contract on a stand-
alone basis. The primary features can be divided into two main
categories: Guaranteed Minimum Death Benefits (GMDB) or
Guaranteed Minimum Income Benefits (GMIB) off ered on Unit-
Linked contracts and guaranteed annuity purchase rates. As of
December 2019, the AXA Group exposure to these liabilities was
residual as a consequence of the loss of control on Equitable
Holdings, Inc.
GMDB features provide a guaranteed death benefit which may
be higher than the contract account balances of the Unit-Linked
contract, depending on performance of the Unit-Linked assets.
GMIB features provide a guaranteed lifetime annuity which may
be elected by the contract-holder after a stipulated waiting
period, and which may be larger than what the contract account
balance could purchase at then-current annuity purchase rates.
The risk of GMDB and GMIB features to AXA are related to the
unhedged portion of the benefits and to the policyholder
behavior becoming materially different from the expected
behavior. Reserves are established for these features on the
basis of actuarial assumptions related to projected benefits
and related contract charges. The determination of estimated
GMDB and GMIB liabilities is based on models which involve
numerous estimates and subjective judgments, including
those regarding expected market rates of return and volatility,
policyholder behavior assumptions and GMIB election rates.
There can be no assurance that ultimate experience will not diff er
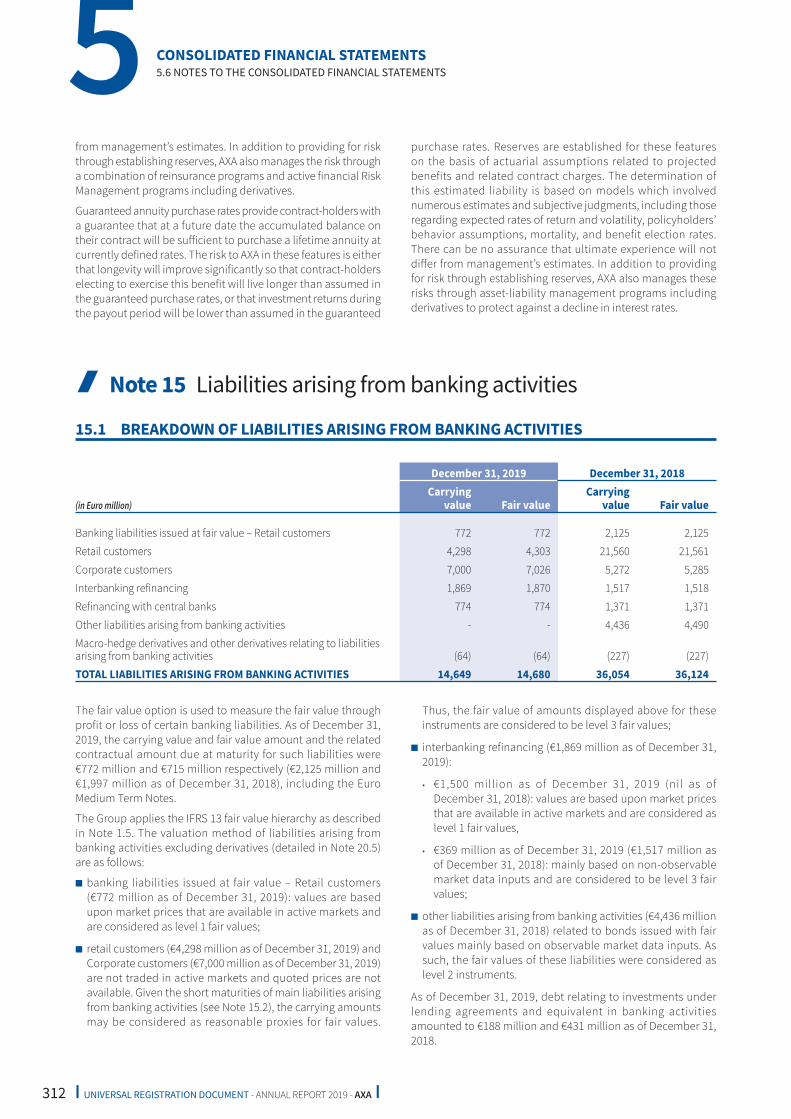
312 I UNIVERSAL REGISTRATION DOCUMENT - ANNUAL REPORT 2019 - AXA I
CONSOLIDATED FINANCIAL STATEMENTS 5 5.6 NOTES TO THE CONSOLIDATED FINANCIAL STATEMENTS
from management’s estimates. In addition to providing for risk
through establishing reserves, AXA also manages the risk through
a combination of reinsurance programs and active financial Risk
Management programs including derivatives.
Guaranteed annuity purchase rates provide contract-holders with
a guarantee that at a future date the accumulated balance on
their contract will be suff icient to purchase a lifetime annuity at
currently defined rates. The risk to AXA in these features is either
that longevity will improve significantly so that contract-holders
electing to exercise this benefit will live longer than assumed in
the guaranteed purchase rates, or that investment returns during
the payout period will be lower than assumed in the guaranteed
purchase rates. Reserves are established for these features
on the basis of actuarial assumptions related to projected
benefits and related contract charges. The determination of
this estimated liability is based on models which involved
numerous estimates and subjective judgments, including those
regarding expected rates of return and volatility, policyholders’
behavior assumptions, mortality, and benefit election rates.
There can be no assurance that ultimate experience will not
diff er from management’s estimates. In addition to providing
for risk through establishing reserves, AXA also manages these
risks through asset-liability management programs including
derivatives to protect against a decline in interest rates.
I Note 15 Liabilities arising from banking activities
15.1 BREAKDOWN OF LIABILITIES ARISING FROM BANKING ACTIVITIES
(in Euro million)
December 31, 2019 December 31, 2018
Carrying
value Fair value
Carrying
value Fair value
Banking liabilities issued at fair value – Retail customers 772 772 2,125 2,125
Retail customers 4,298 4,303 21,560 21,561
Corporate customers 7,000 7,026 5,272 5,285
Interbanking refinancing 1,869 1,870 1,517 1,518
Refinancing with central banks 774 774 1,371 1,371
Other liabilities arising from banking activities - - 4,436 4,490
Macro-hedge derivatives and other derivatives relating to liabilities
arising from banking activities (64) (64) (227) (227)
TOTAL LIABILITIES ARISING FROM BANKING ACTIVITIES 14,649 14,680 36,054 36,124
The fair value option is used to measure the fair value through
profit or loss of certain banking liabilities. As of December 31,
2019, the carrying value and fair value amount and the related
contractual amount due at maturity for such liabilities were
€772 million and €715 million respectively (€2,125 million and
€1,997 million as of December 31, 2018), including the Euro
Medium Term Notes.
The Group applies the IFRS 13 fair value hierarchy as described
in Note 1.5. The valuation method of liabilities arising from
banking activities excluding derivatives (detailed in Note 20.5)
are as follows:
■ banking liabilities issued at fair value – Retail customers
(€772 million as of December 31, 2019): values are based
upon market prices that are available in active markets and
are considered as level 1 fair values;
■ retail customers (€4,298 million as of December 31, 2019) and
Corporate customers (€7,000 million as of December 31, 2019)
are not traded in active markets and quoted prices are not
available. Given the short maturities of main liabilities arising
from banking activities (see Note 15.2), the carrying amounts
may be considered as reasonable proxies for fair values.
Thus, the fair value of amounts displayed above for these
instruments are considered to be level 3 fair values;
■ interbanking refinancing (€1,869 million as of December 31,
2019):
• €1,500 million as of December 31, 2019 (nil as of
December 31, 2018): values are based upon market prices
that are available in active markets and are considered as
level 1 fair values,
• €369 million as of December 31, 2019 (€1,517 million as
of December 31, 2018): mainly based on non-observable
market data inputs and are considered to be level 3 fair
values;
■ other liabilities arising from banking activities (€4,436 million
as of December 31, 2018) related to bonds issued with fair
values mainly based on observable market data inputs. As
such, the fair values of these liabilities were considered as
level 2 instruments.
As of December 31, 2019, debt relating to investments under
lending agreements and equivalent in banking activities
amounted to €188 million and €431 million as of December 31,
2018.

313I UNIVERSAL REGISTRATION DOCUMENT - ANNUAL REPORT 2019 - AXA I
CONSOLIDATED FINANCIAL STATEMENTS
5
5.6 NOTES TO THE CONSOLIDATED FINANCIAL STATEMENTS
15.2 BREAKDOWN BY MATURITY
The table below sets out the contractual maturities of liabilities arising from banking activities. These contractual maturities are mostly
classified under the category “12 months or less”. Consequently, the diff erence between maturities based on contractual cash flows in
comparison with the carrying values is not significant:
(in Euro million)
December 31, 2019 December 31, 2018
Carrying value
by contractual maturity
Carrying
value
Carrying value
by contractual maturity
Carrying
value
12 months
or less
More
than
1 year up
to 5 years
More
than
5 years
12 months
or less
More
than
1 year up
to 5 years
More
than
5 years
Banking liabilities issued at fair value –
Retail customers - 237 535 772 129 1,004 991 2,125
Retail customers 4,198 95 6 4,298 21,432 120 8 21,560
Corporate customers 5,372 1,429 199 7,000 3,248 1,834 190 5,272
Interbanking refinancing 57 87 1,726 1,869 1,360 19 139 1,517
Refinancing with central banks 54 720 - 774 - 1,371 - 1,371
Other liabilities arising from banking
activities - - - - 554 2,378 1,504 4,436
Macro-hedge derivatives and other
derivatives related to liabilities arising
from banking activities - (12) (53) (64) (21) (169) (37) (227)
TOTAL LIABILITIES ARISING
FROM BANKING ACTIVITIES 9,680 2,556 2,413 14,649 26,702 6,557 2,795 36,054

314 I UNIVERSAL REGISTRATION DOCUMENT - ANNUAL REPORT 2019 - AXA I
CONSOLIDATED FINANCIAL STATEMENTS 5 5.6 NOTES TO THE CONSOLIDATED FINANCIAL STATEMENTS
I Note 16 Provisions for risks and charges
16.1 BREAKDOWN OF PROVISIONS FOR RISKS AND CHARGES
Provisions for risks and charges included the following items:
(in Euro million)
December 31,
2019
December 31,
2018
Employee benefits 8,409 8,716
Share-based compensation 102 118
Sub-total employee benetifs and share-based compensation 8,511 8,834
Restructuring provisions 108 307
Lawsuits contingency provisions 143 278
Other provisions for risks and charges (a) 980 1,943
Sub-total others 1,231 2,528
TOTAL PROVISIONS FOR RISKS AND CHARGES 9,742 11,363
(a) As of January 1, 2019, Uncertain Tax Positions amounted to €862 million were reclassified from “Other provisions for risks and charges” to “Payables-current tax” and “Deferred tax assets”.
Provisions relating to employee benefits and share-based
compensations are commented in Note 26 “Employees”.
As of December 31, 2019, the “Other provisions for risks and
charges” amounted to €980 million, mainly driven by France
(€281 million), AXA SA (€207 million), Switzerland (€173 million)
and Germany (€116 million).
16.2 CHANGE IN PROVISIONS FOR RISKS AND CHARGES
(EXCLUDING EMPLOYEE BENEFITS AND SHARE-BASED COMPENSATION)
Changes in provisions for risks and charges (excluding employee benefits and share-based compensation) are set out below:
(in Euro million) 2019 2018
Carrying value as of January 1 2,528 2,728
Financial cost related to unwind 0 1
Impact of change in scope of consolidation and other changes (a) (1,152) 106
Increase in provisions 508 498
Write back aft er use (154) (258)
Write back aft er final cost review (534) (589)
Impact of foreign exchange fluctuations 34 42
Carrying value as of December 31 1,231 2,528
(a) As of January 1, 2019, Uncertain Tax Positions that amounted to €862 million were reclassified from “Other provisions for risks and charges” to “Payables-current tax” and “Deferred tax assets”.

315I UNIVERSAL REGISTRATION DOCUMENT - ANNUAL REPORT 2019 - AXA I
CONSOLIDATED FINANCIAL STATEMENTS
5
5.6 NOTES TO THE CONSOLIDATED FINANCIAL STATEMENTS
I Note 17 Financing debt
17.1 FINANCING DEBT BY ISSUANCE
(in Euro million)
Carrying value
December 31,
2019
December 31,
2018
AXA 9,794 9,358
Subordinated Notes, 5.25% due 2040 (€) 1,300 1,300
Subordinated Notes, 5.125% due 2043 (€) 1,000 1,000
US registered redeemable subordinated debt, 8.60% 2030 (US$) 1,183 1,064
US registered redeemable subordinated debt, 7.125% 2020 (£) 382 363
Subordinated debt, 5.625% due 2054 (£) 882 838
Derivatives relating to subordinated debts (a) (99) (324)
Subordinated debt, 3.375% due 2047 (€) 1,500 1,500
Undated Subordinated Notes, US$ 850M, 4.5% 757 742
Subordinated Notes, 5.125% due 2047 (US$) 890 873
Subordinated Notes, 3.25% due 2049 (€) 2,000 2,000
AXA XL 1,400 1,385
Subordinated Notes, 4.45% due March 2025 (US$) 445 437
Subordinated Notes, 5.5% due March 2045 (US$) 455 448
Subordinated Notes, 3.25% due June 2047 (€) 500 501
AXA Bank Belgium - 26
Subordinated debt maturity below 10 years fixed rate - 11
Undated Subordinated debt fixed rate - 16
AXA Italy 67 67
Subordinated Notes, EURIBOR 6 months +81 bps 67 67
Other subordinated debt (under €100 million) 33 39
Subordinated debt 11,294 10,876
AXA 1,268 622
Debt component of bonds mandatorily exchangeable into shares of Equitable Holdings, Inc. - 122
Bonds mandatorily exchangeable into shares of Equitable Holdings, Inc. 768 -
Euro Medium Term Note, due 2028 500 500
AXA XL 289 607
Senior Notes, 6.25% due May 2027 (US$) - 322
Senior Notes, 5.25% due December 2043 (US$) 289 285
AXA Financial - 3,594
Senior Notes, 7% due 2028 - 305
Senior Notes, 3.9% due 2023 - 694
Senior Notes, 4.35% due 2028 - 1,300
Senior Notes, 5% due 2048 - 1,295
AXA UK Holdings - 168
GRE: Loan Notes, 6.625% due 2023 - 168
AXA Switzerland 146 -
Deferred payment for the acquisition of Tianping, due 2020 (in CNY) 146 -
Other financing debt instruments issued (under €100 million) 104 104
Other financing debt instruments issued (under €100 million) 104 104
Derivatives relating to other financing debt instruments issued (a) - (1)
Financing debt instruments issued 1,806 5,096
TOTAL FINANCING DEBT (b)
13,101 15,971
(a) Hedging instruments in accordance with IAS 39 and economic hedge derivatives not eligible for hedge accounting.
(b) Excluding accrued interest on derivatives.
Derivative instruments hedging financing debt (included in the table above) are commented in Note 20.

316 I UNIVERSAL REGISTRATION DOCUMENT - ANNUAL REPORT 2019 - AXA I
CONSOLIDATED FINANCIAL STATEMENTS 5 5.6 NOTES TO THE CONSOLIDATED FINANCIAL STATEMENTS
For the sensitivity to movements in interests rates, please refer to
page 192 of the “Interest rates & Equity risk related to the operating
activities of Group subsidiaries” Section 4.3 Market risks.
The table below sets out the reconciliation of financing debt and
undated subordinated debt with the statement of cash flows
(excluding the impact of derivatives):
(in Euro million)
January 1,
2018
New debt
issued Repayments
Currency
translation
adjustment Others (a)
December 31,
2018
Subordinated debt 7,742 2,000 (18) 100 1,377 11,200
Financing debt 1,055 3,356 (994) 103 1,576 5,096
Preferred shares - - (372) - 1,397 1,025
Undated subordinated debt 7,391 (0) (665) 123 - 6,849
TOTAL 16,188 5,356 (2,049) 325 4,350 24,169
(a) Debt from the acquisition of the XL Group including €1,377 million subordinated debt, €1,576 million financing debt and €1,397 million preferred shares.
17.2 FAIR VALUE MEASUREMENT OF FINANCING DEBT
(in Euro million)
December 31, 2019 December 31, 2018
Carrying
value Fair value
Carrying
value Fair value
Subordinated debt at cost 11,393 13,243 11,200 11,749
Derivatives on subordinated debt (a) ) (99) (99) (324) (324)
Subordinated debt 11,294 13,144 10,876 11,425
Financing debt instruments issued at cost 1,806 2,011 5,096 4,937
Derivatives on financing debt instruments issued (a) - - (1) (1)
Financing debt instruments issued 1,806 2,011 5,096 4,936
FINANCING DEBT 13,101 15,155 15,971 16,361
(a) Hedging instruments in accordance with IAS 39 and economic hedge derivatives which are not acting as hedge under IAS 39.
The Group does not hold any financing debt designated as
at fair value through profit or loss (fair value option or trading
instruments).
Information on the fair value figures presented in this Note is
provided in addition to information on carrying values and
should be used with caution. On the one hand, these estimates
are based on closing date parameters such as interest rates
and spreads, which fluctuate over time, and resulting in
instantaneous values, and on the other hand because there are
multiple possible methods to derive these estimates.
(in Euro million)
January 1,
2019
New debt
issued (a)
Repayments (b)
Currency
translation
adjustment Others (c)
December 31,
2019
Subordinated debt 11,200 - (25) 237 (18) 11,393
Financing debt 5,096 145 (503) 97 (3,029) 1,806
Preferred shares 1,025 - (1,086) 61 - -
Undated subordinated debt 6,849 - (253) 113 - 6,708
TOTAL 24,169 145 (1,868) 508 (3,047) 19,908
(a) Debt related to the acquisition of Tianping amounted to €145 million (see Note 5.3.1).
(b) Mainly driven by AXA XL preferred shares for €1,086 million, AXA XL senior debt for €330 million, AXA SA undated subordinated debt for €253 million and UK senior debt for €172 million.
(c) Mainly related to Equitable Holdings, Inc. deconsolidation for €3,659 million partly off set by Mandatory Exchangeable Bonds reclassified from non-controlling interests for €614 million.

317I UNIVERSAL REGISTRATION DOCUMENT - ANNUAL REPORT 2019 - AXA I
CONSOLIDATED FINANCIAL STATEMENTS
5
5.6 NOTES TO THE CONSOLIDATED FINANCIAL STATEMENTS
Data used when calculating the fair value of financing debt are
period-end market data that reflect (i) interest rates by currency,
(ii) AXA’s average spread by maturity and currency, distinguishing
subordinated and senior debt, and (iii) options included in issued
contracts, such as issuer redemption options.
The fair value of financing debt as of December 31, 2019,
excluding accrued interests, was €15,155 million, including
related hedging derivative instruments. The fair value decreased
by €1,206 million compared to December 31, 2018, mainly driven
by the deconsolidation of Equitable Holdings, Inc. (€3,413 million)
partly off set by AXA SA (€2,329 million) driven by the decrease in
interest rates during the period. The Group applies the IFRS 13
fair value hierarchy as described in Note 1.5. The fair value
amounts are mainly based on observable market data inputs
and are therefore considered as level 2 fair value.
17.3 EXPOSURE TO INTEREST RATE RISK AND CONTRACTUAL MATURITIES
The table below sets out the maturities based on contractual cash flows of financing debt (including the impact of derivatives detailed
in Note 20.1). Eff ective maturities may diff er from those presented, mainly because some instruments include clauses allowing early
redemption, with or without penalty.
Maturity and interest-rate risk exposure
(in Euro million)
Contractual cash flows of financing debt by contractual maturity as of December 31
12 months or less
More than 1 year
up to 5 years More than 5 years
Total contractual
cash flows
2019 1,105 3,377 20,655 25,137
2018 697 3,649 27,426 31,772
I Note 18 Payables
18.1 BREAKDOWN OF PAYABLES
(in Euro million)
Carrying value Carrying value
December 31, 2019 December 31, 2018
Minority interests of consolidated investment funds 8,567 6,796
Other debt instruments issued, notes and bank overdraft s 6,249 7,104
Debts relating to investments under total return swap agreement (“TRS”) 3,616 4,365
Other debt instruments issued, notes and bank overdraft s excluding TRS (a) 2,633 2,739
Payables arising from direct insurance and inward reinsurance operations 10,702 10,307
Deposits and guarantees 1,446 564
Current accounts payables to other insurance companies 628 781
Payables to policyholders, brokers and general agents 8,628 8,962
Payables arising from direct outward reinsurance operations 11,588 11,488
Deposits and guarantees 1,775 1,808
Current accounts payable to other companies 9,812 9,677
Other payables arising from direct outward reinsurance operations 1 4
Payable – current tax position 1,166 940
Collateral debts relating to investments under lending agreements
and equivalent (b)
37,920 32,814
Other payables 12,735 17,048
TOTAL PAYABLES 88,929 86,498
(a) Other activities than banking operations.
(b) Excludes collateral debts relating to investments under lending agreements and equivalent in banking activities (see Note 15).

318 I UNIVERSAL REGISTRATION DOCUMENT - ANNUAL REPORT 2019 - AXA I
CONSOLIDATED FINANCIAL STATEMENTS 5 5.6 NOTES TO THE CONSOLIDATED FINANCIAL STATEMENTS
The “Minority interests of consolidated investment funds”
caption is the counterparty of assets recognized on the diff erent
lines of the consolidated balance sheet for the share not held by
the Group in consolidated investment funds. Movements in this
caption both depend on the changes in the Group’s ownership
and the changes in fair value of these funds.
Minority interests in funds under this caption amounted
to €8,567 million as of December 31, 2019, an increase of
€1,771 million compared to December 31, 2018, mainly coming
from France.
“Collateral debts relating to investments under lending
agreements and equivalent” amounted to €37,920 million as
of December 31, 2019, an increase of €5,106 million compared
to December 31, 2018, mainly in France (€+3,069 million),
Switzerland (€+1,205 million), Germany (€+499 million) and
Belgium (€+440 million).
18.2 OTHER DEBT INSTRUMENTS ISSUED, NOTES AND BANK OVERDRAFTS
(OTHER THAN FINANCING DEBT) BY ISSUANCE
Other debt instruments issued, notes and bank overdraft s (other than financing debt) by issuance are described below:
(in Euro million)
Carrying value
December 31, 2019 December 31, 2018
AB - 456
Short term commercial paper, 4.3% - 456
Other 93 48
OTHER DEBT INSTRUMENTS ISSUED (OTHER THAN FINANCING DEBT) 93 505
AXA Financial - 262
AXA Financial (Delayed draw term loan, 3 month LIBOR + 1.125%, due 2021 (US$) - 262
AXA Life Insurance Japan 154 150
Collateralized debt – JPY Libor 3M + 4 bps annual interest – maturity March 27, 2021 154 150
Real estate investment funds 1,663 342
Other 45 706
Other debt (other than financing debt) – owed to credit institutions 1,862 1,460
Bank overdraft s 679 773
OTHER DEBT INSTRUMENTS ISSUED,
NOTES AND BANK OVERDRAFTS EXCLUDING TRS 2,633 2,739
As of December 31, 2019, other debt instruments issued and bank overdraft s excluding total return swap agreement (“TRS”) amounted
to €2,633 million, a decrease of €106 million compared to December 31, 2018.
18.3 FAIR VALUE MEASUREMENT OF OTHER DEBT INSTRUMENTS ISSUED AND BANK
OVERDRAFTS (OTHER THAN FINANCING DEBT)
The fair value of other debt instruments issued and bank
overdraft s excluding total return swap agreement (“TRS”) was
€2,633 million as of December 31, 2019. Among the elements
included in the preceding table, fair value is only calculated for
other debt instruments issued.
Such fair values are mainly based on observable market data
input (see Note 1.5 for a description of observable data) and are
therefore classified as level 2 instruments.

319I UNIVERSAL REGISTRATION DOCUMENT - ANNUAL REPORT 2019 - AXA I
CONSOLIDATED FINANCIAL STATEMENTS
5
5.6 NOTES TO THE CONSOLIDATED FINANCIAL STATEMENTS
18.4 PAYABLES ARISING FROM DIRECT INSURANCE, INWARD REINSURANCE OPERATIONS
AND DIRECT OUTWARD REINSURANCE OPERATIONS
As of December 31, 2019, payables arising from direct insurance
and inward reinsurance operations as disclosed in the Note 18.1,
amounted to €10,702 million, an increase of €395 million
compared to December 31, 2018, mainly related to AXA XL.
As of December 31, 2019, payables arising from direct outward
reinsurance operations amounted to €11,588 million, an increase
of €100 million compared to December 31, 2018 as the increase
in insurance business was offset by Equitable Holdings, Inc.
deconsolidation.
Payables arising from direct insurance, inward reinsurance
and direct outward reinsurance operations are measured at
amortized cost.
18.5 EXPOSURE TO INTEREST RATE RISK AND CONTRACTUAL MATURITIES
The table below sets out the contractual maturities of other debt
instruments (excluding the impact of derivatives which is detailed
in Note 20.1). These maturities are mostly “12 months or less”,
therefore the diff erence between maturities based on contractual
cash flows or based on carrying values is not significant. Eff ective
maturities may differ from those presented, mainly because
some instruments include clauses allowing early redemption,
with or without penalty.
(in Euro million)
December 31, 2019
Carrying value of other debt instrument
by contractual maturity
Total
carrying
value
12 months
or less
More than
1 year up
to 5 years
More than
5 years
Debts relating to investments under total return swap agreement (“TRS”) 347 2,490 780 3,616
Other debt instruments issued, notes and bank overdraft s excluding TRS –
Carrying value 697 270 1,666 2,633
Collateral debts relating to investments under a lending agreement or
equivalent 28,233 7,594 2,093 37,920
(in Euro million)
December 31, 2018
Carrying value of other debt instrument
by contractual maturity
Total
carrying
value
12 months
or less
More than
1 year up
to 5 years
More than
5 years
Debts relating to investments under total return swap agreement (“TRS”) - 426 3,939 4,365
Other debt instruments issued, notes and bank overdraft s excluding TRS –
Carrying value 1,425 314 999 2,739
Collateral debts relating to investments under a lending agreement or
equivalent 25,433 7,381 - 32,814

320 I UNIVERSAL REGISTRATION DOCUMENT - ANNUAL REPORT 2019 - AXA I
CONSOLIDATED FINANCIAL STATEMENTS 5 5.6 NOTES TO THE CONSOLIDATED FINANCIAL STATEMENTS
I Note 19 Tax
19.1 TAX EXPENSE
19.1.1 Breakdown of tax expense between current and deferred tax
The income tax charge was split as follows:
(in Euro million)
December 31,
2019
December 31,
2018
Current income tax 1,375 1,070
Deferred income tax 43 404
TOTAL INCOME TAX FROM CONTINUED OPERATIONS 1,419 1,474
TOTAL INCOME TAX FROM LOSS ON GROUP LIFE PORTFOLIO IN SWITZERLAND (6) (110)
TOTAL INCOME TAX 1,412 1,364
19.1.2 Tax proof
The reconciliation between the theoretical tax charge (pre-tax profit multiplied by the applicable tax rate in France for the period
concerned) and the eff ective tax charge was as follows:
(in Euro million)
December 31,
2019
December 31,
2018
Income from operating activities, gross of tax expenses (excluding result
from investments consolidated using equity method) 5,120 1,243
Notional tax rate 34.43% 34.43%
Notional tax charge 1,763 428
Impact of rates diff erence on notional tax charges (487) 311
Impact of change in tax rates (74) (82)
Impact of diff erences in tax rate and impact of taxes not linked to pre-tax income 7 11
Impact of diff erences in tax rates and tax bases (555) 240
Tax losses of prior years used in the current year without DTA recognized previously (24) (20)
Deferred tax assets recognized on tax losses of prior years (65) (9)
Deferred tax assets not recognized on tax losses of the year 76 79
Derocognition of deferred tax assets on tax losses of prior years (a) 21 4
Tax losses impact 9 52
Impact of permanent diff erences 277 848
Adjustments of tax relating to prior years (45) (122)
Derecognition/Recognition of DTA on temporary diff erences of prior years
(other than tax losses) (a) (36) 1
Other 5 27
Impact of adjustments, decrease in value and other items (76) (95)
EFFECTIVE TAX CHARGE 1,419 1,474
EFFECTIVE TAX RATE (%) 27.70% 118.59%
(a) Derecognition of Deferred Tax Assets (DTA) arising on tax losses is shown in “Tax losses impact”.

321I UNIVERSAL REGISTRATION DOCUMENT - ANNUAL REPORT 2019 - AXA I
CONSOLIDATED FINANCIAL STATEMENTS
5
5.6 NOTES TO THE CONSOLIDATED FINANCIAL STATEMENTS
Effective tax rate stood at 28% in 2019 versus 119% in 2018.
Excluding the exceptional goodwill impairment of the United
States (€6,328 million), the eff ective tax rate would have stood
at 22% in 2018. The change relates to:
■ impact of rate differences on notional tax charges (€-
798 million) corresponding to the difference between the
blended tax (expected tax calculated at each entity level with
the applicable standard rate) and the tax calculated using
the 34.43% French tax rate applicable to the Company. This
tax rate is composed of a basic tax rate (33.33%) and a social
contribution (1.1%). The blended standard rate was 25% in
2019 and 59% in 2018. Excluding the impact of the above-
mentioned exceptional goodwill impairment, the blended rate
would have been 27% in 2018;
■ impact of permanent differences (€-571 million) mainly
representing the impact in some countries of non-taxable
dividends and realized capital gains on equity instruments,
partly compensated by non-deductible impairment on financial
assets and realized capital losses on equity instruments. In
2019, the impact was mainly driven by the losses following the
deconsolidation of Equitable Holdings, Inc. and the negative
impact of the AXA Bank Belgium reclassification in held for
sale. In 2018, the impact was mainly driven by the goodwill
impairment in Equitable Holdings, Inc.
19.2 DEFERRED TAX
In the table below, the net deferred tax position corresponds to
the diff erence between Deferred Tax Assets (DTA) and Deferred
Tax Liabilities (DTL) carried on the Group’s consolidated
statement of financial position. Note that the breakdown of DTA/
DTL disclosed in these tables corresponds to the deferred tax
before the netting that occurs for balance sheet presentation
purposes as required by IAS 12. Net deferred tax balances are
broken down as follows:
(in Euro million)
December 31, 2019
December 31,
2018
Deferred tax
assets
Deferred tax
liabilities
Net deferred
tax position
Net deferred
tax position
Value of Business In-force 0 275 (274) (355)
Deferred Acquisition Costs 118 1,340 (1,222) (3,144)
Other intangible assets (including Goodwill) 67 662 (595) (700)
Real estate 297 268 29 157
Financial assets 1,618 16,253 (14,635) (10,635)
Technical reserves 11,976 2,978 8,997 7,807
Provision for risks and charges 238 167 71 39
Pensions and other employees benefits 1,511 94 1,417 1,577
Tax losses carried forward 808 0 807 1,008
Other 498 258 239 541
TOTAL DEFERRED TAX BY NATURE 17,132 22,297 (5,165) (3,706)
of which deferred tax through Profit and Loss 8,033 8,078 (45) (603)
of which deferred tax through reserves relating to the change in fair value of financial instruments available for sale and financial liabilities measured at fair value through profit and loss that are attributable to changes in own credit risk 8,150 14,310 (6,160) (4,186)
of which deferred tax through other equity reserves 949 (91) 1,040 1,082
As of December 31, 2019, the €17,132 million DTA were mainly related to entities located in France (€6,969 million), Germany
(€4,028 million), Switzerland (€1,678 million), Belgium (€939 million), Japan (€655 million) and Italy (€645 million).

322 I UNIVERSAL REGISTRATION DOCUMENT - ANNUAL REPORT 2019 - AXA I
CONSOLIDATED FINANCIAL STATEMENTS 5 5.6 NOTES TO THE CONSOLIDATED FINANCIAL STATEMENTS
(in Euro million)
December 31,
2019
December 31,
2018
Deferred tax assets 651 915
Deferred tax liabilities 5,843 4,621
Net deferred tax position including Uncertain tax positions (5,192) (3,706)
Deferred tax – Uncertain Tax Positions (a) (27) (0)
Net deferred tax position excluding Uncertain tax positions (5,165) (3,706)
(a) In 2018, prior to the reclassification done in the context of the first application of IFRIC 23 on January 1st 2019, the Uncertain Tax Positions were presented in provisions for risks and charges in Note 16.
The change from net liability position €-3,706 million in 2018 to €-5,165 million in 2019 mainly came from the increase in unrealized
capital gains on fixed-income assets and the deconsolidation of Equitable Holdings, Inc.
(in Euro million)
2019 2018
Net deferred tax Net deferred tax
January 1 (3,706) (4,947)
Movements through profit or loss (41) (404)
Movements through shareholders’ equity (a) (1,762) 1,399
Forex impact (66) (158)
Change in scope and other variations 409 404
December 31 (5,165) (3,706)
(a) The movements through shareholders’ equity mainly concern net investment hedge in the Company, revaluation to fair value of financial investments through shareholders’ equity and employee benefits actuarial gains and losses.

323I UNIVERSAL REGISTRATION DOCUMENT - ANNUAL REPORT 2019 - AXA I
CONSOLIDATED FINANCIAL STATEMENTS
5
5.6 NOTES TO THE CONSOLIDATED FINANCIAL STATEMENTS
As of December 31, 2018, the €3,706 million net DTL position included €15,932 million DTA of which €1,008 million DTA on tax losses
carried forward of which €509 million for the French Tax Group.
(in Euro million)
2018
DTA
maturity
date
1 year
DTA
maturity
date
2 years
DTA
maturity
date
3 years
DTA
maturity
date
4 years
DTA
maturity
date
5 years
DTA
maturity
date
6 years
DTA
maturity
date
between
7 and
11 years
DTA
maturity
date >
11 years
No
maturity
date Total
Expected date of use
DTA recognized on tax
losses carried forward 230 257 195 153 117 24 24 9 - 1,008
Corresponding carry
forward losses 939 1,032 826 620 472 123 84 48 2 4,145
Latest date of possible use
DTA recognized on tax
losses carried forward 2 0 4 1 1 2 66 148 783 1,008
Corresponding carry
forward losses 6 0 22 5 7 10 311 693 3,091 4,145
Recognized deferred tax assets (DTA)
on tax loss carried forward by maturity
and expiration date
The tables below are broken down by (i) in the first part the
maturity by which the Group expects to use the DTA accounted
at year-end and the corresponding tax losses carried forward,
(ii) in the second part, the “expiration date” of the DTA, i.e. the
latest date at which the Group could use them.
The €17,132 million DTA included €808 million of DTA on
tax losses carried forward as of December 31, 2019, of which
€410 million for the French Tax Group.
(in Euro million)
2019
DTA
maturity
date
1 year
DTA
maturity
date
2 years
DTA
maturity
date
3 years
DTA
maturity
date
4 years
DTA
maturity
date
5 years
DTA
maturity
date
6 years
DTA
maturity
date
between
7 and
11 years
DTA
maturity
date >
11 years
No
maturity
date Total
Expected date of use
DTA recognized on tax
losses carried forward 298 220 168 23 22 18 39 21 - 808
Corresponding carry
forward losses 1,086 896 721 95 87 72 207 115 10 3,290
Latest date of possible use
DTA recognized on tax
losses carried forward 11 14 1 1 6 5 5 84 681 808
Corresponding carry
forward losses 51 70 6 7 24 22 23 396 2,691 3,290
Unrecognized deferred tax assets (DTA)
The amount of potential DTA, which has not been recorded in the
accounts as of December 31, 2019 as considered unrecoverable,
amounted to €635 million (€764 million in 2018) of which:
■ €505 million concerned unrecognized DTA on €2,392 million
tax losses carried forward (€556 million DTA on €2,771 million
tax losses carried forward in 2018). The major part of these
losses occurred in countries where losses can be carried
forward without time limit (€1,890 million in 2019 and
€2,154 million in 2018);
■ €130 million related to other unrecognized deferred tax assets
(€207 million in 2018).

324 I UNIVERSAL REGISTRATION DOCUMENT - ANNUAL REPORT 2019 - AXA I
CONSOLIDATED FINANCIAL STATEMENTS 5 5.6 NOTES TO THE CONSOLIDATED FINANCIAL STATEMENTS
The rollforward of current tax position (excluding Uncertain Tax Positions) is broken down as follows:
(in Euro million)
2019 2018
Net current tax Net current tax
January 1 435 446
Cash payment in the period 993 662
Movements through profit or loss (1,519) (1,033)
Movements through shareholders’ equity (a) 257 328
Forex impact (3) 11
Change in scope and other variations (58) 23
December 31 105 435
(a) The movements through shareholders’ equity mainly concern the tax impact related to subordinated loans.
The table above includes current payables net of current receivables towards the tax administrations. It also includes some receivables
and payables with non-consolidated entities members of a tax group which are classified in “other receivables” and “other payables”.
19.4 UNCERTAIN TAX POSITIONS
The Uncertain Tax Positions was split as follows:
(in Euro million)
December 31,
2019
Current income tax – Uncertain Tax Positions 358
Deferred income tax – Uncertain Tax Positions 27
TOTAL INCOME TAX – UNCERTAIN TAX POSITIONS 385
As at December 31, 2018 the Uncertain Tax Positions reported
in provisions for risks and charges (Note 16.1) amounted to
€862 million. The main changes in 2019 resulted from the
€111 million opening adjustment done in the context of the first
application of IFRIC 23 and from the deconsolidation of Equitable
Holdings, Inc.
As of December 31, 2019, the Uncertain Tax Positions were mainly
driven by Germany (€147 million) and AXA XL (€84 million).
Uncertain tax treatments are determined separately at entity
level. For these positions considered as probably not accepted by
tax authorities, the assessment of the uncertainty is determined
based on the most likely amount in a range of possible outcomes.
19.3 CURRENT TAX
(in Euro million)
December 31,
2019
December 31,
2018
Receivables – Current tax 949 962
Payables – Current tax 1,166 940
Net current tax position including Uncertain Tax Positions (217) 22
Current tax – Uncertain Tax Positions (a) (358) -
Net current tax position excluding Uncertain Tax Positions 140 22
Group tax receivables and payables (36) 413
Current tax position including Group tax position 105 435
(a) In 2018, prior to the reclassification done in the context of the first application of IFRIC 23 on January 1st 2019, the Uncertain Tax Positions were presented in provisions for risks and charges in Note 16.

325I UNIVERSAL REGISTRATION DOCUMENT - ANNUAL REPORT 2019 - AXA I
CONSOLIDATED FINANCIAL STATEMENTS
5
5.6 NOTES TO THE CONSOLIDATED FINANCIAL STATEMENTS
I Note 20 Derivative instruments
This Note covers all types of derivatives including derivative instruments held by consolidated investment funds in the
“Satellite Investment Portfolio” (see Note 1.8.2) which are recognized at fair value in accordance with the IFRS hierarchy as described
in Note 1.5, but excluding derivative instruments that meet the definition of shareholders’ equity instruments (see Note 13 for details).
20.1 DERIVATIVE INSTRUMENTS: MATURITIES, NOTIONAL VALUES AND FAIR VALUES
(in Euro million)
Maturity of notional amount
as of December 31, 2019 (a)
Notional amount Positive fair value Negative fair value Net fair value
<1 year
1 to
5 years >5 years
Decem-
ber 31,
2019
Decem-
ber 31,
2018
Decem-
ber 31,
2019
Decem-
ber 31,
2018
Decem-
ber 31,
2019
Decem-
ber 31,
2018
Decem-
ber 31,
2019
Decem-
ber 31,
2018
Interest rates derivatives 38,722 74,337 93,012 206,070 200,324 5,797 5,448 5,385 4,441 412 1,007
Equity derivatives 11,082 3,454 4,214 18,750 43,387 300 2,763 78 1,104 223 1,660
Currencies derivatives 138,574 8,451 10,612 157,637 166,873 2,785 4,192 4,606 6,487 (1,820) (2,295)
Credit derivatives 3,970 11,559 2,612 18,140 16,215 210 182 113 46 97 136
Other derivatives 1,145 3,147 7,613 11,905 31,108 297 656 718 845 (421) (189)
TOTAL 193,492 100,948 118,063 412,503 457,907 9,390 13,240 10,900 12,922 (1,509) 318
Note: This table includes all derivatives (assets and liabilities) as described in Note 1.10, i.e. hedge, macro-hedge and other asset or liability positions.
(a) By convention, notional amounts are displayed in absolute value, and exclude potential netting out.
Main reasons for the evolution in the use of derivatives (mostly interest rates, currencies and equity derivatives) are detailed in Note 20.2.
20.2 DERIVATIVE INSTRUMENTS BY IAS 39 TYPE OF HEDGE
Derivative instruments are broken down as follows:
(in Euro million)
December 31, 2019
Derivative instruments
used in fair value hedging
relationship
Derivative instruments
used in cash flow hedging
relationship
Derivative instruments used
in hedges of net investment
in a foreign operation
Macro-hedges and other
derivative instruments
not qualifying under IAS39
but generally used as
economic hedges Total
Notional
amount (a)
Fair value
Notional
amount (a)
Fair value
Notional
amount Fair value
Notional
amount Fair value
Notional
amount Fair value
Interest rates
derivatives (a) 38,291 (679) 15,789 416 - - 151,990 675 206,070 412
Equity derivatives 1,004 53 - - - - 17,746 170 18,750 223
Currencies
derivatives (a) 3,388 19 8,898 (458) 5,998 (30) 139,353 (1,351) 157,637 (1,820)
Credit derivatives 24 (0) - - - - 18,116 97 18,140 97
Other derivatives 287 (25) 6,133 (38) - - 5,485 (357) 11,905 (420)
TOTAL 42,994 (632) 30,820 (80) 5,998 (30) 332,690 (766) 412,503 (1,509)
This table includes all derivatives (assets and liabilities) as described in Note 1.10, i.e. hedge, macro-hedge and other asset or liability positions.
(a) Notional amounts impacted by the IBOR reform: as mentioned in Note 1.2, the IAS 39 amendment ensures prospective assessments and highly probable requirements are maintained in the context of the transition to the new benchmark rates.

326 I UNIVERSAL REGISTRATION DOCUMENT - ANNUAL REPORT 2019 - AXA I
CONSOLIDATED FINANCIAL STATEMENTS 5 5.6 NOTES TO THE CONSOLIDATED FINANCIAL STATEMENTS
(in Euro million)
December 31, 2018
Derivative instruments
used in fair value hedging
relationship
Derivative instruments
used in cash flow hedging
relationship
Derivative instruments
used in hedges of net
Investment in a foreign
operation
Macro-hedges and other
derivative instruments not
qualifying under IAS 39
but generally used as
economic hedges Total
Notional
amount Fair value
Notional
amount Fair value
Notional
amount Fair value
Notional
amount Fair value
Notional
amount Fair value
Interest rates derivatives 52,686 (780) 4,334 306 - - 143,304 1,481 200,324 1,007
Equity derivatives 1,170 49 - - - - 42,217 1,610 43,387 1,660
Currencies derivatives 4,521 25 6,725 (392) 12,919 (200) 142,708 (1,728) 166,873 (2,295)
Credit derivatives 140 (2) - - - - 16,075 137 16,215 136
Other derivatives 287 (22) 4,526 (82) - - 26,294 (86) 31,108 (189)
TOTAL 58,804 (729) 15,585 (168) 12,919 (200) 370,599 1,415 457,907 318
Note: This table includes all derivatives (assets and liabilities) as described in Note 1.10, i.e. hedge, macro-hedge and other asset or liability positions.
As of December 31, 2019, the notional amount of all derivative
instruments totalled €412.5 billion (€457.9 billion at the end of
2018). Their net fair value amounted to €-1,509 million as of
December 31, 2019 (€+318 million at the end of 2018), comprised
of the fair value of derivatives on invested assets (€-2,280 million
and €-1,800 million at the end of 2018 – see Note 20.3) and
the fair value of derivatives on liabilities (€-917 million and
€-2,285 million at the end of 2018 – see Note 20.4).
AXA uses derivatives primarily to hedge various risks stemming
from both sides of the balance sheet in the context of its Asset
Liability Management (ALM) strategy in insurance companies, as
well as holdings and banks. Notional amount of such hedging
strategies amounted to €430.6 billion as of December 31, 2019
(€443.6 billion at the end of 2018) and were mainly used to:
■ manage interest rate exposures on fixed maturity investments,
long-term debt and guaranteed interest rates on insurance
contracts;
■ reduce foreign-currency exposures on foreign-currency
denominated investments and liabilities;
■ manage liquidity positions (including the ability to pay
benefits and claims when due) in connection with Asset
Liability Management and local regulatory requirements for
insurance and banking operations;
■ limit equity risk;
■ limit credit risk about certain investments in corporate debt
instruments.
AXA also uses derivatives as an alternative to gain exposure to
certain asset classes through “synthetic positions”, for example,
holding cash and equity futures instead of physical equities.
Another example is the combination of government bonds
and credit default swaps (CDS) as a synthetic position and an
alternative to the direct purchase of a corporate bond. These
schemes do not add any specific risks compared with other
investment assets.
The notional amount of derivatives which is used to express
the volume of instruments outstanding and to provide a basis
for comparison with other financial instruments most certainly
overstates the level of activity and does not directly measure
risk as it greatly exceeds the possible credit and market loss that
could arise from such transactions. It does not represent the
amounts that are eff ectively exchanged by the parties, and thus is
not a measure of the Group’s exposure to derivative instruments.
For example, the Group is exposed to credit risk in respect of its
counterparties to the derivative instruments but is not exposed to
credit risk on the entire notional amounts. AXA actively manages
counterparty risk generated by derivatives through a specific
group-wide policy. This policy includes a limit framework and
an exposure monitoring process. Limits are specifically set for
each authorized counterparty, based on an internal scoring
system. This policy also includes daily to weekly collateralization
for the majority of the Group’s exposure. The total net collateral
given communicated for all derivative instruments including
those related to derivatives held within investment funds of the
“Satellite Investment Portfolio” (see Note 1.8.2) was €2.6 billion
as of December 31, 2019 (€-0.5 billion at the end of 2018). This
net total includes amounts recognized in the Consolidated
Statement of Financial Position and unrecognized commitments
received or given disclosed in Note 29.
The market turmoil that started in 2008 highlighted increasing
importance of Risk Management and led to additional hedging
activity over the 2008-2012 period. Since then, AXA has continued
the use of derivatives to hedge risks, increasing or decreasing
derivative positions in accordance with AXA’s governance
framework for derivatives.
In particular, hedging activities are one of the most important
instruments to decrease the risk of the options and guarantees
that are embedded in most Life & Savings products and in some
Property & Casualty products; they also lead to a reduction of
the capital requirements for those business activities under
Solvency II. The various policies that AXA applies with reference
to the use of derivatives and hedging instruments, include a

327I UNIVERSAL REGISTRATION DOCUMENT - ANNUAL REPORT 2019 - AXA I
CONSOLIDATED FINANCIAL STATEMENTS
5
5.6 NOTES TO THE CONSOLIDATED FINANCIAL STATEMENTS
close monitoring of its hedging strategy and associated risks as
part of a Systemic Risk Management Plan (SRMP), approved by
the Management Committee and the Board of Directors, in the
context of the policy measures that apply to Global Systemically
Important Insurers (GSII).
For further detail on Asset Liability Management governance,
please refer to page 188 of Section 4.2. “Internal control and Risk
Management”.
In 2019, the use of derivatives within the Group decreased overall
by €45 billion in terms of notional amount for the main reasons
listed below (see also details in Note 20.2.1.):
■ notional amount of equity derivatives decreased by €24.6
billion notably explained by the deconsolidation of Equitable
Holdings, Inc.;
■ notional amount of other derivatives decreased by €19.2
billion notably explained by the deconsolidation of Equitable
Holdings, Inc.;
■ notional amount of currency derivatives decreased by €9.2
billion mainly explained as a result of the model transformation
of the Swiss Group Life business, the deconsolidation of
Equitable Holdings, Inc. and the classification of AXA Bank
Belgium as held for sale.
It was partly off set:
■ notional amount of interest rates derivatives increased by €5.7
billion mainly driven by the additional hedges of duration
gap, the increase within investment funds of the “Satellite
Investment Portfolio” partly off set by the deconsolidation of
Equitable Holdings, Inc. and the classification of AXA Bank
Belgium as held for sale.
■ notional amount of credit derivatives increased by €1.9 billion
explained by the increase within investment funds of the
“Satellite Investment Portfolio.
In the tables above, the column “Macro-hedges and other
derivative instruments” includes derivatives that do not qualify
for hedge accounting under IAS 39, but whose objective is
nevertheless to provide economic hedging of a risk, with the
exception notably of certain credit derivatives. They also include
“macro-hedging” derivatives as defined by the IASB in IAS 39.
As of December 31, 2019, the notional amount of hedging
derivative instruments as defined by IAS 39 (fair value hedge,
cash flow hedge and net investment hedge) of the Group was
€79.8 billion versus €87.3 billion at the end of 2018. The net fair
value recorded was €-742 million as of December 31, 2019, versus
€-1,097 million at the end of 2018.
20.2.1 Interest rate derivative instruments
The AXA Group’s primary interest rate exposure is related to
contracts with guaranteed benefits and the risk that the value
of the financial assets purchased with the consideration received
from the contract holders is insuff icient to fund the guaranteed
benefits and expected discretionary participation payable to
them. To hedge against potential adverse market conditions,
derivative strategies are used to reduce the risk arising from the
guarantee liability over time.
As of December 31, 2019, the notional amount of interest rate
derivative instruments totalled €206.1 billion (€200.3 billion at
the end of 2018). Their net fair value as of December 31, 2019
amounted to €412 million (€1,007 million at the end of 2018).
AXA mainly uses (i) interest rate swaps (62.8% of total notional
amount of interest rate derivative instruments), (ii) interest rate
options (18%), and (iii) futures and forwards (10%).
These instruments are mainly used to:
■ manage duration gap and/or hedge convexity risk between
assets and liabilities on the General Account as a part of Asset
Liability Management strategies mainly in France for €64.9
billion (versus €61.5 billion at the end of 2018), Japan for €17.9
billion at the end of 2019 (versus €17.3 billion at the end of
2018), Germany for €15.3 billion at the end of 2019 (versus
€12.6 billion at the end of 2018) and in Switzerland for €5.8
billion at the end of 2019 (versus €5.4 billion at the end of
2018);
■ minimize the cost of Group debt and limit volatility of financial
charges, mainly in the Company, with notional amount of
€37.7 billion at the end of 2019 (versus €30.9 billion at the
end of 2018), mainly due to the management of its interest
rate derivatives in a context of low interest rate environment;
■ hedge interest rate risk and interest volatility risk as part of
the Asset Liability Management strategy associated with the
guaranteed minimum benefits on Variable Annuity products,
with notional amount of €3.3 billion at the end of 2019 (versus
€25.4 billion at the end of 2018). The decrease is mainly related
to the deconsolidation of Equitable Holdings, Inc. (versus
€20.8 billion at the end of 2018);
■ hedge interest rate risk exposures arising in the context of its
ordinary banking activities, in order to manage an interest
rate exposure between its interest-earning assets and interest-
bearing liabilities mainly by interest rate swaps. There is no
longer significant amount in this category following the
classification as held for sale of AXA Bank Belgium (€21.7
billion at the end of 2018).
20.2.2 Equity derivative instruments
As of December 31, 2019, the notional amount of equity
derivative instruments amounted to €18.7 billion (€43.4 billion
at the end of 2018). Their net fair value amounted to €223 million
as of December 31, 2019 (€1,660 million at the end of 2018). AXA
mainly uses (i) equity option contracts (71% of total notional
amount of equity derivative instruments), (ii) equity swaps (19%),
and (iii) equity futures and forwards (10%).
These instruments are mainly used to:
■ hedge the exposure to equity risk, mainly in the Company
€6.1 billion in 2019 (€4.6 billion in 2018) to support Group
Solvency;
■ hedge equity risk as part of the Asset Liability Management
strategy associated with the guaranteed minimum benefits on
Variable Annuity products, which amounted to €0.1 billion at
the end of 2019 (€5.9 billion at the end of 2018). The decrease
is mainly related to the deconsolidation of Equitable Holdings,
Inc. (€5.8 billion at the end of 2018);

328 I UNIVERSAL REGISTRATION DOCUMENT - ANNUAL REPORT 2019 - AXA I
CONSOLIDATED FINANCIAL STATEMENTS 5 5.6 NOTES TO THE CONSOLIDATED FINANCIAL STATEMENTS
■ hedge the exposure to equity risk within the General Account
assets, protecting policyholders’ investments and their
guaranteed liability over time, mainly in Switzerland (notional
amount of €4.2 billion in 2019 compared with €3.8 billion in
2018).
20.2.3 Currency derivative instruments
The Group has entered into diff erent currency instruments to
reduce its exposure to foreign currency risk. Currency derivative
instruments represent agreements to exchange the currency of
one country for the currency of another country at an agreed
price and settlement date.
As of December 31, 2019, the notional amount of currency
derivative amounted to €157.6 billion versus €166.9 billion at
the end of 2018. Their market value was €-1,820 million versus
€-2,295 million at the end of 2018. AXA mainly uses (i) currency
future and forward contracts (55% of total notional amount of
currency derivative instruments), (ii) currency option contracts
(26%), and (iii) currency swaps (18%).
One of the main objectives of currency derivatives instruments
is to limit variations in net foreign currency-denominated
assets resulting from movements in exchange rates in order to
protect partially or in full the value of AXA’s net foreign-currency
investments in its subsidiaries and thus reduce the variability
of Group consolidated shareholders’ equity against currency
fluctuations, but also of others key indicators such as liquidity,
gearing and solvency ratios. Notional amount of derivatives
used by the Company to hedge the foreign currency exposure
decreased from €36.0 billion at the end of 2018 to €34.6 billion
at the end of 2019.
Currency derivative instruments are also used to hedge foreign
exchange mismatch between assets and liabilities in insurance
subsidiaries of the Group. While most of the operating units’
commitments are matched by assets denominated in the
same currency, some entities may invest in foreign currency
denominated assets to diversify their investments. This is the
case mainly in (i) Switzerland using such contracts to hedge
exchange rate risk arising from their investments in equities and
debt instruments denominated in non-CHF currencies (mainly
Euro and US Dollar) with a total notional amount of €29.4 billion
at the end of 2019 versus €48.0 billion at the end of 2018, and
(ii) Japan using future and forward foreign currency contracts to
hedge exchange-rate risk arising from its investments in fixed-
maturity debt instruments denominated in non JPY currencies
with a total notional amount of €17.2 billion at the end of 2019
versus €13.2 billion at the end of 2018.
A description of exchange-rate risk related to the operating
activities of Group subsidiaries and the Company is included in
Section 4.3 Market Risks with amounts of exposures to exchange-
rate risk and corresponding hedges.
In accordance with IAS 21 and IAS 39, the translation diff erence
relating to these debt instruments used in operational entities
is recognized in profit or loss and off sets most of the change in
market value of associated derivative instruments, which is also
recognized in profit or loss.
20.2.4 Credit derivative instruments
The Group, as part of its investment and credit Risk Management
activities, uses strategies that involve credit derivatives, which
consist mainly of Credit Default Swaps (CDS). These instruments
are used as an alternative to corporate bonds portfolios, when
coupled with government debt instruments, but also as a
protection on single names or specific portfolios.
As of December 31, 2019, the notional amount of credit
derivatives held by the Group was €18.1 billion compared to
€16.2 billion at the end of 2018 (including the instruments held
within investment funds of the “Satellite Investment Portfolio”
(€2.6 billion); see Note 1.8.2).
Credit derivative instruments are mainly used to:
■ hedge credit risk involving the purchase of CDS as a protection
mainly on single corporate names or specific portfolios starting
from a certain level of losses through tranches instruments
(notional amount of €3.9 billion at the end of 2019 versus
€1.8 billion at the end of 2018);
■ enhance the return mainly on government bonds portfolios
by holding government bonds and at same time selling
protection on very good quality names as an alternative to
the direct purchase of a corporate bond. This type of ALM
strategy is implemented to compensate for the lack of depth
or liquidity in some markets by taking a synthetic credit risk
(notional amount of €14.2 billion at the end of 2019 versus
€14.3 billion at the end of 2018).

329I UNIVERSAL REGISTRATION DOCUMENT - ANNUAL REPORT 2019 - AXA I
CONSOLIDATED FINANCIAL STATEMENTS
5
5.6 NOTES TO THE CONSOLIDATED FINANCIAL STATEMENTS
20.3 EFFECT OF HEDGING ON FINANCIAL INVESTMENTS
The impact of derivative instruments is presented in the consolidated statement of financial position within their related underlying
financial assets (and liabilities see Note 20.4). The table below sets out the impact of derivative instruments on the related underlying
assets.
(in Euro million)
December 31, 2019
Insurance Other activities Total
Net book
value
exclu-
ding
eff ect of
deriva-
tives (a)
Impact
of deri-
vative
instru-
ments (b)
Net book
value
including
eff ect of
deriva-
tives (c)
Net book
value
exclu-
ding
eff ect of
deriva-
tives (a)
Impact
of deri-
vative
instru-
ments (b)
Net book
value
including
eff ect of
deriva-
tives (c)
Net book
value
exclu-
ding
eff ect of
deriva-
tives (a)
Impact
of deri-
vative
instru-
ments (b)
Net book
value
including
eff ect of
deriva-
tives (c)
Investment in real estate
properties 23,405 (104) 23,301 3,309 - 3,309 26,714 (104) 26,609
Debt instruments 418,972 (2,447) 416,525 2,308 3 2,311 421,280 (2,445) 418,836
Equity securities 27,979 (14) 27,965 3,155 - 3,155 31,133 (14) 31,119
Non-consolidated investment funds 14,897 33 14,930 99 - 99 14,997 33 15,029
Other investments (d) 15,146 (15) 15,132 232 - 232 15,375 (12) 15,363
Macro-hedge and other derivatives (172) 421 249 1 (111) (110) 0 139 139
TOTAL FINANCIAL INVESTMENTS 476,823 (2,023) 474,800 5,795 (108) 5,687 482,786 (2,299) 480,487
Loans 20,005 (40) 19,965 13,400 (6) 13,393 33,405 (46) 33,359
Assets backing contracts
where the financial risk is borne
by policyholders 72,659 1 72,660 - - - 72,633 25 72,660
TOTAL INVESTMENTS 592,892 (2,166) 590,726 22,503 (114) 22,389 615,537 (2,425) 613,114
(a) Carrying value, i.e. net of impairment, discount premiums and related amortization, including accrued interest, but excluding any impact of derivatives.
(b) Including macro-hedge and other derivatives.
(c) Carrying value (see (a)), including eff ect of hedging instruments (IAS 39), economic hedging instruments not acting as hedging under IAS 39, macro-hedge and other derivatives.
(d) Other investments held through consolidated investment funds designated as at fair value through profit or loss.

330 I UNIVERSAL REGISTRATION DOCUMENT - ANNUAL REPORT 2019 - AXA I
CONSOLIDATED FINANCIAL STATEMENTS 5 5.6 NOTES TO THE CONSOLIDATED FINANCIAL STATEMENTS
(in Euro million)
December 31, 2018
Insurance Other activities Total
Net book
value exclu-
ding eff ect
of deriva-
tives (a)
Impact of
derivative
instru-
ments (b)
Net book
value inclu-
ding eff ect
of deriva-
tives (c)
Net book
value exclu-
ding eff ect
of deriva-
tives (a)
Impact of
derivative
instru-
ments (b)
Net book
value inclu-
ding eff ect
of deriva-
tives (c)
Net book
value exclu-
ding eff ect
of deriva-
tives (a)
Impact of
derivative
instru-
ments (b)
Net book
value inclu-
ding eff ect
of deriva-
tives (c)
Investment in real estate
properties 20,977 (38) 20,939 1,495 - 1,495 22,472 (38) 22,434
Debt instruments 442,267 (2,156) 440,111 5,764 (116) 5,648 448,031 (2,272) 445,759
Equity securities 23,025 (35) 22,990 2,047 - 2,047 25,072 (35) 25,036
Non-consolidated investment funds 13,013 23 13,036 602 - 602 13,615 23 13,639
Other investments (d) 14,847 17 14,864 169 - 169 15,016 17 15,033
Macro-hedge and other derivatives (150) 894 744 1 59 59 (149) 952 803
TOTAL FINANCIAL INVESTMENTS 493,002 (1,257) 491,745 8,583 (57) 8,526 501,585 (1,315) 500,271
Loans 33,565 27 33,593 32,263 (474) 31,789 65,829 (447) 65,381
Assets backing contracts
where the financial risk is borne
by policyholders 160,176 (0) 160,176 - - - 160,176 (0) 160,176
TOTAL INVESTMENTS 707,720 (1,268) 706,452 42,341 (532) 41,809 750,061 (1,800) 748,261
(a) Carrying value, i.e net of impairment, discount premiums and related amortization, including accrued interest, but excluding any impact of derivatives.
(b) Including macro-hedge and other derivatives.
(c) Carrying value (see (a)), including eff ect of hedging instruments (IAS 39), economic hedging instruments not acting as hedging under IAS 39, macro-hedge and other derivatives.
(d) Other investments held through consolidated investment funds designated as at fair value through profit or loss.

331I UNIVERSAL REGISTRATION DOCUMENT - ANNUAL REPORT 2019 - AXA I
CONSOLIDATED FINANCIAL STATEMENTS
5
5.6 NOTES TO THE CONSOLIDATED FINANCIAL STATEMENTS
20.4 EFFECT OF HEDGING ON LIABILITIES
The impact of derivative instruments is presented in the balance sheet within their related underlying financial liabilities (and assets
see Note 20.3). The tables below set out the impact of derivative instruments on the related underlying liabilities:
(in Euro million)
December 31, 2019 December 31, 2018
Carrying
value
excluding
eff ect of
hedging
value
Impact of
derivative
instru-
ments
Carrying
value
including
eff ects of
derivatives
Carrying
value
excluding
eff ect of
hedging
value
Impact of
derivative
instru-
ments
Carrying
value
including
eff ects of
derivatives
Liabilities arising from insurance contracts 376,253 (982) 375,271 437,015 (812) 436,204
Liabilities arising from insurance contracts
where the financial risk is borne by policyholders 56,709 - 56,709 146,058 (0) 146,058
TOTAL LIABILITIES ARISING FROM INSURANCE
CONTRACTS 432,963 (982) 431,980 583,073 (812) 582,262
TOTAL LIABILITIES ARISING FROM INVESTMENT
CONTRACTS 52,547 (101) 52,446 53,593 (73) 53,520
Macro-hedge and other derivative instruments
on insurance and investment contracts (liabilities) - 227 227 - (910) (910)
Subordinated debt 11,393 (99) 11,294 11,200 (324) 10,876
Financing debt instruments issued 1,806 - 1,806 5,096 (1) 5,096
Financing debt owed to credit institutions - - - - - -
FINANCING DEBT (a)
13,199 (99) 13,101 16,295 (324) 15,971
Liabilities arising from banking activities 14,713 (64) 14,649 36,281 (227) 36,054
PAYABLES 87,409 103 87,512 86,436 61 86,498
TOTAL DERIVATIVES (917) (2,285)
(a) Financing debts are disclosed in the balance sheet net of the impact of derivatives. As a result, the amount showing in the column “value including eff ect of derivatives” is their carrying value.
As of December 31, 2019, derivatives related to banking liabilities
shown in Note 15 are used to hedge interest rate risk exposures
in the context of ordinary banking activities, in order to achieve
an appropriate interest rate spread between its interest earning
assets and interest bearing liabilities. Related hedged assets are
disclosed in Note 9.4.2 and liabilities in Note 15.

332 I UNIVERSAL REGISTRATION DOCUMENT - ANNUAL REPORT 2019 - AXA I
CONSOLIDATED FINANCIAL STATEMENTS 5 5.6 NOTES TO THE CONSOLIDATED FINANCIAL STATEMENTS
20.5 BREAKDOWN OF DERIVATIVE INSTRUMENTS BY VALUATION METHOD
(in Euro million)
December 31, 2019 December 31, 2018
Instruments
quoted in an
active market
Instruments not quoted
in an active market –
No active market
Total
Instruments
quoted in an
active market
Instruments not quoted
in an active market –
No active market
Total
Fair value
determined
directly by re-
ference to an
active market
(Level 1)
Fair
value mainly
based on
observable
market
data(Level 2)
Fair value
mainly not
based on
observable
market data
(Level 3)
Fair value
determined
directly by re-
ference to an
active market
(Level 1)
Fair value
mainly
based on
observable
market
data
(Level 2)
Fair value
mainly not
based on
observable
market data
(Level 3)
Net value of derivative instruments –
assets (A) (1,337) (1,088) 0 (2,425) (1,165) (802) (0) (1,966)
Derivative instruments relating to insurance
and investment contracts (6) (850) - (857) 7 (1,802) - (1,795)
Derivative instruments relating
to financing debt, operating debt
and other financial liabilities - (99) - (99) - (324) - (324)
Derivatives on liabilities arising
from banking activities and payables 3 36 - 39 3 (170) 1 (166)
Net value of derivative instruments –
liabilities (B) (4) (913) - (917) 10 (2,295) 1 (2,285)
Net fair value (C= A-B) (1,509) 318
Principles applied by the Group in order to proceed with the
classification of financial instruments into the IFRS 13 fair value
hierarchy categories and the fair value hierarchy applicable to
such instruments are described in Note 1.5. Same principles
apply as far as derivatives instruments are concerned.
The Group mitigates counterparty credit risk of derivative
instruments by contractually requiring collateral for most
derivative contracts. As of December 31, 2019, the adjustment
to the fair value of derivatives for non-performance risk was not
material.
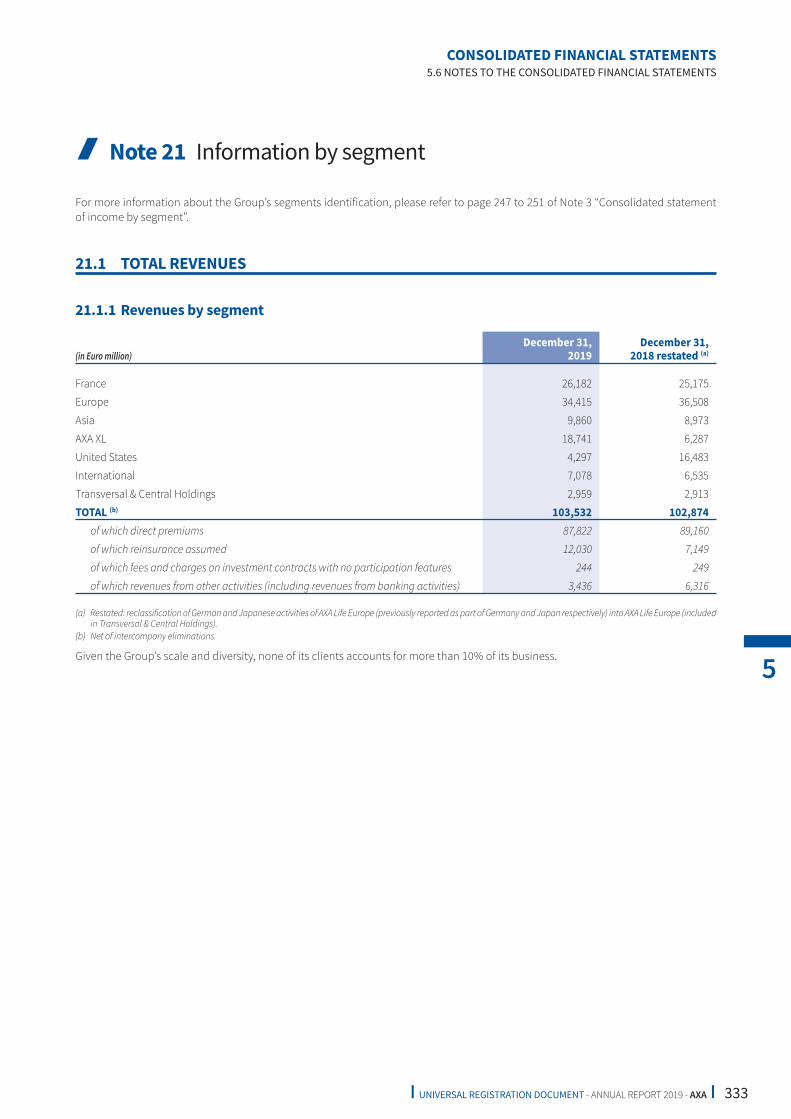
333I UNIVERSAL REGISTRATION DOCUMENT - ANNUAL REPORT 2019 - AXA I
CONSOLIDATED FINANCIAL STATEMENTS
5
5.6 NOTES TO THE CONSOLIDATED FINANCIAL STATEMENTS
I Note 21 Information by segment
For more information about the Group’s segments identification, please refer to page 247 to 251 of Note 3 “Consolidated statement
of income by segment”.
21.1 TOTAL REVENUES
21.1.1 Revenues by segment
(in Euro million)
December 31,
2019
December 31,
2018 restated (a)
France 26,182 25,175
Europe 34,415 36,508
Asia 9,860 8,973
AXA XL 18,741 6,287
United States 4,297 16,483
International 7,078 6,535
Transversal & Central Holdings 2,959 2,913
TOTAL (b)
103,532 102,874
of which direct premiums 87,822 89,160
of which reinsurance assumed 12,030 7,149
of which fees and charges on investment contracts with no participation features 244 249
of which revenues from other activities (including revenues from banking activities) 3,436 6,316
(a) Restated: reclassification of German and Japanese activities of AXA Life Europe (previously reported as part of Germany and Japan respectively) into AXA Life Europe (included in Transversal & Central Holdings).
(b) Net of intercompany eliminations.
Given the Group’s scale and diversity, none of its clients accounts for more than 10% of its business.

334 I UNIVERSAL REGISTRATION DOCUMENT - ANNUAL REPORT 2019 - AXA I
CONSOLIDATED FINANCIAL STATEMENTS 5 5.6 NOTES TO THE CONSOLIDATED FINANCIAL STATEMENTS
21.1.2 Revenues from non-insurance contracts
Revenues from non-insurance contracts including revenues from other activities (€2,924 million), fees & charges relating to investment
contracts with no participating features (€244 million), and commissions from banking activities (€146 million) correspond to the
following types of services:
(in Euro million)
December 31, 2019
Investment
management
service
Distribution
of financial
product
Administration
services Assistance Other Total
France 6 1 - - 68 74
Europe 156 28 73 47 126 430
Asia 39 - - - - 39
AXA XL - - - - 0 0
United States 569 334 11 - 63 977
International 125 9 18 - 47 198
Transversal & Central Holdings 1,198 (0) - 352 46 1,596
TOTAL 2,092 371 102 400 349 3,315
of which recognized over time 1,645 93 12 280 207 2,238
of which recognized at a point in time 447 278 90 119 142 1,077
(in Euro million)
December 31, 2018 restated (a)
Investment
management
service
Distribution
of financial
product
Administration
services Assistance Other Total
France 6 1 - - 59 66
Europe 109 35 71 14 133 361
Asia 38 - - - - 38
AXA XL - - - - 0 0
United States 2,678 968 38 - 291 3,975
International 110 37 3 - 46 197
Transversal & Central Holdings 1,151 0 2 319 109 1,582
TOTAL 4,091 1,042 115 333 638 6,219
of which recognized over time 3,309 389 13 254 355 4,321
of which recognized at a point in time 782 653 102 79 283 1,899
(a) Restated: reclassification of German and Japanese activities of AXA Life Europe (previously reported as part of Germany and Japan respectively) into AXA Life Europe (included in Transversal & Central Holdings).

335I UNIVERSAL REGISTRATION DOCUMENT - ANNUAL REPORT 2019 - AXA I
CONSOLIDATED FINANCIAL STATEMENTS
5
5.6 NOTES TO THE CONSOLIDATED FINANCIAL STATEMENTS
21.2 TOTAL ASSETS
(In Euro million)
December 31,
2019
December 31,
2018 restated (a)
France 250,645 225,332
Europe 264,196 271,080
Asia 89,942 76,378
AXA XL 64,127 61,117
United States 0 193,220
International 44,243 41,951
Transversal & Central Holdings 67,726 61,617
TOTAL (b ) (c)
780,878 930,695
(a) Restated: reclassification of German and Japanese activities of AXA Life Europe (previously reported as part of Germany and Japan respectively) into AXA Life Europe (included in Transversal & Central Holdings).
(b) Net of intercompany eliminations and aft er deduction of the value related to the shares eliminated in consolidation.
(c) Including assets held for sale.
21.3 OTHER INFORMATION BY LINE OF BUSINESS
21.3.1 Life & Savings (including Health)
(In Euro million)
December 31, 2019 December 31, 2018
Gross
revenues
Liabilities
arising from
insurance
contracts
Liabilities
arising from
investment
contracts
Gross
revenues
Liabilities
arising from
insurance
contracts
Liabilities
arising from
investment
contracts
Protection 16,145 135,925 900 21,494 180,938 3,292
G/A Savings 12,991 150,824 35,253 12,398 158,109 30,917
Unit-Linked 8,051 51,177 3,508 14,141 144,939 3,131
Health 9,935 34,199 0 9,385 31,734 51
Funds & Others 309 5,129 0 297 4,739 0
Sub-total 47,430 377,254 39,662 57,714 520,459 37,391
Fees and charges relating to
investment contracts with no
participating features (a) 264 13,372 257 15,719
Fees, commissions and other revenues 559 1,472
TOTAL 48,253 377,254 53,034 59,444 520,459 53,110
(a) Relates to liabilities arising from investment contracts without discretionary participation features including contracts where the financial risk is borne by policyholders.

336 I UNIVERSAL REGISTRATION DOCUMENT - ANNUAL REPORT 2019 - AXA I
CONSOLIDATED FINANCIAL STATEMENTS 5 5.6 NOTES TO THE CONSOLIDATED FINANCIAL STATEMENTS
21.3.2 Property & Casualty (including Health)
Gross revenues Liabilities arising from insurance contracts
(In Euro million) December 31, 2019 December 31, 2018 December 31, 2019 December 31, 2018
Personal lines 18,524 17,814 28,835 27,377
Motor 10,215 9,966 18,765 17,713
Property Damage 4,029 3,916 3,368 3,295
Liability 407 399 909 932
Health 1,829 1,694 1,390 1,241
Other Personal lines 2,044 1,838 4,403 4,196
Commercial lines 34,269 21,093 80,474 77,208
Motor 3,708 3,568 6,210 5,766
Property Damage 5,511 4,100 7,021 6,847
Liability 2,190 2,193 10,330 10,329
Health 2,237 1,977 1,085 983
Specialty 4,940 1,794 8,777 7,811
Reinsurance 4,489 1,093 11,319 11,695
Other Commercial lines 11,193 6,368 35,733 33,777
Other 89 84 33 65
TOTAL 52,883 38,991 109,342 104,650
of which fees, commissions and other revenues 461 392 - -
21.4 NET REVENUES FROM BANKING ACTIVITIES
(in Euro million)
December 31,
2019
December 31,
2018
Net interests revenues 426 391
Net commissions 86 93
Net revenues from banking activities 512 484

337I UNIVERSAL REGISTRATION DOCUMENT - ANNUAL REPORT 2019 - AXA I
CONSOLIDATED FINANCIAL STATEMENTS
5
5.6 NOTES TO THE CONSOLIDATED FINANCIAL STATEMENTS
I Note 22 Net investment result excluding financing expenses
Net investment result (excluding financing expenses) from the financial assets of insurance companies and companies in other business
segments (excluding revenues from the financial assets of banks included in net revenues from banking activities) was as follows:
(in Euro million)
December 31, 2019
Net
investment
income (a)
Net realized
gains and losses
relating to
investments at
cost and at fair
value through
shareholders’
equity
Net realized
gains and
losses and
change in fair
value of other
investments
at fair value
through profit
or loss
Change in
investment
impairments
Net
investment
result
Investment in real estate properties at amortized cost 1,085 632 - (345) 1,372
Investment in real estate properties as at fair value
through profit or loss 48 - 64 - 112
Investment in real estate properties 1,133 632 64 (345) 1,485
Debt instruments held to maturity - - - - -
Debt instruments available for sale 9,645 455 336 (2) 10,435
Debt instruments designated as at fair value through
profit or loss (b) 366 - 596 - 962
Debt instruments held for trading 87 - 192 - 279
Non-quoted debt instruments (amortized cost) 247 (0) - (1) 245
Debt instruments 10,345 455 1,124 (3) 11,921
Equity instruments available for sale 550 524 7 (412) 669
Equity instruments designated as at fair value through
profit or loss (c) 455 - 140 - 595
Equity instruments held for trading 1 - 31 - 32
Equity instruments 1,006 524 178 (412) 1,296
Non-consolidated investment funds available for sale 234 146 (16) (69) 294
Non-consolidated investment funds designated as at
fair value through profit or loss 294 - 87 - 381
Non-consolidated investment funds held for trading 1 - 23 - 24
Non consolidated investment funds 528 146 95 (69) 700
Other assets held by consolidated investment
funds designated as at fair value through profit
or loss 82 - 17 - 99
Loans held to maturity - - - - -
Loans available for sale - - - - -
Loans designated as at fair value through profit or loss - - - - -
Loans held for trading - - - - -
Loans at cost 640 1 - 0 641
Loans 640 1 - 0 641
Assets backing contracts where the financial risk
is borne by policyholders - - 18,286 - 18,286
Derivative instruments (1,286) - (657) - (1,943)
Investment management expenses (533) - - - (533)
Other 200 (400) (633) 3 (831)
NET INVESTMENT RESULT 12,115 1,356 18,475 (826) 31,121
(a) Includes gain/losses from derivatives hedging variable annuities.
(b) Includes debt instruments held by consolidated investment funds, designated as at fair value through profit or loss.
(c) Includes equity instruments held by consolidated investment funds, designated as at fair value through profit or loss.

338 I UNIVERSAL REGISTRATION DOCUMENT - ANNUAL REPORT 2019 - AXA I
CONSOLIDATED FINANCIAL STATEMENTS 5 5.6 NOTES TO THE CONSOLIDATED FINANCIAL STATEMENTS
(in Euro million)
December 31, 2018
Net
investment
income (a)
Net realized
gains and losses
relating to
investments at
cost and at fair
value through
shareholders’
equity
Net realized
gains and
losses and
change in fair
value of other
investments
at fair value
through profit
or loss
Change in
investment
impairments
Net
investment
result
Investment in real estate properties at amortized cost 888 574 0 (258) 1,204
Investment in real estate properties as at fair value
through profit or loss 57 - 21 - 78
Investment in real estate properties 945 574 21 (258) 1,281
Debt instruments held to maturity - - - - -
Debt instruments available for sale 10,796 58 (321) (53) 10,480
Debt instruments designated as at fair value through
profit or loss (b) 981 - (933) - 48
Debt instruments held for trading 18 - (10) - 8
Non quoted debt instruments (amortized cost) 220 (2) - - 218
Debt instruments 12,015 57 (1,264) (53) 10,754
Equity instruments available for sale 653 1,253 (116) (764) 1,026
Equity instruments designated as at fair value through
profit or loss (c) 551 - 143 - 694
Equity instruments held for trading 3 - 1 - 4
Equity instruments 1,206 1,253 28 (764) 1,723
Non consolidated investment funds available for sale 324 144 27 (186) 310
Non consolidated investment funds designated as at
fair value through profit or loss 288 - 2 - 290
Non consolidated investment funds held for trading 13 - (26) - (13)
Non consolidated investment funds 626 144 3 (186) 587
Other assets held by consolidated investment
funds designated as at fair value through profit
or loss 107 - (35) - 72
Loans held to maturity - - - - -
Loans available for sale - - - - -
Loans designated as at fair value through profit or loss - - - - -
Loans held for trading - - - - -
Loans at cost 1,112 2 - (10) 1,104
Loans 1,112 2 - (10) 1,104
Assets backing contracts where the financial risk
is borne by policyholders - - (10,706) - (10,706)
Derivative instruments 689 - (1,321) - (632)
Investment management expenses (625) - - - (625)
Other 503 (47) 170 0 626
NET INVESTMENT RESULT 16,579 1,982 (13,104) (1,271) 4,186
(a) Includes gain/losses from derivatives hedging variable annuities.
(b) Includes debt instruments held by consolidated investment funds, designated as at fair value through profit or loss.
(c) Includes equity instruments held by consolidated investment funds, designated as at fair value through profit or loss.

339I UNIVERSAL REGISTRATION DOCUMENT - ANNUAL REPORT 2019 - AXA I
CONSOLIDATED FINANCIAL STATEMENTS
5
5.6 NOTES TO THE CONSOLIDATED FINANCIAL STATEMENTS
Net investment income is presented net of impairment
charges on directly-owned investment properties, and net
of amortization of debt instruments premiums/discounts. All
investment management fees are also included in the aggregate
figure.
Net realized gains and losses relating to investment at cost
and at fair value through shareholders’ equity include write
back of impairment following investment sales.
Net realized gains and losses and change in fair value of
investments designated as at fair value through profit or
loss consist mainly of:
■ adjustments relating to investments backing contracts where
the financial risk is borne by policyholders which are off set
by an adjustment of related policyholder reserves, as there is
a full pass through of the performance of held assets to the
individual contract holder;
■ changes in the fair value of investments designated as at fair
value through profit or loss held by funds of the “Satellite
Investment Portfolios” as defined in Note 1.8.2;
■ changes in fair value of underlying hedged items in fair value
hedges (as designated by IAS 39) or “natural hedges” (i.e.
underlying assets designated as at fair value through profit
or loss part of an economic hedge not eligible for hedge
accounting as defined by IAS 39).
The changes in investment impairments for available for sale
assets include impairment charges on investments, and release
of impairments only following revaluation of the recoverable
amount. Write back of impairments following investment
sales are included in the net realized capital gains or losses on
investments aggregate.
I Note 23 Net result of reinsurance ceded
Net result of reinsurance ceded was as follows:
(in Euro million)
December 31, 2019
France Europe Asia AXA XL
United
States
Interna-
tional
Trans-
versal &
Central
Holdings
Inter-
seg-
ment
elimina-
tions Total
Premiums ceded and unearned
premiums ceded (1,701) (841) (737) (5,925) (124) (851) (58) 692 (9,544)
Claims ceded (including change
in claims reserves) 1,401 381 465 4,399 215 422 79 (312) 7,050
Commissions received from/paid
to reinsurers 168 113 148 725 2 163 111 (53) 1,376
NET RESULT OF REINSURANCE
CEDED (132) (347) (124) (801) 93 (266) 132 327 (1,118)
(in Euro million)
December 31, 2018 restated (a)
France Europe Asia AXA XL
United
States
Interna-
tional
Trans-
versal &
Central
Holdings
Inter-
seg-
ment
elimina-
tions Total
Premiums ceded and unearned
premiums ceded (1,324) (759) (547) (2,220) (1,046) (793) (72) 457 (6,303)
Claims ceded (including change
in claims reserves) 957 327 387 2,021 1,046 443 241 (231) 5,191
Commissions received from/paid
to reinsurers 117 90 88 322 7 122 107 (26) 828
NET RESULT OF REINSURANCE
CEDED (249) (342) (72) 123 7 (228) 276 200 (285)
(a) Restated: reclassification of German and Japanese activities of AXA Life Europe (previously reported as part of Germany and Japan respectively) into AXA Life Europe (included in Transversal & Central Holdings).

340 I UNIVERSAL REGISTRATION DOCUMENT - ANNUAL REPORT 2019 - AXA I
CONSOLIDATED FINANCIAL STATEMENTS 5 5.6 NOTES TO THE CONSOLIDATED FINANCIAL STATEMENTS
I Note 24 Financing debt expenses
As of December 31, 2019, financing debt expenses, which include income and expenses relating to hedging derivative instruments on
financing debt, amounted to €720 million (€562 million as of December 31, 2018) mainly in the Company: for €445 million (€387 million
as of December 31, 2018).
I Note 25 Expenses by type
25.1 ACQUISITION EXPENSES
(in Euro million)
December 31, 2019 December 31, 2018
Insurance
Other
activities
Intersegment
eliminations Total Total
Acquisition expenses – gross (a) 14,335 (0) (96) 14,239 12,514
Change in deferred acquisition expenses
and equivalents (b) (1,757) - - (1,757) (1,312)
NET ACQUISITION EXPENSES 12,578 (0) (96) 12,482 11,201
(a) Includes all acquisition expenses relating to insurance and investment contracts before capitalization/amortization of deferred acquisition expenses and equivalents.
(b) Change (capitalization and amortization) in deferred acquisition expenses relating to insurance and investment contracts with discretionary participation features and changes in net rights to future management fees relating to investment contracts with no discretionary participation features.
25.2 EXPENSES BY TYPE
(in Euro million)
December 31, 2019 December 31, 2018
Insurance
Other
activities
Intersegment
eliminations Total Total
Acquisition expenses – gross 14,335 0 (96) 14,239 12,514
Claims handling expenses 2,877 - (36) 2,840 2,433
Investment management expenses 296 (11) (21) 263 170
Administrative expenses 7,926 3,290 (494) 10,722 10,976
Banking expenses - 67 - 67 91
Increase/ write back of tangible assets amortization 0 - - 0 0
Other income/expenses (a) 197 96 304 598 49
TOTAL EXPENSES BY DESTINATION 25,632 3,442 (343) 28,730 26,233
Breakdown of expenses by type
Staff expenses 6,761 1,384 (1) 8,144 8,471
Outsourcing and professional services 1,038 325 (30) 1,333 1,095
IT expenses 1,444 271 153 1,868 1,663
Charges relating to owner occupied properties 543 193 (1) 736 740
Commissions paid 12,968 434 (316) 13,086 11,389
Other expenses (a) 2,877 835 (149) 3,563 2,875
(a) Include losses related to the disposal processes of AXA Bank Belgium and AXA Life Europe (see Note 5.3).

341I UNIVERSAL REGISTRATION DOCUMENT - ANNUAL REPORT 2019 - AXA I
CONSOLIDATED FINANCIAL STATEMENTS
5
5.6 NOTES TO THE CONSOLIDATED FINANCIAL STATEMENTS
Expenses increased by €2,498 million compared to December 31,
2018. On a constant exchange rate basis, expenses increased by
€1,950 million mainly from:
■ AXA XL (€+3,853 million) mainly due to the full impact in 2019
of the acquisition of the XL Group completed on September 12,
2018;
■ International (€+662 million) mainly due to the loss related to
the expected disposal of AXA Bank Belgium (€+568 million);
■ Europe (€+266 million) notably in Germany (€+258 million)
mainly from the impact in 2019 of the consolidation of Roland
Rechtsschutz starting from October 1, 2018, and the United
Kingdom & Ireland (€+72 million) from business growth and
investments in transformation programs;
■ France (€+245 million) mainly due to higher commissions on
premiums resulting from volume growth in Life & Savings and
higher staff costs to enhance service quality;
■ Transversal (€+132 million) notably from AXA Life Europe
(€+122 million) due to the loss related to the expected
disposal, and AXA Assistance (€+85 million) as a result of
higher commissions from a change in business mix and
higher investments to improve customer experience and
simplification;
■ Asia (€+117 million) mainly in Japan (€+100 million) notably
from higher acquisition costs given volume growth in Health
and Protection with Unit-Linked.
This is partly off set by the United States (€-3,329 million), only
contributing to 3 months of operations on the expenses of the
Group following the deconsolidation of Equitable Holdings,
Inc. (1) as of March 31, 2019.
(1) For further information, please refer to Note 3 “Consolidated statement of income by segment” in Part 5 – “Consolidated Financial Statements” of this Annual Report.
I Note 26 Employees
26.1 BREAKDOWN OF STAFF EXPENSES
(in Euro million)
December 31,
2019
December 31,
2018
Wages and benefits 5,761 6,202
Social contributions 828 900
Employee benefits expenses 714 634
Share based compensation 159 326
Other staff expenses and employees’ profit sharing (a) 681 408
TOTAL STAFF EXPENSES 8,144 8,471
(a) Including redundancies and early retirement expenses (triggering event = set up of the plan), and profit sharing with employees in France.
26.2 EMPLOYEE BENEFITS
26.2.1 Defined contribution plans
The cost of the contributions paid was recognized as an expense
in the income statement, and amounted to €236 million in
2019 (€183 million in 2018). The 2019 cost included €82 million
of expenses for defined contribution plans in force at AXA XL
(€17 million in 2018 for the three months since the acquisition
date).
26.2.2 Defined benefit plans
AXA operates various defined post-employment benefit plans
mainly in the United Kingdom, Germany, Switzerland, France
and Belgium.
The defined benefit pension plans within AXA are mostly final
salary pension plans or based on a cash balance formula, which
provide benefits in the form of a guaranteed level of lump-sum
payable at retirement age or pension payable for life. The level
of benefits is generally based on members’ length of service and
their salary in the final years leading up to retirement.
In Switzerland, the benefit plan is a Swiss contribution-based
plan classified as a defined benefit plan under IAS 19 because of
guarantees, risks related to the mortality and disability coverage.
In the United Kingdom and Germany, pensions in payment are
generally updated in line with the retail price index or inflation,
as opposed to other countries where pensions do not necessarily
receive inflationary increases once in payment.

342 I UNIVERSAL REGISTRATION DOCUMENT - ANNUAL REPORT 2019 - AXA I
CONSOLIDATED FINANCIAL STATEMENTS 5 5.6 NOTES TO THE CONSOLIDATED FINANCIAL STATEMENTS
Most of the defined benefit pension plans are funded through
long-term employee benefit funds or covered by insurance
policies or Mutual funds.
Benefit payments in the United Kingdom and Switzerland are
from trustee-administered funds and plan assets held in trusts
are governed by local regulations and practices. The Board of
trustees, generally composed of representatives of the Company
and plan participants in accordance with the respective plan’s
regulations is responsible for governance of the plans including
investment decisions and contribution schedules in order to
meet the existing minimum funding requirement or funding
regime objective.
In France and Belgium, benefit payments are managed by
insurance companies or Mutual funds.
In the United Kingdom, the main defined benefit plan was closed
to new members on August 31, 2013, and members who were
part of defined benefit sections had the option to participate in
the defined contributions sections.
Following the acquisition of XL Group which became AXA XL
and the full consolidation of Roland Rechtsschutz in 2018, AXA
assumed liabilities and plan assets associated with defined
benefit plans sponsored by those entities in the United Kingdom,
the United States and Germany. Main pension plans are closed
to new entrants, partially funded, governed by local regulations
and trustees. AXA XL also maintains deferred cash awards which
are qualified as other long-term benefits under IAS 19.
As the result of the loss of control of AXA over Equitable Holdings,
Inc. (“EQH”), all pensions and other defined benefit plans
sponsored by EQH, including AB, have been deconsolidated as
at March 31, 2019.
26.2.3 Significant actuarial assumptions
The assumptions used to value defined benefit plans are consistent with the economic and financial conditions in the countries where
they are located. The weighted-average financial assumptions used by AXA for pension plans in the main regions and countries were
as follows:
DECEMBER 2019 ASSUMPTIONS
Europe Switzerland United Kingdom United States Japan Other
Pension benefit obligation –
assumptions as of December 31, 2019
Discount rate 0.9% 0.1% 1.9% 3.2% 0.6% 6.3%
Salary increase for future years 2.4% 1.7% N/A N/A 2.3% 3.8%
Inflation rate 1.8% 1.0% 2.0% 2.5% 0.0% 3.7%
DECEMBER 2018 ASSUMPTIONS
Europe Switzerland United Kingdom United States Japan Other
Pension benefit obligation –
assumptions as of December 31, 2018
Discount rate 1.7% 0.8% 2.8% 4.1% 0.5% 8.0%
Salary increase for future years 2.5% 1.7% N/A 6.3% 2.3% 3.5%
Inflation rate 1.8% 1.1% 2.2% 2.5% 0.0% 3.7%
For any given plan, the discount rate is determined at the closing
date by using market yields for the corresponding currency on
high quality corporate bonds with consideration of AA-rated
bonds and depending on the plan’s duration and the maturity
profile of the defined benefit obligation.
Significant demographic assumptions used by AXA are mortality
tables in the measurement of the Group’s obligations under its
defined benefit schemes. These assumptions are oft en set based
on actuarial advice in accordance with published statistics and
experience in each country. Translated into averages remaining
life expectancy at retirement age (between 60 and 65 in average),
the mortality assumptions would give:
■ 22.80 years for male and 25.39 years for female retiring at end
of December 2019;
■ 23.63 years for male and 26.20 years for female retiring at end
of December 2029 (i.e. 10 years aft er the reporting date).

343I UNIVERSAL REGISTRATION DOCUMENT - ANNUAL REPORT 2019 - AXA I
CONSOLIDATED FINANCIAL STATEMENTS
5
5.6 NOTES TO THE CONSOLIDATED FINANCIAL STATEMENTS
26.2.4 Statement of financial position/balance sheet information
The table below presents the change in benefit obligation and the change in plan assets associated with pension plans and other
benefit plans sponsored by AXA, together with the separate assets and the balance sheet position.
Pension benefits Other benefits Total
(in Euro million) 2019 2018 2019 2018 2019 2018
Change in benefit obligation
Defined Benefit Obligation at the beginning of the year 19,754 20,497 622 566 20,376 21,062
Current service cost 241 230 145 41 386 271
Interest cost 273 306 5 16 278 322
Employee contributions 68 65 - - 68 65
Plan amendments and curtailments (a) (9) (0) (1) (11) (10) (11)
Experience (gains) and losses (18) 92 0 (0) (17) 92
Actuarial (gains) and losses arising from changes in demographic assumptions (b) (106) (158) (0) (3) (107) (161)
Actuarial (gains) and losses arising from changes in financial assumptions (c) 2,073 (579) 21 (31) 2,094 (610)
Benefits paid by plan assets and by separate assets (511) (636) (1) (1) (512) (637)
Benefits directly paid by the employer (283) (300) (116) (44) (399) (344)
Settlements (1) (216) - - (1) (216)
Net transfer In/(Out) (including acquisitions, disposals and reclassifications) (d) (2,605) 161 (447) 67 (3,052) 228
Other 6 4 (1) - 5 4
Foreign exchange impact 589 288 6 22 596 311
Defined Benefit Obligation at the end of the year (A) 19,469 19,754 234 622 19,703 20,376
Change in plan assets
Fair value of plan assets at the beginning of year 12,139 12,420 5 5 12,145 12,425
Interest income on plan assets 193 217 0 0 193 217
Actual return on plan assets, excluding interest income 967 (279) 0 (0) 967 (279)
Employer contributions (e) 149 236 - - 149 236
Employee contributions 60 55 - - 60 55
Net transfer In/(Out) (including acquisitions, disposals and reclassifications) (d) (2,144) 72 - - (2,144) 72
Benefits paid by plan assets (406) (515) - - (406) (515)
Amounts paid in respect of settlements (1) (226) - - (1) (226)
Other - (11) - - - (11)
Foreign exchange impact 506 171 - - 506 171
Fair value of plan assets at the end of the year (B) 11,465 12,139 6 5 11,470 12,145
Change in separate assets
Fair value of separate assets at the beginning of year 1,233 1,281 - - 1,233 1,281
Interest income on separate assets 13 12 - - 13 12
Actual return on separate assets, excluding interest income 54 (36) - - 54 (36)
Employer contributions 73 73 1 1 74 74
Employee contributions 7 11 - - 7 11
Net transfer In/(Out) (including acquisitions, disposals and reclassifications) 1 14 - - 1 14
Benefits paid by separate assets (105) (121) (1) (1) (106) (122)
Other - - - - - -
Fair value of separate assets at the end of the year 1,276 1,233 - - 1,276 1,233
Change in the cumulative eff ect of asset ceiling
Cumulative eff ect of asset ceiling at the beginning of the year 19 17 - - 19 17
Interest cost on asset ceiling 1 0 - - 1 0
Changes in the asset ceiling, excluding the interest cost 12 1 - - 12 1
Foreign exchange impact 2 (0) - - 2 (0)
Cumulative eff ect of asset ceiling at the end of the year 33 19 - - 33 19
Funded status
Funded status (B)-(A) (8,005) (7,614) (228) (617) (8,233) (8,231)
Cumulative impact of asset ceiling (33) (19) - - (33) (19)
Liability and asset recognized in the statement of financial position
(excluding separate assets)
Net position (excluding separate assets) (8,037) (7,633) (228) (617) (8,266) (8,250)
Fair value of separate assets at the end of the year 1,276 1,233 - - 1,276 1,233
Net balance sheet position (including separate assets) (6,761) (6,400) (228) (617) (6,990) (7,017)
(a) In 2019, this amount included plan amendment eff ects in Switzerland and Germany, and a restructuring plan in France. In 2018, this amount mainly reflected a plan amendment in Belgium.
(b) In 2019, actuarial gains pertaining to changes in demographic assumptions resulted mainly from the update for the latest CMI mortality projections model in the United Kingdom.
(c) In 2019, actuarial losses pertaining to changes in financial assumptions resulted mainly from the overall decrease in discount rate assumptions used to value liabilities.
(d) In 2019, this amount mainly reflected the deconsolidation of benefit obligation and plan assets associated with defined benefit plans sponsored by Equitable Holdings, Inc. as at March 31, 2019. In 2018, this amount comprised the additional benefit obligation and plan assets in connection with the AXA XL acquisition and the consolidation of Roland Rechtsschutz.
(e) Amounts are mainly related to plan assets contributions in Switzerland, the United Kingdom and Ireland.

344 I UNIVERSAL REGISTRATION DOCUMENT - ANNUAL REPORT 2019 - AXA I
CONSOLIDATED FINANCIAL STATEMENTS 5 5.6 NOTES TO THE CONSOLIDATED FINANCIAL STATEMENTS
Benefits classified in “Other benefits” include post-retirement
benefits other than pensions, principally health care benefits
for retirees, pre-retirement benefits and deferred cash awards.
A surplus (including minimum funding requirement eff ect) is
recognized to the extent that it is recoverable, either through
future contribution reductions or a refund to which AXA has an
unconditional right, including the ability to use the surplus to
generate future benefits.
26.2.5 Pension and other benefits expense
The annual expense for employee pension and other benefits recorded in the income statement (included in Note 26.1.), for the years
ended December 31, 2019 and 2018 is presented below:
Pension benefits Other benefits Total
(in Euro million)
December 31,
2019
December 31,
2018
December 31,
2019
December 31,
2018
December 31,
2019
December 31,
2018
Pension and other benefits
expense
Current service cost 241 230 145 41 386 271
Plan amendments and curtailments (9) (0) (1) (11) (10) (11)
Settlement gains or losses 0 10 - - 0 10
Other 8 15 (1) - 8 15
Total service cost 240 255 144 30 383 285
Interest cost on the defined benefit
obligation 273 306 5 16 278 322
Interest income on plan assets (193) (217) (0) (0) (193) (217)
Interest income on separate assets (13) (12) - - (13) (12)
Interest cost on asset ceiling 1 0 - - 1 0
Net interest cost/income 67 78 5 16 72 94
DEFINED PENSION AND OTHER
BENEFITS EXPENSE (SERVICE
COST + NET INTEREST COST/
INCOME) 307 332 149 46 455 378
The calculation of the periodic pension cost is based on a “spot
rate approach” or “full yield approach” that involves the use
of separate discount rates of the yield curve, to determine the
related service cost, interest cost and interest income on assets
associated to each discounted cashflow or segregated subsets
of the plan’s obligation.
26.2.6 Change in the liability (net of plan
assets but excluding separate assets
and assets within the insurance
General Accounts backing employee
benefits) recognized in the statement
of financial position
Consistently with IAS 19, the statement of financial position
liability reflects the funded status (liabilities net of plan assets
and cumulative impact of asset ceiling), excluding Separate
Assets and Assets within the insurance General Accounts that
are backing employee benefits.
DESCRIPTION OF THE RELATIONSHIP BETWEEN SEPARATE
ASSETS (OR REIMBURSEMENT RIGHT) AND RELATED
OBLIGATIONS
Separate Assets amounted to €1,276 million as of December 31,
2019 (€1,233 million as of December 31, 2018) mainly in France
and Belgium. This represents the fair value of assets backing
Defined Benefit Obligations covered by both (i) insurance
policies written within the Group that provide direct rights to the
employees, and (ii) insurance policies with related parties that are
outside the scope of consolidation. Under these circumstances,
these assets are not considered as Plan Assets that would be
deducted from the pensions’ Defined Benefit Obligation (DBO),
but represent reimbursement rights accounted for as Separate
Assets under IAS 19. Insurance assets or liabilities (within the
Group) and pension obligations remain on the balance sheet.

345I UNIVERSAL REGISTRATION DOCUMENT - ANNUAL REPORT 2019 - AXA I
CONSOLIDATED FINANCIAL STATEMENTS
5
5.6 NOTES TO THE CONSOLIDATED FINANCIAL STATEMENTS
Similarly in some other countries (mainly in Switzerland),
although non-transferable insurance policies related to Defined
Benefits Obligation between entities within the Group are
effectively backed by General Account assets (available to
general creditors in case of bankruptcy), they are not taken into
consideration in the pension assets disclosures.
IAS 19 considers liabilities net of Plan Assets on the one hand
and Separate Assets and a part of Swiss assets on the other hand
separately, while economically, Separate Assets and a part of
Swiss assets should be considered as backing the Defined Benefit
Obligation like any other Plan Assets (which are presented in
Note 26.2.8 ) and deducted from the Defined Benefit Obligation.
The presentation required by IAS 19 seems to imply that such
DBOs are not covered by corresponding assets.
Consistently with IAS 19 requirements, the roll-forward of the
statement of financial position liability from January 1, 2019, to
December 31, 2019, shown below only captures the evolution of
the liability recorded in the Group’s statement of financial position
net of Plan Assets and does not include Separate Assets and Swiss
assets included in the Insurance General Account liabilities (which
are presented in Note 26.2.8 ). The table below shows the detailed
roll-forward of the statement of financial position liability, with
the Separate Assets added at each year end.
Pension benefits Other benefits Total
(in Euro million) 2019 2018 2019 2018 2019 2018
Change in the liability
recognized in the statement
of financial position
Statement of financial position
liability at the beginning of the year (7,633) (8,094) (617) (560) (8,250) (8,654)
Pension and other benefits expense (307) (332) (149) (46) (455) (378)
Adjustment due to separate assets (75) 14 - - (75) 14
Employer contributions 149 236 - - 149 236
Benefits directly paid by the
employer 283 300 116 44 399 344
Benefits paid by separate assets 105 121 1 1 106 122
Net transfer (In)/Out (including
acquisitions, disposals and
reclassifications) 461 (89) 447 (67) 908 (156)
Actuarial gains and losses
recognized in OCI (937) 329 (20) 34 (957) 362
Other - - - - - -
Foreign exchange impact (85) (117) (6) (22) (91) (139)
Statement of financial position
liability at the end of the year (8,037) (7,633) (228) (617) (8,266) (8,250)
Fair value of separate assets
at the end of the year 1,276 1,233 - - 1,276 1,233
Net balance sheet position
at the end of the year (6,761) (6,400) (228) (617) (6,990) (7,017)
26.2.7 Sensitivity analysis of the Defined Benefit Obligation (DBO): gross of all assets
A description of the risk that pension schemes are exposed to is presented in Note 26.2.10. The sensitivity analysis for significant actuarial
assumptions showing how the Defined Benefit Obligation (totaling €19,703 million as of December 31, 2019 and €20,376 million as
of December 31, 2018) would have been aff ected by changes in the relevant actuarial assumption that is reasonably possible for year
ended as of December 31, 2019, and 2018 is presented below:
2019 2018
Eff ect of 0.50%
increase
Eff ect of 0.50%
decrease
Eff ect of 0.50%
increase
Eff ect of 0.50%
decrease
Discount rate -6.9% 7.9% -6.2% 7.0%
Salary growth rate 0.9% -0.8% 0.8% -0.6%
Inflation rate 3.6% -3.3% 3.1% -2.9%
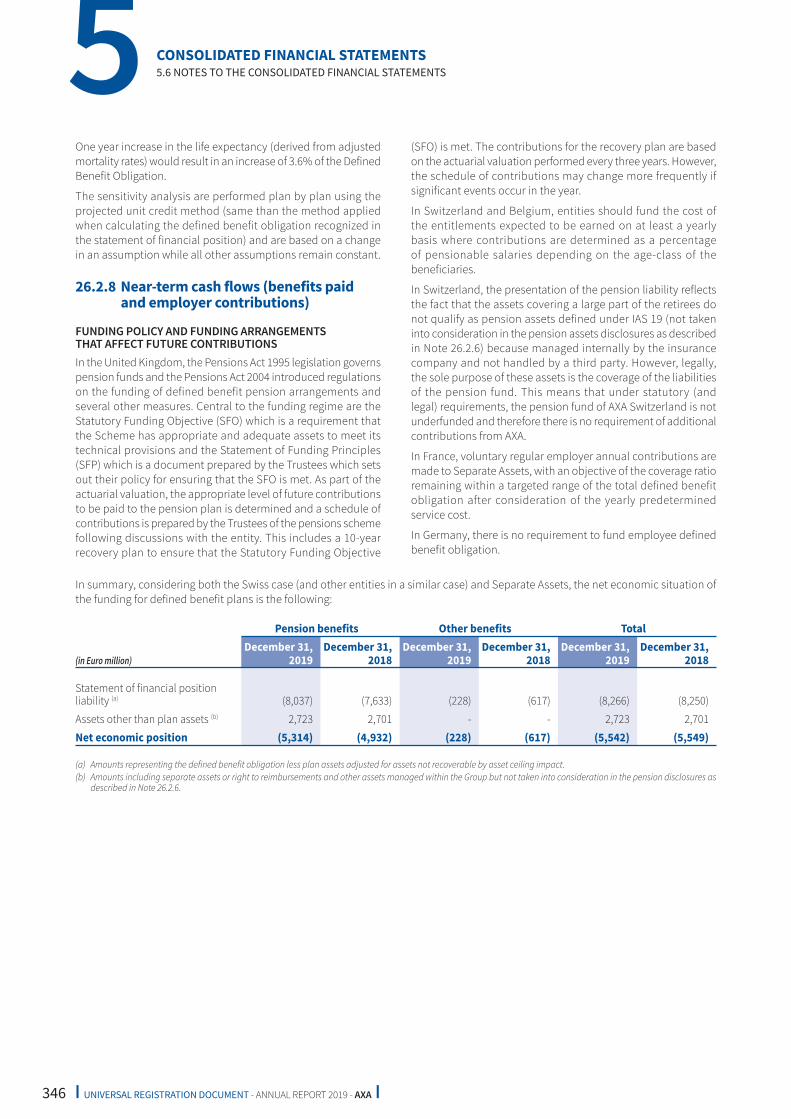
346 I UNIVERSAL REGISTRATION DOCUMENT - ANNUAL REPORT 2019 - AXA I
CONSOLIDATED FINANCIAL STATEMENTS 5 5.6 NOTES TO THE CONSOLIDATED FINANCIAL STATEMENTS
One year increase in the life expectancy (derived from adjusted
mortality rates) would result in an increase of 3.6% of the Defined
Benefit Obligation.
The sensitivity analysis are performed plan by plan using the
projected unit credit method (same than the method applied
when calculating the defined benefit obligation recognized in
the statement of financial position) and are based on a change
in an assumption while all other assumptions remain constant.
26.2.8 Near-term cash flows (benefits paid
and employer contributions)
FUNDING POLICY AND FUNDING ARRANGEMENTS
THAT AFFECT FUTURE CONTRIBUTIONS
In the United Kingdom, the Pensions Act 1995 legislation governs
pension funds and the Pensions Act 2004 introduced regulations
on the funding of defined benefit pension arrangements and
several other measures. Central to the funding regime are the
Statutory Funding Objective (SFO) which is a requirement that
the Scheme has appropriate and adequate assets to meet its
technical provisions and the Statement of Funding Principles
(SFP) which is a document prepared by the Trustees which sets
out their policy for ensuring that the SFO is met. As part of the
actuarial valuation, the appropriate level of future contributions
to be paid to the pension plan is determined and a schedule of
contributions is prepared by the Trustees of the pensions scheme
following discussions with the entity. This includes a 10-year
recovery plan to ensure that the Statutory Funding Objective
(SFO) is met. The contributions for the recovery plan are based
on the actuarial valuation performed every three years. However,
the schedule of contributions may change more frequently if
significant events occur in the year.
In Switzerland and Belgium, entities should fund the cost of
the entitlements expected to be earned on at least a yearly
basis where contributions are determined as a percentage
of pensionable salaries depending on the age-class of the
beneficiaries.
In Switzerland, the presentation of the pension liability reflects
the fact that the assets covering a large part of the retirees do
not qualify as pension assets defined under IAS 19 (not taken
into consideration in the pension assets disclosures as described
in Note 26.2.6) because managed internally by the insurance
company and not handled by a third party. However, legally,
the sole purpose of these assets is the coverage of the liabilities
of the pension fund. This means that under statutory (and
legal) requirements, the pension fund of AXA Switzerland is not
underfunded and therefore there is no requirement of additional
contributions from AXA.
In France, voluntary regular employer annual contributions are
made to Separate Assets, with an objective of the coverage ratio
remaining within a targeted range of the total defined benefit
obligation after consideration of the yearly predetermined
service cost.
In Germany, there is no requirement to fund employee defined
benefit obligation.
In summary, considering both the Swiss case (and other entities in a similar case) and Separate Assets, the net economic situation of
the funding for defined benefit plans is the following:
Pension benefits Other benefits Total
(in Euro million)
December 31,
2019
December 31,
2018
December 31,
2019
December 31,
2018
December 31,
2019
December 31,
2018
Statement of financial position
liability (a) (8,037) (7,633) (228) (617) (8,266) (8,250)
Assets other than plan assets (b) 2,723 2,701 - - 2,723 2,701
Net economic position (5,314) (4,932) (228) (617) (5,542) (5,549)
(a) Amounts representing the defined benefit obligation less plan assets adjusted for assets not recoverable by asset ceiling impact.
(b) Amounts including separate assets or right to reimbursements and other assets managed within the Group but not taken into consideration in the pension disclosures as described in Note 26.2.6.

347I UNIVERSAL REGISTRATION DOCUMENT - ANNUAL REPORT 2019 - AXA I
CONSOLIDATED FINANCIAL STATEMENTS
5
5.6 NOTES TO THE CONSOLIDATED FINANCIAL STATEMENTS
ESTIMATED FUTURE BENEFITS TO BE PAID BY THE ASSETS OR THE EMPLOYER
(in Euro million) Pension benefits Other benefits
2020 859 122
2021 828 86
2022 800 45
2023 837 4
2024 882 4
Five years thereaft er 4,415 18
From year N+11 until the last benefit payments is paid 18,919 62
These estimated future contributions and benefits expected to be paid are subject to uncertainty as they will be notably driven by
economics of future years.
26.2.9 Asset mix of plan assets
As pension liabilities have a long-term nature, a mix of equity instruments, debt instruments, investment funds and real estate
investments is used in Plan Assets.
The following tables disclose the fair values of Plan Assets and their level within the fair value hierarchy for the defined benefit plans
of AXA Group as at December 31, 2019, and 2018, respectively (fair value hierarchy principles as described by the Group are described
in Note 1.5):
December 31, 2019
Total Group United Kingdom Switzerland Other
Quoted
in an
active
market
Not
quoted
in an
active
market Total
Quoted
in an
active
market
Not
quoted
in an
active
market Total
Quoted
in an
active
market
Not
quoted
in an
active
market Total
Quoted
in an
active
market
Not
quoted
in an
active
market Total
Equity instruments 8.8% 0.1% 8.9% 0.1% 0.2% 0.3% 22.2% 0.0% 22.2% 10.6% 0.0% 10.6%
Debt instruments 43.2% 0.0% 43.2% 59.2% 0.0% 59.2% 15.2% 0.0% 15.2% 53.4% 0.0% 53.4%
Other (a) 11.4% 36.5% 47.9% 5.0% 35.5% 40.5% 20.5% 42.2% 62.7% 15.0% 21.0% 36.0%
TOTAL 63.4% 36.7% 100.0% 64.3% 35.7% 100.0% 57.9% 42.2% 100.0% 79.0% 21.0% 100.0%
TOTAL
(in Euro million) 7,266 4,204 11,470 4,106 2,282 6,388 2,341 1,706 4,047 817 218 1,035
(a) The other category of plan assets mainly includes investment funds.
December 31, 2018
Total Group United Kingdom Switzerland Other
Quoted
in an
active
market
Not
quoted
in an
active
market Total
Quoted
in an
active
market
Not
quoted
in an
active
market Total
Quoted
in an
active
market
Not
quoted
in an
active
market Total
Quoted
in an
active
market
Not
quoted
in an
active
market Total
Equity instruments 11.0% 0.1% 11.1% 0.1% 0.3% 0.4% 18.5% 0.0% 18.5% 22.8% 0.0% 22.8%
Debt instruments 48.3% 0.0% 48.3% 58.0% 0.0% 58.0% 21.8% 0.0% 21.8% 61.2% 0.1% 61.3%
Other (a) 12.8% 27.9% 40.6% 2.3% 39.4% 41.7% 32.8% 26.9% 59.7% 8.8% 7.1% 15.9%
TOTAL 72.0% 28.0% 100.0% 60.3% 39.7% 100.0% 73.1% 26.9% 100.0% 92.8% 7.2% 100.0%
TOTAL
(in Euro million) 8,741 3,404 12,145 3,405 2,242 5,647 2,581 950 3,531 2,754 213 2,967
(a) The other category of plan assets mainly includes investment funds.
ESTIMATED EMPLOYER CONTRIBUTIONS TO THE PLAN FOR THE NEXT ANNUAL REPORTING PERIOD
The estimated amount of 2020 employer contributions for pension benefits is €228 million (€205 million estimated in 2018 for 2019).

348 I UNIVERSAL REGISTRATION DOCUMENT - ANNUAL REPORT 2019 - AXA I
CONSOLIDATED FINANCIAL STATEMENTS 5 5.6 NOTES TO THE CONSOLIDATED FINANCIAL STATEMENTS
26.2.10 Management of risks specific
to the Group arising from defined
benefit plans
Local operating entities and trustees have the primary
responsibility for managing the risks that plans are exposed
to through a defined benefit plan, in accordance with local
legislation if any and the risk framework defined at local level.
Defined benefit plans expose AXA mainly to market investment
risk, interest rate risk, inflationary risk and longevity risk:
■ a decline in asset market value (equity, real estate, alternatives
etc.) will immediately increase the balance sheet liability and
the near-term cash flows for countries where there is minimum
funding requirements;
■ a decrease in corporate bond yields will result in an increase
in plan liabilities even if this eff ect will be partially off set by an
increase in the value of the plans’ bonds; and
■ an increase in inflation rate or an increase in life expectancy
will result in higher plan liabilities thus, an increase in future
employer contributions in countries where there are minimum
funding requirements.
INVESTMENT POLICIES AND STRATEGIES USED
BY ENTITIES/TRUSTEES TO MANAGE RISKS
In most countries, Trustees or Investment Committees set
the general investment policies and guidelines regarding the
allocation of plan assets in accordance with the long-term
horizon of the benefit plans. The investment strategy is reviewed
regularly, following actuarial valuations of the funded benefit
plans.
The investment positions are managed within an Asset
Liability Management (ALM) framework defining an optimal
strategic allocation with respect to the liabilities structure.
The management of the assets notably includes liquidity
management, diversification of each asset type so that the failure
of any specific investment does not present a material risk to the
plans, and implementation of hedging programs.
In 2015, the UK pension scheme entered into a longevity swap
transaction with the aim of economically hedging longevity risk
inherent within the pensioner population of the Scheme. In
2019, the scheme entered into another longevity swap, covering
pensioner members that retired prior to April 1, 2019. Moreover,
caps on inflationary increases were in place to protect the plan
against extreme inflation in the United Kingdom.
26.2.11 Statement of financial position/balance sheet reconciliation
(in Euro million)
December 31,
2019
December 31,
2018
Net position (excluding separate assets) (a) (8,266) (8,250)
(assets)/liabilities held for sale (b) 169 -
Other liabilities (233) (426)
TOTAL (c)
(8,329) (8,676)
(a) Net position (excluding separate assets) for pension benefits and other benefits as reported in Note 26.2.6.
(b) Included in the net position above (related to AXA Bank Belgium) classified in separate asset and liability items on the statement of financial position.
(c) It corresponds to a liability of €8,409 million as of December 31, 2019 (€8,716 million as of December 31, 2018) included in the statement of financial position under the caption “provision for risks and charges”, and an asset of €79 million included in the statement of financial position under the caption “other receivables”.

349I UNIVERSAL REGISTRATION DOCUMENT - ANNUAL REPORT 2019 - AXA I
CONSOLIDATED FINANCIAL STATEMENTS
5
5.6 NOTES TO THE CONSOLIDATED FINANCIAL STATEMENTS
26.3 SHARE-BASED COMPENSATION
All figures are gross of tax.
(in Euro million) 2019 2018
Cost by plan
AXA SA stock options 3.2 3.4
■ 2014 grants 0.1 0.3
■ 2015 grants 0.4 0.6
■ 2016 grants 0.8 1.0
■ 2017 grants 1.2 1.1
■ 2018 grants 0.8 0.4
■ 2019 grants - -
AXA stock options for EQH 0.6 0.3
■ 2015 AXA SA grants 0.1 0.1
■ 2016 AXA SA grants 0.2 0.1
■ 2017 AXA SA grants 0.3 0.1
■ 2018 AXA SA grants - -
■ 2019 AXA SA grants - -
AXA Group Shareplan 3.5 3.0
■ Classic Plan 0.5 0.3
■ Leverage Plan 2.9 2.7
AXA Performance Shares (in France) 58.2 45.8
■ 2015 grants - 5.3
■ 2016 grants 8.1 15.0
■ 2017 grants 19.9 16.4
■ 2018 grants 19.2 9.0
■ 2019 grants 11.0 -
AXA International Performance Shares plans and Performance Units 71.9 59.2
■ 2015 grants 11.6 15.4
■ 2016 grants 15.7 16.5
■ 2017 grants 17.4 17.8
■ 2018 grants 14.8 7.3
■ 2019 grants 12.4 -
AXA Retirement Performance Shares 15.1 14.0
EQH Share-based compensation instruments 1.3 (0.1)
■ AXA Financial TSARs/SARs 0.9 0.1
■ AXA Financial Restricted Shares and PARS 0.4 (0.2)
AXA Investment Managers Performance Shares 14.6 25.4
AB Share-based compensation instruments 16.6 158.8
TOTAL EMPLOYEE SHARE-BASED COMPENSATION COST 185.1 309.7
The cost includes the expenses from share-based compensation
instruments issued by the Group as well as by AXA subsidiaries.
The share-based compensation instruments listed above are
mostly composed of instruments settled in equity but include
also instruments settled in cash. The unit cost of the equity
settled instruments does not vary for a given plan while the cash
settled instruments unit cost is updated at each closing.
The total charge is amortized over the vesting period and
adjusted at each future closing date for the diff erence between
actual and expected lapse to take into account actual service
conditions and actual non-market performance conditions.
A detail of each of the major plans and the associated cost is
presented in Note 26.3.1 and Note 26.3.2.

350 I UNIVERSAL REGISTRATION DOCUMENT - ANNUAL REPORT 2019 - AXA I
CONSOLIDATED FINANCIAL STATEMENTS 5 5.6 NOTES TO THE CONSOLIDATED FINANCIAL STATEMENTS
26.3.1 Share-based compensation
instruments issued by the Group
AXA SA STOCK OPTIONS
Since 2019, AXA SA stock options have not been granted.
Previously, executive officers and other key employees were
granted options on AXA ordinary shares under employee stock
option plans. These options were either subscription options
involving newly issued AXA ordinary shares or purchase
options involving AXA treasury shares. While the precise terms
and conditions of each option grant may vary, options were
(i) granted at a price not less than the average closing price of the
ordinary share on the Paris Stock Exchange during the 20 trading
days preceding the date of grant, (ii) valid for a maximum term
of ten years, and (iii) vest in instalments of 33.33% per year on
each of the third, fourth and fift h anniversaries of the grant date.
Since 2013, for all beneficiaries, the vesting of the final instalment
has been subject to the fulfilment of the market performance
conditions regarding the performance of the AXA shares
compared to the STOXX Insurance Index (“SXIP”).
All options granted to the members of the Management
Committee have been subject to the fulfilment of this market-
based performance condition.
The following table shows AXA SA stock options status:
Options (in million) Weighted exercise price (in Euro)
2019 2018 2019 2018
Options AXA
Outstanding on January 1 20.0 23.1 19.38 18.79
Granted - 2.7 - 21.60
Exercised (4.2) (2.6) 15.75 14.51
Cancelled and expired (0.6) (3.3) 17.04 20.11
Outstanding as of December 31 15.2 20.0 20.48 19.38

351I UNIVERSAL REGISTRATION DOCUMENT - ANNUAL REPORT 2019 - AXA I
CONSOLIDATED FINANCIAL STATEMENTS
5
5.6 NOTES TO THE CONSOLIDATED FINANCIAL STATEMENTS
Outstanding options
Exercisable options
(taking into account
the market-based
performance condition)
Expiry year of options
(in million)
December 31,
2019
December 31,
2018
December 31,
2019
December 31,
2018
2019 - 0.8 - 0.8
2020 0.5 1.7 0.5 1.7
2021 1.2 2.0 1.2 2.0
2022 0.5 0.8 0.5 0.8
2023 0.7 1.1 0.7 1.1
2024 1.7 2.2 1.7 1.3
2025 2.5 2.8 1.7 0.5
2026 2.6 2.9 1.0 -
2027 2.7 3.0 0.3 -
2028 2.7 2.7 - -
2029 - - - -
TOTAL AXA 15.2 20.0 7.6 8.3
Options AXA
Outstanding options
Exercisable options
(taking into account
the market-based
performance condition)
Number
(in million)
Exercise price
(in Euro)
Number
(in million)
Exercise price
(in Euro)
Price range
€6.48 – €12.96 0.5 12.22 0.5 12.22
€12.97 – €19.44 4.1 16.30 4.1 16.30
€19.45 – €25.92 10.6 22.49 3.0 22.56
€6.48 – €25.92 15.2 20.48 7.6 18.52
The fair value of AXA SA stock options was calculated using the
Black & Scholes option pricing model. The eff ect of expected
early exercise was taken into account through the use of an
expected life assumption based on historical data. AXA SA share
price volatility is estimated on the basis of implied volatility,
which was checked against an analysis of historical volatility
to ensure consistency. The expected AXA SA dividend yield was
based on the market consensus. The risk-free interest rate was
based on the Euro Swap Rate curve for the appropriate term.
The number of outstanding options and the number of exercisable options among the outstanding options are shown below by
maturity date. The vesting of the grants in 2015, 2016 and 2017 to the employees of Equitable Holdings, Inc. was accelerated aft er the
loss of control of AXA over EQH.

352 I UNIVERSAL REGISTRATION DOCUMENT - ANNUAL REPORT 2019 - AXA I
CONSOLIDATED FINANCIAL STATEMENTS 5 5.6 NOTES TO THE CONSOLIDATED FINANCIAL STATEMENTS
There was no grant in 2019. The option pricing assumptions and fair value at grant date for plans issued before 2019 are shown below:
2018 2017 2016 2015
Assumptions
Dividend yield 5.79% 6.50% 6.60% 6.39%
Volatility 20.72% 25.05% 26.60% 23.68%
Risk-free interest rate 0.72% 0.55% 0.36% 0.99%
Expected life (in years) 8.6 8.5 8.5 8.8
Weighted average fair value per option at grant date (in Euro) 1.21 1.81 1.80 1.42
The total cost has been amortized over the vesting period and
a nil estimated pre-vesting lapse rate was applied over the
remaining vesting period. On that basis, the expense recognized
in profit or loss for the year ended December 31, 2019 was
€3.9 million (€3.7 million for the year ended December 31, 2018).
AXA GROUP SHAREPLAN
AXA off ers its employees the opportunity to become shareholders
through a special employee share off ering. In countries that meet
the legal and fiscal requirements, two investment options are
available: the traditional plan and the leveraged plan.
The traditional plan allows employees to purchase, through a
personal investment, AXA shares (either through Mutual funds
(FCPE) or through direct share ownership, depending on the
country) with a discount of 20%. The shares are held within
the Group Company Savings Plans and are restricted from sale
during a period of approximately 5 years (except specific early
exit cases allowed by applicable laws). Employees are subject
to the share price evolution, up or down, as compared to the
subscription price.
The leveraged plan allows employees to purchase, on the
basis of 10 times their personal investment, AXA shares (either
through Mutual funds (FCPE) or through direct share ownership,
depending on the country) with a discount. The shares are held
within the Group Company Savings Plans and are restricted from
sale during a period of approximately 5 years (except specific
early exit cases allowed by applicable laws). Employees’ personal
investment is guaranteed by a bank, and employees also benefit
from a portion of the share appreciation, calculated on the basis
of the non-discounted reference price. At the end of the 5 years
holding period, the employees can, depending on their residence
country, do any one of the following: (i) receive the cash value
of their investment, (ii) receive the value of their investment in
the form of AXA shares, or (iii) transfer their assets invested in the
leveraged plan into the traditional plan.
The cost of this plan is valued taking into account the five-year
lock-up period, as recommended by the ANC (Autorité des
Normes Comptables). The ANC approach values the restricted
shares through a replication strategy whereby the employee
would sell the restricted shares forward at the end of the lock-
up period, borrow enough money to buy unrestricted shares
immediately, and uses the proceeds of the forward sale together
with dividends paid during the lock-up period to finance the loan.
For the leveraged plan, the cost also includes the opportunity
gain implicitly provided by AXA by enabling its employees to
benefit from an institutional price for derivatives as opposed to
a retail price.
In 2019, AXA offered its employees to subscribe to a share
off ering, at a price of €18.30 per share for the traditional plan
(discount of 20% to the reference price of €22.87 representing
the average over the twenty trading days ending on the date
preceding the Chief Executive Officer’s decision setting the
definitive terms of the operation) and at a price of €21.73 per
share for the leverage plan (discount of 4.99% to the reference
price). A total of 17.8 million new shares were issued, increasing
the share capital by €375 million. This off ering represented a
total cost of €3.5 million taking into account the five-year lock-
up period.
In 2019, the cost of the lock-up period was measured at 19.32%
for the traditional plan and 4.98% for the leveraged plan (due
to different discounts). In addition to the lock-up cost, the
opportunity gain off ered to the employees under the leveraged
plan was measured at 0.90%.

353I UNIVERSAL REGISTRATION DOCUMENT - ANNUAL REPORT 2019 - AXA I
CONSOLIDATED FINANCIAL STATEMENTS
5
5.6 NOTES TO THE CONSOLIDATED FINANCIAL STATEMENTS
The table below shows the main features of the plan, the amounts subscribed, valuation assumptions, and the cost of the plan for
2018 and 2019:
2019 2018
Traditional Leveraged Traditional Leveraged
Plan maturity (in years) 5 5 5 5
[A] Discount to face value 20.00% 4.99% 20.00% 5.85%
Reference price (in Euro) 22.87 23.19
Subscription price (in Euro) 18.30 21.73 18.56 21.83
Amount subscribed by employee (in Euro million) 63.5 31.2 39.8 29.0
Total amount subscribed (in Euro million) 63.5 311.7 39.8 289.9
Total number of shares subscribed (in million shares) 3.5 14.3 2.1 13.3
Interest rate on employee loan 6.74% 6.83% 6.73% 6.87%
5-year risk-free rate (euro zone) -0.64% 0.16%
Dividend yield 8.16% 6.83%
Early exit rate 2.15% 1.77%
Interest rate for borrowing securities (repo) -0.15% -0.20%
Retail/institutional volatility spread N/A 1.24% N/A 1.26%
[B] Cost of the lock-up for the employee 19.32% 4.98% 19.40% 5.85%
[C] Opportunity gain N/A 0.90% N/A 0.89%
Total cost for AXA = [A] – [B] + [C]
(as a percentage of the reference price) 0.68% 0.91% 0.60% 0.89%
TOTAL COST FOR AXA (in Euro million) 0.54 2.95 0.30 2.73
OTHER SHARE-BASED COMPENSATION
AXA Performance Shares
Performance Shares are granted to executive off icers and other
key employees mainly in France. These Performance Share
plans are equity-settled award plans subjected to a non-market
performance criteria and have a three years vesting period.
In 2019, the valuation was based on a market price of €23.12 per
share at grant date and an estimate 5% pre-vesting lapse rate per
year. The grant date average fair value of Performance Shares
granted in 2019 was €16.39 (€14.06 for 2018 grants).
The total cost of Performance Shares recognized was €58.2 million
as of December 31, 2019 (€45.8 million as of December 31, 2018).
AXA Performance Units and International Performance Shares
AXA issues Performance Units and International Performance
Shares to executive off icers and other key employees mainly
outside France.
The Performance Units plans, granted until 2012 outside
the United States and until 2017 to the eligible employees
of Equitable Holdings, Inc. were mainly cash-settled plans
subjected to a non-market performance criteria.
Since 2013, AXA has established common terms and conditions
for the attribution of “International Performance Shares” to
eligible employees. Under the International Performance Shares
(PSi) plan, beneficiaries of Performance Shares have the right to
receive at the settlement date, a certain number of AXA shares
based on the achievement of performance criteria defined by
AXA and vesting period. The performance period is currently
three years. The vesting period (service condition) is between
three and four years. However, as opposed to Performance Units,
under the International Performance Shares plan, the settlement
will be made in shares rather than in cash (except where the
settlement in shares is impossible for legal or other reasons).
The total cost of the International Performance Shares and
Performance Units recorded as of December 31, 2019, was
€71.9 million in earnings (€59.2 million as of December 31, 2018).
AXA Retirement Performance Shares
As voted by the Shareholders’ Meeting of April 24, 2019, AXA’s
Board of Directors is authorized to grant retirement performance
shares to designated senior executives in France. Under this plan,
beneficiaries of Performance Shares have the right to receive at
the settlement date, a certain number of AXA shares based on the
achievement of a performance condition related to the average
AXA Group Solvency II ratio calculated during the performance
period of three years.
For the grants from 2016 to 2018, aft er the three years performance
period, the performance shares definitively acquired are subject
to (i) an additional restriction on transfer period of two years
following the performance period, and (ii) an obligation to hold
the shares until retirement, provided that the beneficiaries may
sell their shares for diversification purposes (following the three-
year performance period and two-year restriction on transfer
period), as long as the sale proceeds are invested in a long-term
savings plan until the beneficiary’s retirement.

354 I UNIVERSAL REGISTRATION DOCUMENT - ANNUAL REPORT 2019 - AXA I
CONSOLIDATED FINANCIAL STATEMENTS 5 5.6 NOTES TO THE CONSOLIDATED FINANCIAL STATEMENTS
From 2019 grants, the restriction on the two years transfer period
is no longer applicable.
The total cost of the Performance Shares Retirement recorded
as of December 31, 2019, was €15.1 million in earnings, gross of
tax (€14.0 million as of December 31, 2018).
26.3.2 S hare-based compensation
instruments issued by AXA subsidiaries
Main share-based compensation plans issued by AXA subsidiaries
are described below:
AXA INVESTMENT MANAGERS SHARE-BASED
COMPENSATION PLANS
AXA Investment Managers grants Performance Shares to
certain key employees as part of its overall LTI policy that
also includes DIP (Deferred Incentive Plan). The Investment
Managers Performance Shares incentive plan is a long-term
award plan in which participants are allocated AXA Investment
Managers shares or, more specifically rights to acquire shares
upon completion of a specified vesting period depending on
applicable local regulations, and subject to fulfilment of certain
performance conditions. The performance condition is based on
the achievement of Actual AXA Investment Managers Underlying
earnings Group share versus budgeted and/or investment
performance conditions.
The total cost of AXA Investment Managers Performance Shares
recorded as of December 31, 2019, amounted to €14.6 million
in earnings (€25.4 million as of December 31, 2018), gross of tax.
AB SHARE-BASED COMPENSATION PLANS
AB grants restricted AB Holding units and options to acquire AB
Holding units, which are valued and booked according to IFRS
principles.
The deferred awards under AB Incentive Compensation Award
Plan are in the form of restricted AB Holding units or cash which
are granted to certain key employees.
AB also awarded restricted Holding units in connection with
certain employee and separation agreements.
For the period from January 1, 2019 to the deconsolidation
of Equitable Holdings, Inc. including AB as at March 31, 2019,
the cost for AB share-based compensation plans amounted to
€16.6 million (€158.8 million in 2018), gross of tax.
26.4 COMPENSATION OF MANAGEMENT
AND OFFICERS
Compensation costs/expenses:
■ short-term benefits: compensation paid to members of
the Management Committee in 2019 totaled €22.6 million
(€20.8 million in 2018), including fixed salary, bonuses,
directors’ fees, benefits in kind and other short-term benefits;
■ share-based compensation: the expense recognized in 2019
in respect of share-based compensation granted by AXA SA
to Management Committee members was €9.8 million
(€7.4 million in 2018);
■ post-retirement benefits: the estimated cost to the Group of
providing defined benefit pensions and other post-retirement
benefits to members of the Management Committee for the
current year of service measured in accordance with IAS 19
amounted to €3.2 million in 2019 (€2.7 million in 2018).
26.5 SALARIED WORKFORCE
At December 31, 2019, the Group employed 99,843 salaried
people on a full-time equivalent basis (104,065 at the end of
December 2018).
The decrease in salaried employees by 4,222 in 2019 was mainly
driven by the United States (-7,959) from the deconsolidation of
Equitable Holdings, Inc. It was partially off set by China (+2,988)
following the full consolidation of AXA Tianping in the Group
Consolidated Financial Statements as of December 31, 2019.

355I UNIVERSAL REGISTRATION DOCUMENT - ANNUAL REPORT 2019 - AXA I
CONSOLIDATED FINANCIAL STATEMENTS
5
5.6 NOTES TO THE CONSOLIDATED FINANCIAL STATEMENTS
I Note 27 Net income per ordinary share
The Group calculates a basic net income per ordinary share and
a diluted net income per ordinary share:
■ the calculation of the basic net income per ordinary share
assumes no dilution and is based on the weighted average
number of outstanding ordinary shares during the period;
■ the calculation of diluted net income per ordinary share takes
into account shares that may be issued as a result of stock
option plans. The eff ect of stock option plans on the number
of fully diluted shares is taken into account only if options are
considered to be exercisable on the basis of the average stock
price of the AXA share over the period.
Net income per ordinary share takes into account interest
payments related to undated subordinated debt classified in
shareholders’ equity.
(in Euro million) (a)
December 31,
2019
December 31,
2018
Net income Group share 3,857 2,140
Undated subordinated debt financial charge (b) (253) (262)
Net income including impact of undated subordinated debt A 3,603 1,878
Weighted average number of ordinary shares (net of treasury shares) – opening 2,383 2,383
Increase in capital (excluding stock options exercised) (c) 2 1
Stock options exercised (c) 2 1
Treasury shares (c) 10 1
Capital increase/decrease (13) (4)
Weighted average number of ordinary shares B 2,383 2,383
BASIC NET INCOME PER ORDINARY SHARE C = A /B 1.51 0.79
Potentially dilutive instruments:
■ Stock options 2 3
■ Other 4 4
Fully diluted – weighted average number of shares (d)
D 2,389 2,389
FULLY DILUTED NET INCOME PER ORDINARY SHARE E = A/D 1.51 0.79
(a) Except for number of shares (million of units) and earnings per share (Euro).
(b) As of December 31, 2019, it includes financial charges of €9 million related to Mandatory Exchangeable Bonds for only the first three months of 2019 and €51 million related to preferred shares.
As of December 31, 2018, it includes financial charges of €23 million related to Mandatory Exchangeable Bonds and €17 million related to preferred shares.
(c) Weighted average.
(d) Taking into account the impact of potentially dilutive instruments.
In 2019, net income per ordinary share attributable to continuing
operations stood at €1.51 on a basic and fully diluted basis.
In 2018, net income per ordinary share attributable to continuing
operations stood at €0.79 on a basic and fully diluted basis.

356 I UNIVERSAL REGISTRATION DOCUMENT - ANNUAL REPORT 2019 - AXA I
CONSOLIDATED FINANCIAL STATEMENTS 5 5.6 NOTES TO THE CONSOLIDATED FINANCIAL STATEMENTS
I Note 28 Related-party transactions
In 2019, the Company was party to the following transactions
with related parties which may be deemed to have been material
to AXA or the related party in question or unusual in their nature
or conditions.
28.1 RELATIONSHIPS
WITH THE MUTUELLES AXA
The Mutuelles AXA (AXA Assurances IARD Mutuelle and AXA
Assurances Vie Mutuelle, hereafter the “Mutuelles AXA”) are
two mutual insurance companies engaged respectively in the
Property & Casualty insurance business and Life & Savings
insurance business in France. On December 31, 2019, the
Mutuelles AXA collectively owned 14.45% of the Company’s
outstanding ordinary shares representing 24.21% of the voting
rights.
Each Mutuelle AXA is supervised by a b oard of d irectors elected
by delegates representing policyholders. Certain members of the
Company’s Executive Management and Board of Directors serve
as directors or executive off icers of the Mutuelles AXA.
The Mutuelles AXA and two of the Company’s French insurance
subsidiaries engaged in the Property & Casualty insurance
business and Life & Savings insurance business, AXA France IARD
and AXA France Vie respectively (the “Subsidiaries”), are parties
to an agreement pursuant to which they provide a full range
of management services to manage the insurance operations
and portfolios of the Mutuelles AXA. The agreement includes
provisions designed to ensure the legal independence and
protection of the respective client portfolios of the Mutuelles
AXA and these Subsidiaries. Certain costs and charges (excluding
commissions) are allocated between the Subsidiaries and
the Mutuelles AXA through an economic interest grouping
(groupement d’intérêt économique) or “GIE”.
The Property & Casualty insurance business generated in France
by insurance brokers is mainly underwritten through co-insurance
and reinsurance arrangements between AXA Assurances IARD
Mutuelle and AXA France IARD. Aggregate written premiums
under these agreements amounted to €2,241 million in 2019 (of
which €2,094 million was attributed to AXA France IARD).
28.2 GROUPEMENT D’INTÉRÊT ÉCONOMIQUE (GIE)
From time to time the Company enters into GIEs with certain of
its subsidiaries. GIEs are intercompany partnerships, governed by
French law, created to perform various common services for their
members and to allocate associated costs and expenses among
their members. The allocation of costs and expenses invoiced
to GIE members is based on various agreed criteria including
particular activity drivers. The GIEs of which the Company was
a member during 2019 covered a variety of common services
including services performed by the Group’s central functions
(GIE AXA) for the benefit of AXA Group companies (e.g. finance,
accounting and reporting, tax, legal, internal audit, human
resources, procurement, information systems, r isk m anagement,
cash management). Expenses invoiced by these GIEs to the
Company and its subsidiaries are generally invoiced at cost and
are included in the consolidated expenses reflected in Note 25
“Expenses by type” to the Company’s consolidated financial
statements. Expenses invoiced by the GIE AXA to its members
in 2019 and 2018 amounted to respectively €265 million and
€255 million.
28.3 LOANS/GUARANTEES/CAPITAL
CONTRIBUTIONS, ETC.
The Company has given numerous commitments, including
financing commitments, guarantees given to financial
institutions and customers, pledged assets, collateralized
commitments and letters of credit. For a description of these
commitments and guarantees, see Note 29 “Contingent assets
and liabilities and unrecognized contractual commitments” to
the Group’s Consolidated Financial Statements.
Certain of these guarantees are given by the Company for the
benefit of its subsidiaries and affiliates for various business
purposes including to promote development of their business
(e.g. to facilitate acquisitions, integration of acquired businesses,
distribution arrangements, off -shoring arrangements, internal
restructurings, sales or other disposals of assets or businesses,
sales or renewals of products or services or similar transactions),
to support their credit ratings, and/or to promote eff icient use
of the Group’s capital resources. In this context, the Company
may guarantee repayment of loans or other obligations of its
subsidiaries to third parties, or provide other types of guarantees
to support its subsidiaries’ obligations. The beneficiaries of
these guarantees are generally required to compensate the
Company at a negotiated rate based on prevailing market rates
for guarantees with similar conditions. In addition, from time to
time, the Company may provide comfort letters or similar letters
to rating agencies and/or regulators in support of its subsidiaries
and aff iliates for various business purposes, including facilitating
specific transactions, achieving target rating levels and, more
generally, helping to develop the business of these subsidiaries.
Commitments granted by the Company to its subsidiaries are
disclosed in Appendix III of this Annual Report “AXA parent
C ompany financial statements: Subsidiaries and participating
interests”.
The Company may enter into various types of transactions with its
subsidiaries and aff iliates from time to time for various business
purposes including (i) in connection with liquidity, solvency and
capital management initiatives designed to promote eff icient use
and fungibility of the Group’s capital resources or (ii) to finance
their business operations and/or to promote the development
of their business (e.g. to facilitate acquisitions, integration

357I UNIVERSAL REGISTRATION DOCUMENT - ANNUAL REPORT 2019 - AXA I
CONSOLIDATED FINANCIAL STATEMENTS
5
5.6 NOTES TO THE CONSOLIDATED FINANCIAL STATEMENTS
of acquired businesses, distribution arrangements, internal
restructurings, or similar transactions). These transactions may
involve loans or other types of credit arrangements, capital
contributions, acquisitions or sales of assets, securities or
other financial instruments (including swaps or other types of
derivatives), securitization transactions, and/or other types of
arrangements or transactions to which the Company may be
a direct party and/or guarantor. The Company may also from
time to time borrow from its subsidiaries for various business
purposes. These transactions are generally carried out on
arms-length terms and conditions with loans bearing interest
at floating rates that generally reflect prevailing market rates at
the respective dates such loans were originated.
28.4 KEY MANAGEMENT AND DIRECTORS
To the best of the Company’s knowledge, based on information
reported to it:
■ on December 31, 2019, there were no loans outstanding from
the Group to the Company’s two corporate off icers or to any
member of the Company’s Board of Directors;
■ various members of the Company’s Board of Directors as well
as various other executive off icers and directors of other AXA
Group companies may, from time to time, purchase insurance,
wealth management or other products or services off ered by
AXA in the ordinary course of its business. The terms and
conditions of these transactions are substantially similar to
the terms and conditions generally available to the public or
to AXA employees in general. In addition, certain members
of the Board of Directors are corporate off icers, directors or
have interests, directly or indirectly, in companies that may
have agreements or enter into transactions from time to
time with AXA Group entities including extensions of credit,
loans, purchases of securities (for their own account or for
third parties), underwriting of securities and/or furnishing of
other types of services or goods. These agreements or deals
are generally fully negotiated and performed on arm’s length
terms and conditions.

358 I UNIVERSAL REGISTRATION DOCUMENT - ANNUAL REPORT 2019 - AXA I
CONSOLIDATED FINANCIAL STATEMENTS 5 5.6 NOTES TO THE CONSOLIDATED FINANCIAL STATEMENTS
I Note 29 Contingent assets and liabilities and unrecognized contractual commitments
29.1 BREAKDOWN OF COMMITMENTS RECEIVED
(in Euro million)
December 31,
2019
December 31,
2018
Financing commitments 11,305 16,311
Customers - -
Credit institutions 11,305 16,311
Guarantee commitments 26,487 25,936
Credit institutions 7,242 4,330
Customers 19,245 21,605
Other 14,056 39,385
Pledged securities and collaterized commitments 10,759 32,625
Letters of credit 277 2,762
Other commitments 3,020 3,998
TOTAL 51,848 81,631
Commitments received by AXA totaled €51,848 million at the
end of 2019, and decreased by €29,783 million compared to the
end of 2018, mainly due to a decrease in pledged assets and
collaterals mostly following the held for sale classification of AXA
Bank Belgium for €22,320 million and the deconsolidation of
Equitable Holdings, Inc. for €6,014 million (notably impacting
letters of credit (€2,425 million), and pledge assets and collaterals
(€2,517 million)).
These commitments can be broken down as follows:
Financing commitments received totaled €11,305 million at
the end of 2019, and mainly consisted of:
■ credit facilities received by holdings for €9,058 million mainly
at AXA SA (€8,468 million);
■ commitment lines granted to AXA XL (€1,874 million) and
Japan (€373 million) as part of their operations.
Guarantee commitments received totaled €26,487 million
at the end of 2019, (i) guarantees from customers related to
mortgage loans €12,935 million received mainly at Switzerland
(€10,359 million), AXA Banque France (€1,997 million) and
Belgium (€574 million), (ii) €7,038 million guarantees related
to loans mainly at AXA Banque France (€6,951 million), and
(iii) €6,310 million other guarantees received from customers,
mainly at AXA Banque France (€6,308 million).
Pledged securities and collateralized commitments received
totaled €10,759 million at the end of 2019:
■ security reverse repurchase agreements and similar operations
totaled €4,988 million mainly in Germany (€2,340 million),
France (€1,707 million) and Japan (€483 million);
■ collaterals for reinsurance operations totaled €3,509 million
mainly in France (€2,583 million), AXA Global Re (€653 million)
and AXA XL (€196 million);
■ collateral for derivatives totaled €2,262 million mainly in
Germany (€1,010 million), France (€491 million), Belgium
(€359 million), and Spain (€167 million).
Letters of credit received totaled €277 million at the end of
2019 mainly related to from AXA Global Re (€156 million) and
Turkey (€93 million) due to letter of credits related to reinsurance
transactions.
Other commitments received totaled €3,020 million at the end
of 2019, mainly related to mortgages received as guarantees to
debt instruments received by Germany (€706 million), France
(€600 million), Japan (€540 million), Italy (€416 million) and
Belgium (€365 million).

359I UNIVERSAL REGISTRATION DOCUMENT - ANNUAL REPORT 2019 - AXA I
CONSOLIDATED FINANCIAL STATEMENTS
5
5.6 NOTES TO THE CONSOLIDATED FINANCIAL STATEMENTS
29.2 BREAKDOWN OF COMMITMENTS GIVEN
(in Euro million)
December 31, 2019 December 31, 2018
Expiring date
Total Total
12 months
or less
More than
1 year up to
3 years
More than
3 years up
to 5 years
More than
5 years
Financing commitments 953 314 144 19 1,429 3,530
Customers 953 314 144 19 1,429 3,508
Credit institutions - - - - - 22
Guarantee commitments 3,967 588 834 1,191 6,580 11,796
Credit institutions 21 573 817 565 1 ,976 7,915
Customers 3,946 15 17 626 4,604 3,881
Other 46,136 16,320 3,876 12,896 79,228 66,115
Pledged securities and collaterized
commitments 40,287 8,921 2,177 6,941 58,326 46,131
Letters of credit 1,762 5 535 73 2,374 133
Other commitments (a) 4,087 7,394 1,165 5,883 18,528 19,852
TOTAL 51,055 17,222 4,854 14,106 87,237 81,441
(a) Includes future minimum payments for operating leases.
Commitments given totaled €87,237 million at the end of 2019,
increasing by €5,796 million compared to the end of 2018, mainly
due to an increase of €12,195 million in pledged securities and
collateralized commitments, and €2,241 million in letters of
credit partly off set by a decrease of €5,216 million in guarantees
commitments and €2,101 million in financing commitments.
These commitments can be broken down as follows:
Financing commitments given totaled €1,429 million at the
end of 2019 and only consisted of financing loans commitments
to customers granted at AXA Banque France (€970 million) and
Germany (€434 million).
Guarantee commitments given totaled €6,580 million at
the end of 2019 and consisted of (i) other guarantees given to
customers for €3,988 million mainly at Germany (€3,859 million),
and (ii) guarantee commitments given to credit institutions
related to loans for €1 ,976 million at AXA SA (€1,744 million).
Pledged securities and collateralized commitments given
totaled €58,326 million at the end of 2019:
■ security repurchase agreements and similar operations
totaled €46,963 million mainly in France (€21,455 million),
Japan (€8,335 million), Belgium (€5,737 million), Hong
Kong (€4,025 million), Switzerland (€2,729 million), Spain
(€538 million) and AXA XL (€370 million);
■ pledged assets and collaterals for reinsurance operations
totaled €6,851 million mainly in AXA XL (€5,658 million) and
France (€1,099 million);
■ pledged assets and collaterals for derivatives instruments
totaled €3,167 million mainly in Japan (€1,359 million),
France (€883 million), Germany (€394 million) and Belgium
(€258 million);
■ other pledged assets/collaterals totaled €1,344 million mainly
from AXA Banque France (€1,308 million).
Letters of credit given totaled €2,374 million at the end of 2019
and were mainly from AXA XL (€2,274 million).
Other commitments given totaled €18,528 million at the end
of 2019 and mainly consisted of:
■ €8,821 million commitments to private equity funds mainly
in France (€3,956 million), Germany (€2,066 million), Japan
(€1,315 million), Switzerland (€901 million), Hong Kong
(€338 million) and AXA XL (€122 million);
■ €5,511 million commitments to invested assets other
than real estate funds or private equity funds mainly in
Belgium (€1,896 million), Germany (€1,795 million), France
(€976 million), the United Kingdom & Ireland (€390 million)
and Japan (€340 million);
■ €1,314 million commitments to Real Estate funds mainly in
Germany (€599 million) and France (€558 million);
360 I UNIVERSAL REGISTRATION DOCUMENT - ANNUAL REPORT 2019 - AXA I
CONSOLIDATED FINANCIAL STATEMENTS 5 5.6 NOTES TO THE CONSOLIDATED FINANCIAL STATEMENTS
■ €1,052 million commitments related to Group insurance
contracts mainly from AXA SA (€947 million);
■ €777 million commitments to insurance protection funds and
other regulatory requirements in Germany (€391 million),
AXA SA (€333 million) and Turkey (€54 million).
29.3 OTHER AGREEMENTS
29.3.1 Partial disposal of UK Life & Savings
operations
AXA has guaranteed the liabilities and obligations of AXA UK in
connection with the sale, in 2010, of part of its Life & Savings
insurance business to Resolution Ltd. This includes the potential
liability of AXA UK under customary warranties and indemnities
given by AXA UK to Resolution Ltd. in connection with this
transaction.
29.3.2 Employee and director indemnification
obligations
In addition to other employment-related obligations, various
AXA subsidiaries are required to indemnify their employees and
directors against certain liabilities and costs that they may incur
from time to time in performing activities within the scope of
their duties. These activities may include, for example, service as
a director, off icer, agent, general partner, or in a similar capacity
for (i) an AXA Group company other than the employee’s principal
employer or (ii) a company outside the AXA Group where
service is at the request of (or for the benefit of) the Group (e.g.
joint ventures, partnerships, or special-purpose investment
Companies or funds). The potential amount of compensation
relating to commitments covered by these obligations cannot
be evaluated with any certainty.
29.3.3 Supports provided without having
a contractual or constructive obligation
to do so
The Group did not provide any material support without having
a contractual or constructive obligation to do so to structured
entities during the period.
29.4 OTHER ITEMS: RESTRICTION
ON DIVIDEND PAYMENTS
TO SHAREHOLDERS
Certain AXA subsidiaries and joint ventures, principally insurance
companies, are subject to restrictions on the amount of funds
they may transfer in the form of cash dividends or otherwise.
In most cases, the amounts available for distribution from
AXA’s insurance subsidiaries and joint ventures are limited to
net income for the year and retained earnings calculated in
accordance with the statutory accounting policies used by the
subsidiaries to prepare their local financial statements. Further
restrictions may be imposed by the local insurance regulators in
countries where AXA operates. In some cases, amounts available
for distribution are also subject to regulatory capital adequacy
tests or the approval of an independent actuary or subject to
individual provisions contained in a company’s by laws.
In accordance with European Union directives, insurance
companies with their registered office in a European Union
member country are required to maintain minimum solvency
ratios which must be supported by eligible elements. AXA’s
insurance operations in countries outside the European Union
are also subject to local capital adequacy and solvency margin
regulations.
AXA SA is exposed to foreign currency fluctuations notably
stemming from its Non-Euro participations. The aim of the
hedging programs of the Company is to protect the shareholder
value while managing the associated costs.
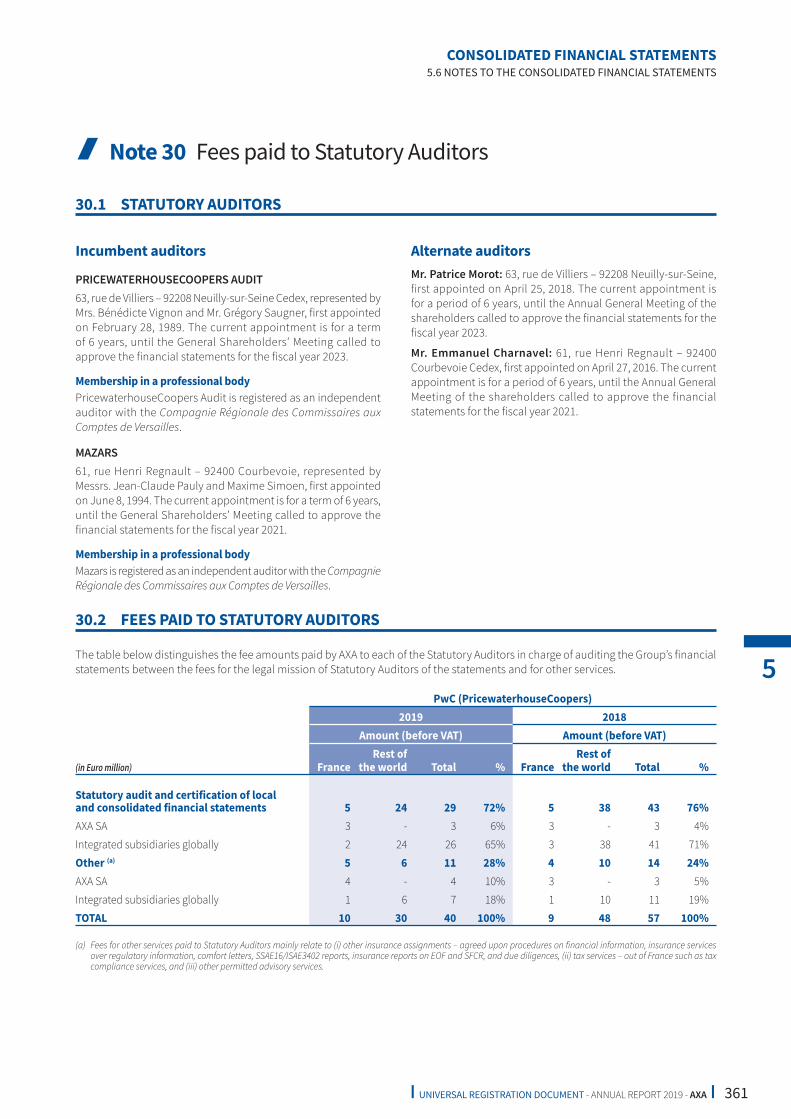
361I UNIVERSAL REGISTRATION DOCUMENT - ANNUAL REPORT 2019 - AXA I
CONSOLIDATED FINANCIAL STATEMENTS
5
5.6 NOTES TO THE CONSOLIDATED FINANCIAL STATEMENTS
I Note 30 Fees paid to Statutory Auditors
30.1 STATUTORY AUDITORS
Incumbent auditors
PRICEWATERHOUSECOOPERS AUDIT
63, rue de Villiers – 92208 Neuilly-sur-Seine Cedex, represented by
Mrs. Bénédicte Vignon and Mr. Grégory Saugner, first appointed
on February 28, 1989. The current appointment is for a term
of 6 years, until the General Shareholders’ Meeting called to
approve the financial statements for the fiscal year 2023.
Membership in a professional body
PricewaterhouseCoopers Audit is registered as an independent
auditor with the Compagnie Régionale des Commissaires aux
Comptes de Versailles.
MAZARS
61, rue Henri Regnault – 92400 Courbevoie, represented by
Messrs. Jean-Claude Pauly and Maxime Simoen, first appointed
on June 8, 1994. The current appointment is for a term of 6 years,
until the General Shareholders’ Meeting called to approve the
financial statements for the fiscal year 2021.
Membership in a professional body
Mazars is registered as an independent auditor with the Compagnie
Régionale des Commissaires aux Comptes de Versailles.
Alternate auditors
Mr. Patrice Morot: 63, rue de Villiers – 92208 Neuilly-sur-Seine,
first appointed on April 25, 2018. The current appointment is
for a period of 6 years, until the Annual General Meeting of the
shareholders called to approve the financial statements for the
fiscal year 2023.
Mr. Emmanuel Charnavel: 61, rue Henri Regnault – 92400
Courbevoie Cedex, first appointed on April 27, 2016. The current
appointment is for a period of 6 years, until the Annual General
Meeting of the shareholders called to approve the financial
statements for the fiscal year 2021.
30.2 FEES PAID TO STATUTORY AUDITORS
The table below distinguishes the fee amounts paid by AXA to each of the Statutory Auditors in charge of auditing the Group’s financial
statements between the fees for the legal mission of Statutory Auditors of the statements and for other services.
(in Euro million)
PwC (PricewaterhouseCoopers)
2019 2018
Amount (before VAT) Amount (before VAT)
France
Rest of
the world Total % France
Rest of
the world Total %
Statutory audit and certification of local
and consolidated financial statements 5 24 29 72% 5 38 43 76%
AXA SA 3 - 3 6% 3 - 3 4%
Integrated subsidiaries globally 2 24 26 65% 3 38 41 71%
Other (a)
5 6 11 28% 4 10 14 24%
AXA SA 4 - 4 10% 3 - 3 5%
Integrated subsidiaries globally 1 6 7 18% 1 10 11 19%
TOTAL 10 30 40 100% 9 48 57 100%
(a) Fees for other services paid to Statutory Auditors mainly relate to (i) other insurance assignments – agreed upon procedures on financial information, insurance services over regulatory information, comfort letters, SSAE16/ISAE3402 reports, insurance reports on EOF and SFCR, and due diligences, (ii) tax services – out of France such as tax compliance services, and (iii) other permitted advisory services.

362 I UNIVERSAL REGISTRATION DOCUMENT - ANNUAL REPORT 2019 - AXA I
CONSOLIDATED FINANCIAL STATEMENTS 5 5.6 NOTES TO THE CONSOLIDATED FINANCIAL STATEMENTS
(in Euro million)
Mazars
2019 2018
Amount (before VAT) Amount (before VAT)
France
Rest of
the world Total % France
Rest of
the world Total %
Statutory audit and certification of local and
consolidated financial statements 3 6 9 70% 3 7 9 68%
AXA SA 1 - 1 6% 1 - 1 5%
Integrated subsidiaries globally 2 6 9 64% 2 7 9 63%
Other (a)
2 2 4 30% 2 2 4 32%
AXA SA 1 - 1 7% 1 - 1 10%
Integrated subsidiaries globally 1 2 3 23% 1 2 3 21%
TOTAL 4 9 13 100% 5 9 14 100%
(a) Fees for other services paid to Statutory Auditors mainly relate to (i) other insurance assignments – agreed upon procedures on financial information, insurance services over regulatory information, comfort letters, SSAE16/ISAE3402 reports, insurance reports on EOF and SFCR, and due diligences, (ii) tax services – out of France such as tax compliance services, and (iii) other permitted advisory services.
External audit fees are also paid by certain Aff iliates and Mutual funds which are not required to be included in the table above.
I Note 31 Litigation
With respect to all significant litigation matters, we consider the
likelihood of a negative outcome. If we determine the likelihood
of a negative outcome is probable, and the amount of the loss
can be reasonably estimated, we establish a reserve and record
an estimated loss for the expected outcome of the litigation.
However, it is oft en diff icult to predict the outcome or estimate
a possible loss or range of loss because litigation is subject
to inherent uncertainties, particularly when plaintiffs allege
substantial or indeterminate damages, the litigation is in its early
stages, or when the litigation is highly complex or broad in scope.
31.1 MATTERS DIRECTLY CONCERNING
AXA SA
AXA SA is involved in lawsuits, investigations and other actions
arising in the various jurisdictions where it does business,
including the following:
In 2007, AXA SA completed the squeeze out of the minority
shareholders at two German subsidiaries, AXA Konzern AG
(“AKAG”) and Kölnische Verwaltungs-AG für Versicherungswerte
(“KVAG”). Following the effective date of these squeeze out
transactions in July 2007, certain former AKAG and KVAG
shareholders brought proceedings in Germany alleging that
the cash compensation off ered by AXA SA was not adequate.
In the first half of 2016, an initial expert valuation report was
delivered to the court based on recent precedents in other
German minority buy-out transactions and recommending
a significant increase in the cash compensation to be paid to
minority shareholders. In addition, interest will be payable on
any additional amount finally decided. AXA SA appointed an
independent expert to challenge this report and submitted its
statement in February 2017. A court-appointed expert provided
a revised report in response to AXA’s expert in November 2018.
A first instance decision was issued in December 2019. The court
decided that the AKAG and KVAG valuation compensation should
be increased by approximately 22% of the amount paid by AXA
in 2007. The decision requires AXA to make a further payment of
approximately €116 million as at December 2019 which amount
was significantly less than the increase proposed by the court
appointed expert. The minority shareholders have appealed the
decision and AXA counter appealed. Annual interest will accrue
in the amount of €3.14 million per annum while the appeal is
pending. The appeal determination could take several years.
Consequently, the precise financial impact of this matter cannot
be estimated with any certainty at this time.
In 2015, AXA SA acquired Financial Insurance Company Limited
(“FICL”) and Financial Assurance Company Limited (“FACL”) from
Genworth Financial Inc. (“Genworth”). Pursuant to the sale and
purchase agreement (the “SPA”) Genworth agreed to indemnify
AXA SA on demand for 90% of certain costs related to complaints
alleging misselling of payment protection insurance underwritten
by FICL and FACL. Following a claim for indemnification for

363I UNIVERSAL REGISTRATION DOCUMENT - ANNUAL REPORT 2019 - AXA I
CONSOLIDATED FINANCIAL STATEMENTS
5
5.6 NOTES TO THE CONSOLIDATED FINANCIAL STATEMENTS
misselling losses under the SPA which has not been satisfied,
in December 2017, AXA SA filed a lawsuit in the United Kingdom
against Genworth for breach of contract. In December 2019, AXA
obtained a first instance judgement in its favour. Genworth has
appealed that judgement, but this appeal will not postpone a
hearing to determine the amount of damages to be awarded
which is scheduled for June 2020.
31.2 MATTERS CONCERNING AXA
SUBSIDIARIES
AXA and its subsidiaries are involved in various legal actions and
proceedings of a character normally incidental to their business
including claims litigation arising in connection with the Group’s
insurance business and litigation arising from the Group’s Asset
Management business.
In addition, several AXA subsidiaries are involved in lawsuits
(both class action and individual), investigations, and other
actions arising in the various jurisdictions where they do
business, including the United States.
A number of lawsuits have been filed against insurers in
the United States and elsewhere involving the scope and
interpretation of policies, insurers’ sales practices, alleged
misconduct or misrepresentation, alleged failure to properly
supervise agents, compensation of intermediaries, product
features, fees or performance as well as numerous other matters.
Some of these actions have resulted in the award of substantial
judgements against insurers (including material amounts of
punitive damages) or in substantial settlements. In certain
jurisdictions, juries have broad discretion in awarding punitive
damages. AXA’s United States subsidiaries are involved in these
types of litigations as well as regulatory inquiries, investigations
or actions with respect to these and a wide variety of other
matters related to the ownership or management of real estate,
asset or investment activities, corporate transactions, employee
benefit disputes, alleged discrimination in employment
practices, as well as other matters.
Some of the litigations described above have been brought on
behalf of various alleged classes of claimants, and certain of
the claimants in these actions seek significant or unspecified
amounts of damages, including punitive damages.
31.2.1 Other litigation
AXA FRANCE
A class action was brought against AXA France and AGIPI (a
French insurance association) on October 28, 2014 by a French
consumer association, CLCV. This action alleges that AXA France
and AGIPI breached their contractual obligation to maintain a
4.5% interest rate on certain life insurance contracts (CLER)
subscribed by policyholders prior to June 1995. The class action
complaint cites seven individual cases and is brought on behalf
of all similarly situated policyholders. AXA France believes that it
has strong defenses to these claims and is defending this matter
vigorously.
AXA XL DIVISION
Enedis (formerly ERDF, a subsidiary of Électricité de France,
the primary electric utility in France) has notified claims for
coverage under a professional liability policy underwritten by
AXA Corporate Solutions Assurance, which was merged into XL
Insurance Company SE on December 31, 2019 (“AXA XL Division”).
The underlying liabilities in question arise out of a series of
lawsuits (more than 500 individual suits) brought against Enedis
by local electricity producers in France engaged in production
of solar/green energy. These local producers allege financial
losses due to Enedis’ delay in processing their applications to be
connected to the public grid within the statutory period, resulting
in their inability to profit from attractive buyback rates under
certain French government Decrees promulgated in 2006 and
2010 (the “Decrees”). AXA XL Division was joined to proceedings,
as insurer, in over 200 cases. AXA XL Division pleaded the illegality
of the Decrees as its defense and in September 2016, the Court of
Appeal of Versailles referred the question as to the legality of the
Decrees to the European Court of Justice (“ECJ”) which rendered
a decision in favor of the arguments raised in March 2017. In
March 2019, the French Supreme Court upheld the decision of
the ECJ. Lower courts continue to dismiss cases based on the
above rulings.
RBS has notified claims for coverage to AXA XL Division under
general liability policies covering the years 2001-2004. AXA XL
Division insured the primary layer (up to £5 million per claim or
series of related claims) under these policies. RBS seeks coverage
for potential liabilities arising out of three class actions brought
against NatWest (an RBS subsidiary) between 2005-2007 in New
York Federal Court under the US Anti-Terrorism Act for aiding
and abetting terrorism due to certain accounts it maintained.
NatWest succeeded in having this case dismissed in March 2013
on a summary judgment motion but in 2014 this was overturned
and the case was remanded to the court of first instance who
granted NatWest’s motion for summary judgment and dismissed
the claims under the US Anti-Terrorism Act. AXA XL Division is
not a party to this litigation. The plaintiff s appealed the Court’s
decision and a decision is not expected before the end of 2020.
In the event the appellate court reverses the summary judgment
decision, the exposure, if any, of AXA XL Division in this matter
cannot be reasonably estimated at this time and will depend
on a variety of factors including (i) the ultimate outcome of the
litigation for NatWest and, in the event of an adverse outcome,
(ii) the number of deemed separate incidents that would trigger
coverage, and (iii) whether certain policy exclusions apply.
In addition to the various matters noted above, AXA and certain
of its subsidiaries are involved in numerous legal actions and
proceedings arising out of transactions involving the acquisition
or sale of businesses or assets, mergers or other business

364 I UNIVERSAL REGISTRATION DOCUMENT - ANNUAL REPORT 2019 - AXA I
CONSOLIDATED FINANCIAL STATEMENTS 5 5.6 NOTES TO THE CONSOLIDATED FINANCIAL STATEMENTS
combination transactions, the establishment or dissolution
of joint ventures or other partnerships, public exchange or
tender offers, buy-outs of minority interests or similar types
of transactions (“M&A Transactions”). In connection with M&A
Transactions, AXA and its subsidiaries from time to time:
■ are involved in legal actions or other claims brought by
purchasers, joint venture partners, shareholders or other
transaction parties asserting claims for damages on various
theories (including misrepresentation, failure to disclose
material information, failure to perform contractual
duties, breach of fiduciary duties), seeking contractual
indemnification, or otherwise seeking to impose liability on
AXA and/or its subsidiaries; and/or
■ benefit from contractual rights to indemnification from third
party sellers or other transaction counterparties that are
designed to protect the Group against existing or potential
future litigation exposures or other types of contingent
liabilities of the acquired businesses or assets. These
indemnities generally constitute unsecured obligations of
the indemnifying party and, consequently, their value may be
substantially impaired or rendered worthless in the event of
the bankruptcy or insolvency of the indemnifying party.
AXA and certain of its subsidiaries are also involved in tax
assessment negotiations and/or active litigation with tax
authorities over contested assessments or other matters in a
number of jurisdictions including in France. These actions or
assessments arise in a variety of circumstances including matters
in connection with M&A, restructuring or financing transactions
as well as in the ordinary course of business.
Over the past several years a number of jurisdictions, including
France and Belgium, have enacted legislation that permits
corporate entities to be charged with criminal offences. The
standard for attributing criminal conduct by corporate off icers
and employees to corporate entities is not clearly defined in many
of these jurisdictions and government prosecutors and judges
have broad discretion in this area. In recent years, complaints
against or indictments of corporate entities for alleged criminal
off ences have become increasingly common and certain AXA
Group companies have been the subject of penal complaints
and/or indictments from time to time including in Belgium and
France. While a criminal complaint against or indictment of a
corporate entity may not pose material financial risk, it has broad
potential implications for a regulated financial institution like
AXA both from a reputation point of view and from a regulatory
perspective because a criminal conviction can have potentially
far reaching negative implications for AXA Group companies
engaged in regulated businesses around the world (including
for their ability to obtain or maintain licenses to engage in certain
types of regulated business activities such as Asset Management,
insurance and banking).
Beyond litigation risks of the type described above, AXA and
its subsidiaries are subject to comprehensive regulation in the
various jurisdictions where they do business. In this context,
AXA and its subsidiaries are subject, from time to time, to
examinations, investigations, enforcement proceedings and other
actions by regulatory and law enforcement authorities (involving
civil and/or penal matters) as well as to proposed changes in law
and/or regulation that may significantly impact their business
and results of operations. For additional information on these
matters as well as other risks and contingent liabilities aff ecting
the Group and its business, please see Section 4.1 “Risk Factors”
and Section 6.3 “General Information” of this Annual Report and
Note 29 “Contingent assets and liabilities and unrecognized
contractual commitments” in Part 5 – “Consolidated Financial
Statements” of this Annual Report.
Although the outcome of any lawsuit cannot be predicted
with certainty, particularly in the early stages of an action,
Management believes that the ultimate resolutions of the
matters described above are not likely to have a material
adverse effect on the consolidated financial position of the
Group, taken as a whole. In addition, as of December 31, 2019,
to the Company’s knowledge, there were no other governmental,
judicial or arbitration proceedings, either pending or threatened,
that may have, or have had a significant impact on the financial
situation or profitability of the Company or the Group over the
past 12 months. However, due to the nature of such lawsuits
and investigations and the frequency of large damage awards
and regulatory sanctions in certain jurisdictions (particularly the
United States) that bear little or no relation to actual economic
damages incurred by plaintiffs or the underlying regulatory
violations, Management cannot make an estimate of loss, if any,
or predict whether these matters, individually or in the aggregate,
will have a material adverse eff ect on the Group’s consolidated
results of operations in any particular period.

365I UNIVERSAL REGISTRATION DOCUMENT - ANNUAL REPORT 2019 - AXA I
CONSOLIDATED FINANCIAL STATEMENTS
5
5.6 NOTES TO THE CONSOLIDATED FINANCIAL STATEMENTS
I Note 32 Subsequent events
AXA to sell its operations in Central
and Eastern Europe (1)
for €1.0 billion
On February 7, 2020, AXA entered into an agreement with UNIQA
Insurance Group AG (“UNIQA”) to sell its operations in Poland,
Czech Republic and Slovakia.
Under the terms of the agreement, AXA would sell 100% of its
Life & Savings, Property & Casualty and Pension businesses in
Central and Eastern Europe for a total cash consideration of
€1,002 million, representing an implied 12.4x 2019 P/E multiple (2).
The completion of the transaction is expected to result in a
positive impact on AXA Group’s Solvency II ratio of ca. 2 points.
No significant net income impact is expected for AXA Group from
this transaction.
Completion of the transaction is subject to customary closing
conditions, including the receipt of regulatory approvals, and is
expected to be finalized during the 4th quarter of 2020.
COVID -2019 outbreak
Since December 2019, a significant number of cases of
pneumonia associated with the Coronavirus, now called
COVID-19 by the World Health Organization (“WHO”), has
been reported worldwide. Initially reported in the province of
Hubei in the People’s Republic of China, it has spread across
other countries, resulting in reported infections and deaths in
numerous countries, including South Korea, Iran, Italy, France,
the United Kingdom and the United States, and new cases and
fatalities are reported daily. Furthermore, it is currently not
possible to know or to predict the extent to which the current
levels of reported cases reflect the actual transmission of the
virus within populations, and accordingly the scale of the
pandemic may be significantly larger than is presently recorded.
The spread of COVID-19 has resulted globally in governmental
authorities imposing quarantines and travel restrictions of
varying scope; has led to significant disruptions in the global
travel and hospitality industries, and in global trade and supply
chains more broadly; has resulted in decreased economic activity
and lowered estimates for future economic growth; has created
severe strains on local, national and supra-national medical
and healthcare systems and institutions; and has caused global
financial markets to experience significant volatility and the
worst downturn since the 2008 financial crisis.
AXA and each of its regulated entities has or is in the process
of establishing plans to address how it will manage the eff ects
of the outbreak, and assess disruptions and other risks to
its operations. These include the protection of employees,
sustaining our services to clients and other stakeholders and
ensuring eff ective processes are in place to communicate and
execute such plans.
Although no material claims have been reported at this stage,
AXA is closely monitoring the Group’s exposure, including (i) the
operational impact on its business, (ii) the consequences of a
deterioration in macroeconomic conditions or of a slowdown
in the flow of people, goods and services, especially on new
business volumes, (iii) the extent of insurance coverage impacted,
including Life, Health, Protection and Property & Casualty
insurance and reinsurance cover (following, for example,
increased business interruptions, travel and event cancellations
and higher medical costs), and (iv) change in asset prices and
financial conditions (including interest rates).
Information in this section should be read in conjunction with
the paragraph “Pricing and Underwriting-related risks” in Section
4.1 “Risk Factors” of this Annual Report.
(1) Includes AXA Ubezpieczenia Towarzystwo Ubezpieczeń i Reasekuracji SA (P&C business), AXA Życie Towarzystwo Ubezpieczeń SA (L&S business) and AXA Powszechne Towarzystwo Emerytalne SA (Pension business) in Poland, and AXA pojišťovna a.s. (P&C business), AXA životni pojišťovna a.s (L&S business) and AXA penzijni společnost a.s. (Pension business) in Czech Republic, together with their subsidiaries and branches in Slovakia. AXA XL’s and AXA Partners’ operations in the three countries are not within the scope of this transaction.
(2) Price/2019 IFRS Net income (including the 2019 IFRS Net income of Czech Republic and Slovakia P&C operations which are not consolidated in AXA Group’s financial statements).

366 I UNIVERSAL REGISTRATION DOCUMENT - ANNUAL REPORT 2019 - AXA I
CONSOLIDATED FINANCIAL STATEMENTS 5 5.7 REPORT OF THE STATUTORY AUDITORS ON THE CONSOLIDATED FINANCIAL STATEMENTS
5.7 REPORT OF THE STATUTORY AUDITORS ON THE CONSOLIDATED FINANCIAL STATEMENTS
PricewaterhouseCoopers Audit
63, rue de Villiers
92208 Neuilly-sur-Seine Cedex
Mazars
61, rue Henri Régnault
92400 Courbevoie
I S tatutory A uditors’ R eport consolidated financial
statements
For the year ended December 31, 2019
This is a translation into English of the Statutory Auditors’ report on the consolidated financial statements of the Company issued in
French and it is provided solely for the convenience of English speaking users. This statutory auditors’ report includes information
required by European regulation and French law, such as information about the appointment of the statutory auditors or verification
of the information concerning the Group presented in the management report and other documents provided to shareholders.
This report should be read in conjunction with, and construed in accordance with, French law and professional auditing standards
applicable in France.
To the Shareholders,
OPINION ON THE CONSOLIDATED FINANCIAL STATEMENTS
In compliance with the engagement entrusted to us by your Shareholders’ Meeting, we have audited the accompanying consolidated
financial statements of AXA SA for the year ended December 31, 2019.
In our opinion, the consolidated financial statements give a true and fair view of the assets and liabilities and of the financial position
of the Group as at December 31, 2019, and of the results of its operations for the year then ended in accordance with International
Financial Reporting Standards (IFRS) as adopted by the European Union.
The audit opinion expressed above is consistent with our report to the Audit Committee.
BASIS FOR OPINION
Audit Framework
We conducted our audit in accordance with professional standards applicable in France. We believe that the audit evidence we have
obtained is suff icient and appropriate to provide a basis for our opinion.
Our responsibilities under those standards are further described in the Statutory Auditors’ Responsibilities for the Audit of the
Consolidated Financial Statements section of our report.
Independence
We conducted our audit engagement in compliance with independence rules applicable to us, for the period from January 1, 2019
to the date of our report and specifically we did not provide any prohibited non-audit services referred to in Article 5 (1) of Regulation
(EU) No. 537/2014 or in the French Code of Ethics (code de déontologie) for statutory auditors.

367I UNIVERSAL REGISTRATION DOCUMENT - ANNUAL REPORT 2019 - AXA I
CONSOLIDATED FINANCIAL STATEMENTS
5
5.7 REPORT OF THE STATUTORY AUDITORS ON THE CONSOLIDATED FINANCIAL STATEMENTS
Emphasis of Matter
We draw attention to the following matter described in Note 1.2 to the consolidated financial statements relating to the impacts
regarding the first application of the IFRS 16 “Leases” and IFRIC 23 “Uncertainty over Income Tax Treatments” standards. Our opinion
is not modified with respect to this matter.
JUSTIFICATION OF ASSESSMENTS – KEY AUDIT MATTERS
In accordance with the requirements of Articles L.823-9 and R.823-7 of the French Commercial Code (code de commerce) relating
to the justification of our assessments, we inform you of the key audit matters relating to risks of material misstatement that, in our
professional judgment, were of most significance in our audit of the consolidated financial statements of the current period, as well
as how we addressed those risks.
These matters were addressed in the context of our audit of the consolidated financial statements as a whole, and in forming our
opinion thereon, and we do not provide a separate opinion on specific items of the consolidated financial statements.
Measurement of Life & Savings future policy benefit reserves including deferred acquisition costs
(See Notes 1.7.3, 1.14.2, 4.4 and 14 to the consolidated financial statements)
Key audit matter How our audit addressed the matter
At December 31, 2019, the Group has recorded material Life & Savings
liabilities arising from insurance contracts (€267,454 million) and
liabilities arising from investment contracts with discretionary
participation features (€36,036 million), where risks are born by
the group, as described in Notes 14.2 and 14.3 to the consolidated
financial statements.
The primary assumptions that must be made as part of the valuation
include assumptions about mortality, longevity, lapses, morbidity,
disability and costs as well as economic assumptions such as interest
rates and equity market performance.
As described in Notes 1.14.2 and 4.4 to the consolidated financial
statements, measurements of Life & Savings technical reserves are
as follows:
■ For life and protection insurance contracts, the future policy
benefit reserves relating to these contracts are generally
measured based on a prospective basis using assumptions on
investment yield, mortality, longevity, lapses, morbidity and
expenses.
■ Some of these reserves, in particular Protection and Health
products, include contracts with surrender guarantees and, in
some cases a guaranteed long-term rate or long-term guarantees.
■ For investment contracts with discretionary participation
features, future policy benefits reserves are generally calculated
using a prospective approach based on discount rates usually
set at inception.
Assumptions used are generally locked-in at inception, and for
some Life & Savings reserves are based on unlocked discount rates
as stated in note 14.10.2.
At each closing, the Company uses a Liability Adequacy Test to
determine that technical reserves are suff icient, and that deferred
acquisition costs are recoverable. Liability Adequacy Test is based
on current best estimates of all future contractual cash flows that
are valued using complex actuarial models and involve a significant
degree of judgment.
Certain changes in these assumptions could result in material impact
to the valuation of these liabilities and assets.
Accordingly, we deemed the valuation of the future policy benefit
reserves covering these contracts to be a key audit matter.
Our audit approach to the risk relating to the valuation of these
liabilities and assets in the Life & Savings line of business was as
follows:
■ We assessed the compliance of the methodology with current
accounting standards.
■ We updated our knowledge of the methodologies for measuring
future policy benefit reserves covering these contracts as well as
the models used to calculate the reserves and evaluated their
appropriateness.
■ We assessed the IT systems used to process the technical data
and integrate that data into the accounting system.
■ We assessed the design of the control system and tested the
eff ectiveness of the controls we deemed key to our audit.
■ We tested, on a sample basis and based on our risk assessment,
the calculation models applied to estimate the future cash flows
used to determine the future policy benefit reserves and for the
liability adequacy tests.
■ We applied procedures to test the reliability of the underlying
data used in the models and reserve calculations.
■ We evaluated the reasonability of the assumptions used
by management and the sensitivity of the models to the
assumptions.
■ We applied analytical procedures with a view to identifying and
analyzing any material unusual and/or unexpected changes.
Finally, we assessed the adequacy of the disclosures in the financial
statements.

368 I UNIVERSAL REGISTRATION DOCUMENT - ANNUAL REPORT 2019 - AXA I
CONSOLIDATED FINANCIAL STATEMENTS 5 5.7 REPORT OF THE STATUTORY AUDITORS ON THE CONSOLIDATED FINANCIAL STATEMENTS
Measurement of claim reserves in the Property & Casualty line of business
(See Notes 1.14.2 and 14 to the consolidated financial statements)
Key audit matter How our audit addressed the matter
At December 31, 2019, the Group had recorded claim reserves
of €81,689 million, as described in Note 14.2 to the consolidated
financial statements.
As stated in Note 1.14.2 to the consolidated financial statements,
these reserves correspond to the estimated ultimate cost of settling
an insurance claim. They include claims incurred and reported,
claims incurred but not reported (IBNR) as well as claims handling
costs.
These reserves are calculated using statistical and actuarial
methods, on the basis of historical claims data and patterns, and
use assumptions to estimate ultimate claims cost.
For some line of business, these estimates require a high degree
of judgment, and the assumptions selected may have a significant
impact on the ultimate claims cost of these reserves at the end of
the reporting period as the inherent uncertainty is higher. This is
especially the case for Property & Casualty lines of business that
are considered long-tail such as general and professional liability,
worker’s compensation, and other specialty lines.
In addition, estimates of loss from natural catastrophe events and
large man-made losses, including business written or reinsured
through AXA XL, are more diff icult to project as they are less frequent
but can be of higher severity.
Accordingly, due to these inherent uncertainties to calculate the
estimates, we deemed the measurement of claim reserves in the
Property & Casualty line to be a key audit matter.
Our audit approach to the risk relating to the valuation of claim
reserves was as follows:
■ We assessed the compliance of the methodology applied by the
Group with current accounting standards.
■ We evaluated and tested the internal control environment
relating to:
– the management of claims and, in particular, the measurement
of reserves on a case-by-case basis;
– the process of calculating the ultimate cost (assumptions,
judgments, data, methods, compliance with the applicable
accounting principles and methods), including any second
opinions supplied by Risk Management with respect to
technical reserves;
– the IT systems used to process the technical data and integrate
that data into the accounting system.
■ We applied procedures to test the reliability and the completeness
and accuracy of the underlying data.
■ We applied procedures (including monitoring the change in loss
ratios) to analyse the significant changes that took place over the
reporting period.
■ We assessed the outcome of the accounting estimates made the
previous year with a view to assessing the reliability of the process
used by management to calculate these estimates.
■ Our work also consisted in assessing the statistical methods and
actuarial inputs applied, as well as of the assumptions used, with
respect to the applicable regulations, market practices, and the
economic and financial context of the AXA Group taking into
account contrary and corroborating evidence.
■ Focusing on those classes of business where reserve estimates
present a higher risk of uncertainty and judgement, we undertook
an independent evaluation of the reserves for certain insurance
risk categories with a view to providing a basis for our professional
judgment and our assessment of the estimates used by the
Group.
Finally, we assessed the adequacy of the disclosures in the financial
statements.

369I UNIVERSAL REGISTRATION DOCUMENT - ANNUAL REPORT 2019 - AXA I
CONSOLIDATED FINANCIAL STATEMENTS
5
5.7 REPORT OF THE STATUTORY AUDITORS ON THE CONSOLIDATED FINANCIAL STATEMENTS
Measurement of the recoverable amount of goodwill
(See Notes 1.3.2, 1.7.1 and 5 to the consolidated financial statements)
Key audit matter How our audit addressed the matter
At December 31, 2019, the Group’s statement of financial position
showed goodwill with a net carrying amount of €17,776 million
(including €7,615 million related to the AXA XL cash generating unit
(CGU)).
As stated in Note 1.3.2 to the consolidated financial statements,
goodwill corresponds to the excess of the consideration of the
business combination over the net identifiable assets acquired and
liabilities assumed on the acquisition date. Goodwill is allocated to
the CGUs of the activities into which that business was incorporated.
An impairment test of goodwill, as stated in Note 1.7.1 to the
consolidated financial statements, is performed at least once a
year to ensure that the net carrying amount does not exceed the
recoverable amount and there is no impairment. The recoverable
amount corresponds to the higher of fair value less costs to sell and
value in use.
As stated in Note 5 to the consolidated financial statements, value
in use calculations are based on the following main assumptions:
■ cash flow projections based on business plans
■ discount rates, and
■ long-term growth rates
thus, requiring significant judgment from management. This is
especially the case for the AXA XL CGU.
Accordingly, we deemed the measurement of the recoverable
amount of goodwill to be a key audit matter.
Our audit approach to the risk relating to recoverability of goodwill
was as follows:
■ We assessed the compliance of the methodology applied by the
Group with current accounting standards and its implementation;
■ We also applied procedures to test that:
– the projected future cash flows are consistent with
management’s most recent estimates, as calculated during
the budget process;
– the assumptions made with respect to projected future
cash flows are reasonable in terms of the economic and
financial context of the CGU and, by assessing the reasons for
diff erences between projected and actual performances, that
the process by which the estimates were calculated is reliable.
■ We performed sensitivity analysis around the key assumptions
to ascertain that selected adverse changes to key assumptions
would not cause the carrying amount of goodwill to exceed the
recoverable amount.
We assessed the adequacy of the disclosures in the financial
statements.
SPECIFIC VERIFICATIONS
We have also performed, in accordance with professional standards applicable in France, the specific verifications required by laws
and regulations of the Group’s information given in the management report of the Board of Directors.
We have no matters to report as to the fair presentation and the consistency with the consolidated financial statements, reminded that
it is not our responsibility to conclude on the fair presentation and consistency with the financial statements of the solvency related
information required by article L. 356-23 of the French Insurance Code (Code des assurances).
We attest that the consolidated non-financial statement required by Article L.225-102-1 of the French Commercial Code (code de
commerce) is included in the Group’s management report, it being specified that, in accordance with Article L.823-10 of this Code, we
have verified neither the fair presentation nor the consistency with the financial statements of the information contained therein. This
information should be reported on by an independent third party.
REPORT ON OTHER LEGAL AND REGULATORY REQUIREMENTS
Appointment of Statutory Auditors
We were appointed as statutory auditors of AXA SA by the Shareholders’ Meetings held on February 28, 1989 (PricewaterhouseCoopers
Audit) and on June 8, 1994 (Mazars). As at December 31, 2019, PricewaterhouseCoopers Audit and Mazars were in the thirty-first and
in the twenty-sixth consecutive year of total uninterrupted engagement, respectively.

370 I UNIVERSAL REGISTRATION DOCUMENT - ANNUAL REPORT 2019 - AXA I
CONSOLIDATED FINANCIAL STATEMENTS 5 5.7 REPORT OF THE STATUTORY AUDITORS ON THE CONSOLIDATED FINANCIAL STATEMENTS
RESPONSIBILITIES OF MANAGEMENT AND THOSE CHARGED WITH GOVERNANCE FOR THE
CONSOLIDATED FINANCIAL STATEMENTS
Management is responsible for the preparation and fair presentation of the consolidated financial statements in accordance with
International Financial Reporting Standards (IFRS) as adopted by the European Union and for such internal control as management
determines is necessary to enable the preparation of consolidated financial statements that are free from material misstatement,
whether due to fraud or error.
In preparing the consolidated financial statements, management is responsible for assessing the Company’s ability to continue as a
going concern, disclosing, as applicable, matters related to going concern and using the going concern basis of accounting unless it
is expected to liquidate the Company or to cease operations.
The Audit Committee is responsible for monitoring the financial reporting process and the eff ectiveness of internal control and risk
management systems and where applicable, its internal audit, regarding the accounting and financial reporting procedures.
The consolidated financial statements were approved by the Board of Directors.
STATUTORY AUDITORS’ RESPONSIBILITIES FOR THE AUDIT OF THE CONSOLIDATED
FINANCIAL STATEMENTS
Objective and audit approach
Our role is to issue a report on the consolidated financial statements. Our objective is to obtain reasonable assurance about whether the
consolidated financial statements as a whole are free from material misstatement. Reasonable assurance is a high level of assurance,
but is not a guarantee that an audit conducted in accordance with professional standards will always detect a material misstatement
when it exists. Misstatements can arise from fraud or error and are considered material if, individually or in the aggregate, they could
reasonably be expected to influence the economic decisions of users taken on the basis of these consolidated financial statements.
As specified in Article L.823-10-1 of the French Commercial Code (code de commerce), our statutory audit does not include assurance
on the viability of the Company or the quality of management of the aff airs of the Company.
As part of an audit conducted in accordance with professional standards applicable in France, the statutory auditor exercises professional
judgment throughout the audit and furthermore:
■ Identifies and assesses the risks of material misstatement of the consolidated financial statements, whether due to fraud or error,
designs and performs audit procedures responsive to those risks, and obtains audit evidence considered to be suff icient and
appropriate to provide a basis for his opinion. The risk of not detecting a material misstatement resulting from fraud is higher than
for one resulting from error, as fraud may involve collusion, forgery, intentional omissions, misrepresentations, or the override of
internal control.
■ Obtains an understanding of internal control relevant to the audit in order to design audit procedures that are appropriate in the
circumstances, but not for the purpose of expressing an opinion on the eff ectiveness of the internal control.
■ Evaluates the appropriateness of accounting policies used and the reasonableness of accounting estimates and related disclosures
made by management in the consolidated financial statements.
■ Assesses the appropriateness of management’s use of the going concern basis of accounting and, based on the audit evidence
obtained, whether a material uncertainty exists related to events or conditions that may cast significant doubt on the Company’s
ability to continue as a going concern. This assessment is based on the audit evidence obtained up to the date of his audit report.
However, future events or conditions may cause the Company to cease to continue as a going concern. If the statutory auditor
concludes that a material uncertainty exists, there is a requirement to draw attention in the audit report to the related disclosures in
the consolidated financial statements or, if such disclosures are not provided or inadequate, to modify the opinion expressed therein.
■ Evaluates the overall presentation of the consolidated financial statements and assesses whether these statements represent the
underlying transactions and events in a manner that achieves fair presentation.
■ Obtains suff icient appropriate audit evidence regarding the financial information of the entities or business activities within the Group
to express an opinion on the consolidated financial statements. The statutory auditor is responsible for the direction, supervision
and performance of the audit of the consolidated financial statements and for the opinion expressed on these consolidated financial
statements.

371I UNIVERSAL REGISTRATION DOCUMENT - ANNUAL REPORT 2019 - AXA I
CONSOLIDATED FINANCIAL STATEMENTS
5
5.7 REPORT OF THE STATUTORY AUDITORS ON THE CONSOLIDATED FINANCIAL STATEMENTS
REPORT TO THE AUDIT COMMITTEE
We submit a report to the Audit Committee which includes in particular a description of the scope of the audit and the audit program
implemented, as well as the results of our audit. We also report, if any, significant deficiencies in internal control regarding the accounting
and financial reporting procedures that we have identified.
Our report to the Audit Committee includes the risks of material misstatements that, in our professional judgement, were of most
significance in the audit of the consolidated financial statements of the current period and which are therefore key audit matters that
we are required to describe in this report.
We also provide the Audit Committee with the declaration provided for in Article 6 of Regulation (EU) No. 537-2014, confirming our
independence within the meaning of the rules applicable in France such as they are set in particular by Articles L.822-10 to L.822-14
of the French Commercial Code (code de commerce) and in the French Code of Ethics (code de déontologie) for statutory auditors.
Where appropriate, we discuss with the Audit Committee the risks that may reasonably be thought to bear on our independence, and
the related safeguards.
Neuilly-sur-Seine and Courbevoie, March 19 , 2020
The Statutory Auditors
PricewaterhouseCoopers Audit MAZARS
Bénédicte Vignon Grégory Saugner Jean-Claude Pauly Maxime Simœn

372 I UNIVERSAL REGISTRATION DOCUMENT - ANNUAL REPORT 2019 - AXA I
CONSOLIDATED FINANCIAL STATEMENTS 5
This page was intentionally left blank.

373I UNIVERSAL REGISTRATION DOCUMENT - ANNUAL REPORT 2019 - AXA I
6.1 AXA SHARES 374
Trading on Euronext Paris 374
6.2 SHARE CAPITAL 375
Capital ownership 375
Transactions involving AXA’s share capital 377
Fully diluted capital on December 31, 2019 378
Financial authorizations 378
6.3 GENERAL INFORMATION 380
Regulation and Supervision 380
AXA Group Tax Policy 387
Bylaws 390
SHARES,
SHARE CAPITAL
AND GENERAL
INFORMATION 6

374 I UNIVERSAL REGISTRATION DOCUMENT - ANNUAL REPORT 2019 - AXA I
SHARES, SHARE CAPITAL AND GENERAL INFORMATION 6 6.1 AXA SHARES
6.1 AXA SHARES
The principal trading market for AXA ordinary shares is Euronext Paris (Compartment A). Since the delisting of AXA ADRs (American
Depositary Receipts representing American Depositary Shares (“ADS”), each representing one AXA ordinary share) from the New York
Stock Exchange on March 26, 2010, AXA ADRs have traded on the US over-the-counter (“OTC”) market and are listed on the OTC QX
platform under the symbol AXAHY.
I Trading on Euronext Paris
In France, AXA ordinary shares are included in the principal index
published by Euronext Paris, the CAC 40 Index, which comprises
the 40 most capitalized and actively traded shares on Euronext
Paris. AXA ordinary shares are also included in Euronext 100,
the index representing Euronext’s blue chip companies based
on market capitalization and liquidity and in EURO STOXX 50,
the blue chip index comprised of the 50 most highly capitalized
and most actively traded equities of the main industry sectors of
the eurozone. In addition, AXA ordinary shares are also included
in STOXX® Europe 600 Insurance, the insurance sector index for
European companies and in the EURO STOXX Sustainability
40, the index representing the largest sustainability leaders in
the eurozone in terms of long-term environmental, social and
governance criteria.
The table below sets forth, for the periods indicated, the reported high and low prices (intraday) in Euro for AXA ordinary shares on
Euronext Paris:
Calendar period
Intraday High
(in Euro)
Intraday Low
(in Euro)
2018
Third quarter 23.7 20.5
Fourth quarter 23.9 18.4
2019
First quarter 23.0 18.4
Second quarter 23.9 21.7
Third quarter 24.0 20.5
Fourth quarter 25.4 22.2
Annual 25.4 18.4
2019 and 2020
August 2019 23.2 20.5
September 2019 23.4 20.8
October 2019 24.4 22.2
November 2019 25.4 23.6
December 2019 25.4 24.1
January 2020 25.6 23.7
February 2020 25.6 20.7

375I UNIVERSAL REGISTRATION DOCUMENT - ANNUAL REPORT 2019 - AXA I
SHARES, SHARE CAPITAL AND GENERAL INFORMATION
6
6.2 SHARE CAPITAL
6.2 SHARE CAPITAL
I Capital ownership
On December 31, 2019, AXA’s fully paid up and issued share capital amounted to €5,536,521,831.67 divided into 2,417,695,123 ordinary
shares, each with a par value of €2.29 and eligible for dividends as of January 1, 2019.
To the best of the Company’s knowledge, the table below summarizes the ownership of its issued outstanding ordinary shares and
related voting rights on December 31, 2019:
Number
of shares
% of capital
ownership
% of voting
rights (a)
Mutuelles AXA (b) 349,441,956 14.45% 24.21%
Employees and agents 103,450,594 4.28% 6.09%
Treasury shares held directly by the Company 31,102,295 1.29% [1.09%] (c)
Treasury shares held by Company subsidiaries (d) 240,194 0.01% [0.01%] (c)
General public 1,933,460,084 79.97% 68.60%
TOTAL 2,417,695,123 (e)
100% 100%
(a) In this table, voting rights’ percentages are calculated on the basis that all outstanding ordinary shares are entitled to voting rights, notwithstanding the fact that certain of these shares may be deprived of voting rights by law or otherwise (for example, treasury shares are deprived of voting rights under French law).
(b) AXA Assurances IARD Mutuelle (11.57% of capital ownership and 19.33% of voting rights) and AXA Assurances Vie Mutuelle (2.88% of capital ownership and 4.88% of voting rights).
(c) These shares will be entitled to vote when they cease to be treasury shares (e.g. upon their sale or other transfer to an unaff iliated third party).
(d) Treasury shares as indicated in Note 13 “Shareholders’ equity and minority interests” in Part 5 – “Consolidated Financial Statements” of this Annual Report.
(e) Source: Euronext Notice of January 9, 2020.
AXA Assurances IARD Mutuelle and AXA Assurances Vie Mutuelle
(the “Mutuelles AXA”) are parties to agreements pursuant to
which they have stated their intention to collectively vote their
shares in AXA. As part of these agreements, the Mutuelles AXA
have established a Strategy Committee (Comité de Coordination
Stratégique) composed of certain directors from their respective
Boards. The Strategy Committee has elected amongst its
members Mr. François Martineau and Mr. Philippe Guerand
as co-chairmen. It is generally consulted on all significant
matters relating to the Mutuelles AXA including their collective
shareholding in AXA and overall relationship with the Company
and the AXA Group.
To the best of the Company’s knowledge, no shareholder held
more than 5% of the Company’s share capital or voting rights
on December 31, 2019 except as indicated in the table above.
Certain of the Company’s shares are entitled to double voting
rights as described in Section 6.3 – “General information
– Voting rights” of this Annual Report. Of the Company’s
2,417,695,123 outstanding ordinary shares on December 31,
2019, 440,314,817 shares entitled their holders to double voting
rights as of that date.

376 I UNIVERSAL REGISTRATION DOCUMENT - ANNUAL REPORT 2019 - AXA I
SHARES, SHARE CAPITAL AND GENERAL INFORMATION 6 6.2 SHARE CAPITAL
SIGNIFICANT CHANGES IN CAPITAL OWNERSHIP
Significant changes in the Company’s share capital ownership between December 31, 2017 and December 31, 2019 are set forth in
the table below:
On December 31, 2019 (a)
On December 31, 2018 (a)
On December 31, 2017 (a)
Number of
shares
Capital
owner-
ship (%)
Number of
voting rights
Voting
rights
(%)
Number of
shares
Capital
owner-
ship (%)
Number of
voting rights
Voting
rights
(%)
Number of
shares
Capital
owner-
ship (%)
Number of
voting rights
Voting
rights
(%)
Mutuelles AXA (b) 349,441,956 14.45% 692,059,674 24.21% 349,083,119 14.40% 691,850,894 24.16% 342,767,775 14.13% 685,535,550 23.97%
Employees
and agents 103,450,594 4.28% 174,037,495 6.09% 125,932,806 5.19% 182,434,659 6.37% 129,418,305 5.34% 196,680,918 6.88%
Treasury shares
held directly by
the Company 31,102,295 1.29% [31,102,295] (c) [1.09%] (c) 41,245,315 1.70% [41,245,315] (c) [1.44%] (c) 41,395,855 1.71% [41,395,855] (c) [1.45%] (c)
Treasury
shares held
by Company
subsidiaries (d) 240,194 0.01% [247,342] (c) [0.01%] (c) 368,439 0.02% [375,587] (c) [0.01%] (c) 413,421 0.02% [420,569] (c) [0.01%] (c)
General public 1,933,460,084 79.97% 1,960,563,134 68.60% 1,908,286,947 78.69% 1,947,968,800 68.02% 1,911,240,395 78.81% 1,935,625,200 67.69%
TOTAL 2,417,695,123 (e)
100% 2,858,009,940 100% 2,424,916,626 100% 2,863,875,255 100% 2,425,235,751 100% 2,859,658,092 100%
(a) In this table, voting rights’ percentages are calculated on the basis that all outstanding ordinary shares are entitled to voting rights, notwithstanding the fact that certain of these shares may be deprived of voting rights by law or otherwise (for example, treasury shares are deprived of voting rights under French law).
(b) AXA Assurances IARD Mutuelle and AXA Assurances Vie Mutuelle.
(c) These shares will be entitled to vote when they cease to be treasury shares (e.g. upon their sale or other transfer to an unaff iliated third party).
(d) Treasury shares as indicated in Note 13 “Shareholders’ equity and minority interests” in Part 5 – “Consolidated Financial Statements” of this Annual Report.
(e) Source: Euronext Notice of January 9, 2020.
On December 31, 2019, to the best of the Company’s knowledge
based on the information available to it, the Company had 11,466
total registered holders of its ordinary shares (i.e. shareholders
holding in nominative form).
TRANSACTIONS COMPLETED IN 2019
BY AXA INVOLVING ITS OWN SHARES
In connection with the share repurchase programs approved
by AXA’s shareholders during their Shareholders’ Meetings held
on April 25, 2018 (resolution 18) and April 24, 2019 (resolution
11) and pursuant to Article L.225-209 of the French Commercial
Code (Code de commerce), (i) 26,420,747 AXA shares were
repurchased (for the purposes of (a) hedging free grants of shares
to employees of the Group or (b) cancelling them in order to
neutralize the dilutive impact of shares issued in connection with
equity compensation arrangements and employee share plan
off erings) for an average weighted gross unit price per share of
€22.53, and (ii) no AXA shares were sold between January 1 and
December 31, 2019.
As a result, on December 31, 2019, the total number of AXA
treasury shares, all allocated for hedging or cancellation
purposes, was 31,102,295 (or 1.29% of AXA’s share capital at
that date). The booking value of these 31,102,295 treasury
shares on December 31, 2019 is €725,811,332.64. These shares
were acquired for an aggregate purchase price of €595,187,973.10
(with a par value of €2.29 per share).
Furthermore, for information purposes, it should be noted that
on December 31, 2019, the total number of treasury shares held
by Company subsidiaries was 240,194 (or 0.01% of AXA’s share
capital at that date). The booking value of these 240,194 treasury
shares on December 31, 2019 is €7,055,000.
EMPLOYEE SHAREHOLDERS
Shareplan
Since 1993, the AXA Group has promoted employee shareholding
by offering each year to its employees an opportunity to
become shareholders through a share capital increase reserved
exclusively to them (“Shareplan”).
By virtue of the authorization granted by the Shareholders’
Meeting of April 24, 2019, the Board of Directors increased the
Company’s share capital through the issue of shares reserved to
the Group employees under the Shareplan 2019 program. The
shareholders waived their preferential subscription rights so
that this off ering could be made exclusively to Group employees
(Shareplan 2019).
In countries that met the legal, regulatory and tax requirements
to participate in Shareplan, two investment options were off ered
to the Group employees in 2019:
■ the traditional plan, off ered in 38 countries;
■ the leveraged plan, off ered in 37 countries.
The traditional plan allowed employees to subscribe through
a personal investment to AXA shares (either through Mutual
funds (FCPE) or through direct share ownership, depending
on countries) with a 20% discount. The shares are held within
the Group Company Savings Plans and are restricted from sale

377I UNIVERSAL REGISTRATION DOCUMENT - ANNUAL REPORT 2019 - AXA I
SHARES, SHARE CAPITAL AND GENERAL INFORMATION
6
6.2 SHARE CAPITAL
during a period of approximately 5 years (except specific early
exit cases allowed by applicable law). Employees are subject
to the share price evolution, up or down, as compared to the
subscription price.
At the end of the 5 year holding period, the employees can,
depending on their country of residence, do any one of the
following: (1) receive the cash value of their investment;
(2) receive the value of their investment in the form of AXA shares;
or (3) transfer their assets invested in the leveraged plan into the
traditional plan.
The leveraged plan in 2019 allowed employees to subscribe,
on the basis of 10 times their personal investment, in AXA
shares (either through Mutual funds (FCPE) or through direct
share ownership, depending on their countries of residence)
with a 4.99% discount. These shares are held within the Group
Company Savings Plans and are restricted from sale during a
period of approximately 5 years (except specific early exit cases
allowed by applicable law). Employees’ personal investment is
guaranteed by a bank, and employees also benefit from a portion
of the share appreciation, calculated on the basis of the non-
discounted reference price.
Mutual funds (FCPE) with direct voting rights have been created
since 2005 to allow beneficiaries, in most cases, to directly
exercise their voting rights during the Company’s Shareholders’
Meetings.
The Shareplan 2019 program was carried out through a capital
increase that took place in November 2019. Approximately
26,000 employees took part in the Shareplan 2019 program,
representing approximately 24% of eligible employees:
■ the total amount invested was over €375 million, as follows:
• €64 million in the traditional plan, and
• €312 million in the leveraged plan;
■ a total of approximately 18 million new shares were issued,
each with a par value of €2.29. These shares began earning
dividends on January 1, 2019.
On December 31, 2019, AXA employees and agents held 4.28%
of the share capital and 6.09% of the voting rights. These shares
are owned through Mutual funds (FCPE) or directly either in the
form of ordinary shares or ADS.
I Transactions involving AXA’s share capital
On December 31, 2019, AXA’s share capital was comprised of 2,417,695,123 ordinary shares, each with a par value of €2.29. All these
shares were fully paid up and non-assessable and began earning dividends on January 1, 2019.
The following table sets forth changes in the number of shares from January 1, 2017 to December 31, 2019:
Date Transaction
Number of
shares issued
or cancelled
Issue or
merger
premium
(in Euro)
Number
of shares
aft er the
transaction
Amount of
share capital
aft er the
transaction
( in Euro)
2017 Share capital reduction by cancellation of shares (4,247,422) (93,006,551) 2,420,901,708 5,543,864,911
Exercise of stock options 3,077,495 41,047,758 2,423,979,203 5,550,912,375
New equity issue reserved for employees of AXA
(SharePlan 2017)
19,558,841 394,238,574 2,443,538,044 5,595,702,121
Share capital reduction by cancellation of shares (23,272,226) (531,851,334) 2,420,265,818 5,542,408,723
Exercise of stock options 4,969,933 73,161,594 2,425,235,751 5,553,789,870
2018 Share capital reduction by cancellation of shares (2,935,769) (63,784,085) 2,422,299,982 5,547,066,959
Exercise of stock options 1,047,114 14,226,407 2,423,347,096 5,549,464,850
New equity issue reserved for employees of AXA
(SharePlan 2018)
15,423,549 290,581,688 2,438,770,645 5,584,784,777
Share capital reduction by cancellation of shares (15,423,549) (323,167,103) 2,423,347,096 5,549,464,849
Exercise of stock options 1,569,530 17,745,639 2,424,916,626 5,553,059,074
2019 Share capital reduction by cancellation of shares (1,644,442) (35,703,764) 2,423,272,184 5,549,293,301
Share capital reduction by cancellation of shares (9,804,700) (212,073,425) 2,413,467,484 5,526,840,538
Exercise of stock options 1,494,925 18,617,056 2,414,962,409 5,530,263,917
New equity issue reserved for employees of AXA
(SharePlan 2019)
17,815,616 332,631,486 2,432,778,025 5,571,061,677
Share capital reduction by cancellation of shares (17,815,616) (368,227,901) 2,414,962,409 5,530,263,917
31/12/2019 Exercise of stock options 2,732,714 38,290,141 2,417,695,123 5,536,521,832

378 I UNIVERSAL REGISTRATION DOCUMENT - ANNUAL REPORT 2019 - AXA I
SHARES, SHARE CAPITAL AND GENERAL INFORMATION 6 6.2 SHARE CAPITAL
I Fully diluted capital on December 31, 2019
The following table indicates the Company’s fully diluted share capital, assuming that the maximum number of new shares is issued
following the exercise of all outstanding stock options.
Fully diluted capital
Ordinary shares issued on December 31, 2019 (a) 2,417,695,123
Stock options 15,154,663
Maximum total number of shares 2,432,849,786
(a) Source: Euronext Notice of January 9, 2020.
I Financial authorizations
FINANCIAL AUTHORIZATIONS VALID AS OF DECEMBER 31, 2019
AXA’s authorizations to issue shares or other types of securities as at December 31, 2019 are summarized in the tables below:
issues with preferential subscription rights for shareholders
Securities
Maximum nominal
amount in case of debt
instruments (in Euro)
Maximum
nominal amount
of the capital
increase (in Euro) Term Expiry date
Capitalization of reserves, earnings or premiums – 1 billion (a) 26 months June 24, 2021
Ordinary shares and other securities giving a
claim to ordinary shares of the Company through
subscription, conversion, exchange, redemption,
presentation of a warrant or otherwise (b) 6 billion (c) 2 billion (d) 26 months June 24, 2021
(a) Independent ceiling.
(b) Including the issue of ordinary shares as result of securities issued by subsidiaries of AXA.
(c) The aggregate nominal value of debt instruments associated with the issue of securities with or without preferential subscription rights may not exceed the global upper limit of €6 billion.
(d) The aggregate nominal value of the capital increase with or without preferential subscription rights may not exceed €2 billion in nominal value.

379I UNIVERSAL REGISTRATION DOCUMENT - ANNUAL REPORT 2019 - AXA I
SHARES, SHARE CAPITAL AND GENERAL INFORMATION
6
6.2 SHARE CAPITAL
Issues without preferential subscription rights for shareholders
Securities
Maximum nominal
amount in case of
debt instruments
(in Euro)
Maximum nominal
amount of the capital
increase (in Euro or in
percentage of the share capital) Term Expiry date
Ordinary shares and other securities giving a claim to
ordinary shares of the Company through subscription,
conversion, exchange, redemption, presentation of
a warrant or otherwise (a) 6 billion (b) 550 million 26 months June 24, 2021
Ordinary shares or securities giving access to the capital,
reserved for employees – 135 million (c) 18 months October 24, 2020
Ordinary shares reserved for a specific category of
beneficiaries in connection with off erings for employees – 135 million (c) 18 months October 24, 2020
Performance shares (actions de performance ) (d) – 1% (e) 38 months June 24, 2022
Performance shares (actions de performance ) (d) (g) – 0.40% (e) 38 months June 24, 2022
Shares issued in connection with the exercise of stock
options – 1% (f) 38 months June 26, 2020
(a) Including the issue of ordinary shares or securities (i) in the event of private investments or through public off ers, (ii) in the event of public exchange off ers initiated by the Company, (iii) in consideration for contributions-in-kind for up to 10% of the Company’s share capital, or (iv) as result of securities issued by subsidiaries of AXA.
(b) The aggregate nominal value of debt instruments associated with the issue of securities with or without preferential subscription rights may not exceed the global upper limit of €6 billion.
(c) Common and independent ceiling.
(d) Existing shares and/or newly issued shares.
(e) At the date on which performance shares are granted by the Board of Directors.
(f) At the date on which stock options are granted by the Board of Directors.
(g) Dedicated to retirement plans.
NEW FINANCIAL AUTHORIZATIONS
The following authorizations to issue shares or securities giving a claim to ordinary shares of the Company and will be submitted to
the Shareholders’ Meeting on April 30, 2020:
Issues without preferential subscription rights for shareholders
Securities
Maximum nominal
amount in case of
debt instruments
(in Euro)
Maximum nominal
amount of the capital
increase (in Euro) Term Expiry date
Ordinary shares or securities giving access to the capital,
reserved for employees – 135 million (a) 18 months October 30, 2021
Ordinary shares reserved for a specific category of
beneficiaries in connection with off erings for employees – 135 million (a) 18 months October 30, 2021
(a) Common and independent ceiling.
USE OF THE FINANCIAL AUTHORIZATIONS IN 2019
Equity issue reserved for employees
Please see paragraph “Employee shareholders” of Section 6.2
of this Annual Report.
Performance shares
In 2019, by virtue of the authorizations granted by the
shareholders at the Shareholders’ Meeting of April 24,
2019 (resolutions 23 and 24) respectively 2,961,225 performance
shares and 571,909 performance shares dedicated to retirement
plans were granted by the AXA Board of Directors.
380 I UNIVERSAL REGISTRATION DOCUMENT - ANNUAL REPORT 2019 - AXA I
SHARES, SHARE CAPITAL AND GENERAL INFORMATION 6 6.3 GENERAL INFORMATION
6.3 GENERAL INFORMATION
AXA is a société anonyme (a public limited company) organized
under the laws of France, and is the publicly traded parent
company of the AXA Group. The Company’s registered off ice
is located at 25, avenue Matignon, 75008 Paris, France and
its telephone number is +33 (0) 1 40 75 57 00. AXA SA was
incorporated in 1957 but the origin of its activities dates to 1852.
The Company’s corporate existence will continue, subject to
dissolution or prolongation, until December 31, 2059. The
Company is registered with the Paris Trade and Companies
Register (Registre du commerce et des sociétés) under
number 572 093 920. AXA’s legal entity identifier (LEI) is
F5WCUMTUM4RKZ1MAIE39.
The following documents may be consulted at the AXA Group
Legal Department (25, avenue Matignon, 75008 Paris, France)
until the filing of AXA’s next Universal Registration Document with
the AMF: (i) the Bylaws of the Company, (ii) the reports or other
documents prepared by any expert at the Company’s request
which are (in whole or in part) included or referred to in this
Universal Registration Document, and (iii) AXA SA’s financial
statements and Consolidated Financial Statements for each
of the three financial years preceding the publication of this
Universal Registration Document. These documents are also
available on AXA’s website and, more specifically, at the following
links for the Bylaws of the Company (https://group.axa.com/en/
about-us/governance-overview) and the documents referred to
in (ii) and (iii) (https://group.axa.com/en/investor/annual-and-
interim-reports) .
I Regulation and Supervision
AXA is engaged in regulated business activities on a global scale
through numerous operating subsidiaries. The Group’s principal
business activities of (re)insurance and Asset Management are
subject to comprehensive regulation and supervision in each of
the various jurisdictions where the Group operates. AXA SA, the
ultimate parent holding company of the AXA Group, is also subject
to extensive regulation as a result of its listing on Euronext Paris
and its direct and indirect shareholding in numerous regulated
insurance and Asset Management subsidiaries. Given that the
AXA Group is headquartered in Paris, France, this supervision
is based to a significant extent on European Union directives
and regulations and on the French regulatory system. AXA’s
principal regulators in France are the AMF, which is the financial
markets regulator, and the Autorité de contrôle prudentiel et de
résolution (the “ACPR”), which is the insurance and financial
services regulator.
INSURANCE AND REINSURANCE
OPERATIONS
While the extent and nature of regulation varies from country
to country, most jurisdictions in which AXA’s (re)insurance
subsidiaries operate have laws and regulations governing
distribution practices, standards of solvency, levels of capital and
reserves, permitted types and concentrations of investments,
and business conduct to be maintained by (re)insurance
companies, as well as agent licensing, approval of policy forms
and, for certain lines of insurance, approval or filing of rates.
In certain jurisdictions, regulations limit sales commissions,
fees and certain other marketing expenses that may be incurred
by the insurer and impose product suitability and disclosure
requirements. In general, insurers are required to file detailed
annual financial statements with their supervisory agencies
in each of the jurisdictions in which they do business. Such
agencies may conduct regular or unexpected examinations of
the (re)insurers’ operations and accounts and request additional
information from the (re)insurer. Certain jurisdictions also require
registration and periodic reporting by holding companies that
control a licensed (re)insurer. This holding company legislation
typically requires periodic disclosure, reporting concerning the
corporation that controls the licensed insurer and other aff iliated
companies, including prior approval (or notice) of transactions
between the (re)insurer and other aff iliates such as intra-group
transfers of assets and payment of dividends by the controlled
(re)insurer. In addition, such legislation generally provides that
any direct or indirect acquisition of “control” of our (re)insurance
subsidiaries domiciled in a given jurisdiction will be subject to
the prior approval of the insurance regulatory authorities in
such jurisdiction; the definition of “control” for such purposes
generally includes any direct or indirect acquisition of shares
or other instruments representing more than a 9.9% voting
interest, and would include the acquisition of shares of AXA SA
as an insurance holding company. In general, these regulatory
schemes are designed to protect the interests of policyholders
rather than shareholders. For additional information, see the
paragraph “Our businesses are subject to extensive regulation
and regulatory supervision in the various jurisdictions in which
we operate” in Section 4.1 “Risk Factors” of this Annual Report.

381I UNIVERSAL REGISTRATION DOCUMENT - ANNUAL REPORT 2019 - AXA I
SHARES, SHARE CAPITAL AND GENERAL INFORMATION
6
6.3 GENERAL INFORMATION
REGULATORY CAPITAL AND SOLVENCY
REQUIREMENTS
The Company’s (re)insurance subsidiaries are subject to
regulatory capital requirements in the jurisdictions where they
do business, which are designed to monitor capital adequacy
and to protect policyholders. While the specific regulatory capital
requirements (including the definition of admitted assets and
methods of calculation) vary between jurisdictions, an insurer’s
required regulatory capital can be impacted by a wide variety
of factors, including, but not limited to, business mix, product
design, sales volume, invested assets, liabilities, reserves and
movements in the capital markets, including interest rates and
financial markets. Regulatory capital requirements may increase,
possibly significantly, during periods of declining financial
markets and/or lower interest rates.
In recent years, the European Union has implemented a
regulatory regime for European insurers which became
eff ective on January 1, 2016, following the adoption of Directive
2009/138/EC of November 25, 2009 on the taking-up and pursuit
of the business of insurance and reinsurance, as amended
(the “Solvency II Directive”) and the regulations promulgated
thereunder (together with the Solvency II Directive, “Solvency II”).
Solvency II was implemented into French law beginning in 2015.
Solvency II is designed to implement solvency requirements that
better reflect the risks that (re)insurance companies face and
build a supervisory system that is consistent across all EU Member
States. Solvency II is based on three pillars: (1) Pillar 1 consists
of the quantitative requirements around own funds, valuation
rules for assets and liabilities and solvency capital requirements;
(2) Pillar 2 sets out qualitative requirements for the governance
and Risk Management of insurers, as well as for the eff ective
supervision of insurers, including the requirement for insurers
to submit an Own Risk and Solvency Assessment (“ORSA”); and
(3) Pillar 3 introduces an enhanced reporting and disclosure
regime, pursuant to which subject insurance undertakings
headquartered in the European Union are required to prepare
the Regular Supervisory Report (“RSR”), to be submitted by the
undertaking to the competent national regulator on a regular
basis as determined by the regulation, and the Solvency and
Financial Condition Report (“SFCR”), to be made publicly
available on an annual basis. Solvency II covers, among other
matters, valuation of assets and liabilities, the treatment of
insurance groups, the definition of capital and the overall level
of required capital. A key aspect of Solvency II is that assessment
of the Group’s risks and capital requirements is aligned more
closely with economic capital methodologies and allows the
use of either a standard model or an insurer’s own internal
economic capital model (to permit a better understanding of
the actual risks and Risk Management of the insurer) to calculate
the Solvency Capital Requirement (“SCR”), subject in the latter
case to the approval of the insurer’s lead regulator.
Solvency II provides for two separate levels of solvency capital
requirements: (i) the Minimum Capital Requirement (“MCR”),
which is the amount of own funds below which policyholders
and beneficiaries are exposed to an unacceptable level of risk
should the (re)insurance companies be allowed to continue
their operations, and (ii) the SCR, which corresponds to a level
of eligible own funds that enables (re)insurance companies to
absorb significant losses and that gives reasonable assurance
to policyholders and beneficiaries that payments will be made.
The ACPR has approved the use by AXA of its internal model
(the “Internal Model”) to calculate its SCR under Solvency II. The
Solvency II ratio of the Group as of December 31, 2019, published
on February 20, 2020, was estimated at 198% (1), compared to
193% as of December 31, 2018, and remains within AXA’s target
range of 170-220%. The Group maintained eligible own funds in
excess of its SCR at all times during 2019.
AXA continues to regularly review the scope, underlying
methodologies and assumptions of the Internal Model, and will
adjust its SCR accordingly. In addition, AXA’s Internal Model has
been and may be revised from time to time in accordance with
applicable regulations. However, any significant change to the
Internal Model would be subject to the prior approval of the ACPR
which may require adjustments to the level of SCR.
For more information on the Internal Model, please refer to
Section 4.2 “Internal control and Risk Management – Internal
Model” of this Annual Report. For further information on AXA’s
SCR, Internal Model and other Solvency II disclosures, please
refer to the AXA Group’s SFCR for the year ended December 31,
2018, available on AXA’s website (www.axa.com). AXA Group’s
SFCR for the year ended December 31, 2019 is expected to be
published on May 14, 2020, on the same website.
In the event of a failure by a (re)insurance company or an
insurance holding company to meet applicable regulatory capital
requirements (including the MCR and the SCR, as applicable),
insurance regulators generally have broad authority to require or
take various regulatory actions, including limiting or prohibiting
the issuance of new business, prohibiting payment of dividends
or other shareholder distributions, and/or putting a company
into rehabilitation or insolvency proceedings. In particular, under
the French recovery and resolution framework for the insurance
industry, set forth in Order no. 2017-1608 of November 27, 2017
and its various implementing measures (the “French Resolution
Framework”), the ACPR has broad resolution powers with respect
to insurance groups, insurance holding companies, such as
AXA SA, and (re)insurance companies, including prohibiting
payment of dividends, ordering portfolio transfers, establishing
temporary bridge institutions and imposing a temporary
stay on early termination rights. Under the French Resolution
Framework, French major insurance groups, such as the AXA
Group, are required to prepare and file with the ACPR a pre-
emptive recovery plan (plan préventif de rétablissement) covering
insurance holding companies, insurance and reinsurance
(1) The Solvency II ratio is estimated primarily based on the Internal Model calibrated based on an adverse 1/200 years shock. As in previous disclosures, all AXA US entities are taken into account assuming US equivalence. The Solvency II ratio will be finalized prior to the publication of the AXA Group’s SFCR currently expected to be published on May 14, 2020. As from January 1st, 2019, entities that were part of the XL Group (“XL entities”) have been fully consolidated for Solvency II purposes (as per the consolidation-based method set forth in the Solvency II Directive) and their contribution to the Group’s SCR has been calculated using the Solvency II standard formula. Subject to the prior approval of the ACPR, the Group intends as soon as year-end 2020 to extend its Internal Model to XL entities.

382 I UNIVERSAL REGISTRATION DOCUMENT - ANNUAL REPORT 2019 - AXA I
SHARES, SHARE CAPITAL AND GENERAL INFORMATION 6 6.3 GENERAL INFORMATION
subsidiaries thereof, and any other entity of such groups,
providing key services (services indispensables) thereto, and to
ensure that such recovery plan remains up-to-date thereaft er.
In addition, there are continuing discussions regarding the
development of recovery and resolution frameworks and
strategies in the insurance industry, as the FSB and the
International Association of Insurance Supervisors (“IAIS”)
are currently developing guidance on eff ective recovery and
resolution tools and strategies for the insurance industry, and
the European Insurance and Occupational Pensions Authority
(“EIOPA”) is working towards harmonization and strengthening
of recovery and resolution frameworks within the EU and cross-
border coordination between EU competent authorities in this
respect.
While EIOPA continues to issue regulations and guidelines
under Solvency II, the European Commission and EIOPA are
currently reviewing Solvency II, including regarding insurance
group supervision and the consistency of European insurers’
internal models. Such review may lead to further regulatory
changes to increase convergence and to strengthen oversight of
cross-border groups, as well as changes to internal models and
Solvency II capital requirements. Most recently, on October 15,
2019, EIOPA published its third consultation paper on the review
of the Solvency II framework, which covers nineteen topics,
including group supervision, solvency capital requirements
and the use of the volatility adjustment for the calculation of
technical provisions. Comments on this paper were due by
January 15, 2020 and EIOPA is expected to issue its opinion in
June 2020.
In connection with Solvency II, on September 22, 2017, the
European Union and the United States signed the “Bilateral
Agreement between the European Union and the United
States of America on Prudential Measures Regarding Insurance
and Reinsurance” (the “Covered Agreement”) which sets out
principles governing the imposition of Group capital and
supervisory standards for insurance groups headquartered in
an EU Member State or the United States with operations in both.
Following approval by the European Parliament on March 1,
2018 and the European Council on March 20, 2018, the Covered
Agreement entered into force on April 4, 2018 and will be fully
implemented within five years from its signing date. Pursuant
to the Covered Agreement, the AXA Group will remain subject
to group supervisory and capital requirements, as currently
provided under Solvency II, with AXA’s US insurance subsidiaries
remaining subject to local requirements. The Covered Agreement
also addresses various regulatory information-sharing and
reporting matters, as well as EU/US reinsurance market issues.
In addition, following the acquisition of the XL Group in 2018,
AXA has been managing, through Catlin Underwriting Agencies
Limited, Syndicate 2003, one of Lloyd’s largest syndicates. As a
result, AXA is exposed to a variety of Lloyd’s-related regulatory
matters, such as the Council of Lloyd’s wide discretionary powers
to regulate members of Lloyd’s, vary the method by which the
capital solvency ratio is calculated, or impose additional or
special levies on members.
For further information on the risks related to regulatory
capital requirements, see the paragraph “The Group’s or its
(re)insurance subsidiaries’ failure to meet their solvency and
capital adequacy requirements could have a material adverse
eff ect on our business, liquidity, ratings, results of operations
and financial position” in Section 4.1 “Risk Factors” of this Annual
Report.
IAIS AND INTERNATIONALLY ACTIVE
INSURANCE GROUP (“IAIG”) STATUS
The IAIS has developed several sets of supervisory requirements
and actions applicable to the insurance industry: (i) insurance
core principles (“ICPs”), which are intended to apply to the
supervision of all insurers and insurance groups, regardless of
size or importance; (ii) the Common Framework (“ComFrame”),
which builds and expands on the standards and guidance set
forth in the ICPs to establish supervisory standards and guidance
focusing on the eff ective group-wide supervision of IAIGs, as well
as a globally comparable risk-based measure of capital adequacy
of IAIGs, the Insurance Capital Standard (the “ICS”); and (iii) policy
measures for global systemically important insurers (“GSIIs”)
and an assessment methodology for designating GSIIs. From
2013 to 2016, the FSB, in consultation with the IAIS and national
authorities, annually published a list of GSIIs, which included
AXA in each of such years.
On November 14, 2019, the IAIS adopted the ComFrame,
which includes the version 2.0 of the ICS. As part of the IAIS
implementation schedule, ICS 2.0 is first subject to a five-year
monitoring period, starting in January 2020, during which
IAIGs can be asked by their supervisors to compute an ICS, on
a voluntary basis, for confidential reporting and discussion
in supervisory colleges. The end objective for the IAIS is to
have the ICS implemented in all jurisdictions as a group-wide
prescribed capital requirement for IAIGs aft er the monitoring
period. On November 14, 2019, the IAIS also adopted a holistic
framework for the assessment and mitigation of systemic risk
in the insurance sector (the “Holistic Framework”), in lieu of the
previous individual GSII designation mechanism, which will be
implemented starting in 2020.

383I UNIVERSAL REGISTRATION DOCUMENT - ANNUAL REPORT 2019 - AXA I
SHARES, SHARE CAPITAL AND GENERAL INFORMATION
6
6.3 GENERAL INFORMATION
The Holistic Framework comprises a set of enhanced supervisory
measures and powers of intervention (e.g., ongoing supervisory
requirements, applied to insurers, enhanced macroprudential
surveillance, crisis management and recovery planning), which
are embedded within certain ICPs and ComFrame materials,
an annual global monitoring exercise by the IAIS (at individual
insurer and sector-wide levels), as well as implementation
assessment activities aimed at assessing and mitigating the
potential build-up of systemic risk in the global insurance sector.
The Holistic Framework moves away from the previous binary
approach, in which a set of pre-determined policy measures
applied to only a small group of identified GSIIs, to an approach
promoting a proportionate application of an enhanced set of
supervisory policy measures and powers of intervention for
macroprudential purposes to a broader portion of the insurance
sector.
The IAIS will however continue to use risk factors similar to those
used in the past to identify GSIIs, to assess potential systemic risk
at individual insurers as part of its global monitoring exercise and
systemic risk assessment. In addition, many of the enhanced
supervisory measures reflected in the Holistic Framework are
similar to and derived from the enhanced policy measures the
IAIS had formerly adopted for application to GSIIs only. In light
of the development and adoption of the Holistic Framework
by the IAIS, the FSB has decided to continue suspending the
annual identification of GSIIs as from the beginning of 2020.
In November 2022, the FSB will review the need to either
discontinue or re-establish an annual identification of GSIIs
based on the initial implementation of the Holistic Framework.
AXA will continue to monitor the development of the Holistic
Framework, ICPs and ComFrame and expects the regulatory
landscape with respect to (re)insurance and financial markets
to continue to evolve in 2020 and beyond with further legislative
and regulatory initiatives.
For additional information, see paragraphs “The Group’s or its
(re)insurance subsidiaries’ failure to meet their solvency and
capital adequacy requirements could have a material adverse
eff ect on our business, liquidity, ratings, results of operations and
financial position”, “As a holding company, we are dependent on
our subsidiaries to cover our operating expenses and dividend
payments” and “Our businesses are subject to extensive
regulation and regulatory supervision in the various jurisdictions
in which we operate” in Section 4.1 “Risk Factors” of this Annual
Report.
ASSET MANAGEMENT & BANKING
ACTIVITIES
AXA Investment Managers and other AXA Asset Management
entities are subject to extensive regulation in the various
jurisdictions in which they operate. These include, in Europe,
Directive 2011/61/EU of June 8, 2011 on Alternative Investment
Fund Managers, and Directive 2009/65/EC of July 13, 2009 on the
coordination of laws, regulations and administrative provisions
relating to undertakings for collective investment in transferable
securities (UCITS), and their various implementing regulations
and transposition measures. In addition AXA’s investment
management operations in the United States are subject to
regulation by the SEC.
These regulations are generally designed to safeguard client
assets and ensure adequacy of disclosures concerning
investment returns, risk characteristics of invested assets in
various funds, suitability of investments for client investment
objectives and risk tolerance, as well as the identity, regulatory
approvals and qualifications of the investment manager.
These regulations generally grant supervisory agencies broad
administrative powers, including the power to limit or restrict
the carrying on of business for failure to comply with such laws
and regulations. In such event, the possible sanctions that may
be imposed include the suspension of individual employees,
limitations on engaging in business for specific periods, the
revocation of the registration as an investment company,
censures and/or fines.
The European Union (Regulation (EU) No. 648/2012 of July 4,
2012, also referred to as the European Market Infrastructure
Regulation – “EMIR”) and the US regulations (principally the
Dodd-Frank Act), as amended from time to time, set several
requirements and prescriptive guidelines for derivatives which
impact operations, liquidity and credit Risk Management for
derivatives. AXA’s asset managers and banks, which manage
derivatives on behalf of various AXA Group aff iliates (including on
behalf of AXA), are currently operating in conformity with these
rules, in line with the Group’s financial risk framework.
In addition, certain AXA entities must comply with revised
obligations on capital resources for banks and certain investment
firms, including Directive 2013/36/EU of June 26, 2013 on access
to the activity of credit institutions and the prudential supervision
of credit institutions and investment firms (as amended “CRD”),
and Regulation (EU) No. 575/2013 of June 26, 2013 on prudential
requirements for credit institutions and investment firms, as
amended, which set forth specific capital, governance and
remuneration requirements (as amended “CRR”). On June 27,
2019, Directive (EU) 2019/878 of May 20, 2019 (“CRD II”) and
Regulation (EU) 2019/876 of May 20, 2019 (“CRR II”), which
respectively amend CRD and CRR, entered into force. CRD II and
CRR II further implement the Basel III framework by amending
various CRD and CRR provisions regarding, e.g. holding company
rules, leverage ratios, large exposures, liquidity, market risk and
counterparty credit risk, as well as reporting and disclosure
requirements (including on remuneration).

384 I UNIVERSAL REGISTRATION DOCUMENT - ANNUAL REPORT 2019 - AXA I
SHARES, SHARE CAPITAL AND GENERAL INFORMATION 6 6.3 GENERAL INFORMATION
Most provisions of CRD II will have to be transposed into national
law by EU Member states by December 28, 2020, while most CRR
II requirements will be applicable from June 28, 2021.
Moreover, certain AXA entities are subject to Directive 2014/65/
EU of May 15, 2014 on markets in financial instruments (as
amended, “MiFID II”) and Regulation (EU) No. 600/2014 on
markets in financial instruments, as amended (together with
MiFID II, and the various regulations promulgated thereunder, the
“MiFID II Package”) which entered into force in 2018. The MiFID II
package has been designed to better integrate the European
Union’s financial markets and increase cross-border investments,
market transparency and investor protection, imposes a wide
variety of new requirements including with respect to trading/
clearing of certain derivatives on organized platforms, regular
reporting with respect to derivatives positions and certain
other types of financial instruments, enhanced governance and
investor protection standards, restrictions and/or prohibitions on
certain types of compensation arrangements or other monetary
inducements to firms providing independent investment advice
and greater regulation of structured products and other complex
financial instruments.
The reforms introduced by the MiFID II Package significantly
impacted EU securities and derivatives markets. The MiFID II
Package may also be revised in the future, including as a result
of implementing regulations, transposition laws and regulatory
guidance enacted or issued in connection therewith, and any
such modification or revision may have an adverse impact on
our business, results of operations and financial condition.
Furthermore, some AXA entities are directly or indirectly subject
to Regulation (EU) No. 1286/2014 of November 26, 2014 on key
information documents for packaged retail and insurance-based
investment products (as amended, the “PRIIPs Regulation”)
which entered into force in 2018, the objective of which is
to enhance retail investor protection by standardizing the
information through predefined key information documents.
While the PRIIPs Regulation already started impacting insurance
undertakings, banks and asset managers, its revision is under
consideration by the EU Commission in order to reach better
convergence with other EU regulations.
For additional information, see the paragraph “Our businesses
are subject to extensive regulation and regulatory supervision
in the various jurisdictions in which we operate” in Section 4.1
“Risk Factors” of this Annual Report.
OTHER SIGNIFICANT LEGISLATIVE
AND REGULATORY FRAMEWORKS
EU data protection reform
The EU Data Protection Reform, which was adopted in 2016
and entered into force in 2018, establishes a comprehensive
framework governing the protection and processing of personal
data in the private and public sectors, which includes the GDPR.
The main principles of the GDPR include (i) the strengthening
of citizens’ fundamental rights, giving them more control over
their personal data and making it easier for them to access it,
(ii) an increased harmonization of the applicable law across
the European Union and a “one-stop-shop” that will streamline
cooperation between the data protection authorities on issues
with implications for all the European Union, and (iii) a stronger
enforcement regime, under which data protection authorities will
be able to fine companies which do not comply with EU rules
up to 4% of their global annual turnover. The GDPR applies to
both EU and non-EU companies, if the latter are off ering goods
and services or monitoring the behavior of individuals in the
European Union. As (re)insurance companies need an EU license
for providing insurance services in the European Union, the GDPR
applies primarily, in the insurance and reinsurance sector, to
companies operating in the European Union.
In France, the EU Data Protection Reform has been transposed
by Law No. 2018-493 regarding personal data protection, which
entered into force on May 25, 2018, and various implementing
measures, including Decree No. 2018-687 of August 1, 2018.
For further information concerning data protection, please
see the paragraph “The evolving and complex regulatory
environment surrounding data protection and transfer in the
European Union could increase our costs and adversely impact
our business” in Section 4.1 “Risk Factors” of this Annual Report.
Personal data transfers to the United States
Following invalidation in 2015 of the European Commission’s
Safe Harbor Decision by the European Union Court of Justice,
which allowed for the transfer of personal information for
commercial purposes from companies in the European Union
to companies in the United States which had signed up to the
US Department of Commerce “Safe Harbor Privacy Principles,”
transatlantic data flows between companies continued using
other mechanisms, such as standard contractual clauses with
US companies and binding corporate rules for transfers within a
multinational corporate group. While a new safe harbor, referred
to as the “EU-US Privacy Shield,” was adopted in July 2016, banks
and insurance companies are generally not currently eligible to
register on the EU-US Privacy Shield list, and the AXA Group has

385I UNIVERSAL REGISTRATION DOCUMENT - ANNUAL REPORT 2019 - AXA I
SHARES, SHARE CAPITAL AND GENERAL INFORMATION
6
6.3 GENERAL INFORMATION
accordingly been relying on the above-mentioned mechanisms
to transfer personal data from the Company or its EU-based
affiliates to its banking and insurance affiliates based in the
United States. For further information concerning transatlantic
data transfers, please see the paragraph “The evolving and
complex regulatory environment surrounding data protection
and transfer in the European Union could increase our costs and
adversely impact our business” in Section 4.1 “Risk Factors” of
this Annual Report.
Executive compensation
Solvency II sets out the remuneration policy principles and
governance requirements to be implemented by European
insurers and specifies that the companies subject to Solvency II
must adopt a written remuneration policy compliant with a
number of principles set out in the Delegated Regulation (EU)
2015/35 of October 10, 2014 which promotes sound and eff ective
Risk Management and does not encourage risk-taking that
exceeds the risk tolerance limits of the Company. In this context,
AXA has reviewed and formalized its existing Group remuneration
policy, identified the individuals responsible for managing
and having an impact on the Group’s overall risk profile, and
defined a consistent approach to manage remuneration of
individuals in charge of control functions. AXA’s Compensation
& Governance Committee is in charge of overseeing the design
of the remuneration policy and remuneration practices, their
implementation and operation.
Since 2008, there have been a variety of proposals with respect
to executive compensation practices at financial institutions
including from the FSB and other regulatory bodies. Certain of
these proposals have been embodied in regulation or legislation,
while others remain best practice recommendations.
In 2009, the FSB published the “Principles for Sound
Compensation Practices”, together with implementation
standards. Among the matters covered in these standards and
principles are a variety of mechanisms (including minimum
recommended deferrals of cash bonuses, greater use of long-
term equity grants rather than cash as a form of compensation,
minimum vesting/deferral periods, and performance criteria
for vesting of long-term awards) that are designed to ensure
an appropriate alignment of interests between (i) Executive
Management and certain employees (such as traders) who can
have a potentially significant impact on the nature and duration
of risks incurred, (ii) the Company and (iii) shareholders. The FSB’s
principles were supplemented by additional guidance published
by the FSB in 2018, which has been developed in the form of
recommendations regarding improvements in compensation
practices and tools that could be used to reduce misconduct
risk and address misconduct incidents.
These principles and standards are reflected in a variety of
regulations and legislative initiatives that have been enacted
over the past few years in various jurisdictions where the Group
does business. While these restrictions are oft en aimed primarily
at the banking sector and do not apply uniformly to the Group
across the various jurisdictions where it does business, the
Group has largely aligned its global executive compensation
practices with these standards and principles, and conducts
regular reviews of its compensation practices and policies in
light of these standards as well as applicable legal and regulatory
requirements. The application of these principles and standards
may vary among the diff erent actors in the financial sector (such
as banks, insurers, asset managers, private equity funds, hedge
funds) and across the various jurisdictions where the Group does
business, which may give rise to certain competitive issues for
the Group, including by aff ecting the Group’s ability to attract
and retain top-rate talents.
Evolution of accounting standards
Policyholders’ liabilities are currently accounted for according
to IFRS 4, which generally allows the use of a wide variety of
accounting practices for insurance contracts, reflecting diff erent
national accounting requirements, and the continuation of
accounting policies applied prior to conversion to IFRS. On
May 18, 2017, the International Accounting Standards Board
(“IASB”) issued the IFRS 17 – Insurance Contracts, which will
replace IFRS 4, finalizing a long-standing project of the IASB
to develop a single, consistent approach to the accounting for
insurance contracts. In particular, IFRS 17 requires insurance
obligations to be accounted for using current values, instead
of historical costs. Subject to adoption by the European Union,
IFRS 17 is scheduled to become effective for annual periods
beginning on or aft er January 1, 2021.
In parallel with IFRS 17, the Group will apply the IFRS 9 –
Financial Instruments. The published eff ective date of IFRS 9
was January 1, 2018. However, given the interaction between
financial assets and insurance liabilities, the IASB issued
amendments to IFRS 4 allowing, under certain criteria, entities
issuing insurance contracts within the scope of IFRS 4 to defer the
implementation of IFRS 9 until the eff ective date of IFRS 17, but
no later than January 1, 2021. Those amendments were adopted
by the European Union on November 3, 2017. The Group is
eligible for this temporary exemption and has decided to apply it.
In the beginning of March 2020, the staff of the IASB proposed
to defer the IFRS 17 eff ective date to annual reporting periods
beginning on or aft er January 1, 2023. The staff also proposed
to extend the expiry date of the temporary exemption from
applying IFRS 9 off ered to qualifying insurers to annual periods
beginning on or aft er January 1, 2023. This would mean that
qualifying insurers could apply both standards for the first time
simultaneously. These proposals remain subject to the IASB
approval and should be confirmed through amendments.
The implementation of these two standards within the Group is
in progress and M anagement is currently assessing the impact
of their adoption.

386 I UNIVERSAL REGISTRATION DOCUMENT - ANNUAL REPORT 2019 - AXA I
SHARES, SHARE CAPITAL AND GENERAL INFORMATION 6 6.3 GENERAL INFORMATION
Climate change and sustainable finance
initiatives
There are various initiatives at the French, EU and international
levels with respect to climate change and sustainable finance,
which generally aim at proposing reforms to and potential
changes affecting (i) investment activities, (ii) disclosure
requirements, such as the recently adopted Regulation (EU)
2019/2088 on sustainability-related disclosures in the financial
services sector or Regulation (EU) 2019/2089 amending the
Benchmark Regulation as regards EU Climate Transition
Benchmarks, EU Paris-aligned Benchmarks and sustainability-
related disclosures for benchmarks, or (iii) requirements relating
to the inclusion of environmental, social and governance
considerations in insurance and Asset Management products
and advice. In particular, EIOPA has been working towards the
integration of sustainability considerations into the prudential
and conduct framework for (re)insurance undertakings and
insurance distributors. EIOPA released its technical advice to
the EU Commission on the integration of sustainability risks
and factors in the delegated acts under the Solvency II Directive
and Directive (EU) 2016/97 of January 20, 2016 on insurance
distribution (as amended, the “IDD”) on April 30, 2019, as well
as its opinion on sustainability within the Solvency II framework
on September 30, 2019. Those or similar initiatives are expected
to continue in 2020 and could result in new or additional
requirements for financial institutions.
For further information on climate change, please refer to
Section 7.3 “Climate change and biodiversity” of this Annual
Report.
Reform and potential changes to reference
rates and indices (benchmarks)
Regulatory authorities have also proposed reforms to and
potential changes aff ecting interest rate, equity, foreign exchange
rate and other types of indices (also known as “benchmarks”).
In particular, Regulation (EU) 2016/1011 of June 8, 2016 (as
amended, the “Benchmark Regulation”), which entered into
force on January 1, 2018, imposed additional requirements
on the provision of financial market-related benchmarks, the
contribution of input data to a benchmark and the use of
benchmarks within the EU.
Several interbank market benchmarks have been designated
as critical benchmarks under the Benchmark Regulation,
including Libor, Euribor and Eonia, and their related benchmark
methodologies have been made subject to review. Certain critical
benchmarks might be discontinued in the future, including,
Eonia, which is currently expected to cease being published on
January 3, 2022, and Libor, as it is likely that contributing banks
will cease providing submissions for the calculation of Libor aft er
2021.
We are closely following industry and regulatory developments
with respect to the potential impacts of future benchmark
changes, which could have implications for our capital models,
Risk Management eff orts, investment strategies and product
design, amongst others.
Evolution of the compliance regulatory
and litigation environment
The Group’s (re)insurance, Asset Management and banking
operations are subject to an increasing number of legislative
and regulatory initiatives designed to increase consumer
protection in the sector of financial services. In the European
Union, initiatives related to the financial sector include in
particular the IDD, MiFID II and the PRIIPs Regulation. Similar
initiatives are under review (or in the course of implementation)
in other jurisdictions where the Group operates and are likely to
increase operational compliance costs to ensure point-of-sale
compliance.
The IDD supersedes the Insurance Mediation Directive and is
designed to improve consumer protection by ensuring that all
distributors of insurance products operate on a level playing field.
The main provisions of the IDD relate to enhanced professional
requirements (e.g., continuing training and development for
distributors), conduct of business rules, conflicts of interest
(relating to fees, commissions and bonuses), increased
disclosure and transparency and extensive product governance
requirements. It also includes additional requirements for the
sale of insurance products with investment elements in order
to ensure that policyholders receive a similar level of protection
as buyers of retail investment products regulated under MiFID II
(e.g., when providing advice, distributors have to assess whether
the insurance-based investment product is suitable for the
customer).
The IDD entered into force on October 1, 2018, while MiFID II
and the PRIIPs Regulation entered into force at the beginning of
January 2018. In October 2019, ESMA, EIOPA and the European
Banking Authority have issued a consultation on amendments
to the PRIIPs Regulation. Subject to endorsement procedures
and an adequate implementation period for market participants,
the amendments proposed in the consultation could become
applicable to existing packaged retail and insurance-based
investment products in the course of 2021.
Finally, financial crime compliance programs of financial
institutions (anti-money laundering, anti-corruption and
international sanctions compliance) continue to be a major focus
of regulatory and law enforcement authorities with increasingly
significant penalties imposed for compliance failures. In
particular, French Law No. 2016-1691 of December 9, 2016 on
transparency, fight against corruption and modernization of
the economy, known as “Sapin II”, which entered into force
on June 1, 2017, introduces new requirements for all large
French companies and corporate groups, such as the Group,
including the establishment of internal procedures to prevent
and detect acts of corruption and influence peddling committed
in France and abroad. Sapin II also established a new French
387I UNIVERSAL REGISTRATION DOCUMENT - ANNUAL REPORT 2019 - AXA I
SHARES, SHARE CAPITAL AND GENERAL INFORMATION
6
6.3 GENERAL INFORMATION
anti-corruption agency (Agence française anticorruption), which
was given strengthened supervisory and enforcement powers.
In light of this and other initiatives in respect of compliance
requirements, M anagement believes that the complexity and
risks for international financial institutions like AXA in this area
will likely continue to increase, and that compliance costs will
also increase accordingly.
The litigation environment in which the Group operates also
continues to evolve. In continental Europe, the introduction
of class actions, including in France in 2014, has, and is likely
to continue to, increase litigation risks and costs for insurers,
asset managers and other financial institutions. Most recently,
on April 11, 2018, the EU Commission proposed a directive
on representative actions for the protection of the collective
interests of consumers, as part of its ‘New Deal for Consumers’
initiative. This proposed directive aims at enabling qualified
entities to seek remedy through representative actions against
infringements of provisions of EU law in a variety of areas
(including data protection and financial services), in order to
provide an eff ective and eff icient way of protecting the collective
interests of consumers. The EU Parliament adopted this
proposed directive in March 2019, and the EU Council adopted
a general approach with respect to such proposed directive on
November 28, 2019. Trilateral negotiations among EU institutions
are expected to commence in 2020.
For additional information, please see “Our businesses are
subject to extensive regulation and regulatory supervision in
the various jurisdictions in which we operate” in Section 4.1
“Risk Factors” and Section 4.8 “Other material risks – Regulatory
risks” of this Annual Report.
I AXA Group Tax Policy
Both as a multinational company and as a provider of
investments and savings products, the AXA Group follows a
responsible and transparent approach on tax issues.
The taxes AXA pays are an important part of its wider economic
and social impact and play a key role in the development of
countries where it operates (1 ). AXA regards it as a critical element
of its commitment to grow in a sustainable, responsible and
socially inclusive way.
AXA also squares its responsibilities as a co-operative, compliant
taxpayer in each and every country in which it operates, with
the need to support competitive business growth – serving all
its stakeholders including investors, suppliers and employees.
TAX ASPECTS IN RELATION TO AXA AS A
MULTINATIONAL COMPANY
The AXA Group’s approach to tax issues
In the countries where it operates, AXA is both a tax payer and
a tax collector, given that many specific taxes are levied on (re)
insurance policies and collected from our customers as part of
the insurance and Asset Management revenues while others are
remitted to the various state and federal administrations around
the world.
The tax function is organized within the Group to ensure full
compliance with all tax legislation in the countries where AXA
operates. In addition to the Group Tax Department based in
France, all key operational entities/countries/geographic zones
have a tax team in charge of ensuring that tax regulations are
well understood and fully satisfied by the entities.
As a part of the global internal risk assessment, a specific tax
internal control program is implemented. These controls must
be reported and documented by each team in scope to ensure
full compliance.
A Tax Code of Ethics, agreed between Group Tax Department and
local tax teams, highlights the key principles guiding the actions
of the various tax teams:
■ to remain up to date with respect to applicable laws and
regulations;
■ to comply with tax laws and regulations;
■ to maintain a good relationship with the local tax authorities;
■ and not to engage in aggressive tax driven transactions that
could compromise the good reputation of the Group.
The satisfaction of this Code of Ethics is a prerequisite of the
activities performed by all AXA tax teams. In this respect, a bi-
annual tax review process of each key entity or business line is
performed by the Group Tax Department in connection with each
local team. During these reviews, specific attention is given to
tax audits and associated tax risks as well as market positions
on tax matters that may impact AXA. These reviews off er a global
framework for the tax teams to identify, analyze, control, and
report tax risks.
(1 ) The list of the Group’s main subsidiaries and participating interests is available in Appendix III “AXA parent company financial statements” of this Annual Report. The legal organizational chart of the Group is also published on the Company’s website (www.axa.com).

388 I UNIVERSAL REGISTRATION DOCUMENT - ANNUAL REPORT 2019 - AXA I
SHARES, SHARE CAPITAL AND GENERAL INFORMATION 6 6.3 GENERAL INFORMATION
In addition, an International Tax Committee composed of various
senior tax executives within AXA tax teams meets every quarter
to ensure consistency in approach on some technical topics, as
well as agreements on guidelines connected to specific items.
As an international group operating in several countries, the AXA
Group is subject to various tax regimes and regulations and takes
into account any changes in tax law. AXA is specifically vigilant
about the changes that could result in higher tax expenses
and payments, higher compliance costs or that may aff ect the
AXA Group’s tax liability, return on investments and business
operations. In particular, please see the paragraph “Changes
in tax laws or uncertainties in the interpretation of certain tax
laws may result in adverse consequences to our business and
our results of operations” in Section 4.1 “Risk Factors” of this
Annual Report.
When considering how AXA entities structure commercial
arrangements, tax implications are analyzed in parallel with
other consequences such as capital eff iciency and legal and
regulatory aspects when deciding between potential alternative
arrangements.
AXA has no licensed insurance or operating business activities
in the countries specifically identified as non-cooperative
jurisdictions (1 ) under French and European rules, except in
Panama and Oman. The presence in these two countries is purely
driven by operational purposes.
In Oman, AXA has been acting locally for several years through
one insurance operating branch of its Bahrain insurance
subsidiary. It employs circa 130 people there to achieve this
business. AXA holds two operating companies in Panama
employing circa 150 people at the end of 2018. AXA has decided
to close its subsidiary providing assistance services to local
customers and/or travelers, but keeps a non-consolidated health
claim processing center in the country. As a result, the number
of employees locally has decreased to circa 45 people at the
end of 2019.
More globally, AXA does not use non cooperative jurisdictions
to avoid taxes on operational activities performed elsewhere.
Any presence in countries in which AXA operates with tax rates
lower than France are driven by business operations. With the
acquisition of the XL Group in September 2018, AXA now has
a material presence and substance in Bermuda with nearly
200 employees working for AXA XL there. Despite the fact that
Bermuda is a low-tax jurisdiction, it is a center of expertise and
one of the key location of the worldwide reinsurance market. It is
not considered as a non-cooperative jurisdiction according to the
French and European Union laws. This presence is mainly driven
by local capital management regulation enabling flexibility on
the required capital for reinsurance activities and AXA supports
the Economic Substance legislation recently enacted in this
country. This situation will in no way change how the AXA Group
is managed on the tax side. AXA will continue to tax its operations
in the various countries where operational profits are made.
Disclosure on tax matters and information on
taxes connected with the Group’s activities in
each country
The consolidated financial statements are prepared in
compliance with IFRS standards (as disclosed in Note 1
“Accounting principles” in Part 5 – “Consolidated Financial
Statements” of this Annual Report). Accounting for income taxes
recognizes both the current tax consequences of transactions
and events and the future tax consequences of the future
recovery or settlement of the carrying amount of the entity’s
assets and liabilities, as required by IAS 12 (see Note 1.17.1
“Income taxes” in Part 5 – “Consolidated Financial Statements”
of this Annual Report).
The Consolidated Financial Statements present the reconciliation
between the theoretical tax charge and the eff ective tax charge
under IFRS. All diff erences are fully explained (see Note 19 “Tax”
in Part 5 – “Consolidated Financial Statements” of this Annual
Report). It should be noted that in many jurisdictions where AXA
operates, the income and capital gains on savings-products
benefit from a favorable tax treatment, also when such products
are included in life insurance products. This leads to a lower
eff ective tax rate for life insurance companies.
In addition to the details reported around the Group eff ective tax
rate, AXA reports substantial information on the impacts of any
change in local tax regulations on its business, as well as details
of the tax burden per line of business and per country. AXA’s
income tax expenses/benefits are extensively disclosed in the
Annual Report and are broken down by business segment and
country. For each, a dedicated paragraph provides a comment
about the line related to Tax Income (see Section 2.3 “Activity
Report – Underlying earnings, adjusted earnings and net income
Group share” of this Annual Report).
(1 ) The list of non-cooperative jurisdictions under French tax rules is given by a ministerial decree dated January 6, 2020 and is composed of the following countries: Anguilla, American Samoa, Bahamas, British Virgin Islands, Fiji, Guam, Oman, Panama, Samoa, Seychelles, Trinidad and Tobago, US Virgin Islands and Vanuatu. Pursuant to Article 238-0 A of the French Code général des impôts, this list includes the states and jurisdictions on the blacklist set out in Annex I to the conclusions adopted by the Council of the European Union on December 5, 2017, as updated from time to time (the most recent version of this list was published on November 14, 2019, and is composed of American Samoa, Fiji, Guam, Oman, Samoa, Trinidad and Tobago, US Virgin Islands and Vanuatu).

389I UNIVERSAL REGISTRATION DOCUMENT - ANNUAL REPORT 2019 - AXA I
SHARES, SHARE CAPITAL AND GENERAL INFORMATION
6
6.3 GENERAL INFORMATION
Lastly, AXA reported in 2019 for the first time a Tax Transparency
Report where it discloses a lot of information around its tax
footprint in its key geographies, as well as key principles of its
tax policy. This Report is available on axa.com at the end of the
AXA Group Tax Policy page. AXA will update this Report annually
and the next version will be available by July 2020.
TAX ASPECTS OF ACTIVITIES AND
PRODUCTS OFFERED BY THE GROUP
Activities of the Group
The Group’s activities are subject to strict regulations and rigorous
control in each territory in which AXA operates. In addition to
these regulations, AXA has developed a set of detailed internal
standards that applies to all Group entities that are managed or
controlled by AXA, regardless of the activities undertaken by the
entity or its ownership structure.
According to these internal standards, CEOs must ensure that
staff are fully conversant, and comply with applicable laws,
mandatory Codes of Conduct, rules and regulations (including
applicable tax laws and regulations) relevant to their area of
operations.
This means that local senior management must appreciate
the tax implications of the activities in their entity. The main
considerations are:
■ compliance with the taxation of employees in the territory in
which they are employed;
■ compliance with the taxation of business undertaken in the
territory (including levies and sales taxes); and
■ cross-border tax issues.
A specific focus on transfer pricing is made in application of these
standards, to ensure that the pricing of our intra-group activities
is consistent with the OECD “arm’s length” principle as well as
with local transfer pricing rules to pay adequate tax on profits
where the value is created.
In particular, Chief Financial Officers must ensure that (re)
insurance policies entered into represent a true transfer of risk
and that their status as (re)insurance contracts could not be
subject to challenge. Business between Group companies must
be transacted at market prices where a market price exists, or
in the absence of market prices, must be supported by formally
documented justification for the charge made.
Products off ered by the Group
AXA products are not designed to allow or encourage tax evasion.
The Group has set up a validation framework to ensure that new
products undergo a thorough approval process before they go
to market.
The local decision to launch a new product must result from
a documented approval process that complies with the AXA
Group’s standards in terms of product features, pricing, asset-
liability management and aspects related to legal, compliance,
regulatory, accounting and reputation.
Moreover, AXA has established strict policies regarding its
cross-border activities and knowledge of its customers, in order
to ensure that our products and services are not misused for
money laundering or tax evasion purposes and are governed
by specific rules according to which cross-border life insurance
proposals must be presented to the Group Tax and Compliance
Departments for validation.
While all Group entities must in any case comply with local
regulation, the Group Tax Department can veto a product if this
product is not compliant with internal rules.
Pursuant to Council Directive (EU) 2018/822, AXA may, as a
provider of investments and savings products, have tax reporting
obligations with respect to certain cross-border products it
designs or implements. In particular, certain investments and
savings products with no particular tax motive may be reportable
under the above-mentioned Directive.

390 I UNIVERSAL REGISTRATION DOCUMENT - ANNUAL REPORT 2019 - AXA I
SHARES, SHARE CAPITAL AND GENERAL INFORMATION 6 6.3 GENERAL INFORMATION
I Bylaws
Certain material provisions of applicable French law, in force
at the filing date of this Annual Report, and of the Company’s
Bylaws are summarized below. Copies of AXA’s Bylaws are
available at the Paris Trade and Companies Register (Registre
du commerce et des sociétés du Tribunal de commerce de Paris)
and on the Company’s website (axa.com).
CORPORATE PURPOSE
Pursuant to Article 3 of its Bylaws, AXA’s corporate purpose is
generally to:
■ acquire all types of ownership interests in any French or foreign
company or business, including insurance companies;
■ acquire, manage and sell all listed or unlisted shares and
securities, as well as personal or real estate properties, rights,
shares or securities, whether listed or unlisted, that are related
to such properties; and
■ perform all industrial, commercial, financial, personal or real
estate property transactions, directly or indirectly related to
any of the foregoing.
MEMBERS OF THE BOARD OF DIRECTORS
AND EXECUTIVE OFFICERS
In addition to French law provisions, AXA’s Bylaws and the Board’s
Terms of Reference include a number of specific provisions
concerning members of the Board of Directors and corporate
off icers, including the following:
Compensation
The corporate off icers of the Company receive compensation
in the amount and on conditions set by the Board of Directors,
upon proposal of the Compensation & Governance Committee.
Members of the Board of Directors receive a fixed annual directors’
fee, the maximum overall amount of which is determined by the
Shareholders’ Meeting and apportioned by the Board of Directors
among its members, pursuant to the rules set forth in the Terms
of Reference of the Board of Directors. Notwithstanding the
above, the Board’s Terms of Reference provide that no directors’
fee shall be paid to the Company’s management.
For further information, please see Part 3 – “Corporate
governance” of this Annual Report.
Age limit
Notwithstanding the term of off ice for which the Chairman of the
Board of Directors is appointed, his/her functions shall terminate,
at the latest, at the end of the Ordinary Shareholders’ Meeting
convened to approve the financial statements of the preceding
fiscal year and held during the year the Chairman reaches the
age of 70.
Notwithstanding the term of off ice for which the Chief Executive
Off icer is appointed, his/her functions shall terminate at the
latest at the end of the Ordinary Shareholders’ Meeting convened
to approve the financial statements of the preceding fiscal year
and held during the year the Chief Executive Off icer reaches the
age of 65. The same rule applies for the Deputy Chief Executive
Off icers.
An individual aged 70 or older may be appointed or reappointed
to the Board of Directors exclusively for a two-year term of off ice.
His/her term of off ice can be renewed only once.
When the number of Board members aged 70 or older exceeds
one-third of the directors in off ice, the oldest director is deemed
to have resigned automatically unless any member of the Board
of Directors aged 70 or older voluntarily resigns within three
months.
When the permanent representative of a legal entity member
of the Board of Directors reaches 70 years old, the legal entity is
deemed to have resigned automatically unless it designates a
new representative within three months.
Shareholding
In accordance with the Afep-Medef Code and regardless of any
statutory obligation of holding shares, the directors, with the
exception of directors representing employees, shall personally
be shareholders of the Company and own a significant number
of shares in the Company; if they do not own such shares at the
time they are first appointed, they shall use their directors’ fees
to acquire AXA shares. Accordingly, the Board of Directors has set
for each Board member, whether an individual or a permanent
representative of a legal entity to whom directors’ fees were
paid, the objective of holding, within two years aft er first being
appointed, a number of shares in the Company, the value of
which, on the basis of the closing price of the AXA share on
December 31 of the preceding fiscal year, shall correspond to an
amount at least equivalent to the gross director’s fees earned in
respect of the previous fiscal year. The shares purchased for the
purpose of this holding objective will be held in registered form.
For additional information regarding the Board of Directors and
corporate off icers of the Company, please see Part 3 – “Corporate
governance” of this Annual Report.

391I UNIVERSAL REGISTRATION DOCUMENT - ANNUAL REPORT 2019 - AXA I
SHARES, SHARE CAPITAL AND GENERAL INFORMATION
6
6.3 GENERAL INFORMATION
RIGHTS, PREFERENCES
AND RESTRICTIONS ATTACHED
TO THE SHARES
Voting rights
Each AXA share entitles its holder to one vote at every AXA
Shareholders’ Meeting, subject to the provisions regarding
double voting rights described below. On May 26, 1977, the
Shareholders’ Meeting decided that each ordinary share fully
paid up and held in registered form by the same person for at
least two full fiscal years entitled its holder to double voting rights
with respect to such share.
In the event of a capital increase by capitalization of existing
reserves, profits or premiums, shares granted for free to any
shareholder holding shares entitled to double voting rights will
also carry double voting rights.
The rights of the holders of double voting rights may only be
modified or cancelled upon the decision of an Extraordinary
Shareholders’ Meeting and after authorization by a special
meeting of the holders of these rights.
With the exception of double voting rights, there is currently only
one class of shares with equal rights for all shareholders.
Dividends
Upon proposal by the AXA Board of Directors, the shareholders
of AXA may decide to allocate all or part of distributable profits
to special or general reserves, to carry them forward to the
next fiscal year as retained earnings, or to allocate them to the
shareholders as dividends. If AXA has earned a distributable profit
since the end of the previous fiscal year, as reflected in an interim
balance sheet certified by its Statutory Auditors, the Board of
Directors may distribute interim dividends to the extent of the
distributable profit without prior approval of the shareholders.
AXA’s Bylaws require AXA to distribute any dividends between its
shareholders in proportion to their share in the capital.
Under the provisions of AXA’s Bylaws, the actual dividend
payment date is decided by the Board of Directors.
AXA’s Bylaws provide that, the Shareholders’ Meeting may grant
each shareholder the choice to receive dividends in either cash
or additional ordinary shares.
Pre-emptive rights
Under French law, shareholders have preferential subscription
rights to subscribe, on a pro rata basis, additional ordinary
shares (and/or convertible, exchangeable or other securities
giving a claim, directly or indirectly, to AXA ordinary shares).
This subscription right is transferable and normally trades
separately during the subscription period for a capital increase.
Issuing additional shares without preferential subscription rights
requires the approval of two-thirds of the shareholders attending
or represented at an Extraordinary Shareholders’ Meeting.
Liquidation rights
If AXA is liquidated, the assets remaining aft er it pays its debts,
liquidation expenses and all prior claims will be used to repay
AXA shareholders up to the amount of the liquidation balance
and the par value of the shares held by each shareholder. Any
surplus will be divided among all shareholders, subject to rights
arising, if any, from diff erent classes of shares, in proportion to
the rights they own in the Company’s share capital.
MODIFICATION OF SHAREHOLDERS’
RIGHTS
Under French law, shareholders of a French public company
(société anonyme) have the power to amend AXA’s Bylaws.
Such an amendment generally requires the approval of
two-thirds of the shareholders attending or represented at
an Extraordinary Shareholders’ Meeting. However, no such
Extraordinary Shareholders’ Meetings may decide (i) to increase
the liability of the shareholders in respect of the Company or a
third party; or (ii) to reduce the individual rights vested in each
shareholder (such as voting rights, right to distributable profits
of the Company, right to sell one’s shares and right to sue the
Company).
SHAREHOLDERS’ MEETINGS
Shareholders are convened, meet and deliberate in accordance
with applicable French laws and AXA’s Bylaws.
A notice of meeting must be published in the Bulletin des
annonces légales obligatoires (“BALO”), at least 35 days before
any Shareholders’ Meeting (or 15 days in certain specific cases),
and must indicate, in particular, the agenda and the proposed
resolutions.
At least 15 days (or six days in certain cases) prior to the date set
for the meeting on first call, and at least 10 days (or four days in
certain cases) before any second call, the Company shall send a
final notice containing all the information requested by law by
mail to all registered shareholders who have held shares for more
than one month prior to the date of this final notice and publish
a final notice in a bulletin of legal notices, as well as the BALO.
All shareholders are entitled to attend these meetings, either in
person or by proxy, provided that they show valid proof of ID and
share ownership as specified under French law. This ownership
is justified by a book entry showing the number of shares in the
name of the shareholder (or the intermediary for the account), on
the second business day preceding the meeting at 0:00 am, Paris
time (France), either in the registered share accounts kept by the
Company or in the bearer share accounts kept by a qualified
intermediary.

392 I UNIVERSAL REGISTRATION DOCUMENT - ANNUAL REPORT 2019 - AXA I
SHARES, SHARE CAPITAL AND GENERAL INFORMATION 6 6.3 GENERAL INFORMATION
In accordance with the provisions of Article L.225-37-4 (9) of the
French Code de commerce, the conditions for the participation to
Shareholders’ Meetings are detailed in Article 23 of AXA’s Bylaws,
which is expressly incorporated by reference herein.
In addition, the information referred to in Article L.225-37-5 of
the French Code de commerce is made public in the corporate
governance report approved by AXA’s Board of Directors’ and
attached to the Board of Directors’ report of AXA included in
this Annual Report. For further information, please refer to
Appendix VII “Corporate governance report – Cross Reference
Table” to this Annual Report.
ANTI-TAKEOVER PROVISIONS
There are no French anti-takeover statutes similar to the anti-
takeover statutes enacted by certain states in the United States
and other jurisdictions. However, a number of French law
provisions, in particular those resulting from the Law No. 2014-
384 of March 29, 2014 (visant à reconquérir l’économie réelle) or
from certain provisions of the European Directive of April 21, 2004
(which was implemented in France in 2006) concerning takeover
bids, may have certain anti-takeover eff ects. In the case of AXA, the
relevant provisions include, among other things, the existence of
AXA shares with double voting rights, which are described above,
and specific notification requirements applicable when holdings
exceed specified thresholds, as described below.
French law generally requires mergers and certain consolidations
to be approved by two-thirds of the shareholders attending
or represented at the Extraordinary Shareholders’ Meeting
convened to decide on such matters.
NOTIFICATION REQUIREMENTS
WHEN HOLDINGS EXCEED SPECIFIED
THRESHOLDS
Pursuant to Article 7 of AXA’s Bylaws, any person, acting alone
or jointly, who comes to hold, directly or indirectly through
companies it controls within the meaning of Article L.233-3 of the
French Code de commerce, a number of shares representing 0.5%
of the Company’s share capital or voting rights, shall notify the
Company by registered letter with acknowledgment of receipt
within five days from the threshold crossing. This notification
shall detail the total number of shares and voting rights held as
well as the total number of securities giving a diff ered claim to
the share capital and the potential voting rights attached thereto.
The notification shall be repeated in the conditions stated above
each time an additional fraction of 0.5% of the share capital or
voting rights is crossed upward or downward.
In the event of failure to comply with the notification requirements
described above, shares exceeding the fraction that should have
been notified will be deprived of voting rights at Shareholders’
Meetings if, at such meetings, the notification failure has been
recorded and if one or more shareholders jointly holding at least
5% of the share capital so request. Loss of voting rights shall be
applicable in all Shareholders’ Meetings that would be held up
until two years following proper notification.
CHANGES IN CAPITAL
The Company’s share capital may be modified only under the
conditions stipulated by the legal and regulatory provisions
in force. The provisions of the Bylaws or the Board’s Terms of
Reference shall not prevail over changes in the law governing
the Company’s share capital.

393I UNIVERSAL REGISTRATION DOCUMENT - ANNUAL REPORT 2019 - AXA I
7.1 INTRODUCTION 394
Sustainable Value Creation 394
AXA’s Corporate Responsibility Strategy 395
AXA’s contribution to the sustainable development goals of the united nations 395
Corporate Responsibility governance & Stakeholder dialogue 397
Sustainability Risk Assessment 397
AXA Tianping, our new P&C insurance entity in the Chinese market 398
Ratings 398
Reporting certification 399
Reporting methodology 399
7.2 SOCIAL INFORMATION 401
Foreword 401
Workforce at a glance 402
Employee relations and work conditions 402
Learning environment and skills management 403
Diversity and Inclusion breeding talent and innovation 404
7.3 CLIMATE CHANGE AND BIODIVERSITY 411
AXA’s position on climate change and biodiversity 411
Investments 411
Insurance 415
Own operations 417
7.4 INCLUSIVE INSURER 421
Business-related societal initiatives 421
Corporate philanthropy and engagement 424
7.5 BUSINESS BEHAVIOUR 426
Business ethics 426
Responsible data use and data privacy 427
Responsible procurement 428
Tax policy 428
Report by one of the Statutory Auditors, appointed as an independent third party, on the non-financial information statement included in the management report 429
7.6 VIGILANCE PLAN 433
Scope of the vigilance plan 433
Identification and evaluation of risks to human rights and the environment 433
Protection of human rights and the environment 434
Alert procedure 436
Follow-up and report on the eff ective implementation of the vigilance plan 436
CORPORATE
RESPONSIBILITY 7

394 I UNIVERSAL REGISTRATION DOCUMENT - ANNUAL REPORT 2019 - AXA I
CORPORATE RESPONSIBILITY 7 7.1 INTRODUCTION
7.1 INTRODUCTION
This chapter describes AXA Group’s Corporate Responsibility (CR) strategy. It includes an extra-financial performance statement that
AXA publishes in accordance with the provisions of the EU Directive 2014/95 related to extra-financial reporting (1) and French law (2).
This statement includes the AXA Group’s business model and information on its main extra-financial risks related to environmental,
social, human rights, tax evasion and corruption issues.
In-depth information on the AXA Group’s Corporate Responsibility-related policies and practices is also available in the “Integrated
Report”, in the online “Group Human Capital Report” (3) and on the AXA Group’s website (www.axa.com), in particular in the “Corporate
Responsibility” Section.
(1) Directive 2014/95/EU of the European Parliament and of the Council of October, 22, 2014, amending Directive 2013/34/EU as regards disclosure of non-financial information and information relating to diversity by certain large companies and groups.
(2) Articles L.225-101-1, R.225-105 and R.225-105-1 of the French Commercial Code.
(3) No information, documents or items contained in AXA’s 2019 Integrated Report and the 2019 Group Human Capital Report, or available on the Company’s website in connection therewith, is incorporated by reference in this Annual Report.
I Sustainable Value Creation
AXA’s business is to protect people, goods and assets over the long-term, by better understanding, selecting, quantifying and managing
risks.
Operating at the intersection of the economy, finance and society as a whole, our businesses are vectors of innovation, wealth
creation and sustainable growth. Indeed, the protection off ered by insurance encourages innovation, risk-taking and borrowing, which
contributes not only to growth but also to the stability of economic cycles. In this way, AXA contributes to preserving the global financial
system through sound risk management and investment proposals with robust and stable returns. Moreover, the collectivization and
mutualization of risks and the social protection off ered by life insurance and micro insurance generate social cohesion. In doing so,
AXA not only contributes to global economic growth, but also to social stability in line with its ambition of “Empowering people to live
better”. This approach is inherent to AXA business and guides its Corporate Responsibility strategy.
For more information on AXA’s business model presented on page 9 , please refer to Section 1.3 “Business overview” of this Annual Report.

395I UNIVERSAL REGISTRATION DOCUMENT - ANNUAL REPORT 2019 - AXA I
CORPORATE RESPONSIBILITY
7
7.1 INTRODUCTION
I AXA’s Corporate Responsibility Strategy
Our Corporate Responsibility (CR) strategy is a key driver of
employee engagement, customer trust and brand image. CR
is also a risk/opportunity management concern: it enables AXA
to reduce certain operational costs and risks, while providing
market opportunities in emerging business segments or being
factor of innovation by taking better account of social and
environmental issues.
In 2019, our Corporate Responsibility strategy has been refocused
around 3 priorities:
■ Climate Change and the environment: AXA reduces its own
carbon footprint and leverages its core business of insurance
and investment to better address climate risks, both in the
fight against the causes of global warming and in adaptation
to its consequences (mitigation and resilience);
■ Health risk and disease prevention: as a trusted partner of its
clients, drawing on its Risk Management expertise, AXA keeps
developing its health risk prevention eff orts to achieve positive
outcomes for public health, particularly regarding tobacco and
the dual epidemics of obesity and diabetes;
■ Social inequalities and inclusion: as an insurance company,
AXA aims to provide protection and risk prevention to under-
served populations in many countries where it operates,
thereby contributing to global socio-economic development.
Our corporate responsibility is therefore now structured around
these three thematic priorities, and in its implementation, AXA
uses the various levers of action related to its expertise and
business lines, as well as its international footprint: investments,
insurance, but also the responsible use of its data and its
partnerships and philanthropic activities.
AXA is also committed to being a responsible employer, striving
to keep employee engagement at the heart of its strategy and to
create a workplace inspired by its values that fosters diversity and
equal opportunity for all, promotes engagement, encourages
professional development and supports employee well-being.
I AXA’s contribution to the sustainable development goals
of the united nations
In 2018, the Group developed a strategic thinking framework
to identify its themes of commitment that take into account
the 17 United Nations Sustainable Development Goals
(SDGs). The complete framework is described in the website:
sustainabledevelopment.un.org. AXA’s approach consists of
identifying the major potential causes of engagement based on
the SDGs, supplemented by its in-house risk analysis expertise.
These potential commitments are then examined using a
business filter that enables AXA to invest its eff orts on subjects
where the Group can make a real impact through its activities.
This process enabled us to select biodiversity loss as an extension
of the Group’s action against climate change: biodiversity loss
is now being accelerated by global warming. In terms of Public
Health, the dual epidemics of obesity and diabetes has also been
identified as a priority issue for AXA.
In 2019, the Group refined the vision of its contribution to the
SDGs, aligning its strategic objectives with the 8 SDGs on which
the Group’s initiatives have an impact, and validating these
orientations by Stakeholder Advisory Committee (see paragraph
“Governance and Dialogue with Stakeholders”).

396 I UNIVERSAL REGISTRATION DOCUMENT - ANNUAL REPORT 2019 - AXA I
CORPORATE RESPONSIBILITY 7 7.1 INTRODUCTION
AXA’s Responsible Corporate strategy thus contributes directly to 8 following SDGs:
Climate and
biodiversity
SDG no. 13 – Climate Action
Section 7.3 “Climate change and biodiversity” of this Annual Report is largely
dedicated to AXA’s action against climate change, which meets the 3 targets of SDG
no. 13. “AXA’s new Climate strategy”, including a strong commitment to align with
the 1.5 degree trajectory of the Paris Accord, contributes to target 13.2 (incorporate
climate change measures into national policies, strategies and planning). Through
the partnerships developed with C40 and UN Habitat, AXA also contributes, via
its insurance business, to: 1/strengthen, in all countries, resilience and adaptive
capacities in the face of climate hazards and climate-related natural disasters
(SDG 13.1), and 2/improve education, awareness and individual and institutional
capacities with regard to climate change adaptation, mitigation and early warning
systems (SDG 13.3).
SDG no. 14 – Life below water
In 2019, AXA initiated the first actions as part of its new approach to better take
biodiversity into account in these activities. The Ocean program developed by
its subsidiary AXA XL contributes directly to targets 14.2 (manage and protect
marine and coastal ecosystems on a sustainable basis) and 14.3 (minimize ocean
acidification and combat its eff ects). By adhering to the UNPSI-Oceana global
declaration, AXA also contributes to target 14.4 (eff ectively regulate fishing, put an
end to overfishing and illegal fishing). The Biodiversity action plan will be further
developed during 2020 to refine AXA’s contribution to this SDG.
SDG no. 15 – Life on land
The AXA-WWF report and the creation of the Climate and Biodiversity Impact Fund
(described in Section 7.3 “Climate change and biodiversity”) as well as the first
actions developed within the framework of the WWF partnership initiate AXA’s
contribution to “mobilize financial resources from all sources and significantly
increase them to preserve biodiversity and ecosystems” (SGD 15.a). The Biodiversity
action plan will be further developed during 2020 to refine AXA’s contribution to
this SDG.
SDG no. 7 – Aff ordable
and clean energy
Our “green” investment target of €24 billion by 2023 as described in Section 7.3
“Climate change and biodiversity” contributes directly to the 7.2 target, which
consists in significantly increasing the share of renewable energy in the global
energy mix by 2030.
Health
and disease
prevention
SDG no. 3 – Good health
and well-being
AXA’s initiatives to exclude the cigarette industry (described in Section 7.3 “Climate
change and biodiversity”) are in line with the objective of implementing the WHO
Framework Convention on Tobacco Control. In addition, AXA’s Health initiatives
are strongly focused on the prevention of non-communicable diseases, with the
“Beating Obesity and Diabete Initiative (BODI) and the Unicef partnership described
in Section 7.4 “Inclusive Insurance”, which aimed at struggling against the dual
global epidemic of obesity and diabetes, aff ecting both mature and emerging
countries (SDG 3.4). AXA also contributes to the prevention of road accidents (SDG
3.6).
Social
inequalities
and inclusion
SDG no. 1 – No poverty
AXA Hearts in Action volunteers provide assistance to people living in extreme
poverty and help eradicate the phenomenon, notably through a financial education
program (SDG 1.1 and 1.2). In addition, the AXA-Care partnership contributes
directly to building the resilience of poor people and reducing their exposure
to extreme weather events (SDG 1.5). These actions are described in Section 7.4
“Inclusive Insurance”.
SDG no. 5 – Gender equality
For many years now, AXA has been pursuing a proactive diversity and inclusion
policy (described in Section 7.2 “Social Information”): ending discrimination against
women and girls (SDG 5.1), guaranteeing the equal participation of women in
management positions (SDG 5.5). The program “Women in insurance” developed
in Section 7.4 “Inclusive Insurance” constitutes the “business” component of the
program, providing women with adapted financial protection solutions.
SDG no. 10 – Reduced
Inequalities
Program towards women and emerging customers (described in Section 7.4
“Inclusive Insurance”) are also part of SDG 10.2, helping to empower all people
and promote their social, economic and political integration, regardless of age,
gender, disability, race, ethnicity, origin, religion or economic or other status.

397I UNIVERSAL REGISTRATION DOCUMENT - ANNUAL REPORT 2019 - AXA I
CORPORATE RESPONSIBILITY
7
7.1 INTRODUCTION
I Corporate Responsibility governance & Stakeholder
dialogue
I Sustainability Risk Assessment
AXA has established a solid governance framework to develop
and implement its Corporate Responsibility (CR) strategy. Each
year, the Compensation and Governance Committee of the Board
of Directors reviews the CR strategy, which is also submitted to
the Group Executive Committee, at least once a year, for major
decision-making. At the local entity level, a network of Corporate
Responsibility Directors is in charge of implementing the CR
strategy and promoting best practices. This network is supported
by local CR teams.
AXA also relies on its Stakeholder Advisory Committee to
better assess issues of future interest. In 2014, AXA created
this committee to push forward the Group’s role in building
a stronger, safer and more sustainable society. Twice a year,
it brings together external and influential figures, who are
collectively representative of civil society, as well as AXA’s
Management Committee and members of the Board of Directors.
This group acts as an informal forum for in-depth discussions
on the major trends that are shaping the world by addressing
“business” and “sustainable” issues. Topics discussed in 2019
included: social inequalities and inclusion, AXA’s contribution
to the SDGs as well as Group’s responsible investment strategy,
Climate policy, and AXA XL’s Ocean program.
In addition, the November 2019 session was largely devoted to
the integration of social and environmental issues into the new
AXA Group 2021-2023 Strategic Plan .
More detailed information on the Stakeholder Advisory
Committee is available hereaft er: www.axa.com/en/about-us/
stakeholder-advisory-panel.
It should also be noted that AXA’s responsible business strategy
and initiatives are presented at least once a year to the Company’s
social authorities (social partners). Dialogue with NGOs is also
regular through meetings or responding to their requests (replies
to questionnaires, for instance).
In accordance with the requirements of Directive 2014/95/
EU related to extra-financial reporting, AXA has conducted an
internal risk assessment to identify its main “sustainability risks”.
APPLIED METHODOLOGY TO MAP
SUSTAINABILITY RISKS
The approach implemented is based on collaborative work by
Group Risk Management and Corporate Responsibility teams,
which consisted in identifying risk factors for each area related
to corporate responsibility: social impact, respect for human
rights, environmental impact, societal impact and to business
behavior. These risks have been revised and assessed by experts
according to their frequency and potential impact (financial,
human, reputation, operational, environmental). The rating
scale from 1 (“Low”) to 3 (“High”) is the same as for the Group
operational risks mapping.
Results were then cross-referenced with the AXA Group
Operational Risk Profile (for more information on operational
risks, please refer to Section 4.7 “Operational risk” of this Annual
Report) as well as AXA’s Emerging Risks Survey, which outlines
major emerging risks for society at large (for more information on
emerging risks, please refer to Section 4.8 “Other material risks”).
In order to incorporate external analysis, the most significant
risks were also compared to the Dow Jones Sustainability Index’
assessment.
In order to update non-financial risk assessment carried out
in 2018, results were reviewed by the Group departments
initially involved: Group Corporate Responsibility, Group Risk
Management, Group Human Resources, Group Emerging
Customers, Group Compliance, Group Procurement, Group
Public Aff airs, Group Investor Relations, Group Tax, and Group
Legal. In addition, following the acquisition of the XL Group in
September 2018, CR and Risk teams of XL Group have been
included in this review. From this year update, the following
emerged:
■ the consideration of UN sustainable development objectives
no longer as a risk but as a framework for strategic thinking
developed in the paragraph “AXA’s contribution to UN
sustainable development objectives”;
■ the split of environmental risk into two distinct risks related
to climate change: both AXA’s impact on climate change and
the impact of climate change on the business;
■ the consideration of biodiversity as an emerging risk despite
a stable rating compared to 2018;
■ fair business practices-related issues have been removed from
the list of AXA main CSR risks and are treated as “ other issue”
outside of the extra-financial regulated framework.
This approach led to identify main non-financial risks and
corresponding mitigation policies been implemented with key
performance indicators.
The non-financial risk mapping has been approved by Group
Operational Risks Committee (OPARCC).
398 I UNIVERSAL REGISTRATION DOCUMENT - ANNUAL REPORT 2019 - AXA I
CORPORATE RESPONSIBILITY 7 7.1 INTRODUCTION
2019 UPDATE RESULTS FOR MAIN
NON-FINANCIAL RISKS
Based on this methodology, and in application of article L.225-
105-102-1 of the French Commercial Code related to extra-
financial reporting, the following main risks have been identified:
■ social risks: responsible employment practices, social
dialogue and working conditions, employee development,
talent attraction and retention. See Sections 7.2 “Social
Information” and 7.4 “Inclusive Insurance” for further
information;
■ Human Rights risks-related: “inclusive” insurance solutions,
customer protection, customer data protection, and
preventing human rights violations within our supply chain.
More information on these risks can be found in Sections 7.4
“Inclusive Insurance”, 7.5 “Business behavior” and 7.6
“Vigilance plan”;
■ environmental risks: climate change related issues (both
AXA’s impact on climate change and the impact of climate
change on AXA’s business) are developed in Section 7.3
“Climate change and biodiversity”;
■ societal risks issues: include partnerships and philanthropy
and stakeholder engagement practices. See paragraph
“Governance and Stakeholder Dialogue” and Section 7.4
“Inclusive Insurance” for more information;
■ risks related to fight against corruption and tax evasion:
see Section 7.5 “Business conduct” and 7.6 “Vigilance Plan”.
Other issues have also been identified:
■ fair business practices-related issues: include ensuring
our suppliers and contractors meet CR requirements. See
Sections 7.5 “Business behavior” and 7.6 “Vigilance plan” for
more information;
■ biodiversity: AXA has chosen to develop an ambitious
biodiversity strategy. Indeed, as explained in Section 7.3,
despite suff ering from a relatively low attention by investors
today, biodiversity-related risks may become a significant area
within sustainable finance going forward.
I AXA Tianping, our new P&C insurance entity in the Chinese
market
AXA Tianping became a fully owned AXA company on December,
13, 2019. However, its commitment to Corporate Responsibility
is already deeply rooted, through actions taken around poverty
alleviation, health, and the environment. AXA Tianping is an active
participant in Insurance Day, a Chinese government initiative to
consolidate and amplify insurance company’s charitable actions
at the national level. Each one of our 25 branches spread across
the country participate in community led projects in the form of
charitable giving for poverty alleviation (such as the donation
of 100,000 RMB to finance a “foster home” for blind children
awaiting care and adoption), community actions (including
prevention through safe driving), and environmental actions
(such as the planting of 34,484 trees in central China, Shaanxi
province, in 2019).
In 2019, AXA Tianping had been included in the social reporting
for headcount and payroll indicators and excluded from
environmental and societal reportings.
I Ratings
The Group’s environment, social and governance (ESG) performance is evaluated by specialized rating agencies. The Group generally
ranks close to the top in its industry and is also included in main international sustainability indices. These ratings are described in
further detail in Chapter 1 “The AXA Group” of this Annual Report.

399I UNIVERSAL REGISTRATION DOCUMENT - ANNUAL REPORT 2019 - AXA I
CORPORATE RESPONSIBILITY
7
7.1 INTRODUCTION
I Reporting certification
PricewaterhouseCoopers Audit, one of AXA SA’s Statutory Auditors, appointed as an independent third-party, presents in its report,
featured in Section 7.5 , a reasoned opinion on the compliance of the extra-financial performance statement with the provisions of
French regulations (Article R.225-105 of the French Commercial Code) and on the sincerity of the information provided.
I Reporting methodology
An assessment of the social, environmental, societal, business
behavior and Human Rights impacts of the Group’s activities
has enabled the appropriate performance indicators to be
defined in accordance with the requirements of the French
Commercial Code. Definition of key performance indicators are
still in progress for issues related to: corruption, responsible
procurement, Human rights and consumer protection.
PERIMETER
For perimeters defined below, indicators are fully consolidated,
unless otherwise indicated.
Scope of social indicators
The social data provided in Section 7.2 “Social Information” are
collected from 256 active entities of the AXA Group, all included
in the consolidation scope of AXA (i.e. fully consolidated for the
preparation of the Consolidated Financial Statements as of
December 31, 2019, in other words, subsidiaries in which AXA
holds, directly or indirectly, management control).
The scope corresponds to legal entities (companies and/or
organizations) which AXA owns, as of the end of year, directly or
indirectly with at least 50% of the capital or voting rights. This
scope is updated annually following potential acquisitions/
mergers or business disposals. 256 active legal entities reported
their 2019 social data. Therefore the subsidiaries that were
financially consolidated during the reporting year or whose
employees were incorporated during the reporting year are
included in the 2019 scope. In particular, AXA Tianping has
been included in the social reporting for headcount and payroll
indicators only.
Scope of environmental indicators
The environmental data provided in Section 7.3 “Climate change
and biodiversity – Own operations” are collected from 98 entities,
in accordance with the same rules used to define the scope of
the social indicators (i.e. subsidiaries that are consolidated using
the full consolidation method as at December 31, 2019). AXA sites
with fewer than 50 FTEs are not included in the data collection,
but are part of an extrapolation process. In 2019, environmental
indicators were collected for 101,354 FTEs working on AXA
sites (unless otherwise indicated) and were then extrapolated,
continent by continent, to cover all 121,337 salaried FTEs (all
types of contracts) working at AXA Group in average in 2019.
Section 7.3 also describes the manner in which AXA strives to
integrate environmental issues into its business, as an insurer
and an investor. The perimeter of AXA’s responsible investment
strategy (which includes climate finance) covers AXA’s own assets,
while our climate-related insurance activities cover essentially
our P&C Commercial lines business.
In particular, AXA Tianping has not been included in the
environmental reporting process. This entity is nonetheless
gradually being integrated into AXA’s policies and processes.
Scope of societal indicators
Our Community Investment Survey, as described in Section 7.4
“Inclusive Insurance”, covers 84% of AXA’s FTEs. AXA Tianping
has not been included in this year scope for societal indicators.
PERIOD
The indicators cover the period from January 1 to December 31,
2019, unless mentioned otherwise. To facilitate their collection
and processing, some data may be collected earlier in the year.
The data for any remaining months (maximum 6 months) is then
estimated in accordance with Group’s defined methodology.
DATA COLLECTION
The social data provided in Section 7.2 “Social Information” are
collected through a reporting process defined by procedures
associated with a list of indicators shared with all entities of
the AXA Group. This process is updated and communicated to
each entity on a yearly basis. Social data are provided by local
correspondents into an IT tool dedicated to the social data
reporting process. Consistency checks and quality controls are
carried out before and during the data collect process. There
400 I UNIVERSAL REGISTRATION DOCUMENT - ANNUAL REPORT 2019 - AXA I
CORPORATE RESPONSIBILITY 7 7.1 INTRODUCTION
is no estimation or extrapolation made on the data provided.
Regarding data published in ratios and percentages, numerator
and denominator are realigned for each calculation to exclude
entities with empty data points.
As explained above, environmental data is collected from
AXA sites with more than 50 FTEs as well as AXA-owned data
centers. Environmental data contributors are required to gather
all the relevant data into a dedicated reporting tool. For each
site, contributors specify whether data has been measured
or estimated based on the calculation rules defined in the
Group’s reporting procedures. In 2019, environmental data was
collected for 84% of our total FTEs, and the remaining 16% was
extrapolated. Please refer to Section 7.3 “Climate change and
biodiversity – Environmental reporting process and verification”
as well as perimeter notes below our environmental data table
for further information. Environmental data and more generally
policies regarding our investments and insurance business are
handled by various teams including Group Investment, Group
Corporate Responsibility, Group Risk Management and Group
Insurance Off ice.
Regarding societal data, please refer to Section 7.4 “Inclusive
Insurance – Corporate philanthropy and engagement”. Notably,
the number of unique volunteers is an estimate based on local
entity knowledge of volunteering activities.
METHODOLOGICAL PRECISIONS
AND LIMITATIONS
Reporting on certain indicators may have limitations due to:
■ the absence of nationally and/or internationally recognized
definitions, concerning the diff erent categories of employment
contracts;
■ the necessary estimates, the representativeness of the
measurements made or the limited availability of external
data required for calculations as the required annual update
of emission factors;
■ the practical procedures for collecting and entering this
information.
Therefore, whenever possible, definitions, methodologies and,
where applicable, the associated margins of uncertainty are
specified for the concerned indicators.
BUSINESS BEHAVIOR: METHODOLOGY AND
REPORTING SCOPE
Over the year 2019, AXA has provided in-depth information related
to policy and governance of the main risk linked to business
behavior. Specific to these, AXA has developed robust internal
processes and has implemented necessary policies as well as
Key Performance Indicators to measure their eff ectiveness.
However for some specific risks such as customer protection,
prevention of human rights violations within the supply chain
and fight against corruption, the current disclosure includes
internal policies, framework and due-diligences measures
implemented by AXA. These are described in Sections 7.5
“Business Behavior” and 7.6 “Vigilance plan”. In line with 2014/95/
UE Directive requirements relative to extra-financial reporting,
the Group has been working towards the development of Key
Performance Indicators for these specific topics as part of its 2019
non-financial disclosure.
USE OF INTERNATIONAL BENCHMARK
In order to develop its Corporate Responsibility strategy and
report on its extra-financial performance, AXA voluntarily
complies with certain international benchmarks, as described
in this chapter. These include, for example, the United Nations
SDGs (as developed above) and the Greenhouse Gas Protocol
(ghgprotocol.org) for the calculation of CO2 emissions. Other
benchmarks are highlighted in the relevant sections, where
appropriate.
401I UNIVERSAL REGISTRATION DOCUMENT - ANNUAL REPORT 2019 - AXA I
CORPORATE RESPONSIBILITY
7
7.2 SOCIAL INFORMATION
7.2 SOCIAL INFORMATION
I Foreword
AXA is constantly working on being a responsible employer,
placing employee engagement at the heart of its business
strategy. Achieving this ambition has meant creating a
workplace built on AXA’s values, which foster diversity and equal
opportunities for all, promote employee participation, encourage
professional development and support employee well-being. For
additional and more comprehensive information, refer to “About
Us” and “Career” pages on www.axa.com.
In accordance with the non-financial reporting Directive 2014/95/
EU, the AXA Group has identified three main potential social
challenges looking forward:
■ not maintaining sustainable and responsible employer
practices everywhere through an ambitious employer value
proposition, including work conditions and continuous
dialogue with our people;
■ insuff icient growth and development opportunities, limited
internal and external employability and skills becoming
obsolete in a disrupted business environment;
■ not attracting, retaining and managing talents because of
inability to build an inclusive and engaging environment.
For further details on the sustainable risk assessment, please
refer to Section 7.1.
AXA is committed to analyze those trends, to anticipate and
adapt its employer proposition and practices. AXA is targeting
the creation of a workplace reflecting the values of the Company,
which:
■ fosters diversity as it breeds performance and innovation,
promotes equal opportunities for all and creates the conditions
for everybody to express his/her full potential at work;
■ encourages employees’ participation in the decision-making
process and enable them to take risks;
■ provides best in class solutions and opportunities for
continuous learning and professional development;
■ recognizes merit and people contribution to inspire others to
follow the example;
■ promotes a culture where people are encouraged to share
feedbacks to collectively improve the way of operating
together;
■ promotes the balance between work and life and safeguards
physical and mental health of people at work.
To confirm the relevance of the employer’s proposition and
its adequate global execution, the Group has established a
continuous dialogue with its people who have the responsibility
to spot potential misalignments and suggest the management
actions to repair. Regular employee engagement surveys are
managed across the organization.

402 I UNIVERSAL REGISTRATION DOCUMENT - ANNUAL REPORT 2019 - AXA I
CORPORATE RESPONSIBILITY 7 7.2 SOCIAL INFORMATION
I Workforce at a glance
AXA’s overall salaried workforce on December 31, 2019, was 120,869 employees (open-ended and fixed-term contracts), which represents
a decrease of more than 4% compared to 2018. This decrease is mainly due to (i) the disposal of Equitable Holdings, Inc., representing
some 7,800 employees, (ii) the finalization of the acquisition of the AXA Tianping entity, representing some 3,000 employees, and
(iii) the decrease of AXA’s workforce split between the diff erent markets and transversal operations.
HIGHLIGHT & KEY FIGURES: GEOGRAPHICAL FOOTPRINT DISTRIBUTIONS*
Continents Headcount Distribution
Europe 69,989 58.0%
Asia-Pacific 31,267 26.0%
Americas 12,460 10.0%
Africa 7,153 6.0%
TOTAL 120,869
* Open-ended and fixed-term contract headcount.
In terms of geographies, the footprint of AXA’s salaried workforce in 2019 was: 58% in Europe (+1.4 points compared to 2018), 26% in
Asia-Pacific and the Middle-East (+3.5 points compared to 2018), 10% in the Americas (-5.2 points compared to 2018) and 6% in Africa
(+0.4 point compared to 2018).
For further details on the above figures and a comparison between 2018 and 2019, please refer to the tables at the end of Section 7.2.
I Employee relations and work conditions
Maintaining sustainable and responsible employer practices
and fostering social dialogue and work conditions are priorities
at AXA. Over the past years, AXA, as a mature organization,
implemented processes and instances that let the social dialogue
and work conditions develop in its diff erent entities globally.
A CONTINUOUS AND ESTABLISHED SOCIAL
DIALOGUE
AXA is a United Nation Global Compact signatory and is committed
to uphold the right to freedom of association and collective
bargaining. Besides, labor-management communications
and social dialogue pave the way for the stability required to
implement the Group’s business development strategy. Each AXA
entity, therefore engages with staff and/or their representatives
for communications on a regular basis. AXA has also set up a
European Works Council (EWC), which extensive role goes
beyond regulatory requirements.
ENGAGING PEOPLE AND BUILDING
A FEEDBACK CULTURE
AXA is committed to build an environment where the voices
of employees are heard, and actions are taken to ensure they
remain engaged. AXA uses the short and focused Pulse survey
approach to measure its culture and quickly identify areas of
improvement.
The frequency has steadily increased from one Pulse survey in
2017 to two in 2018 and three in 2019. AXA, globally measures
employee engagement using Employee Net Promoter Score
(eNPS). In 2017, this score was -5, in 2018, it was +7, against a
balanced target of 0. The Group had a target of reaching 14 by
December 2019 which was surpassed by 7 points standing at
an eNPS of 21.
For further information on the eNPS and to know more about
the eNPS calculation methodology, please refer to the “A new
method to collect feedback and measure employee engagement”
on www.axa.com.

403I UNIVERSAL REGISTRATION DOCUMENT - ANNUAL REPORT 2019 - AXA I
CORPORATE RESPONSIBILITY
7
7.2 SOCIAL INFORMATION
RESPONSIBLE WORK CONDITIONS
RESPECTING WORK-LIFE BALANCE
AXA is committed to helping employees to live a better life,
including well-being and work-life balance.
Offering an inspiring and inclusive work environment is a
significant part in AXA’s overall employee value proposition.
The Group is working on building an inclusive workplace
environment through the New Way of Working (NWOW)
approach: an environment that sustains diff erent forms of flexible
work arrangements (teleworking, part-time work, hot desking,
desk sharing, flexible hours, compressed work week). In 2019,
32% of AXA salaried employees under open-ended contracts do
teleworking (36% of non-sales and 8% of sales salaried forces).
In Europe, more than 41% of non-sales salaried workforce with
open-ended contract do telework.
SECURED WORK CONDITIONS
As a responsible insurer and employer, it is in AXA’s DNA to
protect all its personnel as per international best practices, under
the legal requirements of “duty of care” and “duty of vigilance”
and in three major dimensions:
■ “Physical security”: protection of employees from intentional
threats (crime, terrorism, political and social instability);
■ “Health & safety”: protection of personnel from hazard and
accidents (fire, pandemics, natural disasters, etc.);
■ “Crisis management”: when an incident requires extraordinary
processes to be managed.
The physical security baseline defined by Group Security has
been implemented in 90% of the Group as of end 2018 – in line
with Group Management Committees objectives.
I Learning environment and skills management
In an unpredictable business environment, with the emergence of
new risks and competitors, AXA needs to ensure that its business,
organization and people are ready to face new challenges. The
insurance sector is changing fast as technologies and customers’
expectations disrupt the market. Therefore, business and support
functions need to constantly adapt to the environment, which
opens plenty of opportunities for AXA people to enhance their
skills-set. Learning is more than a key lever to enable employees
to grow and develop the skills of the future. A lack of career, skills
and talent management, in a highly-competitive environment,
could impact AXA’s competitiveness.
TALENT AND SKILLS MANAGEMENT
FRAMEWORKS AIMING AT ATTRACTING KEY
TALENTS
AXA ambitions to act on key dimensions of the employee
lifecycle:
■ Employer brand and value proposition, to continue attracting
new critical talents with a strong capability to deliver to
ensure AXA’s strategy success; AXA Group applies a “pay-for-
performance” approach. AXA’s policy is to target benefits
coverage at a minimum level of the median of the relevant
market. Benefits should include pension, healthcare and
protection covers.
■ AXA established Group-wide mobility policies and processes
which allow people to move within the Group and thereby
help AXA better source the right people for its business
needs. In 2019 the number of international moves supported
by the dedicated center of expertise (IMS) remained stable
(794 employees supported compared to 785 in 2018).
■ Leadership management, to ensure current and future
leaders, as well as supporting employees with potential for
future growth to get the continuous support they need to
lead and transform our business and culture. Through the
Organization and Talent Review (OTR) that is in place since
2005, AXA performs a systematic review of the organization
structure required by its current business and its future needs;
■ Employee development, to off er diff erentiating learning and
development actions to employees.
AN AMBITIOUS AND GLOBAL LEARNING
AND DEVELOPMENT OFFER
AXA’s learning and development function is dedicated to
the progressive transformation of AXA into an adaptive and
self-learning organization. The vision of the Group is to help
people to continuously learn at any time of their workday,
individually and collectively, and to foster new ways of learning:
to learn continuously in order to thrive in a constantly changing
environment. This ambition is supported by an easily accessible
and dedicated digital ecosystem. Following the success of AXA’s
partnership with Coursera since 2017, AXA is getting into a new
partnership with LinkedIn Learning, which platform will allow
more people to learn.

404 I UNIVERSAL REGISTRATION DOCUMENT - ANNUAL REPORT 2019 - AXA I
CORPORATE RESPONSIBILITY 7 7.2 SOCIAL INFORMATION
After the 2018 “AXA Learning Games” dedicated to learning
practices and to support AXA’s employees to understand the
changing consumer behaviors, a global learning competition,
“AXA Learning Week”, was launched in 2019 to bring a common
understanding of evolving customer needs and expectations.
More than 8,030 employees worldwide actively took part to it.
Besides, the AXA Leadership Academy guide our Global
Leadership Network members into dedicated Leadership
programs. For the rest of AXA learning employees, 574 digital
modules are off ered on the topics of Leadership, Management
and Personal excellence (40,000 short courses were followed in
2019 and over 28,000 were completed).
In 2019, more than 362,000 days (compared to 327,000 days in
2018) have been delivered corresponding to 3.2 learning days on
average by employee, compared to 2.7 days in 2018.
To tackle tomorrow’s challenges, AXA aims at setting and
enriching an environment and culture, which values diversity
and inclusion, for all employees. AXA’s workforce should reflect
the diversity of the markets in which AXA operates, and the
middle and top management play a central role in reaching
those objectives. Indeed, AXA Group is convinced that diversity
and inclusion management are key levers to breed talent and
innovation within the organization and to remain a top player
of the market.
DIVERSITY AND INCLUSION AMBITION,
AND FOCUS ON GENDER BALANCE
As diversity and inclusion are recognized as important drivers to
breed talent and innovation, attract and retain the best talents
and remain the preferred employer of the market, AXA promotes
diversity through its recruitment, learning and development and
talent management processes. AXA’s leaders act as advocates for
those commitments and are committed to support the Group
to (i) reach gender balance across all levels of the organization,
(ii) raise awareness on disability and (iii) maintain the momentum
on the inclusion of LGBT+ community.
At the end of 2019, women made up over 54% of AXA’s sales and
non-sales workforce and held 31% (+2 points compared to 2018)
of all Executives sales and non-sales positions. Since 2009, AXA
has been tracking representation of women among its Top Senior
Executives’ population.
The priority is to reach gender parity by 2023 among Top Senior
Executives’ population. When we implemented the Global
Leadership Network in early 2019, women represented 30% of
this population. By the end of 2019, we had reached 32%. AXA
has focused on several actions:
■ ask top management to play a more active role to foster
gender diversity – diversity objectives are set to all Top Senior
Executives with a clear focus on gender diversity. Diversity in
teams is a shared goal for AXA’s 300 Top Senior Executives (the
Global Leadership Network – GLN). Management Committee
and Partners members were involved in a sponsorship
initiative launched until December 2019 targeting 30 talents: 23
women (among them 83% are in operational roles) and 7 men
(among them 86% are in operational roles). This sponsorship
initiative is a component of two diff erent programs feeding
the pipeline of future leaders:
• launched in 2014, the “Group Sponsorship Tandem”
program (GSTP) was designed to develop female talent
across the Group. In 2019, we ran the 5th wave of this
program, involving 16 talented women, each one being
sponsored by a Group Management Committee or
Partners Group member. Among the participants to the
five successive waves of the GSTP, 35% have a GLN position,
• launched in 2017, the “Global Executive Development”
(GEDP) program was a 2-year program built for executives,
women and men, who have the potential to grow into key
global leadership positions. 55% (40% of women) of GEDP
participants are now holding a GLN role;
■ strengthen gender balanced talent pipelines and succession
plans: AXA entities have been requested to set up local
targets of female representation at local Executive Committee
level (some 300 people) and executive level (more than
3,000 people);
■ design the innovative AXELERATE learning solution to support
10,000 managers worldwide in the transformation journey,
with the aim to equip them with key collaboration skills and
modern networking leadership skills. The roll-out of this
solution was finalized in 2019;
■ hire and promote talented women at leadership levels – AXA
applies gender equality in recruitment processes. For each
opened Senior position, the shortlisted applicants are at least
one man and one woman. Recruiter managers are key players
in that domain.
I Diversity and Inclusion breeding talent and innovation
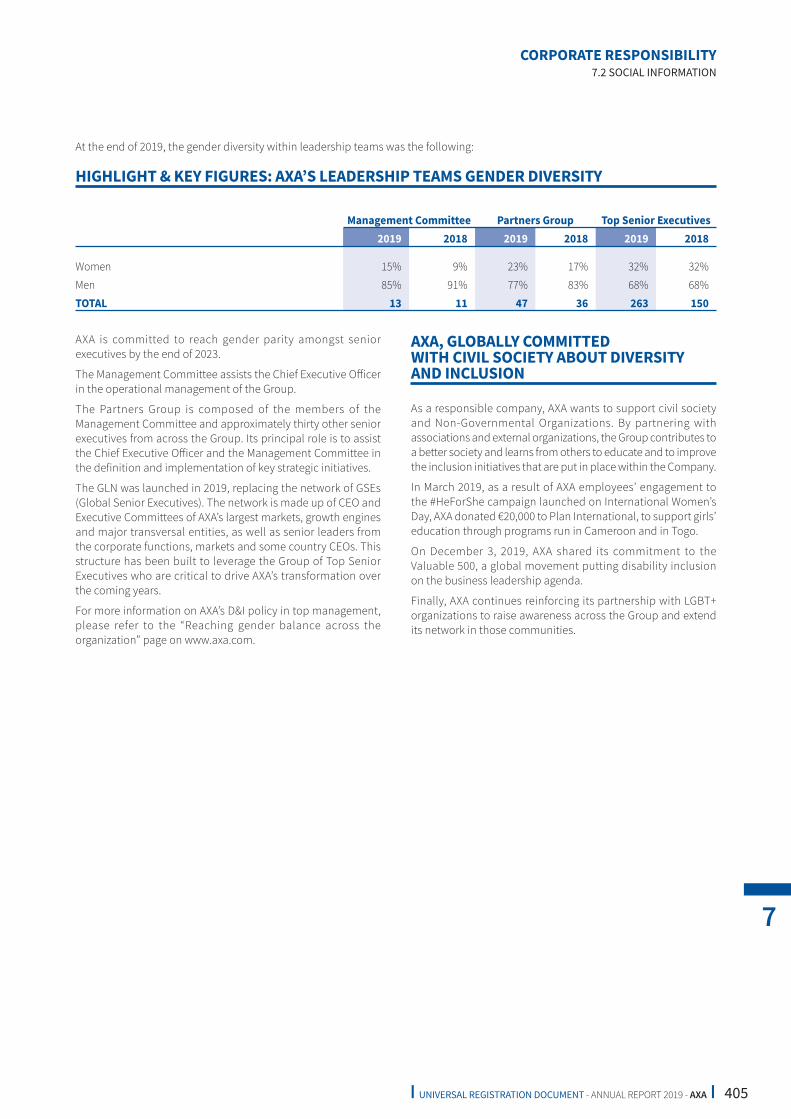
405I UNIVERSAL REGISTRATION DOCUMENT - ANNUAL REPORT 2019 - AXA I
CORPORATE RESPONSIBILITY
7
7.2 SOCIAL INFORMATION
At the end of 2019, the gender diversity within leadership teams was the following:
HIGHLIGHT & KEY FIGURES: AXA’S LEADERSHIP TEAMS GENDER DIVERSITY
Management Committee Partners Group Top Senior Executives
2019 2018 2019 2018 2019 2018
Women 15% 9% 23% 17% 32% 32%
Men 85% 91% 77% 83% 68% 68%
TOTAL 13 11 47 36 263 150
AXA is committed to reach gender parity amongst senior
executives by the end of 2023.
The Management Committee assists the Chief Executive Off icer
in the operational management of the Group.
The Partners Group is composed of the members of the
Management Committee and approximately thirty other senior
executives from across the Group. Its principal role is to assist
the Chief Executive Off icer and the Management Committee in
the definition and implementation of key strategic initiatives.
The GLN was launched in 2019, replacing the network of GSEs
(Global Senior Executives). The network is made up of CEO and
Executive Committees of AXA’s largest markets, growth engines
and major transversal entities, as well as senior leaders from
the corporate functions, markets and some country CEOs. This
structure has been built to leverage the Group of Top Senior
Executives who are critical to drive AXA’s transformation over
the coming years.
For more information on AXA’s D&I policy in top management,
please refer to the “Reaching gender balance across the
organization” page on www.axa.com.
AXA, GLOBALLY COMMITTED
WITH CIVIL SOCIETY ABOUT DIVERSITY
AND INCLUSION
As a responsible company, AXA wants to support civil society
and Non-Governmental Organizations. By partnering with
associations and external organizations, the Group contributes to
a better society and learns from others to educate and to improve
the inclusion initiatives that are put in place within the Company.
In March 2019, as a result of AXA employees’ engagement to
the #HeForShe campaign launched on International Women’s
Day, AXA donated €20,000 to Plan International, to support girls’
education through programs run in Cameroon and in Togo.
On December 3, 2019, AXA shared its commitment to the
Valuable 500, a global movement putting disability inclusion
on the business leadership agenda.
Finally, AXA continues reinforcing its partnership with LGBT+
organizations to raise awareness across the Group and extend
its network in those communities.

406 I UNIVERSAL REGISTRATION DOCUMENT - ANNUAL REPORT 2019 - AXA I
CORPORATE RESPONSIBILITY 7 7.2 SOCIAL INFORMATION
GROUP SOCIAL INDICATORS
Workforce (a)
Headcount (number of persons) as of December 31 2019 Evolution 2018 2017
Total headcount of salaried workforce (open-ended and fixed-term contract) 120,869 emp. -4.0% 125,934 emp. 116,514 emp.
Headcount of salaried workforce with open-ended contract 115,070 emp. -3.9% 119,780 emp. 111,588 emp.
■ Proportion of men 46.4 % 46.6 % 46.6 %
■ Proportion of women 53.6 % 53.4 % 53.4 %
Headcount of salaried non-sales force 98,883 emp. -3.9% 102,843 emp. 95,447 emp.
All Executives 3,172 emp. 3,583 emp. 3,255 emp.
■ Proportion of men 69.0 % 71.0 % 70.6 %
■ Proportion of women 31.0 % +2.0pts 29.0 % 29.4 %
All Professionals 46,611 emp. 48,504 emp. 14,828 emp.
■ Proportion of men 53.9 % 54.9 % 57.4 %
■ Proportion of women 46.1 % +1.0pt 45.1 % 42.6 %
Associates 49,100 emp. 50,756 emp. 77,364 emp.
■ Proportion of men 37.0 % 36.0 % 42.7 %
■ Proportion of women 63.0 % 64.0 % 57.3 %
Headcount of salaried sales force 16,187 emp. -4.4% 16,937 emp. 16,141 emp.
■ Proportion of men 49.2 % 49.4 % 50.8 %
■ Proportion of women 50.8 % +0.2pt 50.6 % 49.2 %
Headcount of salaried workforce with fixed-term contract 5,799 emp. 6,154 emp. 4,926 emp.
■ Non-sales force 4,321 emp. 4,752 emp. 4,282 emp.
■ Sales force 1,478 emp. 1,402 emp. 644 emp.
Profile of employees 2019 Evolution 2018 2017
Average age of salaried workforce 40.5 yrs - 0.7% 40.8 yrs 40.9 yrs
■ Non-sales force 40.4 yrs 40.7 yrs 40.8 yrs
■ Sales force 41.2 yrs 41.4 yrs 41.4 yrs
Average length of service of salaried workforce 10.3 yrs 10.4 yrs 10.8 yrs
■ Non-sales force 10.6 yrs 10.7 yrs 11.3 yrs
■ Sales force 8.1 yrs 8.2 yrs 8.3 yrs
Disability (open-ended and fixed-term contract)
Number of employees with disabilities – concerns entities
operating in France only 760 emp. 743 emp. 770 emp.
(a) Salaried workforce refers to non-sales and sales force employees with open-ended contracts, unless stated otherwise.
Full-Time Equivalents
(headcount converted into full-time equivalents) 2019 Evolution 2018 2017
Average FTE of salaried workforce 110,701.9 ft e -4.4% 115,768.5 ft e 106,928.6 ft e
Average FTE of salaried non-sales force 94,558.6 ft e 99,134.4 ft e 91,109.7 ft e
■ All Executives 3,133.2 ft e 3,657.6 ft e 3,203.2 ft e
■ All Professionals 44,744.6 ft e 46,263.1 ft e 14,804.2 ft e
■ Associates 46,680.7 ft e 49,213.7 ft e 73,102.3 ft e
Average FTE of salaried sales force 16,143.3 ft e 16,634.1 ft e 15,818.9 ft e
Average FTE of temporary non-salaried staff 10,634.8 ft e 8,586.9 ft e 8,399.9 ft e
■ Non salaried temporary staff and contingent workers 7,594.0 ft e 5,768.1 ft e 5,784.9 ft e
■ Trainees/Apprentices 3,040.8 ft e 2,818.8 ft e 2,615.0 ft e

407I UNIVERSAL REGISTRATION DOCUMENT - ANNUAL REPORT 2019 - AXA I
CORPORATE RESPONSIBILITY
7
7.2 SOCIAL INFORMATION
Workforce Dynamics (a)
Movements 2019 Evolution 2018 2017
Movements of salaried workforce
Net headcount evolution (entries versus departures) -8,369 emp. 707 emp. -2,176 emp.
■ Entries 17,199 emp. -11.9% 19,533 emp. 16,766 emp.
■ Departures 25,568 emp. +35.8% 18,826 emp. 18,942 emp.
Movements of salaried non-sales force
Net headcount evolution (entries versus departures) -6,891 emp. 234 emp. -1,729 emp.
Entries 13,538 emp. -10.7% 15,165 emp. 13,302 emp.
■ Number of external recruitments (including re-hires) 11,603 emp. 13,218 emp. 11,467 emp.
■ Number of fixed-term contracts transformed into
open-ended contracts 1,882 emp. 1,915 emp. 1,637 emp.
■ Number of entries following mergers and acquisitions 53 emp. 32 emp. 198 emp.
Departures 20,429 emp. +36.8% 14,931 emp. 15,031 emp.
■ Number of resignations 8,418 emp. 9,460 emp. 8,332 emp.
■ Number of economic/collective layoff s 1,213 emp. 1,352 emp. 1,894 emp.
■ Number of individual layoff s 1,735 emp. 2,028 emp. 1,847 emp.
■ Number of retirements/pre-retirements 1,244 emp. 1,769 emp. 1,538 emp.
■ Number of departures due to external transfers (b) 7,636 emp. 129 emp. 1,252 emp.
■ Number of other departures 183 emp. 193 emp. 168 emp.
Movements of salaried sales force
Net headcount evolution (entries versus departures) -1,478 emp. 473 emp. -447 emp.
Entries 3,661 emp. -16.2% 4,368 emp. 3,464 emp.
■ Number of external recruitments (including re-hires) 3,567 emp. 4,265 emp. 3,336 emp.
■ Number of fixed-term contracts transformed into
open-ended contracts 86 emp. 98 emp. 94 emp.
■ Number of entries following mergers and acquisitions 8 emp. 5 emp. 34 emp.
Departures 5,139 emp. +31.9% 3,895 emp. 3,911 emp.
■ Number of resignations 3,103 emp. 2,913 emp. 2,752 emp.
■ Number of economic/collective layoff s 117 emp. 122 emp. 82 emp.
■ Number of individual layoff s 410 emp. 500 emp. 490 emp.
■ Number of retirements/pre-retirements 254 emp. 264 emp. 240 emp.
■ Number of departures due to external transfers (b) 1224 emp. 77 emp. 321 emp.
■ Number of other departures 31 emp. 19 emp. 26 emp.
Movements of salaried workforce with fixed-term contract
Net headcount evolution of salaried non-sales force
(entries versus departures) 1,028 emp. 2,212 emp. 1,828 emp.
■ Number of external recruitments 4,842 emp. 5,531 emp. 5,337 emp.
■ Number of fixed-term contracts ended 3,814 emp. 3,319 emp. 3,509 emp.
Net headcount evolution of salaried sales force (entries
versus departures) 597 emp. 376 emp. 172 emp.
■ Number of external recruitments 926 emp. 585 emp. 335 emp.
■ Number of fixed-term contracts ended 329 emp. 209 emp. 163 emp.
(a) AXA Tianping (2,988 salaried employees with open-ended contract), AXA Next (38 salaried employees with open-ended contract) and Kamet (352 salaried employees with open-ended contract) businesses did not report the movement indicators.
(b) Salaried workforce who have left AXA because of an activity/job transfer to an external company or due to disposal of businesses, the employee is no longer under a contract with AXA.

408 I UNIVERSAL REGISTRATION DOCUMENT - ANNUAL REPORT 2019 - AXA I
CORPORATE RESPONSIBILITY 7 7.2 SOCIAL INFORMATION
Mobility 2019 Evolution 2018 2017
Internal mobility rate of salaried workforce 8.2 % -0.7pt 8.9 % 10.5 %
■ Non-sales force 8.9 % 9.6 % 11.3 %
■ Sales force 4.2 % 5.0 % 6.1 %
Employee turnover 2019 Evolution 2018 2017
Turnover rate of salaried workforce 15.0 % -0.6pt 15.6 % 15.4 %
■ Involuntary (layoff s/dismissals) 3.1 % 3.6 % 3.8 %
■ Voluntary (resignations) 10.4 % 10.4 % 9.8 %
■ Other reasons (pre/retirements and miscellaneous) 1.5 % 1.9 % 1.8 %
Turnover rate of salaried non-sales force 13.3 % -1.1pt 14.4 % 14.3 %
■ Involuntary (layoff s/dismissals) 3.0 % 3.6 % 3.9 %
■ Voluntary (resignations) 8.8 % 9.2 % 8.6 %
■ Other reasons (pre/retirements and miscellaneous) 1.5 % 1.9 % 1.8 %
Turnover rate of salaried sales force 24.9 % +2.1pts 22.8 % 22.3 %
■ Involuntary (layoff s/dismissals) 3.4 % 3.7 % 3.6 %
■ Voluntary (resignations) 19.7 % 17.4 % 17.0 %
■ Other reasons (pre/retirements and miscellaneous) 1.7 % 1.7 % 1.7 %
Labour Relations(1)
Working time 2019 Evolution 2018 2017
Average number of working days 226.7 days -1.1% 229.1 days 227.7 days
Average number of working hours per week 37.0 hrs +0.5% 36.8 hrs 36.9 hrs
■ Full-time employees 38.8 hrs 38.6 hrs 38.0 hrs
■ Part-time employees 26.4 hrs 25.9 hrs 26.6 hrs
Part-time salaried workforce
■ Proportion of part-time salaried non-sales force 10.2 % 10.0 % 11.1 %
■ Proportion of part-time salaried sales force 4.4 % 3.1 % 2.7 %
(1) AXA Tianping (2,988 salaried employees with open-ended contract), AXA Next (38 salaried employees with open-ended contract) and Kamet (352 salaried employees with open-ended contract) businesses did not report the labor indicators.

409I UNIVERSAL REGISTRATION DOCUMENT - ANNUAL REPORT 2019 - AXA I
CORPORATE RESPONSIBILITY
7
7.2 SOCIAL INFORMATION
Absenteeism 2019 Evolution 2018 2017
Absenteeism rate of salaried workforce 4.7 % +0.0pt 4.7 % 4.7 %
■ Proportion of absences due to sickness 70.3 % 69.7 % 69.9 %
■ Proportion of absences due to work related accidents 2.0 % 1.9 % 2.0 %
■ Proportion of absences linked to maternity/paternity
leave 27.7 % 28.4 % 28.1 %
Absenteeism rate of salaried non-sales force 4.9 % 4.9 % 4.9 %
■ Proportion of absences due to sickness 69.8 % 69.7 % 69.5 %
■ Proportion of absences due to work related accidents 1.9 % 1.7 % 1.9 %
■ Proportion of absences linked to maternity/paternity
leave 28.3 % 28.6 % 28.6 %
Absenteeism rate of salaried sales force 3.8 % 3.5 % 3.7 %
■ Proportion of absences due to sickness 73.9 % 69.4 % 72.5 %
■ Proportion of absences due to work related accidents 2.8 % 3.4 % 2.9 %
■ Proportion of absences linked to maternity/paternity
leave 23.3 % 27.1 % 24.6 %
Compensation
Compensation cost 2019 Evolution 2018 2017
Compensation cost of salaried workforce (a)8,152 €m -12.1% 9,275 €m 8,501 €m
■ Proportion of fixed pay (related to wages) 81.2 % 77.2 % 76.2 %
■ Proportion of variable pay (related to wages) 18.8 % 22.8 % 23.8 %
Annual gross payroll of salaried non-sales force
■ Proportion of fixed pay (related to wages) 84.7 % 83.1 % 83.1 %
■ Proportion of variable pay (related to wages) 15.3 % 16.9 % 16.9 %
Annual gross payroll of salaried sales force
■ Proportion of fixed pay (related to wages) 52.8 % 45.0 % 44.9 %
■ Proportion of variable pay (related to wages) 47.2 % 55.0 % 55.1 %
(a) As per the definition of compensation, it includes the individual fixed pay, the individual variable pay, employer social contribution and collective profit sharing (if any) and excludes equity based compensation (stocks options, performance shares, AXA Miles). On a constant exchange rate basis, total compensation cost increased by 11.2%.

410 I UNIVERSAL REGISTRATION DOCUMENT - ANNUAL REPORT 2019 - AXA I
CORPORATE RESPONSIBILITY 7 7.2 SOCIAL INFORMATION
Training(1)
Training days 2019 Evolution 2018 2017
Number of training days of salaried workforce 362,448.3 days +10.8% 327,011.4 days 330,248.7 days
■ Non-sales force 262,461.7 days 224,034.3 days 226,600.0 days
■ Sales force 99,986.6 days 102,977.1 days 103,648.7 days
(1) AXA Tianping (2,988 salaried employees with open-ended contract), AXA Next (38 salaried employees with open-ended contract) and Kamet (352 salaried employees with open-ended contract) businesses did not report the training indicators.
Training attendees 2019 Evolution 2018 2017
Percentage of salaried workforce having received at least one training course 100.0 % +2.2pts 97.8 % 84.2 %
■ Non-sales force 100.0 % 97.6 % 83.5 %
■ Sales force 100.0 % 99.2 % 88.6 %
Average number of training days per salaried workforce 3.2 days 2.7 days 3.1 days
■ Non-sales force 2.7 days 2.2 days 2.5 days
■ Sales force 6.1 days 6.1 days 6.6 days

411I UNIVERSAL REGISTRATION DOCUMENT - ANNUAL REPORT 2019 - AXA I
CORPORATE RESPONSIBILITY
7
7.3 CLIMATE CHANGE AND BIODIVERSITY
7.3 CLIMATE C HANGE AND BIODIVERSITY
As described above in Section 7.1, environmental protection, including the interconnected issues related to climate change and
biodiversity loss, is a key concern for the AXA Group as an insurer, investor and a large multinational corporation. This section covers
all three dimensions.
I AXA’s position on climate change and biodiversity
Insurers are well positioned to address climate-related risks.
They have claims loss data, as well as models and tools to
analyze and project this data. They have a duty to disseminate
knowledge about new risks and create adequate insurance
products and investments policies. Finally, through their
significant investments, they are also well positioned to send
the right signals to the investment community and to the specific
companies they invest in. This requires both collective eff orts and
more competitive initiatives:
■ investments: green “transition” investments, divestments,
carbon neutrality in investment portfolios shareholder
engagement, and climate risk analysis (TCFD (1));
■ insurance: underwriting restrictions, “green/sustainable”
products;
■ operations: environmental footprint management;
■ thought leadership, NGO partnerships, academic research.
In addition, several important steps were taken in 2019:
■ in May 2019, the AXA Group published recommendations for
stronger action on biodiversity risks (https://www.axa.com/en/
newsroom/news/how-to-support-the-transition-towards-the-
protection-of-biodiversity);
■ in November 2019, the Group launched a new phase in its
climate strategy, based on four new developments: the
“Warming potential” of AXA’s investments is to be contained
below 1.5°C by 2050, a green investments target doubled to
€24 billion by 2023, launching the “Transition Bonds” asset
class, and a total exit from the coal industry. This is developed
online (https://www.axa.com/en/newsroom/news/new-
climate-strategy-2019) and below;
■ a new CO2 emissions target for the 2018-2025 period was
defined.
These are developed online and in the following sections.
(1) Related to the recommendations from the TaskForce on Climate-related Financial Disclosures: www.fsb-tcfd.org.
(2) No information, document or item contained in AXA’s Climate Report/TCFD 2020, or available on the Company’s website in connection with the Climate Report/TCFD 2020, is incorporated by reference in this Annual Report.
I Investments
This section describes our Responsible Investment (RI) initiatives
in line with the voluntary disclosure requirements related to
the Taskforce on Climate-related Financial Disclosures (TCFD,
which focuses on climate risks) and the mandatory disclosure
requirements set out in the French decree implementing
Article 173 VI of Law No. 2015-992 of August 17, 2015, on the
energy transition for green growth (which focuses more broadly
on ESG). This is why the text below extends beyond purely
environmental factors. Furthermore, this text is an overview of
our more detailed “2020 Climate Risk Report” (2), to be published
on www.axa.com in 2Q 2020.

412 I UNIVERSAL REGISTRATION DOCUMENT - ANNUAL REPORT 2019 - AXA I
CORPORATE RESPONSIBILITY 7 7.3 CLIMATE CHANGE AND BIODIVERSITY
DEFINITIONS AND GOVERNANCE
AXA defines RI as the integration of Environmental, Social and
Governance (ESG) considerations into investment processes,
including ownership practices. AXA’s conviction is that ESG
integration may impact long-term investment performance
by offering an enhanced understanding of risk drivers. This
conviction is derived from academic research and empirical
market data. It is also a way to strive for alignment between our
investments and broader CR commitments. AXA developed a
comprehensive RI strategy covering the Group’s General Account
assets and is gradually extending it to its Unit-Linked investments.
The process of ESG integration is coordinated centrally, with an
active input from our asset managers that include ESG metrics
in their investment analysis across asset classes and regions.
AXA’s Group-level Responsible Investment Committee (RIC) is
chaired by the Group Chief Investment Officer, and includes
representatives from AXA’s Asset Management entity, Corporate
Responsibility, Risk Management and Communication. The
RIC reports to the Group Investment Committee, chaired
by the Group Chief Financial Officer. In addition, the “ESG
Footprint Committee” reviews risks posed by companies or
sectors presenting a low ESG performance and/or serious and
persistent controversies. AXA’s RI policy is supported by the RI
Center of Expertise, a transversal working group from AXA’s local
investment teams interacting with the CR network. In addition,
as mentioned in Section 7.1 “Social Information”, the Board of
Directors and Stakeholder Advisory Panel provide input into the
Group’s CR strategy.
RESPONSIBLE INVESTMENT STRATEGY
AXA’s Responsible Investment strategy, embodied in its Global
Responsible Investment policy (published on the Group’s
website: www.axa.com/en/about-us/responsible-investment),
is based on five main pillars:
■ developing and integrating ESG, climate and biodiversity-
related metrics into investment processes and decision-
making, using KPIs and qualitative research across most of
our assets;
■ excluding sectors or companies that face acute social, human
rights, ethical or environmental challenges. These sector
restrictions (which apply both to investments and insurance)
are published on AXA Group website (www.axa.com/en/
about-us/responsible-investment) and currently include
controversial weapons, coal, oil sands, tobacco, palm oil, and
food commodity derivatives;
■ investing in green bonds, transition bonds and impact
investment funds;
■ activating stewardship through voting and engagement on a
range of ESG or sustainability issues.
The AXA Group as well as its in-house Asset Management
entity AXA IM are signatories of the UN-backed principles for
Responsible Investment (UN PRI). AXA launched an online
training course on responsible investment in collaboration with
the AXA Group’s Responsible Investment Center of Expertise
and AXA Investment Managers, which is mandatory for the
AXA Group’s investment community and is also open to all AXA
employees.
ESG TOOLS AND METHODOLOGY
AXA tracks its investments’ ESG performance by leveraging
AXA IM’s in-house ESG tool, where cross-asset ESG scores and
“impact-type” metrics are developed to help monitor ESG risks,
identify areas of improvement, set targets or guide shareholder
engagement. This analysis process covers AXA’s General Account
assets (Sovereign and corporate bonds, equity, property,
infrastructure and Commercial Real Estate debt):
■ for corporate issuers (equity and debt): the ESG assessment
focuses on the most material and impactful key ESG issues
at sector level, taking into account sector/peer group
performance and also factoring an analysis of material
controversies;
■ for sovereign issuers: AXA’s ESG scoring uses public data
sources such as the World Bank, the OECD, and the UN (e.g.
environment, social and political risks), and the criteria are
adapted to the development levels of countries;
■ for real assets (direct property, commercial real estate
loans and infrastructure debt): AXA’s analysis framework is
based on proprietary questionnaires covering criteria such as
energy eff iciency, environmental certificates, and accessibility.
Finally, “carbon footprinting”, which is applied to our
equities, corporate Fixed Income and Sovereign Debt assets,
complements the ESG metrics. See also further climate-related
KPI development in the following section.
CLIMATE RISK METHODOLOGY
As required by the TCFD guidelines and article 173, AXA strives
to translate international climate objectives derived from the
COP21 Paris Agreement into quantitative investment targets since
2016. In 2019, AXA deepened its work based on methodologies
provided by external climate risk experts (Carbon Delta, Beyond
Ratings, Trucost), while also using internal “NatCat” models to
cover our Real Assets investments. This work covers two broad
areas: “transition risks” and “physical risks”, as defined by the
TCFD and explained in more details below.

413I UNIVERSAL REGISTRATION DOCUMENT - ANNUAL REPORT 2019 - AXA I
CORPORATE RESPONSIBILITY
7
7.3 CLIMATE CHANGE AND BIODIVERSITY
“Transition risks”: financial risks
and “portfolio alignment”
Modelling the extent to which investors may be impacted by
shift ing market and regulatory trends related to the transition
to a low-carbon economy is termed “transition risk”. It can be
measured in financial risk terms (measured in Euros) or purely
“climate impact” terms (measured in temperature rise).
■ Climate risk (the potential impacts of climate change on AXA’s
investments): for equity and corporate bonds assets, AXA uses
a framework developed by Carbon Delta (acquired by MSCI in
2019) which models transition risk based on “policy-related”
risks arising from regulatory eff orts to curb carbon emissions
and comply with the 2015 Paris Agreement. This top down
approach identifies emissions reductions targets by country,
sector and company-level targets, applies corresponding
carbon price constraints, compensated by future “green
revenue” estimates. This approach enables to project
companies’ potential costs or gains, which are translated into a
forward-looking “cost of climate” indicator. For AXA’s sovereign
portfolios, AXA uses another methodology (developed by
Beyond Ratings, acquired by the London Stock Exchange in
2019) to evaluate a comparable “transition risk” metric based
on the allocation of carbon budget by countries supporting
various warming scenarios, depending on macroeconomic
variables such as GDP growth, population growth and energy
eff iciency;
■ Climate impact (the potential impacts of AXA’s investments
on the climate): in 2019, AXA has deepened its investigation of
the concept of an “investment temperature”. This approach,
labelled “warming potential” in Carbon Delta’s methodology,
captures the climate-related aspects of a company’s activities,
including its direct and indirect greenhouse gas emissions,
technology developments, and “green revenue” opportunities.
This is derived from the carbon intensity alignment of each
company relative to the sectoral carbon intensity target
needed to reach global climate target. This produces a
“warming potential” indicator per company and sector, and
ultimately for AXA’s investments.
“Physical” risks: Climate Impacts on AXA’s
Real Assets portfolio
In addition to the aforementioned “transition” risks, climate
change, and in particular, extreme weather events, may impact
“real assets” such as real estate. This is termed “physical” risks
according to the TCFD guidelines. As an insurer, AXA has a
significant amount of claims-related data to conduct a “physical
risks” analysis on its real estate portfolio. AXA’s Investments and
Group Risk Management teams collaborate to evaluate the
financial impact of floods and windstorms on the buildings and
infrastructure of these portfolios.
Our physical risk assessment for real estate uses “NatCat”
models – generally only used to assess the impact of natural
catastrophes on insured exposure – combining stochastic events
(windstorms, floods, hurricanes) and a geolocalised portfolio of
real assets. Specific “destruction rates”, which factor location,
building/infrastructure type and construction materials are then
used to determine potential damage rates and derive a loss for
each and every building/infrastructure.
Moreover, for corporate bonds and equities, the costs of “physical
risks” have been assessed by modeling the expected financial
impacts of extreme weather events on companies’ facilities. The
physical risk cost estimates factor in vulnerability to business
interruption risk and asset damage, based on the exposure of
facility locations to extreme weather events.
The analysis of “transition” and “physical” risks is further
developed in our 2020 Climate/TCFD report.
2019: a new Carbon neutrality/1.5°C portfolio
target
The Paris Agreement’s goal to stabilize carbon emissions by 2050
(“carbon neutrality”) requires that global warming be kept below
+1.5°C compared to preindustrial levels during this century. The
“warming potential” described above, which is a forward-looking
and dynamic concept, is a relevant answer to this objective
insofar as it is similar to a “projected carbon footprint”.
Following in-depth analysis of “temperature” methodologies,
AXA decided in November 2019 to align its investments with
the Paris Agreement, thereby committing to achieve a 1.5°C
“warming potential” by 2050.
Our 2019 TCFD-related modelling shows that our investments
(corporates and sovereign) have a 3.1°C “warming potential”. This
is below the market reference of 3.7°C but nonetheless shows
that investors are operating in a carbon-intensive economy that
is not aligned with the Paris Accord. A vast energy transition eff ort
is required. All companies must evolve, and it is incumbent on
investors to identify and support relevant transition strategies.
AXA has therefore decided to join and support the UN-led “Net
Zero Asset Owner Alliance”, whose objective is aligned with this
transition imperative (see below).
ESG AND CLIMATE-RELATED EXCLUSIONS
Certain activities and products are deemed to be inconsistent
with our climate strategy and broader CR goals of protecting
people over the long term. AXA has developed specific “sector
guidelines” which apply both to investments and insurance (see
following section). These currently include the following sectors:
■ coal and oil sands;
■ “controversial weapons” manufacturers that are banned by
international conventions (antipersonnel landmines, cluster
munitions/cluster bombs chemical, biological and depleted
uranium weapons, nuclear weapons proliferation);

414 I UNIVERSAL REGISTRATION DOCUMENT - ANNUAL REPORT 2019 - AXA I
CORPORATE RESPONSIBILITY 7 7.3 CLIMATE CHANGE AND BIODIVERSITY
■ tobacco manufacturers, whose products conflict with our role
as one of the world’s largest health insurers;
■ palm oil producers which do not adhere to this industry’s best
sustainability practices (notably regarding deforestation, land
and labor rights);
■ soft commodity derivatives which may be responsible for
inflating the price of basic food commodities.
In total, AXA’s divestments (including new coal-related eff orts
in 2019 – see below) represent approximately €7.5 billion (coal,
tobacco, oil sands, controversial weapons and palm oil, in
decreasing order of magnitude, and including XL Group assets).
Climate-related exclusions: coal and oil sands
Carbon emissions will require significant curbing in order to
reduce the risk of climate change, which may place business
constraints on carbon-intensive industries, leaving some assets
“stranded”, which in turn may lead to reduced valuations. Current
valuation models may not account for such risks adequately.
Coal-based power generation is seen as the most risky industry
in terms of such “asset stranding”.
AXA acted early in May 2015 with a pioneering coal divestment,
later strengthened in 2017 with underwriting restrictions,
and extended these to our new entity AXA XL in 2018. In
November 2019, this approach have been strengthened and
complemented with a long-term perspective. AXA now bans
investments, for General Accounts and in Unit-Linked assets in
fully controlled mandates, in the following companies:
■ power generation companies with coal share of power
production (energy mix) over 30% and/or coal “expansion
plans” producing more than 300 MW (previously: 3,000 MW)
and/or over 10 GW of coal-based power installed capacity;
■ mining companies with coal share of revenues over 30% and/
or with annual coal production over 20 million tons and/or
developing new coal mines;
■ certain coal industry partners, defined as manufacturers (e.g.
equipment suppliers) and infrastructure players (e.g. port
terminals, dedicated railways) developing significant new
coal assets;
■ in addition to the above restrictions, AXA is now committed to
a long-term “exit” strategy reducing exposure to the thermal
coal industry to zero by 2030 in the European Union and OECD
countries, and by 2040 in the rest of the world, as suggested
by the main climate scenarios (such as the IEA “Beyond 2°C”
scenario). This approach is applied both to our investments
and underwriting (see below) activity.
AXA notably encourages this transition through active
shareholder engagement and client communication. In
particular, as a shareholder, AXA engages, alone or within
specific investor coalitions such as Climate Action 100+, with the
companies concerned (whether client or portfolio companies),
in order to encourage them to develop and disclose an exit or
closure plan.
Because oil sands are also a particularly carbon-intensive form
of energy, AXA also divested from the main oil sands producers
and from the main associated pipelines players.
GREEN INVESTMENT S
In addition to “temperature” targets and divestments, green
investments encourage various sectors to ramp up their climate
strategy. In November 2019, having almost achieved previous
target, AXA decided to commit to invest €24 billion in green
investments by 2023. Green investments are defined as: green
bonds, infrastructure debt & equity, impact investments, real
estate, and commercial real estate loans. In December 2019,
AXA’s green investments reached €11.8 billion (€11.3 billion end
of 2018).
AXA and the IFC, a member of the World Bank Group focused
on the private sector, launched a US$500 million partnership
in 2017, supporting an infrastructure fund that will notably
finance green infrastructures in emerging countries, including
renewable energy, water, green transport and telecoms. At the
end of 2019, mandatory loans amount to US$390 million, of
which US$120 million has already been financed. Coal and oil-
sands related projects are explicitly excluded.
TRANSITION BONDS
Green or climate bonds are a recent but successful instrument
designed to support projects with climate or environmental
added value. However, it is also important to support carbon
intensive players that are actively decarbonizing but have not
yet reached the “greenness” that makes these eff orts eligible
to green bonds. This is why AXA IM developed the concept of
“transition bonds” in 2019. In November 2019, AXA announced
the launch of a first of its kind “transition bond” in partnership
with Crédit Agricole CIB. AXA entirely financed a 100 million euro
bond in a private placement where the proceeds will be used to
refinance existing commercial loans made by Credit Agricole. In
this transaction, the use of proceeds from the bond will be used
to finance electricity production shift ing from coal to gas, marine

415I UNIVERSAL REGISTRATION DOCUMENT - ANNUAL REPORT 2019 - AXA I
CORPORATE RESPONSIBILITY
7
7.3 CLIMATE CHANGE AND BIODIVERSITY
transport shift ing from heavy fuel to gas, and industrial process
improvements. The details of this project are available online
and in our 2020 TCFD report. AXA IM is working with peers and
policymakers to define acceptable “Transition Bonds principles”.
BIODIVERSITY
Biodiversity loss endangers “ecosystemic services”, which
threatens both society and businesses that depend on them,
and in turn investors and insurers that rely on a well-functioning
economy. Biodiversity challenge is a natural extension of AXA’s
climate eff orts. Indeed, climate change is severely compounding
the destruction of ecosystems all around the world, adding
pressures related to drought, ocean acidification, more intense
natural catastrophes, etc. AXA’s biodiversity strategy currently
includes the following developments:
■ in May 2019, during the G7 Ministerial meetings, AXA has
presented with the WWF the report “Into the Wild – Integrating
nature into investment strategies” designed to raise awareness
on biodiversity loss and its economic and financial impacts. It
presents several recommendations, including the launch of a
“TCFD-like” broad-based taskforce to promote the protection
and restoration of biodiversity. The report also called on the
creation of biodiversity risk metrics adapted to investors, as
well as several other developments (see www.axa.com/en/
newsroom/news/how-to-support-the-transition-towards-the-
protection-of-biodiversity);
■ AXA launched its third “Impact Investment” fund during the
G7 meetings, with a strong focus on biodiversity protection.
This Impact Fund will invest between €150 million and
€200 million of AXA capital to fund credible solutions that
deliver measurable positive outcomes;
■ the AXA Research Fund actively supports academic research
on biodiversity risks (see Section 7.4 “Inclusive Insurance”);
■ AXA XL actively contributes to the Ocean Risk and Resilience
Action Alliance (ORRAA), an alliance focused on developing
risk management strategies using the experience and expertise
of the insurance and broader finance community, to protect
ocean biodiversity.
I Insurance
GOVERNANCE
Insurance-related ESG risks and opportunities also benefit from a
specific governance, notably the Group Underwriting Committee,
which defines underwriting restrictions. The Group CR team
provides a bridge with the RI-related governance. In addition, a
dedicated team with Group Risk Management analyses Emerging
Risks via a specific framework, tools and local network. These
risks, which oft en relate to long term ESG issues, are monitored
and their potential impact assessed within a risk mapping
framework (e.g. regulatory & legal, environmental, socio &
political, economic & financial, medical and technological).
UNDERWRITING RESTRICTIONS
It is inconsistent to commercially support industries that the
Group has divested from. Therefore, AXA also restricts insurance
coverage for coal and oil sands-related assets (as well as in the
other industries mentioned in the previous section), and arctic
drilling. Since 2017, the underwriting restrictions ban Property
and Construction covers for coal mines, coal plants, oil sands
extraction sites or associated pipeline. In November 2019,
AXA significantly strengthened these restrictions by adding
the following coal-related restrictions at client-level, mirroring
divestment criteria:
■ any new and existing business, in any line of business is
banned for power generation and mining clients developing
new coal capacity (defined as developing more than 300 MW
of new coal-based power);
■ any new and existing business, in any line of business is banned
for power generation and mining clients with significant coal
business (defined as: power generation clients with more than
30% of coal share of revenues or coal-based energy mix and
mining clients with over 20 million tons of coal extracted per
year). A long-term target to achieve a “0%” exposure to coal
business by 2030 in the European Union and OECD, and 2040
in the rest of the world, is also set;
■ a case by case referral process is used to ban or authorize
business with coal industry partners (such as equipment
suppliers, port terminals, dedicated railways);
■ Property and Construction covers are also banned for Oil &
Gas extraction in the Arctic Region;
■ the above rules do not apply to Employee Benefits (Health,
Savings, Life insurance) or to reinsurance treaty. The details of
these policies are published on AXA Group’s website: https://
www.axa.com/en/about-us/responsible-investment.

416 I UNIVERSAL REGISTRATION DOCUMENT - ANNUAL REPORT 2019 - AXA I
CORPORATE RESPONSIBILITY 7 7.3 CLIMATE CHANGE AND BIODIVERSITY
OUR PRODUCTS
In addition to reorienting its investment strategy, the Group
seeks to minimize its “indirect” impact by off ering insurance
solutions that promote environmentally-friendly behavior.
AXA XL underwriters have significant expertise and capacity
for insuring clients in the energy industry, with a strong focus
on renewable energy. Some local entities also develop Motor
and car fleet insurance policies encouraging low CO2 emission
vehicles, home insurance policies encouraging energy eff iciency,
renewable energy installations, and environmentally friendly
claims strategies. AXA Climate offers parametric insurance
products which, for example, help insured communities facing
the consequences of climate-related disasters on agricultural
crops (notably drought or flooding). See details page 424.
Climate, biodiversity and ESG-related
“outreach” and engagement
SHAREHOLDER ENGAGEMENT
AXA’s investment and insurance restrictions are complemented
by an active engagement strategy. Indeed, as a shareholder
and bondholder, AXA has the possibility to engage with the
management of companies in which it invests in order to help
catalyze positive change on certain sustainability issues. AXA
joined several shareholder coalitions, notably Climate Action
100+, an initiative to engage for 5 years with the world’s largest
corporate greenhouse gas emitters to curb emissions, strengthen
climate-related financial disclosures and improve governance
on climate change.
OUTREACH, MEMBERSHIPS AND PARTNERSHIPS
AXA supports various initiatives related to climate change and
environmental protection. These include the following:
■ Net-Zero Asset Owner Alliance (www.unepfi.org/net-zero-
alliance): the NZAOA is a coalition of institutional investors
(insurers, pension funds etc.), convened under the auspices
of the UN Principles for Responsible Investments, and
launched during the 09/2019 UN Climate Summit. Its members
collectively commit to transition their investment portfolios
to net-zero greenhouse gas emissions by 2050, with united
investor action to align portfolios with a 1.5°C scenario. The
AXA Group leads the NZAOA’s “Methodology” working group;
■ TCFD: AXA co-presided the global industry-led Task Force on
Climate Related Financial Disclosures (TCFD) upon its launch
in December 2015. The TCFD was set up by the Financial
Stability Board (FSB) and chaired by Michael Bloomberg and
Mark Carney (former Governor of the Bank of England, now UN
Special Envoy for Climate Action). The TCFD provides guidance
on how to disclose climate change risk and opportunities. In
2019, the FSB approved AXA’s renewed membership of the
TCFD, notably with an ambition to investigate the relevance
of “investment temperature” metrics;
■ Climate Finance Leadership Initiative: the CFLI, which was
launched in September 2018 by the UN Secretary General,
and is presided by Michael Bloomberg, seeks to develop
standardized and securitized investments at scale to tackle
climate change;
■ Alliance of CEO Climate Leaders: this is a group of 50 CEOs set
up by the World Economic Forum (Davos) to actively engage
in global eff orts to create market opportunities for tackling
climate change. Its goals are to promote strong climate
action including a commitment to reduce carbon emissions,
to support the TCFD, to support low-carbon solutions and
finance, and to promote adequate regulation. AXA joined in
2018;
■ IDF: AXA’s Chairman presides the Insurance Development
Forum since 2018. The IDF brings together the private sector
insurers, reinsurers and brokers, together with the World
Bank and the United Nations Development Program, with
the aim to support the G20 “InsuResilience” objective of
insuring 400 million more people in emerging countries by
2020 against climate-related disasters and of improving their
climate resilience;
■ Plastic Solutions Investor Alliance: as part of its engagements
to protect biodiversity, in 2019 AXA became a member of the
Plastic Solutions Investor Alliance, an international coalition
of 25 institutional investors that engage with consumer
goods companies on the threat posed by plastic waste and
associated pollution.
The Group has signed several NGO partnerships:
■ in 2019, the AXA Group signed a three-year partnership with the
WWF France in order to develop and strengthen its biodiversity
strategy. The partnership will include: craft ing an industry-led
taskforce to develop a biodiversity risk-related guidelines for
the financial services industry, developing biodiversity risk and
impact metrics, and supporting AXA’s Impact Investing work
on biodiversity solutions. See “Biodiversity” paragraph above;
■ C40: during a year-long partnership, AXA and C40 Cities
collaborated on a study on infrastructure interdependencies
in cities. The purpose of this study was to better understand
the progress that cities are making to include infrastructure
interdependencies in their adaptation plans, to identify barriers
cities face and to provide practical recommendations for how
cities can overcome these challenges to improve the resiliency
of their networks. The results of the study were published in a
report Understanding infrastructure interdependencies in cities,
which was launched in November 2019;

417I UNIVERSAL REGISTRATION DOCUMENT - ANNUAL REPORT 2019 - AXA I
CORPORATE RESPONSIBILITY
7
7.3 CLIMATE CHANGE AND BIODIVERSITY
■ UN Habitat: in May 2019, at the Global Platform for Disaster
Risk Reduction in Geneva, AXA launched the publication
Supporting Safer Housing Reconstruction Aft er Disasters –
Planning and Implementing Technical Assistance at Scale,
the result of our multi-year partnership with UN Habitat. This
publication contributes to risk reduction and prevention
measures by providing practical and accessible information
on technical assistance to all stakeholders involved in housing
reconstruction.
AXA has also joined or supported many Investor and Insurance-
led coalitions over the years in the fields of ESG, RI and CR: UN
PRI, UN PSI (notably supporting its “Pilot project” to adapt the
TCFD guidelines to the insurance business), UN Global Compact,
CDP, ORSE, EpE, Finance for Tomorrow.
I Own operations
AXA also monitors and reduces its direct (operational)
environmental footprint.
ENVIRONMENTAL REPORTING PROCESS
AND VERIFICATION
AXA has implemented an environmental reporting process and
related policies since 2002, in line with 2014/95/EU Directive
relative to non-financial reporting.
This process provides standards and controls, supports
environmental data collection through an internal reporting tool
and promotes transparent reporting of environmental impacts
across our operations. It helps us in monitoring and managing
our CO2 footprint, managing our use of natural resources
including water and energy, and reducing our waste. Thanks to
a network of around 300 dedicated environmental managers in
local entities, AXA monitors evolution on its reduction targets,
which helps local entities evaluate their own action plans and
targets.
AXA’s environmental reporting is part of a broader management
system that includes internal controls, processes and progress in
deploying objectives. The data collected and reported through
the reporting process is validated locally by the entity CFOs. In
addition, the firm PricewaterhouseCoopers conducts audits at
the Group and entity levels to ensure data quality and measure
the eff ectiveness of local environmental management systems.
The accuracy of the data and indicators presented is measured
by following these steps:
■ review of the environmental protocol and reporting procedures
at Group and entity level;
■ review of data and detailed tests on selected entities to verify
the accuracy of the data, and consideration of comments;
■ consolidation of data covering all indicators, as well as
consistency and control tests performed by the Group and
our auditors;
■ verification of qualitative information (organization, policies
and actions), as well as quantitative information (indicators,
sampling techniques). The audit covers all of the entity’s data
used to feed the environmental information published in this
report. The report is included in this chapter.
PERFORMANCE TARGETS
AXA has a target to reduce its carbon emissions covering all
greenhouse gas emissions “Scopes (1)”:
■ Scope 1: emissions from fuel consumed on AXA sites as well
as by AXA-owned car fleet;
■ Scope 2: emissions from purchased energy (essentially
electricity consumed by AXA buildings);
■ Scope 3: emissions from business travel and paper
consumption. Note: investment-related “indirect” Scope 3
emissions are analyzed in Section 7.3 “Investments”.
AXA’s initial target for the 2012-2020 period is to reduce CO2
emissions per Full-Time Employee (FTE) by 25%, broken-down
into the following sub-targets:
■ -35% power consumption (kwh/FTE) – Scopes 1&2;
■ -15% business travel: vehicle fleet (km/FTE) – Scope 1;
■ -5% business travel: air and train (km/FTE) – Scope 3;
■ -45% off ice paper (kg/FTE) – Scope 3;
■ -50% marketing and distribution paper consumption (kg/
client) – Scope 3.
The Group has also set two environmental targets that are
unrelated to carbon emissions:
■ -15% water consumption;
■ 95% of paper must originate from recycled or sustainable
sources.
In addition, the Group has set a target to source 100% of its
electricity consumed (off ice sites and AXA-owned data centers)
from renewable energy sources by 2025, in line with our “RE100”
commitment (RE100 is a coalition of companies pledging to buy
100% of their electricity from renewable sources).
(1) As defined by the Greenhouse Gas Protocol www.ghgprotocol.org

418 I UNIVERSAL REGISTRATION DOCUMENT - ANNUAL REPORT 2019 - AXA I
CORPORATE RESPONSIBILITY 7 7.3 CLIMATE CHANGE AND BIODIVERSITY
AXA 2018-2025 CO2 emissions reduction targets are based on
the approach promoted by the “Science Based Targets” (SBT)
initiative, which AXA joined in 2015. According to the SBT, targets
adopted by companies to reduce greenhouse gas emissions
are considered “science-based” if they are in line with the latest
climate science expects from companies to meet the goals of
the Paris Agreement to limit global warming to well-below 2°C
above pre-industrial levels. More specifically, AXA has chosen the
“Sectoral Decarbonization Approach” to produce these targets,
which have been submitted to SBT as follow:
■ 25% reduction in AXA’s CO2 emissions (in absolute terms t.CO
2
eq.) broken down into the following CO2 emissions reduction
sub-targets: -20% from AXA’s vehicle fleet emissions, -35%
from AXA’s power consumption linked to building and data
centers, and -15% from AXA’s business travel emissions. Our
absolute CO2 emissions target represents a 17% CO
2 emissions
reduction per FTE;
■ reduce waste by FTE by 15%;
■ reduce water consumption by FTE by 15%.
Progress on these targets is described below.
2019 PERFORMANCE OVERVIEW
CO2 emissions
AXA’s CO2 emissions per FTE related to paper, power, business
travel and AXA vehicle fleet per person increased by 9% between
2018 and 2019 and decreased by 32% since 2012 (AXA global
2020 target has thus been achieved ahead of schedule). Emission
factors used to calculate CO2 emissions per FTE have been
updated in 2019. When recalculated using the same emission
factors as for previous years, CO2 emissions per FTE related to
paper, power, business travel and AXA vehicle fleet per person are
stable between 2018 and 2019 and decreased by 38% between
2012 and 2019.
37% of the Group’s CO2 emissions are related to energy
consumption, 46% from business travel (air and train), 14% from
AXA’s vehicle fleet and 4% from paper.
Scope 1 CO2 emissions
AXA’s Scope 1 emissions include CO2 emissions generated from
gas and heating oil burned onsite, as well as fuel used by AXA’s
car fleets. Scope 1 emissions per FTE was stable between 2018
and 2019 and decreased by 37% since 2012. The decrease of CO2
emissions related to gas consumption by 6% compared to 2018,
is explained by the fact that some entities in Germany released
part of occupied buildings. The increase of 21% of CO2 emissions
per FTE related to heating oil consumption in 2019 compared to
2018 is mostly due to power outage from service provider in India
resulting into use of diesel generator. In 2019, AXA’s car fleet-
related CO2 emissions per FTE were stable compared to 2018.
Scope 2 CO2 emissions
AXA’s Scope 2 emissions per FTE decreased by 7% between 2018
and 2019 and by 55% since 2012. This performance is notably
related to the purchase of renewable electricity. In order to
calculate our CO2 emissions from purchased electricity, AXA
uses both market-based (electricity supplier energy mix) and
location-based (average country energy mix) approaches. For the
entities buying renewable electricity and which have electricity
consumption data by technology (such as hydro, solar, wind,
biomass and geothermal or others based on power generation
mix used by their providers), AXA uses a more precise “market-
based” approach, thus attributing the corresponding emissions
factors to each source type. For entities which do not have
information about their energy provider’s energy mix, AXA uses
a “location-based” approach (with emissions factors provided by
the French Environmental Regulatory body ADEME).
Scope 3 CO2 emissions
AXA’s Scope 3 emissions include CO2 emissions from business
travel and paper consumption. In 2019, our Scope 3 CO2
emissions per FTE increased by 19% compared to 2012 and by
43% between 2018 and 2019, mostly due to emission factors
updating. When recalculating data with same emission factors as
used in previous year, CO2 emissions for business travel airplane
and train increased by 23% between 2018 and 2019. This increase
is mostly due to the integration of the XL Group. For example, XL
Group number of kilometers traveled by plane contributed by
36% to AXA Group data.
In addition, AXA also measures the carbon emissions related to
its employee commuting, even though such indirect emissions
may be considered to be outside of the scope of the Group’s
responsibilities. In 2019, based on responses collected from 57
entities where AXA employees commuted a total of 1,047 million
kilometers, out of which 49% travelled by public transport, 7% by
company cars, and 31% by personal vehicles and the rest by foot
or bicycle. Employee commuting-related CO2 emissions per FTE
increased by 15% compared to 2018 (representing 0.13 tons eq.
CO2 per FTE). This increase in emissions is linked to an increase
of participation rate from AXA employees (from 17% in 2018 to
22% in 2019) allowing more accurate data.
Power Consumption
AXA’s power consumption includes the total energy consumed
by its corporate sites and data centers during the reporting
year. This includes on-site energy consumption for heating and
cooling as well as electricity for daily operational activities. In
2019, our total energy mix consisted of electricity (74%), gas
(13%), fuel/steam (10%) and chilled water (3%). AXA achieved
a 6% decrease in total power consumption by square meters
between 2018 and 2019, and a 45% decrease compared to 2012.
Our power consumption per FTE decreased by 4% between 2018
and 2019, and by 53% between 2012 and 2019. 64 out of 249 AXA
sites included in the environmental reporting benefit from an

419I UNIVERSAL REGISTRATION DOCUMENT - ANNUAL REPORT 2019 - AXA I
CORPORATE RESPONSIBILITY
7
7.3 CLIMATE CHANGE AND BIODIVERSITY
environmental certificate from building certification programs
such as Building Research Establishment Environmental
Assessment Methodology (BREEAM), Leadership in Energy and
Environmental Design (LEED), HQE etc.
In 2019, 59% of the electricity consumed by AXA originated
from renewable energy sources (hydro, wind, solar, geothermal,
biomass). AXA’s “RE100” target is to reach 100% by 2025. In 2018,
the share of renewable energy was 55%. This increase is mainly
due to a better knowledge of the energy source.
Business Travel
Business travel per FTE increased by 20% between 2018 and
2019 and by 35% between 2012 and 2019. Business travel
trends are closely correlated to our business dynamics, despite
the implementation of online collaborative tools which help to
reduce business travel, as well as the purchase of carbon credits
by certain entities, in particular AXA XL, the largest contributor
to this indicator.
Vehicle Fleet
AXA’s car fleet consists of sales vehicles and benefits-related
vehicles. In 2019, the total distance travelled by the Group’s car
fleet decreased by 2% compared to 2018. Further, in terms of per
FTE usage, there were a decrease of 29% compared to 2012. The
Group has implemented car fleet guidelines which define carbon
emission limits for all types of vehicles regardless of employee
contributions. The guidelines also feature vehicle security
standards and promote employee access to “safe and green
driving” courses. In 2019, 26% of km travelled by AXA vehicle
fleet were by vehicles emitting equal to or less than 100 g of CO2/
km (compared to 4% in 2012), 39% of vehicles emitting equal or
less than 101 g-120 g (25% in 2012) and an average emissions
rate of 124 g of CO2/km. Employees are also incentivized to opt
for hybrid or electric cars.
Paper
AXA’s use of paper concerns office (printing, measured per
employee) and marketing & distribution (leaflets, etc., measured
per customer). Our off ice paper consumption per FTE decreased
by 12% between 2018 and 2019, and by 59% since 2012 (our
global 2020 target has thus been achieved ahead of schedule).
Many entities have implemented a printing policy which includes
reducing the number of printers and installing an employee
badging system to collect all printed documents. In 2019, AXA’s
marketing and distribution paper consumption per customer
decreased by 51% compared to 2018 and by 50% since 2012 (our
global 2020 target has thus been achieved ahead of schedule).
This recent significant decrease is partly linked to the fact that
Equitable Holdings, Inc. is no longer part of AXA Group and that
in 2018 it contributed to 39% to total value reported on that
indicator.
AXA also strives to increase the volume of paper originating from
recycled sources or sustainably managed forests (Group target:
95% of recycled paper by 2020). In 2019, AXA procured 58% of
off ice paper and 72% of marketing and distribution paper from
recycled sources. To promote this approach, the Group requires
environmentally-friendly off ice paper as a minimum standard.
Water consumption
AXA’s water consumption per FTE decreased by 13% between
2018 and 2019, and by 30% between 2012 and 2019. This
decrease in our water consumption is linked to better water
management initiatives led by our local entities.
Waste Management
In 2019, AXA’s sorted paper for recycling decreased by 29%
compared to 2018, and decreased by 57% since 2012. This
decrease in the total recycling rate is due to the overall decrease
in office paper consumption (see section above). 71% of ink
cartridges and toners were recycled. AXA’s IT business unit, AXA
Group Operations, for which electronic waste is of particular
relevance, is a key contributor to this effort, as it ensures
compliance with the 2012/19/EU Directive relative to Waste
Electronic and Electrical Equipment (WEEE). For example, in
2019, the IT Direction of GIE AXA added second-hand or rebuilt
equipment in its catalogue for mobile device.
Unsorted waste increased by 3% between 2018 and 2019,
and decreased by 27% since 2012. This is mainly due to the
improvement of waste measurement processes in local entities.

420 I UNIVERSAL REGISTRATION DOCUMENT - ANNUAL REPORT 2019 - AXA I
CORPORATE RESPONSIBILITY 7 7.3 CLIMATE CHANGE AND BIODIVERSITY
2019 GROUP ENVIRONMENTAL PERFORMANCE
Unit 2019 2018 2017
AXA Group environmental indicators (a)
Number of employees on site, Full-Time Equivalent (FTEs) FTE 121,337 124,355 115,328
Net internal area (sites) m2 1,629,198 1,705,774 1,777,687
POWER (sites) - -
Power consumption (b) Mwh 305,484 344,684 363,283
KPI: Power consumption per person KWh/FTE 2,518 2,772 3,150
Evolution compared to previous year -25% -21% 0%
TRANSPORTATION
Business travel: airplane and train (c) Thousands of km 393,322 336,918 328,523
Business travel: AXA vehicle fleet Thousands of km 220,173 223,577 266,242
Home/workplace commute (round trip) (d) Thousands of km 976,840 920,155 932,534
CO2 EMISSIONS
(e)
CO2 emissions: onsite power consumption T. eq CO
273,425 80,652 94,756
CO2 emissions: business travel: airplane and train T. eq CO
290,584 64,948 63,494
CO2 emissions: business travel: AXA vehicle fleet (f) T. eq CO
227,223 27,287 31,799
CO2 emissions: paper T. eq CO
27,197 13,056 11,446
KPI: CO2 emissions resulting from onsite power consumption, paper
and business travel (airplane, train, AXA vehicle fleet) per person T. eq CO2/FTE 1.64 1.50 1.75
Evolution compared to previous year -7% -14% 0%
CO2 emissions: home/workplace commute (g) T. eq CO
2123,094 109,389 87,116
WATER
Water consumption (h) m3 850,506 1,003,964 927,017
KPI: Water consumption per person m3/FTE 7.01 8.07 8.04
Evolution compared to previous year -15% 0% 0%
PAPER (i)
Off ice paper consumption T 1,384 1,616 1,815
KPI: Off ice paper consumption per person kg/FTE 11 13 16
Evolution compared to previous year -31% -17% 0%
Paper recycled and/or garanteeing sustainable management: off ice % 58 58 58
Marketing and distribution paper consumption T 6,153 12,078 10,220
KPI: Marketing and distribution paper consumption per customer (j)
kg/customer 0.06 0.12 0.10
Evolution compared to previous year -49% 18% 0%
Paper recycled and/or garanteeing sustainable management:
marketing & distribution % 72 41 51
WASTE
Unsorted waste (k) T 4,646 4,512 4,301
Sorted paper for recycling T 2,289 3,223 3,588
Cartridge and/or toners for recycling % 71 66 0
Data collected from 98 entities. Key Performance Indicators (KPIs) highlighted in bold. AXA sites with fewer than 50 FTEs are not included in data collection, but are part of extrapolation process.
(a) In 2019, environmental indicators were collected for 101,354 FTEs working on AXA sites (unless otherwise indicated in these footnotes), and were then extrapolated, continent by continent, to cover all 121,337 salaried FTEs (all types of contrat), working at the AXA Group in average in 2019.
(b) Includes electricity, naturalgas, heating oil, steam, chilled water.
(c) This data have been collected from entities representing 97,402 FTEs.
(d) Home/workplace commute estimations are based on an annual online transportation surveu, issued to every AXA salaried employee. This data has been collected from surveys answers by 19,563 FTEs and then extrapolated. Sites whose response rate was below 5% have been excluded from the data consolidation process.
(e) The emission factors specific to each country used for energy, train and air were revised in 2019. Source: Ademe and DEFRA.
(f) The AXA vehicle fleet data was collected from entities representing 101,270 FTEs.
(g) Does not include company cars, to avoid double counting with the AXA vehicle fleet data.
(h) This data has been collected from entities representing 101,044 FTEs. Some sites in Asia and America are nont equipped with water meters, which prevents accurate measurement and excludes the from the reporting scope before extrapolation. -
(i) Paper data collected from entities representing 101,354 FTEs.
( j) The Group had 107.8 millions customers in 2019.
(k) Unsorted waste data collected from entities 99,128 FTEs.

421I UNIVERSAL REGISTRATION DOCUMENT - ANNUAL REPORT 2019 - AXA I
CORPORATE RESPONSIBILITY
7
7.4 INCLUSIVE INSURER
7.4 INCLUSIVE INSURER
Being a responsible insurer has always been part of AXA’s DNA, because of the very nature of our insurance business which is based
on the principle of a social safety net by pooling risks, but also because of its Corporate Responsibility strategy that positions it as a
company striving for a stronger and safer society. In the previous section, AXA’s vision and practices on its Environment pillar has been
shared. This section encompasses AXA’s practices and key achievements as an inclusive insurer when it comes to the other two pillars,
respectively on Health & Disease Management and on Social Inequalities and Inclusion.
I Business-related societal initiatives
Beyond investments where AXA has led the way with some
pioneer positions in the past such as the divestment from
tobacco, the Group is now moving forward on the insurance side
as well, through fully fledged business opportunities such as:
■ the integration of ESG criteria in its product approval process;
■ its Emerging customers and initiatives to foster more resilience;
■ its AXA Climate parametric insurance off er;
■ its insurance products dedicated to Women;
■ its Health and disease prevention projects;
■ as well as new initiatives to contribute to a more inclusive
economy & growth.
INTEGRATING SOCIETAL ISSUES
IN PRODUCT RANGE
In France, demand for responsible products from clients
continues to grow. Consequently, back in 2015, AXA France
created the “Assurance Citoyenne” (“Citizen Insurance”) label,
which guarantees that all insurance contracts off er benefits to
clients as well as positively impact society. In 2019, this initiative
was adapted and deployed on AXA’s Savings contracts under the
“Épargne citoyenne” (“Citizen Savings”) label. These two labels
are based on an assessment toolkit built in collaboration with a
panel of external stakeholders and audited by an independent
third party. Our engagements are communicated through the
label’s four pillars, which are the following: “Trust” (e.g. simple
contracts for readability and transparency), “Prevention” (e.g.
preventive services or financial education to minimize the risks
our clients are facing for themselves, their goods and their
savings), “Environment” (e.g. paperless contract, investment
decisions based on environmental impact), and “Fairness” (e.g.
product accessibility for populations usually excluded from
insurance mechanisms, investments in companies which create
recruiting opportunities and protect human rights). In 2019, AXA
France built every new off er around these engagements and
distributed in total 60 diff erent labelled products. Since 2015,
4.9 million labelled contracts have been sold.
EMERGING CUSTOMERS AND INITIATIVES
TO FOSTER MORE RESILIENCE
Through the development of its Emerging Customer insurance
off er across high-growth markets, AXA addresses social exclusion
by enabling vulnerable segments of the population to access
insurance services that accompany them in their economic
progression and that provide a safety net that prevents them
from falling into poverty. This approach is to design products
that are simple, fair, and accessible. The products are designed
involving co-creation with customers leveraging technology and
alternative distribution partners like mobile network operators,
banks and microfinance institutions, and remittance companies.
In 2019, AXA’s Emerging Customers business covered almost
18 million customers and has continued to develop various
partnerships (India, Indonesia, Thailand, Egypt, Malaysia,
Morocco). Local AXA entities have also established distribution
partnerships in Nigeria (via several MFI’s), Brazil (via a leading
retailer), and Mexico (MFI for P&C and credit life insurance to
micro-entrepreneurs).
Other examples to foster resilience through more accessible
insurance include Mexico: in September 2017, two violent
earthquakes hit Oaxaca, one of the poorest and most vulnerable
Regions of Mexico. In order to respond to this emergency and
to increase the resilience of the population against future
catastrophic events, AXA Mexico, in alliance with the public
sector and civil society associations, implemented an integrated
reconstruction project in the heavily damaged community of
Unión Hidalgo and use it as an example to continue insuring
Santiago Niltepec.
Those micro-insurances were designed by AXA Mexico to respond
to the principal risks faced by the communities and cover the
total value of the houses against earthquakes, fires and hydro-
meteorological phenomena such as flood or hurricanes. They
are free of charge for the beneficiaries for the first 3 years
(construction companies pay for it and use it to promote the
quality of their work), with the objective to progressively develop
an insurance culture, in a region where the insurance penetration
is close to 0%. At the term of the 3 years, the extension of this

422 I UNIVERSAL REGISTRATION DOCUMENT - ANNUAL REPORT 2019 - AXA I
CORPORATE RESPONSIBILITY 7 7.4 INCLUSIVE INSURER
micro-insurance contract is offered voluntarily to the house
owner, at a very aff ordable price.
At end of December 2019, AXA Mexico covers 243 houses in
Unión Hidalgo and 287 in Santiago Niltepec for a total of 996,000
Mexican pesos (av. US$53,000).
PARAMETRIC INSURANCE
AXA Climate (formerly AXA Global Parametrics) provides
immediate protection to communities facing climate risks in
order to prevent them from falling into poverty.
By drawing on the latest advances in technology and data
science to protect vulnerable communities from the eff ects of
climate change, AXA Climate provides parametric insurance
solutions based on satellite and weather data that triggers
quick and automatic payouts within a few days aft er a natural
catastrophe or extreme weather event has struck. AXA Climate is
also developing early warning systems using satellite and other
weather data to anticipate and initiate contingency planning
before a natural catastrophe occurs.
AXA Climate works closely with governments and international
organizations to develop public-private partnerships in emerging
markets. Public-private partnerships represent 60% of portfolio.
With more than 100 “B to B” clients worldwide, AXA Climate
exceeded its 2019 business target. AXA Climate’s public clients
include all major international sovereign risk pools which provide
governments protection against natural disaster risks including
tropical cyclone, earthquake, excess rainfall and drought. AXA
Climate also works with governments in the agriculture sector
to protect farmers against yield losses due to multiple climate
risks. AXA Climate supports the national agriculture insurance
scheme in India which allows more than 55 million farmers to
benefit from agriculture insurance.
Moreover, AXA Climate also works with the public sector on
agriculture insurance projects at smaller scale in Senegal, Ivory
Coast, Cameroon, Zambia, Ethiopia and Rwanda.
Corporate clients of AXA Climate include also leading industrialists
in Europe, agriculture cooperatives, forestry organizations both
in Europe and Latin America, and renewable energy companies.
WOMEN IN INSURANCE
Women, particularly in emerging countries, are less well insured
than men, despite being a powerful force in the economy. In
2014, AXA commissioned a special report, “SheForShield”, which
looked at women’s attitudes towards insurance, as well as their
needs and expectations. As a result, AXA developed the “Women
in Insurance” initiative aimed at increasing women’s access to
insurance products and services that respond to their needs and
expectations, in line with our “Payer-to-Partner” vision.
The 3 main focus areas are: women as retail clients, as
entrepreneurs and in the distribution force. AXA has developed
a dual approach: in mature markets, AXA will empower women
to be financially independent, and in emerging markets the
objective is to empower women to “live better lives”. In 2019, 17
entities included “Women in Insurance” as a strategic priority and
26 products have been developed. This strategy is implemented
through our “2020 Women Insurer of Choice” targets:
■ 45% of women retail clients;
■ 30% of SME clients are women (mirroring the global market
opportunity);
■ 25% of women in distribution and sales management;
■ 40% of women amongst recruits and promotions.
Further, through AXA Research Fund, AXA dedicates €1 million
to research to better understand and prevent health and
entrepreneurial barriers for women.
Since 2018, AXA is a strategic partner of the Global Women’s
Forum. The objective is to bring AXA’s expertise and influence
to collect insights and develop the best practices, solutions
and projects to add value to the Forum’s on a yearly basis.
Through this organization, in 2019, AXA leads the publication of
a white paper – Addressing health barriers through technology
– highlighting how women still face unequal access to adequate
healthcare around the world.
In November 2019, AXA partnered with 50inTech, a global
network of entrepreneurs who are committed to the fight for
gender equality in the Tech sector. Together, they launched the
FemTech 2020 accelerator program. The objective is to identify
and accelerate 10 rising FEMTECH female founders through
mentoring, learning and networking.
HEALTH AND DISEASE PREVENTION
As announced publicly in May 2016, AXA decided to divest
from and end insurance covers for the Tobacco industry. AXA
believes that supporting an industry which is the main cause of
long-term non-communicable diseases, including cancer, heart
disease and chronic respiratory illnesses, is not compatible with
our role as one of the world’s largest health insurers, and our
strategy to become our clients’ health risk prevention partner.
Sending such a signal to markets and regulators reinforces the
development of tobacco controls, which ultimately contribute

423I UNIVERSAL REGISTRATION DOCUMENT - ANNUAL REPORT 2019 - AXA I
CORPORATE RESPONSIBILITY
7
7.4 INCLUSIVE INSURER
to improving customers’ health, and aligned with the Group’s
broader CR strategy to promote a stronger and safer society.
AXA’s Group divestment covers €2.05 billion (including XL
Group assets added in 2018): equity assets have been divested
immediately, while debt assets are run of gradually. In this
perspective, AXA continues to support important anti-tobacco
initiatives such as the NGO “Tobacco-Free Portfolios” whose
Tobacco-Free Finance Pledge was launched at the UN General
Assembly in September 2018 by AXA, BNP Paribas, Natixis and
AMP Capital. This pledge aims to “denormalize” relationships
between the financial community and the tobacco industry.
It is now supported by 128 signatories with total assets under
management of US$8.1 trillion. AXA also contributes to this anti-
tobacco fight through dedicated awareness campaigns. For the
World no tobacco day on May 31, 2019, AXA launched a global
awareness campaign #TobaccoFreeMe on the social media
with a series of 6 videos. Being one of the world’s largest health
insurers, AXA’s strategy is indeed to become its clients’ health
risk prevention partner.
INCLUSIVE ECONOMY AND GROWTH
To respond to the growing urge of the population and the public
sector that private sector take a more active role in bridging
the gap of inequalities, AXA has embarked in 2019 in several
coalitions for a more inclusive economy.
Inclusive Economy Coalition
The first one, called “inclusive economy coalition” was launched
back on December 18, 2018, when CEOs of major companies
in France, including AXA’s, signed a commitment in favor of a
more inclusive economy and committed to a list of initiatives
to complement government measures in favor of purchasing
power. This collective commitment is one of the private sector’s
responses to the social vulnerabilities in France, as each of
the signatories belong to sectors of the economy that directly
address the concerns expressed by French people (e.g. energy,
transports, financial services).
This collective of now 33 companies has set itself three working
groups: 1/employment (apprenticeship, integration, training),
2/more accessible products and services, and 3/inclusive
purchasing. As far as the first working group is concerned, one
of the main commitments of the coalition was a 35% increase
in the number of work-study students between 2018 and 2020.
In France, AXA recruited 1,927 work-study students in 2019
(+28% vs. 2017). With local associations, AXA also participated
in events in various employment areas (Seine St-Denis, Bordeaux,
Lyon, Marseille, Rouen, Strasbourg). As a result of these actions,
about a hundred candidates were recruited. Finally, to meet the
collective objective of +5 million hours of training in 2019 and
2020, AXA provided more than 78,000 days of training to all AXA
employees in France.
The second working group worked on inclusive off ers proposed
individually or in partnerships within the coalition members. With
Renault and Total, AXA has launched a first initiative to reinforce
access to driving licenses for young people in diff iculty and in
remote areas where mobility is critical given the lack of public
transports. Free all risk insurance has been provided to five cars
in “missions locales”, reaching 15-20 young people per mission,
hence a total of 75-100 people driving each 2,000 km per year
(total of 150,000-200,000 insured km). This project which was
launched operationally in November 2019 also fosters employee
engagement by identifying volunteers among AXA retired
employees to supervise the young people among the Partners
companies through AXA Hearts in Action.
The third working group wants to make the purchasing power
of companies a lever for social inclusion and diversity, for
the development of territories, VSE/SMEs and the social and
solidarity economy.
Business for Inclusive Growth
At an international scale, AXA also joined the “Business for
Inclusive Growth” coalition. This OECD-led coalition of private
companies contributes to fighting social inequalities by working
closely with policymakers to advance inclusion at both the
global and local levels. This initiative was off icially launched
on August 23, 2019, at the G7 Summit whose theme is “fighting
inequalities of all types”. This announcement will be followed by
a 3-year-program monitored through a Board of CEOs. The scope
of this initiative covers the G7, the OECD and African countries
with three main deliverables:
■ a pledge signed in our head off ice on promoting equality of
opportunities, eliminating gender disparities, reducing spatial
inequalities;
■ an international incubator hosted at the OECD;
■ a global pool of funds hosted by the World Bank.
Through this coalition, AXA aims at scaling up inclusive growth
project beyond France, complementing government measures
to increase the purchasing power of the lower income people
in developed countries and developing social business in
our industry that directly addresses constrained expenses
(Insurance represents on average 8% of low income Households’
constrained expenses).
The AXA projects submitted to the incubator include among
others the previously mentioned projects on Emerging
Customers, Women and AXA Climate.
424 I UNIVERSAL REGISTRATION DOCUMENT - ANNUAL REPORT 2019 - AXA I
CORPORATE RESPONSIBILITY 7 7.4 INCLUSIVE INSURER
I Corporate philanthropy and engagement
In line with our Sustainability Risk Assessment (described in
Section 7.1 “General Information”), community involvement and
corporate philanthropy have been identified as key enablers of
AXA’s role as a responsible corporate citizen. As a result, AXA
has developed and implemented various policies and initiatives,
whose alignment with its responsible corporate citizenship
strategy has been strengthened in 2019.
COMMUNITY INVESTMENT
As a responsible corporate citizen, AXA strives to play a positive
role in society, by sharing our business expertise, by helping
to build better understanding of the risks faced by individuals
and society at large, and by building a culture that promotes
employee volunteering to support the communities in which
AXA operates.
In 2019, AXA has profoundly changed its corporate philanthropy
policy, with the aim of better integrating it into its CR strategy
and increasing its impact. A Corporate Philanthropy Committee
has been set up to decide collectively on major partnerships
based on precise criteria. The Group aligns its patronage with
the three CR pillars: climate and the environment, health and
disease prevention, social inequalities and inclusion. Through
the Community Investment Guidelines, AXA entities are also
encouraged to focus their philanthropic actions around these
three pillars.
In 2019, almost 41% of the €45.3 million (€25.7 million in 2018)
in donations made by the Group and entities (including the AXA
Research Fund) were dedicated to projects on these themes:
Climate and the Environment
■ C oncerning climate and environment, AXA has been
supporting since 2011 the NGO Care, which acts to protect
vulnerable populations in the face of climate change. In
particular, AXA has supported the Where the Rain Falls
program from the outset, which aims to better understand
the impact of changes in rainfall (study phase in 8 countries
between 2011 and 2013) and to help populations cope through
an education and adaptation program (in India and Thailand
between 2014 and 2019). As a result , beneficiaries have notably
seen an improvement in their agricultural productivity (+60%)
and their ability to recover from extreme weather events such
as drought and floods (+72%), compared to the situation they
experienced before their participation.
■ I n addition, AXA signed a new global partnership with WWF in
2019 to address climate and biodiversity issues. Through this
three-year program, WWF supports AXA in its eff orts to ensure
that natural capital is better taken into account in all of our
activities (see Section 7.3 “Climate change and biodiversity”).
In addition, the philanthropy component of this program
makes it possible to contribute directly to the preservation
of ecosystems in Mexico and New Caledonia. In Mexico, the
objective of the program supported is to demonstrate that it
is possible to strike a balance between nature conservation,
agricultural development and water use through a project
to restore degraded forest. In New Caledonia, AXA wanted
to support WWF’s conservation efforts to strengthen the
resilience of coral reef biodiversity, which is now considered
one of the most threatened ecosystems on the planet.
Health and disease prevention
■ I n 2019, the AXA Group has also entered into a new partnership
with UNICEF under the “Health and prevention” pillar. In order
to respond to the global epidemic of overweight and obesity,
this 3-year program allows for action on the ground in the
Philippines and Brazil to prevent overweight and obesity
from early childhood by promoting healthier eating habits.
To reach children aged from 0 to 5, AXA acts on their immediate
environment, namely mothers and the health and education
professionals around them. Training, communication and
advocacy activities with authorities will be implemented
by local UNICEF teams. The objective is to support 177,000
children and their mothers in the Philippines and 16,000 in
Brazil.
■ P revention is also a component developed by our entities
in connection with our insurance business. In 2019, eff orts
linked to prevention were up to €5.3 million, with two major
contributors, France and Spain, developing ambitious
programs. Risks related to road accidents are also covered, in
connection with our Motor insurance business. France, Spain,
Switzerland and Mexico are notably developing awareness
campaigns in this area, with an investment of €2 million.
Social Inequalities and Inclusion
■ N umerous actions are being carried out around the “Social
Inequalities and Inclusion” pillar by all Group entities,
particularly through the AXA Atout Cœur volunteer program
(see below). 68% of the volunteer activities off ered by AXA
Atout Cœur and 54% of the sums paid out are destined for
projects designed to fight inequality.
The AXA Group also redeployed a policy of cultural and heritage
philanthropy in 2019. Indeed, the values of protecting and
passing on patrimony are at the heart of the insurance business.
Joining forces with major French symbols of international
stature, AXA financed the acquisition of a national treasure for
the Musée d’Orsay, the restoration of the Salle des États of the
Louvre Museum (where the Mona Lisa by Léonard de Vinci is
exhibited), and joined forces with the global solidarity that was
demonstrated during the dramatic fire at Notre-Dame de Paris
in April 2019 (€10 million mobilized for its reconstruction). AXA
entities, such as AXA France and AXA XL, are also developing
heritage and cultural philanthropy actions, promoting access
to heritage and culture for all (priority “social inequalities and
inclusion”).

425I UNIVERSAL REGISTRATION DOCUMENT - ANNUAL REPORT 2019 - AXA I
CORPORATE RESPONSIBILITY
7
7.4 INCLUSIVE INSURER
AXA RESEARCH FUND
The AXA Research Fund, in line with AXA’s societal mission and
as part of a scientific philanthropy initiative launched in 2008,
aims to support “transformative” research projects that explore
solutions to the challenges society faces today. In line with the
pillars of corporate responsibility, the AXA Research Fund’s work
covers the areas of climate and environment, health and socio-
economic issues/inclusion. It also develops the transversal
pillar of new technologies. The selection of research projects is
overseen by an independent Scientific Council.
In 2019, the Fund selected 4 AXA Chairs for a total amount of
€4 million (€1 million per project over 5 years). The four selected
areas of support are Invasive Species at the University of Paris
Sud (France), Explainable Artificial Intelligence and Health with
the University of Oxford (UK), Population-Stabilizing Portfolio
Effects of Fine-Scale Environmental Variations in Natural
Resource Availability to Malaria Vector Mosquitoes at the
University of Cork (Ireland) and Communication Technologies
and Molecular Information at Koç University (Turkey). The AXA
Research Fund also selected a total of 18 post-doctoral fellows on
the key topics of Marine Biodiversity (8 projects), Mental Health
(6 projects), and Cyber Risk (4 projects) for a total of €2.25 million.
The AXA Research Fund continued to support strong initiatives
around women through the Women, Leadership and
Entrepreneurship Chair at IEP Paris and was vocal in the field
of women’s health. In particular, it confirmed its commitment
to the research on the issue of equal access to healthcare and
solutions to the gender health gap.
For the third consecutive year, the AXA Research Fund has
partnered with the Red Cross Foundation to support research
in the humanitarian field around the pillars of health and climate
change; 8 African researchers were rewarded.
Beyond funding, the AXA Research Fund strengthened its
dissemination eff orts through two publications – “Silver Age:
Aging Better” and “Biodiversity at Risk,” that highlight the
economic, social and biological problems of ageing and the
loss of the natural world.
In September 2019, the AXA Fund and the Foresight Teams came
together to integrate the scientific vision with that of future
societal trends and to inform our role as responsible insurer
more holistically.
EMPLOYEE VOLUNTEERING
AXA Atout Cœur is the international volunteer program for AXA
employees, in which they carry out activities on themes that have
been aligned in 2019 (when new guidelines were released) with
the 3 pillars of AXA’s CR strategy. In 2019, nearly 39,000 employees
(estimated – almost 34,000 in 2018) donated their time and skills.
Contributing entities in 2019 represents 84% of AXA average FTEs.
In total, AXA employees completed 81,200 volunteering acts
(66,500 in 2018), which represents more than 284,000 hours
(200,700 in 2018) during the year, while working on solidarity
projects. A large majority of volunteer hours are performed
during working hours (more than 240,000 versus 157,000 in 2018).
Through AXA Atout Cœur program, the Group seeks to promote
all forms of employee engagement, particularly skills-based
philanthropy. In 2019, AXA France continued to develop the “AXA
Expérience Solidaire” program: 110 employees volunteered in
partner associations (versus 47 in 2018). In total, the salaries paid
for the 109,300 hours spent on these skills sponsorship missions
represent the equivalent of a donation of nearly €7.9 million
(versus €4.5 million in 2018).
The integration of XL Group brings a positive synergy to the AXA
Atout Cœur program in 2019, as the entity has also long been
developing volunteer work and skills sponsorship among its
employees. XL Group employees contributed to 42,800 volunteer
hours, or 15% of the total number of hours in 2019.
Every year, AXA organizes a “Corporate Responsibility Week”
(CR Week) that helps to amplify employee mobilization and
promote the AXA Atout Cœur program and the diversity of our
commitments around the world. In 2019, the estimated number
of volunteering acts (on or off the job) reached 33,000 for a
total of 93,000 hours in 43 countries. XL Group made a major
contribution to the success of this edition of CR Week thanks to
its Global Day Of Giving volunteer day (23% of participants and
57% of time spent).
A wide variety of activities were carried out by AXA employees,
both during and outside of CR Week: for example, beach clean-
ups, tree planting, support for disadvantaged young people or
women in diff iculty, solidarity races, and solidarity collections of
toys or used mobile phones.

426 I UNIVERSAL REGISTRATION DOCUMENT - ANNUAL REPORT 2019 - AXA I
CORPORATE RESPONSIBILITY 7 7.5 BUSINESS BEHAVIOUR
7.5 BUSINESS BEHAVIOUR
AXA is committed to conducting its business according to the high ethical principles. This commitment is designed to ensure compliance
with laws and regulations in the various jurisdictions where AXA operates, to earn the continued trust of our clients, shareholders,
employees and business partners, but also frequently extends beyond legal obligations on a range of topics about which AXA has
strong convictions.
I Business ethics
COMPLIANCE & ETHICS GUIDE
AXA’s Group Compliance and Ethics Code seeks to establish
Group-wide rules and guidelines to ensure that AXA Group
companies and employees have a common understanding
of the compliance and ethical standards the Group requires.
The Guide covers a variety of matters, including specific rules
concerning conflicts of interest, anti-bribery and Corruption,
insider trading, management of confidential information, etc.
The Code is available on the Group’s website (www.axa.com/
en/newsroom/publications/compliance-ethics-guide). In 2019,
a new AXA Group Compliance & Ethics Code was launched. The
Code includes some subjects that have become increasingly
important in recent years; these include Health & Safety at work,
Protection and Responsible use of Customer Data, Engagement
with Social Media, Prevention of Discrimination and Harassment
and Fair and Professional Treatment of customers. The content
and style of the Code has also been revised to make it more
accessible and easier to reference.
ANTI-BRIBERY & FIGHT AGAINST
CORRUPTION
To prevent this risk of bribery and corruption, AXA Group has
introduced a Group ABC Policy that establishes minimum
standards for ABC that must be implemented by AXA entities.
This policy has been regularly updated to take account of new
regulations and most notably the recent French law known as
“Sapin II” no. 2016-1691 of December 9, 2016, on transparency,
fight against corruption and modernization of economic life. A
Group Anti-Bribery Off icer has been designated to design and
reinforce the global ABC program at Group level and to guide
its implementation across AXA. AXA entities have designated
local Anti-Bribery Off icers to implement their ABC programs in
accordance with AXA’s policy. Processes and procedures are in
place to monitor compliance with AXA ABC standards across the
Group.
BUSINESS CONDUCT
The Group’s insurance, banking and asset management
operations are subject to an increasing number of legislative and
regulatory initiatives designed to increase customer protection
in the financial services sector. In the European Union, initiatives
related to financial service include the Insurance Distribution
Directive, MiFID II Directive and the regulation on Key Information
Documents for Packaged Retail and Insurance based Investment
Products (PRIIPs regulations).
As a result, consumer protection regulations have become an
increasingly important area for the financial services sector
and AXA has taken significant action to comply with these
requirements in each of its businesses operating in the European
Union. Similar regulatory developments regarding business
conduct are also taking place in many other parts of the world
in which AXA operates and similar measures are in place to
respond to those and to share experience between businesses
facing similar challenges. Compliance risks, specifically business
conduct risks, are assessed on an annual basis and the results
and any necessary mitigation actions are developed and shared
with senior management. Internal Control processes have been
developed to ensure controls are eff ective and cover entities’
own operations and those of proprietary sales channels.

427I UNIVERSAL REGISTRATION DOCUMENT - ANNUAL REPORT 2019 - AXA I
CORPORATE RESPONSIBILITY
7
7.5 BUSINESS BEHAVIOUR
I Responsible data use and data privacy
In line with AXA’s sustainability risk assessment, the Group has
put in place various initiatives to promote the use of data to
address societal challenges, as well as to ensure client data is
protected.
DATA PRIVACY
AXA has implemented a Group Data Privacy policy with the
following objectives:
■ to ensure that AXA entities adequately protect the personal
and sensitive data of customers and other persons obtained
during their business activities;
■ to minimize the risk of AXA entities breaching applicable data
privacy and protection laws (e.g. EU General Data Protection
Regulation – GDPR).
■ AXA has implemented a Group level team dedicated to data
protection, as well as a network of over 100 Data Privacy
Off icers whose mandate is to ensure the protection of sensitive
personal data across the Group.
The information related to AXA’s policy and control mechanisms
to address data privacy risks are explained in paragraph “Personal
data protection” in Section 7.6 “Vigilance plan”. Information
related to why AXA considers data privacy as a key risk topic is
detailed in Sections 4.1 and 6.3.
In addition to our data privacy policies, AXA has developed
cybersecurity capabilities. Indeed, security is a competitive
advantage. A key success factor for AXA’s “Payer-to-Partner”
strategy is that customers trust AXA to keep them and their
data safe and secure. While social unrest, terrorism, disruptive
technologies, unpredictable natural disasters, cyber risk
and misuse of information are a reality, it is critical for AXA to
remain operational in case of crisis, to protect its customers’
data, employees, reputation, and assets. Security at AXA is
managed by Group Security and based on three disciplines:
Information Security, Operational Resilience and Physical
Security & Safety. Data hacking, identity theft , and trading of
sensitive information are daily threats, in a context where cyber
criminals are becoming more and more professional. AXA has
developed and strengthened its capabilities to protect, detect
and react to cyber threats, by investing in particular in innovative
solutions, advanced technologies and solutions according to the
security “by design” principle in order to remain among the best
performing companies in terms of security. The deployment of
its next-generation security operations center is an illustration of
this. Moreover, AXA employees have a key role to play and are
fully part of AXA security strategy. To make it an eff ective “first
line of defense”, safety training and awareness campaigns are
deployed throughout the Group and aimed at all employees.
RESPONSIBLE ARTIFICIAL INTELLIGENCE
AXA is one of the founding member of the French association
Impact AI (Artificial Intelligence). Impact AI is a “think and do
tank” composed of companies, consulting firms, startups,
schools and actors working on Responsible AI with 5 programs
of actions, such as analyzing the perception of AI and the
development of a “trusted AI”, sharing tools for a responsible
use of AI, helping people adapt to the digital era, and creating
partnerships to foster responsible AI among all types of actors
(companies, schools, associations, etc.).
Within this organization, AXA is leading the Impact AI’s
Responsible AI Committee in charge of contributing to answer
to “the trustworthy AI assessment list” from the High-Level
Expert group on artificial intelligence (set up by the European
Commission). The European Commission has published the
“The Ethics Guidelines for Trustworthy Artificial Intelligence”:
these Guidelines put forward a human-centric approach on
AI and list 7 key requirements that AI systems should meet in
order to be trustworthy. These requirements will go through a
piloting process expected to conclude with the presentation of
an AI Policy paper in early 2020.
DATA FOR GOOD
Leveraging the initial “Give Data Back” platform that was, back in
2017, one of the first illustrations of how to share our P&C claims
data for free in a prevention perspective, the concept has been
replicated in Singapore to explore accident hotspots, as well as in
Mexico, where road data is shared with public institutions in order
to improve road safety. These two initiatives are still outstanding.
In Singapore, by sharing an analysis and consolidation of our
claims and policy data for car accidents, users (both customers
and non-customers) can better understand the risks on the roads
they frequent and how they can avoid car accidents. With the
same objective, AXA Mexico have helped Mexico City authorities
secure dangerous crossroads through an interactive map and
open dataset of car crashes (raw data) available for download for
authorities through the International Institute for Data Science
website. In 2019, follow-up projects included an impact survey
with the National Health Institute on speed areas and bodily
injury severity as well as the creation of a super database with
a university.

428 I UNIVERSAL REGISTRATION DOCUMENT - ANNUAL REPORT 2019 - AXA I
CORPORATE RESPONSIBILITY 7 7.5 BUSINESS BEHAVIOUR
I Responsible procurement
Translating AXA’s CR strategy and commitments into its
management of vendors is a continuous activity for AXA. This
alignment means AXA includes CR topics to select and monitor
its providers. This approach is articulated around two axes:
■ responsible people & processes: all the AXA professionals
working in a procurement department, in addition to the
Group’s Code of Professional Conduct, must sign a dedicated
and reinforced Code of Ethics which promotes fairness and
neutrality, confidentiality and transparency of our sourcing
decisions. They also are aware of the AXA CR strategy and
the AXA Responsible Procurement policy through awareness
sessions given by the network of Responsible Procurement
Champions identified in our various entities;
■ responsible vendors: AXA requires from its vendors to
be socially and environmentally responsible through the
mandatory inclusion of a “Corporate Responsibility Clause”
in all our contracts. It includes in particular complying with
the principles of the International Labour Organization
(prohibiting the resort to child/forced labor, promoting
employee health & safety and freedom of expression, and
non-discrimination). In addition, AXA implemented a CR Risk
assessment of its suppliers, identified thanks to an internal CR
Risks Matrix. Suppliers are thus classified into procurement risk
categories and evaluated against five CR criteria (environment,
social, product & services end-use impact, suppliers’ supply
chain, and business integrity). Vendors falling in the highest CR
risks categories are asked to share their valid DJSI or EcoVadis
scores or even follow an EcoVadis assessment.
Detailed information on our responsible procurement policy and
standard is elaborated in AXA’s Group Procurement Guidelines.
The document is used for supplier selection and management
purposes.
I Tax policy
Both as a multinational company and as a provider of investments and savings products, the AXA Group follows a responsible and
transparent approach on tax issues. For more information on AXA’s Tax policy, please refer to Section 6.3 “General Information”, paragraph
“AXA Group Tax policy”.

429I UNIVERSAL REGISTRATION DOCUMENT - ANNUAL REPORT 2019 - AXA I
CORPORATE RESPONSIBILITY
7
7.5 BUSINESS BEHAVIOUR
I Report by one of the Statutory Auditors, appointed
as an independent third party, on the non-financial
information statement included in the management report
This is a free translation into English of the Statutory Auditor’s report issued in French and is provided solely for the convenience of
English speaking readers. This report should be read in conjunction with, and construed in accordance with, French law and professional
standards applicable in France.
FOR THE YEAR ENDED DECEMBER 31st
, 2019
To the AXA S.A Annual General Meeting,
In our capacity as Statutory Auditor of AXA S.A, appointed as an independent third party and accredited by COFRAC under number 3-1060
rév.2 (whose scope is available at www.cofrac.fr), we hereby report to you on the non-financial information statement for the year ended...
(hereinaft er the “Statement”), included in the management report pursuant to the legal and regulatory provisions of articles L.225-102-1,
R.225-105 and R.225-105-1 of the French Commercial Code (Code de commerce).
THE ENTITY’S RESPONSIBILITY
Pursuant to legal and regulatory requirements, the Board of Directors is responsible for preparing the Statement, including a presentation
of the business model, a description of the principal non-financial risks, a presentation of the policies implemented considering those
risks and the outcomes of said policies, including key performance indicators.
The Statement has been prepared in accordance with the entity’s procedures (hereinaft er the “Guidelines”), the main elements of
which are presented in the Statement of which are available on request from the Company’s head off ice.
INDEPENDENCE AND QUALITY CONTROL
Our independence is defined by the provisions of article L.822-11-3 of the French Commercial Code and the French Code of Ethics
(Code de déontologie) of our profession. In addition, we have implemented a system of quality control including documented policies
and procedures regarding compliance with the ethical requirements, French professional guidance and applicable legal and regulatory
requirements.
RESPONSIBILITY OF THE STATUTORY AUDITOR, APPOINTED AS AN INDEPENDENT THIRD PARTY
On the basis of our work, our responsibility is to provide a report expressing a limited assurance conclusion on:
■ the compliance of the Statement with the provisions of article R.225-105 of the French Commercial Code;
■ the fairness of the information provided in accordance with article R.225-105 I, 3 and II of the French Commercial Code, i.e., the
outcomes, including key performance indicators, and the measures implemented considering the principal risks (hereinaft er the
“Information”).
However, it is not our responsibility to comment on:
■ the entity’s compliance with other applicable legal and regulatory provisions, in particular the French duty of care law and anti-
corruption and tax evasion legislation;
■ the compliance of products and services with the applicable regulations.
NATURE AND SCOPE OF OUR WORK
The work described below was performed in accordance with the provisions of articles A. 225-1 et seq. of the French Commercial Code
determining the conditions in which the independent third party performs its engagement and with the professional guidance of the
French Institute of Statutory Auditors (“CNCC”) applicable to such engagements, as well as with ISAE 3000 – Assurance engagements
other than audits or reviews of historical financial information.
Our procedures allowed us to assess the compliance of the Statement with regulatory provisions and the fairness of the Information:
■ we obtained an understanding of the entity’s activities, the description of the social and environmental risks associated with their
activities and the impact of these activities on compliance with human rights and anti-corruption and tax evasion legislation, as well
as the resulting policies and their outcomes;
■ we assessed the suitability of the Guidelines with respect to their relevance, completeness, reliability, objectivity and understandability,
with due consideration of industry best practices, where appropriate;
■ we verified that the Statement includes each category of social and environmental information set out in article L.225-102-1 III, as
well as information regarding compliance with human rights and anti-corruption and tax evasion legislation;

430 I UNIVERSAL REGISTRATION DOCUMENT - ANNUAL REPORT 2019 - AXA I
CORPORATE RESPONSIBILITY 7 7.5 BUSINESS BEHAVIOUR
■ we verified that the Statement includes an explanation for the absence of the information required under article L.225-102-1 III, 2;
■ we verified that the Statement presents the business model and the principal risks associated with the entity’s activities, including
where relevant and proportionate, the risks associated with their business relationships and products or services, as well as their
policies, measures and the outcomes thereof, including key performance indicators;
■ we verified, where relevant with respect to the principal risks or the policies presented, that the Statement provides the information
required under article R.225-105 II;
■ we assessed the process used to identify and confirm the principal risks;
■ we asked what internal control and risk management procedures the entity has put in place;
■ we assessed the consistency of the outcomes and the key performance indicators used with respect to the principal risks and the
policies presented;
■ we verified that the Statement covers the scope of consolidation, i.e., all the companies included in the scope of consolidation in
accordance with article L.233-16;
■ we assessed the data collection process implemented by the entity to ensure the completeness and fairness of the Information;
■ for the key performance indicators and other quantitative outcomes that we considered to be the most important, we implemented:
• analytical procedures to verify the proper consolidation of the data collected and the consistency of any changes in those data,
• substantive tests, using sampling techniques, in order to verify the proper application of the definitions and procedures and
reconcile the data with the supporting documents. This work was carried out on a selection of contributing entities which are AXA
Partners Columbia, AXA Colpatria Seguros, AXA Hong Kong, AXA General Insurance HK, AXA Partners Mexico, AXA Life Insurance
Japan, AXA Direct Japan, AXA General Insurance Japan, AXA Partners Malaysia, AXA Malaysia General Insurance, Bordeaux Pessac,
Nanterre – Terrasses 1,2,3, GIE AXA Group Operations France, AXA Group Operations SAS, AXA France (CIS), AXA Insurance UK, XL
Catlin Services SE (UK), AXA UK Holding, AXA PPP Healthcare, AXA Polska SA, XL Global Services (US) and covers between 22% and
51% of the consolidated data relating to the key performance indicators and outcomes selected for these tests;
■ we referred to documentary sources and conducted interviews to corroborate the qualitative information (measures and outcomes)
that we considered to be the most important;
■ we assessed the overall consistency of the Statement based on our knowledge of all the consolidated entities.
We believe that the work carried out, based on our professional judgement, is suff icient to provide a basis for our limited assurance
conclusion; a higher level of assurance would have required us to carry out more extensive procedures.
MEANS AND RESSOURCES
Our work was carried out by a team of 10 people between mid-September 2019 and end of March 2020 took a total of 8 weeks.
We were assisted in our work by our specialists in sustainable development and corporate social responsibility. We conducted
around fift een interviews with the people responsible for preparing the Statement, representing Group Public Aff airs and Corporate
Responsibility, Risk Management, Compliance, Tax, Legal, Procurement and Human Resources.
CONCLUSION
Based on our work, nothing has come to our attention that causes us to believe that the non-financial information statement is not in
accordance with the applicable regulatory provisions and that the Information, taken as a whole, is not presented fairly in accordance
with the Guidelines.

431I UNIVERSAL REGISTRATION DOCUMENT - ANNUAL REPORT 2019 - AXA I
CORPORATE RESPONSIBILITY
7
7.5 BUSINESS BEHAVIOUR
COMMENTS
Without qualifying our conclusion and in accordance with article A. 225-3 of the French Commercial Code, we have the following
comments:
The entity is still working on the presentation of Key Performance Indicators for some of the main CSR risks defined by AXA within its
Statement: customer protection, prevention of human rights violations within the supply chain and fight against corruption.
These limitations are explained in the paragraph “Methodology and Reporting Scope: Business Behaviour” Section of the Statement.
Neuilly sur Seine, March 18, 2020
One of the Statutory Auditors
PricewaterhouseCoopers Audit
Bénédicte Vignon
Partner
Sylvain Lambert
Sustainable Development Partner

432 I UNIVERSAL REGISTRATION DOCUMENT - ANNUAL REPORT 2019 - AXA I
CORPORATE RESPONSIBILITY 7 7.5 BUSINESS BEHAVIOUR
Appendix: List of the information we considered most important
QUANTITATIVE INFORMATION (AMONG WHICH KEY PERFORMANCE INDICATORS):
■ environment: energy consumption, distance covered by business travel and vehicle fleet, CO2 emission by scope, water consumption,
off ice and marketing paper consumption, waste production, “green” investments;
■ human resources: headcounts and distribution, number of external recruitments, number of resignations, number of dismissals,
annual gross payroll (fixed and variable), number of training days, absenteeism rate;
■ human rights: number of emerging customers, number of entities which adhered to “Binding Corporate Rules”;
■ social: number of Stakeholder Advisory Panels, cash donations for community investment projects, number of employees who
participated to volunteering acts, total hours contributed to volunteering acts;
■ corruption and tax evasion: tax expense of the consolidated financial statements.
QUALITATIVE INFORMATION (ACTIONS AND RESULTS):
■ environment: information relative to environment and climate change;
■ human resources: information relative to employee relations and work conditions, learning environment and skills management,
diversity and inclusion;
■ human rights: information relative to women in insurance, emerging customers, parametric insurance, business behaviour, responsible
data use, responsible procurement;
■ social: information relative to stakeholder dialogue, corporate philanthropy and engagement;
■ corruption and tax evasion: information relative to corruption and tax policy.

433I UNIVERSAL REGISTRATION DOCUMENT - ANNUAL REPORT 2019 - AXA I
CORPORATE RESPONSIBILITY
7
7.6 VIGILANCE PLAN
7.6 VIGILANCE PLAN
The AXA Group is committed to promoting and protecting human
rights (including fundamental freedoms and the health and
safety of persons) as well as the environment in conducting its
business.
To comply with the requirements of French law (1), AXA has
(i) adopted a vigilance plan (the “vigilance plan”) that sets out
safeguards established and implemented by it to identify and
prevent serious violations of human rights and environmental
abuses and (ii) submitted a report on the application of this
vigilance plan during the year 2019 which is included in this
section.
The vigilance plan has reinforced an existing internal system that
already included a number of tools and procedures implemented
within the Group.
(1) Law No. 2017-399 of March 27, 2017 relating to the duty of vigilance of parent companies and instructing companies (“devoir de vigilance des sociétés mères et des entreprises donneuses d’ordre”) and Article L.225-102-4 of the French Commercial Code.
I Sco pe of the vigilance plan
The vigilance plan encompasses the activities of AXA Group
companies, including intra-group activities and operations, as
well as those of contractors and suppliers with whom the AXA
Group has an established business relationship.
Given the diversity of the activities of AXA’s subsidiaries,
contractors and suppliers, the vigilance plan sets out certain
guiding principles and AXA-wide policies designed to ensure
that they have a common vision of the AXA Group’s standards in
terms of corporate responsibility, safety, whistleblowing and data
protection, and operate accordingly. These common measures
do not prevent or restrict AXA from voluntarily taking additional
actions in relation to such matters.
I Identification and evaluation of risks to human rights
and the environment
To ensure that each identified potential risk is covered by a
Group policy, AXA conducted an analysis to measure how the
AXA Group’s activities and operations potentially impact the
environment and human rights. According to AXA, the definition
of human rights includes fundamental freedoms, health and
personal safety.
The work carried out by AXA to establish its mapping of corporate
responsibility risks as well as the main non-financial risks
identified by the Group is presented in Section 7.1 “Introduction
– Sustainability Risk Assessment” of this Annual Report.
HUMAN RIGHTS
The AXA Group considers that its activities could have potential
direct and indirect impacts on the human rights of its employees
and customers, as well as potential indirect impacts on the
human rights of others through relations with (i) corporate
customers or (ii) investments in companies that are active in
sectors and/or countries with increased risk of human rights
violations.
Consequently, in 2017 the AXA Group developed a human rights
risk assessment that identified the most relevant risks to human
rights that the AXA Group should consider in conducting its
business. Risks were identified in areas such as equality before the
law and non-discrimination (with respect to minorities), freedom
from all forms of forced or compulsory labour, child protection,
freedom of association, collective bargaining, the right to just and
favourable working conditions, people’s freedom and security,
the right to be healthy and have an adequate standard of living
and the right to privacy. This evaluation (“AXA SA Human rights
risk assessment and recommendations to further improve AXA’s
Human Rights policy”) will be reviewed in 2020.

434 I UNIVERSAL REGISTRATION DOCUMENT - ANNUAL REPORT 2019 - AXA I
CORPORATE RESPONSIBILITY 7 7.6 VIGILANCE PLAN
ENVIRONMENT
Environmental risks were already identified in the AXA Group’s
risk mapping, particularly those related to climate change
and biodiversity. AXA’s direct operations, focusing on financial
services, do not generate major impacts on the environment.
As a result, AXA’s environmental reporting and management
processes focus on energy, water and paper consumption,
as well as related CO2 emissions. AXA’s global environmental
reporting process, which is verified by an independent third-
party, allows AXA to (i) evaluate its impact on the environment
each year and (ii) identify the risks stemming from its activities for
the environment. Please refer to Section 7.3 “Climate Change and
biodiversity – Own o perations – Environmental reporting process
and verification” of this Annual Report for further information on
AXA’s environmental reporting process.
In addition:
■ A s an investor, AXA has proactively implemented a Global
Responsible Investment Policy and built an analysis framework
in order to identify potential indirect impacts on human rights
and the environment.
■ A s a business partner, AXA has implemented processes to
identify and assess the risk of human rights violations and
environmental risk associated with its use of service providers
and suppliers. AXA implemented a Corporate responsibility
(CR) Risk assessment for its suppliers who were identified
through an internal CR Risks Matrix. Suppliers are classified
into Procurement risk categories and evaluated against five
CR criteria (environment; social; product & services end-
use impact; suppliers’ supply chain; and business integrity).
Suppliers falling in the highest CR risks categories are annually
asked to share their current DJSI or EcoVadis scores or undergo
an EcoVadis assessment.
I Protection of human rights and the environment
PROTECTION OF HUMAN RIGHTS
AND HUMAN RIGHTS POLICY
AXA’s human rights policy (the “human rights policy”), available
on the AXA Group’s website (www.axa.com/en/about-us/
our-commitment-to-human-rights), aims at preventing the
violation of human rights and reflects AXA’s commitment to
international general and sector-specific standards. The AXA
Group is committed to respecting internationally recognized
human rights principles as defined by the (i) United Nations
Universal Declaration of Human Rights, (ii) core standards
of the International Labour Organization and (iii) Guiding
Principles on Business and Human Rights (implementation of
the United Nations “Protect, Respect and Remedy” Framework
or “Ruggie Principles”). The human rights policy describes AXA’s
commitments as an employer, a responsible business partner, an
insurer and an investor as well as how the protection of human
rights is implemented at the core of its activities.
Protection of employee human rights
AXA is committed to protecting AXA employees’ human rights,
specifically the principles of freedom of association, the right to
just and favourable working conditions and non-discrimination,
through:
■ promoting the 10 guiding principles of the UN’s Global
Compact (with principles 1 & 2 relating to human rights and
principles 3 to 6 to labour standards) and encouraging the
reporting of breaches to the compliance function;
■ setting ambitious Diversity and Inclusion (D&I) targets and
initiatives. See further details on Diversity and Inclusion in
Section 7.2 “Social Information – Diversity and Inclusion
breeding talent and innovation ” of this Annual Report;
■ the AXA Compliance & Ethics Code, available on the AXA
Group’s website (www.axa.com/en/newsroom/publications/
compliance-ethics-guide), pursuant to which employees must
annually certify the compliance of their activity with the Code.
Please refer to Section 7.2 “Social Information – Employee
relations and work conditions – A continuous and established
social dialogue” of this Annual Report for further information on
AXA employee relations and collective bargaining.
Protection of employee safety, health
and security
The AXA Group has implemented safety, health and security
standards with which all Group entities must comply in order to
protect employees against intentional, health or accident risks
related to their business activity. These standards set out:
■ processes to identify risks, depending on the specific
characteristics of the environment and the activity of each
entity;
■ proactive and reactive measures to be implemented according
to identified risks (information, training, protective measures,
incident management procedures and crisis plans);
■ a performance measurement, quarterly reported to the AXA
Group central team.
See further details in Section 7.2 “Social Information – Employee
relations and work conditions – Secured work conditions” of this
Annual Report.

435I UNIVERSAL REGISTRATION DOCUMENT - ANNUAL REPORT 2019 - AXA I
CORPORATE RESPONSIBILITY
7
7.6 VIGILANCE PLAN
Personal data protection
AXA was the first insurance group to adopt privacy-related
Binding Corporate Rules, following consultations with European
data protection authorities, and constituting an internationally
approved data privacy contractual framework for the treatment
of customer, employee and other stakeholder personal data.
These rules and AXA’s Data Privacy Declaration, whereby the
Group undertakes not to sell personal data of its customers, are
available on the AXA Group’s website (www.axa.com/en/about-
us/our-commitments).
The AXA Group was committed to implementing the General Data
Protection Regulation and had in this respect delivered thirty
projects dedicated to data privacy, involving over three hundred
people in entities located in sixteen countries. The Group is also
implementing similar regulations recently adopted in countries
outside the European Union.
See further details in Section 7.5 “Business behaviour –
Responsible data use and data privacy – Data privacy”.
Integration of human rights into business
processes
As an insurer, AXA strives to incorporate Environmental, Social
and Governance (ESG) criteria (including those relating to human
rights) into its insurance business processes, in line with AXA’s
commitment to the UN Principles for Sustainable Insurance.
Further, underwriting guidelines define prohibited business and
integrate AXA’s policies (which can be directly or indirectly related
to human rights) regulating insurance activities in sectors that
represent increased risks.
AXA further seeks to support its customers’ rights while
preventing or mitigating adverse human rights impacts that may
arise from the provision of insurance products and services to
corporate customers by:
■ ensuring fair treatment of all customers;
■ offering products and services which help reduce social
exclusion and empower insured people to achieve positive
health and safety outcomes;
■ providing customers with the means to express and resolve
any disputes that may arise with AXA Group companies,
notably through dedicated complaints departments.
Please refer to Sections 7.3 “Climate Change and biodiversity
– Investments” and 7.4 “Inclusive insurer – Business-related
societal initiatives” of this Annual Report for further information
on integration of ESG criteria in our products and services.
PROTECTION OF THE ENVIRONMENT
AND AXA’S STRATEGY
The AXA Group’s Environmental Policy, available on the Group’s
website (www.axa.com/en/about-us/environmental-policy),
describes key actions aimed at reducing AXA’s direct and indirect
environmental impacts.
In particular, AXA’s ambitious environmental targets included
in its 2020 environmental strategy are notably focused on the
reduction of carbon emissions, one of the main contributors to
climate change. AXA’s carbon emissions reduction targets for
2018-2025 are based on an approach promoted by the “Science
Based targets” initiative. Please refer to Section 7.3 “Climate
Change and biodiversity – Investments” of this Annual Report
for further details on our policies for the reduction of carbon
emissions.
AXA also seeks to minimize its indirect impact on the environment
by off ering customers insurance and investment solutions that
promote environmentally-friendly behaviour.
Certain AXA sites benefit from environmental certificates such as
BREEAM, LEED, HQE. Please refer to Section 7.3 “Climate Change
and biodiversity – Own o perations – 2019 performance overview
– Power Consumption” of this Annual Report for further details
on AXA’s certifications.
Finally, please refer to Section 7.3 “Climate Change and
biodiversity” of this Annual Report for further details on AXA’s
strategy, policy, targets and results with respect to environment
protection.
Responsible investment activities
In line with the Group’s Responsible Investment Policy, available
on the AXA Group’s website (www.axa.com/en/about-us/
responsible-investment), the Group has designed six sector
policies to address investments in particularly sensitive sectors
from an ESG perspective. These guidelines cover human rights
and environmental concerns (i.e. controversial weapons,
tobacco, coal, oil sands, palm oil production and soft commodity
derivatives), and entities are required to certify compliance
annualy.
Moreover, AXA has decided to align its investments with the Paris
Agreement, committing to reach a “warming potential” of 1.5°C
by 2050.
Please refer to Section 7.3 “Climate Change and biodiversity
– Investments” of this Annual Report for detailed information
about AXA’s responsible investment governance, policy, targets
and results.
Responsible procurement activities
The AXA Group ensures that it works with service providers
and suppliers that meet AXA standards with respect to human
rights and the environment. Please refer to Section 7.5 “Business
behaviour – Responsible procurement” of the Annual Report for
detailed information.

436 I UNIVERSAL REGISTRATION DOCUMENT - ANNUAL REPORT 2019 - AXA I
CORPORATE RESPONSIBILITY 7 7.6 VIGILANCE PLAN
I Follow-up and report on the eff ective implementation
of the vigilance plan
In 2019, the AXA Group ensured the implementation of all
policies and procedures described in the vigilance plan
through the involvement of (i) central teams from the
Corporate Responsibility, Procurement, Legal, Compliance,
Risk Management and Human Resources Departments and (ii) a
network of local correspondents .
REPORTING PROCESS
In 2019, the Group strengthened its eff orts to raise awareness
on the vigilance plan amongst its entities. Awareness sessions
were organized in order to remind entities of the duty of care
regulation, as well as the penalties which could be incurred in the
event of non-compliance with legal obligations. Correspondents
of the Corporate Responsibility network attended these sessions
in 2019 and sessions are also scheduled for 2020 within the
Procurement network.
In addition, a reporting process for Group entities has been
established. Reporting relies on pre-existing procedures and
monitoring tools and notably on an internal review conducted
by the Corporate Responsibility Department. In 2019, the
principal operating entities were asked to conduct an internal
risk assessment to identify any gaps with the vigilance plan.
Following this assessment, where gaps were identified as
follows, remedial action plans were implemented and include
the following:
■ the addition of a corporate responsibility clause requiring
relevant suppliers to be socially responsible and to comply
with the standards referred to above that the Group committed
to abide by (including the core standards of the International
Labour Organization) in any remaining commercial contracts
not including such clause;
■ the adjustment of local alert procedures to cover human rights
and/or the environment;
■ the inclusion of certain high-risk emergency situations
(e.g., earthquakes, floods, cyber-attacks) in crisis management
guides of entities; and
■ designing a remediation plan on the accessibility/security
of any entity’s premises following an audit by an external
consultant.
I Aler t procedure
The current alert procedure allows all stakeholders (employees,
business partners, etc.) to share their concerns and/or report any
practice, action or behaviour that they consider inappropriate,
illegal, or unethical. Alerts can be made within the relevant entity
or sent directly to the Group using a dedicated email address
([email protected]) allowing alerts from all geographical areas
where the Group conducts business, without restrictions and
irrespective of the stakeholders.
The AXA Group examines all alerts received with the objective
of ensuring an adequate response (intervention by adequate
actors, deployment of immediate corrective actions and/or
precautionary measures, investigations etc.). Alerts are handled
in accordance with a strict, independent process that includes
key stakeholders in the vigilance plan where relevant. The identity
of the author of such alert is treated in a confidential manner and
cannot be disclosed without his/her consent (except to judicial
authorities). AXA has expressly stated that there will be no act
of retaliation against anyone who reports actual or suspected
misconduct in good faith, or who participated in establishing the
facts confirming a misconduct by providing evidence.
Furthermore, all AXA Group companies are required to define
internal regulations and other policies governing whistleblowing
pursuant to local laws and regulations. In 2019, a global
communication campaign, “Speak-up”, was launched to
refresh employee awareness of both the local and Group alert
procedure. The purpose of the campaign was to strengthen the
process, and to increase consistency and simplify the process
across AXA. Various media were used to broadcast this campaign,
increasing its impact and making it available to all, including
through newsletters, screen savers, posters, videos, training,
formal presentation, etc.

437I UNIVERSAL REGISTRATION DOCUMENT - ANNUAL REPORT 2019 - AXA I
CORPORATE RESPONSIBILITY
7
7.6 VIGILANCE PLAN
RESPONSIBLE PURCHASING BUSINESS
In 2018, AXA launched a dedicated Vendor Risk program to
reinforce its operational control and Risk Management of third
parties. Please refer to Section 4.7 “Operational Risk” of this
Annual Report for further information on this program.
In 2019, the AXA Group put together a panel of main suppliers
using an approach based on an analysis of supplier risk by
purchasing category and volume. Most of the main suppliers
were evaluated, including through the specialised evaluation
platform EcoVadis. With this assessment, the Group ascertained
that very few of its main suppliers had been identified as deficient
and any such suppliers have been sent a corrective action plan
by EcoVadis. AXA teams have access to the corrective action plan
through the platform. The main suppliers of the AXA Group panel
can be evaluated by EcoVadis every two years.
The AXA Group is pursuing its committed to implementing these
same principles and received a “Platine” score in its last EcoVadis
evaluation.
Most contracts entered into or renewed in 2019 included
a Corporate Responsibility clause. At the end of 2019, AXA
undertook a review of the CR clause in order to ensure that
it is consistent with the Group’s policy and the vigilance plan
requirements. For further information on the CR clause,
please refer to Section 7.5 “Business behaviour – Responsible
p rocurement” of this Annual Report.
INVOLVEMENT OF AXA STAKEHOLDERS
In line with its strong culture of dialogue, AXA has regular
discussions with its various stakeholders at different levels.
Please refer to Section 7.1 “Introduction – CR governance &
S takeholder dialogue” of this Annual Report for further details
about the s takeholder dialogue initiated by AXA.
In order to maintain effective communication between
employees and management as well as a constructive social
dialogue, the vigilance plan was once again presented to
employee representatives in 2019. Through discussions with the
Group’s French employee representatives and more particularly
with the Social Committee of the French Group Works Council,
certain provisions of the vigilance plan have been placed at the
heart of the employer-employee dialogue.
The AXA Group strives to strengthen the communication of its
vigilance plan to all stakeholders, in particular by making it
available on AXA’s website (https://www.axa.com/en/about-us/
our-commitment-to-human-rights).

438 I UNIVERSAL REGISTRATION DOCUMENT - ANNUAL REPORT 2019 - AXA I
CORPORATE RESPONSIBILITY 7
This page was intentionally left blank.

439I UNIVERSAL REGISTRATION DOCUMENT - ANNUAL REPORT 2019 - AXA I
AAPPENDICES
APPENDIX I MANAGEMENT’S ANNUAL EVALUATION OF INTERNAL CONTROL
OVER FINANCIAL REPORTING 440
APPENDIX II STATEMENT OF THE PERSON RESPONSIBLE FOR THE UNIVERSAL
REGISTRATION DOCUMENT 443
APPENDIX III AXA PARENT COMPANY FINANCIAL STATEMENTS 444
APPENDIX IV GROUP EMBEDDED VALUE AND SOLVENCY II OWN FUNDS 470
APPENDIX V GLOSSARY 471
APPENDIX VI BOARD OF DIRECTORS’ REPORT – CROSS-REFERENCE TABLE 476
APPENDIX VII CORPORATE GOVERNANCE REPORT – CROSS-REFERENCE TABLE 477
APPENDIX VIII COMMISSION DELEGATED REGULATION (EU) 2019/980
OF MARCH 14, 2019 – CROSS-REFERENCE TABLE 478
APPENDIX IX ANNUAL FINANCIAL REPORT – CROSS-REFERENCE TABLE 482

440 I UNIVERSAL REGISTRATION DOCUMENT - ANNUAL REPORT 2019 - AXA I
APPENDICES A APPENDIX I MANAGEMENT’S ANNUAL EVALUATION OF INTERNAL CONTROL OVER FINANCIAL REPORTING
APPENDIX I MANAGEMENT’S ANNUAL EVALUATION OF INTERNAL CONTROL OVER FINANCIAL REPORTING
The AXA Group’s Internal Control Over Financial Reporting (ICOFR)
is a process designed under the supervision of the Group Chief
Financial Off icer (CFO) and assessed under the supervision of the
Group Chief Risk Off icer (CRO) to provide reasonable assurance
regarding the reliability of financial reporting and the preparation
of Consolidated Financial Statements.
Since its delisting from the New York Stock Exchange (NYSE) in
March 2010 and its deregistration with the United States Securities
and Exchange Commission (SEC) in June 2010, the Group has
maintained an annual Internal Financial Control (IFC) program
designed to evaluate the eff ectiveness of AXA Group’s ICOFR.
AXA’s Statutory Auditors provide a reasonable assurance report
on AXA Group’s ICOFR each year.
The IFC program is based on the Group Internal Control Standard
and the Group Internal Control Policy, which include additional
specific requirements for the IFC framework.
(a) IFC framework
The IFC framework is based on the “Internal Control – Integrated
Framework” issued by the Committee of Sponsoring Organizations
of the Treadway Commission (COSO). It is designed to define
the IFC scope, governance, and principles in order to ensure
consistency and quality in AXA Group’s financial reporting.
(A.1) IFC SCOPE
The IFC program includes primarily the entities which are
individually significant to consolidated financial position or results
of operations, as well as the entities which provide significant
services to AXA and/or its consolidated subsidiaries (the “Group”).
(A.2) IFC GOVERNANCE
Management, including the Group Chief Executive Off icer (CEO),
is responsible for establishing and maintaining adequate ICOFR.
The IFC program is managed by Group Risk Management and
is steered by the Group IFC Committee chaired by the Group
CFO and involves the Planning Budgets Results Central (PBRC)
department, other relevant AXA departments, and representatives
from each in-scope entity. The IFC program and the conclusion
of management as to the eff ectiveness of AXA Group’s ICOFR are
also reviewed by AXA’s Audit Committee.
(A.3) IFC PRINCIPLES
AXA Group’s ICOFR includes policies and procedures that provide
reasonable assurance that:
■ the maintenance of records accurately and fairly reflect the
transactions and dispositions of Group assets;
■ the transactions are recorded as necessary to permit the
preparation of financial statements in accordance with the
applicable generally accepted accounting principles;
■ the receipts and expenditures are being made only in
accordance with the authorization of management and directors
of the Group; and
■ unauthorized acquisition, use or disposition of Group assets
that could have a material eff ect on the Group’s financial
statements would be prevented or detected in a timely manner.
In order to assess the eff ectiveness of ICOFR, financial reporting
risks are initially identified at Group level with a focus on
identifying those risks that may result in a material misstatement
of Consolidated Financial Statements not being prevented or
detected in a timely manner. This top-down and risk-based
approach enables to identify in-scope entities and processes.
In line with the COSO framework, AXA Group’s ICOFR is organized
around the following key process categories: Entity-Level Controls
(ELC), IT ELC, Financial Statement Closing Process, Business
Processes, and IT General Controls.
For every key process category, the in-scope entities (i) document
the significant processes and/or controls, as well as the rationale
of how the associated risk of material misstatement due to
error or fraud can be reduced to an acceptable level, (ii) test the
design and operational eff ectiveness of key controls based on the
test plans elaborated with insight into risks, and (iii) remediate
identified control deficiencies.
Outstanding control deficiencies are consolidated at Group level
to evaluate their impact on Consolidated Financial Statements,
compensating controls and other qualitative factors. This
evaluation process is designed to identify any control deficiencies
that may rise to the level of a material weakness. A material
weakness is a deficiency or a combination of deficiencies in
internal control over financial reporting, such that there is a
reasonable possibility that a material misstatement of the
Company’s financial statements will not be prevented or detected
on time.

441I UNIVERSAL REGISTRATION DOCUMENT - ANNUAL REPORT 2019 - AXA I
APPENDICES
A
APPENDIX I MANAGEMENT’S ANNUAL EVALUATION OF INTERNAL CONTROL OVER FINANCIAL REPORTING
(A.4) IFC CERTIFICATION
At each year-end, the in-scope entities are required to perform
an evaluation of their ICOFR as part of an internal certification
process. This process involves formal sign-off by the entity’s
process owners and culminates with a formal management
report from the entity’s CFO or another senior executive off icer,
co-signed by the Risk Management department , stating their
conclusion as to the eff ectiveness of the entity’s ICOFR.
This internal certification process across all in-scope entities is
designed to assist AXA’s management in its evaluation of AXA
Group’s ICOFR and to support its conclusion as to the eff ectiveness
of AXA Group’s ICOFR.
(b) Management’s annual evaluation on ICOFR
based on the IFC framework
Management conducted an evaluation of the eff ectiveness of AXA
Group’s ICOFR in accordance with the IFC framework as described
above. Based on this evaluation, management concluded that
AXA Group’s ICOFR was eff ective as of December 31, 2019.
All internal control systems, no matter how well designed, have
inherent limitations. Therefore, even those systems determined
to be eff ective may not prevent or detect misstatements and
can provide only reasonable assurance with respect to financial
statement preparation and presentation. Also, projections of any
evaluation of eff ectiveness to future periods are subject to the
risk that controls may become inadequate because of changes
in conditions or if the degree of compliance with the policies or
procedures deteriorates.
(c) Report of the Statutory Auditors on ICOFR
PricewaterhouseCoopers Audit and Mazars have performed audit
procedures in order to be able to obtain reasonable assurance
as to whether management’s conclusion as to the eff ectiveness
of AXA Group’s ICOFR based on the IFC framework is fairly stated.

442 I UNIVERSAL REGISTRATION DOCUMENT - ANNUAL REPORT 2019 - AXA I
APPENDICES A APPENDIX I MANAGEMENT’S ANNUAL EVALUATION OF INTERNAL CONTROL OVER FINANCIAL REPORTING
PricewaterhouseCoopers Audit
63, rue de Villiers
92208 Neuilly-sur-Seine Cedex
Mazars
61, rue Henri Regnault
92400 Courbevoie
I Report of the Statutory Auditors on internal
control over financial reporting
To the Board of Directors of AXA:
As Statutory Auditors of AXA and in response to your request , we have performed audit procedures on AXA and its subsidiaries’ (the
“Company”) internal control over financial reporting as of December 31, 2019, in order to be able to obtain reasonable assurance as to
whether AXA’s management’s assertion that internal control over financial reporting is eff ective, as included in management’s annual
evaluation of internal control over financial reporting, is fairly stated.
The Company’s management is responsible for maintaining eff ective internal control over financial reporting and for establishing a
statement on its assessment of the eff ectiveness of internal control over financial reporting as of December 31, 2019. A company’s internal
control over financial reporting is a process designed to provide reasonable assurance regarding the reliability of financial reporting
and the preparation of financial statements for external purposes in accordance with IFRS accounting principles. The assessment
of the eff ectiveness of internal control over financial reporting is based on criteria established in the Internal Financial Control (IFC)
framework, as described in management’s annual evaluation of internal control over financial reporting on page 440 of this Annual
Report. Our responsibility is to express an opinion on the Company’s management’s assertion, based on our audit procedures.
We conducted our work in accordance with French professional standards and ISAE 3000 (“Assurance engagements other than audits
or reviews of historical financial information”). These standards require that we plan and perform the audit procedures to obtain
reasonable assurance about whether AXA management’s assertion that internal control over financial reporting is eff ective, was fairly
stated in all material respects. Our audit procedures included obtaining an understanding of internal control over financial reporting,
assessing the risk that a material weakness exists, testing and evaluating the design and operating eff ectiveness of internal control
based on the assessed risk, and performing such other procedures as we considered necessary in the circumstances. We believe the
evidence gathered is suff icient and appropriate to express our opinion.
Because of its inherent limitations, internal control over financial reporting may not prevent or detect misstatements. Also, projections
of any evaluation of eff ectiveness to future periods are subject to the risk that controls may become inadequate because of changes
in conditions or if the degree of compliance with the principles or procedures may deteriorate.
In our opinion, the Company’s management’s assertion that internal control over financial reporting as of December 31, 2019 is eff ective,
in all material respects, is fairly stated based on the criteria established in the IFC framework.
Neuilly-sur-Seine and Courbevoie, March 19 , 2020
The Statutory Auditors
PricewaterhouseCoopers Audit Mazars
Bénédicte Vignon - Grégory Saugner Jean-Claude Pauly - Maxime Simoen

443I UNIVERSAL REGISTRATION DOCUMENT - ANNUAL REPORT 2019 - AXA I
APPENDICES
A
APPENDIX II STATEMENT OF THE PERSON RESPONSIBLE FOR THE UNIVERSAL REGISTRATION DOCUMENT
APPENDIX II STATEMENT OF THE PERSON RESPONSIBLE FOR THE UNIVERSAL REGISTRATION DOCUMENT
I, the undersigned, having taken all reasonable care to ensure that such is the case, hereby certify that the information contained in
this Universal Registration Document is, to the best of my knowledge, in accordance with the facts and contains no material omission
likely to render it misleading or inaccurate.
I confirm that, to the best of my knowledge, the financial statements have been prepared in accordance with applicable accounting
standards and fairly present the assets and liabilities, the financial position and the profit or loss of the Company and its consolidated
subsidiaries, and that the Board of Directors’ report presented in page 476 fairly presents the evolution of the business, results and
financial position of the Company and its consolidated subsidiaries, and describes the principal risks and contingencies facing the Group.
Paris, March 19 , 2020
Thomas Buberl
Chief Executive Off icer of AXA

444 I UNIVERSAL REGISTRATION DOCUMENT - ANNUAL REPORT 2019 - AXA I
APPENDICES A APPENDIX III AXA PARENT COMPANY FINANCIAL STATEMENTS
APPENDIX III AXA PARENT COMPANY FINANCIAL STATEMENTS
BOARD OF DIRECTORS’ REPORT
Net income
Net income for the fiscal year ended December 31, 2019 resulted
in a profit of €4,301 million compared to a profit of €307 million
for the year ended December 31, 2018. This increase was mainly
due to the rise in dividends received from subsidiaries and by the
€3,180 million loss on Equitable Holdings, Inc. securities in 2018.
Dividends received from subsidiaries amounted to
€5,865 million, versus €3,973 million in 2018, representing an
increase of €1,892 million, mainly due to:
■ dividends from French entities of €1,661 million compared to
€1,575 million in 2018;
■ dividends paid by the European entities of €2,974 million
compared to €1,576 million in 2018, mainly due to the dividends
paid by Switzerland, up €1,070 million, thanks to a capital
surplus;
■ €268 million in dividends paid by the Asian entities compared
to €179 million in 2018;
■ €962 million in dividends received from other Group entities
compared to €643 million in 2018.
Net financial charges, which include interests and similar
charges net of income from loans and investments, amounted
to €953 million compared to €919 million in 2018, representing
an increase of €34 million notably as part of the acquisition of
the XL Group.
Operating expenses amounted to €413 million compared to
€441 million in 2018.
Capital operations resulted in a loss of €1,084 million in 2019,
versus a loss of €3,048 million in 2018, broken down as follows:
■ €284 million provision for unrealized capital losses relating to
hedging derivatives on equity markets;
■ €328 million for impairment following the agreement to sell
AXA Bank Belgium;
■ €201 million in foreign exchange losses, primarily on the US
dollar;
■ €395 million for payments and additional provisions for internal
guarantee in the context of a business litigation.
The corporate income tax benefit amounted to €909 million
compared to €762 million in 2018, and included €865 million of
tax receivables from members of the tax consolidation group.
BALANCE SHEET
As of December 31, 2019, total assets amounted to €77,458 million,
versus €79,033 million as of December 31, 2018.
Assets
Intangible assets totaled €329 million and included the AXA
brand valued at €307 million, and €21 million related to the
capitalization of soft ware expenses.
Investments in subsidiaries, net of valuation allowances,
totaled €67,663 million versus €71,317 million at year-end 2018,
representing a decrease of €3,654 million, reflecting:
■ €5,081 million net book value of the 269 million shares in
Equitable Holdings, Inc. sold;
partly off set by:
■ €1,296 million in capital increases from the XL Group, primarily
related to its debt deleveraging plan.
Receivables from subsidiaries amounted to €1,144 million
compared to €774 million at year-end 2018, i.e. an increase of
€370 million, including a €492 million ($553 million) loan also
related to the deleveraging plan of the XL Group.
Tax receivables amounted to €83 million, representing an increase
of €56 million mainly due to corporate income tax instalments.
Marketable securities of €726 million represented the repurchase
of AXA shares to meet its obligations to deliver shares and to
eliminate the dilutive eff ect of certain share-based compensation
schemes.
Cash instruments amounted to €448 million and represented
the option premiums paid within the context of the purchase of
protection on equity markets.
Cash and cash equivalents totaled €2,956 million compared
to €1,538 million at the end of 2018, up €1,418 million resulting
from the dividends received and the proceeds coming from the
disposal of Equitable Holdings, Inc., partly off set by the dividend
paid and the repayment of loans made by the operating entities.
Unrealized foreign exchange losses amounted to €3,419 million,
including €3,058 million related to the deferred recognition of net
foreign exchange losses in line with statutory hedge accounting
principles, more than off set by unrealized gains on investments
in subsidiaries. This item also reflects unrealized losses on assets
and liabilities denominated in foreign currencies attributable
to the eff ects of their revaluation at the closing exchange rate.
The €286 million increase versus 2018 was primarily due to
the recognition in profits of the foreign exchange translation
diff erences on the US dollar, following the disposal of Equitable
Holdings, Inc. and the hedge accounting on the Swiss franc.

445I UNIVERSAL REGISTRATION DOCUMENT - ANNUAL REPORT 2019 - AXA I
APPENDICES
A
APPENDIX III AXA PARENT COMPANY FINANCIAL STATEMENTS
Liabilities
Shareholders’ equity, before net income for the period and aft er
the payment of the dividends relating to the prior fiscal year, stood
at €37,151 million, representing a decrease of €241 million, of
which €375 million for the capital increase reserved for employees,
and €67 million following the exercise of stock options, partly off set
by €683 million related to the cancellation of shares bought back.
Other shareholders’ equity including the undated super
subordinated debts, totaled €3,858 million compared to
€4,032 million in 2018, due to a debt repayment of £219 million
(or €245 million) and a foreign exchange impact of €75 million.
Provisions for risks and charges amounted to €1,563 million,
and mainly included €412 million of provisions for the possible
repayment of tax savings to subsidiaries belonging to the French
tax consolidation group, a €220 million provision for exchange-rate
risk, a €284 million reserve for unrealized capital losses on equity
options, and a €352 million provision for internal guarantees in
the context of a business litigation.
Subordinated debt amounted to €13,028 million compared
to €12,885 million in 2018, up €143 million, primarily due to an
unfavorable foreign exchange rate impact.
Financial debts amounted to €16,389 million from €19,522 million
as of December 31, 2018, representing a decrease of €3,133 million
reflecting a decrease by €2,322 million from loans granted by
Group entities mainly related to the financing of the acquisition
of the XL Group as well as a €497 million reduction in margin call
under collateral agreements.
Unrealized foreign exchange gains totaled €799 million
compared to €1,099 million as of December 31, 2018. reflecting
the revaluation of foreign currency denominated assets and
liabilities at the closing exchange rates. It decreased mainly
due to an unfavorable impact of the sterling pound and the US
dollar on debts.
Other information
In accordance with Article L.225-102-1 of the French Commercial
Code (Code de commerce), disclosures related to the Company’s
executive compensation appear in Part 3, Section 3.2. “Executive
compensation and share ownership” of this Annual Report.

446 I UNIVERSAL REGISTRATION DOCUMENT - ANNUAL REPORT 2019 - AXA I
APPENDICES A APPENDIX III AXA PARENT COMPANY FINANCIAL STATEMENTS
Invoices issued during the period
and not paid at the closing date
Payment delay group
0 day
1 to
30 days
31 to
60 days
61 to
90 days
More than
91 days
Total
(1 day
and more)
Number of invoices concerned 31 30 - 49 13 92
Total Amount VAT included of invoices concerned (in Euro) 21,998,690 1,219,793 - 5,607,764 410,386 7,231,943
Percentage of revenue VAT included of the period 7.94% 0.44% - 2.02% 0.15% 2.61%
Invoices issued during the period
with a delay of payment
Payment delay group
0 day
1 to
30 days
31 to
60 days
61 to
90 days
More than
91 days
Total
(1 day
and more)
Number of invoices concerned 265 112 53 31 27 223
Total Amount VAT included of invoices concerned (in Euro) 112,759,797 82,002,097 46,811,183 5,840,507 317,701 134,971,488
Percentage of revenue VAT included of the period 40.71% 29.61% 16.90% 2.11% 0.11% 48.73%
Invoices received and not paid
at the closing date
Payment delay group
0 day
1 to
30 days
31 to
60 days
61 to
90 days
More than
91 days
Total
(1 day
and more)
Number of invoices concerned 6 4 1 0 3 8
Total Amount VAT included of invoices concerned (in Euro) 10,075,754 8,252,596 49,131 51,167 370,441 8,723,335
Percentage of the total amount VAT included period
purchases (in Euro) 1.51% 1.23% 0.01% 0.01% 0.06% 1.30%
Invoices received and paid
with a delay during the period
Payment delay group
0 day
1 to
30 days
31 to
60 days
61 to
90 days
More than
91 days
Total
(1 day
and more)
Number of invoices concerned 2025 1114 367 193 393 2,067
Total Amount VAT included of invoices concerned (in Euro) 368,273,106 129,230,512 77,846,236 10,926,170 83,156,756 301,159,674
Percentage of the total amount VAT included period
purchases (in Euro) 55.01% 19.30% 11.63% 1.63% 12.42% 44.99%
Payment delay used for these calculations is French legal delay (30 days aft er the invoice issuing day).
Acquisition of equity interests
In 2019, the Company did not acquire any significant equity interests within the meaning of Article L.233-6 of the French Commercial Code.

447I UNIVERSAL REGISTRATION DOCUMENT - ANNUAL REPORT 2019 - AXA I
APPENDICES
A
APPENDIX III AXA PARENT COMPANY FINANCIAL STATEMENTS
This page was intentionally left blank.

448 I UNIVERSAL REGISTRATION DOCUMENT - ANNUAL REPORT 2019 - AXA I
APPENDICES A APPENDIX III AXA PARENT COMPANY FINANCIAL STATEMENTS
BALANCE SHEET
Assets
(in Euro million)
December 31, 2019
Net carrying
value as at
December 31, 2018
Gross
carrying
value
Amortizations
and provisions
Net
carrying
value
Fixed assets
Intangible assets 376 46 329 333
Tangible assets
Land - - - -
Buildings and other fixed assets 1 - 1 1
Financial assets
Investments in subsidiaries 69,315 1,652 67,663 71,317
Receivables from subsidiaries 1,145 1 1,144 774
Other financial assets 350 97 253 230
Loans 64 - 64 70
I71,251 1,796 69,454
72,725
Current assets
Operating receivables
Tax receivables 83 - 83 27
Receivables and subsidiaries’ current accounts 306 - 306 255
Marketable securities 726 - 726 987
Cash instruments 448 - 448 290
Cash and cash equivalents 2,956 - 2,956 1,538
Prepaid expenses 10 - 10 9
II 4,529 - 4,529 3,106
Prepayments and accrued income
Deferred charges 325 295 30 40
Bond redemption premiums 26 - 26 29
Unrealized foreign exchange losses 3,419 - 3,419 3,133
TOTAL ASSETS 79,549 2,091 77,458 79,033

449I UNIVERSAL REGISTRATION DOCUMENT - ANNUAL REPORT 2019 - AXA I
APPENDICES
A
APPENDIX III AXA PARENT COMPANY FINANCIAL STATEMENTS
Liabilities
(in Euro million) December 31, 2019 December 31, 2018
Shareholders’ equity
Capital
Ordinary shares 5,537 5,553
Capital in excess of nominal value
Issue premiums 18,754 18,981
Merger and contribution premiums 2,076 2,076
Reserves
Legal reserve 557 558
Specific reserves for long term capital gains 2,316 2,316
Other reserves 1,488 1,488
Retained earnings 6,378 9,257
Tax driven provision 45 45
Net income for the financial year 4,301 307
I 41,452 40,581
Other shareholders’ equity
Undated subordinated notes 3,858 4,032
II 3,858 4,032
Provisions for risks and charges III 1,563 561
Liabilities
Subordinated debt 13,028 12,885
Financial debt 16,389 19,522
Operating payables
Tax payables 1 4
Social payables - -
Other payables
Debt on fixed assets 75 75
Other 293 273
Cash instruments - -
Deferred income - 1
IV 29,786 32,760
Prepayments and accrued expense
Unrealized foreign exchange gains 799 1,099
TOTAL LIABILITIES AND SHAREHOLDERS’ EQUITY 77,458 79,033
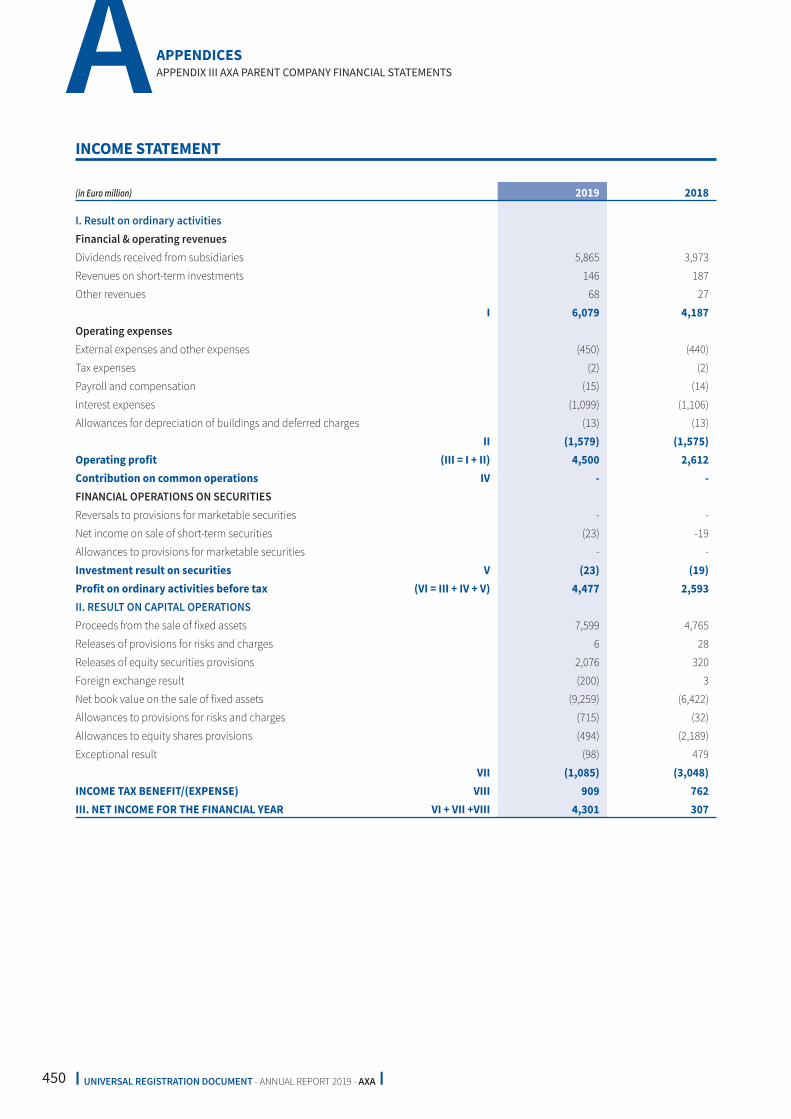
450 I UNIVERSAL REGISTRATION DOCUMENT - ANNUAL REPORT 2019 - AXA I
APPENDICES A APPENDIX III AXA PARENT COMPANY FINANCIAL STATEMENTS
INCOME STATEMENT
(in Euro million) 2019 2018
I. Result on ordinary activities
Financial & operating revenues
Dividends received from subsidiaries 5,865 3,973
Revenues on short-term investments 146 187
Other revenues 68 27
I 6,079 4,187
Operating expenses
External expenses and other expenses (450) (440)
Tax expenses (2) (2)
Payroll and compensation (15) (14)
Interest expenses (1,099) (1,106)
Allowances for depreciation of buildings and deferred charges (13) (13)
II (1,579) (1,575)
Operating profit (III = I + II) 4,500 2,612
Contribution on common operations IV - -
FINANCIAL OPERATIONS ON SECURITIES
Reversals to provisions for marketable securities - -
Net income on sale of short-term securities (23) -19
Allowances to provisions for marketable securities - -
Investment result on securities V (23) (19)
Profit on ordinary activities before tax (VI = III + IV + V) 4,477 2,593
II. RESULT ON CAPITAL OPERATIONS
Proceeds from the sale of fixed assets 7,599 4,765
Releases of provisions for risks and charges 6 28
Releases of equity securities provisions 2,076 320
Foreign exchange result (200) 3
Net book value on the sale of fixed assets (9,259) (6,422)
Allowances to provisions for risks and charges (715) (32)
Allowances to equity shares provisions (494) (2,189)
Exceptional result (98) 479
VII (1,085) (3,048)
INCOME TAX BENEFIT/(EXPENSE) VIII 909 762
III. NET INCOME FOR THE FINANCIAL YEAR VI + VII +VIII 4,301 307

451I UNIVERSAL REGISTRATION DOCUMENT - ANNUAL REPORT 2019 - AXA I
APPENDICES
A
APPENDIX III AXA PARENT COMPANY FINANCIAL STATEMENTS
FINANCIAL RESULTS OF THE COMPANY OVER THE PAST FIVE YEARS
December 31,
2015
December 31,
2016
December 31,
2017
December 31,
2018
December 31,
2019
1 – CLOSING BALANCE SHEET SUMMARY
a) Capital – Ordinary shares (in Euro million) 5,557 5,554 5,554 5,553 5,536
b) Ordinary shares (numbers in million) 2,426 2,425 2,425 2,425 2,418
c) Bonds convertible into ordinary shares (numbers in million) 7 7 - - -
2 – Income statement summary (in Euro million)
a) Gross revenues before sales tax 2,709 3,608 5,287 4,161 6,011
b) Pre-tax income from continuing operations,
before depreciation, amortization and releases 1,079 252 3,799 2,610 4,492
c) Income tax expense/benefit 784 692 1,048 762 909
d) Net aft er-tax income aft er depreciation, amortization
and releases 1,747 432 4,958 307 4,301
e) Net dividend distribution 2,656 2,808 3,056 3,249 3,457
3 – Per share data (in Euro)
a) Aft er tax income, before depreciation, amortization
and releases 0.71 0.31 1.44 0.90 1.57
b) Aft er tax income, aft er depreciation, amortization
and releases 0.72 0.18 2.04 0.13 1.78
c) Net dividend per share (a) 1.10 1.16 1.26 1.34 1.43
(a) Dividend proposed at year end 2019 is submitted to the Shareholders’ Meeting of April 30, 2020 and based on 2,417,695,123 outstanding ordinary shares.

452 I UNIVERSAL REGISTRATION DOCUMENT - ANNUAL REPORT 2019 - AXA I
APPENDICES A APPENDIX III AXA PARENT COMPANY FINANCIAL STATEMENTS
STATEMENT OF CASH FLOWS
(in Euro million) December 31, 2019 December 31, 2018
CASH INFLOWS
Profit on ordinary activities before tax 4,476 2,594
Result on capital operations before tax (1,084) (3,048)
Income tax expense/benefit 909 762
Changes in reserves and amortization (557) 1,019
Cash flow for the year 3,744 1,327
Increases in shareholders’ equity 441 368
New borrowings - 9,489
Sale or decrease in fixed assets
■ Intangible assets - -
■ Tangible fixed assets - -
■ Financial assets 9,440 8,697
TOTAL CASH INFLOWS 13,625 19,881
CASH OUTFLOWS
Dividends paid out during the year 3,189 2,998
Reduction in shareholders’ equity 683 429
Repayment of financial debt 3,029 1,761
Purchase of fixed assets
■ Intangible assets - -
■ Tangible fixed assets - -
■ Financial assets 5,093 14,956
Expenses amortized over several years - 37
TOTAL CASH OUTFLOWS 11,994 20,181
Change in working capital 1,631 (300)
Short-term equivalents
Change in:
■ operating receivables 111 (841)
■ operating payables (8) (14)
■ cash and cash equivalent 1,528 555
TOTAL 1,631 (300)

453I UNIVERSAL REGISTRATION DOCUMENT - ANNUAL REPORT 2019 - AXA I
APPENDICES
A
APPENDIX III AXA PARENT COMPANY FINANCIAL STATEMENTS
This page was intentionally left blank.

454 I UNIVERSAL REGISTRATION DOCUMENT - ANNUAL REPORT 2019 - AXA I
APPENDICES A APPENDIX III AXA PARENT COMPANY FINANCIAL STATEMENTS
SUBSIDIARIES AND PARTICIPATING INTERESTS
(in Euro thousand)
Share
capital
Other
shareholders’
equity
Percentage of
capital held
Gross Book
Value of
securities held
1 2 3 4
A. DETAILED INFORMATION CONCERNING SUBSIDIARIES
AND INVESTMENTS ACCOUNTING FOR IN EXCESS
OF 1% OF AXA’S SHAREHOLDERS’ EQUITY
1) Subsidiaries (at least 50%-owned)
AXA ASIA 8,401,354 388,765 100.00% 8,413,436
21, avenue Matignon – 75008 PARIS - - -
ARCHITAS LIMITED 7 34,479 100.00% 76,851
5 Old Broad Street – EC2N 1AD – LONDON – United Kingdom - - -
AXA PARTNERS HOLDINGS SA 174,952 26,642 100.00% 195,138
6, rue André Gide – 92320 CHATILLON - - -
AXA BANK BELGIUM (ex AXA BANK EUROPE SA) 636,318 506,058 100.00% 915,000
25, Boulevard du Souverain – 1170 BRUXELLES – Belgium - - -
AXA CHINA 461,655 (13,719) 51.00% 235,448
23, avenue Matignon – 75008 PARIS - - -
AXA France VIE 487,725 5,075,556 98.34% 2,525,109
313,Terrasses de l’Arche – 92727 Nanterre - France - - -
AXA France IARD 214,799 2,223,934 99.92% 1,801,832
313,Terrasses de l’Arche – 92727 Nanterre – France - - -
AXA France PARTICIPATIONS 453,966 (21) 100.00% 453,966
313,Terrasses de l’Arche – 92727 Nanterre – France - - -
AXA EQUITY AND LAW PLC 1,208 2,221,506 99.96% 1,133,234
5 Old Broad Street – EC2N 1AD – LONDON – United Kingdom - - -
XL GROUP - 8,431,157 100.00% 16,285,977
O’Hara House, One Bermudiana Road – Hamilton Bermuda HM 08 - - -
AXA GENERAL INSURANCE 193,247 12,437 99.71% 293,728
395-70, Shindaebang-dong, Dongjak-gu – SEOUL – Corée du Sud - - -
AXA GLOBAL RE (ex AXA GLOBAL P&C) 196,723 252,169 100% 490,268
61, rue Mstislav Rostropovitch – 75017 Paris – France - - -
AXA HOLDINGS BELGIUM 453,101 330,130 100.00% 4,493,243
25, Boulevard du Souverain – 1170 BRUXELLES – Belgium - - -
AXA INVESTMENT MANAGERS 52,843 1,237,830 78.96% 1,550,558
Cœur Défense – Tour B – La Défense 4 – 100 Esplanade du - - -
Général de Gaulle – 92932 PARIS LA DEFENSE - - -
AXA LIFE INSURANCE COMPANY 696,792 2,104,652 78.55% 2,384,259
NBF Platinium Tower 1-17-3 Shirokane – Minato-ku - - -
108 – 8020 TOKYO – Japan - - -
AXA LIFE EUROPE 99,970 843,848 100.00% 1,019,424
Wolfe Tone House, Wolfe Tone Street, Dublin 1 – Irlande - - -
ARCHITAS SOLUTIONS 120,000 (112,071) 100.00% 120,000
Wolfe Tone House, Wolfe Tone Street, Dublin 1 – Irlande - - -
AXA MEDITERRANEAN HOLDING 211,477 3,779,929 100.00% 4,485,474
Calle monseñor Palmer numéro 1 – PALMA DE MALLORCA –
Îles Baléares
- - -
(a) For Insurance companies: gross written premiums. For real estate companies: rental revenues. For holding companies: dividends. For financial services companies: gross banking revenues.
(b) Consolidated data.

455I UNIVERSAL REGISTRATION DOCUMENT - ANNUAL REPORT 2019 - AXA I
APPENDICES
A
APPENDIX III AXA PARENT COMPANY FINANCIAL STATEMENTS
Net Book
Value of
securities held
Loans
and cash
advances
given by the
Company
still
outstanding
Guarantees and
commitments given
by the Company
under commitments
made by subsidiary/
participation
Last closing
revenues
available (a)
Last closing
result available
Dividends
received
Closing date
and other
observations
5 6 7 8 9 10 11
8,413,436 - - 230,793 203,301 - December 31, 2019
- - - - - -
76,851 - - - 25,354 - December 31, 2019
- - - - - -
195,138 86,000 - 1,723,822 (18,485) - December 31, 2019
- - - - - -
587,000 - - 729,372 457,623 - December 31, 2019
- - - - - -
235,448 - - - 7 - December 31, 2019
- - - - - -
2,525,109 - - 18,878,221 1,008,718 639,067 December 31, 2019
- - - - - -
1,801,832 - - 7,031,255 736,407 867,956 December 31, 2019
- - - - - -
453,966 - - - 9,491 - December 31, 2019
- - - - - -
1,133,234 - - - 254,527 250,457 December 31, 2019
- - - - - -
16,285,977 - - 16,052,970 3,903 - December 31, 2019
- - - - - -
293,728 - - 561,060 10,017 - December 31, 2019
- - - - - -
490,268 - - 2,841,065 96,559 2,771 December 31, 2019
- - - - - -
4,493,243 - - 525,260 523,094 532,404 December 31, 2019
- - - - - -
1,550,558 - 134,000 217,057 183,186 114,501 December 31, 2019
- - - - - -
- - - - - -
2,384,259 - - 4,849,520 465,610 267,754 December 31, 2019
- - - - - -
- - - - - -
974,524 - - 2,790 (109,176) - December 31, 2019
- - - - - -
12,941 6,000 - 18,575 4,553 - December 31, 2019
- - - - - -
4,485,474 375,500 331,274 206,597 136,206 201,216 December 31, 2019
- - - - - -

456 I UNIVERSAL REGISTRATION DOCUMENT - ANNUAL REPORT 2019 - AXA I
APPENDICES A APPENDIX III AXA PARENT COMPANY FINANCIAL STATEMENTS
(in Euro thousand)
Share
capital
Other
shareholders’
equity
Percentage of
capital held
Gross Book
Value of
securities held
1 2 3 4
AXA GROUP OPERATIONS SAS (ex AXA SERVICES SAS) 38,893 118,101 99.92% 236,406
81, rue Mstislav Rostropovitch – 75017 Paris – France - - -
AXA UK PLC (b) 1,802,964 4,661,636 53.12% 4,555,833
5 Old Broad Street – LONDON EC2N 1AD – United Kingdom - - -
AXA VERSICHERUNGEN AG 155 ,202 1,740,911 100.00% 5,171,327
General Guisan-str,40 – CH-8401 WINTERTHUR – Switzerland - - -
CFP MANAGEMENT 1,300 11,823 100.00% 139,808
21, avenue Matignon – 75008 PARIS - - -
KAMET (ex AXA Matignon 5) 141,360 (17,948) 100.00% 203,990
30, Rue Fortuny – 75017 PARIS - - -
COLISEE RE 95,436 155,668 100.00% 619,892
61, rue Mstislav Rostropovitch – 75017 PARIS - - -
HOLDING VENDOME 3 145 (50) 100.00% 163,015
21, avenue Matignon – 75008 PARIS - - -
AVANSSUR 99,429 89,580 100.00% 367,793
313,Terrasses de l’Arche – 92727 Nanterre – France - - -
SOCIETE BEAUJON 52,537 1,107,436 99.99% 1,375,662
21, avenue Matignon – 75008 PARIS - - -
VINCI BV 1,438,711 799,991 100.00% 4,284,806
Graadt van Roggenweg 500 – Postbus 30800 - - -
3503 AP UTRECHT – Netherlands - - -
AXA HOLDING AS 187,645 6,477 16.75% 112,497
Meclisi Mebusan cad n° 15 – Salipazari - - -
34433 ISTANBUL – Turkey - - -
AXA MILLESIMES 107,662 128,171 22.09% 70,396
21-23 avenue Matignon – 75008 Paris – France - - -
AXA KONZERN AG 79,840 1,533,046 34.63% 2,193,018
Colonia Allee, 10-20 – 51067 KOLN – Germany - - -
LOR Matignon 8,538 151,803 27.78% 56,695
100, Esplanade du Général De Gaulle – Cœur Défense Tour B - - -
92400 COURBEVOIE - - -
RGI Holdings 143,045 939,133 39.34% 700,000
51, avenue de la Gare - 1611 Luxembourg - - -
Sub-total A 17,205,844 38,769,059 0.00% 67,124,083
B. GENERAL INFORMATION ABOUT OTHER UNITS
AND PARTICIPATING INTERESTS
- - -
1) Subsidiaries not shown in section A - - -
a) French subsidiaries (total) - - 138,956
b) Foreign subsidiaries (total) - - 95,348
2) Participating interests not shown in section A - - -
a) in French companies (total) - - 8,025
b) in foreign companies (total) - - 120,068
TOTAL (A+B) - - 67,486,480
(a) For Insurance companies: gross written premiums. For real estate companies: rental revenues. For holding companies: dividends. For financial services companies: gross banking revenues.
(b) Consolidated data.

457I UNIVERSAL REGISTRATION DOCUMENT - ANNUAL REPORT 2019 - AXA I
APPENDICES
A
APPENDIX III AXA PARENT COMPANY FINANCIAL STATEMENTS
Net Book
Value of
securities held
Loans
and cash
advances
given by the
Company
still
outstanding
Guarantees and
commitments given
by the Company
under commitments
made by subsidiary/
participation
Last closing
revenues
available (a)
Last closing
result available
Dividends
received
Closing date
and other
observations
5 6 7 8 9 10 11
163,568 101,000 - - 6,573 - December 31, 2019
- - - - - -
4,555,833 - 1,410,437 - 292,293 275,257 December 31, 2019
- - - - - -
5,171,327 - - 3,125,484 1,852,102 1,262,157 December 31, 2019
- - - - - -
13,081 - - - (42) 1,300 December 31, 2019
- - - - - -
104,000 - - - (12,423) - December 31, 2019
- - - - - -
189,741 - - 3,149 22,500 67,573 December 31, 2019
- - - - - -
3,701 - - - (9) - December 31, 2019
- - - - - -
367,793 - - - 84,794 20,042 December 31, 2019
- - - - - -
1,298,050 - 123,011 35,693 64,680 - December 31, 2019
- - - - - -
4,284,806 - - 256,600 256,371 256,600 December 31, 2019
- - - - - -
- - - - - -
112,497 - - - 4,049 - December 31, 2019
- - - - - -
- - - - - -
70,396 - - - 5,743 218 December 31, 2019
- - - - - -
2,193,018 - - 566,616 560,587 157,018 December 31, 2019
- - - - - -
56,695 - - - 6,550 - December 31, 2019
- - - - - -
- - - - - -
700,000 - - 1,461,639 214,631 - December 31, 2019
- - - - - -
65,677,492 568,500 1,998,722 59,317,538 7,349,294 4,916,291
- - - - - -
- - - - - -
76,076 6,000 2,722 - - -
71,383 1,500 - - - 9,758
- - - - - -
8,025 - - - - 10,433
78,831 758 - - - 13,180
65,911,807 576,758 2,001,444 59,317,538 7,349,294 4,949,662

458 I UNIVERSAL REGISTRATION DOCUMENT - ANNUAL REPORT 2019 - AXA I
APPENDICES A APPENDIX III AXA PARENT COMPANY FINANCIAL STATEMENTS
I Notes to the financial statements as at December 31, 2019
Net income
Net income for the fiscal year ended December 31, 2019 resulted
in a profit of €4,301 million compared to a profit of €307 million
for the year ended December 31, 2018.
1. HIGHLIGHTS
The significant account movements are presented in the tables
in these notes.
2. ACCOUNTING PRINCIPLES
2.1. General principles
The financial statements as at December 31, 2019 are prepared
and presented in accordance with the provisions of the 2014
Chart of Accounts (regulation ANC n°2014-03 dated June 5, 2014).
Since January 1, 2011, AXA has applied regulation ANC n°2015-05
linked to term financial instrument and hedge operation.
Since January 1, 2005, AXA has applied regulations CRC 2002-10
related to depreciation and amortization of assets (amended by
regulations CRC 2003-07 and CRC 2005-09), and CRC 2004-06
related to the definition, recognition and measurement of assets,
repealed and replaced by regulation ANC n°2014-03 chapter “titre
II, chapitre I Actifs non financiers”; application of these regulations
has had no impact on the Company’s financial statements.
In accordance to regulation CRC 2008-15, repealed and replaced
by regulation ANC n°2014-03 chapter “titre VI, chapitre II,
section 4 Plans d’options d’achat ou de souscription d’actions et
plans d’attribution d’actions gratuites aux salariés” (especially
Articles 624-15 and 624-16) and chapters “titre IX, chapitre IV,
section 5 Comptes financiers” (especially Article 945-50) treasury
shares are recorded in “Marketable securities”. As of December 31,
2019, 31,102,295 shares were allocated to hedging purposes,
representing €726 million.
The application of regulations relating to the accounting treatment
of stock options (subscription and purchase) and performance
shares/units (free shares granted to employees and subject
to performance conditions) had no impact on the Company’s
financial statements (regulation ANC n°2014-03 chapter “titre VI,
chapitre II, section 4 Plans d’options d’achat ou de souscription
d’actions et plans d’attribution d’actions gratuites aux salariés”).
Find below a summary of options and performance shares or units shares granted in 2019 and 2018 to members of the Management
Committee paid by the Company:
(in Euro)
Year 2019 Year 2018
Value of options
granted during
the year
Value of performance
shares and performance
units granted during
the year
Value of options
granted during
the year
Value of performance
shares granted
during the year
TOTAL - 5,619,964 687,288 4,004,072
Stocks options, performance shares and performance units plans
are described in Part 3 – Section 3.2 “Executive compensation
and share ownership” of this Universal Registration Document.
2.2. Presentation of the financial
statements
BALANCE SHEET
Intangible assets include concessions, patents, brands and
soft ware.
Tangible assets include investments in real estate, split between
land and buildings, as well as fixtures and fittings.
Financial assets consist in (i) investments in and receivables from
subsidiaries and aff iliates, and (ii) other financial assets and loans.
Securities are classified using the following criteria:
■ investments in subsidiaries and affiliates are securities
representing at least 10% of the share capital of the issuing
company plus those which the Company deems held for the
long term;
■ other financial assets comprise securities representing less
than 10% of the share capital and which are not investments
in subsidiaries and aff iliates.
INCOME
The income statement distinguishes between ordinary operations
and capital operations:
■ ordinary operations include dividends, revenues from other
investments, financial expenses, operating expenses and
income from transactions in marketable securities;
■ capital operations include gains or losses on the disposal
of investments in subsidiaries and aff iliates and portfolio

459I UNIVERSAL REGISTRATION DOCUMENT - ANNUAL REPORT 2019 - AXA I
APPENDICES
A
APPENDIX III AXA PARENT COMPANY FINANCIAL STATEMENTS
management investments, impairment charges and reversals
in respect of these securities and related receivables, gains and
losses arising from exchange rate movements, charges and
reversals of provisions for risks and charges, and exceptional
income and expense.
Disposals of investments in subsidiaries and affiliates are
measured using the weighted average unit cost method.
To improve the transparency of the financial statements, (i) charges
and releases of provisions for exchange rate risk are recognized
in foreign exchange result, and (ii) charges and reversals of
provisions for tax repayment risk are recognized in income tax
benefit/expense.
2.3. Intangible assets
Intangible assets totaled €329 million. They mainly included the
AXA brand valued at €307 million and €21 million relating to the
capitalization of soft ware expenses.
2.4. Tangible assets
Tangible assets are recognized at acquisition cost or transfer
value. Buildings are depreciated using the straight line method
over fift y years, and fitting work is depreciated over five or ten
years as appropriate.
2.5. Financial assets
Financial assets are measured at acquisition cost or transfer cost.
At the balance sheet date, the acquisition cost is compared to the
fair value, and the lower of these two values is then recognized
in the balance sheet.
The fair value of investments in subsidiaries and aff iliates is their
going concern value for the firm. This may be determined as a
function of (i) their share price, (ii) their shareholders’ equity
(including unrealized gains) or (iii) prospects for the subsidiary.
This multi-criteria analysis reflects the long-term nature of AXA’s
ownership in these subsidiaries and excludes factors relating to
short-term market volatility. Net book value is compared with the
going concern value, which is the value of the assets and expected
profits of existing and new business, taking into account the
entity’s future prospects. The value of future profits is estimated
on the basis of calculations of the European Embedded Value
of the Life & Savings business published by the Group, or similar
calculations for other activities.
For other investments, the fair value is the share price for listed
securities and the likely trading value for unlisted securities.
2.6. Receivables
Receivables are measured at nominal value. An impairment
provision is charged in the event of risk of non-recovery.
2.7. Marketable securities
At the balance sheet date, the acquisition cost is compared to
the fair value, which corresponds to the exit value for SICAV and
FCP Mutual funds and to the average share price over the last
month before the balance sheet date for the other securities.
2.8. Prepayments and accrued income
Deferred charges correspond to debt issue costs, which are spread
over the lifetime of the issue or for a maximum of 10 years when
the debt has no predetermined maturity.
2.9. Employee benefits
Employee benefit liability was reviewed and a valuation was
carried out, in accordance with the Recommendation ANC n°
2013-02, so as to measure any additional adjustment necessary to
ensure the coverage of defined post-retirement benefit obligations
and for accounting purposes. The method 1, as defined by this
Recommendation has been applied: past service costs are
recognized in profit and loss over the vesting period and the
expected return on asset is used in developing the net periodic
pension cost. Pursuant to this review, the employee benefit
liability recognized was nil as at December 31, 2019. Additional
information on employees’ defined benefit obligations is provided
in Note 26.2 of Consolidated Financial Statements.
2.10. Unrealized foreign exchange gains/
losses
Foreign currency receivables and liabilities are adjusted at
the balance sheet date exchange rate. The matching item for
this adjustment is a translation variance asset account when
the diff erence is an unrealized loss, and a translation variance
liability account when it is an unrealized gain. These items do not
flow through the income statement but a provision for foreign
exchange risk is made to recognize unrealized losses relating to
the translation variance asset.
When a loan or borrowing generates an unrealized translation
loss, but is hedged, a provision for unhedged risk is registered.
2.11. Derivative products
■ Interest rate swaps: these transactions are recognized by
applying the accrued interest method. A distinction is made
in the income statement and balance sheet between income
from the principal transaction, which is the subject of the swap,
and the net income from the swap transaction. The nominal
value of the swaps serving as a basis for interest rate swaps is
recognized off -balance sheet;
■ Derivative products qualifying as hedges against foreign
exchange risk (exchange rate or currency swaps, currency
futures) are recognized off -balance sheet as a reciprocal liability
and receivable commitment. For currency options, the premium
paid on acquisition is recognized as an asset on the balance
sheet in the “cash instruments” account. When the option is
exercised, the premium is recorded in the income statement. The
same is true when the option is not exercised at term. For option
sales, a provision for risks and charges is recognized to take into
account the unrealized loss. Other derivative instruments are
recognized off -balance sheet at their nominal value. Unrealized
losses arising from the estimated market value of these financial
instruments give rise to recognition of a provision for foreign
exchange loss when the hedge accounting cannot be applied;

460 I UNIVERSAL REGISTRATION DOCUMENT - ANNUAL REPORT 2019 - AXA I
APPENDICES A APPENDIX III AXA PARENT COMPANY FINANCIAL STATEMENTS
■ Equity derivative products: equity option rights paid or received
are posted in a suspense account on payment or receipt of
funds. At the balance sheet date, if the option has not been
exercised, the rights received, representing possible income, are
not recognized in the income statement. A provision is created
against rights paid if it is likely, given market trends, that the
option will not be exercised. When the option is exercised,
this represents an addition to the acquisition price of the
underlying instrument and an addition to the sale price when
the option is sold.
2.12. Other shareholders’ equity
Undated deeply subordinated notes are classified as “Other
shareholders’ equity” when, like for ordinary shares, there is no
contractual obligation to remit cash or any other financial assets.
Other shareholders’ equity included the undated deeply
subordinated debts (TSS), amounting to €3,858 million compared
to €4,032 million in 2018, due to a debt repayment of £219 million
(or €245 million) and a foreign exchange impact of €75 million.
2.13. Provisions for risks and charges
The Company is the head of a French tax consolidation regime
group. The tax consolidation regime provides that tax savings
should be recognized directly in the Company’s financial
statements. However, a provision for the return of tax savings is
recognized when there is a high probability that the benefit will
accrue to subsidiaries as a result of the prospect of future taxable
income resulting from the Group’s strategic planning.
3. NOTES TO THE BALANCE SHEET
3.1. Movements in intangible assets
This account included the AXA brand valued at €307 million and €21 million relating to the capitalization of soft ware expenses.
3.2. Movements in financial assets (before provisions)
(in Euro million)
Gross value
at December 31, 2018 Acquisitions
Disposals/
Translation
variance and
accrued interests
Gross value at
December 31, 2019
Investments in subsidiaries (a) 74,552 4,018 9,256 69,314
Receivables from subsidiaries (b) 775 633 263 1,145
Other financial assets 327 23 - 350
Loans 70 105 111 64
TOTAL 75,724 4,779 9,630 70,873
(a) The net decrease of €5,238 million is mainly explained by €6,326 million book value of the shares in Equitable Holdings, Inc. sold.
(b) I ncrease of €370 million, including a €492 million ($553 million) loan related to the deleveraging plan of the XL Group.
3.3. Movements in provisions for impairment of financial assets
(in Euro million)
Provisions at
December 31, 2018 Allowances Releases
Provisions at
December 31, 2019
Investments in subsidiaries (a) 3,235 493 2,076 1,652
Receivables from subsidiaries 1 - - 1
Other financial assets 97 - - 97
TOTAL 3,333 493 2,076 1,750
(a) Net impairments release of €2,076 million of which €1,377 million on Equitable Holdings,Inc. shares sold.

461I UNIVERSAL REGISTRATION DOCUMENT - ANNUAL REPORT 2019 - AXA I
APPENDICES
A
APPENDIX III AXA PARENT COMPANY FINANCIAL STATEMENTS
3.4. Statement of receivables by maturity
(in Euro million)
Gross value at
December 31, 2019 Less than 1 year 1 to 5 years More than 5 years
Receivables on aff iliates 1,145 548 528 69
Tax receivables 83 83 - -
Loans 64 51 - 13
Miscellaneous receivables and currents accounts
with subsidiaries 306 306 - -
Total 1,598 988 528 82
3.5. Miscellaneous receivables and subsidiaries’ current accounts
(in Euro million)
Income receivable 122
Miscellaneous debtors 70
Accrued interest on swaps 114
TOTAL 306
3.6. Expenses payable over more than one period
(in Euro million)
Gross value at
December 31, 2019
Amount amortized at
December 31, 2018
Charge and increase
for the period
Net value at
December 31, 2019
Debts issue expenses 254 214 10 30
Investment acquisition expenses 71 71 - -
TOTAL 325 285 10 30
3.7. Unrealized foreign exchange losses
Unrealized foreign exchange losses amounted to €3,419 million,
including €3,058 million related to the deferred recognition of
foreign exchange losses in line with statutory hedge accounting
principles, more than off set by unrealized gains on investments
in subsidiaries. This item also reflects unrealized losses on assets
and liabilities denominated in foreign currencies attributable
to the eff ects of their revaluation at the closing exchange rate.
The €286 million increase versus 2018 was primarily due to
the recognition in profits of the foreign exchange translation
diff erences on the US dollar, following the disposal of Equitable
Holdings, Inc. shares, and the hedge accounting on the Swiss franc.
3.8. Share capital
The Company’s share capital is represented by 2,417,695,123 shares
with a par value of €2.29, giving a total value of €5,536,521,832 as
at December 31, 2019. These shares were all entirely subscribed
and paid with rights from January 1, 2019.
3.9. Movement in shareholders’equity
(in Euro million)
Year ending
December 31, 2018
Year ending
December 31, 2019
Net income 307 4,301
Per share 0.13 1.78
Movement in shareholders’ equity compared to opening balance (1,737) 870
Per share (0.72) 0.36
Proposed dividend (a) 3,249 3,457
Per share 1.34 1.43
(a) Proposed dividend at year-end 2019 is submitted to Shareholders’ Meeting of April 30, 2020.

462 I UNIVERSAL REGISTRATION DOCUMENT - ANNUAL REPORT 2019 - AXA I
APPENDICES A APPENDIX III AXA PARENT COMPANY FINANCIAL STATEMENTS
(in Euro million)
Equity at December 31, 2018 40,581
Capital increase for employees 375
Exercise of equity instruments 67
Shares buyback/cancellation (683)
Dividends paid out (3,189)
Net income for the period 4,301
Tax driven provision and others -
Equity at December 31, 2019 41,452
3.10. Other shareholders’ equity
Other shareholders’ equity includes the undated deeply subordinated debts (TSS), and amounted to €3,858 million compared to
€4,032 million in 2018, due to a debt repayment of £219 million (or €245 million) and a foreign exchange impact of €75 million.
(in Euro million)
Value at
December 31, 2018 Repayment
Translation variance/
accrued interests
Value at
December 31, 2019
Undated deeply Subordinated Notes
(nominal) 3,960 (245) 74 3,789
Accrued interests 72 - (3) 69
TOTAL 4,032 (245) 71 3,858
3.11. Provisions for risks and charges
(in Euro million)
Value at
beginning
of period
Allowances
for the period
Releases for
the period
(provisions used)
Releases for the
period (provisions
not used)
Value at end
of period
Provisions for deferred taxes 396 62 15 - 443
Provision for foreign exchange losses 44 176 - - 220
Other provisions for risks 121 834 55 - 900
TOTAL (a)
561 1,072 70 - 1,563
(a) Mainly include €412 million of provisions for the possible repayment of tax savings to subsidiaries belonging to the French tax consolidation group, a €220 million provision for exchange-rate risk, a €284 million reserve for unrealized capital losses on equity options and a €352 million provision for internal guarantees in the context of a business litigation.

463I UNIVERSAL REGISTRATION DOCUMENT - ANNUAL REPORT 2019 - AXA I
APPENDICES
A
APPENDIX III AXA PARENT COMPANY FINANCIAL STATEMENTS
3.12. Subordinated debt
(in Euro million)
Value at
December 31, 2019 Less than one year 1 to 5 years More than 5 years
Undated subordinated debt 221 - - 221
Undated subordinated Euro Medium Term Notes 2,715 - - 2,715
Subordinated bonds 5.25% due 2040 1,300 - - 1,300
Subordinated bonds 5,125% due 2043 1,000 - - 1,000
Subordinated bonds 4.5% due 2046 ($) 757 - - 757
Subordinated bonds 3,375% due 2047 1,500 - - 1,500
Subordinated bonds 5,625% due 2054 (£) 882 - - 882
Subordinated bonds 5,125% due 2047 ($) 890 - - 890
Subordinated bonds 3,337% due 2049 2,000 - - 2,000
Redeemable subordinated bonds 8.60% due 2030 ($) 1,113 - - 1,113
Redeemable subordinated bonds 7,125% due 2020 (£) 382 382 - -
Subordinated EMTN 10 - 10 -
Accrued interests 258 258 - -
TOTAL 13,028 640 10 12,378
Subordinated debt amounted to €13,028 million compared to
€12,885 million in 2018, up €143 million, primarily due to an
unfavorable foreign exchange rate impact.
The perpetual subordinated notes are undated bonds. The
Company has the option of deferring payment of the coupons
under certain conditions. Nonetheless, the coupons must be
paid when these conditions cease to be met or on redemption
of the instruments. When payment is deferred for an extended
period, the coupons remain payable b y law. Similarly, in the
absence of dividends being paid, unpaid coupons accumulated
over the years will be recognized as payable upon liquidation, if
any. These instruments are classified as debt on the basis of this
contractual obligation to pay the coupons.
3.13. Financial debt
(in Euro million)
Value at
December 31, 2019 Less than one year 1 to 5 years More than 5 years
Euro Medium Term Notes 500 - - 500
Bonds 7,602 300 6,279 1,023
Deposits under collateral agreements - - - -
Loans granted by Group entities 8,188 982 4,217 2,989
Accrued interests 99 99 - -
TOTAL 16,389 1,381 10,496 4,512
Financial debt amounted to €16,389 million versus €19,522 million
as at December 31, 2018, down €3,133 million reflecting a decrease
by €2,322 million on loans granted by Group entities mainly related
to the financing of the acquisition of the XL Group, as well as a
€497 million reduction in margin call under collateral agreements.

464 I UNIVERSAL REGISTRATION DOCUMENT - ANNUAL REPORT 2019 - AXA I
APPENDICES A APPENDIX III AXA PARENT COMPANY FINANCIAL STATEMENTS
3.14. Statement of operating payables
(in Euro million)
Value at
December 31, 2019 Less than 1 year 1 to 5 years
Debt on fixed assets (a) 75 75 -
Other payables, including tax and social payables (b) 293 293 -
TOTAL 368 368 -
(a) Debt relating to non-current assets totaled €75 million and included shares issued by AXA Life Europe but not yet fully paid.
(b) Of which 185 million of expenses payables.
3.15. Unrealized foreign exchange gains
Unrealized foreign exchange gains totaled €799 million compared to €1,099 million as at December 31, 2018. This item reflects the
eff ects derived from the revaluation of foreign currency denominated assets and liabilities at the closing exchange rates. It decreased
mainly due to an unfavorable impact of the sterling pound and the US dollar on debts.
4. NOTES TO THE STATEMENT OF INCOME
4.1. Executive remuneration
■ Directors’ fees allocated to members of the Board of Directors €1.7 million.
■ Other remuneration (net of recharging) €12.8 million.
The Company had 4 employees and 2 executive off icers at the balance sheet date.
4.2. Income tax
(in Euro million)
Income
before tax
Tax benefit/
expense* Net income
Ordinary income (a) 4,476 - 4,476
Income from capital operations (1,084) - (1,084)
Income tax expense (b) - 909 909
TOTAL 3,392 909 4,301
* A positive sign indicates tax benefit.
(a) Dividends received from investments in subsidiaries with more than 5% ownership for more than 2 years are tax-exempt, apart from a share of the costs and charges equal to 5% for non European entities or 1% for European entities.
(b) The corporate income tax benefit amounted to €909 million compared to €762 million in 2018. It mainly included €865 million of tax receivables from members of the tax consolidation group.

465I UNIVERSAL REGISTRATION DOCUMENT - ANNUAL REPORT 2019 - AXA I
APPENDICES
A
APPENDIX III AXA PARENT COMPANY FINANCIAL STATEMENTS
5. OFF-BALANCE SHEET COMMITMENTS
(in Euro million)
Notional value
(commitments given) Market value
Financial futures instruments 80,560 (24)
Foreign exchange Forward 100 -
Swaps 56,601 (58)
Interest rate swaps 37,002 321
Cross Currency swaps (long term) 10,162 (313)
Foreign Exchange swaps (short term) 9,437 (66)
Options 23,859 34
Foreign Exchange Options 16,235 (22)
Equity options 4,032 62
Index options 2,087 -
Swaption 1,500 (6)
Floor 5 -
Other commitments Commitments given Commitments received
Credit facilities (authorized but not drawn) 933 8,468
Guarantees and securities
Commitments to buy back shares and bonds from Group entities - -
Other commitments 11,216 55
Of which financial guarantees given to Group entities 8,073 -
6. SENSITIVITY
By virtue of its business, the Company is mainly exposed to interest rate and exchange rate risks.
The table below shows an estimate of changes in the fair value of debt, loans and hedging instruments in the event of a 1% rise in the
interest rate curve or a 10% depreciation of the Euro.
(in Euro million) Change in fair value
Sensitivity
Interest rates:
+100 bps (1)
Depreciation of the Euro:
10% (2)
Debt (a) 6.2% 6.6%
Derivatives (b) 892.0% -930.0%
Loans (c) -0.1% -8.5%
(a) External and internal debts.
(b) Both eligible and not eligible derivatives to hedge accounting.
(c) External and internal loans.
(1) A 100 bps rise in interest rates leads to a 6.2% improvement in the fair value of debt, a -0.1% deterioration in the fair value of loans, and an improvement of 892% in the fair value of loans.
(2) A 10% depreciation of the Euro leads to a 6.6% improvement in the fair value of debt, a -8.5% deterioration in the fair value of derivatives and a -930% deterioration in the fair value of loans.
The information on fair value presented above should be used with care: ■ since these estimates are based on the use of measurements such as interest rates and spreads at the balance sheet date; such measurements may fluctuate over time; ■ and because there are a number of possible ways to perform these calculations.
The information used for calculating the fair value of financing
debt is market prices at the end of the period, using (i) market
rates for each currency, (ii) AXA’s average spread by maturity and
for the main currencies, distinguishing subordinated debt and
senior debt, and (iii) options included in issue contracts, such as
issuer redemption options.
This note does not omit any material commitment or any which
might become material in the future.
7. OTHER INFORMATION
None of the transactions operated by related parties, that are still
outstanding at year end or that occurred during the course of the
year, account for the distinctive characteristics of transactions to
be disclosed in accordance with the ANC regulations n° 2014-03
(Article 831-3).

466 I UNIVERSAL REGISTRATION DOCUMENT - ANNUAL REPORT 2019 - AXA I
APPENDICES A APPENDIX III AXA PARENT COMPANY FINANCIAL STATEMENTS
PricewaterhouseCoopers Audit
63, rue de Villiers
92208 Neuilly-sur-Seine Cedex
MAZARS
61, rue Henri Régnault
92400 Courbevoie
I Statutory Auditors’ report on the financial statements(For the year ended December 31, 2019)
This is a translation into English of the Statutory Auditors’ report on the financial statements of the Company issued in French and it
is provided solely for the convenience of English speaking users.
This statutory auditors’ report includes information required by European regulation and French law, such as information about
the appointment of the statutory auditors or verification of the management report and other documents provided to shareholders.
This report should be read in conjunction with, and construed in accordance with, French law and professional auditing standards
applicable in France.
AXA SA
25, Avenue Matignon
75008 Paris
France
To the Shareholders,
Opinion
In compliance with the engagement entrusted to us by your Shareholders’ Meeting, we have audited the accompanying financial
statements of AXA SA for the year ended December 31, 2019.
In our opinion, the financial statements give a true and fair view of the assets and liabilities and of the financial position of the Company
as at December 31, 2019 and of the results of its operations for the year then ended in accordance with French accounting principles.
The audit opinion expressed above is consistent with our report to the Audit Committee.
Basis for Opinion
AUDIT FRAMEWORK
We conducted our audit in accordance with professional standards applicable in France. We believe that the audit evidence we have
obtained is suff icient and appropriate to provide a basis for our opinion.
Our responsibilities under those standards are further described in the Statutory Auditors’ Responsibilities for the Audit of the Financial
Statements section of our report.
INDEPENDENCE
We conducted our audit engagement in compliance with independence rules applicable to us, for the period from January 1, 2019
to the date of our report and specifically we did not provide any prohibited non-audit services referred to in Article 5(1) of Regulation
(EU) No 537/2014 or in the French Code of Ethics (code de déontologie) for statutory auditors.
Justification of Assessments – Key Audit Matters
In accordance with the requirements of Articles L.823-9 and R.823-7 of the French Commercial Code (code de commerce) relating
to the justification of our assessments, we inform you of the key audit matters relating to risks of material misstatement that, in our
professional judgment, were of most significance in our audit of the financial statements of the current period, as well as how we
addressed those risks.

467I UNIVERSAL REGISTRATION DOCUMENT - ANNUAL REPORT 2019 - AXA I
APPENDICES
A
APPENDIX III AXA PARENT COMPANY FINANCIAL STATEMENTS
These matters were addressed in the context of our audit of the financial statements as a whole, and in forming our opinion
thereon, and we do not provide a separate opinion on specific items of the financial statements.
Measurement of investments in subsidiaries and aff iliates
(See Notes 2.5 to the financial statements)
Key audit matter How our audit addressed the matter
At December 31, 2019, investments in subsidiaries and aff iliates
represented €67 663 million, a significant balance sheet item.
These investments are initially carried at acquisition cost or their
contribution value. At the end of the fiscal year, an impairment
allowance is recognized if the value at closing date is less than the
acquisition cost.
As described in note 2.5 to the financial statements, the value at
closing date corresponds to the value in use and is determined
by management on the basis of the share price, the equity
value (including unrealized gains), or the future prospects of the
subsidiary.
Estimating the value in use of these types of investments requires
a significant degree of judgment from management in terms of
selecting the measurement methods, depending on the investment
in question, and in determining which data and assumptions should
be used to estimate the expected profits when these are taken into
account in the valuation. The value of future profits is estimated
on the basis of the European Embedded Value (EEV) calculations
for the Life & Savings segment published by the Group, or similar
calculations for the other activities.
Given the inherent uncertainty involved in the use of forecasts
(in terms of whether or not they will be achieved) and in the
judgment required to assess value in use, we deemed the correct
measurement of investments in subsidiaries and aff iliates,
particularly those based on forward-looking data, to be a key audit
matter.
To assess the reasonableness of the estimated value in use
of investments in subsidiaries and aff iliates, based on the
information provided to us, our audit work consisted primarily of
verifying that the estimated values determined by management
were based on an appropriate measurement method and
assumptions, depending on the investment concerned.
For valuations based on forecast data:
■ Assess the appropriateness of the methodology and
assumptions used with regard to the Solvency II texts and the
European Embedded Value principles published by the CFO
Forum when the values in use of life and non-life insurance
companies are based on these frameworks;
■ For the other entities, obtain the projections for cash flow
and operating cash flow for the businesses produced by their
respective operational management teams, and:
– Check the consistency of the historical data used with the
audited financial statements;
– Check that the assumptions made are consistent with the
economic environment at the closing date and at the date
the financial statements were prepared;
– Compare projections made in previous periods with actual
results in order to assess the reliability of the estimates;
– Verify the accuracy of the value in use calculated;
– Confirm that the value in use, which is based on projected
cash flows, has been adjusted to account for debts;
We also verified the recording of provisions for contingencies
where the company is exposed to the losses of a subsidiary with
negative equity.
Finally, we assessed the adequacy of the disclosures in the
financial statements.
Specific verifications
We have also performed, in accordance with professional standards applicable in France, the specific verifications required by law
and regulations.
INFORMATION GIVEN IN THE MANAGEMENT REPORT AND IN THE OTHER DOCUMENTS WITH RESPECT TO THE FINANCIAL
POSITION AND THE FINANCIAL STATEMENTS PROVIDED TO THE SHAREHOLDERS
We have no matters to report as to the fair presentation and the consistency with the financial statements of the information given in
the management report of the Board of Directors and in the other documents with respect to the financial position and the financial
statements provided to the Shareholders.
We attest the fair presentation and the consistency with the financial statements of the information relating to the payment deadlines
mentioned in Article D.441-4 of the French Commercial Code (code de commerce).
REPORT ON CORPORATE GOVERNANCE
We attest that the Board of Directors’ report on corporate governance sets out the information required by Articles L.225-37-3 and
L.225-37-4 of the French Commercial Code (code de commerce).
Concerning the information given in accordance with the requirements of Article L.225-37-3 of the French Commercial Code (code
de commerce) relating to remunerations and benefits received by or allocated to the directors and any other commitments made in
their favour, we have verified its consistency with the financial statements, or with the underlying information used to prepare these
financial statements and, where applicable, with the information obtained by your Company from controlled companies which are
included in the scope of consolidation. Based on these procedures, we attest the accuracy and fair presentation of this information.
With respect to the information relating to items that your company considered likely to have an impact in the event of a takeover
bid or exchange off er, provided pursuant to Article L. 225-37-5 of the French Commercial Code (code de commerce), we have agreed
this information to the source documents communicated to us. Based on these procedures, we have no observations to make on this
information.

468 I UNIVERSAL REGISTRATION DOCUMENT - ANNUAL REPORT 2019 - AXA I
APPENDICES A APPENDIX III AXA PARENT COMPANY FINANCIAL STATEMENTS
OTHER INFORMATION
In accordance with French law, we have verified that the required information concerning the purchase of investments and the identity
of the shareholders and holders of the voting rights has been properly disclosed in the management report.
Report on Other Legal and Regulatory Requirements
APPOINTMENT OF STATUTORY AUDITORS
We were appointed as statutory auditors of AXA SA by the Shareholders’ Meetings held on February 28, 1989 for PricewaterhouseCoopers
Audit and on June 8, 1994 for Mazars. As at December 31, 2019, PricewaterhouseCoopers Audit and Mazars were in the thirty-first and
in the twenty-sixth consecutive year of total uninterrupted engagement, respectively.
Responsibilities of Management and Those Charged with Governance for the Financial
Statements
Management is responsible for the preparation and fair presentation of the financial statements in accordance with French accounting
principles and for such internal control as management determines is necessary to enable the preparation of financial statements that
are free from material misstatement, whether due to fraud or error.
In preparing the financial statements, management is responsible for assessing the Company’s ability to continue as a going concern,
disclosing, as applicable, matters related to going concern and using the going concern basis of accounting unless it is expected to
liquidate the Company or to cease operations.
The Audit Committee is responsible for monitoring the financial reporting process and the eff ectiveness of internal control and risks
management systems and where applicable, its internal audit, regarding the accounting and financial reporting procedures.
The financial statements were approved by the Board of Directors.
Statutory Auditors’ Responsibilities for the Audit of the Financial Statements
OBJECTIVES AND AUDIT APPROACH
Our role is to issue a report on the financial statements. Our objective is to obtain reasonable assurance about whether the financial
statements as a whole are free from material misstatement. Reasonable assurance is a high level of assurance, but is not a guarantee that
an audit conducted in accordance with professional standards will always detect a material misstatement when it exists. Misstatements
can arise from fraud or error and are considered material if, individually or in the aggregate, they could reasonably be expected to
influence the economic decisions of users taken on the basis of these financial statements.
As specified in Article L.823-10-1 of the French Commercial Code (code de commerce), our statutory audit does not include assurance
on the viability of the Company or the quality of management of the aff airs of the Company.
As part of an audit conducted in accordance with professional standards applicable in France, the statutory auditor exercises professional
judgment throughout the audit and furthermore:
■ Identifies and assesses the risks of material misstatement of the financial statements, whether due to fraud or error, designs and
performs audit procedures responsive to those risks, and obtains audit evidence considered to be suff icient and appropriate to
provide a basis for his opinion. The risk of not detecting a material misstatement resulting from fraud is higher than for one resulting
from error, as fraud may involve collusion, forgery, intentional omissions, misrepresentations, or the override of internal control.
■ Obtains an understanding of internal control relevant to the audit in order to design audit procedures that are appropriate in the
circumstances, but not for the purpose of expressing an opinion on the eff ectiveness of the internal control.
■ Evaluates the appropriateness of accounting policies used and the reasonableness of accounting estimates and related disclosures
made by management in the financial statements.
■ Assesses the appropriateness of management’s use of the going concern basis of accounting and, based on the audit evidence
obtained, whether a material uncertainty exists related to events or conditions that may cast significant doubt on the Company’s
ability to continue as a going concern. This assessment is based on the audit evidence obtained up to the date of his audit report.
However, future events or conditions may cause the Company to cease to continue as a going concern. If the statutory auditor
concludes that a material uncertainty exists, there is a requirement to draw attention in the audit report to the related disclosures
in the financial statements or, if such disclosures are not provided or inadequate, to modify the opinion expressed therein.
■ Evaluates the overall presentation of the financial statements and assesses whether these statements represent the underlying
transactions and events in a manner that achieves fair presentation.

469I UNIVERSAL REGISTRATION DOCUMENT - ANNUAL REPORT 2019 - AXA I
APPENDICES
A
APPENDIX III AXA PARENT COMPANY FINANCIAL STATEMENTS
REPORT TO THE AUDIT COMMITTEE
We submit a report to the Audit Committee which includes in particular a description of the scope of the audit and the audit program
implemented, as well as the results of our audit. We also report, if any, significant deficiencies in internal control regarding the accounting
and financial reporting procedures that we have identified.
Our report to the Audit Committee includes the risks of material misstatement that, in our professional judgement, were of most
significance in the audit of the financial statements of the current period and which are therefore the key audit matters that we are
required to describe in this report.
We also provide the Audit Committee with the declaration provided for in Article 6 of Regulation (EU) No 537/2014, confirming our
independence within the meaning of the rules applicable in France such as they are set in particular by Articles L.822-10 to L.822-14
of the French Commercial Code (code de commerce) and in the French Code of Ethics (code de déontologie) for statutory auditors.
Where appropriate, we discuss with the Audit Committee the risks that may reasonably be thought to bear on our independence, and
the related safeguards.
Neuilly-sur-Seine and Courbevoie, March 19 , 2020
The Statutory Auditors
PricewaterhouseCoopers Audit Mazars
Bénédicte Vignon - Grégory Saugner Jean-Claude Pauly - Maxime Simœn

470 I UNIVERSAL REGISTRATION DOCUMENT - ANNUAL REPORT 2019 - AXA I
APPENDICES A APPENDIX IV GROUP EMBEDDED VALUE AND SOLVENCY II OWN FUNDS
APPENDIX IV GROUP EMBEDDED VALUE AND SOLVENCY II OWN FUNDS
The information is disclosed in the “Embedded Value and Solvency II Own Funds report 2019” which is available on AXA’s website
(www.axa.com).

471I UNIVERSAL REGISTRATION DOCUMENT - ANNUAL REPORT 2019 - AXA I
APPENDICES
A
APPENDIX V GLOSSARY
APPENDIX V GLOSSARY
This glossary includes definitions of non-GAAP financial measures,
or alternative performance measures (“APMs”), indicated by an
asterisk * , that Management believes are useful to understand the
Group’s business and analyze the Group’s performance. The scope
of the following definitions of APMs remains unchanged compared
to prior periods, except that the scope of certain definitions was
updated to take into account (i) the deconsolidation of EQH, and
(ii) the impact of the issuance by AXA of mandatory exchangeable
bonds into shares of EQH (the “MEBs”) in May 2018, which were
recorded in “shareholders’ equity - Minority interests” and
“financial debt” and subsequently reclassified from “shareholders’
equity” components to financing debt starting 1Q19.
SCOPE AND COMPARABLE BASIS
Split by geography
The split by geography is detailed below:
■ France (insurance and banking activities, and holdings);
■ Europe, consisting of:
• Switzerland (insurance activities),
• Germany (insurance and banking activities, and holdings),
• Belgium (insurance activities and holdings),
• United Kingdom and Ireland (insurance activities and
holdings),
• Spain (insurance activities),
• Italy (insurance activities);
■ Asia, consisting of:
• Japan (insurance activities and holdings),
• Hong Kong (insurance activities),
• Asia High Potentials, consisting of:
• Thailand (insurance activities),
• Indonesia (insurance activities),
• China (insurance activities),
• The Philippines (insurance activities),
• Asia - Direct, consisting of:
• Direct Japan (insurance activities),
• Direct South Korea (insurance activities),
• Asia Holdings;
■ AXA XL, consisting of:
• XL Group (insurance activities and holdings) as acquired on
September 12, 2018,
• AXA Corporate Solutions Assurance (insurance activities),
• AXA Art (insurance activities);
■ United States (insurance activities, AB and holdings);
■ International, consisting of:
• AXA Bank Belgium (banking activities),
• Brazil (insurance activities and holdings),
• Colombia (insurance activities),
• Czech Republic and Slovak Republic (insurance activities),
• Greece (insurance activities),
• The Gulf Region (insurance activities and holdings),
• India (insurance activities and holdings),
• Lebanon (insurance activities and holdings),
• Luxembourg (insurance activities and holdings),
• Malaysia (insurance activities),
• AXA Mediterranean Holdings,
• Mexico (insurance activities),
• Morocco (insurance activities and holdings),
• Nigeria (insurance activities and holdings),
• Poland (insurance activities),
• Russia (Reso) (insurance activities),
• Singapore (insurance activities and holdings),
• Turkey (insurance activities and holdings);
■ Transversal & Central Holdings, consisting of:
• AXA Investment Managers,
• AXA Assistance,
• AXA Liabilities Managers,
• AXA Global Re,
• AXA Life Europe,
• AXA SA and other Central Holdings.

472 I UNIVERSAL REGISTRATION DOCUMENT - ANNUAL REPORT 2019 - AXA I
APPENDICES A APPENDIX V GLOSSARY
Current Engines and High Potentials
The split between current engines and high potentials is detailed
below:
■ Current Engines: Belgium, France, Germany, Hong Kong, Italy,
Japan, Spain, Switzerland, UK & Ireland, AXA XL, the United
States and AB;
■ High Potentials: Brazil, China, Indonesia, Mexico, the Philippines
and Thailand.
Comparable basis for Revenues, Annual
Premium Equivalent and NBV Margin
“On a comparable basis” means the following:
■ data for the current period were restated using the prevailing
foreign currency exchange rates for the same period of prior
year (constant exchange rate basis);
■ data in one of the two periods being compared were restated
for the results of acquisitions, disposals and business transfers
(constant structural basis) and for changes in accounting
principles (constant methodological basis).
EARNINGS AND CAPITAL
Adjusted Earnings*
Adjusted Earnings represent the net income (Group share) as
disclosed in the table set forth on pages 44 to 45 of this Annual
Report, before the impact of the following items net of policyholder
participation, deferred acquisition costs, VBI, taxes and minority
interests:
■ integration and restructuring costs related to material newly
acquired companies as well as restructuring and associated
costs related to productivity improvement plans;
■ goodwill and other related intangibles;
■ exceptional operations (primarily change in scope and
discontinued operations); and
■ profit or loss on financial assets accounted for under fair value
option (excluding assets backing liabilities for which the financial
risk is borne by the policyholder), foreign exchange impacts
on assets and liabilities, and derivatives related to invested
assets and liabilities.
Derivatives related to invested assets:
■ include all foreign exchange derivatives, except the ones related
to currency options in earnings hedging strategies which are
included in underlying earnings;
■ exclude derivatives related to insurance contracts evaluated
according to the “selective unlocking” accounting policy; and
■ exclude derivatives involved in the economic hedging of realized
gains and impairments of equity securities backing General
Account and shareholders’ funds, for which cost at inception,
intrinsic value and pay-off flow through adjusted earnings, and
only time value flows through net income when there is no
intention to sell the derivatives in the short term (if not, flows
through adjusted earnings).
Underlying Earnings*
Underlying Earnings correspond to Adjusted Earnings without
the following elements net of policyholder participation, deferred
acquisition costs, VBI, taxes and minority interests:
■ realized gains and losses and change in impairment valuation
allowances (on assets not designated under fair value option
or trading assets); and
■ cost at inception, intrinsic value and pay-off of derivatives used
for the economic hedging of realized gains and impairments of
equity securities backing General Account and shareholders’
funds.
Earnings per share
Earnings per share (EPS) represent AXA’s consolidated earnings
(net of financial charges related to undated subordinated debt
recorded through shareholders’ equity, preferred shares and
MEBs up to the date of the deconsolidation of EQH), divided by
the weighted average number of outstanding ordinary shares.
Diluted earnings per share (diluted EPS) represent AXA’s
consolidated earnings (net of financial charges related to undated
subordinated debt recorded through shareholders’ equity,
preferred shares and MEBs up to the date of the deconsolidation
of EQH), divided by the weighted average number of outstanding
ordinary shares, on a diluted basis (i.e. including the potential
impact of all outstanding dilutive stock options being exercised,
performance shares, and conversion of existing convertible debt
into shares, provided that their impact is not anti-dilutive).
Underlying Earnings per share* correspond to Underlying
Earnings (net of financial charges related to undated subordinated
debt recorded through shareholders’ equity, preferred shares and
MEBs up to the date of the deconsolidation of EQH), divided by
the weighted average number of outstanding ordinary shares.

473I UNIVERSAL REGISTRATION DOCUMENT - ANNUAL REPORT 2019 - AXA I
APPENDICES
A
APPENDIX V GLOSSARY
Return on Equity
The Return on Equity (“RoE”) is calculated as earnings divided
by the weighted average shareholders’ equity. The weighted
average shareholders’ equity is based on opening shareholders’
equity adjusted for weighted average impacts of capital flows
(including dividends).
■ for underlying RoE and adjusted RoE*:
• reserves relating to the change in the fair value through
shareholders’ equity are excluded from the average
shareholders’ equity,
• undated subordinated debts (“Super Subordinated Debts”
TSS/“Undated Subordinated Debts” TSDI) are treated as
financing debt, thus excluded from the average shareholders’
equity,
• and earnings include interest charges on TSS/TSDI, on
preferred shares, and on shareholders’ equity component
of the MEBs up to the date of deconsolidation of EQH;
■ for net income RoE: calculation is based on consolidated
financial statements, i.e.
• average shareholders’ equity including undated subordinated
debt (TSS/TSDI) and reserves relating to the change in the
fair value through shareholders’ equity,
• and net income.
Free Cash Flows
Free Cash Flows are defined as a measure of dividend capacity
calculated as the sum of earnings and required capital change.
EOF (Eligible Own Funds)
Surplus derived from a Solvency II balance sheet. It is defined as
the excess of market value of assets over best estimate liabilities
and Risk Margin as per Solvency II regulation.
Solvency II ratio
This ratio is calculated as per Solvency II, and is equal to the total
amount of the Group’s Eligible Own Funds (“EOF”) divided by the
Group’s Solvency Capital Requirement (“SCR”). The Solvency
Capital Requirement, i.e. the denominator of the Solvency II ratio,
is set at a level ensuring that insurers and reinsurers are able to
meet their obligations towards policyholders and beneficiaries
over the next 12 months, with a 99.5% probability. The Solvency
Capital Requirement can be calculated either based on the
standard formula or an internal model. The Group is using an
internal model.
The Solvency II ratio is estimated primarily using AXA’s internal
model calibrated based on an adverse 1/200 years shock. For
further information on AXA’s internal model and Solvency II
disclosures, please refer to AXA Group’s SFCR for the year ended
December 31, 2018, available on AXA’s website (www.axa.com).
In compliance with the ACPR’s decision, from January 1, 2019,
entities that were part of the XL Group (“XL entities”) have been fully
consolidated for Solvency II purposes (as per the consolidation-
based method set forth in the Solvency II Directive) and their
contribution to the Group’s Solvency Capital Requirement has
been calculated using the Solvency II standard formula. Subject
to prior approval of the ACPR, the Group intends to extend its
internal model to XL entities as soon as December 31, 2020.
Debt Gearing*
Debt Gearing refers to the level of a company’s debt related to its
equity capital, usually expressed as a percentage. Debt Gearing
is used by Management to measure the financial leverage of
the Group and the extent to which its operations are funded
by creditors as opposed to shareholders. AXA’s Debt Gearing is
calculated by dividing the gross debt (financing debt and undated
subordinated debt) by total capital employed (consolidated
shareholders’ equity excluding undated subordinated debt
and reserves relating to the change in the fair value of financial
instruments and of hedge accounting derivatives plus the gross
debt). Furthermore, following the deconsolidation of EQH the
MEBs were excluded from Debt Gearing.
ACTIVITIES
Insurance
LIFE & SAVINGS HYBRID AND G/A CAPITAL LIGHT PRODUCTS
Hybrid products: Savings products allowing clients to invest in
both Unit-Linked and General Account funds.
G/A capital light products: General Account Savings products
which, at inception, create more EOF than the economic capital
they consume.
LIFE & SAVINGS NET INFLOWS
Life & Savings Net Inflows are defined as the collected premiums
(including risk premiums, fees and revenues), net of surrenders,
maturities, claims paid and other benefits paid. This definition
is applicable to all Life & Savings products as well as Life-like
Health products, with the exception of Mutual funds products.
NEW BUSINESS APE (NEW BUSINESS ANNUAL
PREMIUM EQUIVALENT)
New business APE represents 100% of new regular premiums
plus 10% of single premiums, in line with EEV methodology.
APE is Group share.

474 I UNIVERSAL REGISTRATION DOCUMENT - ANNUAL REPORT 2019 - AXA I
APPENDICES A APPENDIX V GLOSSARY
NBV (NEW BUSINESS VALUE)
The value of newly issued contracts during the current year. It
consists of the present value of future profits aft er the costs of
acquiring business, less (i) an allowance for the time value of
financial option and guarantees, (ii) cost of capital and non-
financial risks. AXA calculates this value net of tax.
NBV MARGIN (NEW BUSINESS VALUE MARGIN)
New Business Value Margin is the ratio of:
■ New Business Value representing the value of newly issued
contracts during the current year; to
■ Annual Premium Equivalent.
This ratio represents the profitability of the new business.
MARGIN ANALYSIS
The Margin Analysis is presented on an underlying earnings basis.
Even though the presentation of the Margin Analysis is not the
same as the Statement of Income (underlying basis), it is based
on the same GAAP measures as used to prepare the Statement
of Income in accordance with IFRS.
Underlying investment margin includes the following items:
■ net investment income; and
■ interests and bonuses credited to policyholders and unallocated
policyholder bonuses (and the change in specific reserves
purely linked to invested assets returns) related to the net
investment income as well as the unwind of the discount rate
used in calculating technical reserves.
Underlying fees & revenues include:
■ revenues derived from mutual fund sales (which are part of
consolidated revenues);
■ loadings charged to policyholders (or contractual charges) on
premiums of all Life & Savings products;
■ loadings on deposits received on all Life & Savings products
and fees on funds under management for separate account
(Unit-Linked) business;
■ deferred income such as capitalization net of amortization
of URR (Unearned Revenue Reserve) and UFR (Unearned Fee
Reserve); and
■ other fee revenues, e.g. fees received on financial planning or
sales of third party products.
Underlying net technical margin includes the following
components:
■ mortality and morbidity margin: the diff erence between income
or earned premiums for assuming risk and the cost of benefits
and claims charges directly linked to the claims experience or
its anticipation (death or disability);
■ surrender margin: the diff erence between the benefit reserve
and the surrender value paid to the policyholder in the event
of early contract termination;
■ GMxB (Variable Annuity guarantees) active financial Risk
Management: the net result from GMxB lines corresponding
to explicit charges related to these types of guarantees less
cost of hedging. It also includes the unhedged business result;
■ policyholder bonuses if the policyholders participate in the
risk margin;
■ ceded reinsurance results;
■ other changes in claims and insurance reserves: all the reserve
strengthening or release coming from changes in valuation
assumptions, claims experience, additional reserves for
mortality risk and other technical impacts such as premium
deficiencies net of derivatives if any; and
■ claims handling costs.
Underlying expenses include the following components:
■ acquisition expenses, including commissions and general
expenses allocated to new business;
■ capitalization of acquisition expenses linked to new business:
Deferred Acquisition Costs (DAC) and net rights to future
management fees only for investment contracts without DPF;
■ amortization of Deferred Acquisition Costs (DAC) and net rights
to future management fees for investment contracts without
DPF, including the impact of interest capitalized;
■ administrative expenses; and
■ policyholder bonuses if the policyholder participates in the
expenses of the Company.
Underlying VBI amortization includes VBI (Value of Purchased
Life Business In-force) amortization related to underlying margins.
There are certain material diff erences between the detailed
line-by-line presentation in the Statement of Income and the
components of Life & Savings Margin Analysis as set out below:
■ for insurance contracts and investment contracts with
Discretionary Participation Features (DPF):
• gross premiums (net of deposits), fees and other revenues
are allocated in the Margin Analysis based on the nature of
the revenue between “Fees & Revenues” and “Net Technical
Margin”,
• policyholders’ interest in participating contracts is reflected
as a change in insurance benefits in the Statement of Income.
In the Margin Analysis, it is allocated to the related margin,
i.e. primarily “Investment Margin” and “Net Technical Margin”,

475I UNIVERSAL REGISTRATION DOCUMENT - ANNUAL REPORT 2019 - AXA I
APPENDICES
A
APPENDIX V GLOSSARY
• the “Investment margin” represents the net investment result
in the Statement of Income and is adjusted to consider the
related policyholder participation (see above) as well as
changes in specific reserves linked to invested assets’ returns
and to exclude the fees on (or contractual charges included
in) contracts with the financial risk borne by policyholders,
which are included in “Fees & Revenues”,
• change in URR (Unearned Revenue Reserve – capitalization
net of amortization) is presented in the line “Change in
unearned premiums net of unearned revenues and fees” in
the underlying Statement of Income, whereas it is located in
the line “Fees & Revenues” in the Margin Analysis;
■ for investment contracts without DPF:
• deposit accounting is applied. As a consequence, fees and
charges related to these contracts are presented in the
Underlying Statement of Income within Gross Consolidated
Revenues on a separate line, and in Margin Analysis in the
lines “Fees & Revenues” and “Net Technical Margin”,
• change in UFR (Unearned Fee Reserve - capitalization net of
amortization) is presented in the line “Change in unearned
premiums net of unearned revenues & fees” in the Underlying
Statement of Income, whereas it is located in the line “Fees
& Revenues” in the Margin Analysis.
INSURANCE RATIOS (APPLICABLE TO PROPERTY &
CASUALTY, HEALTH AND PROTECTION ACTIVITIES)
Current accident year loss ratio net of reinsurance is the ratio of:
■ current year claims charge gross of reinsurance + claims
handling costs + result of reinsurance ceded on current accident
year, excluding for the discounted reserves the unwind of the
discount rate used in calculating technical reserves; to
■ earned revenues gross of reinsurance.
All accident year loss ratio net of reinsurance is the ratio of:
■ all accident years claims charge gross of reinsurance + claims
handling costs + result of reinsurance ceded on all accident
years, excluding the unwind of the discount rate used in
calculating technical reserves; to
■ earned revenues gross of reinsurance.
Underlying expense ratio is the ratio of:
■ underlying expenses (excluding claims handling costs, including
changes in VBI amortization); to
■ earned revenues gross of reinsurance.
Underlying expenses include two components: expenses
(including commissions) related to the acquisition of contracts
(with the related acquisition expense ratio) and all other expenses
excluding claims handling costs (with the related administrative
expense ratio). Underlying expenses exclude customer intangible
amortization, but include the impact from the changes in VBI
amortization.
The Underlying Combined ratio* is the sum of the all accident
year loss ratio and the underlying expense ratio.
Asset Management
Net inflows: Inflows of client money less outflows of client money.
Net inflows are used by the Management to measure the impact
of sales eff orts, product attractiveness (mainly dependent on
performance and innovation), and the general market trend in
investment allocation.
Underlying cost income ratio is the ratio of:
■ general expenses excluding distribution related expenses; to
■ gross revenues excluding distribution fees received.
Assets under management (AUM) are defined as the assets
whose management has been delegated by their owner to an
asset management company such as AXA Investment Managers.
AUM only include funds and mandates which generate fees and
exclude double counting.
Banking
Operating net banking revenues are disclosed before
intercompany eliminations and before realized capital gains/
losses or changes in fair value of “fair-value-P&L” assets and
hedging derivatives.

476 I UNIVERSAL REGISTRATION DOCUMENT - ANNUAL REPORT 2019 - AXA I
APPENDICES A APPENDIX VI BOARD OF DIRECTORS’ REPORT – CROSS-REFERENCE TABLE
APPENDIX VI BOARD OF DIRECTORS’ REPORT – CROSS-REFERENCE TABLE
This Annual Report includes all the elements required to be included in the Board of Directors’ report of AXA established pursuant to
Articles L.225-100 et seq. of the French Commercial Code (Code de commerce).
The following references to the sections of this Annual Report correspond to the components of the Board of Directors’ report as
approved by the Board of Directors of the Company.
Sections Pages
1. Trends/Earnings/Financial position and key performance indicators 14 to 18; 30 to 90
and 444 to 469
2. Use of financial instruments by the Company when relevant for assessing its assets and liabilities,
financial position, and profits and losses
82 to 88; 176 to 208
and 266 to 285
3. Description of major risk factors and uncertainties 158 to 175 and 190 à 208
4. Internal control and Risk Management procedures 176 to 208
5. Acquisition of significant equity interests in companies headquartered in France 446
6. Events subsequent to fiscal year end/Outlook 88 to 90 and 365
7. Dividend distributions over the last three years 16
8. Information on market and liquidity risks (interest rate, exchange rate and stock price fluctuation risk) 82 to 88 and 158 to 175
and 190 to 201
9. Purchase and sale of the Company’s own shares 376
10. Transactions involving Company stock completed by corporate off icers 144
11. Capital ownership 375 to 376
12. Employee shareholders 376 to 377
13. Adjustment of the rights of holders of securities with a claim on the capital of the Company n/a
14. Extra-financial performance statement 394 to 432
15. Financial risks related to climate change 164 to 165 and 411 to 420
16. Research and development activities 425
17. Terms of payment 446
18. Vigilance plan 433 to 437
19. Corporate governance report 477
Exhibits
20. Table of the Company’s financial results over the last five years 451
21. Report of the Statutory Auditors on the corporate governance report 467

477I UNIVERSAL REGISTRATION DOCUMENT - ANNUAL REPORT 2019 - AXA I
APPENDICES
A
APPENDIX VII CORPORATE GOVERNANCE REPORT – CROSS-REFERENCE TABLE
APPENDIX VII CORPORATE GOVERNANCE REPORT – CROSS-REFERENCE TABLE
This Annual Report includes all the elements required to be included in AXA’s corporate governance report established pursuant to
Articles L.225-37 et seq. of the French Commercial Code (Code de commerce).
The following references to the sections of this Annual Report correspond to the components of the corporate governance report as
approved by the Board of Directors of the Company.
Sections Pages
1. Compensation policy of the coporate off icers 147 to 151
2. Corporate off icers’ compensation 120 to 146
3. Directorships and positions held by the corporate off icers 100 to 107
4. Agreements between a corporate off icer or a shareholder of the Company and a subsidiary of the Company 118
5. Procedure for assessment of ordinary agreements concluded at arm’s length terms and conditions 153
6 . Table of the capital increase delegations 378 and 379
7 . Exercise of Executive Management 92 and 93
8 . Composition and conditions of preparation and organization of the Board of Directors’ work 93 to 116
9 . Application the principle of balanced representation of women and men on the Board of Directors 93 and 94; 97 to 99
10 . Board of Directors’ diversity policy 93 to 96
11 . Gender diversity within leadership teams 404 to 405
12 . Limitation of the powers of the Chief Executive Off icer 110 and 117
13 . Corporate Governance Code of reference 152
14 . Conditions for the participation to Shareholders’ Meetings 391 and 392
15 . Anti-takeover provisions 392

478 I UNIVERSAL REGISTRATION DOCUMENT - ANNUAL REPORT 2019 - AXA I
APPENDICES A APPENDIX VIII COMMISSION DELEGATED REGULATION (EU) 2019/980 OF MARCH 14, 2019 – CROSS-REFERENCE TABLE
A PPENDIX VIII COMMISSION DELEGATED REGULATION (EU) 2019/980 OF MARCH 14, 2019 – CROSS- REFERENCE TABLE
Universal Registration Document filed with the Autorité des marchés financiers (“AMF”) on March 19, 2020.
ANNEX 1 OF COMMISSION DELEGATED REGULATION (EU) 2019/980
Items Pages
1.
Persons responsible, third party information, experts’ reports and competent authority
approval
1.1 Indication of responsible persons 443
1.2 Statement by responsible persons 443
1.3 Statement or report attributed to a person as an expert n/a
1.4 Information obtained from third parties n/a
1.5 Statement of approval of the Registration Document by the competent authority n/a
2. Statutory Auditors
2.1 Names and addresses of the auditors, including membership in a professional body 361
2.2 Resignation, removal or re-appointment of auditors 361
3. Risk factors 158 to 175
4. Information about the issuer
4.1 Legal and commercial name 380; 390
4.2 Place and number of registration, and legal entity identifier (LEI) 380
4.3 Date of incorporation and length of life 380
4.4 Registered off ice, legal form, applicable law, country of incorporation,
address and phone number of its registered off ice, and website
1; 380
5. Business overview
5.1 Principal activities
5.1.1 Nature of the operations and main activities 21 to 28 and 40 to 43
5.1.2 New products and/or services 21 to 28
5.2 Principal markets 30 to 34
5.3 Important events in the development of the issuer’s business 35 to 39
5.4 Strategy and objectives 8 to 9; 11
5.5 Degree of dependence on patents or licenses, industrial, commercial or financial
contracts or new manufacturing process
n/a
5.6 Basis for statements made by the issuer regarding its competitive position 31 to 33
5.7 Investments
5.7.1 Material investments completed 36
5.7.2 Material investments in progress or for which firm commitments
have already been made
n/a
5.7.3 Significant joint ventures and undertakings 241 to 246; 286-290; 454 to 457
5.7.4 Environmental issues that may aff ect the issuer’s utilization
of the tangible fixed assets
386; 411 to 420

479I UNIVERSAL REGISTRATION DOCUMENT - ANNUAL REPORT 2019 - AXA I
APPENDICES
A
APPENDIX VIII COMMISSION DELEGATED REGULATION (EU) 2019/980 OF MARCH 14, 2019 – CROSS-REFERENCE TABLE
Items Pages
6. Organizational structure
6.1 Brief description of the Group and the issuer’s position within the Group 6 to 11; 14
6.2 List of the issuer’s significant subsidiaries 241 to 246
7. Operating and financial review
7.1 Financial condition 210 to 219
7.2 Operating results
7.2.1 Significant factors materially aff ecting the income from operations 47 to 49
7.2.2 Reasons of the change in net sales or revenues 40 to 43
8. Capital resources
8.1 Issuer’s capital resources 82 to 88; 315 to 317
8.2 Sources and amounts of the issuer’s cash flows 82 to 85; 218 to 219; 292 to 293
8.3 Borrowing requirements and funding structure of the issuer 82 to 88; 315 to 317
8.4 Restrictions on the use of capital resources 82 to 88
8.5 Anticipated sources of funds needed to perform commitments referred to in Item 5.7.2 82 to 85
9. Regulatory environment 380 to 392
10. Trend information
10.1(a) Most significant recent trends in production, sales and inventory,
and costs and selling price
88 to 90; 365
10.1(b) Any significant change in the financial performance of the Group
from December 31, 2019 to the date of the Registration Document
88 to 89; 365
10.2 Known trends, uncertainties, demands, commitments or events that
are reasonably likely to have a material eff ect on the issuer’s prospects
89 to 90; 365; 380 to 392
11. Profit forecasts or estimates
11.1 Inclusion of profit forecast or estimate in the Registration Document n/a
11.2 Assumptions upon which the issuer has based its forecast or estimate n/a
11.3 Statement that the profit forecast or estimate has been compiled and
prepared on a basis which is both: (a) comparable with the historical financial
information; (b) consistent with the issuer’s accounting policies
n/a
12. Administrative, management, and supervisory bodies and senior management
12.1 Information concerning members of the Board of Directors and senior management 92 to 118
12.2 Conflicts of interests aff ecting administrative, management and supervisory
bodies and senior management
118; 142 and 143; 153;
356 and 357
13. Remuneration and benefits
13.1 Amount of remuneration paid and benefits in kind granted by the issuer
and its subsidiaries
120 to 144
13.2 Amounts set aside or accrued by the issuer or its subsidiaries to provide for pension,
retirement or similar benefits
145 and 146
14. Board practices
14.1 Current terms of off ice 98 to 99
14.2 Information about members of the administrative, management or supervisory bodies’
service contracts with the issuer or any of its subsidiaries providing for benefits upon
termination of employment
118
14.3 Information about the issuer’s Audit Committee and Remuneration Committee 114 and 116
14.4 Statement regarding the compliance with the corporate governance regime
applicable to the issuer
152
14.5 Potential material impacts on the corporate governance 99
15. Employees
15.1 Number of employees 119; 402
15.2 Shareholdings and stock options 137 to 143
15.3 Arrangements for involving the employees in the capital of the issuer 131 to 143
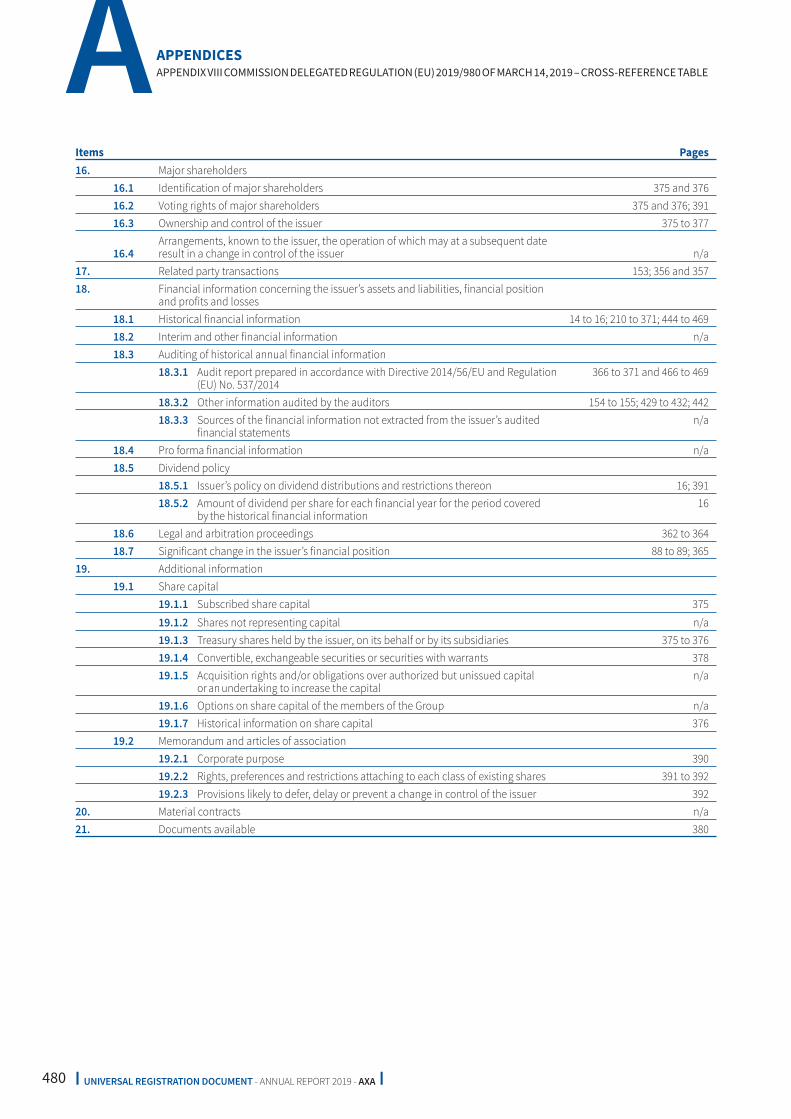
480 I UNIVERSAL REGISTRATION DOCUMENT - ANNUAL REPORT 2019 - AXA I
APPENDICES A APPENDIX VIII COMMISSION DELEGATED REGULATION (EU) 2019/980 OF MARCH 14, 2019 – CROSS-REFERENCE TABLE
Items Pages
16. Major shareholders
16.1 Identification of major shareholders 375 and 376
16.2 Voting rights of major shareholders 375 and 376; 391
16.3 Ownership and control of the issuer 375 to 377
16.4
Arrangements, known to the issuer, the operation of which may at a subsequent date
result in a change in control of the issuer n/a
17. Related party transactions 153; 356 and 357
18. Financial information concerning the issuer’s assets and liabilities, financial position
and profits and losses
18.1 Historical financial information 14 to 16; 210 to 371; 444 to 469
18.2 Interim and other financial information n/a
18.3 Auditing of historical annual financial information
18.3.1 Audit report prepared in accordance with Directive 2014/56/EU and Regulation
(EU) No. 537/2014
366 to 371 and 466 to 469
18.3.2 Other information audited by the auditors 154 to 155; 429 to 432; 442
18.3.3 Sources of the financial information not extracted from the issuer’s audited
financial statements
n/a
18.4 Pro forma financial information n/a
18.5 Dividend policy
18.5.1 Issuer’s policy on dividend distributions and restrictions thereon 16; 391
18.5.2 Amount of dividend per share for each financial year for the period covered
by the historical financial information
16
18.6 Legal and arbitration proceedings 362 to 364
18.7 Significant change in the issuer’s financial position 88 to 89; 365
19. Additional information
19.1 Share capital
19.1.1 Subscribed share capital 375
19.1.2 Shares not representing capital n/a
19.1.3 Treasury shares held by the issuer, on its behalf or by its subsidiaries 375 to 376
19.1.4 Convertible, exchangeable securities or securities with warrants 378
19.1.5 Acquisition rights and/or obligations over authorized but unissued capital
or an undertaking to increase the capital
n/a
19.1.6 Options on share capital of the members of the Group n/a
19.1.7 Historical information on share capital 376
19.2 Memorandum and articles of association
19.2.1 Corporate purpose 390
19.2.2 Rights, preferences and restrictions attaching to each class of existing shares 391 to 392
19.2.3 Provisions likely to defer, delay or prevent a change in control of the issuer 392
20. Material contracts n/a
21. Documents available 380

481I UNIVERSAL REGISTRATION DOCUMENT - ANNUAL REPORT 2019 - AXA I
APPENDICES
A
APPENDIX VIII COMMISSION DELEGATED REGULATION (EU) 2019/980 OF MARCH 14, 2019 – CROSS-REFERENCE TABLE
ANNEX 2 OF COMMISSION DELEGATED REGULATION (EU) 2019/980
Items Pages
1. Information to be disclosed about the issuer
1.1
Information disclosed in accordance with Annex 1 of Commission Delegated Regulation (EU)
2019/980 478 to 480
1.2
Statement that (a) the universal Registration Document has been filed with the AMF
as the competent authority under Regulation (EU) 2017/1129 without prior approval
pursuant to Article 9 of Regulation (EU) 2017/1129; and (b) the universal Registration
Document may be used for the purposes of an off er to the public of securities or admission
of securities to trading on a regulated market if approved by the AMF together with any
amendments, if applicable, and a securities note and summary approved in accordance
with Regulation (EU) 2017/1129 1
Pursuant to Article 19 of Regulation (EU) 2017/1129, the following
items are incorporated by reference into this Universal Registration
Document:
■ the following sections of AXA’s Registration Document for
the year ended December 31, 2018 (the “2018 DDR”), the
French version of which was filed with the AMF on March 11,
2019 under number D.19-0130 and is available on the AMF’s
website within the AMF’s Decisions and Financial Disclosures
Database (the “BDIF”) https://bdif.amf-france.org/technique/
multimedia?docId=a0c912e8-745d-4629-ab1e-2789120dd695
&famille=BDIF&bdifId=0310-91.D_D.19-0130 :
(a) Section 2.2 “Operating Highlights” on pages 37 to 44;
(b) the report of the Board of Directors of AXA for the year
ended December 31, 2018, including all sections listed in
Appendix VI “Board of Directors’ report – Cross-Reference
Table” on page 480; and
(c) Part 5 “Consolidated Financial Statements”, which includes
AXA’s consolidated financial statements for the year ended
December 31, 2018 and the Statutory Auditors’ report
thereon, respectively, on pages 215 to 369 and pages 370
to 376;
■ the following sections of AXA’s Registration Document for
the year ended December 31, 2017 (the “2017 DDR”), the
French version of which was filed with the AMF on March 19,
2018 under number D.18-0145 and is available on the AMF’s
website within the BDIF https://bdif.amf-france.org/technique/
multimedia?docId=037df515-e0bf-4744-909f-2733858ff 676&fa
mille=BDIF&bdifId=5410-81.D_D.18-0145:
(a) Section 2.2 “Operating Highlights” on pages 30 to 33;
(b) the report of the Board of Directors of AXA for the year
ended December 31, 2017, including all sections listed in
Appendix VI “Board of Directors’ report – Cross-Reference
Table” on page 438; and
(c) Part 5 “Consolidated Financial Statements”, which includes
AXA’s consolidated financial statements for the year ended
December 31, 2017 and the Statutory Auditors’ report
thereon, respectively, on pages 187 to 333 and pages 334
to 339;
■ the Bylaws of AXA SA, as amended from time to time, are
available on the website of the Company (https://group.axa.
com/en/about-us/governance-overview).
The non-incorporated parts of the 2017 DDR and the 2018 DDR
are either not relevant for investors or covered elsewhere in this
Universal Registration Document.

482 I UNIVERSAL REGISTRATION DOCUMENT - ANNUAL REPORT 2019 - AXA I
APPENDICES A APPENDIX IX ANNUAL FINANCIAL REPORT – CROSS-REFERENCE TABLE
APPENDIX IX ANNUAL FINANCIAL REPORT – CROSS-REFERENCE TABLE
This Annual Report includes all the components of the Annual Financial Report (Rapport Financier Annuel) referred to in paragraph I of
Article L.451-1-2 of the French Monetary and Financial Code (Code monétaire et financier) as well as in Article 222-3 of the AMF General
Regulation.
The following references to sections of this Annual Report correspond to the components of the Annual Financial Report.
Sections Pages
Financial statements of AXA, the parent Company 444 to 465
Consolidated financial statements of the Group 210 to 365
Board of Directors’ report 476
Statement made by the person responsible for the Annual Financial Report 443
Report of the Statutory Auditors on the financial statements of AXA, the parent Company 466 to 469
Report of the Statutory Auditors on the consolidated financial statements of the Group 366 to 371
Statutory Auditors’ fees 361 and 362
Corporate governance report 477
Report of the Statutory Auditors on the corporate governance report 467

483I UNIVERSAL REGISTRATION DOCUMENT - ANNUAL REPORT 2019 - AXA I
NOTES

484 I UNIVERSAL REGISTRATION DOCUMENT - ANNUAL REPORT 2019 - AXA I
NOTES

CONTACTS
Readers can address any comments and questions
on this document to:
Analysts and Institutional Investors
AXA Group
25, avenue Matignon
75008 Paris – France
Phone: + 33 (0) 1 40 75 48 42
E-mail: [email protected]
Individual Shareholders
AXA Group
Retail Shareholders Relations
25, avenue Matignon
75008 Paris – France
Phone: 0 800 43 48 43
(toll-free number from France)
Phone: + 33 (0) 1 40 75 48 43
E-mail: [email protected]
THIS UNIVERSAL
REGISTRATION DOCUMENT
IS ALSO AVAILABLE
ON THE COMPANY’S
WEBSITE AT
www.axa.com
on which you will fi nd the aggregate
regulated information published by
our Company.
Photos: © Raphaël Dautigny, Benjamin Boccas, Antoine Doyen.
This document is printed in compliance with ISO 14001.2004 for an environment management system.

www.axa.com