2020 UNIVERSAL REGISTRATION DOCUMENT - Manitou ...
212
2020 U NIVERSAL R EGISTRATION D OCUMENT 1 2020 UNIVERSAL REGISTRATION DOCUMENT INCLUDING THE ANNUAL FINANCIAL REPORT
-
Upload
khangminh22 -
Category
Documents
-
view
3 -
download
0
Transcript of 2020 UNIVERSAL REGISTRATION DOCUMENT - Manitou ...
2020 UNIVERSAL REGIST RATION DOC UMENT 1
2020 UNIVERSAL REGISTRATION DOCUMENT
INCLUDING THE ANNUAL FINANCIAL REPORT
2
This universal registration document was submitted on April 16, 2021 to the AMF in its capacity as competent authority pursuant to Regulation (EU) no. 2017/1129, without prior approval in accordance with Article 9 of said regulation.
The universal registration document may be used for the purposes of offering financial securities to the public or admitting financial securities for trading on a regulated market, if it is accompanied by an offering notice and, as applicable, a summary and all amendments made to the universal registration document. The whole set of documents is then approved by the AMF in accordance with Regulation (EU) no. 2017/1129.
This document is a copy of the official version of the universal registration document incorporating the 2020 annual financial report, which was prepared in ESEF (European Single Electronic Format) and filed with the AMF. It is available on the Company's website and the AMF's website.
2020 UNIVERSAL REGIST RATION DOC UMENT 3
TABLE OF CONTENTS

4
EDITORIAL MESSAGE FROM THE CHAIRMAN OF THE BOARD OF DIRECTORS
2020 will certainly be a year forever marked by the pandemic that hit the entire world.
We thought that after a record 2019 year, 2020 would be down slightly. But everything stopped in March due to the lockdown. Only production units based in the United States have been able to continue working but with lower throughputs. We also managed to keep our spare parts service active, with a small team, but under safe working conditions.
Here, I must commend these teams, who have worked tirelessly, and those who have also prepared for the recovery by implementing the protocols and steps necessary to protect our employees.
The first half of the year saw a very sharp drop in revenue compared to the previous year. We then immediately made the decision to stop or freeze investment projects and drastically reduce the company's operating expenses, thus ending the first half of the year with positive net income of €13.5 million, despite revenue that was down -35% compared to 2019.
But this was without counting on our ability to rebound. Our teams continued to make progress on the implementation of our ERP, particularly in our Italian production subsidiary and commercial subsidiaries. We have also decided to completely restructure our manufacturing activities in the United States to make work on our ranges more streamlined. This led to the closure of the Waco site in Texas and the reorganization of manufacturing at other US and European sites.
The external structure of our new Candé plant for the manufacture of platforms is now complete. The interior facilities will be operational as of summer 2021. Projects in India also advanced. In a nutshell, the health crisis did not put a stop to everything. We have prepared for a possible recovery, and the end of the year has proven us right.
After a more than bleak first half of the year, order intake reached a particularly high level in Q4 2020 thanks to the continued work of our dealers and sales representatives, and renters who had taken a wait-and-see also returned for purchases at the end of 2020.
Our financial year therefore ended down compared to 2019 but was still strong given the working conditions experienced during 2020.
Our Board of Directors had cautiously suspended the dividend expected in June, and we were ultimately able, as we expected, to pay a dividend at the end of 2020.
Once again, we put our trust in the leadership and "women and men of Manitou." After "breaking" at just the right time, we will be able to get started on the right foot! And the projects for 2021 and the coming years are ambitious.
This pandemic will certainly profoundly alter the working world and the methods of working and communication. We are on our way with these changes, which we want to implement immediately with determination and on a voluntary basis. The development of digitalization and all CSR topics are now essential points, and we will continue to work to progress in these areas. The optimization of our industrial organization will also increase our performance.
In 2020 once again, our Board of Directors worked closely with the CEO and the Executive Committee to act cautiously but also with agility.
I would like to thank our shareholders, who continue to put their trust in us.
Jacqueline Himsworth
Chairman of the Board of Directors

2020 UNIVERSAL REGIST RATION DOC UMENT 5
MESSAGE FROM THE CEO
VISION AND STRATEGIC PRIORITIES
A year of profound change
Who could have imagined this at the beginning of 2020? In a few weeks, the Covid-19 pandemic disrupted the world, wiped out our certainty, caused the sudden halt of all markets, and impacted our industrial activities in all geographic regions. An unprecedented storm!
Reinventing our methods and our organization
In this particular context, we had to reinvent our working methods and organizational models. With preserving the health of employees and the sustainability of the company as our priorities, we worked to simplify our channels and optimize our cost control through concrete measures:
Accelerating digitization in our day-to-day lives.
Creating a single product division in order to streamline our activities.
Relocating our forklift production from the United States to France.
Accelerating the deployment of an ERP common to all of our production sites and subsidiaries in order to harmonize our processes.
Staying the course no matter what
Thus, with everyone mobilized around an efficient operational structure, I am proud to say that we managed to carry out several major projects:
The presentation in the United States of our first Gehl electric skid steer concept and the first deliveries of our 100% electric rough-terrain platform, highlighting our ecological transition.
Co-construction with our stakeholders of our new 2025 CSR road map, thanks to a consultation conducted in partnership with students from the Asian Business School of Management in Manila, Philippines. This collaboration was recognized by the UN PRME Innovation Challenge program.
The diversification of our service offering in order to provide our customers with increasingly comprehensive solutions: machine connectivity, financing, after-sales service, etc.
The launch of a new range of autonomous machines for logistics platforms.
The enhancement of our NewAg range (MLT 841/1041) with new telehandler models.
Thanks to the unwavering commitment of our teams, we also maintained our ties and proximity with our customers, despite the constraints we encountered. We thank each and every one of them.
Results in line with our commitment
This exemplary commitment paid off, as Manitou Group finished 2020 with sales of €1.6 billion, slightly above expectations, and recorded an all-time record order intake in the last quarter. This recovery, which is much stronger than the initial projections, is the result of the tremendous work carried out by our sales teams on the ground, supported by a more favorable economic outlook across our markets. This renewed momentum allows the group to announce a growth outlook of more than 10% for 2021.
Getting the world back in motion
This atypical year revealed, once again, the strength of our group as well as the total investment and passion that motivates its employees, which helped us overcome the difficulties. With this collective support, we will be able to roll out our new road map in 2021 by continuing to assert our commitment, as our institutional signature says, to "set the world (back) in motion."
Michel Denis
CEO

6
MANITOU GROUP
2020 UNIVERSAL REGIST RATION DOC UMENT 7
8
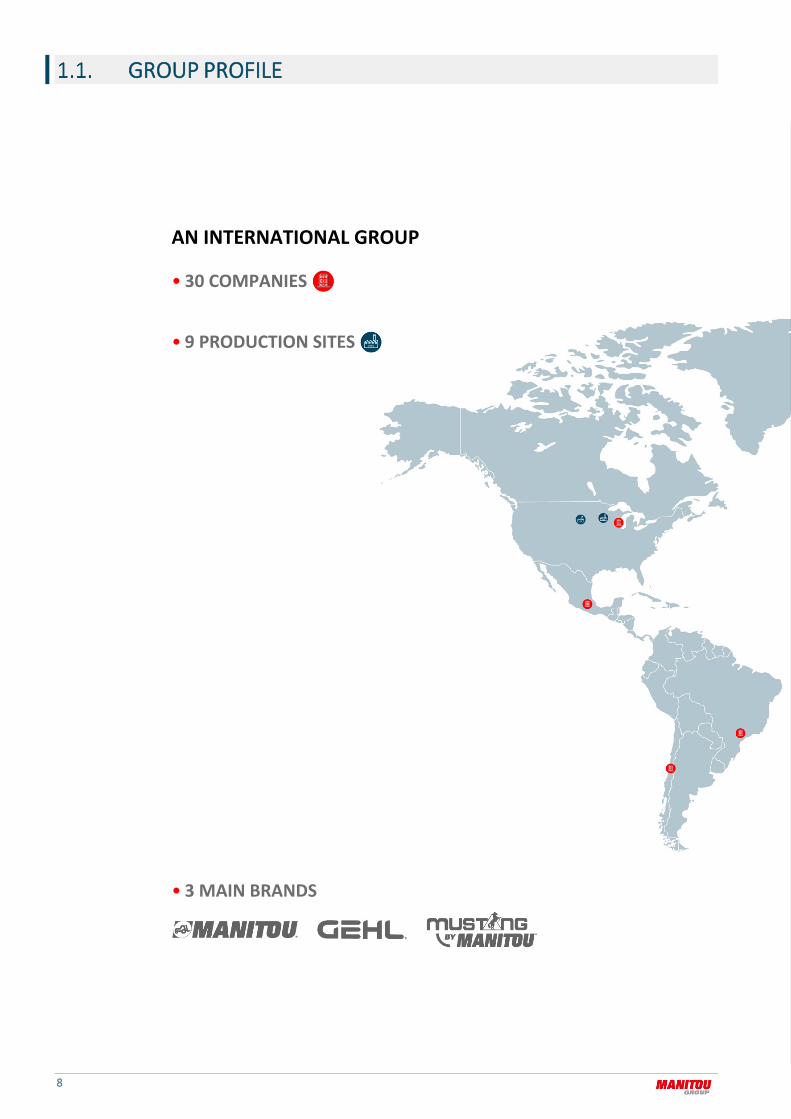
GROUP PROFILE
AN INTERNATIONAL GROUP
• 9 PRODUCTION SITES
• 3 MAIN BRANDS
• 30 COMPANIES
2020 UNIVERSAL REGIST RATION DOC UMENT 9
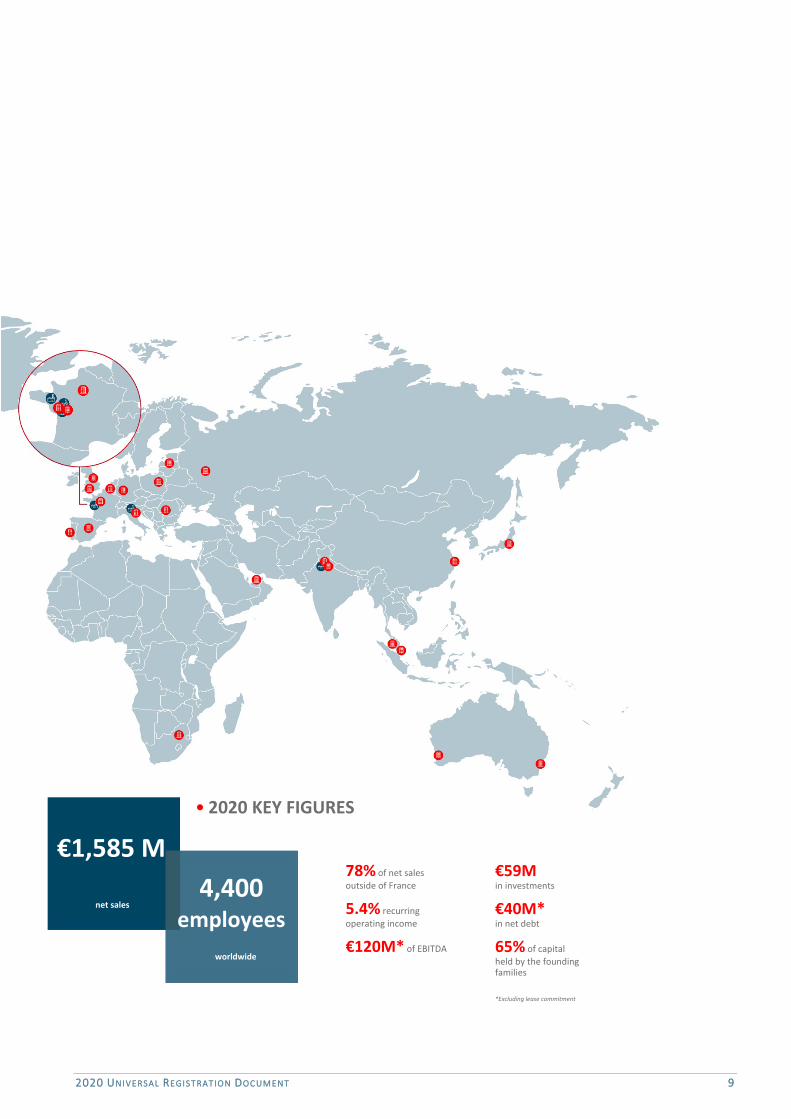
€1,585 M • 2020 KEY FIGURES
net sales 4,400
employees worldwide
78% of net sales outside of France
5.4% recurring operating income
€120M* of EBITDA
€59M in investments
€40M* in net debt
65% of capital held by the founding families
*Excluding lease commitment

10
HISTORY AND HIGHLIGHTS
GROUP HISTORY
1945 Creation of the Ets BRAUD Mécanique Générale by Andrée Braud, a construction and public works company.
1953 Association Braud and Faucheux, with Henri Faucheux.
2017 Acquisition of the company Terex Equipment India.
2019 Historic record for revenue (> €2BN) and income.
2018 • Celebration of 60 years since the first Manitou forklift. • Introduction of the world's first electric telehandler prototype.
2015 Celebration of the 500,000th machine produced.
SIGNIFICANT EVENTS IN 2020 MARCH Covid-19 crisis: implementation of the Resilience plan based on four pillars: operator safety and restarting operations, activity with adaptation of deliveries and order book, cost reduction to adapt to sales and production volumes with reorganizations in the USA, South Africa, India, and Brazil, and cash flow by securing financing.
Closure of production sites in France, Italy, and India for health reasons.
For the first time, Manitou Group unveiled the Gehl 165E, an electric skid steer loader prototype at the Conexpo exhibition in Las Vegas. This zero-emission machine, powered by lithium-ion batteries, illustrates the group's commitment to alternative energy.
Capital magazine ranked Manitou Group the 2nd best employer in France.
Commercial launch in Europe of the 200 ATJ E, the first 100% electric rough-terrain platform to work up to 20 meters high. This environmentally-responsible solution is a key step in the energy transformation and guarantees increased return on investment and reduced operating costs on internal and external projects.
MAY Recovery of production at all sites.
JUNE Manitou Group signed the EMC2 (European competitiveness cluster for manufacturing technologies) manifesto to promote an environmentally responsible industry. Like 33 other industrial companies in western France, the group is committed to ensuring that the rebound in activity after Covid-19 gives rise to a sober and environmentally friendly industry that puts humans at the heart of its concerns and is innovative, collaborative, and committed to solidarity.
SEPTEMBER Manitou Group and the Asian Institute of Management won the PRME Innovation challenge organized by the United Nations. Following the consultation conducted by the students with the group's various stakeholders, a new 2021-2025 CSR road map was co-constructed.
Signing of a strategic partnership with Effidence for the co-development and marketing of a range of logistics robots for warehouse activities.
Appointment of Carole Lajous as Group HR Director and member of the Executive Committee.
Michel Trotter joined the Board of Directors as an employee Board member.

2020 UNIVERSAL REGIST RATION DOC UMENT 11
1958 Creation of the first rough-terrain forklift based on the idea of Marcel Braud.
1963 Creation of the Manitou department at Braud and Faucheux.
1980 Celebration of the 50,000th Manitou rough-terrain forklift.
1984 Entry to the Secondary Stock Market in Paris.
1959 Launch of the Manitou brand (in French“manie tout” - handles everything).
1972 Beginning of internationalization with the opening of the first subsidiary in the United Kingdom.
1981 Launch of the first telehandlers in Ancenis.
2010 Launch of Gehl and Mustang articulated loaders.
1995 Launch of the first truck-mounted forklifts.
1986 Acquisition of stake in FARGH, which will become MCI, the Italian subsidiary.
2008 Acquisition of the American company, Gehl Company, specialized in agricultural equipment since 1859.
1993 • Launch of the first MRT rotating telehandlers and aerial work platforms. • Acquisition of Loc Manutention.
1985 Creation of the first US subsidiary "K-D Manitou" Waco in Texas.
OCTOBER Manitou Group is formalizing its partnership with the innovative and environmentally-responsible company Neoline, which specializes in ro-ro freight shipping. With the signing of this contract, the group is accelerating its ecological transition by choosing a solution that drastically reduces the carbon impact of its exports to the United States.
NOVEMBER Co-optation of Alexandre Matzneff as independent Board member of Manitou BF.
DECEMBER Manitou Group streamlines its operations in the United States and announces the closure of its operations in Waco (Texas) scheduled for the end of March 2021.
Announcement of the creation of the Products Division resulting from the merger of the MHA and CEP activities, under the leadership of Elisabeth Ausimour as of January 1st.
In 2020, the group maintained its position as number 18 of 230 companies in the Gaïa index, which assesses corporate social responsibility, and 15th out of 81 companies in the above €500 million revenue category. Its overall rating increased from 77 to 82/100.
Portrait of Mr. Marcel Braud In 1953, Marcel Braud joined the family business Braud and Faucheux, alongside his mother, Andrée Braud. The family business manufactured concrete, cranes, and concrete block presses.
Then in 1958 as a workshop leader, he had the idea of diversifying the company's activity by "inverting" the classic use of a tractor to make it a rough-terrain forklift. It would make the company's success and give it global reach.
Marcel Braud would go on to hold various positions, from workshop manager to head of procurement, before taking on the position of Chairman and CEO of Manitou BF from 1971 to 1998. He would then become Chairman of the Supervisory Board, then of the Board of Directors until 2017.
Today, Marcel Braud is Honorary Chairman and Founder of the Manitou forklift truck.

12
GROUP GOVERNANCE The group relies on its strong corporate governance structure led by the Board of Directors, comprised of 12 members, 4 of whom are independent members, and two employee representatives, as well as by the Executive Committee, which is comprised of six members, one of whom is the CEO.
The primary mission of this corporate governance structure is to define and implement the group's strategy.
For more information, see chapter 5 “Corporate Governance.”
COMPOSITION OF THE BOARD OF DIRECTORS
1 Jacqueline Himsworth – Chairman of the Board of Directors
2 Michel Trotter – Employee Board member
3 Stéphane Renaud – Employee Board member
4 Dominique Bamas – Independent Board member
5 Alexandra Matzneff – Independent Board member
6 Gordon Himsworth – Board member
7 Sébastien Braud – Board member
8 Cécile Helme-Guizon – Independent Board member
9 Emilie Braud – Board member
10 Pierre-Henri Ricaud – Independent Board member
11 Marcel-Claude Braud – Board member
12 Christopher Himsworth – Board member
COMPOSITION OF THE EXECUTIVE COMMITTEE
1 Michel Denis – President & CEO
2 Maxime Deroch – President, Services & Solutions division
3 Elisabeth Ausimour – President, Products Division
4 Hervé Rochet – Secretary General & CFO
5 Laurent Bonnaure – Executive Vice President, Sales & Marketing
6 Carole Lajous – Executive Vice President, Human Resources
6
1
9
11 7
12
6 4 8 5
10 3 2
5
4 1
3
2

2020 UNIVERSAL REGIST RATION DOC UMENT 13
PRESENTATION OF ACTIVITIES AND MARKETS
THE GROUP'S ACTIVITIES
A worldwide reference in handling, access platforms, and earth moving equipment, Manitou Group's mission is to improve working conditions, safety, and performance around the world, while protecting people and their environment.
Through its three iconic brands - Manitou, Gehl, and Mustang by Manitou - the group develops, manufactures, and provides equipment and services for construction, agriculture, and industries.
Since January 1, 2021, the group's organization has been based on two divisions around which the operating activities are structured: the Products division, the consolidation of the two Handling and Access divisions (MHA - Material Handling & Access) and Compact Equipment (CEP - Compact Equipment Products) and the Services and Solutions division.
The distribution of the group’s range of products and services is led by the sales and marketing entity, which both develops the network of 1,050 dealerships and builds direct relationships with key accounts (international groups and rental companies). The group is active in 140 countries.
NET SALES BY DIVISION AS OF DECEMBER 31, 2020
PRODUCTS DIVISION
The Products division designs, manufactures, and distributes material handling, access, and earthmoving equipment for construction, agriculture and industrial markets (environment, defense, oil & gas, mines and quarries, etc.). It boosts group development through the quality, appeal, and competitiveness of its products, thus pursuing the historic tradition. The product ranges cover rough-terrain fixed, rotating, and heavy tonnage telehandlers, rough-terrain, semi-industrial, and industrial forklift trucks, wheeled or tracked skid-steer loaders, articulated loaders, backhoe loaders, aerial work platforms, truck-mounted forklifts, as well as warehousing equipment and attachments. The division develops and manufactures all of its machines at sites in Ancenis, Candé, Laillé and Beaupréau (France), Castelfranco (Italy), Yankton and Madison (United States), and Greater Noida (India).
FIXED TELEHANDLERS
With a reach of between 4 and 18 meters and a lifting capacity of up to 6 tons, the fixed telehandlers are used in both the construction and agricultural sectors, and the utilization rate of the telehandler may be up to 1,500 hours per year. A wide variety of attachments (bucket, jib, winch, cup, clamps, etc.) make the telehandlers very versatile.
ROTATING TELEHANDLERS
The rotating telehandlers make it simple to lift loads or personnel to heights ranging from 14 to 32 meters with a load capacity of up to 7 tons. These characteristics give these telehandlers with the largest lifting capacity in the world. The very large range of available attachments and the 360 degree rotation make these machines very versatile for any work site, including civil engineering works.
HEAVY TONNAGE TELEHANDLERS
The heavy tonnage rough-terrain equipment offers specialized handling solutions for the environmental, mining, and industrial sectors, as well as to institutional customers such as the armed forces and organizations such as the UN, civil protection bodies, etc. When equipped with attachments such as tire clamps or cylinder clamps, these machines manage the maintenance of bulky, heavy equipment. The highest-performing equipment can lift loads of over 33 tons to a height of up to 12 meters.
S&S 19%
CEP 16%
MHA 65%

14
AERIAL WORK PLATFORMS
The platforms designed and marketed by the group include articulated, telescopic, and vertical platforms. They are adapted to a working height of between 8 and 28 meters depending on the model.
The engines of the platforms are primarily combustion engines for rough-terrain outdoor uses or electric engines for interior industrial applications. In 2019, Manitou launched the "Oxygen" label to classify low-pollution products. The first machine of this label is an all-terrain zero-emission 20 meter-high aerial work platform.
The platforms are primarily marketed through independent regional, national, or international rental companies, which makes this a cyclical business.
ROUGH-TERRAIN FORKLIFT TRUCKS
Sturdy and simple to use, the rough-terrain forklift trucks are the ideal product for outdoor applications where stability and maneuverability are essential. With a load capacity ranging from 1.8 to 7 tons, they carry heavy and bulky loads and are designed to work on all the land, even the most rugged.
INDUSTRIAL AND SEMI-INDUSTRIAL FORKLIFT
TRUCKS
The forklift trucks are designed for industrial handling applications. Several ranges are offered to meet various user needs: semi-industrial forklift trucks, combustion forklift trucks, and electric forklift trucks.
TRUCK-MOUNTED FORKLIFTS
The truck-mounted forklifts are compact forklifts that use telescopic booms or masts and are intended to meet the handling needs of carriers. The days of waiting for a forklift truck to become available for unloading are over. A forklift mounted directly on the truck gives the carrier total autonomy and provides a complete handling service.
WAREHOUSING EQUIPMENT
Warehousing equipment is distributed under the Loc and Manitou brand names and is designed for warehouse handling activities. Numerous adaptations allow the equipment to be used for specific purposes.

2020 UNIVERSAL REGIST RATION DOC UMENT 15
SKID-STEERS
Skid-steers are compact handling machines that are both highly agile and versatile and can pivot 360°. Their small size means they can be used in cramped environments. Simple and robust, these machines can be equipped with multiple attachments for a wide range of applications. Skid-steers are primarily intended for the construction and agricultural sectors, and to a lesser extent, the industrial sector.
ARTICULATED LOADERS
Articulated loaders are compact and versatile machines of small, medium, or high capacity designed to conduct handling operations in tight spaces.
TRACK LOADERS
The track loaders are designed with tracks, which make them particularly agile on loose surfaces. This type of equipment is mainly used for construction and agriculture.
BACKHOE LOADERS
In 2017, the group added to its offering with a range of backhoe loaders produced by its production site located in India. This range is aimed at the Asian markets and is suitable for the construction industry in these countries.
16
SERVICES AND SOLUTIONS DIVISION
The S&S, Services & Solutions, division seeks to develop offerings that meet the expectations of its users. In addition to the products and their performance, Manitou Group supports its customers with a range of value-added services: technical training for the network and major accounts, new or refurbished spare parts, after-sales service, machine connectivity, financing solutions, maintenance contracts, warranty extension contracts, rent-to-rent leases, full service contracts, recovery, repair, and resale of used equipment. Developed in partnership with its dealers and large accounts, these services provide support to our customers throughout the life cycle of the machine and differentiate themselves by promoting proximity, collaboration, and long-term loyalty.
SPARE PARTS
All new spare parts for the maintenance and repair of machines are available for order through various digital tools. Manitou Group is also a committed player in the circular economy and sells a standard alternative exchange parts solution.
Five main platforms for storage and shipping are based in France, the United States, Italy, India, and Singapore to ensure delivery of parts to its customers within the shortest possible time frame. For regions that are farther away, some of the group’s distribution subsidiaries are also equipped with logistics platforms for improved responsiveness.
ATTACHMENTS
A wide range of traditional or customized attachments is offered to make the machines versatile, an essential advantage for customers. The group offers solutions to customers when purchasing the machine or during its life cycle through the S&S division and its spare parts channel.
In order to better serve customers and strengthen the expertise acquired in attachments, the group has created a unique brand "Manitou Group Attachments" to equip all the group's machines.
FINANCING SOLUTIONS
End customers are offered a complete range of solutions incorporating financing and services (extension of warranty / maintenance). Stock financing solutions for the Manitou network are also available in certain countries to give customers a simple solution to ensure that cash flow problems are not an obstacle to sales development.
FLEET MANAGEMENT
In order to respond to the operational needs of its key accounts, the S&S division offers direct management of the maintenance of industrial forklift trucks and other leased equipment (including a full-service contract and long or short-term rentals). Our customers can focus on their core business by delegating their fleet management to us.
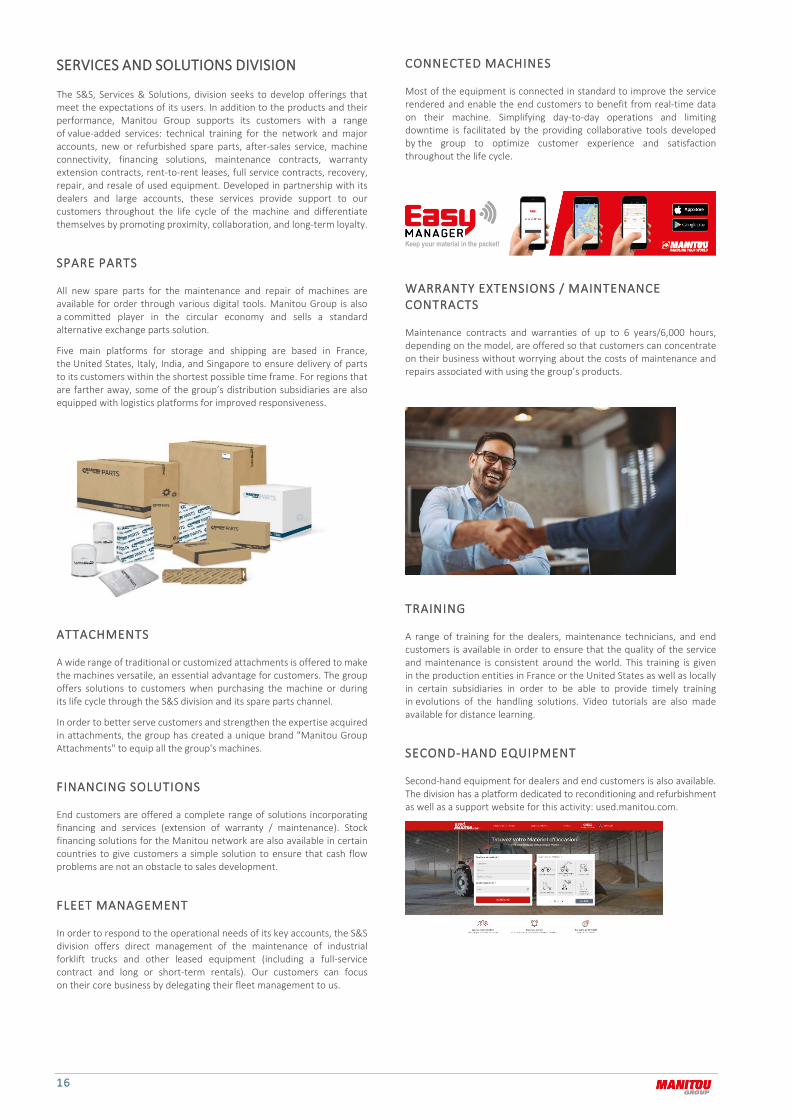
CONNECTED MACHINES
Most of the equipment is connected in standard to improve the service rendered and enable the end customers to benefit from real-time data on their machine. Simplifying day-to-day operations and limiting downtime is facilitated by the providing collaborative tools developed by the group to optimize customer experience and satisfaction throughout the life cycle.
WARRANTY EXTENSIONS / MAINTENANCE
CONTRACTS
Maintenance contracts and warranties of up to 6 years/6,000 hours, depending on the model, are offered so that customers can concentrate on their business without worrying about the costs of maintenance and repairs associated with using the group’s products.
TRAINING
A range of training for the dealers, maintenance technicians, and end customers is available in order to ensure that the quality of the service and maintenance is consistent around the world. This training is given in the production entities in France or the United States as well as locally in certain subsidiaries in order to be able to provide timely training in evolutions of the handling solutions. Video tutorials are also made available for distance learning.
SECOND-HAND EQUIPMENT
Second-hand equipment for dealers and end customers is also available. The division has a platform dedicated to reconditioning and refurbishment as well as a support website for this activity: used.manitou.com.
Keep your material in the packet!

2020 UNIVERSAL REGIST RATION DOC UMENT 17
SALES REGIONS AND MARKETS
SALES REGIONS
The distribution of the group’s full range of products and services is led by the sales and marketing entity (S&M), which both develops the network of business partners (dealers) and builds direct relationships with key accounts (international groups and rental companies). The group is active in 140 countries.
These sales and marketing teams are divided into four geographical regions:
the Northern Europe region represented 37% of the group's revenue in 2020. The primary countries in this region are the United Kingdom, Germany, and Belgium;
the Southern Europe region represented 35% of the group's revenue in 2020. France, Italy, and Spain are the main countries in the region;
the Americas region represented 19% of the group's revenue in 2020. The United States is the main contributor;
the APAM region (Asia, Pacific, Africa, Middle East), where the significant countries are Australia, South Africa, and India, represented 9% of the group's revenue in 2020.
NET SALES BY GEOGRAPHIC REGION
THE MARKETS
In response to users’ needs, Manitou Group developed a range of products to meet the requirements of markets as diverse as agriculture, construction, or industries.
NET SALES BY MARKET
ADDRESSABLE MARKETS
AND COMPETITIVE POSITION
ADDRESSABLE MARKETSIN 2020
The markets on which the group's machines may potentially be sold are estimated at €36 billion. The breakdown by geographic region and product range is as follows:
ADDRESSABLE MARKET BY REGION
ROUGH-TERRAIN HANDLING ADDRESSABLE MARKET BY PRODUCT RANGE
Income Billions of euros %
Telehandlers 3.0 26 Compact track loaders 2.5 21 Aerial work platforms 2.4 20 Backhoe loaders 1.3 11 Compact skid-steer loaders 1.1 9 Compact loaders 1.0 9 Truck-mounted forklifts 0.3 3 Rough-terrain forklift trucks 0.1 1
TOTAL 11.7 100
INDUSTRIAL HANDLING ADDRESSABLE MARKET BY PRODUCT RANGE
Income Billions of euros %
Internal combustion forklift trucks 13.1 53 Electric warehousing trucks 6.6 27 Electric forklift trucks 4.8 20
TOTAL 24.5 100
APAM 9%
SOUTHERN EUROPE 35%
AMERICAS 19%
NORTHERN EUROPE 37%
INDUSTRIES 14%
AGRICULTURE 30%
CONSTRUCTION 56%
SOUTHERN EUROPE 10%
NORTHERN EUROPE
20%
NORTH AMERICA
42%
REST OF THE WORLD
28%

18
MANITOU GROUP'S POSITION IN 2020
COMPETITIVE POSITION OF THE GROUP For the Products division, following the merger of the MHA and CEP divisions, the main competitors are as follows:
CONSTRUCTION AND AGRICULTURE MARKETS
Name Nationality Listed/ unlisted
Ausa Spain Unlisted Bobcat (Doosan Group) South Korea Listed Caterpillar United States of America Listed Claas Germany Unlisted CNH Industrial United States of America Listed Dieci Italy Unlisted Genie (Terex Group) United States of America Listed Haulotte France Listed JCB United Kingdom Unlisted JLG (Oshkosh Group) United States of America Listed John Deere United States of America Listed Magni Italy Unlisted Merlo Italy Unlisted
INDUSTRIAL MARKET
Name Nationality Listed/ unlisted
Kion Germany Listed Jungheinrich Germany Listed Nacco United States of America Listed Toyota Japan Listed
1. Leader 2. Challenger 3. Outsider World Europe North
America Rest
of the world
ROUGH-TERRAIN HANDLING EQUIPMENT
MOBILE AERIAL WORK PLATFORMS
COMPACT EQUIPMENT
INDUSTRIAL AND WAREHOUSING TRUCKS
2020 UNIVERSAL REGIST RATION DOC UMENT 19
STRATEGY AND BUSINESS MODEL
VISION AND STRATEGIC PRIORITIES (2025 NEW HORIZONS)
VISION
Manitou Group sees human life and the environment as capital to be preserved and developed. It contributes to this through its engaged brands by designing safe and efficient solutions while limiting their environmental impact.
MISSION
Our mission is to improve working conditions, safety, and performance around the world, while protecting people and their environment.
OUR ACTIONS
Through our three iconic brands - Manitou, Gehl, and Mustang by Manitou - we develop, manufacture, and provide equipment and services for handling, access platforms, and earthmoving businesses. Through innovation, we continuously strive to bring value to our customers.
We are committed to inspiring and cultivating the passion of the men and women of the group. We make every effort to “elevate” our talented employees to promote their personal and professional development.
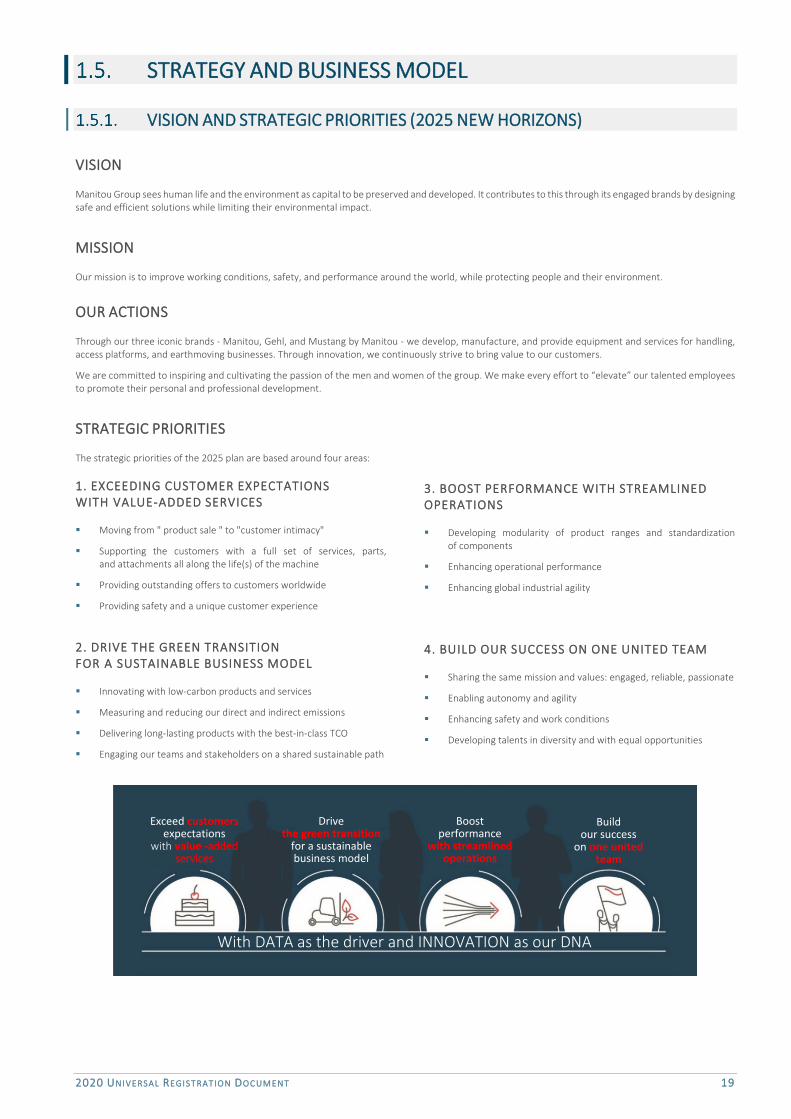
STRATEGIC PRIORITIES
The strategic priorities of the 2025 plan are based around four areas:
1. EXCEEDING CUSTOMER EXPECTATIONS
WITH VALUE-ADDED SERVICES
Moving from " product sale " to "customer intimacy"
Supporting the customers with a full set of services, parts, and attachments all along the life(s) of the machine
Providing outstanding offers to customers worldwide
Providing safety and a unique customer experience
2. DRIVE THE GREEN TRANSITION
FOR A SUSTAINABLE BUSINESS MODEL
Innovating with low-carbon products and services
Measuring and reducing our direct and indirect emissions
Delivering long-lasting products with the best-in-class TCO
Engaging our teams and stakeholders on a shared sustainable path
3. BOOST PERFORMANCE WITH STREAMLINED
OPERATIONS
Developing modularity of product ranges and standardization of components
Enhancing operational performance
Enhancing global industrial agility
4. BUILD OUR SUCCESS ON ONE UNITED TEAM
Sharing the same mission and values: engaged, reliable, passionate
Enabling autonomy and agility
Enhancing safety and work conditions
Developing talents in diversity and with equal opportunities
Exceed customers expectations
with value -added services
Drive the green transition
for a sustainable business model
Boost performance
with streamlined operations
Build our success
on one united team
With DATA as the driver and INNOVATION as our DNA
20
BUSINESS MODEL
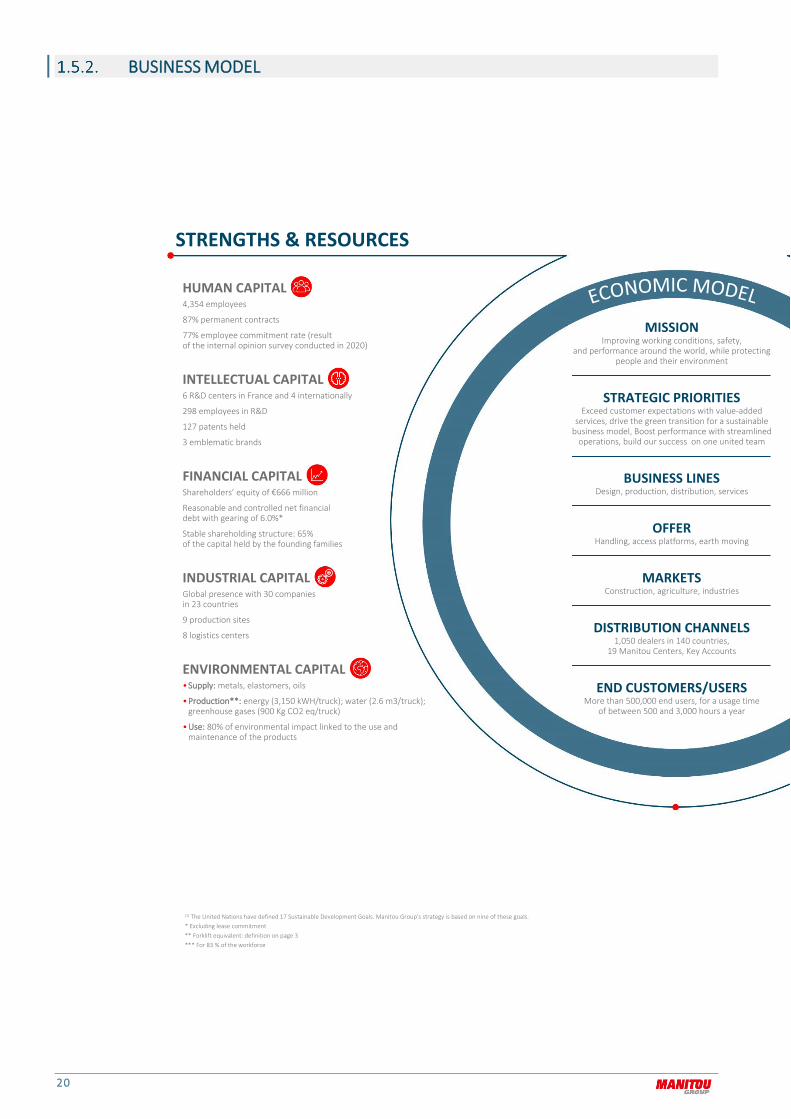
STRENGTHS & RESOURCES
HUMAN CAPITAL 4,354 employees
87% permanent contracts
77% employee commitment rate (result of the internal opinion survey conducted in 2020)
INTELLECTUAL CAPITAL 6 R&D centers in France and 4 internationally
298 employees in R&D
127 patents held
3 emblematic brands
FINANCIAL CAPITAL Shareholders’ equity of €666 million
Reasonable and controlled net financial debt with gearing of 6.0%*
Stable shareholding structure: 65% of the capital held by the founding families
INDUSTRIAL CAPITAL Global presence with 30 companies in 23 countries
9 production sites
8 logistics centers
ENVIRONMENTAL CAPITAL • Supply: metals, elastomers, oils
• Production**: energy (3,150 kWH/truck); water (2.6 m3/truck); greenhouse gases (900 Kg CO2 eq/truck)
• Use: 80% of environmental impact linked to the use and maintenance of the products
(1) The United Nations have defined 17 Sustainable Development Goals. Manitou Group's strategy is based on nine of these goals. * Excluding lease commitment ** Forklift equivalent: definition on page 3 *** For 83 % of the workforce
MISSION Improving working conditions, safety,
and performance around the world, while protecting people and their environment
STRATEGIC PRIORITIES Exceed customer expectations with value-added
services, drive the green transition for a sustainable business model, Boost performance with streamlined
operations, build our success on one united team
BUSINESS LINES Design, production, distribution, services
OFFER Handling, access platforms, earth moving
MARKETS Construction, agriculture, industries
DISTRIBUTION CHANNELS 1,050 dealers in 140 countries,
19 Manitou Centers, Key Accounts
END CUSTOMERS/USERS More than 500,000 end users, for a usage time
of between 500 and 3,000 hours a year

2020 UNIVERSAL REGIST RATION DOC UMENT 21
2020 DEVELOPMENTS
VALUE CREATION SHARED
WITH STAKEHOLҐDERS
HUMAN CAPITAL 377 new recruits with open-ended contracts
11 hrs training on average***
18% drop in accident frequency rate and 29% in accident severity rate
INTELLECTUAL CAPITAL Product development and innovation
19 patents filed
3 prizes won
44 % of new products incorporate
eco-design criteria
FINANCIAL CAPITAL Net sales: contained decline
(-24% compared to 2019)
Recurring operating income: €85.3 M
Dividend paid per share: €0.5
Group portion of net income per share as of December 31, 2020: €1.0
INDUSTRIAL CAPITAL €59 M in investments
Continued investments in innovative and development projects
ENVIRONMENTAL CAPITAL • Supply
22% of suppliers audited and CSR certified
• Production** Implementation of the Manitou Environmental Footprint (MEF)
at production sites
• Use Reduce Program and development of machine connectivity
NET SALES 2020:
€1,585 M
SUPPLIERS (RAW MATERIAL PURCHASING):
€1,024 M
EMPLOYEES (COMPENSATION IN 2020):
€267 M
GOVERNMENTS (CORPORATE TAX IN 2020):
€25 M
SHAREHOLDERS (DIVIDENDS PAID IN 2020):
€19.4M
(1)
22
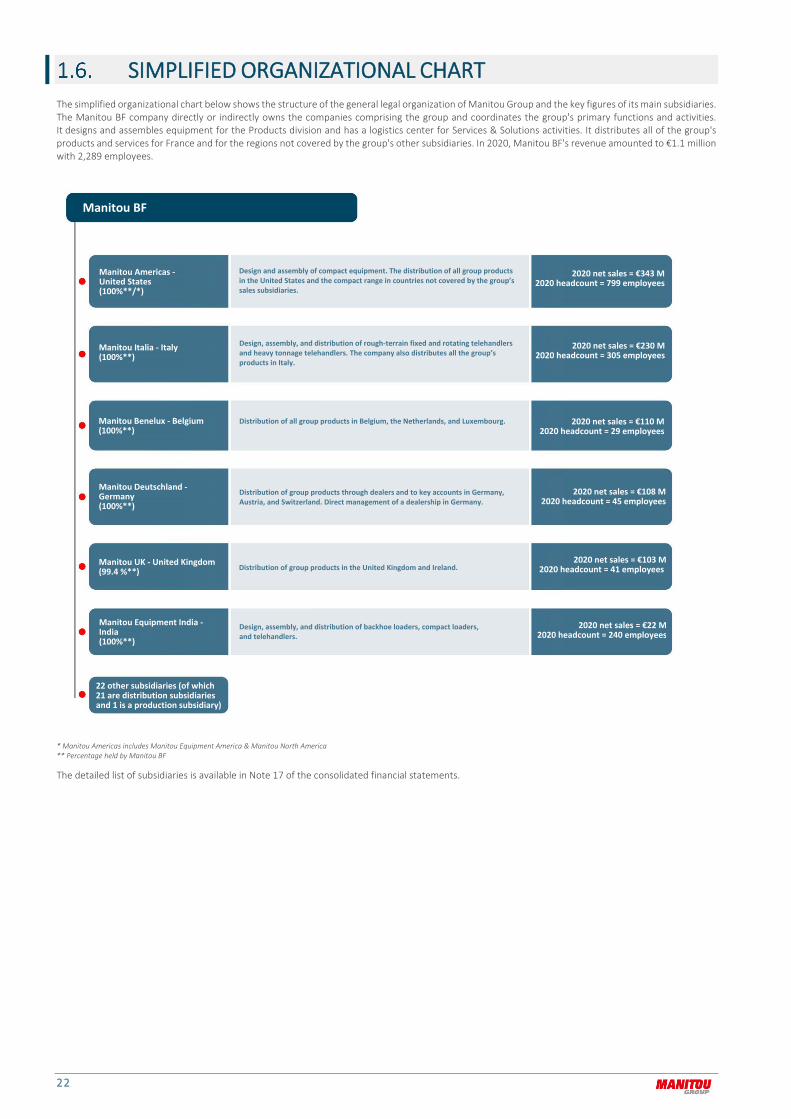
SIMPLIFIED ORGANIZATIONAL CHART The simplified organizational chart below shows the structure of the general legal organization of Manitou Group and the key figures of its main subsidiaries. The Manitou BF company directly or indirectly owns the companies comprising the group and coordinates the group's primary functions and activities. It designs and assembles equipment for the Products division and has a logistics center for Services & Solutions activities. It distributes all of the group's products and services for France and for the regions not covered by the group's other subsidiaries. In 2020, Manitou BF's revenue amounted to €1.1 million with 2,289 employees.
* Manitou Americas includes Manitou Equipment America & Manitou North America ** Percentage held by Manitou BF
The detailed list of subsidiaries is available in Note 17 of the consolidated financial statements.
Manitou BF
Manitou Americas - United States (100%**/*)
Design and assembly of compact equipment. The distribution of all group products in the United States and the compact range in countries not covered by the group’s sales subsidiaries.
2020 net sales = €343 M 2020 headcount = 799 employees
Manitou Italia - Italy (100%**)
Design, assembly, and distribution of rough-terrain fixed and rotating telehandlers and heavy tonnage telehandlers. The company also distributes all the group’s products in Italy.
2020 net sales = €230 M 2020 headcount = 305 employees
Manitou Benelux - Belgium (100%**)
Distribution of all group products in Belgium, the Netherlands, and Luxembourg. 2020 net sales = €110 M 2020 headcount = 29 employees
Manitou Deutschland - Germany (100%**)
Distribution of group products through dealers and to key accounts in Germany, Austria, and Switzerland. Direct management of a dealership in Germany.
2020 net sales = €108 M 2020 headcount = 45 employees
Manitou UK - United Kingdom (99.4 %**) Distribution of group products in the United Kingdom and Ireland.
2020 net sales = €103 M 2020 headcount = 41 employees
Manitou Equipment India - India (100%**)
Design, assembly, and distribution of backhoe loaders, compact loaders, and telehandlers.
2020 net sales = €22 M 2020 headcount = 240 employees
22 other subsidiaries (of which 21 are distribution subsidiaries and 1 is a production subsidiary)

2020 UNIVERSAL REGIST RATION DOC UMENT 23

24
2020 ACTIVITY & FINANCIAL RESULTS
2020 UNIVERSAL REGIST RATION DOC UMENT 25
26
The group's consolidated financial statements are drawn up in accordance with the IFRS published by the International Accounting Standards Board (IASB) and as approved by the European Union. The accounting principles are explained in detail in the notes to the consolidated financial statements.
Sector information is provided on the basis of the group's organization in 2020, with three divisions, Material Handling & Access (MHA ), Compact Equipment Products (CEP), and Services & Solutions (S&S).
Since January 2021, the MHA and CEP divisions have been combined together in the Product division.
The consolidated financial statements for fiscal year 2020 were closed by the Board of Directors on March 4, 2021. The consolidated financial statements were audited and certified by the statutory auditors.
2020 KEY FIGURES
SIGNIFICANT EVENTSCOVID-19 CRISIS
The global spread of Covid-19 had an impact on the group's sales, which were down 24% over the year 2020, as well as its production capacities.
Since the first signs of the Covid-19 pandemic, Manitou Group has taken measures to protect the health of its employees and limit the crisis’ impacts on its operating income.
A crisis unit was established, consisting of members from the management and key functions within the group. This cell coordinated operations to protect employees and ensure the continuity of the company.
It made it possible to align the implementation of health measures, communication, implementation of business recovery scenarios, identification of recovery-related risks, definition of priorities, allocation of teams to priority activities, and support for teams during recovery.
During this period, the Board of Directors and General Management and its Executive Committee regularly met and discussed ongoing developments. Substantive work has also begun in order to integrate the consequences of Covid-19 and its repercussions into the group's road map.
PROTECTION OF EMPLOYEE HEALTH AND SAFETY
The group responded quickly to the Covid-19 crisis by implementing effective health protocols to protect employees and limit the spread of the virus.
Since March, the group has put in place emergency health measures and decided to close its production sites in France, Italy, and India in accordance with international and national guidance’s applied to the countries where the group operates. In the United States, production activities defined as priority by the government were maintained for the entire period.
The spare parts and services business areas were still carried out, and distribution continued at a reduced pace.
Production shutdowns were accompanied, whenever possible, by implementation of partial operations, especially in France and Italy. The group also extensively adopted work-from-home arrangements and imposed restrictions on travel.
Production has progressively resumed in France and in Italy since mid-April, after defining and implementing new health protocols.
Since May, all sites have resumed production. For the support functions, partial operations were maintained in France in order to adapt to the decline of the market.
Despite productivity problems related to health measures, current production capacities are adequate for the group's order book and are able to meet the strong demand on the agricultural market, taking into account seasonality.
IMPLEMENTATION OF THE “RESIL IENCE” PLAN
To deal with this crisis and decline in business, the group has developed the “Resilience” plan. This plan has 4 pillars:
the safety of operators and the restarting of operations, with the introduction of new safety standards and the adaptation of our processes in order to deliver group's customers,
activity, with the sorting of critical orders to deliver in priority urgent requests, such as agricultural market and industrials, and the search for additional markets and orders,
cash flow, securing the financing and reducing the investments and projects,
costs reduction, to adapt to sales and production volumes, with a plan to limit overheads and personnel costs. Accordingly, the group has implemented partial activity measures and employee departure plans in the United States, India and South Africa. It also decided to stop its production operations in Brazil and optimize its production capacity in the United States with the closure of its operations in Waco (Texas) at the end of March 2021. The production of articulated loaders will be consolidated in Yankton, one of thetwo plants in South Dakota. The production of forklift trucks will be transferred to Beaupréau, France. The North American import platform will be concentrated in Baltimore, Maryland;
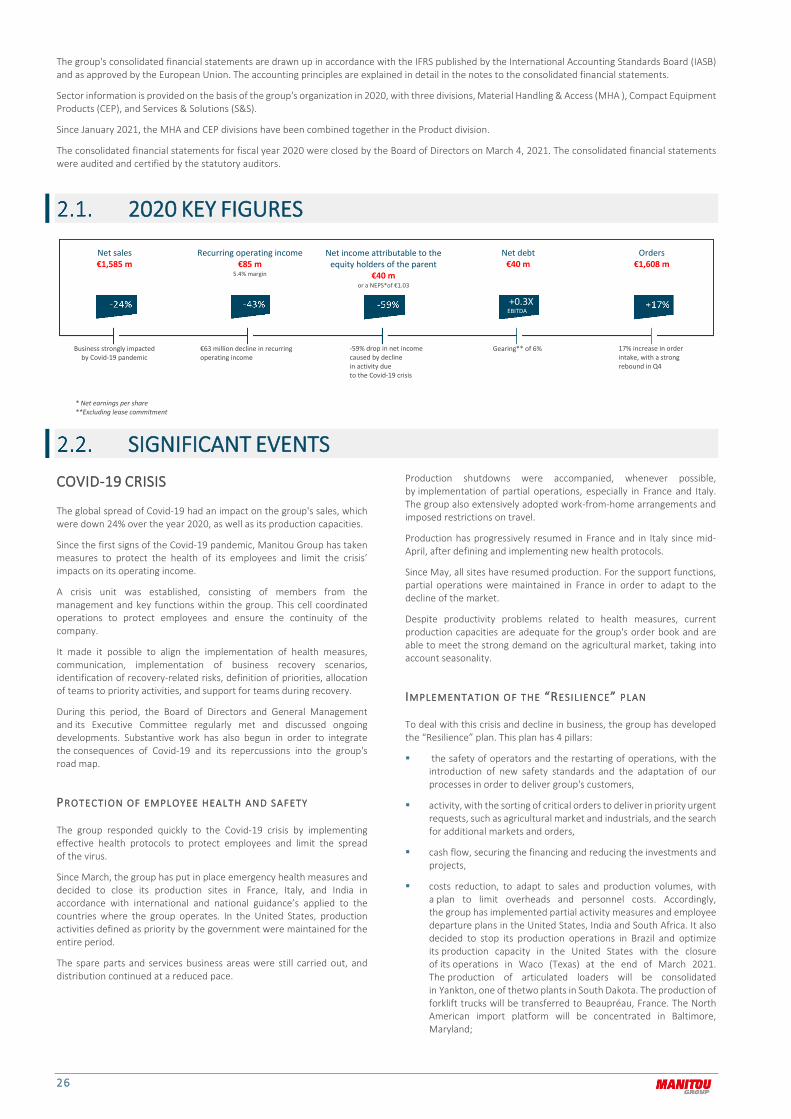
Net sales €1,585 m
Recurring operating income €85 m
5.4% margin
Net income attributable to the equity holders of the parent
€40 m or a NEPS*of €1.03
Net debt €40 m
Orders €1,608 m
+0.3X
Business strongly impacted by Covid-19 pandemic
€63 million decline in recurring operating income
-59% drop in net income caused by decline in activity due to the Covid-19 crisis
Gearing** of 6% 17% increase in order intake, with a strong rebound in Q4
* Net earnings per share **Excluding lease commitment
EBITDA

2020 UNIVERSAL REGIST RATION DOC UMENT 27
cash management by securing financing, in particular through an additional credit line draw of €110 million (maturity of September 2020), and by reducing investments and projects. This decision was made so as to ensure a balance between protecting cash flows and maintaining the group’s ability to support innovative development projects. In addition, projects that strengthen the group were maintained. During this period, the group demonstrated its financial strength and benefited from its financing strategy, with the implementation of a bond loan in 2019, for example.
DISTRIBUTION OF DIVIDENDS
On April 15, 2020, the Board of Directors decided, due to the uncertainties related to the health crisis, to waive the proposed dividend
payment of €0.78 per share that was initially announced when the 2019 annual results were published on March 3, 2020. The Board had also mentioned that it could, after October 1st, 2020 and subject to the context, convene a Shareholders' Meeting in order to proceed with a distribution of reserves for its shareholders, replacing dividends.
In accordance with this approach and in light of the evolution of the business, the Board of Directors of Manitou BF met on November 9, 2020 to call an Ordinary Shareholders’ Meeting on December 21st, 2020 which decided on an exceptional payment of €0.50 per share, taken from reserves.
See note 2.4 of this report and note 4 of the consolidated financial statements ended December 31, 2020 for the financial impact of the Covid-19 crisis and note 13.1.3 of the consolidated financial statements ended December 31, 2020 for liquidity risk
BUSINESS ORDERS
In 2020, orders reached a total of €1,607.6 million, versus €1,376.9 million in 2019, up 16.8%.
After declining in the 1st half of the year, hit hard by the Covid-19 crisis, the group experienced an increase in order intake in June, thanks to the quality of its dealer network.
Order intake accelerated at the end of the year, with a record high in Q4. All regions and markets were dynamic, including European and North American leasing companies.
Therefore, as of December 31, 2020, the group's order book stood at €917.6 million, up 54.2% compared to the previous year, i.e. the second highest order book level in the group's history.
It represents nearly nine months of billing based on the 2020 revenue of the product divisions.
MHA & CEP in millions of euros
Orders Order book

28
NET SALES IN MILLIONS OF EUROS
In 2020, the group achieved revenue of €1,585.1 million, down 24.3% based on actual data and 23.5% based on comparable data versus 2019, which had reported record business.
The Covid-19 crisis has negatively impacted all of the group's activities, with production shutdowns and a slowdown in order intake in the beginning of the year. However, strong activity in the second half of the year helped catch up with delays in delivery.
The foreign exchange impact is -€22.5 million (-1.1 point), and the scope effect contributes to the total growth, at €6.3 million (+0.3 point). The scope effect corresponds to the integration of the Mawsley company as of November 1, 2019, ten months over 2020.
The group's three divisions experienced a decline in their business, especially the MHA and CEP divisions, with a decrease of 29.7% and 20.3% respectively.
The business of the S&S division, which continued its spare parts and services activities, was better off, with a drop of only 3.0% in revenue and a return to growth in the second half of the year.
Revenue decreased in all geographical regions with better resistance in Southern Europe (-18.0%).
All of the group's markets are down.
BUSINESS TRENDS BY DIVISION (% CHANGE IN NET SALES)
BUSINESS TRENDS BY REGION (% CHANGE IN NET SALES)
+0.3%
-23.5% -1.1%
Volumes / Prices Exchange rate Scope
-3% S&S
€300 m 19%*
-20% CEP
€262 m 16%*
-30% MHA
€1,023 m 65%*
*Breakdown of net sales
-26% AMERICAS
€296 m 19%*s
-25% APAM
€150 m 9%*
-18% SOUTHERN
EUROPE €555 m 35%*
*Breakdown of net sales
-28% NORTHERN
EUROPE €584 m 37%*

2020 UNIVERSAL REGIST RATION DOC UMENT 29
INCOME
RECURRING OPERATING INCOME
The group's recurring operating income was €85.3 million, or 5.4% of revenue, down 1.7 points compared to 2019 (€148.6 million, or 7.1% of revenue).
It was significantly impacted by the decrease in activity in the product divisions and a margin on sales costs that was down by 0.8 points due to production shutdowns, the implementation of health measures, and the increase in depreciation expenses.
The shutdown of production sites, partial activity measures, and the implementation of savings under the "Resilience" plan partially offset the negative effects.
With the implementation of the cost-saving plan, sales, marketing, services, and administrative expenses were down €32.8 million (- 18,8 %) over the period. The decrease in R&D spending was limited to 11.6% (-€3.2 million) to ensure the development of new products.
The total savings achieved under the "Resilience" plan amounted to €59.7 million compared to 2019, including €8.1 million on direct costs and €51.6 million on indirect costs.
These savings include partial activity measures in France and similar measures in other countries. For example, the group received €9.1 million in aid and benefited from social security deferrals of €6.6 million. These savings also include a cost reduction of €1.2 million linked to the implementation of special inactivity schemes, particularly in the United States ("Furlough").
Costs directly attributable to Covid-19 are estimated at €1.5 million. They correspond to the implementation of health measures and donations to support medical teams.
Income for the period includes other income and expenses for a net amount of +€2.9 million (+€4.9 million in 2019), mainly including income of €3.0 million as part of a tax appeal in our favor.
OPERATING INCOME
The operating income amount to €74.8 million, or 4.7% of revenue, down €71.3 million compared to 2019 (€146.1 million, or 7.0% of revenue).
This result includes other operating income and expenses for-€10.6 million (-€2.5 million in 2019).
The increase in other operating expenses for the year mainly includes restructuring costs (€9.0 million euros) following the decision to stop production activities at Waco (United States), workforce reductions in the United States, South Africa, India and France, and the shutdown of production activity in Brazil.
NET INCOME
PROFIT OF COMPANIES ACCOUNTED
FOR USING THE EQUITY METHOD The profit recorded for companies accounting for using the equity method is €1.7 million, down €0.5 million compared to 2019.
This profit was generated by Manitou Group France and Manitou Finance LTD, 49% owned by the group and 51% by BNP Paribas Leasing Solutions. They offer financing, leasing, and long-term rental solutions to end users of Manitou Group’ products in France and the United Kingdom as well as stock financing solutions for dealerships.
FINANCIAL RESULT The net result was -€11.3 million, compared with -€7.5 million in 2019. This decrease was due to an increase in foreign exchange losses over the period.
+€148.6M 7.1%
+€22.0 m +1.4%
+€8.9 m +0.6%
€85.3 m 5.4%
+€19.2 m +1.2%
+€12.6 m +0.8%
+€3.0 m +0.2%
-€1.6 m -0.1%
€1.4m +0.1%
-€128.7 m -5.8%
ROC 2019
Volume/Mix Exchange effect
Price Production costs
R&D Sales and marketing
Administrative expenses
Other ROC 2020
30
TAX RATE
The effective tax rate is 39.1 % versus 32.5 % in 2019. See Note 12.3 of the annual financial statements ended December 31, 2020.
Income tax amounts to -€24.9 million, versus -€45.0 million in 2019.
NET INCOME
The group share of the net income amounted to €39.6 million, or 2.5% of revenue, down €56 million compared to 2019.
.
OPERATIONAL PERFORMANCE BY DIVISION
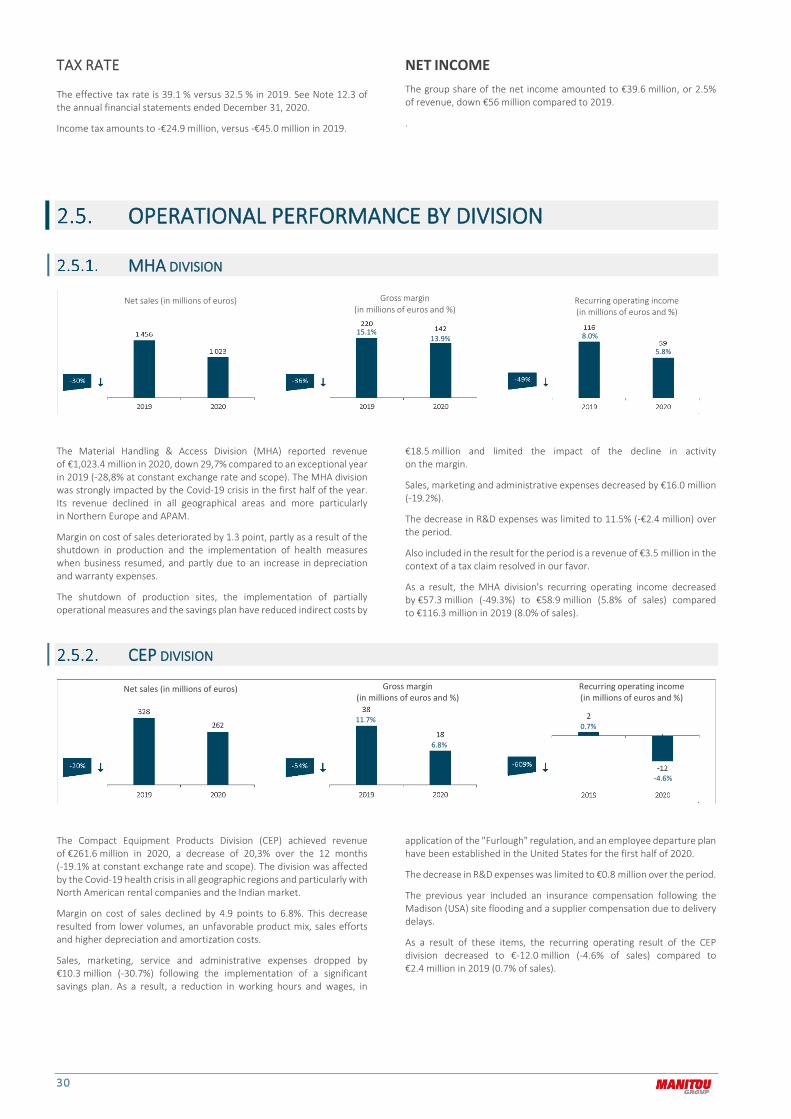
MHA DIVISION
The Material Handling & Access Division (MHA) reported revenue of €1,023.4 million in 2020, down 29,7% compared to an exceptional year in 2019 (-28,8% at constant exchange rate and scope). The MHA division was strongly impacted by the Covid-19 crisis in the first half of the year. Its revenue declined in all geographical areas and more particularly in Northern Europe and APAM.
Margin on cost of sales deteriorated by 1.3 point, partly as a result of the shutdown in production and the implementation of health measures when business resumed, and partly due to an increase in depreciation and warranty expenses.
The shutdown of production sites, the implementation of partially operational measures and the savings plan have reduced indirect costs by
€18.5 million and limited the impact of the decline in activity on the margin.
Sales, marketing and administrative expenses decreased by €16.0 million (-19.2%).
The decrease in R&D expenses was limited to 11.5% (-€2.4 million) over the period.
Also included in the result for the period is a revenue of €3.5 million in the context of a tax claim resolved in our favor.
As a result, the MHA division's recurring operating income decreased by €57.3 million (-49.3%) to €58.9 million (5.8% of sales) compared to €116.3 million in 2019 (8.0% of sales).
CEP DIVISION
The Compact Equipment Products Division (CEP) achieved revenue of €261.6 million in 2020, a decrease of 20,3% over the 12 months (-19.1% at constant exchange rate and scope). The division was affected by the Covid-19 health crisis in all geographic regions and particularly with North American rental companies and the Indian market.
Margin on cost of sales declined by 4.9 points to 6.8%. This decrease resulted from lower volumes, an unfavorable product mix, sales efforts and higher depreciation and amortization costs.
Sales, marketing, service and administrative expenses dropped by €10.3 million (-30.7%) following the implementation of a significant savings plan. As a result, a reduction in working hours and wages, in
application of the "Furlough" regulation, and an employee departure plan have been established in the United States for the first half of 2020.
The decrease in R&D expenses was limited to €0.8 million over the period.
The previous year included an insurance compensation following the Madison (USA) site flooding and a supplier compensation due to delivery delays.
As a result of these items, the recurring operating result of the CEP division decreased to €-12.0 million (-4.6% of sales) compared to €2.4 million in 2019 (0.7% of sales).
Gross margin (in millions of euros and %)
Recurring operating income (in millions of euros and %)
Net sales (in millions of euros)
15.1% 13.9%
5.8% 8.0%
Gross margin (in millions of euros and %)
Recurring operating income (in millions of euros and %)
Net sales (in millions of euros)
11.7% 0.7%
-4.6%
6.8%

2020 UNIVERSAL REGIST RATION DOC UMENT 31
S&S DIVISION
The Services & Solutions (S&S) division closed the financial year with revenues of €300.1 million very close to 2019, confirming the resilience of this activity. The decline in revenues (-3.0% year-on-year, -3.4% at constant exchange rates and scope) affected all geographical areas and particularly the APAM zone. The services and rental activities, which are more resilient by nature, recorded dynamic growth.
The favorable mix of service activities allowed the division to increase its margin on cost of sales by €1.7 million to €89.0 million, representing a 1.4 point increase in the margin on cost of sales to 29.6%.
The deployment of the savings plan and partial activity measures led to an 11.3% (€6.5 million) reduction in the division's administrative, sales, marketing and service expenses.
In this year, which has been very affected by the health and economic crisis, the S&S division delivered a record level of recurring operating income, up 28.2% to €38.4 million, or 12.8% of revenues (9.7% in 2019).
Net sales (in millions of euros) Gross margin (in millions of euros and %)
Recurring operating income (in millions of euros and %)
28.2% 29.6% 12.8% 9.7%
32
CASH FLOW AND FINANCIAL STRUCTURE
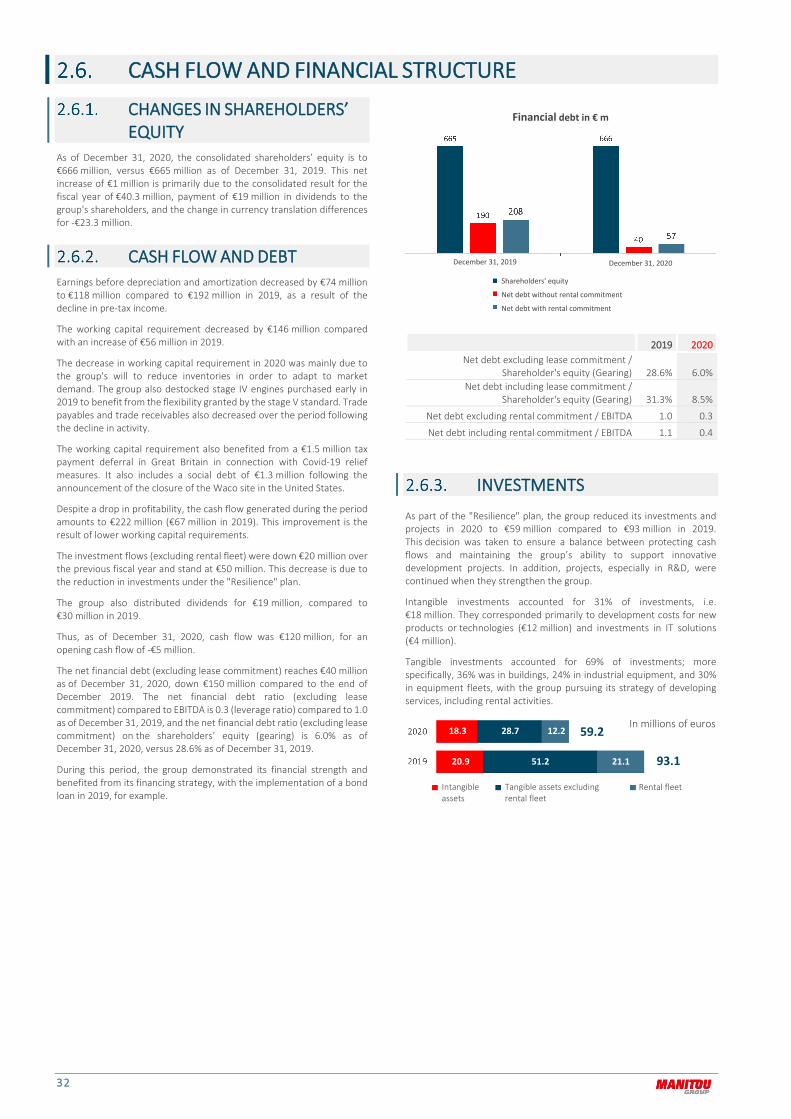
CHANGES IN SHAREHOLDERS’ EQUITY
As of December 31, 2020, the consolidated shareholders’ equity is to €666 million, versus €665 million as of December 31, 2019. This net increase of €1 million is primarily due to the consolidated result for the fiscal year of €40.3 million, payment of €19 million in dividends to the group's shareholders, and the change in currency translation differences for -€23.3 million.
CASH FLOW AND DEBT Earnings before depreciation and amortization decreased by €74 million to €118 million compared to €192 million in 2019, as a result of the decline in pre-tax income.
The working capital requirement decreased by €146 million compared with an increase of €56 million in 2019.
The decrease in working capital requirement in 2020 was mainly due to the group's will to reduce inventories in order to adapt to market demand. The group also destocked stage IV engines purchased early in 2019 to benefit from the flexibility granted by the stage V standard. Trade payables and trade receivables also decreased over the period following the decline in activity.
The working capital requirement also benefited from a €1.5 million tax payment deferral in Great Britain in connection with Covid-19 relief measures. It also includes a social debt of €1.3 million following the announcement of the closure of the Waco site in the United States.
Despite a drop in profitability, the cash flow generated during the period amounts to €222 million (€67 million in 2019). This improvement is the result of lower working capital requirements.
The investment flows (excluding rental fleet) were down €20 million over the previous fiscal year and stand at €50 million. This decrease is due to the reduction in investments under the "Resilience" plan.
The group also distributed dividends for €19 million, compared to €30 million in 2019.
Thus, as of December 31, 2020, cash flow was €120 million, for an opening cash flow of -€5 million.
The net financial debt (excluding lease commitment) reaches €40 million as of December 31, 2020, down €150 million compared to the end of December 2019. The net financial debt ratio (excluding lease commitment) compared to EBITDA is 0.3 (leverage ratio) compared to 1.0 as of December 31, 2019, and the net financial debt ratio (excluding lease commitment) on the shareholders’ equity (gearing) is 6.0% as of December 31, 2020, versus 28.6% as of December 31, 2019.
During this period, the group demonstrated its financial strength and benefited from its financing strategy, with the implementation of a bond loan in 2019, for example.
2019 2020 Net debt excluding lease commitment /
Shareholder's equity (Gearing) 28.6% 6.0% Net debt including lease commitment /
Shareholder's equity (Gearing) 31.3% 8.5%
Net debt excluding rental commitment / EBITDA 1.0 0.3
Net debt including rental commitment / EBITDA 1.1 0.4
INVESTMENTS
As part of the "Resilience" plan, the group reduced its investments and projects in 2020 to €59 million compared to €93 million in 2019. This decision was taken to ensure a balance between protecting cash flows and maintaining the group’s ability to support innovative development projects. In addition, projects, especially in R&D, were continued when they strengthen the group.
Intangible investments accounted for 31% of investments, i.e. €18 million. They corresponded primarily to development costs for new products or technologies (€12 million) and investments in IT solutions (€4 million).
Tangible investments accounted for 69% of investments; more specifically, 36% was in buildings, 24% in industrial equipment, and 30% in equipment fleets, with the group pursuing its strategy of developing services, including rental activities.
December 31, 2019 December 31, 2020
18.3 28.7 12.2 59.2 In millions of euros
20.9 51.2 21.1 93.1
Intangible assets
Tangible assets excluding rental fleet
Rental fleet
Shareholders' equity Net debt without rental commitment Net debt with rental commitment
Financial debt in € m

2020 UNIVERSAL REGIST RATION DOC UMENT 33
RESEARCH AND DEVELOPMENT
Research and development are at the heart of the group's strategy and goals. It aims to differentiate its offer and create value for the customer, whether through machines, attachments, or related services and solutions, as well as reduce the total cost of ownership of machines, while improving their performance and environmental impact.
The activity is conducted based on:
studies of changes in the use or market of its customers;
studies that provide a better understanding and appreciation of the technological changes that affect the business lines;
ongoing monitoring of technological changes occurring in associated industry sectors (automotive, etc.);
long-standing collaboration with suppliers or public and private institutions that develop innovative technological solutions. For example, the "zero accident" project, in collaboration with the Nantes Atlantic Design School, brought together students from the Human Machine Design program to train UX designers specialized in connected environments (objects, interfaces) and a Manitou team formed around a major issue: safety on construction sites.
It is also intended to meet the needs of the three types of customers who may use a machine:
owners, who expect high performance and a return on their investment;
users, or drivers, who expect safety, usability, and ease of use;
those in charge of its maintenance, who expect reliability and a high level of associated service.
The group's research and development consist of a central department called R&I (Research and Innovation) and seven separate entities called Research Offices. The research teams represent 7% of the group's workforce.
In 2020, the group limited its research and development expenses in order to take into account the uncertain environment linked to the Covid-19 health crisis. It was decided to prioritize the regulatory aspect of the defined product plan and comply with normative and regulatory changes relating to its components.
in millions of euros 2019 2020
Capitalized expenses 12.5 11.3
% of net sales 0.6% 0.7% Non capitalized expenses and amortization allowance 27.7 24.5
% of net sales 1.3% 1.6%
TOTAL 40.3 35.8
% of net sales 1.9% 2.3%
The group holds a number of patents protecting the innovations developed in its various research offices.
The total number of active patents at the end of the 2020 fiscal year was 127. In addition, more than 20 patent applications were filed in 2020.
DEVELOPMENT OF INNOVATIONS
AND LAUNCH OF NEW PRODUCTS In 2020, Manitou Group continued to roll out innovations, focusing on enhanced user comfort, a reduction in the environmental impact of machines, and improved performance. In particular, the group:
continued development of a range of low-emission products and solutions. This group of concepts designated under the name Oxygen Concept illustrates the future trends that will guide the design of the group’s low-emission solutions. It contributes to making the TCO as low as possible;
continued the Reduce approach for platforms and telehandlers with the stop and go system;
continued the deployment of its connected machine management system on all of its product ranges;
thanks to its Special Solutions department, developed adapted solutions by reviewing the ergonomics of the cabin for a farmer with disabilities. All the functions of the machine's joystick, located on the right of the driving station, were shifted to the left while still allowing him to easily enter and exit the cabin. The joystick on the right is still usable by an able-bodied person, thanks to a simple knob. Some of the other specially installed equipment included a back-up camera with a screen placed on the dashboard;
continued to reduce fuel consumption with the Ecostop system, which automatically turns off the engine when the driver gets out of the cab;
continued to deploy a digital offer intended for all of its customers with connected machines. An application provides information on the machine’s condition and its location and advice, including in the form of videos;
signed a partnership with Effidence for the co-development and marketing of a range of logistics robots with the aim of combining the latest robotics technologies with expertise in warehousing and the strength of a distribution network.
The group is also continuing to launch new products and renew its product ranges in order to incorporate the changes in requirements and make substantial improvements for its users.
2020 saw the launches of:
ranges of telehandlers, articulated loaders, masted forklift trucks, and platforms according to the Stage V regulation;
a range of 100% electric, rough-terrain 200 ATJe aerial work platforms;
an XL version for intensive applications of its range of agricultural NewAg telehandlers that meets the needs of large cereal farms, polyculture farms, and methanization;
MXT 1740 P and MXT 840 P telehandlers, and a full range of TLB 844/818 backhoe loaders for the South American market.
RESPONSES TO REGULATORY DEVELOPMENTS The equipment designed and distributed by the group is subject to various regulatory standards relating to emissions, pollutants, noise, visibility, safety, electromagnetic compatibility, the environment, etc.
These developments continually change the design of the equipment and require major investments in product development. These standards impose increasingly strict requirements, notably to limit CO2 emissions.
The regulatory authorities in the European Union, Japan, the USA (the Environmental Protection Agency (EPA)), and Canada have agreed on regulations for non-road diesel equipment to reduce the following polluting emissions:
carbon monoxide (CO);
hydrocarbons (HC);
particulate matter (PM);
nitrogen oxides (NOX).
This led to the introduction of Stage III to V regulations in Europe and Final Tier 4 in the United States. These standards impose further reductions in PM and NOX levels. They are accompanied by the development of new fuels (NRD - non-road diesel) and new types of engines, notably using particle filters and NOX reduction systems.
34
Europe is continuing to develop its regulations with Stage V. Since 2019, this standard has imposed further reductions in particulate matter emissions and introduced monitoring of the number of particles emitted. This development would mean extending the use of particle filters.
Therefore, new-generation engines require diesel of a specific quality, which currently makes it impossible to market machines complying with these new standards in those countries with low levels of regulation.
For the past several years, Manitou Group has been attempting to find improved engine technologies that meet the regulations while optimizing the performance of its machines and has mobilized a significant proportion of its research and development resources to achieve such changes. The group has had to establish product ranges that are marketable by region to meet the requirements of those geographical areas where these regulations apply, while continuing to produce machines that are suitable for other areas.
POST-CLOSING EVENTSLITIGATION FOR INFRINGEMENT OF INTELLECTUAL
PROPERTY RIGHTS On February 26, 2021, the Court of Justice of Paris ruled, in the first instance, on the litigation for infringement of the French part of two European patents relating to certain characteristics concerning the overload cut-off control system of certain telehandlers, initiated in May 2017 by JC Bamford Excavators Limited (JCB) against Manitou BF.
Under this decision, the court completely annulled the French part of one of these two patents owned by JCB.
The court also annulled most claims of the French part of the second patent held by JCB.
The court found infringement of only two claims of the French part of the second patent by three models of equipment of an old configuration that has not been marketed by Manitou BF since May 2017. Manitou contests this decision, while noting that it has no impact on its activity due to the fact that this old configuration is no longer marketed.
In view of the very residual nature of the infringement, the court ordered Manitou BF to pay to the applicant the total amount of €150,000 for the loss suffered, dismissing JCB's claims, which claimed a loss of €190 million. The court's decision reinforces Manitou BF's position, which has always challenged the merits of the plaintiff's action and the disproportionate nature of its claims.
As such, the group will continue to vigorously defend itself in the infringement disputes between it and JCB over three patents.
See also Note 11.2 of the consolidated financial statements ending December 31, 2020.
NEW GROUP ORGANIZATION In January 2021, the former MHA and CEP divisions were combined into the new Product Division led by Elisabeth Ausimour, member of the Executive Committee, former President of the MHA division and member of the Executive Committee.
2025 NEW HORIZONS AND 2021 OUTLOOK
“2025 NEW HORIZONS” ROAD MAP The upheavals caused by the 2020 health crisis have had a profound impact on all economic and market players. New challenges are changing global priorities and, as a result, those of Manitou Group. Influenced by these changes, the group has defined its new road map by 2025.
The "2025 New Horizons" plan is based on four priorities:
Exceed customer expectations with value-added services Drive the green transition for a sustainable business model Boost performance with streamlined operations Build our success on one united team
with DATA as a game changer and innovation as our DNA.
Based on this new plan, Manitou Group has adopted the following targets for 2025:
more than €2.5 billion in revenue; a recurring operating income of more than 8% of revenue; a recurring EBITDA* that is above 10% of revenue.
In addition, Manitou Group anticipates investments of around €460 million over the life of the plan.
All of these targets were defined excluding acquisitions and assuming that market conditions are not affected by any new major or structural crisis.
*EBITDA: recurring operating income before depreciation, write-backs, and impairment losses, restated for the impact of IFRS 16.
2021 OUTLOOK The unexpected extent of the recovery in order intake and the end-of-year order book has pushed the group into a new growth phase. The group is accelerating its production rate to meet its customers’ demand in a context of high steel price inflation and shortages in shipping and electronic components.
In addition to these issues related to the realignment of economic players after the crisis, the trends of the group's markets remain very dynamic.
Based on these factors, and provided that the general environment stabilizes, the group now expects revenue growth for 2021 of more than 15% and recurring operating income up 40 basis points compared to 2020.

2020 UNIVERSAL REGIST RATION DOC UMENT 35
36
CORPORATE SOCIAL AND ENVIRONMENTAL RESPONSIBILITY
2020 UNIVERSAL REGIST RATION DOC UMENT 37

38
The value of Manitou Group’s machines and services lies in the functional benefits provided by their use: they facilitate, secure, increase productivity and transform uses. Materials handling, access platforms and earthmoving lie at the heart of many agricultural, industrial, human and environmental challenges. Population growth, urbanization, and economic development all require an increase in agricultural production and the construction and renovation of housing and communications infrastructures, all the while optimizing the use of natural resources.
Manitou Group is rising to the challenge, and its mission is to improve working conditions, safety, and performance around the world, while protecting people and their environment.
Innovative and adapted machines make people’s work easier and meet the need to transport increasingly heavy loads.
Products and service offerings dedicated to each application are meeting increasing productivity needs, with the lowest total cost of ownership (TCO) and smallest environmental footprint possible.
Low carbon impact machines are meeting the needs of low emission zones and clean work sites.
Connected machines are meeting the need for integration in a digital world.
New services are meeting customers’ needs for innovative approaches that view the life cycle and accessibility conditions of the machines differently: leasing and used machines are becoming relevant solutions to control TCO and limit environmental footprint.
Machines suited to each use and focused on promoting the health and safety of people and property are meeting needs for improved working conditions.
Corporate Social and Environmental Responsibility (CSR), at the heart of the group's mission, helps it move towards a safer, more innovative, sustainable world of handling, access platforms, and earthmoving.
The name of the CSR approach, the Elevation Plan, therefore conveys several meanings.
Elevation is the heart of the business and the group’s “raison d’être,” a way of supporting its users to make their work easier and safer.
Elevation reflects our commitment to rise to the challenges facing society related to the group's business. The group has acknowledged its responsibilities and those of its stakeholders and is working with its entire value chain to anticipate and respond to these challenges more effectively.
Elevation also means mobilizing all of the company's employees on sustainable development issues, supporting talent by promoting diversity and encouraging entrepreneurial spirit, and rewarding success, while safeguarding optimum quality of life at work.
And finally, Elevation means the goal of driving the group towards governance that incorporates the Sustainable Development Goals.
This approach is directly led by the Executive Committee with the full backing of the Board of Directors.
Since 2015, Manitou Group has adhered to the 10 principles of the UN Global Compact. This membership, which the group renewed in 2020, has committed the group to integrating each of these principles into its strategy, its culture, its operations and its stakeholder relations1.
AMBITION AND COMMITMENTS This report covers the 2018-2022 Elevation Plan, in line with the group's Ambition 22 strategy. In January 2021, Manitou Group's strategy is moving forward over another timescale and has strong goals with a new Elevation plan that is fully embedded in the group's new strategy: New Horizons 2021-2025 (see Chapter 1.5.1).
The Elevation Plan reflects Manitou Group’s ambitions in terms of CSR. The group is not working alone: it involves its value chain to construct together the handling, access platform, and earthmoving solutions of tomorrow while respecting people and the environment.
In line with the Sustainable Development Goals of the United Nations, the road map validated by the members of the Executive Committee and the Board of Directors demonstrates the group's intention to accelerate its transformation. It aims to anticipate, reduce risks, and create value for all stakeholders.
1 Global Compact: level GC Advanced.
In 2018, the group set the objectives of the Elevation
Plan for 2022
1
CREATE SUSTAINABLE
PRODUCTS AND SERVICES
3
IN CLOSE PARTNERSHIP WITH
ITS PARTNERS
2
POWERED BY THE WOMEN AND MEN
OF MANITOU GROUP
3 ambitions associated with 13 objectives
and key actions

2020 UNIVERSAL REGIST RATION DOC UMENT 39
2018-2022 CSR ROAD MAP The level of progress illustrates the level of achievement of the 2022 target (out of 100) at the end of the year in question.
2 Moving towards 2020 significant actions 2022 Goals
Progress
(base 2017)
PRODUCTS AND SERVICES 2019 2020
More optimization
Development of Stage V engines across all ranges to improve fuel consumption Availability of consumption and CO2 emissions data for the platforms range
x 3 the amount of machines with the “REDUCE” label: to better combine safety, productivity, and a reduced environmental impact
More functionality Deployment of machine connectivity to better support users and clients’ uses
x 5 the rate of reduction in the total cost of ownership for the top 50% most sold machines (in net sales)
More innovation
Launch of the ATJE electric platform
Development of Eco-Stop and "Stop and Go" options3
Inclusion of thematic fact sheets in the ecodesign checklist to promote the sharing of best practices
100% of new products will incorporate ecodesign and TCO criteria4
More circularity
Launch of a program to reduce the environmental impact of spare parts packaging
Study of remanufacturable parts and components
8% of parts revenue will be produced from renovated or used parts
PEOPLE
More safety
Extension of QEHS Division's scope at group level with recruitment of EHS Representatives in the US and India
ISO 45001 certification of France
Launch of a safety culture campaign
Achieving a frequency rate of 13.95% and a severity rate of 0.32%5
More diversity
Renewal of the mentoring program6
Appointment of 2 women to the Executive Committee
Results of the French Parity Index: 87/1007
Achieve a total of 850 women within the group
More well-being
Digital and collaborative work support program
Development of a 100% digital Elevation Days program
Deployment of a CSR e-learning course
Ensure that 100% of entities have initiated at least one initiative to improve the employee experience
More engagement 3rd survey8: 89% participation and 77 % engagement in 2020 Get 72% of employees engaged based on the internal opinion survey
PARTNERSHIPS
More value Results of 2nd reverse rating9 60% of suppliers CSR certified (rating > 12/20) after the audit
More trust
Implementation of global dealer assessment criteria including CSR criteria
Development of assessment tools and a global testing phase
25% of all sales to dealers labeled “Partner Dealer” (dealers with best CSR practices)
More ethics ISO 3700110 certification of the South African subsidiary
100% of group employees (excluding operators) will be trained in and made aware of anti-corruption
ISO 19 600 evaluation of the group11
More education Victory of Manitou Group project supported by students from the University of Manila at the finale of the PRME partnership12 organized by the United Nations
1% of the group's net income will be dedicated to financing educational initiatives
More solidarity Continuation of the skills-based sponsorship program 2 200 volunteer hours will be offered by the group
2 The United Nations defined 17 Sustainable Development Goals. Manitou Group's strategy is based on nine of these goals. 3 "Stop and go" available on all models of stage V platforms, and Eco-stop available on MLT NewAg and NewAg XL telehandlers. 4 Total Cost of Ownership. 5 Employees and temporary staff. 6 Mentoring pairs program to facilitate access to management positions. 7 See note on methodology 8 Survey conducted in 2016, 2018, and 2020 over the period from March 2 - 13. 9 Assessment of the group's performance by its suppliers. 10 Anti-corruption management system. 11 Compliance management system. 12 The Principles for Responsible Management Education (PRME) initiative of the United Nations Global Compact is intended to inspire and promote training, research, and responsible management practices at the international level. See chapter 3.4.4.
Reduce Fuel
109 % Reduce Risks
60 %
Frequency rate
122 %
Severity rate
122 %
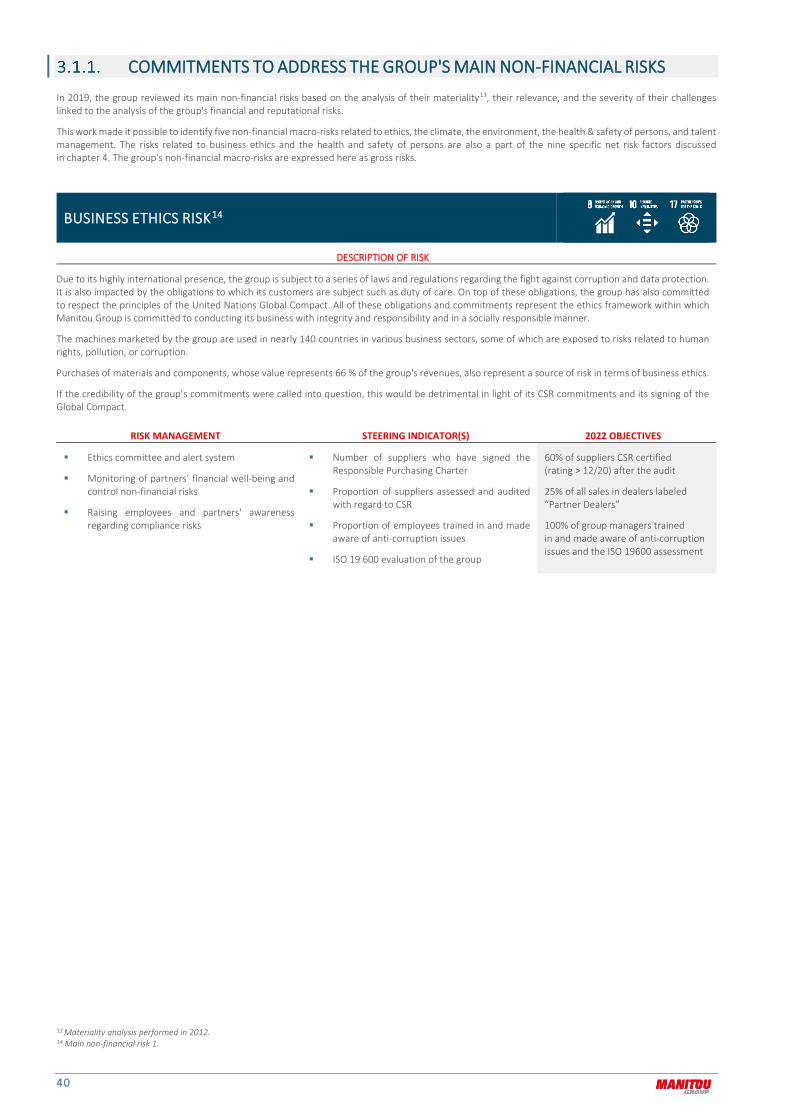
40
COMMITMENTS TO ADDRESS THE GROUP'S MAIN NON-FINANCIAL RISKS
In 2019, the group reviewed its main non-financial risks based on the analysis of their materiality13, their relevance, and the severity of their challenges linked to the analysis of the group's financial and reputational risks.
This work made it possible to identify five non-financial macro-risks related to ethics, the climate, the environment, the health & safety of persons, and talent management. The risks related to business ethics and the health and safety of persons are also a part of the nine specific net risk factors discussed in chapter 4. The group's non-financial macro-risks are expressed here as gross risks.
BUSINESS ETHICS RISK14
DESCRIPTION OF RISK
Due to its highly international presence, the group is subject to a series of laws and regulations regarding the fight against corruption and data protection. It is also impacted by the obligations to which its customers are subject such as duty of care. On top of these obligations, the group has also committed to respect the principles of the United Nations Global Compact. All of these obligations and commitments represent the ethics framework within which Manitou Group is committed to conducting its business with integrity and responsibility and in a socially responsible manner.
The machines marketed by the group are used in nearly 140 countries in various business sectors, some of which are exposed to risks related to human rights, pollution, or corruption.
Purchases of materials and components, whose value represents 66 % of the group's revenues, also represent a source of risk in terms of business ethics.
If the credibility of the group’s commitments were called into question, this would be detrimental in light of its CSR commitments and its signing of the Global Compact.
RISK MANAGEMENT STEERING INDICATOR(S) 2022 OBJECTIVES
Ethics committee and alert system
Monitoring of partners’ financial well-being and control non-financial risks
Raising employees and partners' awareness regarding compliance risks
Number of suppliers who have signed the Responsible Purchasing Charter
Proportion of suppliers assessed and audited with regard to CSR
Proportion of employees trained in and made aware of anti-corruption issues
ISO 19 600 evaluation of the group
60% of suppliers CSR certified (rating > 12/20) after the audit
25% of all sales in dealers labeled “Partner Dealers”
100% of group managers trained in and made aware of anti-corruption issues and the ISO 19600 assessment
13 Materiality analysis performed in 2012. 14 Main non-financial risk 1.
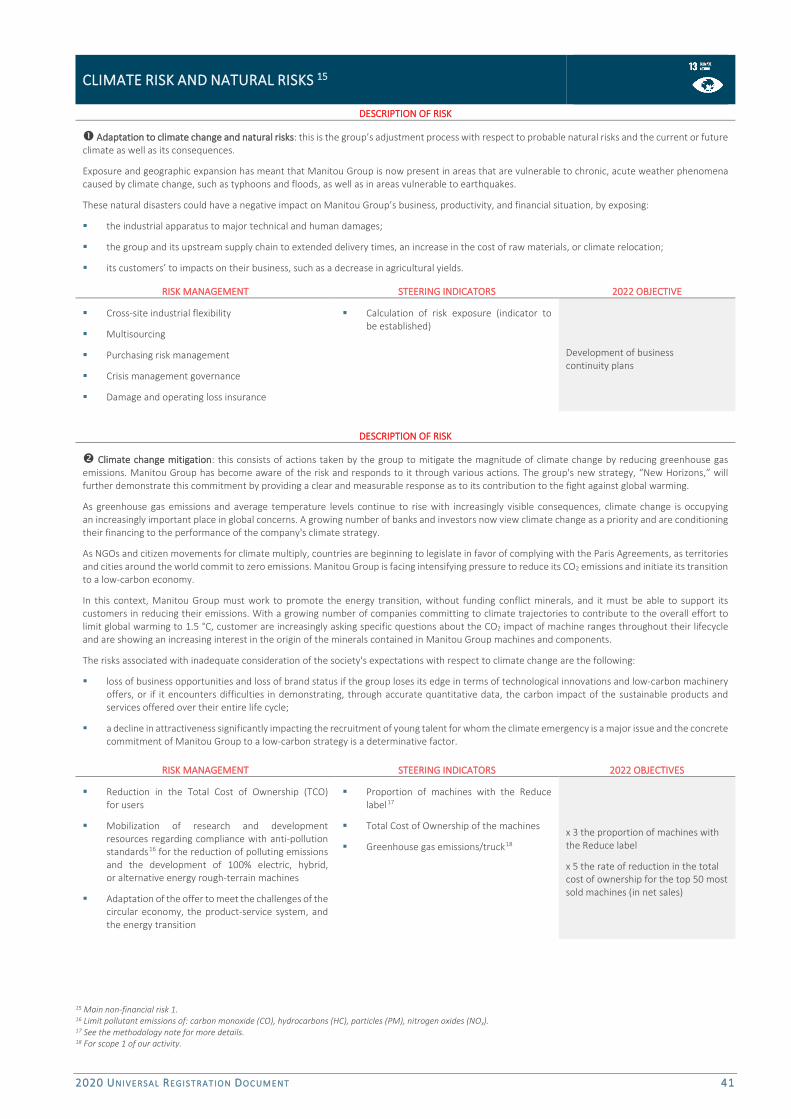
2020 UNIVERSAL REGIST RATION DOC UMENT 41
CLIMATE RISK AND NATURAL RISKS 15
DESCRIPTION OF RISK
Adaptation to climate change and natural risks: this is the group’s adjustment process with respect to probable natural risks and the current or future climate as well as its consequences.
Exposure and geographic expansion has meant that Manitou Group is now present in areas that are vulnerable to chronic, acute weather phenomena caused by climate change, such as typhoons and floods, as well as in areas vulnerable to earthquakes.
These natural disasters could have a negative impact on Manitou Group’s business, productivity, and financial situation, by exposing:
the industrial apparatus to major technical and human damages;
the group and its upstream supply chain to extended delivery times, an increase in the cost of raw materials, or climate relocation;
its customers’ to impacts on their business, such as a decrease in agricultural yields.
RISK MANAGEMENT STEERING INDICATORS 2022 OBJECTIVE
Cross-site industrial flexibility
Multisourcing
Purchasing risk management
Crisis management governance
Damage and operating loss insurance
Calculation of risk exposure (indicator to be established)
Development of business continuity plans
DESCRIPTION OF RISK
Climate change mitigation: this consists of actions taken by the group to mitigate the magnitude of climate change by reducing greenhouse gas emissions. Manitou Group has become aware of the risk and responds to it through various actions. The group's new strategy, “New Horizons,” will further demonstrate this commitment by providing a clear and measurable response as to its contribution to the fight against global warming.
As greenhouse gas emissions and average temperature levels continue to rise with increasingly visible consequences, climate change is occupying an increasingly important place in global concerns. A growing number of banks and investors now view climate change as a priority and are conditioning their financing to the performance of the company's climate strategy.
As NGOs and citizen movements for climate multiply, countries are beginning to legislate in favor of complying with the Paris Agreements, as territories and cities around the world commit to zero emissions. Manitou Group is facing intensifying pressure to reduce its CO2 emissions and initiate its transition to a low-carbon economy.
In this context, Manitou Group must work to promote the energy transition, without funding conflict minerals, and it must be able to support its customers in reducing their emissions. With a growing number of companies committing to climate trajectories to contribute to the overall effort to limit global warming to 1.5 °C, customer are increasingly asking specific questions about the CO2 impact of machine ranges throughout their lifecycle and are showing an increasing interest in the origin of the minerals contained in Manitou Group machines and components.
The risks associated with inadequate consideration of the society's expectations with respect to climate change are the following:
loss of business opportunities and loss of brand status if the group loses its edge in terms of technological innovations and low-carbon machinery offers, or if it encounters difficulties in demonstrating, through accurate quantitative data, the carbon impact of the sustainable products and services offered over their entire life cycle;
a decline in attractiveness significantly impacting the recruitment of young talent for whom the climate emergency is a major issue and the concrete commitment of Manitou Group to a low-carbon strategy is a determinative factor.
RISK MANAGEMENT STEERING INDICATORS 2022 OBJECTIVES
Reduction in the Total Cost of Ownership (TCO) for users
Mobilization of research and development resources regarding compliance with anti-pollution standards16 for the reduction of polluting emissions and the development of 100% electric, hybrid, or alternative energy rough-terrain machines
Adaptation of the offer to meet the challenges of the circular economy, the product-service system, and the energy transition
Proportion of machines with the Reduce label17
Total Cost of Ownership of the machines
Greenhouse gas emissions/truck18 x 3 the proportion of machines with the Reduce label
x 5 the rate of reduction in the total cost of ownership for the top 50 most sold machines (in net sales)
15 Main non-financial risk 1. 16 Limit pollutant emissions of: carbon monoxide (CO), hydrocarbons (HC), particles (PM), nitrogen oxides (NOx). 17 See the methodology note for more details. 18 For scope 1 of our activity.
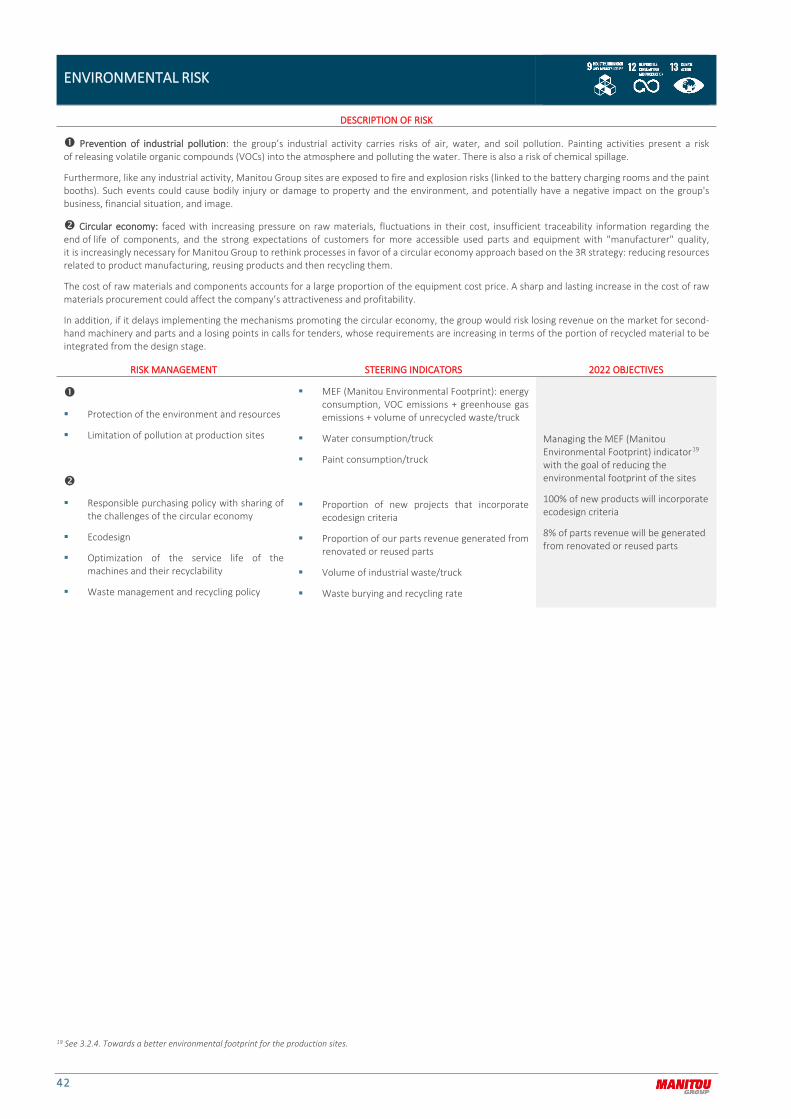
42
ENVIRONMENTAL RISK
DESCRIPTION OF RISK
Prevention of industrial pollution: the group’s industrial activity carries risks of air, water, and soil pollution. Painting activities present a risk of releasing volatile organic compounds (VOCs) into the atmosphere and polluting the water. There is also a risk of chemical spillage.
Furthermore, like any industrial activity, Manitou Group sites are exposed to fire and explosion risks (linked to the battery charging rooms and the paint booths). Such events could cause bodily injury or damage to property and the environment, and potentially have a negative impact on the group's business, financial situation, and image.
Circular economy: faced with increasing pressure on raw materials, fluctuations in their cost, insufficient traceability information regarding the end of life of components, and the strong expectations of customers for more accessible used parts and equipment with "manufacturer" quality, it is increasingly necessary for Manitou Group to rethink processes in favor of a circular economy approach based on the 3R strategy: reducing resources related to product manufacturing, reusing products and then recycling them.
The cost of raw materials and components accounts for a large proportion of the equipment cost price. A sharp and lasting increase in the cost of raw materials procurement could affect the company’s attractiveness and profitability.
In addition, if it delays implementing the mechanisms promoting the circular economy, the group would risk losing revenue on the market for second-hand machinery and parts and a losing points in calls for tenders, whose requirements are increasing in terms of the portion of recycled material to be integrated from the design stage.
RISK MANAGEMENT STEERING INDICATORS 2022 OBJECTIVES
Protection of the environment and resources
Limitation of pollution at production sites
MEF (Manitou Environmental Footprint): energy consumption, VOC emissions + greenhouse gas emissions + volume of unrecycled waste/truck
Water consumption/truck
Paint consumption/truck
Managing the MEF (Manitou Environmental Footprint) indicator19 with the goal of reducing the environmental footprint of the sites
100% of new products will incorporate ecodesign criteria
8% of parts revenue will be generated from renovated or reused parts
Responsible purchasing policy with sharing of the challenges of the circular economy
Ecodesign
Optimization of the service life of the machines and their recyclability
Waste management and recycling policy
Proportion of new projects that incorporate ecodesign criteria
Proportion of our parts revenue generated from renovated or reused parts
Volume of industrial waste/truck
Waste burying and recycling rate
19 See 3.2.4. Towards a better environmental footprint for the production sites.
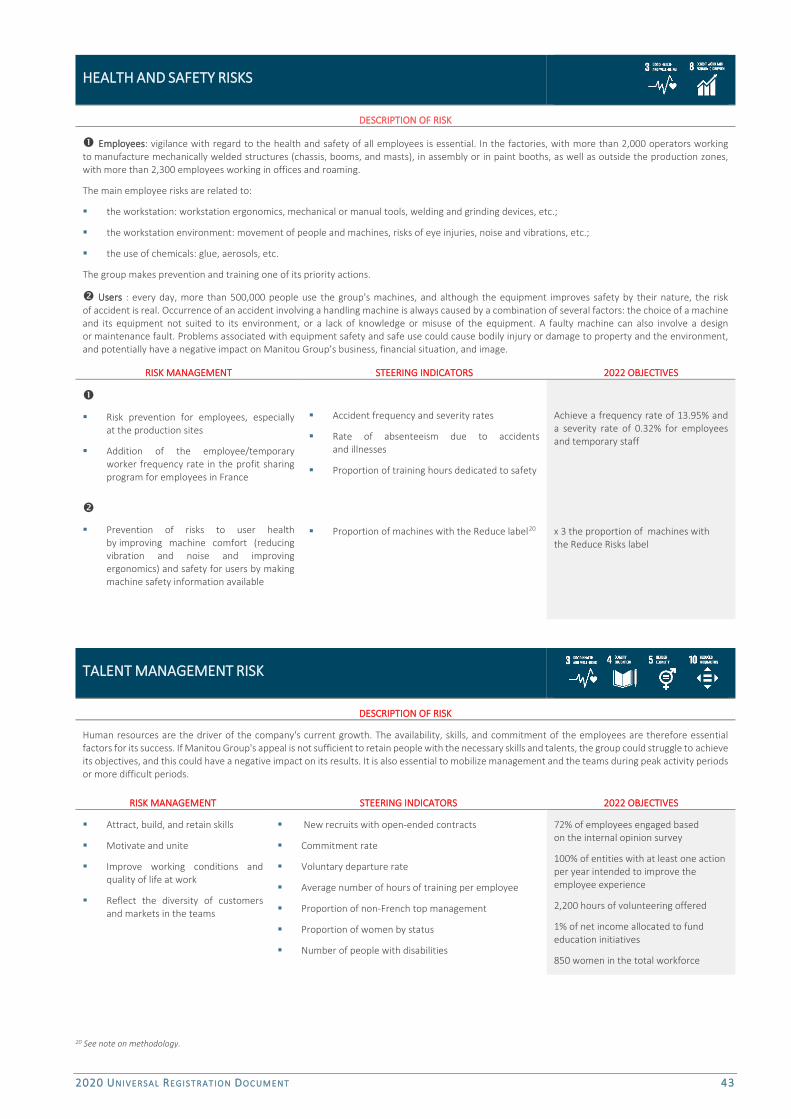
2020 UNIVERSAL REGIST RATION DOC UMENT 43
HEALTH AND SAFETY RISKS
DESCRIPTION OF RISK
Employees: vigilance with regard to the health and safety of all employees is essential. In the factories, with more than 2,000 operators working to manufacture mechanically welded structures (chassis, booms, and masts), in assembly or in paint booths, as well as outside the production zones, with more than 2,300 employees working in offices and roaming.
The main employee risks are related to:
the workstation: workstation ergonomics, mechanical or manual tools, welding and grinding devices, etc.;
the workstation environment: movement of people and machines, risks of eye injuries, noise and vibrations, etc.;
the use of chemicals: glue, aerosols, etc.
The group makes prevention and training one of its priority actions.
Users : every day, more than 500,000 people use the group's machines, and although the equipment improves safety by their nature, the risk of accident is real. Occurrence of an accident involving a handling machine is always caused by a combination of several factors: the choice of a machine and its equipment not suited to its environment, or a lack of knowledge or misuse of the equipment. A faulty machine can also involve a design or maintenance fault. Problems associated with equipment safety and safe use could cause bodily injury or damage to property and the environment, and potentially have a negative impact on Manitou Group’s business, financial situation, and image.
RISK MANAGEMENT STEERING INDICATORS 2022 OBJECTIVES
Risk prevention for employees, especially at the production sites
Addition of the employee/temporary worker frequency rate in the profit sharing program for employees in France
Accident frequency and severity rates
Rate of absenteeism due to accidents and illnesses
Proportion of training hours dedicated to safety
Achieve a frequency rate of 13.95% and a severity rate of 0.32% for employees and temporary staff
Prevention of risks to user health by improving machine comfort (reducing vibration and noise and improving ergonomics) and safety for users by making machine safety information available
Proportion of machines with the Reduce label20
x 3 the proportion of machines with the Reduce Risks label
TALENT MANAGEMENT RISK
DESCRIPTION OF RISK
Human resources are the driver of the company's current growth. The availability, skills, and commitment of the employees are therefore essential factors for its success. If Manitou Group's appeal is not sufficient to retain people with the necessary skills and talents, the group could struggle to achieve its objectives, and this could have a negative impact on its results. It is also essential to mobilize management and the teams during peak activity periods or more difficult periods.
RISK MANAGEMENT STEERING INDICATORS 2022 OBJECTIVES
Attract, build, and retain skills
Motivate and unite
Improve working conditions and quality of life at work
Reflect the diversity of customers and markets in the teams
New recruits with open-ended contracts
Commitment rate
Voluntary departure rate
Average number of hours of training per employee
Proportion of non-French top management
Proportion of women by status
Number of people with disabilities
72% of employees engaged based on the internal opinion survey
100% of entities with at least one action per year intended to improve the employee experience
2,200 hours of volunteering offered
1% of net income allocated to fund education initiatives
850 women in the total workforce
20 See note on methodology.

44
RESPONSIBILITY AT THE HEART OF THE STRATEGY AND GOVERNANCE
The group's Corporate Social and Environmental Responsibility policy is the outcome of contributions from all actors of the group. The CSR Department coordinates the various activities through the 2018-2022 CSR road map, while the contact persons within the business lines and subsidiaries facilitate the sharing of actions and information.
The CSR Department reports directly to the Corporate Secretary, who is a member of the Executive Committee. Each member of management is responsible for one or more 2022 objectives and has a project manager in their organization assigned to facilitate the transformation.
Twice a year, the group's Executive Committee reviews the lines of action and progress made on the road map. The Board of Directors takes into account the environmental and societal issues when defining and validating the five-year action plan and when considering the strategy to adopt.
Finally, the social, societal and environmental data required for non-financial reporting are collected by local contributors. The CSR Department relies on a project team to consolidate the data.
Internal audits, strengthened in 2020 on environmental indicators, validate the reported data and consolidated indicators. The published indicators are also audited by an independent external auditor (see 3.6. OTI Report).
THE CSR ACTIVATORS NETWORK
The CSR activators network was created in 2018 to bring together the contact persons of the various business lines around a common project. Driven by the Elevation plan and based on the involvement of the men and women of the group, in 2019, the network defined an action plan aligned with the 2018-2022 CSR road map to accelerate CSR integration in the business lines.
In 2020, the members met every quarter to discuss and monitor the progress of the actions. Activators in Italy and the US also integrated the dynamics. The main themes of the year were as follows:
The progress of the activators' action plan, including a reflection on the reduction of waste related to spare parts packaging (see 3.1.3. Towards more circularity), the completion of a carbon assessment on downstream transport21, the preparation of a group safety culture campaign, or the establishment of training workshops on risks related to mechanical welding safety.
Sharing feedback from the CSR consultation (see Stakeholder Concerns opposite).
Consultation with activators on changes in governance and the CSR road map to move forward together and respond to the current and future challenges of the group and its stakeholders.
RAISING OF EMPLOYEE AWARENESS
AND TRAINING
Each year, two events punctuate the life of the group to foster a sense of co-responsibility and competition surrounding the Elevation plan.
Elevation Days, a week of employee awareness raising at all sites. In 2020, the CSR Department adapted to social distancing measures and the development of teleworking by offering a 100% digital event across all the group's countries with:
the live broadcast of the final of the “PRME Innovation Challenge” organized by the United Nations, where students from the Asian Institute of Management, with the support of Manitou Group, including the presentation of the results of the CSR consultation (see Stakeholder Concerns below);
the launch of a comprehensive CSR training module at Manitou Group, available in three languages;
the dissemination of a podcast on CSR and group employees, available in French and English;
educating and motivating employees in France and Belgium, for a period of one year, on environmental issues through the Energic application and through a comprehensive event program: articles, quizzes, collective missions, commitment, and sharing of best practices as well as regular individual carbon reviews so that employees can quickly see the impact of their efforts.
21 MBF, MILE, MUK. 22 See chapter 3.4.4.
This program was an opportunity to meet the needs expressed by employees during the consultation for more information on CSR in general and the steps that Manitou Group takes on a daily basis to improve its environmental and societal impact.
Since 2014, the Elevation Challenge encourages intrapreneurship by giving all employees the opportunity to implement CSR projects. These best practices are then accessible from the group's “CSR best practices platform” to promote sharing between countries. This challenge was canceled in 2020 in order to prioritize the CSR consultation internally during the gradual resumption of activity as well as the management of the health and safety of employees around the world and to facilitate the resumption of activity.
STAKEHOLDER CONCERNS
As part of an approach initiated in December 2019 via the PRME partnership22 organized by the United Nations, Manitou Group launched a new consultation process with its stakeholders at the end of the first half of 2020 on CSR issues related to its activities. Led by the CSR Department, the consultation was conducted via online questionnaires with employees, customers and users, dealers, suppliers, professional associations and local authorities, and citizens more broadly. More qualitative interviews were also conducted with around fifteen key stakeholders.
In total, the consultation collected more than 1 100 responses, including 867 from employees, across 20 countries. The study and analysis of this data allowed Manitou Group to:
update the materiality matrix of its CSR issues and identify the sustainable development macro-issue that need to be accelerated in order to continue its transformation towards a more sustainable future for the group and its internal and external stakeholders;
present an updated and enhanced CSR road map to the Executive Committee and the Board of Directors;
evolve its CSR strategy towards a model that is more integrated into the overall strategy, that is, within the 2025 New Horizons strategic plan, which, effective January 2021, replaces the 22 Ambition plan (see Chapter 1.5.1).
The identified CSR macro-issues are as follows:
Low-carbon products and services Products and services that reduce greenhouse gas emissions throughout the product life cycle.
User health and safety Measures and services to reduce and prevent risks associated with the use of machines designed and manufactured by Manitou Group.
Climate-compatible solutions All virtuous actions that provide tangible evidence of the group's contribution to the fight against global warming.

2020 UNIVERSAL REGIST RATION DOC UMENT 45
CSR communication Transparency, relevance, frequency, and accessibility of the quantitative and qualitative data on the group's environmental and social impact.
Stakeholder relations The frequency and level of dialog established with the group's stakeholders to develop sustainable, constructive, and transparent relationships while continuing to create value.
Talent management The actions taken to detect potential at all levels of the company, combat turnover over the long term and achieve a better match between positions and required skills in order to anticipate the company's needs for today and tomorrow.
Machines and components with Eco-features The characteristics of machines and/or components aimed at reducing their environmental impact in all or part of their life cycle.
Remanufacturing and reconditioning The logistical and technical capacity to collect, clean, repair, or re-machine used parts and equipment to give them a second life.
Business ethics and the fight against corruption Consistency, transparency, and the level of ethics between values and compliance with the commitments made by Manitou Group and the way in which the group conducts its business throughout its value chain.
The matrix below23 defines CSR issues and priorities based on their importance for internal and external stakeholders and according to their impact on the group's success and sustainability.
CSR ISSUE MATERIALITY MATRIX
23 See note on methodology
High
Employee health and safety
Environmental data for products
Low-emission products/services
User health and safety
CSR communication Climate-compatible solutions
CSR training Talent management
Stakeholder relations
Recyclability Products and components with environmental benefits
Impo
rtan
ce fo
r sta
keho
lder
s
Diversity and inclusion
Impact of operations
Regulations and policies
Social dialog
Local community
Biodiversity
Impact of transportation and logistics
Renovation and reconditioning
Training
Co-innovation
Data protection
Business ethics and corruption
Responsible purchasing
Leadership and strategic engagement
Low Strategic importance for Manitou Group High
Thematic Maturity level of Manitou Group
Environmental Governance Employees Society Good Average Room for improvement
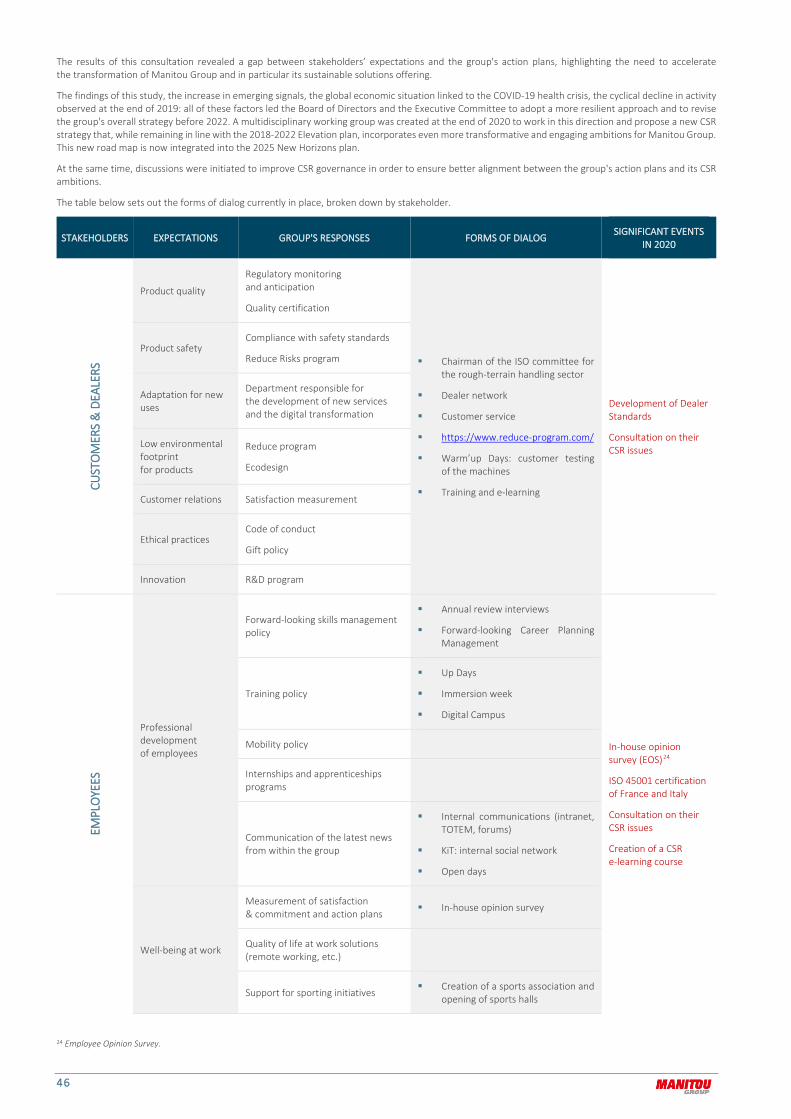
46
The results of this consultation revealed a gap between stakeholders’ expectations and the group's action plans, highlighting the need to accelerate the transformation of Manitou Group and in particular its sustainable solutions offering.
The findings of this study, the increase in emerging signals, the global economic situation linked to the COVID-19 health crisis, the cyclical decline in activity observed at the end of 2019: all of these factors led the Board of Directors and the Executive Committee to adopt a more resilient approach and to revise the group's overall strategy before 2022. A multidisciplinary working group was created at the end of 2020 to work in this direction and propose a new CSR strategy that, while remaining in line with the 2018-2022 Elevation plan, incorporates even more transformative and engaging ambitions for Manitou Group. This new road map is now integrated into the 2025 New Horizons plan.
At the same time, discussions were initiated to improve CSR governance in order to ensure better alignment between the group's action plans and its CSR ambitions.
The table below sets out the forms of dialog currently in place, broken down by stakeholder.
STAKEHOLDERS EXPECTATIONS GROUP'S RESPONSES FORMS OF DIALOG SIGNIFICANT EVENTS IN 2020
CUST
OM
ERS
& D
EALE
RS
Product quality
Regulatory monitoring and anticipation
Quality certification
Chairman of the ISO committee for the rough-terrain handling sector
Dealer network
Customer service
https://www.reduce-program.com/
Warm’up Days: customer testing of the machines
Training and e-learning
Development of Dealer Standards
Consultation on their CSR issues
Product safety Compliance with safety standards
Reduce Risks program
Adaptation for new uses
Department responsible for the development of new services and the digital transformation
Low environmental footprint for products
Reduce program
Ecodesign
Customer relations Satisfaction measurement
Ethical practices Code of conduct
Gift policy
Innovation R&D program
EMPL
OYE
ES
Professional development of employees
Forward-looking skills management policy
Annual review interviews
Forward-looking Career Planning Management
In-house opinion survey (EOS)24
ISO 45001 certification of France and Italy
Consultation on their CSR issues
Creation of a CSR e-learning course
Training policy
Up Days
Immersion week
Digital Campus
Mobility policy
Internships and apprenticeships programs
Communication of the latest news from within the group
Internal communications (intranet, TOTEM, forums)
KiT: internal social network
Open days
Well-being at work
Measurement of satisfaction & commitment and action plans
In-house opinion survey
Quality of life at work solutions (remote working, etc.)
Support for sporting initiatives Creation of a sports association and
opening of sports halls
24 Employee Opinion Survey.

2020 UNIVERSAL REGIST RATION DOC UMENT 47
STAKEHOLDERS EXPECTATIONS GROUP'S RESPONSES FORMS OF DIALOG SIGNIFICANT EVENTS
IN 2020
Promotion of team and individual success
Rewards/prizes and long-service awards
Boosting diversity
Gender equality in the workplace
Wo’Men by Manitou Group network
Mentoring program
Intergenerational cooperation
Policy aimed at supporting people with disabilities
Adviser to people with disabilities
Disabilities week
Social and trade-union rights Social dialog
Employee representative bodies and trade unions
Mobilization around CSR issues Internal CSR communications
Annual Elevation Challenge, Elevation Days, platform for sharing the group's best CSR practices
Health and safety at work QEHS policy and certifications
EHS Corporation, health division & social worker
SUPP
LIER
S &
SU
BCO
NTR
ACTO
RS
Economic competitiveness Total Cost of Ownership approach
Supplier Convention and technical sessions
Consultation on their CSR issues
Sharing of the group's best practices to reduce Covid-19 risks on the supplier portal
Sustainability of supplier relationships
Supplier Development Department
Supplier extranet
Responsible Purchasing Charter
CSR supplier ratings
LOCA
L CO
MM
UN
ITIE
S
Academic partnerships
Local relationships with the education sector and collaborative projects
Handling the Future Challenge with students
Partnerships with schools
School visits - Student fairs
Support into employment
Handling the Future Challenge – 4th edition
PRME partnership as part of the United Nations Global Compact
Consultation on their CSR issues
Signature of the "For a environmentally responsible industry" manifesto with 34 companies from Pays de la Loire
Reinforcing regional presence Participation in networks Involvement in local networks
Commitment to the community Skill-based sponsorship policy
Internal site with proposed missions in schools or associations
SHAR
EHO
LDER
S &
FI
NAN
CIAL
CO
MM
UN
ITY
Good governance
Regular detailed communication
Registration document
Annual United Nations Global Compact Progress Report
Answers to questionnaires from non-financial rating agencies
Website
Consultation on their CSR issues
2020 Gaïa Index classification: 18/230
Relationship of trust and consideration
CSR performance transparency
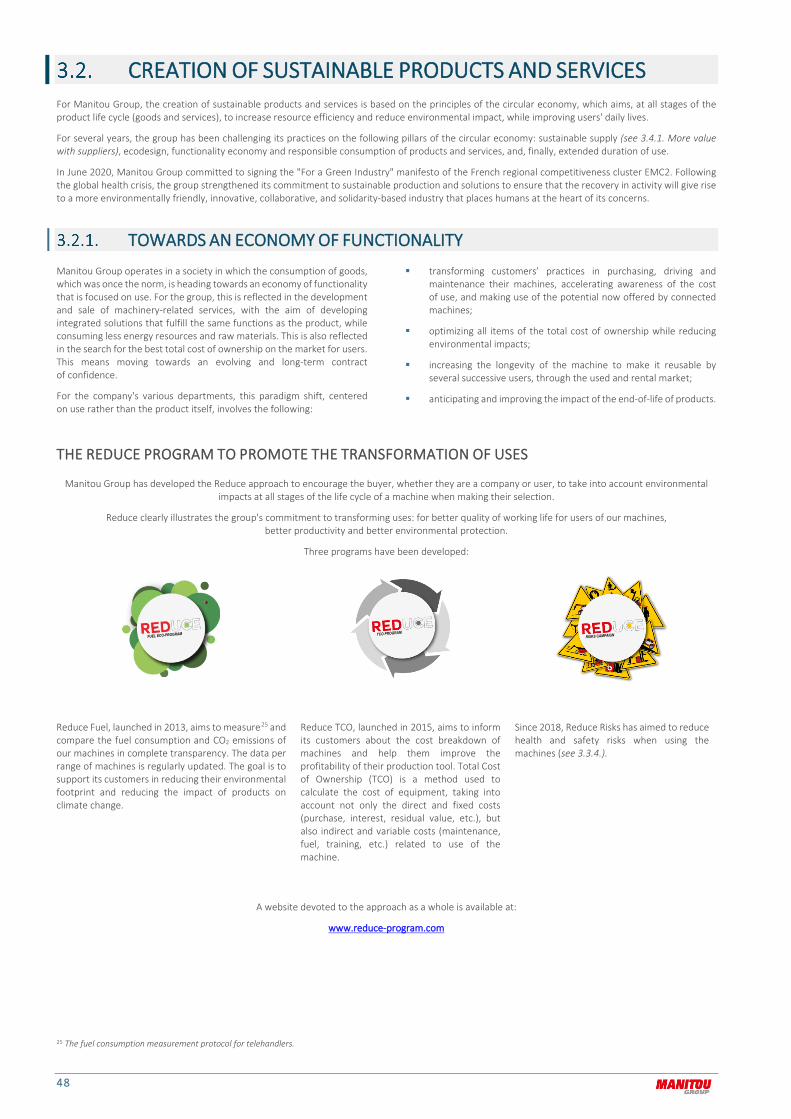
48
CREATION OF SUSTAINABLE PRODUCTS AND SERVICES For Manitou Group, the creation of sustainable products and services is based on the principles of the circular economy, which aims, at all stages of the product life cycle (goods and services), to increase resource efficiency and reduce environmental impact, while improving users' daily lives.
For several years, the group has been challenging its practices on the following pillars of the circular economy: sustainable supply (see 3.4.1. More value with suppliers), ecodesign, functionality economy and responsible consumption of products and services, and, finally, extended duration of use.
In June 2020, Manitou Group committed to signing the "For a Green Industry" manifesto of the French regional competitiveness cluster EMC2. Following the global health crisis, the group strengthened its commitment to sustainable production and solutions to ensure that the recovery in activity will give rise to a more environmentally friendly, innovative, collaborative, and solidarity-based industry that places humans at the heart of its concerns.
TOWARDS AN ECONOMY OF FUNCTIONALITY
Manitou Group operates in a society in which the consumption of goods, which was once the norm, is heading towards an economy of functionality that is focused on use. For the group, this is reflected in the development and sale of machinery-related services, with the aim of developing integrated solutions that fulfill the same functions as the product, while consuming less energy resources and raw materials. This is also reflected in the search for the best total cost of ownership on the market for users. This means moving towards an evolving and long-term contract of confidence.
For the company's various departments, this paradigm shift, centered on use rather than the product itself, involves the following:
transforming customers’ practices in purchasing, driving and maintenance their machines, accelerating awareness of the cost of use, and making use of the potential now offered by connected machines;
optimizing all items of the total cost of ownership while reducing environmental impacts;
increasing the longevity of the machine to make it reusable by several successive users, through the used and rental market;
anticipating and improving the impact of the end-of-life of products.
THE REDUCE PROGRAM TO PROMOTE THE TRANSFORMATION OF USES
Manitou Group has developed the Reduce approach to encourage the buyer, whether they are a company or user, to take into account environmental impacts at all stages of the life cycle of a machine when making their selection.
Reduce clearly illustrates the group's commitment to transforming uses: for better quality of working life for users of our machines, better productivity and better environmental protection.
Three programs have been developed:
Reduce Fuel, launched in 2013, aims to measure25 and compare the fuel consumption and CO2 emissions of our machines in complete transparency. The data per range of machines is regularly updated. The goal is to support its customers in reducing their environmental footprint and reducing the impact of products on climate change.
Reduce TCO, launched in 2015, aims to inform its customers about the cost breakdown of machines and help them improve the profitability of their production tool. Total Cost of Ownership (TCO) is a method used to calculate the cost of equipment, taking into account not only the direct and fixed costs (purchase, interest, residual value, etc.), but also indirect and variable costs (maintenance, fuel, training, etc.) related to use of the machine.
Since 2018, Reduce Risks has aimed to reduce health and safety risks when using the machines (see 3.3.4.).
A website devoted to the approach as a whole is available at:
www.reduce-program.com
25 The fuel consumption measurement protocol for telehandlers.

2020 UNIVERSAL REGIST RATION DOC UMENT 49
The digital platform of the Reduce program, which is available in 10 languages, directly targets customers and end users. It allows them to:
measure the Total Cost of Ownership (Reduce TCO) of their machine. Thanks to the various usage criteria, research is precise, and the machine suitable for the user’s requirements and business can be identified in just a few clicks. The tool gives the cost per hour including fuel consumption, maintenance, insurance, and the resale value of the machine;
compare the fuel consumption and CO2 emissions of a Manitou Group machine with an equivalent competitor machine or with another machine of the group (Reduce Fuel). Measurements are available on agricultural and construction telehandlers, and more recently on platforms;
follow simple recommendations for use in order to reduce their consumption, impact in terms of CO2 emissions, and TCO;
watch almost 300 videos on the safe use of the machine (Reduce Risks). These videos explain, for example, how to start and maintain a machine and secure the attachments, what safety precautions should be taken, or how technology such as the JSM® works;
quickly identify good and bad practices and therefore prevent the risk of accident, thanks to prevention posters (Reduce Risks);
directly access instruction manuals and maintenance documents;
discover all of the equipment and innovations for reducing risks, TCO, and fuel consumption and for improving user comfort (ergonomics, vibration, and acoustics).
In 2020, the group also finalized a white paper on TCO intended for users of telehandlers, expected for publication in the first half of 2021. The idea is to help customers think about the total cost of their machine and not only the purchase price.
CONNECTED MACHINES TO SUPPORT
THE TRANSFORMATION OF USES
The Internet of Things (IoT) has accelerated the digital transformation throughout the group's value chain by generating new value-added services.
Thanks to connected machines, the hardware manager and user benefit from real-time machine data accessible on a mobile app or portal. Fleet monitoring is simplified thanks to the wealth of data collected (machine condition, fuel/battery level, activity cycle, location, maintenance alerts, etc.) and each customer interaction is more valued.
Through these connected services, Manitou Group is innovating and making every effort to share this information between users and support teams (fleet managers, technicians, site managers) in order to reduce downtime and optimize performance (machines and operators). Facilitating collaborative exchanges between teams and helping them make the right decisions on site and remotely are among the continuous improvements resulting from connectivity - now standard for 90% of the range.
The transformation of uses and service is underway with new ways of working: monitoring, anticipating, and sharing for a better customer experience, with players involved in performance (energy efficiency and performance), reducing costs, and safety of persons.
From now on, use cases and feedback are driving innovation: real-time operator safety alerts, machine misuse alerts, machine idling time reports, precise TCO data based on uses and users, and CO2 emissions report.
TOWARDS GREATER ECONOMIC AND ENVIRONMENTAL
OPTIMIZATION FOR USERS
REDUCTION IN TOTAL COST OF OWNERSHIP
BY DESIGN
The continuous optimization of TCO allows customers to reduce their costs as well as reduce their environmental footprint.
For several years, the group has made this goal the core of its strategy and actions. This starts with the design of a product or service.
TOTAL COST OF OWNERSHIP OF A MACHINE
In order to achieve the TCO reduction 2022 CSR objective, the group is working on several drivers: reducing energy consumption and maintenance costs (preventive and corrective maintenance) by optimizing servicing frequencies, reducing oil and filter volumes, and conducting major work on component reliability for a longer machine service life. Among the major actions in 2020:
improving the maintenance intervals of the 280 TJ platform engine, with a significant impact on the recommendation to change telescope cables from every 5 years to every 12 years;
the launch of MLT 841 XL stage V equipped with a new engine with a significant improvement in fuel consumption and engine maintenance recommendations;
the launch of the MC, MSI, platforms, as well as NewAg, in stage V, with maintenance gains;
the development of the Eco-Stop option on additional machine models (MT11 at 18,100 CV): gains in consumption, maintenance, and resale value;
the series launch of the group's first rough-terrain electric platform, the 200 ATJE, with gains in consumption and maintenance;
actions to reduce maintenance costs for several rotating telehandlers, such as the MRT.
Lastly, as a practical application of TCO reduction and ecodesign, it is worth discussing the Eco-Stop function, which helps reduce fuel consumption, maintenance, and depreciation of the machine. The idea is that the engine turns off automatically when it is idling and the driver is not in the cab. Thanks to data collection, the time when the engine is idling without a driver in the cab is estimated at 15% to 30%. Assuming a base of 15% for a machine that is used for 1,000 hours/year for 3 years, the Eco Stop function can save €4,500 (based on a diesel price of €1/liter).
In fact, more than one third of the costs of using the group's products are linked to customers’ fuel consumption. Over the past six years, this work to reduce energy consumption and TCO at all stage of the machines’ life cycle has been reflected in important steps in the life of the group.
11% FINANCIAL
COSTS
3% TIRES
13% MAINTENANCE
& REPAIRS
42% FUEL
31% IMPAIRMENT
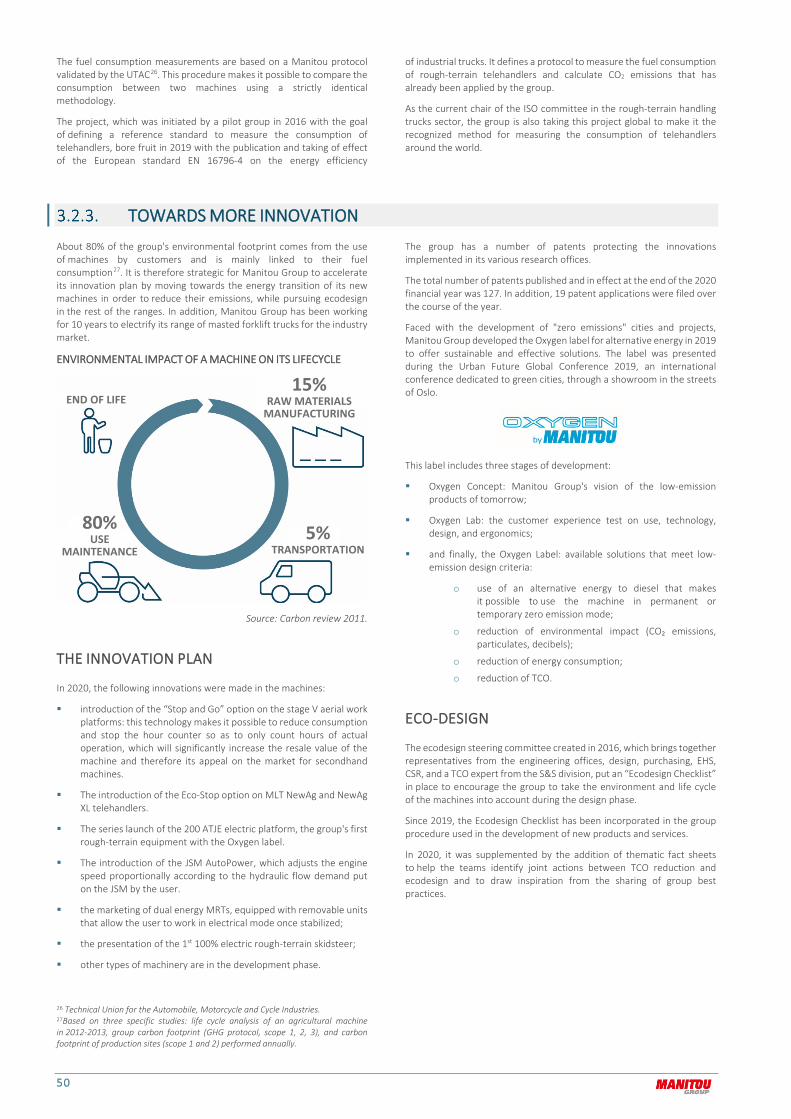
50
The fuel consumption measurements are based on a Manitou protocol validated by the UTAC26. This procedure makes it possible to compare the consumption between two machines using a strictly identical methodology.
The project, which was initiated by a pilot group in 2016 with the goal of defining a reference standard to measure the consumption of telehandlers, bore fruit in 2019 with the publication and taking of effect of the European standard EN 16796-4 on the energy efficiency
of industrial trucks. It defines a protocol to measure the fuel consumption of rough-terrain telehandlers and calculate CO2 emissions that has already been applied by the group.
As the current chair of the ISO committee in the rough-terrain handling trucks sector, the group is also taking this project global to make it the recognized method for measuring the consumption of telehandlers around the world.
TOWARDS MORE INNOVATION
About 80% of the group's environmental footprint comes from the use of machines by customers and is mainly linked to their fuel consumption27. It is therefore strategic for Manitou Group to accelerate its innovation plan by moving towards the energy transition of its new machines in order to reduce their emissions, while pursuing ecodesign in the rest of the ranges. In addition, Manitou Group has been working for 10 years to electrify its range of masted forklift trucks for the industry market.
ENVIRONMENTAL IMPACT OF A MACHINE ON ITS LIFECYCLE
Source: Carbon review 2011.
THE INNOVATION PLAN
In 2020, the following innovations were made in the machines:
introduction of the “Stop and Go” option on the stage V aerial work platforms: this technology makes it possible to reduce consumption and stop the hour counter so as to only count hours of actual operation, which will significantly increase the resale value of the machine and therefore its appeal on the market for secondhand machines.
The introduction of the Eco-Stop option on MLT NewAg and NewAg XL telehandlers.
The series launch of the 200 ATJE electric platform, the group's first rough-terrain equipment with the Oxygen label.
The introduction of the JSM AutoPower, which adjusts the engine speed proportionally according to the hydraulic flow demand put on the JSM by the user.
the marketing of dual energy MRTs, equipped with removable units that allow the user to work in electrical mode once stabilized;
the presentation of the 1st 100% electric rough-terrain skidsteer;
other types of machinery are in the development phase.
26 Technical Union for the Automobile, Motorcycle and Cycle Industries. 27Based on three specific studies: life cycle analysis of an agricultural machine in 2012-2013, group carbon footprint (GHG protocol, scope 1, 2, 3), and carbon footprint of production sites (scope 1 and 2) performed annually.
The group has a number of patents protecting the innovations implemented in its various research offices.
The total number of patents published and in effect at the end of the 2020 financial year was 127. In addition, 19 patent applications were filed over the course of the year.
Faced with the development of "zero emissions" cities and projects, Manitou Group developed the Oxygen label for alternative energy in 2019 to offer sustainable and effective solutions. The label was presented during the Urban Future Global Conference 2019, an international conference dedicated to green cities, through a showroom in the streets of Oslo.
This label includes three stages of development:
Oxygen Concept: Manitou Group's vision of the low-emission products of tomorrow;
Oxygen Lab: the customer experience test on use, technology, design, and ergonomics;
and finally, the Oxygen Label: available solutions that meet low-emission design criteria:
o use of an alternative energy to diesel that makes it possible to use the machine in permanent or temporary zero emission mode;
o reduction of environmental impact (CO₂ emissions, particulates, decibels);
o reduction of energy consumption;
o reduction of TCO.
ECO-DESIGN
The ecodesign steering committee created in 2016, which brings together representatives from the engineering offices, design, purchasing, EHS, CSR, and a TCO expert from the S&S division, put an “Ecodesign Checklist” in place to encourage the group to take the environment and life cycle of the machines into account during the design phase.
Since 2019, the Ecodesign Checklist has been incorporated in the group procedure used in the development of new products and services.
In 2020, it was supplemented by the addition of thematic fact sheets to help the teams identify joint actions between TCO reduction and ecodesign and to draw inspiration from the sharing of group best practices.
END OF LIFE 15%
RAW MATERIALS MANUFACTURING
80% USE
MAINTENANCE 5%
TRANSPORTATION

2020 UNIVERSAL REGIST RATION DOC UMENT 51
Specific ecodesign examples in 2020:
A hydraulic filter for the NewAg and P150 telehandlers: collaboration with the supplier in order to lighten the part to be changed every 2,000 hours as part of preventive maintenance.
This project represents a savings of 1.96 tons of raw materials per year;
a hydraulic filter for the ultra-compact telehandlers: reduction of required oil quantities by up to 25%.
TOWARDS MORE CIRCULARITY
REDUCE, REUSE, AND RECYCLE
In line with the 3Rs (reduce the quantity of waste generated, re-use machines, parts, and accessories, and recycle materials) program, Manitou Group is working on:
optimizing the service life of its machines: choice of components with as long a service life as possible from the design stage and work on improving the reliability of components through the use of corrective maintenance statistics by the quality departments. Recent developments include the introduction of new material to make repairable hoods available as standard, which will have a considerable impact on hood reliability and sustainability;
promoting the use of new or used spare parts: through the spare parts logistics centers based in Ancenis (France) and Belvidere (USA), orders are processed with an order fill rate of close to 95%. Thus, the machine fleet is kept in optimal operating condition and its service life is extended. In 2017, the “ReMAN By Manitou” project received the in-house Elevation challenge award and today is part of the 2022 CSR objectives. This involves a range of remanufactured replacement parts (engines, gearboxes, turbo engines, etc.). This alternative to new parts reduces maintenance costs and gives used parts a second life. The parts are refurbished with original components and therefore have a warranty identical to new parts.
By facilitating the reverse logistics of the ReMAN loop for the dealer, Manitou Group gives its customers the opportunity to extend the duration of use of their machines while limiting the environmental impact of the spare part, with an economic gain for the customer.
In 2020, the health context delayed the logistics flows of the ReMAN loop, resulting in a reduction in the availability rate of ReMAN parts with customers. Despite this context, Manitou Group has reworked and developed its ReMAN parts offering, including the addition of new range families, in order to follow the technological evolution of the group's machines. Several projects are planned in 2021 in order to adjust the service and improve the visibility of the ReMAN offer.
After a comprehensive review, begun at the end of 2019, regarding how to reduce the environmental impact of spare parts packaging and optimize their purchase costs, Manitou Group launched the following actions in 2020:
pooling of the packaging of the Manitou and Gehl brands under the single Manitou Group Parts brand for the customer;
the use of 100% recyclable cardboard packaging with environmentally-friendly inks and solvents, with 50% of the range FSC certified28. They will be distributed from the first quarter of 2021.
The study will continue in 2021 with packaging optimization with Manitou Group suppliers and the reduction of plastic packaging.
A NETWORK OF USED MACHINES
In 2020, Manitou Group sold more than 1 012 used pieces of equipment through its subsidiaries, or an increase of 6% over 2019. The group continues to promote the high-quality second-hand market with almost 1,500 dealer advertisements published on the website used.manitou.com in 2020, which drew nearly 45 000 visitors. The increase in demand in terms of the recovery of old customer equipment allows the group to contribute to extending the life of its equipment and move towards more circularity.
The reconditioning center created in 2015 continues to progressively ramp up activities with the goal of recovering, repairing, and restoring machines, while accelerating the development of ReMAN part ranges. These activities will allow the group to anticipate regulations on end of life vehicles (ELV), which does not yet apply to heavy machinery.
It is also a central location for supporting the deployment of long-term lease offers with financing and services that will, in the near future, need infrastructure in order to manage the return of these machines.
Lastly, in partnership with the group's dealer network, the Services & Solutions division is developing solutions that have a positive effect on the service life of the equipment:
the 1 050 Manitou Group dealers spread across 140 countries and the 2 000 expert technicians are trained regularly in order to be able to offer support to users, from purchase of the equipment through to after-sales service;
maintenance contracts help keep machines in good working order and ensure a better value for money for the machine;
warranty extensions provide added value, protecting the equipment beyond the contractual warranty.
TOWARDS A BETTER ENVIRONMENTAL FOOTPRINT
FOR THE PRODUCTION SITES
In addition to striving to reduce the environmental impact of its machines, Manitou Group also intends to manage the impact of its manufacturing processes on the environment.
As resources grow more scare, the group has a duty to seek to reduce its environmental impact by saving the natural resources needed for its business as much as possible, such as energy and water and by optimizing the recycling of its waste and globally reducing greenhouse gas emissions in both the design phase of its machines and their use.
28 Forest Stewardship Council.
With production sites in France and around the world, accelerating the development of a common environmental management system for all of the production sites is essential. In addition to ISO 14001, which is aimed at optimizing environmental standards processes, in 2020 the group confirmed its commitment to certifying its ISO 50001 sites in order to control energy consumption. This project will be initiated in 2021 with the goal of certifying the French and Italian sites in 2023.

52
2018 2019 2020
Proportion of ISO 14001-certified or eligible sites (as % of general revenue in the group*)
78 % 78.6 % 75.6 %
The certification scope remained constant in 2020. The decrease is explained by the breakdown of the revenues of the sites concerned.
In addition to improving the time and efficiency of processes and reducing sites’ CO2 emissions, this development will ensure that sustainable energy is managed over time at production sites by improving the group's
environmental performance, particularly from the perspective of a low-carbon strategy.
Since 2019, the group has used a common composite indicator consolidating the performance of all of its production sites: the Manitou Environmental Footprint (MEF). It is used to monitor the environmental impact of the group’s manufacturing processes and reduce them. The reliability of this indicator was proven in 2020 for France, which led to its adoption by the HSE teams and management as well.
The Group now plans to consolidate and integrate data from all production sites in order to be able to monitor a Group MEF in 2021, with the goal of setting reduction targets starting in 2022.
* 2019 data has been updated after the scope was extended to the entire Group and after strengthening our internal controls, allowing us to make our data more reliable.
a) d) The increase in energy consumption and GHG emissions per equivalent truck is due to the 34% decrease compared to 2019 in the number of equivalent trucks produced, while energy consumption, which is directly related to GHG emissions, remains a fixed item and was therefore not impacted by the decline in rates during the gradual recovery in activity. With the decline in rates and Covid-19 lockdowns, the group's energy consumption and absolute GHG emissions decreased in 2020: - 19.8% for energy and -18.4% for GHGs compared to 2019.
b) c) The volume of paint and solvents in absolute terms decreased for the group by 13.4%. The more significant increase in VOC emissions by equivalent truck and by absolute value (+4.8%) is due to the increase in requests for colors from rental customers, which requires that the systems be cleaned and drained for each color change.
e) The increase in water consumption by equivalent truck represents an increase in absolute value of 2.21%, due in particular to the Covid-19 health measures at all sites, and the cleaning of residues from the parts, machinery, and premises following the flooding that occurred at the end of 2019 at the site in Madison, United States.
f) The group is continuing its waste management efforts by improving sorting at the source and giving precedence to the recycling and reuse of materials rather than their energy recovery. Work was also carried out in 2020 at the group level to harmonize waste reporting. The production of industrial waste decreased in absolute terms by 8.18% compared with 2019, with an increase of 39.2% per equivalent truck. This is due to the numerous cleaning operations in workshops and storage warehouses caused by the slowdown in production activity. Despite this increase, 83% of the waste is reused or recycled (versus 80% in 2019), 5.6% is recovered for energy (versus 9% in 2019), and 11.3% is buried (versus 11 % in 2019). All waste from steel is reused.
Operationally, many actions are undertaken every day to ensure management of these risks:
working groups on the reduction of specific risks;
regular communications on EHS issues (meetings, circulation of safety/environmental instructions, intranet articles, and posters);
the CSR best practices platform to share the best safety and environment practices.
In 2020, improvement actions were completed at the production sites:
solar energy production in Italy: the solar energy produced is consumed for the use of a new building that is equipped with photovoltaic solar panels. The rest of the energy produced is fed back into the electrical grid;
improvement of waste monitoring with the implementation of a new tool for the French sites;
the continued deployment of LED lighting technology in the logistics center for spare parts;
the deployment of centralized energy management at the Laillé site;
education, promotion of best practices, and sharing of ideas in order to improve the environmental impact of the group and its employees in France and Belgium through an environmental challenge launched in September 2020. This challenge, managed through a digital application, will end in September 2021.
Unit 2019* 2020
2019-2020 variation Scope
Equivalent trucks produced No. of MLT735 equivalent trucks produced 35,854 23,648 - 34%
All of the production sites and the main logistics center around the world
Energy consumption kWh/truck equivalent 2,588 3,149 + 21.7% (a) VOC emissions kg VOC/truck equivalent 6.9 11 + 58.9% (b) Paint consumption kg/truck equivalent 14.9 19.6 + 31.3% (c) GHG emissions kg CO2 eq/truck equivalent 722 894 + 23.8% (d) Water abstracted m3/truck equivalent 1.7 2.6 55 % (e) Volume of industrial waste Kg/truck equivalent 285.6 397.6 + 39.2% (f)
2020 UNIVERSAL REGIST RATION DOC UMENT 53
MANITOU GROUP, A SOCIALLY RESPONSIBLE EMPLOYER
The women and men of Manitou Group are passionate and driven by an entrepreneurial spirit and a sense of shared goodwill. This is a key part of the corporate culture, encouraging a sense of belonging among employees. Based on trust, management encourages innovation, experimentation, challenges, and acceptance of responsibility. All HR actions and policy are consistent with the group's values, defined by the employees themselves in 2020: reliability, passion, and commitment.
The competitive environment in which the group operates and its desire to transform means that it must attract the best talent, developing them, motivating them, retaining them, and recognizing their performance. The group is committed to offering these women and men safe working conditions conducive to their development, while involving them fully in its CSR approach.
IMPACTS OF THE COVID-19 CRISIS
EMPLOYEE SAFETY FIRST AND FOREMOST
2020 was marked by a severe and sudden crisis that forced Manitou Group to review its immediate priorities: first, protect the health and ensure the safety of its employees, while ensuring the sustainability of the company.
To manage the impact of the health crisis on the company's activities, increase agility, and centralize decision-making, the group has set up a coordination unit composed of members of the Executive Committee and several key business lines: Purchasing, Communication, HR, Audit Risk and Compliance, Operations and Finance.
Travel to China, then gradually all international travel, was suspended. As government authorities announced widespread lockdowns in the various countries, the group's employees were placed on partial activity or work-from-home for several weeks between the end of the first quarter and the beginning of the second quarter 2020. Only production sites in the United States (declared as essential activity) and the international logistics center for spare parts in Ancenis (France) remained operational throughout the crisis, in order to serve the users of machinery. Production picked up gradually starting on 15 April 2020, first in France, then in Italy, and finally in India. In France, a multidisciplinary working group made up of representatives from Environment, Health & Safety and at each site, the Health division, human resources managers, the head of Quality of Life at Work, and maintenance, has designed, rolled out, and adapted throughout the year a health protocol for employee protection in order to allow activities to resume and employees to return on site safely.
MAINTAINING CONNECTIONS
Despite the lockdown, work from home, or partial activity, regular communications took place in different formats in order to maintain a link with the group's employees. A 20-episode web series was launched in the spring and was broadcast on the intranet for employees around the world, recounting through videoconference interviews the daily lives of several employees who played a central role during the crisis. Regular internal memoranda were also written and sent through several communication channels: intranet, email, SMS, and posting. Videos were made to distribute messages from the CEO and the Chairman of the Board of Directors to the group's employees, as well as to show how the group was organized to prepare for a gradual resumption of activities and thus reassure employees who were required to return to the site.
DISRUPTED WORKING METHODS
A work-from-home agreement has been in place within Manitou Group in France since 2014. All employees whose function allows it can perform 1 or 2 days of remote work per week. This allowed the group to quickly organize itself when this method of working had to be extended to the extremes with the arrival of the pandemic.
With regard to working and management practices, tools and conferences have been put in place to support employees with this new 100% remote environment: to give managers advice and ideas to manage their teams remotely and to share best practices on working from home (right to the chosen connection, ergonomics of workstations, break times, tips to limit its environmental footprint, etc.). This period was also an opportunity for the group to communicate regularly to promote its online training tools and encourage its employees to taking training through the Digital Campus, in particular. Finally, the group also capitalized on the collaborative tools available to facilitate remote working (see below in the section on “Collaborative work and agility”).
THE RESILIENCE PLAN TO ADAPT AND CONSOLIDATE
THE GROUP
This crisis has also appeared to be a catalyst for certain trends observed since mid-2019, particularly the cyclical turnaround of the markets in which the company operates. Faced with these findings, the consequences of these crises and the need for agility, Manitou Group had to make many decisions in 2020 that were sometimes difficult but necessary.
Readjustment of direct production organization by significantly limiting the use of temporary staff and service providers.
Restructuring operations carried out in India, Brazil, South Africa, the UK, and the United States, which resulted in more than a hundred indirect job cuts.
After initially planning a moderate Employment Protection Plan (63 positions) in France, the company finally decided to opt for a project to redeploy resources internally to adapt and consolidate the group.
Discontinuation of assembly activities in Brazil.
Reorganization and consolidation of machinery design and production activities within a single Product division for greater efficiency in the industrial organization and greater consistency for the group's customers and external stakeholders.
Announcement of the closure of operations in Waco (United States) starting in March 2021 in order to streamline the group's production tools and increase its performance.
Major global savings plan (reduction of expenses and overheads, cancellation of travel, trade fairs, etc.).
Postponement or cancellation of several projects, including the new head office.
The various health and economic crises that the company faced had a significant impact on the human resources actions carried out in 2020. The management of these crises and the resulting consequences have disrupted the initial priorities.

54
GROUP PROFILE
GROUP HEADCOUNT AS OF DECEMBER 31, 2020
2018 2019 2020
Headcount No. 4,425 4,574 4,354 Total headcount (including temps) No. 5,335 5,068 4,929 Staff with open-ended contracts % 79.46 86.76 86.51 Staff with fixed-term contracts % 3.49 3.49 1.83 Temporary workers % 17.06 9.75 11.66 International corporate volunteer program
No. 4 6 3
Internationally mobile employees No. 11 10 6
The Resilience plan allowed the company to limit the decrease in the total headcount to 4.81% between 2019 and 2020, despite a drop in revenue of around 24%.
BREAKDOWN OF GROUP HEADCOUNT BY GEOGRAPHICAL AREA AS OF DECEMBER 31, 2020
2018 2019 2020
France % 51.9 52.6 54.1 Southern Europe (excluding France)
% 7.8 8.3 8.6
Northern Europe % 3.8 4.7 4.7 Americas % 23.1 19.6 18.9 APAM % 13.4 14.9 13.6
Proof of its international reach, 45.9% of the group's workforce is outside France, a figure down slightly compared to 2019 due to reorganizations carried out in certain subsidiaries. The “Americas” (North America, Latin America, and South America) portion represents the second largest region in terms of employees (18.9%). The rest of the workforce is found
in the APAM region (Asia, Pacific, Africa, Middle East - 13.6%), and in Europe, excluding France (13.3%). The diversity of nationalities on the global leadership team is progressively increasing, with 19 different nationalities as of December 31, 2020.
BREAKDOWN OF GROUP HEADCOUNT BY STATUS, AS OF DECEMBER 31, 2020
2018 2019 2020
Managers % 22.2 23.6 25.5 Supervisory staff % 1.7 1.7 1.6 ETD % 27.5 28.6 27.7 Manual workers % 48.7 46.1 45.3
BREAKDOWN OF THE GROUP HEADCOUNT BY AGE, AS OF DECEMBER 31, 2020
2018 2019 2020
Aged 24 and less % 5.3 4.8 4 25-34 years % 21.2 21.1 19.4 35-44 years % 35.7 34.6 35.1 45-54 years % 25.4 26.7 28 55-64 years % 11.5 12 12.8 Over 65 years % 0.9 0.8 0.8
In 2020, the 35-44 years age segment remains the center of gravity of the group’s workforce, reflecting efforts to recruit workers in this age range. A slight shift upwards towards the higher age ranges is still underway. Nearly 41.6% of employees are over the age of 45 (39.5% in 2019). The average seniority in the group's teams is progressively increasing, thanks especially to actions geared towards loyalty-building and improving the quality of life at work.
TOWARDS MORE ENGAGEMENT, MORE DEVELOPMENT OF TALENT
ATTRACTING TALENTS THROUGH ITS
EMPLOYER BRAND
Manitou Group would like to offer an employee experience that revolves around a motivating and high performing workplace that gives them the opportunity to develop and thrive. The slogan of the employer brand, “Join the Up Movement,” enhances the group’s positioning and attractiveness and encourages external candidates to join a movement, an innovative and dynamic community. The “Up,” a nod to the handling, access platforms, and earthmoving activities of Manitou Group, represents the company's promise to “elevate talents” throughout their experience within the group.
The actions conducted in 2020 also focused on the external notoriety and internal appropriation of this employer brand.
Updating messages for the career site.
Production of a video presenting the employer brand, whose main players are the men and women who work for the group.
Production of four short videos for social media.
Highlighting the group's business lines through employee testimonial videos presenting their job, career path, integration, and day-to-day activities within the group.
Employee awareness and training on the use of social networks as an employer brand driver using the group's LinkedIn account, which has more than 40 000 followers.
INTEGRATION OF NEW EMPLOYEES
When new employees are hired by the group (including interns and work-study students), they attend a specific training course including:
a mandatory EHS training session;
a new online training course including 8 modules (presentation of the group and its vision, organization, markets, sales regions, business lines, commitments, and tools).
Depending on the profiles and countries, personalized welcome courses are organized by the local HR teams. In Italy, for example, a tailored course is offered to newcomers: individual interviews, training and factory visits for tertiary functions, safety training, HR and business lines for production staff. In France, every employee with a contract of more than three months attends an orientation and the Up Days, while newly hired French executives attend an immersion week in production learning about the business lines, know-how, and products and services of the group.
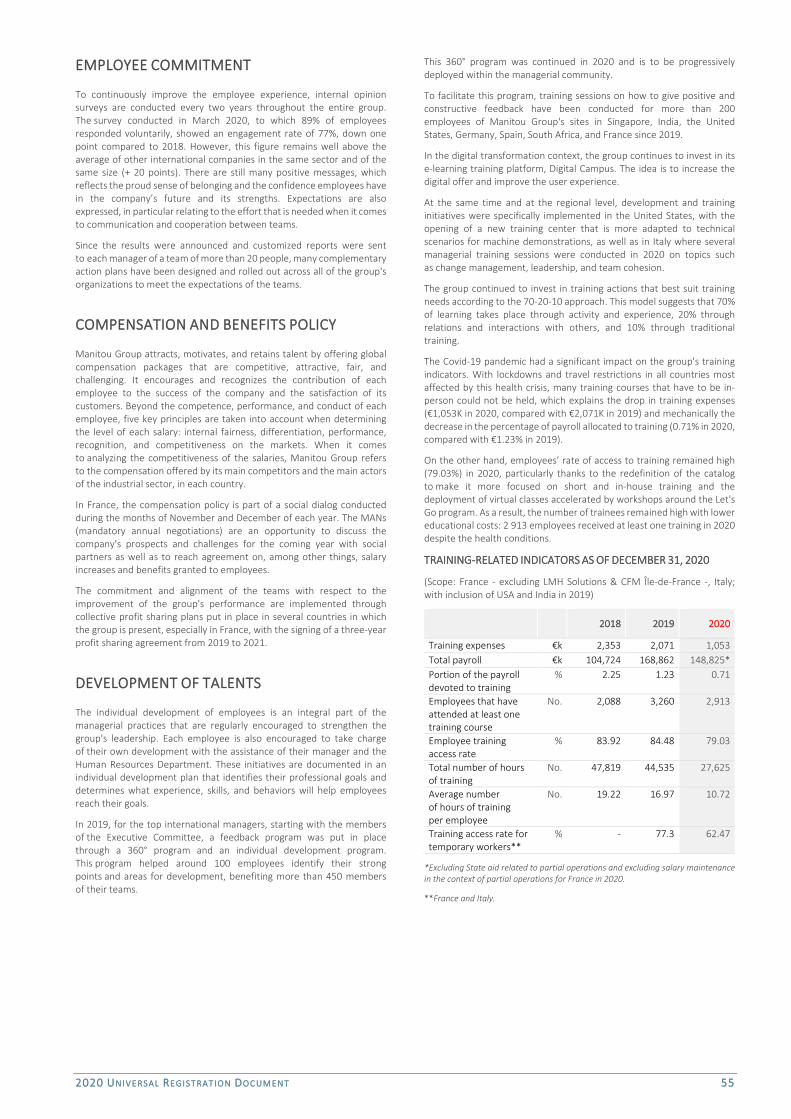
2020 UNIVERSAL REGIST RATION DOC UMENT 55
EMPLOYEE COMMITMENT
To continuously improve the employee experience, internal opinion surveys are conducted every two years throughout the entire group. The survey conducted in March 2020, to which 89% of employees responded voluntarily, showed an engagement rate of 77%, down one point compared to 2018. However, this figure remains well above the average of other international companies in the same sector and of the same size (+ 20 points). There are still many positive messages, which reflects the proud sense of belonging and the confidence employees have in the company’s future and its strengths. Expectations are also expressed, in particular relating to the effort that is needed when it comes to communication and cooperation between teams.
Since the results were announced and customized reports were sent to each manager of a team of more than 20 people, many complementary action plans have been designed and rolled out across all of the group's organizations to meet the expectations of the teams.
COMPENSATION AND BENEFITS POLICY
Manitou Group attracts, motivates, and retains talent by offering global compensation packages that are competitive, attractive, fair, and challenging. It encourages and recognizes the contribution of each employee to the success of the company and the satisfaction of its customers. Beyond the competence, performance, and conduct of each employee, five key principles are taken into account when determining the level of each salary: internal fairness, differentiation, performance, recognition, and competitiveness on the markets. When it comes to analyzing the competitiveness of the salaries, Manitou Group refers to the compensation offered by its main competitors and the main actors of the industrial sector, in each country.
In France, the compensation policy is part of a social dialog conducted during the months of November and December of each year. The MANs (mandatory annual negotiations) are an opportunity to discuss the company's prospects and challenges for the coming year with social partners as well as to reach agreement on, among other things, salary increases and benefits granted to employees.
The commitment and alignment of the teams with respect to the improvement of the group's performance are implemented through collective profit sharing plans put in place in several countries in which the group is present, especially in France, with the signing of a three-year profit sharing agreement from 2019 to 2021.
DEVELOPMENT OF TALENTS
The individual development of employees is an integral part of the managerial practices that are regularly encouraged to strengthen the group's leadership. Each employee is also encouraged to take charge of their own development with the assistance of their manager and the Human Resources Department. These initiatives are documented in an individual development plan that identifies their professional goals and determines what experience, skills, and behaviors will help employees reach their goals.
In 2019, for the top international managers, starting with the members of the Executive Committee, a feedback program was put in place through a 360° program and an individual development program. This program helped around 100 employees identify their strong points and areas for development, benefiting more than 450 members of their teams.
This 360° program was continued in 2020 and is to be progressively deployed within the managerial community.
To facilitate this program, training sessions on how to give positive and constructive feedback have been conducted for more than 200 employees of Manitou Group's sites in Singapore, India, the United States, Germany, Spain, South Africa, and France since 2019.
In the digital transformation context, the group continues to invest in its e-learning training platform, Digital Campus. The idea is to increase the digital offer and improve the user experience.
At the same time and at the regional level, development and training initiatives were specifically implemented in the United States, with the opening of a new training center that is more adapted to technical scenarios for machine demonstrations, as well as in Italy where several managerial training sessions were conducted in 2020 on topics such as change management, leadership, and team cohesion.
The group continued to invest in training actions that best suit training needs according to the 70-20-10 approach. This model suggests that 70% of learning takes place through activity and experience, 20% through relations and interactions with others, and 10% through traditional training.
The Covid-19 pandemic had a significant impact on the group's training indicators. With lockdowns and travel restrictions in all countries most affected by this health crisis, many training courses that have to be in-person could not be held, which explains the drop in training expenses (€1,053K in 2020, compared with €2,071K in 2019) and mechanically the decrease in the percentage of payroll allocated to training (0.71% in 2020, compared with €1.23% in 2019).
On the other hand, employees’ rate of access to training remained high (79.03%) in 2020, particularly thanks to the redefinition of the catalog to make it more focused on short and in-house training and the deployment of virtual classes accelerated by workshops around the Let's Go program. As a result, the number of trainees remained high with lower educational costs: 2 913 employees received at least one training in 2020 despite the health conditions.
TRAINING-RELATED INDICATORS AS OF DECEMBER 31, 2020
(Scope: France - excluding LMH Solutions & CFM Île-de-France -, Italy; with inclusion of USA and India in 2019)
*Excluding State aid related to partial operations and excluding salary maintenance in the context of partial operations for France in 2020.
**France and Italy.
2018 2019 2020
Training expenses €k 2,353 2,071 1,053 Total payroll €k 104,724 168,862 148,825* Portion of the payroll devoted to training
% 2.25 1.23 0.71
Employees that have attended at least one training course
No. 2,088 3,260 2,913
Employee training access rate
% 83.92 84.48 79.03
Total number of hours of training
No. 47,819 44,535 27,625
Average number of hours of training per employee
No. 19.22 16.97 10.72
Training access rate for temporary workers**
% - 77.3 62.47

56
TOWARDS MORE EQUALITY AND DIVERSITY
In 2020, the group continued to implement its CSR strategy by working to improve its diversity and inclusion policy. The challenge is to monitor the improvement of its practices in this area through precise and relevant indicators.
WELCOMING EMPLOYEES WITH DISABILITIES
The group strongly believes that the inclusion of employees with disabilities helps to improve the engagement and solidarity of the teams.
In 2020, France and Italy employed 78 workers with disabilities, direct and indirect jobs combined.
STAFF WITH A DISABILITY, AS OF DECEMBER 31, 2020
(Scope: France, other than LMH & CFM Île-de-France, Italy)
2018 2019 2020
Staff recognized as having a disability
No. 89 95 78
% 3.58 3.62 3.03
In Italy, in 2020, nearly 7% of the group's workforce consisted of employees with disabilities, as required by law.
In France, the agreement signed in 2016 with Agefiph (the association managing the fund for the hiring of disabled persons), which was renewed in January 2019, allows the group to pursue various initiatives.
The disabilities mission continues to implement its French policy through three pillars, which are recruitment, job retention, and employee education.
At the same time, the group continues to assist disabled employees to retain their jobs. During 2020, adjustments were made to a workstation for an employee with disabilities: height adjustable desk as well as a chair and the necessary accessories.
In addition, the Agefiph co-finances the purchase of inclusive masks for deaf employees and their entourage.
An agreement on the priority hiring of disabled employees was proposed for negotiation with social partners.
GENDER EQUALITY IN THE WORKPLACE
The group continues its commitment to gender equality by promoting diversity through recruitment and management of employees’ careers, while fighting against any form of discrimination.
BREAKDOWN OF THE GROUP'S FEMALE WORKFORCE BY STATUS, AS OF DECEMBER 31, 2020
2018 2019 2020
Managers % 23.5 23.9 22.7 Supervisory staff % 5.4 7.8 5.9 ETD % 29.3 28.1 27.6 Manual workers % 8.4 8.5 9.7 Total % 17.5 17.7 17.9
The female employees accounted for 17.9% of the workforce as of 12/31/2020, up slightly compared to 2019. The socio-professional categories associated with operational professions, such as the “Workers” category, remain mostly male, even though the figures have been moving in the right direction for several years.
In France, the Wo’Men by Manitou Group network concretely works towards diversity and professional equality through its joint network of 60 volunteers acting in conjunction with human resources to promote diversity.
In 2020, among other things, the network proposed participating in a social media communication campaign on International Women's Rights Day, inviting employees around the world to post a commitment to gender equality on social media. A conference on “parenting and making of gender” was also offered to employees in France in March 2020.
In France, the group maintains its commitment through a four-year workplace gender equality agreement signed in 2018 with all of the social partners. This agreement defines the objectives and action plans that are carried out:
equal pay for equal work, already achieved in 2018;
extension of the mentoring program with nine pairs in 2020 (four in 2019) in order to facilitate access to management positions;
promotion of the business lines among women with implementation of an investment plan (parking spaces for pregnant women, female changing rooms, etc.);
payment, for employees on part-time parental leave, of the difference in the pension contributions between full-time work and part-time work.
MOBILITY
With 45.9 % of the group's workforce located outside of France and 19 different nationalities comprising the top management, the group has been developing an new international support policy since 2016 to strengthen its global exposure and promote international mobility. In 2020, nine employees fell under this policy, which takes place simultaneously through expatriation and inpatriation contracts, both locally and in the VIEs.
WELCOMING INTERNS AND WORK-STUDY
PARTICIPANTS AND INTERACTION WITH
THE EDUCATIONAL WORLD
Each year, the group hosts and trains students through job placements or work-study contracts within its various organizations.
Furthermore, its partnerships with business or engineering schools allow the group to support the training of its future technicians, sales staff, engineers, and managers within the employment pools and facilitate recruitment.
In France, these partnerships were reflected in the signing of agreements with regional actors (15 partner schools in 2020, versus 14 in 2019).
In Italy, the group renewed its partnership with Bologna's engineering faculty in 2020.

2020 UNIVERSAL REGIST RATION DOC UMENT 57
TOWARDS GREATER SAFETY
The health and safety of employees is a major priority for the group. Due to the international presence of Manitou Group, developing a culture of vigilance, health, and safety is fundamental.
These commitments are made by the Executive Committee in the Quality, Environment, Hygiene, Safety (QEHS) policy and are shared with all Group employees. They are then broken down into strategic and operational objectives at all levels of the company.
Since 2019, in order to highlight the importance placed on employee health and safety and make safety everyone’s responsibility and priority, the group added the accident frequency rate of temporary workers to the profit sharing of employees in France.
A STRONG ORGANIZATION
With the strengthening of the safety culture, an EHS director in the US and a EHS manager in India arrived at the beginning of the year. In addition, in the context of the global health crisis, the scope of the MHA division's QEHS division was expanded to a group scope in 2020.
In addition to contributing to the standardization of processes and the homogenization of practices, this new organization strengthens the management of the safety culture at the group's various production sites, while increasing the skills of the EHS teams in line with the creation of the corporation EHS in 2019. The scope of the monitoring indicators relating to the accident rate of employees and temporary staff now covers the entire group.
Since 2017, in France, the Health, Hygiene, and Safety Cluster, comprised of a full-time occupational physician and three occupational nurses, has made it possible to increase responsiveness and more closely monitor employees’ health. The autonomous health department is authorized to work at five French sites.
This cluster allows employees to benefit from the increased presence of the occupational physician on all of the CSSCTs (Health, Safety, and Working Conditions Commissions) to work more intensively on the
workstation studies to be conducted and be able to meet medical examination needs.
In addition, since 2017 the group has benefited from the regular presence of a social worker at our French sites, putting in place a confidential support system for employees who need assistance.
COVID-19 MANAGEMENT
In order to preserve the health and safety of its employees, Manitou Group has worked hard from the beginning of the crisis to prepare for the recovery and define all applicable health measures.
In Italy, for example, the creation of a Covid-19 Committee has facilitated the deployment of protective measures.
After benchmarking with several companies, Manitou Group established a strategy of measures to supplement the mandatory protective measures in France. A detailed protocol was developed and has gradually evolved as adjustments were to the measures announced by the Government. The recovery in production activity and schedule has been gradual and in compliance with the health measures implemented. The resumption of non-production activities was carried out by alternating between working from home, to the extent that the function allowed it, and working on site with a rotation within the teams in order to limit the number of employees present at the same time.
In France, to respond to the consequences of the health crisis on the social life of employees and in addition to the regular communication distributed by the group and managers to maintain connections, the Health division contributed to the prevention of psychosocial risks with:
the establishment of a free, anonymous telephone listening platform, available 24 hours a day, 7 days a week;
the presence of a psychologist at Ancenis' main site to facilitate consultations.
KEY FIGURES IN HEALTH & SAFETY
2018 2019 2020 Scope
Rate of absenteeism due to accidents and illnesses (including occupational illnesses)
Rate of absenteeism due to illness
% 2.99 2.97 3.23
France, Italy
Rate of absenteeism due to workplace accidents and
occupational illnesses
% 0.29 0.34 0.28
Rate of absenteeism due to accidents and illnesses
(including occupational illnesses)
% 3.28 3.32 3.51
Accident frequency and severity rates (employees)
Frequency rate No. - 9.76 8.78
Group Severity rate No. - 0.17 0.23
Accident frequency and severity rates (temporary workers)
Frequency rate No. - 34.97 27.83 Severity rate No. - 0.70 0.45
Number of occupational illnesses reported during the year*
No. 4 11 4 France
*See note on methodology.
Manitou Group, which is attentive to the wellbeing and health of its teams, regularly tracks absenteeism for simple illnesses, workplace accidents, and occupational illnesses. In 2020, this rate fell slightly (0.28% vs. 0.34% in 2019), particularly thanks to numerous campaigns and awareness-raising initiatives.
Within the group, safety is everyone’s responsibility. Thanks to efforts on prevention, training, and communication campaigns, the safety culture was strengthened in 2020. This reduced the frequency of accidents for employees (8.78% vs. 9.76% in 2019) and for temporary workers (27.83 % vs. 34.97 % in 2019). At the same time, the French production sites
obtained ISO 45001 certification, and the group intends to expand its scope in 2021.
Efforts have been made to prevent accidents among temporary workers with a decrease in the frequency rate (27.83% vs. 34.97% in 2019) and the severity rate (0.45% vs. 0.70% in 2019) of temporary workers' accidents.

58
SAFETY-RELATED TRAINING FIGURES
2018 2019 2020 Scope
Hours of safety training as a proportion of total training hours
% 25.2 24.7 39.5 France, Italy
Number of hours of safety training
No. 15,051 12,711 10,910 France, Italy, USA
In addition to safety training hours, the group is strengthening its communications regarding employee health and safety risks by improving visual management through a DANTOTSU type approach (analysis of near accidents, accidents, and incidents directly in the production center workshops), while educating and training new arrivals during orientation and regularly communicating EHS information: meetings, dissemination of safety and environment guidelines, intranet articles, and posters.
The CSR best practices platform also shares the best safety and environment practices.
CONTROL OF HEALTH & SAFETY RISKS
Each industrial site analyzes its safety and environment risks and opportunities each year.
The main safety risks associated with the group's business are as follows:
Falling objects, falls from height, trips.
Impact between a truck and a pedestrian or another vehicle.
Injury caused by manual or mechanical handling.
Injury caused by use of welding and grinding equipment.
Noise and vibrations.
Fire and explosion.
Acute or chronic pain caused by workstation ergonomics.
Exposure to chemicals.
Methods for controlling safety-related operational risks are as follows:
Ergonomic adaptation of workstations and validation processes of new stations and equipment;
working groups on the reduction of specific risks.
Significant improvement actions conducted in 2020 at the production sites:
harmonization of reporting and accident management at the group level: deployment of a digital tool for reporting incidents and accidents with automation of reporting. This new tool makes it possible to manage accidents on a daily basis and prepare and track action plans.
At the international level:
strengthening the safety culture in India with the implementation of a safety protocol for visitors, measures to reduce fire risk, and safety awareness sessions for employees;
strengthening the safety culture in the United States with the review of the safety training plan, improvement of incident reporting, and monitoring of “near accidents”;
the launch of the new safety culture communication campaign in India and the United States.
In France:
the training of all drafters and instructing parties in the new external business management procedure;
the implementation of cross-audits;
the roll-out of the safety report with the teams;
the implementation of daily stretching sessions for logistics warehouse personnel before taking up a shift.
REDUCING THE HEALTH AND SAFETY RISKS
OF USERS
Improving working conditions and the safety of users operating machines designed and manufactured by Manitou Group is at the heart of the group's mission.
Since 2018, in addition to securing and transforming uses, Manitou Group has provided a specific response to the health and safety challenges of its customers and the many users of its machines with the Reduce Risks component of the Reduce program (see 3.2.1 Towards an economy of functionality).
Reduce Risks is aimed at the handling of machines so that they can be driven safely. The objective is also to provide customers’ with guidance on the choice of equipment and services to increase awareness of health and safety risks.
In 2020, the following actions were taken to reduce the health and safety risks of users of Manitou Group machines:
the development of an exclusive Safety pack for a customer through a collaborative project to reduce health and safety risks at the sites;
the implementation of a new operator protection system on the platforms with improved detection.
To carry out these actions and continuously provide users with more information and knowledge, Manitou Group is working to improve the structure of its Risks library for the Manitou & Gehl brands by implementing common processes.
2020 UNIVERSAL REGIST RATION DOC UMENT 59
TOWARDS MORE WELL-BEING
THE EMPLOYEE EXPERIENCE
The group's goal is to offer an attractive working environment and improve employee well-being. Well-being at work is recognized as a strong driver for engagement, creativity, and performance. Initiatives, whether structuring or informal, have been put in place as close as possible to the field to support employees, such as access to sports equipment, creative workshops, communities (facilitators, co-development, network of professional equality), and conferences on societal issues or internal challenges. It reinforces the feeling of belonging to the group and therefore contributes to better collaboration between departments, especially because of the many exchanges and shared practices during these meetings.
In Italy, the group also launched an initiative in 2020 to deliver lunch to employees after the sudden closure of restaurants.
COLLABORATIVE WORK AND AGILITY
Collaborative work and deployment of agility are elements that will support the group's transformation on a profound level.
As such, the Let's Go program was launched in 2020 to optimize the collaborative tools used within the group and migrate all employees to the Google suite. Ambitious support and extensive communication have been implemented, including training at different levels (performed by group employees and external stakeholders), conferences and testimonials, a forum open to all on the company's social network to ask questions about these tools and obtain answers, and the creation of a community of local ambassadors. First launched in France, this program will be rolled out in the rest of the world in 2021.
Other initiatives are also carried out regularly to promote collaborative work, facilitate cross-functional actions, and foster team accountability.
The group's employees are regularly consulted on local projects that concern them through surveys (new sites, office remodeling, corporate catering, sports activities).
In each region of the world, such as in Asia or the United States, all of the teams regularly meet to share key information about the group across divisions, find common ground when it comes to priorities, as well as celebrate successes and events.
In Italy, as part of the deployment of the ERP core model, a change management project was launched with all employees. Agents of change were identified on the project team and in HR, and the project was then progressively expanded to all employees concerned.
In the United States, the implementation of “human centered design” promotes innovation: this program helps the cross-functional teams move towards a customer focus and provides an opportunity to work collaboratively in order to improve the products, processes, and services.
The progressive deployment of agility, in particular through the training of many managers or teams, helps to progressively simplify the processes
and methodologies used in the company, as well as projects on a daily basis. In addition, a community of facilitators works regularly to conduct periodic sessions in project groups or during team seminars.
ORGANIZATION OF WORKING TIME
The duration and organization of working time in Manitou Group is established in close coordination with those in the field either by managerial decision or through a corporate agreement based on employees’ job categories.
To contribute to a better balance and better use of employees’ professional and personal time, the group supports all of its organizations to improve work methods and organizations.
In France, the management population has enjoyed remote work options since 2014. In 2018, the introduction of a remote work charter has extended the scope to all employees whose positions allow them to work remotely. Roll-out of these work methods improves efficiency and performance, while contributing to the well-being of employees.
A similar policy is in place in the United States, where employees may adjust their attendance time in the office according to their personal requirements.
In 2020, all employees worked from home where their positions allowed them to do so.
ORGANIZATION OF SOCIAL DIALOG
Social dialog is managed at the country level in accordance with local rules.
In Italy, several agreements were signed in 2020 on the creation of an inactivity fund during the spring lockdown, or the elimination of the limit on the number of temporary staff with hiring priority for future hires in the same position. These agreements allowed the company to remain highly flexible.
In France, the unprecedented health environment in 2020 made it unpredictable on many levels. Social dialog was carried out through exceptional meetings regularly disseminating information on current issues, including updates on Covid-19 health measures, the use of partial operations, and the arrangements in place for remote work. Communication about employees was also strengthened in various forms, e-mails, SMS, intranet publications, and videos.
The various Committees on Health, Safety and Working Conditions as well as the Central and Local Economic and Social Councils were therefore in high demand, holding around ten extraordinary meetings in 2020, in order to maintain a strong connection with all employees.
In 2020, there were also elections: a second director representing employees was elected by the employees of Manitou BF and its subsidiaries.
60
CREATION OF VALUE WITH PARTNERS Manitou Group places particular importance on the dialog it maintains with its stakeholders, throughout the regions in which it operates. The CSR strategy is based on the creation of shared value with all of the key players, developed through:
suppliers, via a Responsible Purchasing policy;
dealers, with the Elevation plan;
regional players, with which the group interacts to ensure a strong local presence;
civil society, by taking part in socially-responsible actions and doing business ethically.
TOWARDS MORE VALUE WITH SUPPLIERS
The sustainability of the group rests largely on the strength of its network of suppliers. Working with them over time, leading innovative projects together, and building win-win partnerships and equitable relationships all help to strengthen its sector.
The group must also constantly adapt to the volatility of its markets. The proximity to the production sites and their regional presence help to meet the need for responsiveness and flexibility and also reduce the environmental footprint of the group by limiting the use of transport.
Furthermore, monitoring the financial health of our customers and suppliers (see Purchasing risks, p. 75) is a major part of reducing risk for the group.
Lastly, by involving all the partners in the value chain, the Elevation Plan now has greater relevance because it is now shared. Manitou Group is therefore committed to discussing its aims with its suppliers and customers operating in 140 countries.
More than 50 suppliers were consulted in the summer of 2020 on the relevance of the group's current CSR approach, their expectations and needs, and short- and medium-term CSR issues. Their feedback fueled the evolution of the Elevation plan, which began in September 2020, with the aim of bringing more value to our partners.
THE IMPACT OF COVID-19 ON SUPPLIER
RELATIONS
With the health crisis in 2020, appropriate risk management mitigated the consequences of the pandemic starting in China and then in all countries with respect to the location of suppliers and the alert level.
A stronger relationship with all suppliers was established starting in March, the first lockdown period in France. These actions made it possible to immediately restart the activities of the sites shut down during the lockdown and to continue to power those that had remained in operation, including the logistics and spare parts center in France and the sites in the United States.
At the same time, Manitou Group shared on its supplier portal the best health practices adopted at its own sites to continue its activities safely, in order to share with them the skills and solutions developed internally.
Given the context, the 2020 supplier convention could not be held.
RESPONSIBLE PURCHASING POLICY
Since 2012, the group has deployed a Responsible Purchasing policy aimed at creating sustainable, balanced, and value-creating relationships with its suppliers for all of its stakeholders. This initiative is undertaken in conjunction with all of the staff members of the Purchasing Department and all divisions involved in collaborating with suppliers.
Since this policy began, the focus has been put on the following areas:
PROMOTING COMMITMENT
TO A RESPONSIBLE PURCHASING CHARTER
Improving the performance of the group's suppliers has a direct impact on the performance of its machines and the satisfaction of its customers, while also boosting the profitability of the suppliers. This is why the group developed and rolled out a Responsible Purchasing Charter to all of its suppliers in 2014 (production scope). Its aim is to share its expectations with respect to environmental, social, ethical, and economic responsibilities and to detail the commitments expected in return from suppliers and subcontractors.
In 2020, 214 suppliers signed this charter.
MONITORING THE CSR PERFORMANCE
OF SUPPLIERS
Since 2016, the performance assessment criteria for suppliers of production items have been were improved and five CSR criteria were added: responsible offer, health and safety, sourcing and suppliers, environment, and HR development and socially-responsible policies. These criteria, incorporated in the overall evaluation of suppliers and accounting for 10% of the overall rating, measure the supplier's level of commitment to sustainable development.
In 2018 and 2019, purchasers (from the MHA and S&S divisions) were given training in the CSR audit of suppliers. This training was used to co-construct an audit kit and define a list of priority suppliers, in order to achieve the 2019-2022 objectives.
In 2020, despite the difficult conditions linked to the Covid-19 pandemic, the Purchasing teams certified 32 suppliers in terms of CSR criteria.
The analysis of the 2019-2020 audits shows a total of 83 suppliers with a favorable audit result, representing 22% of suppliers evaluated for an overall rating.
REVERSE RATING BY SUPPLIERS
In 2020, the results of the second reverse rating (evaluation of the group's performance by its suppliers) were published by the Purchasing Department.
This reverse rating, launched with suppliers that have already been CSR-certified by the group, had a high participation rate. The results will be communicated during the next supplier convention with action plans for the identified areas of improvement and more generally to facilitate supplier relations with Manitou Group.
2020 UNIVERSAL REGIST RATION DOC UMENT 61
OPTIMIZED PROCUREMENT
AND DISTRIBUTION
In order to limit costs and the environmental impact resulting from under-use of its road freight capacity, the logistics departments developed and deployed for its transport companies an optimization tool for European logistics flows. The latter is based on volume parameters, size, weight of the products transported, and the grouping of loads.
Optimization of upstream road flows with suppliers has therefore been rolled out and integrated since 2017 into Manitou Italia flows for more consolidation.
In France, the project to drastically reduce transportation of machines between the various production sites and the main site and/or external storage areas begun in 2018 was deployed in 2019.
Therefore, the machines leave from each site headed directly for customers, which frees up volume at the main site and decreases the kilometers traveled and carbon impact of the transportation: 100 tons of CO2 equivalent saved in 2020 (compared to 76 tons in 2019).
The group deployed an internal tool, the Transport Management System (TMS), in 2019 with the goal of optimizing the upstream flows and distribution of machines in North America. Some initial work on tracing upstream and downstream flows in North America provided more visibility to the group for the purpose of their optimization.
After showing its support for the NEOLINE project in 2019, Manitou Group formalized its partnership in October 2020 with the French shipowner that specializes in maritime transport by ro-ro ship. These ships, which are powered mainly by Néoline's sails, will export more than 1 000 Manitou Group machines per year from the port of Saint-Nazaire in France to Baltimore in the United States. An innovation that will reduce CO2emissions by up to 90%29 from the distribution of machinery between Europe and the United States.
In continuation of the NEOLINE project, the group plans to continue optimizing its logistics flows and expects to deploy the TMS (Transport Management System) for its shipping flows and air flows (for spare parts) and express and courier service for Manitou Americas.
TOWARDS MORE TRUST WITH DEALERS
The Dealer Standard, shared in 2019 with the group's dealers, made it possible to discuss mutual expectations, including in terms of CSR.
After a test phase in Northern Europe, in 2020, a tool for assessing practices based on the Dealer Standard was tested and rolled out to a larger group of dealers.
The segmentation of the group's dealers will be based on these standards between now and 2022 in order to identify “partner dealers,” meaning those with the best CSR practices.
TOWARDS MORE ETHICS
Being a community-minded company also means measuring the respect that the group must demonstrate in its dedication to its practices; this is as much a response to the new regulations (especially the “Sapin 2” law), as it is a commitment shared by the Board of Directors, the Executive Committee, and senior management bodies.
Personal data protection is also a major issue for the group in the context of respect for privacy.
PERSONAL DATA PROTECTION
The requirements of the General Data Protection Regulation (European Regulation 2016/679) reinforces the obligations of companies processing personal data.
Manitou Group is continuing its actions to ensure that it complies with this regulation and that personal data, whether it relates to its employees, suppliers, or customers, is processed and kept securely.
Specifically with regard to employee data, the applications have been mapped and processes have been recorded. The HR teams regularly monitor the compliance plan, which was defined with help from an external service provider.
THE FIGHT AGAINST CORRUPTION AND ANTI-COMPETITIVE PRACTICES
In 2010, the group decided to adopt an ethical charter promoting integrity and responsibility that applies both to the company as a legal entity and to all employees.
In 2015, the group also signed up to the United Nations Global Compact.
According to the 2019 Corruption Perceptions Index (CPI) of Transparency International, 11.55 %30 of the workforce is operating in corruption-prone countries as of December 31, 2020.
29 Compared to a traditional cargo solution on the same route. 30 The selected countries have a score of <50 (out of 100).
Since 2019, several key actions have been put in place:
An independent report collection site for whistleblowers is accessible to the group's employees and its stakeholders on the intranet;
an independent ethics committee governed by an ethical charter was established to respond to this alert system;
compliance training consisting of four mandatory modules:
o Understanding anti-corruption constraints.
o Understanding why this concerns everyone.
o Identifying risk situations.
o Reacting appropriately to identified risk situations.
As of December 31, 2020, 93% of employees31 completed the online training deployed in 2019 aimed at raising awareness regarding the risks of active and passive corruption.
In 2020, the group continued to roll out its anti-corruption system:
the deployment of a new procedure for agents acting in the name and on behalf of Manitou Group entities;
valuations of listed third-party assets: the assessment process, consisting in particular of a mandatory self-assessment questionnaire for any new external stakeholders, may be supplemented, where applicable, by an outsourced assessment carried out by a leading provider. Since 2019, more than 900 third parties have undergone the double verification;
the continuation of the compliance training program, notably with training dedicated to employees whose business line is the most at risk on this subject.
31 Excluding operators.
62
The group therefore is continuing its work to ensure that it respects the eight pillars of the 2016-1691 Law of December 9, 2016, called Sapin 2, as well as the recommendations of the French Anti-corruption Agency (AFA).
Compliance has been a strategic topic for the group since 2018 (see Chapter 4. Risks and controls). The Audit, Risk, and Compliance department regularly reports on the progress of its work to the Audit Committee and the Executive Committee.
TOWARDS MORE EDUCATION
NETWORKS & LOCAL PLAYERS
The group is aware of the important role networks and local presence play in the success of its business. That is why it values and promotes dialog with its dealers, end customers, and regional players (schools, local communities and organizations, associations, etc.). The actions developed must contribute to a responsible economy, co-construction of solutions, the distribution and sharing of its expertise, and dialog.
Through its partnership with the United Nations, Manitou Group won the final of the 2nd edition of the PRME challenge in September 2020. The winning project was presented by students from the Asian Institute of Management in a digital final with the presence of Manitou Group’s Executive Committee and employees. After nine months of work, the students' project, which was conducted in close collaboration with the group's CSR Department, stood out for its innovative approach to taking into account the current and future CSR challenges of Manitou Group and its stakeholders and its impact on changes in the group's CSR strategy.
In June 2020 the final of the 4th “Handling the Future” challenge was held. Launched at the end of 2019 at the initiative of human resources in coordination with the Purchasing Department, the challenge focused on the theme: “New vision of sourcing: which transformation for which innovation?” .
It brought together 10 schools and 29 teams of 3 or 4 students. Each team presented an innovative project on the topic “How purchases will be made tomorrow,” for the final, which was held remotely for the first time.
This competition among schools helps promote and encourage innovation in industries while developing local partnerships between the group and regional schools.
In addition, the group is committed locally in the Pays de la Loire region through its interactions with local players: COMPA (Community of municipalities in the Pays d’Ancenis area), ADIRA (Association for the industrial and economic development of the Ancenis region), the DROs (Dirigeants Responsables de l’Ouest), or even the CSR Platform of Nantes Métropole and the Nantes Saint-Nazaire Chamber of Commerce and Industry (CCI). The actions concern both initiatives related to the circular economy in the territory and other CSR subjects.
For the third consecutive year, the group is continuing its partnership with Social Change, a major CSR event. Organized remotely this year, the digital platform hosted more than 1 100 people for this 3rd edition, and the event brought together public and private players in the metropolis and the region. In particular, Manitou Group shared its experience during the roundtable "Health crisis, how are companies dealing with it?” with other players in the territory. All of them are working towards the same goal: putting sustainable development and societal challenges at the heart of the company.
TOWARDS MORE SOLIDARITY
Manitou Group believes that it has a responsibility to share its environmental, social, and societal commitments with the communities in order to encourage other players to set up similar initiatives. The group's actions must have a positive impact on the territories.
In 2020, Manitou Group supported Modena Hospital (in Italy) by donating €100,000 for the purchase of health care equipment and supported health care professionals in France through the donation of 20 000 masks. In the United States, the Gehl Foundation donated 500 protective visors to the Milwaukee Hospital.
SPONSORSHIP POLICY
Through its business lines, the group has a presence in a wide variety of territories and is in a position to reach a great diversity of players and stakeholders.
For many years, diverse actions have been undertaken at the initiative of employees, in partnership with the dealer network, in order to improve people’s everyday life and have a more beneficial impact on the environment.
In 2018, a group sponsorship policy, focused on education, was launched. Since then, the group has supported new generations in their personal and professional development in all regions in which it operates. A steering committee, made up of two members of the Executive
Committee and the CSR and communication departments, is in charge of reviewing the educational and environmental projects proposed by the employees. Lastly, to give all employees the opportunity to get involved in socially-minded projects, the group has set the target of volunteering 2 200 hours to solidarity actions in 2022.
A strong point of the group's CSR policy, the skills-based sponsorship of employees was launched in 2019 in France, the United States, India, and Singapore. The goal of 1 500 volunteer hours set for 2020 was exceeded: more than 4,100 hours conducted with associations, schools, and social integration companies for local communities (versus more than 1,500 in 2019).
For example, in the United States, the group is a partner of a program to help and support local communities through which employees carry out sponsorship missions.
In France, the group expanded its engagement with a social training company whose purpose is the social and professional integration of vulnerable or excluded individuals. This new two-year partnership includes a donation in kind, financial sponsorship, and the opportunity for Group employees to carry out skills sponsorship missions with employees of the association.
Thanks to this success, Manitou Group is continuing its momentum with the continuation of the program in the new CSR road map.

2020 UNIVERSAL REGIST RATION DOC UMENT 63
GROUP CSR PERFORMANCE Thanks to its level of commitment, Manitou Group has been regularly rewarded by external bodies for its CSR performance.
In this section, we also provide information about the methodology used to calculate indicators and the tables of correspondence with the key standards.
PRIZES AND AWARDS
The group's CSR performance has been recognized and rewarded with several prizes as well as inclusion in the most important CSR indexes. In particular:
Manitou Group responded for the eighth year running to the questionnaire of the Gaïa Index, a national stock market index, and its rating was unchanged from 2019. Manitou Group is in 18th place (out of 230) in the general ranking and in 15th place in the ranking of companies with “Revenue > €500 million” (out of 81).
Manitou Group was ranked 79th /250 in the 2021 ranking of the most responsible companies in France established by Le Point magazine. The initial panel was made up of 2,000 companies employing more than 500 employees and having their registered office in France.
A human resources award: Capital magazine's 2nd best employer in France.
The product and solutions distinctions include the ERA - Technical Committee Award: Manitou Group was recognized by the European Rental Association for solutions developed for rental companies, particularly in terms of safety and environment.
METHODOLOGY NOTE
Implementing an annual non-financial reporting system within Manitou Group is intended to meet several goals:
manage the social, environmental, and societal performance of the group;
communicate transparently about the group's major CSR challenges and actions;
comply with the non-financial performance declaration (Decree of August 9, 2017).
In this regard, the group drew inspiration from the Global Reporting Initiative (GRI) guidelines and complies with the principles of the UN Global Compact. Its road map is in line with the United Nations' Sustainable Development Goals.
The CSR department may be contacted using the contact form at the website
https://www.manitou-group.com/fr/
SCOPE
Since the first reporting year in 2012, the group has acquired reporting procedures and adopted a suitable organization for gathering the information for publishing. The scope of the information, initially restricted to France (Manitou BF), has been gradually extended. The scope in 2020 covered the following:
For environmental indicators:
all of the French, Italian, and Indian sites and the production sites in the United States (83.03% of the workforce) are covered by all of the indicators. In 2020, this reporting scope therefore includes 9 of the group’s 10 production sites (including the group’s largest industrial site and logistics center, with more than 2,000 orders a day);
the reporting scope included 28% of indicators in 2019 with the integration of India for water consumption and the Madison site in the United States for waste production. The 2019 scope is therefore consistent with the 2020 scope;
the three logistics centers of Belvidere (USA) (31 employees, 430 orders per day), Singapore, and Greater Noida in India (40 orders per day) were excluded. The warehousing site in France (36 employees) was also excluded from the environmental reporting.
For the social indicators: since 2015, the scope for social reporting has covered all of Manitou Group's subsidiaries as regards social information related to headcount. Italy, the United States, France, and India (accounting for 83% of the workforce) include indicators relating to salaries, training, safety, and accident rates of employees. The training, workplace accidents, and absenteeism indicators only cover France and Italy (57% of headcount).
The France scope excludes LMH (36 employees) and CFM Île-de-France (created on 01/01/2017). The internal audit department conducts audits (HR) on all of the subsidiaries.
In the context of global management of the 2018-2022 CSR objectives, indicators were able to be incorporated to better assess the progress made on the action plans. Their scope is the entire group.
64
PROCEDURE
The follow-up procedures are deployed through three main tools:
the methodological guidelines, which explain the organization of the reporting;
the dashboards for each topic (environment, social);
internal control monitoring.
Each of the indicators is monitored on a half-yearly or yearly basis.
Consistency (indicator scope and definition) is checked by the topic leaders, to whom the data is sent. Lastly, an internal auditor, independent of the procedure, is appointed to approve or challenge indicators, by linking them with the action plans rolled out throughout the year or comparing them with source data.
In order to meet the requirements set out by Order 2017-1180 of July 19, 2017 and Decree 2017-1265 of August 9, 2017, Manitou Group commissioned the Grant Thornton firm to certify the presence and fairness of the social, environmental and societal information published in its management report.
CLARIFICATIONS REGARDING METHODOLOGY
ON THE GROUP'S 2018-2022 CSR OBJECTIVES
Non-financial reporting covers the period from January 1st to December 31st of each year. The reference year for the reduction goals is 2017.
2020 was an opportunity to strengthen the reporting process and improve the steering tool with respect to achieving the objectives of the 2018-2022 roadmap.
Towards more optimization: the number of machines with the Reduce label* will be tripled.
*Machines for which the test measuring energy consumption was developed according to the company's testing protocol or the current standard, if one exists, for which the Reduce Risk information pack (including videos, instructions, catalog of spare parts) is made available to users on the platform reduce-program.com.
Towards more functionality: the rate of reduction in the total cost of ownership (TCO) for the top 50% of the most sold machines (in sales) will be multiplied by 5.
The TCO measurement includes four items: fuel consumption, preventive maintenance, corrective maintenance, and depreciation.
Towards more innovation: 100% of new products will incorporate ecodesign and TCO criteria.
Machine project that applies in its design phase at least five actions from the criteria on the group's ecodesign checklist in order to improve the environmental impact of the product over its lifecycle.
Towards more circularity: 8% of the parts revenue will be generated from renovated or reused parts.
Refurbished parts, “Reman,” correspond to an alternative offer to the original new part that is less costly and available from stock (engine, gear box, turbo engine, wheel reducer, etc.) that can be ordered by the dealer during a repair. The defective part is returned to Manitou Group, which refurbishes it and returns it to inventory. The group's commitment in a circular economy: reduce and recover waste and get local suppliers involved.
Towards more safety: the targets of the “More Safety” indicator have been reviewed on a scope that includes temporary staff to be more in line with the international nature of the group. The 2022 ambitions have a new target: to reach a frequency rate of 13.95% and a severity rate of 0.32% for employees and temporary workers.
The definition of the accident frequency rate and severity rate is addressed below in the social indicators.
Towards more gender equality: achieve a total of 850 women within the group. This objective concerns female employees (“employee” being defined below).
Towards more well-being: ensure that every entity has initiated at least one initiative to improve the employee experience.
The initiatives taken into consideration may concern the improvement of the working environment of a significant portion of the entity's employees, improvement of health and prevention of health problems, and initiatives with an impact on the quality of life at work. Initiatives conducted as part of the group's sustainable development week are taken into account.
Towards more engagement: get 72% of employees engaged according to the internal opinion survey.
Every two years, Manitou Group measures the motivation and satisfaction of its employees through an opinion survey conducted by a third party. The indicators measured by the group includes the rate of engagement, with is measured using the following four questions: I am proud to work at my company - I intend to stay at my company for a long time - I would recommend my company as a good place to work - My company motivates me to go farther.
Towards more value: 60% of suppliers CSR certified (rating > 12/20) after audit.
A certified supplier has a CSR score of more than 60. This score is measured using the CSR self-assessment performed by listed suppliers and must be confirmed by an on site audit conducted by the buyers.
Towards more trust: 25% of all sales in our dealers will be given the “Partner Dealers” label (dealers with best practices in CSR).
Partner Dealers will be identified through an evaluation that includes CSR concepts.
Towards more ethics: 100% of group managers will be trained in and made aware of anti-corruption issues.
ISO 19600 evaluation of the group.
The concept of “managers” is defined below in the social indicators. The objective concerns the number of managers who have validated their anti-corruption training online.
The group’s monitoring of the ISO 19600 (compliance management systems) evaluation is measured in accordance with progress made on the road map defining the group's entities that are eligible for this evaluation.
Towards more education: 1% of net group income will be used to fund education initiatives.
This objective concerns the group's sponsorship policy, which supports education-related initiatives. This policy, which can be viewed on the group's intranet, establishes a framework for the type of actions that the group wishes to support.
Towards more solidarity: 2 200 hours of volunteering will be offered by the group.
The solidarity and skills-based sponsorship initiatives are carried out to support non-profit organizations or schools and must be significant and meet the needs of the local associations or communities, in particular with regards to education and the environment. For employees, the time off is counted against their working hours.

2020 UNIVERSAL REGIST RATION DOC UMENT 65
METHODOLOGICAL CLARIFICATIONS –
MATERIALITY ANALYSIS
Based on the expertise of a project team, both internal and external and various work carried out by the group until that point (1st analysis of materiality, mapping of the group's risks, ESG questionnaires of our stakeholders and monitoring of emerging signals), the 2020 materiality analysis was carried out according to the following steps.
Identifying current and future environmental, social, and governance issues relevant to Manitou Group and its stakeholders.
Prioritizing, assessing, and quantifying the impacts of these issues for Manitou Group and its stakeholders based on the analysis of the results of the 2020 CSR consultation.
Representation of the materiality of each issue in a matrix by cross-checking the importance of the issue for stakeholders with its strategic importance for Manitou Group.
The conclusions of this study, conducted from January to September 2020, were shared with the Executive Committee and the Board of Directors to validate the new 2021-2025 CSR road map.
CLARIFICATIONS REGARDING
METHODOLOGY – ENVIRONMENT, HEALTH, AND SAFETY INDICATORS
To facilitate reporting, the environmental indicators are collected for the period from December 1st to November 30th.
“MLT 735 truck equivalent”: because the sites produce different ranges and different sizes of machines, the group has selected a common indicator, the MLT 735 of the agricultural range, in order to facilitate understanding and harmonize the return of indicators. The group divides the production tonnage of the sites by 7.01, the weight in tons of the MLT 735.
Waste: the European waste classification system is used to determine the category to which waste belongs: hazardous waste, non-hazardous recyclable waste, and non-recyclable waste.
Material recycling or recovery: reprocessing of materials or substances contained in waste using a production process that leads to the creation, or incorporated into, new products, materials or substances. This includes the reprocessing of organic materials but does not include energy recovery.
Re-use: direct use of the waste without using any process to transform it.
Energy recovery: use of an energy source produced through the processing of waste.
Landfill: storage of waste at a landfill or buried underground.
Volatile Organic Compound (VOC) emissions: emissions are assessed using mass balance calculations.
The following solvent content coefficients were applied during assessment of the paint and solvent VOC emissions. Water-based paint: 0.09 / solvent-based paint (polyurethane): 0.52 / solvent-based paint (oil): 0.65 / thinner, solvent: 1.
Water abstracted: total consumption distributed by the water supply system is calculated using water bills.
Paint: consumption is evaluated based on quantities purchased over the year, which closely approximates the quantities used, with regard to the frequency of paint purchases (quantities purchased).
Energy: the energy consumption taken into consideration is the purchased consumption of electricity and gas.
GHG: the greenhouse gas emissions of the production sites (scopes 1 and 2) measure the impact of gas, electricity, non-road diesel, arctic diesel, and refrigerant gas leaks (since 2019). Welding gases are excluded due to their insignificance. The emission factors were updated in 2018 and will be updated again in three years (Ademe database). They take into
account the energy mix in the countries in which the group operates. Refrigerant gas leaks concern air conditioning leaks of new machines on the assembly lines as well as leaks of the fixed air conditioning systems.
Sick leave: the sick leave considered concerns leave approved by the country's reference organization (the CPAM health insurance office in France). The theoretical number of hours worked corresponds to the theoretical number of hours, minus any holidays specified in the collective labor agreement.
Workplace accidents: the frequency rate is the number of accidents with sick leave x 1,000,000 / number of hours actually worked. The severity rate is the number of days of sick leave x 1,000 / number of hours actually worked. The group counts occupational illnesses separately: when the same employee is affected by two separate occupational illnesses, the group counts both illnesses. Since 2015, the indicator has counted recognized occupational illnesses.
Reported occupational diseases: the indicator was reviewed in 2020 and the history is now used to report the number of occupational diseases declared in the year instead of the number of occupational diseases recognized during the year. In order to harmonize practices and standardize the indicator, its scope covers France - excluding LMH and CFM Île-de-France.
CLARIFICATIONS REGARDING
METHODOLOGY – SOCIAL INDICATORS
Non-financial reporting covers the period from January 1st to December 31st of each year.
Employee: members of staff with an employment contract with Manitou or one of its companies - excluding non-consolidated companies. This means staff with open-ended or fixed term employment contracts (including those on the international corporate volunteer program) present on December 31st, whether they are full-time or part-time. Those with vocational-training or apprenticeship contracts or on sabbatical, maternity, parental or sick leave are included in headcount. Job-placement students are not counted as employees. Expatriates and seconded employees are included in the host country figures.
Headcount
France headcount: employees working for Manitou BF, LMH and CFM Ile de France are out of scope (subsidiaries with insignificant headcount).
Italy headcount: employees working for Manitou Italia.
USA headcount: employees working for Manitou Americas.
India headcount: employees working for Manitou Equipment India.
Executives: any member of staff working in a post classed as an executive position by the Global Grading System (Towers Watson methodology).
USA executives: any member of staff with an IC (Incentive Compensation).
Worker: any member of staff who supports the production processes or supports other processes, such as design or distribution.
Operator: any member of staff whose main activity is to contribute directly to the production processes.
Recruitment: any new employment contract, be it for a fixed term or open ended, concluded during the year under consideration. A recruitment is not counted when a fixed-term contract is renewed on the same basis. Two recruitments are counted when a second fixed-term contract is concluded following a break period, when the basis of the contract changes, or when someone on a fixed-term contract is recruited on a permanent basis. Transfers are not considered to recruitment. Expatriations and secondments of staff are not considered recruitment.
Training: the volume of training hours between January 1st and December 31st of each year is taken into account for employees (under fixed term and open ended contracts), whether the training is provided internally or externally, regardless of whether or not the participant is certified. Training entitlement under the personal training account arrangement is included in the hours of training. Only training with a sign-off or attendance sheet is included for this indicator. The actual hours
66
of training are counted. Hours of training are counted in the year of the training plan to which they are linked. Health and safety training covers, for example, fitness-to-drive certificates (CACES), transport of hazardous materials, ATEX (explosive atmospheres), etc. It includes in-house training.
Training costs: training costs cover the salary costs of the people receiving training, teaching costs, any equipment and organization costs, transport and logistics costs, the salary costs of in-house trainers and mandatory contributions (e.g. the accredited employer/trade union-funded training contribution collection body for the metal industry, OPCAIM, and the individual training leave management fund, Fongecif) after deduction of training subsidies.
Training access: starting in 2019, the training access rates of employees and temporary works are calculated using the average number of monthly employees and the number of temporary workers as of 12/31, not using the number of employees as of 12/31, as was the case until 2018.
Disability: a person is considered to have disabilities if acknowledged as disabled by an accredited organization or institution under the terms and conditions laid down in the prevailing legislation and regulations.
French parity index : calculated based on the analysis of data from the previous year.
2020 UNIVERSAL REGIST RATION DOC UMENT 67
INDEPENDENT VERIFIER'S REPORT ON THE CONSOLIDATED NON-FINANCIAL PERFORMANCE DECLARATION PRESENTED IN THE MANAGEMENT REPORT
Year ended December 31, 2020
To the Shareholders,
In our capacity as an independent third-party organization of Manitou, accredited by COFRAC under number 3-1080, we hereby present you with our report on the consolidated non-financial performance declaration related to the year ended December 31, 2020 (hereinafter the “Declaration”), presented in the management report pursuant to the legal and regulatory provisions of Articles L.225 102-1, R.225-105, and R.225-105-1 of the French Commercial Code.
COMPANY RESPONSIBILITY
It is the responsibility of the Board of Directors to draft a Declaration that complies with legal and regulatory provisions, including a presentation of the business model, a description of the main non-financial risks, a presentation of the policies applied in light of these risks, and the results of these policies, including key performance indicators.
The Declaration was established by applying the company’s procedures (hereinafter the “Reference System”), the significant elements of which are presented in the Declaration.
INDEPENDENCE AND QUALITY CONTROL
Our independence is established under the provisions of Article L.822-11-3 of the French Commercial Code and the code of ethics of our profession. In addition, we have put in place a quality control system that includes documented policies and procedures to ensure compliance with ethical standards, professional standards, and applicable laws and regulations.
RESPONSIBILITY OF THE INDEPENDENT VERIFIER
It is our responsibility, based on our work, to give a reasoned opinion expressing a moderate assurance conclusion on:
the compliance of the Declaration with the provisions laid down in Article R.225-105 of the French Commercial Code;
the accuracy of the information provided pursuant to Article 3 of I and II of Article R.225 105 of the French Commercial Code, namely the results of the policies, including key performance indicators, and the actions, relating to the main risks, hereinafter the “Information”.
It is not our responsibility, however, to decide on:
compliance by the company with the other applicable legal and regulatory provisions, particularly with regard to the vigilance plan and the fight against corruption and tax evasion;
the conformity of the products and services to applicable regulations.
NATURE AND SCOPE OF THE WORK
Our work described below was performed in accordance with the provisions of Articles A.225 1 et seq. of the French Commercial Code laying down the conditions under which the independent third-party organization conducts its mission and according to international standard ISAE 3000 - Assurance Engagements other than audits or reviews of historical financial information.
We carried out work enabling us to assess the conformity of the Declaration to regulatory provisions and the accuracy of the Information:
we familiarized ourselves with the activity of all of the companies included in the consolidation scope, the statement of the main social and environmental risks associated with this activity;
we assessed the suitability of the reporting criteria based on their relevance, completeness, reliability, neutrality, and understandability, taking into consideration, where applicable, industry best practices;
we verified that the Declaration presents the information provided for in part II of Article R. 225-105 when relevant with regard to the main risks and includes, where applicable, an explanation of the reasons for the absence of the information required by paragraph 2 of part III of Article L. 225-102-1;
we checked that the Declaration presents the business model and the main risks associated with the activity of all of the entities within the consolidation scope, including, where this proves relevant and proportionate, the risks created by its business relations, its products, or its services, as well as the policies, actions, and results, including key performance indicators;
We consulted the documentary sources and conducted interviews to:
assess the selection and validation process for the main risks as well as the consistency of the results of the key performance indicators selected with regard to the main risks and policies presented, and
corroborate the consolidated quantitative information (actions and results) that we considered to be the most important.
We checked that the Declaration covers the consolidated scope, namely all of the companies included in the consolidation scope in accordance with Article L.233-16;
We reviewed the internal control and risk management procedures implemented by the entity and assessed the collection process with respect to the completeness and accuracy of the Information;
For the key performance indicators and the other quantitative results that we considered to be the most important, we implemented:
analytical procedures involving checking the correct consolidation of the data collected and the consistency of any changes;
detailed tests on the basis of surveys, involving checking correct application of the definitions and procedures and comparing the data in the supporting documents. This work was conducted for a selection of contributing entities and covers between 56% and 81% of the consolidated data selected for these tests;
We assessed the overall consistency of the Declaration with respect to our knowledge of all the entities included in the scope of consolidation.
We consider that the work we conducted by exercising our professional judgment enables us to draw a moderate assurance conclusion; a higher level of assurance would have needed more extensive verification work.
68
MEANS AND RESOURCES
Our work mobilized the skills of four people and took place between October 2020 and February 2021 for a total project time of around four weeks.
To assist us in our work, we called upon sustainable development and social responsibility experts. We held interviews with the people responsible for preparing the Declaration.
CONCLUSION
Based on our work, we did not find any significant anomalies likely to call into question the fact that the non-financial performance declaration complies with the applicable regulatory provisions and that the information, taken as a whole, is presented sincerely in accordance with the Reference System.
COMMENTS
Without qualifying the conclusion expressed above and in accordance with the provisions of Article A. 225-3 of the French Commercial Code, we make the following comments: for the group’s environmental indicators presented in the “Environmental Management” section, the new organization made it possible to clarify the roles and responsibilities in the collection chain and strengthen internal controls. However, given the successful integration of all the group's production sites, the collection and consolidation tool is still too limited to ensure robust reporting and increased efficiency.
Neuilly-sur-Seine, April 16, 2021.
The Independent Verifier Grant Thornton
French Member of Grant Thornton International
Vincent Frambourt Tristan Mourre
Partner Director

2020 UNIVERSAL REGIST RATION DOC UMENT 69
70
RISKS AND CONTROLS

2020 UNIVERSAL REGIST RATION DOC UMENT 71
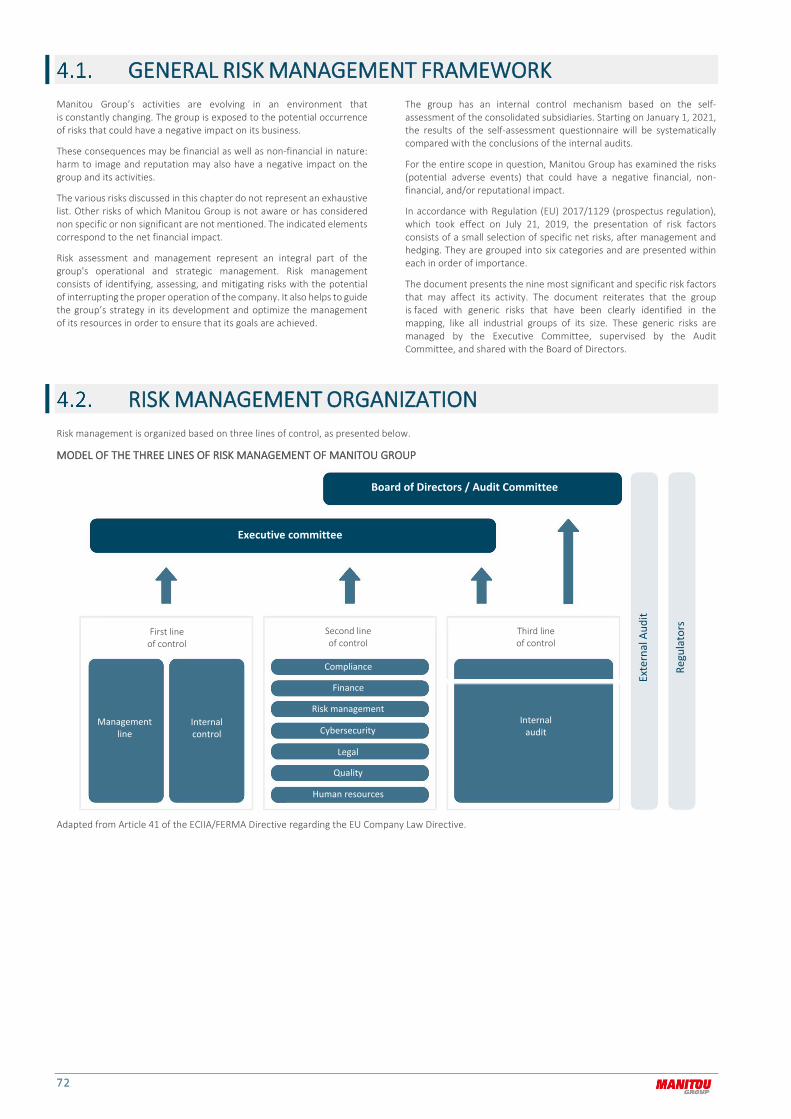
72
GENERAL RISK MANAGEMENT FRAMEWORK Manitou Group’s activities are evolving in an environment that is constantly changing. The group is exposed to the potential occurrence of risks that could have a negative impact on its business.
These consequences may be financial as well as non-financial in nature: harm to image and reputation may also have a negative impact on the group and its activities.
The various risks discussed in this chapter do not represent an exhaustive list. Other risks of which Manitou Group is not aware or has considered non specific or non significant are not mentioned. The indicated elements correspond to the net financial impact.
Risk assessment and management represent an integral part of the group's operational and strategic management. Risk management consists of identifying, assessing, and mitigating risks with the potential of interrupting the proper operation of the company. It also helps to guide the group’s strategy in its development and optimize the management of its resources in order to ensure that its goals are achieved.
The group has an internal control mechanism based on the self-assessment of the consolidated subsidiaries. Starting on January 1, 2021, the results of the self-assessment questionnaire will be systematically compared with the conclusions of the internal audits.
For the entire scope in question, Manitou Group has examined the risks (potential adverse events) that could have a negative financial, non-financial, and/or reputational impact.
In accordance with Regulation (EU) 2017/1129 (prospectus regulation), which took effect on July 21, 2019, the presentation of risk factors consists of a small selection of specific net risks, after management and hedging. They are grouped into six categories and are presented within each in order of importance.
The document presents the nine most significant and specific risk factors that may affect its activity. The document reiterates that the group is faced with generic risks that have been clearly identified in the mapping, like all industrial groups of its size. These generic risks are managed by the Executive Committee, supervised by the Audit Committee, and shared with the Board of Directors.
RISK MANAGEMENT ORGANIZATION Risk management is organized based on three lines of control, as presented below.
MODEL OF THE THREE LINES OF RISK MANAGEMENT OF MANITOU GROUP
Adapted from Article 41 of the ECIIA/FERMA Directive regarding the EU Company Law Directive.
Board of Directors / Audit Committee
Executive committee
First line of control
Second line of control
Third line of control
Compliance
Finance
Management line
Internal control
Risk management
Cybersecurity Internal
audit
Legal
Exte
rnal
Aud
it
Regu
lato
rs
Quality
Human resources

2020 UNIVERSAL REGIST RATION DOC UMENT 73
THE FIRST RISK CONTROL LINE
A) THE MANAGEMENT LINE (OPERATIONS):
implements the strategy, taking into account the execution risks involved, and identifies targets as a function of the risks of deviations;
coordinates the various functions of the company and relations with stakeholders;
is mandated to represent the company towards third parties; it forms a chain of delegation and assumes the associated civil and criminal liability;
relies on the internal control system to self-assess its risks.
B) INTERNAL CONTROL:
works to ensure compliance with laws and regulations;
makes it possible to verify actual implementation of governance rules;
evaluates how well the processes function;
guarantees the reliability of financial information;
relies on a self-assessment questionnaire revised in 2016 that was deployed in all controlled entities of the group.
Like any control system, this mechanism cannot entirely guarantee the efficiency of operations. As a priority, it strives to identify operational risks and ensure deployment of the ad hoc action plan in order to guarantee that those risks are managed.
The internal control system is under the responsibility of the group's finance director.
THE SECOND RISK CONTROL LINE
It provides necessary support to the first line in order to:
define roles and responsibilities and set the relevant objectives for their implementation;
prepare the risk management guidelines;
identify and control risks as part of a structured and targeted approach to the challenges of Manitou Group and its activities;
assist the management line to define and deploy the processes and controls in order to manage risks;
observe developments and anticipate emerging risks;
monitor the adequacy and effectiveness of the internal control system, especially with respect to reporting efficiency and compliance with laws and regulations;
propose and support timely remediation of failures.
THE THIRD RISK CONTROL LINE
The internal audit function forms the third control line:
by assessing the mastery of operational and functional rules and the execution of operations with respect to the organization's concerns.
by verifying the relevance of internal procedures and their compliance with rules, standards, procedures, laws, and regulations;
by assisting Manitou Group to achieve its objectives through a systematic and disciplined approach to assess and improve the effectiveness of the management, control, and governance processes of the organization;
The internal audit department is one of the three components of the Audit, Risks, and Compliance Department, placed under the double authority of the Chairman of the Audit Committee and the Corporate Secretary of Manitou Group in order to guarantee its independence.
The Audit, Risks, and Compliance Department periodically reports to the Executive Committee and the Audit Committee regarding the overall control of risks and the governance of the group and its controlled subsidiaries, as well as potential improvements of its processes.
The role of the Audit Committee is described in chapter 5.
RISK MAPPING It makes it possible to understand changes in existing risks and anticipate emerging risks across all of its activities, which must be managed by the various divisions and cross-disciplinary functions of Manitou Group. The risk mapping process was revised in 2019.
Risks are assessed based on their human, environmental, and reputational consequences, in addition to their financial impact.
The Audit, Risks, and Compliance Department is in charge of leading this process. It formalizes the risks and monitors progress on the action plans placed under the responsibility of the members of the Executive Committee.
The Executive Committee prioritizes resources for the action plans.
The Audit, Risks, and Compliance Department periodically reports on progress made on the action plans to the Audit Committee, which ensures that the necessary resources have been properly implemented.

74
RISK FACTORS The risks to which the group believes that it is exposed can be grouped into six categories. The risk factors are presented within each category by order of importance.
COVID-19
The AMF's communication dated 03/23/2020 concerning “filings of universal registration documents and permanent information rules in the context of the Covid-19 crisis” encourages the company to make a statement on its impact. The Covid-19 pandemic has had, and could continue to have, health, human, economic, financial, and political impacts.
Since February 2020, the group has had a coordination cell that has centralized all alerts and communicated with its employees and stakeholders. It has acted to propose mitigation solutions to the Executive Committee concerning the protection of employees and operational decisions. The members of the crisis unit immediately implemented action plans to continue operations, taking into account the requirements imposed by the pandemic. The crisis unit was then dissolved at the end of the first half of the year once all of the group's activities were operational.
With respect to the health and human aspects, the group continues to follow the government recommendations of the countries in which it operates. Adjustments were made to workstations, and work from home was implemented when the situation required it.
On the economic front, the crisis led Manitou's customers to suddenly reduce their investments. As soon as the arrival of a vaccine was confirmed, all markets and regions experienced a very strong rebound in order intake. The group and its entire supply chain approached 2021 with a challenge of increasing speed of operations and with risks of availability of certain components as well as high commodity inflation.
With respect to the financial aspects, the sequence of crisis and strong recovery may result in an increase in defaults by our stakeholders, pre-litigation disputes and litigation on the non-execution clause, foreign exchange risk, liquidity risk, and/or any risk to other aggregate financial indicators that could be impacted by an unusual change in indexes, parameters, etc. on which their valuation is based.
With respect the national and international policies, the sequence of crisis and recovery may result in the implementation of new governmental measures, both incentives and constraints, which could have an impact on the recovery of the group's business and that of its stakeholders, the movement of goods and/or persons, or any other type of movement.
CATEGORY 1: STAFF RISKS
EMPLOYEE HEALTH AND SAFETY RISKS
IDENTIFICATION OF RISK RISK MANAGEMENT
Manitou is an international industrial group that boasts 9 production sites, 9 logistics centers, and 19 Manitou Centers where automated and manual processing, assembly, static and dynamic testing, and repair operations are carried out.
The accident occurrence frequency is particularly concentrated in occasional parties (subcontractors, temporary workers, and visitors).
Personnel performing the most taxing tasks may be exposed to occupational hazards.
In addition to the mandatory safety rules, Manitou Group has committed to an ISO 45001 certification program and for the first time obtained ISO 45001 certification for Manitou BF in France (four production sites, logistics platform, and head office).
The risk is audited annually in accordance with ISO 9001 and 14001 standards, which are gradually being rolled out within the group.
The alert system has been reinforced, and the monthly reporting process has been further harmonized in order to improve responsiveness and implementation of remediation plans, with particular attention paid to serious or frequent risks.
While frequency and severity rates remain high, the rate of accidents with absence of work improved by more than 20% in 2020, from 13.87 in 2019 to 10.94 at the end of 2020.
Probability: possible / Impact: high
CATEGORY 2: FINANCIAL RISKS
There are no critical and specific material risks identified in this category.
See chapter 7.1 “Consolidated financial statements,” note 13.2.2.

2020 UNIVERSAL REGIST RATION DOC UMENT 75
CATEGORY 3: RISKS RELATED TO INFORMATION SYSTEMS
RISKS OF CYBER ATTACKS
IDENTIFICATION OF RISK RISK MANAGEMENT
Manitou Group's business relies on the proper operation of its IT infrastructure and the availability of its information systems.
The digitalization of the group's management, production, distribution, and maintenance tools exposes it to a risk of internal and external attacks.
The malfunction, shutdown, or paralysis of information systems and/or the theft, alteration, or distribution of data would have a significant impact on the group's activity. Systems may also be the victim of a targeted attack resulting in leaks of confidential information and compromising its ability to achieve its objectives.
The group has taken organizational and technical measures. In order to improve technical responsiveness, the Chief Information Security Officer (CISO), who used to be attached to the Risk Division, is now integrated into the operational teams of the IT Department with a functional reporting line to the Corporate Secretary.
An information security policy based on the work of the NIST (National Institute of Standards and Technology) was defined for the entire group.
Operations are regularly carried out to raise user awareness of these matters. In addition to security audits, infiltration tests are regularly conducted.
Manitou Group continuously invests in means of protection, detection, and correction to minimize the impact of this risk factor.
In 2020, the group experienced a surge in cyberattacks and attempted cyberattacks that did not have a significant impact operations or data management and confidentiality.
Probability: probable / Impact: high
CATEGORY 4: EXTERNAL RISKS
RISKS RELATED TO CORRUPTION AND ANTI-COMPETITIVE PRACTICES
IDENTIFICATION OF RISK RISK MANAGEMENT
Manitou Group's international footprint means that it must comply with a large number of laws and regulations, which are continuously evolving.
This is especially the case in the legal environment surrounding the fight against corruption and respect for competition.
In addition to an isolated act committed by an employee of the group, the risk may come from stakeholders that disregard or violate their legal obligations and/or the strict rules.
Some countries are the subject of specific export controls or partial or total embargoes; some companies are held by individuals under sanctions that make the sale of dual use machines impossible.
Therefore, Manitou Group must verify the quality of the third party and the destination of the machines under penalty of violating the rules imposed by the European Union and/or the United States and/or others.
Non-compliance with the laws and regulations regarding anti-corruption or export control could have serious legal and financial consequences for the group and seriously harm its reputation.
Manitou Group is strongly committed to preventing corruption and anti-competitive practices. It continues to strengthen its system, which is based on the eight pillars of the 2016-1691 law, called Sapin II.
In 2019, the group launched several initiatives, including an e-learning module that, as of December 31, 2019, was taken by 98% of executives and employees. An international classroom training campaign will be launched in 2021.
The independent whistleblowing platform deployed in 2019 allows any whistleblower, whether a group employee or external employee, to file a report. Reports are allocated to the internal audit team composed of Certified Fraud Examiner (CFE) staff.
Procedures were deployed throughout the group. Checks of compliance with the export rules are performed.
A dual third-party evaluation mechanism has been put in place to anticipate any operation that poses a risk of non-compliance.
In 2020, on top of the obligations imposed by the Sapin II law, Manitou Group continued the process of preparing one of its subsidiaries for ISO 37001 certification.
At the end of 2020, the group initiated a new anti-corruption risk map, which will be finalized in the first half of 2021. A general audit of the effectiveness of the group's anti-corruption system is planned for 2022.
Probability: possible / Impact: high
BUSINESS ETHICS
See chapter 3, note 3.1.1 “Risk related to business ethics.”
Probability: possible / Impact: high
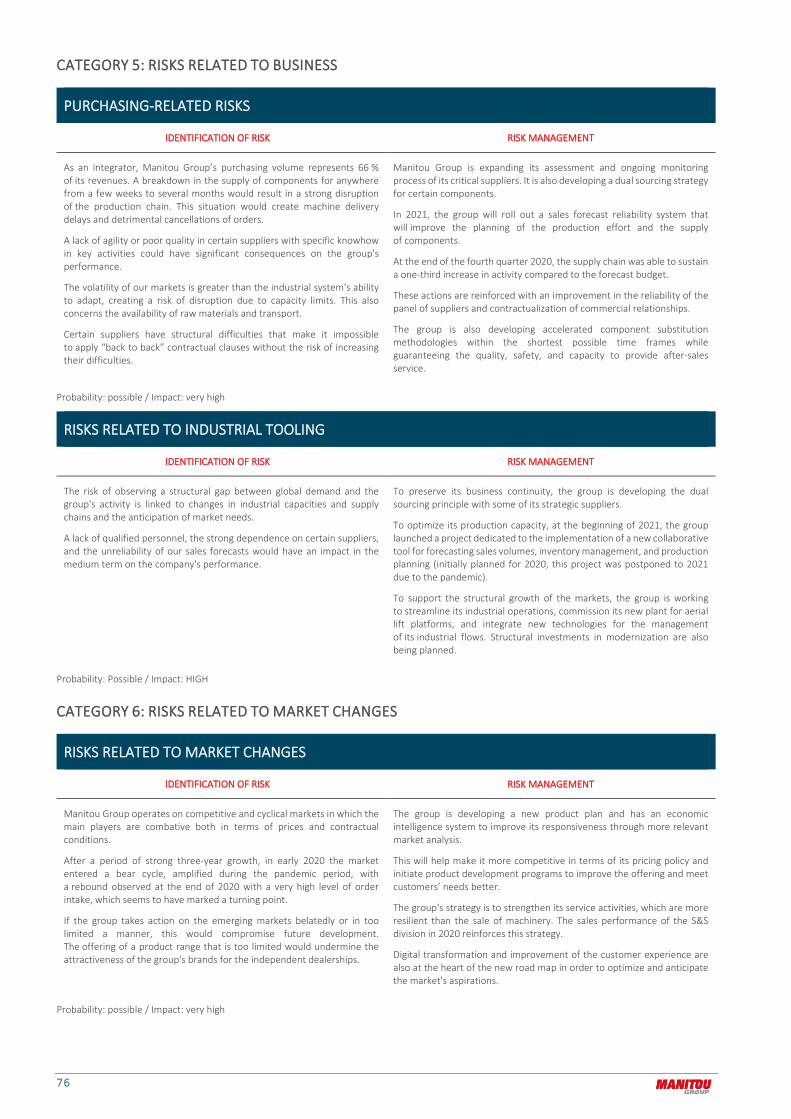
76
CATEGORY 5: RISKS RELATED TO BUSINESS
PURCHASING-RELATED RISKS
IDENTIFICATION OF RISK RISK MANAGEMENT
As an integrator, Manitou Group’s purchasing volume represents 66 % of its revenues. A breakdown in the supply of components for anywhere from a few weeks to several months would result in a strong disruption of the production chain. This situation would create machine delivery delays and detrimental cancellations of orders.
A lack of agility or poor quality in certain suppliers with specific knowhow in key activities could have significant consequences on the group's performance.
The volatility of our markets is greater than the industrial system's ability to adapt, creating a risk of disruption due to capacity limits. This also concerns the availability of raw materials and transport.
Certain suppliers have structural difficulties that make it impossible to apply “back to back” contractual clauses without the risk of increasing their difficulties.
Manitou Group is expanding its assessment and ongoing monitoring process of its critical suppliers. It is also developing a dual sourcing strategy for certain components.
In 2021, the group will roll out a sales forecast reliability system that will improve the planning of the production effort and the supply of components.
At the end of the fourth quarter 2020, the supply chain was able to sustain a one-third increase in activity compared to the forecast budget.
These actions are reinforced with an improvement in the reliability of the panel of suppliers and contractualization of commercial relationships.
The group is also developing accelerated component substitution methodologies within the shortest possible time frames while guaranteeing the quality, safety, and capacity to provide after-sales service.
Probability: possible / Impact: very high
RISKS RELATED TO INDUSTRIAL TOOLING
IDENTIFICATION OF RISK RISK MANAGEMENT
The risk of observing a structural gap between global demand and the group's activity is linked to changes in industrial capacities and supply chains and the anticipation of market needs.
A lack of qualified personnel, the strong dependence on certain suppliers, and the unreliability of our sales forecasts would have an impact in the medium term on the company's performance.
To preserve its business continuity, the group is developing the dual sourcing principle with some of its strategic suppliers.
To optimize its production capacity, at the beginning of 2021, the group launched a project dedicated to the implementation of a new collaborative tool for forecasting sales volumes, inventory management, and production planning (initially planned for 2020, this project was postponed to 2021 due to the pandemic).
To support the structural growth of the markets, the group is working to streamline its industrial operations, commission its new plant for aerial lift platforms, and integrate new technologies for the management of its industrial flows. Structural investments in modernization are also being planned.
Probability: Possible / Impact: HIGH
CATEGORY 6: RISKS RELATED TO MARKET CHANGES
RISKS RELATED TO MARKET CHANGES
IDENTIFICATION OF RISK RISK MANAGEMENT
Manitou Group operates on competitive and cyclical markets in which the main players are combative both in terms of prices and contractual conditions.
After a period of strong three-year growth, in early 2020 the market entered a bear cycle, amplified during the pandemic period, with a rebound observed at the end of 2020 with a very high level of order intake, which seems to have marked a turning point.
If the group takes action on the emerging markets belatedly or in too limited a manner, this would compromise future development. The offering of a product range that is too limited would undermine the attractiveness of the group's brands for the independent dealerships.
The group is developing a new product plan and has an economic intelligence system to improve its responsiveness through more relevant market analysis.
This will help make it more competitive in terms of its pricing policy and initiate product development programs to improve the offering and meet customers’ needs better.
The group's strategy is to strengthen its service activities, which are more resilient than the sale of machinery. The sales performance of the S&S division in 2020 reinforces this strategy.
Digital transformation and improvement of the customer experience are also at the heart of the new road map in order to optimize and anticipate the market's aspirations.
Probability: possible / Impact: very high

2020 UNIVERSAL REGIST RATION DOC UMENT 77
INTELLECTUAL PROPERTY RISKS
IDENTIFICATION OF RISK RISK MANAGEMENT
Research and innovation are two of the group's pillars that contribute to its development. The protection of intellectual property is essential for products with high added technological value.
The risk of not filing a patent or making errors in the preparation of an application exposes the group to the risk that its inventions will be used by competitors and it will be deprived of a competitive advantage for several years. Non-protection or poor protection of patents has a dual effect:
it deprives the group of additional revenue that could have been obtained in the form of licenses;
it prevents it from bringing infringement lawsuits against third parties that use its intellectually property unlawfully.
The inadvertent use of solutions patented by third parties could also result in disputes with the patent owners.
In order to protect itself against the risk of infringement, the group has a department that is dedicated to the protection of intellectual property.
The Research and Innovation Department is responsible for filing of patents, managing the portfolio, and developing a watch network to identify the capture and unlawful use of our intellectual property by third parties.
In 2020, Manitou Group filed 19 applications. At closing of the fiscal year, the group held a portfolio of 127 patents in its intellectual assets and monitors competitors’ patents during the design of new materials.
Probability: possible / Impact: high
RISKS RELATED TO CHANGES IN RAW MATERIAL PRICES
IDENTIFICATION OF RISK RISK MANAGEMENT
Manitou Group's products require mass consumption of special steel and, to a lesser extent, copper, aluminum, lead, plastics, and rubber.
The trend in steel prices is up sharply; the average increase expected for 2021 compared to 2020 is above 40%, while the 2020 average was down 4% compared to 2019.
Exposure to market trends could, therefore, have an impact on the group's profits.
In order to defend against the impact of a strong increase in the prices of raw materials, Manitou Group favors medium and long-term contractual partnerships with price adjustment clauses every six months, which gives it acceptable visibility.
On the US market, where it is possible to use financial instruments, the group was able to protect itself from almost all of the increase for internal production activities by locking in the price of steel with its main supplier.
In order to limit its dependence on certain at risk raw materials, the group has asked its partners to develop components that limit their use.
The risk is shared with second-tier suppliers.
Probability: probable / Impact: medium
INSURANCEGROUP'S GENERAL INSURANCE POLICY
Manitou has group insurance programs and policies purchased locally. They allow the parent company to coordinate the management of its insurance policies in order to optimize total premiums and improve coverage. Manitou Group has put an international civil liability insurance program (operation and products) in place, purchased through leading insurance companies, through which the group's subsidiaries can subscribe to a so-called “integrated” local policy reinsured by a “Master” policy.
The “Master” civil liability insurance policy covers all of its subsidiaries (with some exceptions due to certain country-specific regulatory constraints, more favorable conditions offered by the local market or specific business). If there is no local policy or in case of a non-integrated local policy, the coverage is provided in DIC and/or DIL (“difference in conditions” / “difference in limit”) mode. As of the date of signing of this report, the amount of the civil liability coverage (operation and product) amounted to €50 million per claim and per insurance year.
The property damage policy is an “all risks” (with exclusions) policy for the insured amounts corresponding to the identified risks. It also covers the risk of operating losses over a contractual period.
The group has put an international program in place to cover the French entities of the group as well as the Italian and American subsidiaries. The coverage amount of the property damage and operating losses insurance policy amounts to €200 million as of the date of this report. The group ensures that all of its insurance policies cover the following risks, either purchased for its entities through its group programs or local policies.
The group’s insurance policies cover the following risks:
civil liability;
civil liability of the corporate officers;
environmental impact liability;
property damage and operating loss;
cyber damages;
transport;
customer credit risk.
78
CONTROLS KEY INTERNAL CONTROL PROCESSES
The CEO meets weekly with the Executive Committee, the composition of which is described in the management report. The members of the Executive Committee are surrounded by a Management Committee comprised of the functions within their remit. The activities and achievement of objectives by each division and each sales region are reviewed quarterly. The support functions of the Corporate Secretary and Human Resources are reviewed biannually. In addition, the group uses a decisions and responsibilities delegation manual that is aligned with the organization of the group and is applicable to all of the group's companies concerning the following areas: legal and regulatory obligations (including concerning health & safety and environmental compliance), financial operations (including off-balance sheet commitments), budget processes, commercial operations, purchasing, fixed-asset management, and human resources.
PRODUCTION OF FINANCIAL INFORMATION
The responsibility for drafting the group's corporate and consolidated financial statements lies with the Finance Department. The budget and monthly reporting procedure is an essential tool for Manitou Group in the coordination of its operations. This is a structured and structuring process designed to organize the sharing of information and strategic objectives within the group. The internal and external dissemination of relevant, reliable, and timely information makes it possible for each person to discharge their responsibilities. For the annual closure and interim financial reporting, the consolidation packages are prepared by the subsidiaries in accordance with the financial manual of Manitou Group and are submitted to the consolidation department of the parent company. The Finance Department is responsible for the internal control procedures related to the preparation and processing of financial information.
PRODUCTION OF FINANCIAL STATEMENTS
The group’s consolidated financial statements are drawn up on the balance-sheet date in accordance with IFRS (International Financial Reporting Standards) rules, published by the IASB (International Accounting Standards Board) and adopted by the European Union. The financial statements of Manitou BF are drafted in accordance with the French rules.
The financial statements for both the parent company and the group are prepared by the Accounts Department, with the assistance of a certified public accountant with respect to the unconsolidated financial statements. They are validated by the Finance Department, Corporate Secretary, and the CEO prior to approval by the Board of Directors, after review by the Audit Committee.
The consolidated financial statements for the group are drawn up by the Accounts Department. This department is responsible, inter alia, for updating the procedures for consolidation, training, and integration of the subsidiaries into the scope of consolidation, data processing, as well as the use, maintenance, and development of the consolidation tool and of the financial data system.
Each subsidiary communicates its accounts to the Accounts Department based on a timetable set by the group. The Accounts Department reviews the accounts of the group as a whole and makes the adjustments necessary to draw up consolidated accounts. These accounts are circulated every month to the executive management. A manual sets out the group standards that apply to the accounts and their presentation. This manual is added to each year and is made available to all the group entities. Closure instructions are also communicated monthly to all subsidiaries.
Manitou Group prepares its consolidated financial statements using a unique consolidation tool structured based on a unique accounting plan for all companies of the group. They are validated by the Finance Department, Corporate Secretary, and the CEO prior to approval by the Board of Directors, after review by the Audit Committee.
AUDITING OF THE FINANCIAL STATEMENTS
The interim and annual financial statements are audited by the college of Statutory Auditors, which applies the standards of the profession. For foreign subsidiaries, which are audited in each country, the financial statements and observations of the local auditors were provided to the group's Statutory Auditors and were reviewed with the Finance Department. The Statutory Auditors presented a summary of their work to the Audit Committee on February 26, 2021. The Board of Directors met on March 4, 2021 to close Manitou’s corporate and consolidated financial statements ending December 31, 2020. Working meetings and summary meetings are regularly held between the Statutory Auditors and the group's Finance Department as part of a continuous exchange process. The Audit Committee is present at all essential steps to validate the financial information.
PURCHASING AND LOGISTICS DEPARTMENT
The risks and compliance functions are under the responsibility of the Compliance, Audit, and Risk Director:
the compliance function organizes and deploys the processes, awareness raising efforts, and training on compliance subjects. Its approach is based on a compliance map prepared in 2018 specifically for corruption risks, the group's code of conduct, the United Nations pact, as well as the eight key elements of the Sapin II law. During 2019, the group rolled out an alert system and launched an anti-corruption training course taken by 2,330 employees, representing 98% of the target workforce. At the end of 2020, the target workforce training rate reached 93%, or 2,159 employees;
beyond its obligations under the Sapin II law, the group initiated the ISO 19600 (Compliance management systems) evaluation of one of its subsidiaries and is planning to expand this program to the entire group, with the goal of achieving a multi-year ISO 37001 certification program;
the Audit, Risk, and Compliance Director is a member of the Ethics Committee;
the risk function is in charge of risk mapping as well as monitoring the implementation of all action plans. Starting in 2021, the progress of action plans will be measured twice a year by the Executive Committee. Critical risks were re-evaluated in 2020 (see paragraph 4.3).
2020 UNIVERSAL REGIST RATION DOC UMENT 79
FINANCE DEPARTMENT
The finance function controls activities, transactions, and projects in order to optimize the group's profitability and cash flow, while providing reliable information to internal and external stakeholders. The finance function defines the group's principles and financial policy regarding control, offers and projects, financing, cash flow, internal control, accounting, taxes, and management control.
LEGAL DEPARTMENT
The mission of the legal function is to manage the legal risks related to the group's activities. As such, it oversees the insurance policy. The Corporate Legal Department manages the major disputes and compliance with applicable laws. It coordinates legal topics within the entire group. The group's Legal Department is a member of the Ethics Committee and participates, where appropriate, in meetings of the Audit Committee.
QUALITY, HEALTH & SAFETY, AND
ENVIRONMENT DEPARTMENT
The mission of the Health & Safety and Environment function is to monitor and reduce:
risks relating to the quality of the products, parts, and components in their design or qualification phase and production phase, then
analysis of malfunctions once on the market. The quality departments work closely with the after the sales services, production, and development departments. It interacts with purchasing in order to manage the transmission of anomalies relating to purchased parts or components;
risks relating to the safety of employees and persons working at the group's sites. It oversees and implements risk audit programs as well as the action plans needed to eliminate or reduce these risks. Enhanced initiatives have been undertaken since 2019 to increase security at all of the Group's sites: action on training and integration of temporary staff, optimization of steering and continuous improvement by ISO 45001 certification for France, digitization of the single document for greater efficiency. The security services also work to protect the group's property and equipment;
environmental risks by defining action plans designed to ensure compliance with environmental obligations, prevent environmental risks such as the risks of pollution, manage waste, and reduce the environmental impact of the group's activities.
HUMAN RESOURCES DEPARTMENT
The mission of the Human Resources Department is to monitor and reduce risks related to employment law and protect the health of the group's employees on issues not covered by the Quality, Health & Safety, and Environment Department. It defines a series of processes designed to allow the group to control these risks. The human resources function defines and manages the training processes that ensure that the employees have the necessary skills to perform their duties.

80
REPORT ON CORPORATE GOVERNANCE

2020 UNIVERSAL REGIST RATION DOC UMENT 81

82
In accordance with the provisions of Article L. 225-37 of the French Commercial Code, the Board of Directors has drafted this report on corporate governance and attached it to the management report. The “Compensation” portion of the corporate governance report was drafted by the Compensation Committee and reviewed by the Audit Committee. The report was submitted to the Statutory Auditors, then was approved by the Boards of Directors on March 4, 2021.
This chapter presents the functioning and composition of the Board of Directors, its committees and management bodies, the compensation of the administrative and management bodies as well as the special procedures for shareholders to participate in the General Meeting. Information regarding elements that are likely to be influential in case of a public offering are presented in chapter 6.3 of this universal registration document.
GOVERNANCE
REFERENCE TO A CORPORATE GOVERNANCE CODE
Since August 2010, the company refers to the corporate governance code for midcaps, “MiddleNext.” This Code may be consulted at the website www.middlenext.com (Publications tab - Governance reference texts).
In addition, the Board of Directors has taken note of the items presented under the heading “Points to be watched,” which are the key provisions of the Code.
CHOICE OF GOVERNANCE METHOD AND CHANGES IN GOVERNANCE
CHOICE OF GOVERNANCE METHOD
Since 2009, the governance method has involved a disassociation of functions between a non-executive Chair of the Board of Directors and a CEO, the only executive corporate officer. The role of the Chair of the Board consists of organizing and directing the Board's work, regarding which she reports to the General Meeting. She ensures that the corporate bodies that she chairs are functioning properly and in particular that the board members are capable of fulfilling their duties.
CHANGES IN GOVERNANCE
During the past fiscal year, the following changes were made in the composition of the administrative and management bodies and their committees:
Members concerned Type Effects in terms of diversification of the Board Michel Trotter (director representing employees)
On September 10, 2020, he was elected as director representing the employees.
-
Carole Lajous (independent director)
On September 13, 2020, she resigned from her term of office as director. Her duties as a member of the Compensation Committee and as substitute for the Strategic Committee ended.
Alexandra Matzneff was appointed to replace Carole Lajous, taking into account her expertise, skills and knowledge, to maintain the diversity objectives set by the diversity policy applied to Board members.
Alexandra Matzneff (independent director)
On November 9, 2020, she was co-opted as director by the Board of Directors to replace Carole Lajous and was approved by the General Meeting of December 21, 2020.
In addition, the following change was made in the composition of the Executive Committee:
Appointment on September 14, 2020 of Carole Lajous, Group Head of Human Resources, to replace Guillaume Rabel-Suquet.
2020 UNIVERSAL REGIST RATION DOC UMENT 83
INFORMATION ON THE COMPOSITION, OPERATIONS, AND POWERS
OF THE BOARD OF DIRECTORS
OPERATION OF THE BOARD OF DIRECTORS AND ORGANIZATION OF MEETINGS OF THE BOARD
AND ITS SPECIALIZED COMMITTEES
THE BOARD OF DIRECTORS
An internal regulation defines the Board of Directors’ organization and operation. In particular, it specifies the role and operational procedures of the Board of Directors and its specialized committees, established in accordance with the legal and statutory provisions and the provisions of the Articles of Association. The regulation also details the roles and powers of the Chair of the Board and the general management, as well as their respective obligations. In this regard, it includes a board member's charter, which sets out the rights and obligations of the company's board members to ensure good corporate governance. These principles are based on the duties of due diligence, independence, transparency, and confidentiality.
During 2020, the members of the Board of Directors met 17 times. During these meetings, the following topics were addressed:
In the area of governance: assessment of the functioning of the Board of Directors, validation of the diversity policy within the Board (Pacte Act), changes in the Board's internal rules, changes in the articles of association (Pacte Act and updates), the succession of directors, the election of the 2nd director representing employees, the co-opting of Alexandra Matzneff as a director to replace Carole Lajous, and the review of the composition of the executive bodies of the subsidiaries.
As part of the strategic guidelines: the presentation of the "New Horizons 2025” road map, the mapping of the group's risks, progress points on external growth projects, and structural investment projects.
As part of the company's management of the COVID-19 health crisis: the "Resilience" plan aimed at reducing operating costs (savings plan of €48 million), the restructuring of certain foreign subsidiaries, the cancellation or postponement of certain projects, the reorganization of the machinery design and production activities, the plan to reduce 63 structural positions within Manitou BF, the project to streamline the group's operations in the United States (closing of its operations in Waco, Texas).
In the area of control and management: questions relating to the approval of the financial statements, the annual review of regulated and current agreements, the presentation of the 2020-2024 business plan scenarios, updates on the group's financial and operational situation, the waiver of the payment of the dividend for 2019, and the convening of an ordinary general meeting on December 21, 2020 with a view to proposing a dividend distribution of €0.50 per share deducted from reserves.
In the area of compensation: feedback from the Compensation Committee on the compensation of the corporate officers (Chairman, CEO, Directors), the company's policy on equality in the workplace and equal pay.
The Board of Directors also met during a special two-day seminar about the group’s strategy.
The Board meetings were held, at the invitation of the Chair of the Board, at the registered office or by video conference with secure access, due to the lockdown imposed by the Government in the context of the COVID-19 crisis.
Each member of the Board of Directors, and all staff representatives convened, received, in advance of the meetings, all the documents and information required by law that they need to accomplish their tasks.
Minutes of board meetings are systematically drafted and submitted to each member for approval.
The statutory auditors were convened to Board meetings concerning the closure of the interim and annual financial statements, in accordance with Article L.823-17 of the French Commercial Code.
The average attendance rate at Board of Directors’ meetings was 99.5 % for 2020.
Directors receive compensation as detailed in section 5.2.1.3. “Board member compensation policy” and 5.2.2. “Compensation and benefits awarded to corporate officers for 2020 (global ex-post vote)” in this chapter.
BOARD SECRETARY
Hervé Rochet, Corporate Secretary, acts as Secretary of the Board.
THE COMMITTEES
SPECIALIZED COMMITTEES
The Board of Directors has set up four specialized committees responsible for investigating matters falling within their remit and for submitting advice and recommendations to the Board. The work of the Strategic, Audit, and Compensation Committees is systematically reported to the Board of Directors.
THE STRATEGIC COMMITTEE
Its main responsibilities are to assist the Board in the development of the strategy and verify that the CEO's actions are consistent with this strategy: by assessing the company's environment and its positioning, analyzing medium and long-term development opportunities, and assessing the strategic plan proposals made by the CEO. In this respect, it prepares the Board's work on topics such as the strategic plan, any major investment (particularly for external growth) or divestment (particularly for business cessation), any diversification project or a change in the business portfolio, and any draft strategic agreement, alliance, technological cooperation, or industrial partnership.
The work of the 2020 Strategic Committee is not made public for confidentiality reasons.
The Committee met twice in 2020. The average attendance rate at the meetings of the Strategic Committee was 100 % for 2020.
THE AUDIT COMMITTEE
The primary responsibilities of the Audit Committee are to verify the accuracy and sincerity of the financial statements and the financial reporting, the quality of the internal control and risk management procedures, and the group's respect for its compliance obligations.

84
For this purpose, its duties include:
monitoring the financial reporting process and, as applicable, formulating recommendations to ensure its integrity;
reviewing the draft corporate and consolidated financial statements, both annual and interim, before the Board receives them as well as the annual management report;
checking the efficacy of internal control and risk management systems and, where appropriate, the internal audit process in terms of the procedures for drawing up and processing accounting and financial information, without this interfering with its independence;
reviewing with the internal audit manager the identification of risks, their analysis, and their evolution over time as well as actions taken. It approves the annual audit plan. It takes note of the main conclusions and recommendations of each audit mission and the implementation of the action plans;
organizing the Statutory Auditors’ renewal process and issuing a recommendation on the Statutory Auditors proposed for appointment by the General Meeting;
monitoring the Statutory Auditors’ performance of their mandate and taking into account the statements and conclusions of the French supervisory body for the auditing profession, the Haut Conseil du Commissariat aux Comptes, in the wake of any audits conducted pursuant to legislative and regulatory provisions;
ensuring compliance by the Statutory Auditors with the criteria for independence in accordance with the terms and conditions imposed by the regulations;
approving the provision of services other than certification of the accounts in accordance with the applicable regulations;
regularly reporting to the Board on the performance of its tasks. It also reports on the findings of the certification of accounts process, on the way in which this process contributes to the integrity of the financial information, and on the role that it plays in this process. It informs the Board immediately of any difficulty encountered.
The Audit Committee met nine times in 2020. The average attendance rate at the meetings of the Audit Committee was 97.2% for 2020.
In 2020, the Audit Committee met in the presence of the Statutory Auditors before the closing of the annual and interim financial statements as well as for the internal control review.
It verified that the Statutory Auditors had indeed submitted their report to the Audit Committee before issuing their final report.
The Audit Committee received due confirmation that the Statutory Auditors, as well as their partners, senior managers, and managers taking part in the audit, respected the rules of independence.
It also obtained confirmation from the Finance Department that it has submitted to it all requests for SACCs.
In 2020, the group entrusted its Statutory Auditors with an additional task, other than certification of the financial statements.
The Audit Committee questioned the Statutory Auditors regarding a potential inspection of the H3C and took note of the conclusions issued by the regulator following the control.
Regarding internal control and risk management, the Audit Committee reviewed the key points of the audit with the Statutory Auditors, in particular areas for improvement of the internal control system. It also took note of all of summary internal audit reports and the internal control tools and procedures put in place and presented by the Vice President of Audit, Risks & Compliance. It validated the internal audit plan for the following year and monitored the action plans.
During its meetings, the Audit Committee regularly met with the Corporate Secretary - CFO, the Finance Director, the Legal Director, the Audit, Risks & Compliance team, as well as the Vice President of Corporate Development Strategy - Mergers & Acquisitions, primarily regarding finance or compliance topics.
In 2020, the Committee addressed the following topics, in addition to its legal duties and more specifically:
cybersecurity issues and the GDPR in particular in the new COVID context (remote working, etc.) as well as the monitoring of alerts;
the review of the guidance;
monitoring cash and financing and analyzing the consequences of the crisis on cash, impacts and possible scenarios;
updating the risk mapping;
insurance and disputes in progress;
acquisition topics (review of the M&A process, analysis of acquisition projects);
the review of the universal registration document (agenda, specific content on the risk and CSR aspect, the non-financial performance declaration with elements relating to the description of the business model), and the corporate governance report;
the implementation of the new ESEF format (iXbrl);
technical analysis of the PGE file;
reflection on the group's new reporting breakdown following the creation of the Products division;
the work plan of the Audit Committee over the next 12 months;
an update on changes to the duty of care.
THE COMPENSATION COMMITTEE
Its main responsibilities are to submit proposals or recommendations to the Board relating to the appointment of members of the Executive Committee and, at the request of the Chair, assist her in the process of recruiting a CEO.
It also prepares the work of the Board relating to the compensation of:
directors, by formulating its proposals on the distribution of compensation allocated to Board members in accordance with the criteria set out in the internal rules, the compensation of the Chair of the Board, and the compensation of directors to whom specific duties will be entrusted by the Board under the conditions laid down by the regulations (Article L. 225-46 of the French Commercial Code),
the CEO, by expressing an opinion on his total compensation, pension and healthcare schemes, fringe benefits, and miscellaneous rights, proposing rules on variable compensation consistent with the group’s strategy and the corresponding criteria for evaluation and verifying that they are applied in accordance with the company’s duty of transparency relating to compensation, the details of this compensation being set out in the annual report,
More generally, the Committee is informed each year of and monitors the company's compensation policy in effect within the group for the different employee populations and its policy on equality in the workplace, non-discrimination and diversity, as well as continuing education. It is informed of the succession plan for the key positions of the group. It prepares the succession plan for the CEO, specifically to be able to propose succession solutions to the Board of Directors in case of unforeseen vacancy. It monitors the implementation of the Social and Economic Committee (SEC). It prepares the portion of this chapter regarding “Say on Pay.”
During 2020, the Compensation Committee addressed the elements relating to the compensation of corporate officers, the review of watch points, the succession plan of directors, issues relating to equality in the workplace and pay, HR strategy elements and staff review, incentive agreements, social dialog, and the MANs.
The Compensation Committee met six times during the course of 2020. The average attendance rate of the meetings of the Compensation Committee was 95.5 % for 2020.
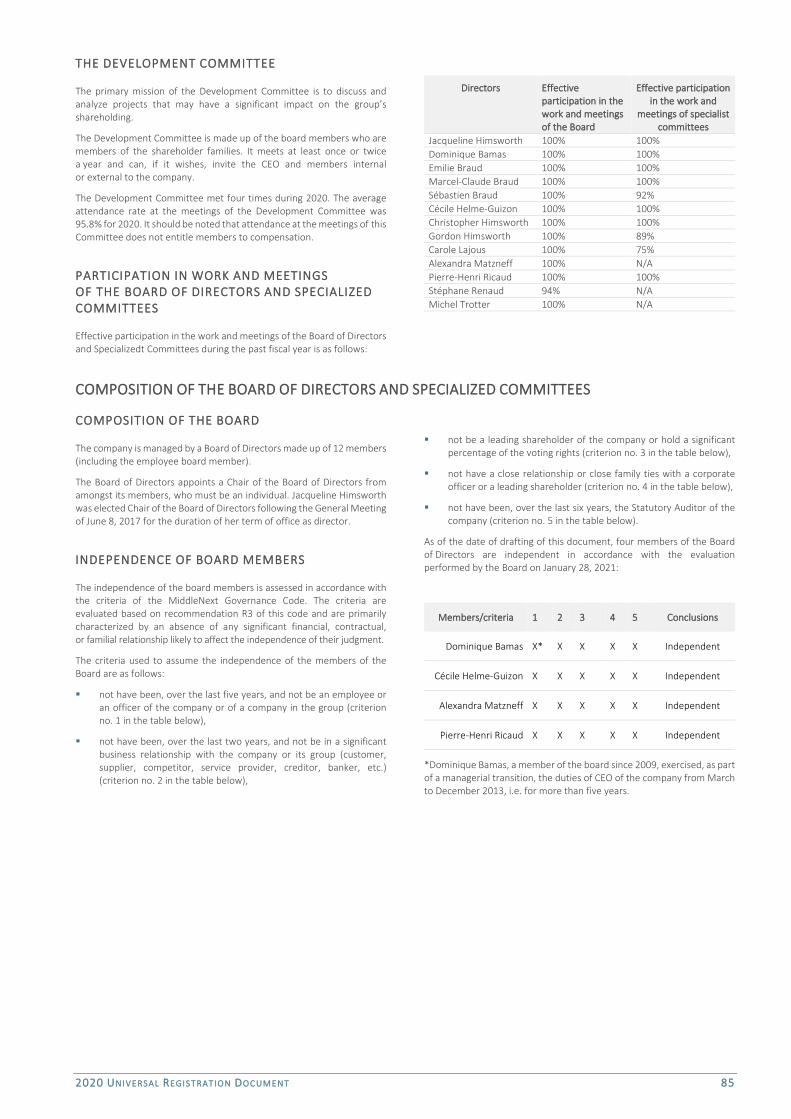
2020 UNIVERSAL REGIST RATION DOC UMENT 85
THE DEVELOPMENT COMMITTEE
The primary mission of the Development Committee is to discuss and analyze projects that may have a significant impact on the group’s shareholding.
The Development Committee is made up of the board members who are members of the shareholder families. It meets at least once or twice a year and can, if it wishes, invite the CEO and members internal or external to the company.
The Development Committee met four times during 2020. The average attendance rate at the meetings of the Development Committee was 95.8% for 2020. It should be noted that attendance at the meetings of this Committee does not entitle members to compensation.
PARTICIPATION IN WORK AND MEETINGS
OF THE BOARD OF DIRECTORS AND SPECIALIZED
COMMITTEES
Effective participation in the work and meetings of the Board of Directors and Specializedt Committees during the past fiscal year is as follows:
Directors Effective participation in the work and meetings of the Board
Effective participation in the work and
meetings of specialist committees
Jacqueline Himsworth 100% 100% Dominique Bamas 100% 100% Emilie Braud 100% 100% Marcel-Claude Braud 100% 100% Sébastien Braud 100% 92% Cécile Helme-Guizon 100% 100% Christopher Himsworth 100% 100% Gordon Himsworth 100% 89% Carole Lajous 100% 75% Alexandra Matzneff 100% N/A Pierre-Henri Ricaud 100% 100% Stéphane Renaud 94% N/A Michel Trotter 100% N/A
COMPOSITION OF THE BOARD OF DIRECTORS AND SPECIALIZED COMMITTEES
COMPOSITION OF THE BOARD
The company is managed by a Board of Directors made up of 12 members (including the employee board member).
The Board of Directors appoints a Chair of the Board of Directors from amongst its members, who must be an individual. Jacqueline Himsworth was elected Chair of the Board of Directors following the General Meeting of June 8, 2017 for the duration of her term of office as director.
INDEPENDENCE OF BOARD MEMBERS
The independence of the board members is assessed in accordance with the criteria of the MiddleNext Governance Code. The criteria are evaluated based on recommendation R3 of this code and are primarily characterized by an absence of any significant financial, contractual, or familial relationship likely to affect the independence of their judgment.
The criteria used to assume the independence of the members of the Board are as follows:
not have been, over the last five years, and not be an employee or an officer of the company or of a company in the group (criterion no. 1 in the table below),
not have been, over the last two years, and not be in a significant business relationship with the company or its group (customer, supplier, competitor, service provider, creditor, banker, etc.) (criterion no. 2 in the table below),
not be a leading shareholder of the company or hold a significant percentage of the voting rights (criterion no. 3 in the table below),
not have a close relationship or close family ties with a corporate officer or a leading shareholder (criterion no. 4 in the table below),
not have been, over the last six years, the Statutory Auditor of the company (criterion no. 5 in the table below).
As of the date of drafting of this document, four members of the Board of Directors are independent in accordance with the evaluation performed by the Board on January 28, 2021:
Members/criteria 1 2 3 4 5 Conclusions
Dominique Bamas X* X X X X Independent
Cécile Helme-Guizon X X X X X Independent
Alexandra Matzneff X X X X X Independent
Pierre-Henri Ricaud X X X X X Independent
*Dominique Bamas, a member of the board since 2009, exercised, as part of a managerial transition, the duties of CEO of the company from March to December 2013, i.e. for more than five years.

86
COMPOSITION OF THE BOARD OF DIRECTORS - SUMMARY TABLE
On the date of drafting of this document, the composition of the Board of Directors is as follows:
Directors Date of 1st
appointment Date of last renewal
Term of office
Expiration of term
Age(1) Independence according to the MiddleNext Code
Gender Committee membership
Jacqueline Himsworth Chair since 6/8/2017
1970 6/8/2017 4 years AGM 2021 77 No F Chairman of the Strategic Committee Chairman of the Development Committee
Dominique Bamas 2009 6/13/2019 4 years AGM 2023 61 Yes M Chairman of the Compensation Committee Member of the Strategic Committee
Émilie Braud 2017 4 years AGM 2021 39 No F Member of the Audit Committee Member of the Development Committee
Marcel-Claude Braud
2013 6/8/2017 4 years AGM 2021 68 No M Member of the Strategic Committee Member of the Development Committee Alternate Member of the Compensation Committee (2)
Sébastien Braud 2009 6/8/2017 4 years AGM 2021 51 No M Member of the Compensation Committee Member of the Strategic Committee Member of the Development Committee Alternate Member of the Audit Committee(2)
Cécile Helme-Guizon
2017 4 years AGM 2021 55 Yes F Member of the Audit Committee
Christopher Himsworth
2009 6/8/2017 4 years AGM 2021 49 No M Member of the Compensation Committee Member of the Strategic Committee Member of the Development Committee Alternate Member of the Audit Committee(2)
Gordon Himsworth 1998 6/8/2017 4 years AGM 2021 82 No M Member of the Audit Committee Member of the Strategic Committee Member of the Development Committee
Alexandra Matzneff BoD 11/9/2020
(co-opted)
Remaining term of
office of the resigning director
AGM 2021 38 Yes F
Stéphane Renaud Director representing employees
2018 3 years 9/10/2021 58 No M
Pierre-Henri Ricaud 2009 6/13/2019 4 years AGM 2023 65 Yes M Chairman of the Audit Committee Alternate Member of the Compensation Committee (2)
Michel Trotter Director representing employees
2020 3 years 9/10/2023 49 no M
(1) The date of drafting of this corporate governance report is used to determine age. (2) The alternate member appointed for the committees replaces, in the meetings of said committee, the member that is unable to attend.

2020 UNIVERSAL REGIST RATION DOC UMENT 87
COMPOSITION OF THE BOARD OF DIRECTORS’ COMMITTEES
COMPENSATION COMMITTEE
MEMBERS DOMINIQUE BAMAS, Chair
CHRISTOPHER HIMSWORTH SÉBASTIEN BRAUD
ALTERNATES PIERRE-HENRI RICAUD
MARCEL-CLAUDE BRAUD
DEVELOPMENT COMMITTEE
MEMBERS
JACQUELINE HIMSWORTH, Chair GORDON HIMSWORTH
CHRISTOPHER HIMSWORTH MARCEL-CLAUDE BRAUD
SÉBASTIEN BRAUD ÉMILIE BRAUD
STRATEGIC COMMITTEE
MEMBERS
JACQUELINE HIMSWORTH, Chair SÉBASTIEN BRAUD
MARCEL-CLAUDE BRAUD CHRISTOPHER HIMSWORTH
GORDON HIMSWORTH DOMINIQUE BAMAS
AUDIT COMMITTEE
MEMBERS
PIERRE-HENRI RICAUD, Chairman1
ÉMILIE BRAUD CÉCILE HELME-GUIZON1 GORDON HIMSWORTH
ALTERNATES SÉBASTIEN BRAUD
CHRISTOPHER HIMSWORTH
1 In accordance with the regulations (Article L. 823-19 of the French Commercial Code), this member: (i) has special expertise in finance, accounting, or statutory audits. This expertise is assessed in light of their training and professional experience. For each of the members of the Audit Committee, this expertise is reported in the individual fact sheets presented following this table; (ii) they also meet the independence criteria set out in section “Independence of Directors” of this section 5.3.1
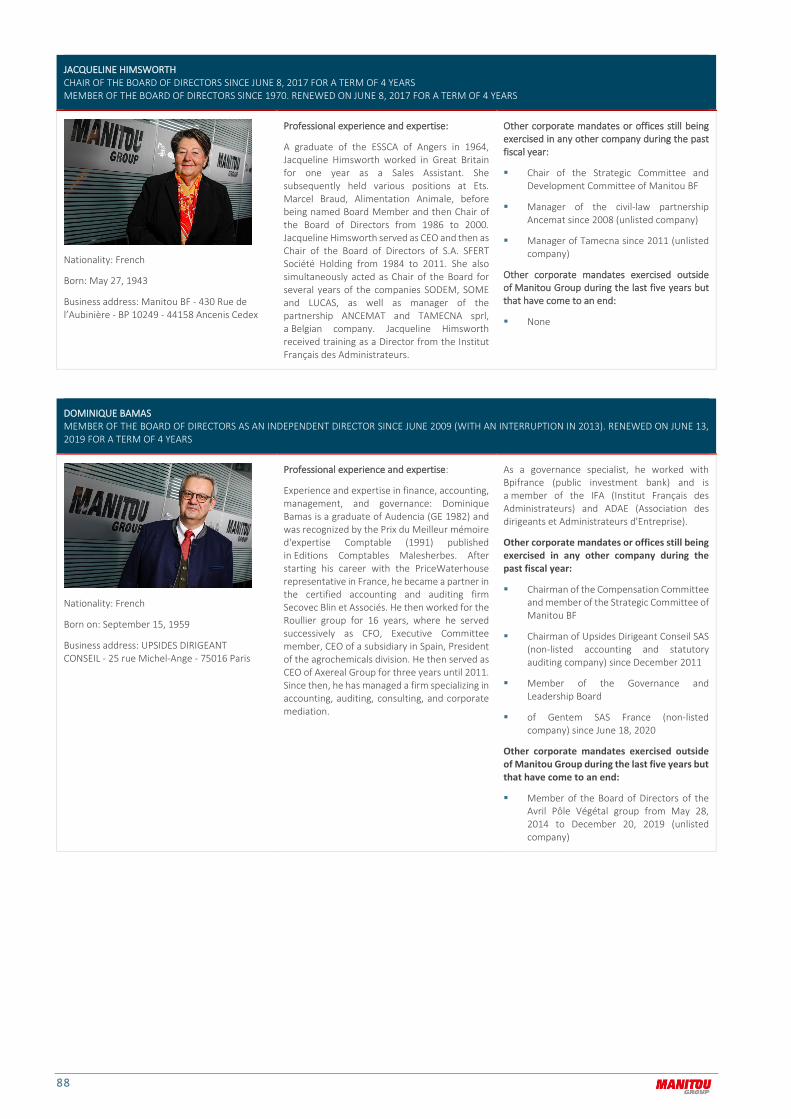
88
JACQUELINE HIMSWORTH CHAIR OF THE BOARD OF DIRECTORS SINCE JUNE 8, 2017 FOR A TERM OF 4 YEARS MEMBER OF THE BOARD OF DIRECTORS SINCE 1970. RENEWED ON JUNE 8, 2017 FOR A TERM OF 4 YEARS
Nationality: French
Born: May 27, 1943
Business address: Manitou BF - 430 Rue de l’Aubinière - BP 10249 - 44158 Ancenis Cedex
Professional experience and expertise:
A graduate of the ESSCA of Angers in 1964, Jacqueline Himsworth worked in Great Britain for one year as a Sales Assistant. She subsequently held various positions at Ets. Marcel Braud, Alimentation Animale, before being named Board Member and then Chair of the Board of Directors from 1986 to 2000. Jacqueline Himsworth served as CEO and then as Chair of the Board of Directors of S.A. SFERT Société Holding from 1984 to 2011. She also simultaneously acted as Chair of the Board for several years of the companies SODEM, SOME and LUCAS, as well as manager of the partnership ANCEMAT and TAMECNA sprl, a Belgian company. Jacqueline Himsworth received training as a Director from the Institut Français des Administrateurs.
Other corporate mandates or offices still being exercised in any other company during the past fiscal year:
Chair of the Strategic Committee and Development Committee of Manitou BF
Manager of the civil-law partnership Ancemat since 2008 (unlisted company)
Manager of Tamecna since 2011 (unlisted company)
Other corporate mandates exercised outside of Manitou Group during the last five years but that have come to an end:
None
DOMINIQUE BAMAS MEMBER OF THE BOARD OF DIRECTORS AS AN INDEPENDENT DIRECTOR SINCE JUNE 2009 (WITH AN INTERRUPTION IN 2013). RENEWED ON JUNE 13, 2019 FOR A TERM OF 4 YEARS
Nationality: French
Born on: September 15, 1959
Business address: UPSIDES DIRIGEANT CONSEIL - 25 rue Michel-Ange - 75016 Paris
Professional experience and expertise:
Experience and expertise in finance, accounting, management, and governance: Dominique Bamas is a graduate of Audencia (GE 1982) and was recognized by the Prix du Meilleur mémoire d'expertise Comptable (1991) published in Editions Comptables Malesherbes. After starting his career with the PriceWaterhouse representative in France, he became a partner in the certified accounting and auditing firm Secovec Blin et Associés. He then worked for the Roullier group for 16 years, where he served successively as CFO, Executive Committee member, CEO of a subsidiary in Spain, President of the agrochemicals division. He then served as CEO of Axereal Group for three years until 2011. Since then, he has managed a firm specializing in accounting, auditing, consulting, and corporate mediation.
As a governance specialist, he worked with Bpifrance (public investment bank) and is a member of the IFA (Institut Français des Administrateurs) and ADAE (Association des dirigeants et Administrateurs d'Entreprise).
Other corporate mandates or offices still being exercised in any other company during the past fiscal year: Chairman of the Compensation Committee
and member of the Strategic Committee of Manitou BF
Chairman of Upsides Dirigeant Conseil SAS (non-listed accounting and statutory auditing company) since December 2011
Member of the Governance and Leadership Board
of Gentem SAS France (non-listed company) since June 18, 2020
Other corporate mandates exercised outside of Manitou Group during the last five years but that have come to an end: Member of the Board of Directors of the
Avril Pôle Végétal group from May 28, 2014 to December 20, 2019 (unlisted company)

2020 UNIVERSAL REGIST RATION DOC UMENT 89
ÉMILIE BRAUD MEMBER OF THE BOARD OF DIRECTORS APPOINTED ON JUNE 8, 2017 FOR A TERM OF 4 YEARS
Nationality: French
Born: February 20, 1981
Business address: Manitou BF - 430, rue de l’Aubinière - BP 10249 - 44158 Ancenis
Professional experience and expertise:
A graduate of the ESSEC business school, with a specialization in Audit and Management Control, holder of a DECF (accounting and financial studies diploma) as well as a “Target: Board member” certificate from the EM LYON business school, Emilie Braud began her career in 2006 as financial controller for Cartier in Paris, a subsidiary of the Swiss group Richemont, specializing in luxury jewelery and clock making. At the end of 2007, Emilie Braud joined HRA Pharma, a pharmaceutical company specializing in the development and marketing of treatments in the fields of women’s health and endocrinology, where she held the position of Senior Financial Controller.
Other corporate mandates or offices still being exercised in any other company during the past fiscal year:
Member of the Audit Committee and Development Committee of Manitou BF
Other corporate mandates exercised outside of Manitou Group during the last five years but that have come to an end:
None
MARCEL-CLAUDE BRAUD MEMBER OF THE BOARD OF DIRECTORS SINCE JUNE 2013. RENEWED ON JUNE 8, 2017 FOR A TERM OF 4 YEARS
Nationality: French
Born on: April 6, 1952
Business address: Manitou BF - 430, rue de l’Aubinière - BP 10249 - 44158 Ancenis
Professional experience and expertise:
A graduate of ESLSCA Paris Business School (1975), he undertook management training in Atlanta and Chicago (International Harvester), USA, from 1977 to 1978. Administrative and Financial Director for SM Termit France, a subsidiary of Manitou BF, from 1979 to 1981, CFO of KD Manitou (a subsidiary of Manitou BF, Texas, USA) from 1981 to 1985, Product Marketing Director (Manitou Group) from 1986 to 1997 and Deputy CEO of Manitou BF from 1986 to 1998, Chairman of the Supervisory Board of Manitou BF from 1998 to June 2009 (offices held in subsidiaries and companies associated with the group), Director of Ligerien Yachting from 2009 to 2015, then Director of Manitou BF since 2013.
Other corporate mandates or offices still being exercised in any other company during the past fiscal year:
Member of the Strategic Committee, Development Committee and alternate for the Compensation Committee of Manitou BF
Co-Manager of HB-Holding Braud (France) since 1997 (unlisted company)
Other corporate mandates exercised outside of Manitou Group during the last five years but that have come to an end:
None
SÉBASTIEN BRAUD MEMBER OF THE BOARD OF DIRECTORS SINCE JUNE 2009. RENEWED ON JUNE 8, 2017 FOR A TERM OF 4 YEARS
Nationality: French
Born on: January 16, 1969
Business address: Actiman - 34 avenue de Larrieu – Centre de Gros 2 – 31094 Toulouse Cedex
Professional experience and expertise:
President of Actiman Equipements et Services SASU (Manitou dealership), President of Actiman Location SAS since 2005 (now a leasing company specializing in handling materials and aerial work platforms), Product Manager at Manitou for 10 years.
Other corporate mandates or offices still being exercised in any other company during the past fiscal year:
Member of the Strategic Committee, Compensation Committee, and Development Committee, alternate for the Audit Committee of Manitou BF
President of Actiman Location SAS since 2005 (unlisted company)
President of Actiman Equipements et Services SASU since December 2015 (unlisted company)
Other corporate mandates exercised outside of Manitou Group during the last five years but that have come to an end:
None

90
CÉCILE HELME-GUIZON MEMBER OF THE BOARD OF DIRECTORS AS INDEPENDENT DIRECTOR. APPOINTED ON JUNE 8, 2017 FOR A TERM OF 4 YEARS
Nationality: French
Born: June 12, 1965
Business address: Manitou BF - 430, rue de l'Aubinière - BP 10249 - 44158 Ancenis
Professional experience and expertise:
Cécile Helme-Guizon worked for 11 years at the PwC firm in Paris and New York. In 1998, she joined Kingfisher Plc in London as Head of M&A and then Head of International Development. In 2003, she joined Darty, where until 2017 she consecutively held the positions of General Director of Services, Deputy CEO, CEO of Mistergooddeal, and Strategy Director. She was the General Delegate of the Institut Français des Administrateurs from 2018 to 2019. Cécile Helme-Guizon has also been a member of the Audit and Risk Committee of Glen Dimplex since October 2020. Other corporate mandates or offices still being exercised in any other company during the past fiscal year:
Member of the Audit Committee of Manitou BF
Manager of CHG Consulting since October 11, 2019 (unlisted company)
Director and member of the Audit and Risk Committee of Glen Dimplex since 01 October 2020
Director, Audit Committee member, Appointments & Compensation Committee member, and Ad Hoc Committee member of Antalis (listed company) from June 6, 2017 to July 21, 2020.
Director of Sequana from May 12, 2016 to January 31, 2020 (listed company)
Other corporate mandates exercised outside of Manitou Group during the last five years but that have come to an end:
Strategy Director for the Fnac Darty Group from January 1, 2011 to May 22, 2017
Board member of Kesa France from October 22, 2014 to July 25, 2017
CEO of Ménafinance SA from January 10, 2015 to July 25, 2017
Board Member of Menafinance SA from November 27, 2013 to July 25, 2017
General Manager for Mistergooddeal from November 13, 2014 to April 30, 2016
Board member of Mistergooddeal from April 12, 2014 to October 2, 2015
CEO of Mistergooddeal from January 2 to October 2, 2015
CEO of Institut Français des Administrateurs from January 2, 2018 to
September 30, 2019 (non-listed company)
CHRISTOPHER HIMSWORTH MEMBER OF THE BOARD OF DIRECTORS SINCE DECEMBER 2009. RENEWED ON JUNE 8, 2017 FOR A TERM OF 4 YEARS
Nationality: French
Born on: June 7, 1971
Business address: Avenue de Floréal 156, 1180 Uccle - Belgium
Professional experience and expertise:
Christopher Himsworth has a Marketing Degree from Newcastle Polytechnic (Newcastle upon Tyne, UK - 1990), a European Management Teaching Certificate - ECE - from the European Business School in Bordeaux (1993), and a Degree in Advanced Studies in International Business from Salford University (UK - 1994).
Other corporate mandates or offices still being exercised in any other company during the past fiscal year:
Member of the Compensation Committee, Strategic Committee, and Development Committee, alternate for the Audit Committee of Manitou BF
Manager of Trinity Group Sprl since October 13, 2011 (unlisted company)
Managing Director of Choose and Work since 2016 (unlisted company)
Other corporate mandates exercised outside of Manitou Group during the last five years but that have come to an end:
None

2020 UNIVERSAL REGIST RATION DOC UMENT 91
GORDON HIMSWORTH MEMBER OF THE BOARD OF DIRECTORS SINCE 1998. RENEWED ON JUNE 8, 2017 FOR A TERM OF 4 YEARS
Nationality: British
Born on: September 4, 1938
Business address: Manitou BF - 430 Rue de l’Aubinière - BP 10249 - 44158 Ancenis Cedex
Professional experience and expertise:
National Certificate in Mechanical Engineering. Diploma from the School of Management (Institut Français de Gestion).
Member of the British Institute of Management. Member of the Institution of British Engineers. Member of the British Materials Handling Institute.
CEO of Braud SA, Director of Manitou UK, Director of SFERT (holding company), Chairman and CEO of SAEMIA (a semi-public real estate company of Ancenis) for 25 years.
Other corporate mandates or offices still being exercised in any other company during the past fiscal year:
Member of the Strategic Committee, Audit Committee, and Development Committee of Manitou BF
Board member of Manitou Finance Ltd. (United Kingdom)
Manager of the SCI “6 rue Poupard Davyl” Ancenis (France) since 2000 (unlisted company)
Other corporate mandates exercised outside of Manitou Group during the last five years but that have come to an end:
Manager of Menskin SARL (France) from October 8, 2012 to December 31, 2019
CAROLE LAJOUS MEMBER OF THE BOARD OF DIRECTORS AS INDEPENDENT DIRECTOR. APPOINTED ON JUNE 8, 2017 FOR A TERM OF 4 YEARS; RESIGNED FROM HER TERM OF OFFICE ON SEPTEMBER 13, 2020
Nationality: French
Born: December 30, 1964
Business address: Manitou BF - 430 Rue de l’Aubinière - BP 10249 - 44158 Ancenis Cedex
Professional experience and expertise:
After 17 years of experience in financial management and human resources at a global leader in the paper industry, Carole Lajous chaired Polyrey, one of its subsidiaries, to restructure it and manage its sale to the American conglomerate Illinois Tool Works. She then joined the chemical sector as VP Chief Administration Officer and Global HRD for the international Nutrition & Health division at Cognis (a leader in chemical active ingredients for detergents, cosmetics, and nutritional products). Carole Lajous then directed Cognis France during its integration into the BASF group and then took over the general management of BASF Coatings France, another division of the BASF Group. Carole Lajous left the chemical industry to direct Libre Energies, a subsidiary of the Quadran group (which became Direct Energy, then Total Direct Energy) in the renewable energy sector; she was in charge of the Supply, Services, and Solutions division in B to B and made a major acquisition in this fast-growing sector.
As a director certified by IFA Sciences Po in 2013, she holds an MBA from HEC. She also held several mandates as independent director in family-owned industrial groups of various sizes, as well as a volunteer directorship for a humanitarian association working on child protection and carried out senior advisor assignments with high-growth family ISEs on behalf of BPI.
Other corporate mandates or offices still being exercised in any other company during the past fiscal year:
Chairman of the Compensation Committee and alternate for the Strategic Committee of Manitou BF until September 2020
Other corporate mandates exercised outside of Manitou Group during the last five years but that have come to an end:
General Delegate of Fipec between October 2017 and September 2019
Independent board member of the Roquette group from December 2014 to May 2018
President and CEO of Energies Libres – Quadran from August 2016 to January 2018
President and CEO of BASF Coatings France from 2010 to June 2016
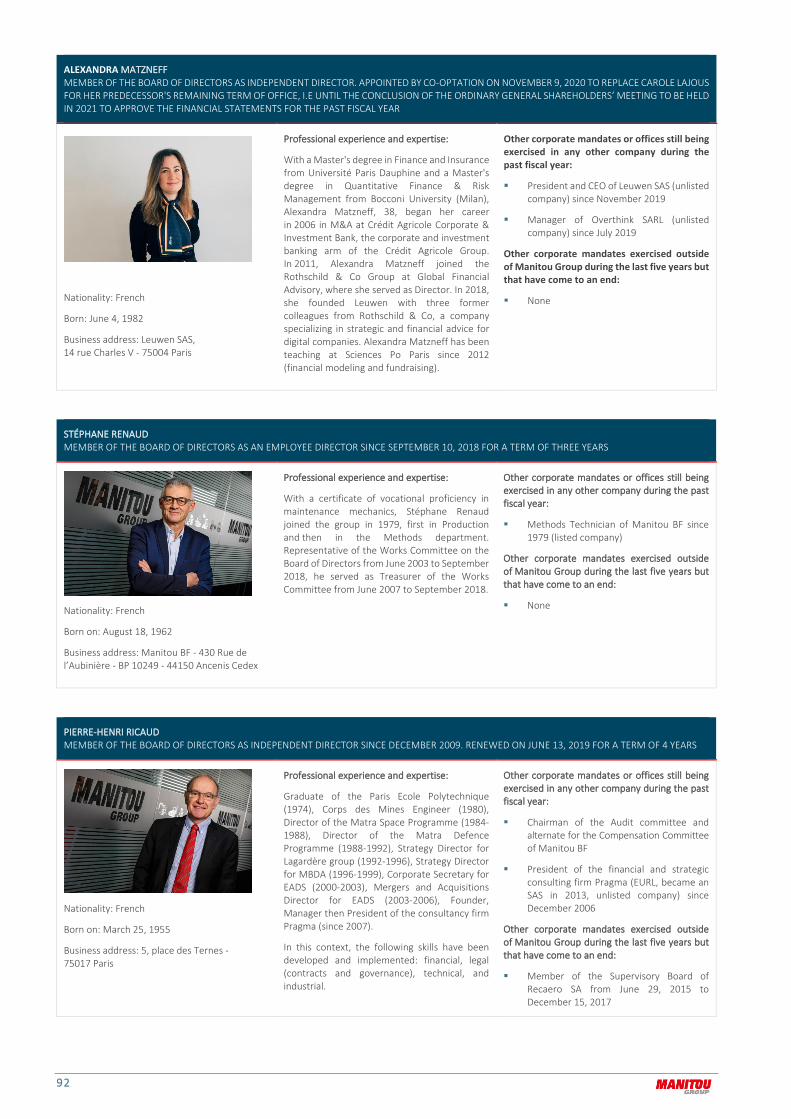
92
ALEXANDRA MATZNEFF MEMBER OF THE BOARD OF DIRECTORS AS INDEPENDENT DIRECTOR. APPOINTED BY CO-OPTATION ON NOVEMBER 9, 2020 TO REPLACE CAROLE LAJOUS FOR HER PREDECESSOR'S REMAINING TERM OF OFFICE, I.E UNTIL THE CONCLUSION OF THE ORDINARY GENERAL SHAREHOLDERS’ MEETING TO BE HELD IN 2021 TO APPROVE THE FINANCIAL STATEMENTS FOR THE PAST FISCAL YEAR
Nationality: French
Born: June 4, 1982
Business address: Leuwen SAS, 14 rue Charles V - 75004 Paris
Professional experience and expertise:
With a Master's degree in Finance and Insurance from Université Paris Dauphine and a Master's degree in Quantitative Finance & Risk Management from Bocconi University (Milan), Alexandra Matzneff, 38, began her career in 2006 in M&A at Crédit Agricole Corporate & Investment Bank, the corporate and investment banking arm of the Crédit Agricole Group. In 2011, Alexandra Matzneff joined the Rothschild & Co Group at Global Financial Advisory, where she served as Director. In 2018, she founded Leuwen with three former colleagues from Rothschild & Co, a company specializing in strategic and financial advice for digital companies. Alexandra Matzneff has been teaching at Sciences Po Paris since 2012 (financial modeling and fundraising).
Other corporate mandates or offices still being exercised in any other company during the past fiscal year: President and CEO of Leuwen SAS (unlisted
company) since November 2019
Manager of Overthink SARL (unlisted company) since July 2019
Other corporate mandates exercised outside of Manitou Group during the last five years but that have come to an end: None
STÉPHANE RENAUD MEMBER OF THE BOARD OF DIRECTORS AS AN EMPLOYEE DIRECTOR SINCE SEPTEMBER 10, 2018 FOR A TERM OF THREE YEARS
Nationality: French
Born on: August 18, 1962
Business address: Manitou BF - 430 Rue de l’Aubinière - BP 10249 - 44150 Ancenis Cedex
Professional experience and expertise:
With a certificate of vocational proficiency in maintenance mechanics, Stéphane Renaud joined the group in 1979, first in Production and then in the Methods department. Representative of the Works Committee on the Board of Directors from June 2003 to September 2018, he served as Treasurer of the Works Committee from June 2007 to September 2018.
Other corporate mandates or offices still being exercised in any other company during the past fiscal year:
Methods Technician of Manitou BF since 1979 (listed company)
Other corporate mandates exercised outside of Manitou Group during the last five years but that have come to an end:
None
PIERRE-HENRI RICAUD MEMBER OF THE BOARD OF DIRECTORS AS INDEPENDENT DIRECTOR SINCE DECEMBER 2009. RENEWED ON JUNE 13, 2019 FOR A TERM OF 4 YEARS
Nationality: French
Born on: March 25, 1955
Business address: 5, place des Ternes - 75017 Paris
Professional experience and expertise:
Graduate of the Paris Ecole Polytechnique (1974), Corps des Mines Engineer (1980), Director of the Matra Space Programme (1984-1988), Director of the Matra Defence Programme (1988-1992), Strategy Director for Lagardère group (1992-1996), Strategy Director for MBDA (1996-1999), Corporate Secretary for EADS (2000-2003), Mergers and Acquisitions Director for EADS (2003-2006), Founder, Manager then President of the consultancy firm Pragma (since 2007).
In this context, the following skills have been developed and implemented: financial, legal (contracts and governance), technical, and industrial.
Other corporate mandates or offices still being exercised in any other company during the past fiscal year:
Chairman of the Audit committee and alternate for the Compensation Committee of Manitou BF
President of the financial and strategic consulting firm Pragma (EURL, became an SAS in 2013, unlisted company) since December 2006
Other corporate mandates exercised outside of Manitou Group during the last five years but that have come to an end:
Member of the Supervisory Board of Recaero SA from June 29, 2015 to December 15, 2017

2020 UNIVERSAL REGIST RATION DOC UMENT 93
MICHEL TROTTER MEMBER OF THE BOARD OF DIRECTORS AS AN EMPLOYEE DIRECTOR SINCE SEPTEMBER 10, 2020 FOR A TERM OF THREE YEARS
Nationality: French
Born on: August 2, 1971 Business address: Manitou BF - 430 Rue de l’Aubinière - BP 10249 - 44150 Ancenis Cedex
Professional experience and expertise: Michel Trotter, who holds a certificate of vocational proficiency in metal works and a certificate of professional competence in metals with additional “mention” in aluminum, joined the group in 1997 as a Production Technician and then Team Leader since 2000.
Other corporate mandates or offices still being exercised in any other company during the past fiscal year: Final control team leader at Manitou BF
since 2018 (listed company)
Alternate for the Hermitage SEC of Manitou BF (listed company)
Other corporate mandates exercised outside of Manitou Group during the last five years but that have come to an end: None
PROCEDURE FOR EVALUATING THE WORK OF THE BOARD AND COMMITTEES
On March 4, 2021, the Board conducted an internal evaluation of its operations. To do so, each board member presented his/her evaluation based on a questionnaire developed around nine quality and progress criteria as compared to the previous year. The evaluation concerned the operations of the Board and its committees, the information provided before and after their meetings, compliance with the Governance Code, the quality of the Board's decisions, the relations with the executive management, as well as the quality of the debate and relations within the Board, all with the objective of monitoring the implementation of areas
for improvement identified during the previous internal evaluation conducted during fiscal year ended December 31, 2020. These contributions were analyzed and synthesized by an independent board member. In general, this internal evaluation revealed a positive overall assessment regarding all of the criteria submitted for evaluation. Areas for improvement were identified with respect to the organization of the meetings of the Board and management of the committees as well as specific points regarding the agenda of the seminar.
DIVERSITY POLICY APPLIED TO THE MEMBERS OF THE BOARD OF DIRECTORS
In accordance with the internal regulations, the board members appointed by General Meeting are selected for their expertise, diverse backgrounds, willingness to be associated with the company's strategy, and the contribution that they can make to the Board’s work. Therefore, the Board endeavors to define and apply a diversity policy with respect to the expertise and experience provided by each board member to ensure that their backgrounds are complementary in terms of nationality, gender, and experience.
Pursuant to Article L. 22-10-10 of the French Commercial Code, the diversity policy criteria applied to the Board of Directors are defined below, as well as the targets set by the Board of Directors, the implementing procedures, and the results achieved during fiscal year 2020.

94
Criteria Objectives Conditions Result
Balanced representation of men and women on the Board
At least equal to 40% of each gender pursuant to the provisions of Article L. 225-18-1 of the French Commercial Code
Proposal at the General Meeting of board members to appoint or re-elect
Objective achieved: The Board appointed by the General Assembly consists of 40% women and 60% men
Professional qualifications and experience
Complementary backgrounds both in terms of nationality and experience
Proposal at the General Meeting of board members to appoint or re-elect
Objective achieved: The Board has a member with a foreign nationality, and several members of the Board have international experience as well as diverse professional training or experience especially in the industrial, finance, economics, and corporate management fields
Diversity of ages The objective is to combine members with experience and very strong knowledge about the company with younger members who can bring a fresh eye and more modern practices
Proposal at the General Meeting of board members to appoint or re-elect
Objective achieved: As of the date of closing of the 2020 financial statements by the Board, 40% of the board members were less than 55 years of age, 30% were between 55 and 65, and 30% were over 65
Independence of board members
The Board has at least two independent board members. The independence criteria used are those of the MiddleNext governance code
Proposal to the General Meeting to renew the corporate mandates of the independent members in office, provided that the Board proposes their renewal, as long as they meet the criteria of independence or appoint new independent members to replace non-independent members
Objective achieved: The Board includes four independent board members (two men and two women), each appointed for a term of four years
TABLE OF VALID DELEGATIONS AND AUTHORIZATIONS GRANTED BY GENERAL MEETING IN THE AREA OF CAPITAL INCREASES
Nature of delegation or authorization Date of delegation
or authorization
Expiration date
Amount authorized
Use Amount remaining as of December 31,
2020
Delegation to issue ordinary shares and/or securities with maintenance of the PSR
6/18/2020 (resolution 13)
8/17/2022 €8 million1 None €8 million
Delegation to issue ordinary shares and/or securities with elimination of PSR by public offer and/or remuneration of securities in the context of a public exchange offer
6/18/2020 (resolution 14)
8/17/2022 €8 million1 None €8 million
Delegation to issue ordinary shares and/or securities with elimination of PSR by public offer referred to in part II of Article L.411-2 of the French Monetary and Financial Code (private placement)
6/18/2020 (resolution 15)
8/17/2022 €8 million1, limited to 20% of
the capital per year
None €8 million
Delegation for the purpose of increasing the capital by incorporation of premiums, reserves, earnings, or other elements
6/18/2020 (resolution 17)
8/17/2022 €8 million None €8 million
Delegation by issue of ordinary shares and/or securities giving access to the capital for the purpose of remunerating contributions in kind
6/18/2020 (resolution 18)
8/17/2022 10 % of the capital1
None 10 % of the capital
Authorization to allocate existing free shares or free shares to be issued for the benefit of the members of the salaried staff and/or certain corporate officers
6/18/2020 (resolution 19)
8/17/2023 2 % of the capital on the date
of the Board of Directors’ meeting
None 2 % of the capital on the date of the
Board of Directors’ meeting
1 Common ceiling.

2020 UNIVERSAL REGIST RATION DOC UMENT 95
DECLARATION REGARDING THE SITUATION
OF THE MEMBERS OF THE BOARD
To the company's knowledge, on the date of drafting of this document, no member of an administrative(*), management, or supervisory body has, within the last five years:
been convicted of fraud,
been affected by a bankruptcy, sequestration, liquidation, or forced administration of a company in which they have served as a member of an administrative, management, or supervisory body,
been disqualified by a court of law from acting as a member of an administrative, management, or supervisory body or from participating in the management or business conduct of an issuer,
been the subject of proceedings and/or official public sanction pronounced by a statutory or regulatory authority (including designated professional bodies).
(*) With the exception of Ms. Cécile Helme Guizon, board member (between May 12, 2016 and January 31, 2020) of Sequana, in court-ordered liquidation since May 15, 2019.
SERVICE CONTRACTS AND GRANT OF SPECIAL
ADVANTAGES
On the date on which this document is drawn up and to the knowledge of the company, there are no service agreement linking members of the administrative or management bodies to the issuer or to any of its subsidiaries and granting any special advantages under the terms thereof.
It should also be noted that Sébastien Braud is the President of Actiman Equipements et Services, which has a dealer agreement with the company.
CONFLICTS OF INTEREST
CONFLICT OF INTEREST REPORTING
AND MANAGEMENT PROCEDURES
In accordance with the Internal Regulation of the Board, the board members must notify the Board of any conflicts of interest concerning them with the company or one of its subsidiaries and then refrain from the associated deliberations.
In the event a situation suggests or could suggest that there is a conflict between the company's interest and the board member's direct or indirect personal interest or the interest of the shareholder or the group of shareholders that he or she represents, the board member in question must:
notify the Board as soon as he or she becomes aware of it;
and draw any conclusions from it as regards exercise of the term of office. Thus, as appropriate, the board member should:
- either abstain from participating in the deliberations voting on the corresponding decision,
- or not attend the meetings of the Board of Directors during the period in which the conflict of interests exists,
- or resign from his or her position as a board member.
Corporate officers are asked to update the declarations annually.
The Board reviews conflicts of interest at least once a year in accordance with Recommendation R2 of the MiddleNext Code. This review was carried out at the Board meeting of March 4, 2021. To the company's knowledge, on the date of drafting of this document, and with the exception of the information below, no potential conflict of interest has been identified between the duties of any of the persons who are members of an administrative, management, or supervisory body with regard to the issuer and their private interests and/or other duties.
With the exception of the Shareholder Agreement referred to in chapter 6.2, there is no:
other arrangement or agreement entered into with the primary shareholders or with customers, suppliers, or other parties pursuant to which one of the persons who is a member of an administrative, management, or supervisory body was selected in the capacity of member of an administrative, management, or supervisory body or as a member of the general management,
other restriction accepted by the persons who are members of an administrative, management, or supervisory body concerning the transfer of the securities of the issuer that they hold within a certain period of time.
Certain non-independent members of the Board of Directors have exercised functions as a company director or senior executive within the company as well as other structures.
FAMILY LINKS
It is specified that:
Gordon Himsworth is the spouse of Jacqueline Himsworth,
Marcel-Claude Braud, Sébastien Braud, and Émilie Braud are siblings and the nieces and nephews of Jacqueline and Gordon Himsworth,
Christopher Himsworth is the son of Jacqueline and Gordon Himsworth.
On the date on which this document is drawn up and to the knowledge of the company, there are no other family relationships between the members of the administrative or management bodies of the company.
REGULATED AGREEMENTS
All of the regulated agreements are the subject of a special Statutory Auditors’ report, which can be found in section 7.4.2 of this universal registration document.
EVALUATION PROCEDURE FOR ONGOING
AGREEMENTS AS WELL AS ITS
IMPLEMENTATION
In accordance with the provisions of Article L. 22-10-12 of the French Commercial Code, the Board of Directors, at its meeting of March 3, 2020, adopted a procedure making it possible to regularly assess whether agreements involving day-to-day operations entered into under normal conditions indeed meet these conditions.
It is intended, on the one hand, to clarify the criteria selected by the company to identify and characterize ongoing agreements entered into under normal conditions and, on the other hand, to formalize a procedure to be used to regularly assess whether these agreements continue to meet these conditions.
The identification criteria for ongoing agreements entered into under normal conditions are as follows:
“Day-to-day operations” means those that the company usually carries out and that are executed as part of its ordinary business, in particular in light of its business purpose. To assess whether an operation is a day-to-day operation, the following elements are taken into consideration, among others: routineness and repetition, nature of the operation and its duration, the circumstances surrounding the conclusion of the agreement, the legal importance of economic consequences of the operation, and the customary practices of companies in a similar situation.
Operations concluded under “normal conditions” are those that are performed by the company under the same conditions as those that it customarily practices in its relations with third parties, with the result that they do not allow the contracting party to gain an advantage that would not have been available to a third party. To determine whether

96
these conditions are “normal,” the conditions under which the agreements in question are customarily entered into by other companies in the same business sector are also taken into consideration.
This procedure requires that the Finance Department and Legal Department be informed in advance of any agreement likely to be considered regulated under the provisions of Article L. 225-38 of the French Commercial Code for the purposes of assessment, after hearing the opinion of the Statutory Auditors, as applicable, of the identification criteria of ongoing agreements entered into under normal conditions set forth above. The conclusions of the evaluation are documented in a written report. The assessment of the criteria is reviewed whenever a previously entered into agreement is modified, renewed, extended, or terminated.
Every year, before the financial statements for the previous year are closed, the Legal Department informs the Audit Committee of the list of ongoing agreements entered into under normal conditions between the company and less than wholly owned subsidiaries, accompanied by the basis for the judgment characterizing them as such.
If, during the annual review, the Audit Committee believes that an agreement previously considered an ongoing agreement entered into under normal conditions no longer meets the aforesaid criteria, it will inform the Board of Directors. The Board of Directors will classify the agreement as a regulated agreement, if necessary, and will approve it and submit for approval at the next General Meeting, with a special report from the Statutory Auditors in accordance with the provisions of Article L. 225-42 of the French Commercial Code.
The annual review was carried out by the Audit Committee on February 26, 2021. At the date this document is drawn up, the implementation of this evaluation procedure shows that, with the exception of the regulated agreements described in the section "Regulated agreements," all agreements likely to be regulated in accordance with the provisions of Article L. 225-38 of the French Commercial Code are free agreements, that is, agreements entered into with wholly-owned subsidiaries or agreements that meet the criteria of standard agreements entered into under normal conditions.
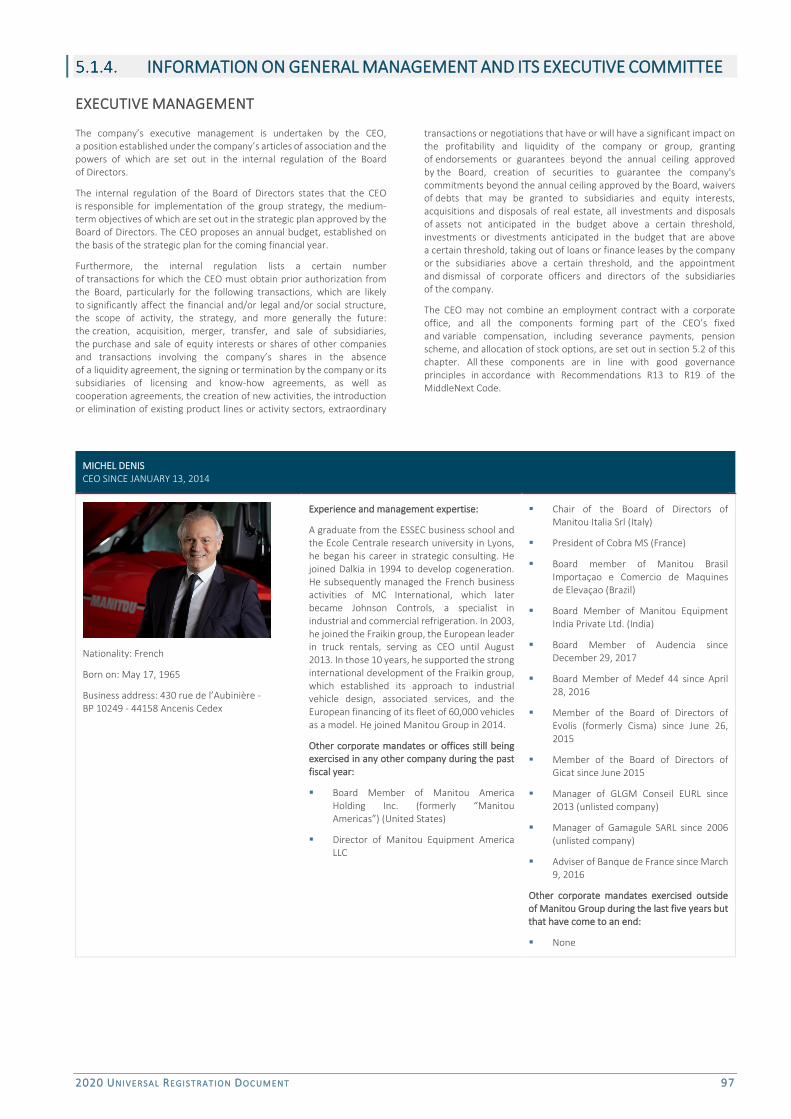
2020 UNIVERSAL REGIST RATION DOC UMENT 97
INFORMATION ON GENERAL MANAGEMENT AND ITS EXECUTIVE COMMITTEE
EXECUTIVE MANAGEMENT
The company’s executive management is undertaken by the CEO, a position established under the company’s articles of association and the powers of which are set out in the internal regulation of the Board of Directors.
The internal regulation of the Board of Directors states that the CEO is responsible for implementation of the group strategy, the medium-term objectives of which are set out in the strategic plan approved by the Board of Directors. The CEO proposes an annual budget, established on the basis of the strategic plan for the coming financial year.
Furthermore, the internal regulation lists a certain number of transactions for which the CEO must obtain prior authorization from the Board, particularly for the following transactions, which are likely to significantly affect the financial and/or legal and/or social structure, the scope of activity, the strategy, and more generally the future: the creation, acquisition, merger, transfer, and sale of subsidiaries, the purchase and sale of equity interests or shares of other companies and transactions involving the company’s shares in the absence of a liquidity agreement, the signing or termination by the company or its subsidiaries of licensing and know-how agreements, as well as cooperation agreements, the creation of new activities, the introduction or elimination of existing product lines or activity sectors, extraordinary
transactions or negotiations that have or will have a significant impact on the profitability and liquidity of the company or group, granting of endorsements or guarantees beyond the annual ceiling approved by the Board, creation of securities to guarantee the company's commitments beyond the annual ceiling approved by the Board, waivers of debts that may be granted to subsidiaries and equity interests, acquisitions and disposals of real estate, all investments and disposals of assets not anticipated in the budget above a certain threshold, investments or divestments anticipated in the budget that are above a certain threshold, taking out of loans or finance leases by the company or the subsidiaries above a certain threshold, and the appointment and dismissal of corporate officers and directors of the subsidiaries of the company.
The CEO may not combine an employment contract with a corporate office, and all the components forming part of the CEO’s fixed and variable compensation, including severance payments, pension scheme, and allocation of stock options, are set out in section 5.2 of this chapter. All these components are in line with good governance principles in accordance with Recommendations R13 to R19 of the MiddleNext Code.
MICHEL DENIS CEO SINCE JANUARY 13, 2014
Nationality: French
Born on: May 17, 1965
Business address: 430 rue de l’Aubinière - BP 10249 - 44158 Ancenis Cedex
Experience and management expertise:
A graduate from the ESSEC business school and the Ecole Centrale research university in Lyons, he began his career in strategic consulting. He joined Dalkia in 1994 to develop cogeneration. He subsequently managed the French business activities of MC International, which later became Johnson Controls, a specialist in industrial and commercial refrigeration. In 2003, he joined the Fraikin group, the European leader in truck rentals, serving as CEO until August 2013. In those 10 years, he supported the strong international development of the Fraikin group, which established its approach to industrial vehicle design, associated services, and the European financing of its fleet of 60,000 vehicles as a model. He joined Manitou Group in 2014.
Other corporate mandates or offices still being exercised in any other company during the past fiscal year:
Board Member of Manitou America Holding Inc. (formerly “Manitou Americas”) (United States)
Director of Manitou Equipment America LLC
Chair of the Board of Directors of Manitou Italia Srl (Italy)
President of Cobra MS (France)
Board member of Manitou Brasil Importaçao e Comercio de Maquines de Elevaçao (Brazil)
Board Member of Manitou Equipment India Private Ltd. (India)
Board Member of Audencia since December 29, 2017
Board Member of Medef 44 since April 28, 2016
Member of the Board of Directors of Evolis (formerly Cisma) since June 26, 2015
Member of the Board of Directors of Gicat since June 2015
Manager of GLGM Conseil EURL since 2013 (unlisted company)
Manager of Gamagule SARL since 2006 (unlisted company)
Adviser of Banque de France since March 9, 2016
Other corporate mandates exercised outside of Manitou Group during the last five years but that have come to an end:
None

98
EXECUTIVE COMMITTEE
The Executive Committee is comprised of six members and is chaired by Michel Denis.
ÉLISABETH AUSIMOUR PRESIDENT OF THE PRODUCTS DIVISION
Professional experience and expertise:
A graduate of the EPF Ecole d’ingénieurs de Sceaux, Elisabeth Ausimour began her career in purchasing at Chantiers de l’Atlantique. In 2005, she joined the purchasing department of Manitou Group, then moved to Customer Quality.
In 2011, she took over management of the Candé factory until 2016, when she became director of the ERP and process redesign project. She held the position of President of the MHA division starting in October 2019, until she became President of the Products Division.
LAURENT BONNAURE EXECUTIVE VICE-PRESIDENT OF SALES & MARKETING
Professional experience and expertise:
A dual French and Canadian citizen, Laurent Bonnaure is a graduate of the Ecole Centrale de Paris and holds a Master's of Science from MIT (USA). He has held various management positions in the United States and in France, in particular at VidaMed as co-founder and Director of Engineering and Manufacturing, before joining Elis as International Director in 1996.
He was then the Deputy General Director and member of the management board of Fraikin from 2008 to 2016, before joining Manitou Group as Executive Vice President, Global Sales and Marketing, on September 1, 2016.
MAXIME DEROCH PRESIDENT OF THE SERVICES & SOLUTIONS DIVISION (S&S)
Professional experience and expertise:
A graduate of the Ecole Centrale Lyon in 1994, Maxime Deroch joined the chemical branch of the Elf group (now Total), holding various positions in Research and Development, Marketing, then Internal Auditing in France and the US.
In 2004, he joined Manitou Group as Internal Audit and Control Manager and then moved towards the positions of ERP project manager and VP Marketing. He has held the position of President of the Services & Solutions division since July 2014.
CAROLE LAJOUS EXECUTIVE VICE PRESIDENT OF HUMAN RESOURCES
Professional experience and expertise:
Carole Lajous is a certified director by IFA Science Po and holds an MBA from HEC. She spent 17 years in financial and human resources in the International Paper Group, the world leader in paper. She later served as Global HRD and CEO of large groups such as Cognis, BASF, and Direct Energy.
In addition, Carole Lajous has held several independent directorships in family-owned industrial groups of various sizes. After three and a half years on the Board of Directors of Manitou Group and the Compensation Committee, she resigned from all her positions in September 2020 to join the operational teams of the Executive Committee, led by Michel Denis, as Executive Vice President of Human Resources.
2020 UNIVERSAL REGIST RATION DOC UMENT 99
HERVÉ ROCHET GENERAL SECRETARY
Professional experience and expertise:
A graduate of the IEP of Lyon and holder of a DECF, Hervé Rochet began his career in auditing before joining the financial teams of the Huntsman Chemical group, then the Trelleborg AB group.
In 2005, he joined Manitou Group as the group's Chief Financial Officer. He has held the position of Corporate Secretary - CFO since April 2014.
The Executive Committee typically meets weekly as well as several times per year in the context of seminars.
INFORMATION REGARDING THE BALANCED REPRESENTATION OF MEN AND WOMEN
ON THE EXECUTIVE COMMITTEE AND IN THE TOP 10% OF POSITIONS WITH THE MOST
RESPONSIBILITY
In accordance with the law of September 5, 2018, the company is looking to achieve balanced representation of men and women on the Executive Committee. In addition, the Board deliberates annually on the company's professional gender equality and equal pay policy. The Group thus maintains its commitment via a four-year professional equality agreement signed in 2018 with all the social partners. This agreement defines the objectives and action plans that are carried out. In 2020, the Board reviewed the 2018-2022 action plan (corresponding to the corporate agreement signed in 2018 and put in place in accordance with Article L 1143-1 of the French Labor Code) as well as a statement of accomplishments to date. The measures provided for by this action plan include promoting access by women to management positions and facilitating the exercise by women of the management role through access to training and mentorships. The Executive Committee has also committed to systematically solicit the nomination of a female candidate and a male candidate when renewing or creating positions on the teams of the Executive Committee and the management companies.
A recruitment process was initiated within the Executive Committee to fill the position previously held by Guillaume Rabel Suquet, Group Human Resources Director. Carole Lajous' nomination was selected, and she joined the Executive Committee in September 2020.
The Executive Committee is made up of 33% women and 66% men.
In addition, of the top 10 % of positions with the most responsibility (top management), 16.6 % are held by women.

100
COMPENSATION-RELATED INFORMATION
CORPORATE OFFICERS’ COMPENSATION POLICY (EX-ANTE VOTE)
At the recommendation of the Compensation Committee and taking into account the recommendations of the MiddleNext Code, the Board of Directors has established a compensation policy for each of the company's corporate officers in accordance with its corporate interests, contributing to its continuity, and as part of its commercial strategy, as described in chapter 1.5 of this document. For this purpose, the Board establishes the compensation policy of the CEO in light of these elements, specifically by establishing the criteria of his variable compensation related to the implementation of this commercial strategy, with respect for the interests of the company.
No compensation element of any nature whatsoever may be determined, awarded, or paid by the company and no commitment can be made by the company, unless it is compliant with the approved compensation policy or, in the absence of such policy, with the compensation or practices existing within the company. However, in case of exceptional circumstances, the Board of Directors may deviate from the application of the compensation policy if that deviation is temporary, consistent with the company's interests, and necessary to guarantee the continuity or viability of the company.
The Board of Directors determines, revises, and implements the compensation policy of each corporate officer at the recommendation of the Compensation Committee. It is noted that the CEO and Chair of the Board of Directors cannot take part in the Board's deliberations or associated voting on issues relating to their compensation in accordance with that policy.
As part of the decision-making process followed to determine and revise the compensation policy for corporate officers, the compensation and
employment conditions of the company's employees were taken into account by the Board as follows: discussions took place beforehand between the Compensation Committee and the group's Human Resources Director in order to ensure that the elements of the compensation policy of the CEO are consistent with the human resources policy regarding the compensation of the company's senior executives.
This compensation policy has not been substantially modified compared to that approved by the Ordinary General Meeting of June 18, 2020.
In case of change in governance, the compensation policy will be applied to the company's new corporate officers, with the necessary adaptations, as applicable.
The compensation policy of the corporate officers will be consistent with the current policy until a new policy is voted upon, as applicable.
Provided that the conditions defined above are met, the Board may temporarily depart from the application of the CEO's compensation policy in accordance with the second paragraph of part III of Article L. 22-10-8 of the French Commercial Code concerning all of the elements of variable compensation (including those of the Phantom Shares long-term incentive program). The Board will decide on the recommendations of the Compensation Committee and will determine whether this deviation is in line with the company's interests and necessary to guarantee the continuity or viability of the company. These justifications will be brought to the attention of the shareholders in the next corporate governance report. It is noted that the CEO and the Chair of the Board of Directors do not participate in the Board's deliberations or voting on these matters.
5.2.1.1. CEO'S COMPENSATION POLICY
The compensation policy established by the Board at the recommendation of the Compensation Committee is as follows:
The fixed, variable, and extraordinary elements comprising the total compensation and benefits of all kinds that may be granted to the CEO in connection with that office, as well as their respective importance, are as follows:
FIXED COMPENSATION
The CEO receives fixed compensation for his duties determined at the recommendation of the Compensation Committee, taking into account market practices, among other factors. It was set by the Board of Directors’ meeting of March 3, 2020 and is increased annually by 1.50%, regardless of the company's performance. The Board reserves the right to review the amount, subject to the opinion of the Compensation Committee.
VARIABLE ANNUAL COMPENSATION
The CEO may receive annual variable compensation for his duties, the criteria of which are based on elements relating to the group's financial, commercial, environmental, and societal performance. These criteria were determined by the Board of Directors on March 3, 2020 at the proposal of the Compensation Committee. These criteria are based on: (i) market shares, (ii) Recurring Operating Income (ROI) in value, (iii) Recurring Operating Income (ROI) as a percentage, (iv) Return on Average Capital Employed (ROACE), (v) the gearing ratio, (vi) qualitative objectives, and (vii) Corporate Social Responsibility (CSR) goals.
The maximum global amount of the annual variable compensation corresponding to this multi-criteria portion that may be paid to the CEO corresponds to 65% of the fixed compensation paid to the CEO for the fiscal year in question.
For each criterion (or sub-criterion), the allocation and valuation guidelines are as follows:
each criterion (or sub-criterion) will be valued as soon as between 80% and 150% of the target has been reached individually;
for some criteria, a floor and ceiling will be defined in value;
if less than 80 % of a target has been reached (or below a certain floor), the corresponding criterion will not trigger any bonus;
underperformance, namely achieving between 80% and 99 % of the target objective, is penalized with a discount of 25 %: for example, if 80 % of the target is reached, it would trigger payment of 60 % of the corresponding bonus;
achieving the target objective will trigger payment of 100 % of the bonus amount for that criterion;
outperformance, namely achieving more than 100% of the target objective, is valued linearly, or for example achievement of 110% of the criterion (or sub-criterion) triggers payment of a bonus equal to 110% of the corresponding criterion (or sub-criterion) up to a limit of 150%;
when a criterion is broken down into sub-criteria, the above rules apply individually to each sub-criterion;
when the target objective relating to one of the aforesaid criteria has been reached during a fiscal year, payment of the portion of the annual variable compensation relating to that criterion would be triggered for the fiscal year in question regardless of whether or not the target objectives set for the other criteria have been achieved;
In any event, although the bonus awarded for each criterion (or sub-criterion) may in practice vary individually from 60% to 150% of the target amounts, the total amount of the annual variable compensation for all seven criteria may never exceed 65% of the gross annual fixed compensation.

2020 UNIVERSAL REGIST RATION DOC UMENT 101
The table below summarizes the identified criteria, their nature, their correlation with the commercial strategy, the percentage of the annual fixed compensation to which each of the criterion taken individually entitles payment (based on the achievement of 100 % of the criterion target), as well as the overall maximum amount of the annual variable portion for 2021:
Criteria % of gross annual fixed
compensation
Nature of criterion Sales strategy
Financial Non-financial Quantitative Qualitative
No. 1 Market share
14%(1) X X Strengthen or defend the group's market share
No. 2 ROI in value 6%(1) X Empowering the group to achieve its ambitions
No. 3 ROI in % of net sales
6%(1) X Establishing profitable business development
No. 4 ROACE 6%(1) X Maintaining financial balance allowing for future development
No. 5 Gearing Ratio
6%(1) X Maintaining the resources to finance future activity
No. 6 Qualitative Objectives
12%(1) X X
No. 7 CSR 15%(1) X X X Managing the ecological transition to a sustainable business model
Total overall maximum
65%
(1) % of fixed compensation, based on 100% achievement of the criterion target.
To determine to what extent the performance criteria established for the variable compensation have been met, the Board has put the following evaluation methods in place:
market share: this criterion is assessed on the basis of statistics provided by international professional associations. This criterion is broken down into five sub-criteria. Market share targets are defined by type of machine/product range, market segment, and geographic area;
the Recurring Operating Income (ROI) in value: The ROI is comprised of the revenue, cost of sales, research and development costs, sales and marketing costs, administrative costs, other operating income and expenses, and the income and expenses on current items;
the Recurring Operating Income (ROI) as a percentage: The ROI as a percentage refers to the recurring operating income as a percentage of the revenue by dividing the ROI for the fiscal year by the revenue for the fiscal year;
return on Average Capital Employed (ROACE): The ROACE refers to the return on capital employed, calculating the ratio between the recurring operating income and the average capital employed for the three financial situations of December N-1, June N, and December N;
gearing corresponds to the ratio at end-December of net debt divided by the amount of equity, excluding lease commitments under IFRS16. For the purpose of calculating this criterion, data at constant scope and exchange rates will be used, excluding any modification(s) of the IFRS;
the qualitative criterion is broken down into three sub-criteria enabling deployment of performance drivers and accelerating commercial development in certain areas;
Corporate Social Responsibility (CSR) was broken down as follows: seven quantitative objectives represent 8% of the fixed compensation and four qualitative objectives represent 7% of the annual fixed compensation.
The objectives of the criteria (or sub-criteria) mentioned above for the fiscal year in question and the expected levels of achievement were pre-established and defined at the Board of Directors’ meeting of March 4, 2021 on the proposal of the Compensation Committee but are not made public for reasons of confidentiality.
The annual variable compensation contributes to the objectives of the compensation policy as follows: it allows the group to be consistent and align itself with market practices, establish under-performance and over-performance mechanisms, and establish target objectives that are achievable.
“Phantom Shares” long-term incentive program: The Board of Directors, on proposal by the Compensation Committee, has put in place for the benefit of the CEO a Phantom Shares plan (a mechanism for the allocation of the value of shares based on the annual performance of the net result per share) under which the CEO may be paid an annual premium, the amount of which is determined in accordance with the conditions for allocation established by the Board of Directors (financial criterion and presence criterion). The number of Phantom Shares allocated to the CEO is determined on the basis of a criterion relating to the earning per share (EPS) according to the performance tranches set by the Board of Directors. The number of Phantom Shares that can be allocated to the CEO is between 0 and 15,500, 15,500 being the maximum. The Phantom Shares levels attributable to these EPS ranges are 0, 3,100, 12,400, and 15,500.
Each Phantom Share awarded to the CEO is converted on the basis of the simple average of the stock prices of the Manitou share determined at closing on the 20 days preceding the date of the Board of Directors’ meeting closing the financial statements for the year in question and the 20 days following that date.
The performance targets of this criterion for the fiscal year in question were pre-established and defined at the Board of Directors’ meeting of March 4, 2021 on the proposal of the Compensation Committee but are not made public for reasons of confidentiality.

102
EXTRAORDINARY COMPENSATION
The Board may decide, by proposal of the Compensation Committee, to grant extraordinary compensation to the CEO in light of very special circumstances, such as the completion of a major transaction for the company or the group.
COMMITMENTS
The CEO benefits from the following commitments:
Commitments made by the company or by a subsidiary
or parent company
Main characteristics Criteria for award Conditions for termination
Severance package in case of departure
The CEO is eligible for a severance package if his term of office is revoked or is not renewed. The amount of the severance pay would correspond to 200% of the fixed compensation and annual variable compensation (excluding the Phantom Shares plan) awarded for the fiscal year preceding the year in which the dismissal or non-renewal has taken place, provided that the criteria triggering payment of this benefit have been met. However, if the severance pay is owed, it will be adjusted as a function of the Board of Director's implementation of the non-compete commitment and, in particular, if this non-compete payment is implemented, the amount of the severance pay will be decreased by the amount actually paid to the CEO by way of a non-compete payment.
Date of submission to the General Meeting: 6/18/2020 (resolution no. 9)
The criteria triggering payment of the Severance Pay (“SP Criteria”) will be assessed in light of the performance of the CEO, which is measured using the same quantitative and qualitative criteria as those used to calculate his Variable Compensation.
The SP Criteria and therefore the condition for payment of the Severance Payment will be considered met if the CEO has received at least 60% of the arithmetic average of the potential maximum amounts of his annual variable compensation for all fiscal years from 2014 to the year preceding the fiscal year during which his term of office comes to an end.
The payment will not be owed in case of:
serious breach by the CEO;
resignation of the CEO during his term of office;
non-renewal of the corporate office if the Board of Directors has formulated a written offer for a new corporate mandate under terms and conditions that represent a significant improvement over all of the conditions of this corporate mandate but the CEO refuses it.
Non-compete payment In return for this, the CEO will receive a monthly payment for a period of one year from the actual date of termination of his office. This payment will be equal to half of the fixed monthly compensation paid in the last month preceding the termination of his office.
This payment will not apply when his beneficiary claims his pension rights.
Date of submission to the General Meeting: 6/18/2020 (resolution no. 9)
Defined benefit retirement commitments
None None None
Defined contribution retirement commitments
None N/A None
Other commitments corresponding to elements of compensation, allowances, or advantages owed or that could be owed in connection with the termination or change of functions, or subsequent thereto
None None None

2020 UNIVERSAL REGIST RATION DOC UMENT 103
BENEFITS OF ALL KINDS
The CEO enjoys the following benefits of all kinds:
coverage of transportation costs between Angers/Nantes and his residence;
the company purchased an unemployment policy for the benefit of the CEO from the Association pour la Garantie Sociale des Chefs et Dirigeants d’entreprise (GSC);
retirement: the CEO is covered by the same pension and healthcare schemes as the company’s executives;
car: the company covers the costs of a vehicle for the CEO;
civil liability insurance for Corporate Officers, which is enjoyed by all relevant persons of the group.
ANY OTHER ELEMENT OF COMPENSATION
THAT MAY BE RECEIVED IN CONNECTION
WITH THE CORPORATE MANDATE:
None
It is noted that the payment of variable compensation elements and, as applicable, extraordinary elements awarded for the past fiscal year, are subject to approval by the Ordinary General Meeting of the elements comprising the compensation and benefits of all kinds of the CEO paid during the previous fiscal year or awarded in connection with that fiscal year (individual ex post vote).
5.2.1.2. CHAIR OF THE BOARD’S COMPENSATION POLICY
The compensation policy established by the Board at the recommendation of the Compensation Committee is as follows:
The elements comprising the total compensation and benefits of all kinds that may be granted to the Chair of the Board in connection with that office are as follows:
annual fixed compensation: the Chair receives in connection with that office an annual fixed compensation determined at the
recommendation of the Compensation Committee, taking into account market practices, among other factors,
compensation allocated for the office of member of the Board,
benefits of all kinds: a company vehicle.
5.2.1.3. BOARD MEMBER COMPENSATION POLICY
The General Meeting of December 17, 2009 established the compensation of the members of the Board in its 15th ordinary resolution at an annual fixed overall sum of €600,000, which will be valid until a new General Meeting decision.
The allocation rules for the annual fixed sum set aside by the General Meeting for the members of the Board were set by the Board at the proposal of the Compensation Committee, taking into account the rules imposed by the internal regulations. These rules are as follows:
the board members appointed by General Meeting do not receive fixed compensation. They collect only variable compensation awarded as a function of their attendance and work performed,
for board members appointed by General Meeting, this variable portion takes into account their actual participation in the work and
meetings (i) of the Board of Directors, (ii) of the specialist committees (excluding the Development Committee), as well as (iii) in the context of their special assignments determined in advance by the Board of Directors,
board members representing the employees may be allocated an annual fixed amount.
The Board may also determine the compensation of directors to whom specific duties are entrusted by the Board under the conditions set out in the regulations (Article L. 225-46 of the French Commercial Code).
The members of the Board may benefit from civil liability insurance for corporate officers.

104
5.2.1.4. INFORMATION ON CORPORATE MANDATES AND EMPLOYMENT CONTRACTS
AND/OR SERVICE AGREEMENTS BETWEEN CORPORATE OFFICERS AND THE COMPANY
The table below shows the duration of the term(s) of the Company's corporate officers and, as applicable, employment contracts or service agreements entered into with the company, the prior notice periods, and the applicable conditions for dismissal or termination:
Officers in the company
Mandate(s) performed
Term of mandate(s) Employment contracts entered
into with the company
(indicate the duration)
Service agreements
entered into with the company (indicate the
duration)
Prior notice periods
Conditions for dismissal
or termination
Michel Denis CEO At the end of the General Meeting held in 2022
to approve the financial statements ended
December 31, 2021
No No N/A Revocation of mandate
in accordance with the law and case law
Departure conditions (see section 5.2.1.2)
Jacqueline Himsworth
Chair and Member of the
Board
At the end of the General Meeting held in 2021
to approve the financial statements ended
December 31, 2020
No No N/A Revocation of mandate
in accordance with the law and case law
Dominique Bamas
Member of the Board
At the end of the General Meeting held in 2023
to approve the financial statements ended
December 31, 2022
No No N/A Revocation of mandate
in accordance with the law and case law
Émilie Braud Member of the Board
At the end of the General Meeting held in 2021
to approve the financial statements ended
December 31, 2020
No No N/A Revocation of mandate
in accordance with the law and case law
Marcel Claude Braud
Member of the Board
At the end of the General Meeting held in 2021
to approve the financial statements ended
December 31, 2020
No No N/A Revocation of mandate
in accordance with the law and case law
Sébastien Braud Member of the Board
At the end of the General Meeting held in 2021
to approve the financial statements ended
December 31, 2020
No No N/A Revocation of mandate
in accordance with the law and case law
Cécile Helme-Guizon
Member of the Board
At the end of the General Meeting held in 2021
to approve the financial statements ended
December 31, 2020
No No N/A Revocation of mandate
in accordance with the law and case law
Christopher Himsworth
Member of the Board
At the end of the General Meeting held in 2021
to approve the financial statements ended
December 31, 2020
No No N/A Revocation of mandate
in accordance with the law and case law
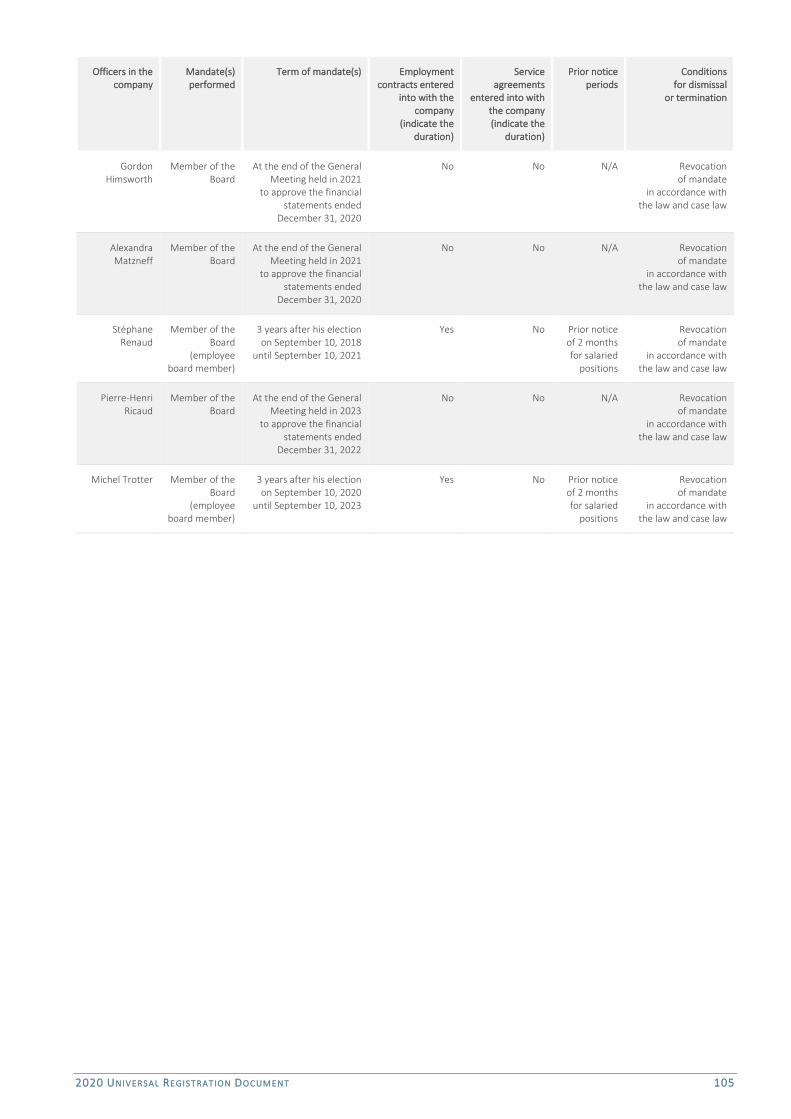
2020 UNIVERSAL REGIST RATION DOC UMENT 105
Officers in the company
Mandate(s) performed
Term of mandate(s) Employment contracts entered
into with the company
(indicate the duration)
Service agreements
entered into with the company (indicate the
duration)
Prior notice periods
Conditions for dismissal
or termination
Gordon Himsworth
Member of the Board
At the end of the General Meeting held in 2021
to approve the financial statements ended
December 31, 2020
No No N/A Revocation of mandate
in accordance with the law and case law
Alexandra Matzneff
Member of the Board
At the end of the General Meeting held in 2021
to approve the financial statements ended
December 31, 2020
No No N/A Revocation of mandate
in accordance with the law and case law
Stéphane Renaud
Member of the Board
(employee board member)
3 years after his election on September 10, 2018
until September 10, 2021
Yes No Prior notice of 2 months for salaried
positions
Revocation of mandate
in accordance with the law and case law
Pierre-Henri Ricaud
Member of the Board
At the end of the General Meeting held in 2023
to approve the financial statements ended
December 31, 2022
No No N/A Revocation of mandate
in accordance with the law and case law
Michel Trotter Member of the Board
(employee board member)
3 years after his election on September 10, 2020
until September 10, 2023
Yes No Prior notice of 2 months for salaried
positions
Revocation of mandate
in accordance with the law and case law

106
COMPENSATION AND BENEFITS AWARDED TO CORPORATE OFFICERS
FOR 2020 (GLOBAL EX-POST VOTE)
Pursuant to the provisions of Article L. 22-10-9 of the French Commercial Code, the total amount of the compensation and benefits paid to each corporate officer for the fiscal year is presented in detail below.
In accordance with the MiddleNext Code, the level of the board members’ compensation is based on the following seven principles: exhaustive, balanced, benchmarked, consistent, clear, measured, and transparent.
It is clarified that the total compensation of each corporate officer respects the compensation policy approved by the General Meeting of June 18, 2020 in its 8th (Chair of the Board of Directors) and 9th (CEO) resolutions.
COMPENSATION OF JACQUELINE HIMSWORTH, CHAIR OF THE BOARD OF DIRECTORS
SUMMARY OF COMPENSATION AND OPTIONS AND SHARES AWARDED TO JACQUELINE HIMSWORTH (TABLE 1 OF THE AMF
NOMENCLATURE)
In euros 2019 2020 Compensation awarded for the period (see details in table 2) 185,848 206,352 Value of options granted during the period (see details in table 4) Value of performance shares granted during the period (see details in table 6) Valuation of other long-term compensation plans
TOTAL 185,848 206,352
SUMMARY OF COMPENSATION AWARDED TO JACQUELINE HIMSWORTH (TABLE 2 OF THE AMF NOMENCLATURE)
In euros
2019 2020 Amounts awarded Amounts paid Amounts awarded Amounts paid
Fixed compensation 152,500 152,500 155,004 155,004 Variable annual compensation Extraordinary compensation Compensation allocated for the office of member of the Board 30,000 39,000 48,000 33,000 Benefits in kind 3,348 3,348 3,348 3,348
TOTAL 185,848 194,848 206,352 191,352
SHARE SUBSCRIPTION OR PURCHASE OPTIONS AWARDED DURING THE FISCAL YEAR TO JACQUELINE HIMSWORTH (TABLE 4 OF THE AMF
NOMENCLATURE)
No stock option or free shares were awarded during the fiscal year.
SHARE SUBSCRIPTION OR PURCHASE OPTIONS EXERCISED DURING THE FISCAL YEAR BY JACQUELINE HIMSWORTH (TABLE 5 OF THE AMF
NOMENCLATURE)
There is no stock option/free share plan in place currently.
PERFORMANCE SHARES AWARDED TO JACQUELINE HIMSWORTH (TABLE 5 OF THE AMF NOMENCLATURE)
No performance share plan was awarded during the fiscal year.
PERFORMANCE SHARES THAT BECAME AVAILABLE FOR JACQUELINE HIMSWORTH
There is no performance share plan in place currently.
EMPLOYMENT CONTRACT / CORPORATE MANDATE (TABLE 11 OF THE AMF NOMENCLATURE)
Employment contract Supplementary pension plan
Indemnities or benefits due, or potentially due,
as a result of termination or change of functions
Indemnities related to a non-competition
clause
Yes No Yes No Yes No Yes No
Jacqueline Himsworth
X X X X
Chair of the Board of Directors Start date of term of office: June 8, 2017 End date of term of office: 2021 General Meeting approving the results as of December 31, 2020

2020 UNIVERSAL REGIST RATION DOC UMENT 107
SUMMARY OF THE ELEMENTS OF COMPENSATION OF MICHEL DENIS, CEO
SUMMARY OF THE COMPENSATION AND OPTIONS AND SHARES AWARDED TO MICHEL DENIS (TABLE 1 OF THE AMF NOMENCLATURE)
In euros 2019 2020 Compensation awarded for the period (see details in table 2) 1,083 805 1,230 078 Value of options granted during the period (see details in table 4) Value of performance shares granted during the period (see details in table 6) Valuation of other long-term compensation plans
TOTAL 1,083 805 1,230 078
SUMMARY OF COMPENSATION AWARDED TO MICHEL DENIS (TABLE 2 OF THE AMF NOMENCLATURE)
In euros
2019 2020 Amounts awarded Amounts paid Amounts awarded Amounts paid
Fixed compensation 609,000 609,000 618,135 618,135 Annual variable compensation(1)(2) 362,528 748,714 318,340 362,528 Extraordinary compensation 80,000 44,000 260,839 80,000 Compensation allocated for the office of member of the Board Benefits in kind(3) 32,277 32,277 32,764 32,764
TOTAL 1,083 805 1,433 991 1,230 078 1,093 427 (1) For fiscal year 2020, the variable compensation awarded represented 94% of the fixed compensation (73% in 2019). (2) With respect to the variable compensation awarded for fiscal year 2020, the allocation criteria are based on the group's recurring operating income, market shares, net debt, profitability of shareholder's equity, and qualitative criteria. As of December 31, 2020, the variable compensation awarded did not include a provision for Phantom Shares (€247,000 in 2019). This annual bonus is determined according to an earnings per share criterion. See section 5.2.1.1 of this chapter and note 6.4 of the appendix to the consolidated financial statements (section 7.1). (3) The CEO enjoys unemployment insurance coverage.
SHARE SUBSCRIPTION OR PURCHASE OPTIONS AWARDED DURING THE FISCAL YEAR TO MICHEL DENIS (TABLE 4 OF THE AMF
NOMENCLATURE)
No stock option or free shares were awarded during the fiscal year.
SHARE SUBSCRIPTION OR PURCHASE OPTIONS EXERCISED DURING THE FISCAL YEAR BY MICHEL DENIS (TABLE 5 OF THE AMF
NOMENCLATURE)
There is no stock option/free share plan in place currently.
PERFORMANCE SHARES AWARDED TO MICHEL DENIS (TABLE 5 OF THE AMF NOMENCLATURE)
No performance share plan was awarded during the fiscal year.
PERFORMANCE SHARES THAT BECAME AVAILABLE FOR MICHEL DENIS
There is no performance share plan in place currently.
EMPLOYMENT CONTRACT/CORPORATE MANDATE (TABLE 11 OF THE AMF NOMENCLATURE)
Employment contract Supplementary pension plan
Indemnities or benefits due, or potentially due,
as a result of termination or change of functions
Indemnities related to a non-competition
clause
Yes No Yes No Yes No Yes No
Michel Denis CEO Start date of term of office: January 13, 2014, renewed on December 5, 2017 End date of term of office: 2022 General Meeting approving the results as of December 31, 2021
X X X(1) X(2)
(1) A severance payment may be paid to the CEO if his office is terminated before its due term or if it is not renewed, except where this termination or non-renewal is the result of serious misconduct. For the amount of the severance payment, see note 5.2.1.1 of this chapter. (2) The CEO will be required to abide by a non-compete obligation for a period of 12 months after leaving office. See section 5.2.1.1 of this chapter.

108
COMPENSATION OF BOARD MEMBERS
TABLE OF COMPENSATION RECEIVED BY CORPORATE OFFICERS (TABLE 3 OF THE AMF NOMENCLATURE)
In euros
2019 2020 Amounts awarded
Amounts paid
Amounts awarded
Amounts paid
Jacqueline Himsworth Compensation allocated for the office of Chair of the Board of Directors of Manitou BF
155,848 155,848 158,352 158,352
Compensation allocated for the office of member of the Board of Directors of Manitou BF
30,000 39,000 48,000 33,000
Other compensation Dominique Bamas Compensation allocated for the office of member
of the Board of Directors of Manitou BF 39,000 48,000 66,000 42,000
Other compensation Émilie Braud Compensation allocated for the office of member
of the Board of Directors of Manitou BF 42,000 54,000 63,000 45,000
Other compensation Marcel-Claude Braud Compensation allocated for the office of member
of the Board of Directors of Manitou BF 30,000 36,000 45,000 33,000
Other compensation Sébastien Braud Compensation allocated for the office of member
of the Board of Directors of Manitou BF 36,000 42,000 60,000 39,000
Other compensation Cécile Helme-Guizon Compensation allocated for the office of member
of the Board of Directors of Manitou BF 51,000 51,000 63,000 54,000
Other compensation Christopher Himsworth Compensation allocated for the office of member
of the Board of Directors of Manitou BF 39,000 48,000 60,000 42000
Other compensation Gordon Himsworth Compensation allocated for the office of member
of the Board of Directors of Manitou BF 57,000 69,000 66,000 60,000
Other compensation Carole Lajous (board member until December 13, 2020)
Compensation allocated for the office of member of the Board of Directors of Manitou BF
33,000 33,000
36,000 36,000
Other compensation Alexandra Matzneff (board member since November 9, 2020)
Compensation allocated for the office of member of the Board of Directors of Manitou BF
3,000
Other compensation Stéphane Renaud (board member representing employees) since September 10, 2018
Compensation allocated for the office of member of the Board of Directors of Manitou BF
0 0 0 0
Other compensation* N/C N/C N/C N/C
Pierre-Henri Ricaud Compensation allocated for the office of member of the Board of Directors of Manitou BF
57,000 63,000 75,000 60,000
Other compensation Michel Trotter (board member representing employees since September 10, 2020)
Compensation allocated for the office of member of the Board of Directors of Manitou BF
0 0 0 0
Other compensation* N/C N/C N/C N/C
TOTAL 569,848 638,848 743,352 602,352
Including Compensation allocated for the office of Chair of the Board of Directors of Manitou BF
155,848 155,848 158,352 158,352
Including Compensation allocated for the office of members of the Board of Directors of Manitou BF
414,000 483,000 585,000 444,000
* The salary paid to board members representing employees is not communicated.

2020 UNIVERSAL REGIST RATION DOC UMENT 109
EQUITY RATIOS
In euros
Jacqueline Himsworth Chair of the Board
of Directors *
Marcel Braud Chair of the Board
of Directors * Michel Denis
CEO 2020
Average compensation of employees excluding corporate officers 44,997 44,997 Median compensation of employees excluding corporate officers 39,014 39,014 Compensation of the CEO 206,352 1,230 078 Ratio with average employee compensation 4.59 27.34 Ratio with median employee compensation 5.29 31.53
2019 Average compensation of employees excluding corporate officers 46,893 46,893 Median compensation of employees excluding corporate officers 41,567 41,567 Compensation of the CEO 185,848 1,083 805 Ratio with average employee compensation 3.96 23.11 Ratio with median employee compensation 4.47 26.07
2018 Average compensation of employees excluding corporate officers 46,974 46,974 Median compensation of employees excluding corporate officers 41,344 41,344 Compensation of the CEO 203,790 1,393 647 Ratio with average employee compensation 4.34 29.67 Ratio with median employee compensation 4.93 33.71
2017 Average compensation of employees excluding corporate officers 45,437 45,437 45,437 Median compensation of employees excluding corporate officers 39,951 39,951 39,951 Compensation of the CEO 174,000 182,163 846,925 Ratio with average employee compensation 3.83 4.01 18.64 Ratio with median employee compensation 4.36 4.56 21.20
2016 Average compensation of employees excluding corporate officers 43,458 43,458 Median compensation of employees excluding corporate officers 38,001 38,001 Compensation of the CEO 176,664 794,630 Ratio with average employee compensation 4.07 18.29 Ratio with median employee compensation 4.65 20.91
* Jacqueline Himsworth is the Chair of the Board of Directors since June 8, 2017, when she replaced Marcel Braud. For 2017, the data for Jacqueline Himsworth and Marcel Braud were recalculated on an annual basis in order to keep the information consistent.

110
FIXED, VARIABLE, AND EXTRAORDINARY ELEMENTS COMPRISING THE TOTAL
COMPENSATION AND BENEFITS OF ALL KINDS PAID DURING THE PAST FISCAL
YEAR OR AWARDED IN CONNECTION WITH THE PAST FISCAL YEAR
TO THE CHAIR OF THE BOARD OF DIRECTORS AND THE CEO (INDIVIDUAL EX-POST VOTE)
ELEMENTS OF COMPENSATION AND BENEFITS OF ALL KINDS PAID DURING OR AWARDED IN CONNECTION
WITH FISCAL YEAR 2020 TO THE CEO
The fixed, variable, or extraordinary elements comprising the total compensation and the benefits of all kinds paid during or awarded in connection with fiscal year 2020 to Michel Denis, CEO, will be submitted for approval by the General Meeting called to approve the financial statements for the fiscal year ended December 31, 2020. The 2020 compensation policy was approved by the General Meeting of June 18, 2020.
Elements of compensation submitted for approval
Amounts paid during past fiscal year
Amounts awarded in connection with past fiscal year
or accounting valuation
Presentation
Fixed compensation €618,135 €618,135 See note 5.2.1.1 on the compensation policy
Variable annual compensation €115,101* €318,340** See below (1) “Phantom Shares” variable annual compensation
€247,427* €0** Bonus based on the result per share of the group not achieved in 2020
Multi-year variable compensation None None None Extraordinary compensation €80,000* €260,839** See below(2) and note 5.2.1.1
on the compensation policy Stock options, performance shares, or any other long-term benefit (stock warrants, etc.)
None None
Board member compensation None None None Benefits of all kinds €32,764*** €32,764*** Unemployment insurance
and care Severance package Severance package None None No amount is submitted for approval Additional retirement benefits None None None
* Amount awarded for fiscal year 2019 and paid in 2020. The payment was already approved at the General Meeting of June 18, 2020. ** Amount awarded for fiscal year 2020 and payable in 2021, subject to approval of the General Meeting. *** Accounting value (1) Annual variable compensation: the remuneration was awarded according to the following assessment:
Criteria Achievement level Valuation given the allocation and valuation grid
Amount
No. 1 market share Between 80% and 100% 12/14 74,176 No. 2 ROI in value Less than 80% 0/7 0 No. 3 ROI in % of net sales Less than 80% 0/7 0 No. 4 ROACE Less than 80% 0/8 0 No. 5 Gearing ratio Greater than 150% 9/6 55,632 No. 6 Qualitative objectives Between 100% and 150% 11.75/9 72,631 No. 7 CSR Between 100% and 150% 18.75/14 115,900
(2) Extraordinary compensation: based on performance observed in fiscal year 2020 and, in addition to the variable compensation criteria set out in the remuneration policy, the Board noted that the CEO has demonstrated: − In the interest of the company - agile and effective management of 2020 which, in a context of extreme crisis, has made it possible to resize and
reorganize the group while maintaining a level of financial performance close to the initial objective, strengthening the group's financial solidity through very strong deleveraging and maintaining maximum employment in order to support the market rebound as soon as possible.
− In the interests of shareholders - management enabling the return of a "calmer" climate based on the group's financial performance and financial structure, which enabled the Board of Directors to propose the payment of a dividend of €0.50 per share in December 2020, as well as the strengthening of the group's valuation during 2020.
In order to reward this performance despite a particularly difficult environment, the Board of Directors proposes the payment of extraordinary compensation amounting to €260,839 This extraordinary compensation is consistent with the group's executive pay policy, which has been adapted for 2020 to the crisis context and capped at 75% of the maximum target for all executives.

2020 UNIVERSAL REGIST RATION DOC UMENT 111
ELEMENTS OF COMPENSATION AND BENEFITS OF ALL KINDS PAID DURING OR AWARDED IN CONNECTION WITH FISCAL YEAR 2020 TO THE CHAIRMAN
The fixed, variable, or exceptional elements comprising the total compensation and the benefits of all kinds paid during or awarded in connection with fiscal year 2020 to Jacqueline Himsworth, Chair of the Board of Directors, will be submitted for approval by the General Meeting called to approve the financial statements for the fiscal year ended December 31, 2020.
Elements of compensation submitted for approval
Amounts paid during past fiscal year
Amounts awarded in connection with past fiscal year or accounting
valuation
Presentation
Fixed compensation €155,004 €155,004 See note 5.2.1.2 on the compensation policy
Variable annual compensation None None None Multi-year variable compensation None None None Extraordinary compensation None None None Stock options, performance shares, or any other long-term benefit (stock warrants, etc.)
None None None
Board member compensation €33,000 €48,000 See note 5.2.1.2 on the compensation policy
Benefits of all kinds €3,348* €3,348* Car Severance package None None None Additional retirement benefits None None None
* Accounting value.
SPECIFIC SHAREHOLDER PROCEDURES FOR TAKING PART IN ANNUAL GENERAL MEETINGS
These elements are defined in Article 19 of the company’s Articles of Association. Under the terms of the Articles of Association, any shareholder is entitled to attend the Annual General Meetings under the conditions laid down by law.
A shareholder may be represented by any natural person or legal entity of their choosing. Designation and revocation may be notified electronically.
The shareholders can, under the conditions laid down by the law and regulations, send their proxy and voting by correspondence forms concerning any Annual General Meeting, either as a hard copy or by electronic mail.
Two members of the Social and Economic Committee appointed by this committee, one belonging to the category of technical executives and supervisors, and the other to the category of employees and workers, or, where appropriate, the persons referred to in Articles L. 2312-74 and L. 2312-75 of the French Labor Code, can attend the Annual General Meetings.
The shareholders are informed of the procedures for holding the General Meeting as well as the voting procedures in the meeting notice, which will be published within the regulatory timeframe.

112
SHARE OWNERSHIP AND SHARE CAPITAL

2020 UNIVERSAL REGIST RATION DOC UMENT 113
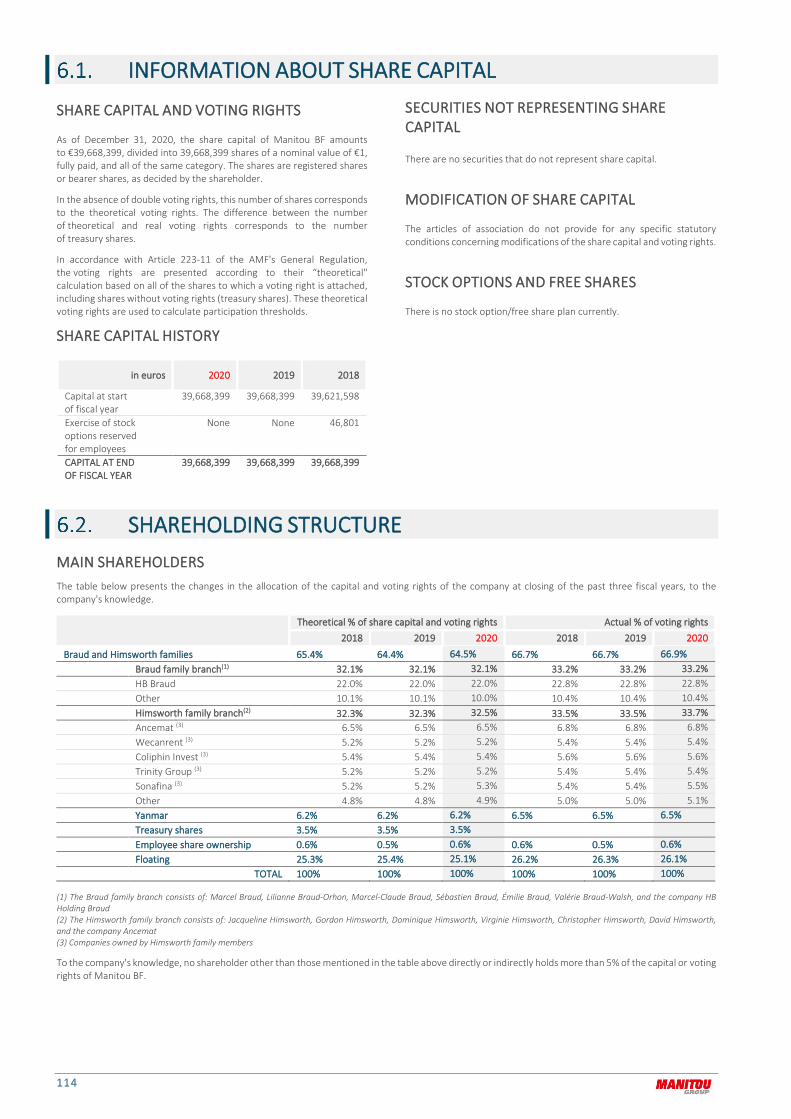
114
INFORMATION ABOUT SHARE CAPITAL
SHARE CAPITAL AND VOTING RIGHTS
As of December 31, 2020, the share capital of Manitou BF amounts to €39,668,399, divided into 39,668,399 shares of a nominal value of €1, fully paid, and all of the same category. The shares are registered shares or bearer shares, as decided by the shareholder.
In the absence of double voting rights, this number of shares corresponds to the theoretical voting rights. The difference between the number of theoretical and real voting rights corresponds to the number of treasury shares.
In accordance with Article 223-11 of the AMF's General Regulation, the voting rights are presented according to their “theoretical" calculation based on all of the shares to which a voting right is attached, including shares without voting rights (treasury shares). These theoretical voting rights are used to calculate participation thresholds.
SHARE CAPITAL HISTORY
in euros 2020 2019 2018
Capital at start of fiscal year
39,668,399 39,668,399 39,621,598
Exercise of stock options reserved for employees
None None 46,801
CAPITAL AT END OF FISCAL YEAR
39,668,399 39,668,399 39,668,399
SECURITIES NOT REPRESENTING SHARE
CAPITAL
There are no securities that do not represent share capital.
MODIFICATION OF SHARE CAPITAL
The articles of association do not provide for any specific statutory conditions concerning modifications of the share capital and voting rights.
STOCK OPTIONS AND FREE SHARES
There is no stock option/free share plan currently.
SHAREHOLDING STRUCTURE MAIN SHAREHOLDERSThe table below presents the changes in the allocation of the capital and voting rights of the company at closing of the past three fiscal years, to the company's knowledge.
Theoretical % of share capital and voting rights Actual % of voting rights 2018 2019 2020 2018 2019 2020
Braud and Himsworth families 65.4% 64.4% 64.5% 66.7% 66.7% 66.9% Braud family branch(1) 32.1% 32.1% 32.1% 33.2% 33.2% 33.2%
HB Braud 22.0% 22.0% 22.0% 22.8% 22.8% 22.8% Other 10.1% 10.1% 10.0% 10.4% 10.4% 10.4% Himsworth family branch(2) 32.3% 32.3% 32.5% 33.5% 33.5% 33.7% Ancemat (3) 6.5% 6.5% 6.5% 6.8% 6.8% 6.8% Wecanrent (3) 5.2% 5.2% 5.2% 5.4% 5.4% 5.4% Coliphin Invest (3) 5.4% 5.4% 5.4% 5.6% 5.6% 5.6% Trinity Group (3) 5.2% 5.2% 5.2% 5.4% 5.4% 5.4% Sonafina (3) 5.2% 5.2% 5.3% 5.4% 5.4% 5.5% Other 4.8% 4.8% 4.9% 5.0% 5.0% 5.1% Yanmar 6.2% 6.2% 6.2% 6.5% 6.5% 6.5% Treasury shares 3.5% 3.5% 3.5% Employee share ownership 0.6% 0.5% 0.6% 0.6% 0.5% 0.6% Floating 25.3% 25.4% 25.1% 26.2% 26.3% 26.1% TOTAL 100% 100% 100% 100% 100% 100%
(1) The Braud family branch consists of: Marcel Braud, Lilianne Braud-Orhon, Marcel-Claude Braud, Sébastien Braud, Émilie Braud, Valérie Braud-Walsh, and the company HB Holding Braud (2) The Himsworth family branch consists of: Jacqueline Himsworth, Gordon Himsworth, Dominique Himsworth, Virginie Himsworth, Christopher Himsworth, David Himsworth, and the company Ancemat (3) Companies owned by Himsworth family members
To the company's knowledge, no shareholder other than those mentioned in the table above directly or indirectly holds more than 5% of the capital or voting rights of Manitou BF.

2020 UNIVERSAL REGIST RATION DOC UMENT 115
CONTROL OF THE COMPANY
Manitou Group is controlled by the Braud and Himsworth families, who together hold 64.5% of the share capital, 59.4% of which is jointly held. On the date of drafting of this document, Manitou's Board of Directors included four independent Board members, as defined by the Middlenext Corporate Governance Code, out of a total of twelve Board members (including the two members representing the employees). The position of President & CEO is separate from the office of Chair of the Board of Directors and has been held by Michel Denis, who is independent of the Braud and Himsworth families, since January 13, 2014 (and renewed on December 5, 2017).
The graph below shows the shareholding structure of Manitou BF as of Thursday, December 31, 2020 by major shareholder category.
THRESHOLD CROSSINGS
During fiscal year 2020, no crossing of a threshold pursuant to Article L233-7 of the French Commercial Code was reported, in capital or voting rights.
VARIOUS VOTING RIGHTS
The company's shares do not benefit from any double voting rights.
SHAREHOLDER AGREEMENT
On May 3, 2017, the family shareholders signed a shareholder agreement, which took effect on June 10, 2017 for a term of four years. An addendum n°1 to this shareholder agreement has been signed and entered into force on 6 March 2019. The shareholder agreement, as modified by amendment no. 1, contains the following provisions, among others:
an objective by each of the family branches to retain a number of Manitou shares representing at least 20% of the company’s share capital (i.e. a total of 40% of the share capital for the combined family investment),
a right of first refusal in favor of members of the agreement for sales of shares that would reduce the investment of either family branch to less than 20 % of Manitou BF’s share capital, or reduce the entire investment of the two family branches to less than 40 % of the company’s share capital, and any subsequent sale provided these thresholds are not exceeded, on the understanding that members of the seller's family branch have priority in the purchase of the shares sold,
Manitou BF will continue to be governed by three Board members representing the Braud family branch, three Board members representing the Himsworth family branch, and four independent Board members appointed jointly by the Board members representing the family shareholders,
Jacqueline Himsworth will be Manitou BF’s Non-Executive Chair throughout the duration of the agreement,
any transaction that would dilute the capital and/or voting rights will be subject to prior approval by the Board of Directors of Manitou BF adopted by a three-quarters majority. It should be noted that Dominique Himsworth, who was included in the previous shareholder agreement but was not a signatory to this agreement, may join both on a personal basis and as a representative of the company Wecanrent, at any time, as a member of the Himsworth family branch.
Any spouse or direct descendant of any of the signatories to the shareholder agreement may join, at any time, as a member of the family branch to which they belong, on condition that they own at least 10,000 full or stripped Manitou BF shares.
COLLECTIVE COMMITMENTS
Signature date
Type of commitment Number of shares – Percentage of capital and voting rights
Term Shareholder signatories
11/28/2011 Collective commitment to retain shares in accordance with Article 787 B of the French General Tax Code
12,719,721 shares representing 32.2% of the share capital and voting rights
Minimum term of two years from the registration of the commitment, which is renewed for two-year periods by tacit agreement
Braud family branch (*)
11/28/2011 Collective commitment to retain shares in accordance with Article 885 I Bis of the French General Tax Code
A total of 12,719,721 shares representing 32.2% of the share capital and voting rights
Minimum term of two years from the registration of the commitment, which is renewed for 12-month periods by tacit agreement
Braud family branch
(*) The Braud family branch consists of: Marcel Braud, Liliane Braud-Orhon, Marcel-Claude Braud, Sébastien Braud, Émilie Braud, Valérie Braud-Walsh, and the company HB Holding Braud.
3.5%
Treasury shares 6.2%
YANMAR
25.8%
Stock market and others
64.5%
BRAUD & HIMSWORTH Families
116
OTHER INFORMATION ON THE CAPITALTHE EXISTENCE OF AGREEMENTS WHOSE
IMPLEMENTATION COULD RESULT
IN A CHANGE OF CONTROL
As of the date of this document, and to the company's knowledge, there is no shareholder agreement or any agreement whose implementation could subsequently result in a change in its control.
ELEMENTS LIKELY TO HAVE AN IMPACT IN
CASE OF PUBLIC OFFERING
The structure of the company's share capital is indicated in this chapter 6.
There is no statutory restriction on the exercise of voting rights and on transfers of shares with the exception of (i) provisions of the articles of association regarding reporting crossings of thresholds and (ii) the shareholder agreement signed on May 3, 2017 described in this chapter (6.2). The clauses of the agreements brought to the attention of the company pursuant to Article L. 233-11 are indicated in this chapter 6 (shareholder agreement).
Direct or indirect participations in the company’s share capital of which it has knowledge by virtue of Articles L.233-7 and L. 233-12 are indicated in this chapter 6 (thresholds crossing).
As of the date of drafting of this document, and to the company's knowledge, there is no holder of the company's securities entailing special control rights.
As of the date of drafting of this document, and to the company's knowledge, there is no employee shareholding system whose control rights have not been exercised.
Agreements between shareholders of which the company has knowledge and that may lead to restrictions on the transfer of shares and on the exercise of voting rights are primarily laid down in the shareholder agreement signed on May 3, 2017 described in this chapter 6 (shareholder agreement).
The rules applicable to the appointment and replacement of members of the Board of Directors and to amendment of the company’s articles of association are primarily laid down in the shareholder agreement signed on May 3, 2017 described in this chapter 6 (shareholder agreement) and the articles of association.
The powers of the Board of Directors with regard to the issue of shares are specified in chapter 5.1.3 (Table of current delegations and authorities granted by the General Shareholders’ Meeting relating to capital increases). Furthermore, the Board was authorized by the General Shareholders’ Meeting of June 18, 2020 (11th resolution) to purchase the company's shares or have them purchased, up to a limit of 10% of the shares comprising the company's capital. The maximum share purchase price in this context is €60 per share, and the overall amount allocated to the share buyback program may not exceed €100 million.
Agreements entered into by the company that would be amended or terminated in the event of a change in control of the company mainly
correspond to financing agreements. These financing agreements are described in chapter 7.1 (Note 13 to the consolidated financial statements) of this document and consist of a credit agreement (for a maximum amount of €180 million until December 31, 2023) and four bond issues (one concluded in 2015 for a period of 7 years and an amount of €25 million and three others in 2019, respectively for a period of 6 years and an amount of €10 million; a period of 7 years and an amount of €25 million; and a period of 8 years and an amount of €70 million) as well as four bank loans (granted between 2014 and 2019 for €16 million, for which the remaining principal at the end of 2020 was €12.3 million).
The agreements providing for compensation of members of the Board of Directors or employees, if they resign or are dismissed without fair cause or if their job comes to an end as a result of a public takeover bid or exchange offer, are, primarily, those adopted with regard to the Executive and provided for in Chapter 5.2.1.1 (severance payments).
OWNERSHIP THRESHOLDS
Under Article L. 233-7 of the French Commercial Code, any individual or entity, acting alone or with others, who has just acquired a number of shares representing more than 5%, 10%, 15%, 20%, 25%, 30% 33.33%, 50%, 66.66%, 90%, or 95% of the company's share capital and voting rights, must inform the company and the AMF (French Market Authority), indicating the total number of shares and voting rights held before the end of trading on the fourth stock-exchange day following the day on which the holding threshold was exceeded. The exceeding of thresholds reported to the AMF are publicly disclosed by the latter. This information is also transmitted within the same time frame and under the same conditions whenever the equity investment or voting rights fall below the thresholds referred to above. If they are not declared in accordance with the regulations, the shares exceeding the fraction that should have been declared in accordance with the statutory provisions indicated above are denied voting rights at any shareholders’ meetings held for two years following the date of the amending declaration.
Article 9 of Manitou's articles of association provides (in addition) that any physical person or legal entity who comes to hold, directly or indirectly, alone or with others, a number of shares representing more than 1% of the company's capital or voting rights, is obliged to inform the company, within fifteen days of the date when the 1% threshold was exceeded, by registered mail with return receipt requested, stating their identity and that of the persons acting in concert with them. This disclosure obligation also applies to each additional fraction of 1% of the capital or voting rights held. This same obligation to disclose applies if the fraction drops below 1% or a multiple thereof. This obligation also applies to the holder of shares in accordance with Article L. 228-1, paragraph eight, of the French Commercial Code for all shares registered to that shareholder.
Any failure to make such declarations where the regulatory thresholds are crossed shall result in the application of the penalties laid down in Article L. 233-14 of the French Commercial Code, provided that a request to that effect is made by one or more shareholders who own at least 3% of the share capital or voting rights and is recorded in the minutes of the Annual General Meeting.
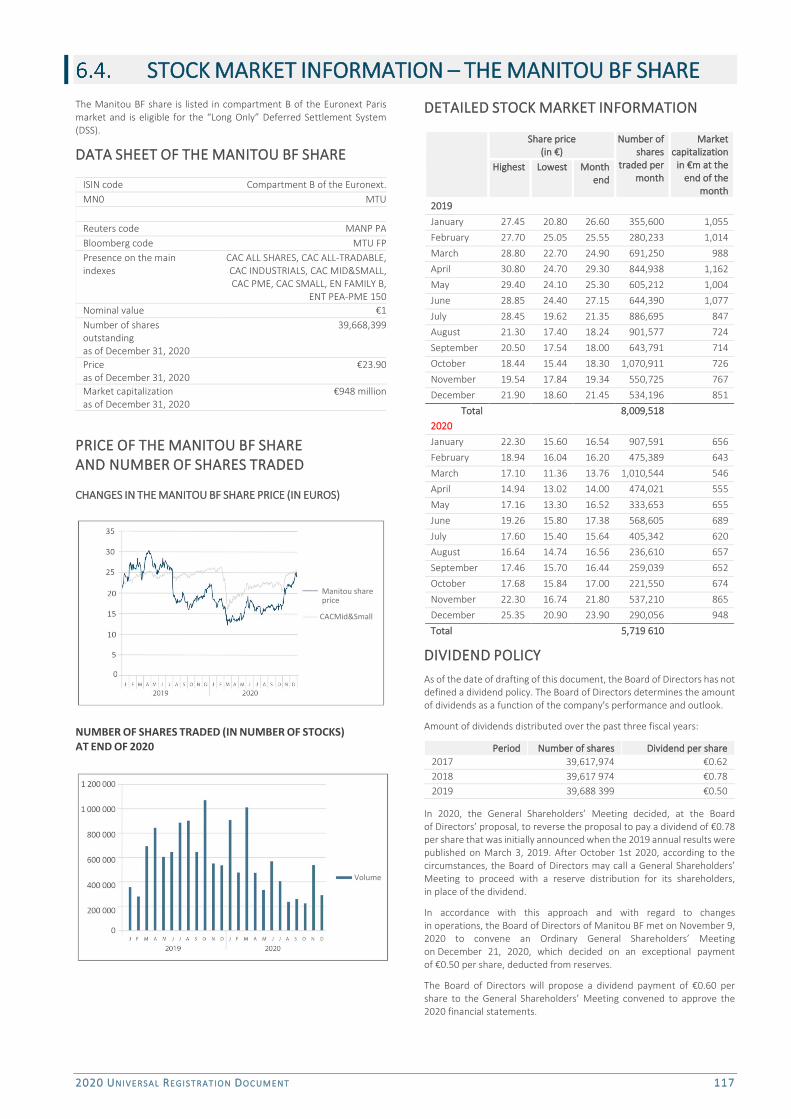
2020 UNIVERSAL REGIST RATION DOC UMENT 117
STOCK MARKET INFORMATION – THE MANITOU BF SHAREThe Manitou BF share is listed in compartment B of the Euronext Paris market and is eligible for the “Long Only” Deferred Settlement System (DSS).
DATA SHEET OF THE MANITOU BF SHARE
ISIN code Compartment B of the Euronext. MN0 MTU Reuters code MANP PA Bloomberg code MTU FP Presence on the main indexes
CAC ALL SHARES, CAC ALL-TRADABLE, CAC INDUSTRIALS, CAC MID&SMALL, CAC PME, CAC SMALL, EN FAMILY B,
ENT PEA-PME 150 Nominal value €1 Number of shares outstanding as of December 31, 2020
39,668,399
Price as of December 31, 2020
€23.90
Market capitalization as of December 31, 2020
€948 million
PRICE OF THE MANITOU BF SHARE
AND NUMBER OF SHARES TRADED
CHANGES IN THE MANITOU BF SHARE PRICE (IN EUROS)
NUMBER OF SHARES TRADED (IN NUMBER OF STOCKS) AT END OF 2020
DETAILED STOCK MARKET INFORMATION
Share price (in €)
Number of shares
traded per month
Market capitalization
in €m at the end of the
month
Highest Lowest Month end
2019 January 27.45 20.80 26.60 355,600 1,055 February 27.70 25.05 25.55 280,233 1,014 March 28.80 22.70 24.90 691,250 988 April 30.80 24.70 29.30 844,938 1,162 May 29.40 24.10 25.30 605,212 1,004 June 28.85 24.40 27.15 644,390 1,077 July 28.45 19.62 21.35 886,695 847 August 21.30 17.40 18.24 901,577 724 September 20.50 17.54 18.00 643,791 714 October 18.44 15.44 18.30 1,070,911 726 November 19.54 17.84 19.34 550,725 767 December 21.90 18.60 21.45 534,196 851
Total 8,009,518 2020 January 22.30 15.60 16.54 907,591 656 February 18.94 16.04 16.20 475,389 643 March 17.10 11.36 13.76 1,010,544 546 April 14.94 13.02 14.00 474,021 555 May 17.16 13.30 16.52 333,653 655 June 19.26 15.80 17.38 568,605 689 July 17.60 15.40 15.64 405,342 620 August 16.64 14.74 16.56 236,610 657 September 17.46 15.70 16.44 259,039 652 October 17.68 15.84 17.00 221,550 674 November 22.30 16.74 21.80 537,210 865 December 25.35 20.90 23.90 290,056 948 Total 5,719 610
DIVIDEND POLICY As of the date of drafting of this document, the Board of Directors has not defined a dividend policy. The Board of Directors determines the amount of dividends as a function of the company's performance and outlook.
Amount of dividends distributed over the past three fiscal years:
Period Number of shares Dividend per share 2017 39,617,974 €0.62 2018 39,617 974 €0.78 2019 39,688 399 €0.50
In 2020, the General Shareholders’ Meeting decided, at the Board of Directors’ proposal, to reverse the proposal to pay a dividend of €0.78 per share that was initially announced when the 2019 annual results were published on March 3, 2019. After October 1st 2020, according to the circumstances, the Board of Directors may call a General Shareholders’ Meeting to proceed with a reserve distribution for its shareholders, in place of the dividend.
In accordance with this approach and with regard to changes in operations, the Board of Directors of Manitou BF met on November 9, 2020 to convene an Ordinary General Shareholders’ Meeting on December 21, 2020, which decided on an exceptional payment of €0.50 per share, deducted from reserves.
The Board of Directors will propose a dividend payment of €0.60 per share to the General Shareholders’ Meeting convened to approve the 2020 financial statements.
Manitou share price
CACMid&Small
Volume

118
FINANCIAL AND ACCOUNTING INFORMATION
2020 UNIVERSAL REGIST RATION DOC UMENT 119

120
CONSOLIDATED FINANCIAL STATEMENTS
STATEMENTS OF COMPREHENSIVE INCOME
CONSOLIDATED INCOME STATEMENT
in thousands of euros 2019 2020
Net sales Note 5.2.1 2,093,577 1,585,105
Cost of goods and services sold Note 5.2.2 -1,747,509 -1,336,314 Research & development costs Note 5.2.3 -27,732 -24,520 Selling, marketing, & service expenses Note 5.2.4 -113,504 -89,879 Administrative expenses Note 5.2.4 -61,170 -51,958 Other operating income and expenses Note 5.2.5 4,946 2,907 Recurring operating income 148,608 85,342 Non-recurring operating income and expenses Note 5.2.6 -2,534 -10,561 Operating income 146,074 74,781 Share of profits of associates 2,192 1,683 Operating income including net income from equity consolidated associated undertakings 148,265 76,464 Financial income 37,617 37,418 Financial expenses -45,144 -48,733 Financial result Note 13.2.1 -7,527 -11,315 Income before tax 140,738 65,149 Taxes Note 12 -44,982 -24,851 Net income 95,757 40,298 Attributable to equity holders of the parent 95,625 39,583 Portion attributable to non-controlling equity interests 132 715
EARNINGS PER SHARE (IN EUROS)
2019 2020
Group share of net income Note 10.2 2.50 1.03
Diluted earnings per share Note 10.2 2.50 1.03
OTHER COMPONENTS OF COMPREHENSIVE INCOME AND EXPENSE
in thousands of euros 2019 2020
Income (loss) for the period 95,757 40,298
Items that will be reclassified to profit or loss in subsequent periods
Adjustments in the fair value of available-for-sale financial assets 131 219
Translation differences arising on foreign activities 6,861 -23,200
Interest rate hedging and exchange instruments -2,715 2,227
Items that will not be reclassified to profit or loss in subsequent periods
Actuarial gains (losses) on defined benefits plans -2,282 -169
Total gains and losses recognized directly in other components of comprehensive income 1,995 -20,923
Comprehensive income (loss) for the period 97,752 19,374
Attributable to equity holders of the parent 97,417 19,103
Portion attributable to non-controlling equity interests 335 271
THE OTHER COMPONENTS OF COMPREHENSIVE INCOME ARE REPORTED NET OF ASSOCIATED TAXES. THE TAX IMPACT IS AS FOLLOWS:
in thousands of euros 2019 2020
Items that will be reclassified to profit or loss in subsequent periods 1,180 -1,191
Items that will not be reclassified to profit or loss in subsequent periods 342 156
Total tax impact 1,522 -1,035

2020 UNIVERSAL REGIST RATION DOC UMENT 121
CONSOLIDATED STATEMENT OF FINANCIAL SITUATION
ASSETS
in thousands of euros December 31, 2019 Net amount as of
December 31, 2020
Goodwill Note 7 288 288
Intangible assets Note 7 54,705 56,879
Tangible assets Note 7 211,593 212,663
Right-of-use of leased assets Note 8 16,461 15,785
Investments in equity affiliates Note 14 16,986 18,277
Sales financing receivables Note 13.1.2 7,738 6,699
Other non-current assets Notes 9.3 and 13.1.2 11,346 11,766
Deferred tax assets Note 12 17,581 14,829
Non-current assets 336,698 337,186
Inventories & work in progress Note 9.1 589,745 450,867
Net trade receivables Note 9.2 380,438 300,034
Income taxes Note 12.1 7,990 13,777
Other current assets Notes 9.3 and 13.1.2
and 13.1.2 47,536 48,256
Cash and cash equivalents Note 13.1.2 22,333 120,721
Current assets 1,048,043 933,656
Non-current assets held for sale 0 0
Total assets 1,384,741 1,270,842
LIABILITIES
in thousands of euros December 31, 2019 Net amount as of
December 31, 2020
Share capital Note 10 39,668 39,668
Share premiums 46,098 46,098
Treasury shares -23,714 -23,799
Reserves and net income - Group share 596,779 597,042
Shareholder's equity attributable to company's shareholders 658,831 659,009
Non controlling equity interests 5,815 6,780
Shareholders' equity 664,646 665,789
Non-current provisions Note 11.1 48,862 47,157
Non-current financial liabilities Note 13.1.3 149,726 145,089
Non-current rental liabilities Note 8.2 12,269 12,105
Other non-current liabilities Note 9.4 3,088 2,130
Deferred tax liabilities Note 12 1,751 2,841
Non-current liabilities 215,696 209,323
Current provisions Note 11.1 18,964 20,403
Current financial liabilities Note 13.1.3 64,722 17,375
Current rental liabilities Note 8.2 5,602 4,806
Supplier accounts payable and related Note 9.4 253,446 215,887
Income taxes Note 12 4,087 1,139
Other current liabilities Note 9.4 157,579 136,120
Current liabilities 504,399 395,730
Total liabilities 1,384,741 1,270,842

122
CONSOLIDATED SHAREHOLDERS’ EQUITY
CHANGE IN CONSOLIDATED SHAREHOLDERS’ EQUITY
Total shareholder's equity
in thousands of euros Share
Capital Share
premiums
Currency translation differences
Treasury shares
Consolidated reserves
Attributable to company's shareholders
Non controlling
equity interests Total
As of December 31, 2018 39,668 46,098 1,723 -24,018 533,503 592,389 4,585 596,974
Effect of applications of new standards -1,003 -999 -3 -1,003
As of January 1, 2019 39,668 46,098 1,723 -24,018 532,501 591,390 4,582 595,971
Gains and losses recognized in equity
6,861 -4,866 1,792 203 1,995
Net income 95,757 95,625 132 95,757
Comprehensive income (loss) 0 0 6,861 0 90,891 97,417 335 97,752 Expenses related to option plans
0
Distributed dividends -30,162 -30,039 -123 -30,162
Treasury shares 304 -304 -0 -0
Capital increase 0
Changes in control of consolidated entities
-437 609 -15 187 172
Acquisitions and disposals of minority interests -8 -119 111 -8
Commitments to buy back minority interests 723 723 723
Other 197 197 197
As of December 31, 2019 39,668 46,098 8,148 -23,714 594,447 658,831 5,815 664,646
Effect of applications of new standards 0
As of January 1, 2020 39,668 46,098 8,148 -23,714 594,447 658,831 5,815 664,646
Gains and losses recognized in equity -23,200 2,277 -20,479 -444 -20,923
Net income 40,298 39,583 715 40,298
Comprehensive income (loss) 0 0 -23,200 0 42,575 19,103 271 19,374 Expenses related to option plans
Distributed dividends -19,443 -19,417 -25 -19,443
Treasury shares -85 18 -67 -67
Capital increase
Changes in control of consolidated entities
Acquisitions and disposals of minority interests
Commitments to buy back minority interests
719 719 719
Other 560 560 560
As of December 31, 2020 39,668 46,098 -15,052 -23,799 618,876 659,009 6,780 665,789

2020 UNIVERSAL REGIST RATION DOC UMENT 123
CASH FLOW STATEMENT
in thousands of euros December 31, 2019 December 31, 2020
Income for the period 95,757 40,298
Net income of companies accounted for by the equity method, net of dividends 1,375 -1,683
Amortization and depreciation of tangible and intangible assets 46,022 53,077
Funding (reversal) of provisions and impairments 3,829 1,184
Tax expenses (payable and deferred) 44,982 24,851
Other non-cash expenses (income) 135 437
Self-financing capacity 192,100 118,165
Taxes paid -48,265 -30,876
Change in working capital requirement Note 9 -56,134 146,443
Changes in assets and liabilities related to leased machines -21,060 -12,180
Net cash flows of operational activities 66,641 221,552
Acquisitions of intangible assets -20,864 -18,330
Acquisitions of tangible assets -50,243 -28,117
Changes in suppliers of fixed assets 2,761 -3,593
Disposals of tangible and intangible assets 882 -37
Acquisitions of equity interests with gain of control, net of cash acquired -2,668 0
Disposals of equity interests with loss of control, net of cash transferred 0 0
Other -25 -197
Net cash flows on operational investments -70,157 -50,275
Capital increase 171 0
Dividends paid to company's shareholders -30,162 -19,442
Acquisitions of own shares (net of disposals) 0 0
Buy-back of interests not conferring control 0 0
Changes in other financial assets and liabilities Note 13.1.3 32,430 -20,424
Repayment of rental liabilities Note 13.1.3 -5,178 -5,600
Other Note 13.1.3 1,098 -512
Net cash flows on operational financing -1,641 -45,977
Change in net cash position -5,157 125,300
Cash, cash equivalents, and bank overdrafts at beginning of the year -609 -4,997
Exchange gains (losses) on cash and bank overdrafts 769 -485
Cash, cash equivalents, and bank overdrafts at closing -4,997 119,818

124
NOTES TO THE CONSOLIDATED FINANCIAL STATEMENTS
The consolidated financial statements reflect the accounting situation of Manitou BF SA and its subsidiaries (jointly, “Manitou Group”) as well as the group’s interests in related companies and joint ventures. They are expressed in euros.
The consolidated financial statements of Manitou Group were approved by the Board of Directors on March 4, 2021.
The accounting rules and principles are identified by a box of a specific color.
NOTE 1 ACCOUNTING PRINCIPLES
NOTE 1.1 ACCOUNTING STANDARDS USED
BY THE GROUP
The financial statements of Manitou Group as of December 31, 2020 were drawn up, on the balance-sheet date, in accordance with the IFRS standards, as adopted by the European Union. These international standards include the IAS (International Accounting Standards), IFRS (International Financial Reporting Standards), and the interpretations (SIC and IFRIC).
NOTE 1.1.1 STANDARDS, INTERPRETATIONS, AND AMENDMENTS TO EXISTING STANDARDS
THAT MUST BE APPLIED TO FISCAL YEARS
STARTING ON OR AFTER JANUARY 1, 2020
The accounting and valuation rules applied by the group in the consolidated financial statements ending December 31, 2020 are identical to those used in the financial statements ending December 31, 2019.
The standards, interpretations, and amendments of existing and applicable standards that must be applied from the beginning of fiscal year 2020 have no significant impact on the group's financial statements.
NOTE 1.1.2 STANDARDS, INTERPRETATIONS, AND
AMENDMENTS TO EXISTING STANDARDS
APPLICABLE IN ADVANCE TO FISCAL YEARS
STARTING ON OR AFTER JANUARY 1, 2020
The new standards, interpretations, and amendments of existing and applicable standards, applicable by anticipation to accounting periods starting from January 1, 2020 onwards have not been adopted by the group.
NOTE 1.2 ESTIMATES AND ASSUMPTIONS
The consolidated financial statements were prepared according to the historical cost principle, with the exception of certain categories of assets and liabilities which were valued at fair value in accordance with the rules laid down by IFRS. The asset and liability categories concerned are specified in the notes below.
The preparation of financial statements in accordance with IFRS requires the use of estimates and assumptions that affect the accounting value of certain assets and liabilities and income and expense items, and certain information given in the notes to the financial statements. Manitou regularly reviews the estimates and assumptions used, to reflect past experience and other factors that may influence the amounts reported in the financial statements. The Audit Committee was also required to provide its opinion in the application of the group’s accounting methods.
The main financial statement items that rely on estimates and judgments are as follows:
the recoverable value of intangible and tangible assets, as well as their expected useful life (see note 7),
provisions, especially for warranties and litigation (see note 11),
employee benefits (see note 6),
valuation of the financial instruments (see note 13.2.2),
deferred tax assets (see note 12),
valuation of rights-of-use of leased assets and lease liabilities (see note 8).
The income and expenses related to the Covid-19 pandemic are recognized as ordinary operating income and expenses, with the exception of income and expenses typically recognized as non-operating income/expenses in accordance with previously applied accounting principles.
For the impacts of Covid-19, see Note 4.
NOTE 2 SIGNIFICANT EVENTS
Note
Covid-19 crisis Note 4 Developments in the JCB dispute Note 11.2
2020 UNIVERSAL REGIST RATION DOC UMENT 125
NOTE 3 CONSOLIDATION SCOPE
ACCOUNTING PRINCIPLES
CONSOLIDATION METHODS Manitou BF and the companies over which it exercises full direct or indirect control (subsidiaries) are fully consolidated. Control exists when the group:
has power over the company,
is exposed or entitled to variable returns due to its links with the company,
has the ability to exercise its power over the activities of the company that it deems relevant so as to influence the amount of returns it obtains.
The companies over which Manitou BF directly or indirectly exercises significant influence (associates) are accounted for using the equity method. The group exercises significant influence when it holds more than 20 % of the voting rights in the company.
Manitou Group also consolidates companies under its joint control (joint ventures) using the equity method. Joint control is a partnership that entails common control over the company by the group and at least one other partner.
Apart from Manitou Group Finance and Manitou Finance Ltd., which were accounted for using the equity method, all companies were fully consolidated.
Consolidation using the equity method involves recognizing, in the group's consolidated statement of financial situation, its stake in the companies.
All the companies were consolidated on the basis of the financial statements ended December 31, 2020.
Manitou Group has no special purpose entities. Furthermore, there was no deconsolidation in the fiscal year or in the prior periods.
All transactions between consolidated subsidiaries and the group’s internal results are eliminated (capital gains, profits on inventories, dividends).
The results of acquired subsidiaries are consolidated at the time that control is exercised.
CHANGE IN SCOPE The business combinations that took place after January 1, 2010 are accounted for using the purchase method, in accordance with IFRS 3 “Business Combinations.”
Identifiable assets, liabilities and contingent liabilities of the entity acquired are accounted for at their fair value on the date of acquisition provided they fulfill the accounting criteria of IFRS 3 (revised). Residual goodwill represents the expected cash flow from post-acquisition synergies in addition to the assets and liabilities recognized during the first consolidation. The transaction costs are recognized immediately in expenses when they are incurred. In the event of a price adjustment in the 12 months following the date of acquisition, the initial provisional valuation is adjusted in exchange for goodwill. Any subsequent adjustment is recognized as a liability or a receivable through the group’s income.
In the event of acquisition of an additional interest in a consolidated subsidiary, the difference between the acquisition price and the accounting value of the non-controlling interests is recognized as a change in shareholders' equity.
Any negative difference between the acquisition cost and the fair value of the identifiable net assets is recognized as income during the acquisition period.
In accordance with the provisions of IAS 36 “Impairment of assets,” goodwill is not amortized, but is subject to an annual impairment test.
NON-CURRENT ASSETS HELD FOR SALE The non-current assets, or group of assets and liabilities directly linked, are considered as held for sale if it is highly likely that their accounting value will be covered primarily by a sale rather than by continued use. Pursuant to IFRS 5, these assets are then measured and recognized at their net book value or their fair value less the selling costs, whichever is the lowest. They cease to be depreciated as soon as they are qualified as assets held for sale. In the case of securities consolidated using the equity method, this consolidation stops as soon as the asset meets the IFRS 5 application conditions.
According to IFRS 5, a discontinued activity is a component of an entity that has been disposed of or is classified as held for sale, and
represents a primary and separate business line or geographic region,
is part of a unique and coordinated plan for disposal of a primary and separate business line or geographical region, or
is a subsidiary acquired exclusively for resale and the disposal entails loss of control.
The non-current assets held for sale are presented on a separate line of the group’s balance sheet, without the previous periods being restated.
TRANSLATION METHOD FOR FOREIGN CURRENCY
OPERATIONS AND TRANSACTIONS
TRANSLATION OF FINANCIAL STATEMENTS IN FOREIGN CURRENCIES The consolidated financial statements of the group are presented in euros.
The financial statements of group companies whose operating currency (currency of the primary economic environment, which is typically the local currency) is different from the reporting currency of the consolidated financial statements (the euro) are translated as follows:
assets and liabilities: at the closing exchange rate in effect on each balance sheet date (also called the closing rate),
income and expenses on the income statement: at the average exchange rate for the period. All resulting currency translation differences are recognized as a separate line item under shareholders’ equity.
Upon consolidation, exchange differences arising from net investments in foreign operations are allocated to shareholders’ equity. When a foreign entity is disposed of, any such currency translation differences are recognized in the income statement as a profit or loss on disposal.
Goodwill and fair value adjustments arising from the acquisition of a foreign operation are treated as assets and liabilities of the foreign operation and translated at the closing exchange rate.
No Manitou Group company operates in a hyperinflationary economy.
TRANSLATION OF FOREIGN CURRENCY TRANSACTIONS Transactions denominated in a currency other than the operating currency are initially translated using the exchange rate prevailing on the transaction date.
The amounts recognized in the income statement are reported:
as financial income for currency translation differences relating to financial transactions,
as costs of goods and services sold in operating income for other currency translation differences.
EXCHANGE GAINS AND LOSSES Exchange gains and losses recognized on foreign currency operating transactions resulting from the difference between the valuation at the exchange rate on the day of the transaction and the rate on the day of settlement are allocated to “Cost of goods and services sold,” after hedging derivatives are factored in.
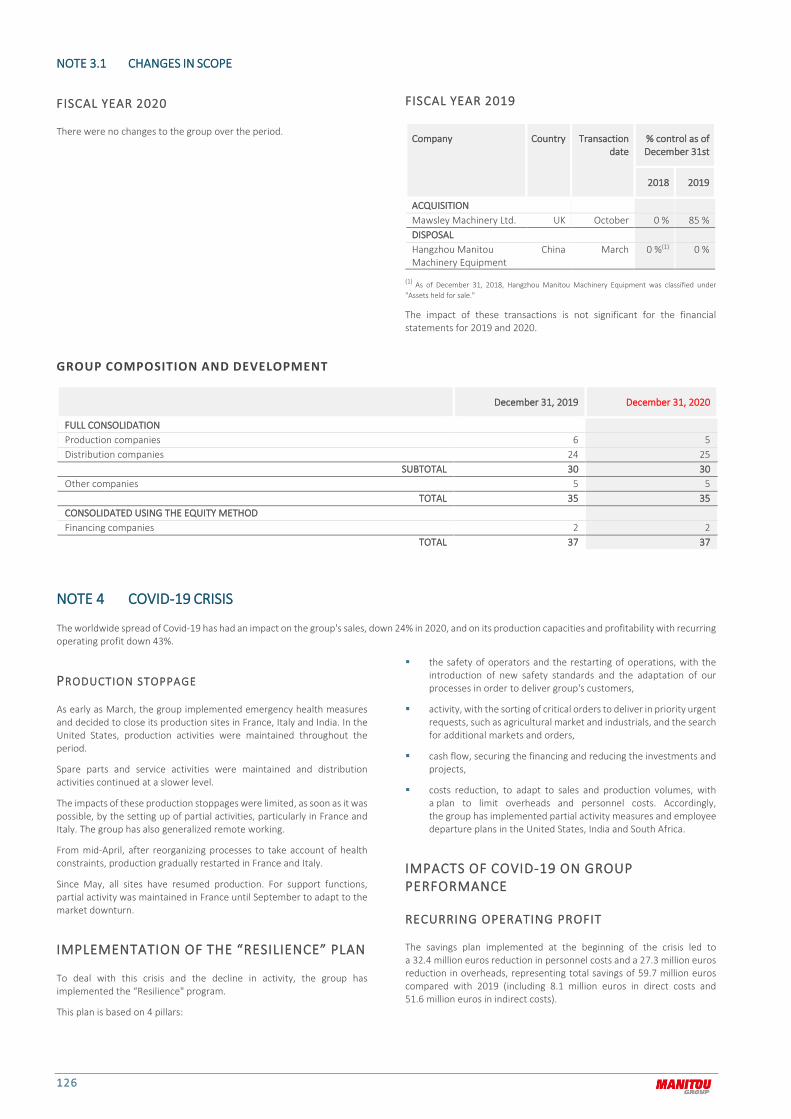
126
NOTE 3.1 CHANGES IN SCOPE
FISCAL YEAR 2020
There were no changes to the group over the period.
FISCAL YEAR 2019
Company Country Transaction date
% control as of December 31st
2018 2019
ACQUISITION Mawsley Machinery Ltd. UK October 0 % 85 % DISPOSAL Hangzhou Manitou Machinery Equipment
China March 0 %(1) 0 %
(1) As of December 31, 2018, Hangzhou Manitou Machinery Equipment was classified under "Assets held for sale."
The impact of these transactions is not significant for the financial statements for 2019 and 2020.
GROUP COMPOSITION AND DEVELOPMENT
December 31, 2019 December 31, 2020
FULL CONSOLIDATION Production companies 6 5 Distribution companies 24 25
SUBTOTAL 30 30 Other companies 5 5
TOTAL 35 35 CONSOLIDATED USING THE EQUITY METHOD Financing companies 2 2
TOTAL 37 37
NOTE 4 COVID-19 CRISIS
The worldwide spread of Covid-19 has had an impact on the group's sales, down 24% in 2020, and on its production capacities and profitability with recurring operating profit down 43%.
PRODUCTION STOPPAGE
As early as March, the group implemented emergency health measures and decided to close its production sites in France, Italy and India. In the United States, production activities were maintained throughout the period.
Spare parts and service activities were maintained and distribution activities continued at a slower level.
The impacts of these production stoppages were limited, as soon as it was possible, by the setting up of partial activities, particularly in France and Italy. The group has also generalized remote working.
From mid-April, after reorganizing processes to take account of health constraints, production gradually restarted in France and Italy.
Since May, all sites have resumed production. For support functions, partial activity was maintained in France until September to adapt to the market downturn.
IMPLEMENTATION OF THE “RESILIENCE” PLAN
To deal with this crisis and the decline in activity, the group has implemented the “Resilience" program.
This plan is based on 4 pillars:
the safety of operators and the restarting of operations, with the introduction of new safety standards and the adaptation of our processes in order to deliver group's customers,
activity, with the sorting of critical orders to deliver in priority urgent requests, such as agricultural market and industrials, and the search for additional markets and orders,
cash flow, securing the financing and reducing the investments and projects,
costs reduction, to adapt to sales and production volumes, with a plan to limit overheads and personnel costs. Accordingly, the group has implemented partial activity measures and employee departure plans in the United States, India and South Africa.
IMPACTS OF COVID-19 ON GROUP PERFORMANCE
RECURRING OPERATING PROFIT
The savings plan implemented at the beginning of the crisis led to a 32.4 million euros reduction in personnel costs and a 27.3 million euros reduction in overheads, representing total savings of 59.7 million euros compared with 2019 (including 8.1 million euros in direct costs and 51.6 million euros in indirect costs).
2020 UNIVERSAL REGIST RATION DOC UMENT 127
The savings in personnel costs include the impact of the implementation of partial activity measures in France and similar measures in other countries, as soon as it was possible. The group received 9.1 million euros in aid and benefited from a social security tax exemption of 6.6 million euros. These savings also include a cost reduction of 1.2 million euros related to the implementation of special inactivity plans, particularly in the United States ("Furlough").
At December 31, 2020, the main current costs incurred in connection with the Covid-19 epidemic amounted to 1.5 million. They correspond to costs related to the implementation of sanitary measures and donations to support medical teams.
OTHER NON-RECURRING OPERATING INCOME AND EXPENSES
As part of the "Resilience" program, the group has set up employee departure plans in the United States, India and South Africa. It has also decided to shut down its production activities in Brazil and to optimize its production capacity in the United States with the closure of its operations in Waco (Texas) at the end of March 2021. The production of articulated loaders will be consolidated in Yankton, one of its two plants in South Dakota. Forklift production will be transferred to Beaupréau, France. The North American import platform will be concentrated in Baltimore, Maryland.
All of these measures have generated non-recurring operating expenses of 9,0 million euros over the year 2020 and a reduction in the workforce of 200 employees, including 50 direct employees.
TREASURY AND FINANCING
On April 15, 2020, the Board of Directors decided, due to the uncertainties related to the health crisis, to waive the proposed dividend payment of €0.78 per share that was initially announced when the 2019 annual results were published on March 3, 2020. The Board had also mentioned that it could, after October 1st, 2020 and subject to the context, convene a Shareholders' Meeting in order to proceed with a distribution of reserves for its shareholders, replacing dividends.
In accordance with this approach and in light of the evolution of the business, the Board of Directors of Manitou BF met on November 9, 2020 to call an Ordinary Shareholders' Meeting on December 21st, 2020 which decided on an exceptional payment of €0.50 per share, taken from reserves.
In order to secure its financing and cash flow risk, the group issued an additional credit line of 110 million euros in March 2020, expiring in September 2020.
The group also obtained tax deferrals from the United Kingdom as part of aid measures related to the Covid-19 epidemic in the amount of 1.5 million euros.
OTHER EFFECTS OF COVID-19 ON THE GROUP'S CONSOLIDATED FINANCIAL STATEMENTS
Covid-19 did not have any significant impact on the 2020 consolidated financial statements other than those described above.
In particular :
the group has not identified any major risk of default among its customers and, as such, has not recognized any significant additional impairment losses for expected losses on its receivables,
the value and method of valuing inventories had not been questioned as of December 31, 2020,
the value of tangible assets, consisting mainly of land, buildings and industrial equipment, is not called into question with the current crisis. The group has not identified any facts or circumstances that would call into question the value of these assets,
the group considers that Covid-19 has not had any impact on its financial risk exposure related to operating and financing activities and on the management of these risks,
finally, the group has not made use of the guaranteed financing and support measures granted by certain States.

128
NOTE 5 OPERATIONAL DATA
NOTE 5.1 SEGMENT INFORMATION
NOTE 5.1.1 RESULT BY DIVISION
ACCOUNTING PRINCIPLES
In accordance with IFRS 8, the information by operating segment is prepared on the basis of operating reports submitted to group management.
This information is prepared in accordance with the IFRS applicable to consolidated financial statements.
It includes the following items:
sales,
operating income,
operating income including net income from equity associates, which are the performance indicators of the divisions.
The group is organized into three divisions, two product divisions and one service division.
The MHA (Material Handling and Access) product division is dedicated in particular to telehandlers, masted industrial and rough-terrain forklift trucks, mounted forklift trucks, and aerial work platforms. Its mission is to optimize the development and production of Manitou brand name products.
The CEP (Compact Equipment Products) product division optimizes the development and production of Gehl & Mustang-branded skidsteer loaders, track loaders, articulated loaders, backhoe loaders, and telehandlers.
The S&S (Services & Solutions) division includes service activities to support sales (financing approaches, warranty contracts, maintenance and full service contracts, fleet management, etc.), after-sales services (spare parts, technical training, warranty contract management, used equipment management, etc.), and services to end users (geolocation, user training, advice, etc.). The aim of this division is to create service offers to meet the expectations of each of our customers in our value chain and increase the resilience of group sales.
These three divisions design and assemble the products and services that are distributed by the sales and marketing organization to dealers and the group’s major accounts in 140 countries.
in thousands of euros
MHA Material Handling
and Access
CEP Compact Equipment
Products
S&S Services & Solutions
TOTAL
2019 2020 2019 2020 2019 2020 2019 2020
Net sales 1,455,822 1,023,418 328,313 261,580 309,442 300,106 2,093,577 1,585,105
Cost of goods and services sold -1,235,507 -881,357 -289,828 -243,804 -222,174 -211,153 -1,747,509 -1,336,314
Gross margin 220,315 142,061 38,485 17,777 87,268 88,954 346,068 248,791
As a % 15.1% 13.9% 11.7% 6.8% 28.2% 29.6% 16.5% 15.7%
Research and development costs -21,225 -18,793 -6,509 -5,727 2 0 -27,732 -24,520
Selling, marketing, and service expenses -48,127 -37,371 -17,257 -10,959 -48,120 -41,548 -113,504 -89,879
Administrative expenses -35,423 -30,144 -16,175 -12,215 -9,573 -9,598 -61,170 -51,958
Other operating income and expenses 710 3,179 3,822 -909 414 637 4,946 2,907
Recurring operating income 116,251 58,931 2,367 -12,034 29,990 38,444 148,608 85,342
As a % 8.0% 5.8% 0.7% -4.6% 9.7% 12.8% 7.1% 5.4%
Non-recurring operating income and expenses -2,004 -5,315 -286 -4,835 -244 -411 -2,534 -10,561
Operating income 114,247 53,617 2,081 -16,869 29,746 38,033 146,074 74,781
As a % 7.9% 5.2% 0.6% -6.5% 9.6% 12.7% 7.0% 4.7%
Share of profits of associates 0 0 0 0 2,192 1,683 2,192 1,683
Operating income including net income from equity consolidated associated undertakings
114,247 53,617 2,081 -16,869 31,938 39,716 148,265 76,464
The spare parts and attachments distribution business, which is part of the Services & Solutions division, benefits from services provided by the MHA and CEP divisions (R&D, qualification of parts, qualification of suppliers), from the installed base of machines sold, and from the brand name recognition developed by these divisions.
In order to compensate for all these benefits, the group’s divisional reporting includes fees from the Services & Solutions division to the MHA and CEP divisions. This fee is calculated based on comparable external indicators from independent spare parts distributors for which the
median operating income over a 5-year period amounted to 4.25% in Europe and 4.87% in the USA, the main regions in which the S&S division operates. The fee is allocated to each division in the “Cost of goods and services sold” line item, which therefore corresponds to the cost of goods and services sold, net of royalties expense or income.
Assets, cash flows and liabilities are not allocated to the individual divisions, as the operating sector information used by group management does not include those various items.

2020 UNIVERSAL REGIST RATION DOC UMENT 129
NOTE 5.1.2 SALES BY DIVISION AND REGION
2019 net sales 2020 net sales
SOUTHERN EUROPE
NORTHERN EUROPE AMERICAS APAM * TOTAL in millions of euros
and % of total
SOUTHERN EUROPE
NORTHERN EUROPE AMERICAS APAM * TOTAL
542.7 664.9 129.4 118.9 1,455.9 MHA
424.7 430.8 87.5 80.5 1,023.4 26% 32% 6% 6% 70% 27% 27% 6% 5% 65%
23.1 45.5 218.9 40.9 328.3 CEP
23.5 46.7 157.1 34.2 261.6 1% 2% 10% 2% 16% 1% 3% 10% 2% 17%
111.1 103.1 54.4 40.8 309.4 S&S
106.7 106.1 51.6 35.7 300.1 5% 5% 3% 2% 15% 7% 7% 3% 2% 19%
676.9 813.5 402.6 200.6 2,093.6 TOTAL
554.9 583.6 296.2 150.3 1,585.1 32% 39% 19% 10% 100% 35% 37% 19% 9% 100%
* Asia, Pacific, Africa, Middle East.
THE MAIN COUNTRIES AS A % OF NET SALES
as a % 2019 2020
France 21% 22%
United States of America 15% 15%
United Kingdom 9% 7%
Germany 6% 6%
Belgium 5% 5%
Italy 5% 6%
Spain 3% 3%
Pays-Bas 3% 3%
Australia 3% 3%
Russia 3% 3%
NOTE 5.2 OPERATING INCOME
ACCOUNTING PRINCIPLES The operating income includes all recurring and non-recurring items described below, before taking into account the financial result, income tax, and the group's share of the net income from equity associates. It includes:
revenues (note 5.2.1),
the cost of goods and services sold (note 5.2.2),
research and development costs (note 5.2.3),
sales, marketing, and services costs and administrative expenses (note 5.2.4),
other operating income and expenses (note 5.2.5),
non-recurring operating income and expenses (note 5.2.6).
The group uses operating income as a primary performance indicator.
NOTE 5.2.1 NET SALES
ACCOUNTING PRINCIPLES Revenues amount to all proceeds from the sales of the group’s products, from trading activities, and the provision of services associated with sales. They are primarily comprised of:
sales of new handing equipment assembled within the group or acquired from third parties,
spare parts and attachments,
equipment rentals,
equipment fleet management services,
miscellaneous services (extended warranties).
They are net of:
value-added tax,
returns of goods,
discounts and allowances,
intra-group sales.
In accordance with IFRS 15, product sales are recognized when the group has honored its service commitment to the purchaser and when control over the products has been transferred. In general, this corresponds to when the products are made available to the distribution network (in the case of independent dealers) or upon delivery to the end customer (for direct sales). In the case of provision of services, the product is recognized when the service has been performed. Thus, for warranty extensions, the revenue is recognized as the service is provided.

130
NET SALES BY TYPE AND REGION
in millions of euros
Sales of goods Sales of services TOTAL
2019 as a % 2020 as a % 2019 as a % 2020 as a % 2019 as a % 2020 as a %
Southern Europe 658 32% 536 35% 19 45% 19 43% 677 32% 555 35%
Northern Europe 804 39% 572 37% 9 23% 12 27% 813 39% 584 37%
Americas 400 20% 294 19% 2 6% 2 6% 403 19% 296 19%
APAM 190 9% 139 9% 11 27% 11 25% 201 10% 150 9%
TOTAL 2,052 100% 1,542 100% 42 100% 43 100% 2,094 100% 1,585 100%
NET SALES BY MARKET
Services are sold exclusively by the S&S (Services & Solutions) division. The amount of revenue from sales and services is therefore attributable to this division alone.
The group’s customer base is very diverse, with the largest customer representing no more than 2% of total revenue.
NOTE 5.2.2 COST OF GOODS AND SERVICES SOLD
ACCOUNTING PRINCIPLES
COST OF GOODS AND SERVICES SOLD
The cost of sales is made up of the cost of goods and services sold, which comprises the cost of raw materials and components, labor directly attributable to the goods or services, and all related production and logistics operating costs. It also includes the amortization of intangible assets, equipment and materials allocated to production, contractual warranty costs, provisions for inventory impairment, and exchange gains and losses on operating income in foreign currency resulting from the difference between the valuation at the exchange rate on the day of the transaction and the rate on the day of settlement.
GROSS MARGIN
The gross margin on the cost of sales is the difference between sales and the cost of sales.
in thousands of euros 2019 2020
Material purchases -1,387,998 -1,024,169
Direct and indirect labor -203,008 -166,006
Depreciation, amortization and impairment* -35,926 -40,054
Other -120,577 -106,084
Cost of goods and services sold -1,747,509 -1,336,314
* of which €2.7 million in IFRS 16 impact
INDUSTRIES 14%
CONSTRUCTION 56%
AGRICULTURE 30%

2020 UNIVERSAL REGIST RATION DOC UMENT 131
NOTE 5.2.3 RESEARCH AND DEVELOPMENT COSTS
ACCOUNTING PRINCIPLES
RESEARCH AND DEVELOPMENT COSTS
Research and development costs consist of personnel costs for staff assigned to innovation, development, design, prototyping, and product improvements. The businesses frequently use external services as well as dedicated equipment and materials for which depreciation is charged to the function.
Development activities meeting the criteria of IAS 38 may be recognized in intangible assets and subsequently amortized in cost of sales (note 7.1).
The expenses of the fiscal year include research costs, study and development costs uncapitalized pursuant to the criteria noted in 7.1, as well as the depreciation expense of capitalized development costs.
The Research Tax Credit in France, which is calculated on the basis of certain research expenses associated with “eligible” projects, is paid by the State. If the beneficiary of the Research Tax Credit owes corporate tax, this credit will be deducted against taxes to be paid; otherwise, it will be repaid by the State within three years. Therefore, the Research Tax Credit does not fall within the scope of IAS 12 “Income taxes” and is recognized as a decrease in the Research and Development costs in the group's operating margin at the rate at which the financed costs are recognized in the income statement.
in millions of euros 2019 2020
Total expenses incurred 40,255 35,801
Capitalized development costs -12,523 -11,281
Total research and development costs 27,732 24,520
NOTE 5.2.4 SALES, MARKETING, AND SERVICE COSTS AND ADMINISTRATIVE EXPENSES
ACCOUNTING PRINCIPLES
SALES AND MARKETING COSTS
Sales costs consist primarily of personnel and associated costs allocated to business development assignments, coordination of dealer networks, and marketing and technical expenses. This line item also includes sales commissions, advertising costs, trade shows, credit insurance expenses, the cost of sales warranties, travel expenses, and the depreciation of associated infrastructure.
ADMINISTRATIVE EXPENSES
Administrative expenses consist primarily of personnel expenses and costs associated with the support functions (human resources, finance, general secretariat, etc.). They also include depreciation of the infrastructure associated with these functions.
in thousands of euros 2019 2020
External expenses -59,546 -40,371
Personnel expenses -93,174 -82,292
Net depreciation/amortization expenses (non-production)* -8,308 -9,388
Other** -13,646 -9,785
Sales, marketing, and service costs and administrative expenses -174,674 -141,836
* of which €2.8 million in IFRS 16 impact ** Primarily concerns commissions
NOTE 5.2.5 OTHER OPERATING INCOME AND EXPENSES
in thousands of euros 2019 2020
Disposal of assets -245 -492
Other income 8,133 5,572
Other expenses -1,860 -1,023
Net increase in provisions -1,082 -1,150
Total other operating income and expenses 4,946 2,907
The result for the year included income of €3.0 million following a favorable outcome in a dispute over an environmental tax in Russia.

132
In 2019, other operating income and expenses included insurance compensation of €2.8 million due to the flooding and shutdown of the CEP production site in Madison (USA) and commercial compensation of + €0.9 million to compensate for costs due to late deliveries of engines by one of our suppliers in the United States.
NOTE 5.2.6 NON-RECURRING OPERATING INCOME AND EXPENSES
ACCOUNTING PRINCIPLES
NON-RECURRING INCOME & EXPENSES
The other non-recurring operating income and expenses, excluded from the recurring operating income, include:
impairment,
income from significant or unusual disposals of tangible and intangible assets,
acquisition and consolidation expenses,
income relating to “Badwill,”
income from disposals of consolidated securities,
restructuring costs,
unusual items corresponding to other income and expenses that are not usual in terms of their frequency, nature, and amount.
in thousands of euros 2019 2020
Staff costs associated with restructuring 0 -4,360
Impairment of financial assets 0
Net provisions for risks and contingencies 0 639
Other non-recurring income and expenses -2,534 -6,840
Total other operating income and expenses -2,534 -10,561
In 2020, other non-recurring income and expenses mainly included restructuring costs (€9.0 million) following the decision to stop production activities at Waco (United States), workforce reductions in the United States, South Africa, India and France, and the shutdown of production activity in Brazil.
In 2019, other non-recurring income and expenses included costs related to acquisition projects and legal costs relating to an ongoing patent disputes.
NOTE 5.2.7 EBITDA
in thousands of euros 2019 2020
Operating income 146,074 74,781
Amortization and depreciation 46,473 52,174
Impairment -339 0
EBITDA with lease commitments 192,207 126,955
Cancellation of the lease payment charge on contracts previously classified as operating leases -6,691 -6,655
EBITDA without lease commitments 185,516 120,300
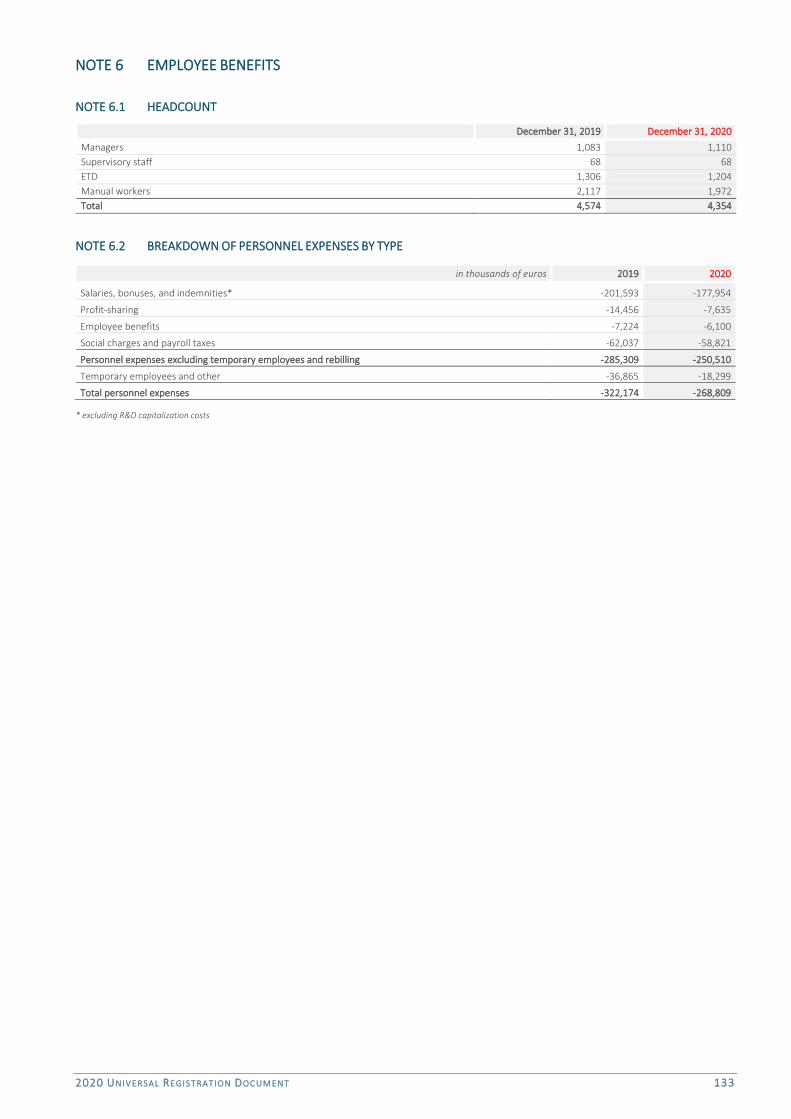
2020 UNIVERSAL REGIST RATION DOC UMENT 133
NOTE 6 EMPLOYEE BENEFITS
NOTE 6.1 HEADCOUNT
December 31, 2019 December 31, 2020 Managers 1,083 1,110 Supervisory staff 68 68 ETD 1,306 1,204 Manual workers 2,117 1,972 Total 4,574 4,354
NOTE 6.2 BREAKDOWN OF PERSONNEL EXPENSES BY TYPE
in thousands of euros 2019 2020
Salaries, bonuses, and indemnities* -201,593 -177,954
Profit-sharing -14,456 -7,635
Employee benefits -7,224 -6,100
Social charges and payroll taxes -62,037 -58,821
Personnel expenses excluding temporary employees and rebilling -285,309 -250,510
Temporary employees and other -36,865 -18,299
Total personnel expenses -322,174 -268,809
* excluding R&D capitalization costs

134
NOTE 6.3 EMPLOYEE BENEFITS
ACCOUNTING PRINCIPLES
The group has put in place a number of employee benefit plans with defined contributions or defined benefits.
The defined contribution plans are post-employment benefit plans under which Manitou Group pays contributions to an independent entity. In this case, the group is not bound by any legal or implicit requirement that compels it to make additional contributions in the event that the assets are not sufficient to pay the benefits due for services rendered. The contributions are accounted for as an expense when they fall due.
The liabilities resulting from defined benefit plans, and their costs, are calculated according to IAS 19 (revised), using the projected unit credit method. Commitments corresponding to benefits granted are
assessed taking into account the demographic and economic assumptions for each entity concerned. They are discounted to their present value using a discount rate based on the interest rates for the highest-quality bonds. The various categories of defined benefit plans in place within Manitou Group and the main assumptions used are presented in detail below.
Actuarial gains and losses generated by changes in assumptions are recorded in reserves.
The net expense for the period is the sum of the cost of services rendered, the cost related to unwinding the discount, the expected return on plan assets, and, if applicable, the cost of managing the assets.
NOTE 6.3.1 DEFINITION The defined benefit plans that result in the recognition of a provision relate to:
employee indemnities related to retirement or contract completion,
other long-term benefits such as long service awards,
pension schemes and other retirement benefits for certain employees,
a supplementary pension scheme for certain management employees in the USA,
medical insurance and post-employment life insurance.
These defined benefit schemes are usually covered by funds paid to insurance companies, which are valued at their fair value at year end. The value of these funds is deducted from the commitment valued in accordance with the provisions of IAS 19 (revised). The characteristics of the primary schemes are as follows:
United States
of America United States
of America United Kingdom France Italy
Pension plan b SERP Pension Retirement indemnity
Severance pay
Description
A “qualified” post-employment benefits plan that was closed to new members as of May 1, 2005 and frozen in terms of the acquisition of rights for all participants as of October 3, 2009. The benefits attributed are the greater of 1% of final salary multiplied by the number of years of service (capped at 35 years) or $22 per year of service.
A “non-qualified” post-employment benefits plan including a limited number of designated beneficiaries on the basis of individual agreements. One active employee is currently in the plan; all the other beneficiaries are former employees. The benefits granted under this plan are calculated based on a percentage of final average earnings.
Final salary-based scheme, frozen to new entrants and to the acquisition of new rights.
Amount paid at the time of retirement calculated based on years of service and final salary. This plan complies with legal requirements.
Amount paid at the time of retirement calculated based on years of service and final salary. This plan complies with legal requirements and has been frozen since 2007.
Plan risks
Investment risk, life expectancy risk, and interest rate risk.
Interest rate risk and life expectancy risk.
Investment risk, life expectancy risk, and market risk.
Volatility of the benefit disbursement amounts depending on the effective retirement date.
Volatility of the benefit disbursement amounts depending on the effective departure date of employees hired before 2007.
Investment strategy
A combination of 60 % in equities and the remainder in fixed-income instruments. The aim of this strategy is to grow the plan assets faster than its liabilities and to fund the minimum contribution in accordance with US law (ERISA and the Internal Revenue Code).
Although not considered as plan assets, the plan is funded via a Rabbi trust.
A combination of 50% in a diversified fund, 25% in non-indexed government bonds, and the remainder in corporate bonds denominated in GBP. The aim of this strategy is to provide a return sufficient to cover the future liabilities of members while maintaining a certain level of low-risk assets to cover pensions due in the short term.
Insurance contract making the funds invested immediately available. Assets characterized by the low volatility of their yield.
Lack of asset
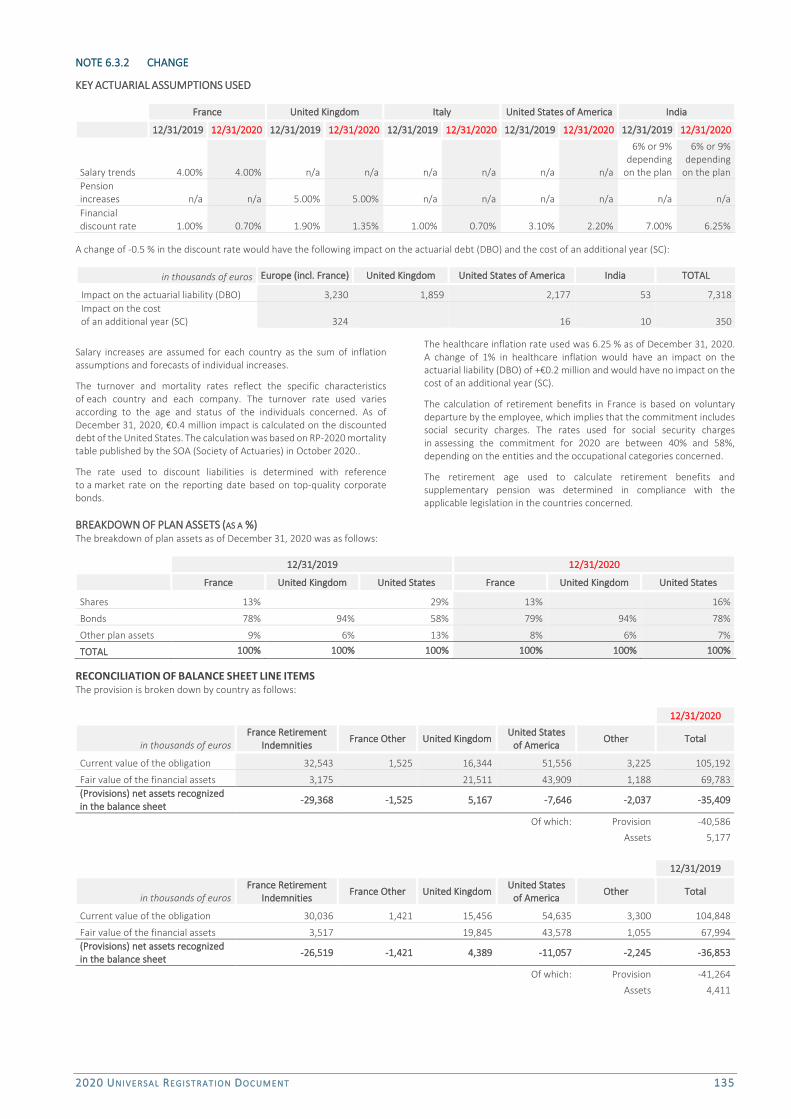
2020 UNIVERSAL REGIST RATION DOC UMENT 135
NOTE 6.3.2 CHANGE
KEY ACTUARIAL ASSUMPTIONS USED
France United Kingdom Italy United States of America India
12/31/2019 12/31/2020 12/31/2019 12/31/2020 12/31/2019 12/31/2020 12/31/2019 12/31/2020 12/31/2019 12/31/2020
Salary trends 4.00% 4.00% n/a n/a n/a n/a n/a n/a
6% or 9% depending
on the plan
6% or 9% depending
on the plan Pension increases n/a n/a 5.00% 5.00% n/a n/a n/a n/a n/a n/a Financial discount rate 1.00% 0.70% 1.90% 1.35% 1.00% 0.70% 3.10% 2.20% 7.00% 6.25%
A change of -0.5 % in the discount rate would have the following impact on the actuarial debt (DBO) and the cost of an additional year (SC):
in thousands of euros Europe (incl. France) United Kingdom United States of America India TOTAL
Impact on the actuarial liability (DBO) 3,230 1,859 2,177 53 7,318 Impact on the cost of an additional year (SC) 324 16 10 350
Salary increases are assumed for each country as the sum of inflation assumptions and forecasts of individual increases.
The turnover and mortality rates reflect the specific characteristics of each country and each company. The turnover rate used varies according to the age and status of the individuals concerned. As of December 31, 2020, €0.4 million impact is calculated on the discounted debt of the United States. The calculation was based on RP-2020 mortality table published by the SOA (Society of Actuaries) in October 2020..
The rate used to discount liabilities is determined with reference to a market rate on the reporting date based on top-quality corporate bonds.
The healthcare inflation rate used was 6.25 % as of December 31, 2020. A change of 1% in healthcare inflation would have an impact on the actuarial liability (DBO) of +€0.2 million and would have no impact on the cost of an additional year (SC).
The calculation of retirement benefits in France is based on voluntary departure by the employee, which implies that the commitment includes social security charges. The rates used for social security charges in assessing the commitment for 2020 are between 40% and 58%, depending on the entities and the occupational categories concerned.
The retirement age used to calculate retirement benefits and supplementary pension was determined in compliance with the applicable legislation in the countries concerned.
BREAKDOWN OF PLAN ASSETS (AS A %) The breakdown of plan assets as of December 31, 2020 was as follows:
12/31/2019 12/31/2020
France United Kingdom United States France United Kingdom United States
Shares 13% 29% 13% 16%
Bonds 78% 94% 58% 79% 94% 78%
Other plan assets 9% 6% 13% 8% 6% 7%
TOTAL 100% 100% 100% 100% 100% 100%
RECONCILIATION OF BALANCE SHEET LINE ITEMS The provision is broken down by country as follows:
12/31/2020
in thousands of euros France Retirement
Indemnities France Other United Kingdom United States
of America Other Total
Current value of the obligation 32,543 1,525 16,344 51,556 3,225 105,192
Fair value of the financial assets 3,175 21,511 43,909 1,188 69,783 (Provisions) net assets recognized in the balance sheet -29,368 -1,525 5,167 -7,646 -2,037 -35,409
Of which: Provision -40,586 Assets 5,177
12/31/2019
in thousands of euros France Retirement
Indemnities France Other United Kingdom United States
of America Other Total
Current value of the obligation 30,036 1,421 15,456 54,635 3,300 104,848
Fair value of the financial assets 3,517 19,845 43,578 1,055 67,994 (Provisions) net assets recognized in the balance sheet
-26,519 -1,421 4,389 -11,057 -2,245 -36,853
Of which: Provision -41,264
Assets 4,411

136
CHANGE IN COMMITMENTS AND PLAN ASSETS DURING THE YEAR
France United Kingdom United States
of America Other Total
in thousands of euros 12/31/2019 12/31/2020 12/31/2019 12/31/2020 12/31/2019 12/31/2020 12/31/2019 12/31/2020 12/31/2019 12/31/2020
Commitment
Beginning of period 26,311 31,457 15,180 15,456 50,261 54,636 2,993 3,296 94,746 104,845
Service costs 2,021 2,660 72 121 237 203 2,331 2,984
Discounting 507 337 410 274 2,021 1,614 147 82 3,085 2,307
Benefits paid -690 -407 -1,247 -876 -4,633 -4,348 -298 -234 -6,869 -5,865 Actuarial differences recognized in income statement 0 0 Liquidation/reduction and other 0 0
Past service costs -165 12 -153 0 Additions to the scope of consolidation 0 0 Actuarial losses (gains) – experience and demographic assumptions -463 -1,672 -2,689 630 -614 138 20 -2,383 -2,265 Actuarial losses (gains) – financial assumptions 3,936 1,693 2,581 2,139 4,929 4,681 150 94 11,596 8,607
Other costs 456 197 402 199 -83 -95 774 300 Exchange rate adjustment 765 -847 954 -4,734 -0 -141 1,719 -5,722
End of period 31,457 34,068 15,456 16,344 54,636 51,556 3,296 3,225 104,845 105,192 Plan assets
Beginning of period 4,052 3,517 18,015 19,845 36,754 43,578 865 1,055 59,686 67,995 Employer contributions 570 562 3,933 3,788 105 96 4,608 4,446
Benefits paid -633 -407 -1,247 -876 -4,287 -4,094 -5 -19 -6,172 -5,395 Expected return on assets 79 34 488 357 1,527 1,338 15 11 2,108 1,740 Difference - Expected return/actual return on assets 19 31 1,066 2,714 4,966 3,281 56 27 6,107 6,053 Additions to the scope of consolidation 0 0 0 0 0
Liquidations 0 0 0 0 0
Other 0 0 19 18 19 18 Exchange rate adjustment 954 -1,093 685 -3,981 1,639 -5,074
End of period 3,517 3,175 19,845 21,511 43,578 43,910 1,055 1,188 67,995 69,783 Reconciliation of the provision
Beginning of period -22,259 -27,940 2,835 4,389 -13,507 -11,058 -2,128 -2,241 -35,059 -36,850
Expense for the year -2,284 -2,963 -378 -114 -968 -596 -299 -179 -3,929 -3,851 Employer contributions 0 0 570 562 3,933 3,788 105 96 4,608 4,446
Benefits paid 57 0 0 0 347 254 293 215 697 469
SORIE -3,454 10 1,173 575 -593 -787 -232 -87 -3,106 -289 Additions to the scope of consolidation 0 0
Other 19 18 19 18 Exchange rate adjustment 189 -246 -269 753 0 141 -79 648
End of period -27,940 -30,893 4,389 5,167 -11,058 -7,646 -2,241 -2,037 -36,850 -35,408 Of which: Provisions -41,264 -40,586 Assets 4,411 5,177

2020 UNIVERSAL REGIST RATION DOC UMENT 137
BREAKDOWN OF EXPENSE FOR THE PERIOD
IAS 19 (Revised) France United Kingdom United States
of America Other Total
in thousands of euros 12/31/2019 12/31/2020 12/31/2019 12/31/2020 12/31/2019 12/31/2020 12/31/2019 12/31/2020 12/31/2019 12/31/2020
Adjustments to methodology 0
Service costs 1,856 2,660 0 0 72 121 250 203 2,178 2,984
Discounting 507 337 410 274 2,021 1,614 147 82 3,085 2,307 Expected return on assets -79 -34 -488 -357 -1,527 -1,338 -15 -11 -2,108 -1,740 Losses/gains recognized 0 0 0 0 Administrative expenses 0 456 197 402 199 -83 -95 774 300
Net expense 2,284 2,963 378 114 968 596 299 179 3,929 3,851
NOTE 6.4 SHARE-BASED COMPENSATION
In return for services rendered, the group is likely to grant certain members of personnel equity-settled or cash-settled share-based plans. The group then records its commitment as services are rendered by the beneficiaries, from the grant date to the date the rights are acquired.
NOTE 6.4.1 SUBSCRIPTION OPTION PLAN
There is no stock option plan.
NOTE 6.4.2 ALLOCATION OF PHANTOM SHARES
Since January 1, 2018, the President and CEO has benefited from a Phantom Shares plan whereby an annual bonus is paid, the amount of which will be based on the Manitou share value for the periods from 2018 to 2021. This bonus is subject to performance and attendance conditions.
For fiscal year 2020, no phantom shares were allocated. (15,500 phantom shares valued at 247,000 in 2019) subject to approval of the General Shareholders’ Meeting.
NOTE 6.4.3 CHARGE RELATING TO SHARE-BASED
COMPENSATION
In the consolidated financial statements, the benefit given to the beneficiaries under the plans explained above is recorded as an operating expense.
The amounts are presented below:
Plan (in thousands of euros) 2019 expenses 2020 expenses Subscription option plan Phantom shares 247 0 Other Total 247 0
NOTE 6.5 EXECUTIVE COMPENSATION AND OTHER BENEFITS
Total amount of compensation and benefits in kind paid to executives:
in thousands of euros
Non-executive corporate officers Executive corporate officers Executive Committee members who are not corporate officers
2019 2020 2019 2020 2019 2020 Salaries 156 158 2,602 2,744 Mandates 483 444 1,434 1,093 Additional benefits 210 Options granted Value of options granted Options exercised Balance sheet provisions and commitments (provision for premiums)
443 579 876 878
Information on the compensation policy can be found in chapter 5 of this document.

138
NOTE 7 INTANGIBLE AND TANGIBLE FIXED ASSETS
NOTE 7.1 GOODWILL AND INTANGIBLE ASSETS
NOTE 7.1.1 CHANGE IN NET BOOK VALUE
ACCOUNTING PRINCIPLES
In accordance with IAS 38, an intangible asset is recognized in the assets side of the balance sheet if it is identifiable (separately, meaning that it can be separated from the entity and be sold, transferred, granted under license, leased, or exchanged, either individually or in the context of a contract with a related asset or liability; or it results from contractual rights or other legal rights, whether or not these rights are transferable or separable from the entity, or other rights and obligations):
it is probable that the future economic benefits attributable to the asset will go to the entity,
the cost of this asset may be reliably valued.
GOODWILL
The accounting principles regarding goodwill are described in Note 3 “Scope of consolidation.”
INTANGIBLE ASSETS
Development costs are capitalized as an asset when they meet all the following criteria:
the product or process is clearly determined and the costs attributable to the product or process can be identified separately and reliably assessed,
the product or process is new or represents a substantial improvement to an existing product or process,
the technical feasibility of producing the product or process can be demonstrated,
the company intends to produce and market or use the product or process,
there is a market for the product or process or, in case of internal use, its usefulness to the company can be demonstrated,
there are sufficient available resources to complete the development and then use or sell the intangible asset.
These costs primarily include the costs of the personnel assigned to the projects, the portion of overhead costs dedicated to the development activity, the costs of external studies and the costs of prototype creation.
Development costs incurred between the decision to start development, the manufacture of new equipment and the testing, and pre-series production phase for that equipment are recognized as intangible assets. Depreciation of the asset begins when development is complete and the asset is ready to be put into operation.
Costs related to preliminary study, the functional analysis phase, and user training are recognized as expenses for the period.
Software
Costs incurred in connection with the implementation of an integrated information system (ERP) are recognized as assets for the portion relating to the detailed design of the project and to programming, testing and documentation, if it is likely that the future economic benefits attributable to the asset will flow to the entity and if the cost of that asset can be reliably assessed and monitored.
Because software acquired as an operating asset is intended to be retained by the group for the long term, it is capitalized.
Brand names, customer relationships acquired, and other intangible assets are recognized in assets if they meet the criteria of IAS 38.
Subsequent revaluation: IAS 38 provides the option of revaluing all or a portion of the assets after the transition date. The group has decided not to make use of this option.
Depreciation is calculated according to the estimated useful lives of the different categories of assets, using the straight-line method. The amortizable amount is the difference between the cost of the asset and the residual value, which is considered to be zero for all amortizable assets.
The main depreciation periods are as follows:
Nature of fixed assets Term
Patents 5 years Software 3 years Complex information systems – ERP 7 years Development costs 5 years
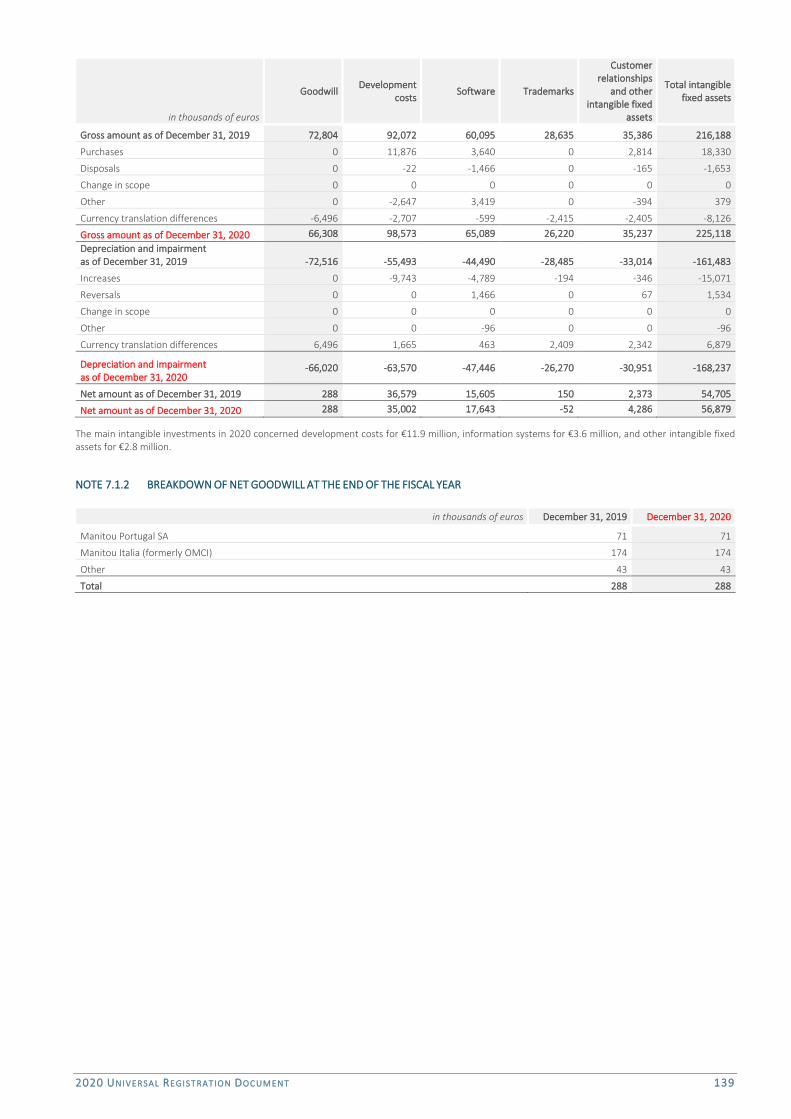
2020 UNIVERSAL REGIST RATION DOC UMENT 139
in thousands of euros
Goodwill Development
costs Software Trademarks
Customer relationships
and other intangible fixed
assets
Total intangible fixed assets
Gross amount as of December 31, 2019 72,804 92,072 60,095 28,635 35,386 216,188
Purchases 0 11,876 3,640 0 2,814 18,330
Disposals 0 -22 -1,466 0 -165 -1,653
Change in scope 0 0 0 0 0 0
Other 0 -2,647 3,419 0 -394 379
Currency translation differences -6,496 -2,707 -599 -2,415 -2,405 -8,126
Gross amount as of December 31, 2020 66,308 98,573 65,089 26,220 35,237 225,118 Depreciation and impairment as of December 31, 2019 -72,516 -55,493 -44,490 -28,485 -33,014 -161,483
Increases 0 -9,743 -4,789 -194 -346 -15,071
Reversals 0 0 1,466 0 67 1,534
Change in scope 0 0 0 0 0 0
Other 0 0 -96 0 0 -96
Currency translation differences 6,496 1,665 463 2,409 2,342 6,879
Depreciation and impairment as of December 31, 2020
-66,020 -63,570 -47,446 -26,270 -30,951 -168,237
Net amount as of December 31, 2019 288 36,579 15,605 150 2,373 54,705
Net amount as of December 31, 2020 288 35,002 17,643 -52 4,286 56,879
The main intangible investments in 2020 concerned development costs for €11.9 million, information systems for €3.6 million, and other intangible fixed assets for €2.8 million.
NOTE 7.1.2 BREAKDOWN OF NET GOODWILL AT THE END OF THE FISCAL YEAR
in thousands of euros December 31, 2019 December 31, 2020
Manitou Portugal SA 71 71
Manitou Italia (formerly OMCI) 174 174
Other 43 43
Total 288 288
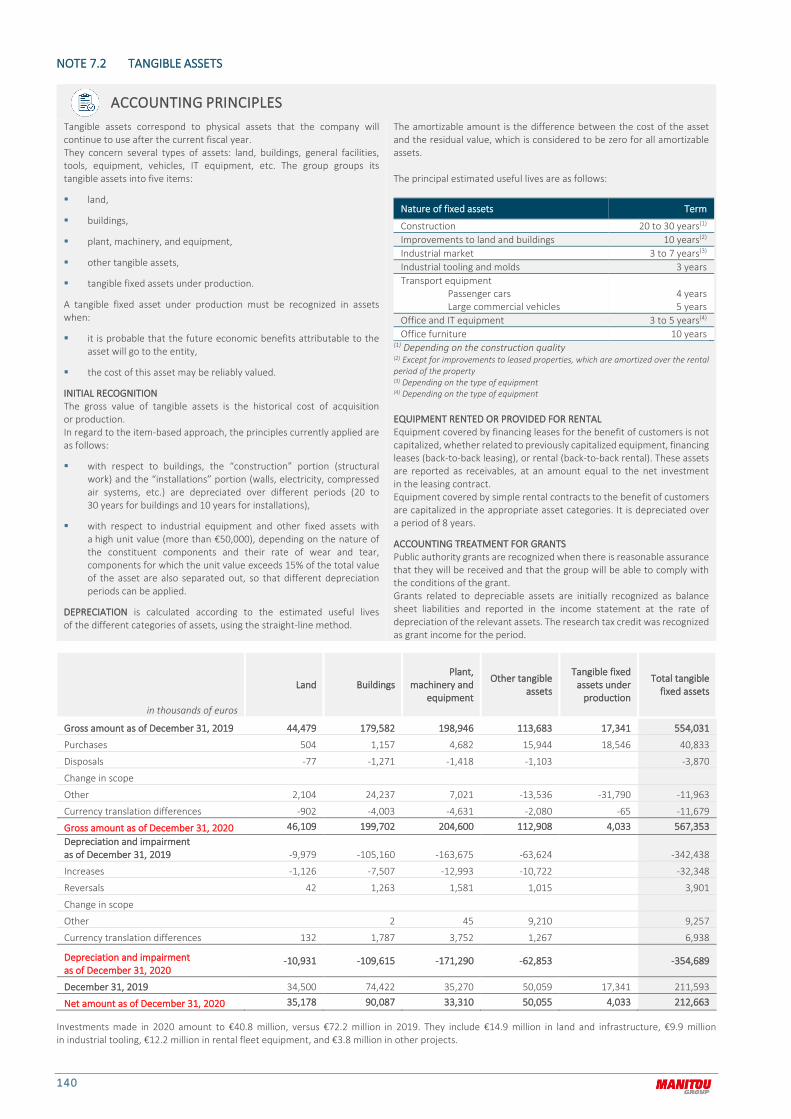
140
NOTE 7.2 TANGIBLE ASSETS
ACCOUNTING PRINCIPLES Tangible assets correspond to physical assets that the company will continue to use after the current fiscal year. They concern several types of assets: land, buildings, general facilities, tools, equipment, vehicles, IT equipment, etc. The group groups its tangible assets into five items:
land,
buildings,
plant, machinery, and equipment,
other tangible assets,
tangible fixed assets under production.
A tangible fixed asset under production must be recognized in assets when:
it is probable that the future economic benefits attributable to the asset will go to the entity,
the cost of this asset may be reliably valued.
INITIAL RECOGNITION The gross value of tangible assets is the historical cost of acquisition or production. In regard to the item-based approach, the principles currently applied are as follows:
with respect to buildings, the “construction” portion (structural work) and the “installations” portion (walls, electricity, compressed air systems, etc.) are depreciated over different periods (20 to 30 years for buildings and 10 years for installations),
with respect to industrial equipment and other fixed assets with a high unit value (more than €50,000), depending on the nature of the constituent components and their rate of wear and tear, components for which the unit value exceeds 15% of the total value of the asset are also separated out, so that different depreciation periods can be applied.
DEPRECIATION is calculated according to the estimated useful lives of the different categories of assets, using the straight-line method.
The amortizable amount is the difference between the cost of the asset and the residual value, which is considered to be zero for all amortizable assets. The principal estimated useful lives are as follows:
Nature of fixed assets Term
Construction 20 to 30 years(1) Improvements to land and buildings 10 years(2) Industrial market 3 to 7 years(3) Industrial tooling and molds 3 years Transport equipment
Passenger cars Large commercial vehicles
4 years 5 years
Office and IT equipment 3 to 5 years(4) Office furniture 10 years
(1) Depending on the construction quality (2) Except for improvements to leased properties, which are amortized over the rental period of the property (3) Depending on the type of equipment (4) Depending on the type of equipment EQUIPMENT RENTED OR PROVIDED FOR RENTAL Equipment covered by financing leases for the benefit of customers is not capitalized, whether related to previously capitalized equipment, financing leases (back-to-back leasing), or rental (back-to-back rental). These assets are reported as receivables, at an amount equal to the net investment in the leasing contract. Equipment covered by simple rental contracts to the benefit of customers are capitalized in the appropriate asset categories. It is depreciated over a period of 8 years.
ACCOUNTING TREATMENT FOR GRANTS Public authority grants are recognized when there is reasonable assurance that they will be received and that the group will be able to comply with the conditions of the grant. Grants related to depreciable assets are initially recognized as balance sheet liabilities and reported in the income statement at the rate of depreciation of the relevant assets. The research tax credit was recognized as grant income for the period.
in thousands of euros
Land Buildings Plant,
machinery and equipment
Other tangible assets
Tangible fixed assets under
production
Total tangible fixed assets
Gross amount as of December 31, 2019 44,479 179,582 198,946 113,683 17,341 554,031
Purchases 504 1,157 4,682 15,944 18,546 40,833
Disposals -77 -1,271 -1,418 -1,103 -3,870
Change in scope
Other 2,104 24,237 7,021 -13,536 -31,790 -11,963
Currency translation differences -902 -4,003 -4,631 -2,080 -65 -11,679
Gross amount as of December 31, 2020 46,109 199,702 204,600 112,908 4,033 567,353 Depreciation and impairment as of December 31, 2019 -9,979 -105,160 -163,675 -63,624 -342,438
Increases -1,126 -7,507 -12,993 -10,722 -32,348
Reversals 42 1,263 1,581 1,015 3,901
Change in scope
Other 2 45 9,210 9,257
Currency translation differences 132 1,787 3,752 1,267 6,938
Depreciation and impairment as of December 31, 2020
-10,931 -109,615 -171,290 -62,853 -354,689
December 31, 2019 34,500 74,422 35,270 50,059 17,341 211,593
Net amount as of December 31, 2020 35,178 90,087 33,310 50,055 4,033 212,663
Investments made in 2020 amount to €40.8 million, versus €72.2 million in 2019. They include €14.9 million in land and infrastructure, €9.9 million in industrial tooling, €12.2 million in rental fleet equipment, and €3.8 million in other projects.
2020 UNIVERSAL REGIST RATION DOC UMENT 141
NOTE 7.3 IMPAIRMENT OF TANGIBLE AND INTANGIBLE ASSETS
ACCOUNTING PRINCIPLES Assets for which the expected useful life is not defined, for example, goodwill, are not amortized and are subject to an annual test for impairment. R&D assets are reviewed on each reporting date to identify any indication of impairment. The indicators of impairment taken into account by the group include:
investments significantly above the initial budget,
a market downturn and weaker economic performance,
changes in laws or standards,
major technological developments,
decisions to stop production.
Whenever there is an internal or external indication of impairment, the recoverable value of the asset concerned is appraised with reference to the asset group to which it belongs (cash-generating unit). Cash-generating units are coherent subsets that produce independent cash flows. At Manitou Group level, the main cash-generating units (CGUs) identified correspond to the manufacturing and marketing of handling equipment, the manufacturing of masts, the marketing of spare parts and attachments, and the sales financing of handling equipment to end users. The CGUs are part of the operating sectors defined by the group.
The recoverable value of an asset or an asset group is its fair value less disposal costs or its expected useful value, whichever is greater. The expected useful value is the expected discounted cash flow from the use of the cash-generating unit under consideration. The estimated cash flows are derived from 5-year plans approved by group management. The assumptions underlying the preparation of these plans include developments in the markets in which these cash-generating units operate and the trends in the selling prices of the products and the purchase prices of materials and components. The discount rate is the weighted average cost of capital established by the group. When the recoverable value is less than the net carrying amount of the CGU under consideration, an impairment loss is recorded against non-recurring operating income to reduce the asset or the asset group concerned.
GOODWILL AND INTANGIBLE ASSETS WITH INDEFINITE USEFUL LIFE
As of December 31, 2020, Manitou Group does not have significant goodwill or other assets with a significant indeterminate useful life requiring annual impairment tests.
R&D INTANGIBLE ASSETS
Given the existence of indicators of impairment, specific tests relating to R&D assets were carried out on the basis of sales forecasts and profitability. The discount rate applied is 10.3%. These tests resulted in an impairment of €0.9 million in recurring operating income on assets held by MHA and €1.8 million on assets held by CEP. An additional decrease of 10% of revenue would not result in recognition of impairment.
OTHER ASSETS
Following the announcement of the closure of the Waco site (United States) and the shutdown of production in Brazil, the group has made impairments on the tangible assets of the sites concerned. These tests resulted in the recognition of an impairment expense, in other non-current operating expenses, for €0.6 million. The group has not conducted any tests on its tangible assets, which are primarily made up of land, buildings, and industrial equipment. As of December 31, 2020, the value of these assets has not been called into question by the Covid-19 crisis.
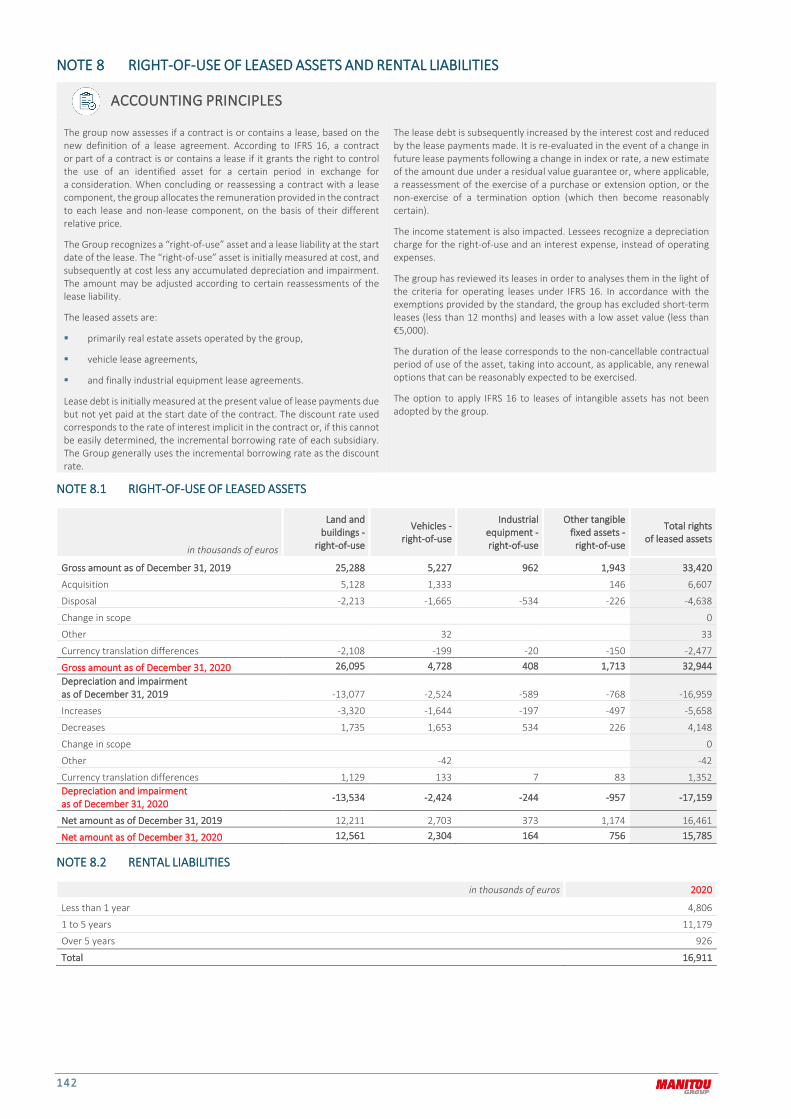
142
NOTE 8 RIGHT-OF-USE OF LEASED ASSETS AND RENTAL LIABILITIES
ACCOUNTING PRINCIPLES
The group now assesses if a contract is or contains a lease, based on the new definition of a lease agreement. According to IFRS 16, a contract or part of a contract is or contains a lease if it grants the right to control the use of an identified asset for a certain period in exchange for a consideration. When concluding or reassessing a contract with a lease component, the group allocates the remuneration provided in the contract to each lease and non-lease component, on the basis of their different relative price.
The Group recognizes a “right-of-use” asset and a lease liability at the start date of the lease. The “right-of-use” asset is initially measured at cost, and subsequently at cost less any accumulated depreciation and impairment. The amount may be adjusted according to certain reassessments of the lease liability.
The leased assets are:
primarily real estate assets operated by the group,
vehicle lease agreements,
and finally industrial equipment lease agreements.
Lease debt is initially measured at the present value of lease payments due but not yet paid at the start date of the contract. The discount rate used corresponds to the rate of interest implicit in the contract or, if this cannot be easily determined, the incremental borrowing rate of each subsidiary. The Group generally uses the incremental borrowing rate as the discount rate.
The lease debt is subsequently increased by the interest cost and reduced by the lease payments made. It is re-evaluated in the event of a change in future lease payments following a change in index or rate, a new estimate of the amount due under a residual value guarantee or, where applicable, a reassessment of the exercise of a purchase or extension option, or the non-exercise of a termination option (which then become reasonably certain).
The income statement is also impacted. Lessees recognize a depreciation charge for the right-of-use and an interest expense, instead of operating expenses.
The group has reviewed its leases in order to analyses them in the light of the criteria for operating leases under IFRS 16. In accordance with the exemptions provided by the standard, the group has excluded short-term leases (less than 12 months) and leases with a low asset value (less than €5,000).
The duration of the lease corresponds to the non-cancellable contractual period of use of the asset, taking into account, as applicable, any renewal options that can be reasonably expected to be exercised.
The option to apply IFRS 16 to leases of intangible assets has not been adopted by the group.
NOTE 8.1 RIGHT-OF-USE OF LEASED ASSETS
in thousands of euros
Land and buildings -
right-of-use
Vehicles - right-of-use
Industrial equipment - right-of-use
Other tangible fixed assets -
right-of-use
Total rights of leased assets
Gross amount as of December 31, 2019 25,288 5,227 962 1,943 33,420
Acquisition 5,128 1,333 146 6,607
Disposal -2,213 -1,665 -534 -226 -4,638
Change in scope 0
Other 32 33
Currency translation differences -2,108 -199 -20 -150 -2,477
Gross amount as of December 31, 2020 26,095 4,728 408 1,713 32,944 Depreciation and impairment as of December 31, 2019 -13,077 -2,524 -589 -768 -16,959
Increases -3,320 -1,644 -197 -497 -5,658
Decreases 1,735 1,653 534 226 4,148
Change in scope 0
Other -42 -42
Currency translation differences 1,129 133 7 83 1,352 Depreciation and impairment as of December 31, 2020 -13,534 -2,424 -244 -957 -17,159
Net amount as of December 31, 2019 12,211 2,703 373 1,174 16,461
Net amount as of December 31, 2020 12,561 2,304 164 756 15,785
NOTE 8.2 RENTAL LIABILITIES
in thousands of euros 2020
Less than 1 year 4,806
1 to 5 years 11,179
Over 5 years 926
Total 16,911

2020 UNIVERSAL REGIST RATION DOC UMENT 143
NOTE 9 WORKING CAPITAL REQUIREMENT
NOTE 9.1 INVENTORIES
ACCOUNTING PRINCIPLES
VALUATION AND WRITE-DOWN OF INVENTORIES
The inventories are valued on the following basis:
merchandise: valued at the weighted average purchase price,
raw materials: valued at the weighted average purchase price,
semi-finished products, work in process and finished products: valued at the cost of production (raw materials, equipment and labor at actual cost).
Semi-finished and finished products are valued on the basis of a standard level of activity.
Furthermore, provisions for write-down of inventories are recognized when the net realizable value of goods and merchandise is less than their cost price.
in thousands of euros Raw materials
Work in progress
Finished products Merchandise
Total inventories
Gross amount as of December 31, 2019 228,864 37,412 228,374 117,243 611,892
Change in scope
Reclassification 1,570 728 2,298
Changes -62,232 -97 -43,589 -17,717 -123,636
Currency translation differences -4,565 -482 -7,596 -3,051 -15,694
Gross amount as of December 31, 2020 162,066 36,832 178,759 97,203 474,860
Provisions as of December 31, 2019 -6,341 -4,309 -11,497 -22,147
Change in scope
Reclassification 67 84 151
Changes -2,379 -857 93 -3,143
Currency translation differences 356 220 572 1,147
Provisions as of December 31, 2020 -8,364 -4,881 -10,748 -23,993
Net amount as of December 31, 2019 222,522 37,412 224,065 105,747 589,745
Net amount as of December 31, 2020 153,702 36,832 173,878 86,455 450,867
The reclassifications mainly concern leased-out and capitalized equipment, which is transferred to the inventory at the end of the lease to be sold as used equipment.
Changes during the period included a provision for impairment of €3.0 million, following the decision to close the Waco site (United States). This expense is recorded underother non-current operating expenses.
NOTE 9.2 TRADE RECEIVABLES
ACCOUNTING PRINCIPLES
Trade receivables are current financial assets that are initially recognized in accordance with the provisions of IFRS 15 and subsequently at amortized cost, net of any impairment. The fair value of trade receivables is assimilated into their nominal value, given that the payment terms are generally less than 3 months.
Trade receivables are subject to write-downs for impairment based on expected credit losses (note 13.1.2).
CURRENT RECEIVABLES
in thousands of euros Gross amount Impairment Net amount
December 31, 2019 385,352 -4,914 380,438
Change in scope 0
Reclassification -105 196 91
Changes -73,369 -60 -73,429 Currency translation differences -7,287 219 -7,068 Total as of December 31, 2020 304,592 -4,559 300,032
NON-CURRENT RECEIVABLES
There are no non-current receivables for the period.
The group generally uses credit insurance to protect its trade receivables. In certain cases, based on the group’s knowledge of the customer, the amount due from a given customer may be higher than the amount covered.
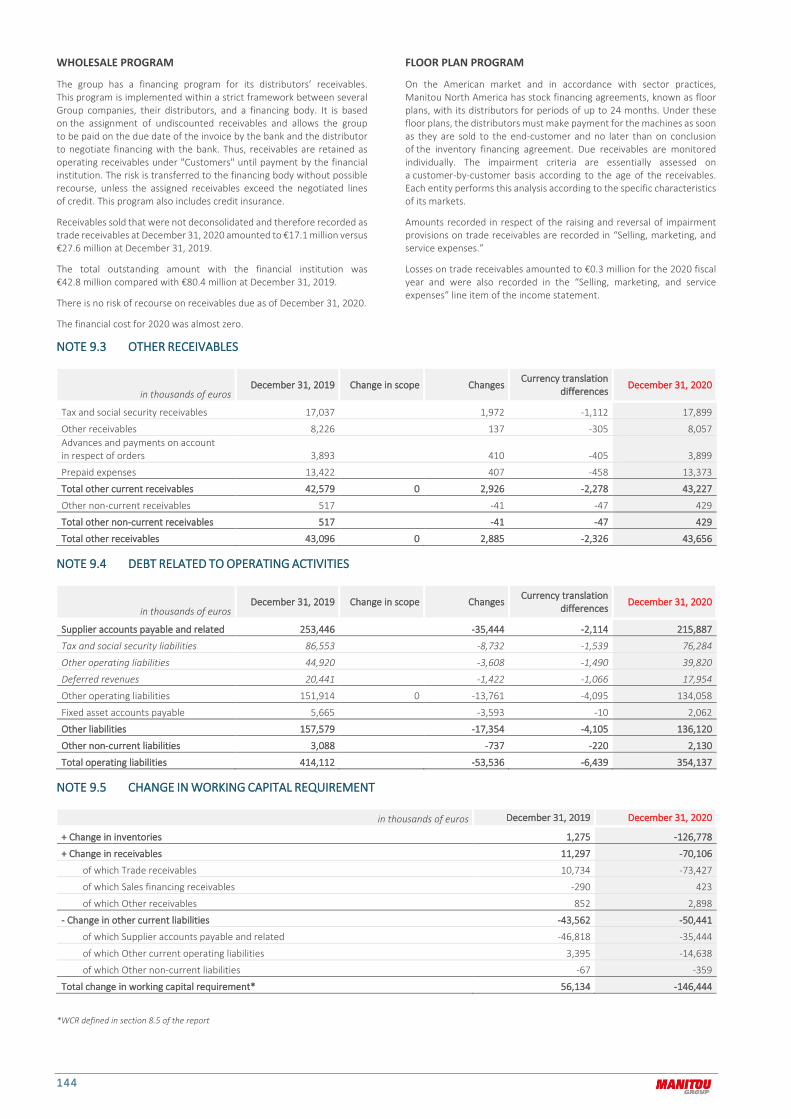
144
WHOLESALE PROGRAM
The group has a financing program for its distributors’ receivables. This program is implemented within a strict framework between several Group companies, their distributors, and a financing body. It is based on the assignment of undiscounted receivables and allows the group to be paid on the due date of the invoice by the bank and the distributor to negotiate financing with the bank. Thus, receivables are retained as operating receivables under "Customers" until payment by the financial institution. The risk is transferred to the financing body without possible recourse, unless the assigned receivables exceed the negotiated lines of credit. This program also includes credit insurance.
Receivables sold that were not deconsolidated and therefore recorded as trade receivables at December 31, 2020 amounted to €17.1 million versus €27.6 million at December 31, 2019.
The total outstanding amount with the financial institution was €42.8 million compared with €80.4 million at December 31, 2019.
There is no risk of recourse on receivables due as of December 31, 2020.
The financial cost for 2020 was almost zero.
FLOOR PLAN PROGRAM
On the American market and in accordance with sector practices, Manitou North America has stock financing agreements, known as floor plans, with its distributors for periods of up to 24 months. Under these floor plans, the distributors must make payment for the machines as soon as they are sold to the end-customer and no later than on conclusion of the inventory financing agreement. Due receivables are monitored individually. The impairment criteria are essentially assessed on a customer-by-customer basis according to the age of the receivables. Each entity performs this analysis according to the specific characteristics of its markets.
Amounts recorded in respect of the raising and reversal of impairment provisions on trade receivables are recorded in “Selling, marketing, and service expenses.”
Losses on trade receivables amounted to €0.3 million for the 2020 fiscal year and were also recorded in the “Selling, marketing, and service expenses” line item of the income statement.
NOTE 9.3 OTHER RECEIVABLES
in thousands of euros December 31, 2019 Change in scope Changes
Currency translation differences December 31, 2020
Tax and social security receivables 17,037 1,972 -1,112 17,899
Other receivables 8,226 137 -305 8,057 Advances and payments on account in respect of orders 3,893 410 -405 3,899
Prepaid expenses 13,422 407 -458 13,373
Total other current receivables 42,579 0 2,926 -2,278 43,227
Other non-current receivables 517 -41 -47 429
Total other non-current receivables 517 -41 -47 429
Total other receivables 43,096 0 2,885 -2,326 43,656
NOTE 9.4 DEBT RELATED TO OPERATING ACTIVITIES
in thousands of euros December 31, 2019 Change in scope Changes Currency translation
differences December 31, 2020
Supplier accounts payable and related 253,446 -35,444 -2,114 215,887
Tax and social security liabilities 86,553 -8,732 -1,539 76,284
Other operating liabilities 44,920 -3,608 -1,490 39,820
Deferred revenues 20,441 -1,422 -1,066 17,954
Other operating liabilities 151,914 0 -13,761 -4,095 134,058
Fixed asset accounts payable 5,665 -3,593 -10 2,062
Other liabilities 157,579 -17,354 -4,105 136,120
Other non-current liabilities 3,088 -737 -220 2,130
Total operating liabilities 414,112 -53,536 -6,439 354,137
NOTE 9.5 CHANGE IN WORKING CAPITAL REQUIREMENT
in thousands of euros December 31, 2019 December 31, 2020
+ Change in inventories 1,275 -126,778
+ Change in receivables 11,297 -70,106
of which Trade receivables 10,734 -73,427
of which Sales financing receivables -290 423
of which Other receivables 852 2,898
- Change in other current liabilities -43,562 -50,441
of which Supplier accounts payable and related -46,818 -35,444
of which Other current operating liabilities 3,395 -14,638
of which Other non-current liabilities -67 -359
Total change in working capital requirement* 56,134 -146,444
*WCR defined in section 8.5 of the report

2020 UNIVERSAL REGIST RATION DOC UMENT 145
NOTE 10 SHAREHOLDERS’ EQUITY AND EARNINGS PER SHARE
NOTE 10.1 SHAREHOLDERS’ EQUITY
NOTE 10.1.1 SHARE CAPITAL
The share capital consists of 39,668,399 shares as of December 31, 2020.
NOTE 10.1.2 TREASURY SHARES
ACCOUNTING PRINCIPLES
Treasury shares held by the group are recognized at their purchase price against shareholders’ equity, regardless of their future use (IAS 32).
When securities are sold, the sale price is recognized directly in group shareholders’ equity and the related cash receipt is recognized in cash and cash equivalents. No gain or loss is therefore recorded in the income statement for the period.
Number of shares Realization as of
December 31, 2019 % of capital Realization as of December 31, 2020 % of capital
HELD AT OPENING (SHARE PLAN) 1,381,461 1,381,461 Shares purchased Shares sold Stock options exercised HELD AT CLOSING (SHARE REPURCHASE PROGRAM) 1,381,461 3.48% 1,381,461 3.48% Stock option coverage Liquidity contract 13,515 15,562 TOTAL TREASURY SHARES HELD 1,394,976 3.52% 1,397,023 3.52%
The acquisition cost of shares purchased, in addition to the proceeds from shares sold, were recorded respectively as a reduction or increase in net position. Treasury shares do not confer dividend rights.
NOTE 10.2 EARNINGS PER SHARE
ACCOUNTING PRINCIPLES
CALCULATION OF EARNINGS PER SHARE
Earnings per share are calculated by dividing the net profit for the period attributable to ordinary shareholders by the weighted average number of ordinary shares outstanding during the period, after deducting the average number of treasury shares. To calculate the diluted earnings per share, the profit attributable to ordinary shareholders of Manitou BF and the weighted average number of shares outstanding are adjusted for the effects of all potentially diluting ordinary shares.
December 31, 2019 December 31, 2020
Net income for the period attributable to ordinary shareholders (in thousands of euros) 95,625 39,581 Average number of total shares (in thousands of shares) 39,668 39,668 Average number of treasury shares (in thousands of shares) 1,401 1,396
Weighted average number of ordinary shares outstanding during the period (in thousands of shares) 38,267 38,272 NET INCOME GROUP SHARE (in euros) 2.50 1.03 Net income for the period attributable to ordinary shareholders (in thousands of euros) 95,625 39,581
Weighted average number of ordinary shares outstanding during the period (in thousands of shares) 38,267 38,272 Average number of dilutive shares (in thousands of shares) 0 0
Weighted average number of ordinary shares adjusted for dilutive shares (in thousands of euros) 38,267 38,272 DILUTED EARNINGS PER SHARE (in euros) 2.50 1.03
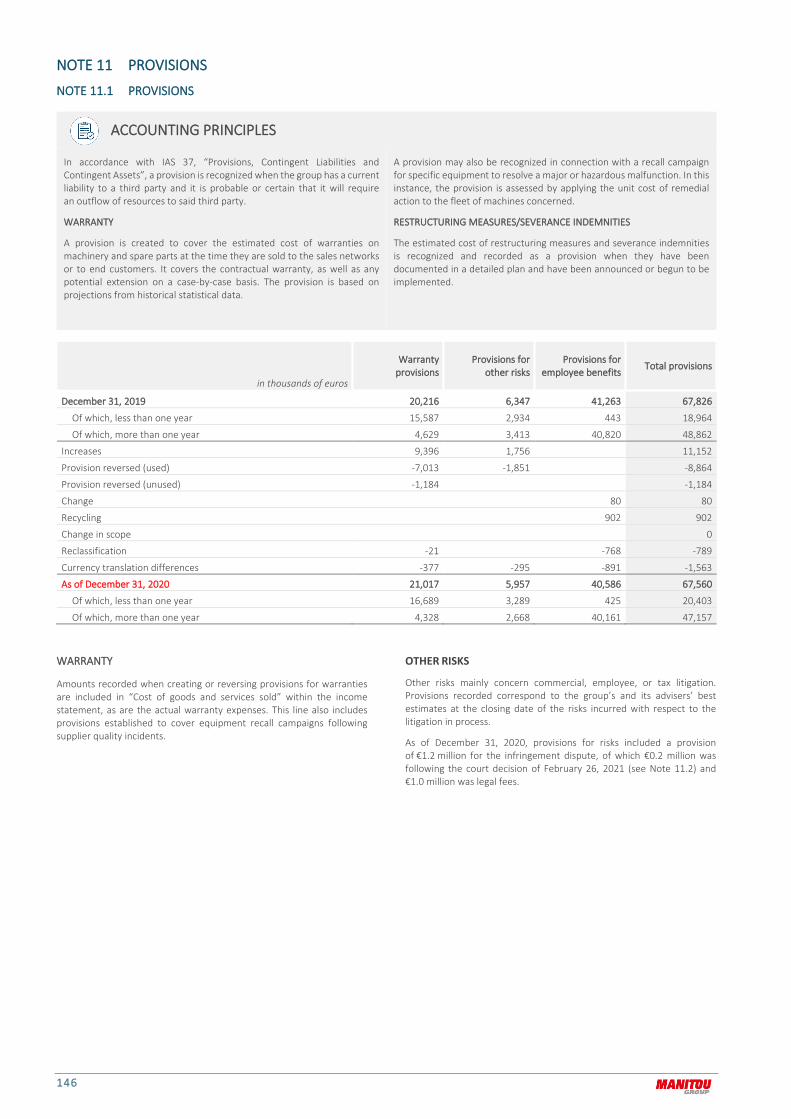
146
NOTE 11 PROVISIONS
NOTE 11.1 PROVISIONS
ACCOUNTING PRINCIPLES
In accordance with IAS 37, “Provisions, Contingent Liabilities and Contingent Assets”, a provision is recognized when the group has a current liability to a third party and it is probable or certain that it will require an outflow of resources to said third party.
WARRANTY
A provision is created to cover the estimated cost of warranties on machinery and spare parts at the time they are sold to the sales networks or to end customers. It covers the contractual warranty, as well as any potential extension on a case-by-case basis. The provision is based on projections from historical statistical data.
A provision may also be recognized in connection with a recall campaign for specific equipment to resolve a major or hazardous malfunction. In this instance, the provision is assessed by applying the unit cost of remedial action to the fleet of machines concerned.
RESTRUCTURING MEASURES/SEVERANCE INDEMNITIES
The estimated cost of restructuring measures and severance indemnities is recognized and recorded as a provision when they have been documented in a detailed plan and have been announced or begun to be implemented.
in thousands of euros
Warranty provisions
Provisions for other risks
Provisions for employee benefits Total provisions
December 31, 2019 20,216 6,347 41,263 67,826
Of which, less than one year 15,587 2,934 443 18,964
Of which, more than one year 4,629 3,413 40,820 48,862
Increases 9,396 1,756 11,152
Provision reversed (used) -7,013 -1,851 -8,864
Provision reversed (unused) -1,184 -1,184
Change 80 80
Recycling 902 902
Change in scope 0
Reclassification -21 -768 -789
Currency translation differences -377 -295 -891 -1,563
As of December 31, 2020 21,017 5,957 40,586 67,560
Of which, less than one year 16,689 3,289 425 20,403
Of which, more than one year 4,328 2,668 40,161 47,157
WARRANTY
Amounts recorded when creating or reversing provisions for warranties are included in “Cost of goods and services sold” within the income statement, as are the actual warranty expenses. This line also includes provisions established to cover equipment recall campaigns following supplier quality incidents.
OTHER RISKS
Other risks mainly concern commercial, employee, or tax litigation. Provisions recorded correspond to the group’s and its advisers’ best estimates at the closing date of the risks incurred with respect to the litigation in process.
As of December 31, 2020, provisions for risks included a provision of €1.2 million for the infringement dispute, of which €0.2 million was following the court decision of February 26, 2021 (see Note 11.2) and €1.0 million was legal fees.

2020 UNIVERSAL REGIST RATION DOC UMENT 147
NOTE 11.2 MONITORING OF LITIGATION FOR INFRINGEMENT OF INTELLECTUAL PROPERTY RIGHTS
In May 2017, Manitou Group was sued by JC Bamford Excavators Limited (JCB) in France, the United Kingdom and then Italy for alleged infringement of two European patents relating to certain features concerning the overload cut-off control system of certain telescopic forklift trucks manufactured and/or marketed in these three countries.
In May 2017, the plaintiff filed a claim in the French court for a provision of 20 million euros, to be increased to 50 million euros in June 2018. The financial claims before the English court were not quantified and are still not quantified at the date of publication of this report, but the summons indicates that for procedural purposes the commercial value of the claim is estimated to be in excess of 10 million. For Italy, the summons does not specify any quantified claim.
In December 2018, JCB served Manitou Group with a new patent infringement suit in France and the United Kingdom relating to a third European patent, also relating to certain features concerning the overload cut-off control system of certain telescopic forklift trucks. This summons takes up the request for a provision of 50 million euros, subsequently increased to 100 million euros in its last conclusions communicated in May 2020. The summons relating to this third patent has been joined in the United Kingdom but remains separated in France.
In 2018, JCB had produced an expert opinion estimating its damages of 160 million euros for the first two patents. At the end of 2019, in the first main proceedings, JCB increased its damage assessment to 190 million euros in its final conclusions. This increase is due to an update of the prejudice in its duration, which according to JCB is until March 2019. This assessment also includes the estimated prejudice under the third patent.
In France, In the context of a procedural incident in 2018, JCB applied for preliminary injunctions against Manitou BF. A decision was issued by the Pre-Trial Judge on January 31, 2019, which dismissed the applicant's request for preliminary injunction on the first patent on which JCB based its allegations and, regarding the second patent, prohibited Manitou BF from manufacturing, offering for sale, renting and owning an old configuration of certain telescopic forklift trucks. This decision has no impact on Manitou BF's business as it relates to the ordering system for certain models produced and sold before August 2017 which are therefore no longer manufactured by Manitou BF, as underlined in the order. Manitou BF immediately appealed this decision in order to challenge the prohibition order in so far as it relates to a configuration that Manitou had ceased to produce for 18 months. This immediate appeal on the grounds of abuse of authority was held not to be admissible, reserving the possibility of appeal with judgment on the merits.
On the occasion of the same incident, Manitou BF had proposed in the alternative, if the judge considered the request for prohibition to be well-founded, the establishment of a bank guarantee of 470,000 euros for the two patents as a replacement for the prohibitions. This proposal became irrelevant for the first patent, for which the judge did not pronounce a prohibition. JCB requested that this guarantee, if ordered, be 30 million euros (also for the two patents) on the basis of the expert opinion it had produced estimating its damages at 160 million euros (for the two patents). This proposal was not accepted by the judge, nor was JCB's request for a penalty payment of 100 000 euros per day of delay, the penalty payment ordered by the judge being 1 000 euros per infringement, the decision having emphasized that the damage alleged
by the plaintiff relates to the overload cut-off control system alone and not to the machine as a whole.
In 2020, the legal proceedings on the merits of the dispute relating to the first two patents continued. On February 26, 2021, the Paris Court of Justice (“Tribunal Judiciaire”) ruled, in first instance, on the French part relating to these first two patents.
Under the terms of this decision, the Tribunal invalidated the French part of the second patent in its entirety rendering ineffective the January 31, 2019 preliminary injunction order against Manitou BF.
The Court also invalidated most of the claims of the French part of the first patent. The Court found that only two claims of the French part of the first patent were infringed by three models of equipment from an old configuration which is no longer marketed by Manitou BF since May 2017. Manitou challenges this decision while noting that it has no impact on its business as this old configuration is no longer marketed.
Given the very residual character of the infringement uphold, the Court ordered Manitou BF to pay the plaintiff the total sum of 150,000 euros for the loss suffered, rejecting the claim of JCB, which was claiming a loss of 190 million euros. The Court's decision reinforces the position of Manitou, which has always contested the merits of the plaintiff's action and the disproportionate nature of its claims.
In the United Kingdom, no progress was made in the course of 2018 as JCB did not carry out any due diligence in this respect. A case management conference was held in January 2019 after JCB finally performed its due diligence. The litigation schedule has been established. However, the hearing originally scheduled for October 2020 has been postponed due to the increased length of the trial resulting from the addition of the third patent in the proceeding, the first available date being November 2021.
In Italy, the proceedings on the merits relating to these first two patents remain in a preliminary phase, the appointment of a court expert was pronounced at the end of 2019 and the court expert measures are still in progress at the closing date.
In Italy, JCB had also requested interim injunctions against Manitou's Italian subsidiary on the second and third patents. This request was rejected by the Italian courts by decision of January 30, 2020. JCB has not appealed this decision.
Following the decision of the Paris Court of Justice on February 26, 2021, which strengthened the group's position, a provision of 0.2 million euros was recorded for the first patent and no provision was recorded for the second patent.
For the third patent, given the progress of the proceedings, the financial risk likely to be incurred is still difficult to measure with reliability. Furthermore, a significant outflow of resources in respect of this claim seems unlikely in respect of the matters put forward by Manitou Group to defend itself. Consequently, no provision for this claim has been recognized in the group's financial statements.
The group will continue to firmly defend itself against infringement allegations of three patents claimed by JCB.

148
NOTE 12 TAXES
ACCOUNTING PRINCIPLES
The tax expense recognized in the income statement comprises:
INCOME TAXES
The income tax expense corresponds to the amounts of taxes on profits owed to the various tax administrations for the fiscal year, determined using the tax rates and tax rules applicable in the country in question on the closing date, and any adjustment to the tax amount payable for previous periods.
DEFERRED TAXES
In accordance with IAS 12, “Income Taxes,” deferred taxes are recognized on all temporary differences between the book value of assets and liabilities and their fiscal value, using the liability method. Deferred tax assets and liabilities are systematically recorded. They are valued at the tax rates to be applied over the period during which the asset will be realized and the liability will be paid, based on the tax regulations enacted or substantively enacted on the closing date.
For investments in the subsidiaries, a deferred tax is recognized on the difference between the consolidated value of the securities and their tax value, when the temporary difference is likely to reverse itself in the foreseeable future.
Deferred taxes are recognized in expenses or profits in the income statement when they are incurred by elements allocated directly to shareholders’ equity or other elements of the comprehensive income. In this case, deferred taxes are charged against equity or other comprehensive income. During a change in tax rate, the resulting tax is recognized in profit or loss, unless it relates to elements that are originally recognized in shareholders’ equity or other elements of the comprehensive income.
Deferred tax assets are only recognized if it is probable that the group will record future taxable profits to which the corresponding temporary difference can be allocated. Deferred tax assets are examined at each closing date and are written down if there is a risk that they will not be used.
Within the same tax entity, deferred tax assets and liabilities are offset, since it has the right to offset its tax assets and its tax liabilities payable.
In addition, the group considered that the French CVAE (Business Contribution on Value Added) had characteristics similar to certain other foreign taxes such as the Italian IRAP, already assessed by the issuers concerned as falling within the scope of IAS 12. In accordance with IAS 12, the total amount of current and deferred expense related to the CVAE is reported in the “Income taxes” line item of the income statement.
NOTE 12.1 CHANGES IN BALANCE SHEET POSITION
in thousands of euros
December 31, 2019
Scope Result Payment Currency
translation differences
Other* December 31, 2020
Current taxes
Assets 7,990 13,777
Liabilities 4,087 1,139
TOTAL 3,903 0 -22,132 30,876 -4 -5 12,638
Deferred taxes
Assets 17,581 14,829
Liabilities 1,751 2,841
TOTAL 15,830 0 -2,719 0 -311 -813 11,987
* Other changes in current and deferred taxes can be broken down as follows:
in thousands of euros 2019 2020
Deferred taxes recorded as reserves – OCI 345 157
Deferred taxes recorded as consolidated reserves – Interest rate hedging instruments 1,240 -1,124
Other -290 154
TOTAL 1,295 -813
The deferred taxes of the entities within the French scope include, for long-term differences, the progressive reduction in the tax rate first enacted in the 2017 Finance Law and subsequently modified, thus a rate of 28% in 2020 and then 25% in 2022.
NOTE 12.2 INCOME TAXES RECORDED IN THE INCOME STATEMENT
in thousands of euros 2019 2020
Current taxes -44,019 -22,132
Deferred taxes for the period -366 -1,585
Change in deferred tax rate -351 383
Impairment losses (-) and capitalization of unrecognized losses (+) -246 -1,517
Total deferred taxes -963 -2,719
TOTAL -44,982 -24,851

2020 UNIVERSAL REGIST RATION DOC UMENT 149
NOTE 12.3 RECONCILIATION OF THE FRENCH STATUTORY TAX RATE AND THE EFFECTIVE TAX RATE APPLIED TO
CONSOLIDATED INCOME
in thousands of euros 2019 2020
Income before taxes on fully consolidated companies 138,548 63,465
Statutory tax rate in France 34.44% 32.02%
Theoretical tax expense for the fiscal year -47,716 -20,321
Other taxes -4,092 -2,790
Impairment of assets 0 -819
Permanent differences -914 785 Increase/decrease in tax rates (current and deferred) -351 383 Tax loss carryforwards capitalized (uncapitalized tax loss carryforwards) -246 -1,517
Differences in (local/group) tax rates and others 8,337 -572
Total - Income taxes -44,982 -24,851
Effective tax rate 39.16%
The rate used to calculate the theoretical tax rate is the rate applicable to Manitou BF, i.e. the statutory tax rate in France of 32.02 %. This rate includes the standard income tax rate of 31 % and the social contribution rate of 3.3 %.
For fully consolidated companies, the main rate differences (local/group) concern the following countries:
in thousands of euros 2020
Manitou BF -446
Manitou Italia 738
United States of America -1,830
Manitou UK 360
Manitou Vostock 814
Manitou Benelux 188
Other countries 449
TOTAL 273
Over the period, the tax rate comes to 39.2 % versus 32.5% as of December 31, 2019. This increase in tax rate is due to the greater contribution of Manitou BF to the income by the larger relative weight of the CVAE (company value-added contribution) in light of the decrease in the group’s income as well as unrecognized loss carried forward in India and Brazil, for an estimated tax of €1.4 million. These loss carry-forwards were not activated in light of uncertainties regarding their recoverability in the near term. An expense of €0.8 million for the impairment of deferred tax assets that have become irrecoverable was also recognized for the US subsidiaries.
As of December 31, 2020, the group has capitalized €1.0 million in losses for its American subsidiaries. Recovery is highly likely based on a budget, with clearance within a maximum of two years.
NOTE 12.4 DEFERRED TAXES
Recognized deferred taxes arise from the following temporary differences:
in thousands of euros – Assets/(Liabilities)
Temporary differences at December 31, 2019
Deferred tax assets at December 31, 2019
Temporary differences at December 31, 2020
Deferred tax assets at December 31, 2020
Intangible assets -1,607 -313 -1,443 -248
Tangible assets -32,338 -7,571 -15,887 -4,075
Financing leases -9,726 -1,411 473 490
Employee benefits 34,067 8,591 36,517 9,457
Provisions 34,366 8,804 23,710 5,582
Inventories & receivables -85 2,100 -16,678 -2,325
Miscellaneous 9,692 2,781 2,008 95
Subtotal 34,370 12,980 28,699 8,977
Tax credits 1,130 1,269
Tax loss carryforwards 1,720 1,742*
Total 15,830 11,987
* o/w €1,656K Manitou Americas and €86K Marpoll

150
NOTE 13 FINANCING AND FINANCIAL INSTRUMENTS
NOTE 13.1 RECONCILIATION OF BALANCE SHEET LINE ITEMS
NOTE 13.1.1 BALANCE SHEET
ACCOUNTING PRINCIPLES
PRINCIPLES OF VALUATION AT FAIR VALUE
The fair value of all financial assets and liabilities is determined on the reporting date, either for accounting purposes or for disclosure in the Notes to the financial statements. Fair value is determined:
either based on market prices on an active market (level 1),
or based on internal valuation methods using standard mathematical calculations which include observable market data (forward rates, yield curves, etc.), with the resulting valuations being adjusted to take account of reasonable change in the group or counterparty risks (level 2),
or based on internal valuation methods which, in the absence of available data, incorporate parameters estimated by the group (level 3).
ASSETS
in thousands of euros
Financial assets at fair value through other
elements of the income statement
Financial assets at amortized cost
Financial assets at fair value through income Balance sheet total
12/31/2019 12/31/2020 12/31/2019 12/31/2020 12/31/2019 12/31/2020 12/31/2019 12/31/2020
Non-current financial assets 4,120 3,968 73 63 6,637 7,306 10,829 11,337
Current financial assets 12 13 1,922 1,855 1,933 1,868
Cash and cash equivalents 22,333 120,721 22,333 120,721
Sales financing receivables - non-current portion 7,738 6,699 7,738 6,699
Other non-current assets 517 429 517 429
Accounts receivable 380,438 300,034 380,438 300,034
Sales financing receivables - current portion 3,024 3,163 3,024 3,163
Other current receivables 42,579 43,226 42,579 43,226
Total 4,120 3,968 434,380 353,626 30,891 129,882 469,391 487,476
The financial assets are valued using internal valuation techniques (level 2) with the exception of certain cash equivalents (Note 13.1.2.6) valued according to quoted market prices in an active market (level 1).
LIABILITIES
The various categories of financial liabilities on the reporting date are as follows. They are set out in Note 13.1.3 below.
in thousands of euros December 31, 2019 December 31, 2020
Non-current financial liabilities 149,726 145,089
Non-current rental liabilities 12,269 12,105
Other non-current liabilities 3,088 2,130
Current financial liabilities 64,722 17,375
Current rental liabilities 5,602 4,806
Suppliers 253,446 215,887
Other current liabilities 157,579 136,120
Total 646,431 533,513
The financial liabilities are valued using internal valuation techniques (level 2).

2020 UNIVERSAL REGIST RATION DOC UMENT 151
NOTE 13.1.2 ASSETS IN DETAIL
ACCOUNTING PRINCIPLES
VALUATION AND RECOGNITION OF FINANCIAL ASSETS
Pursuant to IFRS 9, the financial assets are classified in one of the following categories:
financial assets valued at fair value through the income statement,
financial assets valued at amortized cost,
financial assets valued at fair value by the other elements of the comprehensive income.
SALES FINANCING RECEIVABLES
Receivables on finance contracts are valued at their discounted value using the effective interest rate method. The amount of any loss recognized is recorded in the income statement.
FINANCIAL ASSETS VALUED AT FAIR VALUE THROUGH THE OTHER ELEMENTS OF THE INCOME STATEMENT
The financial assets are valued at their fair value and changes in this fair value are recorded in the other components of comprehensive income. They include, in particular, the assets associated with the American subsidiary's SERP (Supplemental Employment Retirement Plan).
CASH AND CASH EQUIVALENTS
The availabilities and cash equivalents are mainly made up of bank accounts and marketable securities that can be disposed of quickly, are very liquid, can be easily converted into a known cash amount and of which the underlying assets do not present significant fluctuation risks. The marketable securities are revalued at fair value by the income statement.
SHORT-TERM FINANCIAL ASSETS
This item mainly includes derivative financial instruments whose recognition is explained in note 13.2.2.
SALES FINANCING RECEIVABLES
in thousands of euros Receivables
on financing leases Receivables on financing
granted to end customers Total
Gross amount as of December 31, 2019 10,762 526 11,288
Change in scope
Other 0 0 0
Changes 423 -10 413
Currency translation differences -1,323 -44 -1,367
Gross amount as of December 31, 2020 9,862 473 10,335
Impairments as of December 31, 2019 -526 -526
Change in scope
Other 0 -0 -0
Changes 10 10
Currency translation differences 44 44
Impairments as of December 31, 2020 -473 -473
Net amount as of December 31, 2019 10,762 0 10,762
Net amount as of December 31, 2020 9,862 0 9,862
Of which: non-current portion 6,699
current portion 3,163
Impairment is calculated based on historical statistical data for trade receivables not analyzed in unitary terms.
The schedule of non-current sales financing receivables is as follows:
in thousands of euros December 31, 2020 1 to 3 years 3 to 5 years Over 5 years
Receivables on financing leases – Net 6,699 5,200 1,272 226
Receivables on financing granted to end customers – Net
Sales financing receivables - Non-current portion 6,699 5,200 1,272 226
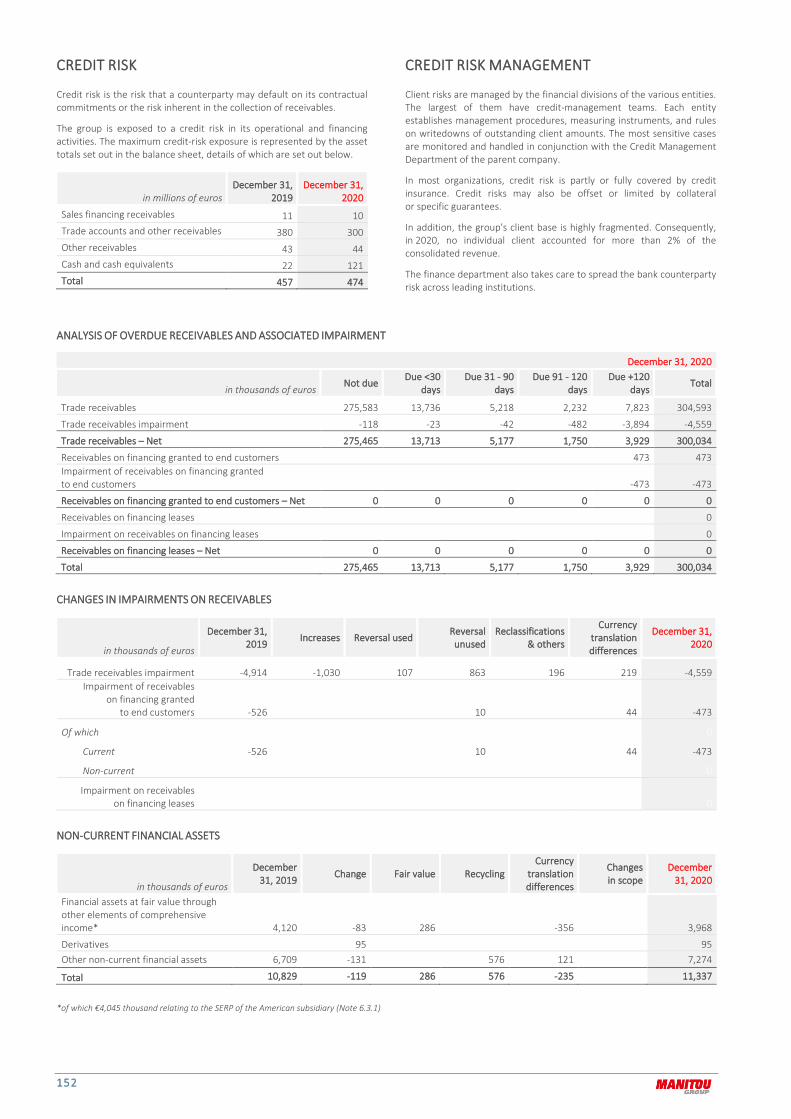
152
CREDIT RISK
Credit risk is the risk that a counterparty may default on its contractual commitments or the risk inherent in the collection of receivables.
The group is exposed to a credit risk in its operational and financing activities. The maximum credit-risk exposure is represented by the asset totals set out in the balance sheet, details of which are set out below.
in millions of euros December 31,
2019 December 31,
2020
Sales financing receivables 11 10 Trade accounts and other receivables 380 300 Other receivables 43 44 Cash and cash equivalents 22 121 Total 457 474
CREDIT RISK MANAGEMENT
Client risks are managed by the financial divisions of the various entities. The largest of them have credit-management teams. Each entity establishes management procedures, measuring instruments, and rules on writedowns of outstanding client amounts. The most sensitive cases are monitored and handled in conjunction with the Credit Management Department of the parent company.
In most organizations, credit risk is partly or fully covered by credit insurance. Credit risks may also be offset or limited by collateral or specific guarantees.
In addition, the group's client base is highly fragmented. Consequently, in 2020, no individual client accounted for more than 2% of the consolidated revenue.
The finance department also takes care to spread the bank counterparty risk across leading institutions.
ANALYSIS OF OVERDUE RECEIVABLES AND ASSOCIATED IMPAIRMENT
December 31, 2020
in thousands of euros Not due Due <30
days Due 31 - 90
days Due 91 - 120
days Due +120
days Total
Trade receivables 275,583 13,736 5,218 2,232 7,823 304,593
Trade receivables impairment -118 -23 -42 -482 -3,894 -4,559
Trade receivables – Net 275,465 13,713 5,177 1,750 3,929 300,034
Receivables on financing granted to end customers 473 473 Impairment of receivables on financing granted to end customers -473 -473
Receivables on financing granted to end customers – Net 0 0 0 0 0 0
Receivables on financing leases 0
Impairment on receivables on financing leases 0
Receivables on financing leases – Net 0 0 0 0 0 0
Total 275,465 13,713 5,177 1,750 3,929 300,034
CHANGES IN IMPAIRMENTS ON RECEIVABLES
in thousands of euros
December 31, 2019 Increases Reversal used Reversal
unused Reclassifications
& others
Currency translation differences
December 31, 2020
Trade receivables impairment -4,914 -1,030 107 863 196 219 -4,559 Impairment of receivables
on financing granted to end customers -526 0 0 10 0 44 -473
Of which 0 0 0 0 0 0 0
Current -526 0 0 10 0 44 -473
Non-current 0 0 0 0 0 0 0
Impairment on receivables on financing leases 0 0 0 0 0 0 0
NON-CURRENT FINANCIAL ASSETS
in thousands of euros
December 31, 2019 Change Fair value Recycling
Currency translation differences
Changes in scope
December 31, 2020
Financial assets at fair value through other elements of comprehensive income* 4,120 -83 286 -356 3,968
Derivatives 95 95 Other non-current financial assets 6,709 -131 576 121 7,274
Total 10,829 -119 286 576 -235 11,337
*of which €4,045 thousand relating to the SERP of the American subsidiary (Note 6.3.1)

2020 UNIVERSAL REGIST RATION DOC UMENT 153
CURRENT FINANCIAL ASSETS
Marketable securities and derivatives were valued at their fair value on the reporting date.
in thousands of euros December 31, 2019
Net amount as of December 31, 2020
Financial assets at fair value through other elements of the income statement 3 2
Derivatives 486 512
Financial assets valued at amortized cost 12 13 Other current financial assets 1,433 1,341
Total 1,933 1,868
CASH AND CASH EQUIVALENTS
in thousands of euros December 31, 2019 Net amount as of
December 31, 2020
Cash and cash equivalents 16,383 110,039
Term deposits and others 5,950 10,681 Money-market funds (SICAV) & others 0 0
Total 22,333 120,721

154
NOTE 13.1.3 LIABILITIES IN DETAIL
ACCOUNTING PRINCIPLES
VALUATION AND RECOGNITION OF FINANCIAL
LIABILITIES
BORROWINGS AND OTHER FINANCIAL LIABILITIES
Borrowings are initially recognized at their fair value, net of directly attributable transaction costs. These borrowings are valued at their amortized cost on each reporting date, using the effective interest rate method. Financial expenses therefore include interest and other costs incurred which are spread over the life of the loan.
VALUATION OF SHAREHOLDER AGREEMENTS (MINORITY PUT OPTIONS)
Manitou BF SA has signed shareholder agreements specifying the terms for repurchasing shares held by the minority shareholders of consolidated subsidiaries. In the absence of a specific standard or interpretation, the fair value of the commitment to minority shareholders is recognized as a financial liability by deduction from minority interests and, for the portion exceeding the value of the minority interests, by deduction from the group portion of shareholders’ equity. The change in the financial liability related to the change in the fair value of the commitment to minority shareholders from one period to the next is also recognized as a financial liability by deduction from minority interests and, for the portion exceeding the value of the minority interests, by deduction from the group portion of shareholders’ equity.
NET DEBT
The group's net debt is as follows:
in thousands of euros December 31, 2019 December 31, 2020
Total current financial liabilities* 64,722 17,375
Total non-current financial liabilities* 149,726 145,089
TOTAL GROSS DEBT 214,447 162,464
Cash and cash equivalents -22,333 -120,721
Current financial assets -1,933 -1,868
TOTAL NET DEBT 190,181 39,876
*Excluding IFRS 16.
in thousands of euros December 31, 2019 Current December 31, 2020 Current
Short-term financing and bank overdrafts 27,223 790
Bank loans 19,367 3,070
Financing lease liabilities 1,264 1,107
Liabilities related to receivables securitised with recourse 0 0
Derivative liabilities - currency and interest rates 7,362 3,100
Financial liabilities at fair value through income 0 109
Bond issues 0 0
Other borrowings 9,506 9,199
Commitments to buy back minority interests 0 0
CURRENT FINANCIAL LIABILITIES 64,722 17,375
Current rental liabilities 5,602 4,806
TOTAL CURRENT FINANCIAL LIABILITIES 70,324 22,182
in thousands of euros December 31, 2019
Non-current December 31, 2020
Non-current 1 to 5 years over 5 years
Bank loans 13,228 10,260 8,083 2,177
Financing lease liabilities 166 124 124 0
Liabilities related to receivables securitised with recourse 0 0 0
Derivative liabilities - currency and interest rates 6 6 0
Financial liabilities at fair value through income 776 776 0
Bond issues 128,747 128,946 24,928 104,018
Other borrowings 6,920 4,976 4,654 322
Commitment to buy back minority interests 665 0 0 0
NON-CURRENT FINANCIAL LIABILITIES 149,726 145,089 38,572 106,517
Non-current rental liabilities 12,269 12,105 11,179 926
TOTAL NON-CURRENT FINANCIAL LIABILITIES 161,995 157,194 49,751 107,443
The group funds most of its needs through bank financing (medium-term loans or bank overdrafts) and bond issues (of the Euro PP type). The parent company’s bank financing agreement had been renegotiated and extended in December 2016 for a period of five years, plus two possible one-year extensions, which were activated, taking the expiry date of the financing to December 2023.

2020 UNIVERSAL REGIST RATION DOC UMENT 155
CHARACTERISTICS OF THE MAIN BANK LOANS
in thousands of euros
December 31, 2019 December 31, 2020
Current Non-current Current Non-current Currency Due date Effective rate
Revolving 17,203 EUR Variable
BPI 1 429 1,711 599 EUR Q4/2021 2.82%
BPI 2 600 603 581 1,184 EUR Q4/2024 4.41%
BPI 3 4,980 650 4,397 EUR Q2/2026 1.93%
BPI 4 4,980 463 4,583 EUR Q2/2029 2.20%
Australia 486 823 757 70 AUD Q2/2022 2.71%
Other 649 131 19 25
Total 19,367 13,228 3,070 10,260
In December 2016, Manitou renegotiated and extended its financing put in place in 2013. The multicurrency RCF (Revolving Credit Facility) stands at €180 million with a maturity of five years, plus a possible two-year extension, which was activated, and takes the expiry date of the financing to December 2023.
This contract includes ratio clauses (covenants) and “material adverse change*” and “cross default*” clauses that could restrict the possibilities for drawdown or affect the term of the credit facilities. It includes negative pledge* clauses to which thresholds and exemptions are attached.
Facility Signatories Main contractual clauses 2nd half of 2016 to second half of 2023
Revolving Facility Manitou BF
Gearing < 1 Leverage < 3.5 except in certain cases
Cap on investments Cap on acquisitions and disposals of assets
Limits on additional debt Clause on changes in control
Dividends are limited to 100% of net income
* definition in paragraph 8.5 of this document.
CHARACTERISTICS OF BOND LOANS
in thousands of euros
December 31, 2019 December 31, 2020
Current Non-current Current Non-current Currency Due date Effective rate
Bond issue 2015-2022 24,885 24,824 EUR Q3/2022 4.00%
Bond issue 2019-2025 9,894 9,924 EUR Q2/2025 2.35%
Bond issue 2019-2026 24,731 24,763 EUR Q2/2026 2.59%
Bond issue 2019-2027 69,238 69,435 EUR Q2/2027 2.93%
Total 128,747 128,946
OUTSTANDING LIABILITY TO FINANCIAL INSTITUTIONS
The portion of outstanding liability to financial institutions is broken down as follows:
in thousands of euros
December 31, 2019 December 31, 2020
Outstandings authorized Outstandings used Outstandings authorized Outstandings used
Short-term financing and bank overdrafts 69,000 27,223 69,000 0
Financing lease liabilities 1,429 1,429 1 1
Other bank loans
- Amortizable term loans 13,320 13,320 12,192 12,192
- Revolving loan facilities 180,000 17,203 180,000 0
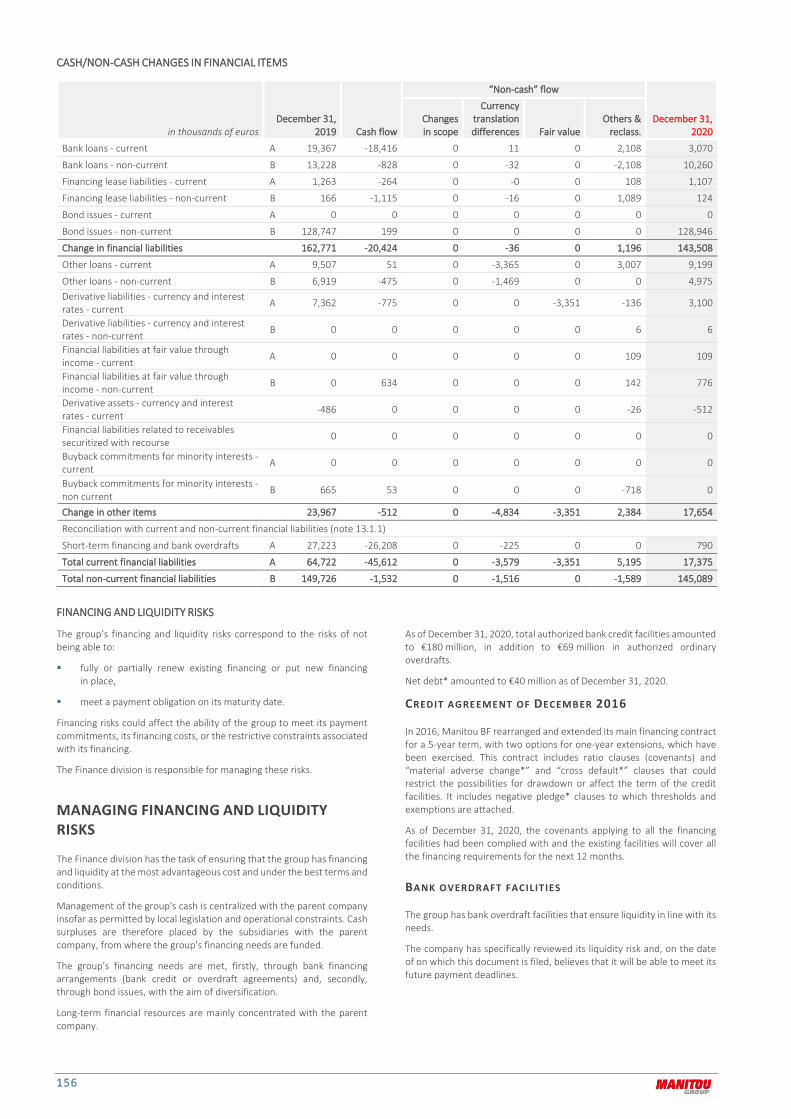
156
CASH/NON-CASH CHANGES IN FINANCIAL ITEMS
in thousands of euros December 31,
2019 Cash flow
“Non-cash” flow
December 31, 2020
Changes in scope
Currency translation differences Fair value
Others & reclass.
Bank loans - current A 19,367 -18,416 0 11 0 2,108 3,070
Bank loans - non-current B 13,228 -828 0 -32 0 -2,108 10,260
Financing lease liabilities - current A 1,263 -264 0 -0 0 108 1,107
Financing lease liabilities - non-current B 166 -1,115 0 -16 0 1,089 124
Bond issues - current A 0 0 0 0 0 0 0
Bond issues - non-current B 128,747 199 0 0 0 0 128,946
Change in financial liabilities 162,771 -20,424 0 -36 0 1,196 143,508
Other loans - current A 9,507 51 0 -3,365 0 3,007 9,199
Other loans - non-current B 6,919 -475 0 -1,469 0 0 4,975 Derivative liabilities - currency and interest rates - current A 7,362 -775 0 0 -3,351 -136 3,100
Derivative liabilities - currency and interest rates - non-current B 0 0 0 0 0 6 6
Financial liabilities at fair value through income - current A 0 0 0 0 0 109 109
Financial liabilities at fair value through income - non-current B 0 634 0 0 0 142 776
Derivative assets - currency and interest rates - current
-486 0 0 0 0 -26 -512
Financial liabilities related to receivables securitized with recourse
0 0 0 0 0 0 0
Buyback commitments for minority interests - current
A 0 0 0 0 0 0 0
Buyback commitments for minority interests - non current
B 665 53 0 0 0 -718 0
Change in other items 23,967 -512 0 -4,834 -3,351 2,384 17,654
Reconciliation with current and non-current financial liabilities (note 13.1.1)
Short-term financing and bank overdrafts A 27,223 -26,208 0 -225 0 0 790
Total current financial liabilities A 64,722 -45,612 0 -3,579 -3,351 5,195 17,375
Total non-current financial liabilities B 149,726 -1,532 0 -1,516 0 -1,589 145,089
FINANCING AND LIQUIDITY RISKS
The group’s financing and liquidity risks correspond to the risks of not being able to:
fully or partially renew existing financing or put new financing in place,
meet a payment obligation on its maturity date.
Financing risks could affect the ability of the group to meet its payment commitments, its financing costs, or the restrictive constraints associated with its financing.
The Finance division is responsible for managing these risks.
MANAGING FINANCING AND LIQUIDITY RISKS
The Finance division has the task of ensuring that the group has financing and liquidity at the most advantageous cost and under the best terms and conditions.
Management of the group's cash is centralized with the parent company insofar as permitted by local legislation and operational constraints. Cash surpluses are therefore placed by the subsidiaries with the parent company, from where the group's financing needs are funded.
The group's financing needs are met, firstly, through bank financing arrangements (bank credit or overdraft agreements) and, secondly, through bond issues, with the aim of diversification.
Long-term financial resources are mainly concentrated with the parent company.
As of December 31, 2020, total authorized bank credit facilities amounted to €180 million, in addition to €69 million in authorized ordinary overdrafts.
Net debt* amounted to €40 million as of December 31, 2020.
CREDIT AGREEMENT OF DECEMBER 2016
In 2016, Manitou BF rearranged and extended its main financing contract for a 5-year term, with two options for one-year extensions, which have been exercised. This contract includes ratio clauses (covenants) and “material adverse change*” and “cross default*” clauses that could restrict the possibilities for drawdown or affect the term of the credit facilities. It includes negative pledge* clauses to which thresholds and exemptions are attached.
As of December 31, 2020, the covenants applying to all the financing facilities had been complied with and the existing facilities will cover all the financing requirements for the next 12 months.
BANK OVERDRAFT FACILITIES
The group has bank overdraft facilities that ensure liquidity in line with its needs.
The company has specifically reviewed its liquidity risk and, on the date of on which this document is filed, believes that it will be able to meet its future payment deadlines.
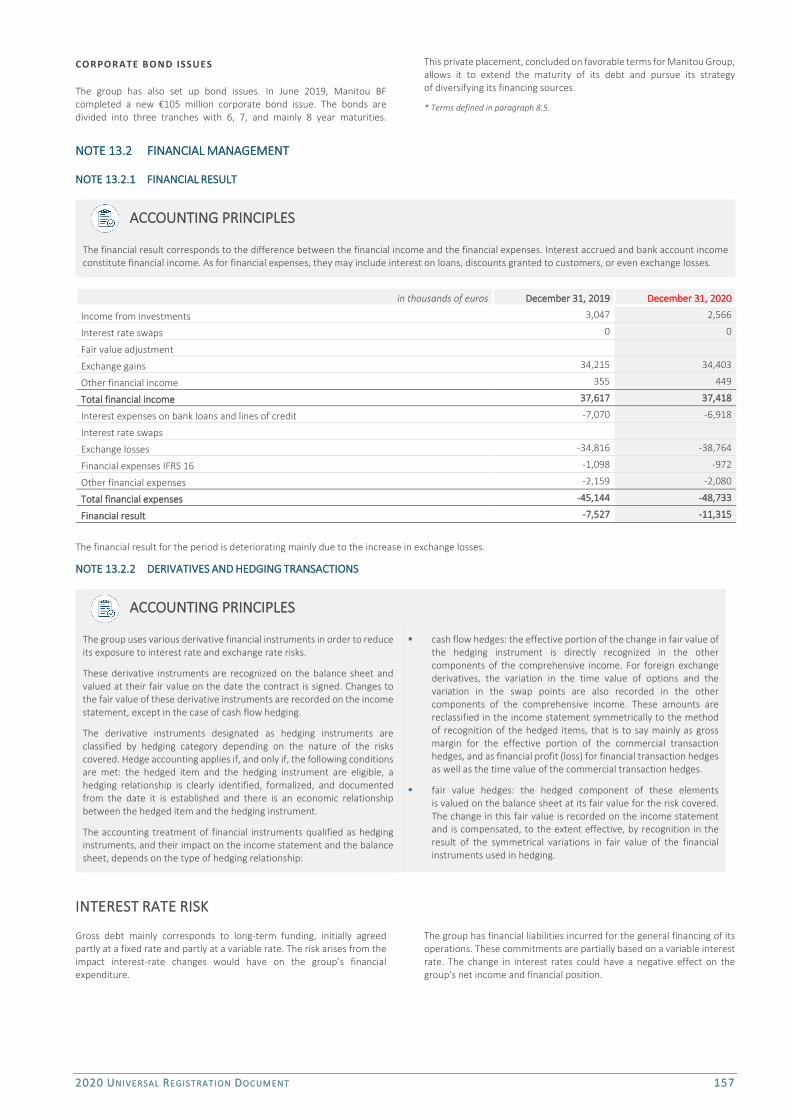
2020 UNIVERSAL REGIST RATION DOC UMENT 157
CORPORATE BOND ISSUES
The group has also set up bond issues. In June 2019, Manitou BF completed a new €105 million corporate bond issue. The bonds are divided into three tranches with 6, 7, and mainly 8 year maturities.
This private placement, concluded on favorable terms for Manitou Group, allows it to extend the maturity of its debt and pursue its strategy of diversifying its financing sources.
* Terms defined in paragraph 8.5.
NOTE 13.2 FINANCIAL MANAGEMENT
NOTE 13.2.1 FINANCIAL RESULT
ACCOUNTING PRINCIPLES
The financial result corresponds to the difference between the financial income and the financial expenses. Interest accrued and bank account income constitute financial income. As for financial expenses, they may include interest on loans, discounts granted to customers, or even exchange losses.
in thousands of euros December 31, 2019 December 31, 2020
Income from investments 3,047 2,566
Interest rate swaps 0 0
Fair value adjustment
Exchange gains 34,215 34,403
Other financial income 355 449
Total financial income 37,617 37,418
Interest expenses on bank loans and lines of credit -7,070 -6,918
Interest rate swaps
Exchange losses -34,816 -38,764
Financial expenses IFRS 16 -1,098 -972
Other financial expenses -2,159 -2,080
Total financial expenses -45,144 -48,733
Financial result -7,527 -11,315
The financial result for the period is deteriorating mainly due to the increase in exchange losses.
NOTE 13.2.2 DERIVATIVES AND HEDGING TRANSACTIONS
ACCOUNTING PRINCIPLES
The group uses various derivative financial instruments in order to reduce its exposure to interest rate and exchange rate risks.
These derivative instruments are recognized on the balance sheet and valued at their fair value on the date the contract is signed. Changes to the fair value of these derivative instruments are recorded on the income statement, except in the case of cash flow hedging.
The derivative instruments designated as hedging instruments are classified by hedging category depending on the nature of the risks covered. Hedge accounting applies if, and only if, the following conditions are met: the hedged item and the hedging instrument are eligible, a hedging relationship is clearly identified, formalized, and documented from the date it is established and there is an economic relationship between the hedged item and the hedging instrument.
The accounting treatment of financial instruments qualified as hedging instruments, and their impact on the income statement and the balance sheet, depends on the type of hedging relationship:
cash flow hedges: the effective portion of the change in fair value of the hedging instrument is directly recognized in the other components of the comprehensive income. For foreign exchange derivatives, the variation in the time value of options and the variation in the swap points are also recorded in the other components of the comprehensive income. These amounts are reclassified in the income statement symmetrically to the method of recognition of the hedged items, that is to say mainly as gross margin for the effective portion of the commercial transaction hedges, and as financial profit (loss) for financial transaction hedges as well as the time value of the commercial transaction hedges.
fair value hedges: the hedged component of these elements is valued on the balance sheet at its fair value for the risk covered. The change in this fair value is recorded on the income statement and is compensated, to the extent effective, by recognition in the result of the symmetrical variations in fair value of the financial instruments used in hedging.
INTEREST RATE RISK
Gross debt mainly corresponds to long-term funding, initially agreed partly at a fixed rate and partly at a variable rate. The risk arises from the impact interest-rate changes would have on the group’s financial expenditure.
The group has financial liabilities incurred for the general financing of its operations. These commitments are partially based on a variable interest rate. The change in interest rates could have a negative effect on the group's net income and financial position.
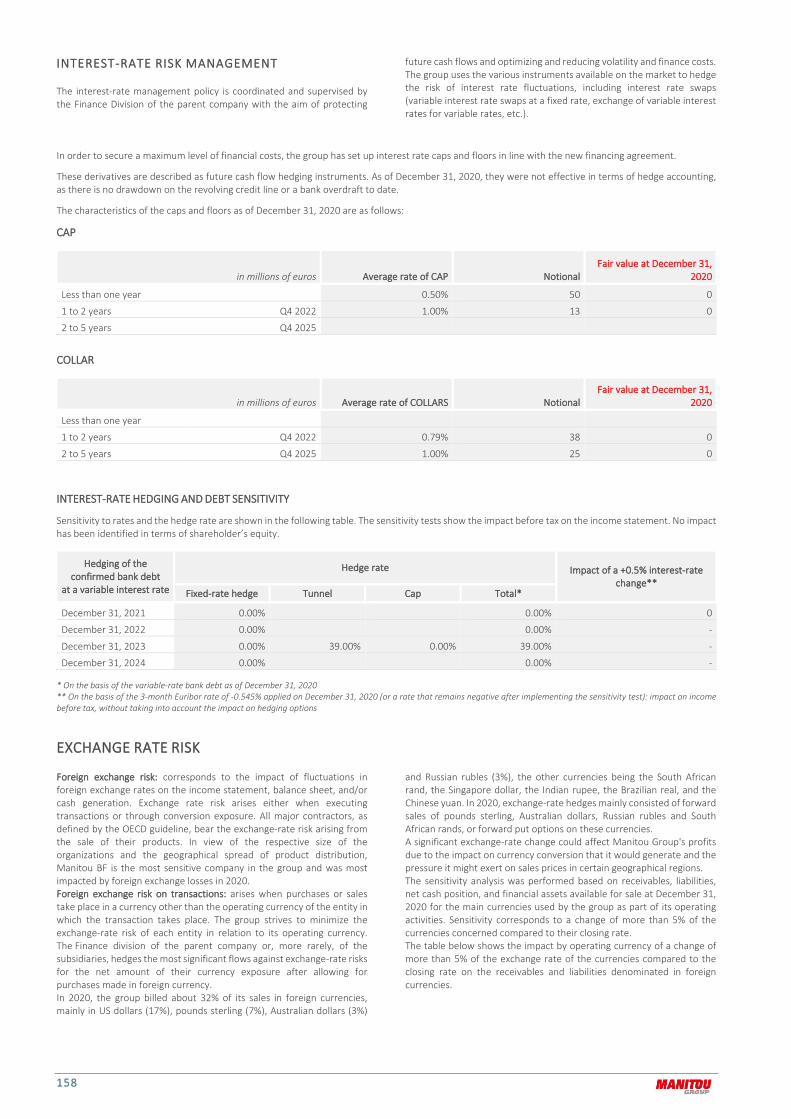
158
INTEREST-RATE RISK MANAGEMENT
The interest-rate management policy is coordinated and supervised by the Finance Division of the parent company with the aim of protecting
future cash flows and optimizing and reducing volatility and finance costs. The group uses the various instruments available on the market to hedge the risk of interest rate fluctuations, including interest rate swaps (variable interest rate swaps at a fixed rate, exchange of variable interest rates for variable rates, etc.).
In order to secure a maximum level of financial costs, the group has set up interest rate caps and floors in line with the new financing agreement.
These derivatives are described as future cash flow hedging instruments. As of December 31, 2020, they were not effective in terms of hedge accounting, as there is no drawdown on the revolving credit line or a bank overdraft to date.
The characteristics of the caps and floors as of December 31, 2020 are as follows:
CAP
in millions of euros Average rate of CAP Notional Fair value at December 31,
2020
Less than one year 0.50% 50 0
1 to 2 years Q4 2022 1.00% 13 0
2 to 5 years Q4 2025
COLLAR
in millions of euros Average rate of COLLARS Notional Fair value at December 31,
2020
Less than one year
1 to 2 years Q4 2022 0.79% 38 0
2 to 5 years Q4 2025 1.00% 25 0
INTEREST-RATE HEDGING AND DEBT SENSITIVITY
Sensitivity to rates and the hedge rate are shown in the following table. The sensitivity tests show the impact before tax on the income statement. No impact has been identified in terms of shareholder’s equity.
Hedging of the confirmed bank debt
at a variable interest rate
Hedge rate Impact of a +0.5% interest-rate change**
Fixed-rate hedge Tunnel Cap Total*
December 31, 2021 0.00% 0.00% 0
December 31, 2022 0.00% 0.00% -
December 31, 2023 0.00% 39.00% 0.00% 39.00% -
December 31, 2024 0.00% 0.00% -
* On the basis of the variable-rate bank debt as of December 31, 2020 ** On the basis of the 3-month Euribor rate of -0.545% applied on December 31, 2020 (or a rate that remains negative after implementing the sensitivity test): impact on income before tax, without taking into account the impact on hedging options
EXCHANGE RATE RISK
Foreign exchange risk: corresponds to the impact of fluctuations in foreign exchange rates on the income statement, balance sheet, and/or cash generation. Exchange rate risk arises either when executing transactions or through conversion exposure. All major contractors, as defined by the OECD guideline, bear the exchange-rate risk arising from the sale of their products. In view of the respective size of the organizations and the geographical spread of product distribution, Manitou BF is the most sensitive company in the group and was most impacted by foreign exchange losses in 2020. Foreign exchange risk on transactions: arises when purchases or sales take place in a currency other than the operating currency of the entity in which the transaction takes place. The group strives to minimize the exchange-rate risk of each entity in relation to its operating currency. The Finance division of the parent company or, more rarely, of the subsidiaries, hedges the most significant flows against exchange-rate risks for the net amount of their currency exposure after allowing for purchases made in foreign currency. In 2020, the group billed about 32% of its sales in foreign currencies, mainly in US dollars (17%), pounds sterling (7%), Australian dollars (3%)
and Russian rubles (3%), the other currencies being the South African rand, the Singapore dollar, the Indian rupee, the Brazilian real, and the Chinese yuan. In 2020, exchange-rate hedges mainly consisted of forward sales of pounds sterling, Australian dollars, Russian rubles and South African rands, or forward put options on these currencies. A significant exchange-rate change could affect Manitou Group's profits due to the impact on currency conversion that it would generate and the pressure it might exert on sales prices in certain geographical regions. The sensitivity analysis was performed based on receivables, liabilities, net cash position, and financial assets available for sale at December 31, 2020 for the main currencies used by the group as part of its operating activities. Sensitivity corresponds to a change of more than 5% of the currencies concerned compared to their closing rate. The table below shows the impact by operating currency of a change of more than 5% of the exchange rate of the currencies compared to the closing rate on the receivables and liabilities denominated in foreign currencies.
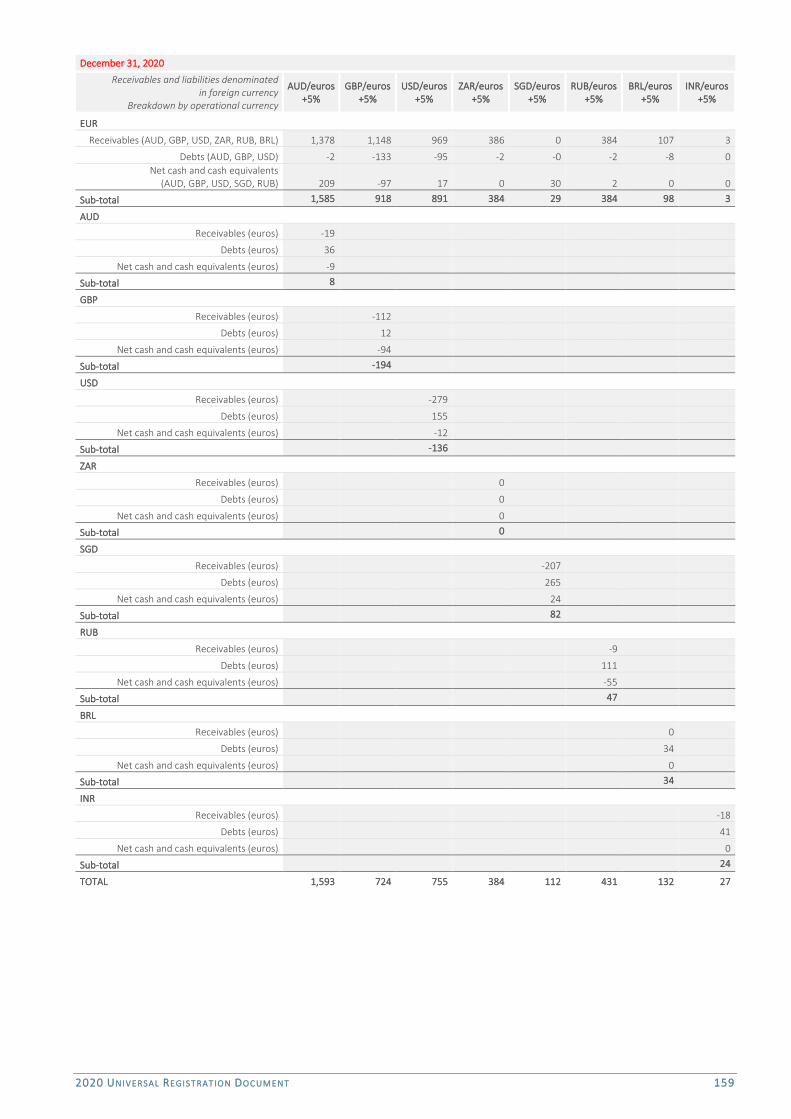
2020 UNIVERSAL REGIST RATION DOC UMENT 159
December 31, 2020
Receivables and liabilities denominated in foreign currency
Breakdown by operational currency
AUD/euros +5%
GBP/euros +5%
USD/euros +5%
ZAR/euros +5%
SGD/euros +5%
RUB/euros +5%
BRL/euros +5%
INR/euros +5%
EUR
Receivables (AUD, GBP, USD, ZAR, RUB, BRL) 1,378 1,148 969 386 0 384 107 3
Debts (AUD, GBP, USD) -2 -133 -95 -2 -0 -2 -8 0 Net cash and cash equivalents
(AUD, GBP, USD, SGD, RUB) 209 -97 17 0 30 2 0 0
Sub-total 1,585 918 891 384 29 384 98 3
AUD
Receivables (euros) -19
Debts (euros) 36
Net cash and cash equivalents (euros) -9
Sub-total 8
GBP
Receivables (euros) -112
Debts (euros) 12
Net cash and cash equivalents (euros) -94
Sub-total -194
USD
Receivables (euros) -279
Debts (euros) 155
Net cash and cash equivalents (euros) -12
Sub-total -136
ZAR
Receivables (euros) 0
Debts (euros) 0
Net cash and cash equivalents (euros) 0
Sub-total 0
SGD
Receivables (euros) -207
Debts (euros) 265
Net cash and cash equivalents (euros) 24
Sub-total 82
RUB
Receivables (euros) -9
Debts (euros) 111
Net cash and cash equivalents (euros) -55
Sub-total 47
BRL
Receivables (euros) 0
Debts (euros) 34
Net cash and cash equivalents (euros) 0
Sub-total 34
INR
Receivables (euros) -18
Debts (euros) 41
Net cash and cash equivalents (euros) 0
Sub-total 24
TOTAL 1,593 724 755 384 112 431 132 27
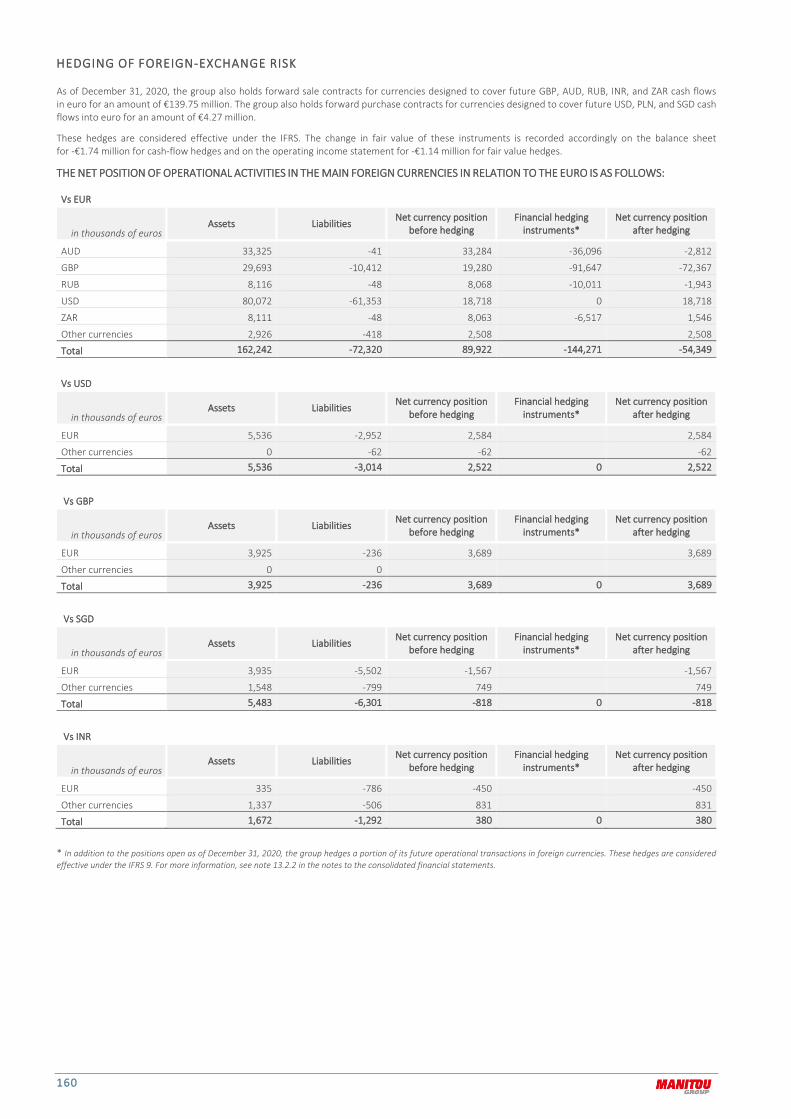
160
HEDGING OF FOREIGN-EXCHANGE RISK
As of December 31, 2020, the group also holds forward sale contracts for currencies designed to cover future GBP, AUD, RUB, INR, and ZAR cash flows in euro for an amount of €139.75 million. The group also holds forward purchase contracts for currencies designed to cover future USD, PLN, and SGD cash flows into euro for an amount of €4.27 million.
These hedges are considered effective under the IFRS. The change in fair value of these instruments is recorded accordingly on the balance sheet for -€1.74 million for cash-flow hedges and on the operating income statement for -€1.14 million for fair value hedges.
THE NET POSITION OF OPERATIONAL ACTIVITIES IN THE MAIN FOREIGN CURRENCIES IN RELATION TO THE EURO IS AS FOLLOWS:
Vs EUR
in thousands of euros Assets Liabilities Net currency position
before hedging Financial hedging
instruments* Net currency position
after hedging
AUD 33,325 -41 33,284 -36,096 -2,812
GBP 29,693 -10,412 19,280 -91,647 -72,367
RUB 8,116 -48 8,068 -10,011 -1,943
USD 80,072 -61,353 18,718 0 18,718
ZAR 8,111 -48 8,063 -6,517 1,546
Other currencies 2,926 -418 2,508 2,508
Total 162,242 -72,320 89,922 -144,271 -54,349
Vs USD
in thousands of euros Assets Liabilities Net currency position
before hedging Financial hedging
instruments* Net currency position
after hedging
EUR 5,536 -2,952 2,584 2,584
Other currencies 0 -62 -62 -62
Total 5,536 -3,014 2,522 0 2,522
Vs GBP
in thousands of euros Assets Liabilities Net currency position
before hedging Financial hedging
instruments* Net currency position
after hedging
EUR 3,925 -236 3,689 3,689
Other currencies 0 0
Total 3,925 -236 3,689 0 3,689
Vs SGD
in thousands of euros Assets Liabilities Net currency position
before hedging Financial hedging
instruments* Net currency position
after hedging
EUR 3,935 -5,502 -1,567 -1,567
Other currencies 1,548 -799 749 749
Total 5,483 -6,301 -818 0 -818
Vs INR
in thousands of euros Assets Liabilities Net currency position
before hedging Financial hedging
instruments* Net currency position
after hedging
EUR 335 -786 -450 -450
Other currencies 1,337 -506 831 831
Total 1,672 -1,292 380 0 380
* In addition to the positions open as of December 31, 2020, the group hedges a portion of its future operational transactions in foreign currencies. These hedges are considered effective under the IFRS 9. For more information, see note 13.2.2 in the notes to the consolidated financial statements.
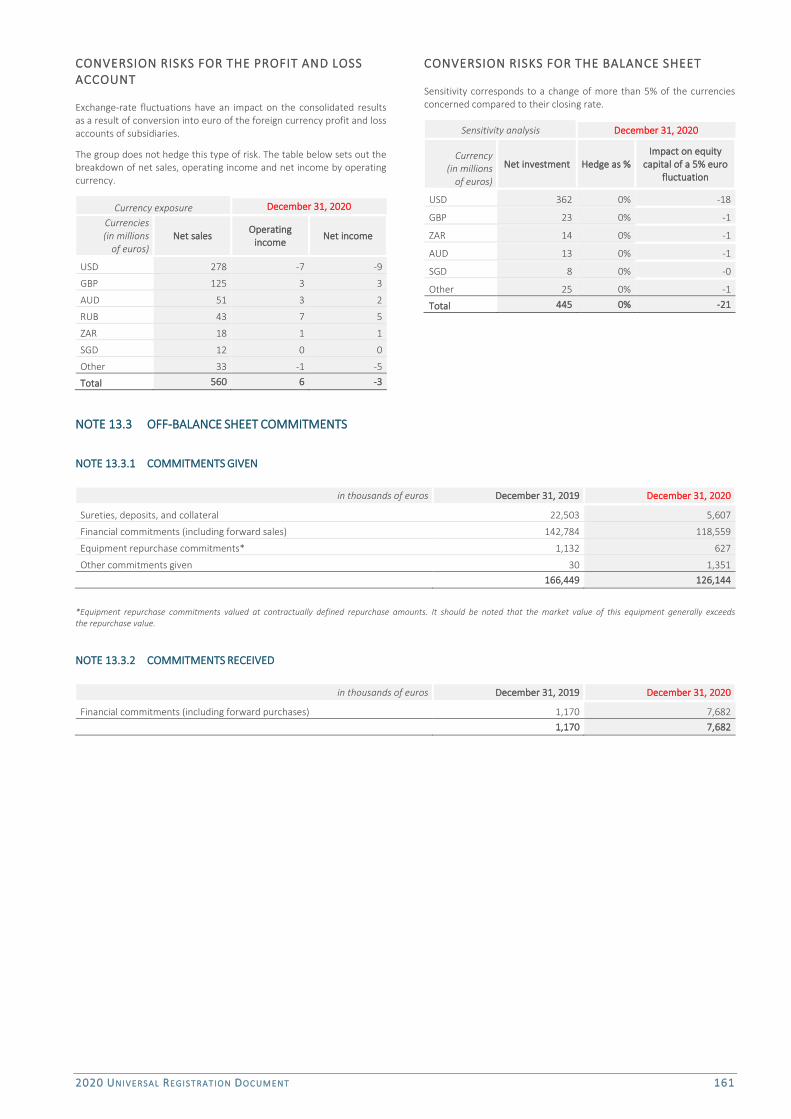
2020 UNIVERSAL REGIST RATION DOC UMENT 161
CONVERSION RISKS FOR THE PROFIT AND LOSS
ACCOUNT
Exchange-rate fluctuations have an impact on the consolidated results as a result of conversion into euro of the foreign currency profit and loss accounts of subsidiaries.
The group does not hedge this type of risk. The table below sets out the breakdown of net sales, operating income and net income by operating currency.
Currency exposure December 31, 2020
Currencies (in millions
of euros) Net sales Operating
income Net income
USD 278 -7 -9
GBP 125 3 3
AUD 51 3 2
RUB 43 7 5
ZAR 18 1 1
SGD 12 0 0
Other 33 -1 -5
Total 560 6 -3
CONVERSION RISKS FOR THE BALANCE SHEET
Sensitivity corresponds to a change of more than 5% of the currencies concerned compared to their closing rate.
Sensitivity analysis December 31, 2020
Currency (in millions
of euros)
Net investment Hedge as % Impact on equity
capital of a 5% euro fluctuation
USD 362 0% -18
GBP 23 0% -1
ZAR 14 0% -1
AUD 13 0% -1
SGD 8 0% -0
Other 25 0% -1
Total 445 0% -21
NOTE 13.3 OFF-BALANCE SHEET COMMITMENTS
NOTE 13.3.1 COMMITMENTS GIVEN
in thousands of euros December 31, 2019 December 31, 2020
Sureties, deposits, and collateral 22,503 5,607
Financial commitments (including forward sales) 142,784 118,559
Equipment repurchase commitments* 1,132 627
Other commitments given 30 1,351
166,449 126,144
*Equipment repurchase commitments valued at contractually defined repurchase amounts. It should be noted that the market value of this equipment generally exceeds the repurchase value.
NOTE 13.3.2 COMMITMENTS RECEIVED
in thousands of euros December 31, 2019 December 31, 2020
Financial commitments (including forward purchases) 1,170 7,682
1,170 7,682
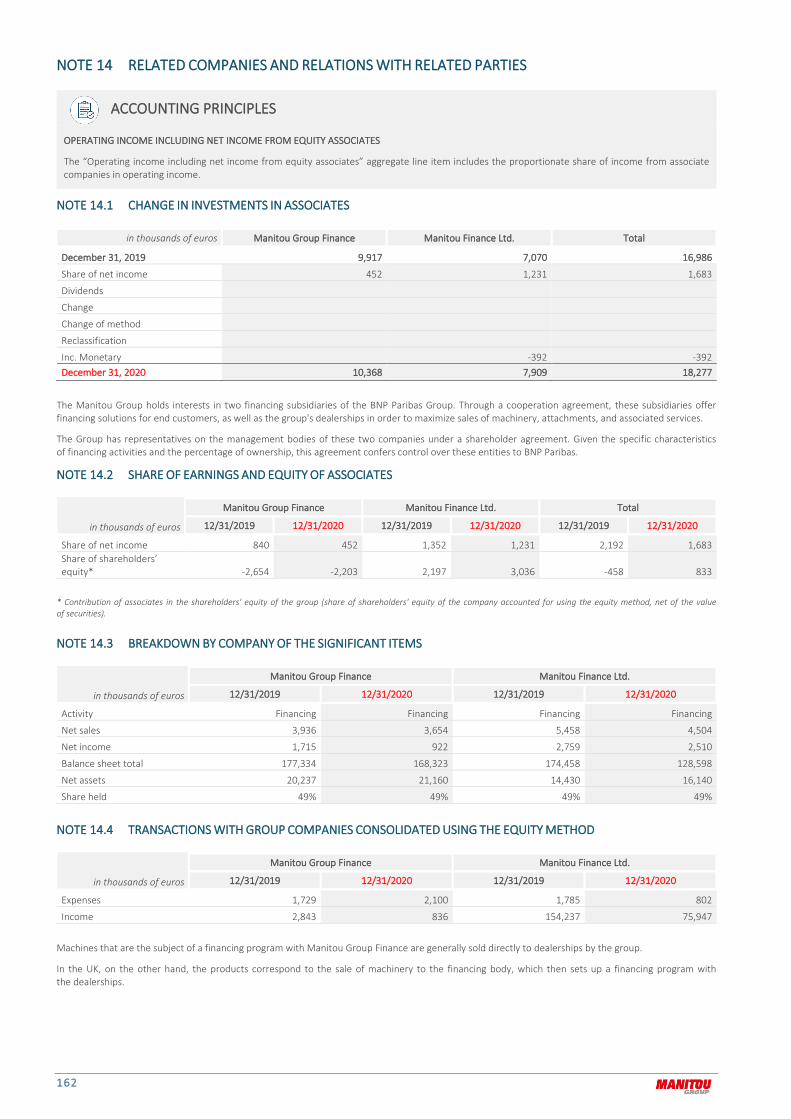
162
NOTE 14 RELATED COMPANIES AND RELATIONS WITH RELATED PARTIES
ACCOUNTING PRINCIPLES
OPERATING INCOME INCLUDING NET INCOME FROM EQUITY ASSOCIATES
The “Operating income including net income from equity associates” aggregate line item includes the proportionate share of income from associate companies in operating income.
NOTE 14.1 CHANGE IN INVESTMENTS IN ASSOCIATES
in thousands of euros Manitou Group Finance Manitou Finance Ltd. Total
December 31, 2019 9,917 7,070 16,986
Share of net income 452 1,231 1,683
Dividends
Change
Change of method
Reclassification
Inc. Monetary -392 -392 December 31, 2020 10,368 7,909 18,277
The Manitou Group holds interests in two financing subsidiaries of the BNP Paribas Group. Through a cooperation agreement, these subsidiaries offer financing solutions for end customers, as well as the group's dealerships in order to maximize sales of machinery, attachments, and associated services.
The Group has representatives on the management bodies of these two companies under a shareholder agreement. Given the specific characteristics of financing activities and the percentage of ownership, this agreement confers control over these entities to BNP Paribas.
NOTE 14.2 SHARE OF EARNINGS AND EQUITY OF ASSOCIATES
in thousands of euros
Manitou Group Finance Manitou Finance Ltd. Total
12/31/2019 12/31/2020 12/31/2019 12/31/2020 12/31/2019 12/31/2020
Share of net income 840 452 1,352 1,231 2,192 1,683 Share of shareholders’ equity* -2,654 -2,203 2,197 3,036 -458 833
* Contribution of associates in the shareholders' equity of the group (share of shareholders' equity of the company accounted for using the equity method, net of the value of securities).
NOTE 14.3 BREAKDOWN BY COMPANY OF THE SIGNIFICANT ITEMS
in thousands of euros
Manitou Group Finance Manitou Finance Ltd.
12/31/2019 12/31/2020 12/31/2019 12/31/2020
Activity Financing Financing Financing Financing
Net sales 3,936 3,654 5,458 4,504
Net income 1,715 922 2,759 2,510
Balance sheet total 177,334 168,323 174,458 128,598
Net assets 20,237 21,160 14,430 16,140
Share held 49% 49% 49% 49%
NOTE 14.4 TRANSACTIONS WITH GROUP COMPANIES CONSOLIDATED USING THE EQUITY METHOD
in thousands of euros
Manitou Group Finance Manitou Finance Ltd.
12/31/2019 12/31/2020 12/31/2019 12/31/2020
Expenses 1,729 2,100 1,785 802
Income 2,843 836 154,237 75,947
Machines that are the subject of a financing program with Manitou Group Finance are generally sold directly to dealerships by the group.
In the UK, on the other hand, the products correspond to the sale of machinery to the financing body, which then sets up a financing program with the dealerships.

2020 UNIVERSAL REGIST RATION DOC UMENT 163
NOTE 14.5 TRANSACTIONS WITH INDIVIDUALS
in thousands of euros
2019 2020
Interest for 2019 Balance at
December 31, 2019
Purchase price 2019
Interest for 2020 Balance at
December 31, 2020
Purchase price 2020
Current accounts with shareholders:
Mr. Marcel Braud 79 6,055 71 6,050
Ms. Jacqueline Himsworth 4 278 3 280
Purchases of equity interests
Not applicable
NOTE 15 STATUTORY AUDITORS’ FEES
in thousands of euros
KPMG RSM Ouest & members of the RSM International network
Other TOTAL
Amount % Amount % Amount % Amount %
2019 2020 2019 2020 2019 2020 2019 2020 2019 2020 2019 2020 2019 2020 2019 2020
Statutory audits, certification of individual and consolidated financial statements
Issuer 165 162 33% 34% 165 162 40% 47% 0 0 0% 0% 330 324 35% 38% Fully consolidated subsidiaries 340 306 67% 64% 227 182 55% 53% 20 23 100% 78% 587 511 62% 60%
Services other than certification of financial statements
Issuer 0 0 0% 0% 24 0 6% 0% 0 0 0% 0% 24 0 3% 0% Fully consolidated subsidiaries 0 8 0% 2% 0 0 0% 0% 0 7 0% 22% 0 14 0% 2%
SUBTOTAL 505 476 100% 100% 416 344 100% 100% 20 30 100% 100% 941 850 100% 100% Other services rendered by the networks for fully consolidated subsidiaries 0 0 0% 0% 0 0 0% 0% 0 0 0% 0% 0 0 0% 0%
TOTAL 505 476 100% 100% 416 344 100% 100% 20 30 100% 100% 941 850 100% 100%
NOTE 16 POST-CLOSING EVENTS
LITIGATION FOR INFRINGEMENT
On February 26, 2021, the Paris Court of Justice (“Tribunal Judiciaire”) ruled in first instance on the litigation for infringement of the French part of two European patents relating to certain features concerning the control system of the overload cut-off of certain telescopic forklift trucks, initiated in May 2017 by J.C. Bamford Excavators Limited (JCB) against Manitou BF.
Under the terms of this decision, the Court has invalidated in its entirety the French part of one of the two patents held by JCB.
The Tribunal has also invalidated most of the claims of the French part of the second patent held by JCB.
The Court found that only two claims of the French part of the second patent were infringed by three models of equipment from an old configuration which is no longer marketed by Manitou BF since May 2017. Manitou challenges this decision while noting that it has no impact on its business as this old configuration is no longer marketed.
Given the very residual character of the infringement uphold, the Court ordered Manitou BF to pay the plaintiff the total sum of 150,000 euros for the loss suffered, rejecting the claim of JCB, which was claiming a loss of 190 million euros.
The Court's decision reinforces the position of Manitou, which has always contested the merits of the plaintiff's action and the disproportionate nature of its claims. The group will continue to firmly defend itself against infringement allegations of three patents claimed by JCB.
NEW GROUP ORGANIZATION
As of January 2021, the former MHA and CEP divisions will merge into the new Product Division chaired by Elisabeth Ausimour, Executive Committee member, previously President of the MHA Division and Executive Committee member.
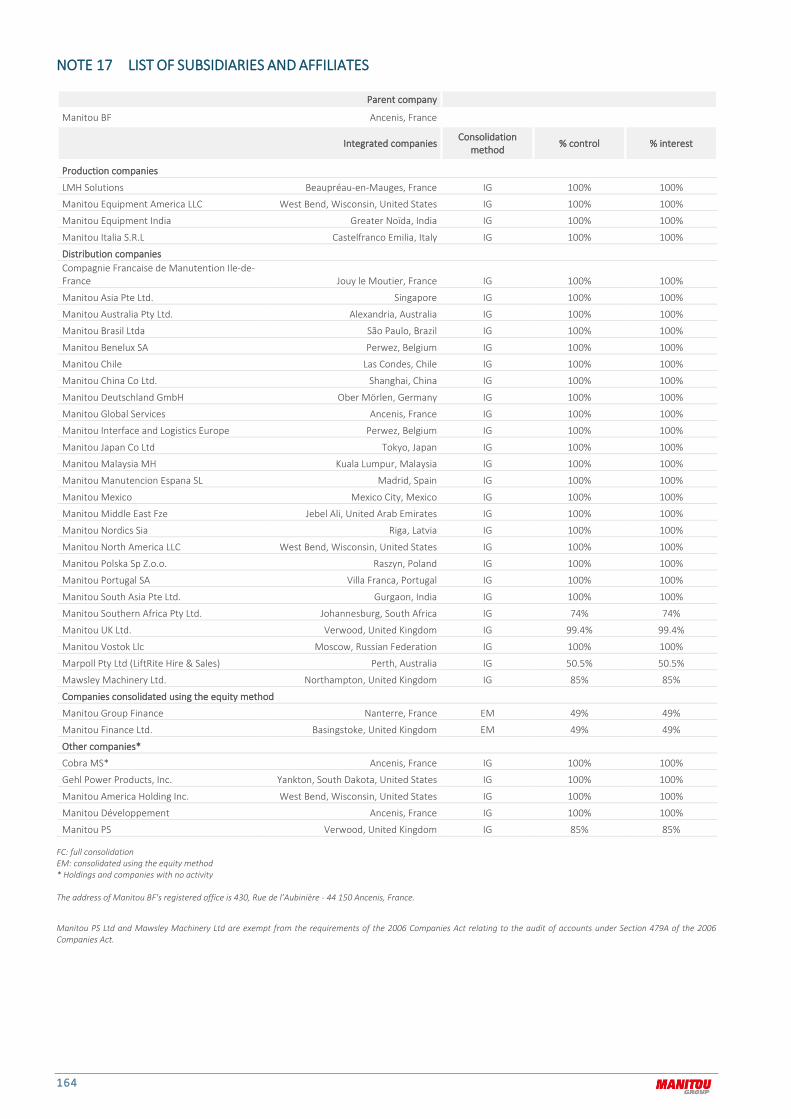
164
NOTE 17 LIST OF SUBSIDIARIES AND AFFILIATES
Parent company
Manitou BF Ancenis, France
Integrated companies Consolidation
method % control % interest
Production companies
LMH Solutions Beaupréau-en-Mauges, France IG 100% 100%
Manitou Equipment America LLC West Bend, Wisconsin, United States IG 100% 100%
Manitou Equipment India Greater Noïda, India IG 100% 100%
Manitou Italia S.R.L Castelfranco Emilia, Italy IG 100% 100%
Distribution companies Compagnie Francaise de Manutention Ile-de-France Jouy le Moutier, France IG 100% 100%
Manitou Asia Pte Ltd. Singapore IG 100% 100%
Manitou Australia Pty Ltd. Alexandria, Australia IG 100% 100%
Manitou Brasil Ltda São Paulo, Brazil IG 100% 100%
Manitou Benelux SA Perwez, Belgium IG 100% 100%
Manitou Chile Las Condes, Chile IG 100% 100%
Manitou China Co Ltd. Shanghai, China IG 100% 100%
Manitou Deutschland GmbH Ober Mörlen, Germany IG 100% 100%
Manitou Global Services Ancenis, France IG 100% 100%
Manitou Interface and Logistics Europe Perwez, Belgium IG 100% 100%
Manitou Japan Co Ltd Tokyo, Japan IG 100% 100%
Manitou Malaysia MH Kuala Lumpur, Malaysia IG 100% 100%
Manitou Manutencion Espana SL Madrid, Spain IG 100% 100%
Manitou Mexico Mexico City, Mexico IG 100% 100%
Manitou Middle East Fze Jebel Ali, United Arab Emirates IG 100% 100%
Manitou Nordics Sia Riga, Latvia IG 100% 100%
Manitou North America LLC West Bend, Wisconsin, United States IG 100% 100%
Manitou Polska Sp Z.o.o. Raszyn, Poland IG 100% 100%
Manitou Portugal SA Villa Franca, Portugal IG 100% 100%
Manitou South Asia Pte Ltd. Gurgaon, India IG 100% 100%
Manitou Southern Africa Pty Ltd. Johannesburg, South Africa IG 74% 74%
Manitou UK Ltd. Verwood, United Kingdom IG 99.4% 99.4%
Manitou Vostok Llc Moscow, Russian Federation IG 100% 100%
Marpoll Pty Ltd (LiftRite Hire & Sales) Perth, Australia IG 50.5% 50.5%
Mawsley Machinery Ltd. Northampton, United Kingdom IG 85% 85%
Companies consolidated using the equity method
Manitou Group Finance Nanterre, France EM 49% 49%
Manitou Finance Ltd. Basingstoke, United Kingdom EM 49% 49%
Other companies*
Cobra MS* Ancenis, France IG 100% 100%
Gehl Power Products, Inc. Yankton, South Dakota, United States IG 100% 100%
Manitou America Holding Inc. West Bend, Wisconsin, United States IG 100% 100%
Manitou Développement Ancenis, France IG 100% 100%
Manitou PS Verwood, United Kingdom IG 85% 85%
FC: full consolidation EM: consolidated using the equity method * Holdings and companies with no activity The address of Manitou BF's registered office is 430, Rue de l’Aubinière - 44 150 Ancenis, France.
Manitou PS Ltd and Mawsley Machinery Ltd are exempt from the requirements of the 2006 Companies Act relating to the audit of accounts under Section 479A of the 2006 Companies Act.

2020 UNIVERSAL REGIST RATION DOC UMENT 165
STATUTORY AUDITORS’ REPORT ON THE CONSOLIDATED FINANCIAL STATEMENTS 2020
To the annual general meeting of Manitou BF S.A.
OPINION
In compliance with the engagement entrusted to us by your annual general meeting, we have audited the accompanying consolidated financial statements of Manitou BF S.A. for the year ended 31 December, 2020.
In our opinion, the consolidated financial statements give a true and fair view of the assets and liabilities and of the financial position of the group as at 31 December 2020 and of the results of its operations for the year then ended in accordance with International Financial Reporting Standards as adopted by the European Union.
The audit opinion expressed above is consistent with our report to the Audit Committee.
BASIS FOR OPINION
AUDIT FRAMEWORK
We conducted our audit engagement in accordance with professional standards applicable in France. We believe that the audit evidence we have obtained is sufficient and appropriate to provide a basis for our opinion.
Our responsibilities under those standards are further described in the Statutory Auditors’ Responsibilities for the Audit of the Consolidated Financial Statements section of our report.
INDEPENDENCE
We conducted our audit engagement in compliance with independence requirements of the French Commercial Code (code de commerce) and the French Code of Ethics (code de déontologie) for statutory auditors for the period from 1st January 2020 to the date of our report and specifically we did not provide any prohibited non-audit services referred to in Article 5(1) of Regulation (EU) No 537/2014.
JUSTIFICATION OF ASSESSMENTS - KEY AUDIT MATTERS
Due to the global crisis related to the Covid-19 pandemic, the financial statements of this period have been prepared and audited under specific conditions. Indeed, this crisis and the exceptional measures taken in the context of the state of sanitary emergency have had numerous consequences for companies, particularly on their operations and their financing, and have led to greater uncertainties on their future prospects. Those measures, such as travel restrictions and remote working, have also had an impact on the companies' internal organization and the performance of the audits.
It is in this complex and evolving context that, in accordance with the requirements of Articles L.823-9 and R.823-7 of the French Commercial Code (code de commerce) relating to the justification of our assessments, we inform you of the key audit matters relating to risks of material misstatement that, in our professional judgment, were of most significance in our audit of the consolidated financial statements of the current period, as well as how we addressed those risks. These matters were addressed in the context of our audit of the consolidated financial statements as a whole, and in forming our opinion thereon, and we do not provide a separate opinion on specific items of the consolidated financial statements.
PROVISIONS FOR WARRANTIES
Key audit matter
As specified in the note 11.1 to the consolidated financial statements, the group records provisions for warranties and equipment recall campaigns to cover the estimated warranty costs of machines and spare parts, and the costs of overhauling sold equipment and the stock of machines in the event of major or dangerous malfunctions. These provisions, totalling €21 million as at 31 December 2020, are recorded for warranties when machines are sold to networks or end customers, and for recall campaigns when a malfunction is detected. The warranty provision amount covers the contractual warranty and its potential extension and is determined using historical statistical data projections. The campaign provision amount is determined using the unit cost of repair applied to the fleet of machines concerned.
We considered the valuation of these provisions to be a key audit matter in the consolidated financial statements due to their importance in understanding the financial statements, the complexity of their calculation components (average on warranty costs over the last five years, machine commissioning dates, outsourcing rate to suppliers, margin rate on spare parts) and their sensitivity to the assumptions adopted by management.
Response as part of our audit
Our work consisted in:
familiarizing ourselves with the identification process of the population with warranty or which should be subject to recall campaigns and with provision valuation,
testing the key controls set up by management that we consider as most relevant to determine the costs underlying this valuation, and particularly those relating to the various rates used in the estimates,
assessing the relevance of the group’s methodology,
assessing the validity of the assumptions used to determine the warranty provisions, checking all of the data and calculations underlying these assumptions,
reviewing the calculations on a test basis,
comparing the accounting estimates of prior periods with the corresponding actual figures,
assessing the appropriateness of the disclosures in Note 11.1 to the consolidated financial statements.
VALUATION OF LITIGATION PROVISIONS – INFRINGEMENT
OF INTELLECTUAL PROPERTY RIGHTS
Key audit matter
In May 2017, action was taken against Manitou Group by J.C. Bamford Excavators Limited (JCB), in France, the United Kingdom and later Italy, for allegedly infringing two European patents, as mentioned in Note 11.2 to the consolidated financial statements. The claims before the French court amounted initially to €20 million (subject to further evaluation) and before the UK court to an amount in excess of £10 million. The financial claims for Italy were not specified. In December 2018, JCB served a new summon on Manitou Group for infringement of intellectual property rights relating to a third patent in France and the United Kingdom, and then in Italy in 2019. The legal proceedings for this dispute continued throughout 2020 and JCB valued its prejudice to €190 million in 2019. The judicial court of Paris, dated February 26th, 2021, ordered to Manitou to pay the amount of €150.000 regarding the assignment of the first two patents.
166
This amount has been booked as at 31 December 2020 in addition to the litigation costs already accounted for.
Regarding the assignment for the third patent and the assignment relating to other proceedings still in progress in other countries, Manitou Group considers, on the one hand, that a financial estimate of the risk actually incurred cannot be determined given the evidence at its disposal and the progress of the proceedings, and, on the other hand, that a significant outflow of resources in respect of these claims seems unlikely given the arguments put forward by Manitou group in its defence. In light of this, no provision was set aside in the consolidated financial statements for these claims. The Group only recorded the estimated future legal costs relating to this litigation in its 2020 financial statements, as indicated in Note 11.2 to the consolidated financial statements.
We considered this issue to be a key audit matter given its potential weight on the group’s consolidated financial statements and insofar as significant judgment is required at the year-end regarding the uncertain outcome of this litigation in order to estimate the actual risk incurred.
Response as part of our audit
As part of our audit of the consolidated financial statements, our work primarily consisted in:
examining the procedures implemented by the group to estimate the risk relating to this litigation,
familiarising ourselves with the group’s risk analysis,
assessing the validity of the absence of provisions (excluding the legal costs) in light of the documentation provided by the company, the documents filed and the written consultations of external advisors;
assessing the reasonableness of the assumptions used by management to estimate the provision for legal costs;
analysing the documentation elements of opposing party request and of the Company defence elements;
analysing, if necessary, Courts judgments;
verifying the appropriateness of the disclosures relating to this litigation in Note 11.2 to the consolidated financial statements.
SPECIFIC VERIFICATIONS
We have also performed, in accordance with professional standards applicable in France, the specific verifications required by laws and regulations of the group’s information given in the management report of the Board of Directors.
We have no matters to report as to its fair presentation and its consistency with the consolidated financial statements.
We attest that the consolidated non-financial statement required by Article L. 225-102-1 of the French Commercial Code (Code de commerce), is included in the group’s management report, it being specified that, in accordance with the provisions of Article L. 823-10 of this Code, we have verified neither the fair presentation nor the consistency with the consolidated financial statements of the information contained therein and this information must be reported by an independent third party.
REPORT ON OTHER LEGAL AND REGULATORY
REQUIREMENTS
FORMAT OF PRESENTATION OF THE CONSOLIDATED
FINANCIAL STATEMENTS INCLUDED IN THE ANNUAL
FINANCIAL REPORT
We have also verified, in accordance with the professional standard applicable in France relating to the procedures performed by the statutory auditor relating to the annual and consolidated financial statements presented in the European single electronic format, that the
presentation of the consolidated financial statements included in the annual financial report mentioned in Article L.451-1-2, I of the French Monetary and Financial Code (code monétaire et financier), prepared under the responsibility of CEO, complies with the single electronic format defined in the European Delegated Regulation N° 2019/815 of 17 Decembre 2018. As it relates to consolidated financial statements, our work includes verifying that the tagging of these consolidated financial statements complies with the format defined in the above delegated regulation.
Based on the work we have performed, we conclude that the presentation of the consolidated financial statements included in the annual financial report complies, in all material respects, with the European single electronic format.
APPOINTMENT OF THE STATUTORY AUDITORS
We were appointed as statutory auditors of Manitou BF S.A. by the annual general meeting held on 13 June, 2019 for KPMG and on 28 June, 1989 for RSM.
As at 31 December, 2020, KPMG was in the 2nd year of total uninterrupted engagement and RSM was in the 31st year of total uninterrupted engagement.
RESPONSIBILITIES OF MANAGEMENT AND THOSE CHARGED WITH GOVERNANCE FOR THE CONSOLIDATED FINANCIAL STATEMENTS
Management is responsible for the preparation and fair presentation of the consolidated financial statements in accordance with International Financial Reporting Standards as adopted by the European Union and for such internal control as management determines is necessary to enable the preparation of consolidated financial statements that are free from material misstatement, whether due to fraud or error.
In preparing the consolidated financial statements, management is responsible for assessing the Company’s ability to continue as a going concern, disclosing, as applicable, matters related to going concern and using the going concern basis of accounting unless it is expected to liquidate the Company or to cease operations.
The Audit Committee is responsible for monitoring the financial reporting process and the effectiveness of internal control and risks management systems and where applicable, its internal audit, regarding the accounting and financial reporting procedures.
The consolidated financial statements were approved by the Board of Directors.
STATUTORY AUDITORS’ RESPONSIBILITIES FOR THE
AUDIT OF THE CONSOLIDATED FINANCIAL STATEMENTS
OBJECTIVES AND AUDIT APPROACH
Our role is to issue a report on the consolidated financial statements. Our objective is to obtain reasonable assurance about whether the consolidated financial statements as a whole are free from material misstatement. Reasonable assurance is a high level of assurance, but is not a guarantee that an audit conducted in accordance with professional standards will always detect a material misstatement when it exists. Misstatements can arise from fraud or error and are considered material if, individually or in the aggregate, they could reasonably be expected to influence the economic decisions of users taken on the basis of these consolidated financial statements.
As specified in Article L.823-10-1 of the French Commercial Code (code de commerce), our statutory audit does not include assurance on the viability of the Company or the quality of management of the affairs of the Company.
2020 UNIVERSAL REGIST RATION DOC UMENT 167
As part of an audit conducted in accordance with professional standards applicable in France, the statutory auditor exercises professional judgment throughout the audit and furthermore:
Identifies and assesses the risks of material misstatement of the consolidated financial statements, whether due to fraud or error, designs and performs audit procedures responsive to those risks, and obtains audit evidence considered to be sufficient and appropriate to provide a basis for his opinion. The risk of not detecting a material misstatement resulting from fraud is higher than for one resulting from error, as fraud may involve collusion, forgery, intentional omissions, misrepresentations, or the override of internal control.
Obtains an understanding of internal control relevant to the audit in order to design audit procedures that are appropriate in the circumstances, but not for the purpose of expressing an opinion on the effectiveness of the internal control.
Evaluates the appropriateness of accounting policies used and the reasonableness of accounting estimates and related disclosures made by management in the consolidated financial statements.
Assesses the appropriateness of management’s use of the going concern basis of accounting and, based on the audit evidence obtained, whether a material uncertainty exists related to events or conditions that may cast significant doubt on the Company’s ability to continue as a going concern. This assessment is based on the audit evidence obtained up to the date of his audit report. However, future events or conditions may cause the Company to cease to continue as a going concern. If the statutory auditor concludes that a material uncertainty exists, there is a requirement to draw attention in the audit report to the related disclosures in the consolidated financial statements or, if such disclosures are not provided or inadequate, to modify the opinion expressed therein.
Evaluates the overall presentation of the consolidated financial statements and assesses whether these statements represent the underlying transactions and events in a manner that achieves fair presentation.
Obtains sufficient appropriate audit evidence regarding the financial information of the entities or business activities within the group to express an opinion on the consolidated financial statements. The statutory auditor is responsible for the direction, supervision and performance of the audit of the consolidated financial statements and for the opinion expressed on these consolidated financial statements.
REPORT TO THE AUDIT COMMITTEE
We submit a report to the Audit Committee which includes in particular a description of the scope of the audit and the audit program implemented, as well as the results of our audit. We also report, if any,
significant deficiencies in internal control regarding the accounting and financial reporting procedures that we have identified.
Our report to the Audit Committee includes the risks of material misstatement that, in our professional judgment, were of most significance in the audit of the consolidated financial statements of the current period and which are therefore the key audit matters, that we are required to describe in this audit report.
We also provide the Audit Committee with the declaration provided for in Article 6 of Regulation (EU) N° 537/2014, confirming our independence within the meaning of the rules applicable in France such as they are set in particular by Articles L.822-10 to L.822-14 of the French Commercial Code (code de commerce) and in the French Code of Ethics (code de déontologie) for statutory auditors. Where appropriate, we discuss with the Audit Committee the risks that may reasonably be thought to bear on our independence, and the related safeguards.
The statutory auditors
Nantes, on the 16 April 2021
KPMG S.A
Saint-Herblain, on the 16 April 2021
RSM Ouest
Gwenaël Chedaleux
Partner
Vincent Broyé
Partner
Jean-Michel Picaud
Partner
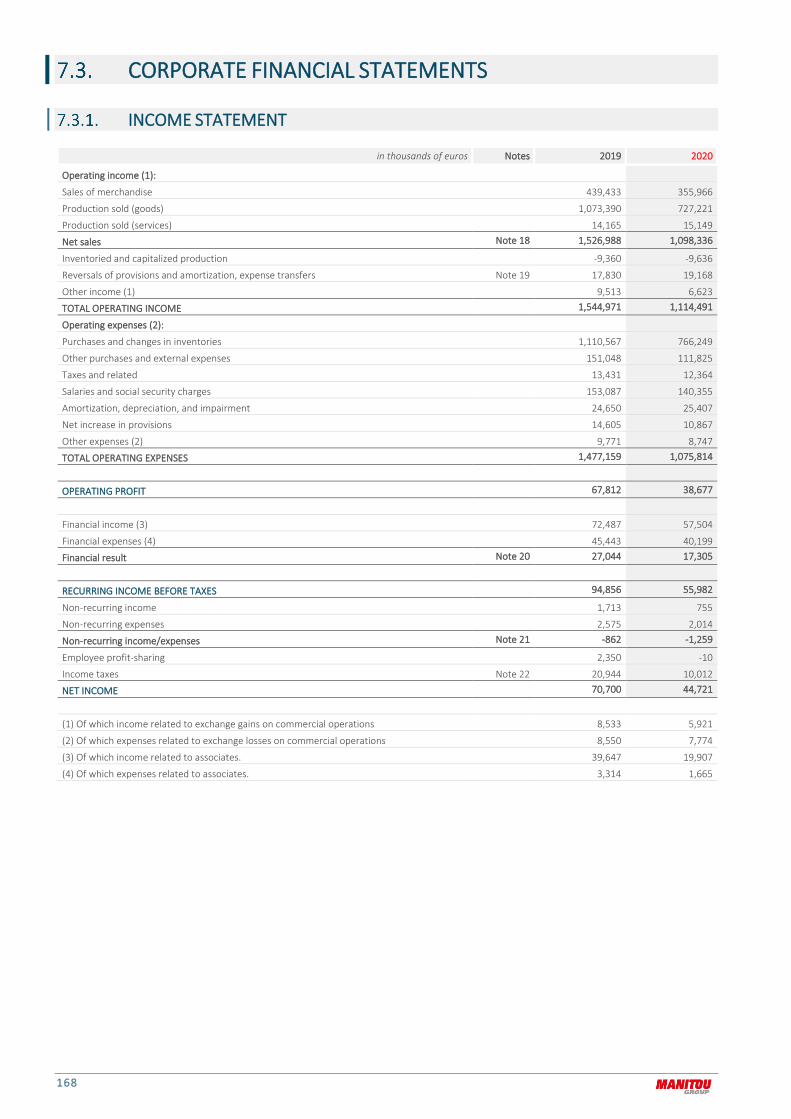
168
CORPORATE FINANCIAL STATEMENTS
INCOME STATEMENT
in thousands of euros Notes 2019 2020
Operating income (1):
Sales of merchandise 439,433 355,966
Production sold (goods) 1,073,390 727,221
Production sold (services) 14,165 15,149
Net sales Note 18 1,526,988 1,098,336
Inventoried and capitalized production -9,360 -9,636
Reversals of provisions and amortization, expense transfers Note 19 17,830 19,168
Other income (1) 9,513 6,623
TOTAL OPERATING INCOME 1,544,971 1,114,491
Operating expenses (2):
Purchases and changes in inventories 1,110,567 766,249
Other purchases and external expenses 151,048 111,825
Taxes and related 13,431 12,364
Salaries and social security charges 153,087 140,355
Amortization, depreciation, and impairment 24,650 25,407
Net increase in provisions 14,605 10,867
Other expenses (2) 9,771 8,747
TOTAL OPERATING EXPENSES 1,477,159 1,075,814
OPERATING PROFIT 67,812 38,677
Financial income (3) 72,487 57,504
Financial expenses (4) 45,443 40,199
Financial result Note 20 27,044 17,305
RECURRING INCOME BEFORE TAXES 94,856 55,982
Non-recurring income 1,713 755
Non-recurring expenses 2,575 2,014
Non-recurring income/expenses Note 21 -862 -1,259
Employee profit-sharing 2,350 -10
Income taxes Note 22 20,944 10,012
NET INCOME 70,700 44,721
(1) Of which income related to exchange gains on commercial operations 8,533 5,921
(2) Of which expenses related to exchange losses on commercial operations 8,550 7,774
(3) Of which income related to associates. 39,647 19,907
(4) Of which expenses related to associates. 3,314 1,665
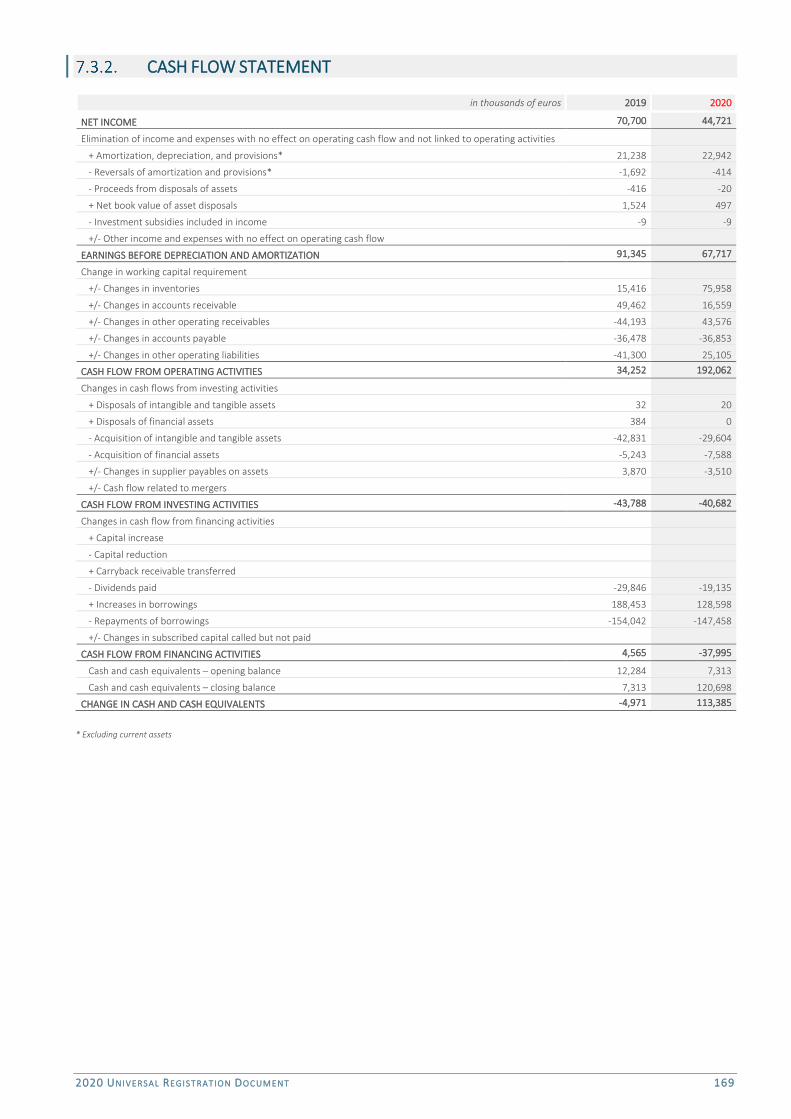
2020 UNIVERSAL REGIST RATION DOC UMENT 169
CASH FLOW STATEMENT
in thousands of euros 2019 2020
NET INCOME 70,700 44,721
Elimination of income and expenses with no effect on operating cash flow and not linked to operating activities
+ Amortization, depreciation, and provisions* 21,238 22,942
- Reversals of amortization and provisions* -1,692 -414
- Proceeds from disposals of assets -416 -20
+ Net book value of asset disposals 1,524 497
- Investment subsidies included in income -9 -9
+/- Other income and expenses with no effect on operating cash flow
EARNINGS BEFORE DEPRECIATION AND AMORTIZATION 91,345 67,717
Change in working capital requirement
+/- Changes in inventories 15,416 75,958
+/- Changes in accounts receivable 49,462 16,559
+/- Changes in other operating receivables -44,193 43,576
+/- Changes in accounts payable -36,478 -36,853
+/- Changes in other operating liabilities -41,300 25,105
CASH FLOW FROM OPERATING ACTIVITIES 34,252 192,062
Changes in cash flows from investing activities
+ Disposals of intangible and tangible assets 32 20
+ Disposals of financial assets 384 0
- Acquisition of intangible and tangible assets -42,831 -29,604
- Acquisition of financial assets -5,243 -7,588
+/- Changes in supplier payables on assets 3,870 -3,510
+/- Cash flow related to mergers
CASH FLOW FROM INVESTING ACTIVITIES -43,788 -40,682
Changes in cash flow from financing activities
+ Capital increase
- Capital reduction
+ Carryback receivable transferred
- Dividends paid -29,846 -19,135
+ Increases in borrowings 188,453 128,598
- Repayments of borrowings -154,042 -147,458
+/- Changes in subscribed capital called but not paid
CASH FLOW FROM FINANCING ACTIVITIES 4,565 -37,995
Cash and cash equivalents – opening balance 12,284 7,313
Cash and cash equivalents – closing balance 7,313 120,698
CHANGE IN CASH AND CASH EQUIVALENTS -4,971 113,385
* Excluding current assets

170
BALANCE SHEET
in thousands of euros Notes
December 31, 2019 December 31, 2020
Net amount Gross amount Depreciation and impairment
Net amount
Fixed assets
Intangible assets (1) Note 2 31,179 110,459 78,367 32,092
Tangible assets Note 3 81,273 301,970 215,144 86,826
Financial assets (2) Note 4 448,191 425,789 0 425,789
560,643 838,218 293,511 544,707
Current assets
Inventories & work in progress Note 6 272,450 206,516 10,024 196,492
Prepayments and advances to suppliers 54 79 79
Receivables from operations (3) Note 7 425,244 365,114 330 364,784
Cash and marketable securities Note 9 30,705 121,519 0 121,519
Accruals Note 15 3,801 4,136 4,136
732,254 697,364 10,354 687,010
Currency translation differences on assets Note 16 10,278 11,105 11,105
TOTAL PROVISIONS 1,303,175 1,546,687 303,865 1,242,822
(1) Of which leasehold rights
(2) Of which less than one year 4,263 3,166
(3) Of which more than one year
in thousands of euros Notes
December 31, 2019 December 31, 2020
Net amount Net amount
Shareholders' equity Note 10
Share capital Note 10 39,668 39,668
Issue, merger, and acquisition premiums, etc. 45,119 45,119
Revaluation differences (4) Note 17 44,476 14,486
Retained earnings and reserves 474,645 526,209
Income for the period 70,700 44,721
Investment subsidies Note 6 56 47
Regulated provisions 7,354 7,240
682,018 677,490
Provisions for risks and contingencies Note 11 49,227 52,523
Liabilities (1)
Financial liabilities (2) (3) Note 12 275,263 259,139
Operating liabilities Note 12
Supplier accounts payable and related 201,923 165,070
Tax and social security liabilities 54,237 49,181
Other operating liabilities 12,140 19,940
Other liabilities Note 12 8,424 2,611
Accruals Note 15 12544 12799
564,531 508,740
Currency translation differences on liabilities Note 16 7,399 4,069
TOTAL PROVISIONS 1,303,175 1,242,822
(1) Of which more than one year 148,983 147,747
Of which less than one year 415,548 360,993
(2) Of which outstanding bank overdrafts and credit balances 23,400 821
(3) Of which equity loans
(4) Of which equity method valuation difference 43,568 13,578
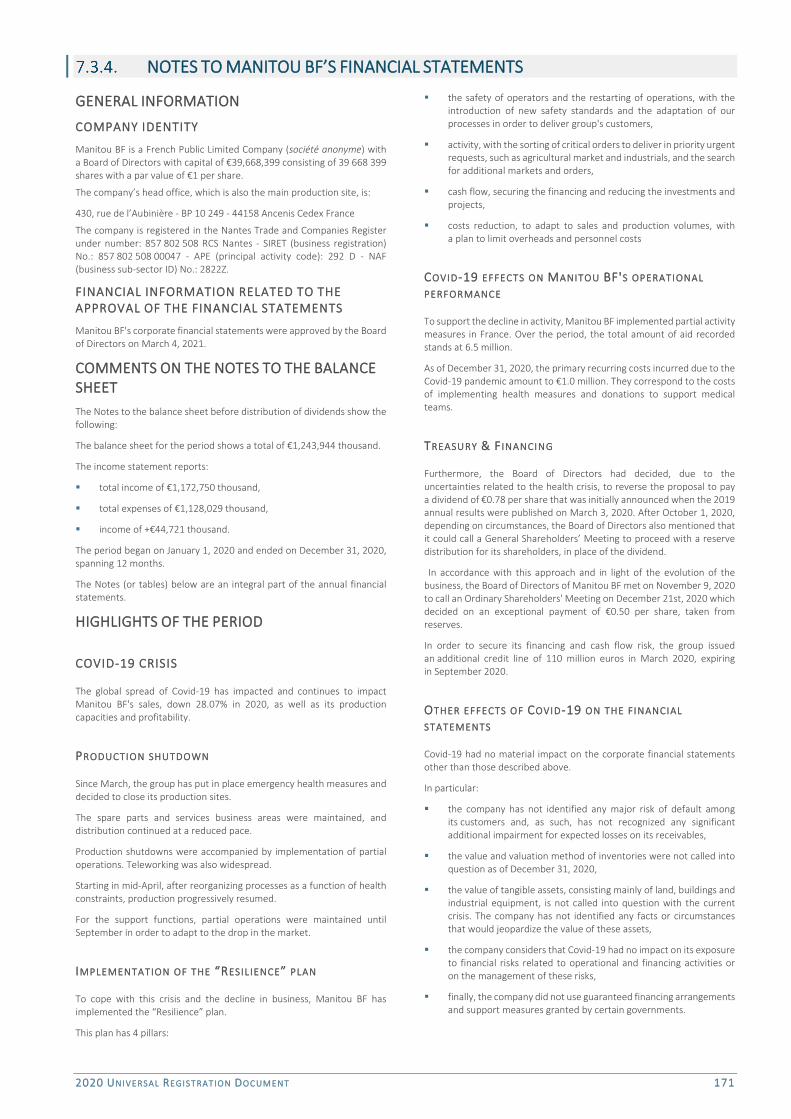
2020 UNIVERSAL REGIST RATION DOC UMENT 171
NOTES TO MANITOU BF’S FINANCIAL STATEMENTS
GENERAL INFORMATION
COMPANY IDENTITY
Manitou BF is a French Public Limited Company (société anonyme) with a Board of Directors with capital of €39,668,399 consisting of 39 668 399 shares with a par value of €1 per share.
The company’s head office, which is also the main production site, is:
430, rue de l’Aubinière - BP 10 249 - 44158 Ancenis Cedex France
The company is registered in the Nantes Trade and Companies Register under number: 857 802 508 RCS Nantes - SIRET (business registration) No.: 857 802 508 00047 - APE (principal activity code): 292 D - NAF (business sub-sector ID) No.: 2822Z.
FINANCIAL INFORMATION RELATED TO THE
APPROVAL OF THE FINANCIAL STATEMENTS
Manitou BF's corporate financial statements were approved by the Board of Directors on March 4, 2021.
COMMENTS ON THE NOTES TO THE BALANCE
SHEET The Notes to the balance sheet before distribution of dividends show the following:
The balance sheet for the period shows a total of €1,243,944 thousand.
The income statement reports:
total income of €1,172,750 thousand,
total expenses of €1,128,029 thousand,
income of +€44,721 thousand.
The period began on January 1, 2020 and ended on December 31, 2020, spanning 12 months.
The Notes (or tables) below are an integral part of the annual financial statements.
HIGHLIGHTS OF THE PERIOD
COVID-19 CRISIS
The global spread of Covid-19 has impacted and continues to impact Manitou BF's sales, down 28.07% in 2020, as well as its production capacities and profitability.
PRODUCTION SHUTDOWN
Since March, the group has put in place emergency health measures and decided to close its production sites.
The spare parts and services business areas were maintained, and distribution continued at a reduced pace.
Production shutdowns were accompanied by implementation of partial operations. Teleworking was also widespread.
Starting in mid-April, after reorganizing processes as a function of health constraints, production progressively resumed.
For the support functions, partial operations were maintained until September in order to adapt to the drop in the market.
IMPLEMENTATION OF THE “RESIL IENCE” PLAN
To cope with this crisis and the decline in business, Manitou BF has implemented the “Resilience” plan.
This plan has 4 pillars:
the safety of operators and the restarting of operations, with the introduction of new safety standards and the adaptation of our processes in order to deliver group's customers,
activity, with the sorting of critical orders to deliver in priority urgent requests, such as agricultural market and industrials, and the search for additional markets and orders,
cash flow, securing the financing and reducing the investments and projects,
costs reduction, to adapt to sales and production volumes, with a plan to limit overheads and personnel costs
COVID-19 EFFECTS ON MANITOU BF'S OPERATIONAL
PERFORMANCE
To support the decline in activity, Manitou BF implemented partial activity measures in France. Over the period, the total amount of aid recorded stands at 6.5 million.
As of December 31, 2020, the primary recurring costs incurred due to the Covid-19 pandemic amount to €1.0 million. They correspond to the costs of implementing health measures and donations to support medical teams.
TREASURY & FINANCING
Furthermore, the Board of Directors had decided, due to the uncertainties related to the health crisis, to reverse the proposal to pay a dividend of €0.78 per share that was initially announced when the 2019 annual results were published on March 3, 2020. After October 1, 2020, depending on circumstances, the Board of Directors also mentioned that it could call a General Shareholders’ Meeting to proceed with a reserve distribution for its shareholders, in place of the dividend.
In accordance with this approach and in light of the evolution of the business, the Board of Directors of Manitou BF met on November 9, 2020 to call an Ordinary Shareholders' Meeting on December 21st, 2020 which decided on an exceptional payment of €0.50 per share, taken from reserves.
In order to secure its financing and cash flow risk, the group issued an additional credit line of 110 million euros in March 2020, expiring in September 2020.
OTHER EFFECTS OF COVID-19 ON THE FINANCIAL
STATEMENTS
Covid-19 had no material impact on the corporate financial statements other than those described above.
In particular:
the company has not identified any major risk of default among its customers and, as such, has not recognized any significant additional impairment for expected losses on its receivables,
the value and valuation method of inventories were not called into question as of December 31, 2020,
the value of tangible assets, consisting mainly of land, buildings and industrial equipment, is not called into question with the current crisis. The company has not identified any facts or circumstances that would jeopardize the value of these assets,
the company considers that Covid-19 had no impact on its exposure to financial risks related to operational and financing activities or on the management of these risks,
finally, the company did not use guaranteed financing arrangements and support measures granted by certain governments.
172
MONITORING OF LITIGATION FOR INFRINGEMENT
OF INTELLECTUAL PROPERTY RIGHTS
In May 2017, Manitou BF was sued by J.C. Bamford Excavators Limited (JCB) for for alleged infringement of two European patents relating to certain features concerning the overload cut-off control system of certain telescopic forklift trucks manufactured and/or marketed
Financially, in May 2017, the claimant was seeking preliminary damages (subject to further evaluation) of €20 million before the French court, which was increased in June 2018 to €50 million.
In December 2018, JCB served Manitou BF with a new patent infringement suit relating to a third European patent, also relating to certain features concerning the overload cut-off control system for certain telehandlers. This summons repeats the application for a provision of €50 million submitted in the first proceedings brought in France.
In 2018, JCB had produced an expert opinion estimating its damages of 160 million euros for the first two patents. At the end of 2019, in the first main proceedings, JCB increased its damage assessment to 190 million euros in its final conclusions. This increase is due to an update of the prejudice in its duration, which according to JCB is until March 2019. This assessment also includes the estimated prejudice under the third patent.
I In the context of a procedural incident in 2018, JCB applied for preliminary injunctions against Manitou BF. A decision was issued by the Pre-Trial Judge on January 31, 2019, which dismissed the applicant's request for preliminary injunction on the first patent on which JCB based its allegations and, regarding the second patent, prohibited Manitou BF from manufacturing, offering for sale, renting and owning an old configuration of certain telescopic forklift trucks. This decision has no impact on Manitou BF's business as it relates to the ordering system for certain models produced and sold before August 2017 which are therefore no longer manufactured by Manitou BF, as underlined in the order. Manitou BF immediately appealed this decision in order to challenge the prohibition order in so far as it relates to a configuration that Manitou had ceased to produce for 18 months. This immediate appeal on the grounds of abuse of authority was held not to be admissible, reserving the possibility of appeal with judgment on the merits.
On the occasion of the same incident, Manitou BF had proposed in the alternative, if the judge considered the request for prohibition to be well-founded, the establishment of a bank guarantee of 470,000 euros for the two patents as a replacement for the prohibitions. This proposal became irrelevant for the first patent, for which the judge did not pronounce a prohibition. JCB requested that this guarantee, if ordered, be 30 million euros (also for the two patents) on the basis of the expert opinion it had produced estimating its damages at 160 million euros (for the two patents). This proposal was not accepted by the judge, nor was JCB's request for a penalty payment of 100 000 euros per day of delay, the penalty payment ordered by the judge being 1 000 euros per infringement, the decision having emphasized that the damage alleged by the plaintiff relates to the overload cut-off control system alone and not to the machine as a whole.
The legal proceedings on the merits of the dispute relating the first two patents continued in 2020. On February 26, 2021, the Court of Justice of Paris ruled, at first instance, on the French part relating to these first two patents.
Under the terms of this decision, the Tribunal invalidated the French part of the second patent in its entirety rendering ineffective the January 31, 2019 preliminary injunction order against Manitou BF.
The Court also invalidated most of the claims of the French part of the first patent. The Court found that only two claims of the French part of the first patent were infringed by three models of equipment from an old configuration which is no longer marketed by Manitou BF since May 2017. Manitou challenges this decision, while noting that it has no impact on its activity due to the fact that this old configuration is no longer marketed.
Given the very residual character of the infringement uphold, the Court ordered Manitou BF to pay the plaintiff the total sum of 150,000 euros for the loss suffered, rejecting the claim of JCB, which was claiming a loss of 190 million euros. The Court's decision reinforces the position of Manitou, which has always contested the merits of the plaintiff's action and the disproportionate nature of its claims.
Following the decision of the Paris Court of February 26, 2021, which reinforces the company's positions, a provision of €0.2 million was recorded in respect of the first patent and no provision was recorded in respect of the second patent.
For the third patent, given the progress of the proceedings, the financial risk likely to be incurred is still difficult to measure with reliability. Furthermore, a significant outflow of resources in respect of this claim seems unlikely in respect of the matters put forward by Manitou BF to defend itself. As a result, no provision in respect of these claims has been recognized in the company’s financial statements.
Manitou BF will continue to firmly defend itself against infringement allegations over these three patents.
2020 UNIVERSAL REGIST RATION DOC UMENT 173
NOTE 1 ACCOUNTING PRINCIPLES
NOTE 1.1 GENERAL PRINCIPLES
The balance sheet and the income statement are prepared in accordance with French legislation and generally accepted accounting methods in France.
The base method used for financial statement items is the historical cost method.
A number of points that could have a material impact are described in detail below.
NOTE 1.2 CHANGES IN ACCOUNTING METHODS AND
RULES
There were no changes in accounting methods in the financial year.
NOTE 1.3 FIXED ASSETS
NOTE 1.3.1 DEVELOPMENT COSTS
In compliance with Article 212-3-2 of ANC Regulation No. 2014-03, the development costs incurred by the company in 2020 relating to clearly defined projects likely to be completed and marketed profitably were capitalized, as the capitalization requirements specified by the French accounting regulations had been fulfilled. As it is a recommended method, the company made the decision in 2005 to apply this accounting treatment.
All research expenses and the costs of studies and development other than those described above are expensed in the period in which they are incurred.
NOTE 1.3.2 SOFTWARE
These mainly include the costs incurred in the implementation of various projects, for the portion related to the detailed design of these projects, and to programming, testing, and documentation.
Costs recorded during the preliminary study phase, the functional analysis phase and for user training are recognized as expenses.
NOTE 1.3.3 DEPRECIATION OF FIXED ASSETS
In accordance with ANC Regulation No. 2014-03, the accounting methods relating to tangible and intangible assets (excluding development costs) are as follows:
the depreciable amount is the difference between the cost of the asset and its residual value, considered to be zero for all depreciable assets,
the depreciation periods have been adjusted to the estimated useful lives of the various asset categories and calculated using the straight-line method,
the main depreciation periods are as follows:
o goodwill: 5 years,
o patents: 5 years,
o software: 3 years and 7 years for the integrated information system (ERP),
o development costs: 5 years,
o buildings: between 20 and 30 years depending on the construction quality,
o improvements to land and buildings: 10 years,
o technical facilities: 10 years,
o industrial equipment: between 3 and 7 years depending on the type of equipment,
o industrial tooling and molds: 3 years,
o transport equipment: 4 years for passenger cars, 5 years for large commercial vehicles,
o office and IT equipment: between 3 and 5 years depending on the type of equipment,
o office furniture: 10 years.
The difference between tax depreciation calculated using the declining balance method and straight-line depreciation based on the estimated useful life is recorded in regulated provisions (special depreciation allowances). For development costs, special amortization allowances are recognized as of the date the asset is capitalized, as provided by law.
NOTE 1.3.4 IMPAIRMENT OF ASSETS
Tangible and intangible assets must be tested for impairment whenever there is an indication of impairment.
When an indication of impairment exists, an impairment test is conducted. The net book value is assessed as a function of the market and the useful life of the asset for the company. It is the result of the comparison between the market value and the value in use.
NOTE 1.4 SHARE INVESTMENTS
In order to report its shareholders’ equity on a comparable basis for both the corporate and the consolidated financial statements, the company chose, as of year-end 1990, to value shares in wholly controlled companies using the portion of shareholders’ equity owned, as determined using the rules of consolidation, in accordance with Article 3 of the French Law of January 3, 1985 and Article 11 of the Decree of February 17, 1986.
In accordance with Article 221-4 of ANC regulation No. 2014-03, if, at year-end, the aggregate value of securities valued using the equity method is less than their purchase price, the aggregate value of the portfolio is reduced accordingly. A provision for overall portfolio risk is also created if the aggregate value using the equity value is negative.
Acquisition costs are capitalized. In accordance with the applicable tax laws, such acquisition costs are amortized over 5 years on a straight-line basis.
NOTE 1.5 TREASURY SHARES
Treasury shares are recorded in “Marketable securities” when such securities are intended to cover stock option plans and share awards and in “Other financial assets” in other cases.
For plans deemed to be exercisable (where the the market value of the share is greater than the exercise price of the option) for which an outflow of resources is probable, the corresponding shares are classified in a specific “Marketable securities” account.
When the market value of Manitou shares falls below their purchase price, an impairment loss is recorded for the difference. No impairment loss is recorded for shares classified as marketable securities to be canceled, nor for shares classified in the specific marketable securities sub-account (plans deemed to be exercisable). Such shares are relevant to the calculation of liabilities, determined as described below.
In accordance with Articles 624-2 to 624-18 of ANC Regulation No. 2014-03, expenses relating to option plans and performance share awards pertaining to Manitou BF shares are spread over the employees’ vesting period, on a straight-line basis. They are recognized in the income statement under “Salaries and social security charges” against a balance sheet expense provision.
For purchase option plans, these expenses correspond to the difference between the portfolio value, net of impairment, of the shares allocated to such plans, and the corresponding exercise price, if lower. For performance share plans, they amount to the portfolio value of the shares granted.

174
NOTE 1.6 INVENTORIES
NOTE 1.6.1 VALUATION
Merchandise: valued at the weighted average purchase price.
Raw materials: valued at the weighted average purchase price.
Semi-finished products, work in process and finished products: valued at the cost of production (raw materials, equipment and labor at actual cost).
NOTE 1.6.2 IMPAIRMENT
Merchandise: as in previous years, merchandise was subject to write-downs for impairment calculated statistically based on inventory turnover and probable losses from impairment.
Raw materials: the same method as for merchandise is used, i.e. low-turnover items are subject to a write-down for impairment.
Finished products: equipment is subject to a component-by-component analysis, the equipment in question being used or demonstration equipment in storage or with a low turnover. The rate of write-downs for impairment is determined by product group.
NOTE 1.7 RECEIVABLES AND PAYABLES
Receivables and payables are recorded at their nominal value. An impairment loss is recognized when their recoverable value, appraised on a case-by-case basis, is estimated to be less than their accounting value.
NOTE 1.8 PROVISIONS FOR RISKS AND CONTINGENCIES
Provisions are created for risks and contingencies when the company has a liability to a third party and it is probable or certain that it will face an outflow of resources to the said third party, without consideration.
Such provisions are estimated taking into account the best-estimate assumptions as of the reporting date.
NOTE 1.9 RETIREMENT BENEFIT COMMITMENTS
The liability is calculated in accordance with IAS 19 (Revised) as authorized by ANC Recommendation 2013-02 of November 7, 2013. The method used is the projected unit credit method, sometimes known as the “project benefits method prorated on years of service.”
Retirement benefit commitments are assessed taking demographic and economic assumptions into account. They are discounted to their present value using a discount rate based on the interest rates for the highest-quality bonds. The various categories of defined benefit plans in place within Manitou BF and the main assumptions used are set out in Note 11 to the financial statements.
NOTE 1.10 LONG-SERVICE AWARDS
The liability was calculated in the same way as for the previous period, in accordance with CNC (French accounting authority) Recommendation 2003-R-01 of 04/01/2003, which reproduces the terms of IAS 19.
NOTE 1.11 FOREIGN CURRENCY TRANSLATIONS
Foreign currency transactions are valued at the exchange rate on the date of the transaction. Receivables and payables are translated at the exchange rate on the reporting date. The difference resulting from the translation of foreign currency payables and receivables at the rate on the reporting date is recorded in the balance sheet as currency translation differences. Unrealized exchange losses that are not hedged are subject to a provision for risk.
NOTE 1.12 FORWARD FINANCIAL INSTRUMENTS AND
HEDGING TRANSACTIONS
In accordance with ANC Regulation No. 2015-05 on financial instruments, the exchange losses and gains related to commercial operations were recognized in operating income and the hedging instruments at year-end were revalued.
The effects of hedging instruments are recognized in the income statement symmetrically with those of the hedged item. The impairment or provision for contingencies relating to a hedged item takes the effect of the hedge into account. Changes in the fair value of the instruments are not recognized on the balance sheet, unless this would make the accounting treatment symmetrical with the hedged risk and for the non-currency derivatives (receivables, liabilities, etc.) converted at closing.
The company documents the relationship between the hedging instrument and the hedged instrument, in addition to is hedging policy.
The company endeavors to minimize the exchange risk by performing exchange hedges on the largest cash flows for the net amount of their exposure to currencies, after recognition of purchases in foreign currency.
NOTE 2 INTANGIBLE ASSETS
in thousands of euros 12/31/2019 Purchases Transfers between
line items Outflows Net amounts as of
12/31/2020
Research and development costs 38,975 3,783 0 42,758
Concessions, patents, and licenses 49,270 571 2,800 52,641
Goodwill 1,708 1,708
Other intangible fixed assets 0 0
Intangible assets in process 11,696 8,239 -6,583 0 13,352
Prepayments and advances TOTAL 101,649 8,810 0 0 110,459

2020 UNIVERSAL REGIST RATION DOC UMENT 175
in thousands of euros 12/31/2019 Increases Other decreases Amortization and depreciation
as of 12/31/2020
Research and development costs 30,756 4,254 35,010
Concessions, patents, and licenses 38,015 3,778 41,793
Goodwill 1,564 1,564
Other intangible fixed assets 0 0
Intangible assets in process 0 0
Prepayments and advances 0 0 TOTAL 70,335 8,032 0 78,367
in thousands of euros 12/31/2019 Net amounts as of 12/31/2020
Research and development costs 8,219 7,748
Concessions, patents, and licenses 11,120 10,848
Goodwill 144 144
Other intangible fixed assets 0 0
Intangible assets in process 11,696 13,352
Prepayments and advances 0 0 TOTAL 31,179 32,092
NOTE 2.1 RESEARCH AND DEVELOPMENT COSTS
Development costs, incurred directly by the company and capitalized in 2020 amounted to €6,480 thousand, making a total of €54,745 thousand in capitalized expenses as of December 31, 2020 (versus €48,265 thousand in 2019). This amount was split between projects in process for €11,987 thousand (€9,289 thousand in 2019) and completed projects for €42,758 thousand (€38,976 thousand in 2019). All research costs and the costs of studies and development other than those described above were expensed in 2020 for an amount of €7,781 thousand, as compared to €9,034 thousand in 2019.
NOTE 3 TANGIBLE ASSETS
in thousands of euros 12/31/2019 Purchases Transfers between
line items Disposals Net amounts
as of 12/31/2020
Land 19,588 492 1,722 0 21,802
Buildings 50,407 60 14,853 0 65,320
Installations, improvements, and fixtures 46,647 499 5,675 15 52,806
Technical installations and industrial equipment 133,582 2,952 2,687 659 138,562
Other tangible assets 20,095 844 44 158 20,825
Tangible fixed assets under production 12,168 15,947 -24,981 479 2,655 TOTAL 282,487 20,794 0 1,311 301,970
in thousands of euros 12/31/2019 Increases Outflows Amortization and depreciation
as of 12/31/2020
Land 7,888 869 8,757
Buildings 33,096 2,133 35,229
Installations, improvements, and fixtures 32,801 2,376 10 35,167
Technical installations and industrial equipment 111,282 7,745 647 118,380
Other tangible assets 16,150 1,617 156 17,611
Tangible fixed assets under production TOTAL 201,217 14,740 813 215,144
in thousands of euros 12/31/2019 Net amounts as of 12/31/2020
Land 11,700 13,045
Buildings 17,311 30,091
Installations, improvements, and fixtures 13,846 17,639
Technical installations and industrial equipment 22,300 20,182
Other tangible assets 3,945 3,214
Tangible fixed assets under production 12,168 2,655 TOTAL 81,270 86,826
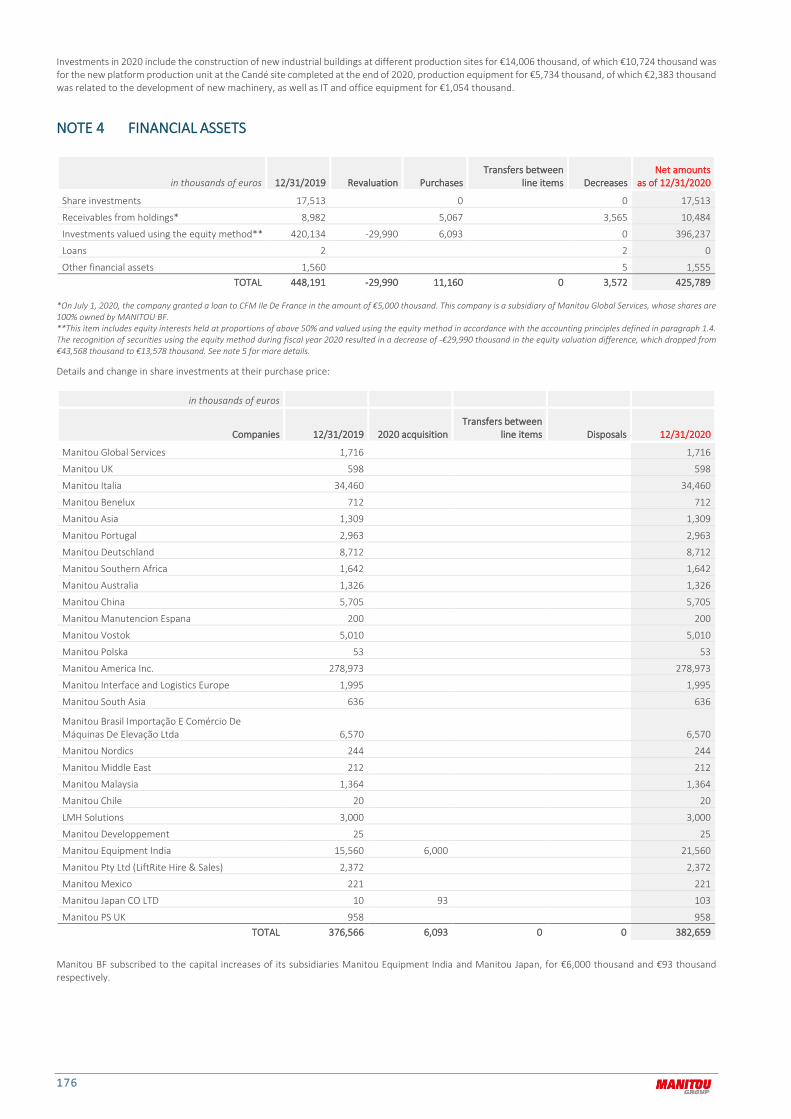
176
Investments in 2020 include the construction of new industrial buildings at different production sites for €14,006 thousand, of which €10,724 thousand was for the new platform production unit at the Candé site completed at the end of 2020, production equipment for €5,734 thousand, of which €2,383 thousand was related to the development of new machinery, as well as IT and office equipment for €1,054 thousand.
NOTE 4 FINANCIAL ASSETS
in thousands of euros 12/31/2019 Revaluation Purchases Transfers between
line items Decreases Net amounts
as of 12/31/2020
Share investments 17,513 0 0 17,513
Receivables from holdings* 8,982 5,067 3,565 10,484
Investments valued using the equity method** 420,134 -29,990 6,093 0 396,237
Loans 2 2 0
Other financial assets 1,560 5 1,555 TOTAL 448,191 -29,990 11,160 0 3,572 425,789
*On July 1, 2020, the company granted a loan to CFM Ile De France in the amount of €5,000 thousand. This company is a subsidiary of Manitou Global Services, whose shares are 100% owned by MANITOU BF. **This item includes equity interests held at proportions of above 50% and valued using the equity method in accordance with the accounting principles defined in paragraph 1.4. The recognition of securities using the equity method during fiscal year 2020 resulted in a decrease of -€29,990 thousand in the equity valuation difference, which dropped from €43,568 thousand to €13,578 thousand. See note 5 for more details.
Details and change in share investments at their purchase price:
in thousands of euros
Companies 12/31/2019 2020 acquisition Transfers between
line items Disposals 12/31/2020
Manitou Global Services 1,716 1,716
Manitou UK 598 598
Manitou Italia 34,460 34,460
Manitou Benelux 712 712
Manitou Asia 1,309 1,309
Manitou Portugal 2,963 2,963
Manitou Deutschland 8,712 8,712
Manitou Southern Africa 1,642 1,642
Manitou Australia 1,326 1,326
Manitou China 5,705 5,705
Manitou Manutencion Espana 200 200
Manitou Vostok 5,010 5,010
Manitou Polska 53 53
Manitou America Inc. 278,973 278,973
Manitou Interface and Logistics Europe 1,995 1,995
Manitou South Asia 636 636
Manitou Brasil Importação E Comércio De Máquinas De Elevação Ltda 6,570 6,570
Manitou Nordics 244 244
Manitou Middle East 212 212
Manitou Malaysia 1,364 1,364
Manitou Chile 20 20
LMH Solutions 3,000 3,000
Manitou Developpement 25 25
Manitou Equipment India 15,560 6,000 21,560
Manitou Pty Ltd (LiftRite Hire & Sales) 2,372 2,372
Manitou Mexico 221 221
Manitou Japan CO LTD 10 93 103
Manitou PS UK 958 958 TOTAL 376,566 6,093 0 0 382,659
Manitou BF subscribed to the capital increases of its subsidiaries Manitou Equipment India and Manitou Japan, for €6,000 thousand and €93 thousand respectively.
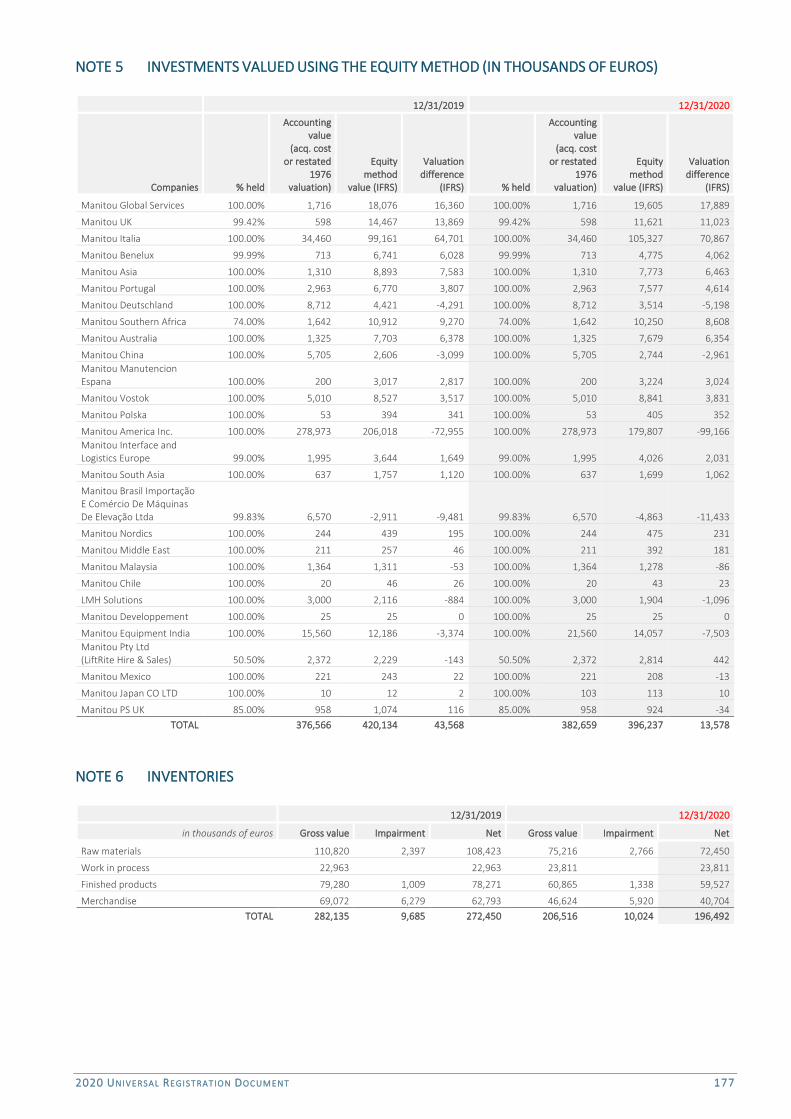
2020 UNIVERSAL REGIST RATION DOC UMENT 177
NOTE 5 INVESTMENTS VALUED USING THE EQUITY METHOD (IN THOUSANDS OF EUROS)
12/31/2019 12/31/2020
Companies % held
Accounting value
(acq. cost or restated
1976 valuation)
Equity method
value (IFRS)
Valuation difference
(IFRS) % held
Accounting value
(acq. cost or restated
1976 valuation)
Equity method
value (IFRS)
Valuation difference
(IFRS)
Manitou Global Services 100.00% 1,716 18,076 16,360 100.00% 1,716 19,605 17,889
Manitou UK 99.42% 598 14,467 13,869 99.42% 598 11,621 11,023
Manitou Italia 100.00% 34,460 99,161 64,701 100.00% 34,460 105,327 70,867
Manitou Benelux 99.99% 713 6,741 6,028 99.99% 713 4,775 4,062
Manitou Asia 100.00% 1,310 8,893 7,583 100.00% 1,310 7,773 6,463
Manitou Portugal 100.00% 2,963 6,770 3,807 100.00% 2,963 7,577 4,614
Manitou Deutschland 100.00% 8,712 4,421 -4,291 100.00% 8,712 3,514 -5,198
Manitou Southern Africa 74.00% 1,642 10,912 9,270 74.00% 1,642 10,250 8,608
Manitou Australia 100.00% 1,325 7,703 6,378 100.00% 1,325 7,679 6,354
Manitou China 100.00% 5,705 2,606 -3,099 100.00% 5,705 2,744 -2,961 Manitou Manutencion Espana 100.00% 200 3,017 2,817 100.00% 200 3,224 3,024
Manitou Vostok 100.00% 5,010 8,527 3,517 100.00% 5,010 8,841 3,831
Manitou Polska 100.00% 53 394 341 100.00% 53 405 352
Manitou America Inc. 100.00% 278,973 206,018 -72,955 100.00% 278,973 179,807 -99,166 Manitou Interface and Logistics Europe 99.00% 1,995 3,644 1,649 99.00% 1,995 4,026 2,031
Manitou South Asia 100.00% 637 1,757 1,120 100.00% 637 1,699 1,062
Manitou Brasil Importação E Comércio De Máquinas De Elevação Ltda 99.83% 6,570 -2,911 -9,481 99.83% 6,570 -4,863 -11,433
Manitou Nordics 100.00% 244 439 195 100.00% 244 475 231
Manitou Middle East 100.00% 211 257 46 100.00% 211 392 181
Manitou Malaysia 100.00% 1,364 1,311 -53 100.00% 1,364 1,278 -86
Manitou Chile 100.00% 20 46 26 100.00% 20 43 23
LMH Solutions 100.00% 3,000 2,116 -884 100.00% 3,000 1,904 -1,096
Manitou Developpement 100.00% 25 25 0 100.00% 25 25 0
Manitou Equipment India 100.00% 15,560 12,186 -3,374 100.00% 21,560 14,057 -7,503 Manitou Pty Ltd (LiftRite Hire & Sales) 50.50% 2,372 2,229 -143 50.50% 2,372 2,814 442
Manitou Mexico 100.00% 221 243 22 100.00% 221 208 -13
Manitou Japan CO LTD 100.00% 10 12 2 100.00% 103 113 10
Manitou PS UK 85.00% 958 1,074 116 85.00% 958 924 -34 TOTAL 376,566 420,134 43,568 382,659 396,237 13,578
NOTE 6 INVENTORIES
12/31/2019 12/31/2020
in thousands of euros Gross value Impairment Net Gross value Impairment Net
Raw materials 110,820 2,397 108,423 75,216 2,766 72,450
Work in process 22,963 22,963 23,811 23,811
Finished products 79,280 1,009 78,271 60,865 1,338 59,527
Merchandise 69,072 6,279 62,793 46,624 5,920 40,704 TOTAL 282,135 9,685 272,450 206,516 10,024 196,492
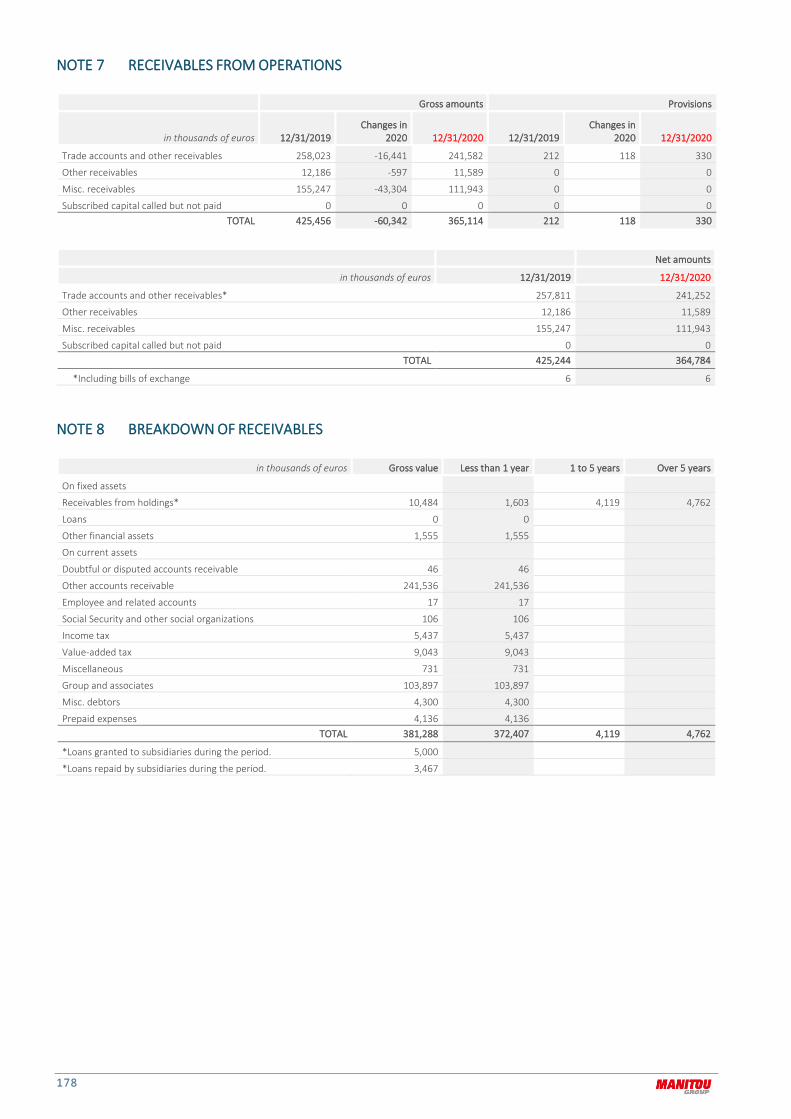
178
NOTE 7 RECEIVABLES FROM OPERATIONS
Gross amounts Provisions
in thousands of euros 12/31/2019 Changes in
2020 12/31/2020 12/31/2019 Changes in
2020 12/31/2020
Trade accounts and other receivables 258,023 -16,441 241,582 212 118 330
Other receivables 12,186 -597 11,589 0 0
Misc. receivables 155,247 -43,304 111,943 0 0
Subscribed capital called but not paid 0 0 0 0 0 TOTAL 425,456 -60,342 365,114 212 118 330
Net amounts
in thousands of euros 12/31/2019 12/31/2020
Trade accounts and other receivables* 257,811 241,252
Other receivables 12,186 11,589
Misc. receivables 155,247 111,943
Subscribed capital called but not paid 0 0 TOTAL 425,244 364,784
*Including bills of exchange 6 6
NOTE 8 BREAKDOWN OF RECEIVABLES
in thousands of euros Gross value Less than 1 year 1 to 5 years Over 5 years
On fixed assets
Receivables from holdings* 10,484 1,603 4,119 4,762
Loans 0 0
Other financial assets 1,555 1,555
On current assets
Doubtful or disputed accounts receivable 46 46
Other accounts receivable 241,536 241,536
Employee and related accounts 17 17
Social Security and other social organizations 106 106
Income tax 5,437 5,437
Value-added tax 9,043 9,043
Miscellaneous 731 731
Group and associates 103,897 103,897
Misc. debtors 4,300 4,300
Prepaid expenses 4,136 4,136 TOTAL 381,288 372,407 4,119 4,762
*Loans granted to subsidiaries during the period. 5,000
*Loans repaid by subsidiaries during the period. 3,467
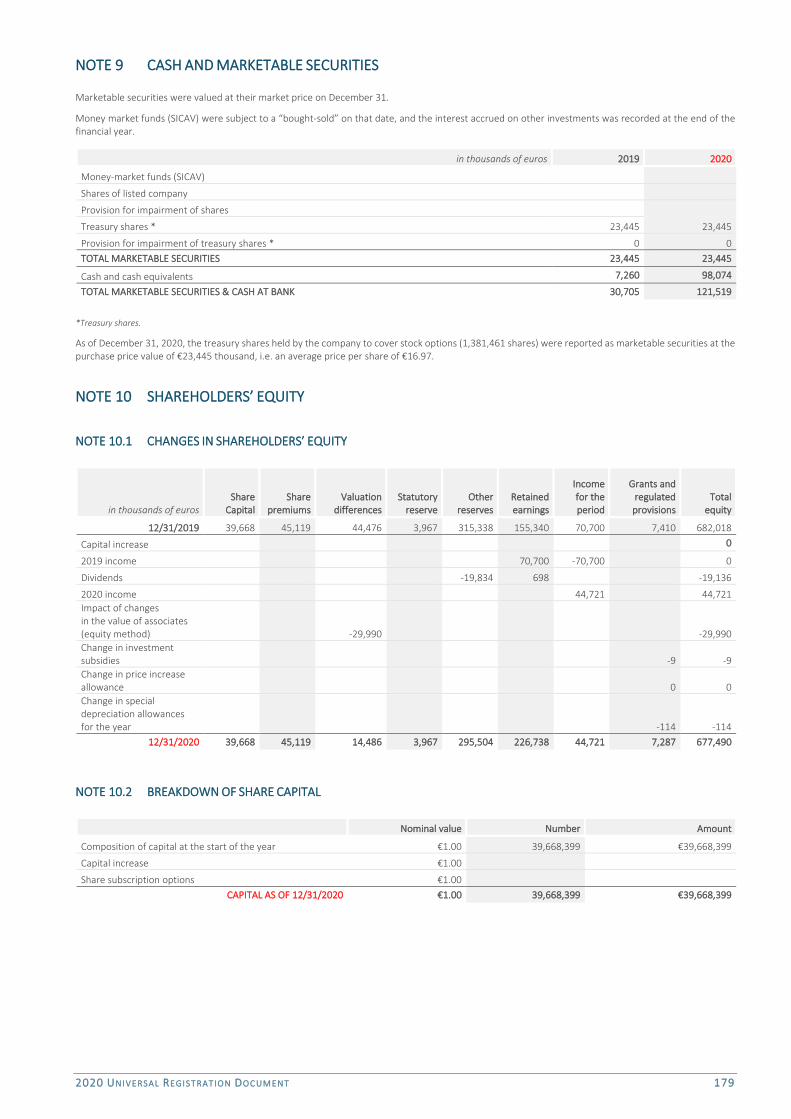
2020 UNIVERSAL REGIST RATION DOC UMENT 179
NOTE 9 CASH AND MARKETABLE SECURITIES
Marketable securities were valued at their market price on December 31.
Money market funds (SICAV) were subject to a “bought-sold” on that date, and the interest accrued on other investments was recorded at the end of the financial year.
in thousands of euros 2019 2020
Money-market funds (SICAV)
Shares of listed company
Provision for impairment of shares
Treasury shares * 23,445 23,445
Provision for impairment of treasury shares * 0 0 TOTAL MARKETABLE SECURITIES 23,445 23,445
Cash and cash equivalents 7,260 98,074
TOTAL MARKETABLE SECURITIES & CASH AT BANK 30,705 121,519
*Treasury shares.
As of December 31, 2020, the treasury shares held by the company to cover stock options (1,381,461 shares) were reported as marketable securities at the purchase price value of €23,445 thousand, i.e. an average price per share of €16.97.
NOTE 10 SHAREHOLDERS’ EQUITY
NOTE 10.1 CHANGES IN SHAREHOLDERS’ EQUITY
in thousands of euros Share
Capital Share
premiums Valuation
differences Statutory
reserve Other
reserves Retained earnings
Income for the period
Grants and regulated provisions
Total equity
12/31/2019 39,668 45,119 44,476 3,967 315,338 155,340 70,700 7,410 682,018
Capital increase 0
2019 income 70,700 -70,700 0
Dividends -19,834 698 -19,136
2020 income 44,721 44,721 Impact of changes in the value of associates (equity method) -29,990 -29,990 Change in investment subsidies -9 -9 Change in price increase allowance 0 0 Change in special depreciation allowances for the year -114 -114
12/31/2020 39,668 45,119 14,486 3,967 295,504 226,738 44,721 7,287 677,490
NOTE 10.2 BREAKDOWN OF SHARE CAPITAL
Nominal value Number Amount
Composition of capital at the start of the year €1.00 39,668,399 €39,668,399
Capital increase €1.00
Share subscription options €1.00 CAPITAL AS OF 12/31/2020 €1.00 39,668,399 €39,668,399

180
NOTE 11 PROVISIONS
in thousands of euros
Reversals
12/31/2019 Increases Used Unused 12/31/2020
REGULATED PROVISIONS
Provision for price increases 0 0 0
Special depreciation allowances 7,355 165 279 7,241
Other regulated provisions -0 0 -0 TOTAL 7,355 165 279 0 7,241
PROVISIONS FOR RISKS AND CONTINGENCIES
Litigation (1) 2,357 866 1,251 1,972
Customer warranties (2) 10,100 6,018 5,592 436 10,090
Exchange losses 9,656 10,519 9,656 10,519
Pensions and related liabilities (3) 1,371 100 0 1,471
Other provisions for risks & contingencies
Provisions for retirement benefit plan commitments (5) 25,743 2,728 0 28,471
TOTAL 49,227 20,231 16,499 436 52,523
PROVISIONS FOR IMPAIRMENT
Intangible assets 135 135 0
Tangible assets 1 0 1
Share investments 0 0 0 0
Inventories and work in process 9,685 3,463 2,714 410 10,024
Accounts receivable 212 245 46 81 330
Other (4) 0 0 0 0 0 TOTAL 10,033 3,708 3,305 81 10,355
TOTAL PROVISIONS 66,615 24,104 20,083 517 70,119
Of which increases and reversals: Increases Reversals
- operating 14,575 10,912
- financial 9,364 9,274
- extraordinary 165 414
(1) DISPUTES: the allocation for the fiscal year includes a provision to cover procedural costs in the context of patent disputes.
(2) WARRANTIES: a provision is created to cover the estimated cost of warranties on machinery and spare parts when they are put into use by the sales networks or end customers. It covers the contractual warranty, as well as any potential extension on a case-by-case basis or in relation to campaigns. The provision is calculated on a statistical basis.
(3) PENSIONS AND RELATED LIABILITIES: this line item corresponds to the amount of the provision for long-service awards.
(4) OTHER: impairment of treasury shares (see Note 9).
(5) PROVISIONS FOR RETIREMENT BENEFIT PLAN COMMITMENTS: provisions for retirement benefits were valued according to the principles described in Note 1.9. The actuarial assumptions used in the valuation of these commitments are as follows:
12/31/2019 12/31/2020
Retirement age - managers 62/67 years 62/67 years
- non-managers 62/67 years 62/67 years
Progressive increase in the number
of contribution years to 43 years Progressive increase in the number
of contribution years to 43 years
Annual employee growth rate 4.00% 4.00%
Discount rate 1.00% 0.70%
Rate of return on plan assets 1.00% 0.70%
Mortality rate TGH05/TGF05 TGH05/TGF05
Staff turnover rate - managers 2.50% 2.50%
- non-managers 1.00% 1.00%
Actuarial gains and losses are recognized in full in income.

2020 UNIVERSAL REGIST RATION DOC UMENT 181
Provisions for retirement indemnities changed as follows:
in thousands of euros 12/31/2019 12/31/2020
Commitment at end of period -29,088 -31,469
Plan assets at end of period 3,345 2,998
Financial situation -25,743 -28,471
Past service costs 0 0
(Provision)/amount prepaid -25,743 -28,471
The impact on income recorded in the financial statements in 2019 and 2020 can be broken down as follows:
in thousands of euros 12/31/2019 12/31/2020
Past service costs 1,828 2,420
Cost of discounting 468 314
Expected return on plan assets -76 -32
Reduction
Past service costs 0 0 SUBTOTAL 2,220 2,702
Acquisition transfer 0 0
Actuarial gain/loss calculated 3,140 26 TOTAL 5,360 2,728
NOTE 12 BREAKDOWN OF DEBT
in thousands of euros Gross amount at 12/31/2020 Less than 1 year 1 to 5 years Over 5 years
Bank loans and debt* 143,757 3,284 33,286 107,187
Loans and other financial liabilities 6,330 6,330
Supplier accounts payable and related 165,070 165,070
Employee and related accounts 27,283 27,283
Social Security and other social organizations 19,315 19,315
Income tax 0 0
Value-added tax 118 118
Other taxes 3,001 3,001
Debts on fixed assets and related accounts 1,712 1,712
Group and associates 109,052 109,052
Other liabilities 20,303 20,303
Deferred revenues 12,799 5,524 7,263 12 TOTAL 508,740 360,992 40,549 107,199
*Loans taken out during the period. 128,598
*Loans repaid during the period. 147,458
NOTE 13 ITEMS RELATED TO AFFILIATES
in thousands of euros 12/31/2019 12/31/2020
Investments valued using the equity method* 420,134 396,237
Receivables from affiliates 8,982 10,484
Other investments 17,513 17,513
Accounts receivable and related 152,186 137,576
Other receivables 150,147 104,226
Supplier accounts payable and related 49,822 28,375
Debt on fixed assets 2 0
Other liabilities 88,601 116,984
Financial expenses 3,313 1,665
Income from equity investments 31,817 14,716
Other financial income 8,882 5,191
*Of which change in equity method valuation: 43,568 14,700
No transactions were made outside of normal market conditions.
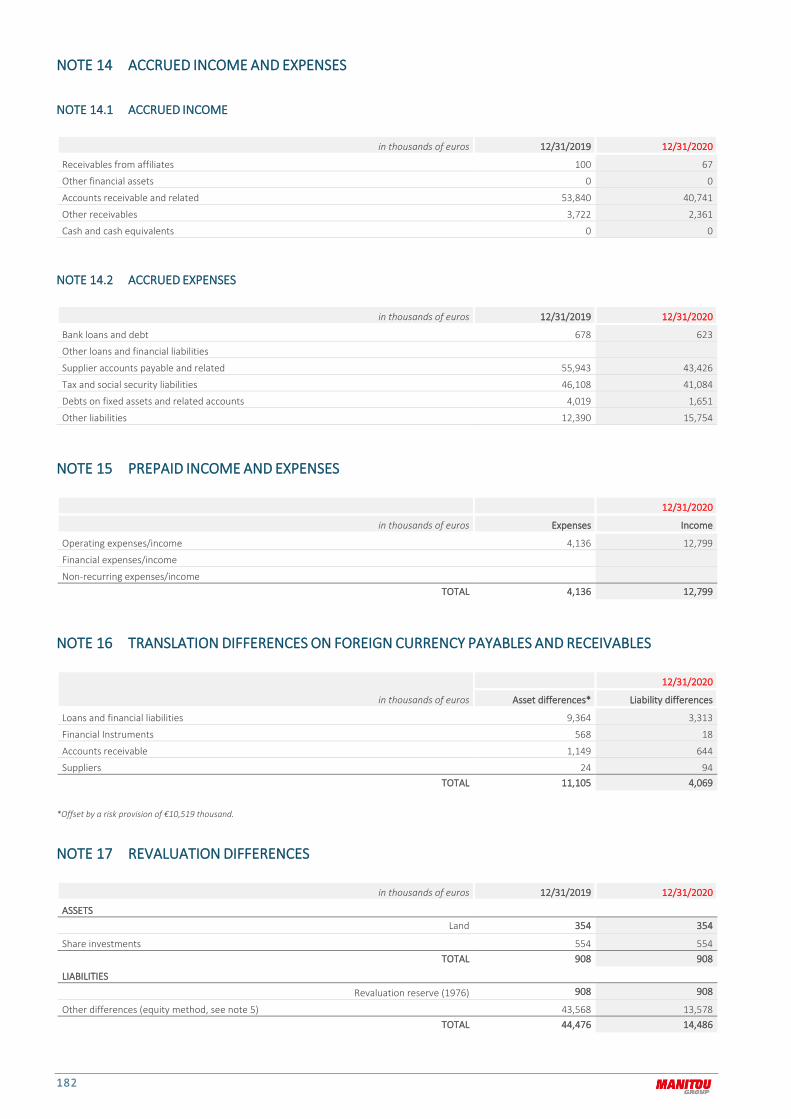
182
NOTE 14 ACCRUED INCOME AND EXPENSES
NOTE 14.1 ACCRUED INCOME
in thousands of euros 12/31/2019 12/31/2020
Receivables from affiliates 100 67
Other financial assets 0 0
Accounts receivable and related 53,840 40,741
Other receivables 3,722 2,361
Cash and cash equivalents 0 0
NOTE 14.2 ACCRUED EXPENSES
in thousands of euros 12/31/2019 12/31/2020
Bank loans and debt 678 623
Other loans and financial liabilities
Supplier accounts payable and related 55,943 43,426
Tax and social security liabilities 46,108 41,084
Debts on fixed assets and related accounts 4,019 1,651
Other liabilities 12,390 15,754
NOTE 15 PREPAID INCOME AND EXPENSES
12/31/2020
in thousands of euros Expenses Income
Operating expenses/income 4,136 12,799
Financial expenses/income
Non-recurring expenses/income TOTAL 4,136 12,799
NOTE 16 TRANSLATION DIFFERENCES ON FOREIGN CURRENCY PAYABLES AND RECEIVABLES
in thousands of euros
12/31/2020
Asset differences* Liability differences
Loans and financial liabilities 9,364 3,313
Financial Instruments 568 18
Accounts receivable 1,149 644
Suppliers 24 94 TOTAL 11,105 4,069
*Offset by a risk provision of €10,519 thousand.
NOTE 17 REVALUATION DIFFERENCES
in thousands of euros 12/31/2019 12/31/2020
ASSETS Land 354 354
Share investments 554 554 TOTAL 908 908
LIABILITIES
Revaluation reserve (1976) 908 908
Other differences (equity method, see note 5) 43,568 13,578 TOTAL 44,476 14,486

2020 UNIVERSAL REGIST RATION DOC UMENT 183
NOTE 18 BREAKDOWN OF SALES
in thousands of euros 2019 2020
A - BREAKDOWN BY BUSINESS ACTIVITY
Production (Manitou BF) 1,084,355 739,772
Spare parts trading 164,727 157,670
Equipment trading 277,906 200,894 TOTAL 1,526,988 1,098,336
B - BREAKDOWN BY MARKET REGION
France 435,171 338,334
Export 1,091,817 760,002 TOTAL 1,526,988 1,098,336
NOTE 19 REVERSALS OF PROVISIONS AND TRANSFERS OF EXPENSES
in thousands of euros
2019 2020
Income Income
Reversal of provision for risks 6,530 7,661
Reversal of impairment on tangible assets 0 0
Reversal of provision for impairment of current assets 3,842 3,251
Transfer of operating expenses* 7,458 8,256 TOTAL 17,830 19,168
*The expense transfer item mainly includes reinvoicing of central services to the subsidiaries Manitou Italia and Manitou Americas for €1,921 thousand and €403 thousand respectively, reinvoicing of the group's ERP roll-out costs in certain European subsidiaries for €2,408 thousand, as well as reinvoicing of various fees.
NOTE 20 FINANCIAL RESULT
NOTE 20.1 FINANCIAL INCOME
in thousands of euros
2019 2020
Income Income
Income from securities 31,817 14,716
Exchange gains 31,632 37,577
Reversal of impairment provision on securities* 1,051
Other income 7,987 5,211 TOTAL 72,487 57,504
*As a reminder, the sale of the securities of the Chinese company Hanghzou Manitou Machinery Equipment resulted over fiscal year 2019 in a reversal of a securities impairment of €1,051 thousand.
NOTE 20.2 FINANCIAL EXPENSES
in thousands of euros
2019 2020
Expenses Expenses
Loan interest 4,314 4,861
Exchange losses 36,430 33,027
Increases in impairment on securities* 0 0
Other expenses 4,699 2,311 TOTAL 45,443 40,199
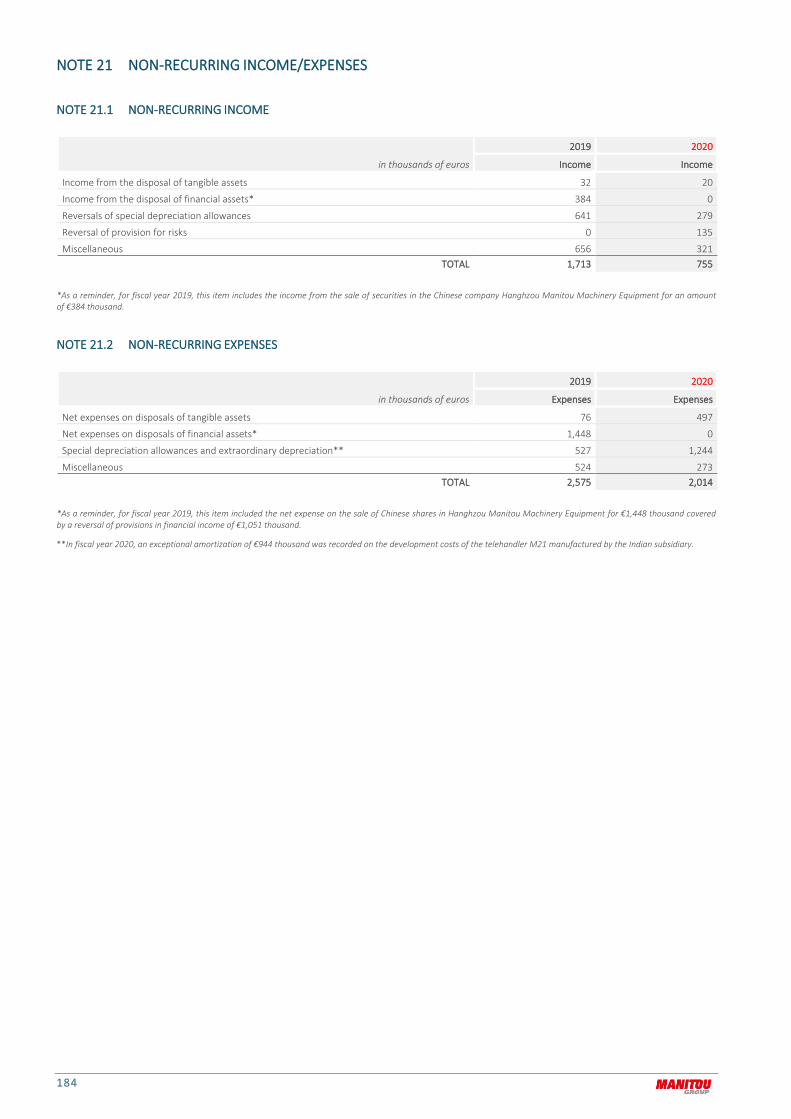
184
NOTE 21 NON-RECURRING INCOME/EXPENSES
NOTE 21.1 NON-RECURRING INCOME
in thousands of euros
2019 2020
Income Income
Income from the disposal of tangible assets 32 20
Income from the disposal of financial assets* 384 0
Reversals of special depreciation allowances 641 279
Reversal of provision for risks 0 135
Miscellaneous 656 321 TOTAL 1,713 755
*As a reminder, for fiscal year 2019, this item includes the income from the sale of securities in the Chinese company Hanghzou Manitou Machinery Equipment for an amount of €384 thousand.
NOTE 21.2 NON-RECURRING EXPENSES
in thousands of euros
2019 2020
Expenses Expenses
Net expenses on disposals of tangible assets 76 497
Net expenses on disposals of financial assets* 1,448 0
Special depreciation allowances and extraordinary depreciation** 527 1,244
Miscellaneous 524 273 TOTAL 2,575 2,014
*As a reminder, for fiscal year 2019, this item included the net expense on the sale of Chinese shares in Hanghzou Manitou Machinery Equipment for €1,448 thousand covered by a reversal of provisions in financial income of €1,051 thousand.
**In fiscal year 2020, an exceptional amortization of €944 thousand was recorded on the development costs of the telehandler M21 manufactured by the Indian subsidiary.
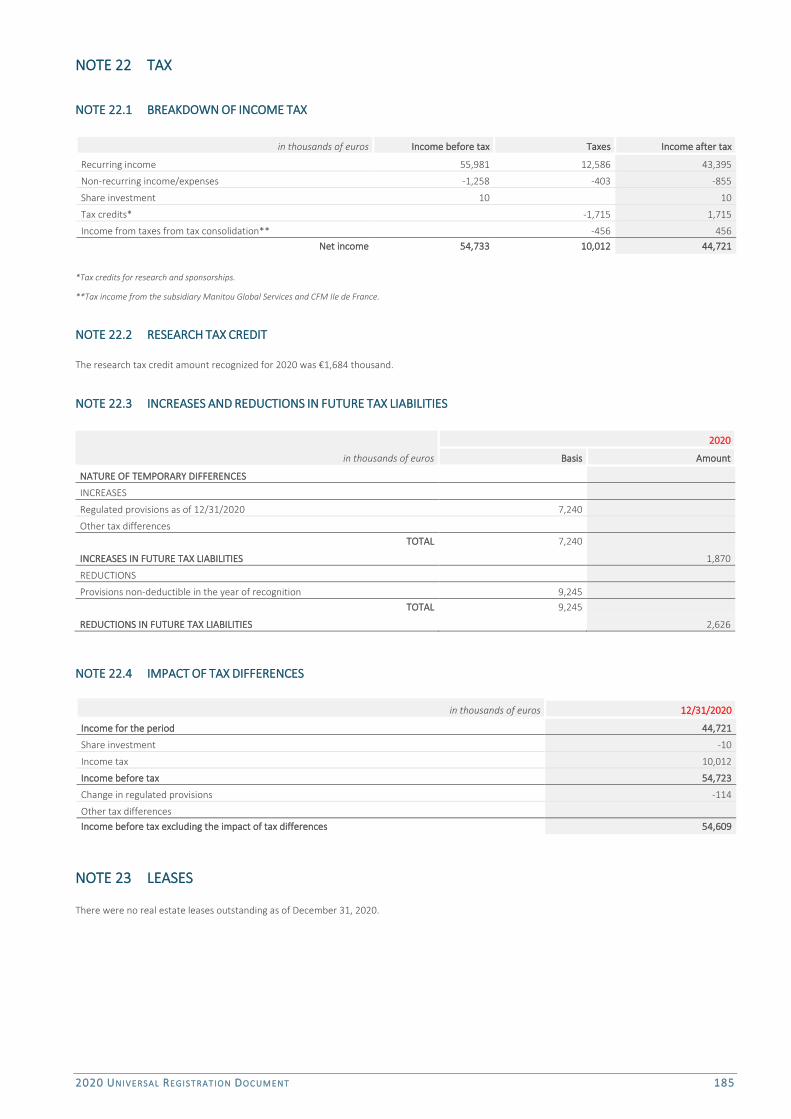
2020 UNIVERSAL REGIST RATION DOC UMENT 185
NOTE 22 TAX
NOTE 22.1 BREAKDOWN OF INCOME TAX
in thousands of euros Income before tax Taxes Income after tax
Recurring income 55,981 12,586 43,395
Non-recurring income/expenses -1,258 -403 -855
Share investment 10 10
Tax credits* -1,715 1,715
Income from taxes from tax consolidation** -456 456 Net income 54,733 10,012 44,721
*Tax credits for research and sponsorships.
**Tax income from the subsidiary Manitou Global Services and CFM Ile de France.
NOTE 22.2 RESEARCH TAX CREDIT
The research tax credit amount recognized for 2020 was €1,684 thousand.
NOTE 22.3 INCREASES AND REDUCTIONS IN FUTURE TAX LIABILITIES
in thousands of euros
2020
Basis Amount
NATURE OF TEMPORARY DIFFERENCES
INCREASES
Regulated provisions as of 12/31/2020 7,240
Other tax differences TOTAL 7,240
INCREASES IN FUTURE TAX LIABILITIES 1,870
REDUCTIONS
Provisions non-deductible in the year of recognition 9,245 TOTAL 9,245
REDUCTIONS IN FUTURE TAX LIABILITIES 2,626
NOTE 22.4 IMPACT OF TAX DIFFERENCES
in thousands of euros 12/31/2020
Income for the period 44,721
Share investment -10
Income tax 10,012
Income before tax 54,723
Change in regulated provisions -114
Other tax differences Income before tax excluding the impact of tax differences 54,609
NOTE 23 LEASES
There were no real estate leases outstanding as of December 31, 2020.
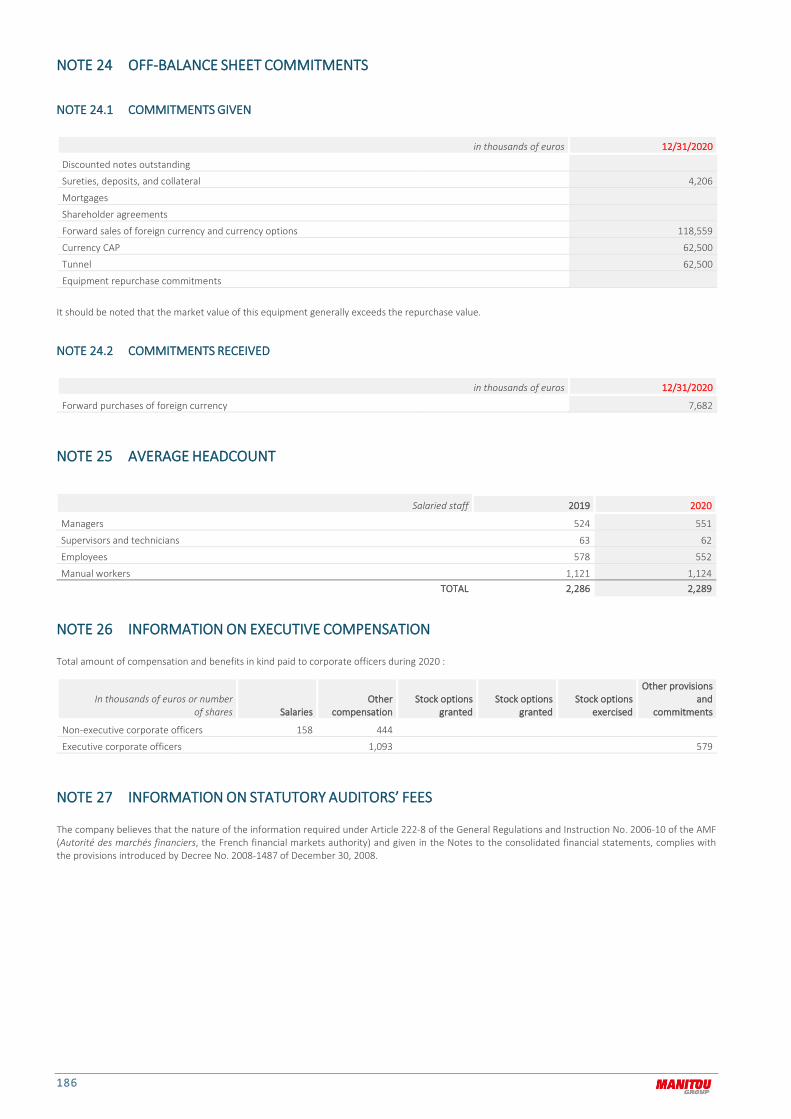
186
NOTE 24 OFF-BALANCE SHEET COMMITMENTS
NOTE 24.1 COMMITMENTS GIVEN
in thousands of euros 12/31/2020
Discounted notes outstanding
Sureties, deposits, and collateral 4,206
Mortgages
Shareholder agreements
Forward sales of foreign currency and currency options 118,559
Currency CAP 62,500
Tunnel 62,500
Equipment repurchase commitments
It should be noted that the market value of this equipment generally exceeds the repurchase value.
NOTE 24.2 COMMITMENTS RECEIVED
in thousands of euros 12/31/2020
Forward purchases of foreign currency 7,682
NOTE 25 AVERAGE HEADCOUNT
Salaried staff 2019 2020
Managers 524 551
Supervisors and technicians 63 62
Employees 578 552
Manual workers 1,121 1,124 TOTAL 2,286 2,289
NOTE 26 INFORMATION ON EXECUTIVE COMPENSATION
Total amount of compensation and benefits in kind paid to corporate officers during 2020 :
In thousands of euros or number of shares Salaries
Other compensation
Stock options granted
Stock options granted
Stock options exercised
Other provisions and
commitments
Non-executive corporate officers 158 444
Executive corporate officers 1,093 579
NOTE 27 INFORMATION ON STATUTORY AUDITORS’ FEES
The company believes that the nature of the information required under Article 222-8 of the General Regulations and Instruction No. 2006-10 of the AMF (Autorité des marchés financiers, the French financial markets authority) and given in the Notes to the consolidated financial statements, complies with the provisions introduced by Decree No. 2008-1487 of December 30, 2008.
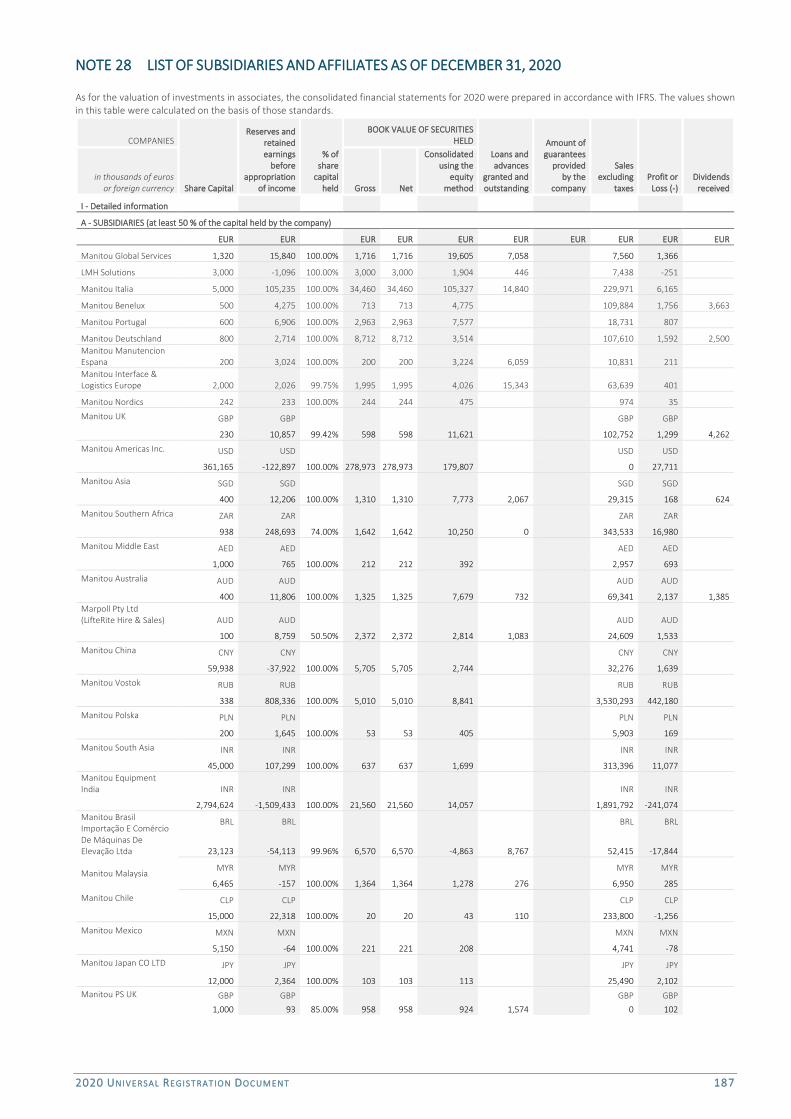
2020 UNIVERSAL REGIST RATION DOC UMENT 187
NOTE 28 LIST OF SUBSIDIARIES AND AFFILIATES AS OF DECEMBER 31, 2020
As for the valuation of investments in associates, the consolidated financial statements for 2020 were prepared in accordance with IFRS. The values shown in this table were calculated on the basis of those standards.
COMPANIES
Share Capital
Reserves and retained earnings
before appropriation
of income
% of share
capital held
BOOK VALUE OF SECURITIES HELD
Loans and advances
granted and outstanding
Amount of guarantees
provided by the
company
Sales excluding
taxes Profit or
Loss (-) Dividends
received in thousands of euros
or foreign currency Gross Net
Consolidated using the
equity method
I - Detailed information
A - SUBSIDIARIES (at least 50 % of the capital held by the company)
EUR EUR EUR EUR EUR EUR EUR EUR EUR EUR
Manitou Global Services 1,320 15,840 100.00% 1,716 1,716 19,605 7,058 7,560 1,366
LMH Solutions 3,000 -1,096 100.00% 3,000 3,000 1,904 446 7,438 -251
Manitou Italia 5,000 105,235 100.00% 34,460 34,460 105,327 14,840 229,971 6,165
Manitou Benelux 500 4,275 100.00% 713 713 4,775 109,884 1,756 3,663
Manitou Portugal 600 6,906 100.00% 2,963 2,963 7,577 18,731 807
Manitou Deutschland 800 2,714 100.00% 8,712 8,712 3,514 107,610 1,592 2,500 Manitou Manutencion Espana 200 3,024 100.00% 200 200 3,224 6,059 10,831 211 Manitou Interface & Logistics Europe 2,000 2,026 99.75% 1,995 1,995 4,026 15,343 63,639 401
Manitou Nordics 242 233 100.00% 244 244 475 974 35
Manitou UK GBP GBP GBP GBP 230 10,857 99.42% 598 598 11,621 102,752 1,299 4,262
Manitou Americas Inc. USD USD USD USD 361,165 -122,897 100.00% 278,973 278,973 179,807 0 27,711
Manitou Asia SGD SGD SGD SGD 400 12,206 100.00% 1,310 1,310 7,773 2,067 29,315 168 624
Manitou Southern Africa ZAR ZAR ZAR ZAR 938 248,693 74.00% 1,642 1,642 10,250 0 343,533 16,980
Manitou Middle East AED AED AED AED 1,000 765 100.00% 212 212 392 2,957 693
Manitou Australia AUD AUD AUD AUD 400 11,806 100.00% 1,325 1,325 7,679 732 69,341 2,137 1,385 Marpoll Pty Ltd (LifteRite Hire & Sales) AUD AUD AUD AUD 100 8,759 50.50% 2,372 2,372 2,814 1,083 24,609 1,533
Manitou China CNY CNY CNY CNY 59,938 -37,922 100.00% 5,705 5,705 2,744 32,276 1,639
Manitou Vostok RUB RUB RUB RUB 338 808,336 100.00% 5,010 5,010 8,841 3,530,293 442,180
Manitou Polska PLN PLN PLN PLN 200 1,645 100.00% 53 53 405 5,903 169
Manitou South Asia INR INR INR INR 45,000 107,299 100.00% 637 637 1,699 313,396 11,077 Manitou Equipment India INR INR INR INR 2,794,624 -1,509,433 100.00% 21,560 21,560 14,057 1,891,792 -241,074 Manitou Brasil Importação E Comércio De Máquinas De Elevação Ltda
BRL BRL BRL BRL
23,123 -54,113 99.96% 6,570 6,570 -4,863 8,767 52,415 -17,844
Manitou Malaysia MYR MYR MYR MYR
6,465 -157 100.00% 1,364 1,364 1,278 276 6,950 285
Manitou Chile CLP CLP CLP CLP 15,000 22,318 100.00% 20 20 43 110 233,800 -1,256
Manitou Mexico MXN MXN MXN MXN 5,150 -64 100.00% 221 221 208 4,741 -78
Manitou Japan CO LTD JPY JPY JPY JPY 12,000 2,364 100.00% 103 103 113 25,490 2,102 Manitou PS UK GBP GBP GBP GBP
1,000 93 85.00% 958 958 924 1,574 0 102
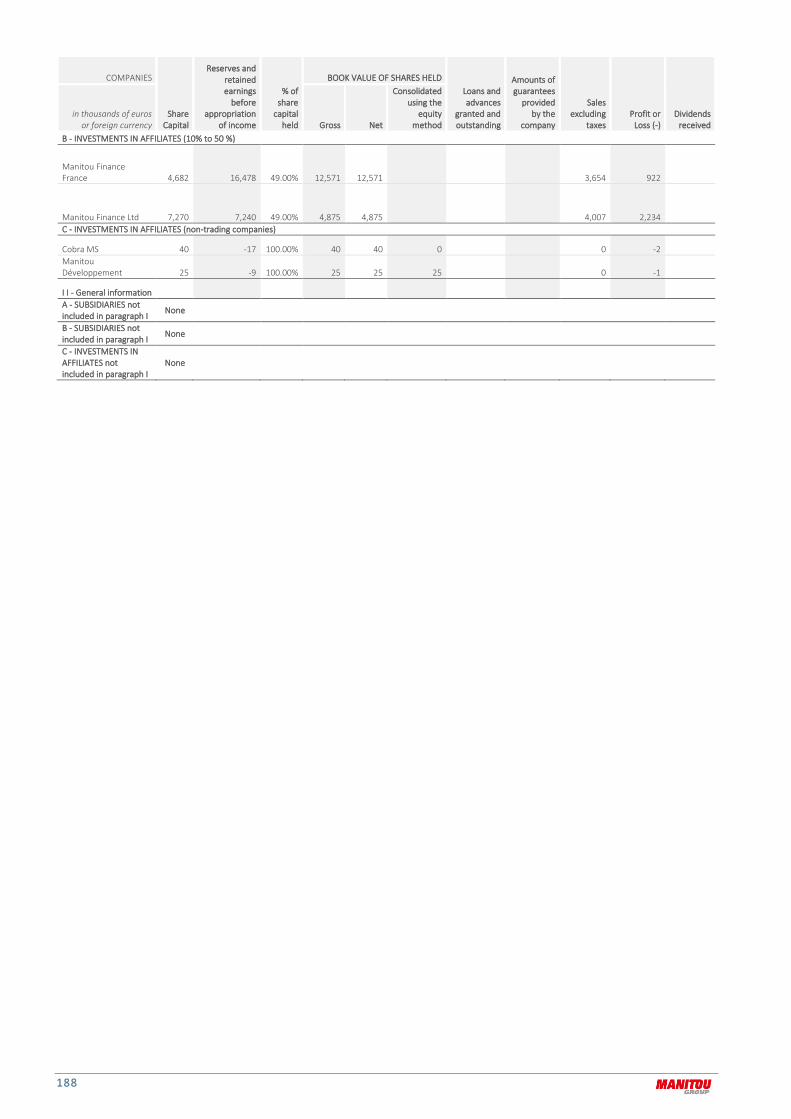
188
COMPANIES
Share Capital
Reserves and retained earnings
before appropriation
of income
% of share
capital held
BOOK VALUE OF SHARES HELD Loans and advances
granted and outstanding
Amounts of guarantees
provided by the
company
Sales excluding
taxes Profit or
Loss (-) Dividends
received in thousands of euros
or foreign currency Gross Net
Consolidated using the
equity method
B - INVESTMENTS IN AFFILIATES (10% to 50 %)
Manitou Finance France 4,682 16,478 49.00% 12,571 12,571 3,654 922
Manitou Finance Ltd 7,270 7,240 49.00% 4,875 4,875 4,007 2,234 C - INVESTMENTS IN AFFILIATES (non-trading companies)
Cobra MS 40 -17 100.00% 40 40 0 0 -2 Manitou Développement 25 -9 100.00% 25 25 25 0 -1
I I - General information A - SUBSIDIARIES not included in paragraph I
None
B - SUBSIDIARIES not included in paragraph I None C - INVESTMENTS IN AFFILIATES not included in paragraph I
None
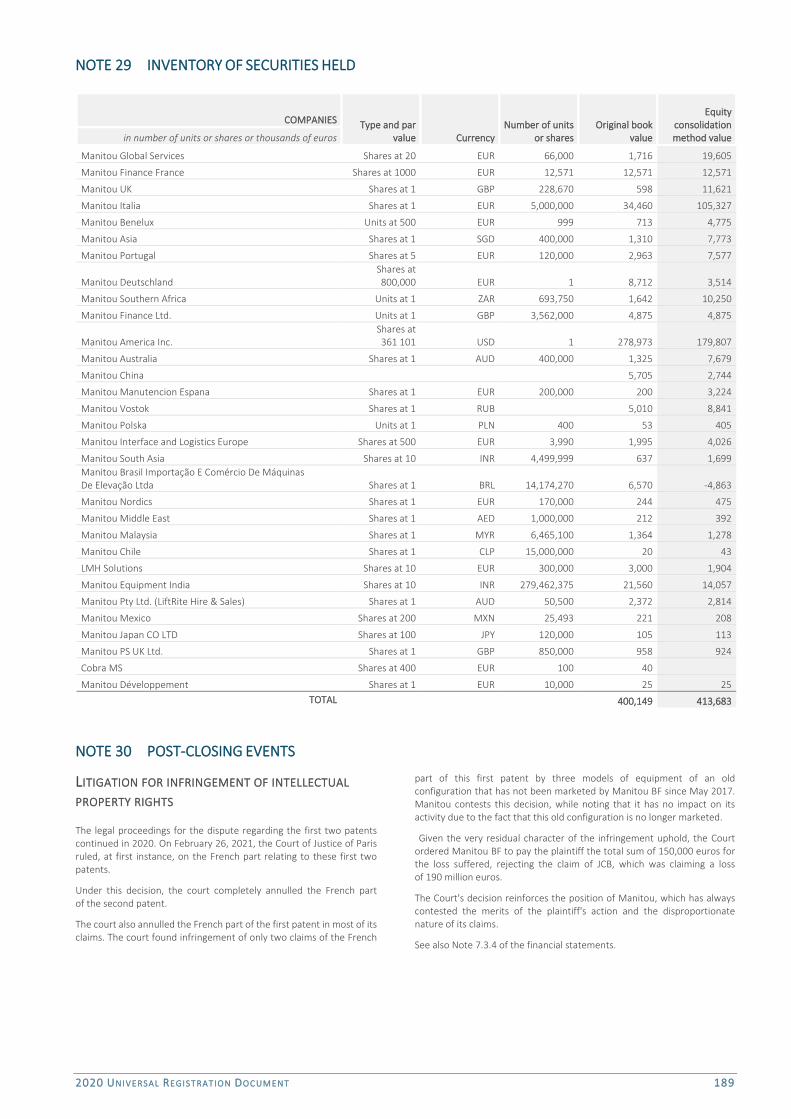
2020 UNIVERSAL REGIST RATION DOC UMENT 189
NOTE 29 INVENTORY OF SECURITIES HELD
COMPANIES Type and par value Currency
Number of units or shares
Original book value
Equity consolidation method value in number of units or shares or thousands of euros
Manitou Global Services Shares at 20 EUR 66,000 1,716 19,605
Manitou Finance France Shares at 1000 EUR 12,571 12,571 12,571
Manitou UK Shares at 1 GBP 228,670 598 11,621
Manitou Italia Shares at 1 EUR 5,000,000 34,460 105,327
Manitou Benelux Units at 500 EUR 999 713 4,775
Manitou Asia Shares at 1 SGD 400,000 1,310 7,773
Manitou Portugal Shares at 5 EUR 120,000 2,963 7,577
Manitou Deutschland Shares at 800,000 EUR 1 8,712 3,514
Manitou Southern Africa Units at 1 ZAR 693,750 1,642 10,250
Manitou Finance Ltd. Units at 1 GBP 3,562,000 4,875 4,875
Manitou America Inc. Shares at 361 101 USD 1 278,973 179,807
Manitou Australia Shares at 1 AUD 400,000 1,325 7,679
Manitou China 5,705 2,744
Manitou Manutencion Espana Shares at 1 EUR 200,000 200 3,224
Manitou Vostok Shares at 1 RUB 5,010 8,841
Manitou Polska Units at 1 PLN 400 53 405
Manitou Interface and Logistics Europe Shares at 500 EUR 3,990 1,995 4,026
Manitou South Asia Shares at 10 INR 4,499,999 637 1,699 Manitou Brasil Importação E Comércio De Máquinas De Elevação Ltda Shares at 1 BRL 14,174,270 6,570 -4,863
Manitou Nordics Shares at 1 EUR 170,000 244 475
Manitou Middle East Shares at 1 AED 1,000,000 212 392
Manitou Malaysia Shares at 1 MYR 6,465,100 1,364 1,278
Manitou Chile Shares at 1 CLP 15,000,000 20 43
LMH Solutions Shares at 10 EUR 300,000 3,000 1,904
Manitou Equipment India Shares at 10 INR 279,462,375 21,560 14,057
Manitou Pty Ltd. (LiftRite Hire & Sales) Shares at 1 AUD 50,500 2,372 2,814
Manitou Mexico Shares at 200 MXN 25,493 221 208
Manitou Japan CO LTD Shares at 100 JPY 120,000 105 113
Manitou PS UK Ltd. Shares at 1 GBP 850,000 958 924
Cobra MS Shares at 400 EUR 100 40
Manitou Développement Shares at 1 EUR 10,000 25 25 TOTAL 400,149 413,683
NOTE 30 POST-CLOSING EVENTS
LITIGATION FOR INFRINGEMENT OF INTELLECTUAL
PROPERTY RIGHTS
The legal proceedings for the dispute regarding the first two patents continued in 2020. On February 26, 2021, the Court of Justice of Paris ruled, at first instance, on the French part relating to these first two patents.
Under this decision, the court completely annulled the French part of the second patent.
The court also annulled the French part of the first patent in most of its claims. The court found infringement of only two claims of the French
part of this first patent by three models of equipment of an old configuration that has not been marketed by Manitou BF since May 2017. Manitou contests this decision, while noting that it has no impact on its activity due to the fact that this old configuration is no longer marketed.
Given the very residual character of the infringement uphold, the Court ordered Manitou BF to pay the plaintiff the total sum of 150,000 euros for the loss suffered, rejecting the claim of JCB, which was claiming a loss of 190 million euros.
The Court's decision reinforces the position of Manitou, which has always contested the merits of the plaintiff's action and the disproportionate nature of its claims.
See also Note 7.3.4 of the financial statements.

190
STATUTORY AUDITORS’ REPORTS 2020
STATUTORY AUDITORS’ REPORT
ON THE FINANCIAL STATEMENTS
To the annual general meeting of Manitou BF S.A.,
OPINION
In compliance with the engagement entrusted to us by your annual general meeting, we have audited the accompanying financial statements of Manitou BF S.A. for the year ended 31 December, 2020.
In our opinion, the financial statements give a true and fair view of the assets and liabilities and of the financial position of the Company as at 31 December, 2020 and of the results of its operations for the year then ended in accordance with French accounting principles.
The audit opinion expressed above is consistent with our report to the Audit Committee.
BASIS FOR OPINION
AUDIT FRAMEWORK
We conducted our audit in accordance with professional standards applicable in France. We believe that the audit evidence we have obtained is sufficient and appropriate to provide a basis for our opinion.
Our responsibilities under those standards are further described in the Statutory Auditors’ Responsibilities for the Audit of the Financial Statements section of our report.
INDEPENDENCE
We conducted our audit engagement in compliance with independence rules applicable to us, for the period from 1 January, 2020 to the date of our report and specifically we did not provide any prohibited non-audit services referred to in Article 5(1) of Regulation (EU) No 537/2014 or in the French Code of ethics (code de déontologie) for statutory auditors.
JUSTIFICATION OF ASSESSMENTS - KEY AUDIT MATTERS
Due to the global crisis related to the Covid-19 pandemic, the financial statements of this period have been prepared and audited under specific conditions. Indeed, this crisis and the exceptional measures taken in the context of the state of sanitary emergency have had numerous consequences for companies, particularly on their operations and their financing, and have led to greater uncertainties on their future prospects. Those measures, such as travel restrictions and remote working, have also had an impact on the companies' internal organization and the performance of the audits.
It is in this complex and evolving context that, in accordance with the requirements of Articles L.823-9 and R.823-7 of the French Commercial Code (code de commerce) relating to the justification of our assessments, we inform you of the key audit matters relating to risks of material misstatement that, in our professional judgment, were of most significance in our audit of the consolidated financial statements of the current period, as well as how we addressed those risks. These matters were addressed in the context of our audit of the financial statements as a whole, approved in the context described above, and in forming our opinion thereon, and we do not provide a separate opinion on specific items of the financial statements.
PROVISIONS FOR WARRANTIES
Key audit matter
The Company records provisions for warranties and equipment recall campaigns to cover the estimated warranty costs of machines and spare parts, and the costs of overhauling sold equipment and the stock of machines in the event of major or dangerous malfunctions. These provisions, totalling €10.1 million as at 31 December 2020, are recorded for warranties when machines are sold to networks or end customers, and for recall campaigns when a malfunction is detected. The warranty provision amount covers the contractual warranty and its potential extension and is determined using historical statistical data projections. The campaign provision amount is determined using the unit cost of repair applied to the fleet of machines concerned.
We considered the valuation of these provisions to be a key audit matter in the financial statements due to their importance in understanding the financial statements, the complexity of their calculation components (average on warranty costs over the last five years, machine commissioning dates, outsourcing rate to suppliers, margin rate on spare parts) and their sensitivity to the assumptions adopted by management.
Response as part of our audit
Our work consisted in:
familiarizing ourselves with the provision valuation process,
testing the key controls set up by management that we consider as most relevant to determine the costs underlying this valuation, and particularly those relating to the various rates used in the estimates,
assessing the relevance of the group’s methodology,
assessing the validity of the assumptions used to determine the warranty provisions, checking all of the data and calculations underlying these assumptions,
reviewing the calculations on a test basis,
assessing the judgements made by management and the appropriateness of the disclosures in Note 11 to the financial statements,
comparing the accounting estimates of prior periods with the corresponding actual figures.
JCB LITIGATION
Key audit matter
In May 2017, Manitou BF was sued by J.C. Bamford Excavators Limited for infringing two patents, as mentioned in Note 7.3.4 to the financial statements. The claim before the French court amounted initially to €20 million (subject to further evaluation).
In December 2018, JCB served Manitou BF with a writ of summons for infringement of a third patent.
The legal proceedings for this dispute continued throughout 2020 and JCB valued its prejudice to €190 million in 2019. The judicial court of Paris, dated February 26th, 2021, ordered to Manitou to pay the amount of €150.000 regarding the assignment of the first two patents. This amount has been booked as at 31 December 2020 in addition to the litigation costs already accounted for.
Regarding the assignment for the third patent, Manitou BF considers, on the one hand, that a financial estimate of the risk actually incurred cannot be determined given the evidence at its disposal and the progress of the proceedings, and, on the other hand, that a significant outflow of resources in respect of these claims seems unlikely given the arguments put forward by Manitou BF in its defence. In light of this, no provision was set aside in the financial statements for these claims. The Company only recorded the estimated future legal costs relating

2020 UNIVERSAL REGIST RATION DOC UMENT 191
to this litigation in its 2020 financial statements, as indicated in Note 7.3.4 to the financial statements.
We considered this issue to be a key audit matter given its potential weight on the Company’s financial statements and insofar as significant judgment is required at the year-end regarding the uncertain outcome of this litigation in order to estimate the actual risk incurred.
Response as part of our audit
Our work primarily consisted in:
examining the procedures implemented by the Company to estimate the risk relating to this litigation,
familiarising ourselves with the Company’s risk analysis,
assessing the validity of the absence of provisions (excluding the legal costs) in light of the documentation provided by the Company, the documents filed and the written consultations of external advisors;
assessing the reasonableness of the assumptions used by management to estimate the provision for legal costs;
analysing the documentation elements of opposing party request and of the Company defence elements;
analysing, if necessary, Courts’ judgments;
verifying the appropriateness of the disclosures relating to this litigation in the notes to the financial statements.
SPECIFIC VERIFICATIONS
We have also performed, in accordance with professional standards applicable in France, the specific verifications required by laws and regulations.
INFORMATION GIVEN IN THE MANAGEMENT REPORT AND
IN THE OTHER DOCUMENTS WITH RESPECT TO THE
FINANCIAL POSITION AND THE FINANCIAL STATEMENTS
PROVIDED TO THE SHAREHOLDERS
We have no matters to report as to the fair presentation and the consistency with the financial statements of the information given in the management report of the Board of Directors and in the other documents with respect to the financial position and the financial statements provided to Shareholders.
We attest the fair presentation and the consistency with the financial statements of the information relating to payment deadlines mentioned in Article D.441-6 of the French Commercial Code (Code de commerce).
INFORMATION RELATING TO CORPORATE GOVERNANCE
We attest that the Board of Directors’ report on corporate governance sets out the information required by Articles L.225-37-4, L.22-10-10 and L.22-10-9 of the French Commercial Code.
Concerning the information given in accordance with the requirements of Article L.22-10-9 of the French Commercial Code (code de commerce) relating to remunerations and benefits received by the members of the Executive Board and of the Supervisory Board and any other commitments made in their favour, we have verified its consistency with the financial statements, or with the underlying information used to prepare these financial statements and, where applicable, with the information obtained by your company from controlling and controlled companies. Based on these procedures, we attest the accuracy and fair presentation of this information.
OTHER INFORMATION
In accordance with French law, we have verified that the required information concerning the purchase of investments and controlling interests and the identity of the shareholders and holders of the voting rights has been properly disclosed in the management report.
REPORT ON OTHER LEGAL AND REGULATORY
REQUIREMENTS
FORMAT OF PRESENTATION OF THE FINANCIAL
STATEMENTS INCLUDED IN THE ANNUAL FINANCIAL REPORT
We have also verified, in accordance with the professional standard applicable in France relating to the procedures performed by the statutory auditor relating to the annual and consolidated financial statements presented in the European single electronic format, that the presentation of the financial statements included in the annual financial report mentioned in Article L. 451-1-2, I of the French Monetary and Financial Code (code monétaire et financier), prepared under the responsibility of the CEO, complies with the single electronic format defined in the European Delegated Regulation No 2019/815 of 17 December 2018.
Based on the work we have performed, we conclude that the presentation of the financial statements included in the annual financial report complies, in all material respects, with the European single electronic format.
APPOINTMENT OF THE STATUTORY AUDITORS
We were appointed as statutory auditors of Manitou BF S.A. by the annual general meeting held on 13 June, 2019 for KPMG and on 28 June, 1989 for RSM.
As at 31 December, 2020, KPMG was in the 2nd year of total uninterrupted engagement and RSM was in the 31st year of total uninterrupted engagement
RESPONSIBILITIES OF MANAGEMENT AND THOSE CHARGED
WITH GOVERNANCE FOR THE FINANCIAL STATEMENTS
Management is responsible for the preparation and fair presentation of the financial statements in accordance with French accounting principles and for such internal control as management determines is necessary to enable the preparation of financial statements that are free from material misstatement, whether due to fraud or error.
In preparing the financial statements, management is responsible for assessing the Company’s ability to continue as a going concern, disclosing, as applicable, matters related to going concern and using the going concern basis of accounting unless it is expected to liquidate the Company or to cease operations.
The Audit Committee is responsible for monitoring the financial reporting process and the effectiveness of internal control and risks management systems and where applicable, its internal audit, regarding the accounting and financial reporting procedures.
The financial statements were approved by the Board of Directors.
192
STATUTORY AUDITORS’ RESPONSIBILITIES
FOR THE AUDIT OF THE FINANCIAL STATEMENTS
OBJECTIVES AND AUDIT APPROACH
Our role is to issue a report on the financial statements. Our objective is to obtain reasonable assurance about whether the financial statements as a whole are free from material misstatement. Reasonable assurance is a high level of assurance, but is not a guarantee that an audit conducted in accordance with professional standards will always detect a material misstatement when it exists. Misstatements can arise from fraud or error and are considered material if, individually or in the aggregate, they could reasonably be expected to influence the economic decisions of users taken on the basis of these financial statements.
As specified in Article L.823-10-1 of the French Commercial Code (code de commerce), our statutory audit does not include assurance on the viability of the Company or the quality of management of the affairs of the Company.
As part of an audit conducted in accordance with professional standards applicable in France, the statutory auditor exercises professional judgment throughout the audit and furthermore:
Identifies and assesses the risks of material misstatement of the financial statements, whether due to fraud or error, designs and performs audit procedures responsive to those risks, and obtains audit evidence considered to be sufficient and appropriate to provide a basis for his opinion. The risk of not detecting a material misstatement resulting from fraud is higher than for one resulting from error, as fraud may involve collusion, forgery, intentional omissions, misrepresentations, or the override of internal control.
Obtains an understanding of internal control relevant to the audit in order to design audit procedures that are appropriate in the circumstances, but not for the purpose of expressing an opinion on the effectiveness of the internal control.
Evaluates the appropriateness of accounting policies used and the reasonableness of accounting estimates and related disclosures made by management in the financial statements.
Assesses the appropriateness of management’s use of the going concern basis of accounting and, based on the audit evidence obtained, whether a material uncertainty exists related to events or conditions that may cast significant doubt on the Company’s ability to continue as a going concern. This assessment is based on the audit evidence obtained up to the date of his audit report. However, future events or conditions may cause the Company to cease to
continue as a going concern. If the statutory auditor concludes that a material uncertainty exists, there is a requirement to draw attention in the audit report to the related disclosures in the financial statements or, if such disclosures are not provided or inadequate, to modify the opinion expressed therein.
Evaluates the overall presentation of the financial statements and assesses whether these statements represent the underlying transactions and events in a manner that achieves fair presentation.
REPORT TO THE AUDIT COMMITTEE
We submit a report to the Audit Committee which includes in particular a description of the scope of the audit and the audit program implemented, as well as the results of our audit. We also report, if any, significant deficiencies in internal control regarding the accounting and financial reporting procedures that we have identified.
Our report to the Audit Committee includes the risks of material misstatement that, in our professional judgment, were of most significance in the audit of the financial statements of the current period and which are therefore the key audit matters that we are required to describe in this report.
We also provide the Audit Committee with the declaration provided for in Article 6 of Regulation (EU) N° 537/2014, confirming our independence within the meaning of the rules applicable in France such as they are set in particular by Articles L.822-10 to L.822-14 of the French Commercial Code (code de commerce) and in the French Code of Ethics (code de déontologie) for statutory auditors. Where appropriate, we discuss with the Audit Committee the risks that may reasonably be thought to bear on our independence, and the related safeguards.
The statutory auditors
Nantes, on the 16 April 2021
KPMG S.A
Saint-Herblain, on the 16 April 2021
RSM Ouest
Gwenaël Chedaleux
Partner
Vincent Broyé
Partner
Jean-Michel Picaud
Partner
2020 UNIVERSAL REGIST RATION DOC UMENT 193
STATUTORY AUDITORS’ SPECIAL
REPORT ON REGULATED AGREEMENTS
To the annual general meeting of Manitou BF S.A.
In our capacity as Statutory Auditors of your Company, we hereby report to you on the regulated agreements.
The terms of our engagement require us to communicate to you, based on information provided to us, the principal terms and conditions of those agreements brought to our attention or which we may have discovered during the course of our audit, and the reasons justifying that these agreements are in the Company’s interest, without expressing an opinion on their usefulness and appropriateness or identifying such other agreements, if any. It is your responsibility, pursuant to Article R. 225-31 of the French Commercial Code (Code de Commerce), to assess the interest involved in respect of the conclusion of these agreements for the purpose of approving them.
Our role is also to provide you with the information provided for in Article R. 225-31 of the French Commercial Code in respect of the performance of the agreements already authorised by the Shareholders' Meeting and having continuing effect during the year, if any.
We conducted the procedures we deemed necessary in accordance with the professional guidelines of the French National Institute of Statutory Auditors (Compagnie Nationale des Commissaires aux Comptes) relating to this engagement. These procedures consisted in agreeing the information provided to us with the relevant source documents.
AGREEMENTS SUBMITTED TO THE APPROVAL
OF THE SHAREHOLDERS' MEETING
AGREEMENTS AUTHORISED DURING THE YEAR
We hereby inform you that we have not been notified of any following agreements authorised and signed during the year to be submitted to the approval of the Shareholders’ meeting pursuant to Article L. 225-38 of the French Commercial Code.
AGREEMENTS PREVIOUSLY APPROVED
BY THE SHAREHOLDERS' MEETING
AGREEMENTS AUTHORISED IN PREVIOUS YEARS HAVING
CONTINUING EFFECT DURING THE YEAR
Pursuant to Article R. 225-30 of the French Commercial Code, we have been advised that the following agreements authorised in previous years have had continuing effect during the year.
AGREEMENTS WITH MR MARCEL BRAUD, FOUNDING
HONORARY PRESIDENT OF THE MANITOU
As a reminder, Mr. Marcel BRAUD began his career at BRAUD & FAUCHEUX in 1952. Today, he and his family group own approximately 30% of MANITOU BF.
Since the General Meeting called to approve the financial statements for the 2016 financial year, Mr. Marcel BRAUD is no longer a director or Chairman of MANITOU BF, and therefore no longer attends the Board of Directors and committees. His title is founding honorary President of the Manitou. As a result, Marcel BRAUD has access to the preparatory documents of the boards and committees as well as to the minutes. He has occasional meetings with the Executive Committee and the General Management and remains in contact with the General Management, Sales & Marketing, customers and the network. He travels without restriction to the group's factories and to trade fairs and exhibitions where MANITOU is present or represented.
The duration of Marcel BRAUD's status is unlimited. Marcel BRAUD may interrupt it due to his state of health.
Marcel BRAUD does not request any remuneration in this respect.
PAYMENT OF TRAVEL AND ENTERTAINMENT EXPENSES
On 26 April 2017, your Board of Directors authorised an agreement covering the travel and entertainment expenses and resources needed for the performance of Mr Marcel Braud’s duties, as Honorary Chairman and Founder of the Manitou (mainly a company car with chauffeur, broadband, mobile phone and travel expenses), the latter assuming the role of Group representative and remaining in contact with Executive Management and the various boards and committees.
As at 31 December 2020, your Company paid corresponding expenses of €49 576.
CURRENT ACCOUNT
Mr. and Mrs. Braud’s current account totalled €6,049 658 as of 31 December 2020 (including interest, net of deductions). This account bore interest at 1.18%. The amount of interest assumed by your Company in this respect totalled €70,811 in 2020.
AGREEMENT UNDERTAKEN FOR MR. MICHEL DENIS, CEO
SINCE 13 JANUARY 2014, RENEWED IN ADVANCE ON 5
DECEMBER 2017
AUTHORISATION TO EXTEND THE CONTRACT FOR THE
SUPPLY OF TWO VEHICLES
On 5 December 2017, your Board of Directors authorised the signing of an amendment to the contract for the supply by GLGM Conseil, of which Mr. Michel Denis is manager, to Manitou BF, of which Mr. Michel Denis is CEO, of two vehicles, one for strictly professional use and one for professional and private use by Mr. Michel Denis, stipulating that the lease amount will be revised annually according to the SYNTEC index prevailing on 1 January of each year.
This agreement was signed on 10 March 2015 for a period of one year and is renewable by tacit agreement, subject to its termination by either of the parties or the termination of Mr. Michel Denis’ duties as manager of GLGM Conseil and/or CEO of Manitou BF.
The total monthly budget allocated to the management of the two vehicles is €2,150, including VAT. This price may be revised annually.
As at 31 December 2020, your Company paid corresponding expenses of €21,781.
AGREEMENT WITH MRS. JACQUELINE HIMSWORTH,
CHAIRMAN OF THE BOARD OF DIRECTORS
CURRENT ACCOUNT
Mrs. Jacqueline Himsworth's current account totalled €279,983 (including interest, net of deductions) as of 31 December 2020. This account bore interest at 1.18%. The amount of interest assumed by your Company in this respect totalled €3,286 in 2020.

194
The statutory auditors
Nantes, on the 16 April 2021
KPMG S.A
Saint-Herblain, on the 16 April 2021
RSM Ouest
Gwenaël Chedaleux
Partner
Vincent Broyé
Partner
Jean-Michel Picaud
Partner
MANAGEMENT REPORT WITH THE ANNUAL FINANCIAL STATEMENTS OF THE MBF COMPANY
HIGHLIGHTS OF THE PERIOD - COVID-19 CRISIS
The global spread of Covid-19 has impacted and continues to impact Manitou BF's sales, down 28.1 % in 2020, as well as its production capacities and profitability.
PRODUCTION SHUTDOWN
Since March, the group has put in place emergency health measures and decided to close its production sites.
The spare parts and services business areas were maintained, and distribution continued at a reduced pace.
Production shutdowns were accompanied by implementation of partial operations. Teleworking was also widespread.
Starting in mid-April, after reorganizing processes as a function of health constraints, production progressively resumed.
For the support functions, partial operations were maintained until September in order to adapt to the drop in the market.
IMPLEMENTATION OF THE “RESIL IENCE” PLAN
To cope with this crisis and the decline in business, Manitou BF has implemented the “Resilience” plan.
This plan is based on 4 pillars:
he safety of operators and the restarting of operations, with the introduction of new safety standards and the adaptation of our processes in order to deliver group's customers,
activity, with the sorting of critical orders to deliver in priority urgent requests, such as agricultural market and industrials, and the search for additional markets and orders,
cash flow, securing the financing and reducing the investments and projects,
costs reduction, to adapt to sales and production volumes, with a plan to limit overheads and personnel costs
EFFECTS OF COVID-19 ON MANITOU BF'S OPERATIONAL
PERFORMANCE
To support the decline in activity, Manitou BF implemented partial activity measures in France. Over the period, the total amount of aid recorded stands at 6.5 million.
As of December 31, 2020, the primary recurring costs incurred due to the Covid-19 pandemic amount to €1.0 million. They correspond to the costs of implementing health measures and donations to support medical teams.
TREASURY AND FINANCING
Furthermore, the Board of Directors had decided, due to the uncertainties related to the health crisis, to reverse the proposal to pay a dividend of €0.78 per share that was initially announced when the 2019 annual results were published on March 3, 2020. After October 1, 2020, depending on circumstances, the Board of Directors also mentioned that it could call a General Shareholders’ Meeting to proceed with a reserve distribution for its shareholders, in place of the dividend.
In accordance with this approach and in light of the evolution of the business, the Board of Directors of Manitou BF met on November 9, 2020 to call an Ordinary Shareholders' Meeting on December 21st, 2020 which decided on an exceptional payment of €0.50 per share, taken from reserves.
In order to secure its financing and cash flow risk, the group issued an additional credit line of 110 million euros in March 2020, expiring in September 2020.
MANITOU BF REVENUE
Manitou BF's revenue dropped 28.1% to €1,098 million compared to €1,527 million in 2019, due to the impact of the Covid-19 crisis.
The company saw its revenue drop across all markets (construction, agriculture and industry) and geographical regions.

2020 UNIVERSAL REGIST RATION DOC UMENT 195
MANITOU BF RESULTS
In 2020, the operating profit was €38.7 million, a decrease of -€29.1 million (43.0 %) as compared with the previous year. It comes to 3.5 %, of revenue, versus 4.4 % in 2019.
It was heavily impacted by the decline in activity. The shutdown of production sites, partial activity measures, and implementation of the "Resilience" savings and improved margins offset some of the adverse effects.
Aid granted in connection with the Covid-19 partial operations during the period amounted to €6.5 million.
Costs directly attributable to Covid-19 are estimated at €1.0 million. They correspond to the costs of implementing the health measures.
Financial income was down by €9.7 million to +€17.3 million, with a decrease in dividends received of €17.1 million (€14.7 million in 2020 vs. €31.8 million in 2019) and an increase in foreign exchange gains.
The tax expense decreased by €10.9 million (-52.2 %) to €10.0 million in light of the financial performance of the fiscal year.
The net profit was €44.7 million, as compared with €70.7 million in 2019.
POST-CLOSING EVENTS
LITIGATION FOR INFRINGEMENT OF INTELLECTUAL
PROPERTY RIGHTS
The legal proceedings for the dispute regarding the first two patents continued in 2020. On February 26, 2021, the Court of Justice of Paris
ruled, at first instance, on the French part relating to these first two patents.
Under this decision, the court completely annulled the French part of the second patent.
The court also annulled the French part of the first patent in most of its claims. The court found infringement of only two claims of the French part of this first patent by three models of equipment of an old configuration that has not been marketed by Manitou BF since May 2017. Manitou contests this decision, while noting that it has no impact on its activity due to the fact that this old configuration is no longer marketed.
Given the very residual character of the infringement uphold, the Court ordered Manitou BF to pay the plaintiff the total sum of 150,000 euros for the loss suffered, rejecting the claim of JCB, which was claiming a loss of 190 million euros.
The Court's decision reinforces the position of Manitou, which has always contested the merits of the plaintiff's action and the disproportionate nature of its claims.
See also Note 7.3.4 of the financial statements.
OTHER INFORMATION
NON-DEDUCTIBLE ITEMS PROVIDED FOR UNDER
ARTICLES 39-4 AND 39-5 OF THE FRENCH
GENERAL TAX CODE
In accordance with the provisions of Article 223 quater of the French General Tax Code, the accounts for the financial year just ended included a sum of €565,892, corresponding to rental charges and the non-tax-deductible portion of attendance allowances.
INFORMATION ON PAYMENT PERIODS FOR SUPPLIERS OF MANITOU BF
In accordance with Articles L.441-6-1 and D.441-4 of the French Commercial Code, we hereby indicate that at the end of the financial year, the balance of debts to suppliers, broken down by payment due date, is as follows:
Payment period 0 days 1-30 days 31-60 days 61-90 days 91 days or more TOTAL 1 day or more
Number of bills concerned 2,335 Total amount of the bills concerned before tax (millions of euros) 4.6 0.8 0.3 1.9 7.6 Percentage of total purchases before tax for the fiscal year 0.6% 0.1% 0.0% 0.2% 0.9%
BILLS EXCLUDED FROM (A) RELATING TO DISPUTED DEBT AND CLAIMS NOT RECOGNIZED
Number of bills excluded 400 Total amount of bills excluded (millions of euros) 1.4
It is based on the statutory periods, although they may be shorter for certain suppliers (45 days from the end of the month for goods not imported, 30 days for carriers and certain service providers, and less than 30 days for certain other service providers).
INFORMATION ON PAYMENT PERIODS FOR CLIENTS OF MANITOU BF
In accordance with Articles L.441-6-1 and D.441-4 of the French Commercial Code, we hereby indicate that at the end of the financial year, the balance of bills issued but not settled by our clients, broken down by payment due date, is as follows:
Payment period (a) 0 days 1-30 days 31-60 days 61-90 days 91 days or more TOTAL 1 day or more
Number of bills concerned 3,019 Total amount of the bills concerned before tax (millions of euros) 2.6 1.1 1.1 3.2 8.0 Percentage of total revenue before tax for the fiscal year 0.2% 0.1% 0.1% 0.3% 0.8%
BILLS EXCLUDED FROM (A) RELATING TO DISPUTED DEBT AND CLAIMS NOT RECOGNIZED
Number of bills excluded 0
Total amount of bills excluded 0
For France, the payment periods used for these calculations are the minimum statutory periods, if not shorter for certain clients (45 days from the end of the month). For exports, the periods vary depending on the geographical region concerned.

196
COMPANY FINANCIAL RESULTS FOR THE LAST FIVE FISCAL YEARS
in euros 2016 2017 2018 2019 2020 I - FINANCIAL POSITION AT YEAR END
a) Share capital 39,557,449 39,621,598 39,668,399 39,668,399 39,668,399
b) Number of shares issued 39,557,449 39,621,598 39,668,399 39,668,399 39,668,399
c) Number of convertible bonds II - COMPREHENSIVE INCOME FROM ACTUAL OPERATIONS
a) Sales excluding taxes 950,604,154 1,164,794,691 1,371,296,011 1,526,988,385 1,098,335,824
b) Income before taxes, depreciation, amortization, provisions, and employee profit-sharing
64,585,177 77,809,954 99,752,816 122,741,938 81,003,965
c) Income tax 7,061,863 13,167,140 15,808,625 20,944,489 10,011,969
d) Income after taxes, depreciation, amortization, provisions, and employee profit-sharing
54,342,359 38,039,778 69,359,358 70,700,087 44,720,818
e) Total dividends paid 14,238,702 17,035,707 24,563,144 30,941,351 19,834,200 III - INCOME PER SHARE FROM OPERATIONS
a) Income after taxes but before depreciation, amortization, provisions, and employee profit-sharing
1.45 1.63 2.12 2.57 1.79
b) Income after taxes, depreciation, amortization, provisions, and employee profit-sharing
1.37 0.96 1.75 1.78 1.13
c) Dividend paid per share 0.43 0.62 0.78 0.50 0.60 IV - PERSONNEL
a) Number of employees 1,794 1,898 2,085 2,286 2,289
b) Total payroll expense 74,417,961 81,367,375 91,504,420 101,509,115 94,100,173
c) Amounts paid for employee benefits 40,879,418 43,272,286 46,745,235 51,578,464 46,254,584

2020 UNIVERSAL REGIST RATION DOC UMENT 197

198
ADDITIONAL INFORMATION

2020 UNIVERSAL REGIST RATION DOC UMENT 199

200
MAIN PROVISIONS OF THE ARTICLES OF ASSOCIATION AND INTERNAL REGULATION OF THE BOARD OF DIRECTORS
NAME
Manitou BF
HEAD OFFICE
430, rue de l’Aubinière BP 10,249
44158 Ancenis Cedex – France Telephone + 33 (0)2 40 09 10 11
LEGAL FORM - LEGAL IDENTIFIER
A French public limited liability company (société anonyme) with a Board of Directors, governed by the provisions of the French Commercial Code.
The legal entity identifier (LEI) of the issuer is FR0000038606.
LAWS GOVERNING ITS ACTIVITIES
The group designs, assembles, and distributes high technology products that meet the standards set by the administrative authorities as well as national and supranational organizations.
DURATION OF THE COMPANY
The company’s incorporation was published on February 5, 1954, and the company was registered in the Nantes Trade Register on September 23, 1957. The company’s duration was set at ninety-nine years (99) as of June 3, 1980.
BUSINESS PURPOSE
(ART. 3 OF THE COMPANY'S ARTICLES OF ASSOCIATION)
The company’s purpose in France and in all countries consists of all industrial and commercial operations relating to:
the operation of all industrial and commercial establishments aimed at the representation, concession, manufacture, purchase, sale, rental, import, and export of all construction and lifting equipment, and all agricultural and industrial equipment and the directly or indirectly associated spare parts,
the creation, acquisition, rental, leasing, installation, and operation of any establishments or factories,
the purchase, acquisition, operation, or disposal of any processes and patents related to these activities,
the direct or indirect participation of the company in any commercial, industrial, or financing transactions that may be related to the company purpose, including the creation of new companies, investments in partnerships, mergers, alliances, joint ventures, or other transactions,
and generally, all financial, commercial, industrial, civil, movable, or real property transactions, including insurance intermediation and bank transaction and services intermediation activities that are directly or indirectly related to any of the specified purposes or any other similar or related purpose.
COMPANY REGISTRATION DETAILS
Trade and Companies Register number and APE (principal activity code):
857 802 508 RCS Nantes – APE (principal activity code) 292 D – NAF (business sub-sector ID) number 2822Z
FINANCIAL PERIOD
The financial period covers twelve months starting on 1 January and ending on 31 December of each year.
STATUTORY DISTRIBUTION OF EARNINGS
Net earnings are composed of the net gains for the financial period recognized in the annual financial statements, after deduction of general expenses and other personnel expenses, any asset amortization or depreciation charges and any provisions for commercial or industrial risks.
Distributable earnings are composed of the net profit for the year less prior year losses and the amounts retained in reserves in accordance with the law or the articles of association, plus retained earnings.
The Shareholders’ Meeting may decide to distribute amounts deducted from the reserves at its disposal, in which case the decision will expressly indicate the reserve items from which the payments are to be deducted.
Except in the case of a capital reduction, no distribution can be made to shareholders if the net assets are, or would become as a result of such a distribution, less than the amount of the paid-in-capital plus reserves whose distribution is prohibited by the law or the articles of association.
VOTING RIGHTS
Excerpt from Article 9 of the Articles of Association, “Rights and obligations associated with shares”:
“Each share grants the right to one vote at Shareholders’ Meetings. In accordance with the option provided by subparagraph 3 of Article L.225-123 of the French Commercial Code, fully paid-up shares that have been registered in a shareholder's name for at least two years shall not benefit from double voting rights.”
2020 UNIVERSAL REGIST RATION DOC UMENT 201
PERSON RESPONSIBLE FOR THE 2020 REGISTRATION DOCUMENT
PERSON RESPONSIBLE FOR THE 2020
REGISTRATION DOCUMENT
Michel Denis, President and CEO of Manitou BF.
STATEMENT OF THE PERSON RESPONSIBLE
FOR THE 2020 REGISTRATION DOCUMENT
I declare that, having taken all reasonable care to ensure that such is the case, the information contained in this Universal Registration Document is, to the best of my knowledge, in accordance with the facts and omits no information likely to affect the scope.
I certify, to my knowledge, that the financial statements have been prepared in accordance with the accounting standards applicable and give a true and fair view of the assets, liabilities, financial situation, and income of the company and all the companies included in the consolidation and that the management report contained in this document, as specified in the correspondence table in section 8.6, presents an accurate picture of the development of the business, income, and financial situation of the company and all the companies included
in the consolidation and that it describes the main risks and uncertainties that they face.
Ancenis, April 16, 2021
Michel Denis, President and CEO
PERSONS RESPONSIBLE FOR FINANCIAL
INFORMATION
Michel Denis, President and CEO
Hervé Rochet, Corporate Secretary
MANITOU BF
430, rue de l’Aubinière - BP 10 249
44158 Ancenis Cedex France
Telephone: +33 (0)2 40 09 10 11
DOCUMENTS ACCESSIBLE TO THE PUBLICThe Registration Document is available at the company's head office, 430, rue de l’Aubinière - BP 10 249 - 44 158 Ancenis Cedex – France
Telephone +33 (0)2 40 09 10 11
For the validity period of the universal registration document, the following documents can be consulted at Manitou's head office and at the website (www.manitou-group.com / relations investisseurs):
the company’s memorandum and the latest version of the articles of association,
all reports, letters, and other documents.
Pursuant to Article 19 of Regulation (EU) 2017/1129, the following information is included by reference in this universal registration document:
the 2017 Registration Document filed with the AMF on April 3, 2018, under reference number D.18-0257, (https://www.manitou-group.com/fr/investisseurs/informations-reglementees/),
the 2018 Registration Document filed with the AMF on April 12, 2019, under reference number D. 19-0320 (https://www.manitou-group.com/fr/investisseurs/ informations-reglementees/),
the 2019 Registration Document filed with the AMF on April 21, 2020, under reference number D.20-0329, (https://www.manitou-group.com/fr/investisseurs/ informations-reglementees/),
the parts of this document that are not included are either not applicable to the investor or are covered in said document.
The information found at the website links www.reduce-program.com, www.manitou-group.com, www.cofrac.fr, and www. middlenext.com in this universal registration document, with the exception of the information included as a reference, is not a part of this universal registration document. As a result, this information was not reviewed or approved by the AMF.
PERSONS RESPONSIBLE FOR THE CONTROL OF THE FINANCIAL STATEMENTS
STATUTORY AUDITORS
KPMG Audit, registered member of the Regional Association of Statutory Auditors of Ouest-Atlantique, represented by Vincent Broyé and Gwénaël Chedaleux, partners,
7, boulevard Albert Einstein 6 BP 41125 - 44311 Nantes Cedex 3
appointed on June 13, 2019 (to replace the firm Deloitte et Associés).
Mandate expires: Shareholders’ Meeting called to approve the financial statements for the period ended December 31, 2024.
RSM OUEST, registered member of the Regional Association of Statutory Auditors of Ouest-Atlantique, represented by Jean Michel Picaud, partner,
18, avenue Jacques Cartier – BP 30266 – 44818 Saint-Herblain Cedex
appointed June 13, 2019 (renewal).
Mandate expires: Shareholders’ Meeting called to approve the financial statements for the period ended December 31, 2024.
STATUTORY AUDITORS’ FEES
The fees recorded in 2020 by Manitou BF and its fully consolidated subsidiaries for the assignments entrusted to the college of Statutory Auditors, their respective network, and their colleagues are detailed in Note 15 of the annex of the consolidated financial statements.
202
GLOSSARYEXPLANATION OF THE REPORTING LINES
NET SALES
Sales mainly consist of the sales of new handling equipment assembled within the group or acquired from third parties, spare parts and attachments, equipment rentals, equipment fleet management services and other miscellaneous services.
COST OF SALES
The cost of sales is made up of the cost of goods and services sold, which comprises the cost of raw materials and components, labor directly attributable to the goods or services, and all related production and logistics operating costs. It also includes the amortization of intangible assets, equipment, and materials allocated to production, contractual warranty costs, provisions for inventory impairment, and exchange gains and losses on operating income in foreign currency resulting from the difference between the valuation at the exchange rate on the day of the transaction and the rate on the day of settlement.
GROSS MARGIN
The gross margin on the cost of sales is the difference between revenue and the cost of sales.
RESEARCH AND DEVELOPMENT COSTS
Research and development costs consist of personnel costs for staff assigned to innovation, development, design, prototyping, and product improvements. The businesses frequently use external services as well as dedicated equipment and materials for which depreciation will affect the function. Research and development expenses that meet the criteria of feasibility and innovation may be capitalized as intangible assets and subsequently amortized in cost of sales. Expenses that do not meet the capitalization criteria are recognized directly as expenses.
SALES AND MARKETING COSTS
Sales costs consist primarily of personnel and associated costs allocated to business development assignments, coordination of dealer networks, and marketing and technical expenses. This line item also includes sales commissions, advertising costs, trade shows, credit insurance expenses, the cost of sales warranties, travel expenses and the depreciation of associated infrastructure.
ADMINISTRATIVE EXPENSES
Administrative expenses consist primarily of personnel expenses and costs associated with the support functions (human resources, finance, general secretariat, etc.). They also include depreciation of the infrastructure associated with these functions.
CURRENT (OR RECURRING) OPERATING INCOME
The recurring operating income (ROI) includes all of the recurring items described below, before taking into account the non-recurring elements of the financial result, income tax, and the group's share of the net income from equity associates. It includes:
revenue,
cost of goods and services sold,
research and development costs,
sales, marketing, and services costs and administrative expenses,
other operating income and expenses.
NON-CURRENT (OR NON-RECURRING) INCOME
AND EXPENSES
Non-current expenses and income include the following items:
the recognition of impairment,
income from significant or unusual disposals of tangible and intangible assets,
acquisition and consolidation expenses,
income relating to “Badwill,”
income from disposals of consolidated securities,
restructuring costs,
unusual items corresponding to other income and expenses that are not usual in terms of their frequency, nature, and amount.
OPERATING INCOME OR OPERATING MARGIN
Operating income, also referred to as operating margin in this document, includes all the recurring and non-recurring items described above.
OPERATING INCOME INCLUDING NET INCOME
FROM EQUITY ASSOCIATES
The “Operating income including net income from equity associates” aggregate line item includes the proportionate share of income from associate companies in the operating income.
FINANCIAL INDICATORS AND OTHER
DEFINITIONS
AT CONSTANT EXCHANGE RATE
The foreign exchange effect is calculated by applying the exchange rate for the previous period to the revenue for the current period, or for 2020, the 2019 exchange rate.
AT CONSTANT SCOPE
The scope effect is calculated by:
excluding the revenue, for the current period, of the companies acquired during the period,
excluding the revenue, from January 1st of the current period to the anniversary month of their acquisition, of the companies acquired during the previous period,
excluding the revenue, for the current period and the comparable period, of the companies sold during the current period or the comparable period.
For 2020:
company acquired in November 2019: Mawsley Machinery in November 2019. Deduction of its contribution from January 1, 2020 to the anniversary of the acquisition,
acquisitions and exits in 2020: none.
2020 UNIVERSAL REGIST RATION DOC UMENT 203
NET DEBT
Net debt corresponds to the difference between current and non-current financial liabilities on the one hand and, on the other hand, current financial assets and cash and cash equivalents.
EBITDA
Operating income +/- provisions - reversals of amortization and impairment losses.
RECURRING EBITDA
Operating income - income and expenditure on non-recurring items +/- provisions - reversals of amortization and impairment losses.
GEARING
Ratio of net debt divided by the amount of shareholders' equity.
LEVERAGE
Ratio determined by dividing the amount of net debt at the end of the period by rolling 12-month EBITDA. This measures the amount of the debt in number of years of EBITDA.
OPERATING WORKING CAPITAL REQUIREMENT
Inventory and work in progress + trade receivables + other debtors - trade accounts payable - other current liabilities.
Operating working capital requirement excludes sales financing receivables, which do not change in proportion to the operating activity.
RETURN ON CAPITAL EMPLOYED (ROCE OR ROACE)
Indicator calculated from the ratio between the recurring operating income and the capital employed.
ORDER BOOK
The order book corresponds to machine orders received and not yet delivered, for which the group:
has not yet provided the promised machines to the customer,
has not yet received consideration and is not yet been entitled to consideration.
These orders are delivered within less than one year and may be canceled.
EVENT OF DEFAULT
Actual occurrence of credit risk such as, for example, the bankruptcy of the reference entity, payment default, or restructuring.
MATERIAL ADVERSE CHANGE
Any action, omission or event that, taken in isolation or with others, has a significantly unfavorable effect on the assets, liabilities, financial situation or operating result of the borrowing company and its subsidiaries taken as a whole or the borrower taken individually.
NEGATIVE PLEDGE
Provision that forbids a party to a contract from creating sureties on certain specific goods.
CROSS DEFAULT
Safeguard clause, which provides that if the company defaults on a loan, all the facilities included in the cross default clause are considered as being in default. A trip threshold is generally established.
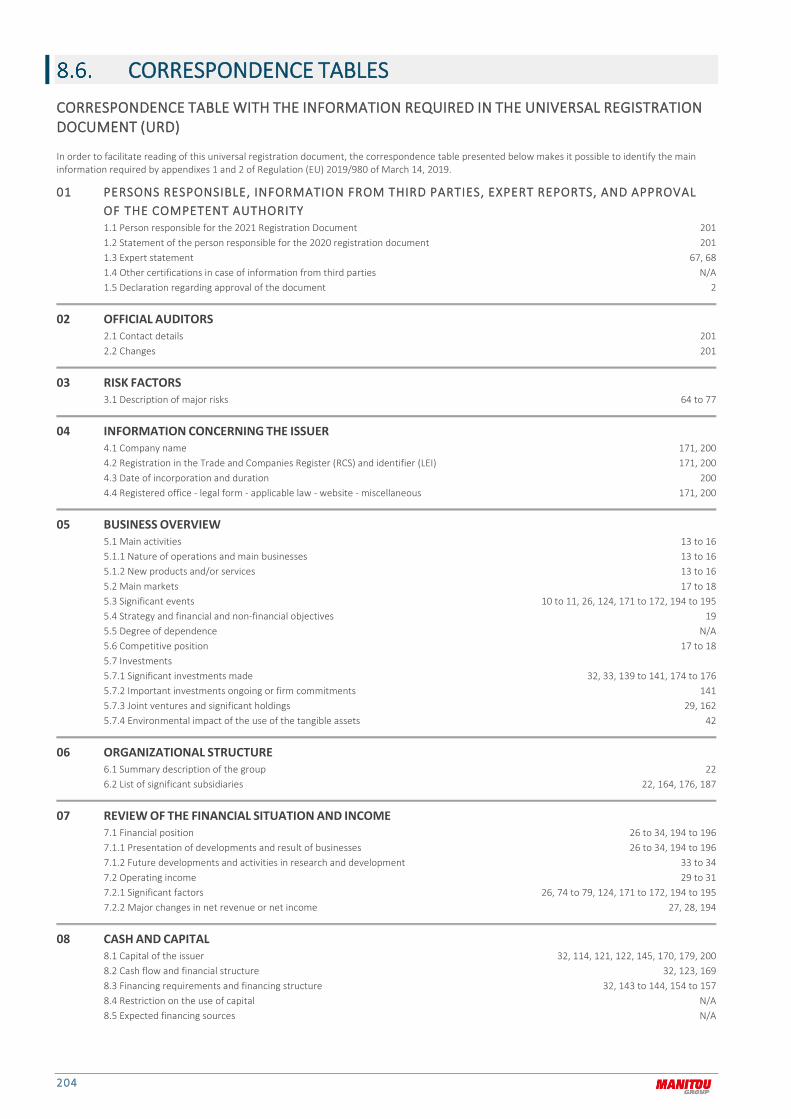
204
CORRESPONDENCE TABLES CORRESPONDENCE TABLE WITH THE INFORMATION REQUIRED IN THE UNIVERSAL REGISTRATION
DOCUMENT (URD)
In order to facilitate reading of this universal registration document, the correspondence table presented below makes it possible to identify the main information required by appendixes 1 and 2 of Regulation (EU) 2019/980 of March 14, 2019.
01 PERSONS RESPONSIBLE, INFORMATION FROM THIRD PARTIES, EXPERT REPORTS, AND APPROVAL
OF THE COMPETENT AUTHORITY 1.1 Person responsible for the 2021 Registration Document 201 1.2 Statement of the person responsible for the 2020 registration document 201 1.3 Expert statement 67, 68 1.4 Other certifications in case of information from third parties N/A 1.5 Declaration regarding approval of the document 2
02 OFFICIAL AUDITORS 2.1 Contact details 201 2.2 Changes 201
03 RISK FACTORS 3.1 Description of major risks 64 to 77
04 INFORMATION CONCERNING THE ISSUER 4.1 Company name 171, 200 4.2 Registration in the Trade and Companies Register (RCS) and identifier (LEI) 171, 200 4.3 Date of incorporation and duration 200 4.4 Registered office - legal form - applicable law - website - miscellaneous 171, 200
05 BUSINESS OVERVIEW 5.1 Main activities 13 to 16 5.1.1 Nature of operations and main businesses 13 to 16 5.1.2 New products and/or services 13 to 16 5.2 Main markets 17 to 18 5.3 Significant events 10 to 11, 26, 124, 171 to 172, 194 to 195 5.4 Strategy and financial and non-financial objectives 19 5.5 Degree of dependence N/A 5.6 Competitive position 17 to 18 5.7 Investments 5.7.1 Significant investments made 32, 33, 139 to 141, 174 to 176 5.7.2 Important investments ongoing or firm commitments 141 5.7.3 Joint ventures and significant holdings 29, 162 5.7.4 Environmental impact of the use of the tangible assets 42
06 ORGANIZATIONAL STRUCTURE
6.1 Summary description of the group 22 6.2 List of significant subsidiaries 22, 164, 176, 187
07 REVIEW OF THE FINANCIAL SITUATION AND INCOME 7.1 Financial position 26 to 34, 194 to 196 7.1.1 Presentation of developments and result of businesses 26 to 34, 194 to 196 7.1.2 Future developments and activities in research and development 33 to 34 7.2 Operating income 29 to 31 7.2.1 Significant factors 26, 74 to 79, 124, 171 to 172, 194 to 195 7.2.2 Major changes in net revenue or net income 27, 28, 194
08 CASH AND CAPITAL 8.1 Capital of the issuer 32, 114, 121, 122, 145, 170, 179, 200 8.2 Cash flow and financial structure 32, 123, 169 8.3 Financing requirements and financing structure 32, 143 to 144, 154 to 157 8.4 Restriction on the use of capital N/A 8.5 Expected financing sources N/A
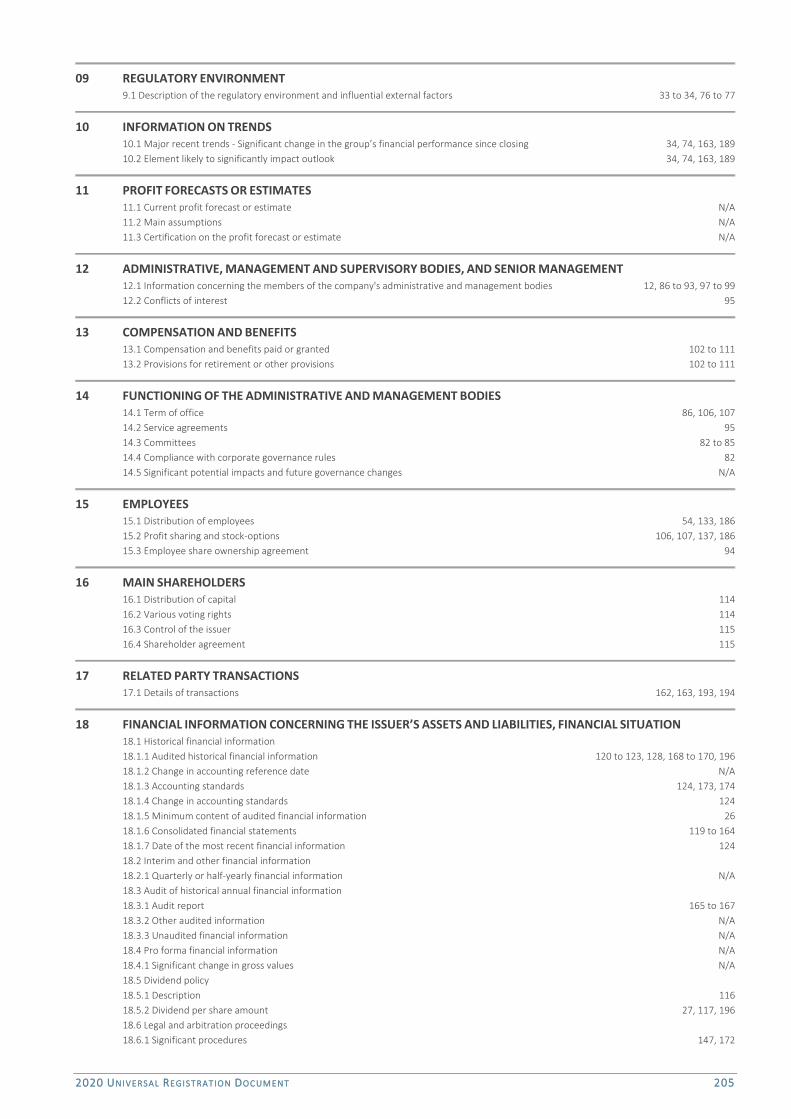
2020 UNIVERSAL REGIST RATION DOC UMENT 205
09 REGULATORY ENVIRONMENT 9.1 Description of the regulatory environment and influential external factors 33 to 34, 76 to 77
10 INFORMATION ON TRENDS 10.1 Major recent trends - Significant change in the group’s financial performance since closing 34, 74, 163, 189 10.2 Element likely to significantly impact outlook 34, 74, 163, 189
11 PROFIT FORECASTS OR ESTIMATES 11.1 Current profit forecast or estimate N/A 11.2 Main assumptions N/A 11.3 Certification on the profit forecast or estimate N/A
12 ADMINISTRATIVE, MANAGEMENT AND SUPERVISORY BODIES, AND SENIOR MANAGEMENT 12.1 Information concerning the members of the company's administrative and management bodies 12, 86 to 93, 97 to 99 12.2 Conflicts of interest 95
13 COMPENSATION AND BENEFITS 13.1 Compensation and benefits paid or granted 102 to 111 13.2 Provisions for retirement or other provisions 102 to 111
14 FUNCTIONING OF THE ADMINISTRATIVE AND MANAGEMENT BODIES 14.1 Term of office 86, 106, 107 14.2 Service agreements 95 14.3 Committees 82 to 85 14.4 Compliance with corporate governance rules 82 14.5 Significant potential impacts and future governance changes N/A
15 EMPLOYEES 15.1 Distribution of employees 54, 133, 186 15.2 Profit sharing and stock-options 106, 107, 137, 186 15.3 Employee share ownership agreement 94
16 MAIN SHAREHOLDERS 16.1 Distribution of capital 114 16.2 Various voting rights 114 16.3 Control of the issuer 115 16.4 Shareholder agreement 115
17 RELATED PARTY TRANSACTIONS 17.1 Details of transactions 162, 163, 193, 194
18 FINANCIAL INFORMATION CONCERNING THE ISSUER’S ASSETS AND LIABILITIES, FINANCIAL SITUATION 18.1 Historical financial information 18.1.1 Audited historical financial information 120 to 123, 128, 168 to 170, 196 18.1.2 Change in accounting reference date N/A 18.1.3 Accounting standards 124, 173, 174 18.1.4 Change in accounting standards 124 18.1.5 Minimum content of audited financial information 26 18.1.6 Consolidated financial statements 119 to 164 18.1.7 Date of the most recent financial information 124 18.2 Interim and other financial information 18.2.1 Quarterly or half-yearly financial information N/A 18.3 Audit of historical annual financial information 18.3.1 Audit report 165 to 167 18.3.2 Other audited information N/A 18.3.3 Unaudited financial information N/A 18.4 Pro forma financial information N/A 18.4.1 Significant change in gross values N/A 18.5 Dividend policy 18.5.1 Description 116 18.5.2 Dividend per share amount 27, 117, 196 18.6 Legal and arbitration proceedings 18.6.1 Significant procedures 147, 172
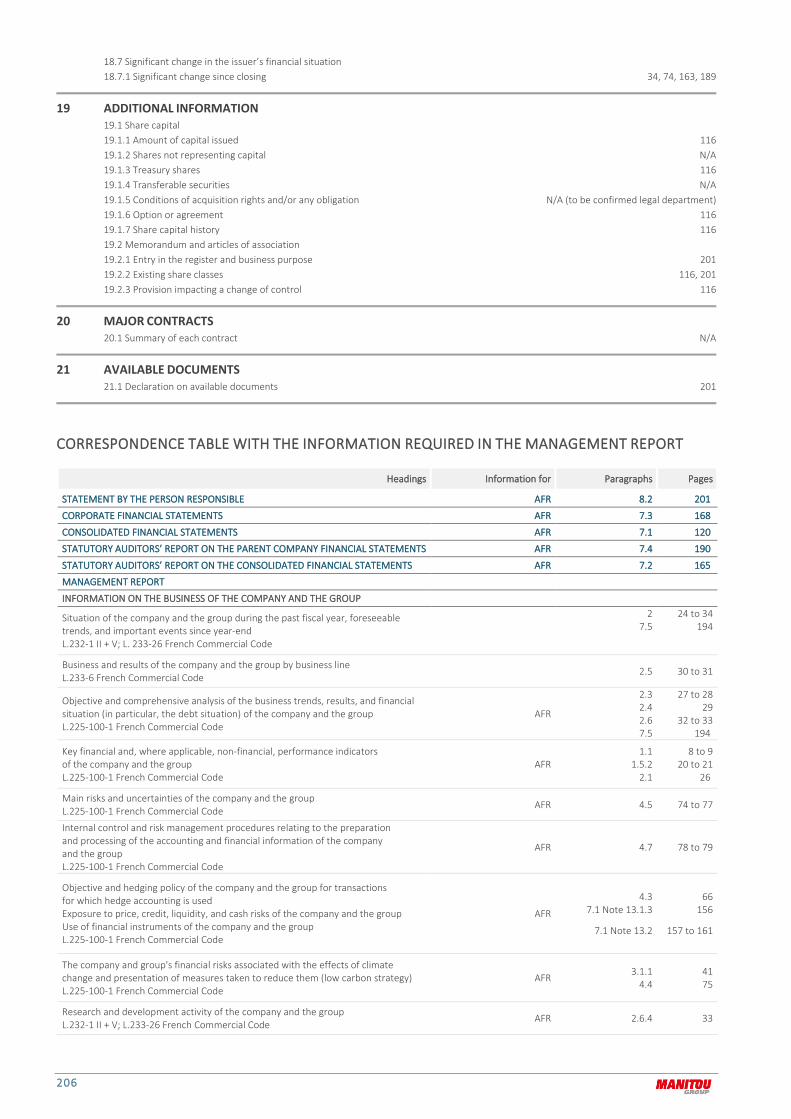
206
18.7 Significant change in the issuer’s financial situation 18.7.1 Significant change since closing 34, 74, 163, 189
19 ADDITIONAL INFORMATION 19.1 Share capital 19.1.1 Amount of capital issued 116 19.1.2 Shares not representing capital N/A 19.1.3 Treasury shares 116 19.1.4 Transferable securities N/A 19.1.5 Conditions of acquisition rights and/or any obligation N/A (to be confirmed legal department) 19.1.6 Option or agreement 116 19.1.7 Share capital history 116 19.2 Memorandum and articles of association 19.2.1 Entry in the register and business purpose 201 19.2.2 Existing share classes 116, 201 19.2.3 Provision impacting a change of control 116
20 MAJOR CONTRACTS 20.1 Summary of each contract N/A
21 AVAILABLE DOCUMENTS 21.1 Declaration on available documents 201
CORRESPONDENCE TABLE WITH THE INFORMATION REQUIRED IN THE MANAGEMENT REPORT
Headings Information for Paragraphs Pages
STATEMENT BY THE PERSON RESPONSIBLE AFR 8.2 201
CORPORATE FINANCIAL STATEMENTS AFR 7.3 168
CONSOLIDATED FINANCIAL STATEMENTS AFR 7.1 120
STATUTORY AUDITORS’ REPORT ON THE PARENT COMPANY FINANCIAL STATEMENTS AFR 7.4 190
STATUTORY AUDITORS’ REPORT ON THE CONSOLIDATED FINANCIAL STATEMENTS AFR 7.2 165
MANAGEMENT REPORT
INFORMATION ON THE BUSINESS OF THE COMPANY AND THE GROUP
Situation of the company and the group during the past fiscal year, foreseeable trends, and important events since year-end L.232-1 II + V; L. 233-26 French Commercial Code
2 7.5
24 to 34 194
Business and results of the company and the group by business line L.233-6 French Commercial Code 2.5 30 to 31
Objective and comprehensive analysis of the business trends, results, and financial situation (in particular, the debt situation) of the company and the group L.225-100-1 French Commercial Code
AFR
2.3 2.4 2.6 7.5
27 to 28 29
32 to 33 194
Key financial and, where applicable, non-financial, performance indicators of the company and the group L.225-100-1 French Commercial Code
AFR 1.1
1.5.2 2.1
8 to 9 20 to 21
26
Main risks and uncertainties of the company and the group L.225-100-1 French Commercial Code AFR 4.5 74 to 77
Internal control and risk management procedures relating to the preparation and processing of the accounting and financial information of the company and the group L.225-100-1 French Commercial Code
AFR 4.7 78 to 79
Objective and hedging policy of the company and the group for transactions for which hedge accounting is used Exposure to price, credit, liquidity, and cash risks of the company and the group Use of financial instruments of the company and the group L.225-100-1 French Commercial Code
AFR
4.3 7.1 Note 13.1.3
7.1 Note 13.2
66 156
157 to 161
The company and group's financial risks associated with the effects of climate change and presentation of measures taken to reduce them (low carbon strategy) L.225-100-1 French Commercial Code
AFR 3.1.1 4.4
41 75
Research and development activity of the company and the group L.232-1 II + V; L.233-26 French Commercial Code
AFR 2.6.4 33

2020 UNIVERSAL REGIST RATION DOC UMENT 207
Headings Information for Paragraphs Pages
Branches L.232-1 II + V French Commercial Code
AFR N/A
LEGAL, FINANCIAL, AND TAX INFORMATION OF THE COMPANY
Breakdown and changes in share ownership structure L.233-13 French Commercial Code 6.2 114
Name of controlled companies and portion of the company’s share capital they hold L.233-13 French Commercial Code 7.1 Note 17 164
Significant stakes acquired during the period in companies having their head office on French territory L.233-6 French Commercial Code
N/A
Cross-shareholdings R.233-19 French Commercial Code N/A
Employee share ownership situation L.225-102 French Commercial Code
6.2 114
Acquisition and disposal by the company of its own shares (share buyback) L.225-211 French Commercial Code
AFR 6.2
7.1 Note 10.1.2 7.3 Note 9
114 145 179
Adjustments to shares giving access to capital in the event of financial operations R.228-91 French Commercial Code N/A
Adjustments to shares giving access to capital and stock options in the event of share buybacks R.228-90 and R. 225-138 French Commercial Code
N/A
Dividend distributions over the last three years 243 bis CGI (French General Tax Code) 6.4 117
Expenses and costs that are not tax deductible 223 quater CGI (French General Tax Code) 7.5 194
Injunctions or financial penalties for anti-competitive practices L.464-2 I-5 French Commercial Code
N/A
Payment deadlines and breakdown of the balance of trade payables L.441-6-1; D.441-4; A 441-2 French Commercial Code 7.5 194 to 196
Amount of inter-company loans L.511-6 3 bis Comofi (French Monetary and Financial Code) 7.3 Note 4 176
INFORMATION ON CORPORATE OFFICERS
Summary of securities transactions of persons discharging managerial responsibilities and closely associated persons. L.621-18-2 Comofi (French Monetary and Financial Code); 223-26 RG AMF (AMF General Regulations)
5.2 100 to 111
CSR INFORMATION
Non-Financial Performance Declaration L.225-102-1; R.225-105; R.225-105-1 French Commercial Code 3 37 to 68
DOCUMENTS ATTACHED TO THE MANAGEMENT REPORT
Table of the company’s results for each of the last five years R. 225-102 French Commercial Code 7.5 196
Report on corporate governance L.225-37-2 to L.225-37-5; L.225-68; L.226-10-1 French Commercial Code
5 6
81 to 111 113 to 117
AFR: Annual Financial Report
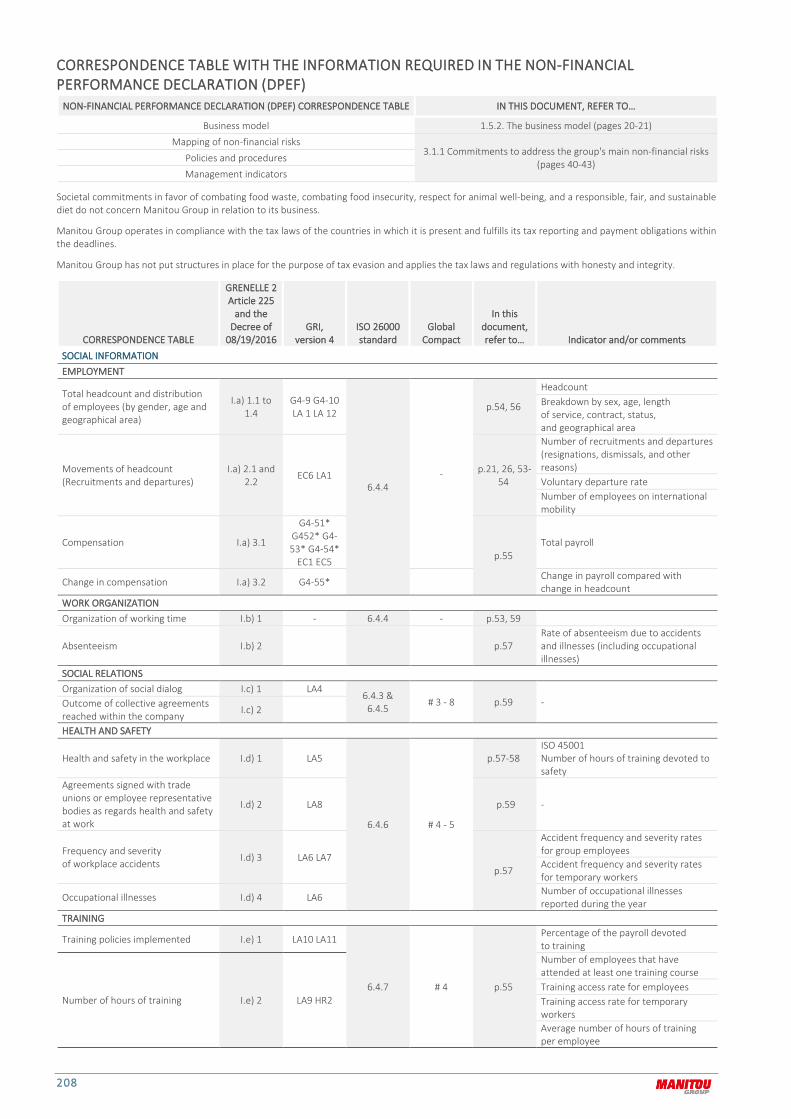
208
CORRESPONDENCE TABLE WITH THE INFORMATION REQUIRED IN THE NON-FINANCIAL
PERFORMANCE DECLARATION (DPEF) NON-FINANCIAL PERFORMANCE DECLARATION (DPEF) CORRESPONDENCE TABLE IN THIS DOCUMENT, REFER TO…
Business model 1.5.2. The business model (pages 20-21) Mapping of non-financial risks
3.1.1 Commitments to address the group's main non-financial risks (pages 40-43) Policies and procedures
Management indicators
Societal commitments in favor of combating food waste, combating food insecurity, respect for animal well-being, and a responsible, fair, and sustainable diet do not concern Manitou Group in relation to its business.
Manitou Group operates in compliance with the tax laws of the countries in which it is present and fulfills its tax reporting and payment obligations within the deadlines.
Manitou Group has not put structures in place for the purpose of tax evasion and applies the tax laws and regulations with honesty and integrity.
CORRESPONDENCE TABLE
GRENELLE 2 Article 225
and the Decree of
08/19/2016 GRI,
version 4 ISO 26000 standard
Global Compact
In this document, refer to… Indicator and/or comments
SOCIAL INFORMATION EMPLOYMENT
Total headcount and distribution of employees (by gender, age and geographical area)
I.a) 1.1 to 1.4
G4-9 G4-10 LA 1 LA 12
6.4.4 -
p.54, 56
Headcount Breakdown by sex, age, length of service, contract, status, and geographical area
Movements of headcount (Recruitments and departures)
I.a) 2.1 and 2.2
EC6 LA1 p.21, 26, 53-54
Number of recruitments and departures (resignations, dismissals, and other reasons) Voluntary departure rate Number of employees on international mobility
Compensation I.a) 3.1
G4-51* G452* G4-53* G4-54*
EC1 EC5 p.55 Total payroll
Change in compensation I.a) 3.2 G4-55* Change in payroll compared with change in headcount
WORK ORGANIZATION Organization of working time I.b) 1 - 6.4.4 - p.53, 59
Absenteeism I.b) 2 p.57 Rate of absenteeism due to accidents and illnesses (including occupational illnesses)
SOCIAL RELATIONS Organization of social dialog I.c) 1 LA4
6.4.3 & 6.4.5
# 3 - 8 p.59 - Outcome of collective agreements reached within the company
I.c) 2
HEALTH AND SAFETY
Health and safety in the workplace I.d) 1 LA5
6.4.6 # 4 - 5
p.57-58 ISO 45001 Number of hours of training devoted to safety
Agreements signed with trade unions or employee representative bodies as regards health and safety at work
I.d) 2 LA8 p.59 -
Frequency and severity of workplace accidents I.d) 3 LA6 LA7
p.57
Accident frequency and severity rates for group employees Accident frequency and severity rates for temporary workers
Occupational illnesses I.d) 4 LA6 Number of occupational illnesses reported during the year
TRAINING
Training policies implemented I.e) 1 LA10 LA11
6.4.7 # 4 p.55
Percentage of the payroll devoted to training
Number of hours of training I.e) 2 LA9 HR2
Number of employees that have attended at least one training course Training access rate for employees Training access rate for temporary workers Average number of hours of training per employee

2020 UNIVERSAL REGIST RATION DOC UMENT 209
CORRESPONDENCE TABLE
GRENELLE 2 Article 225
and the Decree of
08/19/2016 GRI,
version 4 ISO 26000 standard
Global Compact
In this document, refer to… Indicator and/or comments
EQUAL TREATMENT Measures taken to promote gender equality I.f) 1 LA3 LA12
LA13 # 5 - 10
p.56
Proportion of female headcount by status
Measures taken to promote the employment and integration of people with disabilities
I.d) 2 LA12 6.3 & 6.3.7 Number of people with disabilities and proportion in the headcount
Anti-discrimination policy I.f) 3 LA12 HR3 PROMOTION AND COMPLIANCE WITH THE FUNDAMENTAL CONVENTIONS OF THE INTERNATIONAL LABOUR ORGANISATION (ILO)
Respect for freedom of association and the right to collective bargaining
I.g) 1 HR4 6.3.3-6.3.5
# 3 p.59
6.3.8-6.3.10 Signature of the UN Global Compact 6.4.5-6.6.6
Elimination of discrimination in employment and profession I.g) 2 HR3
6.3.6-6.3.7
# 6 p.56
Proportion of female headcount by status
6.3.10 Proportion of people with disabilities in headcount
6.4.3
Elimination of forced labor I.g) 3 HR6 6.3.3-6.3.5
# 4
p.60 Signature of the UN Global Compact
6.3.10 6.6.6
Effective abolition of child labor I.g) 4 HR5
6.3.3-6.3.5
# 5 6.3.7-6.3.10 6.4.5-6.6.6
6.8.4 ENVIRONMENTAL INFORMATION GENERAL ENVIRONMENTAL POLICY Company organization in place to deal with environmental issues
II.a) 1.1 G4-1
6.5.1 & 6.5.2
# 7 - 8 - 9
p.45 Consultation with stakeholders and materiality matrix of CSR issues
Environmental assessment or certification procedures II.a) 1.2 -
p.52
Proportion of revenue generated by ISO 14001-certified sites
Training and information provided to employees on environmental protection issues
II.a) 2 G4-43*
Resources devoted to the prevention of environmental risks and pollution
II.a) 3 EN30 EN31 p.51-52
Amount of provisions and guarantees allocated to environmental risks
II.a) 4 EC2
Since 2013, the company has taken out a specific “environmental damage” insurance policy to insure against environmental damage caused by its businesses (France and Italy)
POLLUTION Prevention, reduction and repair measures: air II.b) 1.1
EN20 EN21 EN24 6.5.3 # 7 - 8 - 9 p.50, 52
Oxygen Label, VOC emissions per truck equivalent produced
Prevention, reduction, and repair measures: water II.b) 1.2
EN10 EN22 EN24 EN26
p.52
Prevention, reduction, and repair measures: soil
II.b) 1.3 EN24
Integration of noise pollution and any other form of pollution specific to an activity
II.b) 2 EN24 - - p.50 Oxygen label

210
CORRESPONDENCE TABLE
GRENELLE 2 Article 225
and the Decree of
08/19/2016 GRI,
version 4 ISO 26000 standard
Global Compact
In this document, refer to… Indicator and/or comments
THE CIRCULAR ECONOMY Waste prevention and management II.c).i) - - - p.51 -
Prevention measures, recycling, re-use, and other forms of waste recovery and elimination
II.c).i) 1 EN23 EN24 EN25 EN28 6.5.3 # 7 - 8 - 9 p.51-52
ReMAN spare parts range
Used machine network
Volume of industrial waste generated per equivalent truck produced
Recycling rate by type of industrial waste
Actions taken to combat food waste
II.c).i) 2 - - - - -
Sustainable use of resources II.c).ii) - - - - -
Water consumption II.c).ii) 1.1 EN8
6.5.4
# 7 - 8 - 9 p.52 Water consumption per truck equivalent
Water supply as per local constraints II.c).ii) 1.2 EN8 EN9
The group is not subject to local constraints regarding supply
Consumption of raw materials II.c).ii) 2.1 EN1 EN2
p.51-52
Paint consumption per truck equivalent Measures taken to improve efficiency in the use of raw materials
II.c).ii) 2.2 -
Energy consumption II.c).ii) 3.1 EN3 EN4 Energy consumption per truck equivalent
Measures taken to improve energy efficiency
II.c).ii) 3.2 EN6 EN7 Actions taken to reduce environmental impact
Measures taken to improve the use of renewable energies
II.c).ii) 3.3 - p.52
Installation of solar panels in Benelux (360 m2) and several panels at the Castelfranco site in Italy No other use of renewable energies
Use of land II.c).ii) 4 EN11 -
CLIMATE CHANGE The significant items of greenhouse gas emissions generated by the company's activity, especially due to the use of the goods and services that it produces
III.d) 1 EN15 EN16 EN17 EN18
EN19 6.5.5 # 7 - 8 - 9 p.50, 52 Carbon footprint of a machine
Emissions of GHG by equivalent truck
Adaptation to the consequences of climate change III.d) 2 - # 12 - 13 p.41 Climate risk and natural risks
PROTECTION OF BIODIVERSITY
Measures taken to preserve or develop biodiversity III.e) 1
EN11 EN12 EN13 EN14
EN26 6.5.6 # 7 - 8 - 9 p.52
Actions taken to reduce environmental impact
INFORMATION RELATING TO SOCIETAL COMMITMENTS TO PROMOTE SUSTAINABLE DEVELOPMENT AND REGARDING THE TERRITORIAL, ECONOMIC, AND SOCIAL IMPACT OF THE COMPANY’S BUSINESS RELATIONSHIPS MAINTAINED WITH PERSONS OR ORGANIZATIONS INTERESTED IN THE COMPANY'S ACTIVITIES Conditions of dialog with these persons or organizations
III.b) 1 G4 26 G4-37 5.3.3 # 3 - 8 p.44-47 Concerns of the stakeholders
Partnership and corporate sponsorship actions
III.b) 2 EC 7 6.8.9 # 4 - 5 - 10 - 17
p.62 Local networks and players, new sponsorship policy
SUB-CONTRACTING AND SUPPLIERS Integration of the social and environmental challenges in the purchasing policy
III.c) 1 LA14 LA15 EN33 HR5 HR9 HR11
6.6.6 # 1 - 2 p.60 Responsible purchasing policy
Importance of sub-contracting and the integration of social and environmental responsibility into relationships with suppliers and sub-contractors
III.c) 2
LA14 LA15 G4-12 EN32 EN33 HR5 HR9 HR11 S09 S010
6.6 # 1 - 2 p.60 CSR performance of suppliers, reverse CSR rating of suppliers
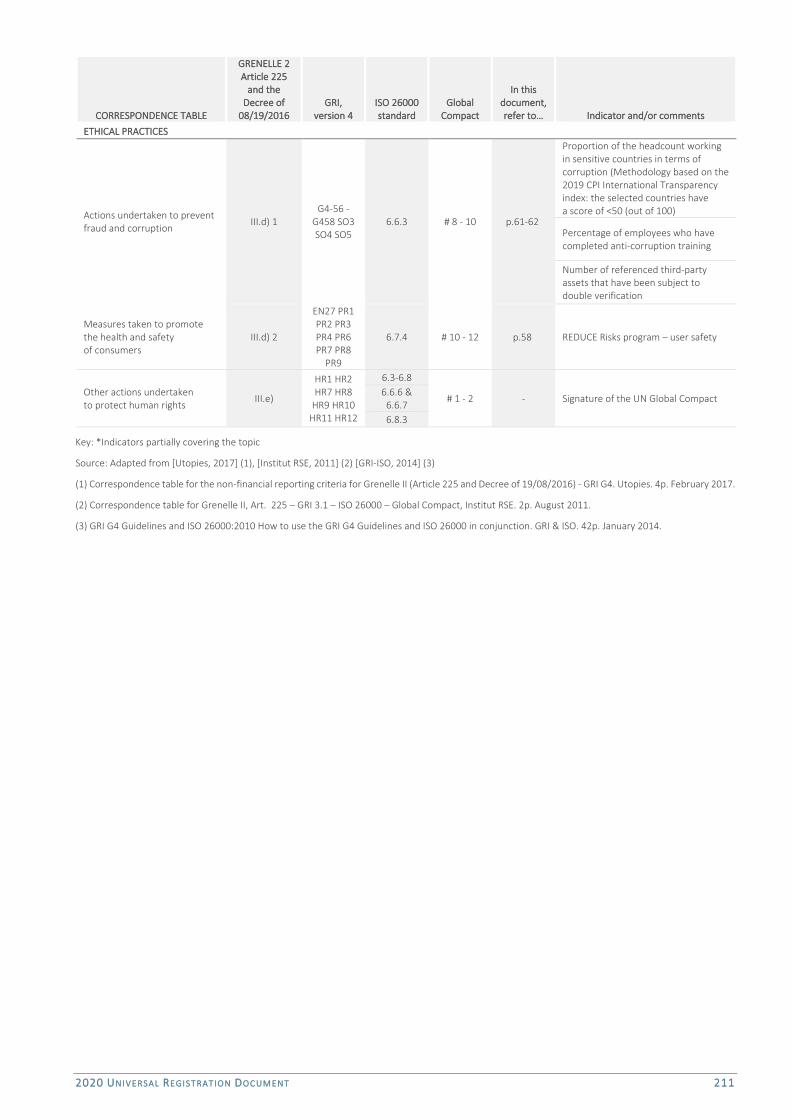
2020 UNIVERSAL REGIST RATION DOC UMENT 211
CORRESPONDENCE TABLE
GRENELLE 2 Article 225
and the Decree of
08/19/2016 GRI,
version 4 ISO 26000 standard
Global Compact
In this document, refer to… Indicator and/or comments
ETHICAL PRACTICES
Actions undertaken to prevent fraud and corruption III.d) 1
G4-56 - G458 SO3 SO4 SO5
6.6.3 # 8 - 10 p.61-62
Proportion of the headcount working in sensitive countries in terms of corruption (Methodology based on the 2019 CPI International Transparency index: the selected countries have a score of <50 (out of 100)
Percentage of employees who have completed anti-corruption training
Number of referenced third-party assets that have been subject to double verification
Measures taken to promote the health and safety of consumers
III.d) 2
EN27 PR1 PR2 PR3 PR4 PR6 PR7 PR8
PR9
6.7.4 # 10 - 12 p.58 REDUCE Risks program – user safety
Other actions undertaken to protect human rights
III.e)
HR1 HR2 HR7 HR8
HR9 HR10 HR11 HR12
6.3-6.8
# 1 - 2 - Signature of the UN Global Compact 6.6.6 & 6.6.7 6.8.3
Key: *Indicators partially covering the topic
Source: Adapted from [Utopies, 2017] (1), [Institut RSE, 2011] (2) [GRI-ISO, 2014] (3)
(1) Correspondence table for the non-financial reporting criteria for Grenelle II (Article 225 and Decree of 19/08/2016) - GRI G4. Utopies. 4p. February 2017.
(2) Correspondence table for Grenelle II, Art. 225 – GRI 3.1 – ISO 26000 – Global Compact, Institut RSE. 2p. August 2011.
(3) GRI G4 Guidelines and ISO 26000:2010 How to use the GRI G4 Guidelines and ISO 26000 in conjunction. GRI & ISO. 42p. January 2014.

212
HEAD OFFICE
430, rue de l’Aubinière BP 10249
44 158 Ancenis cedex - France
T +33 (0)2 40 09 10 11
PHOTO CREDITS: MANITOU GROUP
MANITOU BF PUBLIC LIMITED COMPANY WITH CAPITAL OF €39,668,399 Nantes Trade and Companies Register B857 802 508 / SIRET 857 802 508 00047 APE 292 D / APE - NAF 28222
@GroupManitou
linkedin.com/company/manitougroup