Interstate Cablevision dba OmniTel Communications Oakland ...
Upload
khangminh22Category
view
1download
0
U.S. HIGHWAY 24 ALTERNATIVES
ANALYSIS
(MANITOU SPRINGS TO INTERSTATE 25)
MARKET AND SOCIO-ECONOMIC
IMPACTS
U.S. HIGHWAY
COLORADO SPRINGS, COLORADO
PREPARED FOR:COLORADO DEPARTMENT OF
TRANSPORTATION (CDOT)

U.S. HIGHWAY 24 ALTERNATIVES
ANALYSIS
(MANITOU SPRINGS TO INTERSTATE 25)
MARKET AND SOCIO-ECONOMIC IMPACTS
U.S. HIGHWAY
COLORADO SPRINGS, COLORADO
PREPARED FOR:COLORADO DEPARTMENT OF
TRANSPORTATION (CDOT)
June 12, 2006

U.S. HIGHWAY 24
TABLE OF CONTENTS
Page
Executive Summary............................................................................................................. i
I. Introduction............................................................................................................ 1
II. Description of the U.S. Highway 24 Corridor fromManitou Springs to Interstate 25............................................................................... 4
III. Economic Base and Demographic Analysis for the Two-County Colorado Springs MarketArea
A. Employment Growth Trends .......................................................................... 6B. Population and Household Growth Trends in the
Two-County Colorado Springs MSA ...............................................................19C. Residential Construction Trends in the
Two-County Colorado Springs Market Area ....................................................24D. Population and Household Projections for the
Two-County Colorado Springs Market Area ....................................................32E. Tourism and Visitation Trends in the
Two-County Colorado Springs Market Area ....................................................35F. The Residential Market in the Two-County Colorado Springs Market Area .........36G. The Retail Commercial Market in the Two-County Market Area ........................38H. The Office Market in the Two-County Market Area..........................................39I. The Industrial/Flex/R&D Market in the Two-County Market Area......................44J. The Hotel Market in the Two-County Market Area...........................................50
IV. Socio-Economic Trends in the U.S. Highway 24 Environs from Manitou Springs toInterstate 25
A. Population and Household Trends in the Primary Trade Area...........................53B. Current Businesses in the Existing Primary Trade Area....................................57C. Income Expenditure Patterns for the
Existing Primary Trade Area Households........................................................63D. Estimated Sales and Square Footage Support in the
Existing Primary Trade Area..........................................................................66E. Future Business Potentials Under the
Expressway and Freeway Alternatives ...........................................................70
V. Projected Demands
A. Projected Retail and Personal Service Businesses ..........................................74B. Projected Residential Demand by Unit Type ...................................................75C. Projected Office Demand..............................................................................87D. Projected Industrial/Flex Demand .................................................................93E. Projected Demand for Hotel Rooms...............................................................99F. Summary of Land Use Development Potentials.............................................101
Appendices

U.S. HIGHWAY 24
i
EXECUTIVE SUMMARY
The two-county Colorado Springs metropolitan area is a very dynamic region that currentlyincludes 633,424 people living in 237,004 households, of which 360,412 are employed. Thedynamics of these socio-economic characteristics, as well as construction trends, will impactfuture potentials along U.S. Highway 24 from Manitou Springs to Interstate 25, which is thesubject study corridor.
Historically, since 1980 the greater Colorado Springs area has been growing annually by 7,592new jobs per year and this has caused the population to grow annually by 12,150 people in4,860 households.
Through the next decade, the greater Colorado Springs area is projected to grow annually by6,930 new jobs per year. This will result in annual population increases of 14,950 in 6,010households and by 2016 the two-county Colorado Springs area will have 783,200 people livingin 297,100 households.
Greater Colorado Springs has approximately 13,600 lodging rooms and, annually, 6 milliontourists visit this region.
Since 1980, the greater Colorado Springs area has averaged annually the construction of 3,947single-family homes and 1,164 multi-family units, for a total of 5,110 units.
Over the next decade the greater Colorado Springs region is projected to average annually theconstruction of 6,556 units, including 4,616 single-family homes, 551 townhomes andcondominiums, 1,311 rental apartments, and 79 manufactured housing units.
The greater Colorado Springs area has approximately 15.5 million square feet of retail spaceand adds approximately 225,000 square feet per year. Of this total, 2,154,350 square feet arein the west and southwest subregions that make up the environs of the U.S. Highway 24subject corridor.
The greater Colorado Springs area has 26.5 million square feet of office space and 1,790,365square feet are in the southwest market that makes up the environs of the subject studycorridor. Since 1970, office space construction has averaged annually 514,200 square feet inmetropolitan Colorado Springs.
The demand for office space construction in greater Colorado Springs is projected annually overthe next decade to average 722,260 square feet.
The inventory of industrial and flex space in greater Colorado Springs includes 29.2 millionsquare feet. The northwest and southwest submarkets, which make up the environs of thesubject study corridor include 9 million square feet. Since 1970, greater Colorado Springs hasconstructed 626,850 square feet of industrial/flex space.
The demand for industrial/flex space construction in greater Colorado Springs is projectedannually over the next decade to average 604,530 square feet.

U.S. HIGHWAY 24
ii
Greater Colorado Springs has approximately 13,600 hotel/motel rooms that accommodate inexcess of 6 million visitors each year. The hotel/motel market is projected to grow by 419hotel/motel rooms each.
U.S. Highway 24 stretches approximately 6 miles from Interstate Highway 24 through ManitouSprings and in this reach it serves as the major vehicular access route for a substantialpopulation base and a significant number of businesses. The immediate neighborhoods thatare within 5 minutes of 0.7 of a mile of U.S. Highway 24 are in its primary trade area forconvenience or neighborhood oriented commercial and personal service establishments, asdefined by the Urban Land Institute. When higher speeds and better access are accomplishedalong this stretch of U.S. Highway 24 through improvements that upgrade the roadway to anexpressway or a freeway, this primary trade area expands. Under expressway standards,neighborhoods within 1.5 miles are now within 5 minutes of this corridor and under freewaystandards neighborhoods within 2.0 miles are within 5 minutes of this corridor. It is importantto understand and profile the socio-economic characteristics of these three alternative primarytrade areas because they have substantial impacts on business and development potentials forthe areas serviced.
29,773 people reside in 13,978 households in this primary trade area, which has historicallybeen growing by 270 people in approximately 150 households, and almost 5% of the ColoradoSprings metropolitan area population live in this area. With improvements to expresswaystandards 52,214 people reside in 24,173 households and this primary trade area hashistorically been growing by 580 people in 310 households and over 8% of the Colorado Springsmetropolitan area population live in this area. With improvements to freeway standards 65,239people reside in 29,654 households and this primary trade area has been growing by 750people in 375 households and over 10% of the Colorado Springs metropolitan area populationlive in this area.
By 2016 it is estimated that, under the current conditions, the primary trade area will grow to32,564 people in 15,440 households; as an expressway, by 2016 the primary trade area wouldgrow to 58,250 people in 27,236 households; and as a freeway the primary trade area wouldgrow to 72,781 people in 33,491 households by 2016.
In the existing primary trade area of the subject stretch of U.S. Highway 24, THK inventoried361 businesses, which represents 7.7% of the metro Colorado Springs total. These businessesoccupy 995,949 square feet of space, which is 6.3% of the metro total. This area also has1,674 hotel/lodging rooms in 51 hotels/motels, which is 12% of the total room count in thegreater Colorado Springs area. Most of the businesses are restaurants.
Of this total, 91 businesses with 205,599 square feet are in Manitou Springs, and thisrepresents 25.2% of the businesses and 20.6% of the space.
Of this total, 72 businesses with 104,800 square feet are in Old Colorado City and thisrepresents 19.9% of the businesses and 10.5% of the space.
Of this total, 68 businesses with 331,198 square feet are at or near the I-25 intersection andthis represents 18.8% of the businesses and 33.3% of the space.
Of the total, 114 businesses with 375,392 square feet are convenience/neighborhood orientedbusinesses, which is 31.6% of businesses and 37.7% of the space.

U.S. HIGHWAY 24
iii
Primary trade area households have a median family income of $39,691, and $12,680 is spentin retail commercial and personal service businesses.
The existing primary trade area can support 193 business establishments and approximately712,779 square feet.
Research indicates that approximately 72% of the support for businesses in this area comesfrom residents that are conveniently located in surrounding neighborhoods, but more than 28%of the support for the businesses served by this segment of U.S. Hwy 24 comes from outside ofthe immediate area. This means that convenient access, shorter drive times, good visibility,and adequate parking are critical to a significant number of patrons to this area.
This situation is even more dramatic when looking at specific businesses in the area. 50% ofthe patrons to hardware stores in the existing primary trade area come from beyond the nearbyneighborhoods. 57% of the automobile related businesses gain their support from outsiders,64% of restaurant patronage comes from outsiders, 34% of drugstore patronage, and 45% ofmiscellaneous business support comes from outsiders.
Given the fact that U.S. Hwy 24 businesses in this market rely heavily on regional support, anexamination has been made to determine how much more business could be done by thesebusinesses if U.S. Hwy 24 is improved to either an expressway or a freeway. An expresswaywould expand the primary trade area from 0.7 miles to 1.5 miles and a freeway would expand itto 2.0 miles.
The population of the primary trade area under expressway standards would grow to 52,214people in 24,173 households, and as a freeway to 65,239 people in 29,654 households.
More importantly to the businesses serviced by this segment of U.S. Hwy 24, $130.72 millionmore dollars of support will be available, an increase of 74% under expressway standards and$203.23 million more dollars of support will be available, an increase of 115%, under freewaystandards. These increases widen by 2011 and 2016. This added potential dollar support willsignificantly improve the sales volume and profitability accomplished by the many businessesthat rely on U.S. Hwy 24.
When existing store types are compared to demand estimates, the existing primary trade areais substantially underrepresented by apparel and accessory stores, as well as furniture andequipment stores. In total, as much as 187,154 square feet of additional retail and personalservice space could be currently added to the existing primary trade area. Under existingconditions, the business sales are projected to grow by approximately 1% per year in theprimary trade area over the next decade. As a result, the need for additional retail andpersonal service space, especially in the underrepresented store types, will grow to 196,700square feet in 2011 and 206,734 square feet by 2016.
If this segment of U.S. Highway 24 is upgraded to an expressway, the support forunderrepresented business space, especially apparel and furniture square footage demandwould expand to 284,850 square feet today and grow to 302,350 square feet by 2011 and320,940 square feet by 2016. If this segment of U.S. Highway 24 is upgraded to a freeway, the

U.S. HIGHWAY 24
iv
Annual Sq.Ft./Units 10 yr. Cumulative Sq.Ft./Units 10 yr. Acreage Requirements
Retail 20,673 206,734 23.7Office 72,226 722,260 82.9Hotel 52 518 13.0
Industrial 18,136 181,359 11.9
Rental Apartments 35 350 23.3Condominiums and Townhomes 14 140 14.0
Single-Family Detached 104 1,039 346.4
Total 515.1
Note: Retail coverage is estimated at 20%, office coverage is estimated at 25%, hotel at 40 rooms per acre, industrial/flex at 35%,
rental apartments at 15 per acre, townhome/condo at 10 units per acre, and single family at 3 units per acre
Source: THK Associates, Inc.
Summary of Real Estate Demands for the U.S. Highway 24 Primary Trade Area (Current Scenario)
support for underrepresented business space, especially apparel and furniture square footagedemand would expand to 351,920 square feet today and grow to 372,550 square feet by 2011and 396,520 square feet by 2016. When the demand for retail and personal service businessspace is compared from existing conditions of the primary trade area versus an expressway, thedemand for additional space is 97,696 square feet greater today and would grow to 114,206square feet by 2016. When the demand for retail and personal service business space iscompared from existing conditions of the primary trade area versus a freeway, the demand foradditional space is 164,760 square feet greater today and would grow to 189,790 square feetby 2016.
Market research and analysis has demonstrated real estate development potentials that willevolve over the next decade in the primary trade area of this segment of U.S. Highway 24.These potentials have been studied under distinct classifications including residential, hotel andlodging, retail commercial, and office and flex space. Residential potentials were distinguishedas single-family, townhome and condominiums, and rental apartments. The hotel and lodgingmarkets included full service and limited service hotel rooms. Under current conditions, or asan expressway or freeway, the primary trade area for this segment of U.S. Highway 24 cancapture the following percentages of the greater Colorado Springs market for various land uses:
With these capture rates of the projected markets for real estate in the greater ColoradoSprings area, estimates of the annual demand, 10 year cumulative demand and land arearequirements for the primary trade area under existing conditions, as an expressway and as afreeway have been made and summarized as follows.
Current Expressway FreewayScenario Scenario Scenario
Retail 1.81% 3.80% 4.70%Office 10.00% 15.60% 16.40%Hotel 15.34% 23.93% 25.16%
Industrial 3.00% 4.68% 4.92%Rental Apartments 2.67% 5.57% 6.87%
Condominiums and Townhomes 2.54% 5.27% 6.36%Single-Family Detached 2.25% 4.73% 5.81%
Real Estate Market Capture Rates

U.S. HIGHWAY 24
v
Over the next decade there will be a demand for the urbanization of approximately 515.1 acresin the subject segment of U.S. Highway 24 and this would take the form as new construction orredevelopment of existing structures. If U.S. Highway 24 from Manitou Springs to Interstate 25is upgraded to an expressway, the demand for the urbanization of land would grow to984.6acres, which is an increase of 469.5 acres over the projected demand under existingconditions. If this segment of U.S. Highway 24 is upgraded to a freeway, the demand for theurbanization of land would grow to 1,183.7 acres, which is 668.6 acres over the demand underexisting conditions. The demand for the urbanization of the land would grow by 199.1 acres iffreeway improvements occur, as opposed to an expressway.
Annual Sq.Ft./Units 10 yr. Cumulative Sq.Ft./Units 10 yr. Acreage Requirements
Retail 32,094 320,940 36.8Office 112,673 1,126,726 103.5Hotel 81 809 20.2
Industrial 28,292 282,920 18.6
Rental Apartments 73 731 48.7Condominiums and Townhomes 29 290 29.0
Single-Family Detached 218 2,183 727.8
Total 984.6
Note: Retail coverage is estimated at 20%, office coverage is estimated at 25%, hotel at 40 rooms per acre, industrial/flex at 35%,
rental apartments at 15 per acre, townhome/condo at 10 units per acre, and single family at 3 units per acre
Source: THK Associates, Inc.
Summary of Real Estate Demands for the U.S. Highway 24 Primary Trade Area (Expressway Scenario)
Annual Sq.Ft./Units 10 yr. Cumulative Sq.Ft./Units 10 yr. Acreage Requirements
Retail 39,652 396,520 45.5Office 118,451 1,184,506 108.8Hotel 85 850 21.3
Industrial 29,743 297,429 19.5
Rental Apartments 90 900 60.0Condominiums and Townhomes 35 350 35.0
Single-Family Detached 268 2,681 893.6
Total 1,183.7
Note: Retail coverage is estimated at 20%, office coverage is estimated at 25%, hotel at 40 rooms per acre, industrial/flex at 35%,
rental apartments at 15 per acre, townhome/condo at 10 units per acre, and single family at 3 units per acre
Source: THK Associates, Inc.
Summary of Real Estate Demands for the U.S. Highway 24 Primary Trade Area (Freeway Scenario)

U.S. HIGHWAY 24
1
I. INTRODUCTION
Substantial improvements are being considered for approximately 6 miles of U.S. Highway 24from Manitou Springs to Interstate 25. An important part of the evolution of alternativeimprovement programs being considered for this segment of U.S. Highway 24 is an assessmentof impacts on local businesses serviced by the stretch of U.S. Highway 24 from Manitou Springsto Interstate 25.
Currently, the three alternative improvement programs include a “do nothing” approach; awidening program that anticipates at grade intersections upgrading this segment of U.S.Highway 24 to an expressway with posted speeds of approximately 50 miles per hour; and,finally, a widening program that anticipates grade separated interchanges upgrading thissegment of U.S. Highway 24 to a freeway with posted speeds at approximately 55 miles perhour.
To make an assessment of impacts that these alternative improvements will have on businessesserviced by this segment of U.S. Highway 24, initially a profile of the two-county greaterColorado Springs metropolitan region was conducted to establish a set of baseline statistics forthe performance of this market in general. Socio-economic trends for the greater ColoradoSprings area were profiled, including historical and projected employment, population, andhousehold growth. Real estate development trends were also profiled, demonstrating recentand projected construction activity in the retail, office, industrial/flex, and hotel sectors, as wellas residential construction including rental apartments, condominiums, and townhomes andsingle-family units.
With this information as the foundation, research then focused upon the U.S. Highway 24corridor from Manitou Springs to Interstate 25 and the primary trade area it services. Initially,the primary trade area under current conditions was profiled to include the population,households, incomes, expenditure patterns, and growth dynamics for neighborhoods within afive-minute drive time, or approximately 0.7 miles of this segment of U.S. Highway 24. Thisfive-minute drive time is typically used to define the convenience or neighborhood orientedtrade are for shopping. The primary trade area for the expressway was then defined andprofiled to include a five-minute drive time, but the distance grew to approximately 1.5 milesbecause of the higher speed. Finally, the primary trade area for the freeway alternative wasdefined to include a five-minute drive time, but the distance grew to approximately 2 milesbecause of even higher speeds. These profiles allowed a determination to be made regardingexisting and future expenditures and the business support that can be anticipated by businessesserviced by this segment of U.S. Highway 24 under the three alternative improvementprograms.
A perspective of these demand projections was gained through an inventory that characterizedthe 361 businesses with 995,949 square feet of retail and personal service establishments alongwith the 51 hotels and motels with 1,674 rooms that are in close proximity and serviced by thissegment of U.S. Highway 24. Businesses were distinguished by location in Manitou Springs, OldColorado City, or near the Interstate 25 interchange and their convenience orientation was alsoassessed. A determination was made as to their portion of their business support that comesfrom nearby neighborhoods versus that from the region. Regional support, which overall wasestimated at over 28% and as high as 56% for restaurants in this area, would improve throughbetter access, visibility, and parking proposed under the expressway and freeway alternatives.

U.S. HIGHWAY 24
2
Identifying how much more business and, specifically, what kinds of businesses thrive wheninitial dollar support increases by 74%, as is the case of the expressway alternative, or anincrease of 115% in the case of the freeway alternative, became the final focus of this phase ofthis research analysis.
In addition to existing businesses gaining more dollar support potential as a result of expandedprimary trade areas with improvements to an expressway or freeway, this segment of the U.S.Highway 24 corridor will experience substantially more demand for the development of realestate. The final section of this report focuses on identifying and quantifying these potentials.The historical performance of this corridor suggests that under existing conditions this regionwill experience a demand over the next decade for the urbanization of 501.5 acres. This wouldgrow to 756.1 acres if improved to an expressway and 800.7 acres if improved to a freeway. Inthe final section, this projected absorption is profiled as retail and personal service space, officespace, industrial/flex space, hotel/motel rooms, rental apartments, townhome andcondominiums, and single-family development.

REGIONAL LOCATION

U.S. HIGHWAY 24
4
II. DESCRIPTION OF THE U.S. HIGHWAY 24 CORRIDOR FROM MANITOU
SPRINGS TO INTERSTATE 25
The study corridor spans approximately 6 miles from Manitou Springs to Interstate 25 andservices approximately 360 businesses that are housed in 996,000 square feet of businessspace, as well as 51 hotels/motels with 1,674 rooms. Most of these businesses are located inManitou Springs, Old Colorado City, or near the Interstate 25 interchange. This segment ofU.S. Highway 24 is a major gateway to the Rocky Mountains and offers scenic views of PikesPeak, The Garden of the Gods, and the front range. Rolling, undulating terrain parallels thiscorridor and Fountain Creek is adjacent to the roadway, further enhancing its beauty. U.S.Highway 24 and its intersections with Interstate 25, 21st street, 26th Street, 31st Street andRidge Road afford easy access to Fort Carson Army Base, Peterson Air Force Base, the ColoradoSprings Airport, and downtown Colorado Springs. Massive expansion at Fort Carson is expectedto add 12,000 new soldiers in the next 4 to 5 years.
Three alternative improvement alternatives are being considered for this segment of U.S.Highway 24, including a “no build” alternative, an expressway alternative, and a freewayalternative. The “no build” alternative would continue with 7.5 access points with mostly atgrade intersections; the expressway would have the same 7.5 access points but 5 intersectionswould be removed and 35 side street access points would be removed resulting in a 57%decrease in travel time on this segment of U.S. Highway 24 and a 5% increase in travel time onColorado Avenue; the freeway alternative would reduce access points to 5.5 by treating 26th
Street and Ridge Road to overpasses and 5 intersections would be removed along with 39 sidestreet access points, which would reduce travel time by 63% on this segment of U.S. Highway24 and a 3% decrease in travel time on Colorado Avenue. Significant other safety, accessibility,mobility, community, environmental, economical, and implementation issues are beingevaluated and some will be addressed in this market research report.

SITE VICINITY

U.S. HIGHWAY 24
6
III. ECONOMIC BASE AND DEMOGRAPHIC ANALYSIS FOR THE TWO-COUNTY
COLORADO SPRINGS MARKET AREA
A. Employment Growth Trends
This section examines historical and projected trends in employment growth. Table III-1 showshistorical employment growth by year in the two-county Colorado Springs MetropolitanStatistical Area (MSA) that includes El Paso and Teller Counties. Over a 36-year period, totalemployment jumped from 116,503 in 1970 to 360,412 in 2005 -- an annual average growth of6,969 jobs. Between 1995 and 2005, this market area added an average of 6,737 jobs on anannual basis. The market area experienced a net loss of jobs in 2002. However, the marketarea gained approximately 199 jobs in 2003, 6,702 jobs in 2004, and 4,475 jobs in 2005;modest gains by historical standards. Tables III-1A and III-1B distinguish employment growthby county and demonstrate that El Paso County dominates by capturing 96.1% of the annualaverage employment increases since 1970.
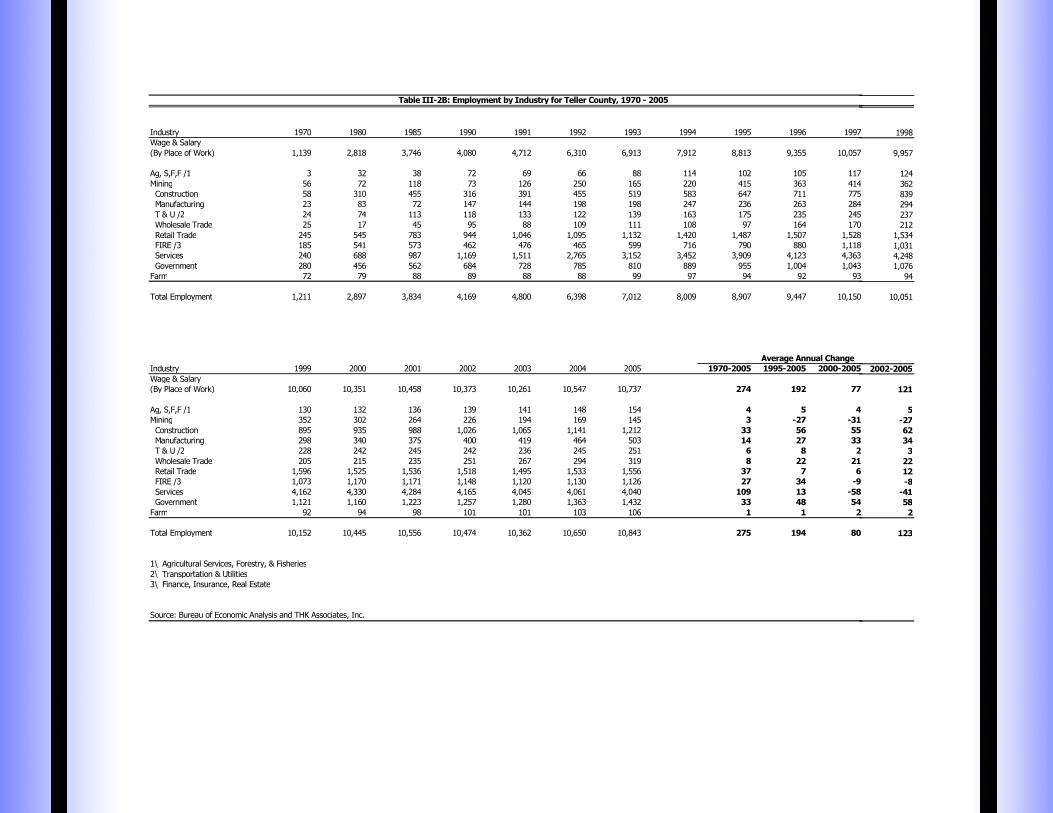
Since 1970, the market area has experienced growth in all industries. In terms of growthmagnitudes, the most significant contributor to the local economy has been the servicesindustry, which averaged the addition of 2,522 new jobs per year during the 1970-2005 period.Other strong growth industries include the retail and FIRE (Finance, Insurance, and Real Estate)sectors, which added 1,217 and 933 jobs respectively on an average annual basis between1970 and 2005. During the 2002 to 2005 period, an average of 3,669 jobs were addedannually in the two-county market area (see Table III-2). Tables III-2A and III-2B distinguishhistorical employment growth by industry in each of the two counties, and again, it shows thedominance of El Paso County.
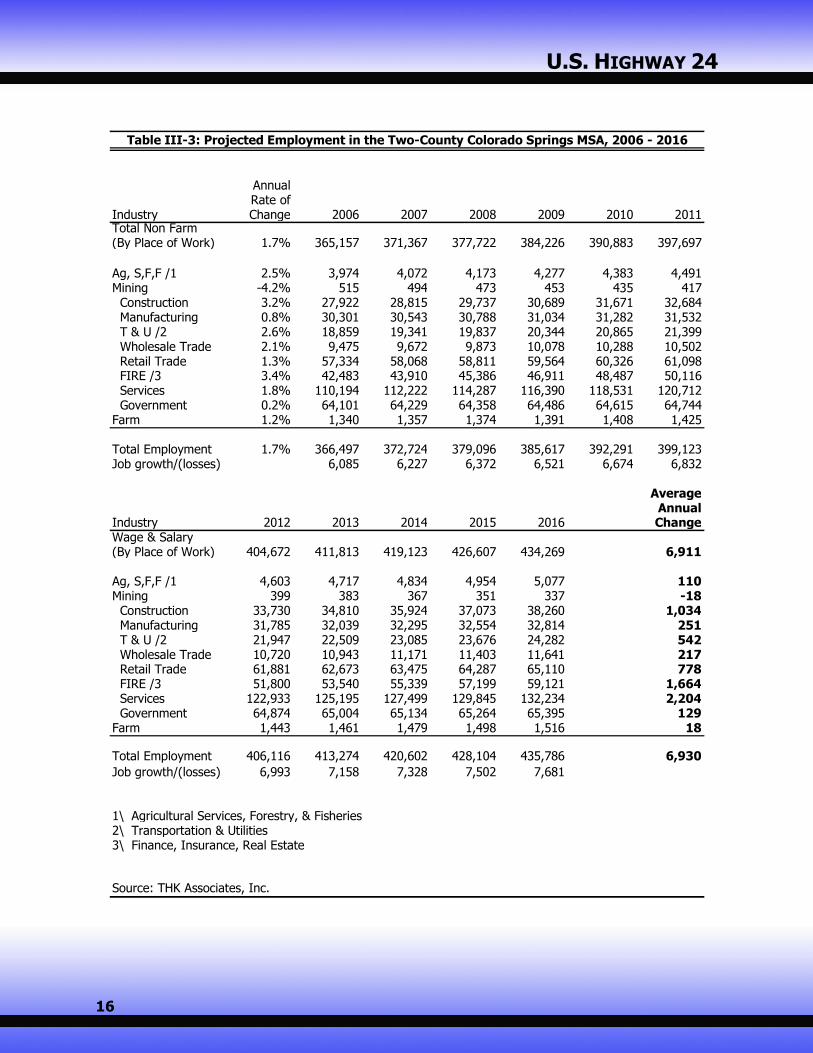
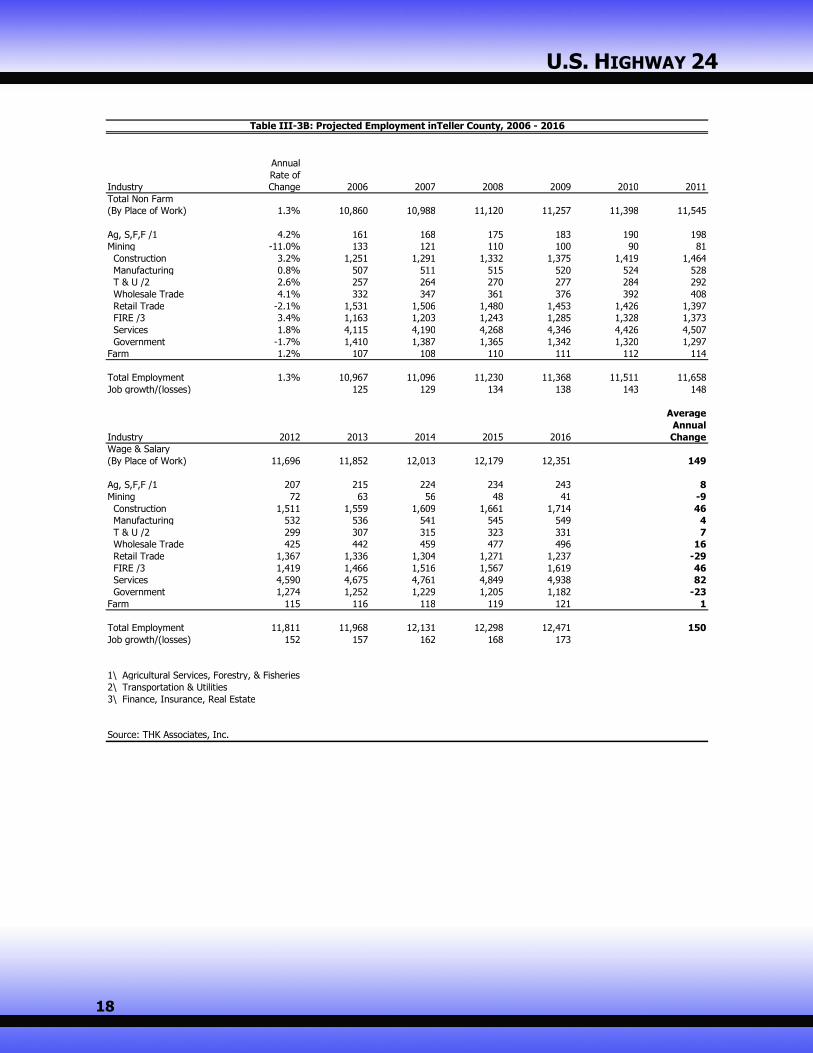
Fueling the market area’s employment growth is a reasonably diverse economic base with solidemployment in a range of industries. Table III-3 projects employment by industry for themarket area from 2006 to 2016. As shown, the market area will continue to add jobs at astrong pace throughout the decade, with total employment averaging increases of 6,930 jobsannually. The services sector will lead the way averaging annual gains of 2,204 jobs. The FIREsector will also continue to expand, averaging the addition of 1,664 new jobs per year, whilethe government and farm sectors are expected to remain relatively flat and the mining sector isexpected to experience some contraction.

U.S. HIGHWAY 24
7
Annual Change
Year Total Employment Numerical Percent
1970 116,503
1980 170,599 5,410 3.9%
1981 178,992 8,393 4.9%
1982 185,703 6,711 3.7%
1983 192,862 7,159 3.9%
1984 210,414 17,552 9.1%
1985 221,996 11,582 5.5%
1986 227,860 5,864 2.6%
1987 231,057 3,197 1.4%
1988 237,624 6,567 2.8%
1989 240,241 2,617 1.1%
1990 236,989 -3,252 -1.4%
1991 243,303 6,314 2.7%
1992 253,040 9,737 4.0%
1993 264,355 11,315 4.5%
1994 281,411 17,056 6.5%
1995 293,044 11,633 4.1%
1996 305,975 12,931 4.4%
1997 317,850 11,875 3.9%
1998 328,681 10,831 3.4%
1999 337,890 9,209 2.8%
2000 348,425 10,535 3.1%
2001 350,980 2,555 0.7%
2002 349,036 -1,944 -0.6%
2003 349,235 199 0.1%
2004 355,937 6,702 1.9%
2005 360,412 4,475 1.3%
Annual Change
1970-2005 6,969 3.3%
1995-2005 6,737 2.1%
2000-2005 2,397 0.7%
2002-2005 3,792 1.1%
* Two-County Area includes El Paso and Teller Counties
Table III-1: Employment Trends in the Two-County Colorado Springs MSA, 1970 - 2005
Source: U.S. Dept. of Commerce, Bureau of Economic Analysis, and THK Associates, Inc.

U.S. HIGHWAY 24
8
Annual Change
Year Total Employment Numerical Percent
1970 115,292
1980 167,702 5,241 3.8%
1981 175,989 8,287 4.9%1982 182,605 6,616 3.8%
1983 189,524 6,919 3.8%
1984 206,821 17,297 9.1%1985 218,162 11,341 5.5%
1986 223,897 5,735 2.6%1987 227,065 3,168 1.4%1988 233,399 6,334 2.8%
1989 236,004 2,605 1.1%1990 232,820 -3,184 -1.3%1991 238,503 5,683 2.4%1992 246,642 8,139 3.4%
1993 257,343 10,701 4.3%1994 273,402 16,059 6.2%1995 284,137 10,735 3.9%
1996 296,528 12,391 4.4%1997 307,700 11,172 3.8%
1998 318,630 10,930 3.6%1999 327,738 9,108 2.9%2000 337,980 10,242 3.1%2001 340,424 2,444 0.7%
2002 338,562 -1,862 -0.5%2003 338,873 311 0.1%
2004 345,287 6,414 1.9%
2005 349,569 4,282 1.2%
Annual Change
1970-2005 6,694 3.2%
1995-2005 6,543 2.1%
2000-2005 2,318 0.7%
2002-2005 3,669 1.1%
Table III-1A: Employment Trends in El Paso County, 1970 - 2005
Source: U.S. Dept. of Commerce, Bureau of Economic Analysis, and THK Associates, Inc.

U.S. HIGHWAY 24
9
Annual ChangeYear Total Employment Numerical Percent
1970 1,2111980 2,897 169 9.1%1981 3,003 106 3.7%1982 3,098 95 3.2%1983 3,338 240 7.7%1984 3,593 255 7.6%1985 3,834 241 6.7%1986 3,963 129 3.4%1987 3,992 29 0.7%1988 4,225 233 5.8%1989 4,237 12 0.3%1990 4,169 -68 -1.6%1991 4,800 631 15.1%1992 6,398 1,598 33.3%1993 7,012 614 9.6%1994 8,009 997 14.2%1995 8,907 898 11.2%1996 9,447 540 6.1%1997 10,150 703 7.4%1998 10,051 -99 -1.0%1999 10,152 101 1.0%2000 10,445 293 2.9%2001 10,556 111 1.1%2002 10,474 -82 -0.8%2003 10,362 -112 -1.1%2004 10,650 288 2.8%2005 10,843 192 1.8%
Annual Change
1970-2005 275 6.5%
1995-2005 194 2.0%
2000-2005 80 0.8%
2002-2005 123 1.2%
Source: U.S. Dept. of Commerce, Bureau of Economic Analysis, and THK Associates, Inc.
Table III-1B: Employment Trends in Teller County, 1970 - 2005

U.S. HIGHWAY 24
10
0
50,000
100,000
150,000
200,000
250,000
300,000
350,000
400,000
1970 1980 1981 1982 1983 1984 1985 1986 1987 1988 1989 1990 1991 1992 1993 1994 1995 1996 1997 1998 1999 2000 2001 2002 2003 2004 2005
Employment Trends in the Two-County Market Area, 1970-2005
0
50,000
100,000
150,000
200,000
250,000
300,000
350,000
1970 1980 1981 1982 1983 1984 1985 1986 1987 1988 1989 1990 1991 1992 1993 1994 1995 1996 1997 1998 1999 2000 2001 2002 2003 2004 2005
Employment Trends in El Paso County, 1970-2005
0
2,000
4,000
6,000
8,000
10,000
12,000
1970 1980 1981 1982 1983 1984 1985 1986 1987 1988 1989 1990 1991 1992 1993 1994 1995 1996 1997 1998 1999 2000 2001 2002 2003 2004 2005
Employment Trends in Teller County, 1970-2005

11
Table III-2: Employment by Industry for the Two-County Market Area, 1970 - 2005
Industry 1970 1980 1985 1990 1991 1992 1993 1994 1995 1996
Wage & Salary
(By Place of Work) 115,495 169,438 220,879 235,916 242,319 252,080 263,261 280,293 291,958 304,840
Ag, S,F,F /1 271 762 1,396 1,671 1,639 1,633 1,907 2,270 2,342 2,538
Mining 234 444 906 654 816 900 754 878 985 863
Construction 5,285 9,246 15,157 9,659 10,079 11,872 13,065 14,834 15,619 17,685
Manufacturing 6,638 16,430 25,096 24,123 22,976 23,076 24,283 25,720 26,190 26,728
T & U /2 3,352 5,103 6,334 6,973 7,173 7,648 9,084 10,487 11,557 13,228
Wholesale Trade 1,632 3,813 4,588 6,380 6,544 6,723 6,155 6,344 6,498 6,848
Retail Trade 14,008 26,101 35,056 38,911 40,060 41,651 43,829 47,728 50,761 53,845
FIRE /3 8,453 16,438 20,902 18,184 17,656 18,022 18,536 18,727 21,486 23,128
Services 19,940 35,911 50,627 66,128 71,457 75,684 80,730 86,589 90,245 94,865
Government 55,682 55,190 60,817 63,233 63,919 64,871 64,918 66,716 66,275 65,112
Farm 1,008 1,161 1,117 1,073 984 960 1,094 1,118 1,086 1,135
Total Employment 116,503 170,599 221,996 236,989 243,303 253,040 264,355 281,411 293,044 305,975
Industry 1999 2000 2001 2002 2003 2004 2005 1970-2005 1995-2005
Wage & Salary
(By Place of Work) 336,701 347,208 349,716 347,779 347,954 354,635 359,088 6,960 6,713
Ag, S,F,F /1 3,311 3,337 3,443 3,506 3,590 3,744 3,877 103 154
Mining 905 831 763 691 629 583 537 9 -45
Construction 20,788 22,389 23,281 23,894 24,662 25,921 27,056 622 1,144
Manufacturing 29,105 30,157 30,174 29,798 29,594 29,930 30,060 669 387
T & U /2 15,943 16,104 16,557 16,801 17,146 17,817 18,388 430 683
Wholesale Trade 8,011 8,456 8,626 8,684 8,792 9,065 9,282 219 278
Retail Trade 56,349 57,334 57,258 56,437 55,945 56,471 56,609 1,217 585
FIRE /3 30,272 32,576 34,168 35,371 36,824 39,039 41,102 933 1,962
Services 104,433 107,773 107,991 106,798 106,221 107,579 108,204 2,522 1,796
Government 67,584 68,251 67,455 65,800 64,551 64,484 63,973 237 -230
Farm 1,189 1,217 1,264 1,257 1,281 1,302 1,324 9 24
Total Employment 337,890 348,425 350,980 349,036 349,235 355,937 360,412 6,969 6,737
1\ Agricultural Services, Forestry, & Fisheries
2\ Transportation & Utilities
3\ Finance, Insurance, Real Estate
Source: Bureau of Economic Analysis and THK Associates, Inc.
Average Annual Change
1997 1998
316,644 327,474
2,817 3,022
997 915
18,427 19,627
27,877 29,202
13,828 13,652
7,512 7,956
54,445 54,790
26,188 29,581
99,129 101,685
65,424 67,044
1,206 1,207
317,850 328,681
2000-2005 2002-2005
2,376 3,770
108 124
-59 -51
933 1,054
-19 87
457 529
165 199
-145 57
1,705 1,910
86 468
-856 -609
21 22
2,397 3,792

12
Industry 1970 1980 1985 1990 1991 1992 1993 1994 1995 1996 1997Wage & Salary
(By Place of Work) 114,356 166,620 217,133 231,836 237,607 245,770 256,348 272,381 283,145 295,485 306,587
Ag, S,F,F /1 268 730 1,358 1,599 1,570 1,567 1,819 2,156 2,240 2,433 2,700Mining 178 372 788 581 690 650 589 658 570 500 583
Construction 5,227 8,936 14,702 9,343 9,688 11,417 12,546 14,251 14,972 16,974 17,652
Manufacturing 6,615 16,347 25,024 23,976 22,832 22,878 24,085 25,473 25,954 26,465 27,593T & U /2 3,328 5,029 6,221 6,855 7,040 7,526 8,945 10,324 11,382 12,993 13,583Wholesale Trade 1,607 3,796 4,543 6,285 6,456 6,614 6,044 6,236 6,401 6,684 7,342
Retail Trade 13,763 25,556 34,273 37,967 39,014 40,556 42,697 46,308 49,274 52,338 52,917FIRE /3 8,268 15,897 20,329 17,722 17,180 17,557 17,937 18,011 20,696 22,248 25,070
Services 19,700 35,223 49,640 64,959 69,946 72,919 77,578 83,137 86,336 90,742 94,766Government 55,402 54,734 60,255 62,549 63,191 64,086 64,108 65,827 65,320 64,108 64,381
Farm 936 1,082 1,029 984 896 872 995 1,021 992 1,043 1,113
Total Employment 115,292 167,702 218,162 232,820 238,503 246,642 257,343 273,402 284,137 296,528 307,700
Average Annual ChangeIndustry 1999 2000 2001 2002 2003 2004 2005 1970-2005 1995-2005 2000-2005
Wage & Salary
(By Place of Work) 326,641 336,857 339,258 337,406 337,693 344,088 348,351 6,686 6,521 2,299
Ag, S,F,F /1 3,181 3,205 3,306 3,367 3,449 3,596 3,723 99 148 104Mining 553 529 499 464 435 414 392 6 -18 -27
Construction 19,893 21,454 22,294 22,868 23,597 24,780 25,844 589 1,087 878
Manufacturing 28,807 29,817 29,799 29,398 29,176 29,466 29,557 655 360 -52
T & U /2 15,715 15,862 16,312 16,559 16,909 17,573 18,137 423 676 455Wholesale Trade 7,806 8,241 8,390 8,432 8,525 8,771 8,963 210 256 144Retail Trade 54,753 55,809 55,722 54,919 54,450 54,939 55,054 1,180 578 -151FIRE /3 29,199 31,406 32,997 34,222 35,705 37,910 39,976 906 1,928 1,714Services 100,271 103,443 103,707 102,633 102,176 103,518 104,163 2,413 1,783 144
Government 66,463 67,091 66,232 64,543 63,271 63,121 62,541 204 -278 -910Farm 1,097 1,123 1,166 1,156 1,180 1,199 1,218 8 23 19
Total Employment 327,738 337,980 340,424 338,562 338,873 345,287 349,569 6,694 6,543 2,318
1\ Agricultural Services, Forestry, & Fisheries2\ Transportation & Utilities3\ Finance, Insurance, Real Estate
Source: Bureau of Economic Analysis and THK Associates, Inc.
Table-2A: Employment by Industry for El Paso County, 1970-2005
1998
317,517
2,898553
18,78828,90813,4157,744
53,25628,55097,43765,9681,113
318,630
2002-2005
3,648
119-24992
53526177
451,918
510-667
21
3,669
13
Table III-2B: Employment by Industry for Teller County, 1970 - 2005
Industry 1970 1980 1985 1990 1991 1992 1993 1994 1995 1996 1997Wage & Salary
(By Place of Work) 1,139 2,818 3,746 4,080 4,712 6,310 6,913 7,912 8,813 9,355 10,057
Ag, S,F,F /1 3 32 38 72 69 66 88 114 102 105 117
Mining 56 72 118 73 126 250 165 220 415 363 414Construction 58 310 455 316 391 455 519 583 647 711 775Manufacturing 23 83 72 147 144 198 198 247 236 263 284
T & U /2 24 74 113 118 133 122 139 163 175 235 245Wholesale Trade 25 17 45 95 88 109 111 108 97 164 170
Retail Trade 245 545 783 944 1,046 1,095 1,132 1,420 1,487 1,507 1,528FIRE /3 185 541 573 462 476 465 599 716 790 880 1,118Services 240 688 987 1,169 1,511 2,765 3,152 3,452 3,909 4,123 4,363
Government 280 456 562 684 728 785 810 889 955 1,004 1,043Farm 72 79 88 89 88 88 99 97 94 92 93
Total Employment 1,211 2,897 3,834 4,169 4,800 6,398 7,012 8,009 8,907 9,447 10,150
Industry 1999 2000 2001 2002 2003 2004 2005 1970-2005 1995-2005 2000-2005
Wage & Salary(By Place of Work) 10,060 10,351 10,458 10,373 10,261 10,547 10,737 274 192 77
Ag, S,F,F /1 130 132 136 139 141 148 154 4 5 4Mining 352 302 264 226 194 169 145 3 -27 -31
Construction 895 935 988 1,026 1,065 1,141 1,212 33 56 55Manufacturing 298 340 375 400 419 464 503 14 27 33T & U /2 228 242 245 242 236 245 251 6 8 2
Wholesale Trade 205 215 235 251 267 294 319 8 22 21Retail Trade 1,596 1,525 1,536 1,518 1,495 1,533 1,556 37 7 6FIRE /3 1,073 1,170 1,171 1,148 1,120 1,130 1,126 27 34 -9
Services 4,162 4,330 4,284 4,165 4,045 4,061 4,040 109 13 -58Government 1,121 1,160 1,223 1,257 1,280 1,363 1,432 33 48 54
Farm 92 94 98 101 101 103 106 1 1 2
Total Employment 10,152 10,445 10,556 10,474 10,362 10,650 10,843 275 194 80
1\ Agricultural Services, Forestry, & Fisheries
2\ Transportation & Utilities3\ Finance, Insurance, Real Estate
Source: Bureau of Economic Analysis and THK Associates, Inc.
Average Annual Change
1998
9,957
124
362839294
237212
1,534
1,0314,2481,076
94
10,051
2002-2005
121
5
-276234
32212
-8-4158
2
123

U.S. HIGHWAY 24
14
-1,000
-500
0
500
1,000
1,500
2,000
2,500
3,000
Ag,S,F
,F/1
Min
ing
Const
ruct
ion
Manufa
cturing
T&
U/2
Whole
sale
Tra
de
Reta
ilTra
de
FIR
E/3
Serv
ices
Gove
rnm
ent
Farm
Employment Trends By Industry in the Two-County Market Area, 1970-2005
1970-2005 1995-2005 2000-2005 2002-2005
-1,000
-500
0
500
1,000
1,500
2,000
2,500
Ag,S,F
,F/1
Min
ing
Const
ruct
ion
Manufa
cturing
T&
U/2
Whole
sale
Tra
de
Reta
ilTra
de
FIR
E/3
Serv
ices
Govern
ment
Farm
Employment Trends By Industry inEl Paso County, 1970-2005
1970-2005 1995-2005 2000-2005 2002-2005
-60
-40
-20
0
20
40
60
80
100
120
Ag,S,F
,F/1
Min
ing
Const
ruct
ion
Manufa
cturing
T&
U/2
Whole
sale
Tra
de
Reta
ilTra
de
FIR
E/3
Serv
ices
Govern
ment
Farm
Employment Trends By Industry inTeller County, 1970-2005
1970-2005 1995-2005 2000-2005 2002-2005

15
Percent of Total Employment by Industry, 2005
Construction
8% Manufacturing8%
Wholesale Trade
3%
Retail Trade
16%
FIRE /311%
Services
30%
Government
18% T & U /25%
Farm0%
Mining0%
Ag, S,F,F /11%
U.S. HIGHWAY 24
16
AnnualRate of
Industry Change 2006 2007 2008 2009 2010 2011Total Non Farm(By Place of Work) 1.7% 365,157 371,367 377,722 384,226 390,883 397,697
Ag, S,F,F /1 2.5% 3,974 4,072 4,173 4,277 4,383 4,491Mining -4.2% 515 494 473 453 435 417
Construction 3.2% 27,922 28,815 29,737 30,689 31,671 32,684Manufacturing 0.8% 30,301 30,543 30,788 31,034 31,282 31,532T & U /2 2.6% 18,859 19,341 19,837 20,344 20,865 21,399Wholesale Trade 2.1% 9,475 9,672 9,873 10,078 10,288 10,502Retail Trade 1.3% 57,334 58,068 58,811 59,564 60,326 61,098FIRE /3 3.4% 42,483 43,910 45,386 46,911 48,487 50,116Services 1.8% 110,194 112,222 114,287 116,390 118,531 120,712Government 0.2% 64,101 64,229 64,358 64,486 64,615 64,744
Farm 1.2% 1,340 1,357 1,374 1,391 1,408 1,425
Total Employment 1.7% 366,497 372,724 379,096 385,617 392,291 399,123Job growth/(losses) 6,085 6,227 6,372 6,521 6,674 6,832
142 145 149 153
AverageAnnual
Industry 2012 2013 2014 2015 2016 ChangeWage & Salary(By Place of Work) 404,672 411,813 419,123 426,607 434,269 12,570 6,911
Ag, S,F,F /1 4,603 4,717 4,834 4,954 5,077 110Mining 399 383 367 351 337 -18
Construction 33,730 34,810 35,924 37,073 38,260 3600 1,034Manufacturing 31,785 32,039 32,295 32,554 32,814 -3750 251T & U /2 21,947 22,509 23,085 23,676 24,282 542Wholesale Trade 10,720 10,943 11,171 11,403 11,641 217Retail Trade 61,881 62,673 63,475 64,287 65,110 778FIRE /3 51,800 53,540 55,339 57,199 59,121 3442 1,664Services 122,933 125,195 127,499 129,845 132,234 9275 2,204Government 64,874 65,004 65,134 65,264 65,395 129
Farm 1,443 1,461 1,479 1,498 1,516 18
Total Employment 406,116 413,274 420,602 428,104 435,786 12,570 6,930
Job growth/(losses) 6,993 7,158 7,328 7,502 7,6814800
1\ Agricultural Services, Forestry, & Fisheries2\ Transportation & Utilities3\ Finance, Insurance, Real Estate
Table III-3: Projected Employment in the Two-County Colorado Springs MSA, 2006 - 2016
Source: THK Associates, Inc.

U.S. HIGHWAY 24
17
AnnualRate of
Industry Change 2006 2007 2008 2009 2010 2011
Total Non Farm(By Place of Work) 1.8% 354,297 360,379 366,602 372,969 379,485 386,153
Ag, S,F,F /1 2.4% 3,813 3,904 3,998 4,094 4,192 4,293Mining -2.5% 382 372 363 354 345 336Construction 3.2% 26,671 27,525 28,405 29,314 30,252 31,220
Manufacturing 0.8% 29,793 30,032 30,272 30,514 30,758 31,004T & U /2 2.6% 18,602 19,078 19,566 20,067 20,581 21,108Wholesale Trade 2.0% 9,142 9,325 9,512 9,702 9,896 10,094
Retail Trade 1.4% 55,803 56,561 57,331 58,110 58,901 59,702FIRE /3 3.4% 41,319 42,708 44,143 45,626 47,159 48,744Services 1.8% 106,080 108,032 110,019 112,044 114,105 116,205
Government 0.2% 62,691 62,842 62,993 63,144 63,295 63,447Farm 1.2% 1,233 1,249 1,264 1,280 1,296 1,312
Total Employment 1.8% 355,530 361,627 367,866 374,249 380,781 387,465Job growth/(losses) 5,960 6,098 6,239 6,383 6,532 6,684
137 141 145 148Average
AnnualIndustry 2012 2013 2014 2015 2016 ChangeWage & Salary 0
(By Place of Work) 392,977 399,961 407,110 414,428 421,919 12,570 6,7620
Ag, S,F,F /1 4,396 4,501 4,609 4,720 4,833 0 102
Mining 327 319 311 303 295 0 -9Construction 32,219 33,250 34,315 35,413 36,546 3600 987Manufacturing 31,252 31,502 31,755 32,009 32,265 -3750 247
T & U /2 21,648 22,202 22,771 23,354 23,951 0 535Wholesale Trade 10,296 10,502 10,712 10,926 11,144 0 200Retail Trade 60,514 61,337 62,171 63,016 63,873 0 807
FIRE /3 50,381 52,074 53,824 55,632 57,502 3442 1,618Services 118,343 120,521 122,738 124,997 127,296 9275 2,122Government 63,600 63,752 63,905 64,059 64,212 0 152
Farm 1,328 1,345 1,361 1,378 1,396 0 160
Total Employment 394,305 401,306 408,471 415,806 423,314 12,570 6,780
Job growth/(losses) 6,840 7,001 7,166 7,335 7,508 04800
1\ Agricultural Services, Forestry, & Fisheries2\ Transportation & Utilities3\ Finance, Insurance, Real Estate
Table III-3A: Projected Employment inEl Paso County, 2006 - 2016
Source: THK Associates, Inc.
U.S. HIGHWAY 24
18
Annual
Rate ofIndustry Change 2006 2007 2008 2009 2010 2011
Total Non Farm(By Place of Work) 1.3% 10,860 10,988 11,120 11,257 11,398 11,545
Ag, S,F,F /1 4.2% 161 168 175 183 190 198Mining -11.0% 133 121 110 100 90 81
Construction 3.2% 1,251 1,291 1,332 1,375 1,419 1,464
Manufacturing 0.8% 507 511 515 520 524 528T & U /2 2.6% 257 264 270 277 284 292
Wholesale Trade 4.1% 332 347 361 376 392 408
Retail Trade -2.1% 1,531 1,506 1,480 1,453 1,426 1,397FIRE /3 3.4% 1,163 1,203 1,243 1,285 1,328 1,373
Services 1.8% 4,115 4,190 4,268 4,346 4,426 4,507
Government -1.7% 1,410 1,387 1,365 1,342 1,320 1,297Farm 1.2% 107 108 110 111 112 114
Total Employment 1.3% 10,967 11,096 11,230 11,368 11,511 11,658
Job growth/(losses) 125 129 134 138 143 148
141.7812067 145.4505841 149.2275073 153.115101Average
Annual
Industry 2012 2013 2014 2015 2016 ChangeWage & Salary
(By Place of Work) 11,696 11,852 12,013 12,179 12,351 12,570 149
0Ag, S,F,F /1 207 215 224 234 243 0 8
Mining 72 63 56 48 41 0 -9
Construction 1,511 1,559 1,609 1,661 1,714 3,600 46Manufacturing 532 536 541 545 549 -3,750 4
T & U /2 299 307 315 323 331 0 7Wholesale Trade 425 442 459 477 496 0 16
Retail Trade 1,367 1,336 1,304 1,271 1,237 0 -29
FIRE /3 1,419 1,466 1,516 1,567 1,619 3,442 46Services 4,590 4,675 4,761 4,849 4,938 9,275 82
Government 1,274 1,252 1,229 1,205 1,182 0 -23
Farm 115 116 118 119 121 0 1
Total Employment 11,811 11,968 12,131 12,298 12,471 12,570 150
Job growth/(losses) 152 157 162 168 173 04,800
1\ Agricultural Services, Forestry, & Fisheries
2\ Transportation & Utilities
3\ Finance, Insurance, Real Estate
Table III-3B: Projected Employment inTeller County, 2006 - 2016
Source: THK Associates, Inc.

U.S. HIGHWAY 24
19
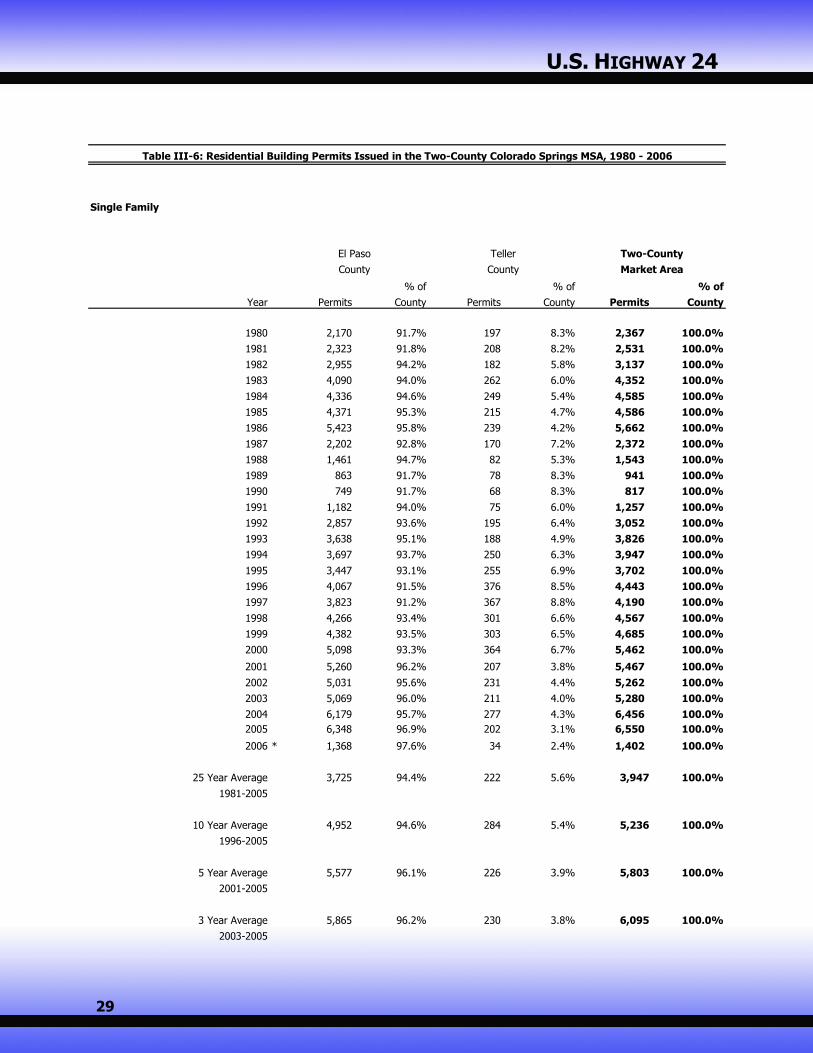
B. Population and Household Growth Trends in the Two-County Colorado SpringsMSA
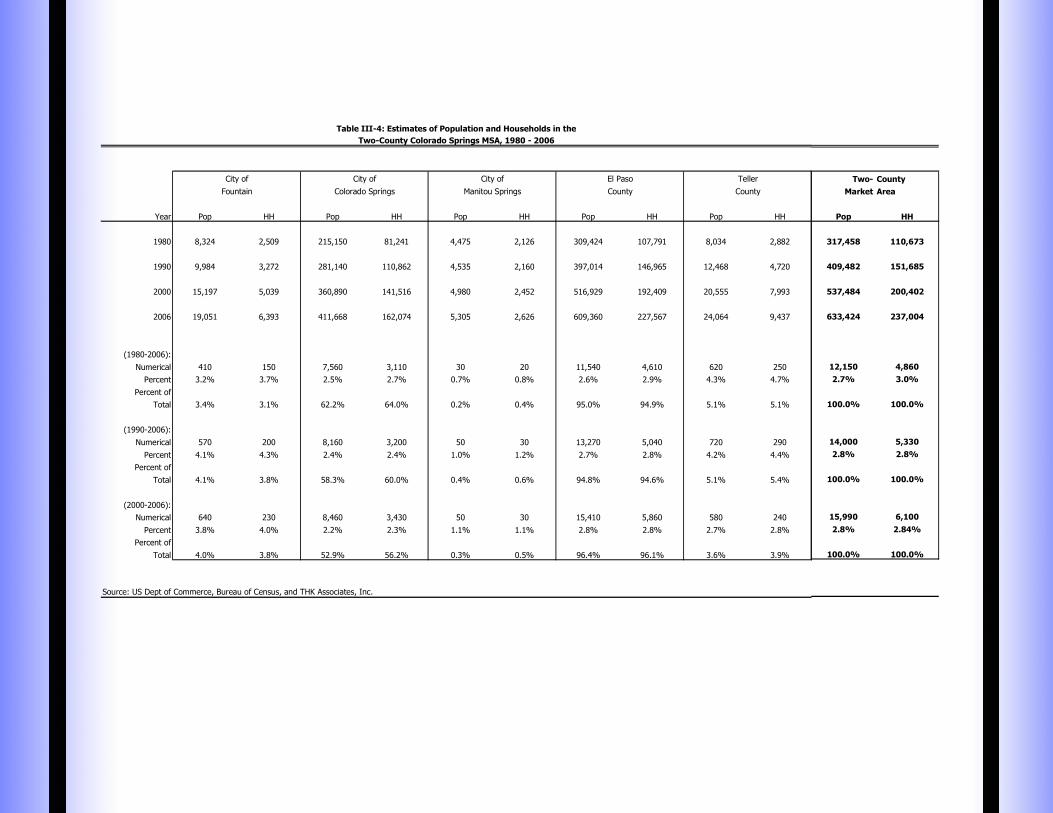
Population and household growth drive the demand for real estate development, and thepopulation and household growth in the two-county market area was strong during the 1980-2006 period. Moreover, growth picked up in the 1990s and the most significant gains wereposted in recent years. Between 1980 and 2006, the population in the market area increasedby 12,150 people annually from 317,458 to an estimated 633,424 in 2006. The number ofhouseholds increased by 4,860 annually during the same period, jumping from 110,673 in 1980to 237,004 in 2006. The compound annual growth rate for population in the market area overthe last 26 years was 2.7% per year; households grew at a compound rate of 3.0%.
Table III-4 also isolates historical population and household trends for the cities of Fountain,Colorado Springs and Manitou Springs. Fountain has experienced explosive growth, averagingannual population and household gains of 410 and 150, respectively, during the 1980-2005period; or a compound annual growth rate for population of 3.2% and a household compoundgrowth rate of 3.7%. These annual gains in Fountain have increased to 640 people and 230households from 2000 to 2006. Colorado Springs grew by 7,560 people annually over the last26 years, roughly 64.7% of the two-county total. The annual household growth rate has been2.7% or more than 3,100 units annually since 1980 in Colorado Springs. The City of ManitouSprings has been averaging a growth rate of 30 people and 20 households per year, onaverage, over the last 26 years, or a compound annual growth rate for population of 0.7% anda household compound growth rate of 0.8%. These annual gains in Manitou Springs haveincreased to 50 people and 30 households from 2000 to 2006.
20
2004
Year Pop HH Pop HH Pop HH Pop HH Pop HH
1980 8,324 2,509 215,150 81,241 4,475 2,126 309,424 107,791 8,034 2,882
3.318 2.648 2.871
1990 9,984 3,272 281,140 110,862 4,535 2,160 397,014 146,965 12,468 4,720
3.051 2.536 2.701
2000 15,197 5,039 360,890 141,516 4,980 2,452 516,929 192,409 20,555 7,993
2006 19,051 6,393 411,668 162,074 5,305 2,626 609,360 227,567 24,064 9,437
2.996 2.530
2.995 2.559 2.678
(1980-2006): 340 130 7,290 3,010
Numerical 410 150 7,560 3,110 30 20 11,540 4,610 620 250
Percent 3.2% 3.7% 2.5% 2.7% 0.7% 0.8% 2.6% 2.9% 4.3% 4.7%
Percent of
Total 3.4% 3.1% 62.2% 64.0% 0.2% 0.4% 95.0% 94.9% 5.1% 5.1%
(1990-2006): 520 180 7,980 3,070 40 30 11,990 4,540 810 330
Numerical 570 200 8,160 3,200 50 30 13,270 5,040 720 290
Percent 4.1% 4.3% 2.4% 2.4% 1.0% 1.2% 2.7% 2.8% 4.2% 4.4%
Percent of
Total 4.1% 3.8% 58.3% 60.0% 0.4% 0.6% 94.8% 94.6% 5.1% 5.4%
(2000-2006):
Numerical 640 230 8,460 3,430 50 30 15,410 5,860 580 240
Percent 3.8% 4.0% 2.2% 2.3% 1.1% 1.1% 2.8% 2.8% 2.7% 2.8%
Percent of
Total 4.0% 3.8% 52.9% 56.2% 0.3% 0.5% 96.4% 96.1% 3.6% 3.9%
2000-2004 265
Source: US Dept of Commerce, Bureau of Census, and THK Associates, Inc.
Table III-4: Estimates of Population and Households in the
Two-County Colorado Springs MSA, 1980 - 2006
Teller
County
El Paso
County
City of
Fountain
City of
Colorado Springs
City of
Manitou Springs
Two- County
Market Area
Pop HH
317,458 110,673
2.868
409,482 151,685
2.700
537,484 200,402
633,424 237,004
2.662
2.672
11,000 4,490
12,150 4,860
2.7% 3.0%
100.0% 100.0%
12,800 4,870
14,000 5,330
2.8% 2.8%
100.0% 100.0%
15,990 6,100
2.8% 2.84%
100.0% 100.0%

21
3.0%
65.0%
0.8%
96.2%
3.8%
0
100,000
200,000
300,000
400,000
500,000
600,000
700,000
Population & Households in the Two-
County Market Area, 2006
Population 19,051 411,668 5,305 609,360 24,064 633,424
Households 6,393 162,074 2,626 227,567 9,437 237,004
Fountain Colorado Springs Manitou Springs El Paso County Teller County Two-County

U.S. HIGHWAY 24
22
Table III-3C shows a comparison of THK Associates’ employment projections, based on censustracking numbers, to the Pikes Peak Area Council of Government employment projections. Forthe 2006-2016 period, the Pikes Peak Area Council of Government projects a more aggressiveapproach of 2.78% growth annually, including the thousands of new Fort Carson soldiers beingsent over the next several years. THK Associates project an increase of 1.75% jobs annuallyover the next 11 years in the two-county market area.
Pikes Peak Council Area of Government THK Associates2006 343,606 366,4972010 394,416 392,2912015 443,730 428,1042020 487,077 --
Annual Change Pikes Peak Council Area of Government THK Associates2006-2016
Numerical 10,879 6,930
Percentage 2.78% 1.75%
Source: Pikes Peak Area Council of Government and THK Associates, Inc.
Table III-3: Projected Employment Comparisons for the Two-County Market Area
Employment Estimates

2.78%
1.75%
0.00%
0.50%
1.00%
1.50%
2.00%
2.50%
3.00%
2006-2016
Pikes Peak Area Council of Government
THK Associates
Average AnnualChange 10,879
Average AnnualChange 6,930
U.S. HIGHWAY 24
24
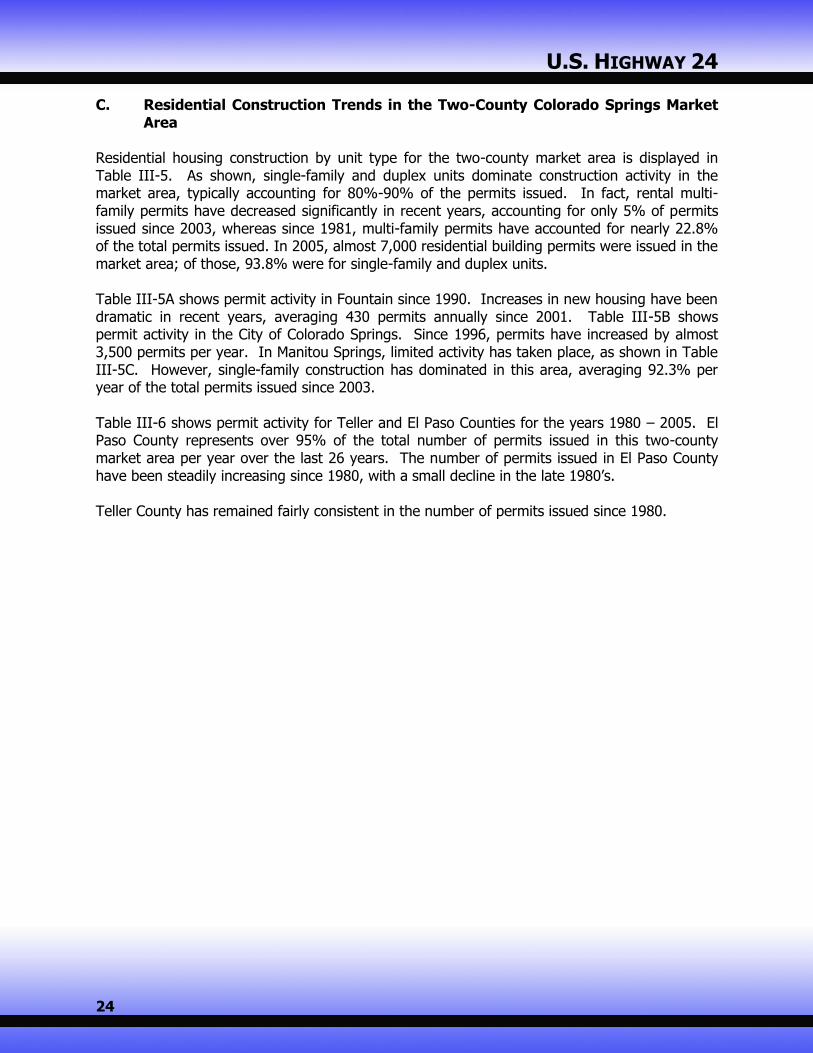
C. Residential Construction Trends in the Two-County Colorado Springs MarketArea
Residential housing construction by unit type for the two-county market area is displayed inTable III-5. As shown, single-family and duplex units dominate construction activity in themarket area, typically accounting for 80%-90% of the permits issued. In fact, rental multi-family permits have decreased significantly in recent years, accounting for only 5% of permitsissued since 2003, whereas since 1981, multi-family permits have accounted for nearly 22.8%of the total permits issued. In 2005, almost 7,000 residential building permits were issued in themarket area; of those, 93.8% were for single-family and duplex units.
Table III-5A shows permit activity in Fountain since 1990. Increases in new housing have beendramatic in recent years, averaging 430 permits annually since 2001. Table III-5B showspermit activity in the City of Colorado Springs. Since 1996, permits have increased by almost3,500 permits per year. In Manitou Springs, limited activity has taken place, as shown in TableIII-5C. However, single-family construction has dominated in this area, averaging 92.3% peryear of the total permits issued since 2003.
Table III-6 shows permit activity for Teller and El Paso Counties for the years 1980 – 2005. ElPaso County represents over 95% of the total number of permits issued in this two-countymarket area per year over the last 26 years. The number of permits issued in El Paso Countyhave been steadily increasing since 1980, with a small decline in the late 1980’s.
Teller County has remained fairly consistent in the number of permits issued since 1980.

U.S. HIGHWAY 24
25
Single Family Percent Multi Family Percent Total Percent
Year Construction of Total Construction of Total Construction of Total
1980 2,367 80.9% 559 19.1% 2,926 100.0%
1981 2,531 83.0% 517 17.0% 3,048 100.0%
1982 3,137 73.0% 1,158 27.0% 4,295 100.0%
1983 4,352 39.5% 6,670 60.5% 11,022 100.0%
1984 4,585 47.7% 5,024 52.3% 9,609 100.0%
1985 4,586 67.1% 2,249 32.9% 6,835 100.0%
1986 5,662 84.9% 1,010 15.1% 6,672 100.0%
1987 2,372 81.4% 543 18.6% 2,915 100.0%
1988 1,543 93.5% 107 6.5% 1,650 100.0%
1989 941 98.5% 14 1.5% 955 100.0%
1990 817 73.1% 300 26.9% 1,117 100.0%
1991 1,257 96.1% 51 3.9% 1,308 100.0%
1992 3,052 100.0% 0 0.0% 3,052 100.0%
1993 3,826 97.7% 89 2.3% 3,915 100.0%
1994 3,947 96.5% 145 3.5% 4,092 100.0%
1995 3,702 74.2% 1,286 25.8% 4,988 100.0%
1996 4,443 76.3% 1,381 23.7% 5,824 100.0%
1997 4,190 81.2% 972 18.8% 5,162 100.0%
1998 4,567 86.9% 687 13.1% 5,254 100.0%
1999 4,685 80.3% 1,148 19.7% 5,833 100.0%
2000 5,462 82.4% 1,170 17.6% 6,632 100.0%
2001 5,467 74.7% 1,856 25.3% 7,323 100.0%
2002 5,262 74.5% 1,800 25.5% 7,062 100.0%
2003 5,280 96.9% 169 3.1% 5,449 100.0%
2004 6,456 95.4% 310 4.6% 6,766 100.0%
2005 6,550 93.8% 434 6.2% 6,984 100.0%
2006 * 1,402 94.1% 88 5.9% 1,490 100.0%
25 Year Average 3,947 77.2% 1,164 22.8% 5,110 100.0%
1981-2005
10 Year Average 5,236 84.1% 993 15.9% 6,229 100.0%
1996-2005
5 Year Average 5,803 86.4% 914 13.6% 6,717 100.0%
2001-2005
3 Year Average 6,095 95.2% 304 4.8% 6,400 100.0%
2003-2005
* 2006 permits through March
Table III-5: Residential Building Permits Issued by Type
Source: THK Associates, Inc.
in the Two-County Colorado Springs MSA, 1980 - 2006

U.S. HIGHWAY 24
26
Single Family Percent Multi Family Percent Total PercentYear Construction of Total Construction of Total Construction of Total
1990 3 100.0% 0 0.0% 3 100.0%1991 2 100.0% 0 0.0% 2 100.0%1992 16 100.0% 0 0.0% 16 100.0%1993 95 100.0% 0 0.0% 95 100.0%1994 56 87.5% 8 12.5% 64 100.0%1995 75 100.0% 0 0.0% 75 100.0%1996 176 100.0% 0 0.0% 176 100.0%1997 155 100.0% 0 0.0% 155 100.0%1998 198 84.6% 36 15.4% 234 100.0%1999 269 100.0% 0 0.0% 269 100.0%2000 278 97.2% 8 2.8% 286 100.0%2001 330 100.0% 0 0.0% 330 100.0%2002 284 97.3% 8 2.7% 292 100.0%2003 334 74.4% 115 25.6% 449 100.0%2004 400 90.5% 42 9.5% 442 100.0%2005 575 90.6% 60 9.4% 635 100.0%2006 * 119 60.4% 78 39.6% 197 100.0%
16 Year Average 203 92.1% 17 7.9% 220 100.0%1990-2005
10 Year Average 300 91.8% 27 8.2% 327 100.0%1996-2005
5 Year Average 385 89.5% 45 10.5% 430 100.0%2001-2005
3 Year Average 436 85.8% 72 14.2% 509 100.0%2003-2005
*2006 permits through April**2005 figures estimated based on available data
Table III-5A: Residential Building Permits Issued by Type and Tenurein the City of Fountain, 1990 - 2006
Source: City of Fountain and THK Associates, Inc.

U.S. HIGHWAY 24
27
Single Family Percent Multi Family Percent Total PercentYear Construction of Total Construction of Total Construction of Total
1990 477 72.5% 181 27.5% 658 100.0%1991 728 96.2% 29 3.8% 757 100.0%1992 1,703 100.0% 0 0.0% 1,703 100.0%1993 2,419 97.8% 56 2.2% 2,475 100.0%1994 2,596 95.9% 112 4.1% 2,708 100.0%1995 2,442 74.1% 855 25.9% 3,297 100.0%1996 2,695 74.9% 903 25.1% 3,598 100.0%1997 2,581 80.5% 627 19.5% 3,208 100.0%1998 2,942 87.4% 424 12.6% 3,366 100.0%1999 2,925 80.0% 731 20.0% 3,656 100.0%2000 3,007 80.6% 722 19.4% 3,729 100.0%2001 3,137 73.6% 1,126 26.4% 4,263 100.0%2002 2,891 72.7% 1,084 27.3% 3,975 100.0%2003 2,703 96.2% 108 3.8% 2,811 100.0%2004 2,800 94.5% 162 5.5% 2,962 100.0%2005 2,818 92.4% 231 7.6% 3,049 100.0%2006 * 982 94.2% 60 5.8% 1,042 100.0%
16 Year Average 2,344 81.1% 459 15.9% 2,888 100.0%1990-2005
10 Year Average 2,850 82.3% 612 17.7% 3,462 100.0%1996-2005
5 Year Average 2,870 84.1% 542 15.9% 3,412 100.0%2001-2005
3 Year Average 2,774 94.3% 167 5.7% 2,941 100.0%2003-2005
* 2006 Permits through April** 2004 data is an estimate based on available data due to a computer crash
Table III-5B: Residential Building Permits Issued by Type and Tenurein the City of Colorado Springs, 1990 - 2006
Source: Regional Building Department and THK Associates, Inc.

U.S. HIGHWAY 24
28
Single Family Percent Multi Family Percent Total PercentYear Construction of Total Construction of Total Construction of Total
1990 4 100.0% 0 0.0% 4 100.0%1991 4 100.0% 0 0.0% 4 100.0%1992 5 100.0% 0 0.0% 5 100.0%1993 9 100.0% 0 0.0% 9 100.0%1994 15 100.0% 0 0.0% 15 100.0%1995 10 71.4% 4 28.6% 14 100.0%1996 18 100.0% 0 0.0% 18 100.0%1997 13 100.0% 0 0.0% 13 100.0%1998 10 62.5% 6 37.5% 16 100.0%1999 18 100.0% 0 0.0% 18 100.0%2000 14 100.0% 0 0.0% 14 100.0%2001 11 47.8% 12 52.2% 23 100.0%2002 18 56.3% 14 43.8% 32 100.0%2003 8 72.7% 3 27.3% 11 100.0%2004 15 100.0% 0 0.0% 15 100.0%2005 13 100.0% 0 0.0% 13 100.0%2006 * 8 42.1% 11 57.9% 19 100.0%
16 Year Average 11 79.4% 3 20.6% 14 100.0%1990-2005
10 Year Average 14 79.8% 4 20.2% 17 100.0%1996-2005
5 Year Average 13 69.1% 6 30.9% 19 100.0%2001-2005
3 Year Average 12 92.3% 1 7.7% 13 100.0%2003-2005
* 2006 permits through April
Table III-5C: Residential Building Permits Issued by Type and Tenurein the City of Manitou Springs, 1990 - 2006
Source: Regional Building Department and THK Associates, Inc.
U.S. HIGHWAY 24
29
Table III-6: Residential Building Permits Issued in the Two-County Colorado Springs MSA, 1980 - 2006
Single Family
% of % of % of
Year Permits County Permits County Permits County
1980 2,170 91.7% 197 8.3% 2,367 100.0%
1981 2,323 91.8% 208 8.2% 2,531 100.0%
1982 2,955 94.2% 182 5.8% 3,137 100.0%
1983 4,090 94.0% 262 6.0% 4,352 100.0%
1984 4,336 94.6% 249 5.4% 4,585 100.0%
1985 4,371 95.3% 215 4.7% 4,586 100.0%
1986 5,423 95.8% 239 4.2% 5,662 100.0%
1987 2,202 92.8% 170 7.2% 2,372 100.0%
1988 1,461 94.7% 82 5.3% 1,543 100.0%
1989 863 91.7% 78 8.3% 941 100.0%
1990 749 91.7% 68 8.3% 817 100.0%
1991 1,182 94.0% 75 6.0% 1,257 100.0%
1992 2,857 93.6% 195 6.4% 3,052 100.0%
1993 3,638 95.1% 188 4.9% 3,826 100.0%
1994 3,697 93.7% 250 6.3% 3,947 100.0%
1995 3,447 93.1% 255 6.9% 3,702 100.0%
1996 4,067 91.5% 376 8.5% 4,443 100.0%
1997 3,823 91.2% 367 8.8% 4,190 100.0%
1998 4,266 93.4% 301 6.6% 4,567 100.0%
1999 4,382 93.5% 303 6.5% 4,685 100.0%
2000 5,098 93.3% 364 6.7% 5,462 100.0%
2001 5,260 96.2% 207 3.8% 5,467 100.0%
2002 5,031 95.6% 231 4.4% 5,262 100.0%
2003 5,069 96.0% 211 4.0% 5,280 100.0%
2004 6,179 95.7% 277 4.3% 6,456 100.0%
2005 6,348 96.9% 202 3.1% 6,550 100.0%
2006 * 1,368 97.6% 34 2.4% 1,402 100.0%
25 Year Average 3,725 94.4% 222 5.6% 3,947 100.0%
1981-2005
10 Year Average 4,952 94.6% 284 5.4% 5,236 100.0%
1996-2005
5 Year Average 5,577 96.1% 226 3.9% 5,803 100.0%
2001-2005
3 Year Average 5,865 96.2% 230 3.8% 6,095 100.0%
2003-2005
Market Area
Two-CountyEl Paso
County County
Teller

U.S. HIGHWAY 24
30
Multi-Family
% of % of % of
Year Permits County Permits County Permits County
1980 535 95.7% 24 4.3% 559 100.0%
1981 473 91.5% 44 8.5% 517 100.0%1982 1,129 97.5% 29 2.5% 1,158 100.0%
1983 6,586 98.7% 84 1.3% 6,670 100.0%
1984 4,968 98.9% 56 1.1% 5,024 100.0%1985 2,191 97.4% 58 2.6% 2,249 100.0%
1986 1,006 99.6% 4 0.4% 1,010 100.0%
1987 543 100.0% 0 0.0% 543 100.0%
1988 107 100.0% 0 0.0% 107 100.0%1989 14 100.0% 0 0.0% 14 100.0%
1990 300 100.0% 0 0.0% 300 100.0%
1991 51 100.0% 0 0.0% 51 100.0%1992 0 0.0% 0 0.0% 0 0.0%
1993 77 86.5% 12 13.5% 89 100.0%
1994 145 100.0% 0 0.0% 145 100.0%1995 1,278 99.4% 8 0.6% 1,286 100.0%
1996 1,225 88.7% 156 11.3% 1,381 100.0%
1997 972 100.0% 0 0.0% 972 100.0%
1998 687 100.0% 0 0.0% 687 100.0%1999 1,148 100.0% 0 0.0% 1,148 100.0%
2000 1,166 99.7% 4 0.3% 1,170 100.0%
2001 1,856 100.0% 0 0.0% 1,856 100.0%2002 1,796 99.8% 4 0.2% 1,800 100.0%
2003 169 100.0% 0 0.0% 169 100.0%
2004 306 98.7% 4 1.3% 310 100.0%2005 434 100.0% 0 0.0% 434 100.0%
2006 * 88 100.0% 0 0.0% 88 100.0%
25 Year Average 1,145 98.4% 19 1.6% 1,164 100.0%1981-2005
10 Year Average 976 98.3% 17 1.7% 993 100.0%1996-2005
5 Year Average 912 99.8% 2 0.2% 914 100.0%2001-2005
3 Year Average 303 99.6% 1 0.4% 304 100.0%
2003-2005
El Paso Teller Two-County
Market AreaCounty County

U.S. HIGHWAY 24
31
Total
% of % of % of
Year Permits County Permits County Permits County
1980 2,705 92.4% 221 7.6% 2,926 100.0%
1981 2,796 91.7% 252 8.3% 3,048 100.0%
1982 4,084 95.1% 211 4.9% 4,295 100.0%
1983 10,676 96.9% 346 3.1% 11,022 100.0%
1984 9,304 96.8% 305 3.2% 9,609 100.0%
1985 6,562 96.0% 273 4.0% 6,835 100.0%
1986 6,429 96.4% 243 3.6% 6,672 100.0%
1987 2,745 94.2% 170 5.8% 2,915 100.0%
1988 1,568 95.0% 82 5.0% 1,650 100.0%
1989 877 91.8% 78 8.2% 955 100.0%
1990 1,049 93.9% 68 6.1% 1,117 100.0%
1991 1,233 94.3% 75 5.7% 1,308 100.0%
1992 2,857 93.6% 195 6.4% 3,052 100.0%
1993 3,715 94.9% 200 5.1% 3,915 100.0%
1994 3,842 93.9% 250 6.1% 4,092 100.0%
1995 4,725 94.7% 263 5.3% 4,988 100.0%
1996 5,292 90.9% 532 9.1% 5,824 100.0%
1997 4,795 92.9% 367 7.1% 5,162 100.0%
1998 4,953 94.3% 301 5.7% 5,254 100.0%
1999 5,530 94.8% 303 5.2% 5,833 100.0%
2000 6,264 94.5% 368 5.5% 6,632 100.0%
2001 7,116 97.2% 207 2.8% 7,323 100.0%
2002 6,827 96.7% 235 3.3% 7,062 100.0%
2003 5,238 96.1% 211 3.9% 5,449 100.0%
2004 6,485 95.8% 281 4.2% 6,766 100.0%
2005 6,782 97.1% 202 2.9% 6,984 100.0%
2006 * 1,456 97.7% 34 2.3% 1,490 100.0%
25 Year Average 4,870 95.3% 241 4.7% 5,110 100.0%
1981-2005
10 Year Average 5,928 95.2% 301 4.8% 6,229 100.0%
1996-2005
5 Year Average 6,490 96.6% 227 3.4% 6,717 100.0%
2001-2005
3 Year Average 6,168 96.4% 231 3.6% 6,400 100.0%
2003-2005
* 2006 Permits through March
CountyCounty
El Paso
Source: U.S. Department of Commerce, C-40 Reports and THK Associates, Inc.
Market Area
Teller Two-County

U.S. HIGHWAY 24
32
D. Population and Household Projections for the Two-County Colorado SpringsMarket Area
Population, household, and employment data for the two-county market area are compared inTable III-7. In 1980, the population of the market area was 317,458 and resident employmentwas 170,599 for an employment participation rate of .537, meaning that 53.7% of thepopulation was employed. By 1990, the market area’s resident employment had increased to236,989 with a population of 409,482 for an employment participation rate of .579. In TableIII-6, the population growth of the two-county market area is projected based on theanticipated employment growth. With a projected 2016 resident employment of 435,790, theestimated 2016 population for the market area will be 783,200 with a projected employmentparticipation rate of .556. The market area’s population is projected to grow by 14,980 personsper year through 2016.
Table III-7 also shows the projected trends in new household formations for the two-countymarket area. The population per household in the market area declined from 2.73 in 1980 to2.61 in 2006.
During the next decade, household size should continue to decline but at a slower rate. Newhousehold formations in the market area are projected to grow by an average of 6,010 annuallyduring the next decade, with the average household size declining to 2.58. Population in groupquarters, e.g., institutions, dormitories, etc., is expected to increase modestly during the decadeto approximately 16,017.

U.S. HIGHWAY 24
33
1.007442613 0.995011982
Employment Annual Population Population Population Annual
Total Participation January 1, Population in Group In Per Household
Year Employment Ratio Population Change Quarters Households Household Households Change
1980 170,599 0.5374 317,458 -- 15,350 302,108 2.7297 110,673 --
1990 236,989 0.5788 409,482 9,200 15,618 393,864 2.5966 151,685 4,100
2000 348,425 0.6483 537,484 12,800 15,516 521,968 2.6046 200,402 4,870
2006 366,497 0.5786 633,424 15,990 15,700 617,724 2.6064 237,004 6,100
0.9961 1.002 8.3 0.99907
2007 372,720 0.5763 646,700 13,276 15,731 630,969 2.6040 242,310 5,306
2008 379,100 0.5741 660,350 13,650 15,763 644,587 2.6015 247,770 5,460
2009 385,620 0.5719 674,330 13,980 15,794 658,536 2.5991 253,370 5,600
2010 392,290 0.5696 688,680 14,350 15,826 672,854 2.5967 259,120 5,750
2011 399,120 0.5674 703,420 14,740 15,858 687,562 2.5943 265,030 5,910
2012 406,120 0.5652 718,560 15,140 15,889 702,671 2.5919 271,100 6,070
2013 413,270 0.5630 734,070 15,510 15,921 718,149 2.5895 277,330 6,230
2014 420,600 0.5608 750,020 15,950 15,953 734,067 2.5871 283,750 6,420
2015 428,100 0.5586 766,380 16,360 15,985 750,395 2.5847 290,330 6,580
2016 435,790 0.5564 783,200 16,820 16,017 767,183 2.5822 297,100 6,770
38576 16257.8 2.372768763
Average 8,890 11,000 0.808 4,490 2.4498886
Annual Change 11,140 12,800 0.870 4,870 2.6283368
(2006-2016) 0.839 2.5391127
Numerical: 6,930 14,980 0.463 30 14,950 6,010 2.4925125
15157.24508 32 6100
Percent: 1.7% 2.1% 0.2% 2.2% 2.3%
Source: Dept of Commerce, Bureau of the Census and THK Associates, Inc.
Table III-7: Projected Population and Households in the Two-County Colorado Springs MSA, 2006 - 2016
34
0
2,000
4,000
6,000
8,000
10,000
12,000
14,000
16,000
Population & Household Growth in the Two-County Colorado Springs Market Area
Average Annual Population Growth 12,150 14,000 15,990 14,980
Average Annual Household Growth 4,860 5,330 6,100 6,010
1980-2006 1990-2006 2000-2006 2006-2016*
* Projected

U.S. HIGHWAY 24
35
E. Tourism and Visitation Trends in the Two-County Colorado Springs Market Area
According to Experience Colorado Springs at Pikes Peak, tourism is Colorado Springs’ thirdlargest industry, employing over 17,000 people and contributing over $1 billion into the localeconomy. Based on an estimated 6 million annual visitors, this equates to over $165 inexpenditures per visitor. These visitors are an important base for retail sales, lodging occupancyand other sectors of the service economy. In turn, these revenues provide spinoff demands forhousing, employment and other economic activities.
There are nearly 13,600 lodging units in Colorado Springs, with total occupancy at 59.6% in2005, according to the Rocky Mountain Lodging Report. This amounts to over 3 million roomnights sold in 2005, at an average daily rate of $78, equaling $235 million in room revenues.The Colorado Springs Airport reported just over 1 million enplaned passengers in 2005, a figurethat has held steady in recent years.
These visitors are coming to see the plethora of major attractions the region has to offer,centered around spectacular Pikes Peak towering over the city. The list of main attractions andtheir estimated visitor totals is as follows:
Garden of the Gods Park 1,700,000Garden of the Gods Visitor and Nature Center 700,000US Air Force Academy Visitor Center 490,000Cheyenne Mountain Zoo 400,000Focus on the Family 258,000Pikes Peak – America’s Mountain 241,000Pikes Peak Cog Railway 223,000Seven Falls 183,000Flying W Ranch 150,000Olympic Training Center 100,000Pioneers Museum 49,000
Many of these attractions and facilities are centered around and accessed by the U.S. 24corridor. The road to the summit of Pikes Peak, the Pikes Peak Cog Railway, Seven Falls, Caveof the Winds, Cliff Dwellings Museum, Garden of the Gods Trading Post and Miramont Castleare all serviced by Highway 24. The highway also serves Woodland Park, and the historicmining, and now gambling, town of Cripple Creek. Old Colorado City and Manitou Springs, themain community along the subject stretch of highway, are tourist attractions in themselves,with numerous restaurants, antiques, art galleries, bed and breakfasts and mineral springs.
The defined trade area for the US 24 corridor contains 1,674 lodging units in 51 separatefacilities, or approximately 12% of Colorado Springs region total. There is a projected need forclose to 200 more units over the next decade, assuming occupancies remain stable at close to60%. Several Recreational Vehicle parks serve tourists near the highway.

U.S. HIGHWAY 24
36
F. The Residential Market in the Two-County Colorado Springs Market Area
This section of the study uses the statistics, estimates and projections from the economic baseand demographic analyses as a basis for projecting residential demand for the two-countymarket area.
1. Projected Demand in the Two- County Market Area
Based on the historical performance of the two-county market areas’ housing markets and onthe projected growth in new household formations shown earlier in this report, the demand fornew residential construction can be segmented by tenure and type of unit. This will allow themarket potentials for specific types of residential construction to be examined. The keycomponents of residential demand during the next decade will include new housing units tomeet the demands of new population growth and household formations, construction to meetthe demands of the existing households in the area looking to upgrade or downgrade into newownership or rental units, and construction to replace units lost through demolition andconversion. Table III-8 summarizes the net change in housing unit demand expected duringthe next decade in the two-county market area.
THK estimates that new household formations will average 6,010 per year during the 2006-2016 projection period. This will produce a demand for the construction of 6,556 dwelling unitsannually when adjusted for vacancies and demolitions. Single-family detached construction of4,616 units annually during the next decade will account for approximately 70% of totalconstruction in the market area. Townhome and condominium construction will average 551units annually, or 8% of the total construction; rental apartment construction will average 1,311units annually, or 20% of total construction; and manufactured home construction will average79 units annually, or 1.2% of total construction.

U.S. HIGHWAY 24
37
1.075 80.0% 88.0% 10.5% 1.5% 20.0%
0.70 0.08 0.01 0.20
Annual
Housing Total Detached Attached Rental
Annual Unit Owner- Single Single Manufactured Multi-
Year Households Change Demand ship Family Family Housing family
2006 237,004 5,306 5,704 4,563 4,016 479 68 1,141
2007 242,310 5,460 5,870 4,696 4,132 493 70 1,174
2008 247,770 5,600 6,020 4,816 4,238 506 72 1,204
2009 253,370 5,750 6,181 4,945 4,352 519 74 1,236
2010 259,120 5,910 6,353 5,083 4,473 534 76 1,271
2011 265,030 6,070 6,525 5,220 4,594 548 78 1,305
2012 271,100 6,230 6,697 5,358 4,715 563 80 1,339
2013 277,330 6,420 6,902 5,521 4,859 580 83 1,380
2014 283,750 6,580 7,074 5,659 4,980 594 85 1,415
2015 290,330 6,770 7,278 5,822 5,124 611 87 1,456
2016 297,100 6,990 7,514 6,011 5,290 631 90 1,503
Average
Annual Demand
(2006-2016) 6,010 6,556 5,245 4,616 551 79 1,311
Table III-8: Projected Two-County Market Area
Residential Demand by Unit Type, 2006-2016
Ownership Units
Source: THK Associates, Inc.
0
500
1,000
1,500
2,000
2,500
3,000
3,500
4,000
4,500
5,000
Average Annual Demand by Unit Type
Unit Type 4,616 551 79 1,311
Detached Single
Family
Attached Single
Family
Manufactured
HousingRental Multi-Family
U.S. HIGHWAY 24
38
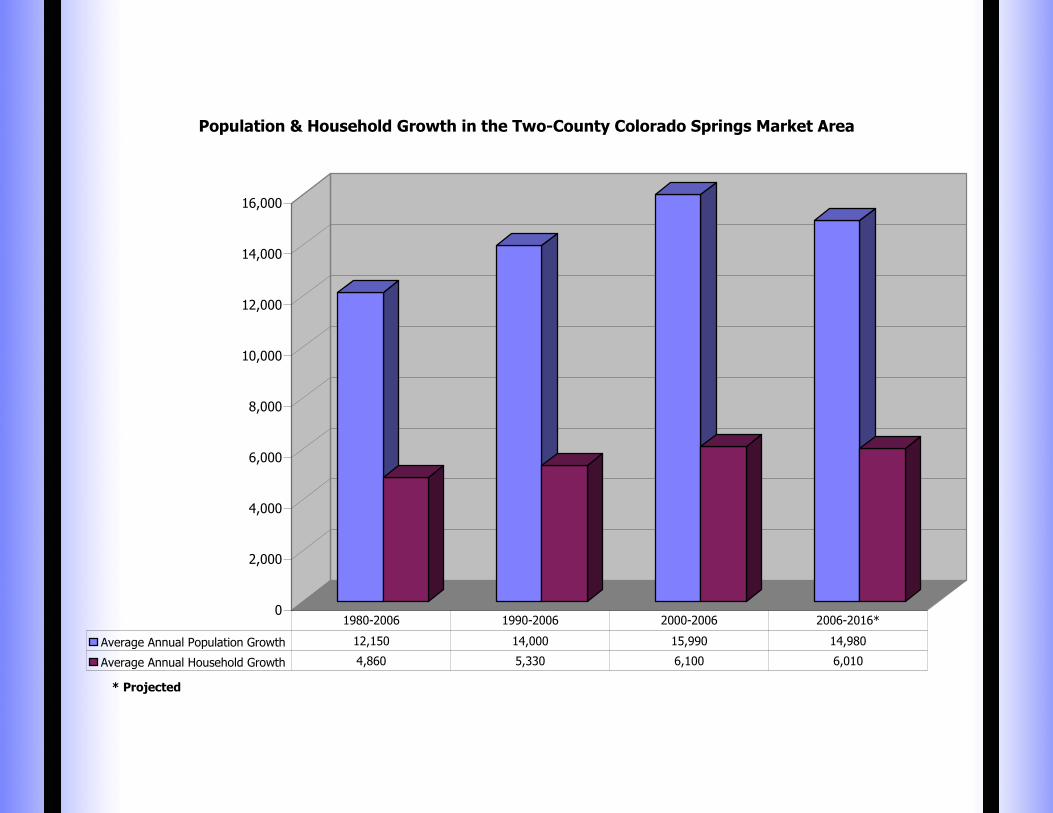
G. The Retail Commercial Market in the Two-County Market Area
The retail commercial development potentials for the two-county market area are a product of thesupply and demand forces affecting greater Colorado Springs and its trade area. The commercialand retail competition in this trade area represent the supply side of the market, and the size,market acceptance, and proximity of the competition will influence the capture rate anycommercial development can expect to achieve. The demand for commercial space in greaterColorado Springs depends on population growth, income characteristics, household expenditurepatterns, and visitation trends within the region’s primary trade area.
Table III-9 illustrates recent market characteristics in greater Colorado Springs for the firstquarter of 2006. Overall, the area has almost 15.5 million square feet of rentable retailcommercial space. The west and southwest submarkets, near Highway 24 have 2,154,350square feet. The vacancy rate in these two areas is 9.7%, with the southwest submarkethaving the lowest vacancy of all submarkets. In these two submarkets, over 21,000 squarefeet has been leased in 2006, almost 13% of the region’s total.
Total Rentable Percent of Vacant Percent of Vacancy Leasing LeasingSubmarket Square Feet Total Square Feet Total Rate Activity Absorption Activity AbsorptionCBD 157,969 1.0% 32,960 2.6% 20.9% 3,094 -10,858 7,180 -1,287CBD Fringe 339,521 2.2% 20,279 1.6% 6.0% 0 0 41,002 26,777Northwest 790,752 5.1% 82,850 6.6% 10.5% 8,035 8,035 40,114 6,807Northeast 3,342,651 21.6% 92,724 7.4% 2.8% 38,423 32,738 102,145 22,437East 2,993,808 19.3% 259,415 20.7% 8.7% 38,061 11,313 124,395 19,782Southeast 1,844,070 11.9% 370,869 29.6% 20.1% 18,070 333 91,782 57,008Southwest 1,801,638 11.6% 46,137 3.7% 2.6% 17,392 13,026 27,111 -9,012West 352,712 2.3% 25,205 2.0% 7.1% 3,949 -9,095 3,528 -4,415North Central 3,574,141 23.1% 304,049 24.3% 8.5% 37,815 14,558 58,775 -85,821Monument 129,540 0.8% 7,500 0.6% 5.8% 2,000 2,000 11,400 10,600Falcon 162,740 1.1% 9,399 0.8% 5.8% 1,200 1,200 5,251 2,601
Total 15,489,542 100.0% 1,251,387 100.0% 8.1% 168,039 63,250 512,683 45,477
Source: Sierra Commercial Real Estate, Inc. and THK Associates, Inc.
First Quarter, 2006 1st Quarter 2006
TABLE III-9: Greater Colorado Springs Retail Market Characteristics, 2006
Total 2005

U.S. HIGHWAY 24
39
H. The Office Market in the Two-County Market Area
1. Office Market Trends
As the local greater Colorado Springs market evolves and the regional market continues toexpand, additional demand will be generated for office space.
Table III-10 shows market characteristics of the greater Colorado Springs market area for thefirst quarter of 2006. The U.S. Highway 24 sites reside in the southwest submarket. Thegreater Colorado Springs area presently has 25.6 million square feet of office space andcurrently, there are 1,790,365 square feet of office space, 7% of the total in the southwestmarket. Absorption is down in the first quarter of 2006 at 52,915 square feet in the region, butonly 3,284 in the southwest submarket, compared to the average of 2005 per quarter of 9,936.
Table III-11 demonstrates characteristics of a representative sample of office buildings in thetwo-county Colorado Springs market area. As shown, 909 office buildings were sampled andthis represented total office square footage of 24,752,116 square feet, for an average buildingsize of 27,230 square feet. The median office building size, however, is approximately 10,000square feet and only 14% of the buildings are greater than 50,000 square feet. A total of 18%of the office space was built prior to 1970 and in the 1970’s construction averaged 408,310square feet per year, while during the 1980’s construction averaged 722,700 square feet peryear, with the 1990’s averaging 311,600 square feet. Since 2000, office construction hasaveraged 713,900 square feet per year. Since 1970, office space construction has averaged514,200 square feet per year.
Total Rentable Percent of Vacant Percent of Vacancy Leasing Leasing
Submarket Square Feet Total Square Feet Total Rate Activity Absorption Activity AbsorptionCBD 3,345,202 13.1% 266,797 8.7% 8.0% 32,717 -81 92,787 -10,172
CBD Fringe 2,712,409 10.6% 215,813 7.0% 8.0% 44,774 16,552 73,864 -45,922North I-25 10,272,728 40.1% 1,440,155 47.0% 14.0% 148,334 8,766 606,522 219,100Northeast 3,855,011 15.1% 462,619 15.1% 12.0% 53,354 31,831 205,526 -233
Southeast 3,635,018 14.2% 521,334 17.0% 14.3% 41,361 -7,437 234,097 36,032Southwest 1,790,365 7.0% 156,880 5.1% 8.8% 4,359 3,284 94,843 39,743
Total 25,610,733 100.0% 3,063,598 100.0% 12.0% 324,899 52,915 1,307,639 238,548
Source: Sierra Commercial Real Estate, Inc. and THK Associates, Inc.
First Quarter, 2006 1st Quarter 2006
Table III-10: Greater Colorado Springs Office Market Characteristics, 2006
Total 2005

U.S. HIGHWAY 24
40
A. Office Buildings by Size
Number of Percent Square Percent VacancyBuildings of Total Footage of Total Rate
100,000 and Over 53 6% 9,192,973 37% 16%50,000 - 99,999 71 8% 5,050,852 20% 19%20,000 - 49,999 165 18% 5,169,652 21% 18%10,000 - 19,999 194 21% 2,734,821 11% 17%Less than 10,000 426 47% 2,603,818 11% 14%
Total 909 100% 24,752,116 100% 17%
B. Office Buildings by Year of Construction
Number of Percent Square Percent VacancyBuildings of Total Footage of Total Rate
Before 1970 163 18% 2,254,751 9% 13%1970s 160 18% 4,083,116 16% 10%1980s 261 29% 7,227,203 29% 15%1990s 90 10% 3,115,961 13% 9%2000s 116 13% 3,569,421 14% 17%N/A 119 13% 4,501,664 18% 32%
Total 909 100% 24,752,116 100% 17%
C. Office Buildings by Class
Number of Percent Square Percent VacancyBuildings of Total Footage of Total Rate
Class A 114 13% 6,811,155 28% 31%Class B 241 27% 6,912,545 28% 24%Class C 113 12% 1,253,308 5% 30%N/A 441 49% 9,775,108 39% 0%
Total 909 100% 24,752,116 100% 17%
Source: DMCAR, & THK Associates, Inc.
Table III-11: Characteristics of the Representative Office Buildingsin the Two-County Colorado Springs Market Area

U.S. HIGHWAY 24
41
Table III-12 illustrates the estimated percentages of new employment that will be housed inoffice buildings for each major employment category. Some industries are more likely thanothers to house employees in office space rather than in industrial buildings, retail facilities,schools, or public buildings. Those industries projected to generate the bulk of the new jobsand their respective occupational breakdowns make it clear that employment growth in the two-county market area during the next decade will include a sizeable number of service oriented,white collar occupations.
In Table III-13 office employment percentages are applied to the projected change inemployment by industry in the two-county market area in order to project the total growth inoffice employment over the next decade. As shown, it’s estimated that total office employmentwill increase by an average of approximately 3,178 per year over the next decade in the two-county market area. FIRE (finance, insurance, real estate) employment will account for anaverage of approximately 1,414 new office employees annually, or 44% of the total growth inoffice employment; the service sector will add 1,234 jobs annually, and the retail trade sector willadd approximately 171 office employees annually.
TABLE III-12: Proportion of New Employment Housed in Office Space
Proportion of
New Employment
Industry Housed in Office Space
Mining 20%
Construction 10%
Manufacturing 15%
Transportation, Communcation, Public Utilities 30%
Wholesale Trade 15%
Retail Trade 22%
Finance, Insurance, Real Estate 85%
Services 56%
Government 20%
Source: Colorado Dept. of Labor and Employment and THK Associates, Inc.

42
TABLE III-13: Projected Annual Change in Office Employment in the Two-County Colorado Springs MSA, 2006-2016
Annual
Average
Industry 2006 2007 2008 2009 2010 2011 2012 2013 2014 2015 2016 Change
Mining 103 99 95 91 87 83 80 77 73 70 67 -4
Construction 2,792 2,882 2,974 3,069 3,167 3,268 3,373 3,481 3,592 3,707 3,826 103
Manufacturing 4,545 4,581 4,618 4,655 4,692 4,730 4,768 4,806 4,844 4,883 4,922 38
T & U* 5,658 5,802 5,951 6,103 6,260 6,420 6,584 6,753 6,926 7,103 7,285 163
Wholesale Trade 1,421 1,451 1,481 1,512 1,543 1,575 1,608 1,642 1,676 1,711 1,746 32
Retail Trade 12,613 12,775 12,938 13,104 13,272 13,442 13,614 13,788 13,964 14,143 14,324 171
FIRE** 36,111 37,324 38,578 39,874 41,214 42,599 44,030 45,509 47,039 48,619 50,253 1,414
Services 61,709 62,844 64,001 65,178 66,378 67,599 68,843 70,109 71,399 72,713 74,051 1,234
Goverment 12,820 12,846 12,872 12,897 12,923 12,949 12,975 13,001 13,027 13,053 13,079 26
Farm 0 0 0 0 0 0 0 0 0 0 0
Total Office Employment 137,772 140,604 143,507 146,483 149,535 152,665 155,874 159,165 162,540 166,002 169,553 3,178
* Transportation & Utilities
** Finance, Insurance, and Real Estate
Source: THK Associates, Inc.

U.S. HIGHWAY 24
43
Two important trends affecting the demand for office space are the increasing use ofsophisticated electronic business machines and the adoption of open space floorplans that can beadapted rapidly as space needs change. New technology will enable firms to do more work withfewer employees. Routine filing and record keeping will be handled automatically, reducing thedemand for unskilled office help. On the other hand, firms will need space for expansions toaccommodate the growing use of electronic equipment. Consequently, while the actual spaceavailable for each office worker will decline, the average number of square feet per officeemployee will increase.
Recent research by the Urban Land Institute indicates the national average square footage permetropolitan office employee increased from 195 square feet to 210 square feet, primarily becauseof increased equipment needs. By multiplying the standard of 210 square feet per office employeewith the annual growth in new office employment, the annual demand for new office space can beestimated. Given that growth in office employment will average 3,178 workers per year in thetwo-county area, there should be an average annual demand for approximately 722,260 squarefeet of office space from 2006 to 2016. Approximately 80% of this demand, 577,810 square feetper year, will be for speculative or multi-tenant office space, with the remaining 20% (an averageof 144,450 square feet) going to single tenant owners/users.
Table III-14: Projected Office Space Demand in
the Two-County MSA, 2006-2016
Annual Projected
Total Change Projected Annual Multi-tenant
Office Office Occupied Office Office Space
Year Employment Employment Space Demand Demand
2006 137,772 2,762 635,297 508,237
2007 140,604 2,832 651,284 521,027
2008 143,507 2,903 667,713 534,170
2009 146,483 2,977 684,595 547,676
2010 149,535 3,052 701,946 561,557
2011 152,665 3,129 719,779 575,823
2012 155,874 3,209 738,108 590,486
2013 159,165 3,291 756,948 605,559
2014 162,540 3,375 776,316 621,052
2015 166,002 3,462 796,226 636,981
2016 169,553 3,551 816,695 653,356
Annual Average
2006-2016 154,593 3,178 722,260 577,810
Note: Square footage/office worker: 230
Multi-tenant demand distribution: 80%
Source: THK Associates, Inc.

U.S. HIGHWAY 24
44
I. The Industrial/Flex/R&D Market in the Two-County Market Area
As of the first quarter of 2006, industrial vacancy rates for the greater Colorado Springs marketarea was around 11% of the total square footage of 29,165,402 square feet. The markets inwhich the U.S. Highway 24 Corridor exists are in the northwest and southwest submarkets thataccount for 30.9% of the total square footage. The southwest submarket has a very lowvacancy at under 1%. Absorption rates were up in the first quarter of 2006 in the regioncompared to absorption in 2005 per quarter average.
Table III-16 demonstrates characteristics of a representative sample of industrial/flex buildingsin the two-county Colorado Springs market area. As shown, 1,188 industrial/flex buildings weresampled, representing a total of 28,142,128 square feet for an average building size of 23,690square feet, but the median size is approximately 15,000 square feet. In the 1980’s, theColorado Springs area averaged the construction of 937,140 square feet; in the 1990’s, itaveraged 483,720 square feet; and 406,550 square feet per year since 2000. On average,since 1970, Colorado Springs has constructed 681,600 square feet per year.
Total Rentable Percent of Vacant Percent of Vacancy Leasing Leasing
Submarket Square Feet Total Square Feet Total Rate Activity Absorption Activity Absorption
CBD 6,723,131 23.1% 614,157 18.7% 9.1% 78,645 13,538 332,793 28,437
Northwest 7,609,320 26.1% 763,810 23.3% 10.0% 51,135 -177 263,641 83,441Northeast 3,142,604 10.8% 384,658 11.7% 12.2% 54,402 40,557 120,860 -43,923
Southeast 10,286,143 35.3% 1,490,751 45.5% 14.5% 148,722 3,421 664,736 115,968
Southwest 1,404,204 4.8% 24,588 0.8% 1.8% 8,864 -4,457 8,032 -11,568
Total 29,165,402 100.0% 3,277,964 100.0% 11.2% 341,768 52,882 1,390,062 172,355
Source: Sierra Commercial Real Estate, Inc. and THK Associates, Inc.
First Quarter, 2006 1st Quarter 2006
TABLE III-15: Colorado Springs Industrial Market Characteristics, 2006
Total 2005

U.S. HIGHWAY 24
45
A. Industrial Buildings by Size
Number of Percent Square Percent Vacancy
Buildings of Total Footage of Total Rate
100,000 and Over 42 4% 7,092,259 25% 12%
50,000 - 99,999 83 7% 5,666,111 20% 19%20,000 - 49,999 238 20% 7,459,843 27% 15%10,000 - 19,999 351 30% 4,779,529 17% 15%Less than 10,000 474 40% 3,144,386 11% 6%
Total 1,188 100% 28,142,128 100% 14%
B. Industrial Buildings by Year of Construction
Number of Percent Square Percent Vacancy
Buildings of Total Footage of Total Rate
Before 1970 214 18% 3,603,014 13% 14%
1970s 251 21% 5,697,927 20% 13%1980s 344 29% 9,371,441 33% 11%1990s 159 13% 4,837,721 17% 4%
2000s 128 11% 2,032,747 7% 19%N/A 92 8% 2,599,278 9% 42%
Total 1,188 100% 28,142,128 100% 14%
C. Industrial Buildings by Specfic Use
Number of Percent Square Percent VacancyBuildings of Total Footage of Total Rate
Flex/R&D 146 12% 6,723,188 24% 21%Light Manufacturing 148 12% 5,769,933 21% 15%Warehouse - Distribution 814 69% 14,412,311 51% 8%
Other 49 4% 839,952 3% 29%N/A 31 3% 396,744 1% 40%
Total 1,188 100% 28,142,128 100% 14%
Source: DMCAR, & THK Associates, Inc.
Table III-16: Characteristics of the Representative Industrial Buildingsin the Two-County Colorado Springs Market Area

U.S. HIGHWAY 24
46
The preceding discussion describing the current characteristics of the industrial/flex market inthe two-county market area provide the framework necessary to project local demands forindustrial/flex space. Employment growth of the next decade will create the principal demandsfor additional industrial/flex land and building space of all types in the relevant market areas.
Some enterprises are more likely than others to house employees in industrial/flex space ratherthan in office buildings, retail establishments, schools or public buildings. The percentage ofnew employment that will be housed in industrial buildings for each major industrial group isgiven below in Table III-17.
In Table III-18, the industrial employment percentages from Table III-17 are applied toprojected employment change per year by industry in the two-county market area to find thegrowth per year in the number of employees expected to be housed in industrial facilities in thecoming decade. Industrial employment is projected to experience an average annual growth of1,109 new industrial jobs from 2006 through 2016. Cyclical employment forces have not beenillustrated in order to present an overall economic employment growth trend. The servicessector is expected to account for 35.8% of the total growth, with 19.3% coming from themanufacturing sector.
Table III-17: Proportion of New Employment Housed in Industrial Space
Proportion of
New Employment
Industry Housed in Industrial Space
Mining and Construction 13%
Manufacturing 85%
Transportation, Communcation, Public Utilities 25%
Wholesale Trade 85%
Retail Trade 5%
Finance, Insurance, Real Estate 0%
Services 18%
Government 5%
Agriculture 10%
Source: Colorado Dept. of Labor and Employment and THK Associates, Inc.

Table III-18: Projected Average Inustrial Employment in the Two-County Colorado Springs MSA, 2006-2016
Annual
Average
Industry 2006 2007 2008 2009 2010 2011 2012 2013 2014 2015 2016 Change
Mining and Construction 3,697 3,810 3,927 4,049 4,174 4,303 4,437 4,575 4,718 4,865 5,018 132
Manufacturing 25,756 25,962 26,169 26,379 26,590 26,803 27,017 27,233 27,451 27,671 27,892 214
T & U* 4,715 4,835 4,959 5,086 5,216 5,350 5,487 5,627 5,771 5,919 6,071 136
Wholesale Trade 8,054 8,221 8,392 8,567 8,745 8,927 9,112 9,302 9,495 9,693 9,894 184
Retail Trade 2,867 2,903 2,941 2,978 3,016 3,055 3,094 3,134 3,174 3,214 3,256 39
FIRE** 0 0 0 0 0 0 0 0 0 0 0 0
Services 19,835 20,200 20,572 20,950 21,336 21,728 22,128 22,535 22,950 23,372 23,802 397
Goverment 3,205 3,211 3,218 3,224 3,231 3,237 3,244 3,250 3,257 3,263 3,270 6
Farm 134 136 137 139 141 143 144 146 148 150 152 2
Farm 0 0 0 0 0 0 0 0 0 0 0
Total Industrial Employment 68,261 69,279 70,315 71,372 72,448 73,545 74,663 75,802 76,963 78,147 79,353 1,109
* Transportation & Utilities
** Finance, Insurance, and Real Estate
Source: THK Associates, Inc.

U.S. HIGHWAY 24
48
Table III-19 Space Requirements for Industrial Employment
Square Feet of
Building Space
Activity per Employee
Management & Administration 250-300
Sales & Marketing 250-300
Data Processing 450-500
R & D Assembly 500-600
Warehousing, Distribution, Manufacturing 1,000-1,500
Overall Colorado Springs Average 550
Source: THK Associates, Inc.
Differences between warehouse, manufacturing, light assembly and office space have becomeincreasingly less distinct in recent years as firms move toward office/service center concepts.The relative space needs of firms in terms of quantity depend on their principal type of activity.The following shows the estimated per employee space needs of various types of industrialoperations.
The two-county industrial market is generally split between the management and marketingsegments, and the larger warehouse, distribution, and manufacturing uses which generallyrequire more square feet of building space per employee. The majority of future growth islikely to be for service-oriented uses, which require less square footage of building space peremployee. Overall, in the two-county market area, industrial users are estimated to requireapproximately 500 square feet per employee. By using this standard, projected industrialemployment can be converted into industrial space demand estimates. Table III-20 shows theprojected demand for industrial space in the two-county market area during the next decader.
Warehouse distribution in the trade area will account for over 60% of total demand in the two-county market area, or an annual average of approximately 368,760 square feet, withmanufacturing accounting for approximately 120,910 square feet per year, or 20% of the total.R & D industrial space will account for the remaining 19% of the demand in the two-countymarket area, or 114,860 annually. During the period from 2006 through 2016, totalindustrial/flex space demand will increase by an annual average of 604,530 square feet.

U.S. HIGHWAY 24
49
Table III-20: Projected Industrial Space Demand in
the Two-County Colorado Springs MSA, 2006-2016
Annual Annual Occupied Industrial Space Demand
Total Change
Industrial Industrial Warehouse &
Year Employment Employment Total Distribution Manufacturing R & D
2006 68,261 998 549,140 334,975 109,828 104,337
2007 69,279 1,017 559,565 341,334 111,913 106,317
2008 70,315 1,037 570,154 347,794 114,031 108,329
2009 71,372 1,056 580,968 354,390 116,194 110,384
2010 72,448 1,076 592,012 361,127 118,402 112,482
2011 73,545 1,097 603,291 368,008 120,658 114,625
2012 74,663 1,118 614,868 375,069 122,974 116,825
2013 75,802 1,139 626,637 382,248 125,327 119,061
2014 76,963 1,161 638,659 389,582 127,732 121,345
2015 78,147 1,184 650,996 397,108 130,199 123,689
2016 79,353 1,206 663,489 404,728 132,698 126,063
Annual Average
2006-2016 1,109 1,109 604,530 368,760 120,910 114,860
NOTE:
Square Footage/Employee 550
Space Distribution
Warehouse & Distribution 61%
Manufacturing 20%
R & D/Service 19%
Source: THK Associates, Inc.
U.S. HIGHWAY 24
50
J. The Hotel Market in the Two-County Market Area
The demand for hotel accommodations is derived from three principal sources: business relatedtravel, conventions and tourism. Travelers, whether they be business/commercial travelers,group travelers or noncommercial pleasure travelers, have varying demand characteristics thatinfluence the selection of particular hotels, how long they stay and how much they are willing topay for a room. The demographic trends most responsible for determining the popularity oftravel destinations and room demand are population growth and shifts; rising householdincomes; increased leisure time; interstate highway construction; suburbanization of businessactivities; and air travel and airport construction. The table below lists the principal reasons fortravel today in the United States.
One-third of the total travel market is accounted for by business related travel; the remainder isaccounted for by pleasure travel and friend/relative visitation. The market for pleasure travel inthe United States has been increasing during the past decade, due largely to the increasing costof foreign travel and the growing number of foreign tourists visiting this country.
Overall, some 55 percent of the market for hotel/motel accommodations is derived from guestson business trips and 25 percent is derived from conventioneers. Tourists comprise just 20percent of the market for hotel/motel rooms. Business travelers prefer locations near airports,in suburban areas, and near highways close to business contacts and transportation facilities;tourists are more likely to locate along highways and in resorts; and conferences prefer resortor downtown locations within easy reach of tourist-related services and amenities.
The group travel market is currently being pulled by two conflicting trends. Corporations areincreasingly turning to incentive travel and meetings as a means of rewarding valuedemployees, and the overall growth in white-collar jobs is generating solid growth in theconvention and meetings markets. On the other hand, technological advances intelecommunications and teleconferencing and the desire to control travel costs may ultimatelyreduce the demand for large conventions and out-of-town meetings.
On the construction side of the industry, hotels are becoming increasingly expensive to buildand operate. This is due largely to the need for more complex systems to serve security,
Purpose of Trip Percent
Visit Friends or Relatives 28%Other Pleasure 34%Business and Conventions 33%Other 5%
Source: U.S. Travel Data Center and THK Associates, Inc.
Distribution of United States Travel Market by Purpose of Trip
U.S. HIGHWAY 24
51
communications, safety and mechanical requirements. The traditional rule-of-thumb is that ahotel should achieve stabilized rate and occupancy levels by its second or third year ofoperation. Today, many show losses through the first three to five years of operation. As aresult, the hotel market itself is becoming increasingly complex and diversified, offeringdifferent product lines for a growing number of market segments.
As discussed previously, annually, approximately 6.2 million people visit the Colorado Springsarea with 30% spending the night in the area’s 13,600 hotel rooms, of which, approximately5,000 are at resort and conference centers. The number of visits to Colorado Springs isprojected annually by 2.2% and by 2016, more than 7.6 million visitors can be expected and17,000 hotel rooms will be needed to accommodate these visitors. Annually, the ColoradoSprings area will need to add 419 hotel rooms to keep pace with projected visitor growth.

Resort/Average Percent Daily Daily Stabilized Total Conference Balance of
Total Daily Overnight Overnight Persons/ Room Occupancy Room Annual Room HotelYear Visitors Visitors Visitors Visitors Room Demand Rate Demand Increase Demand Demand2006 6,183,100 16,940 30.0% 5,082 1.9 8,024 59% 13,600 375 4,760 8,8402007 6,319,128 17,313 30.0% 5,194 1.9 8,201 59% 13,900 384 4,865 9,0352008 6,458,149 17,694 30.0% 5,308 1.9 8,381 59% 14,205 391 4,972 9,2332009 6,600,228 18,083 30.0% 5,425 1.9 8,566 59% 14,518 401 5,081 9,4372010 6,745,433 18,481 30.0% 5,544 1.9 8,754 59% 14,837 409 5,193 9,6442011 6,893,833 18,887 30.0% 5,666 1.9 8,947 59% 15,164 418 5,307 9,8562012 7,045,497 19,303 30.0% 5,791 1.9 9,143 59% 15,497 427 5,424 10,0732013 7,200,498 19,727 30.0% 5,918 1.9 9,345 59% 15,838 437 5,543 10,2952014 7,358,909 20,161 30.0% 6,048 1.9 9,550 59% 16,187 446 5,665 10,5212015 7,520,805 20,605 30.0% 6,181 1.9 9,760 59% 16,543 457 5,790 10,7532016 7,686,263 21,058 30.0% 6,317 1.9 9,975 59% 16,907 466 5,917 10,989
Annual GrowthNumerical 150,316 412 124 419 116 215
Percentage 2.2% 2.2% 2.2% 2.2%
Source: THK Associates, Inc.
Table III-21: Projected Lodging Demand in the
Two County Colorado Springs Market Area, 2006-2016
U.S. HIGHWAY 24
53
IV. SOCIO-ECONOMIC TRENDS IN THE U.S. HIGHWAY 24 ENVIRONS FROM
MANITOU SPRINGS TO INTERSTATE 25
A. Population and Household Trends in the Primary Trade Areas
U.S. Highway 24 stretches approximately 6 miles from Interstate Highway 24 through ManitouSprings and in this reach it serves as the major vehicular access route for a substantialpopulation base and a significant number of businesses. The immediate neighborhoods thatare within 5 minutes or 0.7 of a mile of U.S. Highway 24 are in its primary trade area forconvenience or neighborhood oriented commercial and personal service establishments, asdefined by the Urban Land Institute. This area is depicted in the accompanying illustration.When higher speeds and better access are accomplished along this stretch of U.S. Highway 24through improvements that upgrade the roadway to an expressway or a freeway, this primarytrade area expands. Under expressway standards, neighborhoods within 1.5 miles are nowwithin 5 minutes of this corridor and under freeway standards neighborhoods within 2.0 milesare within 5 minutes of this corridor. It is important to understand and profile the socio-economic characteristics of these three alternative primary trade areas because they havesubstantial impacts on business and development potentials for the areas serviced.
Table IV-1 demonstrates historical trends for neighborhoods within 5 minutes along U.S.Highway 24 from Manitou Springs to Interstate 25 under current conditions, with improvementsto expressway standards and improvements to freeway standards. Under current conditions,29,773 people reside in 13,978 households in this primary trade area, which has historicallybeen growing by 270 people in approximately 150 households, and almost 5% of the ColoradoSprings metropolitan area population live in this area. With improvements to expresswaystandards 52,214 people reside in 24,173 households and this primary trade area hashistorically been growing by 580 people in 310 households and over 8% of the Colorado Springsmetropolitan area population live in this area. With improvements to freeway standards 65,239people reside in 29,654 households and this primary trade area has been growing by 750people in 375 households and over 10% of the Colorado Springs metropolitan area populationlive in this area. Table IV-2 shows projected populations for these 3 primary trade areas. Asshown, by 2016 it is estimated that, under the current conditions, the primary trade area willgrow to 32,564 people in 15,440 households; as an expressway, by 2016 the primary tradearea would grow to 58,250 people in 27,236 households; and as a freeway the primary tradearea would grow to 72,781 people in 33,491 households by 2016.
Realizing these factors, it is now possible to profile existing and projected impacts on businessdevelopment in these potential primary trade areas.

POTENTIAL PRIMARY TRADE AREAS ALONG THE U.S. HIGHWAY 24 CORRIDOR

Two-County Colorado Springs MSA 1980 1990 2000 2006 Numerical Percent Numerical Percent Numerical Percent
Population 317,458 409,482 537,484 633,424 12,153 2.7% 13,996 2.8% 15,990 2.8%
Households 110,673 151,685 200,402 237,004 4,859 3.0% 5,332 2.8% 6,100 2.8%
2.868 2.700 2.682 2.673
Current Primary Trade Area (5 minute drivetime = 0.7 miles)
Population 24,709 25,413 28,151 29,773 195 0.7% 273 1.0% 270 0.9%
Households 10,830 11,423 13,095 13,978 121 1.0% 160 1.3% 147 1.1%
Current Trade Area
as a percent of the
Two-County Colorado Springs MSA
Population 7.8% 6.2% 5.2% 4.7% 1.6% 1.9% 1.7%
Households 9.8% 7.5% 6.5% 5.9% 2.5% 3.0% 2.4%
Expressway Primary Trade Area (5 minute drivetime = 1.5 miles)
Population 44,334 43,252 48,714 52,214 303 0.6% 560 1.2% 583 1.2%
Households 19,080 19,220 22,336 24,173 196 0.9% 310 1.4% 306 1.3%
2.3235849 2.2503642 2.1809635
Expressway Trade Area
as a percent of the
Two-County Colorado Springs MSA
Population 14.0% 10.6% 9.1% 8.2% 2.5% 4.0% 3.6%
Households 17.2% 12.7% 11.1% 10.2% 4.0% 5.8% 5.0%
Freeway Primary Trade Area (5 minute drivetime = 2 miles)
Population 52,464 54,025 60,760 65,239 491 0.8% 701 1.2% 746 1.2%
Households 22,152 23,699 27,402 29,654 289 1.1% 372 1.4% 375 1.3%
Freeway Trade Area
as a percent of the
Two-County Colorado Springs MSA
Population 16.5% 13.2% 11.3% 10.3% 4.0% 5.0% 4.7%
Households 20.0% 15.6% 13.7% 12.5% 5.9% 7.0% 6.2%
Source: U.S. Bureau of the Census and THK Associates, Inc.
Table IV-1: Population and Household Trends in the Two-County Colorado Springs MSA and the Alternative U.S. Highway 24 Primary Trade Areas, 1980-2006
1980-2006
Annual Average
1990-2006 2000-2006

Two-County Colorado Springs MSA 2006 2011 2016 Numerical Percent Numerical Percent
Population 633,424 703,420 783,200 13,999 2.1% 14,978 2.1%
Households 237,004 265,030 297,100 5,605 2.3% 6,010 2.3%
Current Primary Trade Area (5 minute drivetime = 0.7 miles)
Population 29,773 31,137 32,564 273 0.9% 279 0.9%
Households 13,978 14,691 15,440 1.00100 143 1.0% 146 1.0%
Current Trade Area
as a percent of the
Two-County Colorado Springs MSA
Population 4.7% 4.4% 4.2% 1.9% 1.9%
Households 5.9% 5.5% 5.2% 2.5% 2.4%
Expressway Primary Trade Area (1.5 miles)
Population 52,214 55,149 58,250 587 1.1% 604 1.1%
Households 24,173 25,659 27,236 1.00100 297 1.2% 306 1.2%
Expressway Trade Area
as a percent of the
Two-County Colorado Springs MSA
Population 8.2% 7.8% 7.4% 4.2% 4.0%
Households 10.2% 9.7% 9.2% 5.3% 5.1%
Freeway Primary Trade Area (2.0 miles)
Population 65,239 68,907 72,781 734 1.1% 754 1.1%
Households 29,654 31,476 33,411 1.00100 364 1.2% 376 1.2%
Freeway Trade Area
as a percent of the
Two-County Colorado Springs MSA
Population 10.3% 9.8% 9.3% 5.2% 5.0%
Households 12.5% 11.9% 11.2% 6.5% 6.3%
Annual Average
2006-2011 2006-2016
Source: U.S. Bureau of the Census, Claritas, & THK Associates, Inc.
Table IV-2: Projected Population and Household Trends in the Colorado Springs MSA and the Alternative U.S. Highway 24 Primary Trade Areas, 2006-2016

U.S. HIGHWAY 24
57
B. Current Businesses in the Existing Primary Trade Area
In the existing primary trade area of the subject stretch of U.S. Highway 24, THK inventoried361 businesses, which represents 7.7% of the metro Colorado Springs total. These businessesoccupy 995,949 square feet of space, which is 6.3% of the metro total. This area also has1,674 hotel/lodging rooms in 51 hotels/motels, which is 12% of the total room count in thegreater Colorado Springs area. Most of the businesses are restaurants.
Of this total, 91 businesses with 205,599 square feet are in Manitou Springs, and thisrepresents 25.2% of the businesses and 20.6% of the space.
Of this total, 72 businesses with 104,800 square feet are in Old Colorado City and thisrepresents 19.9% of the businesses and 10.5% of the space.
Of this total, 68 businesses with 331,198 square feet are at or near the I-25 intersection andthis represents 18.8% of the businesses and 33.3% of the space.
Of the total, 114 businesses with 375,392 square feet are convenience/neighborhood orientedbusinesses, which is 31.6% of businesses and 37.7% of the space.

U.S. HIGHWAY 24
58
Estimated Estimated
Store Type Number of Stores Retail Space
Hardware and Building Materials
1 Building Materials and Supplies 1 30,308
2 Hardware 2 10,726
Food Stores
3 Grocery (Includes Convenience/Gas Stations) 15 114,277
Automotive
4 Tire, Battery and Accessory 11 52,518
Apparel and Accessory
5 Men's Clothing 3 12,616
6 Women's Clothing 10 27,831
7 Children's Clothing 3 9,594
8 Shoes 1 2,331
9 Other Apparel & Accessories 4 7,423
Furniture and Equipment
10 Furniture 3 7,797
11 Home Furnishings & Accessories 5 36,144
12 Household Appliances 1 1,958
13 Furniture 2 4,831
14 Records & Music 2 4,398
Eating and Drinking Places
15 Restaurant 97 251,509
Drug and Proprietary
16 Drug / Cosmetics 2 23,595
Other Retail and Personal Services
17 Liquor / Wine & Spirits 8 14,600
18 Sporting Goods & Bicycle 8 16,532
19 Books & Stationary 5 10,816
20 Jewelry 11 13,360
21 Hobby & Specialty 33 112,947
22 Florist 6 8,400
23 Miscellaneous Retail 69 129,994
24 Personal Care Products & Services 49 70,943
25 Video Tape Rental 4 10,900
26 Dry Cleaner / Coin Laundry 5 8,300
27 Misc Personal Services 1 1,300
Total Retail 361 995,949
Table IV-3: Total Retail Establishments in U.S. Highway 24 Market Area
Source: THK Associates, Inc.

U.S. HIGHWAY 24
59
The following table displays the percentage and square footage breakdown by store categoryfor the two stores that include multiple categories.
Store Address Category Square Footage % of total
Office Depot 535 S. 8th Street Furniture 3,797 12.66%
Home Furnishings & Accessories 18,987 63.29%
Books & Stationary 3,418 11.39%
Hobby & Specialty 3,797 12.66%
30,000
Walmart 707 S. 8th Street Building Materials and Supplies 30,308 23.31%
Hardware 9,326 7.17%
Grocery 27,977 21.52%
Tire, Battery and Accessory 2,518 1.94%
Men's Clothing 6,994 5.38%
Women's Clothing 9,326 7.17%
Children's Clothing 6,994 5.38%
Shoes 2,331 1.79%
Other Apparel & Accessories 2,331 1.79%
Home Furnishings & Accessories 11,657 8.97%
Household Appliances 1,958 1.51%
Radio, Television, Stereo, Computer 2,331 1.79%
Records & Music 2,098 1.61%
Drug / Cosmetics 5,595 4.30%
Sporting Goods & Bicycle 1,166 0.90%
Books & Stationary 2,098 1.61%
Jewelry 560 0.43%
Hobby & Specialty 2,331 1.79%
Miscellaneous Retail 933 0.72%
Personal Care Products & Services 1,166 0.90%
130,000
Square Footages and Percentages are based on average size across all categories
Source: THK Associates, Inc.
Table IV-3A: Stores counted in multiple store categories in U.S. Highway 24 Market Area

U.S. HIGHWAY 24
60
Estimated Estimated
Store Type Number of Stores Retail Space
Food Stores
3 Grocery (Includes Convenience/Gas Stations) 5 12,200
Apparel and Accessory
5 Men's Clothing 1 1,821
6 Women's Clothing 5 11,005
9 Other Apparel & Accessories 2 3,791
Furniture and Equipment
10 Furniture 1 2,000
Eating and Drinking Places
15 Restaurant 28 82,859
Other Retail and Personal Services
17 Liquor / Wine & Spirits 1 1,800
18 Sporting Goods & Bicycle 2 4,066
20 Jewelry 1 1,800
21 Hobby & Specialty 10 18,118
22 Florist 1 2,000
23 Miscellaneous Retail 28 53,961
24 Personal Care Products & Services 6 10,178
Total Retail 91 205,599
Some stores such as Department Stores are included in multiple store categories
Table IV-4: Retail Establishments in Manitou Springs
Source: THK Associates, Inc.

U.S. HIGHWAY 24
61
Estimated Estimated
Store Type Number of Stores Retail Space
Apparel and Accessory
6 Women's Clothing 2 3,300
7 Children's Clothing 2 2,600
9 Other Apparel & Accessories 1 1,300
Furniture and Equipment
10 Furniture 1 2,000
11 Home Furnishings & Accessories 1 1,300
Eating and Drinking Places
15 Restaurant 13 21,300
Other Retail and Personal Services
17 Liquor / Wine & Spirits 1 2,000
18 Sporting Goods & Bicycle 1 1,300
19 Books & Stationary 1 1,300
20 Jewelry 6 7,800
21 Hobby & Specialty 14 20,800
23 Miscellaneous Retail 24 33,300
24 Personal Care Products & Services 5 6,500
Total Retail 72 104,800
Some stores such as Department Stores are included in multiple store categories
Table IV-5: Retail Establishments in Old Colorado City
Source: THK Associates, Inc.

U.S. HIGHWAY 24
62
Estimated Estimated
Store Type Number of Stores Retail Space
Hardware and Building Materials
1 Building Materials and Supplies 1 30,308
2 Hardware 1 9,326
Food Stores
3 Grocery (Includes Convenience/Gas Stations) 4 36,977
Automotive
4 Tire, Battery and Accessory 5 30,318
Apparel and Accessory
5 Men's Clothing 1 6,994
6 Women's Clothing 1 9,326
7 Children's Clothing 1 6,994
8 Shoes 1 2,331
9 Other Apparel & Accessories 1 2,331
Furniture and Equipment
10 Furniture 1 3,797
11 Home Furnishings & Accessories 2 30,644
12 Household Appliances 1 1,958
13 Radio, Television, Stereo, Computer 1 2,331
14 Records & Music 1 2,098
Eating and Drinking Places
15 Restaurant 18 47,500
Drug and Proprietary
16 Drug / Cosmetics 1 5,595
Other Retail and Personal Services
17 Liquor / Wine & Spirits 1 1,800
18 Sporting Goods & Bicycle 3 5,666
19 Books & Stationary 2 5,516
20 Jewelry 1 560
21 Hobby & Specialty 6 68,629
23 Miscellaneous Retail 3 5,533
24 Personal Care Products & Services 10 12,666
25 Video Tape Rental 1 2,000
Total Retail 68 331,198
Some stores such as Department Stores are included in multiple store categories
Table IV-6: Retail Establishments near the I-25/Highway 24 Interchange
Source: THK Associates, Inc.

U.S. HIGHWAY 24
63
C. Income Expenditure Patterns for the Existing Primary Trade Area Households
Table IV-7 demonstrates that households in the current primary trade area have a medianfamily income of $39,691, of which $12,680 is spent in retail and personal service businessestablishments with the greatest expenditure occurring in grocery stores and restaurants.
Tables IV-8 shows key operating characteristics of selected store types found in the primarytrade area. By comparing these performance characteristics with the expenditure patterns forthe primary trade area, the total dollar volume support and square footage support generatedfor each retail use can be estimated.
The first column of Table IV-8 illustrates the median household expenditure in the trade area bystore type as shown previously. The second column of Table IV-8 shows the sales per squarefoot GLA that the median store achieves based upon the performance characteristics surveyedin the Urban Land Institute's Dollars and Cents of Shopping Centers. These estimates have beenadjusted for inflation to reflect current operating characteristics. The next column shows themedian store size in square feet of typical tenants. For purposes of this analysis, this isconsidered to be an indication of the threshold size given that the anticipated sales per squarefoot performance as shown in the second column would have to be supported in order to maketheir introduction feasible.
The fifth column in Table IV-8 shows that annual sales of $27,157,000 would be necessary tosupport a building materials and supply store, a restaurant requires annual sales of $988,581and a women's clothing store needs sales support of $3,547,716. Finally, based upon theexpenditure patterns of households in each trade area as shown in the first column, theminimum number of households required to support each type of establishment can beestimated.

U.S. HIGHWAY 24
64
Median Household
Amount Percent
Median Gross Income $39,691
Taxes $9,644 24.3% of Gross
Disposable Income $30,047 75.7% of Gross
Housing $7,512 25.0% of Disposable
Transportation $5,409 18.0%
Savings / Pensions $1,442 4.8%
Medical / Insurance $1,382 4.6%
Recreation $421 1.4%
Education $421 1.4%
Miscellaneous $781 2.6%
Total Available for Retail $12,680 42.2% of Disposable
Store Type
Hardware and Building MaterialsBuilding Materials and Supplies $218 1.7% of Retail
Hardware $107 0.8%
Food StoresGrocery $3,608 28.5%
AutomotiveTire, Battery and Accessory $359 2.8%
Apparel and AccessoryMen's Clothing $333 2.6%
Women's Clothing $602 4.8%
Children's Clothing $295 2.3%
Shoes $277 2.2%
Other Apparel & Accessories $58 0.5%
Furniture and EquipmentFurniture $347 2.7%
Home Furnishings & Accessories $582 4.6%
Household Appliances $251 2.0%
Radio, Television, Stereo, Computer $457 3.6%
Records & Music $76 0.6%
Eating and Drinking PlacesRestaurant $1,853 14.6%
Drug and ProprietaryDrug / Cosmetics $420 3.3%
Other Retail and Personal ServicesLiquor / Wine & Spirits $303 2.4%
Sporting Goods & Bicycle $248 2.0%
Books & Stationary $243 1.9%
Jewelry $112 0.9%
Hobby & Specialty $86 0.7%
Florist $53 0.4%
Miscellaneous Retail $766 6.0%
Video Tape Rental $48 0.4%
Personal Care Products & Services $324 2.6%
Dry Cleaner / Coin Laundry $118 0.9%
Misc Personal Services $535 4.2%
Total Retail $12,680 100.0%
Source: U.S. Department of Labor, Bureau of Labor Statistics; and THK Associates, Inc.
Table IV-7: Estimated Household Expenditure Patterns
in the U.S. Highway 24 Current Primary Trade Area

U.S. HIGHWAY 24
65
Median Sales Per Median Threshold Minimum
Household Square Foot Store Size Household Expenditure
Store Type Expenditure GLA (Sq. Ft.) Support Support
Hardware and Building MaterialsBuilding Materials and Supplies $218 $417.80 65,000 124,444 $27,157,000
Hardware $107 $111.45 20,000 20,845 $2,229,000
Food StoresGrocery/Convenience $3,608 $390.25 10,000 1,082 $3,902,500
AutomotiveTire, Battery and Accessory $359 $219.72 6,000 3,672 $1,318,320
Apparel and AccessoryMen's Clothing $333 $185.37 15,000 8,355 $2,780,550
Women's Clothing $602 $177.39 20,000 5,890 $3,547,716
Children's Clothing $295 $235.54 15,000 11,993 $3,533,100
Shoes $277 $210.20 5,000 3,792 $1,050,994
Other Apparel & Accessories $58 $226.83 5,000 19,612 $1,134,141
Furniture and EquipmentFurniture $347 $224.68 20,000 12,951 $4,493,600
Home Furnishings & Accessories $582 $188.73 25,000 8,113 $4,718,213
Household Appliances $251 $237.49 15,000 14,195 $3,562,350
Radio, Television, Stereo, Computer $457 $319.34 5,000 3,492 $1,596,711
Records & Music $76 $254.45 4,500 14,991 $1,145,025
Eating and Drinking PlacesRestaurant $1,853 $282.45 3,500 534 $988,581
Drug and ProprietaryDrug / Cosmetics $420 $374.26 12,000 10,691 $4,491,120
Other Retail and Personal ServicesLiquor / Wine & Spirits $303 $321.25 4,000 4,236 $1,285,000
Sporting Goods & Bicycle $248 $197.34 6,000 4,780 $1,184,043
Books & Stationary $243 $143.41 4,500 2,652 $645,351
Jewelry $112 $445.74 1,200 4,759 $534,888
Hobby & Specialty $86 $213.04 5,000 12,358 $1,065,220
Florist $53 $174.70 1,500 4,901 $262,050
Miscellaneous Retail $766 $201.00 2,000 525 $402,000
Video Tape Rental $48 $145.37 6,000 18,168 $872,220
Personal Care Products & Services $324 $147.29 1,200 545 $176,748
Dry Cleaner / Coin Laundry $118 $124.26 1,600 1,687 $198,816
Misc. Personal Services $535 $158.59 1,200 356 $190,308
Total Retail $12,680
Source: U.S. Department of Labor, Bureau of Labor Statistics; and THK Associates, Inc.
Table IV-8: Characteristics of Selected Store Types
for the U.S. Highway 24 Current Primary Trade Area
U.S. HIGHWAY 24
66
D. Estimated Sales and Square Footage Support in the Existing Primary TradeArea
Realizing household expenditure patterns and sales per square foot typically accomplished bybusiness establishments, it is possible to estimate the amount of space and the dollar volume ofsupport that can be generated by households living in the current primary trade area for thisstretch of U.S. Highway 24. Table IV-9 demonstrates that the 13,978 households generateexpenditures of $177.24 million and can support 712,779 square feet of retail and personalservice space. The greatest support is for grocery store space at $50.44 million in 129,245square feet and restaurants at $25.9 million in 91,689 square feet.
Estimated Annual
Annual Sales per 2006 Support 2011 Support 2016 Support
Household Square Dollars Number of Dollars Dollars
Store Type Expenditures Foot GLA (000,000's) Square Feet Establishments (000,000's) Square Feet (000,000's) Square Feet
Households 13,978 14,691 15,440
Hardware and Building MaterialsBuilding Materials and Supplies $218 $417.80 $3.05 7,301 0.15 $3.21 7,673 $3.37 8,065
Hardware $107 $111.45 $1.49 13,411 1.06 $1.57 14,095 $1.65 14,814
Food StoresGrocery $3,608 $390.25 $50.44 129,245 3.82 $53.01 135,838 $55.71 142,767
AutomotiveTire, Battery and Accessory $359 $219.72 $5.02 22,837 4.49 $5.27 24,002 $5.54 25,227
Apparel and AccessoryMen's Clothing $333 $185.37 $4.65 25,095 2.61 $4.89 26,375 $5.14 27,720
Women's Clothing $602 $177.39 $8.42 47,462 4.17 $8.85 49,883 $9.30 52,427
Children's Clothing $295 $235.54 $4.12 17,483 1.92 $4.33 18,375 $4.55 19,312
Shoes $277 $210.20 $3.87 18,430 5.03 $4.07 19,370 $4.28 20,358
Other Apparel & Accessories $58 $226.83 $0.81 3,564 1.04 $0.85 3,745 $0.89 3,937
Furniture and EquipmentFurniture $347 $224.68 $4.85 21,587 5.68 $5.10 22,688 $5.36 23,845
Home Furnishings & Accessories $582 $188.73 $8.13 43,074 2.67 $8.54 45,271 $8.98 47,580
Household Appliances $251 $237.49 $3.51 14,771 4.80 $3.69 15,524 $3.87 16,316
Radio, Television, Stereo, Computer $457 $319.34 $6.39 20,012 5.40 $6.72 21,032 $7.06 22,105
Records & Music $76 $254.45 $1.07 4,196 1.25 $1.12 4,410 $1.18 4,635
Eating and Drinking PlacesRestaurant $1,853 $282.45 $25.90 91,689 30.10 $27.22 96,366 $28.61 101,281
Drug and ProprietaryDrug / Cosmetics $420 $374.26 $5.87 15,690 1.32 $6.17 16,490 $6.49 17,331
Other Retail and Personal ServicesLiquor / Wine & Spirits $303 $321.25 $4.24 13,198 4.53 $4.46 13,872 $4.68 14,579
Sporting Goods & Bicycle $248 $197.34 $3.46 17,544 7.68 $3.64 18,439 $3.82 19,380
Books & Stationary $243 $143.41 $3.40 23,716 7.12 $3.57 24,926 $3.76 26,197
Jewelry $112 $445.74 $1.57 3,524 2.92 $1.65 3,704 $1.74 3,893
Hobby & Specialty $86 $213.04 $1.20 5,656 1.34 $1.27 5,944 $1.33 6,247
Florist $53 $174.70 $0.75 4,278 2.95 $0.79 4,496 $0.83 4,725
Miscellaneous Retail $766 $201.00 $10.71 53,268 27.43 $11.25 55,985 $11.83 58,841
Video Tape Rental $48 $145.37 $0.67 4,616 2.34 $0.71 4,852 $0.74 5,099
Personal Care Products & Services $324 $147.29 $4.53 30,754 15.67 $4.76 32,323 $5.00 33,972
Dry Cleaner / Coin Laundry $118 $124.26 $1.65 13,256 8.13 $1.73 13,932 $1.82 14,643
Misc Personal Services $535 $158.59 $7.47 47,124 37.70 $7.85 49,528 $8.26 52,054
Total Retail $12,680 $234.37 $177.24 712,779 193.33 $186.28 749,138 $195.78 787,351
Source: U.S. Department of Labor, Bureau of Labor Statistics; and THK Associates, Inc.
Table IV-9: Estimated Retail Sales and Square Footage Support in the Current Primary Trade Area, 2006

U.S. HIGHWAY 24
67
This analysis demonstrates that the existing primary trade area can support approximately 193business establishments and approximately 712,779 square feet of business space. Theinventory of business in this area established that currently this existing primary trade area has361 businesses in 995,949 square feet. Table IV-10 illustrates a comparison of existingestablishments to supportable square footage. As shown, in general, more square footage ofbusinesses exist than can be supported by residents of the neighborhood primary trade area.Some store types are underrepresented especially clothing stores and furniture stores. Thisresearch indicates, as shown in Table IV-11, that approximately 72% of the support forbusinesses in this area comes from residents that are conveniently located in surroundingneighborhoods, but more than 28% of the support for the businesses served by U.S. Hwy 24comes from outside of the immediate area. This means that convenient access, shorter drivetimes, good visibility, and adequate parking are critical to a significant number of patrons in thisarea. This situation is even more dramatic when you look at specific businesses in the area.50% of the patrons to hardware stores in the area come from beyond the nearbyneighborhoods. 57% of the automobile related businesses gain their support from outsiders,64% of restaurant patronage comes from outsiders, 34% of drugstore patronage, and 45% ofmiscellaneous business support comes from outsiders.

U.S. HIGHWAY 24
68
2006 2006
Estimated Existing Supportable Space
Store Type Square Footage Square Footage Requirements
Hardware and Building MaterialsBuilding Materials and Supplies 30,308 7,301 --
Hardware 10,726 13,411 2,686
Food StoresConvenience Grocery 114,277 129,245 14,968
AutomotiveTire, Battery and Accessory 52,518 22,837 --
Apparel and AccessoryMen's Clothing 12,616 25,095 12,479
Women's Clothing 27,831 47,462 19,631
Childrens Clothing 9,594 17,483 7,889
Shoes 2,331 18,430 16,099
Other Apparel & Accessories 7,423 3,564 --
Furniture and EquipmentFurniture 7,797 21,587 13,789
Home Furnishings & Accessories 36,144 43,074 6,929
Household Appliances 1,958 14,771 12,812
Radio, Television, Stereo, Computer 4,831 20,012 15,180
Records & Music 4,398 4,196 --
Eating and Drinking PlacesRestaurant 251,509 91,689 --
Drug and ProprietaryDrug / Cosmetics 23,595 15,690 --
Other Retail and Personal ServicesLiquor / Wine & Spirits 14,600 13,198 --
Sporting Goods & Bicycle 16,532 17,544 1,012
Books & Stationary 10,816 23,716 12,900
Jewelry 13,360 3,524 --
Hobby & Specialty 112,947 5,656 --
Florist 8,400 4,278 --
Miscellaneous Retail 129,994 53,268 --
Video Tape Rental 10,900 4,616 --
Personal Care Products & Services 70,943 30,754 --
Dry Cleaner / Coin Laundry 8,300 13,256 4,956
Misc Personal Services 1,300 47,124 45,824
Total Retail 995,949 712,779 187,154
Source: THK Associates, Inc.
Table IV-10: Existing and Supportable Business Space in the
Existing U.S. Highway 24 Primary Trade Area
TotalExisting Primary Existing Primary % of Support
Trade Area Trade Area from Primary Excess
Category Demand (Sq. Ft.) Supply (Sq. Ft.) Trade Area Demand (Sq. Ft.)
Hardware 20,712 41,034 50.5% (20,322)
Grocery 129,245 114,277 14,968
Automotive 22,837 52,518 43.5% (29,681)
Apparel 112,034 59,795 52,239
Furniture & Equipment 103,640 55,128 48,512
Eating & Drinking 91,689 251,509 36.5% (159,820)
Drug 15,690 23,595 66.5% (7,905)
Misc. 216,932 398,093 54.5% (181,161)
TOTAL 712,779 995,949 71.6% (283,170)
Source: THK Associates, Inc.
Table IV-11: Business Square Footage Supply and Demand Comparison by Major Category in the U.S. Highway 24 Current Primary Trade Area, 2006

U.S. HIGHWAY 24
70
E. Future Business Potentials Under the Expressway and Freeway Alternatives
As demonstrated in the previous section, a significant amount of the support for existingbusinesses along U.S. Highway 24 from Manitou Springs to Interstate 25, gain their supportfrom residents and tourists beyond nearby neighborhoods in which regional access is veryimportant. Upgrading this segment of the highway will significantly improve business support.
The current U.S. Highway 24 corridor from Manitou Springs to Interstate 25 serves aneighborhood population base within 5 minutes or 0.7 miles of 29,773 people in 13,978households. These have a median income of $39,691 with annual retail and personal serviceexpenditures of $12,680. If this stretch of U.S. Highway 24 was upgraded to an expressway,the neighborhood population base within 5 minutes, or 1.5 miles, would expand to 52,214people in 24,713 households. These have a median income of $39,918 with annual retail andpersonal expenditures of $12,740. As a freeway, the neighborhood population base within 5minutes or 2.0 miles would expand to 65,239 people in 29,654 households. These have anincome of $40,263 with annual retail and personal service expenditures of $12,830. By usingthe same methodology as presented in the previous section of this report, the dollar volume ofbusiness support by major business classification can be demonstrated with U.S. Highway 24under existing conditions, improved to an expressway and improved to a freeway and these arepresented for 2006 in Table IV-12. As shown, nearby neighborhoods served by existing U.S.Highway 24 generate $177.24 million dollars of support for businesses. If this segment of U.S.Highway 24 is improved to an expressway, the dollar support for businesses from the newprimary trade area would grow to $307.96 million, an increase of $130.72 million per year. Ifthis segment of U.S. Highway 24 is improved to a freeway the dollar support for businessesfrom the new primary trade area would grow to $380.47 million, an increase of $203.23 millionper year. These margins grow when projected to 2011 and 2016. As discussed previously, by2016 a total of 32,564 people will reside in the current primary trade area with businessexpenditures of $195.78 million and, if improved to an expressway by 2016, the primary tradearea would have a population of 58,250 with business expenditures of $346.98 million. If U.S.Highway 24 is improved to a freeway by 2016, the primary trade area would have 72,781people with business expenditures of $428.69 million. By 2016, the businesses serviced by U.S.Highway 24 from Manitou Springs to Interstate 25 will have an additional $151.2 million insupport available, an increase of 77.2% under expressway standards and $232.91 million ofsupport, an increase of 119%, under freeway standards. It should also be noted that in 2006,to the businesses serviced by this segment of U.S. Highway 24, a total of an additional $72.51million would be available with a freeway as opposed to an expressway. This would grow to$81.71 million by 2016 if this segment of U.S. Highway 24 is improved to a freeway versus anexpressway.

Additional Additional
Existing Primary Expressway Primary Freeway Primary Expenditures ExpendituresTrade Area Trade Area Trade Area Existing to Existing to
Business Business Business Expressway Primary Freeway PrimaryCategory Expenditures Expenditures Expenditures Trade Areas Trade Areas
Hardware $4.54 $7.90 $9.76 $3.36 $5.22
Grocery $50.54 $87.64 $108.27 $37.10 $57.73
Automotive $5.02 $8.72 $10.77 $3.70 $5.75
Apparel $21.87 $37.99 $46.96 $16.12 $25.09
Furniture & Equipment $23.95 $41.59 $51.40 $17.64 $27.45
Eating & Drinking $25.90 $45.00 $55.59 $19.10 $29.69
Drug $5.87 $10.20 $12.60 $4.33 $6.73
Misc. $39.55 $68.92 $85.12 $29.37 $45.57
TOTAL $177.24 $307.96 $380.47 $130.72 $203.23
* Dollar figures are in millions.
Source: THK Associates, Inc.
Table IV-12: Additional Business Expenditures Demanded by Category through Expanded Primary Trade Area at the U.S. Highway 24 site, 2006

Additional Additional
Existing Primary Expressway Primary Freeway Primary Expenditures ExpendituresTrade Area Trade Area Trade Area Existing to Existing to
Business Business Business Expressway Primary Freeway PrimaryCategory Expenditures Expenditures Expenditures Trade Areas Trade Areas
Hardware $4.78 $8.39 $10.36 $3.61 $5.58
Grocery $53.01 $93.02 $114.93 $40.01 $61.92
Automotive $5.27 $9.25 $11.43 $3.98 $6.16
Apparel $22.99 $40.34 $49.83 $17.35 $26.85
Furniture & Equipment $25.17 $44.16 $54.56 $19.00 $29.39
Eating & Drinking $27.22 $47.76 $59.01 $20.54 $31.79
Drug $6.17 $10.83 $13.38 $4.66 $7.21
Misc. $41.68 $73.13 $90.36 $31.46 $48.68
TOTAL $186.28 $326.88 $403.86 $140.60 $217.58
* Dollar figures are in millions.
Source: THK Associates, Inc.
Table IV-13: Additional Retail Expenditures Demanded by Category through Expanded Trade Area at the U.S. Highway 24 site, 2011

Additional Additional
Existing Primary Expressway Primary Freeway Primary Expenditures ExpendituresTrade Area Trade Area Trade Area Existing to Existing to
Business Business Business Expressway Primary Freeway PrimaryCategory Expenditures Expenditures Expenditures Trade Areas Trade Areas
Hardware $5.02 $8.90 $11.00 $3.88 $5.98
Grocery $55.71 $98.74 $121.99 $43.03 $66.28
Automotive $5.54 $9.82 $12.14 $4.28 $6.60
Apparel $24.16 $42.82 $52.90 $18.66 $28.74
Furniture & Equipment $26.45 $46.88 $57.91 $20.43 $31.46
Eating & Drinking $28.61 $50.70 $62.64 $22.09 $34.03
Drug $6.49 $11.50 $14.20 $5.01 $7.71
Misc. $43.80 $77.63 $95.91 $33.83 $52.10
TOTAL $195.78 $346.98 $428.69 $151.20 $232.91
* Dollar figures are in millions.
Source: THK Associates, Inc.
Table IV-14: Additional Retail Expenditures Demanded by Category through Expanded Trade Area at the U.S. Highway 24 site, 2016

U.S. HIGHWAY 24
74
V. PROJECTED DEMANDS
Section IV of this report dramatically demonstrates that substantially more dollars, up to 74%more, will be available to businesses serviced by this segment of U.S. Highway 24 if it isupgraded to expressway standards. These support dollars would increase by 115% if thissegment of U.S. Highway 24 was upgraded to freeway standards. This results from expandingthe primary trade area through better accessibility. Additionally, the primary trade areaserviced by this segment of U.S. Highway 24 will experience enhanced real estate demands forurbanization as a result of better access. This will occur through new construction orredevelopment.
A. Projected Retail and Personal Service Businesses
The previous discussion demonstrated that the primary trade area of this segment of U.S.Highway 24 has a total of 361 retail and personal service business establishments, with a totalof 995,949 square feet of space. Further research of business square footage demandsindicated that households and retail expenditure patterns in this primary trade area couldsupport 712,779 square feet with almost 28% of support coming from beyond the primarytrade area. Additionally, when existing store types are compared to demand estimates, it wasshown that this primary trade area is substantially underrepresented by apparel and accessorystores, as well as furniture and equipment stores. In total, as much as 187,154 square feet ofadditional retail and personal service space could be currently added to the primary trade area.Under existing conditions, the business sales are projected to grow by approximately 1% peryear in the primary trade area over the next decade. As a result, the need for additional retailand personal service space, especially in the underrepresented store types, will grow to 196,700square feet in 2011 and 206,734 square feet by 2016.
If this segment of U.S. Highway 24 is upgraded to an expressway, the support forunderrepresented business space, especially apparel and furniture square footage demandwould expand to 284,850 square feet and grow to 302,350 square feet by 2006 and 320,940square feet by 2016. If this segment of U.S. Highway 24 is upgraded to a freeway, the supportfor underrepresented business space, especially apparel and furniture square footage demandwould expand to 351,920 square feet today and grow to 372,550 square feet by 2006 and396,520 square feet by 2016. When the demand for retail and personal service business spaceis compared from existing conditions of the primary trade area versus an expressway, thedemand for additional space is 97,696 square feet greater today and would grow to 114,206square feet by 2016. When the demand for retail and personal service business space iscompared from existing conditions of the primary trade area versus a freeway, the demand foradditional space is 164,760 square feet greater today and would grow to 189,790 square feetby 2016.

U.S. HIGHWAY 24
75
B. Projected Residential Demand by Unit Type
This section of the study uses the statistics, estimates and projections from the economic baseand demographic analyses included in Section III as a basis for projecting residential office,industrial/flex, and hotel demand for the two-county market area and the Current, Expresswayand Freeway Primary Trade Areas.
1. Projected Demand in the Two- County Market Area
Based on the historical performance of the two-county market areas’ housing markets and onthe projected growth in new household formations shown earlier in this report, the demand fornew residential construction or redevelopment can be segmented by tenure and type of unit.This will allow the market potentials for specific types of construction and redevelopmentactivity to be examined. The key components of residential demand during the next decade willinclude new housing units to meet the demands of new population growth and householdformations, construction to meet the demands of the existing households in the area looking toupgrade or downgrade into new ownership or rental units, and construction to replace units lostthrough demolition and conversion. Table V-1 summarizes the net change in housing unitdemand expected during the next decade in the two-county market area.
THK estimates that new household formations will average 6,010 per year during the 2006-2016 projection period. This will produce a demand for the construction of 6,556 dwelling unitsannually when adjusted for vacancies and demolitions. Single-family detached construction of4,616 units annually during the next decade will account for approximately 70% of totalconstruction in the market area. Townhome and condominium construction will average 551units annually, or 8% of the total construction; rental apartment construction will average 1,311units annually, or 20% of total construction; and manufactured home construction will average79 units annually, or 1.2% of total construction.
U.S. HIGHWAY 24
76
1.075 80.0% 88.0% 10.5% 1.5% 20.0%
0.70 0.08 0.01 0.20
Annual
Housing Total Detached Attached Rental
Annual Unit Owner- Single Single Manufactured Multi-
Year Households Change Demand ship Family Family Housing family
2006 237,004 5,306 5,704 4,563 4,016 479 68 1,141
2007 242,310 5,460 5,870 4,696 4,132 493 70 1,174
2008 247,770 5,600 6,020 4,816 4,238 506 72 1,204
2009 253,370 5,750 6,181 4,945 4,352 519 74 1,236
2010 259,120 5,910 6,353 5,083 4,473 534 76 1,271
2011 265,030 6,070 6,525 5,220 4,594 548 78 1,305
2012 271,100 6,230 6,697 5,358 4,715 563 80 1,339
2013 277,330 6,420 6,902 5,521 4,859 580 83 1,380
2014 283,750 6,580 7,074 5,659 4,980 594 85 1,415
2015 290,330 6,770 7,278 5,822 5,124 611 87 1,456
2016 297,100 6,990 7,514 6,011 5,290 631 90 1,503
Average
Annual Demand
(2006-2016) 6,010 6,556 5,245 4,616 551 79 1,311
Table V-1: Projected Two-County Market Area
Residential Demand by Unit Type, 2006-2016
Ownership Units
Source: THK Associates, Inc.
0
500
1,000
1,500
2,000
2,500
3,000
3,500
4,000
4,500
5,000
Average Annual Demand by Unit Type
Unit Type 4,616 551 79 1,311
Detached Single
Family
Attached Single
Family
Manufactured
HousingRental Multi-Family
U.S. HIGHWAY 24
77
2. Projected Demand in the Subject Segment of U.S. Highway 24 Primary Trade Areas
Having quantified the demand for new housing units in the two-county Colorado Springs marketand identified its major growth centers, THK can project housing demand in the primary tradeareas. In Table V-1, THK projected that there will be an average annual demand for 6,556housing units in the market area over the next decade. In Table V-2A, it is estimated that theCurrent Primary Trade Area will capture approximately 2.4% of that demand. Table V-2B andTable V-2C show residential demand for an expressway and freeway, respectively, as upgradesto the current highway. An expressway has a demand of 5.1% and a freeway has a demand of6.3% of this two-county area. On an average annual basis for the 2006-2016 period, thedemand for new residential construction in the Current Primary Trade Area will total 104detached single-family units, 14 townhome/condominiums, and 35 rental apartments.
1.01 1.04 77.12% 88.14% 11.86% 22.88%Total
Annual Housing Total Detached Attached Rental
Household Unit Owner- Single Single Multi-
Year Households Growth Demand ship Family Family family2006 13,978 140 145 112 99 13 332007 14,118 141 147 113 100 13 342008 14,259 143 148 114 101 14 342009 14,402 144 150 116 102 14 342010 14,546 145 151 117 103 14 352011 14,691 147 153 118 104 14 352012 14,838 148 154 119 105 14 352013 14,986 150 156 120 106 14 362014 15,136 151 157 121 107 14 362015 15,288 153 159 123 108 15 362016 15,440 154 161 124 109 15 37
AverageAnnual Demand
(2006-2016) 150 153 118 104 14 35
0.007532 1% 0.010056
Table V-2A: Projected Total Residential Demand in the US 24 Highway PTA, 2006-2016 (current)
Source: THK Associates, Inc.
Ownership Units

U.S. HIGHWAY 24
78
1.012 1.04 77.2% 88.3% 11.7% 22.80%Total
Annual Housing Total Detached Attached Rental
Household Unit Owner- Single Single Multi-
Year Households Growth Demand ship Family Family family2006 24,173 290 302 233 206 27 692007 24,463 294 305 236 208 28 702008 24,757 297 309 239 211 28 702009 25,054 301 313 241 213 28 712010 25,354 304 316 244 216 29 722011 25,659 308 320 247 218 29 732012 25,967 312 324 250 221 29 742013 26,278 315 328 253 223 30 752014 26,593 319 332 256 226 30 762015 26,913 323 336 259 229 30 772016 27,236 327 340 262 232 31 77
AverageAnnual Demand
(2006-2016) 310 320 247 218 29 73
0.015806 1% 0.02100591
Table V-2B: Projected Total Residential Demand in the US 24 Highway PTA, 2006-2016 (expressway)
Source: THK Associates, Inc.
Ownership Units
1.012 1.04 77.1% 88.5% 11.55% 22.90%Total
Annual Housing Total Detached Attached Rental
Household Unit Owner- Single Single Multi-
Year Households Growth Demand ship Family Family family2006 29,654 356 370 285 252 33 852007 30,010 360 375 289 255 33 862008 30,370 364 379 292 258 34 872009 30,734 369 384 296 262 34 882010 31,103 373 388 299 265 35 892011 31,476 378 393 303 268 35 902012 31,854 382 398 307 271 35 912013 32,236 387 402 310 274 36 922014 32,623 391 407 314 278 36 932015 33,015 396 412 318 281 37 942016 33,411 401 417 321 284 37 95
AverageAnnual Demand
(2006-2016) 380 393 303 268 35 90
0.019364 2% 0.025882
Table V-2C: Projected Total Residential Demand in the US 24 Highway PTA, 2006-2016 (freeway)
Source: THK Associates, Inc.
Ownership Units

U.S. HIGHWAY 24
79
3. Representative Active Detached Single-Family Projects in the U.S. Highway 24 PrimaryTrade Area
A survey of detached single-family projects selling units within the current primary trade areawas conducted in May 2006. Four residential projects were surveyed and all are profiled below.
Tables V-3 and V-4 illustrate these points:
The 4 projects range in size from 36 units at Bear Creek Terraces to 80 units at CrownHill Mesa by Feature Homes, Inc. A total of 224 units are planned for an average of 56units per project.
Only 1 of the 4 projects has recently sold out, the Crown Hill Mesa project by FeatureHomes, Inc.
There are 181 units sold in the Crown Hill Mesa project, with 7 units remaining.
The Bear Creek Terraces just recently began selling units last summer and have not soldany in the last 8 months.
The projects in Crown Hill Mesa have posted an average monthly sales rate anywherefrom .98 to 1.34 units per month.
The Crown Hill Mesa projects range in price from $181,900 to $366,270 and a squarefootage range from 1,206 to 2,598.
The Bear Creek Terraces range in price from $269,500 to $339,500 and the range insquare feet of 1,178 to 2,277.
The average price range of all four projects is $220,349 to $335,191 and an averagesquare footage range of 1,228 to 2,345 on a typical lot size of 5,200 square feet.
A summary of the 4 projects is located on Table V-3, while each project is individually detailedon Table V-4.
U.S. HIGHWAY 24
80
Number % of Number of % of
Total Units Planned of Projects Total Total Units Unsold Projects Total
0 - 24 0 0.0% 0 1 25.0%
25 - 49 2 50.0% 1 - 9 2 50.0%
50 - 74 1 25.0% 10 - 24 0 0.0%
75 - 99 1 25.0% 25 - 49 1 25.0%
100 - 199 0 0.0% 50 + 0 0.0%
200 + 0 0.0% TOTAL 4
TOTAL 4
Number of % of Number of % of
Unit Price Range Projects Total Unit Price Range Units Total
Under $175,000 0 0.0% Under $175,000 0 0.0%
$175,000 - $199,999 0 0.0% $175,000 - $199,999 0 0.0%
$200,000 - $224,999 0 0.0% $200,000 - $224,999 0 0.0%
$225,000 - $249,999 0 0.0% $225,000 - $249,999 0 0.0%
$250,000 - $274,999 2 50.0% $250,000 - $274,999 124 55.4%
$275,000 - $299,999 1 25.0% $275,000 - $299,999 64 28.6%
$300,000 + 1 25.0% $300,000 + 36 16.1%
TOTAL 4 TOTAL 224
Average Total Number % of
Unit Price Range Sales Pace Units Sold of Projects Total
Under $175,000 #DIV/0! 0.00 0 - 0.49 1 25.0%
$175,000 - $199,999 #DIV/0! 0.00 0.5 - 0.99 1 25.0%
$200,000 - $224,999 #DIV/0! 0.00 1 - 1.99 2 50.0%
$225,000 - $249,999 #DIV/0! 0.00 2 - 2.99 0 0.0%
$250,000 - $274,999 1.09 1.09 3 - 3.99 0 0.0%
$275,000 - $299,999 1.34 1.34 4 + 0 0.0%
$300,000 + 0.00 0.00 TOTAL 4
AVERAGE 0.88
Total % of
Ave. Unit Minimum Price Sales Pace Total
Under $175,000 0.00 0.0%
$175,000 - $199,999 0.00 0.0%
$200,000 - $224,999 0.00 0.0%
$225,000 - $249,999 0.00 0.0%
$250,000 - $274,999 2.18 61.9%
$275,000 - $299,999 1.34 38.1%
$300,000 + 0.00 0.0%
TOTAL 3.52
* Sales data as of January 2006
E. Monthly Sales Pace by Ave. Unit Base Price F. Projects by Monthly Sales Pace *
Source: Hanley Wood Market Intelligence, and THK Associates, Inc.
Table V-3: Characteristics of Representative Detached Residential
A. Projects by Number of Units B. Projects by Units Remaining
C. Projects by Average Unit Base Price D. Planned Units by Ave. Unit Base Price
Projects in the U.S. Highway 24 Current Primary Trade Area
G. Total Monthly Sales Pace by Price Range
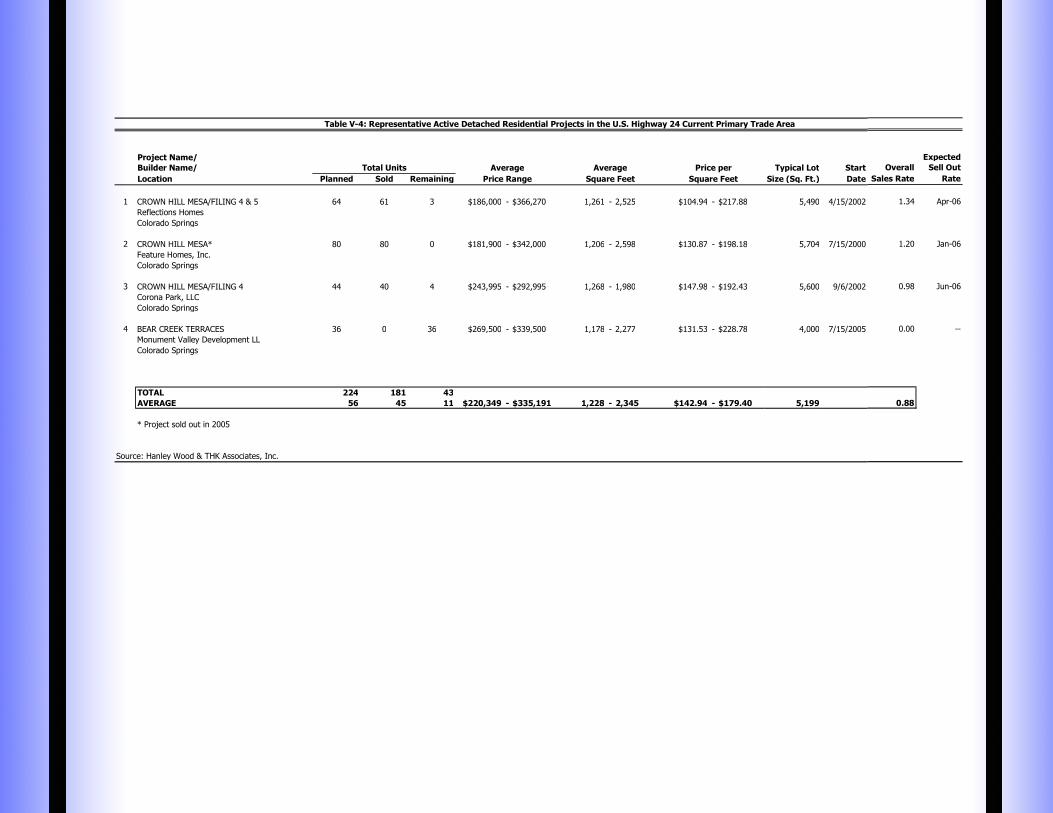
Table V-4: Representative Active Detached Residential Projects in the U.S. Highway 24 Current Primary Trade Area
Project Name/
Builder Name/ Typical Lot Start
Location Planned Sold Remaining Size (Sq. Ft.) Date
1 CROWN HILL MESA/FILING 4 & 5 64 61 3 $186,000 - $366,270 1,261 - 2,525 $104.94 - $217.88 5,490 4/15/2002
Reflections Homes
Colorado Springs
2 CROWN HILL MESA* 80 80 0 $181,900 - $342,000 1,206 - 2,598 $130.87 - $198.18 5,704 7/15/2000
Feature Homes, Inc.
Colorado Springs
3 CROWN HILL MESA/FILING 4 44 40 4 $243,995 - $292,995 1,268 - 1,980 $147.98 - $192.43 5,600 9/6/2002
Corona Park, LLC
Colorado Springs
4 BEAR CREEK TERRACES 36 0 36 $269,500 - $339,500 1,178 - 2,277 $131.53 - $228.78 4,000 7/15/2005
Monument Valley Development LL
Colorado Springs
TOTAL 224 181 43
AVERAGE 56 45 11 $220,349 - $335,191 1,228 - 2,345 $142.94 - $179.40 5,199
* Project sold out in 2005
Source: Hanley Wood & THK Associates, Inc.
Price Range Square Feet Square Feet
Total Units Average Average Price per
Expected
Overall Sell Out
Sales Rate Rate
1.34 Apr-06
1.20 Jan-06
0.98 Jun-06
0.00 --
0.88

U.S. HIGHWAY 24
82
4. Representative Active Attached Single-Family Projects in the U.S. Highway 24 PrimayTrade Area
A survey of attached single-family (townhome/condominium) projects selling units within thetrade area was conducted in May 2006. Five townhome/condominium projects were surveyedand all are profiled below.
Tables V-5 and V-6 illustrate these points:
The 5 projects range in size from 14 units at Lowell Neighborhood/Prestwick to 86 unitsat City Walk Downtown. Of the 5 projects for which information was available, a total of211 units are planned for an average of 42 units per project.
One project recently sold out, and 2 projects have less than 10 unit remaining to besold.
In summary, 41 units of the 211 townhome/condominium units planned within the tradearea have yet to be sold.
The average price range for the 5 surveyed projects is approximately $303,240 to$571,178. The average size range is roughly 1,870 to 2,713 square feet. Therefore,the average price per square foot in the primary trade area is $210.52 to $162.14.
Overall, the 5 projects average monthly sales of 0.87 units. Therefore, the 5 projectscombined have monthly sales of roughly 4 units. The majority of these projects, 77.1%,have occurred in projects with an average base price of $300,000 and over.
A summary of the 5 projects is located on Table V-5, while each project is individually detailedon Table V-6.

U.S. HIGHWAY 24
83
Number % of Number of % of
Total Units Planned of Projects Total Total Units Unsold Projects Total
0 - 24 2 40.0% 0 1 20.0%
25 - 49 1 20.0% 1 - 9 2 40.0%
50 - 74 1 20.0% 10 - 24 2 40.0%
75 - 99 1 20.0% 25 - 49 0 0.0%
100 - 199 0 0.0% 50 + 0 0.0%
200 + 0 0.0% TOTAL 5
TOTAL 5
Number of % of Number of % of
Unit Price Range Projects Total Unit Price Range Units Total
Under $125,000 0 0.0% Under $125,000 0 0.0%
$125,000 - $149,999 0 0.0% $125,000 - $149,999 0 0.0%
$150,000 - $174,999 1 20.0% $150,000 - $174,999 60 28.4%
$175,000 - $199,999 0 0.0% $175,000 - $199,999 0 0.0%
$200,000 - $249,999 0 0.0% $200,000 - $249,999 0 0.0%
$250,000 - $299,999 0 0.0% $250,000 - $299,999 0 0.0%
$300,000 + 4 80.0% $300,000 + 151 71.6%
TOTAL 5 TOTAL 211
Average Total Number % of
Unit Price Range Sales Pace Units Sold of Projects Total
Under $125,000 #DIV/0! 0.00 0 - 0.49 3 60.0%
$125,000 - $149,999 #DIV/0! 0.00 0.5 - 0.99 0 0.0%
$150,000 - $174,999 1.00 1.00 1 - 1.99 1 20.0%
$175,000 - $199,999 #DIV/0! 0.00 2 - 2.99 1 20.0%
$200,000 - $249,999 #DIV/0! 0.00 3 - 3.99 0 0.0%
$250,000 - $299,999 #DIV/0! 0.00 4 + 0 0.0%
$300,000 + 0.84 0.84 TOTAL 5
AVERAGE 0.87
Total % of
Ave. Unit Minimum Price Sales Pace Total
Under $125,000 0.00 0.0%
$125,000 - $149,999 0.00 0.0%
$150,000 - $174,999 1.00 22.9%
$175,000 - $199,999 0.00 0.0%
$200,000 - $249,999 0.00 0.0%
$250,000 - $299,999 0.00 0.0%
$300,000 + 3.37 77.1%
TOTAL 4.37
* Sales data as of January 2006
E. Monthly Sales Pace by Ave. Unit Base Price F. Projects by Monthly Sales Pace *
Source: Hanley Wood Market Intelligence, and THK Associates, Inc.
Table V-5: Characteristics of Representative Attached Residential
A. Projects by Number of Units B. Projects by Units Remaining
C. Projects by Average Unit Base Price D. Planned Units by Ave. Unit Base Price
Projects in the U.S. Highway 24 Current Primary Trade Area
G. Total Monthly Sales Pace by Price Range

Table V-6: Representative Active Attached Residential Projects in the U.S. Highway 24 Current Primary Trade Area
Project Name/
Builder Name/ Start Overall
Location Planned Sold Remaining Date Sales Rate
1 VILLAGE AT STONE MANOR* 22 22 0 $660,000 - $675,000 3,519 - 3,520 $187.50 - $191.82 3/15/1999 0.30
Windsor Construction
Broadmoor
2 CITY WALK DOWNTOWN 86 77 9 $129,900 - $988,541 570 - 1,865 $134.81 - $534.00 6/15/2003 2.44
G.E. Johnson Construction
Colorado Springs
3 MADISON RIDGE 60 45 15 $137,000 - $192,350 1,062 - 1,701 $ 80.54 - $150.05 5/1/2002 1.00
Harmony Homes
Colorado Springs
4 LOWELL NEIGHBORHOOD/PRESTWICK 29 17 12 $294,900 - $575,000 2,600 - 4,230 $106.36 - $168.42 8/15/2002 0.41
Goebel Construction
Colorado Springs
5 LOWELL NEIGHBORHOOD/POET LOFTS 14 9 5 $294,400 - $425,000 1,600 - 2,250 $184.00 - $188.89 8/15/2002 0.22
Windsor Construction
Colorado Springs
TOTAL 211 170 41
AVERAGE 42 34 8 $303,240 - $571,178 1,870 - 2,713 $210.52 - $162.14 0.87
* Project sold out in 2005
Source: Hanley Wood & THK Associates, Inc.
Price Range Square Feet Square Feet
Total Units Average Average Price perExpected
Sell Out
Rate
Mar-05
May-06
May-07
Jul-08
Jan-08

U.S. HIGHWAY 24
85
5. Proposed Residential Projects in the U.S. Highway 24 Environs
Table V-7 lists the proposed residential projects in the local environs. Below are some of themore significant findings.
19 planned projects with approximately 700 units in various stages of theplanning process have been identified within the U.S. Highway 24 environs
Of the roughly 700 proposed units, only 502 units have received final platapproval, another 122 units are in the process of receiving final plat approval.Ninety-Eight units planned for a future phase are currently on hold.
It should also be noted that recently Gold Hill Mesa gained $19 million of financing to revitalize210 acres that formerly was a gold mill site. Gold Hill Mesa is west of U.S. Highway 24 and 21st
Street and was the site of Golden Cycle Mill. The gold and silver mill began operations in 1906and ceased in 1949, leaving behind a mesa comprising 14 million tons of gold t ailing-infusedsoils.
Gold Hill Mesa Partners has begun cleanup and development at the property, slated for mixed-use development. Anchored by a community center with parks, Gold Hill Mesa also will includecommercial and residential product. A total of 877 condominiums, townhomes and single-family, detached residences are planned with John Laing Homes committed to purchasing morethan 40% of the available lots. The community center is anticipated to open in the fall of 2006,with revenues anticipated to start in the summer.

Table V-7: Planned Residential Projects in the U.S. Highway 24 Environs
COMMUNITY NAME/ PROJECT NUMBERBUILDER/DEVELOPER ADDRESS LOCATION TYPE OF UNITS STATUS
1 BEAR CREEK TERRACES - TH W OF 21ST ST L& LOWER GULCH CAMP RD COL. SPRS. MOD 37 CONCEPT PLAN/ FINAL PLAT - APPROVEDBEAR CREEK VILLAS LLC
2 BROADMOOR CAMPUS 3-B SE OF LAKE CIR & BEACH AVE COL. SPRS. TH 12 FINAL PLAT - APPROVEDBROADMOOR DEVELOP CO
3 GOLD CAMP STUDIOS NW OF LOWER GOLD CAMP RD & 21ST ST COL. SPRS. SF 42 DEV PLAN/ FINAL PLAT - APPROVEDBERGE BREWER (ZEPHYR DEVL)
4 GOLD HILL MESA SE OF US HWY 24 & 21ST ST COL. SPRS. SF 176 CONCEPT PLAN/ DEV PLAN/ FINAL PLAT - APPROVEDNES
5 GOLD HILL MESA 1-A NE OF LOWER GOLD CAMP RD & MILLSTREAM COL. SPRS. SF 114 FINAL PLAT - APPROVEDGOLD HILL MESA TOWNSHIP, LLC
6 INDIAN HEIGHTS CASITAS 1905, 1915 & 1925 KING ST COL. SPRS. SF 15 ZONE CHANGE/ DEV PLAN/ FINAL PLAT - APPROVEDWILLIAM R SKEELE
7 INDIAN MESA 3 SE OF FILLMORE ST & MESA RD COL. SPRS. SF 18 DEV PLAN / FINAL PLAT - APPROVEDDHM DESIGN
8 LOWELL HOTEL CONDOS NEVADA & LAS ANIMAS COL. SPRS. CD 22 FUTURE PHASE - ON HOLDLOWELL DEV
9 LOWELL LOT LINER A NEVADA & LAS ANIMAS COL. SPRS. TH 14 FUTURE PHASE - ON HOLDLOWELL DEV
10 LOWELL LOT LINER C RIO GRANDE AND NEVADA SE COL. SPRS. TH 15 FUTURE PHASE - ON HOLDLOWELL DEV
11 LOWELL LOT LINER D RIO GRANDE & NEVADA SW COL. SPRS. TH 22 FUTURE PHASE - ON HOLDLOWELL DEV
12 LOWELL TOWNHOUSE RIO GRANDE AND NEVADA SE COL. SPRS. TH 25 FUTURE PHASE - ON HOLDLOWELL DEV
13 LOWELL/PRESTWICK TOWNHOMES PH 2 RIO GRANDE AND NEVADA SE COL. SPRS. TH 27 FINAL PLAT - APPROVEDLOWELL DEV
14 MONUMENT VALLEY 2 W OF PECAN & BRITTANIA COL. SPRS. SF 110 FINAL SUB PLAT - PROCESSDUSTIN GORDON
15 TRESTERS 2/ RIO GRANDE VILLAGE S CORONA ST & RIO GRANDE ST COL. SPRS. MF -- FINAL PLAT - APPROVEDCOLO SPRINGS HOUSING AUTH
16 VAN BUREN TOWNHOMES 2 W ON VAN BUREN FROM CHESTNUT COL. SPRS. TH 31 FINAL PLAT - APPROVEDERIC HEMINGWAY
17 VICTORIAN HEIGHTS 2 28TH ST & WILLIAMETTE COL. SPRS. DP 12 CONCEPT PLAN/ FINAL PLAT - PROCESS--
18 VILLAS @MESA PARK NE OF 19TH ST & MESA RD COL. SPRS. SF 14 ZONING/ PUD/ FINAL PLAT - APPROVEDWALT HIERONYMUS
19 WESTWOOD TOWNHOMES 2 NE OF WEBER ST & FOUNTAIN BLVD COL. SPRS. TH 16 FINAL PLAT - APPROVEDLOWELL PARTNERS, LLC
TOTAL APPROVED (FINAL PLAT/PLAN) 502TOTAL IN PROGRESS (FINAL PLAT/PLAN) 122
TOTAL 722AVERAGE 40
SF = Single Family, CD = Condominium, TH = Townhome, DP = Duplex, MOD = Modular, ASL = Assisted Senior Living, MF = Multi-Family, MIX = Could contain detached single family, attached single family, or multi-family
Source: Home Builders Research & THK Associates, Inc.
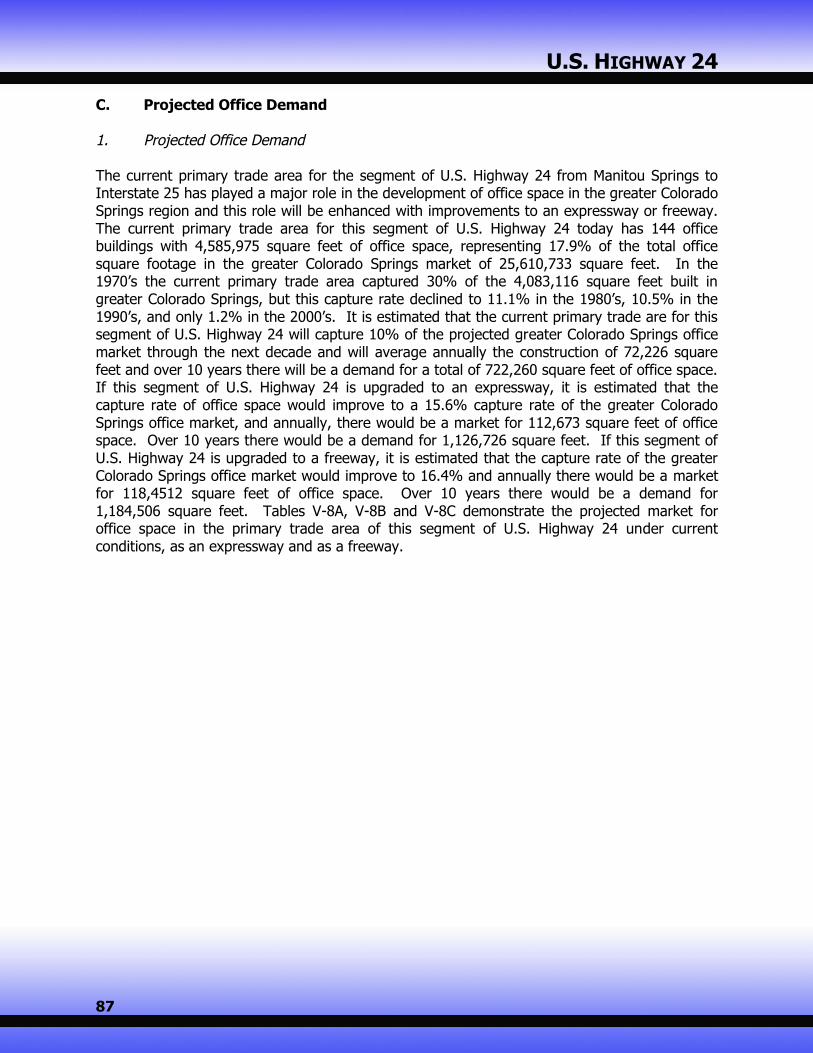
U.S. HIGHWAY 24
87
C. Projected Office Demand
1. Projected Office Demand
The current primary trade area for the segment of U.S. Highway 24 from Manitou Springs toInterstate 25 has played a major role in the development of office space in the greater ColoradoSprings region and this role will be enhanced with improvements to an expressway or freeway.The current primary trade area for this segment of U.S. Highway 24 today has 144 officebuildings with 4,585,975 square feet of office space, representing 17.9% of the total officesquare footage in the greater Colorado Springs market of 25,610,733 square feet. In the1970’s the current primary trade area captured 30% of the 4,083,116 square feet built ingreater Colorado Springs, but this capture rate declined to 11.1% in the 1980’s, 10.5% in the1990’s, and only 1.2% in the 2000’s. It is estimated that the current primary trade are for thissegment of U.S. Highway 24 will capture 10% of the projected greater Colorado Springs officemarket through the next decade and will average annually the construction of 72,226 squarefeet and over 10 years there will be a demand for a total of 722,260 square feet of office space.If this segment of U.S. Highway 24 is upgraded to an expressway, it is estimated that thecapture rate of office space would improve to a 15.6% capture rate of the greater ColoradoSprings office market, and annually, there would be a market for 112,673 square feet of officespace. Over 10 years there would be a demand for 1,126,726 square feet. If this segment ofU.S. Highway 24 is upgraded to a freeway, it is estimated that the capture rate of the greaterColorado Springs office market would improve to 16.4% and annually there would be a marketfor 118,4512 square feet of office space. Over 10 years there would be a demand for1,184,506 square feet. Tables V-8A, V-8B and V-8C demonstrate the projected market foroffice space in the primary trade area of this segment of U.S. Highway 24 under currentconditions, as an expressway and as a freeway.

U.S. HIGHWAY 24
88
Projected U.S. Highway 24
New Construction Total Office Cumulative
Year Two County Demand Demand
1995.0 166399.5 #REF! #REF!
2006 635,297 63,530 63,530
2007 651,284 65,130 128,660
2008 667,713 66,780 195,540
2009 684,595 68,460 263,900
2010 701,946 70,190 334,090
2011 719,779 71,980 406,070
2012 738,108 73,810 479,880
2013 756,948 75,690 555,570
2014 776,316 77,630 632,200
2015 796,226 79,230 711,430
2016 816,695 81,670 793,100
Average 0.13
Annual Change 722,260 72,230
*capture rate is estimated to be 10% of total market
Source: THK Associates, Inc.
Table V-8A: Office Space Demand in the
U.S. Highway 24 Corridor, 2006-2016 (current conditions)
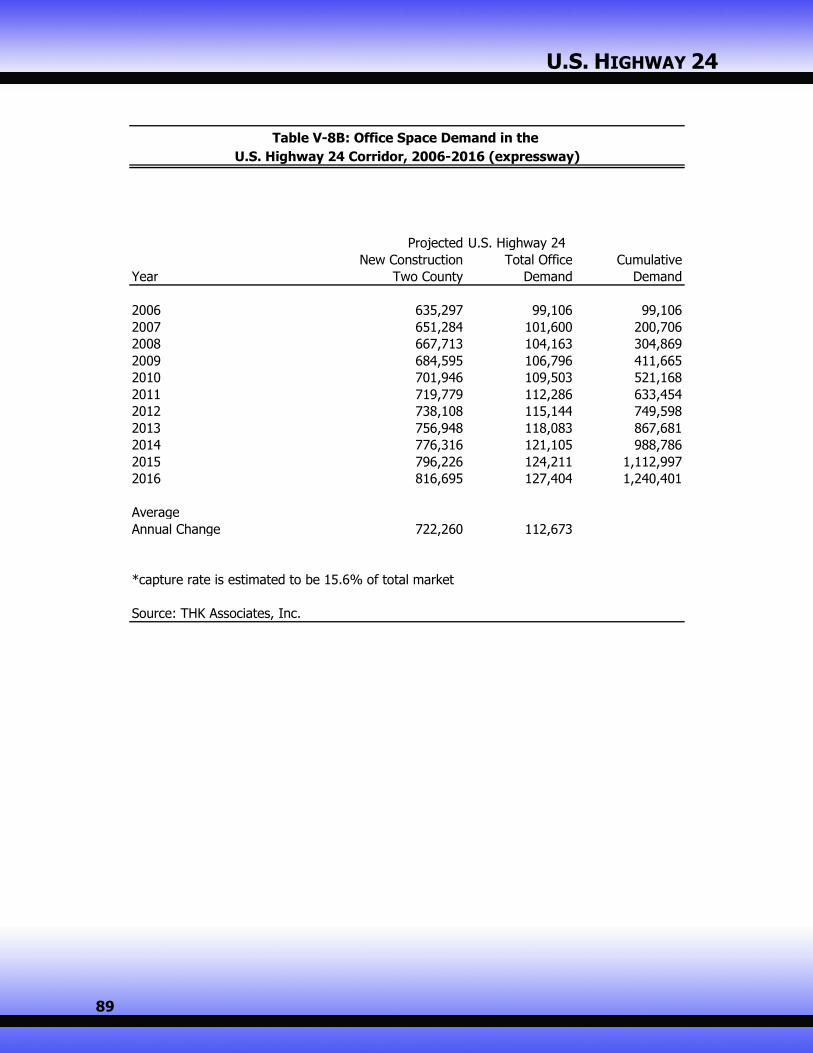
U.S. HIGHWAY 24
89
Projected U.S. Highway 24
New Construction Total Office Cumulative
Year Two County Demand Demand
1995.0 166399.5 #REF! #REF!
2006 635,297 99,106 99,106
2007 651,284 101,600 200,706
2008 667,713 104,163 304,869
2009 684,595 106,796 411,665
2010 701,946 109,503 521,168
2011 719,779 112,286 633,454
2012 738,108 115,144 749,598
2013 756,948 118,083 867,681
2014 776,316 121,105 988,786
2015 796,226 124,211 1,112,997
2016 816,695 127,404 1,240,401
Average 0.13
Annual Change 722,260 112,673
*capture rate is estimated to be 15.6% of total market
Source: THK Associates, Inc.
Table V-8B: Office Space Demand in the
U.S. Highway 24 Corridor, 2006-2016 (expressway)

U.S. HIGHWAY 24
90
Projected U.S. Highway 24
New Construction Total Office Cumulative
Year Two County Demand Demand
1995.0 166399.5 #REF! #REF!
2006 635,297 104,189 104,189
2007 651,284 106,811 211,000
2008 667,713 109,505 320,505
2009 684,595 112,274 432,779
2010 701,946 115,119 547,898
2011 719,779 118,044 665,942
2012 738,108 121,050 786,992
2013 756,948 124,139 911,131
2014 776,316 127,316 1,038,447
2015 796,226 130,581 1,169,028
2016 816,695 133,938 1,302,966
Average 0.13
Annual Change 722,260 118,450
*capture rate is estimated to be 16.4% of total market
Source: THK Associates, Inc.
Table V-8C: Office Space Demand in the
U.S. Highway 24 Corridor, 2006-2016 (freeway)

U.S. HIGHWAY 24
91
2. Characteristics of Existing Office Buildings in the Current U.S. Highway 24 Primary TradeAreas
A profile of representative office buildings was compiled in May 2006. This survey, for theCurrent Primary Trade Area, inventories 144 office buildings with a total of almost 4.6 millionsquare feet. All information was obtained through the Denver Metro Commercial Association ofRealtors (DMCAR). The surveyed office building details for the Current Primary Trade Area aresummarized in Table V-9 and detailed in the appendix.
Of the 144 total inventoried office buildings in the trade area, 9 buildings, or 3% of thetotal, have been built since 1990. 97 buildings have been built before 1980, totaling2,450,646 square feet, more than 53.4% of the total office space in the Current Trade Area.
There were 11 office buildings inventoried with more 100,000 square feet each. These 11buildings had a total of over 2 million square feet of space and accounted for 45% of totalsquare footage in the trade area. Vacancy at these 11 buildings was only 7%, which islower than the 9% overall.
Almost 29% of the inventoried office buildings in the trade area were Class B officebuildings. Ten of the office buildings were Class A, 24 of the buildings were Class C, andthe remaining 69 buildings did not disclose class. Vacancy in Class A office space is only7.8%, Class B office space vacancy is 19.9%, and vacancy in Class C space was also 19.9%.

U.S. HIGHWAY 24
92
A. Office Buildings by Size
Number of Percent Square Percent VacancyBuildings of Total Footage of Total Rate
100,000 and Over 11 8% 2,060,781 45% 7%50,000 - 99,999 11 8% 780,212 17% 11%
20,000 - 49,999 30 21% 987,298 22% 12%10,000 - 19,999 27 19% 390,006 9% 9%Less than 10,000 65 45% 367,678 8% 11%
Total 144 100% 4,585,975 100% 9%
B. Office Buildings by Year of Construction
Number of Percent Square Percent Vacancy
Buildings of Total Footage of Total Rate
Before 1970 63 44% 1,222,134 27% 13%
1970s 34 24% 1,228,512 27% 8%1980s 23 16% 804,692 18% 13%1990s 5 3% 327,892 7% 6%2000s 4 3% 41,860 1% 3%
N/A 15 10% 960,885 21% 5%
Total 144 100% 4,585,975 100% 9%
C. Office Buildings by Class
Number of Percent Square Percent VacancyBuildings of Total Footage of Total Rate
Class A 10 6.9% 1,145,845 25.0% 7.8%Class B 41 28.5% 1,371,351 29.9% 19.9%Class C 24 16.7% 323,213 7.0% 19.9%
N/A 69 47.9% 1,745,566 38.1% 0.0%
Total 144 100.0% 4,585,975 100.0% 9%
Source: DMCAR, & THK Associates, Inc.
Table V-9: Characteristics of the Representative Office Buidingsin the U.S. Highway 24 Current Trade Area

U.S. HIGHWAY 24
93
D. Projected Industrial/Flex Demand
1. Projected Industrial/Flex Demand
The current primary trade area for the segment of U.S. Highway 24 from Manitou Springs toInterstate 25 has played a major role in the development of industrial/flex space in the greaterColorado Springs region and this role will be enhanced with improvements to an expressway orfreeway. The current primary trade area for this segment of U.S. Highway 24 today has 144industrial/flex buildings with 1,549,570 square feet of industrial/flex space, representing 5.3%of the total industrial/flex square footage in the greater Colorado Springs market of 29,165,402square feet. In the 1970’s the current primary trade area captured 6.5% of the 5,697,927square feet built in greater Colorado Springs, but this capture rate declined to 3.0% in the1980’s, 2.4% in the 1990’s, and 2.7% in the 2000’s. It is estimated that the current primarytrade are for this segment of U.S. Highway 24 will capture 3% of the projected greaterColorado Springs industrial/flex market through the next decade and will average annually theconstruction of 18,136 square feet and over 10 years there will be a demand for a total of181,359 square feet of industrial/flex space. If this segment of U.S. Highway 24 is upgraded toan expressway, it is estimated that the capture rate of industrial/flex space would improve to a4.7% capture rate of the greater Colorado Springs industrial/flex market, and annually, therewould be a market for 28,292 square feet of industrial/flex space. Over 10 years there wouldbe a demand for 282,920 square feet. If this segment of U.S. Highway 24 is upgraded to afreeway, it is estimated that the capture rate of the greater Colorado Springs industrial/flexmarket would improve to 4.9% and annually there would be a market for 29,743 square feet ofindustrial/flex space. Over 10 years there would be a demand for 297,429 square feet. TablesV-10A, V-10B and V-10C demonstrate the projected market for industrial/flex space in theprimary trade area of this segment of U.S. Highway 24 under current conditions, as anexpressway and as a freeway.

U.S. HIGHWAY 24
94
Two-County
Colorado Springs U.S. Highway 24 Cumulative
Year Industrial Demand Total Demand Demand
2006 549,140 16,474 16,474
2007 559,565 16,787 33,261
2008 570,154 17,105 50,366
2009 580,968 17,429 67,795
2010 592,012 17,760 85,555
2011 603,291 18,099 103,654
2012 614,868 18,446 122,100
2013 626,637 18,799 140,899
2014 638,659 19,159 160,058
2015 650,996 19,529 179,587
2016 663,489 19,905 199,492
Average 0.015
Annual Change 604,525 18,136 105,386
* Assumes site will capture 3.0% of the demand for industrial space in the Two-County market
Source: THK Associates, Inc.
TABLE V-10A: Projected Industrial Space Demand in the
U.S. Highway 24 Corridor, 2006-2016 (current conditions)

U.S. HIGHWAY 24
95
Two-County
Colorado Springs U.S. Highway 24 Cumulative
Year Industrial Demand Total Demand Demand in the
2006 549,140 25,700 25,700
2007 559,565 26,188 51,888
2008 570,154 26,683 78,571
2009 580,968 27,189 105,760
2010 592,012 27,706 133,466
2011 603,291 28,234 161,700
2012 614,868 28,776 190,476
2013 626,637 29,327 219,803
2014 638,659 29,889 249,692
2015 650,996 30,467 280,159
2016 663,489 31,051 311,210
Average 0.0275
Annual Change 604,525 28,292 164,402
* Assumes site will capture 4.7% of the demand for industrial space in the Two-County market
Source: THK Associates, Inc.
TABLE V-10B: Projected Industrial Space and Acreage Demands in the
U.S. Highway 24 Corridor, 2006-2016 (expressway)

U.S. HIGHWAY 24
96
Two-County
Colorado Springs U.S. Highway 24 Cumulative
Year Industrial Demand Total Demand Demand
2006 549,140 27,018 27,018
2007 559,565 27,531 54,549
2008 570,154 28,052 82,601
2009 580,968 28,584 111,185
2010 592,012 29,127 140,312
2011 603,291 29,682 169,994
2012 614,868 30,252 200,246
2013 626,637 30,831 231,077
2014 638,659 31,422 262,499
2015 650,996 32,029 294,528
2016 663,489 32,644 327,172
Average 0.0325
Annual Change 604,525 29,743 172,835
* Assumes site will capture 4.9% of the demand for industrial space in the Two-County market
Source: THK Associates, Inc.
TABLE V-10C: Projected Industrial Space Demand in the
U.S. Highway 24 Corridor, 2006-2016 (freeway)
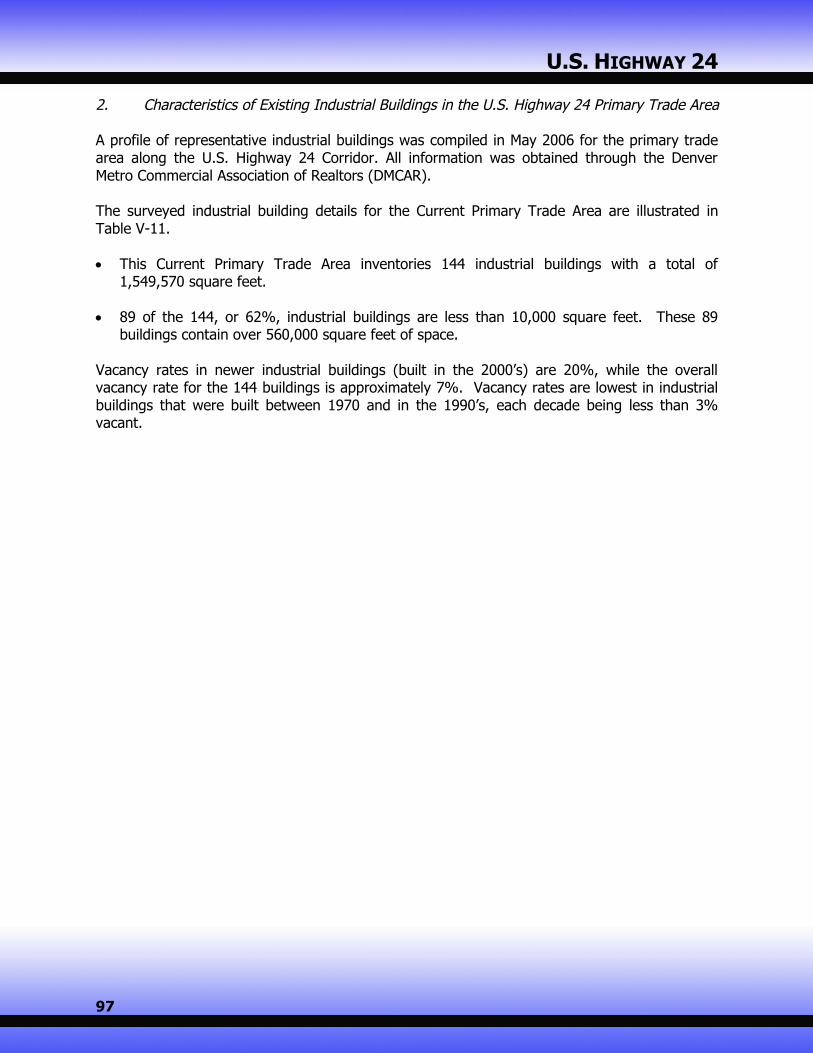
U.S. HIGHWAY 24
97
2. Characteristics of Existing Industrial Buildings in the U.S. Highway 24 Primary Trade Area
A profile of representative industrial buildings was compiled in May 2006 for the primary tradearea along the U.S. Highway 24 Corridor. All information was obtained through the DenverMetro Commercial Association of Realtors (DMCAR).
The surveyed industrial building details for the Current Primary Trade Area are illustrated inTable V-11.
This Current Primary Trade Area inventories 144 industrial buildings with a total of1,549,570 square feet.
89 of the 144, or 62%, industrial buildings are less than 10,000 square feet. These 89buildings contain over 560,000 square feet of space.
Vacancy rates in newer industrial buildings (built in the 2000’s) are 20%, while the overallvacancy rate for the 144 buildings is approximately 7%. Vacancy rates are lowest in industrialbuildings that were built between 1970 and in the 1990’s, each decade being less than 3%vacant.

U.S. HIGHWAY 24
98
A. Industrial Buildings by Size
Number of Percent Square Percent VacancyBuildings of Total Footage of Total Rate
100,000 and Over 0 0% 0 0% 0%50,000 - 99,999 1 1% 94,000 6% 0%
20,000 - 49,999 12 8% 343,686 22% 3%10,000 - 19,999 42 29% 546,482 35% 15%Less than 10,000 89 62% 565,402 36% 2%
Total 144 100% 1,549,570 100% 7%
B. Industrial Buildings by Year of Construction
Number of Percent Square Percent Vacancy
Buildings of Total Footage of Total Rate
Before 1970 68 47% 677,915 44% 9%
1970s 21 15% 371,417 24% 3%1980s 30 21% 282,120 18% 0%1990s 12 8% 114,621 7% 2%2000s 6 4% 55,274 4% 20%
N/A 7 5% 48,223 3% 34%
Total 144 100% 1,549,570 100% 7%
C. Industrial Buildings by Specfic Use
Number of Percent Square Percent VacancyBuildings of Total Footage of Total Rate
Flex/R&D 8 6% 84,444 5% 49%Light Manufacturing 13 9% 109,489 7% 10%Warehouse - Distribution 112 78% 1,256,518 81% 4%
Other 11 8% 99,119 6% 6%N/A 0 0% 0 0% 0%
Total 144 100% 1,549,570 100% 7%
Source: DMCAR, & THK Associates, Inc.
Table V-11: Characteristics of the Representative Industrial Buidingsin the U.S. Highway 24 Current Primary Trade Area

U.S. HIGHWAY 24
99
E. Projected Demand for Hotel Rooms
The segment of U.S. Highway 24 from Manitou Springs to Interstate 25 and the primary tradearea that it currently services has a significant number of hotel rooms which includes 1,674rooms in 51 hotels. This represents approximately 12.4% of the total hotel room count of13,530 in the greater Colorado Springs region. It was previously demonstrated that the greaterColorado Springs region will enjoy an average annual demand for 419 new hotel rooms per yearover the next decade. It is estimated that the current primary trade area for this segment ofU.S. Highway 24 will capture 12.4% of the projected greater Colorado Springs hotel marketthrough the next decade and will average annually the demand for 512 hotel rooms. Over 10years there will be a demand for 520 total hotel rooms. If this segment of U.S. Highway 24 isupgraded to an expressway, it is estimated that the capture rate of hotel rooms would improveto 19.3% of the greater Colorado Springs demand for new hotel rooms and annually there willbe a demand for 81 hotel rooms. Over 10 years there will be a demand for 810 hotel rooms. Ifthis segment of U.S. Highway 24 is upgraded to a freeway, it is estimated that the capture rateof the demand for hotel rooms in the greater Colorado Springs market would improve to 20.3%and annually there would be a market for 85 hotel rooms. Over 10 years there would be ademand for 850 hotel rooms. Tables V-12A, V-12B and V-12C demonstrate the projectedmarket for hotel rooms in the primary trade area of this segment of U.S. Highway 24 undercurrent conditions, as an expressway, and as a freeway.
New Hotel
Room Demand Primaryin Greater Trade Area
Colorado Springs Demand2006 375 46
2007 383 472008 392 48
2009 400 50
2010 409 512011 418 52
2012 427 532013 437 54
2014 446 552015 456 56
2016 466 58
Average 419 52570
*capture rate estimated at 12.37%
Source: THK Associates, Inc.
Table V-12A: Hotel Room Demand in theU. S. Highway 24 Corridor, 2006-2016 (current conditions)

U.S. HIGHWAY 24
100
New Hotel
Room Demand Primaryin Greater Trade Area
Colorado Springs Demand2006 375 72
2007 383 742008 392 76
2009 400 77
2010 409 792011 418 81
2012 427 822013 437 84
2014 446 862015 456 88
2016 466 90
Average 419 81890
*capture rate estimated at 19.30%
Source: THK Associates, Inc.
Table V-12B: Hotel Room Demand in theU. S. Highway 24 Corridor, 2006-2016 (expressway)
New Hotel
Room Demand Primaryin Greater Trade Area
Colorado Springs Demand2006 375 76
2007 383 782008 392 79
2009 400 81
2010 409 832011 418 85
2012 427 872013 437 89
2014 446 912015 456 93
2016 466 95
Average 419 85935
*capture rate estimated at 20.29%
Source: THK Associates, Inc.
Table V-12C: Hotel Room Demand in theU. S. Highway 24 Corridor, 2006-2016 (freeway)

U.S. HIGHWAY 24
101
F. Summary of Land Use Development Potentials
The previous market research and analysis has demonstrated real estate developmentpotentials that will evolve over the next decade in the primary trade area of this segment ofU.S. Highway 24. These potentials have been studied under distinct classifications includingresidential, hotel and lodging, retail commercial, office and industrial/flex space. Residentialpotentials were distinguished as single-family, townhome and condominiums, and rentalapartments. The hotel and lodging markets included full service and limited service hotelrooms. Under current conditions, or as an expressway or freeway, the primary trade area forthis segment of U.S. Highway 24 can capture the following percentages of the greater ColoradoSprings market for various land uses:
With these capture rates of the projected markets for real estate in the greater ColoradoSprings area, estimates of the annual demand, 10 year cumulative demand and land arearequirements for the primary trade area under existing conditions, as an expressway and as afreeway have been made and summarized in Tables V-13A, V-13B, and V-13C.
Current Expressway FreewayScenario Scenario Scenario
Retail 1.81% 3.80% 4.70%Office 10.00% 15.60% 16.40%Hotel 15.34% 23.93% 25.16%
Industrial 3.00% 4.68% 4.92%Rental Apartments 2.67% 5.57% 6.87%
Condominiums and Townhomes 2.54% 5.27% 6.36%Single-Family Detached 2.25% 4.73% 5.81%
Real Estate Market Capture Rates
Annual Sq.Ft./Units 10 yr. Cumulative Sq.Ft./Units 10 yr. Acreage Requirements
Retail 20,673 206,734 23.7Office 72,226 722,260 82.9Hotel 52 518 13.0
Industrial 18,136 181,359 11.9Rental Apartments 35 350 23.3
Condominiums and Townhomes 14 140 14.0
Single-Family Detached 104 1,039 346.4
Total 515.1
Note: Retail coverage is estimated at 20%, office coverage is estimated at 25%, hotel at 40 rooms per acre, industrial/flex at 35%,
rental apartments at 15 per acre, townhome/condo at 10 units per acre, and single family at 3 units per acre
Source: THK Associates, Inc.
Table V-13A: Summary of Real Estate Demands for the U.S. Highway 24 Primary Trade Area (Current Scenario)

U.S. HIGHWAY 24
102
Annual Sq.Ft./Units 10 yr. Cumulative Sq.Ft./Units 10 yr. Acreage Requirements
Retail 32,094 320,940 36.8Office 112,673 1,126,726 103.5Hotel 81 809 20.2
Industrial 28,292 282,920 18.6
Rental Apartments 73 731 48.7Condominiums and Townhomes 29 290 29.0
Single-Family Detached 218 2,183 727.8
Total 984.6
Note: Retail coverage is estimated at 20%, office coverage is estimated at 25%, hotel at 40 rooms per acre, industrial/flex at 35%,
rental apartments at 15 per acre, townhome/condo at 10 units per acre, and single family at 3 units per acre
Source: THK Associates, Inc.
Table V-13B: Summary of Real Estate Demands for the U.S. Highway 24 Primary Trade Area (Expressway Scenario)
Annual Sq.Ft./Units 10 yr. Cumulative Sq.Ft./Units 10 yr. Acreage Requirements
Retail 39,652 396,520 45.5Office 118,451 1,184,506 108.8Hotel 85 850 21.3
Industrial 29,743 297,429 19.5
Rental Apartments 90 900 60.0Condominiums and Townhomes 35 350 35.0
Single-Family Detached 268 2,681 893.6
Total 1,183.7
Note: Retail coverage is estimated at 20%, office coverage is estimated at 25%, hotel at 40 rooms per acre, industrial/flex at 35%,
rental apartments at 15 per acre, townhome/condo at 10 units per acre, and single family at 3 units per acre
Source: THK Associates, Inc.
Table V-13C: Summary of Real Estate Demands for the U.S. Highway 24 Primary Trade Area (Freeway Scenario)

U.S. HIGHWAY 24
103
As shown in the previous tables, over the next decade there will be a demand for theurbanization of approximately 515.1 acres and this would take the form as new construction orredevelopment of existing structures. If U.S. Highway 24 from Manitou Springs to Interstate 25is upgraded to an expressway, the demand for the urbanization of land would grow to 984.6acres, which is an increase of 469.5 acres over the projected demand under existing conditions.If this segment of U.S. Highway 24 is upgraded to a freeway, the demand for the urbanizationof land would grow to 1,183.7 acres, which is 68.6 acres over the demand under existingconditions. The demand for the urbanization of the land would grow by 199.1 acres if freewayimprovements occur, as opposed to an expressway.

APPENDIX
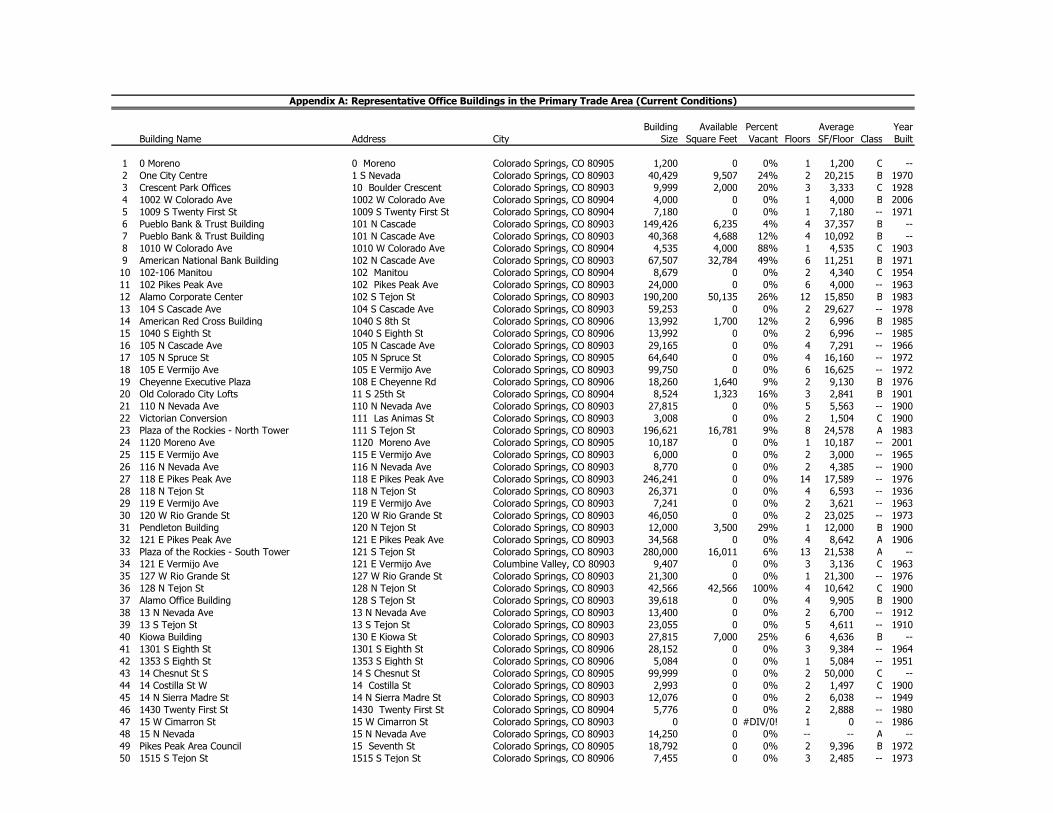
Building Available Percent Average YearBuilding Name Address City Size Square Feet Vacant Floors SF/Floor Class Built
,
1 0 Moreno 0 Moreno Colorado Springs, CO 80905 1,200 0 0% 1 1,200 C --2 One City Centre 1 S Nevada Colorado Springs, CO 80903 40,429 9,507 24% 2 20,215 B 19703 Crescent Park Offices 10 Boulder Crescent Colorado Springs, CO 80903 9,999 2,000 20% 3 3,333 C 19284 1002 W Colorado Ave 1002 W Colorado Ave Colorado Springs, CO 80904 4,000 0 0% 1 4,000 B 20065 1009 S Twenty First St 1009 S Twenty First St Colorado Springs, CO 80904 7,180 0 0% 1 7,180 -- 19716 Pueblo Bank & Trust Building 101 N Cascade Colorado Springs, CO 80903 149,426 6,235 4% 4 37,357 B --7 Pueblo Bank & Trust Building 101 N Cascade Ave Colorado Springs, CO 80903 40,368 4,688 12% 4 10,092 B --8 1010 W Colorado Ave 1010 W Colorado Ave Colorado Springs, CO 80904 4,535 4,000 88% 1 4,535 C 19039 American National Bank Building 102 N Cascade Ave Colorado Springs, CO 80903 67,507 32,784 49% 6 11,251 B 197110 102-106 Manitou 102 Manitou Colorado Springs, CO 80904 8,679 0 0% 2 4,340 C 195411 102 Pikes Peak Ave 102 Pikes Peak Ave Colorado Springs, CO 80903 24,000 0 0% 6 4,000 -- 196312 Alamo Corporate Center 102 S Tejon St Colorado Springs, CO 80903 190,200 50,135 26% 12 15,850 B 1983
13 104 S Cascade Ave 104 S Cascade Ave Colorado Springs, CO 80903 59,253 0 0% 2 29,627 -- 197814 American Red Cross Building 1040 S 8th St Colorado Springs, CO 80906 13,992 1,700 12% 2 6,996 B 198515 1040 S Eighth St 1040 S Eighth St Colorado Springs, CO 80906 13,992 0 0% 2 6,996 -- 198516 105 N Cascade Ave 105 N Cascade Ave Colorado Springs, CO 80903 29,165 0 0% 4 7,291 -- 196617 105 N Spruce St 105 N Spruce St Colorado Springs, CO 80905 64,640 0 0% 4 16,160 -- 197218 105 E Vermijo Ave 105 E Vermijo Ave Colorado Springs, CO 80903 99,750 0 0% 6 16,625 -- 197219 Cheyenne Executive Plaza 108 E Cheyenne Rd Colorado Springs, CO 80906 18,260 1,640 9% 2 9,130 B 197620 Old Colorado City Lofts 11 S 25th St Colorado Springs, CO 80904 8,524 1,323 16% 3 2,841 B 190121 110 N Nevada Ave 110 N Nevada Ave Colorado Springs, CO 80903 27,815 0 0% 5 5,563 -- 190022 Victorian Conversion 111 Las Animas St Colorado Springs, CO 80903 3,008 0 0% 2 1,504 C 190023 Plaza of the Rockies - North Tower 111 S Tejon St Colorado Springs, CO 80903 196,621 16,781 9% 8 24,578 A 198324 1120 Moreno Ave 1120 Moreno Ave Colorado Springs, CO 80905 10,187 0 0% 1 10,187 -- 200125 115 E Vermijo Ave 115 E Vermijo Ave Colorado Springs, CO 80903 6,000 0 0% 2 3,000 -- 1965
26 116 N Nevada Ave 116 N Nevada Ave Colorado Springs, CO 80903 8,770 0 0% 2 4,385 -- 190027 118 E Pikes Peak Ave 118 E Pikes Peak Ave Colorado Springs, CO 80903 246,241 0 0% 14 17,589 -- 197628 118 N Tejon St 118 N Tejon St Colorado Springs, CO 80903 26,371 0 0% 4 6,593 -- 193629 119 E Vermijo Ave 119 E Vermijo Ave Colorado Springs, CO 80903 7,241 0 0% 2 3,621 -- 196330 120 W Rio Grande St 120 W Rio Grande St Colorado Springs, CO 80903 46,050 0 0% 2 23,025 -- 197331 Pendleton Building 120 N Tejon St Colorado Springs, CO 80903 12,000 3,500 29% 1 12,000 B 190032 121 E Pikes Peak Ave 121 E Pikes Peak Ave Colorado Springs, CO 80903 34,568 0 0% 4 8,642 A 190633 Plaza of the Rockies - South Tower 121 S Tejon St Colorado Springs, CO 80903 280,000 16,011 6% 13 21,538 A --34 121 E Vermijo Ave 121 E Vermijo Ave Columbine Valley, CO 80903 9,407 0 0% 3 3,136 C 196335 127 W Rio Grande St 127 W Rio Grande St Colorado Springs, CO 80903 21,300 0 0% 1 21,300 -- 197636 128 N Tejon St 128 N Tejon St Colorado Springs, CO 80903 42,566 42,566 100% 4 10,642 C 190037 Alamo Office Building 128 S Tejon St Colorado Springs, CO 80903 39,618 0 0% 4 9,905 B 1900
38 13 N Nevada Ave 13 N Nevada Ave Colorado Springs, CO 80903 13,400 0 0% 2 6,700 -- 191239 13 S Tejon St 13 S Tejon St Colorado Springs, CO 80903 23,055 0 0% 5 4,611 -- 191040 Kiowa Building 130 E Kiowa St Colorado Springs, CO 80903 27,815 7,000 25% 6 4,636 B --41 1301 S Eighth St 1301 S Eighth St Colorado Springs, CO 80906 28,152 0 0% 3 9,384 -- 196442 1353 S Eighth St 1353 S Eighth St Colorado Springs, CO 80906 5,084 0 0% 1 5,084 -- 195143 14 Chesnut St S 14 S Chesnut St Colorado Springs, CO 80905 99,999 0 0% 2 50,000 C --44 14 Costilla St W 14 Costilla St Colorado Springs, CO 80903 2,993 0 0% 2 1,497 C 190045 14 N Sierra Madre St 14 N Sierra Madre St Colorado Springs, CO 80903 12,076 0 0% 2 6,038 -- 194946 1430 Twenty First St 1430 Twenty First St Colorado Springs, CO 80904 5,776 0 0% 2 2,888 -- 198047 15 W Cimarron St 15 W Cimarron St Colorado Springs, CO 80903 0 0 #DIV/0! 1 0 -- 198648 15 N Nevada 15 N Nevada Ave Colorado Springs, CO 80903 14,250 0 0% -- -- A --49 Pikes Peak Area Council 15 Seventh St Colorado Springs, CO 80905 18,792 0 0% 2 9,396 B 197250 1515 S Tejon St 1515 S Tejon St Colorado Springs, CO 80906 7,455 0 0% 3 2,485 -- 1973
Appendix A: Representative Office Buildings in the Primary Trade Area (Current Conditions)

51 1516 Tejon St S 1516 S Tejon St Colorado Springs, CO 80906 1,100 0 0% 1 1,100 C 191852 1521 S Eighth St 1521 S Eighth St Colorado Springs, CO 80906 7,771 0 0% 2 3,886 -- 196953 1526 Tejon 1526 Tejon Colorado Springs, CO 80906 1,100 300 27% 1 1,100 C 191854 1540 S Eighth St 1540 S Eighth St Colorado Springs, CO 80906 26,478 0 0% 1 26,478 -- 200155 1605 S Tejon St 1605 S Tejon St Colorado Springs, CO 80906 8,010 0 0% 2 4,005 -- 195556 Rolofson Veterinary Hosp 17 Las Vegas St Colorado Springs, CO 80903 2,688 0 0% 1 2,688 B 196557 17 N Spruce St 17 N Spruce St Colorado Springs, CO 80905 21,120 0 0% 2 10,560 -- 197458 17 S Tejon St 17 S Tejon St Colorado Springs, CO 80903 41,605 0 0% 5 8,321 -- 191459 1749 S Eighth St 1749 S Eighth St Colorado Springs, CO 80906 5,268 0 0% 1 5,268 -- 197460 1755 S Eighth St 1755 S Eighth St Colorado Springs, CO 80906 7,584 0 0% 1 7,584 -- 197461 1757 S Eighth St 1757 S Eighth St Colorado Springs, CO 80906 8,784 0 0% 2 4,392 -- 197362 1765 S 8th St 1765 S 8th St Colorado Springs, CO 80906 9,600 0 0% 2 4,800 C 197363 1765 S Eighth St 1765 S Eighth St Colorado Springs, CO 80906 9,600 0 0% 2 4,800 -- 197364 Broadmarket Square 1773 S 8th St Colorado Springs, CO 80906 9,999 1,998 20% 2 5,000 B --65 1773 Eighth St S 1773 Eighth St Colorado Springs, CO 80906 4,840 0 0% 1 4,840 B 197466 1775 Eighth St 1775 Eighth St Colorado Springs, CO 80906 5,436 0 0% 1 5,436 -- 197567 Sierra Madre Office 18 N Sierra Madre St Colorado Springs, CO 80903 12,076 6,400 53% 1 12,076 B --68 19 & 31 N. Tejon St. 19 N Tejon St Colorado Springs, CO 80903 49,854 7,105 14% 3 16,618 B --69 Atrium at Palmer Center 2 Cascade Ave Colorado Springs, CO 80903 92,756 0 0% 2 46,378 A 199870 Palmer Center Holly Sugar Building 2 N Cascade Ave Colorado Springs, CO 80903 149,426 14,327 10% 14 10,673 A 196871 Colorado Square 2 N Nevada Ave Colorado Springs, CO 80903 246,000 2,154 1% 13 18,923 B --72 2 S Tejon St 2 S Tejon St Colorado Springs, CO 80903 51,601 0 0% 8 6,450 -- 192173 20 Boulder Crescent St 20 Boulder Crescent St Colorado Springs, CO 80903 9,977 0 0% 2 4,989 -- 196174 20 E Vermijo Ave 20 E Vermijo Ave Colorado Springs, CO 80903 151,674 0 0% 5 30,335 -- 197075 200 S Cascade Ave 200 S Cascade Ave Colorado Springs, CO 80903 43,953 0 0% 1 43,953 -- 197676 2011 W Colorado Ave 2011 W Colorado Ave Colorado Springs, CO 80904 1,629 0 0% 1 1,629 B --77 Medical Office Condo 2020 W Colorado Ave Colorado Springs, CO 80906 2,459 0 0% 1 2,459 B --78 209-211 E Colorado Ave 209 E Colorado Ave Colorado Springs, CO 80903 6,000 800 13% 1 6,000 C 194179 2103 W Uintah St 2103 W Uintah St Colorado Springs, CO 80904 5,274 0 0% 2 2,637 -- 198380 2150 Naegele Rd 2150 Naegele Rd Colorado Springs, CO 80904 9,060 0 0% 1 9,060 -- 197181 219 Colorado Ave W 219 Colorado Ave Colorado Springs, CO 80904 19,000 0 0% 2 9,500 B 194982 23 S Nevada Ave 23 S Nevada Ave Colorado Springs, CO 80903 40,429 0 0% 2 20,215 -- 197083 230 N Tejon St 230 N Tejon St Colorado Springs, CO 80903 14,304 0 0% 3 4,768 -- 192984 PRESTWICK COMMUNITY 233 Fountain Blvd Colorado Springs, CO 80903 1,195 1,125 94% 1 1,195 B 200385 Former Andrew Wommack Ministries Building 2335 Robinson St Colorado Springs, CO 80904 14,344 14,344 100% 1 14,344 B 197186 25 N Cascade Ave 25 N Cascade Ave Colorado Springs, CO 80903 40,000 8,408 21% 4 10,000 B 196387 Spruce Professional Center 25 N Spruce St Colorado Springs, CO 80905 30,122 2,025 7% 3 10,041 B 197588 2502 W Colorado Ave 2502 W Colorado Ave Colorado Springs, CO 80904 18,084 0 0% 3 6,028 -- 193589 2627 W Colorado Ave 2627 W Colorado Ave Colorado Springs, CO 80904 6,080 0 0% 2 3,040 -- 189990 27 S Tejon St 27 S Tejon St Colorado Springs, CO 80903 25,000 0 0% 6 4,167 A --91 28 N Spruce 28 N Spruce Colorado Springs, CO 80905 810 810 100% 1 810 C --92 28 S Tejon St 28 S Tejon St Colorado Springs, CO 80903 14,868 0 0% 2 7,434 B 191193 2812 W Colorado Ave 2812 W Colorado Ave Colorado Springs, CO 80904 8,088 0 0% 2 4,044 -- 198594 2906 Morrison St 2906 Morrison St Colorado Springs, CO 80904 11,167 0 0% 1 11,167 -- 197595 3 S Seventh St 3 S Seventh St Colorado Springs, CO 80905 7,806 0 0% 1 7,806 -- 195396 3 S Tejon St 3 S Tejon St Colorado Springs, CO 80903 20,086 9,025 45% 4 5,022 B 190097 Bank One 30 Pikes Peak Ave Colorado City, CO 80903 100,444 0 0% 5 20,089 B 198898 3009 W Colorado Ave 3009 W Colorado Ave Colorado Springs, CO 80904 7,419 0 0% 2 3,710 -- 198199 303 S Cascade Ave 303 S Cascade Ave Colorado Springs, CO 80903 5,000 817 16% 2 2,500 B 1970100 309 S Tejon St 309 S Tejon St Colorado Springs, CO 80903 60,068 0 0% 3 20,023 -- 1972101 31 E Platte Ave 31 E Platte Ave Colorado Springs, CO 80903 14,304 0 0% 3 4,768 C 1929102 31 N Tejon St 31 N Tejon St Colorado Springs, CO 80903 38,684 0 0% 5 7,737 -- 1925103 315 S Cascade Ave 315 S Cascade Ave Colorado Springs, CO 80903 42,225 0 0% 2 21,113 -- 1964104 316 N Tejon St 316 N Tejon St Colorado Springs, CO 80903 10,978 0 0% 2 5,489 -- 1956105 318 Cascade 318 Cascade Colorado Springs, CO 80903 3,710 0 0% 2 1,855 C 1904106 Kennedy Law Building 324 S Cascade Ave Colorado Springs, CO 80903 5,246 6,000 114% 1 5,246 B 1984

107 325 S Tejon St 325 S Tejon St Colorado Springs, CO 80903 7,648 0 0% 2 3,824 -- 1955
108 3310 W Colorado Ave 3310 W Colorado Ave Colorado Springs, CO 80904 921 921 100% 1 921 C 1893109 Raintree Business Center 332 Bijou Colorado Springs, CO 80905 9,999 3,700 37% 2 5,000 B 1978
110 335 Manitou Ave 335 Manitou Ave Manitou Springs, CO 80829 2,475 2,475 100% 1 2,475 A 1997111 402 W Bijou St 402 W Bijou St Colorado Springs, CO 80905 7,372 0 0% 1 7,372 -- 1983
112 Courtside Plaza 405 S Cascade Ave Colorado Springs, CO 80903 29,308 2,647 9% 3 9,769 C 1975113 411 S Cascade Ave 411 S Cascade Ave Colorado Springs, CO 80903 3,281 3,220 98% 2 1,641 C 1978114 415 Sahwatch St 415 Sahwatch St Colorado Springs, CO 80903 11,337 0 0% 2 5,669 -- 1984
115 431 S Cascade Ave 431 S Cascade Ave Colorado Springs, CO 80903 7,000 2,740 39% 1 7,000 C 1965116 441 Manitou Ave 441 Manitou Ave Manitou Springs, CO 80829 8,963 1,000 11% 1 8,963 B 1961
117 4935 N Thirtieth St 4935 N Thirtieth St Colorado Springs, CO 80904 13,146 0 0% 2 6,573 -- 1983118 4945 N Thirtieth St 4945 N Thirtieth St Colorado Springs, CO 80904 21,026 0 0% 3 7,009 -- 1985
119 4965 N Thirtieth St 4965 N Thirtieth St Colorado Springs, CO 80904 11,749 0 0% 2 5,875 -- 1984120 5 S Tejon St 5 S Tejon St Colorado Springs, CO 80903 20,086 0 0% 4 5,022 -- 1900
121 50 Costilla St 50 Costilla St Colorado Springs, CO 80903 66,600 0 0% 5 13,320 -- 1959122 5015 N Thirtieth St 5015 N Thirtieth St Colorado Springs, CO 80904 15,627 0 0% 1 15,627 -- 1983123 515 S Cascade Ave 515 S Cascade Ave Colorado Springs, CO 80903 13,509 0 0% 1 13,509 -- 1900
124 Trolley Lofts 517 S Cascade Ave Colorado Springs, CO 80903 12,878 9,252 72% 1 12,878 B 1898125 520 E Colorado Ave 520 E Colorado Ave Colorado Springs, CO 80903 6,291 0 0% 1 6,291 -- 1955
126 520 Communications Cir 520 Communications Cir Colorado Springs, CO 80905 16,043 0 0% 2 8,022 -- 1987127 520 Sahwatch St 520 Sahwatch St Colorado Springs, CO 80903 8,840 0 0% 2 4,420 -- 1962
128 525 Communications Cir 525 Communications Cir Colorado Springs, CO 80905 19,819 0 0% 2 9,910 -- 1985129 Bank One Building 6 N Tejon St Colorado Springs, CO 80903 129,749 23,401 18% 5 25,950 A 1983130 Exchange Building 6 S Tejon St Colorado Springs, CO 80903 57,859 3,339 6% 8 7,232 C 1921
131 Cascade Station 620 S Cascade Ave Colorado Springs, CO 80903 1,659 3,681 222% 2 830 B 1984132 Metso Minerals Office Building 621 S Sierra Madre St Colorado Springs, CO 80903 46,050 23,000 50% 2 23,025 B 1973
133 7 E Bijou St 7 E Bijou St Colorado Springs, CO 80903 19,824 0 0% 2 9,912 -- 1900134 701 S Cascade Ave 701 S Cascade Ave Colorado Springs, CO 80903 1,114 0 0% 1 1,114 C 1957
135 724 S Cascade Ave 724 S Cascade Ave Colorado Springs, CO 80903 1,308 1,088 83% 1 1,308 C 1891136 730 Cheyenne Blvd 730 Cheyenne Blvd Colorado Springs, CO 80906 5,900 0 0% 1 5,900 -- 1980
137 Poppek Building 730 Nineteenth St Colorado Springs, CO 80904 4,968 0 0% 2 2,484 B 1979138 8 S Nevada Ave 8 S Nevada Ave Colorado Springs, CO 80903 60,179 50,000 83% 5 12,036 B 1900139 801 Weber St N 801 N Weber St Colorado Springs, CO 80907 3,412 0 0% 2 1,706 C 1889
140 9 E Vermijo Ave 9 E Vermijo Ave Colorado Springs, CO 80903 9,269 0 0% 1 9,269 -- 1952141 Palmer Center-Wells Fargo Tower 90 Cascade Colorado Springs, CO 80903 221,000 16,447 7% 15 14,733 A 1990
142 915 S 8th St 915 S 8th St Colorado Springs, CO 80906 4,213 4,213 100% 3 1,404 B 1980143 965 summer games 965 summer games Colorado Springs, CO 80906 8,221 0 0% 1 8,221 B 1994
144 Santa Fe Law Center 985 Pico Pt Colorado Springs, CO 80906 3,440 0 0% 1 3,440 B 1996
Total 4,585,975 426,632
Average 31,847 2,963 9% 9,253 1956
Source: DMCAR and THK Associates, Inc.

Building Available Percent Average Year
Building Name Address City Size Square Feet Vacant Floors SF/Floor Class Built,
1 1013 S Tejon St 1013 Tejon St Colorado Springs, CO 80903 5,169 0 0% 1 5,169 -- 19632 108 W Cimarron St 108 Cimarron St Colorado Springs, CO 80903 4,800 0 0% 1 4,800 -- 19103 110 S Sierra Madre St 110 Sierra Madre St Colorado Springs, CO 80903 10,810 0 0% 1 10,810 -- 19204 110 S Twenty Fifth St 110 Twenty Fifth St Colorado Springs, CO 80904 9,982 0 0% 1 9,982 -- 19885 110 W Vermijo Ave 110 Vermijo Ave Colorado Springs, CO 80903 27,030 0 0% 2 13,515 -- 19076 111 W Las Vegas St 111 Las Vegas St Colorado Springs, CO 80903 18,880 0 0% 1 18,880 -- 19787 1110 Pecan St 1110 Pecan St Colorado Springs, CO 80904 7,200 0 0% 1 7,200 -- 1984
8 112 W Las Vegas St 112 Las Vegas St Colorado Springs, CO 80903 30,000 10,000 33% 1 30,000 -- 19799 1134 Manitou Ave 1134 Manitou Ave Manitou Springs, CO 80829 9,832 0 0% 1 9,832 -- 1920
10 114 W Cimarron St 114 Cimarron St Colorado Springs, CO 80903 11,882 11,882 100% 1 11,882 -- 191011 1140 Pecan St 1140 Pecan St Colorado Springs, CO 80904 5,000 0 0% 1 5,000 -- 198612 116 W Rio Grande St 116 Rio Grande St Colorado Springs, CO 80903 12,000 0 0% 1 12,000 -- 195713 117 E Las Vegas St 117 Las Vegas St Colorado Springs, CO 80903 18,075 18,000 100% 1 18,075 -- 196514 117 W Vermijo Ave 117 Vermijo Ave Colorado Springs, CO 80903 35,340 0 0% 1 35,340 -- 197615 118 W Vermijo Ave 118 Vermijo Ave Colorado Springs, CO 80903 9,131 0 0% 1 9,131 -- 195916 12 W Costilla St 12 Costilla St Colorado Springs, CO 80903 7,500 0 0% 1 7,500 -- 1899
17 120 W Cucharras St 120 Cucharras St Colorado Springs, CO 80903 5,615 0 0% 1 5,615 -- 190618 120 W Las Vegas St 120 Las Vegas St Colorado Springs, CO 80903 5,960 0 0% 1 5,960 -- 198419 120 Sahwatch St 120 Sahwatch St Colorado Springs, CO 80903 13,527 0 0% 1 13,527 -- 193220 121 W Cucharras St 121 Cucharras St Colorado Springs, CO 80903 26,850 0 0% 1 26,850 -- 197421 125 S Chestnut St 125 Chestnut St Colorado Springs, CO 80905 7,600 0 0% 1 7,600 -- 197622 125-129 W Costilla St 125 Costilla St Colorado Springs, CO 80903 11,822 11,822 100% 1 11,822 -- 195623 127 Colorado Ave 127 Colorado Ave Colorado Springs, CO 80903 8,419 0 0% 1 8,419 -- 195224 127 W Moreno Ave 127 Moreno Ave Colorado Springs, CO 80903 16,416 0 0% 1 16,416 -- 1975
25 130 W Vermijo Ave 130 Vermijo Ave Colorado Springs, CO 80903 9,064 0 0% 1 9,064 -- 195226 1305 Pecan St 1305 Pecan St Colorado Springs, CO 80904 6,000 0 0% 1 6,000 -- 199527 1309 E Cheyenne Rd 1309 Cheyenne Rd Colorado Springs, CO 80906 6,080 0 0% 1 6,080 -- 197528 1310 Manitou Ave 1310 Manitou Ave Manitou Springs, CO 80829 5,690 0 0% 1 5,690 -- 194029 1310 Pecan St 1310 Pecan St Colorado Springs, CO 80904 20,150 0 0% 1 20,150 -- 198530 1313 E Cheyenne Rd 1313 Cheyenne Rd Colorado Springs, CO 80906 10,000 0 0% 1 10,000 -- 198631 135 Manitou Ave 135 Manitou Ave Manitou Springs, CO 80829 7,655 0 0% 1 7,655 -- 196832 1392 S Twenty First St 1392 Twenty First St Colorado Springs, CO 80904 7,760 0 0% 1 7,760 -- 199033 1414 W Vermijo Ave 1414 Vermijo Ave Colorado Springs, CO 80904 5,728 0 0% 1 5,728 -- 1983
34 1540 S Twenty First St 1540 Twenty First St Colorado Springs, CO 80904 14,014 0 0% 1 14,014 -- 198235 Commercial Storage 16 Las Vegas St Colorado Springs, CO 80903 13,930 0 0% 1 13,930 -- --36 1716 Mt Washington Ave 1716 Mt Washington Ave Colorado Springs, CO 80906 10,640 0 0% 1 10,640 -- 195137 1725 S Nevada Ave 1725 Nevada Ave Colorado Springs, CO 80906 7,797 0 0% 1 7,797 -- 196438 1823 W Vermijo 1823 Vermijo Colorado Springs, CO 80904 5,170 5,170 100% 1 5,170 -- 196539 19 W Las Vegas St 19 Las Vegas St Colorado Springs, CO 80903 5,350 0 0% 1 5,350 -- 198640 2 W Las Vegas St 2 Las Vegas St Colorado Springs, CO 80903 18,054 0 0% 1 18,054 -- 196441 2008-2012 Sheldon Ave 2008 Sheldon Ave Colorado Springs, CO 80904 2,400 2,400 100% 1 2,400 -- 1998
42 201 W Colorado Ave 201 Colorado Ave Colorado Springs, CO 80903 6,496 0 0% 1 6,496 -- 194343 202 S Twenty First St 202 Twenty First St Colorado Springs, CO 80904 5,474 0 0% 1 5,474 -- 192544 21 W Las Vegas St 21 Las Vegas St Colorado Springs, CO 80903 5,350 0 0% 1 5,350 -- 198645 210 Colorado Ave W 210 Colorado Ave Colorado Springs, CO 80903 6,000 0 0% 1 6,000 -- 196946 2109 Broadway St 2109 Broadway St Colorado Springs, CO 80904 6,720 0 0% 1 6,720 -- 196647 2110 Busch Ave 2110 Busch Ave Colorado Springs, CO 80904 20,004 0 0% 1 20,004 -- 198448 2110 Naegele Rd 2110 Naegele Rd Colorado Springs, CO 80904 9,521 0 0% 1 9,521 -- 196449 2110 Wheeler Ave 2110 Wheeler Ave Colorado Springs, CO 80904 7,000 0 0% 1 7,000 -- 198650 2115 Wheeler Ave 2115 Wheeler Ave Colorado Springs, CO 80904 6,000 0 0% 1 6,000 -- 1979
Appendix B: Representative Industrial/Flex Space in the U.S. Highway 24 Current Primary Trade Area

51 2120 Bott Ave 2120 Bott Ave Colorado Springs, CO 80904 10,918 0 0% 1 10,918 -- 1900
52 2120 Naegele Rd 2120 Naegele Rd Colorado Springs, CO 80904 7,000 0 0% 1 7,000 -- 196553 2125 Busch Ave 2125 Busch Ave Colorado Springs, CO 80904 6,000 0 0% 1 6,000 -- 198154 2130 Bott Ave 2130 Bott Ave Colorado Springs, CO 80904 8,444 0 0% 1 8,444 -- 1955
55 2135 Broadway - AKA 1110 Pecan 2135 Broadway Colorado Springs, CO 80904 7,200 0 0% 1 7,200 -- 198456 214 W Colorado Ave 214 Colorado Ave Colorado Springs, CO 80903 8,160 0 0% 1 8,160 -- 196957 2140 Broadway St 2140 Broadway St Colorado Springs, CO 80904 21,900 0 0% 1 21,900 -- 197958 218 W Colorado Ave 218 Colorado Ave Colorado Springs, CO 80903 14,208 0 0% 1 14,208 -- 1903
59 2190 Busch Ave 2190 Busch Ave Colorado Springs, CO 80904 9,830 0 0% 2 4,915 -- 200160 22 W Costilla St 22 Costilla St Colorado Springs, CO 80903 14,288 0 0% 1 14,288 -- 192561 22 N Sierra Madre St 22 Sierra Madre St Colorado Springs, CO 80903 10,135 0 0% 2 5,068 -- 1955
62 16-22 N Spruce St 22 Spruce St Colorado Springs, CO 80905 10,120 0 0% 1 10,120 -- --63 2204 Hagerman St 2204 Hagerman St Colorado Springs, CO 80904 12,800 0 0% 1 12,800 -- 197264 2210 Bott Ave 2210 Bott Ave Colorado Springs, CO 80904 6,460 0 0% 1 6,460 -- 1984
65 2215 Spectra Dr 2215 Spectra Dr Colorado Springs, CO 80904 7,200 0 0% 1 7,200 -- 200466 2220 Busch Ave 2220 Busch Ave Colorado Springs, CO 80906 3,500 0 0% 1 3,500 -- 198867 2235 Spectra Dr 2235 Spectra Dr Colorado Springs, CO 80904 5,000 0 0% 1 5,000 -- 200368 2250 Busch Ave 2250 Busch Ave Colorado Springs, CO 80904 5,000 0 0% 1 5,000 -- 1994
69 2264 Naegele Rd 2264 Naegele Rd Colorado Springs, CO 80904 6,482 0 0% 1 6,482 -- 196770 2275 Spectra Dr 2275 Spectra Dr Colorado Springs, CO 80904 6,000 0 0% 1 6,000 -- 200371 229 E Moreno Ave 229 Moreno Ave Colorado Springs, CO 80903 8,550 0 0% 1 8,550 -- 1955
72 23 E Las Vegas St 23 Las Vegas St Colorado Springs, CO 80903 5,350 0 0% 1 5,350 -- 198673 2305 Busch Ave 2305 Busch Ave Colorado Springs, CO 80904 5,750 0 0% 1 5,750 -- 197174 2330 Naegele Rd 2330 Naegele Rd Colorado Springs, CO 80904 5,000 0 0% 1 5,000 -- 197275 Simpich Buildings 2411 Colorado Ave Colorado Springs, CO 80904 10,793 10,973 102% 2 5,397 -- 1900
76 2413 W Colorado Ave 2413 Colorado Ave Colorado Springs, CO 80904 5,061 0 0% 2 2,531 -- 188977 25 W Las Vegas St 25 Las Vegas St Colorado Springs, CO 80903 5,300 0 0% 1 5,300 -- 198678 25 W Vermijo Ave 25 Vermijo Ave Colorado Springs, CO 80903 42,750 0 0% 1 42,750 -- 1921
79 Robinson Group Building 2506 Robinson St Colorado Springs, CO 80904 4,200 0 0% 1 4,200 -- 199980 2515 W Colorado Ave 2515 Colorado Ave Colorado Springs, CO 80904 6,830 0 0% 1 6,830 -- 190281 2519 W Colorado Ave 2519 Colorado Ave Colorado Springs, CO 80904 6,615 0 0% 1 6,615 -- 190982 2623 St Anthony St 2623 St Anthony St Colorado Springs, CO 80904 10,400 0 0% 1 10,400 -- 1984
83 2710 Robinson St 2710 Robinson St Colorado Springs, CO 80904 21,212 0 0% 1 21,212 -- 197384 2719 Robinson St 2719 Robinson St Colorado Springs, CO 80904 10,583 0 0% 1 10,583 -- 195985 2815 W Howbert St 2815 Howbert St Colorado Springs, CO 80904 6,960 0 0% 1 6,960 -- 1967
86 2845 Ore Mill Rd 2845 Ore Mill Rd Colorado Springs, CO 80904 16,000 960 6% 1 16,000 -- 198587 2902 Morrison St 2902 Morrison St Colorado Springs, CO 80904 5,000 0 0% 1 5,000 -- 197088 2905 Morrison St 2905 Morrison St Colorado Springs, CO 80904 14,515 0 0% 1 14,515 -- 1981
89 30 W Costilla St 30 Costilla St Colorado Springs, CO 80903 10,599 0 0% 1 10,599 -- 191990 301 Manitou Ave 301 Manitou Ave Manitou Springs, CO 80829 10,080 0 0% 2 5,040 -- 196691 301 S Tenth St 301 Tenth St Colorado Springs, CO 80904 8,058 0 0% 2 4,029 -- 195092 3015 Morrison St 3015 Morrison St Colorado Springs, CO 80904 7,840 0 0% 1 7,840 -- 1972
93 302 S Chestnut St 302 Chestnut St Colorado Springs, CO 80905 14,016 0 0% 1 14,016 -- 195994 302 S Tenth St 302 Tenth St Colorado Springs, CO 80904 7,423 0 0% 1 7,423 -- 195995 3030 Morrison St 3030 Morrison St Colorado Springs, CO 80904 5,280 0 0% 2 2,640 -- 1905
96 3031 Morrison St 3031 Morrison St Colorado Springs, CO 80904 7,680 0 0% 1 7,680 -- 196897 306 S Chestnut St 306 Chestnut St Colorado Springs, CO 80905 7,116 0 0% 1 7,116 -- 195798 308 S Twenty Fifth St 308 Twenty Fifth St Colorado Springs, CO 80904 8,000 0 0% 1 8,000 -- 198799 311 S Chestnut St 311 Chestnut St Colorado Springs, CO 80905 8,910 0 0% 1 8,910 -- 1999
100 Pickrell Building 331 14th St Colorado Springs, CO 80904 6,086 0 0% 1 6,086 -- --101 3333 W Kiowa 3333 Kiowa St Colorado Springs, CO 80904 3,334 3,334 100% 1 3,334 -- --102 350 18th St S 350 18th St Colorado Springs, CO 80906 1,743 1,743 100% 1 1,743 -- --
103 Cobra OSW Building 3680 Bijou St Colorado Springs, CO 80903 6,688 0 0% 1 6,688 -- 1985104 385 S Thirty First St 385 Thirty First St Colorado Springs, CO 80904 10,810 0 0% 1 10,810 -- 1999105 397 S Eighth St 397 Eighth St Colorado Springs, CO 80905 6,097 0 0% 1 6,097 -- 1983
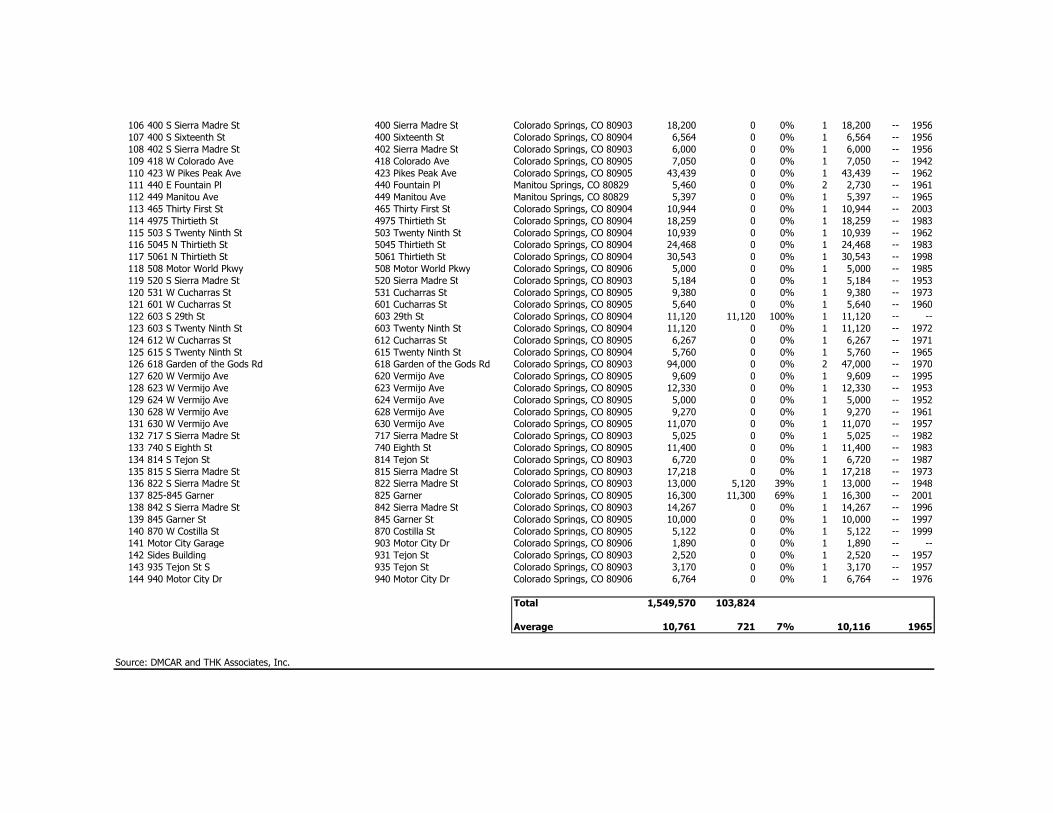
106 400 S Sierra Madre St 400 Sierra Madre St Colorado Springs, CO 80903 18,200 0 0% 1 18,200 -- 1956107 400 S Sixteenth St 400 Sixteenth St Colorado Springs, CO 80904 6,564 0 0% 1 6,564 -- 1956108 402 S Sierra Madre St 402 Sierra Madre St Colorado Springs, CO 80903 6,000 0 0% 1 6,000 -- 1956109 418 W Colorado Ave 418 Colorado Ave Colorado Springs, CO 80905 7,050 0 0% 1 7,050 -- 1942110 423 W Pikes Peak Ave 423 Pikes Peak Ave Colorado Springs, CO 80905 43,439 0 0% 1 43,439 -- 1962111 440 E Fountain Pl 440 Fountain Pl Manitou Springs, CO 80829 5,460 0 0% 2 2,730 -- 1961112 449 Manitou Ave 449 Manitou Ave Manitou Springs, CO 80829 5,397 0 0% 1 5,397 -- 1965113 465 Thirty First St 465 Thirty First St Colorado Springs, CO 80904 10,944 0 0% 1 10,944 -- 2003114 4975 Thirtieth St 4975 Thirtieth St Colorado Springs, CO 80904 18,259 0 0% 1 18,259 -- 1983115 503 S Twenty Ninth St 503 Twenty Ninth St Colorado Springs, CO 80904 10,939 0 0% 1 10,939 -- 1962116 5045 N Thirtieth St 5045 Thirtieth St Colorado Springs, CO 80904 24,468 0 0% 1 24,468 -- 1983117 5061 N Thirtieth St 5061 Thirtieth St Colorado Springs, CO 80904 30,543 0 0% 1 30,543 -- 1998118 508 Motor World Pkwy 508 Motor World Pkwy Colorado Springs, CO 80906 5,000 0 0% 1 5,000 -- 1985119 520 S Sierra Madre St 520 Sierra Madre St Colorado Springs, CO 80903 5,184 0 0% 1 5,184 -- 1953120 531 W Cucharras St 531 Cucharras St Colorado Springs, CO 80905 9,380 0 0% 1 9,380 -- 1973121 601 W Cucharras St 601 Cucharras St Colorado Springs, CO 80905 5,640 0 0% 1 5,640 -- 1960122 603 S 29th St 603 29th St Colorado Springs, CO 80904 11,120 11,120 100% 1 11,120 -- --123 603 S Twenty Ninth St 603 Twenty Ninth St Colorado Springs, CO 80904 11,120 0 0% 1 11,120 -- 1972124 612 W Cucharras St 612 Cucharras St Colorado Springs, CO 80905 6,267 0 0% 1 6,267 -- 1971125 615 S Twenty Ninth St 615 Twenty Ninth St Colorado Springs, CO 80904 5,760 0 0% 1 5,760 -- 1965126 618 Garden of the Gods Rd 618 Garden of the Gods Rd Colorado Springs, CO 80903 94,000 0 0% 2 47,000 -- 1970127 620 W Vermijo Ave 620 Vermijo Ave Colorado Springs, CO 80905 9,609 0 0% 1 9,609 -- 1995128 623 W Vermijo Ave 623 Vermijo Ave Colorado Springs, CO 80905 12,330 0 0% 1 12,330 -- 1953129 624 W Vermijo Ave 624 Vermijo Ave Colorado Springs, CO 80905 5,000 0 0% 1 5,000 -- 1952130 628 W Vermijo Ave 628 Vermijo Ave Colorado Springs, CO 80905 9,270 0 0% 1 9,270 -- 1961131 630 W Vermijo Ave 630 Vermijo Ave Colorado Springs, CO 80905 11,070 0 0% 1 11,070 -- 1957132 717 S Sierra Madre St 717 Sierra Madre St Colorado Springs, CO 80903 5,025 0 0% 1 5,025 -- 1982133 740 S Eighth St 740 Eighth St Colorado Springs, CO 80905 11,400 0 0% 1 11,400 -- 1983134 814 S Tejon St 814 Tejon St Colorado Springs, CO 80903 6,720 0 0% 1 6,720 -- 1987135 815 S Sierra Madre St 815 Sierra Madre St Colorado Springs, CO 80903 17,218 0 0% 1 17,218 -- 1973136 822 S Sierra Madre St 822 Sierra Madre St Colorado Springs, CO 80903 13,000 5,120 39% 1 13,000 -- 1948137 825-845 Garner 825 Garner Colorado Springs, CO 80905 16,300 11,300 69% 1 16,300 -- 2001138 842 S Sierra Madre St 842 Sierra Madre St Colorado Springs, CO 80903 14,267 0 0% 1 14,267 -- 1996139 845 Garner St 845 Garner St Colorado Springs, CO 80905 10,000 0 0% 1 10,000 -- 1997140 870 W Costilla St 870 Costilla St Colorado Springs, CO 80905 5,122 0 0% 1 5,122 -- 1999141 Motor City Garage 903 Motor City Dr Colorado Springs, CO 80906 1,890 0 0% 1 1,890 -- --142 Sides Building 931 Tejon St Colorado Springs, CO 80903 2,520 0 0% 1 2,520 -- 1957143 935 Tejon St S 935 Tejon St Colorado Springs, CO 80903 3,170 0 0% 1 3,170 -- 1957144 940 Motor City Dr 940 Motor City Dr Colorado Springs, CO 80906 6,764 0 0% 1 6,764 -- 1976
Total 1,549,570 103,824
Average 10,761 721 7% 10,116 1965
Source: DMCAR and THK Associates, Inc.

Number of
Rooms
1 ALPINE MOTEL 45 MANITOU AVE MANITOU SPRINGS CO 80829 46
2 AMARILLO MOTEL 2801 W COLORADO AVE COLORADO SPRINGS CO 80904 12
3 BECKERS LANE LODGE 115 BECKERS LN MANITOU SPRINGS CO 80829 22
4 BED & BREAKFAST AT ONALEDGE 336 EL PASO BLVD MANITOU SPRINGS CO 80829 6
5 BEVERLY HILLS MOTEL 6 EL PASO BLVD COLORADO SPRINGS CO 80904 -
6 BLACK BEAR INN 5250 PIKES PEAK HWY CASCADE CO 80809 12
7 BLUE SKIES INN BED & BREAKFAST 402 MANITOU AVE MANITOU SPRINGS CO 80829 10
8 BUFFALO LODGE INC 2 EL PASO BLVD COLORADO SPRINGS CO 80904 46
9 CASTAWAYS INN & SUITES 103 MANITOU AVE MANITOU SPRINGS CO 80829 49
10 CLIFF HOUSE AT PIKES PEAK 306 CANON AVE MANITOU SPRINGS CO 80829 57
11 COTTONWOOD COURT MOTEL 120 MANITOU AVE MANITOU SPRINGS CO 80829 24
12 DALE DOWNTOWN MOTEL 620 W COLORADO AVE COLORADO SPRINGS CO 80905 29
13 DILLON MOTEL 134 MANITOU AVE MANITOU SPRINGS CO 80829 104
14 EAGLE MOTEL 423 MANITOU AVE MANITOU SPRINGS CO 80829 25
15 EASTHOLME IN THE ROCKIES B & B 4445 HAGERMAN AVE CASCADE CO 80809 8
16 EL COLORADO LODGE 23 MANITOU AVE MANITOU SPRINGS CO 80829 27
17 EXPRESS INN 725 W CIMARRON ST COLORADO SPRINGS CO 80905 278
18 GARDEN OF THE GODS MOTEL 2922 W COLORADO AVE COLORADO SPRINGS CO 80904 36
19 GRAYS AVENUE HOTEL 711 MANITOU AVE MANITOU SPRINGS CO 80829 7
20 HOLDEN HOUSE-1902 B & B 1102 W PIKES PEAK AVE COLORADO SPRINGS CO 80904 5
21 LA BARON HOTEL 314 W BIJOU ST COLORADO SPRINGS CO 80905 202
22 LA FON MOTEL 123 MANITOU AVE MANITOU SPRINGS CO 80829 53
23 MAPLE LODGE 9 EL PASO BLVD MANITOU SPRINGS CO 80829 18
24 MAVERICK MOTEL 3612 W COLORADO AVE COLORADO SPRINGS CO 80904 20
25 MECCA MOTEL 3518 W COLORADO AVE COLORADO SPRINGS CO 80904 21
26 MEL HAVEN LODGE 3715 W COLORADO AVE COLORADO SPRINGS CO 80904 20
27 MOUNTAINSCAPE HOTEL 3445 W COLORADO AVE COLORADO SPRINGS CO 80904 13
28 OLD TOWN GUEST HOUSE B & B 115 S 26TH ST COLORADO SPRINGS CO 80904 8
29 OUR HEARTS INN OLD COLO CITY 2215 W COLORADO AVE COLORADO SPRINGS CO 80904 4
30 PARK ROW LODGE 54 MANITOU AVE MANITOU SPRINGS CO 80829 20
31 PEACOCK BED & BREAKFAST 41 LINCOLN AVE MANITOU SPRINGS CO 80829 7
32 PIKES PEAK INN 626 MANITOU AVE MANITOU SPRINGS CO 80829 17
33 RAINBOW MOTEL 3709 W COLORADO AVE COLORADO SPRINGS CO 80904 42
34 RED CRAGS BED & BREAKFAST 302 EL PASO BLVD MANITOU SPRINGS CO 80829 8
35 RED WING MOTEL 56 EL PASO BLVD MANITOU SPRINGS CO 80829 27
36 RIDGEVIEW MOTEL 3501 W COLORADO AVE COLORADO SPRINGS CO 80904 9
37 ROCKLEDGE COUNTRY INN 328 EL PASO BLVD MANITOU SPRINGS CO 80829 5
38 ROCKY MOUNTAIN LODGE & CABINS 4680 HAGERMAN AVE CASCADE CO 80809 6
39 SILVER SADDLE MOTEL 215 MANITOU AVE MANITOU SPRINGS CO 80829 54
40 SKYWAY INN 311 MANITOU AVE MANITOU SPRINGS CO 80829 38
41 SPRING COTTAGE 113 PAWNEE AVE MANITOU SPRINGS CO 80829 5
42 SPURS-N-LACE BED & BREAKFAST 2829 W PIKES PEAK AVE COLORADO SPRINGS CO 80904 5
43 SUNFLOWER LODGING CO 3703 W COLORADO AVE COLORADO SPRINGS CO 80904 9
44 SUPER 8 MOTEL 229 MANITOU AVE MANITOU SPRINGS CO 80829 39
45 TIMBER LODGE 3627 W COLORADO AVE COLORADO SPRINGS CO 80904 24
46 TOWN & COUNTRY COTTAGES 123 CRYSTAL PARK RD MANITOU SPRINGS CO 80829 10
47 TRAVELODGE 2625 ORE MILL RD COLORADO SPRINGS CO 80904 111
48 TWO SISTERS INN 10 OTOE PL MANITOU SPRINGS CO 80829 5
49 VICTORIA'S KEEP BED BREAKFAST 202 RUXTON AVE MANITOU SPRINGS CO 80829 6
50 VILLA MOTEL 481 MANITOU AVE MANITOU SPRINGS CO 80829 47
51 WHEELER HOUSE 36 PARK AVE MANITOU SPRINGS CO 80829 18
Manitou Springs Total 667
Average 25
PTA Total 1674
Average 33
Appendix C: Lodging Inventory in the U.S. Highway 24 Primary Trade Area
Company Name Address City
Source: stdbonline.com & THK Associates, Inc.
State ZIP

Company Name Address City State ZIP SF Type
1 COTTON CLUB 1 RUXTON AVE MANITOU SPRINGS CO 80829 1613 Women's Clothing
2 TAJINE ALAMI 10 OLD MANS TRL MANITOU SPRINGS CO 80829 3000 Restaurant
3 FILTHY WILMA'S GALLERY 10 RUXTON AVE MANITOU SPRINGS CO 80829 803 Hobby
4 HOLLY LEAF 10 S 25TH ST COLORADO SPRINGS CO 80904 1300 Misc. Retail
5 MOUNTAIN MAN 1001 MANITOU AVE MANITOU SPRINGS CO 80829 2800 Sporting Goods
6 WONG WARES 101 OKLAHOMA RD MANITOU SPRINGS CO 80829 2200 Misc. Retail
7 KERRY BARLOW JEWELRY STUDIO 1010 W COLORADO AVE COLORADO SPRINGS CO 80904 1200 Jewerly
8 ART & FRAME APPROACH 1010 W COLORADO AVE # A COLORADO SPRINGS CO 80904 1200 Hobby
9 7-ELEVEN 1011 S 21ST ST COLORADO SPRINGS CO 80904 3200 Convenience Store
10 RHYME & REASON 1012 W COLORADO AVE COLORADO SPRINGS CO 80904 2500 Misc. Retail
11 SEVEN ELEVEN STORE 1013 S 21ST ST COLORADO SPRINGS CO 80904 3000 Misc. Retail
12 PLAZA 21 CLEANERS 1014 S 21ST ST COLORADO SPRINGS CO 80904 2200 Dry Cleaner
13 WONG'S KITCHEN RESTAURANT 1014 S 21ST ST # A COLORADO SPRINGS CO 80904 2200 Restaurant
14 A FLAVOR OF NY 1014 S 21ST ST # B COLORADO SPRINGS CO 80904 2200 Restaurant
15 PLAZA 21 DISCOUNT LIQUORS 1014 S 21ST ST # E COLORADO SPRINGS CO 80904 2200 Liquor
16 1015 GRILL 1015 W COLORADO AVE COLORADO SPRINGS CO 80904 2500 Restaurant
17 LA PETITE MAISON 1015 W COLORADO AVE COLORADO SPRINGS CO 80904 2500 Restaurant
18 COMMONWHEEL ARTISTS CO-OP 102 CANON AVE MANITOU SPRINGS CO 80829 2600 Hobby
19 ALFONSO'S MEXICAN FOOD 1022 S 21ST ST COLORADO SPRINGS CO 80904 2800 Restaurant
20 DUTCH KITCHEN 1025 MANITOU AVE MANITOU SPRINGS CO 80829 2500 Restaurant
21 CARLOS BISTRO 1025 S 21ST ST COLORADO SPRINGS CO 80904 2500 Restaurant
22 HAIR E'CLIPS INC 1027 W COLORADO AVE COLORADO SPRINGS CO 80904 1200 Personal Care
23 CATERING BANQUETS & GROUP SALE 103 MANITOU AVE MANITOU SPRINGS CO 80829 2300 Restaurant
24 PIRAMIDE NATURAL FIBRE 106 CANON AVE MANITOU SPRINGS CO 80829 2100 Women's Clothing
25 CHINA CHINA RESTAURANT 106 MANITOU AVE MANITOU SPRINGS CO 80829 2500 Restaurant
26 BAMBOO SPA ORIENTAL MASSAGE 106 MANITOU AVE # A MANITOU SPRINGS CO 80829 2000 Personal Care
27 BUD STAFFORD-JEWELER 106 MANITOU AVE # B MANITOU SPRINGS CO 80829 1800 Jewerly
28 CASTAWAYS 107 MANITOU AVE MANITOU SPRINGS CO 80829 2500 Restaurant
29 MO'S DINER & LOUNGE 108 MANITOU AVE MANITOU SPRINGS CO 80829 2600 Restaurant
30 NAVAJO GALLERY & GIFTS 11 ARCADE MANITOU SPRINGS CO 80829 1600 Misc. Retail
31 ADAMS MOUNTAIN CAFE 110 CANON AVE MANITOU SPRINGS CO 80829 2800 Restaurant
32 TUBBY'S TURN AROUND 1106 MANITOU AVE MANITOU SPRINGS CO 80829 2000 Grocery
33 SPIRIT TOUCH THERAPEUTIC 1106 W CUCHARRAS ST COLORADO SPRINGS CO 80904 1200 Personal Care
34 CREEKSIDE LIQUORS 1108 MANITOU AVE MANITOU SPRINGS CO 80829 1800 Liquor
35 OPEN RANGE 12 RUXTON AVE MANITOU SPRINGS CO 80829 2000 Furniture
36 SAGEBRUSH & TUMBLEWEEDS 12 S 25TH ST COLORADO SPRINGS CO 80904 2000 Misc. Retail
37 STARLIGHT VIDEO 1201 W COLORADO AVE COLORADO SPRINGS CO 80904 2200 Video Tape Rental
38 BARBER POLE 1206 W COLORADO AVE COLORADO SPRINGS CO 80904 1800 Personal Care
39 ANGEL STORE 1211 W COLORADO AVE COLORADO SPRINGS CO 80904 2000 Misc. Retail
40 CACTUS FLOWER TROPICALS 1219 W COLORADO AVE COLORADO SPRINGS CO 80904 1200 Florist
Appendix D: Retail Establishments in the U.S. Highway 24 Primary Trade Area

41 ISLAND ORCHID 1219 W COLORADO AVE COLORADO SPRINGS CO 80904 1200 Florist
42 POPPY SEED 123 CANON AVE MANITOU SPRINGS CO 80829 2000 Misc. Retail
43 ANNELIESE ESTHETIC SKIN & BODY 1232 W COLORADO AVE COLORADO SPRINGS CO 80904 1800 Personal Care
44 STRINGS WOK 125 N SPRUCE ST COLORADO SPRINGS CO 80905 2500 Restaurant
45 LIFE FORCE 1301 S 8TH ST # 106 COLORADO SPRINGS CO 80906 1200 Personal Care
46 INTEGRATIVE MEDICAL MASSAGE 1301 S 8TH ST # 112 COLORADO SPRINGS CO 80906 1200 Personal Care
47 ESSENCE OF MOVEMENT PILATES 1301 S 8TH ST # 115 COLORADO SPRINGS CO 80906 1500 Personal Care
48 REVOLUTION 1312 W COLORADO AVE COLORADO SPRINGS CO 80904 2200 Women's Clothing
49 PLANET HAIR 1314 W COLORADO AVE COLORADO SPRINGS CO 80904 1800 Personal Care
50 BARGAIN MART 135 MANITOU AVE # 135 MANITOU SPRINGS CO 80829 2000 Misc. Retail
51 VIDEOS FOR LEARNING 1353 S 8TH ST COLORADO SPRINGS CO 80906 2200 Video Tape Rental
52 LOAF 'N JUG 137 MANITOU AVE MANITOU SPRINGS CO 80829 2600 Convenience Store
53 DASSEL'S FLORIST & WEDDINGS 1380 S 21ST ST COLORADO SPRINGS CO 80904 1300 Florist
54 GALERIA DAY LA LUZ ORIGINALS 14 RUXTON AVE MANITOU SPRINGS CO 80829 1800 Hobby
55 VINTAGE REVIVAL 14 S 18TH ST COLORADO SPRINGS CO 80904 2600 Misc. Retail
56 SHEAR COMPETENCE 1403 S 8TH ST COLORADO SPRINGS CO 80906 1500 Personal Care
57 SKYWAY CREATIONS 1407 S 8TH ST COLORADO SPRINGS CO 80906 1300 Florist
58 DRIVE-IN LIQUORS 141 N SPRUCE ST COLORADO SPRINGS CO 80905 2000 Liquor
59 TOTAL IMAGE DESIGN 1416 S 21ST ST COLORADO SPRINGS CO 80904 1500 Personal Care
60 JUG & BASIN ANTIQUES 1420 W COLORADO AVE COLORADO SPRINGS CO 80904 1800 Misc. Retail
61 7-ELEVEN 1428 W COLORADO AVE COLORADO SPRINGS CO 80904 3000 Convenience Store
62 7-ELEVEN 145 N SPRUCE ST COLORADO SPRINGS CO 80905 3200 Convenience Store
63 ESTATE SALES 1501 W COLORADO AVE COLORADO SPRINGS CO 80904 2000 Misc. Retail
64 ROCKY MOUNTAIN NATURAL STORE 1502 W COLORADO AVE COLORADO SPRINGS CO 80904 2000 Personal Care Products
65 SUN SHINE HAIR DESIGN 1507 W COLORADO AVE COLORADO SPRINGS CO 80904 1200 Personal Care
66 SUPERIOR CLEANERS & SHIRT 1532 W COLORADO AVE COLORADO SPRINGS CO 80904 1500 Dry Cleaner
67 CHRYSTINA'S GALLERY 16 COLBRUNN CT COLORADO SPRINGS CO 80904 2700 Misc. Retail
68 PHOTOTROPH GALLERY 16 RUXTON AVE MANITOU SPRINGS CO 80829 1950 Hobby
69 WESTERN OMELETTE 16 S WALNUT ST COLORADO SPRINGS CO 80905 2900 Restaurant
70 P WEST SIDE LIQUOR 1602 W COLORADO AVE COLORADO SPRINGS CO 80904 1500 Liquor
71 SASSY FINGERS 1618 W COLORADO AVE COLORADO SPRINGS CO 80904 1200 Personal Care
72 MILL HILL 1668 S 21ST ST COLORADO SPRINGS CO 80904 2500 Restaurant
73 CLEVERWOOD 1672 S 21ST ST COLORADO SPRINGS CO 80904 1800 Misc. Retail
74 BJD TROPHIES 1674 S 21ST ST COLORADO SPRINGS CO 80904 1800 Misc. Retail
75 JEROME DEFAZIO SALON 1682 S 21ST ST COLORADO SPRINGS CO 80904 1800 Personal Care
76 SKYWAY FRAMING 1686 S 21ST ST COLORADO SPRINGS CO 80904 2000 Hobby
77 DESIGNING WOMEN 1702 W COLORADO AVE COLORADO SPRINGS CO 80904 1300 Personal Care
78 STUDIO 3 1709 W COLORADO AVE COLORADO SPRINGS CO 80904 1500 Personal Care
79 MISSION BELL INN 178 CRYSTAL PARK RD MANITOU SPRINGS CO 80829 3300 Restaurant
80 ARTAZIA GALLERY & FRAME 1801 W COLORADO AVE COLORADO SPRINGS CO 80904 2700 Hobby
81 HOLE IN THE WALL 1809 W COLORADO AVE COLORADO SPRINGS CO 80904 1200 Personal Care
82 SWISH 1816 W COLORADO AVE COLORADO SPRINGS CO 80904 2000 Women's Clothing
83 BONA DEA TEA HOUSE & EMPORIUM 1824 W COLORADO AVE COLORADO SPRINGS CO 80904 2800 Restaurant
84 BEARS OF MANITOU 2 MANITOU AVE MANITOU SPRINGS CO 80829 2000 Misc. Retail
85 SINCLAIR 201 MANITOU AVE MANITOU SPRINGS CO 80829 3000 Convenience Store
86 GLORIA HEARTEN 2020 W COLORADO AVE COLORADO SPRINGS CO 80904 1300 Personal Care

87 ALTERNATIVE REHABILITATION 2020 W COLORADO AVE # 101A COLORADO SPRINGS CO 80904 1200 Personal Care
88 THIRSTY'S TAVERN 2028 SHELDON AVE COLORADO SPRINGS CO 80904 3800 Restaurant
89 WESTSIDE TATTOO 2031 W COLORADO AVE COLORADO SPRINGS CO 80904 900 Personal Care
90 COLORADO COUNTRY ANTIQUE MALL 2109 BROADWAY ST COLORADO SPRINGS CO 80904 3800 Misc. Retail
91 A SPECIAL OCCASION 2126 W KIOWA ST COLORADO SPRINGS CO 80904 1300 Misc. Personal Service
92 DAIRY QUEEN 2131 W COLORADO AVE COLORADO SPRINGS CO 80904 800 Restaurant
93 LEGEND ANTIQUES 2165 BROADWAY ST COLORADO SPRINGS CO 80904 2200 Misc. Retail
94 RUXTON'S TRADING POST 22 RUXTON AVE MANITOU SPRINGS CO 80829 1200 Misc. Retail
95 A-1 TIRE & WHEEL 220 S CHESTNUT ST COLORADO SPRINGS CO 80905 3500 Tire, Battery and Accessory
96 CELEBRATION CONSCIOUS LIVING 2209 W COLORADO AVE COLORADO SPRINGS CO 80904 2100 Book
97 WESTERN SIZZLIN RESTAURANT 221 S 8TH ST COLORADO SPRINGS CO 80905 5000 Restaurant
98 MOUNTAIN SHADOWS RESTAURANT 2223 W COLORADO AVE COLORADO SPRINGS CO 80904 3200 Restaurant
99 PERSUASIONS TRICHOLOGY STUDIO 227 PLAINVIEW PL MANITOU SPRINGS CO 80829 1500 Personal Care
100 WEST SIDE LAUNDRY & DRY CLNG 2323 W COLORADO AVE COLORADO SPRINGS CO 80904 1300 Dry Cleaner
101 FRONT RANGE BARBEQUE 2330 W COLORADO AVE COLORADO SPRINGS CO 80904 3000 Restaurant
102 SANTA FE SILVER 2401 W COLORADO AVE # B COLORADO SPRINGS CO 80904 1800 Misc. Retail
103 MAKETI MUA MARKETPLACE 2403 W COLORADO AVE COLORADO SPRINGS CO 80904 1900 Misc. Retail
104 HOLLY BERRY HOUSE 2411 W COLORADO AVE COLORADO SPRINGS CO 80904 1800 Misc. Retail
105 THUNDER & BUTTONS 2415 W COLORADO AVE COLORADO SPRINGS CO 80904 1800 Restaurant
106 LA BAGUETTE 2417 W COLORADO AVE COLORADO SPRINGS CO 80904 1700 Restaurant
107 MICHAEL GARMAN GALLERIES 2418 W COLORADO AVE COLORADO SPRINGS CO 80904 1800 Hobby
108 SECOND FLOOR STUDIOS 2418 W COLORADO AVE COLORADO SPRINGS CO 80904 1600 Hobby
109 PINE CREEK ART GALLERY 2419 W COLORADO AVE COLORADO SPRINGS CO 80904 1700 Hobby
110 SANTA FE SPRINGS 2422 W COLORADO AVE COLORADO SPRINGS CO 80904 1800 Misc. Retail
111 RICK LEWIS GALLERY 2423 W COLORADO AVE COLORADO SPRINGS CO 80904 2000 Hobby
112 BADDA BING 2423 W COLORADO AVE COLORADO SPRINGS CO 80904 2000 Women's Clothing
113 ARATI ARTISTS GALLERY 2425 W COLORADO AVE COLORADO SPRINGS CO 80904 2000 Hobby
114 OUT WEST FURNITURE 2426 W COLORADO AVE COLORADO SPRINGS CO 80904 2000 Furniture
115 HENRI'S MEXICAN FOOD 2427 W COLORADO AVE COLORADO SPRINGS CO 80904 2500 Restaurant
116 MEADOW MUFFINS 2432 W COLORADO AVE COLORADO SPRINGS CO 80904 3000 Restaurant
117 GOODWILL INDUSTRIES 25 N SPRUCE ST COLORADO SPRINGS CO 80905 8000 Misc. Retail
118 PETTI'S FINE JEWELRY & GIFTS 2501 W COLORADO AVE COLORADO SPRINGS CO 80904 1300 Jewerly
119 KMJ GIFTS 2501 W COLORADO AVE COLORADO SPRINGS CO 80904 1300 Misc. Retail
120 BODY SCENTER 2501 W COLORADO AVE COLORADO SPRINGS CO 80904 1300 Personal Care
121 ROCKY MOUNTAIN STYLES/NAILS 2501 W COLORADO AVE # 104 COLORADO SPRINGS CO 80904 1300 Personal Care
122 BOOK SLEUTH 2501 W COLORADO AVE # 105 COLORADO SPRINGS CO 80904 1300 Book
123 PUTTIN ON THE PAINT 2501 W COLORADO AVE # 107 COLORADO SPRINGS CO 80904 1300 Hobby
124 OLD TOWN SUB & SOUP 2501 W COLORADO AVE # 108 COLORADO SPRINGS CO 80904 1300 Restaurant
125 CRYING OUT LOUD 2501 W COLORADO AVE # 110 COLORADO SPRINGS CO 80904 1300 Childrens Clothing
126 BARRACUDA BAZAAR 2502 W COLORADO AVE COLORADO SPRINGS CO 80904 1300 Misc. Retail
127 SANCTUARY BODYWORK & HERBS 2502 W COLORADO AVE # 206 COLORADO SPRINGS CO 80904 1300 Personal Care
128 CREATIVE OCCASIONS 2502 W COLORADO AVE # 301 COLORADO SPRINGS CO 80904 1300 Misc. Retail
129 NICE 'N' NAUGHTY 2504 W COLORADO AVE COLORADO SPRINGS CO 80904 1300 Other Apparel
130 THUNDER MOUNTAIN TRADING CO 2508 W COLORADO AVE COLORADO SPRINGS CO 80904 1300 Misc. Retail

131 INTERLUDE LACE & GIFTS 2508 W COLORADO AVE COLORADO SPRINGS CO 80904 1300 Women's Clothing
132 CLASSIC DIAMONDS 2510 W COLORADO AVE COLORADO SPRINGS CO 80904 1300 Jewerly
133 FLUTE PLAYER GALLERY 2511 W COLORADO AVE COLORADO SPRINGS CO 80904 1300 Hobby
134 AVIATION HERITAGE COLLECTIBLES 2513 W COLORADO AVE COLORADO SPRINGS CO 80904 1300 Misc. Retail
135 VILLAGERS ANTIQUES & CLLCTBLS 2514 W COLORADO AVE COLORADO SPRINGS CO 80904 1300 Misc. Retail
136 CLASSIC DIAMONDS 2514 W COLORADO AVE # 103 COLORADO SPRINGS CO 80904 1300 Jewerly
137 ALL THAT GLITTERS 2518 W COLORADO AVE COLORADO SPRINGS CO 80904 1300 Jewerly
138 BERNIDEEN'S 2520 W COLORADO AVE COLORADO SPRINGS CO 80904 1300 Misc. Retail
139 PINE NEEDLE GIFTS 2521 W COLORADO AVE # B COLORADO SPRINGS CO 80904 1300 Misc. Retail
140 SOAP BOX 2522 W COLORADO AVE # A COLORADO SPRINGS CO 80904 1300 Hobby
141 TRADITIONS 2525 W COLORADO AVE COLORADO SPRINGS CO 80904 1300 Misc. Retail
142 EXPRESSIONS 2528 W COLORADO AVE # A COLORADO SPRINGS CO 80904 1300 Misc. Retail
143 JUST FOR YOU 2528 W COLORADO AVE # B COLORADO SPRINGS CO 80904 1300 Misc. Retail
144 SQUASH BLOSSOM 2531 W COLORADO AVE COLORADO SPRINGS CO 80904 1300 Jewerly
145 MOUNTAIN MOPPETS 2532 W COLORADO AVE COLORADO SPRINGS CO 80904 1300 Childrens Clothing
146 MANITOU PANCAKE & STEAK HOUSE 26 MANITOU AVE MANITOU SPRINGS CO 80829 3000 Restaurant
147 BON TON'S CAFE 2601 W COLORADO AVE COLORADO SPRINGS CO 80904 1300 Restaurant
148 COLORADO CITY CREAMERY 2602 W COLORADO AVE COLORADO SPRINGS CO 80904 1300 Restaurant
149 SILVER MOON PRESENTS 2603 W COLORADO AVE COLORADO SPRINGS CO 80904 1300 Hobby
150 HIDDEN CREEK MOUNTAIN GOODS 2606 W COLORADO AVE COLORADO SPRINGS CO 80904 1300 Misc. Retail
151 ELLY BLUE 2607 W COLORADO AVE COLORADO SPRINGS CO 80904 1300 Misc. Retail
152 RED MOUNTAIN SPORTS 2611 W COLORADO AVE COLORADO SPRINGS CO 80904 1300 Sporting Goods
153 EVERYBODY LOVES DINOSAURS 2616 W COLORADO AVE COLORADO SPRINGS CO 80904 1300 Hobby
154 ELEMENTS ART GALLERY 2616 W COLORADO AVE COLORADO SPRINGS CO 80904 1300 Hobby
155 OLD COLORADO STYLIST 2616 W COLORADO AVE # 12 COLORADO SPRINGS CO 80904 1300 Personal Care
156 CELTIC MERCANTILE 2616 W COLORADO AVE # 22 COLORADO SPRINGS CO 80904 1300 Misc. Retail
157 JAKE & TELLY'S GREEK CUISINE 2616 W COLORADO AVE # 24 COLORADO SPRINGS CO 80904 1300 Restaurant
158 LAURA REILLY GALLERY 2616 W COLORADO AVE # 3 COLORADO SPRINGS CO 80904 1300 Hobby
159 ANTIQUE LEGACY 2624 W COLORADO AVE COLORADO SPRINGS CO 80904 1300 Misc. Retail
160 GERTRUDE'S RESTAURANT 2625 W COLORADO AVE COLORADO SPRINGS CO 80904 1300 Restaurant
161 RODNEY'S ANTIQUES 2626 W CUCHARRAS ST COLORADO SPRINGS CO 80904 1300 Misc. Retail
162 EL DORADO GALLERY 2627 W COLORADO AVE COLORADO SPRINGS CO 80904 1300 Hobby
163 DOOLEY ARTS 2627 W COLORADO AVE # 202 COLORADO SPRINGS CO 80904 1300 Hobby
164 HOUSE OF YAKITORI 2628 W COLORADO AVE COLORADO SPRINGS CO 80904 1300 Restaurant
165 ANTIQUE FURNITURE SHOPPE 2629 W COLORADO AVE COLORADO SPRINGS CO 80904 1300 Misc. Retail
166 COLORADO GOLD & SILVER 2644 W COLORADO AVE COLORADO SPRINGS CO 80904 1300 Jewerly
167 LITTLE COLORADO & CAMINO REAL 2703 W COLORADO AVE COLORADO SPRINGS CO 80904 1300 Misc. Retail
168 CRAFTED WOOD 2710 ROBINSON ST COLORADO SPRINGS CO 80904 1500 Hobby
169 LEASURES TREASURES 2801 W COLORADO AVE COLORADO SPRINGS CO 80904 1300 Misc. Retail
170 PARAVICINI'S ITALIAN BISTRO 2802 W COLORADO AVE COLORADO SPRINGS CO 80904 1300 Restaurant
171 ADOBE WALLS ANTIQUE MALL 2808 W COLORADO AVE COLORADO SPRINGS CO 80904 1300 Misc. Retail
172 MARIE L SEE 2812 W COLORADO AVE # 200B COLORADO SPRINGS CO 80904 1300 Personal Care
173 A HOUSE OF FLAGS 2822 W COLORADO AVE COLORADO SPRINGS CO 80904 1300 Misc. Retail

174 CASA CRISTAL RUGS 2829 W COLORADO AVE COLORADO SPRINGS CO 80904 1300 Home Furnishings
175 BALLE RACING 2845 ORE MILL RD COLORADO SPRINGS CO 80904 3000 Sporting Goods
176 ROCKY MOUNTAIN HIGH WHEELS 2845 ORE MILL RD COLORADO SPRINGS CO 80904 3000 Tire, Battery and Accessory
177 SPRINGS LIQUORS 2905 W COLORADO AVE COLORADO SPRINGS CO 80904 2000 Liquor
178 MASON JAR 2925 W COLORADO AVE COLORADO SPRINGS CO 80904 2000 Restaurant
179 SUBWAY SANDWICHES & SALADS 2930 W COLORADO AVE COLORADO SPRINGS CO 80904 1200 Restaurant
180 ANGLER'S COVEY 295 S 21ST ST COLORADO SPRINGS CO 80904 2500 Sporting Goods
181 7-ELEVEN 3004 W COLORADO AVE COLORADO SPRINGS CO 80904 3100 Convenience Store
182 SAVELLI'S PIZZA 301 MANITOU AVE MANITOU SPRINGS CO 80829 1500 Restaurant
183 MC DONALD'S 3019 W COLORADO AVE COLORADO SPRINGS CO 80904 2500 Restaurant
184 SUBWAY SANDWICHES & SALADS 302 MANITOU AVE MANITOU SPRINGS CO 80829 900 Restaurant
185 WESTERN CONVENIENCE 302 W BIJOU ST # 2187 COLORADO SPRINGS CO 80905 2600 Convenience Store
186 WILD GINGER THAI RESTAURANT 3020 W COLORADO AVE # A COLORADO SPRINGS CO 80904 3000 Restaurant
187 TACO BELL 3029 W COLORADO AVE COLORADO SPRINGS CO 80904 2300 Restaurant
188 WENDY'S 3036 W COLORADO AVE COLORADO SPRINGS CO 80904 3000 Restaurant
189 SEVEN HEAVEN 304 MANITOU AVE MANITOU SPRINGS CO 80829 1800 Convenience Store
190 INDEPENDENT RECORDS & VIDEO 3040 W COLORADO AVE COLORADO SPRINGS CO 80904 2300 Records & Tapes
191 ACORN FOOD STORE 305 S 8TH ST COLORADO SPRINGS CO 80905 4000 Convenience Store
192 LA CASITA PATIO CAFE 306 S 8TH ST COLORADO SPRINGS CO 80905 2800 Restaurant
193 COLLEEN'S HAIR SALON & DAY SPA 308 S 8TH ST COLORADO SPRINGS CO 80905 1200 Personal Care
194 SUBWAY SANDWICHES & SALADS 308 S 8TH ST COLORADO SPRINGS CO 80905 1000 Restaurant
195 VIP NAILS 308 S 8TH ST # C COLORADO SPRINGS CO 80905 1200 Personal Care
196 BILLY'S OLD WORLD PIZZA 308 S 8TH ST # E COLORADO SPRINGS CO 80905 1200 Restaurant
197 SHINJIS 308 S 8TH ST # N COLORADO SPRINGS CO 80905 1200 Restaurant
198 BURLAP BAG CLOTHING & BOOTS 31 S 32ND ST COLORADO SPRINGS CO 80904 3800 Mens Clothing
199 TAN YOUR HIDE 310 S 8TH ST COLORADO SPRINGS CO 80905 1700 Personal Care
200 GALLERY OF FRAMES 310 S 8TH ST # A COLORADO SPRINGS CO 80905 1800 Hobby
201 PAUL'S 310 S 8TH ST # B COLORADO SPRINGS CO 80905 1800 Restaurant
202 SHELDON'S LUNCHEONETTE 310 S 8TH ST # F COLORADO SPRINGS CO 80905 1800 Restaurant
203 KFC 3101 W COLORADO AVE COLORADO SPRINGS CO 80904 1900 Restaurant
204 ONE SUNSATIONAL TAN 3103 W COLORADO AVE # B COLORADO SPRINGS CO 80904 1700 Personal Care
205 STARBUCKS 3104 W COLORADO AVE COLORADO SPRINGS CO 80904 1400 Restaurant
206 DAYLIGHT DONUTS 3105 W COLORADO AVE COLORADO SPRINGS CO 80904 1700 Restaurant
207 BEST TOP NAILS 3109 W COLORADO AVE COLORADO SPRINGS CO 80904 1500 Personal Care
208 RED ROCK LOUNGE 3113 W COLORADO AVE COLORADO SPRINGS CO 80904 3000 Restaurant
209 SAIGON GRILL RESTAURANT 3119 W COLORADO AVE COLORADO SPRINGS CO 80904 3500 Restaurant
210 POPEYE'S CHICKEN & BISCUITS 312 S 8TH ST COLORADO SPRINGS CO 80905 2250 Restaurant
211 AVENUE HIGHLANDER CTR 3125 W COLORADO AVE COLORADO SPRINGS CO 80904 1500 Dry Cleaner
212 HAIR & NOW BARBERS 3126 W COLORADO AVE COLORADO SPRINGS CO 80904 1400 Personal Care
213 A BAKER'S DO IT BEST 3131 W COLORADO AVE COLORADO SPRINGS CO 80904 1400 Hardware
214 RED ROCK LIQUORS 3139 W COLORADO AVE COLORADO SPRINGS CO 80904 1500 Liquor
215 BLOCKBUSTER VIDEO 3141 W COLORADO AVE COLORADO SPRINGS CO 80904 4500 Video Tape Rental
216 LONGS DRUG 3143 W COLORADO AVE COLORADO SPRINGS CO 80904 18000 Drug/Cosmetics

217 DENNY'S 315 W BIJOU ST COLORADO SPRINGS CO 80905 3200 Restaurant
218 BEST CLEANERS 3157 W COLORADO AVE COLORADO SPRINGS CO 80904 1800 Dry Cleaner
219 SUPERCUTS 3161 W COLORADO AVE COLORADO SPRINGS CO 80904 1100 Personal Care
220 BOOKMAN 3163 W COLORADO AVE COLORADO SPRINGS CO 80904 1900 Books
221 PIZZA HUT 3167 W COLORADO AVE COLORADO SPRINGS CO 80904 1800 Restaurant
222 RED ROCK GARDENS & FLORIST 3178 W COLORADO AVE COLORADO SPRINGS CO 80904 1400 Florist
223 SAFEWAY 3275 W COLORADO AVE COLORADO SPRINGS CO 80904 50000 Grocery
224 BLADES 329 MANITOU AVE MANITOU SPRINGS CO 80829 1600 Personal Care
225 DOMINO'S PIZZA 3302 W COLORADO AVE COLORADO SPRINGS CO 80904 1300 Restaurant
226 LA UNICA 3317 W COLORADO AVE COLORADO SPRINGS CO 80904 3000 Restaurant
227 LA CASITA PATIO CAFE 332 W BIJOU ST COLORADO SPRINGS CO 80905 2800 Restaurant
228 7-ELEVEN 339 MANITOU AVE MANITOU SPRINGS CO 80829 2800 Convenience Store
229 SONIC DRIVE-IN 3401 W COLORADO AVE COLORADO SPRINGS CO 80904 1350 Restaurant
230 UNCLE SAM'S PANCAKE HOUSE 341 MANITOU AVE MANITOU SPRINGS CO 80829 3300 Restaurant
231 KYOTO MASSAGE 3419 W COLORADO AVE COLORADO SPRINGS CO 80904 1000 Personal Care
232 RANDY'S OLDE THYME BARBER SHOP 3436 W COLORADO AVE COLORADO SPRINGS CO 80904 900 Personal Care
233 MARGO'S VIENNA STATION 3442 W COLORADO AVE COLORADO SPRINGS CO 80904 3100 Restaurant
234 CHEROKEE'S OF MANITOU 351 MANITOU AVE MANITOU SPRINGS CO 80829 2200 Hobby
235 BOB'S WESTSIDE LIQUORS 3601 W COLORADO AVE COLORADO SPRINGS CO 80904 1800 Liquor
236 HEALTH QUARTERS 3620 W COLORADO AVE COLORADO SPRINGS CO 80904 1700 Personal Care
237 AMANDA'S FONDA 3625 W COLORADO AVE COLORADO SPRINGS CO 80904 2500 Restaurant
238 INK JET CITY 385 S 31ST ST COLORADO SPRINGS CO 80904 2500 Radio, TV, Stereo, Computer
239 MC DONALD'S 390 S 8TH ST COLORADO SPRINGS CO 80905 2500 Restaurant
240 ARBY'S 393 S 8TH ST COLORADO SPRINGS CO 80905 3100 Restaurant
241 WAFFLE HOUSE 395 S 8TH ST COLORADO SPRINGS CO 80905 2900 Restaurant
242 HEMP STORE 4 RUXTON AVE MANITOU SPRINGS CO 80829 2000 Misc. Retail
243 BASHFUL BRIDE 402 MANITOU AVE MANITOU SPRINGS CO 80829 2000 Florist
244 CAPTAIN D'S SEAFOOD 402 S 8TH ST COLORADO SPRINGS CO 80905 2700 Restaurant
245 CHECKER AUTO PARTS 403 S 26TH ST COLORADO SPRINGS CO 80904 9000 Tire, Battery and Accessory
246 CRAFTWOOD INN 404 EL PASO BLVD MANITOU SPRINGS CO 80829 3000 Restaurant
247 BRIARHURST MANOR 404 MANITOU AVE MANITOU SPRINGS CO 80829 3800 Restaurant
248 SAIGON STARS 410 S 26TH ST COLORADO SPRINGS CO 80904 3500 Restaurant
249 BINGO'S D & S SADDLE SHOP 418 S 8TH ST COLORADO SPRINGS CO 80905 3000 Hobby
250 NATURAL ELEMENTS 441 MANITOU AVE MANITOU SPRINGS CO 80829 2000 Personal Care
251 8TH STREET ADULT VIDEO & BOOKS 502 S 8TH ST COLORADO SPRINGS CO 80905 2000 Video Tape Rental
252 AUTOZONE 505 S 8TH ST COLORADO SPRINGS CO 80905 6000 Tire, Battery and Accessory
253 JMB 8TH STRET LIQUOR 506 S 8TH ST COLORADO SPRINGS CO 80905 1800 Liquor
254 REX TIRE INC 509 W COLORADO AVE COLORADO SPRINGS CO 80905 4000 Tire, Battery and Accessory
255 BENNY'S RESTAURANT & LOUNGE 517 W COLORADO AVE COLORADO SPRINGS CO 80905 3400 Restaurant
256 HOBBY LOBBY CREATIVE CTR 525 S 8TH ST COLORADO SPRINGS CO 80905 55000 Hobby
257 CREATIVE FITNESS 530 COMMUNICATION CIR # 202 COLORADO SPRINGS CO 80905 4000 Personal Care
258 OFFICE DEPOT 535 S 8TH ST COLORADO SPRINGS CO 80905 30000 Multiple Categories
259 PEAK DOLLAR 559 S 8TH ST COLORADO SPRINGS CO 80905 3000 Misc. Retail
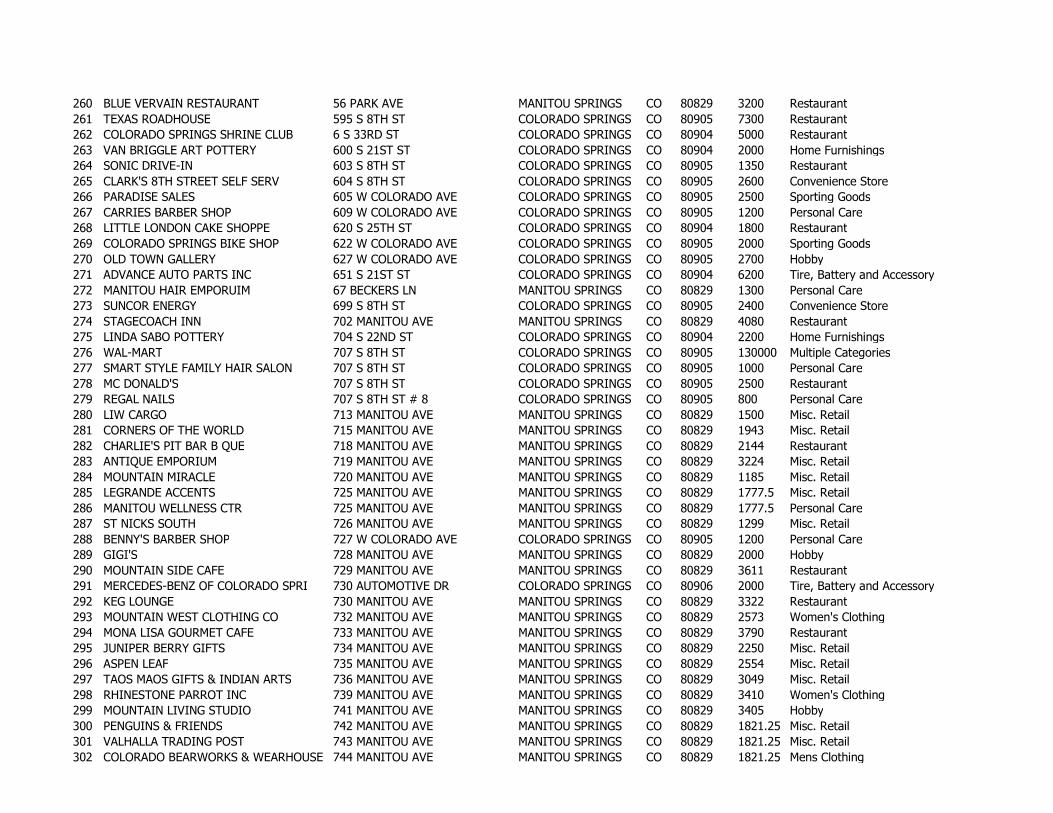
260 BLUE VERVAIN RESTAURANT 56 PARK AVE MANITOU SPRINGS CO 80829 3200 Restaurant
261 TEXAS ROADHOUSE 595 S 8TH ST COLORADO SPRINGS CO 80905 7300 Restaurant
262 COLORADO SPRINGS SHRINE CLUB 6 S 33RD ST COLORADO SPRINGS CO 80904 5000 Restaurant
263 VAN BRIGGLE ART POTTERY 600 S 21ST ST COLORADO SPRINGS CO 80904 2000 Home Furnishings
264 SONIC DRIVE-IN 603 S 8TH ST COLORADO SPRINGS CO 80905 1350 Restaurant
265 CLARK'S 8TH STREET SELF SERV 604 S 8TH ST COLORADO SPRINGS CO 80905 2600 Convenience Store
266 PARADISE SALES 605 W COLORADO AVE COLORADO SPRINGS CO 80905 2500 Sporting Goods
267 CARRIES BARBER SHOP 609 W COLORADO AVE COLORADO SPRINGS CO 80905 1200 Personal Care
268 LITTLE LONDON CAKE SHOPPE 620 S 25TH ST COLORADO SPRINGS CO 80904 1800 Restaurant
269 COLORADO SPRINGS BIKE SHOP 622 W COLORADO AVE COLORADO SPRINGS CO 80905 2000 Sporting Goods
270 OLD TOWN GALLERY 627 W COLORADO AVE COLORADO SPRINGS CO 80905 2700 Hobby
271 ADVANCE AUTO PARTS INC 651 S 21ST ST COLORADO SPRINGS CO 80904 6200 Tire, Battery and Accessory
272 MANITOU HAIR EMPORUIM 67 BECKERS LN MANITOU SPRINGS CO 80829 1300 Personal Care
273 SUNCOR ENERGY 699 S 8TH ST COLORADO SPRINGS CO 80905 2400 Convenience Store
274 STAGECOACH INN 702 MANITOU AVE MANITOU SPRINGS CO 80829 4080 Restaurant
275 LINDA SABO POTTERY 704 S 22ND ST COLORADO SPRINGS CO 80904 2200 Home Furnishings
276 WAL-MART 707 S 8TH ST COLORADO SPRINGS CO 80905 130000 Multiple Categories
277 SMART STYLE FAMILY HAIR SALON 707 S 8TH ST COLORADO SPRINGS CO 80905 1000 Personal Care
278 MC DONALD'S 707 S 8TH ST COLORADO SPRINGS CO 80905 2500 Restaurant
279 REGAL NAILS 707 S 8TH ST # 8 COLORADO SPRINGS CO 80905 800 Personal Care
280 LIW CARGO 713 MANITOU AVE MANITOU SPRINGS CO 80829 1500 Misc. Retail
281 CORNERS OF THE WORLD 715 MANITOU AVE MANITOU SPRINGS CO 80829 1943 Misc. Retail
282 CHARLIE'S PIT BAR B QUE 718 MANITOU AVE MANITOU SPRINGS CO 80829 2144 Restaurant
283 ANTIQUE EMPORIUM 719 MANITOU AVE MANITOU SPRINGS CO 80829 3224 Misc. Retail
284 MOUNTAIN MIRACLE 720 MANITOU AVE MANITOU SPRINGS CO 80829 1185 Misc. Retail
285 LEGRANDE ACCENTS 725 MANITOU AVE MANITOU SPRINGS CO 80829 1777.5 Misc. Retail
286 MANITOU WELLNESS CTR 725 MANITOU AVE MANITOU SPRINGS CO 80829 1777.5 Personal Care
287 ST NICKS SOUTH 726 MANITOU AVE MANITOU SPRINGS CO 80829 1299 Misc. Retail
288 BENNY'S BARBER SHOP 727 W COLORADO AVE COLORADO SPRINGS CO 80905 1200 Personal Care
289 GIGI'S 728 MANITOU AVE MANITOU SPRINGS CO 80829 2000 Hobby
290 MOUNTAIN SIDE CAFE 729 MANITOU AVE MANITOU SPRINGS CO 80829 3611 Restaurant
291 MERCEDES-BENZ OF COLORADO SPRI 730 AUTOMOTIVE DR COLORADO SPRINGS CO 80906 2000 Tire, Battery and Accessory
292 KEG LOUNGE 730 MANITOU AVE MANITOU SPRINGS CO 80829 3322 Restaurant
293 MOUNTAIN WEST CLOTHING CO 732 MANITOU AVE MANITOU SPRINGS CO 80829 2573 Women's Clothing
294 MONA LISA GOURMET CAFE 733 MANITOU AVE MANITOU SPRINGS CO 80829 3790 Restaurant
295 JUNIPER BERRY GIFTS 734 MANITOU AVE MANITOU SPRINGS CO 80829 2250 Misc. Retail
296 ASPEN LEAF 735 MANITOU AVE MANITOU SPRINGS CO 80829 2554 Misc. Retail
297 TAOS MAOS GIFTS & INDIAN ARTS 736 MANITOU AVE MANITOU SPRINGS CO 80829 3049 Misc. Retail
298 RHINESTONE PARROT INC 739 MANITOU AVE MANITOU SPRINGS CO 80829 3410 Women's Clothing
299 MOUNTAIN LIVING STUDIO 741 MANITOU AVE MANITOU SPRINGS CO 80829 3405 Hobby
300 PENGUINS & FRIENDS 742 MANITOU AVE MANITOU SPRINGS CO 80829 1821.25 Misc. Retail
301 VALHALLA TRADING POST 743 MANITOU AVE MANITOU SPRINGS CO 80829 1821.25 Misc. Retail
302 COLORADO BEARWORKS & WEARHOUSE 744 MANITOU AVE MANITOU SPRINGS CO 80829 1821.25 Mens Clothing

303 MANITOU SPRINGS T SHIRT CO USA 744 MANITOU AVE MANITOU SPRINGS CO 80829 1821.25 Other Apparel
304 NAPA AUTO PARTS 750 ABBOTT LN COLORADO SPRINGS CO 80905 8000 Tire, Battery and Accessory
305 DISCOUNT TIRE CO 770 ABBOTT LN COLORADO SPRINGS CO 80905 4500 Tire, Battery and Accessory
306 COLORADO SPRINGS FISH MARKET 775 W BIJOU ST COLORADO SPRINGS CO 80905 3000 Restaurant
307 ROCKY HILLS STEAK HOUSE 775 W BIJOU ST COLORADO SPRINGS CO 80905 3000 Restaurant
308 HUMAN TOUCH GALLERIES 8 CANON AVE MANITOU SPRINGS CO 80829 2700 Misc. Retail
309 RISING SUN 801 MANITOU AVE MANITOU SPRINGS CO 80829 1309 Women's Clothing
310 DUNKIN' DONUTS 806 W COLORADO AVE COLORADO SPRINGS CO 80905 1500 Restaurant
311 ANY OLDE THING 813 DUCLO AVE MANITOU SPRINGS CO 80829 2000 Misc. Retail
312 FANZ SPORTS GRILL 817 W COLORADO AVE COLORADO SPRINGS CO 80905 3200 Restaurant
313 BABA-YAGA RESTAURANT 819 MANITOU AVE MANITOU SPRINGS CO 80829 XX Restaurant
314 C & P HUBCAP & WHEEL 827 W COLORADO AVE COLORADO SPRINGS CO 80905 3800 Tire, Battery and Accessory
315 PEPPERTREE RESTAURANT 888 W MORENO AVE COLORADO SPRINGS CO 80905 2800 Restaurant
316 TOWNHOUSE LOUNGE 907 MANITOU AVE MANITOU SPRINGS CO 80829 9719 Restaurant
317 DISTINCTIVE DESIGN IN PRECIOUS 915 W CUCHARRAS ST COLORADO SPRINGS CO 80905 1000 Jewerly
318 W WADE PETERSILLE 915 W CUCHARRAS ST COLORADO SPRINGS CO 80905 1000 Jewerly
319 ATHLETIC & THERAPEUTIC MASSAGE 917 W COLORADO AVE # 100 COLORADO SPRINGS CO 80905 1200 Personal Care
320 LA'CHEMERE GIFT SHOP 920 MANITOU AVE MANITOU SPRINGS CO 80829 2831 Misc. Retail
321 LA TIENDA MEXICAN IMPORTS 921 MANITOU AVE MANITOU SPRINGS CO 80829 2230 Misc. Retail
322 ROYAL TAVERN 924 MANITOU AVE MANITOU SPRINGS CO 80829 3006 Restaurant
323 TANGLES 930 W COLORADO AVE COLORADO SPRINGS CO 80905 2000 Personal Care
324 EUROPEAN CAFE 935 MANITOU AVE MANITOU SPRINGS CO 80829 1852 Restaurant
325 MUSHROOM MONDAY T-SHIRTS 937 MANITOU AVE MANITOU SPRINGS CO 80829 1192 Misc. Retail
326 LEPRECHAUN SHOPPE 943 MANITOU AVE MANITOU SPRINGS CO 80829 1724 Misc. Retail
327 ZEB'S RESTAURANT 945 S 8TH ST COLORADO SPRINGS CO 80906 3200 Restaurant
328 FLYING EAGLE 946 MANITOU AVE MANITOU SPRINGS CO 80829 1970 Other Apparel
329 EAGLE DANCER 947 MANITOU AVE MANITOU SPRINGS CO 80829 952 Misc. Retail
330 SANTE FE SPRINGS 948 MANITOU AVE MANITOU SPRINGS CO 80829 1185 Misc. Retail
331 RUSSELL DESIGN STUDIO 949 MANITOU AVE MANITOU SPRINGS CO 80829 952 Hobby
332 KINFOLKS 950 MANITOU AVE MANITOU SPRINGS CO 80829 1266 Sporting Goods
333 OSBURN'S GIFT SHOP 951 MANITOU AVE MANITOU SPRINGS CO 80829 408 Hobby
334 SOUTHWEST SILVER CO 952 MANITOU AVE MANITOU SPRINGS CO 80829 1039 Misc. Retail
335 ANTIQUE BAZAAR 958 MANITOU AVE MANITOU SPRINGS CO 80829 2684 Misc. Retail
336 ANCIENT MARINER 962 MANITOU AVE MANITOU SPRINGS CO 80829 2508 Restaurant
337 MARILYN'S CAFE 964 MANITOU AVE MANITOU SPRINGS CO 80829 2258 Restaurant
338 LOOP 965 MANITOU AVE MANITOU SPRINGS CO 80829 5644 Restaurant
339 MATE'FACTOR-A-COMMON GROUND 966 MANITOU AVE MANITOU SPRINGS CO 80829 725 Restaurant
Source: stdbonline.com & THK Associates, Inc.

market r e s e a r c h p l a n n i n g l a n d s c a p e a r c h i t e c t u r e g o l f f e a s i b i l i t y / v a l u a t i o n
MEMORANDUMDate: September 9, 2008
To: CH2MHill
From: THK Associates, Inc.
Re: Economic Impacts of Vacant Land and Properties Likely to be Re-Developed as a Resultof the US Highway 24 Expressway Expansion between Interstate 25 and ManitouSprings
As a part of the U.S. Highway 24 Environmental Assessment, THK Associates, Inc. is conductingan economic analysis of properties along the U.S. Highway 24 corridor. The purpose of thisanalysis is to help assess the potential economic impacts that will result from the upgrade ofU.S. Highway 24 to an expressway. During this phase of the analysis, vacant land andproperties likely to be re-developed were quantified.
In order to make this assessment THK Associates, Inc. undertook the following:
A visual inspection of the study area and U.S. Highway 24 corridor.
Identification of over 3,508 parcels of land in the corridor from Assessor’s records.Information obtained included:
Parcel numberVacant or improvedLand areaSize of improvements and date of construction
Segmentation of the entire corridor into five distinct areas.
Re-examination of the study area to refine the number of parcels most likely to bedeveloped or re-developed.
Estimated, based on age, the number of parcels that have existing improvements bestsuited for re-development.
Determined the amount of acreage, by sub-area, that are or could be available toaccommodate growth in the study corridor.
The detailed property information is contained in the appendix of this memorandum andthe study area and sub-areas are shown on the following map.

Study Area and Sub-Areas

CH2MHILL
September 9, 2008Page Three
The results of our findings and key assumptions are as follows:
The original compilation of parcels identified 3,508 parcels broken down asfollows:
We have assumed that vacant land controlled by governmental agencies will not be re-developed.
We have assumed that parcels with improvements constructed or re-modeled after 1940will not be redeveloped as they still have remaining “economic life”.
After making these adjustments the following number of parcels (1,676) and acreage(653) exists:
Area Parcels Acres Parcels Acres Parcels Acres
1 328 235 725 180 1,053 415
2 52 70 110 38 162 108
3 54 19 162 30 216 49
4 16 5 213 33 229 38
5 10 23 6 20 16 43
TOTAL 460 352 1,216 301 1,676 653
Vacant Improved Total
# of
Area Parcels
1 1,803
2 575
3 601
4 343
5 186
TOTAL 3,508

CH2MHillSeptember 9, 2008Page Four
Based on our inspection of the area, the physical characteristics of each area, andoverall condition and nature of the existing properties we have applied the followingpercentages to the vacant land area for each sub-area representing the amount of theacreage that could potentially be developed or re-developed:
When these percentages are applied to the amount of acreage that exists within eachsub-area that could potentially be available for development or re-developed it isindicated that there is a total of 116 acres to accommodate growth in the U.S. Highway24 corridor.
In May of 2006, THK Associates, Inc., prepared a detailed market analysis for the U.S.Highway 24 study area to estimate demand for retail, residential, office, industrial/flex, andhotel uses. Based on that analysis we would suggest the 16-acres would be redeveloped asfollows:
Area % of Vacant % of Improved
1 15.0% 5.0%
2 25.0% 10.0%
3 75.0% 30.0%
4 50.0% 30.0%
5 50.0% 10.0%
Area Vacant Acres Improved Acres Total Acres
1 35 9 44
2 18 4 22
3 14 9 23
4 3 10 13
5 12 2 14
TOTAL 82 34 116
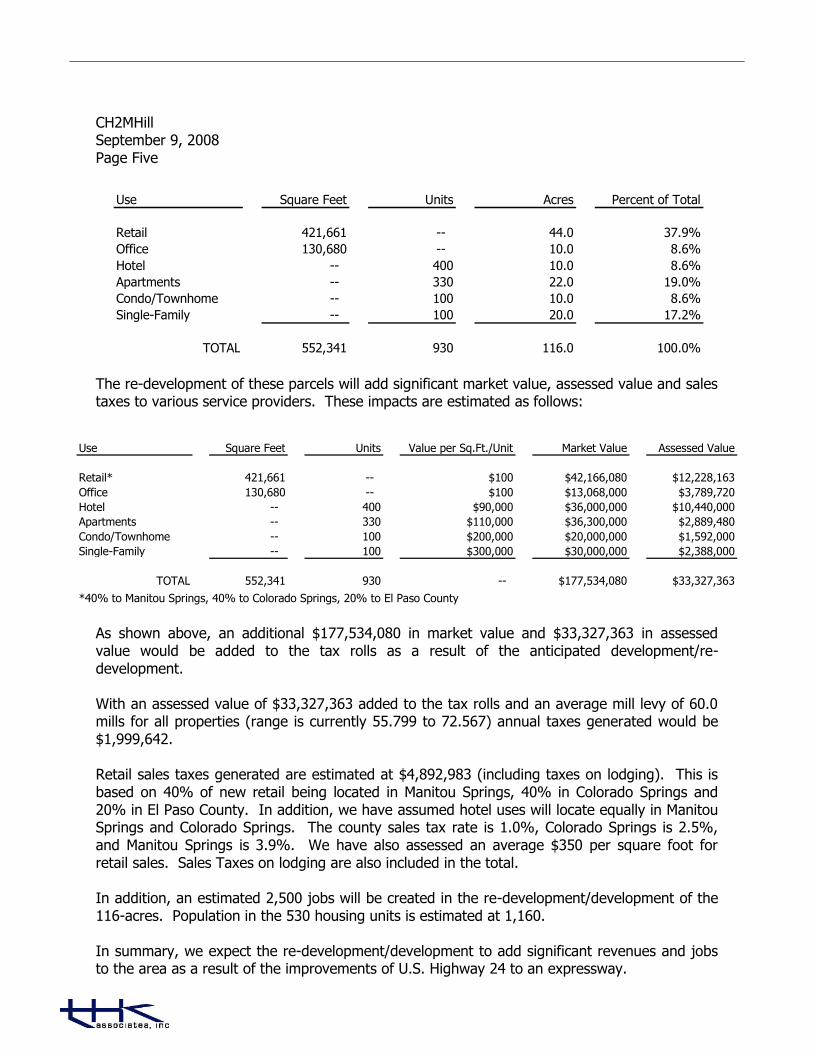
CH2MHillSeptember 9, 2008Page Five
The re-development of these parcels will add significant market value, assessed value and salestaxes to various service providers. These impacts are estimated as follows:
As shown above, an additional $177,534,080 in market value and $33,327,363 in assessedvalue would be added to the tax rolls as a result of the anticipated development/re-development.
With an assessed value of $33,327,363 added to the tax rolls and an average mill levy of 60.0mills for all properties (range is currently 55.799 to 72.567) annual taxes generated would be$1,999,642.
Retail sales taxes generated are estimated at $4,892,983 (including taxes on lodging). This isbased on 40% of new retail being located in Manitou Springs, 40% in Colorado Springs and20% in El Paso County. In addition, we have assumed hotel uses will locate equally in ManitouSprings and Colorado Springs. The county sales tax rate is 1.0%, Colorado Springs is 2.5%,and Manitou Springs is 3.9%. We have also assessed an average $350 per square foot forretail sales. Sales Taxes on lodging are also included in the total.
In addition, an estimated 2,500 jobs will be created in the re-development/development of the116-acres. Population in the 530 housing units is estimated at 1,160.
In summary, we expect the re-development/development to add significant revenues and jobsto the area as a result of the improvements of U.S. Highway 24 to an expressway.
Use Square Feet Units Acres Percent of Total
Retail 421,661 -- 44.0 37.9%
Office 130,680 -- 10.0 8.6%
Hotel -- 400 10.0 8.6%
Apartments -- 330 22.0 19.0%
Condo/Townhome -- 100 10.0 8.6%
Single-Family -- 100 20.0 17.2%
TOTAL 552,341 930 116.0 100.0%
Use Square Feet Units Value per Sq.Ft./Unit Market Value Assessed Value
Retail* 421,661 -- $100 $42,166,080 $12,228,163
Office 130,680 -- $100 $13,068,000 $3,789,720
Hotel -- 400 $90,000 $36,000,000 $10,440,000
Apartments -- 330 $110,000 $36,300,000 $2,889,480
Condo/Townhome -- 100 $200,000 $20,000,000 $1,592,000
Single-Family -- 100 $300,000 $30,000,000 $2,388,000
TOTAL 552,341 930 -- $177,534,080 $33,327,363
*40% to Manitou Springs, 40% to Colorado Springs, 20% to El Paso County

APPENDIX

SECTION ONE
Parcel Land Year Land
Section 1 Number Use Size Built Area
VACANT LAND
1 7404306066 CODE 101 AT PRESENT WORTH 1806 sq ft 1,806
2 7404306067 CODE 101 AT PRESENT WORTH 1806 sq ft 1,806
3 7404306068 CODE 101 AT PRESENT WORTH 1806 sq ft 1,806
4 7404306069 CODE 101 AT PRESENT WORTH 1806 sq ft 1,806
5 7404306070 CODE 101 AT PRESENT WORTH 2168 sq ft 2,186
6 7404306071 CODE 101 AT PRESENT WORTH 2010 sq ft 2,010
7 7404306072 CODE 101 AT PRESENT WORTH 28691 sq ft 28,691
8 7404308115 CODE 101 AT PRESENT WORTH 3479 sq ft 3,479
9 7404308116 CODE 101 AT PRESENT WORTH 2138 sq ft 2,138
10 7404308117 CODE 101 AT PRESENT WORTH 2226 sq ft 2,226
11 7404308118 CODE 101 AT PRESENT WORTH 1833 sq ft 1,833
12 7404412004 CODE 101 AT PRESENT WORTH 2.05 acres 89,298
13 7404412005 CODE 101 AT PRESENT WORTH 29659 sq ft 29,659
14 7404412006 CODE 101 AT PRESENT WORTH 1.51 acres 65,776
15 7406101035 CODE 101 AT PRESENT WORTH 1.15 acres 50,094
16 7409101055 CODE 101 AT PRESENT WORTH 1.61 acres 70,132
17 7409101056 CODE 101 AT PRESENT WORTH 1.19 acres 51,836
18 7409101057 CODE 101 AT PRESENT WORTH 1.04 acres 45,302
19 7409101058 CODE 101 AT PRESENT WORTH 1.11 acres 48,352
20 7409101059 CODE 101 AT PRESENT WORTH 1.24 acres 54,014
21 7409101060 CODE 101 AT PRESENT WORTH 1.52 acres 66,211
22 7409101061 CODE 101 AT PRESENT WORTH 26639 sq ft 26,639
23 7409101062 CODE 101 AT PRESENT WORTH 27326 sq ft 27,326
24 7409101064 CODE 101 AT PRESENT WORTH 30576 sq ft 30,576
25 7409101065 CODE 101 AT PRESENT WORTH 30708 sq ft 30,708
26 7409101067 CODE 101 AT PRESENT WORTH 23685 sq ft 23,685
27 7409101070 CODE 101 AT PRESENT WORTH 22288 sq ft 22,228
28 7409101071 CODE 101 AT PRESENT WORTH 22351 sq ft 22,351
29 7403325020 UNIMPROVED LAND 13000 sq ft 13,000
30 7403325039 UNIMPROVED LAND 9583 sq ft 9,583
31 7403325045 UNIMPROVED LAND 7462 sq ft 7,462
32 7403327015 UNIMPROVED LAND 23609 sq ft 23,609
33 7403327023 UNIMPROVED LAND 31600 sq ft 31,600
34 7404300011 UNIMPROVED LAND 11275 sq ft 11,275
35 7404300022 UNIMPROVED LAND 617 sq ft 617
36 7404303015 UNIMPROVED LAND 31600 sq ft 31,600
37 7404303018 UNIMPROVED LAND 25300 sq ft 25,300
38 7404303021 UNIMPROVED LAND 3 acres 130,680
39 7404303024 UNIMPROVED LAND 36375 sq ft 36,375
40 7404303036 UNIMPROVED LAND 21276 sq ft 21,276
41 7404303037 UNIMPROVED LAND 31214 sq ft 31,214
42 7404303060 UNIMPROVED LAND 16801 sq ft 16,801
43 7404306015 UNIMPROVED LAND 3000 sq ft 3,000
44 7404308017 UNIMPROVED LAND 2.9 acres 126,324
45 7404308126 UNIMPROVED LAND 556 sq ft 556
46 7404415001 UNIMPROVED LAND 1.47 acres 64,033
47 7404421002 UNIMPROVED LAND 16838 sq ft 16,838
48 7405201004 UNIMPROVED LAND 750 sq ft 750
49 7405201014 UNIMPROVED LAND 16553 sq ft 16,553
50 7405201016 UNIMPROVED LAND 1.12 acres 48,787
51 7405201018 UNIMPROVED LAND 3629 sq ft 3,629
52 7405201022 UNIMPROVED LAND 11945 sq ft 11,945
53 7405202005 UNIMPROVED LAND 15250 sq ft 15,250
54 7405202009 UNIMPROVED LAND 21050 sq ft 21,050
55 7405202014 UNIMPROVED LAND 1.11 acres 48,352
56 7405203006 UNIMPROVED LAND 2700 sq ft 2,700
57 7405203016 UNIMPROVED LAND 41875 sq ft 41,875
58 7405203021 UNIMPROVED LAND 24550 sq ft 24,550
59 7405203039 UNIMPROVED LAND 2925 sq ft 2,925
60 7405203073 UNIMPROVED LAND 1178 sq ft 1,178
61 7405203099 UNIMPROVED LAND 2881 sq ft 2,881
62 7405203100 UNIMPROVED LAND 8014 sq ft 8,014
63 7405203102 UNIMPROVED LAND 4193 sq ft 4,193
64 7405203103 UNIMPROVED LAND 3597 sq ft 3,597
65 7405203112 UNIMPROVED LAND 15393 sq ft 15,393
66 7405207007 UNIMPROVED LAND 8300 sq ft 8,300
67 7405207021 UNIMPROVED LAND 2.09 acres 91,040
68 7405208002 UNIMPROVED LAND 6325 sq ft 6,325
69 7405208003 UNIMPROVED LAND 5857 sq ft 5,857
70 7405208004 UNIMPROVED LAND 2735 sq ft 2,735
71 7405208005 UNIMPROVED LAND 2781 sq ft 2,781
72 7405208006 UNIMPROVED LAND 11921 sq ft 11,921
73 7405208007 UNIMPROVED LAND 9050 sq ft 9,050
74 7405209002 UNIMPROVED LAND 2150 sq ft 2,150
75 7405209003 UNIMPROVED LAND 3663 sq ft 3,663
76 7405209009 UNIMPROVED LAND 1555 sq ft 1,555
77 7405209047 UNIMPROVED LAND 2125 sq ft 1895 2,125
78 7405209054 UNIMPROVED LAND 3070 sq ft 3,070
79 7405209066 UNIMPROVED LAND 3241 sq ft 3,241
80 7405209068 UNIMPROVED LAND 4092 sq ft 4,092
81 7405209070 UNIMPROVED LAND 3457 sq ft 3,457
82 7405210006 UNIMPROVED LAND 2500 sq ft 2,500
83 7405210018 UNIMPROVED LAND 3060 sq ft 3,060
84 7405211007 UNIMPROVED LAND 3815 sq ft 3,815
85 7405212005 UNIMPROVED LAND 2638 sq ft 2,638

SECTION ONE
Parcel Land Year Land
Section 1 Number Use Size Built Area
VACANT LAND
86 7405212022 UNIMPROVED LAND 934 sq ft 934
87 7405212025 UNIMPROVED LAND 1651 sq ft 1,651
88 7405212036 UNIMPROVED LAND 1887 sq ft 1,887
89 7405216011 UNIMPROVED LAND 15.43 acres 672,131
90 7405217002 UNIMPROVED LAND 1875 sq ft 1,875
91 7405217004 UNIMPROVED LAND 1600 sq ft 1,600
92 7405217005 UNIMPROVED LAND 3296 sq ft 3,296
93 7405217006 UNIMPROVED LAND 2850 sq ft 2,850
94 7405217007 UNIMPROVED LAND 2337 sq ft 2,337
95 7405217012 UNIMPROVED LAND 7200 sq ft 7,200
96 7405217016 UNIMPROVED LAND 9120 sq ft 9,120
97 7405217017 UNIMPROVED LAND 4.29 acres 186,872
98 7405301004 UNIMPROVED LAND 6380 sq ft 6,380
99 7405302004 UNIMPROVED LAND 2500 sq ft 2,500
100 7405302010 UNIMPROVED LAND 1150 sq ft 1,150
101 7405302015 UNIMPROVED LAND 3675 sq ft 3,675
102 7405302023 UNIMPROVED LAND 2225 sq ft 2,225
103 7405303008 UNIMPROVED LAND 5800 sq ft 5,800
104 7405303015 UNIMPROVED LAND 2100 sq ft 2,100
105 7405303022 UNIMPROVED LAND 10690 sq ft 10,690
106 7405306027 UNIMPROVED LAND 977 sq ft 977
107 7405306028 UNIMPROVED LAND 20248 sq ft 20,248
108 7405306030 UNIMPROVED LAND 737 sq ft 737
109 7405308030 UNIMPROVED LAND 15425 sq ft 15,425
110 7405308066 UNIMPROVED LAND 571 sq ft 571
111 7405311012 UNIMPROVED LAND 10870 sq ft 10,870
112 7405312004 UNIMPROVED LAND 4525 sq ft 4,525
113 7405312006 UNIMPROVED LAND 8625 sq ft 8,625
114 7405312007 UNIMPROVED LAND 3250 sq ft 3,250
115 7405312008 UNIMPROVED LAND 7675 sq ft 7,675
116 7405312009 UNIMPROVED LAND 31725 sq ft 31,725
117 7405312013 UNIMPROVED LAND 12164 sq ft 12,164
118 7405313009 UNIMPROVED LAND 31887 sq ft 31,887
119 7405314015 UNIMPROVED LAND 1620 sq ft 1,620
120 7405314016 UNIMPROVED LAND 2156 sq ft 2,156
121 7405314017 UNIMPROVED LAND 7011 sq ft 7,011
122 7405314018 UNIMPROVED LAND 4680 sq ft 4,680
123 7405315001 UNIMPROVED LAND 2300 sq ft 2,300
124 7405315018 UNIMPROVED LAND 2425 sq ft 2,425
125 7405315019 UNIMPROVED LAND 4825 sq ft 4,825
126 7405315020 UNIMPROVED LAND 9975 sq ft 9,975
127 7405316006 UNIMPROVED LAND 2050 sq ft 2,050
128 7405316008 UNIMPROVED LAND 5250 sq ft 5,250
129 7405316009 UNIMPROVED LAND 5250 sq ft 5,250
130 7405317004 UNIMPROVED LAND 3550 sq ft 3,550
131 7405317005 UNIMPROVED LAND 2525 sq ft 2,525
132 7405317007 UNIMPROVED LAND 2800 sq ft 2,800
133 7405317008 UNIMPROVED LAND 7875 sq ft 7,875
134 7405321020 UNIMPROVED LAND 7900 sq ft 7,900
135 7405321029 UNIMPROVED LAND 669 sq ft 669
136 7405325021 UNIMPROVED LAND 5168 sq ft 5,168
137 7405335016 UNIMPROVED LAND 17308 sq ft 17,308
138 7405336020 UNIMPROVED LAND 6660 sq ft 6,660
139 7405336021 UNIMPROVED LAND 5785 sq ft 5,785
140 7405336027 UNIMPROVED LAND 15665 sq ft 15,665
141 7405340015 UNIMPROVED LAND 732 sq ft 732
142 7405342011 UNIMPROVED LAND 5107 sq ft 5,107
143 7405343046 UNIMPROVED LAND 8250 sq ft 8,250
144 7405344006 UNIMPROVED LAND 625 sq ft 625
145 7405345008 UNIMPROVED LAND 6213 sq ft 6,213
146 7405345010 UNIMPROVED LAND 4800 sq ft 4,800
147 7405347014 UNIMPROVED LAND 1450 sq ft 1,450
148 7405347015 UNIMPROVED LAND 1950 sq ft 1,950
149 7405347020 UNIMPROVED LAND 3500 sq ft 3,500
150 7405402004 unimproved land 1450 sq ft 1,450
151 7405402005 unimproved land 1450 sq ft 1,450
152 7405402029 unimproved land 5000 sq ft 5,000
153 7405402033 unimproved land 7870 sq ft 7,870
154 7405403021 unimproved land 5181 sq ft 5,181
155 7405403022 unimproved land 6291 sq ft 6,291
156 7405403024 unimproved land 6808 sq ft 6,808
157 7405404016 UNIMPROVED LAND 9000 sq ft 9,000
158 7405405018 UNIMPROVED LAND 2500 sq ft 2,500
159 7405405033 UNIMPROVED LAND 7948 sq ft 7,948
160 7405406008 unimproved land 19781 sq ft 19,781
161 7405410003 unimproved land 1225 sq ft 1,225
162 7405411013 UNIMPROVED LAND 1152 sq ft 1,152
163 7405411018 UNIMPROVED LAND 518 sq ft 518
164 7405412003 unimproved land 3475 sq ft 3,475
165 7405412017 unimproved land 7100 sq ft 7,100
166 7405413009 unimproved land 15030 sq ft 15,030
167 7405413016 unimproved land 1800 sq ft 1,800
168 7405413017 unimproved land 9120 sq ft 9,120
169 7405413021 unimproved land 476 sq ft 476
170 7405415006 unimproved land 2950 sq ft 2,950
171 7405415008 unimproved land 3850 sq ft 3,850

SECTION ONE
Parcel Land Year Land
Section 1 Number Use Size Built Area
VACANT LAND
172 7405415009 unimproved land 3275 sq ft 3,275
173 7405416003 unimproved land 1550 sq ft 1,550
174 7405416008 unimproved land 1350 sq ft 1,350
175 7405416009 unimproved land 1225 sq ft 1,225
176 7405416013 unimproved land 1250 sq ft 1,250
177 7405416019 unimproved land 2450 sq ft 2,450
178 7405416024 unimproved land 1250 sq ft 1,250
179 7405416029 unimproved land 2537 sq ft 2,537
180 7405417006 unimproved land 1250 sq ft 1,250
181 7405417007 unimproved land 1500 sq ft 1,500
182 7405417011 unimproved land 2425 sq ft 2,425
183 7405417017 unimproved land 280 sq ft 280
184 7405417018 unimproved land 3170 sq ft 3,170
185 7405418002 unimproved land 1750 sq ft 1,750
186 7405419006 unimproved land 4650 sq ft 4,650
187 7405419007 unimproved land 1700 sq ft 1,700
188 7405420001 unimproved land 29000 sq ft 29,000
189 7405421002 unimproved land 2050 sq ft 2,050
190 7405421010 unimproved land 22050 sq ft 22,050
191 7405422001 unimproved land 3956 sq ft 3,956
192 7405423003 UNIMPROVED LAND 43187 sq ft 43,187
193 7405423008 UNIMPROVED LAND 8600 sq ft 8,600
194 7405424001 UNIMPROVED LAND 2236 sq ft 2,236
195 7405424002 UNIMPROVED LAND 1.04 acres 45,302
196 7405424009 UNIMPROVED LAND 625 sq ft 625
197 7405424010 UNIMPROVED LAND 825 sq ft 825
198 7405424011 UNIMPROVED LAND 1100 sq ft 1,100
199 7405424012 UNIMPROVED LAND 1125 sq ft 1,125
200 7405424018 UNIMPROVED LAND 1408 sq ft 1,408
201 7405424037 UNIMPROVED LAND 1539 sq ft 1,539
202 7405424038 UNIMPROVED LAND 2032 sq ft 2,032
203 7405424040 UNIMPROVED LAND 773 sq ft 773
204 7405424041 UNIMPROVED LAND 5265 sq ft 5,265
205 7405424042 UNIMPROVED LAND 1870 sq ft 1,870
206 7405424044 UNIMPROVED LAND 2362 sq ft 2,362
207 7405424046 UNIMPROVED LAND 4160 sq ft 4,160
208 7405425011 UNIMPROVED LAND 1.3 acres 56,628
209 7405425013 UNIMPROVED LAND 1.29 acres 56,192
210 7405425028 UNIMPROVED LAND 17560 sq ft 17,560
211 7405425029 UNIMPROVED LAND 5400 sq ft 5,400
212 7405425030 UNIMPROVED LAND 10816 sq ft 10,816
213 7405426001 UNIMPROVED LAND 1.29 acres 56,192
214 7405426004 UNIMPROVED LAND 12700 sq ft 12,700
215 7405427001 UNIMPROVED LAND 788 sq ft 788
216 7405427026 UNIMPROVED LAND 48 sq ft 48
217 7405427031 UNIMPROVED LAND 8933 sq ft 8,933
218 7405428008 UNIMPROVED LAND 5000 sq ft 5,000
219 7405428026 UNIMPROVED LAND 24394 sq ft 24,394
220 7405428027 UNIMPROVED LAND 15109 sq ft 15,109
221 7405429005 UNIMPROVED LAND 3012 sq ft 3,012
222 7405430004 UNIMPROVED LAND 3120 sq ft 3,120
223 7405430006 UNIMPROVED LAND 1855 sq ft 1,855
224 7405431002 UNIMPROVED LAND 1155 sq ft 1,155
225 7405431003 UNIMPROVED LAND 8000 sq ft 8,000
226 7405432010 UNIMPROVED LAND 3234 sq ft 3,234
227 7405432011 UNIMPROVED LAND 16225 sq ft 16,225
228 7405432012 UNIMPROVED LAND 2314 sq ft 2,314
229 7405432013 UNIMPROVED LAND 2300 sq ft 2,300
230 7405432014 UNIMPROVED LAND 4599 sq ft 4,599
231 7405432019 UNIMPROVED LAND 8455 sq ft 8,455
232 7405433008 UNIMPROVED LAND 4612 sq ft 4,612
233 7405434010 UNIMPROVED LAND 3190 sq ft 3,190
234 7405434012 UNIMPROVED LAND 5187 sq ft 5,187
235 7405434018 UNIMPROVED LAND 17175 sq ft 17,175
236 7405434019 UNIMPROVED LAND 5600 sq ft 5,600
237 7405435032 UNIMPROVED LAND 13424 sq ft 13,424
238 7405435033 UNIMPROVED LAND 3957 sq ft 3,957
239 7405436005 UNIMPROVED LAND 3500 sq ft 3,500
240 7405436011 UNIMPROVED LAND 2400 sq ft 2,400
241 7405436016 UNIMPROVED LAND 4370 sq ft 4,370
242 7405439005 UNIMPROVED LAND 6125 sq ft 6,125
243 7405441014 unimproved land 900 sq ft 900
244 7405441016 unimproved land 11919 sq ft 11,919
245 7405442030 unimproved land 4570 sq ft 4,570
246 7405442031 unimproved land 13967 sq ft 13,967
247 7405443001 unimproved land 7775 sq ft 7,775
248 7405443002 unimproved land 7450 sq ft 7,450
249 7405443006 unimproved land 5200 sq ft 5,200
250 7405443009 unimproved land 21075 sq ft 21,075
251 7405443016 unimproved land 9173 sq ft 9,173
252 7405444002 unimproved land 32670 sq ft 32,670
253 7405444004 unimproved land 11235 sq ft 11,235
254 7405445001 unimproved land 24850 sq ft 24,850
255 7405445003 unimproved land 29825 sq ft 29,825
256 7405445005 unimproved land 6075 sq ft 6,075
257 7405446004 unimproved land 29250 sq ft 29,250
258 7405446005 unimproved land 28025 sq ft 28,025
259 7405447004 unimproved land 12525 sq ft 12,525
260 7405448027 unimproved land 1680 sq ft 1,680
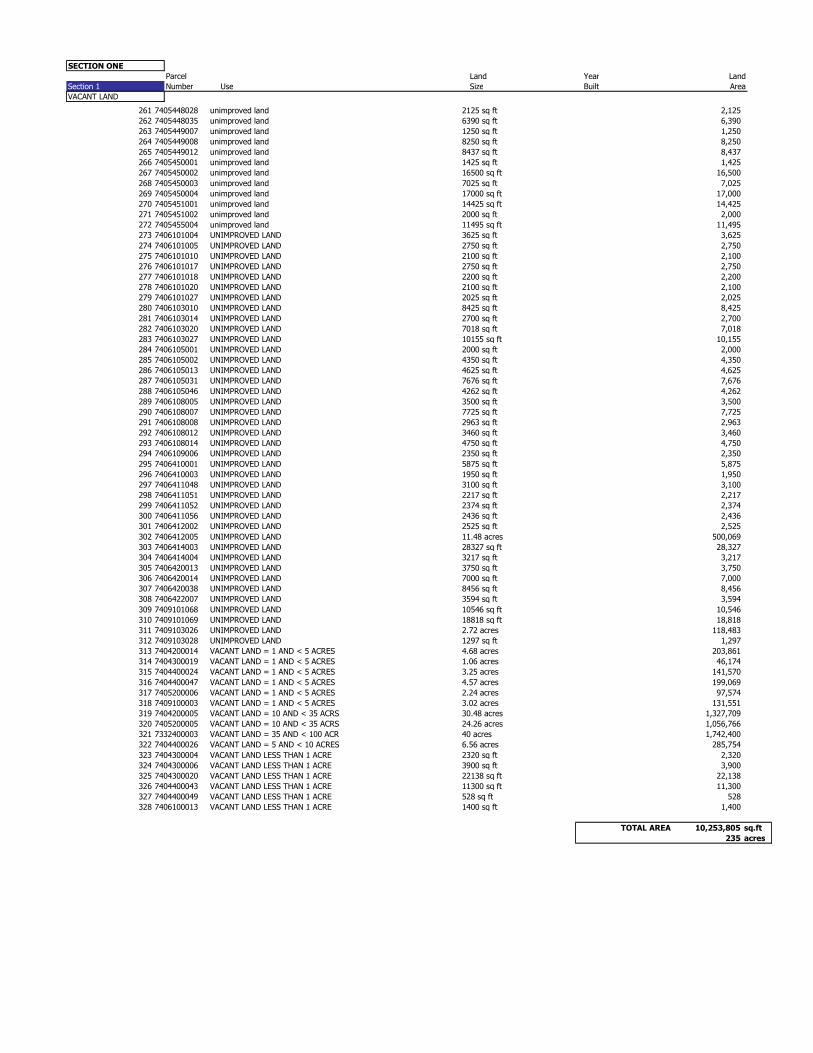
SECTION ONE
Parcel Land Year Land
Section 1 Number Use Size Built Area
VACANT LAND
261 7405448028 unimproved land 2125 sq ft 2,125
262 7405448035 unimproved land 6390 sq ft 6,390
263 7405449007 unimproved land 1250 sq ft 1,250
264 7405449008 unimproved land 8250 sq ft 8,250
265 7405449012 unimproved land 8437 sq ft 8,437
266 7405450001 unimproved land 1425 sq ft 1,425
267 7405450002 unimproved land 16500 sq ft 16,500
268 7405450003 unimproved land 7025 sq ft 7,025
269 7405450004 unimproved land 17000 sq ft 17,000
270 7405451001 unimproved land 14425 sq ft 14,425
271 7405451002 unimproved land 2000 sq ft 2,000
272 7405455004 unimproved land 11495 sq ft 11,495
273 7406101004 UNIMPROVED LAND 3625 sq ft 3,625
274 7406101005 UNIMPROVED LAND 2750 sq ft 2,750
275 7406101010 UNIMPROVED LAND 2100 sq ft 2,100
276 7406101017 UNIMPROVED LAND 2750 sq ft 2,750
277 7406101018 UNIMPROVED LAND 2200 sq ft 2,200
278 7406101020 UNIMPROVED LAND 2100 sq ft 2,100
279 7406101027 UNIMPROVED LAND 2025 sq ft 2,025
280 7406103010 UNIMPROVED LAND 8425 sq ft 8,425
281 7406103014 UNIMPROVED LAND 2700 sq ft 2,700
282 7406103020 UNIMPROVED LAND 7018 sq ft 7,018
283 7406103027 UNIMPROVED LAND 10155 sq ft 10,155
284 7406105001 UNIMPROVED LAND 2000 sq ft 2,000
285 7406105002 UNIMPROVED LAND 4350 sq ft 4,350
286 7406105013 UNIMPROVED LAND 4625 sq ft 4,625
287 7406105031 UNIMPROVED LAND 7676 sq ft 7,676
288 7406105046 UNIMPROVED LAND 4262 sq ft 4,262
289 7406108005 UNIMPROVED LAND 3500 sq ft 3,500
290 7406108007 UNIMPROVED LAND 7725 sq ft 7,725
291 7406108008 UNIMPROVED LAND 2963 sq ft 2,963
292 7406108012 UNIMPROVED LAND 3460 sq ft 3,460
293 7406108014 UNIMPROVED LAND 4750 sq ft 4,750
294 7406109006 UNIMPROVED LAND 2350 sq ft 2,350
295 7406410001 UNIMPROVED LAND 5875 sq ft 5,875
296 7406410003 UNIMPROVED LAND 1950 sq ft 1,950
297 7406411048 UNIMPROVED LAND 3100 sq ft 3,100
298 7406411051 UNIMPROVED LAND 2217 sq ft 2,217
299 7406411052 UNIMPROVED LAND 2374 sq ft 2,374
300 7406411056 UNIMPROVED LAND 2436 sq ft 2,436
301 7406412002 UNIMPROVED LAND 2525 sq ft 2,525
302 7406412005 UNIMPROVED LAND 11.48 acres 500,069
303 7406414003 UNIMPROVED LAND 28327 sq ft 28,327
304 7406414004 UNIMPROVED LAND 3217 sq ft 3,217
305 7406420013 UNIMPROVED LAND 3750 sq ft 3,750
306 7406420014 UNIMPROVED LAND 7000 sq ft 7,000
307 7406420038 UNIMPROVED LAND 8456 sq ft 8,456
308 7406422007 UNIMPROVED LAND 3594 sq ft 3,594
309 7409101068 UNIMPROVED LAND 10546 sq ft 10,546
310 7409101069 UNIMPROVED LAND 18818 sq ft 18,818
311 7409103026 UNIMPROVED LAND 2.72 acres 118,483
312 7409103028 UNIMPROVED LAND 1297 sq ft 1,297
313 7404200014 VACANT LAND = 1 AND < 5 ACRES 4.68 acres 203,861
314 7404300019 VACANT LAND = 1 AND < 5 ACRES 1.06 acres 46,174
315 7404400024 VACANT LAND = 1 AND < 5 ACRES 3.25 acres 141,570
316 7404400047 VACANT LAND = 1 AND < 5 ACRES 4.57 acres 199,069
317 7405200006 VACANT LAND = 1 AND < 5 ACRES 2.24 acres 97,574
318 7409100003 VACANT LAND = 1 AND < 5 ACRES 3.02 acres 131,551
319 7404200005 VACANT LAND = 10 AND < 35 ACRS 30.48 acres 1,327,709
320 7405200005 VACANT LAND = 10 AND < 35 ACRS 24.26 acres 1,056,766
321 7332400003 VACANT LAND = 35 AND < 100 ACR 40 acres 1,742,400
322 7404400026 VACANT LAND = 5 AND < 10 ACRES 6.56 acres 285,754
323 7404300004 VACANT LAND LESS THAN 1 ACRE 2320 sq ft 2,320
324 7404300006 VACANT LAND LESS THAN 1 ACRE 3900 sq ft 3,900
325 7404300020 VACANT LAND LESS THAN 1 ACRE 22138 sq ft 22,138
326 7404400043 VACANT LAND LESS THAN 1 ACRE 11300 sq ft 11,300
327 7404400049 VACANT LAND LESS THAN 1 ACRE 528 sq ft 528
328 7406100013 VACANT LAND LESS THAN 1 ACRE 1400 sq ft 1,400
TOTAL AREA 10,253,805 sq.ft
235 acres
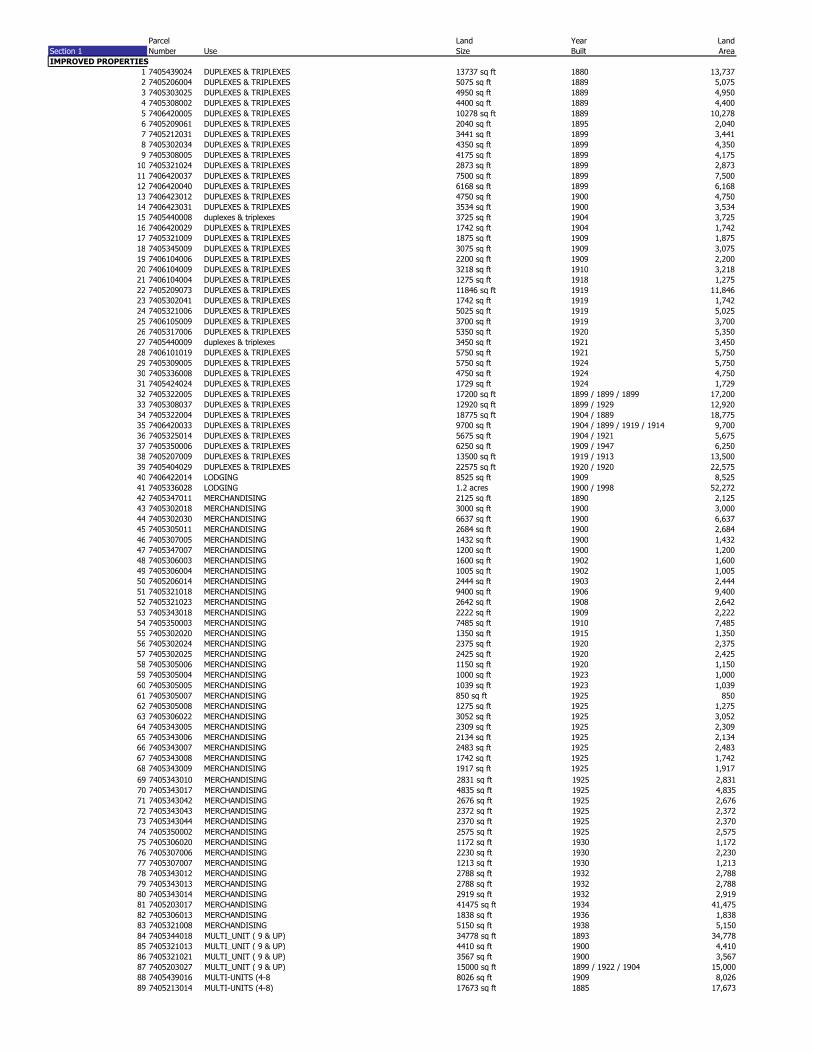
Parcel Land Year Land
Section 1 Number Use Size Built Area
IMPROVED PROPERTIES
1 7405439024 DUPLEXES & TRIPLEXES 13737 sq ft 1880 13,737
2 7405206004 DUPLEXES & TRIPLEXES 5075 sq ft 1889 5,075
3 7405303025 DUPLEXES & TRIPLEXES 4950 sq ft 1889 4,950
4 7405308002 DUPLEXES & TRIPLEXES 4400 sq ft 1889 4,400
5 7406420005 DUPLEXES & TRIPLEXES 10278 sq ft 1889 10,278
6 7405209061 DUPLEXES & TRIPLEXES 2040 sq ft 1895 2,040
7 7405212031 DUPLEXES & TRIPLEXES 3441 sq ft 1899 3,441
8 7405302034 DUPLEXES & TRIPLEXES 4350 sq ft 1899 4,350
9 7405308005 DUPLEXES & TRIPLEXES 4175 sq ft 1899 4,175
10 7405321024 DUPLEXES & TRIPLEXES 2873 sq ft 1899 2,873
11 7406420037 DUPLEXES & TRIPLEXES 7500 sq ft 1899 7,500
12 7406420040 DUPLEXES & TRIPLEXES 6168 sq ft 1899 6,168
13 7406423012 DUPLEXES & TRIPLEXES 4750 sq ft 1900 4,750
14 7406423031 DUPLEXES & TRIPLEXES 3534 sq ft 1900 3,534
15 7405440008 duplexes & triplexes 3725 sq ft 1904 3,725
16 7406420029 DUPLEXES & TRIPLEXES 1742 sq ft 1904 1,742
17 7405321009 DUPLEXES & TRIPLEXES 1875 sq ft 1909 1,875
18 7405345009 DUPLEXES & TRIPLEXES 3075 sq ft 1909 3,075
19 7406104006 DUPLEXES & TRIPLEXES 2200 sq ft 1909 2,200
20 7406104009 DUPLEXES & TRIPLEXES 3218 sq ft 1910 3,218
21 7406104004 DUPLEXES & TRIPLEXES 1275 sq ft 1918 1,275
22 7405209073 DUPLEXES & TRIPLEXES 11846 sq ft 1919 11,846
23 7405302041 DUPLEXES & TRIPLEXES 1742 sq ft 1919 1,742
24 7405321006 DUPLEXES & TRIPLEXES 5025 sq ft 1919 5,025
25 7406105009 DUPLEXES & TRIPLEXES 3700 sq ft 1919 3,700
26 7405317006 DUPLEXES & TRIPLEXES 5350 sq ft 1920 5,350
27 7405440009 duplexes & triplexes 3450 sq ft 1921 3,450
28 7406101019 DUPLEXES & TRIPLEXES 5750 sq ft 1921 5,750
29 7405309005 DUPLEXES & TRIPLEXES 5750 sq ft 1924 5,750
30 7405336008 DUPLEXES & TRIPLEXES 4750 sq ft 1924 4,750
31 7405424024 DUPLEXES & TRIPLEXES 1729 sq ft 1924 1,729
32 7405322005 DUPLEXES & TRIPLEXES 17200 sq ft 1899 / 1899 / 1899 17,200
33 7405308037 DUPLEXES & TRIPLEXES 12920 sq ft 1899 / 1929 12,920
34 7405322004 DUPLEXES & TRIPLEXES 18775 sq ft 1904 / 1889 18,775
35 7406420033 DUPLEXES & TRIPLEXES 9700 sq ft 1904 / 1899 / 1919 / 1914 9,700
36 7405325014 DUPLEXES & TRIPLEXES 5675 sq ft 1904 / 1921 5,675
37 7405350006 DUPLEXES & TRIPLEXES 6250 sq ft 1909 / 1947 6,250
38 7405207009 DUPLEXES & TRIPLEXES 13500 sq ft 1919 / 1913 13,500
39 7405404029 DUPLEXES & TRIPLEXES 22575 sq ft 1920 / 1920 22,575
40 7406422014 LODGING 8525 sq ft 1909 8,525
41 7405336028 LODGING 1.2 acres 1900 / 1998 52,272
42 7405347011 MERCHANDISING 2125 sq ft 1890 2,125
43 7405302018 MERCHANDISING 3000 sq ft 1900 3,000
44 7405302030 MERCHANDISING 6637 sq ft 1900 6,637
45 7405305011 MERCHANDISING 2684 sq ft 1900 2,684
46 7405307005 MERCHANDISING 1432 sq ft 1900 1,432
47 7405347007 MERCHANDISING 1200 sq ft 1900 1,200
48 7405306003 MERCHANDISING 1600 sq ft 1902 1,600
49 7405306004 MERCHANDISING 1005 sq ft 1902 1,005
50 7405206014 MERCHANDISING 2444 sq ft 1903 2,444
51 7405321018 MERCHANDISING 9400 sq ft 1906 9,400
52 7405321023 MERCHANDISING 2642 sq ft 1908 2,642
53 7405343018 MERCHANDISING 2222 sq ft 1909 2,222
54 7405350003 MERCHANDISING 7485 sq ft 1910 7,485
55 7405302020 MERCHANDISING 1350 sq ft 1915 1,350
56 7405302024 MERCHANDISING 2375 sq ft 1920 2,375
57 7405302025 MERCHANDISING 2425 sq ft 1920 2,425
58 7405305006 MERCHANDISING 1150 sq ft 1920 1,150
59 7405305004 MERCHANDISING 1000 sq ft 1923 1,000
60 7405305005 MERCHANDISING 1039 sq ft 1923 1,039
61 7405305007 MERCHANDISING 850 sq ft 1925 850
62 7405305008 MERCHANDISING 1275 sq ft 1925 1,275
63 7405306022 MERCHANDISING 3052 sq ft 1925 3,052
64 7405343005 MERCHANDISING 2309 sq ft 1925 2,309
65 7405343006 MERCHANDISING 2134 sq ft 1925 2,134
66 7405343007 MERCHANDISING 2483 sq ft 1925 2,483
67 7405343008 MERCHANDISING 1742 sq ft 1925 1,742
68 7405343009 MERCHANDISING 1917 sq ft 1925 1,917
69 7405343010 MERCHANDISING 2831 sq ft 1925 2,831
70 7405343017 MERCHANDISING 4835 sq ft 1925 4,835
71 7405343042 MERCHANDISING 2676 sq ft 1925 2,676
72 7405343043 MERCHANDISING 2372 sq ft 1925 2,372
73 7405343044 MERCHANDISING 2370 sq ft 1925 2,370
74 7405350002 MERCHANDISING 2575 sq ft 1925 2,575
75 7405306020 MERCHANDISING 1172 sq ft 1930 1,172
76 7405307006 MERCHANDISING 2230 sq ft 1930 2,230
77 7405307007 MERCHANDISING 1213 sq ft 1930 1,213
78 7405343012 MERCHANDISING 2788 sq ft 1932 2,788
79 7405343013 MERCHANDISING 2788 sq ft 1932 2,788
80 7405343014 MERCHANDISING 2919 sq ft 1932 2,919
81 7405203017 MERCHANDISING 41475 sq ft 1934 41,475
82 7405306013 MERCHANDISING 1838 sq ft 1936 1,838
83 7405321008 MERCHANDISING 5150 sq ft 1938 5,150
84 7405344018 MULTI_UNIT ( 9 & UP) 34778 sq ft 1893 34,778
85 7405321013 MULTI_UNIT ( 9 & UP) 4410 sq ft 1900 4,410
86 7405321021 MULTI_UNIT ( 9 & UP) 3567 sq ft 1900 3,567
87 7405203027 MULTI_UNIT ( 9 & UP) 15000 sq ft 1899 / 1922 / 1904 15,000
88 7405439016 MULTI-UNITS (4-8 8026 sq ft 1909 8,026
89 7405213014 MULTI-UNITS (4-8) 17673 sq ft 1885 17,673

Parcel Land Year Land
Section 1 Number Use Size Built Area
IMPROVED PROPERTIES90 7405436018 MULTI-UNITS (4-8) 3225 sq ft 1889 3,225
91 7405206009 MULTI-UNITS (4-8) 4825 sq ft 1899 4,825
92 7405203086 MULTI-UNITS (4-8) 14285 sq ft 1900 14,285
93 7405301005 MULTI-UNITS (4-8) 7192 sq ft 1900 7,192
94 7405302031 MULTI-UNITS (4-8) 6025 sq ft 1900 6,025
95 7405321027 MULTI-UNITS (4-8) 1085 sq ft 1900 1,085
96 7405321028 MULTI-UNITS (4-8) 1525 sq ft 1900 1,525
97 7405321026 MULTI-UNITS (4-8) 1270 sq ft 1905 1,270
98 7405212017 MULTI-UNITS (4-8) 3625 sq ft 1909 3,625
99 7405321010 MULTI-UNITS (4-8) 6900 sq ft 1909 6,900
100 7404400044 MULTI-UNITS (4-8) 29850 sq ft 1927 29,850
101 7405427007 MULTI-UNITS (4-8) 13000 sq ft 1937 13,000
102 7405439008 MULTI-UNITS (4-8) 20700 sq ft 1885 / 1935 20,700
103 7405310014 MULTI-UNITS (4-8) 5539 sq ft 1899 / 1895 5,539
104 7405209044 MULTI-UNITS (4-8) 32875 sq ft 1900 / 1900 32,875
105 7405206018 MULTI-UNITS (4-8) 6150 sq ft 1900 / 1987 6,150
106 7405212020 MULTI-UNITS (4-8) 7700 sq ft 1911 / 1913 7,700
107 7405347009 MULTI-UNITS (4-8) / MERCHANDISING 500 sq ft / 500 sq ft 1890 / 1890 1,000
108 7405347006 MULTI-UNITS (4-8) / MERCHANDISING 625 sq ft / 625 sq ft 1900 / 1900 1,250
109 7405347013 MULTI-UNITS (4-8) / MERCHANDISING 1596 sq ft / 2279 sq ft 1900 / 1900 3,875
110 7405347016 MULTI-UNITS (4-8) / MERCHANDISING 1200 sq ft / 1200 sq ft 1900 / 1900 2,400
111 7405347017 MULTI-UNITS (4-8) / MERCHANDISING 1964 sq ft / 2711 sq ft 1900 / 1900 4,675
112 7405347018 MULTI-UNITS (4-8) / MERCHANDISING 1058 sq ft / 1292 sq ft 1900 / 1900 2,350
113 7405347021 MULTI-UNITS (4-8) / MERCHANDISING 2698 sq ft / 552 sq ft 1900 / 1900 3,250
114 7405348003 MULTI-UNITS (4-8) / MERCHANDISING 1952 sq ft / 1248 sq ft 1900 / 1900 3,200
115 7405348004 MULTI-UNITS (4-8) / MERCHANDISING 710 sq ft / 940 sq ft 1900 / 1900 1,650
116 7405348005 MULTI-UNITS (4-8) / MERCHANDISING 1833 sq ft / 2867 sq ft 1900 / 1900 4,700
117 7405302019 MULTI-UNITS (4-8) / MERCHANDISING 535 sq ft / 803 sq ft 1905 / 1905 6,885
118 7405302038 MULTI-UNITS (4-8) / MERCHANDISING 5095 sq ft / 1790 sq ft 1905 / 1905 6,885
119 7405347023 MULTI-UNITS (4-8) / MERCHANDISING 581 sq ft / 2144 sq ft 1908 / 1908 2,725
120 7405348002 MULTI-UNITS (4-8) / OFFICES 1087 sq ft / 1088 sq ft 1900 / 1900 2,175
121 7405347010 MULTI-UNITS (4-8) / SPECIAL PURPOSE 604 sq ft / 1121 sq ft 1900 / 1900 1,725
122 7405302009 MULTI-UNITS (4-8) / SPECIAL PURPOSE 475 sq ft / 605 sq ft 1942 / 1942 1,080
123 7405306023 MULTI-UNITS (4-8) / SPECIAL PURPOSE 2536 sq ft / 5644 sq ft 1902 / 1902 8,180
124 7405348001 OFFICES 4872 sq ft 1900 4,872
125 7405400002 OFFICES / MULTI-UNITS (4-8) 25714 sq ft / 4536 sq ft 1961 / 1910 / 2002 30,250
126 7405309012 RELIGIOUS WORSHIP 27175 sq ft 1900 27,175
127 7405404033 RELIGIOUS WORSHIP 33839 sq ft 1902 33,839
128 7405302005 RES LAND AT 29% 3300 sq ft 1919 3,300
129 7405344008 RES LAND AT 29% 3925 sq ft 1944 3,925
130 7405203035 RES LAND AT 29% 3700 sq ft 3,700
131 7405402032 res land at 29% 8227 sq ft 8,227
132 7405403004 res land at 29% 5575 sq ft 5,575
133 7405418001 res land at 29% 1225 sq ft 1,225
134 7406103011 RES LAND AT 29% 10125 sq ft 10,125
135 7406416001 RES LAND AT 29% 850 sq ft 850
136 7406420023 RES LAND AT 29% 1000 sq ft 1,000
137 7405415007 res land at res rate 2100 sq ft 2,100
138 7405416020 res land at res rate 1225 sq ft 1,225
139 7405439011 RES LAND AT RES RATE 3378 sq ft 3,378
140 7405309009 RESIDENTIAL RELIGIOUS PURPOSES 7650 sq ft 1909 7,650
141 7405323013 SINGLE FAMILY RES 3540 sq ft 1881 3,540
142 7405342002 SINGLE FAMILY RES 7275 sq ft 1884 7,275
143 7405342005 SINGLE FAMILY RES 4725 sq ft 1884 4,725
144 7405401028 single family res 4524 sq ft 1885 4,524
145 7405439010 SINGLE FAMILY RES 3619 sq ft 1885 3,619
146 7405323017 SINGLE FAMILY RES 5262 sq ft 1889 5,262
147 7405340013 SINGLE FAMILY RES 3438 sq ft 1889 3,438
148 7405439022 SINGLE FAMILY RES 17717 sq ft 1889 17,717
149 7405404015 SINGLE FAMILY RES 9000 sq ft 1890 9,000
150 7405439002 SINGLE FAMILY RES 8525 sq ft 1890 8,525
151 7405439004 SINGLE FAMILY RES 6517 sq ft 1890 6,517
152 7405439023 SINGLE FAMILY RES 4503 sq ft 1890 4,503
153 7405325016 SINGLE FAMILY RES 5675 sq ft 1892 5,675
154 7405321015 SINGLE FAMILY RES 3475 sq ft 1894 3,475
155 7405321014 SINGLE FAMILY RES 2400 sq ft 1899 2,400
156 7405321022 SINGLE FAMILY RES 6425 sq ft 1899 6,425
157 7405322001 SINGLE FAMILY RES 3475 sq ft 1899 3,475
158 7405322006 SINGLE FAMILY RES 5880 sq ft 1899 5,880
159 7405322007 SINGLE FAMILY RES 4075 sq ft 1899 4,075
160 7405322008 SINGLE FAMILY RES 3225 sq ft 1899 3,225
161 7405322014 SINGLE FAMILY RES 3500 sq ft 1899 3,500
162 7405322015 SINGLE FAMILY RES 3550 sq ft 1899 3,550
163 7405322016 SINGLE FAMILY RES 2850 sq ft 1899 2,850
164 7405325010 SINGLE FAMILY RES 4943 sq ft 1899 4,943
165 7405342004 SINGLE FAMILY RES 9250 sq ft 1899 9,250
166 7405342006 SINGLE FAMILY RES 6400 sq ft 1899 6,400
167 7405342009 SINGLE FAMILY RES 7498 sq ft 1899 7,498
168 7405350005 SINGLE FAMILY RES 6075 sq ft 1899 6,075
169 7405402006 single family res 15500 sq ft 1899 15,500
170 7405402010 single family res 7500 sq ft 1899 7,500
171 7405402021 single family res 5325 sq ft 1899 5,325
172 7405402022 single family res 4025 sq ft 1899 4,025
173 7405403002 single family res 5875 sq ft 1899 5,875
174 7405401009 single family res 16025 sq ft 1900 16,025
175 7405402003 single family res 1450 sq ft 1900 1,450
176 7405402037 single family res 7329 sq ft 1900 7,329
177 7405415016 single family res 2070 sq ft 1900 2,070
178 7405417012 single family res 4300 sq ft 1900 4,300
179 7405323002 SINGLE FAMILY RES 4175 sq ft 1904 4,175
180 7405401010 single family res 3200 sq ft 1905 3,200

Parcel Land Year Land
Section 1 Number Use Size Built Area
IMPROVED PROPERTIES181 7405406005 single family res 33419 sq ft 1905 33,419
182 7405417002 single family res 2550 sq ft 1905 2,550
183 7405417014 single family res 2124 sq ft 1905 2,124
184 7405417016 single family res 4750 sq ft 1905 4,750
185 7405403023 single family res 14898 sq ft 1906 14,898
186 7405342001 SINGLE FAMILY RES 5275 sq ft 1908 5,274
187 7405321025 SINGLE FAMILY RES 6634 sq ft 1909 6,634
188 7405322009 SINGLE FAMILY RES 6475 sq ft 1909 6,475
189 7405322011 SINGLE FAMILY RES 3925 sq ft 1909 3,925
190 7405323006 SINGLE FAMILY RES 5725 sq ft 1909 5,725
191 7405325018 SINGLE FAMILY RES 4279 sq ft 1909 4,279
192 7405402020 single family res 7200 sq ft 1909 7,200
193 7405403001 single family res 23337 sq ft 1909 23,337
194 7405403003 single family res 6250 sq ft 1909 6,250
195 7405403009 single family res 4700 sq ft 1909 4,700
196 7405404021 SINGLE FAMILY RES 5750 sq ft 1909 5,750
197 7405433009 SINGLE FAMILY RES 4200 sq ft 1909 4,200
198 7405433010 SINGLE FAMILY RES 5775 sq ft 1909 5,775
199 7405434007 SINGLE FAMILY RES 9671 sq ft 1909 9,671
200 7405325013 SINGLE FAMILY RES 5675 sq ft 1910 5,675
201 7405401016 single family res 5250 sq ft 1910 5,250
202 7405401027 single family res 2955 sq ft 1910 2,955
203 7405410011 single family res 12025 sq ft 1910 12,025
204 7405415001 single family res 1000 sq ft 1910 1,000
205 7405415019 single family res 1657 sq ft 1910 1,657
206 7405415020 single family res 5077 sq ft 1910 5,077
207 7405416010 single family res 3750 sq ft 1910 3,750
208 7405416021 single family res 3825 sq ft 1910 3,825
209 7405416031 single family res 7638 sq ft 1910 7,638
210 7405419003 single family res 4987 sq ft 1910 4,987
211 7405419005 single family res 5725 sq ft 1910 5,725
212 7405419008 single family res 9525 sq ft 1910 9,525
213 7405449013 single family res 11360 sq ft 1910 11,360
214 7405327001 SINGLE FAMILY RES 6534 sq ft 1912 6,534
215 7405315003 SINGLE FAMILY RES 3025 sq ft 1913 3,025
216 7405315005 SINGLE FAMILY RES 4300 sq ft 1913 4,300
217 7405315021 SINGLE FAMILY RES 8400 sq ft 1913 8,400
218 7405317003 SINGLE FAMILY RES 14825 sq ft 1913 14,825
219 7405402015 single family res 7850 sq ft 1913 7,850
220 7405402016 single family res 3200 sq ft 1913 3,200
221 7405412020 single family res 7625 sq ft 1913 7,625
222 7405416004 single family res 4235 sq ft 1913 4,235
223 7405416005 single family res 2125 sq ft 1913 2,125
224 7405416007 single family res 1187 sq ft 1913 1,187
225 7405416012 single family res 2500 sq ft 1913 2,500
226 7405416023 single family res 7225 sq ft 1913 7,225
227 7405416030 single family res 4922 sq ft 1913 4,922
228 7405417008 single family res 2325 sq ft 1913 2,325
229 7405417019 single family res 3750 sq ft 1913 3,750
230 7405323009 SINGLE FAMILY RES 4025 sq ft 1914 4,025
231 7405323016 SINGLE FAMILY RES 7998 sq ft 1914 7,998
232 7405325004 SINGLE FAMILY RES 4626 sq ft 1914 4,626
233 7405325009 SINGLE FAMILY RES 9200 sq ft 1914 9,200
234 7405325022 SINGLE FAMILY RES 4080 sq ft 1914 4,080
235 7405402027 single family res 6000 sq ft 1914 6,000
236 7405403010 single family res 4400 sq ft 1914 4,400
237 7405432002 SINGLE FAMILY RES 5175 sq ft 1914 5,175
238 7405432018 SINGLE FAMILY RES 7327 sq ft 1914 7,327
239 7405412023 single family res 7850 sq ft 1915 7,850
240 7405323011 SINGLE FAMILY RES 2875 sq ft 1916 2,875
241 7405419004 single family res 3325 sq ft 1916 3,325
242 7405322010 SINGLE FAMILY RES 11275 sq ft 1918 11,275
243 7405323010 SINGLE FAMILY RES 1450 sq ft 1918 1,450
244 7405406007 single family res 12325 sq ft 1918 12,325
245 7405315004 SINGLE FAMILY RES 3380 sq ft 1919 3,380
246 7405322002 SINGLE FAMILY RES 6425 sq ft 1919 6,425
247 7405322003 SINGLE FAMILY RES 4750 sq ft 1919 4,750
248 7405325005 SINGLE FAMILY RES 11298 sq ft 1919 11,298
249 7405325006 SINGLE FAMILY RES 3338 sq ft 1919 3,338
250 7405350007 SINGLE FAMILY RES 6614 sq ft 1919 6,614
251 7405406004 single family res 8750 sq ft 1919 8,750
252 7405412022 single family res 2502 sq ft 1919 2,502
253 7405327004 SINGLE FAMILY RES 8495 sq ft 1920 8,495
254 7405327005 SINGLE FAMILY RES 6500 sq ft 1920 6,500
255 7405415010 single family res 1200 sq ft 1920 1,200
256 7405412006 single family res 2200 sq ft 1921 2,200
257 7405315006 SINGLE FAMILY RES 9050 sq ft 1922 9,050
258 7405317002 SINGLE FAMILY RES 3934 sq ft 1922 3,934
259 7405337009 SINGLE FAMILY RES 10250 sq ft 1922 10,250
260 7405402011 single family res 9250 sq ft 1922 9,250
261 7405402031 single family res 2635 sq ft 1922 2,635
262 7405409008 single family res 2950 sq ft 1922 2,950
263 7405410004 single family res 1800 sq ft 1922 1,800
264 7405410006 single family res 2975 sq ft 1922 2,975
265 7405410009 single family res 4749 sq ft 1922 4,749
266 7405412007 single family res 2725 sq ft 1922 2,725
267 7405441001 single family res 3200 sq ft 1922 3,200
268 7405441002 single family res 1425 sq ft 1922 1,425
269 7405441003 single family res 5700 sq ft 1922 5,700
270 7405441005 single family res 6325 sq ft 1922 6,325
271 7405317001 SINGLE FAMILY RES 9250 sq ft 1923 9,250

Parcel Land Year Land
Section 1 Number Use Size Built Area
IMPROVED PROPERTIES
272 7405327006 SINGLE FAMILY RES 5700 sq ft 1923 5,700
273 7405333006 SINGLE FAMILY RES 14450 sq ft 1923 14,450
274 7405340010 SINGLE FAMILY RES 3380 sq ft 1923 3,380
275 7405402035 single family res 3438 sq ft 1923 3,438
276 7405402036 single family res 2701 sq ft 1923 2,701
277 7405409007 single family res 4475 sq ft 1923 4,475
278 7405410002 single family res 1281 sq ft 1923 1,281
279 7405417013 single family res 1250 sq ft 1923 1,250
280 7405441004 single family res 9813 sq ft 1923 9,813
281 7405441006 single family res 2220 sq ft 1923 2,220
282 7405323012 SINGLE FAMILY RES 4325 sq ft 1924 4,325
283 7405325020 SINGLE FAMILY RES 4500 sq ft 1924 4,500
284 7405339019 SINGLE FAMILY RES 10250 sq ft 1924 10,250
285 7405412021 single family res 2146 sq ft 1924 2,146
286 7405439020 SINGLE FAMILY RES 6343 sq ft 1924 6,343
287 7405401018 single family res 6451 sq ft 1925 6,451
288 7405439021 SINGLE FAMILY RES 6368 sq ft 1925 6,368
289 7405316005 SINGLE FAMILY RES 7679 sq ft 1926 7,679
290 7405412009 single family res 1375 sq ft 1927 1,375
291 7405412010 single family res 1450 sq ft 1927 1,450
292 7405448021 single family res 13509 sq ft 1927 13,509
293 7405327010 SINGLE FAMILY RES 3300 sq ft 1929 3,300
294 7405333007 SINGLE FAMILY RES 11025 sq ft 1929 11,025
295 7405339008 SINGLE FAMILY RES 5200 sq ft 1929 5,200
296 7405410005 single family res 2200 sq ft 1929 2,200
297 7405403008 single family res 5875 sq ft 1933 5,875
298 7405316010 SINGLE FAMILY RES 7869 sq ft 1934 7,869
299 7405340016 SINGLE FAMILY RES 8359 sq ft 1936 8,359
300 7405325001 SINGLE FAMILY RES 4751 sq ft 1937 4,751
301 7405404019 SINGLE FAMILY RES 8125 sq ft 1883 / 1885 8,125
302 7405321007 SINGLE FAMILY RES 7325 sq ft 1884 / 1909 7,325
303 7405404011 SINGLE FAMILY RES 6750 sq ft 1899 / 1910 6,750
304 7405341001 SINGLE FAMILY RES 5250 sq ft 1900 / 1899 5,250
305 7405404012 SINGLE FAMILY RES 10750 sq ft 1900 / 1900 10,750
306 7405322013 SINGLE FAMILY RES 10650 sq ft 1909 / 1909 / 1889 10,650
307 7405325023 SINGLE FAMILY RES 4080 sq ft 1909 / 1914 4,080
308 7405325024 SINGLE FAMILY RES 4147 sq ft 1914 / 1914 4,147
309 7405432021 SINGLE FAMILY RES 11450 sq ft 1914 / 1914 11,450
310 7405323005 SINGLE FAMILY RES 6425 sq ft 1919 / 1919 / 1919 6,425
311 7405209058 SINGLE FAMILY RES. 19987 sq ft 1880 19,987
312 7405203089 SINGLE FAMILY RES. 12675 sq ft 1881 12,675
313 7404306014 SINGLE FAMILY RES. 7400 sq ft 1885 7,400
314 7405203109 SINGLE FAMILY RES. 19500 sq ft 1885 19,500
315 7405306010 SINGLE FAMILY RES. 8000 sq ft 1885 8,000
316 7405308001 SINGLE FAMILY RES. 13450 sq ft 1886 13,450
317 7405309001 SINGLE FAMILY RES. 6025 sq ft 1888 6,025
318 7405206001 SINGLE FAMILY RES. 4450 sq ft 1889 4,450
319 7405206010 SINGLE FAMILY RES. 5000 sq ft 1889 5,000
320 7405303003 SINGLE FAMILY RES. 5000 sq ft 1889 5,000
321 7405303016 SINGLE FAMILY RES. 5500 sq ft 1889 5,500
322 7405303018 SINGLE FAMILY RES. 4950 sq ft 1889 4,950
323 7405308049 SINGLE FAMILY RES. 11196 sq ft 1889 11,196
324 7405309003 SINGLE FAMILY RES. 9825 sq ft 1889 9,825
325 7406410011 SINGLE FAMILY RES. 3550 sq ft 1889 3,550
326 7406423037 SINGLE FAMILY RES. 11657 sq ft 1889 11,657
327 7405203003 SINGLE FAMILY RES. 6500 sq ft 1890 6,500
328 7405203019 SINGLE FAMILY RES. 24164 sq ft 1890 24,164
329 7405203048 SINGLE FAMILY RES. 6825 sq ft 1890 6,825
330 7405203059 SINGLE FAMILY RES. 5075 sq ft 1890 5,075
331 7405303020 SINGLE FAMILY RES. 3975 sq ft 1890 3,975
332 7405306026 SINGLE FAMILY RES. 6632 sq ft 1890 6,632
333 7405310006 SINGLE FAMILY RES. 7250 sq ft 1890 7,250
334 7405310009 SINGLE FAMILY RES. 10575 sq ft 1890 10,575
335 7405336026 SINGLE FAMILY RES. 10164 sq ft 1890 10,164
336 7405203113 SINGLE FAMILY RES. 1.02 acres 1893 2,014,650
337 7405203061 SINGLE FAMILY RES. 2750 sq ft 1894 2,750
338 7405207001 SINGLE FAMILY RES. 2200 sq ft 1894 2,200
339 7405308016 SINGLE FAMILY RES. 13175 sq ft 1894 13,175
340 7405405035 SINGLE FAMILY RES. 16608 sq ft 1894 16,608
341 7405203053 SINGLE FAMILY RES. 6625 sq ft 1895 6,625
342 7405207006 SINGLE FAMILY RES. 4925 sq ft 1895 4,925
343 7405209064 SINGLE FAMILY RES. 2789 sq ft 1895 2,789
344 7405310013 SINGLE FAMILY RES. 2313 sq ft 1895 2,313
345 7406423024 SINGLE FAMILY RES. 5410 sq ft 1895 5,410
346 7406423025 SINGLE FAMILY RES. 3240 sq ft 1895 3,240
347 7406423029 SINGLE FAMILY RES. 16125 sq ft 1895 16,125
348 7405430016 SINGLE FAMILY RES. 8205 sq ft 1898 8,205
349 7403327016 SINGLE FAMILY RES. 10890 sq ft 1899 10,890
350 7403327017 SINGLE FAMILY RES. 8276 sq ft 1899 8,276
351 7403327025 SINGLE FAMILY RES. 26070 sq ft 1899 26,070
352 7405203002 SINGLE FAMILY RES. 3075 sq ft 1899 3,075
353 7405206017 SINGLE FAMILY RES. 3750 sq ft 1899 3,750
354 7405207010 SINGLE FAMILY RES. 5100 sq ft 1899 5,100
355 7405209001 SINGLE FAMILY RES. 9900 sq ft 1899 9,900
356 7405210002 SINGLE FAMILY RES. 4350 sq ft 1899 4,350
357 7405212004 SINGLE FAMILY RES. 5150 sq ft 1899 5,150
358 7405212013 SINGLE FAMILY RES. 13950 sq ft 1899 13,950
359 7405302026 SINGLE FAMILY RES. 13950 sq ft 1899 13,950
360 7405302027 SINGLE FAMILY RES. 10075 sq ft 1899 10,075
361 7405303002 SINGLE FAMILY RES. 5352 sq ft 1899 5,352
362 7405303007 SINGLE FAMILY RES. 5737 sq ft 1899 5,737

Parcel Land Year Land
Section 1 Number Use Size Built Area
IMPROVED PROPERTIES
363 7405303017 SINGLE FAMILY RES. 3960 sq ft 1899 3,960
364 7405308004 SINGLE FAMILY RES. 2300 sq ft 1899 2,300
365 7405308017 SINGLE FAMILY RES. 6850 sq ft 1899 6,850
366 7405308069 SINGLE FAMILY RES. 16025 sq ft 1899 16,025
367 7405309006 SINGLE FAMILY RES. 4337 sq ft 1899 4,337
368 7405336031 SINGLE FAMILY RES. 12131 sq ft 1899 12,131
369 7405347012 SINGLE FAMILY RES. 5656 sq ft 1899 5,656
370 7406105048 SINGLE FAMILY RES. 8437 sq ft 1899 8,437
371 7406108003 SINGLE FAMILY RES. 7600 sq ft 1899 7,600
372 7406109019 SINGLE FAMILY RES. 2582 sq ft 1899 2,582
373 7406110003 SINGLE FAMILY RES. 3925 sq ft 1899 3,925
374 7406415013 SINGLE FAMILY RES. 7485 sq ft 1899 7,485
375 7406415024 SINGLE FAMILY RES. 2550 sq ft 1899 2,550
376 7406415025 SINGLE FAMILY RES. 2450 sq ft 1899 2,450
377 7406420027 SINGLE FAMILY RES. 6861 sq ft 1899 6,861
378 7406420031 SINGLE FAMILY RES. 1070 sq ft 1899 1,070
379 7406420036 SINGLE FAMILY RES. 8832 sq ft 1899 8,832
380 7405203044 SINGLE FAMILY RES. 2350 sq ft 1900 2,350
381 7405203058 SINGLE FAMILY RES. 4125 sq ft 1900 4,125
382 7405203114 SINGLE FAMILY RES. 19016 sq ft 1900 19,016
383 7405209069 SINGLE FAMILY RES. 6887 sq ft 1900 6,887
384 7405310007 SINGLE FAMILY RES. 15020 sq ft 1900 15,020
385 7405336009 SINGLE FAMILY RES. 6180 sq ft 1900 6,180
386 7405336025 SINGLE FAMILY RES. 8064 sq ft 1900 8,064
387 7405411023 SINGLE FAMILY RES. 5120 sq ft 1900 5,120
388 7405416017 SINGLE FAMILY RES. 1225 sq ft 1900 1,225
389 7406401020 SINGLE FAMILY RES. 11674 sq ft 1900 11,674
390 7406103022 SINGLE FAMILY RES. 3900 sq ft 1902 3,900
391 7405206003 SINGLE FAMILY RES. 2475 sq ft 1903 2,475
392 7405206002 SINGLE FAMILY RES. 4050 sq ft 1904 4,050
393 7405206012 SINGLE FAMILY RES. 4900 sq ft 1904 4,900
394 7405212011 SINGLE FAMILY RES. 1500 sq ft 1904 1,500
395 7405302028 SINGLE FAMILY RES. 9600 sq ft 1904 9,600
396 7405303004 SINGLE FAMILY RES. 5000 sq ft 1904 5,000
397 7405349004 SINGLE FAMILY RES. 2175 sq ft 1904 2,175
398 7406109008 SINGLE FAMILY RES. 3325 sq ft 1904 3,325
399 7406420006 SINGLE FAMILY RES. 6625 sq ft 1904 6,625
400 7406420028 SINGLE FAMILY RES. 3808 sq ft 1904 3,808
401 7405206006 SINGLE FAMILY RES. 3475 sq ft 1905 3,475
402 7405207024 SINGLE FAMILY RES. 7500 sq ft 1905 7,500
403 7405209062 SINGLE FAMILY RES. 11068 sq ft 1905 11,068
404 7406422018 SINGLE FAMILY RES. 26495 sq ft 1905 26,495
405 7405308011 SINGLE FAMILY RES. 12675 sq ft 1906 12,675
406 7405326013 SINGLE FAMILY RES. 9625 sq ft 1906 9,625
407 7405326007 SINGLE FAMILY RES. 10100 sq ft 1908 10,100
408 7403325013 SINGLE FAMILY RES. 11250 sq ft 1909 11,250
409 7403325014 SINGLE FAMILY RES. 11250 sq ft 1909 11,250
410 7405201020 SINGLE FAMILY RES. 12209 sq ft 1909 12,209
411 7405203004 SINGLE FAMILY RES. 13200 sq ft 1909 13,200
412 7405203062 SINGLE FAMILY RES. 2575 sq ft 1909 2,575
413 7405205001 SINGLE FAMILY RES. 7225 sq ft 1909 7,225
414 7405205002 SINGLE FAMILY RES. 4500 sq ft 1909 4,500
415 7405205004 SINGLE FAMILY RES. 4875 sq ft 1909 4,875
416 7405210001 SINGLE FAMILY RES. 1525 sq ft 1909 1,525
417 7405212026 SINGLE FAMILY RES. 1633 sq ft 1909 1,633
418 7405212030 SINGLE FAMILY RES. 3441 sq ft 1909 3,441
419 7405212037 SINGLE FAMILY RES. 5478 sq ft 1909 5,478
420 7405213002 SINGLE FAMILY RES. 2050 sq ft 1909 2,050
421 7405213005 SINGLE FAMILY RES. 1500 sq ft 1909 1,500
422 7405213010 SINGLE FAMILY RES. 1974 sq ft 1909 1,974
423 7405213011 SINGLE FAMILY RES. 1510 sq ft 1909 1,510
424 7405213012 SINGLE FAMILY RES. 1204 sq ft 1909 1,204
425 7405215001 SINGLE FAMILY RES. 5475 sq ft 1909 5,475
426 7405215003 SINGLE FAMILY RES. 6425 sq ft 1909 6,425
427 7405215004 SINGLE FAMILY RES. 6525 sq ft 1909 6,525
428 7405302006 SINGLE FAMILY RES. 2900 sq ft 1909 2,900
429 7405302007 SINGLE FAMILY RES. 3050 sq ft 1909 3,050
430 7405302008 SINGLE FAMILY RES. 1620 sq ft 1909 1,620
431 7405303006 SINGLE FAMILY RES. 6726 sq ft 1909 6,726
432 7405303009 SINGLE FAMILY RES. 9656 sq ft 1909 9,656
433 7405308008 SINGLE FAMILY RES. 12500 sq ft 1909 12,500434 7405308013 SINGLE FAMILY RES. 4375 sq ft 1909 4,375
435 7405308014 SINGLE FAMILY RES. 4550 sq ft 1909 4,550
436 7405308015 SINGLE FAMILY RES. 2175 sq ft 1909 2,175
437 7405308018 SINGLE FAMILY RES. 5750 sq ft 1909 5,750
438 7405308019 SINGLE FAMILY RES. 3250 sq ft 1909 3,250
439 7405308045 SINGLE FAMILY RES. 3872 sq ft 1909 3,872
440 7405308046 SINGLE FAMILY RES. 5003 sq ft 1909 5,003
441 7405309007 SINGLE FAMILY RES. 4850 sq ft 1909 4,850
442 7405309008 SINGLE FAMILY RES. 2250 sq ft 1909 2,250
443 7405309011 SINGLE FAMILY RES. 4475 sq ft 1909 4,475
444 7405310012 SINGLE FAMILY RES. 4430 sq ft 1909 4,430
445 7405311002 SINGLE FAMILY RES. 6645 sq ft 1909 6,645
446 7405311006 SINGLE FAMILY RES. 8100 sq ft 1909 8,100
447 7405322012 SINGLE FAMILY RES. 3050 sq ft 1909 3,050
448 7405326002 SINGLE FAMILY RES. 3350 sq ft 1909 3,350
449 7405336010 SINGLE FAMILY RES. 6750 sq ft 1909 6,750
450 7405345007 SINGLE FAMILY RES. 2337 sq ft 1909 2,337
451 7405345021 SINGLE FAMILY RES. 1.7 acres 1909 74,052
452 7405424047 SINGLE FAMILY RES. 2266 sq ft 1909 2,266
453 7405424053 SINGLE FAMILY RES. 1236 sq ft 1909 1,236

Parcel Land Year Land
Section 1 Number Use Size Built Area
IMPROVED PROPERTIES
454 7405424054 SINGLE FAMILY RES. 1444 sq ft 1909 1,444
455 7405427006 SINGLE FAMILY RES. 8800 sq ft 1909 8,800
456 7405427016 SINGLE FAMILY RES. 5925 sq ft 1909 5,925
457 7405427019 SINGLE FAMILY RES. 12209 sq ft 1909 12,209
458 7405427032 SINGLE FAMILY RES. 2813 sq ft 1909 2,813
459 7406106005 SINGLE FAMILY RES. 3900 sq ft 1909 3,900
460 7406108017 SINGLE FAMILY RES. 6567 sq ft 1909 6,567
461 7406109017 SINGLE FAMILY RES. 13575 sq ft 1909 13,575
462 7406409006 SINGLE FAMILY RES. 5350 sq ft 1909 5,350
463 7406410004 SINGLE FAMILY RES. 2950 sq ft 1909 2,950
464 7406410008 SINGLE FAMILY RES. 1700 sq ft 1909 1,700
465 7406410009 SINGLE FAMILY RES. 5000 sq ft 1909 5,000
466 7406410018 SINGLE FAMILY RES. 1950 sq ft 1909 1,950
467 7406411029 SINGLE FAMILY RES. 4913 sq ft 1909 4,913
468 7406415022 SINGLE FAMILY RES. 8000 sq ft 1909 8,000
469 7406416008 SINGLE FAMILY RES. 6029 sq ft 1909 6,029
470 7406420001 SINGLE FAMILY RES. 17650 sq ft 1909 17,650
471 7406423034 SINGLE FAMILY RES. 3800 sq ft 1909 3,800
472 7404400020 SINGLE FAMILY RES. 11921 sq ft 1910 11,921
473 7404400021 SINGLE FAMILY RES. 13900 sq ft 1910 13,900
474 7405203036 SINGLE FAMILY RES. 4750 sq ft 1910 4,750
475 7405205007 SINGLE FAMILY RES. 6725 sq ft 1910 6,725
476 7405207020 SINGLE FAMILY RES. 5896 sq ft 1910 5,896
477 7405212019 SINGLE FAMILY RES. 9425 sq ft 1910 9,425
478 7405213007 SINGLE FAMILY RES. 3250 sq ft 1910 3,250
479 7405411005 SINGLE FAMILY RES. 1237 sq ft 1910 1,237
480 7405411006 SINGLE FAMILY RES. 2388 sq ft 1910 2,388
481 7405411020 SINGLE FAMILY RES. 2724 sq 1910 2,724
482 7405416018 SINGLE FAMILY RES. 1225 sq ft 1910 1,225
483 7405416027 SINGLE FAMILY RES. 3267 sq ft 1910 3,267
484 7406104008 SINGLE FAMILY RES. 1282 sq ft 1910 1,282
485 7406409004 SINGLE FAMILY RES. 2500 sq ft 1910 2,500
486 7406415023 SINGLE FAMILY RES. 5500 sq ft 1910 5,500
487 7406423039 SINGLE FAMILY RES. 10275 sq ft 1910 10,275
488 7405308012 SINGLE FAMILY RES. 2125 sq ft 1911 2,125
489 7406104005 SINGLE FAMILY RES. 1425 sq ft 1912 1,425
490 7405207016 SINGLE FAMILY RES. 5650 sq ft 1913 5,650
491 7405315002 SINGLE FAMILY RES. 3250 sq ft 1913 3,250
492 7405315022 SINGLE FAMILY RES. 19150 sq ft 1913 19,150
493 7405411011 SINGLE FAMILY RES. 1625 sq ft 1913 1,625
494 7406108004 SINGLE FAMILY RES. 8625 sq ft 1913 8,625
495 7406415020 SINGLE FAMILY RES. 3500 sq ft 1913 3,500
496 7405205005 SINGLE FAMILY RES. 4875 sq ft 1914 4,875
497 7405209071 SINGLE FAMILY RES. 10960 sq ft 1914 10,960
498 7405212016 SINGLE FAMILY RES. 3375 sq ft 1914 3,375
499 7405212029 SINGLE FAMILY RES. 4193 sq ft 1914 4,193
500 7405303014 SINGLE FAMILY RES. 2325 sq ft 1914 2,325
501 7405326009 SINGLE FAMILY RES. 13025 sq ft 1914 13,025
502 7405336007 SINGLE FAMILY RES. 4700 sq ft 1914 4,700
503 7405345006 SINGLE FAMILY RES. 2718 sq ft 1914 2,718
504 7405405027 SINGLE FAMILY RES. 33018 sq ft 1914 33,018
505 7405425005 SINGLE FAMILY RES. 6525 sq ft 1914 6,525
506 7405428005 SINGLE FAMILY RES. 11187 sq ft 1914 11,187
507 7406105024 SINGLE FAMILY RES. 5175 sq ft 1914 5,175
508 7406105047 SINGLE FAMILY RES. 5866 sq ft 1914 5,866
509 7406109007 SINGLE FAMILY RES. 5825 sq ft 1914 5,825
510 7406411001 SINGLE FAMILY RES. 6450 sq ft 1914 6,450
511 7406411002 SINGLE FAMILY RES. 6350 sq ft 1914 6,350
512 7406411014 SINGLE FAMILY RES. 5000 sq ft 1914 5,000
513 7406411055 SINGLE FAMILY RES. 9249 sq ft 1914 9,249
514 7406415003 SINGLE FAMILY RES. 4300 sq ft 1914 4,300
515 7406415004 SINGLE FAMILY RES. 2500 sq ft 1914 2,500
516 7406415005 SINGLE FAMILY RES. 3500 sq ft 1914 3,500
517 7406415012 SINGLE FAMILY RES. 3500 sq ft 1914 3,500
518 7406415021 SINGLE FAMILY RES. 3500 sq ft 1914 3,500
519 7406416003 SINGLE FAMILY RES. 4950 sq ft 1914 4,950
520 7406416004 SINGLE FAMILY RES. 5850 sq ft 1914 5,850
521 7406420018 SINGLE FAMILY RES. 6368 sq ft 1914 6,368
522 7406420024 SINGLE FAMILY RES. 2000 sq ft 1914 2,000
523 7405302003 SINGLE FAMILY RES. 1250 sq ft 1915 1,250
524 7406105007 SINGLE FAMILY RES. 6275 sq ft 1915 6,275525 7406415014 SINGLE FAMILY RES. 2225 sq ft 1915 2,225
526 7406107004 SINGLE FAMILY RES. 9425 sq ft 1916 9,425
527 7406415006 SINGLE FAMILY RES. 4500 sq ft 1916 4,500
528 7405312014 SINGLE FAMILY RES. 2615 sq ft 1917 2,615
529 7405313010 SINGLE FAMILY RES. 5220 sq ft 1917 5,220
530 7405313012 SINGLE FAMILY RES. 1740 sq ft 1917 1,740
531 7405313013 SINGLE FAMILY RES. 1740 sq ft 1917 1,740
532 7405344002 SINGLE FAMILY RES. 7284 sq ft 1918 7,284
533 7406105012 SINGLE FAMILY RES. 2250 sq ft 1918 2,250
534 7404400060 SINGLE FAMILY RES. 42078 sq ft 1919 42,078
535 7405206011 SINGLE FAMILY RES. 3325 sq ft 1919 3,325
536 7405207017 SINGLE FAMILY RES. 5000 sq ft 1919 5,000
537 7405207023 SINGLE FAMILY RES. 3237 sq ft 1919 3,237
538 7405207028 SINGLE FAMILY RES. 3819 sq ft 1919 3,819
539 7405212012 SINGLE FAMILY RES. 1050 sq ft 1919 1,050
540 7405213008 SINGLE FAMILY RES. 1500 sq ft 1919 1,500
541 7405213009 SINGLE FAMILY RES. 3726 sq ft 1919 3,726
542 7405214005 SINGLE FAMILY RES. 6987 sq ft 1919 6,987
543 7405218002 SINGLE FAMILY RES. 7950 sq ft 1919 7,950
544 7405302042 SINGLE FAMILY RES. 2178 sq ft 1919 2,178
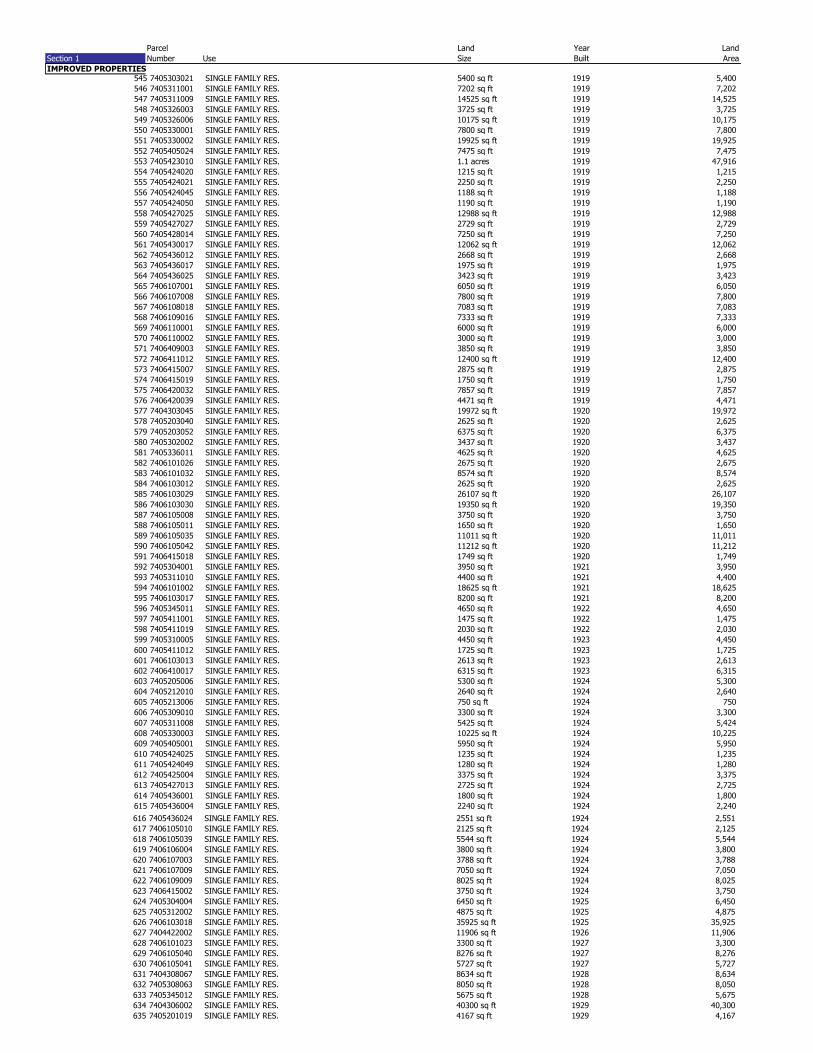
Parcel Land Year Land
Section 1 Number Use Size Built Area
IMPROVED PROPERTIES545 7405303021 SINGLE FAMILY RES. 5400 sq ft 1919 5,400
546 7405311001 SINGLE FAMILY RES. 7202 sq ft 1919 7,202
547 7405311009 SINGLE FAMILY RES. 14525 sq ft 1919 14,525
548 7405326003 SINGLE FAMILY RES. 3725 sq ft 1919 3,725
549 7405326006 SINGLE FAMILY RES. 10175 sq ft 1919 10,175
550 7405330001 SINGLE FAMILY RES. 7800 sq ft 1919 7,800
551 7405330002 SINGLE FAMILY RES. 19925 sq ft 1919 19,925
552 7405405024 SINGLE FAMILY RES. 7475 sq ft 1919 7,475
553 7405423010 SINGLE FAMILY RES. 1.1 acres 1919 47,916
554 7405424020 SINGLE FAMILY RES. 1215 sq ft 1919 1,215
555 7405424021 SINGLE FAMILY RES. 2250 sq ft 1919 2,250
556 7405424045 SINGLE FAMILY RES. 1188 sq ft 1919 1,188
557 7405424050 SINGLE FAMILY RES. 1190 sq ft 1919 1,190
558 7405427025 SINGLE FAMILY RES. 12988 sq ft 1919 12,988
559 7405427027 SINGLE FAMILY RES. 2729 sq ft 1919 2,729
560 7405428014 SINGLE FAMILY RES. 7250 sq ft 1919 7,250
561 7405430017 SINGLE FAMILY RES. 12062 sq ft 1919 12,062
562 7405436012 SINGLE FAMILY RES. 2668 sq ft 1919 2,668
563 7405436017 SINGLE FAMILY RES. 1975 sq ft 1919 1,975
564 7405436025 SINGLE FAMILY RES. 3423 sq ft 1919 3,423
565 7406107001 SINGLE FAMILY RES. 6050 sq ft 1919 6,050
566 7406107008 SINGLE FAMILY RES. 7800 sq ft 1919 7,800
567 7406108018 SINGLE FAMILY RES. 7083 sq ft 1919 7,083
568 7406109016 SINGLE FAMILY RES. 7333 sq ft 1919 7,333
569 7406110001 SINGLE FAMILY RES. 6000 sq ft 1919 6,000
570 7406110002 SINGLE FAMILY RES. 3000 sq ft 1919 3,000
571 7406409003 SINGLE FAMILY RES. 3850 sq ft 1919 3,850
572 7406411012 SINGLE FAMILY RES. 12400 sq ft 1919 12,400
573 7406415007 SINGLE FAMILY RES. 2875 sq ft 1919 2,875
574 7406415019 SINGLE FAMILY RES. 1750 sq ft 1919 1,750
575 7406420032 SINGLE FAMILY RES. 7857 sq ft 1919 7,857
576 7406420039 SINGLE FAMILY RES. 4471 sq ft 1919 4,471
577 7404303045 SINGLE FAMILY RES. 19972 sq ft 1920 19,972
578 7405203040 SINGLE FAMILY RES. 2625 sq ft 1920 2,625
579 7405203052 SINGLE FAMILY RES. 6375 sq ft 1920 6,375
580 7405302002 SINGLE FAMILY RES. 3437 sq ft 1920 3,437
581 7405336011 SINGLE FAMILY RES. 4625 sq ft 1920 4,625
582 7406101026 SINGLE FAMILY RES. 2675 sq ft 1920 2,675
583 7406101032 SINGLE FAMILY RES. 8574 sq ft 1920 8,574
584 7406103012 SINGLE FAMILY RES. 2625 sq ft 1920 2,625
585 7406103029 SINGLE FAMILY RES. 26107 sq ft 1920 26,107
586 7406103030 SINGLE FAMILY RES. 19350 sq ft 1920 19,350
587 7406105008 SINGLE FAMILY RES. 3750 sq ft 1920 3,750
588 7406105011 SINGLE FAMILY RES. 1650 sq ft 1920 1,650
589 7406105035 SINGLE FAMILY RES. 11011 sq ft 1920 11,011
590 7406105042 SINGLE FAMILY RES. 11212 sq ft 1920 11,212
591 7406415018 SINGLE FAMILY RES. 1749 sq ft 1920 1,749
592 7405304001 SINGLE FAMILY RES. 3950 sq ft 1921 3,950
593 7405311010 SINGLE FAMILY RES. 4400 sq ft 1921 4,400
594 7406101002 SINGLE FAMILY RES. 18625 sq ft 1921 18,625
595 7406103017 SINGLE FAMILY RES. 8200 sq ft 1921 8,200
596 7405345011 SINGLE FAMILY RES. 4650 sq ft 1922 4,650
597 7405411001 SINGLE FAMILY RES. 1475 sq ft 1922 1,475
598 7405411019 SINGLE FAMILY RES. 2030 sq ft 1922 2,030
599 7405310005 SINGLE FAMILY RES. 4450 sq ft 1923 4,450
600 7405411012 SINGLE FAMILY RES. 1725 sq ft 1923 1,725
601 7406103013 SINGLE FAMILY RES. 2613 sq ft 1923 2,613
602 7406410017 SINGLE FAMILY RES. 6315 sq ft 1923 6,315
603 7405205006 SINGLE FAMILY RES. 5300 sq ft 1924 5,300
604 7405212010 SINGLE FAMILY RES. 2640 sq ft 1924 2,640
605 7405213006 SINGLE FAMILY RES. 750 sq ft 1924 750
606 7405309010 SINGLE FAMILY RES. 3300 sq ft 1924 3,300
607 7405311008 SINGLE FAMILY RES. 5425 sq ft 1924 5,424
608 7405330003 SINGLE FAMILY RES. 10225 sq ft 1924 10,225
609 7405405001 SINGLE FAMILY RES. 5950 sq ft 1924 5,950
610 7405424025 SINGLE FAMILY RES. 1235 sq ft 1924 1,235
611 7405424049 SINGLE FAMILY RES. 1280 sq ft 1924 1,280
612 7405425004 SINGLE FAMILY RES. 3375 sq ft 1924 3,375
613 7405427013 SINGLE FAMILY RES. 2725 sq ft 1924 2,725
614 7405436001 SINGLE FAMILY RES. 1800 sq ft 1924 1,800
615 7405436004 SINGLE FAMILY RES. 2240 sq ft 1924 2,240
616 7405436024 SINGLE FAMILY RES. 2551 sq ft 1924 2,551
617 7406105010 SINGLE FAMILY RES. 2125 sq ft 1924 2,125
618 7406105039 SINGLE FAMILY RES. 5544 sq ft 1924 5,544
619 7406106004 SINGLE FAMILY RES. 3800 sq ft 1924 3,800
620 7406107003 SINGLE FAMILY RES. 3788 sq ft 1924 3,788
621 7406107009 SINGLE FAMILY RES. 7050 sq ft 1924 7,050
622 7406109009 SINGLE FAMILY RES. 8025 sq ft 1924 8,025
623 7406415002 SINGLE FAMILY RES. 3750 sq ft 1924 3,750
624 7405304004 SINGLE FAMILY RES. 6450 sq ft 1925 6,450
625 7405312002 SINGLE FAMILY RES. 4875 sq ft 1925 4,875
626 7406103018 SINGLE FAMILY RES. 35925 sq ft 1925 35,925
627 7404422002 SINGLE FAMILY RES. 11906 sq ft 1926 11,906
628 7406101023 SINGLE FAMILY RES. 3300 sq ft 1927 3,300
629 7406105040 SINGLE FAMILY RES. 8276 sq ft 1927 8,276
630 7406105041 SINGLE FAMILY RES. 5727 sq ft 1927 5,727
631 7404308067 SINGLE FAMILY RES. 8634 sq ft 1928 8,634
632 7405308063 SINGLE FAMILY RES. 8050 sq ft 1928 8,050
633 7405345012 SINGLE FAMILY RES. 5675 sq ft 1928 5,675
634 7404306002 SINGLE FAMILY RES. 40300 sq ft 1929 40,300
635 7405201019 SINGLE FAMILY RES. 4167 sq ft 1929 4,167

Parcel Land Year Land
Section 1 Number Use Size Built Area
IMPROVED PROPERTIES
636 7405212023 SINGLE FAMILY RES. 1520 sq ft 1929 1,520
637 7405304006 SINGLE FAMILY RES. 33814 sq ft 1929 33,814
638 7405308007 SINGLE FAMILY RES. 13225 sq ft 1929 13,225
639 7405336030 SINGLE FAMILY RES. 10308 sq ft 1929 10,308
640 7405411010 SINGLE FAMILY RES. 3492 sq ft 1929 3,492
641 7405436010 SINGLE FAMILY RES. 5325 sq ft 1929 5,325
642 7405436015 SINGLE FAMILY RES. 4370 sq ft 1929 4,370
643 7406101012 SINGLE FAMILY RES. 3500 sq ft 1929 3,500
644 7406104007 SINGLE FAMILY RES. 2125 sq ft 1929 2,125
645 7406107002 SINGLE FAMILY RES. 5625 sq ft 1929 5,625
646 7406107005 SINGLE FAMILY RES. 4100 sq ft 1929 4,100
647 7406410005 SINGLE FAMILY RES. 6400 sq ft 1929 6,400
648 7406415009 SINGLE FAMILY RES. 10040 sq ft 1929 10,040
649 7405313003 SINGLE FAMILY RES. 3.5 acres 1930 152,460
650 7406101003 SINGLE FAMILY RES. 3875 sq ft 1931 3,875
651 7406101022 SINGLE FAMILY RES. 2000 sq ft 1931 2,000
652 7405207027 SINGLE FAMILY RES. 6675 sq ft 1933 6,675
653 7406105021 SINGLE FAMILY RES. 8500 sq ft 1934 8,500
654 7404304001 SINGLE FAMILY RES. 33298 sq ft 1935 33,298
655 7404400045 SINGLE FAMILY RES. 15950 sq ft 1935 15,950
656 7405427017 SINGLE FAMILY RES. 2300 sq ft 1935 2,300
657 7406411009 SINGLE FAMILY RES. 7500 sq ft 1935 7,500
658 7405344005 SINGLE FAMILY RES. 8639 sq ft 1937 8,639
659 7405427029 SINGLE FAMILY RES. 5556 sq ft 1937 5,556
660 7406109014 SINGLE FAMILY RES. 7436 sq ft 1937 7,436
661 7406410020 SINGLE FAMILY RES. 3600 sq ft 1937 3,600
662 7406411008 SINGLE FAMILY RES. 10000 sq ft 1938 10,000
663 7405205003 SINGLE FAMILY RES. 4350 sq ft 1939 4,350
664 7405436013 SINGLE FAMILY RES. 4750 sq ft 1939 4,750
665 7406411005 SINGLE FAMILY RES. 5000 sq ft 1939 5,000
666 7406411049 SINGLE FAMILY RES. 18146 sq ft 1939 18,146
667 7405212021 SINGLE FAMILY RES. 3300 sq ft 1940 3,300
668 7406106003 SINGLE FAMILY RES. 13800 sq ft 1940 13,800
669 7409110003 SINGLE FAMILY RES. 11000 sq ft 1965 11,000
670 7409110004 SINGLE FAMILY RES. 10560 sq ft 1965 10,560
671 7409110005 SINGLE FAMILY RES. 10560 sq ft 1966 10,560
672 7409110001 SINGLE FAMILY RES. 12646 sq ft 1968 12,646
673 7409110008 SINGLE FAMILY RES. 12370 sq ft 1968 12,370
674 7409110002 SINGLE FAMILY RES. 11806 sq ft 1968 11,806
675 7409110007 SINGLE FAMILY RES. 10880 sq ft 1969 10,880
676 7409110006 SINGLE FAMILY RES. 9350 sq ft 1977 9,350
677 7405209046 SINGLE FAMILY RES. 19475 sq ft 1880 / 1899 / 1900 19,475
678 7405307004 SINGLE FAMILY RES. 17250 sq ft 1885 / 1920 17,250
679 7405309004 SINGLE FAMILY RES. 6725 sq ft 1889 / 1919 6,725
680 7405203051 SINGLE FAMILY RES. 6125 sq ft 1890 / 1900 6,125
681 7405203049 SINGLE FAMILY RES. 11225 sq ft 1890 / 1989 11,225
682 7405207029 SINGLE FAMILY RES. 7437 sq ft 1894 / 1899 7,437
683 7405310008 SINGLE FAMILY RES. 10925 sq ft 1894 / 1899 10,925
684 7405209045 SINGLE FAMILY RES. 20500 sq ft 1895 / 1890 20,500
685 7405209042 SINGLE FAMILY RES. 39500 sq ft 1895 / 1905 / 1922 / 1922 / 1922 39,500
686 7405203023 SINGLE FAMILY RES. 12113 sq ft 1895 / 1919 12,113
687 7405349003 SINGLE FAMILY RES. 7475 sq ft 1899 / 1904 / 1890 7,475
688 7405207005 SINGLE FAMILY RES. 2700 sq ft 1899 / 1910 2,700
689 7405330007 SINGLE FAMILY RES. 8750 sq ft 1899 / 1914 8,750
690 7405302032 SINGLE FAMILY RES. 23975 sq ft 1899 / 1924 23,975
691 7406415008 SINGLE FAMILY RES. 6225 sq ft 1899 / 1937 6,225
692 7405207030 SINGLE FAMILY RES. 23069 sq ft 1903 / 1905 23,069
693 7406423014 SINGLE FAMILY RES. 7125 sq ft 1904 / 1905 7,125
694 7405203041 SINGLE FAMILY RES. 4875 sq ft 1905 / 1900 4,875
695 7405302033 SINGLE FAMILY RES. 12195 sq ft 1907 / 1905 12,195
696 7405212033 SINGLE FAMILY RES. 14335 sq ft 1908 / 1961 / 1919 14,335
697 7405203072 SINGLE FAMILY RES. 17667 sq ft 1909 / 1899 17,667
698 7405308022 SINGLE FAMILY RES. 5225 sq ft 1909 / 1899 5,225
699 7405215002 SINGLE FAMILY RES. 5475 sq ft 1909 / 1914 5,475
700 7405212032 SINGLE FAMILY RES. 14381 sq ft 1909 / 1919 14,381
701 7405303005 SINGLE FAMILY RES. 6950 sq ft 1909 / 1919 6,950
702 7404400016 SINGLE FAMILY RES. 31900 sq ft 1909 / 1929 / 1945 31,900
703 7405209063 SINGLE FAMILY RES. 1.09 acres 1910 / 1910 / 1910 / 1910 / 1910 47,480
704 7405411016 SINGLE FAMILY RES. 4224 sq ft 1913 / 1922 4,224
705 7405303023 SINGLE FAMILY RES. 7875 sq ft 1914 / 1933 7,875
706 7405206016 SINGLE FAMILY RES. 5500 sq ft 1915 / 1910 5,500707 7406420034 SINGLE FAMILY RES. 15831 sq ft 1919 / 1914 15,831
708 7405213015 SINGLE FAMILY RES. 5816 sq ft 1919 / 1919 5,816
709 7405213013 SINGLE FAMILY RES. 8408 sq ft 1919 / 1919 / 1919 / 1919 8,408
710 7405427018 SINGLE FAMILY RES. 12838 sq ft 1919 / 1934 12,838
711 7406101024 SINGLE FAMILY RES. 2250 sq ft 1921 / 1924 2,250
712 7405206008 SINGLE FAMILY RES. 9200 sq ft 1924 / 1894 / 1910 9,200
713 7406105032 SINGLE FAMILY RES. 4175 sq ft 1924 / 1908 4,175
714 7405326011 SINGLE FAMILY RES. 3200 sq ft 1924 / 1909 3,200
715 7406415017 SINGLE FAMILY RES. 3500 sq ft 1924 / 1913 3,500
708 7406101034 SINGLE FAMILY RES. 6944 sq ft 1924 / 1929 6,944
709 7405401017 SINGLE FAMILY RES. 5841 sq ft 1937 / 1935 5,841
710 7406420030 SINGLE FAMILY RES. / 4 PLEX 4765 sq ft 1909 / 1923 4,765
711 7405203043 SINGLE FAMILY RES. / LODGING 3024 sq ft / 501 sq ft 1885 / 1885 3,525
712 7405203094 SINGLE FAMILY RES. / LODGING 20020 sq ft / 1980 sq ft 1889 / 1900 22,000

Parcel Land Year Land
Section 1 Number Use Size Built Area
IMPROVED PROPERTIES
713 7406108015 SINGLE FAMILY RES. / LODGING 10304 sq ft / 221 sq ft 1980 / 1980 10,525
714 7404303009 SINGLE FAMILY RES. / LODGING 1.54 acres / 1583 sq ft 1900 / 1900 68,665
715 7405330005 SINGLE FAMILY RES. / LODGING 5810 sq ft / 240 sq ft 1904 / 1904 6,050
716 7404303054 SINGLE FAMILY RES. / LODGING 41381 sq ft / 2179 sq ft 1912 / 1912 43,560
717 7404303057 SINGLE FAMILY RES. / LODGING 2.78 acres / 1448 sq ft 1912 / 1912 122,545
718 7405308006 SINGLE FAMILY RES. / MERCHANDISING / MULTI-UNITS (4-8) 9711 sq ft / 685 sq ft / 2054 sq ft1910 / 1917 / 1916 12,450
719 7405307010 SINGLE FAMILY RES. / RESIDENTIAL RELIGIOUS PURPOSES (EX) 25622 sq ft / 1.14 acres 1899 / 1910 / 1923 75,280
720 7405203060 SINGLE FAMILY RES. / SPECIAL PURPOSE 2256 sq ft / 2454 sq ft 1915 / 1904 4,710
721 7405440015 SINGLE FAMILY RES. / SPECIAL PURPOSE / CHARITABLE 398 sq ft / 2540 sq ft / 21542 sq ft1900 / 1900 / 1900 24,480
722 7404304006 SPECIAL PURPOSE 4.81 acres 1900 209,524
723 7405347025 SPECIAL PURPOSE 28152 sq ft 1900 28,152
724 7405343011 SPECIAL PURPOSE 3006 sq ft 1936 3,006
725 7405302016 SPECIAL PURPOSE 11325 sq ft 1938 11,325
TOTAL AREA 7,848,622 sq.ft.
180 Acres

SECTION TWO
Parcel Land Year Land
Section 2 Number Use Size Built Area
Vacant Land
1 7403300003 UNIMPROVED LAND 1.78 acres 77,537
2 7403300020 UNIMPROVED LAND 69812 sq ft 69,812
3 7403300023 UNIMPROVED LAND 1500 sq ft 1,500
4 7403308015 UNIMPROVED LAND 9681 sq ft 9,681
5 7403313004 UNIMPROVED LAND 1400 sq ft 1,400
6 7403313009 UNIMPROVED LAND 10700 sq ft 10,700
7 7403314039 UNIMPROVED LAND 9025 sq ft 9,025
8 7403315004 UNIMPROVED LAND 7500 sq ft 7,500
9 7403324007 UNIMPROVED LAND 21900 sq ft 21,900
10 7403400053 UNIMPROVED LAND 15000 sq ft 15,000
11 7403404013 UNIMPROVED LAND 9989 sq ft 9,989
12 7403406003 UNIMPROVED LAND 7150 sq ft 7,150
13 7403406017 UNIMPROVED LAND 28001 sq ft 28,001
14 7403408010 UNIMPROVED LAND 7500 sq ft 7,500
15 7403408031 UNIMPROVED LAND 4760 sq ft 4,760
16 7403414017 UNIMPROVED LAND 7500 sq ft 7,500
17 7403414022 UNIMPROVED LAND 11113 sq ft 11,113
18 7403414023 UNIMPROVED LAND 7500 sq ft 7,500
19 7403414024 UNIMPROVED LAND 7500 sq ft 7,500
20 7403417017 UNIMPROVED LAND 7500 sq ft 7,500
21 7403417020 UNIMPROVED LAND 7500 sq ft 7,500
22 7404101043 UNIMPROVED LAND 33541 sq ft 33,541
23 7404101056 UNIMPROVED LAND 21126 sq ft 2,116
24 7404101059 UNIMPROVED LAND 18077 sq ft 18,077
25 7404101067 UNIMPROVED LAND 26266 sq ft 26,255
26 7404101086 UNIMPROVED LAND 15015 sq ft 15,015
27 7404101097 UNIMPROVED LAND 5837 sq ft 5,837
28 7404102001 UNIMPROVED LAND 37300 sq ft 37,300
29 7404102010 UNIMPROVED LAND 13990 sq ft 13,990
30 7404104004 UNIMPROVED LAND 2670 sq ft 2,670
31 7404105013 UNIMPROVED LAND 7400 sq ft 7,400
32 7404303011 UNIMPROVED LAND 9600 sq ft 9,600
33 7404303013 UNIMPROVED LAND 25300 sq ft 25,300
34 7404303015 UNIMPROVED LAND 31600 sq ft 31,600
35 7404303018 UNIMPROVED LAND 25300 sq ft 25,300
36 7404303021 UNIMPROVED LAND 3 acres 130,680
37 7404410021 UNIMPROVED LAND 1.04 acres 45,302
38 7404410037 UNIMPROVED LAND 2.59 acres 112,820
39 7404411028 UNIMPROVED LAND 1300 sq ft 1,300
40 7404411039 UNIMPROVED LAND 1500 sq ft 1,500
41 7404411042 UNIMPROVED LAND 5619 sq ft 5,619
42 7405423003 UNIMPROVED LAND 43187 sq ft 43,187
43 7405423005 UNIMPROVED LAND 1.39 acres 60,548
44 7405424041 UNIMPROVED LAND 5265 sq ft 5,265
45 7403414025 UNIMPROVED LAND / SINGLE FAMILY RES. 6000 sq ft / 1500 sq ft 6,000
46 7403324076 VACANT LAND = 1 AND < 5 ACRES 1.5 acres 65,340
47 7404200014 VACANT LAND = 1 AND < 5 ACRES 4.68 acres 203,861
48 7404200005 VACANT LAND = 10 AND < 35 ACRS 30.48 acres 1,327,709
49 7404100006 VACANT LAND = 5 AND < 10 ACRES 8.32 acres 362,419
50 7403300026 VACANT LAND LESS THAN 1 ACRE 34848 sq ft 34,848
51 7403300028 VACANT LAND LESS THAN 1 ACRE 9924 sq ft 9,924
52 7404100004 VACANT LAND LESS THAN 1 ACRE 39967 sq ft 39,967
TOTAL AREA 3,040,359 sq.ft.
70 acres

Parcel Land Year Land
Section 2 Number Use Size Built Area
IMPROVED PROPERTIES
1 7403417038 DUPLEXES & TRIPLEXES 7500 sq ft 1899 7,500
2 7403319005 DUPLEXES & TRIPLEXES 7800 sq ft 1900 7,800
3 7403314021 DUPLEXES & TRIPLEXES 7803 sq ft 1901 7,803
4 7403414020 DUPLEXES & TRIPLEXES 15000 sq ft 1919 15,000
5 7403324014 DUPLEXES & TRIPLEXES / OFFICES 9723 sq ft / 17284 sq ft 1992 / 1900 / 1900 27,007
6 7403324059 LODGING / SINGLE FAMILY RES. 20251 sq ft / 11390 sq ft 1925 / 1924
7 7404406003 MOBILE HOME PARKS 2.73 acres 1936 / 1924 118,919
8 7403300005 MULTI-UNITS (4-8) / LODGING / SINGLE FAMILY RES. 31834 sq ft / 39640 sq ft / 23052 sq ft1930 71,474
9 7403400008 RES LAND AT 29% 15000 sq ft 15,000
10 7404410011 RES LAND AT 29% 1.06 acres 46,174
11 7403413006 SINGLE FAMILY RES. 9500 sq ft 1889 9,500
12 7403414003 SINGLE FAMILY RES. 22125 sq ft 1889 22,125
13 7403408015 SINGLE FAMILY RES. 7500 sq ft 1890 7,500
14 7403409040 SINGLE FAMILY RES. 7500 sq ft 1890 7,500
15 7403406012 SINGLE FAMILY RES. 15241 sq ft 1894 15,241
16 7403314033 SINGLE FAMILY RES. 6500 sq ft 1895 6,500
17 7403408008 SINGLE FAMILY RES. 11250 sq ft 1895 11,250
18 7403409002 SINGLE FAMILY RES. 9000 sq ft 1895 9,000
19 7403417013 SINGLE FAMILY RES. 7500 sq ft 1895 7,500
20 7404301007 SINGLE FAMILY RES. 41826 sq ft 1895 41,826
21 7403313022 SINGLE FAMILY RES. 7500 sq ft 1899 7,500
22 7403314012 SINGLE FAMILY RES. 7500 sq ft 1899 7,500
23 7403314034 SINGLE FAMILY RES. 6500 sq ft 1899 6,500
24 7403319002 SINGLE FAMILY RES. 6000 sq ft 1899 6,000
25 7403319003 SINGLE FAMILY RES. 10000 sq ft 1899 10,000
26 7403413010 SINGLE FAMILY RES. 7500 sq ft 1899 7,500
27 7403417014 SINGLE FAMILY RES. 7500 sq ft 1899 7,500
28 7403417025 SINGLE FAMILY RES. 7500 sq ft 1899 7,500
29 7404405005 SINGLE FAMILY RES. 35750 sq ft 1899 35,750
30 7403314030 SINGLE FAMILY RES. 5350 sq ft 1900 5,350
31 7403314048 SINGLE FAMILY RES. 14794 sq ft 1900 14,794
32 7403314053 SINGLE FAMILY RES. 4692 sq ft 1900 4,692
33 7403317012 SINGLE FAMILY RES. 5000 sq ft 1900 5,000
34 7403318009 SINGLE FAMILY RES. 18258 sq ft 1900 18,258
35 7403324010 SINGLE FAMILY RES. 10550 sq ft 1900 10,550
36 7403408022 SINGLE FAMILY RES. 7500 sq ft 1900 7,500
37 7403408028 SINGLE FAMILY RES. 6500 sq ft 1900 6,500
38 7403409008 SINGLE FAMILY RES. 7500 sq ft 1900 7,500
39 7403413013 SINGLE FAMILY RES. 9000 sq ft 1900 9,000
40 7403417026 SINGLE FAMILY RES. 11250 sq ft 1900 11,250
41 7403417002 SINGLE FAMILY RES. 22500 sq ft 1901 22,500
42 7403319010 SINGLE FAMILY RES. 11250 sq ft 1904 11,250
43 7403410020 SINGLE FAMILY RES. 6000 sq ft 1904 6,000
44 7403417019 SINGLE FAMILY RES. 7500 sq ft 1904 7,500
45 7403417023 SINGLE FAMILY RES. 7500 sq ft 1904 7,500
46 7403417027 SINGLE FAMILY RES. 11250 sq ft 1904 11,250
47 7403314025 SINGLE FAMILY RES. 10800 sq ft 1905 10,800
48 7403317014 SINGLE FAMILY RES. 6875 sq ft 1905 6,875
49 7403414014 SINGLE FAMILY RES. 8276 sq ft 1905 8,276
50 7403417007 SINGLE FAMILY RES. 7500 sq ft 1905 7,500
51 7403417022 SINGLE FAMILY RES. 7500 sq ft 1906 7,500
52 7403324071 SINGLE FAMILY RES. 24185 sq ft 1907 24,185
53 7403417009 SINGLE FAMILY RES. 15000 sq ft 1907 15,000
54 7403313019 SINGLE FAMILY RES. 7500 sq ft 1909 7,500
55 7403314019 SINGLE FAMILY RES. 13806 sq ft 1909 13,806
56 7403314020 SINGLE FAMILY RES. 9670 sq ft 1909 9,670
57 7403314022 SINGLE FAMILY RES. 11900 sq ft 1909 11,900
58 7403409027 SINGLE FAMILY RES. 11554 sq ft 1909 11,554
59 7403417004 SINGLE FAMILY RES. 10800 sq ft 1909 10,800
60 7403417015 SINGLE FAMILY RES. 7500 sq ft 1909 7,500
61 7403417016 SINGLE FAMILY RES. 7500 sq ft 1909 7,500
62 7403417021 SINGLE FAMILY RES. 7500 sq ft 1909 7,500
63 7404301008 SINGLE FAMILY RES. 33686 sq ft 1909 33,686
64 7403314036 SINGLE FAMILY RES. 13000 sq ft 1910 13,000
65 7403317005 SINGLE FAMILY RES. 6278 sq ft 1910 6,278
66 7403317008 SINGLE FAMILY RES. 5625 sq ft 1910 5,625
67 7403318008 SINGLE FAMILY RES. 7342 sq ft 1910 7,342
68 7403407016 SINGLE FAMILY RES. 14505 sq ft 1910 14,50568 7403407016 SINGLE FAMILY RES. 14505 sq ft 1910 14,505
69 7403314037 SINGLE FAMILY RES. 13000 sq ft 1914 13,000
70 7403409039 SINGLE FAMILY RES. 7500 sq ft 1914 7,500
71 7403417018 SINGLE FAMILY RES. 15000 sq ft 1914 15,000
72 7403319006 SINGLE FAMILY RES. 11700 sq ft 1915 11,700
73 7403317010 SINGLE FAMILY RES. 6200 sq ft 1918 6,200
74 7403313018 SINGLE FAMILY RES. 13550 sq ft 1919 13,550
75 7403314035 SINGLE FAMILY RES. 6500 sq ft 1920 6,500
76 7403413008 SINGLE FAMILY RES. 15000 sq ft 1921 15,000
77 7403413011 SINGLE FAMILY RES. 7500 sq ft 1921 7,500
78 7403414016 SINGLE FAMILY RES. 20923 sq ft 1921 20,923
79 7403414012 SINGLE FAMILY RES. 4325 sq ft 1922 4,325
80 7403414013 SINGLE FAMILY RES. 4660 sq ft 1922 4,660
81 7403317017 SINGLE FAMILY RES. 6250 sq ft 1924 6,250
82 7403318005 SINGLE FAMILY RES. 5600 sq ft 1924 5,600
83 7404405017 SINGLE FAMILY RES. 14529 sq ft 1924 14,529
84 7403313025 SINGLE FAMILY RES. 13500 sq ft 1931 13,500
85 7404301009 SINGLE FAMILY RES. 9429 sq ft 1931 9,429
86 7403313014 SINGLE FAMILY RES. 21300 sq ft 1932 21,300
87 7403313015 SINGLE FAMILY RES. 10212 sq ft 1934 10,212
88 7403413012 SINGLE FAMILY RES. 6000 sq ft 1934 6,000
89 7403413016 SINGLE FAMILY RES. 5000 sq ft 1934 5,000
90 7403308007 SINGLE FAMILY RES. 11000 sq ft 1936 11,000
91 7403408030 SINGLE FAMILY RES. 6500 sq ft 1936 6,500
92 7403307003 SINGLE FAMILY RES. 7500 sq ft 1942 7,500
93 7404410033 SINGLE FAMILY RES. 10072 sq ft 1943 10,072
94 7403314016 SINGLE FAMILY RES. 10500 sq ft 1946 10,500
95 7403314031 SINGLE FAMILY RES. 13000 sq ft 1895 / 1948 13,000

Parcel Land Year Land
Section 2 Number Use Size Built Area
IMPROVED PROPERTIES96 7403417008 SINGLE FAMILY RES. 7500 sq ft 1899 / 1914 / 1914 7,500
97 7403313024 SINGLE FAMILY RES. 12250 sq ft 1899 / 1934 12,250
98 7403314052 SINGLE FAMILY RES. 21525 sq ft 1900 / 1909 21,525
99 7403413009 SINGLE FAMILY RES. 15000 sq ft 1900 / 1914 / 1924 15,000
100 7404105002 SINGLE FAMILY RES. 40900 sq ft 1900 / 1942 40,900
101 7403313023 SINGLE FAMILY RES. 9320 sq 1909 / 1909 9,320
102 7403314058 SINGLE FAMILY RES. 20389 sq ft 1909 / 1923 / 1922 20,389
103 7403319007 SINGLE FAMILY RES. 11400 sq ft 1914 / 1914 11,400
104 7404301015 SINGLE FAMILY RES. 9658 sq ft 1921 / 1991 9,658
105 7403417043 SINGLE FAMILY RES. 1.88 acres 1925 / 1904 / 1929 81,893
106 7403314010 SINGLE FAMILY RES. 9490 sq ft 1929 / 1924 9,490
107 7403324074 SINGLE FAMILY RES. 15274 sq ft 1939 / 1900 15,274
108 7403324067 SINGLE FAMILY RES. / LODGING 2.88 acres 1885 / 1937 125,453
109 7403318011 SINGLE FAMILY RES. / RESIDENTIAL RELIGIOUS PURPOSES 2320 sq ft / 1680 sq ft 1924 4,000
110 7403324009 SINGLE FAMILY RES. / SINGLE FAMILY RES. 11556 sq ft / 9844 sq ft 1914 / 1930 / 1930 / 1930 / 1930 / 1937 / 1925 21,400
TOTAL AREA 1,646,766 sq.ft.
38 acres

SECTION 3
Parcel Land Year Land
Section 3 Number Use Size Built Area
Vacant Land
1 7410100038 UNIMPROVED LAND 1.61 ACRES 70,132
2 7410105003 UNIMPROVED LAND 20000 sq ft 20,000
3 7410105015 UNIMPROVED LAND 2.71 acres 118,048
4 7410105019 UNIMPROVED LAND 1.59 acres 69,260
5 7410106004 UNIMPROVED LAND 5000 sq ft 5,000
6 7410106008 UNIMPROVED LAND 11000 sq ft 11,000
7 7410401007 UNIMPROVED LAND 6033 sq ft 6,033
8 7410401009 UNIMPROVED LAND 17000 sq ft 17,000
9 7410402002 UNIMPROVED LAND 32033 sq ft 32,033
10 7410403013 UNIMPROVED LAND 7009 sq ft 7,009
11 7411227022 UNIMPROVED LAND 15660 sq ft 15,660
12 7411228023 UNIMPROVED LAND 6240 sq ft 6,240
13 7411229016 UNIMPROVED LAND 10050 sq ft 10,050
14 7411234007 UNIMPROVED LAND 14400 sq ft 14,400
15 7411300028 UNIMPROVED LAND 1.37 ACRES 59,677
16 7411300035 UNIMPROVED LAND 4060 sq ft 4,060
17 7411300043 UNIMPROVED LAND 35371 sq ft 35,371
18 7411300071 UNIMPROVED LAND 13579 sq ft 13,579
19 7411300077 UNIMPROVED LAND 483 sq ft 483
20 7411302009 UNIMPROVED LAND 7800 sq ft 7,800
21 7411302021 UNIMPROVED LAND 7800 sq ft 7,800
22 7411302029 UNIMPROVED LAND 7800 sq ft 7,800
23 7411302030 UNIMPROVED LAND 5982 sq ft 5,982
24 7411302031 UNIMPROVED LAND 6053 sq ft 6,053
25 7411303004 UNIMPROVED LAND 3600 sq ft 3,600
26 7411303005 UNIMPROVED LAND 3600 sq ft 3,600
27 7411303006 UNIMPROVED LAND 7200 sq ft 7,200
28 7411303007 UNIMPROVED LAND 3600 sq ft 3,600
29 7411306023 UNIMPROVED LAND 3600 sq ft 3,600
30 7411306024 UNIMPROVED LAND 3600 sq ft 3,600
31 7411306025 UNIMPROVED LAND 3600 sq ft 3,600
32 7411306026 UNIMPROVED LAND 3600 sq ft 3,600
33 7411306027 UNIMPROVED LAND 3600 sq ft 3,600
34 7411306028 UNIMPROVED LAND 3600 sq ft 3,600
35 7411306029 UNIMPROVED LAND 3600 sq ft 3,600
36 7411306031 UNIMPROVED LAND 7273 sq ft 7,273
37 7411308010 UNIMPROVED LAND 2400 sq ft 2,440
38 7411312005 UNIMPROVED LAND 6449 sq ft 6,449
39 7411314012 UNIMPROVED LAND 3600 sq ft 3,600
40 7411326006 UNIMPROVED LAND 3000 sq ft 3,000
41 7411326007 UNIMPROVED LAND 4500 sq ft 4,500
42 7411328034 UNIMPROVED LAND 30201 sq ft 30,201
43 7411328038 UNIMPROVED LAND 10463 sq ft 10,463
44 7411436004 UNIMPROVED LAND 18859 sq ft 18,859
45 7411436006 UNIMPROVED LAND 4507 sq ft 4,507
46 7411436007 UNIMPROVED LAND 22566 sq ft 22,566
47 7414213011 UNIMPROVED LAND 26387 sq ft 26,387
48 7414213012 UNIMPROVED LAND 21125 sq ft 21,125
49 7414213013 UNIMPROVED LAND 31432 sq ft 31,432
50 7414214014 UNIMPROVED LAND 3600 sq ft 3,600
51 7414215011 UNIMPROVED LAND 7500 sq ft 7,500
52 7411300063 VACANT LAND LESS THAN 1 ACRE 5405 sq ft 5,405
53 7411300078 VACANT LAND LESS THAN 1 ACRE 15506 sq ft 15,506
54 7414213026 VACANT LAND LESS THAN 1 ACRE 2000 sq ft 2,000
TOTAL AREA 820,483 Sq.Ft.
19 Acres

Parcel Land Year Land
Section 3 Number Use Size Built Area
Improved Properties
1 7411303013 DUPLEXES & TRIPLEXES 6000 sq ft 1899 6,000
2 7410104035 DUPLEXES & TRIPLEXES 4338 sq ft 1905 1,905
3 7411228013 DUPLEXES & TRIPLEXES/merchandising 7200 sq ft/0 sq ft 1899/1899 3,798
4 7410103024 LODGING 3600 sq ft 1919/1909 3,828
5 7410103019 MERCHANDISING 4800 sq ft 1880 4,800
6 7411300022 MERCHANDISING 2.99 acres 1887 130,244
7 7411231023 MERCHANDISING 3600 sq ft 1900 3,600
8 7411231029 MERCHANDISING 2687 sq ft 1895 2,687
9 7411231002 MERCHANDISING 10800 sq ft 1904 10,800
10 7410104011 MERCHANDISING 6000 sq ft 1915 6,000
11 7411231021 MERCHANDISING 2340 sq ft 1939 2,340
12 7411231014 MULTI-UNITS (4-8) 7200 sq ft 1899 7,200
13 7411303015 MULTI-UNITS (4-8) 7200 sq ft 1912 7,200
14 7411312015 MULTI-UNITS (4-8) / MERCHANDISING 1575 sq ft / 1575 sq ft 1900 / 1900 3,150
15 7411229005 MULTI-UNITS (4-8)/SPECIAL PURPOSE 6600 sq ft 1908 6,600
16 7411229006 MULTI-UNITS (4-8)/SPECIAL PURPOSE 6240 sq ft 1911 6,240
17 7411228017 MULTI-UNITS (4-8)/SPECIAL PURPOSE 1800 sq ft/1800 sq ft 1900/1900 3,600
18 7411231022 OFFICES 4860 sq ft 1899 4,860
19 7411312016 RELIGIOUS WORSHIP 4200 sq ft 1885 4,200
20 7410103026 RELIGIOUS WORSHIP 18720 sq ft 1920 18,720
21 7411231019 RESIDENTIAL CHARITABLE 21600 sq ft 1920 21,600
22 7411231011 RESIDENTIAL RELIGIOUS PURPOSES 6000 sq ft 1909 6,000
23 7411235009 SCHOOLS-PRIVATE 3600 sq ft 3,600
24 7411313003 SINGLE FAMILY RES. 11400 sq ft 1885 11,400
25 7411314017 SINGLE FAMILY RES. 7010 sq ft 1885 7,010
26 7411314018 SINGLE FAMILY RES. 4860 sq ft 1885 4,860
27 7411306018 SINGLE FAMILY RES. 3600 sq ft 1887 3,600
28 7411235006 SINGLE FAMILY RES. 14400 sq ft 1888 14,400
29 7411307019 SINGLE FAMILY RES. 8400 sq ft 1888 8,400
30 7410103001 SINGLE FAMILY RES. 5400 sq ft 1889 5,400
31 7410103018 SINGLE FAMILY RES. 3000 sq ft 1889 3,000
32 7411306007 SINGLE FAMILY RES. 2850 sq ft 1889 2,850
33 7410403001 SINGLE FAMILY RES. 13890 sq ft 1890 13,890
34 7410403002 SINGLE FAMILY RES. 9000 sq ft 1890 9,000
35 7411302026 SINGLE FAMILY RES. 7036 sq ft 1890 7,036
36 7411306019 SINGLE FAMILY RES. 7800 sq ft 1890 7,800
37 7411308013 SINGLE FAMILY RES. 6000 sq ft 1890 6,000
38 7411310004 SINGLE FAMILY RES. 6750 sq ft 1890 6,750
39 7411312010 SINGLE FAMILY RES. 5625 sq ft 1890 5,625
40 7411314007 SINGLE FAMILY RES. 3750 sq ft 1890 3,750
41 7411314010 SINGLE FAMILY RES. 6480 sq ft 1890 6,480
42 7411314014 SINGLE FAMILY RES. 10350 sq ft 1890 10,350
43 7410103017 SINGLE FAMILY RES. 3000 sq ft 1894 3,000
44 7411234022 SINGLE FAMILY RES. 18000 sq ft 1894 18,000
45 7411229010 SINGLE FAMILY RES. 2400 sq ft 1895 2,400
46 7411300060 SINGLE FAMILY RES. 16930 sq ft 1895 16,930
47 7411306016 SINGLE FAMILY RES. 7200 sq ft 1895 7,200
48 7411312008 SINGLE FAMILY RES. 5625 sq ft 1895 5,625
49 7411312017 SINGLE FAMILY RES. 7311 sq ft 1895 7,311
50 7411312019 SINGLE FAMILY RES. 23551 sq ft 1895 23,551
51 7411314004 SINGLE FAMILY RES. 7200 sq ft 1895 7,200
52 7411314005 SINGLE FAMILY RES. 5400 sq ft 1895 5,400
53 7411326009 SINGLE FAMILY RES. 9000 sq ft 1895 9,000
54 7411234003 SINGLE FAMILY RES. 8400 sq ft 1898 8,400
55 7411234005 SINGLE FAMILY RES. 7200 sq ft 1898 7,200
56 7411234006 SINGLE FAMILY RES. 3600 sq ft 1898 3,600
57 7411235008 SINGLE FAMILY RES. 18000 sq ft 1898 18,000
58 7411306010 SINGLE FAMILY RES. 6600 sq ft 1898 6,600
59 7411307002 SINGLE FAMILY RES. 3600 sq ft 1898 3,600
60 7411307003 SINGLE FAMILY RES. 3600 sq ft 1898 3,600
61 7411307004 SINGLE FAMILY RES. 3600 sq ft 1898 3,600
62 7411307005 SINGLE FAMILY RES. 3600 sq ft 1898 3,600
63 7411307006 SINGLE FAMILY RES. 3600 sq ft 1898 3,600
64 7411307007 SINGLE FAMILY RES. 3600 sq ft 1898 3,600
65 7411307008 SINGLE FAMILY RES. 3600 sq ft 1898 3,600
66 7411307010 SINGLE FAMILY RES. 3600 sq ft 1898 3,600
67 7411307012 SINGLE FAMILY RES. 7200 sq ft 1898 7,200
68 7411307013 SINGLE FAMILY RES. 7200 sq ft 1898 7,20069 7411307015 SINGLE FAMILY RES. 3600 sq ft 1898 3,600
70 7411307020 SINGLE FAMILY RES. 7200 sq ft 1898 7,200
71 7411307023 SINGLE FAMILY RES. 9600 sq ft 1898 9,600
72 7411307027 SINGLE FAMILY RES. 7200 sq ft 1898 7,200
73 7410103003 SINGLE FAMILY RES. 3600 sq ft 1899 3,600
74 7410103016 SINGLE FAMILY RES. 3600 sq ft 1899 3,600
75 7410104010 SINGLE FAMILY RES. 6000 sq ft 1899 6,000
76 7411228002 SINGLE FAMILY RES. 4056 sq ft 1899 4,056
77 7411228003 SINGLE FAMILY RES. 3120 sq ft 1899 3,120
78 7411228004 SINGLE FAMILY RES. 3120 sq ft 1899 3,120
79 7411228005 SINGLE FAMILY RES. 3120 sq ft 1899 3,120
80 7411228007 SINGLE FAMILY RES. 3120 sq ft 1899 3,120

Parcel Land Year Land
Section 3 Number Use Size Built Area
Improved Properties
81 7411236004 SINGLE FAMILY RES. 7680 sq ft 1899 7,680
82 7411236005 SINGLE FAMILY RES. 1950 sq ft 1899 1,950
83 7411302002 SINGLE FAMILY RES. 7800 sq ft 1899 7,800
84 7411306009 SINGLE FAMILY RES. 7200 sq ft 1899 7,200
85 7411306015 SINGLE FAMILY RES. 7200 sq ft 1899 7,200
86 7411307025 SINGLE FAMILY RES. 4209 sq ft 1899 4,209
87 7411308008 SINGLE FAMILY RES. 1200 sq ft 1899 1,200
88 7411308020 SINGLE FAMILY RES. 4914 sq ft 1899 4,914
89 7411311008 SINGLE FAMILY RES. 9000 sq ft 1899 9,000
90 7411312004 SINGLE FAMILY RES. 6300 sq ft 1899 6,300
91 7411326021 SINGLE FAMILY RES. 13500 sq ft 1899 13,500
92 7410104032 SINGLE FAMILY RES. 9450 sq ft 1900 9,450
93 7410403021 SINGLE FAMILY RES. 5114 sq ft 1900 5,114
94 7411227003 SINGLE FAMILY RES. 9360 sq ft 1900 9,360
95 7411229009 SINGLE FAMILY RES. 4800 sq ft 1900 4,800
96 7411300068 SINGLE FAMILY RES. 4389 sq ft 1900 4,389
97 7411306020 SINGLE FAMILY RES. 8775 sq ft 1900 8,775
98 7411308009 SINGLE FAMILY RES. 10800 sq ft 1900 10,800
99 7411310006 SINGLE FAMILY RES. 4500 sq ft 1900 4,500
100 7411312003 SINGLE FAMILY RES. 12150 sq ft 1900 12,150
101 7411312014 SINGLE FAMILY RES. 4800 sq ft 1900 4,800
102 7411307021 SINGLE FAMILY RES. 7200 sq ft 1903 7,200
103 7411308003 SINGLE FAMILY RES. 3600 sq ft 1903 3,600
104 7411326010 SINGLE FAMILY RES. 9000 sq ft 1903 9,000
105 7410104003 SINGLE FAMILY RES. 4200 sq ft 1904 4,200
106 7411306030 SINGLE FAMILY RES. 7051 sq ft 1904 7,051
107 7411326011 SINGLE FAMILY RES. 4500 sq ft 1904 4,500
108 7411308018 SINGLE FAMILY RES. 15920 sq ft 1905 15,920
109 7411312007 SINGLE FAMILY RES. 7500 sq ft 1905 7,500
110 7411312009 SINGLE FAMILY RES. 5625 sq ft 1905 5,625
111 7411314008 SINGLE FAMILY RES. 7500 sq ft 1905 7,500
112 7411314011 SINGLE FAMILY RES. 7200 sq ft 1905 7,200
113 7411236006 SINGLE FAMILY RES. 1950 sq ft 1907 1,950
114 7410403006 SINGLE FAMILY RES. 7104 sq ft 1908 7,104
115 7410403007 SINGLE FAMILY RES. 7104 sq ft 1908 7,104
116 7410403009 SINGLE FAMILY RES. 7104 sq ft 1908 7,104
117 7411303002 SINGLE FAMILY RES. 5400 sq ft 1908 5,400
118 7411303011 SINGLE FAMILY RES. 1500 sq ft 1908 1,500
119 7411307009 SINGLE FAMILY RES. 3600 sq ft 1908 3,600
120 7411307014 SINGLE FAMILY RES. 3600 sq ft 1908 3,600
121 7411307016 SINGLE FAMILY RES. 3600 sq ft 1908 3,600
122 7410102011 SINGLE FAMILY RES. 4800 sq ft 1909 4,800
123 7410103002 SINGLE FAMILY RES. 5400 sq ft 1909 5,400
124 7410103005 SINGLE FAMILY RES. 7200 sq ft 1909 7,200
125 7410103006 SINGLE FAMILY RES. 7200 sq ft 1909 7,200
126 7410403008 SINGLE FAMILY RES. 7104 sq ft 1909 7,104
127 7411310007 SINGLE FAMILY RES. 4500 sq ft 1909 4,500
128 7411306006 SINGLE FAMILY RES. 2775 sq ft 1910 2,775
129 7411308005 SINGLE FAMILY RES. 4200 sq ft 1913 4,200
130 7411300069 SINGLE FAMILY RES. 22325 sq ft 1914 22,325
131 7411310008 SINGLE FAMILY RES. 6750 sq ft 1915 6,750
132 7411310009 SINGLE FAMILY RES. 6750 sq ft 1915 6,750
133 7411228006 SINGLE FAMILY RES. 3120 sq ft 1919 3,120
134 7411236002 SINGLE FAMILY RES. 5400 sq ft 1919 5,400
135 7411227004 SINGLE FAMILY RES. 3120 sq ft 1920 3,120
136 7411227005 SINGLE FAMILY RES. 6236 sq ft 1920 6,236
137 7411234021 SINGLE FAMILY RES. 7200 sq ft 1920 7,200
138 7411314006 SINGLE FAMILY RES. 5625 sq ft 1920 5,625
139 7411314009 SINGLE FAMILY RES. 6774 sq ft 1920 6,774
140 7411306013 SINGLE FAMILY RES. 7200 sq ft 1922 7,200
141 7411315004 SINGLE FAMILY RES. 7650 sq ft 1924 7,650
142 7410103004 SINGLE FAMILY RES. 7200 sq ft 1925 7,200
143 7411314003 SINGLE FAMILY RES. 7200 sq ft 1925 7,200
144 7411300002 SINGLE FAMILY RES. 14074 sq ft 1929 14,074
145 7411236017 SINGLE FAMILY RES. 7200 sq ft 1930 7,200
146 7411312011 SINGLE FAMILY RES. 3750 sq ft 1930 3,750
147 7411234013 SINGLE FAMILY RES. 7200 sq ft 1934 7,200
148 7411312006 SINGLE FAMILY RES. 11250 sq ft 1935 11,250
149 7411234014 SINGLE FAMILY RES. 7200 sq ft 1940 7,200
150 7411303012 SINGLE FAMILY RES. 7200 sq ft 1888/1933 7,200
151 7411229015 SINGLE FAMILY RES. 7800 sq ft 1890/1899 7,800
152 7410104008 SINGLE FAMILY RES. 5400 sq ft 1890/1909 5,400
153 7411303014 SINGLE FAMILY RES. 6000 sq ft 1908/1908 6,000
154 7411308016 SINGLE FAMILY RES. 9000 sq ft 1910/1926 9,000
155 7411234010 SINGLE FAMILY RES. 7200 sq ft 1923/1925 7,200
156 7411227009 SINGLE FAMILY RES. 7200 sq ft 1925/1925/1910 7,200
157 7411228022 SINGLE FAMILY RES./LODGING 5693 sq ft/547 sq ft 1895/1895 6,240
158 7411230009 SINGLE FAMILY RES./RESIDENTIAL RELIGIOUS PURPOSES/SPECIAL PURPOSE 7200 sq ft/7200 SQ FT/21600 SQ FT 1940/1940 14,400
159 7411231007 SPECIAL PURPOSE 3600 sq ft 1900 3,600
160 7411228016 SPECIAL PURPOSE 3600 sq ft 1938 3,600
161 7411300021 WAREHOUSE/STORAGE 1.66 acres 1900 72,310
162 7411428012 WAREHOUSE/STORAGE 35456 sq ft 1925 35,456
TOTAL AREA 1,303,684 Sq.Ft.
30 Acres

SECTION 4
Parcel Land Year Land
Section 4 Number Use Size Built Area
Vacant Land
1 7411431009 UNIMPROVED LAND 7200 sq ft 7,200
2 7411437022 UNIMPROVED LAND 1017 sq ft 1,017
3 7411438005 UNIMPROVED LAND 15600 sq ft 15,600
4 7411438046 UNIMPROVED LAND 14400 sq ft 14,400
5 7413214003 UNIMPROVED LAND 6400 sq ft 6,400
6 7413222002 UNIMPROVED LAND 16765 sq ft 16,765
7 7413222014 UNIMPROVED LAND 5568 sq ft 5,568
8 7413231002 UNIMPROVED LAND 13020 sq ft 13,020
9 7413232003 UNIMPROVED LAND 11760 sq ft 11,760
10 7413232009 UNIMPROVED LAND 20865 sq ft 20,865
11 7413403004 UNIMPROVED LAND 35284 sq ft 35,284
12 7413404007 UNIMPROVED LAND 5001 sq ft 5,001
13 7414101002 UNIMPROVED LAND 3142 sq ft 3,142
14 7414105007 UNIMPROVED LAND 18911 sq ft 18,911
15 7413222013 UNIMPROVED LAND/CHARITABLE 1 ACRE 43,560
16 7414100003 VACANT LAND LESS THAN 1 ACRE 6300 sq ft 6,300
TOTAL AREA 224,793 Sq.Ft.
5 Acres

Parcel Land Year Land
Section 4 Number Use Size Built Area
Improved Properties
1 7413226005 DUPLEXES & TRIPLEXES 7500 sq ft 1889 7,500
2 7413221006 DUPLEXES & TRIPLEXES 7500 sq ft 1895 7,500
3 7411429003 DUPLEXES & TRIPLEXES 4400 sq ft 1899 4,400
4 7413215006 DUPLEXES & TRIPLEXES 5000 sq ft 1899 5,000
5 7413223021 DUPLEXES & TRIPLEXES 6800 sq ft 1903 6,800
6 7413215004 DUPLEXES & TRIPLEXES 7500 sq ft 1910 7,500
7 7413134006 DUPLEXES & TRIPLEXES 7500 sq ft 1890/1900 7,500
8 7414100040 MULTI-UNITS (4-8) 19372 sq ft 1913 19,372
9 7413214002 OFFICES 16740 sq ft 1924 16,740
10 7414104004 SINGLE FAMILY RES. 11258 sq ft 1881 11,258
11 7413226004 SINGLE FAMILY RES. 7500 sq ft 1884 7,500
12 7411429017 SINGLE FAMILY RES. 3615 sq ft 1885 3,615
13 7411431002 SINGLE FAMILY RES. 3600 sq ft 1888 3,600
14 7414102002 SINGLE FAMILY RES. 3600 sq ft 1888 3,600
15 7414102009 SINGLE FAMILY RES. 3600 sq ft 1888 3,600
16 7411438010 SINGLE FAMILY RES. 7560 sq ft 1889 7,460
17 7413213001 SINGLE FAMILY RES. 4500 sq ft 1889 4,500
18 7413213002 SINGLE FAMILY RES. 3000 sq ft 1889 3,000
19 7413213003 SINGLE FAMILY RES. 7500 sq ft 1889 7,500
20 7413213005 SINGLE FAMILY RES. 7500 sq ft 1889 7,500
21 7413213006 SINGLE FAMILY RES. 7500 sq ft 1889 7,500
22 7413213008 SINGLE FAMILY RES. 7500 sq ft 1889 7,500
23 7413213010 SINGLE FAMILY RES. 6000 sq ft 1889 6,000
24 7413213011 SINGLE FAMILY RES. 4500 sq ft 1889 4,500
25 7413213012 SINGLE FAMILY RES. 4500 sq ft 1889 4,500
26 7413215005 SINGLE FAMILY RES. 7500 sq ft 1889 7,500
27 7414104008 SINGLE FAMILY RES. 21945 sq ft 1889 21,945
28 7411429002 SINGLE FAMILY RES. 3850 sq ft 1890 3,850
29 7411430009 SINGLE FAMILY RES. 6600 sq ft 1890 6,600
30 7413213007 SINGLE FAMILY RES. 7500 sq ft 1890 7,500
31 7413221004 SINGLE FAMILY RES. 5355 sq ft 1890 5,355
32 7413221005 SINGLE FAMILY RES. 6850 sq ft 1890 6,850
33 7413221019 SINGLE FAMILY RES. 4456 sq ft 1890 4,456
34 7414100004 SINGLE FAMILY RES. 4150 sq ft 1890 4,150
35 7414101007 SINGLE FAMILY RES. 4350 sq ft 1890 4,350
36 7414105005 SINGLE FAMILY RES. 5000 sq ft 1890 5,000
37 7414106001 SINGLE FAMILY RES. 7500 sq ft 1890 7,500
38 7414102017 SINGLE FAMILY RES. 5052 sq ft 1893 5,052
39 7411438039 SINGLE FAMILY RES. 3720 sq ft 1894 3,720
40 7411438052 SINGLE FAMILY RES. 5421 sq ft 1894 5,421
41 7413215007 SINGLE FAMILY RES. 5000 sq ft 1894 5,000
42 7413223004 SINGLE FAMILY RES. 15000 sq ft 1894 15,000
43 7413228002 SINGLE FAMILY RES. 7500 sq ft 1894 7,500
44 7414104002 SINGLE FAMILY RES. 9006 sq ft 1894 9,006
45 7411429004 SINGLE FAMILY RES. 6600 sq ft 1895 6,600
46 7411430001 SINGLE FAMILY RES. 7200 sq ft 1895 7,200
47 7411430027 SINGLE FAMILY RES. 3150 sq ft 1895 3,150
48 7411430028 SINGLE FAMILY RES. 2850 sq ft 1895 2,850
49 7411438053 SINGLE FAMILY RES. 5421 sq ft 1895 5,421
50 7413221007 SINGLE FAMILY RES. 7500 sq ft 1895 7,500
51 7413221008 SINGLE FAMILY RES. 7500 sq ft 1895 7,500
52 7413221009 SINGLE FAMILY RES. 7500 sq ft 1895 7,500
53 7413221010 SINGLE FAMILY RES. 7500 sq ft 1895 7,500
54 7413222006 SINGLE FAMILY RES. 1895 sq ft 1895 1,895
55 7413226002 SINGLE FAMILY RES. 7500 sq ft 1895 7,500
56 7414101003 SINGLE FAMILY RES. 7847 sq ft 1895 7,847
57 7414101004 SINGLE FAMILY RES. 5807 sq ft 1895 5,807
58 7414101006 SINGLE FAMILY RES. 7500 sq ft 1895 7,500
59 7414106003 SINGLE FAMILY RES. 7500 sq ft 1895 7,500
60 7414106006 SINGLE FAMILY RES. 7500 sq ft 1895 7,500
61 7411438001 SINGLE FAMILY RES. 7757 sq ft 1897 7,757
62 7411431003 SINGLE FAMILY RES. 7200 sq ft 1898 7,200
63 7411431005 SINGLE FAMILY RES. 9840 sq ft 1898 9,840
64 7411431006 SINGLE FAMILY RES. 4560 sq ft 1898 4,560
65 7411431012 SINGLE FAMILY RES. 3600 sq ft 1898 3,600
66 7411431014 SINGLE FAMILY RES. 3600 sq ft 1898 3,600
67 7411431016 SINGLE FAMILY RES. 3600 sq ft 1898 3,600
68 7411431017 SINGLE FAMILY RES. 7200 sq ft 1898 7,200
69 7411431018 SINGLE FAMILY RES. 3600 sq ft 1898 3,600
70 7411431021 SINGLE FAMILY RES. 4800 sq ft 1898 4,800
71 7411433002 SINGLE FAMILY RES. 6215 sq ft 1898 6,215
72 7411440005 SINGLE FAMILY RES. 7200 sq ft 1898 7,200
73 7413134003 SINGLE FAMILY RES. 7000 sq ft 1898 7,000
74 7413134005 SINGLE FAMILY RES. 7000 sq ft 1898 7,000
75 7413230004 SINGLE FAMILY RES. 7500 sq ft 1898 7,500
76 7413403002 SINGLE FAMILY RES. 6873 sq ft 1898 6,873
77 7413403003 SINGLE FAMILY RES. 7420 sq ft 1898 7,420
78 7413404006 SINGLE FAMILY RES. 5765 sq ft 1898 5,765
79 7414102003 SINGLE FAMILY RES. 3600 sq ft 1898 3,600

Parcel Land Year Land
Section 4 Number Use Size Built Area
Improved Properties
80 7414102006 SINGLE FAMILY RES. 3600 sq ft 1898 3,600
81 7414102007 SINGLE FAMILY RES. 3600 sq ft 1898 3,600
82 7414102008 SINGLE FAMILY RES. 3600 sq ft 1898 3,600
83 7414102011 SINGLE FAMILY RES. 7200 sq ft 1898 7,200
84 7414102014 SINGLE FAMILY RES. 7200 sq ft 1898 7,200
85 7414102016 SINGLE FAMILY RES. 7200 sq ft 1898 7,200
86 7414102020 SINGLE FAMILY RES. 5400 sq ft 1898 5,400
87 7414102022 SINGLE FAMILY RES. 5400 sq ft 1898 5,400
88 7411430004 SINGLE FAMILY RES. 3810 sq ft 1899 3,810
89 7411430008 SINGLE FAMILY RES. 3300 sq ft 1899 3,300
90 7411430011 SINGLE FAMILY RES. 3300 sq ft 1899 3,300
91 7411430012 SINGLE FAMILY RES. 3300 sq ft 1899 3,300
92 7411430016 SINGLE FAMILY RES. 6600 sq ft 1899 6,600
93 7411430036 SINGLE FAMILY RES. 4214 sq ft 1899 4,214
94 7411432001 SINGLE FAMILY RES. 9650 sq ft 1899 9,650
95 7411432002 SINGLE FAMILY RES. 5490 sq ft 1899 5,490
96 7411432008 SINGLE FAMILY RES. 5670 sq ft 1899 5,670
97 7411432009 SINGLE FAMILY RES. 4830 sq ft 1899 4,830
98 7411433009 SINGLE FAMILY RES. 3325 sq ft 1899 3,325
99 7411434001 SINGLE FAMILY RES. 6500 sq ft 1899 6,500
100 7411438004 SINGLE FAMILY RES. 10800 sq ft 1899 10,800
101 7411440004 SINGLE FAMILY RES. 3600 sq ft 1899 3,600
102 7413134002 SINGLE FAMILY RES. 7715 sq ft 1899 7,715
103 7413215002 SINGLE FAMILY RES. 3936 sq ft 1899 3,936
104 7413215008 SINGLE FAMILY RES. 5000 sq ft 1899 5,000
105 7413215009 SINGLE FAMILY RES. 7500 sq ft 1899 7,500
106 7413215010 SINGLE FAMILY RES. 7500 sq ft 1899 7,500
107 7413215014 SINGLE FAMILY RES. 15000 sq ft 1899 15,000
108 7413223014 SINGLE FAMILY RES. 6750 sq ft 1899 6,750
109 7413223020 SINGLE FAMILY RES. 7500 sq ft 1899 7,500
110 7413223022 SINGLE FAMILY RES. 3602 sq ft 1899 3,602
111 7413226010 SINGLE FAMILY RES. 12750 sq ft 1899 12,750
112 7413226014 SINGLE FAMILY RES. 7500 sq ft 1899 7,500
113 7413228003 SINGLE FAMILY RES. 15000 sq ft 1899 15,000
114 7414101005 SINGLE FAMILY RES. 7659 sq ft 1899 7,659
115 7414102010 SINGLE FAMILY RES. 7200 sq ft 1899 7,200
116 7414103001 SINGLE FAMILY RES. 3650 sq ft 1899 3,650
117 7414103002 SINGLE FAMILY RES. 6250 sq ft 1899 6,250
118 7414104005 SINGLE FAMILY RES. 11282 sq ft 1899 11,282
119 7414104010 SINGLE FAMILY RES. 4180 sq ft 1899 4,180
120 7414106008 SINGLE FAMILY RES. 5475 sq ft 1899 5,475
121 7414106010 SINGLE FAMILY RES. 7500 sq ft 1899 7,500
122 7411429001 SINGLE FAMILY RES. 3850 sq ft 1900 3,850
123 7411429011 SINGLE FAMILY RES. 7350 sq ft 1900 7,350
124 7411429016 SINGLE FAMILY RES. 3190 sq ft 1900 3,190
125 7411430029 SINGLE FAMILY RES. 3450 sq ft 1900 3,450
126 7411430032 SINGLE FAMILY RES. 2832 sq ft 1900 2,832
127 7411431010 SINGLE FAMILY RES. 10800 sq ft 1900 10,800
128 7413221016 SINGLE FAMILY RES. 7000 sq ft 1900 7,000
129 7413222007 SINGLE FAMILY RES. 2977 sq ft 1900 2,977
130 7413222008 SINGLE FAMILY RES. 6370 sq ft 1900 6,370
131 7413223013 SINGLE FAMILY RES. 6000 sq ft 1900 6,000
132 7414105001 SINGLE FAMILY RES. 5013 sq ft 1900 5,013
133 7414105006 SINGLE FAMILY RES. 5297 sq ft 1900 5,297
134 7414106007 SINGLE FAMILY RES. 5475 sq ft 1900 5,475
135 7413221003 SINGLE FAMILY RES. 5681 sq ft 1901 5,681
136 7411431007 SINGLE FAMILY RES. 3600 sq ft 1903 3,600
137 7414102001 SINGLE FAMILY RES. 3744 sq ft 1903 3,744
138 7414102004 SINGLE FAMILY RES. 5400 sq ft 1903 5,400
139 7411430018 SINGLE FAMILY RES. 4346 sq ft 1904 4,346
140 7411430023 SINGLE FAMILY RES. 3300 sq ft 1904 3,300
141 7411433001 SINGLE FAMILY RES. 8500 sq ft 1904 8,500
142 7411434013 SINGLE FAMILY RES. 7200 sq ft 1904 7,200
143 7413134004 SINGLE FAMILY RES. 7000 sq ft 1904 7,000
144 7413223018 SINGLE FAMILY RES. 4200 sq ft 1904 4,200
145 7413223019 SINGLE FAMILY RES. 4200 sq ft 1904 4,200
146 7414106002 SINGLE FAMILY RES. 7500 sq ft 1904 7,500
147 7414106011 SINGLE FAMILY RES. 7500 sq ft 1904 7,500
148 7413222005 SINGLE FAMILY RES. 12695 sq ft 1905 12,695
149 7414106004 SINGLE FAMILY RES. 7309 sq ft 1905 7,309
150 7414106009 SINGLE FAMILY RES. 15000 sq ft 1905 15,000
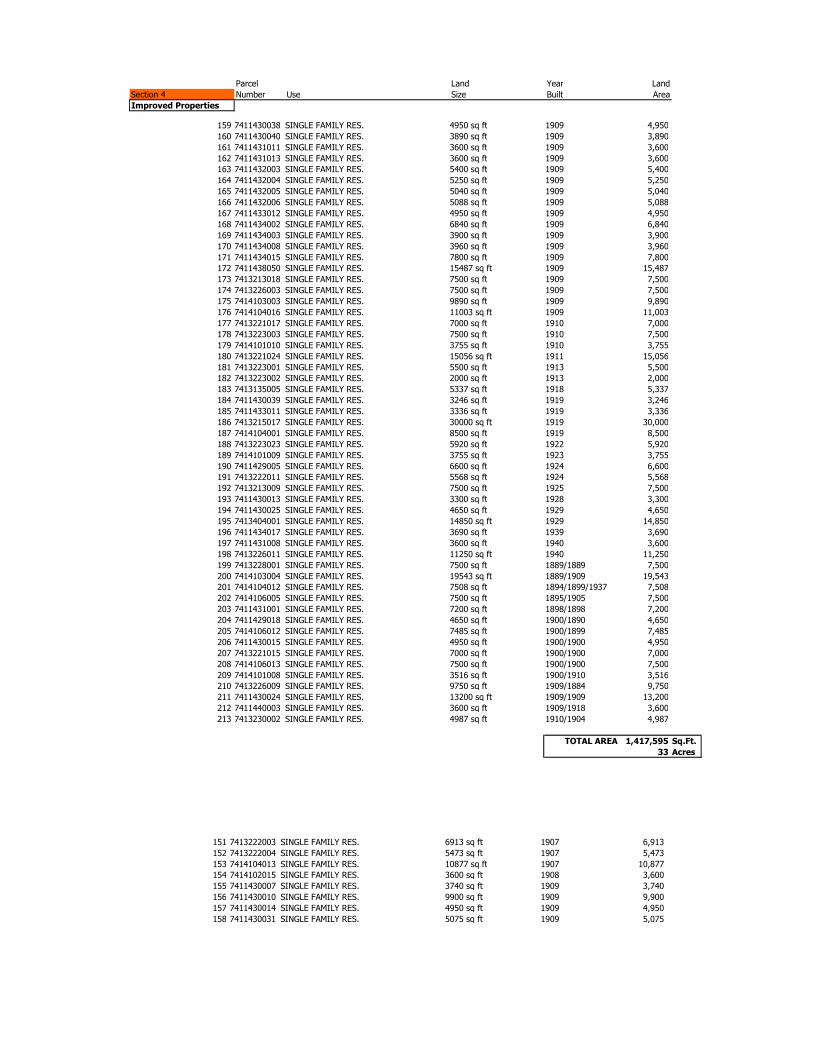
Parcel Land Year Land
Section 4 Number Use Size Built Area
Improved Properties
159 7411430038 SINGLE FAMILY RES. 4950 sq ft 1909 4,950
160 7411430040 SINGLE FAMILY RES. 3890 sq ft 1909 3,890
161 7411431011 SINGLE FAMILY RES. 3600 sq ft 1909 3,600
162 7411431013 SINGLE FAMILY RES. 3600 sq ft 1909 3,600
163 7411432003 SINGLE FAMILY RES. 5400 sq ft 1909 5,400
164 7411432004 SINGLE FAMILY RES. 5250 sq ft 1909 5,250
165 7411432005 SINGLE FAMILY RES. 5040 sq ft 1909 5,040
166 7411432006 SINGLE FAMILY RES. 5088 sq ft 1909 5,088
167 7411433012 SINGLE FAMILY RES. 4950 sq ft 1909 4,950
168 7411434002 SINGLE FAMILY RES. 6840 sq ft 1909 6,840
169 7411434003 SINGLE FAMILY RES. 3900 sq ft 1909 3,900
170 7411434008 SINGLE FAMILY RES. 3960 sq ft 1909 3,960
171 7411434015 SINGLE FAMILY RES. 7800 sq ft 1909 7,800
172 7411438050 SINGLE FAMILY RES. 15487 sq ft 1909 15,487
173 7413213018 SINGLE FAMILY RES. 7500 sq ft 1909 7,500
174 7413226003 SINGLE FAMILY RES. 7500 sq ft 1909 7,500
175 7414103003 SINGLE FAMILY RES. 9890 sq ft 1909 9,890
176 7414104016 SINGLE FAMILY RES. 11003 sq ft 1909 11,003
177 7413221017 SINGLE FAMILY RES. 7000 sq ft 1910 7,000
178 7413223003 SINGLE FAMILY RES. 7500 sq ft 1910 7,500
179 7414101010 SINGLE FAMILY RES. 3755 sq ft 1910 3,755
180 7413221024 SINGLE FAMILY RES. 15056 sq ft 1911 15,056
181 7413223001 SINGLE FAMILY RES. 5500 sq ft 1913 5,500
182 7413223002 SINGLE FAMILY RES. 2000 sq ft 1913 2,000
183 7413135005 SINGLE FAMILY RES. 5337 sq ft 1918 5,337
184 7411430039 SINGLE FAMILY RES. 3246 sq ft 1919 3,246
185 7411433011 SINGLE FAMILY RES. 3336 sq ft 1919 3,336
186 7413215017 SINGLE FAMILY RES. 30000 sq ft 1919 30,000
187 7414104001 SINGLE FAMILY RES. 8500 sq ft 1919 8,500
188 7413223023 SINGLE FAMILY RES. 5920 sq ft 1922 5,920
189 7414101009 SINGLE FAMILY RES. 3755 sq ft 1923 3,755
190 7411429005 SINGLE FAMILY RES. 6600 sq ft 1924 6,600
191 7413222011 SINGLE FAMILY RES. 5568 sq ft 1924 5,568
192 7413213009 SINGLE FAMILY RES. 7500 sq ft 1925 7,500
193 7411430013 SINGLE FAMILY RES. 3300 sq ft 1928 3,300
194 7411430025 SINGLE FAMILY RES. 4650 sq ft 1929 4,650
195 7413404001 SINGLE FAMILY RES. 14850 sq ft 1929 14,850
196 7411434017 SINGLE FAMILY RES. 3690 sq ft 1939 3,690
197 7411431008 SINGLE FAMILY RES. 3600 sq ft 1940 3,600
198 7413226011 SINGLE FAMILY RES. 11250 sq ft 1940 11,250
199 7413228001 SINGLE FAMILY RES. 7500 sq ft 1889/1889 7,500
200 7414103004 SINGLE FAMILY RES. 19543 sq ft 1889/1909 19,543
201 7414104012 SINGLE FAMILY RES. 7508 sq ft 1894/1899/1937 7,508
202 7414106005 SINGLE FAMILY RES. 7500 sq ft 1895/1905 7,500
203 7411431001 SINGLE FAMILY RES. 7200 sq ft 1898/1898 7,200
204 7411429018 SINGLE FAMILY RES. 4650 sq ft 1900/1890 4,650
205 7414106012 SINGLE FAMILY RES. 7485 sq ft 1900/1899 7,485
206 7411430015 SINGLE FAMILY RES. 4950 sq ft 1900/1900 4,950
207 7413221015 SINGLE FAMILY RES. 7000 sq ft 1900/1900 7,000
208 7414106013 SINGLE FAMILY RES. 7500 sq ft 1900/1900 7,500
209 7414101008 SINGLE FAMILY RES. 3516 sq ft 1900/1910 3,516
210 7413226009 SINGLE FAMILY RES. 9750 sq ft 1909/1884 9,750
211 7411430024 SINGLE FAMILY RES. 13200 sq ft 1909/1909 13,200
212 7411440003 SINGLE FAMILY RES. 3600 sq ft 1909/1918 3,600
213 7413230002 SINGLE FAMILY RES. 4987 sq ft 1910/1904 4,987
TOTAL AREA 1,417,595 Sq.Ft.
33 Acres
151 7413222003 SINGLE FAMILY RES. 6913 sq ft 1907 6,913
152 7413222004 SINGLE FAMILY RES. 5473 sq ft 1907 5,473
153 7414104013 SINGLE FAMILY RES. 10877 sq ft 1907 10,877
154 7414102015 SINGLE FAMILY RES. 3600 sq ft 1908 3,600
155 7411430007 SINGLE FAMILY RES. 3740 sq ft 1909 3,740
156 7411430010 SINGLE FAMILY RES. 9900 sq ft 1909 9,900
157 7411430014 SINGLE FAMILY RES. 4950 sq ft 1909 4,950
158 7411430031 SINGLE FAMILY RES. 5075 sq ft 1909 5,075

SECTION FIVE
Parcel Land Year Land
Section 5 Number Use Size Built Area
Vacant Land
1 7411439005 UNIMPROVED LAND 21000 sq ft 21,000
2 7413200010 UNIMPROVED LAND 980 sq ft 980
3 7413300063 UNIMPROVED LAND 7.25 acres 315,810
4 7413400041 UNIMPROVED LAND 7.33 acres 319,295
5 7413400042 UNIMPROVED LAND 41700 sq ft 41,700
6 7413410009 UNIMPROVED LAND 6824 sq ft 6,824
7 7413410021 UNIMPROVED LAND 1.24 acres 54,014
8 7414100022 UNIMPROVED LAND 10500 sq ft 10,500
9 7414110001 UNIMPROVED LAND 42708 sq ft 42,708
10 7414100041 VACANT LAND = 1 AND < 5 ACRES 4.22 acres 183,823
TOTAL AREA 996,654 sq.ft.
23 acres
Parcel Land Year Land
Section 5 Number Use Size Built Area
Improved Properties
1 7413200013 MOBILE HOME PARKS 11.24 acres 1922 / 1954 489,614
2 7413200009 POLITICAL SUBDIVISION 25699 sq ft 25,699
3 7413200012 POLITICAL SUBDIVISION 3.43 acres 149,411
4 7413300007 POLITICAL SUBDIVISION 50694 sq ft 50,694
5 7413300066 POLITICAL SUBDIVISION 3.23 acres 140,699
6 7413410023 POLITICAL SUBDIVISION 31293 sq ft 31,293
TOTAL AREA 887,410 sq.ft.
20 acres


market r e s e a r c h p l a n n i n g l a n d s c a p e a r c h i t e c t u r e g o l f f e a s i b i l i t y / v a l u a t i o n
Annual Sq.Ft./Units 10 yr. Acreage Requirements
Retail 32,094 320,940 36.8Office 112,673 1,126,726 103.5Hotel 81 809 20.2
Industrial 28,292 282,920 18.673 731 48.729 290 29.0
218 2,183 727.8
Total 984.6
10 yr. Cumulative Sq.Ft./Units
Summary of Real Estate Demands for the U.S. Highway 24 Primary Trade Area (Recommended Alternative)
Note: Retail coverage is estimated at 20%, office coverage is estimated at 25%, hotel at 40 rooms per acre, industrial/flex at 35%,rental apartments at 15 per acre, townhome/condo at 10 units per acre, and single-family at 3 units per acre
Source: THK Associates, Inc.
Rental ApartmentsCondominiums and Townhomes
Single-Family Detached
MEMORANDUM
Date: October 7, 2008
To: CH2MHILL
From: THK Associates, Inc.
Re: Summary of Economic Impacts Resulting From U.S. Highway 24 Being Upgradedto the Recommended Alternative
This memorandum summarizes the economic effects to the area effected by the upgrading ofU.S. Highway 24 to the recommended alternative from current conditions. The net effect ofthe required acquisition and development/redevelopment are an increase of $1,478,529 inproperty taxes, an increase of $3,721,983 in sales taxes, 641 additional employees, and over1,000 new residents.
Market Analysis
In May of 2006 THK Associates, Inc. prepared a market analysis to determine the economiceffects created by the upgrade of U.S. Highway 24 to recommended alternatives from currentconditions. The analysis indicted positive economic effects would result from upgrading thehighway in terms of increased demand for a variety of land uses.
The market analysis analyzed employment, population, household, demographic, and othertrends to estimate current and future demand for retail/commercial, office, flex/industrial,hotel, and residential land uses. This was done for existing conditions and three alternatives(expressway, freeway, and “as-is”) for U.S. Highway 24 improvements. A comprehensiveinventory of existing land uses was also complied. A comparison of supply and demand dataresulted in the following market potentials for the U.S. Highway 24 environs, if therecommended alternative conditions exist.

CH2MHILLOctober 7, 2008Page Two
Effects of Acquiring the Required Properties
The next step in this process was to estimate the amount of property, sales taxes, andjob/population displacement that would occur due to acquisition of properties required toconstruct the proposed upgrade of U.S. Highway 24 to the recommended alternative. Theseeffects were outlined in THK Associates, Inc. memorandum completed in April of 2008. As aresult of acquiring the required properties, there would be a reduction of $8,582,350 in assessedvalue and $521,113 per year in property taxes to various entities. In addition, sales taxes wouldbe reduced by $4,728,901 per year. The demand for many of the retail goods/expenditures willremain constant in area from residents and employee regardless of the removal of someestablishments. This demand will simply shift to other retail outlets. The properties acquiredfor the project would also displace 1,859 employees and 76 residents. Of the total retailexpenditures illustrated in the May 2006 market analysis, approximately 75% are made for itemssuch as automotive, clothing, furniture and equipment, restaurants, and other retail items. Ofthe $4.73 million dollars in reduced retail sales taxes, it is estimated that $3.55 million dollars willremain in the El Paso County/Colorado Springs environs, resulting in a net reduction of $1.18million dollars in annual sales taxes.
Effects of Development/Re-development
The final step of this exercise was to identify the areas along the recommended alternative thatare most likely to have pressures for development and re-development. THK Associates, Inc.identified these areas along with likely land uses that would develop/re-develop. Among fivedesignated areas, it was determined that there are 116-acres of land likely to develop/re-developas a result of the recommended alternative. For these 116-acres THK Associates, Inc. estimatesthe following land uses.
These land uses will generate approximately $177,534,080 in market value and $33,327,363 inassessed value. Using an average mill levy of 60, the development/redevelopment will generateapproximately $1,999,642 in annual property taxes. This is almost four times the amount ofproperty taxes being reduced from the tax rolls for properties necessary to accommodate therecommended alternative.
Sales taxes generated from new retail and lodging uses are estimated to total $4,892,983annually. This compares to the $1.18 net loss of sales taxes from the property acquisitions.
Use Square Feet Units Acres Percent of Total
Retail 421,661 -- 44.0 37.9%
Office 130,680 -- 10.0 8.6%
Hotel -- 400 10.0 8.6%
Apartments -- 330 22.0 19.0%
Condo/Townhome -- 100 10.0 8.6%
Single-Family -- 100 20.0 17.2%
TOTAL 552,341 930 116.0 100.0%
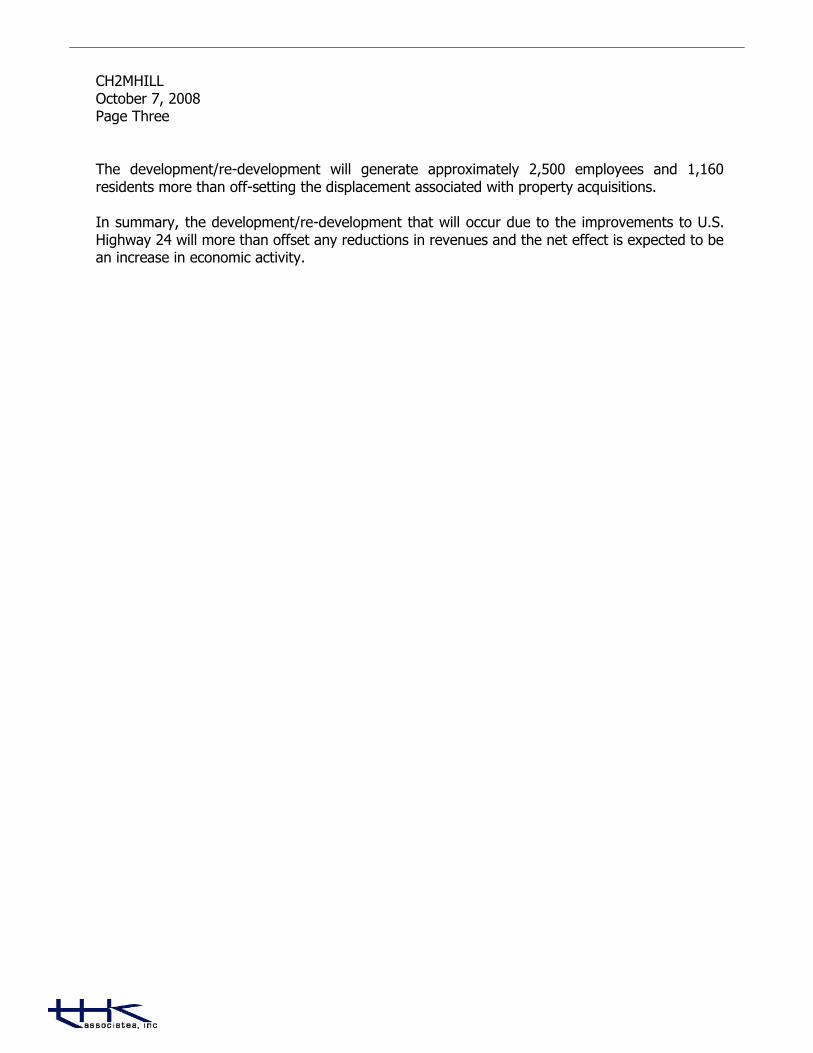
CH2MHILLOctober 7, 2008Page Three
The development/re-development will generate approximately 2,500 employees and 1,160residents more than off-setting the displacement associated with property acquisitions.
In summary, the development/re-development that will occur due to the improvements to U.S.Highway 24 will more than offset any reductions in revenues and the net effect is expected to bean increase in economic activity.
Copyright © 2022 FDOKUMEN