United Utilities Group PLC - Annual Report
266
United Utilities Group PLC Annual Report and Financial Statements for the year ended 31 March 2021
-
Upload
khangminh22 -
Category
Documents
-
view
0 -
download
0
Transcript of United Utilities Group PLC - Annual Report

United Utilities Group PLCAnnual Report and Financial Statements for the year ended 31 March 2021
UN
ITED
UT
ILITIES G
RO
UP PLC
AN
NU
AL R
EPO
RT
AN
D FIN
AN
CIA
L STA
TEM
ENT
S FO
R T
HE Y
EAR
END
ED 31 M
AR
CH
2021

We are a purpose-led organisation.United Utilities is the UK’s largest listed water and wastewater company. Our purpose is to provide great water and more for the North West.
Our response to COVID-19Throughout the pandemic our focus has been on supporting customers, protecting colleagues and continuing to deliver reliable water and wastewater services across our region.
Read more about our response to COVID-19 on pages 44 to 45
Our approach to reporting Being open, honest and transparent in our reporting is key to building trust and confidence in what we do.
Read more on pages 13 and 50 to 51

CONTENTS
Business overviewWhat it means to be purpose-led 02Chairman and Chief Executive Officer's review 042020/21 highlights 08Our approach as a responsible business 12Reporting responsible business performance 13Strategic reportOur purpose, vision, strategy and values 16How we operate 18Serving our region 20Engaging with our stakeholders 22S172(1) Statement 28Non-financial information statement 29Our business model 30– Our key resources 34– Our external drivers and
relationships 36– How we respond to challenges 38– How we plan for the future 46How we measure our performance 50Our performance in 2020/21 52Being a responsible business 84Our approach to climate change 86Principal risks and uncertainties 100GovernanceCorporate governance report– Board of directors 112– Letter from the Chairman 116– Nomination committee report 130– Audit committee report 144– Corporate responsibility
committee report 156– Remuneration committee report 160– Tax policies and objectives 190Directors’ report 192Statement of directors’ responsibilities 196Financial statementsIndependent auditor’s report to the members of United Utilities Group PLC only 200Consolidated income statement 207Consolidated statement of comprehensive income 208Consolidated and company statements of financial position 209Consolidated statement of changes in equity 210Company statement of changes in equity 211Consolidated and company statements of cash flows 212Guide to detailed financial statements disclosures 213Accounting policies 214Notes to the financial statements 218Notes to the financial statements – appendices 235Five-year summary – unaudited 261Shareholder information 262
Key stakeholders for whom we generate valueThere are six key stakeholder groups for whom we create longer-term value and it is essential we understand what matters most to them.
Communities
Customers
Communities
Customers
Customers
Employees
Environment
Employees
Environment
Environment
Shareholders
Investors
Media
Suppliers
Read more about our stakeholders on pages 22 to 26
Look out for our key icons throughout this report:Our strategic themesOur strategy is broken down into these three themes, which form the framework through which we provide great water and more for the North West.
The best service to customers
At the lowest sustainable cost
In a responsible manner
Read more about our strategic themes on pages 16 to 17
01
BUSIN
ESS OV
ERV
IEW
Stock Code: UU. Annual Report and Financial Statements for the year ended 31 March 2021

What it means to be purpose-led:
Read more about our purpose on pages 16 to 17
T
o pr
ovid
e gr
eat w
ater...
and more...
for the North West
lead
ing
the
way
on
serv
icedelivering value to all stakeholders
we are part of the region and it is part of us
Our purpose is why we exist and it drives us to focus on what matters to our stakeholders. There are three elements to our purpose:
02
BUSINESS OVERVIEW
United Utilities Group PLC unitedutilities.com/corporate 02 United Utilities Group PLC unitedutilities.com/corporate
BUSINESS OVERVIEW

Providing ‘more’ means creating value for our stakeholders by understanding what matters to them through strong and constructive relationships. We do this by:• supporting communities to be stronger;
• caring for customers through trusted relationships;
• protecting and enhancing the environment;
• creating a great place to work for all our employees;
• delivering a sustainable return to investors; and
• innovating in partnership with suppliers.
Supporting our suppliers during COVID-19We have continued to work closely with our suppliers during the pandemic, including accelerating payment by seven days.
Read more on page 45
Delivering value for: Employees
Environment
Media
Introducing our sustainable finance framework Following the introduction of the framework, we successfully launched our first sustainable bond, allowing us to raise financing based on our strong responsible business credentials.
Read more on page 70
Delivering value for: Customers Environment Shareholders
We are singularly focused on the North West
Helping families via our Home Learning Hub With many of the region's families having to adapt to home-schooling, our Home Learning Hub has provided some help for primary and secondary school children.
Read more on page 45
Delivering value for:Communities
Customers
Customers Environment
Supporting local communities, including funding for local foodbanks COVID-19 has created even greater need in the communities we serve. Our support for FareShare will play a part in helping communities get through tricky times.
Read more on page 43
Delivering value for:
Media
Communities
Customers
Customers
Kickstarting careers for young peopleWe are working with our supply chain to provide an initial 250 placements to 16–24 year olds who are at risk of long-term unemployment.
Read more on page 54
Delivering value for:Communities
Customers
Employees
Environment
Media
Embracing environmental innovation via partnershipsWe are working in partnership with environmental NGOs, local authorities and other stakeholders to deliver collaborative solutions to protect and enhance the environment of the North West.
Read more on page 23
Delivering value for: Customers Environment
Media
Strong and confident start to AMP7Earning fast-track status in the PR19 regulatory assessment enabled us to get a flying start to this investment period.
Read more on page 6
Delivering value for:Customers
Media
Shareholders
Robust support for customers during COVID-19Customers have been able to depend on us throughout the pandemic. We have adapted the way we work to maintain resilient and reliable services.
Read more on page 45
Delivering value for: CustomersCommunities
Customers
Employees
Environment
Providing great water means delivering our core water, wastewater and customer services, reliably and to the highest quality. It is what our customers expect and deserve.
Extended eligibility for social tariffWe were the first and only water company by March 2021 to extend our social tariff, allowing us to support a broader range of customers whose income has been affected by COVID-19.
Read more on page 58
Delivering value for:CustomersCommunities
Customers
PURPOSE-LED IN ACTION:
PURPOSE-LED IN ACTION:
PURPOSE-LED IN ACTION:
03
BUSIN
ESS OV
ERV
IEW
Stock Code: UU. Annual Report and Financial Statements for the year ended 31 March 2021Stock Code: UU. Annual Report and Financial Statements for the year ended 31 March 2021 03
BUSIN
ESS OV
ERV
IEW
for the North West
and more...
To provide great water...

Chairman and Chief Executive Officer’s review
This has been an unprecedented year in which we have had to adapt our operations to protect customers, employees and supply chain partners from the impact of COVID-19.
We responded well to the challenges and delivered our best ever year of operational performance for customers and the environment. Customer satisfaction remains high and we have made a strong start against our customer outcome delivery incentives (ODIs). This year has seen us reduce leakage to its lowest ever level and supply interruptions to customers have been halved. We are on track to achieve the maximum 4 star rating in the Environment Agency’s assessment for 2020, and have reduced environmental pollution incidents by around a third.
Our operational performance has been strong against key metrics and we are pleased to have met or exceeded over 80 per cent of our performance commitments for year 1 of AMP7. In those areas where we have fallen short of our target – such as sewer flooding – we are innovating and investing in new technology in order to improve performance and service to customers over the longer term.
We witnessed further variability in weather conditions now characteristic of climate change. Our region experienced a hot, dry spring that, coupled with people spending more time at home, resulted in a high level of demand for water. We continued to encourage customers to save water through water efficiency programmes, helping them to preserve this precious resource and save money on their bills. Throughout this period we maintained supplies to customers, demonstrating the benefits of our Systems Thinking approach and supported by the investment we made in previous regulatory periods to enhance the resilience of our services.
We have a deep and strong relationship with the environment and communities of the North West. Our plans ensure we protect and improve the natural environment and for many years we have been at the forefront of addressing climate change. We are proud to be a signatory to the UN’s Race to Zero campaign and we are delivering against all of our six carbon pledges. Our
We have responded well to the challenges of a year that has been dominated by the impact of COVID-19 in maintaining service and support so critical to customers in the North West. Our operational performance has been strong, building on the improvements we delivered in the previous regulatory period and providing us with a great start to achieving our targets for the new 2020–25 price review period (AMP7).
purpose drives us to make a real, positive contribution to the communities we serve through everything we do, and our investment programme plays a significant role in supporting the north west economy.
This excellent start to the delivery of our AMP7 plans provides a strong platform for us to play our full part in the economic recovery of the communities we serve as the country emerges from the COVID-19 pandemic.
Maintaining excellent service to customers while supporting our employeesOur continued focus on delivering the best service to customers has never been more important. We delivered significant and sustainable improvements over AMP6 and we ended the period as a leading water and wastewater company. The way Ofwat measures customer satisfaction in AMP7 has changed, with C-MeX measuring household customer satisfaction and D-MeX measuring developer satisfaction. Despite a challenging operating environment, customer satisfaction remains high, earning us an outperformance payment for both C-MeX and D-MeX and positioning us in the sector upper quartile for all-round customer satisfaction.
The impact of COVID-19 has led to many customers facing increasing financial hardship. At the start of the pandemic we saw an increase in the number of customers needing affordability support and the initiatives we put in place in AMP6 enabled us to respond swiftly and effectively. We were the first water company to secure support and regulatory approval for an extension to the scale and scope of our social tariff, providing an additional £15 million to help a further 45,000 customers. We had to consider the appropriateness of continuing our normal billing and collection activities and the most suitable means of engagement. As part of our COVID-19 response, we proactively encouraged customers to contact us if they had been impacted financially by the pandemic. We carried out targeted activities aligned to specific customer segments and changes in customer behaviour to engage with customers, ensuring they knew they could talk to us about their water bill, and highlighting alternative ways to pay.
We could not have delivered such great service to customers during this time without highly engaged and motivated colleagues right across the organisation who demonstrate tremendous resilience and adaptability to deliver for a region hard hit by the pandemic. To keep employees safe, early on in the year we moved 60 per cent of our workforce to home working and the remainder continued working at
Sir David Higgins Chairman
Steve Mogford Chief Executive
Officer
04
BUSINESS OVERVIEW
United Utilities Group PLC unitedutilities.com/corporate

our COVID-19 secure facilities. We have continued to work in this way in line with the government roadmap out of lockdown, while defining and shaping the way for future working. Our employee engagement score this year positioned us above the norm for UK high-performing companies – a remarkable score given the past year and testimony to the cohesiveness of the United Utilities team.
Transforming into a digital utilityThrough our Systems Thinking approach we make use of technology, automation and machine intelligence to deliver better performance for customers and the environment.
Through implementation of Dynamic Network Management – an example of the most advanced form of Systems Thinking in the water sector – we are shifting from reactive management of our wastewater network to using a web of sensors that will provide near real-time performance information. This new digital capability will optimise performance in a predictive and preventative way, delivering greater efficiency, improved service to customers and helping to enhance the environment.
We recognise the benefits to be gained through building digital skills among our workforce, and our purpose-built technical training academy, established in 2014, has provided skills development and certification to over 2,800 colleagues. The focus on digital skills means that we have the in-house ability to develop and deploy breakthrough technologies at pace and efficiently.
We make extensive use of apps, many of which are developed in-house, to create digital capability for our field and customer-facing teams. Our new voids app, aimed at unbilled but occupied properties, has helped us to earn the maximum customer ODI outperformance payment on voids this year as well as securing future year benefits of a further £24 million over AMP7.
Delivering a robust financial performanceWe have delivered another year of robust financial performance, supported by the strength of our balance sheet.
Underlying earnings per share is 56.2 pence, a decrease of 21 per cent but more than covering the dividend for the year. The anticipated decrease is due to lower allowed regulatory revenue in the first year of the new regulatory period, and an increase in infrastructure renewals expenditure due to planned work to optimise the performance of our network, higher depreciation reflecting continued investment in the asset base and a slight increase in the remaining cost base.
This is partly offset by a decrease in the underlying net finance expense reflecting lower inflation applied to our index-linked debt. We have simplified our approach to alternative performance measures (APMs) this year and are no longer, as a matter of course, adjusting our underlying earnings for restructuring costs, net pension interest, capitalised borrowing costs and prior years’ tax matters. This brings our approach more in line with peers and therefore makes cross-company comparisons easier.
Reported earnings per share is 66.5 pence per share, which is higher than the underlying figure, mainly due to fair value movements. Adjusting items are outlined in the reconciliation table on pages 82 to 83 and reflect our change in approach to APMs with prior year numbers re-presented for comparability.
The board has proposed a final dividend of 28.83 pence per ordinary share, taking the total dividend for 2020/21 to 43.24 pence. This is an increase of 1.5 per cent, in line with our policy in this regulatory period of targeting an annual growth rate of CPIH inflation through to 2025.
£21mnet customer ODI reward achieved in 2020/21
£300m extension to our AMP7 final determination
05
BUSIN
ESS OV
ERV
IEW
Stock Code: UU. Annual Report and Financial Statements for the year ended 31 March 2021

Chairman and Chief Executive Officer’s review
Our balance sheet continues to be one of the strongest in the sector, with low customer debtor risk, net debt to regulatory capital value within our target range and a pension scheme that is fully funded on a low dependency basis.
Given the uncertainty created by the COVID-19 pandemic, the recoverability of household debtors has been a key area of focus. It has been an area of focus for us for most of the last decade, during which we have managed the position robustly. This manifests itself in the balance reducing from £115 million in 2016 to £78 million in 2021. Our net debtor balance as at 31 March 2021 is the lowest it has been for five years and is one of the best managed positions in the sector. Knowing this gives us added confidence as we emerge from the pandemic.
We have retained our policy of targeting gearing of 55–65 per cent, measured as net debt to regulatory capital value, for this new regulatory period and at 62 per cent, our gearing remains within this target range. During the year, we changed our definition of net debt to exclude the impact of derivatives that are not hedging specific debt instruments. This provides a better reflection of the debt balances we are contractually obliged to repay and is more consistent with the approach taken by credit rating agencies and the
sustainable bond in January 2021 and were extremely pleased by the high level of interest. As a result, we secured not only our lowest ever coupon at that particular maturity, but also the lowest ever coupon for any UK corporate at that maturity, locking in financing outperformance.
Good start to the new regulatory period (AMP7)We are performing well against the principal areas of our regulatory contract for AMP7 despite many targets getting tougher.
Our accelerated investment strategy and digital transformation is delivering value across the breadth of our customer ODIs. The £21 million outperformance payment earned this year is ten times the performance we delivered in the first year of AMP6. The net reward earned this year will be reflected in an increase to revenues earned in 2022/23. This provides a great platform for continued delivery against our customer ODIs for the remainder of the AMP and gives us the confidence to target a cumulative outperformance payment of around £150 million for the 2020–25 period.
Thanks to our good performance in AMP6, we started AMP7 at a total expenditure (totex) run rate which supports delivery of our AMP7 scope within our final determination totex allowance. Since accepting our final determination, our investment plan has been extended by a further £300 million, which we expect to be fully remunerated through regulatory mechanisms, with this expenditure extending our environmental programme, accelerating our digital transformation and exploiting spend to save opportunities. While we continue to seek efficiencies in the delivery of totex, as we have demonstrated through the £300 million extension to our totex plans, we will invest totex where we are confident we can deliver improved customer or environmental outcomes and better customer ODI performance.
On financing performance, we have consistently issued debt at efficient rates that compare favourably with the industry average, thanks to our leading treasury management, clear and transparent financial risk management policies, and ability to act swiftly to access pockets of opportunity as they arise. This delivered significant financing outperformance during AMP6 and the rates we have already locked in for AMP7 compare favourably with the price review assumptions.
ESG at our heart Our purpose drives us to deliver our services in an environmentally sustainable, economically beneficial and socially responsible manner and what we do creates
regulatory economics. Our gearing policy is supportive of United Utilities Water Limited’s A3 credit rating with Moody’s and we have liquidity extending out to August 2023. This provides us with resilience and financial flexibility as we progress through AMP7 and demonstrates our prudent and responsible approach to financial risk management.
We have eliminated our pension funding deficit on a low-dependency basis and our pension position is in surplus on an IAS 19 basis. Having no pension funding deficit puts us at an underlying advantage versus most other companies in the sector, as well as against many companies in the Financial Times Stock Exchange (FTSE), that continue to make cash contributions into their pension schemes to achieve a fully-funded position. We are proud to have already achieved this, protecting employees past and present and shareholders from the risk of a large pension deficit.
In November 2020, we published our new sustainable finance framework, which allows us to raise financing based on our strong environmental, social and governance (ESG) credentials. This replaces the green funding we have previously secured through the European Investment Bank (EIB), which is no longer available post-Brexit. We issued our debut
06
BUSINESS OVERVIEW
United Utilities Group PLC unitedutilities.com/corporate

a deep connection with the stakeholders we serve. We have a long-standing commitment to deliver against our ESG objectives and we have a strong track record of doing so. We are also looking to our supply chain partners to adopt these values and objectives via the United Supply Chain (USC) initiative, a fundamental step change as to how we engage with them in AMP7 and into AMP8.
Having achieved our climate change objectives up to 2020, reducing greenhouse gas emission by 73 per cent, we made six carbon pledges and have made good progress against them all. From October of this year, 100 per cent of our electricity will be sourced from renewable technologies and we have set ambitious science-based scope 3 emissions targets that have been submitted for endorsement by the Science Based Targets initiative (SBTi).
Our Catchment Systems Thinking (CaST) approach continues to mature. We have been working with the Environment Agency (EA) and other stakeholders to develop a north west natural capital baseline and once this process is complete, we will engage with other partners across the region to drive a consistent approach to delivering greater natural capital value. This year, we pledged a £300,000 CaST Fund, for which charities and community groups are able to bid, to boost the idea of working collaboratively to address the challenges facing the environment.
We are in a unique position to make a real, positive contribution to society and have an ambitious and innovative approach to addressing affordability and vulnerability. We have an extensive range of schemes available to help customers and around 200,000 are currently benefiting from that help. We are providing more customers than ever with access to Priority Services in times of need, with over 133,000 now on our register. We have committed to providing £71 million in financial support over AMP7, and have accelerated payments this year to provide much needed assistance to households struggling as a result of the economic impact of the pandemic. During the early stages of the pandemic, recognising the importance of cash flow to businesses, we took swift action to accelerate payment terms with suppliers, paying them within seven days where possible.
We want fantastic people from a range of different backgrounds and life experiences to enable us to deliver a great public service, and we are committed to creating a diverse and inclusive workforce, reaching and recruiting from every part of our community. We were delighted to be one of the top one per cent of 15,000 companies across Europe in the Financial Times’
Statista Survey for Diversity and Inclusion Leadership and to achieve inclusion in the Bloomberg Gender Equality Index.
We operate in a manner that aims to maintain high ethical standards of business conduct and corporate governance. We have attained World Class status on the Dow Jones Sustainability Index for the 14th consecutive year. We were delighted to retain the Fair Tax Mark independent certification which recognises our commitment to paying our fair share of tax and acting in an open and transparent manner in relation to our tax affairs. We continue to focus on our long-term financial resilience, supported by our strong balance sheet and prudent approach to financial risk management, maintaining a responsible level of gearing and well-controlled pension position for many years.
OutlookWe started the new regulatory period as one of the sector’s best performers and have delivered further improvements this year, giving us the confidence that we will continue to be able to meet our targets across AMP7. Our transformation to a digital utility is helping us operate more efficiently and deliver better service to customers while protecting and improving the natural environment. Although it remains uncertain how the country will emerge from the COVID-19 pandemic, we have proven to be resilient over this period and will continue to rise to the challenges that lie ahead, playing our part in the recovery of the north west economy.
Grateful to our stakeholders for their supportWe would like to express our gratitude to our highly engaged and motivated employees and supply chain partners who have shown great resilience and adaptability in continuing to deliver excellent performance over such a challenging period, and we extend our thanks to customers, shareholders and other stakeholders for their continued support.
Sir David Higgins Chairman
Steve Mogford Chief Executive Officer
The strategic report on pages 14 to 109 was approved at a meeting of the board on 26 May 2021 and signed on its behalf by Steve Mogford, Chief Executive Officer.
This annual report contains information in line with the recommendations of the Task Force on Climate-related Financial Disclosures (TCFD), and is an Integrated Report prepared and presented in accordance with the International <IR> Framework published by the International Integrated Reporting Council in December 2013. The board, which is responsible for the integrity of this report, has considered the preparation and presentation of this report and concluded that it has been prepared and presented in accordance with the <IR> Framework.
Our annual report and financial statements aim to meet the information needs of our investors to help them make informed decisions regarding their participation – for example, whether to buy, sell or hold our shares or bonds, whether to engage with management on issues, and how to vote their shares. We have included information that we believe is material to these decisions, which is presented in a way that we believe is fair, balanced and understandable. We engage with – and recognise that this report will be read by – a wide variety of other stakeholders including customers, suppliers, employees, analysts, regulators, community bodies, politicians, non-governmental organisations, and devolved authorities. Where we believe that a topic is material to a large number of them, which is assessed in part through a matrix approach to stakeholder materiality as set out on page 27, we either include it in this report or refer the reader to other reports and information (such as our regulatory reports, customer communications, or corporate responsibility web pages). We believe this approach meets the requirements of company law, the UK Corporate Governance Code, IFRS and the International <IR> Framework, and that we go beyond those requirements where we feel it is particularly helpful to do so and where that can be done without making the report unnecessarily lengthy or difficult to read.
INTEGRATED REPORT AND TCFD DISCLOSURE
MATERIALITY
Read more about our performance in 2020/21 on pages 52 to 83
07
BUSIN
ESS OV
ERV
IEW
Stock Code: UU. Annual Report and Financial Statements for the year ended 31 March 2021

2020/21 highlightsOperational highlights
Our transformation to an innovative digital utility has helped us deliver another year-on-year improvement against key targets that our stakeholders value most.
Our progress this past year• Committed to supporting the
Government's Kickstart Scheme by providing 250 placements to young people, working with our supply chain.
• Hosted the industry's first Social Mobility Summit.
• Provided ongoing charitable support, including a donation to the FareShare charity, supporting them in delivering 600,000 meals to struggling families across the region.
• Adapted our community engagement approach in response to COVID-19 restrictions, consulting virtually rather than traditional face-to face exhibitions.
KPI performance Community investment
Read more about how our performance in 2020/21 created value for communities on pages 52 to 53
Read more about how we are supporting the Kickstart Scheme on page 54
Our progress this past year• Took swift proactive action to secure an
additional £15 million to help customers whose incomes had been affected by COVID-19.
• Accelerated payments of the £71 million financial support we committed to provide over AMP7, providing much needed assistance to struggling families.
• Now supporting around 200,000 customers through our extensive range of support schemes.
• Significantly increased the availability and performance of our digital channels with over 1 million customers engaging with us digitally.
• Met or exceeded over 80 per cent of performance commitments in areas that customers value most.
• Achieved the Utilities and Telecoms Team of the Year at the 2020 Credit Awards.
KPI performance C-MeX
Read more about how our performance in 2020/21 created value for customers on pages 55 to 57
Read more about how we are supporting customers in need on page 58
Our work puts us at the heart of local communities in the North West of England, where customers and employees live and work. Working in partnership with others means we can create better places, stronger communities, and accomplish more to address mutual issues together.
We put customers at the heart of everything we do. Through innovation and efficiency we provide a continually improving service at an efficient, low cost, and we support thousands of vulnerable customers through a wide range of assistance schemes.
CommunitiesCommunities
Customers
CustomersCustomers
In line with our purpose, we measure our performance by reference to the value we create for each of our stakeholder groups. For AMP7, we have selected one operational key performance indicator (KPI) for each of these groups.
HOW WE REPORT ON OUR PERFORMANCE
Met expectation/target
Close to meeting expectation/target
Behind expectation/target
Baseline year
KPI STATUS KEY
08
BUSINESS OVERVIEW
United Utilities Group PLC unitedutilities.com/corporate

Our progress this past year• Facilitated home working for over
3,000 of our employees during the COVID-19 pandemic.
• Conducted over 390 COVID-secure risk assessments.
• Supported the wellbeing needs of our colleagues, delivering initiatives to help build resilience across our workforce.
• Included in the top one per cent of 15,000 companies across Europe in the Financial Times' Statista Survey for Diversity and Inclusion Leadership.
• Our employee accident frequency rate for 2020/21 was 0.094 accidents per 100,000 hours worked, representing a 15 per cent improvement on performance from the prior year.
KPI performance Employee engagement score
Read more about how our performance in 2020/21 created value for employees on pages 59 to 61
Read more about our commitment to diversity and inclusion on page 62
Our progress this past year• Met our leakage target for the 15th
consecutive year, and we are now at the lowest ever level reported in the North West.
• Delivered zero serious pollution incidents for the second year running, and around one third reduction in pollution overall.
• Progressing well with our six carbon pledges, including the use of science-based targets to reduce our carbon footprint.
• Committed to the sector's net zero carbon pledge by 2030, and became a proud signatory to the UN Race to Zero campaign.
• Continued to develop our approach to natural capital, working with stakeholders to develop a north west natural capital baseline.
KPI performance Environment Agency's annual performance assessment
Read more about how our performance in 2020/21 created value for the environment on pages 63 to 65
Read more about our approach to climate change on pages 86 to 99
We have a deep and strong relationship with the environment. Our plans ensure we protect and enhance the natural environment in the way we deliver our services.
Our people are critical to enabling us to deliver a great public service now and into the future. It is important we give them the opportunity to develop their skills and knowledge and support them with the most effective technology.
EmployeesEmployees
Environment
EnvironmentEnvironment
09Stock Code: UU. Annual Report and Financial Statements for the year ended 31 March 2021
BUSIN
ESS OV
ERV
IEW

2020/21 highlightsOperational highlights
Our progress this past year• Achieved a £21 million net customer
ODI reward for 2020/21. The net reward earned this year will be reflected in an increase to revenues earned in 2022/23.
• Our AMP7 totex plans will be extended by £300 million, with plans to accelerate our digital transformation, extend our environmental programme and exploit spend to save opportunities.
• Published our new sustainable finance framework, allowing us to raise finance based on our strong ESG credentials, and subsequently issued our debut sustainable bond.
• Attained World Class rating in Dow Jones Sustainability Index for the 14th consecutive year.
• Ranked as leading water utility in the Sustainalytics' ESG Risk Rating assessment.
KPI performance Return on Regulated Equity (RoRE)
Read more about how our performance in 2020/21 created value for investors on pages 67 to 69
Read more about our sustainable finance framework on page 70
Our progress this past year• Continued to work closely with our
supply chain, protecting our suppliers and customers while maintaining delivery of critical services during the pandemic.
• Supported the north west economy through acceleration of capital expenditure in the first year of AMP7, helping to generate jobs and income.
• Successfully launched our new responsible approach to supply chain management for AMP7 called United Supply Chain (USC), recognising suppliers as an extension of the United Utilities family.
• Launched our third Innovation Lab programme, encouraging innovative solutions from suppliers around the world.
KPI performance Invoices paid within 60 days
Read more about how our performance in 2020/21 created value for suppliers on pages 71 to 72
Read more about United Supply Chain on page 73
InvestorsShareholders
SuppliersMedia
Our investment strategy and digital transformation, underpinned by our pioneering Systems Thinking approach, is delivering significant performance improvement and efficiency. We manage risk prudently, investing in our assets for growth and resilience.
Through our capital programme we invest in the north west infrastructure, generating jobs, skills and income across the region. Treating our supply chain fairly, through prompt payments and adequate guidance and support, is something we are fully committed to.
Met expectation/target
Close to meeting expectation/target
Behind expectation/target
Baseline year
KPI STATUS KEY
10
BUSINESS OVERVIEW
United Utilities Group PLC unitedutilities.com/corporate
Financial highlights
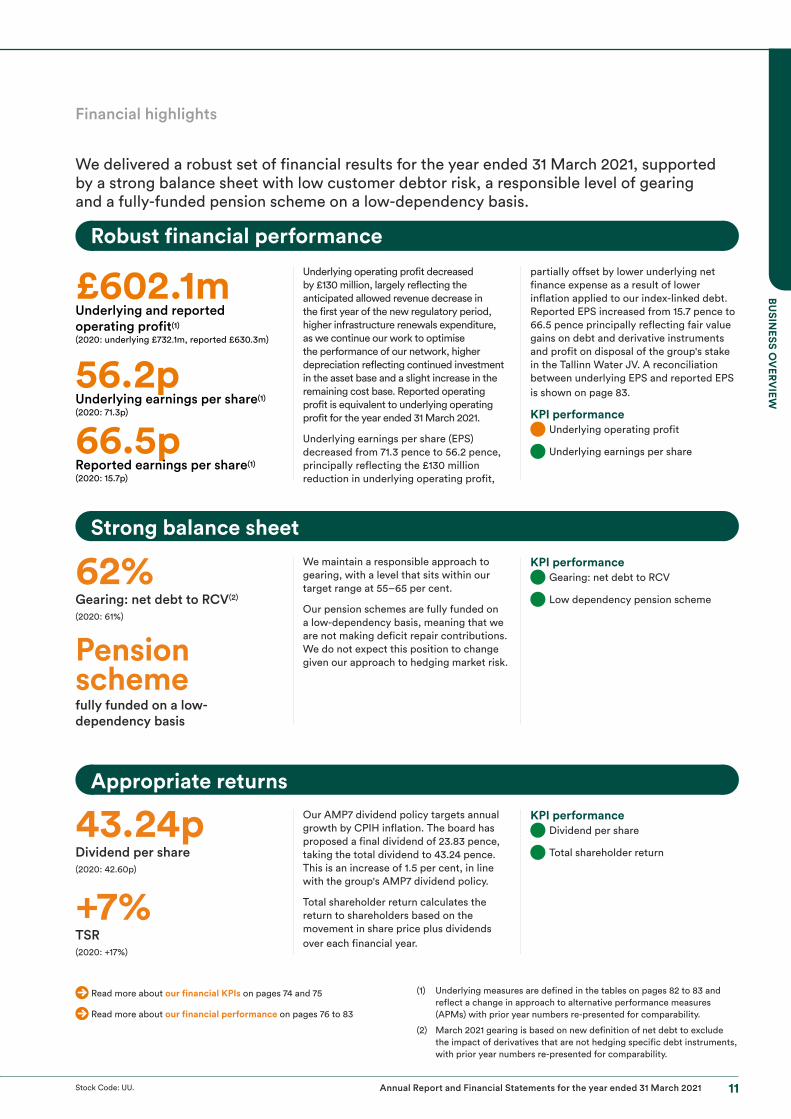
£602.1mUnderlying and reported operating profit(1)
(2020: underlying £732.1m, reported £630.3m)
56.2pUnderlying earnings per share(1)
(2020: 71.3p)
66.5pReported earnings per share(1)
(2020: 15.7p)
Underlying operating profit decreased by £130 million, largely reflecting the anticipated allowed revenue decrease in the first year of the new regulatory period, higher infrastructure renewals expenditure, as we continue our work to optimise the performance of our network, higher depreciation reflecting continued investment in the asset base and a slight increase in the remaining cost base. Reported operating profit is equivalent to underlying operating profit for the year ended 31 March 2021.
Underlying earnings per share (EPS) decreased from 71.3 pence to 56.2 pence, principally reflecting the £130 million reduction in underlying operating profit,
partially offset by lower underlying net finance expense as a result of lower inflation applied to our index-linked debt. Reported EPS increased from 15.7 pence to 66.5 pence principally reflecting fair value gains on debt and derivative instruments and profit on disposal of the group's stake in the Tallinn Water JV. A reconciliation between underlying EPS and reported EPS is shown on page 83.
KPI performance Underlying operating profit
Underlying earnings per share
We maintain a responsible approach to gearing, with a level that sits within our target range at 55–65 per cent.
Our pension schemes are fully funded on a low-dependency basis, meaning that we are not making deficit repair contributions. We do not expect this position to change given our approach to hedging market risk.
KPI performance Gearing: net debt to RCV
Low dependency pension scheme
Our AMP7 dividend policy targets annual growth by CPIH inflation. The board has proposed a final dividend of 23.83 pence, taking the total dividend to 43.24 pence. This is an increase of 1.5 per cent, in line with the group's AMP7 dividend policy.
Total shareholder return calculates the return to shareholders based on the movement in share price plus dividends over each financial year.
KPI performance Dividend per share
Total shareholder return
We delivered a robust set of financial results for the year ended 31 March 2021, supported by a strong balance sheet with low customer debtor risk, a responsible level of gearing and a fully-funded pension scheme on a low-dependency basis.
Read more about our financial KPIs on pages 74 and 75
Read more about our financial performance on pages 76 to 83
(1) Underlying measures are defined in the tables on pages 82 to 83 and reflect a change in approach to alternative performance measures (APMs) with prior year numbers re-presented for comparability.
(2) March 2021 gearing is based on new definition of net debt to exclude the impact of derivatives that are not hedging specific debt instruments, with prior year numbers re-presented for comparability.
62%Gearing: net debt to RCV(2)
(2020: 61%)
Pension schemefully funded on a low- dependency basis
43.24pDividend per share(2020: 42.60p)
+7%TSR(2020: +17%)
Robust financial performance
Strong balance sheet
Appropriate returns
11Stock Code: UU. Annual Report and Financial Statements for the year ended 31 March 2021
BUSIN
ESS OV
ERV
IEW

Our approach as a responsible business
The way we act as a business has a profound influence on the social, economic and environmental wellbeing of the region.
Responsible business is in our DNAWe have a strong track record leading on environmental, social and governance (ESG) matters. Over the past 20 years we have measured ourselves against national and international benchmarks of responsible business practice, often breaking new ground in the way the water sector approaches challenges such as catchment management schemes and support for vulnerable customers.
This long-standing commitment to responsible business has provided a solid foundation upon which to evolve existing programmes, develop new initiatives, and respond to the changing world in which we operate.
What is our approach?We will only deliver our purpose and create and maintain value for our stakeholders if we act in a responsible manner. This comes from understanding what matters most to them and balancing these different perspectives in our decision-making.
Our approach isn’t just about what we do, but how we do it. A key strength is our commitment to open, honest and transparent reporting about the continuity of our approach, underpinned by a clear purpose and strategic objectives.
Increasingly, stakeholders assess how companies approach responsible business through the lens of ESG. We believe there is a close relationship between ESG performance and investor value.
Demonstrating how we act responsibly and create valueBeing a purpose-led business it is up to us to provide the evidence that we are providing great water and more for the North West. Our stakeholders are ultimately the ones who will judge whether we are delivering on our purpose.
Having tangible, externally recognised measures of our behaviour and performance helps retain the trust of those who take an interest in the way we do business. It enables us to demonstrate
that we are operating in our stakeholders' interests. We collate, monitor and report on a wide range of performance measures, linked to what stakeholders tell us matter most, and align ourselves to recognised management standards and accreditations to give confidence in the way we are operating. We report these publicly so stakeholders can assess our progress.
Alongside this we actively participate in a range of global ESG ratings, indices and frameworks to benchmark our approach against best practice and emerging sustainability challenges.
As responsible business practice evolves we look constantly at how we can improve. For instance, we are currently exploring whether embedding multi-capital thinking (manufactured, financial, natural, social, human and intellectual capital) into business processes will add value and better inform our decision-making processes. This includes how we might report publicly against these capitals.
12
BUSINESS OVERVIEW
United Utilities Group PLC unitedutilities.com/corporate

Reporting responsible business performanceEvolving market expectations
TCFD sets out a framework for companies to provide stakeholders with an assessment of the financial implications of climate change and what this means for governance, strategy, risk and metrics. For the second year, we have included a TCFD section in our annual report.
TASKFORCE FOR CLIMATE-RELATED FINANCIAL DISCLOSURES (TCFD)
Read more on pages 86 to 99
The way we report on environmental, social and governance (ESG) issues is evolving as stakeholder interest grows.
There is increasing interest in how companies respond to sustainability challenges and growing expectations on how they disclose relevant information and data on their responsible business activities. For example, there is more interest in the disclosure of the ESG performance of companies and, last year, we published an investor guide to ESG at United Utilities in response to that trend.
unitedutilities.com/globalassets/documents/pdf/united-utilities-esg-booklet-2020.pdf
The way in which we report has evolved over the past ten years to incorporate more ESG information and data through such action as moving to integrated reporting. We have looked to do this without making this report unnecessarily lengthy or difficult to read. Rather than adopt one specific framework, our approach is to use the framework of our purpose-led approach to disclose performance and data for each of the stakeholders we create value for. Many of the ESG indices in which we participate (see page 84) draw their data from this report.
However, we do recognise that some stakeholders prefer to have specific data provided in one place. The following indicates where further information on certain frameworks can be found:
World Economic Forum (WEF) International Business Council (IBC)The WEF IBC has proposed a set of common metrics for the consistent reporting of sustainable value creation in mainstream annual reports. We already integrate many of these metrics in our annual report and to make this easier for those searching for the information we have collated them into one place on our website.
unitedutilities.com/wef
Sustainability Accounting Standards Board (SASB)SASB standards aim to standardise disclosure of material sustainability information mainly for companies based in the United States. As many of our shareholders are located in North America we are publishing comparable SASB data on our corporate website. This covers the main SASB data points for the water utilities industry of which we are part.
unitedutilities.com/sasb
Sustainable Development Goals (SDGs)We have identified six SDGs that are material to our business. More details can be found on page 85.
We also complete a variety of issue and stakeholder-specific rankings and benchmarks such as the Workforce Disclosure Initiative (WDI). Disclosure of these performance scores can be found on our website.
unitedutilities.com/corporate/responsibility/our-approach/cr-performance
13
BUSIN
ESS OV
ERV
IEW
Stock Code: UU. Annual Report and Financial Statements for the year ended 31 March 2021

What it means to be
leading the way on serviceOur relentless focus on customer service drove us to deliver significant and continuous improvements over AMP6, ending the period as a leading water and wastewater company, and through AMP7 we will not let this focus falter.
In September we were named by the Consumer Council for Water (CCW) as the largest of only four companies that are 'leading the way' in performance on household customer complaint handling. Delivering our essential service and getting things right first time for customers is very important to us.
This year we have significantly increased the availability and performance of our digital channels with over one million customers engaging with us digitally, driving both service improvements and cost efficiencies. Customers rate us 4.7 out of 5 on the App Store and 4.2 out of 5 on Google reviews.

Strategic Report
Our purpose, vision, strategy and values 16How we operate 18Serving our region 20Engaging with our stakeholders 22S172(1) Statement 28Non-financial information statement 29Our business model 30– Our key resources 34– Our external drivers and
relationships 36– How we respond to challenges 38– How we plan for the future 46How we measure our performance 50Our performance in 2020/21 52Being a responsible business 84Our approach to climate change 86Principal risks and uncertainties 100

Our purpose, vision, strategy and values
Our strategic themes define the way we operate so we can deliver our purpose and work towards our vision, and our core values provide the cultural framework within which we operate.
How we deliver our purpose and vision
The best service to customers
We put customers at the heart of everything we do. As well as delivering a reliable service of great-tasting water and removing wastewater, we proactively keep customers informed about any work we are doing in their area and communicate with them in ways that meet their individual needs; for example, we now use ‘push texts’ to send updates and alerts to customers within a specified location.
The best service to customers means being available when they need to contact us, always interacting in a friendly and helpful manner, and offering tailored support and assistance for customers when they need it. As well as these day-to-day interactions, it means consulting on what matters to them. This shapes what we do; for example, we redesigned our bills based on customer research and feedback.
Our purposeWhy we exist
To provide great water and more for the North WestWe are a purpose-led organisation and this drives us to deliver our services in an environmentally sustainable, economically beneficial and socially responsible manner, looking after the interests of the stakeholders with whom we interact.
Our visionWhat we want to achieve
To be the best UK water and wastewater company This is what motivates us to improve our services and deliver more. To achieve this vision, our strategy has three themes – the best service to customers, at the lowest sustainable cost, in a responsible manner.
STRATEGIC REPORT
16 unitedutilities.com/corporate United Utilities Group PLC

Our core valuesFundamental values that drive decision-making
Customer focusedCustomers are at the heart of everything we do, and we aim to provide a great and resilient service at the most efficient cost.
Innovative We continually look for new ways to make our services better, safer, faster and cheaper.
Trustworthy We make promises knowingly and keep them, behaving with integrity towards all of our stakeholders.
At the lowest sustainable cost
In a responsible manner
We will only deliver our purpose and create and maintain value for our stakeholders if we act in a responsible manner.
This means protecting and enhancing the natural environment, using natural solutions where possible, and reducing our carbon footprint and waste. It means promoting a safe, healthy and engaging workplace for our employees, supporting their physical and mental health. It drives us to support local communities on issues that matter to them, and to work with local schools and training facilities to promote skills for the future.
Above all it means we are open, honest and transparent in our dealings and in reporting our performance.
To run a resilient business, it is important to ensure cost reductions are sustainable so that we can keep them down without compromising on resilience or the quality of service we deliver.
When we develop our plans and assess different options for consideration, we look to minimise the whole-life cost. This fits with the total expenditure (totex) model, because the most cost-effective option can vary between traditional operating expenditure (opex) or capital expenditure (capex) solutions.
Our Systems Thinking approach helps us look holistically at all options, and operating our entire network as a system rather than discrete assets opens up new avenues that would otherwise not have been available.
Our strategic themes run through everything we doOur key performance indicators, risk assessment and remuneration policy are all aligned to these three strategic themes.
Read more about our KPIs on page 51
Read more about our risk management on pages 100 to 109
Read more about our remuneration report on pages 160 to 189
17
STR
AT
EGIC
REPO
RT
Annual Report and Financial Statements for the year ended 31 March 2021Stock Code: UU.

How we operate
Delivering clean waterWe depend on water that we collect from the natural environment in rivers, lakes, open reservoirs and boreholes, but we need to do a lot of work before this water is safe and clean for customers to drink. We maintain covered reservoirs, water treatment works and thousands of kilometres of water pipes across the region to collect, treat, store and deliver billions of litres of reliable, clean drinking water to millions of customers 24 hours a day.
Removing wastewaterOnce the water goes down customers’ drains, or surface water flows into the sewers, our job begins again as it requires separation and treatment before it is clean enough to return to the natural environment. We maintain wastewater treatment works and thousands of kilometres of wastewater pipes to collect, transport, treat and return water to begin the cycle again. We waste nothing, turning sludge by-product into compost for farmers and capturing gas to generate renewable energy.
Household retailWe deal with new connections, metering and billing for millions of household customers, and help vulnerable customers with our Priority Services and other assistance schemes.
WholesaleFor non-domestic customers in the North West, such as businesses, we provide a wholesale service to water retailers. Our wholesale activities include interactions with new appointments and variations, known as NAVs.
We
clea
n th
e re
sidual w
astewater to
meet
strin
gent
env
ironmental c
onsents and
retu
rn it
to th
e natural e
nvironment.
We collect water from the environm
ent, then
treat and store it in reservoirs. We open our land
to the public, providing access to nature.
reduce our carbon footprint and energy costs.
bioresources to generate renewable energy to
We rem
ove wastewater and separate
water for c
ustomers
acro
ss o
ur re
gion
.
through which we deliv
er hig
h-qu
ality
drin
king
We maintain thousa
nds of k
ilom
etre
s of p
ipes
Wastew
ater
W
ater
Cle
an
R
eturn Collect
Treat
Generate
Remove
Use
D
eliv
er
567wastewater treatment works
7,000kilometres of rivers
1,300kilometres of coastline
78,000kilometres of wastewater pipes
198,000tonnes of sewage sludge every year
35renewable energy facilities
United Utilities Group PLC unitedutilities.com/corporate 18
STRATEGIC REPORT
REMOVING WASTEWATER AND
GENERATING ENERGY
CLEANING AND RETURNING
WASTEWATER

Our Systems Thinking approachTraditionally across the water industry, each asset or treatment works was operated, managed and assessed in isolation. Systems Thinking looks at the entire network, using enormous amounts of data from the telemetry backbone we have installed, to consider not just the individual asset but all its linkages, enabling us to find the best overall long-term solution. Our field engineers are linked by an Integrated Control Centre (ICC) at our head office, from which we plan, monitor and control
our operations. From our ICC we process vast amounts of real-time data from across our network, factoring in other source data such as weather forecasts, and use artificial intelligence and machine learning to process this data and spot issues so we can resolve them before they impact customers.
Systems Thinking improves our asset reliability and resilience, reduces unplanned service interruptions, and helps us move away from the traditional
reactive approach to address problems proactively before they affect customers. This pioneering approach helped us deliver operational improvements and cost savings during AMP6, and we have further developments planned for AMP7 and beyond, as Systems Thinking forms part of our long-term strategy to continue creating value for customers and stakeholders.
We
clea
n th
e re
sidual w
astewater to
meet
strin
gent
env
ironmental c
onsents and
retu
rn it
to th
e natural e
nvironment.
We collect water from the environm
ent, then
treat and store it in reservoirs. We open our land
to the public, providing access to nature.
reduce our carbon footprint and energy costs.
bioresources to generate renewable energy to
We rem
ove wastewater and separate
water for c
ustomers ac
ross
our
regi
on.
through which we deliv
er hig
h-qu
ality
drin
king
We maintain thousa
nds of k
ilom
etre
s of p
ipes
Wastew
ater
W
ater
Cle
an
R
eturn Collect
Treat
Generate
Remove
Use
D
eliv
er
56,000hectares of land
165reservoirs
88water treatment works
42,000kilometres of water pipes
1.8bnlitres of clean water every day
7.3mcustomers served 24 hours a day
Stock Code: UU. Annual Report and Financial Statements for the year ended 31 March 2021
STR
AT
EGIC
REPO
RT
19
DELIVERING WATER
TO CUSTOMERS
COLLECTING AND
TREATING WATER

Serving our region
BEING PURPOSE-LED
Our contribution to the regional economy between 2020 and 2025 is estimated to be around £10.5 billion.
Understanding our wider contribution helps us to make better decisions.Through our activities, we make an important contribution to the environment, society and economy of the North West. At the start of each five-year investment cycle, we undertake a study to assess the economic contribution arising from our proposed spend.
We asked Hatch Regeneris, an independent economics consultancy, to estimate our contribution to the regional economy between 2020 and 2025, concluding this will be around £10.5 billion over the five years. Its report calculated we will support an average of 22,700 jobs through direct, indirect and induced employment effects, which is the people we employ directly, through our supply chain or arising from employee expenditure.
To put this into context, this equates to one per cent of all jobs and one in every £80 of gross value add (GVA) in the North West (pre-COVID-19 numbers). Our estimated GVA contribution each year of £2.1 billion compares with £2.8 billion GVA for the whole north west civil engineering sector.
As the economic effects of the pandemic begin to be felt, our investment programme offers a reliable economic contribution and source of employment to the region.
In February, we submitted proposals to support Defra’s green recovery initiative, including plans to accelerate our current investment programme. By bringing expenditure forward, we will support an additional 1,500 to 2,000 jobs in the earlier years, when we can expect to see the worst economic effects of the pandemic.
Such analysis gives greater insight into the value we bring to the North West and enables us to make more informed, rounded, balanced decisions, shaped by stakeholder research and engagement. In AMP7, we’ve agreed a target to generate £4 million of natural capital value through catchment schemes – alongside water quality benefits, this work will protect and enhance biodiversity. Our investment in young people not in education, employment and training has already yielded over £9 million of social value through avoided welfare costs.
Looking ahead, we recently assessed the social and economic value that will arise from our commitment to reduce flooding occurrences by 2025. We’ve estimated that £200 million of social value will be generated based on the avoided impact of internal flooding, which includes the wellbeing benefits for customers. While further analysis is required, thinking this way offers additional insight into how we value future investments plans.
Generating value for:Communities
Customers
Customers
Employees
Environment
Environment
Shareholders
Media
Bringing value to the North West
STRATEGIC REPORT
20 United Utilities Group PLC unitedutilities.com/corporate

(1) based on our 2020–25 business plan
We are committed to understanding the key factors that make our region unique.
Carlisle
Liverpool
Manchester
Lancaster
Bolton
Blackburn
BlackpoolPreston
Warrington
Chester
Workington
Whitehaven
Kendal
Crewe
Burnley
Stockport
Barrow-in-Furness
We are leading the sector on affordability and vulnerability.
41%of the most deprived areas in the country
47%of households have less than £100 savings to cope with unexpected bills
18%of households are affected by water poverty, 20 per cent higher than the national average
SOCIAL FACTORS
We are building resilience to continue serving our growing population and support jobs and the tourism industry.
7.3mpopulation expected to grow significantly in the next 25 years
22,7001jobs actively supported by our work, with over 5,000 direct employees
Tourismrelied on by Lake District, Liverpool and coastal area
ECONOMIC FACTORS
We serve the North West
We have a long coastline, protected rural areas and dense urban areas, all of which create different demands.
30%of land is National Park or Area of Outstanding Natural Beauty or Sites of Special Scientific Interest
29designated bathing waters
830mmhigher than average UK rainfall each year
ENVIRONMENTAL FACTORS
Stock Code: UU. Annual Report and Financial Statements for the year ended 31 March 2021
STR
AT
EGIC
REPO
RT
21

Engaging with our stakeholders
We actively engage with stakeholders to understand what matters most to them through strong and constructive relationships.
To create longer-term value for all it is essential that we identify and engage with our stakeholders to understand what matters most to them.
We do not operate in isolation and it is not for us alone to determine what the region needs us to deliver. Engaging with stakeholders across the North West enables us to identify shared solutions to shared challenges. We value the diverse perspectives that a broad range of stakeholders, representing different and
often competing interests, can bring to our decision-making.
Understanding what matters to stakeholders will only be achieved by building strong, constructive relationships and engaging regularly. This is important to building and maintaining trust. These relationships are subject to robust governance to ensure the insights generated are taken into account in decision-making at executive and board level. The board’s corporate responsibility
committee meets four times a year, with stakeholder engagement as one of its standing agenda items, and the chair of the independent customer challenge group (YourVoice) regularly attends board meetings to provide its perspective.
The following pages detail how we engage with, and are influenced by, each of our key stakeholder groups. Our analysis of what matters most to stakeholders, and how these issues affect our ability to create long-term value, is set out in our material issues matrix on page 27.
As shown below, there are nine key stakeholder groups that influence our planning and activities, and six of these groups benefit from the value we create.
Influence what we do and benefit from the value we create
Influence what we do
Employees
Media
Shareholders
Customers
Environment
Employees
Environment
Communities
Shareholders
Customers
Employees
Environment
Suppliers
RegulatorsPoliticians
Media
Communities
Customers
Investors
Communities
Who are our stakeholders?
Media
United Utilities Group PLC unitedutilities.com/corporate 22
STRATEGIC REPORT

BEING PURPOSE-LED
Reducing the risk of flooding is especially challenging in the North West.Analysis of Met Office data shows that average annual water run-off in the North West is 28 per cent higher than the average for England and Wales, meaning more water runs into our sewers and increasing flood risk.
Covering natural areas with new developments such as house building makes it harder to manage surface water run-off. With climate change increasing the frequency and intensity of storms, tackling flooding is becoming of greater concern for regional stakeholders. No single organisation can tackle this problem alone; only by working in partnership will the benefits from reducing flooding risk to wider society be realised.
One example of partnership working is in Thornton, near Blackpool, which is in the low-lying, flat and saturated River Wyre catchment. The area has experienced flooding from multiple sources and water quality issues from misconnections. Because the sewer network is combined, bringing together surface water and sewage from homes and businesses, there is limited capacity for extra water, which then has to be pumped to nearby Fleetwood wastewater treatment works.
The traditional solution to install concrete storage tanks to reduce the effects of storm flows wasn't cost beneficial or environmentally sustainable.
In 2019, we engaged with other risk management authorities, catchment partners such as the Rivers Trust, and the community group of the Wyre Flood Forum, to develop a plan to tackle the joint issues in the catchment. We challenged ourselves to examine how to store and purify flood waters through natural flood management and how we could realise multiple benefits through targeted extra investment.
The scope of the agreed solution included:
• 3.3 hectares of wetlands, 1,000m3 of flood storage and restoring the river to its natural state;
• 1,300m3 of storage and wetlands habitat constructed in collaboration with McDermott Homes; and
• an investment of £220k to the Wyre Rivers Trust.
This catchment scheme was possible because of strong and effective partnerships. Support came from the EU LIFE-funded Natural Course project. Working with the developer to use land for flood risk management was vitally important, as was access to alternative funding streams to help realise wider benefits. Looking ahead, we will monitor the wetlands to understand the catchment and assess ecological improvement, with input from local communities.
The success of this collaboration can be applied to other partnerships across the North West.
Generating value for:Communities
Customers
Customers
Environment
Shareholders
Partnership approach to tackle flooding
This catchment scheme was possible because of strong and effective partnerships.
STR
AT
EGIC
REPO
RT
23Annual Report and Financial Statements for the year ended 31 March 2021Stock Code: UU.

Engaging with our stakeholders
Our approach to engagement extends across all of our stakeholders, from those who influence what we do and benefit from the value we create, to those who just influence what we do.
Read more about how we manage our material issues on page 27
Why we engageOur work puts us at the heart of local communities, places where customers and employees live and work. We seek to support communities to be stronger based on mutual trust, respect and understanding the impact and contribution our work has on everyday life. We play a constructive role in tackling issues through engagement and investment, and by identifying what matters most to communities we can develop collaborative solutions.
How we engageMuch of our engagement is face-to-face, although over the past year we have adapted to using more digital means of engagement, such as our online consultation as part of the Haweswater Aqueduct Resilience Programme, alongside traditional methods, such as attending parish council meetings.
We engage through facilitated workshops and community partnerships, such as involving those communities affected by our construction work. Issues raised by communities can present opportunities to improve what we do or to help others, while some can be complex and difficult to handle, especially where competing interests between different stakeholder groups are present, and require time and effort to work through.
Top three material issues Land management and access
Community investment
Trust, transparency and legitimacy
Why we engageTo provide a great service in a way that customers value, we need to listen and engage with them to understand both short-term issues, and longer-term expectations of us as their water company. We are always interested to know what domestic and wholesale customers think about us so we can make our services better and address the issues that matter. As customer expectations change, we need to evolve our own services to ensure we meet those expectations.
How we engageWe interact with customers every day through our operational call centres, water retailers and increasingly via social media channels. We also get direct feedback through schemes such as the WOW awards.
Enhancements to our service such as Priority Services have been developed through engagement with customers and groups representing vulnerable customers, such as Age Concern and Autism Together.
Our current business plan was shaped by unprecedented levels of customer engagement. YourVoice, the independent customer challenge group, provided critical support and challenge, as well as contributing to shape our plans to 2025.
Top three material issues Customer service and operational performance
Affordability and vulnerability
Leakage and water efficiency
Why we engageIt is essential we build productive relationships with our employees based on trust. Our employees are the face of the company and we simply could not deliver our services without them, including the 13,000 who form part of our supply chain in the North West. Employees know our business better than anyone, with a diverse range of views and experience, making them well placed to identify opportunities for improvement.
How we engageLine managers play a vital role in supporting employees, with regular one-to-one meetings providing two-way engagement.
Every year our employee opinion survey provides an opportunity for employees to have a say about our company and to be open and honest with their views and opinions. The anonymous and confidential survey is managed by an independent consulting firm. Results are provided to all teams with greater than ten members for them to take action accordingly.
Our Employee Voice panel consists of 24 members from across the company, providing a means by which employee perspectives are heard by the board. We have several employee-led networks, including gender equality, multicultural and LGBT+ groups.
Top three material issues Health, safety and wellbeing
Diverse and skilled workforce
Employee relations
Why we engageWe rely on the environment and play a key role in protecting and enhancing it across the region. Given the environment has no voice of its own, we engage with interested groups such as environmental regulators, non-governmental organisations, campaigners and local communities to find the best ways to tackle environmental issues, like climate change and land management.
How we engageWe have formal discussions with both national and regional representatives of environmental regulators to identify priority issues and solutions.
We conduct facilitated workshops with environmental stakeholders to understand their priorities and have undertaken a large number of customer research projects.
We work with other companies, including within the water sector, landowners and local and national environmental groups to explore where we have common interests and opportunities to collaborate and deliver more together through pilots and partnerships.
Top three material issues Resilience
Environmental impacts
Climate change
Why we engageIt is important that investors have confidence in the company and how it is managed, given their investment in our business. We provide regular updates to debt and equity investors so they can be assured that the company is being managed responsibly. Increasingly, this includes environmental, social and governance updates alongside financial and performance data as investors take a broader view of value and risk.
How we engageOur AGM provides a chance for any shareholder to engage with our board of directors and hold them to account.
Through our investor relations programme, we actively engage with shareholders and analysts who write reports on our company and industry. Regular engagement activities are supplemented by ad hoc events such as capital markets days.
Our treasury team has regular dialogue with the group’s relationship banks and the EIB and credit rating agencies. Updates are provided to credit investors through a programme of meetings and mailings.
We supply information to several investor-led ratings and indices on ESG matters, such as the Dow Jones Sustainability Index.
Top three material issues Customer service and operational performance
Political and regulatory environment
Financial risk management
Why we engageGood relationships with suppliers help ensure that we get projects delivered on time, to good quality, at efficient costs and can identify and realise innovative approaches and solutions. Awareness of issues throughout the supply chain means we can address them together and become more resilient. We rely on suppliers to deliver our services and create value for all.
How we engageExisting suppliers have regular discussions with our commercial team as part of our supplier relationship management (SRM) process. This helps to identify issues and opportunities to make our relationship flow smoothly.
When re-tendering goods or services, we engage with the market directly and through supplier databases such as Achilles, to get a broad view of best practice and market opportunities.
Through our United Supply Chain (USC) approach we engage suppliers on sustainable and ethical issues and performance. Suppliers can join USC by committing to our responsible sourcing principles.
Through memberships of organisations such as the Supply Chain Sustainability School and the Chartered Institute of Procurement and Supply we keep abreast of best practice.
Top three material issues North west regional economy
Responsible supply chain
Human rights
CommunitiesCommunities
Customers
CustomersCustomers
EmployeesEmployees
Environment
United Utilities Group PLC unitedutilities.com/corporate 24
STRATEGIC REPORT

Why we engageOur work puts us at the heart of local communities, places where customers and employees live and work. We seek to support communities to be stronger based on mutual trust, respect and understanding the impact and contribution our work has on everyday life. We play a constructive role in tackling issues through engagement and investment, and by identifying what matters most to communities we can develop collaborative solutions.
How we engageMuch of our engagement is face-to-face, although over the past year we have adapted to using more digital means of engagement, such as our online consultation as part of the Haweswater Aqueduct Resilience Programme, alongside traditional methods, such as attending parish council meetings.
We engage through facilitated workshops and community partnerships, such as involving those communities affected by our construction work. Issues raised by communities can present opportunities to improve what we do or to help others, while some can be complex and difficult to handle, especially where competing interests between different stakeholder groups are present, and require time and effort to work through.
Top three material issues Land management and access
Community investment
Trust, transparency and legitimacy
Why we engageTo provide a great service in a way that customers value, we need to listen and engage with them to understand both short-term issues, and longer-term expectations of us as their water company. We are always interested to know what domestic and wholesale customers think about us so we can make our services better and address the issues that matter. As customer expectations change, we need to evolve our own services to ensure we meet those expectations.
How we engageWe interact with customers every day through our operational call centres, water retailers and increasingly via social media channels. We also get direct feedback through schemes such as the WOW awards.
Enhancements to our service such as Priority Services have been developed through engagement with customers and groups representing vulnerable customers, such as Age Concern and Autism Together.
Our current business plan was shaped by unprecedented levels of customer engagement. YourVoice, the independent customer challenge group, provided critical support and challenge, as well as contributing to shape our plans to 2025.
Top three material issues Customer service and operational performance
Affordability and vulnerability
Leakage and water efficiency
Why we engageIt is essential we build productive relationships with our employees based on trust. Our employees are the face of the company and we simply could not deliver our services without them, including the 13,000 who form part of our supply chain in the North West. Employees know our business better than anyone, with a diverse range of views and experience, making them well placed to identify opportunities for improvement.
How we engageLine managers play a vital role in supporting employees, with regular one-to-one meetings providing two-way engagement.
Every year our employee opinion survey provides an opportunity for employees to have a say about our company and to be open and honest with their views and opinions. The anonymous and confidential survey is managed by an independent consulting firm. Results are provided to all teams with greater than ten members for them to take action accordingly.
Our Employee Voice panel consists of 24 members from across the company, providing a means by which employee perspectives are heard by the board. We have several employee-led networks, including gender equality, multicultural and LGBT+ groups.
Top three material issues Health, safety and wellbeing
Diverse and skilled workforce
Employee relations
Why we engageWe rely on the environment and play a key role in protecting and enhancing it across the region. Given the environment has no voice of its own, we engage with interested groups such as environmental regulators, non-governmental organisations, campaigners and local communities to find the best ways to tackle environmental issues, like climate change and land management.
How we engageWe have formal discussions with both national and regional representatives of environmental regulators to identify priority issues and solutions.
We conduct facilitated workshops with environmental stakeholders to understand their priorities and have undertaken a large number of customer research projects.
We work with other companies, including within the water sector, landowners and local and national environmental groups to explore where we have common interests and opportunities to collaborate and deliver more together through pilots and partnerships.
Top three material issues Resilience
Environmental impacts
Climate change
Why we engageIt is important that investors have confidence in the company and how it is managed, given their investment in our business. We provide regular updates to debt and equity investors so they can be assured that the company is being managed responsibly. Increasingly, this includes environmental, social and governance updates alongside financial and performance data as investors take a broader view of value and risk.
How we engageOur AGM provides a chance for any shareholder to engage with our board of directors and hold them to account.
Through our investor relations programme, we actively engage with shareholders and analysts who write reports on our company and industry. Regular engagement activities are supplemented by ad hoc events such as capital markets days.
Our treasury team has regular dialogue with the group’s relationship banks and the EIB and credit rating agencies. Updates are provided to credit investors through a programme of meetings and mailings.
We supply information to several investor-led ratings and indices on ESG matters, such as the Dow Jones Sustainability Index.
Top three material issues Customer service and operational performance
Political and regulatory environment
Financial risk management
Why we engageGood relationships with suppliers help ensure that we get projects delivered on time, to good quality, at efficient costs and can identify and realise innovative approaches and solutions. Awareness of issues throughout the supply chain means we can address them together and become more resilient. We rely on suppliers to deliver our services and create value for all.
How we engageExisting suppliers have regular discussions with our commercial team as part of our supplier relationship management (SRM) process. This helps to identify issues and opportunities to make our relationship flow smoothly.
When re-tendering goods or services, we engage with the market directly and through supplier databases such as Achilles, to get a broad view of best practice and market opportunities.
Through our United Supply Chain (USC) approach we engage suppliers on sustainable and ethical issues and performance. Suppliers can join USC by committing to our responsible sourcing principles.
Through memberships of organisations such as the Supply Chain Sustainability School and the Chartered Institute of Procurement and Supply we keep abreast of best practice.
Top three material issues North west regional economy
Responsible supply chain
Human rights
EnvironmentEnvironment
InvestorsShareholders
SuppliersMedia
Stock Code: UU. Annual Report and Financial Statements for the year ended 31 March 2021 25
STR
AT
EGIC
REPO
RT

Why we engageIt is through both traditional media and social media that many of our stakeholders receive their information about us and our activities. The media is influenced by the issues that matter most to those stakeholders as well as influencing them through what it reports. Given the nature of our services, it is important that coverage is fair, balanced and accurate. This requires effective two-way dialogue between the company and the media.
How we engageOur media team are available 24/7 to respond to media enquiries and proactively engage media outlets providing digital content suitable for direct media broadcast.
Regular press releases on company activities help to maintain relationships with national, regional and local media outlets.
We have a dedicated social media team who manage and respond to posts on our social media channels while driving proactive messages and articles. We monitor social media sentiment and issues related to the company so we can respond accordingly.
Top three material issues Political and regulatory environment
Leakage and water efficiency
Social media
Why we engagePoliticians influence the long-term national water strategy and environmental priorities, matters that affect how all businesses operate, and champion issues raised by their constituents.
Local government, elected representatives and devolved administrations provide insight into shared social, environmental, economic and governance issues.
How we engageWe engage with regional and national politicians across the different political parties.
Open dialogue with regional MPs is maintained on specific issues and we regularly attend meetings at constituency offices. We have provided each MP in our region with a fact sheet with contact details and information about our activities in their constituency.
We take part in joint working groups with devolved administrations and local authorities on topics such as natural capital.
As part of our capital programme, we often attend local parish council meetings to make the case for our planning applications.
Top three material issues Political and regulatory environment
Leakage and water efficiency
Trust, transparency and legitimacy
Why we engageThrough proactive, constructive engagement with economic, quality and environmental regulators, we agree commitments over specified time periods and finalise the expectations they have of our business planning and performance.
We actively engage to shape the policy and regulatory framework within which we operate, covering customer, economic, environmental, social and governance matters.
How we engageWe hold regular meetings with all of our regulators to discuss priorities and objectives which can change over time.
When they seek views through specific consultations we provide considered responses where we think there is value and we have something to contribute.
We work together with regulators to find new solutions through projects such as Natural Course, which aims to build capacity to protect and improve the water environment of the North West.
Top three material issues Political and regulatory environment
Resilience
Trust, transparency and legitimacy
Engaging with our stakeholders
We maintain close relationships with three stakeholder groups that influence what we do and how we do it.
MediaMedia
Shareholders
PoliticiansEmployees
RegulatorsCommunities
Warrington South MP Andy Carter meeting our apprentices during National Apprenticeship Week.
United Utilities Group PLC unitedutilities.com/corporate 26
STRATEGIC REPORT

Managing our material issues
HigherLower
Hig
her
Low
er
1
9
6
13
916
14
2
25
27
10
22
11
5
19
15
1720
24
21
26
23
18
3
7
4
7
Political and regulatory environmentClimate changeCyber securityNorth west regional economyNatural resourcesSocial mediaLand management and accessHuman rights
Trust, transparency and legitimacyCustomer service and operational performanceLeakage and water e�ciencyA�ordability and vulnerabilityCOVID-19Sewer �oodingEnvironmental impactsCompetitive marketsDiverse and skilled workforce
External factors
Internal factors
Both external and internal factors
2
9
4
6
11
7
13
21
14
10
12
17
20
19
23
26
15
1
3
5
16
8
18
22
25
27
Eect on our ability to create valueBased on the potential e�ect on our ability to create value over the short, medium and long term. Value can be created for United Utilities, investors, regulators, employees, the public, and/or the
environment. Value can be �nancial and non-�nancial.
Leve
l of i
nter
est t
o st
akeh
olde
rsB
ased
on
a ba
lanc
e of
vie
ws
from
cus
tom
er r
esea
rch,
sha
reho
lder
eng
agem
ent,
en
viro
nmen
tal r
egul
ator
s an
d co
mm
unit
ies.
ResilienceFinancial risk managementCorporate governance and business conductInnovationData securityEnergy useResponsible supply chainHealth, safety and wellbeingEmployee relationsCommunity investment
6
1012
5
8
24
Our approach to materialityUnderstanding what matters most to our stakeholders is fundamental to being a purpose-driven organisation. We consider these stakeholder priorities alongside our own assessment of what has the biggest impact on the company and its ability to create value, and the output is presented in the material issues matrix below.
This stakeholder materiality assessment informs decisions about what we report in documents such as this annual report. Setting out issues in this way helps ensure we understand key stakeholder priorities and consider their interests in strategic decision-making, helping us create long-term value.
In defining the strategic relevance of an issue to the company, we have adopted the integrated reporting framework definition of materiality, which states: “a matter is material if it could substantively affect the organisation’s ability to create value in the short, medium or long term”. Value, in this context, may be created internally (for the company, investors and employees) and there can be external value (for customers, communities, suppliers and the environment). Value may be financial or non-financial.
Our assessment of the level of interest to stakeholders is based on a balance of views obtained from communities, customers, employees, investors, regulators, and subject matter experts from the company on an ongoing basis, as well as the extensive insights gathered for the regulatory price review process. We will be undertaking a thorough review of our material issues and matrix in the next 12 months.
We have cross-referenced and aligned these issues with our principal risks and uncertainties, and our approach was reviewed by responsible business consultancy Corporate Citizenship, which commented that “alignment with United Utilities’ way of creating value gives life and credibility to the materiality matrix”, and this sends a very distinct message about our business model and what we value.
Material issues matrixWe consolidated feedback from our various stakeholder groups, as detailed above, which resulted in 26 material issues. Due to the impact and ongoing nature of the COVID-19 pandemic we have included this as a new material issue. These issues are impacted by factors that may be external, internal or both; for example, the material
Striking the right balance between different interests and views is not easy. Discussions at board and management level form part of this alongside the use of tools such as our whole-life cost model when considering investment decisions. We are exploring how multi-capital approaches might help in our decision-making, and expect a plan of how this can add the most value to be completed this year.
OUR PRIORITISATION OF ISSUES
issue of a diverse and skilled workforce has an external dimension of skills and diversity within the region, whereas the training and culture within the company are internal factors. The 27 issues are plotted on the matrix below, from lower to higher in terms of level of interest to stakeholders and how much it can affect our ability to create value.
Stock Code: UU. Annual Report and Financial Statements for the year ended 31 March 2021
STR
AT
EGIC
REPO
RT
27

S172(1) Statement
IntroductionThroughout this annual report, we provide examples of how we have thought about the likely consequences of long-term decisions and how we:
• build relationships with stakeholders and balance their needs and expectations with those of the business;
• understand the importance of engaging with our employees;
• understand the impact of our operations on the communities in our region and the environment we depend upon;
• are mindful of the interactions we have with our regulators; and
• understand the importance of behaving responsibly and being consistent with the company’s purpose, vision and values.
OUR APPROACHStatement by the directors in performance of their statutory duties in accordance with S172(1) Companies Act 2006The board of directors of United Utilities Group PLC consider, both individually and together, that they have acted in the way they consider, in good faith, would be most likely to promote the success of the company for the benefit of its members as a whole and having regard (among other matters) to factors (a) to (f) S172(1) Companies Act 2006, in the decisions taken during the year ended 31 March 2021.
Our key decisions during the year to 31 March 2021 were:
Green recovery
In July 2020, Defra commenced an initiative through which water companies (among others) could propose to accelerate investment to deliver ‘green’ initiatives that would both benefit the environment and support the economic recovery from the COVID-19 pandemic. The requirements for such proposals were further clarified by Ofwat, Defra, the Consumer Council for Water, the Environment Agency and the Drinking Water Inspectorate in November 2020 and January 2021.
The board’s viewThe board believed that the draft investment proposed would help to contribute to the Government’s green recovery plans and bring forward benefits for customers and the environment, but it would not present a significant risk to our financial resilience nor compromise our ability to deliver the remainder of our AMP7 plan. The board believed that our proposals were: of high quality; represented strong outcomes for customers and the environment; offered good value for money; could be implemented alongside existing regulatory and statutory commitments; and would be most likely to promote the long-term success of the company for the benefit of its members as a whole. If our regulators confirm they are supportive, the board will further review its position.
Scope 3 emissions
We had already committed to achieving science-based targets to reduce our emissions in line with the UK’s commitment in the 2008 Climate Change Act (see pages 86 to 97). As part of our carbon strategy the board has made a series of pledges to deliver these targets and to setting further targets across our full value chain, including transitioning to using 100 per cent renewable energy by 2021 and a 100 per cent green fleet by 2028.
The board’s viewDuring the year, we have made a further commitment by setting science-based targets for scope 3 emissions. First, we will reduce our absolute emissions by 25 per cent from the 2020 baseline by 2030, thereby aligning the group to a trajectory needed to limit global warming to ‘well below’ 2⁰C. Secondly, we have set the target that 66 per cent of our construction services suppliers should set their own science-based target by 2025, thereby helping to escalate a carbon focus in the construction services sector. The board believed that committing to our pledges and delivering against the targets set would be most likely to promote the long-term success of the company for the benefit of its members as a whole.
AMP 7 dividend policy
Our AMP 7 dividend policy for the 2020–25 regulatory period was agreed by the board and announced on 29 January 2020. When we announced our full-year results in the early stages of the pandemic in May 2020, we undertook to review the AMP7 dividend policy in light of the uncertainty associated with the impact of the pandemic that existed at that time. In November 2020, the board reaffirmed the AMP7 dividend policy, targeting a growth rate of CPIH inflation each year through to 2025.
The board’s viewOver the summer and autumn of 2020, we had a chance to gain a clearer understanding of the impact of the pandemic on the business, which continued to be robust and supported by a strong balance sheet, along with a stabilised inflation outlook supported by central bank policy and government actions. The board believed that reaffirmation of the AMP7 dividend policy would provide greater certainty for our investors and would be most likely to promote the long-term success of the company for the benefit of its members as a whole.
The best service to customers
At the lowest sustainable cost
In a responsible manner
OUR STRATEGIC THEMES
United Utilities Group PLC unitedutilities.com/corporate 28
STRATEGIC REPORT

Non-financial information statementThe table below constitutes the company’s non-financial information statement, produced to comply with sections 414CA(1) and 414CB(1) of the Companies Act 2006. Our purpose-driven approach, as described on pages 16 to 17, sets out how we act as a responsible business and is applicable to the areas of disclosure required by s414CB(1). The performance tables we publish for each stakeholder that we create value for, so that we can demonstrate we are fulfilling our purpose (see pages 52 to 73), include data in relation to the areas of disclosure required by s414CB(1).
Read more about our purpose on our website: unitedutilities.com/corporate/about-us/what-we-do/our-vision
Reporting requirement
Information necessary to understand our business and its impact; policies and due diligence activities; and outcomes
Policies, guidance and standards which govern our approach (some of which are only published internally)
Environmental matters Reflecting the needs of the environment:
• Natural resources – see page 34
• Natural environment – see pages 25 and 36
• Reducing our carbon footprint – see pages 86 to 99
• Waste and resource use policy
• Environmental policy – see the responsibility pages on our website
• Water Resources Management Plan – see page 48
• Emissions target – see pages 86 to 99
Employees Reflecting the needs of our employees:
• Competitive base salaries and benefits – see page 173
• Health and safety – see page 61
• Mental wellbeing – see pages 59 to 60
• Gender pay report 2020 – see page 139
• Engagement – see pages 5, 24, 59, 61 and 194
• Board diversity – see pages 132 to 133
• Health and safety policy
• Equality, diversity and inclusion policy
• Flexible working arrangements
• Agency worker policy
• Mental wellbeing policy
• Human rights policy – see page 41
• Board diversity policy – see pages 132 to 133
Respect for human rights Reflecting the needs of our stakeholders:
• Suppliers – see page 25
• Diversity within our workforce – see pages 42, 59 to 62, 132 to 133, 137 to 140
• Employee data protection policy
• Slavery and human trafficking statement
• Human rights policy – see page 41
Social matters Reflecting the needs of our stakeholders:
• Customers – see page 24
• Communities – see page 24
• Environment – see pages 25 and 86
• Suppliers – see page 25
• Regulators – see page 26
• YourVoice – see page 22
• Charitable matched funding guidance
• Volunteering policy
• United Supply Chain – see pages 41 and 73
• Commercial procurement policy
Anti-corruption and anti-bribery
Reflecting the needs of employees and suppliers:
• Employees – see pages 59 and 155
• Suppliers – see page 71
• Anti-bribery policy
• Fraud investigation and reporting processes
• Whistleblowing policy
• Internal financial control processes
• Commercial procurement policy
Stock Code: UU. Annual Report and Financial Statements for the year ended 31 March 2021
STR
AT
EGIC
REPO
RT
29

1 year 5 years 25+ years
To provide great water and more for the North West
Read more about our strategy and core values on pages 16 to 17
Read more about our approach to planning on pages 48 to 49
Our business model
OUR KEY RESOURCES
OUR EXTERNAL DRIVERS AND RELATIONSHIPS
Our strategy and core valuesOur strategy sets out how we deliver our purpose, and is broken down into three strategic themes, which govern everything we do.
Our core values – to be customer-focused, innovative and trustworthy – provide the cultural framework within which we operate.
Our planning horizonsWe undertake long, medium, and short-term planning, taking into account our external drivers and what matters to stakeholders.
At the lowest sustainable cost
The best service to customers
In a responsible manner
Our business is very long term by nature and we must build resilience to ensure we can continue to provide this essential service.
Medium-term planning reflects our five-year regulatory periods, and aims to help us work towards our long-term plans.
We set annual targets but retain flexibility in these short-term targets to respond to challenges and meet our five-year goals in the most effective and efficient way possible.
Natural resourcesWe rely on natural resources to supply water and take back wastewater after treatment, as well as to generate renewable energy. We own and manage large areas of land.
People We rely on skilled and engaged employees and suppliers to deliver our services, and must ensure skills are maintained across the generations through training and development.
AssetsWe invest significantly to maintain and enhance our assets and build long-term resilience, and we use telemetry across the network to monitor and control many assets remotely.
FinancingFinancing allows us to preserve intergenerational equity for customers while funding long-term capital investment, and we maintain access to a range of markets to seek good value.
Read more about our key resources on pages 34 and 35
Natural environment We must be resilient to changes such as climate change and population growth, and ensure our impact on the natural environment is positive.
StakeholdersOur work and the huge areas of land we manage impacts a wide variety of stakeholders and we consult them to help develop and execute our plans.
Technology and innovationNew technology and innovations create opportunities for improvements in service and efficiency, but can also create risks such as cyber security.
Economic environmentThe economy impacts our financing, through market rate movements such as interest rates and inflation, and our customers’ ability to pay their bills.
Regulatory environmentRegulators’ priorities drive our five-year commitments, and we must actively engage to influence and prepare for future market reforms in the industry.
Political environmentThis includes regional and national politicians as well as policy makers, and we must understand the key policy issues affecting our industry.
Read more about external drivers and relationships on pages 36 to 37
30
STRATEGIC REPORT
unitedutilities.com/corporate United Utilities Group PLC

HOW WE DO IT
Our core activities are to deliver essential water and wastewater services for household and business customers across the North West.
We maintain and operate thousands of kilometres of pipes and hundreds of treatment works, as well as renewable energy facilities that use our land and bioresources from wastewater treatment to generate clean electricity to help power our operations.Our customersWe deliver a reliable service to over seven million people, with over three million household customers and over 200,000 businesses. We supply clean, great-tasting water and remove wastewater 24 hours a day.
WHAT WE DO
To deliver these essential services in the most effective way, we take an integrated approach that considers what is most material to our stakeholders and to our ability to create value; our risk management; our commitment to environmental, social and governance matters; and our pioneering Systems Thinking approach to operating our network and assets.
Our prioritisation of issues We engage with our stakeholders to understand their priorities and balance their different and often conflicting views.
Our commitment to ESG mattersWe operate in an environmentally and socially conscious manner and uphold the highest standards of corporate governance.
Our risk management We manage a wide variety of risks to enable us to focus on delivering a sustainable and resilient service for the long term.
Systems ThinkingWe operate our network as a system rather than discrete assets, and we have a backbone of sensors that enable remote monitoring and control.
The water cycle
Read more about our water cycle on pages 18 to 19
Read more about our approach on page 46
31Annual Report and Financial Statements for the year ended 31 March 2021Stock Code: UU.

Read more about how we deliver value for our stakeholders on pages 52 to 72
CommunitiesCommunities
Customers
EmployeesEmployees
Environment
InvestorsShareholders
CustomersCustomers
EnvironmentEnvironment
SuppliersMedia
Many of our investors are pension funds and charities and the income we provide is relied on by millions. We manage risk prudently and provide an appropriate return, investing in our assets for growth and resilience. Regulatory incentives help align shareholder value with what matters to customers and the environment.
How we measure this• KPI – RoRE
• Other metrics, including performance across investor indices, gearing and Fair Tax Mark
We invest in the North West’s infrastructure and generate jobs, skills and income across the region through our capital programme that supports the supply chain and the local economy. We act fairly and transparently with all our suppliers and are a signatory to the Prompt Payment Code.
How we measure this• KPI – percentage of invoices
paid within 60 days
• Other metrics, including average time taken to pay invoices and suppliers signed up to our United Supply Chain
We build partnerships to help create better places and support communities to be stronger. We work with schools and young people to develop skills and help people get back to work. Our land is open to the public and we encourage people to use it responsibly.
How we measure this• KPI – Community investment
• Other metrics, including partnership leverage, provision of education and visitor satisfaction
We put customers at the heart of everything we do. Through responding to customers' needs we provide a continually improving service at an efficient, low cost, and we support thousands of vulnerable customers through a wide range of assistance schemes.
How we measure this• KPI – C-MeX
• Other metrics, including D-MeX, managing complaints, vulnerability support and customer awareness
We focus on attracting, developing and retaining a diverse workforce, and ensuring we look after their health, safety and wellbeing. We run graduate and apprenticeship programmes, and wider training schemes, to develop skilled employees. We pay the Living Wage and have a secure pension provision.
How we measure this• KPI – Employee engagement
• Other metrics, including diversity and inclusion, learning and development, and accident frequency rate
We protect and enhance reservoirs, catchments, rivers and bathing waters that provide a home for wildlife, areas for recreation, and a major pull for tourism. We aim to reduce our impact and generate renewable energy to protect the environment for years to come.
How we measure this• KPI – EA performance
assessment
• Other metrics, including leakage reduction, clean air, carbon footprint and natural capital value added
The value we generate
STR
AT
EGIC
REPO
RT
32Stock Code: UU. Annual Report and Financial Statements for the year ended 31 March 2021

To p
rovi
de g
reat
wat
er.
.. and more...
for the North West
Open the page to see how we deliver our purpose and create value for all our stakeholders

Our business modelOur key resources
We rely on natural sources of water, such as reservoirs, rivers and boreholes, from which abstraction licences permit us to take water in a safe and sustainable way to be treated and supplied to customers. We rely on natural watercourses to take wastewater back into the environment after extensive cleaning. We generate renewable energy from the sun and wind, and extract bioresources from wastewater that we break down into biogas (which is used to generate renewable energy) and biosolids (which are treated to provide a high-quality fertiliser for farmers).
Coping with severe dry periods requires action in relation to supply (ensuring we have resilient water resources and infrastructure to move water efficiently around the region) and demand (encouraging and supporting customers to use water more efficiently). In periods of heavy rainfall we need to deal with excess surface water drainage and minimise the risk of sewer flooding, pollution and spills.
How we manage this key resourceMuch of the water we abstract originates on land before running off into the bodies of water. We own and manage large areas of this land, much of which is managed by tenant farmers, or in partnership with other organisations, such as the RSPB and Wildlife Trusts, and we focus on ensuring it is well managed to improve water quality and help protect habitats and species that live there.
Our Systems Thinking approach is central to how we manage water supply. We have an integrated supply zone covering most of our region, our West-East Link Main allows us to transfer water between Manchester and Liverpool, and where there is a potential shortfall we can bring more supplies online to meet demand. Forty-six per cent of households in our region now have water meters installed, and we encourage customers to save water by raising awareness, sharing tips, and providing free water-saving devices.
Traditional interventions to flooding, such as storage tanks and enlarging sewers, are costly and subject to space constraints. We are innovating with new sustainable drainage solutions by working with partners to transform hard grey areas into living planted places. We use integrated catchment solutions, working with others to improve the lakes, rivers and coastal waters in our region, and often using the natural environment as part of the solution. We manage our own woodland in a sustainable way to protect water quality, conservation, access, recreation and timber.
Our activities produce various wastes, including sludges, which we manage in a sustainable way with more than 97 per cent going to beneficial uses such as recycling and application to land as a fertiliser. We use recycled products where practical, and are working to reduce our use of plastics and raw materials to minimise our environmental impact.
Our people are the face of our company and are essential in delivering our purpose. We believe the most effective decision-making comes from a diverse range of people who feel encouraged to share their views, and that having a skilled, engaged and motivated team of employees, suppliers and contractors is fundamental to the performance we deliver.
Rewarding employees well has been shown to enhance quality of work, increase employee retention, and reduce absenteeism, as well as providing societal benefits. Employee retention helps ensure efficient and effective training and higher levels of performance.
How we manage this key resourceWe support thousands of jobs in the North West, including graduate and apprenticeship programmes, helping to secure a legacy for the future in our region. We are an accredited Living Wage Foundation employer, providing our employees with competitive salaries and benefits, an attractive pension offering, and the opportunity to join the employee healthcare scheme and our share incentive plan.
We provide comprehensive training and development opportunities, including digital skills to help with our Systems Thinking approach and enable remote working where practical, which has been more important than ever this year with restrictions as a result of the COVID-19 pandemic.
We promote diversity and equal opportunity to drive a comprehensive and balanced skill set, and we recruit and promote employees on the basis of merit. We are committed to being an inclusive workplace, supporting employees to reach their full potential whilst feeling valued and included. Employee networks, representing certain groups of employees that may face specific challenges, are overseen by an executive sponsor and support employees through their career progression.
Read more about diversity and inclusion on pages 60 to 62 and 138 to 140
We are committed to protecting the health, safety and wellbeing of our people, and have been awarded the workplace wellbeing charter.
We measure employee engagement through an annual survey, and regularly achieve results higher than the UK norm.
We monitor and measure employee performance through annual reviews, and employees at all levels of the company participate in the bonus scheme, so they benefit from company success. The bonus performance measures are the same for all employees as those for the executive directors, and can be found on page 168.
NATURAL RESOURCES Link to risks 1 2 7
PEOPLE Link to risks 5 7
To p
rovi
de g
reat
wat
er.
..
for the North West
unitedutilities.com/corporate
STRATEGIC REPORT
United Utilities Group PLC 34

Our network assets and treatment works are essential to delivering our services for customers and protecting public health, and our energy assets enable us to generate renewable energy, which helps reduce costs and minimise our environmental impact. It is important we have the right systems and procedures in place to monitor and control our assets efficiently and effectively.
Many of our assets are very long term in nature, such as our impounding reservoirs that can last hundreds of years. We must invest to maintain these assets in good condition so they can continue to provide for customers in the long term. We need to make improvements to ensure we can meet the needs of a growing population, and increasingly high quality standards and tighter environmental consents driven by our quality and environmental regulators.
How we manage this key resourceSince privatisation, the significant investment we have made in our assets has provided substantial benefits to customers, including reduced supply interruptions, reduced sewer flooding incidents, and improved water quality, and we expect to continue with a substantial investment programme for the foreseeable future as
current environmental legislation requires continued investment. We plan for the long term to help us understand where and when we need to invest in our assets, and we monitor the condition, performance and health of our assets.
We manage our assets in a holistic way that seeks to minimise whole-life costs, and we embrace new technology and innovation, which is at the heart of our Systems Thinking approach. This helps us deliver efficient total expenditure (totex) without compromising on quality of service or long-term resilience, saving future operating costs and reducing future customer bills.
We saw in AMP6 the benefit of accelerating our investment to deliver improvements sooner, and we are taking the same approach in AMP7, bringing forward £500 million of our capital expenditure into the first three years of the five-year period.
Our assets and infrastructure projects can affect people who live nearby. We consult with these communities in the planning stage and work hard to minimise odours from our wastewater treatment works and other impacts.
ASSETS Link to risks 1 2 5
As a result of the long-term nature of our assets and the need to spread the cost between the generations of customers that benefit from them, it is necessary to raise financing to fund investment in building, maintaining and improving our assets, networks and services.
It is important that we are able to raise finance when needed to preserve adequate liquidity, and that we manage financial risks such as our exposure to movements in interest rates and inflation, to ensure we maintain long-term financial resilience.
How we manage this key resourceWe maintain a robust capital structure, with a responsible mix of equity and debt financing. We monitor our performance against required thresholds for key credit ratios to help us maintain strong and stable investment grade credit ratings. This gives us efficient access to debt capital markets across the economic cycle.
We maintain relationships with a diverse range of banks and access to a broad and diverse range of sources of financing in a number of markets, across which we seek the best relative value when issuing new debt. We periodically refresh our euro medium-term note (EMTN) programme to
enable efficient debt issuance under pre-agreed contractual terms, and the board delegates authority to the CFO, allowing us to respond quickly to attractive financing opportunities. This helps us to consistently raise efficient financing at a cost cheaper than many of our peers. This year we published our new sustainable finance framework, allowing us to raise debt based on our strong ESG credentials.
Read more about our sustainable finance framework on page 70
We aim to avoid a concentration of refinancing in any one year, and fund long term where possible. Our debt portfolio has a very long average life, and we monitor liquidity forecasts with a policy of having resources available to cover the next 15–24 months of projected cash flows to ensure forward funding needs are met. We have clear and transparent hedging policies covering credit, liquidity, interest rate, inflation and currency risk, and these are aligned with the regulatory model.
FINANCING Link to risks 6
1 Water service
2 Wastewater service
3 Retail and commercial
4 Supply chain and programme delivery
5 Resource
6 Finance
7 Health, safety and environmental
8 Security
9 Conduct and compliance
10 Political and regulatory
OUR PRINCIPAL RISKS
An indication of the current exposure of each principal risk relative to the prior year.
Decreased
Stable
Increased
RISK EXPOSURE
Stock Code: UU. Annual Report and Financial Statements for the year ended 31 March 2021
STR
AT
EGIC
REPO
RT
35

Our business modelOur external drivers and relationships
The way we work is impacted by a number of factors external to our business that we must consider and manage.
NATURAL ENVIRONMENT ECONOMIC ENVIRONMENT
The natural environment is constantly changing, and we must adapt and prepare for future impacts such as climate change and population growth. We can help mitigate climate change by minimising our own environmental impact. Our use and return of water to the environment is a continuous cycle, and returning water cleanly and safely, as well as managing our catchment land effectively, allows this cycle to begin again from the best starting point.
Link to challenges• Protecting and enhancing the natural
environment
• Adapting to a changing climate
We are impacted by market rate movements, such as interest rates and inflation, but we seek to manage these prudently to reduce risk as far as practical. As well as these direct impacts on the company, the economic climate impacts our customers and their ability to pay their bills. We operate in an area with high levels of extreme deprivation, so helping vulnerable customers is particularly important for us.
Link to challenges• Protecting corporate and financial
resilience
• Helping customers with affordability and vulnerability
STAKEHOLDERS REGULATORY ENVIRONMENT
The nature of our work means we are at the heart of communities in our region, and have an impact on a large variety of stakeholders. We own and manage huge areas of land in areas of natural beauty that are valued by locals and tourists alike. It is important, therefore, that we give consideration to what matters to those stakeholders, and we build relationships and consult with them in developing and executing our plans.
Link to challenges• Securing long-term operational
resilience
Sustainable business means preparing for future market reforms as well as meeting current regulatory commitments. We place great value on our relationships with economic, quality and environmental regulators. We engage actively and regularly, both on our ongoing plans, and on consultations for future reforms where we offer our views and influence where we can.
Link to challenges• Securing long-term operational
resilience
• Maintaining trust and confidence
TECHNOLOGY AND INNOVATION POLITICAL ENVIRONMENT
New technologies and innovative ideas present opportunities for us to make things faster, better, safer and cheaper. These can come from a variety of places – across different industries and countries as well as from within our business. We encourage innovation externally and internally at all levels of our business, from our Innovation Lab to our annual CEO Challenge. Technology can also create risks, which is why our approach to cyber security is so crucial.
Link to challenges• Delivering a reliable service in a
changing world
Political decisions have the potential to significantly impact on our operations. As a responsible business, we ensure that we abide by the directions set by government, and stay flexible to adapt to developments. We engage closely with politicians and other policymakers to understand developments which will affect our business, and to communicate the value that United Utilities delivers in the North West, and the UK as a whole.
Link to challenges• Maintaining trust and confidence
One of the key external drivers is what matters to our stakeholders, as our plans and the way we operate are influenced by their views.
Read more on pages 24 to 26
External factors present challenges to how we operate our business. It is important that we are able to identify these challenges and develop plans to respond to them.
Read more on pages 38 to 42
STAKEHOLDERS
HOW WE RESPOND TO CHALLENGES
United Utilities Group PLC unitedutilities.com/corporate 36
STRATEGIC REPORT

To provide great water and more for the North West, we must first consider our economic, quality and environmentalregulation, and the particular characteristics of our region.
Our industry and marketCustomers in England and Wales are served by 10 large licensed water and wastewater companies and smaller companies providing water-only services.
Our regulated entity, United Utilities Water Limited, is the second largest, based on the size of our Regulatory Capital Value (RCV), which represents the value of accumulated investment in the company’s asset base. We serve over seven million people, with over three million household customers making up around two-thirds of our revenue, and over 200,000 businesses. In the non-domestic marketplace, we provide wholesale services to water retailers. As a monopoly provider of essential services, we are regulated by various bodies as set out below.
Our economic regulator (Ofwat) sets the price, service and incentive package that companies must deliver in five-year periods, known as Asset Management Plan periods (AMPs). These packages are based on Ofwat’s methodology and priorities, and consideration and scrutiny of company business plans. We must therefore engage constructively with Ofwat on its future priorities and methodology consultations, and submit high-quality plans to help ensure we receive a determination that targets the best outcomes for us to continue creating value for customers and all our stakeholders, and effectively incentivises us to continue improving performance.
To ensure our plan is robust and balanced, we consult with customers and other
Our regulatorsWe are subject to regulation of our price and performance by economic, quality and environmental regulators, as shown in the diagram.
These bodies exist to help protect the interests of customers and the environment, but they can have competing interests. For example, in agreeing environmental improvements and over what timeframe these will be delivered, we must consider how much it will cost and the need to protect customers from bill shocks. Balancing these interests requires open and continuous dialogue.
The regulatory framework can change significantly in the long term and we have seen substantial tightening of laws and regulations since privatisation.
While much is outside our direct control, maintaining good relationships enables us to engage positively with regulators to influence future policy, aiming to achieve the best outcome for all our stakeholders.
stakeholders (including quality and environmental regulators) and factor in long-term planning and resilience needs.
This was the first year of AMP7, covering the 2020–25 period, and our focus has been on delivering and trying to outperform our final determination through:
• delivering higher customer satisfaction than the other companies in our industry;
• beating the outcome delivery incentive (ODI) targets for operational performance;
• delivering our AMP7 scope within our final determination total expenditure (totex) allowance; and
• raising debt finance at a cost below the industry allowed cost of debt.
Since privatisation, the water industry has invested a significant amount, contributing to improvements in public health and environmental standards, better quality of services, and superior quality drinking water. In its final determinations for AMP7, Ofwat allowed a further £51 billion across the industry to deliver even more improvements.
Our regulators assess our comparative operating performance against the other water and wastewater companies in England and Wales, with the Drinking Water Inspectorate (DWI) assessing performance in water, the Environment Agency (EA) assessing performance in wastewater, and Ofwat assessing customer
satisfaction. The latter two are included in our operational key performance indicators (KPIs).
Our vision is to be the best UK water and wastewater company, so we regularly benchmark our performance against these peers. As well as assessment against our water peers, we benchmark our customer service performance against other leading service providers in our region.
10large licensed water and wastewater companies
2ndlargest waste and wastewater company in England and Wales
£51bnallowance across the industry to deliver further improvements over the 2020–25 period
Read more about our stakeholder engagement on pages 22 to 26Enviro
nmen
tal r
egul
atio
n
Quality regulation
Economic regulation
Stock Code: UU. Annual Report and Financial Statements for the year ended 31 March 2021
STR
AT
EGIC
REPO
RT
37

Link to material issue Resilience
Innovation
Customer service and operational performance
Link to risks1 2 3
Read more on page 39
Link to material issue Political and regulatory environment
Resilience
Customer service and operational performance
Link to risks4 5
Read more on page 39
Link to material issue Natural resources
Environmental impacts
Land management and access
Link to risks7 10
Read more on page 40
Link to material issue North west regional economy
COVID-19
Affordability and vulnerability
Link to risks3
Read more on page 40
Link to material issue Climate change
Resilience
Leakage and water efficiency
Link to risks1 2
Read more on page 41
Link to material issue Cyber security
Corporate governance and business conduct
Trust, transparency and legitmacy
Link to risks8 9
Read more on page 41
Our business modelHow we respond to challenges
Managing short, medium and long-term challenges facing our business.OverviewAddressing the challenges we face is key to delivering a resilient service. How we respond to these can be seen in the material issues and risks identified below.
Delivering a reliable service in a changing world
Helping customers with affordability and vulnerability
Protecting corporate and financial resilience
Securing long-termoperational resilience
Adapting to a changing climate
Responding to theCOVID-19 pandemic
Protecting and enhancing the natural environment
Maintaining trust andconfidence
Link to material issue Financial risk management
Corporate governance and business conduct
Diverse and skilled workforce
Link to risks5 6 9
Read more on page 42
Link to material issue North west regional economy
Health, safety and wellbeing
Affordability and vulnerability
Link to risks5 7 10
Read more on page 44 to 45
Read more about our material issues on pages 26 to 27
Read more about our approach to risk management on page 100
Read more about our emerging risks on page 109
1 Water service
2 Wastewater service
3 Retail and commercial
4 Supply chain and programme delivery
5 Resource
6 Finance
7 Health, safety and environmental
8 Security
9 Conduct and compliance
10 Political and regulatory
OUR PRINCIPAL RISKS
United Utilities Group PLC unitedutilities.com/corporate 38
STRATEGIC REPORT

In an increasingly digitised and instant economy, customers expect more from services now than ever before. This includes the water sector, with high expectations for the reliability of services, the water we supply and the assets we operate.
Many of our assets are ageing compared to other utilities. To meet the expectations of customers and regulators, it is critical that we combine modern technology into our networks and management of customer service. Quick response to issues raised by stakeholders, often through digital means such as social media, is part of this growing expectation.
Ensuring a reliable service in the face of a growing population, changing climate and increasing expectations of service requires integrated long-term thinking and targeting investment to ensure both short and longer-term reliability.
How we respondOur culture of innovation and Systems Thinking approach drive us to adapt our assets and the way we operate to use modern technology and the best new ways of working. Examples include sensors across our network that allow remote monitoring and control from our integrated control centre, and our fleet of alternative supply vehicles (ASVs) that can inject treated water directly into supply while we undertake repairs. We have a substantially enhanced social media presence to respond quickly to stakeholders.
Over one million customers now engage with us digitally, whether this is through our website, our mobile app or on social media. Customers rate us 4.7 our of 5 on the App Store and 4.2 our of 5 on Google reviews.
We monitor the performance and health of our assets, with the help of sensors across the network, and this allows us to be proactive. For example, by monitoring pressure in the water network we can spot issues and fix them before we get a burst, saving costs and sparing customers the impact.
Link to strategic themes We are installing over 100,000
sensors across our networks to proactively manage issues and sort them before customers are impacted.
We balance our capital and maintenance expenditure to ensure affordability and reliability over the short, medium and long term.
We are targeting a 15 per cent reduction in leakage over the 2020–25 period to further protect the reliability of service and water resources.
Our future plansWe have a number of challenging targets for the 2020–25 period that will help improve the reliability of our service, including helping and encouraging customers to use less water. Wider deployment of Systems Thinking will deliver further improvements in the reliability of services.
It is vital to our operational resilience that we have plans in place to manage future challenges and maintain the provision of our essential services to customers. Our assets must be prepared to cope with a growing population, and comply with increasingly challenging environmental constraints in areas such as water abstraction and wastewater treatment levels. We must build increased resilience to cope with the anticipated impacts of a changing climate in the long term, including reducing the risk of sewer flooding.
Balancing the risk of service interruptions against investment for the future is a constant challenge for water companies. Understanding what matters to stakeholders to plan our investment programme requires in-depth engagement and analysis, especially in the context of longer-term challenges that span more than five years.
How we respondIt can take many years and require substantial investment to increase the resilience of existing assets or build new ones, which is why our long-term planning is so important. We have detailed plans in place to anticipate future challenges and understand what we need to do to address these, and we build these needs into our business plans for each five-year regulatory period to ensure we can agree the funding we need to act at the right time. We invested an additional £250 million over 2015–20, from the outperformance we earned over that period, to improve our operational resilience further.
Where possible, we design our assets to work in tandem with the natural environment, which provides more sustainable and efficient solutions, such as our innovative Catchment Systems Thinking approach.
Link to strategic themes Through innovative approaches we
are improving the reliability and resilience of our assets, helping to reduce unplanned service interruptions, and enabling us to be more proactive.
By monitoring the health and performance of our assets we can ensure we invest at the right time in solutions that offer the lowest whole-life cost.
We invest in training centres to build technical skills and promote future skills through our education programmes.
Our future plansSystems Thinking provides opportunities for us to increase our resilience further. Our Haweswater Aqueduct Resilience Programme (HARP) will be progressed through direct procurement for customers in AMP7 and AMP8, addressing our biggest operational risk in a critical pipeline that transports water from the Lake District to Greater Manchester.
CHALLENGE: DELIVERING A RELIABLE SERVICE IN A CHANGING WORLD
CHALLENGE: SECURING LONG-TERM OPERATIONAL RESILIENCE
Stock Code: UU. Annual Report and Financial Statements for the year ended 31 March 2021
STR
AT
EGIC
REPO
RT
39

Our business modelHow we respond to challenges
The socioeconomic situation in the UK is still very challenging and water poverty is an important issue. The COVID-19 pandemic, national lockdowns and slowdown of the economy will only make this more difficult for many customers. How we respond will be crucial to securing and maintaining customers’ trust and confidence in the sector in the years ahead.
Our region suffers high levels of extreme deprivation. Eighteen per cent of households in the North West are affected by water poverty, higher than the national average, and research indicates that many customers who are behind on water charges are behind on other bills and many have a pay-day loan. Our stakeholders are interested in how we provide support for customers in vulnerable circumstances beyond just financial distress, such as disability, first language not being English, or temporary vulnerability brought on by illness or a life event.
How we respondWe have a leading approach to affordability and vulnerability, with the sector’s widest range of assistance schemes. We are helping over 200,000 customers through our affordability schemes, and through our assistance schemes 71,000 customers became water debt free this year.
Customer support has been at the forefront of our activities throughout COVID-19, such as increasing the number of customers eligible for our social tariff, ‘Back on Track’, and providing the option to request a three-month payment holiday without affecting credit scores.
We led the sector in establishing our Priority Services scheme, with dedicated teams providing additional support to customers with physical, mental health, or financial difficulties during an incident. This scheme is now accredited by the British Standards Institute (BSI), and over 128,000 customers are now registered for this support, with more joining every day.
Link to strategic themes We have a wide range of schemes
that help customers struggling with affordability concerns and other vulnerable circumstances.
Initiatives such as our affordability schemes help us manage our household bad debt expense.
Through the charity FareShare we have provided support that has enabled 600,000 meals for struggling families in the North West.
Our future plansThrough bill reductions and financial support we will help over 300,000 customers out of water poverty by 2025 whilst extending our Priority Services offering to over 210,000 customers, and improving the quality and scale of the support we provide.
The UK Government’s current goal is to be the first generation to leave the environment in a better state than we found it. Water management is a key part of this and our industry has a leading role to play. However, the cost of solutions has an impact on customer bills and so we need to balance this goal with the need to maintain affordability and avoid bill shocks.
Environmental regulators set stringent consents for our activities to ensure the environment is protected. We take these obligations seriously and work hard to maintain compliance. This requires striking a balance with environmental impacts, such as the use of natural resources and emissions of greenhouse gases.
Our region is fortunate to have some of England’s finest countryside and wildlife, much of it legally protected being designated as National Parks and Sites of Special Scientific Interest. There is growing realisation, brought further to the fore by the COVID-19 pandemic, of the physical and mental health benefits that access to green space has for people and communities.
How we respondThe EA assesses water companies’ performance across a basket of measures, and we are one of the best-performing companies over the last five years.
Our regulatory framework shapes the way we manage natural resources and our interaction with the environment, and we work with our environmental regulators to agree long-term plans.
A phased, long-term approach to address all of the concerns and interests of our many stakeholders, including environmental regulators, ensures that the necessary work can be delivered without placing too much pressure on customer bills by spreading some of the spend over several years. We work with partners to improve the quality of rivers and bathing waters in our region, providing access to the recreational benefits of the natural environment and boosting the local tourism industry.
Our catchment land is open to the public with millions of visits a year. National lockdowns have increased the popularity of many of our sites and made managing visitor numbers at certain sites difficult. We have worked with local interest groups and local MPs to manage these issues when they arise.
Link to strategic themes Customer engagement tells us that
they value the natural environment in our region and want us to protect and enhance it, while maintaining affordable bills.
We use pioneering catchment projects that combine multiple partners and access to other sources of funding to achieve more together for less.
We provide free public access to our land, much of which is in areas of outstanding beauty, with over nine million visits every year.
Our future plansWe are expanding our Catchment Systems Thinking approach, using more natural solutions to create more value for the environment, and we are reviewing our approach to land management to enable multiple benefits from a targeted approach.
CHALLENGE: PROTECTING AND ENHANCING THE NATURAL ENVIRONMENT
CHALLENGE: HELPING CUSTOMERS WITH AFFORDABILITY AND VULNERABILITY
United Utilities Group PLC unitedutilities.com/corporate 40
STRATEGIC REPORT

The biggest anticipated impact on our natural environment comes from climate change. We must plan well into the future to understand what changes we are likely to experience in our region as a result of climate change, and continually adapt to meet the risks and opportunities this presents.
One of the main opportunities is the potential for water sharing, as our region typically receives more rainfall than the comparatively drier south.
The main risks from climate change are the impact of prolonged severe dry periods, which constrain water resources, and intense periods of heavy rainfall, which increase the risk of flooding and pollution incidents. We need to ensure we have access to resilient water resources, reduce leakage, and encourage less water use in the future to protect this critical resource. We need to ensure our infrastructure can cope with increased surface water to reduce the risk of flooding.
How we respondOur response to climate change risk involves mitigation (minimising our greenhouse gas emissions) and adaptation (ensuring our services are resilient to a changing climate). Where practical, we generate renewable energy on our sites through solar panels, wind turbines, and the use of bioresources at wastewater treatment works, helping to reduce our emissions. We have reduced our carbon footprint considerably since 2005/06 and have set ambitious science-based targets as part of our continued efforts to reduce emissions. We have committed to six pledges to help us achieve significant further reductions in emissions.
Read more about our approach to climate change on pages 86 to 99.
We have detailed plans that set out how we will adapt to meet the challenges of climate change, and we are targeting a 15 per cent reduction in leakage over AMP7.
We work with third parties to encourage sustainable drainage solutions to help cope with surface water in periods of heavy rain and are finalising a Drainage and Wastewater Management Plan with key authorities across the region.
Link to strategic themes We help customers use less water,
with advice and free water saving gadgets, saving them money as well as this precious resource.
Our renewable energy generation helps to reduce our reliance on purchasing energy and therefore save costs.
We have reduced our carbon footprint significantly over recent years and are committed to further reducing our emissions.
Our future plansWe have a detailed 25-year Water Resources Management Plan, a Drought Plan, and we plan to publish our third adaptation report in 2021 setting out how we aim to adapt to meet the challenges of climate change.
Read more at unitedutilities.com/corporate/about-us/our-future-plans
CHALLENGE: ADAPTING TO A CHANGING CLIMATE
Strong relationships are based on trust. Being open, honest and transparent is key to building and maintaining trust and legitimacy. As well as reporting openly this means setting out commitments and delivering on them. Our stakeholders want to know that we are treating employees fairly, protecting customer data, and paying our fair amount of tax.
The increasing pace of globalisation means many customers feel disconnected from many large businesses. This has led to growing calls for companies to demonstrate how they are contributing to society as a whole and operating in the public interest.
In recent years the UK water sector has faced challenges to its legitimacy, amplified by some specific issues at a small number of companies. Consequently, trust has been eroded and questions raised about the ownership structure of the sector, and Ofwat has called for further transparency and disclosure around board leadership and decision-making processes, as well as starting discussion on companies' contribution to public value.
How we respondWe have open and transparent reporting around all of our equity and debt financing arrangements, do not use offshore financing vehicles, and we have secured the Fair Tax Mark independent certification for the past two years.
We have updated our human rights policy which can be found on our website, with links to other related policies, including our modern slavery policy and whistleblowing policy.
Cybercrime has been on the increase and, as the holder of customer information, it is a threat we take very seriously through our policies and dedicated data protection team.
We work with suppliers and contractors whose principles, conduct and standards align with our own. Our key suppliers have committed to United Supply Chain. We are a signatory to the Prompt Payment Code, and fully comply with rules on reporting payments to suppliers.
Link to strategic themes We engage on a continual basis
with customers to understand their expectations in relation to service and behaviour, through activities like our quarterly brand tracker.
We maintain stable credit ratings with key agencies which helps us to retain efficient access to the debt capital markets.
We set qualitative and quantitative performance targets across all of our stakeholders to evidence how we are delivering on our purpose.
Our future plansOperating in a responsible manner is a key driver of trust with our stakeholders. Our continued compliance with the corporate governance requirements of a listed company helps ensure the transparency of our reporting and behaviour.
CHALLENGE: MAINTAINING TRUST AND CONFIDENCE
Stock Code: UU. Annual Report and Financial Statements for the year ended 31 March 2021
STR
AT
EGIC
REPO
RT
41

Our business modelHow we respond to challenges
We believe the most resilient and effective companies have a diverse, engaged and motivated workforce, who can bring their different ideas and perspectives to help us find solutions.
The availability of skilled engineers depends on economic and social conditions, and we need to ensure an appropriate pipeline of skills in younger generations too, especially in the areas of science, technology, engineering and mathematics (STEM). As the world becomes increasingly digital, we need to have the right people and skills to manage our business in the modern world.
Long-term financial resilience starts with a robust balance sheet and management of financial risks. Companies have to be aware of their own financial situation and make sure that they understand the financial resilience of others, such as suppliers and former employees.
How we respond We support employees to achieve their full potential and feel valued and included, regardless of their gender, age, race, disability, sexual orientation or social background.
We build skills resilience internally through training and development, including digital skills.
We have graduate and apprentice schemes, and ambassadors that work with schools and education institutes to encourage the younger generation to pursue STEM careers.
We maintain good relationships with employees, and employee representatives, to ensure an engaged and motivated workforce, and we continually strive to build diversity across all types of role and all levels within our business. We have a Gender Equality Network that helps by providing role models, mentoring and opportunities. Women are represented at all levels of our company, and 38 per cent of our combined board and executive team is female.
As a public listed company, we consistently adhere to the highest levels of governance, accountability and assurance.
We have a strong balance sheet, a secure pension position, and take a prudent approach to financial risk management, which delivers long-term predictability and resilience to financial shocks.
Our clearly articulated policies, covering a variety of market risks, help us reduce our exposure to the economic and regulatory environment, providing more predictable returns.
Link to strategic themes As we did in AMP6, we are
accelerating our capital programme into the early years of AMP7 to deliver service improvements for customers earlier.
Our robust capital structure, relatively low gearing and strong pensions position provide long-term financial resilience and future financial flexibility.
We have award-winning training centres, the only ones in the water industry approved to run Ofsted-accredited programmes.
Our future plansCreating strong relationships with employees and suppliers will help build a resilient value chain, and our focus on good corporate governance and prudent financial management ensures we have a basis for long-term success.
UU Group board(1)
7 3
Executive team(2)
4 4
Senior managers(3)
29 10
Wider employees(4)
3,724 1,915
CHALLENGE: PROTECTING CORPORATE AND FINANCIAL RESILIENCE
(1) Group board as at 31 March 2021
(2) Executive team excludes CEO and CFO, who are included in group board figures
(3) As at 31 March 2021, there were eight male and three female employees appointed as statutory directors of subsidiary group companies but who do not fulfil the Companies Act 2006 definition of ‘senior managers’
(4) Wider employees as at 31 March 2021
United Utilities Group PLC unitedutilities.com/corporate 42
STRATEGIC REPORT

BEING PURPOSE-LED
In shaping our response to COVID-19, understanding the impact on our stakeholders has influenced the measures we adopted.North west communities, already home to some of the country’s most social and economically deprived areas, have suffered as a result of the economic stress and job losses caused by the pandemic. As a consequence, more people have turned to food banks to ensure there is food on their tables. Through our work helping vulnerable customers across the region and tackling affordability issues, we have a better understanding of the challenges faced by some of our communities and we wanted to help in some way.
Through a combination of director salary sacrifice, matched by the company, and employee donations, we have donated £240,000 to food distribution charity FareShare. The charity helps redistribute surplus food, which would otherwise go to waste, to 250 charities and community groups which provide meals to people in need – including children’s breakfast clubs, domestic violence refuges, homeless shelters and drug and alcohol rehab units. Lockdown has been particularly challenging and FareShare has been especially busy dealing with increased demand. At the peak of the COVID-19 crisis, FareShare Greater Manchester was distributing enough food for around 200,000 meals each week. Two thirds of people accessing FareShare food are children and families.
Our donation helps FareShare meet this increased demand and will provide families with 600,000 meals. Our funds have given FareShare much needed financial support and the money has been used to purchase a brand new long-wheel Mercedes Sprinter delivery van. This will deliver over six tonnes of food per week to frontline charities, schools and foodbanks across Greater Manchester.
More details on our response to COVID-19 can be found on pages 44 to 45
Generating value for:Communities
Customers
Employees
Environment
FareShare donations support communities in need
At the peak of the COVID-19 crisis, FareShare Greater Manchester was distributing enough food for around 200,000 meals each week.
STR
AT
EGIC
REPO
RT
43Annual Report and Financial Statements for the year ended 31 March 2021Stock Code: UU.

Our business modelHow we respond to challenges
How our responsible approach has helped us make a difference during the COVID-19 pandemic
How we respondedWe serve some of England’s most socioeconomically deprived communities, many of which have been severely impacted by COVID-19. We have prioritised supporting customers, the wider communities and our colleagues during this difficult time. Recognising the importance of water for public health and sanitation, especially with the emphasis placed on washing hands, we have maintained water supplies and wastewater services throughout the pandemic, keeping our employees safe while they carried out their duties.
Our communication with stakeholders during this time has been more important than ever, whether that has been encouraging customers to get in touch if they have been impacted financially by the pandemic or issuing guidance reinforcing government guidelines to protect employees, suppliers and customers. Our consultation for the Haweswater Aqueduct Resilience Programme (HARP) was stopped in its tracks by COVID-19. We changed approach, developed a virtual consultation, and as a result we have seen better engagement than our traditional approach.
Board oversight COVID-19 has changed ways of working for everyone and our board has been no exception. We have continued to hold scheduled board meetings in a virtual format to ensure that the board's oversight has remained effective. We were able to hold a number of events during the year, including a board strategy day, conducting external board evaluation and providing our major shareholders with the opportunity to virtually meet with the Chairman.
Outlook Lessons we have learnt from the pandemic will shape how we deliver for stakeholders in the future. We now have an even better understanding of our customers and how we can support them. We have been challenged to think more creatively about how we engage with our stakeholders. The pandemic has accelerated our digital strategy and changed our ways of working in such a way that we do not see a return to how we worked before.
Although there remains a degree of uncertainty as to how the UK and the economy will continue to recover after the pandemic, it has taught us that our sustainable and responsible approach to business means we can tackle future challenges as they emerge.
Our response at a glance
600,000meals funded via local foodbanks
7,300pupils supported via Home Learning Hub during school closures
67apprentices and graduates recruited
Staff Outreach Schemesupporting colleagues’ struggling families
United Utilities response timeline
31 March 2020
June 2020Innovated to ensure apprentices sat final exams
June 2020Extended the scope of our social tariff, securing an additional £15m of support
Mar 2020Moved 60% of our workforce to working from home
May 2020Launched Staff Outreach Scheme providing financial support to employees
Apr 2020Temporarily accelerated payment terms from 14 to 7 days
May 2020Launched our Home Learning Hub
Employees
Environment
Employees
Environment
Communities
Customers
Communities
Customers
Customers
Media
United Utilities Group PLC unitedutilities.com/corporate 44
STRATEGIC REPORT

31 March 2021
Jan 2021Welcomed our largest ever apprentice intake
Nov 2020Pledged support to the Kickstart Scheme
Nov 2020Charitable donations made to FareShare
Jan 2021Widened eligibility for ‘Back on Track’ social tariff
Communities
Customers
Communities
Customers
July 2020Virtual consultation with local communities on HARP
Communities
Customers
Customers
CommunitiesCommunities
Customers
Communities
Customers
CustomersCommunities
Customers
Customers
EmployeesCommunities
Customers
Employees
Environment
How we responded We have continued to support young people in our region throughout the pandemic. Recruitment of apprentices and graduates has continued uninterrupted and we are supporting the Kickstart Scheme, offering training and meaningful work placements, with the support of our supply chain partners, to an initial 250 young people.
This year, as part of our ongoing charitable donations, we supported the FareShare charity in delivering 600,000 meals to struggling families via local foodbanks and replaced one of the charity’s delivery vans, helping to ensure meals get to families in need over the next eight years.
During school closures our education team created a Home Learning Hub, providing teachers and children with home schooling material.
How we responded Recognising affordability has been even more important during the pandemic, we took swift action and were the first company to secure support and regulatory approval for an extension to our social tariff, with an additional £15 million available to help customers keep out of debt.
We are committed to providing over £71 million of financial support over AMP7, and we have accelerated payments this year to provide much needed assistance to struggling households.
We have increased the extensive financial assistance we already provide, for instance by widening eligibility for our ‘Back on Track’ social tariff.
How we responded We facilitated home working for over 3,000 of our employees with the remainder of our workforce continuing to work at COVID-secure facilities.
A huge focus has been on the wellbeing needs of our colleagues, in particular mental health support. We have delivered initiatives to help build resilience across our workforce, including e-learning and bitesize webinars.
We have not furloughed any employees, but, recognising that our employees and their families have not been immune to the hardships as a result of changing circumstances, we created a Staff Outreach Scheme to provide one-off grants through a confidential application process.
EnvironmentCommunities
Customers
Environment
InvestorsCommunities
Customers
Shareholders
SuppliersCommunities
CustomersMedia
How we responded As we emerge from the pandemic, we are determined to play our part in supporting a green recovery in the North West. We have accelerated investment plans, spending more over the early years of AMP7 than our original business plan. This will support recovery to build a greener, more sustainable future, all while helping the region to recover from the economic impact of the COVID-19 pandemic.
Our new investment plans include delivering environmental improvements in rivers, protecting habitats, combating invasive species, enhancing water quality, drainage and reducing pollution. This investment will generate lasting benefits for the environment, for customers and for communities.
How we respondedThroughout the pandemic we have maintained regular contact through calls and video calls with both existing and new investors. This year we offered our major shareholders the opportunity to meet, albeit virtually, with the Chairman as part of our active investor relations programme.
We hosted our first virtual capital markets day in March, allowing us to share updates with our investor community on developments within our business. This year focused on key areas of value creation – innovation and Systems Thinking, customer service, totex and financing.
How we respondedWe have continued to work closely and actively engage with our supply chain during the pandemic. Looking out for the health, safety and wellbeing of our suppliers has been as important to us as that of our employees.
We continued with the majority of our construction programme throughout the national lockdowns, supporting our supply chain partners.
We acted swiftly at the beginning of the pandemic to accelerate payments from 14 days down to seven days to help with cash flow and offered a range of payment options.
Communities
Customers
Stock Code: UU. Annual Report and Financial Statements for the year ended 31 March 2021
STR
AT
EGIC
REPO
RT
45
Media
Communities
Customers
CustomersEmployees
Environment
Key: Suppliers Communities Customers Employees

Our business modelHow we plan for the future
Our approach to long, medium and short-term planning horizons helps us continue fulfilling our purpose in a sustainable and resilient way.
Our approach to planningWe take an integrated approach to everything we do. To help us create and prioritise our plans, we consider:
• what the material issues are, to stakeholders and to our ability to create value;
• our assessment of principal risks and uncertainties;
• our environmental, social and governance (ESG) commitments; and
• how our plans will fit with our Systems Thinking approach.
We undertake planning for long, medium and short-term horizons.
Long-term (25+ years) planning helps us identify what we need to do to address challenges and opportunities that may arise, so we can ensure that we are able to provide our essential service to customers far into the future.
These long-term plans influence our medium-term (five to ten years) planning, which sets out how we will deliver the commitments of our final determination for each regulatory period, as well as our non-regulatory activities, such as renewable energy.
Short-term (one year) planning enables us to monitor and measure progress against our five-year plans and regulatory targets. We retain flexibility in our one-year plans to meet our five-year targets in the most effective and efficient way as circumstances change.
Our plans take into account the issues that have been identified as material, and our assessment of principal risks and uncertainties.
Read more about our material issues on page 27 and our risk management on pages 100 to 109
We continuously assess our performance against our plans using key performance indicators (KPIs) and other performance metrics of interest to our stakeholders.
Read more about how we measure our performance on pages 50 to 51
MATERIALITY AND RISK ASSESSMENT
MONITORING PERFORMANCE
1 year 5 years 25+ years
Our planning horizons
Our business is very long term by nature and we must build resilience to ensure we can continue to provide this essential service.
Medium-term planning reflects our five-year regulatory periods, and aims to help us work towards our long-term plans.
We set annual targets but retain flexibility in these short-term targets to respond to challenges and meet our five-year goals in the most effective and efficient way possible.
United Utilities Group PLC unitedutilities.com/corporate 46
STRATEGIC REPORT

2022
2050
2023
2050
2025+
2045
20302030
2025
2035
2050
2030
2025
We aim to have 210,000 customers registered for our
Priority Services scheme
We aim to improve water quality in 1,315 kilometres of rivers across the North
West
We will deliver our service using natural capital in a sustainable, efficient and
resilient way
We commit to reducing our scope 1 and 2 greenhouse gas (GHG) emissions by
42 per cent in line with our ambitious science-based
target
We will publish our Water Resources
Management Plan and Drainage and Wastewater
Management Plan
We will work to enable future national water
trading
We will install additional water meters to achieve
coverage of around 75 per cent of households
We will work with others to achieve ‘Blue Flag’ beaches
along our coastlines
We aim to have reduced leakage by 50 per cent
We aim to achieve our long-term science-based target for net zero
GHG emissions aligned to the Paris Agreement's ambition to limit global warming to 1.5°C
We will extend our integrated water supply
network into West Cumbria
We will make bills affordable for all customers
in line with the industry’s Public Interest Commitment
We will have reduced water demand to 110 litres per
person per day
STR
AT
EGIC
REPO
RT
47Annual Report and Financial Statements for the year ended 31 March 2021Stock Code: UU.

Our business modelHow we plan for the future
Our approach to long-term planning ensures we are responding to long-term challenges and opportunities.To maintain a reliable, high-quality service for customers far into the future, we have to look a long way ahead to anticipate and plan for the changes and core issues that are likely to impact on our activities.
This involves looking at a lot of current and predictive data from various sources, such as economic forecasts, expectations for population growth in certain areas, climate and weather predictions, legal and regulatory consultations and changes, as well as the age and condition of our assets, and keeping track of innovations and technological advancements. We review this information as part of our long-term planning and our risk management processes.
Over the next 25+ years we have identified many challenges and opportunities that we are likely to be faced with, including:
• Climate change;
• Population growth;
• A more open, competitive market;
• Water trading;
• More stringent environmental regulations;
• Developments in technology; and
• Combining affordable bills with a modern, responsive service.
There is a section of our website dealing with our future plans, where we examine the challenges ahead and how we will focus our resources and talents so we can meet them.
Read more at unitedutilities.com/corporate/about-us/our-future-plans
This includes our 25-year Water Resources Management Plan (WRMP) covering the 2020–45 period, which was developed and published in 2019 following consultation with stakeholders, and our Drought Plan, which was published in 2018 with an amendment appendix in 2018/19. These long-term plans set out the investment needed to ensure we have sufficient water to continue supplying our customers, taking into account the potential impact of climate change, and the actions we will take to manage the risk of a drought. In 2023 we will publish an update to our WRMP and, for the first time, publish a Drainage and Wastewater Management Plan (DWMP).
We create long-term value for stakeholders by:
• Systems Thinking and innovation;
• long-term planning and responding to challenges and opportunities, including management of water resources;
• sustainable catchment management;
• disciplined investment, based on a sustainable whole-life cost modelling approach, to ensure the resilience of our assets and network;
• investing in our employees to maintain a skilled, healthy and motivated workforce;
• close collaboration with suppliers; and
• maintaining a robust and appropriate mix of debt and equity financing.
Long-term planningOur medium-term planning aligns with delivery of our plans as set out in Ofwat’s final determination. The majority of the group’s activities sit within our regulated water and wastewater business, therefore our medium-term planning predominantly sets out how we will deliver against the final determination (FD) we receive from Ofwat for each five-year period. The business plans we submit focus mainly on the subsequent five-year AMP period whilst providing a high-level view of the following AMP. This provides medium-term planning visibility of between five and ten years at any one point in time.
It is important that our ambitions align with those of our regulator, therefore we carefully evaluate all consultation and methodology publications from Ofwat and engage with them to put forward our views and help ensure a balanced approach that creates value for all stakeholders.
Our business plans are designed to help us work towards our long-term plans, build and maintain resilience, and ultimately fulfil our purpose. We engage in extensive research to ensure the plans we put forward are robust and balanced, targeting the best overall outcomes for all our stakeholders.
Following scrutiny and challenge from Ofwat, we receive the FD, which sets the price (in terms of total expenditure and customer bills), level of service, and incentive package that we must deliver over the five-year period, and an allowed return we can earn (expressed as a percentage of Regulatory Capital Value).
25+ years
5–10 years
Medium-term
United Utilities Group PLC unitedutilities.com/corporate 48
STRATEGIC REPORT

When we receive the FD, we refine our company business plan for any changes, such as in allowed expenditure or performance level targets, and we must decide whether to accept the FD.
Our business plan submission for 2020–25 was awarded fast-track status by Ofwat and we were given one of the lowest cost challenges in the sector, reflecting the efficient totex proposals we put forward.
We made a flying start to our 2020–25 plans by investing an additional £130 million in 2019/20, helping us deliver a strong start to this new period. The acceleration of our capital programme during the 2015–20 period helped us deliver improvements early and we are adopting the same strategy in this regulatory period with around £500 million of total expenditure brought forward over years one to three of the five-year period. Our total expenditure for this period will be extended by £300 million, with this expenditure extending our environmental programme.
Our strategy of delivering the best service to customers at the lowest sustainable cost in a responsible manner helps us create value for our stakeholders by delivering or outperforming the FD. Since 2015 we have published an Annual Performance Report (APR), which reports our regulatory performance in a format that helps customers and other stakeholders understand it and compare it with other companies in the sector. This includes reporting of Return on Regulated Equity (RoRE), which is made up of the base allowed return and any outperformance/underperformance, on an annual and cumulative basis for each five-year period.
In the short term we set annual, measurable targets but we retain flexibility to enable us to respond to challenges that may arise.Short-term planning helps us work towards our medium and long-term goals and provides us with measurable targets so that we can continually monitor and assess our progress, which helps us ensure the long-term resilience and sustainability of our business.
Before the start of each financial year, we develop a business plan for that year, which is reviewed and approved by the board. This sets our annual targets, designed to help deliver further improvements in service delivery and efficiency, and to help move us towards achievement of our five-year goals. Performance against these annual targets determines annual bonuses for executive directors and employees right through the organisation, who are remunerated against the same bonus targets as the executive team.
To avoid short-term decision-making and ensure management is focused on the long-term performance of the company, as well as these annual targets, executive directors are remunerated through long-term incentive plans that assess three-year performance, measured during the current period through Return on Regulated Equity and a customer basket of measures.
See details of the 2020/21 annual bonus and vested long-term incentive plans for our executive directors on pages 168 to 170
The executive directors hold quarterly business review meetings with senior managers across the business to monitor and assess our performance against our annual targets, helping to ensure that we are on track to deliver our targets for the year, and longer term.
It is vital that we retain flexibility within this short-term planning so we can adapt to meet challenges that may arise during each year, and deliver high quality and resilient services to customers in the most effective and cost-efficient way possible. This may involve bringing enhancements forward to deliver improvements for customers early, investing further into the business to maintain service, or delaying projects to occur later in the regulatory period in order to prioritise expenditure and allow our people to spend their time dealing with any unexpected challenges that arise.
The challenges presented by COVID-19 are a clear example of why this flexibility is crucial. We enacted our robust contingency plans, enabling us to quickly and efficiently move thousands of our people to home working and introduce additional safeguarding measures for those that remained on sites or in the field, while maintaining reliable water and wastewater services that are critical for public health at this time.
Read more about our response to the challenges of COVID-19 on pages 44 to 45
planning
1 year
Short-term planning
Information on companies’ regulatory performance can be found at discoverwater.co.uk
Our APRs are published in July each year at unitedutilities.com/corporate/about-us/performance
Stock Code: UU. Annual Report and Financial Statements for the year ended 31 March 2021
STR
AT
EGIC
REPO
RT
49

How we measure our performance
To measure progress on delivering our purpose and creating value for all our stakeholders, we monitor and measure our performance against each stakeholder group.
Shareholders
Communities
Customers
Delivering our purpose
Media
Environment
Employees
Environment
Customers
Read about how we generated value for customers on pages 55 to 58
Read about how we generated value for communities on pages 52 to 54
Read about how we generated value for suppliers on pages 71 to 73
Read about how we generated value for investors on pages 67 to 70
Read about how we generated value for the environment on pages 63 to 66
Read about how we generated value for employees on pages 59 to 62
Suppliers Customers
Investors Employees
Communities
Environment
STRATEGIC REPORT
unitedutilities.com/corporate United Utilities Group PLC 50

OverviewDuring the 2015–20 period, we reported against a range of operational KPIs that were aligned to our strategic themes to demonstrate how we realise our purpose and deliver on our vision.
Our purpose drives us to create long-term value for all our stakeholders, so between 2020 and 2025 we are measuring our performance by reference to the value we create for each of our stakeholder groups.
Operational KPIsOur operational KPIs include one main metric for each stakeholder group, based on the top material issues identified through stakeholder engagement. A description of these operational KPIs, our targets for each, and our performance against these targets can be seen on pages 52 to 72.
Our executive bonuses and long-term incentives are closely aligned to financial and operational KPIs, as highlighted in the remuneration report on pages 168 to 170.
Financial KPIsOur financial KPIs assess both profitability and sustainability of our business from a financial perspective. They are largely the same as the 2015–20 period, with the addition of having low dependency defined benefit pension schemes with nil deficit. This recognises the increasing importance of this strong and secure position for our people, representing a significant driver of relative value.
A description of these financial KPIs and our performance against our targets can be seen on pages 74 to 75.
OverviewOur KPIs provide a snapshot of our performance across a variety of areas, but these are by no means the only metrics by which we monitor and assess our performance on a regular basis, and we report against other metrics both internally and externally.
As discussed on pages 22 to 26, we engage with a variety of stakeholders and this gives us a view of what matters most to them. We report on a selection of other metrics on pages 52 to 72 of this report, based on the measures shown to be of highest interest to our stakeholders.
For example, for customers our KPI is Ofwat’s measure, C-MeX, but on page 57 we report on Ofwat’s D-MeX measure, the level of customer complaints, vulnerability support, customers lifted out of water poverty, and the impact of water efficiency measures.
On environmental performance, our KPI is the overall assessment by the Environment Agency and on page 65 we report on more specific environmental performance indicators, such as leakage reduction, climate change, proportion of waste going to beneficial use rather than landfill, and measures of natural capital.
We regularly report on numerous corporate responsibility performance measures on our external website.
All these performance indicators have received an appropriate level of assurance, such as independent third-party verification, regulatory reporting assurance processes or through our own internal audit team.
OverviewPerformance against our regulatory contract is monitored and assessed each year, and reported within an Annual Performance Report (APR), as required by Ofwat for all water companies since the start of the current regulatory period in 2015/16, replacing the previous ‘regulatory accounts’.
Many of our performance indicators relate to regulatory performance on a high level, and it is within the APR that more detail can be found on the components within these measures, as well as narrative detail about our performance during the year.
There is financial information contained within the APR. This relates only to the regulated company and its appointed activities, and is calculated and prepared in accordance with the regulatory accounting framework. This differs from IFRS reporting, and a reconciliation to IFRS reporting is provided in our APR. For the purposes of clarification, our financial KPIs relate to our performance at the group level, and are calculated in line with the definitions given in this report.
Our APRs for previous years are available on our external website, and the APR for 2020/21 will be published in July 2021.
OUR KEY PERFORMANCE INDICATORS
OUR OTHER PERFORMANCE INDICATORS
OUR ANNUAL PERFORMANCE REPORT (APR)
In addition to our KPIs and regulatory targets, we monitor our performance against an assortment of ESG metrics that are of interest to our many stakeholders.
We report against these within this report on page 84 and on our website at unitedutilities.com/corporate/responsibility/our-approach/cr-performance
FIND MORE INFORMATION ABOUT OUR EXTERNAL ACCREDITATIONS
Stock Code: UU. Annual Report and Financial Statements for the year ended 31 March 2021
STR
AT
EGIC
REPO
RT
51

Our performance in 2020/21Operational performance
Our performance at a glance
Supporting communities to be stronger – our work puts us at the heart of local communities in the North West.
How we deliver value to communitiesShort term• We look after beautiful landscapes
and beaches and open our land to the public, which supports the regional tourism industry and offers communities health and wellbeing benefits through access to relaxation and recreation.
• Working in partnership with others means we can accomplish more in tackling mutual issues, such as partnering to develop employability skills for those who need it most.
• Engaging with communities near our operations and projects builds understanding and trust between all involved.
Long term• Early career and outreach schemes
break down barriers to employment and increase social mobility, reducing welfare costs.
• Managing land responsibly means we leave the north west environment in a better condition for future generations.
• We work with teachers and children to raise awareness about water and the natural environment, giving the next generation an understanding of the true value water brings and how we can all play our part in protecting the services nature provides.
Link to strategic themes Promoting our support services
and campaign messages places us at the heart of communities and builds trust with hard-to-reach groups.
By working with community partners we can share resources, access new funding opportunities and achieve more together.
Providing access to our land enables communities to enjoy the physical and mental wellbeing benefits that green spaces can bring, helping reduce the burden on health services.
CommunitiesCommunities
Customers
Link to material issue Land management and access
Community investment
Trust, transparency and legitimacy
Read more about our approach to materiality on page 27
Link to risks9
Read more about our principal risks on pages 104 to 107
READ MORE
Our key performance indicator to measure value created for communities during 2020–25 is community investment, and we target increasing our investment by at least 10 per cent compared with the average between 2010 and 2020.
OPERATIONAL KEY PERFORMANCE INDICATOR
Community investmentDefinitionTotal community investment as measured by the Business for Social Impact* (B4SI) method (*previously LBG).
TargetIncreasing our investment by at least 10 per cent compared with the average between 2010 and 2020.
Status Close to achieving target but more work to be done
PerformanceThe average investment between 2010 and 2020 was £2.56 million per annum and in 2020/21 we supported communities through direct community investment of £2.15 million (calculated
using the B4SI method). This is slightly lower than our target, mainly as a result of much lower community activity as a result of the impact of COVID-19. However, we contributed an additional £2.7 million from our Trust Fund to help those struggling to pay their bills and a further £15 million was made available to help customers reduce their water bill to an affordable amount through extending our social tariff. As we emerge from the pandemic, and events can safely recommence, we expect our community investment to increase.
• 2019/20: £2.26 million
• 2018/19: £2.93 million
• 2017/18: £3.65 million
• 2016/17: £3.59 million
STRATEGIC REPORT
52 unitedutilities.com/corporate United Utilities Group PLC

OverviewOur work puts us at the heart of local communities in the North West, where customers and employees live and work. We understand the impact our work can have on everyday lives across our region, and we seek to play an active role in tackling the issues that matter most to these communities through active engagement and investment, developing strong relationships and building partnerships where we work together to generate solutions. We also look after beautiful landscapes and open our land to the public, which supports the regional tourism industry and offers physical and mental health and wellbeing benefits for communities through access to relaxation and recreation.
Helping young people We are committed to supporting the Government’s Kickstart Scheme by providing 250 placements to young people, working with our supply chain. Our new employees will have a dedicated placement manager as well as a Kickstart skills coach, and will also receive job-related and employability skills training to enhance their CVs in order to help secure employment in the future. We work with local schools and training facilities to promote skills for the future, including youth programmes that support young people not in education, employment and training (NEETs) to help improve social mobility in our region and break down barriers in bringing people from all backgrounds into employment. It is estimated this programme has generated over £9 million of social value through avoided welfare costs and new employment. During the school closures brought about by the pandemic lockdowns, our education team created a Home Learning Hub that supported teachers and children across the region, and even extending overseas, with materials for home schooling. Recruitment of apprentices and graduates has continued uninterrupted, with the help of some online challenges, skills sessions and live streamed assessments while face-to-face interaction was limited. We have continued to create our early careers pipeline, welcoming 67 apprentices and graduates in 2020/21.
Social mobility In October we hosted the sector’s first Social Mobility Summit, an online event at which more than 100 organisations joined us for the launch of our Opportunity Action Plan – another first for the sector – which aims to identify and share best practice and leading-edge thinking from businesses that are successful in promoting social mobility, including case studies from our own employees reflecting the progress we have already made.
Charitable support Our ongoing charitable support, including a voluntary salary reduction by board
members at the height of the COVID-19 pandemic, has helped provide support to local communities. One of our donations to the FareShare charity has supported them in delivering 600,000 meals to struggling families across the North West via local foodbanks, and will replace one of the charity’s delivery vans, helping to ensure 6.4 million meals get to families in need over the next eight years.
Community engagement We build trust with local communities through effective engagement, whether that is around large capital projects or day-to-day management of our landholdings. Our consultation for the Haweswater Aqueduct Resilience Programme (HARP) was stopped in its tracks by COVID-19, halfway through the traditional face-to-face exhibitions. We changed approach, developed a virtual consultation, with accessible content advertised through letters and social media, and, as a result, we have seen better engagement. We received over 100 per cent more feedback compared with the traditional approach, with over 8,000 hits to the specific HARP section of the website. Sixty-nine per cent of all feedback has been supportive of the plans. Given the success of this approach, we will continue with virtual consultations for other aspects of this project.
250young people to be supported through the Kickstart Scheme
£9m social value generated through our youth programme
OTHER PERFORMANCE INDICATORS
Measure2025 target
2020/21 performance
StatusAnnual
performanceAgainst 2025
target
KPI: Community investment 10% increase
(£2.82m)£2.15m
Partnership leverage 1:4 1:7
Percentage of participants who remain employed six months after completing an early careers or outreach scheme with United Utilities
50–60% 83%
Number of children benefiting from education materials
20,000 19,120
Visitor experience/ satisfaction measure at recreation sites
Dependent on 2021 baseline
Baseline in 2021
Status key:
Annual performance Against 2025 target
Met expectation/target Confident of meeting target
Close to meeting expectation/target Some work to do
Behind expectation/target Target unobtainable
Baseline year Baseline year
Access to our land for recreational use As a result of COVID-19 restrictions, there has been a marked increase in the number of people visiting our catchment land to enjoy the countryside and benefit from open spaces. While the majority of visitors have respected the countryside, sadly a small minority have not. Our teams have worked hard to address this anti-social behaviour through a variety of methods, including targeted social media campaigns on issues such as moorland fire risk, improved site signage and the creation of local stakeholder groups. We are currently testing several ideas to better connect visitors to the land and to encourage them to behave responsibly.
Stock Code: UU. Annual Report and Financial Statements for the year ended 31 March 2021
STR
AT
EGIC
REPO
RT
53

BEING PURPOSE-LED
Our performance in 2020/21Operational performance
We’ve committed to supporting the Government’s Kickstart Scheme, taking on an initial 250 young unemployed people over the year and integrating those with potential into our apprentice schemes – expanding our early careers approach.Kickstart funds six-month placements with firms for 16–24 year olds who are claiming Universal Credit and are at risk of long-term unemployment. The Government provides a grant of £1,500 per recruit to support skills development.
The recruits will be found placements in customer service, operational support, office administration, grounds maintenance and labs support, and our supply chain partners will also provide placements to support us to achieve our aim. All will be recruited on a six-month fixed-term contract and will have a dedicated placement manager and a Kickstart skills coach. They will receive job-related and employability skills training supported by our learning and development team.
Customer services and people director, Louise Beardmore, explained: “Kickstart is a brilliant initiative that aims to help companies give work opportunities to young people who have borne the brunt of the economic slowdown during COVID-19.
“We know the North West has some of the highest levels of deprivation in the UK and this year life has got even tougher. We’re absolutely certain there are some fantastic young people out there who just need a break. For many of the people who apply this will lead to full-time roles, and others will leave us with some great new skills to take to other employers.”
We already run several schemes to support young people into work. We recruit around 30 apprentices every year from across the North West, and our graduate scheme recruits people from targeted communities based on their diversity and inclusion data. We also have a Youth Programme for young people between 18 and 24 years who are not in education, employment or training. Around 90 per cent of youth programme participants have a disability or long-term health condition and are from an area of low social mobility and high deprivation.
We have taken part in the Department for Work and Pensions' ‘mentoring circles’ initiative which provides mentoring, support and coaching to young unemployed people who are Black, Asian or from ethnic minorities, have a disability or long-term health condition.
Generating value for:Communities
Customers
Employees
Environment Media
Kickstarting careers in the North West
Kickstart is a brilliant initiative that aims to help companies give work opportunities to young people who have borne the brunt of the economic slowdown during COVID-19.
STRATEGIC REPORT
unitedutilities.com/corporate 54 United Utilities Group PLC

Our performance at a glance
Caring for customers through trusted relationships – we put customers at the heart of everything we do.
How we deliver value to customersShort term• We focus on delivering a great service
so customers can simply get on with their lives and not have to worry about their water and wastewater services.
• When they do need to contact us, we are helpful, friendly and supportive, talking and listening to customers so we can understand and meet their expectations.
• We maintain bills that are good value for money, providing help and support to those who struggle to pay.
Long term• Our water and wastewater services
make a major contribution to the long-term health and wellbeing of customers in the North West.
• Through long-term financing and the regulatory framework, we are delivering multi-million pound infrastructure projects to improve services and resilience for the long term. We ensure the cost of this is shared fairly and affordably between those that benefit now and in the future.
• Providing additional help to vulnerable customers builds long-term trust relationships.
Link to strategic themes We will continue to invest in our
assets and people over the next five years to meet the stretching targets customers support.
By achieving sustainable cost reductions we can provide an efficient service, keeping bills low and maintaining good value for money.
We provide assistance schemes to those who need it most and provide practical advice on how to manage water in the home.
CustomersCustomers
Link to material issue Customer service and operational performance
Affordability and vulnerability
Leakage and water efficiency
Read more about our approach to materiality on page 27
Link to risks1 2 3
Read more about our principal risks on pages 104 to 107
READ MORE
Our ranking in Ofwat’s customer measure of experience, C-MeX, is our key performance indicator for customers as it is influenced by a broad range of service components and so best satisfies the spectrum of what matters to customers.
C-MeXDefinitionOfwat's customer measure of experience, comprising two surveys: the customer service survey; and the customer experience survey.
TargetTo be in positive reward territory.
Status Achieved/confident of achieving target
PerformanceAt the end of the year we are ranked fifth out of 17 companies, the highest listed company, achieving a reward of
£2.1 million in the first year of AMP7. While our written customer complaints performance for the year has fallen below our targets, in part reflecting the higher level of complaints during the dry spring in 2020 and our focus on collecting cash from those customers who are able to pay, but choose not to, we still expect our relative performance to be upper quartile compared with the other water and wastewater companies.
C-MeX has replaced SIM as Ofwat's measure of customer satisfaction for AMP7. As 2020/21 is the first year of the measurement period, prior year comparators are not provided this year.
OPERATIONAL KEY PERFORMANCE INDICATOR
STR
AT
EGIC
REPO
RT
55Annual Report and Financial Statements for the year ended 31 March 2021Stock Code: UU.

Our performance in 2020/21Operational performance
support to those impacted financially by the pandemic and struggling to pay. We have achieved all of our reputational performance commitments, most notably continued certification to BSI standard for our Priority Services scheme that supports over 133,000 customers, and we were recognised as providing the best customer support initiative at the Utilities and Telecoms Awards for the support provided to customers during the pandemic. We are one of only 14 brands in the UK with the Institute of Customer Service Accreditation with distinction.
For developers, customer experience is measured in AMP7 by D-MeX, of which there are two elements: quantitative (service level agreement performance); and qualitative (customer satisfaction survey). For 2020/21, we are ranked first in the sector for our quantitative performance, with final qualitative results expected later in the year. We estimate our overall industry position to be fourth. This strong performance reflects the transformation programme we are delivering in this area that continues to deliver tangible and much improved results, benefiting all developers who are building in the North West.
Operational performance for customers Our AMP7 business plan includes 46 customer commitments, delivering the outcomes that are important to customers and measured through customer ODIs.
Our performance has been strong across the broad range of our activities with us having met or exceeded over 80 per cent of our performance commitments for the year. We have delivered particularly strong performance in the areas of hydraulic flood risk resilience and pollution, where we have delivered another year of sector-leading performance with no serious pollution incidents for the second consecutive year. We were also able to deliver leakage at its lowest ever level and have more than halved supply interruptions to customers – outperforming our targets on both these key service delivery measures.
We entered AMP7 knowing that our biggest challenge would be against our internal flooding ODI and this is the measure that has yielded the largest penalty this year. As part of the £300 million extension to our AMP7 totex plans, we will be investing around £100 million in Dynamic Network Management (DNM) – a ground-breaking application of Systems Thinking using state of the art sensors and predictive machine intelligence to move to a more proactive management of our wastewater network. This new digital capability is expected to improve service to customers and improve performance against our internal flooding ODI.
£15mextension to our social tariff to support customers affected by COVID-19
200,000customers benefiting from our support schemes
We work hard to encourage customers to save water through water efficiency programmes, helping them to preserve this precious resource and save money on their bills. More customers have spent more time at home during the pandemic and used more water for sanitation, increasing per capita consumption (PCC) measures for 2020/21. Recognising that the long term impact of COVID-19 remains uncertain and that there may also be a variety of drivers of changes in behaviour, Ofwat has proposed to assess company performance for this customer ODI at the end of the AMP when fuller facts and evidence of absolute and relative company performance are available.
We have our own in-house app development capability and this is paying dividends in creating digital capability for our field and customer-facing teams with agility, flexibility and at low cost. Our new voids app which helps us to easily identify unbilled but occupied properties has contributed to a 93,000 reduction in the number of void properties in the year, helping us earn maximum customer ODI reward on voids this year and underpins a further £24 million reward over the AMP.
Haweswater Aqueduct Resilience Programme (HARP)In November 2020, we successfully completed the replacement of the Hallbank section of the Haweswater Aqueduct, part of a critical asset that delivers around a third of our total water production to 2.5 million people in Cumbria, Lancashire and Greater Manchester. Work to replace the majority of the aqueduct is expected to be undertaken using a direct procurement for customers (DPC) approach and we have been preparing for a DPC tender in 2021/22. If the tender process proceeds as planned, contract award is anticipated in 2023, with construction to begin later in the AMP.
Cash collection Despite the impact of COVID-19, our overall cash collection has performed well throughout the year. We are encouraged by the continued growth in our direct debit volumes, now at 72 per cent and one of the highest across the industry. Overall, the proportion of customers on a payment plan has continued to increase to 82 per cent despite the challenging economic environment and providing a high level of collection certainty for a significant proportion of the household customer base.
We are recognised as a leader in credit management and collections across all industries, not just water. In the year we have won three external awards for our credit services, most recently winning the Utilities and Telecoms Team of the Year at the 2020 Credit Awards. Our industry-leading approach to collections and innovative affordability offerings have ensured we were well placed
OverviewWe put customers at the heart of everything we do. This relentless focus drove us to deliver significant and continuous improvements over AMP6, ending the period as a leading water and wastewater company. Despite the challenging environment we have continued to operate in during the pandemic, customer satisfaction has remained high. Reliable access to clean water has been more important than ever before, and we have continued to provide a robust service for customers throughout the year. Serving the most economically deprived areas in the country, we are always mindful of the need to help customers who struggle to pay their bills. We reduced typical household bills by 5 per cent this year in real terms, have committed to providing £71 million in financial support to customers over AMP7, and have an extensive range of schemes offering financial assistance and tailored support for customers struggling with affordability and vulnerability. We are delighted to have received a positive recommendation for continued certification to BS 18477:2010, which is the accreditation for our Priority Services scheme and one of our customer ODI measures looking at the quality of services provided to vulnerable customers.
Customer serviceWe have significantly increased the availability and performance of our digital channels with over 1 million customers engaging with us digitally, driving both service improvements and cost efficiencies. Customers rate us 4.7 out of 5 on the App Store and 4.2 out of 5 on Google reviews.
We have been proactive and used targeted communications with customers to offer
United Utilities Group PLC unitedutilities.com/corporate 56
STRATEGIC REPORT

to respond to the challenges brought about by the pandemic.
In the current year, we have enhanced our credit reference sharing process to include another agency with a greater high street focus. This has further extended our footprint and will facilitate improvements in our collections activity, and is just one example of our comprehensive approach to collections activity, supporting our ability to collect cash from customers who have the ability to pay, but attempt to avoid doing so.
Affordability When the country first went into lockdown we saw an increase in demand for affordability support. The initiatives we delivered over AMP6 enabled us to respond efficiently and effectively, with our Payment Break scheme giving over 8,000 customers the breathing space they required.
The nature of the pandemic and the significant impact it is having on customers’ lives has meant we have had to consider the appropriateness of continuing our normal billing and collection activities and the most suitable means of engagement. While as an industry we took steps to pause collection activity, our COVID-19 response encouraged customers to contact us if they had been impacted financially by the pandemic and found themselves struggling to pay. We carried out targeted activities aligned to specific customer segments and changes in customer behaviour to engage with customers, actively promoting our range of affordability support, ensuring customers knew they could talk to us about their bill, and highlighting alternative ways to pay. Over the course of the year we sent over 5 million proactive customer communications; a 30 per cent increase on the previous year.
We have an extensive range of schemes available to help customers and around 200,000 are currently benefiting from that help. Recognising affordability has been even more important during the pandemic, we took swift proactive action and were the first water company to secure support and regulatory approval for an extension to the scale and scope of our social tariff, allowing us to support a broader range of customers whose income has been affected by COVID-19. This augments our support schemes this year with an additional £15 million to help customers keep out of debt and was intended to support an additional 45,000 customers who have been furloughed, are claiming through the self-employed income support scheme (SEISS) or are now unemployed, by reducing their water bill to an affordable amount. Through efficient use of the additional £15 million funding secured we
Measure 2025 target 2020/21 performance
StatusAnnual
performanceAgainst 2025
target
KPI: C-MeX Above industry
medianAbove industry median
Additional service measures:D-MeX Above industry
medianAbove industry median
Market Performance Standards
Upper quartile Second quartile
Operational Performance Standards
Upper quartile Upper quartile
Managing complaints:Number of household written complaints compared to WASCs
Upper quartile Upper quartile*
Speed of resolution 5 days 3.5 days
Vulnerability:Number of households registered for Priority Services
In excess of 220,000 (7%)
128,831 (4.1)%
BS18477 ‘Inclusive service provision’ certification for Priority Services
Maintain certification
Maintained
Affordability: Number of customers lifted out of water poverty
66,500 71,057
Helping customers look after water in their home
10% increase 13.75%
Status key:Annual performance Against 2025 target
Met expectation/target Confident of meeting target
Close to meeting expectation/target Some work to do
Behind expectation/target Target unobtainable
Baseline year Baseline year
* Latest comparative data available 2019/20
OTHER PERFORMANCE INDICATORS
were able to support 73,000 customers – 62 per cent more than originally estimated – preventing customers from falling into debt. This additional support meant that in the year we supported 160 per cent more customers via our Back on Track scheme than the previous year. We promoted the new scheme directly to customers, via partner organisations and the Hardship Hub, to increase overall awareness. The £71 million financial support we have committed to providing over AMP7 is the largest of any water company, and we have accelerated payments this year to provide much needed assistance to households struggling as a result of the economic impact of the pandemic.
We continually innovate to further enhance our affordability processes, and we are piloting a first-of-its-kind real-time income verification tool to streamline eligibility for reduced-rate social tariffs. We’re proud to be the first water company in the UK to roll out an Open Banking solution for social tariff applications, modernising our income verification. In March 2021 we were the first water company to begin data sharing with the DWP, leveraging the new provisions under the Digital Economy Act, to assist people living in water poverty. We’re excited to be able to use these new provisions to continue to proactively provide lower bill support to customers.
Stock Code: UU. Annual Report and Financial Statements for the year ended 31 March 2021
STR
AT
EGIC
REPO
RT
57

BEING PURPOSE-LED
Our performance in 2020/21Operational performance
During the last year, many customers have been affected by COVID-19 due to being furloughed or made redundant, and have contacted us for support with their bills.We’ve been able to help many customers get back on their feet with flexible payment arrangements or payment breaks. Our Payment Break scheme was used by over 8,000 customers during the early stages of the pandemic. We also donated £3.5 million into our Trust Fund to support financially vulnerable customers.
We had regulatory approval to extend our social tariff to help even more customers impacted by COVID-19, and, as such, we are currently providing financial assistance to more than 200,000 customers – a significant increase on the previous year. Through our Payment Matching scheme, another 15,000 customers became water debt free in 2020/21.
Our Lowest Bill Guarantee scheme was rolled out in September after a successful pilot to ensure customers who choose to have a meter fitted will not pay more than their current charge method. Customers have saved over £4.6 million as a result.
Since creating the North West Utilities Together group at the start of 2020 with Electricity North West, Cadent and Northern Gas Networks, we have been regularly meeting to discuss ways to help those customers in vulnerable circumstances.
As part of this, we have once again joined with Electricity North West in the promotion of our Priority Services registers on paper medicine bags in over 200 pharmacies across our region, and have worked with Electricity North West and Cadent to jointly fund a £50,000 refurbishment of a mobile advice centre for Age Concern Central Lancashire.
The charity launched this new community outreach service in March 2021, one year on from the first national lockdown, in a bid to reach those in need. The mobile advice centre, which is specially designed to be dementia friendly, will offer support and help promote our services to customers in and around the Lancashire area. The three utility companies involved in the collaboration will be giving residents free advice on water and energy efficiency, as well as tips on how to stay safe and warm in their homes.
Suzanne Carr, CEO of Age Concern Central Lancashire, praised the project: “...we are delighted to have formed partnerships with the North West's big three utility companies which in turn means our customers will have access to a full suite of services, and most importantly, will be able to access one-to-one support on a range of important matters from independent living through to seeking help during an energy crisis.”
Generating value for:Communities
Customers
Customers
Media
Support for those customers in need
We have worked with Electricity North West and Cadent to jointly fund a £50,000 refurbishment of a mobile advice centre for Age Concern Central Lancashire.
STRATEGIC REPORT
unitedutilities.com/corporate United Utilities Group PLC 58

Our performance at a glance
Creating a great place to work for all our employees – our employees are the face of the company and we could not deliver our services without them.
How we deliver value to employeesShort term• We have a strong focus on health,
safety and wellbeing. We firmly believe that nothing we do is worth getting hurt for, and we aim to ensure all employees go home safe and well at the end of the day.
• We invest in training and development to enable our employees to grow their skills and to help keep them motivated.
• Listening to our employees helps create an engaged workforce, increasing job satisfaction, and through employee communications and conferences we update our people on business developments so they feel part of a team.
Long term• Investing in the development of
current, and future, employees, means we will have a workforce with the right skills for the future.
• Health, safety and wellbeing extends to mental as well as physical health. We promote awareness of stress and other mental health issues, promoting an all-round healthy lifestyle in the long term which, in turn, reduces the burden on health care services.
• We provide pension offerings that support employees in later life.
• Promoting diversity and inclusion means we have a workforce that truly represents the region.
Link to strategic themes Improving our performance creates
employee pride in a job well done, enhancing employee satisfaction and a desire to do more.
Encouraging innovative ideas from employees can lead to cost reductions, and improving employee satisfaction reduces turnover which ensures training and development costs are efficient.
We take a responsible approach to protecting the health, safety and wellbeing of our employees, ensuring we send everyone home each day safe and well.
EmployeesEmployees
Environment
Link to material issue Health, safety and wellbeing
Diverse and skilled workforce
Employee relations
Read more about our approach to materiality on page 27
Link to risks5 7
Read more about our principal risks on pages 104 to 107
READ MORE
Employee engagementDefinitionLevel of employee engagement as measured by our annual employee opinion survey.
TargetUpper quartile against UK utilities norm.
Status Achieved/confident of achieving target
PerformanceThis year we achieved 89 per cent engagement, which is 5 per cent above the UK high performance norm and is the highest engagement score we have achieved while comparatively tracking engagement over the last six years.
• 2020: 84 per cent
• 2019: 81 per cent
• 2018: 79 per cent
• 2017: 75 per cent
Our annual employee opinion survey provides a mechanism for formal feedback on a number of topics, including employee engagement which is our key performance indicator for employees.
OPERATIONAL KEY PERFORMANCE INDICATOR
STR
AT
EGIC
REPO
RT
59Annual Report and Financial Statements for the year ended 31 March 2021Stock Code: UU.

Our performance in 2020/21Operational performance
OverviewOur people are critical to the success of our business and it is important we give them the opportunity to develop their skills and knowledge and support them with the most effective technology. We have continued to invest in skills training throughout the pandemic and have accelerated our digital strategy to support new ways of working. The health and wellbeing of our employees is paramount and keeping them safe remains our primary concern. During the initial lockdown in 2020, we moved 60 per cent of our workforce to home working and the remainder continued working at our COVID-secure facilities. Around 80 per cent of our employees were designated as key workers, delivering our essential services to customers. We have largely continued with business as usual, operating within COVID-19 guidelines and in line with the government roadmap out of lockdown, while defining and shaping the way we will work post-COVID-19 based on the changes in the last year.
Protecting colleagues through theCOVID-19 pandemic During the pandemic, we have facilitated home working for over 3,000 of our employees and are providing support for employees’ health, safety and wellbeing while temporarily working at home in extraordinary circumstances. As well as facilitating home working for more than half of our employees, we have introduced a range of measures to ensure those who are still working on sites and in the field are able to do so in a COVID-secure way. We conducted over 390 COVID-secure risk assessments across all our operational sites and carried out a number of control measures to ensure they met the Government’s requirements for COVID-secure workplaces. This included temperature checking stations, extra sanitation provisions, safe desks and one-way procedures in offices to ensure social distancing can be maintained. Additional personal protective clothing has been provided and we have adapted new ways of working for our front line field employees. We adapted the way we carry out our mandatory health surveillance checks to virtual assessments and more recently COVID-secure face-to-face assessments.
With the involvement of over 200 trained mental health supporters and wellbeing champions across the business, we have supported the wellbeing needs of our colleagues, delivering initiatives to help build resilience across our workforce. This includes delivery of several bitesize webinars on topics such as mental health, stress control, and managing change to around 2,000 people over 20 webinars. We have been encouraged by the take up of the zero suicide alliance e-learning module
which now includes a specific module on COVID-19 and isolation, and have produced new resource packs and initiatives to help our workers through winter. Crucially, we engage regularly with managers, providing awareness of the support services available and how to make best use of them and the widely introduced Wellness Action Plans, to enable managers to have wellbeing conversations with their teams.
We have not furloughed any employees, but we are aware that our employees and their families are not immune from the hardships caused by the economic impacts of COVID-19. Therefore, we have established a staff outreach scheme (SOS) that provides financial support to employees whose families are struggling financially as a direct result of the pandemic.
Committed to equality, diversity and inclusion We want fantastic people to enable us to deliver a great public service now and into the future, so we are determined to make sure we are reaching and recruiting from every part of our community. We are supporting employees to achieve their full potential and feel valued and included, regardless of their gender, age, race, disability, sexual orientation or social background. Our employee diversity networks, including LGBT+, gender equality, ability and multicultural groups, have a growing membership of 730 people, and play a pivotal role in providing insight, raising awareness and giving support to colleagues. We are committed to creating a diverse and inclusive workforce and so we are delighted to be one of the top 1 per cent of 15,000 companies across Europe in the Financial Times’ Statista Survey for Diversity and Inclusion Leadership.
We are working hard to improve how we attract women into the industry, and developing women within our existing workforce. We are seeing good progress with increasing numbers of female graduates and apprentices in our talent pipeline, and 96 per cent of our current female workforce recommend United Utilities as an employer. Following our 2021 AGM, the measurable targets of 33 per cent female representation on the board and one director of non-white ethnicity will be met. We achieved inclusion in the Bloomberg Gender Equality Index, recognising our commitment to gender equality and transparency.
Staff Outreach Scheme established to support employees
390COVID-secure risk assessments undertaken
96%of our current female workforce recommend United Utilities as an employer
United Utilities Group PLC unitedutilities.com/corporate 60
STRATEGIC REPORT

Training and development Our technical training academy established in February 2014 has provided skills development and certification to over 2,800 people to date, including programmes for those individuals not in education, employment or training (NEETs). Many people have received multiple training opportunities such that in total, around 11,000 technical training sessions have been delivered over that period. We are the only water company currently governed by Ofsted (Office for Standards in Education), with a “good” overall rating.
Ensuring everyone goes home safe and well Over the last couple of years our health, safety and wellbeing agenda has centred on behaviours and the part they play in accidents and the culture across our organisation. Having spent a number of years focusing on site standards, asset condition, training and personal protective equipment, it was clear from our root cause analysis that behaviours play a key part in many of the accidents we have had. We delivered our 'home safe and well' behavioural safety programme to everyone in the company and we are embedding a culture of looking after ourselves and each other, to ensure we all go home safe and well.
We are seeing improvements in a number of important performance measures, including the number of accidents, the severity of accidents and an increase in hazard and near miss reporting. Our employee accident frequency rate for 2020/21 was 0.094 accidents per 100,000 hours worked, representing a 15 per cent improvement on performance from the prior year. Our contractor accident frequency remained broadly consistent despite an increased workload at the start of AMP7, with 0.087 accidents per 100,000 hours worked, compared to 0.083 last year. Our aim by 2030 is that no one will be harmed while working on our behalf, and we will actively promote, support and improve their wellbeing.
Measure 2025 target 2020/21 performance
StatusAnnual
performanceAgainst 2025
target
KPI: Employee engagement Upper quartile
against UK utilities norm
Upper quartile against UK utilities norm
Employee opinion survey diversity and inclusion questions score
UK high performance norm
UK high performance norm
Employee opinion survey learning and development category score
UK utilities high performance norm
UK utilities high performance norm
Living Wage accreditation Secure and retain
Secured accreditation
Pension Quality Mark + Retain accreditation
Retained
Health and safety:AFR employees (per 100,000 hours)
0.064 0.094
AFR contractors (per 100,000 hours)
Year-on-year improvement in score
0.087
Wellbeing Charter accreditation
Retain accreditation
Retained
Status key:
Annual performance Against 2025 target
Met expectation/target Confident of meeting target
Close to meeting expectation/target Some work to do
Behind expectation/target Target unobtainable
Baseline year Baseline year
OTHER PERFORMANCE INDICATORS
Stock Code: UU. Annual Report and Financial Statements for the year ended 31 March 2021
STR
AT
EGIC
REPO
RT
61

BEING PURPOSE-LED
Our performance in 2020/21Operational performance
Our aim is to have a workforce that is representative and understanding of our communities and the customers we serve in the North West.We are committed to driving equality and providing diverse working environments for all our employees. We want our people to feel valued for individual differences, such as social background, disability, gender and sexual orientation.
Our employee networks play a pivotal role in helping us to achieve our aim, providing insight and feedback on our people policies, helping to challenge the status quo, raising awareness, and giving support to colleagues right across the organisation.
With so many colleagues working remotely over the year, our networks worked tirelessly, and creatively. To mark National Inclusion Week, with its theme for 2020 of ‘Each One, Reach One’, the groups organised training sessions, webinars, interviews and support, and emphasised that it has never been more important to think about the opportunities we all have to connect and inspire each other to make inclusion an everyday reality.
We have four active employee network groups with a growing membership of 730 people. Each network has a lead and an executive sponsor who supports each network to drive change across the business.
Our Gender Equality Network is open to men and women across the company, and works to support, mentor, develop, inspire and promote all employees.
The Identity LGBT+ Network provides a social and support network for LGBT+ employees and those who are LGBT+ friendly, helping to create a safe, inclusive and diverse working environment that encourages respect and equality for all.
Our Ability Network works to bring people with disabilities and long-term conditions together. Its aim is to raise the profile of different disabilities so we can recognise and better support our employees and customers living with those conditions.
The Multicultural Network is about celebrating distinct cultural differences stemming from personal traits such as race, ethnic origin and religion. The group aims to provide a voice to all employees with a multicultural background, and to help ensure everyone feels valued and their talents fully utilised.
More details on what we have done to improve diversity and inclusion can be found on pages 138 to 140
Generating value for:Communities
Customers
Employees
Environment Media
Employee networks helping us to drive diversity and inclusion
Our employee networks play a pivotal role in helping us to achieve our aim... helping to challenge the status quo.
STRATEGIC REPORT
62 United Utilities Group PLC unitedutilities.com/corporate

Our performance at a glance
Protecting and enhancing the environment – we rely on the natural environment and play a key role in improving the water, land and air of the North West.
How we deliver value to the environmentShort term• We meet increasingly stringent
environmental consent levels, which help to improve the quality of rivers and bathing waters and so support tourism in the region.
• Our investment in renewable energy generation is reducing our carbon footprint and contribution to climate change.
• We have invested in new infrastructure, such as our West Cumbria project, to allow us to transfer water around the region more efficiently to avoid depletion of individual water sources.
• Our accredited environmental management system builds trust with regulators and partners.
Long term• By promoting campaigns to educate
the public and younger generations on water usage, it helps protect this valuable resource and reduce usage now and for years to come.
• We innovate and invest in new technologies to solve environmental challenges for future generations.
• We manage our land in a way that safeguards habitats for indigenous wildlife, as well as protecting wildlife that makes its home in rivers and other water bodies.
• We plan far ahead to ensure our activities and investment enhance the long-term resilience of the environment.
Link to strategic themes Many customers care about the
environment, so providing the best service to customers involves protecting the places they live in and love.
Many ways we protect the environment reduce cost; for example, renewable energy generation reduces our energy costs as well as our carbon footprint.
We manage water and wastewater in a responsible way that protects the environment and enhances its resilience.
EnvironmentEnvironment
Link to material issue Resilience
Environmental impacts
Climate change
Read more about our approach to materiality on page 27
Link to risks1 3 5
Read more about our principal risks on pages 104 to 107
READ MORE
The Environment Agency’s Environmental Performance Assessment (EPA) of water and wastewater companies in England and Wales comprises a broad range of performance measures on what matters with regard to environmental performance.
EPADefinitionEnvironment Agency assessment across six key sector environmental performance measures.
TargetUpper quartile performance within the water industry each year.
Status Achieved/confident of achieving target
PerformanceIn the assessment for 2020, we expect to be awarded the maximum 4 star rating, meaning we would be classed by the Environment Agency as an “industry leading company”.
• 2019: Joint third
• 2018: Joint second
• 2017: Joint first
• 2016: Joint first
OPERATIONAL KEY PERFORMANCE INDICATOR
STR
AT
EGIC
REPO
RT
Stock Code: UU. Annual Report and Financial Statements for the year ended 31 March 2021 63

Our performance in 2020/21Operational performance
OverviewWe are fortunate to have many areas of natural beauty within our region, and these are important in offering health, fitness and wellbeing benefits to local communities and drivers for tourism in the area, as well as being essential for us to deliver our services to customers. It is of great importance we continue to protect and enhance the environment across the North West, and manage our land responsibly to improve the environment in our region for future generations. We delivered a number of environmental improvements over AMP6, including improving 338.5 kilometres of rivers, significantly reducing our carbon footprint, increasing our renewable energy production and ensuring zero emissions energy usage. We have agreed an environmental improvement programme to be delivered in AMP7 that will continue to improve the river, bathing and shellfish water quality for the benefit of customers and visitors to the North West as well as society as a whole. Our investment in AMP7 is expected to result in an improvement in water quality in 1,315 kilometres of rivers in the North West. Having completed the first year of the period, we remain on track for the improvements we have committed to.
Leakage reductionWe have beaten our leakage target for the 15th consecutive year and we are now at the lowest ever level of leakage reported in the North West. Our leakage performance improvement has been achieved through a combination of techniques. Alongside satellite technology to geo-locate potential leaks in our network and sniffer dogs to accurately locate the leak, we have deployed 66,000 acoustic loggers since 2019 with a further 29,000 being installed over the next year. We have recruited around 20 per cent additional leakage detection resources, further supported this year by our first intake of apprentices on a bespoke two-year technical training scheme, mitigating the risk of a national shortage in leakage technicians. Over AMP7, we plan to reduce total leakage by at least 15 per cent, with a delivery plan that continues to make best use of available technologies and is flexible to ensure that we can embrace the heightened level of innovation in this area.
Pollution performanceIn 2020, we had no serious pollution incidents for the second year running, and have reduced total pollution incidents by almost a third. Here, we are seeing the benefits of delivering the action developed as part of our Pollution Incident Reduction Plan which covers a range of interventions, and for the first time we had no wastewater treatment works classed by the Environment Agency as “failing works”, which is something that has only ever been achieved across the sector once before.
Greenhouse gas emissions and climate changeCarbon reduction ('mitigation') and climate resilience ('adaptation') have influenced both our strategic and operational decisions for over two decades. We have achieved substantial progress over recent years and we have ambitious plans and commitments to go much further.
Carbon reduction – We are signatories to the UN Race to Zero campaign and we are contributing to the UK water industry’s commitment to achieve carbon net zero by 2030. In May 2020 we announced six carbon pledges including the use of science-based targets to reduce our carbon footprint. We have successfully reduced our operational emissions by over 70 per cent in recent years, primarily by investing in our own renewable energy generation capabilities and purchasing green energy from the national grid. We continue to deliver on our commitments to peatland restoration and woodland creation, recently establishing two tree nurseries in the North West. We are also committed to delivering our green fleet strategy and have introduced more low-carbon vehicles and charging.
Our portfolio of renewable energy assets is operating satisfactorily and our investment has delivered the returns that we targeted. Having maximised the opportunities to date and established long-term contracts to secure a proportion of our renewable energy out to 2045, we are now looking at how we can recycle our investment in order to achieve further strong returns and take the next steps in our plans to achieve net zero by 2030.
15thconsecutive year meeting our leakage target
Zeroserious pollution incidents for the second year running
4 starrating expected in the EA's Environmental Performance Assessment for 2020
United Utilities Group PLC unitedutilities.com/corporate 64
STRATEGIC REPORT

Climate resilience – In AMP6 we invested an additional £250 million targeted to increase resilience against climate change, and we continue to invest across our business to protect and enhance the climate resilience of our assets, processes and customer services. We are working to further mature our already advanced level of climate risk understanding. We will soon be publishing an overview of our climate risks and plans in our new adaptation report. This will be released in draft for open consultation and engagement before we finalise our submission over the months ahead. Our latest annual statement in support of the recommendations of the Taskforce for Climate-related Financial Disclosures (TCFD) can be seen on pages 86 to 99, and provides an update on our performance this year.
Natural capital and biodiversityWe continue to develop our approach to natural capital and improve our understanding to influence investment decisions, allowing us to assess the full value of our activity. We have a natural capital ODI in AMP7, which encourages assessment of the added natural capital value we deliver by pursuing nature-based and catchment solutions. Understanding this value will help us drive partnership working and our Catchment Systems Thinking (CaST) approach, which seeks to understand the broader needs of a catchment and deliver outcomes across multiple stakeholders. As part of this approach we have worked with stakeholders to develop a north west natural capital baseline to understand the natural assets the North West has, the benefits they provide and the value of them. Once completed, we will engage with other partners across the North West to drive a consistent approach in order to drive greater natural capital value. To facilitate this we are seeking to establish a north west governance group for natural capital.
Biodiversity is a key pillar of natural capital and plays an important part in our CaST approach. As the largest private land owner in the UK, and an organisation delivering significant development in the North West, we have committed to no net loss of biodiversity and delivered significant investment in improving the condition of habitats on our land. We are actively reviewing our approach to how we can best manage and enhance biodiversity.
Measure 2025 target 2020/21 performance
StatusAnnual
performanceAgainst 2025
target
KPI: EA EPA Upper
quartileUpper quartile(1)
Leakage reduction 15%(2) On track
% waste to beneficial use 98% 97.3%
Enhancing natural capital for customers
£4 million Delivery scheduled from 2022
Number of trees planted 500,000 216,601
Better air quality: nitrogen oxides (NOx) emissions per GWh of renewable electricity generated
1.42 NOx/GWh
1.3 NOx/GWh
Climate change mitigation: meeting our science-based reduction target
14% 1% increase
Climate change adaptation: multiple measures
See TCFD section, pages 86 to 99
Status key:
Annual performance Against 2025 target
Met expectation/target Confident of meeting target
Close to meeting expectation/target Some work to do
Behind expectation/target Target unobtainable
Baseline year Baseline year
(1) For the year 2020, we expect to be awarded the maximum 4 star rating.
(2) As measured against a 2017/18 baseline.
OTHER PERFORMANCE INDICATORS
Stock Code: UU. Annual Report and Financial Statements for the year ended 31 March 2021
STR
AT
EGIC
REPO
RT
65

BEING PURPOSE-LED
Our performance in 2020/21Operational performance
Young couple breathe new life into farmlandMuch of our land is managed on our behalf by tenant farmers, who do a great job of handling it in a way that supports our water quality and environmental goals. Through our Sustainable Catchment Management Programme (SCaMP) and Catchment Systems Thinking (CaST) approach we have a long history of protecting and enhancing the water environment, with wildlife and biodiversity enhancement as key drivers.
During the year, Bradleys Farm, a 103-acre smallholding on the edge of Rivington Village, became vacant and our land management team decided to package the farm as an exciting opportunity, suitable for young farmers interested in a ‘starter farm’.
The farm sits within the West Pennine Moors Site of Special Scientific Interest and is included in the Government’s Higher Level Stewardship Scheme to promote environmentally beneficial management.
Following enquiries from all over the country and lots of interesting ideas as to how the farm could be run, the farm has been let to Arron Parker and his partner Gemma Coar. The Lancashire-born couple, both from farming backgrounds, have big plans to bring the community into their venture.
They’re planning to organise walks and provide educational visits for the public on farming, conservation, ecology and water quality as the farm is a gateway site for the main Rivington reservoirs and associated recreational walks.
“An added aim of our management of the farm is to maintain and improve areas for visitors to enjoy”, said Gemma. “As tenants, we have these goals at the forefront of our farming enterprise and land management proposals.”
Arron and Gemma can’t wait to get started: “We both worked closely alongside my parents at their family farm for many years”, said Gemma, “but have always dreamed of managing our own family farm. This is our dream come true. We’re able to manage our own farm, close to family and friends, in the beautiful area of Rivington. Our children can grow up in a wonderful place of open space and countryside and we have our lives ahead to plan, enjoy and grow.”
Generating value for:Communities
Customers
Environment
The Lancashire-born couple, both from farming backgrounds, have big plans to bring the community into their venture.
STRATEGIC REPORT
66 United Utilities Group PLC unitedutilities.com/corporate

Our performance at a glance
Delivering a sustainable return to investors – through prudent financial risk management and a strong track record of performance across all components of ESG.How we deliver value to investorsShort term• Since many of our shareholders are
pension funds, charities and employees, the income we provide through dividends benefits millions of people every year.
• We are committed to high ethical standards of business conduct, strong corporate governance and acting with integrity so investors can have confidence in the way we do business.
• We maintain a high level of quality and transparency, building trust and confidence in what we report.
• Our innovation culture drives continuous improvements, enabling us to be at the frontier of our industry and ahead of peers.
Long term• Our shareholders have placed their
money into our business as a long-term investment and we provide an appropriate return through a combination of short-term dividend income and long-term growth.
• We plan far into the future and invest in our infrastructure to ensure the sustainability of the business and the services we provide.
• We manage risk prudently so investors can have confidence in our stability and resilience in the round.
• We link investors' return to our environmental and social projects through our sustainable finance framework.
Link to strategic themes By delivering better performance
for customers we are able to achieve greater regulatory incentives, aligning improved service with shareholder return.
By reducing costs in a sustainable way through innovation and efficiency, we can target outperformance of our allowed expenditure without compromising operational performance.
Our strong corporate governance, prudent risk management, and clear and transparent reporting create a lower-risk investment and build trust.
InvestorsShareholders
Link to material issue Customer service and operational performance
Political and regulatory environment
Financial risk management
Read more about our approach to materiality on page 27
Link to risks6 10
Read more about our principal risks on pages 104 to 107
READ MORE
Return on Regulated EquityDefinitionKey measure encompassing regulatory out/under performance across financial and operational efficiency, customer satisfaction, and regulatory performance targets.
TargetOur targets will be updated throughout the period in line with guidance on the individual components of RoRE.
Status Achieved/confident of achieving target
Performance2020/21 reported RoRE was 4.3 per cent on a real, RPI/CPIH blended basis,
mainly comprising the base return of 3.9 per cent (including our 11 basis point fast-track reward that we receive in each of the five years of the AMP), financing outperformance of 1.2 per cent and customer ODI outperformance of 0.3 per cent as a result of our year one net reward of £21 million.
Our totex performance of -0.3 per cent represents the year one impact of the £300 million additional totex which provides benefits that are not all reflected in RoRE. Retail performance of -0.3 per cent reflects a small overspend this year in adapting to the effects of COVID-19 and tax performance of -0.5 per cent reflects the Government’s
reversal of the planned reduction in the rate of corporation tax from 19 per cent to 17 per cent from 1 April 2020 (which will be recovered through the tax sharing mechanism), and the tax impact of our strong financing outperformance.
Our underlying RoRE is higher at 4.8 per cent and is adjusted for the tax impact that will be recovered through the tax sharing mechanism and the additional totex that drives better outcomes against future customer ODIs.
This is a new measure for the 2020-25 period hence no prior year comparators. These will be provided from 2021/22 onwards.
Return on Regulated Equity (RoRE) expresses the return the company has managed to earn above and beyond expectations set by the regulator through financial and operational performance.
OPERATIONAL KEY PERFORMANCE INDICATOR
STR
AT
EGIC
REPO
RT
67Annual Report and Financial Statements for the year ended 31 March 2021Stock Code: UU.

Our performance in 2020/21Operational performance
OverviewOur investment strategy and digital transformation, underpinned by our pioneering Systems Thinking approach, is delivering significant performance improvement and efficiency. This has been our best year of operational performance for customers and the environment, manifesting itself in a net reward against our customer ODIs for the year of £21 million. Since accepting our AMP7 final determination, we have increased our totex plan by a further £300 million, all of which we expect to be remunerated through regulatory mechanisms, and we continue to accelerate our overall AMP7 investment programme to deliver benefits sooner and boost the regional economy as we emerge from the worst effects of COVID-19. We have delivered another robust year of financial performance and we are raising finance effectively, locking in rates favourable to the price review assumptions and leveraging our strong ESG credentials.
Total expenditure (totex) Our AMP7 business plan was assessed by Ofwat as being among the most efficient in the sector. Thanks to the strong performance we delivered in AMP6, we started AMP7 at the target totex run rate and we are confident that we can deliver our AMP7 scope within our final determination totex allowance. Our investment strategy delivers long-term sustainable performance improvements and efficiency and our AMP7 totex plans will be extended by around £300 million, which we expect to be fully remunerated through regulatory mechanisms, with this investment extending our environmental programme, accelerating our digital transformation and exploiting spend to save opportunities.
In this first year of AMP7, we have invested £617 million in net regulatory capital expenditure (excluding infrastructure renewals expenditure (IRE)), representing the continued acceleration of our AMP7 investment programme and early expenditure against the £300 million extension to our original totex plans. This represents a good start to the delivery of our AMP7 programme, benefiting from the early start and transition investment we made in 2019/20 and our ability to continue working, where it was safe to do so, during the COVID-19 pandemic. As a consequence, we have been able to deliver this expenditure effectively, maintaining our high performance scores against our Time, Cost and Quality index (TCQi) at over 95 per cent.
While we continue to seek efficiencies in the delivery of totex, as we have demonstrated through the £300 million extension to our totex plans, we will invest where we are confident we can deliver improved customer or environmental outcomes and better customer ODI performance.
Customer outcome delivery incentives (ODIs)Our digital transformation and investment strategy are delivering improved performance and we have made a strong start to AMP7, achieving a £21 million net customer ODI reward for 2020/21. This is ten times the net reward we achieved in the first year of AMP6 and is particularly pleasing in light of the tougher targets we have set.
The earlier 'Customers' section provides more detail on the customer ODIs where we are performing well and others where the targets for AMP7 are challenging. We see opportunities across a number of ODI targets, and our Systems Thinking approach, including new digital capability driven by Dynamic Network Management (DNM), increased use of data and analytics within our retail function, coupled with early investment, have and will continue to help us drive performance improvements.
Unlike AMP6, ODI rewards and penalties in AMP7 will be adjusted in revenues on a two-year lag, therefore any net reward earned this year will be reflected in an increase to revenues earned in 2022/23 through allowed increases in the rates charged to customers in that financial year, in accordance with the regulatory mechanism. Overall, we are targeting a cumulative net ODI reward over the 2020–25 period of around £150 million, a significant improvement on the £44 million achieved in the previous regulatory period.
Financing On financing performance, we have consistently issued debt at efficient rates that compare favourably with the industry average, thanks to our leading treasury management, clear and transparent financial risk management policies, and ability to act swiftly to access pockets of opportunity as they arise. This delivered significant financing outperformance during AMP6 and the rates we have already locked in for AMP7 compare favourably with the price review assumptions.
£21mnet customer ODI reward for 2020/21
£300mextension to our AMP7 totex plan
Leadingwater utility in Sustainalytics ESG Risk Rating assessment
United Utilities Group PLC unitedutilities.com/corporate 68
STRATEGIC REPORT

In November 2020, we published our new sustainable finance framework, allowing us to raise finance based on our strong ESG credentials and replacing the green funding that we have previously secured through the European Investment Bank (EIB), which is no longer available post-Brexit. In January 2021, we issued our debut sustainable bond, generating a huge amount of interest for the company and our ESG credentials and delivering a coupon of 0.875 per cent. This is not only our lowest ever coupon at this maturity, locking in financing outperformance, but also the lowest ever coupon for any UK corporate at this maturity.
ESG performance We perform well across a broad range of ESG indices and for 2021 we attained World Class status on the Dow Jones Sustainability Index for the 14th consecutive year. In April 2021, we were ranked 6th out of 613 global utilities in the Sustainalytics’ ESG Risk Rating assessment, positioning us as the leading water utility in the index. We achieved a score of A- from the CDP which evaluates how companies assess climate change-related financial risks and opportunities, including their approach to transparency and disclosure. We were assessed by the Environment Agency (EA) as the best performing company on pollution for the second year in a row with no serious pollution incidents and we expect to be awarded industry-leading 4 star rating in the EA’s Environmental Performance Assessment for 2020. From an employee perspective, we achieved a significant improvement in the Workforce Disclosure Initiative, scoring well above the overall average and receiving special recognition in the 'COVID-19 transparency' category at its Workforce Transparency Awards.
Measure 2025 target 2020/21 performance
StatusAnnual
performanceAgainst 2025
target
KPI: RoRE Assessed
annually4.3%
UK Corporate Governance Code
Maintain compliance
Compliant
Maintain performance across a range of trusted investor indices
Upper quartile Upper quartile
Credit rating UUW (Moody's, S&P, Fitch)
A3, BBB+, A- A3, BBB+, A-(stable outlook)
Gearing 55–65% 62%
Maintain sustainable finance framework
Available/continued issuance
Available
Fair Tax mark Retain annual accreditation
Retained
Sustainable dividend Grow by CPIH In line with commitment
Risk maturity Year on year improvement
Met expectation
Anti-bribery: % of identified employees completing required training
100% 94%
Investor engagement: % met or offered to meet by value (active targetable institutional shareholder base)
75% 81%
Status key:
Annual performance Against 2025 target
Met expectation/target Confident of meeting target
Close to meeting expectation/target Some work to do
Behind expectation/target Target unobtainable
Baseline year Baseline year
OTHER PERFORMANCE INDICATORS
Stock Code: UU. Annual Report and Financial Statements for the year ended 31 March 2021
STR
AT
EGIC
REPO
RT
69

BEING PURPOSE-LED
Our performance in 2020/21Operational performance
Linking investment to our ESG goals.Historically, the European Investment Bank funded much of our environmental programme, but following Brexit this funding is no longer available. We were keen to offer a wider range of investors a similar ability to more directly link their investment in us to our environmental and sustainability goals.
In November we formally launched our sustainable finance framework. Dovetailing well with our long-standing and comprehensive ESG strategy, the framework allows us to more clearly demonstrate how investment in our business makes a positive impact on the North West’s environment and society in which we live and operate.
Our ‘use of proceeds’ based framework follows market principles set out by the International Capital Market Association and the Loan Market Association, covering issuance in both bond and loan format. Second-party opinion was provided by Sustainalytics and was assessed to be 'credible and impactful'.
Our framework sets out eight eligible categories of environmental and social spend that can be funded, covering a wide range of areas from core activities such as ‘sustainable water and wastewater management’ to other more targeted areas such as ‘clean transportation’ and ‘access to essential services’.
Following two days of engagement with institutional investors, our first sustainable bond was issued in January 2021, becoming, at the time, the lowest ever 8yr+ GBP corporate nominal coupon. The £300 million bond was oversubscribed by more than three times and attracted notable new investors to the company.
This additional debt finance option has provided value to both us and investors, and we look forward to giving additional insight into the projects funded through sustainable finance in our allocation and impact reports to be released in 2021.
You can find out more about our sustainable finance framework on our website: unitedutilities.com/corporate/investors/credit-investors/sustainable-finance
Generating value for:Customers
Environment
Shareholders
Our sustainable finance framework
The framework allows us to more clearly demonstrate how investment in our business makes a positive impact on the North West's environment and society.
STRATEGIC REPORT
70 United Utilities Group PLC unitedutilities.com/corporate

Our performance at a glance
Innovating in partnership with suppliers – we rely on suppliers to deliver our services and to help identify ways to make them better.
How we deliver value to suppliersShort term• We spend significant amounts of
money with our suppliers each year to help deliver maintenance and enhancement projects across our asset base, and this helps support thousands of jobs in our region.
• Paying suppliers on time gives them confidence in us and allows companies to maintain cash flow and become more resilient.
• While our operations and suppliers are mainly UK and European, they work closely with us to address human rights, in particular, modern slavery.
Long term• Supporting jobs through our supply
chain in the short term catalyses the development of skills and jobs in the North West, providing a stimulus to benefit the regional economy in the long term.
• Working together to develop innovations and new technologies means we can identify solutions that will make our services better in the future.
• We act with integrity, giving suppliers confidence in the way we do business, which translates to transparency and fairness for our suppliers.
Link to strategic themes Working on our behalf, suppliers
are a face for our business. Ensuring they are motivated to deliver good quality work helps us deliver the best service to customers.
Developing innovations with suppliers, and ensuring they deliver goods and services efficiently, contributes to a sustainably low cost for customers.
Working with responsible suppliers who share our sustainability objectives helps us achieve more in tackling environmental and social issues.
SuppliersMedia
Link to material issue North west regional economy
Responsible supply chain
Human rights
Read more about our approach to materiality on page 27
Link to risks4
Read more about our principal risks on pages 104 to 107
READ MORE
Invoices paid within 60 daysDefinitionPercentage of invoices paid within 60 working days of issue.
TargetAt least 95 per cent, in line with requirements of the Prompt Payment Code.
Status Achieved/confident of achieving target
PerformanceFor 2020/21, 99.55 per cent of invoices were paid within 60 days. The average number of days taken to pay our suppliers was 13 days, which is reflective of our efforts to accelerate payment to suppliers by seven days during COVID-19.
• 2019/20: 97.35 per cent
• 2018/19: 98.57 per cent
• 2017/18: 95.44 per cent
• 2016/17: 97.40 per cent
We act fairly and transparently with all our suppliers and are a signatory to the Prompt Payment Code, which involves our commitment to paying invoices within 60 days.
OPERATIONAL KEY PERFORMANCE INDICATOR
STR
AT
EGIC
REPO
RT
Stock Code: UU. Annual Report and Financial Statements for the year ended 31 March 2021 71

Our performance in 2020/21Operational performance
OverviewOur activities support around 17,700 jobs in the supply chain, and the acceleration of around £500 million of capital expenditure into the first three years of AMP7 will play a part in helping to generate jobs and income for the north west economy at a critical time as the country emerges from the worst effects of the COVID-19 pandemic. Suppliers play an important role in maintaining supply for key parts of our business, and contractors, as well as direct employees, act as the face of our business for many customers and communities. The pandemic has shown the importance of our relationship with our supply chain partners. We have continued to work closely with our supply chain and issued guidance reinforcing government guidelines to protect employees, suppliers and customers while maintaining delivery of critical services.
'Better together' through United Supply ChainIn November 2020 we successfully launched our new approach to responsible supply chain management for AMP7 called United Supply Chain (USC). USC recognises suppliers as an extension of the United Utilities family and suppliers are asked to become signatory to our responsible sourcing principles as a minimum. Those suppliers who are integral to our operations we encourage to become leaders and to work jointly with us to deliver improvements across environmental, social and governance areas and improve value to customers. At the end of March 2021 we had signed 38 per cent of our targeted suppliers to our responsible sourcing principles and continue to pursue the remaining suppliers to reach our target of 100 per cent. Via our partnership with the Supply Chain Sustainability School we have been able to offer both our commercial colleagues and supply chain partners free resources to learn more about the responsible sourcing principles.
Innovation in action Our Innovation Lab programme is designed to “look for ideas where others aren’t looking” – in other sectors, other countries and with suppliers that are often small, start-up businesses, just starting on their idea development or business growth journey. It does all this whilst being fully compliant with procurement legislation – allowing for rapid idea testing and idea adoption / contract award – an obstacle that most regulated companies struggle with. The open, collaborative nature means that feedback is given more frequently and ideas get tailored for United Utilities adoption faster than traditional product testing. We have worked with 23 suppliers in this way, and our highest profile success
is with FIDO (tackling leakage detection in our Lab 2 programme). FIDO is becoming known as a disruptor in the global water sector, and we have first mover advantage on new developments.
We are part-way through our third Innovation Lab programme; we have published four high level problems and encouraged innovative solutions from around the world. Over 120 supplier applications have been reviewed by our experts and we have selected eight suppliers with high potential ideas; with our help, they could offer a performance step change across a range of areas from helping us to reduce our carbon footprint and be more self-sufficient on energy, to predicting asset failures before they occur. All ideas support our Systems Thinking ambitions, most are digitally-centric, and half are new entrants to the UK water sector.
17,700jobs supported by our activities
120supplier applications reviewed as part of our third Innovation Lab programme
Measure 2025 target 2020/21 performance
StatusAnnual
performanceAgainst 2025
target
KPI: Invoices paid within 60 days
At least 95% 99.55%
Average time taken to pay invoices
<28 days 13
% suppliers in high risk categories, as identified by sustainability risk assessments, covered by enhanced due diligence audits
5% Delivery scheduled from 2021
% of partner and strategic suppliers that have sustainability risk assessment in place
75% 35%
Supplier Relationship Management score
90% 69%
% of targeted suppliers signed up to United Supply Chain
100% 38%
CIPS ethical mark Retain annual accreditation
Retained
Savings delivered through innovation and efficiency
£40 million £3.9million
Status key:
Annual performance Against 2025 target
Met expectation/target Confident of meeting target
Close to meeting expectation/target Some work to do
Behind expectation/target Target unobtainable
Baseline year Baseline year
OTHER PERFORMANCE INDICATORS
STRATEGIC REPORT
72 unitedutilities.com/corporate United Utilities Group PLC

BEING PURPOSE-LED
USC is centred on using our responsible sourcing principles to create a high-quality supply chain and provide suppliers with a way of enhancing their performance in the North West and beyond.
Having an integrated culture throughout our supply chain is fundamental to the successful delivery of our strategic aims. This means extending our values beyond our own business and into the supply chain, recognising it as an extension of our operations and commitments, delivering critical services to our region and providing great water and more for the North West.
United Supply Chain (USC) is a fundamental step change in the way we are looking to engage and work with our suppliers through AMP7, and into AMP8 – replacing the previous Sustainable Supply Chain Charter used through AMP6. USC is centred on using our responsible sourcing principles to create a high-quality supply chain and provide suppliers with a way of enhancing their performance in the North West and beyond. We believe that operating and procuring in a responsible manner will mitigate risk, build resilience, improve compliance and ultimately deliver better value for customers.
In November 2020, as part of our launch of USC, we held our first digital supplier event, with senior leaders from across the business sharing their role in helping us to achieve our company’s vision of being the best UK water and wastewater company.
A variety of supplier engagement activities followed, and we are now in the process of signing up 100 per cent of all targeted suppliers to our responsible sourcing principles. We will then be surveying suppliers to capture our progress and successes, and to identify new ways that we can work better together.
Since 2016, we have had a strong relationship with the Supply Chain Sustainability School, and the launch of USC has seen them partner us on our journey to embed best practice across our business and broader supply chain. This collaboration allows our suppliers direct access to the latest thinking and training in responsible sourcing. Recent insightful workshops have covered carbon and modern slavery – with the latter leading to us enhancing key internal documents to align to best practice.
‘Pride in the workplace’ training by The Proud Trust provided education on diversity and inclusion, another key theme of our USC roll-out. Ensuring that learning gained from this training is replicated internally and throughout our supply chain will be key to helping us embed USC.
We will be showcasing more examples of collaborative working on our USC supplier web pages, as we work to create, adopt and develop better practice across our delivery chain.
Generating value for:Customers
Environment
Media
Working better together
STR
AT
EGIC
REPO
RT
Stock Code: UU. 73Annual Report and Financial Statements for the year ended 31 March 2021
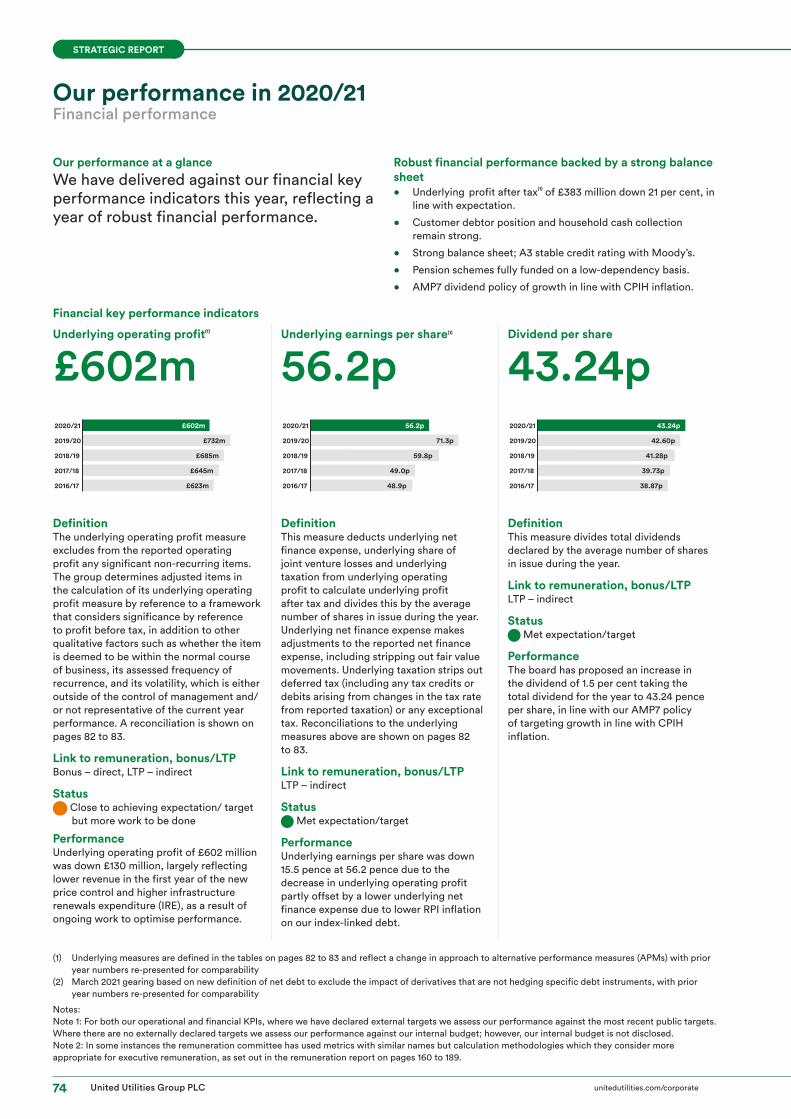
Our performance in 2020/21Financial performance
Financial key performance indicators
Underlying operating profit(1)
£602mUnderlying earnings per share(1)
56.2pDividend per share
43.24pGearing: net debt to RCV(2)
62%Total shareholder return
+7%Low dependency pension scheme
£nil deficit repair contributions
£602m
£732m
£685m
£645m
£623m
2020/21
2019/20
2018/19
2017/18
2016/17
56.2p
71.3p
59.8p
49.0p
48.9p
2020/21
2019/20
2018/19
2017/18
2016/17
43.24p
42.60p
41.28p
39.73p
38.87p
2020/21
2019/20
2018/19
2017/18
2016/17
62%
61%
61%
61%
61%
2020/21
2019/20
2018/19
2017/18
2016/17
+7%
+17%
+20%
-25%
+19%
2020/21
2019/20
2018/19
2017/18
2016/17
This is a new measure for the 2020–25 period hence no prior years' comparators. From 2021/22 onwards comparators will be provided.
DefinitionThe underlying operating profit measure excludes from the reported operating profit any significant non-recurring items. The group determines adjusted items in the calculation of its underlying operating profit measure by reference to a framework that considers significance by reference to profit before tax, in addition to other qualitative factors such as whether the item is deemed to be within the normal course of business, its assessed frequency of recurrence, and its volatility, which is either outside of the control of management and/or not representative of the current year performance. A reconciliation is shown on pages 82 to 83.
Link to remuneration, bonus/LTPBonus – direct, LTP – indirect
Status Close to achieving expectation/ target but more work to be done
PerformanceUnderlying operating profit of £602 million was down £130 million, largely reflecting lower revenue in the first year of the new price control and higher infrastructure renewals expenditure (IRE), as a result of ongoing work to optimise performance.
DefinitionThis measure deducts underlying net finance expense, underlying share of joint venture losses and underlying taxation from underlying operating profit to calculate underlying profit after tax and divides this by the average number of shares in issue during the year. Underlying net finance expense makes adjustments to the reported net finance expense, including stripping out fair value movements. Underlying taxation strips out deferred tax (including any tax credits or debits arising from changes in the tax rate from reported taxation) or any exceptional tax. Reconciliations to the underlying measures above are shown on pages 82 to 83.
Link to remuneration, bonus/LTPLTP – indirect
Status Met expectation/target
PerformanceUnderlying earnings per share was down 15.5 pence at 56.2 pence due to the decrease in underlying operating profit partly offset by a lower underlying net finance expense due to lower RPI inflation on our index-linked debt.
DefinitionThis measure divides total dividends declared by the average number of shares in issue during the year.
Link to remuneration, bonus/LTPLTP – indirect
Status Met expectation/target
PerformanceThe board has proposed an increase in the dividend of 1.5 per cent taking the total dividend for the year to 43.24 pence per share, in line with our AMP7 policy of targeting growth in line with CPIH inflation.
DefinitionGroup net debt divided by United Utilities Water Limited's (UUW) shadow (adjusted for actual spend) regulatory capital value (RCV).
TargetMaintain gearing with a range of 55 per cent to 65 per cent.
Status Met expectation/target
PerformanceOur gearing at 62 per cent is marginally higher this year but remains within our target range of 55 per cent to 65 per cent, supporting a solid investment grade credit rating.
DefinitionThis measure calculates the return to shareholders based on the movement in share price plus dividends over each financial year.
Link to remuneration, bonus/LTPLTP – direct
Status Met expectation/target
PerformanceOur total shareholder return was 7 per cent over the year to 31 March 2021.
DefinitionFully-funded defined benefit pension schemes on a low -dependency basis.
Status Met expectation/target
PerformanceOur pension scheme has minimal reliance on the company in order to meet all of its liabilities – in other words, we have achieved low dependency as defined in The Pensions Regulator's defined benefit funding consultation published in March 2020. We have no further deficit repair contributions to make, a position we do not expect to change given our approach to hedging market risk.
Our performance at a glanceWe have delivered against our financial key performance indicators this year, reflecting a year of robust financial performance.
Robust financial performance backed by a strong balance sheet• Underlying profit after tax(1) of £383 million down 21 per cent, in
line with expectation.
• Customer debtor position and household cash collection remain strong.
• Strong balance sheet; A3 stable credit rating with Moody’s.
• Pension schemes fully funded on a low-dependency basis.
• AMP7 dividend policy of growth in line with CPIH inflation.
(1) Underlying measures are defined in the tables on pages 82 to 83 and reflect a change in approach to alternative performance measures (APMs) with prior year numbers re-presented for comparability
(2) March 2021 gearing based on new definition of net debt to exclude the impact of derivatives that are not hedging specific debt instruments, with prior year numbers re-presented for comparability
Notes:Note 1: For both our operational and financial KPIs, where we have declared external targets we assess our performance against the most recent public targets. Where there are no externally declared targets we assess our performance against our internal budget; however, our internal budget is not disclosed. Note 2: In some instances the remuneration committee has used metrics with similar names but calculation methodologies which they consider more appropriate for executive remuneration, as set out in the remuneration report on pages 160 to 189.
United Utilities Group PLC unitedutilities.com/corporate 74
STRATEGIC REPORT

Financial key performance indicators
Underlying operating profit(1)
£602mUnderlying earnings per share(1)
56.2pDividend per share
43.24pGearing: net debt to RCV(2)
62%Total shareholder return
+7%Low dependency pension scheme
£nil deficit repair contributions
£602m
£732m
£685m
£645m
£623m
2020/21
2019/20
2018/19
2017/18
2016/17
56.2p
71.3p
59.8p
49.0p
48.9p
2020/21
2019/20
2018/19
2017/18
2016/17
43.24p
42.60p
41.28p
39.73p
38.87p
2020/21
2019/20
2018/19
2017/18
2016/17
62%
61%
61%
61%
61%
2020/21
2019/20
2018/19
2017/18
2016/17
+7%
+17%
+20%
-25%
+19%
2020/21
2019/20
2018/19
2017/18
2016/17
This is a new measure for the 2020–25 period hence no prior years' comparators. From 2021/22 onwards comparators will be provided.
DefinitionThe underlying operating profit measure excludes from the reported operating profit any significant non-recurring items. The group determines adjusted items in the calculation of its underlying operating profit measure by reference to a framework that considers significance by reference to profit before tax, in addition to other qualitative factors such as whether the item is deemed to be within the normal course of business, its assessed frequency of recurrence, and its volatility, which is either outside of the control of management and/or not representative of the current year performance. A reconciliation is shown on pages 82 to 83.
Link to remuneration, bonus/LTPBonus – direct, LTP – indirect
Status Close to achieving expectation/ target but more work to be done
PerformanceUnderlying operating profit of £602 million was down £130 million, largely reflecting lower revenue in the first year of the new price control and higher infrastructure renewals expenditure (IRE), as a result of ongoing work to optimise performance.
DefinitionThis measure deducts underlying net finance expense, underlying share of joint venture losses and underlying taxation from underlying operating profit to calculate underlying profit after tax and divides this by the average number of shares in issue during the year. Underlying net finance expense makes adjustments to the reported net finance expense, including stripping out fair value movements. Underlying taxation strips out deferred tax (including any tax credits or debits arising from changes in the tax rate from reported taxation) or any exceptional tax. Reconciliations to the underlying measures above are shown on pages 82 to 83.
Link to remuneration, bonus/LTPLTP – indirect
Status Met expectation/target
PerformanceUnderlying earnings per share was down 15.5 pence at 56.2 pence due to the decrease in underlying operating profit partly offset by a lower underlying net finance expense due to lower RPI inflation on our index-linked debt.
DefinitionThis measure divides total dividends declared by the average number of shares in issue during the year.
Link to remuneration, bonus/LTPLTP – indirect
Status Met expectation/target
PerformanceThe board has proposed an increase in the dividend of 1.5 per cent taking the total dividend for the year to 43.24 pence per share, in line with our AMP7 policy of targeting growth in line with CPIH inflation.
DefinitionGroup net debt divided by United Utilities Water Limited's (UUW) shadow (adjusted for actual spend) regulatory capital value (RCV).
TargetMaintain gearing with a range of 55 per cent to 65 per cent.
Status Met expectation/target
PerformanceOur gearing at 62 per cent is marginally higher this year but remains within our target range of 55 per cent to 65 per cent, supporting a solid investment grade credit rating.
DefinitionThis measure calculates the return to shareholders based on the movement in share price plus dividends over each financial year.
Link to remuneration, bonus/LTPLTP – direct
Status Met expectation/target
PerformanceOur total shareholder return was 7 per cent over the year to 31 March 2021.
DefinitionFully-funded defined benefit pension schemes on a low -dependency basis.
Status Met expectation/target
PerformanceOur pension scheme has minimal reliance on the company in order to meet all of its liabilities – in other words, we have achieved low dependency as defined in The Pensions Regulator's defined benefit funding consultation published in March 2020. We have no further deficit repair contributions to make, a position we do not expect to change given our approach to hedging market risk.
Met expectation/target
Close to meeting expectation/target
Behind expectation/target
Baseline year
KPI STATUS KEY
Stock Code: UU. Annual Report and Financial Statements for the year ended 31 March 2021
STR
AT
EGIC
REPO
RT
75

Our performance in 2020/21Financial performance
Revenue 1,808.0
1,859.3
1,818.5
1,735.8
1,704.0
2020/21
2019/20
2018/19
2017/18
2016/17
Underlying operating profit(1)
602.1
732.1
684.8
645.1
622.9
2020/21
2019/20
2018/19
2017/18
2016/17
Reported operating profit 602.1
630.3
634.9
636.4
605.5
2020/21
2019/20
2018/19
2017/18
2016/17
RCV gearing(2)
62%Total dividend per ordinary share (pence)
43.24(1) We have changed our approach to
alternative performance measures (APMs) during the year, with prior year numbers restated for comparability. A guide to APMs and a reconciliation between underlying profit and reported profit is shown on pages 82 to 83.
(2) Regulatory capital value (RCV) gearing calculated as group net debt/United Utilities Water Limited shadow RCV (out-turn prices).
Revenue
Year to31 March
2020
1,859.3
(79.5)(46.7)
46.8 12.5 6.2 9.42,000
1,400
1,600
1,800
800
600
1,000
1,200
0
400
200
Regulatoryrevenuechanges
Non-household
consumption
Household consumption
WRFIMadjustments
Innovationfund
Other
1,808.0
Year to31 March
2021
Operating profit
Underlyingyear to
31 March2020
732.1
(51.3)(21.8) (21.8) (13.5) (6.2) (15.4)
602.1
800
600
400
200
0
Revenue Depreciationand
amortisation
Infrastructurerenewals
expenditure
Propertyrates
Innovationfund
Otherunderlyingoperating
costs
Underlying and reported year
to 31 March2021
* Adjusted items are set out on pages 82 and 83
Revenue was down £51 million, at £1,808 million, largely reflecting the £80 million reduction from the new pricing regime in this, the first year of AMP7, incorporating a 5.5 per cent real reduction in typical household bills and a 1.5 per cent CPIH-linked increase.
The impact of the COVID-19 pandemic and related lockdown periods has seen non-household revenue decrease by £47 million, with an increase in household revenue of £47 million as a result of more time spent at home and the hot, dry weather in spring 2020.
Revenue in 2020/21 includes £6 million in relation to the Innovation in Water Challenge Scheme. This is a new scheme introduced by Ofwat in AMP7, and therefore did not apply last year, and is intended to fund industry-wide innovation projects. In 2020/21, we have provided for £6 million of offsetting costs with the balance of revenue and costs as the scheme matures in future years dependent upon how successful companies are in bidding for funds.
United Utilities Group PLC unitedutilities.com/corporate 76
STRATEGIC REPORT

Underlying operating profit(1) at £602 million was £130 million lower than last year. This principally reflects the £51 million reduction in revenue, and also a £22 million increase in IRE as a result of ongoing work to optimise the performance of our network. Depreciation is £22 million higher, principally reflecting the higher capex programme in AMP6 with a high number of assets commissioned towards the end of the AMP. In the near term we would expect depreciation to flatten out, reflecting the lower AMP7 capex programme. Property rates are £14 million higher this year, largely reflecting a rates refund received last year. We have accrued £6 million of costs in 2020/21 in relation to the Innovation in Water Challenge Scheme mentioned above, along with £13 million of extra COVID-19 related costs (including a £5 million increase in the underlying bad debt charge), which have been absorbed within our cost base and which have not been treated as adjusted items when calculating our underlying operating profit.
Reported operating profit was £28 million lower than last year, reflecting the decrease in underlying operating profit partially offset by a decrease in adjusted items. As a result of the changes we have made to alternative performance measures, we will no longer, as a matter of course, adjust for restructuring costs to derive underlying operating profit and therefore we do not have any adjusted items in the year to 31 March 2021, with prior year numbers re-presented for comparative purposes. Adjusted items totalling £102 million were made in the full year to 31 March 2020, comprising £83 million of accelerated depreciation of bioresources assets that had been taken out of use and £19 million in relation to provisions for the anticipated impact of COVID-19, principally reflecting a higher bad debt charge recognising the higher risk of future non-payment of household customer bills. These adjusted items can also be found on pages 82 to 83 and more detail can be found in our announcement of results for the year to 31 March 2020.
Household bad debt is 2.2 per cent of regulated revenue, representing a marginal increase of £5 million on the underlying bad debt cost in the prior year, reflecting the ongoing uncertainty associated with the third lockdown and taking into account expected cash collection into the future, as government support unwinds in the coming months.
Underlying profit before tax(1) was £460 million, £75 million lower than last year. This reflects the £130 million reduction in underlying operating profit, and an increase in the share of underlying losses of joint ventures of £3 million, partly offset by a £58 million decrease in underlying net finance expense.
Underlying profit before tax reflects consistently applied presentational adjustments as outlined on pages 82 to 83. Reported profit before tax increased by £248 million to £551 million, reflecting the £28 million reduction in reported operating profit and the £3m increase in the share of underlying losses of joint ventures, more than offset by a £210 million reduction in reported net finance expense (including fair value movements), a £37 million profit on the disposal of our Tallinn joint venture and the impact in the prior year of our £32 million share of Water Plus losses arising as a result of COVID-19.
Net finance expenseThe underlying net finance expense of £133 million was £58 million lower than last year, on a consistent basis. Interest of £83 million on non-index linked debt was £13 million lower than last year due to lower rates locked in on debt and associated swaps. The indexation of principal on index-linked debt, including the impact of inflation swaps, amounted to a net charge in the income statement of £54 million, compared with a net charge of £100 million last year.
Reported net finance expense of £79 million was £210 million lower than last year, principally reflecting a £151 million increase in the fair value gains on debt and derivative instruments, from a £76 million loss in the prior year to a £74 million gain in the current year, and lower inflation applied to our index-linked debt.
Joint ventures On 31 March 2021, the group completed the disposal of its stake in the Tallinn Water joint venture for consideration of EUR 100.3 million (£85.3 million) and a total recognised profit on disposal of £37 million. Given its material and atypical nature, this profit on disposal has been excluded from underlying results.
For the year to 31 March 2021, we recognised £14 million losses in the income statement relating to our joint venture Water Plus, comprising £9 million of our share of Water Plus’s underlying losses for the year and £5 million of previously unrecognised share of losses. At 31 March 2021 there was a clear expectation that the £32.5 million revolving credit facility extended to Water Plus would be converted into additional equity share capital, and as a result share of losses are recognised against this capital, this includes recognition of any previously unrecognised losses. The transaction to convert the £32.5 million revolving credit facility was subsequently executed on 23 April 2021.
For the year to 31 March 2020, we recognised £51 million losses in the income statement relating to our joint venture Water Plus, comprising £14 million of our share of Water Plus’ underlying losses and our £32 million share of Water Plus losses arising as a result of COVID-19, as well as a £5 million allowance for expected credit losses. As a result, our long-term interest in Water Plus was written down to £nil. A further £5 million of our share of Water Plus’ underlying losses were not recognised in the income statement.
Our £9 million underlying share of losses of joint ventures in the year to 31 March 2021 comprises a £5 million share of profits from Tallinna Vesi AV, more than offset by a £14 million share of losses from Water Plus.
Profit before tax
Underlyingyear to
31 March2020
534.8
(130.0) 58.4
(3.2)
460.0
91.0 551.0600
400
200
0
Underlyingoperating
pro�t
Underlyingnet �nance
expensedecrease
Share ofJVs
losses
Underlyingyear to
31 March2021
Adjusteditems*
Reportedyear to
31 March2021
* Adjusted items are set out on pages 82 and 83
Stock Code: UU. Annual Report and Financial Statements for the year ended 31 March 2021
STR
AT
EGIC
REPO
RT
77

Our performance in 2020/21Financial performance
Profit after tax and earnings per share
Underlying profit after tax(1) of £383 million was £103 million lower than last year, and underlying earnings per share decreased from 71.3 pence to 56.2 pence, principally reflecting the £75 million reduction in underlying profit before tax and a £28 million higher underlying tax charge largely due to the pension deficit repair payment we made last year.
Reported profit after tax increased by £347 million to £453 million, and reported basic earnings per share increased from 15.7 pence to 66.5 pence, principally reflecting the £248 million increase in the reported profit before tax and a £99 million decrease in the reported tax charge primarily as a result of a £136 million deferred tax adjustment for the change in tax rate reflecting the Government’s reversal of the planned reduction in the rate of corporation tax recognised in the prior year.
TaxThe group continues to be fully committed to paying its fair share of tax and acting in an open and transparent manner in relation to its tax affairs and we were delighted to have retained the Fair Tax Mark independent certification for a second year, having been only the second FTSE 100 company to be awarded the Fair Tax Mark in July 2019.
In addition to corporation tax, the group pays significant other contributions to the public finances on its own behalf as well as collecting and paying over further amounts for its 5,000 strong workforce. The total payments for 2020/21 were around £258 million and included business rates, employment taxes, environmental taxes and other regulatory service fees such as water abstraction charges, as well as corporation tax.
effective tax rate was around 19 per cent for both the current year and the prior year. Subject to any legislative or tax practice changes, we would expect the total effective tax rate to be in line with the headline rate of corporation tax for the medium term.
In 2020/21, there are £31 million of tax adjustments taken to equity, primarily relating to remeasurement movements on the group’s defined benefit pension schemes. As in the prior year the rate at which the deferred tax liabilities are measured on the group’s defined benefit pension scheme is 35 per cent, being the rate applicable to refunds from a trust.
An increase in the headline rate of corporation tax to 25 per cent from 1 April 2023 was announced in the Chancellor’s Budget on 3 March 2021. This change has been enacted in May 2021, and will result in a future deferred tax charge currently estimated at around £380 million.
Dividend per shareThe board has proposed a final dividend of 28.83 pence per ordinary share in respect of the year ended 31 March 2021. Taken together with the interim dividend of 14.41 pence per ordinary share, paid in February, this results in a total dividend per ordinary share for 2020/21 of 43.24 pence. This is an increase of 1.5 per cent compared with the dividend relating to last year, in line with the group’s dividend policy of targeting a growth rate of CPIH inflation each year through to 2025. The inflationary increase of 1.5 per cent is based on the CPIH element included within the allowed regulated revenue increase for the 2020/21 financial year (i.e. the movement in CPIH between November 2018 and November 2019).
The final dividend is expected to be paid on 2 August 2021 to shareholders on the register at the close of business on 25 June 2021. The ex-dividend date is 24 June 2021.
Cash flowNet cash generated from continuing operating activities for the year to 31 March 2021 was £859 million, broadly consistent with £810 million last year. The group’s net capital expenditure was £639 million, principally in the regulated water and wastewater investment programmes. This excludes infrastructure renewals expenditure which is treated as an operating cost. Cash flow capex differs from regulatory capex, since the latter is based on capital work done in the period, rather than actual cash spent.
In 2020/21, we paid corporation tax of £75 million, which represents an effective cash tax rate on underlying profits of 16 per cent, which is 3 per cent lower than the headline rate of corporation tax of 19 per cent. The key reconciling item to the headline rate of corporation tax continues to be allowable tax deductions on capital investment and also, in the prior year, pension payments – these being deductions put in place by successive governments to encourage such investment and thus reflecting responsible corporate behaviour in relation to taxation.
We have expressed the effective cash tax rate in terms of underlying profits as this measure excludes fair value movements on debt and derivative instruments and thereby enables a medium-term cash tax rate forecast. We expect the average cash tax rate on underlying profits to remain below the headline rate of tax for the medium term.
As well as the payments we also received a repayment of corporation tax of £27 million following agreement of routine prior years’ UK tax matters.
The current tax charge was £80 million in 2020/21, compared with £51 million in the previous year. There were current tax credits of £1 million in 2020/21 and £12 million in 2019/20, following agreement of prior years’ UK tax matters.
For 2020/21, the group recognised a deferred tax charge of £18 million, compared with £158 million for 2019/20. Of the deferred tax charge for 2019/20, £136 million related to the Government’s reversal of the planned reduction in the rate of corporation tax from 19 per cent to 17 per cent from 1 April 2020. Excluding the above change in tax rate related deferred tax adjustment in the prior year and the current year non-taxable profit on the disposal of the joint venture investment in AS Tallinna Vesi, the total
Underlyingpro�t after
tax to 31 March2020
486.3
(74.8)(28.5)
383.0
70.4 453.4
600
0
200
400
Underlyingpro�t before
tax
Underlyingtax
Underlyingpro�t after
tax to 31 March2021
Adjusteditems*
Reportedpro�t after
tax to 31 March2021
* Adjusted items are set out on pages 82 and 83
United Utilities Group PLC unitedutilities.com/corporate 78
STRATEGIC REPORT

PensionsAs at 31 March 2021, the group had an IAS 19 net pension surplus of £689 million, compared with a net pension surplus of £754 million at 31 March 2020. This £65 million decrease is predominantly due to the unwinding of a
spike in credit spreads at 31 March 2020 due to COVID-19 that resulted in a temporary decrease in the valuation of liabilities. The scheme-specific funding basis does not suffer volatility due to credit spread movements to the same extent as it uses a prudent, fixed
credit spread assumption and is hedged for inflation and interest rates. Any inflation and credit spread movements are therefore not expected to have a material impact on the pension liabilities calculated on a scheme-specific funding basis.
FinancingSummary of net debt movement
As at31 March
2020
Cash generated
fromoperations
Proceeds from
disposal
Fairvalue
movements
Dividendsfromjoint
ventures
Net capitalexpenditure
Dividends Interest Indexation Tax Other As at31 March
2021
Adjustments As at31 March
2021(new
de nition)
7,2507,361.4
(1,037.2)(85.3) (7.5) (6.4)
639.0
291.9
129.3
52.6 48.511.4
7,397.7
(91.9)
7,305.8
6,750
5,750
6,250
The group’s gross borrowings at 31 March 2021 had a carrying value of £8,452 million. The fair value of these borrowings was £9,855 million. This £1,403 million difference principally reflects the significant fall in real interest rates compared with the rates at the time we raised a portion of the group’s index-linked debt. This difference has increased from £471 million at 31 March 2020 due primarily to a decrease in credit spreads.
Cash and short-term deposits at 31 March 2021 amounted to £744 million.
Net debt at 31 March 2021 was £7,306 million, compared with £7,361 million at 31 March 2020. This comprises gross borrowings of £8,452 million and derivative liabilities of £115 million net of cash of £744 million and derivative assets of £425 million. This is then adjusted to exclude derivatives with a net liability of £92 million under our revised definition of net debt to exclude the impact of derivatives that are not hedging-specific debt instruments and therefore gives a fairer reflection of the amount we are contractually obliged to repay. This approach is more consistent with that taken by the credit rating agencies and better reflects the regulatory economics.
Underlying movements in net debt are largely a result of net operating cash inflows offset by our net capital expenditure, dividends, cash interest, indexation interest and tax, and in 2020/21 also reflects the impact of the £85 million sales proceeds from the disposal of our Tallinn JV.
Gearing, measured as group net debt divided by UUW’s shadow (adjusted for actual spend) regulatory capital value, was 62 per cent at 31 March 2021. This is marginally higher than the 61 per cent as at 31 March 2020 but remains within our target range of 55 to 65 per cent.
Cost of debtAs at 31 March 2021, the group had approximately £3.0 billion of RPI-linked debt at an average real rate of 1.3 per cent, and £1.1 billion of CPI or CPIH-linked debt at an average real rate of -0.2 per cent.
A lower RPI inflation charge compared with the same period last year contributed to the group’s average effective interest rate of 2.5 per cent being lower than the rate of 3.4 per cent for the year to 31 March 2020. The average underlying interest rate represents the underlying net finance expense adjusted for capitalised borrowing costs and net pension interest income, divided by average notional debt.
The group has fixed the interest rates on its non index-linked debt in line with its 10-year reducing balance basis at a net effective nominal interest rate of 2.2 to 2.5 per cent for the 2020–25 regulatory period.
Credit ratingsUUW’s senior unsecured debt obligations are rated A3 with Moody’s Investors Service (Moody’s), A- with Fitch Ratings (Fitch) and BBB+ with Standard & Poor’s Ratings Services (S&P) and all on stable outlook. United Utilities PLC’s (UU PLC’s) senior unsecured debt obligations are rated Baa1 with Moody’s, A- with Fitch and BBB- with S&P, all on stable outlook.
Debt financingThe group has access to the international debt capital markets through its €7 billion euro medium-term note (EMTN) programme. The EMTN programme does not represent a funding commitment, with funding dependent on the successful issue of the notes.
In total over 2020–25, we expect to raise around £2.4 billion to cover refinancing and incremental debt, supporting our five-year investment programme. In 2020/21 we have raised £900 million, taking advantage of the attractive rates available and extending our liquidity position out to August 2023.
Stock Code: UU. Annual Report and Financial Statements for the year ended 31 March 2021
STR
AT
EGIC
REPO
RT
79

Our performance in 2020/21Financial performance
In November 2020, we published our new sustainable finance framework, through which we expect to raise financing based on our strong ESG credentials alongside conventional issuance. This replaces the green funding we have previously secured through the European Investment Bank (EIB), which is no longer available post-Brexit.
In January 2021, we issued our debut sustainable bond raising £300 million, maturing in October 2029 and subsequently swapped to CPI-linkage.
We remain one of the sector leaders in the issuance of CPI-linked debt in response to Ofwat’s decision to transition away from RPI inflation linkage. At 31 March 2021, we have increased the CPI-linkage in our debt portfolio to £1,015 million with a further £50 million of CPIH-linkage, and therefore a perfect match for the regulatory regime.
Since March 2020, we have renewed £50 million of revolving credit facilities with a relationship bank for a further five-year term, and extended £100 million of revolving credit facilities for a further three years, and £250 million of revolving credit facilities for a further year.
Interest rate managementLong-term borrowings are structured or hedged to match assets and earnings, which are largely in sterling, indexed to UK price inflation and subject to regulatory price reviews every five years.
Long-term sterling inflation index-linked debt provides a natural hedge to assets and earnings. At 31 March 2021, approximately 41 per cent of the group’s net debt was in RPI-linked form, representing around 26 per cent of UUW’s regulatory capital value, with an average real interest rate of 1.3 per cent. A further 15 per cent of the group’s net debt was in CPI or CPIH-linked form, representing around 9 per cent of UUW’s RCV, with an average real rate of -0.2 per cent. The long-term nature of this funding also provides a good match to the company’s long-life infrastructure assets and is a key contributor to the group’s average term debt maturity profile, which is around 18 years.
Our inflation hedging policy is to target around 50 per cent of net debt to be maintained in index-linked form. This reflects a balanced assessment across a range of factors.
Where nominal debt is raised in a currency other than sterling and/or with a fixed interest rate, the debt is generally swapped to create a floating rate sterling liability for the term of the debt. To manage exposure to medium-term interest rates, the group fixes underlying interest costs on nominal debt out to ten years on a reducing balance basis.
Historically, this has been supplemented by fixing substantially all remaining floating rate exposure across a forthcoming regulatory period around the time of the price control determination. Recognising Ofwat’s intention to apply debt indexation for new debt raised during the 2020–25 regulatory period, we have retained the hedge to fix underlying interest costs on nominal debt out to ten years on a reducing balance basis, but have not supplemented this with the additional ‘top up’ fixing at the start of the new regulatory period.
LiquidityShort-term liquidity requirements are met from the group’s normal operating cash flow and its short-term bank deposits and supported by committed but undrawn credit facilities. Our €7 billion EMTN programme provides further support.
At 31 March 2021, we had liquidity out to August 2023, comprising cash and short-terms deposits (enhanced by new finance raised in the period), plus committed undrawn revolving credit facilities. This gives us flexibility in terms of when and how further debt finance is raised to help refinance maturing debt and support the delivery of our regulatory capital investment programme.
We consider that we operate a prudent approach to managing banking counterparty risk. Counterparty risk, in relation to both cash deposits and derivatives, is controlled through the use of counterparty credit limits. Our cash is held in the form of short-term money market deposits with prime commercial banks.
We operate a bilateral rather than a syndicated approach to our core relationship banking facilities. This approach spreads maturities more evenly over a longer time period, thereby reducing refinancing risk and providing the benefit of several renewal points rather than a large single refinancing requirement.
OutlookWe have responded well to the challenges presented by COVID-19 and delivered another year of strong operational performance, building on the improvements we delivered in AMP6. We are leading the way on customer satisfaction and have made a strong start to our AMP7 customer ODIs, delivering net outperformance of £21 million this year. We have extended our AMP7 totex plans by £300 million to underpin the delivery of long-term sustainable performance improvements and efficiency, and we continue with our strategy of accelerating investment to bring forward benefits for customers and the environment and contributing to the economic recovery of our region.
This is a great start to the new regulatory period and provides a strong platform to deliver further good operational performance for the benefit of all stakeholders. This gives us the confidence to target cumulative net outperformance of around £150 million against our customer ODIs for AMP7.
2021/22 full-year guidance• Revenue is expected to be marginally
lower in 2021/22, reflecting the November 2020 CPIH of 0.6 per cent offset by the regulatory revenue reduction of 2.0 per cent.
• Underlying operating costs are expected to be marginally higher year-on-year, reflecting small inflationary increases coming through core costs while IRE is expected to increase, reflecting the additional investment in DNM.
• Underlying finance expense is expected to be higher year-on-year as higher inflation impacts our index-linked debt.
• Capex in 2021/22 is expected to be in the range of £625 million to £675 million, reflecting the ongoing acceleration of our AMP7 programme and around £50 million of additional capex (of the £300 million extension to our AMP7 totex plans).
• Targeting a net customer ODI reward of around £20 million, consistent with targeting a cumulative net AMP7 reward of around £150 million.
United Utilities Group PLC unitedutilities.com/corporate 80
STRATEGIC REPORT

Stock Code: UU. Annual Report and Financial Statements for the year ended 31 March 2021
STR
AT
EGIC
REPO
RT
81

Our performance in 2020/21Financial performance
Guide to Alternative Performance Measures (APMs)The underlying profit measures in the following table represent APMs as defined by the European Securities and Markets Authority (ESMA). These measures are linked to the group’s financial performance as reported in accordance with international accounting standards in conformity with the requirements of the Companies Act 2006, and in accordance with International Financial Reporting Standards (IFRSs) adopted pursuant to Regulation (EC) No 1606/2002 as it applies in the European Union, in the group’s consolidated income statement, which can be found on page 207. As such, they represent non-GAAP measures.
These APMs have been presented in order to provide a more representative view of business performance. The group determines adjusted items in the calculation of its underlying measures against a framework which considers significance by reference to profit before tax, in addition to other qualitative factors, such as whether the item is deemed to be within the normal course of business, its assessed frequency of recurrence and its volatility which is either outside the control of management and/or not representative of current year performance.We have simplified our approach to APMs and are no longer, as a matter of course, adjusting our underlying earnings for restructuring costs, net pension interest, capitalised borrowing costs and prior years’
tax matters. This brings our approach more in line with peers and therefore makes cross-company comparisons easier. The tables that follow present the prior year APMs both on a re-presented basis using the new definition of APMs and as presented as at 31 March 2020 for comparative purposes.In addition, a reconciliation of the group’s average effective interest rate has been presented, together with a prior year comparison. In arriving at net finance expense used in calculating the group’s effective interest rate, underlying net finance expense is adjusted to add back net pension interest income and capitalised borrowing costs in order to provide a view of the group’s cost of debt that is better aligned to the return on capital it earns through revenue.
Adjusted item Rationale
Adjustments not expected to recur
Bioresources asset write down
A strategic review of the group’s bioresources activities was undertaken in the second half of the year ended 31 March 2020, informed by the PR19 process and the group’s zero-carbon commitments. This resulted in the likelihood of future economic benefit being derived from certain assets now being considered remote in light of improvements in alternative lower-cost and more environmentally-friendly processes. This resulted in a material asset write down that was not considered to be part of the normal course of business, with similarly material write downs not expected to reoccur in future years.
COVID-19 The group incurred significant costs resulting from the COVID-19 pandemic in the early part of 2020, including incremental expected credit losses on household and non-household customer receivables caused by the economic impact of business closures and expected increases in unemployment. The group’s joint venture, Water Plus, was also significantly impacted, resulting in the business recognising an impairment of certain assets and a higher allowance for expected credit losses at 31 March 2020, feeding through to the group’s share of losses from joint ventures. This also caused the group to recognise an allowance for expected credit losses in relation to loans extended to Water Plus. Due to the unprecedented nature of the pandemic and the initial economic shock associated with early lockdown measures, these costs were not deemed to be representative of normal business performance when compared against prior periods. In line with best practice, we make no COVID-19 adjustment in the year ended 31 March 2021.
Profit on disposal of joint ventures
This relates to the disposal of the group’s 35.3 per cent stake in its Estonian joint venture, AS Tallinna Vesi, which represents a significant, atypical event and as such is not considered to be part of the normal course of business.
Consistently applied presentational adjustments
Net fair value (gains)/losses on debt and derivative instruments, excluding interest on derivatives and debt under fair value option(2)
Fair value movements on debt and derivative instruments can be both very significant and volatile from one period to the next, and are therefore excluded in arriving at underlying net finance expense as they are determined by macroeconomic factors which are outside of the control of management and relate to instruments that are purely held for funding and hedging purposes (not for trading purposes). Included within fair value movement on debt and derivatives is interest on derivatives and debt under fair value option. In making this adjustment it is appropriate to add back interest on derivatives and debt under fair value option to provide a view of the group’s cost of debt which is better aligned to the return on capital it earns through revenue. Taking these factors into account, management believes it is useful to adjust for these fair value movements to provide a more representative view of performance.
Deferred tax adjustment Management adjusts to exclude the impact of deferred tax in order to provide a more representative view of the group’s profit after tax and tax charge for the year given that the regulatory model allows for cash tax to be recovered through revenues, with future revenues allowing for cash tax including the unwinding of any deferred tax balance as it becomes current. By making this adjustment, the group’s underlying tax charge does not include tax that will be recovered through revenues in future periods, thus reducing the impact of timing differences.
Tax in respect of adjustments to underlying profit before tax
Management adjusts for the tax impacts of the above adjusted items to provide a more representative view of current year performance.
Presentational adjustments no longer applied (1)
Restructuring costs The group typically incurs a certain level of restructuring costs each year, the quantum of which is dependent on the significance of discrete events in a given year, which can cause volatility in the reported results. Management adjusts internally for these costs to provide a view of underlying performance which it considers to be representative of the normal course of business and more comparable period to period. For the year ended 31 March 2021 and going forward, an adjustment will only be made if part of a more significant strategic restructure.
Net fair value (gains)/losses on debt and derivative instruments(2)
Fair value movements on debt and derivatives can be both very significant and volatile from one period to the next. These movements are determined by macroeconomic factors which are outside the control of management and these instruments are purely held for funding and hedging purposes (not for trading purposes). Taking these factors into account, management believes it is useful to adjust for this to provide a more representative view of performance.
Interest on derivatives and debt under fair value option(2)
Net fair value gains on debt and derivative instruments includes interest on derivatives and debt under fair value option. In adjusting for net fair value gains on debt and derivatives, it is appropriate to add back interest on derivatives and debt under fair value option to provide a view of the group’s cost of debt which is better aligned to the return on capital it earns through revenue.
Net pension interest income This item can be very volatile from one period to the next and it is a direct function of the extent to which the pension scheme is in an accounting deficit or surplus position.
Capitalised borrowing costs Accounting standards allow for the capitalisation of borrowing costs in the cost of qualifying assets. These significant costs have previously been adjusted for to provide a representative cost of borrowings and current year performance when considered in the context of the return on capital the group earns through revenue.
Agreement of prior years’ tax matters
The agreement of prior years’ tax matters is part of the group’s normal processes of ensuring that the right amount of tax is paid. Depending on the agreements made in any given year, this can be significant, volatile and often related to final settlement of numerous prior year periods. Historically, management has adjusted for this as a matter of course to provide a more representative view of the tax charge/credit in relation to current year performance. For the year ended 31 March 2021 and going forward, an adjustment will only be made if significant and relating to numerous prior year periods.
(1) These adjustments are no longer made in the year ended 31 March 2021 and going forward reflect our change in approach to APMs.(2) For the year ended 31 March 2021, and going forward, this adjustment combines 'net fair value (gains)/losses on debt and derivative instruments' and
‘interest on derivatives and debt under fair value option’.
United Utilities Group PLC unitedutilities.com/corporate 82
STRATEGIC REPORT

Underlying profit
Operating profit
Year ended 31 March
2021 £m
Re-presentedYear ended
31 March2020
£m
As reported Year ended
31 March 2020
£m
Operating profit per published results 602.1 630.3 630.3Bioresources asset write down – 82.6 82.6COVID-19 – expected credit loss on non-household receivables – 1.4 1.4COVID-19 – expected credit loss on household receivables – 16.7 16.7COVID-19 – operating expenses – 1.1 1.1Restructuring costs – – 11.8Underlying operating profit 602.1 732.1 743.9
Net finance expenseFinance expense (103.5) (313.0) (313.0)Investment income 25.0 24.0 24.0
Net finance expense per published results (78.5) (289.0) (289.0)COVID-19 – expected credit losses on loans to JVs – 5.0 5.0Net fair value (gains)/losses on debt and derivative instruments, excluding interest on swaps and debt under fair value option
(54.3) 92.8 –
Net fair value (gains)/losses on debt and derivative instruments – – 76.3Interest on swaps and debt under fair value option – – 16.5Net pension interest income – – (14.0)Adjustment for capitalised borrowing costs – – (40.6)Underlying net finance expense (132.8) (191.2) (245.8)
Share of losses of joint ventures per published results (9.3) (38.1) (38.1)COVID-19 – Water Plus impairment losses and expected credit losses – 32.0 32.0
Underlying share of losses of joint ventures (9.3) (6.1) (6.1)
Profit on disposal of joint ventures per published results 36.7 – –Profit on disposal of AS Tallinna Vesi joint venture (36.7) – –Underlying profit on disposal of joint ventures – – –
Profit before tax per published results 551.0 303.2 303.2Adjustments in respect of operating profit – 101.8 113.6Adjustments in respect of net finance expense (54.3) 97.8 43.2Adjustments in respect of share of losses of joint ventures – 32.0 32.0Adjustments in respect of profit on disposal of joint ventures (36.7) – –Underlying profit before tax 460.0 534.8 492.0
Profit after tax per published results 453.4 106.8 106.8Adjustments in respect of profit before tax (91.0) 231.6 188.8Deferred tax adjustment 18.4 157.5 157.5Agreement of prior years’ UK tax matters – – (12.2)Tax in respect of adjustments to underlying profit before tax 2.2 (9.6) (11.3)Underlying profit after tax 383.0 486.3 429.6
Earnings per share £m £m £m
Profit after tax per published results (a) 453.4 106.8 106.8Underlying profit after tax (b) 383.0 489.5 429.6Weighted average number of shares in issue, in millions (c) 681.9m 681.9m 681.9mEarnings per share per published results, in pence (a/c) 66.5 15.7 15.7Underlying earnings per share, in pence (b/c) 56.2 71.3 63.0Dividend per share, in pence 43.24p 42.60p 42.60p
Average effective interest rateIn arriving at net finance expense used in calculating the group’s effective interest rate, management adjusts underlying net finance expense to add back net pension income and capitalised borrowing costs in order to provide a view of the group’s cost of debt which is better aligned to the return on capital it earns through revenue.
31 March 2021
31 March 2020
Underlying net finance expense (132.8) (191.2)Net pension interest income (17.5) (14.0)Adjustment for capitalised borrowing costs (30.4) (40.6)Net finance expense for effective interest rate (a) (180.7) (245.8)Average notional net debt (b) (7,315) (7,136)Average effective interest rate (a/b) 2.5% 3.4%
Stock Code: UU. Annual Report and Financial Statements for the year ended 31 March 2021
STR
AT
EGIC
REPO
RT
83

STRATEGIC REPORT
Being a responsible businessOur ESG credentials
Through our purpose, vision and strategic themes, responsible business is a core part of who we are as a business and has been for many years.
We actively participate in a range of global ESG ratings, indices and frameworks to benchmark our approach against best practice and emerging sustainability challenges.
Index/rating Description Performance
The Dow Jones Sustainability Index ranks the sustainability approach of the top 10 per cent of the world’s biggest companies based on long-term economic, environmental and social criteria.
For 2020, our overall performance was 79 per cent and we attained World Class status for the 14th consecutive year. We were awarded SAM Bronze Class in the Sustainability Yearbook 2021.
The FTSE4Good Index Series measures the performance of companies who demonstrate strong ESG practices against globally recognised responsible business standards.
United Utilities Group PLC has been included in the FTSE4Good Index Series since 27 June 2001. Latest review June 2020.
ISS ESG’s Corporate ESG Rating provides investors with comprehensive portfolio company research on social, environmental and governance factors to help identify and mitigate ESG risks and to capitalise on investment opportunities.
In the annual review of November 2020, our status was assessed as Prime.(1)
Provides ESG ratings on an AAA to CCC scale according to exposure to industry-specific ESG risks and ability to manage those risks relative to peers.
As of February 2021, United Utilities Group PLC received an MSCI ESG rating of AA.(2)
Sustainalytics, a Morningstar company, is a leading independent ESG research, ratings and data firm. Its ESG Risk Ratings measure a company’s exposure to industry-specific material ESG risks and how well a company is managing those risks.
In April 2021, United Utilities received an ESG Risk Rating of 13.0 and was assessed by Sustainalytics to be at low risk of experiencing material financial impacts from ESG factors. United Utilities is a Sustainalytics ESG Industry Top Rated Company for 2021.(3)
Vigeo Eiris (V.E), an affiliate of Moody’s, is a global leader in ESG assessments, data, research, benchmarks and analytics. Leveraging their extensive proprietary database, they equip market players with the ESG insight they need to manage risks and better understand and address their social and environmental impact. The Euronext ESG indices serve as a benchmark for investors to incorporate ESG considerations into their investment strategies.
We received an overall Advanced ESG score by V.E of 65 and United Utilities Group PLC has been confirmed as a constituent of the Euronext UK 20 and Europe 120 Indices in year 2020.(4)
(1) issgovernance.com/esg/ratings/badge
(2) msci.com/notice-and-disclaimer
(3) sustainalytics.com/legal-disclaimers
(4) vigeo-eiris.com/privacy-legal-information
United Utilities Group PLC unitedutilities.com/corporate 84

Alignment to wider global goals
The Sustainable Development Goals (SDGs) comprises 17 global goals to be achieved by the year 2030, and were adopted by a summit of the United Nations (UN) in 2015. They are designed to be the blueprint to achieve a better and more sustainable future for all. Our approach to responsible business
aligns quite naturally with the goals and we have identified six that are most material to our business and where we contribute the most.
We contribute to the delivery of a wider selection of the SDGs through our investment projects and these are described in our sustainable finance framework.
Clean water and sanitationPart of our purpose is to provide great water and is the reason we exist, ensuring customers in the North West have safe, resilient and affordable water and wastewater services.
This includes avoiding wasting water, and we promote water efficiency through campaigns, advice, education and free water saving gadgets for customers.
We protect and enhance water-related ecosystems across our region through initiatives such as our Catchment Systems Thinking approach.
Generating value for:Communities
Customers
Customers
Environment
Decent work and economic growthOur daily operations provide direct, indirect and induced employment for 22,700 people, and we are a big contributor to the north west economy.
We provide training and development opportunities in safe, secure working environments, graduate and apprentice opportunities, programmes for young people experiencing difficulties securing employment, offer equal opportunities to all and value diversity among our employees.
Generating value for:Communities
Customers
Employees
Environment Media
Industry, innovation and infrastructure We invest heavily in infrastructure, including plans for over £4 billion between 2020 and 2025 to improve the performance and resilience of our assets and operations to impacts such as those arising from climate change.
We embrace innovation, especially in an increasingly digital world, to ensure the region where we operate has reliable, sustainable and resilient infrastructure, now and into the future.
Generating value for:Customers
Shareholders
Media
Sustainable cities and communitiesWe use our understanding of customer needs and priorities to deliver services that meet their expectations and engage with communities to enhance participation in what we do. We plan at least 25 years into the future to prepare for increases in the population and new housing that will need connections for water and wastewater services. We are exploring ways to do this using natural solutions to manage water and wastewater, such as Sustainable Drainage Systems (SuDS).
Generating value for:Communities
Customers
Customers
Environment
Climate action Responding to the climate emergency is an imperative for us all.
Reducing our greenhouse gas emissions, delivering against our six carbon pledges and ensuring that we, and the region we serve, are resilient to the impacts that a changing climate might bring, are key to our long-term planning.
Read more about our approach to climate change on pages 86 to 99
Generating value for:Communities
Customers
Customers
Environment
Peace, justice and strong institutionsWe run our business in a responsible manner, and being trustworthy is one of our core values.
We have high levels of transparency in our reporting and ethical standards of business conduct and corporate governance – those systems and processes through which our organisation is managed, controlled and held accountable.
Generating value for:Employees
Environment
Shareholders
Media
STR
AT
EGIC
REPO
RT
Stock Code: UU. Annual Report and Financial Statements for the year ended 31 March 2021 85

Our approach to climate changeTask Force on Climate-related Financial Disclosures
• On track to deliver our climate change mitigation pledges and our public commitments.
• Science-based targets covering all emission scopes set and submitted for validation by the Science Based Target initiative (SBTi).
• Three 'alternative' scenarios, each one aligned to a specific emissions pathway, developed and used to support strategic planning.
• Impact of climate change now specifically considered as part of corporate risk framework.
• CDP is a global disclosure system for environmental reporting. Our CDP climate change rating improved from B to A- in 2020, demonstrating leadership-level reporting and disclosure. We are one of only two companies in the UK water sector achieving leadership level.
• The Sustainability Reporting Performance report by EcoAct measures how businesses are acting and reporting on climate-related sustainability. We have been ranked in the top 20 FTSE 100 list, improving from 17th to 11th position in 2020, and are the highest ranking water company.
ACHIEVEMENTS
SUCCESSES
OverviewWeather is fundamental to how we deliver water and wastewater services so climate change has been, and always will be, of strategic and operational importance. With advances in climate science, our understanding of climate change and how we respond is ever evolving, as is the external policy environment in which we operate.
Incorporating climate into long-term planningBuilding on our long-standing approach to climate change mitigation and adaptation, we now integrate consideration of climate-related risks and opportunities directly into our business planning to influence strategy and behaviours throughout the organisation.
This year, we've enhanced our understanding of the sensitivity of our business risks to climate change and applied Systems Thinking to embed physical and transitional risks into both operational planning and long-term strategy development.
We now have a good understanding of the controls required to adapt to a changing climate, and are building our confidence to recognise and manage cascade impacts where multiple weather events in a short time frame can have a cumulative impact.
Scenario analysis To support strategic planning, we developed three comprehensive scenarios exploring how multiple drivers of change might evolve and interact over time, compared to a baseline scenario. Each one is aligned to a specific emissions pathway, enabling us to test out scenarios where there is: an effective transition to a low carbon world; a climate crisis due to suboptimal climate change mitigation efforts; and a central case where more moderate impacts of climate change are experienced after slow initial progress is followed by a step change in de-carbonisation.
Pledges and commitmentsWe have made good progress on our six carbon pledges (see page 93), which include science-based emission reduction targets and four specific pledges on how those reductions will be achieved.
Pledge 1 is to reduce our scope 1 and 2 emissions by 42 per cent by 2030. We are on track to achieve this pledge although progress will not be linear year-on-year while we work to reverse the pressures that are driving growth in emissions.
Pledge 2 – Over 94 per cent of the electricity we used in 2020/21 came from renewable technologies. From October 2021, we will meet our pledge for 100 per cent.
Pledge 3 commits us to 100 per cent green fleet by 2028. We have deployed 27 electric vehicles at operational sites, and are trialling a 44-tonne biogas-powered HGV.
Pledge 4 commits us to 1,000 hectares of peatland restoration by 2030. We have proposed five sites for green recovery catchment peatland restoration.
Pledge 5 commits us to 550 hectares of woodland creation by 2030. We have planted 9,783 woodland carbon code compliant trees, established two tree nurseries and identified hundreds of potential sites for new and ‘replanted’ woodlands.
Pledge 6 commits us to set a science-based target for our scope 3 emissions, which we have done (see page 96).
An important element of our approach is to encourage others to contribute by making public commitments. We joined the global movement of 'Business Ambition for 1.5°C: Our Only Future', with a commitment to setting science-based targets aligned with limiting global temperature rise to 1.5°C above pre-industrial levels. We are signatories to the UN Race to Zero campaign and are proud to be contributing to the UK water industry’s commitment to be net zero from 2030.
Transparency and disclosureWe have published carbon and climate change disclosures in our annual report and CDP’s Climate Change Programme assessment for over a decade. We report in adherence with the Greenhouse Gas Protocol Corporate Accounting and Reporting Standards (2015) and the 2019 UK Governmental Environmental Reporting guidelines.
We have signed the Statement of Support for the Financial Stability Board’s Task Force on Climate-related Financial Disclosures (TCFD) which was published in June 2017, and we report in line with its recommendations across its four thematic areas.
Corporate Citizenship, a leading sustainability consultancy, reviewed this disclosure and provides an ISAE assurance against the Principles of Effective Disclosure to ensure that it accords with Task Force on Climate-related Financial Disclosures recommendations.
Read more at fsb-tcfd.org/recommendations
CORPORATE CITIZENSHIP REVIEW
United Utilities Group PLC unitedutilities.com/corporate 86
STRATEGIC REPORT

TCFD recommendationsThis table shows progress this year towards meeting the TCFD recommendations and the areas we will focus on in the future. The table includes cross-references where there is more material within this annual report and financial statements.
Progress this year• Implemented enhancements required
to reach overall ‘leadership level’ in the 2020 CDP assessment.
• Included special report on climate-related risks in board-level risk review.
• Created long-term strategy team with primary focus on climate change adaptation and mitigation.
Future focus• Further inclusion of climate-related
risks and opportunities into all investment decisions, processes and governance.
• Continue to demonstrate leadership in climate-related disclosure, for example CDP assessment.
Further information Our corporate responsibility committee report on pages 156 to 159 provides a summary of committee discussions on climate change
A summary of the board and its management committees can be found on page 120
Governance
Progress this year• Completed comprehensive review
of all scope 3 emissions and set ambitious science-based targets (currently being validated by SBTi).
• Achieved A- rating in 2020 CDP assessment of targets and emission-reduction initiatives.
• Updated drought plan triggers to minimise the impact on customers and improve our resilience to periods of prolonged dry weather.
Future focus• Secure SBTi validation for science-
based targets for all three emission scopes.
• Implement data improvements for scope 3 emissions so more are supplier and product-based factors rather than spend based.
• Analysis to understand cascade impacts and our resilience to them where multiple extreme weather events can occur in a single short time frame.
Further information Read more about metrics used to assess climate impact to our key risks on page 92
Read more about setting our science-based targets on pages 92 and 96
Read our energy and GHG emissions report on pages 97 to 99
Metrics and targets The metrics and targets used to assess and manage relevant climate-related risks and opportunities
Progress this year• Enhanced analysis of risks arising from
the climate change we are already experiencing and the extent to which that might affect operations.
• Completed a robust review to identify which corporate risks are vulnerable to climate change and quantified the impact and time sensitivity.
Future focus • Further formalisation of climate-related
physical and transitional risks into risk management systems.
• Embed identification of climate-related risks and opportunities throughout the organisation as business as usual.
Further information Read more about the processes for identifying, assessing and managing climate risks on page 90
Read more about our risk management framework on page 100
Risk management The processes used by the organisation to identify, assess and manage climate-related risks
Progress this year• Extensive preparations for the publication
of our third climate change adaptation progress report later in 2021, after widespread stakeholder consultation. This report will include a review of climate impacts and how we will adapt.
• Updated water resources and flood models to include climate scenario analysis and UKCP18 forecasts.
• Developed company-wide scenarios to explore how multiple factors (including climate change) interact to provide a structured framework to think about future uncertainty.
Future focus • Whole-life costing for capital projects
and appraisals to include variable carbon pricing.
• Implement climate change resilience plans (both physical and transitional) across AMP7, incorporating natural capital solutions.
• Build relationships with key suppliers to reduce our environmental impact by sharing best practice and collaborating on how to reduce greenhouse gas emissions.
• Identify and evaluate climate-related opportunities.
Further information Read more about how our climate-related risks, opportunities and commitments are shaping our strategy and financial planning on page 93
Strategy The actual and potential impacts of climate-related risks and opportunities of the organisation’s businesses, strategy and financial planning
The organisation’s governance around climate-related risks and opportunities
Stock Code: UU. Annual Report and Financial Statements for the year ended 31 March 2021
STR
AT
EGIC
REPO
RT
87

Our approach to climate changeTask Force on Climate-related Financial Disclosures
GOVERNANCE
Chief Executive Officer Steve Mogford has ultimate responsibility for the group’s preparedness for both adapting to climate change and driving our mitigation strategy. As climate change is a significant causal factor for the group’s principal risks (see page 103), the executive team is tasked with managing the risks and mitigating actions, for example by ensuring the company has the necessary financial resources and people with the required skills to achieve its climate-related objectives.
Chief Financial Officer Phil Aspin has executive responsibility for risk management and is supported in this role by the head of audit and risk and the corporate risk manager.
The group audit and risk board (GARB) reviews the effectiveness and performance of the governance processes along with the identification of emerging trends, including climate change. The work of the GARB feeds into the information and assurance processes of the audit committee and into the board’s assessment of risk exposures and strategies to manage these risks.
There is further board oversight of climate-related issues through the corporate responsibility committee (see pages 156 to 159). Mitigation and adaptation are priority topics for the committee, which plays an important role in challenging and encouraging consideration of climate-related issues. It initiated the review of the company’s carbon strategy and endorsed the mitigation policy, defining our corporate ambition and objectives. This led to the development of our mitigation strategy and the establishment of an executive-level steering group. This group has delegated responsibility to embed climate-related issues throughout business planning, to bring consistent focus to the delivery of our climate-related commitments, such as the six carbon pledges, and to provide updates to the board and corporate responsibility committee.
RISK MANAGEMENT
We have a strong track record of risk management and of climate change disclosure. We continually mature our capacity and capability to manage risk and uncertainty to build and maintain long-term resilience across the corporate, financial and operational structures of the group.
Our company risk management framework follows an enterprise-wide approach and covers all principal risk areas such as water service, supply chain and programme delivery.
Climate-related risks are identified, assessed and managed in the same way as any other risk through our embedded risk management framework which is described on pages 100 to 101. Having been identified, each business risk is assessed in two ways. First, we consider the likelihood of the event occurring based on multiple causal factors; secondly, we examine the full range of potential impacts and their severity should the event occur, from a minimum (best case) to a maximum (worst case) scenario.
We take a variety of approaches to identify and assess risks, including using risk breakdown structures and tools such as PESTLE to formalise horizon scanning, as well as complex modelling of the physical impacts of climate change on our water resources and wastewater management.
Horizon scanning such as tracking legal and regulatory changes, emerging technologies and comparison of our strategies with other companies is particularly useful when considering transitional risks. We have found risk breakdown structures and detailed modelling are better suited to acute or chronic physical risks.
Risks sensitive to climate change Climate change has been identified as a critical cross-cutting driver, so all our 100 event-based risks in our business risk profile were reviewed for their exposure to climate change. Last year we identified seven risks most sensitive to climate change in that their likelihood or the impact will increase with global warming. We have further analysed these risks and now have a good understanding of the controls required to adapt to a changing climate. This is set out on pages 90 to 91. This exercise highlighted a further risk in the potential for cascade impacts where multiple weather events in a relatively short time span can have a more challenging impact.
Looking ahead, we will explore how innovation can help us learn more about the profile of risk events, their causes and consequences and the capacity and capability of our company to manage them. By understanding this, we have the opportunity to be proactive and better prepared by prioritising issues.
By incorporating longer-term climate change impacts more explicitly in our corporate risk framework, we have raised the profile of climate change adaptation, providing the board enhanced insight to consider our risk appetite and capacity from within existing risk management processes and with the same thresholds for materiality. We have identified where climate risks are not well enough understood or where existing controls might be inadequate to manage the risk in the long term.
STRATEGY
Planning horizonsOur planning horizons are illustrated on pages 46 to 49. Climate-related risks are manifesting themselves in the short to medium term and in common with the rest of the water industry, we are also vulnerable to physical climate risks in the long term (ten to 25 years and beyond) as our assets typically have long, even very long, lifespans. Many of our services are based on legacy infrastructure which was designed decades ago to deliver water and wastewater services for the climate we had rather than the one that is ahead of us.
Already seeing climate change in the North WestFive of the top ten wettest years for the North West since 1880 have occurred since 2000, and all of the ten hottest years have occurred since 2002. A top ten coldest year has not been recorded since 1963. These trends, and their impact on local weather conditions, are impacting our climate sensitive risks already.
For example, changes in precipitation and temperature have contributed to changing patterns of river flow in our water supply catchments. There has been an increase in winter flows in almost all catchments, with significant upward trends in ten of the 14 river basins, and a reduction in flows in most catchments in spring, most notably for the strategic Vyrnwy catchment where there has been a significant downward trend over the last 20 years.
Annual average rainfall has not changed significantly, although the year-to-year variability has increased (with more dry and wet years) and some research shows an increase in the probability of heavier rainfall events. The greatest change in seasonal rainfall trends is an increase in winter rainfall, due to an intensification of heavy rainfall events, which leaves us increasingly susceptible to a range of key risks, including sewer flooding, asset flooding and land quality deterioration.
Annual and monthly temperatures in the North West are already higher than those experienced before 1900, largely due to anthropogenic activity, with the rate of warming accelerating.
Application of temperature-based estimates show an increase in potential evapo-transpiration in our region. This may influence the water balance, particularly in spring and summer, leading to a sensitivity to drought, and potentially water network failure and water sufficiency events.
United Utilities Group PLC unitedutilities.com/corporate 88
STRATEGIC REPORT

Physical risksAll seven of the risks identified as being sensitive to climate change are physical risks, so we set about quantifying that vulnerability.
Predicting the effects of climate change is complex, with a large amount of uncertainty involved. Focusing on the predominant downsides, we assessed the potential implications for the seven risks in 2050 and 2100 compared to today, using the latest climate research, the Met Office UK Climate Projections 2018 (UKCP18). This has four pathways to 2100 depending on concentrations of greenhouse gases in the atmosphere and we have used what is widely accepted as the most likely pathway, RCP 6.0, which is consistent with peak emissions occurring in 2080. Best and worst case scenarios will be considered in due course.
The outcomes of the risk assessment were the topic of a special report prepared for a board-level risk review which took place in April 2021. They are presented on pages 90 to 91, together with a summary of assumptions, climate sensitivity and existing controls. In each case the downside effect is quite significant relative to the baseline, and four risks in particular stand out as having the most significant increases in likelihood: water sufficiency event; water network failure; recycling of biosolids to agriculture; and risk of inadequate land management.
Transitional risksWe are also vulnerable to risks associated with the transition to a low-carbon economy. Changing policies, regulation and legislation to address mitigation and adaptation requirements can increase operating costs due to, for example, enhanced emissions reporting. Environmental requirements to meet water quality standards can lead to increased fuel or chemical consumption and legislation such as the Industrial Emissions Directive will result in operational and strategic planning interventions.
One likely consequence of changing legislation is potential asset redundancy, where the case to move to lower carbon technologies might result in the consolidation of assets on a fewer number of sites.
OpportunitiesWe are a relatively energy-intensive business, typically using around 800 GWh of electricity each year. As well as the risks associated with this dependency we see opportunities in the way we manage energy and have developed an approach to use less, generate more and use our assets and resources smarter while maintaining security of supply.
We have already invested in innovation and research to minimise the total amount of energy we consume, for instance in pioneering UV LED water treatment. We
have increased renewable generation through bioresources, solar and wind, increasing the amount of self-generated energy from 108 GWh in 2012/13 to 205 GWh in 2020/21.
We aim to develop more successful innovation projects and that by meeting more of our own energy demands we can rely less on imports from the grid and mitigate the risks of future energy price fluctuations and uncertainty, as well as bolstering our own security of supply.
Resilience of our organisation to a changing climateThe main climate-related risks to the resilience of our operational assets are uncertainty of the health of ageing infrastructure and the increasing challenges presented by predictions for climate change and population growth over the long term.
Our Water Resources Management Plan 2019 is an example of how our strategy, to achieve a long-term, best value and sustainable plan for water supplies in the North West, has been developed to ensure that we have an adequate supply to meet demand over the 25 years from 2020 to 2045. This will ensure that our supply system is resilient to drought and other hazards, including climate change (using 'stochastic weather' and scenarios from the latest UK climate projections, UKCP18) and demand (population growth, economic trends and patterns of water use).
Climate change in the North WestRainfall
RainfallAnnual average rainfall has not changed significantly, however year-to-year variability has increased, with more dry and wet years. Evaporation
EvaporationThe amount of water lost to evaporation has increased, putting increasing pressure on water resources during spring and summer and potentially increasing the demand for outdoor water use.
Riverflows
River flowsWinter river flows have increased in almost all catchments, with significant upward trends in ten of the 14 river basins, and a reduction in flows during spring in most catchments.
Seasonal variation
Seasonal variationSeasonal changes in the North West are projected to be greater than those for England and Wales, with much wetter winters and, under some scenarios, much hotter and drier summers.
Sea level
Sea levelBy 2100 under the likely warming scenarios (3°C-5°C), sea level at Liverpool is projected to rise between 0.3 and 1.0m. Extreme events
Extreme eventsEvidence demonstrates that climate change has exacerbated extreme rainfall and storm events, and will continue to do so, as well as increasing the likelihood of heatwaves.
Stock Code: UU. Annual Report and Financial Statements for the year ended 31 March 2021
STR
AT
EGIC
REPO
RT
89

Our approach to climate changeClimate sensitive risks overview
Below is the outcome of a special risk assessment on the risks identified as sensitive to climate change.
Likelihood and impact are as predicted at 2050 and 2100 using the accepted most likely emission pathway RCP 6.0.
Water sufficiency event C
When temperatures rise, higher water usage, evapo-transpiration and lower average summer rainfall from associated dry periods, causes supply pressures.
The most likely impact assumes weather patterns similar to 2018 happening twice in five years at 2050, and four times in five years by 2100.
Likelihood (%)
Baseline
2050
2100
0 25
10%
50 75 100
80%
40%
Impact (NPV £m)
0 100 200 300 400 500 600
£66m
£530m
£265m
Controls• Development of new sources of water, particularly boreholes.
• Water trading between different regions of the UK.
• Leakage reduction.
• Encourage and inform customers about using less water.
• Installation of more meters on domestic properties.
Failure of wastewater network (sewer flooding) * C A
Increased rainfall (storm) events can result in severe sewer flooding. The frequency of such events is forecast to almost double with climate change. For a storm with a return period of one in 50 years or greater, 15 per cent of our region is currently at risk of internal flooding. By 2050 it is expected 20 per cent of our region would be impacted, rising to 29 per cent by 2100. The cost of an internal flooding incident is assumed to stay constant.
Likelihood (%)
Baseline
2050
2100
0 25 50 75 100
40%
77%
53%
Impact (NPV £m)
0 100 200 300 400 500 600
£210m
£404m
£278m
Controls• Increase sewer capacity and build storm water holding tanks.
• Implement and encourage sustainable drainage solutions.
• Use technology to monitor and better control flows in the sewer system.
• Install flood protection devices to at-risk properties.
Land management C A
Deterioration in the quality of land due to climate change will increase the frequency and impact of weather events on our owned land. Such events have led to more fire, flood, subsidence and landslip events which in turn have associated impacts on: health, safety and environmental issues; access to operational and capital activities; corporate reputation; missed opportunities; legal liability and additional unplanned spend associated with invasive species.
The annual likelihood of such events is forecast to increase from 20 to 100 per cent by 2100.
Likelihood (%)
Baseline
2050
2100
0 25 50 75 100
20%
100%
50%
Impact (NPV £m)
0 100 200 300 400 500 600
£31m
£153m
£76m
Controls• Proactive land management action to protect quality, including through
nature-based solutions.
• Provide net gain in biodiversity from our construction projects.
• Directly restore peatland and woodland.
• Work in partnership with farmers, the Environment Agency and others to improve upland watercourses.
The effectiveness of controls at 2025 to mitigate the climate-related risk at 2050.
Largely insufficient
Somewhat sufficient
Mostly sufficient
C Chronic physical risk – changing trends in weather patterns, such as rising temperatures, sea level, rainfall
A Acute physical risk – chance of severe weather events, such as storms, heat waves and floods.
* Indicates the most significant event-based risks reported to the board (see pages 108 to 109)
CONTROL EFFECTIVENESS RISK TYPE
United Utilities Group PLC unitedutilities.com/corporate 90
STRATEGIC REPORT

Failure of above-ground water and wastewater assets (flooding) C
Average winter rainfall is projected to increase by 6 per cent by 2050, and by 12 per cent by 2100, increasing the likelihood of extreme events where sites are flooded from sea, river or surface water sources.
The impact is estimated based on three modelled events (of likelihood 1:1000, 1:100 and 1:30) each having a 10 per cent annual increase in frequency every 20 years.
Likelihood (%)
Baseline
2050
2100
0 25 50 75 100
8%
15%
12%
Impact (NPV £m)
0 100 200 300 400 500 600
£45m
£142m
£117m
Controls• Install permanent flood defences at most flood-prone sites.
• Improve flood forecasting capabilities.
• Build better network connectivity so that supplies can be maintained from elsewhere if a treatment works is flooded.
• Invest to ensure sites can bounce back quickly once flooding subsides.
Water network failure C
Warmer, milder winters will decrease the likelihood of cold snaps/freeze thaws that result in burst pipes. However, these milder winters will result in more precipitation and flood events, causing a risk to assets close to, or crossing, rivers. Increased summer temperatures may result in considerably more heatwaves, which cause a higher peak demand. Such events can result in low pressure and no water for some customers.
Likelihood (%)
Baseline
2050
2100
0 25 50 75 100
13%
32%
24%
Impact (NPV £m)
0 100 200 300 400 500 600
£2.1m
£41m
£28m
Controls• Already increased the size of our fleet of alternative supply vehicles
(ASVs), and introduced a new 24/7 logistics capability.
• New Network Maintenance Services contracts with key third-party suppliers include elements to ensure all can respond effectively in an incident when required.
• Leakage reduction.
• Encourage and inform customers about using less water.
• Installation of more meters in domestic properties.
Recycling biosolids to agriculture C
Climate change is expected to increase persistent rainfall. The resultant water logging will limit spreading biosolids to land for a greater part of the year and uncovered sludge stores and stockpiles will be more vulnerable in persistent wet, winter weather.
The impact calculation assumes the sludge that cannot be spread to land will be sent to restoration and the impact is the associated ODI and EA fines.
Likelihood (%)
Baseline
2050
2100
0 25 50 75 100
20%
52%
37%
Impact (NPV £m)
0 100 200 300 400 500 600
£2.3m
£27m
£12m
Controls• Increased sludge storage capability.
• Utilise covered storage.
• Increased distance travelled for disposal of sludge.
Failure to adequately treat wastewater *
A
Extreme rainfall events cause overflows and variation between high rainfall and drought periods causes further susceptibility. Likelihood of failure to adequately treat wastewater is expected to remain at one in two years but the most likely impact expects six more failing works (above 2020 baseline) and uses the current ODI penalties as the impact magnitude.
Likelihood (%)
Baseline
2050
2100
0 25 50 75 100
50%
50%
50%
Impact (NPV £m)
0 100 200 300 400 500 600
£75m
£114m
£95m
Controls• Enhancements linked to no deterioration funded through price review.
• DWMP investigations into increased dilution.
• Infrastructure investment to increase resilience to extreme events.
Stock Code: UU. Annual Report and Financial Statements for the year ended 31 March 2021
STR
AT
EGIC
REPO
RT
91

Our approach to climate changeTask Force on Climate-related Financial Disclosures
Our WRMP proposals include enhanced demand management activities to offset upward pressures on water suppliers and will enable us to reduce the frequency of needing drought permits to augment supply by 2025.
As well as targeted scenario analysis, we have developed three company-wide alternative scenarios for 2050 incorporating combinations of key factors that are both highly relevant and uncertain. These scenarios, named 'climate chaos', 'green guardianship' and 'public purpose', are plausible narratives, with associated metrics, of a 2050 future for water and wastewater services in the North West.
The scenarios recognise climate change as one of the most critical uncertainties and use RCPs 2.6, 4.5 and 8.5 (GHG concentration pathways adopted by the IPCC) to describe how well climate change has been mitigated in each case.
The scenarios have provided a simple way to understand the interaction of multiple factors so we can enhance resilience, help manage future uncertainty and shape long-term decisions.
Climate change mitigation strategyBefore agreeing our strategy, we developed a matrix to assess and compare our mitigation capabilities with other water companies and brands, to explore principles, priorities and define our objectives. The matrix began with the premise that great carbon management is more than just a number and that our strategy should cover four themes: vision and visibility; ambition and commitment; demonstrating action; and beyond here and now. See figure on page 93.
We already have a strong track record of sustainability reporting and disclosure, having reported our GHG emissions for nearly 20 years. Through this TCFD section, and improvements in our CDP response, we want our carbon reporting to be open and transparent and recognised as among the best in the UK.
Other aspects of our climate mitigation strategy can be summarised as:
• integrating carbon into strategic and day-to-day business planning;
• improving our carbon reporting and climate-related disclosure;
• setting ambitious and comprehensive commitments and greenhouse gas emissions targets to contribute to limiting global temperature rise;
• reducing emissions across water and wastewater processes, sludge process and disposal, fleet management, fuel use, land use, and waste and resources; and
• collaborating to drive innovation and challenge standards to deliver a low-carbon future.
Playing our partPages 94 to 95 illustrate and describe how there are climate-related risks and opportunities throughout our organisation. Our approach to managing those risks, and taking advantage of the opportunities, involves all our stakeholders across our value chain.
METRICS AND TARGETS
Metrics to assess climate risksThe metrics which determine the magnitude of our climate risks and opportunities relate mainly to the weather, for instance measures such as temperature and rainfall by season. To manage our climate risks effectively we must track and understand patterns of weather, and weather events, and learn how they can affect us operationally, so we can put into place appropriate controls such as those in the risk table on pages 90 to 91.
We monitor several measures that can affect transitional risks. These include energy pricing (electricity, natural gas, diesel and alternative fuels, such as compressed natural gas and hydrotreated vegetable oil) and carbon pricing through purchasable credits, offsets and certificates (such as REGOs not bundled with electricity). We monitor the marketplace for the availability and pricing of alternative fuelled vehicles, battery storage and for emerging technologies to reduce process and fugitive emissions.
Operational metrics and targetsWe have key metrics that assess the effectiveness of the controls for our principal risks and therefore determine our capability to adapt to a changing climate and ensure the resilience of our service. For these operational metrics we have set ambitious targets. For instance, to give us headroom in our water supply demand balance we have set short and long-term targets for leakage and per capita consumption (how much customers use) to reduce the demand for water in all climate scenarios. Recognising the need to maintain service to customers, even in extreme weather events, we have also set targets for supply interruptions, sewer flooding and pollution incidents.
Metric 2020 2025 2045
Per capita consumption 140 135 115
Leakage --- ↓ 15% ↓ 40%
Network interruptions --- ↓ 50%
Sewer flooding --- ↓ 20% ↓ 70%
Pollution incidents --- ↓ 37% ↓ 64%
Climate commitments and targetsWe have made several climate-related public commitments, on our own and with other organisations. Having exceeded the emissions targets we set in 2015, last year we made six pledges to reduce our carbon footprint. Central to these is to set and meet science-based targets for all emission scopes (see figure of greenhouse gas emissions by scope on page 97) and we have joined the global movement of 'Business Ambition for 1.5˚C: Our Only Future' and the UN Race to Zero campaign.
Science-based targetsScience-based emission reduction targets are set in line with what climate science says is enough to limit global temperature rise to well below 2°C or 1.5°C above pre-industrial levels. This requires emissions to halve from 2010 levels by 2030 and to hit net zero by 2050.
The Science Based Target initiative (SBTi) defines and promotes global best practice in science-based target setting. We have applied the 'SBTi Criteria and Recommendations' guidance to our policies and greenhouse gas accounting standards and have applied for our targets to be validated.
Pledge 1 is to meet our science-based target to reduce scope 1 and 2 emissions by 42 per cent by 2030 (from the 2019/20 baseline). This ambition is based on the Paris Agreement’s highest level of ambition, to limit global temperature rise to 1.5°C above pre-industrial levels. We have a longer-term science-based target for a 100 per cent reduction from the 2019/20 baseline (net zero without purchased offsets) by 2050.
Pledge 6 committed us to set a science-based target for scope 3 emissions and we describe how this was achieved on page 96 .
Net Zero 2030 Routemap: Unlocking a net zero futureIn November 2020 the UK water sector launched the 'Net Zero 2030 Routemap: Unlocking a net zero future', understood to be the world’s first sector-wide plan for net zero. We have committed to contributing by stating our ambition that our water emissions (scope 1, 2 and a small selection of scope 3) will be net zero from 2030. This routemap allows companies to offset residual emissions (using agreed offsetting principles) whereas science-based targets require absolute emission reductions. This explains the difference between our science-based target to achieve a 42 per cent reduction by 2030 and being net zero from 2030 in line with the water industry ambitions.
United Utilities Group PLC unitedutilities.com/corporate 92
STRATEGIC REPORT

AMBITION AND COMMITMEN
T
Demonstrating integrity and leadership in carbon reporting and disclosure.
Carbon management is integrated into decision-making and driving
decisions and behaviours.
Enhanced disclosure aligned to TCFD recommendations.VIS
ION
AN
D V
IS
IBILITY
DEM
ONSTRATING ACTION
Our approach to climate change mitigationA collaborative strategy for a low carbon future: embedding carbon commitments across our processes, technology, culture and beyond.
BEYOND HERE AN
D N
OW
2030Scope 1 & 2 SBT
140,000
Scop
e 1
and
2 G
reen
hous
e ga
s em
issi
ons
(tC
02e
)
0
Fossil fuel alternatives
Lower emission sludge treatment
Pledge 5: Create 550 ha woodland
Pledge 2: 100% renewable electricity
Pledge 4: 1,000 ha of peat restoration
Pledge 3: 100% green �eet
Delivery underway
Renewable energy exports
Lower emissionwastewater process solutions
Additional bene�ts realised after 2030
Known technology
New/emerging technology
More peatlandMore woodland
Baseline
Innovation across our processes, technology and
culture and beyond.Beyond here: influencing others,
collaboration with value chain.
Beyond now: innovative solutions for multi-capital benefits,
questioning legacy standards and specifications.
Delivering ambitious commitments to mitigate climate change and lower
our carbon footprint.
Delivering consistent and prolonged reduction of our greenhouse gas emissions and other environmental impacts.
Science-based targets (SBTs)
Pledge 1 Meeting SBTs for scope 1 and 2
2 100% renewable electricity by 2021
3 100% green fleet by 2028
4 1,000 ha peatland restoration by 2030
5 550 ha woodland creation by 2030
6 Set SBT for scope 3 in 2021
Six pledges to reduce our carbon footprint
Delivery approach in our strategy to meet our climate change
mitigation commitments
Net Zero 2030 Routemap: Unlocking a
net zero future(UK water industry)
Science- based target
to reduce scope 1 and 2 emissions by 42% by 2030
(from the 2019/20 baseline)
Science- based targets
for scope 3(see page 96)
Stock Code: UU. Annual Report and Financial Statements for the year ended 31 March 2021
STR
AT
EGIC
REPO
RT
93

Our approach to climate changePlaying our part to reduce greenhouse gas emissions across our value chainThis picture illustrates many of the operational sources of greenhouse gas emissions and the ways in which we’re tackling them to deliver multiple benefits.
1
2
5
6
8
7
12
1 Grid electricity – Delivering water and wastewater services is energy intensive but by the end of 2021 all of the electricity we use will be from renewable sources. This is helping to greatly reduce our carbon footprint, and we are going much further.
2 Water network – Moving water to where it is needed can require energy for pumping, but we can use gravity to help. Victorian aqueducts help us to deliver a billion litres of water a day from the Lake District and Wales.
3 Wastewater network – Energy is often needed to pump wastewater out of harm’s way. We are working innovatively and in partnership to better
manage surface water to help reduce the need for pumping at the same time as reducing the risk of flooding.
4 Wastewater treatment – Biological processes used to treat sewage can release greenhouse gases. We are working collaboratively with the UK water industry to improve the measurement and control of these process emissions.
5 Chemicals – There is a carbon impact from producing the chemicals used in water and wastewater processes. We want to find innovative ways to minimise the amount and their impact.
Sewage sludge treatment – We have invested in digestion technologies to generate renewable energy from sewage ‘waste’. Combined with other renewables we now generate 25 per cent of our electricity needs. At our Manchester Bioresources Centre we are also able to export biogas to the national grid.
7 Sludge disposal to land – Sewage contains valuable nutrients that can provide a renewable fertiliser. Greenhouse gases are released as the biosolids decay but there are also benefits from displacing fertilisers that are not reflected in our accounts.
6
United Utilities Group PLC unitedutilities.com/corporate 94
STRATEGIC REPORT

3
49
11
10
8 Construction services – Around 30 per cent of our scope 3 emissions are related to the construction of new and replacement infrastructure. Our new science-based target seeks to address these.
9 Maintenance services – Maintaining our sites, pipes and pumps has a significant footprint. New techniques can reduce the emissions by using less power, less carbon-intensive materials and by enabling proactive intervention.
10 Transport – We cover many miles across the North West but we are already switching to low carbon vehicles and by 2028, none of our fleet of cars, vans and tankers will run on fossil fuels.
11 Business travel, offices and employee footprint – A relatively small part of our emissions providing the opportunity for employee engagement on climate change.
12 Solar and wind power – We have invested to generate more of our own electricity through hydro, wind and solar photovoltaics, including floating panels on Godley and Langthwaite reservoirs.
13 Woodland creation – We manage a lot of woodland across the North West and continue to plant more. We will create 550 hectares of additional carbon code verified woodland by 2030.
14 Nature-based solutions – We are at the forefront of deploying innovative approaches that work with nature to clean and store water. For example, wetlands can support biodiversity, reduce flood risk and provide recreation opportunities.
15 Peatland restoration – We have 20 years of experience working in partnership to restore and protect large areas of peatland in the North West.
16 Recycling – Our operations produce lots of waste, from the biosolids recovered from our wastewater treatment facilities to the excavated material displaced when we dig holes. We divert over 97 per cent to beneficial use.
14
13
15
16
Stock Code: UU. Annual Report and Financial Statements for the year ended 31 March 2021
STR
AT
EGIC
REPO
RT
95

Our approach to climate changeTask Force on Climate-related Financial Disclosures
BEING PURPOSE-LED
Playing our part for the planet means we must look ‘beyond here and now’, plan for the long term and influence beyond our company boundary.
Working with others to protect the environment we fundamentally rely on.When we committed to our carbon pledges last year we recognised that we had a limited understanding of the scale of the emissions in our value chain beyond the small number of scope 3 emissions we had reported for over ten years.
We pledged to quantify the emissions and to set a science-based target to reduce them in line with our ambitious targets for scope 1 and 2 emissions (those we own and have control over).
Together with EcoAct, an Atos company (an international sustainability consultancy), we produced an inventory of the relevant emissions using the GHG Protocol guidance and explored the target options recommended by the Science Based Target Initiative.
We have chosen two targets to obtain maximum coverage of our value chain emissions:
• That 66 per cent of our construction services suppliers (by emissions) will set their own science-based target by 2025; and
• To reduce absolute emissions for the remainder of scope 3 categories by 25 per cent by 2030, from a 2020 baseline.
Our supplier engagement target enables us to focus on the important area of carbon in construction. Our current estimate of scope 3 construction emissions is based on spend and this target will help transition to actual emissions reporting for this activity. This target aligns with our drive for efficiency, innovation and collaboration.
The absolute reduction target for the remainder of our scope 3 emissions will ensure we align to a trajectory needed to limit global warming to 'well below' 2˚C.
De-carbonisation efforts across society will support further success with this target, as can be seen with the momentum behind low-carbon vehicles and energy sources. We believe we can go further and show leadership in areas of opportunity and challenge specific to our operations and climate change objectives.
Generating value for:Environment
Media
Scope 3 emissions: beyond our control but not beyond our influence
STRATEGIC REPORT
96 unitedutilities.com/corporate United Utilities Group PLC

Energy and carbon reportReporting and assurance We measure and report the greenhouse gases that result from all United Utilities’ activities. We have used the financial control approach so our energy and greenhouse gas emissions reports are aligned with the consolidated financial statements for United Utilities Group PLC. This includes its subsidiaries listed in section A8 on page 260.
Our measurement and reporting is aligned to the GHG Protocol Corporate Accounting and Reporting Standard (2015) and the recommendations of the TCFD. As required, we report under the Companies Act 2006 (Strategic Report and Directors’ Reports) Regulations and we apply the 2019 UK Government Environmental Reporting Guidelines, including the Streamlined Energy and Carbon Reporting Guidance (SECR). Our reporting is compliant with the international carbon reporting standard (ISO 14064, Part 1) and assured by the Carbon Reduce programme previously known as Certified Emissions Measurement and Reduction Scheme (CEMARS). We hold a Platinum status certificate as we have demonstrated emission reductions over ten years.
How we measure our greenhouse gas emissions A carbon footprint is calculated by converting all emissions of Kyoto Protocol gases into a carbon dioxide equivalent (tCO2e). Emissions are categorised as direct, indirect or avoided emissions.
Direct emissions (scope 1 emissions) are those from activities we own or control, including those from our treatment processes, company vehicles, and burning of fossil fuels for heating.
Indirect emissions, known as scope 2 and 3 emissions, result from operational activities we do not own or control. These include emissions produced as a consequence of electricity we purchase to power our treatment plants (scope 2) and other indirect emissions such as products and services we buy and travel on company business (scope 3).
Avoided emissions are reductions from the purchase, or export, of renewable energy. Gross emissions are the sum of all three scopes. Net emissions are the gross emissions minus reductions from avoided emissions and removals.
The GHG Protocol recommends using two methods to quantify emissions
– the ‘location-based’ method which uses average grid electricity emissions factors and the ‘market-based’ method which is specific to the actual electricity purchased. Following the GHG protocol recommendation we report results using both methods and use the ‘market-based’ figures to report our headline emissions.
Greenhouse gas emissions and energy performance in 2020/21 Our investment in renewable energy generation has resulted this year in a further increase to 205.3 GWh, equivalent to a quarter of the electricity we consumed.
Our net scope 1 and 2 greenhouse gas emissions for 2020/21 were 127,173 tCO2e, 1.5 per cent more than last year. This is due to an increase in fossil fuel use, the volume of wastewater being processed and the subsequent amount of wastewater sludge being produced.
Our scope 3 emissions, covering our new comprehensive inventory, have increased by 4 per cent, due to increased spend in the value chain on goods and services. In the coming years we plan to reduce the reliance on spend-based emissions calculations and will incentivise use of lower emission products, services and suppliers.
CO₂N₂OCH₄
Avoided emissions
SF₆PFCs HFCs
Scope 1Emissions from activities we
Burning of fossil fuels
Direct Indirect Indirect
Renewable power generation and export
Company vehicles
Sludge disposal
Operational maintenance
Business travel
Capital investment
Grid electricity generation
Grid electricity,transmission and
distribution
Commuting and home
working
Sludge processing
Wastewater storage and processing
own or control
Scope 3Emissions emitted in our value chain
Scope 2Purchased electricity
Greenhouse gases
Stock Code: UU. Annual Report and Financial Statements for the year ended 31 March 2021
STR
AT
EGIC
REPO
RT
97

Our approach to climate changeGreenhouse gas emissions and energy
The greenhouse gas emissions for the financial year 2020/21 are presented in the table below. Emissions have been estimated using the water industry Carbon Accounting Workbook v15 (CAW v15) which incorporates the UK Government GHG conversion factors for company reporting. 2019/20 data has been restated using CAW v15 to reflect the significant changes from the previous version of the workbook, including improvements to the accounting for biogas and renewable electricity generated and used on site and an increased emission factor for wastewater process emissions (following the recommendation in UK Water Industry Research project report 'Quantifying and reducing direct greenhouse gas emissions from waste and water treatment processes – Phase 1' (20/CL/01/28)).
Scope 1, 2 and 3 emissions have been separated to align with the boundaries of our science-based targets. We now disclose all the scope 3 emissions categories described in the Corporate Value Chain (scope 3) Accounting and Reporting Standard that are deemed relevant to United Utilities. This change in scope 3 emissions reporting boundary has significantly increased our emissions in this area. The increase over the past year is due to variation in supply chain spend on goods and services.
CurrentCAW v15
2020/21tCO2e
SBT baseline
CAW v15
2019/20tCO2e
CAW v13 2020
2019/20tCO2e
CAW v13 2019
2018/19tCO2e
Scope 1 Direct emissions Direct emissions from burning of fossil fuels 17,371 15,247 17,129 16,809
Process and fugitive emissions from our treatment plants – including refrigerants 98,569 96,186 84,048 88,136
Transport: company-owned or leased vehicles 16,634 15,739 15,739 14,409
Scope 1 Total 132,575 127,172 116,916 119,354
Scope 2 Energy indirect emissions Grid electricity purchased – generation Market-based (1) 8,507 11,789 11,789 18,503
Location-based 149,030 164,521 164,521 187,171
Scope 2 Total 8,507 11,789 11,789 18,503
SCOPE 1 AND 2 GREENHOUSE GAS EMISSIONS (GROSS) Market-based 141,082 138,961 128,705 137,857
Avoided emissions from renewable electricity Renewable electricity exported -4,184 -3,979 -3,979 -3,434
Biomethane exported -9,725 -9,302 -9,302 -8,446
Avoided emissions Total -13,909 -13,281 -13,281 -11,880
SCOPE 1 AND 2 GREENHOUSE GAS EMISSIONS (NET) Market-based 127,173 125,680 115,424 125,977
Scope 3 Other indirect emissions Purchased goods and services 271,871 213,442 – –
Capital goods 95,968 128,286 – –
Fuel and energy-related emissions Market-based 42,599 45,262 1,007(2) 1,577(2)
Upstream transportation and distribution (sludge transport) 1,119 3,374 – –
Waste generated in operations (including sludge disposal to land) 26,333 27,936 27,410(3) 26,186(3)
Business travel (public transport, private vehicles and hotel accommodation) 1,226 3,508 2,123(4) 2,236(4)
Employee commuting and home working 4,108 4,231 – –
Scope 3 Total Market-based 443,223 426,039 n/a n/a
SCOPE 3 GREENHOUSE GAS EMISSIONS (excluding capital goods)Science based target measure Market-based 347,255 297,753 n/a n/a
(1) Market-based figures for electricity purchased on a standard tariff have been calculated using specific emissions factors from published generator fuel mix disclosures, shown in energy use table. Location-based figures use average grid emissions and are shown in blue.
(2) Well-to-tank emissions were not included in previous scope 3 inventory. We include well-to -tank emissions for electricity, natural gas and all liquid fuels.(3) Sludge-to-land and grit and screenings only, other business waste was not included in the previous scope 3 inventory.(4) Hotel accommodation, other travel services and outsourced transport were not included in the previous scope 3 inventory.
United Utilities’ greenhouse gas emissions intensityAs in previous years we state our emissions as tonnes CO2e per £million revenue. We include scope 1 and 2 emissions only in this measure. We also report the regulated emissions tonnes CO2e per megalitre treated (using the location-based method as calculated in the CAW v15), as these are common metrics for our industry. The methodology for this calculation changed from CAW v13 so the figure is not available for 2018/19.
Greenhouse gas emissions intensity measures 2020/21 2019/20 2018/19
Scope 1 and 2 greenhouse gas emissions (gross) per £m revenue tCO2e 78.0 74.7 75.8
Scope 1 and 2 greenhouse gas emissions (net) per £m revenue tCO2e 70.3 67.6 69.3
Regulated emissions per megalitre of treated water kg tCO2e/Ml 118.51 131.98 n/a
Regulated emissions per megalitre of sewage treated kg tCO2e/Ml 152.26 168.51 n/a
United Utilities Group PLC unitedutilities.com/corporate 98
STRATEGIC REPORT

Scope 1 and 2 emissions – breakdown by activity and greenhouse gas
-20,000 0 20,000 40,000 60,000
Exportedbiomethane
Exported renewableelectricity
Refrigerants
Grid electricity purchased
Fuels used for transport
Burning of fossil fuels
Sludge processing
Mechanical treatment andstorage of wastewater
Carbon dioxide
Methane
Nitrous oxide
HFC refrigerant
tCO2e
55,508
43,056
17,371
16,634
8,507
5
-4,184
-9,725
Scope 3 emissions by GHG Protocol category
Downstream transportation and distribution (sludge transport)1,119
Business travel1,226
Employee commuting and home working4,108
Capital goods construction services 95,968
Purchased goods andservices271,871
Fuel andenergy related42,599
Waste generated in operations (including sludge disposal to land)26,333
Renewable energy generated
0
50
100
150
200
2012/13 2013/14 2014/15 2015/16 2016/17 2017/18 2018/19 2019/20 2020/21
CHP
Biomethane (gas to grid)
Solar
Wind
Hydro
Energy use, generation and export 2020/21
GWh2019/20
GWh2018/19
GWh
Energy useElectricityNatural gasOther fuels(1)
807.340.0
104.0
802.338.3116.3
807.933.0
135.0
Total energy use 951.3 956.9 975.8
Electricity purchased Renewable Tariff (2)
Supplier Standard Tariff (3)
591.447.8
602.940.8
601.559.7
Total electricity purchased 639.2 643.7 661.2
Renewable energy generated CHPSolarWindHydroBiomethane(4)
127.650.7
5.36.9
14.8
121.542.6
5.76.8
14.2
115.734.6
4.84.6
13.2
Total renewable energy generated 205.3 190.8 172.9
Renewable energy exportedElectricityBiomethane(4)
22.414.8
18.114.2
13.013.2
Total renewable energy exported 37.2 32.3 26.2
(1) Other fuels includes liquid fuel purchased for processing and transport plus business mileage in private vehicles converted to GWh using 2020 UK Government GHG Conversion Factors for Company Reporting.
(2) Electricity purchased on a renewable tariff had 0 CO2e/kWh emissions. (3) Electricity purchased on our standard tariff had 289 CO2e/kWh
emissions in 2019/20 and 178 CO2e/kWh emissions in 2020/21 .(4) Biomethane generated and exported to grid is expressed as an
electricity equivalent.
Energy use and emissionsOur energy management strategy aims to achieve an appropriate balance between managing energy consumption, use of renewables and self-generation and being smart about how we operate our assets to get best value while maintaining security of supply. We are a relatively energy-intensive business, consuming 951 GWh in 2020/21. We have increased the amount of energy generated from renewable sources, such as hydro, solar photovoltaics, wind, biomethane and sewage sludge powered combined heat and power (CHP) generators. In 2020/21 we generated the equivalent of 205 GWh of renewable electricity, an increase of 14 GWh on 2019/20. We exported 37.2 GWh back to the national electricity and gas grids, 4.9 GWh more than the previous year. Overall we reduced our electricity purchase by 4.5 GWh.
Energy efficiency action takenOur energy management programme brings together management processes, asset optimisation and data analytics. We have focused on optimisation of existing operations alongside realising opportunities through our capital programme to improve our use of pumps and how we manage wastewater treatment processes.
A focus area for 2020/21 has been our use of pumps. At Watchgate water treatment works, performance analysis of two key pump types led to the tactical refurbishment of the worst performing pumps and changes to the control philosophy – resulting in better efficiency, saving an estimated £40,500 per year, and a longer asset life.
At Heronbridge water treatment works, analysis of pump operation identified an opportunity to operate two pumps at minimum speed rather than a single pump at maximum speed. Running pumps closer to their best efficiency point reduces energy use and costs and should save approximately £45,000 per year.
Stock Code: UU. Annual Report and Financial Statements for the year ended 31 March 2021
STR
AT
EGIC
REPO
RT
99

Principal risks and uncertaintiesOur risk management framework
We have a robust risk management framework for the identification, assessment and mitigation of risk.
How we identify and assess risk
Consult & communicate
Identify & assess
Control & mitigate
Record & update
Monitor & review
We have a number of mechanisms in place to identify risk. These include a risk universe, cross-business horizon scanning forums, consultation with third parties and comparison with National Risk Registers.
Each risk is event based and is sponsored by a senior manager who is responsible for the analysis of the corresponding causal factors, consequences and the control effectiveness, taking account of both the internal and external business environment. This process determines the likelihood of the event occurring and the full range of potential impacts from a minimum (best case) to a maximum (worst case). Comparing this position against the desired target state, in combination with the strengths, weaknesses and gaps of the control environment, supports the decisions for further mitigation as appropriate. This ongoing analysis culminates in the biannual business unit risk assessment (BURA) which forms part of the governance and reporting process (as outlined opposite) to ensure consistency of approach and a true reflection of the risk facing the company. It also serves to calibrate the most significant risks from a financial and reputational context and to assess how these relate to our risk appetite.
Our approach to risk and resilience Successful management of risks and uncertainties enables us to deliver on our purpose to provide great water and more for the North West, and be more resilient across our corporate, financial and operational structures. A key objective of our approach is to support the sustainable achievement of the strategic themes that underpin our vision to be the best UK water and wastewater company delivering:
• the best service to customers;
• at the lowest sustainable cost; and
• in a responsible manner.
Our risk management framework provides the foundation for the business to anticipate threats to delivering an effective service in these challenging times, and to respond and recover effectively when risks materialise. Key components of the framework include:
• An embedded group-wide risk management process which is aligned to ISO 31000:2018 Risk management guidelines;
• A board-led approach to risk appetite, based on strategic goals;
• A strong and well-established governance structure giving the board oversight of the nature and extent of risks the group faces, as well as the effectiveness of risk management processes and controls; and
• A portfolio of policies, procedures, guidance and training to enable consistent, group-wide participation by our people.
Continuous improvement is a key feature of the framework which incorporates a maturity assessment model to identify areas to enhance. Based on risk management capabilities relative to five levels of maturity, a recent assessment has supported the development of a road map of improvements. These include an update to risk appetite statements, greater focus and analysis of cross-cutting themes and improved escalation of data from operational risk management systems.
Governance and reporting processThe board ensures that its oversight of risk remains effective, and in compliance with the UK Corporate Governance Code, through a number of established reporting routes.
Twice yearly the board receives an extensive update on the risk profile as part of the full and half-year reporting cycle. This provides an overview of the nature and extent of risk exposure in the context of the group’s principal risks (as detailed on pages 104 to 107), and emphasises the most significant event-based risks (summarised on pages 108 and 109) in both their current state relative to the risk appetite, and target state of acceptable exposure. The board is also advised of new and emerging risks (see page 109). In addition to the biannual risk reporting, specific risk topics are reported to the board to support decision-making. The board is therefore able to:
• make decisions on the level of risk it is prepared to manage relative to risk appetite and tolerance in order to deliver on the group’s strategy;
• engage with the business to ensure appropriate controls and mitigation are in place, and test the appropriateness of plans;
• report externally on the long-term viability of the company in an informed manner; and
• monitor and review the effectiveness of risk management procedures and internal control systems.
United Utilities Group PLC unitedutilities.com/corporate 100
STRATEGIC REPORT

Risk-specific governance and steering groups manage ongoing individual risks. The operational risk and resilience board provides oversight of asset and operational process risk and resilience capability, escalates risks and issues to the group audit and risk board (GARB) and contributes to the BURA process.
The executive-led GARB focuses on: the adequacy, effectiveness and performance of governance processes; risk management and internal control; monitoring compliance and assurance activities; identification of emerging themes and trends; and resilience across the group.
The audit committee is also a fundamental component of the governance structure. Supported by company secretariat and the corporate audit teams, the audit committee reviews the effectiveness of risk management and internal controls before these are agreed by the board.
Risk profileThe business risk profile consists of approximately 100 event-based risks, each of which relates to one of ten inherent risk areas, which we regard as our principal risks due to their potential to affect the performance, future prospects or reputation of the company. The allocation of event-based risks to principal risks enables the company to consider risks in the context of systems and production lines, in line with our Systems Thinking approach.
Corporate audit team
Third line review and assurance of risk
management and internal control
Board/board committee
Business unit risk assessment (BURA)
Management committee/activity
Group boardReviews the nature and
extent of risk, con�rms the company’s viability and
reports on e�ectiveness of risk management and
internal control systems
Audit committeeReviews the e�ectiveness of risk management and internal control systems
Group audit and risk board
Reviews governance, risk and compliance
matters
Group audit and risk board
Reviews governance, risk and compliance
matters
Operational and project risk
First line identi�cation, analysis, evaluation and
management of operational and project risk
Operational and project risk
First line identi�cation, analysis, evaluation and
management of operational and project risk
Operational risk and resilience boardMonitors status of risk,
controls and actions associated with water,
wastewater and bioresources
Operational risk and resilience boardMonitors status of risk,
controls and actions associated with water,
wastewater and bioresources
Corporate risk team
Second line framework development, advisory, assurance and reporting
Group strategic and tactical risk
First line identi�cation, analysis, evaluation and
management of strategic/tactical risk
Principal risk heat mapThe heat map provides an indicative view of the current risk exposure (likelihood of occurrence and most likely impact) of each of the principal risks relative to each other.
Seven of the ten principal risks have remained relatively stable in the last 12 months. Water service, Supply chain and programme delivery and Finance have reduced due to the replacement of a section of the Haweswater Aqueduct, the trade deal with the EU and improvement in the economic outlook, respectively. See pages 104 to 107 for further details of the principal risks.
Principal risks
1 Water service
2 Wastewater service
3 Retail and commercial
4 Supply chain and programme delivery
5 Resource
6 Finance
7 Health, safety and environmental
8 Security
9 Conduct and compliance
10 Political and regulatory
Low Likelihood High
High
Impact
Low
7 1 6
5 9
8 3 10 2
4
The governance and reporting process
An indication of the current exposure of each principal risk relative to the prior year.
Decreased
Stable
Increased
RISK EXPOSURE
Stock Code: UU. Annual Report and Financial Statements for the year ended 31 March 2021
STR
AT
EGIC
REPO
RT
101

Principal risks and uncertaintiesCommon themes
As illustrated in the bow-tie diagram below, each of the event-based risks has multiple causes and consequences which in turn lead to financial and/or reputational impact. Preventative and responsive controls are applied to reduce the likelihood of the event occurring and limit the impact if the event were to materialise. New and emerging circumstances in respect of causes, consequences and controls make the profile multifaceted and dynamic. Analysis of the profile highlights common themes, notably associated with the causes and consequences. These common themes can then be considered more holistically to enable a more integrated, Systems Thinking approach to risk mitigation. Analysis of the control environment indicates the strengths, weaknesses and gaps in the mitigation of risk, as well as the interdependencies across the business to manage risk as part of the integrated approach.
Cause
Event
Financial impact
Reputational impact
Cause
Cause
Cause
Preventative controls Responsive controls
Consequence
Consequence
Consequence
Consequence
Common causal themes The event-based risks include multiple causal factors which individually or in combination could trigger the risk event to occur. Categorisation illustrates six common causal themes:
• Extreme weather/climate change: In the majority of cases our water resources, asset base and operations can cope with extreme weather conditions, although these can become overwhelmed in intense situations. Climate change projections highlight increased temperatures, rainfall, wind and more frequent extreme variations in weather patterns. This means that climate change remains a key focus for us, because of its impact on our capacity and capability for service delivery, and because of the effect on the environment that we strive to protect and enhance. We are committed to the principles set by the Financial Stability Board’s Task Force on Climate-related Financial Disclosures (TCFD) – see pages 86 to 99.
• Demographic changes: Demographic changes, including population growth and evolving age profiles, can impact the capacity and capability of water and wastewater treatment and network assets; can affect demand on water resources; and increase uncertainty in relation to pension obligations.
• Legislative and regulatory change: Changes in legislation and/or regulation can have implications for the business model, asset base and ways of working. For example: the anticipated post-Brexit changes in law bring an element of uncertainty; and the introduction of competition, whilst positive to customers and markets, can affect ongoing revenue and the asset base.
• Economic conditions: Macro events, such as the financial crisis in 2008 and more recently COVID-19, can have multiple financial implications, including: lower revenue; increased bad debt; increased operational cost; increased cost of borrowing; and a reduction in the Regulatory Capital Value. The events can also impact the wider supply chain with knock-on effects to our service delivery and cost to serve.
• Asset health: General use, exposure to natural hazards, pressure and load all contribute to the deterioration of assets. In addition, other factors such as technological obsolescence and operating assets beyond their optimal capacity to cope with increased demand (population growth and/or climate change) also affect asset health. Ageing assets therefore provide an underlying and cross-business risk and uncertainty both to efficiency and for the long-term resilience of asset integrity and the associated service capability.
• Culture: Embedded through processes, reward mechanisms, values and behaviours, corporate culture is important to maintain high performance and cuts across the majority of risks in the profile. In an increasingly challenging business environment, our focus is to continue to embed a culture of innovation, customer service and behaving in a responsible manner at the same time as being open and transparent.
Common consequence themes Each consequence is analysed for the financial and reputational implications relative to multiple stakeholders. Categorisation of the consequences illustrates four common impact themes:
• Customer: Customers are impacted through our service offering, the quality of their experience when dealing with us, and how our operational and capital schemes affect them in the community.
• Environment: Our assets, operations and capital programmes can have a significant impact on the environment in both rural and urban settings. As a major land owner and operator of a large fleet of vehicles, the way we manage these also has environmental implications.
• Investors: The vast majority of risks in the profile have financial implications that could affect shareholder investment in the short and long term. Reputational impact associated with ethics, environmental protection and efficiency is also relevant for investors' interest in the company.
• Employees: Our employees are fundamental to delivering our service requirements as well as our strategic objectives. Equally, our employees can be affected by multiple risks across the business, but primarily in relation to employment and health, safety and wellbeing risks.
United Utilities Group PLC unitedutilities.com/corporate 102
STRATEGIC REPORT

Mapping of common themes to the principal risks The diagram below illustrates how the common themes (causal and consequence) relate to the principal risks (see pages 104 to 107).
Extreme weather/ climate change
Customers Employees
Environment Investors
Culture
Demographic changes
Asset health
Legislative andregulatory change
Economicconditions
21 6 9
1 2 3
5 6 9
10
4
3 4 5 7
8 9
6 7 8
9
1 2 3 5
3 4 5
8 9
10
6
1 2 5 7 9
1 2 5
7 9
1 2 3 4 5
6 7 8
9 10
4 6 7 8
9 10
1 2 3 4 5
6 8 9
10
Consequence themes
Causalthemes
Principal risks1 Water service
2 Wastewater service
3 Retail and commercial
4 Supply chain and programme delivery
5 Resource
6 Finance
7 Health, safety and environmental
8 Security
9 Conduct and compliance
10 Political and regulatory
An indication of the current exposure of each principal risk relative to the prior year.
Decreased
Stable
Increased
RISK EXPOSURE
Stock Code: UU. Annual Report and Financial Statements for the year ended 31 March 2021 103
STR
AT
EGIC
REPO
RT

Principal risks and uncertaintiesOur principal risks
CORE OPERATIONS AND SERVICE PROVISION
An indication of the current exposure of each principal risk relative to the prior year.
Decreased
Stable
Increased
* Indicates a significant event-based risk reported to the board (see pages 108 and 109).
RISK EXPOSURE
MOST SIGNIFICANT RISKS
The best service to customers
At the lowest sustainable cost
In a responsible manner
OUR STRATEGIC THEMES
1Water serviceA failure to provide a secure supply of clean, safe drinking water and the potential for a negative impact on public confidence in water supply.
Main strategic theme
Risk exposureCovering the entire water system from source to customers' taps, threats include: extreme weather which not only affects supply and demand through reduced rainfall, but can also affect raw water quality through fire or flooding; demographic changes affecting demand; asset health contributes to the frequency and magnitude of failure; and legal and regulatory change potentially increases the quality standards which will require time and investment in order to maintain compliance.
Potential impacts include: regulatory non-compliance; interruptions to water supply; or, in extreme cases, a danger to public health caused by poor water quality.
Control and mitigationStrict quality controls supplement the physical and chemical treatment including a rigorous sampling regime, alarm systems and 'shut down and start up to waste' processes. Asset inspections, regular maintenance and cleaning are undertaken across our water assets, supported by a prioritised replacement regime. Water resources management, production planning, pressure/flow management and leak detection are undertaken to maintain supply and minimise interruptions. The integrated network, alternative supply vehicles and maintenance crews provide a response capability.
Performance indicators• C-MeX• Leakage• Interruptions to supply• Water quality compliance (CRI)
Most significant event-based risks• Failure of significant water supply
systems * • Failure of the distribution system
(leakage) * • Dam failure * • Water sufficiency (dry weather)• Water network failure
2Wastewater serviceThe failure to remove, treat and return water to the environment and recycle sludge to land.
Main strategic theme
Risk exposureCovering the entire wastewater and bioresource systems from customer properties to land, river or the sea, the key factors are: the capacity and capability of assets and operational processes; and the availability of sludge recycling outlets. Compounding issues include unauthorised third party discharges into the sewer network, changing demographics and extreme weather. Whilst generally designed to cope with the vast majority of storms, high intensity rainfall can overwhelm the system. Legal and regulatory change potentially increases standards or imposes restrictions which will require time and investment to maintain compliance.
Potential impacts include: regulatory non-compliance; interruptions to drainage services; pollution incidents (including odour nuisance and sewer flooding); and inability to dispose of sludge to land.
Control and mitigationThe sewer network is managed through a combination of the drainage and wastewater management plans and the wastewater network operating model which include asset condition surveys to identify defects, sewer rehabilitation projects, customer campaigns and sewer cleaning programmes. Integrated drainage area studies and the adoption of a pollution incident reduction plan aim to make further enhancements. Proactive maintenance, operative training, sampling, compliance audits and odour management systems supplement the treatment processes across our wastewater and biosolids systems.
Performance indicators• C-MeX• EA performance assessment• Internal flooding incidents• Pollution incidents
Most significant event-based risks• Failure of wastewater network
(sewer flooding) * • Failure to treat wastewater *• Failure of wastewater assets
(serious pollution) * • Recycling of biosolids to agriculture
3Retail and commercialFailing to provide good and fair service to domestic customers and third-party retailers or a failure of or issue in relation to non-United Utilities Water operations or businesses.
Main strategic theme
Risk exposureKey factors include the social deprivation across the North West, the macroeconomic environment, and the experience and perception of customers towards our operations and service. Commercial contractual terms and conditions and the structure, positioning and efficiency of joint ventures, subsidiaries and undertakings are also factors.
Potential impacts include financial losses and an impact on profitability associated with poor cash flow and an increase in bad debt. Poor service and associated decreased customer satisfaction could result in regulatory penalties and reputational harm.
Control and mitigationOur customer-focused initiatives aim to drive excellent service and enhance the experience of all our customers. We have an award-winning Priority Services scheme for vulnerable customers and those needing help to pay, which has driven up our success in recovering charges. Bad debt risk is managed through best practice collection techniques, segmentation of customers and the use of data sharing to determine the most effective and collaborative collection and support activities.
The wholesale business maintains processes, systems and data to deal fairly with market participants and the central market operator in the business retail market in order to generate and collect revenue. Similarly strong governance applies to non-United Utilities Water operations and businesses.
Performance indicators• C-MeX• Customer complaints• D-MeX
Most significant event-based risks• Billing accuracy• Customer experience
Pages 104 to 107 provide details of our principal risks, including a description of the risk, a summary of the risk exposure, control mitigation actions and references to performance indicators and related event-based risks.
United Utilities Group PLC unitedutilities.com/corporate 104
STRATEGIC REPORT

CORE OPERATIONS AND SERVICE PROVISION
1Water serviceA failure to provide a secure supply of clean, safe drinking water and the potential for a negative impact on public confidence in water supply.
Main strategic theme
Risk exposureCovering the entire water system from source to customers' taps, threats include: extreme weather which not only affects supply and demand through reduced rainfall, but can also affect raw water quality through fire or flooding; demographic changes affecting demand; asset health contributes to the frequency and magnitude of failure; and legal and regulatory change potentially increases the quality standards which will require time and investment in order to maintain compliance.
Potential impacts include: regulatory non-compliance; interruptions to water supply; or, in extreme cases, a danger to public health caused by poor water quality.
Control and mitigationStrict quality controls supplement the physical and chemical treatment including a rigorous sampling regime, alarm systems and 'shut down and start up to waste' processes. Asset inspections, regular maintenance and cleaning are undertaken across our water assets, supported by a prioritised replacement regime. Water resources management, production planning, pressure/flow management and leak detection are undertaken to maintain supply and minimise interruptions. The integrated network, alternative supply vehicles and maintenance crews provide a response capability.
Performance indicators• C-MeX• Leakage• Interruptions to supply• Water quality compliance (CRI)
Most significant event-based risks• Failure of significant water supply
systems * • Failure of the distribution system
(leakage) * • Dam failure * • Water sufficiency (dry weather)• Water network failure
2Wastewater serviceThe failure to remove, treat and return water to the environment and recycle sludge to land.
Main strategic theme
Risk exposureCovering the entire wastewater and bioresource systems from customer properties to land, river or the sea, the key factors are: the capacity and capability of assets and operational processes; and the availability of sludge recycling outlets. Compounding issues include unauthorised third party discharges into the sewer network, changing demographics and extreme weather. Whilst generally designed to cope with the vast majority of storms, high intensity rainfall can overwhelm the system. Legal and regulatory change potentially increases standards or imposes restrictions which will require time and investment to maintain compliance.
Potential impacts include: regulatory non-compliance; interruptions to drainage services; pollution incidents (including odour nuisance and sewer flooding); and inability to dispose of sludge to land.
Control and mitigationThe sewer network is managed through a combination of the drainage and wastewater management plans and the wastewater network operating model which include asset condition surveys to identify defects, sewer rehabilitation projects, customer campaigns and sewer cleaning programmes. Integrated drainage area studies and the adoption of a pollution incident reduction plan aim to make further enhancements. Proactive maintenance, operative training, sampling, compliance audits and odour management systems supplement the treatment processes across our wastewater and biosolids systems.
Performance indicators• C-MeX• EA performance assessment• Internal flooding incidents• Pollution incidents
Most significant event-based risks• Failure of wastewater network
(sewer flooding) * • Failure to treat wastewater *• Failure of wastewater assets
(serious pollution) * • Recycling of biosolids to agriculture
3Retail and commercialFailing to provide good and fair service to domestic customers and third-party retailers or a failure of or issue in relation to non-United Utilities Water operations or businesses.
Main strategic theme
Risk exposureKey factors include the social deprivation across the North West, the macroeconomic environment, and the experience and perception of customers towards our operations and service. Commercial contractual terms and conditions and the structure, positioning and efficiency of joint ventures, subsidiaries and undertakings are also factors.
Potential impacts include financial losses and an impact on profitability associated with poor cash flow and an increase in bad debt. Poor service and associated decreased customer satisfaction could result in regulatory penalties and reputational harm.
Control and mitigationOur customer-focused initiatives aim to drive excellent service and enhance the experience of all our customers. We have an award-winning Priority Services scheme for vulnerable customers and those needing help to pay, which has driven up our success in recovering charges. Bad debt risk is managed through best practice collection techniques, segmentation of customers and the use of data sharing to determine the most effective and collaborative collection and support activities.
The wholesale business maintains processes, systems and data to deal fairly with market participants and the central market operator in the business retail market in order to generate and collect revenue. Similarly strong governance applies to non-United Utilities Water operations and businesses.
Performance indicators• C-MeX• Customer complaints• D-MeX
Most significant event-based risks• Billing accuracy• Customer experience
FUNCTIONAL SERVICE AND SUPPORT
4Supply chain and programme deliveryThe potential ineffective delivery of capital, operational and change programmes/processes.
Main strategic theme
Risk exposureAs the supplier of essential water and wastewater services with a significant asset base, key factors include the consistent supply of critical goods and services and the ongoing development of operational facilities, distribution networks and systems. Disruption and delay can occur through macroeconomic conditions, political issues or natural disasters in the country of origin. Contractual issues, technical or engineering complications, natural hazards such as extreme weather or legal aspects such as planning permission or access rights are also factors.
Potential impacts include: implications to cash flow; failure to take opportunities and competitive advantage; and ultimately failure to meet our obligations and customer outcomes.
Control and mitigationCategory management and supplier relationship management are key areas of control underpinned by contract management across our extensive supply chain. Capital, change and operational programmes are undertaken in order of priority following approval. Within the capital programme we have created better alignment and integration between our capital delivery partners, engineering service providers and our operating model. Our programmes and project management include risk and issue management.
Performance indicators• Percentage of invoices paid within 60
days• Time, cost and quality index
Most significant event-based risks• Unfunded developer-led projects• Dispute with supplier
5ResourceThe potential failure to provide appropriate resources (human, technological or physical) required to support business activity.
Main strategic theme
Risk exposureThe nature and scale of our operations warrants a highly efficient, effective and competent set of resources that is adaptable to a constantly changing business environment. Key factors include: the recruitment and selection of talent, employee engagement, skill-set and knowledge; obsolescent systems due to innovative new ways of working and advances in technology; the quality of tools, equipment and vehicles; and ongoing deterioration of property, land and other assets.
Potential impacts include the inability to maintain efficiency, optimise opportunity and competitive advantage, or meet our obligations and customer outcomes.
Control and mitigationWe develop our people with the right skills and knowledge and deliver effective technology to support the business in meeting its objectives. Employees are kept informed regarding business strategy and progress through various communication channels. Training and personal development programmes exist for all employees in addition to talent management programmes and apprentice and graduate schemes. We focus on change programmes and innovative ways of working to deliver better, more resilient and more cost-effective operations. Resources are closely monitored because of COVID-19, with home working and safe site working practices being adopted. People with multiple skill sets are able to add resilience across the business.
Performance indicators• Employee engagement
Most significant event-based risks• Land management• Business critical data
Stock Code: UU. Annual Report and Financial Statements for the year ended 31 March 2021
STR
AT
EGIC
REPO
RT
105

Principal risks and uncertaintiesOur principal risks
HAZARD-BASEDFUNCTIONAL SERVICE AND SUPPORT
6FinanceThe potential inability to finance the business appropriately.
Main strategic theme
Risk exposureThe extent of our capital programme and the scale of our operations means that it is important that we are able to raise finance when needed to preserve adequate liquidity. Key factors include unexpected and/or higher costs associated with an operational incident, fluctuations in commodity prices and our exposure to movements in interest rates and inflation. A reduction in credit ratings, the over payment of tax and a worsening of the pension scheme funding position are also factors. Contributing factors include the macroeconomy, the political and regulatory environments relative to the water sector, and our internal financial structure.
Potential impacts include cash flow implications, reduced profit and ultimately the solvency of the company in extreme cases.
Control and mitigationWe arrange long-term refinancing with staggered maturity dates and maintain significant liquidity to minimise the effect of short-term downturns. Counterparty credit exposure and settlement limits exist to reduce any potential future impacts. These are based on a number of factors, including the credit rating and the size of the asset base of the individual counterparty. The group employs hedging strategies to manage the impact of market fluctuations for inflation, interest rates and energy prices. Sensitivity analysis is carried out as part of the business planning process, influencing the various financial limits employed. Continuous monitoring of the markets takes place, including movements in credit default swap prices and movements in equity levels.
Performance indicators• Return on Regulated Equity (RoRE)• Underlying operating profit• Gearing (net debt : RCV)
Most significant event-based risks• Financial outperformance *• Credit ratings * • Pension deficit * • Fair payment of tax *
7Health, safety and environmentalThe potential harm to employees, contractors, the public or the environment.
Main strategic theme
Risk exposureThe nature and scale of our operations presents multiple hazards to employees, contractors, the public and the environment. These include confined spaces, excavations, explosive atmospheres or high volume asset failures (e.g. dams or aqueducts), and polluting sewage and chemicals if accidentally or uncontrollably released.
Potential impacts include: serious injury or loss of life; catastrophic damage to property/infrastructure; and damage to, or destruction of, wildlife, fish or natural habitats. Environmental hazards, notably extreme weather, can affect our operational assets and service delivery.
Control and mitigationWe have a strong health, safety and environmental culture supported by strong governance and management systems certified to OHSAS 18001 and ISO 14001 respectively. We actively seek to improve health, safety and wellbeing across the group through targeted improvements and benchmarking against our peers and seek to protect and improve the environment through the responsible delivery of our services. This includes helping to support rare species and habitats through targeted engagement and activity, as well as our commitment to reducing our carbon emissions by designing out waste from our operations, generating our own energy and looking at ways to reduce our use of raw materials. Due to the impact the environment can have on our services, extreme weather and climate change is being integrated into our risk, planning and decision-making processes.
Performance indicators• EA performance assessment• Accident frequency rates
Most significant event-based risks• Disease pandemic *• Process safety *• Personal safety• Carbon commitments• Failure of above-ground assets
(flooding)
8SecurityThe potential for malicious activity (physical or technological) against people, assets or operations.
Main strategic theme
Risk exposureAs the supplier of essential services and the owner and operator of critical national infrastructure, security is of paramount importance against an ever evolving and increasingly sophisticated threat through physical, technological, chemical or biological means. This could originate from rogue independent actors, nation states, organised crime, disgruntled employees, or as a result of commercial espionage.
Potential impacts include the loss or compromise of commercially sensitive data, the disruption of business activity and/or damage or destruction of systems, assets or infrastructure with a knock-on impact to service delivery and community infrastructure.
Control and mitigationSecurity measures and awareness training combined with strong governance and inspection regimes aim to protect infrastructure, assets and operational capability. We work closely with our industry peers, the Centre for the Protection of National Infrastructure (CPNI), the National Cyber Security Centre (NCSC), the Drinking Water Inspectorate and Defra. We liaise with these organisations to shape the sector approach to security, understand how to better protect our business, and be compliant with the Network and Information Systems (NIS) Directive. Ongoing system and network integration improves operational resilience and we maintain robust incident response, business continuity and disaster recovery procedures. We maintain insurance cover for loss and liability, and the instrument of appointment (licence) of the regulated business also contains a ‘shipwreck’ clause that, if applicable, may offer a degree of recourse in the event of a catastrophic incident.
Performance indicators• Cyber incidents
Most significant event-based risks• Cybercrime *• Terrorism *
United Utilities Group PLC unitedutilities.com/corporate 106
STRATEGIC REPORT

9Conduct and complianceThe failure to adopt or apply ethical standards, or to comply with legal and regulatory obligations and responsibilities.
Main strategic theme
Risk exposureOur business extends to multiple stakeholders and is subject to a significant amount of legislation and regulation. Long-term sustainability, resilience and reputation rely on responsible conduct and compliance across our business and extended supply chain.
Failure to comply with legal obligations could lead to financial penalties, reputational harm and loss of customer and investor confidence. Fines of up to 10 per cent of group turnover could be imposed, particularly in the areas of environmental, health and safety, competition, and information and data security. Ultimately sanctions could include, in extreme circumstances, revocation of the instrument of appointment (licence) and the imposition of a special administration regime.
Control and mitigationWe place high importance and focus on corporate responsibility. Our well-established internal forums and engagement activities with communities, landowners, environmental groups and other stakeholders allow us to be aware of current issues and concerns. These include ethical supply chains, modern slavery risks, the needs of vulnerable customers and diversity and equality within our own employee population.
Performance indicators• Community investment• EA performance assessment• C-MeX
Most significant event-based risks• Non-compliance with the Bribery Act• Digital Service licensing
10Political and regulatoryDevelopments connected with the political, regulatory and legislative environment.
Main strategic theme
Risk exposureAs a regulated business, the political and regulatory environment shapes how we operate as a business. Factors include the public perception of the water industry and its legitimacy to provide value, increased challenges on efficiency and the imposition of increased levels of competition across the sector.
There is the potential for increased costs of administration and for sources of income and funding to be impacted. There is also the potential for reduced Regulatory Capital Value (RCV) and for greater uncertainty of returns.
Control and mitigationWe continue to take part in government and regulatory consultations to influence outcomes in respect of policy and legislation. We routinely communicate with customers so that their needs and expectations can be factored into our thinking and plans.
Performance indicators• Return on Regulated Equity (RoRE)• Underlying operating profit
Most significant event-based risks• Reduced revenue at the next price
review * • Upstream competition
(bioresources) * • DPC – Haweswater Aqueduct
Replacement Programme (HARP)
An indication of the current exposure of each principal risk relative to the prior year.
Decreased
Stable
Increased
* Indicates a significant event-based risk reported to the board (see pages 108 and 109).
RISK EXPOSURE
MOST SIGNIFICANT RISKS
The best service to customers
At the lowest sustainable cost
In a responsible manner
OUR STRATEGIC THEMES
REGULATORY AND LEGAL
Stock Code: UU. Annual Report and Financial Statements for the year ended 31 March 2021
STR
AT
EGIC
REPO
RT
107

Principal risks and uncertaintiesThe company's most significant event-based risks
The most significant event-based risks represent the ten highest-ranked risks by exposure (likelihood of occurrence of the event multiplied by the most likely financial impact) and those risks which have been assessed as having a significantly high impact, but low likelihood. Depending on the circumstances, financial impacts will include loss of revenue, additional or extra cost, fines, regulatory penalties and compensation. Reputational impact relative to our multiple stakeholders is also assessed, reported and considered as part of the mitigation.
Failure of significant water supply systemsRisk exposure: The Haweswater Aqueduct (HA) is a key asset with current low resilience due to deterioration, potentially resulting in water quality issues and/or supply interruptions to a large proportion of our customer base.
Control/mitigation: Capital projects for asset replacement (including HARP), as well as extensive programmes of asset monitoring, surveys and maintenance.
1Failure of wastewater network (sewer flooding)Risk exposure: Equipment failure, collapses/bursts or inadequate hydraulic/operational capacity to cope with extreme weather and population growth, resulting in sewer flooding.
Control/mitigation: Preventative maintenance and inspection regimes, customer campaigns and sewer rehabilitation programmes.
2Cybercrime Risk exposure: Data and technology assets compromised due to malicious or accidental activity, leading to a major impact to key business processes and operations.
Control/mitigation: Multiple layers of control, including a secure perimeter, segmented internal network zones, access controls, constant monitoring and forensic response capability.
3
Financial outperformanceRisk exposure: Failure to achieve financial outperformance due to macro economic conditions and efficiency challenges, impacting the cost of debt and delivery of the company business plan.
Control/mitigation: Interest rate and inflation management, ongoing monitoring of markets and regulatory developments, and company business planning.
6
Pension deficitRisk exposure: The potential for the pension scheme funding deficit to increase because of life expectancy rates leading to additional contributions.
Control/mitigation: Constant monitoring combined with hedging against interest rates, inflation and growth asset risk.
A
Credit ratingsRisk exposure: Credit ratings below internal targets, due to deterioration in financial and/or operational performance and/or external factors (such as inflation) resulting in more expensive funding.
Control/mitigation: Continuous monitoring of markets, and the management of key financial risks within defined policy parameters.
7
Dam failureRisk exposure: Uncontrolled release of a significant volume of water from reservoirs due to flood damage, overtopping, earthquake or erosion leading to catastrophic impacts downstream.
Control/mitigation: Each reservoir is regularly inspected by engineers. Where appropriate, risk reduction interventions are implemented through a prioritised investment programme.
C
Upstream competition (bioresources)Risk exposure: Competition in the bioresources market leading to a loss of business and reduced operational efficiency.
Control/mitigation: Delivering operational efficiency, continued engagement with Ofwat and a strategic review of the bioresources business.
9
Disease pandemicRisk exposure: Serious illness in a large proportion of the UK population and consequences to our workforce, the wider supply chain and macroeconomy.
Control/mitigation: The incident management process would be invoked, supported by the Pandemic Response Plan. This includes the implementation of multi-channel communication with non-pharmaceutical interventions as per government guidance.
D
Failure to treat wastewaterRisk exposure: Inadequate capacity and capability of wastewater treatment works, leading to environmental permit breaches.
Control/mitigation: Improved Effective Operations and Maintenance (EO&M) programme and operating procedures including proactive maintenance, operative training and compliance audits.
5
Failure of the distribution system (leakage)Risk exposure: Network characteristics, asset condition, extreme weather or third-party damage resulting in the loss of treated water and failure of the leakage target.
Control/mitigation: Management of pressure and flow combined with traditional and innovative leakage detection techniques.
10
TerrorismRisk exposure: A significant asset to be compromised by terrorist activity leading to loss of supply, contamination and/or pollution.
Control/mitigation: A risk-based protection of assets in line with the Security and Emergency Measures Direction (SEMD) and close liaison with the Centre for the Protection of National Infrastructure (CPNI), regional counter terrorist units, local agencies and emergency services.
E
United Utilities Group PLC unitedutilities.com/corporate 108
STRATEGIC REPORT

New and emerging risks
We continue to review and monitor external and internal business environments to establish and understand risks and issues that are new, developing, growing or becoming more prominent. We do this through a combination of business unit risk assessments, a specific new and emerging risk forum and other horizon scanning forums such as a compliance working group. This enables us to plan our strategy and operations to minimise threats of this nature. Notable new and emerging risks and some possible impacts are set out below.
• Post-Brexit supply chain: Despite the agreement of a trade deal with the EU, there remains some uncertainty in relation to the supply of goods and services. We manage the supply chain through category management, with chemicals and critical spares being two categories which are fundamental to the delivery of our service provision. We will continue to monitor how the supply chain emerges and will adapt accordingly through category management and supplier relationship management.
• Post-Brexit legislative change: Post-Brexit uncertainty remains in relation to how European legislation will transition into UK law, for example, data protection laws governing the flow of data and information between the EU and UK. Changes in UK law, such as the Environment Bill, Sewage (Inland Waters) Bill and changes to Public Procurement will all have implications for the water sector.
• Regulatory change: The political landscape remains challenging for the water sector. There remains uncertainty regarding the introduction of further competition and therefore the associated implications for revenue and the asset base. Looking ahead to Price Review 2024 (PR24), the methodology remains uncertain, particularly in light of the outcome of other water companies' PR19 CMA appeals.
• Plastics: The current attention on single use plastics and microplastic pollution in water, wastewater effluent discharge and sludge disposal (see biosolids recycling to agriculture) could have implications for our assets and operations.
• Biosolids recycling to agriculture: The practice of disposing of biosolids to agriculture could be banned (partially or in full) in the UK based on similar actions within Europe.
• Water scarcity and water trading: Water scarcity is an emerging issue within the UK, which has knock-on implications for us in relation to the proposed strategic transfer of water from the North West to the South East of England, and the associated service, commercial and reputational impacts.
• COVID-19: To a large degree, COVID-19 has become business as usual, however, the longer-term implications of the economic downturn, with potential corporate failures and high unemployment, could affect cash collection. Continued lower inflation will affect revenues, financing costs and RCV, however, rising inflation will have an upside over the longer term.
Reduced revenue at the next price review Risk exposure: One of many potential issues relates to the totex allowances through AMP8 revenues for labour costs, due to the Office of National Statistics ASHE Index taking account of lower wages associated with COVID-19.
Control/mitigation: Reviewing the rule book once published and liaising with Ofwat accordingly.
4
Process safetyRisk exposure: The unintentional generation and/or release of dangerous substances and explosive atmospheres in sludge digestion or other processes, resulting in a catastrophic incident.
Control/mitigation: The design and engineering of facilities, training and maintenance of equipment. Effective control points exist with alarms monitored remotely and statutory inspections.
F
Fair payment of taxRisk exposure: Failure to maximise the available tax efficiencies and reliefs due to changing mechanisms.
Control/mitigation: Tax policies and objectives cover: efficient structuring of commercial activities; maintaining a robust governance and risk management framework; and an open and transparent relationship with tax authorities.
B
Failure of wastewater assets (serious pollution)Risk exposure: The unintended introduction of pollutants (including sewage) into the environment due to the capacity and capability of wastewater assets.
Control/mitigation: Proactive identification of asset defects through condition surveys, staff training, incident analysis, drainage area studies and improvement plans.
8
Material litigationThe group robustly defends litigation where appropriate and seeks to minimise its exposure by establishing provisions and seeking recovery wherever possible. Litigation of a material nature is regularly reported to the group board. Beyond that reported in previous years on the Argentina multiparty ‘class action’ and the Manchester Ship Canal Company matters (to which there have been no material developments), there is nothing specific to report on material litigation.
The top ten ranking risks relative to likelihood and impact
High impact, low likelihood risk
KEY
Stock Code: UU. Annual Report and Financial Statements for the year ended 31 March 2021
STR
AT
EGIC
REPO
RT
109

What it means
to govern responsibly In the following pages of this corporate governance report we have set out how we have applied the principles and reported against the provisions of the 2018 UK Corporate Governance Code (the code).

Governance Corporate governance report– Board of directors 112– Letter from the Chairman 116– Nomination committee report 130– Audit committee report 144– Corporate responsibility
committee report 156– Remuneration committee report 160– Tax policies and objectives 190Directors’ report 192Statement of directors’ responsibilities 196

Corporate governance reportBoard of directors
C TN
Responsibilities: Responsible for the leadership of the board, setting its agenda and ensuring its effectiveness on all aspects of its role.
Qualifications: BEng Civil Engineering, Diploma Securities Institute of Australia, Fellow of the Institute of Civil Engineers and the Royal Academy of Engineering.
Appointment to the board: May 2019; appointed as Chairman in January 2020.
Skills and experience: Sir David has spent his career overseeing high profile infrastructure projects, including: the delivery of the Sydney Olympic Village and Aquatics centre; Bluewater Shopping Centre, Kent; and the delivery of the 2012 London Olympic Infrastructure Project.
Career experience: Sir David was previously chief executive of: Network Rail Limited; The Olympic Delivery Authority; and English Partnerships. He has held non-executive roles as chairman of both High Speed Two Limited and Sirius Minerals plc. In December 2019 he stepped down as non-executive director and chair of the remuneration committee at Commonwealth Bank of Australia.
Current directorships/business interests: Chairman of Gatwick Airport Limited and a member of the Council at the London School of Economics. He is Chairman of United Utilities Water Limited.
Independence: Sir David met the 2018 UK Corporate Governance Code’s independence criteria (provision 10) on his appointment as a non-executive director and chairman designate.
Specific contribution to the company’s long-term success: Sir David’s experience of major infrastructure projects and his knowledge and understanding of the role of regulators will be invaluable in meeting the challenges of the current regulatory period and beyond. As chairman of the nomination committee he is responsible for ensuring the succession plans for the board and senior management identify the right skillsets to face the challenges of the business.
Responsibilities: To manage the group’s business and to implement the strategy and policies approved by the board.
Qualifications: BSc (Hons) Astrophysics/Maths/Physics.
Appointment to the board: January 2011.
Skills and experience: Steve’s experience of the highly competitive defence market and of complex design, manufacturing and support programmes has driven forwards the board’s strategy of improving customer service and operational performance at United Utilities. His perspective of the construction and infrastructure sector provides valuable experience and insight to support United Utilities’ capital investment programme.
Career experience: Steve was previously chief executive of SELEX Galileo, the defence electronics company owned by Italian aerospace and defence organisation Finmeccanica, chief operating officer BAE Systems PLC and a member of its PLC board. His early career was spent with British Aerospace PLC. Steve ceased to be a non-executive director of G4S plc following its takeover in April 2021.
Current directorships/business interests: He is Chief Executive Officer of United Utilities Water Limited and a non-executive director of Water Plus, a joint venture with Severn Trent serving business customers.
Specific contribution to the company’s long-term success: As the Chief Executive Officer, Steve has driven a step change in the company’s operational performance, and has implemented a Systems Thinking approach to underpin future operational activities and improved performance.
Responsibilities: To manage the group’s financial affairs, to contribute to the management of the group’s business and to the implementation of the strategy and policies approved by the board.
Qualifications: BSc (Hons) Mathematics, Chartered Accountant (ACA), Fellow of the Association of Corporate Treasurers (FCT).
Appointment to the board: July 2020.
Skills and experience: Phil has extensive experience of financial and corporate reporting, having qualified as a chartered accountant with KPMG and more latterly through his role as group controller. He has a comprehensive knowledge of capital markets and corporate finance underpinned through his previous role as group treasurer and his FCT qualification. Having been actively engaged in the last four regulatory price reviews he has a strong understanding of the economic regulatory environment.
Career experience: Phil has over 25 years’ experience working for United Utilities. Prior to his appointment as CFO in July 2020, he was group controller with responsibility for the group’s financial reporting and prior to that he was group treasurer with responsibility for funding and financial risk management. He has been a member of EFRAG TEG and chaired the EFRAG Rate Regulated Activities Working Group.
Current directorships/business interests: Phil was appointed as a member of the UK Accounting Standards Endorsement Board in March 2021. He is chair of the 100 Group pensions committee and a member of both the 100 Group main committee and the stakeholder communications and reporting committee. He is Chief Financial Officer of United Utilities Water Limited and a non-executive director of Water Plus, a joint venture with Severn Trent serving business customers.
Specific contribution to the company’s long-term success: Phil has driven forward the financial performance of the group and delivered the group’s competitive advantage in financial risk management and excellence in corporate reporting.
Responsibilities: Responsible, in addition to his role as an independent non-executive director, for discussing any concerns with shareholders that cannot be resolved through the normal channels of communication with the Chairman or Chief Executive Officer.
Qualifications: Chartered Management Accountant (FCMA).
Appointment to the board: November 2013.
Skills and experience: Through his previous roles at British Gas and BAA, Mark has a strong background operating within regulated environments. His extensive knowledge of customer-facing businesses is particularly valuable for United Utilities in the pursuit of our strategy to improve customer service.
Career experience: Mark was previously chief executive of Barratt Developments plc. He is a former trustee of the Building Research Establishment and the UK Green Building Council. Mark held senior executive roles in Centrica plc and British Gas. He is a former non-executive director at BAA plc and Ladbrokes Coral PLC.
Current directorships/business interests: Mark was appointed as a non-executive director and chairman designate at Aggreko plc in October 2020. He was appointed as senior independent non-executive director at Wickes Group plc and as chair of the remuneration committee in April 2021. He is non-executive chairman at Grainger plc and a non-executive director at Premier Marinas Holdings Limited. He is an independent non-executive director of United Utilities Water Limited.
Specific contribution to the company’s long-term success: As senior independent non-executive director, Mark applies his own considerable board experience gained during his career to United Utilities and provides a sounding board to the executive in many areas.
Responsibilities: To challenge constructively the executive directors and monitor the delivery of the strategy within the risk and control framework set by the board and to lead the board’s agenda on acting responsibly as a business.
Qualifications: Bachelor of Laws (Hons).
Appointment to the board: September 2014.
Skills and experience: As the chief executive of a FTSE 100 listed company, Stephen brings current operational experience to the board. His public sector experience provides additional insight in regulation and government relations. His day-to-day experience in the information and technology industries ensures that the board is kept abreast of these areas of the company’s operating environment.
Career experience: Stephen previously held senior executive roles at Alcatel Lucent Inc. and a number of public sector/service roles, including serving a term as the founding chief executive of Ofcom. He stepped down as a non-executive director at the Department for Business Energy and Industrial Strategy in December 2020. Former chairman Ashridge Business School. A Life Peer since 2008.
Current directorships/business interests: Group chief executive Informa plc. He is an independent non-executive director of United Utilities Water Limited.
Specific contribution to the company’s long-term success: Stephen’s experience as a current chief executive and his previous work in the public sector and government provides valuable insight for board discussions on regulatory matters.
Sir David Higgins Chairman
Steve MogfordChief Executive Officer (CEO)
Phil AspinChief Financial Officer (CFO)
United Utilities Group PLC unitedutilities.com/corporate 112
GOVERNANCE

Board roleChairman
Executive director
Senior independent non-executive director
Independent non-executive director
Committee membershipN Nomination committeeC Corporate responsibility committeeT Treasury committeeR Remuneration committeeA Audit committee
Chair of the committee
Responsibilities: Responsible for the leadership of the board, setting its agenda and ensuring its effectiveness on all aspects of its role.
Qualifications: BEng Civil Engineering, Diploma Securities Institute of Australia, Fellow of the Institute of Civil Engineers and the Royal Academy of Engineering.
Appointment to the board: May 2019; appointed as Chairman in January 2020.
Skills and experience: Sir David has spent his career overseeing high profile infrastructure projects, including: the delivery of the Sydney Olympic Village and Aquatics centre; Bluewater Shopping Centre, Kent; and the delivery of the 2012 London Olympic Infrastructure Project.
Career experience: Sir David was previously chief executive of: Network Rail Limited; The Olympic Delivery Authority; and English Partnerships. He has held non-executive roles as chairman of both High Speed Two Limited and Sirius Minerals plc. In December 2019 he stepped down as non-executive director and chair of the remuneration committee at Commonwealth Bank of Australia.
Current directorships/business interests: Chairman of Gatwick Airport Limited and a member of the Council at the London School of Economics. He is Chairman of United Utilities Water Limited.
Independence: Sir David met the 2018 UK Corporate Governance Code’s independence criteria (provision 10) on his appointment as a non-executive director and chairman designate.
Specific contribution to the company’s long-term success: Sir David’s experience of major infrastructure projects and his knowledge and understanding of the role of regulators will be invaluable in meeting the challenges of the current regulatory period and beyond. As chairman of the nomination committee he is responsible for ensuring the succession plans for the board and senior management identify the right skillsets to face the challenges of the business.
Responsibilities: To manage the group’s business and to implement the strategy and policies approved by the board.
Qualifications: BSc (Hons) Astrophysics/Maths/Physics.
Appointment to the board: January 2011.
Skills and experience: Steve’s experience of the highly competitive defence market and of complex design, manufacturing and support programmes has driven forwards the board’s strategy of improving customer service and operational performance at United Utilities. His perspective of the construction and infrastructure sector provides valuable experience and insight to support United Utilities’ capital investment programme.
Career experience: Steve was previously chief executive of SELEX Galileo, the defence electronics company owned by Italian aerospace and defence organisation Finmeccanica, chief operating officer BAE Systems PLC and a member of its PLC board. His early career was spent with British Aerospace PLC. Steve ceased to be a non-executive director of G4S plc following its takeover in April 2021.
Current directorships/business interests: He is Chief Executive Officer of United Utilities Water Limited and a non-executive director of Water Plus, a joint venture with Severn Trent serving business customers.
Specific contribution to the company’s long-term success: As the Chief Executive Officer, Steve has driven a step change in the company’s operational performance, and has implemented a Systems Thinking approach to underpin future operational activities and improved performance.
Responsibilities: To manage the group’s financial affairs, to contribute to the management of the group’s business and to the implementation of the strategy and policies approved by the board.
Qualifications: BSc (Hons) Mathematics, Chartered Accountant (ACA), Fellow of the Association of Corporate Treasurers (FCT).
Appointment to the board: July 2020.
Skills and experience: Phil has extensive experience of financial and corporate reporting, having qualified as a chartered accountant with KPMG and more latterly through his role as group controller. He has a comprehensive knowledge of capital markets and corporate finance underpinned through his previous role as group treasurer and his FCT qualification. Having been actively engaged in the last four regulatory price reviews he has a strong understanding of the economic regulatory environment.
Career experience: Phil has over 25 years’ experience working for United Utilities. Prior to his appointment as CFO in July 2020, he was group controller with responsibility for the group’s financial reporting and prior to that he was group treasurer with responsibility for funding and financial risk management. He has been a member of EFRAG TEG and chaired the EFRAG Rate Regulated Activities Working Group.
Current directorships/business interests: Phil was appointed as a member of the UK Accounting Standards Endorsement Board in March 2021. He is chair of the 100 Group pensions committee and a member of both the 100 Group main committee and the stakeholder communications and reporting committee. He is Chief Financial Officer of United Utilities Water Limited and a non-executive director of Water Plus, a joint venture with Severn Trent serving business customers.
Specific contribution to the company’s long-term success: Phil has driven forward the financial performance of the group and delivered the group’s competitive advantage in financial risk management and excellence in corporate reporting.
Responsibilities: Responsible, in addition to his role as an independent non-executive director, for discussing any concerns with shareholders that cannot be resolved through the normal channels of communication with the Chairman or Chief Executive Officer.
Qualifications: Chartered Management Accountant (FCMA).
Appointment to the board: November 2013.
Skills and experience: Through his previous roles at British Gas and BAA, Mark has a strong background operating within regulated environments. His extensive knowledge of customer-facing businesses is particularly valuable for United Utilities in the pursuit of our strategy to improve customer service.
Career experience: Mark was previously chief executive of Barratt Developments plc. He is a former trustee of the Building Research Establishment and the UK Green Building Council. Mark held senior executive roles in Centrica plc and British Gas. He is a former non-executive director at BAA plc and Ladbrokes Coral PLC.
Current directorships/business interests: Mark was appointed as a non-executive director and chairman designate at Aggreko plc in October 2020. He was appointed as senior independent non-executive director at Wickes Group plc and as chair of the remuneration committee in April 2021. He is non-executive chairman at Grainger plc and a non-executive director at Premier Marinas Holdings Limited. He is an independent non-executive director of United Utilities Water Limited.
Specific contribution to the company’s long-term success: As senior independent non-executive director, Mark applies his own considerable board experience gained during his career to United Utilities and provides a sounding board to the executive in many areas.
Responsibilities: To challenge constructively the executive directors and monitor the delivery of the strategy within the risk and control framework set by the board and to lead the board’s agenda on acting responsibly as a business.
Qualifications: Bachelor of Laws (Hons).
Appointment to the board: September 2014.
Skills and experience: As the chief executive of a FTSE 100 listed company, Stephen brings current operational experience to the board. His public sector experience provides additional insight in regulation and government relations. His day-to-day experience in the information and technology industries ensures that the board is kept abreast of these areas of the company’s operating environment.
Career experience: Stephen previously held senior executive roles at Alcatel Lucent Inc. and a number of public sector/service roles, including serving a term as the founding chief executive of Ofcom. He stepped down as a non-executive director at the Department for Business Energy and Industrial Strategy in December 2020. Former chairman Ashridge Business School. A Life Peer since 2008.
Current directorships/business interests: Group chief executive Informa plc. He is an independent non-executive director of United Utilities Water Limited.
Specific contribution to the company’s long-term success: Stephen’s experience as a current chief executive and his previous work in the public sector and government provides valuable insight for board discussions on regulatory matters.
Changes to board directors:Russ Houlden (CFO) and Sara Weller (independent non-executive director) both left the board at the end of the company’s AGM in July 2020. Furthermore, they both ceased to be directors of United Utilities Water Limited at that time.
Brian May will not be seeking reappointment at the AGM in July 2021, having served on the board for almost nine years. At the same time he will cease to be a director of United Utilities Water Limited.
Mark Clare Senior
independent non-executive
directorN R N A C
Stephen Carter CBE Independent
non-executive director
Stock Code: UU. Annual Report and Financial Statements for the year ended 31 March 2021 113
GO
VER
NA
NC
E

Corporate governance reportBoard of directors
N A T R
Brian May Independent
non-executive director
N R C
Alison Goligher
Independent non-executive
director
Responsibilities: To challenge constructively the executive directors and monitor the delivery of the strategy within the risk and control framework set by the board.
Qualifications: Solicitor of England and Wales.
Appointment to the board: September 2020.
Skills and experience: Kath has spent most of her career working in a regulated environment in the financial services industry. Since 2014, she has focused on her non-executive roles, chairing all the main board committees and undertaking the role of senior independent director.
Career experience: Kath previously was chief operating officer at Standard Chartered plc before which she held a number of roles at UBS Limited over a 22- year period, prior to which she qualified as a solicitor. She stepped down as a non-executive director at Brewin Dolphin Holdings plc in February 2021.
Current directorships/business interests: Kath is a non-executive director at RSA Insurance Group plc and chair of the remuneration committee. She is a non-executive director at Columbia Threadneedle Investments where she chairs the TPEN audit committee and a non-executive director of TP ICAP Group Plc. She is an independent non-executive director of United Utilities Water Limited.
Specific contribution to the company’s long-term success: Kath’s broad board experience enables her to contribute to board governance and risk management at United Utilities.
Responsibilities: To challenge constructively the executive directors and monitor the delivery of the strategy within the risk and control framework set by the board and to lead the board’s activities concerning directors’ remuneration.
Qualifications: BSc (Hons) Mathematical Physics, MEng Petroleum Engineering.
Appointment to the board: August 2016.
Skills and experience: Alison has strong technical and capital project management skills, having been involved in large projects and the production side of Royal Dutch Shell’s business. This experience of engineering and industrial sectors provides the board with additional insight into delivering United Utilities’ capital investment programme.
Career experience: Royal Dutch Shell (2006 to 2015), where Alison’s most recent executive role was Executive Vice President Upstream International Unconventionals. Prior to that she spent 17 years with Schlumberger, an international supplier of technology, integrated project management and information solutions to the oil and gas industry.
Current directorships/business interests: Alison is a non-executive director and chair of the remuneration committee at Meggitt PLC and a part-time executive chair at Silixa Ltd. In February 2021 she was appointed as a non-executive director of Technip Energies NV. She is an independent non-executive director of United Utilities Water Limited.
Specific contribution to the company’s long-term success: Alison’s understanding of the operational challenges of large capital projects and the benefits of deploying technology provides valuable insight into addressing the longer-term strategic risks faced by the business. Her role as the designated non-executive director for workforce engagement will provide the board with a better understanding of the views of employees and greater clarity on the culture of the company.
Responsibilities: To challenge constructively the executive directors and monitor the delivery of the strategy within the risk and control framework set by the board and to lead the audit committee.
Qualifications: BSc (Hons) Actuarial Science, Chartered Accountant (FCA).
Appointment to the board: September 2012.
Skills and experience: Brian’s background in finance and accounting and the various roles that he has held are major assets to the board. He has been chair of the audit committee since September 2013 and has considerable knowledge of the company and the specifics of the utilities sector.
Career experience: Brian was appointed group finance director of Bunzl plc in January 2006 and he retired from the board of Bunzl plc on 31 December 2019.
Current directorships/business interests: Brian was appointed as a non-executive director and member of the audit committee of Ferguson plc in January 2021. He is a non-executive director of ConvaTec Group Plc and a member of its audit and risk committee and chair of its remuneration committee. He is an independent non-executive director of United Utilities Water Limited.
Specific contribution to the company’s long-term success: Brian contributes his considerable expertise in finance to the company primarily through the important roles as chair of both the audit committee and the treasury committee, which are important in overseeing the risk management of the group. The industry knowledge he has gained over the eight years he has been a board member enabled him to focus on, and contribute to, key risk areas during the regulatory price review process for the 2020–25 regulatory period.
Responsibilities: To challenge constructively the executive directors and monitor the delivery of the strategy within the risk and control framework set by the board.
Qualifications: MEng + Man (Hons), MBA.
Appointment to the board: July 2017.
Skills and experience: Paulette has spent most of her career in the regulated finance industry and so provides the board with additional perspective and first-hand regulatory experience. Her experience of technology-driven transformation will contribute to United Utilities’ customer experience programme and its Systems Thinking approach.
Career experience: Previously held senior executive roles in banking and technology at Facebook, Barclays and the Royal Bank of Scotland/NatWest. Former trustee and chair of children’s charity The Mayor’s Fund for London.
Current directorships/business interests: CEO of Integrated and Ecommerce Solutions and member of the Paysafe Group executive since January 2020. Paysafe, a former FTSE 250 company, is now privately owned by PE firms CVC and Blackstone. She is an independent non-executive director of United Utilities Water Limited.
Specific contribution to the company’s long-term success: Paulette’s wide-ranging experience in regulated sectors, profit and loss management, technology and innovation enables her to provide a first-hand contribution to many board topics of discussion. In her current executive role she often faces many of the same issues, and has been able to provide support to senior management at United Utilities.
Responsibilities: To challenge constructively the executive directors and monitor the delivery of the strategy within the risk and control framework set by the board.
Qualifications: MA Geography and Management Science, Chartered Accountant (FCA).
Appointment to the board: September 2020.
Skills and experience: Doug has extensive career experience in finance from qualifying as a chartered accountant with Price Waterhouse, his executive roles as CFO of major listed companies and more recently through his non-executive positions and focus on audit committee activities.
Career experience: Doug was previously chief financial officer at Meggitt PLC from 2013 to 2018 and prior to that, he was chief financial officer at both the London Stock Exchange Group plc and QinetiQ Group plc. He is a former non-executive director and audit committee chair at SEGRO plc, having stepped down in 2019.
Current directorships/business interests: Doug currently serves as a non-executive director and audit committee chair at Johnson Matthey plc, BMT Group Ltd and the Manufacturing Technology Centre Ltd. He is an independent non-executive director of United Utilities Water Limited.
Specific contribution to the company’s long-term success: Doug’s financial capabilities and his experience as an audit committee chair strengthen the board’s financial expertise.
N R
Kath CatesIndependent
non-executive director
United Utilities Group PLC unitedutilities.com/corporate 114
GOVERNANCE

AN
Paulette RoweIndependent
non-executive director
AN
Doug WebbIndependent
non-executive director
Responsibilities: To challenge constructively the executive directors and monitor the delivery of the strategy within the risk and control framework set by the board.
Qualifications: Solicitor of England and Wales.
Appointment to the board: September 2020.
Skills and experience: Kath has spent most of her career working in a regulated environment in the financial services industry. Since 2014, she has focused on her non-executive roles, chairing all the main board committees and undertaking the role of senior independent director.
Career experience: Kath previously was chief operating officer at Standard Chartered plc before which she held a number of roles at UBS Limited over a 22- year period, prior to which she qualified as a solicitor. She stepped down as a non-executive director at Brewin Dolphin Holdings plc in February 2021.
Current directorships/business interests: Kath is a non-executive director at RSA Insurance Group plc and chair of the remuneration committee. She is a non-executive director at Columbia Threadneedle Investments where she chairs the TPEN audit committee and a non-executive director of TP ICAP Group Plc. She is an independent non-executive director of United Utilities Water Limited.
Specific contribution to the company’s long-term success: Kath’s broad board experience enables her to contribute to board governance and risk management at United Utilities.
Responsibilities: To challenge constructively the executive directors and monitor the delivery of the strategy within the risk and control framework set by the board and to lead the board’s activities concerning directors’ remuneration.
Qualifications: BSc (Hons) Mathematical Physics, MEng Petroleum Engineering.
Appointment to the board: August 2016.
Skills and experience: Alison has strong technical and capital project management skills, having been involved in large projects and the production side of Royal Dutch Shell’s business. This experience of engineering and industrial sectors provides the board with additional insight into delivering United Utilities’ capital investment programme.
Career experience: Royal Dutch Shell (2006 to 2015), where Alison’s most recent executive role was Executive Vice President Upstream International Unconventionals. Prior to that she spent 17 years with Schlumberger, an international supplier of technology, integrated project management and information solutions to the oil and gas industry.
Current directorships/business interests: Alison is a non-executive director and chair of the remuneration committee at Meggitt PLC and a part-time executive chair at Silixa Ltd. In February 2021 she was appointed as a non-executive director of Technip Energies NV. She is an independent non-executive director of United Utilities Water Limited.
Specific contribution to the company’s long-term success: Alison’s understanding of the operational challenges of large capital projects and the benefits of deploying technology provides valuable insight into addressing the longer-term strategic risks faced by the business. Her role as the designated non-executive director for workforce engagement will provide the board with a better understanding of the views of employees and greater clarity on the culture of the company.
Responsibilities: To challenge constructively the executive directors and monitor the delivery of the strategy within the risk and control framework set by the board and to lead the audit committee.
Qualifications: BSc (Hons) Actuarial Science, Chartered Accountant (FCA).
Appointment to the board: September 2012.
Skills and experience: Brian’s background in finance and accounting and the various roles that he has held are major assets to the board. He has been chair of the audit committee since September 2013 and has considerable knowledge of the company and the specifics of the utilities sector.
Career experience: Brian was appointed group finance director of Bunzl plc in January 2006 and he retired from the board of Bunzl plc on 31 December 2019.
Current directorships/business interests: Brian was appointed as a non-executive director and member of the audit committee of Ferguson plc in January 2021. He is a non-executive director of ConvaTec Group Plc and a member of its audit and risk committee and chair of its remuneration committee. He is an independent non-executive director of United Utilities Water Limited.
Specific contribution to the company’s long-term success: Brian contributes his considerable expertise in finance to the company primarily through the important roles as chair of both the audit committee and the treasury committee, which are important in overseeing the risk management of the group. The industry knowledge he has gained over the eight years he has been a board member enabled him to focus on, and contribute to, key risk areas during the regulatory price review process for the 2020–25 regulatory period.
Responsibilities: To challenge constructively the executive directors and monitor the delivery of the strategy within the risk and control framework set by the board.
Qualifications: MEng + Man (Hons), MBA.
Appointment to the board: July 2017.
Skills and experience: Paulette has spent most of her career in the regulated finance industry and so provides the board with additional perspective and first-hand regulatory experience. Her experience of technology-driven transformation will contribute to United Utilities’ customer experience programme and its Systems Thinking approach.
Career experience: Previously held senior executive roles in banking and technology at Facebook, Barclays and the Royal Bank of Scotland/NatWest. Former trustee and chair of children’s charity The Mayor’s Fund for London.
Current directorships/business interests: CEO of Integrated and Ecommerce Solutions and member of the Paysafe Group executive since January 2020. Paysafe, a former FTSE 250 company, is now privately owned by PE firms CVC and Blackstone. She is an independent non-executive director of United Utilities Water Limited.
Specific contribution to the company’s long-term success: Paulette’s wide-ranging experience in regulated sectors, profit and loss management, technology and innovation enables her to provide a first-hand contribution to many board topics of discussion. In her current executive role she often faces many of the same issues, and has been able to provide support to senior management at United Utilities.
Responsibilities: To challenge constructively the executive directors and monitor the delivery of the strategy within the risk and control framework set by the board.
Qualifications: MA Geography and Management Science, Chartered Accountant (FCA).
Appointment to the board: September 2020.
Skills and experience: Doug has extensive career experience in finance from qualifying as a chartered accountant with Price Waterhouse, his executive roles as CFO of major listed companies and more recently through his non-executive positions and focus on audit committee activities.
Career experience: Doug was previously chief financial officer at Meggitt PLC from 2013 to 2018 and prior to that, he was chief financial officer at both the London Stock Exchange Group plc and QinetiQ Group plc. He is a former non-executive director and audit committee chair at SEGRO plc, having stepped down in 2019.
Current directorships/business interests: Doug currently serves as a non-executive director and audit committee chair at Johnson Matthey plc, BMT Group Ltd and the Manufacturing Technology Centre Ltd. He is an independent non-executive director of United Utilities Water Limited.
Specific contribution to the company’s long-term success: Doug’s financial capabilities and his experience as an audit committee chair strengthen the board’s financial expertise.
Board roleChairman
Executive director
Senior independent non-executive director
Independent non-executive director
Committee membershipN Nomination committeeC Corporate responsibility committeeT Treasury committeeR Remuneration committeeA Audit committee
Chair of the committee
Stock Code: UU. Annual Report and Financial Statements for the year ended 31 March 2021 115
GO
VER
NA
NC
E

Corporate governance reportLetter from the Chairman
• Sir David Higgins met the independence criteria as set out in provision 10 of the 2018 UK Corporate Governance Code (the code) when he was appointed.
• The code requires that at least halfof the board, excluding the chair, should be non-executive directors whom the board considers to be independent. At United Utilities, seven out of the remaining nine directors are independent non-executive directors.
• The company secretary attendsall board and committee meetingsand advises the Chairman ongovernance matters. The companysecretariat team provides administrative support.
• The directors’ biographies (see pages 112 to 115) include specific reasons why each director’s contribution is, and continues to be, important to the company’s long-term sustainable success.
• All directors are subject to annualelection at the annual generalmeeting (AGM) held in July. The board concluded, following the completion of the evaluation of the effectiveness of the board, that each director continues to contribute effectively.
• The board recommends thatshareholders vote in favour of those directors standing for a further term at the forthcoming AGM, as they will be doing in respect of their individual shareholdings.
Quick linkSchedule of matters reserved for the boardunitedutilities.com/corporate-governanceA copy of the Financial Reporting Council’s 2018 UK Corporate Governance Code can be found at frc.org.uk
QUICK FACTS
The board has responsibility for the health of the company and needs to take a long-term view, managing the conflict between short-term interests and the long-term impacts of its decisions.
Dear Shareholder Over the past year the board’s focus has been has been dominated by the group’s response to the pandemic and ensuring the safety and support for our employees while maintaining the delivery of services to customers across our region. As a regulated monopoly supplier, with a population of 7.3 million in our region, we need to work hard to meet the high expectations customers have for us, both in terms of the services we provide but also in behaving as a responsible business in the way in which we provide them. To do so is crucial to the long-term success of United Utilities.
During the period May to November 2020, the board reviewed the impact of the pandemic on the financial performance of the group, including understanding the ability of some customers facing financial hardship to pay for our services. As a consequence, an extension of UUW’s social tariff arrangements were approved, to apply until the end of the 2021/22 financial year. At the same time, the board did not want to jeopardise the great progress made over the last five years in improved
operational performance, led by Steve Mogford and his team. Throughout this report you will see examples of our improved operational performance as recognised against the benchmarks set by our regulators. These improvements have given the board greater confidence of achieving regulatory outperformance during AMP7, and support our longer-term plans for the next asset management period.
GovernanceThe past year has challenged the normal interaction of both the board and management. The board were kept fully apprised of management’s actions and changes to normal business practices in the early stages of the pandemic. A combination of physical meetings where possible, in conjunction with virtual board and committee meetings, have been held to maintain the integrity of our governance structure. Induction programmes for Kath and Doug were undertaken virtually, I know, in due course, Kath and Doug will welcome the opportunity to visit some of the company’s principal operational sites and important capital projects, as will all board members. Informal virtual meetings have been held the evening before board meetings, as a substitute for our usual informal pre-board dinners. The annual board evaluation was externally facilitated this year, by virtual means by Independent Audit Limited (see page 135).
Additionally, we have held a number of virtual workshops on key topics, including: leakage; digital strategy; diversity and inclusion and, as a direct consequence of the pandemic, considering the options for new ways of working for employees across appropriate parts of our business. These in-depth sessions have provided board members with a greater understanding of these particular challenges and initiatives, and how they are being addressed by management. We held a strategy day in November 2020, enabling the board to spend time debating a number of strategic and long-term business priorities, an action which was identified in the 2019/20 board evaluation. A particular focus for the day, was understanding the plans for the Haweswater Aqueduct Resilience Programme and Ofwat’s ‘direct procurement for customers’ approach, through which the programme will be delivered.
Historically, the company’s annual general meeting held in July each year has welcomed a number of shareholders who have been regular attendees, last year of course being the exception. We are hoping that this will be an event in the corporate calendar that can be reinstated in the years to come. We are however, proposing to
Sir David Higgins Chairman
United Utilities Group PLC unitedutilities.com/corporate 116
GOVERNANCE

A combination of physical meetings where possible, in conjunction with virtual board and committee meetings, have been held to maintain the integrity of our governance structure.
adopt new articles of association at the forthcoming 2021 annual general meeting, including the power to be able to hold fully hybrid meetings should the need arise, in line with market best practice.
In the following pages of this corporate governance report we have set out how we have applied the principles and reported against the provisions of the 2018 UK Corporate Governance Code (the code). On page 167 we have explained our proposals in relation to code provision 38.
RiskThe board has an agreed framework for managing strategic and operational risks in accordance with the agreed risk appetite. The board regularly reviews the position to ensure that management are managing and mitigating risk in accordance with the board’s agreed risk appetite. These risks include succession planning for senior management and asset resilience, with particular consideration for the impacts of climate change. The board is directly supported in this by the internal audit and risk management team and indirectly by KPMG during the course of their audit of the financial statements.
PeopleI would like to thank Brian May for his excellent work and support during my first full year as Chairman. It was announced in May 2021, that after nearly nine years’ on the board, Brian would be stepping down at the conclusion of the AGM in July 2021. Doug Webb, whom we welcomed to the board in September 2020, was recruited as an independent non-executive director, to chair both the audit and treasury committees on Brian’s departure. Doug brings to the role, as required by the code, ‘recent and relevant financial experience’. Given the complexities of the work of both the audit committee, and the treasury committee particularly in terms of the regulatory operating model, it was felt that a handover period between Brian and Doug covering a full audit cycle would be particularly beneficial. Doug will also become a member of the remuneration committee when Brian steps down from the board.
In September 2020, along with Doug, we welcomed Kath Cates, as a new independent non-executive director. Kath brings a wealth of experience of regulated businesses from her executive career in financial services. Alison Goligher, who has served as a member of the remuneration committee since 2016, accepted the role as chair of the remuneration committee on Sara Weller’s departure from the board at the conclusion of the 2020 AGM.
2021 is the first annual report presented by the board under the tenure of Phil Aspin as CFO. As demonstrated by his biography, Phil has many years’ experience in different financial roles within the business, which has undoubtedly facilitated a smooth transition in a challenging year. Phil succeeded Russ Houlden, who retired from his executive responsibilities in July 2020.
InvestorsWe are in regular contact with our large investors through a regular scheduled programme of meetings attended by either our CEO or CFO, or both. The programme is supported by the activities of our investor relations team who are readily available to address investors’ queries. I, too, have had the opportunity to engage with a number of our major investors during the year, their feedback was shared with my board colleagues. ESG, and specifically our progress in terms of diversity and inclusion were areas of particular interest. We have sought to respond by better articulation of our ESG activities throughout this annual report, including our efforts toward improving diversity and inclusion both at board level and across the business, and more information can be found on pages 132 and pages 138 respectively.
Sir David HigginsChairman
UK CORPORATE GOVERNANCE CODE
Reporting on the application of principles and against the provisions of the 2018 UK Corporate Governance Code
1 Board leadership and company purpose
See page 117
2 Division of responsibilities
See page 129
3 Composition, succession and evaluation
See page 132
4 Audit, risk and internal control
See page 141
5 Remuneration
See page 162
Stock Code: UU. Annual Report and Financial Statements for the year ended 31 March 2021 117
GO
VER
NA
NC
E

Corporate governance report
Providing great water and more for the North WestThinking about the ‘more’Board members, individually and collectively, are cognisant of their statutory duties as set out in the Companies Act 2006 (the Act). In accordance with section 172 of the Act, directors are individually required to act in the way they consider, in good faith, would most likely be to promote the success of the company for the benefit of its members as a whole. In doing so, the directors must have regard to the likely consequences of any decision in the long term and the interests of, among other matters, employees, customers, suppliers, the community and the environment, and on the company’s reputation. By virtue of the long-term nature of the water and wastewater industry, thinking about our stakeholders is an integral part of our decision-making process and underpinned by our regulatory contract. The board’s 2020/21 S172(1) Statement can be found on page 28.
Incorporating sustainability in our stewardshipHistorically, a board’s success criteria has primarily been judged on the company’s financial performance and while this is still fundamental, boards of companies are now encouraged to adopt a more holistic approach to their stewardship. It is the responsibility of the directors to exercise their judgement, balancing the use of the company’s resources to ensure its sustainable long-term success, and at times, the requirements and criteria for assessing our success by our different stakeholder groups will be in competition. Sustainability is a key component of the way in which we manage our business. We set out on page 32 how we create value for our shareholders and other stakeholders. Our board governance ethos, our culture and the way we operate as a business is to behave responsibly towards all our stakeholders.
Consideration of our AMP7 dividend policy During the year, the board took the time to review the AMP7 Dividend Policy. In light of the extraordinary circumstances, we wanted to ensure we had a better understanding of the impact of COVID-19 on the financial and operational performance of the business and on the impact of the macroeconomic environment. The board consulted investors and advisers to fully understand their expectations and likely market reactions to different scenarios and indeed the implication of the board taking the extra time to formulate its decisions. Taking all factors into account and with a view to the promotion of the long-term sustainable success of the company, the board confirmed the AMP7 dividend policy in the half-year results in November 2020.
• Sets the strategy of the group, ensuring the long-term success of the group for customers, investors and wider stakeholders.
• Is responsible for challenging and encouraging the executive team in its interpretation and implementation of how it manages the business, and that it is doing so in accordance with the strategic goals the board has set.
• Has responsibility for ensuring the company’s internal control systems (including financial, operational and compliance) and processes are sound and fit for purpose (see pages 154 to 155).
• Must ensure that the company has the necessary financial resources
and people with the necessary skills to achieve its objectives. It reviews managerial performance annually.
• Approves appointments to and removal from the board and membership of the committees.
• Applies the principles of the code and reports against the provisions.
• Has oversight of major capital expenditure projects within UUW that exceed £150 million, and any project which materially increases the group’s risk profile or is not in the ordinary course of the group’s business.
Quick linkTerms of reference – unitedutilities. com/corporate-governance
OVERVIEW OF THE BOARD’S RESPONSIBILITIES
Board leadership and company purpose
Principle A:A successful company is led by an effective and entrepreneurial board, whose role is to promote the long-term sustainable success of the company, generating value for shareholders and contributing to wider society.
We set out our application of principle A and provision 1 on pages 118 and 119, our reporting against risk as part of provision 1 on pages 100 to 109. The S172(1) Statement is on page 28.
Principle B:The board should establish the company’s purpose, values and strategy, and satisfy itself that these and its culture are aligned. All directors must act with integrity, lead by example and promote the desired culture.
The board is satisfied it has applied principle B - see page 2. See pages 125 to 126 and 172 for our reporting against provisions 2 and 5.
Principle C:The board should ensure that the necessary resources are in place for the company to meet its objectives and measure performance against them. The board should also establish a framework of prudent and effective controls, which enable risk to be assessed and managed.
Application of principle C to identify the resource within the business is delegated to management, but monitored by the board through the measurement of
performance. See page 137 regarding our succession pipeline, and page 141 for the board’s approach to risk management and internal control.
Principle D:In order for the company to meet its responsibilities to shareholders and stakeholders, the board should ensure effective engagement with, and encourage participation from, these parties.
Engagement of stakeholders fulfilling the application of principle D, and our reporting against provision 3 is set out on pages 127 to 128 in relation to our engagement with shareholders and stakeholders.
Principle E:The board should ensure that workforce policies and practices are consistent with the company’s values and support its long-term sustainable success. The workforce should be able to raise any matters of concern.
Our application of principle E can be demonstrated by our approach to ensuring the safety of our employees during the pandemic (see page 45) and our reporting against provision 6. The board recognises the importance of a two-way flow of communication and the importance of employees having the facilities to raise matters of concern. See page 126 to 127 in relation to engagement with employees for our reporting against provisions 5 and 6.
1
United Utilities Group PLC unitedutilities.com/corporate 118
GOVERNANCE

operations via conference call and other forms of communication. The board would be informed of any material points of learning identified in the post-incident review process, and progress with the implementation of material actions. Our reporting against TCFD can be found on pages 86 to 99.
Working with our regulators – responding responsibly to the ‘green recovery’ in our regionAs a business, we are aware of the importance of our financial contribution to the north west economy. The board was keen to respond to the Government’s green recovery challenge and play our part, by putting forward a programme of work that we believe is achievable and which will not generate an unnecessary risk for the company. Consideration of our green recovery proposal is included in the statement by the directors in performance of their statutory duties in accordance with S172(1) of the Act set out on page 28.
Diversity and inclusion We recognise that we need fantastic people to enable us to deliver a great service now and to ensure the long-term sustainable success of the business. We have to reach and recruit from every part of our community and to support our employees to achieve their full potential and feel valued and included, regardless of their gender, age, race, disability, sexual orientation or
social background. We acknowledge that it will be a challenge to make significant step changes quickly in the workforce with low levels of attrition, regional variations in demographics and difficulties in recruiting females to STEM roles.
Working with a specialist inclusion partner we have updated our employee diversity and inclusion plan to drive our changes. We plan to set targets for the next 12 months based on the implementation of enabling activities before moving to comprehensive representation targets once we have understood our employee data and we will assess our progress with a further maturity audit.
Delivering against our regulatory contractUnder the current regulatory model, we are a monopoly supplier of water and wastewater services to our domestic customers. Simplistically, the opportunities for improving our financial performance are based on outperforming our five-year contract. Underlying this is a complex set of regulatory key performance indicators, including total expenditure (totex) outperformance, the outcome delivery incentive mechanism (ODI), customer measure of experience (C-MeX) and financing expenditure (see pages 50 to 73) which are managed and monitored by the business.
Being a guardian for future generations Environmental issues are high on the list of matters considered by the board. The corporate responsibility committee takes the lead in overseeing management’s development of our climate change mitigation strategy, and reports regularly to the board on the matter. Plans are progressing to drive the group’s transition to a low carbon future by minimising our contribution to global warming through a reduction in our carbon emissions. Carbon has been incorporated as a factor to be considered in:
• our investment appraisal and decision-making processes;
• our land management practices to enhance/improve natural capital
• the innovation that we encourage both within our operations and through working with our partners and suppliers; and
• our implementation of a ‘circular’ mindset.
The board is kept fully informed by management on the impacts of climate change from an operational perspective. Extreme weather events impacting our region and our operations in recent years are increasingly common. When such incidents occur, the CEO keeps board members fully apprised of the impact on
Stock Code: UU. Annual Report and Financial Statements for the year ended 31 March 2021 119
GO
VER
NA
NC
E

Executive teamChair: Steve Mogford, CEO
Group audit and risk boardChair: Steve Mogford, CEO
Quarterly business reviewChair: Steve Mogford, CEO
Principal management committeesPrincipal board committees
Political and regulatory group Chair: Gaynor Kenyon, corporate affairs director
Capital investment committeeChair: Steve Mogford, CEO
Audit committeeChair: Brian May
Remuneration committeeChair: Alison Goligher
Nomination committeeChair: Sir David Higgins
Corporate responsibility committee Chair: Stephen Carter
Treasury committeeChair: Brian May
Read more on
pages 144 to 155
The committee considers and approves borrowing, leasing, bonding and other banking facilities within limits set by the board. The CFO and treasurer are also members. Some powers are sub-delegated, within certain limits, to the CFO and treasurer.
Read more on
pages 160 to 189
Read more on
pages 130 to 140
Read more on
pages 156 to 159
Read more on page 101
This forum is responsible for implementing the board’s strategy and the day-to-day operation of running the business and the CEO will cascade decisions made by the board to the business via this forum.
This forum is responsible for the quarterly review of operational, financial and health and safety performance.
This forum is responsible for discussing political and regulatory issues affecting the company, where any ‘horizon scanning’ issues are raised and business responses to consultations are agreed.
The committee is responsible for authorising expenditure relating to the capital investment programme.
Chief Executive OfficerSteve Mogford
Group boardChair: Sir David Higgins
Key to strategic themes:
In a responsible manner
At the lowest sustainable cost
The best service to customers
Read more on page 125
Corporate governance report
to the board on matters requiring its approval. The reports of the principal board committees required by the code can be found on the subsequent pages. Minutes of the board and principal board committee meetings (with the exception of the remuneration committee) are tabled at board meetings and the chairs of each of the board committees report verbally to the board on their activities. The Chairman chairs the nomination committee; all other principal board committees are chaired by independent non-executive directors who have particular skills or interests in the activities of those committees.
The executive team is chaired by the CEO, and its members are the senior managers who have a direct reporting line to the CEO. Our executive team meets monthly; it is responsible for the day-to-day running of the business and other operational matters
and implementing the strategies that the board has set. Short biographies of the executive team can be found on our website at unitedutilities.com/executive-team. The diagram below shows the principal management committees and a brief description of their roles. These committees are vital to the implementation of the group’s strategic themes. These committees enable senior management to meet to understand, delegate the implementation of appropriate actions, and monitor progress and provide challenge as needs be. The board received reports from the CEO and CFO at every scheduled meeting, providing an updated overview of the business, and its financial and operational performance.
Governance structure for our board and our committees The board has responsibility for establishing the strategy, which is broken down into the three strategic themes. The governance structure encompassing the board, its principal committees and the principal management committees (and set out in the diagram below) contributes to ensuring that the group focuses on its strategic themes.
In line with the code, the board delegates certain roles and responsibilities to its principal board committees. While the board retains overall responsibility, a sub-committee structure allows these committees to probe the subject matters more deeply and gain a greater understanding of the detail. The committees then report back to the board on the matters discussed, decisions taken, and, where appropriate, make recommendations
Governance structure of the board and its principal committees and the principal management committees
United Utilities Group PLC unitedutilities.com/corporate 120
GOVERNANCE

Summary of board activity in 2020/21
Actions OutcomesCross reference
Link to strategic themes
Leadership and employees
Review of health, safety and wellbeing activities and consideration of health and safety incidents of employees and contractors.
Continued focus on the ‘home safe and well’ programme embedding a health and safety culture within the business. Further development and implementation of employee wellbeing policies and activities has been a major focus throughout the year.
See pages 24 and 32
Review of board succession plans. Succession plans for the appointment of two non-executive directors were implemented during the year.
See page 132
Reviewed progress with our aspiration for a diverse and inclusive workforce.
Board kept apprised of programme of work to increase diversity of the workforce and improve inclusivity.
See pages 138 to 140
Reviewed and discussed the results of the annual employee engagement survey and received updates on employee voice workforce engagement mechanisms including the Employee Voice panel chaired by Alison Goligher, the non-executive director designated for engagement with the workforce.
Board kept informed of the activities and insight provided by the Employee Voice panel and links to employee network groups including its contribution to the work on diversity and inclusion and the next ways of working project.
See page 126
Reviewed the company's dashboard of culture metrics and associated analysis.
Monitored and assessed culture and agreed it was aligned with the company's purpose, values and strategy.
See page 125
Strategy
Discussed and reviewed the climate change mitigation strategy and the proposals to set Scope 3 carbon emissions targets.
Approved the setting of Scope 3 carbon emissions targets as part of the group’s commitment to reducing carbon emissions and in accordance with our Climate Change Mitigation Policy.
See page 28
Reviewed the financial implications of the COVID-19 pandemic on the business and the impact on the company’s dividend policy for the 2020–25 asset management period.
Re-affirmed the company’s dividend policy for the 2020–25 asset management period.
See page 28
Received regular updates at each meeting of items with a strategic component, such as emerging changes to regulation, major capital expenditure and business structuring decisions.
Facilitated more informed board discussion and planning.
–
Considered the non-appointed business strategy for the bioresources market for sewage sludge and development of a northern hub and strategy for green energy services.
Agreed an action plan to progress initial steps to develop a northern hub for sewage sludge treatment and reviewed the strategy for green energy services.
–
Held a full day meeting to consider the strategic development of the group and its long term priorities.
In-depth review of the Haweswater Aqueduct Resilience Programme and direct procurement for customers approach, water and wastewater strategy and the 2025–30 price review.
–
Governance
Reviewed and debated the overall risk profile of the group, and in particular the principal risks, emerging risks and risk appetite, including a review of the most significant operational risks.
Endorsed the nature, extent and management of key business risks and endorsed the view that the risk appetite approach and framework remained fit for purpose.
See page 100
Reviewed the risk management systems, including financial, operational and compliance controls and reviewed the effectiveness of the internal control systems.
The risk management and internal control systems were considered to be effective.
See page 141
Stock Code: UU. Annual Report and Financial Statements for the year ended 31 March 2021 121
GO
VER
NA
NC
E

Corporate governance report
Actions OutcomesCross reference
Link to strategic themes
Reviewed and discussed developments in cyber crime.
Approved the activities undertaken to enhance the effectiveness of the group’s security controls.
See page 106
Reviewed the terms of reference for the audit, remuneration, treasury and corporate responsibility committees and received post-meeting reports from the chairs of each committee summarising discussions and actions.
Approved amendments to the terms of reference of the company’s committees as recommended particularly relating to the 2018 code.
–
Reviewed biannual updates on changes and developments in corporate governance.
Matters implemented as considered appropriate. –
Reviewed and discussed the external evaluation of the board, its committees and individual directors and conflicts of interest.
Identified action points and any ongoing training needs.
See page 135
Reviewed the performance of the statutory auditor and recommendation for reappointment at the 2021 AGM.
Accepted the recommendation from the audit committee that KPMG be reappointed at the 2021 AGM.
See page 151
Reviewed the approach and progress of work to identify areas where there is any risk of modern slavery occurring in our supply chain.
Approved the 2021/22 slavery and human trafficking statement.
See page 195
Reviewed the effectiveness of the whistleblowing policies and processes and incidents under investigation and noted the activities within the business to prevent and detect fraud.
Concluded that the whistleblowing policies and processes were effective and noted the activities within the business to protect and detect fraud.
See pages 127 and 155
Considered a reduction in the base remuneration of the Chairman and the executive directors in light of the COVID-19 pandemic.
Agreed to apply a 20 per cent reduction to base fee/salary for the Chairman and executive directors for a 3 month period, with funds to be donated to FareShare.
See page 161
United Utilities Water Limited (UUW) regulated business and its stakeholders
Regular review of the progress of the direct procurement approach and readiness ahead of the expected tender issue date of 2021/22 to replace sections of the Haweswater Aqueduct.
Noted the successful completion in November 2020 of the replacement of the Hallbank section of the Haweswater Aqueduct, as a preliminary stage of the programme.
See page 190
Reviewed customer service performance measures.
In-year customer performance measures monitored against regulatory targets.
See page 57
Considered an approach from Defra to propose to accelerate investment to deliver ‘green’ initiatives that would both benefit the environment and support the economic recovery from the COVID-19 pandemic.
Approved and proposed a plan of work to Ofwat. See page 28
United Utilities Group PLC unitedutilities.com/corporate 122
GOVERNANCE

Actions OutcomesCross reference
Link to strategic themes
Other group business
Considered the offer from the City of Tallinn to dispose of the group’s 35.3 per cent shareholding in AS Tallinna Vesi, the water and wastewater services company serving customers in Tallinn, Estonia.
Approved the disposal of the group’s 35.3 per cent shareholding in AS Tallinna Vesi.
See page 153
Regular review of progress of Water Plus, the group’s joint venture with Severn Trent serving commercial customers.
Approved the restructuring and increase in working capital facilities, aligning with those provided by Severn Trent the joint venture partner, reflecting the challenges to the business relating to the COVID-19 pandemic.
See page 153
Shareholder relations
Received and discussed a presentation by Rothschild Investor Advisory on investors’ views and perceptions of the group in relation to, among other things: strategy; the group’s unique selling proposition; dividend policy; and how the company compares with other listed water and wastewater companies.
Provided the board with an indirect view of investor perceptions.
See page 127
Regularly received and discussed feedback from roadshows, presentations and face-to-face meetings between investors and the Chairman, CEO and/or the CFO and other communications received from large investors.
Provided the board with a direct view of investor perceptions and provided a point of comparison with the indirect approach.
See page 127
Financial
Reviewed the AMP7 dividend policy in light of the uncertainty associated with the COVID-19 pandemic.
After consideration, the board reaffirmed the AMP7 dividend policy, targeting a growth rate of CPIH inflation each year through to 2025 as announced in November 2020.
See page 28
Reviewed the 2020–25 business plan and the 2021/22 budget.
Noted the 2020–25 business plan and approved the 2021/22 budget.
–
Reviewed and approved the half and full-year results and associated announcements and applicable dividend payments.
Approved the half and full-year results and associated announcements and considered and approved the interim and final dividend payments to be paid to shareholders.
–
Reviewed management's proposed going concern and long-term viability statement.
Approved the going concern and long-term viability statement.
See pages 142 to 143
Reviewed tax policies and objectives proposed by management for 2020/21.
Approved tax policies and objectives for 2020/21.
See page 190
Reviewed the annual pensions update. Pensions strategy affirmed and endorsed the preferred methodology for Guaranteed Minimum Pension equalisation.
See page 230
Reviewed the annual treasury update. Approved the treasury policies; the group’s funding requirements for the year and the potential sources to meeting these funding requirements; and managing the group’s interest rate and other market risk exposure.
See pages 79 and 125
Reviewed the annual insurance programme for 2021/22.
Approved the annual insurance programme for 2021/22.
–
Reviewed progress with material litigation involving the group.
Strategy to defend claims robustly affirmed. See page 109
Stock Code: UU. Annual Report and Financial Statements for the year ended 31 March 2021 123
GO
VER
NA
NC
E

Corporate governance report
Boardmeetings1
Auditcommittee
Remunerationcommittee
Nomination committee
Corporateresponsibility
committeeTreasury
committee
Sir David Higgins 8 8 5 5
Steve Mogford 8 8 4 4
Phil Aspin 4 4 2 2
Mark Clare 8 8 5 5 5 5
Stephen Carter 8 8 4 4 5 5 4 4
Kath Cates 4(2) 4 3 3 1 1
Alison Goligher 8 8 5 5 5 5 4 4
Brian May 8 8 4 4 5 5 5 5 3 3
Paulette Rowe 8 8 4 4 4(3) 5
Doug Webb 4(4) 4 4 4 1 1
Russ Houlden 4(5) 4 1(5) 1
Sara Weller 4(6) 4 2(6) 2 4(6) 4
Meetings attended Possible meetings
(1) Actual number of meetings attended/maximum number of scheduled meetings which the directors could have attended during the financial year ended 31 March 2021.
(2) Kath Cates was appointed to the Board on 1 September 2020.
(3) Paulette Rowe was unable to attend one nomination committee meeting due to other commitments.
(4) Doug Webb was appointed to the Board on 1 September 2020.
(5) Russ Houlden stepped down from the board at the AGM in July 2020.
(6) Sara Weller stepped down from the board at the AGM in July 2020.
Attendance at board and committee meetingsEight scheduled board meetings were planned and held during the year (2020: eight). A number of other board meetings and telephone conferences were held during the year, as the need arose. The table below shows the number of scheduled meetings attended and the maximum number of scheduled meetings that the directors could have attended. Only in exceptional circumstances would directors not attend board and committee meetings. Similarly, every effort is made to attend ad hoc meetings either in person or via the use of video or telephone conferencing facilities if needs be. None of our non-executive directors has raised concerns over the time commitment required of them to fulfil their duties. Scheduled meetings are normally held face- to-face, but due to the COVID-19 restrictions, meetings were held remotely via audio or video conference.
On the evening before most scheduled board meetings all the non-executive directors meet either by themselves, or together with just the CEO, or with the entire board and the company secretary, and this time is usefully spent enabling board colleagues to share views and consider issues impacting the company. This year, these informal pre-board meeting sessions have been held virtually, and were felt to be particularly useful for Kath and Doug as part of their familiarisation with the company and provide time for board members to build relationships on a personal level, contributing to better board dynamics and decision-making.
United Utilities Group PLC unitedutilities.com/corporate 124
GOVERNANCE

• treasury delegated authorities, internal controls and governance; and
• reporting to the board on matters relating to the group’s treasury activities, including board approval of the annual treasury update and associated financing plan and board delegated authorities.
During the year, with the board’s endorsement, the committee oversaw the successful execution of a funding programme which raised approximately £900 million of new term funding, with financial market conditions being closely monitored as policymakers responded to prevailing COVID-19 pandemic related uncertainties. This funding programme has positioned the group well with regard to its circa £2.4 billion financing requirement across the AMP7 regulatory period. The committee evaluated the group’s long-term financing strategy beyond the current regulatory period.
The committee reviewed the group’s preparations with regard to the transition of benchmark reference rates from GBP LIBOR to replacement ‘risk free rates’ (with SONIA replacing GBP LIBOR with effect from the end of 2021), and oversaw the group’s management of its interest rate and inflation hedging programmes, including further transitioning the mix of the group’s inflation hedging to CPI and CPIH from RPI-linked.
Following approval by the treasury committee, the group launched its sustainable finance framework in November 2020, and issued its debut sustainable bond in January 2021 (see page 70). Details of the group’s engagement with banks and credit investors can be found on page 128.
Alongside the other committees, the members of the treasury committee undertook a self-evaluation in December
2020. The responses, which were reviewed by Independent Audit Limited, indicated that the committee was effective, and its members had appropriate skills and experience.
Purpose, values and strategyOur purpose is to provide great water and more for the North West. Our vision is to be the best UK water and wastewater company through providing the best service to customers, at the lowest sustainable cost and in a responsible manner. In setting the company’s purpose, the board took into account information and views from stakeholders, utilising much of the research and engagement that contributed to our 2020–25 business plan submission and feedback obtained from customers as part of the company’s brand refresh undertaken during 2019/20. For the year ended 31 March 2021, the board is satisfied that the formulation of our aspirations in terms of our purpose, values and culture have been informed by our stakeholders and we operate our business in such a way that will create long-term value for all.
Our values demonstrate how we behave individually and collectively as the board and how we ask our employees to behave. Our employees are fundamental to delivering our strategy and achieving our purpose. Our values of being customer focused, trustworthy and innovative underpin our culture of behaving as a responsible business in the way we interact with all the stakeholders we serve. We must continually reinforce these values so that the right behaviours cascade throughout the organisation, ensuring our culture of behaving responsibly drives what we do. Key to this is taking action to address any issues where there is
Treasury committeeTreasury management is fundamental to the group’s operating model. In the first instance, the group’s treasury activities are overseen by the treasury committee, which operates under terms of reference and delegated authorities approved by the board.
The chairman of the audit committee, always an independent non-executive director, has historically chaired the treasury committee, given the synergies with the work of the audit committee and the need for financial expertise. Brian May chairs the committee, the other members of the committee are the CFO and the group treasurer, with the company secretary in attendance at committee meetings. Since his appointment, Doug Webb has attended meetings of the committee, with a view to him taking over as chair when Brian steps down from the board in July 2021.
The committee’s work relates to:
• review of the group’s treasury policies in relation to: financing; liquidity; hedging of market risks (interest rates; inflation; currency and electricity hedging); financial counterparty credit risk; credit ratings and capital structure;
• execution of the financing plan and evaluation of funding opportunities;
• liquidity management and review of forecasts;
• execution of hedging transactions and programmes in relation to the management of market risks in accordance with treasury policy parameters;
• developments in relation to the credit ratings agencies;
• creditor investor relations;
• banking relationships;
Dashboard of culture metrics
In addition to the existing reporting, management has developed a dashboard of culture metrics in accordance with the Denison Culture Model, providing a comprehensive overview to support the board in fulfilling its role in monitoring and assessing culture. The dashboard comprises relevant metrics derived from: the annual employee engagement survey; human resources policies in relation to diversity and associated training; whistleblowing reporting; health, safety and wellbeing policies and practices; and other key performance indicators relating to how we behave as a responsible business.
Existing reporting structures for discussion
There are a number of existing reporting structures that allow these cultural indicators to be measured, discussed and challenged by the board and its committees.
Alignment with purpose, values and strategic themes
The board was satisfied that policies, practices and behaviours within the business were aligned with the company’s purpose, values and strategic themes.
1
2
3
Stock Code: UU. Annual Report and Financial Statements for the year ended 31 March 2021 125
GO
VER
NA
NC
E

The board
Employee Voice panel Chair: Alison Goligher (non-executive director)
Employee networks groups:
• Multicultural
• GENEq
• Armed Forces
• LGBT Identity+
• Ability
Employee champion groups:
• Health, safety and wellbeing champions
• Engagement champions
• Colleague engagement group
• Career development forums
Early careers and managers:
• The Early Careers Board
• Aspiring managers
• Apprentices
• Graduates
• Bands 3 and 4 managers
Union partners:
• UNISON • Unite • GMB • Prospect
Corporate governance report
Employee Voice panel
Members of the panel rotate approximately every two years. There is an open invitation to all board members to attend meetings of the panel. When the panel was established, the intention was to hold physical meetings, rotating around different operational and office locations, in order to encourage participation and enable colleagues to get a different perspective on working for the company; and enabling Alison to have first-hand experience of different company sites and gain a view of the company at ‘grass-roots’ level. However, due to the pandemic, all four meetings were held virtually. This did prove to be particularly beneficial to colleagues in operational roles, who found it much easier to attend panel meetings. Terms of reference were agreed when the panel was established along with the way in which the panel would operate. Such mechanisms will be reviewed in due course, particularly in relation to whether meetings will be held virtually.
Sub-groups, made up of panel members, have focused on specific aspects of the business, including cross-networks, culture and the employee engagement survey, providing updates at each meeting. The culture sub-group has focused its energies
on obtaining a grass-roots view of changes to ways of working during the pandemic and contributing to the ‘next ways of working’ project and on the discussion of topical issues relating to culture, such as the focus on racial inequality. As part of the two-way communication, Alison provides updates to the panel from the perspective of the board and the corporate responsibility committee and she similarly provides feedback to the board and the committee on the work of the panel.
Listening to our employeesEmployees’ views are measured annually through the employee engagement survey with the objective of taking any required action to improve how permanent employees feel about the company and understand its direction. Employees are provided with information through briefings and access to online materials, to enable them to understand the financial and economic factors affecting the group’s performance. Along with our employee relations team, our CEO holds regular face-to-face meetings with senior trade union representatives to facilitate two-way communication and engagement with the views of employees’ representatives.
Outcomes from the work since the panel was established to strengthen the ‘employee voice’ in the boardroom include:
• the transfer of the governance of the annual employee survey to the Employee Voice panel. The panel enhanced the underlying anonymity of the survey for employees and provided more opportunities to provide free text comments. Survey questions were updated to reflect key topics, including: wellbeing; inclusivity; and working differently;
• additional administrative and communications resource made available for network groups and executive sponsors identified; and
• panel members sought colleagues’ views to contribute to the ‘next ways of working’ project, the ‘home safe and well’ project and the ‘diversity and inclusion’ audit.
EMPLOYEE VOICE PANEL misalignment with the company’s culture. As well as our engagement survey we run regular employee barometers to ask employees what they are seeing, hearing and feeling. This approach allows us to act quickly if there are any areas of misalignment and take immediate action.
Culture and employee engagementOur employees are at the heart of the culture of our business and further insight and evidence, as part of the board’s assessment and monitoring of culture, has been gathered, and fed back to the board by Alison Goligher, the current designated non-executive director for engagement with the workforce.
Alison chairs the Employee Voice panel (the panel) formed from representatives of a number of employee groups and employee networks from within the business and with representatives drawn from across the geographical region. Alison has met the panel virtually four times throughout the year, it was recognised that the panel needed to meet more frequently during such a challenging period.
United Utilities Group PLC unitedutilities.com/corporate 126
GOVERNANCE

quarterly. The board routinely reviews matters considered by the whistleblowing committee, the outcome of the investigation and the ways in which the matters were brought to a conclusion, thus ensuring that the core value of integrity is upheld and fostering an environment where employees feel it is ‘safe to speak up’ and to do so without fear of reprisal.
Board engagement with shareholders and other stakeholdersThe board as a whole accepts its responsibility for engaging with shareholders and is kept fully informed about information in the marketplace through the following channels:
• The investor relations adviser produces an annual survey of investors’ views and perceptions about United Utilities, the results of which are presented and discussed by the board;
• The board receives regular updates and feedback on investor meetings involving the CEO, CFO and/or investor relations team and reports from sector analysts to ensure that the board maintains an understanding of investors’ priorities; and
• The executive and non-executive directors are available to meet with major shareholders and institutional investors. When revising the directors’ remuneration policy, the chair of the remuneration committee invited engagement from the company’s major shareholders. Feedback from any such engagement would be shared with all board members.
Institutional investorsAs well as current investors, we engage actively with institutional investors who do not currently hold shares in United Utilities, as we are keen to ensure our business is well understood across the investment community, and to hear and discuss the views of all investors.
We have an active investor relations programme, which includes:
• An invitation to major shareholders to meet with the Chairman;
• A regular schedule of meetings between the CEO and CFO and representatives from our major shareholders, supplemented with meetings hosted by our investor relations team;
• Presentations by the CEO and CFO to groups of institutional investors, both on an ad hoc basis and linked to our half and full-year results announcements and at our ‘Capital Markets Days’;
• The programme covers a range of major global financial centres, typically including the UK, Europe, North America and the Asia Pacific region;
• Regular feedback is provided to the board on the views of our institutional investors following these meetings; and
• Close contact is maintained between the investor relations team and a range of City analysts that conduct research on United Utilities.
In 2020/21, all our investor relations activities were conducted virtually. We met or offered to meet with 81 per cent (2019/20: 82 per cent), by value, of the active targetable institutional shareholder base (after adjusting for shareholders who do not typically meet with companies, such as indexed funds).
Frequent areas of common interest arising in meetings with investors include operational and environmental performance, customer service, capital investment, efficiency initiatives, regulatory performance, regulatory changes and ESG matters. Investors are always keen to observe financial stability and are interested in: the level of gearing versus regulatory assumptions; cost of finance; our debt portfolio and debt maturity profile; future financing requirements; and dividends. Investors are keen to understand how the company is performing relative to the price review allowances and targets each year, along with the potential implications of regulatory change.
The group has a commercial arrangement with a third party for the provision of agency staff and contractors. Engagement and communication in relation to their work with the group for these members of the wider workforce is managed directly by the third party via a dedicated third party account manager who liaises directly with the company’s human resources team. If there is any significant change activity, a representative of the third party joins the project team, thereby ensuring consistency when communicating key information to employees, agency staff and contractors.
During the year, a virtual all employee engagement day was held which was very well received by those who attended.
Set out on page 34 is the company’s approach to our engagement with and creating value for employees, with health, safety and well-being a priority. Furthermore, an explanation of the company’s approach to rewarding the workforce can be found in the report of the remuneration committee on page 172.
Whistleblowing policyThe following sets out the company’s compliance with code provision 6.
As part of our two-way communication the board has responsibility for reviewing the group’s arrangements for individuals to raise matters of concern and the arrangements for the investigation of such matters. The group’s whistleblowing policy (the policy) supports the culture within the group where genuine concerns may be reported and investigated without reprisals for whistleblowers. A confidential telephone helpline and a web portal are available to enable employees (including agency workers and contractors) to raise matters of concern in relation to possible incidents of fraud, dishonesty, corruption, theft, security and bribery. Furthermore, employees are encouraged to raise any matters relating to health and safety and any activities of the business that have caused or may cause damage to the environment, such as pollution or other contamination. Both the helpline and web portal are operated by a third party, enabling any concerns to be reported anonymously. The policy states that no employee will be victimised for raising a matter in accordance with the policy. Matters raised with the helpline/portal are in the first instance raised with the relevant director and investigated by senior managers independent of any involvement of the issues being considered. Details of the findings of the investigation and proposed solution are considered by the whistleblowing committee (whose membership comprises the company secretary, customer services and people director, head of internal audit and commercial director) and which meets
During the year the Chairman met virtually with representatives from a number of institutional investors. Common themes from these discussions were as follows:
• encouraged by the group’s early adoption of TCFD disclosures, updates sought on the outcome of science-based target setting to deliver carbon pledges to net zero by 2030;
• making progress on diversity and inclusion within the business
• board succession; and
• comparisons with the group’s listed peers.
INVESTOR DIALOGUE WITH THE CHAIRMAN
Stock Code: UU. Annual Report and Financial Statements for the year ended 31 March 2021 127
GO
VER
NA
NC
E

Corporate governance report
Relations with banks and credit investorsRunning a water and wastewater business, by its very nature, requires a long-term outlook. Our regulatory cycle is based on five-year periods, and we raise funding to build and improve our water and wastewater treatment works and associated network of pipes for each five-year cycle and beyond. We are heavily reliant on successfully raising long-term funding from banks and credit investors to fund our capital investment programme and refinance upcoming debt maturities.
This requires long-term support from our credit investors who invest in the company by making term funding available in return for receiving interest on their investment and repayment of principal on maturity of the loans or bonds. We arrange term debt finance in the debt capital markets (with maturities typically ranging from seven years to up to 50 years at issue). Debt finance is primarily raised via the group’s London listed multi-issuer Euro Medium Term Note Programme, which gives us access to the sterling and euro public bond markets and privately arranged note issues. Committed credit facilities are arranged with our relationship banks on a bilateral basis. Additionally, the European Investment Bank (EIB), which is the financing arm of the European Union (EU), remains a significant lender to United Utilities Water, currently providing around £1.1 billion of loan funding supporting past capital investment programmes.
Given that the UK left the EU on 31 January 2020, we are unlikely to obtain future funding from the EIB under its existing mandate, with our existing loan portfolio with the EIB entering into ‘run-off’ in line with the scheduled maturities of each loan. A greater proportion of the group’s term finance is therefore likely to come from the
debt capital markets, and during the year the group raised a total of £725 million of term funding in the sterling public bond market, including our first sustainable bond of £300 million with a maturity date of October 2029, and paying a coupon of 0.875 per cent. The bond was issued under the group’s sustainable finance framework established in November 2020.
The group currently has gross borrowings of circa £8,452 million. Given the importance of debt funding to our group, we have an active credit investor programme coordinated by our group treasury team, which provides a first point of contact for credit investors’ queries and maintains a dedicated area of the company’s website. One-to-one meetings are held with credit investors through a programme aimed at the major European fund managers known to invest in corporate bonds that may be existing holders of the group’s debt or potential holders. Regular mailings of company information are sent to keep credit investors informed of significant events. The treasury team has regular dialogue with the group’s relationship banks and the EIB and the credit rating agencies. More information can be found on our website at unitedutilities.com/corporate/investors/credit-investors
Rating agency services continue to be provided to the group by Moody’s Investors Service Limited, Fitch Ratings Ltd and S&P Ratings UK Limited under contracts signed at the beginning of 2020 for an initial three-year term. Debt capital markets issuance by the group has therefore been made on a solicited basis by all three rating agencies during the 2020/21 financial year.
Outcome of 2020 AGMAt the 2020 AGM, votes were cast in relation to approximately 69 per cent of the issued share capital (2019: 67 per cent; 2018: 65 per cent). All 18 resolutions proposed by the board were passed by the required majority; there were no significant votes cast against the board’s recommendations.
Votes cast in favour of the reappointment of the board directors were as follows:
Sir David Higgins 98.64% Alison Goligher 98.90%
Steve Mogford 99.84% Brian May 99.03%
Mark Clare 99.03% Paulette Rowe 99.23%
Stephen Carter 99.09%
Retail shareholdersDespite the privatisation process being around 30 years ago, we have retained a large number of individual shareholders with registered addresses in the North West – in fact, over 50 per cent of registered shareholdings on the share register. We have historically held our AGM in our region in Manchester, which enables our more local shareholders, many of whom are customers, to attend the meeting. A resolution is being proposed to shareholders at the 2021 AGM to amend the articles of association to allow for ‘hybrid’ general meetings to be held. There is a considerable amount of information on our website, which provides information on our key social and environmental impacts and performance during the year. Together with the annual and half-yearly results announcements, our annual report and financial statements are also available on our website; these are the principal ways by which we communicate with our retail shareholders. Our company secretariat and investor relations teams, along with our registrar, Equiniti, are on hand to help our retail shareholders with any queries. Information for shareholders can also be found on the inside back cover of this document, with a number of useful website addresses.
Other stakeholdersThe board has direct contact with other stakeholder representatives, including: Ofwat and YourVoice (the independent customer challenge group). The chair of YourVoice regularly attends parts of UUW board meetings to provide an opportunity for discussion, in-depth customer insight and the sharing of views.
Prior to the AGM in 2019, Sara Weller, the then chair of the remuneration committee, consulted with shareholders, in relation to the revised directors’ remuneration policy, which was proposed to shareholders for approval at the 2019 AGM and which was approved by 99.41 per cent of the votes cast.
Engagement with representatives of all our stakeholder groups occurs widely across many aspects of the business, and more information can be found on pages 24 to 26.
Further information on stakeholder engagement can be found in the report of the corporate responsibility committee on page 156 and in the measures reported on pages 52 to 76.
United Utilities Group PLC unitedutilities.com/corporate 128
GOVERNANCE

packs are distributed electronically five days before the meeting. Ensuring board materials are of an appropriate length, on what can be particularly complex and technical issues, is a constant challenge.
Conflicts of interest and time commitmentThe following section sets out the company’s compliance with provision 7.
The company’s articles of association contain provisions which permit unconflicted directors to authorise conflict situations. Each director is required to notify the Chairman of any potential conflict or potential new appointment or directorship. Additionally, the board reviews the position of each director annually. No changes were recorded that would impact the independence of any of the directors. No conflicts of interest had arisen during the year.
The board does not specify the precise time commitment it requires from its non-executive directors in taking on the role as they are expected to fulfil it and manage their diaries accordingly. The board is content that none of its directors is overcommitted and unable to fulfil their responsibilities as a board director for United Utilities. Each individual’s circumstances are different, as is their ability to take on the responsibilities of a non-executive directorship role. Should a director be unable to attend meetings on a regular basis, not be preparing appropriately or not contributing appropriately to board discussions, the Chairman would be responsible for discussing the matter with them and agreeing a course of action.
During the year, permission was sought from the board to take on additional non-executive responsibilities by: Brian May appointed as a non-executive director at Ferguson plc; Mark Clare appointed as a non-executive director and chairman designate at Aggreko plc and as a non-executive director of Wickes Group plc; Alison Goligher as a non-executive director of Technip Energies NV and Kath Cates as a non-executive director of TP ICAP Group Plc.
Executive directors are not normally allowed to take on more than one non-executive position, a non-executive role is considered to be beneficial from a developmental perspective. In March 2021, although not a statutory directorship, Phil Aspin accepted a position on the UK Accounting Standards Endorsement Board (UKEB).
Chairman of the boardThe role and behaviour of the Chairman is fundamental to the effective operation and decision-making of the board and in creating an atmosphere where open and frank discussion is facilitated and encouraged. The roles and responsibilities of the Chairman are set out as part of the company’s governance framework. Sir David was independent on appointment when assessed against the circumstances set out in provision 10 of the code.
It is the role of the Chairman, supported by the company secretary, to drive forward the business agenda of board meetings to ensure that the board is kept abreast of the regulatory drivers and strategic needs of the business.
It is the role of the Chairman, supported by the company secretary, to ensure that the directors receive accurate, timely and clear information. The Chairman and company secretary hold regular meetings to discuss agenda items and board materials. Board
Division of responsibilities
2Principle F:The chair leads the board and is responsible for its overall effectiveness in directing the company. They should demonstrate objective judgement throughout their tenure and promote a culture of openness and debate. In addition, the chair facilitates constructive board relations and the effective contribution of all non-executive directors, and ensure that directors receive accurate, timely and clear information.The external board evaluation (see page 135) tested and confirmed the Chairman’s application of principle F. Sir David was independent on appointment when assessed against the circumstances set out in provision 10, his biography is on page 112.
Principle G:The board should include an appropriate combination of executive and non-executive (and, in particular, independent non-executive) directors, such that no one individual or small group of individuals dominates the board’s decision-making. There should be a clear division of responsibilities between the leadership of the board and the executive leadership of the company’s business. The external board evaluation (see page 135) tested and confirmed the application of principle G, concluding that the skills and experience of executive and independent non-executives were appropriate with the board working together as a cohesive unit, but maintaining the clear division of responsibility between the board and the
executive management team. See pages 112 to 115 for our reporting against provision 10; and the governance structure of the board and its principal committees on page 120.
Principle H:Non-executive directors should have sufficient time to meet their board responsibilities. They should provide constructive challenge, strategic guidance, offer specialist advice and hold management to account.As part of the annual review of conflicts of interest, the board was satisfied that, after taking into account the other commitments of directors, board members have sufficient time to meet their board responsibilities and principle H had been applied (see page 129). The board demonstrated constructive challenge and offered strategic guidance and advice to management in relation to the review of the AMP7 dividend policy (see page 28), and the appropriate time period applicable to the company’s long-term viability statement (see page 142).
Principle I:The board, supported by the company secretary, should ensure that it has the policies, processes, information, time and resources it needs in order to function effectively and efficiently. The external board evaluation tested and confirmed the application of principle I, the views of board members was sought on whether the necessary support and information was provided effectively and efficiently, see page 135.
Stock Code: UU. Annual Report and Financial Statements for the year ended 31 March 2021 129
GO
VER
NA
NC
E

Corporate governance reportNomination committee
• All members of the committee are independent, thus fulfilling the code requirement that a ‘majority of members of the nomination committee should be independent non-executive directors’. On joining the board, all independent non-executive directors become members of the nomination committee.
• The role of the committee is to lead the process for appointments to the board and ensure plans are in place for orderly succession to both the board and senior management positions and oversee a diverse pipeline for succession.
• The company secretary attends all meetings of the committee.
• The customer services and people director has responsibility for human resources, she regularly attends meetings and is responsible for engaging with executive search recruitment advisers.
• The CEO is not a member of the committee, but from time to time is invited to attend. Neither the Chairman nor the CEO would participate in the recruitment of their own successor.
Quick linkTerms of reference – unitedutilities. com/corporate-governance
Nomination committee members
Sir David Higgins (chair)
Brian May Paulette Rowe Stephen Carter
Mark Clare Alison Goligher Kath Cates Doug Webb
QUICK FACTS
The committee’s board recruitment process is continuous and proactive, it takes into account the factors affecting the long-term success of the group and its strategic priorities.
Dear ShareholderBoard changes during the year are summarised on page 117, suffice to say it has been a year of considerable change around the board table. We endeavoured to ensure a smooth induction (see page 134), albeit virtually, for our new independent non-executive colleagues Kath Cates and Doug Webb, both of whom joined the board in September 2020.
The nomination committee has undertaken a comprehensive review of the board succession plan, which addresses both contingency planning needs and requirements in the short to medium term, and incorporates a reasonable degree of certainty on timescales for key board
positions. The committee’s role is to ensure that the board and senior management have the appropriate balance of skills and experience to support the group’s strategic objectives and that any developmental needs are met. Board members and senior managers need to be in tune with the culture of the company and be supportive of the company’s ESG credentials which are embedded in the way the business is operated and will be ever more important.
Historically, independent non-executive directors at United Utilities have served a term of between seven and nine years; a pattern that has facilitated the refreshing of the board in recent years almost on an annual basis, along with ensuring a high degree of continuity. Notwithstanding this, the specifics of each of the non-executive directors’ time of departure have been driven by their own personal circumstances. Serving beyond a nine-year term is identified in the code as being one of the reasons that could affect a non-executive director’s independence. For this reason, we say a fond farewell to Brian May, the chair of audit committee, at the annual general meeting. In accordance with our succession plans, Brian will be succeeded in this important board position by Doug Webb, whom the board is satisfied as having recent and relevant financial expertise. Two-thirds of board members are independent non-executive directors, fulfilling provisions 10 and 11 of the code. Biographies of board directors can be found on pages 112 to 115.
Diversity and inclusion is high on the board agenda with the board’s focus on the matter both across the entire workforce, and in terms of the board’s own members. The board diversity policy (see page 133) is taken into account during every candidate selection process. Ultimately, we do strive to appoint the person we believe is best matched to the role in terms of what they have to offer the company and to make a positive contribution to the board conversation and board dynamics. Diversity in its broadest sense and in terms of outlook and interest is essential to ensuring we have a variety of views to contribute to discussions and the decision-making process. The board is committed to ethnic diversity, and its membership is in line with the board diversity policy, reflecting the recommendations of the Parker Review Committee, that there should be at least one director of non-white ethnicity by 2021.
The annual board and committee evaluation (see page 135) was externally facilitated in December 2020/January 2021 by Independent Audit Limited.
Sir David HigginsChair of the nomination committee
United Utilities Group PLC unitedutilities.com/corporate 130
GOVERNANCE

Diversity and inclusion is high on the board agenda, with the board’s focus on the matter both across the entire workforce, and in terms of the board’s own members.
During the year, Steve has re-shaped his executive management team to better reflect the needs of the business going forward and to provide key senior managers with new opportunities for challenge and development. The board is satisfied that this will contribute to the strength and quality of the senior management succession pipeline, as has management’s response to the pandemic, quickly evolving from the ‘new normal’ to ‘business as usual’. The board has good visibility and communication links with senior management, indeed this is one of the contributing factors to the board’s confidence in its management team. Excluding the CEO and CFO, there are now eight members of the executive team (2020:13) of which 50 per cent are women. Short biographies can be found on our website at unitedutilities.com/executive-team. While the executive team reflects strong gender diversity, there is a way to go to achieve our aspirations for ethnic diversity.
Sir David HigginsChair of the nomination committee
• Lead the process for board appointments and make recommendations to the board about filling vacancies on the board, including the company secretary;
• Consider the succession planning of directors and members of the executive team;
• Make recommendations to the board on refreshing the membership of the board’s principal committees;
• Review directors’ conflict authorisations;
• Consider the request from executive directors for election to the boards of other companies and make a recommendation to the board; and
• Consider requests from non-executive directors for election to the boards of other companies; this role has been delegated to the Chairman (other than in respect of his own requests).
MAIN RESPONSIBILITIES
Directors’ tenure as at 31 March 2021
Age and gender profile at 31 March 2021
Phil Aspin
Steve Mogford
Sir David Higgins
31 M
arch
20
11
31 M
arch
20
12
31 M
arch
20
13
31 M
arch
20
14
31 M
arch
20
15
31 M
arch
20
16
31 M
arch
20
17
31 M
arch
20
18
31 M
arch
20
19
31 M
arch
20
20
31 M
arch
20
21
31 M
arch
20
10
Alison Goligher
Brian May
Paulette Rowe
Kath Cates 7m
Stephen Carter 6yrs 7m
Mark Clare 7yrs 5m
8yrs 7m
4yrs 8m
3yrs 8m
Doug Webb 7m
1 yr 10m
10yrs 3m
9m
53–5630%
Chairman
Male Female
Executive director
Senior independent non-executive director
Independent non-executive director
57–6040%
61–6630%
Stock Code: UU. Annual Report and Financial Statements for the year ended 31 March 2021 131
GO
VER
NA
NC
E

Corporate governance reportNomination committee
What has been on the committee’s agenda during the year?Board successionIn line with the board succession plan, and the approximate timescales therein, the process of the appointment of Kath Cates was undertaken to fill the vacancy when Sara Weller stepped down from the board at the end of the 2020 AGM. Doug Webb was recruited with the knowledge that Brian May was approaching nine years’ service on the board. The committee is supported during any recruitment process by the customer services and people director, Louise Beardmore, as part of her human resources responsibilities. The executive search firm Lygon Group were engaged as part of the recruitment process.
The succession planning matrix tool and skills matrix (see opposite) for board directors is used to support the planning process for board appointments. The succession planning matrix highlights the code governance requirements; existing directors’ terms of appointment and a forecast/anticipated time frame when an individual might leave the business; the projected strategic needs of the business and resulting preferred experience of any potential new board member; existing potential internal successors to a role (where identified) and those who could act as an interim should the need arise. A candidate suitable for the role of CEO would need to demonstrate that their management approach would fit with the company’s culture of behaving responsibly.
The committee would seek to consult with the incumbent CEO, given his unique knowledge and perspective of the group, on his view of the needs of the business going forward. Neither the Chairman nor the CEO would be involved in the appointment process of their successor.
Other than providing executive search services on previous occasions Lygon Group have no other connection with the company.
Membership of the principal board committeesAlison Goligher took over the role as chair of the remuneration committee when Sara Weller left the board in July 2020, Alison had served as a member of the committee since 2016 and chairs the remuneration committee at Meggitt plc. On appointment, Kath Cates joined the remuneration committee, bringing her experience from her existing non-executive appointments. Doug Webb was appointed with a view to taking over as chair of the audit committee and treasury committee when Brian steps down at the conclusion of the 2021 AGM, at which point Doug will also replace Brian on the remuneration committee.
The board is satisfied that the membership of the audit committee is in accordance with provision 24, and that the membership of the remuneration committee is in accordance with provision 32.
Board diversityThe board diversity policy is to ‘ensure the selection process for board appointments provides access to a range of candidates. Any appointments will be made on the basis of merit and objective criteria, and within this context, should promote diversity of gender, social and ethnic backgrounds, cognitive and personal strengths, but with due regard for the benefits of diversity on the board, including gender diversity.’ The objective of the policy is for new directors to bring something different to the board table, be it in terms of experience, skills, perspective, interests or other attributes. As referred to above, our board diversity policy would be brought to the attention of any executive search firm used as part of the selection and appointment process for a board position. Feedback would be sought from the search firm in terms of their success in attracting potential candidates in terms of their diversity of attributes. Feedback would also be gathered first hand through the interview process with candidates conducted by other board members and taken into consideration in identifying those suitable for the role in question. As a board, the benefits of diversity and associated benefits to the decision-making process
Principle J:Appointments to the board should be subject to a formal, rigorous and transparent procedure, and an effective succession plan should be maintained for board and senior management. Both appointments and succession plans should be based on merit and objective criteria and, within this context, should promote diversity of gender, social and ethnic backgrounds, cognitive and personal strengths.
The board is satisfied it has applied principle J. An explanation of the board appointment and succession planning activities can be found on page 132 and forms our disclosure as part of provision 23. Our disclosure against provision 20 is on page 132. In relation to provision 23, our policy on board diversity is on page 133 and details of the gender balance of senior management on page 137. Information on the company’s approach to diversity and inclusion is set out on pages 138 to 140.
Principle K:The board and its committees should have a combination of skills, experience and knowledge. Consideration should be given to the length of service of the board as a whole and membership regularly refreshed.
The board is satisfied it has applied principle K. Biographies of the board can be found on pages 112 to 115. An overview of directors’ areas of expertise is set out in the skills matrix on page 133 and the length of service of board members on page 131. Board biographies include our reporting against provision 18.
Principle L:Annual evaluation of the board should consider its composition, diversity and how effectively members work together to achieve objectives. Individual evaluation should demonstrate whether each director continues to contribute effectively.
The board is satisfied it has applied principle L. Details of the board evaluation and disclosure against provision 23 can be found on pages 116 and 135.
Composition, succession and evaluation
3
United Utilities Group PLC unitedutilities.com/corporate 132
GOVERNANCE

is widely recognised and has been the subject of discussion with major investors. When Brian May steps down from the board at the annual general meeting, the measurable targets of 33 per cent female representation on the board and one director of non-white ethnicity will be met. On the board at 31 March 2021, female representation was 30 per cent and BAME was representation 10 per cent. Amongst the workforce BAME representation was 2.5 per cent (15 per cent choose not to disclose) and 9.2 per cent* (*Office for National Statistics, Regional Ethnic Diversity, August 2020) as a comparator, across our region. We recognise the benefits of diversity across our business with initiatives in place to support women in the workplace and tackle the ethnic imbalance of our workforce, thereby aligning with our strategic theme of operating our business in a responsible manner (see page 17).
Summary of board diversity policy• Ensure the selection process for
board appointments provides access to a range of candidates. Any such appointments will be made on the basis of merit and objective criteria, and within this context should promote diversity of gender, social and ethnic backgrounds, cognitive and personal strengths.
• Ensure that the policies adopted by the group will promote diversity in the broadest sense among senior managers who will in turn aspire to a board position.
• In selecting candidates for board positions, only use the services of executive search firms who have signed up to the voluntary code of conduct for executive search firms as recommended by the Davies Report.
• Adopt measurable objectives from time to time for achieving gender diversity at board level, which shall be to maintain at least 25 per cent, and aspire to 33 per cent, female representation by 2020, and to have at least one director of non-white ethnicity by 2021.
SUMMARY
Skills matrix of board directors Sir David
HigginsSteve
MogfordPhil
AspinMark Clare
StephenCarter
Kath Cates
Alison Goligher
Brian May
Paulette Rowe
Doug Webb
Finance/accounting
Utilities
Regulation
Government
Construction/ engineering
Industrial
Customer-facing
FTSE companies
Digital/Technology
ESG
Current CEO/CFO of FTSE 350 *
Former CEO/CFO of FTSE 350
* Excludes UU
Stock Code: UU. Annual Report and Financial Statements for the year ended 31 March 2021 133
GO
VER
NA
NC
E

Corporate governance reportNomination committee
Non-executive directors’ induction programmeSince joining the board in September 2020, Kath Cates and Doug Webb have spent time (both virtually and face-to-face as was permitted from time to time) with members of the executive team and met with representatives from the company’s advisers as follows:
• The CFO and members of the finance function and gained external perspective from the group’s statutory auditor, KPMG. Met representatives from JPM Cazenove and Deutsche Bank, the group’s corporate brokers;
• The water, wastewater and digital services director to gain an understanding of the company’s operations and digital monitoring and control of the group’s water and wastewater network and assets and insight into the group’s IT systems;
• The company secretary to gain an understanding of the group’s corporate structure, governance arrangements
and associated processes and met with Slaughter and May, the group’s legal adviser, to receive an external perspective on governance and best practice;
• The commercial, engineering and capital delivery director to gain an understanding of the group’s capital delivery programme and insight into the Haweswater Aqueduct Resilience Programme;
• The customer services and people director to discuss the actions undertaken by the business to improve service to customers and the group’s employee agenda and the director of health, safety and wellbeing;
• The strategy and regulation director and the director of environment, planning and innovation to discuss the requirements of the economic and quality regulators; and
• The corporate affairs director to gain an understanding of the group’s engagement with political stakeholders.
CFO transition programme Phil Aspin had extensive finance experience within the group prior to his appointment as CFO, having previously been both group controller and group treasurer. To support his transition to his new role he has taken part in a programme of activities, including:
• Investor relations: met with Rothschild & Co the group’s investor relations adviser and received a briefing on equity investor themes and perceptions;
• Corporate brokers: met with JPM Cazenove and Deutsche Bank and received a briefing on equity markets:
• Legal advisers: met with Slaughter and May and received an in-depth review of directors’ responsibilities and corporate governance requirements;
• Media and communications advisers: received media training provided by Tulchan Communications; and
• Participated in a CFO transition programme provided by Deloitte.
United Utilities Group PLC unitedutilities.com/corporate 134
GOVERNANCE

Evaluation of the effectiveness of the board, board committees and individual directorsOur board evaluation was conducted by Independent Audit Limited (IAL) who were engaged after a competitive tender process; this was the first review undertaken by IAL. Bids were received from six bidders. The tender process was conducted by the company secretary, head of legal and deputy secretary. Prior to this, an external evaluation was last conducted in 2018. In the intervening years the evaluation was facilitated by the company secretary and his team. IAL does not have any other connection with the group. IAL reviewed the accuracy of the content set out in relation to their work.
A summary of IAL’s 2020/21 review of responses to the board self-assessment questionnaire is set out below:
2020/21 areas of assessment Commentary and actions
Overview IAL found the responses to be, on the whole, very positive. They recommended that the board should continually challenge itself to ensure it maintained consistency in the areas that were felt to be working particularly well. The review of responses identified a broad mix of skills, experience, personalities and diversity in the board composition which should continue to be an aspiration for future board appointments.
Board fundamentals The review of responses indicated board members felt there was an appropriate mix of skills and experience with members drawn from a diverse range of backgrounds. The mix of personalities helped to encourage diversity of thinking. There was a constructive relationship between the non-executive directors and the executive directors and management team, of which there was good visibility at board level.
Strategy Responses indicated there was a clear understanding of the strategic goals for the core business and with good visibility of both short and long-term strategy, although it was felt that a better understanding of the sustainable aspects of strategy was needed. Oversight of the financial performance of the business was felt to be good. Greater visibility of the people skills, characteristics and diversity for the future needs of the business was an area to be addressed along with that of enhancing the oversight of culture.
Managing risk Responses indicated that risk was considered to be well managed and the board had a clear overview of the principal risks. More opportunity for the discussion of IT risk was cited along with other emerging risks.
Support and information Respondents felt meetings were well chaired and the board arrangements and administration provided by the company secretary and his team were effective. On the whole, papers were considered to be well structured, although better signposting of key issues on more complex topics would be helpful.
Committees • Overview: responses suggest that committees were well chaired and supported. Agendas were focused and members were provided with appropriate information. Members had the right skills to debate issues and provide challenge to management.
• Audit committee: questionnaire responses indicated that members agreed that the reporting environment was satisfactory and oversight of internal and external audit was appropriate. Some respondents indicated the need for better insight on how the key risk and control functions operated together.
• Remuneration committee: questionnaire responses indicated that the committee was working well and the focus of the committee’s agenda was appropriate. The committee should consider the employee’s perspective on how remuneration and wider policies align with the values and impact on culture.
• Nomination committee: respondents agreed there to be a good level of debate and discussion. A revised skills planning matrix was developed during the year which would aid future non-executive succession planning. It was suggested that the executive succession pipeline would benefit from a more structured approach.
• Corporate responsibility committee: given the broad range of ESG activities, respondents felt the committee should focus on the areas where it could add greater value to the debate and more feedback should be sought from the board on the committee’s activities.
Individual directors IAL reviewed the responses from the questionnaires completed by each director assessing their own effectiveness and that of the evaluation of the Chairman. The meeting witnessed by IAL observed good interaction and participation by directors, supporting the view from directors and the board that each director continues to contribute effectively.
Stock Code: UU. Annual Report and Financial Statements for the year ended 31 March 2021 135
GO
VER
NA
NC
E

Corporate governance reportNomination committee
Ongoing board development and trainingBoard directors regularly receive updates to improve their understanding and knowledge about the business and, in particular, its regulatory environment. As part of the individual director’s element of the board evaluation exercise, directors are asked to identify any skills or knowledge gaps they would like to address. Directors made a number of suggestions, as set out above.
Consideration of ESG issues are fundamental to the way in which we operate as a responsible business at United Utilities; such matters are central to board discussions (see the summary of board activity on pages 121 to 123 and the report of the corporate responsibility committee on pages 156 to 159). The board’s approach to these matters is reflected in our strategic themes, and our corporate culture of behaving in a responsible manner as reflected throughout the strategic report. Through presentations and discussions with representatives of YourVoice, the independent customer challenge group, whose role is predicated on protecting customer interests in how the group goes about its business, the board is kept informed of customer, in-region environmental affairs and social matters.
In addition to this less formal approach to board development, during the year the board received briefings from both Slaughter and May (legal and governance matters) and KPMG (governance changes relating to reporting requirements), along with a number of other advisers. Non-executive directors completed in-house online training courses on the Competition Act and the Bribery Act. A number of board members attended events organised by Ofwat for non-executive directors.
Our non-executive directors are conscious of the need to keep themselves properly briefed and informed about current issues and to deepen their understanding of the
2019/20 evaluation recommendations Actions taken during 2020/21
More focus was needed on longer term business priorities such as climate change, technology and innovation, resilience and people development.
In addition to the strategy day held in November 2020, the board have received a number of ‘deep dive’ sessions on topics including: leakage, digital strategy, people, diversity and inclusion and ‘next ways of working’.
Nomination committee: continuing the focus on succession planning for executive and non-executive board positions.
During the year nomination committee conducted selection processes for two new non-executive directors, appointing Kath Cates and Doug Webb.
Audit committee: the authors of committee papers to focus on the key issues to be brought to the attention of the committee, particularly in relation to the risk management systems and controls.
Audit committee papers have focused on key issues, with greater use of appendices for the explanation of detail.
Corporate responsibility committee: the priorities over the next 18 months should be identified.
The corporate responsibility committee has reviewed and focused the matters within its remit.
Part 1A brief for the board effectiveness evaluation was first discussed between the Chairman and the company secretary. Thereafter a further session was held with IAL who drafted self-assessment questionnaires, which were then shared with the Chairman, committee chairs and company secretary for feedback. Final versions were then issued to board members and the regular committee attendees via IAL’s bespoke online platform, Thinking Board®, in December 2020. The respondents’ views were analysed and the reports shared with the Chairman, committee chairs and company secretary and then formally presented at the February 2021 board meeting and respective committee meetings. IAL attended the board strategy day held virtually in November 2020 to observe the board in action. They reviewed the papers for the strategy day along with a more standard set of board papers to assess the quality of materials being provided to the board.
Part 2The evaluation of the effectiveness of individual directors followed in January 2021. Following discussion with the Chairman and company secretary, IAL drafted questionnaires to enable individual director self-assessment. The senior independent director (SID) agreed the form of the questionnaire to assess the effectiveness of the Chairman and a copy of the questionnaire was shared with the Chairman. Questionnaires were again distributed via IAL’s online platform, Thinking Board®, and the results analysed by IAL. A report based on responses to the questionnaire on the effectiveness of the Chairman was sent to the SID, who then discussed the outcome with the other non-executive directors and provided feedback to the Chairman. IAL’s report based on the responses from the individual directors was provided to the Chairman who subsequently provided feedback to each of the individual directors.
EXTERNALLY FACILITATED SELF-ASSESSMENT EVALUATION PROCESS
United Utilities Group PLC unitedutilities.com/corporate 136
GOVERNANCE

on a non-executive directorship role as part of their personal development, but it is recognised that this is very much a personal commitment for each individual. Along with the wider employee population, we continue to work towards improving the diversity of our succession pipeline as part of our ongoing diversity and inclusion plans.
Fifty per cent of our executive team (excluding the CEO and CFO) is made up of women, and as yet there is no ethnic diversity among the team. The gender balance of the direct reports of the executive team is 65 per cent male and 35 per cent female, BAME representation is 1.5 per cent. We are keen to develop our succession pipeline of female senior managers so that, over time, they can be considered for executive board appointments or as potential candidates for non-executive directorships in other companies. Our current talent programme at a senior level is well embedded and we believe a non-executive appointment for senior managers provides an excellent
business. During the year, Alison Goligher has again chaired the Employee Voice panel as part of the ongoing work to ensure the board has a direct link to understand the views of employees (see page 126) of the business. Paulette Rowe has contributed to the work on diversity and inclusion (see page 138).
Induction of new non-executive directors An induction programme is arranged for new non-executive directors. The programme for Kath Cates and Doug Webb is set out on page 134. In addition, virtual one-to-one meetings with the Chairman and each of the existing non-executive directors were held. Furthermore, one-to-one meetings were held with the CEO. Ordinarily, on joining the board, non-executive directors would meet members of the operational teams and visit some of the key operational sites and capital projects to ensure they get a first-hand understanding of the water and wastewater business. New directors receive a briefing on the key duties of being a director of a regulated water company, including the role of the regulated company’s holding company. They are required to meet with representatives of Ofwat prior to appointment.
Wider succession pipeline and talent managementFor a number of years, we have had a written succession plan for our executive directors and other members of the executive team, which includes outline timescales. The plan identifies an interim internal successor to fill a role in the short term should the need arise, and the longer-term development needs of potential successors to be able to fulfil a role on a more permanent basis. As with all our board appointments, we would always aim to appoint the best person to fulfil a role. It would be common, when recruiting for a senior role, for an external search to be conducted alongside an internal candidate recruitment process.
Any changes that are required to the profile of the management team to reflect the changing needs of the business are considered by the board in the executive succession plan. Succession and development initiatives for senior executives include executive mentoring and coaching and/or participating in an executive business school programme, as appropriate. Leadership development centres have been delivered to identify and validate potential for future director and senior leader positions and develop a number of role-ready diverse candidates to provide the group with leadership capacity in an increasingly complex environment. Senior managers are encouraged to take
opportunity for both personal and career development. It is a way of gaining valuable experience that may be applied at United Utilities so long as no conflicts of interest occur. Our graduate and apprentice programmes are thriving and we are focusing more effectively on middle/junior management succession. Our gender pay data can be found on page 139. Historically, our industry has been male dominated, but we have measures in place to increase diversity in broad terms, including gender among our employees. During the year, board directors have a number of opportunities to meet with members of the executive team, both formally when senior managers are required to present at board meetings on matters related to their responsibilities, and on more informal occasions. From time to time, board members have the opportunity to attend events and meet with members of the apprentice and graduate population and other employees identified as potential talent within the business.
Stock Code: UU. Annual Report and Financial Statements for the year ended 31 March 2021 137
GO
VER
NA
NC
E

Corporate governance reportNomination committee
• Increasing awareness of diversity and inclusion through education, debate and discussion; and
• Facilitating inclusion through encouraging and supporting our active employee networks.
Louise Beardmore, our customer services and people director, sponsors the overall diversity and inclusion plan and tracks its progress against activity-based targets with the executive team. A further maturity audit will be completed in the next 12 months to independently assess progress and inform representation targets.
In 2021 we were the highest placed water company for our diversity efforts in the Diversity Leaders ranking.
EthnicityWith 2.5 per cent of our workforce identifying as BAME (15 per cent choose not to disclose ethnicity), attracting a future pipeline of talent from across multi-cultural backgrounds remains a priority.
In the North West where we operate, BAME representation is 9.2 per cent* (*Office for National Statistics, Regional Ethnic Diversity, August 2020) and there is considerable variability area by area. Fifty-five per cent of permanent roles recruited during 2020/21 were at our biggest employment hub in Warrington in Cheshire, where BAME representation in the area is 2.7 per cent.
Diversity and inclusion in 2020/21 What have we done to improve diversity and inclusion in 2020/21We are committed to providing a diverse and inclusive workforce that is representative of the communities we serve. Our stakeholders would expect this and it is more relevant than ever before. We need fantastic people to enable us to deliver a great public service now and into the future, so we are determined to make sure we are reaching and recruiting from every community and supporting employees to achieve their full potential and feel valued and included.
Our inclusion plan Working with a specialist inclusion partner, The Clear Company, we have focused our approach in 2020/21 on five key programmes:
• Leadership development, ensuring managers understand and embrace our inclusion strategy;
• Encouraging openness to enable us to understand more about our employees to improve the support and services we offer to them;
• Enhancing our processes and policies to attract and develop diverse talent and remove bias throughout our employee population;
In 2020, we trialled a bespoke approach as part of our apprentice campaign with a specialist diversity recruitment provider. By ring fencing a number of the roles, we were able to target under-represented groups and successfully increase the 2020 intake to include 18 per cent ethnic minority, a 12 per cent increase since the 2019 programme. We adapted our selection processes for this year’s graduate programme and increased ethnic minority representation to 21 per cent, a 15 per cent increase since 2019.
We have become a patron member of the BAME Apprentice Alliance and have an active Multicultural Network which supports colleagues and educates the wider workforce on cultural differences by providing insight and stories from a range of cultural backgrounds.
Gender Throughout 2020/21, our workforce profile remained quite static at 66 per cent male and 34 per cent female. This is primarily driven by the limited number of females with the relevant skills available in the market and the legacy of a traditional male-orientated bias in science, technology, engineering and maths (STEM) careers. Women made up circa 24 per cent of the UK workforce employed in core STEM- related jobs in 2020 (WISE campaign summary of Office for National Statistics Labour Force Survey Data).
We have focused on creating a strong pipeline of female candidates for future roles, forming strategic recruitment partnerships to source external talent alongside a range of internal programmes. A new Female Pipeline Talent programme was launched in 2020, supporting progression through cross-company mentoring schemes and targeted future progression. We actively encourage all employees to join our award-winning GENEq gender equality network which continues to provide insight, education and support for female colleagues.
Against a backdrop of low attrition levels, variable geographical demographics and male-orientated STEM roles, we have seen progress with our targeted diversity and inclusion approach:
• In the last year around 42 per cent of all promotions were achieved by women and 60 per cent of our senior leader external hires were female.
• Our Aspiring Manager Programme continues to support female progression with 71 per cent of female participants being promoted or moved to a new role.
United Utilities Group PLC unitedutilities.com/corporate 138
GOVERNANCE

• Our graduate intake for 2020 was 64 per cent female, a 25 per cent increase since 2019.
• Our apprentice programme has seen 31 per cent females joining us, an 18 per cent increase compared to 2019. This is against a backdrop of females accounting for only 7 per cent of apprentices in the UK engineering, manufacturing and technology sector (Institute for Apprenticeships and Technical Education).
We have been recognised externally and named on Bloomberg’s 2021 Gender Quality Index, an accepted standard for gender quality transparency. In 2020, United Utilities was named as finalists in both the Northern Power Women Awards and in the ‘Women in Water’ category at the Water Industry Awards.
Gender pay reportingSince our reporting began in 2017, our median gender pay gap is lower than the national average. In 2020, the national median gender pay gap was 15.5 per cent (ONS, November 2020). Our median gender pay gap has increased slightly since our last report in 2019. This is mainly because we needed to recruit people for a number of operational roles that receive extra payments due to the nature of their working patterns and, at the moment, it is mainly men working in these roles.
We are pleased to report that our mean gender pay gap has reduced. This is partly due to changes in the organisation, which have meant we have had more women progressing into senior roles and more men in lower-paid roles.
Having challenged our thinking and assessed ourselves against external practices, we are confident that action we are already taking or have planned should result in us being able to reduce our gender pay gap in a way that can be maintained.
LGBT+Our LGBT+ network, Identity+ with over 350 members provides a social and support network for LGBT+ staff and those who are LGBT+ friendly. Its work has continued throughout the pandemic to support virtual events both in the company and externally, including celebrating Pride Month in June 2020.
We are pleased to have partnered with The Proud Trust, a north west-based LGBT+ youth charity. We have sponsored a group youth workers to work with LGBT+ young people in Oldham, a ‘cold spot’ as
defined by the social mobility index. We have funded LGBT+ inclusive educational resources, linked to the English national curriculum.
In 2020, over 200 people participated in Pride in the Workplace training, to help break down barriers and improve confidence to talk about LGBT+ in the workplace. We remain committed to being a Stonewall Diversity Champion. Stonewall are supporting us with a review of our people policies to ensure they are progressive and reflective of societal changes.
DisabilityOur ability network with over 100 members aims to support employees with, or those who support people with, a disability or long-term health conditions. Having gained Disability Confident status, we have
15.3%
13.8%
15.3%
15.9%
2020
2019
2018
2017
0% 5% 10% 15% 20%
14.4%
15.7%
16.3%
17.2%
2020
2019
2018
2017
0% 5% 10% 15% 20%
10.7%
11.3%
13.2%
13.1%
2020
2019
2018
2017
0% 5% 10% 15% 20%
32.4%
38%
36.5%
35.1%
2020
2019
2018
2017
15% 20% 30%25% 35% 40%
Our median gender pay gap over time
Our median gender bonus gap over time
Proportion of women and men receiving a bonusFemale Male
94.7% 93.2%
Note: To be eligible for our bonus scheme, employees need to have completed a minimum level of service. This means that some people who start working for us during the year may not be eligible.
Our mean gender pay gap over time
Our mean gender bonus gap over time
Stock Code: UU. Annual Report and Financial Statements for the year ended 31 March 2021 139
GO
VER
NA
NC
E

Corporate governance reportNomination committee
continued to offer guaranteed interviews and make reasonable adjustments for people who are registered with a disability and we are seeing the positive impact of this with 4 per cent of our 2020 apprentice group having a long-term health condition or a disability.
We have continued to deliver disability awareness training to our people managers and were proud to be finalists at the 2020 Recruitment Industry Disability Initiative awards.
Young peopleResearch indicates that there continues to be significantly fewer females than males studying STEM subjects in secondary schools and universities, which means that females continue to be under-represented in jobs requiring such skills.
In 2020, we sponsored the first STEM Centre of Excellence of its kind at one of our partner schools in Warrington. We provide a range of activities at schools and in our communities to inspire girls to study STEM subjects. Our 50 STEM ambassadors
have together volunteered over 100 hours this year. We are working in partnership with Northern Power Futures, supporting school students across our region, with a specific focus on women.
We have committed to supporting the Government’s Kickstart Scheme by providing 250 placements to young unemployed people in 2021. We have welcomed our first cohort of new recruits into their placements and our supply chain partners are supporting us in our aim to provide opportunities for young people.
Read more about Kickstarting careers in the North West on page 54.
Social mobilityIn 2020, we hosted our first Social Mobility Summit with over 150 employers from the North West. We are keen to play our part, alongside other north west businesses, organisations and agencies, in tackling the challenge of social mobility, contributing to boosting opportunities and social mobility as part of our national recovery.
We invited Rt Hon Justine Greening, founder of the Social Mobility Pledge, to co-host a live virtual event with Louise Beardmore, which officially launched our Opportunity Action Plan – the first of its kind in the North West.
We continue to play our part in driving improvements sector-wide, with partners and external stakeholders. We are active members of the Energy and Utility skills diversity and inclusion forum and have signed the sector pledge. As a member of Water UK, we have led on the creation of a water sector apprenticeship scheme that aims to raise awareness of the sector as an employer and are leading in raising awareness of the importance of social mobility inside and outside of the industry. In 2020, our targeted approach for increasing diversity resulted in 49 per cent of our apprentices coming from areas of low social mobility.
United Utilities Group PLC unitedutilities.com/corporate 140
GOVERNANCE

Financial oversight responsibilities of the board
Principle M:The board should establish formal and transparent policies and procedures to ensure the independence and effectiveness of internal and external audit functions and satisfy itself on the integrity of financial and narrative statements.
Our application of principle M is formalised in our non-audit services policy and terms of engagement with the auditor as agreed by the committee. The head of internal audit and risk reports to the committee and to the CFO but only on a functional basis, thereby ensuring a direct line of communication between internal audit and the committee. In accordance with provision 25, an explanation of the independence and effectiveness of the external audit process can be found on pages 149 to 150, and the reappointment of the statutory auditor on page 151. The board considered and was satisfied on the integrity of the financial and narrative statements, as advised by the audit committee in accordance with DTR 7.1.3(5).
Principle N:The board should present a fair, balanced and understandable assessment of the company’s position and prospects.
We have applied principle N, as confirmed by our disclosure against provision 27, which can be found on page 196 and is supported by our disclosure against provision 25 on page 149.
Principle O:The board should establish procedures to manage risk, oversee the internal control framework, and determine the nature and extent of the principal risks the company is willing to take in order to achieve its long-term strategic objectives.
Our risk management framework and principal risks are on pages 100 to 107. Further information on the company’s internal audit function and controls can be found on pages 154 to 155 and together set out our application of principle O.
Board’s responsibility for financial oversightOne of the fundamental roles of the board is to oversee the financial performance of the business. The board is supported in this role by the audit committee whose activities are described on pages 144 to 154. The board reviews the financial performance of the company at every scheduled board meeting, receiving a report from the CFO which provides the board with the up-to- date position of the consolidated financial statements, interpretative analysis and other key performance indicators, metrics and ratios. The board takes into account the review by the audit committee of the financial and narrative statements, and the auditor’s views on the key risks and judgements identified and given particular focus in their audit work and set out in their report (see page 200), and the information and explanations provided by management in relation to their key judgements and adjustments to APMs. The board considered the review and assurance process undertaken by management, and considered by the audit committee to support the application of principle N. The board concluded that in the 2020/21 annual report and financial statements it has presented a fair, balanced and understandable assessment of the company’s position and prospects, and the board was satisfied on the integrity of the financial and narrative statements. Furthermore, the board approved the accounts and provision of the directors’ responsibility statement at its meeting on 26 May 2021, see page 196.
Oversight of financial aspects of ESG ESG, and behaving responsibly, has been a long-term commitment and part of the board ethos for many years and is embedded in everything we do. It naturally flows through into our approach to the integrity of our financial reporting. Recognising that climate change is a key risk to our provision of water and wastewater services (see page 104), 2020/21 is the second year that we have reported against TCFD. As part of the processes supporting the provision of the ‘fair, balanced and understandable’ statement, we took into account the existing processes of review and assurance of our TCFD and wider narrative reporting (see above). We intend to further review the assurance processes of ESG matters, particularly those relating to TCFD reporting, ahead of the mandatory reporting requirement which will apply to our 31 March 2022 annual report.
Board’s approach to risk management and internal control The board discharges its responsibility for determining the nature and extent of the risks that it is willing to take to achieve its strategic objectives through the risk appetite framework. As a key part of the risk management framework, risk appetite captures the board’s desire to take and manage risk relative to the company’s obligations, stakeholder interests and the capacity and capability of our key resources.
The board is responsible for ensuring that the company’s risk management and internal control systems are effectively managed across the business and that they receive an appropriate level of scrutiny and board time.
The group’s risks predominantly reflect those of all regulated water and wastewater companies. These generally relate to the failing of regulatory performance targets or failing to fulfil our obligations in any five-year planning cycle, potentially leading to the imposition of fines and penalties, in addition to reputational damage. Climate change is a risk that underpins our core operations and provision of water and wastewater services to customers (see page 104).
Review of the effectiveness of the risk management and internal control systemsDuring the year, the board reviewed the effectiveness of the risk management systems and internal control systems, including financial, operational and compliance controls. Taking into account the principal risks and uncertainties set out on pages 100 to 107, the ongoing work of the audit committee in monitoring the risk management and internal control systems (see pages 154 and 155) on behalf of the board, (and to whom the committee provides regular updates), the board:
• is satisfied that it has carried out a robust assessment of the emerging and principal risks facing the company, including those that would threaten its business model, future performance, solvency or liquidity; and
• has reviewed the effectiveness of the risk management and internal control systems, including all material financial, operational and compliance controls (including those relating to the financial reporting process) and no significant failings or weaknesses were identified.
After review, the board concluded that through a combination of the work of the board, the audit committee and the UUW board (which has particular responsibility for operational and compliance controls), the company’s risk management and internal controls were indeed effectively monitored throughout the year.
Audit, risk and internal control
4
Stock Code: UU. Annual Report and Financial Statements for the year ended 31 March 2021 141
GO
VER
NA
NC
E

Corporate governance reportFinancial oversight responsibilities of the board
management processes and structures used to monitor and manage them. Biannually, the board receives a report detailing management’s assessment of the most significant risks facing the company. The report gives an indication of the level of exposure, subject to the mitigating controls in place, for the risk profile of the group, while also highlighting the reputational and customer service impact. This provides the board with information in two categories: group-wide business risks; and wholesale operational risks. The board also receives information during the year from the treasury committee (to which the board has delegated matters of a treasury nature see page 125) including such matters as liquidity policy, the group’s capital funding requirements and interest rate management.
Long-term viability statementThe directors have assessed the viability of the group, taking account of the group’s current position, the potential impact of the principal risks facing the business in severe but reasonable scenarios, and the effectiveness of any mitigating actions. This assessment has been performed in the context of the group’s prospects as considered over the longer term. Based on this viability assessment, the directors have a reasonable expectation that the group will be able to continue in operation and meet its liabilities as they fall due over the seven year period to March 2028.
Basis of assessmentThis viability statement is based on the fundamental assumption that the current regulatory and statutory framework does not substantively change. The long-term planning detailed on page 48 assesses the group’s prospects and establishes its strategy over a 25-year time horizon consistent with its rolling 25-year licence and its published long-term strategy. This provides a framework for the group’s strategic planning process, and is key to achieving the group’s aim of providing the best service to customers at the lowest sustainable price and in a responsible manner over the longer term, underpinning our business model set out on pages 30 to 46.
In order to achieve this aim and promote the sustainability and resilience of the business, due consideration is given to the management of risks over the long term that could impact on the business model, future performance, credit ratings, solvency and liquidity of the group. Specifically, risks associated with the possible ongoing impact of the COVID-19 pandemic and climate change have been incorporated into the baseline position and factored into the various scenarios modelled as part of the group’s assessment. An overview of our risk management approach that supports the group’s long-term planning and prospects, together with the principal risks and uncertainties facing the business, can be found on pages 104 to 107.
The board’s review of the effectiveness of risk management and internal control systems took into account the:
• biannual review of significant risks and emerging risks (see pages 104 to 107 and 109);
• assurance (both internal and external) of the most significant business and operational risks of the group;
• review of matters correlating to specific event based operational risks (see page 108);
• outcome of the biannual business unit risk assessment process (see page 154);
• activities and review of the effectiveness of the internal audit function (see page 154);
• opinion provided by internal audit in relation to their work, that ‘the governance, risk management and internal control framework was suitably designed and effectively applied within the areas under review’;
• self-assessment provided by management confirmed compliance with a range of key internal policies, processes and controls (see page 155);
• review of reports from the group audit and risk board (see page 101);
• oversight of treasury matters, in particular debt financing and interest rate management (see page 125); and
• review of the business risk management framework and management’s approach and tolerance towards risk (see page 100).
Going concern and long-term viability The following section sets out the company’s compliance with part of provisions 30 and 31.
The board, following the review by the audit committee, concluded that it was appropriate to adopt the going concern basis of accounting (see page 214). Similarly, in accordance with the principles of the code, the board concluded, following the recommendation from the audit committee, that it was appropriate to provide the long-term viability statement based on an assessment period of seven years. Assurance supporting these statements was provided by the review of: the group’s key financial measures and contingent liabilities; the key credit financial ratios; and the group’s liquidity and ongoing ability to meet its financial covenants. As part of the assurance process, the board also took into account the principal risks and uncertainties facing the company, and the actions taken to mitigate those risks, and include emerging and more topical risks.
These principal risks and uncertainties are detailed on pages 104 to 107, as are the risk
Within the context of this long-term planning and management of risks, the group’s principal business operates within five year regulatory price control cycles. Medium-term planning considers the current price control period, over which there is typically a high degree of certainty, and looks beyond this in order to facilitate smooth transitions between price control periods. This results in the board concluding a recurring period of seven years to be an appropriate period over which to perform a robust assessment of the group’s long-term viability.
Viability assessment: resilience of the groupThe viability assessment is based upon the group’s medium-term business planning process, which sits within the overarching strategic planning process and considers:
• The group’s current liquidity position – with £1.3 billion of available liquidity at March 2021 providing a significant buffer to absorb short-term cash flow impacts;
• The group’s robust capital solvency and credit rating positions – with a debt to regulatory capital value (RCV) ratio of circa 62 per cent, a robust pension position and current credit ratings of A3/BBB+/A- with Moody’s, S&P and Fitch respectively, this provides considerable headroom supporting access to medium-term liquidity where required;
• The group’s expected performance, underpinned by its historical track-record; and
• The current regulatory framework within which the group operates – which provides a high degree of cash flow certainty over the regulatory period and the broader regulatory protections outlined below.
The group has a proven track-record of being able to raise new finance in most market conditions, and expects to continue to do so into the future. This is despite the group no longer having access to future EIB funding following the UK’s exit from the EU.
From a regulatory perspective, the group benefits from a rolling 25-year licence and a regulatory regime in which regulators – including the economic regulator, Ofwat – are required to have regard to the principles of best regulatory practice. These include that regulation should be carried out in a way that is transparent, accountable, proportionate, consistent and targeted. Ofwat’s primary duties provide that it should protect consumers’ interests, by promoting effective competition wherever appropriate; secure that the company properly carries out its statutory functions; secure that the company can finance the proper carrying out of these functions – in particular through securing
United Utilities Group PLC unitedutilities.com/corporate 142
GOVERNANCE

the group to date, and is not considered to represent a significant risk to the group’s ongoing viability.
The scenarios considered are underpinned by the group’s established risk management processes, taking into account those risks with a greater than 10 per cent (1 in 10) cumulative likelihood of occurrence. The risks associated with COVID-19 are reflected within the baseline position, with further potential downside risks (most notably in relation to bad debt and low inflation) covered by the individual scenarios modelled, and collectively within a combined scenario.
The assessment has considered the impact of these scenarios on the group’s business model, future performance, credit ratings, solvency and liquidity over the course of the viability assessment period. This assessment has demonstrated the group’s ability to absorb the impact of all severe but reasonable scenarios modelled, without the need to rely on the key mitigating actions detailed below.
As part of the assessment, reverse stress testing of two extreme theoretical scenarios focusing on totex overspend and persisting low inflation have been performed to understand the extent to which the group could further absorb financial stress before it reaches a sub-investment grade credit rating. This reverse stress testing demonstrated that these extreme conditions would have to be significantly outside what would be considered ‘severe but reasonable’ scenarios before the group’s long-term viability would be at risk.
reasonable returns on capital; and secure that water and wastewater supply systems have long term resilience and that the company takes steps to meet long-term demands for water supplies and wastewater services.
In addition, from an economic perspective, given the market structure of water and wastewater services, threats to the group’s viability from risks such as reduced market share, substitution of services and reduced demand are low compared to those faced by many other industries.
Viability assessment: resilience to principal risks facing the businessThe directors have assessed the group’s viability based on the resilience of the group and its ability to absorb a number of ‘severe but reasonable’ scenarios, derived from the principal risks facing the group, as set out on pages 104 to 107. The baseline plan against which the viability assessment has been performed incorporates the estimated ongoing impact COVID-19 based on experience to date. This baseline plan is then subject to further stress scenarios and reverse stress testing that takes into account the potential impact of group’s principal risks. Such risks include: environmental risks such as the occurrence of extreme weather events and other impacts of climate change, further details of which are included in the group’s TCFD disclosures on pages 86 to 99; political and regulatory risks; the risk of critical asset failure; significant cyber security breaches; longer term economic impacts resulting from COVID-19, including unemployment and corporate failures affecting debt collection and lower inflation affecting revenues, financing costs and RCV; and the potential for a restriction to the availability of financing resulting from a capital markets crisis. The UK’s withdrawal from the EU and the ending of the transition period has not had a material adverse operational or financial impact on
Viability assessment: key mitigating actionsIn the event of more extreme but low likelihood scenarios occurring, there are a number of key mitigations available to the group, the effectiveness of which are underpinned by the strength of the group’s capital solvency position.
As well as the protections that exist from the regulatory environment within which the group operates, a number of actions are available to mitigate more severe scenarios, which include: the raising of new finance, including hybrid debt; capital programme deferral; reduction in other discretionary totex spend; the close-out of derivative asset positions; the restriction of dividend payments; and access to additional equity.
GovernanceThe analysis underpinning this assessment has been through a robust internal review process, which has included scrutiny and challenge from the audit committee and board, and has been reviewed by the group’s external auditor, KPMG, as part of their normal audit procedures.
Going concernThe directors also considered it appropriate to prepare the financial statements on the going concern basis, as explained in the basis of preparation note to the accounts.
Stock Code: UU. Annual Report and Financial Statements for the year ended 31 March 2021 143
GO
VER
NA
NC
E

Corporate governance reportAudit committee
• Brian May has chaired the committee since July 2013. He is a chartered accountant and is considered by the board to have recent and relevant financial experience, having served as finance director of a FTSE 100 company, from which he retired in February 2020.
• All members of the committee are independent non-executive directors and the board is satisfied that the committee as a whole has competence relevant to the sector. Attendance at audit committee meetings is set out on page 124, and the relevant directors’ biographies can be found on pages 112 to 115.
• Other regular attendees at meetings at the invitation of the committee include the CEO, the
CFO, the company secretary, the head of audit and risk, the group controller, and representatives from the statutory auditor, KPMG LLP (KPMG). None of these attendees are members of the committee.
• The representatives from KPMG and the head of audit and risk each have time with the committee and the company secretary to raise freely any concerns they may have without management being present.
• The committee is authorised to seek outside legal or other independent professional advice as it sees fit, but has not done so during the year.
Quick linkTerms of reference – unitedutilities. com/corporate-governance
Audit committee members
Brian May (chair) Stephen Carter Paulette Rowe Doug Webb
QUICK FACTS
The audit committee is responsible for discharging governance responsibilities in respect of audit, risk and internal control, and reports to the board on these matters.
Dear ShareholderIn my report this year I have sought to provide shareholders with an understanding of the work we have done as the audit committee to provide assurance on the integrity of the annual report and financial statements for the year ended 31 March 2021. Much of the work of the committee is necessarily targeted at the regulated activities of UUW, which represent over 98 per cent of group revenues and is a reflection of our commitment to safeguarding the interests of our stakeholders, particularly our shareholders and customers.
The timing of the pandemic has meant that both the 2020 and 2021 year end audits have been conducted under lockdown rules. Working practices of the group’s financial reporting team and those of KPMG audit team have been adapted, reflecting the lessons learnt from the 2020 audit which was undertaken in the early stages of the pandemic. In addition, through the last year certain changes to internal controls were necessary, reflecting the move to home working, due to the practical difficulties of obtaining
wet signatures as the usual evidence of approval. Changes were implemented by the treasury, commercial and property teams. Such changes, and the effectiveness thereof, were reviewed by, and agreed with, the internal audit team.
Management made a number of changes to its alternative performance measures (APMs) to better enable comparability with other companies, rather than reflect the nuances of the regulatory model. The committee concurred with the changes, and in particular that there should be no adjustments to underlying profit relating to COVID-19 at 31 March 2021, recognising that, for the group, operating in the COVID-19 environment had become business as usual. A guide to APMs can be found on page 82.
The group’s purpose is to ‘provide great water and more for the North West’. The committee’s contribution to achieving the purpose is to ensure that the interests of shareholders and other stakeholders are properly protected by overseeing the group’s financial reporting and internal control arrangements. The committee uses its collective expertise, with input from the auditor, to provide challenge to the approach and judgements made by management in the treatment of financial matters and the resulting disclosures within the company’s financial statements. Transparency and openness are fundamental to the relationship between management and the committee, something which is reinforced through the cultural framework within which the business operates, with being trustworthy one of our core values.
As articulated in the code, ‘the board should present a fair, balanced and understandable assessment of the company’s position and prospects’. The board asks the audit committee to advise on whether in fact ‘the annual report and accounts, taken as a whole, is fair balanced and understandable and provides the information necessary for shareholders to assess the company’s position and performance, business model and strategy’.
The committee chose to retain KPMG as auditor following the competitive tender process conducted in December 2019, as reported in the 2019/20 report. The primary factor for the committee in retaining the services of KPMG, was that, in the committee’s view, it offered a more compelling case for the provision of a high-quality audit than the other candidates participating in the tender. As set out on page 151, the group has tendered and changed the auditor on a number of occasions since the
Brian MayChair of the audit
committee
United Utilities Group PLC unitedutilities.com/corporate 144
GOVERNANCE

Transparency and openness are fundamental to the relationship between management and the committee, something which is reinforced through the cultural framework within which the business operates
group was originally formed in 1989. 2020/21 has been KPMG’s tenth year in office. Ian Griffiths was appointed as the new audit engagement partner for the 2020/21 audit.
As part of the committee’s review of the performance and recommendation on reappointment of auditor, it took into account the annual review published in July 2020 by the Financial Reporting Council’s (FRC’s) Audit Quality Review Team. The findings, based on a sample of 88 audits from across the seven largest UK firms, reported that ‘firms are still not consistently achieving the necessary level of audit quality’. The committee challenged KPMG on the FRC’s findings and also reviewed whether the quality improvement proposals outlined to the committee had indeed been implemented in the 2019/20 audit. Following the committee’s review of the effectiveness of the 2019/20 audit process, additional proposals were put forward as part of the 2020/21 audit scope (see page 149).
Auditor independence is a key principle, and contributing factor to audit quality. It is reviewed as part of the audit scope and re-examined prior to the accounts being approved and signed by the board. The auditor must be independent of the company. It is the committee’s responsibility to ensure that the three-way relationship between the committee, the auditor and the company’s management is appropriate and there is no undue influence by any of the parties on the other, thereby ensuring the integrity of the audit process and the annual report and financial statements. Independence is a key focus for the auditor, whose staff must comply with their firm’s own ethics and independence criteria which must be consistent with the FRC’s Revised Ethical Standard (2019). Information on how the committee assesses the independence of the auditor can be found on page 150. The statutory auditor presents its audit findings to the shareholders as the owners of the business (see page 200).
The committee has responsibility for ensuring that the group’s policy on non-audit services reflects the FRC’s Revised Ethical Standard (2019) whereby the only non-audit services that a statutory auditor is permitted to provide to a public interest entity are those required by law or regulation, loan covenant reporting, other assurance services closely linked to the audit and/or reporting accountant services. Assurance on this matter is provided by the auditor.
In summary, the committee concluded that the statutory audit process and services provided by KPMG for 2019/20 were satisfactory and effective.
We continue to be committed to providing meaningful disclosure of the committee’s activities and ensuring the committee’s agenda is kept abreast of relevant developments. The committee will await the outcome of the BEIS consultation on ‘Restoring trust in audit and corporate governance’ and we expect to contribute to the consultation process. We are fully
committed to ensuring that the group’s audit and governance arrangements reflect best practice and address any new requirements within the expected time frames.
Following review of our 31 March 2020 accounts by the FRC (see page 152), we have enhanced a number of disclosures in our financial statements.
There is an element of overlap between our statutory and regulatory reporting. Engaging the same auditor improves efficiency. It contributes to the integrity of the narrative reporting statements, with the auditor reviewing them in accordance with ISA720 (see page 149). Furthermore, the committee has been provided with greater visibility of the assurance of the non-financial information in the annual report.
The details of the external evaluation of the committee’s performance can be found on page 135.
I would like to extend my thanks to my committee colleagues for their work and support during my last year as chair of the committee. Doug Webb will take over the role at the conclusion of the annual general meeting in July 2021. Doug joined the committee on his appointment in September 2020, and at the beginning of the 2021 financial reporting cycle. He has considerable recent and relevant financial experience both as a former FTSE 100 CFO and through his other non-executive appointments. The skills matrix on page 133 summarises the experience of the committee’s members.
This report was approved by the committee at its meeting held on 19 May 2021.
Brian MayChairman of the audit committee
• Make a recommendation to the board for the appointment or reappointment of the auditor, and to be responsible for the tender of the audit from time to time and to agree the fees paid to the auditor.
• Establish policies for the provision of any non-audit services by the auditor.
• Review the scope and the results of the annual audit and report to the board on the effectiveness of the audit process and how the independence and objectivity of the auditor has been safeguarded.
• Review the half-year and annual financial statements and any announcements relating to financial performance, including reporting to the board on the significant issues considered by the committee in relation to the financial statements and how these were addressed.
• Review the scope, remit and effectiveness of the internal audit function and the group’s internal control and risk management systems.
• Review the group’s procedures for reporting fraud and other inappropriate behaviour and to receive reports relating thereto.
• Report to the board on how it has discharged its responsibilities.
• Apply the principles of the code and report against the provisions.
MAIN RESPONSIBILITIES
Stock Code: UU. Annual Report and Financial Statements for the year ended 31 March 2021 145
GO
VER
NA
NC
E

Corporate governance reportAudit committee
What has been on the committee’s agenda during the year?The committee has an extensive agenda of items of business focusing on the audit, assurance and risk processes within the business which it deals with in conjunction with senior management, the auditor, the internal audit function and the financial reporting team. The committee’s role is to ensure that management’s disclosures reflect the supporting detail provided to the committee or challenge them to explain
and justify their interpretation and, if necessary, re-present the information. The committee reports its findings and makes recommendations to the board accordingly. The committee is supported in this role by using the expertise of the statutory auditor, who, in the course of the audit, considers whether the financial statements have been prepared in accordance with IFRS and whether adequate accounting records have been kept. In doing so it ensures that high standards of financial governance, in
line with the regulatory framework as well as market practice for audit committees going forward, are maintained. Furthermore, the company’s own internal audit team contributes to the assurance process by reviewing compliance with internal processes. The committee’s financial reporting cycle, which starts each year in September, is shown below. There were four meetings of the committee held during the year. Items of business considered by the committee are set out on pages 147 to 148.
Audit committee financial reporting cycle
• Management presents their key
accounting issues and judgements for
approval by committee and recommendation to board
• Auditor presents the findings of the audit and their auditor’s report and provides confirmation of their independence
• Committee makes a recommendation to the board on whether the annual report and financial statements are fair, balanced and understandable and on the reappointment of the auditor at the AGM
• Management presents the half-year financial
statements
• Auditor presents the review of half-year
financial statements
• Auditor confirms their independence
• Management presents their proposed key accounting issues and judgements
at the full year
• Auditor provides an update on their audit processes and confirmation
of their independence
• Review of the effectiveness of the external process
• Auditor presents their audit strategy for forthcoming year
• Committee agrees the audit fee for the forthcoming year
September N
ovember
May
Audit committee: principal statutory reporting matters
March
United Utilities Group PLC unitedutilities.com/corporate 146
GOVERNANCE

Actions Outcomes Cross reference
Annual and half-year reporting
Reviewed and discussed the reports from the financial reporting team on the financial statements, considered management’s significant accounting judgements, and the policies being applied both at the full and half year and how the statutory audit contributed to the integrity of the year end financial reporting.
The committee challenged management on a number of its judgements and sought detailed explanations of its interpretation. The committee was satisfied with the explanations provided by management. Recommendations were made to the board, supporting the approval of the half and full-year accounts and financial statements.
See pages 152 to 153
Reviewed the regulatory reporting process relating to the annual performance report for UUW as required to be submitted to Ofwat and noted the differences between the regulatory and statutory accounts.
Contribution to the assurance of the regulatory reporting to the UUW board.
–
Assessed management’s revision of APMs to better enable comparability with other companies rather than reflecting the nuances of the regulatory model and adjustments to underlying profit.
Concurred with management’s revised approach, and the recognition that, for the group, operational and financial performance in the COVID-19 environment had become business as usual.
See page 82
Reviewed the proposed audit strategy for the 2020/21 statutory audit, including the level of materiality applied by KPMG, audit reports from KPMG on the financial statements and the areas of particular focus for the 2020/21 audit.
Monitoring progress made by the statutory audit team against the agreed plan, and considered issues as they arose.
See page 200
Reviewed the basis of preparation of the financial statements as a going concern as set out in the accounting policies.
Recommendation made to the board to support the going concern statement.
See page 214
Reviewed the long-term viability statement proposed by management and reasons for retaining a seven-year period.
The committee challenged management on the length of the period, particularly in light of time periods provided by peer companies, but were satisfied with management’s preference to provide a statement with greater certainty over a shorter period of time.
See page 142
Reviewed the accounting treatment of the refinancing of Water Plus, the group’s joint venture with Severn Trent.
Considered KPMG’s view and concurred with management’s approach.
See page 153
Reviewed the results of the committee’s assessment of the effectiveness of the 2019/20 audit.
The committee concluded that the audit was effective and a recommendation was made to the board on the reappointment of KPMG as the auditor for the year ending 31 March 2022 at the forthcoming annual general meeting.
See page 149
Reviewed whether the company’s position and prospects as presented in the 31 March 2021 annual report and financial statements were considered to be a fair, balanced and understandable assessment of the company’s position and prospects.
Recommendation made to the board that the 31 March 2021 annual report and financial statements was a fair, balanced and understandable assessment of the company’s position and prospects.
See pages 141 and 149
Reviewed the non-audit services and related fees provided by the auditor for 2020/21 and the policy on non-audit services provided by the auditor for 2021/22.
Approved the non-audit services and related fees provided by KPMG for 2020/21 and concluded that no changes were required to the policy for non-audit services provided by the auditor.
See page 150
Negotiated and agreed the statutory audit fee for the year ended 31 March 2021 and agreed additional fee for 2019/20 reflecting increased audit work due to COVID-19.
2019/20 statutory audit fee paid as agreed by the committee. The committee approved the fees for the 2020/21 audit, including an additional fee in respect of the 2019/20 audit relating to COVID-19 audit work that are reported as part of the 2020/21 fee.
See pages 150 to 151
Reviewed the assurance processes supporting certain aspects of the TCFD and ESG sections in the narrative reporting in the 2020/21 annual report.
The committee concluded that the assurance processes supporting the narrative reporting in the annual report were satisfactory.
See page 149
Stock Code: UU. Annual Report and Financial Statements for the year ended 31 March 2021 147
GO
VER
NA
NC
E

Corporate governance reportAudit committee
Actions Outcomes Cross reference
Risk management and internal control
Received a deep dive into the risk management process and reviewed the effectiveness of the risk management and internal control systems.
Recommendation made to the board that the risk management and internal control systems were effective.
See pages 154 to 155
Considered changes to internal control arrangements brought to the attention of the committee by KPMG
Tasked management to resolve any issues relating to internal controls and risk management systems.
See page 200
Monitored fraud reporting. Reviewed the company’s anti-fraud policies and processes and alleged incidents of fraud and the outcome of their investigation.
See page 155
Biannual oversight and monitoring of the group’s compliance with the Bribery Act.
Reviewed compliance with the company’s ongoing anti-bribery programme.
See page 155
Approved the strategic internal audit planning approach and reviewed reports on the work of the internal audit function from the head of audit and risk.
Monitored the implementation of the 2020/21 internal audit plan. Reviewed findings of specific internal audit and implementation of any resulting actions by management.
See page 154
Considered the issues and findings brought to the committee’s attention by the internal audit team.
The committee was satisfied that management had resolved or was in the process of resolving any outstanding issues or concerns in relation to matters scrutinised by the internal audit team.
See page 154
Reviewed the quality and effectiveness of internal audit and the effectiveness of the current co-source arrangements.
The committee reviewed the process of assessment of internal audit and made recommendations for enhancement, notwithstanding the recommendations it was concluded that the internal audit team, supported by the PwC co-source resource was effective.
See page 154
Reviewed the strategic internal audit planning approach and internal audit plan for 2021/22.
Approved the internal audit plan for 2021/22. See page 154
Undertook a competitive tender process for the internal audit co-source resource.
After analysis of the results of the competitive tender process PwC were reappointed to provide additional resource to the internal audit team.
See page 155
Governance
Review of the committee’s terms of reference No changes were made to the committee’s terms of reference during the year.
Considered the Brydon and Kingman Reviews and established processes to consider the BEIS consultation report ‘Restoring trust in audit and corporate governance’.
Process in place to consider our draft response and next steps in relation to the BEIS consultation.
Reviewed the conclusions of the committee’s annual evaluation. The evaluation was externally facilitated by Independent Audit Limited (IAL). The review explored the effectiveness of: the fundamental reporting environment; the work of the auditor and their audit approach; and the work of internal audit along with the level of understanding of the risk management process.
All elements of the self-assessment reviewed by IAL indicated the committee was working well. The board considered the results of the review of the committee and concluded that the committee continued to be effective.
See page 135
United Utilities Group PLC unitedutilities.com/corporate 148
GOVERNANCE

How we assessed whether ‘the annual report and accounts, taken as a whole, is fair, balanced and understandable and provides the information necessary for shareholders to assess the company’s position and performance, business model and strategy’
The following section sets out the company’s compliance with part of provision 25. The directors’ responsibility for preparing the annual report and financial statements is set out on page 196.
The board delegates to the committee, in the first instance, the review of the annual report and financial statements with the intention of providing advice to the board on whether, as required by the code, ‘the annual report and accounts, taken as a whole, is fair, balanced and understandable and provides the information necessary for shareholders to assess the company’s position and performance, business model and strategy’.
To make this assessment, the committee received copies of the annual report and financial statements to review during the drafting process to ensure that the key messages being followed in the annual report were aligned with the company’s position, performance and strategy being pursued and that the narrative sections of the annual report were consistent with the financial statements. The significant issues considered by the committee in relation to the financial statements include those identified by the auditor in their report on pages 152 to 153.
The committee received regular updates on the calculation of underlying operating profit measures as one of the principal alternative performance measures (APMs). A guide to APMs can be found on page 82.
Management enhanced the review processes to provide support to the board in forming its view on whether the accounts and financial statements were fair, balanced and understandable, as it concluded they were and set out on page 141.
Many of our regulatory performance commitments are used by management as key performance indicators and are monitored by our regulators, who set the methodology against which we report. As part of their role as auditor of UUW’s annual performance, KPMG provides assurance on many of these performance commitments along with Jacobs, the technical auditor.
KPMG is required (under ISA720) to consider whether there are any material inconsistencies between the other information presented in the annual report (e.g. the strategic report), and the financial statements, taking into
Additional audit quality processes for the 2020/21 audit
With a view to further enhancing audit quality, and in response to lessons learnt during the 2019/20 audit, KPMG proposed the following action plan for the 2020/21 audit, including:
• Providing sight of their interim control findings to the committee early in the audit process and sharing their knowledge and best practice recommendations;
• Improving the two-way communication and sharing of information and insight between the external and internal audit teams by implementing regular discussion sessions prior to the scheduled committee meetings;
• Raising audit points in a more timely manner with the financial reporting team during the audit process by holding regular discussions with the external audit team and financial reporting team; and
• Using a project manager to assist with the delivery of the year end audit cycle.
As part of its review of the 2020/21 audit in July 2021, the committee will review the effectiveness of the above processes.
AUDIT QUALITY account the auditor’s knowledge obtained in the audit, or the auditor’s understanding of the legal and regulatory requirements applicable to the other statutory information. The assurance of our greenhouse gas emissions and TCFD disclosures (see pages 88 to 99), is undertaken both by third parties and our internal audit team. Our disclosures against the code are reviewed by the internal audit team and reported to the committee.
Additionally, the committee was satisfied that all the key events and issues which had been reported to the board in the executive team’s monthly board reports during the year, both good and bad, had been adequately referenced or reflected within the annual report.
How we assessed the effectiveness of the statutory audit processThe committee, on behalf of the board, is responsible for the relationship with the auditor, and part of that role is to examine the effectiveness of the statutory audit process. Audit quality is regarded by the committee as the principal requirement of the annual audit process.
KPMG presented the strategy and scope of the audit for the forthcoming financial year at the meeting of the committee held in September, highlighting any areas which would be given special consideration (these key audit matters are included in the auditor’s report on page 200). KPMG reported against their audit scope at subsequent committee meetings, providing an opportunity for the committee to monitor progress and raise questions, and challenge both KPMG and management.
Throughout the year, management presents their up-to-date view of the key accounting issues and their resulting judgements. KPMG responds informing the committee whether, in their professional view, the judgements management propose, or have taken, are appropriate. A number of these issues manifest themselves as the significant issues considered by the committee in relation to the financial statements. For 2020/21 these are set out on pages 152 to 153, in exercising their professional scepticism, as required by auditors’ professional standards, KPMG did not identify any areas of disagreement with management’s judgements.
Private meetings are held at each committee meeting between the committee and representatives of the auditor without management being present to encourage open and transparent feedback by both parties. KPMG meets with management at regular intervals during the annual audit process.
Prior to the board’s approval of the year end financial statements, the committee provides its view to the board
Stock Code: UU. Annual Report and Financial Statements for the year ended 31 March 2021 149
GO
VER
NA
NC
E
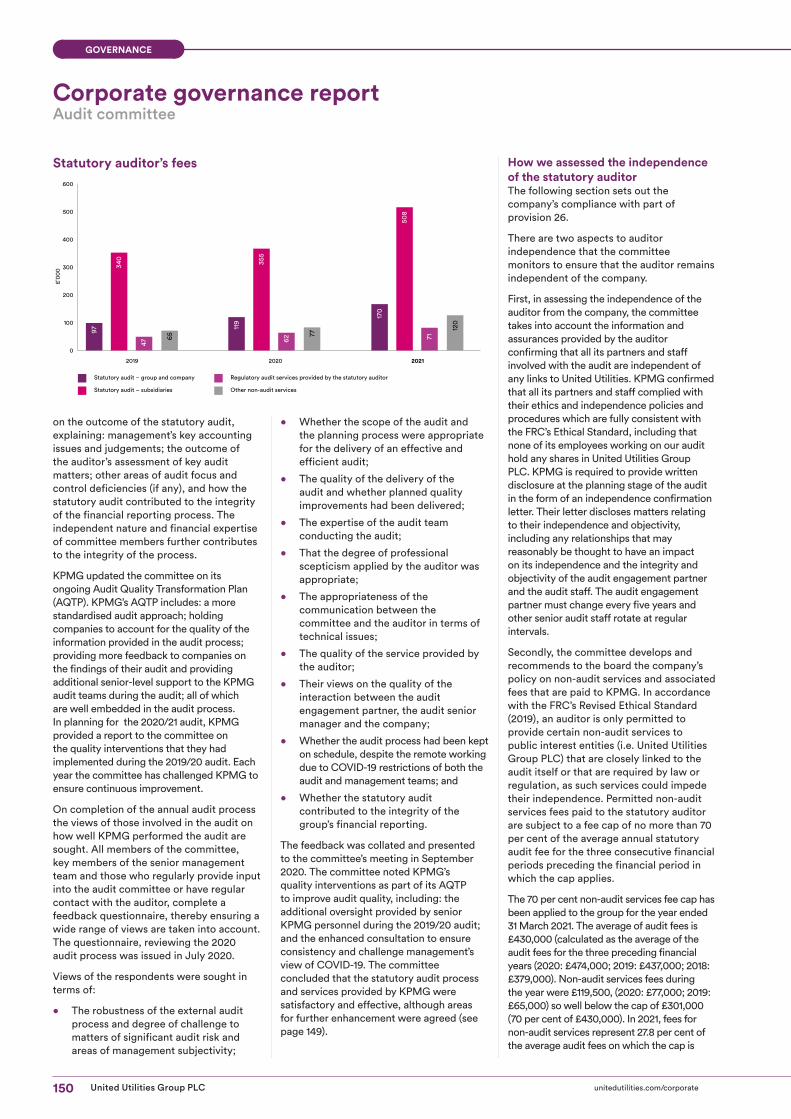
Corporate governance reportAudit committee
on the outcome of the statutory audit, explaining: management’s key accounting issues and judgements; the outcome of the auditor’s assessment of key audit matters; other areas of audit focus and control deficiencies (if any), and how the statutory audit contributed to the integrity of the financial reporting process. The independent nature and financial expertise of committee members further contributes to the integrity of the process.
KPMG updated the committee on its ongoing Audit Quality Transformation Plan (AQTP). KPMG’s AQTP includes: a more standardised audit approach; holding companies to account for the quality of the information provided in the audit process; providing more feedback to companies on the findings of their audit and providing additional senior-level support to the KPMG audit teams during the audit; all of which are well embedded in the audit process. In planning for the 2020/21 audit, KPMG provided a report to the committee on the quality interventions that they had implemented during the 2019/20 audit. Each year the committee has challenged KPMG to ensure continuous improvement.
On completion of the annual audit process the views of those involved in the audit on how well KPMG performed the audit are sought. All members of the committee, key members of the senior management team and those who regularly provide input into the audit committee or have regular contact with the auditor, complete a feedback questionnaire, thereby ensuring a wide range of views are taken into account. The questionnaire, reviewing the 2020 audit process was issued in July 2020.
Views of the respondents were sought in terms of:
• The robustness of the external audit process and degree of challenge to matters of significant audit risk and areas of management subjectivity;
• Whether the scope of the audit and the planning process were appropriate for the delivery of an effective and efficient audit;
• The quality of the delivery of the audit and whether planned quality improvements had been delivered;
• The expertise of the audit team conducting the audit;
• That the degree of professional scepticism applied by the auditor was appropriate;
• The appropriateness of the communication between the committee and the auditor in terms of technical issues;
• The quality of the service provided by the auditor;
• Their views on the quality of the interaction between the audit engagement partner, the audit senior manager and the company;
• Whether the audit process had been kept on schedule, despite the remote working due to COVID-19 restrictions of both the audit and management teams; and
• Whether the statutory audit contributed to the integrity of the group’s financial reporting.
The feedback was collated and presented to the committee’s meeting in September 2020. The committee noted KPMG’s quality interventions as part of its AQTP to improve audit quality, including: the additional oversight provided by senior KPMG personnel during the 2019/20 audit; and the enhanced consultation to ensure consistency and challenge management’s view of COVID-19. The committee concluded that the statutory audit process and services provided by KPMG were satisfactory and effective, although areas for further enhancement were agreed (see page 149).
400
500
600
2019 2020 2021
300
200
100
0
65
47
340
97 120
71
508
170
77
62
355
119
Statutory audit – group and company
Statutory audit – subsidiaries Other non-audit services
Regulatory audit services provided by the statutory auditor
£’0
00
Statutory auditor’s fees How we assessed the independence of the statutory auditor The following section sets out the company’s compliance with part of provision 26.
There are two aspects to auditor independence that the committee monitors to ensure that the auditor remains independent of the company.
First, in assessing the independence of the auditor from the company, the committee takes into account the information and assurances provided by the auditor confirming that all its partners and staff involved with the audit are independent of any links to United Utilities. KPMG confirmed that all its partners and staff complied with their ethics and independence policies and procedures which are fully consistent with the FRC’s Ethical Standard, including that none of its employees working on our audit hold any shares in United Utilities Group PLC. KPMG is required to provide written disclosure at the planning stage of the audit in the form of an independence confirmation letter. Their letter discloses matters relating to their independence and objectivity, including any relationships that may reasonably be thought to have an impact on its independence and the integrity and objectivity of the audit engagement partner and the audit staff. The audit engagement partner must change every five years and other senior audit staff rotate at regular intervals.
Secondly, the committee develops and recommends to the board the company’s policy on non-audit services and associated fees that are paid to KPMG. In accordance with the FRC’s Revised Ethical Standard (2019), an auditor is only permitted to provide certain non-audit services to public interest entities (i.e. United Utilities Group PLC) that are closely linked to the audit itself or that are required by law or regulation, as such services could impede their independence. Permitted non-audit services fees paid to the statutory auditor are subject to a fee cap of no more than 70 per cent of the average annual statutory audit fee for the three consecutive financial periods preceding the financial period in which the cap applies.
The 70 per cent non-audit services fee cap has been applied to the group for the year ended 31 March 2021. The average of audit fees is £430,000 (calculated as the average of the audit fees for the three preceding financial years (2020: £474,000; 2019: £437,000; 2018: £379,000). Non-audit services fees during the year were £119,500, (2020: £77,000; 2019: £65,000) so well below the cap of £301,000 (70 per cent of £430,000). In 2021, fees for non-audit services represent 27.8 per cent of the average audit fees on which the cap is
United Utilities Group PLC unitedutilities.com/corporate 150
GOVERNANCE

COVID-19 as part of the 2019/20 audit. These fees were agreed subsequent to the finalisation of the 2019/20 accounts are therefore included in the audit fees disclosed for 2020/21.
Taking into account our findings in relation to the effectiveness of the audit process and in relation to the independence of KPMG, the committee was satisfied that KPMG continues to be independent, and free from any conflicting interest with the group.
Statutory auditor reappointment for the year ending 31 March 2022The following section sets out the company’s compliance with part of provision 26.
The 2020/21 year-end audit has been KPMG’s tenth consecutive year in office as auditor; they were reappointed after the committee conducted a formal tender process in December 2019 and as reported by the committee in 2020. Prior to this, a formal tender was last undertaken in 2011, and resulted in the appointment of KPMG who thereafter presented their report to shareholders for the year ended 31 March 2012. An audit tender review was held in September 2015. The diagram shown below shows the historical tendering and rotation of the role of statutory auditor. The company, as a public interest entity, is required to
conduct a competitive tender process every ten years, and rotate auditors after 20 years at most. As a matter of good practice, the committee continually keeps under review the performance of the auditor.
The 2020/21 audit has been the first year for Ian Griffiths as audit engagement partner. The audit engagement partner changes at least every five years.
United Utilities has complied fully with the provisions of The Statutory Audit Services for Large Companies Market Investigation (Mandatory Use of Competitive Tender Processes and Audit Committee Responsibilities) Order 2014 for the year ended 31 March 2021.
At its meeting on 19 May 2021, the committee recommended to the board that KPMG be proposed for reappointment for the year ending 31 March 2022 at the forthcoming AGM in July 2021. There are no contractual obligations that restrict the committee’s choice of auditor; the recommendation is free from third-party influence and no auditor liability agreement has been entered into.
First Auditor appointed on formation of group:
Price Waterhouse
Price Waterhouse retired after
completion of audit
Audit tender
KPMG Peat Marwick
audit
Audit tender
Audit tender review
KPMG Audit Plc audit
Audit tender
Audit partner rotation
Deloitte & Touche LLP audit
Audit partner rotation
Audit tender
KPMG LLP audit and audit partner rotation
1989
31 March 2012
September 2015
31 March 2017
31 March 1994
April 2011
December 2019
1993– 1994
31 March 2003
31 March 2008
31 March 2021
31 March 1995
May 2002
ROTATION OF EXTERNAL AUDITOR TO THE GROUP
based. The committee revised the non-audit services policy incorporating the 70 per cent fee cap as described above with effect from 1 April 2017. The company’s non-audit services policy reflects the FRC’s Revised Ethical Standard (2019). Permitted services (which remain subject to the 70 per cent cap, apart from the regulatory audit) can be approved by the CFO subject to a cap of £10,000 applied for individual items. Individual items in excess of £10,000 require the approval of the committee. Auditor-provided permitted services include the non-audit fees paid to the statutory auditor for: the interim review; the regulatory audit; agreed-upon procedures for regulatory reporting and the Euro Medium Term Note Programme and Law Debenture Trust compliance work.
Fees for non-audit services paid to KPMG include the cost of the UUW regulatory assurance work they undertake, which is separate to the regulatory audit. While this work could be performed by a different firm, the information is in fact more granular breakdowns of data that form part of the statutory audit, and by KPMG undertaking the work it reduces duplication and saves considerable cost.
During the year, the committee agreed additional fees of £100,000 in relation to the additional audit work impacted by
Stock Code: UU. Annual Report and Financial Statements for the year ended 31 March 2021 151
GO
VER
NA
NC
E

Corporate governance reportAudit committee
that their review provides no assurance that the company’s accounts are correct in all material respects; the FRC’s role is not to verify the information provided but to consider compliance with reporting requirements. The FRC last reviewed and corresponded with the company in relation to the 31 March 2016 accounts.
Going concern and long-term viabilityThe committee challenged and scrutinised management’s detailed assessment of the group’s long-term viability and its ability to continue as a going concern. In doing
Interactions with the Financial Reporting Council (FRC)During the year, the FRC undertook a review of the company’s annual report and accounts for the year ended 31 March 2020, which resulted principally in queries relating to disclosures associated with the consolidated statement of cash flows (see page 212). These queries were quickly resolved to the FRC’s satisfaction and their review was closed. To provide greater clarity, the group has provided enhanced, voluntary disclosure on these and other matters in this year’s financial statements. In their correspondence, the FRC states
this the committee took into account the risks facing the business, and its ability to withstand a number of severe but reasonable scenarios. Having considered management’s assessment, the committee approved the long-term viability statement set out on page 142.
Significant issues considered by the committee in relation to the financial statements
Significant issues considered How these were addressed by the committee
Impact of COVID-19 – the impact of the COVID-19 pandemic resulted in higher levels of estimation uncertainty and considerably more judgement being required in preparing the financial statements for the year ended 31 March 2020. During the year ended 31 March 2021, the committee has considered how the situation has developed in order to revisit these significant estimates and judgements.
The impacts of the pandemic on the issues considered are outlined below, where applicable. Broadly, with the passage of time and as more data relating to the key areas impacted by the pandemic has become available, the level of estimation uncertainty has fallen compared with the prior year when the pandemic was still in its early stages.
Capitalisation of fixed assets (see pages 201, 216 and 225 to 226 and 256) – fixed assets represents a subjective area, particularly in relation to costs permitted for capitalisation and depreciation policy.
The committee assessed the reasonableness of the group’s capitalisation policy and the basis on which expenditure is determined to relate to enhancement or maintenance of assets and, having considered the work performed by KPMG in this area, deemed both to be appropriate;
The committee challenged the controls around ensuring the accuracy of capital accruals making up part of the total amount of fixed assets capitalised during the year, and satisfied itself that controls in this area were adequate; and
The committee reviewed the recovery of the capital overhead rates that it had approved in the year ended 31 March 2020 for the five-year regulatory period ending 31 March 2025. The committee concluded that the rates remain appropriate, noting that it is early in this period and therefore the continuing appropriateness of the rates used will be kept under review.
Revenue recognition and allowance for doubtful receivables (see pages 201, 215 to 216, 227 to 228 and 255) – due to the nature of the group’s business, the extent to which revenue is recognised and doubtful customer debts are provided against is an area of considerable judgement and estimation. This has particularly been the case in the current and prior year, where the economic impacts of COVID-19 have been highly uncertain, though compared with the prior year these judgements and estimates have been increasingly informed by the availability of more data in relation to consumption of services and customer payment patterns under the conditions brought about by the pandemic.
The committee reviewed the approach taken by management in estimating the impact of changing consumption patterns for both household and non-household customers during periods of lockdown, and the implications this has for estimating the amount of unbilled revenue to recognise for customers with water meters. The committee noted that the level of estimation required has reduced throughout the year, as more meter reads covering periods of changing consumption patterns have been performed. The committee satisfied itself that management’s approach to estimating the level of revenue to recognise has been robust and has been appropriately adapted as more data has become available; and
The committee reviewed management’s assessment of the impact the pandemic appears to have had on the level of doubtful debt and credit note provisioning, recognising that the situation remains uncertain as government support schemes are set to unwind in future periods. The committee challenged management’s judgement around the appropriate period over which to consider cash collection history in assessing the level of expected future credit losses, and concurred that the judgement around the period chosen was appropriate.
Retirement benefits (see pages 202, 230 to 231, 248 to 253 and 258) – the group’s defined benefit retirement schemes are an area of considerable judgement, the performance and position of which is sensitive to the assumptions made. The group employs the services of an external actuary to determine the calculation of the net retirement benefit surplus and determine the appropriate assumptions to make.
The committee sought from management an understanding of changes to the methodology and assumptions used in calculating the defined benefit scheme surplus, including an expansion of the corporate bond population used in deriving the discount rate, the application of an inflation risk premium in determining the RPI inflation assumption, and a reduction in the long-term rate of improvement assumed in the mortality assumptions adopted. Having challenged the rationale for making these changes and considered how they compare with market practice and the requirements of the relevant accounting standards, the committee concluded that the resulting assumptions were appropriate and balanced in estimating the level of defined benefit obligations and therefore the net retirement benefit surplus.
United Utilities Group PLC unitedutilities.com/corporate 152
GOVERNANCE

Significant issues considered How these were addressed by the committee
Accounting for loans to the Water Plus joint venture (see pages 216 to 217, 226 to 227 and 253 to 254) – during the year ended 31 March 2020 the carrying value of the group’s long-term interest in Water Plus, comprising its equity investment and zero coupon loan notes extended to the joint venture, was reduced to £nil as a result of significant losses recorded by Water Plus due to the COVID-19 pandemic. During the year ended 31 March 2021, the group and its joint venture partner, Severn Trent, each agreed to refinance £32.5 million of revolving credit facilities extended to Water Plus by replacing it with additional long-term capital, which took the form of equity shares issued in April 2021. This resulted in an increase in the group’s long-term interest as at the reporting date and the £32.5 million facility was included in the statement of financial position in the form of a non-current receivable. Accordingly the previously unrecognised brought forward Water Plus losses, were set against this additional long-term interest.
Having satisfied itself as to the rationale for refinancing part of the loans extended to Water Plus, the committee considered whether the conditions existed as at the reporting date to account for the £32.5 million revolving credit facility as part of the group’s long-term interest in Water Plus, and therefore the appropriateness of the recognition of current and prior year losses against this balance. Having sought to understand alternative accounting approaches that were considered, the committee concluded that the nature of the balance and the conditions extant at 31 March 2021 were such that it formed part of the group’s long-term interest at the reporting date and that it was satisfied with how this is presented in the financial statements; and
The committee reviewed and challenged management’s updated assessment of expected credit losses in relation to loans to Water Plus, concluding that the assumptions and judgements underpinning the assessment remain reasonable, and noting that the reduction in the required allowance was primarily driven by a reduction in the level of exposure to future credit losses resulting from the refinancing of the £32.5 million facility with new equity.
Accounting for the disposal of the group’s stake in its joint venture, AS Tallinna Vesi (Tallinn Water) (pages 226 to 227) – during the year the group disposed of its 35.3 per cent stake in AS Tallinna Vesi, which gave rise to a profit on disposal of £36.8 million.
The committee noted the proposed accounting approach for the disposal of the Tallinn Water JV and after taking account of the specific circumstances and the views of management and KPMG, concluded that the approach and presentation in the financial statements was appropriate.
Derivative financial instruments (see pages 240 to 247 and 257 to 258) – the group has a significant value of swap instruments, the valuation of which is based upon models which require certain judgements and assumptions to be made. Management performs periodic checks to ensure that the model-derived valuations agree back to third-party valuations and KPMG check a sample against their own valuation models.
The committee noted that the periodic checks performed by management had been completed at the year end reporting date, and that KPMG had undertaken their testing with no significant issues identified.
Provisions and contingent liabilities (see pages 232, 234 and 258) – the group provides for contractual, legal and environmental claims brought against it based on management’s best estimate of the value of settlement, the timing of which is dependent on the resolution of the relevant legal claims. Judgement is also required in determining when contingent liabilities exist that require disclosure in the financial statements.
The committee assessed and challenged the appropriateness of the basis on which provisions are recognised, and management’s estimate of the value applied to individual claims, focusing particularly on instances where new provisions were required or where the likelihood of financial outflow was deemed to have diminished such that provisions were no longer needed and were therefore released. The committee concluded that the approach to provisioning was appropriate and that management’s best estimates were reasonable; and
The committee considered the reasonableness of disclosures made in respect of contingent liabilities, challenging management as to whether any provision should be recognised in the financial statements and concluding that the recognition criteria had not been met and therefore that disclosure as contingent liabilities was the most appropriate approach.
Taxation (see pages 222 to 223, 231 and 255 to 256) – judgement is required in assessing provisions for potential tax liabilities and in considering the recoverability of deferred tax assets.
The committee considered the tax risks that the group faces and the key judgements made by management underpinning the provisions for potential tax liabilities and deferred tax assets. In addition, the committee took account of KPMG’s assessment of these provisions. Based on the above, the committee was satisfied with the judgements made by management.
Alternative performance measures (APMs) (see pages 82 to 83) – during the year the group revisited the adjustments made in arriving at the underlying profit measures reported in its APMs. This resulted in the removal of adjustments for: restructuring costs in arriving at underlying operating profit as a matter of course, unless highly material; net pension interest and capitalised borrowing costs in arriving at underlying net finance expense; and agreement of prior years’ tax matters relating to annual tax rebates received as a result of the group’s approach to paying tax.
The committee also considered the implications of these changes for the group’s measure of effective interest rate which, while not an alternative to a GAAP measure of financial performance, expresses the underlying interest cost as an effective interest rate on the nominal value debt and therefore provides a useful comparison against the Ofwat’s allowed cost of debt to illustrate financing outperformance during the period versus the regulatory determination. The committee concurred with management’s view that it is appropriate to include effective interest rate as a measure alongside other APMs in order to increase transparency, and that in reaching this rate it is appropriate to adjust for capitalised borrowing costs and net pension interest to be consistent with the regulatory economics; and
In considering management’s judgements around adjusting items, the committee satisfied itself that as operating under the conditions brought about by the COVID-19 pandemic has become part of normal business practice, adjusting for COVID-19 related items becomes more subjective and therefore APMs could become less reliable. The committee therefore endorsed management’s approach of not adjusting for such items in the current year.
Net debt disclosure in the financial statements (see pages 236 to 237) – following the alignment of rating agency approaches to defining net debt, the group has amended its definition of net debt reported in the financial statements as set out in note A2 (pages 236 to 237) to now exclude the fair value of derivatives hedging future interest rates, power derivatives, and the fair value of inflation swaps (excluding the principal accretion element).
The committee challenged management as to why the updated definition, which excludes the fair value of derivatives hedging future interest rates, power derivatives, and the fair value of inflation swaps (excluding the principal accretion element), gives a more useful view of the group’s net debt, ultimately satisfying itself that the updated definition more closely aligns to definitions used by credit rating agencies and the approach taken by industry peers, as well as giving a better reflection of the regulatory economics associated with the group’s borrowings and treasury management.
Stock Code: UU. Annual Report and Financial Statements for the year ended 31 March 2021 153
GO
VER
NA
NC
E

Corporate governance reportAudit committee
Internal controls and risk management systems The main features of the group’s internal controls and risk management systems are summarised below:
Internal audit functionThe internal audit function is a key element of the group’s corporate governance framework. Its role is to provide independent and objective assurance, advice and insight on governance, risk management and internal control to the audit committee, the board and to senior management. It supports the organisation’s vision and objectives by evaluating and assessing the effectiveness of risk management systems, business policies and processes, systems and key internal controls. In addition to reviewing the effectiveness of these areas and reporting on aspects of the group’s compliance with them, internal audit makes recommendations to address any key issues and improve processes and, as such, provides an indication of the behaviours being exhibited by employees in the areas under review. Once any recommendations are agreed with management, the internal audit function monitors their implementation and reports to the committee on progress made at every meeting.
A five-year strategic audit planning approach is applied. This facilitates an efficient deployment of internal audit resource in providing assurance coverage over time across the whole business, as well as greater variation in the nature, depth and breadth of audit activities. This strategic approach supports the annual audit plan, which is then endorsed by management, and which the committee reviews, challenges and approves. The plan focuses the team’s work on those areas of greatest risk to the business. Building on the strategic planning approach, the development of the plan considers risk assessments, issues raised by management, areas of business and regulatory change, prior audit findings and the cyclical review programme. The purpose, scope and authority of internal audit is defined within its charter which is approved annually by the audit committee.As set out in the charter, internal audit perform their work in accordance with the mandatory aspects of the International Professional Practice Framework of the Chartered Institute of Internal Auditors; and with integrity (honestly, diligently and responsibly) and objectively (without conflicts of interest).
Internal audit, led by the head of audit and risk, covers the group’s principal activities and reports to the committee and functionally to the CFO. The head of audit and risk attends all scheduled meetings of the audit committee, and has the opportunity
to raise any matters with the members of the committee at these meetings without the presence of management. He is also in regular contact with the chair of the committee outside of committee meetings.
The in-house team is expanded as and when required with additional resource and skills co-sourced from external providers. The committee keeps the relationship with co-source providers under review to ensure the independence of the internal audit function is maintained and there is a documented process to manage possible conflicts of interest with the co-sourced resource. Ensuring that any co-source resource remain independent in the course of its work is crucial to the integrity of its work. During the year, PwC was re-appointed as co-source resource provider following a competitive tender process (see page 155).
The internal audit function liaises with the statutory auditor, discussing relevant aspects of their respective activities which ultimately supports the assurance provided to the audit committee and board. During the year, the committee reviewed the current operating model, in particular the balance of in-house versus co-sourced resource, and concluded that, while minor improvements were identified, the current approach was satisfactory.
Assessing the effectiveness of the internal audit functionThe effectiveness of the internal audit function’s work is continually monitored using a variety of inputs, including the ongoing audit reports received, the audit committee’s interaction with the head of audit and risk, an annual review of the department’s internal quality assurance report, a quarterly summary dashboard providing a snapshot of the progress against the internal audit plan tabled at each committee meeting as well as any other periodic quality reporting requested.
An annual stakeholder survey in the form of a feedback questionnaire is circulated to committee members, senior management and other managers who have regular contact with the internal audit function, including representatives from the auditor KPMG and the co-source audit provider PwC. The responses were anonymous to encourage open and honest feedback, and were consistently favourable, as were previous surveys.
Periodically, the quality and effectiveness of the internal audit function is also assessed externally, with the most recent review being undertaken in early 2019. The committee has received regular updates during the year from the head of audit and risk on the impact of the pandemic on the schedule of work of the internal audit
team, due to remote working and social distancing measures. Some re-phasing of the original work was undertaken, with the team keeping on track with re-planned work. Only one audit, which required access to a third party’s site, was deferred, with agreement by the committee, to the 2021/22 audit plan.
Taking all these elements into account, the committee concluded that the internal audit function was an effective provider of assurance over the organisation’s risks and controls and appropriate resources were available as required.
Risk management systems The committee receives updates and reports from the head of audit and risk on key activities relating to the company’s risk management systems and processes at every meeting. These are then reported to the board, as appropriate. The group designs its risk management activities to manage rather than eliminate the risk of failure to achieve its strategic objectives.
The CFO has executive responsibility for risk management and is supported in this role by the head of audit and risk and the corporate risk manager and his team. The group audit and risk board (GARB) is a sub-committee of the executive team. The GARB meets quarterly and reviews the governance processes and the effectiveness and performance of these processes along with the identification of emerging trends and themes within and across the business. The work of the GARB then feeds into the information and assurance processes of the audit committee and into the board’s assessment of risk exposures and the strategies to manage these risks.
Supplementing the more detailed ongoing risk management activities within each business area, the biannual business unit risk assessment process (BURA) seeks to identify how well risk management is embedded across the different teams in the business. The BURA involves a high-level review of the effectiveness of the controls that each business unit has in place to mitigate risks relating to activities in their business area, while identifying new and emerging risks and generally to facilitate improvements in the way risks are managed. The outcome of the BURA process is communicated to the executive team and the board. This then forms the basis of the determination of the most significant risks that the company faces which are then reviewed by the board. The group utilises risk management software to underpin the company’s risk management process. The maturity of the risk management framework and its application across the business is assessed on an annual basis against a defined
United Utilities Group PLC unitedutilities.com/corporate 154
GOVERNANCE

maturity model. This assessment provides an objective appraisal of the degree of maturity in how the risk management system is being applied and the quality of each risk in terms of quantification and management. The results of the maturity assessment are reported to the GARB, and actions agreed with business units.
An external assessment of the risk management process last took place in 2017/18.
The committee received a ‘deep dive’ session on the risk management process. This provided an explanation of the process of identification and assessment of risk along with the governance mechanisms in place prior to the reporting of the risk profile to the board.
Internal controls The committee reviews the group’s internal control systems and receives updates on the findings of internal audit’s investigations at every meeting, prior to reporting any significant matters to the board. Internal control systems are part of our ‘business as usual’ activities and are documented in the company’s internal control manual which covers financial, operational and compliance controls and processes. Internal control systems are the responsibility of the CFO, with the support of the GARB, the financial control team and the internal audit team, although the head of audit and risk and his team are directly accountable to the audit committee.
Confirmation that the controls and processes are being adhered to throughout the business is the responsibility of managers, but is continually tested by the work of the internal audit team as part of its annual plan of work which the committee approves each year as well as aspects being tested by other internal assurance providers. Compliance with the internal control system is monitored annually by the completion of a self-assessment checklist by senior managers in consultation with their teams. The results are then reviewed and audited on a sample basis by the internal audit team and reported to the committee.
Anti-fraud and anti-bribery The audit committee is responsible for reviewing the group’s procedures for detecting fraud, and the systems and controls for preventing other inappropriate behaviour. In the first instance of an incident being reported, a summary of the allegations is passed to the fraud and whistleblowing committee (consisting of the company secretary, customer services and people director, commercial director and head of internal audit and risk) to decide on the appropriate course of action and investigation and by whom.
During the year, the committee led and supervised a formal tender process for the internal audit co-source resource. The contract with the incumbent, PwC, was due to expire on 31 March 2021. The request for proposal was issued in December 2020. Five proposals were received, which were evaluated on a weighting of 85 per cent technical and 15 per cent commercial. After initial analysis, three proposals progressed to the presentation stage in front of the tender review panel made up of audit committee members and senior members of the finance team. Taking into account both technical and commercial scores, PwC achieved the highest score and was re-appointed.
INTERNAL AUDIT CO-SOURCE COMPETITIVE TENDER
During the year, the audit committee was kept fully apprised in regular updates on the progress and findings of investigations of cases of alleged fraud and any remedial actions taken. A number of employees have been selected and received specialist training in order to conduct investigations of cases of alleged fraud.
In line with the group’s anti-fraud culture and zero-tolerance attitude towards fraud, a fraud incident forum has been established to identify and understand potential threats, and optimise the group’s response and mitigation and ensure consistency across the business.
The company has an anti-bribery policy to prevent bribery being committed on its behalf, which all employees must follow, and processes in place to monitor compliance with the policy. Employees in certain roles are required to complete anti-bribery training materials. As part of the anti-bribery programme, employees must comply with the group’s hospitality policy. The hospitality policy permits employees to accept proportionate and reasonable hospitality for legitimate business purposes only. Our employees and representatives of our suppliers must comply with the group’s sustainable supply chain charter which explains that we will not tolerate corruption, bribery and anti-competitive actions and we expect our suppliers to comply with applicable laws and regulations, and in particular never to offer or accept any undue payment or other consideration, directly or indirectly, for the purposes of inducing any person or entity to act contrary to their prescribed duties.
As part of the internal control self-assessment checklist (part of the group’s internal control processes), senior managers in consultation with their teams are required to confirm, among other things, that they have complied with the group’s anti-bribery and hospitality policies. The anti-bribery programme is monitored and reviewed biannually by the committee. Our United Supply chain approach sets out that we do not tolerate corruption, bribery and unfair anti-competitive actions on our own behalf or that of our suppliers.
The anti-bribery policy is available at unitedutilities.com/corporate/about-us/ governance
The United Supply chain approach is available at unitedutilities.com/corporate/about-us/governance/suppliers/delivering-value/united-supply-chain
Stock Code: UU. Annual Report and Financial Statements for the year ended 31 March 2021 155
GO
VER
NA
NC
E

Corporate governance reportCorporate responsibility committee
• The corporate responsibility committee has existed for over thirteen years.
• The committee comprises three directors appointed by the board, two of whom are independent non-executive directors.
• The company secretary, corporate affairs director and customer services and people director attend all meetings of the committee.
• Senior operational directors attend the committee to report on the environmental, social and governance aspects of particular topics and initiatives.
Quick linkTerms of reference – unitedutilities. com/corporate-governance
Corporate responsibility committee members
Stephen Carter (chair)
Alison Goligher Steve Mogford
QUICK FACTS
In what has been a challenging year, it has mattered more than ever that the company has engaged with its stakeholders on topics relevant to them.
Dear ShareholderI am pleased to introduce the report on the activities of the corporate responsibility committee in 2020/21.
The committee has discussed the COVID-19 pandemic at every meeting this year to assess the actions taken by the company from a responsible business perspective. It considers the approach to be comprehensive and thoughtful, ranging from enhanced support for vulnerable customers through extension of the company’s social tariff and the prominent promotion of its payment break scheme, to the help offered to suppliers through accelerated payment terms and the unrelenting focus on employee health and wellbeing.
It has been encouraging to see that the company is already well advanced in its thinking about working patterns in a post-pandemic environment, positioning it as the ‘next ways of working’. The committee recognises there are many implications associated with changed working patterns and it looks forward to the opportunity to comment on plans as they develop. The committee debated the broader impact of
COVID-19 for the company’s approach to responsible business, concluding that it was premature to draw lasting conclusions as the pandemic was still with us.
As a result of the lockdown, there has been a marked increase in the number of visitors to United Utilities’ recreation sites which, regrettably, has resulted in an increase in anti-social behaviour. The committee welcomed a paper on the company’s approach to land management which set out clearly the risks and opportunities that come with being custodians of land in some of the most highly valued parts of the North West, such as the Lake District.
In response to growing investor interest in ESG – environmental, social and governance – the committee was pleased to comment on the company’s sustainable finance framework ahead of its first successful sustainable bond issuance. The fact that the bond was three times over-subscribed reveals the level of investor focus on ESG. To help this community better understand the company’s approach, an investor guide to ESG at United Utilities was published in 2020 to provide a helpful summary of the material issues the company is managing. It is also the fifth consecutive year that my report to shareholders has been structured under ESG headings.
The creation of the sustainable finance framework was a further example of the company’s long-standing commitment to responsible business. While the committee is clear, on behalf of the board, that the company is making real progress, we believe that judgement is best left to others. It is both pleasing and reassuring that the company continues to perform well across a broad range of ESG indices. In the Dow Jones Sustainability Index, in which the company has participated almost longer than any other, it was again ranked world class – for the 14th consecutive year.
Over the past twelve months, the sector has transitioned from AMP6 to AMP7, and the company took the opportunity to review its approach to responsible business. As it exited AMP6, it reported that over 75 per cent of the stretching targets first set in 2015 to measure responsible business progress had been achieved. With AMP7 underway, the committee supported an evolution in its approach to frame the company’s responsible business efforts around its purpose ‘to provide great water and more for the North West’, with particular emphasis on the value the company creates for its stakeholders.
The committee endorsed a new set of measures and targets out to 2025 that are aligned to each stakeholder the company
Stephen CarterChair of the corporate
responsibility committee
United Utilities Group PLC unitedutilities.com/corporate 156
GOVERNANCE

It has been encouraging to see that the company is already well advanced in its thinking about working patterns in a post-pandemic world.
creates value for and reflects what matters to them. We welcomed the intention to include these measures in a revised section of the annual report (see pages 50 to 73), reporting openly and transparently on them to help stakeholders to determine if the company is purpose led. This means that a ‘golden thread’ from purpose, through to vision and strategy, and then to measurement, will be clearly evident.
In what has been a challenging year, it has mattered more than ever that the company has engaged with its stakeholders on topics relevant to them. At every meeting, the committee discusses the company’s approach to stakeholder engagement, ranging from national political and regulatory stakeholders through to the devolved administrations in the North West and regional NGOs. For example, it was good to hear of the favourable response to the company’s first virtual caseworker event from the staff in regional MP offices.
The pandemic has drawn attention to many issues, with three of particular interest to the committee. First, it is evident that the pandemic has had a disproportionate impact on socially and economically deprived communities, of which there is a greater proportion in the North West than the rest of the country. The committee focused on the affordability and vulnerability support offered by the company.
Second, inequality in society has been brought into sharp focus, whether that is through the Black Lives Matter movement or increasing youth unemployment. In response, the company presented its refreshed diversity and inclusion strategy, marking a step change in its efforts to address the issue, and the committee welcomed United Utilities’ first social mobility summit, hosted virtually, where it convened over 150 regional businesses to debate how best to tackle inequality, setting out its own intentions in its Opportunity on Tap plan.
The third issue has been the climate and nature emergencies. The committee reviewed the company’s progress on its climate change adaptation plan and how its stewardship of 56,000 hectares of land will pay a critical role in both mitigating climate change (for example through planting trees and restoring peatland) and adapting to the impacts that are already occurring, such as slowing the flow of water to reduce flood risk.
Changes to the Corporate Governance Code in 2018 means that the committee now examines some additional responsible business topics on behalf of the board, in particular in relation to employees. Two papers were presented to the committee on progress in relation to work of the Employee Voice panel and how it has established an important role in contributing to the company’s plans.
As the contribution that businesses make to society is examined ever more closely, especially as we think about a post-pandemic world, I am confident that the company, with its long-standing commitment to corporate responsibility and its determination to fulfil its purpose, will continue to build legitimacy amongst the opinions of customers, regulators, government and other stakeholders.
As a listed company, United Utilities complies with the UK Corporate Governance Code and continues to drive for the highest standards of board leadership, transparency and governance.
Stephen CarterChair of the corporate responsibility committee
The terms of reference remained unchanged for the committee. Its main duties are to:
• consider and recommend to the board the broad corporate responsibility (CR) policy, taking into account the company’s desired CR positioning;
• keep under review the group’s approach to CR and ensure it is aligned with the group strategy;
• review CR issues and objectives material to the group’s stakeholders and identify and monitor the extent to which they are reflected in group strategies, plans and policies;
• monitor and review the status of the company’s reputation and examine the contribution the group’s CR activities make towards protecting and enhancing this;
• monitor and review compliance with the board’s CR policy and scrutinise the effectiveness of the delivery of the CR policy requirements;
• develop and recommend to the board CR targets and key performance indicators and receive and review reports on progress towards the achievement of such targets and indicators;
• monitor and review the steps taken by the company to support customers in vulnerable circumstances; and
• review all approved specific giving where the aggregate financial contribution exceeds £100,000 over the period of the proposed funding and to review all community giving expenditure annually.
MAIN RESPONSIBILITIES
Stock Code: UU. Annual Report and Financial Statements for the year ended 31 March 2021 157
GO
VER
NA
NC
E

Corporate governance reportCorporate responsibility committee
Diversity and inclusion A refreshed and updated strategy was discussed by the committee. It agreed that to attract great people to deliver a great public service, the company had to reach out and recruit from every part of society and support employees to achieve their full potential and feel valued and included. Five key work streams had been identified: leadership development; encouraging openness; people policies and processes; increasing awareness; and enabling inclusion. The committee welcomed the company’s strong performance in the FT Diversity Index, indicating efforts to engage on diversity and inclusion were being recognised.
Gender pay reportThe committee commented on the draft gender pay report for 2020 and welcomed that employee feedback had been sought in shaping the report. Progress against the action plan and commitments would continue to be monitored as part of the wider diversity and inclusion strategy.
Affordability and vulnerability: lower income groups As a standing item, the committee was provided with an update on the company’s performance in assisting customers on low incomes, focusing on free meter options and how the company is responding through planned initiatives.
Human rights policy The committee approved an updated Human Rights policy. Analysis by the company’s working group on its risk assessment showed movement in the likelihood and severity of some risks but this did not change the most salient issues: forced/child labour (modern slavery); health and safety; data protection and privacy; and access to clean water and sanitation. Material updates to the policy included the addition of a clause concerning the company’s expectations of personnel, business partners and other relevant parties and a statement that the company has a mechanism by which to report concerns safely and in confidence.
GovernanceCR committee terms of reference Following review, the committee concluded that no further changes were needed to its terms of reference at the current time. The emergence of recent trends, such as the greater emphasis on purpose, were accommodated by the existing terms.
The committee’s agenda during the year:EnvironmentalClimate change adaptation strategyA comprehensive overview of the company’s approach was presented to the committee, which included: meeting government requirements for climate change adaptation reporting; embedding climate risk into the corporate risk framework; using UK Climate Projections 2018 in future planning; an independent review of climate change preparedness and the interaction climate change adaptation will have with PR24; and plans for the company’s involvement in COP26.
Land management update The committee debated the company’s approach to land management. As a result of excess visitor numbers due to COVID-19 lockdowns, efforts were underway to stabilise the current situation and reduce the impact of visitor behaviour. Alongside this, the company had begun a comprehensive review of its strategy, including: overall ambition and direction; processes; governance; funding; partnerships; stakeholder engagement; communications and culture.
Waste and circular economy The committee discussed conclusions reached by the company that business benefits could be gained through circular economy thinking. This will involve engagement across the company and with partners and suppliers in four areas: water and wastewater; energy; materials; and restoration of natural systems. As an example, the committee heard about scope to work more closely with housebuilding companies on water efficiency. A pilot will be undertaken in the Carlisle area with government agencies, customers and other stakeholders to explore opportunities.
Social Next ways of workingTwo updates were provided to the committee on plans for employee working patterns post-pandemic. The first phase of work will develop a ‘flexibility framework’ and common principles to optimise and hardcode the benefits of the current ways of working. The second phase considers the medium-term workforce strategy, assessing the impact from disruptors such as technology and automation, changing demographics and changing employee expectations. The committee debated the impact on line management, measuring productivity, and the development of skills, and observed how other factors such as diversity and inclusion were shaping working patterns.
CR committee evaluationThe committee reviewed the external evaluation results and, in particular, points raised about the visibility of ESG and how its elements are brought together. It noted that ESG was already represented in the committee’s section of the annual report and, through the standing item on reputation, it reviewed company efforts to promote its ESG credentials and encouraged it to do more.
Employee VoiceTwice a year the committee reviews progress on employee and board engagement. During lockdown, the company adopted a ‘virtual’ Employee Voice panel which covered key topics such as reward strategy and the scope of the ‘next ways of working’ programme, with members providing feedback on the company’s response to COVID-19. The committee heard of the work of the Employee Voice networks and sub-groups, discussions on the employee opinion survey, and feedback on the culture in United Utilities. The committee considered further opportunities for the employee voice to be heard and was advised that the management conference was to be replaced with an all-employee conference. The committee noted that the company was satisfied that activities and progress enabled it to demonstrate compliance with the code.
Stakeholder engagement and reputationEngagement and reputation remained a standing agenda item allowing time to examine the relationship between responsible business and reputation. Each paper provided an update on national and regional political and regulatory engagement, and interaction with people and organisations representing regulatory, social and environmental interests. The committee was keen to understand the company’s stakeholder approach during COVID-19 and discussed the virtual consultation approach for the Haweswater Aqueduct Resilience Programme. It welcomed the favourable response to the company’s first virtual MP caseworker event. The committee was presented with an update on current reputational risks under active management.
United Utilities Group PLC unitedutilities.com/corporate 158
GOVERNANCE

Measuring and reporting CR performance against the business principles measures was reviewed for the final time as the targets were aligned to the end of AMP6. The committee welcomed the outcome that the company had met over 75 per cent of the targets it had set in 2015.
Cross cuttingUnited Supply ChainThe committee was updated on the company’s new approach to suppliers in AMP7, called United Supply Chain (USC), with its aim to embed responsible sourcing principles. This had taken into account best practice in other sectors, with the aim of providing a consistent approach to suppliers, with customers positioned as a common theme. Adherence will be monitored through the company’s established supplier relationship management mechanism.
Sustainable finance framework A paper setting out the design for the company’s sustainable finance framework was presented to the committee. It included: categories of green/sustainable projects eligible for funding; the governance around identifying and selecting projects; tracking the net proceeds to eligible projects and pre-allocation investment; and publishing reports annually until full allocation, with external verification. The committee endorsed the approach, concluding that it aligned well with the company’s responsible business and ESG credentials.
Value framework – multi-capitals An update was provided to the committee on a project related to embedding the company’s purpose into business processes. Aligned with the six capitals of integrated reporting, the work will determine what level of maturity the company wants for each capital (manufactured, financial, natural, social, human and intellectual).
• examine new and emerging issues, such as how the company deals with the impact of COVID-19 and its legacy;
• review new or updated responsible business strategies, such as the company’s community strategy, how it delivers its purpose objectives through its capital programme and its approach to talent and young people;
• consider the responsible business themes emerging for PR24;
• return to several issues to review progress, including digital and responsible business, approach to air quality, waste and circular economy, land management, carbon strategy, climate change adaptation and an update on surface water management;
• review performance, specifically the new measures and targets that will evidence how the company is fulfilling its purpose, ESG rating performance and the dashboard tracking the company’s efforts to support customers on low incomes;
• on behalf of board, review progress and issues arising from the Employee Voice panel and the company’s approach to culture;
• continue to examine the interaction between purpose, ESG and reputation and review the approach to stakeholder engagement and the management of reputational risks;
• oversee matters of general governance, such as reviewing the gender pay report; and
• undertake matters of committee governance, such as reviewing its rolling calendar of agenda items, the annual committee evaluation and examination of the committee’s terms of reference.
LOOKING TO THE NEXT YEAR, THE COMMITTEE WILL:
Stock Code: UU. Annual Report and Financial Statements for the year ended 31 March 2021 159
GO
VER
NA
NC
E

Corporate governance reportAnnual statement from the remuneration committee chair
• The code requires that “the board should establish a remuneration committee of at least three independent non-executive directors”.
• The role of the committee is to set remuneration terms for all executive directors, other senior executives and the Chairman.
• By invitation of the committee, meetings are attended by the Chairman, the CEO, the company secretary, the customer services and people director, the head of reward and the external adviser to the committee.
• Our remuneration policy was approved by shareholders at the 2019 AGM and is intended to apply until the 2022 AGM.
Quick linkTerms of reference – unitedutilities. com/corporate-governance
Index Read about how our remuneration approach complies with the UK Corporate Governance Code on page 162
Read our At a glance summary: executive directors’ remuneration on pages 164 to 166
Read our Annual report on remuneration on pages 167 to 181
Read our Directors’ remuneration policy on pages 182 to 188
Remuneration committee members
Alison Goligher (chair)
Kath Cates Mark Clare Brian May
QUICK FACTS
Our executive pay arrangements are aligned to our purpose, vision and strategy, thereby incentivising great customer service and the creation of long-term value for all.
Dear ShareholderI am pleased to introduce the directors’ remuneration report for the year ended 31 March 2021, which includes the annual report on remuneration and an abridged version of our directors’ remuneration policy which was approved by shareholders at our 2019 AGM.
The onset of the COVID-19 pandemic in early 2020 introduced a unique set of challenges for the company and the communities within which we operate. As is outlined elsewhere in this annual report, our focus throughout the past year has been on protecting colleagues, supporting customers, and maintaining our essential water and wastewater services across the North West. Thanks to the extraordinary hard work and dedication of our employees, many of whom are key workers, we have continued to deliver high quality services to our customers and support the interests of our other stakeholders.
The year in focusAs a remuneration committee we are always mindful of the extent to which the remuneration of the executives aligns with the experience of our stakeholder groups. We have taken a close interest in the actions that have been taken to protect our employees and support their wellbeing
during this difficult year. As outlined on pages 126 to 127, my role as the designated non-executive director for workforce engagement has enabled me to gain a first-hand understanding of the various initiatives that have been put in place and the feedback received from employees, which I have then been able to share with the committee for consideration. The committee has received regular updates on relevant matters affecting the workforce from our customer services and people director and head of reward at each meeting.
In the initial days and weeks of the pandemic, we made important changes to support the safety of our front-line colleagues, introducing safeguarding measures such as conducting risk assessments across all our sites. We implemented a range of measures to help and support over 3,000 employees who transitioned to home-working during the period. Recognising the broader impact of the pandemic on our employees and their families, we introduced a staff outreach scheme, offering one-time grants to employees whose families faced COVID-19 related financial challenges, to supplement our existing group-wide health and wellbeing schemes. No government support was accessed, no employees were furloughed or had their pay or benefits reduced, we have continued to recruit people through our graduate and apprentice programmes, and we are currently supporting the Government’s Kickstart Scheme providing jobs for 16 to 24 year olds who are at risk of long term unemployment.
The team has performed extremely well in these challenging circumstances, with high levels of customer satisfaction and resilient services in times of significantly increased demand. In serving some of the most economically deprived areas in the country, we have been alert to the need to help customers who struggle to pay their bills and have extended our ongoing charitable support and community engagement programmes. As part of our commitment to Ofwat, we reduced average household bills by 5 per cent in real terms this year and acted swiftly to increase the number of households eligible for our social tariff alongside the extensive support we already provide to customers struggling with affordability, which now covers over 200,000 customers. We worked with our suppliers across the region to provide enhanced payment terms to aid cash flows, and accelerated our capital expenditure to bring forward benefits and help support 17,700 jobs in the supply chain.
Against this background our performance in this first year of the new regulatory period has been strong, with outperformance of the regulatory contract and positive ODI rewards resulting in good outcomes for shareholders.
Alison GoligherChair of the
remuneration committee
United Utilities Group PLC unitedutilities.com/corporate 160
GOVERNANCE
Implementation of the directors’ remuneration policy during 2020/21SalaryRecognising the difficulty being experienced by many customers in our region, all members of the board, including the executive directors, volunteered a 20 per cent reduction to their salary/fees for the three-month period to August 2020, and agreed that giving the money to the foodbank charity FareShare would be an effective way to support vulnerable groups within our communities. Further details on our relationship with FareShare are shown on page 43.
Whilst our policy is that executive directors normally receive a salary increase broadly in line with the increase awarded to the general workforce (which was 2.3 per cent in the year), in recognition of the wider economic environment, all members of the board agreed that they would not receive scheduled increases during 2020/21. Salaries will next be reviewed in September 2021.
Annual bonusEmployees throughout the company participate in the same bonus scorecard as the executive directors, to ensure a shared focus on the business plan at all levels. As outlined in the Strategic Report we have seen another strong year of customer service, operational and financial performance, despite the challenges presented by the pandemic and periods of significantly increased demand.
We are leading the way on customer satisfaction and have made a strong start to our AMP7 customer ODIs delivering net outperformance this year, demonstrating resilient performance across most of the targets set for us by the regulators. While our written customer complaints performance for the year has fallen below our targets, in part reflecting the higher level of complaints during the dry spring in 2020 and our focus on collecting cash from those customers who are able to pay, but choose not to, we still expect our relative performance to be upper quartile compared with the other water and wastewater companies.
Underlying operating profit was down compared to last year as expected, and largely reflecting lower revenues arising from the new price control.
The efficient and effective delivery of the capital programme is reflected in our Time, Cost and Quality index (TCQi) score which remains high at 95.3 per cent.
Overall company results have led to an annual bonus out-turn for the executive directors of around 82 per cent of maximum (compared to the 2019/20 outcome of around 71 per cent of maximum) and a company-wide bonus pool totalling around £18 million (compared to around £17 million in the prior year),
reflecting the exceptional efforts and high levels of performance of the workforce during the very challenging year.
Long-term incentivesThe outcome of the Long Term Plan (LTP) awards which were granted in 2018 will be confirmed in the summer of 2021, with an estimated vesting outcome of around 90 per cent. This reflects the continued delivery of high standards of customer service set in recent years, the achievement of just under the stretch level of sustainable dividend performance, and full vesting under the relative total shareholder return condition due to a return of 48 per cent over the performance period (compared to the stretch target of 26 per cent). As outlined in last year’s report and as noted on page 169, as a result of Ofwat transitioning from SIM to C-MeX, the committee used its discretion to amend the customer service element of the award to be based on the new C-MeX measure and written complaints. The final outcome of this element will not be known until the volume of written complaints received by other companies are available later in 2021 and the overall vesting level can be confirmed. The awards for the executive directors will vest only after the completion of a two-year holding period, during which the shares will remain subject to withholding provisions. The committee believes that this approach aligns the interests of the executive directors with those of shareholders and customers.
During 2018/19, the committee consulted with shareholders on changing the structure of the LTP, so future awards would be based on two equally weighted components: Return on Regulated Equity (RoRE) and a customer basket of measures. These changes were approved at the 2019 AGM and applied with respect to the 2020 awards onwards. LTP awards are normally granted in June each year, but due to the uncertainties posed by the COVID-19 pandemic and particular concerns at the time about the possible extent of the disruption caused, the committee delayed the 2020 grants until November to allow more time to settle the targets, details of which are set out on page 170. Stretching targets have been set for RoRE based on the allowed return over the period (as set out in the final determination) and the expected returns to be generated through financial and operational performance. In respect of the customer basket, the committee finalised the selection of measures having taking into account the feedback received from customer research and focus groups (as to which areas of service/performance they considered the highest priority) and the performance commitments agreed with Ofwat, thereby ensuring that the measures reflect the views of our stakeholders.
Executive director changesRuss Houlden retired from the board and as chief financial officer on 24 July 2020 and left the company on 31 July 2020. Russ’ departure was treated in line with the remuneration policy for retirees and in line with the approach set out in last year’s remuneration report. Following a rigorous selection process, we were delighted to appoint Phil Aspin to the role as successor. Phil’s salary was set at £400,000 on his appointment, with a pension contribution aligned to the workforce rate. Other details of his package are set out on page 167.
Agenda for 2021/22As a committee, we have always sought to fully embrace the changing landscape and implement remuneration arrangements that are transparent and well-aligned to our purpose, vision and strategy, and this continues to guide our approach for the current year and beyond.
No significant changes are proposed to the operation of the policy for 2021/22. Details of the measures and targets for the annual bonus plan and 2021 LTP awards are set out on page 171.
We have a regular programme of engagement with shareholders each year in advance of our AGM and were pleased that towards the end of 2020 the company had the opportunity to speak with Glass Lewis about our approach to executive remuneration.
The next directors’ remuneration policy will be subject to approval by shareholders in 2022 and we will engage with shareholders about any potential changes to the policy at the appropriate time.
We continue to use our Employee Voice panel meetings as opportunities to discuss directly with employees our executive pay approach and its alignment with that of the workforce, as well as hearing the general views, concerns and comments from our workforce. Listening to the views of all the company’s key stakeholders plays a vital role in formulating and implementing a successful remuneration policy, and the committee is grateful for all inputs received.
This is my first report as chair of the remuneration committee, having been on the board and a member of the committee since 2016. I was delighted to be appointed committee chair in July 2020, taking over from Sara Weller, and I would like to express my personal thanks and that of the whole committee to Sara for her guidance and stewardship over last eight years.
I hope we will continue to receive your support this year for the remuneration resolution at the forthcoming AGM.
Alison GoligherChair of the remuneration committee
Stock Code: UU. Annual Report and Financial Statements for the year ended 31 March 2021 161
GO
VER
NA
NC
E

Corporate governance reportCode principle – remuneration
The following table summarises how our shareholder approved remuneration policy fulfils the factors set out in provision 40 of the 2018 UK Corporate Governance Code.
Performance measures used in our variable incentive schemes are selected to be consistent with the company’s purpose, values and strategy. The use of annual bonus deferral, LTP holding periods and our shareholding requirements provide a clear link to the ongoing performance of the group and ensure alignment with shareholders, which continues after employment.
Principle P:Remuneration policies and practices should be designed to support strategy and promote long-term sustainable success. Executive remuneration should be aligned to company purpose and values, and be clearly linked to the successful delivery of the company’s long-term strategy.
We describe how our remuneration approach aligns with our business strategy on page 164.
Principle Q:A formal and transparent procedure for developing policy on executive remuneration and determining director and senior management remuneration should be established. No director should be involved in deciding their own remuneration outcome.
This is detailed in the committee’s terms of reference which are available on the company website. The committee consults with shareholders when changes to policy are being considered.
Principle R:Directors should exercise independent judgement and discretion when authorising remuneration outcomes, taking account of company and individual performance, and wider circumstances.
The shareholder approved directors’ remuneration policy outlines the ways in which the committee may exercise discretion.
ALIGNMENT TO CULTUREPROPORTIONALITY
SIMPLICITYCLARITY
RISKPREDICTABILITY
The committee is committed to providing transparent disclosures to shareholders and the workforce about executive remuneration arrangements and, to this end, the directors’ remuneration report sets out the remuneration arrangements for the executive directors in a clear and transparent way. Our AGM allows shareholders to ask any questions on the remuneration arrangements, and we welcome any queries on remuneration practices from shareholders throughout the year.
Payouts under the annual bonus and LTP schemes are dependent on the performance of the company over the short and long-term, and a significant proportion of executive director remuneration is performance-linked. These schemes have strict maximum opportunities, with the potential value at threshold, target and maximum performance scenarios provided in the directors’ remuneration report.
Payments from variable incentive schemes require strong performance against challenging conditions over the short and longer term. Performance conditions have been selected to support group strategy and consist of both financial and non-financial metrics.
The committee retains discretion to override formulaic outcomes in both schemes to ensure that they are appropriate and reflective of overall performance.
Our remuneration arrangements for executive directors, as well as those throughout the group, are simple in nature and understood by all participants, having been operated in a similar manner for a number of years. Executive directors receive fixed pay (salary, benefits, pension), and participate in a single short-term incentive (the annual bonus) and a single long-term incentive (the Long Term Plan).
The committee has designed incentive arrangements that explicitly do not encourage inappropriate risk-taking. The committee retains overarching discretion in both the annual bonus and LTP schemes to adjust payouts where the formulaic outcomes are not considered reflective of underlying business performance and individual contributions. Robust withholding and recovery provisions apply to variable incentives.
5Remuneration
United Utilities Group PLC unitedutilities.com/corporate 162
GOVERNANCE

Alignto our purpose, vision and strategy
Incentivisegreat customer service
Create long-term valuefor all of our stakeholders
There are three key principles of our approach to executive remuneration.
REMUNERATION APPROACH
1
2
3
Stock Code: UU. Annual Report and Financial Statements for the year ended 31 March 2021 163
GO
VER
NA
NC
E

ALIGNING OUR REMUNERATION APPROACH TO BUSINESS STRATEGY
Our remuneration approach is aligned to our purpose, vision and strategy, thereby incentivising great customer service and the creation of long-term value for all of our stakeholders.
The following table provides a summary of how our incentive framework in 2020/21 aligns with our business strategy and the results that it delivers. Many of the performance measures are key performance indicators (KPIs) for the regulatory period 2020–25 (see pages 50 to 51). Details about how our approach to executive remuneration is aligned with the approach to remuneration across the wider workforce are shown on pages 172 to 175.
Alignment to strategy
Link to strategic themes
Alignment to purpose reflecting views of different stakeholders
Annual bonus
Underlying operating profit Key measure of shareholder value. Shareholders
Customer service in year• C-MeX ranking
• Written complaints
Delivering the best service to customers is a strategic objective.
Ofwat can apply financial incentives or penalties depending on our customer service performance.
Customers
Communities
Customers
Shareholders
Maintaining and enhancing services for customers• Outcome delivery incentive
(ODI) composite
• Time, cost and quality of the capital programme (TCQi)
Delivering the best service to customers is a strategic objective.
There is a direct financial impact on the company of Ofwat incentives and penalties for delivery/non-delivery of customer promises.
Keeping tight control of our capital programmes ensures we can provide a reliable service to our customers at the lowest sustainable cost.
Customers
Communities
Customers
Shareholders
Environment
Media
Compulsory deferral of bonus Deferral of part of bonus into shares aligns the interests of executive directors and shareholders.
Shareholders
Long Term Plan (LTP)
Return on Regulated Equity (RoRE)
Outperformance will result in an increase to RoRE which should translate into higher returns for investors through share price performance.
Customers
Communities
Customers
Shareholders
Environment
Customer basket of measures
Delivering the best service to customers is a strategic objective.
There is a direct financial impact on the company of Ofwat incentives and penalties for delivery/non-delivery of customer promises.
Customers
Communities
Customers
Shareholders
Environment
Additional holding period (at least two years)
Ensures continued alignment with shareholder interests and provides an additional period over which withholding can be applied.
Shareholders
Shareholding guidelines It is important that each executive director builds and maintains a significant shareholding in shares of the company to provide alignment with shareholder interests.
Shareholders
The best service to customers
At the lowest sustainable cost
In a responsible manner
Communities
Customers
Communities
Customers Customers
Environment Environment
Shareholders
Investors
Media
Suppliers
KEY
Corporate governance reportAt a glance summary: executive directors’ remuneration
United Utilities Group PLC unitedutilities.com/corporate 164
GOVERNANCE

Elements of executive directors’ payA significant proportion of executive directors’ pay is performance-linked, long-term and remains ‘at risk’ (i.e. subject to withholding and recovery provisions for a period over which the committee can withhold vesting or recover sums paid):
(1) Based on maximum payout scenario for executive directors in line with the current remuneration policy, assuming the normal maximum award level of 130 per cent of salary for the Long Term Plan (LTP).
Further details on what triggers the withholding and recovery provisions can be found on page 184.
Implementation of directors’ remuneration policy in 2020/21The table below summarises the implementation of the directors’ remuneration policy for executive directors in 2020/21. For further details see the annual report on remuneration on pages 167 to 181.
Key element Implementation of policy in 2020/21
Base salary • No salary increase for Steve Mogford in 2020. Phil Aspin’s salary was set at £400,000 on his appointment as Chief Financial Officer from 24 July 2020. See page 167 for further details.
Benefits and pension • Market competitive benefits package.
• Steve Mogford has a cash pension allowance of 22 per cent of base salary. His pension arrangements will be aligned to those of the wider workforce as part of the next directors’ remuneration policy. See page 167 for further details. Phil Aspin has a cash pension allowance of 12 per cent of base salary in line with the wider workforce.
Annual bonus • Maximum opportunity of 130 per cent of base salary.
• 2020/21 annual bonus outcome of 81.8 per cent of maximum.
• 50 per cent of 2020/21 annual bonus deferred in shares for three years.
• Withholding and recovery provisions apply.
Long Term Plan • Award of 130 per cent of base salary.
• Estimated long-term incentive vesting of 89.6 per cent for the performance period 1 April 2018 to 31 March 2021. These awards will vest after an additional two-year holding period.
• Withholding and recovery provisions apply.
Shareholding guidelines • Personal shareholding for Steve Mogford remains above the 200 per cent of salary minimum guideline. Phil Aspin is expected to reach the minimum guideline within five years of his appointment to the board. Post-employment shareholding requirements apply. See page 176.
Fixed vs performance-linked (%)(1) Short-term vs long-term (%)(1)
Performance-linkedFixed
Base salary
Pension and other bene�ts
Annual bonus – cash
Annual bonus – shares
Long Term Plan (LTP)
31%
27%
4%
69%
17%
17%
35%
Long-term Short-term Base salary
Pension and other bene�ts
Annual bonus – shares
Long Term Plan (LTP)
Annual bonus – cash
48%27%
4%
17%
52%17%
35%
Annual bonus – cash
Annual bonus – shares
Long Term Plan (LTP)
Performance period
Performance period
Performance period
Year -1
Key element Time frame
Year 1 Year 2 Year 3 Year 4 Year 5Award date
Period subject to recovery provisions
Period subject to withholding provisions
Period subject to withholding and recovery provisions
Pay at risk
EXECUTIVE DIRECTORS’ REMUNERATION POLICY
Stock Code: UU. Annual Report and Financial Statements for the year ended 31 March 2021 165
GO
VER
NA
NC
E

Corporate governance reportAt a glance summary: executive directors’ remuneration
(1) For the purpose of annual bonus, underlying operating profit excludes infrastructure renewals expenditure and property trading.
(2) Above stretch versus the comparator group. See page 169 for further details.
(3) Average underlying dividend cover over 2018/19 and 2019/20.
(4) The estimated ranking versus the other WASCs in a combined customer service measure comprising C-MeX and written complaints.
Fixed pay comprises base salary, benefits and pension. Further information on the single figure of remuneration can be seen on page 167.
The charts below show the results of the performance against targets for the annual bonus and LTP. Further information about the annual bonus is shown on page 168 and about the LTP on page 169.
0%
10%
20%
30%
40%
50%
60%
70%
80%
90%
100%
Underlying operating pro�tC-MeX rankingWritten complaintsOutcome delivery incentive (ODI) composite
TCQi
Maximum Actual
Actual total:
20.0%
35.0%
10.0%
10.0%
25.0%
20.0%
35.0%
7.5%
19.3%
81.8% of maximum
0%
10%
20%
30%
40%
50%
60%
70%
80%
90%
100%
Maximum Estimated
Estimated total: 89.6% of award vests
33.3%
33.3%
33.3%
Relative total shareholder return (TSR)Sustainable dividendsCustomer service excellence
25.0%
31.3%
33.3%
Key: At or above stretch target
Between threshold and stretch targets
Below threshold target
ANNUAL BONUS – YEAR ENDED 31 MARCH 2021
LONG TERM PLAN – THREE YEARS ENDED 31 MARCH 2021
2020/21 Annual bonus outcome Estimated 2018 Long Term Plan (LTP) outcome
£0£’000
Total: £2,940Steve Mogford CEO
£1,000£500 £1,500 £2,000 £2,500 £3,000
Fixed pay
Annual bonusLong-term incentives
£937
Total: £703
Phil Aspin CFO(from 24 July 2020) £321 £293 £89
Total: £936
Russ Houlden CFO(until 31 July 2020) £183 £174 £579
£824 £1,179
SINGLE TOTAL FIGURE OF REMUNERATION FOR EXECUTIVE DIRECTORS FOR 2020/21
ANNUAL BONUS AND LONG TERM PLAN (LTP) OUTCOMES
ALIGNING PAY WITH PERFORMANCE
Underlying operating profit(1)
£763.0mC-MeX ranking versus the other water companies
5th out of 17Written complaints
16.51Outcome delivery incentive (ODI) composite
£18.1mTime, Cost and Quality index (TCQi)
95.3%
Relative total shareholder return (TSR)(2)
48.0%Sustainable dividends(3)
1.35Customer service excellence(4)
4th out of 11
United Utilities Group PLC unitedutilities.com/corporate 166
GOVERNANCE
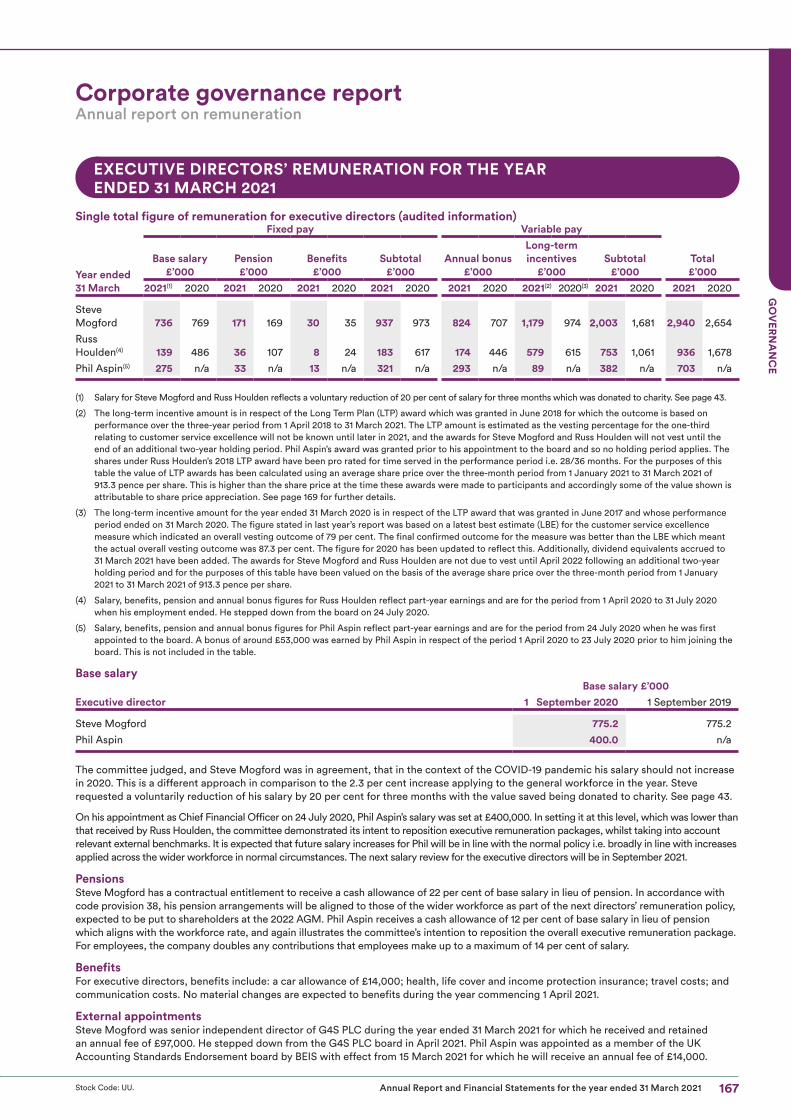
Corporate governance reportAnnual report on remuneration
EXECUTIVE DIRECTORS’ REMUNERATION FOR THE YEAR ENDED 31 MARCH 2021
Single total figure of remuneration for executive directors (audited information)
Year ended 31 March
Fixed pay Variable pay
Total £’000
Base salary £’000
Pension £’000
Benefits £’000
Subtotal £’000
Annual bonus £’000
Long-term incentives
£’000Subtotal
£’0002021(1) 2020 2021 2020 2021 2020 2021 2020 2021 2020 2021(2) 2020(3) 2021 2020 2021 2020
Steve Mogford 736 769 171 169 30 35 937 973 824 707 1,179 974 2,003 1,681 2,940 2,654
Russ Houlden(4) 139 486 36 107 8 24 183 617 174 446 579 615 753 1,061 936 1,678
Phil Aspin(5) 275 n/a 33 n/a 13 n/a 321 n/a 293 n/a 89 n/a 382 n/a 703 n/a
(1) Salary for Steve Mogford and Russ Houlden reflects a voluntary reduction of 20 per cent of salary for three months which was donated to charity. See page 43.
(2) The long-term incentive amount is in respect of the Long Term Plan (LTP) award which was granted in June 2018 for which the outcome is based on performance over the three-year period from 1 April 2018 to 31 March 2021. The LTP amount is estimated as the vesting percentage for the one-third relating to customer service excellence will not be known until later in 2021, and the awards for Steve Mogford and Russ Houlden will not vest until the end of an additional two-year holding period. Phil Aspin’s award was granted prior to his appointment to the board and so no holding period applies. The shares under Russ Houlden’s 2018 LTP award have been pro rated for time served in the performance period i.e. 28/36 months. For the purposes of this table the value of LTP awards has been calculated using an average share price over the three-month period from 1 January 2021 to 31 March 2021 of 913.3 pence per share. This is higher than the share price at the time these awards were made to participants and accordingly some of the value shown is attributable to share price appreciation. See page 169 for further details.
(3) The long-term incentive amount for the year ended 31 March 2020 is in respect of the LTP award that was granted in June 2017 and whose performance period ended on 31 March 2020. The figure stated in last year’s report was based on a latest best estimate (LBE) for the customer service excellence measure which indicated an overall vesting outcome of 79 per cent. The final confirmed outcome for the measure was better than the LBE which meant the actual overall vesting outcome was 87.3 per cent. The figure for 2020 has been updated to reflect this. Additionally, dividend equivalents accrued to 31 March 2021 have been added. The awards for Steve Mogford and Russ Houlden are not due to vest until April 2022 following an additional two-year holding period and for the purposes of this table have been valued on the basis of the average share price over the three-month period from 1 January 2021 to 31 March 2021 of 913.3 pence per share.
(4) Salary, benefits, pension and annual bonus figures for Russ Houlden reflect part-year earnings and are for the period from 1 April 2020 to 31 July 2020 when his employment ended. He stepped down from the board on 24 July 2020.
(5) Salary, benefits, pension and annual bonus figures for Phil Aspin reflect part-year earnings and are for the period from 24 July 2020 when he was first appointed to the board. A bonus of around £53,000 was earned by Phil Aspin in respect of the period 1 April 2020 to 23 July 2020 prior to him joining the board. This is not included in the table.
Base salary
Executive directorBase salary £’000
1 September 2020 1 September 2019
Steve Mogford 775.2 775.2
Phil Aspin 400.0 n/a
The committee judged, and Steve Mogford was in agreement, that in the context of the COVID-19 pandemic his salary should not increase in 2020. This is a different approach in comparison to the 2.3 per cent increase applying to the general workforce in the year. Steve requested a voluntarily reduction of his salary by 20 per cent for three months with the value saved being donated to charity. See page 43.
On his appointment as Chief Financial Officer on 24 July 2020, Phil Aspin’s salary was set at £400,000. In setting it at this level, which was lower than that received by Russ Houlden, the committee demonstrated its intent to reposition executive remuneration packages, whilst taking into account relevant external benchmarks. It is expected that future salary increases for Phil will be in line with the normal policy i.e. broadly in line with increases applied across the wider workforce in normal circumstances. The next salary review for the executive directors will be in September 2021.
PensionsSteve Mogford has a contractual entitlement to receive a cash allowance of 22 per cent of base salary in lieu of pension. In accordance with code provision 38, his pension arrangements will be aligned to those of the wider workforce as part of the next directors’ remuneration policy, expected to be put to shareholders at the 2022 AGM. Phil Aspin receives a cash allowance of 12 per cent of base salary in lieu of pension which aligns with the workforce rate, and again illustrates the committee’s intention to reposition the overall executive remuneration package. For employees, the company doubles any contributions that employees make up to a maximum of 14 per cent of salary.
BenefitsFor executive directors, benefits include: a car allowance of £14,000; health, life cover and income protection insurance; travel costs; and communication costs. No material changes are expected to benefits during the year commencing 1 April 2021.
External appointmentsSteve Mogford was senior independent director of G4S PLC during the year ended 31 March 2021 for which he received and retained an annual fee of £97,000. He stepped down from the G4S PLC board in April 2021. Phil Aspin was appointed as a member of the UK Accounting Standards Endorsement board by BEIS with effect from 15 March 2021 for which he will receive an annual fee of £14,000.
Stock Code: UU. Annual Report and Financial Statements for the year ended 31 March 2021 167
GO
VER
NA
NC
E

Corporate governance reportAnnual report on remuneration
ANNUAL BONUS
Deferred Bonus Plan awards made in the year ended 31 March 2021 (audited information)Bonuses are earned by reference to performance in the financial year and paid in June following the end of the financial year. Fifty per cent of any bonus is deferred into shares under the Deferred Bonus Plan. These awards vest after three years and are subject to withholding provisions. There are no service or additional performance conditions attached.
The table below provides details of share awards made on 16 June 2020 to the executive directors as at that date in respect of deferred share bonus payments for the 2019/20 financial year.
Executive directorType ofaward
Basis ofaward
Number ofshares
Face value of award(1)
(£’000)End ofdeferral period
Steve Mogford Conditional shares 50% of bonus 38,742 £353 16.6.2023
Russ Houlden Conditional shares 50% of bonus 24,469 £223 16.6.2023
(1) The face value has been calculated using the closing share price on 15 June 2020 (the dealing day prior to the date of grant), which was 911.9 pence per share.
Annual bonus in respect of financial year ended 31 March 2021 (audited information)The performance measures, targets and outcomes in respect of the executive directors’ annual bonus for the year ended 31 March 2021 are set out below. As disclosed in last year’s report the annual bonus for 2020/21 was wholly aligned to the group bonus scorecard with no specific personal performance element, although when determining the overall outcomes and whether any discretion should be exercised the committee took in to account the personal contributions of each individual. The table on page 164 summarises how the performance measures are linked to our business strategy.
Measure % weighting
of measureThreshold (25% vesting)
Target(50% vesting)
Stretch (100% vesting)
Vesting as a % of
maximum OutcomeUnderlying operating profit(1)
25.0% £643.0m £729.2m £791.0m 77.3% 19.3%
Actual: £763.0m
Customer service in yearC-MeX ranking out of the 17 water companies
10.0% 8th position 6th position 4th position 75.0% 7.5%
Actual: 5th position
Written complaints 10.0% 14.63 14.49 14.36 0% 0%
16.51
Maintaining and enhancing services for customersOutcome delivery incentive (ODI) composite
35.0% (£25.3m) (£14.3m) £0m 100% 35.0%
Actual: £18.1m
Time, cost and quality of capital programme (TCQi)(2) 20.0% 80.0% 87.5% 95.0% 100% 20.0%
Actual: 95.3%
Total: Actual award (% of maximum) 81.8% Maximum award (% of salary) 130%
Actual award (% of salary)(3) 106.3%Steve
MogfordRuss
Houlden(4)
Phil Aspin(5)
Actual award (£’000 – shown in single figure table)(6) 824 174 293
(1) The underlying operating profit figure for bonus purposes is based on the underlying operating profit on page 83 and excludes infrastructure renewals expenditure and property trading.
(2) TCQi is an internal measure which measures the extent to which we deliver our capital projects on time, to budget and to the required quality standard. It is expressed as a percentage, with a higher percentage representing better performance.
(3) Bonuses have been calculated using contractual salary.
(4) This is the bonus earned by Russ Houlden until his date of leaving the company on 31 July 2020.
(5) This is the bonus earned by Phil Aspin since his appointment as CFO on 24 July 2020. A bonus of around £53,000 was earned by Phil in respect of the period 1 April 2020 to 23 July 2020 prior to him joining the board. This is not included in the table above.
(6) Under the Deferred Bonus Plan, 50 per cent of the annual bonus for Steve Mogford and Phil Aspin will be deferred in shares for three years. As Russ Houlden is no longer employed, in line with the plan rules and as stated in last year’s report the bonus will be paid in cash in full with no element being deferred in to shares.
United Utilities Group PLC unitedutilities.com/corporate 168
GOVERNANCE

LONG-TERM INCENTIVES
2018 Long Term Plan (LTP) awards with a performance period ended 31 March 2021 (audited information)The 2018 LTP awards were granted in June 2018 and performance was measured over the three-year period from 1 April 2018 to 31 March 2021. As they were executive directors when they were granted in 2018 the awards for Steve Mogford and Russ Houlden will normally vest in April 2023, following an additional two-year holding period. The unvested shares will remain subject to withholding provisions during this two-year holding period. Phil Aspin was not an executive director when his award was granted and so in line with the remuneration policy this historic award will vest once the final outcome is confirmed. Under the shareholding guidelines he will be required to hold the vesting shares.
Note that the final outcome for the customer service excellence measure (which forms one-third of the award) will not be known until the customer service scores for the other water and wastewater companies are published in late summer 2021. The values of the 2018 LTP awards in the single total figure of remuneration table are therefore estimated and will be restated in next year’s report once the final outcome is known.
The table below shows how the long-term incentive amount in respect of the 2018 LTP was calculated:
Measure
Achieved
Vesting as a % of
maximum Outcome% weighting of measure
Threshold (25% vesting) Intermediate
Stretch (100%
vesting)
Relative total shareholder return (TSR)TSR versus median TSR of FTSE 100 companies (excluding financial services, oil and gas, and mining companies)(1)
33.3%Median TSR
Straight-line between threshold and stretch
Median TSR 5 1.15 100% 33.3%
Actual: TSR above stretch Company TSR of 48.0% was above stretch TSR of 25.8%
Sustainable dividends (50% vesting)
Average underlying dividend cover over the part of the performance period up to the end of the regulatory period 33.3% 1.18 1.27 1.36 93.9% 31.3%
Actual: 1.35Underpin:Dividend growth of at least RPI in each of the years 2018/19 and 2019/20
✓ Met
Customer service excellence(2)
Ranking for the year ended 31 March 2021 out of the 11 water and wastewater companies using a combined customer service measure comprising C-MeX performance and customer complaints(3)
33.3% Median rank (6th position)
Straight-line between threshold and stretch
Upper quartile
rank (3rd position)
75.0.% 25.0%
Estimate: 4th position
Overall underpinOverall vesting is subject to the committee being satisfied that the company’s performance on these measures is consistent with underlying business performance
✓ Assumed met.
The committee will make a final assessment ofthe company’s performance once the outcomeof the customer service excellence measure isknown.
Estimated vesting (% of award) 89.6%Steve
MogfordRuss
Houlden(4)
Phil Aspin
Number of shares granted 129,030 81,488 9,753Number of dividend equivalent shares 15,016 8,577 1,133Number of shares (including dividend equivalent shares) lapsed due to time pro rating n/a 19,264 n/aNumber of shares before performance conditions applied 144,046 70,801 10,886Estimated number of shares after performance conditions applied 129,065 63,437 9,753Three-month average share price at end of performance period (pence)(5) 913.3 913.3 913.3Estimated value at end of performance period (£’000 – shown in single figure table)(6) £1,179 £579 £89(1) For the purposes of calculating TSR, the TSR index is averaged over the three months prior to the start and end of the performance period. TSR is
independently calculated by the committee’s advisers.(2) As disclosed in the 2019 DRR, this element of the 2018 LTP was originally based on a ranking versus the other water and wastewater companies using
Ofwat’s Service Incentive Mechanism (SIM) combined score, with 25 per cent vesting for a median ranking and 100 per cent vesting for an upper quartile ranking. As a result of Ofwat transitioning from SIM to C-MeX as its primary assessment of customer service, the committee resolved to adjust this element of the 2018 LTP to be based on the new C-MeX measure and written complaints, with targets set to be of equivalent difficulty.
(3) This is an estimate as the final outcome will not be known until the volume of written complaints received by other companies are available later in 2021.(4) As confirmed in last year’s report, the committee exercised its discretion to allow good leaver status to apply to Russ Houlden’s outstanding LTP awards upon his
retirement. A pro rata reduction has been made to his 2018 LTP award to reflect the proportion of the performance period served.(5) Average share price over the three-month period from 1 January 2021 to 31 March 2021.(6) 17.8 per cent of the value vesting is attributable to share price appreciation which equates to £210,000 for Steve Mogford, £103,000 for Russ Houlden and
£16,000 for Phil Aspin.
Stock Code: UU. Annual Report and Financial Statements for the year ended 31 March 2021 169
GO
VER
NA
NC
E

Corporate governance reportAnnual report on remuneration
2020 LTP awards with a performance period ending 31 March 2023 (audited information)The table below provides details of share awards made to executive directors on 30 November 2020 in respect of the 2020 LTP:
Executive director Type of award Basis of award
Face valueof award(£’000)(1)
Number ofshares under
award% vesting at
threshold
End ofperformance
period(2)
Steve Mogford Conditional shares 130% of salary £1,008 112,097 25% 31.3.2023
Phil Aspin Conditional shares 130% of salary £520 57,842 25% 31.3.2023
(1) The face value has been calculated using the closing share price 27 November 2020 (the dealing day prior to the date of grant) which was 899.2 pence per share.(2) An additional holding period applies after the end of the performance period such that the overall vesting period is five years from the grant date.
As part of the directors’ remuneration policy review during 2018/19 the committee consulted with shareholders on changing the structure of the LTP such that the 2020 and future awards would be based on two equally weighted components: Return on Regulated Equity (RoRE) and a customer basket of measures. Shareholders approved the new policy at the 2019 AGM.
Whilst LTP awards are normally granted in June each year, due to the uncertainties posed by the COVID-19 pandemic and particular concerns at the time about the possible extent of the disruption caused, the committee delayed the 2020 LTP award grants until November to allow more time to settle the targets.
Stretching targets were set for the RoRE measure taking into account the allowed return over the period (as set out in the final determination) and the expected returns to be generated through financial and operational performance. When determining the measures that should form the customer basket component of the awards the committee took in to account feedback received from customer research and focus groups (as to which areas of service and performance they considered the highest priority) and the performance commitments agreed with Ofwat in the final determination for the regulatory period, thereby ensuring that the measures selected reflected the views and priorities of key stakeholders. The committee is pleased that alongside focusing on areas of performance that will have meaningful and tangible outcomes for customers, the measures chosen reflect its commitment to recognising evolving expectations in regard to environmental, social and governance matters.
Details about the 2020 LTP performance measures and targets are shown in the following table. Performance is measured over the three-year period 1 April 2020 to 31 March 2023. The table on page 164 summarises how these performance measures are linked to our business strategy.
MeasureTargets(1)
Threshold (25% vesting) Stretch (100% vesting) WeightingReturn on Regulated Equity (RoRE)Company RoRE Equal to the average of Ofwat’s allowed
RoRE over the three financial years of the performance period
1.0% (or more) above the average of Ofwat’s allowed RoRE
over the three financial years of the performance period
50.0%
Customer basket of measures(2)
C-MeX ranking out of all the other water and wastewater companies(3) Ranked 9th Ranked 6th or better
5.0%
Water poverty(3) 62,100 customers have been lifted out of water poverty
83,000 (or more) customers have been lifted out of water poverty
5.0%
Priority services(3) N/A 5.5% or more of our customers are listed on the Priority
Services Register
5.0%
Sewer flooding incidents(3) A combined total of 1,161 sewer flooding incidents per 10,000km
of our wastewater network
A combined total of less than or equal to 990 sewer flooding incidents per
10,000km of our wastewater network
5.0%
Pollution incidents(4) 23.00 pollution incidents per 10,000km of our wastewater network
≤21.54 pollution incidents per 10,000km of our wastewater network
5.0%
Treatment works compliance(4) 97.9% compliance ≥99.0% compliance 5.0%
Water quality contacts(4) 14.7 customer contacts per 10,000 customers
≤13.8 customer contacts per 10,000 customers
5.0%
Leakage(3) A three-year average of 101.6 megalitres of leakage per 10,000km of our
water network per day
A three-year average of less than or equal to 97.6 megalitres of leakage per 10,000km
of our water network per day
5.0%
Compliance risk index (CRI)(4) CRI score of 3.27 CRI score of ≤2.00 5.0%The Environment Agency’s Environmental Performance Assessment (EPA) rating(5)
3 star rating 4 star rating 5.0%
Overall underpinOverall vesting is subject to the committee being satisfied that the company’s performance on these measures is consistent with underlying business performance and that the company’s dividend policy has been delivered in respect of each financial year of the performance period.
(1) Straight-line vesting applies between the threshold and stretch targets, with nil vesting below threshold performance(2) The customer basket of measures are based on the performance commitment definitions as per the AMP7 final determination(3) Outcome based on performance in respect of the financial year ending 31 March 2023 as published in our own and/or the other water companies’ Annual
Performance Reports for 2022/23(4) Outcome based on performance in respect of the calendar year ending 31 December 2022 as published in our own and/or the other water companies’
Annual Performance Reports for 2022/23(5) Outcome based on performance in respect of the calendar year ending 31 December 2022 as published in the Environment Agency’s published report in 2023
United Utilities Group PLC unitedutilities.com/corporate 170
GOVERNANCE

INCENTIVES IN 2021/22Ensuring alignment with our business planThe performance measures used in our incentive schemes during 2021/22 will remain aligned directly with the business plan, with a material weighting on measures that are linked to delivery for customers. Further details about the measures used and the stretching targets set will be provided in next year’s directors’ remuneration report.
Annual bonus in respect of the financial year commencing 1 April 2021The maximum bonus opportunity for the year commencing 1 April 2021 will remain unchanged at 130 per cent of base salary.
The annual bonus will operate in broadly the same way as that for 2020/21, except the calculation approach for the written complaints measure will be different compared to previous years. Complaints were previously reported using the SIM complaints and unwanted contacts methodology which is now discontinued. Water companies now report all complaints to the Consumer Council for Water on the basis of 10,000 connected properties and so the targets for 2021/22 have been set on this basis. This means that comparing the written complaints targets from 2020/21 with those agreed for 2021/22 is not a like-for-like comparison, but the committee is satisfied that the targets set are stretching when taking account of previous performance and expected relative performance versus the other water and wastewater companies.
The table below summarises the measures, weighting and targets for the 2021/22 bonus. Targets that are considered commercially sensitive will be disclosed retrospectively in the 2021/22 annual report on remuneration.
Measure
TargetsWeighting
(% of award)Threshold
(25% vesting)Target
(50% vesting)Stretch
(100% vesting)Underlying operating profit(1) Commercially sensitive 25.0%
Customer service in yearC-MeX ranking out of the 17 water companies 8th position 6th position 4th position 10.0%
Written complaints (per 10,000 connected properties) 20.50 20.25 20.00 10.0%
Maintaining and enhancing services for customersOutcome delivery incentive (ODI) composite Commercially sensitive 35.0%
Time, cost and quality of capital programme (TCQi)(2) 85.0% 90.0% 95.0% 20.0%
Total 100%
(1) Underlying operating profit for bonus purposes excludes infrastructure renewals expenditure and property trading.
(2) TCQi is an internal measure which measures the extent to which we deliver our capital projects on time, to budget and to the required quality standard. It is expressed as a percentage, with a higher percentage representing better performance.
2021 LTP awards with a performance period ending 31 March 2024Awards are expected to be made in late June 2021 and the award level for executive directors will remain unchanged at 130 per cent of base salary.
Stretching targets will be set for the RoRE measure taking into account the allowed return over the period (as set out in the final determination) and the expected returns to be generated through financial and operational performance.
In respect of the customer basket, the committee will again finalise the selection of measures in consideration of customer priorities and performance commitments agreed by Ofwat in the final determination for the regulatory period.
Stock Code: UU. Annual Report and Financial Statements for the year ended 31 March 2021 171
GO
VER
NA
NC
E

Corporate governance reportAnnual report on remuneration
ALIGNMENT OF EXECUTIVE PAY APPROACH WITH THAT OF THE WIDER WORKFORCE AND LISTENING TO THE EMPLOYEE VOICE
The committee is always mindful of the alignment of executive pay arrangements with those of the wider workforce and, as is demonstrated in the table on page 173, there is a high level of alignment and consistency of approach.
When reviewing salaries and assessing incentive outcomes for the executives, the committee takes account of how those elements of remuneration have been (or will be) applied across the wider workforce in respect of the same periods. At each of its meetings the committee receives an update on notable matters affecting pay and benefits among the wider workforce since its previous meeting, and at least annually the committee formally reviews and discusses a report detailing all elements of the workforce’s pay and benefits.
The committee has mechanisms through which it hears from and engages with the workforce on executive pay. As chair of the committee, insights related to remuneration that arise via Alison Goligher in her role as designated non-executive director for workforce engagement can be quickly and appropriately considered, and a formal report is presented to the committee at least annually in this respect. Alison hosts sessions with the Employee Voice panel which cover topics including the alignment of our executive pay approach with that of the wider workforce, providing valuable opportunities for open discussions and feedback. See pages 126 and 127 for further details.
The figures below show how the percentage change in the CEO’s salary, benefits and bonus earned in 2019/20 and 2020/21 compares with the percentage change in the average of each of those components for a group of employees. The table below that shows the same information in respect of each board member.
Change in CEO remuneration
Base salary(1)
-4.2%Bonus(2)
+16.7%Benefits(3)
-14.1%
Change in employee remuneration(4)
Base salary(5)
+4.1Bonus+13.6%
Benefits+6.9%
Change in other board member remuneration
% change in 2020/21 versus 2019/20Salary/Fees Benefits(3) Bonus
Executive directors(2)
Russ Houlden(6) -4.2% n/a n/aPhil Aspin(7) n/a n/a n/aNon-executive directors(8)
Sir David Higgins(6) (9) 111.1% -96.6% n/aStephen Carter -4.4% -93.0% n/aKath Cates(7) n/a n/a n/aMark Clare -4.4% -96.6% n/aAlison Goligher(10) 9.4% -81.0% n/aBrian May -4.4% -96.6% n/aPaulette Rowe -4.2% -95.2% n/aDoug Webb(7) n/a n/a n/aSara Weller(6) -4.4% n/a n/a
(1) Steve Mogford received no salary increase in 2020/21 and the salary received reflects a voluntary reduction of 20 per cent for three months which was donated to charity. See page 43 for further details.
(2) Steve Mogford’s annual bonus in 2019/20 reflected a discretionary reduction related to the performance of Water Plus in that year. No such adjustment has been made to his 2020/21 annual bonus with the outcome being based on the group scorecard, which also applies to the bonuses received by the wider workforce. See page 168 for further details.
(3) Benefits for all board members decreased primarily due to a reduction in travel and subsistence costs arising from the COVID-19 pandemic. A year-on-year comparison of benefits for Russ Houlden and Sara Weller would not be meaningful as they both stepped down from the board on 24 July 2020.
(4) To aid comparison, the group of employees selected by the committee are all those members of the workforce who were employed over the complete two-year period.(5) Includes promotional increases. The headline salary increase for employees was 2.3 per cent.(6) Russ Houlden stepped down from the board on 24 July 2020. Sir David Higgins was appointed to the board on 13 May 2019. Sara Weller stepped down
from the board on 24 July 2020. To enable a meaningful year-on-year comparison their salary/fees reflect hypothetical full-year earnings, however we do not believe a year-on-year comparison of bonus outcomes for Russ Houlden is appropriate given his date of departure.
(7) Phil Aspin was appointed to the board on 24 July 2020. Kath Cates and Doug Webb were appointed to the board on 1 September 2020.(8) Calculated using the fees and taxable benefits shown in the table on page 178. The fees for the non-executive directors were not changed in 2020/21 and
reflect a voluntary reduction of 20 per cent for three months which was donated to charity. See page 43 for further details.(9) The fee increase shown for Sir David Higgins reflects 2020/21 being his first full year as Chairman. In the prior year his fees were associated with his role as
a non-executive director and chairman designate.(10) The fee increase for Alison Goligher reflects her appointment as remuneration committee chair with the associated fee effective from 24 July 2020.
United Utilities Group PLC unitedutilities.com/corporate 172
GOVERNANCE

CASCADE OF REMUNERATION THROUGH THE ORGANISATION
The table below summarises how remuneration compares across the different groups of employees throughout the company.
Employee group (number of employees covered) Element of pay Description
Employees at all levels (around 5,700)
Salary We want to attract and retain employees of the experience and quality required to deliver the company’s strategy. Salaries are reviewed annually, with executive directors normally receiving a salary increase broadly in line with the increase awarded to the general workforce. As a Living Wage accredited employer all our employees (except those on a training scheme such as apprentices) receive at least the voluntary living wage rate. In 2020 the base salary increase for employees was 2.3 per cent (the executive directors did not receive an increase).
Health and wellbeing benefits All employees are eligible for company-funded healthcare and an enhanced company sick pay scheme. Employees have access to a medical advice and information service (Best Doctors) service for them and their families. All employees have free 24/7 access to our employee assistance programme which provides counselling and support to employees and their households. We have over 150 trained mental health first aiders who can listen to and signpost employees to relevant support services, and a similar number of wellbeing champions who help promote our wellbeing campaigns. Financial wellbeing is a key focus, with financial education tools and awareness courses available for all employees covering a broad range of money management topics such as financial planning, managing debt and pensions.
Flexible benefits All employees have access to a variety of additional voluntary benefits to suit their lifestyle, and can choose from a range of deals and discounts all year round. Employees can donate to their chosen charities directly from their pay if they want to. Around 50 per cent of employees take up at least one of these flexible options.
Pension Employees at all levels can participate in our award-winning pension arrangements and almost all of our employees choose to do so. The company doubles any contributions that employees make up to a maximum of 14 per cent of salary. As part of the pension scheme employees receive company-funded life assurance and income protection.
ShareBuy Any employee can become a shareholder in our company and share in our success by participating in our ShareBuy scheme. For every five shares an employee buys the company gives another one free. Just over half of the workforce participate in our ShareBuy scheme.
Annual bonus – cash Employees at all levels participate in the annual bonus scheme, receiving financial rewards based on the performance of the company and their personal contribution. Specific weightings and award levels vary by grade. There is strong alignment to strategy throughout the organisation, with the same scorecard applying at all levels.
CEO, CFO and executives (10)
Annual bonus – deferred shares Each of the executive directors and executives is required to defer a proportion of their bonus into shares for three years.
CEO, CFO, executives and other senior leaders (around 60)
Long Term Plan (LTP) Executives and other senior leaders may be invited to participate in the LTP. Performance conditions are the same for all participants but award sizes vary.
CEO, CFO and executives (10)
Shareholding guidelines All executives are subject to shareholding guidelines, aligning their interests with those of shareholders.
Stock Code: UU. Annual Report and Financial Statements for the year ended 31 March 2021 173
GO
VER
NA
NC
E

Corporate governance reportAnnual report on remuneration
CEO PAY RATIOS
The table below sets out the ratio of the CEO’s pay to that of the 25th percentile (P25), median (P50) and 75th percentile (P75) full-time equivalent employees. The ratios have been calculated in accordance with the regulations which provide for three different approaches to determine the pay ratio (Options A, B and C).
The data in the tables below has been calculated using Option A which is considered to be the most accurate methodology and uses the same calculation basis as required for the CEO’s total remuneration as shown in the single figure table on page 167.
• We identified all employees who received base salary during the year ended 31 March 2021 and who were still employed on that date.
• The calculations were carried out using their total pay and benefits received in respect of the year ended 31 March 2021, including bonuses earned by reference to performance in the financial year and paid in June following the end of the financial year.
• For employees who were employed on a part-time basis, or who were not employed for the full year, their remuneration has been annualised to reflect the full-time equivalent.
• No other estimates or adjustments have been used in the calculations and no other remuneration items have been omitted.
Financial year MethodPay ratios
P25 P50 P75
2020/21 Option A 85:1 64:1 51:1
2019/20(1) Option A 79:1 60:1 48:1
(1) The figures for 2019/20 have been restated to reflect the final vesting outcome, additional dividend equivalents and updated share price for Steve Mogford’s 2017 LTP as shown in the single figure table on page 167.
Along with the ratios comparing total remuneration, the committee keeps under review the ratios for salary and salary plus annual bonus, and tracks how these change over time. With a significant proportion of the remuneration of the CEO linked to company performance and share price movements over the longer term, it is expected that the headline ratios will depend primarily on the Long Term Plan (LTP) outcome, and, accordingly, may fluctuate from year to year. Participation in the LTP is currently limited to around 60 executives and senior leaders, with none of the individuals identified as P25, P50 and P75 in this group. On the other hand, employees at all levels participate in the annual bonus scheme, and so the committee considers this ratio as well as the ratio comparing only salary, to provide helpful additional context.
Pay ratios for different elements of remuneration (2020/21)Pay ratios
P25 P50 P75
Total remuneration (as above) 85:1 64:1 51:1
Salary plus annual bonus 52:1 38:1 30:1
Salary 26:1 19:1 15:1
The table below shows the total remuneration, salary plus annual bonus, and salary at each of the three quartiles.
£’000CEO P25 P50 P75
Total remuneration 2,940 34 46 58
Salary plus annual bonus 1,560 30 42 52
Salary 736 29 39 50
The committee notes that there has been a small increase in the statutory CEO pay ratios this year, with the ratio of CEO total remuneration to the median employee (P50), for example, increasing from 60:1 to 64:1. This increase is driven primarily by a higher payout under the annual bonus and higher expected vesting under the LTP than recorded last year, and is partially offset by the voluntary salary reduction taken by the CEO for three months during the year. Having considered both the statutory and additional ratios, the committee is satisfied that the changes are related to appropriate differences in the structure of remuneration at different levels of the workforce, with ‘at risk’ performance-linked pay elements forming a greater proportion of the overall remuneration package at the most senior levels. See page 165 for further details. The committee will continue to consider the pay ratios in the context of other important metrics such as the gender pay gap and employee engagement levels.
United Utilities Group PLC unitedutilities.com/corporate 174
GOVERNANCE
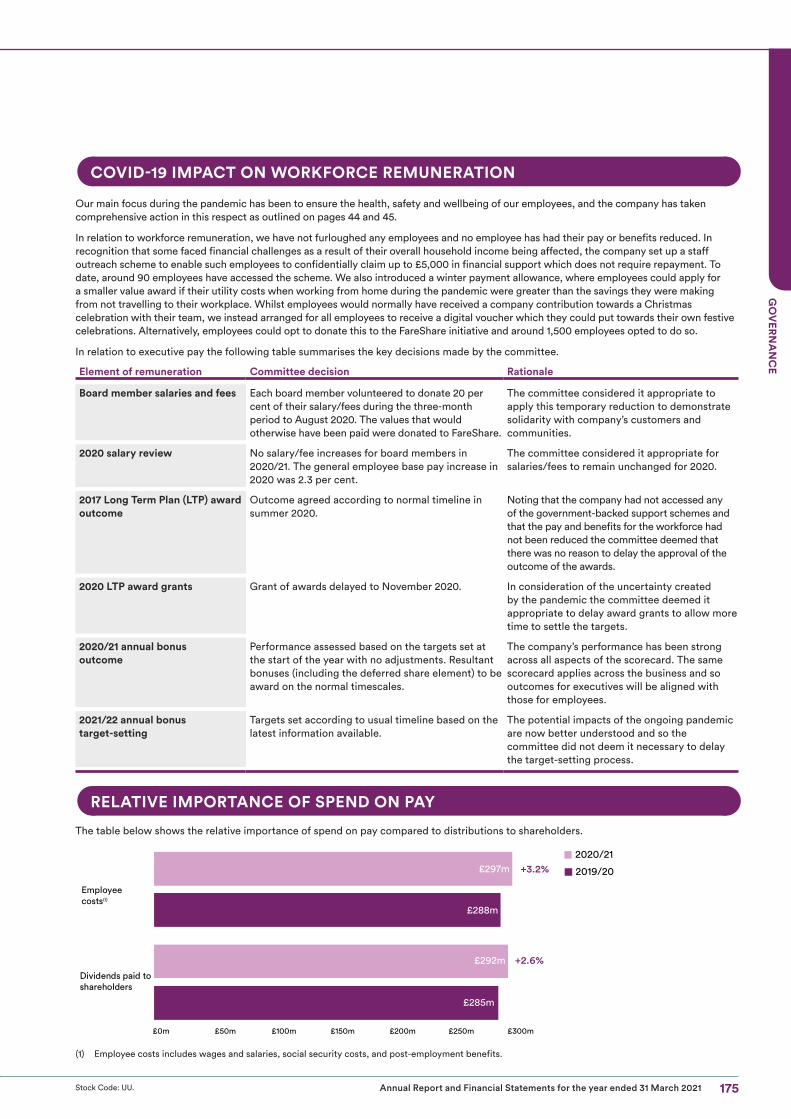
COVID-19 IMPACT ON WORKFORCE REMUNERATION
Our main focus during the pandemic has been to ensure the health, safety and wellbeing of our employees, and the company has taken comprehensive action in this respect as outlined on pages 44 and 45.
In relation to workforce remuneration, we have not furloughed any employees and no employee has had their pay or benefits reduced. In recognition that some faced financial challenges as a result of their overall household income being affected, the company set up a staff outreach scheme to enable such employees to confidentially claim up to £5,000 in financial support which does not require repayment. To date, around 90 employees have accessed the scheme. We also introduced a winter payment allowance, where employees could apply for a smaller value award if their utility costs when working from home during the pandemic were greater than the savings they were making from not travelling to their workplace. Whilst employees would normally have received a company contribution towards a Christmas celebration with their team, we instead arranged for all employees to receive a digital voucher which they could put towards their own festive celebrations. Alternatively, employees could opt to donate this to the FareShare initiative and around 1,500 employees opted to do so.
In relation to executive pay the following table summarises the key decisions made by the committee.
Element of remuneration Committee decision Rationale
Board member salaries and fees Each board member volunteered to donate 20 per cent of their salary/fees during the three-month period to August 2020. The values that would otherwise have been paid were donated to FareShare.
The committee considered it appropriate to apply this temporary reduction to demonstrate solidarity with company’s customers and communities.
2020 salary review No salary/fee increases for board members in 2020/21. The general employee base pay increase in 2020 was 2.3 per cent.
The committee considered it appropriate for salaries/fees to remain unchanged for 2020.
2017 Long Term Plan (LTP) award outcome
Outcome agreed according to normal timeline in summer 2020.
Noting that the company had not accessed any of the government-backed support schemes and that the pay and benefits for the workforce had not been reduced the committee deemed that there was no reason to delay the approval of the outcome of the awards.
2020 LTP award grants Grant of awards delayed to November 2020. In consideration of the uncertainty created by the pandemic the committee deemed it appropriate to delay award grants to allow more time to settle the targets.
2020/21 annual bonusoutcome
Performance assessed based on the targets set at the start of the year with no adjustments. Resultant bonuses (including the deferred share element) to be award on the normal timescales.
The company’s performance has been strong across all aspects of the scorecard. The same scorecard applies across the business and so outcomes for executives will be aligned with those for employees.
2021/22 annual bonus target-setting
Targets set according to usual timeline based on the latest information available.
The potential impacts of the ongoing pandemic are now better understood and so the committee did not deem it necessary to delay the target-setting process.
RELATIVE IMPORTANCE OF SPEND ON PAY
The table below shows the relative importance of spend on pay compared to distributions to shareholders.
£0m £50m £100m £150m £200m £250m £300m
+3.2%2020/21
2019/20
Employee costs(1)
£297m
£288m
Dividends paid to shareholders
+2.6%
£285m
£292m
(1) Employee costs includes wages and salaries, social security costs, and post-employment benefits.
Stock Code: UU. Annual Report and Financial Statements for the year ended 31 March 2021 175
GO
VER
NA
NC
E

Corporate governance reportAnnual report on remuneration
EXECUTIVE DIRECTORS’ INTERESTS IN SHARES
Executive directors’ shareholding (audited information)Executive directors are expected to reach a shareholding guideline of 200 per cent of salary, normally within five years of appointment. The shareholding guideline includes a post-employment shareholding requirement, under which executive directors must continue to hold the lower of 200 per cent of salary in shares or their shareholding on departure, for two years after ceasing employment with the group. As the only current executive director in role before 19 May 2020, Steve Mogford must retain shares vesting from share awards relating to performance periods beginning on or after 1 April 2020 if not doing so would take his shareholding below the guideline. Phil Aspin (and future executive directors) must retain shares vesting from all share awards (including in-flight awards) if not doing so would take his shareholding below the guideline. The committee has put in place nominee arrangements for relevant vesting share awards to enable the post-employment shareholding requirements to be enforced.
Details of beneficial interests in the company’s ordinary shares as at 31 March 2021 held by each of the executive directors and their connected persons are set out in the charts below along with progress against the target shareholding guideline level. Steve Mogford continues to exceed the target shareholding guideline level of 200 per cent of salary. Phil Aspin is expected to reach the minimum guideline by 24 July 2025 (within five years of his appointment to the board).
Phil Aspin (CFO)
’00
0s
of s
hare
s
Year ended 31 March
2020
286
170
107
2021
Year ended 31 March
2021
111
2020
224
111
88
Year ended 31 March
2021
14 n/a
2020
350
300
250
200
150
100
50
0
Steve Mogford (CEO) Russ Houlden (CFO)
Unvested shares not subject to performance conditions after tax and National Insurance
Shares owned outright
Number of shares required to achieve shareholding guideline at 31 March 2021
Further details of the executive directors’ shareholdings and share plan interests are given in the table below and in the appendix on page 189.
Director
Share- holding
guideline (% of
salary)
Number of shares required to meet
share- holding
guide-line(1)
Number of shares owned
outright (including connected persons)
Unvested shares not subject to performance conditions (2)
Total shares counting towards
shareholding guidelines(3)
Share- holding
as % of base
salary at 31 March
Share- holding
guideline met at
31 March
Unvested shares subject to
performance conditions(4)
2021 2020 2021 2020 2021 2020 2021(1) 2021 2021 2020
Steve Mogford(5)(6) 200% 169,758 110,630 70,178 331,476 289,524 286,331 223,646 337% Yes 390,702 381,010
Russ Houlden(6)(7) 200% 107,216 0 14,195 208,838 182,219 110,684 110,791 206% n/a 108,160 240,605
Phil Aspin(5) 200% 87,594 11,439 n/a 4,299 n/a 13,736 n/a 31% No 79,794 n/a
(1) Share price used is the average share price over the three months from 1 January 2021 to 31 March 2021 (913.3 pence per share).
(2) Unvested shares subject to no further performance conditions such as matching shares under the ShareBuy scheme. Includes shares subject only to withholding provisions such as Deferred Bonus Plan shares in the three-year deferral period and Long Term Plan shares in the applicable holding period.
(3) Includes unvested shares not subject to performance conditions (on a net of tax and National Insurance basis), plus the number of shares owned outright.
(4) Includes unvested shares under the Long Term Plan.
(5) In the period 1 April 2021 to 26 May 2021, additional shares were acquired by Steve Mogford (30 ordinary shares) and Phil Aspin (31 ordinary shares) in respect of their regular monthly contributions to the all-employee ShareBuy scheme. These will be matched by the company on a one-for-five basis. Under the scheme, matching shares vest one year after grant provided the employee remains employed by the company.
(6) On 1 April 2021, shares granted on 28 June 2016 under the Long Term Plan vested for Steve Mogford and Russ Houlden following their additional two- year holding period. Steve Mogford had 78,203 shares vesting, of which 36,848 shares were sold to cover tax and National Insurance. Steve retained the remaining balance of 41,355 shares. Russ Houlden had 49,356 shares vesting, of which 23,070 shares were sold to cover tax and National Insurance.
(7) Russ Houlden left the company on 31 July 2020. Whilst due to the timing of his retirement Russ was not subject to the new formal post-exit shareholding policy, under existing provisions he will continue to retain an interest in shares vesting through the incentive schemes until 2023, three years after his retirement from the company.
United Utilities Group PLC unitedutilities.com/corporate 176
GOVERNANCE

OTHER INFORMATION
Dilution limitsAwards granted under the company’s share plans are satisfied by market purchased shares bought on behalf of the company by United Utilities Employee Share Trust immediately prior to the vesting of a share plan. The company does not make regular purchases of shares into the Trust nor employ a share purchase hedging strategy, and shares are bought to satisfy the vesting of share plans. The rules of the Deferred Bonus Plan do not permit awards to be satisfied by newly issued shares and must be satisfied by market purchased shares. The rules of the Long Term Plan permit the awards to be satisfied by newly issued shares but the company has decided to satisfy awards by market purchased shares.
Should the company’s method of satisfying share plan vestings change (i.e. issuing new shares) then the company would monitor the number of shares issued and their impact on dilution limits set by the Investment Association in respect of all share plans (10 per cent in any rolling ten-year period) and executive share plans (5 per cent in any rolling ten-year period). No treasury shares were held or utilised in the year ended 31 March 2021.
Company performance and CEO remuneration comparison
The total shareholder return (TSR) chart below illustrates the company’s performance against the FTSE 100 over the past ten years. The FTSE 100 is an appropriate comparator as the company is a member of the FTSE 100 and it is a widely published benchmark for this purpose. The chart shows the growth in the value of a hypothetical £100 holding invested in the company over the ten-year period. The chart also shows the CEO’s single total figure remuneration over the ten years ended 31 December 2021 for comparison. The table below the TSR chart shows the remuneration data for the CEO over the same period. Steve Mogford was the CEO over the whole period.
United Utilities Group PLC
FTSE 100 Index
250 3,500
CEO
sin
gle
�gur
e of
rem
uner
atio
n £’
00
0
3,000
2,500
2,000
1,500
1,000
500
0
200
100
150
50
02012 2013 2014 2015 2016 2017 2018 2019 2020 2021
100107
132
155
125
191
133
197
126
221
155
166
155
200
167
232250
136
166
117101
Valu
e £
Year ended 31 March 2012 2013 2014 2015 2016 2017 2018 2019 2020 2021
CEO single figure of remuneration (£’000)
1,421 1,549 2,378 2,884 2,760(1) 2,233 2,221 2,448(2) 2,654(3) 2,940
Annual bonus payment (% of maximum)
72.0 84.4 78.2 77.4 54.5 83.7 74.9 79.0 70.7 81.8
LTP vesting (% of maximum)(4) n/a(5) n/a(5) 93.5 97.5 33.6 54.5 55.4 64.4 87.3(3) 89.6(6)
(1) This includes the payout from the 2013 Long Term Plan (LTP) as well as £1.028 million in respect of Steve Mogford’s one-off Matched Share Investment Scheme that ended on 5 January 2016 (vested at 100 per cent).
(2) The payout from the 2016 LTP, which vested on 1 April 2021 after the end of a two-year holding period, has been updated to reflect the additional dividends accruing on this award and the closing share price on the date of vesting of 928.4 pence per share.
(3) The payout and vesting percentage for the 2017 LTP have been restated to reflect the additional dividend equivalents accruing on the award, the final vesting outcome and updated share price. See page 167 for further details.
(4) For performance periods ended on 31 March, unless otherwise stated.
(5) Steve Mogford was not a participant in any long-term incentive plans that had performance periods ending during 2012 and 2013. For those who did participate in those plans, the vesting as a percentage of maximum was 37.5 per cent for those vesting in 2012 and 35.3 per cent for those vesting in 2013.
(6) The 2018 Long Term Plan amount vesting percentage is estimated. See page 169 for further details.
Date of service contracts
Executive directors Date of service contract
Steve Mogford 5.1.11
Phil Aspin 24.7.20
Stock Code: UU. Annual Report and Financial Statements for the year ended 31 March 2021 177
GO
VER
NA
NC
E

Corporate governance reportAnnual report on remuneration
NON-EXECUTIVE DIRECTORSSingle total figure of remuneration for non-executive directors (audited information)
Salary/fees £’000 (1) Taxable benefits £’000 Total £’0002021 2020 2021 2020 2021 2020
Sir David Higgins(2) 285 126 0 3 285 129
Stephen Carter 76 80 0 1 76 81
Kath Cates(3) 40 n/a 0 n/a 40 n/a
Mark Clare 78 81 0 3 78 84
Alison Goligher 74 68 0 0 74 68
Brian May 80 84 0 3 80 87
Paulette Rowe 65 68 0 2 65 70
Doug Webb(3) 40 n/a 0 n/a 40 n/a
Sara Weller(4) 22 81 1 1 23 82
(1) In the context of the COVID-19 pandemic it was determined that fees should not increase in 2020. The fees received by the non-executive directors reflect a voluntary reduction of 20 per cent for three months, the total value of which was donated to charity. The general workforce base salary increase in 2020 was 2.3 per cent.
(2) Sir David Higgins joined the board as a non-executive director and chairman designate with effect from 13 May 2019, receiving annual fees of £80,000. On his appointment as Chairman effective 1 January 2020, his annual fees increased to £300,000.
(3) Kath Cates and Doug Webb joined the board on 1 September 2020.(4) Sara Weller stepped down from the board on 24 July 2020. The benefits value shown for 2021 reflects the cost of a retirement gift she received.
FeesNon-executive director base fees and the additional fees for the senior independent non-executive director and the chairs of committees are reviewed annually, but were not increased in 2020/21.
RoleFees £’000
1 Sept 2020 1 Sept 2019
Base fee: Chairman(1)(2) 300.0 315.0
Base fee: other non-executive directors(3) 68.2 68.2
Senior independent non-executive director(3) 13.5 13.5
Chair of audit and treasury committees(3) 16.0 16.0
Chair of remuneration committee(3) 13.5 13.5
Chair of corporate responsibility committee(3) 12.0 12.0
(1) Approved by the remuneration committee.(2) With effect from the appointment of Sir David Higgins on 1 January 2020 the base fee for the Chairman was set at £300,000.(3) Approved by a separate committee of the board.
Non-executive directors’ shareholdings (audited information)Details of beneficial interests in the company’s ordinary shares as at 31 March 2021 held by each of the non-executive directors and their connected persons are set out in the table below.
Non-executive directors Date first appointed to the board
Number of shares owned outright (including connected persons) at
31 March 2021(1)
Sir David Higgins 13.5.19 3,000
Stephen Carter 1.9.14 3,075
Kath Cates 1.9.20 2,135
Mark Clare 1.11.13 7,628
Alison Goligher 1.8.16 3,000
Brian May 1.9.12 3,000
Paulette Rowe 1.7.17 3,000
Doug Webb 1.9.20 5,700
Sara Weller(2) 1.3.12 11,000
(1) From 1 April 2021 to 26 May 2021 there have been no movements in the shareholdings of the non-executive directors.(2) Sara Weller had 11,000 shares when she stepped down from the board with effect from 24 July 2020.
United Utilities Group PLC unitedutilities.com/corporate 178
GOVERNANCE

THE REMUNERATION COMMITTEE
Summary terms of referenceThe committee’s terms of reference were last reviewed in November 2020 and are available on our website: unitedutilities.com/corporate-governance
The committee’s main responsibilities include:
• Determining and recommending to the board the policy for executive director remuneration, having reviewed and taken into account workforce remuneration and related policies and the alignment of incentives and reward with culture;
• Setting the individual employment and remuneration terms for executive directors and other senior executives, including: recruitment and severance terms, bonus plans and targets, and the achievement of performance against targets;
• Approving the general employment and remuneration terms for selected senior employees;
• Setting the remuneration of the Chairman of the company;
• Proposing all new long-term incentive schemes for approval of the board, and for recommendation by the board to shareholders; and
• Assisting the board in reporting to shareholders and undertaking appropriate discussions as necessary with institutional shareholders on aspects of executive remuneration.
Composition of the remuneration committee as at 31 March 2021
Member Member since
Alison Goligher (chair since 24.7.20) 1.8.16
Kath Cates 1.9.20
Mark Clare 1.9.14
Brian May 16.5.17
Sara Weller was chair of the remuneration committee until 24 July 2020 when she stepped down from the board.
The committee’s members have no personal financial interest in the company other than as shareholders and the fees paid to them as non- executive directors.
Activities of the remuneration committee over the past yearThe committee met five times in the year ended 31 March 2021 and carried out a number of key activities:
• Approved the 2019/20 directors’ remuneration report;
• Considered and agreed the executive remuneration related actions arising from the COVID-19 pandemic as outlined on page 175.
• Reviewed the pay comparator group;
• Reviewed the base salaries of executive directors and other members of the executive team;
• Reviewed the base fee for the Chairman;
• Assessed the achievement of targets for the 2019/20 annual bonus scheme, reviewed progress against the targets for the 2020/21 annual bonus scheme, and considered the targets for the 2021/22 annual bonus;
• Assessed the achievement of targets for the Long Term Plan (LTP) awards made in 2017, reviewed progress against the targets for the 2018 and 2019 LTP awards, and set the measures and targets for the 2020 LTP awards;
• Reviewed and approved awards made under the annual bonus, Deferred Bonus Plan (DBP) and LTP;
• Monitored progress against shareholding guidelines for executive directors and other members of the executive team;
• Reviewed the committee’s performance during the period;
• Considered the remuneration arrangements of the wider workforce and their alignment with those of the executives, alongside feedback received from the workforce via Alison Goligher in her role as the non-executive director for workforce engagement;
• Considered governance developments and market trends in executive remuneration, including in the wider utilities sector; and
• Noted progress on the company’s gender pay gap reporting.
Stock Code: UU. Annual Report and Financial Statements for the year ended 31 March 2021 179
GO
VER
NA
NC
E

Corporate governance reportAnnual report on remuneration
Support to the remuneration committeeBy invitation of the committee, meetings are attended by the Chairman of the company, the chief executive officer, the company secretary (who acts as secretary to the committee), the customer services and people director and the head of reward, who are consulted on matters discussed by the committee, unless those matters relate to their own remuneration. Advice or information is also sought directly from other employees where the committee feels that such additional contributions will assist the decision-making process.
The committee is authorised to take such internal and external advice as it considers appropriate in connection with carrying out its duties, including the appointment of its own external remuneration advisers.
During the year, the committee was assisted in its work by the following external advisers:
Adviser Appointed by How appointed
Services provided to the committee in year ended 31 March 2021
Additional services provided in year ended 31 March 2021
Fees paid by company for these services in respect of year and basis of charge
Mercer/Kepler, a brand of Mercer (and part of the MMC group) (to 31 December 2020)
Committee Appointed following a tender process in 2019
General advice on remuneration matters including analysis of the remuneration policy and regular market and best practice updates.
Advice and benchmarking on non-executive director and senior leader remuneration. Mercer supplied unrelated services to the Group in relation to IAS 19.
£56,000 on a time/ cost basis as set out in accordance with the terms and conditions in the relevant engagement letter
Ellason LLP (from 1 January 2021)
Committee Appointed following the lead adviser moving to Ellason LLP
General advice on remuneration matters including analysis of the remuneration policy and regular market and best practice updates.
Advice and benchmarking on non-executive director and senior leader remuneration.
£8,000 on a time/ cost basis as set out in accordance with the terms and conditions in the relevant engagement letter
Mercer and Ellason are both signatories to the Remuneration Consultant Group’s Code of Conduct which sets out guidelines to ensure that any advice is independent and free of undue influence (which can be found at www.remunerationconsultantsgroup.com). None of the individual directors have a personal connection with Mercer or Ellason. The committee is satisfied that the advice it receives is objective and independent and confirms that neither Mercer|Kepler nor Ellason have any connection with the company that may impair their independence.
In addition, during the year the law firm Eversheds Sutherland provided advice to the company in relation to the company’s share schemes.
United Utilities Group PLC unitedutilities.com/corporate 180
GOVERNANCE

2020 AGM: STATEMENT OF VOTING
At the last annual general meeting on 24 July 2020, votes on the 2020/21 directors’ remuneration report (other than the part containing the directors’ remuneration policy) were cast as follows:
Votes for 460,435,984
Votes against 12,243,691
(97.41% of votes cast)
(2.59% of votes cast)
472,679,675 Total votes cast
2,389,096Votes withheld(abstentions)
At the annual general meeting on 26 July 2019, votes on the directors’ remuneration policy were cast as follows:
Votes for 458,175,960
Votes against 2,709,122
(99.41% of votes cast)
(0.59% of votes cast)
460,885,082 Total votes cast
667,337Votes withheld(abstentions)
The directors’ remuneration report was approved by the board of directors on 26 May 2021 and signed on its behalf by:
Alison GoligherChair of the remuneration committee
Stock Code: UU. Annual Report and Financial Statements for the year ended 31 March 2021 181
GO
VER
NA
NC
E

Corporate governance reportAppendix 1: Directors’ remuneration policy (abridged)
This appendix to the directors’ remuneration report sets out an abridged version of the remuneration policy for the company which was approved by shareholders at the AGM on 26 July 2019. The policy took effect from the data of approval and is intended to apply until the 2022 AGM.
In the interests of clarity, the report includes some minor annotations to additionally show, where appropriate, how the policy will be implemented in 2021/22. A full version of the shareholder approved policy can be found in the annual report and financial statements for the year ended 31 March 2019.
OVERVIEW OF REMUNERATION POLICY
The company’s remuneration arrangements are designed to promote the long-term success of the company. The company does not pay more than is necessary for this purpose. The committee recognises that the company operates in the North West of England in a regulated environment and therefore needs to ensure that the structure of executive remuneration reflects both the practices of the markets in which its executives operate, and stakeholder expectations of how the company should be run.
The committee monitors the remuneration arrangements to ensure that there is an appropriate balance between risk and reward and that the long-term performance of the business is not compromised by the pursuit of short-term value. There is a strong direct link between incentives and the company’s strategy, and if the strategy is delivered within an acceptable level of risk, senior executives will be rewarded through the annual bonus and long-term incentives. If it is not delivered, then a significant part of their potential remuneration will not be paid.
The committee understands that listening to the views of the company’s key stakeholders plays a vital role in formulating and implementing a successful remuneration policy over the long term. The committee thus actively seeks the views of shareholders and other key stakeholders to inform the development of the remuneration policy, particularly where any changes to policy are envisaged.
Although employees are not consulted directly on executive remuneration policy, employee engagement surveys are carried out annually and regular discussion takes place with union representatives on matters of pay and remuneration for employees covered by collective bargaining or consultation arrangements. The committee takes into account the general base salary increase and remuneration arrangements, including pension provision, for the wider employee population when determining remuneration policy for the executive directors. Processes are in place for the committee to review and consider any remuneration-related matters that may arise from the activities undertaken by the board to take account of the ‘employee voice’.
POLICY TABLE FOR DIRECTORS
Base salary
Purpose and link to strategy: To attract and retain executives of the experience and quality required to deliver the company’s strategy.
Operation Maximum opportunity
Normally reviewed annually, typically effective 1 September.
Significant increases in salary should only take place infrequently, for example where there has been a material increase in:
• the size of the individual’s role;
• the size of the company (through mergers and acquisitions); or
• the pay market for directly comparable companies (for example, companies of a similar size and complexity).
On recruitment or promotion to executive director, the committee will take into account previous remuneration, and pay levels for comparable companies, when setting salary levels. This may lead to salary being set at a lower or higher level than for the previous incumbent.
Current salary levels are shown in the annual report on remuneration.
Executive directors will normally receive a salary increase broadly in line with the increase awarded to the general workforce, unless one or more of the conditions outlined under ‘Operation’ is met.
Where the committee has set the salary of a new hire at a discount to the market level initially, a series of planned increases can be implemented over the following few years to bring the salary to the appropriate market position, subject to individual performance.
Performance measuresNone
United Utilities Group PLC unitedutilities.com/corporate 182
GOVERNANCE
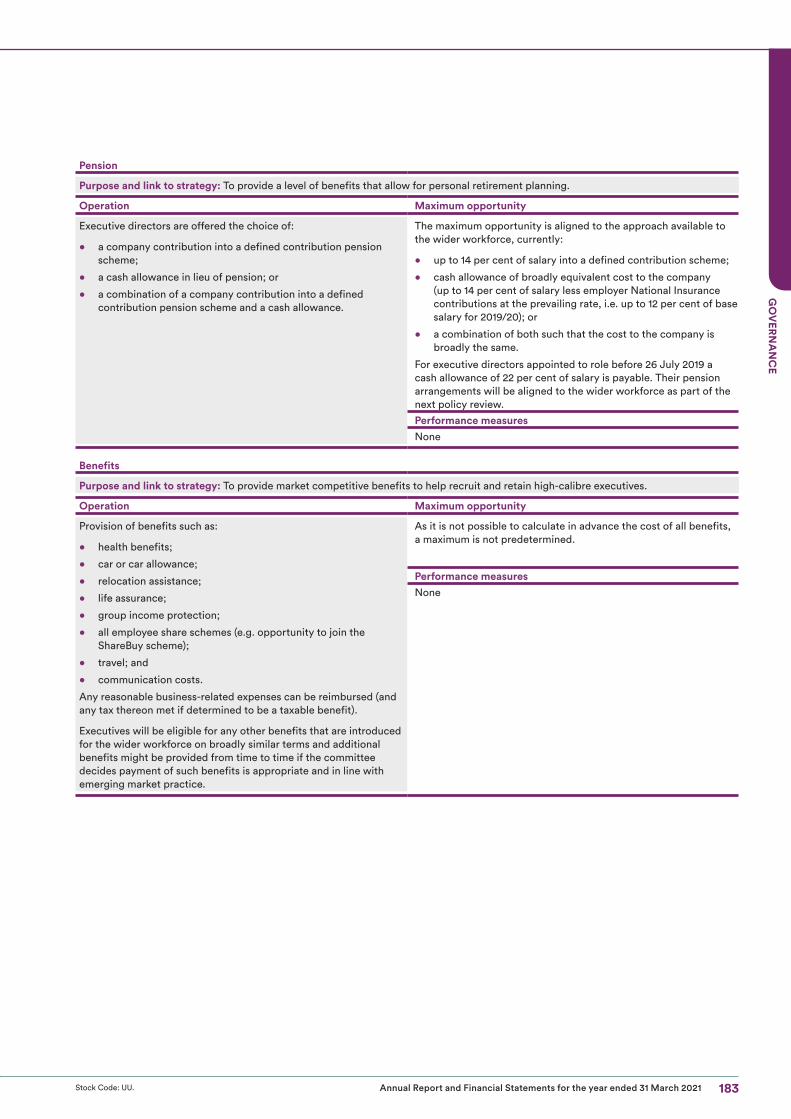
Pension
Purpose and link to strategy: To provide a level of benefits that allow for personal retirement planning.
Operation Maximum opportunity
Executive directors are offered the choice of:
• a company contribution into a defined contribution pension scheme;
• a cash allowance in lieu of pension; or
• a combination of a company contribution into a defined contribution pension scheme and a cash allowance.
The maximum opportunity is aligned to the approach available to the wider workforce, currently:
• up to 14 per cent of salary into a defined contribution scheme;
• cash allowance of broadly equivalent cost to the company (up to 14 per cent of salary less employer National Insurance contributions at the prevailing rate, i.e. up to 12 per cent of base salary for 2019/20); or
• a combination of both such that the cost to the company is broadly the same.
For executive directors appointed to role before 26 July 2019 a cash allowance of 22 per cent of salary is payable. Their pension arrangements will be aligned to the wider workforce as part of the next policy review.
Performance measuresNone
Benefits
Purpose and link to strategy: To provide market competitive benefits to help recruit and retain high-calibre executives.
Operation Maximum opportunity
Provision of benefits such as:
• health benefits;
• car or car allowance;
• relocation assistance;
• life assurance;
• group income protection;
• all employee share schemes (e.g. opportunity to join the ShareBuy scheme);
• travel; and
• communication costs.
Any reasonable business-related expenses can be reimbursed (and any tax thereon met if determined to be a taxable benefit).
Executives will be eligible for any other benefits that are introduced for the wider workforce on broadly similar terms and additional benefits might be provided from time to time if the committee decides payment of such benefits is appropriate and in line with emerging market practice.
As it is not possible to calculate in advance the cost of all benefits, a maximum is not predetermined.
Performance measuresNone
Stock Code: UU. Annual Report and Financial Statements for the year ended 31 March 2021 183
GO
VER
NA
NC
E

Corporate governance reportAppendix 1: Directors’ remuneration policy (abridged)
Annual bonus
Purpose and link to strategy: To incentivise performance against personal objectives and selected financial and operational KPIs that are directly linked to business strategy. Deferral of part of bonus into shares aligns the interests of executive directors and shareholders.
Operation Maximum opportunity
A maximum of 50 per cent of bonus awarded paid as cash.
A minimum of 50 per cent of bonus awarded deferred into company shares under the Deferred Bonus Plan (DBP) for a period of at least three years.
DBP shares accrue dividend equivalents. Not pensionable.
Bonuses and DBP shares are subject to recovery provisions in certain negative circumstances including: material misstatement of audited financial results; an error in the calculation; or gross misconduct.
Additionally, withholding provisions can apply to DBP shares in cases of: serious reputational damage; serious failure of risk management; or other circumstances that the committee may determine.
Maximum award level of up to 130 per cent of salary, for the achievement of stretching performance objectives.
Performance measuresPayments predominantly based on financial and operational performance.
Targets and weightings set by reference to the company’s financial and operating plans.
Bonus outcomes are subject to the committee being satisfied that the company’s performance on the measures is consistent with underlying business performance and individual contributions. The committee will exercise discretion on bonus outcomes if it deems necessary.
100 per cent of maximum bonus potential for stretch performance; up to 50 per cent of maximum for target performance; and up to 25 per cent of maximum for threshold performance. No payout for below- threshold performance.
Long Term Plan (LTP)
Purpose and link to strategy: To incentivise long-term value creation and alignment with the long-term interests of shareholders, customers, and other stakeholders.
Operation Maximum opportunity
Awards under the Long Term Plan are rights to receive company shares, subject to certain performance conditions.
Each award is measured over at least a three-year performance period.
An additional holding period applies after the end of the three- year performance period so that the total vesting and holding period is at least five years.
Vested shares accrue dividend equivalents.
Shares under the LTP are subject to recovery and withholding provisions in certain negative circumstances, including: material misstatement of audited financial results; an error in the calculation; or gross misconduct.
Additionally, withholding provisions can apply in cases of: serious reputational damage; serious failure of risk management; or other circumstances that the committee may determine.
The normal maximum award level will be up to 130 per cent of salary per annum.
The overall policy limit is 200 per cent of salary. It is not anticipated that awards above the normal level will be made to current executive directors and any such increase on an ongoing basis will be subject to prior consultation with major shareholders.
Performance measuresThe two performance conditions are Return on Regulated Equity and a basket of customer measures. The weighting of each of these two components is 50 per cent.
Any vesting is subject to the delivery of the dividend policy during the respective performance period, and the committee being satisfied that the company’s performance on these measures is consistent with underlying business performance. The committee will exercise discretion on LTP outcomes if it deems it necessary.
The committee retains discretion to set alternative performance measures for future awards but will consult with major shareholders before making any changes to the currently applied measures.
100 per cent of awards vest for stretch performance; and up to 25 per cent of awards vest for threshold performance. No awards vest for below-threshold performance.
United Utilities Group PLC unitedutilities.com/corporate 184
GOVERNANCE

Non-executive directors’ fees and benefits
Purpose and link to strategy: To attract non-executive directors with a broad range of experience and skills to oversee the development and implementation of our strategy.
Operation Maximum opportunity
The remuneration policy for the non-executive directors (with the exception of the Chairman) is set by a separate committee of the board. The policy for the Chairman is determined by the remuneration committee (of which the Chairman is not a member).
Fees are reviewed annually taking into account the salary increase for the general workforce and the levels of fees paid by companies of a similar size and complexity. Any changes are normally effective from 1 September. Additional fees are paid in relation to extra responsibilities undertaken, such as chairing certain board sub-committees, and to the senior independent non-executive director.
In exceptional circumstances, if there is a temporary yet material increase in the time commitments for non-executive directors, the board may pay extra fees on a pro rata basis to recognise the additional workload.
No eligibility for bonuses, long-term incentive plans, pension schemes, healthcare arrangements or employee share schemes.
The company repays any reasonable expenses that a non-executive director incurs in carrying out their duties as a director, including travel, hospitality-related and other modest benefits and any tax liabilities thereon, if appropriate.
Current fee levels are shown in the annual report on remuneration.
The value of benefits may vary from year to year according to the cost to the company.
Performance measuresNon-executive directors are not eligible to participate in any performance-related arrangements.
Notes to the policy table - selection of measures and targetsPerformance measures for the annual bonus are selected annually to align with the company’s key strategic goals for the year and reflect financial and operational performance. ‘Target’ performance is typically set in line with the business plan for the year, following rigorous debate and approval of the plan by the board. Threshold to stretch targets are then set based on a sliding scale on the basis of relevant commercial factors.
Only modest rewards are available for delivering threshold performance levels, with rewards at stretch requiring substantial outperformance of the business plan. Details of the measures used for the annual bonus are given in the annual report on remuneration.
The current Long Term Plan (LTP) measures were selected by the committee following an extensive review and shareholder consultation in 2018/19. These measures are considered to align with the company’s key strategic goals and be closely linked to the creation of long- term shareholder value. LTP targets are set taking into account a number of factors, including reference to market practice, the company business plan and analysts’ forecasts where relevant. The LTP will only vest in full if stretching business performance is achieved.
ANNUAL BONUS AND LONG-TERM INCENTIVES – FLEXIBILITY, DISCRETION AND JUDGEMENT
The committee will operate the company’s incentive plans according to their respective rules and consistent with normal market practice, the Listing Rules and HMRC rules where relevant, including flexibility in a number of regards.
These include making awards and setting performance criteria each year, dealing with leavers, and adjustments to awards and performance criteria following acquisitions, disposals, changes in share capital and to take account of the impact of other merger and acquisition activity.
The committee retains discretion within the policy to adjust the targets, set different measures and/or alter weightings for the annual bonus plan, pay dividend equivalents on vested shares up to the date those shares can first reasonably be exercised and, in exceptional circumstances, under the rules of the long-term incentive plans to adjust performance conditions to ensure that the awards fulfil their original purposes (for example, if an external benchmark or measure is no longer available). All assessments of performance are ultimately subject to the committee’s judgement. Any discretion exercised, and the rationale, will be disclosed in the annual remuneration report.
All historic awards that were granted under any current or previous share schemes operated by the company and remain outstanding remain eligible to vest based on their original award terms.
Stock Code: UU. Annual Report and Financial Statements for the year ended 31 March 2021 185
GO
VER
NA
NC
E

Corporate governance reportAppendix 1: Directors’ remuneration policy (abridged)
ALIGNMENT OF EXECUTIVE DIRECTOR REMUNERATION WITH THE WIDER WORKFORCE
The remuneration approach is consistently applied at levels below the executive directors. Key features include:
• market competitive levels of remuneration, incentives and benefits to attract and retain employees;
• employees at all levels participate in a bonus scheme with the same corporate performance measures as for executive directors; and
• all employees have the opportunity to participate in the HMRC-approved share incentive plan, ShareBuy.
At senior levels, remuneration is increasingly long-term, and ‘at risk’ with an increased emphasis on performance-related pay and share- based remuneration.
SCENARIOS FOR TOTAL REMUNERATION
The charts below show the payout under the remuneration policy for each executive director under four different scenarios.
Steve Mogford CEO £’000s
1)
2)
Fixed
Target
3) Maximum
4) Maximum plus 50% share
price growth
0 500 1,000 1,500 2,000 2,500 3,000 3,500
27.9% 28.8% 28.8% 14.4% 3,495
32.6% 33.7% 33.7% 2,991
49.2% 25.4% 25.4% 1,983
100% 976
Phil Aspin CFO£’000s
1)
2)
Fixed
Target
3) Maximum
4)
0 200 400 600 800 1,000 1,200 1,400 1,600 1,800
Maximum plus 50% share
price growth
26.2% 29.5% 29.5% 14.8% 1,761
30.7% 34.6% 34.6% 1,501
47.0% 26.5% 26.5% 981
100% 461
Notes on the scenario methodology:
• ‘Fixed’ is base salary effective 31 March 2021 plus the applicable cash allowance in lieu of pension and the value of benefits as shown in the single total figure of remuneration table for 2020/21;
• ‘Target’ performance is the level of performance required for the annual bonus and Long Term Plan to pay out at 50 per cent of maximum;
• ‘Maximum’ performance would result in 100 per cent vesting of the annual bonus and Long Term Plan (i.e. 260 per cent of salary in total);
• ‘Maximum performance plus 50 per cent share price growth’ shows maximum performance plus the impact on the Long Term Plan of a hypothetical 50 per cent increase in the share price;
• Annual bonus includes amounts compulsorily deferred into shares;
• Long Term Plan is measured at face value, i.e. no assumption for dividends or changes in share price (except in the fourth scenario); and
• Amounts relating to all-employee share schemes have, for simplicity, been excluded from the charts.
Fixed
Annual bonus
Long Term Plan
Additional Long Term Plan value if share price grows by 50 per cent
United Utilities Group PLC unitedutilities.com/corporate 186
GOVERNANCE

SHAREHOLDING GUIDELINES
The committee believes that it is important for each executive director to build and maintain a significant investment in shares of the company to provide alignment with shareholder interests. Shareholding guidelines are therefore operated and the details of how these are currently applied are provided in the annual report on remuneration. With effect from 19 May 2020 the guidelines were updated to include post-employment shareholding requirements as outlined on page 176.
EXTERNAL DIRECTORSHIPS
The company recognises that its executive directors may be invited to become non-executive directors of other companies outside the company and exposure to such non-executive duties can broaden experience and knowledge, which would be of benefit to the company. Any external appointments are subject to board approval (which would not be given if the proposed appointment was with a competing company, would lead to a material conflict of interest or could have a detrimental effect on a director’s performance). Directors will be allowed to retain any fees received in respect of such appointments.
SERVICE CONTRACTS AND LETTERS OF APPOINTMENT
Executive directors’ service contracts are subject to up to one year’s notice period when terminated by the company and at least six months’ notice when terminated by the director.
The policy on payments for loss of office is set out on the next page.
The Chairman and other non-executive directors have letters of appointment rather than service contracts. Their appointments may be terminated without compensation at any time. All non-executive directors are subject to re-election at each AGM.
Copies of executive directors’ service contracts and non-executive directors’ letters of appointment are available for inspection at the company’s registered office during normal hours of business and will be available at the company’s AGM. Copies of non-executive directors’ letters of appointment can be viewed on the company’s website.
APPROACH TO RECRUITMENT REMUNERATION
The remuneration package for a new executive director would be set in accordance with the terms of the company’s approved remuneration policy in force at the time of appointment.
Buy-out awardsThe committee may offer additional cash and/or share-based elements (on a one-time basis or ongoing) when it considers these to be in the best interests of the company (and therefore shareholders). Any such payments would be limited to a reasonable estimate of value of remuneration lost when leaving the former employer and would reflect the delivery mechanism (i.e. cash and/or share-based), time horizons and whether performance requirements are attached to that remuneration. Shareholders will be informed of any such payments at the time of appointment.
Maximum level of variable payThe maximum level of long-term incentives that may be awarded to a new executive director will be limited to the maximum Long Term Plan limit of 200 per cent of salary per annum on an ongoing basis. Therefore, the maximum level of overall variable pay that may be offered will be 330 per cent of salary (i.e. 130 per cent annual bonus plus 200 per cent Long Term Plan) per annum on an ongoing basis. These limits are in addition to the value of any buyout arrangements which are governed by the policy above.
In the case of an internal appointment, any variable pay element awarded in respect of the prior role would be allowed to pay out according to its terms, adjusted as relevant to take into account the appointment. In addition, any other previously awarded entitlements would continue, and be disclosed in the next annual report on remuneration.
Base salary and relocation expensesBase salary levels for new executive directors will be set in accordance with the policy, taking into account the experience of the individual recruited. The committee has the flexibility to set the salary of a new appointee at a discount to the market level initially, with a series of planned increases implemented over the following years to bring the salary to the appropriate market position, subject to individual performance in the role.
The committee may agree that the company will meet certain relocation and/or incidental expenses as appropriate.
Annual bonus performance conditionsWhere a new executive director is appointed part way through a financial year, the committee may set different annual bonus measures and targets for the new executive director from those used for other executive directors (for the initial part-year only).
Appointment of non-executive directorsFor the appointment of a new Chairman or non-executive director, the fee arrangement would be set in accordance with the approved remuneration policy in force at that time. Non-executive directors’ fees are set by a separate committee of the board; the Chairman’s fees are set by the remuneration committee.
Stock Code: UU. Annual Report and Financial Statements for the year ended 31 March 2021 187
GO
VER
NA
NC
E

Corporate governance reportAppendix 1: Directors’ remuneration policy (abridged)
PAYMENT FOR LOSS OF OFFICE
The circumstances of the termination, including the individual’s performance and an individual’s duty and opportunity to mitigate losses, are taken into account in every case. Our policy is to stop or reduce compensatory payments to former executive directors to the extent that they receive remuneration from other employment during the compensation period. A robust line on reducing compensation is applied and payments to departing employees may be phased to mitigate loss. Our policy is shown in the table below:
Provision Summary terms
Compensation for loss of office • An executive director’s service contract may be terminated without notice and without any further payment or compensation, except for sums earned up to the date of termination, on the occurrence of certain contractually specified events such as gross misconduct.
• No termination payment if full notice is worked.
• Otherwise, a payment in respect of the period of notice not worked of basic salary, plus pension and car allowance for that period.
• Half of the termination payment will be paid within 14 days of date of termination.
• The other half will be paid in monthly instalments over what would have been the second half of the notice period. This will be reduced by the value of any salary, pension contribution and car allowance earned in new paid employment in that period.
Treatment of annual bonus on termination
• A time prorated bonus may be payable for the period of active service; however, there is no automatic entitlement to payments under the bonus scheme. Any payment is at the discretion of the committee and is subject to recovery and withholding provisions as detailed in the policy table.
• Performance targets would apply in all circumstances.
Treatment of deferred bonus on termination
• Determined on the basis of the relevant plan rules. Full details can be found on the company’s website.
• Deferred bonuses are subject to recovery and withholding provisions as detailed in the policy table.
• The default treatment is that any outstanding awards will vest in full on the normal vesting date with no time prorating applying.
Treatment of unvested long-term incentives on termination
• Determined on the basis of the relevant plan rules. Full details can be found on the company’s website.
• Normally, any outstanding awards will lapse on date of cessation of employment (if that occurs during the performance period).
• However, under the rules of the plans, in certain prescribed circumstances, such as death, disability, mutually agreed retirement or other circumstances at the discretion of the committee, ‘good leaver’ status can be applied. In these circumstances, a participant’s awards vest on a time prorated basis subject to the satisfaction of relevant performance criteria, with the balance of awards lapsing. The committee retains the discretion not to time prorate if it is inappropriate to do so in particular circumstances. The committee will take into account the individual’s performance and the reasons for their departure when determining whether ‘good leaver’ status can be applied.
Treatment of pensions on termination
• On redundancy, an augmentation may apply in relation to benefits accrued under a United Utilities defined benefit pension scheme, in line with the trust deed and rules of the appropriate section.
Outplacement services, reimbursement of legal costs and any other incidental expenses may be provided where appropriate. Any statutory entitlements or compromise claims in connection with a termination of employment would be paid as necessary. Outstanding savings/ shares under all-employee share plans would be transferred in accordance with the terms of the plans as approved by HMRC.
Change of controlOn a change of control, executive directors’ incentive awards will be treated in accordance with the rules of the applicable plans. In summary:
• Bonus payments will take into account the extent to which the performance measures have been satisfied between the start of the performance period and the date of the change of control, and the value will be prorated to reflect the same period.
• Deferred bonuses will generally vest on the date of a change of control, unless the committee permits (or requires) awards to roll over into equivalent shares in the acquirer.
• Long Term Plan awards will generally vest on the date of a change of control taking into account the extent to which any performance condition has been satisfied at that point. Time prorating will normally apply unless the committee determines otherwise.
United Utilities Group PLC unitedutilities.com/corporate 188
GOVERNANCE

Corporate governance reportAppendix 2: Executive directors’ share plan interests 1 April 2020 to 31 March 2021
Award date
Awards heldat 1 April
2020Granted in
yearVestedin year
Lapsed/forfeited in
year
Notionaldividends
accrued inyear(1)
Awardsheld at
31 March2021(1)
Steve MogfordShares not subject to performance conditions at 31 March 2021DBP 16.6.17 47,238 – 47,238 – – –DBP 18.6.18 52,014 – – – 2,443 54,457DBP 17.6.19 49,262 – – – 2,314 51,576DBP(2) 17.6.20 – 38,742 – – 1,819 40,561LTP 30.6.15 66,320 – 66,320 – – –LTP 28.6.16 74,647 – – – 3,556 78,203LTP 27.6.17 116,535 – – 15,282 5,387 106,640ShareBuy matching shares(3) 1.4.20 to 31.3.21 43 39 43 – – 39Subtotal 406,059 38,781 113,601 15,282 15,519 331,476Shares subject to performance conditions at 31 March 2021LTP 25.6.18 137,582 – – – 6,464 144,046LTP 28.6.19 126,893 – – – 5,961 132,854LTP(4) 30.11.20 – 112,097 – – 1,705 113,802Subtotal 264,475 112,097 – – 14,130 390,702TOTAL 670,534 150,878 113,601 15,282 29,649 722,178Russ Houlden
Shares not subject to performance conditions at 31 March 2021DBP 16.6.17 29,640 – 29,640 – – –DBP 18.6.18 32,626 – – – 1,531 34,157DBP 17.6.19 30,929 – – – 1,452 32,381DBP(2) 17.6.20 – 24,469 – – 1,148 25,617LTP 30.6.15 41,869 – 41,869 – – –LTP 28.6.16 47,112 – – – 2,244 49,356LTP 27.6.17 73,574 – – 9,648 3,401 67,327ShareBuy matching shares(3) 1.4.20 to 31.3.21 43 13 56 – – –Subtotal 255,793 24,482 71,565 9,648 9,776 208,838Shares subject to performance conditions at 31 March 2021LTP 25.6.18 86,888 – – 19,264 3,177 70,801LTP 28.6.19 80,143 – – 44,459 1,675 37,359Subtotal 167,031 – – 63,723 4,852 108,160TOTAL 422,824 24,482 71,565 73,371 14,628 316,998Phil AspinShares not subject to performance conditions at 31 March 2021DBP 17.6.20 – 4,069 – – 190 4,259LTP 27.6.17 8,762 – 8,524 1,241 1,003 –ShareBuy matching shares(3) 1.4.20 to 31.3.21 43 40 43 – – 40Subtotal 8,805 4,109 8,567 1,241 1,193 4,299Shares subject to performance conditions at 31 March 2021LTP 25.6.18 10,398 – – – 488 10,886LTP 28.6.19 9,730 – – – 456 10,186LTP(4) 30.11.20 – 57,842 – – 880 58,722Subtotal 20,128 57,842 – – 1,824 79,794TOTAL 28,933 61,951 8,567 1,241 3,017 84,093
(1) Note that these are subject to performance conditions where applicable.
(2) See page 168 for further details.
(3) Under ShareBuy, matching shares vest provided the employee remains employed by the company one year after grant. During the year Steve Mogford purchased 200 partnership shares and was awarded 39 matching shares (at an average share price of 904.9 pence per share). Russ Houlden purchased 67 partnership shares and was awarded 13 matching shares (at an average share price of 893.2 pence per share). Phil Aspin purchased 199 partnership shares and was awarded 40 matching shares (at an average share price of 904.9 pence per share).
(4) See page 170 for further details.
Stock Code: UU. Annual Report and Financial Statements for the year ended 31 March 2021 189
GO
VER
NA
NC
E

Corporate governance reportUK tax policies and objectives
Consistent with our wider business objectives, we are committed to acting in a responsible manner in relation to our tax affairs.
Our tax policies and objectives, which are approved by the board on an annual basis, ensure that we:
• only engage in reasonable tax planning aligned with our commercial activities and we always comply with what we believe to be both the letter and the spirit of the law;
• do not engage in marketed, aggressive or abusive tax avoidance;
• do not use tax havens for tax avoidance purposes and always seek to declare profits in the place where their economic substance arises;
• are committed to an open, transparent and professional relationship with HMRC based on mutual trust and collaborative working; and
• maintain a robust governance and risk management framework to ensure that these policies and objectives are fully complied with and applied at all levels.
We expect to fully adhere to the HMRC framework for co-operative compliance.
Our Chief Financial Officer (CFO) has responsibility for tax governance with oversight from the board. The CFO is supported by a specialist team of tax professionals with many years of tax experience within the water sector and led by the Head of Tax.
The Head of Tax has day-to-day responsibility for managing the group’s tax affairs and engages regularly with key stakeholders from around the group in ensuring that tax risk is proactively managed. Where appropriate, he will engage with both external advisers and HMRC to provide additional required certainty with the aim of ensuring that any residual risk is typically low. All significant tax issues are reported to the board regularly.
Consistent with the group’s general risk management framework, all tax risks are assessed for the likelihood of occurrence and the negative financial or reputational impact on the group and its objectives, should the event occur. In any given period, the key tax risk is likely to be the introduction of unexpected legislative or tax practice changes which lead to increased cash outflow which has not been reflected in the current regulatory settlement. The group is committed to actively engaging with relevant authorities to actively manage any such risk.
In any given year, the group’s effective cash tax rate on underlying profits may fluctuate from the standard UK rate mainly due to the available tax deductions on capital investment. These deductions are achieved as a result of utilising tax incentives, which have been explicitly put in place by successive governments precisely to encourage such investment. This reflects responsible corporate behaviour in relation to tax.
Under the regulatory framework the group operates within, the majority of any benefit from reduced tax payments will typically not be retained by the group but will pass to customers; reducing their bills. For 2020/21, the impact of tax deductions on capital investment alone reduced average household bills by around £20.
The group’s principal subsidiary, United Utilities Water Limited (UUW), operates solely in the UK and its customers are based here. All of the group’s profits are taxable in the UK (other than profits relating to the group’s 35 per cent holding in Tallinn Water which are fully taxable in Estonia on distribution).
We completed the sale of our investment in Tallinn Water in March this year. In addition, the group’s other remaining overseas subsidiary company, a dormant company resident in Thailand, where the group had historic trading operations, was formally dissolved in February this year.
Every year, the group pays significant contributions to the public finances on its own behalf as well as collecting and paying further amounts for its 5,000 strong workforce. Details of the total payments for 2021 of around £258 million are set out below.
Taxes/contributions to public finances for 2021
Total taxes and contributions to public finances
£258m£91m
Business rates
Corporation tax
Employment taxes: company
Employment taxes: employees
Environmental taxes and other duties
Regulatory services fees (e.g. water extraction charges)
£48m £10m £31m£24m £54m
United Utilities Group PLC unitedutilities.com/corporate 190
GOVERNANCE

The above tax policy disclosure meets the group’s statutory requirement under Paragraph 16(2) of Schedule 19 of Finance Act 2016 to publish its UK tax strategy for the year ended 31 March 2021.
See our website for our latest separate annual tax report, which includes further details in relation to the following key areas:
• How much tax we pay;
• How we ensure that we pay the right tax at the right time; and
• How we ensure that our tax affairs are transparent for all our stakeholders.
Recognising the group’s ongoing commitment to paying its fair share of tax and acting in an open and transparent manner in relation to its tax affairs, we were delighted to have retained the Fair Tax Mark independent certification for a second year, having been only the second FTSE 100 company to be awarded the Fair Tax Mark in July 2019.
Stock Code: UU. Annual Report and Financial Statements for the year ended 31 March 2021 191
GO
VER
NA
NC
E

Directors’ reportStatutory and other information
Our directors present their management report, including the strategic report, on pages 16 to 109 and the audited financial statements of United Utilities Group PLC (the company) and its subsidiaries (together referred to as the group) for the year ended 31 March 2021.
Business model A description of the company’s business model can be found within the strategic report on pages 30 to 49.
Dividends Our directors are recommending a final dividend of 28.83 pence per ordinary share for the year ended 31 March 2021, which, together with the interim dividend of 14.41 pence, gives a total dividend for the year of 43.24 pence per ordinary share (the interim and final dividends paid in respect of the 2019/20 financial year were 14.20 pence and 28.40 pence per ordinary share respectively). Subject to approval by our shareholders at our AGM, the final dividend will be paid on 2 August 2021 to shareholders on the register at the close of business on 25 June 2021.
Directors The names of our directors who served during the financial year ended 31 March 2021 can be found on pages 112 to 115 and on page 124.
Reappointment Our articles of association provide that our directors must retire at every annual general meeting following their last election or reappointment by our shareholders which is consistent with the recommendation contained within the 2018 UK Corporate Governance Code (the code) that all directors should be subject to annual election by shareholders. This has been the case at all the AGMs since 2011. Information regarding the appointment of our directors is included in our corporate governance report on pages 130 to 137.
Interests Details of the interests in the company’s shares held by our directors and persons connected with them are set out in our directors’ remuneration report on pages 160 to 189 which is hereby incorporated by reference into this directors’ report.
Corporate governance statement
The corporate governance report on pages 112 to 189 is hereby incorporated by reference into this directors’ report and includes details of our compliance with the code. Our statement includes a description of the main features of our internal control and risk management systems in relation to the financial reporting process and forms part of this directors’ report. A copy of the 2018 version of the code, as applicable to the company for the year ended 31 March 2021, can be found at the Financial Reporting Council’s website frc.org.uk. Copies of the matters reserved for the board and the terms of reference for each of the main board committees can be found on our website.
Share capital At 31 March 2021, the issued share capital of the company was £499,819,926 divided into 681,888,418 ordinary shares of 5 pence each and 273,956,180 deferred shares of 170 pence each. Details of our share capital and movements in our issued share capital are shown in note 23 to the financial statements on page 234. The ordinary shares represented 71.3 per cent and the deferred shares represented 28.7 per cent respectively of the shares in issue as at 31 March 2021.
All our ordinary shares have the same rights, including the rights to one vote at any of our general meetings, to an equal proportion of any dividends we declare and pay, and to an equal amount of any surplus assets which are distributed in the event of a winding-up.
Our deferred shares convey no right to income, no right to vote and no appreciable right to participate in any surplus capital in the event of a winding-up. The rights attaching to our shares in the company are provided by our articles of association, which may be amended or replaced by means of a special resolution of the company in general meeting. The company renews annually its power to issue and buy back shares at our AGM and such resolutions will be proposed at our 2021 AGM. Our directors’ powers are conferred on them by UK legislation and by the company’s articles. At the AGM of the company held on 24 July 2020, the directors were authorised to issue relevant securities up to an aggregate nominal amount of £11,364,806 and were empowered to allot equity securities for cash on a non-pre-emptive basis to an aggregate nominal amount of £1,704,721.
Voting Electronic and paper proxy appointment and voting instructions must be received by our registrars (Equiniti) no less than 48 hours before a general meeting and when calculating this period, the directors can decide not to take account of any part of a day that is not a working day.
United Utilities Group PLC unitedutilities.com/corporate 192
GOVERNANCE

Transfers There are no restrictions on the transfer of our ordinary shares in the company, nor any limitations on the holding of our shares in the company, save: (i) where the company has exercised its right to suspend their voting rights or to prohibit their transfer following the omission of their holder or any person interested in them to provide the company with information requested by it in accordance with Part 22 of the Companies Act 2006; or (ii) where their holder is precluded from exercising voting rights by the Financial Conduct Authority’s Listing Rules or the City Code on Takeovers and Mergers.
There are no agreements known to us between holders of securities that may result in restrictions on the transfer of securities or on voting rights. All our issued shares are fully paid.
Major shareholdings At 26 May 2021, our directors had been notified of the following interests in the company’s issued ordinary share capital in accordance with the Disclosure and Transparency Rules of the Financial Conduct Authority:
Per cent of issued share capital Direct or indirect nature of holding
Lazard Asset Management LLC 9.93 Indirect
BlackRock Inc. 5.13 Indirect
Norges Bank 2.97 Direct
Purchase of own shares At our AGM held on 24 July 2020, our shareholders authorised the company to purchase, in the market, up to 68,188,841 of our ordinary shares of 5 pence each. We did not purchase any shares under this authority during the year. We normally seek such an authority from our shareholders annually. At our 2021 AGM, we will again seek authority from our shareholders to purchase up to 68,188,841 of our ordinary shares of 5 pence each with such authority expiring at the end of our AGM held in 2022.
Change of control As at 31 March 2021, Ocorian Corporate Services (UK) Limited was the trustee that administered our executive share plans and had the ability to exercise voting rights at its discretion which related to shares that it held under the trust deed constituting the trust. In the event of a takeover offer which could lead to a change of control of the company, the trustee must consult with the company before accepting the offer or voting in favour of the offer. Subject to that requirement, the trustee may take into account a prescribed list of interests and considerations prior to making a decision in relation to the offer, including the interests of the beneficiaries under the trust.
In the event of a change of control, the participants in our all-employee share incentive plan (ShareBuy) would be able to direct the trustee of ShareBuy, Equiniti Share Plan Trustees Limited, how to act on their behalf.
Information required by UK Listing Rule 9.8.4
Details of the amount of interest capitalised by the group during the financial year can be found in note 6 to the financial statements on page 221. In line with current UK tax legislation, the amount is fully deductible against the group’s corporation tax liability, resulting in tax relief of £5.8 million.
There are no other disclosures to be made under Listing Rule 9.8.4.
Directors’ indemnities and insurance
We have in place contractual entitlements for the directors of the company and of its subsidiaries to claim indemnification by the company in respect of certain liabilities which might be incurred by them in the course of their duties as directors. These arrangements, which constitute qualifying third-party indemnity provision and qualifying pension scheme indemnity provision, have been established in compliance with the relevant provisions of the Companies Act 2006 and have been in force throughout the financial year. They include provision for the company to fund the costs incurred by directors in defending certain claims against them in relation to their duties as directors of the company or its subsidiaries. The company maintains an appropriate level of directors’ and officers’ liability insurance.
Stock Code: UU. Annual Report and Financial Statements for the year ended 31 March 2021 193
GO
VER
NA
NC
E

Directors’ reportStatutory and other information
Political donations It is the company’s policy position that we do not support any political party and do not make what are commonly regarded as donations to any political party or other political organisations. However, the wide definition of donations in the Political Parties, Elections and Referendums Act 2000 covers activities which form part of the necessary relationship between the group and our political stakeholders. This can include promoting United Utilities’ activities at the main political parties’ annual conferences, and occasional stakeholder engagement in Westminster. The group incurred expenditure during the year of £5,801 (2020: £23,627; 2019: £9,388) as part of this process. At the 2020 AGM, an authority was taken to cover such expenditure. A similar resolution will be put to our shareholders at the 2021 AGM to authorise the company and its subsidiaries to make such expenditure.
As the provider of services to 7 million people across the North West, customers can sometimes contact their constituency MP and ask that they raise an issue with the company on their behalf. In 2020/21, we received 379 contacts from MPs offices covering topics such as flooding and planning. As part of our work to build constructive relationships with all our stakeholders, we encourage MPs and members of their offices to work closely with us to address constituency concerns and arrange case worker events to discuss such issues in detail. In 2020, this was a virtual event in which over 40 MP representatives accepted to join us. For those unable to participate in the live event, a link was sent so it could be viewed when convenient. There are two devolved administrations in the North West – the Greater Manchester Combined Authority and the Liverpool City Region (LCR) – we engage regularly with both, as well as the region’s local authorities, on a range of topics of shared interest, such as tackling flooding risk and enhancing the North West’s natural capital. Our sponsorship of the All Party Political Groups for Greater Manchester and LCR helps bring MPs and peers of all parties together with key leaders to help maximise future investment in these areas for the benefit of local communities.
In addition, the company’s activities to engage with political stakeholders on matters relevant to the water industry and its operating footprint in the North West extend to its membership of trade associations. This is described in the section below.
Trade associations We are members of a small number of trade associations. Some of these have a national focus, such as Water UK, the representative body of the UK water industry, which considers industry-wide priorities such as development of markets, customer trust, resilience, and legislation and regulation, and the Confederation of British Industry, which provides a policy-making voice for firms at a regional, national and international level. Others focus on specific professions such as the 100 Group representing the views of the finance directors of FTSE 100 and large UK private companies and the GC 100, the voice of general counsel and company secretaries in FTSE 100 companies. The company is a member of regional bodies, such as the North West Business Leadership Team which encourages engagement across the public and private sectors to promote the sustainable economic development and long-term wellbeing of the North West. Our total contribution to these associations in 2020/21 was £420,403 (2019/20: £400,916).
In the past 12 months, the company has been involved in several engagements with political stakeholders through its membership of trade associations. Through Water UK, the company has supported efforts to interact with parliamentary bodies, such as select committees and chairs of other specific committees, to provide information on topics such as water efficiency labelling for white goods and the performance of combined sewer overflows in relation to river water quality. The company has supported Water UK in its effort to encourage the Government to ensure its forthcoming Environment Bill supports the sector’s objectives to deliver resilient water services now and into the future.
Through our membership with both the CBI, in particular as a member of its North West regional council, and the North West Business Leadership Team, we have engaged with regional political stakeholders, such as local authorities and metro mayors, to explore how the business community can work more effectively with the public sector to drive economic growth in the region and tackle some of the North West’s pressing social issues. For example, we have participated in consultations and discussions as part of the unlocking regional growth/levelling up agenda, bringing together views of industry and regional government on opportunities and barriers.
Employees Our policies on employee consultation and on equal opportunities for all employees can be found on pages 32 and 34. Applicants with disabilities are given equal consideration in our application process, and disabled colleagues have equipment and working practices modified for them as far as possible and where it is safe and practical to do so. Importance is placed on strengthening employees’ engagement (see page 24). The effect of our regard towards employees in relation to the decisions taken during the financial year is included in our S172(1) Statement on page 28.
Employees are encouraged to own shares in the company through the operation of an all employee share incentive plan (ShareBuy).
Information on our average number of employees during the year, can be found in note 3 on page 219.
United Utilities Group PLC unitedutilities.com/corporate 194
GOVERNANCE

Environmental, social and community matters
Details of our approach, as a responsible business, is set out in the Strategic Report, in particular where we describe our approach to purpose and stakeholder value on pages 16 to 17 and 32. Further information is available on our website at www.unitedutilities.com/corporate/responsibility/. Our approach to engagement with our environmental stakeholders and those in the communities we serve can be found on pages 22 to 27. The effect of our regard towards the environment, social and community matters in relation to the decisions taken during the financial year is included in our S172(1) Statement on page 28.
Customers and suppliers and key stakeholders
Our approach to engagement with customers, suppliers, regulators and other key stakeholders can be found on pages 22 to 27. The effect of our regard towards customers, suppliers, regulators and other key stakeholders in relation to the decisions taken during the financial year is included in our S172(1) Statement on page 28.
Our United Supply Chain approach sets out how we work with our suppliers, which can be found on our website at: unitedutilities.com/corporate/about-us/governance/suppliers/delivering-value/united-supply-chain/, we are a signatory to the Prompt Payment Code. We publish key statistics and other information on our payment practices in line with the Duty to Report on Payment Practices and Performance on the Department for Business, Energy & Industrial Strategy’s website. Information is published on a six-monthly basis. For the six months to 31 March 2021, our average time taken to pay invoices was 14 days; in the previous six months it was 14 days.
Energy and carbon report Our TCFD reporting includes our energy and carbon report on pages 86 to 99 and is hereby incorporated by reference into this directors’ report.
Approach to technology development
We are committed to using innovative, cost-effective and practical solutions for providing high-quality services and we recognise the importance of ensuring that we focus our investment on the development of technology and that we have the right skills to apply technology to achieve sustainable competitive advantage and that we continue to be alert to emerging technological opportunities.
Financial instruments Our risk management objectives and policies in relation to the use of financial instruments can be found in note A4 on page 240.
Events occurring after the reporting period
Details of events after the reporting period are included in note 25 on page 234.
Slavery and human trafficking statement
Our statement can be found on our website at: unitedutilities.com/human-rights
Annual General MeetingOur 2021 annual general meeting (AGM) will be held on 23 July. Full details of the resolutions to be proposed to our shareholders, and explanatory notes in respect of these resolutions, can be found in our notice of AGM. A copy can be found on our website.
At our 2021 AGM, resolutions will be proposed, among other matters:
• to receive the annual report and financial statements; to approve the directors’ remuneration report; to declare a final dividend; and to reappoint KPMG LLP as auditor; and
• to approve the directors’ general authority to allot shares; to grant the authority to issue shares without first applying statutory rights of pre-emption; to authorise the company to make market purchases of its own shares; to authorise the making of limited political donations by the company and its subsidiaries; to adopt new articles of association; and to enable the company to continue to hold general meetings on not less than 14 clear days’ notice.
Information given to the auditorEach of the persons who is a director at the date of approval of this report confirms that:
• so far as they are aware, there is no relevant audit information of which the company’s auditor is unaware; and
• they have taken all the steps that they ought to have taken as a director in order to make themselves aware of any relevant audit information and to establish that the company’s auditor is aware of that information. This confirmation is given, and should be interpreted, in accordance with the provisions of s418 of the Companies Act 2006.
Reappointment of the auditorOur board is proposing that our shareholders reappoint KPMG LLP as our auditor at the forthcoming AGM and authorises the audit committee of the board to set the auditor’s remuneration.
Approved by the board on 26 May 2021 and signed on its behalf by:
Simon Gardiner Company Secretary
Stock Code: UU. Annual Report and Financial Statements for the year ended 31 March 2021 195
GO
VER
NA
NC
E

Statement of directors’ responsibilities in respect of the annual report and the financial statements
The directors are responsible for preparing the annual report and the group and parent company financial statements in accordance with applicable law and regulations.
Company law requires the directors to prepare group and parent company financial statements for each financial year. Under that law they are required to prepare the Group financial statements in accordance with international accounting standards in conformity with the requirements of the Companies Act 2006 and applicable law and have elected to prepare the parent company financial statements on the same basis. In addition the group financial statements are required under the UK Disclosure Guidance and Transparency Rules to be prepared in accordance with International Financial Reporting Standards adopted pursuant to Regulation (EC) No 1606/2002 as it applies in the European Union (EU).
Under company law the directors must not approve the financial statements unless they are satisfied that they give a true and fair view of the state of affairs of the group and parent company and of their profit or loss for that period. In preparing each of the group and parent company financial statements, the directors are required to:
• select suitable accounting policies and then apply them consistently;
• make judgements and estimates that are reasonable, relevant and reliable;
• state whether they have been prepared in accordance with international accounting standards in conformity with the requirements of the Companies Act 2006 and, as regards the group financial statements, International Financial Reporting Standards adopted pursuant to Regulation (EC) No 1606/2002 as it applies in the EU;
• assess the group and parent company’s ability to continue as a going concern, disclosing, as applicable, matters related to going concern; and
• use the going concern basis of accounting unless they either intend to liquidate the group or the parent company or to cease operations, or have no realistic alternative but to do so.
The directors are responsible for keeping adequate accounting records that are sufficient to show and explain the parent company’s transactions and disclose with reasonable accuracy at any time the financial position of the parent company and enable them to ensure that its financial statements comply with the Companies Act 2006. They are responsible for such internal control as they determine is
necessary to enable the preparation of financial statements that are free from material misstatement, whether due to fraud or error, and have general responsibility for taking such steps as are reasonably open to them to safeguard the assets of the group and to prevent and detect fraud and other irregularities.
Under applicable law and regulations, the directors are also responsible for preparing a strategic report, directors’ report, directors’ remuneration report and corporate governance statement that comply with that law and those regulations.
The directors are responsible for the maintenance and integrity of the corporate and financial information included on the company’s website. Legislation in the UK governing the preparation and dissemination of financial statements may differ from legislation in other jurisdictions.
Responsibility statement of the directors in respect of the annual financial report We confirm that to the best of our knowledge:
• the financial statements, prepared in accordance with the applicable set of accounting standards, give a true and fair view of the assets, liabilities, financial position and profit or loss of the company and the undertakings included in the consolidation taken as a whole; and
• the strategic report includes a fair review of the development and performance of the business and the position of the issuer and the undertakings included in the consolidation taken as a whole, together with a description of the principal risks and uncertainties that they face.
We consider the annual report and accounts, taken as a whole, is fair, balanced and understandable and provides the information necessary for shareholders to assess the group’s position and performance, business model and strategy.
Approved by the board on 26 May 2021 and signed on its behalf by:
Sir David HigginsChairman
Phil AspinChief Financial Officer
United Utilities Group PLC unitedutilities.com/corporate 196
GOVERNANCE

Stock Code: UU. Annual Report and Financial Statements for the year ended 31 March 2021 197
GO
VER
NA
NC
E

Investing in the resilience of our assets and services is a fundamental part of our business plan. The impacts of a changing climate mean that we need to protect our assets so that we continue to provide our essential services (see TCFD section on pages 86 to 99).
Some of our critical assets also require maintenance, and sometimes replacement, as they age and the risk of service failure grows. The Haweswater Aqueduct is the region’s most significant source of water, supplying 2.5 million customers in parts of Cumbria, Lancashire and Greater Manchester with over 500 million litres of water every day. Inspections of the aqueduct undertaken after 60 years of continuous use revealed that urgent action was needed to replace one section of the aqueduct as well as a significant longer-term replacement programme.
Last year, we successfully replaced the Hallbank section of the aqueduct, laying 2.5 kilometres of new pipe, which required reconfiguring our regional water supply system. This complex construction project was completed ahead of schedule and there was no interruption to water supplies.
Our focus has turned to the work to replace the majority of the aqueduct. Called HARP, the Haweswater Aqueduct Resilience Programme, it is expected to be undertaken using a direct procurement for customers (DPC) approach and we have been
preparing for a DPC tender in 2021/22. If the tender process proceeds as planned, contract award is anticipated in 2023, with construction to begin later in the AMP. To encourage participants to engage with the DPC process, we held a series of physical and virtual engagement events providing market participants with details about the scheme and, importantly, the opportunity to question us and shape the approach. Nearly 200 people representing over 70 companies tabled 80 questions over two virtual events.
The project will replace six separate tunnel sections, totalling 50 kilometres in length and will require nine planning applications to seven different planning authorities. As we describe on page 44, as a result of COVID-19 we have adopted a virtual consultation approach, which is proving to be more successful than traditional methods.
As one significant project to deliver more resilient water supplies gathers momentum, another is nearing completion. The £300 million West Cumbria water supplies project is on track to connect customers in the county with water from Thirlmere reservoir rather than from other local sources where environmental requirements mean we can no longer use them. Later in 2021, potable water will flow through a new treatment works and 100 kilometres of new pipework so that over 200,000 customers will receive their water from a new source.
invest in our region
What it means to
Investing in resilience projects

Financial statements
Independent auditor’s report to the members of United Utilities Group PLC only 200Consolidated income statement 207Consolidated statement of comprehensive income 208Consolidated and company statements of financial position 209Consolidated statement of changes in equity 210Company statement of changes in equity 211Consolidated and company statements of cash flows 212Guide to detailed financial statements disclosures 213Accounting policies 214Notes to the financial statements 218Notes to the financial statements – appendices 235Five-year summary – unaudited 261Shareholder information 262

Independent auditor’s report to the members of United Utilities Group PLC only
1. Our opinion is unmodifiedWe have audited the financial statements of United Utilities Group PLC (‘the company’) for the year ended 31 March 2021 which comprise the Consolidated income statement, the Consolidated statement of comprehensive income, the Consolidated and company statements of financial position, the Consolidated statement of changes in equity, the Company statement of changes in equity, the Consolidated and company statements of cash flows, and the related notes, including the accounting policies on 214 to 217 and 255 to 259.
In our opinion:
• The financial statements give a true and fair view of the state of the group’s and of the parent company’s affairs as at 31 March 2021 and of the group’s profit for the year then ended;
• The group financial statements have been properly prepared in accordance with international accounting standards in conformity with the requirements of the Companies Act 2006 and with international financial reporting standards adopted pursuant to Regulation (EC) No 1606/2002 as it applies in the European Union;
• The parent company financial statements have been properly prepared in accordance with international accounting standards in conformity with the requirements of, and as applied in accordance with the provisions of, the Companies Act 2006; and
• The financial statements have been prepared in accordance with the requirements of the Companies Act 2006 and, as regards the group financial statements, Article 4 of the IAS Regulation to the extent applicable.
Basis for opinionWe conducted our audit in accordance with International Standards on Auditing (UK) (‘ISAs (UK)’) and applicable law. Our responsibilities are described below. We believe that the audit evidence we have obtained is a sufficient and appropriate basis for our opinion. Our audit opinion is consistent with our report to the audit committee.
We were first appointed as auditor by the shareholders on 22 July 2011. The period of total uninterrupted engagement is for the ten financial years ended 31 March 2021.
We have fulfilled our ethical responsibilities under, and we remain independent of the group in accordance with, UK ethical requirements including the FRC Ethical Standard as applied to listed public interest entities. No non-audit services prohibited by that standard were provided.
OverviewMateriality: group financial statements as a whole
£19m (2020: £22m)4.1% (2020: 4.5%) of normalised group profit before tax
Coverage 100% (2020: 98%) of group profit before tax
Key audit mattersChange in
risk vs 2020Recurring Revenue recognition and allowance
for customer debts
Capitalisation of costs relating to the capital programme
Valuation of retirement benefit obligations
Recoverability of investment in United Utilities PLC (parent company only)
2. Key audit matters: including our assessment of risks of material misstatementsKey audit matters are those matters that, in our professional judgement, were of most significance in the audit of the financial statements and include the most significant assessed risks of material misstatement (whether or not due to fraud) identified by us, including those which had the greatest effect on: the overall audit strategy; the allocation of resources in the audit; and directing the efforts of the engagement team. We summarise below the key audit matters, in decreasing order of audit significance, in arriving at our audit opinion above, together with our key audit procedures to address those matters and, as required for public interest entities, our results from those procedures. These matters were addressed, and our results are based on procedures undertaken, in the context of, and solely for the purpose of, our audit of the financial statements as a whole, and in forming our opinion thereon, and consequently are incidental to that opinion, and we do not provide a separate opinion on these matters.
200
FINANCIAL STATEMENTS
unitedutilities.com/corporate United Utilities Group PLC

The risk Our responseRevenue recognition and provisions for household customer debt
Revenue not recognised: £27.1 million (2020: £19.4 million)
Provision for customer debts: £74.9 million (2020: £66.1 million)
Refer to page 152 (Audit committee report), note 14 and pages 215 and 216 (accounting policies).
Subjective estimate:At each balance sheet date:• Judgement is required to identify
properties where there is little prospect that cash will be received for revenue that has been billed due to either the occupier not being able to be identified or a past history of non-payment of bills relating to that property and therefore whether the revenue should be recognised; and
• Assumptions involving a high degree of estimation uncertainty are required to assess the recoverability of trade receivables.
The effect of these matters is that, as part of our risk assessment, we determined that the recoverability of trade receivables has a high degree of estimation uncertainty in particular because of the potential effects of the COVID-19 pandemic, with a potential range of reasonable outcomes greater than our materiality for the financial statements as a whole. The financial statements (see pages 215 to 216 accounting policies) disclose the sensitivity estimated by the group.
The risk has increased in the current year due to the likelihood of cash collection profiles changing as a result of the COVID-19 pandemic, particularly when government assistance is withdrawn. This will introduce further uncertainty into the estimation.
We performed the tests below rather than seeking to rely on the group’s controls because the nature of the balance is such that we would expect to obtain audit evidence primarily through the detailed procedures described.
Our procedures included:• Accounting analysis: assessed the derecognition
of revenue for compliance with relevant accounting standards where the collection of consideration is not probable on the date of initial recognition;
• Methodology choice: assessed the appropriateness of the customer debt provisioning policy based on historical cash collections, credits, re-bills and write-off information, and estimates of future economic scenarios and their impact on credit losses;
• Sensitivity analysis: considered the sensitivity of the key assumptions; and
• Assessing transparency: assessed the adequacy of the group’s disclosures of its revenue recognition and customer debt provisioning policies, including the judgement involved in recording revenue and estimation uncertainty of the doubtful debts provision.
Our results:• We found the amount of the revenue recognised to be
acceptable (2020: acceptable); and• We considered the level of doubtful debt provisioning
to be acceptable (2020: acceptable).
Capitalisation of costs relating to the capital programme
£677.5 million (2020: £759.5 million)
Refer to page 152 (Audit committee report), page 216 (accounting policies) and note 10 (financial disclosures)
Subjective classification:The group has a substantial capital programme which has been agreed with the Water Services Regulation Authority (Ofwat) and therefore incurs significant annual expenditure in relation to the development and maintenance of both infrastructure and non-infrastructure assets.
The determination of in-year project costs as capital or operating expenditure is inherently judgemental. Costs capitalised include an allocation of overhead costs, relating to the proportion of time spent by support function staff, which is based on assumptions involving a high degree of judgement.
The effect of these matters is that, as part of our risk assessment, we determined that the costs capitalised has a high degree of judgement, with a potential range of reasonable outcomes greater than our materiality for the financial statements as a whole. The financial statements (Accounting policies section) disclose the sensitivities estimated by the group.
We performed the detailed tests below rather than seeking to rely on any of the group’s controls because our knowledge of the design of these controls indicated that we would not be able to obtain the required evidence to support reliance on controls.
Our procedures included:• Accounting analysis: assessed the group’s
capitalisation policy for compliance with relevant accounting standards;
• Tests of details: critically assessed the capital nature of a sample of projects against the capitalisation policy focusing on new projects approved, project overspend, forecast cost to complete;
• Tests of details: identified and critically assessed the impact of changes in capitalisation rate for a sample of specific cost centres; and challenged the estimates made by management on the specific cost centres for year-on-year movements and rate changes;
• Historical comparisons: critically assessed the proportion of capitalised overhead costs using historical comparisons and expected changes based on enquiry and our sector knowledge;
• Sensitivity analysis: assessed the impact of different capitalisation rates and the impact to capitalised overhead costs; and
• Assessing transparency: assessed the adequacy of the group’s disclosures of its capitalisation policy including the judgement involved in assessing expenditure as capital and the judgement relating to the allocation of overhead costs.
Our results:• We found the group’s classification of expenditure as
capital or operating to be acceptable (2020: acceptable).
201
FINA
NC
IAL STA
TEM
ENT
S
Annual Report and Financial Statements for the year ended 31 March 2021Stock Code: UU.

Independent auditor’s report to the members of United Utilities Group PLC only
The risk Our responseValuation of retirement benefit obligations
£3,295.7 million (2020: £3,057.6 million)
Refer to page 152 (Audit committee report), page 216 (accounting policies) and notes 18 and A5 (financial disclosures)
Subjective valuation:The valuation of the retirement benefit obligations depends on a number of estimates, including the discount rates used to calculate the current value of the future payments to pensioners, the rate of inflation that must be incorporated in the estimate of the future pension payments, and the life expectancy of pension scheme members.
There is a considerable amount of estimation uncertainty involved in setting the above assumptions and a small change in the assumptions and estimates may have a significant impact on the retirement benefit obligations.
The effect of these matters is that, as part of our risk assessment, we determined that the gross defined benefit pension obligations has a high degree of estimation uncertainty, with a potential range of reasonable outcomes greater than our materiality for the financial statements as a whole, and possibly many times that amount. The financial statements (Accounting policies section) disclose the sensitivities estimated by the group.
We performed the tests below rather than seeking to rely on the group’s controls because the nature of the balance is such that we would expect to obtain audit evidence primarily through the detailed procedures described.
Our procedures included:• Our actuarial expertise: used our own actuarial
specialists to challenge key assumptions and estimates used in the calculation of the retirement benefit obligations; and perform a comparison of key assumptions against our own benchmark ranges derived from externally-available data and against those used by other companies reporting on the same period;
• Methodology assessment: used our own actuarial specialists to assess the appropriateness and consistency of the methodology applied by management in setting the key assumptions;
• Assessing external actuary’s credentials: assessed competence and independence of the external actuary engaged by the group; and
• Assessing transparency: considered the adequacy of the group’s disclosure in respect of retirement benefits, in particular the gross defined benefit obligation and the assumptions used, which are set out in notes 18 and A5 to the financial statements.
Our results:• We found the resulting estimate of the retirement
benefit obligations to be acceptable (2020: acceptable).
Recoverability of parent company’s investment in United Utilities PLC
Investment in United Utilities PLC - £6,326.8 million (2020: £6,326.8 million)
Refer to page 255 (accounting policies), and note 12 (financial disclosures).
Low risk, high value:The carrying amount of the parent company’s investment in United Utilities PLC represents 99 per cent (2020: 99 per cent) of the company’s total assets. The recoverability is not at a high risk of significant misstatement or subject to significant judgement. However, due to the materiality in the context of the parent company financial statements, this is considered to be the area that had the greatest effect on our overall parent company audit.
We performed the tests below rather than seeking to rely on any of the group’s controls because testing for recoverability through detailed testing is inherently the most effective means of obtaining audit evidence.
Our procedures included:• Tests of detail: compared the carrying amount of
the investment with the draft balance sheet of United Utilities PLC to identify whether the net assets, being an approximation of the minimum recoverable amount, is in excess of the carrying amount and if not, comparing it with the expected value of the business based on a suitable premium to the regulatory capital value.
Our results:• We found the group’s assessment of the recoverability
of the investment in United Utilities PLC to be acceptable (2020: acceptable).
Following the impairment of the investment in Water Plus in the prior year, we have not assessed this as one of the most significant risks in our current year audit and, therefore, it is not separately identified in our report this year. We continue to perform procedures over accounting for Water Plus losses and expected credit losses
Going concern was included as key audit matter in the prior period as a result of the uncertainty caused by the COVID-19 pandemic. However, there is now considered to be less uncertainty owing to the fact that the situation has moved on by a year and the group has continued to operate throughout. As a result, we have not assessed this as one of the most significant risks in our current year audit and, therefore, it is not separately identified as a key audit matter in our report this year.
202
FINANCIAL STATEMENTS
unitedutilities.com/corporate United Utilities Group PLC
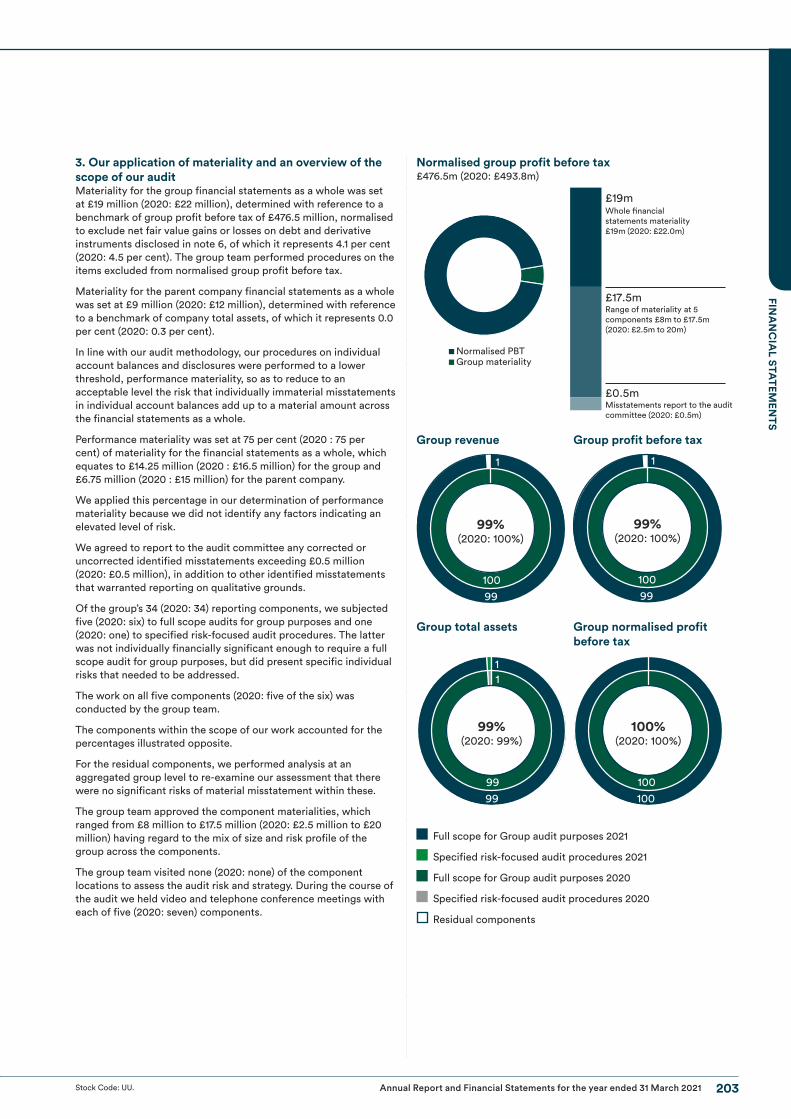
3. Our application of materiality and an overview of the scope of our auditMateriality for the group financial statements as a whole was set at £19 million (2020: £22 million), determined with reference to a benchmark of group profit before tax of £476.5 million, normalised to exclude net fair value gains or losses on debt and derivative instruments disclosed in note 6, of which it represents 4.1 per cent (2020: 4.5 per cent). The group team performed procedures on the items excluded from normalised group profit before tax.
Materiality for the parent company financial statements as a whole was set at £9 million (2020: £12 million), determined with reference to a benchmark of company total assets, of which it represents 0.0 per cent (2020: 0.3 per cent).
In line with our audit methodology, our procedures on individual account balances and disclosures were performed to a lower threshold, performance materiality, so as to reduce to an acceptable level the risk that individually immaterial misstatements in individual account balances add up to a material amount across the financial statements as a whole.
Performance materiality was set at 75 per cent (2020 : 75 per cent) of materiality for the financial statements as a whole, which equates to £14.25 million (2020 : £16.5 million) for the group and £6.75 million (2020 : £15 million) for the parent company.
We applied this percentage in our determination of performance materiality because we did not identify any factors indicating an elevated level of risk.
We agreed to report to the audit committee any corrected or uncorrected identified misstatements exceeding £0.5 million (2020: £0.5 million), in addition to other identified misstatements that warranted reporting on qualitative grounds.
Of the group’s 34 (2020: 34) reporting components, we subjected five (2020: six) to full scope audits for group purposes and one (2020: one) to specified risk-focused audit procedures. The latter was not individually financially significant enough to require a full scope audit for group purposes, but did present specific individual risks that needed to be addressed.
The work on all five components (2020: five of the six) was conducted by the group team.
The components within the scope of our work accounted for the percentages illustrated opposite.
For the residual components, we performed analysis at an aggregated group level to re-examine our assessment that there were no significant risks of material misstatement within these.
The group team approved the component materialities, which ranged from £8 million to £17.5 million (2020: £2.5 million to £20 million) having regard to the mix of size and risk profile of the group across the components.
The group team visited none (2020: none) of the component locations to assess the audit risk and strategy. During the course of the audit we held video and telephone conference meetings with each of five (2020: seven) components.
Normalised group profit before tax£476.5m (2020: £493.8m)
Normalised PBTGroup materiality
Whole nancialstatements materiality£19m (2020: £22.0m)
£17.5m
£19m
Range of materiality at 5 components £8m to £17.5m (2020: £2.5m to 20m)
£0.5mMisstatements report to the audit committee (2020: £0.5m)
Group revenue Group profit before tax
1
100
99%(2020: 100%)
99100
1
99%(2020: 100%)
99
Group total assets Group normalised profit before tax
99
99%(2020: 99%)
99
11
100
100%(2020: 100%)
100
Full scope for Group audit purposes 2021
Specified risk-focused audit procedures 2021
Full scope for Group audit purposes 2020
Specified risk-focused audit procedures 2020
Residual components
203
FINA
NC
IAL STA
TEM
ENT
S
Annual Report and Financial Statements for the year ended 31 March 2021Stock Code: UU.

Independent auditor’s report to the members of United Utilities Group PLC only
4. Going concernThe directors have prepared the financial statements on the going concern basis as they do not intend to liquidate the group or the company or to cease their operations, and as they have concluded that the group’s and the company’s financial position means that this is realistic. They have also concluded that there are no material uncertainties that could have cast significant doubt over their ability to continue as a going concern for at least a year from the date of approval of the financial statements (‘the going concern period’).
We used our knowledge of the group, its industry, and the general economic environment to identify the inherent risks to its business model and analysed how those risks might affect the group’s and company’s financial resources or ability to continue operations over the going concern period. The risk that we considered most likely to adversely affect the group’s and company’s available financial resources and metrics related to the possible failure of the Haweswater water system resulting in a one-off totex impact.
We considered whether these risks could plausibly affect the liquidity or covenant compliance in the going concern period by assessing the directors’ sensitivities over the level of available financial resources and covenant thresholds indicated by the group’s financial forecasts taking account of severe, but plausible, adverse effects that could arise from these risks individually and collectively.
Our procedures included:
• Assessing key assumptions in the forecasts: critically assessed assumptions in base case and downside scenarios relevant to liquidity and covenant metrics such as inflation rate growth compared to market forecasts, forecast bonus payments compared to historical bonus payments and forecast dividend payments compared to group dividend policy. This included assessing whether downside scenarios applied assumptions which are mutually consistent, using our assessment of the possible range of each key assumption and our knowledge of inter-dependencies;
• Funding assessment: considered the availability of existing debt arrangements and committed loan facilities, including testing compliance with covenants and expected maturity dates;
• Historical accuracy of managements forecasts: compared historical budgets to actual results to assess the directors’ track record of budgeting accurately;
• Evaluating directors’ intent: evaluated the achievability of the actions the directors consider they would take to improve the position should the risks materialise, including assessment of mitigating actions within their control; and
• Assessing the completeness and accuracy of the matters covered in the going concern disclosure: considered whether the going concern disclosure in note 1 to the financial statements gives a full and accurate description of the directors’ assessment of going concern, including the identified risks and related sensitivities. We assessed the completeness of the going concern disclosure.
Our conclusions based on this work:
• we consider that the directors’ use of the going concern basis of accounting in the preparation of the financial statements is appropriate;
• we have not identified, and concur with the directors’ assessment that there is not, a material uncertainty related to events or conditions that, individually or collectively, may cast significant doubt on the group’s or company’s ability to continue as a going concern for the going concern period;
• we have nothing material to add or draw attention to in relation to the directors’ statement in the accounting policies to the financial statements on the use of the going concern basis of accounting with no material uncertainties that may cast significant doubt over the group and company’s use of that basis for the going concern period, and we found the going concern disclosure in the accounting policies to be acceptable; and
• the related statement under the Listing Rules set out on page 142 is materially consistent with the financial statements and our audit knowledge.
However, as we cannot predict all future events or conditions and as subsequent events may result in outcomes that are inconsistent with judgements that were reasonable at the time they were made, the above conclusions are not a guarantee that the group or the company will continue in operation.
5. Fraud and breaches of laws and regulations – ability to detectIdentifying and responding to risks of material misstatement due to fraudTo identify risks of material misstatement due to fraud (‘fraud risks’) we assessed events or conditions that could indicate an incentive or pressure to commit fraud or provide an opportunity to commit fraud. Our risk assessment procedures included:
• Enquiring of directors, the audit committee, internal audit and inspection of policy documentation as to the group’s high level policies and procedures to prevent and detect fraud, including the internal audit function, and the group’s channel for ‘whistleblowing’, as well as whether they have knowledge of any actual, suspected or alleged fraud;
• Reading board/audit committee/risk committee minutes; and
• Considering remuneration incentive schemes and performance targets for directors including Long Term Plan awards.
We communicated identified fraud risks throughout the audit team and remained alert to any indications of fraud throughout the audit.
As required by auditing standards, and taking into account possible pressures to meet profit targets and our overall knowledge of the control environment, we perform procedures to address the risk of management override of controls and the risk of fraudulent revenue recognition, the risk that group management may be in a position to make inappropriate accounting entries, and the risk of bias in accounting estimates and judgements such as revenue recognition and provisions for household customer debt, capitalisation of costs relating to the capital programme and valuation of retirement benefit obligations.
Further detail in respect of the above accounting estimates and judgements is set out in the key audit matter disclosures in section 2 of this report.
We also performed procedures including:
• Identifying journal entries to test based on risk criteria and comparing the identified entries to supporting documentation. These included journals relating to revenue or treasury posted to unexpected or unrelated accounts; and
• Assessing significant accounting estimates for bias.
Identifying and responding to risks of material misstatement due to non-compliance with laws and regulationsWe identified areas of laws and regulations that could reasonably be expected to have a material effect on the financial statements from our general commercial and sector experience, through discussion with the directors and other management (as required
204
FINANCIAL STATEMENTS
unitedutilities.com/corporate United Utilities Group PLC

by auditing standards), from inspection of the group’s regulatory and legal correspondence and discussed with the directors and other management the policies and procedures regarding compliance with laws and regulations.
As the group is regulated, our assessment of risks involved gaining an understanding of the control environment including the entity’s procedures for complying with regulatory requirements.
We communicated identified laws and regulations throughout our team and remained alert to any indications of non-compliance throughout the audit.
The potential effect of these laws and regulations on the financial statements varies considerably.
Firstly, the group is subject to laws and regulations that directly affect the financial statements including financial reporting legislation (including related companies legislation), distributable profits legislation, pension legislation and taxation legislation and we assessed the extent of compliance with these laws and regulations as part of our procedures on the related financial statement items.
Secondly, the group is subject to many other laws and regulations where the consequences of non-compliance could have a material effect on amounts or disclosures in the financial statements, for instance through the imposition of fines or litigation. We identified the following areas as those most likely to have such an effect: Ofwat, Environment Agency, Drinking Water Inspectorate, health and safety, anti-bribery, employment law, regulatory capital and liquidity and certain aspects of company legislation recognising the financial and regulated nature of the group’s activities and its legal form. Auditing standards limit the required audit procedures to identify non-compliance with these laws and regulations to enquiry of the directors and inspection of regulatory and legal correspondence, if any. Therefore if a breach of operational regulations is not disclosed to us or evident from relevant correspondence, an audit will not detect that breach.
Context of the ability of the audit to detect fraud or breaches of law or regulationOwing to the inherent limitations of an audit, there is an unavoidable risk that we may not have detected some material misstatements in the financial statements, even though we have properly planned and performed our audit in accordance with auditing standards. For example, the further removed non-compliance with laws and regulations is from the events and transactions reflected in the financial statements, the less likely the inherently limited procedures required by auditing standards would identify it.
In addition, as with any audit, there remained a higher risk of non-detection of fraud, as these may involve collusion, forgery, intentional omissions, misrepresentations, or the override of internal controls. Our audit procedures are designed to detect material misstatement. We are not responsible for preventing non-compliance or fraud and cannot be expected to detect non-compliance with all laws and regulations.
6. We have nothing to report on the other information in the annual reportThe directors are responsible for the other information presented in the annual report together with the financial statements. Our opinion on the financial statements does not cover the other information and, accordingly, we do not express an audit opinion or, except as explicitly stated below, any form of assurance conclusion thereon.
Our responsibility is to read the other information and, in doing so, consider whether, based on our financial statements audit work, the information therein is materially misstated or inconsistent with the financial statements or our audit knowledge. Based solely on that work we have not identified material misstatements in the other information.
Strategic report and directors’ report Based solely on our work on the other information:
• we have not identified material misstatements in the strategic report and the directors’ report;
• in our opinion the information given in those reports for the financial year is consistent with the financial statements; and
• in our opinion those reports have been prepared in accordance with the Companies Act 2006.
Directors’ remuneration report In our opinion the part of the Directors’ remuneration report to be audited has been properly prepared in accordance with the Companies Act 2006.
Disclosures of emerging and principal risks and longer-term viability We are required to perform procedures to identify whether there is a material inconsistency between the directors’ disclosures in respect of emerging and principal risks and the viability statement, and the financial statements and our audit knowledge.
Based on those procedures, we have nothing material to add or draw attention to in relation to:
• the directors’ confirmation within the long-term viability statement on pages 142 to 143 that they have carried out a robust assessment of the emerging and principal risks facing the group, including those that would threaten its business model, future performance, solvency and liquidity;
• the Principal Risks disclosures describing these risks and how emerging risks are identified, and explaining how they are being managed and mitigated; and
• the directors’ explanation in the long-term viability statement of how they have assessed the prospects of the group, over what period they have done so and why they considered that period to be appropriate, and their statement as to whether they have a reasonable expectation that the group will be able to continue in operation and meet its liabilities as they fall due over the period of their assessment, including any related disclosures drawing attention to any necessary qualifications or assumptions.
We are also required to review the long-term viability statement, set out on pages 142 to 143 under the Listing Rules. Based on the above procedures, we have concluded that the above disclosures are materially consistent with the financial statements and our audit knowledge.
Our work is limited to assessing these matters in the context of only the knowledge acquired during our financial statements audit. As we cannot predict all future events or conditions and as subsequent events may result in outcomes that are inconsistent with judgements that were reasonable at the time they were made, the absence of anything to report on these statements is not a guarantee as to the group’s and company’s longer-term viability.
Corporate governance disclosures We are required to perform procedures to identify whether there is a material inconsistency between the directors’ corporate governance disclosures and the financial statements and our audit knowledge.
205
FINA
NC
IAL STA
TEM
ENT
S
Annual Report and Financial Statements for the year ended 31 March 2021Stock Code: UU.

Independent auditor’s report to the members of United Utilities Group PLC only
Based on those procedures, we have concluded that each of the following is materially consistent with the financial statements and our audit knowledge:
• the directors’ statement that they consider that the annual report and financial statements taken as a whole is fair, balanced and understandable, and provides the information necessary for shareholders to assess the group’s position and performance, business model and strategy;
• the section of the annual report describing the work of the audit committee, including the significant issues that the audit committee considered in relation to the financial statements, and how these issues were addressed; and
• the section of the annual report that describes the review of the effectiveness of the group’s risk management and internal control systems.
We are required to review the part of the Corporate Governance Statement relating to the group’s compliance with the provisions of the UK Corporate Governance Code specified by the Listing Rules for our review.
We have nothing to report in this respect.
7. We have nothing to report on the other matters on which we are required to report by exceptionUnder the Companies Act 2006, we are required to report to you if, in our opinion:
• adequate accounting records have not been kept by the parent company, or returns adequate for our audit have not been received from branches not visited by us; or
• the parent company financial statements and the part of the Directors’ remuneration report to be audited are not in agreement with the accounting records and returns; or
• certain disclosures of directors’ remuneration specified by law are not made; or
• we have not received all the information and explanations we require for our audit.
We have nothing to report in these respects.
8. Respective responsibilitiesDirectors’ responsibilities As explained more fully in their statement set out on page 196, the directors are responsible for: the preparation of the financial statements including being satisfied that they give a true and fair view; such internal control as they determine is necessary to enable the preparation of financial statements that are free from material misstatement, whether due to fraud or error; assessing the group and parent company’s ability to continue as a going concern, disclosing, as applicable, matters related to going concern; and using the going concern basis of accounting unless they either intend to liquidate the group or the parent company or to cease operations, or have no realistic alternative but to do so.
Auditor’s responsibilities Our objectives are to obtain reasonable assurance about whether the financial statements as a whole are free from material misstatement, whether due to fraud or error, and to issue our opinion in an auditor’s report. Reasonable assurance is a high level of assurance, but does not guarantee that an audit conducted in accordance with ISAs (UK) will always detect a material misstatement when it exists. Misstatements can arise from fraud or error and are considered material if, individually or in aggregate, they could reasonably be expected to influence the economic decisions of users taken on the basis of the financial statements.
A fuller description of our responsibilities is provided on the FRC’s website at www.frc.org.uk/auditorsresponsibilities.
9. The purpose of our audit work and to whom we owe our responsibilities This report is made solely to the company’s members, as a body, in accordance with Chapter 3 of Part 16 of the Companies Act 2006. Our audit work has been undertaken so that we might state to the company’s members those matters we are required to state to them in an auditor’s report and for no other purpose. To the fullest extent permitted by law, we do not accept or assume responsibility to anyone other than the company and the company’s members, as a body, for our audit work, for this report, or for the opinions we have formed.
Ian Griffiths (Senior Statutory Auditor)for and on behalf of KPMG LLP, Statutory AuditorChartered Accountants1 St Peter’s Square, Manchester, M2 3AE26 May 2021
206
FINANCIAL STATEMENTS
unitedutilities.com/corporate United Utilities Group PLC

Note2021
£m2020
£m
Revenue 2 1,808.0 1,859.3
Employee benefits expense 3 (161.8) (161.4)
Other operating costs 4 (431.9) (403.4)
Allowance for expected credit losses – trade and other receivables 4 (28.7) (41.8)
Other income 4 3.6 3.4
Depreciation and amortisation expense 4 (422.3) (482.8)
Infrastructure renewals expenditure (164.8) (143.0)
Total operating expenses (1,205.9) (1,229.0)
Operating profit 602.1 630.3
Investment income 5 25.0 24.0
Finance expense 6 (107.2) (308.0)
Allowance for expected credit losses – loans to joint ventures A6 3.7 (5.0)
Investment income and finance expense (78.5) (289.0)
Share of losses of joint ventures 12 (9.3) (38.1)
Profit on disposal of joint venture 12 36.7 -
Profit before tax 551.0 303.2
Current tax charge 7 (79.2) (38.9)
Deferred tax charge 7 (18.4) (157.5)
Tax 7 (97.6) (196.4)
Profit after tax 453.4 106.8
Earnings per shareBasic 8 66.5p 15.7p
Diluted 8 66.3p 15.6p
Dividend per ordinary share 9 43.24p 42.60p
All of the results shown above relate to continuing operations.
Consolidated income statementfor the year ended 31 March
207
FINA
NC
IAL STA
TEM
ENT
S
Annual Report and Financial Statements for the year ended 31 March 2021Stock Code: UU.

2021£m
2020£m
Profit after tax 453.4 106.8
Other comprehensive incomeItems that may be reclassified to profit or loss in subsequent periods:
Cash flow hedge effectiveness 9.3 (2.0)
Tax on items taken directly to equity (1.8) 0.4
Foreign exchange adjustments (1.6) 1.3
Foreign exchange adjustments reclassified to profit on disposal of joint ventures 4.0 –
Other comprehensive income that may be reclassified to profit or loss 9.9 (0.3)
Items that will not be reclassified to profit or loss in subsequent periods:
Remeasurement (losses)/gains on defined benefit pension schemes (82.7) 154.6
Change in credit assumptions for debt reported at fair value through profit or loss (43.3) 34.2
Cost of hedging – cross-currency basis spread adjustment (12.7) 1.3
Deferred tax adjustments in respect of prior years on net fair value gains – (2.4)
Tax on items taken directly to equity 36.6 (157.1)
Other comprehensive income that will not be reclassified to profit or loss (102.1) 30.6
Total comprehensive income 361.2 137.1
Consolidated statement of comprehensive incomefor the year ended 31 March
208
FINANCIAL STATEMENTS
unitedutilities.com/corporate United Utilities Group PLC

Group Company
Note2021 £m
2020 £m
2021 £m
2020 £m
ASSETSNon-current assetsProperty, plant and equipment 10 11,799.0 11,510.9 – –
Intangible assets 11 181.1 189.0 – –
Interests in joint ventures and other investments 12 0.1 46.9 6,326.8 6,326.8
Trade and other receivables 14 86.7 97.0 – –
Retirement benefit surplus 18 689.0 754.1 – –
Derivative financial instruments A4 410.3 617.8 – –
13,166.2 13,215.7 6,326.8 6,326.8
Current assetsInventories 13 18.3 16.6 – –
Trade and other receivables 14 229.2 245.9 91.9 81.3
Current tax asset 6.9 37.7 – –
Cash and short-term deposits 15 744.1 528.1 – –
Derivative financial instruments A4 14.4 0.1 – –
1,012.9 828.4 91.9 81.3
Total assets 14,179.1 14,044.1 6,418.7 6,408.1
LIABILITIESNon-current liabilitiesTrade and other payables 21 (798.3) (761.2) – –
Borrowings 16 (7,797.0) (7,518.1) (1,780.6) (1,752.0)
Deferred tax liabilities 19 (1,449.5) (1,462.6) – –
Derivative financial instruments A4 (107.8) (135.4) – –
(10,152.6) (9,877.3) (1,780.6) (1,752.0)
Current liabilitiesTrade and other payables 21 (322.7) (334.4) (10.8) (14.2)
Borrowings 16 (654.8) (845.0) – (0.8)
Provisions 20 (11.1) (16.4) – –
Derivative financial instruments A4 (6.9) (8.9) – –
(995.5) (1,204.7) (10.8) (15.0)
Total liabilities (11,148.1) (11,082.0) (1,791.4) (1,767.0)
Total net assets 3,031.0 2,962.1 4,627.3 4,641.1
EQUITYShare capital 23 499.8 499.8 499.8 499.8
Share premium account 2.9 2.9 2.9 2.9
Other reserves 22 336.3 336.7 1,033.3 1,033.3
Retained earnings 2,192.0 2,122.7 3,091.3 3,105.1
Shareholders’ equity 3,031.0 2,962.1 4,627.3 4,641.1
These financial statements for the group and United Utilities Group PLC (company number: 6559020) were approved by the board of directors on 26 May 2021 and signed on its behalf by:
Steve Mogford Chief Executive Officer
Phil Aspin Chief Financial Officer
Consolidated and company statements offinancial position at 31 March
209
FINA
NC
IAL STA
TEM
ENT
S
Annual Report and Financial Statements for the year ended 31 March 2021Stock Code: UU.

Share capital
£m
Share premium account
£m
Otherreserves*
£m
Retained earnings
£mTotal
£m
At 1 April 2020 499.8 2.9 336.7 2,122.7 2,962.1Profit after tax – – – 453.4 453.4Other comprehensive incomeRemeasurement gains on defined benefit pension schemes (see note 18) – – – (82.7) (82.7)Change in credit assumption for debt reported at fair value through profit or loss – – – (43.3) (43.3)Cash flow hedge effectiveness – – 9.3 – 9.3Cost of hedging – cross-currency basis spread adjustment – – (12.7) – (12.7)Tax on items taken directly to equity (see note 7) – – 0.6 34.2 34.8Foreign exchange adjustments – – (1.6) – (1.6)Foreign exchange adjustments reclassified to profit on disposal ofjoint ventures – – 4.0 – 4.0Total comprehensive income – – (0.4) 361.6 361.2Dividends (see note 9) – – – (291.9) (291.9)Equity-settled share-based payments (see note 3) – – – 3.6 3.6Exercise of share options – purchase of shares – – – (4.0) (4.0)At 31 March 2021 499.8 2.9 336.3 2,192.0 3,031.0
Share capital
£m
Share premium account
£m
Otherreserves*
£m
Retained earnings
£mTotal
£mAt 1 April 2019 499.8 2.9 338.3 2,269.8 3,110.8
Profit after tax – – – 106.8 106.8
Other comprehensive incomeRemeasurement gains on defined benefit pension schemes (see note 18) – – – 154.6 154.6
Change in credit assumption for debt reported at fair value through profit or loss – – – 34.2 34.2
Cash flow hedge effectiveness – – (2.0) – (2.0)
Cost of hedging – cross-currency basis spread adjustment – – 1.3 – 1.3
Deferred tax adjustments in respect of prior years on net fair value gains – – (2.4) – (2.4)
Tax on items taken directly to equity (see note 7) – – 0.2 (156.9) (156.7)
Foreign exchange adjustments – – 1.3 – 1.3
Total comprehensive income – – (1.6) 138.7 137.1
Dividends (see note 9) – – – (284.5) (284.5)
Equity-settled share-based payments (see note 3) – – – 1.5 1.5
Exercise of share options – purchase of shares – – – (2.8) (2.8)
At 31 March 2020 499.8 2.9 336.7 2,122.7 2,962.1
* Other reserves comprise the group's cumulative exchange reserve, capital redemption reserve, merger reserve, cost of hedging reserve and cash flow hedging reserve. Further detail of movements in these reserves is included in note 22.
Consolidated statement of changes in equityfor the year ended 31 March
210
FINANCIAL STATEMENTS
unitedutilities.com/corporate United Utilities Group PLC

Share capital
£m
Share premium
account £m
Other reserves
£m
Retained earnings
£mTotal
£m
At 1 April 2020 499.8 2.9 1,033.3 3,105.1 4,641.1Profit after tax – – – 278.5 278.5Total comprehensive income – – – 278.5 278.5Dividends (see note 9) – – – (291.9) (291.9)Equity-settled share-based payments (see note 3) – – – 3.6 3.6Exercise of share options – purchase of shares – – – (4.0) (4.0)At 31 March 2021 499.8 2.9 1,033.3 3,091.3 4,627.3
Share capital
£m
Share premium
account £m
Other reserves
£m
Retained earnings
£mTotal
£mAt 1 April 2019 499.8 2.9 1,033.3 3,139.4 4,675.4
Profit after tax – – – 251.5 251.5
Total comprehensive income – – – 251.5 251.5
Dividends (see note 9) – – – (284.5) (284.5)
Equity-settled share-based payments (see note 3) – – – 1.5 1.5
Exercise of share options – purchase of shares – – – (2.8) (2.8)
At 31 March 2020 499.8 2.9 1,033.3 3,105.1 4,641.1
At 31 March 2021, 31 March 2020 and 31 March 2019, the company's entire retained earnings balance was distributable to shareholders.
The company's other reserves comprises a capital redemption reserve that arose as a result of a return of capital to shareholders following the reverse acquisition of United Utilities PLC by United Utilities Group PLC in the year ended 31 March 2009.
As permitted by section 408 of the Companies Act 2006, the company has not presented its own income statement. The result of the company for the financial year was a profit after tax of £278.5 million (2020: £251.5 million).
Company statement of changes in equityfor the year ended 31 March
211
FINA
NC
IAL STA
TEM
ENT
S
Annual Report and Financial Statements for the year ended 31 March 2021Stock Code: UU.

Group Company
Note2021
£m2020
£m2021
£m2020
£m
Operating activitiesCash generated from operations A1 1,037.2 1,005.5 302.2 287.0
Interest paid (136.7) (149.4) (28.9) (33.4)
Interest received and similar income 7.4 9.9 – –
Tax paid (75.4) (71.5) – –
Tax received 26.9 15.8 – 5.8
Net cash generated from operating activities 859.4 810.3 273.3 259.4
Investing activitiesPurchase of property, plant and equipment A1 (610.4) (652.8) – –
Purchase of intangible assets A1 (33.6) (27.2) – –
Proceeds from sale of property, plant and equipment – – – –
Grants and contributions received 21 5.0 34.7 – –
(Extension)/repayment of loans to joint ventures A6 (2.0) 34.5 – –
Dividends received from joint ventures 12 6.4 4.9 – –
Proceeds from disposal of investments 12 85.3 12.0 – –
Net cash used in investing activities (549.3) (593.9) – –
Financing activitiesProceeds from borrowings net of issuance costs 909.7 805.4 23.4 27.6
Repayment of borrowings (703.5) (545.9) – –
Dividends paid to equity holders of the company 9 (291.9) (284.5) (291.9) (284.5)
Exercise of share options – purchase of shares (4.0) (2.8) (4.0) (2.8)
Net cash used in financing activities (89.7) (27.8) (272.5) (259.7)
Net increase/(decrease) in cash and cash equivalents 220.4 188.6 0.8 (0.3)
Cash and cash equivalents at beginning of the year 513.2 324.6 (0.8) (0.5)
Cash and cash equivalents at end of the year 15 733.6 513.2 – (0.8)
Consolidated and company statements of cash flowsfor the year ended 31 March
212
FINANCIAL STATEMENTS
unitedutilities.com/corporate United Utilities Group PLC

In the interest of providing clear and relevant information to the users of our financial statements we have included summary information within the notes to the financial statements, with additional detailed information included in appendices where required. These notes and appendices can be grouped as follows:
Notes and appendices Page Notes and appendices Page
Operations – information relating to our operating results
1 2 3
Segmental reporting Revenue Directors and employees
218 218 218
4 17 A1
Operating profit Leases Consolidated statement of cash flows – further analysis
219 230 235
Financing – information relating to how we finance our business
5 6 8 9 15
Investment income Finance expense Earnings per share Dividends Cash and cash equivalents
220 221 223 224 229
16 23 A2 A3 A4
Borrowings Share capital Net debt Borrowings Financial risk management
229 234 236 238 240
Working capital – information relating to the day-to-day working capital of our business
13 14 15
Inventories Trade and other receivables Cash and cash equivalents
227 227 229
21 A6
Trade and other payables Related party transactions
232 253
Tax – information relating to our current and deferred taxation
7 Tax 222 19 Deferred tax liabilities 231
Employees – information relating to the costs associated with employing our people
3 18
Directors and employees Retirement benefit surplus
218 230
A5 Retirement benefits 248
Long-term assets – information relating to our long-term operational and investment assets
10 11 12
Property, plant and equipment Intangible assets Joint ventures and other investments
224 226 226
18 A5
Retirement benefit surplus Retirement benefits
230 248
Other – other useful information
20 22 24
Provisions Other reserves Contingent liabilities
232 233 234
25 A7 A8
Events after the reporting period Accounting policies Subsidiaries and other group undertakings
234 255 260
Guide to detailed financial statements disclosures
213
FINA
NC
IAL STA
TEM
ENT
S
Annual Report and Financial Statements for the year ended 31 March 2021Stock Code: UU.

The principal accounting policies adopted in the preparation of these financial statements are set out below. Further detail can be found in note A7.
Basis of preparationThese group and parent company financial statements have been prepared in accordance with international accounting standards in conformity with the requirements of the Companies Act 2006, and these group financial statements were also in accordance with International Financial Reporting Standards (IFRSs) adopted pursuant to Regulation (EC) No 1606/2002 as it applies in the European Union (EU). They have been prepared under the historical cost convention, except for the revaluation of financial instruments, accounting for the transfer of assets from customers and the revaluation of infrastructure assets to fair value on transition to IFRS.
The preparation of financial statements, in conformity with IFRS, requires management to make estimates and assumptions that affect the amounts of assets and liabilities at the date of the financial statements and the amounts of revenues and expenses during the reporting periods presented. Although these estimates are based on management’s best knowledge of the amount, event or actions, actual results, ultimately, may differ from these estimates.
The financial statements have been prepared on the going concern basis as the directors have a reasonable expectation that the group has adequate resources for a period of at least 12 months from the date of the approval of the financial statements and that there are no material uncertainties to disclose.
In assessing the appropriateness of the going concern basis of accounting the directors have reviewed the resources available to the group in the form of cash and committed facilities as well as consideration of the group’s capital adequacy, along with a baseline plan that incorporates the expected impacts of COVID-19. The directors have considered the magnitude of potential impacts resulting from uncertain future events or changes in conditions, and the likely effectiveness of mitigating actions that the directors would consider undertaking. The baseline position has been subjected to a number of severe but reasonable downside scenarios in order to assess the group’s ability to operate within the amount and terms (including relevant covenants) of existing facilities. These scenarios consider: the potential impacts of increased totex costs, including a significant one-off totex impact arising in the assessment period; lower CPIH inflation; elevated levels of bad debt; outcome delivery incentive penalties; and the impact of these factors materialising on a combined basis. Mitigating actions were considered to include: deferral of capital expenditure; a reduction in other discretionary totex spend; the close-out of derivative asset balances; and the deferral or suspension of dividend payments.
Consequently, the directors are satisfied that the group will have sufficient funds to continue to meet its liabilities as they fall due for at least 12 months from the date of approval of the financial statements, and that the severe but reasonable downside scenarios considered indicate that the group will be able to operate within the amount and terms (including relevant covenants) of existing facilities. The financial statements have therefore been prepared on a going concern basis.
Adoption of new and revised standardsThe following standards, interpretations and amendments, effective for the year ended 31 March 2021, are relevant to the group but have had no material impact on the group’s financial statements:
• Amendments to IFRS 3 ‘Definition of a Business’ (issued on 22 October 2018; and
• Amendments were made to IAS 1 and IAS 8 ‘Definition of Material’ (issued on 31 October 2018).
The IASB issued its revised Conceptual Framework in March 2018 which is mandatory for annual reporting periods beginning on or after 1 January 2020. It is not a standard and does not override any standard, but its principles apply to arrangements not covered by IFRS standards. No arrangements have been identified by the group which require a change in accounting treatment under the revised Conceptual Framework.
Early adopted new and revised standards 'Phase Two' – IBOR reformIn January 2021, the Secretary of State for BEIS and the EU endorsed the IASB-published amendments to IFRS 9 ‘Financial Instruments’, and IFRS 7 ‘Financial Instruments: Disclosures’ in respect of interest rate benchmark reform, effective for annual periods beginning on or after 1 January 2021 with early adoption permitted ('Phase Two' IBOR Reform).
The amendments address the financial reporting impact from reform of the London Interbank Offered Rate (LIBOR) and similar benchmark interest rates (IBOR Reform). The Bank of England has asked UK market participants to complete the transition to alternative risk-free rates by the end of 2021, with the industry-led Working Group on Sterling Risk-Free Reference Rates having previously recommended the Sterling Overnight Index Average (SONIA) as the preferred risk-free rate in sterling markets.
The group chose to early-adopt the Phase Two reforms for the year ended 31 March 2021, though this has had no impact on the financial statements for the year then ended. When applicable, the group will take the relevant practical expedients from certain requirements in IFRS 9 and IFRS 7 relating to changes in the basis for determining contractual cash flows of financial assets, financial liabilities and hedge accounting.
At 31 March 2021, the group had a net balance of £591.3 million relating to financial instruments, along with an additional £700.0 million of undrawn committed facilities, still referencing LIBOR. Detail on the derivation of this net balance can be found in note A4, along with further information on the group’s transition to alternative benchmarks. This figure is inclusive of £2,117.8 million nominal value of swaps designated within fair value hedging relationships.
These Phase Two amendments will be applicable on modification of the instruments to be linked to the alternative risk-free rate, as well as when changes to the fair value hedges are required as a result of the reform. The reliefs provided for in this amendment mean that on transition to the new risk-free rate, no one-off charge or credit to the income statement will be recognised, provided the transition has occurred on an economically equivalent basis. The amendments also mean that the group expects no discontinuation of hedge accounting to be required on transition to the new interest rate benchmarks, with modifications to the documentation permitted, provided these are directly related to the IBOR reform.
Accounting policies
214
FINANCIAL STATEMENTS
unitedutilities.com/corporate United Utilities Group PLC

The group has previously adopted 'Phase One' - Amendments to IFRS 9 and IFRS 7 - Interest rate benchmark reform, which allowed temporary relief from applying specific hedge accounting requirements to hedging arrangements directly impacted by IBOR reform. This temporary relief is expected to cease, on a hedge-by-hedge basis, when the designated hedge relationship is amended and application of Phase Two reliefs begins.
As a result of the relief, the group expects that no material gain or loss will arise from the replacement of LIBOR with an alternative risk-free rate.
Critical accounting judgements and key sources of estimation uncertaintyIn the process of applying its accounting policies set out in note A7, the group is required to make certain estimates, judgements and assumptions that it believes are reasonable based on the information available. These judgements, estimates and assumptions affect the carrying amounts of assets and liabilities at the date of the financial statements and the amounts of revenues and expenses recognised during the reporting periods presented. Changes to these estimates, judgements and assumptions could have a material effect on the financial statements.
On an ongoing basis, the group evaluates its estimates using historical experience, consultation with experts and other methods considered reasonable in the particular circumstances. As estimates carry with them an inherent level of uncertainty, the group performs sensitivity analysis where this is practicable and where, in management’s opinion, it provides useful and meaningful information. This sensitivity analysis is performed to understand a range of outcomes that could be considered reasonably possible based on experience and the facts and circumstances associated with individual areas of the financial statements that are subject to estimates. Actual results may differ significantly from the estimates, the effect of which is recognised in the period in which the facts that give rise to the revision become known.
As part of the evaluation of critical accounting judgements and key sources of estimation uncertainty, the group has considered the implications of climate change on its operations and activities, further details of which are set out below.
The following paragraphs detail the estimates and judgements the group believes to have the most significant impact on the annual results under IFRS, including specific considerations in light of the COVID-19 pandemic.
Revenue recognition and allowance for doubtful receivablesAccounting estimate – The group recognises revenue generally at the time of delivery and when collection of the resulting receivable has been deemed probable. In estimating the amount of revenue to recognise, where the group considers that the criteria for revenue recognition are not met for a transaction, revenue recognition is delayed until such time as collectability is deemed probable. There are two different criteria whereby management does not recognise revenue for amounts which have been billed to those customers on the basis that collectability is not probable. These are as follows:
• The customer has not paid their bills for a period of at least two years; and
• The customer has paid their bills in the preceding two years; however, has previously had bills de-recognised and has more than their current year debt outstanding.
This two-criteria approach resulted in a £27.1 million reduction in revenue compared with what would have been recognised had no adjustment been made for amounts where collectability is not probable. Had management made an alternative judgement that where customers have paid in the preceding two years, and have more than their current year debt outstanding, the recoverability of the entirety of their debt was deemed to be probable (i.e. the second criteria were disapplied), the required adjustment to revenue would have been £7.9 million lower.
Accounting estimate – At each reporting date, the company and each of its subsidiaries evaluate the estimated recoverability of trade receivables and record allowances for expected credit losses based on experience. Estimates associated with these allowances are based on, among other things, a consideration of actual collection history. The actual level of receivables collected may differ from the estimated levels of recovery, which could impact operating results positively or negatively. At 31 March 2021, an allowance for expected credit losses relating to household customer debt of £74.9 million was supported by a six-year cash collection projection. Based on a five-year or seven-year cash collection projection the allowance for doubtful receivables would have increased by £1.3 million or reduced by £0.6 million respectively.
At the prior year balance sheet date, the expected future impact of the COVID-19 pandemic on the ability of some customers to pay their bills was specifically taken into consideration as part of the expected credit loss assessment for trade receivables. This gave rise to a further £16.7 million incremental increase in the allowance for expected credit losses based on judgements around the likely impact of the pandemic on the non-payment risk profile of the group’s customer base on a segmented basis.
A high level of uncertainty remains around how current economic conditions could impact the recoverability of household receivables, particularly in light of further lockdowns during the year. As government support schemes such as furlough unwind, this could result in increased unemployment and therefore further impact the ability of some customers to pay.
In recognition of this future uncertainty, the allowance for expected credit losses covering the group’s household customer base has been determined based on the assumption that cash collection experienced over the last two years continues into the future. This assumption supports the reported household bad debt charge of 2.2 per cent of household revenue and is considered to be a reasonable estimate of future collection. Had the group assumed that future collection was maintained at levels experienced during the last 12 months alone, the charge would have been increased by £2.6 million to 2.4 per cent of household revenue. If the group had assumed that future collection improved to an average of actual collection experienced over the last 3 years, then the bad debt charge would have reduced by £3.8 million to 1.8 per cent of household revenue
Accounting estimate – United Utilities Water Limited raises bills in accordance with its entitlement to receive revenue in line with the limits established by the periodic regulatory price review processes. For household water and wastewater customers with water meters, the receivable billed is dependent on the volume supplied, including the sales value of an estimate of the units supplied between the date of the last meter reading and the billing date. Meters are read on a cyclical basis and the group recognises revenue for unbilled amounts based on estimated usage from the last billing through to each reporting date. The estimated usage is based on historical data, judgement and assumptions; actual results could differ from these estimates, which would result in operating revenues being adjusted in the period that the revision to the estimates is determined.
215
FINA
NC
IAL STA
TEM
ENT
S
Annual Report and Financial Statements for the year ended 31 March 2021Stock Code: UU.

Revenue recognised for unbilled amounts for these customers at 31 March 2021 was £69.4 million. Had actual consumption been 5 per cent higher or lower than the estimate of units supplied, this would have resulted in revenue recognised for unbilled amounts being £4.8 million higher or lower respectively. For customers who do not have a meter, the receivable billed and revenue recognised is dependent on the rateable value of the property, as assessed by an independent rating officer. Consumption patterns during the year have been significantly impacted by changes brought about by the COVID-19 pandemic, with household consumption having been above levels normally seen due to customers spending more time at home. As the year has progressed, the volume of household meter reads has gradually increased, resulting in the increased consumption during the pandemic period largely being captured in actual bills meaning that the level of estimation has reduced. By 31 March 2021, the system generated accrual had largely aligned to the independent automated meter read (AMR) data. AMR data is captured for around 25 per cent of all measured household customers, and this increase has been extrapolated across the remaining measured household customer base. The reasonableness of this approach has been validated through an assessment of bills raised in the period.
Accounting estimate – Due to temporary business closures required as a result of lockdown measures put in place by the UK Government, the level of non-household consumption has fallen significantly throughout the year ended 31 March 2021. Revenue in relation to wholesale charges billed to non-household retailers is recognised based on a series of settlement statements produced by the Central Market Operating System (CMOS), operated by Market Operator Services Ltd (MOSL). When generating bills in the absence of a current meter read, CMOS uses the 12 months prior to the last meter read to assess expected consumption. Depending on when a meter was last read, the calculated volumetric charge may not be wholly reflective of the consumption during the period estimated due to the impact that COVID-19 has had on different industries in the year. In recognition of this issue, MOSL advised non-household retailers in December 2020 that they should consider the trading status of their customers and amend their Yearly Volume Estimate to adjust the wholesale charges calculated by CMOS. The group has performed its own estimations of the adjustments required to these charges determined by CMOS, and has accrued for an additional £13.9 million of revenue in the year relating to non-household wholesale charges. This adjustment is based on an analysis of volume supplied for each particular end user at a supply point level, and comparing this with estimates in the CMOS system. Had this accrued income simply been based on the estimates calculated by CMOS, revenue would therefore have been £13.9 million lower, though based on the volumetric analysis performed management considers that this position would be overly prudent.
Property, plant and equipmentAccounting judgement – The group recognises property, plant and equipment (PPE) on its water and wastewater infrastructure assets where such expenditure enhances or increases the capacity of the network, whereas any expenditure classed as maintenance is expensed in the period it is incurred. Determining enhancement from maintenance expenditure requires an accounting judgement, particularly when projects have both elements within them. Enhancement spend was 58 per cent of total spend in relation to infrastructure assets during the year. A change of +/- 1 per cent would have resulted in £4.0 million less/more expenditure being charged to the income statement during the period. In addition, management capitalises time and resources incurred by the group’s support functions on capital programmes, which requires accounting judgements to be made in relation to the appropriate capitalisation rates. Support costs allocated to PPE represent 37
per cent of total support costs. A change in allocation of +/- 5 per cent would have resulted in £2.1 million less/more expenditure being charged to the income statement during the period.
Accounting estimate – The estimated useful economic lives of PPE and intangible assets is based on management’s experience. When management identifies that actual useful economic lives differ materially from the estimates used to calculate depreciation, that charge is adjusted prospectively. Due to the significance of PPE and intangibles investment to the group, variations between actual and estimated useful economic lives could impact operating results both positively and negatively. As such, this is a key source of estimation uncertainty. The depreciation and amortisation expense for the year was £422.3 million. A 10 per cent increase in average asset lives would have resulted in a £39.2 million reduction in this figure and a 10 per cent decrease in average asset lives would have resulted in a £46.0 million increase in this figure.
Retirement benefitsAccounting estimate – The group operates two defined benefit pension schemes which are independent of the group’s finances. Actuarial valuations of the schemes are carried out as determined by the trustees at intervals of not more than three years. Profit before tax and net assets are affected by the actuarial assumptions used. The key assumptions include: discount rates, pay growth, mortality, and increases to pensions in payment and deferred pensions. It should be noted that actual rates may differ from the assumptions used due to changing market and economic conditions and longer or shorter lives of participants and, as such, this represents a key source of estimation uncertainty. Sensitivities in respect of the assumptions used during the year are disclosed in note A5.
Accounting estimate – Included within the group’s defined benefit pension scheme assets are assets with a fair value estimated to be £268.0 million that are categorised as ‘level 3’ assets within the IFRS 13 ‘Fair value measurement’ hierarchy, meaning that the value of the assets is not observable at 31 March 2021. Estimates of the fair value of these assets have been performed by the investment managers’ valuation specialists using the latest available statements of each of the funds that make up the total level 3 asset balance, updated for any subsequent cash movements between the statement date and the year end reporting date.
Derivative financial instrumentsAccounting estimate – The model used to fair value the group’s derivative financial instruments requires management to estimate future cash flows based on applicable interest rate curves. Projected cash flows are then discounted back using discount factors which are derived from the applicable interest rate curves adjusted for management’s estimate of counterparty and own credit risk, where appropriate. Sensitivities relating to derivative financial instruments are included in note A4.
Joint ventures – Water PlusAccounting judgement – The group’s financial interests in Water Plus Group Limited, a joint venture with Severn Trent PLC, comprise an investment in the ordinary shares of Water Plus, and loans issued to the joint venture in the form of revolving credit facilities and a zero coupon shareholder loan note, further details of which are included in note A6.
Prior to 31 March 2021, it was proposed that existing working capital facilities extended to Water Plus by its shareholders would be restructured, resulting in each shareholder injecting a form of equity capital into the joint venture. United Utilities and Severn Trent would reconfigure an existing revolving credit facility, drawn-down to £32.5 million at the reporting date, into share capital, with the subscription price of this capital equalling the value of the cancelled revolving credit facility. On 23 April 2021, the revolving
Accounting policies
216
FINANCIAL STATEMENTS
unitedutilities.com/corporate United Utilities Group PLC

credit facility was formally cancelled and the group completed the purchase of share capital.
Judgement is required in determining whether, at the reporting date, this revolving credit facility forms part of the group’s long-term interest in Water Plus whose value would be reduced in accordance with the group’s share of joint venture losses in excess of the value of its equity investment when applying the equity method in accordance with IAS 28 ‘Investments in Associates and Joint Ventures’.
Notwithstanding the legal form, management view the revolving credit facility as forming part of the group’s long-term interest in Water Plus at the balance sheet date. Timing differences existed between shareholder agreement to provide additional share capital (pre year-end) and the execution of the transaction (post year-end). The group has therefore determined that, in substance, it had an additional long-term interest in the Water Plus group at the reporting date.
In the year-ended 31 March 2020, the group’s long-term interest in Water Plus was reduced to £nil. £5.3 million of unrecognised losses existed at the balance sheet date. These previously unrecognised losses, together with the group’s share of the Water Plus’s losses in the year ended 31 March 2021 of £8.9 million, have been allocated against the revolving credit facility at the balance sheet date. The £14.2 million total share of losses has been recognised in the group’s income statement for the year-ended 31 March 2021.
Had an alternative judgement been applied such that this revolving credit facility was not considered to be part of the group’s long-term interest in Water Plus, the group’s £5.3 million unrecognised share of Water Plus’s losses for the prior year and the group’s £8.9 million share of Water Plus’s losses for the current year would not have been recognised in the income statement resulting in a lower share of losses from joint ventures, and the carrying value of the amount owed by Water Plus in respect of the revolving credit facility would have been higher by this amount. See note A6 for further details.
Climate changeThe group is continually developing its assessment of the impact that climate change has on the assets and liabilities recognised and presented in its financial statements.
The natural environment within which the group operates is constantly changing, and this influences how its water and wastewater services are to be delivered in the future. In addition, the group has embedded ambitious climate-related targets within its own operations, with this affecting the portfolio of assets required to deliver such services.
The impact of climate change has been considered in the preparation of these financial statements across a number of areas, predominantly in respect of the valuation of the property, plant and equipment held by the group.
Asset life reviews are undertaken regularly for facilities impacted by climate change, environmental legislation or the group’s decarbonisation measures. In the prior year, depreciation was accelerated on a material value of bioresources facilities which were deemed to be commercially obsolete and for which no further use was planned, in part as a result of the group’s decarbonisation strategy. In the current financial year, depreciation was accelerated totalling £2.3 million at bioresource facilities impacted by changes in environmental legislative requirements.
The group is exposed to potential asset write-downs following flooding resulting from extreme weather events, the frequency of which are expected to increase as the effects of climate change become more apparent. Following large-scale flooding, items
are identified that have been damaged beyond repair and require immediate accounting write-downs. No such charges were required in the current financial year.
The group has looked to further enhance the accuracy of its useful life assessment through the introduction of more forward-looking information in asset life reviews. This includes the use of data from the Pioneer strategic asset planning system to assess the economic point of replacement for assets under future investment and performance scenarios. This information is to be used alongside other decommissioning data to inform useful economic asset lives.
The group mitigates the exposure that the carrying value of its book asset base has to climate-related risks through strategic planning activities that incorporate defined climate scenarios, climate change mitigation pledges, and long-term climate projections. The group installs permanent flood defences and other resilience measures at the most vulnerable facilities to protect its assets.
217
FINA
NC
IAL STA
TEM
ENT
S
Annual Report and Financial Statements for the year ended 31 March 2021Stock Code: UU.

1 Segmental reportingThe board of directors of United Utilities Group PLC (the board) is provided with information on a single-segment basis for the purposes of assessing performance and allocating resources. The group’s performance is measured against financial and operational key performance indicators which align with its three strategic themes to deliver the best service to customers, at the lowest sustainable cost, in a responsible manner. The board reviews revenue, operating profit and gearing, along with operational drivers at a consolidated level (see pages 50 to 81). In light of this, the group has a single segment for financial reporting purposes and therefore no further detailed segmental information is provided in this note.
2 RevenueThe group’s revenue predominantly arises from the provision of services within the United Kingdom, with less than 1 per cent of external revenue and non-current assets being overseas.
2021£m
2020£m
Wholesale water charges 751.0 784.8
Wholesale wastewater charges 941.5 939.5
Household retail charges 64.1 83.8
Other 51.4 51.2
1,808.0 1,859.3
In accordance with IFRS 15, revenue has been disaggregated based on what is recognised in relation to the core services of supplying clean water and the removal and treatment of wastewater. Each of these services is deemed to give rise to a distinct performance obligation under the contract with customers, although following the same pattern of transfer to the customer who simultaneously receives and consumes both of these services over time.
Wholesale water and wastewater charges relate to services provided to household customers and non-household retailers. Household retail charges relate solely to the margin applied to the wholesale amounts charged to residential customers. These wholesale charges and the applicable retail margin are combined in arriving at the total revenues relating to water and wastewater services provided to household customers. No margin is applied to wholesale water and wastewater services provided to non-household retailers.
Other revenues comprise a number of smaller non-core income streams, including those relating to energy generation and export, and those associated with activities, typically performed opposite property developers, which impact the group’s capital network assets, including diversions works to relocate water and wastewater assets, and activities that facilitate the creation of an authorised connection through which properties can obtain water and wastewater services.
3 Directors and employeesDirectors’ remuneration
2021£m
2020£m
Fees to non-executive directors 0.8 0.8
Salaries 1.2 1.4
Benefits 0.2 0.3
Bonus 0.7 0.7
Share-based payment charge 1.7 1.0
4.6 4.2
Further information about the remuneration of individual directors and details of their pension arrangements are provided in the Directors’ remuneration report on pages 167 to 189.
Remuneration of key management personnel2021
£m2020
£m
Salaries and short-term employee benefits 6.3 6.4
Share-based payment charge 3.0 1.3
9.3 7.7
Key management personnel comprises all directors and certain senior managers who are members of the executive team.
Notes to the financial statements
218
FINANCIAL STATEMENTS
unitedutilities.com/corporate United Utilities Group PLC

3 Directors and employees continuedEmployee benefits expense (including directors)
Group2021
£m2020
£m
Wages and salaries 240.4 229.6
Employee-related taxes and levies 25.2 23.8
Severance 1.3 7.2
Post-employment benefits:
Defined benefit pension expense (see note 18) 8.5 12.3
Defined contribution pension expense (see note 18) 23.4 22.5
298.8 295.4
Charged to other areas including regulatory capital schemes (137.0) (134.0)
Employee benefits expense 161.8 161.4
Included within employee benefits expense were £1.9 million (2020: £11.8 million) of restructuring costs.
The total expense included within employee benefits expense in respect of equity-settled share-based payments was £3.6 million (2020: £1.5 million). The company operates several share option schemes, details of which are given on pages 167 to 189 in the Directors’ remuneration report.
Average number of employees during the year (full-time equivalent including directors):
2021 number
2020 number
Average number of employees during the year 5,354 5,302
CompanyThe company has no employees.
4 Operating profitThe following items have been charged/(credited) to the income statement in arriving at the group’s operating profit:
2021£m
2020£m
Other operating costsHired and contracted services 96.3 96.6
Property rates 89.4 75.9
Power 83.6 78.9
Materials 82.2 75.1
Regulatory fees 28.0 28.3
Insurance 13.1 13.5
Loss on disposal of property, plant and equipment 10.7 13.9
Accrued innovation costs 6.2 –
Cost of properties disposed 2.6 0.4
Other expenses 19.8 20.8
431.9 403.4
Allowance for expected credit losses – trade and other receivablesAllowance for expected credit losses – trade and other receivables (see note 14) 28.7 41.8
28.7 41.8
Other incomeOther income (3.6) (3.4)
(3.6) (3.4)
Depreciation and amortisation expenseDepreciation of property, plant and equipment: owned assets (see note 10) 379.8 441.6
Amortisation of other intangible assets (see note 11) 42.5 41.2
422.3 482.8
219
FINA
NC
IAL STA
TEM
ENT
S
Annual Report and Financial Statements for the year ended 31 March 2021Stock Code: UU.

4 Operating profit continuedIncluded within depreciation of property, plant and equipment was £2.3 million of accelerated depreciation resulting from the group’s strategic bioresources review. This compares with accelerated depreciation of certain bioresources assets amounting to £82.3 million in the prior year, primarily relating to incineration assets at the group’s Mersey Valley Sludge Processing Centre, known as Shell Green. The accelerated depreciation in both years reflects the outcomes of the strategic review, whereby the likelihood of the group deriving future economic benefit from these assets was considered remote in light of improvements in alternative lower-cost and more environmentally friendly processes. In addition to this, in the prior year, inventory spares held for use by these assets were written down to £nil.
Excluding the impact of this current and prior year accelerated depreciation, the group’s depreciation and amortisation expense has increased by £19.5 million in the current year, principally reflecting the higher capital expenditure programme in AMP6 with a higher number of assets commissioned towards the end of the AMP. In the near term this depreciation and amortisation expense is expected to flatten out, reflecting the lower AMP7 capital programme.
During the prior year, the group incurred operating costs of £19.2 million in relation to the onset of the COVID-19 pandemic, comprising £16.7 million in relation to allowances for expected credit losses in respect of household trade receivables, £1.4 million allowances for expected credit losses in respect of non-household trade receivables, and £1.1 million of other operating expenses. The additional allowances for expected credit losses reflected the group’s estimate of the potential impact of the pandemic on the recoverability of receivables over and above its existing expected credit loss assessment, and was treated as an adjusting item in arriving at the group’s underlying operating profit included in its alternative performance measures. This was possible given the proximity of the group’s year end reporting date to the introduction of lockdown measures in the UK.
Incremental costs for the year ended 31 March 2021 arising as a result of the pandemic are estimated to be around £8 million of operating costs, though these have been partially offset by savings realised elsewhere, and around £5 million of additional costs associated with expected credit losses due to the increased risk associated with cash collection as government support schemes are withdrawn. With the passage of time, and with the conditions brought about by the pandemic becoming embedded into normal processes during the current year, the group considers that, for the purpose of presenting an underlying operating profit position, splitting out these costs does not provide meaningful or useful additional information.
Property rates expenses in the current year include the impact of £1.1 million (2020: £8.1 million) of refunds in relation to rates paid in previous years, and £nil (2020: £8.2 million) reduction in accrued rates costs. These reductions ensure that the cumulative costs associated with property rates paid by the group are appropriately recorded.
Research and development expenditure for the year ended 31 March 2021 was £1.0 million (2020: £1.0 million). In addition, £6.2 million (2020: £nil) of costs have been accrued by United Utilities Water Limited in relation to the Innovation in Water Challenge scheme operated by Ofwat for AMP7, which therefore did not apply in the prior year. These expenses directly offset £6.2 million recognised in revenue during the year intended to fund innovation projects across England and Wales as part of an industry-wide scheme to promote innovation in the sector. The amounts accrued will either be spent on innovation projects that the group successfully bids for or will be transferred to other successful water companies in accordance with the scheme rules.
During the year, the group obtained the following services from its auditor:
2021 £’000
2020 £’000
Audit servicesStatutory audit – group and company 170 119
Statutory audit – subsidiaries 508 355
678 474
Non-audit servicesRegulatory audit services provided by the statutory auditor 71 62
Other non-audit services 120 77
Total audit and non-audit services 869 613
5 Investment income2021
£m2020
£m
Interest receivable on short-term bank deposits held at amortised cost 3.8 6.0
Interest receivable on loans to joint ventures held at amortised cost (see note A6) 3.7 4.0
Net pension interest income (see note 18) 17.5 14.0
25.0 24.0
Notes to the financial statements
220
FINANCIAL STATEMENTS
unitedutilities.com/corporate United Utilities Group PLC

6 Finance expense2021
£m2020
£m
Interest payable Interest payable on borrowings held at amortised cost(1) 181.7 231.7
181.7 231.7
Fair value losses/(gains) on debt and derivative instrumentsFair value hedge relationships:
Borrowings(2) (155.1) 87.1
Designated swaps(2)(3) 132.8 (68.6)
(22.3) 18.5
Financial instruments at fair value through profit or loss:
Borrowings designated at fair value through profit or loss(4) (67.3) 57.8
Associated swaps 67.8 (49.8)
0.5 8.0
Fixed interest rate swaps(5) (36.0) 52.3
Net receipts on swaps and debt under fair value option (17.6) (15.3)
Inflation swaps(5) 3.4 13.4
Other (2.5) (0.6)
(52.7) 49.8
Net fair value (gains)/losses on debt and derivative instruments(6) (74.5) 76.3
107.2 308.0
Notes:(1) Includes a £52.6 million (2020: £100.8 million) non-cash inflation expense repayable on maturity in relation to the group’s index-linked debt and £1.8 million
(2020: £1.6 million) interest expense on lease liabilities, representing the unwinding of the discounting applied to future lease payments.(2) Includes foreign exchange gains of £43.9 million (2020: £14.8 million losses). These losses/gains are largely offset by fair value gains/losses on derivatives.(3) Under the provisions of IFRS 9 ‘Financial Instruments’, a £12.7 million loss (2020: £1.3 million gain) resulting from changes to the foreign currency basis
spread are recognised in other comprehensive income rather than profit or loss as they relate to items designated in an accounting hedge relationship.(4) Under the provisions of IFRS 9 ‘Financial Instruments’, a £43.3 million loss (2020: £34.2 million gain) due to the group's own credit risk is recognised in
other comprehensive income rather than within profit or loss. (5) These swap contracts are not designated within an IFRS 9 hedge relationship and are classed as ‘held for trading' under the accounting standard. These
derivatives form economic hedges and, as such, management intends to hold these through to maturity.(6) Includes £21.5 million income (2020: £16.0 million) due to net interest on derivatives and debt under fair value option and £1.3 million expense (2020:
£0.5 million income) due to non-cash inflation changes on index-linked derivatives. Fair value movements excluding this income are deducted to reach underlying finance expense, which forms part of the group's alternative performance measures (APMs) as set out on pages 82 to 83.
Interest payable is stated net of £30.4 million (2020: £40.6 million) borrowing costs capitalised in the cost of qualifying assets, with £30.3 million (2020: £40.2 million) capitalised within property, plant and equipment and £0.1 million (2020: £0.4 million) capitalised within intangible assets during the year. This has been calculated by applying an average capitalisation rate of 2.3 per cent (2020: 3.2 per cent) to expenditure on such assets as prescribed by IAS 23 ‘Borrowing Costs’.
In addition to the £107.2 million finance expense, the allowance for expected credit losses in relation to loans extended to the group's joint venture, Water Plus, has decreased by £3.7 million during the current year. This is primarily due to refinancing of facilities extended to Water Plus, which has resulted in a lower exposure to expected credit in the future (see note A6 for further details).
Underlying finance expense, which forms part of the group's APMs set out on pages 82 to 83, is calculated by adjusting net finance expense and investment income of £78.5 million (2020: £289.0 million) reported in the Income statement to exclude the £54.3 million of fair value gains (2020: £92.8 million fair value losses) on debt and derivative instruments included in the above table. In addition, underlying finance expense in the prior year excluded the impact of the £5.0 million allowance for expected credit losses on amounts owed by Water Plus, which was recognised in response to a significant increase in credit risk following the onset of the COVID-19 pandemic. The £3.7 million credit reducing the expected credit loss allowance in the current year has not been excluded from the calculation of underlying finance expense as it reflects reduced exposure to future credit losses arising as a result of the refinancing of facilities to Water Plus in the normal course of business.
221
FINA
NC
IAL STA
TEM
ENT
S
Annual Report and Financial Statements for the year ended 31 March 2021Stock Code: UU.

7 Tax2021
£m2020
£m
Current tax UK corporation tax 79.8 51.1
Adjustments in respect of prior years (0.6) (12.2)
Total current tax charge for the year 79.2 38.9
Deferred tax Current year 20.2 16.4
Adjustments in respect of prior years (1.8) 5.6
18.4 22.0
Change in tax rate – 135.5
Total deferred tax charge for the year 18.4 157.5
Total tax charge for the year 97.6 196.4
An increase in the headline rate of corporation tax to 25 per cent effective from 1 April 2023 was announced in the Chancellor's Budget on 3 March 2021. This change was substantively enacted on 24 May 2021 and will result in a future deferred tax charge, currently estimated at around £380 million. The deferred tax charge of £135.5 million in the prior year reflects the Government's reversal of the planned reduction in the rate of corporation tax from 19 per cent to 17 per cent from 1 April 2020.
The adjustments in respect of prior years relate to agreement of routine prior years' UK tax matters.
The table below reconciles the notional tax charge at the UK corporation tax rate to the total charge and total effective tax rate for the year:
2021£m
2021%
2020£m
2020%
Profit before tax 551.0 303.2
Tax at the UK corporation tax rate 104.7 19.0 57.6 19.0
Adjustments in respect of prior years (2.4) (0.4) (6.6) (2.2)
Change in tax rate – – 135.5 44.7
Net (income)/expense not taxable (4.7) (0.9) 9.9 3.2
Total tax charge and effective tax rate for the year 97.6 17.7 196.4 64.7
The movement from net expense not taxable in the year ended 31 March 2020 to net income not taxable in the year ended 31 March 2021 is mainly due to the disposal of the investment in AS Tallinna Vesi (Tallinn Water) and a decrease in losses from our joint venture interest in Water Plus.
The table below reconciles the notional tax charge at the UK corporation tax rate to the total current tax charge for the year:
2021£m
2020£m
Profit before tax 551.0 303.2
Profit before tax multiplied by the standard rate of UK corporation tax of 19% 104.7 57.6
Relief for capital allowances in place of depreciation (78.6) (82.1)
Disallowance of depreciation charged in the accounts 70.0 81.6
Financial transactions timing differences (7.8) 11.7
Pension timing differences – (22.5)
Relief for capitalised interest (5.8) (7.7)
Other timing differences 2.0 2.6
Adjustments to tax charge in respect of prior years (0.6) (12.2)
Joint venture net losses 1.8 7.2
Profit on disposal of joint venture (7.0) –
(Income not taxable)/expenses not deductible for tax purposes (1.8) 0.5
Depreciation charged on non-qualifying assets 2.3 2.2
Current tax charge for the year 79.2 38.9
The group's current tax charge is typically lower than the UK headline rate of 19 per cent, primarily due to a range of adjustments which are simply timing differences between recognition of the income or expense in the accounts and in the related tax computations submitted to HMRC. These include deductions in relation to capital spend, pension timing differences, unrealised profits or losses in relation to financing and related treasury derivatives and capitalised interest.
Notes to the financial statements
222
FINANCIAL STATEMENTS
unitedutilities.com/corporate United Utilities Group PLC

7 Tax continuedFor the current year, the tax charge was reduced due to the profit on the disposal of the joint venture interest in the Estonian water company, AS Tallinna Vesi, being non taxable.
The current year net timing differences in relation to capital spend, i.e. capital allowances less depreciation, was more than the prior year mainly due to the atypical bioresources asset write-down in the prior year.
The year-on-year movement in financial transactions timing differences is sensitive to fair value movements on treasury derivatives and can, therefore, fluctuate significantly from year to year.
The current year pension timing differences were lower than the prior year mainly due to the company making accelerated deficit repair contributions of £103.0 million in the prior year.
The current year adjustments to tax charge in respect of prior years of £0.6 million were lower in the current year mainly due to the agreement of various capital allowance matters covering multiple years in the prior year.
The decrease in joint venture losses is due to a reduction in our share of the losses in relation to Water Plus.
Tax on items taken directly to equity2021
£m2020
£m
Current tax Relating to other pension movements (3.3) –
Deferred tax (see note 19)
On remeasurement (losses)/gains on defined benefit pension schemes (26.0) 150.0
Relating to other pension movements 3.3 –
Adjustments in respect of prior years on net fair value gains – 2.4 On net fair value (losses)/gains on credit assumptions for debt reported at fair value through profit and loss and cost of hedging (8.8) 6.7Total tax charge on items taken directly to equity (34.8) 159.1
The current tax amount of £3.3 million relating to other pension movements is the contributions in excess of the amounts in the profit and loss account which has to be allocated against the actuarial loss.
The tax adjustments taken to equity primarily relate to remeasurement movements on the group's defined benefit pension schemes. In the prior year, this included the adjustment arising from a change in the rate at which the deferred tax liabilities are measured, from 17 per cent to 35 per cent. This change in rate reflected a revised judgement as to the most likely method by which the defined benefit pension surplus would be realised. Whereas prior to the year ended 31 March 2020 it was assumed that the surplus could be realised through a reduction in future contributions, from the year ended 31 March 2020 onwards management considers that the most likely method of realisation would be through a refund, which would be taxed at the rate applicable to refunds from a trust (currently 35 per cent).
8 Earnings per share2021
£m2020
£m
Profit after tax attributable to equity holders of the company – continuing operations 453.4 106.8
2021pence
2020pence
Earnings per shareBasic 66.5 15.7
Diluted 66.3 15.6
Basic earnings per share is calculated by dividing profit after tax for the financial year attributable to equity holders of the company by 681.9 million being the weighted average number of shares in issue during the year (2020: 681.9 million). Diluted earnings per share is calculated by dividing profit after tax for the financial year attributable to equity holders of the company by 683.5 million, being the weighted average number of shares in issue during the year, including dilutive shares (2020: 683.6 million).
The difference between the weighted average number of shares used in the basic and the diluted earnings per share calculations represents those ordinary shares deemed to have been issued for no consideration on the conversion of all potential dilutive ordinary shares in accordance with IAS 33 ‘Earnings Per Share’. Potential dilutive ordinary shares comprise outstanding share options awarded to directors and certain employees (see note 3).
The weighted average number of shares can be reconciled to the weighted average number of shares, including dilutive shares, as follows:
2021 million
2020 million
Average number of ordinary shares – basic 681.9 681.9
Effect of potential dilutive ordinary share options 1.6 1.7
Average number of ordinary shares – diluted 683.5 683.6
223
FINA
NC
IAL STA
TEM
ENT
S
Annual Report and Financial Statements for the year ended 31 March 2021Stock Code: UU.

9 Dividends2021
£m2020
£m
Amounts recognised as distributions to equity holders of the company in the year comprise:
Ordinary sharesFinal dividend for the year ended 31 March 2020 at 28.40 pence per share (2019: 27.52 pence) 193.6 187.7
Interim dividend for the year ended 31 March 2021 at 14.41 pence per share (2020: 14.20 pence) 98.3 96.8
291.9 284.5
Proposed final dividend for the year ended 31 March 2021 at 28.83 pence per share (2020: 28.40 pence) 196.6 193.7
The proposed final dividends for the years ended 31 March 2021 and 31 March 2020 were subject to approval by equity holders of United Utilities Group PLC as at the reporting dates, and hence have not been included as liabilities in the consolidated financial statements at 31 March 2021 and 31 March 2020.
10 Property, plant and equipmentProperty, plant and equipment comprises owned and leased assets.
2021£m
2020£m
Property, plant and equipment – owned 11,739.7 11,453.6
Right of use assets – leased 59.3 57.3
Net book value 11,799.0 11,510.9
Property, plant and equipment –owned
Group
Land and buildings
£m
Infra-structure
assets £m
Operational assets
£m
Fixtures, fittings, tools
and equipment
£m
Assets in course of
construction £m
Total £m
CostAt 1 April 2019 359.7 5,490.4 7,422.1 538.2 1,625.4 15,435.8
Additions 1.8 140.5 157.1 9.7 445.4 754.5
Transfers 6.0 131.1 358.8 24.1 (520.0) –
Disposals (13.6) (31.5) (251.2) (13.0) – (309.3)
At 31 March 2020 353.9 5,730.5 7,686.8 559.0 1,550.8 15,881.0Additions 1.7 100.8 136.7 8.4 430.3 677.9Transfers 9.7 66.5 418.3 (3.9) (492.6) (2.0)Disposals (1.6) – (167.1) (47.6) – (216.3)At 31 March 2021 363.7 5,897.8 8,074.7 515.9 1,488.5 16,340.6
Accumulated depreciationAt 1 April 2019 126.9 421.3 3,333.9 400.3 – 4,282.4
Charge for the year 8.8 44.4 353.4 33.0 – 439.6
Disposals (13.5) (31.2) (237.1) (12.8) – (294.6)
At 31 March 2020 122.2 434.5 3,450.2 420.5 – 4,427.4Charge for the year 8.2 42.6 299.1 28.8 – 378.7Transfers – – – (1.0) – (1.0)Disposals (1.5) – (155.7) (47.0) – (204.2)At 31 March 2021 128.9 477.1 3,593.6 401.3 – 4,600.9
Net book value at 31 March 2020 231.7 5,296.0 4,236.6 138.5 1,550.8 11,453.6
Net book value at 31 March 2021 234.8 5,420.7 4,481.1 114.6 1,488.5 11,739.7
During the year, there was a transfer of £2.0 million cost and associated £1.0 million accumulated depreciation from property, plant and equipment to intangible assets following a data cleanse exercise in respect of the fixed assets register.
Notes to the financial statements
224
FINANCIAL STATEMENTS
unitedutilities.com/corporate United Utilities Group PLC

10 Property, plant and equipment continuedRight of use assets – leased
Group
Land and buildings
£m
Operational assets
£m
Fixtures, fittings
tools and equipment
£mTotal
£mCostAt 1 April 2019
Opening balance adjustment on adoption of IFRS 16(1) 48.6 5.8 – 54.4
Additions 4.2 0.8 – 5.0
Disposals – (0.1) – (0.1)
At 31 March 2020 52.8 6.5 – 59.3Additions 2.4 1.5 0.2 4.1Disposals (0.1) (0.2) – (0.3)At 31 March 2021 55.1 7.8 0.2 63.1
Accumulated depreciationAt 1 April 2019 – – – –
Charge for the year 1.0 1.0 – 2.0
Disposals – – – –
At 31 March 2020 1.0 1.0 – 2.0Charge for the year 1.2 0.9 – 2.1Disposals (0.1) (0.2) – (0.3)At 31 March 2021 2.1 1.7 – 3.8
Net book value at 31 March 2020 51.8 5.5 – 57.3
Net book value at 31 March 2021 53.0 6.1 0.2 59.3
Note:(1) Following a review of underlying assets during the year, the opening balance adjustment on adoption of IFRS 16 at 1 April 2019 has been re-presented
such that £1.4 million of right of use assets relating to vehicles have been included in operational assets whereas they were previously included in fixtures, fittings, tools and equipment. After taking account of additions, disposals and depreciation, the effect of this is that cost and net book value of operational assets is £1.7 million and £0.8 million higher at 31 March 2020 compared with the presentation in the prior year financial statements, and the cost and net book value of fixtures, fittings, tools and equipment at 31 March 2020 are lower by the same amount.
To carry out its activities, the group enters into leases of assets from time to time, typically in relation to items such as land, buildings and vehicles. Due to the nature of the group’s operations, many of the group’s leases have extremely long terms, ranging from one year to 999 years. The group does not typically lease assets on a short-term basis or enter into leases for low value asset and therefore no material costs were incurred during the year, either individually or in aggregate, in relation to lease contracts with a duration of less than 12 months or for low-value assets.
At 31 March 2021, the group had entered into contractual commitments for the acquisition of property, plant and equipment amounting to £335.8 million (2020: £432.6 million). In addition to these commitments, the group has long-term expenditure plans which include investments to achieve improvements in performance required by regulators and to provide for future growth.
CompanyThe company had no property, plant and equipment or contractual commitments for the acquisition of property, plant and equipment at 31 March 2021 or 31 March 2020.
225
FINA
NC
IAL STA
TEM
ENT
S
Annual Report and Financial Statements for the year ended 31 March 2021Stock Code: UU.

11 Intangible assets
GroupTotal
£mCostAt 1 April 2019 436.5
Additions 27.6
Disposals (22.7)
At 31 March 2020 441.4Additions 32.7Disposals (51.0)Transfers 2.0At 31 March 2021 425.1Accumulated amortisationAt 1 April 2019 233.8
Charge for the year 41.2
Disposals (22.6)
At 31 March 2020 252.4Charge for the year 41.5Disposals (50.9)Transfers 1.0At 31 March 2021 244.0Net book value at 31 March 2020 189.0Net book value at 31 March 2021 181.1
The group’s intangible assets relate mainly to computer software.
During the year, there was a transfer of £2.0 million cost and associated £1.0 million accumulated depreciation from property, plant and equipment to intangible assets following a data cleanse exercise in respect of the fixed assets register.
At 31 March 2021, the group had entered into contractual commitments for the acquisition of intangible assets amounting to £0.9 million (2020: £2.6 million).
CompanyThe company had no intangible assets or contractual commitments for the acquisition of intangible assets at 31 March 2021 or 31 March 2020.
12 Joint ventures and other investments2021
£m2020
£m
Joint ventures at the start of the period 46.8 79.0
Share of profit/(losses) of joint ventures (9.3) (38.1)
Less: Share of losses allocated to other components of long-term interest in joint ventures 14.2 9.5
Dividends received from joint ventures (6.4) (4.9)
Currency translation differences (1.6) 1.3
Disposal of joint venture (43.7) –
Joint ventures at the end of the period – 46.8
Other investments 0.1 0.1
Interests in joint ventures and other investments 0.1 46.9
Following the disposal of the group’s overseas investment in AS Tallinna Vesi (Tallinn Water) as set out below, the group’s interests in joint ventures mainly comprises its 50 per cent interest in Water Plus Group Limited (Water Plus), which is jointly owned and controlled by the group and Severn Trent PLC under a joint venture agreement.
Notes to the financial statements
226
FINANCIAL STATEMENTS
unitedutilities.com/corporate United Utilities Group PLC

12 Joint ventures and other investments continuedThe group’s total share of Water Plus losses for the year was £8.9 million (2020: £51.5 million share of losses), all of which has been recognised in the income statement together with £5.3 million of previously unrecognised share of losses (2020: £46.2 million recognised in the income statement, £5.3 million not recognised). The £14.2 million total share of losses recognised in the income statement during the year has been allocated against the fully drawn £32.5 million revolving credit facility extended to Water Plus by United Utilities PLC, which is presented within amounts owed by related parties included within trade and other receivables (see note 14). This facility forms part of the group’s long-term interest in the Water Plus joint venture given that at 31 March 2021 there was a clear expectation that it would be converted into additional equity share capital, with this transaction subsequently executed on 23 April 2021.
In the year ended 31 March 2020, the £46.2 million recognised share of losses comprised £36.7 million which was allocated to the group’s equity investment, and £9.5 million which was allocated to the zero coupon shareholder loan notes extended to Water Plus as this forms part of the group’s long-term interest in the joint venture. The share of losses recognised against each component of the group’s net investment in Water Plus reduced each of them to £nil at 31 March 2020.
On 31 March 2021, the group completed the disposal of its stake in the Tallinn Water joint venture for consideration of EUR 100.3 million (£85.3 million). The value of this stake at the time it was sold, after recognising a £4.9 million share of profits, receipt of a £6.4 million dividend, and £1.6 million of foreign exchange losses, was £43.7 million. This resulted in a profit on disposal of £40.7 million after taking account of £0.9 million of disposal costs. On disposal, the £4.0 million balance of the accumulated foreign exchange losses making up the cumulative exchange reserve, all of which had accumulated in relation to the Tallinn Water joint venture, was reclassified to profit and loss resulting in a total recognised profit on disposal of £36.7 million.
In the year ended 31 March 2020, the group completed the disposal of its overseas investment in the Muharraq sewerage treatment plant. Consideration of £10.9 million was equal to the fair value at which the asset was carried at the point at which it was sold, resulting in no gain or loss on disposal. Prior to this disposal, the group received £1.1 million in repayment of shareholder loans, resulting in a total cash inflow for the year ended 31 March 2020 of £12.0 million in relation to the disposal of this investment.
Details of transactions between the group and its joint ventures and other investments are disclosed in note A6.
CompanyAt 31 March 2021, the company’s investments related solely to its investments in United Utilities PLC, which was recorded at a cost of £6,326.8 million (2020: £6,326.8 million).
13 Inventories
Group2021
£m2020
£m
Properties held for resale 2.5 4.5
Other inventories 15.8 12.1
18.3 16.6
CompanyThe company had no inventories at 31 March 2021 or 31 March 2020.
14 Trade and other receivables Group Company
2021£m
2020£m
2021£m
2020£m
Trade receivables 63.5 81.2 – –
Amounts owed by subsidiary undertakings – – 91.9 81.3
Amounts owed by related parties (see note A6) 113.8 147.9 – –
Other debtors and prepayments 34.3 39.1 – –
Accrued income 104.3 74.7 – –
315.9 342.9 91.9 81.3
At 31 March 2021, the group had £86.7 million (2020: £97.0 million) of trade and other receivables classified as non-current, all of which was owed by related parties (2020: £95.0 million) .
The carrying amounts of trade and other receivables approximates to their fair value at 31 March 2021 and 31 March 2020.
227
FINA
NC
IAL STA
TEM
ENT
S
Annual Report and Financial Statements for the year ended 31 March 2021Stock Code: UU.

14 Trade and other receivables continuedTrade receivables do not carry interest and are stated net of allowances for bad and doubtful receivables, an analysis of which is as follows:
Group2021
£m2020
£m
At the start of the year 71.4 56.5
Amounts charged to operating expenses (see note 4) 28.7 41.8
Trade receivables written off (20.2) (28.0)
Amounts charged to deferred income 0.5 1.1
At the end of the year 80.4 71.4
Amounts charged to deferred income relate to amounts invoiced for which revenue has not yet been recognised in the income statement.
At each reporting date, the group evaluates the recoverability of trade receivables and records allowances for expected credit losses which are measured in a way that reflects an unbiased and probability-weighted amount that is determined by evaluating a range of possible outcomes and considers past events, current conditions and forecasts of future conditions. In the year ended 31 March 2020, an allowance for expected credit losses of £18.1 million was recognised in relation to trade and other receivables, reflecting the direct impact of COVID-19 estimated at the onset of the pandemic In the year ended 31 March 2021, a further charge of around £5 million was recognised due to increased risk associated with cash collection as government support schemes are withdrawn.
At 31 March 2021 and 31 March 2020, the group had no trade receivables that were past due and not individually impaired.
The following table provides information regarding the ageing of net trade receivables that were past due and individually impaired:
At 31 March 2021
Aged less than one
year £m
Aged between one year and two
years £m
Aged greater than
two years £m
Carrying value
£m
Gross trade receivables 61.9 35.3 44.4 141.7Allowance for expected credit losses (19.9) (16.5) (43.9) (80.4)Net trade receivables 42.0 18.8 0.5 61.3
At 31 March 2020
Aged less than one
year £m
Aged between one year and two
years £m
Aged greater than
two years £m
Carrying value
£mGross trade receivables 72.8 31.6 43.4 146.9
Allowance for expected credit losses (19.3) (15.7) (36.4) (71.4)
Net trade receivables 53.5 15.9 7.0 76.4
At 31 March 2021, the group had £2.2 million (2020: £4.8 million) of trade receivables that were not past due.
The majority of accrued income balances represent contract assets arising from timing differences between the billing cycle and the usage of water by customers. They therefore typically reverse in subsequent months, with all amounts held in relation to these contract assets at the beginning of the reporting period having subsequently reversed into the income statement during the year. At 31 March 2021 and 31 March 2020, the group had no accrued income that was past due. In instances where the collection of consideration is not considered probable at the point services are delivered, no accrued income balance is recognised, as the criteria to recognise revenue in accordance with IFRS 15 has not been met.
CompanyAt 31 March 2021 and 31 March 2020, the company had no trade receivables that were past due.
The carrying amount of trade and other receivables approximates to their fair value at 31 March 2021 and 31 March 2020.
Notes to the financial statements
228
FINANCIAL STATEMENTS
unitedutilities.com/corporate United Utilities Group PLC
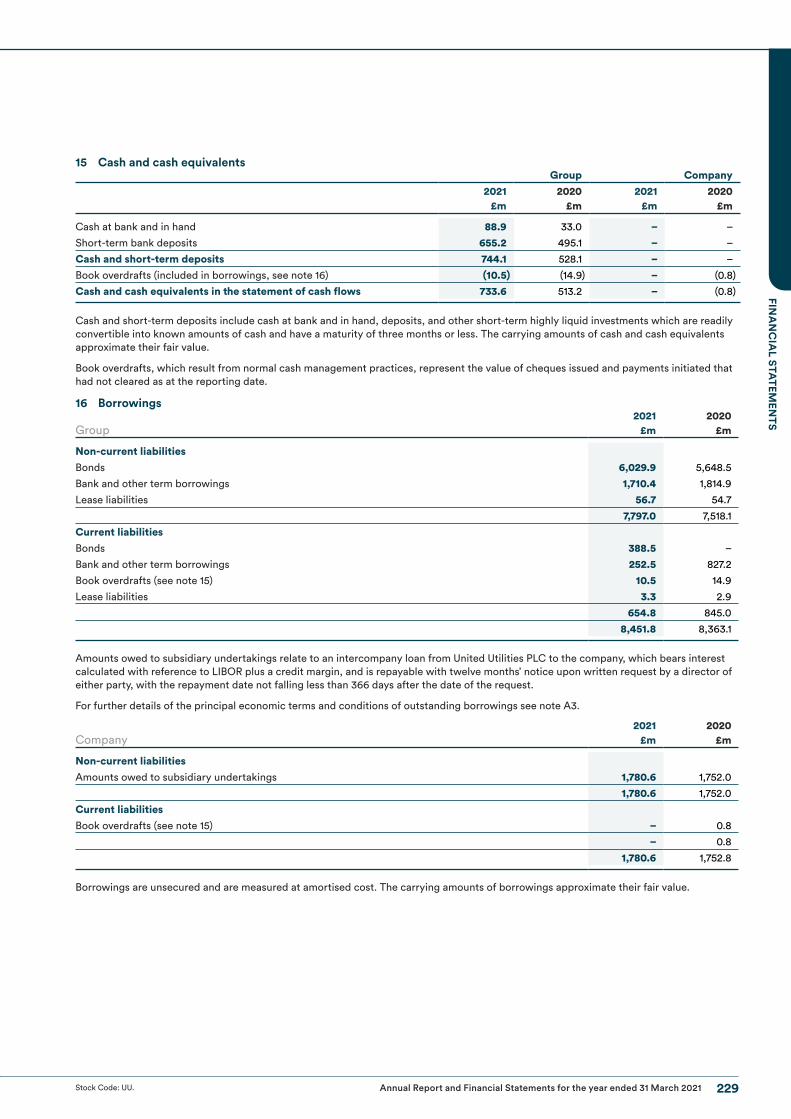
15 Cash and cash equivalents Group Company
2021£m
2020£m
2021£m
2020£m
Cash at bank and in hand 88.9 33.0 – –
Short-term bank deposits 655.2 495.1 – –
Cash and short-term deposits 744.1 528.1 – –
Book overdrafts (included in borrowings, see note 16) (10.5) (14.9) – (0.8)
Cash and cash equivalents in the statement of cash flows 733.6 513.2 – (0.8)
Cash and short-term deposits include cash at bank and in hand, deposits, and other short-term highly liquid investments which are readily convertible into known amounts of cash and have a maturity of three months or less. The carrying amounts of cash and cash equivalents approximate their fair value.
Book overdrafts, which result from normal cash management practices, represent the value of cheques issued and payments initiated that had not cleared as at the reporting date.
16 Borrowings
Group2021
£m2020
£m
Non-current liabilitiesBonds 6,029.9 5,648.5
Bank and other term borrowings 1,710.4 1,814.9
Lease liabilities 56.7 54.7
7,797.0 7,518.1
Current liabilitiesBonds 388.5 –
Bank and other term borrowings 252.5 827.2
Book overdrafts (see note 15) 10.5 14.9
Lease liabilities 3.3 2.9
654.8 845.0
8,451.8 8,363.1
Amounts owed to subsidiary undertakings relate to an intercompany loan from United Utilities PLC to the company, which bears interest calculated with reference to LIBOR plus a credit margin, and is repayable with twelve months’ notice upon written request by a director of either party, with the repayment date not falling less than 366 days after the date of the request.
For further details of the principal economic terms and conditions of outstanding borrowings see note A3.
Company2021
£m2020
£m
Non-current liabilitiesAmounts owed to subsidiary undertakings 1,780.6 1,752.0
1,780.6 1,752.0
Current liabilitiesBook overdrafts (see note 15) – 0.8
– 0.8
1,780.6 1,752.8
Borrowings are unsecured and are measured at amortised cost. The carrying amounts of borrowings approximate their fair value.
229
FINA
NC
IAL STA
TEM
ENT
S
Annual Report and Financial Statements for the year ended 31 March 2021Stock Code: UU.

17 LeasesThe maturity profile of lease liabilities recognised at the balance sheet date is:
2021£m
2020£m
Less than 1 year 3.3 2.9
1 to 5 years 10.5 8.9
5 to 10 years 7.8 9.7
10 to 25 years 25.5 25.2
25 to 50 years 41.0 40.5
50 to 100 years 81.0 80.1
100 to 500 years 107.6 106.9
Longer than 500 years 3.2 3.2
Total undiscounted cash payments 279.9 277.4
Effect of discounting (219.9) (219.9)
Present value of cash payments 60.0 57.5
During the year ending 31 March 2021, £1.8 million (2020: £1.6 million) of interest expense on lease liabilities was recognised; representing the unwinding of the discounting applied to future lease payments (see note 6).
The total cash outflow for leases for the year ending 31 March 2021 was £3.5 million; of this, £1.8 million was payment of interest and £1.7 million payment of principal.
Payment of interest forms part of cash flows from operating activities and payment of principal is included within repayment of borrowings, which forms part of cash flows from financing activities in the group's statement of cash flows.
18 Retirement benefit surplusDefined benefit schemesThe net pension income before tax recognised in the income statement in respect of the defined benefit pension schemes is summarised as follows:
Group2021
£m2020
£m
Current service cost 4.9 6.1
Curtailments/settlements 0.6 4.6
Administrative expenses 3.0 1.6
Pension expense charged to operating profit 8.5 12.3
Net pension interest income credited to investment income (see note 5) (17.5) (14.0)
Net pension income credited to the income statement before tax (9.0) (1.7)
Defined benefit pension costs excluding curtailments/settlements included within employee benefit expense were £7.9 million (2020: £7.7 million) comprising current service costs and administrative expenses. Total post-employment benefits expense excluding curtailments/settlements charged to operating profit of £31.3 million (2020: £30.2 million) comprise the defined benefit costs described above of £7.9 million (2020: £7.7 million) and defined contribution pension costs of £23.4 million (2020: £22.5 million) (see note 3).
Included within curtailments/settlements is £0.5 million (2020: £nil) relating to the equalisation of GMP benefits (see note A5 for further details).
The reconciliation of the opening and closing net pension surplus included in the statement of financial position is as follows:
Group2021
£m2020
£m
At the start of the year 754.1 483.9
Income recognised in the income statement 9.0 1.7
Contributions 8.6 113.9
Remeasurement (losses)/gains gross of tax (82.7) 154.6
At the end of the year 689.0 754.1
Included in the contributions paid of £8.6 million (2020: £113.9 million) were deficit repair contributions of £nil (2020: £103.0 million), enhancements to benefits provided on redundancy of £0.9 million (2020: £1.9 million), payments in relation to historic unfunded, unregistered retirement benefit schemes of £0.7 million (2020: £1.4 million), and administration expenses of £0.4 million (2020: £0.4 million). Following the 2018 actuarial valuation, contributions in relation to current service cost remained broadly stable at £6.6 million (2020: £7.2 million).
Remeasurement gains and losses are recognised directly in the statement of comprehensive income.
Notes to the financial statements
230
FINANCIAL STATEMENTS
unitedutilities.com/corporate United Utilities Group PLC

18 Retirement benefit surplus continued
Group2021
£m2020
£m
The return on plan assets, excluding amounts included in interest 241.0 (131.6)
Actuarial (losses)/gains arising from changes in financial assumptions (429.7) 257.3
Actuarial gains/(losses) arising from changes in demographic assumptions 80.6 (7.2)
Actuarial gains arising from experience 25.4 36.1
Remeasurement (losses)/gains on defined benefit pension schemes (82.7) 154.6
For more information in relation to the group’s defined benefit pension schemes, including changes in financial and demographic assumptions, see note A5.
Defined contribution schemesDuring the year, the group made £23.4 million (2020: £22.5 million) of contributions to defined contribution schemes which are included in employee benefits expense (see note 3).
CompanyThe company did not participate in any of the group’s pension schemes during the years ended 31 March 2021 and 31 March 2020.
19 Deferred tax liabilitiesThe following are the major deferred tax liabilities and assets recognised by the group, and the movements thereon, during the current and prior year:
Group
Accelerated tax
depreciation £m
Retirement benefit
obligations £m
Other £m
Total £m
At 1 April 2019 1,076.7 82.2 (12.9) 1,146.0
Charged/(credited) to the income statement (see note 7) 13.2 22.0 (13.2) 22.0
Change in tax rate 127.5 9.7 (1.7) 135.5
Charged to equity (see note 7) – 150.0 9.1 159.1
At 31 March 2020 1,217.4 263.9 (18.7) 1,462.6Charges to the income statement (see note 7) 9.2 – 9.2 18.4Credited to equity (see note 7) – (22.7) (8.8) (31.5)At 31 March 2021 1,226.6 241.2 (18.3) 1,449.5
Certain deferred tax assets and liabilities have been offset in accordance with IAS 12 ‘Income Taxes’.
The deferred tax charge in the prior year of £135.5 million reflects the Government's reversal of the planned reduction in the rate of corporation tax from 19 per cent to 17 per cent from 1 April 2020.
The accelerated tax depreciation represents the difference between capital allowances and accounting depreciation on the group’s property, plant and equipment. Capital allowances are tax reliefs provided in law and spread the tax relief due over a pre-determined standard number of years. This contrasts with the accounting treatment, where the expenditure is treated as an asset with the cost being depreciated over the useful life of the asset, or impaired if the value of such assets is considered to have reduced materially. Due to the group’s continued significant annual capital expenditure, the deductions for capital allowances are expected to exceed depreciation for the medium term and continue to impact future corporation tax payments.
Given the fully funded nature of the group’s defined benefit pension schemes, the retirement benefit obligations primarily relate to deferred taxation on the pensions schemes surplus position. This amount is significantly impacted by financial market conditions and long-term inflation expectations and therefore it is difficult to forecast future movements. However, these movements have no impact on medium-term future corporation tax payments as they only impact year-on-year deferred tax movement.
Deferred tax on retirement benefit obligations can arise where there are year-on-year differences between the contributions paid and the associated amounts charged to the profit and loss account. However, given the fully funded nature of our pension schemes, any such deferred tax movements, together with the associated impact on future corporation tax payments, are not expected to be significant for the medium term.
The other short-term temporary differences are mainly in relation to the year-on-year movement in financial transactions which are sensitive to fair value movement on treasury derivatives and can therefore fluctuate significantly from year to year. However, these movements have no impact on future corporation tax payments as they only impact the year-on-year deferred tax movement.
CompanyThe company had no deferred tax assets or liabilities at 31 March 2021 or 31 March 2020.
231
FINA
NC
IAL STA
TEM
ENT
S
Annual Report and Financial Statements for the year ended 31 March 2021Stock Code: UU.

20 Provisions
GroupSeverance
£mOther
£mTotal
£mAt 1 April 2019 2.8 14.0 16.8
Charged/(credited) to the income statement 7.2 (0.6) 6.6
Utilised in the year (5.1) (1.9) (7.0)
At 31 March 2020 4.9 11.5 16.4Charged/(credited) to the income statement 1.3 (0.9) 0.4Utilised in the year (4.6) (1.1) (5.7)At 31 March 2021 1.6 9.5 11.1
The group had no provisions classed as non-current at 31 March 2021 or 31 March 2020.
The severance provision as at 31 March 2021 and 31 March 2020 relates to severance costs as a result of group reorganisation.
Other provisions principally relate to contractual, legal and environmental claims against the group and represent management’s best estimate of the value of settlement, the timing of which is dependent on the resolution of the relevant legal claims.
CompanyThe company had no provisions at 31 March 2021 or 31 March 2020.
21 Trade and other payablesGroup Company
Non-current2021
£m2020
£m2021
£m2020
£m
Deferred grants and contributions 780.4 736.8 – –
Other creditors 17.9 24.4 – –
798.3 761.2 – –
Group Company
Current2021
£m2020
£m2021
£m2020
£m
Trade payables 33.3 36.7 – –
Amounts owed to subsidiary undertakings – – 7.6 12.1
Amounts owed to related parties 2.4 4.8 – –
Other tax and social security 5.9 5.8 – –
Deferred grants and contributions 15.4 14.5 – –
Accruals and other creditors 221.1 227.9 3.2 2.1
Deferred income 44.6 44.7 – –
322.7 334.4 10.8 14.2
The average credit period taken for trade purchases is 13 days (2020: 15 days).
The carrying amounts of trade and other payables approximates to their fair value at 31 March 2021 and 31 March 2020.
The majority of deferred income balances represent contract liabilities arising from timing differences between customer payments, the billing cycle, and the usage of water by customers. They therefore typically reverse in subsequent months, with all amounts held in relation to these contract liabilities at the beginning of the reporting period having subsequently reversed into the income statement during the year.
Deferred grants and contributions
Group2021
£m2020
£m
At the start of the year 751.3 684.5
Amounts capitalised during the year 5.0 35.1
Transfers of assets from customers 55.0 47.0
Credited to the income statement – revenue (14.6) (13.8)
Credited to the income statement – other operating expenses (0.4) (0.4)
Credited to allowance for bad and doubtful receivables (0.5) (1.1)
At the end of the year 795.8 751.3
Notes to the financial statements
232
FINANCIAL STATEMENTS
unitedutilities.com/corporate United Utilities Group PLC

22 Other reserves
Group
Cumulative exchange
reserve £m
Capital redemp-
tion reserve
£m
Merger reserve
£m
Cost of hedging reserve
£m
Cash flow hedging reserve
£mTotal
£m
At 1 April 2020 (2.4) 1,033.3 (703.6) 10.7 (1.3) 336.7Other comprehensive incomeChanges in fair value recognised in other comprehensive income – – – (12.7) 9.3 (3.4)Tax on items taken directly to equity – – – 2.4 (1.8) 0.6Foreign exchange adjustments (1.6) – – – – (1.6)Foreign exchange adjustments reclassified to profit on disposal of joint ventures 4.0 – – – – 4.0At 31 March 2021 – 1,033.3 (703.6) 0.4 6.2 336.3
Group
Cumulative exchange
reserve £m
Capital redemp-
tion reserve
£m
Merger reserve
£m
Cost of hedging reserve
£m
Cash flow hedging reserve
£mTotal
£mAt 1 April 2019 (3.7) 1,033.3 (703.6) 12.0 0.3 338.3
Other comprehensive incomeChanges in fair value recognised in other comprehensive income – – – 1.3 (7.6) (6.3)
Amounts reclassified from other comprehensive income to profit or loss – – – – 5.6 5.6
Deferred tax adjustments in respect of prior years on net fair value gains – – – (2.4) – (2.4)
Tax on items taken directly to equity – – – (0.2) 0.4 0.2
Foreign exchange adjustments 1.3 – – – – 1.3
At 31 March 2020 (2.4) 1,033.3 (703.6) 10.7 (1.3) 336.7
The capital redemption reserve arose as a result of a return of capital to shareholders following the reverse acquisition of United Utilities PLC by United Utilities Group PLC in the year ended 31 March 2009. The merger reserve arose in the same year on consolidation and represents the capital adjustment to reserves required to effect the reverse acquisition.
The group recognises the cost of hedging reserve as a component of equity. This reserve reflects accumulated fair value movements on cross-currency swaps resulting from changes in the foreign currency basis spread, which represents a liquidity charge inherent in foreign exchange contracts for exchanging currencies and is excluded from the designation of cross-currency swaps as hedging instruments.
The group designates a number of swaps hedging non-financial risks in cash flow hedge relationships to give a more representative view of operating costs. Fair value movements relating to the effective part of these swaps are recognised in other comprehensive income and accumulated in the cash flow hedging reserve.
CompanyThe company's other reserves at 31 March 2021, 31 March 2020 and 1 April 2019, were comprised entirely of a £1,033.3 million capital redemption reserve that arose as a result of a return of capital to shareholders following the acquisition of United Utilities PLC by the company in the year ended 31 March 2009.
233
FINA
NC
IAL STA
TEM
ENT
S
Annual Report and Financial Statements for the year ended 31 March 2021Stock Code: UU.

23 Share capital
Group and company2021
million2021
£m2020
million2020
£m
Issued, called up and fully paidOrdinary shares of 5.0 pence each 681.9 34.1 681.9 34.1
Deferred shares of 170.0 pence each 274.0 465.7 274.0 465.7
955.9 499.8 955.9 499.8
Details of the voting rights of each category of shares can be found within the directors’ report on pages 192 to 193.
The 170.0 pence deferred shares were created to facilitate a return of capital to shareholders following the reverse acquisition of United Utilities PLC by United Utilities Group PLC in the year ended 31 March 2009 (see company statement of changes in equity on page 211), and represent the amount of a special dividend paid on B shares at that time. The deferred shares convey no right to income, no right to vote and no appreciable right to participate in any surplus capital in the event of a winding up.
24 Contingent liabilitiesSince 2016, the group has received indications from a number of groups of property search companies (PSCs) that they intend to claim compensation for amounts paid in respect of CON29DW water and drainage search reports, which they allege should have been provided to them either free of charge or for a nominal fee in accordance with the Environmental Information Regulations. In April 2020, a group of over 100 PSCs, comprising companies within the groups that had previously issued notice of intended claims, served proceedings on all of the water and sewerage undertakers in England and Wales, including United Utilities Water Limited, for an unspecified amount of compensation. This is an industry-wide issue with the litigation currently in its early stages. While the litigation’s likely direction and the quantum of any compensation being claimed is uncertain at this stage, based on the information currently available, the likelihood of the claim’s success is considered to be low, and any potential outflow is not expected to be material.
The group has credit support guarantees as well as general performance commitments and potential liabilities under contract that may give rise to financial outflow. The group has determined that the possibility of any outflow arising in respect of these potential liabilities is remote and, as such, there are no contingent liabilities to be disclosed in this regard (2020: none).
The company has not entered into performance guarantees as at 31 March 2021 or 31 March 2020.
25 Events after the reporting periodOn 3 March 2021, an increase in the headline rate of corporation tax to 25 per cent from 1 April 2023 was announced in the Chancellor’s Budget. This increase was substantively enacted on 24 May 2021 and will result in a future deferred tax charge currently estimated at around £380 million. As this substantive enactment occurred after the reporting date, no adjustments have been made to current or deferred tax amounts recognised in the financial statements at and for the year ended 31 March 2021.
In April 2021, the group’s board of directors approved a plan to market the group’s renewable energy business, United Utilities Renewable Energy Limited, for sale. This process is expected to commence during June 2021 and will involve the sale of assets – primarily property, plant and equipment – with a carrying value of £65.5 million in the group’s consolidated statement of financial position at 31 March 2021.
In April 2021, the group and its joint venture partner, Severn Trent PLC, each subscribed to £32.5 million of additional equity share capital issued by Water Plus. Simultaneously, the fully drawn £32.5 million revolving credit facilities issued by United Utilities PLC and Severn Trent PLC to Water Plus were cancelled. Accordingly, the group’s equity investment in the Water Plus joint venture increased by £32.5 million, with the £14.2 million share of joint venture losses recognised against the £32.5 million revolving credit facilities during the year being reallocated against the equity investment to bring its value down to £18.3 million. The replacement of debt financing with equity shortly after 31 March 2021 further supports the accounting judgement taken to treat the fully drawn £32.5 million revolving credit facility as part of the group’s long-term interest in Water Plus.
Notes to the financial statements
234
FINANCIAL STATEMENTS
unitedutilities.com/corporate United Utilities Group PLC

A1 Consolidated statement of cash flows – further analysisCash generated from operations
Group Company2021
£m2020
£m2021
£m2020
£m
Profit before tax 551.0 303.2 273.9 251.6
Adjustment for investment income and finance expense (see notes 5, 6 and A6) 78.5 289.0 – 32.9
Adjustment for share of profits of joint ventures (see note 12) 9.3 38.1 – –
Adjustment for profit on disposal of joint ventures (36.7) – – –
Operating profit 602.1 630.3 – 284.5
Adjustments for:
Depreciation of property, plant and equipment (see note 10) 379.8 441.6 24.2 –
Amortisation of intangible assets (see note 11) 42.5 41.2 – –
Loss on disposal of property, plant and equipment (see note 4) 10.7 13.9 – –
Amortisation of deferred grants and contributions (see note 21) (15.0) (13.8) – –
Equity-settled share-based payments charge (see note 3) 3.6 1.5 – –
Changes in working capital:
Increase in inventories (see note 13) (1.7) (1.7) – –
Decrease in trade and other receivables 18.1 4.6 3.0 2.7
Increase/(decrease) in trade and other payables 2.5 (10.1) 1.1 (0.2)
Decrease in provisions (see note 20) (5.3) (0.4) – –
Pension contributions paid less pension expense charged
to operating profit (0.1) (101.6) – –
Cash generated from operations 1,037.2 1,005.5 302.2 287.0
The group has received property, plant and equipment of £55.0 million (2020: £47.0 million) in exchange for the provision of future goods and services (see notes 21 and A7).
Reconciliation of fixed asset purchases to fixed asset additions
Owned property, plant and equipment(1)
2021£m
2020£m
Purchase of property, plant and equipment in statement of cash flows 610.4 652.8
Non-cash additions:
Transfers of assets from customers (see note 21) 55.0 47.0
IAS 23 capitalised borrowing costs (see note 6) 30.3 40.2
Net book value transfers to intangible assets 1.0 –
Timing differences on cash paid(2) (18.8) 14.5
Property, plant and equipment additions 677.9 754.5
Notes:(1) This reconciliation relates to property, plant and equipment owned by the group and therefore excludes right-of-use assets recognised in accordance
with IFRS 16 'Leases', for which cash flows relating to the associated lease liabilities are included within repayment of borrowings and interest paid in the statement of cash flows.
(2) Timing differences arise and reverse when additions are recognised in the statement of financial position in a different period to when cash payments for capital expenditure are made. Capital accruals recognised in relation to these timing differences are included in 'Accruals and other creditors' within trade and other payables (note 21).
Intangible assets2021
£m2020
£m
Purchase of intangible assets in statement of cash flows 33.6 27.2
IAS 23 capitalised borrowing costs – non-cash additions (see note 6) 0.1 0.4
Net book value transfers from property, plant and equipment (1.0) –
Intangible asset additions 32.7 27.6
For the year ended 31 March 2021, the group has enhanced its disclosures relating to the statement of cash flows in respect of relevant accounting policies, judgements taken, and how items can be reconciled to other areas of the financial statements. Please see note A7 for further details.
Notes to the financial statements – appendices
235
FINA
NC
IAL STA
TEM
ENT
S
Annual Report and Financial Statements for the year ended 31 March 2021Stock Code: UU.

Notes to the financial statements – appendices
A2 Net debtNet debt comprises borrowings, net of cash and short-term deposits and derivatives. As such, movements in net debt during the year are impacted by changes in liabilities from financing activities as detailed in the tables below. The tables below should be read in conjunction with the consolidated statement of cash flows.
Borrowings Derivatives
Cashand cash
equivalents£m
Adjust-ments in
calculatingnet debt(2)
£m
Net debt
£mBonds
£m
Bank and other term
borrowings£m
Lease liabilities
£m
in a fair value
hedge£m
at fair value
through profit or
loss£m
Total liabilities
from financing activities
£m
At 31 March 2020 (5,648.5) (2,642.1) (57.6) 395.7 80.1 (7,872.4) 513.2 131.7 (7,227.5)Non-cash movements: Inflation uplift on index-linked debt (32.4) (20.2) – – – (52.6) – – (52.6) Fair value movements 123.8 11.3 – (140.6) (39.6) (45.1) – (33.3) (78.4) Foreign exchange 38.7 5.2 – – – 43.9 – – 43.9 Other 0.7 – (5.9) – – (5.2) – – (5.2)
Cash flows used in financing activities: Receipts in respect of borrowing and derivatives(1) (900.7) (6.1) – (2.9) – (909.7) 909.7 – – Payments in respect of
borrowings and derivatives(1) – 689.0 1.7 10.8 – 701.5 (701.5) – – Dividends paid – – – – – – (291.9) – (291.9) Exercise of share options – purchase of shares – – – – – – (4.0) – (4.0) Other – – – – – – (2.0) – (2.0)
Changes arising from financing activities (769.9) 679.2 (4.2) (132.7) (39.6) (267.2) (89.7) (33.3) (390.2)
Cash flows used in investing activities – – – – – – (549.3) – (549.3)Cash flows generated from operating activities – – 1.8 – – 1.8 859.4 – 861.3At 31 March 2021 (6,418.4) (1,962.9) (60.0) 263.0 40.5 (8,137.8) 733.6 98.4 (7,305.8)
Notes:(1) Where derivatives are in an economic hedge of borrowings, derivative cash flows are shown netted with the net payment or receipt being reported
against the underlying borrowing cash flow to provide a more faithful representation of the substance of the transaction.(2) The fair value of the derivatives reported in financing liabilities that are not hedging specific debt instruments are removed in calculating the group's net
debt position. These derivatives correspond to the group's fixed interest rate swaps and inflation swaps, neither of which are designated within an IFRS 9 hedging relationship and both of which are classified as 'held for trading' under the accounting standard. The fair value movements on those derivatives that are not excluded from the revised definition of net debt (being derivatives in fair value hedge relationships) are expected to be materially equal and opposite in value to the fair value movement included in borrowings, resulting in materially all fair value movements being excluded.
During the period, the group has revised its definition of net debt in order to exclude the impact of derivatives that are not hedging specific debt instruments and therefore give a fairer reflection of the net debt amount the group is contractually obliged to repay. This updated approach is now consistent with that taken by credit rating agencies, and better reflects the underlying regulatory economics. Under this revised definition net debt comprises borrowings, net of cash and short-term deposits and derivatives, but excluding the fair value of group's fixed interest rate swaps, electricity derivatives, and inflation swaps (apart from the principal accretion element). Previously net debt has been defined as borrowings, net of cash and short-term deposits and derivatives.
Fair value movements on borrowings and their associated swaps that are included in net debt are not materially opposite in value for the year ended 31 March 2021. The effects of COVID-19 on financial market volatility in the period has impacted the credit spread recognised on the group's fair-value option debt, and material basis spread adjustments have been recorded on the group's cross-currency swaps. Both of these items have been recorded in other comprehensive income. In addition, material credit spread adjustments have been recorded with respect to the group's derivatives in fair value hedge relationships, which has been recorded in the consolidated income statement in the period.
236
FINANCIAL STATEMENTS
unitedutilities.com/corporate United Utilities Group PLC

A2 Net debt continued
Borrowings Derivatives
Cash and cash
equivalents£m
Adjust-ments in
calculatingnet debt(2)
£m
Net debt
£mBonds
£m
Bank and other term
borrowings£m
Lease liabilities
£m
in a fair value
hedge£m
at fair value
through profit or
loss£m
Total liabilities
from financing activities
£mAt 31 March 2019 (5,256.5) (2,544.6) – 327.1 82.6 (7,391.4) 324.6 76.4 (6,990.4)
Adjustment on initial application of IFRS 16 – – (54.4) – – (54.4) – – (54.4)
At 1 April 2019 (5,256.5) (2,544.6) (54.4) 327.1 82.6 (7,445.8) 324.6 76.4 (7,044.8)
Non-cash movements:
Inflation uplift on index-linked debt (58.2) (42.6) – – – (100.8) – – (100.8)
Fair value movements (93.4) (2.0) – 57.8 (4.7) (42.3) – 55.3 13.0
Foreign exchange (9.5) (5.3) – – – (14.8) – – (14.8)
Other (1.5) – (6.5) – – (8.0) – – (8.0)
Cash flows used in financing activities:
Receipts in respect of borrowing and derivatives(1) (651.1) (157.1) – – – (808.2) 808.2 – –
Payments in respect of borrowings and derivatives(1) 421.7 109.5 1.7 10.8 2.2 545.9 (545.9) – –
Dividends paid – – – – – – (284.5) – (284.5)
Exercise of share options – purchase of shares – – – – – – (2.8) – (2.8)
Other – – – – – – (2.8) – (2.8)
Changes arising from financing activities (392.0) (97.5) (4.8) 68.6 (2.5) (428.2) (27.8) 55.3 (400.7)
Cash flows used in investing activities – – – – – – (593.9) – (593.9)
Cash flows generated from operating activities – – 1.6 – – 1.6 810.3 – 811.9
At 31 March 2020 (5,648.5) (2,642.1) (57.6) 395.7 80.1 (7,872.4) 513.2 131.7 (7,227.5)
Notes:(1) Where derivatives are in an economic hedge of borrowings, derivative cash flows are shown netted with the net payment or receipt being reported
against the underlying borrowing cash flow to provide a more faithful representation of the substance of the transaction.(2) The fair value of the derivatives reported in financing liabilities that are not hedging specific debt instruments are removed in calculating the group's net debt
position. These derivatives correspond to the group's fixed interest rate swaps and inflation swaps, neither of which are designated within an IFRS 9 hedging relationship and both of which are classified as 'held for trading' under the accounting standard. The fair value movements on those derivatives that are not excluded from the revised definition of net debt (being derivatives in fair value hedge relationships) are expected to be materially equal and opposite in value to the fair value movement included in borrowings, resulting in materially all fair value movements being excluded.
237
FINA
NC
IAL STA
TEM
ENT
S
Annual Report and Financial Statements for the year ended 31 March 2021Stock Code: UU.

A3 BorrowingsTerms and debt repayment scheduleThe principal economic terms and conditions of outstanding borrowings, along with fair value and carrying value, were as follows:
CurrencyYear of final repayment
Fair value
Carrying value
Fair value
Carrying value
2021£m
2021£m
2020£m
2020£m
Borrowings in fair value hedge relationships 2,913.6 2,895.5 2,440.0 2,590.5
5.75% 375m bond GBP 2022 394.6 388.6 405.1 399.4
2.0% 450m bond GBP 2025 470.6 465.3 451.8 468.5
2.867% 320m bond HKD 2026 31.7 32.0 33.4 35.9
2.92% 739m bond HKD 2026 73.2 74.1 77.2 83.4
1.129% 52m bond EUR 2027 46.9 46.6 44.2 48.6
2.37% 830m bond HKD 2027 79.6 81.9 82.7 93.3
5.625% 300m bond GBP 2027 388.0 380.4 380.6 398.7
5.02% JPY 10bn dual currency loan JPY/USD 2029 87.2 90.2 94.5 106.8
0.875% 300m bond GBP 2029 284.8 295.8 – –
2.058% 30m bond EUR 2030 28.9 28.6 26.8 30.2
2.625% 425m bond GBP 2031 460.8 440.5 366.4 380.5
1.641% 30m bond EUR 2031 28.0 27.4 25.7 28.9
2.9% 600m bond HKD 2031 60.4 56.4 62.2 67.2
1.474% 35m bond USD 2031 23.5 22.7 – –
1.707% 28m bond EUR 2032 26.1 27.0 23.8 28.7
1.653% 26m bond EUR 2032 24.0 24.7 21.9 26.2
1.70% 30m bond EUR 2033 27.8 29.0 25.3 30.8
2.0% 100m bond GBP 2033 103.8 98.4 51.4 53.3
5.0% 200m bond GBP 2035 273.7 285.9 267.0 310.1
Borrowings designated at fair value through profit or loss 373.6 373.6 397.5 397.5
6.875% 400m bond USD 2028 373.6 373.6 397.5 397.5
Borrowings measured at amortised cost 6,568.1 5,182.7 5,996.0 5,375.1
1.61%+RPI 50m EIB IL loan GBP 2020 – – 68.1 67.0
1.73%+RPI 50m EIB IL loan GBP 2020 – – 68.1 66.9
1.84%+RPI 50m EIB IL loan GBP 2020 – – 68.1 66.9
1.90%+RPI 50m EIB IL loan GBP 2020 – – 68.1 66.8
1.93%+RPI 50m EIB IL loan GBP 2020 – – 68.0 66.7
1.88%+RPI 50m EIB IL loan GBP 2020 – – 67.9 66.6
2.10%+RPI 50m EIB IL loan GBP 2020 – – 67.9 66.5
2.46%+RPI 50m EIB IL loan GBP 2020 – – 68.2 66.6
Short-term bank borrowings – fixed GBP 2021 150.7 150.7 192.2 192.2
0.80%+LIBOR 100m loan GBP 2022 101.1 100.0 99.7 100.0
0.47%+RPI 100m IL loan GBP 2023 125.2 119.7 121.2 118.1
0.49%+RPI 100m IL loan GBP 2025 126.6 115.2 118.9 113.6
0.013%+RPI 25m IL bond GBP 2025 30.7 28.7 29.1 28.3
0.1275%+RPI 100m IL loan GBP 2026 125.0 113.6 116.2 112.1
0.01%+RPI 20m IL bond GBP 2028 25.0 23.7 23.1 23.6
1.23%+RPI 50m EIB (amortising) IL loan GBP 2029 40.5 36.8 43.6 40.8
0.288%+CPI 100m IL loan GBP 2029 113.9 102.1 110.3 101.3
1.29%+RPI 50m EIB (amortising) IL loan GBP 2029 42.9 38.8 45.9 42.8
1.12%+RPI 50m EIB (amortising) IL loan GBP 2029 42.4 38.5 45.3 42.5
1.10%+RPI 50m EIB (amortising) IL loan GBP 2029 42.3 38.5 45.2 42.4
0.75%+RPI 50m EIB (amortising) IL loan GBP 2029 43.6 39.8 46.1 43.7
0.76%+RPI 50m EIB (amortising) IL loan GBP 2030 43.6 39.7 46.0 43.5
1.15%+RPI 50m EIB (amortising) IL loan GBP 2030 44.1 39.6 46.6 43.4
1.11%+RPI 50m EIB (amortising) IL loan GBP 2030 44.2 39.7 46.7 43.5
0.178%+RPI 35m IL bond GBP 2030 46.1 40.2 42.2 39.6
0.245%+CPI 20m IL bond GBP 2031 24.0 21.5 20.7 21.4
0.01%+RPI 38m bond GBP 2031 48.6 44.5 43.8 44.2
Notes to the financial statements – appendices
238
FINANCIAL STATEMENTS
unitedutilities.com/corporate United Utilities Group PLC

A3 Borrowings continued
CurrencyYear of final repayment
Fair value
Carrying value
Fair value
Carrying value
2021£m
2021£m
2020£m
2020£m
Borrowings measured at amortised cost (continued)
3.375%+RPI 50m IL bond GBP 2032 140.2 83.1 105.1 81.7
0.709%+LIBOR 100m EIB (amortising) loan GBP 2032 68.7 68.8 71.3 75.0
0.691%+LIBOR 150m EIB (amortising) loan GBP 2032 107.6 107.8 110.4 117.2
0.573%+LIBOR 100m EIB (amortising) loan GBP 2033 74.2 75.0 75.5 81.3
0.511%+LIBOR 150m EIB (amortising) loan GBP 2033 115.7 117.2 117.7 126.6
2.0% 250m bond GBP 2033 259.4 245.7 257.0 245.7
0.01%+RPI 100m EIB (amortising) IL loan GBP 2033 100.3 92.2 100.1 98.0
0.01%+RPI 75m EIB (amortising) IL loan GBP 2034 75.3 69.1 75.0 73.4
0.01%+RPI 75m EIB (amortising) IL loan GBP 2034 75.3 71.4 75.0 75.6
0.01%+RPI 75m EIB (amortising) IL loan GBP 2034 75.3 71.4 75.0 75.6
1.9799%+RPI 100m IL bond GBP 2035 243.9 155.2 204.0 152.7
0.873%+LIBOR 100m EIB (amortising) loan GBP 2035 91.6 90.6 91.3 96.9
0.840%+LIBOR 75m EIB (amortising) loan GBP 2035 71.2 70.3 69.3 75.0
0.01%+RPI 26.5m IL bond GBP 2036 35.7 33.0 30.3 32.8
0.379%+CPI 20m IL bond GBP 2036 25.6 21.5 20.1 21.3
0.01%+RPI 29m IL bond GBP 2036 38.9 34.2 32.4 33.9
0.093%+CPI 60m IL bond GBP 2037 73.7 64.1 57.3 63.6
1.66%+RPI 35m IL bond GBP 2037 67.1 49.6 60.5 49.0
1.75% 250m bond GBP 2038 239.0 248.1 232.1 248.0
2.40%+RPI 70m IL bond GBP 2039 148.3 96.8 129.6 95.5
1.7829%+RPI 100m IL bond GBP 2040 241.3 153.5 193.5 151.1
0.01%+CPI 125m IL bond GBP 2040 144.5 145.6 – –
1.3258%+RPI 50m IL bond GBP 2041 117.8 76.6 100.7 75.4
1.5802%+RPI 100m IL bond GBP 2042 205.1 153.1 147.3 150.6
1.875% 300m bond GBP 2042 287.7 295.3 – –
1.5366%+RPI 20m IL bond GBP 2043 49.6 30.6 37.9 30.1
1.397%+RPI 50m IL bond GBP 2046 113.6 76.5 94.2 75.3
0.359%+CPI 32m IL bond GBP 2048 41.0 33.8 28.2 33.5
1.7937%+RPI 50m IL bond GBP 2049 122.4 76.2 97.1 75.0
Commission for New Towns (amortising) loan – fixed GBP 2053 52.6 26.2 50.7 26.8
1.847%+RPI 100m IL bond GBP 2056 255.0 149.8 194.6 147.7
1.815%+RPI 100m IL bond GBP 2056 251.9 149.1 188.8 147.1
1.662%+RPI 100m IL bond GBP 2056 241.6 148.8 186.1 146.8
1.5865%+RPI 50m IL bond GBP 2056 122.0 74.4 92.8 73.4
1.591%+RPI 25m IL bond GBP 2056 60.5 37.1 46.3 36.6
1.556%+RPI 50m IL bond GBP 2056 121.6 74.0 92.4 73.0
1.435%+RPI 50m IL bond GBP 2056 119.4 73.7 90.0 72.7
1.3805%+RPI 35m IL bond GBP 2056 82.4 51.6 62.3 50.9
1.585%+RPI 100m IL bond GBP 2057 311.2 143.2 284.1 141.3
0.387%+CPI 33m IL bond GBP 2057 44.4 34.5 26.7 34.2
1.702%+RPI 50m IL bond GBP 2057 124.5 72.2 93.6 71.3
Book overdrafts (see note 15) GBP 2021 10.5 10.5 14.9 14.9
Lease obligations GBP various 60.0 60.0 57.6 57.6
9,855.3 8,451.8 8,833.5 8,363.1
IL Index-linked debt – this debt is adjusted for movements in the Consumer or Retail Prices Indices with reference to a base CPI or RPI established at trade date.CPI The UK general index of consumer prices (for all items) as published by the Office for National Statistics (May 2015 = 100).RPI The UK general index of retail prices (for all items) as published by the Office for National Statistics (Jan 1987 = 100).EIB Borrowings that are held with the European Investment Bank.
Borrowings in the above table are unsecured. Funding raised in foreign currencies is swapped to sterling to match funding costs to income and assets. During the year, the group issued £75 million fixed rate notes as a fungible increase to £350 million fixed rate notes issued in prior years, due February 2031 with a coupon of 2.625 per cent. The group issued £50 million fixed rate notes as a fungible increase to £300 million fixed rate notes issued in the prior year, due July 2033 with a coupon of 2 per cent.
239
FINA
NC
IAL STA
TEM
ENT
S
Annual Report and Financial Statements for the year ended 31 March 2021Stock Code: UU.

A4 Financial risk management Risk management The board is responsible for treasury strategy and governance, which is reviewed on an annual basis.
The treasury committee, a subcommittee of the board, has responsibility for setting and monitoring the group’s adherence to treasury policies, along with oversight in relation to the activities of the treasury function.
Treasury policies cover the key financial risks: liquidity risk, credit risk, market risk (inflation, interest rate, electricity price and currency) and capital risk. As well as managing our exposure to these risks, these policies help the group maintain compliance with relevant financial covenants, which are in place primarily in relation to borrowings from the European Investment Bank (EIB) and include interest cover and gearing metrics. These policies are reviewed by the treasury committee for approval on at least an annual basis, or following any major changes in treasury operations and/or financial market conditions.
Day-to-day responsibility for operational compliance with the treasury policies rests with the treasurer. An operational compliance report is provided monthly to the treasury committee, which details the status of the group’s compliance with the treasury policies and highlights the level of risk against the appropriate risk limits in place.
The group’s treasury function does not act as a profit centre and does not undertake any speculative trading activity.
Liquidity risk The group looks to manage its liquidity risk by maintaining liquidity within a board-approved duration range. Liquidity is actively monitored by the group’s treasury function and is reported monthly to the treasury committee through the operational compliance report.
At 31 March 2021, the group had £1,444.1 million (2020: £1,208.1 million) of available liquidity, which comprised £744.1 million (2020: £528.1 million) of cash and short-term deposits and £700.0 million (2020: £680.0 million) of undrawn committed borrowing facilities.
The group had available committed borrowing facilities as follows:
Group2021
£m2020
£m
Expiring within one year 100.0 50.0
Expiring after one year but in less than two years 100.0 100.0
Expiring after more than two years 600.0 650.0
Total borrowing facilities 800.0 800.0
Facilities drawn(1) (100.0) (120.0)
Undrawn borrowing facilities 700.0 680.0
Note:(1) Facilities expiring after more than two years.
These facilities are arranged on a bilateral rather than a syndicated basis, which spreads the maturities more evenly over a longer time period, thereby reducing the refinancing risk by providing several renewal points rather than a large single refinancing point.
CompanyThe company did not have any committed facilities available at 31 March 2021 or 31 March 2020.
Maturity analysisConcentrations of risk may arise if large cash flows are concentrated within particular time periods. The maturity profile in the following table represents the forecast future contractual principal and interest cash flows in relation to the group’s financial liabilities on an undiscounted basis. Derivative cash flows have been shown net where there is a contractual agreement to settle on a net basis; otherwise the cash flows are shown gross. This table does not include the impact of lease liabilities for which the maturity profile has been disclosed in note 17.
GroupAt 31 March 2021
Total(1)
£m
Adjust-ment(2)
£m
1 year or less£m
1–2 years £m
2–3 years £m
3–4 years £m
4–5 years £m
More than 5 years
£m
Bonds 11,368.2 528.1 132.6 133.6 584.7 255.6 9,733.6Bank and other term borrowings 2,274.8 280.4 348.7 122.4 254.3 257.3 1,011.7Adjustment to carrying value(2) (5,251.2) (5,251.2)Borrowings 8,391.8 (5,251.2) 808.5 481.3 256.0 839.0 512.9 10,745.3Derivatives:
Payable 1,001.2 133.4 43.1 38.0 36.0 129.2 621.5Receivable (1,499.7) (186.0) (125.6) (92.0) (99.7) (202.3) (794.1)Adjustment to carrying value(2) 188.5 188.5Derivatives – net assets (310.0) 188.5 (52.6) (82.5) (54.0) (63.7) (73.1) (172.6)
Notes to the financial statements – appendices
240
FINANCIAL STATEMENTS
unitedutilities.com/corporate United Utilities Group PLC

A4 Financial risk management continued
GroupAt 31 March 2020
Total(1)
£m
Adjust-ment(2)
£m
1 year or less£m
1–2 years £m
2–3 years £m
3–4 years £m
4–5 years £m
More than 5 years
£m
Bonds 10,685.2 144.3 520.4 124.9 126.0 577.2 9,192.4
Bank and other term borrowings 2,894.9 884.9 122.0 352.1 122.7 255.8 1,157.4
Adjustment to carrying value(2) (5,274.6) (5,274.6)
Borrowings 8,305.5 (5,274.6) 1,029.2 642.4 477.0 248.7 833.0 10,349.8
Derivatives:
Payable 952.7 67.4 45.7 41.8 38.2 35.4 724.2
Receivable (1,508.6) (105.7) (90.2) (116.9) (82.6) (165.3) (947.9)
Adjustment to carrying value(2) 82.3 82.3
Derivatives – net assets (473.6) 82.3 (38.3) (44.5) (75.1) (44.4) (129.9) (223.7)
Notes:(1) Forecast future cash flows are calculated, where applicable, using forward interest rates based on the interest environment at year end and are therefore
susceptible to changes in market conditions. For index-linked debt it has been assumed that RPI will be 3 per cent and CPI will be 2 per cent over the life of each instrument.
(2) The carrying value of debt is calculated following various methods in accordance with IFRS 9 'Financial Instruments' and therefore this adjustment reconciles the undiscounted forecast future cash flows to the carrying value of debt in the statement of financial position, excluding £60.0 million (2020: £57.6 million) of lease liabilities.
CompanyThe company has total borrowings of £nil (2020: £0.8 million), which are payable within one year, and £1,780.6 million (2020: £1,752.0 million), which are payable within one to two years.
Credit risk Credit risk arises principally from trading (the supply of services to customers) and treasury activities (the depositing of cash and holding of derivative instruments). While the opening of the non-household retail market to competition from 1 April 2017 has impacted on the profile of the group’s concentration of credit risk, as discussed further below, the group does not believe it is exposed to any material concentrations that could have an impact on its ability to continue as a going concern or its longer-term viability.
The group manages its risk from trading through the effective management of customer relationships. Concentrations of credit risk with respect to trade receivables from household customers are limited due to the customer base being comprised of a large number of unrelated households. However, collection can be challenging as the Water Industry Act 1991 (as amended by the Water Industry Act 1999) prohibits the disconnection of a water supply and the limiting of supply with the intention of enforcing payment for certain premises, including domestic dwellings.
Following the non-household retail market opening to competition, credit risk in this area is now concentrated in a small number of retailers to whom the group provides wholesale water and wastewater services. Retailers are licensed and monitored by Ofwat and as part of the regulations they must demonstrate that they have adequate resources available to supply services. The credit terms for the group’s retail customers are set out in market codes.
In reaction to the impact of the COVID-19 pandemic, changes were made to the payment terms set out within the market codes. These changes provided the option for extended credit terms for retailers. However, this has now ended and all outstanding payments have been made. As at 31 March 2021, Water Plus was the group’s single largest debtor, with amounts outstanding in relation to wholesale services of £27.2 million (2020: £52.7 million). During the year, sales to Water Plus in relation to wholesale services were £362.9 million (2020: £438.3 million). Details of transactions with Water Plus can be found in note A6
Under the group’s revenue recognition policy, revenue is only recognised when collection of the resulting receivable is reasonably assured. Considering the above, the directors believe there is no further credit risk provision required in excess of the allowance for doubtful receivables (see note 14).
The group manages its credit risk from treasury activities by establishing a total credit limit by counterparty, which comprises a counterparty credit limit and an additional settlement limit to cover intra-day gross settlement of cash flows. In addition, potential derivative exposure limits are established to take account of potential future exposure which may arise under derivative transactions. These limits are calculated by reference to a measure of capital and credit ratings of the individual counterparties and are subject to a maximum single counterparty limit.
Credit limits are refreshed annually and reviewed in the event of any credit rating action. Additionally, a control mechanism to trigger a review of specific counterparty limits, irrespective of credit rating action, is in place. This entails daily monitoring of counterparty credit default swap levels and/or share price volatility. Credit exposure is monitored daily by the group’s treasury function and is reported monthly to the treasury committee through the operational compliance report.
241
FINA
NC
IAL STA
TEM
ENT
S
Annual Report and Financial Statements for the year ended 31 March 2021Stock Code: UU.

A4 Financial risk management continuedAt 31 March 2021 and 31 March 2020, the maximum exposure to credit risk for the group and company is represented by the carrying amount of each financial asset in the statement of financial position:
Group Company2021
£m2020
£m2021
£m2020
£m
Cash and short-term deposits (see note 15) 744.1 528.1 – –
Trade and other receivables (see note 14)* 315.9 342.9 91.9 81.3
Investments (see note 12) 0.1 0.1 – –
Derivative financial instruments 424.7 617.9 – –
1,484.8 1,489.0 91.9 81.3
* Included within trade and other receivables is £86.7 million of amounts owed by joint ventures in respect of borrowings, further details of which are disclosed in note A6.
The credit exposure on derivatives is disclosed gross of any collateral held. At 31 March 2021, the group held £50.7 million (2020: £72.2 million) as collateral in relation to derivative financial instruments (included within short-term bank borrowings – fixed in note A3).
Market risk The group’s exposure to market risk primarily results from its financing arrangements and the economic return which it is allowed on the regulatory capital value (RCV).
The group uses a variety of financial instruments, including derivatives, to manage the exposure to these risks.
Inflation riskThe group earns an economic return on its RCV, comprising a real return through revenues and an inflation return as an uplift to its RCV.
For the 2020–2025 regulatory period, from 1 April 2020 the group's RCV is 50 per cent linked to RPI inflation and 50 per cent linked to CPIH inflation, with any new additions being added to the CPIH portion of the RCV.
The group's inflation hedging policy aims to have around half of the group's net debt in index-linked form (where it is economic to do so), by issuing index-linked debt and/or swapping a portion of nominal debt. This is currently weighted towards RPI-linked form, with circa 75 per cent of the hedge linked to RPI and circa 25 per cent linked to CPI and/or CPIH (from circa 87 per cent RPI-linked and circa 13 per cent CPI-linked as at 31 March 2020).
The group believes this is an appropriate inflation hedging policy, taking into account a balanced assessment of the following factors: economic hedge of United Utilities Water Limited's (UUW) RCV and revenues; cash flow timing mismatch between allowed cost of debt and the group's incurred cost of debt; the inflation risk premium that is generally incorporated into nominal debt costs; income statement volatility; hedging costs; debt maturity profile mismatch risk; and index-linked hedging positioning relative to the water sector.
As a result of the evaluation of the above factors, the group continues to identify opportunities to maintain around 50 per cent of the group's net debt being hedged for inflation, which can be evidenced by the increase in the CPI/CPIH-linked hedge proportion over the past few years. Inflation risk is reported monthly to the treasury committee in the operational compliance report.
The carrying value of index-linked debt held by the group, including the carrying value of the nominal debt swapped to CPI, was £4,093.3 million at 31 March 2021 (2020: £4,082.2 million).
Sensitivity analysisThe following table details the sensitivity of profit before tax to changes in the RPI and CPI on the group’s index-linked borrowings. The sensitivity analysis has been based on the amount of index-linked debt held at the reporting date and, as such, is not indicative of the years then ended. In addition, it excludes the impact of inflation on revenues and other income statement costs as well as the hedging aspect of the group’s regulatory assets and post-retirement obligations.
Increase/(decrease) in profit before tax and equity2021
£m2020
£m
1% increase in RPI/CPI (35.4) (39.6)
1% decrease in RPI/CPI 35.4 39.6
The sensitivity analysis assumes a 1 per cent change in RPI and CPI having a corresponding 1 per cent impact on this position over a 12-month period. It should be noted, however, that there is a time lag by which current RPI and CPI changes impact on the income statement, and the analysis does not incorporate this factor. The portfolio of index-linked debt is calculated on either a three- or eight-month lag basis. Therefore, at the reporting date the index-linked interest and principal adjustments impacting the income statement are fixed and based on the annual RPI or CPI change either three or eight months earlier.
CompanyThe company had no material exposure to inflation risk at 31 March 2021 or 31 March 2020.
Notes to the financial statements – appendices
242
FINANCIAL STATEMENTS
unitedutilities.com/corporate United Utilities Group PLC

A4 Financial risk management continuedInterest rate riskThe group’s policy is to structure debt in a way that best matches its underlying assets and cash flows. The group currently earns an economic return on its RCV, comprising a real return through revenues, determined by the real cost of capital fixed by the regulator for each five-year regulatory pricing period, and an inflation return as an uplift to its RCV (see inflation risk section for changes being introduced by Ofwat to inflation indexation from 2020).
From 1 April 2020 for the regulatory period to 2025, Ofwat has continued to set a fixed real cost of debt in relation to embedded debt (80 per cent of net debt), but has introduced a debt indexation mechanism in relation to new debt (20 per cent of net debt), where the allowed rate on new debt will vary in line with specific debt indices. The debt indexation mechanism will be settled as an end of regulatory period adjustment.
Therefore, sterling index-linked debt is left unswapped at inception, in accordance with our inflation hedging policy goal to maintain around half of the group’s net debt in index-linked form. Conventional nominal debt is hedged as set out below.
Where conventional long-term debt is raised in a fixed-rate form, to manage exposure to long-term interest rates, the debt is generally swapped at inception to create a floating rate liability for the term of the liability through the use of interest rate swaps. These instruments are typically designated within a fair value accounting hedge.
To manage the exposure to medium-term interest rates, the group fixes underlying interest rates on nominal debt out to 10 years in advance on a reducing balance basis. As such, at the start of each regulatory period, a proportion of the projected nominal net debt representing new debt for that regulatory period, will remain floating until it is fixed via the above 10-year reducing balance basis, which should approximate Ofwat's new debt indexation mechanism.
This interest rate hedging policy dovetails with our inflation hedging policy should we need to swap a portion of nominal debt to real rate form to maintain our desired mix of nominal and index-linked debt.
The group seeks to manage its risk by maintaining its interest rate exposure within a board-approved range. Interest rate risk is reported to the treasury committee through the operational compliance report.
Sensitivity analysisThe following table details the sensitivity of the group’s profit before tax and equity to changes in interest rates. The sensitivity analysis has been based on the amount of net debt and the interest rate hedge positions in place at the reporting date and, as such, is not indicative of the years then ended.
Group Company
Increase/(decrease) in profit before tax and equity2021
£m2020
£m2021
£m2020
£m
1% increase in interest rate 130.7 122.7 (17.8) (17.5)
1% decrease in interest rate (134.7) (131.0) 17.8 17.5
The sensitivity analysis assumes that both fair value hedges and borrowings designated at fair value through profit or loss are effectively hedged and it excludes the impact on post-retirement obligations. The exposure largely relates to fair value movements on the group’s fixed interest rate swaps which manage the exposure to medium-term interest rates. Those swaps are not included in hedge relationships.
Hedge accountingDetails regarding the interest rate swaps designated as hedging instruments to manage interest rate risk are summarised below:
1 year or less
1 to 2 years 2 to 5 years Over 5 yearsNotional principal amount £m 375.0 – 450.0 1,325.0
Average contracted fixed interest rate % 1.98 – 1.36 2.00
This table represents the derivatives that are held in fair value hedging relationships, with only the weighted average for the fixed interest elements of the swaps disclosed.
Further detail on the fair value hedging relationships is provided below:
Risk exposure
Nominal amount of
the hedging instruments
£m
Carrying amount of
the hedging instruments
£m
Accumulated fair value
(gains)/losses on hedged
items£m
Fair value (gains)/losses*used for calculating hedge
ineffectiveness for the year ended 31 March 2021(1)
Hedge ineffective-
ness recognised
in the income statement
£m
Nominal amount of
hedging instruments
directly impacted by IBOR reform
£mHedged items
£m
Hedging instruments
£mInterest rate risk on borrowings 2,150.0 215.9 198.6 (88.9) 90.9 2.0 1,675.0
Note:(1) The change in fair value of the hedging instruments used to measure hedge ineffectiveness exclude interest accruals and credit spread adjustments. The
full impact of fair value movements on the income statement is disclosed in note 6.
243
FINA
NC
IAL STA
TEM
ENT
S
Annual Report and Financial Statements for the year ended 31 March 2021Stock Code: UU.

A4 Financial risk management continuedCurrency risk Currency exposure principally arises in respect of funding raised in foreign currencies. To manage exposure to currency rates, foreign currency debt is hedged into sterling through the use of cross-currency swaps and these are often designated within a fair value accounting hedge. The group seeks to manage its risk by maintaining currency exposure within board-approved limits. Currency risk in relation to foreign currency denominated financial instruments is reported monthly to the treasury committee through the operational compliance report. The group and company have no material net exposure to movements in currency rates.
Hedge accountingDetails regarding the cross-currency interest rate swaps designated as hedging instruments to manage currency and interest rate risk are summarised below:
1 year or less
1 to 2 years 2 to 5 years Over 5 yearsNotional principal amount £m – – 99.9 369.7
Average contracted fixed interest rate % – – 2.71 2.29
This table represents the derivatives that are held in fair value hedging relationships, with only the weighted average for the fixed interest rate elements of the swap disclosed.
Further detail on the fair value hedging relationships is provided below:
Risk exposure
Nominal amount of
the hedging instruments
£m
Carrying amount of
the hedging instruments
£m
Accumulated fair value
(gains)/losses on hedged
items£m
Fair value (gains)/losses* used for calculating hedge
ineffectiveness for the year ended 31 March 2021(1)
Hedge ineffective-
ness recognised
in the income statement
£m
Nominal amount of
hedging instruments
directly impacted by IBOR reform
£mHedged items
£m
Hedging instruments
£mForeign currency and interest rate risk on borrowings 469.6 59.9 66.6 (66.2) 66.5 0.3 442.8
Note:(1) The change in fair value of the hedging instruments used to measure hedge ineffectiveness excludes interest accruals and credit spread adjustments. The
full impact of fair value movements on the income statement is disclosed in note 6.
Interest rate benchmark reformGlobally, financial regulators are requiring that market participants cease using certain financial market benchmark reference rates (i.e. interbank offered rates, IBORs), and transition to the use of alternative nearly risk-free rate (RFR) such as the Sterling Overnight Index Average (SONIA).
Whilst uncertainty around the mechanism to replace IBOR, the timing of the replacement and the method and timing for the calculation of a spread adjustment remained, amendments were included within IFRS 9 'Financial Instruments', providing temporary exceptions from applying specific hedge accounting requirements in cases where hedging relationships are directly impacted by the IBOR reform. These reliefs are applied until the uncertainty surrounding the IBOR reform has ended or the hedging relationship has been discontinued.
At the point of IBOR transition, further amendments are included within IFRS 9 to allow for specific changes to hedge documentation to be made without the requirement to discontinue the hedging relationship, as well as including a practical expedient when financial liabilities and assets are modified to calculate cash flows based on the alternative interest rate, provided the modification has been done on an economically equivalent basis. Given the reliefs provided as part of the phase 2 amendments, the anticipation is that on transition, the risk of significant movements to the income or balance sheet as a result of the transition is low.
The amount of financial instruments left to transition to alternative benchmarks can be found below. Non-derivative financial instruments are presented at their carrying value, with the derivatives at their nominal value to give the fairest representation of the magnitude of instruments left to transition to RFRs. All of the instruments left to transition reference LIBOR. In addition to the below, the group hold £700 million of undrawn committed facilities that reference LIBOR.
Type of financial instrument
Amount leftto transition
to RFR£m
Non-derivative financial liabilities (pay GBP LIBOR) 729.7
Derivative instruments (pay GBP LIBOR)* 2,343.9
Derivative instruments (receive GBP LIBOR)* (2,482.3)
Net position 591.3
* Future dated transition to RFR contractually agreed.
Notes to the financial statements – appendices
244
FINANCIAL STATEMENTS
unitedutilities.com/corporate United Utilities Group PLC

A4 Financial risk management continuedDuring the financial year, the group adhered to the ISDA 2020 IBOR fall-backs protocol, embedding fall-back provisions into the interest rate derivatives of compounded SONIA plus a spread, which will automatically replace the London Inter-bank Offered Rate (LIBOR) at a future index cessation effective date. On 5 March 2021, following an announcement from the FCA on the future cessation and loss of representativeness of the LIBOR benchmarks, ISDA advised that a LIBOR cessation trigger event had occurred under the protocol, the index cessation effective date for GBP LIBOR will therefore be 1 January 2022. All of the group’s derivative counterparties have adhered to the protocol and so from 1 January 2022 all of the group’s derivatives will automatically transition from LIBOR to RFRs. The group do not expect to renegotiate interest rate swaps to reference a RFR prior to this date.
Further detail on the risk management strategy can be found within the interest rate risk section of this note.
Repricing analysisThe following tables categorise the group’s borrowings, derivatives and cash deposits on the basis of when they reprice or, if earlier, mature. The repricing analysis demonstrates the group’s exposure to floating interest rate risk.
Our largest concentration of floating interest rate risk is with index-linked instruments. This has been classified as repricing in one year or less due to the refixing of the interest charge with changes in RPI and CPI.
Group At 31 March 2021
Total £m
1 year or less £m
1–2 years £m
2–3 years £m
3–4 years £m
4–5 years £m
More than 5 years
£m
Borrowings in fair value hedge relationshipsFixed rate instruments 2,895.5 388.6 – – 465.3 106.1 1,935.5Effect of swaps – 2,506.9 – – (465.3) (106.1) (1,935.5)
2,895.5 2,895.5 – – – – –Borrowings designated at fair value through profit or lossFixed rate instruments 373.6 – – – – – 373.6Effect of swaps – 373.6 – – – – (373.6)
373.6 373.6 – – – – –Borrowings measured at amortised costFixed rate instruments 1,026.0 51.2 1.0 1.1 0.9 3.7 968.1Floating rate instruments 640.2 640.2 – – – – –Index-linked instruments 3,516.5 3,516.5 – – – – –
5,182.7 4,207.9 1.0 1.1 0.9 3.7 968.1Effect of fixed interest rate swaps – (2,332.3) 164.5 575.0 350.0 200.0 1,042.8Total borrowings 8,451.8 5,144.7 165.5 576.1 350.9 203.7 2,010.9Cash and short-term deposits (744.1) (744.1) – – – – –Net borrowings 7,707.7 4,400.6 165.5 576.1 350.9 203.7 2,010.9
At 31 March 2020Total
£m
1 year or less £m
1–2 years £m
2–3 years £m
3–4 years £m
4–5 years £m
More than 5 years
£m Borrowings in fair value hedge relationshipsFixed rate instruments 2,590.5 – 399.4 – – 468.5 1,722.6
Effect of swaps – 2,590.5 (399.4) – – (468.5) (1,722.6)
2,590.5 2,590.5 – – – – –
Borrowings designated at fair value through profit or lossFixed rate instruments 397.5 – – – – – 397.5
Effect of swaps – 397.5 – – – – (397.5)
397.5 397.5 – – – – –
Borrowings measured at amortised costFixed rate instruments 770.3 193.2 1.0 1.1 0.7 0.8 573.5
Floating rate instruments 686.9 686.9 – – – – –
Index-linked instruments 3,917.9 3,917.9 – – – – –
5,375.1 4,798.0 1.0 1.1 0.7 0.8 573.5
Effect of fixed interest rate swaps – (2,382.3) 50.0 164.5 575.0 350.0 1,242.8
Total borrowings 8,363.1 5,403.7 51.0 165.6 575.7 350.8 1,816.3
Cash and short-term deposits (528.1) (528.1) – – – – –
Net borrowings 7,835.0 4,875.6 51.0 165.6 575.7 350.8 1,816.3
245
FINA
NC
IAL STA
TEM
ENT
S
Annual Report and Financial Statements for the year ended 31 March 2021Stock Code: UU.

A4 Financial risk management continued
CompanyTotal
£m
2021 1 year or less
£mTotal
£m
2020 1 year or less
£m
Borrowings measured at amortised costFloating rate instruments 1,780.6 1,780.6 1,752.0 1,752.0
Total borrowings 1,780.6 1,780.6 1,752.0 1,752.0
Electricity price riskThe group is allowed a fixed amount of revenue by the regulator, in real terms, to cover electricity costs for each five-year regulatory pricing period. To the extent that electricity prices remain floating over this period, this exposes the group to volatility in its operating cash flows. The group’s policy, therefore, is to manage this risk by fixing a proportion of electricity commodity prices in a cost-effective manner. The group has fixed the price on a proportion of its anticipated net electricity usage out to the end of the regulatory period from 2020 to 2025, partially through entering into electricity swap contracts.
Hedge accountingElectricity swaps have been designated in cash flow hedge relationships. This means that only the impact of any hedging ineffectiveness is recognised through fair value in the income statement, with movements in the effective portion of the hedge being recognised in other comprehensive income.
Details of electricity swaps that have been designated in cash flow hedging relationships are summarised below:
Risk exposure
Nominal amount of the hedging
instrument £m
Carrying amount of
the hedging instrument
£m
Fair value (gains)/losses used for
calculating hedge
ineffectiveness for the year
ended 31 March 2021(1)
£m
Hedge ineffectiveness
recognised in the income
statement £m
Cash flow hedge reserve
excluding effects of tax
£m
Amount reclassified
from the cash flow hedge
reserve to the income statement
£mElectricity price risk 46.5 6.5 (9.3) – 7.8 –
Note:(1) The change in fair value of the hedging instruments used to measure hedge ineffectiveness exclude credit spread adjustments. The full impact of fair value
movements on the income statement is disclosed in note 6.
Due to the relative low value of the electricity swaps in comparison to that of the derivative portfolio, no maturity profile and fixed price breakdown has been disclosed.
Capital risk management The group’s objective when managing capital is to maintain efficient access to debt capital markets throughout the economic cycle. The board therefore believes that it is appropriate to maintain RCV gearing, measured as group consolidated net debt (including derivatives) to regulatory capital value (RCV) of UUW, within a target range of 55 per cent to 65 per cent. As at 31 March 2021, RCV gearing was within the range at 62 per cent (2020: 62 per cent).
Assuming no significant changes to existing rating agencies’ methodologies or sector risk assessments, the group aims to maintain long-term issuer credit ratings for UUW of at least A3 with Moody's Investors Service (Moody's) and BBB+ with S&P Global Ratings (S&P) and a senior unsecured debt rating for UUW of at least A- with Fitch Ratings (Fitch). Debt issued by UUW's financing subsidiary, United Utilities Water Finance PLC, is guaranteed by UUW and is therefore rated in line with UUW.
To maintain its targeted credit ratings, the group needs to manage its capital structure with reference to the ratings methodology and measures used by Moody’s, S&P and Fitch. The ratings methodology is normally based on a number of key ratios (such as RCV gearing, adjusted interest cover, post maintenance interest cover (PMICR) and Funds from Operations (FFO) to debt) and threshold levels as updated and published from time to time by Moody's, S&P and Fitch. The group looks to manage its risk by maintaining the relevant key financial ratios used by the credit ratings agencies to determine a corporate's credit rating, within the thresholds approved by the board. Capital risk is reported monthly to the treasury committee through the operational compliance report.
Further detail on the precise measures and methodologies used to assess water companies’ credit ratings can be found in the methodology papers published by the rating agencies.
Notes to the financial statements – appendices
246
FINANCIAL STATEMENTS
unitedutilities.com/corporate United Utilities Group PLC

A4 Financial risk management continuedFair valuesThe table below sets out the valuation basis of financial instruments held at fair value and financial instruments where fair value has been separately disclosed in the notes as the carrying value is not a reasonable approximation of fair value.
Group 2021
Level 1 £m
Level 2 £m
Level 3 £m
Total £m
Financial assets at fair value through profit or lossDerivative financial assets – fair value hedge – 275.6 – 275.6Derivative financial assets – held for trading(1) – 142.6 – 142.6Derivative financial assets – cash flow hedge – 6.5 – 6.5Investments – 0.1 – 0.1Financial liabilities at fair value through profit or lossDerivative financial liabilities – fair value hedge – (12.6) – (12.6)Derivative financial liabilities –held for trading(1) – (102.1) – (102.1)Derivative financial liabilities – cash flow hedge – – – –Financial liabilities designated as fair value through profit or loss – (373.6) – (373.6)Financial instruments for which fair value has been disclosedFinancial liabilities in fair value hedge relationships (2,766.0) (147.6) – (2,913.6)Other financial liabilities at amortised cost (2,321.6) (4,246.5) – (6,568.1)
(5,087.6) (4,457.6) – (9,545.2)
2020
Level 1 £m
Level 2 £m
Level 3 £m
Total £m
Financial assets at fair value through profit or lossDerivative financial assets – fair value hedge – 395.7 – 395.7
Derivative financial assets – held for trading(1) – 222.0 – 222.0
Derivative financial assets – cash flow hedge – 0.2 – 0.2
Investments – 0.1 – 0.1
Financial liabilities at fair value through profit or lossDerivative financial liabilities – fair value hedge – – – –
Derivative financial liabilities –held for trading(1) – (141.9) – (141.9)
Derivative financial liabilities – cash flow hedge – (2.4) – (2.4)
Financial liabilities designated as fair value through profit or loss – (397.5) – (397.5)
Financial instruments for which fair value has been disclosedFinancial liabilities in fair value hedge relationships (1,981.5) (458.5) – (2,440.0)
Other financial liabilities at amortised cost (199.9) (5,796.1) – (5,996.0)
(2,181.4) (6,178.4) – (8,359.8)
Note:(1) These derivatives form economic hedges and, as such, management intends to hold these through to maturity. Derivatives forming an economic hedge of
the currency exposure on borrowings included in these balances were £141.5 million (2020: £221.9 million)
• Level 1 fair value measurements are those derived from quoted prices (unadjusted) in active markets for identical assets or liabilities;
• Level 2 fair value measurements are those derived from inputs other than quoted prices included within level 1 that are observable for the asset or liability, either directly (i.e. as prices) or indirectly (i.e. derived from prices); and
• Level 3 fair value measurements are those derived from valuation techniques that include inputs for the asset or liability that are not based on observable market data (unobservable).
The group has calculated fair values using quoted prices where an active market exists, which has resulted in £5,087.6 million (2020: £2,181.4 million) of ‘level 1’ fair value measurements. In the absence of an appropriate quoted price, the group has applied discounted cash flow valuation models utilising market available data in line with prior years. The £2,906.2 million increase (2020: £816.4 million decrease) in level 1 fair value measurements is largely due to an increase in the number of observable quoted bond prices in active markets at 31 March 2021.
During the year, changes in the fair value of financial liabilities designated at fair value through profit or loss resulted in a £23.9 million loss (2020: £23.6 million gain). Included within this was a £43.3 million loss (2020: £34.2 million gain) attributable to changes in own credit risk, recognised in other comprehensive income. The cumulative amount due to changes in credit spread was £35.7 million profit (2020: £79.0 million profit). The carrying amount is £147.5 million (2020: £171.4 million) higher than the amount contracted to settle on maturity.
CompanyThe company does not hold any financial instruments that are measured subsequent to initial recognition at fair value or where fair value has been separately disclosed in the notes as the carrying value is not a reasonable approximation of fair value.
247
FINA
NC
IAL STA
TEM
ENT
S
Annual Report and Financial Statements for the year ended 31 March 2021Stock Code: UU.

A5 Retirement benefitsDefined benefit schemesThe group participates in two major funded defined benefit pension schemes in the United Kingdom – the United Utilities Pension Scheme (UUPS) and the United Utilities PLC group of the Electricity Supply Pension Scheme (ESPS), both of which are closed to new employees. The assets of these schemes are held in trust funds independent of the group’s finances.
The trustees are composed of representatives of both the employer and employees. The trustees are required by law to act in the interests of all relevant beneficiaries and are responsible for the investment policy with regard to the assets plus the day-to-day administration of the benefits.
Since 1 April 2018, the majority of active members in the defined benefit sections of the UUPS have been part of a hybrid section comprising both defined benefit and defined contribution elements. Pension benefits relating to pensionable service before 1 April 2018 have not been affected by the transition to this hybrid section, which was introduced as a consequence of increases in future service costs to reduce the overall costs and risk to the group while balancing the interests of employees by maintaining an element of defined benefit pension provision.
The group operates a series of historic unfunded, unregistered retirement benefit schemes. The costs of these schemes are included in the total pension cost, on a basis consistent with IAS 19 ‘Employee Benefits’ and the assumptions set out below.
Under the group's defined benefit pension schemes, employees are entitled to annual pensions on retirement. Benefits are payable on death and following other events such as withdrawing from active service. No other post-retirement benefits are provided to these employees.
Information about the pension arrangements for executive directors is contained in the directors’ remuneration report.
The defined benefit obligation includes benefits for current employees, former employees and current pensioners as analysed in the table below:
Group2021
£m2020
£m
Total value of current employees benefits 783.5 665.6
Deferred members benefits 574.4 521.9
Pensioner members benefits 1,937.8 1,870.1
Total defined benefit obligation 3,295.7 3,057.6
The duration of the combined schemes is around 17 years. The schemes’ duration is an indicator of the weighted-average time until benefit payments are settled, taking account of the split of the defined benefit obligation between current employees, deferred members and the current pensioners of the schemes.
The estimated profile of cash flows out of the schemes as retirement benefits are paid is as follows:
UUPS ESPS
125
0 5 10 15 20 25 30 35Term (years)
40 45 50 55 60 65 70
Futu
re c
ash
�ow
s (£
m)
100
75
50
25
0
Active members Deferred pensioners Current pensioners
25
0 5 10 15 20 25 30 35Term (years)
40 45 50 55 60
Futu
re c
ash
ow
s (£
m)
20
15
10
5
0
Active members Deferred pensioners Current pensioners
Funding requirementsThe latest finalised funding valuations of the schemes were carried out by independent qualified actuaries as at 31 March 2018, earlier than originally planned due to the aforementioned changes to the pension scheme, and determined that the schemes were both in a deficit position on a funding basis. The basis on which scheme liabilities are valued for funding purposes differs from the basis required under IAS 19, with liabilities on a funding basis being subject to assumptions at the valuation date that are not updated between revaluations. Funding deficits vary significantly from company to company, but neither the deficits, the assumptions on which they are based, the associated sensitivities, nor the risk exposures are disclosed by many companies and, therefore, meaningful cross-company comparisons are not possible. Conversely, scheme liabilities are valued on a consistent basis between companies under IAS 19 and are subject to assumptions and sensitivities that are required to be disclosed. Consequently, the relative economic positions of companies are comparable only on an IAS 19 basis, subject to normalisation of assumptions used between companies.
Notes to the financial statements – appendices
248
FINANCIAL STATEMENTS
unitedutilities.com/corporate United Utilities Group PLC

A5 Retirement benefits continuedA retirement benefit surplus was recognised as an asset at both 31 March 2021 and 31 March 2020 as, under both the UUPS and ESPS scheme rules, the group has an unconditional right to a refund of the surplus assuming the full settlement of the plans’ liabilities in a single event, such as a scheme wind-up.
Under UK legislation there is a requirement that pension schemes are funded prudently, and that funding plans are agreed by pension scheme trustees. The group had plans in place with the schemes’ trustees to address the funding deficits by 31 December 2021 for the UUPS and 30 September 2024 for the ESPS, through a series of deficit recovery contributions. This timescale has been accelerated, with accelerated deficit repair contributions of £97.6 million and £5.4 million made to the UUPS and ESPS respectively in April 2019. These payments represent the final acceleration of deficit repair contributions set out in the schedules of contributions agreed with the schemes’ trustees as part of the 31 March 2018 valuation process, and reduce the deficit repair contributions payable, due from the company, to £nil. Accordingly, no deficit repair contributions were required during the year ended 31 March 2021.
As the 2018 valuation basis was consistent with a long-term target for self-sufficiency, the expectation is that the pension schemes will be fully funded on a low dependency basis without additional contributions from the company.
The group and trustees have agreed long-term strategies for reducing investment risk in each scheme. This includes an asset-liability matching policy which aims to reduce the volatility of the funding level of the pension plan by investing in assets, such as corporate bonds and gilts, supplemented by swap and gilt long-term hedges of interest and inflation rates, which perform in line with the liabilities so as to hedge against changes in interest and inflation rates.
Following further evolution in the group's investment and risk management strategies during the year ended 31 March 2020, both UUPS and ESPS are fully hedged for inflation exposure through external market swaps and gilts. Further details of the derivatives used in reducing investment risk are disclosed in the ‘Further reporting analysis’ section of this appendix.
The group expects to make further contributions of £7.5 million in the year ending 31 March 2022, £6.4 million and £0.7 million in respect of current service contributions to UUPS and ESPS respectively, and £0.4 million in respect of expenses to the ESPS.
The schemes’ funding plans are reviewed regularly, and the next funding valuation for UUPS and ESPS is due as at 31 March 2021. The valuation is expected to be finalised by 31 March 2022.
Impact of scheme risk management on IAS 19 disclosuresUnder the prescribed IAS 19 basis, pension scheme liabilities are calculated based on current accrued benefits. Expected cash flows are projected forward allowing for RPI and CPI and the current member mortality assumptions. These projected cash flows are then discounted by a high-quality corporate bond rate, which comprises an underlying interest rate and a credit spread.
The group has de-risked its pension schemes through hedging strategies applied to the underlying interest rate and future inflation. Both UUPS and ESPS fully hedge RPI inflation exposure along with underlying interest rates through external market swaps and gilts (including gilt repurchase instruments), the value of which is included in the schemes' assets (net of associated derivative liabilities).
Consequently, the reported statement of financial position under IAS 19 remains volatile due to changes in credit spread and changes in mortality, neither of which have been hedged at the current time. Changes in credit spread have not been hedged primarily due to difficulties in doing so over long durations, while changes in mortality have not been hedged due to this exposure being subject to lower volatility in the short term and relatively high hedging costs.
In contrast, the schemes’ specific funding bases, which formed the basis for regular deficit repair contributions, are unlikely to suffer from significant volatility due to credit spread, because a prudent, fixed credit spread assumption is applied.
Pension benefits under the defined benefit element of the UUPS hybrid section, that became effective for pensionable service from 1 April 2018, are linked to CPI rather than RPI.
In the year ended 31 March 2021, the discount rate decreased by 0.25 per cent (2020: 0.1 per cent decrease), which includes a 0.85 per cent decrease in credit spreads and a 0.6 per cent increase in gilt yields over the year. The IAS 19 remeasurement loss of £82.7 million (2020: £154.6 million gain) reported in note 18 has largely resulted from a decrease in credit spreads during the year and an RPI inflation assumption increase of 0.55 per cent (2020: 0.65 per cent decrease). The impact of movements in credit spreads is less pronounced on a scheme funding basis compared with the remeasurement loss recognised on an IAS 19 accounting basis as the discount rate used for valuing obligations utilises a fixed credit spread assumption.
Guaranteed Minimum Pensions (GMP) equalisationA second UK High Court Ruling in the Lloyds Guaranteed Minimum Pensions (GMP) equalisation case was published on 20 November 2020. The implication of the first court ruling on 26 October 2018 was that GMP will be equalised for males and females and resulted in GMP equalisation past service cost (and corresponding increase in liabilities) of £6.6 million (£5.5 million UUPS, £1.1 million ESPS) being recognised for the year ended 31 March 2019. The second ruling requires schemes to equalise GMP in respect of past transfers out (dating back to 17 May 1990) where those benefits were not equalised under the 2018 judgement. This is not expected to have a material impact on the group's financial statements.
For the year ended 31 March 2021, there has been a further £0.5 million (£0.3 million UUPS, £0.2 million ESPS) increase to the pension liability and past service costs in relation to GMP equalisation as a result of the six-year look-back period previously assumed for back payments no longer being applicable, as it has been concluded that there is no limit for back payments.
249
FINA
NC
IAL STA
TEM
ENT
S
Annual Report and Financial Statements for the year ended 31 March 2021Stock Code: UU.

A5 Retirement benefits continuedReporting and assumptionsThe results of the latest funding valuations at 31 March 2018 have been adjusted for IAS 19 to assess the position at 31 March 2021, by taking account of experience over the period, changes in market conditions, and differences in the financial and demographic assumptions. The present value of the defined benefit obligation, and the related current service costs, were measured using the projected unit credit method.
Member data used in arriving at the liability figure included within the overall IAS 19 surplus has been based on the finalised actuarial valuations as at 31 March 2018 for both UUPS and ESPS.
Financial assumptionsThe main financial and demographic assumptions used by the actuary to calculate the defined benefit surplus of UUPS and ESPS are outlined below:
Group2021
% p.a.2020
% p.a.
Discount rate 2.05 2.30
Pension increases 3.35 2.80
Pensionable salary growth:
ESPS 3.35 2.80
UUPS 2.45 1.60
Price inflation – RPI 3.35 2.80
Price inflation – CPI(1) 2.75 1.60
Note:(1) The CPI price inflation assumption represents a single weighted average rate derived from an assumption of 2.45 per cent pre-2030 and 3.25 per cent
post-2030.
The discount rate is consistent with a high-quality corporate bond rate, with 2.05 per cent being equivalent to gilts plus 75 basis points (31 March 2020: 2.30 per cent being equivalent to gilts plus 160 basis points). To align to emerging market practice and provide a more robust estimate, an exercise was carried out during the year to revisit the population of high quality corporate bonds used in deriving the discount rate. The primary change resulting from this exercise was to expand the corporate bond population used to include those rated at least AA by one or more credit rating agencies, whereas previously the rate was derived based on bonds rated AA by two or more agencies. Overall, the changes resulting from this exercise have not given rise to any material change in the discount rate or fair value of defined benefit obligations as at 31 March 2021 compared with using the same approach as that used in the prior year.
In September 2019, the Chancellor of the Exchequer highlighted the UK Statistics Authority’s proposals to change RPI to align with CPIH (Consumer Prices Index, including housing costs). Plans to reform RPI and bring it in line with CPIH from 2030 were confirmed on 25 November 2020. Broadly CPIH increases are expected to average around 1 per cent per annum below RPI in the long-term (about the same as CPI), so this change could have a significant impact on many pension schemes. In arriving at the company’s best estimate for RPI, an inflation risk premium of 0.2 per cent (2020: nil) has been deducted from the breakeven inflation rate for the year ended 31 March 2021. The impact of this is a decrease in the defined benefit obligation of around £120 million and therefore an increase in the net defined benefit surplus compared with no inflation risk premium being deducted. There is no allowance for any further change in the inflation risk premium post 2030 as a result of RPI reform.
The assumption for CPI inflation includes a 0.2 per cent inflation risk premium (2020: 0.3 per cent) and is set by deducting a 'wedge' from the RPI inflation assumption to reflect structural differences. For pre-2030 inflation this wedge has been estimated at 0.9 per cent, reducing to 0.1 per cent post-2030 given that RPI and CPI are expected to converge. The impact of this reduction in the post-2030 wedge as a result of the confirmation of RPI reform is a circa £13 million increase to the defined benefit obligation and therefore a decrease in the net defined benefit surplus compared with the wedge remaining at 0.9 per cent after 2030. A reduction in RPI will result in a reduction to pension scheme liabilities; however, as our pension schemes are hedged for RPI inflation, this will result in a comparable reduction to pension scheme assets.
Demographic assumptionsAt both 31 March 2021 and 31 March 2020, mortality in retirement is assumed to be in line with the Continuous Mortality Investigation’s (CMI) S2PA year of birth tables, with a scaling factor of 106 per cent and 109 per cent for male pensioners and non-pensioners respectively and 104 per cent and 105 per cent for female pensioners and non-pensioners respectively, reflecting actual mortality experience. At 31 March 2021, mortality in retirement is based on CMI 2020 (2020: CMI 2019) long-term improvement factors, with a long-term annual rate of improvement of 1.25 per cent (2020: 1.50 per cent). It is too early at this stage to analytically determine the long-term impact of the COVID-19 pandemic on future mortality trends for the schemes' membership, therefore no explicit adjustment to the mortality assumptions have been made in this regard.
Notes to the financial statements – appendices
250
FINANCIAL STATEMENTS
unitedutilities.com/corporate United Utilities Group PLC

A5 Retirement benefits continuedThe current life expectancies at age 60 underlying the value of the accrued liabilities for the schemes are:
Group2021
years2020 years
Retired member – male 26.0 26.6
Non-retired member – male 26.9 27.7
Retired member – female 28.4 28.9
Non-retired member – female 29.5 30.2
Sensitivity of the key scheme assumptionsThe measurement of the group’s defined benefit surplus is sensitive to changes in key assumptions, which are described above. The sensitivity calculations presented below allow for the specified movement in the relevant key assumption, while all other assumptions are held constant. This approach does not take into account the interrelationship between some of these assumptions or any hedging strategies adopted.
• Asset volatility – If the schemes’ assets underperform relative to the discount rate used to calculate the schemes’ liabilities, this will create a deficit. The schemes hold some growth assets (equities, diversified growth funds and emerging market debt) which, though expected to outperform the discount rate in the long term, create volatility in the short term. The allocation to growth assets is monitored to ensure it remains appropriate given the schemes’ long-term objectives.
• Discount rate – An increase/decrease in the discount rate of 0.25 per cent would have resulted in a £142.1/£151.9 million (2020: £132.8 million) decrease/increase in the schemes’ liabilities at 31 March 2021, although as long as credit spreads remain stable this will be largely offset by an increase/decrease in the value of the schemes’ bond holdings and other instruments designed to hedge this exposure. The discount rate is based on high-quality corporate bond yields of a similar duration to the schemes’ liabilities.
• Price inflation – An increase/decrease in the inflation assumption of 0.25 per cent would have resulted in a £144.3/£136.1 million (2020: £124.5 million) increase/decrease in the schemes’ liabilities at 31 March 2021, as a significant proportion of the schemes’ benefit obligations are linked to inflation. However, nearly all of the schemes’ liabilities were hedged for RPI in the external market at 31 March 2021, meaning that this sensitivity is likely to be insignificant as a result. The sensitivity to price inflation allows for the impact of changes to pensionable salary growth and pension increases, which are both assumed to be linked to price inflation.
• Mortality long-term improvement rate – An increase in the mortality long-term improvement rate from 1.25 per cent to 1.50 per cent would have resulted in a £33.2 million decrease in the schemes' liabilities at 31 March 2021 (2020: £31.1 million decrease based on an increase in the mortality long-term improvement rate from 1.50 per cent to 1.75 per cent).
• Life expectancy – An increase/decrease in life expectancy of one year would have resulted in a £152.8 million (2020: £116.6 million) increase/decrease in the schemes’ liabilities at 31 March 2021. The majority of the schemes’ obligations are to provide benefits for the life of the member and, as such, the schemes’ liabilities are sensitive to these assumptions.
Further reporting analysisAt 31 March, the fair values of the schemes’ assets recognised in the statement of financial position were as follows:
Group
Schemes’ assets
%2021
£m
Schemes’ assets
%2020
£m
Non-equity growth assets 10.2 406.6 9.3 356.4
Gilts(1) 34.5 1,374.5 36.4 1,388.7
Bonds 46.5 1,853.4 48.0 1,828.1
Other(1) 8.8 350.2 6.3 238.5
Total fair value of schemes’ assets 100.0 3,984.7 100.0 3,811.7
Present value of defined benefit obligations (3,295.7) (3,057.6)
Net retirement benefit surplus 689.0 754.1
Note:(1) Following a review of the fair value of the schemes’ assets and derivatives during the year, the fair value of the schemes’ assets at 31 March 2020 have been
re-presented such that £407.1 million fair value of derivatives have been included in gilts where they were previously included in other. The effect of this is that the fair value of the schemes’ assets classified as gilts is £407.1 million lower at 31 March 2020 compared with that presented in the prior year financial statements, and the fair value of the schemes’ assets classified as other is £407.1 million higher.
Included within the group’s defined benefit pension scheme assets are assets with a fair value estimated to be £268.0 million that are categorised as ‘level 3’ assets within the IFRS 13 ‘Fair value measurement’ hierarchy, meaning that the value of the assets is not observable at 31 March 2021. Estimates of the fair value of these assets have been performed by the investment managers’ valuation specialists using the latest available statements of each of the funds that make up the total level 3 asset balance, updated for any subsequent cash movements between the statement date and the year end reporting date.
The assets, in respect of UUPS, included in the table above, have been allocated to each asset class based on the return the assets are expected to achieve as UUPS has entered into a variety of derivative transactions to change the return characteristics of the physical assets held to reduce undesirable market and liability risks. As such, the breakdown shown separates the assets of the schemes to illustrate the underlying risk characteristics of the assets held.
251
FINA
NC
IAL STA
TEM
ENT
S
Annual Report and Financial Statements for the year ended 31 March 2021Stock Code: UU.

A5 Retirement benefits continuedThe portfolio contains a proportion of assets set aside for collateral purposes linked to the derivative contracts entered into, as described above. The collateral portfolio, comprising cash and eligible securities readily convertible to cash, provides sufficient liquidity to manage exposure relating to the derivative transactions and is expected to achieve a return in excess of SONIA (Sterling Overnight Index Average).
The fair values of derivatives included within each of the pension scheme asset categories are analysed as follows:
Group
Underlying assets
£m
Fair value of derivatives
£mCombined
£m
At 31 March 2021Non-equity growth assets 406.6 – 406.6Gilts 2,784.3 (1,409.8) 1,374.5Bonds 1,859.2 (5.8) 1,853.4Other 376.2 (26.0) 350.2Total fair value of schemes' assets 5,426.3 (1,441.6) 3,984.7
At 31 March 2020
Non-equity growth assets 356.4 – 356.4
Gilts 1,795.8 (407.1) 1,388.7
Bonds 1,865.0 (36.9) 1,828.1
Other 330.0 (91.5) 238.5
Total fair value of schemes' assets 4,347.2 (535.5) 3,811.7
The derivative values in the table above represent the net market value of derivatives held within each of these asset categories as follows:
UUPS£m
ESPS£m
2021Total
£mUUPS
£mESPS
£m
2020Total
£m
Gilts Repurchase agreements (1,403.6) (6.2) (1,409.8) (405.9) (1.2) (407.1)
(1,403.6) (6.2) (1,409.8) (405.9) (1.2) (407.1)
Bonds – hedging non-sterling exposure back to sterling Currency forwards (8.9) – (8.9) (27.7) – (27.7)
Interest rate swaps – 3.1 3.1 – (9.2) (9.2)
(8.9) 3.1 (5.8) (27.7) (9.2) (36.9)
Other – managing liability risks targeting a high level of interest rate and inflation hedging Asset swaps (26.6) – (26.6) (30.2) – (30.2)
Interest rate swaps 23.2 0.1 23.3 25.7 (0.4) 25.3
RPI inflation swaps (18.0) (3.5) (21.5) (75.0) (10.6) (85.6)
Total return swaps – (1.2) (1.2) – (1.0) (1.0)
(21.4) (4.6) (26.0) (79.5) (12.0) (91.5)
Total fair value of derivatives (1,433.9) (7.7) (1,441.6) (513.1) (22.4) (535.5)
The derivatives shown in the tables only cover those expressly held for the purpose of reducing certain undesirable asset and liability risks. The schemes invest in a number of other pooled funds that make use of derivatives. No allowance is made in the figures above for any derivatives held within these other pooled funds, as they are not held expressly for the purpose of managing risk. The total fair value of pooled funds held within the schemes’ assets was £667.2 million (2020: £698.3 million).
The intention is that the schemes' assets provide a full economic hedge of interest rates and RPI inflation of the schemes' liabilities on a scheme funding basis. As the scheme funding basis is more prudent than the IAS 19 measurement basis for the defined benefit obligation, the schemes are more than 100 per cent hedged on an accounting basis.
Notes to the financial statements – appendices
252
FINANCIAL STATEMENTS
unitedutilities.com/corporate United Utilities Group PLC

A5 Retirement benefits continuedMovements in the fair value of the schemes’ assets were as follows:
Group2021
£m2020
£m
At the start of the year 3,811.7 3,909.1
Interest income on schemes’ assets 86.0 94.3
The return/(loss) on plan assets, excluding amounts included in interest 241.0 (131.6)
Member contributions 2.4 2.6
Benefits paid (162.0) (175.0)
Administrative expenses (3.0) (1.6)
Company contributions 8.6 113.9
At the end of the year 3,984.7 3,811.7
The group’s actual return on the schemes’ assets was a gain of £327.0 million (2020: £37.3 million loss), largely as a result of the schemes' investment strategies hedging increases in the technical provisions due to change in financial conditions.
Movements in the present value of the defined benefit obligations are as follows:
Group2021
£m2020
£m
At the start of the year (3,057.6) (3,425.2)
Interest cost on schemes’ obligations (68.5) (80.3)
Actuarial (losses)/gains arising from changes in financial assumptions (429.7) 257.3
Actuarial gains/(losses) arising from changes in demographic assumptions 80.6 (7.2)
Actuarial gains arising from experience 25.4 36.1
Curtailments/settlements arising on reorganisation (0.6) (4.6)
Member contributions (2.4) (2.6)
Benefits paid 162.0 175.0
Current service cost (4.9) (6.1)
At the end of the year (3,295.7) (3,057.6)
A6 Related party transactionsGroup Transactions between the company and its subsidiaries, which are related parties, have been eliminated on consolidation and are not disclosed in this note.
The related party transactions with the group’s joint ventures and other related parties during the period, and amounts outstanding at the period end date, were as follows:
2021£m
2020£m
Sales of services 362.9 438.3
Charitable contributions advanced to related parties – 0.4
Purchases of goods and services – 0.1
Interest income and fees recognised on loans to related parties 3.7 4.0
Amounts owed by related parties 113.8 147.9
Amounts owed to related parties 2.4 4.8
Sales of services to related parties during the year mainly represent non-household wholesale charges to Water Plus that were billed during the period. These transactions were on the market credit terms in respect of non-household wholesale charges, which are governed by the wholesale charging rules issued by Ofwat.
Charitable contributions advanced to related parties during the prior year relate to amounts paid to Rivington Heritage Trust, a charitable company limited by guarantee for which United Utilities Water Limited is one of three guarantors.
At 31 March 2021, amounts owed by joint ventures, as recorded within trade and other receivables in the statement of financial position, were £113.8 million (2020: £147.9 million), comprising £27.1 million (2020: £52.9 million) of trade balances, which are unsecured and will be settled in accordance with normal credit terms, and £86.7 million (2020: £95.0 million) relating to loans.
253
FINA
NC
IAL STA
TEM
ENT
S
Annual Report and Financial Statements for the year ended 31 March 2021Stock Code: UU.

A6 Related party transactions continuedIncluded within these loans receivable were the following amounts owed by Water Plus:
• £66.3 million (2020: £93.6 million) outstanding on a £100.0 million revolving credit facility provided by United Utilities PLC, with a maturity date of December 2023, bearing a floating interest rate of the Bank of England base rate plus a credit margin (2020: provided by United Utilities Water Limited and guaranteed by United Utilities PLC, with a maturity date of September 2021, bearing a floating interest rate of LIBOR plus a credit margin). This balance comprises £67.5 million outstanding net of a £1.2 million allowance for expected credit losses (2020: £98.0 million outstanding net of a £4.6 million allowance for expected credit losses);
• £18.3 million (2020: £nil) outstanding on a £32.5 million revolving credit facility provided by United Utilities PLC, with a maturity date of 30 September 2021, bearing a floating interest rate of LIBOR plus a credit margin. This balance comprises £32.5 million outstanding net of the group’s £8.9 million share of Water Plus losses for the year ended 31 March 2021 and the group’s £5.3 million previously unrecognised share of joint venture losses relating to the year ended 31 March 2020 (2020: £nil outstanding, with no share of joint venture losses or allowance for expected credit losses allocated against the facility). This facility forms part of the group’s long-term interest in the Water Plus joint venture given that at 31 March 2021 there was a clear expectation that it would be replaced with additional equity share capital. This additional share capital was issued by Water Plus on 23 April 2021, with the group’s subscription to £32.5 million of new equity shares and the simultaneous cancellation of the revolving credit facility taking place on this same date; and
• £0.7 million (2020: £nil) receivable being the £10.3 million (2020: £10.0 million) fair value of amounts owed in relation to a £12.5 million unsecured loan note held by United Utilities PLC, with a maturity date of 28 March 2027, net of a £0.1 million (2020: £0.5 million) allowance for expected credit losses and £9.5 million of the group’s share of joint venture losses relating to the year ended 31 March 2020 as the loan note is deemed to be part of the group’s long-term interest in Water Plus. This is a zero coupon shareholder loan with a total amount outstanding at 31 March 2021 and 31 March 2020 of £12.5 million, comprising the £10.3 million (2020: £10.0 million) receivable measured at fair value, and £2.2 million (2020: £2.5 million) recorded as an equity contribution to Water Plus recognised within interests in joint ventures.
A further £1.4 million of non-current receivables (2020: £1.4 million) was owed by other related parties at 31 March 2021.
The £1.3 million (2020: £5.0 million) of allowances for expected credit losses in relation to loans extended to Water Plus (£1.2 million (2020: £4.5 million) and £0.1 million (£0.5 million) recognised against Water Plus’s total revolving credit facilities and zero coupon loan notes respectively), is lower than the £5.0 million allowance for expected credit losses recognised at 31 March 2020. This £5.0 million allowance was recognised in the prior year as a result of the impacts of the COVID-19 pandemic that gave rise to a significant increase in credit risk. The £3.7 million release of this allowance during the year is primarily attributable to the group’s exposure to expected credit losses in future periods reducing as a result of the £32.5 million revolving credit facility being cancelled and replaced with additional equity share capital in April 2021.
During the year, United Utilities PLC provided guarantees in support of Water Plus in respect of certain amounts owed to wholesalers. The aggregate limit of these guarantees was £54.1 million (2020: £54.1 million), of which £32.1 million (2020: £32.1 million) related to guarantees to United Utilities Water Limited.
At 31 March 2021, amounts owed to related parties were £2.4 million (2020: £4.8 million). Included within this amount is £1.1 million (2020: £4.5 million) due to Water Plus for the surrender of consortium relief tax losses. The amounts outstanding are unsecured and will be settled in accordance with normal credit terms.
Details of transactions with key management are disclosed in note 3.
CompanyThe parent company receives dividend income and pays and receives interest to and from subsidiary undertakings in the normal course of business. Total dividend income received during the year amounted to £291.9 million (2020: £284.5 million) and total net interest payable during the year was £24.2 million (2020: £32.9 million). Amounts outstanding at 31 March 2021 and 31 March 2020 between the parent company and subsidiary undertakings are disclosed in notes 14, 16 and 21.
At 31 March 2021 and 31 March 2020, no related party receivables and payables were secured and no guarantees were issued in respect thereof. Balances will be settled in accordance with normal credit terms. No allowance for doubtful receivables has been made for amounts owed by subsidiary undertakings as at 31 March 2021 and 31 March 2020.
Notes to the financial statements – appendices
254
FINANCIAL STATEMENTS
unitedutilities.com/corporate United Utilities Group PLC

A7 Accounting policiesOf the accounting policies outlined below, those deemed to be the most significant for the group are those that align with the critical accounting judgements and key sources of estimation uncertainty set out on pages 215 to 217.
Basis of consolidationThe group financial statements consolidate the financial statements of the company and entities controlled by the company (its subsidiaries), and incorporate the results of its share of joint ventures using the equity method of accounting. The results of subsidiaries and joint ventures acquired or disposed of during the year are included in the consolidated income statement from the date control is obtained or until the date that control ceases, as appropriate.
Where necessary, adjustments are made to the financial statements of subsidiaries to bring the accounting policies used under the relevant local GAAP into line with those used by the group. Amounts attributable to non-controlling interests are presented separately in equity and total comprehensive income where material.
SubsidiariesSubsidiaries are entities controlled by the group. Control is achieved where the group is exposed to, or has the rights to, variable returns from its involvement in an entity and has the ability to affect those returns through its power over the entity. In the parent company accounts, investments are held at cost less provision for impairment.
On acquisition, the assets and liabilities and contingent liabilities of a subsidiary are measured at their fair values at the date of acquisition. Any excess of the cost of acquisition over the fair values of the identifiable net assets acquired is recognised as goodwill. Any deficiency of the cost of acquisition below the fair values of the identifiable net assets acquired is credited to the income statement in the period of acquisition. All intra-group transactions, balances, income and expenses are eliminated on consolidation.
Joint venturesJoint ventures are entities in which the group holds an interest on a long-term basis and which are jointly controlled with one or more parties under a contractual arrangement. The group’s share of joint venture results and assets and liabilities is incorporated using the equity method of accounting. Under the equity method, an investment in a joint venture is initially recognised at cost and adjusted thereafter to recognise the group’s share of the profit or loss.
On losing control of a subsidiary disposed of to a joint venture, the group recognises the gain or loss attributable to measuring the investment retained in the former subsidiary at its fair value at the date when control is lost.
Revenue recognitionRevenue from the sale of water, wastewater and other services represents the fair value of the consideration receivable in the ordinary course of business for the goods and services provided, exclusive of value added tax and foreign sales tax. Where relevant, this includes an estimate of the sales value of units supplied to customers between the date of the last meter reading and the period end.
There are two main areas of the group’s activities considered to result in revenue being recognised:
• the provision of core water and wastewater services, accounting for more than 97 per cent of the group’s revenue; and
• capital income streams relating to diversions work, and activities, typically performed opposite property developers, that facilitate the creation of an authorised connection through which properties can obtain water and wastewater services.
The core water and wastewater services, which are deemed to be distinct performance obligations under the contracts with customers, follow the same pattern of transfer to the customer who simultaneously receives and consumes both of these services over time.
Revenue is generally recognised at the time of delivery, with consideration given as to whether collection of the full amount under the contract is considered probable. Should the group consider that the criteria for revenue recognition has not been met for a transaction, revenue recognition would be delayed until such time as collectability is reasonably assured.
Payments received in advance of revenue recognition are recorded as deferred income. This includes the revenue in respect of connection activities, itself a district performance obligation. The revenue in respect of these activities is released to the income statement over a period of 60 years, which is deemed to be the time over which the performance obligation for providing the connection is satisfied.
Operating profitOperating profit is stated after charging operational expenses but before investment income and finance expense.
Borrowing costs and finance incomeExcept as noted below, all borrowing costs and finance income are recognised in the income statement on an accruals basis. Transaction costs that are directly attributable to the acquisition or issue of a financial asset or financial liability are included in the initial fair value of that instrument. Where borrowing costs are attributable to the acquisition, construction or production of a qualifying asset, such costs are capitalised as part of the specific asset.
TaxTax on the profit or loss for the year comprises current and deferred tax. Tax is recognised in the income statement except to the extent that it relates to items recognised directly in equity, in which case it is recognised in equity. Assessing the outcome of uncertain tax positions requires judgements to be made regarding the application of tax law and the result of negotiations with, and enquiries from, tax authorities in a number of jurisdictions. A current tax provision is only recognised when the group has a present obligation as a result of a past event and it is probable that the group will be required to settle that obligation to a taxing authority.
Current taxCurrent tax is based on the taxable profit for the period and is provided at amounts expected to be paid or recovered using the tax rates and laws that have been enacted or substantively enacted at each reporting date.
Taxable profit differs from the net profit as reported in the income statement because it excludes items of income or expense that are taxable or deductible in other years and it further excludes items that are never taxable or deductible.
Current tax is charged or credited in the income statement, except when it relates to items charged or credited to equity, in which case the tax is dealt with in equity.
Deferred taxDeferred tax is the tax expected to be payable or recoverable on differences between the carrying amounts of assets and liabilities in the financial statements and the corresponding tax bases used in the computation of taxable profit. Deferred tax liabilities are provided, using the liability method, on all taxable temporary differences at each reporting date. Such assets and liabilities are not recognised if the temporary difference arises from goodwill or from the initial recognition (other than in a business combination) of other assets and liabilities in a transaction that affects neither the taxable profit nor the accounting profit.
255
FINA
NC
IAL STA
TEM
ENT
S
Annual Report and Financial Statements for the year ended 31 March 2021Stock Code: UU.
A7 Accounting policies continuedDeferred tax liabilities are recognised for taxable temporary differences arising on investments in subsidiaries and interests in joint ventures, except where the group is able to control the reversal of the temporary difference and it is probable that the temporary difference will not reverse in the foreseeable future.
Deferred tax is measured at the average tax rates that are expected to apply in the periods in which the temporary timing differences are expected to reverse based on tax rates and laws that have been enacted or substantively enacted at each reporting date.
The carrying amount of deferred tax assets is reviewed at each reporting date and is reduced to the extent that it is no longer probable that sufficient taxable profits will be available to allow all or part of the asset to be recovered.
Deferred tax is charged or credited in the income statement, except when it relates to items charged or credited to equity, in which case the deferred tax is dealt with in equity.
Property, plant and equipmentProperty, plant and equipment (PPE) comprises water and wastewater infrastructure assets and overground assets.
The useful economic lives of these assets are primarily as follows:
• Water and wastewater infrastructure assets:
• Impounding reservoirs 200 years;
• Mains and raw water aqueducts 30 to 300 years;
• Sewers and sludge pipelines 60 to 300 years;
• Sea outfalls 77 years;
• Buildings 10 to 60 years;
• Operational assets 5 to 80 years; and
• Fixtures, fittings, tools and equipment 3 to 40 years.
Employee and other related costs incurred in implementing the capital schemes of the group are capitalised.
The group is required to evaluate the carrying values of PPE for impairment whenever circumstances indicate, in management’s view, that the carrying value of such assets may not be recoverable. An impairment review requires management to make uncertain estimates concerning the cash flows, growth rates and discount rates of the cash generating units under review.
Costs associated with a major inspection or overhaul of an asset or group of assets are capitalised within property, plant and equipment and depreciated over the period of time expected to elapse between major inspections or overhauls.
Water and wastewater infrastructure assetsInfrastructure assets comprise a network of water and wastewater pipes and systems. Expenditure on the infrastructure assets, including borrowing costs where applicable, relating to increases in capacity or enhancements of the network, is treated as additions. Amounts incurred in maintaining the operating capability of the network in accordance with defined standards of service are expensed in the year in which the expenditure is incurred. Infrastructure assets are depreciated by writing off their cost (or deemed cost for infrastructure assets held on transition to IFRS), less the estimated residual value, evenly over their useful economic lives.
Other assetsAll other property, plant and equipment is stated at historical cost less accumulated depreciation.
Historical cost includes expenditure that is directly attributable to the acquisition of the items, including relevant borrowing costs, where applicable, for qualifying assets. Subsequent costs are included in the asset’s carrying amount or recognised as a separate
asset, as appropriate, only when it is probable that future economic benefits associated with the item will flow to the group and the cost of the item can be measured reliably. All other repairs and maintenance costs are charged to the income statement during the financial period in which they are incurred.
Freehold land and assets in the course of construction are not depreciated. Other assets are depreciated by writing off their cost, less their estimated residual value, evenly over their estimated useful economic lives, based on management’s judgement and experience.
Depreciation methods, residual values and useful economic lives are reassessed annually and, if necessary, changes are accounted for prospectively. The gain or loss arising on the disposal or retirement of an asset is determined as the difference between the sales proceeds and the carrying amount of the asset and is recognised in other operating costs.
Transfer of assets from customers and developersWhere the group receives from a customer or developer an item of property, plant and equipment (or cash to construct or acquire an item of property, plant and equipment) that the group must then use, either to connect the customer to the network, or to provide the customer with ongoing access to a supply of goods or services, or to do both, such items are capitalised at their fair value and included within property, plant and equipment, with a credit of the same amount to deferred grants and contributions. The assets are depreciated over their useful economic lives and the deferred contributions released to revenue over the 60 years, which is the estimated period over which an average connection through which the group provides water and wastewater services is expected to be in place (or where the receipt of property, plant and equipment is solely to connect the customer to the network, the deferred contribution is released immediately to revenue). This accounting treatment has been applied to transfers of assets from customers received on or after 1 July 2009.
Assets transferred from customers or developers are accounted for at fair value. If no market exists for the assets then incremental cash flows are used to arrive at fair value.
Intangible assetsIntangible assets are measured initially at cost and are amortised on a straight-line basis over their estimated useful economic lives. The carrying amount is reduced by any provision for impairment where necessary. On a business combination, as well as recording separable intangible assets already recognised in the statement of financial position of the acquired entity at their fair value, identifiable intangible assets that arise from contractual or other legal rights are included in the acquisition statement of financial position at fair value.
Internal expenditure is capitalised as internally generated intangibles only if it meets the criteria of IAS 38 ‘Intangible Assets’.
Intangible assets, which relate primarily to computer software, are generally amortised over a period of three to 10 years.
Impairment of assets Where appropriate, assets are reviewed for impairment at each reporting date to determine whether there is any indication that those assets may have suffered an impairment loss. Where the asset does not generate cash flows that are independent from other assets, the group estimates the recoverable amount of the cash generating unit to which the asset belongs.
The recoverable amount is the higher of fair value less costs to sell, and value in use. Value in use represents the net present value of expected future cash flows, discounted on a pre-tax basis, using a rate that reflects current market assessments of the time value of money and the risks specific to the asset, for which the estimates of future cash flows have not been adjusted.
Notes to the financial statements – appendices
256
FINANCIAL STATEMENTS
unitedutilities.com/corporate United Utilities Group PLC

A7 Accounting policies continuedIf the recoverable amount of an asset (or cash generating unit) is estimated to be less than its carrying amount, the carrying amount of the asset (or cash generating unit) is reduced to its recoverable amount. Impairment losses in respect of non-current assets are recognised in the income statement within operating costs.
Where an impairment loss subsequently reverses, the reversal is recognised in the income statement and the carrying amount of the asset is increased to the revised estimate of its recoverable amount, but not so as to exceed the carrying amount that would have been determined had no impairment loss been recognised in prior years.
Non-current assets held for saleNon-current assets classified as held for sale are measured at the lower of carrying value and fair value less costs to sell. Non-current assets are classified as held for sale if their carrying amount will be recovered through a sale transaction rather than through continuing use. This condition is regarded as having been met only when the sale is highly probable and the asset is available for immediate sale in its present condition. Management must be committed to the sale, which should be expected to qualify for recognition as a completed sale within one year from the date of classification.
Financial instrumentsFinancial assets and financial liabilities are recognised and derecognised in the group’s statement of financial position on the trade date when the group becomes/ceases to be a party to the contractual provisions of the instrument.
Cash and short-term depositsCash and short-term deposits include cash at bank and in hand, deposits and other short-term highly liquid investments which are readily convertible into known amounts of cash, have a maturity of three months or less from the date of acquisition and which are subject to an insignificant risk of change in value. In the consolidated statement of cash flows and related notes, cash and cash equivalents include cash and short-term deposits, net of book overdrafts.
Financial investmentsInvestments (other than interests in subsidiaries, joint ventures and fixed deposits) are initially measured at fair value, including transaction costs. Investments classified as financial assets measured at fair value through profit or loss (FVPL) in accordance with IFRS 9 ‘Financial Instruments’ are measured at subsequent reporting dates at fair value. Gains and losses arising from changes in fair value are recognised in the net profit or loss for the period. The business model employed in respect of financial assets is that of a hold-to-collect model.
Trade receivablesTrade receivables are initially measured at fair value, and are subsequently measured at amortised cost, less any impairment for irrecoverable amounts. Estimated irrecoverable amounts are based on historical experience of the receivables balance.
Trade payablesTrade payables are initially measured at fair value and are subsequently measured at amortised cost.
Financial liabilities and equityFinancial liabilities and equity instruments are classified according to the substance of the contractual arrangements entered into. An equity instrument is any contract that evidences a residual interest in the assets of the group after deducting all of its liabilities.
Equity instrumentsEquity instruments issued by the group are recorded at the proceeds received, net of direct issue costs.
BorrowingsThe group’s default treatment is that bonds and loans are initially measured at fair value, being the cash proceeds received net of any direct issue costs. They are subsequently measured at amortised cost applying the effective interest method. The difference between the net cash proceeds received at inception and the principal cash flows due at maturity is accrued over the term of the borrowing.
The default treatment of measuring at amortised cost, while associated hedging derivatives are recognised at fair value, presents an accounting measurement mismatch that has the potential to introduce considerable volatility to both the income statement and the statement of financial position. Therefore, where feasible, the group takes advantage of the provisions under IFRS 9 ‘Financial Instruments’ to make fair value adjustments to its borrowing instruments to reduce this volatility and better represent the economic hedges that exist between the group’s borrowings and associated derivative contracts.
Where feasible, the group designates its financial instruments within fair value hedge relationships. To apply fair value hedge accounting, it must be demonstrated that there is an economic relationship between the borrowing instrument and the hedging derivative and that the designated hedge ratio is consistent with the group's risk management strategy.
Borrowings designated within a fair value hedge relationshipWhere designated, bonds and loans are initially measured at fair value, being the cash proceeds received net of any direct issue costs. They are subsequently adjusted for any change in fair value attributable to the risk being hedged at each reporting date, with the change being charged or credited to finance expense in the income statement.
Hedge accounting is discontinued prospectively when the hedging instrument is sold, terminated or exercised, or where the hedge relationship no longer qualifies for hedge accounting.
Under the provisions of IFRS 9 ‘Financial Instruments’, changes in the group’s own credit risk are recognised in other comprehensive income.
Borrowings designated at fair value through profit or lossDesignation is made where the requirements to designate within a fair value hedge cannot be met at inception despite there being significant fair value offset between the borrowing and the hedging derivative. Where designated, bonds and loans are initially measured at fair value being the cash proceeds received, and are subsequently measured at fair value at each reporting date, with changes in fair value being charged or credited to finance expense in the income statement.
Derivative financial instrumentsThe group’s default treatment is that derivative financial instruments are measured at fair value at each reporting date, with changes in fair value being charged or credited to finance expense in the income statement. The group enters into financial derivatives contracts to manage its financial exposure to changes in market rates (see note A4).
Derivative financial instruments designated within a cash flow hedge relationship Gains or losses resulting from the effective portion of the hedging instrument are recognised in other comprehensive income and in the cash flow hedge reserve with any remaining gains or losses recognised immediately in the income statement. The cash flow hedge reserve is adjusted to the lower of the cumulative gain or loss on the hedging instrument and cumulative change in fair value of the hedged item. At the maturity date, amounts paid/received are recognised against operating expenses in the income statement.
257
FINA
NC
IAL STA
TEM
ENT
S
Annual Report and Financial Statements for the year ended 31 March 2021Stock Code: UU.

A7 Accounting policies continuedUpon discontinuation of a cash flow hedge, the amount accumulated in other comprehensive income remains in the cash flow hedge reserve if the hedged future cash flows are still expected to occur. Otherwise the amount is immediately reclassified to the income statement.
Derivatives and borrowings – valuationWhere an active market exists, designated borrowings and derivatives recorded at fair value are valued using quoted market prices. Otherwise, they are valued using a net present value valuation model. The model uses applicable interest rate curve data at each reporting date to determine any floating cash flows. Projected future cash flows associated with each financial instrument are discounted to the reporting date using discount factors derived from the applicable interest curves adjusted for counterparty credit risk where appropriate. Discounted foreign currency cash flows are converted into sterling at the spot exchange rate at each reporting date. Assumptions are made with regard to credit spreads based on indicative pricing data.
The valuation of debt designated in a fair value hedge relationship is calculated based on the risk being hedged as prescribed by IFRS 9 ‘Financial Instruments’. The group’s policy is to hedge its exposure to changes in the applicable underlying interest rate and it is this portion of the cash flows that is included in the valuation model (excluding any applicable company credit risk spread).
The valuation of debt designated at fair value through the profit or loss incorporates an assumed credit risk spread in the applicable discount factor. Credit spreads are determined based on indicative pricing data.
InventoriesInventories are stated at the lower of cost and net realisable value. For properties held for resale, cost includes the cost of acquiring and developing the sites, including borrowing costs where applicable.
Net realisable value represents the estimated selling price less all estimated costs of completion and costs to be incurred in marketing, selling and distribution.
Employee benefitsRetirement benefit obligationsThe group operates two defined benefit pension schemes, which are independent of the group’s finances, for its employees. Actuarial valuations to determine the funding of the schemes, along with future contribution rates, are carried out by the pension scheme actuary as directed by the trustees at intervals of not more than three years. In any intervening years, the trustees review the continuing appropriateness of the funding and contribution rates.
From a financial reporting perspective and in accordance with IAS 19 ‘Employee Benefits’, defined benefit assets are measured at fair value while liabilities are measured at present value, using the projected unit credit method. The difference between the two amounts is recognised as a surplus or obligation in the statement of financial position. Where this difference results in a defined benefit surplus, this is recognised in accordance with IFRIC 14 ‘IAS 19 – The Limit on a Defined Benefit Asset, Minimum Funding Requirements and their Interaction’, on the basis that the group has an unconditional right to a refund of any surplus that may exist following the full settlement of plan liabilities in a single event.
The pension cost under IAS 19 is assessed in accordance with the advice of a firm of actuaries based on the latest actuarial valuation and assumptions determined by the actuary, which are used to estimate the present value of defined benefit obligations. The assumptions are based on information supplied to the actuary by the company, supplemented by discussions between the actuary and management. The assumptions are disclosed in note A5.
The cost of providing pension benefits to employees relating to the current year's service (including curtailment gains and losses) is included within employee benefits expense, while the interest on the schemes’ assets and liabilities is included within investment income and finance expense respectively. Remeasurement gains/losses on scheme assets and liabilities are presented in other comprehensive income.
In addition, the group operates a defined contribution pension section within the United Utilities Pension Scheme. Payments are charged as employee costs as they fall due. The group has no further payment obligations once the contributions have been paid.
Share-based compensation arrangementsThe group operates equity-settled, share-based compensation plans, issued to certain employees. The equity-settled share-based payments are measured at fair value at the date of grant. The fair value determined at the grant date is expensed on a straight-line basis over the vesting period, based on estimates of the number of options that are expected to vest. Fair value is based on simulation models, according to the relevant measures of performance. The group has the option to settle some of these equity-settled share-based payments in cash. At each reporting date, the group revises its estimate of the number of options that are expected to become exercisable with the impact of any revision being recognised in the income statement, and a corresponding adjustment to equity over the remaining vesting period.
ProvisionsProvisions are recognised when the group has a present legal or constructive obligation as a result of past events, it is probable that an outflow of resources will be required to settle the obligation, and the amount can be reliably estimated. Expenditure that relates to an existing condition caused by past operations that does not contribute to current or future earnings is expensed.
Foreign currency translationTransactions and balancesTransactions in foreign currencies are recorded at the exchange rates applicable on the dates of the transactions. At each reporting date, monetary assets and liabilities denominated in foreign currencies are translated into sterling at the relevant rates of exchange applicable on that date. Gains and losses arising on retranslation are included in net profit or loss for the period.
Exchange differences arising on investments in equity instruments classified as fair value through other comprehensive income are included in the gains or losses arising from changes in fair value which are recognised directly in equity. To hedge its exposure to certain foreign exchange risks, the group enters into contracts for derivative instruments (see note A4).
Group companiesOn consolidation, the statements of financial position of overseas subsidiaries and joint ventures (none of which has the currency of a hyperinflationary economy) are translated into sterling at exchange rates applicable at each reporting date. The income statements are translated into sterling using the average rate unless exchange rates fluctuate significantly, in which case the exchange rate at the date the transaction occurred is used. Exchange differences resulting from the translation of such statements of financial position at rates prevailing at the beginning and end of the period, together with the differences between income statements translated at average rates and rates ruling at the period end, are dealt with as movements on the group’s cumulative exchange reserve, a separate component of equity. Such translation differences are recognised as income or expense in the period in which the operation is disposed of.
Notes to the financial statements – appendices
258
FINANCIAL STATEMENTS
unitedutilities.com/corporate United Utilities Group PLC

A7 Accounting policies continuedGoodwill and fair value adjustments arising on the acquisition of a foreign entity are treated as assets and liabilities of the foreign entity and translated at the closing rate. The group has elected to treat goodwill and fair value adjustments arising on acquisitions before the date of implementation of IFRS 3 ‘Business Combinations’ (1 April 1999) as sterling-denominated assets and liabilities.
Grants and contributionsGrants and contributions receivable in respect of property, plant and equipment are treated as deferred income, which is credited to the income statement over the estimated useful economic lives of the related assets.
LeasesAt inception of a contract the group assesses whether a contract is, or contains, a lease. Where a lease is present, a right-of-use asset and lease liability is recognised at the commencement date. The lease liability is measured at the present value of future lease payments due over the term of the lease, with the right-of-use asset recognised as property, plant and equipment at cost. This is generally equivalent to the initial measurement of the lease liability.
The group has elected to apply a practical expedient permitted by IFRS 16 whereby for the fixtures, fittings, tools and equipment asset class of leases the lease and non-lease components of the contracts are not separated, and instead are both accounted for as if they were a single lease component. Where non-lease components exist they are embedded within the lease payments, and the group deems that separation of such contracts into their constituent parts for this asset class would generally not be practicable nor have a material effect on the financial statements. IFRS 16 requires that where this practical expedient is applied, it is applied to the entire class of similar assets. The group has not applied this expedient to the remaining lease asset classes. Non-lease components include service charges, maintenance charges, and monitoring charges. For lease asset classes where the expedient has not been applied, non-lease components are excluded from the projection of future lease payments and are recorded separately within operating costs on a straight-line basis.
Lease payments are discounted using the group’s incremental rate of borrowing if the interest rate implicit in the lease cannot be readily determined. For materially all of the group’s leases, the group’s incremental rate of borrowing is used. This rate is calculated using a number of inputs, being observable risk-free gilt rates, specific data based on bonds already in circulation for the relevant group company, as well as data from the wider utility sector. Further adjustments for payment profile and the term of the lease are made.
After the commencement date, the lease liability is increased for the accretion of interest (being the unwinding of the discounting applied to future lease payments) and reduced by lease payments made. In addition to this the carrying amount is updated to reflect any remeasurement or lease modifications. Remeasurements are typically required as a result of rent reviews or changes to the lease term. In these cases a corresponding adjustment to the right-of-use asset is made.
Depreciation of right-of-use assets is charged on a straight-line basis over the term of the lease. Lease payments are instead charged to the income statement on a straight-line basis over the period of the lease.
Where leases have a term of less than 12 months from the commencement date and do not have a purchase option, the group applies the short-term lease recognition exemption available under IFRS 16. The group applies the low value recognition exemption permitted by the standard to leases of assets with a value of less than £2,500. Payments for short-term and low value leases are instead charged to operating costs on a straight-line basis over the period of the lease.
Statement of cash flowsGrants and contributions receivedGrants and contributions received arise from transactions with customers, typically property developers, that result in the expansion of the group’s water and wastewater network and therefore its fixed asset base. Given that these grants and contributions are used to fund expenditure that results in the enhancement of the group’s network assets, the cash inflows are classified within investing activities in the period.
Interest payments and receiptsIFRS allows interest payments and interest receipts to be classified within operating activities or financing activities/investing activities. The group classifies interest payments and interest receipts within operating activities, with management viewing these in conjunction with other operating cash flows in assessing the ability of the group to maintain its operating capability.
Support costsCosts of time and resources incurred by the group’s support functions that is capitalised in the period (see page 216) is included in purchase of property, plant and equipment within investing activities. These cash flows represent expenditures that have been made for resources intended to generate future income and cash flows, and the group deem these to therefore meet the definition of an investing activity.
Cash flows on derivativesThe cash flows on derivatives as a result of the group’s hedging activities are presented together with the cash flows relating to the underlying hedged item to provide a more faithful representation of the substance of the transaction.
Taxes paidTaxes paid by the group are presented as cash flows from operating activities. The group deem it impracticable to identify the tax cash flows with respect to individual transactions, which may themselves be presented in investing activities or financing activities, and instead present total tax cash flows as operating activities.
Dividend receiptsDividends received from joint ventures have been presented in investing activities, with these cash receipts deemed to represent a return on investments previously made by the group.
259
FINA
NC
IAL STA
TEM
ENT
S
Annual Report and Financial Statements for the year ended 31 March 2021Stock Code: UU.

A8 Subsidiaries and other group undertakingsDetails of the group’s subsidiary undertakings, joint ventures and associates are set out below. Unless otherwise specified, the registered address for each entity is Haweswater House, Lingley Mere Business Park, Lingley Green Avenue, Great Sankey, Warrington, WA5 3LP, United Kingdom. For further details of joint ventures and associates please see note 12.
Class of share
capital held
Proportion of share capital
owned/voting rights %* Nature of business
Subsidiary undertakingsGreat BritainHalkyn District Mines Drainage Company Limited Ordinary 99.9 Dormant
Lingley Mere Management Company Limited Ordinary 87.0 Property management
North West Water International Limited Ordinary 100.0 Non-trading (formerly holding company)
North West Water Limited Ordinary 100.0 Dormant
United Utilities (Overseas Holdings) Limited Ordinary 100.0 Holding company
United Utilities Energy Limited Ordinary 100.0 Energy generation
United Utilities Healthcare Trustee Limited Ordinary 100.0 Corporate trustee
United Utilities International Limited Ordinary 100.0 Consulting services and project management
United Utilities North West Limited Ordinary 100.0 Holding company
United Utilities Pensions Trustees Limited Ordinary 100.0 Corporate trustee
United Utilities Property Services Limited Ordinary 100.0 Property management
United Utilities Renewable Energy Limited Ordinary 100.0 Renewable energy generation
United Utilities Total Solutions Limited Ordinary 100.0 Non-trading
United Utilities Utility Solutions (Industrial) Limited Ordinary 100.0 Holding company
United Utilities Water Finance PLC Ordinary 100.0 Financing company
United Utilities Water Limited Ordinary 100.0 Water and wastewater services
UU (ESPS) Pension Trustee Limited Ordinary 100.0 Corporate trustee
UU Group Limited Ordinary 100.0 Dormant
UU Secretariat Limited Ordinary 100.0 Dormant
YCL Transport Limited Ordinary 100.0 Non-trading
United Utilities Bioresources Limited Ordinary 100.0 Wastewater services
The NetherlandsUnited Utilities (Tallinn) BV(1) Ordinary 100.0 Non-trading (formerly holding company)
Joint venturesAll joint ventures are accounted for using the equity method and are strategic to the group's activities to varying degrees.
Great BritainLingley Mere Business Park Development Company Limited Ordinary 50.0 Development company
Selectusonline Limited Ordinary 16.7 Procurement portal
Water Plus Group Limited(2) Ordinary 50.0 Holding company
Water Plus Limited(2) Ordinary 50.0 Water and wastewater retail services
Water Plus Select Limited(2) Ordinary 50.0 Water and wastewater retail services
* Shares are held by subsidiary undertakings rather than directly by United Utilities PLC
Notes:(1) Registered address: Herikerbergweg 88, 1101 CM Amsterdam, the Netherlands.(2) Water Plus Limited and Water Plus Select Limited are wholly owned subsidiaries of Water Plus Group Limited. Registered address: Two Smithfield, Leonard
Coates Way, Stoke-on-Trent, United Kingdom, ST1 4FD.
Notes to the financial statements – appendices
260
FINANCIAL STATEMENTS
unitedutilities.com/corporate United Utilities Group PLC

The financial summary (unaudited) set out below has been derived from the audited consolidated financial statements of United Utilities Group PLC for the five years ended 31 March 2021. Underlying profit measures and net debt have been re-presented for the years ended 31 March 2017 to 31 March 2020 so that they are presented on a consistent basis to the measures presented for the year ended 31 March 2021. Further detail of the changes to how underlying profit measures are presented can be found on pages 82 to 83, and further detail of the changes to how net debt is calculated can be found on page 236.
Year ended 31 March Continuing operations
2021£m
2020£m
2019£m
2018£m
2017£m
Revenue 1,808.0 1,859.3 1,818.5 1,735.8 1,704.0
Reported operating profit 602.1 630.3 634.9 636.4 605.5
Underlying operating profit 602.1 732.1 677.6 639.1 612.8
Reported profit before tax 551.0 303.2 436.2 432.1 442.4
Underlying profit before tax 460.0 534.8 500.9 411.0 418.7
Reported profit after taxation 453.4 106.8 363.4 354.6 433.9
Underlying profit after tax 383.0 486.3 449.5 389.6 365.0
Reported earnings per share (basic) 66.5p 15.7p 53.3p 52.0p 63.3p
Underlying earnings per share 56.2p 71.3p 65.9p 57.1p 53.5p
Dividend per ordinary share 43.24p 42.06p 41.28p 39.73p 38.38p
Non-current assets 13,179.0 13,215.7 12,466.4 11,853.6 11,768.2
Current assets 1,012.9 828.4 721.4 1,149.9 657.9
Total assets 14,191.9 14,044.1 13,187.8 13,003.5 12,426.1
Non-current liabilities (10,157.2) (9,877.3) (9,025.0) (8,911.1) (8,914.7)
Current liabilities (994.8) (1,204.7) (1,052.0) (1,141.5) (689.8)
Total liabilities (11,152.0) (11,082.0) (10,077.0) (10,052.6) (9,604.5)
Total net assets and shareholders’ equity 3,039.9 2,962.1 3,110.8 2,950.9 2,821.6
Net cash generated from operating activities 859.4 810.3 832.3 815.6 820.8
Net cash used in investing activities (549.3) (593.9) (627.7) (723.2) (804.6)
Net cash (used in)/generated from financing activities (89.7) (27.8) (377.4) 184.7 22.0
Net (decrease)/increase in cash and cash equivalents 220.4 188.6 (172.8) 277.1 38.2
Net debt 7,305.8 7,227.5 6,990.4 6,816.8 6,326.7
RCV gearing(1) (%) 62% 61% 60% 61% 59%
Note:(1) Regulatory capital value (RCV) gearing is calculated as group net debt (see note A2), divided by the RCV expressed in out-turn prices, of United Utilities
Water Limited.
Five-year summary – unaudited
261
FINA
NC
IAL STA
TEM
ENT
S
Annual Report and Financial Statements for the year ended 31 March 2021Stock Code: UU.

Key dates − 24 June 2021
Ex-dividend date for the 2020/21 final dividend
− 25 June 2021Record date for 2020/21 final dividend
− 23 July 2021Annual general meeting
− 2 August 2021Payment of 2020/21 final dividend to shareholders
− 24 November 2021Announcement of half-year results for the six months ending 30 September 2021
− 16 December 2021Ex-dividend date for 2021/22 interim dividend
− 17 December 2021Record date for 2021/22 interim dividend
− 1 February 2022Payment of 2021/22 interim dividend to shareholders
− May 2022Announce the final results for the 2021/22 financial year
− June 2022Publish the Annual Report and Financial Statements for the 2021/22 financial year
Electronic communicationsWe’re encouraging our shareholders to receive their shareholder information by email and via our website. Not only is this a quicker way for you to receive information, it helps us to be more sustainable by reducing paper and printing materials and lowering postage costs.
Registering for electronic shareholder communications is very straightforward, and is done online via shareview.co.uk which is a website provided by our registrar, Equiniti.
Log on to shareview.co.uk and you can:
• set up electronic shareholder communication;
• view your shareholdings;
• update your details if you change you address; and
• get your dividends paid directly into your bank account.
Please do not use any electronic address provided in this annual report or in any related document to communicate with the company for any purposes other than those expressly stated.
Make life easier and have you dividends paid straight into your bank account• The dividend goes directly into your bank account and is
available immediately;
• No need to pay dividend cheques into your bank account;
• No risk of losing cheques in the post;
• No risk of having to replace spoiled or out-of-date cheques; and
• It’s cost-effective for your company.
To take advantage of this, please contact Equiniti via shareview.co.uk or complete the dividend mandate form you receive with your next dividend cheque.
If you choose to have your dividend paid directly into your bank account you’ll receive one tax voucher each year. This will be issued with the interim dividend normally paid in February and will contain details of all the dividends paid in that tax year. If you’d like to receive a tax voucher with each dividend payment, please contact Equiniti.
Online annual reportOur annual report is available online. View or download the full Annual Report and Financial Statements from: unitedutilities.com/corporate unitedutilities.annualreport2021.com
Shareholder information
262
FINANCIAL STATEMENTS
unitedutilities.com/corporate United Utilities Group PLC
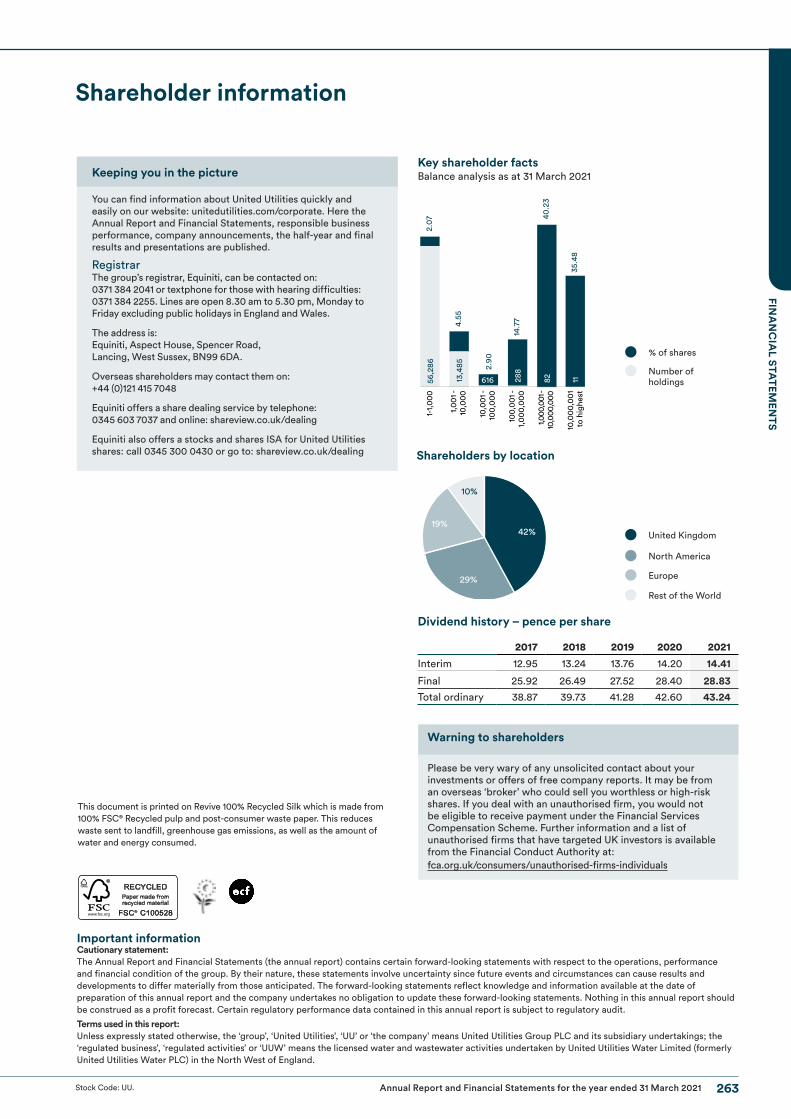
Important informationCautionary statement: The Annual Report and Financial Statements (the annual report) contains certain forward-looking statements with respect to the operations, performance and financial condition of the group. By their nature, these statements involve uncertainty since future events and circumstances can cause results and developments to differ materially from those anticipated. The forward-looking statements reflect knowledge and information available at the date of preparation of this annual report and the company undertakes no obligation to update these forward-looking statements. Nothing in this annual report should be construed as a profit forecast. Certain regulatory performance data contained in this annual report is subject to regulatory audit.
Terms used in this report: Unless expressly stated otherwise, the ‘group’, ‘United Utilities’, ‘UU’ or ‘the company’ means United Utilities Group PLC and its subsidiary undertakings; the ‘regulated business’, ‘regulated activities’ or ‘UUW’ means the licensed water and wastewater activities undertaken by United Utilities Water Limited (formerly United Utilities Water PLC) in the North West of England.
Key shareholder factsBalance analysis as at 31 March 2021
2017 2018 2019 2020 2021Interim 12.95 13.24 13.76 14.20 14.41
Final 25.92 26.49 27.52 28.40 28.83Total ordinary 38.87 39.73 41.28 42.60 43.24
Dividend history – pence per share
2.90
4.55
2.0
756
,286
13,4
85
616
14.7
728
8
40.2
382
35.4
811
1-1,
00
0
1,0
01 -
10,0
00
10,0
01 -
100,
00
0
100,
00
1 -1,
00
0,0
00
1,000
,001
-10
,000
,000
10,0
00,
00
1 to
hig
hest
Shareholders by location
42%
29%
19%
10%
This document is printed on Revive 100% Recycled Silk which is made from 100% FSC® Recycled pulp and post-consumer waste paper. This reduces waste sent to landfill, greenhouse gas emissions, as well as the amount of water and energy consumed.
% of shares
Number of holdings
United Kingdom
North America
Europe
Rest of the World
Keeping you in the picture
You can find information about United Utilities quickly and easily on our website: unitedutilities.com/corporate. Here the Annual Report and Financial Statements, responsible business performance, company announcements, the half-year and final results and presentations are published.
RegistrarThe group’s registrar, Equiniti, can be contacted on: 0371 384 2041 or textphone for those with hearing difficulties: 0371 384 2255. Lines are open 8.30 am to 5.30 pm, Monday to Friday excluding public holidays in England and Wales.
The address is: Equiniti, Aspect House, Spencer Road, Lancing, West Sussex, BN99 6DA.
Overseas shareholders may contact them on: +44 (0)121 415 7048
Equiniti offers a share dealing service by telephone: 0345 603 7037 and online: shareview.co.uk/dealing
Equiniti also offers a stocks and shares ISA for United Utilities shares: call 0345 300 0430 or go to: shareview.co.uk/dealing
Please be very wary of any unsolicited contact about your investments or offers of free company reports. It may be from an overseas ‘broker’ who could sell you worthless or high-risk shares. If you deal with an unauthorised firm, you would not be eligible to receive payment under the Financial Services Compensation Scheme. Further information and a list of unauthorised firms that have targeted UK investors is available from the Financial Conduct Authority at: fca.org.uk/consumers/unauthorised-firms-individuals
Warning to shareholders
Shareholder information
Annual Report and Financial Statements for the year ended 31 March 2021Stock Code: UU.
FINA
NC
IAL STA
TEM
ENT
S
263

United Utilities Group PLC Haweswater HouseLingley Mere Business ParkLingley Green AvenueGreat SankeyWarringtonWA5 3LP
Telephone +44 (0)1925 237000
Stock Code: UU.Registered in England and WalesRegistered number 6559020
UN
ITED
UT
ILITIES G
RO
UP PLC
AN
NU
AL R
EPO
RT
AN
D FIN
AN
CIA
L STA
TEM
ENT
S FO
R T
HE Y
EAR
END
ED 31 M
AR
CH
2021