United States Department of Energy - UNT Digital Library
472
1 I i DOE/NV/100813(Pt~.l-2) DOE/NV/10081--3-PtS. 1-2 1 1 DE85 016048 (DE8501 6048) I I i SWEET LAKE GEOPRESSUREDGEOTHERMAL PROJECT Volume 111 Annual Report for the Period February 1982-March 1985 BY C. 0. Durham, Jr. F. D. O’Brieh R. W. Rodgers Work Performed Under Contract No. AC07-80NV10081 Magma Gulf-Technadril Houston, Texas Technical information Center Office of Scientific and Technical Information United States Department of Energy
-
Upload
khangminh22 -
Category
Documents
-
view
2 -
download
0
Transcript of United States Department of Energy - UNT Digital Library

1
I i DOE/NV/100813(Pt~.l-2) DOE/NV/10081--3-PtS. 1-2 1 1
DE85 016048
(DE8501 6048)
I I
i
SWEET LAKE GEOPRESSUREDGEOTHERMAL PROJECT
Volume 111
Annual Report for the Period February 1982-March 1985
BY C. 0. Durham, Jr. F. D. O’Brieh R. W. Rodgers
Work Performed Under Contract No. AC07-80NV10081
Magma Gulf-Technadril Houston, Texas
Technical information Center Office of Scientific and Technical Information United States Department of Energy

DISCLAIMER
This report was prepared as an account of work sponsored by an agency of the United States Government. Neither the United States Government nor any agency Thereof, nor any of their employees, makes any warranty, express or implied, or assumes any legal liability or responsibility for the accuracy, completeness, or usefulness of any information, apparatus, product, or process disclosed, or represents that its use would not infringe privately owned rights. Reference herein to any specific commercial product, process, or service by trade name, trademark, manufacturer, or otherwise does not necessarily constitute or imply its endorsement, recommendation, or favoring by the United States Government or any agency thereof. The views and opinions of authors expressed herein do not necessarily state or reflect those of the United States Government or any agency thereof.

DISCLAIMER Portions of this document may be illegible in electronic image products. Images are produced from the best available original document.
DISCLAIMER
This report was prepared as an account of work sponsored by an agency of the United States Government. Neither the United States Government nor any agency thereof, nor any of their employees, makes any warranty, express or implied, or assumes any legal liability or responsibility for the accuracy, completeness, or use- fulness of any information, apparatus, product, or process disclosed, or represents that its use would not infringe privately owned rights. Reference herein to any spe- cific commercial product, process, or service by trade name, trademark, manufac- turer, or otherwise does not necessarily constitute or imply its endorsement, recom- mendation, or favoring by the United States Government or any agency thereof. The views and opinions of authors expressed herein do not necessarily state or reflect those of the United States Government or any agency thereof.
This report has been reproduced directly from the best available copy.
Available from the National Technical Information Service, U. S. Department of Commerce, Springfield, Virginia 22 161.
Price: Printed Copy A20 Microfiche A01
Codes are used for pricing all publications. The code is determined by the number of pages in the publication. Information pertaining to the pricing codes can be found in the current issues of the following publications, which are generally avail- able in most libraries: Energy Research Abstracts (ERA): Government Reports Announcements and Index (GRA and I); Scientific and Technical Abstract Reports (STAR): and publication NTIS-PR-360 available from NTIS at the above address.
I
SWEET LAKE
GEOPRESS URED-GEOTHERMAL PROJECT
MAGMA GULF-TECHNADRIL/DOE AMOCO FEE
VOLUME I11
FINAL REPORT
DOE/NV/10081-3 (Pts.1-2) (DE85016048)
Distribution Category UC66b
ANNUAL REPORT f o r the per iod
February 1982 - March 1985
C.O. DURHAM, JR., F.D. O'BRIEN, & R.W. RODGERS Ed i to rs
Magma Gu 1 f -Tec hnadr i 1 430 Hwy. 6 South, Sui te 208
Houston, Texas 77079
Prepared f o r the U.S. Department o f Energy
D i v i s i o n o f Energy Technology Under Contract DE-AC08-80NV10081

PREFACE
br This i s Volume 111, the f i n a l r e p o r t t o the U.S. Department o f Energy
on the Magma Gulf-Technadri l Inc. geopressured we l l t e s t i n g p r o j e c t o f the Amoco No. 1 (Sweet Lake) we l l i n Cameron Parish, Louisiana. This repor t presents the r e s u l t s o f the t e s t i n g o f Sand 3 (15,245 - 15,280 f e e t i n depth) which occurred from November 1983 t o March 1984 and evaluates these new data i n comparison t o r e s u l t s from the t e s t i n g o f Sand 5 (15,385 - 15,415 f e e t i n depth) which occurred from t o June 1981 t o February 1982. It also describes the reworking o f the product ion and s a l t water disposal we l ls preparatory t o the Sand 3 t e s t i n g as we l l as the p lug and abandon procedures requested t o terminate the pro ject .
The per iod t rea ted i n t h i s repo r t extends from the terminat ion o f the Sand 5 t e s t i n February 1982 t o the f i n a l p lug and abandon completed i n November 1984. The present repo r t e f f e c t i v e l y serves as the annual repor ts f o r the t h i r d and f o u r t h years o f the p ro jec t from February 11, 1982 t o completion o f the contract , concluded w i t h submission o f t h i s repo r t i n March, 1985. During a major po r t i on o f t h i s per iod operations were suspended f o r lack o f funding t o rework the we l ls preparatory t o add i t iona l tes t ing .
Two previous repor ts have been published by the Department o f Energy:
Volume I: " D r i l l i n g and Completion Test Well and Disposal Well" (DOE/NV/10081-1) - which serves as the annual repo r t f o r the per iod December 1, 1979 t o February 27, 1981.
Volume 11: IISurface Ins ta l l a t i ons , Reservoir Testing" (DOE/NV/10081- 2) - which serves as the annual repo r t f o r the February 28, 1981 t o February 10, 1982.
I n addition.Gas Research I n s t i t u t e has published a f i n a l repo r t on the auxi 1 i a r y research inves t iga t ions concerning the p ro jec t whch were funded by t h a t organizat ion. This r e p o r t i s e n t i t l e d NGeopressured Wel l Project , Sweet Lake, Cameron Parish, Louisiana" F ina l Report, February 1980 - September 1982 ( G R I - 79/0125).
The present repo r t summarizes the contents o f these previous pub- 1 icat jons, however, f o r de ta i l ed in format ion and repor ts the previous pub1 i ca t i ons should be consulted.
The present volume contains two par ts : Par t 1 includes the t e x t and accompanying plates, f igures and tables; Par t 2 consis ts o f the appendixes inc lud ing a u x i l i a r y repor ts and tabulat ions.
ii

Preface
Table o f Contents
Summary
Text
Figures
Tables P1 ates
T i t l e and Index
Appendices
PART I
ii i x X
1 103 185
208
PART 11
210
212
iii
TABLE OF CONTENTS I u 1.0 Project History, Objectives and Administration
1.1 Project History 1.2 Project Objectives 1.3 Project Administration 1.4 Contract Subcontractors
2.1 Well Location 2.2 Site Preparation 2.3 History of Well Designs 2.4 Disposal Well
2.0 Well Facilities
3.0 Geology 3.1 Regional Geologic Setting 3.2 Geology of the Sweet Lake Area 3.3 Test Well Geology 3.4 Reservoir Description 3.5 Petrophysical Analysis 3.6 Core Analysis 3.7 Organic Geochemistry 3.8 Disposal Well Cores
4.1 Test Wellhead 4.2 Flow Control System 4.3 Brine/Gas Separator System 4.4 Brine Filter System 4.5 Salt Water Disposal Wellhead 4.6 Production Gas System 4.7 Surface Tankage 4.8 Pressure Re1 ief Systems 4.9 Instrumentation 4.10 Scaling/Corrosion Monitoring Systems 4.11 Electrical System 4.12 Instrument Air System 4.13 Fresh Water System 4.14 Waste Water Disposal 4.15 Control Room Trailer
4.0 Description of Surface Facilities
W
1-16 1 4 7 9 17-33 17 17 18 29 34-51 34 34 36 38 41 44 50 51 52-66 52 52 54 54 55 55 56 56 57 62 62 62 63 63 63
i v
4.16 S i t e Laboratory 4.17 Modes o f Operation
4.19 Gas-Water Rat io Measurements 4.20 Proposed Surface Generating System
5.1 Prel iminary Operations 5.2 Sand Zone 5 5.3 Hiatus I n Operations 5.4 Sand Zone 3 5.5 Results and Conclusions
6.0 Chemical Analysis 6.1 Br ine Analysis 6.2 Gas Analysis 6.3 S o l u b i l i t y o f Methane 6.4 Other Chemical Aspects 6.5 IGT Conclusions
7.0 Environmental Monitor ing 7.1 A i r Q u a l i t y 7.2 Water Q u a l i t y 7.3 Microseismic Monitor ing a t Sweet Lake 7.4 Subsidence
8.0 Economics 8.1 In t roduc t ion and E a r l i e r Cost Estimates 8.2 The 1984 P r o j e c t T o t a l Costs
8.3 Analysis o f Pro jec t Costs
9.1 Background 9.2 Plug and Abandon Test Well 9.3 Plug and Abandon Disposal Well 9.4 S i t e Restorat ion
U 4.18 Safety
5.0 Reservoir Test ing
9.0 Abandonment and S i t e Restorat ion
63 63 64 64 65 67-78 67 67 70 71 74 79-83 80 80 81 82 82 84-94 84 86 88 93 95-98 95 96
96 99-102 99 99 101 101
V

LIST OF FIGURES
No.
1-1 1-2 2-1 2-2 2-3 2 -4 3-1 3-2 3-3 3-4 3-5 3-6 3-7 3 -8 3 -9 3-10 3-11 3-12 3-13
3-14 3-15 3-16 3-17 3-18 3-19 3-20 3-21 3-22
3-23b 3 - 2 3 ~ 3-24 4-1 4-2 4-3 4-4 4-5 4 -6 4-7 4-8 4-9 4-10 4-11
3-23a
Title
Joint Venture Personnel-Drilling Joint Venture Personnel-Testing Drillsite Location in Southwest Louisiana Vicinity and Production Well Map Production Well Design Including 1983 Recompletion Disposal We1 1 Design Including 1983 Recompletion Sweet Lake Structure Map - Original 1979 Version Isothermal Map - Top of Miogypsinoides Zone Thickening Index Diagram Cross Section of Mio ypsinoides Sand
Structure Map - Current Interpretation Induction Log of Mio ypsinoides Sand
Mud Resistivity Correction - Dunlap Salinity Correction Chart I - Dunlap Salinity Correction Chart I1 - Dunlap New SP Chart - Silva and Bassiouni Dual Induction Log of Miogypsinoides Sequence Showing
Cored Intervals EDS Analysis - Feldspar EDS Analysis - Drilling Mud EDS Analysis - Illite Quartz Overgrowths and Feldspar Grains Feldspar Grains Showing Dissolution Porosity Quartz Overgrowth Development Drilling Mud contamination Bridging Intergranular Pore Illite Coating Illite Partly Occluding Pore Throat Summary o f Organic Analyses; C1-C7 Hydrocarbon Summary o f Organic Analyses; C4-C7 Hydrocarbon Summary o f Organic Analyses Visual Kerogen Assessment Sweet Lake Site Plot Plan Process and Instrumentation Drawing Process and Instrumentation Drawing Test Wellhead and Casing Spools Diagram Test We1 1 head - Casing Spools Photographs Gray Choke Valve Manifold Diagram Brine/Gas Separator System Photographs Salt Water Disposal Wellhead and Casing Spools Diagram Salt Water Disposal Wellhead Photograph Inhibitor Pilot Plant Photograph Gas Content o f Discharge Brine Compared to Separator
East - West Cross -?-T- ection weet Lake
Schlumburger Salinity + esistivity Chart
Pres sure
Page of Pcge Reference
103 8 104 8 105 17 106 17 107 18,27 108 27 109 35,38 110 35 111 37 112 39 113 114 39 115 39 116 117 43 118 43 119 43 120 43
121 44 1.22 45 123 45,46 124 45,46 125 46 125 46 126 46 126 46 127 46 127 46 128 50 129 50 130 50 131 51 132 133 134 135 136 137 138 139 140 141
52 52,56,57,59,60,61 _ _ _ _ 52,55,56,59,61 52 52 53 54 55 55 56
142 65 1
v i

No.
5-1
5-2
5-3 5-4 5-5 5-6
5-7
5 -8 5 -9 5-10 6-1 7-1
7-2
7-3
7 -4
7-5
7 -6
7-7 7 -8
T i t l e Page o f
Page Reference
Sweet Lake Log o f Miogypsinoides Sand Zone Showing Sands Sands 5 and 3 143 67
Pre l iminary Calculat ions by J. D. Clark o f Sand 5
Drawdown Curve - Sand 5 Drawdown Curve - Sand 5 Pressure Build-Up Curve - Sand 5 Bottom Hole Pressure Pro ject ions f o r Sand 5 P r i o r t o
Time Ant ic ipated f o r Single Zone Flow Fol lowing
Drawdown Curve - Sand 3 Poten t ia l Fau l t Traces Flow Angle o f Reservoir Relat ionship Between A l k a l i n i t y and Br ine ph Fresh Water - Saltwater I n te r face i n Chicot Aqui fer
and Base o f Fresh Water i n S.W. Louisiana A l t i t u d e o f 1000 mg/l, 3000 mg/l, and 10,000 mg/l
Dissolved Sol ids Surface T r i l i n e a r P l o t o f Dissolved Consti tuents i n Natural
Waters i n Southwestern La. Geologic and Physiographic Features o f Southwestern
Louisiana Map o f Test S i t e Area Showing Parameter Observation
S t a t i ons Charac ter is t i c Seismographs Recommended by Sweet Lake
Test Network
Reservoir Drawdown Test
Planned Per fo ra t ion o f Second Zone
Per fo ra t ion
144,145 68 146 68 147 68 148 69
149 7 1
150 7 1 151 73 152 77 153 74 154 81
155 86
156 86,88
157 87
158 88
159 84,88
160 89 Time H is to ry o f Seismic A c t i v i t y , Sweet Lake Test Well Seismic A c t i v i t y and Changes i n Well Pressure, Sweet
Seismic A c t i v i t y and Changes i n Well Pressure, Sweet
161 90
t o 7-12 Lake Test Well 162-166 91
t o 7-17 Lake DisDosal Well 167-171 91 7-13
7-18
7-19
7-20
7-21 7-22 7-23a
7-24a 7-23b
7-24b
7 - 2 4 ~
7-25a
7-25 b
7-26
Seismic A c t i v i t y and Changes i n Well Pressure, Sweet Lake Test Well 172 91
Seismic A c t i v i t y A f t e r Reservoir L i m i t Testing, Sweet Lake Test Well 173 91
Locations o f Seismic A c t i v i t y , Sweet Lake Area Ju l y 1980 - January 1983. 174 91
Locations o f Seismic A c t i v i t y During Reservoir L i m i t Test 175 91 D i s t r i b u t i o n o f Computed Depths o f Seismic A c t i v i t y 176 91 R a i n f a l l a t Lake Charles Ai rpor t , June 1981 - December 1983 177 92 R a i n f a l l a t Lake Charles A i rpor t , January 1984 178 92 Events on Non-Thunder Days, Located with Three o r More
Stat ions 1981 - 83 179 92 Events on Non-Thunder Days, Located With F ive o r More
Stations, 1981 - 1983 180 92 Events on Non-Thunder Days, Located With F ive o r More
Stat ions, 1984 181 92 Events on Non-Thunder, Non-Rain Days Located With Three
o r More Stations, 1981-83 182 92 Events on Non-Thunder, Non-Rain Days Located With F ive
o r More Stations, 1981 - 83 183 92 Seismic Monitor ing Network 184 92
v i i

LIST OF TABLES
No.
3-1 3-2 3-3 3-4 3-5 3-6 3-7 3-8 3-9 3-10 4-1 4-2 5-1
6-1
6-2
6-3
6 -4
6-5 7-1 8-1 8-2
6-la
6-2a
6-3a
I1
Title Page of
Page Reference
Gas Shows 185 Summary o f Micropaleontology 186 Calculated and Measured Porosity 187 Calculated and Measured Permeability 188 Calculated and Measured Salinity 189 X-Ray Diffraction of Test Well Sidewall Cores 190 Porosity and Permeability of Test Well Diamond Cores 191 Porosity and Permeability of Test Well Sidewall Cores 192 Uitrinite Reflectance Summary 193 Porosity and Permeability o f Disposal We1 1 Sidewall Cores 194 Calibration of Hal 1 iburton Liquid Turbine Meters 195 Comparative Gas/Water Ratio Measurements 195 Porosity and Thickness Used to Calculate Original Water
In Place 196 Typical Brine Composition, Sand 5 197 Typical Brine Composition - Sand 3 Compared to Sand 5 198 Typical Gas Analysis 199 Typical Gas Analysis - Sand 3 Compared to Sand 5 200 Brine Analysis - Sand 3 - Sample Nov. 23, 1983 Scan, Inc. 201 Brine Analysis - Sand 3 - Sample Nov. 30, 1983 Scan, Inc. 202 Brine Analysis - Sand 3 - Scan, Inc. Compounded to
Rice University Analyses 203 Gas Composition as a Function of Reservoir Pressure 204 Coordinates of Microseismic Monitoring Stations 205 History of Cost Estimates 1979 - 84 206 Estimated Gas Production, Income and Pay-Out Schedule,
1975 207
Tit1
Sand 5, Flow Test Data
Sand 3, Flow Test Date
List o f Plates
37 38 47,75 41,47,75 42
47 47 51 51 65 65
76 80 80,81 80,81 81 80 80
80 82 88 95,96,97
96
Page of Page Reference
208 40,64,67, 68,69,70,72
2C9 33,40,67,73
v i i i
t Appendices
No.
A. B. C.
D.
E.
F. G.
H. I.
J.
K.
L.
T i t l e
Sand Zone 5 Flow H is to ry Sand Zone 3 Flow H is to ry Engineering I n t e r p r e t a t i o n Miogypsi noides Geopressued
Reservoirs MG-T/DOE Amoco Fee No. 1 Well Sweet Lake Area Cameron Parish, Louisiana J u l y 1984; J. Donald Clark, P.E.
Well During August 1981; C.G. Hayden, P.L. Randolph, T.L. Osif; Prepared by I n s t i t u t e o f Gas Technology.
Well Test Analysis MG-T/DOE Amoco Fee No. 1 Sweet Lake Pro jec t Sand Zone #3, January 1984; Prepared by Dowdle F a i r c h i l d and Ancell, Inc.
IGT Test A c t i v i t i e s On The MG-T/DOE Amoco Fee No. 1
D i s t r i b u t i o n o f Cores Gas Water Rat i o Measurements, Sept. 1981. Separator Water Flush; Weatherly Laboratories, Inc. Reservoir F l u i d Analysis For Magma Gulf-Technadril,
MG-T/DOE Amoco Fee No. 1 We1 1, Sand Zone No. 3, Weatherly Laboratories Inc.
Weatherly Laboratories, Inc. Gas Analysis as a Function o f Separator Pressure;
A Base L ine For Determining Local, Small - Scale
Page of Page Reference
212 68,70 226 73
234 68,76
289 50,65
320 76 337 343 79 351
363
389
i V e r t i c a l Movements I n Louisiana by Drukel l B. Trahan. 411 94 I
Plug and Abandon Correspondence and Permits - Production and S a l t Water Disposal Wells. 431 99
i x

SUMMARY
The Sweet Lake geopressured test site was located in northern Cameron Parish in southwestern Louisiana where the six hundred foot upper Frio (Miogypsinoides) gross sand sequence occurs at depths below 14,000 feet.
The first geothermal leases in Louisiana were taken on the prospect by Magma Gulf Company in 1975.
The prospect was submitted to ERDA in 1976 as a site for a proposed production test and was competitively selected in 1977.
Initial DOE funding supported seismic analysis which depicted the sand as localized in a graben dipping and widening westward.
Additional leases were obtained by Magma Gulf from Amoco Production Co. in 1978 for a specific drillsite with a sand top at 15,060 feet with reservoir temperatures of 2990 F., pressure of 12,060 psi. and salinity exceed i ng 100,000 ppm.
The drilling and testing proposal was submitted by Magma Gulf- Technadril Inc. Joint Venture, and the contract with DOE was signed in December 1979.
Drilling of production well with total depth of 15,740 feet including a sidetracked hole occurred from August 22, 1980 to February 26, 1981 and disposal well with a total depth of 7440 feet occurred from September 19, 1980 to October 13, 1980.
Well casing and surface facilities were designed to accomodate an anticipated flow of 40,000 barrels per day.
Two of the seven sands in the sequence (numbered from the top) were tested: Sand 5 (15,387 - 414 feet in depth) from June 1981 to February 1982 and Sand 3 (15,245 to 15,280 feet in depth) from Nov. 1983 to March 1984. Sand 5 has a porosity exceeding 20% and permeability over 300 md. with its estimated 10,800 millidarcy feet representing 49% of the hydraulic capacity of the total seven sands. Sand 3 is the second rated sand with over 17% of total hydraulic capacity.
Maximum flow rate of 34,000 barrels per day from Sand 5 confirmed the capacity of the production and disposal wells and the surface facilities to accomodate such rates. However, limited reservoir capacity could maintain continuous flow of exceeding 5,000 barrels per day with surface pressure of 2,000 psi. and surface temperatues of 238OF. Maximum flow from Sand 3 slightly exceeded 6,000 barrels per day and was capable of sustaining 2,000 barrels per day with a surface pressure of 290 psi. and surface temperature of 160OF.
Drawdown tests indicated barriers close to the well but with a reservoir extent exceeding four miles in one direction. The barriers were ascribed to bounding graben faults or alternatively to permeability
X

c
barriers, but similarities in Sand 5 and 3 results favor the bounding fault conclusion particularly since it conforms to the graben intepretation based on independent seismic data.
Initial measurements of solution gas content were erroneously low. Subsequently, long term measurements o f separated gas averaged 19 to 20 standard cubic feet per barrel of water with total methane content ranging from 23 to 27 SCF/B. Analyses indicated that the brine is saturated although other interpretations by recombination studies indicated sat- uration at 34 SCF/B (Weatherly Laboratories).
'h(
Average carbon dioxide content of 8 to 10% precluded sale to nearby pipelines. Cleaning equipment was too costly in terms of the limited gas supply so the gas was flared.
Proposals to produce electricity by a portable generator were not approved by DOE, being considered state of the art and hence not experimental.
Sand 5 testing terminated because of pressure buildup in the disposal well which was ultimately cleaned and plugged back to a shallower zone. Meanwhile tubing breaks in the production we1 1 necessitated replacing the tubing. Funding problems for these repairs resulted in the long shut-in period between from early 1982 to late 1983.
Sand 3 testing was terminated on DOE orders to conserve funds. The production and disposal we1 Is were plugged and abandoned, the surface facilities dismantled with the separator moved to the Gladys McCall site and the site returned to the surface owner in November 1984. Submittal o f the present final report concludes the contract.
xi
1.0 PROJECT HISTORY, OBJECTIVES AND ADMINISTRATION
1.1 PROJECT HISTORY
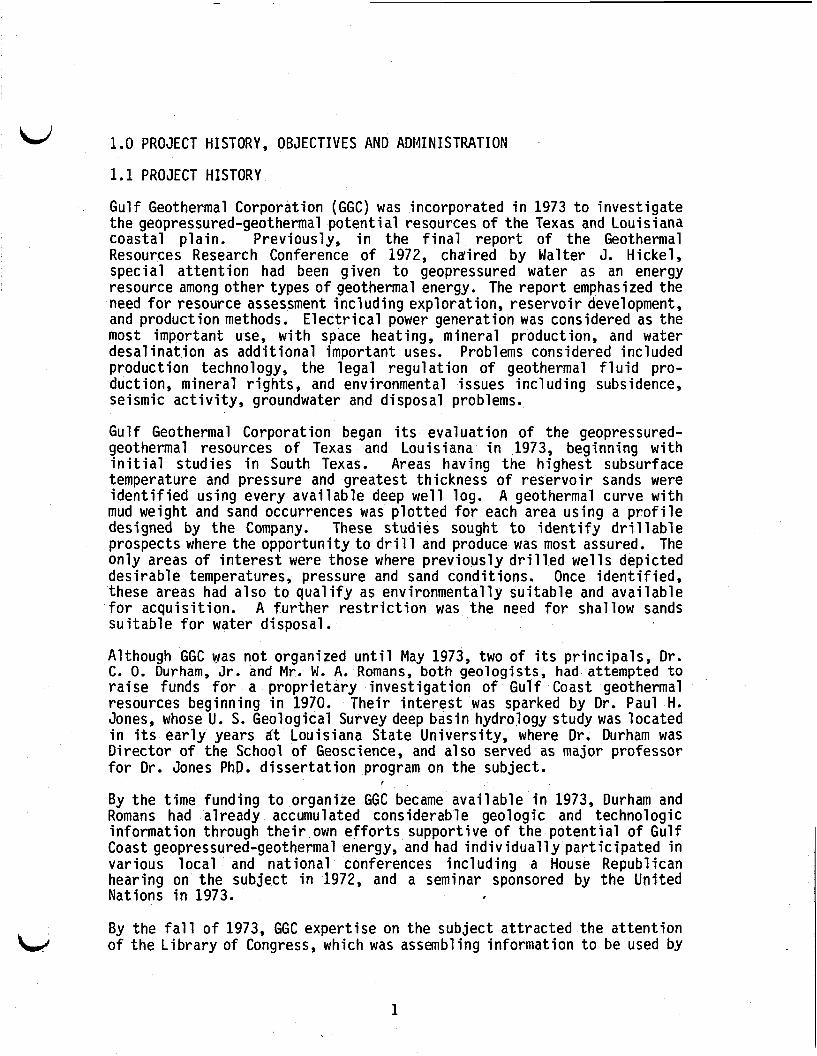
Gulf Geothermal Corporation (GGC) was incorporated in 1973 to investigate the geopressured-geothermal potential resources of the Texas and Louisiana coastal plain. Previously, in the final report of the Geothermal Resources Research Conference of 1972, chaired by Walter J. Hickel, special attention had been given to geopressured water as an energy resource among other types of geothermal energy. The report emphasized the need for resource assessment including exploration, reservoir development, and product ion methods. Electrical power generat ion was considered as the most important use, with space heating, mineral production, and water desal ination as additional important uses. Problems considered included production technology, the legal regulation of geothermal fluid pro- duction, mineral rights, and environmental issues including subsidence, seismic activity, groundwater and disposal problems.
Gulf Geothermal Corporation began its evaluation of the geopressured- geothermal resources of Texas and Louisiana in 1973, beginning with initial studies in South Texas. Areas having the highest subsurface temperature and pressure and greatest thickness of reservoir sands were identified using every available deep well log. A geothermal curve with mud weight and sand occurrences was plotted for each area using a profile designed by the Company. These studies sought to identify drillable prospects where the opportunity to drill and produce was most assured. The only areas of interest were those where previously drilled wells depicted desirable temperatures, pressure and sand conditions. Once identified, these areas had also to qualify as environmentally suitable and available for acquisition. A further restriction was the need for shallow sands suitable for water disposal.
Although GGC was not organized until May 1973, two of its principals, Dr. C. 0. Durham, Jr. and Mr. W. A. Romans, both geologists, had attempted to raise funds for a proprietary investigation o f Gulf Coast geothermal resources beginning in 1970. Their interest was sparked by Dr. Paul H. Jones, whose U. S. Geological Survey deep basin hydrology study was located in its early years d t Louisiana State University, where Dr. Durham was Director of the School of Geoscience, and also served as major professor for Dr. Jones PhD. dissertation program on the subject.
By the time funding to organize GGC became available in 1973, Durham and Romans had already accumulated considerable geologic and technologic information through their ,own efforts supportive of the potential of Gulf Coast geopressured-geothermal energy, and had individually participated in various local and national conferences including a House Republican hearing on the subject in 1972, and a seminar sponsored by the United Nations in 1973.
r
By the fall of 1973, GGC expertise on the subject attracted the attention of the Library of Congress, which was assembling information to be used by
1

the House McCormick subcommittee on energy t o prepare a b i l l t o f o s t e r i nves t i ga t i on on geopressured and hot, d r y rock geothermal resources. The b i l l u l t i m a t e l y passed as the Geothermal Research and Development Act i n 1974. Cost estimates f o r we l ls obtained by GGC f o r i t s in-house studies from Goldrus D r i l l i n g Company o f Texas and Ben H o l t Company o f C a l i f o r n i a were relayed t o Congress w i t h permission o f these companies.
Subsequently, i n February 1974, Durham and Romans were i n v i t e d t o t e s t i f y on the needs fo r geopressured-geothermal research, and they proposed a s i x year $27.4 m i l l i o n program. Fortunately, GGC work was we l l advanced because the other two test imonia ls were i n di’rect cont rad ic t ion. Rep- resentat ives o f She1 1 O i l Company t e s t i f i e d t h a t appropr iate geothermal resources d i d not e x i s t i n Texas and Louisiana, whereas representat ives of Dow Chemical Company t e s t i f i e d t o the tremendous po ten t i a l o f the resource.
As a r e s u l t o f t h a t impasse GGC test imony t h a t the company had already i d e n t i f i e d appropr iate reservo i r$ (cont ra ry t o Shel l ) , bu t t h a t these were d e f i n j t e l y not u n i v e r s a l l y d i s t r i b u t e d (cont ra ry t o Dow) was important t o demonstrate the need f o r the type o f government-sponsored research program t h a t GGC recommended and t h a t ERDA u l t i m a t e l y implemented.
Gul f Geothermal Corporation had l a r g e l y completed i t s inves t iga t ions by the middle o f 1974, as o r g i n a l l y planned, but was unable t o lease any proper t ies u n t i l a j o i n t venture w i t h Magma Power Company was implemented. A t t h a t time, a lease form was developed incorporat ing e a r l i e r lega l f ind ings o f GGC, the newly issued federal geothermal lease form, and geothermal l ega l exper t ise o f Magma Power Company suppl ied by M r . Joseph Aid1 in .
I n 1974, GGC and Magma Power Company formed a j o i n t venture t o lease these prospects. Over 100,000 acres i n s i x areas o f Texas and Louisiana were leased; among them was the pioneer geothermal lease i n the Gulf Coast on the Brazoria, Texas prospect (February, 1975), and a po r t i on o f the Sweet Lake, Louisiana prospect (July, 1975).
Fol lowing the acqu is i t i on o f leases, Magma Gulf Company was incorporated i n 1975 i n order t o secure p r i v a t e d r i l l i n g partners. However, i n February, 1976, when the U. S. D i v i s ion o f Geothermal Research establ ished as an outcome o f the 1974 hearings, announced plans t o d r i l l such we l l s w i t h Federal funds, acqu is i t i on o f p r i v a t e funding proved impossible.
Magma Gul f Company entered the PRDA DGE 76-4 compet i t ion i n May, 1976, by proposing a t e s t we l l i n the upper F r i o Sweet Lake prospect i n Cameron Parish, Louisiana, and a t e s t we l l i n a Wilcox prospect near Katy, Texas, i n Waller County. Although leased and a lso avai lable, the Brazor ia prospect was not included because i t was Upper Fr io , as was Sweet Lake, and a geologic d i v e r s i t y was a self-imposed requirement f o r the proposal. The Katy prospect i n Texas was proposed t o demonstrate h igh volume product ion from higher temperature sand (355OF.) o f Wilcox age w i t h probable low permeabi l i ty , wh i le the Sweet Lake prospect in Louisiana was
2

U
proposed t o demonstrate h igh volume production from lower temperature sand (290OF.) of F r i o age w i t h probable h igh permeabi l i ty .
The Magma Gulf proposal f o r Sweet Lake was selected by DOE i n July, 1977, the Katy prospect was el iminated, and the contract was signed between DOE and Magma Gulf i n June, 1978. As submitted, the proposal included a Phase I geologic study o f the Sweet Lake prospect t o be conducted p r i o r t o proceeding t o d r i l l i n g a t e s t wel l . The Phase I geologic study and a study o f ava i l ab le seismic data completed i n 1978 confirmed t h a t the Sweet Lake prospect contained a geopressured-geothermal rese rvo i r ideal f o r test ing. Addi t ional leases were acquired by Magma Gulf Company i n 1979 t o provide the most su i tab le avai lab le wel l s i t e . The s i t e was moved approximately one m i l e f u r t h e r west from the o r i g i n a l proposed s i t e as a r e s u l t o f seismic i n t e r p r e t a t i o n o f the con f igu ra t i on o f the f a u l t s bounding the graben. A d r i l l i n g and t e s t i n g p lan was completed and organized as the basis f o r the technica l proposal which was submitted as the Phase I 1 d r i l l i n g and t e s t i n g o f the aqui fer under contract ET-78-C-08-1561. This comprehensive proposal was submitted t o DOE i n June 1979, o u t l i n i n g a two- year pro ject . Subsequently, a j o i n t venture was formed between Magma Gulf Co. and Technadril, Inc. t o perform t h i s work. I n order t o implement the program, DOE executed a contract (NO. DE-AC08-80NV10081) i n December 1979 with Magma Gulf-Technadril, Inc. (MG-T), t o conduct the d r i l l i n g , com- p l e t ion, and t e s t i ng of one geopressured-geothermal t e s t we1 1 and one disposal wel l . A cont ract was also executed between MG-T and the Gas Research I n s t i t u t e (No. 5014-321-0290) t o provide funds f o r important c o r o l l a r y aspects o f t he program dur ing the d r i l l i n g and t e s t i n g phases.
P ro jec t management was i n place beginning i n e a r l y January 1980, and proceeded t o implement the program plans. A delay i n the approval o f the f i n a l Environmental Impact Statement resu l ted i n delay i n beginning the t e s t s i t e preparations. This compounded condi t ions i n the d r i l l i n g industry, so t h a t a delay was a lso encountered i n acquir ing subs t i t u te d r i l l i n g r i g s a t t he l a t e r date, and, most importantly, tubular goods. It was management's op in ion t h a t no d r i l l ing p o i n t should be reached without t he necessary mater ia ls a c t u a l l y being on s i t e . It was f e l t t h a t t h i s would prevent possible problems and delays occurr ing dur ing the d r i l l i n g operations . S i t e preparat ion proceeded smoothly, and, w i t h the f i n a l a v a i l a b i l i t y o f a l l t ubu la r goods, Resource D r i l l i n g R ig 12 moved on s i t e i n August 1980. The t e s t w e l l was spudded August 22, 1980, and d r i l l i n g operations were completed on February 26, 1981 w i t h the s e t t i n g o f the 5 1/2" production tubing. The we l l was d r i l l e d t o a t o t a l depth o f 15,740 f e e t w i t h a random s idet rack a t 12,564 feet . The s a l t water disposal wel l was spudded on September 19, 1980 and completed d r i l l i n g operations on October 12, 1980. The s a l t water disposal wel l was d r i l l e d t o a t o t a l depth o f 7,440 feet .
During the d r i l l i n g operations phase, plans f o r the const ruct ion o f t he surface t e s t i n g f a c i l i t i e s were designed and f a b r i c a t i o n began. As soon as d r i l l i n g operations were completed, mod i f i ca t i on o f the s i t e f o r the i n s t a l l a t i o n o f the surface t e s t i n g equipment was implemented. I n - s t a l l a t i o n o f the surface t e s t i n g equipment was completed i n May 1981, and preparations were begun f o r pe r fo ra t i ng the t e s t w e l l and the beginning o f the several f l ow t e s t i n g phases.
W
3

The t e s t we l l was per forated on June 19, 1981, and t h e - i n i t i a l f low t e s t t o c lean the wel l , determine t h a t the disposal we l l would accept the brine, and demonstrate t h a t a l l surface f a c i l i t i e s operated proper ly was begun. This t e s t continued u n t i l June 22; p a r t o f tpe design c r i t e r i a f o r t h i s t e s t was a constant f l ow r a t e t o f a c i l i t a t e the rese rvo i r in te rpre ta t ion . A rese rvo i r l i m i t t e s t was performed dur ing June and J u l y 1981 and las ted a t o t a l o f 17 days. The f i r s t long term t e s t i n g phase a t Sweet Lake continued f o r 208 days, l a s t i n g from June 17, 1981 t o February 10, 1982 (P la te I).
Negot iat ions w i t h Uni ted Gas Co. began i n 1981 o r the sale o f na tura l gas
pr imary one, f o r the l oca t i on o f the t e s t we l l had been the immediate p rox imi ty o f one o f Uni ted 's p ipe l ines which crossed the s i t e . Although United Gas was in te res ted i n purchasing the produced gas, no agreement could be reached due t o the C02 content o f the gas. The maximum CO2 content al lowable under Uni ted Gas contracts was 2%, which was much less than t h a t being produced a t Sweet Lake (approximately 10%). Money f o r purchase o f gas clean-up equipment was not avai lab le, and the quan t i t y o f CO2 allowed under the contract could no t be changed. Therefore, no contract f o r gas sales was ever negotiated.
I n February 1982 the s a l t water disposal w e l l sanded up' necess i ta t ing a recompletion of t h a t wel l . During t h i s t ime a leak was discovered i n the 5 1/2" tub ing o f the t e s t wel l . The Sweet Lake s i t e was shut i n from March 1982 u n t i l August 1983 await ing an admin is t ra t i ve dec is ion from the DOE as t o whether t o continue t e s t i n g o r t o terminate the pro jec t .
I n August 1983 i t was decided t o continue the t e s t i n g o f add i t iona l sands i n the Sweet Lake wel l . The 5 1/2" tubing was repaired, the we l l per forated i n a shal lower sand and a second ser ies o f f low t e s t s was begun. An i n i t i a l f low tes t , fol lowed by a reservo i r l i m i t t e s t and a long term f l ow t e s t were begun i n November 1983 (P la te 11). The long term f l ow t e s t continued f o r 122 days u n t i l March 13, 1984, when the we l l was shut- in. The shut- in was no t necessi tated by mechanical problems but ra ther by budgetary ones. A dec is ion was made by DOE t o terminate the p r o j e c t i n June 1984.
During t h i s per iod a proposal by MG-T t o develop and i n s t a l l surface f a c i l i t i e s a t i t s own expense t o demonstrate e l e c t r i c power generation a t the s i t e was re jec ted by DOE. An RFP t o plug and abandon the s i t e was issued i n June 1984. The t e s t we l l and s a l t water disposal we l l were plugged and abandoned, and s i t e cleanup and res to ra t i on were completed i n November 1984.
1.2 PROJECT OBJECTIVES
The i n i t i a l paragraph o f Magma Gul f ' s proposal t o DOE i n May, 1976, stated:
"Economic analyses by Magma Gul f Company ind i ca te t h a t the energy resources o f geopressured-geothermal reservo i rs cannot be success- f u l l y operated unless la rge volume water product ion can be sustained (over 1,000 GPM). Yet t h i s p o s s i b i l i t y has been challenged by know- ledgeable engineers and geologis ts who c i t e low permeabi l i ty and geopressured formation co l lapse as i n h i b i t i n g factors . However, u n t i l sustained h igh volume product ion i s demonstrated, a l l other quest ions are academic .I'
from the Sweet Lake wel l . One o f the consi !e ra t ions, although no t a
4

Magma Gulf bel ieved t h a t the proposed production we l l had an excel lent chance t o produce such volumes, and the completion and production t e s t i n g schedules were designed t o demonstrate it.
In add i t i on t o pe rm i t t i ng experiments i n high f l ow ra tes t h a t were essent ia l t o geopressured-geothermal energy development, other c r i t i c a l experiments also proposed t o be performed sequent ia l ly were:
w
(1) D r i l l i n g and u t i l i z a t i o n o f disposal wells; (2) Determination o f methane content, and demonstration o f i t s
separation f o r commercial purposes; (3 ) Experimentation w i t h pressure turbines; and, (4 ) U t i l i z a t i o n o f heat energy i n a b ina ry o r f l a s h system.
The proposal was out1 ined t o accomplish a1 1 o f the pr imary goals which were l i s t e d on page 7 o f ERDA PRDA DGE 78-4 as fo l lows:
During d r i l l i n g and coring, data can be acquired concerning " the cha rac te r i s t i cs o f the geopressured geothermal reservoirs, i nc lud ing permeabi l i ty and porosi ty, extent and d i s t r i b u t i o n o f sands and shales, degree o f undercompaction, and rock composition; as w e l l as the acquifer; f l u i d proper t ies inc lud ing i n s i t u temperature, com- pos i t ion, na tu ra l gas content, and pressure."
" the behavior o f f l u i d and rese rvo i r under condi t ions o f f l u i d product ion a t moderate and high rates, inc lud ing pressure-time behavior a t d i f f e r e n t f l ow rates, f l u i d cha rac te r i s t i cs under varying product ion condit ions, other informat ion r e l a t e d t o the rese rvo i r production d r i v e mechanisms, and physical and chemical changes t h a t may occur under production conditions."
Magma Gulf a lso proposed t o t r a n s f e r i t s e x i s t i n g geothermal leases on the Sweet Lake and Katy s i t e s t o ERDA f o r the du ra t i on o f the pro ject . It proposed t o manage and operate a program designed t o accomplish the f o l l o w i n g sequent ia l ly :
During we l l t e s t i n g informat ion w i l l be obtained on
(1) I n the case o f Sweet Lake, secure and analyze seismic data t o determine a s p e c i f i c d r i l l s i t e ;
(2) Prepare de ta i l ed p lan and cost estimates f o r the program;
( 3 ) D r i l l and t e s t one o r two production wel ls by turn-key sub- contract ;
(4) D r i l l accompanying disposal we l l s by turn-key subcontract;
(5 ) Test the production capaci ty o f wel ls under varying f l ow condi t ions f o r a 6 month period. Simultaneously, disposal we l l c a p a b i l i t y would be tested, and gas e x t r a c t i o n by h igh pressure gas separators demonstrated ;
(6) Design and placement o f a high pressure tu rb ine and b ina ry heat conversion system.
5
It was also obvious that many peripheral tests and investigations could be conducted from the samples obtained from the test we1 1. It was anticipated that ERDA (DOE) would wish for as many investigators as possible to have access to the wellsite and the information that would be obtained.
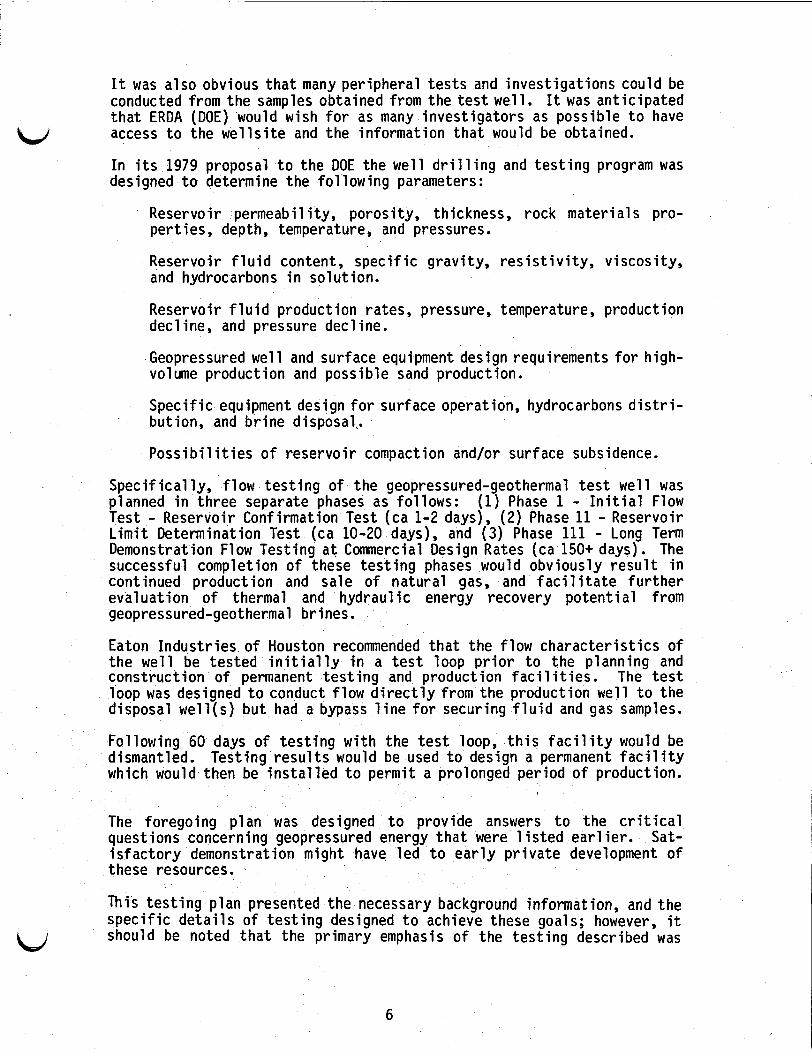
In its 1979 proposal to the DOE the well drilling and testing program was designed to determine the following parameters:
W
Reservoir permeability, porosity, thickness, rock materials pro- perties, depth, temperature, and pressures.
Reservoir fluid content, specific gravity, resistivity, viscosity, and hydrocarbons in sol ut ion.
Reservoir fluid production rates, pressure, temperature, production decline, and pressure decline.
Geopressured we1 1 and surface equipment design requirements for high- volume production and possible sand production.
Specific equipment design for surface operation, hydrocarbons distri- . bution, and brine disposal,.
Possibilities of reservoir compaction and/or surface subsidence.
Specifically, flow testing of the geopressured-geothermal test well was planned in three separate phases as follows: (1) Phase 1 - Initial Flow Test - Reservoir Confirmation Test (ca 1-2 days), (2) Phase 11 - Reservoir Limit Determination Test (ca 10-20 days), and (3) Phase 111 - Long Term Demonstration Flow Testing at Commercial Design Rates (ca 150+ days). The successful completion of these testing phases would obviously result in continued production and sale of natural gas, and facilitate further evaluation of thermal and hydraulic energy recovery potential from geopressured-geothermal brines.
Eaton Industries of Houston recommended that the flow characteristics of the well be tested initially in a test loop prior to the planning and construction of permanent testing and production facilities. The test loop was designed to conduct flow directly from the production well to the disposal well(s) but had a bypass line for securing fluid and gas samples.
Following 60 days of testing with the test loop, this facility would be dismantled. Testing results would be used to design a permanent facility which would then be installed to permit a prolonged period of production.
The foregoing plan was designed to provide answers to the critical questions concerning geopressured energy that were listed earlier. Sat- isfactory demonstration might have led to early private development of these resources.
This testing plan presented the necessary background informat ion, and the specific details of testing designed to achieve these goals; however, it should be noted that the primary emphasis of the testing described was W
6
d i rec ted t o the recovery o f na tura l gas ( p r i m a r i l y methane) from geo- pressured geothermal brines, and high-volume b r ine disposal.
I n add i t ion t o the achievements o f the primary goals, the t e s t i n g p lan was designed t o accumulate s u f f i c i e n t data to : (1) character ize and def ine adequately the nature, s ize, and thus po ten t ia l , o f the reservo i r , (2) character ize a n a l y t i c a l l y the b r ine and na tura l gas produced, (3 ) conf i rm the adequacy o f the t e s t we l l and surface f a c i l i t i e s design, and (4) def ine the extent o f scal ing/corrosion problems associated w i t h the long-term high-volume product ion and disposal o f geopressured-geothermal brine, and t o minimize and con t ro l such scal ing/carrosion. F ina l l y , the e f f e c t s ( i f any) o f t e s t i n g the subject geopressured-geothermal we l l on the en- vironment were t o be monitored through concurrent and separate measure- ments and studies o f subsidence, seismici ty, and the q u a l i t y o f the a i r , surface water, ground water, and eco-systems i n the area.
u
1.3 PROJECT ADMINISTRATION
Program admin is t ra t ion was furn ished by both Magma Gulf Co. and Tech- nad r i l , Inc. through a J o i n t Venture Executive Committee. Purpose o f the committee was t o ensure implementation o f a l l aspects o f the p ro jec t and determine any necessary changes o r modi f icat ions i n the program plans and object ives.
1.3.1 MANAGEMENT ORGANAZATION
The J o i n t Venture Executive Committee consisted o f three members: Dr. C. 0. Durham o f Magma Gulf Co. served as Chairman and Program Coordinator t o ensure t h a t the program operated according t o plans, schedules and budgets and served as l i a i s o n w i t h the DOE. J.I. Marshall o f Technadril, Inc. served as Deputy Chairman t o oversee costs and schedules. R. W. Rodgers o f Magma Gulf Co. served as P ro jec t Manager t o provide o v e r a l l supervis ion o f the pro jec t . Report ing t o the Pro jec t Manager were deputy p r o j e c t managers, assigned t o s p e c i f i c aspects o f the pro jec t .
Key Personnel
Magma Gul f Company
Dr. C. 0. Durham, Jr. Chairman o f Jo in t Venture Executive Committee President o f Magma Gulf Company Program Coordinator f o r Sweet Lake Pro jec t
Member o f Jo in t Venture Executive Committee Operations Pro jec t Manager for Sweet Lake Pro jec t
R. W. Rodgers
K. S . Hoffman Deputy Pro jec t Manager - Research fo r Sweet Lake Project .
7
Technadri 1, Inc.
J. I. Marshall Deputy Chairman o f J o i n t Venture Executive Committee President o f Technadril, Inc.
C. S. Adkins, Jr. Deputy Pro ject Manager - D r i l l i n g & Construction f o r Sweet Lake Pro ject
A. L. Wyand Deputy Pro ject Manager - Administrat ion f o r Sweet Lake Pro jec t
S i t e Manager f o r Sweet Lake Pro ject - D r i l l i n g phase C. D. M i t c h e l l
La r ry Dur re t t
Jonne Berning
Frank O'Brien
Deputy Pro ject Manager - Test ing Phase
S i t e Manager - Test ing Phase
Admin is t ra t ive Deputy and Technical D i rec to r
The management program as ou t l i ned i n Section 1.3.1 (Figure 1-1) remained i n e f f e c t u n t i l the completion o f the d r i l l i n g phase o f the pro ject . A t t h i s t ime i t became necessary f o r R. W. Rodgers t o r e t u r n t o h i s Un ive rs i t y duties. ' D r . C.O. Durham acted as Pro ject Manager dur ing the t e s t i n g phase. I n add i t i on La r ry Dur re t t o f Technadril, Inc. became t e s t i n g Manager and Jonne Berning o f Technadril, Inc. became S i t e Operations Manager. Frank O'Brien o f Technadri 1 served as Deputy Administrator ac t i ng f o r J. I. Marshall and A. L. Wyand dur ing the completion phase, and served as Technical D i rec to r dur ing the t e s t i n g phase (Figure 1-2). Car l G u i l l o t served as consul tant f o r the design and const ruct ion o f the surface f a c i l i t i e s . J. Don Clark served as consul tant f o r r e s e r v o i r test ing.
1.3.2 REPORTING
As a p a r t o f i t s cont ract f o r the Sweet Lake pro ject , Magma Gulf- Technadri 1 submitted per iod ic management and technica l repo r t s (Vol. I - 1982, - Vol. I 1 - 1984) t o the Department o f Energy.
Before operations began, d r i l l i n g plans f o r the p r o j e c t t e s t we l l and disposal w e l l were submitted t o the DOE as a D r i l l i n g and Test ing Plan i n J u l y 19,80. This plan was a rev ised version o f the plans submitted i n 1979 as p a r t o f the Magma Gulf proposal. Addi t ional ly , MG-T submitted a Management Plan which included Milestone and Status schedules, manpower plans, and P o l i c i e s and Procurement procedures.
Monthly repo r t s included the Cost Management Report f o r comparision t o the Cost Plan, Government-Owned Property Inventory, Pro ject Status Report, and a Contract Management Summary Report. Beginning w i th the
i
8

start of site activities and continuing through the drilling and testing phases a Technical Progress Report (Dri 1 1 ing Report-Testing Report) was filed daily with the DOE. This report was a summary of the project for the previous 24 hours, and a forecast of any major scheduled activities.
Beginning in 1981 a weekly Cost Management Report was forwarded from the Sweet Lake site to the Houston offices and then submitted to the DOE Las Vegas Operations office. This cost form includedthe Contract Estimated Cost, Current Cost, Estimated Cost to Complete, and Overrun - Underrun Costs. As a part of the Management Program weekly Progress Review meetings were held with key personnel to review progress and forecast schedules and potential problems.
Periodically, Design Review Meetings were held to review the status of major aspects of the program. These included, for example, a review of the drilling and completion plans, testing procedures, coring procedures held in conjunction with the Rock Mechanics investigations group, reservoir modeling, and chemical analysis. One of the results of these meetings was the inception of the Pilot Plant program for chemical inhibitor injection and chemical analysis.
Technical Progress Reports have been filed which serve as the annual reports. These are Drilling and Completion - Test Well and Disposal Well, Vol. I, June 1982, and Surface Installations and Reservoir Testing Vol. 11, April 1984. This report, Final Summary and Analysis, Vol. 111, 1984, serves as the final report for the drilling and testing of the Sweet Lake geopressured-geothermal reservoir, but a1 1 3 volumes are necessary for a detailed understanding of the project.
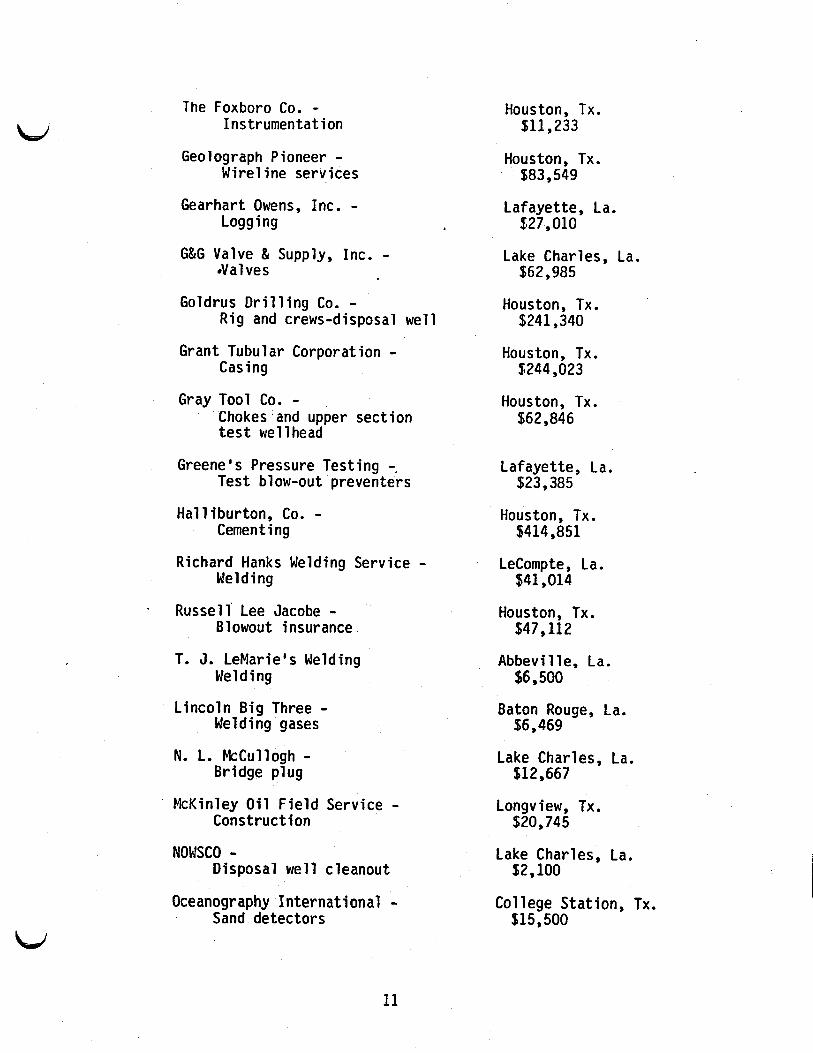
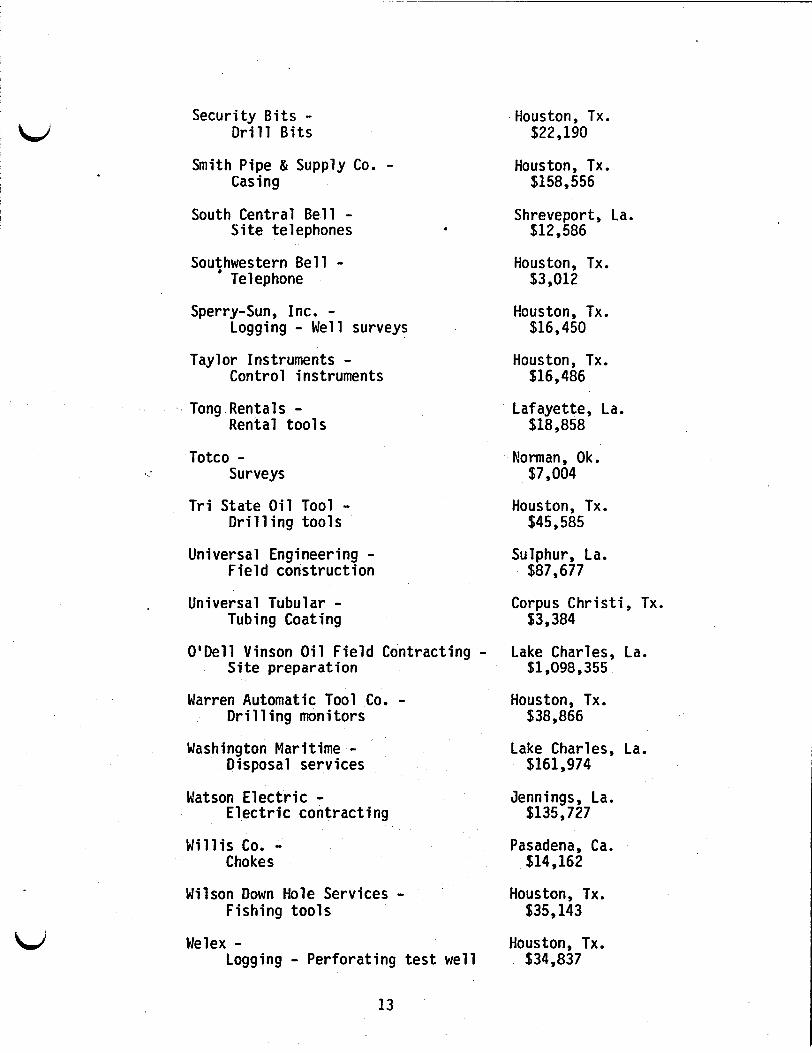
1.4 CONTRACT SUBCONTRACTORS
The following 1 ist represents the major important subcontractors for the project with total costs of $10,729,045. Additionally, some 30 vendors supplied lesser services, supplies, and equipment.
1.4.1 SUBCONTRACTORS - UNDER DOE CONTRACT - DRILLING Amoco Production - Houston, Tx.
Analytical Stress Re1 ieving - Houston, Tx.
Baker Packers - Houston, Tx. Packers $47,450
Benton Casing - Houma, La. Casing crews $52,824
Tubing $18 , 020
Stress tests - welding $11,000
9

c Big Diamond Trucking - Hau 1 ing-cutti ngs, dri 1 1 ing mud
Lake Charles, La. $272,686
Brown Pipe & Supply -
Brown Oil Tools -
Brown Tool 81 Supply -
Tubing-recompletion test well
Too Is
Too 1 s
4
Houston, Tx. $58,000
Houston, Tx. $99,248
Lafayette, La. $128,087
Byrom & Co. - Drilling counsultants
Houston, Tx. $34,582
Chickasaw Distributors, Inc. - Casing
Dallas, Tx. $956,138
Christensen Diamond Products Co. - Diamond coring
Salt Lake City, Utah $10,951
Completion Technology - Completion recommendations
Houston, Tx. $3,245
Crosby Valve - Safety valves
Providence, RI. $10,119
Dave's Welding Service - We1 di ng
Jeff Davis Electric Coop - Electrical power
Schriever, La. $24,800
Jennings, La. $29,651
Dia-Log - Wireline services
Houston, TX. $28,956
Dresser Magcobar - Drilling fluids
Houston, Tx. $695,599
J. F. Eggleston - Drilling consultant
Carencro, La. $19,648
Energy Resource Management - Work over procedures
Houston, Tx. $4,000
FMC Corporation - Part o f production we1 1 head Disposal well head
Dallas, Tx. $191,600
i Franks Casing Crew Casing crew
Lafayette, La. $27,400
10
W The Foxboro Co. -
Instrumentation
Geolograph Pioneer - Wireline services
Gearhart Owens, Inc. - Logging
G&G Valve & Supply, Inc. - *Valves
Goldrus Drilling Co. - Rig and crews-disposal well
Grant Tubular Corporation - Casing
Gray Tool Co. - Chokes,and upper section test we1 1 head
Greene's Pressure Testing -, Test blow-out preventers
Halliburton, Co. - Cementing
Richard Hanks Welding Service - We1 d i ng
. Russell Lee Jacobe - Blowout insurance
T. 3. LeMarie's Welding
Lincoln Big Three - Ne 1 d i ng
Welding gases
Bridge plug N. L. McCullogh -
McKinley Oil Field Service - Construction
NOWSCO - Disposal well cleanout
Oceanography I n ter na t i on a1 - Sand detectors
Houston, Tx. $11,233
Houston, Tx. $83,549
Lafayette, La. f*27,010
Lake Charles, La. $62,985
Houston, Tx. $241,340
Houston, Tx. $244,023
Houston, Tx. $62,846
Lafayette, La. $23,385
Houston, Tx. $414,851
LeCompte , La. $41,014
Houston, Tx. $47,112
Abbeville, La. $6,500
Baton Rouge, La.
Lake Charles, La.
$6,469
$12,667
Longview, Tx. $20,745
Lake Charles, La. $2,100
College Station, Tx. $15,500
11

Oil Field Rental Service Co. - Houston, Tx. Rental tools $130,077
Oil Technology Services - Houston, Tx. Quality assurance - tubing $158,977
Oil Quip, Inc. -
Oilwell - Tubul ars
Tubu 1 ars
4
Houston, Tx. $567,920
Houston, Tx. $133 , 636
Ortego Oil & Supply - Rig fuel
Otis Engineering - ESD System
Opelousas, La. $221,564
Dallas, Tx. $70,019
Otis Pressure Control - Houston, Tx. Packer-recompletion-wireline serv. $17,402
Patterson Truck Line - Hau 1 i ng
Houston, Tx. 86,967
Petroleum Well Service - Sour Lake, Tx. Dri 1 1 ing consultants $73,872
Projects Design - Drafting
Houston, Tx. $17,179
Quality Inspection and Control, Inc. - Houma, La. Pipe inspection $8,179
Mike Queenan Equipment - Construction equipment
Lake Charles, La. $27,080
Resource Drilling, Inc. - Houston, Tx. $2,056,434 Rig and crews-test we1 1
Rig Housing - Site office
Rig 'Water, Inc. - Sandair -
Rig water
Air compressors
Lzfayette, La. $9,308
Church Point, La. $12,937
Houston, Tx. $28 , 007
Schlumberger - Houston, Tx. Logging, sidewall coring, , $347,978 perforating test well and disposal
12
W Security Bits -
Drill Bits
Smith Pipe & Supply Co. - Casing
South Central Bell - Site telephones
Souihwestern Bell - Telephone
Sperry-Sun, Inc. - Logging - Well surveys
Taylor Instruments - Control instruments
Tong Rentals - Rental tools
Surveys
Tri State Oil Tool - Dri 1 1 ing tool s
Universal Engineering - Field construction
Universal Tubular - Tubing Coating
O'Dell Vinson Oil Field Contracting -
Totco -
- Site preparation
Warren Automatic Tool Co. - Drilling monitors
Washington Maritime - D i s posa 1 ser v i ces
Watson Electric -
Willis Co. - Electric contracting
Chokes
Wilson Down Hole Services - Fishing tools
Welex - Logging - Perforating test well
Houston, Tx. $22,190
Houston, Tx. $158,556
Shreveport, La. $12,586
Houston, Tx. $3,012
Houston, Tx. $16,450
Houston, Tx. $16,486
Lafayette, La. $18,858
Norman, Ok. $7,004
Houston, Tx. $45,585
Sulphur, La. $87,677
Corpus Christi, Tx. $3,384
Lake Charles, La. $1,098,355
Houston, Tx. $38,866
Lake Charles, La. $161,974
Jennings, La. $135,727
Pasadena, Ca. $14,162
Houston, Tx. $35,143
Houston, Tx. $34,837
13
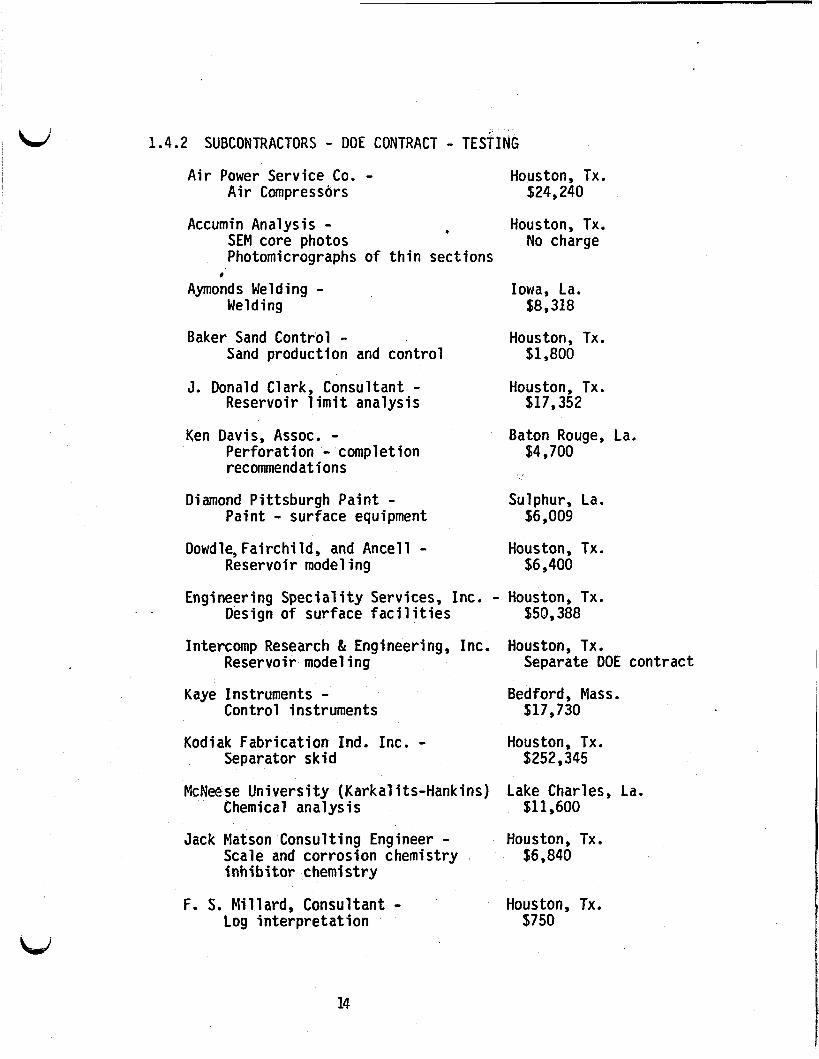
c, 1.4.2 SUBCONTRACTORS - DOE CONTRACT - TES~ING
W
Air Power Service Co. - Air Compressors
Houston, Tx. $24,240
Accumin Analysis - 0 Houston, Tx. SEM core photos No charge Photomicrographs of thin sect ions
Welding $8,318
c
Aymonds Welding - Iowa, La.
Baker Sand Control - Houston, Tx. Sand production and control $1,800
J. Donald Clark, Consultant - Houston, Tx. Reservoir limit analysis $17,352
Ken Davis, Assoc. - Baton Rouge, La. Perforation - completion $4,700 recommend at i on s
Diamond Pittsburgh Paint - Sulphur, La. Paint - surface equipment $6,009
Dowdle, Fairchild, and Ancell - Houston, Tx. Reservoir modeling $6,400
Engineering Speciality Services, Inc. - Houston, Tx. Design of surface facilities $50,388
Intercomp Research & Engineering, Inc. Houston, Tx. Reservoir modeling Separate DOE contract
Kaye Instruments - Con tr o 1 i ns tr umen t s
Bedford, Mass. $17,730
Kodiak Fabrication Ind. Inc. - Houston, Tx.
McNeese University (Karkal its-Hankins) Lake Charles, La. $11,600
Jack Matson Consulting Engineer - Houston, Tx.
Separator skid $252,345
Chemical an a1 ys is
Scale and corrosion chemistry $6,840 inhibitor chemistry
F. S. Millard, Consultant - Log interpretation
Houston, Tx. $750
14

LJ Milton Roy - Inhibitor pumps
Phi 1 ade 1 phi a, Pa. $16,905
Mobile Quarters - Control trailer
Rayne, La. $24,720
Moody Price - Instruments
Eaton Rouge, La, $7,082
Panelmasters Intl. - Control panels
Houston, Tx. $18,731
Pilgrim Steel - F 1 are
Glassboro, N. J. $11,626
Pioneer Centrifuging Co. Inc. - Filters
Liberty, Tx. $71,842
Puffer Sweiven - Instruments
Stafford, Tx. $13,268
Reservoir Data, Jnc. - Monitoring bottom-hole pressure and temperatures
Houston, Tx. $106,039
Rice University (Mason Tomson) - Scale and corrosion chemistry pilot plant monitoring
Houston, Tx. $6,000
Russell Sensat Welding - W&l d i ng
Ragley, La. $29,960
Systems Science and Software - Reservoir Behavior
LaJolla, Ca.
Livermore, Ca.
Sepzirate DOE contract
Separate DOE Contract University o f California -
Lawrence Livermore Laboratory Brine Injection
Weatherly Laboratories, Inc. - Gas recombination .analysis
Lake Charles, La. $12,400
1.4.3 SUBCONTRACTORS - (GRI CONTRACT TO MG-T)
Core Laboratories - Core analysis
Houston, Tx. $10,305
Hartax, Int. - Geoc hemi s try
Baton Rouge, La. $31,393 b,
15

IDL - Mud Log
Paleo-Data, Inc. - Paleontology
Houston, Tx. 258,800
New Orleans, La. 925,773
1.4.4 SUBCONTRACTORS - INDIRECT - THROUGH DOE CONTRACT TO L.S.U.
Louisiana State Un ive rs i t y - Baton Rouge, La. . C1 ay Diagenesis
Louisiana State Un ive rs i t y - Baton Rouge, La. Energy Program O f f i c e Environmental Moni tor ing
U.S. Geological Survey - NSTL Stat ion, Miss. Clay and format ion water analys is
U.S. Geological Survey - Thermal Conduct iv i ty
Menlo Park, Ca.
16

W
2.0 WELL FACILITIES
2.1 WELL LOCATION
The Sweet Lake w e l l s i t e i s located approximately 15 mi les southwest o f Lake Charles i n Cameron Parish, Louisiana (Figure 2-1). The s i t e i s j u s t south o f State Highway 384 i n a 5 acre t e s t s i t e on fee land leased from AMOCO by Magma Gulf Co. The s i t e i s i n the South 1/2, Section 13, Township 12 South, Range 8 West. The surface r i g h t s have been leased t o the Precht f a m i l y which has conducted r i c e farming operations a t t he s i t e f o r the past f i f t y years. Throughout the dura t ion o f t he p r o j e c t c lose communication was maintained between Magma Gulf-Technadril personnel, representat ives of AMOCO, and members o f the Precht fami ly . Every e f f o r t was extended t o ensure the surface lessees t h a t operations a t t he Sweet Lake s i t e would no t unduly i n t e r f e r e w i t h normal farming operations. This c lose cooperation was maintained through the terminat ion o f t he p r o j e c t when the s i t e was res tored and returned t o the owners and lessees.
2.2 SITE PREPARATION
The e x i s t i n g road from Louisiana Highway 384 t o the turnaround (Figure 2- 2) was graded and covered w i t h 6 inches o f she l l . The turnaround area, s i t e manager's t r a i l e r locat ion, was a lso graded and covered w i t h she l l . Th is turnaround was used as a staging and storage area dur ing the s i t e preparat ion and s ta r t -up operations. The s i t e manager's t r a i l e r and a guard s t a t i o n were located a t t he turnaround t o con t ro l access t o the s i t e . Th is was p a r t i c u l a r l y necessary since a l l d r i l l cu t t i ngs and d r i l l i n g f l u i d s had t o be hauled t o a waste disposal s i t e , as no reserve p i t s could be used a t t he s i t e . The State o f Louisiana required t h a t the disposal o f such ma te r ia l s must be c l o s e l y monitored.
The access road from the turnaround t o the w e l l s i t e was graded and covered w i t h one laye r o f Dupont 3401, 4 ounce pervious TYPAR. This ma te r ia l was then covered w i t h 12 inches o f s h e l l which was r o l l e d and compacted p r i o r t o placement o f the boards. Due t o the delays caused by u n a v a i l a b i l i t y of t ubu la r goods, t he s h e l l road was used without t he board covering u n t i l i t was t ime f o r r i g s ta r t -up operations. The board road was th ree p l y cons is t i ng o f a bottom p l y l a i d 14 f e e t wide containing 17 mud boards. The second p l y contained cross t i e s placed on 9 inch centers. The top p l y contained 12 board runners se t on vehicular t rack spacing. The f i r s t two p l y s were used board lumber, and the top p l y was new board lumber na i l ed w i t h a minimum o f f o u r 60P n a i l s per board.
The t e s t w e l l s i t e was approximately 250 f e e t by 325 f e e t i n area. The areas o f heavy t r a f f i c were under la in w i t h Dupont 3401 TYPAR, and covered w i t h 12 inches o f she l l . These areas were covered w i t h three p l y boarding, w i t h the bottom p l y l a i d on 12 inch centers and the middle and top p l y s l a i d on 9 i nch centers. I n the area o f t he ri.gsSubstructure a f o u r t h p l y l a i d on 9 inch centers was a l so used. A l l the boa'rds were 3 X 9 scant good hardwood. The two bottom p l y s were used lumber and the top p l y and top p l y s i n the area o f the r i g substructure were new boards. The top layers were na i l ed w i t h a minimum o f f ou r 60P n a i l s per board. P r i o r t o l a y i n g the boards i n t h e area o f t he r i g substructure, n i n e t y 12 inch p i l i n g s were dr iven w i t h a d iese l hammer t o re fusa l and then cu t o f f a t ground leve l . u
17

A r i n g levee was constructed around the turnaround area which was low enough t o protect , bu t no t i n t e r f e r e with, farming operations. A th ree feet h igh r i n g levee was then constructed along t h e nor th s ide o f t he board run access road t o the we l l s i t e , and then around the t e s t we l l s i t e . Subsequently the r i n g levee was a lso constructed around the disposal we l l s i t e . The levee system and p a r a l l e l d ra in d i t c h drained t o a low po in t from which excess water could be pumped i n t o a l o c a l d r a i n d i t c h o r picked up by vacuum t ruck f o r o f f - s i t e disposal. The levee and d r a i n d i t c h were constructed t o p ro tec t the w e l l s i t e from f looding, and t o p ro tec t t he l o c a l farming operations from any poss ib le contamination. One 36" X 80' c u l v e r t and two 15" X 30' c u l v e r t s w i t h gates were constructed beneath the access road i n order t o f a c i l i t a t e i r r i g a t i o n , and no t i n t e r r u p t t he r i c e farming operations.
W
I n compliance w i t h the lease requirements, no reserve p i t s were used. Instead, d r i l l i n g f l u i d s , so l ids, and excess surface water were hauled by t ruck t o a State o f Louisiana approved disposal s i t e located nearby.
2.3 HISTORY OF WELL DESIGNS
The i n i t i a l w e l l design and cost est imate f o r Magma Gul f f o r t he Sweet Lake design and disposal we l l s was prepared by Louis Records and Associates o f Lafayette, Louisiana. This design was based on in format ion supplied t o Records by Magma Gulf using data from the three deep we l l s d r i l l e d near the proposed s i t e by Union o f Ca l i fo rn ia . The we l l designs and cos t estimates u l t i m a t e l y included by Magma Gu l f Co. i n i t s 1979 proposal t o DOE were prepared by Eaton Indus t r i es o f Houston, Texas. DOE representat ives requested Magma Gul f t o arrange through i t s parent, Magma Power Co., f o r Dr. Ben Eaton o f Eaton Indus t r i es t o v i s i t the Geysers w i t h the view of incorpora t ing pe r t i nen t techniques i n the second Pleasant Bayou wel l . U l t imate ly , through supplementary funding by DOE o f Magma Gu l f ' s DOE cont rac t ET-78-C-08-1561, Eaton prepared the we1 1 designs and cost estimates submitted t o DOE i n Magma Gu l f ' s 1979 proposal.
A f t e r the cont rac t was signed with t h e DOE i n 1979, the Eaton plans were modif ied by Magma Gulf - Technadril, and submitted as the D r i l l i n g and Testing Plan f o r the Sweet Lake p ro jec t t o the DOE i n Ju l y 1980.
2.3.1. WELL DESIGN
The Sweet Lake t e s t we l l , MG-T/AMOCO Fee No. 1 was designed t o demonstrate both f l ow t e s t i n g t o de f ine the geopressured-geothermal r e s e r v o i r and t o permi t long term f l o w a t commercial design rates. The wel l , which i s depicted i n Figure 2-3, was d r i l l e d t o a t o t a l depth o f 15,740 f e e t w i t h a random s idet rack a t 12,564 feet .
W
The 13-3/8 inch casing was se t a t 4,050 f e e t and cemented from t h a t depth t o the surface. The 9-5/8 inch casing was cemented i n a t 10,230 feet. A 7-5/8 inch s t r i ng , r u n as a l i ne r , was cemented i n a t 15,065 feet, and then t i e d back t o the surface and cemented i n the 9-5/8 inch casing t o 5,600 feet .
18

i The production tubing consisted of a 5-1/2 inch liner cemented in place (Plugged Back Total Depth of 15,660 feet to 14,558 feet Top of Liner). A Polished Bore Receptable (PBR) was set on top of the liner at 14,534 feet. A 4-1/8 inch I.D. seal assembly was inside the PBR. The 5-1/2 inch tubing was hung off in the tubing hanger.
The 5-1/2 inch tubing was filled with about 300 barrels o f 10.0 ppg salt water. The annulus between the 5-1/2 inch tubing and the 7-5/8 inch casing was filled (ca 190 bbls) with a calcium bromide packer fluid with a 13.4 ppg density at 70OF. As the well heated up the calciun bromide expanded, the density was reduced to about 12.5 ppg, and it was necessary to bleed off about seven barrels of the fluid from the annulus to avoid excessively high pressures.
The 5 1/2" production tubing was coated internally by Universal Tubular Services - Spincote with their product SC850 after final threading and before shipment to the well. The purpose of the coating was twofold, first to protect the tubing from corrosion and scale adhesion and second to reduce friction losses/pressure drop.
Both purposes were achieved - there were no significant scale deposits on the tubing and the only corrosion was at certain joints where the coating had been mechanically abraided off. There was no evidence of subsurface pitting or blistering after two years of service. It did appear that the coating could be removed by high local flow rates or erosion where joint design could cause local cavitation.
The original application of Spincote 850 was found to be defective during installation and the tubing was removed, blasted clean, and recoated to the uniform proper thickness and then reinstalled. The coated liner had been cemented in place and could not be reworked. The only operational problem was the breaking free of some of the thicker coating on the 5 1/2" liner during perforation. Even this thicker material was unaffected by subsequent operations and there was no flow blockage.
2.3.2 DRILLING HISTORY
The following i s a summary of the design well drilling history. A complete drilling history and detailed well history are included in Vol. I Drilling and Completion Test Well and Disposal Well. On August 16, 1980, Resource Drilling Company's Rig No. 12 began moving on location at the Sweet Lake site. Rigging up was completed, and on August 19, began driving the 30" conductor casing to 126' below ground level. The flow lines were nippled up and the well was spuddedfon August 22, 1980.
INTERVAL TO 20" CASING POINT
The 24" hole interval to 835' was drilled in 2 days using a Magcogel mud which was gradually increased from 8.7 to 9.4 lb./gal. At 835' L,
19
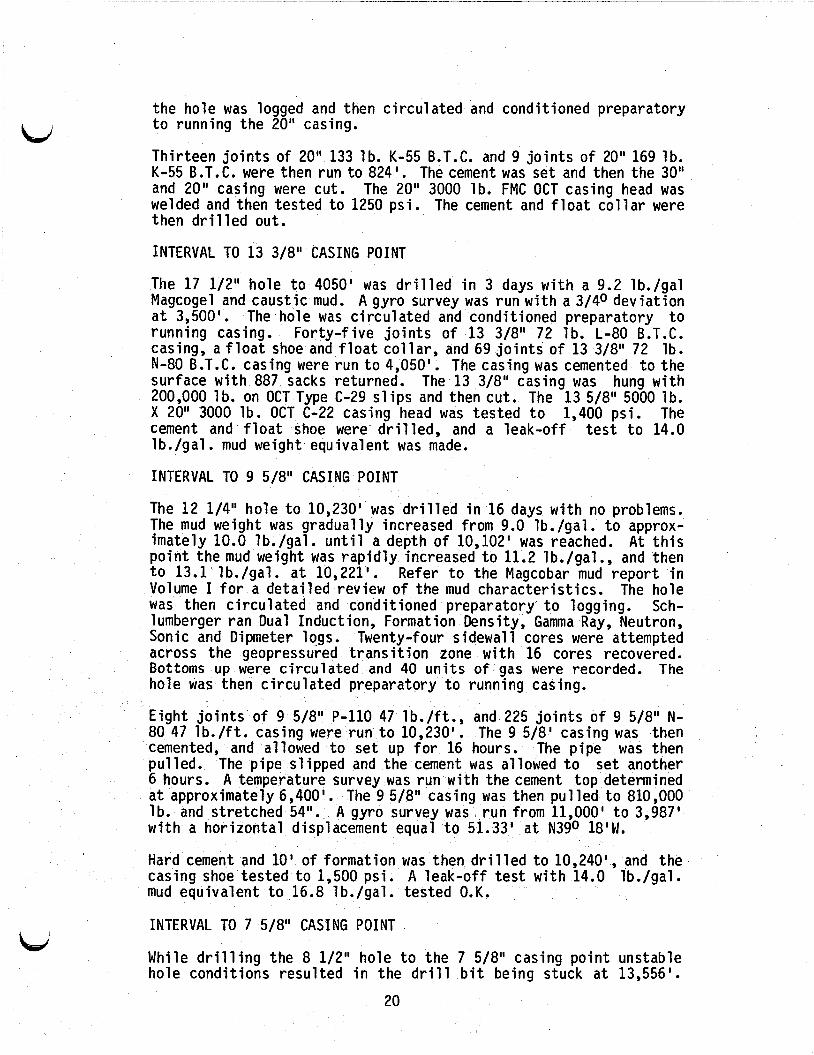
the hole was logged and then c i r c u l a t e d and condit ioned preparatory t o running the 20" casing.
Thir teen j o i n t s o f 20" 133 lb . K-55 B.T.C. and 9 j o i n t s o f 20" 169 lb . K-55 B.T.C. were then run t o 824'. The cement was set and then the 30" and 20" casing were cut. The 20" 3000 lb . FMC OCT casing head was welded and then tested t o 1250 ps i . The cement and f l o a t c o l l a r were then d r i l l e d out.
INTERVAL TO 13 3/8" CASING POINT
The 17 1/2" ho le t o 4050' was d r i l l e d i n 3 days w i t h a 9.2 lb./gal Magcogel and caust ic mud. A gyro survey was run w i t h a 3/40 dev iat ion a t 3,500'. The hole was c i r c u l a t e d and condit ioned preparatory t o running casing. F o r t y - f i v e j o i n t s o f 13 3/8" 72 l b . L-80 B.T.C. casing, a f l o a t shoe and f l o a t c o l l a r , and 69 j o i n t s o f 13 3/8" 72 lb . N-80 B.T.C. casing were run t o 4,050'. The casing was cemented t o the surface w i t h 887 sacks returned. The 13 3/8" casing was hung w i t h 200,000 1 b. on OCT Type C-29 s l i ps and then cut. The 13 5/8" 5000 lb. X 20" 3000 lb. OCT C-22 casing head was tested t o 1,400 psi . The cement and f l o a t shoe were d r i l l e d , and a l eak -o f f t e s t t o 14.0 lb./gal. mud weight equivalent was made.
INTERVAL TO 9 5/8" CASING POINT
The 12 1/4" ho le t o 10,230' was d r i l l e d i n 16 days w i t h no problems. The mud weight was gradual ly increased from 9.0 lb./gal. t o approx- imate ly 10.0 lb./gal. u n t i l a depth o f 10,102' was reached. A t t h i s p o i n t the mud weight was r a p i d l y increased t o 11.2 lb./gal., and then t o 13.1' lb./gal. a t 10,221'. Refer t o the Magcobar mud r e p o r t i n Volume I f o r a de ta i l ed review o f the mud character is t ics . The hole was then c i r c u l a t e d and condit ioned preparatory' t o logging. Sch- lumberger ran Dual Induction, Formation Density, Gamma Ray, Neutron, Sonic and Dipmeter logs. Twenty-four s idewal l cores were attempted across the geopressured t r a n s i t i o n zone w i t h 16 cores recovered. Bottoms up were c i r c u l a t e d and 40 u n i t s o f gas were recorded. The hole was then c i r c u l a t e d preparatory t o running casing.
E ight j o i n t s o f 9 5/8" P-110 47 lb./ f t . , and 225 j o i n t s o f 9 5/8" N- 80 47 l b . / f t . casing were run t o 10,230'. The 9 5/8' casing was then cemented, and allowed t o se t up f o r 16 hours. The p ipe was then pul led. The p ipe sl ipped and the cement was allowed t o set another 6 hours. A temperature survey was run w i t h the cement top determined a t approximately 6,400'. The 9 5/8" casing was then pu l l ed t o 810,000 lb. and stretched 54". A gyro survey was r u n from 11,000' t o 3,987' with a ho r i zon ta l displacement equal t o 51.33' a t N390 18'W.
Hard cement and 10' o f formation was then d r i 1 l e d t o 10,240', and the casing shoe tested t o 1,500 ps i . A l eak -o f f t e s t w i t h 14.0 lb./gal. mud equivalent t o 16.8 lb./gal. tested O.K.
INTERVAL TO 7 5/8" CASING POINT
While d r i l l i n g the 8 1/2" ho le t o the 7 5/8" casing p o i n t unstable ho le condi t ions resu l ted i n the d r i l l b i t being stuck a t 13,556'.
20

After washover and f i s h i n g operations, the hole was plugged back a t 11,015'. A random sidetrack was then s t a r t e d a t 10,645'.
A f t e r s e t t i n g t h e 9 518'' casing t h e hole wdf d r i l l e d t o 11,155' w i t h 13.8 lb./gal. mud gradual ly increased t o 14.5 lb./gal. A t 11,155' 851 u n i t s o f t r i p gas were recorded. A d r i l l i n g break was noted a t
. 11,728' t o 11,732'. A d i r e c t i o n a l survey was r u n a t 11,987' and the instrument was l o s t i n the hole. The d r i l l p ipe was r a b i t t e d and junk d r i l l e d from11,960' t o 11,987'. D r i l l i n g continued t o 12,460' where a survey was attempted a t 12,457'. The survey was rnisrun and d r i l l i n g continued t o 12,064', where another survey was run. D r i l l i n g continued t o 12,872', and t h e ho le reamed from 12,800' t o 12,872'.
D r i l l i n g continued w i t h a d r i l l i n g break a t 12,808' t o 12,894'. Some s l i g h t movement was noted, and the hole was c i r c u l a t e d and mud weight increased t o 15.3 lb./gal. Maximum gas was recorded a t 1,080 uni ts , w i t h background gas a t 280 uni ts . The mud weight was increased t o 15.5 lb./gal., and t h e background gas dropped t o 19 un i t s . D r i l l i n g continued t o 13,126', where 10 stands o f p ipe were pu l l ed and the hole was not t ak ing mud. Bottoms up were c i r c u l a t e d w i t h excessive l a rge cu t t i ngs and 440 u i n i t s o f gas. The 15.6 lb./gal. mud weight was c u t t o 14.2 lb./gal. The gas was c i r c u l a t e d o u t o f the hole and the d r i l l p ipe was pul led. Went i n the hole and washed from 13,050' t o 13,126', and d r i l l e d t o 13,140'. The hole was c i r c u l a t e d t o c lea r bottoms up. Maximum gas was recorded a t 1,400 un i t s , w i t h 12,900 Clp.
I
u
D r i l l i n g continued t o 13,273' where c i r c u l a t i o n w i t h 15.8 lb./gal. mud was l o s t . C i r c u l a t i o n pressure was reduced t o attempt t o regain c i r c u l a t i o n . The p ipe was slugged twice, and 33 stands o f p ipe were pu l l ed s lowly back i n t o the 9 5/8" casing. C i r cu la t i on was attempted a t 10,230', b u t re tu rns were l o s t . The mud weight was c u t f rom 15.8 lb./gal. t o 15.6 lb./gal., and waited f o r t h e hole t o heal. The hole was allowed t o heal f o r 5 1/2 hours and then c i r c u l a t i o n was resumed slowly. Bottoms up a t 10,230' were c i r c u l a t e d with 43 u n i t s o f gas. Went back i n the hole wi th 18 stands o f p ipe and c i r c u l a t e d bottoms up a t 11,964'. There were excessive shale c u t t i n g s and 472 u n i t s o f gas. Went i n the hole with 10 stands o f pipe, and again c i r c u l a t e d bottoms up w i t h less shale and 294 u n i t s o f gas. Went i n the hole w i t h 1 stand o f p ipe and s t a r t e d t o take weight. The ho le was reamed t o 13,273', w i t h some excess shale noted, and 199 u n i t s o f gas recorded. The hole was then d r i l l e d t o 13,335' with only 16 u n i t s o f gas recorded. The hole was then d r i l l e d t o 13,554' w i th 15.6 lb./gal. mud wi th no f u r t h e r problems.
A t t h i s point, 13,554', a 20 stand sho r t t r i p was made t o 11,700' i n order t o pressure t e s t the hole. The w e l l s ta r ted t o swab i n w i t h 15.6 lb./gal. mud. The b i t was lowered back t o bottom and d r i l l e d t o 13,556'. For over h a l f an hour 15.8 lb./gal. mud was c i rcu la ted, and then the w e l l s t a r t e d f lowing. The Cameron annular BOP was closed with 800 p s i on the casing and 50 p s i on the d r i l l pipe, and the w e l l was c i r c u l a t e d through the choke. The 13 3/8" Cameron annular BOP s ta r ted leaking. The rams were closed and the w e l l k i l l e d . The mud was c u t t o 8.5 lb./gal. with gas and 27,000 ppm C12. The rams were opened and c i r c u l a t i o n was attempted, b u t the pipe was stuck. A
Bd
21

U
Schlumberger temperature survey was run from the surface t o 13,550'. A CBL-VDL-GR l o g was run from 13,527' t o 10,000', and a second temperature survey was r u n from 13,530' t o 9,000'. The b i t appeared t o be stuck a t 13,520'. Mud was pumped through the d r i l l pipe f o r h a l f an hour a t 650 lb. a t 20 strokes per minute, and a t 1,050 lb . a t 28 strokes per minute.
A 1 13/16' junk shot was run t o 13,531' and f i r e d t o remove the b i t j e t s . The d r i l l s t r i n g was then cemented. The annulus s ta r ted t o flow 30 minutes a f te r p lac ing the cement, and a f t e r 12 hours pressure increased t o 400 p s i on the d r i l l p ipe and t o 210 p s i on the annulus. The pressure on the d r i l l p ipe was b led t o 0 psi , and a f t e r 6 hours the pressure on the annulus increased t o 300 ps i .
The formation broke down a t 1,250 ps i .
Another temperature survey was run from 12,924' t o 8,000' and a CBL- VDL-GR log was run from 13,500' t o 8,000'.
A Gyro d i r e c t i o n a l survey was run, and t h e temperature l o g was rerun from 10,530' t o 8,000'. A Dialog s t r i n g shot and f r e e p o i n t i n d i c a t o r were run. A comparison o f the logs and f r e e p o i n t i nd i ca to r showed the p ipe stuck a t 11,000' and f r e e a t 10,472'. The w e l l was shut i n and the annulus pressure increased t o 100 ps i . The d r i l l pipe was pressured t o 1,500 p s i and 1 bbl . o f f l u i d was in jec ted a t a bb l ./min. ra te. The pressure decl ined t o 520 p s i on the d r i l l p ipe and increased t o 210 p s i on the casing. The 5" d r i l l pipe was perforated from 12,520' t o 12,591' w i t h f i v e 0.33'' holes using a 21 1/8" Hyperjet gun. The w e l l was then c i rcu la ted. The 5" d r i l l p ipe was again per forated from 12,585' t o 12,586' w i t h f i v e 0.33" holes using a 2 1/8" Hyperjet gun. The we l l was again c i rcu la ted.
The p ipe was worked f o r 1 hour attempting t o re-establ ish c i r c u l a t i o n and the p ipe parted a t 4,712'. The w e l l s ta r ted t o f l o w and it was shut i n w i t h 160 p s i on the casing. F i f t y stands o f p ipe were chained out o f the hole. Went back i n the hole and screwed i n t o t h e f i s h a t 4,712'.
A f r e e p o i n t i n d i c a t o r was yun and showed the p ipe stuck a t 9,350' i n s i d e the 9 5/8" casing.
The d r i l l p ipe was per forated a t 10,120'. The d r i l l p ipe was then per forated a t 9,350', but c i r c u l a t i o n s t i l l could not be established. The d r i l l p ipe was then pu l l ed t o 320,000 lb. t o 9,290' before the f i s h came f r e e and c i r c u l a t i o n was established. The hole was c i r c u l a t e d and the mud condit ioned and cu t from 15.1 lb./gal. t o 14.0 lb./gal. t o stop mud loss.
The hole was then re-entered w i t h f i s h i n g t o o l s t o wash out and around the stuck d r i l l pipe. The d r i l l p ipe was screwed i n t o a t 9,354'. A f r e e p o i n t i n d i c a t o r and c o l l a r l oca to r w i t h s t r i n g shot was r u n and the p ipe was backed o f f a t 10,147'. The hole was then c i r c u l a t e d t o 10,147' and 27 j o i n t s o f d r i l l p ipe and 2 damaged j o i n t s w i t h per forat ions were recovered.
While washing over the f i s h a t 10,235' the wel l s ta r ted f lowing. The d r i l l p ipe was shut i n w i t h 100 ps i , and the casing w i t h 260 ps i . The mud weight was increased from 14.1 lb./gal. t o 15.1 lb./gal. The shut
L,
22

LJ
i n pressure increased t o 800 p s i on the d r i l l p ipe and 900 p s i on the casing. The w e l l was then c i r cu la ted through the choke whi le washing over the f i s h from 10,235' t o 10,363'. The c i r cu la ted mud was cu t from 15.6 lb./gal. t o 15.3 lb./gal. w i th 360 u n i t s o f gas. The hole was c i r cu la ted clean and the f i s h re-engaged. A f r e e p o i n t and s t r i n g shot were run which showed the pipe f r e e a t 11,000' i n torque and f r e e a t 12,000' i n tension. The 5" d r i l l p ipe was backed o f f a t 11,015'. The f i s h and wash p ipe were pu l l ed back i n t o the 9 5/811 casing and then p u l l e d out o f the hole. Ah open hole plug was cemented a t 11,015' on top o f the f i s h .
The hole was then reamed from 10,550' t o 10,579' and cement d r i l l e d from 10,579' t o 10,602'. The shoe and format ion tested t o 16.8 lb./gal . equivalent. Schlumberger ran a borehole geometry l o g from 10,608' t o 10,234'.
SIDETRACKED INTERVAL TO 7 5/8" CASING POINT
On November 11, 1980, a random sidetrack was begun by d r i l l i n g w i t h a Dynadri l from 10,645' t o 10,725'. A survey showed a dev ia t ion o f 1 3/4O a t 10,523'. The hole was then d r i l l e d t o 11,891' with per iod ic surveys t o check hole i nc l i na t i ons .
The bottom-hole assembly and a l l surface equipment were checked and tested, and the hole d r i l l e d t o 12,203'. The hole was c i r c u l a t e d and the mud weight ra ised t o 15.4 lb, /gal . The hole was then d r i l l e d t o 12,614. The hole was then d r i l l e d t o 12,723' where the p ipe became stuck b r i e f l y . The hole was then reamed from 12,164' t o 12,723', and d r i l l e d t o 12,894'. The d i r e c t i o n a l survey showed a 40 deviat ion. The hole was s lowly reamed from 12,804' t o 12,894', and d r i l l e d t o 13,077'. The hole was d r i l l e d t o 13,155', and then d r i l l i n g continued t o 13,550'. The hole was then d r i l l e d t o 13,680', where a t r i p was made t o change the s t a b i l i z e r pos i t ions. Deviat ion a t t h i s po in t was 6 3/40.
D r i l l i n g was continued t o 14,146', w i t h a d r i l l i n g break a t 13,858'. The surface equipment was tested and the hole d r i l l e d t o 14,480'. The hole was then d r i l l e d t o 14,725', and reamed from 14,591' t o 14,651'. The ho le was then d r i l l e d t o 14,856'. The top o f the Camerina I 1 sand was noted a t 14,856'.
D r i l l i n g continued t o 15,065', w i t h the f i r s t appearance o f the m ic ro foss i l Miogypsinoides a t 14,958'. The hole was c i r c u l a t e d and condi t ioned preparatory t o logging. The top o f the Miogyp sand was a t approximately 15,065'. Deviat ion a t 15,065' was 8 1/20.
Schlumberger ran ISF-Sonic, CNL-FDC-GR, and Dipmeter logs. For ty- e i g h t s idewal l cores were attempted from 12,875' t o 15,065'. Forty- two were recovered, data from 26 was re t r ieved, and 6 cores were l o s t i n the hole.
251 j o i n t s o f 7 518" 39 l b . SFJ casing was run t o 15,065', and then cemented.
A 4 3/4" d r i l l c o l l a r assembly was lowered t o tag the cement top a t 9,750'. The cement was d r i l l e d from 9,750' t o 9,814'.
23

hi
Five inch drill pipe was then run in the hole to the float collar at 14,980'. The float collar, 84' of cement, the float shoe, and 5 ' of formation were drilled to 15,070'. The casing shoe was tested to 17.0 lb./gal. equivalent.
INTERVAL TO 5 1/2" LINER POINT (TOTAL DEPTH)
A 6 1/2" 533F bit was lowered to bottom and drilling continued to 15,144' . The Schlumberger RFT tool was run with a pressure differential of 1 lb./gal. or 800 psi. Pressure in the sand at 15,144' was indicated at 11,990 psi.
After conditioning the hole a 4 1/8" X 2 1/8" 60' core barrel was run into the hole. The diamond bit was a 6" X 2 1/8" type MC-20. The hole was cored from 15,144' to 15,185' when the core barrel jammed. The core was pulled after coring 41' of section with 36' of recovery.
A 6 1/2" bit was lowered to 15,144' and a 6" rat hole was reamed to 15,182'. The 6" bit was pulled and the second core barrel was lowered. The hole was cored from 15,185' to 15,204' when the barrel again jammed. When the diamond bit was removed there was evidence of junk on top of the bit, but there was no damage to the bit. Nineteen feet of section was cored with 17' of recovery in the second coring run.
A rat hole was reamed from 15,144' to 15,204', then drilled from 15,204' to 15,234'. The hole was then drilled from 15,234' to 15,389'.
The hole was cored from 15,389' to 15,408'. Nineteen feet of section were cored with 17' of recovery. The hole was then reamed and drilled from 15,408' to 15,435'.
A 6 1/2" hole was then drilled from 15,435' to 15,600'.
The fourth coring run was then made from 15,600' to 15,634' with 32' of recovery. A 5-33 bit was then used to ream a rat hole from 15,600' to 15,694' and then drill from 15,634' to 15,740' - total depth.
an an ISF-Sonic-GR log to total depth. A maximum recording thermometer recorded 3OO0F bottom-hole temperature. An FDC-CNL-GR log was run, and again the maximum recording thermometer recorded 300OF. A dipmeter log was run, and the maximum bottom-hole temperature recorded at 300OF. Deviation at total depth, 15,740, was 18 1/20.
Eight joints of 5 1/2" 25.5 lb./ft. FL4S casing were run as a liner with shoe, float collar, polished-bore receptacle, liner, hanger, and tie-back sleeve. The 5 1/2" liner was run to 15,735' on the drill pipe and cemented. The float collar was at 15,661 PBTD. The top o f the 7 5/8" tie-back sleeve was at 14,535'.
24

'W
Two hundred forty-seven j o i n t s o f 7 5/8" casing w i t h an 8.58' stem i n t o the l i n e r t ie-back sleeve was run and set a t 9,815'. The s t r i n g which had had 1 j o i n t o f FJP casing 43.15' from the stem t o the f l o a t c o l l a r , and 2 j o i n t s o f FJP t o the cross-over (1.12') and 243 j o i n t s o f X- l ine casing was run and cemented.
The cement d i d set up f o r 46 hours before an attempt t o pre-stress the 7 5/8" casing was made. The casing pu l l ed f r e e w i t h on l y 30,000 lb . o f tension. Schlumberger ran a temperature survey and located the p lug a t 8,995, w i t h cement t o 8,780'.
The 7 5/8" t ie-back s t r i n g was then cemented again. The cement set f o r 18 hours and a Schlumberger Temperature Survey showed the cement t o p ins ide the 7 5/8" casing a t 9,438'. Waited on cement approx- imate ly 24 hours and pu l l ed 65,000 l b . above the pipe weight. There was a s l i g h t movement o f the pipe. The pipe was set back i n the PBR w i t h 35,000 lb . and continued t o wa i t on the cement. A f t e r an addi t ional 8 hours the casing moved w i t h 60,000 lb . o f p u l l .
Again the 7 5/8" casing was stressed and i t pu l l ed f r e e a t 40,000 lb . above the weight o f the s t r i ng . The hole was c i r c u l a t e d and H a l l i b u r t o n cemented the 7 5/8" t ie-back s t r i nq . A f t e r 18 hours a Sch lumberger Temperature Survey 1 ocated cement- ins ide the casing a t 9,570'.
A f t e r an addi t ional 63 hours o f wa i t i ng on the cement, 8 1 hours i n a l l , the 7 5/8" casing was p u l l e d w i t h 650,000 lb . and the s l i p s set. The 7 5/8" casing was c u t and a 9" - 10,000 p s i Tubing Spool, and double studded adapter f lange 9" - 10,000 p s i X 13 5/8" - 10,000 p s i were i n s t a l l e d . The casing hanger was tested t o 7,000 ps i .
A 6 1/4" bladed m i l l was used t o d r i l l the cement plug a t 9,546', and d r i l l e d cement t o 9,596'. Cement was then d r i l l e d t o 9,622'. A 6 1/4" b i t was used t o d r i l l cement t o 9,825', and the 7 5/8" casing was gauged i n the hanger spool. The s l i p s had swagged the p ipe inward t o 6,375'. The b i t was run i n the hole w i t h 2 7/8" tub ing and the 7 5/8" casing cleaned from 12,719' t o 14,536'. No cement was found a t t he top o f the 5 1/2" l i n e r a t 14,534'.
The hole was c i r c u l a t e d a t the l i n e r top, and the 7 5/8" casing, 7 5/8" t ie-back sleeve, and top o f the 5 1/2" l i n e r were tested t o 2,000 p s i w i t h 15.2 lb./gal. mud. A 6 3/8" m i l l and 7 5/8" casing scraper were used t o scrape the casing. A Type M-14 Packer and jars, and 6 d r i l l c o l l a r s were r u n i n the hole, and the packer was se t a t 14,419'.
A d r y t e s t o f the 5 1/2" l i n e r 'top was made w i t h a 4,300 p s i d i f f e r e n t i a l . The tub ing was displaced w i t h 42.5 bbl. o f water, and the t ie-back tested w i t h 2,908 ps i . d i f f e r e n t i a l . Schlumberger ran temperature and EBL-VDL logs from 15,661' t o 9,450'.
A Brown O i l Tools 5 7/16" Pol ish ing M i l l was run i n t o the PBR a t 14,558'. A Dummy Seal Assembly was r u n t o 14,536' The casing s ide o f t he seal was tested t o 2,000 psi, and the tub ing side t o 3,500 ps i .
'
L/
25
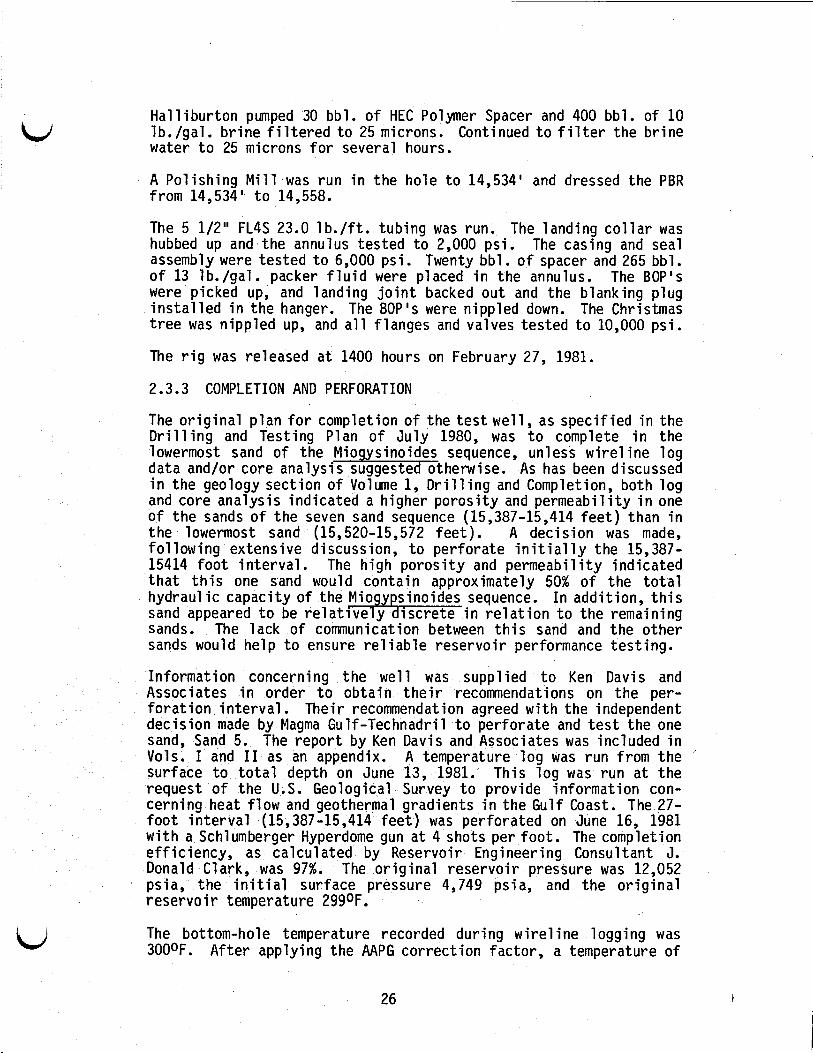
Halliburton pumped 30 bbl. of HEC Polymer Spacer and 400 bbl. of 10 lb./gal. brine filtered to 25 microns. Continued to filter the brine water to 25 microns for several hours.
A Polishing Mill was run in the hole to 14,534' and dressed the PBR from 14,534' to 14,558.
The 5 1/2" FL4S 23.0 lb./ft. tubing was run. The landing collar was hubbed up and the annulus tested to 2,000 psi. The casing and seal assembly were tested to 6,000 psi. Twenty bbl. of spacer and 265 bbl. of 13 lb./gal. packer fluid were placed in the annulus. The BOP's were picked up, and landing joint backed out and the blanking plug installed in the hanger. The BOP's were nippled down. The Christmas tree was nippled up, and all flanges and valves tested to 10,000 psi.
The rig was released at 1400 hours on February 27, 1981.
2.3.3 COMPLETION AND PERFORATION
The original plan for completion of the test well, as specified in the Drilling and Testing Plan of July 1980, was to complete in the lowermost sand of the Mio ysinoides sequence, unless wirel ine log
in the geology section of Volume 1, Drilling and Completion, both log and core analysis indicated a higher porosity and permeability in one of the sands of the seven sand sequence (15,387-15,414 feet) than in the lowermost sand (15,520-15,572 feet). A decision was made, following extensive discussion, to perforate initially the 15,387- 15414 foot interval. The high porosity and permeability indicated that this one sand would contain approximately 50% of the total hydraulic capacity of the Mio sinoides sequence. In addition, this
sands. The lack of communication between this sand and the other sands would help to ensure reliable reservoir performance testing.
Information concerning the well was supplied to Ken Davis and Associates in order to obtain their recommendations on the per- foration interval. Their recommendation agreed with the independent decision made by Magma Gulf-Technadril to perforate and test the one sand, Sand 5. The report by Ken Davis and Associates was included in Vols. I and I1 as an appendix. A temperature log was run from the surface to total depth on June 13, 1981. This log was run at the request of the U.S. Geological Survey to provide information con- cerning heat flow and geothermal gradients in the Gulf Coast. The 27- foot interval (15,387-15,414 feet) was perforated on June 16, 1981 with a Schlumberger Hyperdome gun at 4 shots per foot. The completion efficiency, as calculated by Reservoir Engineering Consultant J. Donald Clark, was 97%. The original reservoir pressure was 12,052 psia, the initial surface pressure 4,749 psia, and the original reservoir temperature 299OF.
data and/or core analysis --9----6. suggeste otherwise. As has been discussed
sand appeared to be relative + y iscrete in relation to the remaining
The bottom-hole temperature recorded during wirel ine logging was 300OF. After applying the AAPG correction factor, a temperature of
26 I
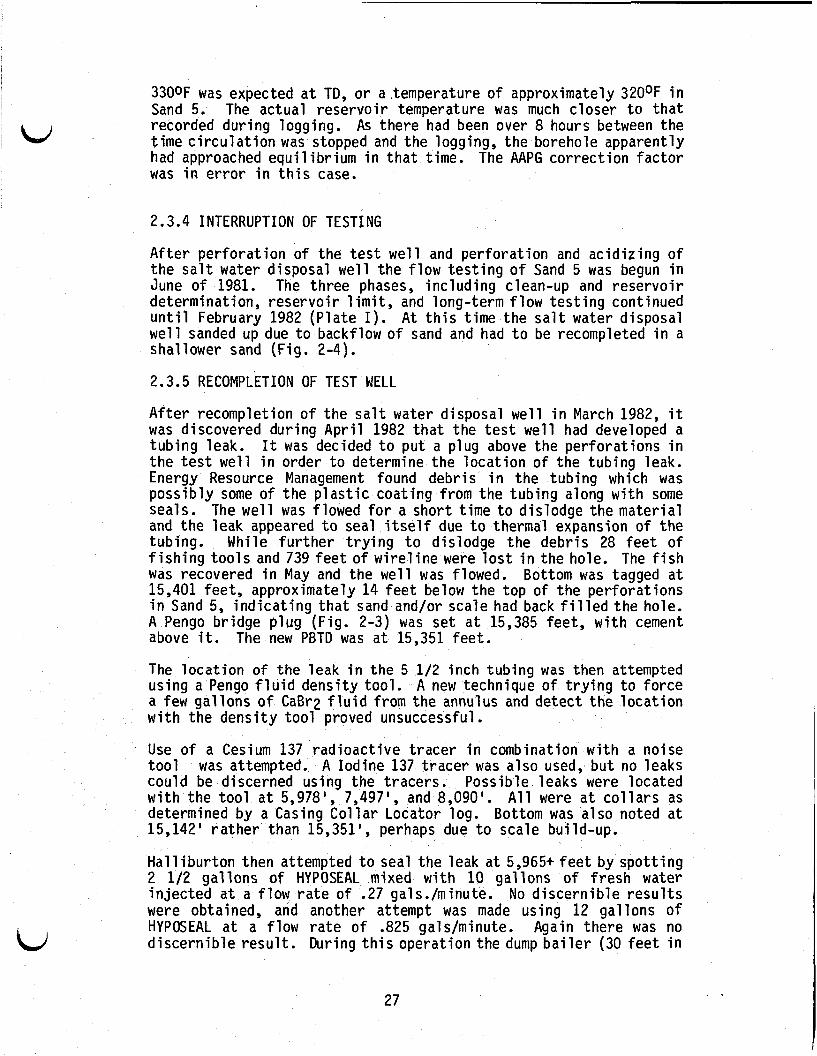
330OF was expected at TD, or a temperature of approximately 320°F in Sand 5. The actual reservoir temperature was much closer to that recorded during logging. As there had been over 8 hours between the time circulation was stopped and the logging, the borehole apparently had approached equilibrium in that time. The AAPG correction factor was in error in this case.
2.3.4 INTERRUPTION OF TEST1 NG
After perforation of the test well and perforation and acidizing of the salt water disposal well the flow testing of Sand 5 was begun in June of 1981. The three phases, including clean-up and reservoir determination, reservoir 1 imit, and long-term flow testing continued until February 1982 (Plate I). At this time the salt water disposal well sanded up due to backflow of sand and had to be recompleted in a shallower sand (Fig. 2-4).
2.3.5 RECOMPLETION OF TEST WELL
After recompletion of the salt water disposal well in March 1982, it was discovered during April 1982 that the test well had developed a tubing leak. It was decided to put a plug above the perforations in the test well in order to determine the location of the tubing leak. Energy Resource Management found debris in the tubing which was possibly some o f the plastic coating from the tubing along with some seals. The well was flowed for a short time to dislodge the material and the leak appeared to seal itself due to thermal expansion of the tubing. While further trying to dislodge the debris 28 feet of fishing tools and 739 feet of wireline were lost in the hole. The fish was recovered in May and the well was flowed. Bottom was tagged at 15,401 feet, approximately 14 feet below the top o f the perforations in Sand 5, indicating that sand and/or scale had back filled the hole. A Pengo bridge plug (Fig. 2-3) was set at 15,385 feet, with cement above it. The new PBTD was at 15,351 feet.
The location of the leak in the 5 1/2 inch tubing was then attempted using a Pengo fluid density tool. A new technique of trying to force a few gallons of CaBr2 fluid from the annulus and detect the location with the density tool proved unsuccessful.
Use of a Cesium 137 radioactive tracer in combination with a noise tool was attempted. A Iodine 137 tracer was also used, but no leaks could be discerned using the tracers. Possible leaks were located with the tool at 5,978', 7,497', and 8,090'. All were at collars as determined by a Casing Collar Locator log. Bottom was also noted at 15,142' rather than 15,351', perhaps due to scale build-up.
Halliburton then attempted to seal the leak at 5,965+ feet by spotting 2 1/2 gallons of HYPOSEAL mixed with 10 gallons of fresh water injected at a flow rate of .27 gals./minute. No discernible results were obtained, and another attempt was made using 12 gallons of HYPOSEAL at a flow rate of .825 gals/minute. Again there was no discernible result. During this operation the dump bailer (30 feet in
27
length with a 2 1/2 inch threaded lockup) was lost from the wireline at 6365'.
Attempts to retrieve the dump bailer were abondoned in July 1982 because no further funding was available from DOE for a rig which was determined necessary to solve the problem. The tool remained in the hole until retrieved after start up operations began in August 1983.
During the intervening 12 months Magma Gulf-Technadril submitted plans and procedures along with cost estimates to the DOE for implementing the recovery and recompletion of the test well.
In August 1983, Pride Rig No. 834 moved on site to begin recovery operations. Bottom was tagged at 14,451', after washing at 14,520'. The top of the fish was located at 15,105 feet and pushed to 15,144'. The complete fish was then recovered in good condition after being in the well for almost a year.
The well was then tested with a 4 3/8 inch Halliburton RTTS packer. The packer was moved to various depths and checked for pressure leaks. After testing it was clear that there were two leaks; one below 14,448' in the seal assembly, and a second at about 5,980'. There was the possibility of a third leak above 75' in the tubing hanger.
The Pride rig which was not big enough to handle the 5 1/2" tubing was released and Petrostar Rig No. 2 was moved on site to pull the 5 1/2 inch tubing.
The 5 1/2 inch tubing was worked and moved approximately 24 inches. A pull of 415,000 pounds was made and it was determined with a free point that the seals were stuck.
An internal cut was made in the 5 1/2 inch tubing at 14,456' or 64' above the stuck seal assembly. The cutting tool twisted and part o f the 2 7/8 inch drill pipe assembly had to be fished from the hole. 334 joints of C-95 X line 5 1/2 inch tubing were recovered along with the Baker Model L sliding sleeve and the BOT seal assembly. The hole was then washed to 15,345 feet.
A preliminary check of the 5 1/2 inch tubing indicated that it was clean and in good condition. There was some pin-end corrosion on joints with FL4S connections that were deep in the well. The 334 joints were visually inspected with 25 rejects because of problems with pins and boxes. Of 201 joints hydrostatically tested to 10,000 psi there were 53 rejects because of bad pin ends. Of 120 joints tested for drift there were no rejects. It was ultimately necessary to scrap only 5 joints o f the original 334. Additional joints of P-
I 110 X line treated with Spincote 850 epoxy coating were acquired to recomplete the-test well. A detailed analysis of the tubing condition was completed by Oil Technology Services, Inc. (TD-06)
The well was again washed to 15,346' to clean out any scale which might have formed. Welex then ran gamma ray and CCL logs in preparation for perforating. Total depth was 15,322'. An Otis WBR packer was set at 14,508'. Fluids were displaced with clean 10.5 ppg.
I
i
28

Ca CL2 packer f l u i d w i t h D-302 corrosion i n h i b i t o r added. The we l l was then pressure tested t o 5,000 p s i w i t h no problems.
The we l l was then perforated a t 15,260 - 15,280', and 15,245 - 15,255' w i t h 4 shots per foot . A f t e r perforat ing, bottom hole pressure a t 15,245' i n Sand 3 was 11,887 psia, w i t h a temperature o f 293OF. The surface pressure was 3,660 psia. The we l l was then flowed a t a r a t e o f 2800 B/D t o the blow down tanks i n order t o clean the we l l i n preparat ion f o r t e s t i n g o f Sand 3.
Bottom was a t 15,312'.
2.4 DISPOSAL WELL
2.4.1 INTRODUCTION
The disposal we l l f o r the Sweet Lake t e s t s i t e (MG-T/DOE AMOCO SWD we1 1) was designed t o demonstrate the f e a s i b i l i t y o f successful ly disposing l a rge q u a n t i t i e s o f geopressured-geothermal b r i n e (up t o 40,000 ba r re l s per day). These f e a s i b i l i t y studies included i n - j e c t i v i t y tests, s ide w a l l core analysis, the e f f e c t s o f chemical i n h i b i t o r s , as we l l as the chemical e f fects o f t he produced b r i n e on the long-term c a p a b i l i t i e s o f the disposal wel l and sands.
The s a l t water disposal w e l l was spudded on September 19, 1980 and completed d r i l l i n g operations on October 13, 1980. This wel l , which i s depicted i n Figure 2-4, was d r i l l e d t o a t o t a l depth p f 7,440'. A d e t a i l e d h i s t o r y o f the w e l l i s presented i n Volume I.
The 13-5/8 inch casing was set a t 1,375 f e e t and cemented back t o the surface. The 9-5/8 inch casing was set a t 7,436' and cemented back t o 1,970'. The Plugged Total Depth (PBTD) i ns ide the 9-5/8 inch casing was 7,350'.
This w e l l was completed w i t h a Baker Model F packer set a t 6,254'. It should be noted t h a t the f i r s t packer f a i l e d t o set and was pushed t o PBTD. The production tub ing i n t h i s we l l was 7-inch 23# K-55. The 7" x 9-5/8" annulus was f i l l e d w i t h an i n h i b i t e d b r ine so lu t i on w i t h a dens i t y o f 9.5 ppg.
2.4.2 DRILLING HISTORY
On September 18, 1980, the Goldrus D r i l l i n g Co. Rig No. 4 began moving on l o c a t i o n a t the Sweet Lake s i t e . Rig up operations were completed on September 19, and the 20" conductor pipe was d r i ven t o a depth o f 93'.
INTERVAL TO 13 3/8" CASING POINT
A 17 1/2" hole was d r i l l e d t o the 13 3/8" casing p o i n t i n 3 1/2 days. The d r i l l i n g f l u i d was a Bar i te, Gel, and caust ic mud t h a t was gradual ly increased from 8.7 lb./gal. t o 8.9 lb./ gal.
'
Schlumberger ran Induct ion and Borehole Geometry logs from 1,375' t o 96'. The hole was c i rcu la ted, and 20 j o i n t s o f 72 l b . N-80 and 10 j o i n t s o f 68 lb. K-55 13 3/8" casing were run and cemented. The 20" and 13 3/8" casing were cut, and the 13 5/8" Bradenhead was welded i n
29

place and tested t o 1,100 psi . A Gyro survey was run from 1,280' t o 100'. Location r e l a t i v e t o the surface was 3.51' N 81° 59'W. The BOP'S were tested t o 5,000 ps i , and the Hydr i l t o 3,500
INTERVAL TO 9 5/8 CASING POINT (TOTAL DEPTH)
A 12 1/4" b i t was used t o tag the cement a t 1,290', and the plugs and cement were d r i l l e d t o 1,375'. A 12 1/4" hole was d r i l l e d t o t o t a l depth o f 7,436' using a d r i l l i n g f l u i d t h a t was gradual ly increased from 9.0 lb./gal. t o 9.2 lb./gal. The formation was then d r i l l e d t o 4,757'. Surveys were run a t 1,888'; 2,392'; 2,908'; 3,410'; 3,910'; 4,155'; and 4,600'. The maximum deviat ion was 3/4O a t 4,600'.
The hole was then d r i l l e d t o 6,316'. A survey a t 6,159' showed 1/2O deviat ion. D r i l l i n g continued t o 6,580' when the s t a b i l i z e r s ba l l ed up and the p ipe stuck. This was caused by d r i l l i n g w i t h a high v i s c o s i t y mud which was the r e s u l t o f not having reserve p i t s avai lable. The hole was then d r i l l e d t o 7,440'. A survey a t 7,170' showed 00 deviat ion.
A f t e r t o t a l depth o f 7,440' was reached, the hole was condit ioned preparatory t o logging. Schlumberger ran an ISF/Sonic l o g from 7,458' (Schlumberger w i re l i n e reading) t o 1,383'. FDC-CNL-GR and Borehole Geometry logs were a lso run from 7,458' t o 1,383'. Sidewall cores were taken from 7,400' t o 6,700'. Th i r t y - fou r cores were attempted and recovered. The cores were taken a t selected po in ts throughout the i n t e r v a l o f prospective i n j e c t i o n sands. The hole was then cleaned up and c i r c u l a t e d preparatory t o running casing.
Two hundred and two j o i n t s o f 9 5/8" casing, cons i s t i ng o f 13 j o i n t s o f 43.5 l b . S-95; 105 j o i n t s o f 43.5 lb . L-80, N-80, and S-95; 35 j o i n t s o f 401b. S-95, P-110, and N-80; and 49 j o i n t s o f 47 lb . AR-95; were run and cemented. The Schlumberger temperature survey showed the top o f the cement a t 1,970'. The 9 5/8" casing was hung w i t h 9 5/8" 510,000 lb., c u t o f f and the 9 5/8" casing spool i ns ta l l ed .
The top o f t he p lug was d r i l l e d , and the mud was displaced w i t h water. The cement was d r i l l e d from 6,637' t o 7,350'. Schlumberger ran a CBL- VDL l o g from 7,350' t o 1,850'.
The f resh water i n the hole was c i r c u l a t e d and condit ioned w i t h 100 ba r re l s o f water wi th detergent t o clean the casing. The water and detergent were displaced w i t h 9.5 lb./gal. b r i n e i n h i b i t e d t o prevent corrosion.
A casing c a l i p e r l o g was run from 7,350' t o the surface and a Gyro d i r e c t i o n a l survey was run. The coordinates were 277.30 azimuth, i n c l i n a t i o n 0.55, and t o t a l dev ia t i on 13.27' from surface.
A Baker F-1 packer was r u n i n the hole t o 6,250', but would no t set. The packer had released from the too l . A new seal assembly was run i n the hole and the packer was pushed t o 7,348'. A decis ion was made no t t o r i s k f i s h i n g f o r the packer, and a new packer was ordered.
W
'30

The second Baker F-1 packer was run in the hole but prematurely set at 1,233'. The packer was milled over 12' with an 8 3/5 x 6 7/8 milling shoe after engaging the packer and pulling 20,000 lb. to recover. The packer started moving down the hole. The pipe was pulled out of the hole but failed to recover the packer. The bottom-hole assembly was changed and the packer was pushed to 7,330'. Thirty thousand pounds were set down on the spear and the pipe was pulled, but failed to recover the packer. Went back in the hole with fishing tools, engaged the packer and recovered it.
The Baker F-1 packer was then run into the hole, and this time was set at 6,254' with no problems. A Baker 6" x 4.875 190-40 seal assembly was run in the hole to 6,255'.
The 7" casing completion string was run and spaced out. The FMC-OCT TC-1A-EN hanger was installed with 130,000 lb. on the hanger. The casing and packer seal assembly were tested to 1,500 psi.
The 11" 5,000 x 9" 5,000 Christmas tree flange was installed on top of the 9 3/4 FMC OCT TC-1A-EN hanger and capped with the 9" 5,000 x 6" 5,000 spool and 6' blind companion flange.
The tanks were cleaned and the rig was released at 2400 hours, October 12, 1980.
2.4.3 SALTWATER DISPOSAL WELL COMPLETION
Wireline log data and sidewall core analysis indicated that the salt water disposal well contained numerous sand intervals between 2,500- 7,500' that were excellent for brine disposal. Porosities were 25- 30% and air permeabilities averaged around 1 darcy, with a range of 200 to 2100 md.
Plugging and pressure build-up due to calcium carbonate precipitation were postulated to inhibit disposal. It was therefore decided to perforate an interval larger than the calculated minimum interval necessary to dispose of 40,000 B/D.
The sands selected were between 7,000-7,300', and were the lowermost in the section. Additional sands above these would then be available if necessary.
Information was again submitted to Ken Davis and Associates for per- foration interval selection. Their recommendation agreed with the intervals chosen by Magma Gulf-Technadril. This report was included as Appendix I1 in Vol. 11. Approximately 200' of sand were perforated in June, 1981 with a Schlumberger gun at 4 shots per foot.
SALTWATER DI SPOSAL WELL ACID IZING
The disposal well was not acidized immediately following its per- foration. However, immediately after flowing from the test 'well began, the pressure increased to 800 psia. The flow was diverted back
31

to the blowdown tanks, and Halliburton acidized the disposal well as follows:
1) 48 bbl 15% HC1 = 15% Pen-5 + 2% HAI-55 2) 96 bbl reg. HF + 15% HC1 + 15% Pen-5 + 2% HAI-55 3) 24 bbl 15% HC1 + 15% Pen-5 + 2% HAI-55 4) 12 bbl MAT - OWG (Plugging Agent) 5) 48 bbl 15% HC1 + 15% Pen-5 + 2% HAI-55 6) 96 bbl reg. HF + 15% Pen-5 + 2% HAI-55 7) 48 bbl clay fix water
Pen-5 and HAI-55 are inhibitors. This acid treatment successfully cleaned the disposal well such that back pressure was reduced to a nominal value, less than 100 psi at full flow.
After a short time back pressure in the disposal well again increased. The disposal well was acidized a second time. 24,000 gallons o f HCL acid were pumped in 4,000 gallon increments, alternated with 4,000 gallons of HF acid. A total of 20,000 gallons of HF acid was pumped. An injectivity test was run to determine the results of the second acid treatment. An injection rate of 13 bbls. per minute at 300 psi, was followed by an injection rate of 16 bbls. per minute at 400 psi. The second acidizing treatment was very successful with a resulting disposal well head pressure of approximately 50 psig at a brine flow rate of 16,000 B/D. No further problems with back pressure were encountered until the disposal well began sanding up after periods of shut-in of the test well in February of 1982.
2.4.5 RECOMPLETION SALTWATER DISPOSAL WELL
On February 12, 1982 back pressure in the disposal well increased to 800 psig. Fine sand had backflowed through the perforations. The top of the sand was at 6,902' which was 98' above the top of the perforated zones. PBTD in the disposal well was 7,365', so approximately 462' of sand had flowed through the perforations.
hi
NOWSCO came on site to use a coiled tubing Nitrogen jet to clean the disposal well. 230' of sand were removed with the top of the sand then at 7,132'. While jetting part of the coiled tubing was lost in the hole. While trying to retrieve the coiled tubing the disposal well sanded up to a depth o f 2,600'. This increased sanding was probably initiated by the jetting operation and the loss of tubing preventing circulation and repressuring of the well.
The well was cleaned by jetting Nitrogen and milling the coiled tubing. The well was then cleaned to a depth o f 4,530'. The 7 inch production tubing was cut at 4,500' and pulled from the hole. A NL McCul.lough Model S drillable bridge plug was set at 4,627', with 11' of cement above it. A Baker Model F packer was set at 2,016' (Fig.2- ). The well was then perforated from 3,976' to 4,425' with 4 shots per foot, opening 230' of sands. An injectivity test equivalent to a flow rate of 24,000 B/D was then run. It was determined that acidizing would be necessary to sustain a high rate (24,000 B/D) o f flow, but
, 32

would not be necessary a t the lower expected flow r a t e from the Sand 3 f low t e s t . No problems with back pressure were encountered during the subsequent f low test ing. A h is tory o f disposal wel l surface pressure during the test ing o f Sand 3 i s presented i n P l a t e 11.
I
33

I
1 3.0 GEOLOGY
The geological interpretation of the Sweet Lake prospect was originally based on seismic, gravity, and regional well log data. Subsequent to the drilling of the test well, information from the Sweet Lake well and other sources led to some modification of the original interpretation of the geology. However, these data plus reservoir modeling studies have confirmed the original basic geologic model of the Sweet Lake prospect.
3.1 REGIONAL GEOLOGIC SETTING
LJ
-
During the Cenozoic Era, the continental margin of southwestern Louisiana has progressively bui It Gulfward through processes of sedimentation. The upper slope and outer shelf are normally characterized by instability with a tendency to form gigantic slumps. Simultaneous sedimentation results in contemporaneous growth faults with abnormally thick deposits of deeper water facies on the basin side, contrasted to shallower water or deltaic deposits on the shoreward side. As a shelf edge moves intermittently basinward, continental facies of massive sands o f relatively even thick- ness and low dip are superposed on the earlier faulted and tilted shales and sands of variable thickness.
In southern Louisiana, these sediments of geosynclinal thickness have been superposed on the deeply buried, thick Louann salt bed which has responded to differential sedimentation by lateral migration into salt ridges, massifs, and ultimately, in some cases, into piercement domes. Early formation of localized basins and ridges by salt migration influenced the geographical location of thicker and thinner sedimentary accumulations, which in turn, reinforced the continued migration of the salt. Thus, sedimentary depocenters and embayments bounded by contemporaneous growth faults developed in areas where salt evacuation was pronounced.
The shelf edge extended east-west through Beauregard Parish, 50 miles north of the prospect, during deposition of the early Eocene Wilcox Formation. Today it is 160 miles to the south, some 145 miles off the present coastline. The Sweet Lake area was occupied by unstable outer shel f and slope conditions with associated growth f a u l t s a t an intermed- iate time during the deposition of the upper Frio Camerina zone of upper 01 igocene or lower Miocene age.
3.2 GEOLOGY OF THE SWEET LAKE AREA
The Sweet Lake geopressured-geothermal prospect was identified and leased by Gulf Geothermal Corporation in 1974. Its successor, Magma Gulf Company, submitted the prospect for drilling and testing in response to a 1976 request for proposals from ERDA. The proposal was accepted in 1977 with funding under contract No. ET-78-C-08-1561 for a geologic study uti1 izing existing seismic data in the area.
3.2.1 INTERPRETATION FROM PREVIOUS STUDY
The geological interpretation made by Magma Gulf under the above mentioned contract was based on 17 deep well logs and 27 miles of
't-d
34

seismic lines. The conclusion of this study was that the Sweet Lake prospect is in a basin located on the north flank of an east- west salt ridge containing the Hackberry, Big Lake, and Sweet Lake structures. The structural interpretation is shown in Figure 3-1. The south side of the basin is bounded by a fault downthrown to the north. This converges eastward with a major east-west fault, downthrown to the south, to form the eastern termination of the basin. The prospect thus lies in a graben, bounded by two major growth faults and unbounded an unknown distance to the northwest. Structural dip is northwesterly into the basin, which opens toward the south flank of the South Lake Charles structure several miles distant to the north. The surface terrain in the prospect area is formed by late Pleis- tocene deltaic deposits. In the subsurface, alternating massive sands and clays extend to an average depth of 9000 feet, and overlie the thick shales of the Anahuac Formation. The Anahuac is in turn underlain by the Frio Formation, the upper member of which is termed the Camerina zone. Several sands occur within this zone, the thickest b e i n i a s a l Miogypsinoides sand, named for a key microfossil.
sand was identified in logs from the entire area and structurally lower in the graben formed
by the two major faults. Only three wells penetrated the Mi?gypsi;- oides in the graben, all in the eastern end. The seismic stu y indicated that the diu was auuroximatelv 170 northwest. so that the Miogypsinoides sand would 'be presentlbelow 18,000 feet in the western part of the graben. The drill site was located close to the three control wells that penetrated the Miogypsinoides sand; the top of the sand was estimated to be at 15,000 feet.
The geothermal gradient in the Sweet Lake area was estimated using bottom-hole temperatures, corrected by the AAPG correction factor. A temperature of 300°F was estimated for the test well at the midpoint of the sand based on the calculated gradient (Figure 3-2).
The geopressured zone begins at a depth of 8,740 to 9,400 feet in the wells in the Sweet Lake area; this is essentially at the base o f the massive sands. The mud weights from these wells indicated that the minimum expected pressure at the top of the Miogypsinoides sand would be 8,700 to 10,800 psi.
Porosity, as calculated fro a sonic log and a density log, was expected to be approximately 22%. No data on permeability were available at the time that this early study was made. Salinity had been calculated from well logs and ranged from 46,000 to 100,000 ppm. It should be noted that these estimates were made before the recent research into calculation of salinity from well logs, and the resultant new methods of calculating salinity were developed.
In general, the geology of the Sweet Lake prospect was fairly well defined by this early study. The reservoir was known to be in a graben which terminated to the east and was open an unknown distance to the west. The Miogypsinoides sand was expected at a depth of 15,000 feet in the test well, approximately midway between the two bounding faults in the eastern portion of the graben. The net sand volume in the reservoir was estimated at .6 to 1.0 cubic miles.
LJ ?
35

3.3 TEST WELL GEOLOGY
This sect ion concerns the t e s t we l l geology based on in format ion accum- u la ted dur ing d r i l l i n g . The two major t o o l s used dur ing t h i s phase o f the p ro jec t were mud logging and micropaleontology. The use o f wire1 ine logs i s discussed i n sect ion 3.5 Petrophysical Analysis.
The expected geology consisted o f t h i c k Miocene sands t o a depth o f approximately 9000 fee t . The t h i c k Anahuac shale l i e s below these sands, and the top o f the geopressured zone was expected t o be close t o the top o f the Anahuac. This t h i c k shale extends down t o the top o f the Miogypsin- oides sand and contains a few sands i n the 5000+ f e e t shale section, -ding the Marginul ina and Camerina sands.
micropaleontology were usefu l c o r r e l a t i o n t z o l s dur ing the d r i l l i ng phase. S i g n i f i c a n t departures from the expected s t ra t ig raphy o r f o s s i l content t h a t would have ind ica ted a s t ruc tu re other than what was i n f e r r e d would have been quickly-noted. No such evidence was observed, but the mud logging and micropaleontology provided important d a i l y c o r r e l a t i o n data, and in format ion f o r determining casing po in ts and cor ing i n te rva l s .
The top o f the Mio s inoides sand was expected a t a d e p t h o f +15,000 feet . Mud logging --5 an
3.3.1. MUD LOGGING
Mud logging services were provided by In tegrated D r i l l i n g and Logging, Inc. (IDL). The mud logging included: . Monitor ing d r i l l i n g r a t e . Monitor ing pore pressure
Examining and descr ib ing we l l cu t t i ngs . Monitor ing mud temperature and mud weight . Monitor ing gas content Co l l ec t i ng w e l l c u t t i n g samples . Recording a u x i l i a r y information, such as weight on b i t , b i t number and type, and rpm.
The mud loggers began monitor ing and recording t h i s in format ion when the we l l had reached a depth of 6000 feet. Samples of we l l cu t t i ngs were co l l ec ted by r i g personnel p r i o r t o t h a t time. The mud loggers remained on s i t e u n t i l the t o t a l depth o f the s idet rack hole (15,750 f e e t ) was reached.
One o f the pr imary purposes o f measuring the d r i 11 ing r a t e was t o make an est imate o f poros i ty . IDL measures the penetrat ion r a t e by mechanical means and converts the data t o a po ros i t y estimate. This information, along w i t h the l i t h o l o g i c descr ip t ion, was usefu l i n cor re la t ion . I n addi t ion, the po ros i t y estimates were i n good agreement w i t h the measured po ros i t y from diamond and sidewal l cores.
Measurement o f the pore pressure was c ruc ia l , since a t l e a s t 5000 f e e t o f hole were t o be d r i l l e d i n geopressured s t ra ta . Knowledge o f the pore pressure was important so t h a t the mud weight could be adjusted c o r r e c t l y t o prevent under - o r overbalancing.
36

Well cuttings were sampled at thirty-foot intervals. The cuttings were examined and described, and a lithologic log was constructed. This information was telecopied from the site daily and was used in correlation with three key control well logs. This enabled the geologist to identify the particular part of the formation that the well drilled through at a given time. Since the test well was located in a graben in which there was sparse well control, the exact location of the major bounding faults was not prescisely known. Prior to the drilling of the well, some concern had been expressed that the well bore might cross one of these faults. The daily correlation of the mud log and the control well logs confirmed that the well did not cross a major fault. A thickening diagram (Figure 3-3) prepared for the test well and the three control wells demonstrated a substantial amount of thickening and thinning of the statigraphic section between the four wells. The changes in thickness did not indicate a major fault, but could possibly indicate some minor faulting that was not directly evident from correlation. Despite the thickening and thinning of the stratigraphic section, the top of the Mio y sinoides sand was encountered very close to the predicted dept + Two gas shows were reported in the original hole, at depths of 10,785,to 10,804 and 12,885 to 12,915 feet. The first show was in a very thin sand stringer and the second was in the first Camerina sand. Both shows were described as fair; a tabulation of all recorded parameters is presented in Table 3-1. Neither of these shows were observed in the sidetrack hole, most likely because the mud weight was heavier.
The mud loggers collected three sets of well cutting samples at thirty-foot intervals. One set was used for micropaleontological analysis and the other two were donated to universities. In addition, canned samples were collected every sixty feet for organic geochem- istry studies.
Mud logging was funded by Gas Research Institute Contract No. 5014- 321-0290.
3.3.2 MICROPALEONTOLOGY
The micropaleontological analysis of the we1 1 cuttings were performed by Paleo-Data, Inc. The identification of the microfossils in the well cuttings was an important correlation tool. Cuttings were sampled at thirty-foot intervals and shipped to Paleo-Data, where they were washed and examined microscopically. The fossils were identified and the cuttings were described 1 ithologically. The ,important correlation fossils were reported to MG-T as soon as they were identified.
The fossil picks were compared to those o f two key control wells, the Union of California Pan h Fee #1 and #2, providing an additional check on the position in and the thickening or thinning o f the stratigraphic section. Again, if the well bore had crossed a major fault, it would most likely be immediately evident by a change in the microfossil assemblage. No such changes were observed, but this does not preclude the possibility of minor faulting in this area.
37

W
The important correlation picks are summarized in Table 3-2. The entire report submitted by Paleo-Data is in Appendix C-1 of Volume I. The picks appear to be slightly deeper in the sidetrack hole than in the original hole; this is primarily because these depths are not true vertical depths.
Micropaleontology was very important in picking the top of the sinoides sand, since the planned coring program included % o taining a core as close to the shale/sand transition zone as
possible. The Miogypsinoides fossil in the control wells appeared 30 to 100 feet above the top of the sand; thus, once the fossil was identified drilling should cease and coring begin. Paleo-Data personnel were on site as the well neared the Miogypsinoides sand, and the microfossil was identified from cuttings at approximately 4:30 p.m. on Christmas Day, 1980.
The fossils present in the well indicate that the depositional environment in Mio sinoides time was most likely outer shelf to
marine environments are those used by Paleo-Data, and are fairly standard zonations.
upper slope, a water + epth of 300 to 1500 feet. The classification of
Micropaleontology was funded by Gas Research Institute contract No. 5014-321-0290.
3.4 RESERVOIR DESCRIPTION
The reservoir geology was determined from well logs, seismic data, and reservoir engineering. A fairly accurate interpretation of the reservoir was made from well logs, gravity, and seismic data before the Sweet Lake test well was drilled. The prospect was located in a graben, with approximately 3,000 feet of throw on the northern fault and 1,000 feet on the southern fault. The structure map in Figure 3-1 shows that the two major faults converge approximately two miles east of the test well location, and diverge westward. A splinter fault was hypothesized to run northeast from Section 18,T12S, R8W. It was not known whether this fault actually existed at the Miogypsinoides depth, or, if so, whether it extended far enough to the northeast to enclose the reservoir. These questions were later resolved by reservoir engineering interpretations of flow tests; this is fully discussed in Section 3.4.3.
The graben was estimated to be approximately 1.5 to 2 miles across at the test well location, although due to the lack of we1,l control, and the fact that the seismic lines were unmigrated, this could not be precisely defined. The expected thickness of the Mio sinoides sequence was on the
graben, this would give a volume of approximately 0.6 to 1.0 cubic miles. A splinter fault which was observed on the seismic lines to the east of the test well site separates one of the control wells, the Union of California Sweet Lake #1, from the other control wells. Although this fault had been observed on the seismic lines, there was no evidence from well correlation to support it directly.
The final description of the reservoir evolved in three stages: first, the drilling of the test well; second, information from other new wells drilled in the area; and third, interpretation of reservoir engineering studies. The reservoir description is discussed in three stages in the following sections.
38
order of 800 feet; assuming the sand covere + t e entire area within the
LJ
3.4.1 DATA FROM TEST WELL
The Sweet Lake test well completed drilling operations in early February 1981. The final set of logs allowed a detailed correlation with control wells. A cross-section of the Mio psinoides sequence is presented in Figure 3-4. This cross-section + s ows that the correlation of the individual sands within the Mio sinoides seque- nce between the four wells is extremely goo *e seven individual sands in the Miogypsinoides sequence, and each set of these sands, with the same characteristics, is present in each of the four wells. There is some change in thickness, but this is geologi- cally reasonable and expected, and could easily be explained by depositional differences.
The primary conclusion from the study of the test well log was that sinoides sand was most likely a sand that blanketed the area
:,hEi- The preservation of the sand character from one well to another indicated good communication, and no evidence of major faulting was observed.
3.4.2 DATA FROM NEW WELLS IN THE AREA
The evidence from seismic lines indicated that the Mio ypsinoides sand was very deep (below 18,000 feet) in the western por * ion o t e graben. In fact, the two deep wells to the west of the Sweet Lake test well did not penetrate the Miogypsinoides sand. In the summer/early fall of 1982, Rio Bravo Oil Company drilled a deep (16,569 foot) well approximately 1.5 miles due west of the Sweet Lake test well. This well did not penetrate the Mio sinoides; in fact, the TD o f the well is barely below the second * amerina san The cross-section in Figure 3-15 shows that the C a m e r i n a a n d the intervening shale thickens considerablv to thewest.f the underlvina strata thickened at the same rate, the Mio sinoides sand would-1 iGwel1 below 18,000 feet in the western portion -=n- o t e graben, and may even approach 19-20.000 feet at the extreme western edge. A reviscd structure map (Figure 3- 6 ) was constructed to show the structure of the top of the Miogyp- sinoides as it is now interpreted. This map shows a strong northwest
sinoides sand is inferred to be dip into the graben. present to the west, with no major fau ts separating the test well from the western portion of the graben.
The + 3.4.3
The specifics of the flow testing and the interpretation of the accumulated data are discussed in detail in section 5.0 Reservoir Testing. Drawdown tests, buildup tests, and the changes in reservoir interpretation due to these tests are presented in that section. The purpose of this section (3.4.3) is to summarize the overall conclu- sions of the reservoir engineering studies and to present a final description of the Sweet Lake reservoir.
Two o f the seven sands in the Mio sinoides sand package were tested, Sand 5 and Sand 3 (Figure 3 - m n s for the perforation of these particular sands are discussed in section 2.3.3 Completion and 2.3.4 Recompletion. The reservoir pressure testing of Sand 5 occurred during July 1981, and that of Sand 3 in November-December
DATA FROM RESERVOIR ENGINEERING STUDIES
39

1983. (Plates I & 11.) Each o f these t e s t s was analyzed by two d i f f e r e n t rese rvo i r engineering consultants. The Sand 5 t e s t was analyzed by J. Donald Clark, consultant, (Appendix C) and by Intercomp Resource Development and Engineering. The Sand 3 t e s t was analyzed by Clark, (Appendix) and by Dowdle F a i r c h i l d and Ancell, Inc. (Appendix E). Each o f these t e s t s ind icated t h a t there were b a r r i e r s c lose t o the wellbore, although the nature o f the b a r r i e r s could no t be determined.
The f i n a l conclusions reached by Dowdle F a i r c h i l d and Ancell were t h a t both Sand 3 and Sand 5 had b a r r i e r s w i t h i n 250 f e e t o f t he wellbore. Computer modeling using the assumption o f close barr iers , produced h i s t o r y matches t h a t were almost exact. The model involved two b a r r i e r s f o r each sand, equid is tant from, but on opposite sides of, the wellbore. An i n t e r e s t i n g p o i n t i s t h a t the b a r r i e r s i n Sand 5 are s l i g h t l y f a r t h e r from the wellbore than are those o f Sand 3. This i s consistent w i t h a s t r u c t u r a l model o f minor f a u l t i n g , w i t h the f a u l t s crossing the wellbore j u s t below the Mio sinoides sands. This would be i n agreement w i t h the f a c t t h a t no * i r e c t e v i ence of f a u l t i n g was observed from the we l l l o g co r re la t i on .
However, according t o Dowdle F a i r c h i l d and Ancell, an a l te rna te model could be devised t h a t would a lso match the pressure h i s t o r y very c l o s e l y bu t would not invo lve b a r r i e r s such as f a u l t s . I n t h i s model, the sand woufd cover the e n t i r e graben, but there would be a substant ia l decrease i n permeabi l i ty close. t o the wel l . It i s geo log i ca l l y u n l i k e l y t h a t the wel l j u s t happened t o be d r i l l e d i n t o the highest permeabi l i ty zone o f each sand, but it i s also u n l i k e l y t h a t the we l l happened t o d r i l l i n t o the exact center o f two f a u l t s . Thus the computer model i ng cannot be accepted verbatim.
One very l i k e l y explanation i s t h a t there i s minor f a u l t i n g i n the graben. The s i m i l a r i t y i n sand cha rac te r i s t i cs between the t e s t w e l l and con t ro l wel ls precludes major d i f ferences i n deposit ion, and the f a c t t h a t t he Mio sinoides sand i s also present outside the graben
In addit ion, pressure t e s t i n g ind icated t h a t although there are c lose ba r r i e rs , the rese rvo i r i s open i n one d i r e c t i o n a t l e a s t 4 1/4 miles. Minor fau l t ing, however, would not have been evident from the seismic l i n e s o r w e l l l o g co r re la t i on , and i s geo log i ca l l y reasonable. The abundance o f major f a u l t s i n t h i s area suggests t h a t there may be accompanying minor f a u l t s .
Although i s i s u n l i k e l y t h a t the Sweet Lake t e s t wel l d r i l l e d i n t o the exact midpoint between two fau l t s , there i s some margin o f e r r o r i n the computer modeling. The conclusion by the geologists i s t h a t the gross s t ruc tu re i s wel l represented by the s t ruc tu re map i n Figure 3- 6. The major bounding f a u l t s o f the graben were no t observed dur ing pressure t e s t i n g due t o b a r r i e r s t h a t are w i t h i n 250 f e e t o f the wellbore. These b a r r i e r s are most l i k e l y minor f a u l t s t h a t are no t d i r e c t l y observable through any other too l . The f a u l t s probably cross the wel lbore below the base o f the Miogypsinoides sand, and probably d i e out before crossing the wellbores o f the c o n t r o l wells. The amount o f throw on these f a u l t s cannot be estimated. The rese rvo i r i s open i n one d i rect ion, however, f o r a t l e a s t 4 1/4 miles. This d i r e c t i o n i s t o the northwest, and there i s no evidence t h a t the rese rvo i r i s enclosed.
ind icates t h a t + t i s s an extensive sand.
k/
40
3.5 P ETROPHYS ICAL ANALYSIS
The logs of both the test well and disposal well were analyzed to estimate porosity, permeability, and salinity. The logs used included SPY resistivity, gamma ray, borehole compensated sonic, compensated neutron, formation density, and Saraband. The results of the log analysis are compared to the core analysis in section 3.6 Core Analysis.
LJ
3.5.1 TEST WELL LOGS
Petrophysical properties of the test well logs were calculated by three different firms: Magma Gulf, Intercomp, and Frank Millard, consultant. The results of these three separate analyses are discussed in the following sections.
3.5.1.1 POROSITY AND PERMEABILITY
Results from all porosity calculations are presented in Table 3-3. Reference to this table will facilitate following the discussion of the various porosity calculations.
The Magma Gulf geologists calculated porosity in two ways; first, from the sonic log, and second from averaging the Schlwnburger-calculated Saraband porosity. The Saraband poro- sity is significantly lower, ranging from 12.1 to 19.oX. This porosity is known to be a few percent lower than measured poro- sities. The sonic porosity ranges from 14.1 to 22.9%.
Frank Millard, a well log analyist, studied the entire suite of Sweet Lake logs and submitted a report on his findings. His complete report is in Appendix E of volume 1. Part of this report included a porosity estimate based on the neutron-densi ty crossplot. These numbers are comparable to the sonic log porosities and range from 14.6 to 23.2%.
Intercomp used a digitized tape prepared by Schlumburger and an in-house computer analysis to estimate porosity. These poros- ities, again are comparable to both the sonic and the neutron- density estimates, and range from 13.9 to 20.8%.
Sand 5 had the highest porosity, followed closely by Sand 3. These figures were taken into consideration when the perforation intervals were chosen.
Permeability is a more difficult parameter to estimate, as no logging tool has yet been developed which can measure permea- bility and gives adequate estimates as far as relative permea- bilities are concerned. The absolute values are often quite different from the actual measured values. Intercomp again used their own computer analysis to estimate permeability. All permeabi 1 ity results are presented in Table 3-4.
The estimates of air permeability from the Saraband log range from 130 to 2960 millidarcys, The Intercomp air permeabilities range from 48 to 2703 millidarcys, and, in most cases, are comparable to the Saraband-derived values. However, these numbers are somewhat misleading as the air permeability values are much higher than the values of permeability to water.
u *
u
An estimate o f permeabi l i ty t o water was made, using the Saraband a i r values as the input data. The r e s u l t i n g water permeabi l i t ies , shown i n Table 3-4, range f r u n 20-400 m i l l i - darcys. These numbers are b a s i c a l l y an order o f magnitude lower than the corresponding a i r values, bu t are much c loser t o the actual values obtained from reservo i r engineering.
3.5.1.2 .SALINITY
S a l i n i t y ca l cu la t i ons from l o g data have been no to r ious l y inaccurate i n the past. Recent research has y ie lded various new methods f o r ca l cu la t i ng s a l i n i t y , most o f which appear t o y i e l d values c lose r t o r e a l i t y than t h e o l d SP method. A l l s a l i n i t y in format ion i s presented i n Table 3-5.
A b r i e f discussion o f how each o f t he n ine sets o f ca lcu la ted s a l i n i t i e s was obtained i s necessary before the r e s u l t s can be evaluated. Reference t o Table 3-5 w i l l be he lp fu l i n fo l l ow ing the discussion.
I n order t o ca l cu la te s a l i n i t y , t he water r e s i s t i v i t y and temperature must be known. Enter ing these two numbers on a cha r t such as t h a t i n Figure 3-8 y i e l d s s a l i n i t y . The fo l l ow ing methods are thus b a s i c a l l y d i f f e r e n t ways o f ca l cu la t i ng water r e s i s t i v i t y .
I n the f i r s t method the SP s a l i n i t y i s t h a t ca lcu la ted using the conventional equation, which has proved t o be g r e a t l y i n e r r o r f o r geopressured reservo i rs . The equation used i s :
Rwe R m f (10 ssp/(60 + .133 T f ) )
where Rwe e f f e c t i v e water r e s i s t i v i t y Rmf mud f i 1 t r a t e r e s i s t i v i t y SSP s t a t i c spontaneous po ten t i a l Tf formation temperature
The ca lcu la ted Rwe i s then used i n the cha r t i n F igure 3-10. Th is equation y ie lded estimates o f s a l i n i t y o f 60,000 t o 78,000 ppn, which i s l ess than h a l f t he actual s a l i n i t y . These ca lcu la t i ons demonstrate the unre l i a b i l i t y o f using the con- vent ional SP equation t o ca l cu la te s a l i n i t y .
A second method i s t h a t termed the Rya method. This method r e l i e s on t r u e r e s i s t i v i t y and po ros i t y t o ca l cu la te water r e s i s t i v i t y . The equation used i s :
where Rwa apparent water r e s i s t i v i t y Rwa R t f12/ -81
R t t r u e r e s i s t i v i t y P poros i t y
The s a l i n i t e s ca lcu la ted using t h i s method ranged from 58,000 t o 120,000 ppn, which are somewhat b e t t e r than the conventional SP estimates, bu t are s t i l l low compared t o the measured values.
42

bi
The t h i r d method used i s t h a t termed the Kf, which was developed by Dunlap (1980). K f I and K f I I r e f e r t o refinements o f t h i s model (Dunlap, 1981). The Kf method concentrates on determining a b e t t e r value f o r Rmf, which i s then used i n the conventional SP equation.
The equation used i s : R m W f Rm
where Rmf r e s i s t i v i t y o f mud f i l t r a t e Rm r e s i s t i v i t y o f mud Kf dimensionless constant
The constant Kf i s determined from the cha r t i n Figure 3-9. Kf depends on the type and the dens i t y o f t h e mud. The ca lcu lated Rmf i s used t o ca l cu la te Rwe from the SP equation. The values obtained from t h i s c a l c u l a t i o n range from 130,000 t o 160,000 ppm, which are very c lose t o the measured values.
Dunlap (1981) has made two refinements t o t h i s model(Figures 3- 10 and 3-11). The f i r s t accounts f o r geologic age, whi le the second i s an unat t r ibuted co r rec t i on fac to r . The values obtained from these correct ions range from 100,000 t o 140,000 ppm, and 100,000 t o 150,000 ppm. respect ively. The values are s l i g h t l y lower than the uncorrected values and, as such, are less an approximation o f the Sweet Lake s a l i n i t i e s , but are s t i l l w i t h i n 10% o f the co r rec t value. This i s a remarkable improvement over the conventional SP calcu lat ion.
A f o u r t h method i s t o use the conduc t i v i t y t o ca l cu la te t r u e r e s i s t i v i t y . The equation used i s :
R t = 1000 c where R t t r u e r e s i s t i v i t y
The ca lcu lated R t i s then used i n the Rwa equation t o ca l cu la te apparent water r e s i s t i v i t y . The va1ue.s ca lcu lated by t h i s method had the l a rges t range, from 68,000 t o 200,000 ppm. The s a l i n i t i e s ca lcu lated by t h i s method are apparently inconsis-
C conduc t i v i t y
t en t .
The f i f t h method used was t h a t developed by Bassiouni and S i l v a (1981). Th is method uses the quan t i t y Rsh/Rmf a t T along w i t h
12), where R,h i s the r e s i s t i v i t y o f the shale. From t h e quan t i t y Rmf a t 750, and obta in ing Rm a t 75O from the we l l l o g
The values obtained from t h i s method were extremely low, on ly 11,000 t o 15,000 ppm. This suggests t h a t the Bassiouni method i s no t accurate i n reservo i rs s i m i l a r t o Sweet Lake.
the SP value t o determine the q u a n t i t y Rmf/Rw a t 75 t; (Figure 3-
data, Rw a t 75O can be ca lcu lated an d s a l i n i t y obtained.
S a l i n i t y was also obtained d i r e c t l y from the Saraband l o g computed by Schlumberger, and ranged from 68,000 - 125,000 ppm.
43

LJ These are low compared to the actual values, but not as low as the conventional SP. The Saraband calculations may be more accurate for hydropressured reservoirs.
Finally, Intercomp also estimated salinity using an in-house computer analysis. Values ranged from 100,000 to 175,000 ppm. These are fairly good estimates.
Overall, it appears that the Kf method developed by Dunlap provides the most accurate estimation- of salinity in geo- pressured reservoirs.
The proper determination of salinity is necessary in order to determine the quantity of methane gas in the brine. Increased salinity appears to decrease or limit the I amount of methane saturation, thus affecting the total gas available from the geopressured-geothermal brine.
3.5.2 DISPOSAL WELL LOGS
The disposal well logs were not analyzed to the same extent as the test well logs. It was sufficient to note that there were multiple thick sands to the total depth of the well, and that these sands had high porosities, on the order of 25-30%. The permeabilities, as calculated from the Saraband log, also appear to be high; some of the air permeabilities from the sidewall cores were on the order of 1-2 darcys. This information led to the conclusion that the disposal sands would adequately handle the volume of brine expected at peak production rates.
3.6 CORE ANALYSIS
Four conventional 2" diamond cores were obtained from the Mio
The cored intervals are shown in Figure 3-13 and are as follows:
Core No. Cored Interval Recovered Inter v a 1 Core Length
1 15,144~15,184 15,144-15,179 38.0 feet 2 15,185-15,201 15,185-15,197.5 12.5 feet 3 15,389-15,411 15,389-15,405 16.0 feet 4 15,600-15,634 15,600-15,632 32.0 feet
Core Labortories, Inc. of Houston handled the core at the site. The core was wrapped in plastic bags and transported to Houston, where samples were obtained for porosity and permeability analysis. After these samples were taken the core was preserved in resin and aluminum foil. This was done to minimize the loss of fluids and other changes in the core before distribution. Various aspects of core analysis are discussed in the following sections.
sinoides sand interval under the supervision of Christiansen Diamond * ro uc s,
44

3.6.1 STRUCTURE
bd Some sedimentary structures had been observed in the cores, notably cross-bedding. Since the majority of the core was to be cut and distributed to various research projects, a method of permanently recording the sedimentary structures was sought. The Coastal Studies Office at Louisiana State University pioneered a whole-core X-ray technique. This X-ray radiography illuminates such structures as cross-bedding and burrows, and provides a permanent record.
Technical Welding Laboratories was suggested to MG-T as a laboratory which had experience in this type of work. The core, which was wrapped in resin and aluminum foil, did not have to be exposed to air in order for this to be done. This was a definite advantage, as the other firms contacted would have had to remove the preservation material and encase the core in plaster of paris. Technical Welding Labs X-rayed the core in March, 1981. The core was returned to Core Labs without damage, and the X-ray radiographs were given to MG-T.
Although some of the X-rays are dim, the sedimentary structures are indeed evident. Cross-bedding is present throughout the core, and other structures which may possibly be burrows are also present.
3.6.2 LITHOLOGY
In general, the Mio sinoides reservoir rock is a tan to gray, fine-
separate the individual sands, the thickest of these being 45 feet thick, Since these shales correlate well between the test well and control wells, it is thought that the individual sands are indeed discrete.
Scanning electron micrography, X-ray diffraction, grain size an- alysis, and conventional porosity and permeabi 1 ity analyses were performed on the core. The results of these analysis are discussed in the following sections.
grained, well-conso + i ate sandstone. There are shale layers that
3.6.2.1 SCANNING ELECTRON MICROSCOPE ANALYSIS
A small portion of Core No. 3 was given to Accumin Analysis for scanning electron micrography. This analysis was performed in part to determine whether there would be problems with sand production during flow testing. An abundance of clays in the pore space or as cementing material would indicate a potential problem. On the other hand, a cementing material such as quartz overgrowth would indicate minimal potential sand movement.
X-ray diffraction of the core showed that it consisted of 75% quartz, 19% feldspar, 4% illite, 2% mixed layer clay (illite/ smectite) and a trace of kaolinite. Three energy dispersive spectra were obtained, which are shown in Figures 3-14, 3-15, and 3-16. Figure 3-14 is the EDS spectrum of a feldspar grain. There are peaks at the Al, Si, and K energies, showing this to be a typical potassium feldspar. Figure 3-15 shows peaks at Al, K,
45
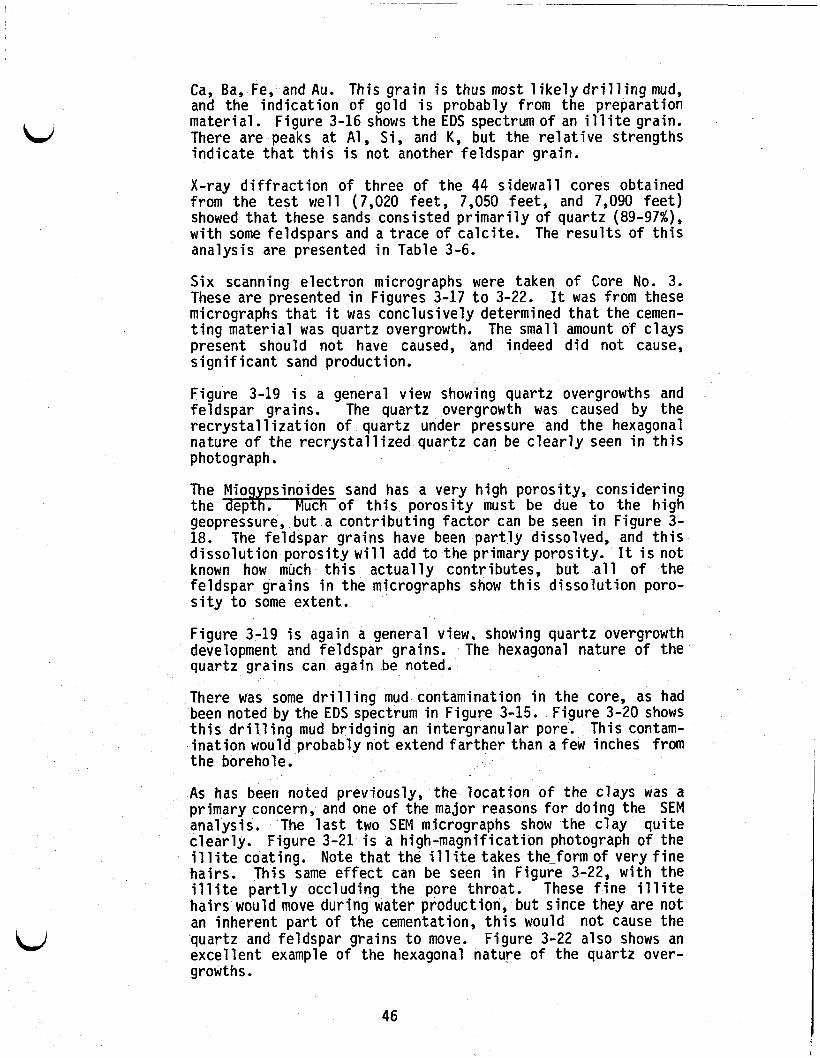
k,
Ca, Ba, Fe, and Au. This g ra in i s thus most l i k e l y d r i l l i n g mud, and the i n d i c a t i o n o f gold i s probably from the preparat ion mater ia l . Figure 3-16 shows the EDS spectrum o f an i l l i t e grain. There are peaks a t A l , S i , and K, bu t the r e l a t i v e strengths i nd i ca te t h a t t h i s i s not another fe ldspar grain.
X-ray d i f f r a c t i o n o f three o f the 44 s idewal l cores obtained from the t e s t w e l l (7,020 feet, 7,050 feet , and 7,090 f e e t ) showed t h a t these sands consisted p r i m a r i l y o f quartz (89-97%), w i t h some feldspars and a t race o f c a l c i t e . The r e s u l t s o f t h i s analysis are presented i n Table 3-6.
Six scanning e lect ron micrographs were taken o f Core No. 3. These are presented i n Figures 3-17 t o 3-22. It was from these micrographs t h a t i t was conclusively determined t h a t the cemen- t i n g mater ia l was quartz overgrowth. The small amount o f c lays present should not have caused, and indeed d i d not cause, s i g n i f i c a n t sand production.
i
Figure 3-19 i s a general view showing quartz overgrowths and ~
fe ldspar grains. The quartz overgrowth was caused by the r e c r y s t a l 1 i z a t i o n o f quartz under pressure and the hexagonal nature o f the r e c r y s t a l l i z e d quartz can be c l e a r l y seen i n t h i s photograph.
The Mio y sinoides sand has a very h igh porosi ty, consider ing the *of ept t h i s p o r o s i t y must be due t o the h igh geopressure, but a con t r i bu t i ng f a c t o r can be seen i n Figure 3- 18. The feldspar gra ins have been p a r t l y dissolved, and t h i s d i s s o l u t i o n p o r o s i t y w i l l add t o the primary porosi ty. It i s no t known how much t h i s a c t u a l l y contr ibutes, bu t a l l o f t he feldspar grains i n the micrographs show t h i s d i sso lu t i on poro- s i t y t o some extent.
Figure 3-19 i s again a general view. showing quartz overgrowth development and fe ldspar grains. The hexagonal nature o f the quartz gra ins can again be noted.
There was some d r i l l i n g mud contamination i n the core, as had been noted by the EDS spectrum i n Figure 3-15. Figure 3-20 shows t h i s d r i l l i n g mud b r idg ing an in tergranular pore. This contam- i n a t i o n would probably n o t extend f a r t h e r than a few inches from t h e borehole.
As has been noted previously, the l o c a t i o n o f the clays was a primary concern, and one o f the major reasons f o r doing the SEM analysis. The l a s t two SEM micrographs show the c l a y q u i t e c lea r l y . Figure 3-21 i s a high-magnif icat ion photograph o f the i l l i t e coating. Note t h a t the i l l i t e takes the-form o f very f i n e hairs. This same e f f e c t can be seen i n Figure 3-22, with the i l l i t e p a r t l y occluding the pore throat . These f i n e i l l i t e h a i r s would move dur ing water production, but since they are no t an inherent p a r t o f t he cementation, t h i s would no t cause the quartz and feldspar grains t o move. Figure 3-22 also shows an excel lent example o f the hexagonal nature o f the quartz over- growths.
46

3.6.3 BENCH CONDITION POROSITY AND PERMEABILITY W
LJ
Core Laboratories, Inc. was responsible f o r bench cond i t ion po ros i t y and permeab i l i t y measurements. These were kept t o a minimum, as the maximum amount o f core poss ib le was t o be reserved f o r o ther research. As a r e s u l t , a t o t a l o f f i v e analyses were made, two on Core No. 1, and one on each o f the remaining cores.
The r e s u l t s o f these analys is are presented i n Table 3-7. The ho r i zon ta l permeab i l i t y ( a i r ) ranges from a low o f 4 md t o a h igh of 3670 md. It should be noted t h a t the 4 md sample was from Core No. 4. Th is core was taken from the lowest sand i n the section, which was no t considered t o be a h i g h l y productive sand. The s i l t content increased s u b s t a n t i a l l y i n the lower p a r t o f t he Miogypsinoides section.
The v e r t i c a l permeab i l i t y ( a i r ) ranged from a low o f 2.6 md t o a h igh o f 3526 md. The lowest value however d i d no t correspond t o the lowest value o f t he hor izon ta l permeabi l i t ies . Instead, t he sample t h a t had 32 md ho r i zon ta l permeab i l i t y had a v e r t i c a l permeab i l i t y o f on l y 2.6 md. Th is ind ica tes t h a t there were s i l t y s t r i nge rs w i t h i n the sands t h a t may have prevented v e r t i c a l comnunication.
.
The measured po ros i t i es ranged from 14.3 t o 24.3%. These agree very w e l l w i t h the po ros i t i es ca lcu la ted from the l o g data. A comparision of l o g and measured data f o r po ros i t i es and permeab i l i t ies can be found i n Tables 3-3 and 3-4, respect ive ly .
Forty- four s idewal l cores were obtained from the t e s t we l l . These were taken over most o f the s t ra t ia raDh ic section. from 6.490 t o 15,075 fee t . As these samples were sbove the MiogpipsiHnoides sand, they could no t be used t o evaluate the reservo i r . owever, t he informat ion was usefu l i n evaluat ing va r ia t i ons between the hydro- pressured and geopressured formations, and i n comparing core analys is t o w i r e l i n e l o g analysis. The p o r o s i t y and permeabi l i ty analys is r e s u l t s are presented i n Table 3-Q.
3.6.4 SIEVE ANALYSIS
The same samples t h a t were used f o r po ros i t y and permeab i l i t y analys is were used f o r g ra in s i ze analysis. The r e s u l t s o f these analyses show t h a t t he median g ra in s i t e i s .0065 t o ,0127 inches (f ine-grained t o medium-grained). The complete Core lab r e p o r t i s included i n Vol. I Appendix A.
3.6.5 DISTRIBUTION OF CORE MATERIAL
A t o t a l depth of 96 f e e t o f core was d iv ided among n ine research pro jects . Requests f o r core mater ia l were f i l l e d as f a r as possible; l i m i t a t i o n s may have occurred because the amount o f core recovered was much less than the amount requested. Core mater ia l was given t o the fo l low ing people and organizations:
47

i
Amoco Product ion Hartax, Inc. I n s t i t u t e o f Gas Technology Lawrence Berkeley Laboratory Louisiana Geological Survey Rice Un ive rs i t y Terra Tek U. S. Geological Survey Un ive rs i t y o f Texas
G. Pit tman George Hart Walter Rose hitri Sverjensky Don Bebout, Ray F e r r e l l Mason Tomson, John Odd0 John Schatz Tom Kraemer Ken Gray
Subsequently, the core given t o Lawrence Berkeley Laboratory was returned, due t o a lack o f funding a t LBL.
The complete l i s t o f core d i s t r i b u t i o n i s included as Appendix F.
3.6.6 ROCK MECHANICS
The product ion o f f l u i d from a rese rvo i r reduces pore f l u i d pressure and may cause surface and subsurface subsidence. The compaction of the rese rvo i r rock i s important as a mechanism t o mainta in pore pressure. As the pore pressure i s reduced through geopressured- geothermal b r i ne production, the e f f e c t i v e s t ress increases. This s t ress increase causes format ion compaction, which may be t ime dependent o r non-time dependent. An increase i n s t ress would tend t o increase and/or mainta in pore pressure, but a lso decreases po ros i t y and permeabi l i ty , which would have a detr imental e f f e c t on b r ine production. I nves t i ga t i on o f the rock mechanics o f the rese rvo i r rock should thus y i e l d in format ion on long-term rese rvo i r behavior, and a lso provide numerical values o f c e r t a i n parameters which could be used d i r e c t l y i n reservo i r engineering ca lcu lat ions.
The rock mechanics of the Sweet Lake geopressured-geothermal reser- v o i r were invest igated by the Un ive rs i t y o f Texas a t Aust in under the d i r e c t i o n o f D r . K. E. Gray. This work was funded by G R I Contract No. 5014-321-0290. Core samples from a l l f o u r diamond cores were provided t o Dr. Gray according t o h i s speci f icat ions. Both types o f rock behavior were invest igated and reported on; f i r s t , non-time dependent (compaction) test ing, and second, t ime dependent (creep) tes t ing . The fo l l ow ing sect ions describe t h i s work. More d e t a i l s are contained i n Un ive rs i t y o f Texas Report CESE-DRM-88.
3.6.6.1 COMPACTION MEASUREMENTS
P r i o r attemps t o quan t i f y compaction d r i v e and subsidence have genera l l y u t i l i z e d s i m p l i s t i c models. This p r o j e c t was un- dertaken t o der ive a more r e a l i s t i c model o f rese rvo i r behavior. The necessary t e s t s t o provide data t o develop t h i s model include u n i a x i a l compaction and hydros ta t i c loading tests . Deformat i on behavior, po ros i t y changes, permeabi 1 i t ies , and acoust ic v e l o c i t i e s were measured under increasing and decreas- i ng e f f e c t i v e pressures dur ing each ser ies o f tests . The r e s u l t s o f these t e s t s lead t o several conclusions:
,
1) As the e f f e c t i v e s t ress increases t o a maximum, the bulk
48

W '
compressi bi 1 i ty decreases by approximately 55-65%. 2) Bulk compressibilities at atmospheric pore pressure are higher than bulk compressibilities at elevated pore pres- sure under the same effective stress. This indicates that matrix compressibility is a significant factor, which has often been ignored in the past. 3) Porosity is reduced by approximately 1-3% under increasing effective stress, but permeability is reduced by
4) The uniaxial compaction coefficient changes in the same direction as bulk compressibility. Under the same effect- ive stress, the uniaxial compaction coefficient is typic- ally one-half to one-third the value of bulk compressibi- 1 ity. 5) Compaction i s more pronounced in the early stages of reservoir fluid production than in later stages.
30 -4 5%.
The above conclusions indicate that compaction of the resevoir rock will contribute to pore pressure maintenance and fluid production at the beginning of production. Over the long term, however, the reduction in porosity and permeability and the decreas i ng effect i ven compaction to pore pressure mainten- ance will significan ecrease the contribution of rock compaction to the re drive mechanism.
3.6.6.2 CREEP P~EASUREI.~ENTS -
The compaction measurements discussed in the previous section described a more or less elastic response of the reservoir rock to changing effective stress. However, in order to completely describe the behavior of the rock under changing stress, the time dependent nonelastic response of the rock must also be considered. This response is described as the "creep" of the rock.
Nine creep tests were performed on samples from the Sweet Lake cores, under three sets of. loading conditions: 1) hydrostatic- elevated pore pressure; 2) hydrostatic-zero pore pressure; and 3) differential-zero pore pressure. Five o f these samples showed creep, and four showed sufficient creep for data analy- sis.
Two nodels have been developed to explain this creep behavior, a delayed elastic and a non-linear strain hardening model. Both of the models adequately fit the data, and at this time one cannot be chosen over the other.
The delayed elastic model notes that the volume strain increases with time at a constant stress. However, this strain approaches a constant value in a finite time. Accordingly, the most simple explanation is to conslder the rock as possessing a composite elastic response to applied stress. This composite response is partly an immediate response and partly a response that is delayed in time. A quantitative description has been derived to explain this behavior.
49
i
Alternately, the creep behavior may be described by a strain hardening model. This model considers the local shear stresses set up around spherical pores in a hydrostatic stress field. In this case, the volume creep strain rate depends on the volume creep strain and the effective stress. A mathematical model has been derived to explain creep behavior under a strain hardening law, and is fully discussed in the text of the complete report (Gray, et al, 1982). In general, creep curves generated by this model also show a good fit to measured data. Neither the delayed elastic nor the strain hardening model can be described as the preferred model at this time.
3.7 ORGANIC GEOCHEMISTRY
Organic geochemical analysis was undertaken by Hartax, Int. under GRI Contract No. 5014-321-0290. As stated in the Hartax report, this project investigated:
1) the quality, type (gas vs. oil), state of thermal maturity, and the areal and stratigraphic distribution of any hydrocarbon source rock's penetrated by this well; 2) the crude oil-parent source rock relationships of any reservoired oil or gas encountered during the drilling of this well as a means of determining whether or not such shows represent indigenous hydro- carbons sourced from contiguous shales or migrated hydrocarbons generated in older and/or more mature source facies; 3) the local geochemical controls influencing hydrocarbon genera- tion, migration, and reservoired petroleum composition (source ma- terial, thermal maturation, secondary thermal and nonthermal alter- ation, etc.) in this specific area; and 4) the quantity of methane gas which may be contained in, and producible from, the geopressured methane-rich aquifer systems po- tentially encounterable at depth in the local area.
These items were investigated using standard organic geochemical techni- ques, including C1-C7 hydrocarbon analysis, C15 liquid/chromatographic separation, total organic carbon analysis, visual kerogen assessment, and vitrinite reflectance analysis. Discussion of these various techniques i s included in the Hartax report summary, Appendix D of Volume I.
Well cuttings were collected for organic geochemical analysis by the IDL mud loggers. Bagged cuttings were collected at thirty-foot intervals from the surface to 6,000 feet by rig personnel, and canned cuttings were collected at sixty-foot intervals by IDL from 6,000 feet to total depth of the sidetrack hole. The samples were sent to GeoChem Laboratories, Inc. for the actual analysis, and the results were submitted to Hartax, Int. for interpretation. A summary of all analyses is presented in Figure 3-23 A, B, and C.
The analyses show that the sediments penetrated by the Sweet Lake well can be divided into five distinct zones. Zone C can be divided into 3 subzones, with the zonation as follows:
surface to 3,000 feet 3,300 feet to 6,400 feet 6,400 feet to 9,100 feet
Zone A Zone B Zone C
u
50
* Subzone C 1 6,400 f e e t t o 7,350 f e e t 7,350 f e e t t o 8,500 f e e t 8,500 fee t t o 9,100 f e e t 9,100 f e e t t o 14,100 f e e t 14,100 f e e t t o 15,720 f e e t
Subzone C2 Subzone C3
Zone D Zone E
Only the bottom zone, E, covers the i n t e r v a l containing the Miogypsinoides sand. This was therefore the zone o f pr imary i n t e r e s t t o MG-T.
3.7.1 THERMAL MATURITY
The Zone E sediments grade from a s l i g h t l y calcareous shale through s i l t s t o n e t o a coarse quartzose sand. The thermal m a t u r i t y o f three samples from the Mio sinoides sand i s an immature Maturation Index
ref lectance analysis (Table 3-9) a l so ind icates immature thermal maturation. However, the increase i n the C15+ p a r a f f in-naphthene and aromatic hydrocarbon contents i n the C15+ bitumen ind i ca te t h a t the r e s e r v o i r may have been infused w i t h o i l sourced from underlying rocks.
Stage 2- t o 2, as -++- s own i n igure 3-24. The r e s u l t o f the v i t r i n i t e
3.7.2 HYDROCARBON SOURCE
The sediments analyzed from Zone E i nd i ca te a moderately immature poor o i l and associated gas source. Any o i l o r gas present must have been sourced from under ly ing rocks. Discussions with Hartax and Geochem ind i ca te t h a t source rocks have not y e t been i d e n t i f i e d i n Gulf Coast sediments, as the sediments have no t been bur ied deeply enough o r long enough t o become thermal ly mature and t o have produced indigenous hydrocarbons. The lack o f thermal ly mature sediments i n the area obviously ra i ses the question o f the source o f the hydrocarbons i n the Sweet Lake reservo i r .
3.8 DISPOSAL WELL CORES
No diamond core was obtained from the disposal wel l , b u t 29 s idewal l cores were col lected. These cores were taken t o conf i rm adequate p o r o s i t y and permeabi l i ty f o r disposal o f geopressured brine. As shown i n Table 3-10, p o r o s i t y ranged from 25 t o 30% and a i r permeabi l i ty from 200 t o 2000 md, with an average o f 1000 md. These r e s u l t s ind icated t h a t these shallow sands would be capable o f accepting large quan t i t i es o f br ine.
51

4.0 DESCRIPTION OF SURFACE FACILITIES
A p l o t p lan on the Sweet Lake s i t e i s given i n Figure 4-1, and surface f a c i l i t y process and instrumentation drawings are shown i n Figures 4-2 and 4-3. Reference t o these three f i gu res w i l l be usefu l i n fo l l ow ing the descr ip t ion o f the surface f a c i l i t i e s .
i
This f a c i l i t y design was establ ished a f t e r f l ow t e s t i n g a t Pleasant Bayou. Pleasant Bayou f a c i l i t i e s were more experimental i n or ientat ion, whereas Sweet Lake surface f a c i l i t i e s were or iented t o a f l ow r a t e o f 40,000 ba r re l s per day, semi-commercial operation, 3OO0F, and w i t h connections f o r power generation and gas sales. The Sweet Lake design has i n f a c t been fu r the r optimized a t the Gladys McCall we l l s i t e .
4.1 TEST WELLHEAD
A schematic diagram o f the t e s t wellhead and casing spools i s shown i n Figure 4-4, and photographs o f the t e s t wellhead, inc lud ing the tw in flow wings, and the casing spools are shown i n Figure 4-5.
The primary on/of f f l ow con t ro l o f the t e s t we l l was through a redundant ser ies of 5 1/8" Gray gate master valves. One o f the master valves was hydraul ical ly-operated and was p a r t o f the Emergency Shutdown (ESD)system described below i n 4.9 Instrumentation. The uppermost Gray gate valve, o r swab valve, on top o f the IlY'l b lock was used f o r w i r e l i n e operations. A l l valves were packd w i t h a special h igh temperature grease. As a f u r t h e r safety precaution, a manual w i r e drum operat ion was added t o one o f the master valves. During per iods when the automatic shutdown system had been by passed ( f o r example, w i t h a w i r e l i n e i n the hole) t h i s manual remote system permits the valve t o be closed without being close t o the wellhead.
The b r i n e f l ow s p l i t near the top o f the wellhead i n t o two f l o w wings f o r balance and t o reduce thrust , and was then recombined near the base o f t he wellhead. It then flowed through heavy-wall 10,000 p s i p i p i n g t o the Gray choke skid.
The t e s t wellhead was ra ted f o r 10,000 psi ; however, the maximum expected surface pressure was 5,000 ps i . The t e s t wellhead was ordered from FMC. However, FMC could not complete manufacture and the upper p o r t i o n o f the wellhead was manufactured by Gray under another DOE con t rac t and t ransferred t o MG-T.
4.2 FLOW CONTROL SYSTEM
The use o f t he terms " f low con t ro l system" herein i s something o f a misnomer i n t h a t the b r i n e f l ow from the t e s t wellhead was no t a c t u a l l y c o n t r o l l e d automatical ly, but r a t h e r was d i rected through two banks o f manual ly-operated adjustable choke valves i n series. The choke valves were used t o s e t the b r i n e f l ow a t o r near the desired rate; t h e f l o w r a t e then var ied w i t h va r ia t i ons i n the upstream pressure unless the choke valve se t t i ngs were readjusted manually. Thus the pressure was dropped i n two stages. The f i r s t stage reduced pressure t o less than 5000 ps i , which was the design r a t i n g o f t he Lj
52
L,
W
Hal l i bu r ton tu rb ine meter. The second stage o f chokes dropped pressure t o t h a t desired i n the separator, 300-1000 psig.
4.2.1 GRAY CHOKE VALVES
The Gray choke system and wellhead were acquired from DOE as a r e s u l t o f FMC no t being able t o complete the wellhead.
The Gray choke valve manifold, which was ra ted a t 10,000 psi , i s shown i n F igure 4-6. Br ine f l o w from the t e s t wellhead entered the manifold, and then was d i rec ted through one o r both adjustable choke valves arranged i n p a r a l l e l before reaching the manifold ou t l e t . The choke valves were sized such t h a t the e n t i r e design f l ow r a t e o f 40,000 B/D could be passed through on ly one o f the p a r a l l e l choke valve legs and the other acted as a spare. This arrangement precluded the n e c e s s i t y o f shu t t ing i n the t e s t we l l t o r e p a i r o r replace one of these choke valves.
I t should be noted t h a t the 4 1/16" gate valves on the i n l e t s o f the two Gray choke valves were a p a r t of the hydraul ical ly-operated ESD system described below i n 4.9 Instrumentation. When low pressures ( l ess then 5,000 p s i a t the surface) were i d e n t i f i e d a t Sweet Lake, it was determined t h a t the Gray chokes could be el iminated.
4.2.2 WILLIS CHOKE VALVES
The b r ine flowed from the Gray choke manifold through heavy-wall 8- inch p i p i n g and a Ha l l i bu r ton tu rb ine meter t o a p a r a l l e l bank o f two W i 11 i s choke valves, which was planned f o r secondary f low cont ro l . One W i l l i s choke valve was sized f o r 0-5,500 B/D, and was u t i l i z e d p r i m a r i l y dur ing the i n i t i a l f l ow t e s t s a t r e l a t i v e l y low f l ow rates. The second W i l l i s Choke valve i n t h i s p a r a l l e l arrangement was sized fo r 0-45,000 B/D.
The ser ies arrangement o f the Gray and W i l l i s choke valve systems was necessi tated by design c r i t e r i a o f (1) maximum wellhead pressure o f 10,000 ps i , (2) i n j e c t i o n o f sca l ing/corros ion i n h i b i t o r a t r e l a - t i v e l y h igh pressure, w i t h a maximum i n h i b i t o r pump discharge pressure r a t i n g o f 7,500 psi, and ( 3 ) a f l o w measurement requirement a t h igh pressure, w i t h a maximum pressure r a t i n g o f 5,000 p s i on the tu rb ine meter. A t the t ime o f i n s t a l l a t i o n , a higher pressure r a t i n g tu rb ine meter was no t a v a i l able commercially.
The Gray chokes were removed l a t e r when low pressures were observed and the valves were needed a t the Gladys McCall wel l . They were replaced by a s t r a i g h t piece o f heavy wa l l pipe, and l a t e r a Gray ESD valve was added. Thus, the W i l l i s chokes f i n a l l y served as pr imary f l o w con t ro l . The W i l l i s chokes requi red a g rea t deal o f maintenance due t o erosion. Thei r angular design requi red a number o f adjacent p ipe r i g h t angles, and erosion damage was experienced a t these points.
53

4.3 BRINE/GAS SEPARATOR SYSTEM L/ As the pressure was decreased across the choke valves from the wellhead pressure of about 5,000 psi to about 1,000 psi, natural gas as well as other gases (e.g. carbon dioxide) was released from solution in the brine. The two-phase gas-liquid flow was then directed into the brine/gas separator system for the gas separation and recovery sequence of the process. Photographs of the separator system are shown in Figure 4-7.
The brine/gas separator vessel (V-301), construction detai 1s of which are given in Volume 11, was a horizontal cylindrical vessel with an internal diameter of 54-inches and a length of 30-feet tangent-to-tangent. The separator system was designed for a 40,000 B/D brine flow rate containing’ 1.2 MMSCF/D of gas. The design operating pressure and temperature were 1,000 psig and 3OO0F, respectively. The maximum working pressure of 1,440 psig at 105OF could be reduced to 1,290 psig at 350OF. These pressures were selected to permit injection of gas into a commercial pipeline system and to permit the disposal of effluent brine into the disposal well without the necessity of installing pumping facilities. On the other hand separator pressure could be reduced to 100 psig if required by low well head pressure. which has been necessary at times.
The brine/gas flow from the Willis choke valves was directed into the separator inlet, and then downward by a splash plate at the inlet. The linear velocity across the separator was 0.32 feet/sec at the design flow rate of 40,000 B/D, and thus residence time in the separator was about 100 seconds. Obviously, the linear velocity was lower, and the residence time longer, at flow rates of less than 40,000 B/D.
The gas and water vapor thus separated from the brine flowed upward and out the top of the separator. Pressure control on the separator system was maintained through a spl it-range pressure indicator/control ler, which adjusted the gas flow primarily to the future gas pipeline system, and secondarily as required to the flare system. However, during all testing phases all gas produced was sent to the flare since the necessary gas cooling and drying facilities had not been provided, and the connections to a commercial gas transmission pipeline system were not made.
The brine level in the separator was controlled by a liquid level indicator/controller. which set the rate of brine flow out the bottom of the separator. Although no oil was expected, the separator was also equipped with a 2-foot vertical baffle plate, so that oil/brine separation could be made in the vessel with only minor external additions should minor quantities of oil be produced. Some heavier liquids were produced- see Section 6 of this report.
Sand drains were included in the separator, but since no sand was produced, they were not used except for occasional cleaning of the separator.
4.4 BRINE FILTER SYSTEM
\
W The brine from the separator system was filtered before flowing to the disposal well. The Pioneer Centrifuging Company brine filter system, consisted of five skid-mounted filters with parallel inlets, and outlet
54 /

headers, valves, gauges, bleed valves, cover davi ts, and other accout- rements. Crossover tees and b l inds were included t o a l low operat ion o f the f i v e f i l t e r s i n p a r a l l e l banks o f three f i l t e r s and two f i l t e r s i n series. The f i l t e r tubes used i n i t i a l l y were f o r 50 micron s i ze separation, bu t were a lso ava i lab le i n 5, 10, 25, 75, and 100 micron sizes. These f i l t e r car t r idges were o f throw-away design. A l oca l pressure gauge on each ind icated the need f o r replacement. Pr inc ipa l species f i l t e r e d were i r o n and scale (calcium carbonate).
b
V i r t u a l l y no sand was observed.
4.5 SALT WATER DISPOSAL WELLHEAD
A schematic diagram o f the s a l t water disposal wellhead and casing spools i s given i n Figure 4-8, and a photograph o f the i n s t a l l e d wellhead i s shown i n Figure 4-9. This wellhead was furnished by FMC Corporation.
4.6 PRODUCTION GAS SYSTEM
As was discussed previously, the gas and water vapor from the separator could be sent v i a sp l i t - range pressure con t ro l on the separator f i r s t t o the gas p i p e l i n e system, and a l t e r n a t e l y as required t o the f i e l d f l a r e . Because the gas p ipe l i ne was no t i ns ta l l ed , both l i n e s were connected together t o go t o the f l a r e .
4.6.1 FIELD FLARE SYSTEM
LJ
As shown i n Figure 4-3, the f i e l d f l a r e system consisted o f a water knock-out po t w i t h l e v e l con t ro l le r , a 30-foot P i l g r i m Steel f l a r e stack, a flame f r o n t generator i g n i t i o n and p i l o t system, and a propane storage tank.
Gas and water vapor was routed t o the water knock-out pot from which condensed water was sent v i a l eve l con t ro l t o surface blowdown tanksfor disposal. The gas from the water knock-out pot was then burned i n the f l a r e . The 30-foot f l a r e stack included a 4- inch X 8- foot t i p , and was designed t o withstand sustained winds o f 125 rnph. The flame f r o n t generator i g n i t i o n and p i l o t system consisted of sending a regulated mixture o f propane and a i r t o the f l a r e t i p w i t h manual e l e c t r i c i g n i t i o n o f the p i l o t from a remote panel. Because of the long p ipe runs involved, the p i l o t system d i d no t work r e l i a b l y . The f l a r e was l o c a l l y l ighted, using a rag on a po le o r a f i reworks rocket.
4.6.2
It would have been necessary t o i n s t a l l add i t iona l surface f a c i l i t i e s before the gas product ion could be so ld t o a gas transmission company. These f a c i l i t i e s would have included a fo rced-dra f t a i r cooler t o cool the gas from about 300OF t o about 125OF, a water knock-out pot t o remove the water thus condensed, a gas/ t r ie thy lene g lyco l contactor f o r water removal, a 40-gph t r i e t h y l e n e g l yco l regenerator, and p i p i n g from the s i t e t o the chosen gas p ipe l ine. It might a lso have been necessary t o i n s t a l l a gas/diethanolamine contactor, and a 10- gpm diethanolamine regenerator f o r reduct ion o f the carbon d iox ide concentrat ion i n the gas stream. Because it was not economic, a gas sales 1 ine was never contracted.
GAS PIPELINE SYSTEM (NEVER COMPLETED)
55
.
4.6.3 INHIBITOR INJECTION SYSTEM
As may be seen in Figure 4-10, the scaling/corrosion inhibitor injection system consisted of two 60-gallon inhibitor storage tanks with gauge glasses, three 30-gph Milton Roy positive displacement injection pumps with pulsation dampners and a maximum discharge pressure of 7,500 psig, and associated pressure relief valves, gauges and piping.
The system was designed so that two different inhibitors could be injected simultaneously at different concentrations into the brine line, with the third pump available as a common spare. The inhibitor injection rate was varied with a micrometer dial on the pump; the pump cal ibration curves were determined by plotting actual volume pumped per unit time as a function of the micrometer setting.
Inhibitors from the pump discharges were injected through separate piping into the 8-inch brine line between the Gray choke valves and the turbine flow meter.
Initially, 10 ppm of the scaling inhibitor AMP-20 were injected; however, the specific inhibitors, combinations thereof, and con- centrations were reduced to about 1 ppm as a result of information gained from the inhibitor pilot plant program. A corrosion inhibitor was not required due to low experienced corrosion rates.
4.7 SURFACE TANKAGE
The blow-down pit utilized commonly in both oilfield drilling and geopressured- geothermal operations was not provided at the Sweet Lake site, primarily for environmental reasons and lease restrictions. Fluids not suitable for injection were piped to, and had to be contained in, four rectanglar open top surface tanks with a total capacity of only 700 barrels (refer to Figures 4-2 and 4-3). There were three tanks with a 100-barrel capacity and one tank with a 300-barrel capacity. The use of these small tanks increased the cost o f Sweet Lake drilling and operating signi- ficantly.
It was necessaryto transport brine and other substances from the blowdown tanks with vacuum trucks to approved disposal areas. One such disposal area was located approximately 4 miles from the site. The blow-down tanks were not drained at the site. The brine from the tanks, however, could, be pumped to the disposal well through the use of the portable pump, if the brine was suitable; i.e., neither contaminated nor diluted with fresh water.
Although the blow-down tankage was indeed very limited, it was nonetheless considered adequate for the anticipated needs, and did not limit oper- ations during the testing period.
4.8 PRESSURE RELIEF SYSTEMS
There were basically two types of pressure relief systems in the surface facilities design: first, there were conventional pressure relief or pop
i d
i
valve systems which r e l i e v e a t preset pressure set t ings, and second, various pressure sensors which r e l i e v e the abnormal pressure s i t u a t i o n by actuat ing the Emergency Shutdown (ESD) system. This, i n turn, closed gate valves upstream o f the Gray choke valves and/or on the t e s t wellhead, and -would shut- in the wel l .
u Pressure sensors which actuate the ESD system and shut- in the t e s t wel l , t h e i r loca t ions and respect ive pressure se t t ings f o l l o w ( r e f e r t o Figure
' 4-2):
8-Inch Br ine L ine Between Gray Choke Valve Manifold and Turbine Flow Meter
4.9
High Pressure Set t ing - 5,000 ps ig Low Pressure Set t ing - 1,500 ps ig
10-Inch Br ine L ine Between W i l l i s Choke Valve Manifold and Gate Valve Block f o r Separator Bypass
High Pressure Set t ing Low Pressure Se t t i ng
- 1,500 ps ig - 200 ps ig
Brine/Gas Separator Vessel (V-301)
High Pressure Se t t i ng - 1,290 ps ig Low Pressure Set t ing - 200 ps ig
8-Inch Br ine L ine t o Disposal Well (Downstream o f PCV-121 Manifold)
Low Pressure - 100 ps ig
Conventional pressure re1 i e f valves, t h e i r locat ions, and pressure se t t i ngs are as fo l lows:
6- Inch Separator Bypass L ine - 1,935 ps ig
6-Inch Br ine F i l t e r I n l e t L ine - 1,290 p s i g
Brine/Gas Separator Vessel (V-301) - 1,290 ps ig
These pressure r e l i e f systems were designed t o adequately p ro tec t t he i n t e g r i t y o f the surface f a c i l i t i e s , and thus f a c i l i t a t e d safe t e s t i n g operations.
INSTRUME NTAT I ON
4.9.1 BOTTOM-HOLE PRESSURE AND TEMPERATURE MEASUREMENTS
Wire1 ine bottom-hole pressure and temperature measurements were made dur ing the i n i t i a l phases o f t e s t i n g by Reservoir Data personnel. Because the expected r e l a t i v e l y h igh bottom-hole temperature (3200 - 330oF) exceeded the l i m i t s of the Hewlett Packard gauge, a modi f ied GRC-512 pressure element was used i n the t e s t wel l , although the
57

actual temperatures would have permitted the use of the Hewlett- Packard gauge. A Hewlett-Packard Quartz Gauge was used in the salt water disposal we1 1. These temperature and pressure measurements were required for reservoir modeling studies to define the reservoir. For much of the testing, no downhole measurements were made and surface pressure measurements were sufficient.
4.9.2 FLOW MEASUREMENT
Flow measurement was made with both f low-proportional Hal 1 iburton turbine meters and by instruments measuring pressure drop across conventional orifice plates. A Komax mixing device was later added at GRI and IGT suggestion.
Large turbine meters (0-50,000 B/D) were in the brine lines down- stream of the Gray choke valve manifold and the separator liquid outlet. A 0-10,000 B/D turbine meter was also arranged in parallel with the larger turbine meter on the separator liquid outlet line. Start-up piping was provided such that the 0-10,OO B/D turbine meter could be utilized during the early stages of the initial flow test at relatively low flow rates ( i .e, 3,000-5,000 B/D) when the separator was bypassed. A 0-2 MM SCF/D turbine meter was installed in the production gas line, which ultimately would have been connected to a commercial gas pipeline, and a positive displacement meter was added later to confirm measurements. Operation at low flow rates has made meter range selection a problem.
The output from these turbine meters was displayed on the control panel in the control room trailer in the form of (1) a six-digit totalizer with manual reset, (2) flow indicators, and (3) strip-chart flow recorders
Conventional 0-2 MM SCF/D orifice plates for flow measurements were located in the total separator overhead gas line and in the gas line to the flare. These gas flows were displayed on strip-chart recorders in the control room trailer. A low range positive displacement gas meter was installed at the flare because of early problems with the orifice plates. The positive displacement meter served as a check on the orifice plates. Orifice meter calibration was also a difficulty magnified by two-phase, multi-component flows.
4.9.3 PANEL-MOUNTED INDICATORS/CONTROLLERS AND STRIP/CHART RECORDERS
The instrumentation that was used for primary control and monitoring of process variables on an hour-to-hour- basis were two panel-mounted indicator/control lers, and eight 30-day two-pen electronic strip- chart recorders located in the control room trailer. A listing of this instrumentation is given below.
In s t r umen t Service Range
PR-100 Test We1 1 head Pressure 0-5,000 psig PR-102 Brine Line Pressure - 0-5,000 psig
Choke Valves
We1 1 head
Downstream of Primary - u FR-100 Brine flow from the Test 0-50,000 B/D
58

'c PR-123 Di sposal We1 1 head Pressure 0-1,000 psig
TR-102 Brine Temperature from test 150-350°F We1 1 head
TR-110 Brine Temperature to Dis- 150-35OoF posal We1 1 head
AR-100 Sand Production Rate from Var i ab1 e Test We1 1
AR-101 Sand Production Rate - Variable Downstream of Fi 1 ters
LIC/LR-100
FR-104
FR-105
PIC/PR-117
FR-102
Brine/Gas Separator Level 0-100%
Brine Flow to Disposal 0-6,000 B/D Wellhead - Low Range
Brine Flow to Disposal Wellhead - High Range
Brine/Gas Separator Pres- sure
Total Separator Gas Pro- duction
0-50,000 B/D
0-1,500 psig
0-2 MM SCF/D
FR-103 Production Gas to pipeline 0-2 MM SCF/D
FR - 1 C18 Production Gas to Flare 0-2 MM SCF/D
4.9.4 LOCAL INDICATOR/CONTROLLERS
The surface facilities control system also contained two local indicator/control lers. One of these indicator/controllers (PC-121- refer to Figure 4-2) maintained pressure on the brine line to the disposal wellhead, and was intended only for operations which bypassed the separator.
The second local indicator/control ler (LIC-107-refer to Figure 4-3) released the high liquid level in the water knock-out pot on the production gas line to the flare.
4.9.5 SAND DETECTORS
Sand production rate was monitored with two Oceaneering International Sand Systems sand detectors. One sand detector monitored the actual sand production rate from the test well, and the second sand detector, located down-stream o f the brine filters, monitored sand content of the brine flowing to the disposal well-head.
The sand detector system consisted basically of (1) a preamplified acoustical probe in the brine flow line and probe cables, (2) panel- mounted signal processing electronics, and (3) panel -mounted strip- chart recorders for data display and sand production quantification.
c/
59

When a probe was struck by a p a r t i c l e o f sand i n the b r ine stream, an acoust ical l y - sens i t i ve c r y s t a l i n the probe converted the acoust ical "pinging" o f the impinging sand i n t o an e lec t ron i c signal, which was processed by the e lec t ron i c c i r c u i t r y and then the s igna l output was displayed on a s t r i p -cha r t recorder.
The sand detectors had f i v e s e n s i t i v i t y ranges, which were ca l i b ra ted i nd i v idua l l y . Sand concentrat ions as low as 30 ppm could be detected.
Based on data avai lable, very l i t t l e sand product ion was expected from the MG-T/DOE AMOCO Fee No. 1 t e s t wel l . The instruments never gave a reading, and product ion inspect ion o f components confirmed t h i s lack o f sand production. Sand found i n the disposal we l l came from backflow o f t h a t wel l .
4.9.6 EMERGENCY SHUTDOWN (ESD) SYSTEM
The ESD system was an O t i s "Wellhead Control and Emergency Shutdown System." The system consisted b a s i c a l l y o f var iab le sensors (pressure, temperature, f low level , sand product ion rate, etc. ), a cont ro l panel, a hydrau l i c f l u i d pumping system, and hydraul ic operators on key process gate valves. The Sweet Lake ESD con t ro l panel, located i n the con t ro l room t r a i l e r , actuated a master valve on the wellhead, and the gate valves upstream o f the choke valves. A de ta i l ed descr ip t ion of t h i s system i s presented i n Volume 11.
The hydrau l i c f l u i d system was a skid-mounted a i r pressurized dual pump (one spare) system t h a t pressurized the hydraul ic f l u i d t o 3,000 psig. Upon r e c e i p t o f s ignals from the sensors,the hydraul ic system actuators closed the gate valves upstream o f the Gray choke valves and a master valve on the t e s t wellhead.
Once the hydraul ic system was pressurized, a i r consumption should have been n i l . However, minor leakage from the system requi red frequent operat ion o f the a i r compressors. Add i t iona l l y , n i t rogen accumulators on the sk id provided f o r f ou r f u l l cyc les o f opening and c los ing each valve. Once a given valve opened, the c los ing o f the valve returned hydrau l i c f l u i d t o the rese rvo i r on the skid. The a i r compressors requi red extensive maintenance on a regu la r basis. A l i q u i d n i t rogen tank provided add i t iona l backup t o the a i r system, i n the u n l i k e l y event t h a t the instrument a i r system became depleted. The sensors which actuated the ESD system on the Sweet Lake surface f a c i l i t i e s are shown i n Figure 4-2.
4.9.7 DIGISTRIP DATA LOGGER
I n add i t i on t o s t r i p -cha r t recording o f key process var iab les these var iab les as w e l l as c e r t a i n others were logged d i g i t a l l y on one o f two - 32-point Kaye Instruments D i g i s t r i p Data Loggers. These data loggers, which were mounted i n the con t ro l panel i n the cont ro l room t r a i l e r , could be programmed t o p r i n t ou t the d i g i t a l data a t p r a c t i c a l l y any desired frequency. h h i l e the data logger was u t i l i z e d i n moni tor ing and t e s t i n g operations, i t s primary func t ion was t o provide permanent
60
i
LU-101 Brine/Gas Separator Level
records o f process var iab le data. The fo l l ow ing var iables were logged on the D i g i s t r i p .
PU-100 PU-101 PU-102
PU-106
PU-116 Brine/Gas Separator Pressure PU-120 Br ine Line Pressure - Downstream o f F i l t e r s PU-123
FU-100 FU-102 Total Separator Gas Production FU-103 Production Gas t o F la re
TU-102 TU-105 TU-110 Br ine/Gas Separator Temperature TU-112 TU-113 Total Separator Gas Temperature TU-08
Test We1 1 head Pressure Test We1 lhead Casing Annulus Pressure Br ine Line Pressure - Downstream o f Primary
Br ine Line Pressures - Downstream o f Secondary Choke Valves
Choke Valves
Disposal We1 1 head Pressure
Br ine Flow from Test Wellhead
Br ine Temperature from Test We1 1 head B r ine/Gas Separator I n l e t Temperature
Br ine Temperature t o Disposal We1 1 head
Gas Temperature t o P i p e l i n e
AU-100 AU-101
Sand Production Rate from Test Well Sand Production Rate - Downstream o f F i l t e r s
4.9.8 ALARM SYSTEMS
Numerous h igh and/or low pressure, temperature, f low, l eve l , and sand product ion r a t e alarm systems were provided as may be seen i n Figures 4- 2 and 4-3. The alarm annunciator panel was mounted i n the con t ro l panel i n the con t ro l room t r a i l e r .
4.9.9 PROCESS GAS CHROMATOGRAPH
A process gas chromatograph was u t i l i z e d t o a l t e r n a t e l y analyze both the production gas stream and the b r i n e stream t o the disposal wellhead on approximately 30 minute t ime cycles.
The concentrat ions of methane, ethane, propane, isobutane, normal butane, isopentane, normal pentane, hexanes plus, and carbon d iox ide were determined i n the production gas stream w i t h carbon dioxide being a key component.
The methane, ethane, and carbon d iox ide concentrat ions were determined i n the res idua l b r i n e stream t o the disposal ' w e l l . The methane concentrat ion was, o f course, i n d i c a t i v e o f production gas l o s t t o the b r i n e stream due t o brine/gas separator i ne f f i c i ency . This instrument was shared w i t h G1 adys McCall . Maintenance and r e 1 i a b i 1 i ty were severe problems due t o the supp l i e r ' s corporate problems. It was supplemented w i t h Draeger tubes fo r H2S and CO2, used both by operators and consultants such as SCAN. Draeger tube r e s u l t s were consistent and re1 iable.
c/
61

4.10 SCALING/CORROSION MONITORING SYSTEMS
Scaling and corros ion were monitored i n the main surface f a c i l i t i e s through coupons mounted i n (1) the b r i n e l i n e down-stream o f the W i l l i s choke valves, (2) the b r ine l i n e downstream o f the separator t o the disposal wel l , and (3) the product ion gas l i n e t o the gas p ipe l ine. The coupons i n the b r ine l i n e s were manifolded such t h a t they could be removed and inspected dur ing t e s t i n g operations; however, the coupon i n the product ion gas l i n e could not be removed unless the separator was bypassed, o r the t e s t w e l l was shut i n .
I
Subject t o experience gained dur ing the f i r s t few weeks o f test ing, i t was planned t h a t these coupons would be removed, inspected, and weighed a t approximately weekly i n te rva l s . The composition o f the scale was a lso determined by per iod ic analysis o f the mater ia l . This system confirmed t h a t no s i g n i f i c a n t scale formed, and t h a t corros ion occurred on ly a t i so la ted po in ts i n connection w i t h erosion. Therefore the frequency o f coupon analys is was reduced.
4.11 ELECTRICAL SYSTEM
The pr imary source o f e l e c t r i c i t y a t the Sweet Lake s i t e was der ived from the Jefferson Davis 7620 VAC l i n e on Highway 384 d i r e c t l y nor th o f the s i te . Four bur ied 25,000 v o l t conductor cables run from the Jefferson Davis l i n e t o feed three 50 KVA 120/240 v o l t transformers. These transformers were connected i n a closed d e l t a system w i t h one spare 25,000 v o l t conductor i n the event o f f a i l u r e o f one o f the other three conductors. This spare conductor had t o be used due t o the c u t t i n g o f one conductor by unrelated construction.
The e l e c t r i c power l e f t the transformers t o one master 400 amp, 3 po le f u s i b l e double-throw disconnect. This disconnect was used f o r both commercial power d i s t r i b u t i o n and generator power. A 75 KW a u x i l i a r y d iese l - d r iven generator was ava i lab le t o feed c r i t i c a l services i n the event o f loss o f commercial e l e c t r i c i t y . The generator was manually s ta r ted l o c a l l y when needed by stored compressed a i r .
E l e c t r i c i t y from the master switch was fed i n l i n e s through two runs o f 2- inch conduit. One condui t run fed the con t ro l room t r a i l e r and i t s equipment. The second condui t run fed the instrument a i r compressors, i n h i b i t o r i n j e c t i o n pumps, i n h i b i t o r p i l o t p lan t and miscellaneous services such as outs ide l i g h t i n g , etc.
4.12 INSTRUMENT A I R SYSTEM
The instrument a i r system was skid-mounted A i r Power Service Company package un i t . The system consisted o f two 55 SCF/M a t 100 ps ig discharge Ingersoll-Rand compressors d r iven by two 20 HP TEFC e l e c t r i c motors, w i t h associated af tercoolers , dryers, and f i l t e r s . These unlubr icated com- pressors requi red excessive maintenance, perhaps p rec ip i t a ted by the f r e - quent s t a r t s due t o leaked-off a i r pressure.
62
L i
4.13 FRESH WATER SYSTEM
Water a t the s i t e was supplied by a 500-feet deep water we l l t h a t was used i n i t i a l l y t o supply water f o r d r i l l i n g operations. Water was supplied a t t he surface by pressur iz ing the annulus of the we l l w i t h a i r , which flowed water t o a 500-gallon head tank located near the con t ro l room t r a i l e r . A small booster pump was used t o supply the con t ro l room t r a i l e r . I f needed, large quan t i t i es o f water could be supplied d i r e c t l y a t about 80 psig. As t h i s water had been contaminated by algae, b o t t l e d d r ink ing water was used. F i r e p ro tec t i on was provided v i a manual ext inguishers, and could be supplemented by pumped f resh water.
4.14 WASTE WATER DISPOSAL
There were no waste water f a c i l i t i e s which would permit d i r e c t disposal a t the s i t e . Waste water, b r i n e from sampling systems, etc. had t o be contained i n surface tankage. and then transported v i a vacuum t ruck t o a nearby approved disposal s i t e . Sani tary wastes were t reated and discharged on s i t e .
4.15 CONTROL ROOM TRAILER
Process monitor ing and con t ro l operations were centered i n a 44-foot x 12- f o o t con t ro l room t r a i l e r , from which the Operators and S i t e Operations Manager worked. A1 1 o f the panel -mounted instruments described prev ious ly under Instrumentation were contained i n t h i s t r a i l e r . A separate con- vent ional t r a i l e r served as the s i t e o f f i ce .
4.16 SITE LABORATORY
A small skid-mounted por tab le laboratory constructed from a t ranspor t container was on -s i t e near the con t ro l room t r a i l e r . The laboratory, which measured 8- feet x 11 feet, contained laboratory bench tops and cabinets, e l e c t r i c a l ou t l e t s , running water and a sink.
Simple a n a l y t i c a l t e s t s on b r i n e samples (e.g., pH, a l k a l i n i t y , chlor ide, suspended sol ids, t o t a l dissolved sol ids, etc.) could be performed d a i l y ( a t l e a s t i n i t i a l l y ) by the Operators. The laboratory was also ava i l ab le as requi red f o r use by other organizat ions working a t the s i t e .
4.17 MODES OF OPERATION
Maximum f l e x i b i l i t y o f t e s t i n g operations was designed i n t o the surface f a c i l i t i e s . The fo l l ow ing modes o f f l ow t e s t i n g operations were conducted.
Test Well D i rec t t o Surface Tankage Test We1 1 D i rec t t o Disposal Well Test Well Through F i l t e r s t o Surface Tankage Test We1 1 Through Separator t o Disposal We1 1 (Bypassing F i 1 t e r s ) Test Well Through Separator and F i l t e r s t o Disposal Well.
63

4.18 SAFETY
The principal mode of well safety was via automatic shut-in of the master valves on loss of power, loss of air, or certain out-of-range process variables. Operator intervention was not required. Some of these shut-ins were manual ly bypassed during start-up.
w
When the ESD valves were blocked, for example during wire line operations, the blocking action could be removed remotely via cable-actuated valves.
A permanent kill line was installed, so that mud could be added to the system at a distance from the wellhead.
4.19 GAS-WATER RATIO MEASUREMENTS
. In all of the geopressured-geothermal wells tested to date, there have been questions as to whether the brines were undersaturated, saturated, or supersaturated with respect to methane gas. This question arose at Sweet Lake as well, primarily during the early part of the Testing Phase when faulty equipment yielded an unexpectedly low methane content.
Wet gas/water ratios of 13-15 SCF/B were reported during early testing (June - July, 1981) of the Sweet Lake well; in fact, a value of 8.5-9 SCF/B was reported during the Initial Flow Test in mid-June (Plate I). These early gas/water ratio measurements were determined to be erroneously low through a systematic study of both gas and brine measurement mechanisms.
4.19.1 GAS MEASUREMENTS
Early gas production measurements were made using concentric orifice plates and strain-gauge differential pressure instrumentat ion. The gas prodution rates thus determined were not initially considered suspect because consistent (a1 beit low) measurements were obtained using several orifice plates of different bores, as well as different differential pressure instruments calibrated at several different ranges. A detailed analysis o f this topic were presented in Appendix 6- 1.
However, a Rockwell positive displacement meter was installed for gas rate measurements on July 29, 1981 (Plate I), and measurements thus obtained were about 113% higher than those obtained with the orifice plates. The positive displacement meter was then removed, tested, and found to be accurate to within about 1%. The gas measurements with the orifice plates were thus determined to be erroneously low.
Inspection and systematic study of all components of the orifice plates-differential pressure instrumentation systems demonstrated that the measurement errors were attributable to the following:
Calculation Errors - 12% Improperly Designed and Constructed Or if ice Plates (Plates not beveled to create proper sharp kn if e-edge ) - 27% Steam Condensation Upstream of Orifice Plates - 61%
64

The o r i f i c e measurement problems a t Sweet lake have included prec ise or ien ta t ion , f l ow d i rec t ion , dimensioning, mechanical problems, and two phase f l o w p e c u l i a r i t i e s .
Comparitive wet gas/water r a t i o s determined using both o r i f i c e p la tes- / d i f f e r e n t i a l pressure instrumentat ion and p o s i t i v e displacement me- t e r s f o r gas r a t e measurements, and tu rb ine meters f o r b r ine meas- urements are given i n Table 4-2. It should be noted t h a t the r a t i o s given i n Table 4-2 are product ion wet gas/water ra t i os , and t h a t gas l o s t i n the b r ine t o the disposal we l l (about 2-3 SCF/B a t 300 ps ig separator pressure - r e f e r t o Figure 4-11) must be added t o a r r i v e a t the t o t a l gas/water r a t i o .
4.19.2 BRINE MEASUREMENTS
Br ine f l o w r a t e measurements were made w i t h a Ha l l i bu r ton tu rb ine meter which was piped upstream o f the separator t o obta in immediate f l ow response from the wellhead, and t o avoid the t ime lag down-stream o f the separator. Unfortunately, f u l l stream f low (i.e., f r e e gas and dissolved gas i n add i t ion t o b r ine) was measured up-stream o f the separator.
The ind ica ted f u l l stream f low r a t e was determined t o be about 26-44% higher than the br ine f l ow r a t e from the separator ( r e f e r t o Table 4-1). This erroneously h igh ind icated f l ow r a t e when used i n gas/water r a t i o ca lcu la t ions w i l l r e s u l t i n r a t i o s o f 5-6 SCF/B lower than the actual ra t i os .
Ca l i b ra t i on t e s t run data f o r the Ha l l i bu r ton tu rb ine meters u t i l i z e d f o r b r i ne f l o w r a t e measurements are given i n Table 4-1. It can be seen from these data t h a t the tu rb ine meters when measuring b r ine on ly are accurate t o w i t h i n less than 1%.
Samples were sent t o Weatherly Laborator ies f o r recombination studies. The r e s u l t s ind icated t h a t the b r ine should conta in 34 SCF/B a t saturat ion, which would mean t h a t the Sweet Lake b r ine was under- saturated. The theo re t i ca l curves o f Blount , Haas , and others, however, i nd i ca te t h a t the Sweet Lake b r ine was saturated w i t h respect t o methane. These curves probably represent more an order o f magnitude ra the r than a prec ise value, and so cannot be used t o determine whether o r no t the b r ine was saturated. These data can be viewed i n two ways. F i r s t , i f the Weatherly data are accepted, the Sweet Lake b r ine was undersaturated. A l te rna t i ve l y , there are some, p a r t i c u l a r l y a t IGT, who view the Weatherly data w i th some skepticism. Their studies i nd i ca te t h a t the Sweet Lake b r ine was a t o r near saturat ion. See Appendix D.
4.20 PROPOSED SURFACE GENERATING SYSTEM
Because the produced na tura l gas had C02 and H2S concentrat ions i n excess o f p ipe l i ne standards, and because the cost o f gas treatment equipment was not economic, .no gas was ever sold from Sweet Lake. Instead MG-T proposed i n s t a l l a t i o n , a t i t s expense o f a hybr id power p lant . This p l a n t would burn produced gas as i n an i n te rna l combustion rec ip roca t ing engine. The engine would d r i v e an e l e c t r i c generator, and i n addi t ion, waste heat from the engine (both exhaust and coo l ing water) would be added t o the separated br ine
L,
65
and i n p u t t o an Organic Rankine Cycle system.
k, However, DOE had made up i t s mind t o terminate the Sweet Lake Project, and the proposal was forthwith rejected. The bladeless turbine to u t i 1 ize pressure energy was never tested.
66

5.0 RESERVOIR TESTING
The Mio y sinoides sequence in the Sweet Lake test well contained seven sands. --Ife_f_ wo o these sands, 5 and 3, were tested, in that order. In each case a short initial clean-up flow was followed by a build-up test. A reservoir 1 imit determination test was then conducted. When this test had been run long enough to observe reservoir barriers, the downhole pressure testing equipment was removed. The well was then put on long-term production at various rates (Plates I and 11).
W .
5.1 PRELIMINARY OPERATIONS
5.2 SAND ZONE 5.
Sand 5 was selected as the first zone to be tested, primarily because of the abnormally high permeability. This sand, as shown in Figure 5-1, is separated from the other sands in the Mio ypsinoides sequence by shale
for the first test. both above and below. For these reasons, + i s san was thought to be ideal
Information concerning this well was supplied to Ken Davis and Associates in order to obtain their recommendations on the perforation interval. Their recommendations agreed with that made by MG-T, to perforate and test only the one sand initially.
\
The original plan for completion of the test well, as specified in the Drilling and Testing Plan of July 1980, was to complete in the lowermost sand of the Mio sinoides sequence, unless wireline log data and/or core
feet) did have porosity and permeability far superior to any of the other sands. These parameters indicated that Sand 5 would contain about 50% of the total hydraulic capacity of the Mio sinoides sequence. Sand 5 also
The lack of communication between this sand and the other sands would help to ensure reliable reservoir performance testing. Following ex- tensive discussion, the decision was made to perforate and test initially the one interval.
Sand 5 was perforated on June 16, 1981 with a Schlumberger Hyperdome gun at 4 shots per foot. The completion efficiency, as calculated by Reservoir Engineering Consultant J. Donald Clark, was 97%. The original reservoir pressure was 12,052 psia, the initial surface pressure 4,749 psia, and the original reservoir temperature 2990 F.
analysis suggeste + otherwise.
appeared to be relatively discrete -Y-- in re ation to the rema'ining sands.
As noted above, Sand 5 (15,387-15,414
5.2.1 INITIAL FLOW TEST
The Initial Flow Test was planned for a period of approximately two days and was intended primarily to clean the test well, to determine that the disposal well would accept brine, and to demonstrate that all surface facilities were operating properly. The test began at 6:18 p.m. on June 19, 1981, and ended at 8:04 p.m. on June 22, a total of 3.03 days. Part of the design criteria for this test was a constant flow fate to facilitate reservoir interpretation.
L/
67

During this time, 10,574 barrels of brine were produced, at an average rate of 3,444 B/D. The variation in the flow rate (2,820- 4,680 B/D) was due primarily to restrictions in the disposal well which necessitated diverting the flow to the blowdown tanks. Acid treatments improved the flow restrictions in the disposal well, and there was no further pressure build-up in the disposal well (Plate 1).
Reservoir Data Inc., equipment and personnel were on site during the Initial Flow Test and Reservoir Limit Test to measure and record bottom-hole and surface pressures in the test well. This in- formation was used by Reservoir Engineering Consultant J. Donald Clark, (Appendix C) and Intercomp Resource Development and Engineer- ing, in reservoir engineering calculations. These calculations (Figure 5-2) indicated that the radial exploration of the reservoir during this initial test reached 7,810 feet. A first approximation of water permeability was 339 md, fairly close to the predicted value of 400 md. Two permeability barriers were noted during this test, at 452 feet and 1,153 feet from the well bore. Indications of the barriers can be seen in the drawdown curves in Figure 5-3 and 5- 4. A preliminary interpretation of these barriers concluded that they may be the major sealing faults, sand pinchouts, thinning, minor faulting, or simply a decrease in permeability. The most unlikely explanation was that the barriers were the major faults; subsequent testing confirmed that this explanation was not reason- able.
The first measurements of gas production rates yielded an estimate of dissolved methane content of 7-8 SCF/B, indicating that the brine was grossly undersaturated with respect to methane gas. A wet
. gas/water ratio of 25-30 SCF/B had been expected. However, these first measurements were proved to be greatly in error due to metering problems. Both brine and gas samples were taken during this test for anal ys is . Before the Initial Flow Test, concern had been expressed about possible vertical elevation changes in the test wellhead, disposal wellhead, and separator as these systems were heated by flowing brine. The three systems were monitored with a transit during this test, and no elevation changes were detected. The temperature of these systems reached 215O F.
A detailed chronology of events of the Initial Flow Test is presented in Appendix A.
5.2.2 BUILD-UP TEST
At the conclusion of the Initial Flow Test, the test well was shut in prior to beginning-the longer Reservoir Limit Test. This build- up period allowed the reservoir to return to near-original pressure which was important for re1 iable reservoir engineering calculations. Additionally, the build-up itself provided data useful in reservoir intrepretation. 'r
68

L,
The bottom-hole pressure in the test well had decreased to 11,141 psi at the end of the Initial Flow Test and the start of the Build-up Test. At the end of the eight-day build-up test, on June 30, the reservoir pressure had increased to 11,974 psi. This was 78 psi less than the original pressure. The rate of pressure build-up can be seen on the plot in Figure 5-5, and also in Plate I. The rate of pressure increase had become minimal after eight days, and it was determined that the reservoir would not return to original pressure in the near future, if at all. Accordingly, the Reservoir Limit Test commenced on June 30, 1981.
5.2.3 RESERVOIR LIMIT TEST
The Reservoir Limit Test was intended primarily to attempt to determine the 1 imits of the geopressured-geothermal brine reservoir at Sweet Lake. This information was necessary to determine the economic potential of long-term production. The reservoir is 1 imited on two sides by major faults, which had been documented through well log and seismic interpretation. A third major fault that would enclose the reservoir to the west, had been postulated, although there were no well log data to support this postulation. If the fault did exist, however, its effect would have been observed within 10 to 20 days during the test. The absence of this fault would therefore indicate the presence of a large reservoir.
The Reservoir Limit Test began at 6:15 p. m. on June 30, I981 and ended at 5:OO p.m. July 17, a total of 17 days. The average flow rate was 13,350 B/D, and approximately 226,300 barrels of brine was produced. The flow rate varied from a high of 16,000 B/D at the start of the test to near 10,000 B/D at the end. The decrease in the flow rate was due to the nearby barriers, which restricted the flow. The average flowing temperature during the test was 265O F. The bottom- hole pressure dropped from 11,974 psi to 7,804 psi (Plate I). This was equivalent to a surface pressure of appoximately 700 psi. The surface facilities did not function with greatest efficiency at wellhead pressures of less than 700 psi. This was considered to be the lowest desirable pressure, and the flow rate was reduced accordingly to maintain this pressure.
RDI personnel and equipment were on site continually throughout this test. Bottom-hole pressures were measured using a Hewlett-Packard quartz gauge. Data collected by RDI were then used to calculate effective permeability, skin effect, completion efficiency, and distance to barriers.
5.2.4 LONG-TERM TEST
The purpose o f the originally planned long-term testing was to demonstrate that brine could be produced at relatively high rates (around 40,000 B/D) from a geopressured-geothermal we1 1 on a sus- tained basis, that natural gas dissolved in the brine can be recovered, and that the brine can be disposed of at these high flow rates in shallow aquifers.
69
i It was evident from the r e s u l t s o f the Reservoir L i m i t Test t h a t Sand 5 alone could not sustain a production r a t e o f 40,000 B/D f o r any s i g n i f i c a n t length o f time. Per forat ion o f addi t ional sands t o a t t a i n t h i s r a t e was not a v iab le a l t e r n a t i v e a t the time, and thus the dec is ion was made t o continue t e s t i n g Sand 5 a t var iab le rates. Documentation o f the d a i l y f l ow ra tes and surface pressures i s presented ch rono log ica l l y i n Appendix A, and i n P la te I.
The long-term t e s t i n g o f Sand 5 continued f o r 208 days, from Ju ly 17, 1981 t o February 10, 1982. The f low r a t e dur ing t h i s t ime var ied considerably, from a h igh o f 38,000 B/D t o a low o f 1,000 B/D. Approx- imately 1.1 m i l l i o n ba r re l s o f b r i ne were produced dur ing t h i s tes t . The t e s t w e l l had been shut i n on l y f o r r o u t i n e maintenance up u n t i l February 10, when the disposal we l l suddenly sanded up and would no t accept brine. It i s probable t h a t t h i s sanding up was due t o backflow r e s u l t i n g from b r i e f periods o f shut t ing i n the t e s t we l l t o t e s t new operators and t r a i n .
A low range p o s i t i v e displacement gas meter was i n s t a l l e d a t the f l a r e because o f e a r l y measurement problems w i t h o r i f i c e plates. O r i f i c e meter c a l i b r a t i o n was a lso a d i f f i c u l t y magnif ied by two- phase, mu1 t i-component f 1 ow.
During t h i s long-term production per iod o f more than seven months, most o f t he purposes o f the designed Long-Term Test were met. Funds were ve ry r e s t r i c t e d dur ing most o f t h i s time, however, which necessi tated operat ion a t on l y 5,000 B/D i n order t o "preserve the wel l . " The shor t periods o f h igh f l ow r a t e demonstrated t h a t t he surface f a c i l i t i e s and disposal w e l l were capable o f handling h igh flow rates.
Approximately 20 SCF/B o f methane gas were recovered from the b r ine dur ing t h i s t e s t and f l a r e d (Plate I). The recovery o f d isolved gas was more than adequately demonstrated.
5.3 HIATUS I N OPERATIONS
From February 10, 1982 t o November 11, 1983 the Sweet Lake production we l l was shut in. A t f i r s t , the shut- in was necessitated by t h e f a c t t h a t the disposal w e l l had sanded up. I n March and A p r i l o f 1982 the disposal we l l was cleaned and reperforated. Immediately a f t e r the reperforat ing, how- 'ever, a leak was detected i n the t e s t w e l l tubing. Flow t e s t i n g could no t be resumed u n t i l the cause o f the leak was i d e n t i f i e d and r e c t i f i e d .
During t h i s t ime meetings were he ld t o discuss the f u t u r e t e s t i n g o f t he Sweet Lake reservo i r . One question t h a t was o f great i n t e r e s t a t the t ime was whether d i f f e r e n t sands i n a sequence such as the Mio sinoides would
c ia ted gas content. Differences would i nd i ca te ' t h a t the sands were indeed d i sc re te throughout t h e reservo i r , whereas the same chemistry would i nd i ca te t h a t there was communication between them.
The u l t ima te goal o f Sweet Lake rese rvo i r t e s t i n g had been t o pe r fo ra te a l l sands i n order t o achieve maximum f l ow rate. Therefore, plugging o f f sands and t e s t i n g them i n d i v i d u a l l y was re jec ted as an opt ion a t t h i s time. An
have s i g n i f i c a n t l y d i f f e r e n t chemical cha rac te r i s t i cs an + I eren asso-
70
a l te rna te scenario was devised by I n t e r 3mD R urce Enqin r i n g and Development t o ob ta in a pure sample from a second zone whi le two zones were open. This proposed t e s t was based on the idea t h a t i f the f i r s t zone produced b r ine a t a h igh enough f low r a t e t o draw down the bottom-hole pressure subs tan t ia l l y , and i f the second zone was per forated immediately fo l l ow ing t h i s drawdown, the b r ine product ion from the we l l would come i n i t i a l l y from the second zone. The d i f fe rence i n reservo i r pressures would be enough t o prevent b r ine from the f i r s t zone from reaching the surface fo r a per iod o f up t o 14 days, depending on the f low rate.
L/
The f i r s t and second zones re fe r red t o were Sands 5 and 4, respect ive ly . Sand 5 had been per forated and tested, and it was proposed t o per fo ra te Sand 4 (15,305 t o 15,355 fee t ) immediately fo l low ing a drawdown o f Sand 5. Figure 5-6 i l l u s t r a t e s Intercomp's suggested procedure f o r f low ing p r i o r t o pe r fo ra t i on o f Sand 4. A t the t ime t h i s procedure was suggested, the we l l was f low ing a t 2000 B/D, which was a l lowing a bui ld-up o f format ion pressure. Intercomp's scheme was t o shut i n the we l l f o r four days p r i o r t o per forat ion, i n order t o se t up the pe r fo ra t i on gun. Fol lowing the shut-in, the we l l would be flowed f o r four days a t 15,000 B/D i n order t o draw the we l l down t o approximately 7800 ps ia bottom-hole pressure.
Figure 5-7 shows Intercomp's ca l cu la t i on o f how long Sand 4 would be able t o f low wi thout in ter ference from Sand 5 ( the " f i r s t zone"). An i n i t i a l bottom-hole pressure o f 7900 ps ia was used. The t ime t o f i r s t zone f l o w was ca lcu lated f o r f ou r f low rates; 500, 1000, 1500, and 2000 B/D. Any o f these flow ra tes would ev iden t l y provide enough t ime t o analyze the f low from Sand 4. Since Sand 4 has a much lower permeabi l i ty than Sand 5, it would hold a higher pressure f o r a longer time, thus r e s t r i c t i n g the o r i g i n a l sand from f lowing.
This scenario was never tested. The we l l was shut i n due t o disposal we l l prob ems and a subsequent tub ing leak i n the product ion wel l . When these prob ems were resolved, and pe r fo ra t i on o f the new zone was approved, it was iscovered t h a t the product ion we l l had had a backflow o f sand, and t h a t both Sands 5 and 4 were now blocked by sand. During remedial work using a small r i g , more tub ing leaks were discovered, which necessi tated employing a large r i g t o p u l l the tubing. The new PBTD o f the w e l l was
' 15,351 fee t . The lower zones were then blocked w i t h a br idge plug, and Sand 3 was per fo ra ted on November 11, 1983.
It was subsequently concluded t h a t the above ca lcu la t ions could no t be reproduced.
5.4 SAND ZONE 3
Sand 3 was selected t o be per forated p r i m a r i l y by defaul t . A l l zones beneath t h i s were unavailable, and the remaining zones had more o r less comparable po ros i t y and permeabi l i ty . The lowermost o f the three remaining zones was chosen f o r t e s t i n g so t h a t the remaining two sands (upper sands) would be ava i lab le f o r t e s t i n g l a t e r , w i t h no danger o f being blocked o f f by sand from Sand 3.
-
I
This zone was per forated i n two in te rva ls , the f i r s t from 15,260 t o 15,280 feet , and the second from 15,245 t o 15,255 feet . The o r i g i n a l rese rvo i r pressure was 11,887 ps ia (15,245 fee t ) , the i n i t i a l surface pressure 3,660 psia, and the o r i g i n a l rese rvo i r temperature 2930~.
bl
71

5.4.1 INITIAL FLOW TEST ,
The Initial Flow Test was planned for a period of 24 hours, primarily to clean the well and to ensure that the disposal well was accepting brine properly through its new perforations. Reservoir Dynamics, Inc. (RDI) equipment and personnel were onsite, and rigging up for downhole pressure and temperature measurement began immediately after perforation.
i
The well was opened up at a rate of 2800 B/D at 11:50 a.m. on November 12. At first, the flow was into the blowdown tanks. After "bottoms up" had been reached, the flow rate increased to 4000 B/D. The first formation brine out of the well was quite clean, without traces of drilling mud or sand production (Plate I).
The brine production was diverted to the separator and back to the blowdown tanks at about 8:OO p.m. on November 12. The separator system was started up at a pressure of 300 psig with production gas being burned in the flare. Brine production was switched from the bottom of the separator to the disposal well at about 1O:OO p.m. November 12. The disposal well functioned successfully, with a wellhead pressure of only 35-40 psig at a brine production rate of 4,000 B/D.
The Initial Flow Test was concluded at 11:50 a.m. November 13, at which time the well was shut in. The first results from this test indicated that the flow from this zone would be very restricted. The bottom-hole pressure decreased from 11,883 to 10,133 psia with a flow rate of only 4,000 BID during 24 hours. Obviously, the well could not sustain even that rate for any significant period of time.
5.4.2 BUILD-UP TEST
The Build-up Test of Sand 3 began at 11:50 a.m. November 13, 1983. A leak was detected at 7:OO p.m. on pressure instrumentation piping external to the wellhead. The downhole equipment had to be removed in order t o repair this leak, which was accomplished on November 14. Downhole equipment was not rigged up again until November 21, so that measurement of the downhole pressure build-up was not made. Res- ervoir engineering calculations thus could not be made on this part of the test.
This test concluded at 8:50 a.m. November 22, for a total of 9.875 days. The bottom-hole pressure had returned to 11,794 psia, which was 93 psi lower than the original reservoir pressure.
5.4.3 RESERVOIR LIMIT TEST
The results of a second reservoir limit test on a sand in the Mio- gypsinoides sequence were important to compare to the first. It= hoped that the results of this test would resolve some of the questions raised by the first test. The barriers observed during the first test were thought not to be the major faults, but rather some minor faults or other sort of barrier. Would a second sand in the same sequence have barriers in the same places? If so, it would tend to confirm that the barriers were perhaps faults, which affected the entire sequence. If not, then perhaps the barriers were stratigraph-
72

i
U
ation imposed; that is, pinchouts or permeability variations that T F E r between individual sands. If the barriers were different, then the shape of the total Mio psinoides reservoir would be very
ave a different shape. There were also questions that concerned the chemistry of the brine. Would the chemistry of the brine be the same in the two sands, and, indeed, should it? It was possible that there would be differences that would point to a lack of communication between the two sands.
The Reservoir Limit Test commenced at 8:50 a.m. November 22, and concluded at 7:30 a.m. December 7, when RDI was released, a total of 15 days. The data collected by RDI was provided to the reservoir engineering consultant for interpretation. However, the behavior of Sand 3 precluded any rigorous calculations. The drawdown curve, shown in Figure 5-8, shows that there are no reliable straight-line portions. Radial flow was not achieved, and so permeability could not be calculated.
complex, as each individual san -a=-Tn- wou
This test of Sand 3 can actually be divided into two separate phases. The Primary Drawdown Phase, from November 22-29, was an essentially constant-flow phase designed primarily to determine the limits of the Sand 3 reservoir. The downhole pressure dropped from 11,794 to 10,065 psia in that seven-day period (Plate 11). The brine production rate was essentially constant, at 2,046 B/D, for a total production of 14,322 barrels. The wet gas/water ratio was 24 SCF/B.
The second phase, the Reservoir Depletion Phase, was actually a combination of the second half of the Reservoir Limit Test and all of the Long-Term Test. Downhole pressure and temperature measuring equipment remained in place for the first eight days of the Reservoir Depletion Phase. The information gathered during this time was used by reservoir engineers to match reservoir behavior. The brine production rate was varied during this phase in order to study gas composition as a function of reservoir pressure. The average production rate during this phase was 2,684 B/D.
5 -4.4 LONG-TERM TEST
The Long-term T can essentially be thought of as the Reservoir Depletion Phase, as described above. Downhole pressure measuring equipment was removed on December 7, 1983. The well continued to produce brine at relatively low rates until 6:44 p.m. on March 13, 1984, after 114 days of testing. The shut-in was not necessitated by any mechanical or reservoir conditions, but rather by economic ones. A total of 276,608 barrels of brine had been produced from Sand 3 at that time, a total of 122 days. This period, along with the long-term production testing of Sand 5, demonstrated that all surface fa- cilities operated properly, and t dissolved methane could be removed from the brine effectively. er types of testing had been planned,including perforating all zones to achieve high flow rates
. and using the brine directly, or the heat from the brine, to grow aquatic cultures such as shrimp or fish, but the lack of funds prohibited this.
A chronology of the Testing of Sand 3 is presented in Appendix B.
73
5.5 RESULTS AND CONCLUSIONS
The reservoir testing was designed primarily to determine the shape and permeability of the reservoir; i.e. how long would the reservoir produce brine and at what rates. The calculations pertinent to those deterinations were those of distance to boundaries, effective permeability, and initial water in place.
i
5.5.1 BOUNDARIES
During the Initial Flow Test of Sand 5, the radial exploration of the reservoir reached 7,810 feet. Two permeability barriers were observed, at 452 feet and 1,753 feet from the wellbore. The reservoir was explored to a radial distance of 22,467 feet during the Reservoir Limit Test of Sand 5. Permeability barriers calculated during this test were interpreted to be 318 feet, 645 feet and 1,289 feet from the wellbore. It is difficult to say which o f the barriers of the Initial Flow Test matched which of the barriers of the Reservoir Limit Test, which only emphasizes the degree of inaccuracy and leeway in interpretation that is involved in these calculations. However, both sets of results indicated that there were barriers much closer to the well than had been expected.
The location of these barriers indicated that the reservoir was more or less pie-shaped, with a flow angle of 250 (Fig. 5-10). While the reservoir was restricted in two directions, it was thought to be open an unknown distance in the third direction. This direction was interpreted as being to the northwest, which would match more closely the original geologic interpretation. Since no enclosing barrier was observed, the postulated fault to the west apparently did not exist.
Confirmation of the reservoir shape was made by Intercomp. Computer history matches of the drawdown and build-up tests were made, and a good match was achieved with a flow angle of 26O. Equally valid matches, however, could be made using different assumptions. As mentioned previously, a reliable interpretation could not be made of the tests made on Sand 3. Since the well never achieved radial flow, there was no straight-line portion of the drawdown curve. This meant that calculation of the permeability was impossible, which in turn meant that the distance to barriers could not be calculated. Computer matches could be made, however, mainly by trial and error, to simulate the drawdown behavior. Dowdle Fairchild and Ancell made such a computer history match. The seven-day constant flow test of Sand 3 was used in this analysis. The variable parameters in the history match were reservoir permeability, distance to the faults, and angle of the faults. The conclusion of this computer simulation was that there were two barriers (faults), each 225 feet from the well; The flow angle in this case is 600. Again, the reservoir was interpreted to be pie-shaped, and open to the west.
There is an equally valid alternate description. The above descrip- tion, with two faults 225 feet from the well and open at an angle of 600, assumes that the rock properties are constant throughout the reservoir. As there is no geological reason why this must be so, a second description can be made based on varying rock characteristics.
74

(In fact, it is highly likely geologically that rock parameters vary to some degree). This second model assumes that there is a change in permeability 175 feet from the well. The computer simulation using this description fits the data equally well as does the first interpretation.
The conclusions of the testing of both Sands 5 and 3 are that there are barriers in the reservoir, close to the well bore. The nature of the barriers, whether due to faulting or a permeability decrease, for example, cannot be determined from the reservoir engineering data. An interpretation must be made on the geologic reasonableness of the descriptions.
LJ
5.5.2 EFFECTIVE PERMEABILITY
The permeabilities that were expected in each of the seven Mio
es. Actual versus estimated permeabilities are shown in Table 3-4. An approximate permeability to water was estimated, which was fairly close for Sand 5. In this case, the estimate for Kw was 400 md, while the permeability calculated from reservoir engineering was 339 md.
oides sands have been discussed in Section 3.5 Petrophysica --?-Y= Ana ys-
The comparison for Sand 3 was not as good. A water permeability of 140 md had been estimated. The permeability used in the successful computer simulation, however, was only 42 md, an order of magnitude lower. If the alternate reservoir description is accepted, the permeability drops from 42 md to 7 md at a distance of 175 feet from the wellbore. Thus there is a large disparity between the estimated and effective values for Sand 3. Part of this discrepancy is probably due to the fact that no core was taken from Sand 3, so a measured air permeability could not be used to estimate water permeability. The Saraband log was used to estimate permeability, and any log calcu- lation of permeability is unreliable. Therefore, the computer history match vaJue of 42 md may be close to the actual value of permeab i 1 i ty for Sand 3.
5.5.3 INITIAL WATER IN PLACE
During the Reservoir Limit test of Sand 5, some 300,000,000 barrels of water in place were explored. Assuming a porosity of 22% (an average of the values in Table 3-3), and assuming that the reservoir thickness remains constant at 27 feet, Sand 5 covers an area of approximately 11,330 acres. Obviously, since no enclosing boundary was detected, the reservoir is larger than this.
The Reservoir Limit Test of Sand 3 explored about 20,000,000 barrels of water. Since this sand had a much lower permeability than Sand 5, the same length of testing explored a much smaller area. It is probable, however, that Sand 3 approaches the same areal extent as Sand 5.
An approximation of the total water in place can be calculated, although it must be emphasized that this is only an approximation. The model assumes that the sand thickness remains constant, which may or may not actually be the case. Assuming that each of the seven sands
75

'1
cover an area o f 10,000 acres, and using the thickness and p o r o s i t i t e s i n Table 5-1, t he t o t a l water i n place i s 1865.2 MM bbl. There are many drawbacks t o t h i s ca lcu lat ion, such as the f a c t t h a t the reservo i r thickness may no t remain constant, o r the poros i ty may change, or not a l l sands may extend f o r 10,000 acres. However, assumptions must be made i n order t o approximate the water volume, and these assumptions are reasonable under the circumstances. This ca l cu la t i on gives an estimate o f the water i n place, but o f course only a f r a c t i o n o f t h i s i s recoverable.
5.5.4 ADDITIONAL INTERPRETATIONS
J. Donald Clark (Appendix C), Intercomp Resource Development and Engineering, and, l a te r , Dowdle F a i r c h i l d and Ancell (Appendix E) worked d i r e c t l y under the auspices o f MG-T. Other in te res ted par t ies, not working f o r MG-T, a l so analyzed the rese rvo i r en- g ineer ing data and made in te rpre ta t ions . Two o f these are Systems, Science, and Software (S-Cubed) and the Un ive rs i t y o f Texas. These in te rp re ta t i ons are discussed i n the fo l l ow ing sections.
5.5.4.1 S-CUBED
The i n t e r p r e t a t i o n by S-Cubed was based on analys is o f the bui ld-up data o f the Sand 5 tes t . The reservo i r cha rac te r i s t i cs determined from t h i s analys is were used i n the rese rvo i r s imulator MUSHRM t o h i s t o r y match the drawdowns o f the I n i t i a l Flow Test and Reservoir L i m i t Test. The conclusions reached were much d i f f e r e n t than those of Clark and o f Intercomp and DFA. A complete discussion o f how these conclusions were obtained can be found i n Garg (1982).
S-Cubed s ta tes t h a t there i s a zone o f r e l a t i v e l y h igh perme- a b i l i t y (162 md) near the we1 1 bore, bu t t h a t t h i s extends only t o a rad ius o f 200 f e e t from the wellbore. The f a r f i e l d permeabi l i ty i s q u i t e low, on ly 11.9 md. The c la im i s made t h a t no b a r r i e r s were observed dur ing the drawdown tests. Obviously, i f these lower permeab i l i t ies are correct , the r a d i a l d istance expl ored and vol ume o f water expl ored w i 11 be correspondingly 1 ower.
This descr ip t ion o f S-Cubed p a r a l l e l s the a l te rna te descr ip t ion o f the Sand 3 t e s t made by Dowdle F a i r c h i l d and Ancell , which has been discussed i n a previous section. It appears t h a t v a l i d computer s imulat ions can be made using a v a r i e t y o f i n t e r - pretat ions. For s imp l i c i t y , the i n t e r p r e t a t i o n which involves a h igh near-wellbore permeabi l i ty and a low f a r f i e l d permeabi l i ty w i l l be re fe r red t o as the "permeabi l i ty descr ipt ion." The i n t e r p r e t a t i o n t h a t proposes the existence o f f a u l t s and cons- t a n t permeabi l i ty w i l l be re fe r red t o as the " f a u l t des- c r i p t i on . " The v a l i d i t y o f the two opposing descr ip t ions i s discussed i n Section 5.5.5 Reservoir Descr ipt ion.
5.5.4.2 UNIVERSITY OF TEXAS
An analys is was made by Andrade e t a1 (1982) on the same Sand 5
76
test. This analysis concluded that the permeability was constant but low, 17.1 md. Again, no barriers were interpreted. This analysis accepts the position of the major bounding faults of the graben, approximately 1 mile on each side of the we1 1, and further states that to see the effects of these faults as a slope change on a pressure drawdown curve would take more than six months.
There are some discrepencies in the data used for this study, however, which may render the conclusions invalid. A gas content of 11 SCF/B was used to determine fluid properties, while the actual content was more than twice this amount. Also, this analysis basically ignores the early flow time data, which is important in barrier determinations. This report is not useful in the interpretations of the Sweet Lake reservoir because of these discrepancies.
5.5.5 RESERVOIR DESCRIPTION
Two distinct sets of interpretations have been made on the flow tests of Sands 5 and 3, and have been termed the fault description and the permeability description. The fault description is the primary interpretation made by the reservoir engineers working directly for MG-T. They also proposed an a1 ternate description, which correlates with the interpretation made by outside engineers; this is the permeability description.
The fault description maintains that the restriction of the reservoir (both Sands 5 and 3) was caused by faults. The faults limit the angle of flow, and the reservoir was essentially wedge-shaped, open an unknown distance in one direction. These faults are 225 feet from the wellbore in Sand 3 and approximately 160 feet from the wellbore in Sand 5. The faults would thus intersect the well just below TD (Figure 5-9). The faults must be oriented as shown in Figure 5-9 as there was no indication of a fault crossing the well either from the drilling or log data.
There are problems with this interpretation, however. It required that the throw on the faults be such that sands do not match up on either side, or that the faults acted as seals. It also seems too coincidental that the well could have been drilled exactly midway between two faults. These problems provided the reason for the a1 ternate description.
The permeability description involves a change in rock properties. Instead of a constant permeability with faults restricting the flow, this interpretation states that there was higher permeability near the well, but low permeability further from the well. This permeability change occured at 175 feet from the wellbore in Sand 3 and 200 feet from the wellbore in Sand 5. In that respect this was the opposite of the fault description because the area of high perme- ability widened with depth instead of narrowing. However, it must be noted that a difference of 50 feet one way or the other is probably within the limits of accuracy of the calculations. The barriers were essentially vertical in either description.
LJ -
77

Geologically, this description was as accurate as the fault des- cription. There was no reason to expect permeability to remain constant throughout a reservoir; in fact, it probably constantly changed. The high measured permeabilities seem to contradict the low calculated values, but this may have been due to inaccuracies in estimating water permeability from air permeability, and the fact that the estimated values did not account for stress.
ki
Again, however, there were some aspects to this description that do not seem reasonable. It seems too much to expect that the well managed to penetrate both sands in the high permeability zone, and that this zone had almost the same radius in both sands. It is difficult to picture a depositional environment in which this would occur. In this respect, faults are much easier to explain. The area surrounding the test well was highly faulted, and the test well itself was in the center of a graben bounded by major faults with hundreds of
. feet of throw. It was entirely reasonable to expect that there would be minor faulting associated with. these major faults. These minor faults would probably not show up on the seismic lines, because the displacement would be short in comparision to the wavelength of the seismic waves. There was the problem of the well being in the exact middle of the two faults, but perhaps the limits of accuracy of the calculations would allow some leeway in the placement of the faults.
One interpretation could not be conclusively chosen over the other at this point in time. Computer simulations of drawdown tests using each of the two reservoir descriptions matched the actual data equally well. Data from the other sand zones may have helped to resolve this question. If one description of the reservoir had to be chosen, the most 1 ikely interpretation is the fault description. Minor faulting fitted in well with the geologic setting o f the surrounding area, and the fact that the barriers moved closer to the well with depth also supports this theory. The reservoir would thus have been bounded on two sides by faults and open in one direction, to the west. An enclosing boundary for the reservoir was not observed.
The actual geology of the reservoir at Sweet Lake was probably much more complex than that which has been modeled. It is quite likely that aspects of both reservoir model descriptions were actually present in the reservoir.
78
6.n CHEMICAL ANALYSES
The chemical and physical analyses o f f l u i d s from the Sweet Lake wel l were c a r r i e d out by several independent groups: the Magma Gulf-Technadril p l a n t operations s t a f f , Professors Hankins and Karkal i t z o f McNeese State Universi ty, Professor Mason Tomson o f Rice Un ive rs i t y and Professor Jack Matson o f t he Un ive rs i t y o f Houston, Weatherly Laboratories, I n s t i t u t e o f Gas Technology, and S c i e n t i f i c Consult ing and Analysts.
i
One o f t h e o r i g i n a l t e s t i n g object ives o f the Sweet Lake Pro ject and indeed o f t he e n t i r e geopressure program was t o "characterize" the resource - what are the physical and chemical propert ies o f the geopressured b r ine and associated gas. I t must be noted t h a t there was no t a separate "chemical t e s t i n g program" butorather t h a t the resource was produced, and sampled and analyzed dur ing product i on.
Sampling and ana ly t i ca l t e s t i n g of ' b r i n e and gas samples were performed using frequency, s p e c i f i c analyses, equi p e n t , methods and techniques given i n "Standard Sampling and Analy t ica l Methods f o r Geopressured Fluids", prepared by McNeese State Universi ty, September, 1980, B.E. Hankins, Ed i to r .
The object ives o f chemical t e s t i n g a t Sweet Lake were to: determine b r i n e chemistry determine gas chemistry determine the r a t i o o f produced gas t o produced b r ine determine the degree o f gas saturat ion i n the rese rvo i r b r i n e determine any changes i n these propert ies w i t h t ime or production provide i npu t f o r the scal ing and corrosion contro l programs optimize gas recovery
I t i s important i n understanding the chemical t e s t i n g r e s u l t s t o review the ove ra l l t e s t i n g scheme as described bel ow.
The i n i t i a l f l ow per iod from Sand Zone 5 was fran June 1981 through February 1982. Very e a r l y r e s u l t s dur ing June 1981 showed a very low ( l e s s than 10 standard cubic f e e t per ba r re l o f br ine) gas t o water r a t i o . Although i t was l a t e r establ ished t h a t these gas t o water r a t i o measurements were t o o low by a f a c t o r o f about 3 - see Appendix G f o r deta i ls , nonetheless, important t e s t i n g decisions were made based on these inaccurate conclusions. The impact o f such informat ion was c r i t i c a l , and i t became very important t o know whether a l l other zones were s i m i l a r l y undersaturated. Subsequently a scheme t h a t would al low t e s t i n g o f Sand Zone 5 and Sand Zone 3 simul- taneously, y e t pe rm i t t i ng an i n i t i a l i so la ted sample of t he new b r i n e from Sand 3, was devised as described i n Section 4. Plans were made t o per forate Zone 3, and by chemical sampling, determine i f i t was undersaturated s i m i l a r l y t o Zone 5.
Before the plan could be implemented, however, some r a d i c a l changes i n instrumentat ion were made conf i rming a much higher gas content ( o f 25 standard cubic f e e t per ba r re l ) than had been previously measured. Furthermore, t he DOE determined t h a t funds were too short t o permit f u r t h e r mechanical work, and the f l o w was c u r t a i l e d from August 1981 through February 1982, a t which t ime the disposal we l l sanded up. I n s u f f i c i e n t LJ
79

funds to fix the well were available so it remained non-operational until August 1983. At that time, the production well was repaired in November 1983 and Sand Zone 5 was plugged off without further testing, and Zone 3 was w perforated and tested instead.
The November 1983 test of Zone 3 was intended to be quite short since its flow potential was known to be small. The principal purpose was to verify whether Zone 3 and Zone 5 were similar in chemistry and methane saturation and in reservoir geometry. The approved plan was, in a few weeks to open all sands and examine their joint flow potential.
However, as soon as the well had been repaired in December 1983 and flow resumed, the DOE became aware of further funding problems, and advised MG- T that other tests would not be conducted. Instead, the flow from Zone 3 was continued at a low level until plugging. Thus, from a chemical test point of view, important results were achieved, but a comprehensive test was not accomplished.
6.1 BRINE ANALYSIS
Results have been reported previously in the Proceedings of the Fifth Geopressured-Geothermal Energy Conference, 1981.
This section will discuss the chemical analyses of the brine and gas produced, with particular emphasis on the relation of these analytical results to the solubility of methane. (Scaling and corrosion, and %he inhibitor system designed to prevent them, were discussed in Section 4.04 The results of these analyses are presented in Table 6-1. Karkalits and Hankins (1981) have noted that the calcium concentration is high compared to other geopressured-geothermal wells, and thus indicates a potentially severe scaling problem. The high concentration of total dissolved solids lowers the solubility of methane in the brine. The amount of dissolved methane was, in fact, lower than the value predicted before testing, primarily because of the higher concentration of dissolved sol ids. These sample analyses were confirmed by independent measurements made by Matson and Tomson, MG-T operators, and IGT personnel. It should be noted that analyses made by seperate contractors were very consistent, and that the analyses were also quite consistent through time. See Tables 6-1A, 6-3, 6- 3 A and 6-4.
Refer to Section 3.5.1.2 of this report for a discussion of brine salinity as predicted from well logs.
6.2 GAS ANALYSIS
The results of the analyses of gas samples are presented in Table 6-2. The gas is, as expected, predominatly methane, with minor amounts of other hydrocarbons, 8-10% carbon dioxide, and a trace of H2S. Most observers would classify the mixed gas as "sweet". This analysis is quite similar to analyses of gas obtained from other geopressured-geothermal we1 1 s, except that the low temperature Wells of Opportunity seem to have a lower C02 content.
A Beckman process gas chromtograph was shared between Sweet Lake and Gladys McCall sites. BecWSe of maintenance and reliability problems, data gathered from the chromatograph were erratic and only confirmatory in nature.
4mJ
80
Another c r i t i c a l chemical problem was the high CO2 content (ca 9%) i n the produced gas. No nearby p i p e l i n e company would accept t h i s gas, and it had t o be f l a r e d f o r the durat ion o f t es t i ng . It should be noted t h a t gas w i t h an equivalent C02 content i s being so ld a t Brazor ia and a t Gladys McCall. Further, the ava i l ab le b r i n e f l ow r a t e was too low t o j u s t i f y i n s t a l l a t i o n o f equipment t o reduce the CO2 content t o acceptable leve ls . The absence o f gas sales i n essence increased p r o j e c t d i r e c t costs, and s i g n i f i c a n t l y reduced enthusiasm f o r t he pro ject . Because gas sales could no t be achieved, the object ives o f the Sweet Lake t e s t program were adjusted. There was no way t o optimize CO2 content f o r gas sales purposes since a l l p h y s i c a l l y achievable concentrat ions were unacceptable f o r sale. The ob jec t i ve became t o f l ow as long as possible and t o note corresponding d i f ferences i n chemistry as a r e s u l t o f pressure, temperature, and time. Table 6-2 shows the e f f e c t s o f Zone 3 pressure drawdown, w i t h a seeming increase i n CO2 percentage, and decrease i n methane percentage as pressure i s reduced from 10,000 p s i t o 7,600 ps i . No co r re la t i ons w i t h t ime o r temperature are s t a t i s t i c a l 1 y re1 i able.
A s i m i l a r analysis o f gas and b r ine composition from Zone 5 i s presented i n Table 6-2.
It i s i n t e r e s t i n g t o note t h a t i n the less important chemical species there were d i f ferences i n b r ine chemistry composition between Zone 3 and Zone 5, but the d i f ferences were no t such as t o a f f e c t s o l u b i l i t y , scale o r corrosion. It was expected t h a t the chemical composition o f the br ines would be s i m i l a r bu t no t necessar i ly i den t i ca l . (See Tables 6-1 A and 6-2 A) The r e l a t i o n s h i p o f b r i n e p-If and a l k a l i n i t y i s presented i n Figure 6-1.
The t e s t i n g program a t Sweet Lake produced on ly pre l iminary data concerning the t o p i c o f "aromatic l i q u i d s " which have recen t l y been produced a t several geopressured wells. Data i s present ly being compiled by Dean Keeley a t the Un ive rs i t y o f Southwestern Louisiana a t Laf ayette, Louisiana.
6.3 SOLUBILITY OF METHANE
I n a l l o f the geopressured-geothermal we l l s tested t o date, there has been some question as t o whether the b r i n e was undersaturated, saturated, o r supersaturated w i t h respect t o methane gas. This question arose a t Sweet Lake as wel l , p r i m a r i l y dur ing the e a r l y p a r t o f the Testing Phase when f a u l t y equipment y ie lded an unexpectedly low methane content. A f t e r t he metering problems were solved, the methane content ranged from 23-27 SCF/B. This was s t i l l lower than expected, although p a r t o f t h i s was due t o the higher s a l i n i t y o f t he br ine.
Samples were sent t o Weatherly Laboratories f o r recombination studies. The r e s u l t s ind icated t h a t the b r i n e should contain 34 SCF/B a t saturation, which would mean t h a t t he Sweet Lake b r i n e was undersaturated. The t h e o r e t i c a l curves o f Blount, Haas, and others, however, i nd i ca te t h a t the Sweet Lake b r ine i s saturated w i t h respect t o methane. These curves probably represent more an order of magnitude ra the r than a precise value, and so cannot be used t o determine whether o r not t he b r ine i s saturated. These data can be viewed i n two ways. F i r s t , i f the Weatherly data are accepted, the Sweet Lake b r ine i s undersaturated. A l te rna t i ve l y , there are some, p a r t i c u l a r l y a t IGT, who view the Weatherly data w i t h some skepticism. Their studies i nd i ca te t h a t the Sweet Lake b r i n e i s a t o r near saturat ion. This question has not been completely resolved.
8 1
Appendix I , Reservoir F l u i d Analysis, i s the resu l t s of analysis of a "recombined reservoir f l u i d sample" showing that fran Zone 3 a gas content of 19.98 SCF/STB corresponds t o a bubble point of 8800 psia a t the 293oF reservoir temperature. Even a t this date, there remains substantial controversy between the Weatherly resu l t s and those of IGT described below i n 6.5.
i
6.4 OTHER CHEMICAL ASPECTS
MG-T in-home analysis of the gas water r a t i o measurements prepared i n September 1981 . The objective of that analysis i s t o discuss certain early measurement results a t Sweet Lake, sane errors i n measurement, and the preventive measures taken t o preclude fur ther such errors.
Appendix H contains the Weatherly Laboratories analysis of water flash. Two of these analyses of separator water f lash a t 50 psig and a t 250 ps ig are s t r ikingly different and clear ly demonstrate an important resu l t of the geopressure program - namely tha t gas phase composition i s strongly dependent on separator pressure. Table 6-5 presents gas composition as a function of reservoir pressure and Appendix J presents gas analysis as a function of separator pressure.
One could control the re la t ive concentration of CO2 i n the overhead gas. The higher the separator pressure, the more CO2 stays i n solution and the lower i t s concentration i n the overhead gas stream. A c lear trade-off t h e n i s the total amount of gas per barrel removed i n the separator. The lower the separator pressure, themore total gas i s removed fran solution, b u t the higher i t s C02 concentration. If one has just single stage separation and no C02 removal system, the separator pressure can be reduced t o produce the maximum acceptable C02 concentration acceptable t o the gas sales pipe1 ine.
I t has been hoped that there would be seine correlation between the geochemical analysis and core analysis performed on cores, and the chemistry of the brine and gas produced. The only correlation made i s tha t the C02 present i n the gas i s related t o the carbonate present i n the formation. Further, the core analysis concluded that the formation was well cemented and sand production would no t be a problem i n the test well.
6.5 IGT CONCLUSIONS
"1. Reservoir brine is probably a t or near saturation w i t h natural gas.
"2. A t the times of sample collection by IGT, partitioning of gaseous species between gas and brine outputs for the separator was reasonably consistent w i t h tha t from separators used on wells of Opportunity tested by Eaton Operating Canpany and the separators used fo r the 1980 tes t ing of the Pleasant Bayou Well No. 2.
"3. Total CO2 content of produced brine, including bicarbonate ions and carbonate precipitates, i s lower than experienced on Wells of Oppor- tunity, as i t would be expected due t o the h i g h Ca++ content of produced brine.
82
"4. Partitioning of C02 between the gas output of the separator, C02 in solution in brine on the disposal well, bicarbonate ions in brine to the disposal well and CaC03 precipitates, is dependent upon details of inhibitor injection in relation to separator pressure and temperature.
"5. Solids retrieved from below perforations in the production well contained about 7 percent by weight plastic lining fromthe production casing and about 6.5 percent by weight carbonates and other salts soluble in HC1.
"The major significance of the IGT work reported herein is the suggestion that reservoir brine may well be at or near saturation with natural gas. At the same time, this result is not definitive due to lack of precision, time dependent metering of gas and brine flow rates required to establish correlation of changes in total produced gas/brine ratio with the observed changes in chemical composition of produced gas.
- h -u
"The above conclusion regarding partitioning of gaseous species between separator outputs was qualified as "reasonably consistent" with prior experience. This qualification is due to a) lack of an onsite gas chromotograph and hardward for prompt acid liberation of C02 from separator brine samples, b) the discrepency between quantities of gas liberated from brine samples in the field vs. samples analyzed later in IGT's Chicago laboratory, and c) the change of 70 psi in separator pressure provided to IGT on the basis of calibration of the pressure guage several days after collection of IGT's last sample.
"Comparison of recombination data by Weatherly Laboratories with ex- pectations from laboratory studies of methane solubility in brine, in the context of prior similar comparisons for Wells of Opportunity, provided a surprising results: Namely, the recombination data points agreed with solubility calculated on the basis of only the NaCl content of produced brine. Differences at actual data points-re a maximum of about 3 SCF/STB and consistent with differences observed on Wells of Opportunity. In contrast, expected gas solubility assuming total dissolved solids are equivalent to that weight of NaCl is less than the recombination measurement at 10,270 psia by 7 to 11 SCF/STB.
"During mid August 1981, operator installation o f a positive displacement meter and changes in the orifice meter run resulted in about doubling reported gas production rates. However, it is IGT's judgement that accuracy of gas and brine rate measurements is not yet adequate to warrant a conclusion regarding actual produced gas/brine ratio in cornparsion with the values of 23 to 27 SCF/STB calculated on the basis of 166,500 mg/ of dissolved solids and the range of 31 to 35 SCF/STB calculated from the 117,000 mg/ NaCl content and extrapolated from recombination studies."
Basically, IGT believes that on-site measurements were not sufficiently accurate to determine whether the reservoir brine is saturated with natural gas. Weatherly's findings imply that the brine was undersaturated (contained much less gas than equivalent saturated brine.)
83

7.0 ENVIRONMENTAL MONITORING
From the inception of the f irst proposals t o t e s t the geopressured- geothermal aquifers of the Gulf Coast region both Gulf Geothermal Corp. and Magma Gulf Co. had been concerned about the e f fec ts of such brine production on the environment. In order t o determine the effects , i f any, Magma Gulf had proposed monitoring the tests t o determine the e f fec ts of resource testing on subsidence, seismicity, and b o t h surface and sub- surface water.
b,
After the contract f o r the Sweet Lake Project was signed in 1979, Louisiana State University personnel, working under a seperate contract w i t h the DOE, began preliminary investigations a t Sweet Lake, and then submitted an environmental monitoring plan t o the DOE. According t o the specifications of the plan, f i e l d s ta t ions (Fig. 7-5) were established t o monitor a i r qual i ty , subsidence, and seismicity within the Sweet Lake prospect. Additionally, three wells were dril led ( F i g . 7-5) t o monitor subsurface water, and sampling s ta t ions t o monitor surface water were established.
7.1 AIR QUALITY
An ambient a i r quali ty and meterological monitoring s ta t ion was es- tab1 ished approximately one mile northwest of the production well s i te (Figure 7-5).
The a i r quali ty monitoring s ta t ion was instal led and operated by Core Laboratories, Incorporated, of Lake Charles, Louisiana on behalf of the State of Louisiana. The instrumentation necessary for monitoring a i r qual i t y and meterol ogy was instal 1 ed by Core Laboratories d u r i n g July, 1980. The s ta t ion provided continuous records of hydrogen sulfide, sulfur dioxide, non-methane hydrocarbons, and total hydorcarbons i n accordance w i t h previously stated EPA guidelines. The following i s a description of instrumentation used t o monitor a i r quali ty and meterology a t the Sweet Lake test site.
1. Sulfur dioxide (S02) was monitored u s i n g a flame photometric technique designated as an EPA equivalent method. The sulfur d ioxide was measured when the monitor was equipped w i t h a hydrogen sulf ide scrubber allowing the measurement of sulfur dioxide i n an activated state.
(2) Hydrogen sulf ide was monitored by the same analyzer used t o monitor sulfur dioxide, b u t equipped w i t h a sulfur dioxide scrubber which allows the specific measurement of hydrogen sulfide. This method has been approved by the EPA.
( 3 ) The monitoring of to ta l hydrocarbons and non-methane hydro- carbons was accompl i shed by the use of the Me1 oy Model HC 500-2C Hydrogen Analyzer, which is a0 approved EPA method. T h i s analyzer uses a flame ionization detector. The analyzer contains a h i g h temperature oxidizer t o oxidize non-methane hydrocarbons a1 lowing only methane hydrocarbons t o be measured. The analyzer compares the methane hydrocarbons t o the total hydrocarbons, determi n i ng the non-methane hydrocarbons.
84

(4) Meterolo ical data (wind direction, wind speed, temperature and rainfall! was collected using Texas Electronics equipment. These sensors exceed all EPA specifications for PSD monitoring.
The ambient air monitoring instrumentation conformed to EPA standards and where applicable, instrumentation was designated as reference or equiv- alent or utilized designed methods of analysis.
Air quality and meteorolgical data at the Sweet Lake site were reported by Core Labs on a monthly basis. The monthly reports included the following tables and graphs for each of the four pollutants monitored:
Maximum and average concentrations Day of month versus concentration Thirty highest 3-hour average concentrat ions Wind direction versus average concentration Hourly averages
Sulfur dioxide and non-methane hydrocarbons were the only pollutants monitored for which NAAQS have been established by the EPA.
Neither primary nor secondary NAAQS for sulfur dioxide were exceeded during the six month period. T e highest 24 hours average concentration during 1980 was 14 micrograms/in$ reported on September 12. The highest 24 hour concentration during 1981 was 23 micrograms/in3 reported on March 12. The wind direction was generally from the northwest (2700 to 3600) when SO2 was reported. The sulfur dioxide was generally recorded during the day from 7:OO a.m. to 5:OO p.m. Lake Charles, the nearest metropolitan area, is located 12 miles north-northwest (3370) of the site. Sulfur, a smaller industrial center, is located 18 miles morthwest (3150) of the site.
Standards for non-methane hydrocarbons were exceeded on an average of four days each month in 1980, and twenty-three days each month during January and February 1981. The highest concentrations of non-methane hydrocarbons during the NAAQS period in 1980 was 8,747 micrograms/m3 on Dec. 4. The highest concentration in 1981 was 10,933 micrograms/mO and occured on February 3. The extremely high concentrations occured only from September 1980 through February 1981, and came primarily from the test well direction (90° to 157O) which was .7 mile from the monitoring station.
Total hydrocarbons were recorded at the monitoring site each day and ranged from 0 to 2,692 micrograms/m3 over a 24 hour period. The time of day when both methane and non-methane hydrocarbons were reported was basically the same each day, from 8:OO p.m. to 9:00 a.m. The wind direction from which the hydrocarbons came varied but were generally from the southeast to the
Hydrogen sulfide was reported in minor amounts at the Sweet Lake site from July to December 1980. The average 24 hour concentration was between 0 and 2 micrograms/m3 during the six month peri d. During 1981 the average
relationship between hydrogen sulfide concentrations and wind speed, direction, or time of day. Air quality monitoring was discontinued at the Sweet Lake site at the end of 1981 as there were no continuing problems
2 northwest (1350 to 292O).
concentration was less than 1 microgram/m 3 . There was apparently no
b 85

associated with the site and further monitoring was deemed unnecessary.
Throughout the period of drilling, construction, and test, there were no incidents of air pollution and no off site environmental impact on air qual i ty.
I
7.2 Water Qual i ty
Closure of the Sweet Lake geopressured-geothemal test site will lead to the eventual termination of water quality monitoring there. LSU will continue monitoring for a minimal period of time to detect potential contamination which may have lagged behind actual abandonment. It is doubtful that enough production or subsurface injection has taken place to adversely impact the natural waters in the area. Historically subsurface injection from other sources has been shallower and possibly volumetrically greater so that, if detected, natural water contamination by brine may not be bl amed soley on geopressure-geothermal product ion.
Expansion of the water quality data base will be crucial. Changes in water quality from brine contamination can only ,,be assessed after careful examination of natural characteristics. For this, reason reliance has been made on statistical and graphical methods which group parameters into origin-related families and which trace the changes through time of major and key constituents. In addition, data have been presented which may relate natural water quality characteristics to geologic variability. Permeability anomalies may allow salt-water intrusion or fresh water recharge to a tested aquifer. These phenomena have been distinguishable to some degree in the analyses.
Extensive research was done in the late '60s on the water quality characteristics of groundwaters in the state and i n southwestern Louisiana (Harder, et al., 1967 and Winslow, et al., 1968). A concentrated effort was made to establish the position of the saltwater interface but little was done to establish the rate o f movement. By comparing data from the present project with data obtained in earlier studies, observations can be made regarding this very important phenomenon.
The regional position of the freshwater-saltwater interface and the 1 imits of fresh water are depicted in Figure 7-1 and total dissolved solids contents with depth are depicted in Figure 7-2. From these diagrams, the approximate TDS concentrations of ground water in the vicinity of the Sweet Lake test site can be interpolated. The values so derived represent the chemical characteristics of these waters prior to 1967-68. A comparison with more recent data should indicate any changes caused bymovement ofthe saltwater interface.
The base of fresh water at Sweet Lake in 1967 was at a depth of approximately 600 ft. MSL. Chloride concentration in project observation wells in November, 1983 from a depth of -200 to -500 ft. MSL were below the laboratory detection limit of 1.0 mg/l . The maximun concentration of chloride in these wells during the period of sampling was 118.0 mg/l. The Sweet Lake test site may be in an area of very active ground-water recharge as indicated by an.anomalously deep saltwater interface shown by the altitude of the 3,000 mg/l dissolved solids surface (Fig. 7-2).
U
86
A common method o f i l l u s t r a t i n g the general chemical cha rac te r i s t i cs o f na tura l waters i s t he t r i l i n e a r p l o t (Piper, 1944). The t r i l i n e a r diagram i s d iv ided i n t o th ree f i e l d s which represent the r e l a t i v e concentrat ions o f major cations, anions, and cation-anion p a i r s (Fig.7-3). I n the lower l e f t t r i ang le , the percentage reac t i ng values (PRV'S) o f major ca t ions (CA, MG, HCO3) are p lo t ted . The in te rsec t i ng rays from these two f i e l d s i n t o the cen t ra l diamond ind i ca te the r e l a t i v e concentrat ions o f the most common cation-anion p a i r s (e.g, NaHC03, NaCl, CaC03, etc.). The l o c a l f i e l d , designated A (Fig.7-3) contains the PRV's o f major dissolved cons t i tuents i n p r o j e c t brines, average seawater, and surface waters i n the southwestern Louisiana marshlands. A s ing le point, p l o t t e d a t B, represents water from drainage o f the Sweet Lake s i t e . C i s a grouping o f surface and subsurface waters a t Parcperdue and D represents shallow groundwaters from Sweet Lake and Rocker fe l le r Refuge. Also ind icated are the general cha rac te r i s t i cs o f waters i n the major southwestern Louisiana aqui fers def ined by Harder e t a l . (1967).
A d e f i n i t e gradation i s ind ica ted from seawater and br ines t o surface waters t o ground waters i n the anion t r i a n g l e and the cen t ra l diamond. This i l l u s t r a t e s the r e l a t i v e HC03 enrichment i n f resh surface and shallow subsurface waters. The grouping o f a l l Parcperdue near-surface waters substant iates a conclusion made e a r l i e r i n the DOE geopressured-geothermal environmental monitor ing phase t h a t shallow groundwaters under ly ing the Parcperdue t e s t s i t e are hyd ro log i ca l l y connected t o the surface; recharge probably occurs i n the Verm i l l i on R iver west o f the prospect.
A l l near-surface waters a t Parcperdue f a l l w i t h i n the range o f con- cent ra t ions reported by Harder e t a l . (1967) t o be c h a r a c t e r i s t i c o f t he Chicot aqu i fe r . This aqu i fe r i s probably commonly connected t o the surface and receives s u f f i c i e n t recharge t o maintain a r e l a t i v e l y h igh Ca t o Na r a t i o . Ground waters from Sweet Lake and Rocker fe l le r Refuge p l o t very c lose t o the l i m i t separating Evangeline aqu i fe r waters from blended Chicot-Evangel i n e waters. The lower ch lo r i de contents o f these waters may ind i ca te a low r a t e o f sa l twater i n t r u s i o n i n t o these aquifers, however, TDS contents are high, which may ind i ca te a diagenetic process whereby c h l o r i d e from seawater i s taken ou t o f so lu t ion .
Diagenetic processes are probably responsible f o r the va r ia t i ons ind ica ted i n the c a t i o n and anion t r i ang les . A r e l a t i v e decrease i n the con- cen t ra t i on o f magnesium w i t h depth i s ind ica ted f o r seawater, ground waters and brines. This i s probably due t o the r o l e o f magnesium i n ca t i on exchange reac t ions.
A number o f na tura l and man-induced processes may be responsible f o r t he spa t ia l and temporal va r ia t i ons which have been i l l u s t r a t e d by the environmental monitor ing data. Water q u a l i t y v a r i a b i l i t y may be due t o sal twater in t rus ion , waste dispersion, o r na tura l d iagenet ic processes. Furthermore, o i l - f i e l d b r ines may f i n d t h e i r way i n t o shallow subsurface waters up f a u l t s o r by molecular d i f f u s i o n through semi-permeable shale membranes.
u
The sa l twater i n te r face has been shown (Harder, e t al., 1967) t o f o l l o w a northwest-southeast t rend i n southwestern Louisiana. Although some l o c a l v a r i a t i o n may be due t o f l u i d production ( o i l , gas, o r ground water), t he reg ional v a r i a b i l i t y i s probably r e l a t e d t o Pleistocene and o lde r d e l t a i c
hi
8 7.

progradation as elements of these systems tend t o be tangent t o the s t r i k e o f the sal twater i n te r face (Fig. 7-4). The anomaly which causes displacement o f the in ter face t o the south on the 3,000 mg/l d issolved so l i ds surface (Fig.7-2) may be due t o an area o f recharge t o the no r th o r may be a r e l a t i v e l y impermeable volume o f sediment through which the f l ow o f sa l i ne water i s impeded.
Present water qual i t y cha rac te r i s t i cs a t the geopressured-geothermal t e s t s i t e s are consistent w i t h those found i n e a r l i e r studies (Harder, e t a l , 1967; Winslow, e t a l . , 1968). Harder, e t a1 (1968) ca lcu lated the r a t e o f movement o f the sal twater i n te r face a t l imi ted, selected po in ts i n southwestern Louisiana. The r a t e o f movement was found t o be best i l l u s t r a t e d by a 1 t o 5 mg/l per year change i n ch lo r i de content. L.S.U. data seem t o substant iate t h a t claim; however, it has also been shown t h a t TDS content may increase a t a f a s t e r r a t e due poss ib ly t o diagenetic processes; movement o f the sal twater i n te r face i n some areas may be masked.
Br ine contamination may come from two sources, i f detected. Subsurface i n j e c t i o n o f o i l - f i e l d br ines i s a common p rac t i ce i n south Louisiana. Br ine contamination may occur through the rup tu r ing o f we l l casings or, a f t e r disposal , by migrat ion up f a u l t s o r through leaky aquitards. Another possible source o f b r i ne contamination may be natura l due t o movement from b r ine o r i g i n up deep f a u l t s o r by slow leakage through semi-permeable shale membranes. The over pressuring o f some br ines i n the subsurface may f a c i l i t a t e such a mechanism although movement w i l l be very slow and diagenetic processes w i l l s i g n i f i c a n t l y a l t e r the composition o f f l u i d s dur ing t h e i r migrat ion.
A t r i l i n e a r analysis o f natura l waters may con t r i bu te g r e a t l y t o an understanding o f mixing and diagenet ic processes. One goal o f t h i s program i s t o determine the parameter most a f fected by these processes. Pre- l i m i n a r y analysis ind icates t h a t magnesium may p lay a major r o l e i n the diagenesis o f ground waters. Su l fa te content may be o f secondary importance. Mixing diagrams w i l l be employed i n f u t u r e studies t o determine and t ry t o separate va r ia t i ons caused by sal twater i n t r u s i o n and/or b r i ne migrat ion.
7.3
The Louisiana Geological Survey (LGS) and Louisiana State Un ive rs i t y (LSU) conducted base-l ine seismic studies a t the DOE Parcperdue, Sweet Lake, and Rocker fe l ler Refuge prospects t o i nves t i ga te microseismic i ty associated w i t h geopressured-geothermal f l u i d production. These monitor ing programs were designed, f i r s t , t o es tab l i sh the nature o f the l oca l seismic a c t i v i t y p r i o r t o production and, second, t o determine i f we l l a c t i v i t i e s induce changes i n the r a t e o f l o c a l f a u l t movement. This sect ion describes the r e s u l t s obtained from microseismic monitor ing a t Sweet Lake through A p r i l ,
MICROSEISMIC MONITORING AT SWEET LAKE
1984.
The Sweet Lake microseismic monitor ing network consisted o f e i g h t per- manent f i e l d s ta t i ons (Fig. 7-5) which were maintained by the Un ive rs i t y subcontractor, Woodward-Clyde Consultants. Location coordinates are given i n Table 7-1. Data co l l ec ted a t each f i e l d s t a t i o n were mul t ip lexed and t ransmi t ted over telephone l i n e s t o the cen t ra l recording f a c i l i t y i n Baton Rouge, Louisiana.
A t the cen t ra l recording f a c i l i t y , a l l data were continuously recorded on
aa

magnetic tape. Para1 le1 with the magnetic tape recording system, selected station data were recorded on three drum recorders. Drum records were scanned daily to detect possible seismic activity. Upon detection of a possible natural seismic event, all station data were played back from the magnetic tape into hard copy format through an oscillograph. Station data were further reviewed and analyzed in hard copy format such that hypocenter locations and other characteristic information could be obtained. Data reduction was accompl ished using a modified version of the earthquake location program FASTHYPO.
u
CHARACTERISTICS OF SEISMIC WAVE ARRIVALS
Seismic events recorded by the seismic monitoring network at Sweet Lake were not representative of microearthquakes recorded by networks in other environments. Microearthquakes in other environments have been typically characterized by a P-wave arrival, an S-wave arrival and, in some instances, a surface wave arrival. At Sweet'Lake, however, typically only one arrival has been observed. This arrival is usually impulsive and has a frequency of 5 to 15 Hz (Figure 7-6). The arrivals appeared to be travelling with a velocity of about 0.35 km/sec. This velocity is similar to the velocity of fundamental mode Rayleigh waves computed using a velocity model derived for a portion of the Gulf Coast in Texas. As the sediment velocities in southern Louisiana are similar to those in coastal Texas, it has been concluded that the recorded arrivals may likely be fundamental mode Rayleigh waves.
P- and S-wave arrivals were observed for seismic events that can be identified as explosions detonated for geophysical surveys. The P-wave velocity determined from these near-surface events is about 1.5 km/sec.
LOCATION OF SEISMIC EVENTS
Microearthquakes were located using a modified version of the computer program FASTHYPO (Herrmann , 1979). This program uses an iterative 1 east squares procedure to minimize the root mean square residual of the travel times. Input to the program usually consists o f arrival times for P- and S- waves and a plane layered velocity model. Because P- and S- waves were not observed for microearthquakes detected by the seismic network at Sweet Lake, a procedure was adopted using the Impulsive Rayleigh wave arrivals to locate the events. Arrival times o f the Rayleigh waves were treated as P- wave arrivals and a half-space with a velocity of 0.342 km/sec was used as the velocity model. Locations determined by this method must be considered uncertain, but for events within the array they were probably fairly accurate.
Depth was left unconstrained in the location procedure. Most calculated depths range from 0 to about 8 km, but the significance, if any, of depths based on surface wave arrivals is not clear, at best. Impulsive wave arrival times can be read with a precision of better the 0.1 sec in most cases. Differences in the calculated travel times for two events located in the center of the array but at depths of 0 and 4 km, respectively, would be on the order o f 4 sec for a half-space with a velocity of 0.342 km/sec.
L d
89

Thus, ca lcu lated depths cannot be explained as the r e s u l t o f unce r ta in t i es i n a r r i v a l t ime readings. I f the l a rge r t r a v e l t imes are compensated by changing the v e l o c i t y o f the half-space ra the r than the depth, a v e l o c i t y decrease o f about 20% would be required. Another p o s s i b i l i t y i s t h a t energy recorded as a Rayleigh wave t r a v e l l e d along p a r t o f i t s path as a body-wave. I n t h i s case the d i f f e r e n t t r a v e l t imes would r e s u l t from the d i f f e r e n t percentage o f t r a v e l path t h a t was transversed as a body-wave. The depths computed i n t h i s case may not be meaningful, bu t r e l a t i v e depths would be co r rec t i n a q u a l i t a t i v e sense.
b/
MAGNITUDES
Magnitudes were ca lcu lated on the basis o f event duration. measured as the t ime from the onset o f the a r r i v a l t o the p o i n t a t which the a r r i v a l recedes i n t o background noise. The formula used f o r magnitude c a l c u l a t i o n i s :
mD = -2.22 + 1.18 log(D)
Duration i s
This formula was der ived f o r use i n the Miss iss ipp i embayment by the Tennessee Earthquake Informat ion Center. I t s a p p l i c a b i l i t y t o the southern Louisiana region has not been tested. While magnitudes t h a t are computed may no t be v a l i d i n terms o f t h e i r absolute values, they do g ive a sense o f t he r e l a t i v e s i ze o f events.
Magnitudes ca lcu lated f o r microearthquakes recorded by the Sweet Lake network ind icated t h a t a l l detected events were small. Calculated magnitudes were t y p i c a l l y less t h a t 1 (mo) f o r t he events detected.
Another measure o f the s i ze o f microseismici ty recorded a t the Sweet Lake s i t e may be found i n f e l t repo r t s o f the l o c a l residents. Local b lasts, using charges o f up t o twenty- f ive pounds o f explosives have been r o u t i n e l y detonated i n - t h e course o f seismic prospecting i n the immediate s i t e area. These b l a s t s are o f t e n f e l t by l o c a l residents. F e l t repor ts consis t o f both an awareness o f the seismic waves by res idents i n the course o f d a i l y a c t i v i t i e s , and e f f e c t s on household ob jects co jnc id ing w i t h t h a t aware- ness. There does no t appear t o have been any f e l t repor ts for the microearthquakes dccuring a t the Sweet Lake s i t e .
SEISMICITY AND WELL PRODUCTION
Microearthquakes were f i r s t detected by the monitor ing network a t Sweet Lake i n June, 1981. This a c t i v i t y followed approximately one year o f seismic quiescence as observed on network records. The detect ion l e v e l o f the network may, however, have changed dur ing t h a t time. I n l a t e May and e a r l y June o f 1981, s t a t i o n gains and f i l t e r se t t i ngs were adjusted t o increase the s e n s i t i v i t y o f the network. While some very small events may have been missed p r i o r t o June, 1981 a c t i v i t y s i m i l a r t o t h a t detected beginning i n June, 1981 would have been evident on the records i f it occurred. No such a c t i v i t y was detected i n a de ta i l ed review o f the network records.
The t ime h i s t o r y o f seismic a c t i v i t y a t Sweet Lake i s characterized by a constant background l e v e l o f se i sm ic i t y t h a t i s punctuated by bursts o f earthquakes (Figure 7-7). These bursts usua l l y cons is t o f a t l e a s t f i v e events,, and i n one case t h i r t y - f i v e events, t h a t occurred, w i t h i n 15 km o f
b,
90

the wells during one day. The first such burst of activity occurred four days prior to perforation of the disposal well (Figure 7-8). The next burst occurred two days after the disposal well was perforated. No activity occurred near the time of perforation of the production well. i Other bursts of activity may have correlated in time with large rapid changes in the fluid pressure as measured at the wellhead of the production and disposal wells (Figures 7-8 through 17). Most bursts occurred with a time delay of two to three days with respect to the measured pressure change, but some preceded the change by less than a day.
There may be correlation between the level of seismic activity in June, 1981 and the activity at the wells (perforation, flow and reservoir limit testing) (Figure 7-18). However, seismic activity continued beyond the end of the Initial Flow Test in February of 1982. In fact, some of the largest bursts of activity occurred after the reservoir limit test ended (Figure 7-18). Letter reports describing activity at the wells subsequent to the termination of the flow test (Magma Gulf-Technadril, 1982) suggest that some of the bursts of seismicity were related to well activity (Figure 7-19). While the largest burst of seismicity, on Julian Day 107, is not related to drilling or flow activity, a large pressure increase was noted at the wellhead of the disposal well on the next day (day 108). There was no correlation between seismicity bursts and well activity after April, 1982 because the well was shut-in until September, 1983.
SPATIAL DISTRIBUTION OF MICROEARTHQUAKES
The spatial distribution of all earthquakes within about 10 km of the wells does not show any clear relation to the locations of growth faults inferred for depths of 12,000 to 15,000 ft (Figure 7-20). Examination of only events that occurred during the reservoir limit test has lead to the same conclusion (Figure 7-21). Even the bursts of seismicity that were tightly clustered in time did not show distinct spatial clustering about or along known structures, but they do appear to be distributed in spatial clusters about the well and within the area covered by the network. There does not appear to be any overall spatial migration of activity with time, however, the spatial clustering o f activity occurring as bursts o f seismicity has indicated potential locational constraints or preferences probably defined by .specific changes occurring in the subsurface.
All well recorded .events within 6 km of the wells have computed depths between 0 and 8 km (Figure 7-22). This suggests that microearthquakes were occurring within the range of depths at which the influence of fluid withdrawal and injection was to be expected. The spatial distribution of the microearthquakes as a function of depth may be related to the relative
. confinement of the reservoir fluids at both the depths of the withdrawal and injection. The geopressured/geothermal brine that was withdrawn from the production well occurs in a graben that is bounded by growth faults. Withdrawal from this reservoir could affect the fluid pressures at the graben boundaries, and perhaps of other aquifers at similar depths. On the other hand, the injection of fluid in the disposal well occurs in relatively unbounded sands. Faults at this level are thought to have significantly smaller displacements with respect to the reservoir thick- ness. Hence, the more dispersed distribution of the shallower activity may have been the result of its unbounded character. b/

DISCUSSION
A f t e r examination o f the apparent large number o f events being detected a t the Sweet Lake s i t e , it was decided t o compare the event detect ion record t o the c l ima to log i ca l data o f the area. A strong c o r r e l a t i o n was found i n the records o f se i sm ic i t y when compared t o the records o f thunderstorm a c t i v i t y and r a i n f a l l , as reported by the N.O.A.A. National Weather Service Off ice i n Lake Charles, Louisiana, and a lso by a d i g i t a l r a i n gauge i n s t a l l e d on Precht Road, about one m i l e west o f the we l l s i t e . For the per iod o f data c o l l e c t i o n beginning i n January, 1981, a complete h i s t o r y of weather a c t i v i t y shows t h a t days i n which large numbers o f small microseisms were detected correspond we1 1 i n t ime t o thunderstorm a c t i v i t y and/ o r r a i n f a l l . I n fact, i t i s q u i t e apparent from the weather data t h a t the sudden onset o f microseismic a c t i v i t y i n June, 1981 could be a r e s u l t o f the v i o l e n t thunderstorms and heavy r a i n f a l l t h a t began t o occur then. We speculate t h a t the tlmicroseismicityll detected dur ing these v i o l e n t thunderstorms i s caused by the coupl ing o f loud a i r waves w i t h the ground. I n addi t ion, f o r many o f these suspect events, a "g l i t ch " , o r sudden o f f s e t i n the seismic traces, occurred simultaneously across a l l s ta t i ons j u s t p r i o r t o the event traces, suggesting t h a t electromagnetic in ter ference from l i g h t n i n g was causing the g l i t c h and thunder was causing the "microevent." Figures 7-23a and b show the r a i n f a l l as recorded a t Lake Charles Municipal A i r p o r t through January, 1984, the l a s t month f o r which data have been issued. We have separated non-thunder r e l a t e d l o c a l events from the r e s t o f the e x i s t i n g data se t i n Figure 7-24 a, b and c, and Figures 7-25 a and b show a l l events which occurred on days when ne i the r thunder nor r a i n were detected. We cannot be c e r t a i n t h a t a l l events which occurred dur ing thunderstroms were i n f a c t caused by thunder. However, dur ing the t ime per iod June t o September, 1983, 88.4% o f a l l detected events were coincident i n t ime w i t h per iods o f thunderstorm and/or ra in , and none o f these had detectable P- o r S- wave a r r i va l s , leading us t o be l ieve t h a t none o f them were tec ton i c i n nature. We must conclude, therefore, t h a t a1 though seismic events o f cur ious character have occurred i n o r near the seismic network on days when it was no t raining, the exact number o f n a t u r a l l y occurr ing events cannot be determined due t o the above- mentioned contamination o f the data se t by weather-re1 ated "psuedo- events." Most o f the events which occurred on days having good weather appear on seismograms as Rayleigh waves t rave rs ing the network from o r i g i n s f a r outs ide the network.
O f a1 1 suspected na tu ra l ly -occurr ing l o c a l seismic events detected dur ing t h i s t ime period, on l y two (Figure 7-26, event A & B ) have a seismic s ignature t y p i c a l o f known earthquakes which occur i n other pa r t s o f the country -- t h a t i s a c l e a r l y discernable P (Primary compressional/dila- t i o n a l ) wave fol lowed by an S (Secondary shear) wave. Event A may be a foreshock o f a l a rge r (MBlg = 3.8) event B which occurred October 16, 1983 i n the Sweet Lake area.
Since the Sweet Lake DOE MG-T Amoco Fee #1 t e s t we l l was shut i n dur ing June and Ju l y and on ly minor (non-pumping) work was performed a t the w e l l s i t e p r i o r t o the occurence o f the event on September 11, 1983, o r the main shock o f October 16, 1983, it would seem u n l i k e l y t h a t these events were r e l a t e d t o w e l l a c t i v i t y . Addi t ional ly , the computed depths o f these two events (7.0 km and 12.5 km, respec t i ve l y ) were considerably below the production
W
horizon. iiJ
92

CONCLUSIONS:
After three years of microseismic monitoring, our contractors have presented us with locations for over 1000 microseismic events. Through the course of data analysis, two problems have been encountered, and are currently being studied in detail. The first one is that almost all of the best located events are of the impulsive Rayleigh wave type. It must be pointed out that locations using only Rayleigh wave arrivals are not as reliable as those using body waves. Furthermore, the depths that go with the locations are extremely questionable. It is because of this that attributing events to particular inferred growth fault locations at depth is impossible. We are currently working on methods of arriving at more reliable event locations and depths.
W
The second problem has been that coincident rainfall and seismic activity has been observed at all three wells. At this time, it is yet unclear whether these slow moving (290 m/sec - 350 m/sec) impulsive Rayleigh wave events can be attributed to meteorological disturbances or indeed are of earth origin. Unfortunately, this slow velocityrange is also occupied by acoustical transmissions through the air, and significant coupling of atmosphereic acoustic and earth Rayleigh waves is highly probable. If, in fact, most of the observed signals are of earth origin, it is extremely difficult to separate them from atmospheric acoustic events, such as thunderstorm activity, associated with times of rainfall and frontal passage
Sweet Lake had two flow testing periods, the first was for seven months in 1981-1982, and a second from November, 1983 until the end of March, 1984. Continuous seismic monitoring during this entire period has shown no believable correlation of events with flow testing. All activity seems to have been at intermittent intervals throughout the three years. Micro- seismic monitoring will continue until spring 1985, one year after shut- in, to access any long term effects that may have resulted from the Sweet Lake testing project.
7.4 SUBSIDENCE The effect of geopressure geothermal production on subsidence rates will only be assessed after careful examination of historical production of oil, gas, and ground water in the area surrounding each test site. Due to a potential subsidence lag following production, consideration must be given to some minimum backlog of data. For our purpose, an arbitrary period of 6 years has been chosen. In addition, cumulative production from each field has been considered. Subsidencemonitoring is incomplete at the Sweet Lake test site.
Historical land surface subsidence in the Sweet Lake area was determined in a related study whereby regional movements were adjusted to movement of the Monroe uplift in northeastern Louisiana. The historical profile follows Highway 27 from Iowa, La. to Creole, La. Maximum subsidence is illustrated for the portion of the profile north of the point which corresponds both to the position of the prairie-coastal marshland boundary and the Sweet Lake salt dome. The absence of pronounced subsidence south of this boundarymay be a result of water saturation since the land surface is at or below sea
93
b/
level. Sediment dewatering may have been curtailed or subsidence to the north of the boundary may be an anomalous response to compaction of a buried Pleistocene Red River fluvial system. On the other hand, natural subsidence may have been counteracted by movement associated with the Hackberry-Sweet Lake salt ridge. A report by D. B. Trahan of Louisiana Geological Survey has discussed regional consideration (Appendix K ) .
i
The important considerations in oil-f ield subsidence analyses are (Geertsma, 1973):
1) The reduction in reservoir pressure. 2) The rate and degree of pore pressure reduction. 3) The uniaxial compaction coefficient.
The reduction in reservoir pressure is a function of the mobility, solubility, density and compressibility of fluids as well as reservoir boundary conditions. Pore pressure reductions depend on the permeability distribution, locations of wells and the production rate. The compaction coefficent depends on rock type; (the number, size and shape of grain contacts in sandstones) , degree of cementation, porosity and depth of burial.
The effect of geopressure-geothermal development on subsidence rates wi 1 1 not be instantaneous. A lag in the transfer of stresses to the surface is expected for geopressure-geothermal development and for other fluid production activities. The effect of historical fluid production may be apparent in our data. Modeling studies which take into consideration the production histories of the producing fields, changes in pressures, depths and volumes of production, etc. will be attempted in the future. Some of the data necessary for such an analysis are presented here, although much more will be necessary. Ground- water production may also cause subsidence of the land surface, however the mechanism for compaction is different than that for deeper oil and/or gas reservoirs. In the most cases, changes in pressure in shallow aquifers has been small due to a relatively steady recharge into these aquifers. Subsidence can occur if the peizometric head is lowered significantly due to a low water budget (ie., discharge exceeds recharge). Therefore, future work will also center on an analysis of these conditions.
Although subsidence monitoring is continuing at all sites as scheduled, subsidence rates may also reflect greater historical fluid production in these areas. The best future efforts would be aimed at the use of models which take into consideration the production from individual wells and fields. Correlations could be made with fluid volumes, reservoir geometries, and pressure changes during production. Some of these data have been obtained as a key element of the program, but only for the geopressured-geothermal we1 1s. Data for other we1 1s and fields in the Sweet Lake area are presently being procured.
94

-7
8.0 ECONOMICS
8.1 INTRODUCTION
In 1974, Gulf Geothermal Corp. was invited to testify before the House Energy Subcommittee concerning the drilling and testing of geopressured- geothermal aquifers of the Gulf Coast province. Rationale for the proposal was based on methane gas recovery as well as the as yet untapped thermal and hydraulic energy potential, At that time exploration for natural gas had not kept pace with demand resulting in a gas shortage. Based on GGC studies over the previous three years and studies by the U. S. Geological Survey and Louisiana State University L.S.U. the potential for a new economic energy resource lay in these Gulf Coast aquifers.
Subsequently, GGC joined with Magma Power Co. to acquire leases in Texas and Louisiana. Leases were acquired on some 100,000 acres in Texas and Louisiana at costs ranging from $0.50 to $2.00 per acre. In order to promote privately funded drilling and testing, Magma Gulf Company was organized in 1975. Midway in its solicitation of industry partners, ERDA announced plans for Federal funding of a similar project which caused Magma Gulf's proposed partners to defer contemplated support. Consequently, Magma Gulf was forced to submit its proposal in ERDA competition in order to salvage its past investments. Two specific sites were presented to ERDA in 1976 for proposed drilling and testing. Selection by ERDA of the Sweet Lake site resulted in the 1979 site specific proposal to the DOE to test the upper Frio Mio sinoides reservoir. The proposal was modified after negotiations wit t e and the contract was signed in December 1979.
8.1.1 THE 1974 PROPOSAL
The cost estimated by Gulf Geothermal Corp. of drilling and testing a single geopressured-geothermal we1 1 was approximately $3,500,000. The salt water disposal well costs were estimated at $800,000, and testing costs at approximately $900,000. The construction and installation of surface production facilities for the commercial eneration of electricity was estimated at approximately B 4,500,000 (Table 8-1). Total cost of the project for exploration, lease acquisition, drilling, testing, environmental monitoring, and construction of electrical generating facilities for the three sites was $27,400,000.
8.1.2 THE 1976 PROPOSAL
The proposal to ERDA by Magma Gulf Co. presented cost estimates for , wells in both Texas and Louisiana. The Louisiana test well was estimated at $3,000,000, with the disposal well costing $510,000. A six month testing schedule was estimated at $200,000. Total costs were estimated at approximately $4,000,000.
95

8.1.3 THE 1979 PROPOSAL
I n Phase I 1 o f DOE con t rac t DE-AC08-78ET01561 Magma Gul f presented three a l te rna te proposals t o the Department o f Energy along w i t h estimated gas production, income, and pay out schedules (Table 8-2). The proposals were: I. based on day-rate d r i l l i n g costs, 11. based on combination day-rate and turn-key costs, and 111. based on a lump sum t u r n key cost. Using the day-rate proposal the t e s t w e l l costs were estimated a t $3,517,800. The disposal we l l costs were estimated a t $1,407,800. Testing costs were estimated a t $1,757,090. Total costs were estimated a t $8,351,189. p lus fees. -These costs f o r d r i l l i n g and t e s t i n g were based on then current costs as presented t o Magma Gulf Co. by Louis Records and Assoc. o f Lafayette, La., and Eaton Indus t r i es o f Houston, Tx.
\I
8.1.4 THE 1979 REVISED CONTRACT
Subsequently, the Magma Gulf-Technadril Inc. j o i n t venture was formed and ins t ruc ted by DOEto negot iate a day r a t e contract. The contract f o r d r i l l i n g and t e s t i n g the Sweet Lake s i t e was negot iated i n September 1979 and the contract signed i n December 1979. The revised contract a l located $3,446,308. f o r the t e s t wel l , $781,0.51. f o r the s a l t water dispoal wel l , $2,150,233. f o r test ing, and $1,439,213. f o r a l l o ther costs t o be incurred.
I n the 1979 proposal Magma Gulf Co. had proposed the i n i t i a l t e s t i n g phases t o be done using a t e s t loop designed by Eaton Indust r ies. These t e s t i n g phases would include the I n i t i a l Flow Test and Reservoir L i m i t tests, l a s t i n g approximately 60 days. I f these t e s t s ind icated the presence o f an extensive rese rvo i r the t e s t loop would then be dismantled and long-term surface t e s t i n g f a c i l i t i e s i n - s t a l l e d .
As a r e s u l t o f discussions with the DOE, the 1979 rev ised con t rac t e l iminated the const ruct ion o f the t e s t loop and provided f o r const ruct ion o f t he long term t e s t f a c i l i t i e s i n order t o conduct a l l t e s t i n g phases.
8.2 THE 1984 PROJECT ACTUAL COSTS
The t e s t w e l l t o t a l costs were $8,067,124. S a l t water disposal w e l l costs were $1,505,592. Test ing costs inc lud ing const ruct ion and i n s t a l l a t i o n o f surface f a c i l i t i e s were $2,286,164. Costs t o workover both we l l s were $1,184,445. Pro ject admin is t ra t ive costs were $2,383,805. Plug and abandonment and s i t e r e s t o r a t i on costs were $225,000. Tota l p r o j e c t costs were $16,152,154. (Table 8-1).
8.3 ANALYSIS OF PROJECT COSTS
8.3.1 PERCENTAGE COST INCREASES
When Magma Gulf presented i t s Phase I 1 proposal t o DOE i n June 1979, p ro jec t costs were estimated based on p r i ces which were cu r ren t and f i r m as o f A p r i l 1979. These costs were audited by DCAA i n August 1979. The contract was no t signed u n t i l December 1979. Pro ject
u
management was in place in late December 1979, however, no site preparation work could begin until the final EPA assessment was completed in February 1980. Procedures for acquiring drilling rigs and tubular goods commenced in January of 1980. However, this was the time when the Iranian crisis caused abnormal price increases for petroleum with resultant heavy drilling. Due to these conditions in the drilling industry during this time, no firm commitment for a rig for the test well, or pipe, was available until August of 1980.
This delay of some 16 months from proposal to start-up was a time of high cost inflation. By the time the well was completed and ready for testing in 1981, for example, fuel costs has increased 81.9% over 1979 prices, cementing services had increased 36.1% over 1979, and perforating costs had increased 41.6% over 1979 costs. (All percentage cost increases are based on IPAA Cost Study Committee Index, World Oil, June 1984.) Project costs were likewise affected with an increase over prior 1979 estimates for casing and tubing costs of 14.8%, fuel cost increase of 49.1%, wellhead equipment cost increase o f 21.7%, cement and cementing services cost increase of 16.8%, drilling mud increase of 17.1%, payments to drilling con- tractors cost increase of 15.2%, and other expenditures average cost increase of 16.2%.
8.3.2 SPECIFIC COST INCREASE ITEMS
INTRODUCTION
The following are the major, easily defined, causes for increases in the total project costs. As seen in Table 8-1, the percentage ratios allocated to each major area of cost did not deviate greatly from the original estimtes, expect in the drilling and completion of the test well due to these problems.
Drilling time - The original proposal and contract had estimated 60 days to drill the test well. Due to a subsurface blowout, the hole had to be sidetracked necessitating an increase of 43 days in test rig expense. Additionally, $160,000. of drilling tools were lost and not recoverable as a result of the blowout. The time needed for redrilling, fishing and recovery for 'the test well is presented in Vol . I - Drilling and Completion of the Sweet Lake project.
Cementing - More time was required than anticipated to complete the 7 5/8 inch completion string. This completion required 3 cementing attempts due to problems with the cement hardening properly.
Location expenses -
L J In order to comply with the requirements of the surface lessee a longer board road had to be constructed than originally planned.
97

Rig u n a v a i l a b i l i t y had necessi tated using a la rger r i g than planned. This l a rge r r i g requi red a stronger s i t e foundation ( d r i v i n g 90 12 inch p i l i n g s ) and la rge r pad. These added requirements increased costs by $740,000.
Environmental - I n order t o comply w i th the lease w i t h AMOCO, no mud p i t s could be constructed a t the s i t e . This necessi tated add i t iona l so l i ds con t ro l equipment and the haul ing o f a l l cu t t i ngs and l i q u i d s t o an approved disposal s i t e . The costs f o r disposal alone were an add i t iona l $425,000. which had no t been an t ic ipa ted i n the o r i g i n a l proposal.
Mud and Completion F l u i d - Increased costs o f mud chemicals, and mud and so l i ds cont ro ls requirements resu l ted i n an increase o f $669,285. i n these costs.
Coring and tub ing - The delay i n s ta r t -up resu l ted i n an increase i n tubu la r costs. Add i t iona l l y , problems w i t h p l a s t i c coat ing o f the 5 inch product ion tub ing caused a l l the tub ing t o have t o be recoated. Although the coat ing company absorbed these costs, an add i t iona l 7 days o f r i g t ime increased r i g costs by $245,000.
Work over - These costs were necessi tated as a r e s u l t o f the s a l t water disposal we l l sanding up and the resu l tan t clean out and repe r fo ra t i on o f the disposal well . The leak i n the 5 1/2 inch tub ing o f the t e s t we l l necessitated p u l l i n g the 5 1/2 inch tub ing and recompleting the t e s t wel l .
The extension o f the p ro jec t resu l ted i n higher costs i n p ro jec t operat ing and administrat ion, although these costs are no t the resu 1 t o f an t ic ipa ted problems.
Extension o f the Contract -
98
9.0 SWEETLAKE ABANDONMENT & SITE RESTORATION
9.1 INTRODUCTION
After the U . S. Department of Energy determined that i t could not afford t o complete tes t ing of the Sweet Lake well the DOE directed MGT on June 7, 1984, t o plug and abandon both the production and the s a l t water disposal wells. Earlier, on March 12, 1984, the DOE issued a limited stop work order.
W
Magma Gul f-Technadri 1 pl anned t o re t r ieve the production t u b i n g and a1 1 possible casing t o reduce total costs. Plugging and abandonment procedures were then conducted i n s t r i c t compliance with a l l State of Louisiana and Federal regulations, with constant adherence t o the best safety con- s iderat i ons. Appendix L contains State requirements and permits.
For both wells the State of Louisiana was kept advised of progress and notified a t the appropriate inspection points. All deviations from the original approved plan were reviewed and approved by the s ta te .
9.2 PLUG AND ABANDON TEST WELL
A t the conclusion of the tes t ing period which was shortened due t o the . unavailabil i ty of DOE funds, a decision was made t o plug and abandon the
wells, res tore the s i t e , and return i t t o the fee owner, Amoco Production Company. Before the wells were plugged, a l l possible e f fo r t s were made t o f i n d additional funding so t h a t the testing program could be completed and extended. Additional sources of government and industry funding were sol ic i ted, t o no avail. The well 's low flow ra t e was subeconomic, and the general conclusion was that no geopresssured gas wells could pay back t h e i r capital cost.
The f i rs t step i n the P & A process was preparation of a plan and budget which were submitted t o the DOE for approval i n January 1983. That plan was not prepared for imedi a te executi on b u t was for general budget planning purposes. Two plugging scenarios were envisioned; an ideal case and a l e s s optimistic version. The principal difference being whether or not t h e 5 1/7" production t u b i n g could be readily retrieved from the packer. A second consideration was whether the r i g contractor ( P & A contractor) would be allowed t o keep a l l the tubular goods.
Plugging and abandonment of the test well was performed i n three d is t inc t steps separated i n time by several months.
The well was s h u t i n on March 12, 1984 w i t h a surface pressure of 1,200 psia. A t the time of s h u t i n , i t was not known whether the well would be reopened, so just the master valves were closed. Later, when i t appeared unlikely t h a t Sweet Lake would be flowed in the near future, on April 12 , 1984 a retrievable pump through plug was pumped down the well.
I t had been hoped that t h i s retrievable bridge plug s e t a t the packer would be suff ic ient t o provide the extra safety margin desired. However, a f t e r set t ing this retrievable bridge p lug on a wireline, the plug leaked and i t was not possible t o depressurize the upper t u b i n g portion for any length of time. Neither positive pressure in flow through the plug nor negative pressure reduced the leak.
id
99

Later, dur ing preparat ion o f the plugging contract, i t was determined t h a t t r a n s i t i o n t o the selected contractor would be simpler i f the w e l l were completely k i l l e d . A cement plug was then set on the leaking packer. This plug was then set between 14,780 ft. and 15,280 ft., using 10 ba r re l s of 'Class H I cement, and the we l l was k i l l e d wi thout f u r t h e r leakage.
P & A spec i f i ca t i ons were prepared f o r both the production and the disposal wel l as one contract on two a l t e r n a t i v e bases. The p o t e n t i a l cont ractors could b i d a reduced p r i c e based on r e t a i n i n g the casing f o r resale o r t u rn ing i t over t o DOE. While b ids were being received, DOE determined t h a t i f the savings were s i g n i f i c a n t the contractor should keep the tubu la r goods, since DOE had no immediate need f o r them.
The successful cont ractor was W.L. E s t i s o f Lafayette, w i t h a f i x e d p r i c e b i d o f $99,000. Bids were taken i n June, and no t i ce t o proceed was given t o E s t i s on J u l y 11, 1984. However, E s t i s became delayed on other wells, and d i d not move t o the Sweet Lake s i t e u n t i l August 13, 1984.
The E s t i s Well Service Rig 20 was r igged up on August 13, 1984. The f i r s t several days were r e l a t i v e l y non-productive. On August 14, E s t i s could not get the w i r e l i n e below 740 f e e t due t o t h i c k mud. August 15 - 17 was spent going i n the hole w i t h 2 3/8" tub ing and a 3 1/2" casing scraper breaking c i r c u l a t i o n down t o 9,705 feet . On August 18, they had cleaned ou t t o 14,495 f e e t and reversed mud out o f the hole.
On August 19, a 4 1/4" j e t shot was run i n the hole t o 14,000 f e e t t o cu t the 5 1/2" casing, and 10 lb /ga l l on calcium ch lo r i de was c i rcu la ted. On August 20, casing jacks exe r t i ng 400,000 l b p u l l were appl ied t o the casing, bu t it would no t come free. Another 4 7/16" j e t shot was run i n the hole stopping a t several depths, and f i n a l l y stopping a t 7,475 feet .
On the 21st, t he j e t c u t t e r was run t o 14,000 f e e t and f i r e d , whi le p u l l i n g on the tub ing w i t h 376,000 pounds. The j e t c u t t e r had t o be pumped below 7,476 feet . On r e t r i e v a l , the j e t c u t t e r and weight j o i n t were l e f t i n the hole. Two add i t i ona l j e t c u t t e r runs, fo l lowed by 424,000 pound p u l l , d i d not c u t the tubing, leav ing a t o t a l o f 3 j o i n t s o f 2 3/8" weight tub ing i n the hole.
A Bowen i n t e r n a l casing c u t t e r was run on August 24th, w i t h a "cut" a t 13,800 feet, but no movement o f the casing occured using 376,000 pounds o f p u l l . On the 25th, 400,000 pounds was s u f f i c i e n t t o move the pipe, and 135 stands were removed. By the 26th, a l l 2 3/8" tub ing had been removed and the w e l l reverse c i r c u l a t i o n had been performed.
The f i r s t 30 j o i n t s o f 5 1/2" were r e t r i e v e d on August 27, 15 days i n t o the operation. 60 more j o i n t s were r e t r i e v e d on the 28th. The 29th y ie lded 74 more j o i n t s and on the 30th, a t o t a l o f 265 j o i n t s t o t a l i n g 13,877 f e e t were removed. On the 31st, a t o t a l o f 346 j o i n t s t o t a l i n g 13,877 f e e t were removed.
On September 1, a f t e r c i r c u l a t i o n , a plug o f 40 sacks of Class H cement p lus 35% s i l i c a f l o u r p lus re ta rde r was pumped down the 2 3/8" tubing. 21 ba r re l s back flowed and plugged the tubing. Another 50 sack plug was se t a t 13,800 feet . On August 4th, the 2 3/8" tub ing was l a i d down, and the absence of pressure on the 9 5/8" X 7 5/8" annulus was confirmed.
,-
100

i
On September 5, the 7 5/8" casing was cu t below the s l i p s and f e l l 6 feet . The casing was worked t o determine the f r e e point , apparently a t about 3,500 feet. On the 6th, a j e t c u t t e r was run i n but would go no deeper then 2,300 f e e t and became stuck. The 7 5/8" was c u t a t t h a t p o i n t and two j o i n t s of 7 5/8" were l a i d down. On the 7th, the r e s t o f the 7 5/8" was removed, a t o t a l o f 61 j o i n t s , t o t a l l i n g 2,365 fee t .
Operations t o remove the 9 5/8" casing began on September 9. The casing was c u t a t 2,330 f e e t w i t h a Bowen casing cu t te r . 58 j o i n t s were removed on September 10, but the connections could not be broken. Therefore, the 9 5/8" was c u t above each c o l l a r .
A back pressure valve was set i n the remaining 13 5/8" a t 1,950 feet . A p lug o f 195 sacks o f Port land Type 81 cement w i t h 2% retarder was se t from 2,565 feet t o 2,165 f e e t (200 f e e t ins ide 7 5/8", 200 f e e t i ns ide 13 5/8"). On September 12, the 9 5/8" hanger spool was removed, and cement samples confirmed t h e p lug se t and cured proper ly. On the 13th, a 68 sack plug (15 ba r re l s ) o f Port land Type #1 cement i n a 14.6#/gallon s l u r r y was set from 110 f e e t up t o 10 feet, and rig-down began.
On September 14, the r i g c u t o f f the 30", 20" and 13 3/8" casing 5 f e e t below grade i n the production wel l . A s tee l p l a t e was welded on the 30".
9.3 PLUG AND ABANDON DISPOSAL WELL ,
On September 14, t he r i g moved t o the disposal wel l .
On September 18, a p u l l o f 160,000 pounds released the 7" casing i n the disposal wel l . On the 19th-, 4 j o i n t s were removed using up t o 254,000 pound p u l l . J o i n t 3 was collapsed. It was necessary t o back o f f some j o i n t s t o continue removal.
By September 19, a t o t a l o f 38 j o i n t s had been removed t o t a l i n g 1,475 feet . On the 20th, a cement p lug o f 58 sacks Por t land Type #1 cement w i t h 2% re ta rde r (weight 14.2 ppg) was set v i a tub ing a t 1,320 f e e t t o 1,120 feet . Then the 9 5/8" was c u t by a j e t shot a t 1,100 feet, bu t could not be p u l l e d w i t h 440,000 pounds. On the 20th, the f r e e p o i n t was found a t 500 feet, and the 9 5/8" was again c u t a t 450 feet . This t ime a 40,000 pound p u l l was required. The casing j o i n t s were t i g h t and each j o i n t had t o be cut. A 108 sack p lug o f Port land Type #1 cement w i t h 2% re ta rde r was set a t 550 fee t . A s i m i l a r 58 sack plug was set from 110 f e e t t o 10 feet .
J o i n t 13 was a1 so co l1 apsed.
On the 22nd, the 13 3/8" and 20" casing were cut . A 1/2" p l a t e w i t h 1/2" needle valve was welded t o 20" d r i v e pipe 40" below grade.
9.4 SITE RESTORATION
S i t e r e s t o r a t i o n work began i n June, when a f i n a l decis ion was made t o p lug and abandon the wells, and was completed by November 1984. The separator had already been moved t o the Gladys McCall s i t e t o become a second stage separator.
101

Dismanteling of Sweet Lake surface equipment began Tuesday, July 10. All equipment was removed and stacked to one side. All materials were removed in a manner to permit possible reuse.
At DOE request, arrangements for storage and protection at the proposed Superior Hulen site were made and all material was trucked there from Sweet Lake. Inspection of the internal high and low pressure pipe was completed as these sections were removed. No corrosion and/or scale deposits were noted on the pipe walls. Loose scale was found in the 10" section of the high pressure pipe from the Willis chokes to the inlet of the separator. This deposit was uniform on the bottom and about 1" thick. All other lines were in excellent condition with the exception of these deposits. Technadril- Fenix and Scisson inventoried and signed for all the equipment on December 1, 1984.
i J
Site cleanup was on a fixed price competitive bid basis, with the contractor required to dispose of all materials. The selected contractor was Ashy Enterprises, and the contract was awarded August 28, 1984.
Because of lease restrictions, no pits had been used on site. Metal tanks had been used, and all drilling fluids had been properly disposed of during drilling operations.
Cleanup included removal of boards and shell, leveling of ring levees, removed of contaminated soil and grading.
Procedures for cleanup were agreed to by the surface leassee, and cleanup operations were reviewed frequently. Cleanup of the test well site began as soon as the P & A rig moved to the disposal well site.
Ring levees were filled in and all fences and posts were removed. Shell on top of the pads were bulldozed up and truck transported to the Gladys McCall site. The cement walls around the production well cellar were removed, and the power cables between the site and Highway 384 were pulled up. All cement piling and piers were removed. All water wells were plugged according to state requirements.
All septic tanks were emptied and removed, Board removal began on September 18. All drilled footings and concrete pads were removed. All 112 wooden pilings were cut off 3 ' below grade with a drag line.
102

CI 0 w
#
SWEET LAKE PROSPECT JOINT VENTURE DRILLING PHASE ORGANIZATTON EXECUTIVE COMMITTEE
' December 1979 C.DURH AM J.MARSHALL R,RODQERS
ntsLAncn L TECHNICAL 8UPPORT WAOMA GULf - C.DURHAM
I JOINT VENTURf 100%
OPERATION8 PROJECT M A N A O I R
i A.ROD0 ERS i i I
TECHNICAL L ADMlNl8TRATlVE SUrrOnT TLCHHADRIL - J.HARSHALL
DEPUTY .PROJ. MGR.-sO%
K.HOffYAW nEsEAncif
Figure 1-1
DRILLINO L CONSTRUCTION C.S.ADKINS A.WYAND
_r <
,SITE O f f l C E MOR
DRILL RIO M O R I
DRlLLlNQ I CONSULTANT8

1
c
SWEET LAKE PROSPECT
CPESTIN(3. PHASE ORGANIZATION ,
Zune 1981
I
Figure 1-2
1. I
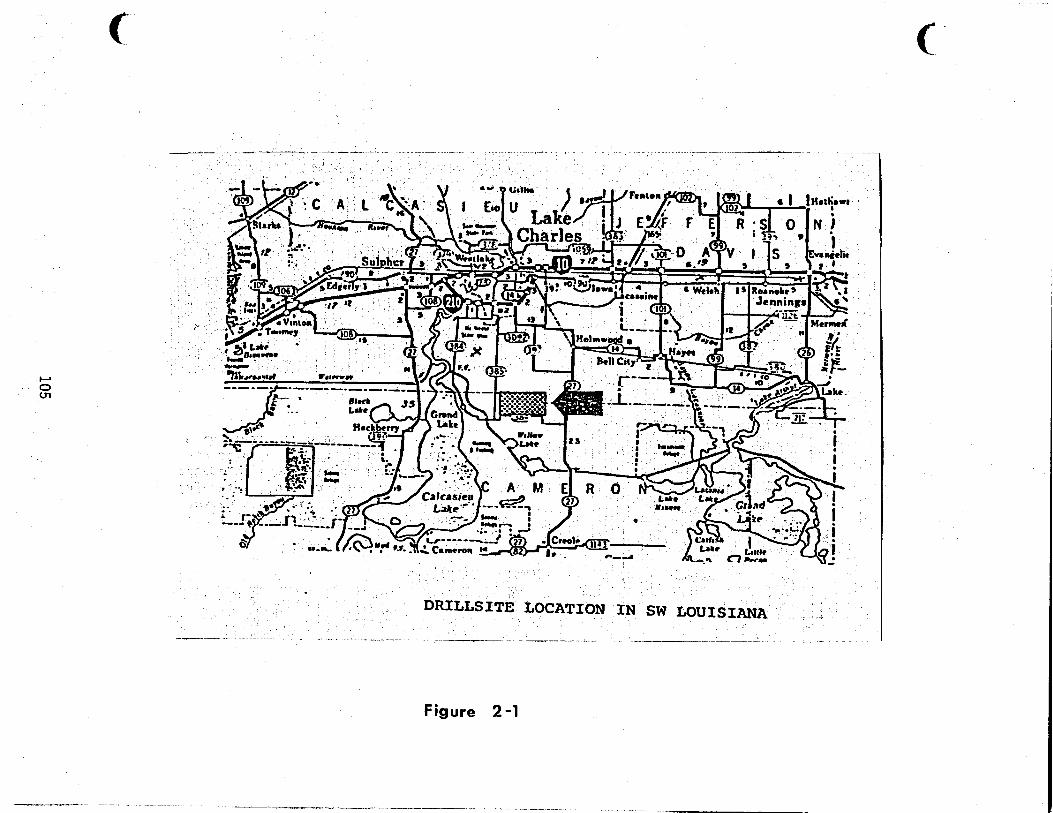
105
I
I !
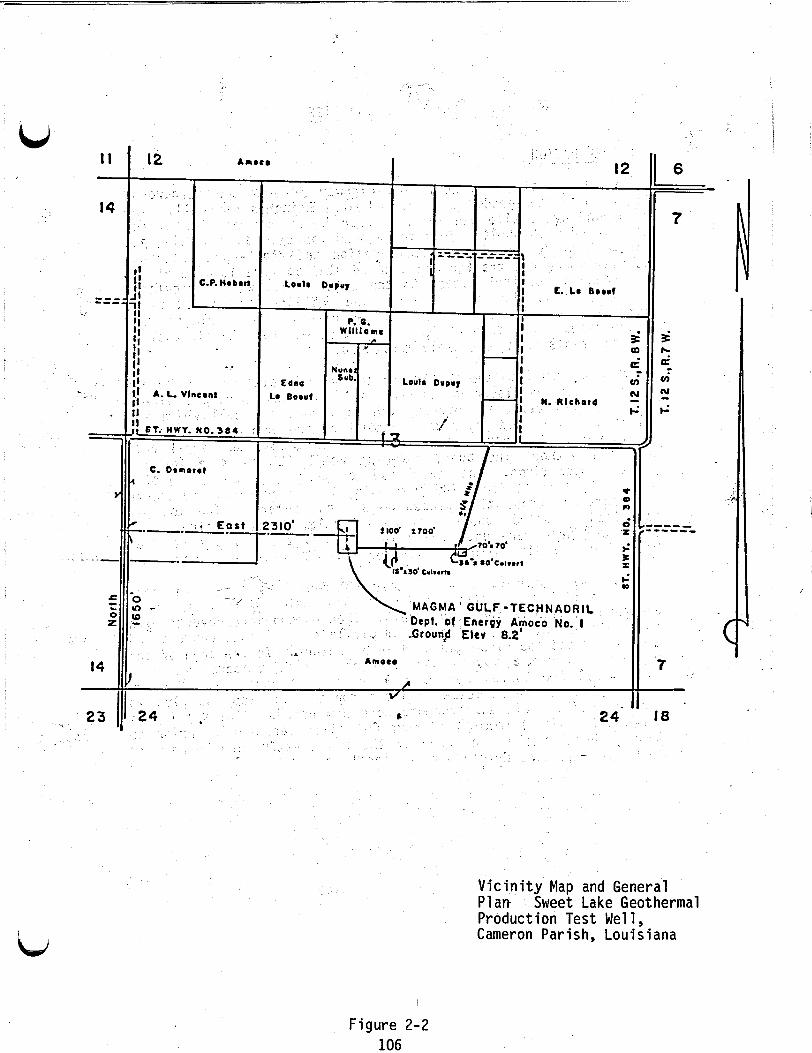
Id
I
23 I
i t !! ST. HWY. NO. 3 8 4
-.
V i c i n i t y Map and General P l a n Sweet Lake Geothermal Product ion Test We1 1, Cameron Parish, Louisiana b
Figure 2-2 106

i
U
MG-T/DOE AMOCO FEE NO.1 WELL SWEETLAKE FIELD WILDCAT
CAMERON PARISH, LOUISIANA t
I - . RECOMPLETION OCTOBER 30, 1983 I
Mated a1 Descri D t i on Length -Sett ing Depth / *Rotary Table Elevat ion
5-1/2" X-Line box connection on bottom and 6" 8-Rd thread box connection on top f o r 6'' 8-RD thread l i f t j o i n t
FMC tub ing hanger r 0.62'
1 J t 5-1/2" 23 pp f C-95 X i L i (inverted, p i n up-box down
1 Obl. p i n sub. 5-1/2" X-Lin 3 Pup J t s 5-1/2" X-Line
2.06', 4.37', d 13.46'
(301 J t s C-95 on top & 60 J t s P-110 on bottom)
O t i s Packer Seal Assembly S t ra igh t s l o t l oca to r Seal Extension R & R Seals (3) 4.10' 14,510.2
Head w i th lugs 0.66' 14,496.99' ,Seal bore extenslon 15.7 1' 14,512.70'( aatch l a t c h with seal - ... . 2.30' 14,515.001 Ot is WBR packer f o r 7-5/8"
14,392.00' 14 495.33' -
-.
361 J t s 5-1/2" 23 pp f X-Li
_. -
Mule Shoe 0.55' 14,510.7
P ' 39 ppf csg, 6.39" OD x r 1 I
4" IO 3.88' l ong from 14,514.12' t o 14,518.00'< 1 _. __-/--- --
Cement @ 15,351' .on top o f ' Pengo bridge p lug @ 15,385'
_NOTE: S t ra igh t s l o t loca tor set down on the seal bore% - ..
- extension head w i t h 34,OOOAr weight. Bottom o f 5-1/2" i s i n compression.
* A l l tublng and associated equipment measurementsi are from ro ta ry tab le elevat ion 35.95" above the 13-3/8" casing flange.
i Sand "5" perforated 4 shots per foot:
Sand '3" perforated 4 shots per f o o t
I
15,387' - 15,414' I I i
DIAMETERS ID DRIiT OD Tubing Hanger - 5 3 C r - 5 . 5 0 " m j 5-1/2" 23f Tubing **4.545" **4.42" 5.50" I
5-1/2" 25.541 L iner **4.423" **4.298" 5.50" 5-1/2" L i n e r Cplngs. 4.423" 4.298" 6.05" I
1
5-1/2" Tubing Upsets 5.545" 4.42" 5.656" Ot is Seal Assembly 4.00" 4.00" 4.96" i Fish neck on O t i s
Ratch Latch 4.00" 4.00" 4.87" 1
;30" Driven t o 156' I I
20" (13 JTS 133 PPF K-55 BUTT ON BOTTOM & 9 JTS I 169 PPF K-55 BUTT ON '
TOP) @ 835' CEMENTED TO: SURFACE
7-5/8" Tie back casing, 39 PPF P-110 X-Line '
i
/
Top o f cement i n 7-5/8"
i x.9-5/8" annulus a t *5,600'
Top o f cement behind 'i 9-5/8" casing-*6,000'1
0.5 PPG Calcium Chlo-\ r i d e B 60'F Packer %.
F l u i d w/O-303
L-80 BUTT on bottom & 69: JTS 72 PPF N-80 BUTT on top) @ 4,050' cemented [to surface i
; ~~,~~~~ ASS!. (4.125" !'
IO x 25.66') 14,542' t o '
i
13-3/8* (45 JTS 72 PPF I-
/
BOT PBR @ 14,556'
-510" (8 JTS 47 PPF . r P-il0 BUTT on. bottom & - 225 JTS 47 PPF N-80 i
BUTT On t O D 1 (P 10.230' cemented tb-6,40Oi 8
-7-5/8" 39 PPF 5-95 SFJ .
-. . __ --. .. . . .
- - - - .
**~ll 5-1/2" tubing i s p l a s t i c coated and therefore the IO' and D r i f t are reduced by 1/8 (0.125) inch from nominal. !
Fig. 2-3
107

1st
, 1 si
set
MG-TIDOE AMOCO FEE N0.2 SALT WATER DISPOSAL WELL
RECOMPLET" APRIL 9 1982
L- 20" CONDUCTOR at d 93'
13 618'' CSG SHOE at ? 1375'
1 10.1 Ib/gal BRINE !
7" COMPLETION STRING (23 +/ft. I.D. 6.366" drift 6.241'')
TOC at 1970'
I
6'' BONDED SEAL ASSY (6" O.D. X 4.875'' I.D. length 21,
BAKER MODEL F PACKER (8.438 O.D. 6.00 I.D. Set at f: 2016' Length 2.42'). \
11' CEMENT TOP at 2 4516'
N t McCullough MODEL S DRILLABLE BRIDGE PLUG SET at 2 4527'
OLD BAKER MODEL F PACKER at f 6243.84' (8.438 Q.D. x 6.0
Top of 1st MODEL F PACKER at f 7327 PBTD f 7350'
9 5/8" CSG SHOE at j: 7436'
I
.6')
1.D.)
n
Fig. 2-4 q$i?

n
N
-, A
I
'
N
' it
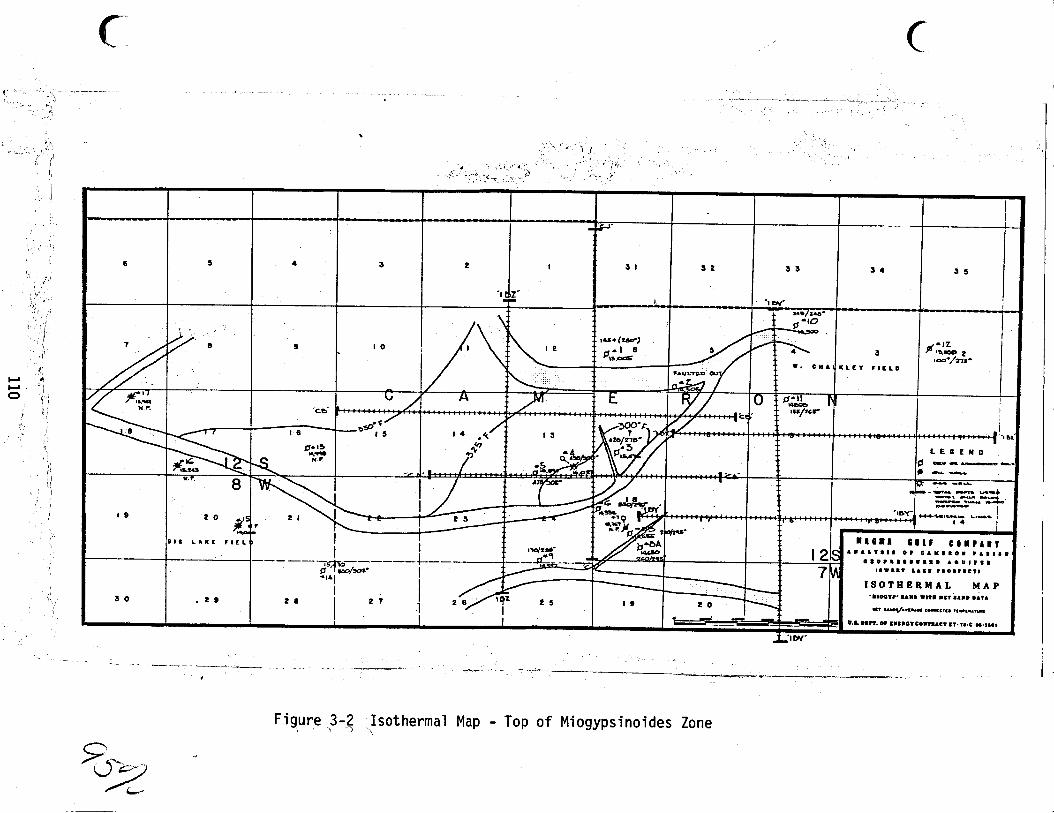
- d
_- - _. -___.----.--.LI-__.c-- __-_-- . - - - - ~ - ~ . --__
Figure 3 - g Isothermal Map - Top o f Miogypsinoides Zone

..
oosu
OM\\

LJ
n
a z v)
Q
bi
I.
I
0
0
0
0
0
0
0
0
(0
0 0
I3
0
P
\n
0 2 I-
-
112
W
J
0
v)
a
z t- 0
z
-I a
t- z 0
N
a 0 I

aJ Y
tu -I
C, aJ IA
c 0
C, 0
a
IA
v)
v) 0
L
u
c, v)
a
c, v)
tu w
In I
M
aJ L
~
.I-
7 .I-
LL
113
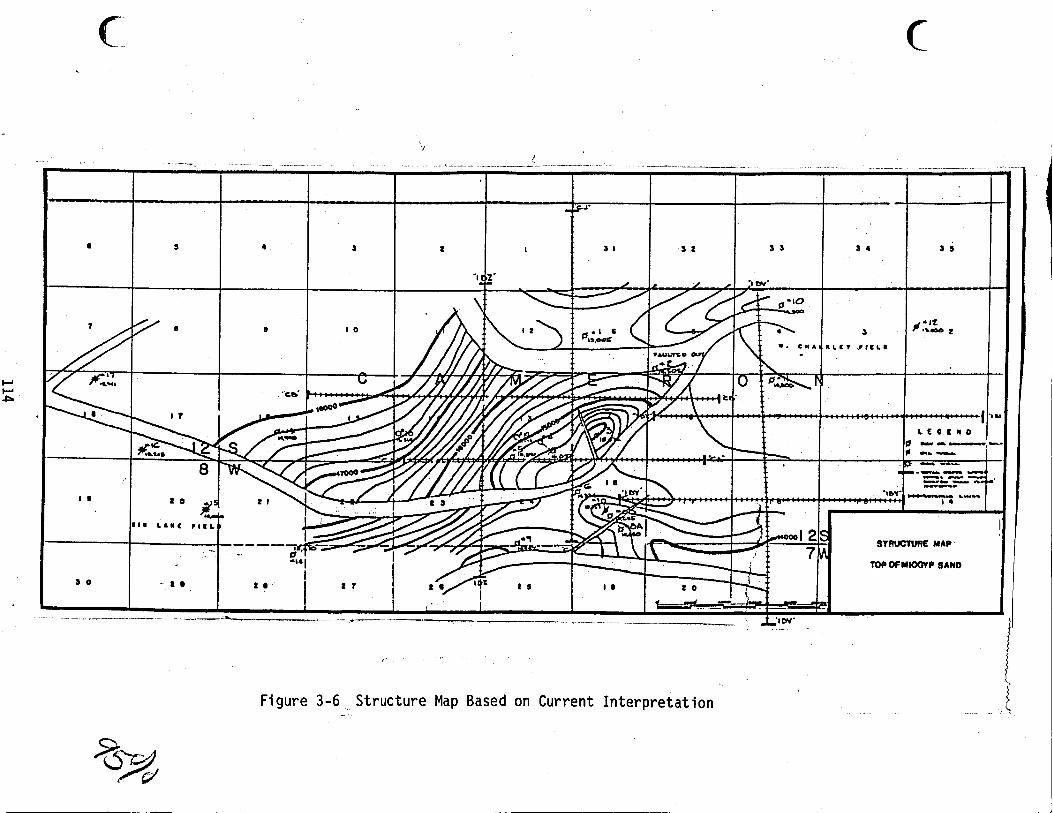
i
.
t
n
n
n
b
NY
n
N
n
U
i
c
N
N
0
a
c 0
.r
c, la c, Q
) L
Q
L
Q)
c, c
c, c
Q) L
H
L 2
V
c 0
-0
a,
m
v)
r6
I C
D
I m
114

. . . . .
ki
u
Induction log of Hiogyp sand, %-TIDOE knoco Fee # I
i i
8 8 8 8
. .
Figure 3-7 Induction Log of Miogyp Sand MG-TDOE Amoco Fee #I
115

e.
>.
'n
r -
9/9
I ,
:: (v
t I
1 I
0
0
- 13- W
dd
L 0
I
s n
(v
8
ooc jo??
O0= tom
s 0
00
9
- - 0006
0001 --00001
00
51
-- OO
oS'
-2
--00
00
2
- - OO
OSZ
00
0s
-- OO
OO
E
- --OO
ooc
00
05
--0o
oo
5
--oo
OO
S
OO
OL --ooooL
OooO
l
OO
OSI - :-ooooe
-~o
oo
oo
.: 0 b
2'
I
vf
f
PV
w
-
00
t
0
=
116

MU 0 R E SI S T I V I TY COR R E CTI ON CHART . 'i
- A U G U S T 1980 \ I J t
H. F. D U N L A P
Figure 3-9 Mud Resistivity Correction, Dunlap
117
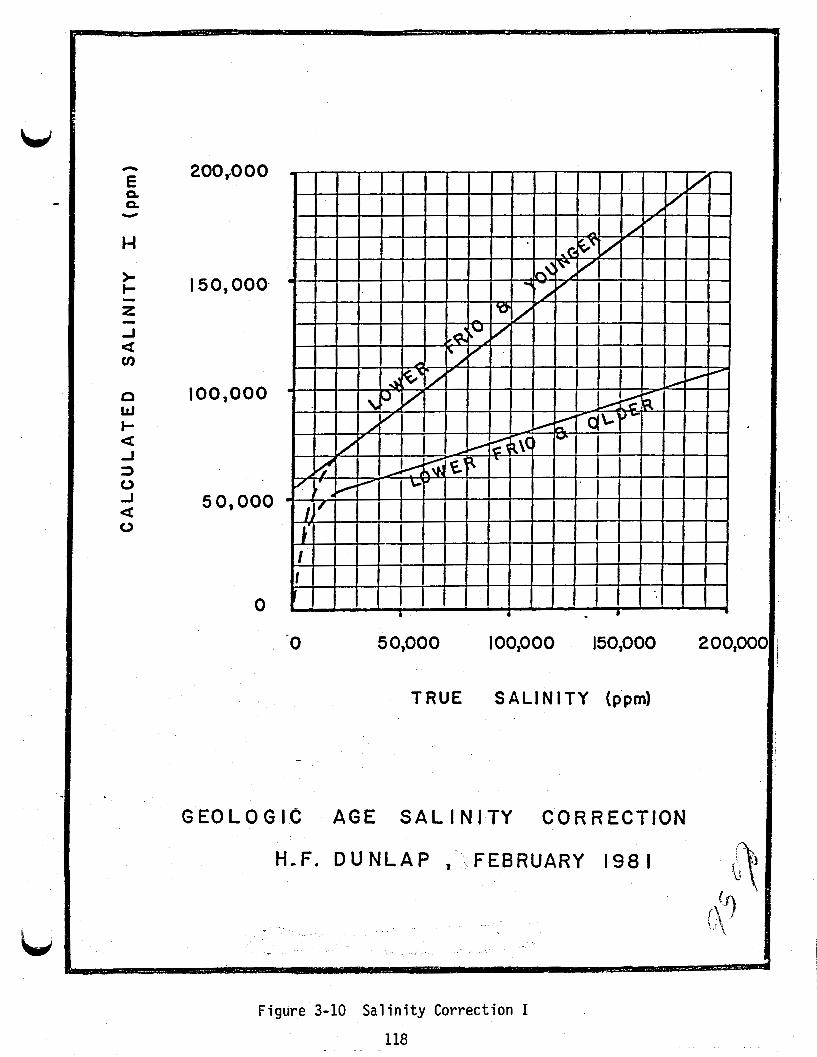
200 ,.o 0 0
150,000
100,000
5 0,000
0
-0 5 0,000 I00,000 150,000 200,001
TRUE SALIN ITY (ppm)
G E O L O G I C A G E S A L I N I T Y C O R R E C T I O N
H-F. D U N L A P , FEBRUARY I98 1
Figure 3-10 Salinity Correction I 118
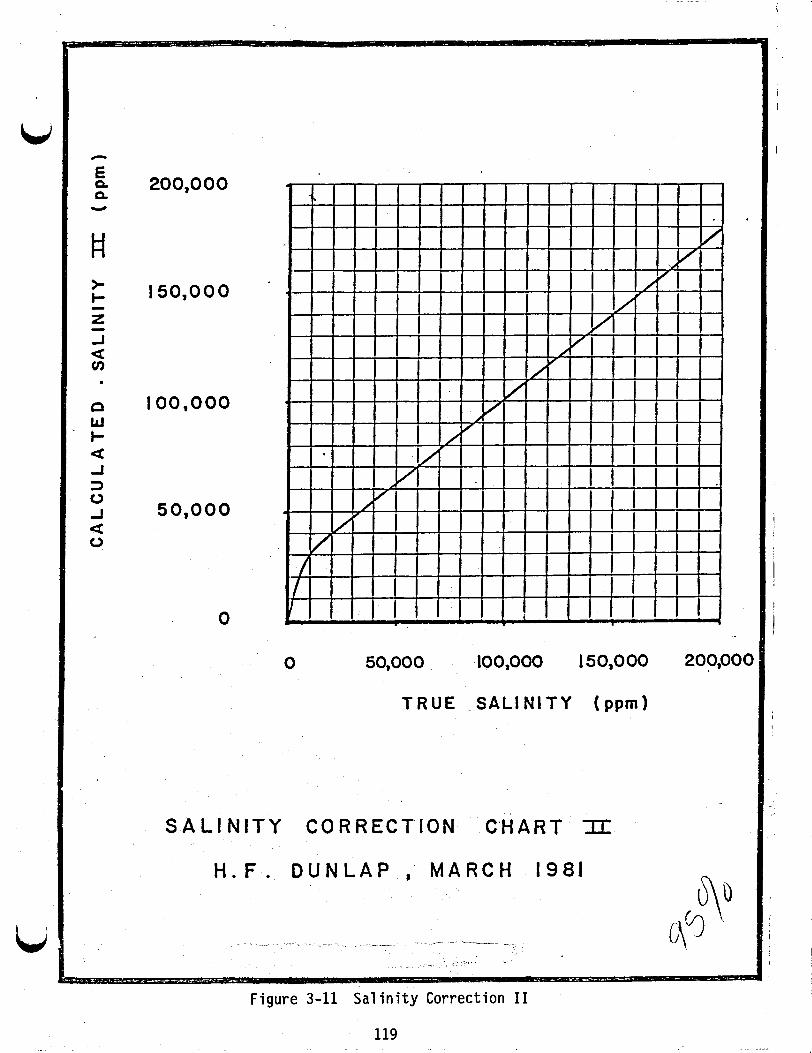
I,
Li
0 50,000 100,000 150,000
TRUE . S A L I N I T Y (pprn)
S A L I N I T Y C O R R E C T I O N CHART IIS
H . F . D U N L A P 8 M A R C H 1981
200,000
Figure 3-11 Salinity Correction I1
119
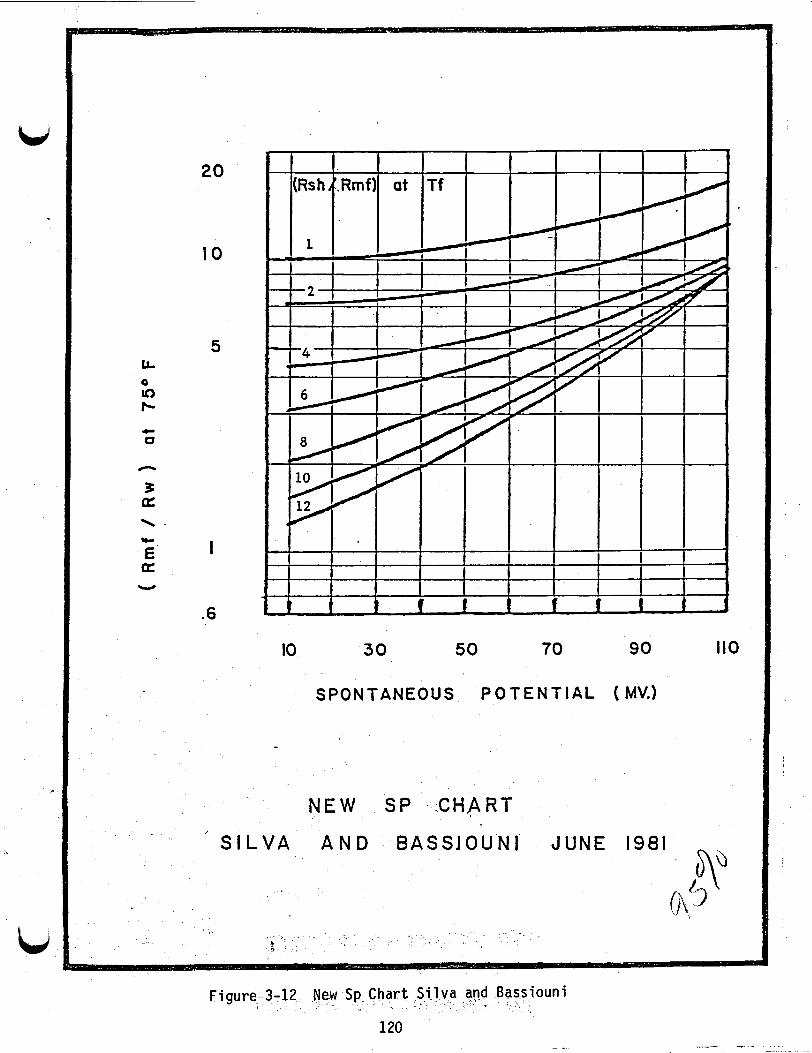
20
IO
5 LL
v) cc Q
c 0
a
3 a
E a
\
I w-
Y
.6
' s
IO 30 50 70 90 110
SPONTANEOUS P O T E N T I A L (MV.)
NEW SP .CHART
L V A A N D B A S S I O U N I
Figure 3 art ouni
120 - I
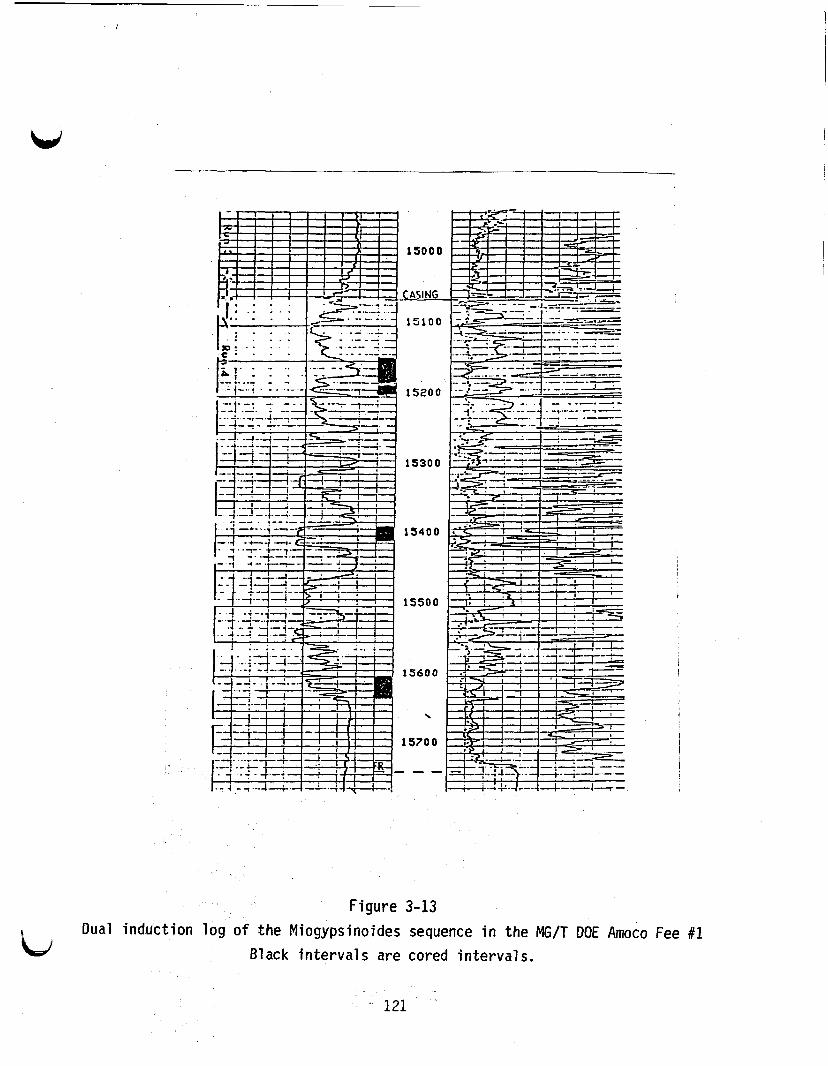
1 .. * . .
I - ' . . , I . I , . I ,
1 5 1 0 0
15200
15300
1 5 4 0 0
1 5 5 0 0
1 5 6 0 0
\
15700
- - -
Figure 3-13 Dual induction log o f the Miogypsinoides sequence i n the MG/T DOE Amoco Fee #1
Black intervals are cored intervals. id
~ 121
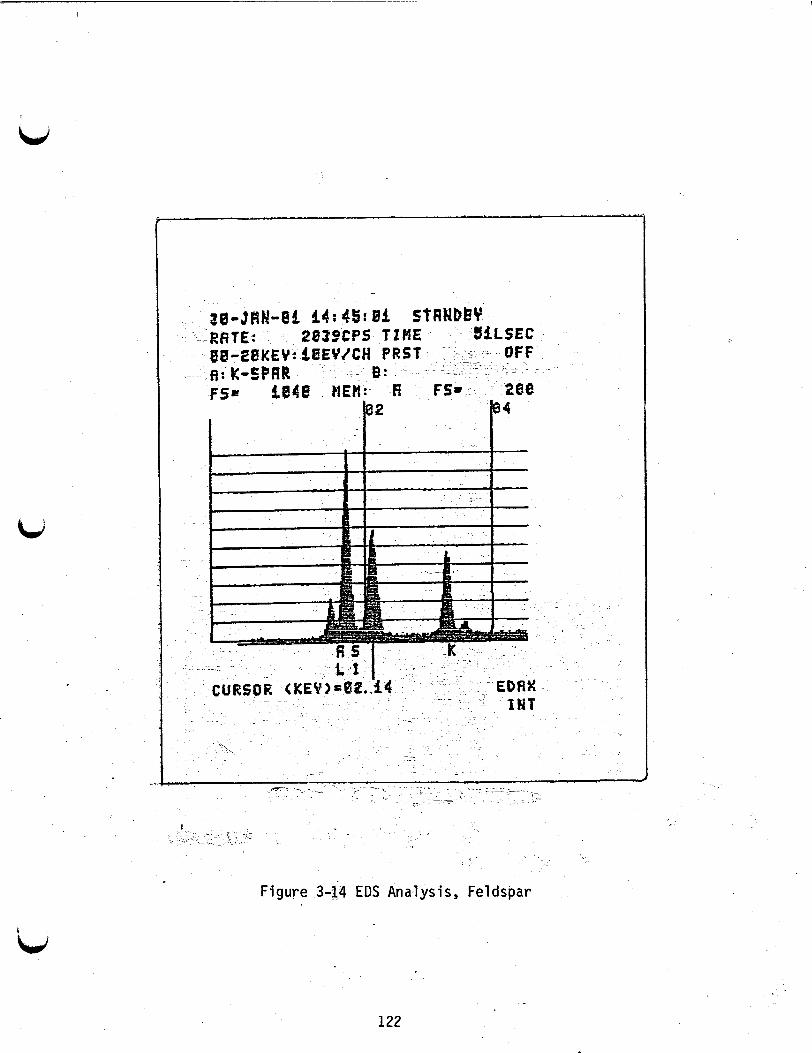
Figure 344 EDS Analysis, Feldspar
122

I , <
\ .
Figure 3-15 EDS Analysis, Drilling Mud
123

. : 'R '
I '
Figure 3-16 EDS Analysis, Illite
124
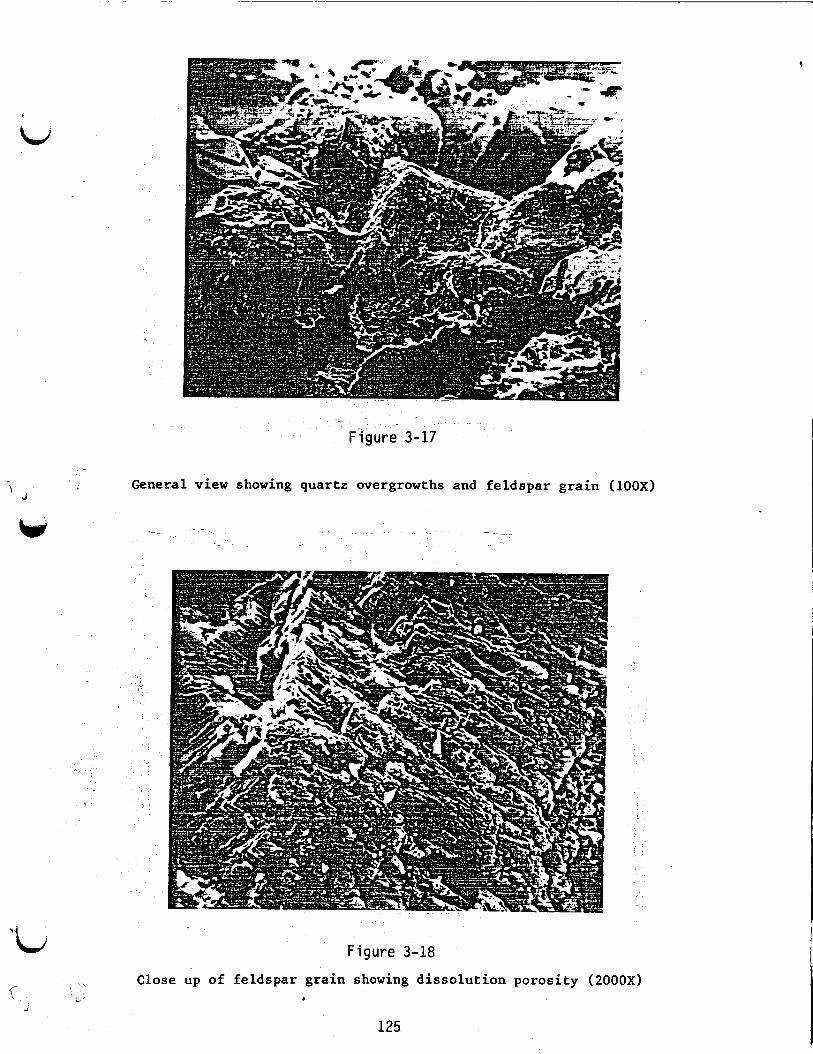
‘ J
w
I ’
’t,
3 b’
General view showing quartz overgrowths and feldspar grain (1OOX)
Figure 3-18 Close up of feldspar grain showing disso lut ion porosity (2000X)
125

F igu re 3-19 -
b
General view showing overgrowth development + feldspar ? (1OOX)
1-
Figure 3-20' Possible dr i l l ing mud.contamination ? bridging intergranular pore (500X)
i.\, ' b 126

Figure 3-21 Illite Coating (looox)
127
Figure 3-22 Illite partly occluding pore throat (200X)
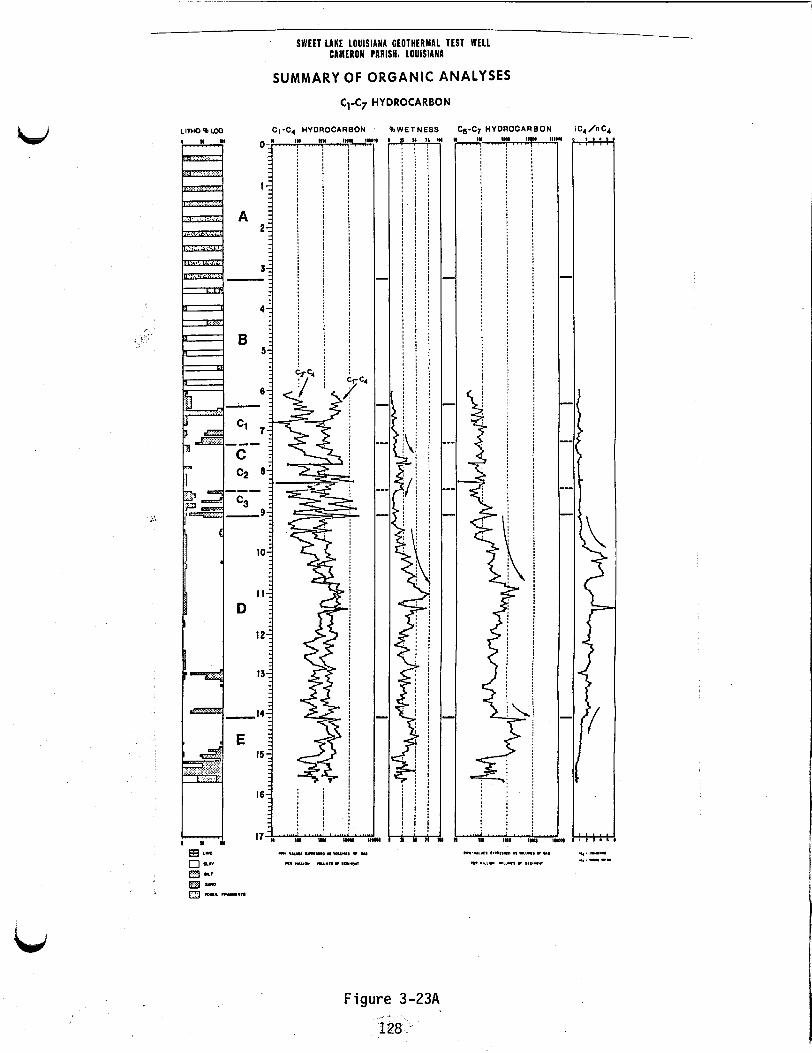
SWEET LAKE LOUISIANA GEOTHERMAL TEST WELL CAMERON PARISH, LOUISIANA
SUMMARY OF ORGANIC ANALYSES C 1 - c ~ HYDROCARBON
4YDROCARBON W 4YDROCARBON %WETNESS Cs-C I -
\
j
r f
j
i
I j - :
E
Figure 3-23A
128

SWEET LAKE LOUISIANA GEOTHERMAL TEST WELL
SUMMARY OF ORGANIC ANALYSES
CAMERON PARISH, LOUISIANA \
C4-C7 HYDROCARBON
CONTENT LITHO e m
w
Y
m
r.
b
b
L
Y
n
L
n
b Figure 3-238
129

SWEET LAKE LOUISIANA GEOTHERMAL TEST WELL CLMEROH PARISH, LOUISIANA
SUMMARY OF ORGANIC ANALYSES
w SOURCE CHARACTER VISUAL KEROGEN MATURATKW TYPE ORGANIC MATTER
I .
ORQANIC CARBON CONTENT C1(I*EXlRACTION DATA A
W ; H ; m
W IHI.-
I H j A r n - W i -
' I
ti
,*.." t : ="7zLu : :z.m*- * ."I - -."- _..I. I I .."."
Figure 3-23C 130 .
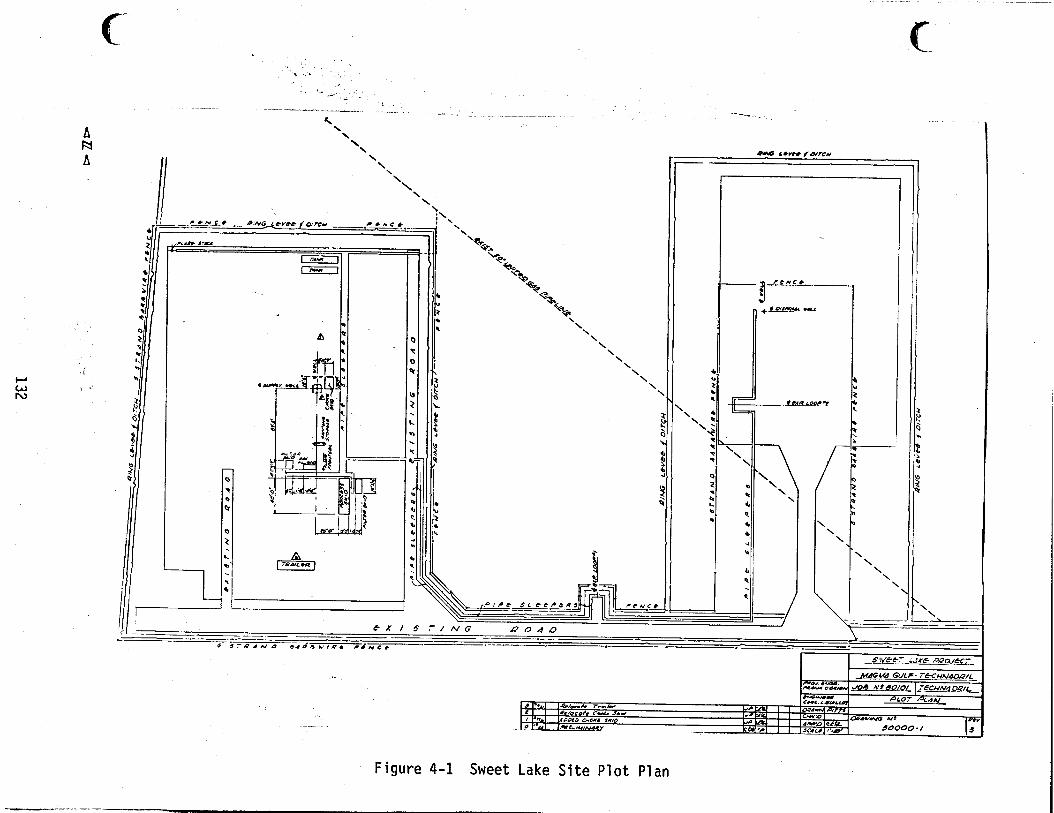
,
i
132

1 I
W
v)
Q)
v)
v)
4
L
0
4J n
E
0)
Y
&
c
c
c
2
B W
w
I1
-I >
131

‘E e
133
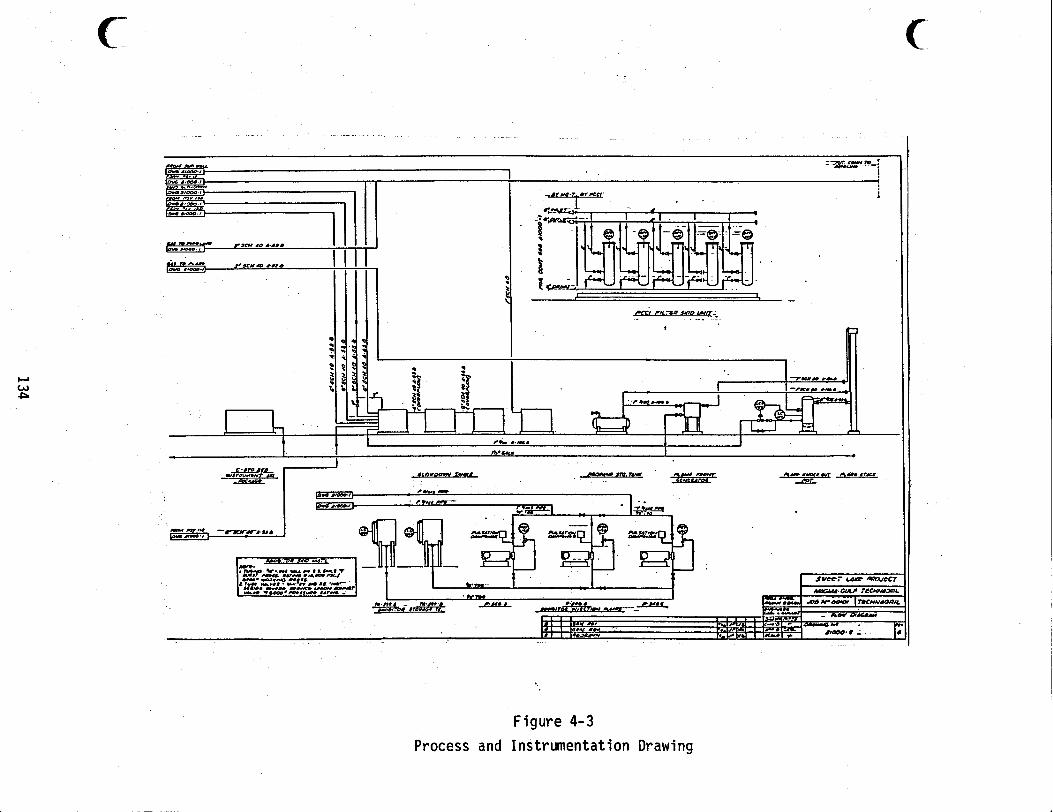
c
0
134
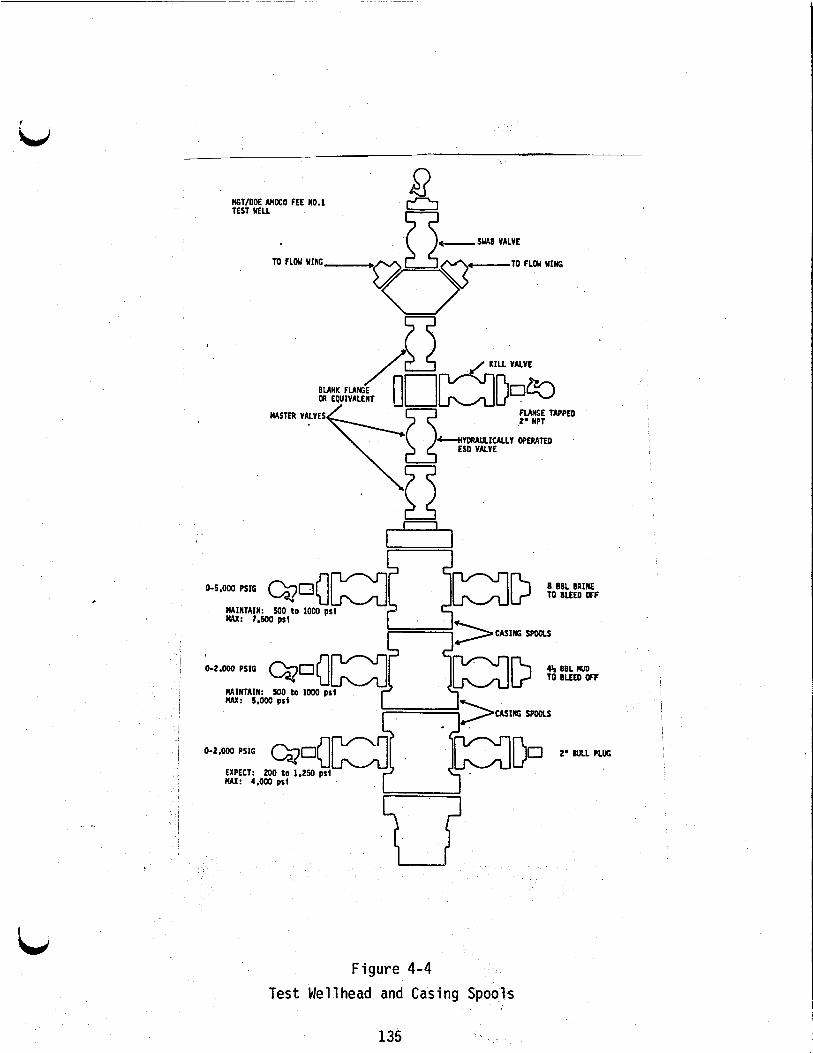
u
L
n
IK;T/OOE AMOCO FEE NO.l TEST MLL
MASTER VAL "'c 'PED 2' NPT
HYORAULIULLY OPmTEo 'I 2- ESO VALVE \ *
0 BBL BRINE TO BLEED CfF
0-5,OOO PSIG 0 BBL BRINE 0-5,OOO PSIG Q o f J D [ MAINTAIN: 500 to 1000 psi 7
]DQ TO BLEED CfF
IIAINTAlN: SO to 1000 p s i MAX: 5.003 psi
EXPECT: 200 t o 1.250 psi UAX: 4.000 psi
Figure 4-4 Test We1 1 head and Casing Spools
135


HYDRAULICALLY -OPERATED ESD VALVES
- FIGURE 426
GRAY CHOKE VALVE MANIFOLD
137

Figure 4-7
BRINEIGAS SEPARATOR SYSTEM .--
_ I
138
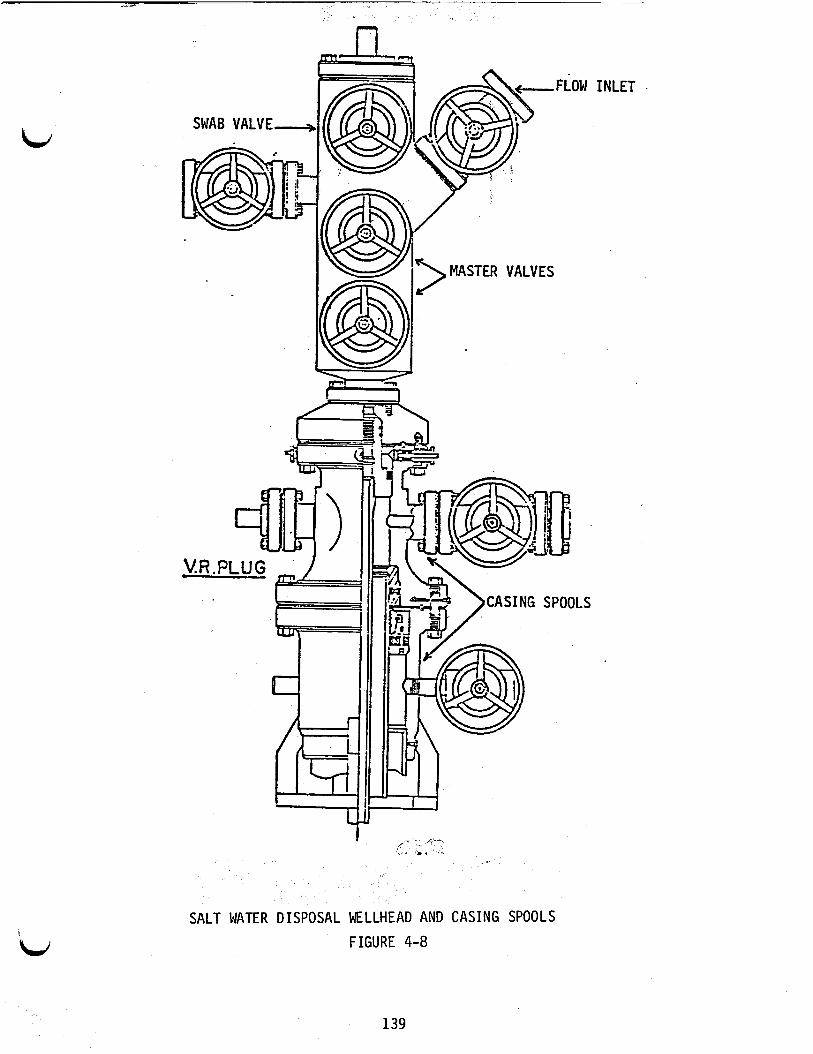
SALT M T E R DISPOSAL WELLHEAD AND CASING SPOOLS
FIGURE 4-8
INLET .
139

Figure 4-9
SALT WATER DISPOSAL WELLHEAD 4 - .’
140

-LJ Figure 4-10
Inhibitor Pi 1 ot P1 ant
141

c c
MG-T/DOE AMOCO FEE NO. 1 WELL SWEET LAKE PROSPECT
CAMERON PARISH, LOUISIANA
* I I AUGUST, 1981 I
- I GAS CONTENT IN BRINE TO DISPOSAL WELL I I I I I 1 AS A FUNCTION OF SEPARATOR PRESSURE I
loo 200 300 400 600 800 700 800 BOO 1
SEPARATOR PRESSURE, PSlG
Figure 4-11 Gas Content of Brine - * Separator Pressure

. .
. . B :- :.-: :. n
* * . , .
I
I Induction log of Hiogyp rand, '
UC-~IMIE h o c 0 k c I1 . 15100 -4 * I
8
Figure 5-1 Sweet Lake Log of Miogypsinoides Sand Zone Showing Sands 5 & 3

Figure 5-2
Prel iminary cal cul at ions
by J.D. Clark o f Sand
Drawdown Test
144
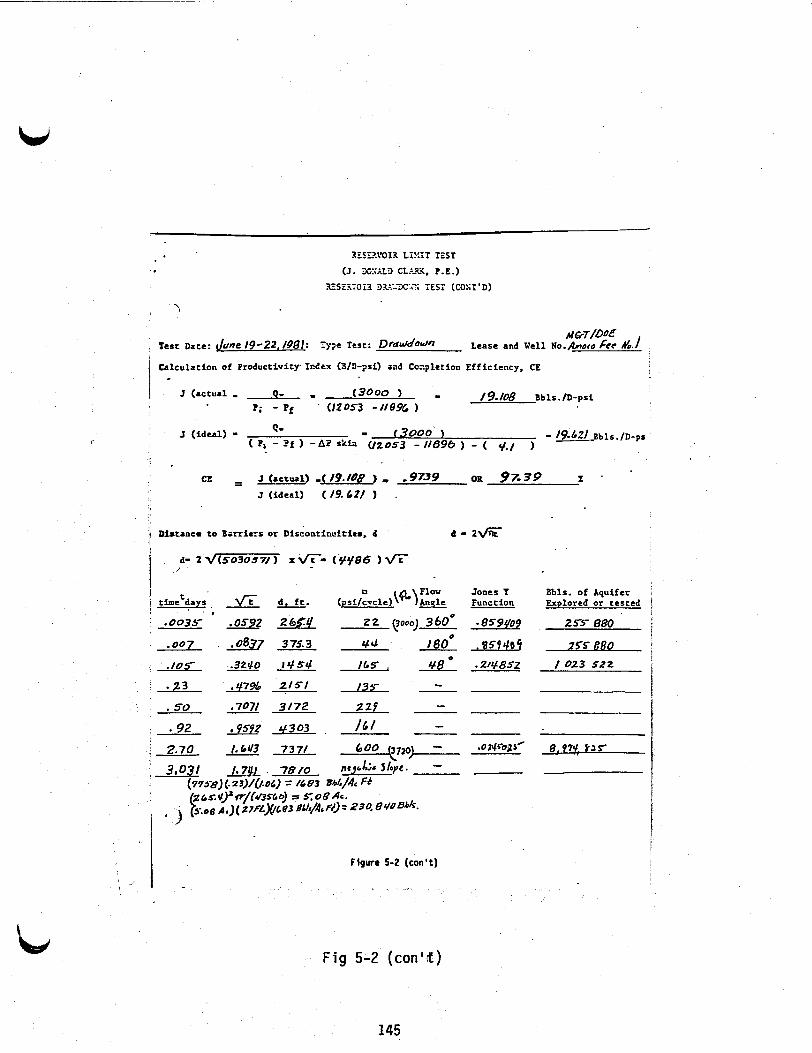
r
.
J (ideal) (l9.&?/ ) .
Distance to aarricrs or Discontindtio, d a - 2 6
a- 2 t/(503037/ ) x 6- (9y86 1 fi -1
Figure 5-2 (con't)
Fig 5-2 (con'&)
Jones I Function
; 859qO9
.sr011a4 * 214852
Bbls. of Aquifer Explored or tested
255- 880
25s 880 / 023 522
145
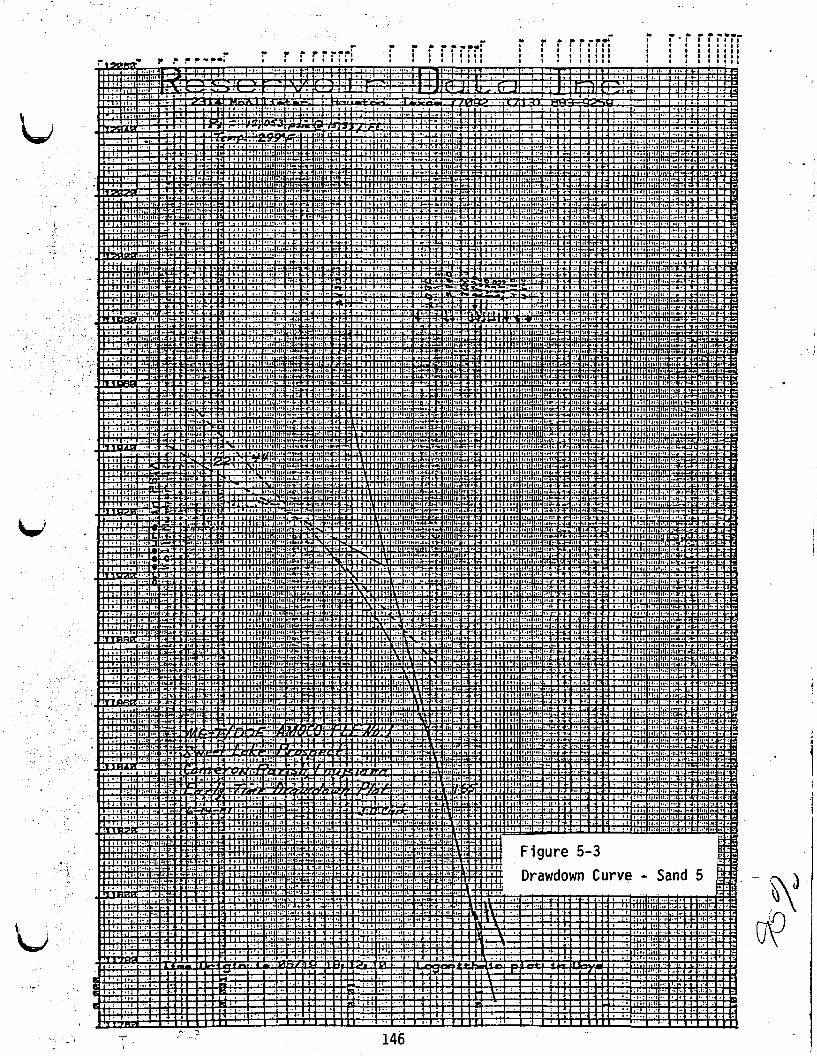
146
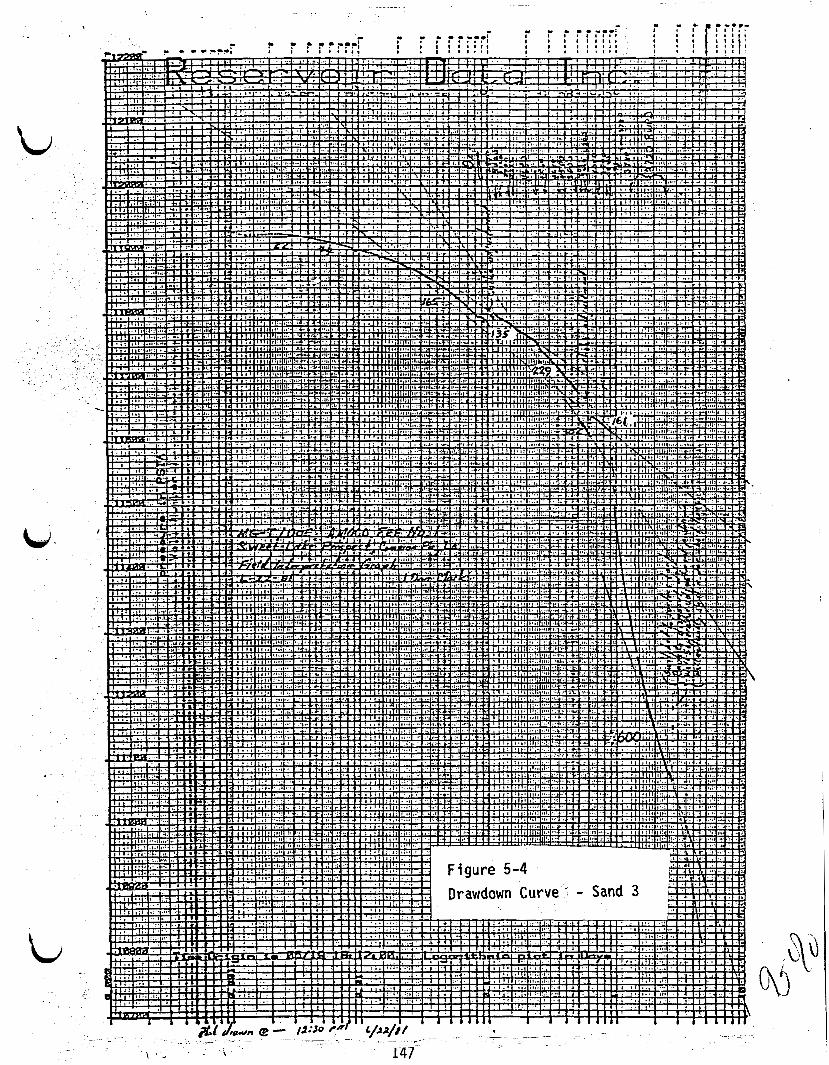
t ii

._
.. .
Li

1 I
I I
1 I
1 1
1 I
I I
\ '_
f
Q
m
W"
n
t
m
N
n
0
*)
O
R
0
N
P
N
U
N
VIS
d'38nSS
3tJd 310HW
O1108
149

-' c-, v, 0
BOTTOMHOLE PRESSURE AT TIME OF PERFORATION s f 8 0 0
01 I I - . I I
1500 2000 500 1000 0 PRODUCTION RATE (BPD). . *AI* _ _ 1- 1 A- _-. -
--
Figure 5-7
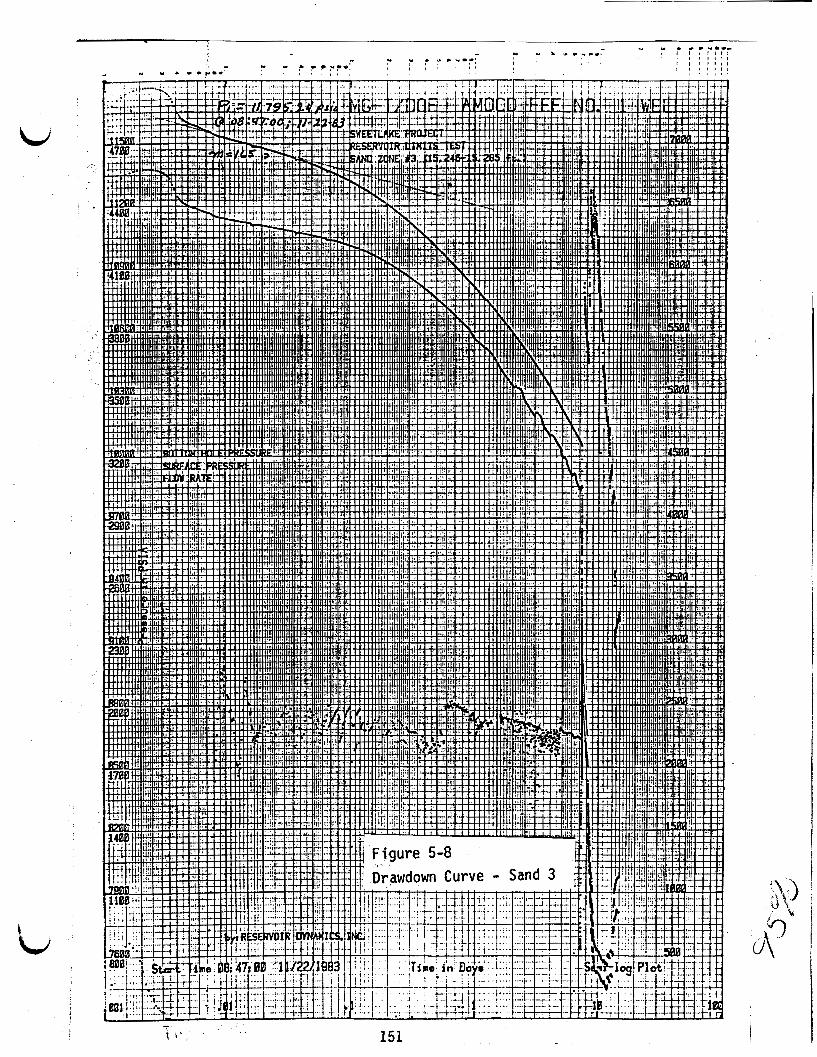
t
i 151
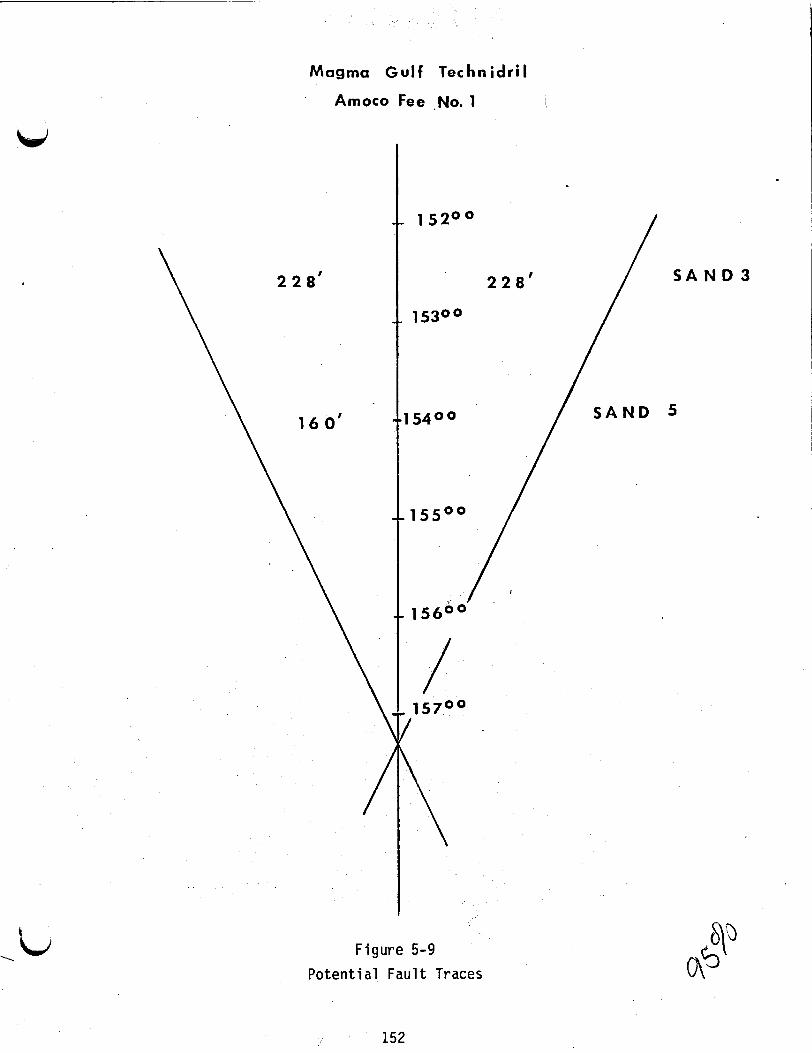
Magma Gulf Technidril
Amoco Fee No. 1 I
/
152"
2 2 8 '
1530°
1540'
155'O
1560'
/ 1570°
/
\ Figure 5-9
Poten t ia l Fau l t Traces
S A N D 3
5
152

. .
.. .
\
srrfc I n s ire-'
Fig 3-10
FLOW ANGLE OF RESERVOIR
153

..
-.
>- c

* TEST SITE LOCATIONS
FRESHWATER - SALTWATER INTERFACE IN THE CHICOT AQUIFER, SOUTHWESTERN LOUISIANA
(After Harder, Kilburn 6 Whitman. 1067)
_- CHLORIDE CONCENTRATION (PPM) ON BOTTOM (B) AND TOP (T) OF UPPER SAND UNIT
IN CHICOT ATCHAFALAYA AOUIFER -- NORTH AND SOUTH LIMITS OF 260 PPM CHLORIDE - SOUTHERN LIMIT OF FRESH WATER IN EVANQELINE AOUIFER
BASE OF FRESH WATER IN SOUTHWESTERN LOUISIANA (After Harder, Kilburn 6 Whitman. 1067)
0 10 2 0 30 40 S O mi
0 10 2 0 30 40 6 0 6 0 k m
SCALE
'FIGURE 7-1
155
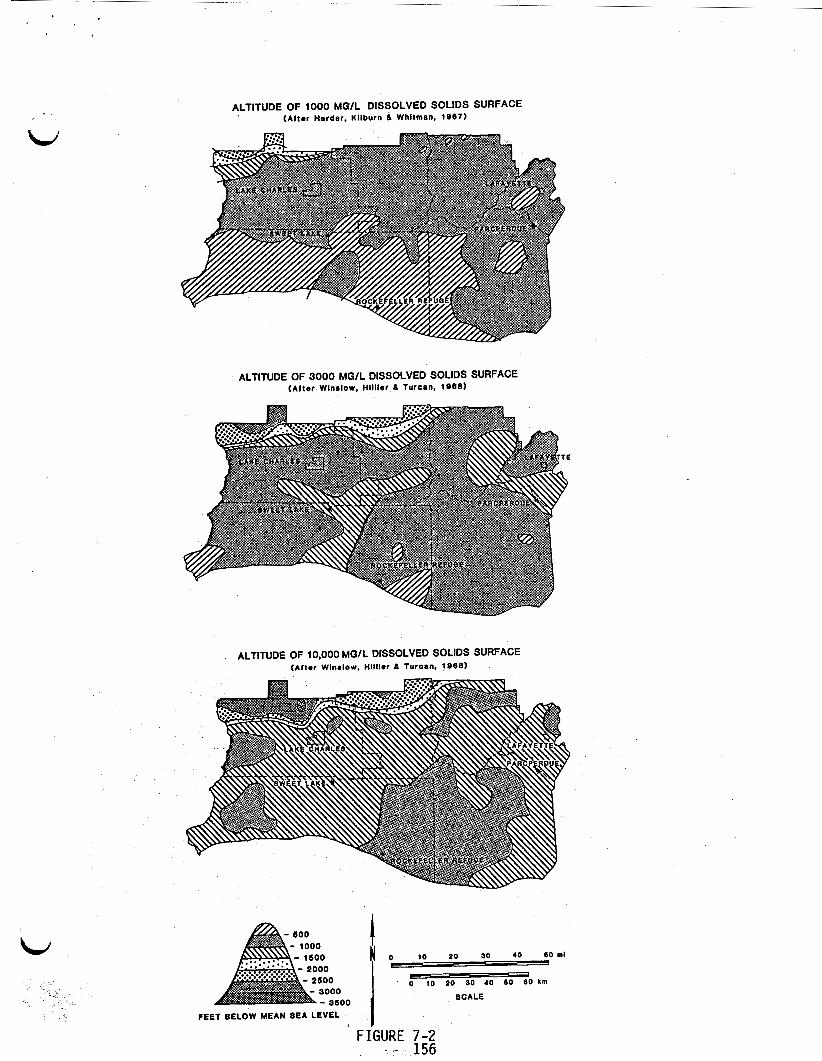
ALTITUDE OF 1000 MGIL DISSOLVED SOLIDS SURFACE (After Harder. Kllburn 4 Whiiman, 1987)
ALTITUDE OF 3000 MGlL DISSOLVED SOLIDS SURFACE (After Wlnrlow. Hillier 6 Turcan, 1988)
ALTITUDE OF 10,000 MGIL DISSOLVED SOLIDS SURFACE (Aftor Wlnalow. Hillier 6 Turcan. 1088)
o IO zo 30 40 so eo hm
0 SCALE
FEET BELOW MEAN SEA LEVEL , I FIGURE 7-2
. - 156

FIGURE 7-3. T R I L I N E A R PLOT OF DISSOLVED CON- STITUENTS FROM NATURAL WATERS I N SOUTHWESTERN
LOU I S I ANA. A. COASTAL WATERS AND BRINE. B. SWEET LAKE DRAINAGE. C. PARCPERDUE SURFACE WATERS AND GROUND WATERS D. SWEET LAKE AND ROCKEFELLER REFUGE GROUND
157 WATERS.

c- ,
1, , i ’ I
GEOLOGIC AND PHYSIOGRAPHIC FEATURES OF SOUTHWESTERN LOUISIANA
(AFTER JONES, TURCAN & SKIBITZKE, 1954)
n 7 H
w I P W
T o 10 20 30 mi N ABANDONED MISSISSIPPI RIVER CHANNELS
ABANDONED R E D RIVER CHANNELS
-CHENIERS ( S A N D AND SHELL R IDGES) MARKING FORMER BEACHES
* TEST SITE LOCATIONS
0 10 20 30 40 km I
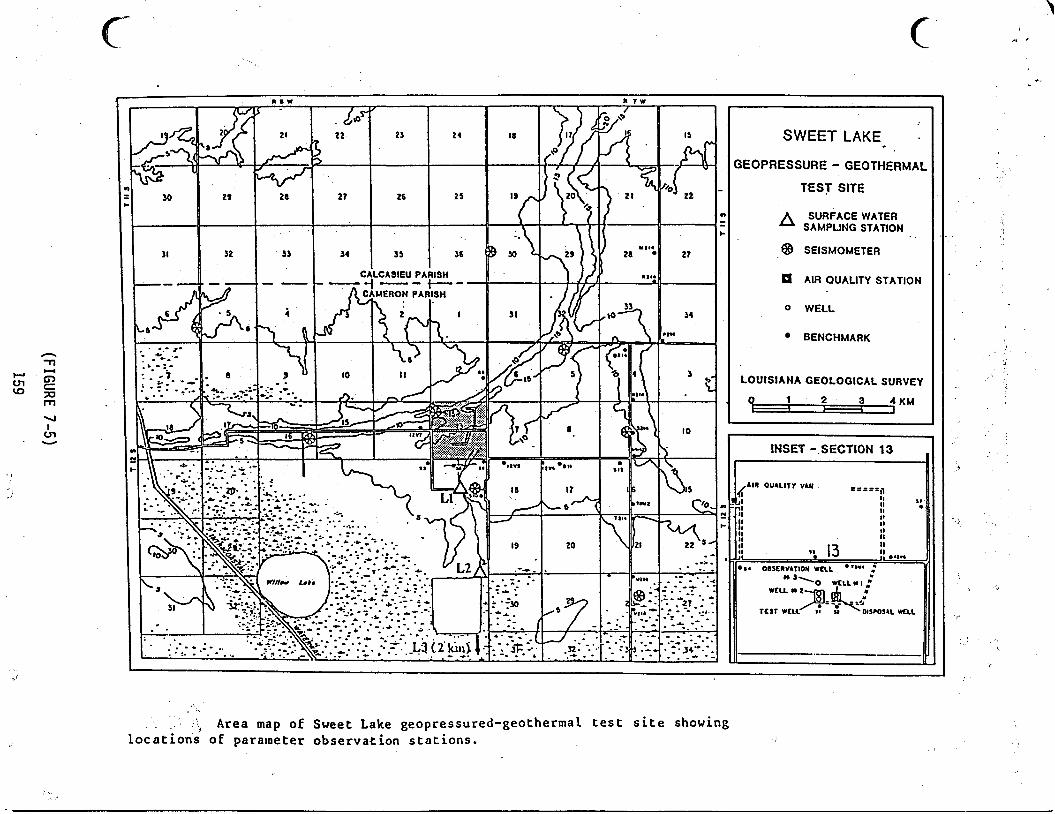
C '
n 7
m U I cn
' U
k T W
SWEET LAKE
3EOPRESSURE - GEOTHERMAL
TEST SITE
SURFACE WATER
. . A SAMPLING STATION
@ SEISMOMETER
AIR OUALITY STATION
0 WELL
BENCHMARK
LOUISIANA GEOLOGICAL SURVEY
9 1 2 3 4 K M 4 F
I
!
A I R QUALITY VAN
msmm VELL
. I '_ :i Area map of Sweet Lake geopressured-geothermal t e s t s i t e showing loca t ions of parameter observation s ta t ions .
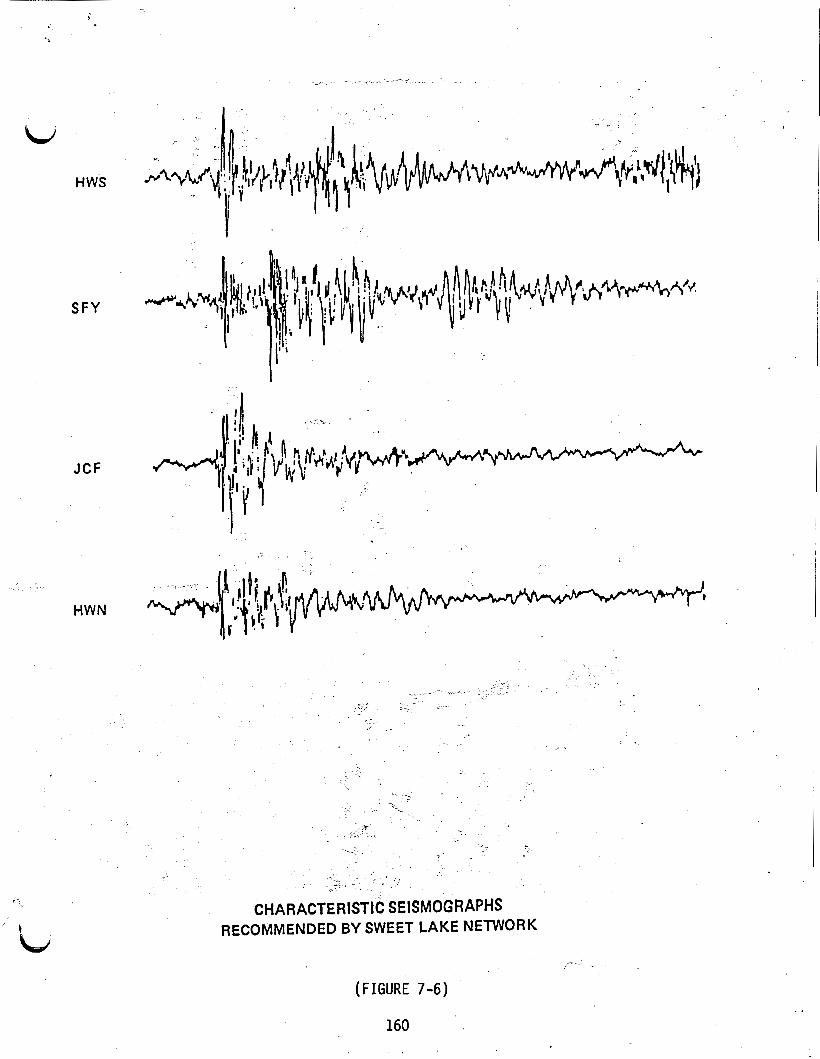
,
I
HWS
SFY
, .__.--
JCF
.. .
MWN
f
‘ h i
- 7
CHARACTERISTIC SEISMOGRAPHS RECOMMENDED BY SWEET LAKE NETWORK
I -
(FIGURE 7-6)
160
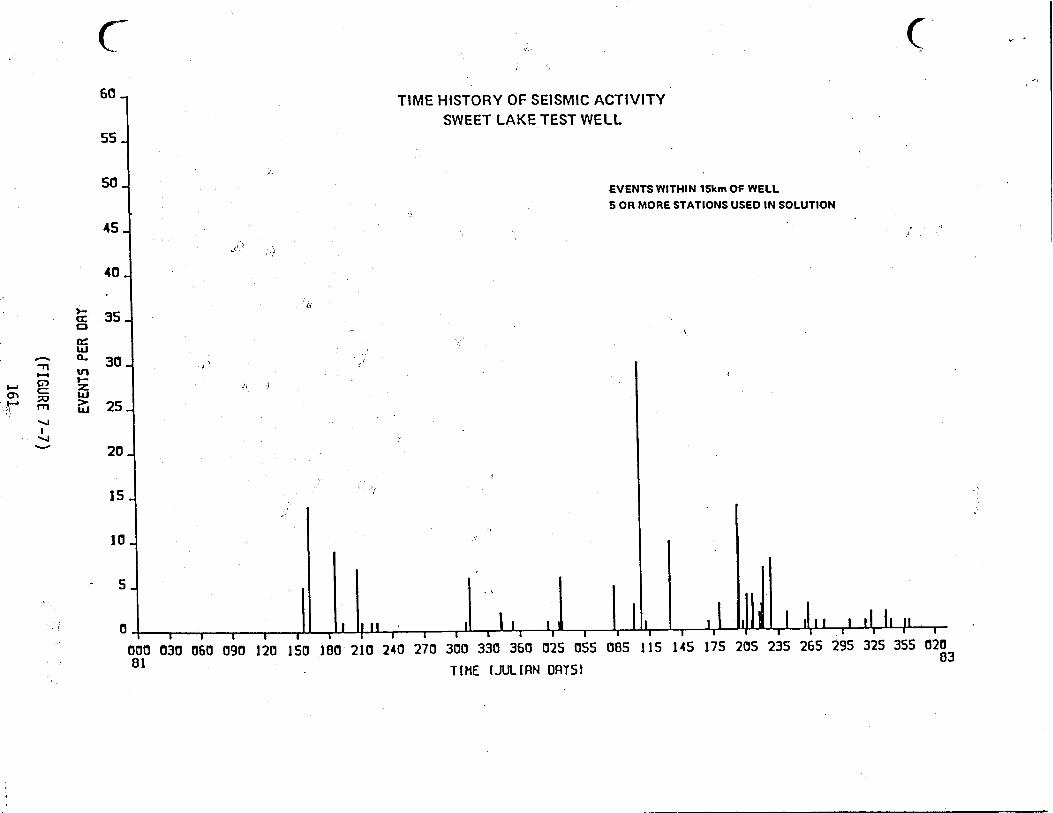
i
I 9
>. I- >
- c I-
A
0-l
4w
- 0%
W E
I- -
+_
AH0 N3d SlN3h3
(FIGURE 7-7)
161.

EVEN
TS P
ER O
RY
ul
0
!3 ul
0
w
w
.L.
&
VI
0
ul
0
I I
I I
I
h)
L
.-.
h)
3 ul
0
ul
0
VI
I I
I I
I I
.
I
-C
- - - - - -
PE
RFO
RA
TIO
N O
F O
Is#
wL
WEL
h -
-C
- - - - - -
PE
RFO
RA
TIO
N OF
PR
OO
UC
TIO
N W
ELL
-.
a
m
m
-0
I
I I
I I
I
PR
OD
UC
TIO
N W
ELL
CHAN
GE IN A
VE
RA
GE
DA
ILY
PR
ES
SU
RE
, PSI
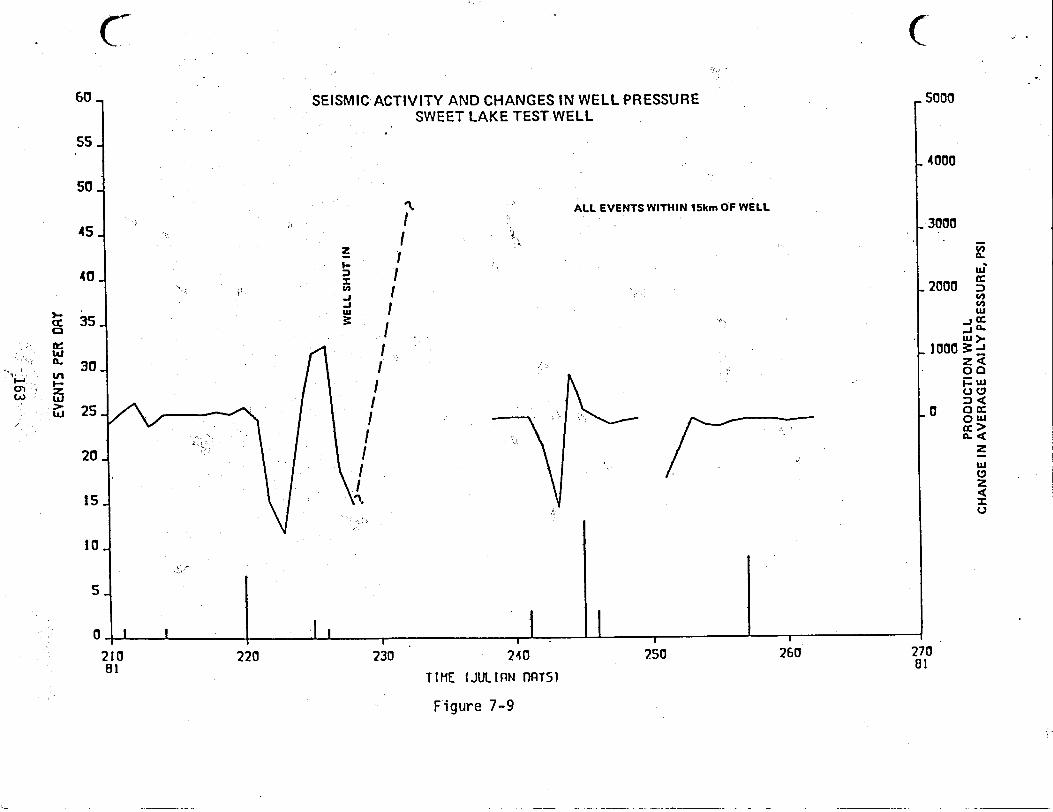
' E
9C
EVEN
TS P
ER o
w
WE
LL S
HU
T IN
i- -0
P
I I
I I
I 1
A
VI
0
0
0
E w
0
.-.
N
a
0
0
0
0
0
a
PR
OD
UC
TIO
N W
EL
L
CH
AN
GE
IN A
VE
RA
GE
DA
ILY
PR
ES
SU
RE
, PSI

.. . .~
. 'i
.::. t
~ B9
T-
~
EVEN
TS P
ER O
RT
W
0 - W
Y a
$ a
.
> I +-
-WEL
L SH
UT
IN
WE
LL S
HU
T IN
A
- -2
--
I I I
1 a
I I
w
'0
0
0
1 n
VI
0
0
0
L
0
0
0
- h)
0
0
0
0
Q
a
PR
OD
UC
TIO
N W
ELL
CH
AN
GE
IN AVE
RAGE
DA
ILY
PR
ES
SU
RE
, PSI
-- -
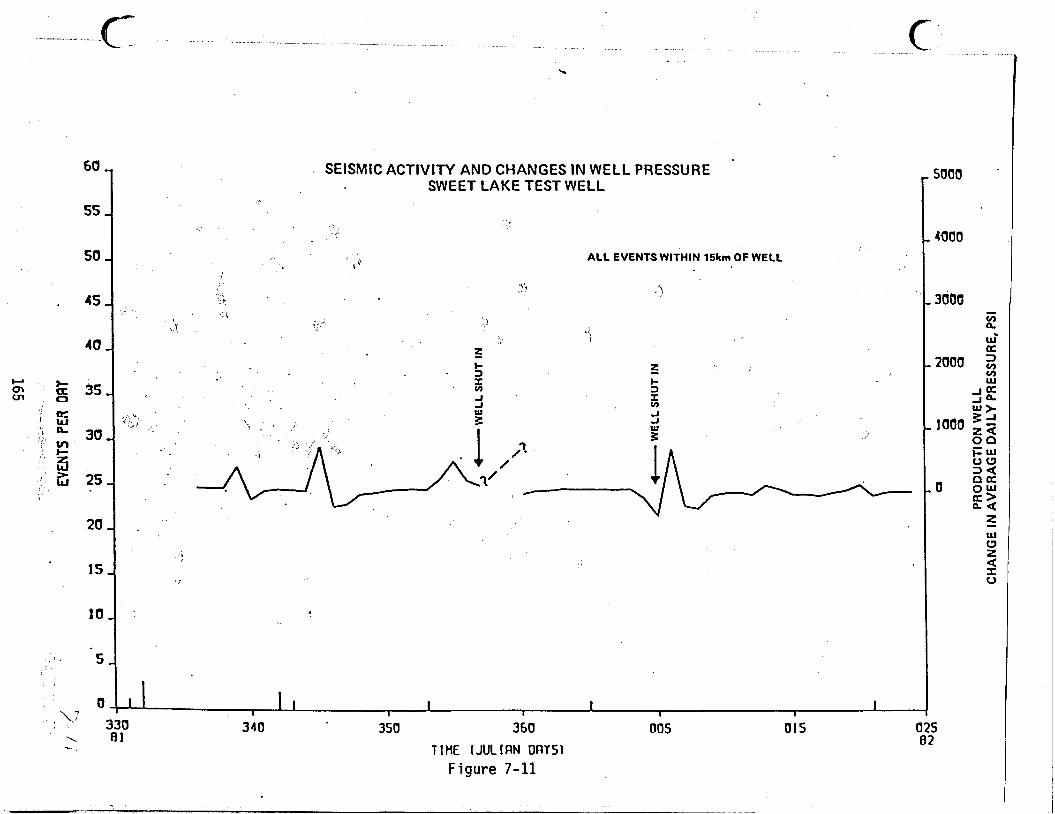
ISd '3tJnSS3Ud A
lIVa
3OVtJ3A
V NI 30NVH3 1
13
M N
0113nOO
tld 0
0
V
0
.o
0
0
'0
0
0
P
0
N
0, V
0
0
0
m
*
NI ln
HS
t
CT.
.. ~. ',
..
.
-- .
.I
165
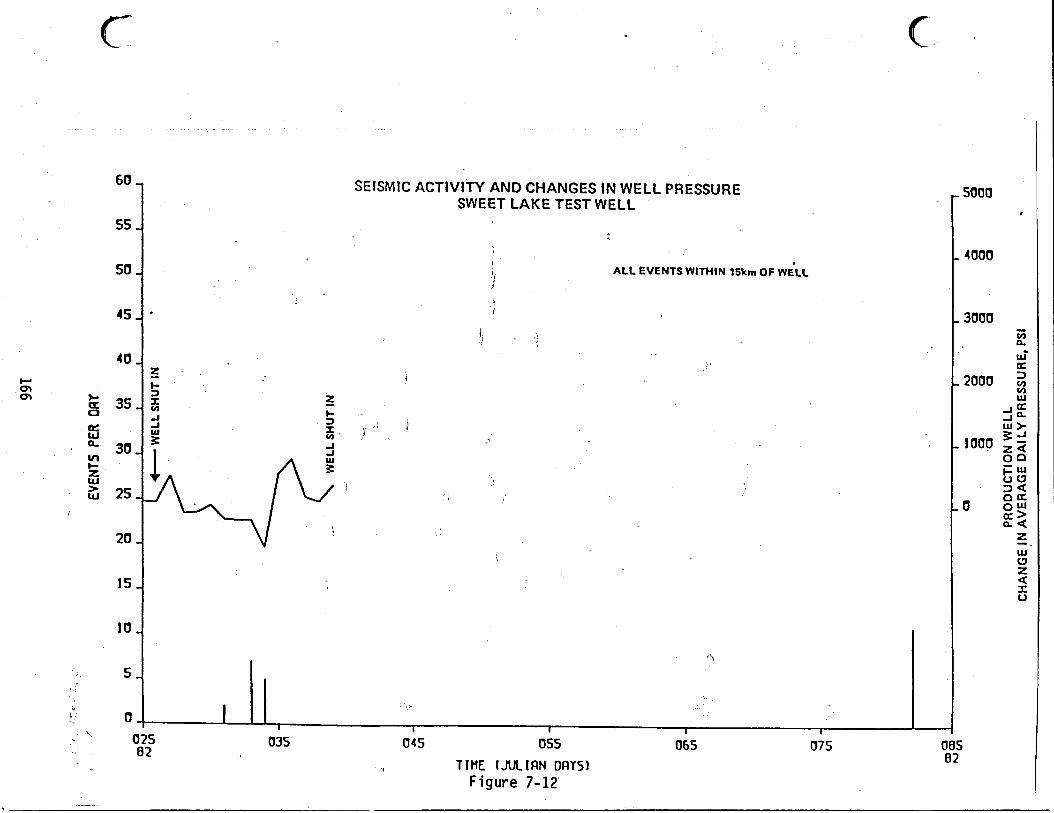
991
a3
Nu
l
.
I.
'
. *-s.
~
EVEN
TS P
ER o
m
I I
I I
I I
I I
I I
1 I
1
WEL
L SH
UT
IN
-
a
w
ul
...
I
3 0
L
N
.u
a
a
a
Q
0
Q
a
0
0
0
0
0
0
PR
OD
UC
TIO
N W
EL
L
CH
AN
GE
IN A
VE
RA
GE
DA
ILY
PR
ES
SU
RE
, PSI
.

I 8
60
55
so
4s
40
35
30
25
2a
15
IC
I
SEISMIC ACTIVITY AND CHANGES iN WELL PRESSURE SWEET LAKE TEST WELL
ALL EVENTS WITHIN 15km OF WELL
I 150 e 1'
f 60 1 I
170 1 eo TIHE tJuttRN ORTSI Figure 7-13
- 190 200
*
. A
264
I 210 e1

60
55
50
45
40
3s
30
25
20
15
10
5
0
SEISMIC ACTlVlTY AND CHANGES IN WELL PRESSURE SWEET LAKE TEST WELL
' 3 ALL EVENTS WITHIN 15km OF WELL . _
330
270 230 ' 240
TIN (JULIRN DflYSl Figure 7-14
250 260 270 81
26 4
198
132
66
0

691
--
EVEN
TS P
ER O
RY
* ul
ul
6
0
*u
1
h)
Oi
n
0
OO
cn
0
ul
Y
CI.
1
VI
0
VI
0
I I
I I
I I
1 I
I I
I I
\
WEL
L S
HU
T IN
C-- W
ELL
SH
UT
IN
.. . .
r-
r
I I
1 I
I 1
0
6' L
m
0
N
DIS
PO
SA
L W
EL
L
CH
AN
GE
IN
AV
ER
AG
E D
AIL
Y P
RE
SS
UR
E, P
SI
..
.
.
%'
0

60
55
50
45
40
* 35 : ; 8
21
I !
SEISMIC ACTIVITY AND CHANGES IN WELL PRESSURE SWEET LAKE TEST WELL
ALL EVENTS WITHIN 15km OF WELL
336
330 340 81
26 4
198
132
66
0
I I I . I I I I
025 82
350 360 005 015
TfHE IJULIRN DRYS1
Figure 7-16
v) v) W
1 I
w (3 2
0 9

sg
a
W
VI 2
VI
4
?? a
0-
VI
_.-
x
\' ., EV
ENTS
PER
ow
V
I V
I m
V
I a
VI.
V
I 0
a
&
w'
w
I4
a
Y
- h
)
a V
I 0
VI
0
VI
I I
I I
I I
I I
I I
I W
ELL
SH
UT
IN
..
,
..
WEL
L S
HU
T IN
v) rn Y
'rti
r
r
rn
V 3
v,
v, C
R
m
a
m
L
m
w
h)
w
W
h)
m
JL
0
-2
DIS
PO
SA
L W
ELL
CH
ANGE
IN A
VE
RA
GE
DA
ILY
PR
ES
SU
RE
. PSI
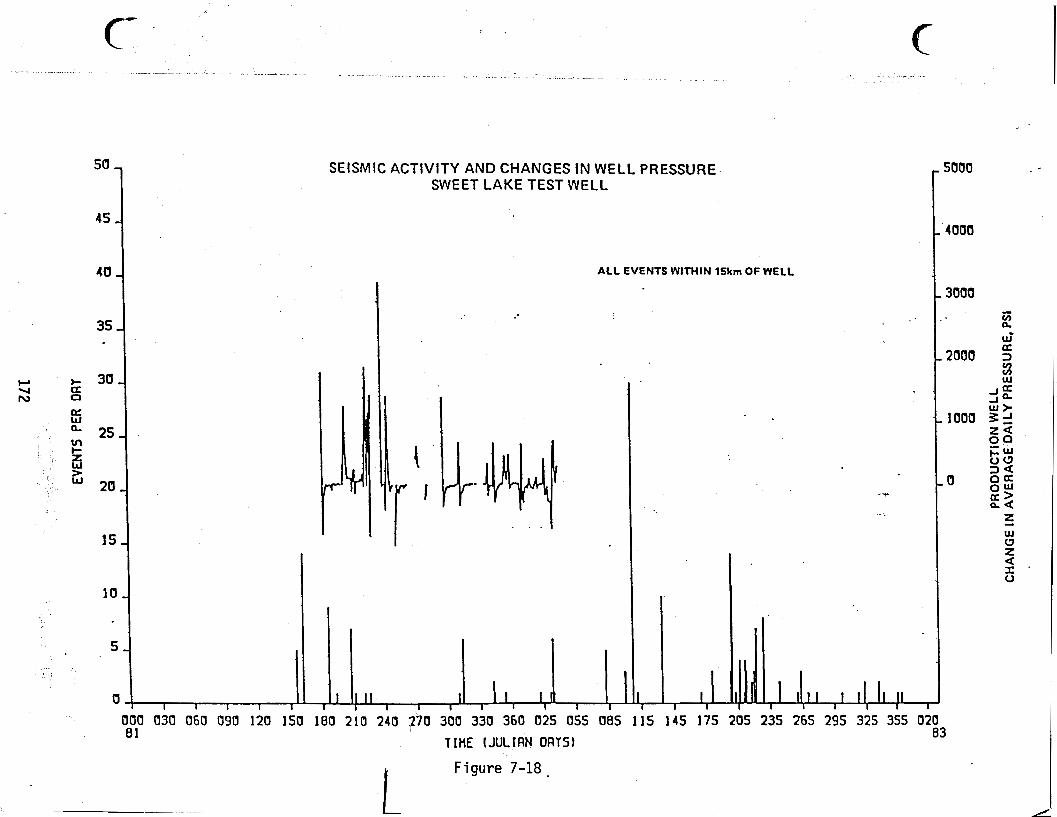
I
L
ISd '3tlnSS3Ud A
lIVC
l3DV
k!3AV
NI 3DN
VH
3 113M N
0113nO
Otld
a 0
J
J
- L - W
v)
M
c z w
o
>
L
I.
--I- d
2
0
03
43
N
0
m
N
0
In
m
N
Ln
tD N
In
O
N
In
I- - In
c1
CI
In
343 0
MI N3d SlN
3A3
172

EVEN
TS P
ER o
ar ...
Y
h)
h)
w
w
A
v)
VI
0
0
VI
0
ul
0
ul
0
VI
0
,ul
0
VI
0
Y
ae I
I I
I I
I I
I I
I I
a0
I
I
I
C
C
I
N
a
-.C
- -
- NITR
OG
EN
INJE
CTI
ON
INTO
DIS
POSA
L WEL
L TO
RED
UC
E H
YD
RO
STA
TIC
PR
ESSU
RE
*---
----
N
EW Z
ON
E PE
FOR
ATE
D IN
DIS
POSA
L W
ELL
AN
0 IN
JEC
TIO
N T
ES
T R
UN
, PR
ESSU
RE
INC
RE
M
NO
TE
0 IN
PR
OO
UC
TIO
N W
ELL
-
NO
TED
UR
G,E
PR
ESSU
RE
INC
REA
SE I
N O
ISPO
SAL
WEL
L ---
----
r
rr
‘2 ri
rn
=! -I
v)

LOCATIONS OF SEISMIC ACTIVITY SWEET CAKE TEST WELL
JULY 1980 - JANUARY 1983
e KEY
8 8 WELL LOCATION
0
0
8 EPICENTER L O C A l l O N 8
0
5 INFERRED FAULT LOCATION 0 .
0
e
t 0
e
ERRTHWRKES
1 2
e
. e
8
Figure 7-20

1 ;'
Y ' v1
Figure 7121
, .

i
c
J
. .i U a
a
eo
a0
r-
u
.. a
a
e 0-
I
a c
a
t
I r
1 I
'
I' I
' '
1 I
I I
I I
9
* cu
0
0
QJ
2-
*
w
cu cu
tWY1 H
ld30 .
176

m
b.’.
u. Z II
a tr
t L4
I I
..

c- c . . . . .
. .- . . ....
. .I
R A I N F A L L AT L A K E C H A R L E S A I R P O R T , J A N U A R Y , 1 9 8 4
. . . ..
END O F MONITORING, D A Y 1 2 1 (30 A P R I L , 1 9 8 4 )
t - I 1 1 I 1 i l l l l l I 1 I I 1 I I I 1 I I I I l l 1 1 1 1
. BB1031861891121 IS1 1812lf241271301331361026056086 116146 176206236266296326356021 051081 1 1 1 141 171201 84 . TIME (JULIRN DRYS1 86
Figure 7-23b . .

'cd
-- -m
-m
c)
'a
2
0
v
I
a2 0
c
c .. v
) )I
a
n
n
U
u1
z 3
2
*I-
z 0 z z 0
v) I- %
w
>
w
I
m
-e
In -
-- - In
--a3
61 v)
-ln
m
v)
N
m
-w
m
m
m
m
-6
)
m
m
-r- N
\. .
..
..
2
I- - 3
m
ln
m
m
N
m
v)
In
m
In
N
m
In
rn N
I-

_ . .. . . .
20 -
18 -
16 -
1 4 -
. + 12- a: 0
& E 0 10-
m I- z W > W 8 -
6 -
4 -
2 -
0 .
... *c .-. .
I I I I I I I I L I I I I I I I I l l I I I I I I I I l l I l l
15018021F3240270300330360025055085115145 175205235265295325355020050080 110140 170200230260290320350
E V E N T S O N N O N - T H U N D E R D A Y S , 1 9 8 1 - 1 9 8 3
LOCATED WITH 5 OR M O R E S T A T I O N S WITHIN 1 5 K M O F W E L L S I T E
. . L

>- 0
e W e m I- z W > W
a
. .. .,
, EVENTS ON NON-THUNDER D A Y S , 1 9 8 4
LOCATED WITH 5 O R M O R E STATIONS
WITHIN 15 K M O F WELL S I T E
./
. .
Figure 7-24c

c E V E N T S O N N O N - T H U N D E R , N O N - R A I N D A Y S , 1 9 8 1 1 9 8 3 LOCATED WITH 3 OR MORE S T A T I O N S
WITHIN 15 K M O F WELL S I T E .
I
I
Figure 7-25a

20
18
16
1 4
1;
1t
I
I
0
, -
EVENTS O N N O N - T H U N D E R , A ~ N - R A I N D A Y S ; W ~ ~ - 1983 c *
. * L O C A T E D W I T H 5 OR M O R E S T A T l O N S W l T H l N 15 KM O F W E L L SITE.
. . . . . .
... . . . .
-. . . .
Figure 7-25b

c- C‘
w . 03 F s ‘
”. i
3
SWEET LAKE
Figure 7-26
3 O o N
C
SWEET LAKE SEISMIC MONITORINQ NETWORK
: FIGURP ‘7-26 66 MOlT GEOPRESSURE WELL

Show No. Date Interval Drill Rate
Before During After
Porosity Rate Before During After
Hot Mire Before During After
Chromatograph Methane Ethane
Fluorescence
Ch 1 or i des Before During After
Mud Ueight Before During After
1 9/28/80
10,785 - 10,804
9.7 50 17.7
10 25 20
12 192
18 ,
2.8 .14
Dull yellow orange
1800 2200
-
14.2 14.2 14.2
Table 3-1 Gas Shows
2 1
12,885 - 12,915 10/16/80
8.3 43
9.0
10 25 12
10 1080
L
20 4.6
Dull yellow
3100 27,900
8200 I
j 14.9 13.2 15.5
185

- 1
Original Hole Sidetrack Hole
Uarginul ina idiomorpha 11,100 11,130
Marginul ina howei 11,550 11,670 Camerina A 12,510 12,570 Mi ogyps i no ides A N DE 14,970
Marginul ina vaginata 11,310 11,220
Table 3-2 Summary o f Micropaleontology

-
Sand
1
2
3
4
5
6
7
Depth
15080-15144
15170-15240
15250-15285
15305-15355
15385-15415
15460-15505
15520-15600
0, Sonic Log
18.1
15.4
19.2
18.3
22.9,
14.1
16.4
0, Saraband
12.3
12.1
15.4
15.3
19.0
12.2
12.9
0, Neutron-Density 0, Intercomp
15.2 16.3
14.6 13.9
20,6 20.4
18.n 18.1
23.2 20.8
15.0 15.7
17.3 16.3
0, Measured
16.6
16.3
NA
NA
24.3
NA
NA
.Table 3-3 Calcul ated and Measured Poros i ty I
187

Sand No. Depth Saraband ( a i r ) Intercomp ( a i r ) Measured ( a i r ) Estimated (water) E f f e c t i v e (water)
1 15080-1 5144 '75 275 2 15 170 - 15240 143 48
4 15305-15355 750 690 5 15385-15415 2960 2703
7 15520-15600 780 143
3 15250-15285 700 1011
6 15460-15505 130 90
30 122 NA NA
3670 NA NA
20 20
140 140 400
20 30
42
343
Table 3-4 Calculated and Measured Permeabi 1 i t y
188

Sand No. Depth SP Rwa Kf kf I Kfll Conductivity
1 15080-15144 60,000 58,000 130,000 100,000 100,OOO 140,000 2 15170-15240 60,000 68,000 130,000 100,000 100,OOO 68,000
4 15305-15355 75,000 120,OOO 145,000 120,000 125,000 155,000
6 15460-15505 65,000 68,000 140,000 123,000 128,000 68,000 7 15520-15600 78,000 120,000 160,000 140,000 150,000 140,000
3 15250-15285 68,000 105,000 145,000 120,000 125,000 140,ooO
5 15385-15415 78,000 75,000 160,000 140,000 150,000 200,000
Bassiouni
11.000 11,000 13,000 14,000 15,500 12,500 15,500
Saraband
76,000 68,000 98,000 12 5,000 125,000 74,000 103,000
Intercomp
100,000 100,000 125,000 175,000 175,000 175,000 175,000
7 Measure
NA NA
161,800 NA
165,000 NA NA
Table 3-5 Calculated and Measured Salinity

Sample Depth
Mineral Percent
Quartz
Feldspars
Calcite
Bartle (mud contaminant)
7020 ' 7050'
I
. I 54 89
7 11
7 trace I
32
Table 3-6 X-ray diffraction of test well sidewall cores
190

Depth 15144.0-15144.4 Permeabi 1 ity (air) ,md Horizontal 27 Vertical 34
Porosjty, x 16.6 Water X pore 48.5 6as X Bulk 8.6 Grain density 2.66
15152.0-15152.4 15191 .O-15191.4
32 122 2.65 83
14.3 16.3 39.3 71.2 8.7 4.7 2.67 2.64
I e _
15403 .O-15403.5 15604.1-15604.5
3670 4.29 3526 5.23
24.3 18.8 81.2 49.3
4.6 9.5 2.65 2.66
I -. .
Table 3-7 Poros i ty and Permeabi l i ty Analysis o f Test Well Diamond Cores
191
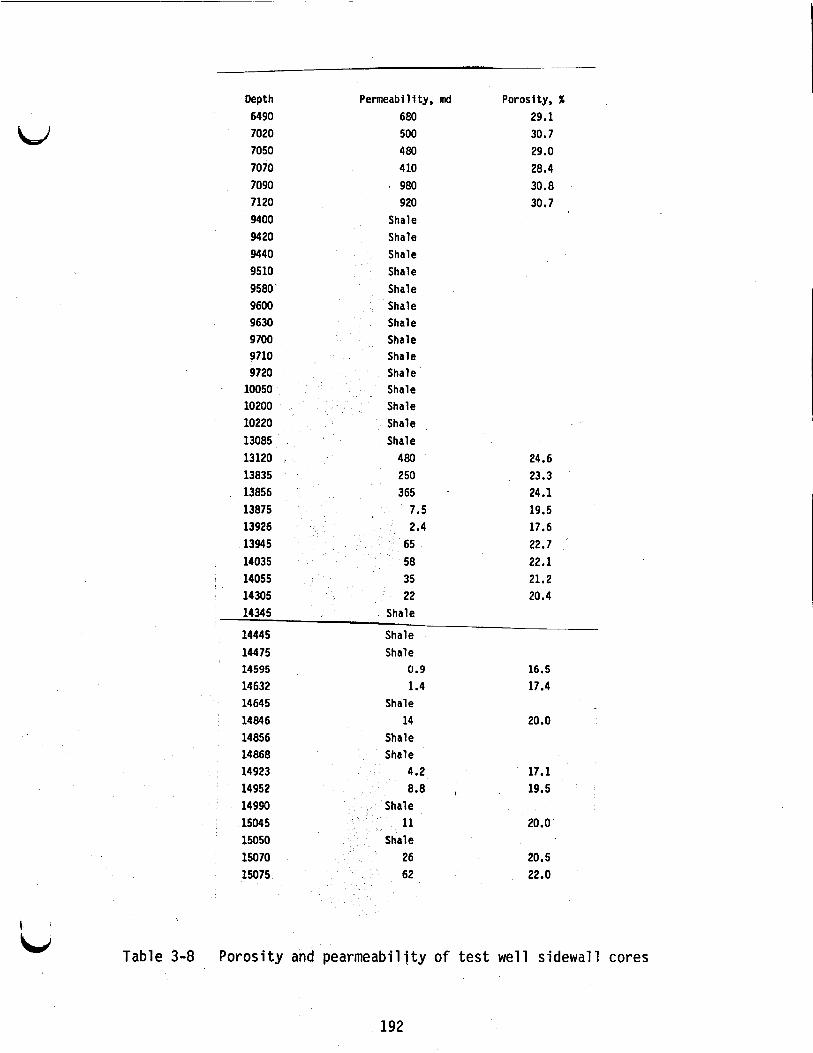
Depth 6490 7020 7050 7070 7090 7120 9400 9420 9440 9510 9580 9600 9630 9700 9710 9720
' 10050 10200 10220 13085 13120 . 13835 13856 13875 13926 13945 14035 14055 14305
Permeabi 1 i ty , md 680 500 480 4 10
. 980 920
Shale Shale Shale Shale Shale Shale Shale Shale Shale Shale Shale Shale Shale Shale
480 250 365 .
7.5 2.4
65 58 35 22
Porosity, X 29.1 30.7 29.0 28.4 30.8 30.7
24.6 , 23.3
24.1 19.5 17.6 22.7 22.1 21.2 20.4
14345 Shale
14445 Shale 14475 14595
14632 14645 14846 14856 14868 14923
Shale 0.9
1.4 Shale
14 Shale Shale
4.2
16.5 17.4
20.0
17.1 14952 8.8 , 19.5 14990 Shale 15045 11 20.0 15050 Shale 15070 26 20.5 15075 62 22.0
Table 3-8 Porosity and pearmeabiljty o f test well sidewall cores
192

Depth Popul a t ion Number o f Readings
15660
Std. Div. Minimum Maximum Fiean Reflectance Ref 1 ectance Reflectance (% Ro)
( X Ro) (% Ro) ( X Ro)
0.18 0.43 0.32 0.054
0.49 0.58 0.53 0.037
0.72 0.97 0.86 0.070
1.02 1.73 1.31 0.231
0.17 0.38 0.28 0.061
0.82 1.06 0.94 0.068
1.11 2.35 1.52 0.339
I
Table 3-9 V i t r i n i t e Reflectance Summary
193
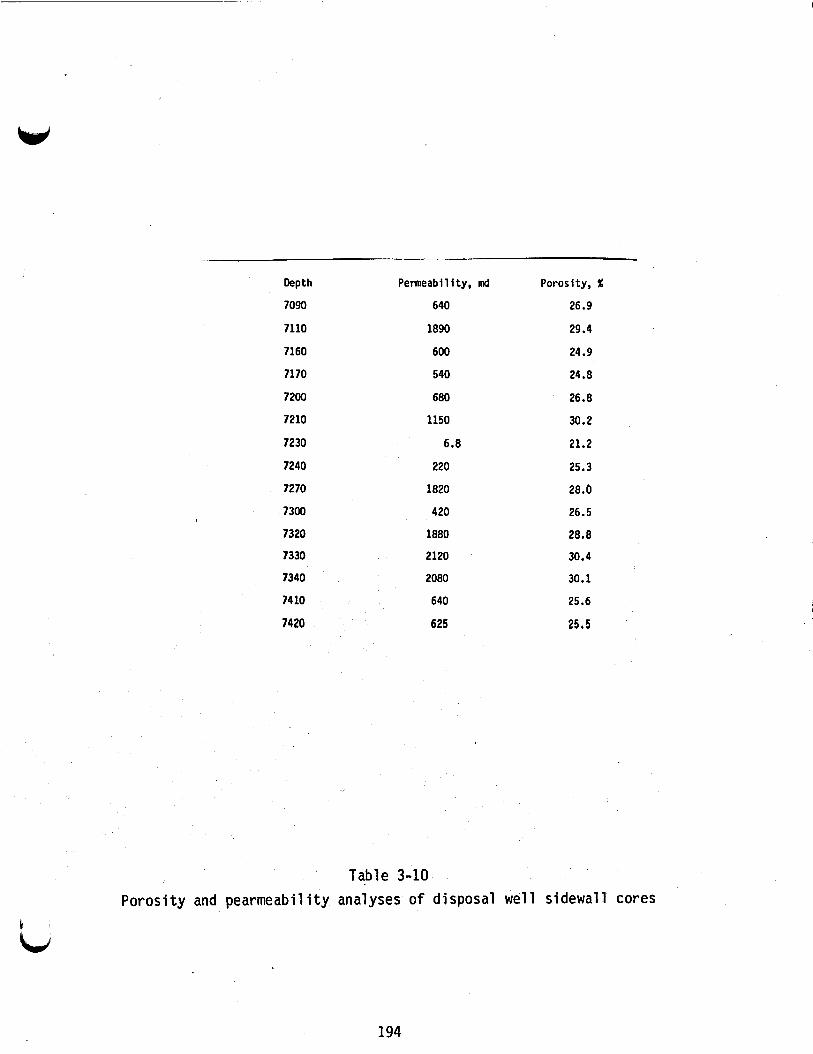
Depth Permeability, md Porosity, %
7090 640 26.9
7110 1890 29.4
7160 600 24.9
7170 540 24.8
7200 680 26.8
7210 1150 30.2
7230 6.8 21.2
7240 220 25.3
7270
7300
7320
7330
7340
74 10
7420
1820
420
1880
2120
2080
640
625
28.6
26.5
28.8
30.4
30.1
25.6
25.5
Table 3-10 Porosity and pearmeabil i ty analyses o f disposal well sidewall cores
I ' L i d
194
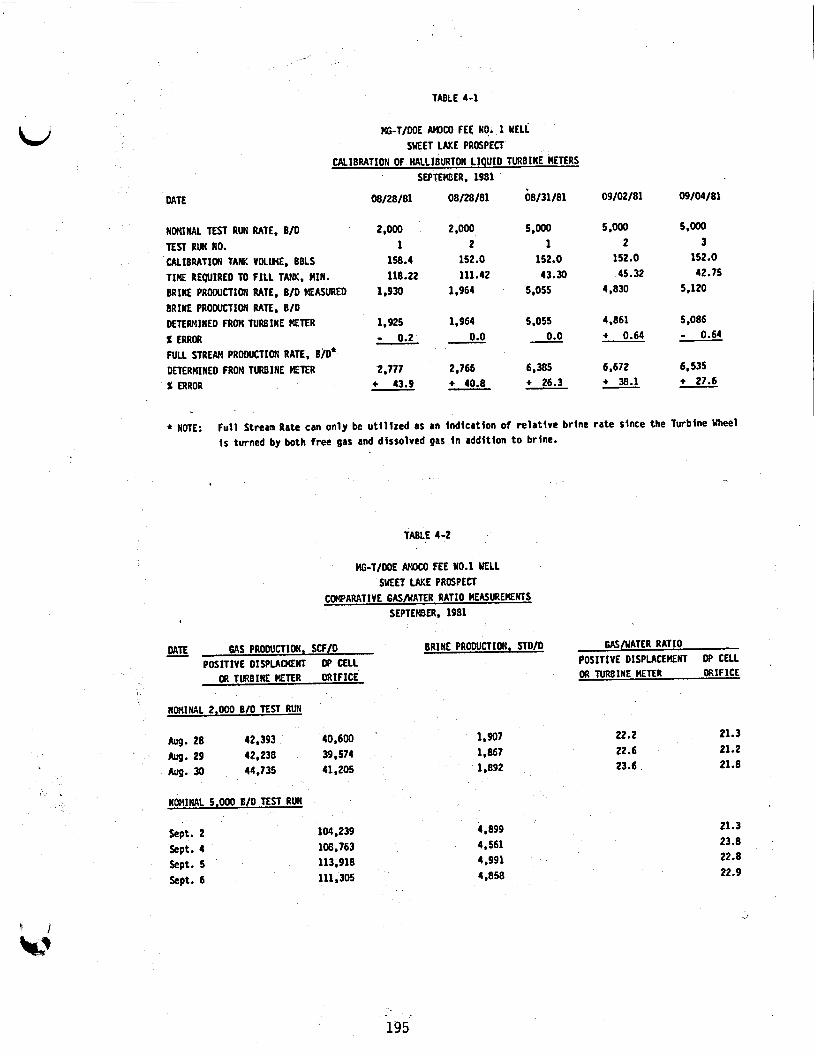
TABLE 4-1
. . , .
ffi-T/WE W C O FEE NO. 1 WELL SWEET LAKE PROSPECT
CALIlRATION OF HALLIBURTON LIQUID TURBINE METERS SEPTEMBER, 1981
NOMINAL TEST RUN RATE, B/O TEST RUN WO. CALIBRATION T A R VOLWE, BBLS
BRINE PROWCTION RATE, BID MEASURED BRINE PROWCTION RATE, BID DETERMIWE0 FROM TURBINE W E R X ERROR FULL STREAM PRODUCTION RATE, 8 n * DETERMINED FROM TURBINE METER X ERROR
TIME REQUIRED TO FILL TANK, MIN.
08/28/81
2,000 1
158.4 118.22
1,930
1,925 - 0.2
2,777 + 43.9
-
08/28/81
2 2
152.0 111.42
1,964
1,964 0.0 -
2,766 + 40.8
08/31/81
5 ,ooo 1
152.0 43.30
5,055
5.055 0.0 -
6,385 + 26.3 7
09/02/81
5,000 2
152.0 45.32
4,830
4,861 + 0.64
6,672 + 38.1 -
03/04/81
5.000 3
152.0 42.75
5,120
5.086 - 0.64 - 6,535 + 27.6 -
* NOTE: F u l l Stream Rate can on ly be u t l l l z e d as an Indlcatlon o f r e l r t l v e br lne ra te since the Turblne Wheel I s turned by both f ree gas and dissolved gas I n addltlon t o brlne.
TABLE 4-2
MG-T/DOE AMOCO FEE WD.1 E L L SWEET LAKE PROSPECT
COMPARATIVE GAS/UATER RATIO MEASUREMKTS SEPTEMBER. 1981
DATE 6AS PRODUCTION. SCFID BRINE PROOUCIXON. STO/D - POSITIVE DISPLAMENT Gf CELL
OR TURBINE METER ORIFICE
NOMINAL 2,000 810 TEST RUN
28 42,393 29 42,238 30 . 44,735
NOMINAt 5.000 B/O TEST RUN
Sept. 2 Sept. 4 Sept. 5 k p t . 6
40,600 1,907 39,574 1,867 41,205 1,892
104,239 4,899
111,305 4,858
108,763 4,561 113,918 4,991
GASfUATER RATIO POSITIVE DISPLACECIENT Gf CELL , OR TURBIWE METER ORIFICE
22.2 21.3 22.6 21.2 23.6 21.8
21.3 23.8 22.8 22.9
195

\
Table 5-1 Poros i t y and thickness used t o ca l cu la te o r i g i n a l water i n p l ace. 6/
Sand No. Thickness Poros i ty Water i n Place, MM bbl
1 41 15.7 286.9
2 42 14.5 271.5 3 27 18.9 227.5 4 25 17.6 196.2 5 27 22 .o 264.8 6 4 1 14.3 261.4 7 5 1 15.7 356.9
Total .254 1865.20
196


Table 6-1A I
SUMIIARY OF TESTING
SWEETLAKE PROSPECT
TYPICAL BRINE COMPOSITION
SAND ZONE
NO- 3s MG/I NO- 5 , MG/L
ALKALINITY 256 - 281 256 - 390 CALCIUM
CHLORIDES
I ROtI
MAGHESIUM
POTASS I UM
SILICA
SODIUM
STROtlT I UM i
TOTAL D 1 SSOLVED i SOLI os
12,500 - 13,400 11,000 - 12,560
99,650 - 99,900 92,340 - 100,100 55- 8 - -63- 5 700 - 720
52 -. 59
630 - 760
860 - 990 1,690 - 1,740 92 - 93
41,750 - 41,800
112 - 120 42,000 - 46,000
I
1,180 - 1,220 840 - 970
168,900 - 168,900 156,900 - 166,500
198

Table 6-2 I
SUPIARY OF TESTING - SKEET LAKE PROSPECT TYPICAL GAS ANALYSIS
NETH ANE ETHANE PROPANE ISOBUTANE NORML BUTANE PENTANES AND HEAVIER NITROGEN CAPaON DIOXIDE HYDROGEN SULFIDE
Z MOL 88 I77 1,73 0,35 0,04 0.06 0,24 0122 8.59
15 -30 PPMV
-
199
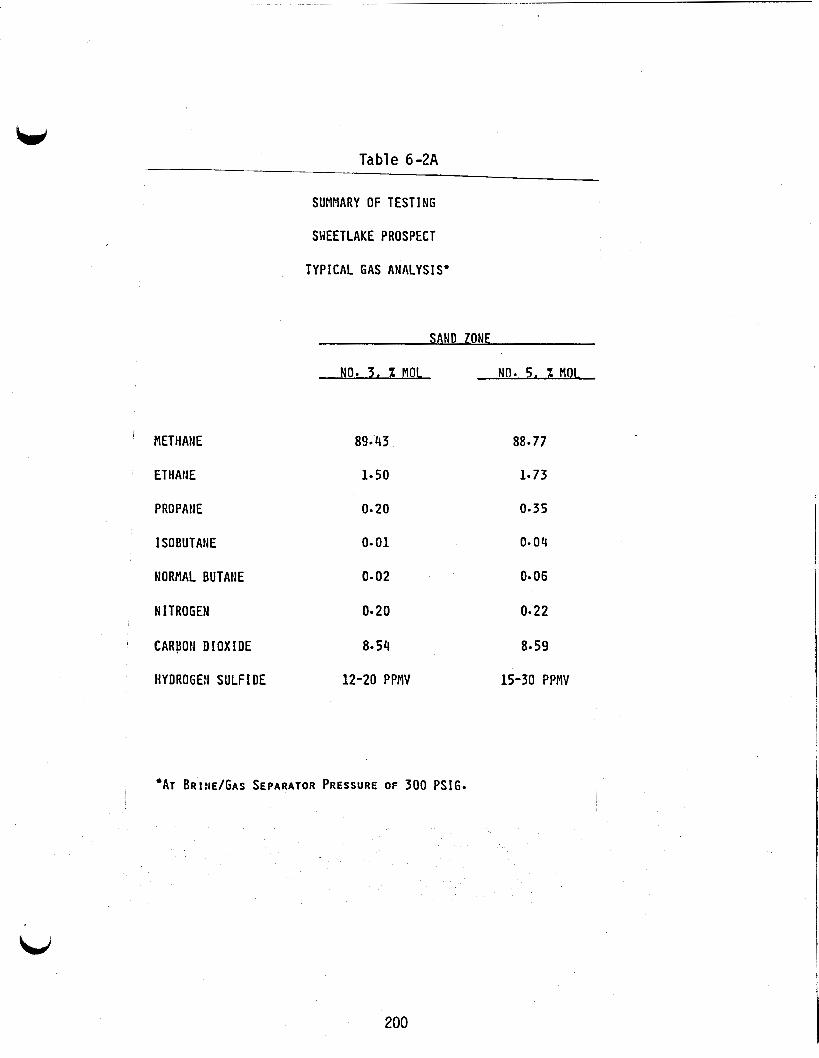
Table 6-2A
SUMMARY OF TESTING
SHEETLAKE PROSPECT
TYPICAL GAS ANALYSIS.
SAND ZONE
NO- 3 , X MOL NO. 5 . X MOL
' METHANE
ET H All E
PROPA HE
ISOBUTAWE
NORMAL BUTANE
N ITROGEN
CARbOti DIOXIDE
HYDROGEW SULFIDE
89.43
1.50
0.20
0.01
0.02
0.20
8.54
12-20 PPMV
88-77
1- 73
0-35
0.04
0.06
0.22
8.59
15-30 PPMV
'AT BRINE/GAS SEPARATOR PRESSURE OF 300 PSIG. I
I
1
200

Table 6-3
December 9, 1983
Revised Chemical a n a l y s i s Production Brine MG-T/DOE Amoco Fee # 1 W e l l
Sand Zone # 3-15248-15285 ft.
kid
RO. Box 6642 LakeCharles,LA. 70606 Sweetlake P r o j e c t
A l k a l i n i t y Alpha (g ross ) Ammonia Arsenic Barium B e t a (gross) Boron Cadmium Calcium Chloride Chromium Copper Dissolved S o l i d s F luo r ide Gamma (g ross ) I ron Lead Magnesium Manganese Mercury
PH Potassium Radium Radon (gas) S i l i c a Sodium S p e c i f i c Conductance S p e c i f i c Gravi ty Stront ium S u l f a t e S u l f i d e Suspended S o l i d s Zinc
Sample Co l l ec t ed 11-23-83 281 mgHCO;/L 71 pCi/L 105 mgNH3/L 4.001 mgAs/L 110 mgBa/L **
50.6 mgB/L .004 rngCd/L 12,500 mgCa/L ** 99,650 mgCl/L .05 mgCr/L ** ,050 mgCu/L 168,900 mg/L .45 mgF/L
63.5 mgFe/L .008 rngPb/L 700 mgMg/L **
**
1050 PCi/L
-------
9.9 mgMn/L 4.001 mgHg/L 5.20 990 mgK/L 210 pCI/L .3 pCi/L 92 mQSi02/L 41,800 mgNa/L 160,000 mhos/cm 1.1103 1220 mgSr/L ** < 1 mgSOi/L
3 mgSP/L .25 mg/L 2.25 mgZn/L
201

Table 6-3A
LakeChorles,LA. 70606 PIIAII , Qnn.,l 256 mgHCOJL A l k a l i n i t y
Alpha (g ross ) Ammonia Arsenic B a r i u m
’ B e t a (g ross ) Boron Cadmium calcium Chlo r ide Chromium Copper Dissolved S o l i d s F luo r ide Gamma (gross). I r o n Lead Magnesium Manganese Mercury
PH Potassium R a d i u m
Radon (gas) S i l i c a Sodium S p e c i f i c Conductance S p e c i f i c Grav i ty Stront ium S u l f a t e S u l f i d e Suspended S o l i d s Zinc
December 9, 1983
Chemical Analysis Product ion Brine MG-”/DOE Amoco Fee I 1 Well Sweetlake P r o j e c t Sand Zone # 3 (15248-15285 f t . )
170 mgNH3/L
130 mgBa/L 1130 pCi/L 52.6 mgB/L .007 mgCd/L 13,400 mgCa/L
.05 mgCr/L
.085 mgCu/L 168,400 mg/L .78 mgF/L
55.8 FgFe/L (. 05 mgPb/L 720 mgMg/L 10.8 mgMn/L (.001 mgHg/L 6.10 860 mgK/L 224 pCi/L
93 mgSi02/L 4 6 , 75 0 mgNa/L 155,000 mhos/cm 1.1079 1180 mgSr/L
.27 mgS /L
.56 mg/L 1.47 rngZn/L .
-014 mgAS/L
99,900 mgCl/L
----*I-
------
(1 mgSO=/L f
.I 80 pCi/L Sample Co l l ec t ed 11-30-83
202

Table 6-4
ANA’dYSIS OF PRODUCTION BRINE FROM SAND ZONE NO. 3 - MG-T/DOE AMOCO FEE NO. 1 WELL
SWEETLAKE PROJECT NOVEMBER 23, 1983 ;
Alkalinity, mg HCO;/L Calcium, mg/L Chloride, mg/L Total Dissolved Solids, mg/L Iron, mg Fe/L Silica, mg S102/L Sulfate, mg/L Sulfide, mg/L Lead, mg/L Chromium, mg/L Copper, mg/L Fluoride, mg/L hlagnesium, mg/L Wanqanese, mg/L Mercury, mg/L Pktassium, mg/L Sodium, mg/L Strbntium, mg/L Zinc, mg/L Boron, mg/L Alpha (Gross) p C i / L Beta (Gross) pCi/L Radium, pCi/L Radon, pCi/L Suspended Solids, mg/L Conductivity, mhos/cm Hardness, mg/L as CaCO3 Phosphonate, mg/L (Inhibitor) PH
SCAN, Inc.
281 13,400 99,650
168,900 63:5
92 < 1
3 0.008 0.13 0.050 0.45 700 9.9
< 0.001 2,220
41, aoo 740
2.25 50.6 710
1,050 210 0.3
0.25 160 , 000 --
0.9 5.2
Rice University
203

N 0 P
Table 6-5
JIG-T/DOE AMOCO FEE NO- 1 WELL .
SWEETLAKE PROJECT
SAWD ZONF NO. 3
GAS COMPOSITION AS A FUWCTIOII OF RESERVOIR PRESSURF'
8ESERVOIR PRESSURE. P S I 4
HETHAIIE, X MOL ETHAIJE, X MOL CARBON D I O X I D E , X MOL '
PESFRVOI R PRESSURE
METHAIIE, X MOL ETHANE, X MOL CAIUUH D I O X I I ) E , X MOL
10,720 10.550 JO.400
91- 8 91- 6 91- 6 l= 8 1.8 1.8 5- 8 5.9 5.9
i
8.310 8.024 7.82q
90.7 90- 5 90.5 1- 6 1- 6 1- 6 7- 0 7.2 7- 4
BHINE/GAS SEPARATOR PRESSURE WAS 500 P S I G =
10.118
91-2 1.8 6- 2
izJi2.5
90.8 1- 5 7- 0
3.030
89.9 1- 8 7.5
z,tilri
90- 5 1- 5 7.3
8,780 8,554
90.6 90.5 1.8 1-6 6.9 7-2
7.603
90.0 1- 6 7.5

.
Table 7-1
SWEET LAKE MICROSEISMIC NONITORING . NETWORK STATION COORDINATES.
\ CPT . CPF
CLB SFY HWN WLR JCF
. HWS
Latitude 30ON02 '37" 300NOO ' 04" 30ON01'16" 30ONOO '50" 30°N01 '05" 300N03 '34 It 300N02 '16" 29ON59 '33"
Longitude 9306112 ' 47 ' I
93oW08'02" 93OHO8 ' 43 It 93°W10'56" 93OWO5 '19" 93°W07"41 It
93Off07 '01 " 93OWO5 * 17"
isL/ t
205

!+” t - t
1974
GGC PROPOSAL HOUSE ENERGY COFPlITTEE
TOTALS 9,700,000
I
TEST WELL 3,500,000 36.0%
DISPOSAL WELL 800,000 8.2%
TESTING
WORKOVER
900,0001 9.4%
SURFACE FACILITIES 4,500,0002 46.4%
ADMINISTRATION - OVERHEAD
P & A - SITE RESTORATION
TABLE 8-1 COST ESTIMATE HISTORY
SWEET LAKE PROJECT
1976 1979
WGMA GULF PROPOSAL MAGMA GULF PROPOSAL ERDA DOE (OPTION I)
3,000,000 78.6% 3,517,800 42.1%
500,000 13.1% 1,407,800 16.9%
200,0003 5 . 8 291,550 3.5%
1,465,540 17.5%
66,967 1.8% 1,567,201 18.8%
50,000 1.3% 102,000 1.2%
3,816,967 8,351,891
1979
MAGMA GULF-TECHNAORIL DOE CONTRACT
3,446,308 44.1%
781,051 10.0%
356,784 4.6%
1,793,449 22.9%
1,439,213 18’;4%
costs included above
7,816, 8054
1984 . . MAGMA GULF-TECHNADRIL
PROJECT TOTAL
8,067,124.49 49.9%.
1,505,592.12 9.3% 1
1,272,134.90 7 . W
1,184,445.00 7 -3%.
1,514,051 -74 J .4P
2,383,805.38 1 4 . 8 X
225,000.00 1.4%
16,152,153.635
1. Includes production well testing and other long term tests not included in other proposais 2. Includes comnercial electrical generating facilities 3. 6 month test does not include surface facilities
i - - ..* . -
4. Does not include 7.9% 5.
. , Does not Include 5.H fee‘
I - - - - _ _ _

.
, . . . - TABLE 8-2
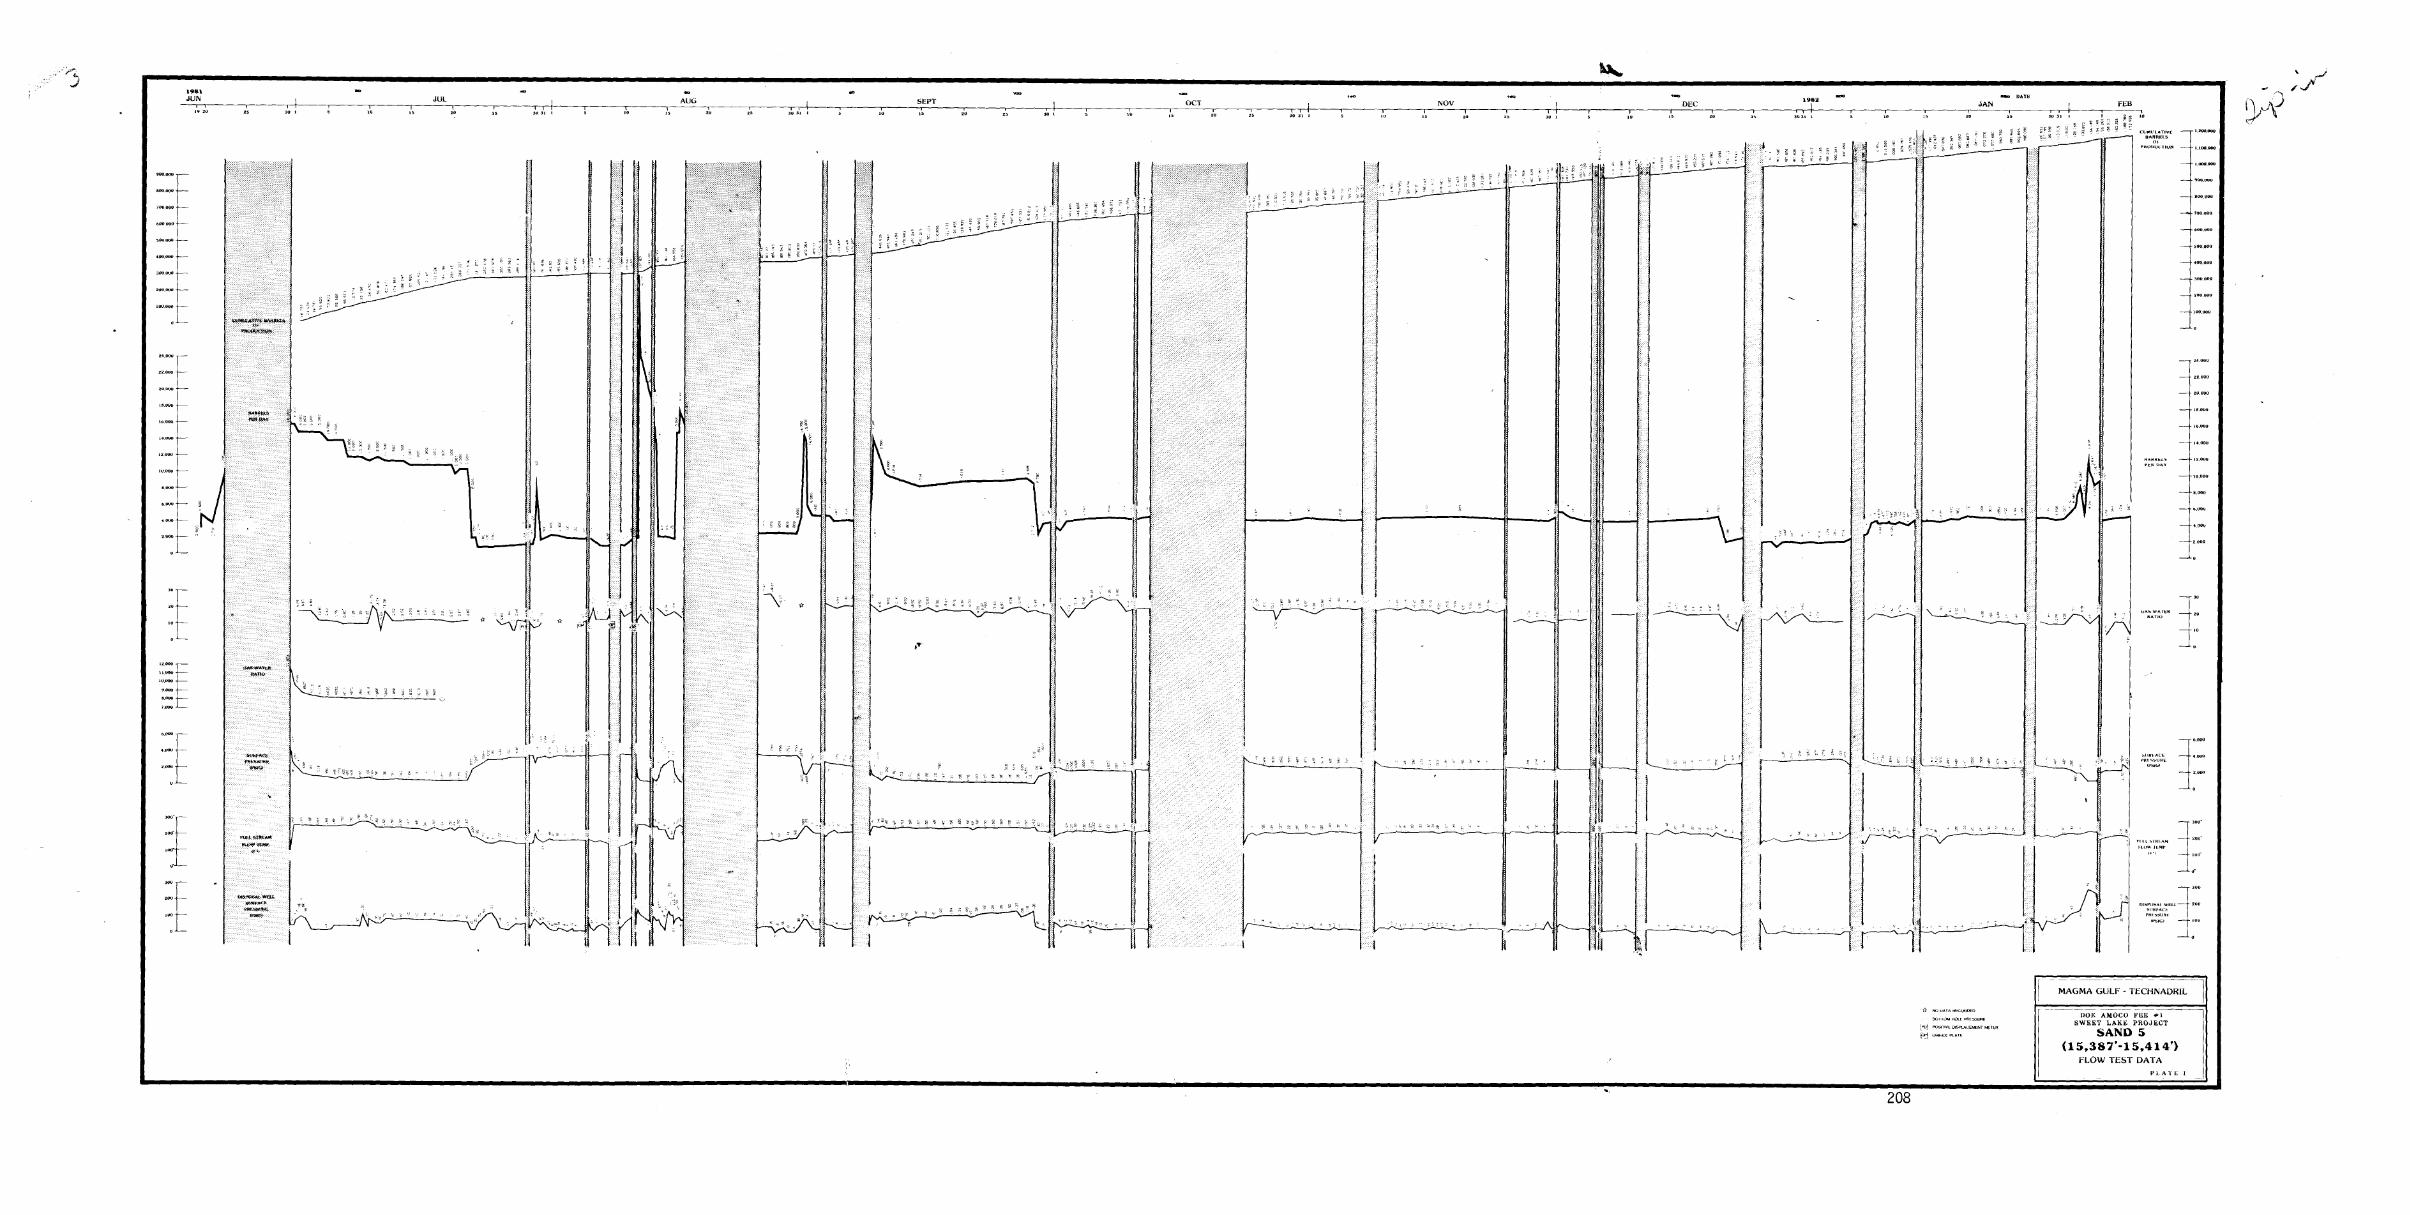
c J

0 90
'83 '84 I I
11 15 20
BARRELS PER DAY 4,000
2.000
BARRELS PER D A Y
O I- c 300,000
2oo.oO0
100.000
0
0
8,000
300.000
2 0 0.0 0 0
100.000
CUMULATIVE BARRELS OF
PRODUCTION
l- 8.000 0
SURFACE PRESSURE (PSIG) 1 SURFACE P R E 8 S U R E
(PSIG) 6.000
4.000
2.000
0
0) P-
:I lo 0
30
20
10
0
GAS-WATER RATIO
300 l- 1 300 FULL STREAM FLOW TEMPERATURE
(F' 1 FULL STREAM FLOW I m
200
100
TEMPEBATURB
( F ' I
DISPOSAL WELL P B P 9 8 U R E
100 I 0 0 - u?
0
"7 n rn n 0 0 n I. D
0 0 W m
m Y) W m N 0 m 0
W 0 0 ID m W m W (0 W
0 Y) y/ 'n
i
0 1- DISPOSAL WELL PRESSURE (PSIG) " (PSIG)
FLOW T E S T DATA SAND 3 DOE AMOCO FEE 9 1
209

_ _ \ -
SWEET LAKE
GEOP RESS URED-GEOTHERMAL PROJECT
MAGMA GULF-TECHNADRIL/DOE AMOCO FEE
VOLUME I11
FINAL REPORT
PART 2
APPEND ICES
DOE/NV/10081-3 Pt 2
ANNUAL REPORT f o r the per iod
February 1982 - March 1985
C.O. DURHAM, JR., F.D. O'BRIEN, & R.W. RODGERS Edi tors
Magma Gulf-Technadril 430 Hwy. 6 South, Sui te 208
Houston, Texas 77079
Prepared f o r the U.S. Department o f Energy
D iv i s ion o f Energy Technology Under Contract DE -AC08-80NV 10081
210

Part 2 Appendices
w No.
A.
B. C.
D.
E.
F. G.
H. I.
J.
K.
L.
T i t l e
Sand Zone 5 Flow H is to ry Sand Zone 3 Flow H is to ry Engineering I n t e r p r e t a t i on M i ogyps i noides Geopressued
Reservoirs MG-T/DOE Amoco Fee No. 1 Well Sweet Lake Area Cameron Parish, Louisiana J u l y 1984; J. Donald Clark, P.E.
Well During August 1981; C.G. Hayden, P.L. Randolph, T.L. Osif; Prepared by I n s t i t u t e o f Gas Technology.
Well Test Analysis MG-T/DOE Amoco Fee No. 1 Sweet Lake Pro jec t Sand Zone #3, January 1984; Prepared by Dowdle F a i r c h i l d and Ancell, Inc.
IGT Test A c t i v i t i e s On The MG-T/DOE Amoco Fee No. 1
D i s t r i b u t i o n o f Cores Gas Water Ra t io Measurements, Sept. 1981. Separator Water Flush; Weatherly Laboratories, Inc. Reservoir F l u i d Analysis For Magma Gulf-Technadri 1 ,
MG-T/DOE Amoco Fee No. 1 Well, Sand Zone No. 3, Weatherly Laboratories Inc.
Weatherly Laboratories, Inc. Gas Analysis as a Function o f Separator Pressure;
Page o f Page Reference
212 68,70 226 73
234 68,76
289 50,65
320 76 337 343 79 351
363
389 A Base L ine For Determining Local, Small - Scale
Plug and Abandon Correspondence and Permits - V e r t i c a l Movements I n Louisiana by Drukel l B. Trahan. 411 94
Production and S a l t Water Disposal Wells. 431 99
211
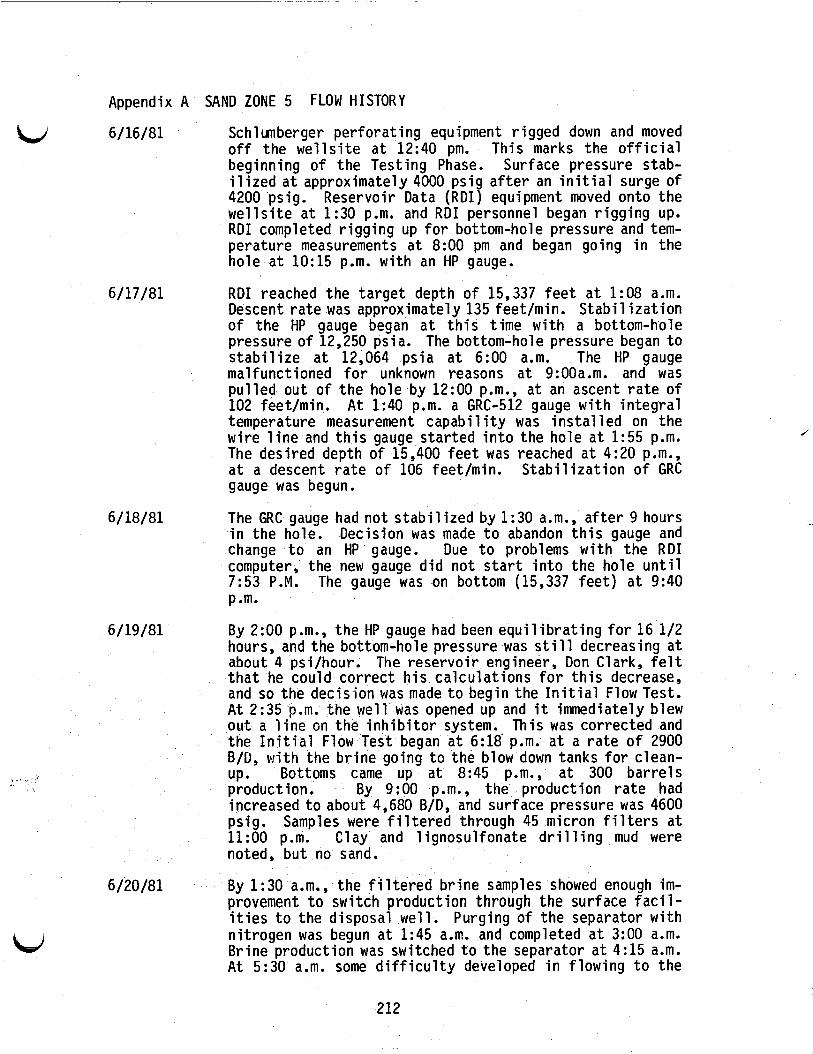
Appendix A SAND ZONE 5 FLOW HISTORY
6/16/81
6/17/81
6/18/81
6/19/81
6120181
Schl unberger p e r f o ra t i ng equipment r i g ed down o f f the w e l l s i t e a t 12:40 pm. This marks the
d moved o f f i c i a l
beginning o f the Test ing Phase. Surface pressure stab- i l i z e d a t approximately 4000 ps ig a f t e r an i n i t i a l surge of 4200 psig. Reservoir Data ( R D I ) equipment moved onto the w e l l s i t e a t 1:30 p.m. and R D I personnel began r i g g i n g up. R D I completed r i g g i n g up f o r bottom-hole pressure and tem- perature measurements a t 8:OO pm and began going i n the hole a t 10:15 p.m. w i t h an HP gauge.
R D I reached the t a r g e t depth o f 15,337 f e e t a t 1:08 a.m. Descent r a t e was approximately 135 feet/min. S t a b i l i z a t i o n o f the HP gauge began a t t h i s t ime w i t h a bottom-hole pressure of 12,250 psia. The bottom-hole pressure began t o s t a b i l i z e a t 12,064 ps ia a t 6:OO a.m. The HP gauge malfunctioned f o r unknown reasons a t 9:OOa.m. and was pu l l ed out o f t he hole by 12:OO p.m., a t an ascent r a t e o f 102 feet lmin. A t 1:40 p.m. a GRC-512 gauge w i t h i n t e g r a l temperature measurement c a p a b i l i t y was i n s t a l l e d on the w i re l i n e and t h i s gauge s ta r ted i n t o the hole a t 1:55 p.m. The desired depth o f 15,400 f e e t was reached a t 4:20 p.m., a t a descent r a t e o f 106 feet/min. S t a b i l i z a t i o n o f GRC gauge was begun.
The GRC gauge had no t s t a b i l i z e d by 1:30 a.m., a f t e r 9 hours i n the hole. Decision was made t o abandon t h i s gauge and change t o an HP gauge. Due t o problems w i t h the R D I computer, the new gauge d i d no t s t a r t i n t o the hole u n t i l 7:53 P.M. The gauge was on bottom (15,337 f e e t ) a t 9:40 p .m.
By 2:OO p.m., t he HP gauge had been e q u i l i b r a t i n g f o r 16 112 hours, and the bottom-hole pressure was s t i l l decreasing a t about 4 psi lhour. The rese rvo i r engineer, Don Clark, f e l t t h a t he could co r rec t h i s ca l cu la t i ons f o r t h i s decrease, and so the decis ion was made t o begin the I n i t i a l Flow Test. A t 2:35 p.m. the well was opened up and i t immediately blew out a l i n e on t he i n h i b i t o r system. This was corrected and the I n i t i a l Flow Test began a t 6:18' p.m. a t a r a t e o f 2900 B/D, w i t h the b r i n e going t o the blow down tanks f o r clean- up. Bottoms came up a t 8:45 p.m., a t 300 bar re l s product ion. By 9:00 p.m., the production r a t e had increased t o about 4,680 BID, and surface pressure was 4600 psig. Samples were f i l t e r e d through 45 micron f i l t e r s a t 11:OO p.m. Clay and l ignosul fonate d r i l l i n g mud were noted, bu t no sand.
By 1:30 a.m., the f i l t e r e d b r i n e samples showed enough im- provement t o switch product ion through the surface f a c i l - i t i e s t o the disposal wel l . Purging o f the separator w i t h n i t rogen was begun a t 1:45 a.m. and completed a t 3:OO a.m. Br ine production was switched t o the separator a t 4:15 a.m. A t 5:30 a.m. some d i f f i c u l t y developed i n f l ow ing t o the
212

I . . .
..
u' 7/6/81
7/7/81
7/8/81
7/9/81
7/10/81
7 1 11 181
71 12 181
7/14/81 - -
7/15/81
7 116181
7/17/81 W
. . allowed t o decrease t o 14,000 $/D and then remained constant. Bottom-hole pressure was 8040 psia and surface pressure 965 psia a t 11:OO p.m.
Flow rate varied between 13,500 - 14,500 BID. Well s h u t i n for short time a t 11.:09 a.m. Bottom-hole pressure was 8033 psia and surface pressure was 958 psia a t 11:OO p.m.
Flow rate decreased around noon t o 12,000 B/D and then remained constant for remainder o f da . Bottom-hole
p .m. pressure.7981 psia and surface pressure 4 12 psia a t 11:OO
Flow rate remained constant 12,000 BID. Bottom-hole pressure 7950 psia and surface pressure 900 psia a t 11:OO p.m.
Flow rate dropped from 12,000 B/D t o 11,500 B/D a t 7:OO p.m. Bottom-hole pressure 7924 psia and surface pressure 850 psia at4l:OO a.m.
Flow rate continued a t 11,500 - 12,000 BID. 'Separator /
pressure was decreased t o 300 psia a t 7:oO p.m. After 1 112 hours, the separator level decreased t o 0%. Numerous attempts-were made between 9:oO p.m. and 7:OO a.m. t o get the pressure and level set. Bottom-hole pressure was 7878 psia and surface pressure 767 psia a t 11:OO p.m.
Flow rate continued t o vary between 11,500 - 12,000 B/D. Separator pressure could not be maintained a t 300 psia, since the reservoir pressures were too low. Bottom-hole pressure was 7850 and surface pressure 756 psia a t 11:OO p.m.
Flow maintained a t 11,500 BID. Bottom-hole pressure was 7,858 psia and surface pressure 745 psia a t 11:OO p.m.
ained a t 11,500 B/D. Bottom-hole pressure was 7844 psia and surface pressure 745 psia a t 11:OO p.m.
Flow rate decreased f ro 1,500 B I D t o 11,000 B I D a t 3:OO p.m. Glacial acetic acid was added i n addition t o the AMP- 20 inhibitor. Bottom-hole pressure was 7835 psia and surface pressure 736 psia a t 11:oO p.m.
Flow rate decreased t o 10,500 B/D between 1:00 - 5:OO p.m. as maintained a t 11,000 B/D for the remainder of the
Bottom-hole pressure was 7817 psia and surface pressure 726 psia a t 11:OO p.m.
Flow rate maintained a t 11,000 BID. Bottom-hole pressure was 7804 psia and surface pressure 711 psia a t 11:OO p.m.
Reservoir L i m i t t e s t was completed today. RDI began out of the hole a t 5:45 p.m. and was out of the hole a t 8:OO p.m.
213
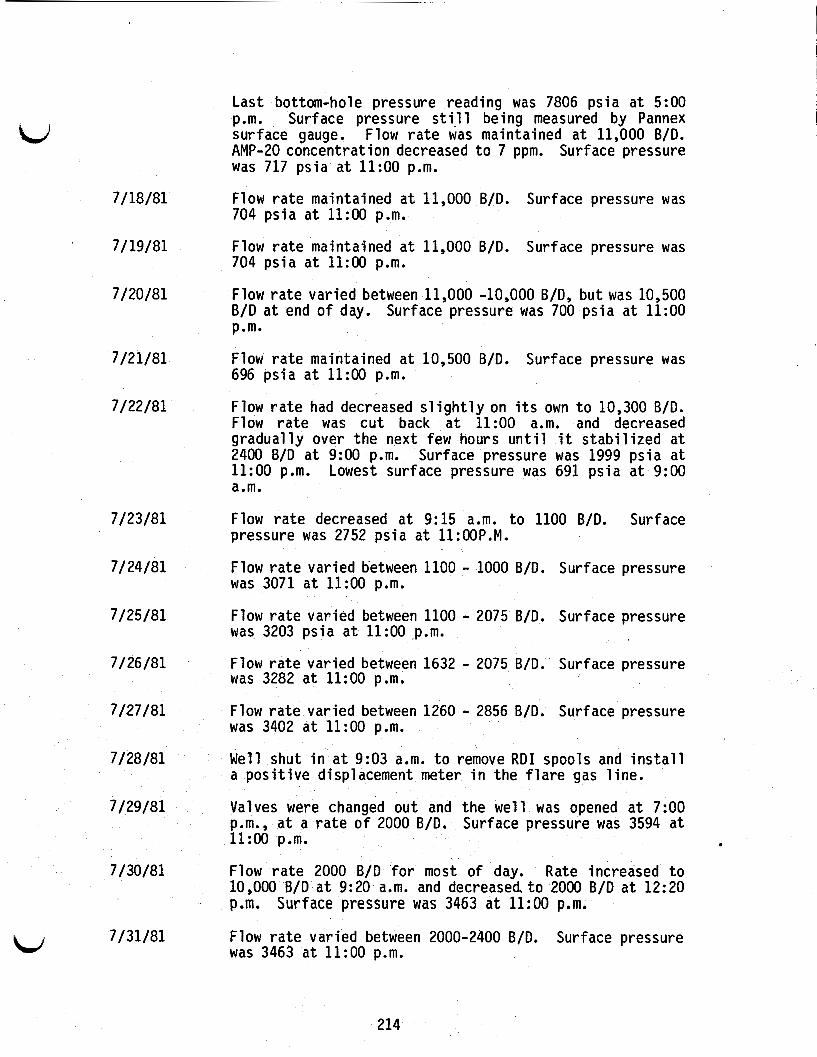
7/18/81
7/19/81
7/ 20/81
7/21/81
7/22/81
7/23/81
7/24/81
7/25/81
7 1 26 181
7 / 2 7 / 8 1
7/28/81
7/29/81
7/30/81
7/31/81
Last bottom-hole pressure reading was 7806 ps ia a t 5:OO p.m. Surface pressure s t i l l being measured by Pannex surface gauge. Flow r a t e was maintained a t 11,000 B/D. AMP-20 concentrat i on decreased t o 7 ppm. Surf ace pressure was 717 ps ia a t 11:OO p.m.
Flow r a t e maintained a t 11,000 B/D. Surface pressure was 704 p s i a a t 11:OO p.m.
Flow r a t e maintained a t 11,000 B/D. Surface pressure was 704 p s i a a t 11:OO p.m.
Flow r a t e var ied between 11,000 -10,000 B/D, bu t was 10,500 B/D a t end o f day. Surface pressure was 700 p s i a a t 11:OO p.m.
Flow r a t e maintained a t 10,500 B/D. Surface pressure was 696 ps ia a t 11:OO p.m.
Flow r a t e had decreased s l i g h t l y on i t s own t o 10,300 B/D. Flow r a t e was c u t back a t 11:OO a.m. and decreased gradual ly over the next few hours u n t i l i t s t a b i l i z e d a t 2400 B/D a t 9:00 p.m. Surface pressure was 1999 ps ia a t 11:OO p.m. Lowest surface pressure was 691 p s i a a t 9:00 a.m.
Flow r a t e decreased a t 9:15 a.m. t o 1100 B/D. Surface pressure was 2752 p s i a a t 1l:OOP.M.
Flow r a t e var ied between 1100 - 1000 B/D. Surface pressure was 3071 a t 11:OO p.m.
Flow r a t e var ied between 1100 - 2075 B/D. Surface pressure was 3203 p s i a a t 11:OO ,p.m.
Flow r a t e var ied between 1632 - 2075 BID. Surface pressure was 3282 a t 11:OO p.m.
Flow r a t e var ied between 1260 - 2856 B/D. Surface pressure was 3402 a t 11:OO p.m.
Well shut i n a t 9:03 a.m. t o remove R D I spools and i n s t a l l a p o s i t i v e displacement meter i n the f l a r e gas l i n e .
Valves were changed ou t and the w e l l was opened a t 7:OO p.m., a t a r a t e o f 2000 B/D. Surface pressure was 3594 a t 11:OO p.m. . Flow r a t e 2000 B/D f o r most o f day. Rate increased t o 10,000 B/D a t 9:20 a.m. and decreased. t o 2000 B/D a t 12:20 p.m. Surface pressure was 3463 a t 11:OO p.m.
Flow r a t e var ied between 2000-2400 B/D. was 3463 a t 11:OO p.m.
Surface pressure
214

8/1/81 L p .m. Flow ra te 2300 BID. Surface pressure was 3524 psia a t 11:OO
8/2/81 Flow ra t e decreased t o 2100 B/D a t 9:00 a.m. Surface pressure was 3564 psia a t 11:OO p.m.
8/3/81 Flow ra te 2200 B / D from'9:OO a.m. to 1:00 p.m., and 2100 B/D fo r remainder of day. Surface pressure was 3598 psia a t 11:00 p.m.
8/4/81 Flow rate dropped t o 2000 B/D a t 1:00 p.m. Surface pressure was 3650 psia a t 11:OO p.m.
8/5/81 A new o r i f i ce plate was installed a t 7:OO p.m. Flow ra te maintained a t 2000 BID. Surface pressure was 3674 psia a t 11:OO p.m.
8/6/81 Flow ra t e reduced to 1400 BID a t 9110 p.m. Surface pressure was 3729 psia a t 11:OO p.m.
8/7/81 Flow rate maintained a t 1400 BID. Surface pressure was 3798 psia a t 11:OO p.m.
81 8/ 84 Well was s h u t i n a t 1O:OO a.m. t o ins ta l l a new or i f ice flange.
8/9/81
8/10/81
Well opened a t 8:OO p.m. Flow rate varied from 1450 - 1400 BID. Surface pressure was 3950 psia a t 11:OO p.m.
Flow ra t e maintained a t 2000 BID. Surface pressure 3875 a t 11:OO p.m.
8/ 11 181 Well s h u t i n a t 7:OO a.m. t o inser t two new o r i f i ce flanges. Flow began again a t 5:OO p.m. a t a ra te of 2,000 B/D and a pressure of 3896 psia. Flow rate was increased to 34,000 B I D a t 8:OO p.m. Surface pressure had dropped t o 1095 psia a t 11:OO p.m.
8/12/81
8/13/81
8/14/81
Flow r a t e decreased t o 25,000 B/D a t 3:OO a.m. and then t o 24,000 BID.
Flow rate decreased t o 20,000 B/D a t 5:OO a.m. Well wasshut i n between 11:OO a.m. and 7:OO p.m. In i t i a l r a t e of 18,000 B I D decreased t o 16,500 by midnight. Surface pressure 727 psia a t 11:OO p.m.
Flow ra t e decreased t o 13,500 BID by 5:OO a.m., then reduced t o 2000 BID a t 11:OO a.m. Rate varied between 2000 - 2200 B/D f o r remainder of day. Surface pressure 2484 a t 11:OO p.m.
Surface pressure was 708 psia a t 11:OO p.m.
8/15/81 Rate variable i n morning, from 1200 - 2300 BID. Rate increased t o 20,000 BID from 3:OO - 5:OO p.m. and reduced t o
215

8/16/81
8/17/81
8/18/81
81 191 81
8120181 8/24/81 8/25/81
8/26 181
8/27/81
8/ 28 181
8/29/81
8/ 30 181
8/31/81
9/ 1/81
9/2/81
9/3/81
9/4/81
2100 B I D by 6:OO p.m. Surface pressure 3072 psia a t 11:OO p.m.
Flow ra t e increased from 2100 B / D t o 15,000 BID at 1O:OO a.m., and then t o 18,000 B / D a t 7:00 p.m. Surface pressure 673 psia a t 11:OO p.m.
Well flowed a t 20,000 BID while Schlumberger rigged up for perforating. A t 8:30 p.m. the wireline h i t an obstruction a t 15,417. Schlumberger pulled o u t of the hole and Otis was called f o r a bailer t o b r i n g up a sample.
Well s h u t in a l l day
Well s h u t i n a l l day. Surface pressure 3600 psig.
Well s h u t in a l l day.
Well opened a t 7:OO p.m. a t flow rate of approximately 3000 BID. Flow ra t e 2800 BID. p.m.
Surface pressure 3788 psia a t 11:OO
Flow ra te 2800 BID. p.m.
Surface pressure 3762 psia a t 11:OO
Flow r a t e 2800 BID. Surface pressure 3752 psia a t 11:OO p .m.
Flow r a t e 2800 BID. Surface pressure 3755 psia a t 11:OO p.m.
Flow r a t e 2800 BID. Surface pressure 3753 psia a t 11:OO p.m.
Flow ra t e increased t o 5000 B/D a t 3:OO p,m. and then t o 13,500 a t 9:OO p.m. Surface pressure 3753 psia a t 11:OO
Flow rate gradually increased t o 15,000 BID a t 7:OO a.m. Well shut i n between 1:OO p.m. and 5:OO p.m. Flow ra te 6000 B I D , gradually decreased t o 4800 BID. Surface pressure 2590 psia a t 11:OO p.m.
Flow ra te 5000 BID. Surface pressure 2759 ps ia a t 11:OO p.m.
Well s h u t i n from 7:OO a.m. to 7:OO p.m. t o replace leading r i n g gasket. Well opened up a t flow ra te of 5,000 BID. Surface pressure 2970 psia a t 11:OO p.m.
Flow ra t e 5000 BID. Surface pressure 2810 psia a t 11:OO p.m.
. p.m.
216

9/5/81
9/6/81
9/7/81
9/8/81
9/91 81
9/10/81
9/11/81
9/ 12/81
9/13/81
9/ 14/81
91 15 /81
9/ 16/81
9/ 17/81
9/18/81
9/19/81
9/20/81
9/21/81
9 / 22 / 81 W
Flow r a t e 5000 - 5200 B I D . Surface pressure 2723 a t 11:OO p.m.
Flow r a t e 5100 - 5200 B I D . Surface pressure 2688 p s i a a t 11:OO p.m.
Well shut i n .
Well shut i n .
Flow r a t e increased from 2800 B I D t o 15,000 B I D a t 9:00 a.m. Rate decreased t o 14,000 a t 5:oO p.m., 13,500 a t 7:OO p.m., and 13,000 a t 9.00 p.m. Surface pressure 1328 a t 11:OO p.m.
Flow r a t e g radua l l y decreased from 13,000 B/D a t 1:00 a.m. t o 11,500 B/D a t 1:00 p.m. Rate increased t o 14,000 B I D a t 5:OO p.m. and then decreased t o 10,000 B I D a t 9:00 p.m. Surface pressure 1294 p s i a a t 11:OO p.m.
Flow r a t e 10,000 B I D . Surface pressure 1115 p s i a a t 11:OO p .m.
Flow r a t e 10,000 B/D. Surface pressure 997 p s i a a t 11:OO p.m.
Flow r a t e 10,000 B I D . p .m.
Surface pressure 868 p s i a a t 11:OO
Flow r a t e 10,000 B I D . Surface pressure 851 p s i a a t 11:OO p.m.
Flow r a t e 10,000 B I D . Surface pressure 830 p s i a a t 11:OO p.m.
Flow r a t e dropped f rom 10,000 B/D t o 9750 B/D a t 300 a.m., and dropped again t o 9500 B/D a t 5 : O O p.m. Surface pressure 815 p s i a a t 11:OO p.m.
Flow r a t e va r ied between 9000 - 10,000 B I D . I n h i b i t o r (AMP-20) concentrat i on decreased a t 5 ppm. Sur f ace pres- sure 753 p s i a a t 11:OO p.m.
Flow r a t e dropped from 10,000 B I D t o 9500 B I D a t 1.1:OO a.m. Surface pressure 730 p s i a a t 11:OO p.m.
Flow r a t e 9500 B I D . Surface pressure 700 p s i a a t 11:OO p.m.
Flow r a t e 9500 B I D , decreased t o 9200 B I D a t 7:OO p.m. Surface pressure 700 p s i a a t 11:OO p.m.
Flow r a t e 9500 B I D . Surface pressure 685 p s i a a t 11:OO p.m.
Flow r a t e 9500 B I D . Surface pressure 675 p s i a a t 11:OO p.m.
Add i t i on o f g l a c i a l a c e t i c ac id discontinued.
I
217
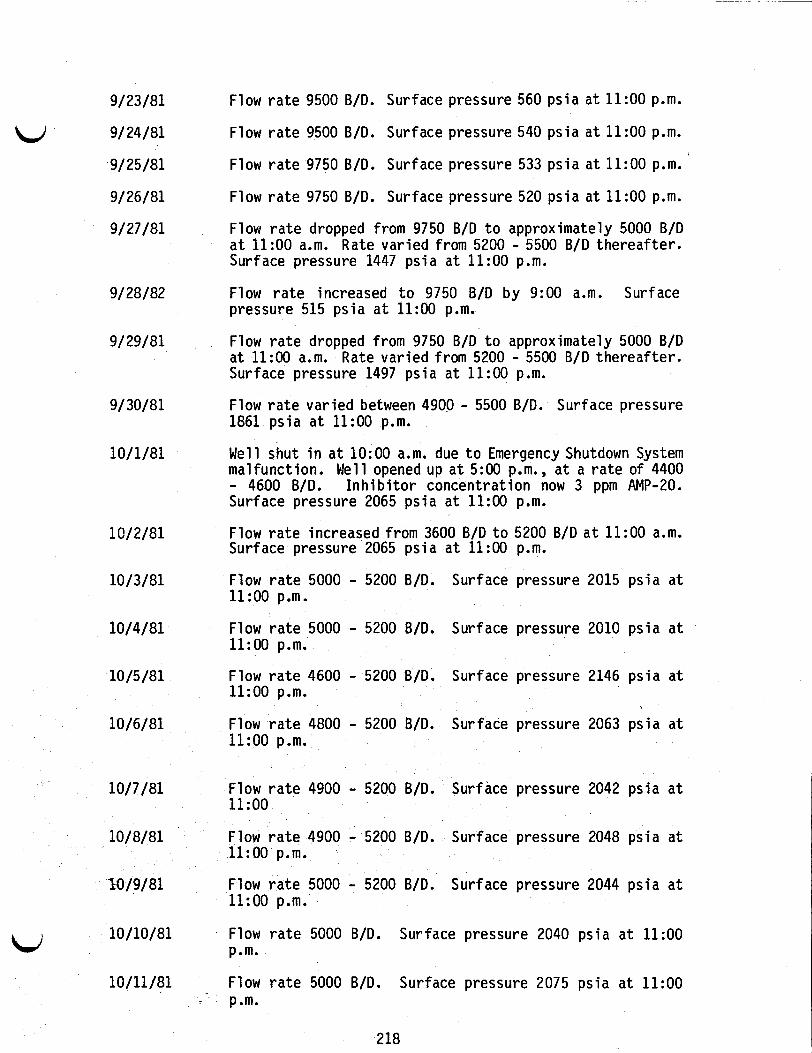
9/23/81
u 9/ 24/81
9/ 25 /81
Flow r a t e 9500 B/D. Surface pressure 560 p s i a a t 11:OO p.m.
Flow r a t e 9500 B/D. Surface pressure 540 p s i a a t 11:OO p.m.
Flow r a t e 9750 B/D. Surface pressure 533 p s i a a t 11:OO p.m.
9/ 26/81 Flow r a t e 9750 B/D. Surface pressure 520 p s i a a t 11:OO p.m.
9/27/81 Flow r a t e dropped from 9750 B/D t o approximately 5000 B/D a t 11:OO a.m. Rate va r ied from 5200 - 5500 B/D t he rea f te r . Surface pressure 1447 p s i a a t 11:OO p.m.
9/28/82 Flow r a t e increased t o 9750 B/D b y 9:00 a.m. Surface pressure 515 p s i a a t 11:OO p.m.
9/29/81 Flow r a t e dropped from 9750 B/D t o approximately 5000 B/D a t 11:OO a.m. Rate va r ied from 5200 - 5500 B/D t he rea f te r . Surface pressure 1497 p s i a a t 11:OO p.m.
9/30/81
10/1/81
Flow r a t e var ied between 4900 - 5500 B/D. Surface pressure 1861 p s i a a t 11:OO p.m.
Well shut i n a t 1O:OO a.m. due t o Emergency Shutdown System mal funct ion. Well opened up a t 5:OO p.m., a t a r a t e o f 4400 - 4600 B/D. I n h i b i t o r concentrat ion now 3 ppm AMP-20. Surface pressure 2065 p s i a a t 11:OO p.m.
Flow r a t e increased f rom 3600 B/D t o 5200 B/D a t 11:OO a.m. Surface pressure 2065 p s i a a t 11:OO p.m.
Flow r a t e 5000 - 5200 B/D. Surface pressure 2015 p s i a a t 11:OO p.m.
Flow r a t e 5000 - 5200 B/D. Surface pressure 2010 p s i a a t 11:OO p.m.
Flow r a t e 4600 - 5200 B/D. Surface pressure 2146 p s i a a t 11:OO p.m.
Flow r a t e 4800 - 5200 B/D. Surface pressure 2063 p s i a a t 11:OO p.m.
10/2/81
10/3/81
10/4/81
10/5/81
10/6/81
10/7/81
10/8/81
f0/9/81
Flow r a t e 4900 - 5200 B/D. Surface pressure 2042 p s i a a t 11:oo
Flow r a t e 4900 - 5200 B/D. Surface pressure 2048 p s i a a t 11:OO p.m.
Flow r a t e 5000 - 5200 B/D. Surface pressure 2044 p s i a a t 11:OO p.m.
10/10/81 bi p.m.
Flow r a t e 5000 B/D. Surface pressure 2040 ps ia a t 11:OO
10/11/81 Flow r a t e 5000 B/D. Surface pressure 2075 p s i a a t 11:OO - p.m.
218

10/12/81
1 O/ 1 3/ 81
Flow rate 5000 B/D. Surface pressure 2075 psia a t 11:OO p .m.
Well s h u t in a t 9:00 a.m. t o repair leak on turbine meter and t o check for corrosion i n welds.
I(
10/14/81 Well s h u t i n for repairs.
10/23/81 Well s h u t i n .
10/24/81 Well opened up a t 3:OO p.m. a t rate of 5000 B/D. Surface pressure 3310 a t 11:OO p.m.
10/25/81
10/26/81
Flow rate 5000 B/D. Surface pressure 2900 psia a t 11:OO p.m.
Flow rate 5000 B/D. Surface pressure 2725 psia a t 11:OO p.m.
10/27/81 Flow rate 5000 B/D. p.m.
Surface pressure 2645 psia a t 11:OO
10/28/81
10/2 91 81
Flow rate 4800 - 5000 B/D. Surface pressure 2598 psia a t 11:OO p.m.
Flow rate 4800 B/D. Surface pressure 2554 psia a t 11:OO p .m.
10/30/81 Flow rate 4800 - 5000 B/D. Surface pressure 2508 psia a t 11:OO p.m.
10/31/81 Flow rate 4800 - 4900 B/D. Surface pressure 2474 psia a t 11:OO p.m.
11/1/81 Flow rate 4800 - 4900 B/D. Surface pressure 2463 psia at- 11:OO p.m.
11/2/81
11 /3/81
11/4/81
Flow rate 4800 - 5000 B/D. Surface pressure 2423 psia a t 11:OO p.m.
Flow rate 4900 - 5000 B/D. Surface pressure 2371 psia a t 11:OO p.m.
Flow rate 4800 - 5000 B/D. Surface pressure 2371 psia a t 11:OO p.m.
Inhibitor concentration now 1 ppn AMP-20.
11/5/81 Flow rate 5000 B/D. p.m.
Surface pressure 2355 psia a t 11:OO
11/6/81 Flow rate 5000 B/D. Surface pressure 2347 psia a t 11:OO p .m.
11/7/81 U p .m.
Flow rate 5000 B/D. Surface pressure 2346 psia a t 11:OO
11/8/81 Well s h u t i n a t 3:OO a.m. due t o leak on choke skid.
219
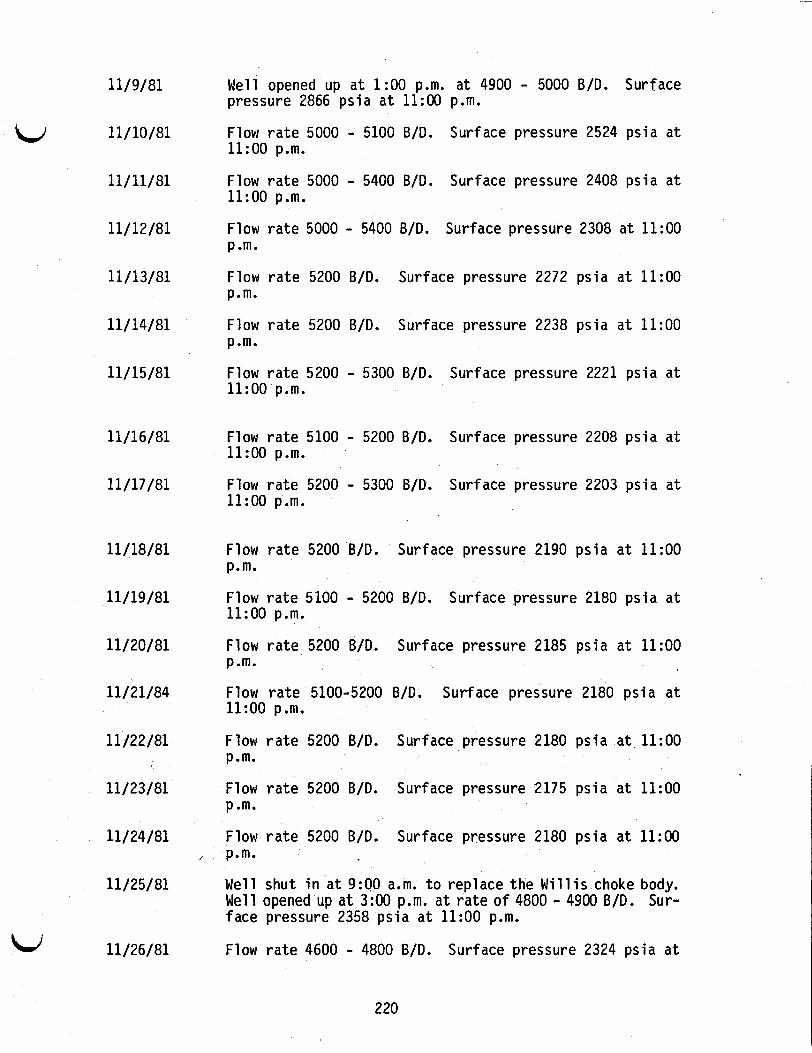
11/9/81
111 10181
111 11/81
11/12/81
11 113181
111 14/81
111 15/81
11/16/81
11/17/81
11/18/81
11 119181
11/20/81
11/21/84
11 122181
11/23/81
11/24 181
11/25/81
11/26/81
Well opened up a t 1:00 p.m. a t 4900 - 5000 B I D . Surface pressure 2866 psia a t 11:OO p.m.
Flow r a t e 5000 - 5100 B I D . 1 1 : O O p.m.
Surface pressure 2524 psia a t
Flow r a t e 5000 - 5400 B I D . 11:OO p.m.
Surface pressure 2408 psia a t
Flow r a t e 5000 - 5400 B I D . Surface pressure 2308 a t 1 1 : O O p.m.
Flow r a t e 5200 B I D . p.m.
Surface pressure 2272 psia a t 1 1 : O O
Flow r a t e 5200 B I D . p.m.
Surface pressure 2238 psia a t 1 1 : O O
Flow r a t e 5200 - 5300 B I D . 1 1 : O O p.m.
Surface pressure 2221 psia a t
Flow r a t e 5100 - 5200 B I D . Surface pressure 2208 psia a t 11 :OO p.m.
Flow r a t e 5200 - 5300 B I D . Surface pressure 2203 psia a t 11 :OO p.m.
Flow r a t e 5200 B I D . Surface pressure 2190 psia a t 11 :OO p.m.
Flow r a t e 5100 - 5200 B I D . Surface pressure 2180 psia a t 11:OO p.m.
Flow rate 5200 B I D . Surface pressure 2185 psia a t 11 :OO p .m.
Flow r a t e 5100-5200 B I D . Surface pressure 2180 psia a t 11:OO p.m.
Flow r a t e 5200 B I D . Surface pressure 2180 psia a t 11 :OO p.m.
Flow rate 5200 B I D . p .m.
Surface pressure 2175 psia a t 11:OO
Flow rate 5200 B I D . Surface pressure 2180 psia a t 11:OO
Well shut i n a t 9:00 a.m. t o replace the Willis choke body. Well opened up a t 3:OO p.m. a t rate of 4800 - 4900 B I D . Sur- face pressure 2358 psia a t 11:OO p.m.
/ p*m*
Flow r a t e 4600 - 4800 B I D . Surface pressure 2324 psia a t
220

1 1 : O O p.m.
W
i
11/27/81
11/28/81
11/29/81
11/30/81
12/1/81
12/2/81
12/3/81
12/4/81
12/5/81
12/6/81
121 7 181
12/8/81
121 9 181
12/10/81
1211 1/81
12/12/81
12/13/81
12/14/81
121 15/81
flow rate 4600 - 5000 B I D . Surface pressure 2296 ps ia a t 11:OO p.m.
Flow r a t e 4700 - 4900 B I D . 11 :OO p.m.
Surface pressure 2279 psia a t
Flow r a t e 5000 - 5200 B I D . Surface pressure 2198 psia a t 11 :OO p.m.
Flow r a t e 3800 - 5200 B I D . Surface pressure 2188 psia a t 11:OO p.m.
Flow r a t e 5000 B I D in morning. Well s h u t in between 1:00 p.m. - 7:OO p.m. Surface pressure 2279 psia a t 11:OO p.m.
Flow r a t e 5100 -5200 B I D . 11:OO p.m.
Flow r a t e 5200 - 5400 B I D in evening.
Surface pressure 2197 psia a t
Flow rate 5000 - 5100 B I D . Surface pressure 2175 psia a t 11:OO p.m.
Flow rate 5000 B I D . p.m.
Surface pressure 2175 ps ia a t 1 1 : O O
Flow r a t e 5000 B I D . Well s h u t i n a t 7:OO p.m. due t o power f a i lu re .
Well opened a t 1:00 p.m. a t approximately 5000 B I D .
Flow r a t e 4800 - 5000 B I D . Surface pressure 2294 psia a t 11:OO p.m.
Flow r a t e 4800 B I D . Surface pressure 2276 psia a t 1 1 : O O p .m.
Flow rate 4800 - 5000 B I D . Surface pressure 2255 psia a t 1 1 : O O p.m.
Flow r a t e 4700 - 5000 B I D . Surface pressure 2189 psia a t 1 1 : O O P.M.
Well shut i n a t 11:30 a.m. t o repair choke skid.
Well opened u p a t 7:OO p.m. a t 5000 B I D . Surface pressure 2756 psia a t 11 :OO p.m.
Flow r a t e 4600 - 5200 B I D . Surface pressure 2352 psia a t 1 1 : O O p.m.
Flow r a t e 5000 - 5200 B I D . Surface pressure 2260 psia a t 1 1 : O O p.m.
Flow r a t e 5000 - 5600 B I D . Surface pressure 2166 psia a t 1 1 : O O p.m.
221
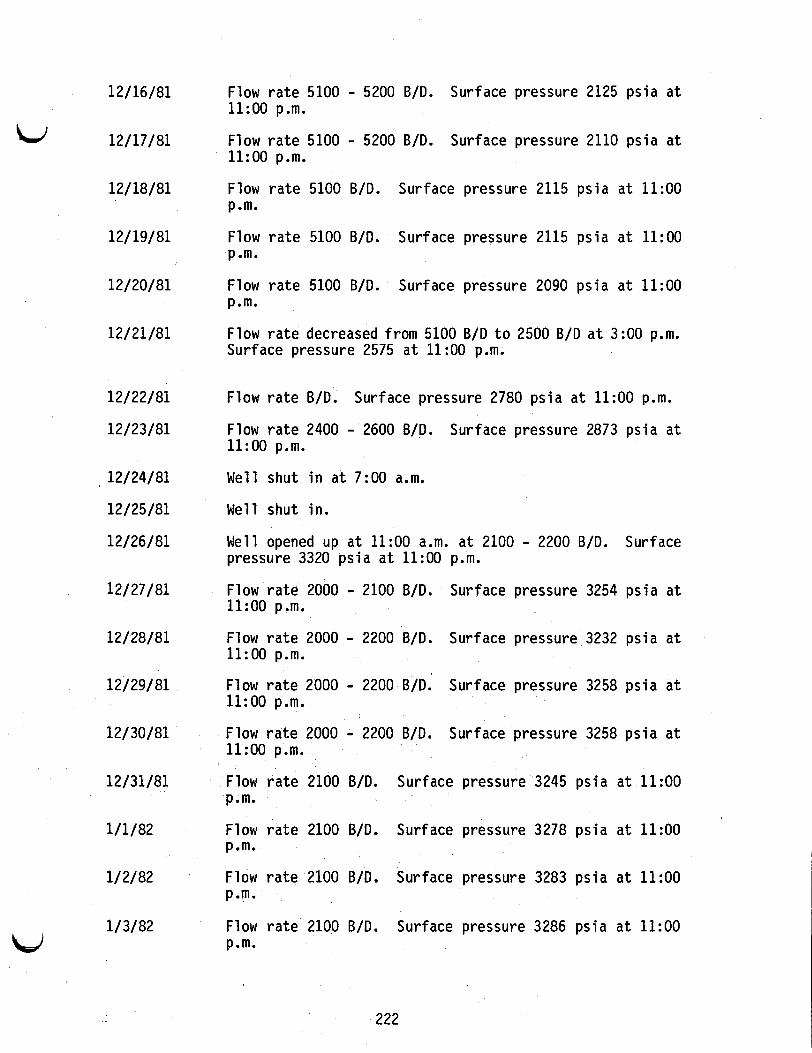
i 12/16/81 Flow r a t e 5100 - 5200 B I D . Surface pressure 2125 p s i a a t
11:OO p.m.
121 171 81 Flow r a t e 5100 - 5200 B I D . Surface pressure 2110 p s i a a t 11:OO p.m.
12/18/81 Flow r a t e 5100 B I D . p.m.
Surface pressure 2115 p s i a a t 11:OO
12/19/81 Flow r a t e 5100 B I D . p.m.
Surface pressure 2115 p s i a a t 11:OO
12/20/81
12/21/81
Flow r a t e 5100 B I D . Surface pressure 2090 p s i a a t 11:OO p.m.
Flow r a t e decreased f rom 5100 B/D t o 2500 B/D a t 3:OO p.m. Surface pressure 2575 a t 11:OO p.m.
12/22/81 Flow r a t e B I D . Surface pressure 2780 p s i a a t 11:OO p.m.
12/23/81
, 12/24/81
Flow r a t e 2400 - 2600 B I D . Surface pressure 2873 p s i a a t 11:OO p.m.
Well shut i n a t 7:OO a.m.
12 125 181 Well shut i n .
12/26/81 Well opened up a t 11:OO a.m. a t 2100 - 2200 B I D . Surface pressure 3320 p s i a a t 11:OO p.m.
12/27/81
12/28/81
12/29/81
121 30181
Flow r a t e 2000 - 2100 B I D . Surface pressure 3254 p s i a a t 11:OO p.m.
Flow r a t e 2000 - 2200 B I D . Surface pressure 3232 p s i a a t 11:OO p.m.
Flow r a t e 2000 - 2200 B I D . Surface pressure 3258 p s i a a t 11:OO p.m.
Flow r a t e 2000 - 2200 B I D . Surface pressure 3258 p s i a a t 11:OO p.m.
12/31/81 Flow r a t e 2100 B I D . p.m.
Surface pressure 3245 p s i a a t 11:OO
1/1/82 Flow r a t e 2100 B I D . p .m.
Surface pressure 3278 p s i a a t 11:OO
1/2/82 Flow r a t e 2100 B I D . Surface pressure 3283 p s i a a t 11:OO p.m.
1/3/82 Flow r a t e 2100 B I D . Surface pressure 3286 p s i a a t 11:OO LJ p.m.

1/4/82
1/5/82
1/6/81
1/7/82
1/8/81
1/9/82
1/10/82
1/11/82
1/12/82
1/13/82
1/14/82
1/ 15 /82
1/16/82
1/ 17 /82
1/18/82
1/19/82
1 / 20182
L,
Flow r a t e 2100 B I D . p.m.
Surface pressure 3300 p s i a a t 11:OO
Flow r a t e increased from 2100 B I D t o 4000 B/d a t 7:OO p.m., and increased g radua l l y t o 5000 B I D by 11:OO p.m. Surface pressure 2798 p s i a a t 11:OO p.m.
Well shut i n t o rep lace Emergency Shutdown System.
Well opened up a t 9:00 p.m. a t 3000 BID. Surface pressure 3355 2355 p s i a a t 11:OO p.m.
Flow r a t e increased from 3000 B/D t o 4600 - 4900 B I D a t 1:00 p.m. Surface pressure 2897 p s i a a t 11:OO p.m.
Flow r a t e 4400 - 4800 BID. Surface pressure 2761 p s i a a t 11:OO p.m.
Flow r a t e 4200 - 4600 BID. Surface pressure 2686 p s i a a t 11:OO p.m.
Flow r a t e 4200 - 5200 BID. Surface pressure 2665 p s i a a t 11:OO p.m.
Flow r a t e 3800 - 4800 B/D. Surface pressure 2625 a t 11:OO p.m.
Flow r a t e 4300 - 5400 B/D. Surface pressure 2500 p s i a a t 11:OO p.m.
Well shut i n a t 4:OO a .m. due t o ma l func t ion i n Emergency Shutdown System. Well opened up a t 9:00 p.m. a t 5000 B I D . Surface pressure 2795 p s i a a t 11:OO #p.m.
Flow r a t e 5000 B/D. Surface pressure 2620 p s i a a t 11:OO p.m.
Flow r a t e 5000 B I D . Surface pressure 2615 p s i a a t 11:OO p.m.
Flow r a t e 5000 B I D . Surface pressure 2510 p s i a a t 11 :OO p.m.
Flow r a t e 5000 B/D. Surface pressure 2465 p s i a a t 11:OO p .m.
Flow r a t e 5000 - 5100 B I D . Surface pressure 2445 p s i a a t 11:OO p.m.
Flow r a t e 5100 BID. Well shut down between 11:OO a.m. and 5:OO p.m. t o c o r r e c t Emergency Shutdown System problems. Surface pressure 2482 p s i a a t 11:OO p.m.
223

W
LJ
1/21/82
1/22/82
1/23/82
1/24/82
1/25/82
1 /26/82
1/27/82
1/28/82
1 /29/82
1 /30/82
1/ 31 /82
2/ 1/82
2/2/82
2/3/82
2/4/82
2/5/82
Well shut i n between 1:00 a.m. and 5:OO a.m. due t o power f a i l u r e . Flow r a t e 5000 - 5100 B/D. Surface pressure 2532 p s i a a t 11:OO p.m.
Flow r a t e 5000 B/D. Surface pressure 2475 p s i a a t 11:OO p.m.
Flow r a t e 5000 B/D. p.m.
Surface pressure 2479 ps ia a t 11:OO
Flow r a t e 5000 B/D. p.m.
Surface pressure 2466 ps ia a t 11:OO
Flow r a t e 5000 B/D. Well shut i n between 11:OO a.m. and 3:OO p.m. and between 5:OO p.m. and 9:OO p.m. f o r mainte- nance work. Surface pressure pressure 2482 ps ia a t 11:OO p.m.
Flow r a t e 5000 B I D . Surface pressure 2460 ps ia a t 11:OO p .m.
Flow r a t e 5000 B/D. Well shut i n a t 9:00 a.m., opened up between 11:OO a.m. and 1:OO p.m., and shut down a t 1:00 p.m. t o clean out separator.
Well opened up a t 7:OO p.m. a t a r a t e o f 5000 B/D. Surface pressure 2831 p s i a a t 11:OO p.m.
Flow r a t e 4800 - 5200 B/D. Surface pressure 2590 p s i a a t 11:OO p.m.
Flow r a t e 5200 B/D. Surface pressure 2500 ps ia a t 11:OO p.m.
Flow r a t e 5100 - 5200 B/D. Surface pressure 2470 p s i a a t 11:OO p.m.
Increased f l o w t o 10,000 B/D. a t 8:OO a.m. Reduced f l ow t o 7000 B / D a t 10:30 a.m. Surface pressure 2103 p s i a a t 11:OO p.m.
Increased f l ow a t 8:30 a.m. t o 8900 B/D. Reduced f low t o 7000 B/D a t 3:45 p.m. Increased t o 8000 B/D a t 9:00 p.m. Surface pressure 1850 p s i a a t 11:OO p.m.
Flow r a t e decreased t o 5000 B/D. a t 1:00 p.m., dropped t o - 4000 B I D a t 5:OO p.m., and increased t o 16,000 B/D a t 7:OO p.m, Rate decreased gradual ly t o 13,500 B/D by 11:OO p.m. Surface pressure 925 ps ia a t 11:OO p.m.
Flow r a t e decreased t o 10,000 B/D by 5:OO p.m. and constant thereaf ter . Surface pressure 937 ps ia a t 11:OO p.m.
Well shut i n a t 1O:OO a.m. Well opened up a t 7:OO p.m. a t 5000 B/D. Surface pressure 1978 ps ia a t 11:OO p.m.
224

hi 2/6/82
2/7/82
Flow r a t e 5000 BID. Surface pressure 2130 ps ia a t 11:OO a.m.
Flow r a t e 5000 - 5300 BID. Surface pressure 2186 ps ia a t 11:OO a.m.
2/8/82 Well shut in .
2/9/82 Flow r a t e increased t o 9000 - 10,000 B/D a t 11:OO a.m., then decreased t o 5400 B I D a t 3:OO p.m. Surface pressure 2499 p s i a a t 11:OO p.m.
2 1 10182 Well shut i n a t 7:OO a.m. due t o sanding o f disposal wel l .
225

111 11 183
11/12/83
11/13/83
111 14/ 83
1 1 / 15 183
11/16/83
111 17/83
111 18/83
1/19/83
15,260 - 15,280 foot interval of Sand 3 perforated at 3:OO p.m. Surface pressure 3650 psia immediately following perforation. Second interval (15,245 - 15,255 feet) perforated at 7:50 p.m. RDI began rigging up immediately.
RDI reached top of perforations (15,245 feet) at 6:30 a.m. Original reservoir pressure 11,887 psia, original temper- ature 293OF. Surface pressure 3660 psia with 10.5 ppg calcium chloride in the well. Well opened up to blowdown tanks at 11:50 a.m. Flow rate 2800 BID Bottoms-up reached at 2:30 p.m. Flow rate increased to 4000 BID. Flow diverted to separator at 8:OO p.m. Brine production switched to disposal well at 1O:OO p.m.
Well shut in at 11:50 a.m. Initial Flow Test of Sand 3 completed. Bottom-hole pressure 10,133 psia. Leak nec- essitated removing wireline equipment at 8:15 p.m. Build- up test began.
Build-up test continuing. Surface pressure 4444 psia.
Build-up test continuing.
Build-up test continuing.
Surface pressure 4498 psia.
Surface pressure 4514 psia.
Build-up test continuing. Surface pressure 4530 psia at 11:OO p.m.
Build-up test continuing. Surface pressure 4549 psia at 11:OO p.m.
Build-up test continuing. Surface pressure 4573 psia at 11:OO p.m.
111 20183 Build-up test continuing. Surface pressure 4587 psia at 11:OO p.m.
11 12 1/83 Build-up test continuing. 11:OO p.m.
Surface pressure 4587 psia at RDI began rigging up at 6:OO p.m.
11/22/83 RDI began measurements at 3:52 a.m. Bottom-hole pressure 11,799 psia at that time. Well opened at 8:50 a.m. Bot- tom-hole pressure at start of test 11,794 psia, surface pressure 4592 psia. Flow rate 2300 BID. Bottom-hole pressure 10,949. psia at 11:OO pa., flow rate 2225 B/D at that time.
11/23/83 Power failure at 5:30 a.m. Readings begun again at 9:00 a.m. Flow rate 2100 BID. Bottom-hole pressure 10,664 psia at 11:OO p.m.
226

L,
W
11 124183
11/ 25/83
11/26/83
11/27/83
11/28/83
11 129183
111 30183
12/1/83
121 2/83
12/3/84
12/4/83
12/5/83
12/6/83
12/7/83
12/8/83
12/9/83
121 10/83
12/11/83
Flow rate 2100 BID. Bottom-hole pressure 10,495 psia at 11:OO p.m.
Flow rate 2100 BID. Bottom-hole pressure 10,370 psia at 11:OO p.m.
Flow rate 2100 B/D. 11:OO p.m.
Bottom-hole pressure 10,258 psia at
Flow rate 2000 BID. 11:OO p.m.
Bottom-hole pressure 10,170 psia at
Flow rate 2000 B/D. 11:OO p.m.
Bottom-hole pressure 10,094 psia at
Flow rate increased t o 4900 BID at 3:OO p.m. Bottom-hole pressure 8860 psia at 11:OO p.m.
Flow rate increased to 5300 B/D at 11:OO a.m. and then to 5700 BID at 3:OO p.m. Bottom-hole pressure 8079 psia at 11:OO p.m.
Flow rate 5400 - 5900 BID. Bottom-hole pressure 7637 psia at 11:OO p.m.
Flow rate 4600 - 5300 B/D. Bottom-hole pressure 7593 psia at 11:OO p.m.
Flow rate 4300 - 4600 BID. Bottom-hole pressure 7564 psia at 11:OO p.m.
Flow rate 3900 - 4300 B/D. Bottom-hole pressure 7590 psia at 11:OO p.m.
Flow rate 3,000 BID. Bottom-hole pressure 7862 psia at 11:OO p.m.
Flow rate 2800 B/D. Bottom-hole pressure 7970 psia at 11:OO p.m.
RDI released at 7:30 a.m. Last bottom-hole pressure 7975 psia at 7:OO a.m. Flow rate decreased to 2600 B/D at 8:OO p.m. Surface pressure 1120 psia at 11:OO p.m.
Flow rate 2625 - 2650 BID. Surface pressure 1081 psia at 11:OO p.m.
Flow rate 2600 - 2675 B/D. Surface pressure 1070 psia at 11:OO p.m.
Flow rate 2600 B/D. Surface pressure 1058 psia at 11:OO p.m.
Flow rate 2550 - 2600 BID. Surface pressure 1046 psia at 11:OO p.m.
227

121 121 83 Flow rate 2550 B I D . p.m.
Surface pressure 1032 psia a t 11:OO
121 13/83
12/14/83
Flow ra te 2475 - 2500 B I D . Surface pressure 1022 psia a t , 11 :OO p.m.
Flow r a t e 2450 - 2475 B I D . Surface pressure 1007 psia a t 11 :OO p.m.
121 151 83 Flow ra te 2450 B I D . Surface pressure 994 psia a t 1 1 : O O p.m.
121 16 183 Flow ra te 2300 - 2600 B I D . Surface pressure 1006 psia a t 11 :OO p.m.
121 17/83
12/18/83
12/19/83
12 1201 83
12/21 183
12/22/83
121 23/83
12/24/83
121 25 183
12/26/83
12/27 183
12/28/83
Flow r a t e 2300 - 2350 B I D . 11 :OO p.m.
Surface pressure 1007 psia a t
Flow ra te 2300 B I D . Surface pressure 999 psia a t 11:OO p.m.
Flow r a t e 2250 - 2300 B I D . 11:OO p.m.
Surface pressure 989 psia a t
Flow ra te 2775 B I D . Surface pressure 989 psia a t 1 1 : O O p.m.
Flow rate 3500 B I D . Surface pressure 787 psia a t 11 :OO p.m.
Flow rate 3550 B I D . Surface pressure 665 psia a t 11:OO p.m.
Flow ra te 3625 B I D . Surface pressure 576 psia a t 1 1 : O O p.m
Flow ra te 3400 B I D . Surface pressure 554 psia a t 1 1 : O O p.m.
Flow r a t e 3350 B I D . Surface pressure 541 psia a t 1 1 : O O p.m.
Flow r a t e 3250 B I D . Surface pressure 530 psia a t 1 1 : O O p.m.
Flow r a t e 3200 B I D . Surface pressure 530 psia a t 1 1 : O O p.m.
Flow ra te 3850 B I D . Surface pressure 323 psia a t 1 1 : O O p.m.
12/29/83
12130183
Flow r a t e 2900 - 3100 B I D . Surface pressure 318 psia a t 11 :OO p.m.
Flow r a t e 3500 B I D . Surface pressure 315 psia a t 11 :OO p.m.
12 131 183
171184
Flow rate 3400 B I D . Surface pressure 318 psia a t 11:OO p.m.
Flow r a t e 3350 B I D . Surface pressure 314 psia a t 11:OO p.m.
1/2/84
1/3/84
1/4/84
Flow r a t e 3300 B/D. Surface pressure 314 psia a t 1 1 : O O p.m.
Flow r a t e 3250 B I D . Surface pressure 313 psia a t 1 1 : O O p.m.
Flow ra te 3225 B I D . Surface pressure 310 psia a t 1 1 : O O p.m.
228
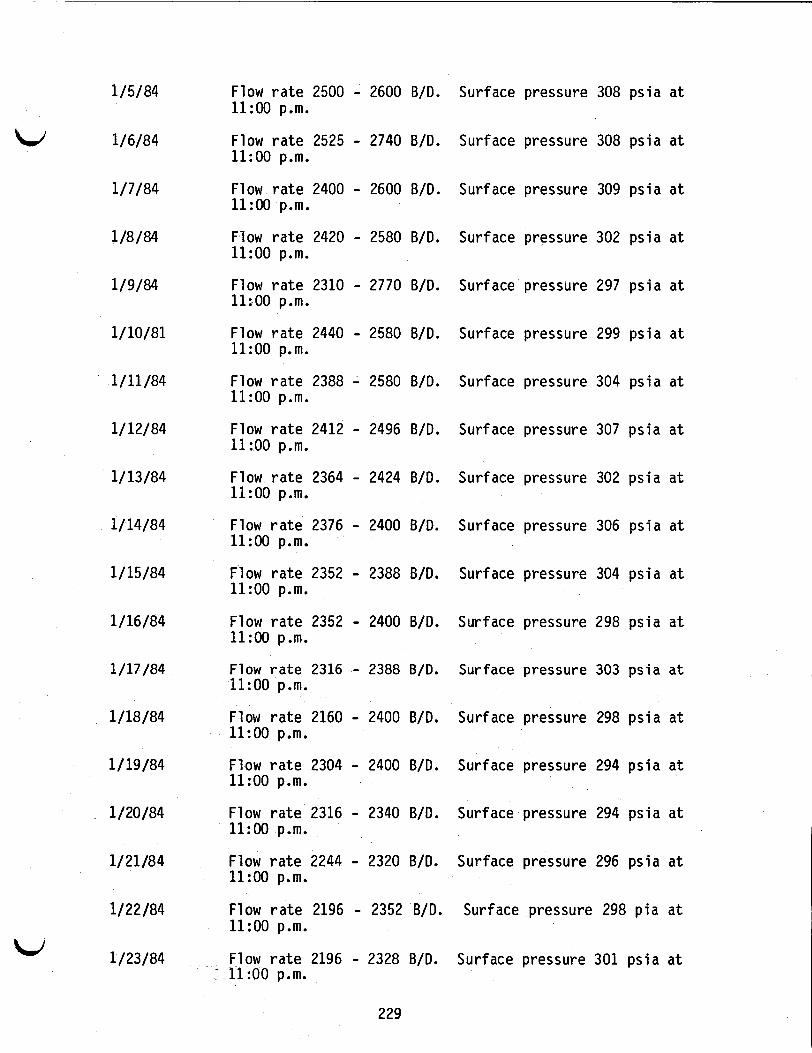
u 1/5/84
1/6/84
1/7/84
1/8/84
1/9/84
1/10/81
1/11/84
1/12/84
1/ 13/84
1/14/84
1/15/84
1/16/84
1 /17 /84
1/18/84
1/ 19/84
1120184
1/21/84
1/22/84
1/23/84 u
Flow r a t e 2500 - 2600 BID. 11:OO p.m.
Flow r a t e 2525 - 2740 BID. 11:OO p.m.
Flow rate 2400 - 2600 BID. 1 1 : O O p.m.
Flow rate 2420 - 2580 BID. 11:OO p.m.
Flow r a t e 2310 - 2770 BID. 11:OO p.m.
Flow r a t e 2440 - 2580 BID. 11 :OO p.m.
Flow r a t e 2388 - 2580 BID. 1 1 : O O p.m.
Flow r a t e 2412 - 2496 BID. 1 1 : O O p.m.
Flow r a t e 2364 - 2424 BID. 11:OO p.m.
Flow ra te 2376 - 2400 BID. 11:OO p.m.
Flow r a t e 2352 - 2388 BID. 11:OO p.m.
Flow r a t e 2352 - 2400 BID. 11 :OO p.m.
Flow r a t e 2316 - 2388 B/D. 11 :OO p.m.
Flow rate 2160 - 2400 BID. 11:OO p.m.
Flow r a t e 2304 - 2400 BID. 1 1 : O O p.m.
~~
Surface pressure 308 psia a t
Surface pressure 308 psia a t
Surface pressure 309 psia a t
Surface pressure 302 psia a t
Surface pressure 297 psia a t
Surface pressure 299 psia a t
Surface pressure 304 psia a t
Surface pressure 307 psia a t
Surface pressure 302 psia a t
Surface pressure 306 psia a t
Surface pressure 304 psia a t
Surface pressure 298 psia a t
Surface pressure 303 psia a t
Surface pressure 298 psia a t
Surface pressure 294 ps ia a t
Flow r a t e 2316 - 2340 BID. 11:OO p.m.
Surface pressure 294 psia a t
Flow r a t e 2244 - 2320 BID. 11:OO p.m.
Surface pressure 296 psia a t
Flow rate 2196 - 2352 B I D . Surface pressure 298 pia a t 1 1 : O O p.m.
Flow r a t e 2196 - 2328 BID. Surface pressure 301 psia a t x - _ l l : O O p.m.
229
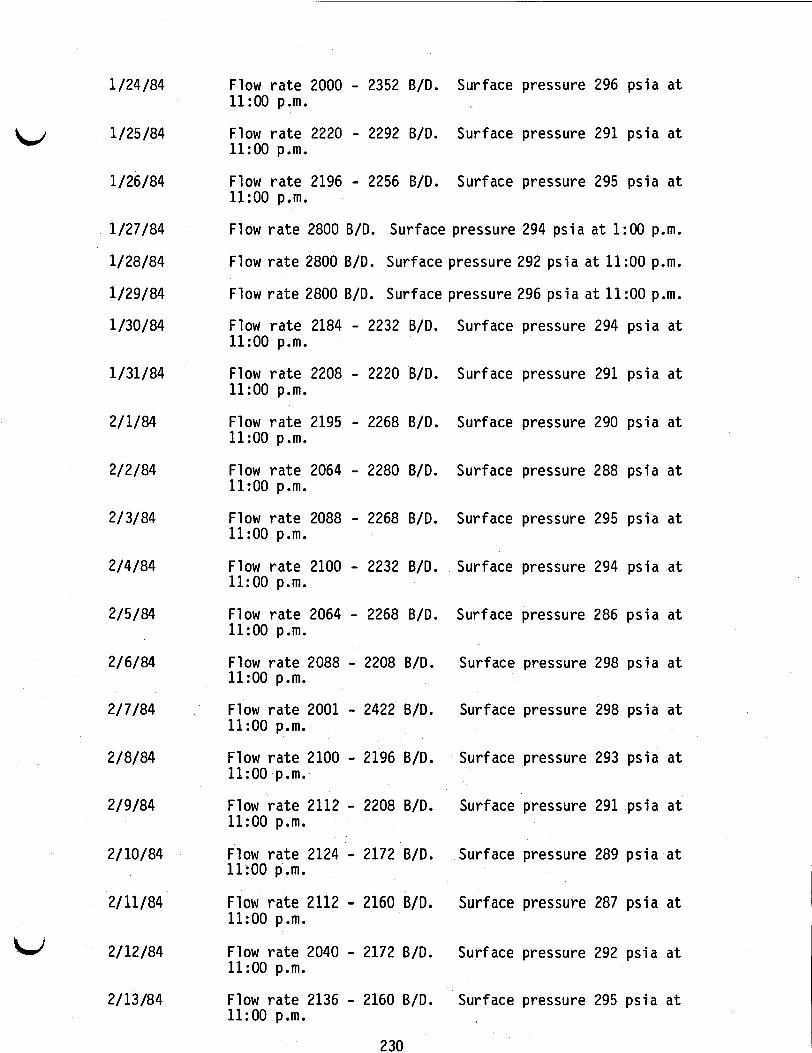
1 /24 /84
u 1/25/84
1/26/84
1 /27/84
1/28/84
1/29/84
1/30/84
1/31/84
2/1/84
2/2/84
2/3/84
2/4/84
2/5/84
2/6/84
2/7/84
2/8/84
2/9/84
2/ 10/84
2/11/84
u 2/12/84
2/13/84
Flow ra te 2000 - 2352 B/D. Surface p re s su re 296 p s i a a t 11:OO p.m.
Flow ra te 2220 - 2292 B/D. Sur face p re s su re 291 psia a t 11 :OO p.m.
Flow r a t e 2196 - 2256 B/D. Surface pressure 295 p s i a a t 11 :OO p.m.
Flow ra te 2800 B/D. Surface p re s su re 294 p s i a a t 1:00 p.m.
Flow r a t e 2800 B/D. Surface pressure 292 psia a t 1 1 : O O p.m.
Flow ra te 2800 B/D. Surface pressure 296 p s i a a t 1 1 : O O p.m.
Flow r a t e 2184 - 2232 B/D. Sur face p re s su re 294 psia a t 1 1 : O O p.m.
Flow ra te 2208 - 2220 B/D. Surface pressure 291 p s i a a t 11 :OO p.m.
Flow r a t e 2195 - 2268 B/D. Surface p re s su re 290 p s i a a t 11 :OO p.m.
Flow r a t e 2064 - 2280 B/D. Surface p re s su re 288 p s i a a t 11:OO p.m.
Flow r a t e 2088 - 2268 B/D. Surface pressure 295 p s i a a t 11 :OO p.m.
Flow r a t e 2100 - 2232 B/D. Surface pressure 294 p s i a a t 1 1 : O O p.m.
Flow r a t e 2064 - 2268 B/D. Sur face p re s su re 286 p s i a a t 1 1 : O O p.m.
Flow r a t e 2088 - 2208 B/D. Surface pressure 298 p s i a a t 1 1 : O O p.m.
Flow r a t e 2001 - 2422 B/D. Surface pressure 298 p s i a a t 1 1 : O O p.m.
Flow ra te 2100 - 2196 B/D. Surface p re s su re 293 p s i a a t 1 1 : O O p.m.
Flow rate 2112 - 2208 B/D. Surface p re s su re 291 p s i a a t 11 :OO p.m.
Flow r a t e 2124 - 2172 B/D. Surface p re s su re 289 p s i a a t 1 1 : O O p.m.
Flow rate 2112 - 2160 B/D. Surface pressure 287 psia a t 11 :OO p.m.
Flow rate 2040 - 2172 B/D. Surface pressure 292 p s i a a t 11:OO p.m.
Flow rate 2136 - 2160 B/D. Sur face pressure 295 p s i a a t 11 :OO p.m.
230

U
W
2/14/84
2/15/84
2/16/84
211 7 184
2/18/84
2/19/84
2120184
212 1/84
2/22/84
2/23/84
2/24/84
2/25/84
2/26/84
2/27 184
21 28 184
2/29/84
3/1/84
3/2/84
3/3/84
3/4/84
Flow rate 2112 - 2148 B I D . 11:OO p.m.
Flow r a t e 2112 - 2148 B I D . 11:OO p.m.
Flow r a t e 2052 - 2136 B I D . 11 :OO p.m.
Flow rate 2016 - 2184 B I D . 11 :OO p.m.
Flow rate 2000 - 2136 B I D . 11 :OO p.m.
Flow r a t e 1900 - 2184 B I D . 11:OO p.m.
Flow rate 1992 - 2412 B I D . 11:OO p.m.
Flow rate 1884 - 2292 B I D . 11:OO p.m.
Flow rate 2088 - 2124 B/D. 11:OO p.m.
Flow r a t e 2064 - 2124 B I D . 11 : OOp . m.
Sur face p re s su re 290 psia a t
Surface p re s su re 290 psia a t
Sur face pressure 294 p s i a a t
Sur face p re s su re 291 psia a t
Sur face pressure 295 psia a t
Surface pressure 291 psia a t
Surface pressure 289 p s i a a t
Sur face p re s su re 296 p s i a a t
Sur face pressure 293 p s i a a t
Sur face pressure 294 psia a t
Flow rate 2750 B I D . Sur face p re s su re 292 p s i a a t 11:OO p.m.
Flow rate 2880 B I D . Sur face p re s su re 288 p s i a a t 1 1 : O O p.m.
Flow rate 2844 B I D . Sur face pressure 287 p s i a a t 1 1 : O O p.m.
Flow r a t e 2064 - 2088 B I D . 11:OO p.m.
Flow rate 2040’- 2076 B I D . 11:OO p.m.
Flow ra te 1944 - 2244 B I D . 11:OO p.m.
Flow r a t e 1344 - 2652 B I D . 11:OO p.m.
Flow rate 2028 - 2064 B I D . 11 :OO p.m.
Flow rate 2028 - 2106 B I D . 11:OO p.m.
Flow rate 1995 - 2112 B I D . 11 :OO p.m.
Sur face pressure 287 p s i a a t
Sur face pressure 291 p s i a a t
Sur face p re s su re 294 p s i a a t
Surface p re s su re 297 p s i a a t
Surface p re s su re 299 psia a t
Surface pressure 296 psia a t
Surface p re s su re 296 p s i a a t
231
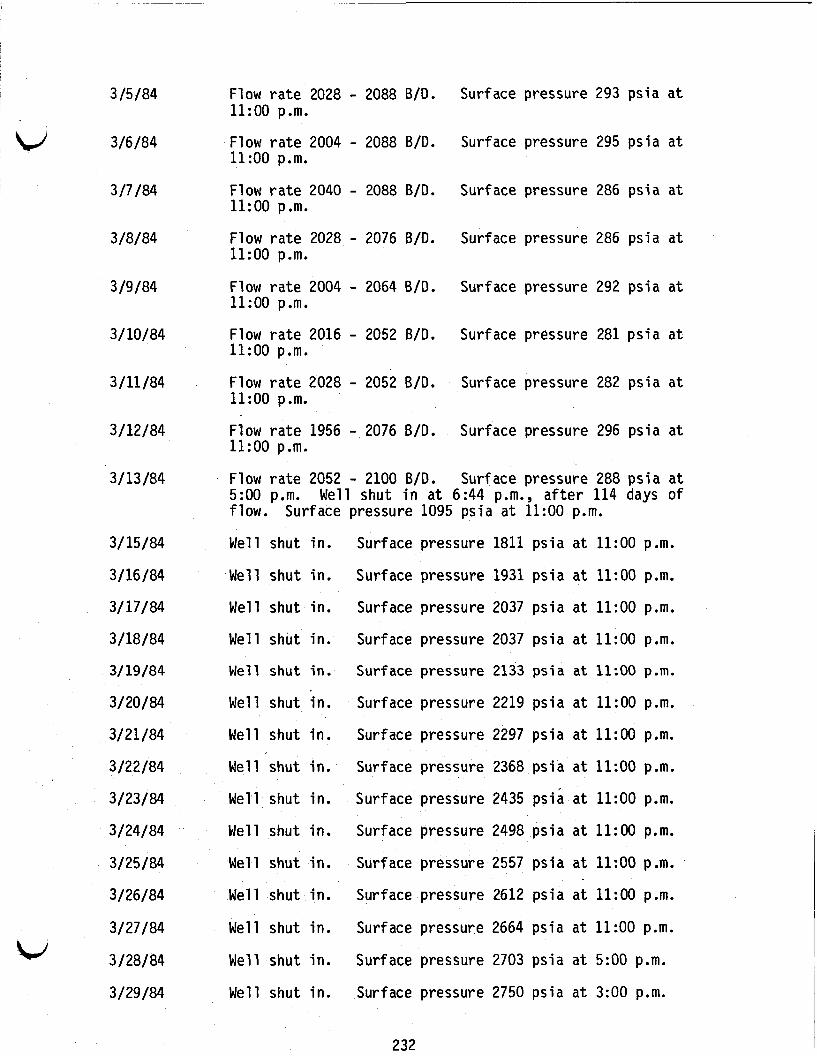
3/5/84
L/ 3/6/84
3 17 184
3/8/84
3/9/84
3110184
3/11/84
3/12/84
3/13/84
Flow r a t e 2028 - 2088 B I D . 11 :OO p.m.
Flow ra te 2004 - 2088 B I D . 11 :OO p.m.
Surface pressure 293 psia a t
Surface pressure 295 psia a t
Flow r a t e 2040 - 2088 B I D . 11 :OO p.m.
Surface pressure 286 psia a t
Flow r a t e 2028 - 2076 BID. 11 :OO p.m.
Surface pressure 286 psia a t
Flow ra te 2004 - 2064 B I D . 11 :OO p.m.
Surface pressure 292 psia a t
Flow ra te 2016 - 2052 B I D . Surface pressure 281 psia a t 1 1 : O O p.m.
Flow ra t e 2028 - 2052 BID. Surface pressure 282 psia a t 11 :OO p.m.
Flow ra t e 1956 - 2076 BID. Surface pressure 296 psia a t 11:OO p.m.
Flow rate 2052 - 2100 B I D . Surface pressure 288 psia a t 5:OO p.m. Well shut i n a t 6:44 p.m., a f t e r 114 days of flow. Surface pressure 1095 psia a t 11:OO p.m.
i
31 15/84 Well shut i n . Surface pressure 1811 psia a t 11 :OO p.m.
31 16 184 Well s h u t i n . Surface pressure 1931 psia a t 11:OO p.m.
3/ 17/84 Well shut i n . Surface pressure 2037 psia a t 11 :OO p.m.
3/18/84 Well shut i n . Surface pressure 2037 psia a t 1 1 : O O p.m.
31 19/84 Well shut in. Surface pressure 2133 psia a t 11:OO p.m.
31 20184
3/21/84
3/22/84
3 / 23 / 84
3/24/84
3/25/84
3/26/84
3/27 / 84
3/28/84
3/29/84
Well shut i n .
Well s h u t i n .
Well s h u t i n .
Well s h u t in.
Well shut in.
Well s h u t i n .
Well shut i n .
Well shut i n .
Well s h u t i n .
Well shut i n .
Surface pressure 2219 psia a t 11:OO p.m.
Surface pressure 2297 psia a t 11 :OO p.m.
Surface pressure 2368 psia a t 11:OO p.m.
Surface pressure 2435 psia a t 1 1 : O O p.m.
Surface pressure 2498 psia a t 1 1 : O O p.m.
Surface pressure 2557 psia a t 11:OO p.m.
Surface pressure 2612 psia a t 1 1 : O O p.m.
Surface pressure 2664 psia a t 11:OO p.m.
Surface pressure 2703 psia a t 5:OO p.m.
Surface pressure 2750 psia a t 3:OO p.m.
232

4/13/84 Final Report from Sweet Lake site. 1150-1200 psia.
Surface pressure
233

Li APPENDIX C
Engineering Interpretation Miogypsinoides Geopressured Brine Reservoirs
MG-T/DOE AMOCO Fee No. 1 Well Sweet Lake Area
Cameron Parish, Louisiana July 1984
J. Donald Clark, P.E. ConsuIting Petroleum Engineer
Bellaire, Texas 77401 5959 West Loop South, Suite 232
Submitted to: Dr. Clay Durham, Project Manager \ Magma Gulf-Technadril
430 Hwy 6, South-Suite 208 Houston, Texas 77079
t
h

INDEX OF GRAPHS AND TABLES MGT/DOE Amoco Fee No. 1 Well
h
Li
t
ki
FigureNo. 1 . . . . . . . . . . . . . . . . . . . . . . . . . . StructureMap Figure No. 2 . . . . . . . . . . . . . . . . . . . . . . . . . . Cross Section
NO. 5 SAND
Figure No. 3 . . . . . . . . . . . Firs t Flow Test FigureNo.3A . . . . . . . . . . . . . . . . . . FigureNo .4A . . . . . . . . . . . . . . . . . . FigureNo. 5 . . . . . . . . . . . . . . . . . . . FigureNo. 6A . . . . . . . . . . . . . . . . . . Figure No. 7 . . . . . . . . . . . . . . . . . . . FigureNo. 8 . . . . . . . . . . . . . . . . . . . FigureNo. 9 . . . . . . . . . . . . . . . . . . .
FigureNo.3B . . . . . . . . . . . . . . . . . . FigureNo. 4 . . . . . . . . . . . . . . . . . . . F i g u f e N o . 6 . . . . . . . . . . . . . . . . . . .
FigureNo .8A . . . . . . . . . . . . . . . . . . FigureNo. 10 . . . . . . . . . . . . . . . . . . FigureNo. 11 . . . . . . . . . . . . . . . . . .
(Semi Log)(Enlarged Scale) . First Flow 61 Bui ldup Test Field Interpretation Graph
R.L.T. 1s t D.D. R.L.T. 1st DODO . . . . . . . . Horner Plot
NO. 1 B.U. NO. 1B.U. . . . . 2nd Flow Test Graph . . R.L.T. No. 2 Flow Test . . R.L.T. No. 2 F l o w Test . . Graph Exploration D.D.
R. Water Explored vs. Time Temp. h Pressure Gradients
Table No. 1 ..................... Reservoir Fluid Summary Table No. 2 .................... Composite Laboratory Data
Table No. 4 . . . . . . . . . . . . . . Tabulation of Temp. 61 Press. by Depth
1
k Table No. 3 . . . . . . . . . . . . . . . . . . . Exploration Drawdown Calc.
L NO. 3 SAND
Figure No. 12 . . . . . . . . . . . . . . . . Pressure Drawdown h B.U. Graph
Figure No. 1 4 ....................... B.U. Data Sheets I Figure No. 15 . . . . . . . . . . . . . . . Extended Drawdown Test (7 .2 Days)
Figure Nos . 16 h 16A . . . . . . . . . . . . . . . . . Calculation Data Sheets
Figure No. 18 . . . . . . . . . . . . . . . Extended Drawdown Test (15 Days) Table No. 5 . . . . . . . . . . . . . . . . . . . Exploration Drawdown Carc. Table NO. 6 ...................... Reservoir Fluid SUXUUary Table No, 7 . . . . . . . . . . . . . . . . . . . Composite Laboratory Data
Figure Nos . 13 h 13A . . . . . . . . . . . . . . . . . . Drawdown Data Sheets
Y Figure No. 17 .................... Log-]tog Explored Water
i e No. 19 . . . . . . . . . . . Flowing Press e & Temperature Gradients
N o . 8 . . . . . . . . . . . . . . . . Tabu1
bd
i
L

Exploration Drawdown Tests on the Miogypsinoides Geothermal-Geopressured Sands found in the
MG-T/DOE AMOCO Fee No. 1 well, Sweet Lake Area Cameron Parish, Louisiana
1
ABSTRACT The MG-T/DOE AMOCO Fee No. 1 well was the second well drilled for the
Department of Energy for the purpose of testing deep Gulf Coast geopressured brine sands for evaluating the energy potential of gas in solution as well as the hydraulic and geothermal possibilities. continuous and accurate readings of down hole sand face and surface well head pressure and temperature.
The tests were designed to maintain
A full well stream flow meter was installed to record simultaneous the flow rate with the pressure Surface gas-water separating equipment was designed manner that a complete and continuous record of the maintained.
The tests produced an excellent amount of basic
and temperature records. and installed in such a produced fluids were
production drawdown data for engineering interpretation. though pertinent, is contained in this report. The report goes into considerable detail to explain the method and results of each phase of the tests and is supported by graphs and calculation data forms.
Only a very small portion of this data, even
The deeper No. 5 sand was interpreted as having very good productivity of some 8300 md.-ft., with average permeability to water of around 307 mds. The well is restricted by close in permeability barriers that reduces the flow area around the well to less than 48 degrees. seen during the measured test period and some 303 million barrels of brine was explored. barrels of brine per day due to a restricted flow area around the well.
All reservoir limits were not
The well was not capable of sustained flow rates in excess of 10,000
The No. 3 sand was found to have fair permeability but relatively small. The sand was interpreted as a lenticular sand deposit containing approximately 11 million barrels of brine. 288 psi surface flowing tubing pressure when test was completed.
The sand was producing around 2000 BWPD with
The reservoir brines in the two sand zones were found to be under saturated with gas at original reservoir temperature and pressure. 24.5 cubic feet of dry gas in solution at a bubble point pressure of 8800 psia. The No. 5 sand was estimated to have 22.2 cubic feet of dry gas in solution at an estimated bubble point pressure of 6340 psia, approximately 349 thousand barrels of brine during testing. MU? of dry gas during its fest period.
The No. 3 sand had
The No. 3 sand produced arly 4 months on flow
The No. 5 sand produced 1.063 million barrels of brine and 23,600

Engine ring Analys s of Expl 2
ration Drawdown Tests Miogypsinoides Sands , MG-T/DOE AMOCO Fee' No. 1 Well
Sweet Lake Geothermal-Geopressure Prospect
J. Donald Clark, P. E. Petroleum Engineering Consultant
INTRODUCTION The MG-T/DOE AMOCO Fee No. 1 well was drilled and completed in the
Miogypsinoides sands of the Camerina Zone of the Upper Frio Formation. is located in the structurally high southeastern portion of a graben bounded by faults to the North, East and South, as shown on Figure No. 1. The Miogyp sands are found at depths between 15,000 and 15,640 feet. potentially productive sands in the Miogyp sequence that were considered for geothermal-geopressure testing. 5 and No. 3 sands are covered by this report.
long-term flow testing, the technological and economic feasibility of recovering dissolved methane from brine, and recovery of thermal and hydraulic energy associated with geopressure-geothermal aquifers. economics, it is necessary to determine the amount of gas in solution, the corrosive chemistry of the brine, the productivity and extent of the brine aquifer. The majority of the energy for brine production depends on the expansibility * - of the existing aquifer.
The well
There are eight
Results of flow tests conducted on the No.
This testing program was designed to determine and demonstrate, through
In order to establish the
No. 5 Sand Selected for First Flow Test The No. 5 Sand was selected as the first zone to be flow-tested. Figure
No. 2 is a log cross-section depicting the eight Miogyp sands. Selection of more than one sand or reservoir, would introduce additional problems in drawdown analysis. Chemistry of the fluids could differ These natural differences between va Therefore, the fifth sand was selected because of a high permeability, determined from core analyses, and relative uniformity of the section as indicated on an electric log. flow at rates of 40 or 50 thousand barrels of brine per day.
sand thickness of approximately 27 feet. (to air) as high as 3.6 darcy's with porosities around 23.4 percent. was believed to be a "blanket" type sand for the area, and is sealed above and below by solid shalk.
The flow test was'designed to supp rt various engineering conclusions as to the well and sand productivity, by yielding a maximum amount of production and pressure data. quifer size and geometric configuration are needed for predicting future duction capabilities. A lengthy constant-rate flow test, with concurrant accurate recordings of d face flowing pressure, is basic for engineering requirements needed to ure early radial-flow interpretation. The high permeability and transmissability of the reservoir required method planning to properly place the well on flow.
Permeability barriers might appear in one sand and not in another. nd cross flow could occur between zones. ous sands make test interpretations difficult.
These data indicate a-sand.zone capable of producing maximum
The No. 5 sand, found between 15,387 and 15,444 feet, has a net effective
The sand Cores from this interval found permeability
Initial Flow Test An initial flow test was designed for a low rate of approximately 5000
barrels of formation brine per day, for a period of 2 to 3 days. was to be maintained as constant as possible. all changes in surface temperatures and pressures. be measured and recorded both before and after separation. for correction of any surface producing equipment and measuring devices prior
The flow-rate b Surface equipment will record
Total flow rates were to This test allows Lb
i
1 to extended flow testing. 1M
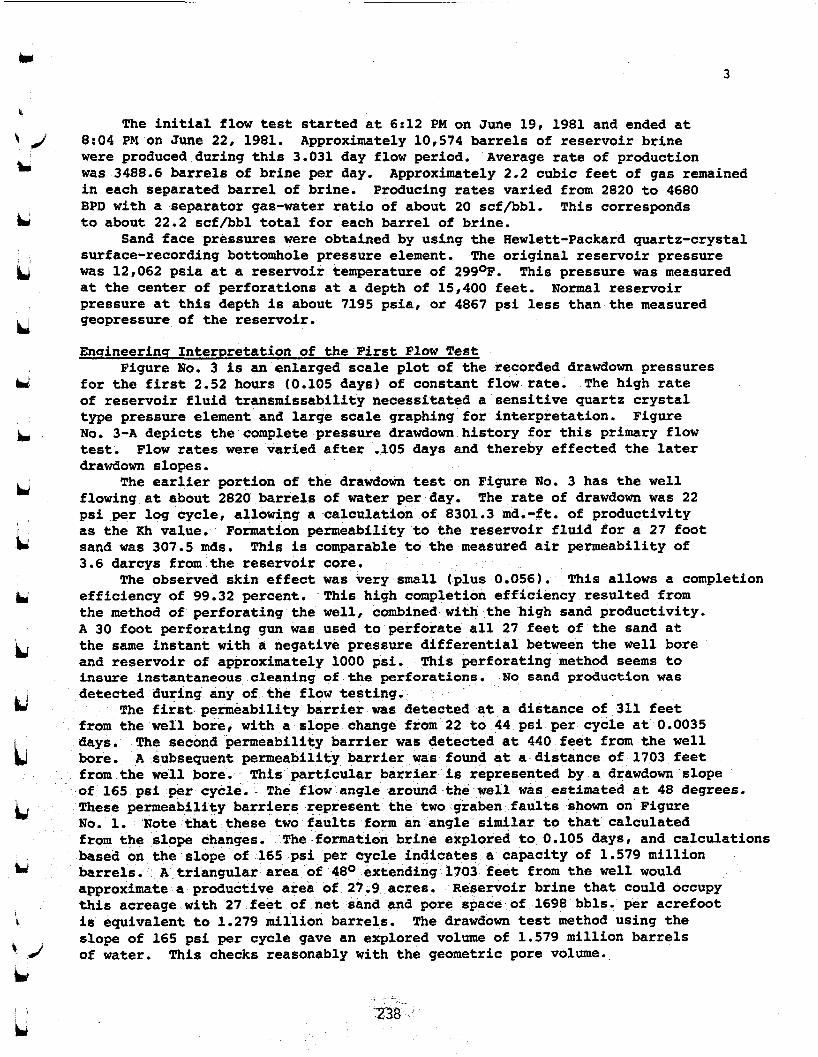
3
The initial flow test started at 6:12 PM on June 19, 1981 and ended at 8:04 PM on June 22, 1981. were produced during this 3.031 day flow period. was 3488.6 barrels of brine per day. in each separated barrel of brine. BPD with a separator gas-water ratio of about 20 scf/bbl. to about 22.2 scf/bbl total for each barrel of brine.
surface-recording bottomhole pressure element. was 12,062 psia at a reservoir temperature of 299OF. at the center of perforations at a depth of 15,400 feet. pressure at this depth is about 7195 psia, or 4867 psi less than the measured geopressure of the reservoir.
Approximately 10,574 barrels of reservoir brine Average rate of production
Producing rates varied from 2820 to 4680 Approximately 2.2 cubic feet of gas remained
This corresponds
Sand face pressures were obtained by using the Hewlett-Packard quartz-crystal The original reservoir pressure
This pressure was measured Normal reservoir
Enqineering Interpretation of the First Flow Test
for the first 2.52 hours (0.105 days) of constant flow rate. The high rate of reservoir fluid transmissability necessitated a sensitive quartz crystal type pressure element and large scale graphing for interpretation. No. 3-A depicts the complete pressure drawdown history for this primary flow test. Flow rates were varied after .lo5 days and thereby effected the later drawdown slopes.
The earlier portion of the drawdown test on Figure No. 3 has the well flowing at about 2820 barrels of water per day. psi per log cycle, allowing a calculation of 8301.3 md.-ft. of productivity as the Kh value. Formation permeability to the reservoir fluid for a 27 foot sand was 307.5 mds. This is comparable to the measured air permeability of 3.6 darcys from the reservoir core.
efficiency of 99.32 percent. the method of perforating the well, combined-with the high sand productivity. A 30 foot perforating gun was used to perforate all 27 feet of the sand at the same instant with a negative pressure differential between the well bore and reservoir of approximately 1000 psi. This perforating method seems to insure instantaneous cleaning of the perforations. No sand production was detected during any of the flow testing.
The first permeability barrier was detected at a distance of 311 feet from the well bore, with a slope change from 22 to 44 psi per cycle at 0.0035
The second permeability barrier was detected at 440 feet from the well A subsequent permeability barrier was found at a distance of 1703 feet
Figure No. 3 is an enlarged scale plot of the recorded drawdown pressures
Figure
The rate of drawdown was 22
The observed skin effect was very small (plus 0.056). This allows a completion This high completion efficiency resulted from
from the well bore. is particular barrier is represented by a drawdown slope of 165 psi per cycle The flow angle around the well was estimated at 48 degrees. These permeability b iers represent the two graben faults shown on Figure No. 1. Note that th ults form an angle similar to that calculated from the slope chan ormation brine explored to 0.105 days, and calculations based on the slope of 165 psi per cycle indicate
A triangular area of 48O extending 170 eet from the well would approximate a productive area of 27.9 acres. Reservoir brine that could occupy this acreage with 27 feet of net sand and pore space of 1698 bbls. per acrefoot is equivalent to 1.279 million barrels. The drawdown test method using the slope of 165 psi per cycle gave an explored volume of 1.579 million barrels of water. This checks reasonably with the geometric pore volume.
capacity of 1.579 million
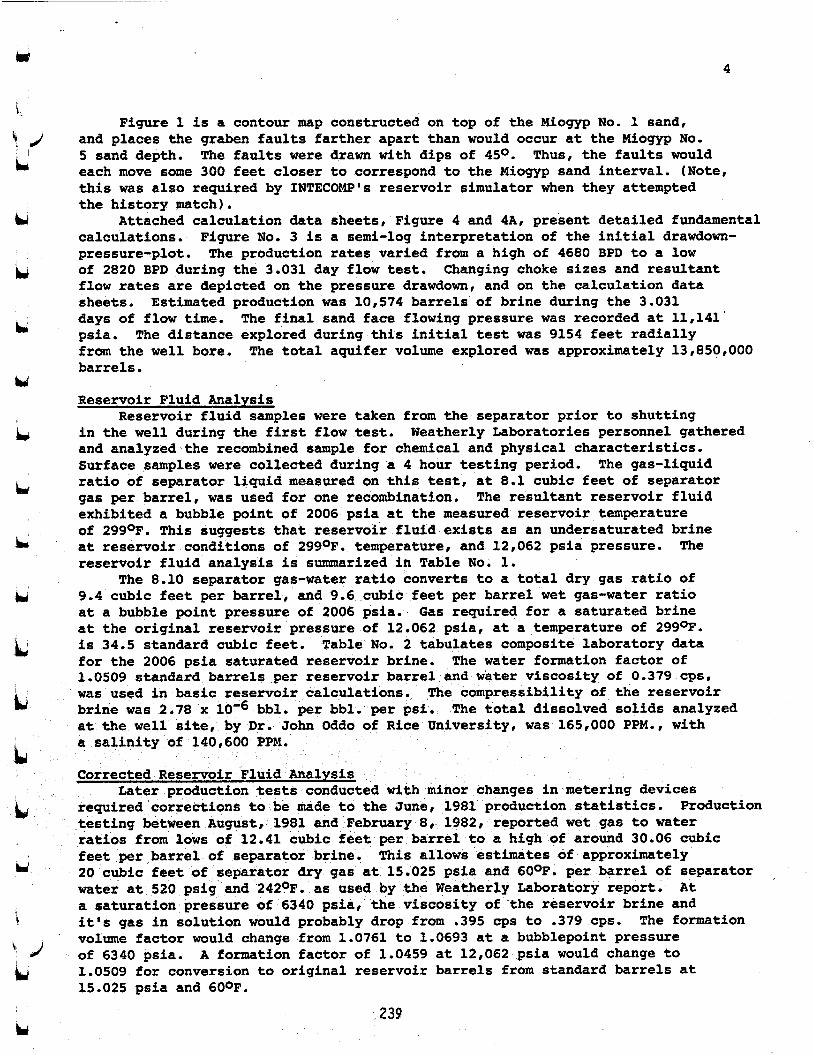
4
Figure 1 is a contour map constructed on top of the Miogyp No. 1 sand, and places the graben faults farther apart than would occur at the Miogyp No. 5 sand depth. The faults were drawn with dips of 450. Thus, the faults would each move some 300 feet closer to correspond to the Miogyp sand interval. (Note, this was also required by INTECOMP's reservoir simulator when they attempted the history match).
calculations. pressure-plot. of 2820 BPI) during the 3.031 day flow test. flow rates are depicted on the pressure drawdown, and on the calculation data sheets. days of flow time. psia. from the well bore. barrels.
Attached calculation data sheets, Figure 4 and 4A, present detailed fundamental Figure No. 3 is a semi-log interpretation of the initial drawdown- The production rates varied from a high of 4680 BPD to a low
Changing choke sizes and resultant
Estimated production was 10,574 barrels of brine during the 3.031
The distance explored during this initial test was 9154 feet radially The final sand face flowing pressure was recorded at 11,141'
The total aquifer volume explored was approximately 13,850,000
Reservoir Fluid Analysis
in the well during the first flow test. and analyzed the recombined sample for chemical and physical characteristics. Surface samples were collected during a 4 hour testing period. The gas-liquid ratio of separator liquid measured on this test, at 8.1 cubic feet of separator gas per barrel, was used for one recombination. The resultant reservoir fluid exhibited a bubble point of 2006 psia at the measured reservoir temperature of 299OF. This suggests that reservoir fluid exists as an undersaturated brine at reservoir conditions of 299OF. temperature, and 12,062 psia pressure. reservoir fluid analysis i s summarized in Table No. 1.
The 8.10 separator gas-water ratio converts to a total dry gas ratio of 9.4 cubic feet per barrel, and 9.6 cubic feet per barrel wet gas-water ratio at a bubble point pressure of 2006 psia. Gas required for a saturated brine at the original reservoir pressure of 12.062 psia, at a temperature of 299OF. is 34.5 standard cubic feet. Table No. 2 tabulates composite laboratory data for the 2006 psia saturated reservoir brine. 1.0509 standard barrels per reservoir barrel and water viscosity of 0.379 cps, was used in basic reservoir calculations. brine was 2.78 x at the well site, by Dr. John Odd0 of Rice University, was 165,000 PPM., with a salinity of 140,600 PPM.
Corrected Reservoir Fluid Analysis Later production tests conducted with minor changes in metering devices
required corrections to be made to the June, 1981 production statistics. testing between August, 1981 and February 8, 1982, reported wet gas to water ratios from lows of 12.41 cubic feet per barrel to a high of around 30.06 cubic feet per barrel of separator brine. 20 cubic feet of separator dry gas at 15.025 psia and 60°F. per barrel of separator water at 520 psig and 242OF. as used by the Weatherly Laboratory report. At a saturation pressure of 6340 psia, the viscosity of the reservoir brine and it's gas in solution would probably drop from ,395 cps to ,379 cps. The formation volume factor would change from 1.0761 to 1.0693 at a bubblepoint pressure of 6340 psia. A formation factor of 1.0459 at 12,062 psia would change to 1.0509 for conversion to original reservoir barrels from standard barrels at 15.025 psia and 600F.
Reservoir fluid samples were taken from the separator prior to shutting Weatherly Laboratories personnel gathered
The
The water formation factor of
The compressibility of the reservoir bbl. per bbl. per psi, The total dissolved solids analyzed
Production
This allows estimates of approximately
b 239

5
Initial Pressure Buildup Test The well was shut in at 7:57 PM on June 22, 1981, and pressure buildup
measurements were recorded. The final flowing pressure was 11,141 psia. A production rate below 2500 BPD and increasing pressure at the time the well was shut in effected the rate of the plotted pressure buildup. difference between the initial instrument pressure of 12,053 psia, at a datum of 15,337 feet, and the final flowing pressure is 912 psi.
The initial buildup slope is 17.6 psi per cycle, with a final prior flow rate of 2820 BWPD. This slope gives a Kh value of 1,376.7 md.ft. and a perme- ability of 384.3 mds. original flow test, and is caused by a pressure buildup at the sand face during the reduced final flow rate. This created a reduction in initial buildup slope when the well was shut in. The skin effect was also effected by these well-flow mechanics.
where pressure increased from 118254.59 psia to 11,267.62 psia in a 10 second reading. The buildup slope increased from 17.6 psi per cycle to 35.2 psi per cycle at this same time. barrier was expected since it occurred this early in the drawdown test interpre- tation. time. the variations in the flow rates prior to closing-in the well. Figure 6 and 6A contain calculations from the buildup test.
The buildup plot (Figure 3A1, prior to 1 day of shut-in time, begins to show the effect of the short 3.031 days of prior flow time. have steepened with a longer flow time instead of decreasing and forming the "S" type configuration. The Horner Type (Figure 5 ) has the same effect, but is not quite as prominent. is less than the original pressure of 12,053 psia. of 118974.21 psia, occurred at 18:15:30 PM on June 30, 1981, just before the second flow period began. The well had been shut in for 8.4708 days at this time, and was still 79 psi below the original pressure.
in engineering interpretation. to prior flow time. about one-fourth of the prior flow time. tations becomes longer with low permeability and shorter with high permeability.
Second Flow Test, No. 5 Sand Interval The second flow test was planned to explore for whichever came first,
the reservoir limits or 20 days of flow analyses. the permeability barrier locations of the geological graben type structure and defined the restricted flow area around the well bore. The second test was planned for a constant flow rate of approximately 15,000 barrels of water per day. An initial measured flow rate was 17,500 BWPD for the first 33 minutes. graphically on Figure No. 7. size within the first 4.9 minutes. for the first 320 feet around the well bore. drawdown slope is desired for support of a good test.
to arrive at the flow rate prevented gaining the radial flow slope. obtained by taking one-half of second flow slope of 253 psi per cycle or 126.5 psi per cycle. average permeability. mds. obtained from the initial cleaning flow test.
The pressure
This value is higher than that interpreted from the
There is an anomalous increase in pressure at 0.002 days on the graph
The 2 to 1 increase in slope for the first permeability
No positive explanation for this anomaly will be presented at this The curving of the buildup slope to 370 psi per cycle was created by
The curve should
Note that the extrapolation of the final slope The final buildup pressure
The use of the Horner Type pressure buildup graph must be used with caution This type psuedo time graph is very sensitive
The interpretation is only valid over a builup time of This time factor for validating interpre-
The first flow test depicted
Flow began at 6:15 PM on June 30, 1981. The pressure-time data is presented
The well was not completely opened to final choke This eliminates interpretation of data
A smooth straight radial flow
The flow rate of 17,500 barrels of brine per day and the time consumed This was
This slope gave a Kh'value of 8959 md.-ft. and 332 mds. for Permeability of 332 mds. is reasonably close to 308

6
A flow meter was installed in the surface flow line and connected to the This installation was made to record flow rates simultaneously RD1 computer.
with sand face pressures. The soft ware design failed to average meter counts over nine to ten second intervals as planned. This caused fluctuation in plotted data; but 'it did record the trend of the brine flow rates on the semi-log plot with surface and bottom hole pressures.
calculations of the explored volumes of the aquifer. were recorded at one to two hour intervals and corrected to standard volume on the daily report.
The main purpose of this test phase was an attempt to determine reservoir volume or limits. 3.5 days to maintain, if possible, a constant flow rate of 158000 BWPD. These adjustments are readily noted on both the surface and the sand face pressures plotted on the semi-log graph (Figure No. 7). The effective flow angle around the well had been reduced to 25.2 degrees at the end of 3.5 days. flowing pressure dropped below 1000 psia. this time was in excess of lO,OOO feet, The explored volume of reservoir fluid was in excess of 24 million barrels of brine. After 3.5 days, production rates were allowed to drop while trying to maintain a surface flowing pressure at/or above 800 psia.
Sand-face pressures were continuously measured and recorded in excess of 17 days, before pulling the pressure instruments from the well bore. pressures were monitored throughout the remainder of production testing. The 17 days of down hole pressure recordings, gives an explored distance of 22,520 feet. limits were not defined, but the drainage flow angle was reduced below 25 degrees.
Summary of Initial Flaw and Buildup Tests
creating a restricted drainage area for the aquifer reservoir. was high at approximately 8301 md.-ft., with permeability to the reservoir fluid averaging 308 mds. 48 degrees conforms to a general faulted graben type of geological structure shown in Figure No. 1. the original exploration drawdown test plan be revised, and shortened to approxi- mately 20 days, or to the detection of reservoir limits. defined as that time when steady-state flow is observed, or when the pressure loss per day, per reservoir barrel of fluid produced, becomes constant.
e original flow $est m y or may not be sealing faults. The two main g aults are positive, the small splinter fault might have en deleted, or e sand might have been pinching out updip of the well. I akes only 302 support 13,850,000 barrel f explored reservoir brine. A distance explored in 2.7 days is 8640 feet, which would result in an area without barriers of 5384 acres, or approximately 246.8 million barrels of brine.
This record of production rates with 'sand face flowing pressures are very valuable in attempting exploration drawdown
Other records of production
This aided in later corrections of RDI data.
Production choke adjustments were made during the first
Surface The radial distance explored by
Surface
The volume of brine explored was 303.0 million barrels. Total productive
Tests depict permeability barriers, relatively close to the well bore, Productivity
The reduction of the flow area to an angle of about
The rapid rate of pressure drawdown suggested that
Final limits are
The permeability barriers detected durin
es with 27 feet of net pay to
Exploration Drawdown Test The No. 2 drawdown test planned for rates of 15,000 barrels of water per
day, primarily would .be used to gather data on the explored volume of the No. 5 sand aquifer. The diffusivity or pressure transmissability rate of around 7.5 million square feet per day, would prevent detecting close-in barriers while bringing the well up to 15,000 or more barrels per day. The flow test voids the first slope because 4.9 minutes were required to get the flow rate
-241

Y
7
to 17,500 BWPD. aquifer with producing time, The Calculation Data Sheet Figure No. 8 & 8A and log-log graph Figure No. 10, depict the explored volumes for the 17 days that reservoir sand face pressures were being recorded.
and the brine producing rate. not accurately calibrated or set to average the meter rates, to depict the declining flow rate with sand face pressure loss, pressures are averaged over approximately 9 seconds of pressure readings, allowing a smooth plot of points forming a solid pressure decline line. a mean average rate, corrected to standard barrels per day, was used in calculating water explored. drawdown slopes determined from the pressure drawdown plot. calculations are listed on the calculation data sheet, Figure No. 8A,
originally scheduled. the volume of reservoir that can be determined as a function of flow time with declining rates of production. a function of cumulative flowing time, explored versus the log of time. the data falls on a 45 degree linear plot for each barrier. pinchout barriers are similar to the plotted data depicted here.
was continued until February, 3982, Total estimated production from the No. 5 sand is 1,063,000 barrels of salt water, and 23,600 M C F of dry gas, The saturation pressure for 22.2 cubic feet of dry gas in solution in a standard barrel of reservoir brine, is about 6340 psia. The saturation pressure is lower than required to flow the reservoir brine to the surface. no free gas saturation is expected to occur in the reservoir.
Permeability to brine above 300 mds. is extremely high for Gulf Coast Sands located below 12,000 feet in depth. Productivity of 8301 md.-ft. is well above normal for most zones in this area. this well to sustain rates in excess of 10,000 barrels of brine per day over any prolonged period, is due to a restricted flow area around the well bore. The well is capable of flowing in excess of 30,000 barrels per day for a very short time period. Th ngle reduction to 25 degrees after about 1 day of flow time, does not a his well to meet even close-to-economical-considerations at the most op mistic gas prices obtainable to date.
11 is a graphical plot of the pressure and temperature well bore gradients conducted during June 17-18, 1981. These data were obtained prior to flowing the well with completion fluid in the well bore. recording down hole pressure and temperature elements were used for recording these data.
Primary data would give the increasing explored volumes of
Figure No. 7 is a semi-log plot of flowing surface and sand face pressures, The computer software for the flow meter was
The data is sufficient The plotted
Therefore,
The standard rates of production were used with the sand face A summary of these
The well was not capable of maintaining the high rate of production as The exploration drawdown test allows calculation of
Table No. 3 contains these calculations as Figure No. 10 plots the log of water
Lenticular time
The pressure element was removed from the well bore, and production testing
When linear type permeability barriers exist
Therefore,
Therefore, the inability of
GRC surface
- 242 '
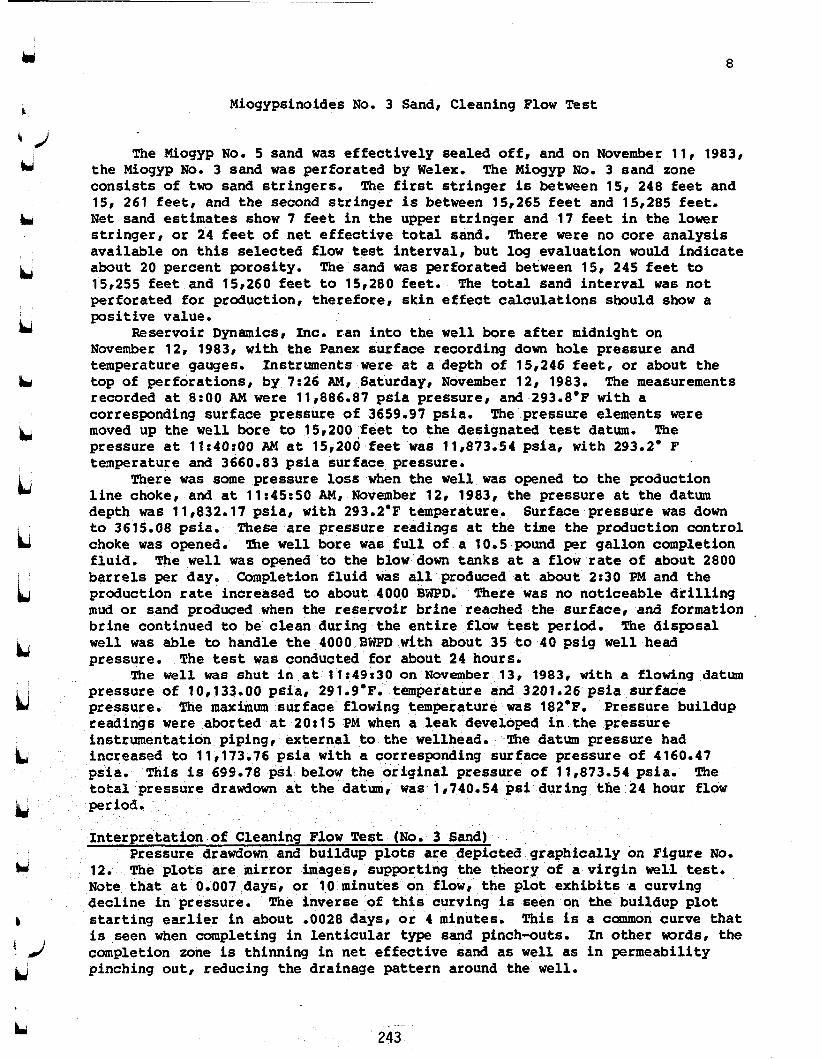
8
Miogypsinoides No. 3 Sand, Cleaning Flow Test
The Miogyp No. 5 sand was effectively sealed off0 and on November l l , 1983,
The first stringer is between 158 248 feet and the Miogyp No. 3 sand was perforated by Welex. The Miogyp No. 3 sand zone consists of two sand stringers. 15, 261 feet, and t h e second stringer is between 15,265 feet and 15,285 feet. Net sand estimates show 7 feet i n the upper s t r inger and 17 feet i n the lower stringer, or 24 feet of net effective total sand. available on t h i s selected flow test interval, but log evaluation would indicate about 20 percent porosity. The sand was perforated between 158 245 feet to 158255 feet and 15,260 feet t o 15,280 feet. The total sand interval was not perforated for production, therefore, sk in effect calculations should show a positive value.
November 12, 1983, with the Panex surface recording down hole pressure and temperature gauges. Instruments were a t a depth of 15,246 feet , or about the top of perforations, by 7:26 A M 8 Saturday, November 12, 1983. The measurements recorded a t 8:OO AM were 11,886.87 psia pressure, and 293.8.F w i t h a corresponding surface pressure of 3659.97 psia. moved up the well bore to 158200 feet to the designated tes t datum. The pressure a t ll:40:00 AM a t 15,200 feet was ii,a73.54 psia, w i t h 293.2. F temperature and 3660.83 psia surface pressure.
There was some pressure loss when the well was opened to the production l ine Choke, and a t 11:45r50 A M 8 November 12, 1983, the pressure a t the datum depth was 110832.17 psia, wi th 293.2.F temprature. t o 3615.08 psia. choke was opened. f l u i d . barrels per day. production rate increased to about 4000 BWPD. mud or sand produced when the reservoir brine reached the surface, and formation . brine continued to be clean during the entire flow tes t period. well was able to handle the 4000 BWPD with about 35 t o 40 psig well head pressure. The tes t was conducted for about 24 hours.
pressure of 10,133.00 psia, 291.9'F. temperature and 3201.26 psia surface pressure. The maximum surface flowing temperature was 182.F. Pressure buildup readings were aborted a t 20:15 PM when a leak developed i n the pressure instrumentation piping, external to the wellhead. The datum pressure had increased to 11,173.76 psia with a rresponding surface pressure of 4160.47 psia. This is 699.78 psi below the iginal pressure of 17,873.54 psia. The total pressure drawdown a t the datum, was 18140.54 psi during the 24 hour flow per iod . Interpretation of Cleaning Flow Test (NO. 3 Sand)
12. The plots are mirror images, supporting the theory of a virgin well test. Note that a t 0.007 days, or 10 minutes on f l o w , the plot exhibits a curving decline i n pressure. starting earlier i n about .0028 days, or 4 minutes. !Phis is a camon curve that is seen when completing i n lenticular type sand pinch-outs. I n other wrds, the completion zone is thinning i n net effective sand as well as i n permeability pinching out, reducing the drainage pattern around the well.
There were no core analysis
Reservoir Dynamics , Inc. ran into the well bore after midnight on
The pressure elements were
Surface pressure was down These are pressure readings a t the time the production control The well bore was f u l l of a 10.5 pound per gallon completion
The well was opened to the blow down t a n k s a t a flow rate of about 2800
There was no noticeable drilling Completion f l u i d was a l l produced a t about 2:30 PM and the
The disposal
The w e l l was shut i n a t llr49t30 on November 138 1983, w i t h a flowing datum
Pressure drawdown and buildup plots are depicted graphically on Figure No.
The inverse of t h i s curving is seen on the buildup plot
243

9
Attempts were made to gain a straight line slope to get an average sand permeability. days and permeability calculated a t 41.89 mds. distance of 60.7 feet to 397.5 feet respectively, which allows the 24 feet of estimated sand thickness i n the well bore to meet radial flow conditions. This same data muld give a calculated s k i n factor of a minus 3.27, or a pressure improvement of 460 psi. p s i per cycle is much too large for radial f l o w . zone has a much higher average permeability. The rate of pressure diffusivity, or transmissability, is very large, and the sand was thinning too fast to gain a straight line flow or buildup pressure slope. This does not mean that the well j u s t happened to be completed i n the thickest part of the sand zone. It does mean that the thinning i n a t least one radial direction is much greater than possible increasing net sand i n another radial direction. is completed i n one end of a lenticular type sand pinch-out and does not show linear type permeability barriers.
less than actual. required. that are highly speculative. explored volume of brine to determine future value of t h i s sand interval.
1.00 days. BrWS?D. The explored water ranged between 1.578 t o 2.819 million barrels during t h i s flow period. was 1717 feet t o 2295 feet for t h i s same time period. feet is equivalent t o nearly 380 acres. barrels of water should 24 feet of net sand be used as a mean average. 4.80 times greater than the explored maximum of 2.819 million barrels. a higher permeability, would result i n an even greater variance.
completed in one end of a lenticular type sand zone, probably of a sand bar type. at t h i s early time would suggest a poor well for the purpose originally planned. Figures No. 13 and 13A give the detailed calculations for the prior comments.
A slope of 162 p s i per cycle was drawn between .0007 days to .03 This would be an explored
This is an impossibility, and shows that a slope of 162 This would suggest the sand
In general, the well
The distance exploredusing the diffusivity calculated, would be considered A different approach to determine reservoir l i m i t s is
Variations i n sand thickness and permeability give distance values Interpretations w i l l require calculation of t h e
There’appears to be a drawdown slope of 1270 psi per cycle between 0.56 and This slope occurred after the production rate was increased to 4000
If permeability is assumed a t 42 mds., t he distance explored A radial distance of 2295
This would support 13.52 million That is Assuming
This short cleaning flow test , of about 24 hours, indicates the well is
The restrictions of t h e flow area around t h e well is very effective and
Pressure Bui ldup Analysis The pressure buildup data is also plotted i n on Figure No. 12 w i t h the
prior cleaning drawdown pressures. (mirror image effect) pressure curve when compared to the drawdown plot. there were no apparent straight line radial buildup slopes that could be interpreted. per cycle as st guess. This gives 1,321 md.-ft. for productivity, Kh; 55 mds. permeability, and a negative s k i n factor of 3.59. is again not possible order t o eliminate negative sk in , the permeability should be the order of 200 mds., with a drawdown or buildup slope of less than 3 0 psi per cycle.
The dashed l ine is drawn hypothetically from the l a s t measured pressure to the pressure of 11,801.51 psia. well bore some 8.8 days later. The pressure buildup plot and the drawdown plot depict a lenticular type of sand, with the well completed close to one end of the sand bar type reservoir.
You W i l l note the inverse b u t similar Again
e calculation data sheet, Figure No. 14, uses a slope of 170 psi
The negative s k i n factor i t h only a portion of the total in t e rva l perforated. In
The pressure instrument was returned to the

b 10
I
Miogypsinoides No. 3 Sand, Extended Flow Test The well remained s h u t i n fram ll:49:30 AM, November 13, to 8:47:00 AM on
November 22, 1983. Pressure elements were rerun into the well t o 15,200 feet, and pressure recordings were started a t 3:52:40 AM on November 22. The f i r s t readings were 11,799.32 psia a t datum depth w i t h a temperature of 293.6.F. Surface pressure was 4601.90 psia. Datum pressure b u i l t slowly, and a t 7:30:10 AM it was 11,801.51 psia, wi th 4604.97 psia a t the surface. s h u t i n period of 8.8199 days. The pressure returnd to within 68.32 psi of the original depth pressure of 11,869.83 psi.
There was an accumulation of free gas i n the upper tubing i n the well bore and an attempt was made to open the valve s l i g h t l y to allow some of t h i s gas to bleed off. The purpose was to attempt to get a radial drawdown flow slope, that was missed on the f i r s t test . The b o t t o m hole pressure was 11,801 psia when the gas bleed off was attempted a t 7:30 AM on November 22, 1984. dropped to a low of 11,612.22 psia by 7:51:40 AM and was back t o 11,795.17 psia a t 8:43:30 AM. The pressure remained relatively stable for the next 13 minutes and a t 8:46:30 was 11,795.27 psia when the flow tes t was started.
The well was opened t o s t a r t the exporation drawdown flow test a t 8:47:00 AM w i t h a datum pressure of 11,795.24 psia and a datum temperature of 293.9.F. The surface wellhead presure was 4602.20 psia. during bleed off of gas and s t a r t of flow should have a negligible effect on the drawdown slope.
Interpretation of Extended Flow Test (Wiogyp No. 3 Sand)
metered flow rate for the f irst 7.2 days of the extended flow test . to get the early straight line radial drawdown slope failed. that uniform sand thickness around the well bore was not sufficient t o gain an interpretable radial flow plot. Figure No. 15 occurred wi th in the f i r s t seven minutes of flow t h e . caused by the method and mechanics of opening the production control choke, free gas i n upper part of well bore and liquid flow reaching the choke.
A slope of 165 ps i per cycle has been drawn through the early pressure plots. per day a t t h i s time. t h i s data. permeability using 24 net effective feet is 34 mds. negative s k i n effect of 4.68, which is not real is t ic for t h i s type of perforating and completion. This would give a 265 percent completion efficiency for perforation of a portion of the total sand zone a t four shots per foot. This again supports a permeability to the rese voir brine much higher than depicted on the calculation sheets, Figure Nos. 16 and 16A. Instead of 34 mds.,
Th i s represents a
The pressure
This 6 psi loss i n pressure
Figure No. 15 depicts the pressure drawdown at the sand face and the The attempt
It is possible
The s l i g h t "hump" i n the pressure plot seen on This was
The metered rate of production was about 2250 barrels of reservoir brine
The resulting productivity, or Kh, value was 813.2 md.-ft. Figures 16 and 16A are the calculation data sheets using
The These data would give a
permeability is probab The drawdown plot, cu
linear type barrier detection. required for engineering interpretation of t h i s type of basic data. allows the integration of pressure decline a t the sand face and the flow rate for interpretation of transient or steady s ta te flow. energy balance calculations or volume of water explored as a function of flow time. The calculation for explored volumes of reservoir aquifer is contained i n Table No. 5. This explored volume of water is also depicted graphically on the log-log plot, Figure No. 17. The volume of reservoir brine explored during t h i s
excess of 150 rnds. continuously for 7.2 days, does not present any The exploration drawdown type analysis is
This method
This is then used i n
245

11
flow test is between 10 t o 12 million barrels. The reservoir limits were approached between 5.13 t o 7.2 days.
determined accurately from t h i s test. The size .of the aquifer explored is relatively proven to be less than 12 million barrels; supported and is shown w i t h continued production.
id The distance explored, average permeability and average net sand cannot be
The productivity is well IJ
Li
t
LJ
Y
Addition Flow Teats, M i o g y p No. 3 Sand Flow testing continued after the 7.2 days of exploration drawdown testing.
The pressure element remained a t pressure datum and the rate was increased above 6500 BWPD. The production rate, bottom hole and surface flowing pressures 8re depicted on Figure No. 18 for a total of 15 days of total flow time. The increased flow rate is depicted by the sharp decrease i n flowing pressures on Figure No. 18. rates for any sustained flow period.
November 29, 1983. The next valid data was after the rate was raised t o 5697 BWPD. midnight. The pressure readings and production rates, thereafter , were not sufficiently stabilized to allow-additional exploration drawdown calculations. The lowest flowing sand face pressure recorded with pressure element i n the well bore was 7546.73 psia a t 10:40 AM on December 4, 1983. The production rate a t t h i s t h e was 4684 BWPD and still dropping.
cubfc feet per barrel. about 1.51 cubic feet evolved. The radius around the well bore that would see the pressure below 8800 psia would be anly a few feet. produced gas-water ratio should have occurred during t h i s period. due to gas coming out of solution and remaining a free gas 'below the c r i t i ca l gas saturation necessary for gas flow. It is possible that we were unable to measure gas volume sufficiently to gain t h i s accuracy for t h i s determination.
December 7, 1983. at a surface temperature of 209.F while making flowing pressure gradient stops coming out of the well bore. graphically depicted on Figure No. 19. psi per foot.and very uniform. temperature gradient and depicts a condition where there is variation i n rate of temperature loss within the well bore. became more uniform w i t h longer flow t h e .
6t44 PM on March 13, 1984. The well was flowing about 2015 standard barrels of water per day wi th 288 psia surface flowing tubing pressure a t 178'F temperature. pressure was 65 psig barrels on the daily
The flow rate on December 31, 1983 was approximately 2780 SBWPD with 315 psia surface tubing pressure at 183.F. per day rate while maintaining around 300 psig m l l head pressure over t h e final 73 days of final flow.
The w e l l was not capable of supporting the higher production
The flow meter went out of service between 5r50 AM and 9:OO AM on
The flowing bottom hole pressure dropped from 10,074 psia to 8835 psia by
The dry gas i n solution a t 8800 psia, bubble point pressure, was 24.50 The gas i n solution a t 7547 psia is 22.99 CU. ft/bbl. or
Theoretically a loss i n This would be
The pressure and temperature elements were removed from the well on The well was flowing a t around 3200 barrels of fluid per day
These details are recorded on Table No. 8 and The flowing pressure gradient was 0.456
The temperature plot shows a variable
This rate of temperature loss w i l l
The Miogyp No. 3 sand zone was finally s h u t in prior to abandonment a t
Separator pressure was 248 psig and the water disposal well head The cumulative brine produced was reported a s 348,919
This is a loss of 760 barrels of water
246
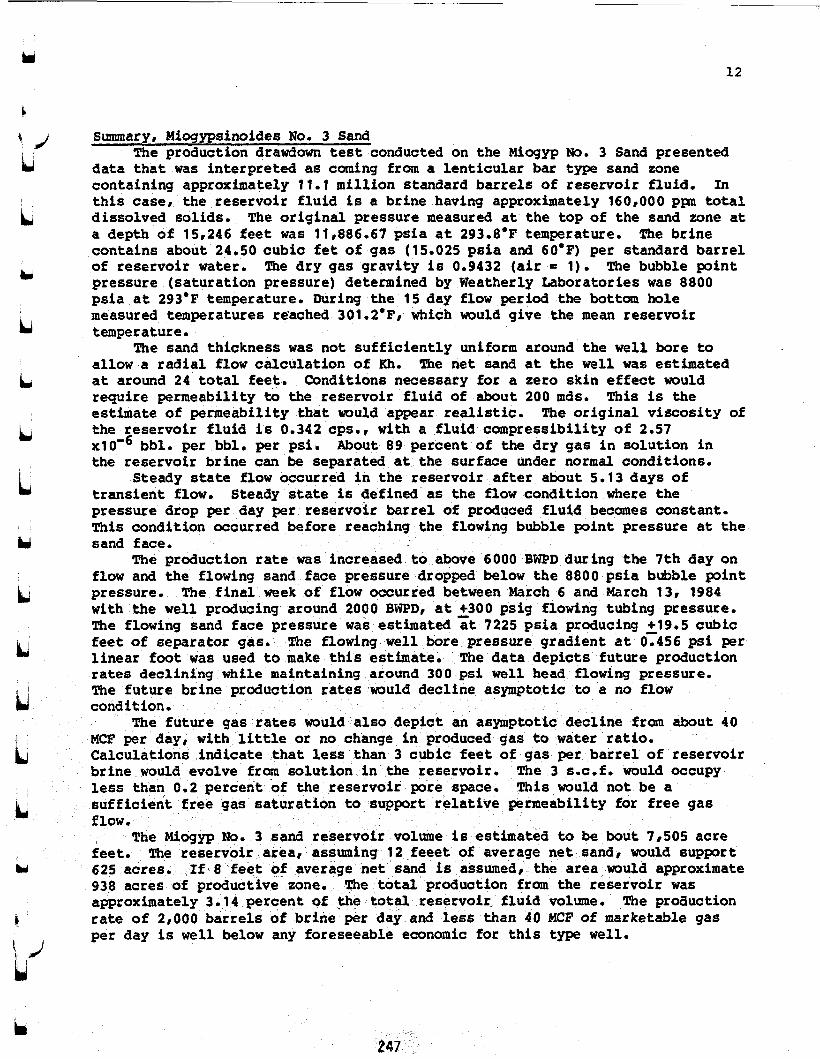
12
Summary, Miogypsinoides No. 3 Sand
data that was interpreted as coming from a lenticular bar type sand zone containing approximately 11.1 million standard barrels of reservoir f l u i d . t h i s case, the reservoir f l u i d is a brine having approximately 160,000 ppn total dissolved solids. The original pressure measured a t the top of the sand zone a t a depth of 15,246 feet was 11,886.67 psia a t 293.8.F temperature. contains about 24.50 cubic f e t of gas (15.025 psia and 60.F) per standard barrel of reservoir water. The dry gas gravity is 0.9432 (air = 1). The bubble point pressure (saturation pressure) determined by Weatherly Laboratories was 8800 psia a t 293.F temperature. During the 15 day flow period the bottom hole measured temperatures re’ached 301.2*F, which would give the mean reservoir temperature.
allow a radial flow calculation of Kh. The net sand a t the well was estimated a t around 24 to ta l feet. require permeability to the reservoir fluid of abou t 200 mds. This is the estimate of permeability that would appear realistic. the reservoir fluid is 0.342 cps., with a f l u i d compressibility of 2.57 xl Oo6 bbl. per bbl. per psi . About 89 percent of the dry gas i n solution i n the reservoir brine can be separated a t the surface under normal conditions.
transient flow. Steady state is defined as the flow condition where the pressure drop per day per reservoir barrel of produced fluid becomes constant. This condition occurred before reaching the flowing bubble point pressure a t the sand face.
flow and the flowing sand face pressure dropped below the 8800 psia bubble point pressure. with the well producing around 2000 BWPD, a t +300 psig flowing tubing pressure. The flowing sand face pressure was esthnated <t 7225 psia producing +19.5 cubic feet of separator gas. linear foot was used to make t h i s estimate. The data depicts future production rates declining while maintaining around 30 psi well head flowing pressure. The future brine production rates muld decl symptotic to a no flow condition.
ymptotic decline from about 40 MCF per day, wi th l i t t l e or no change i n produced gas to water ratio. Calculations indicate that less than 3 cubic feet of gas per barrel of reservoir brine would evolve from solution i n the reservoir. The 3 s.c.f. would occupy less than 0.2 percent of the reservoir pore space. sufficient free gas saturation to support relative flow,
feet. The reservoir area, assuming 2 feeet of average net sand, would support 625 acres. 938 acres of productive zone. approximately 3.14 percent of *e total reservoir fluid volume. rate of 2,000 barrels of brine per day and less than 40 MCF of marketable gas per day is well below any foreseeable economic for t h i s type well.
The production drawdown t e s t conducted on the Miogyp No. 3 Sand presented
In
The brine
The sand thickness was not sufficiently uniform around the well bore to
Conditions necessary for a zero s k i n effect would
The original viscosity of
Steady state flow occurred i n the reservoir after about 5.13 days of
The production rate was increased to above 6000 BWPD during the 7 t h day on
The f i n a l week of flow occurred between March 6 and March 13, 1984
The flowing well bor pressure gradient a t 05456 psi per
The future gas rates would also depict
s would not be a eability for free gas
e Miogyp No. 3 sand reservoir volume Ls estimated to be bout 7,505 acre
If 8 feet of average net sand is assumed, the area would approximate The total production from the reservoir was
The proauction
247

FIGURE NO. 2
I
33 5 8 31 02 4 3 2 1 35
2 3 9 4
18 10 11 9
20 + .:.:.:.:::$s:.A.$ .... . . . . . ................*. ................ :. . .. . .......... . . . . . . . . . . . . . . . . . . . . ......... ~.. ............ 5555. .............. . . ............> :.:.:.A+:.:.:.:*:.: ............ . . . . . . . ...... ...... . . . . . . . . .....
19 18
8-4 L a b Prospect 1 STRUCTURE MAP 1 Contound on lop of Mlogyp Sand
29 28 21 9 30 Cameron Parish, LA I

c . .. . . . ... - -
FIGURE NO. 2 Cross-section of Miogyp sand, Sweet Lake prospect.
Datum Is top of first sand. Note that Pan Am Fee #l Is a gamma ray log.
- -.T__l_f----- - --.__._- - -_.______- "_ ________ - - - . -
MG-TIDOE AMOCO Fee kl
Union of Cal. Union of Cai. Pan Am Fee #2 , Pan Am Fee #1
Unlon of Cal. Sweet Lake #l
400
600
c. c

1 .S
.0001 .001 .01 .1 1 Time in Days
--
c
w
250
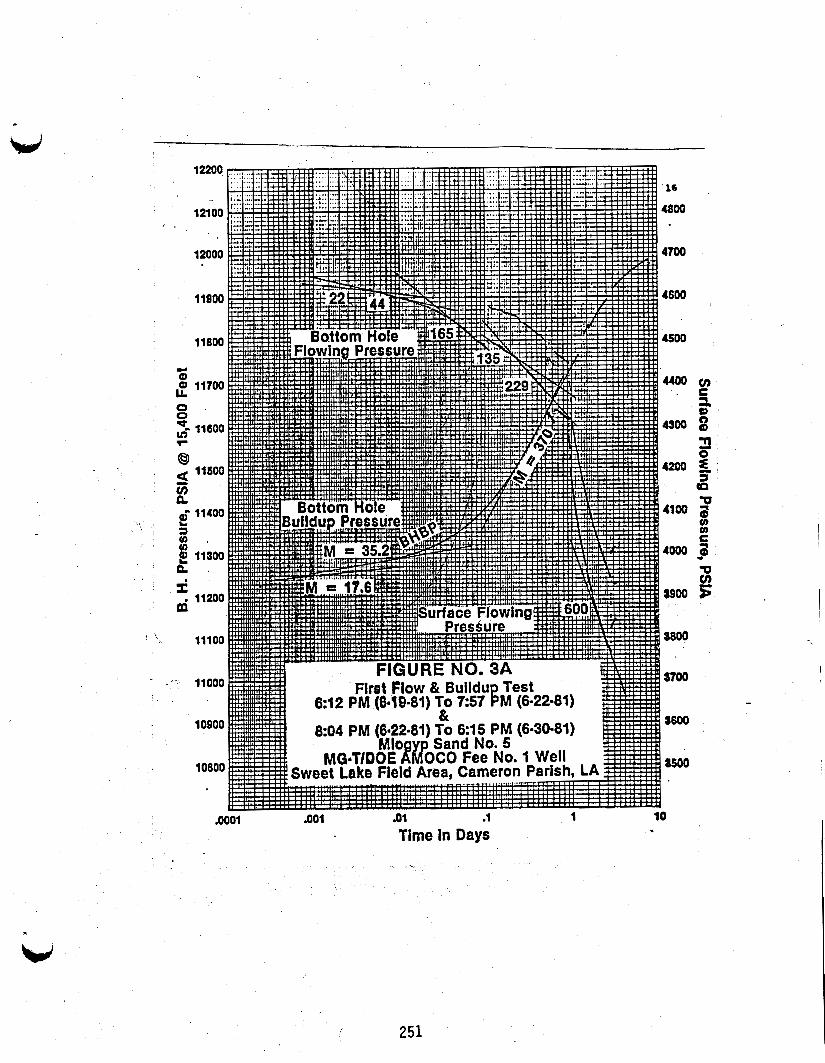
a iii n f
i i m
.mol .OOl .Ol .I 1 10 Time in Days
251

. .
, .. 12200
12100
12000
11900
11800
11 700
11600
11SOO
11400
11 300
1 1200
11100
11000
.10000
10800
I n7nn
17
.-. -- 0 .W1 .01 .l
Time in Days
I
1 10 ..
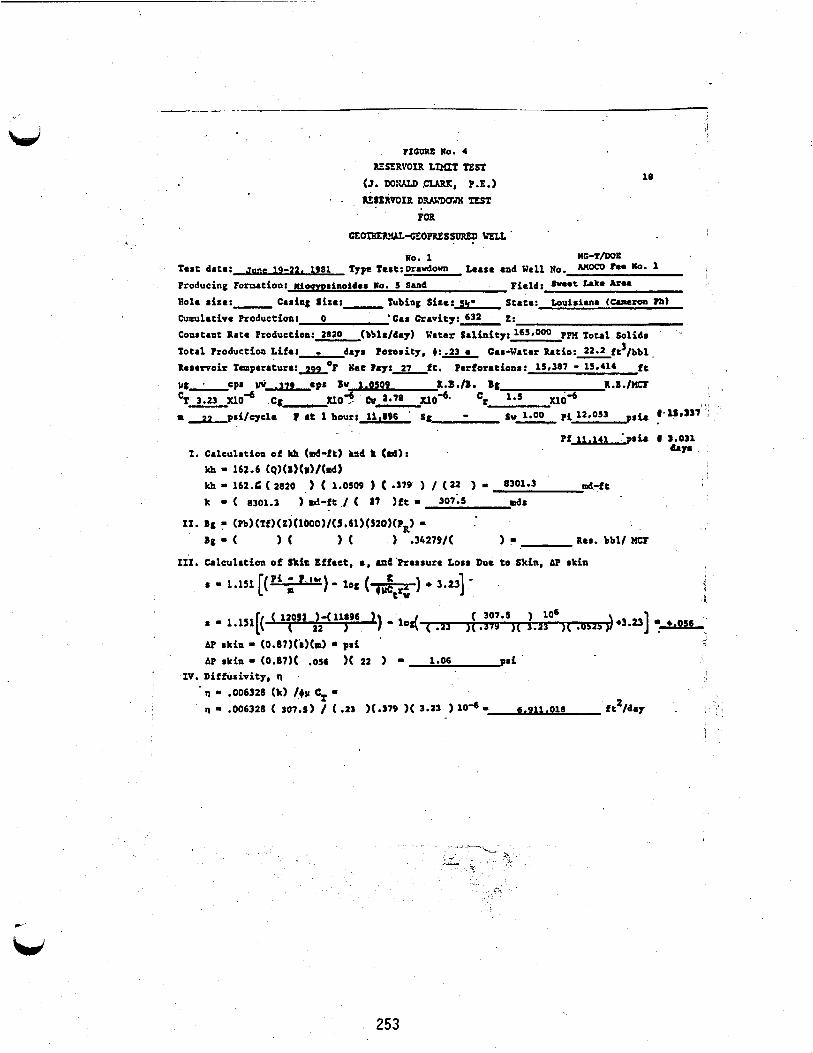
w 18
1x1. Calculat5on o f Skin Pffect, s, md'Prassure Loss Due t o Skin, bP ski0
s - 1.151 [(w) - log (,*) + 3 . ~ 1 - c v
I
253

?IGUFS.Wo. 4A RLSEXVOIR LLqIT TEST
(J. SOKALD C L m , P.E.) 19
I I S L X V O I X DU!JDOWN TEST (COhT'D)
(1820 1 w b l s . / D - p r I c. ' J ( ideal ) -
( pi - ?f - A r skin (12,053 - 11,896 - ( 1.06
DiStAEC8 t o Birriars or Dircontbui t i r s , d d - 2 f i
d- 2 g( 6911018 ) x f i - (.l258 ) c. P Flow Jonas Y Bblr. o f Aquifer
t k c r t d A V S fi d,. ( 9 r i l c r c l e 1 && Function Explored or t o a d
.c022 2820 247 22 360° 1.4671066 233,309
.0035 2820 311 22 360° .92218228 371,174
- - - - - - - .0070 2820 440 44 1800 371,174
1,579,464 -105 3000 1703 165 480
- - - - - -- -105 1703 135 Change Choke S i z e
.23 4680 2522 229
- -- - -- - 1
2.70 3720 8640 600 ,0247147 13,819,640
3.031 2820 9154 Wegative
(311B2 ff//(435601* 6.98 acras to first prmcability barrfer. (7758)(.23)//(1.0509) - 1698 Bbla./Ac.Ct. (6.98 ACr88)(27 ft.Itl698 Bbl#./Ac.?t.l
Weatherly P W data aorrected to i2.2 its/atandard bbl. ( d r y pas1
320,005 Bbla.
E.?.?. - 6340 paia &- 1.0693 @ 6340 psi. B1- 1.0509 @ 12,062 psi. p,- 0.379 CpS. @ 12,062 pafa
254
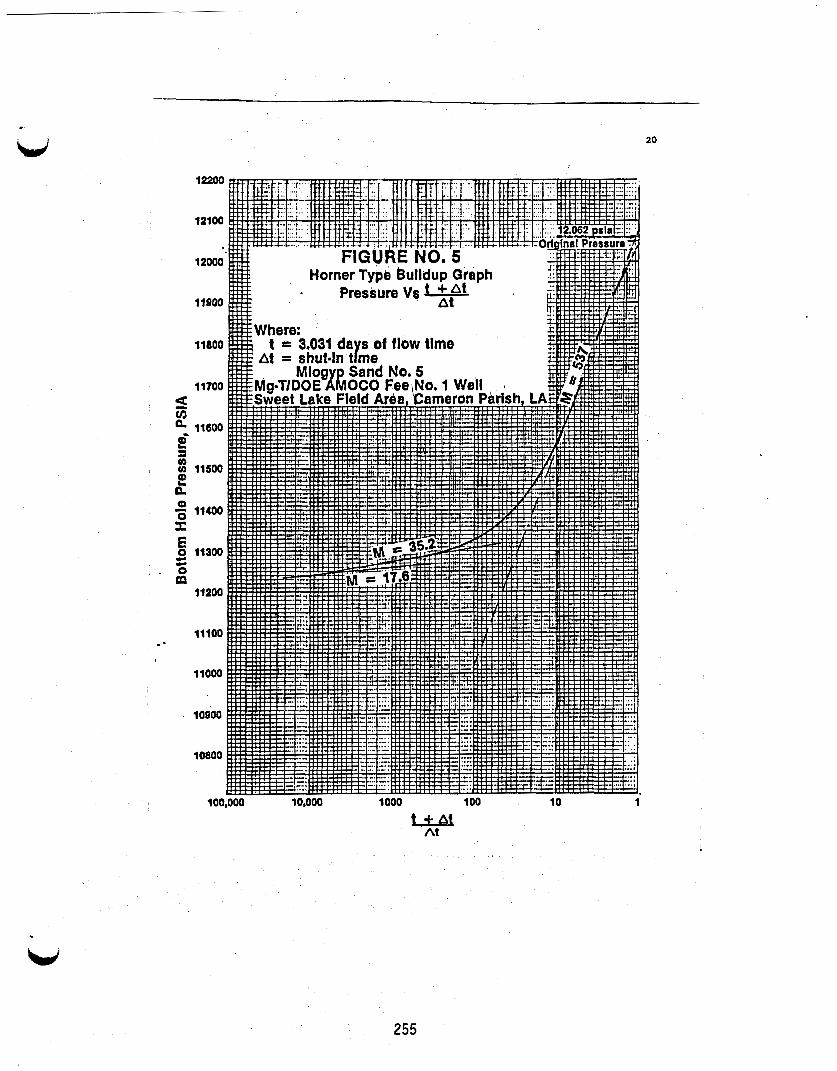
20
255

21
mo. 1 ffi-T/DOI ' Teat date:- 22-23. 1981 Type Yrrt: Buildup Leaae and Well No.- lac No. 1
Producing Fornation: n i m s i n o i d s s WO. 5 Sand Field: sweet Uka Aroa
Hole r i te : Caring Size: Tubing # b e : SI,^ Sta te : Louisiana (Cameron PB) Cumulative Production: 10,s 74 Gar O r r v i t y 632 2: Conatant Rate Production: 2820 (bSla/day) Water Sal in i ty : 165,000 P P I Total Solida
Total Produetion Li fe : 3.031 days Porosity, (:A Car-Water Ratio: 22.2 f?/bbl
' cpr lJv -379 epz Ilv 1.05 09 t . B . / B . Bg R .B . /NCF m 17.6 pai/cycla P a t i hour: 11,277 SI - Sv 1.00 P i 12,053 pais
Reservoir t e m p c r a t u r e : ~ ° F lief by: 27 f t . ?e r fore t iona :_~s ,38 7-15,414 f c
% 3.23 f l O 4 c g nod & 2-78 ao-( ' 'r 1.5 x10⁻⁶
AP skin - (0.87)(s)(m) - pri AP akin = (0.87)( .62 )(17.6 ) .I 9.6 pai
W . Diffua iv i ty , n n 0 .006328 (Is) /4r % = fl .006328 ( 3843 ) / (.* -13 )(.379 )( 3.23 ) 10-6 m 8,655,846 ft2/day
Note8 Pressure *et the # a d Lace was building up at a LlW ?ate of 2820 BWPD' when well was ahut i n . Therdore, low buildup presaure slop..
256
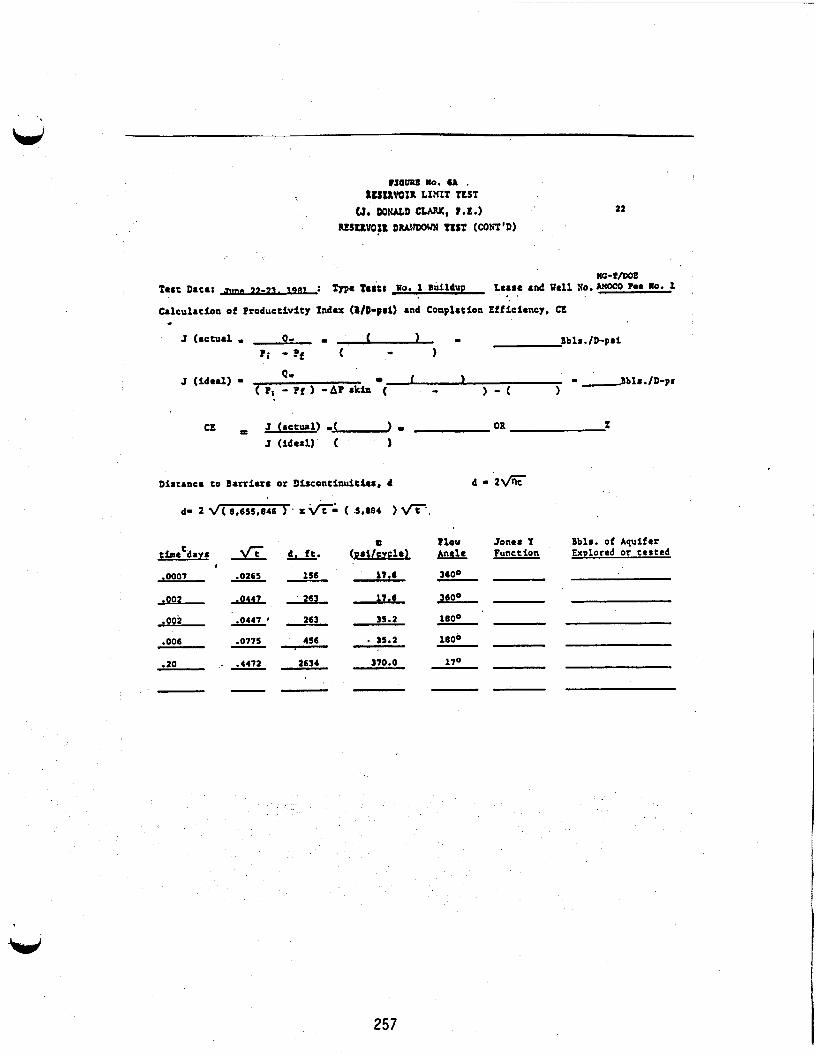
W
nc-T/Doe Test Date: : me h S t c Wo. I Buildup Leare and Well No.AnOc0 Pee WOO 1
Calculation of Productivity Index (l/B-psl) and Coapletion Efficiency. C t - J (actual - Q- Bblr./D-pri - P i - Of ( 1
1 (ideal) - c. I 1 A b l s . / D - p f ( P, - ?f 1 - A P rkio ( - I - ( )
Distance to Barrierr or Discontinuities, 4 d - 2 6
m llov loner Y Bbls. of Aquifer tfmetdaya fl u. ( p s l / c v c l r ~ Function Exdoted or teated
- - - / I t ( i ) c o o .0001 .0265 156 ,
,002 d ! u L - A L L T . ( J B o o LBO0 - .ooi .044? 263 35.2 ---
.006 .0115 456 - 35.2 1800 - --
.10 . .44?2 2634 310.0 110 - -- - --
257

a 5 a C .-
I a p! u)
2 u )
a
12000 6000
20000 11 800 5600
19000
11200 5200
iaooo ioaoo
4800 17000
10400 4400
16000 10000 4000
15000
8800 3600
14000
9200 3200
13000
8800 2800
12000
8400 2400
11 000
8000 2000
10000 7800 1600 9000
7200 1200 8000
6800 800
7000
6400 400
6000
23
0.01 0.1 1 .o 10 100
Time In Days
258

. . r i c m i o . s
24
CEomEr!lcSO~uss~ tJEu
no. 2 UC-T/DOE Tar t date:-" 17 1-8 t 8 8 t ; D~rvdcn! h a s 8 and well NO. AMOCO Fee no. 1 Producing Formation: l i a l d : Sweet
& l a r i r a : Casing Sire: %ubing SiSr t 55. s t a t e : Louisiana (Cameron Phl Cumulative Production: 10.574 Cas Gravity: 632 2:
Constant Bate Production: 17,500 (Hlr /day) Wster Salinity: 16s.000 PPn Total Solids Total Production Life: 3.031 days I c ros f ty , 4: .)a Cas-Water R a t i o : a f t 3 /bbl . Reservoir Tcmperaturc:&°F Net ?ar 37 ft. ?rrforations: 15,387-15,414 f t
%-nod Cg - ~ 1 0 ' 6 U O ~ . C r 1 . 3 X I O - ~ PI cps .379 cps h-.B./X. Bg R . B . / X F
P ~ p s i / c y c l e P a t 1 hour: IA Ig - Sv ise Pi-az.m3 psi. e 15,337 W.
Pf psi. I . CJlCUhtiOn of kh (md-ft) and t (d)i -,
kh - 162.6 (Q)(B)(v)/(d) kh 162.6 ( 17,SoO) (1.0509 ) ( ,379 1 / (I26.9 - ~9.~9.2 d - f t
k ( 6985.2 1 md-ft / .( 17 )ft 9 3 3 1 4 mds
XI. Bg - ~ P b ~ ~ T f ~ ~ Z ~ ~ l O 0 0 ~ / ~ 5 . 6 1 ~ ~ ~ 2 0 ~ ~ ? ~ ~ - Bg - ( f .34179/( 1 - Bas. bbl/ XCF
111. Calculation o f Skin Effect, 8, and'pressure Loss Due t o Skin, AP sk in
259

25
WC-T WE T u C a c e : J U n c B 8 1 - 8 Test: w. 2 DF ewdown Lease and Well No. Anoco Fa0 No. I
Calculation of Productivity I n d u (WD-psi) u d Coaplrtfoo Lfficiency, C t -
. CE J (actual) -< ) I OR X '
J (ideal) ( -1 . Dirtance t o Barriers or Discontinuities. 4 d - 2 C
6- 2 v( 7,457,157 ) x E- ( 5462 ) fl,
.0034 17,500 318 - 1 1 . 5 0 0 6 1 6
.056 17,500 1,293
.18 16,200 2,317
.90 15,250 5,182
1.55 14,900 6,800 3.00 15,000 9,460 7.61 14,150 15,068 8.61 f12.000 16,027 9.61 7,950 16,932
15.66 10,708 21,615 17.00 10,600 22,520
1 . 2 0 1 5 . o O o 5.983
12S.S 0 360° 253 1800 441 JO3O
1150 39.6 1480. 30 .8O 1805 25.2O
? 1670 2045 ? 1805
492 492 492 492 492
-
Jones Y Bbls. of Aquifer Iunc t ion Bxolorcd or tes ted
- - 1.759196 194, 571
.744703 459,632
.499772 684.892
.209983 1,630,080
.0544096 6,290,978
.OM3844 8,917,417 9,343,459 .0366342
.0165949 20,626,158 1.89032 x lo4 184,075r225 1.97011 x 10⁻³ 113,741,007 2.06643 x 10'' 128,471,991 1.21388 x IO') 281,979,839 1.12959 x 10⁻³ 303,020,998
260
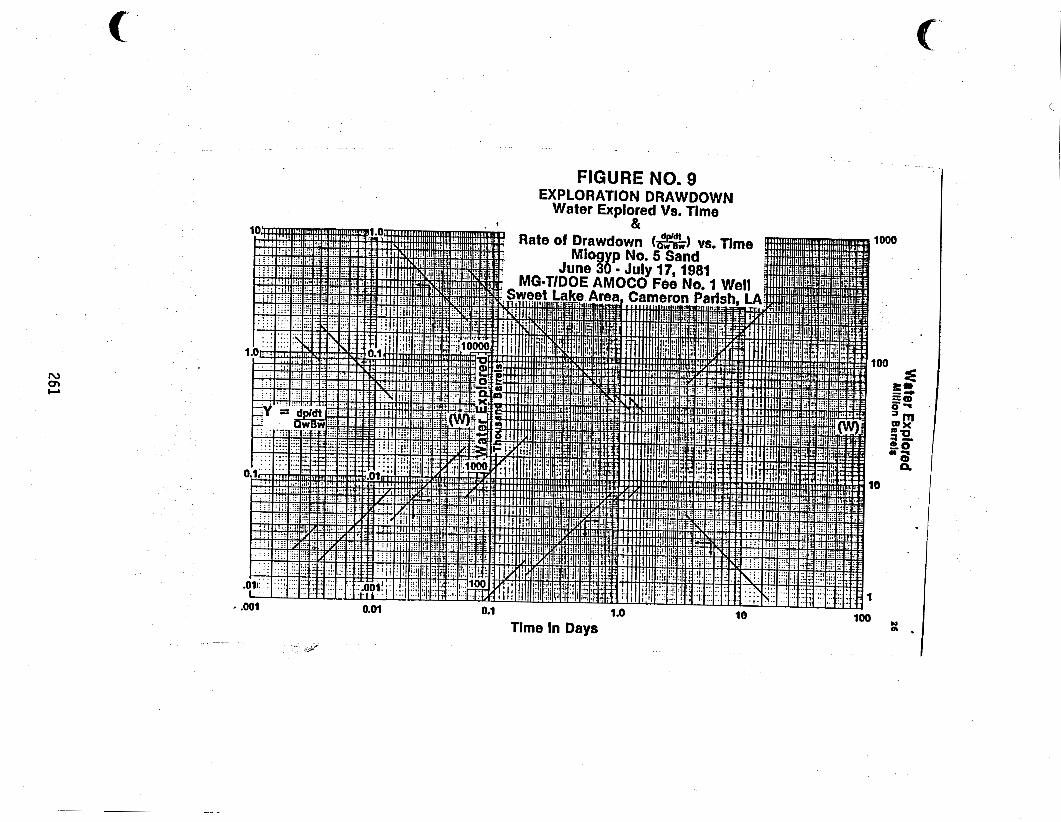
FIGURE NO. 9 EXPLORATION DRAWDOWN
Water Explored Vs. Time
Time in Days
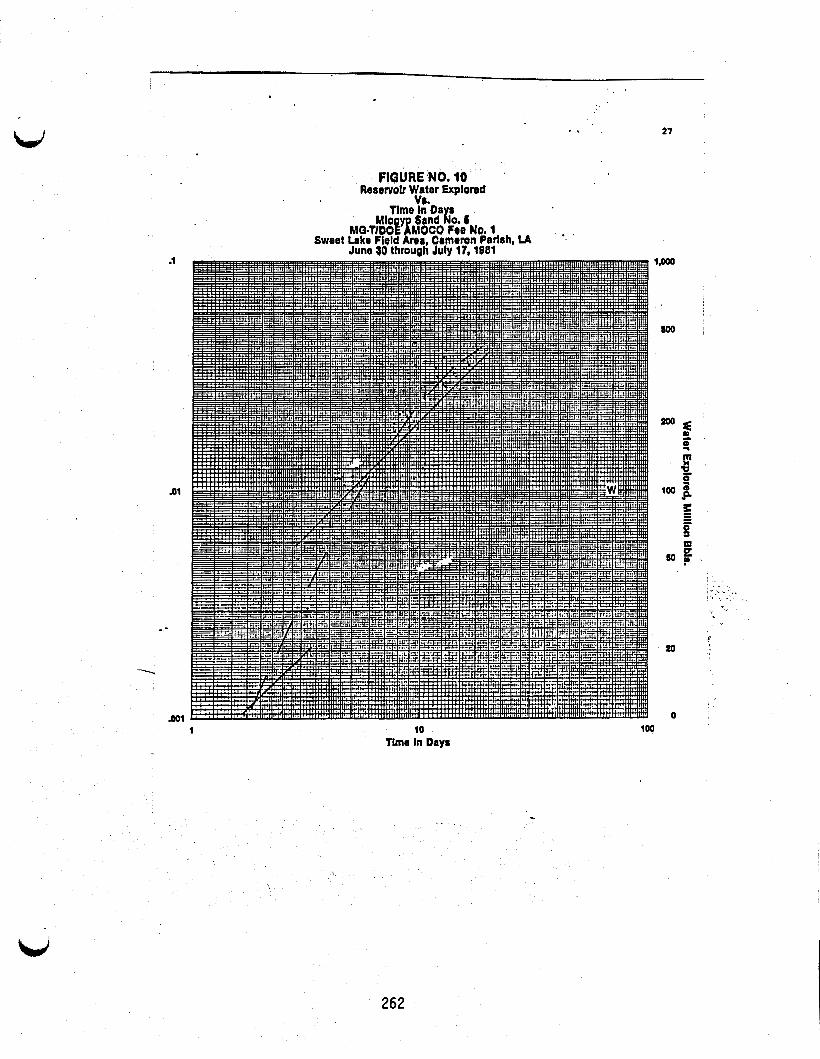
.1
BO1
FIGURE NO. 10 Resorvolr Water Explored
vs.
Mlo y Sand ho. 6 MG-TlDO!fiO~O Foe No. 1
Sweet Lake Field rea. ameron Parlsh. LA '. June 30 through July 1% 1881
1 10 t ime In Day8
loo
F z ;a a 0
262

263
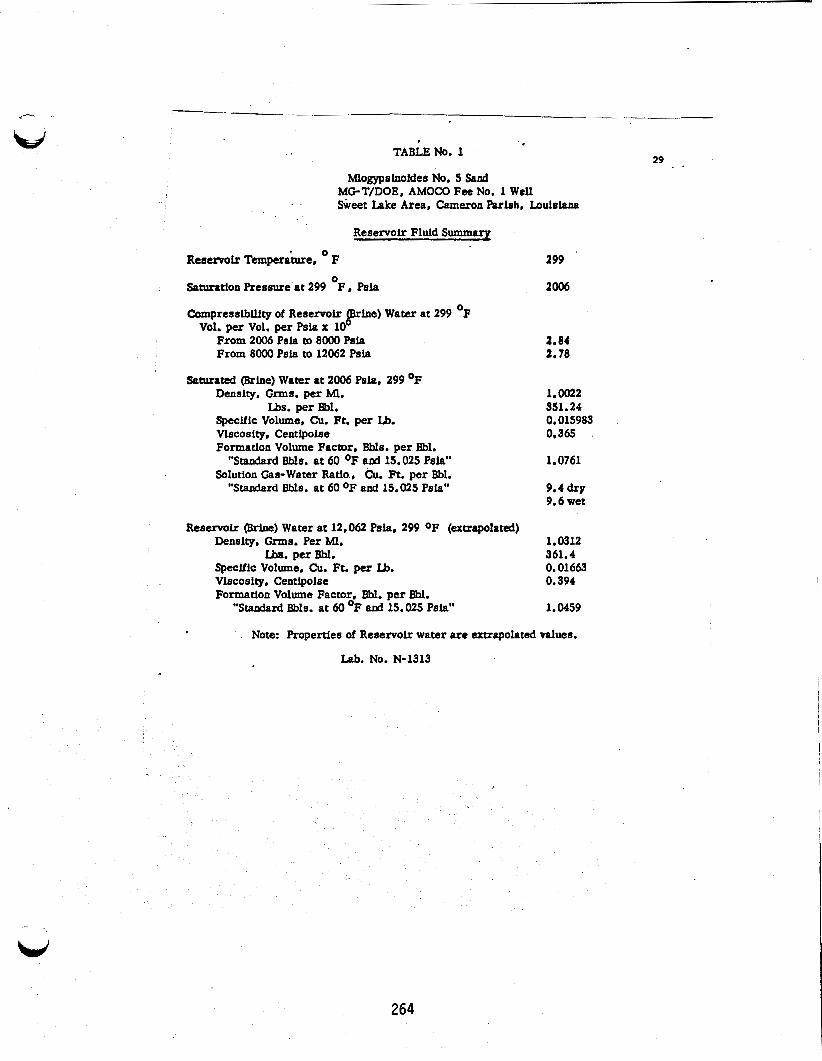
TABLENo. 1 29 . .
Wogypslaoides No. 5 Sand MG-T/DOE, AMOCO Fee No. 1 Well Skeet Lake Area, Cameron Pariah. LoulsLana
Reservoir Fluid Summaq
Rcsmlr Temperature, F 299
Saturatlon Ressure a t 299 F , Psla
Compresslblllty of Reservolr p e ) Water at 299 OF
0 2006
Vol. per Vol. per Psla x 10 2.84 From 2006 Psh tu 8000 Psla
From 8000 Psla to 12062 P s h 2.78
Saturated (Brine) Water at 2006 Psh, 299 O F Denslty. Grms. per MI.
Us. per Bbl. Specific Volume, Cu. Ft. per Lb. V l s ~ ~ ~ i t y , Centlpolse Formation Volume Factor, Bble. per Rbl. "Standard Bhls. at 60 OF a d 15.025 Psla"
Solution Gas-water Ratio., &I. Ft. per &I. 'Staedard Bbls. at 60 O F and 15.025 Psia"
1.0022 351.24 0.015983 0.365
1.0761
9.4 dry 9.6 wet
Reservolr (Brine) Water at 12,062 Psla, 299 O F (extrapolated) Density. Grms. Per MI. 1.0312
VLSCOSI~~, Centlpolee 0.394
Lbs. per Bbl. 361.4 Speclflc Volume, Cu. Ft. per U.
Formadon Volume Factor. Bhl. per Bbl.
0.01663
1.0459 "Scapdard Bbls. at 60 O F aad 15.025 Psla"
' . Note: Roperties of Reservoir water arc extrapolated values.
Lab. NO. N-1313
264
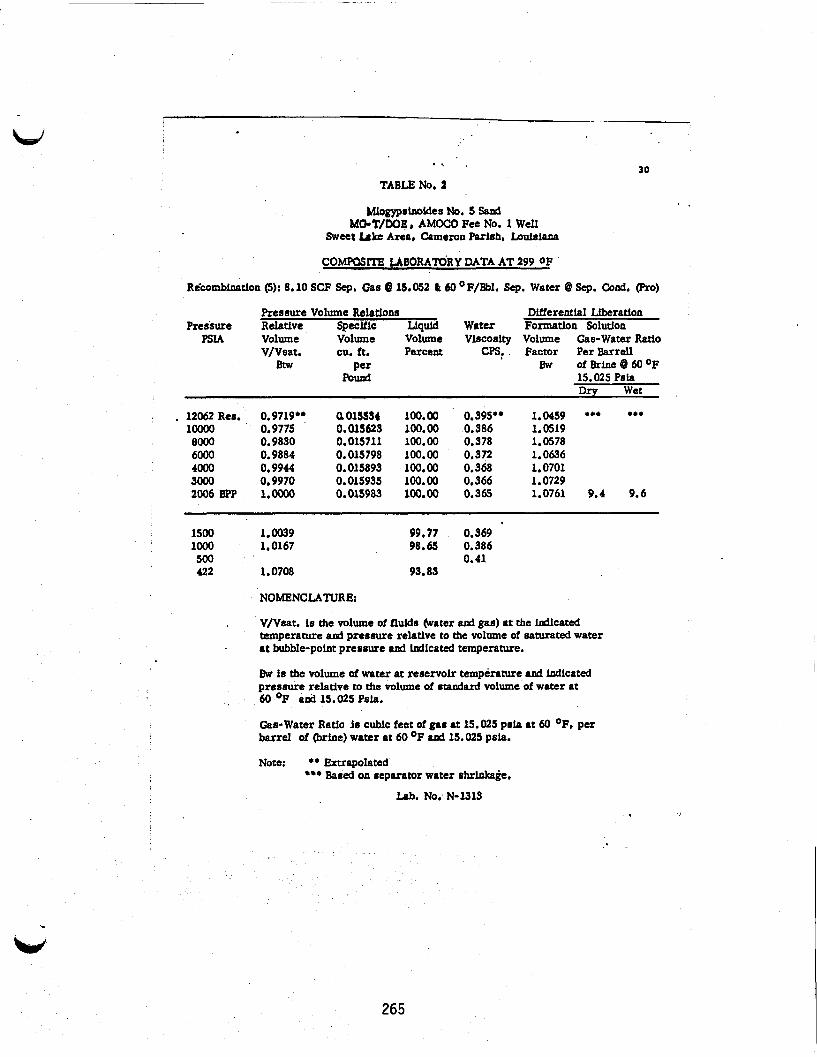
30 a , .
TABLE No, 2 * *
htlogypslnoldes No. 5 Sand M&T/DOEr AMOCO Fee NO. 1 W d l
Sweet &ke Area, Cameron Parish, bulslana
COMPOSITE UeORAmKY DATA AT 299 O F
Re'combinatlon (5): 8.10 SCF Sep. Gas 8 15.052 Q 60 OF/Bbl, Sep. Water @ Sep. Cod. (Ro)
Pressure Volume Relstlons Dtlferentlal -ration Pressure Relative Speclflc LlqM Water Formation Solution
PSIA Volume Volume Volume Vlscoslty Volume Gas- Water Ratio
BtW Der Bw ofErlne@6OoF V/Vsat. CU. ft. Percent CPS. Factor Pe rh r re l l
Po& 15.025 Psia Dry Wet
. 12062Res. 0.9719.. 0015534 100.00 0.395** 1.0459 *** *** loo00 0.9775 0.015623 100,00 0.386 1.0519 eo00 0.9830 0.015711 100.00 0.378 1.0578 6000 0.9884 0.015798 100.00 0.372 1.0636 4000 0,9944 0.015893 100.00 0.368 I. 0701 3000 0.9970 0.015935 100.00 0.366 1.0729 2006BPP Loo00 0.015983 100.00 0.365 1.0761 9.4 9.6
1500 1.0039 lo00 1.0167 500 422 1.0708
99.77 0.369 98.6!5 0.386
93.83 0.41
NOMENCLATURE
V/Vsat. 1s the volume of flulds &%iter and gas) at the Mlcated temperature and presrsure relative to the volume of saturated water at bubble-polnt pressure ond lndlcated temperature.
hu is the volume of water at reservok temperature and lndlcated pressure relative to the volume of standatd volume of water at 60 O F and 15.025 Psh.
Gas-Water Ratio Is cublc feet of gas at 15.025 psla at 60 OF, per barrel of (brlne) water at 60 O F urd 15.025 psla.
Note: ** Extrapolated *** Based on reparator water shrlnka&.
Lpb. No. N-1313
265
. .

. , .
Date Tiae
31
pble No. 3 ?%ploraticn Dravdown Calculation8 . Miogyp Surd #o..1, 8eoond ?low Temt
UG-T/DOE AnOCO ?ea lo. 1 Well
cmn. 8rB.P. . Q u a p / a t ‘ m-sw/BarM Days psi. BWPD QV BW Water Lxplored
106BhL.
1-2-81 lOI00 An 1llOO An 12100 An 13100 PU 14800 PU 15100 PM 16100 PM 17t00 PM 18100 PM 20800 PU
, 21100 PM 22100 PM 7-3-81 1100 M
5100 An 6100 An 7100 An 8100 An 9100 An 10100 M 11100 An 12100 An 7-3-81 17100 PU 18100 PU 19100 PM 20100 PU 21100 PM 22800 PU 23800 PU 24100 PU 1-4-81 - - 1800 An 2100 An 3800 An 4800 An 5100 An 6100 An 1:OO An 8100 An 9100 M 11100 M 12100 M 13100 pn 21100 pn 22100 PU 24100 PU
1.66 1.70 1.74 1.78 1.82 1.86 1.91 1.95 1.99
2.114 2.156
2.28
2.45 2.49 2.53 2.57 2.61 2.66 2.70 2.74
2 -948 2.99 3 .031 3 -037 3.114 3.156 3.198 3.239
3.28 3.32 3.36 3 .41 3.45 3.49 3.53 3.57
CMj. Chokal
CMj. Choke)
-
3.74 3.78
4.15 4.24
8SS8.32 83lS.@9 8S11.12 8497.77 8419.40 8442.79 8422.14 840.64 8388 i49 8368.38 8370.74 8353.41
8426.69
8349.57 8321 -65 8310.76 8285.40
8215.04 8246.37 8231.74
8220r17 8203.24 8193.85 8185.15 8177.36 8170.24 8164.12 8258 -12
8111.10 8144.89 8139.50 8134.56 8129.74 8124.43 8119.48 8115.40 Choke adj. 8130.43 8126.17 8023.63 8093.70 8092.10 8088 .47
8269.19
I)
as, 10s 18,438 Us179 11,206 15,360 15,396 15 , 179 15,179 14,780 14,816 1 4 , ~
13 , 838 - 15,432 15,432 15,396 15,505 15,541 15,613 15,469 15,396
15,360 ’
15,360
15,287 15,396
15,251 15,179 15,142 15 , 106 15 , 106 15,179 15,106 15,179 15,287 14,998
14 , 925 14,672 14,708 14,635
14,581 14,581
15,215
-
Choke adj.
- .03319549 .03088413 .0262287 ,0279049 .OS46927 .q?O7775 ,0264555 .0244146
.0242229
.0267735
;0422188 ’
-
- - .0325941 .025173 .0375317 .0239348 .0207965 - - Adjusting Adjusting .0261885 .013995 .0130592 .0117208 ,0107636 .0083682 .0100257
,009752 .0102949 ,00818767 ,00745818 .00723512 ,00812423 .0074654 ,0062728 - - .006646255 .00398256
.00308073S
.00285634
-
- 10.398 11.176 13.160 12.369 6.311 11.215 13.047 14.138
14.250 .12.892
8.176
-
- - 10.590 13.71 9.197 14.421 16.597 - -
- 13 -180 24.663 26.431 29.448 32.068 41.262 34.428
35.393 33.528 42.157 46.280 47.707 42.486 46.235 55.025 - - 51.934 86.667 - 112.04 120.842
. 266

D8te Tiaa
7-5-81 2100 An 4100 An 6100 An 8100 An 10100 An 12100 AM 14x00 PM 16100 PM 18100 PM 20100 PM 22100 PM 24100 PM 7-6-81
, 2r00 An 4100 An 6100 An 8r00 An lor00 An 7-7-81 9100 An 11100 An 13100 PM 15:OO PM l7:OO PM 7-7-81 19100 PM 21100 PM 23r00 PM 7-8-81 1100 An 3100 An
7100 An 9100 M 11100 An
, 5100 An
13100 pn isloo pn 17100 PM 19100 PM 21100 PM 23100 PM 7-9-81 1100 rm 3100 An 5100 An 7100 An 9100 An 11100 An 13100 PM
cum.
4.32 4.41 4.49 4.57 4.66 4.74 4.82 4.91 4.99 5.07 5.16, 5.24
5.32 5.41 5.49 5.57
- 6.61 6.69 6.78 6.86 6.95
7.03 7.11 7.19
7.28 7.36 7.45 7.53 7.61 7.69 7.78 7.86 7.95 8.03 8.11 8.24
8.28 8.36 8.44 8.53 8.61 8.70 8.78
8084.61 8080.02 8076.27 1072.11 8067 -15 8862.EO
8053.15 8049.84 8046.01
E038.50
E057.06
E042698
14,583 14,491 14,309 14,599 14,455
14,400 14,255
14,400 14,418
14,563
-14,490
14,327
.00303732
.00362192
.00296541.,
.00325363
.00395278
.00342712
.00457341
.00322751
.00262090
.00297093
.0024079
.0034928
8034.46 14,316 .0031457 8030.45 14,273 .00313823 8026.89 14,020 .002836437 8023.60 14,201 .00258790 Choke plugged Well nhut in for 35 minutes - 1005.70 E001.75 7997.36 1994.41 7990.73
7987.35 7984.97 7981 .45
7978.09 7976.03 7971.93 7970.18 7967.54 7963.73 7963 -00 7959.33 7957.35 7955 .58 7953.73 7950.41
7947.50 7945.79 7943.44 7941.14 7939. 50 7936.97 7935.13
13,621 13,367 13,336 13,187 13,313
13,078 13,169 13,223
13,078 ‘13,005 12,969 12,951 12,879 12,896 12,915 12,897 12,879 12,842 12,860 12,897
12,842 12,860 12,806 12,770 12,843 12,876 12,752
.00320644
.003300797
.00367839
.002498895
.00308765
.00289039
.00202635
.0029736
.0028699
.00176936
.00353129
.0015094
.00228978
.0016112996 ,00242682 .003088946 .001943318 .00158232 .001651519 .0029554
.0026014356
.00152654
.00210672
.00206771
.001466044
.0022554
.001656568
32
W-Sw/BvCm Water Explored
‘ 106BhLn
113.642 95.300 116.398 106.089 87.323 100.716 75.473 106.945 131.698 101.233 124.901 86.106
95.608 95.836 106.033 116.216
- 93.797 91.116 81.763 120.355 97.406
104.054 , 148.422 101.141
104.796 169.981 85.169 199.254 131.347 213.575 141.804 111.408 177.085 217.487 208.374 116.441
132.286 225.432 163 -350 166.432 234.736 152.581 207.739
267

W Date T h e
7-9-81 15100 PU 17100 PU 19roo PU 21100 PU 23100 PU 7-10-81 1100 AM 3100 M 5100 AM 7r00 An 9100 AM 11100 AM 13100 PU l5t00 PU 17100 PU 18100 PU '
7-11-81 2rOO An 4100 An 6rOO M 8rOO AM 10100 An 12100 An 14100 PM 16100 PU l8rOO PM 20r00 PU 22100 Pn 24100 PU 7-12-81 2100 AM 8r00 An lor00 An l2rOO An
7-13-81 2100 An 4100 AM 6100 An 8:OO An 10100 An 12100 An . 14100 PU 16r00 PU 7-14-81 8100 An lOtOO An 12100 An
cum. . 8.X.P. Days , pmia
8.86 7933.24 8.95 1931.27 9.03 7929.28 9.11 7927.49 9.20 7925.47
9.28 7924.62 9.36 7921.53 9.45 7920.45 9.53 7918.82 9.62 7917.12 9.70 7915.10 9.78 7913.26 9.87 7911.76 9.95 1910.43 Choke Mjurtment
10.32 10.41
10.57 10.66 10.74 10.82 10.91 10.99 11.07 11.16 11.24
10 L 49
7873.62 7870.59 7867.99 7866.51 7867.49
7862.23 7861 .OS 7859.64 7854.59 7852.06 7849.56
1864.32
11.32 7847.59 11.41 7849.19 11.66 7839.98 11.74 7838.75 Production Problems
12.32 12.41 12.49 12.57 12.66 12.74 12.82 12.99
7857.53 7857.04 7856.16
7854.15 7852.98 7852.41
7855.30
7849.64
13.57 zwk.69 13.66 7840.86 13.74 7839.47
~~
w BWPD
ia,712 12,752
12,943 12,679
12,824
12,752 12,661 12,734 12,679 12,679 12,698 12,553 12,716 12,661
12,680 12,715
12,734 12,752
- - 12,700 12,426 12,715 12,715 12,860 12,896
12,752 12,152 12,679 12,679
11,075 11 ,075 11,075 11,147 11,183 11,147 11 ,111 108931
11,002 11,002 10,821
33
&& , W-Sw/BwCwY Ow BW * y . , Water Kxplored
' 106BhLS
.001704926
.001773608
.001781486
.001625383
.00182613
.000765262
.003010391
.000973708
.001475895
.001539277 ,001826358 .00168283 .001354287 .001205970
,002363 149 .002735766 .0023408028 .00133434 -
- . .00128274 .001090193 .001273079 .0044364 .00258563 .0022552
.001773539
.00393189 ,0009869479 .00111371
.0007976209
.000507577
.0009115668
.000885095
.001179748
.001204141
.0005885336 ,001818636
.0009697S24 ,000865478 .00145245
201.846 194.030 193 -172 211.724 188.419
449.400 114.314 353.426 233.169 223.569 188.426 204.497 254.107 285.358
145.625 125.790 147.015 257.905 - - 26i.802 315.663 270.316 75.474 152.368 154.628
194.038 87.523 348.684 308.997
431.148 677.519 377.255 388.538 291.497 285.592 584.322 183.055
354.620 397.345 236.767
268

Dato Tima
7-14-81 16100 PX 18100 PX 22100 PM 24100 PX 7-15-81 2100 An
l4rOO PX 7-16-81 2100 An 6r00 An 8r00 An 10100 An 12x00 An 16100 PM 22100 PU 24100 PX 7-17-81 2100 An
cum. 3 *"YS
13.91 13.99 14.16 14.24
14.32
14.82
15.32 15.49 15.57 15.66 15.74 15.91 16.16 16.24
16.32
7838.50 10,894 .00104255 . 7837.24 10,810 .0013360816 7835.18 10,930 .00108409 7834.24 10,749 .001003154
7133.06 10,749 .001259399 Changing Aatos 7018.64 10,678 .00122528
7915.45 7814.37 7813.09 7811.94
7809.28 7805.35 7804.46
7811 e02
10,709 10,709 108709 10,708
10 I 788 10,725 10,804
10,613
,00146765 .00098557 .00137123 ,00123208 .000994481 .000926558 .00161412 .009450504
7803.52 10 , 741 .001003998 Ute ohangos, prossure went up.
. *
34
W-Sw/BWCVY Water Explored
106BhLs
329.857 257.389 318.095 342.812
273.061
280.664
234.316 348.927 250.792 279.116 345.799 371.151 205.417 363 .E89
342.523
- .
269

W 3s
' Pressure and Temperature Gradients MG-T/DOE Amoco Fee No.1 Well
Sweetlake Prospect, Cameron Ph., Louisiana
Conducted Reservoir Data Inc. on June 17, 1981. Gauge: EPG 512, SN47553, GRC Cate: June 17, 1981 Time 13:49:20 14: 16:OO
- Pressure, psia D-ation) 3999.51 3000' . 5684.51
14 :27:00 4000 ' 14: 37: 00 5000' 14: 47: 00 6000 ' 14: 57:OO 7000' 15: 06: 00 8000 ' 15: 17:OO 9000' 15:27:00 10,000' 15: 38 : 00 11,000' 15: 4 8 :00 12; 000 ' 15:57: 00 13,000' 16:07:00. 14,000' 16:15:00 15 , 000' 16:21:50 15,400' 16: 25: 00 16:30:00 16: 35: 00 16:40:00 16: 50: 00 17: 00: 00 17 : 30 : 00 18:OO:OO 19r00:00 20: 00: 00 21:oo:oo 22:oo: 00 23:OO: 00 Date: June 18, 1981 00 : 0 0 : 0.0 o1:oo:oo I
01: 12: 00
m
I
I
I
I
m m n
I
m m
m I
I
m
6216.63 6784.08 7291.14 7847.43 8365.74 8893.68 9587.15 9916.95
10,450.92 11,011 .20 11,626.79 12,209.62 12 , 420.65 12,415.83 12,409.17 12 , 403.75 12,398.65 12,389.28 12,380.71 12,357.58 12.336.32 12i262.49 12,228.74 12,198.53 12,172.38 12,149.47
12,129.48 12,111.66 12,108.30
Temp. ,* F 95
108 120 132 147 161 176 190 214 231 250 267 284 296 299 299 299 299 299 299 299 299 299 299 299 298 295 299
299 299 299
2 70

C
Q 3 tn tn
I
L
2 n
.ow1 .001 .01 .l 1 10
Tlme In Days
271
3 16
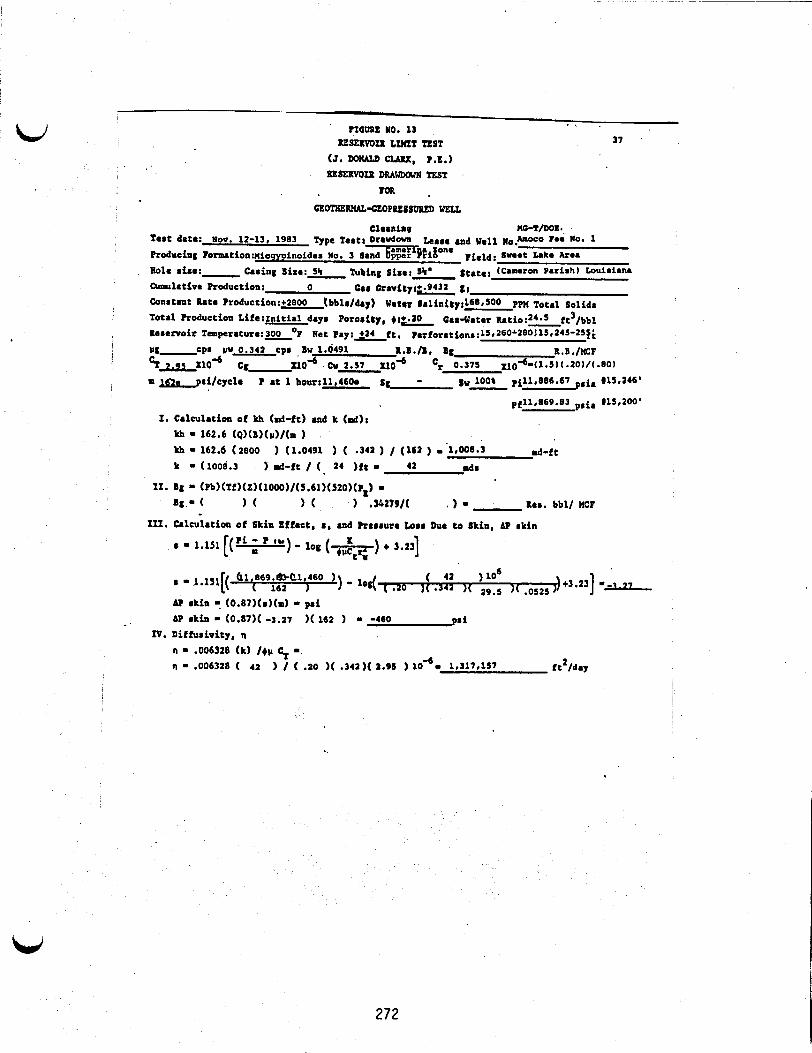
W a . . IIGURE NO. 1)
( J . D O W CLAIX, P.E.1 XESERVOIX DRMJWVW TEST
*
~ ~ W - c E O P p L # 8 V p m WELL!
Chasing ffi-T/DOS * Tart date: Woo. 12-13, 1983 vpe Teatr Drwdm Laare .nd Well
Bole rim: Casing Bira: 5% ~ b i n g Sire: 5%. State: louiaiana
Constant Rate Production:+28OO tbblr/dry) WaCep Sa1inikyr168e500 Ppw Total Solido
Total Production Life:Initial day Pororfky, +I- CaaYater R ~ t i o : ~ ~ . ~ ft3/bbl Xerervoir Temperature:aO? Net Pay: 224 ft. ?erforationr:~5r260~2a0:15~Z45-25~~
Produciog Formation:niogypinoidas No. 3 Sand '6am.fSki8°ne w a r pirid: SwOt Uk. -0.
Cumlatfve Production: 0 ear mavftyr+.9432 21
=me paf/cych ? at 1 bwr:11,460e sg - 1001 pi11,886.67 (lSr246'
272

CE J (actual) -- I 9.122 OR 212.2) x - J ( ideal ) ( 3.2184 ) . IMPOSSIBLE
Distance t o Barriers or Di8COntin~iti88, d d - 2 <
.0007
.03
.09
-32
.56
2800 60.7
2800 397.5 -- 2800 688.5
3500. 1298 -- 4000 1717 --
162t 360.7 34.254231
1627 360.) -7992654
6207 95. 1.019639
6207 ' 94* .2294188
12707 60' .2349692
- * -
-
- - 1.00 4000 2295 12707 ' 60' -13158276 - -- (7758)~.20)/(1.0491) - lr479 lblr./Ac. ?t. ~397.5)'ZT/l43.560) - 11.4 acres (11.4 Ac.)(24 ?t.)(1,479 B/Aclt) - 404,654 lbls (2295)'12/(43,560) - 379.9 Acres (379.9 Ac.)(24 ?t.)(1479) - 13,484,930 Ibla. (2,818,714 BblsJ(1479)(379.9J - 5.02 ?met Wet.
Bbls. of Aquifer fxclorrd or rested
10,828
464.044
363,150
1,616,669
1,578,480
2,818,714
273

?I(IURL W. 14
W
11. Bg - ~ P b ~ ~ T f ~ ~ Z ~ ~ l O O O ~ l ~ 5 . 6 1 ~ ~ 5 2 0 ~ ~ ? ~ ~ - ag - ( I ( ) .X279/( 1 - Rer. bbl/ XCF
111. Calculation of Skin Effect, a, and ?rerrure Loss Due t o Skin, AP skin
274
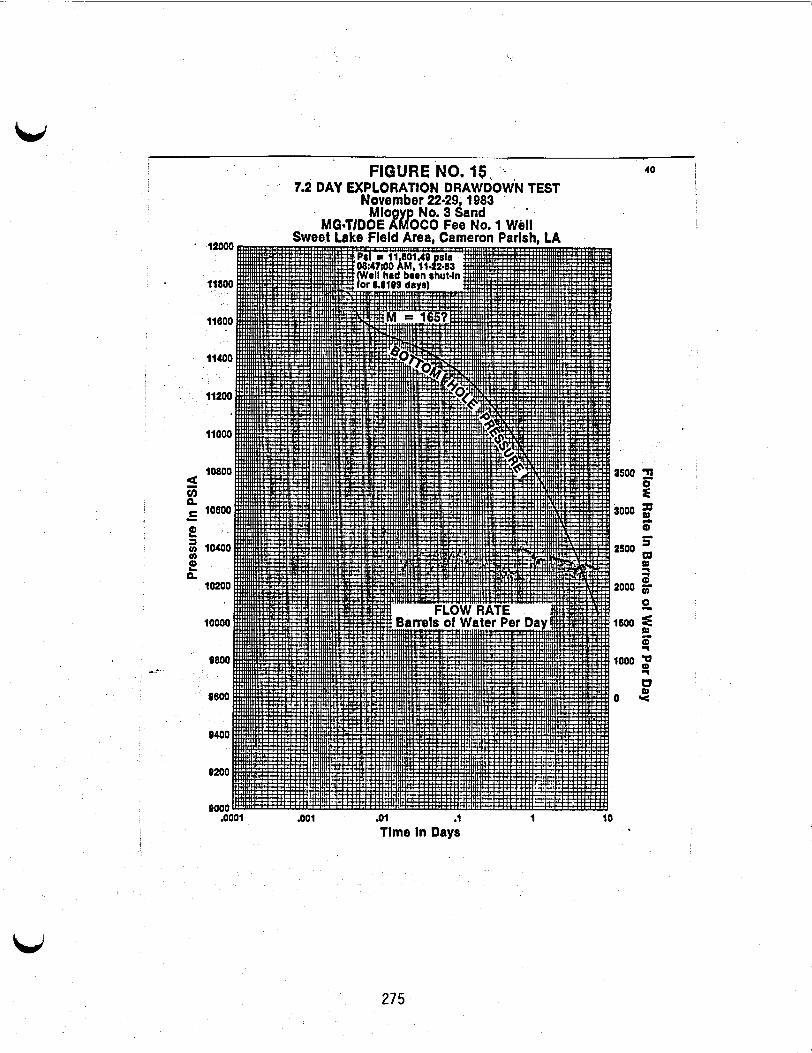
i
.001 .Ol .l Time In Days
1 10
275

. , . lIGvRI YO. 16
RESLRVOIR mm' FOR .
~ ~ ~ - c e o P R x s s ~ VELt
Exploration UG-T/DOE
41
(11,795 )-( 11,430 ) ( 34 ) l o 6 - lo' ( .20 )( .342 )( 2.95 )( ,0525
2 76

.. ?IC= 10. 16A . \ .
R f S E R V O I I L I X I T TEST ( J . DONALD CLARK, P.E.) 42
. . OSIIVOII DWAXJX TEST (CONT'D) '
xrploration HC-T/DOS Tart Dace: wov: z i - ~ e c . 7 , 1988 Type Test: pradown
Calculaciou of Productivity Index (B/D-pril md Co&etion Efficiency, CE
Leare and Vel1 No.&noco ?ea Wo.1
-
r;
6.3014 Bbh./D-pSi ( 2300 ) J (actual I - m
p; - pf ' ( 11794 -11430 )
timatdays ,
.oiori
-0118 -0137 .0146 .0160 .Ole75 .0229 .0299 .509 1.009 1.509
2.05 3.05 4.134 5.13 6.13 6.63
6 d,. 2720 2l1
2 6 2 124 a 6 l . J . L 2165.5 250
-- 2544.8 261 2242.0 283 2315.4 312 2393.8 357 2112.7 1.473
2074 2175 2537
2228 2951 2209.7 3606 2202.2 4199 2300 4677 2160 5113 2130 331'1
--
8 Flow Jonas Y Bblr. of Aquifer ( p r l / c y e l e ~ Function Explored or tasted
:165 7 2.499141 .148'
tl6S 7 2.32053 .159 2.432386 .152 .
tl6S 7 2.042939 .182 7 1 .eoa673 .206 t165
t165 7 1.052636 , .392 tl64 7 1.393793 .267 t16S . ? 1.186521 314
A L -
412.16(dp/dtl 7 >47.52(dp/dtl 7 246,24(dp/dtI 7
173.52(dp/dtI 7 129.36(dp/dtl 7 118,00(dp/dtI 7 80,5S(dpldtI 7 77.16(d~/dtI 7
.2310739
.0925169
.07443090
.05494186
.05l,t0301
.0335536 ,0341351
1.605 2.688
. 4.009
4.983 6.630 7.244 11.054 10.865
73.14(dp/dti 7 .03281297 11.. 303
277
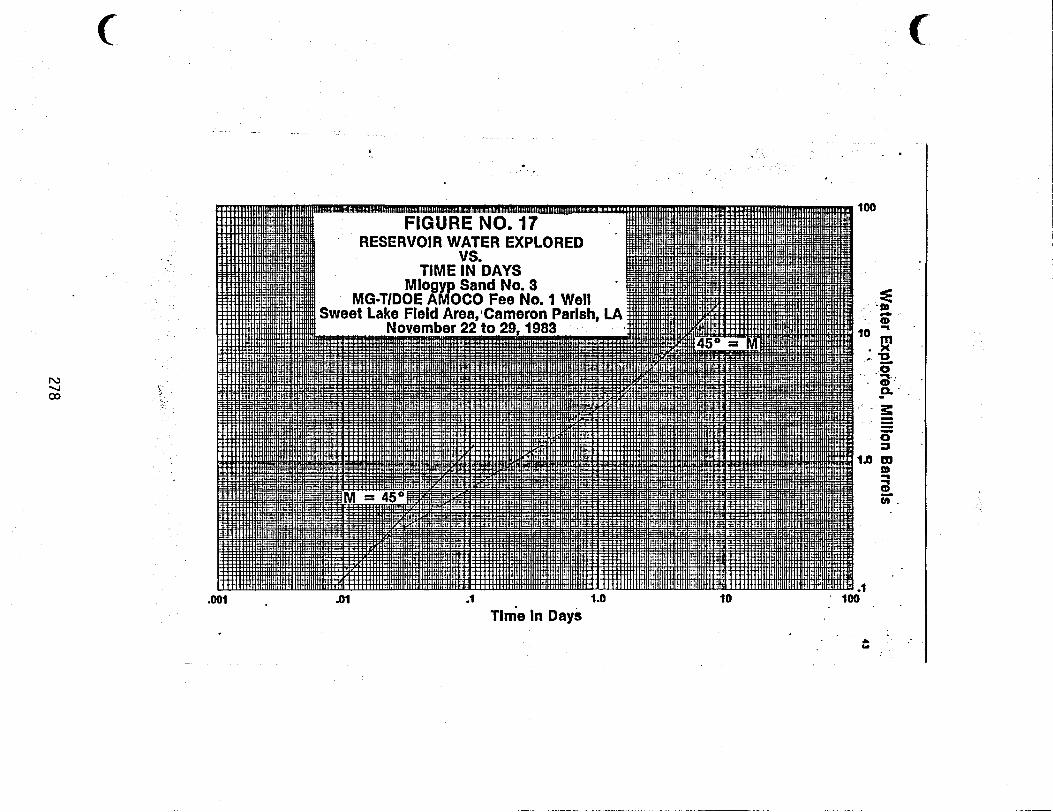
.OOl .01
6 . . . .
.l 1 .o Time In Days
10 ' 100-
L w

I .
.OOl 81 . .l 1
TIme In Days 10 100
44
279
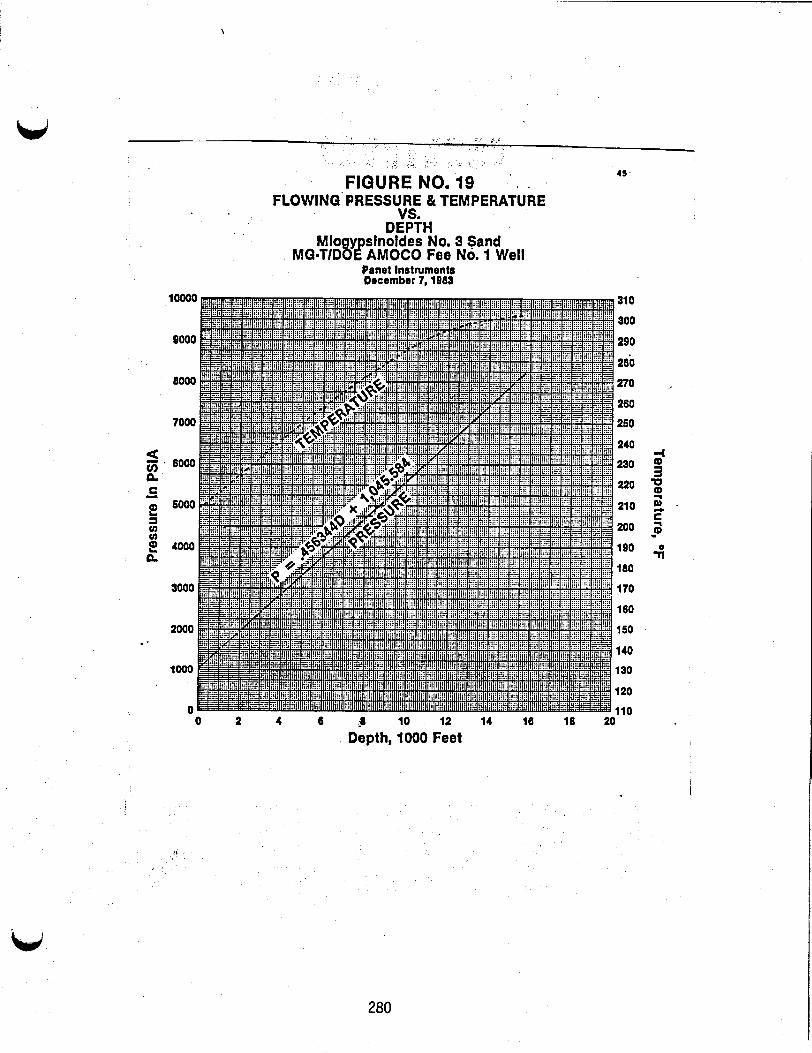
\
a E ' P-
2 a
?! n
v) v)
FIGURE NO. 19 * .
FLOWINO'PRESSURE & TEMPERATURE VS.
DEPTH Mlo y slnoldes No. 3 Sand
MG=T/D8€!AMOCO Fee No. 1 Well Panet Instrument6 December 7,1883
0 2 4 6 b 10 12 14 16 18 20
Depth, 1000 Feet
3 3 L U
d
I
V
280

cj
Date Time
46
Table Mo. 5 lkP1oration Dradown Caloulations
' Miogypsinoide6 No. 3 Sand (15,245 ft.-lS,280 ft.) November 22 thru December 7, 1983
Sweet Lake Area, Cameron Pb., Lauiriana MG-T/DOE hoc0 Fee Uo. 1 Well
11-22-83 0.47 An 9100 AM 9:02 AM 9x04 M 9806 AM 9108 AM 9810 An 9112 AM 9114 AM 9120 AM 9125 M 9130 AM 9135 AM 9840 AM
. 9850 AM 10100 AM 10810 AM 10820 AM 10830 An 11100 M 11130 M 12800 PM 12130 PM 13800 PM\ 13130 PM l4:OO PM 14130 PM 15r00 PM 15830 PM 16100 PM 16830 PM. 17800 PM
WSw/BwCwY Water Explored
1 Ohbls
cm. B.I.?. Qw 4 p / a t - y -fl pria BWPD Qv BwC
0 -00902 e 0 104 17 .0118 -0132 e0146 .0160 -0174 .0188 -0229 e0264 -0299 e0333 ,0368 *0437 a0506 .OS76 ,0646 ,0715 e0924 -113 ,134 ,155 176 197 .211 .238 -259 .280 .301 e322 342
11,795.14 11,533.13 11,S23.11 11,514.98 11,507.67 1 1,501 e24 11,194.57 11,486.96 1 1 ,403.54 11,469.51 11,459.18 11.448.09
11,422.21 11,414.35 11,399.97 11,386.02 11,369.21 11,361.58 11,329.48 11,299.75 11,274.68 11,250.91 1 1 ,228.57 11,208.01 11,189.54 1 1 169.69 11,152.12 11,135.47 1 1,119.65
11,089.97
11,439.81
11,104.24
B r = 1.0491, Cw ='2.57~15~, C = -9975
17r30 PM -363 11,076.08 18800 PM .384 11,062.57 18830 PM * -405 11,050.15 19r00 PM .426 11,037.52 19830 PM -447 ' 11,025.72 20100 PM e467 11,014.03
0
2,720 2,452 2,068 2,166 2,545 2,286 21242 2~31) 2,269 2,394 2,438 2,312 2,308 2,394 2,316 2,328 2,315 2,329 2,300 2,350 2,325 2,326 21271 2,312 2,327 2,278 2,225 2,275 2,275 2,272
-
2,155 2,168 2,156 2,172 2,121 2,170
- - 2.492893 2.314732 2.426305 2.037362 1.803187 2.290399 1.049526 1.389914 1.252935 1.182916 1.018206
0.4686 19
.E28836
2.102159
0.826547
e993613 -442013 e632189 -592896 ,489326 .468940 .440540 e415257 -366430 -391269
,343238 -318960 .3 10694
.353777
e288089
.195642 a285830 e264231 ,266120 ,255184 -241096
- - 0.148 0.160 0.153. 0.182 0,206 0.162
0.267 0.296 0.314 0.364 0.176 0.791 0.449 0.447 0.373 0.839 0.581 0.626 0.758 0.191 0.842 0.893 1.012 0.948 1.048 1.081 1.163 1.194 1.267
0.353
1.254
1.404 1.391 1.453 1.501
1.298
281
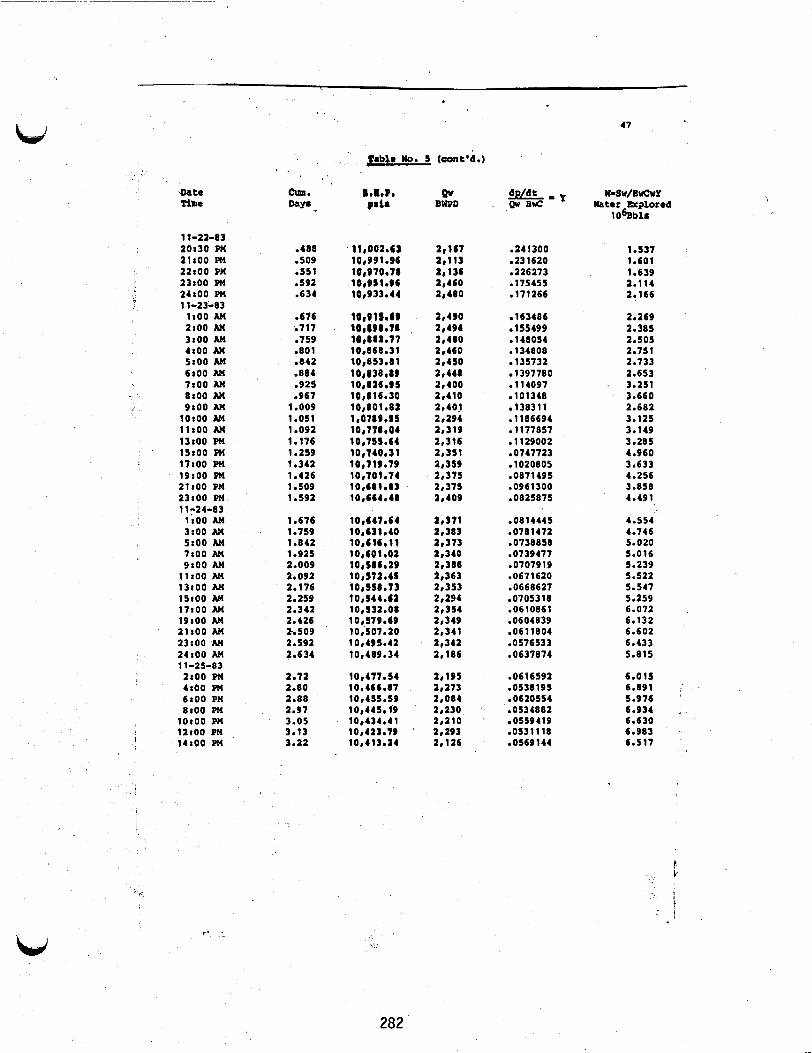
W
+r
Sate Tihe
11-22-83 20t30 PM 2l:OO m 22rOO PM 23rOO PM 24100 PM 11-23-83 1100 AM 2rOO AM 3r00 AM 4rOO Ax 5r00 AM 6r00 An 7rOO AM 8100 AM 9t00 Ax
lor00 AM 1lrOO AM 13100 PM 15t00 PM l7rOO PI4 19100 m 21rOO PI4 23r00 PM 11:24-83 lrOO AM 3t00 AM 5r00 AM 7rOO AM 9t00 Ax 11roo AM 13r00 AM 15roo AM 17r00 AM 19r00 AM 21roo AM 23r00 AM 24100 AM 11-25-83 2r00 PM 4 r O O PM 6rOO PM 8r00 PM 10100 PM l2rOO PU l 4 t O O PM
. .
cmn. --.
,488 .so9 .551 -592 .634
e676 '-717 .759 .eo1 A42 .884 .925 a967 1.009 1.051 1 a092 1.176 1 e259 1.342 1.426 1 .so9 1.592
1.676 1.759 1 .E42 1 e925 2.009 2.092 2.176 2.259 2.342 2.426 x509 2.592 2.634
2.72 2.80 2.88 2.97 3.05
3.22 3.13
.-
. - _
D*E*P* OIL.
11,002.63 10,991.96 101970.78 10,151.16 10,933.44
108s1se61 i0~a0a.78 181882.77 10,868.31 10,853.81 10~838rW lOr8t6.Y 1 lot8 16.30 10,801 e82 1~0789r11 10,178e04 10,715.64 10,740.31 lO*llY e79 10,701.74 10166 1.83 101664.48
10,641.64 10,631.40 10,616.11 10,60 1.02 10,586e29 1 0,112.45 10,118e73 10,944.62 101131.08 10,179 69 10,107.20 10,491.42 10,489.34
lQ1477. 1 4
10,155.59 10,445.19 10,434.41 10,423.19 10,413.34
10.466.87
Qv BWPD
2,167
3,136 2,460 2,480
2,490 2 , 494 2,480 2 ~ 4 6 0 21450 2,446 2,100 2,410 2,401 21294 2,319 2,316 2,311 2,319 2,375 2,375
1,113
a, 409 28371 2,383 2,373 21340 2,386 21363 2,353 21291 21354 2,349 2,341 2,342 2,186
2,191 2,273 2,084 2,230 2r21O 21293 2,126
.241300 -231620
-175455 a226273
e171266
163486 el55499 148054 -131808 135732 1397780
- 1 1 4097 .lo1348 13831 1 ,1186694 1177857 1129002 ,0747723 .lo20805
.0961300 -0825875
-0814445 .0781472
-0739477 .0707919 ,0671 620 -0668627
.0610861
.0604839 06 1 1804 .OS76533 .0637874
*0871495
e0738858
07053 18
-06 16592 .OS38195 .0620554 e0534882 0559419 .OS311 18 OS69 144
47
CSw/BwcrU Water mglored
106Bblr
1.537 1.601
2.114 1.639
2.166
2.269 2.385 2.505 2.751 2.733 2.653 3.251
' 3.660 2.682 3.125 3.149 3.285 4.960 3.633 4.256 3.858 4.491
4.554 4.746 5.020 5.016 5.239 5.522 5.547 5.259 6.072 6.132 6.602 6.433 5.815
6.011 6.891 5.976
6.630 6.983 6.517
6.934
. i
\:
282

w 48 * . .
Date r i m e .
11-25-83 16r00 PM 20roo PM 24rOO PM 11-26-83
4tOO AM 8100 AM 9r00 AM 12r00 AM 14:OO AM 16100 AM 20100 AM 24rOO AM 11-27-83 4rOO PM 8r00 PM 12100 PM 16r00 PH 19r50 PM 24100 PM 11-28-83 4rOO AM 8r00 AM 12100 AM 16r00 AM 20:oo AM 24tOO AM 11-29-83 ltOO PM 4rOO PM 5150 PM
13113 PH 14100 PM l6rOO PM 18rOO PM 2OrOO PM 24r00 PM 11-30-83
4 r O O AM 8rOO AM 12tOO AM 24100 AM 12-1-83 l2:OO PX a r o o pn
Tabla No. 5 (cont'd.)
W-Sv/Btrcvll Water k p l o r c d
cum. B.I.P. ow myr psi8 EWPD
10fJBb1s
3.30
3.64
3.80
4.05
4.22
4.47 4.64
4.80 4.97
5.30 5.47
3.47
3-91
4.13
4.30
. 5.13
5.63
5.80 5.97 6.13 6.30 6.47 6.63
6.68 6.80 6.88
7.19 , 7.22 7.30 7.38
7.63,
1.80 7.97 8.13 8.63
7.47
9.13 9.63
10,402e84 10,J81.14 10,365.00
10,547.43 10,319.63 10,318.51 10,303 e82 10,195.10 10,287.11 10,270.88 10,254.16
10,238.40 10,221 -87 10,208.47 10,193.55 10,181.06 10,166.79
10,153.13 10,1(0.04 10,127-18
10,102~Y9 10,090.80
10,087. I 9 10,01%20 10,073.80
1 0, i 5s. 17
now meter 10,04t.O5 9,022.05 8 , 614 21 8,998.93 8,931.11 8,834 92
0 , I 5 1.98 8,681.65 8,524.27 8,026.18
7,756 20 7,639.19
. . 2,129 .OS34978 6.933 1,216 .0509727 7.276 2,125 .0467988 7.926
1,222 .0474094 .047824 1 2,134
Presaure element moved 2,102 .0512030 2,200 .0454512 2,200 .0421675 1,200 .0430796 2,200 ,0427929
7.823 7.755
7.244 - e.160 8.796 8.610 8.667
2,200 .0410729 9.030 2,250 .0421223 8.805
2,273 a0328751 11.282 2,270 . .0337949 10.975
2,261 .033 1451 11.190
2,300 ,0335536 11.054 2,275 .0374546 9.904
8
2,268 .ON5326 10.740
2,160 .0341357 10.865 2,146 -03 18202 1 1 -656 2,131 .0330444 11.224 2,130 -0328130 11.303
2,000 2,000 1,990
1,990a ? ?
5,881 Sr704 5,518
5,414 5,394 5,786 6,612
out of service
6,423 5,986
-0333691 11.115 .0332162 11.166 -0339451 10.926
.0399229 9.290 Rate increased above 5000 BWPD for apecia l gas-vater r a t i o and gas composition studiea. Presaurea and r a t e s not s t a b i l i z e d for v a l i d ca lculat ions . .OS85566 .0498340 Not val id .lo39684
283
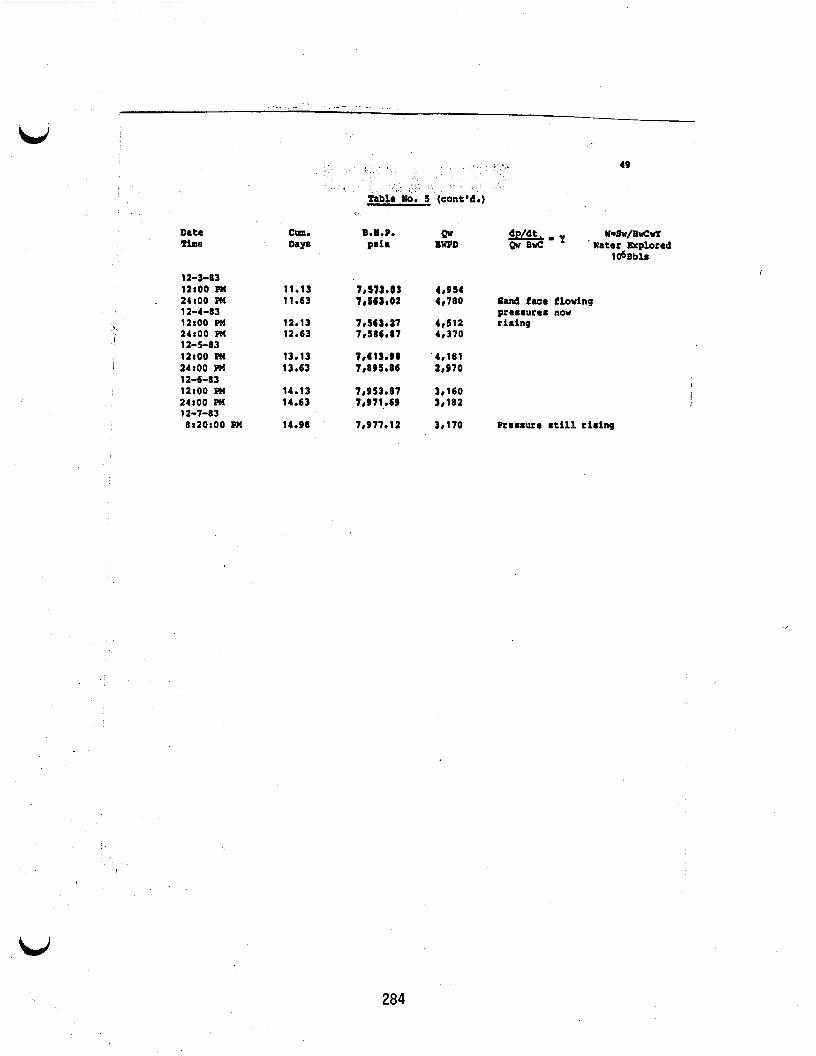
- _c
U ,
h I
~I
Table' 100. 5 (cont'd.)
12-3-83 12100 PII 24100 PI4 12-4-83 12IOO PM 24100 FM 12-5-83 l2:OO pbl 24100 PM 12-6-83 12:OO FM 24100 pbl 12-1-83 8:20:00 Pn
11.13 11.63
12.13 12.63
13.13 13.63
14.13 14.63
14.98
Qw 8WPD
4,954 4,780
4r5lZ 40370
4,181 a m 0
3,160 3r182
3,110
49
W-Sw/BwCwX
1dBbla $%! ' ' Water Explored
/
Sand face flowing prearurea now riaing
Preaaure a t i l l riaing
284
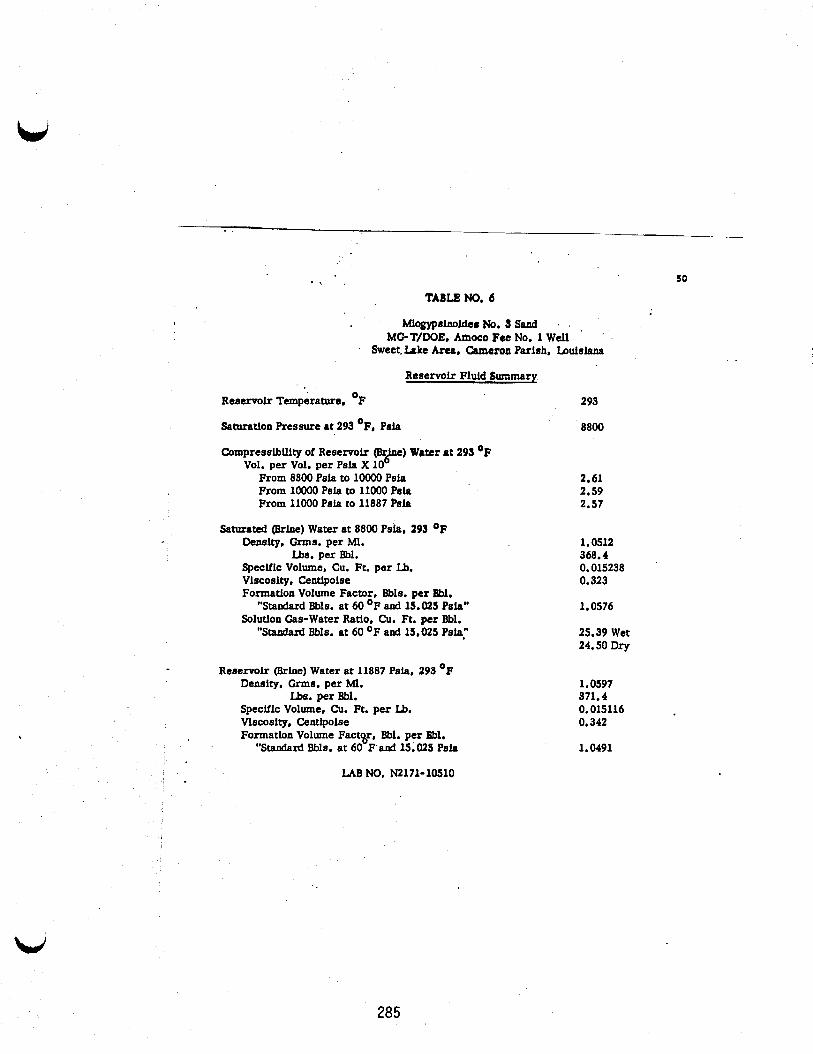
50 - % .
TABLE NO. 6
MiagyprlnoLder No. 3 Sand . . MG-T/DOE, Amoco Fee No. 1 Well '
Sweet. k k e Area, Cameron Parlsh, b u l s h
Reservoir Fluld Summary
Reservoir Temperature, O F 293
Saturatlon Pressure at 293 OF, Psia 8800
Compresslblllty of Reservolr (Br Vol. per Vol. per Psk X 10
) Water at 293 OF P From 8800 Psla to loo00 Psla From loo00 Psh to 11000 Psla From 11000 Psla to 11887 Psia
Saturated (Brhe) Water at 8800 Psla, 193 OF Denslty, Grms. per Ml.
Us. per Bbl. SpecUlc Volume. Cu. Ft. per Lb, Viscosity, Centlpolse Formation Volume Factor, Bbls. per Ebl.
Solutlon Gas-Water Ratio, Cu. Ft. per Bbl. "Standard Bbls. at 60 O F and 1S.025 Psk"
"Standard Bbls. at 60 O F and 15,025 Psla,"
Reservolr (Brine) Water at 11887 Psia, 293 OF Density, Grms. per Ml.
Us. per Bbl. SpecMc Volume, Cu. Ft. per Lb. Vlscosky, Centlpolse Formation Volume Factgr, Bbl. per Bbl.
"Standard Bbls. a t 60 F and 15.029 Psi0
LAB NO, NZ171-10510
2.61 2.59 2.57
1.0512 368.4 0.015238 0.323
1.0576
25.39 Wet 24.50 Dry
1.0597 371.4 0.015116 0.342
1.0491
285
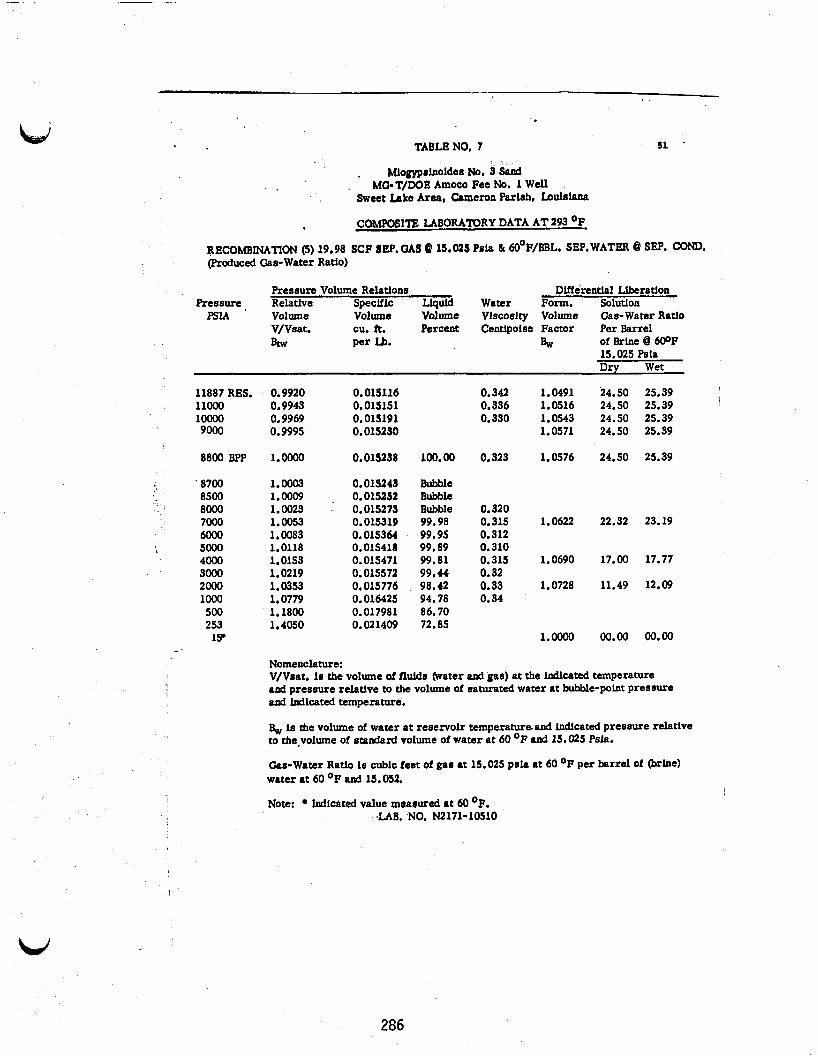
TAELENO, 7 SI .
. Mlogyprinoldes No. 9 Sand
Sweet h k e Area, Cameron Parlsh, Laulslana Ma-T/DOE Amoco Fee No. 1 Wel l
COMFOSITE LABORATORY DATA A T 293 OF
RECOMBINATON (S) 19.98 SCF SEP.OAS @ 15.02s Psla 81 aOoP/BBL. SEP.WATER 8 SEP. Corn. (Produced Gas-Water Ratlo)
Pressure Volume Relations DlfferentIal LlberatIon Pressure Relative Speclric LlqU Water Form. Solutlon
PSlA Volume vo~llme Volume vlSCO8ky Volume Gas-Water Ratlo V/Vsat. cu. a. Percent Centipoise Factor Per Barrel
of Brine @ 600F 15.025 Psla D r y Wet
&v per U. hv
11887 RES. 11000 loo00 9000
8800 EPP
' 8700 8500 8000 7000 6OOo 5000 4000 3000 2000 lo00 500 253 1 9
0.9920 0.015116 0.9943 0.015151 0.9969 0.015191 0.9995 0.015290
1.0000 0.015238
1.0003 1.0009 . 1.0023 . 1.0053 1.0083 1.0118 1.0153 1.0219 1.0353 1.0779 1.1800 1.4050
0.015243 0.015252 0.015273 0.015319 0.015364 0.015418 0.015471 0.015572 0.015776 0.016425 0.017981 0.021409
100. 00
Bubble Bubble Bubble 99.98 99.95 99.89 99.82 99.44 98.42 94.78 86.70 72.85
0.342 0.336 0.330
0.323
0.320 0.315 0.312 0.310 0.315 0.32 0.33 0.34
1.0491 1.0516 1.0543 1.0571
1.0576
1.0622
1.0690
1.0728
Loo00
24.50 25.39 24.50 25.39 24.50 25.39 24.50 25.39
24.50 25.39
22.32 23.19
17.00 17.77
11.49 12.09
00.00 00.00
Nomenclature: V/Vsat. Is the volume of fluids water md gas) at the lndlcated temperature and pressure relatlve to the volume of saturated water at bubble-point pressure and Indlcated temperature.
B, Is the volume of water at reeervolr t e m p e r a t u r e 4 lndlcated pressure relatlve to the,voIume of standald volume of water at 60 OF and 15.025 Psk.
Gas-Water Ratio le cublc feet of gar at 15.025 pela at 60 OF per barrel of @he) water at 60 OF and IS. 052.
Note: Indlcated value moaeured at 60 OF. "LAB. NO, N2171-10510
286
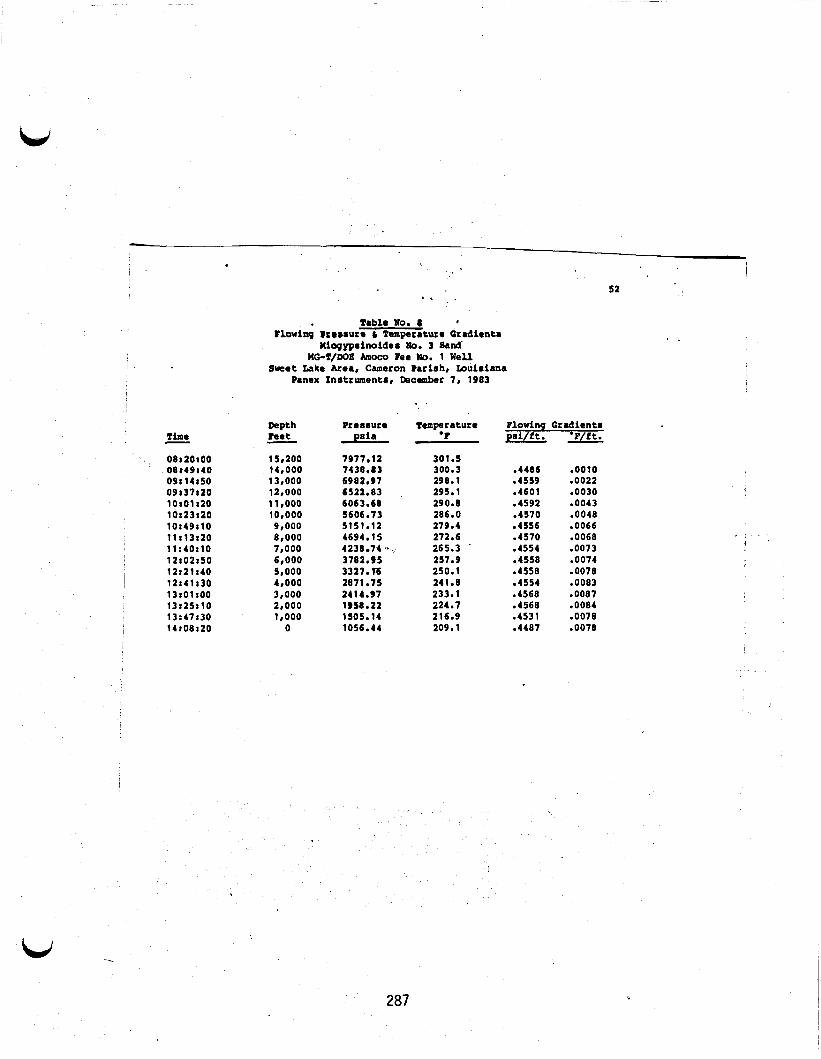
Time
08120100 08149140 09I14lSO 09137c20 10101120 10123120 10149110 11 I13120 l l r 4 0 1 l O 12102150 1212 1140 12:41130 13 IO 1 100 13r25110 13:47130 '
14:08:20
7
* , .
Table NO. o llowing Orrrsuro c Temperature Gradient.
Wiogyprinoider No. 3 Sand'
Sweet Lake Area, Cameron Parish, Lauiaiana Panex Instrmenta, December 7, 1983
MG-lr/OOE hoc0 lee 100. 1 Well
Depth Feet
1 ~ ~ 2 0 0
- 14,000 13,000 12,000 1 1 ,000 10,000 9,000 ~ , O O O 7,000 6,000 5,000 4,000 3,000 2,000 1,000
0
Prosmure psi.
1977.12 7438, B 3
6522.83 6063.68 5606.13
4694.15
6982.97
5151.12
4 23 8 7 4 .-.: 3782.95 3321.m 2871 e75 2414.97 1958.22 1505.14 1056.44
Temperature 'F
301.S 300.3 298.1 295.1 290.8 286.0 279.4 272.6 265.3 257.9 250.1 241.8 233.1 224.7 216.9 209.1
Flowing Gradient. pSi / f t . 'F/ft .
52
.4486 . O O l O
.4559 .0022
.4601 -0030 -4592 -0043 .4570 -0048 -4556 -0066
-4554 -0073 -4558 -0074
-4570 e0068
-4558 -0078 a4554 -0083 -4568 -0087 -4568 -0081 -4531 -0078 e4487 ,0078
287
. . .. I '

1
i , 3 -
1 !
I .
1.
2.
3.
4.
5.
6.
7.
8.
9.
10.
11.
53 9 &
REFERENCES
Hurst, Wm.; 1934 "Unsteady Flow In OU Reservolrs," Physlcs, (March, 1934)Vol. 5
Huret, Wm. : Moore, T. V. I and Gchllthuls, R. J. 1933. "The Determtnatlon of PenneabUIty from Fleld Data, '' Proceedlngr, API Bull. 211 4.
Hurst, Wm.. 1953 "Est+llrhment of the Skln Effect and Its Impedlment to Fluld Flow lnto a Well Bore," Petroleum Englneer, (October, 1953) 25, 56.
Jones, P. J , , 1956. "Gulf Coast WUdcat Verlfles Reservolr Llmlt Test, " OU a d Gas Journal, @me, 1956) pp. 54, 184,
Jones, P. J., 1957. "Drawdown Exploration, Reservolr L h l t , Well and Formatlon Evalutlon," Paper 824-G, P6rmt.n Bash OU Recovery Conference, Mldland, Texas.
Jones, P. J, , 1961 "Reservolr Llmlt Test on Gas Wells," SPE- 24, Gas Technology Symposlum, Tyler, Texas.
Matthews, C. S., 1960 "Analyals of Pressure Buildup and Flow Test Data, " Fonnatlon Evaluatlon Symporlum, Hourton. Texas.
Matthews, C. S., and Russell, D. 0. 1967. "Pressure BuUdup and Flow Tests In Wells," Monograph Vol. 1, SPE, AWE,
. '
Schllthuls, R. J., 1936. "Actlvc OU and Reaervolr Energy," Transactlone. SPE, AIME, Vol 118, 33-52.
Clark, J. D., and Clark. N. J., "R6rervolr Parameters Are Paramount." Petroleum Englneer, (July, 1966) pp. 61-69.
Van Everdlngen, A. F., and Hurt, Wm., 1949 "The Appllcatlon of the La Place Transformatlon to Flow Problem8 ln Reservolri, " lkansactlons, SPE. AIME. Val. 186. *
288
.
APPENDIX D
IGT TEST ACTIVITIES O N THE MG-T/DOE AMOCO FEE NO. 1 WELL DURING AUGUST I981
C. G. Hayden P. L. Randolph
T. L. Osif
Prepared by
Institute of Gas Technology . IIT Center, 3424 S. State Street
Chicago, Illinois 6061 6 -.
October 1981
W
. .. . IGT TEST AC'TWITIES ON THE MG-T/DOE'
by
AMOCO FEE NO. 1 WELL DURING AUGUST, 1981
C. G. Hayden, P. Le Randolph, T. L. Osif
INSTITUTE OF GAS TECHNOLOGY
Introduction
The first month of prod MG-T/DOE Amoco Fee No. 1
well by the operator suggested gas content of brine of less than half of expected values. However, at the same time, it was recognized that problems existed in flow metering and that some sample analyses provided results
inconsistent with understanding from prior tests of other wells. Some of these issues are discussed in the Background section of this report,
During August 1981, IGT personnel collected and analyzed samples of gas
and brine from the separator during testing of the MG-T/DOE h o c 0 Fee No. 1 well.
by participants in the well test were performed in accordance with the state- ments of work for a) IGT's DOE-sponsored project "Computer Simulation of
Geopressured Aquifers, *' b) IGT' s GRI-sponsored project "Gas From Formation Waters," and c) a purchase order to IGT from Magma Gulf-Technadril,
interest of completeness, and with concurrence of the sponsors, work performed under these projects is consolidated into this single report.
Various portions of this work and the related reviews of data developed
In the
IGT focus was on three questions:
- What is the quantity and quality of gas leaving the separator dissolved in the disposal brine?
- Is the reservoir saturated with gas? - In what way$ does the chemistry of the produced brine affect gas
behavior and partitioning between phases?
Achieving meaningful conclusions on these subjects has required substan-
tial departures from the sampling schedule and sample handling procedures prescribed in the procedures manual for geopressured fluids developed for DOE (Ref. 1). For this reason, the procedures used and results of analyses performed are described here in considerable detail.
the above three questions are then presented. are summarized in the last sections of this report.
Discussions addressing
Conclusions and recommendations
1 I N S T I T U T E O F G A S T E C H N O L O G Y
290
. . - *.
1 . Background
Preliminary data obtained.by a-T and its contractors indicated that the gas and brine. effluents were considerably different than had previously been seen by IGT on the Wells of Opportunity (WOO) program. The chernisky of the brine was different from the low-salinity brines observed on wells IGT had tested,'but was consistent with the high volume producing design wells.
quantity of gas produced, as well as the gas lost in disposal brine, was inconsistent with previously expected values based on solubility data. observations will be discussed in more detail in the following sections.
The
\ : These
Brine chemistry data supplied to IGT by Dr. B. E. Hankins of McNeese
State University on August 5, 1981 indicated a high salinity, high calcium content for the produced fluids (Ref. 1). Analysis results transmitted verbally were as follows:
PH Alkalinity Total Dissolved Solids
Na 46,000 mg/R c1 99,350 mg/ k Ca 11,000 mg/L Mg 670 mg/L Sr 850 mg/a
5.66 261 mg HCO-/R 166,500 mg?L
K 1740 m g / R 88 m g / R 62 mg/L B
Fe 59 mg/L si02 112 mgla
"3
Gas measurements and analyses had previously been done by MG-T and Weatherly Laboratories, Inc., personnel. were identified, and much progress had been made by early August in resolving discrepancies. SCF/STB. recombination using 8.1 SCF/STB as the produced gas-to-water ratio (GWR) and found the corresponding bubble point of the reservoir would be approximately 2006 psia. If gas and brine metering were correct, it would appear that the reservoir was undersaturated. John Neal's recombination studies also indicated that -34.3 SCF/STB would be required for saturation at reservoir
pressure and temperature. coupon bypass line provided evidence that two phases existed at the wellhead when wellhead pressure was greater than 2000 psi. than 8.1 SCF/STB were actually being produced.
Flare line gas metering problems
Early reported gas-to-brine ratios ranged from 8 to 12 John. Neal of Weatherly Laboratories, Inc. (Ref. 2) performed a
- -
Accumulation of gas in the high-pressure corrosion
This suggested that more
2
I N S T I T U T E O F G A S
- *
T E C H N O L O G Y
!
I
I
i
291
* . . The analysis of the flare line gas used in the recombination i.s.given
below:
Mole X (dry)
Carbon Dioxide . 7 000 n-Bu t ane 0.03 - Nitrogen Methane
Ethane Propane iso-Butane
0.29 iso-Pentane 0.00 n-Pent ane 0 .Ol 90 065 *, -
1 e66 0.27 0.02
Hexanes 0 000
Heptanes f 0.07
Other flare line gas analyses exist, and are comparable with the above.
Weatherly Laboratories also measured the quantity and composition of gas still remaining in the disposal brine. recombination study was 0.9 SCF/STB (dry). given in Weatherly's report is as fo1lows (Ref. 2):
The value measured in the
The composition of this gas as
Mole % (dry) Mole X (dry)
n-Butane 0.0 Carbon Dioxide 12.3 - Nitrogen - iso-Pentane 0 .o n-Pent ane 0.0 Me thane 85.8 -
E thane 1 e 6 Hexanes 0 .o Propane 0 e3 Heptanes + 0.0 iso-Butane 0 .o
IGT experience with this type of analysis indicated that the C02 content was surprisingly low and may be caused by the high calcium content of the brine. Several measurements were made by Weatherly Laboratories of the amount of gas remaining in the brine after the separator. similar to those obtained at WOO wells having comparable separator temperature
and pressure. However, a measurement on July 28, 198X, gave B solution GWR of 8.3 SCF/STB (Ref. 3).
Most of these gave values
This value is completely inconsistent with proper separator operation. separator malfunction or to a problem with sample collection. point exhibited by the sample was 870 psia, or -630 psi above the sample collection pressure.
IGT Sampling Procedures for Gas and Brine
It is not clear whether the anomalous result was due t o
The bubble
IGT has developed sampling and analysis procedures on Wells of Opportunity tests to accurately measure the total gas production from a
ai 3 _ .
I N S T I T U T E O F G A S T E C H N O L O G Y
I , . .
W
. * geopressured geothermal well. These procedures were modified to compensate, for the lack of an onsite gas chromatograph and an acid liberation-nitrogen purge carbonate train.
samples and performing a hydrogen sulfide analysis in 15 minutes.
gas samples are collected in as short a’time as possible to minimize the
chance that any change in conditions (flowing or compositional) will occur during the sampling procedure.
rapid analysis for accur
Emphasis was placed on collecting both brine and gas
Brine and
Hydrogen sulfide instability necessitates 5 . ult
%.I*
- Flare line gas samples were caught in preheated Teflon-lined stainless steel sample cylinders. minimize water condensation within the sample vessel. ends were fitted with Swagelok caps to prevent leaks, and the sample was shipped to IGT for analysis.
The cylinders were preheated to above 100°C to The closed valve
- The gas samples were heated at IGT to a temperature greater than 100°C and analyzed using a mass spectrometer.
- Draeger hydrogen sulfide analyses of the flare line gas samples were performed using procedures outlined in Gas Processors Association’s Tentative Method of Test for Hydrogen Sulfide in Natural Gas Using Length of Stain Tubes. Draeger CO2 determinations, although C02 5s also quantified in the mass spectrometer analysis.
- At least two brine samples were caught each time in Teflon-lined stainless steel pressure vessels at separator pressure and temperature. The closed valve ends were sealed with Swagelok caps and quickly cooled by immersion into a cold water bath. was shipped to IGT for analysis, and the other was partially analyzed in the field and then discarded.
The same procedure is used for flare line
One of the samples from each set
9
_ . -.
- The brine analysis consisted of several steps. pressure on the cooled brine to 1 atmosphere by using a large syringe. The syringe was connected to the cylinder valve and the valve opened. The exsolved gas pushed the plunger in the syringe. After the cylinder was struck several times-to enhance gas dissolution, the gas volume was read directly off the syringe. cylinder and its volume noted. discarded.
The first was to reduce
The brine was emptied into a graduated At this point the field samples were
Several more analytical steps were performed on samples shipped to IGT as follows :
- The gas was analyzed using a mass spectrometer. - The brine was divided into two portions and measured. The first
portion was immediately treated with sodium hydroxide to stabilize the C02 in solution (going to a pH of -10). ~
sample was untreated. The second portion of the
I . *
LJ 4
I N S T I T U T E O F G A S T E C H N O L O G Y
293

1J
- A representative sample of the alkaline brine was treated with acid and purged with nitrogen, quantitatively trapping and measuring the exsolved COz. dissolved eo2, bicarbonate, and carbonate species.
- A portion of the untreated brine was titrated with sulfuric acid to determine alkalinity. and analyzed For calcium content.
This procedure measures "total C02," which' inc1ude.s
The remaining untreated brine was then acidified
Results of IGT Analyses
IGT performed several types of analyses to help define gas production for
this well. Table 1 contains results of flare line gas analyses. reported pressures have been corrected for instrument drift by subtracting
70 psi from all originally read values as instructed by Larry Durrett. pressure, temperature, and flowrate data were provided by MG-T.) were performed at IGT with a DuPont Model 21-104 mass spectrometer. important to note that the cylinders were heated prior to analysis to avoid .
liquid water, which would d'issolve C02 and cause erroneous measurements.
(All
All Gas analyses
It is
When the flow rate was increased from about 1400 BPD to over 15,000 BPD the temperature of the produced brine rose from -160' to 275'F.
flowing brine temperature, the gas stream contained so much water vapor that
At 275'F
condensation may still have occurred in the preheated gas cylinders. probably remained in solution in this liquid phase in the cylinders when gas was withdrawn.for laboratory analysis.
Some CO2
The high water content at 275'F was also a problem when using Draeger
tubes in the field. Table 2 is a summary of the Draeger tube analyses performed. Note that no analyses were performed after the large flow rate increase on August 11. It was felt that the water interference at that point
made the results unreliable.
The hydrogen sulfide concentration on August 10, 1981 was measured after a shut-in period. hydrogen sulfide with tubulars during this shut-in.
It is believed the low value is due to the reaction of
Table 3 presents the amount of gas liberated from cooled disposal brine It is important to note that all of upon reducing pressure to 1 atmosphere.
the liberations performed at IGT on stored samples yielded lower GWR's than did similar flashes performed in the field.
5
I N S T I T U T E 0 -F G A S T E C H N O L O G Y
294
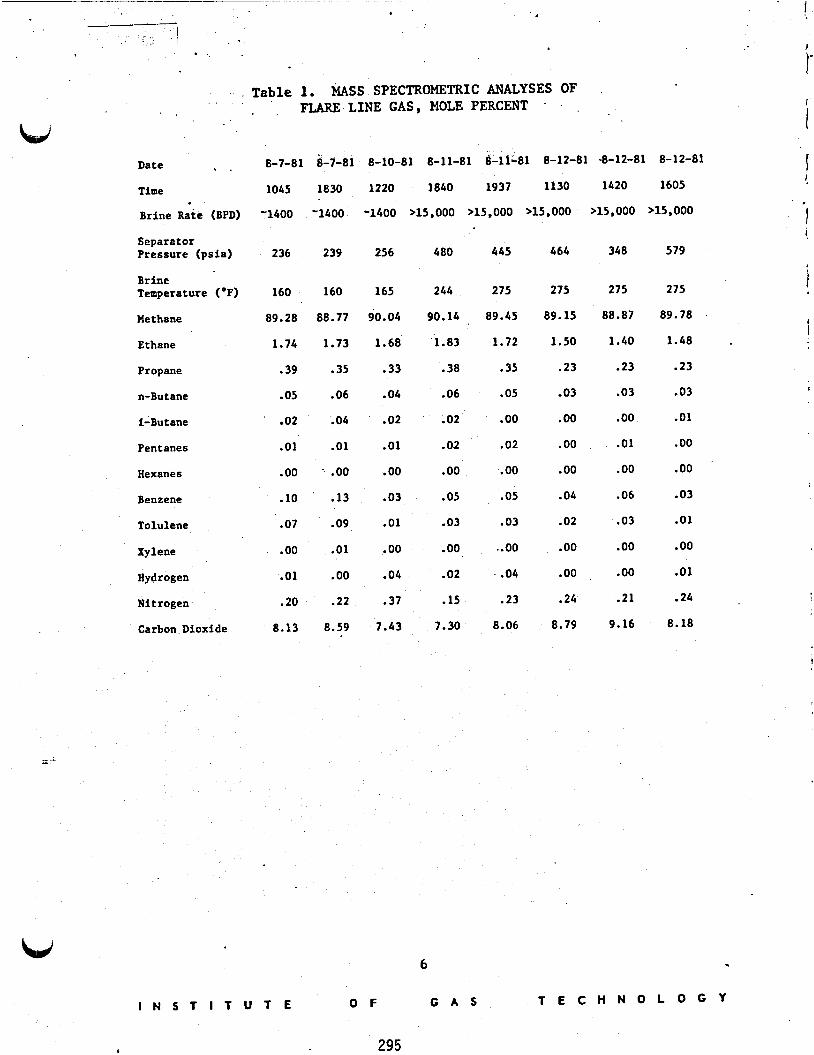
I
I- . Table 1. MASS SPECTROMETRIC ANALYSES OF .
FLARE LINE GAS, MOLE PERCENT ’ . , I
1 W Date
Time
1 . 8-7-81 8-7-81 8-10-81 8-11-81 8-11-81 8-12-81 -8-12-81 8-12-81 ! 1045 1830 1220 1840 1937 1130 1420 1605
Separator Pressure (psia) 236 239 256 480 445 464 348 579
Brine Temperature (OF)
Methane
275
88.87
1.40
.23
.03
. 00
.01
. 00
.06
.03
. 00
. 00
.21
9.16
275
89.78
1.48
.23
.03
.01
.oo
.oo
.03
.01
. 00
.01
.24
8.18
160
89.28
1.74
.39
.05
02
.Ol
. 00
.10
.07
.oo
.Ol
.20
8.13
160 165
88.77 90.04
1.73 1.68
.35 .33
.06 .04
.04 .02
.01 .01
. .oo .oo .13 .03
244 275
90.14 89.45
275
89.15 I I
‘1.83 1.72
.38 .35
.06 .05
.02 . 00
.02 .02
. 00 . 00
.OS .os
1.50 Ethane
.23 Propane
n-Butane .03
. 00 i-Bu t ane
Pentanes . 00
.oo Hexanes
Benzene
Tolulene
Xylene
Hydrogen
Nitrogen
.04
.09 .Ol .03 .03
.01 .oo . 00 r . 00
.oo .04 .02 .04
.22 .37 .15 .23
.02
. 00
. 00
.24
8.79 8.59 7.43 7.30 8.06 Csrbon Dioxide
6
T E C H N O L O G Y I N S T I T U T E O F G A S
295

Table 2. DRAEGER GAS ANALYSIS OF FLARE LINE GAS
( P a 3 1 (OF) ( P P d (vol. X ) c02 Date - Time Pre s sure Temperature H2S -
* 8-7 1030 29 1 160
8-7 1800
8-8 0800
8-10 1205
294
303
311
22 9
160 22 8
167 25 8.5
165 13* 7.8
* " The H 2 S .probably reacted with tubulars during the preceding shut-in period.
7
I N S T I T U T E O F G A S T E C H N O L O G Y
296

I
I
* '.
Table 3. GAS LIBERATED FROM BRINE AFTER THE SEPARATOR BY PRESSURE REDUCTION TO 1 ATMOSPHERE
L 1 Gas-Brine Ratio w
Field* IGT Chicago** SCF/ST3
Pressure, Temperatures - Time . ps ia . O F Date - 160 1.56 1.39 8 -7 1030 . 23 6
8 -7 1800 239
8 -8 0800
160 1.62 1.12
248 167 1.71
8-10 1205
8-11 , 1840
256 165
4 80 244
1.67
2.91
4 64 275 2.99
4 64 27 5 3.05
8-12 1130
8-12 -1130
8-12 "1420
8-12 1605
348
569
27 5 2.36 ,
275 3.76
1.53
2.10
1.96
3.15
* Pressure reduction done in the field less than one hour after sample collection.
** Pressure reduction and analyses done at IGT-Chicago several days after sample collection.
I N S T I T U T E
8 ..
O F G A S T E C H N O L O G Y
297
i I . 1..
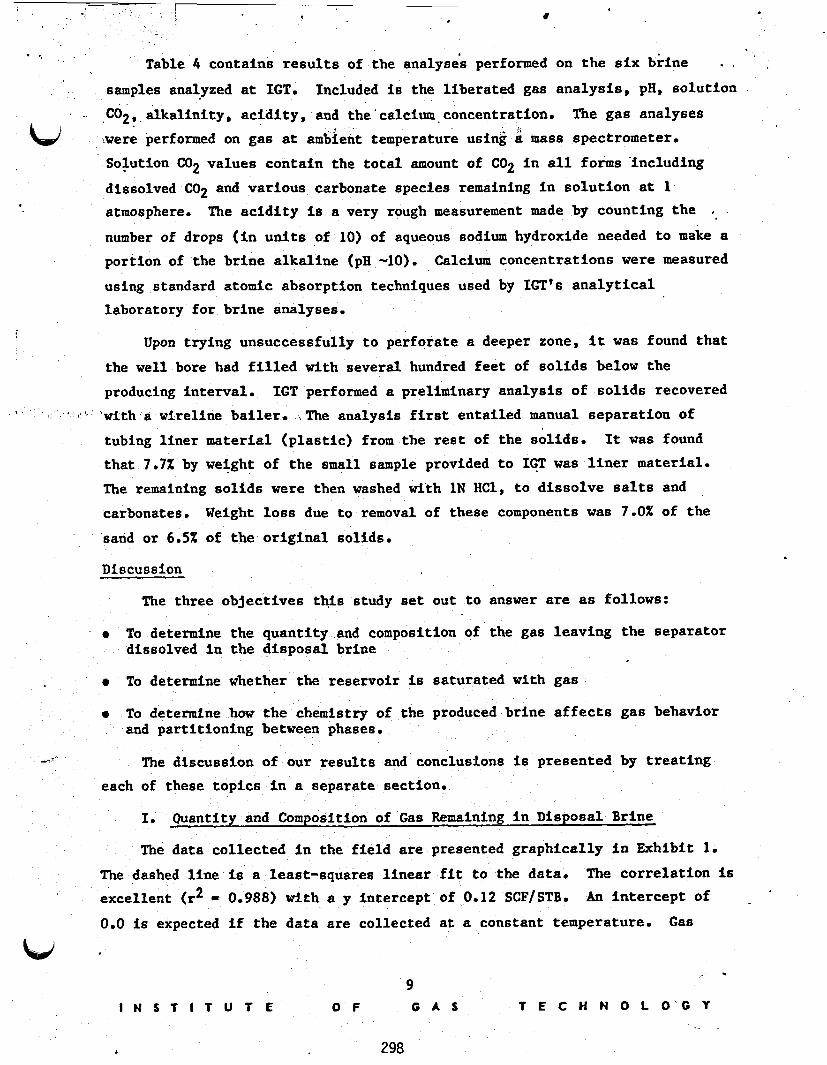
- *. Table 4 contains results of the analyses performed on the six brine . . ' .
samples analyzed at IGT.
. -. ,co2, alkalinity, acidity, and the'calcium, concentration.
Solution C02 values contain the total amount of C02 in all forms 'including dissolved C02 and various carbonate species remaining in solution at 1 atmosphere. The acidity is a very rough measurement made by counting the . .
number of drops (in units of 10) of aqueous sodium hydroxide needed to make a portion of the brine alkaline (pH -10). Calcium concentrations were measured using standard atomic absorption techniques used by IGT's analytical laboratory for brine analyses.
Included is the liberated gas analysis, pH, solution .
The gas analyses hd Lwere performed on gas at ambi temperature usi k mass spectrometer.
! Upon trying unsuccessfully to perforate a deeper zone, it was found that the well bore had filled with several hundred feet of solids below the producing interval. IGT performed a preliminary analysis of solids recovered
' 1 '"with a wireline bailer. .The analysis first entailed manual separation of i
tubing liner material (plastic) from the rest of the solids. that 7.7% by weight of the small sample provided to IGT was liner material. The remaining solids were then washed with 1N HC1, to dissolve salts and carbonates. sand or 6.5% of the original solids.
It was found
Weight loss due to removal of these components was 7.0% of the
Discussion
The three objectives this study set out to answer are as follows:
0 To determine the quantity and composition of the gas leaving the separator dissolved in the disposal brine
0 To determine whether the reservoir is saturated with gas
0 To determine how the chemistry of the produced brine affects gas behavior and partitioning between phases.
-7- The discussion of our results and conclusions is presented by treating each of these topics in a separate section.
I.
The data collected in the field are presented gr8phiCally in Exhibit 1.
Quantity and Composition of Gas Remaining in Disposal Brine
The dashed line is a least-squares linear fit t o the data. excellent (r2 - 0.988) with a y intercept of 0.12 SCF/STB. 0.0 is expected if the data are collected at a constant temperature.
The correlation is An intercept of
Gas
. 9
I N S T I T U T E O F G A S 1 E C H N 0 L 0 - G Y
i 298
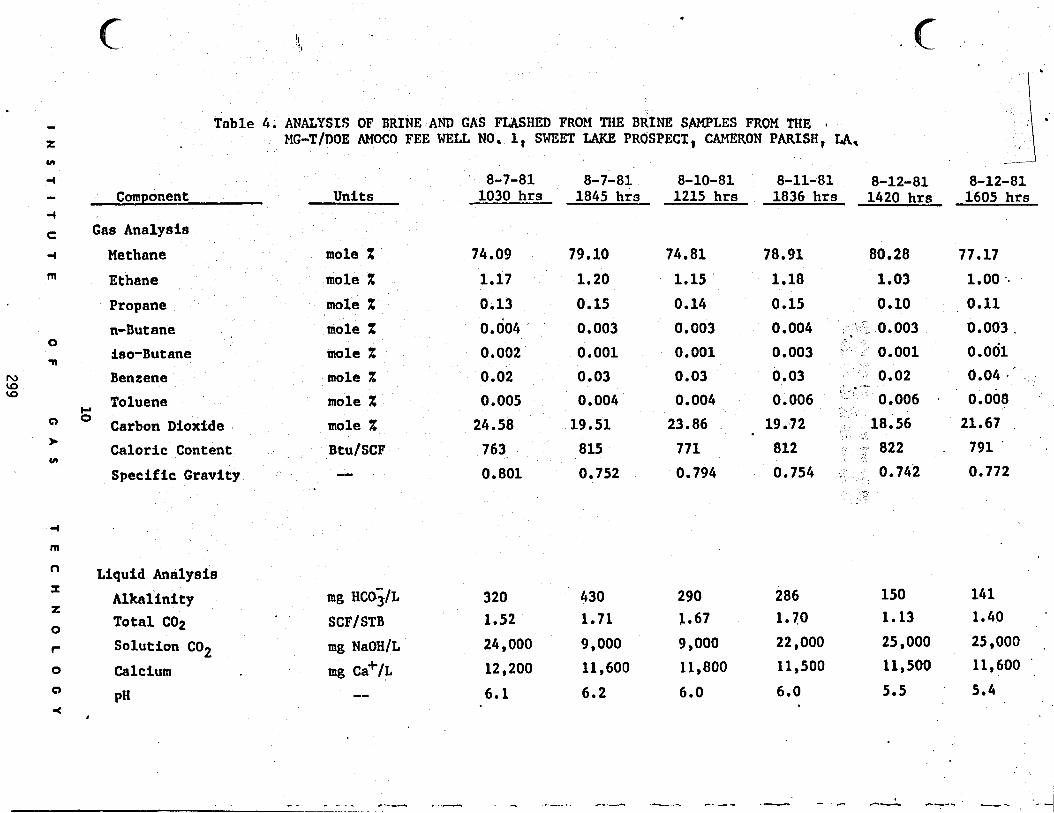
- x cn
4 - 4
t
-4
m
0
n
0
b
(n
4
m
n I
z 0
r
0
c)
4
c I! ,
Table 4. ANALYSIS OF BRINE AND GAS FLASHED FROM THE BRINE SAMPLES FROM THE 4
MG-T/DOE AMOCQ FEE WELL NO. 1, SWEET LAKE PROSPECT, CAMERON PARISH, LA,
8-12-81 8-7-81 8-7-81 8-10-81 8-11- 8 1 Component Units 1030 hrs 1845 hrs 1215 hrs 1836 hrs 1420 hrs
Gas Analysis
Methane mole X 74 . 09 79 . 10 74 . 81 78 . 91 80.28
Ethane mole X 1.17 1.20 1.15 1.18 1.03
Propane mole 2 0.13 0.15 0.14 0.15 0.10
n-But ane mole X 0 . 004 0 . 003 0.003 0 . 004 iso-Butane mole X 0.002 0.001 0.001 0 . 003 Benzene mole X 0.02 0.03 0.03 0.03 Toluene mole X 0.005 0 . 004 0.004 0.006
Carbon Dioxide Caloric Content Btu/SCF 763 8 15 771 812 Specific Gravity -- 0 . 801 0.752 0.794 0.754
P 0 mole X 24.58 19 . 51 23.86 . 19.72
Liquid Analysis Alkalinity mg HCO~/L 320 430 290 286 150
Total CO2 SCF/STB 1.52 1.71 1.67 l .?O 1.13
Solution C02 mg NaOH/L 24,000 9,000 9,000 22,000 25,000
calcium mg ca+/L 12,200 11,600 11,800 11,500 11,500
PH -- 6.1 6.2 6.0 6.0 5.5 *
1605 hrs
77.17 1.00 .*
0.11 0.003. 0.001 0.04 *
0.008
21.67 791 . 0.772
1 4 1 1.40
25,000 .
11,600 .
5.4
. .

0
n
7 -
I
6 -
- h m
tj \ 5 -
c wz U s 4 -
I- u)
i 85 u) 0
z 0 e
LL @ 2 - 4 tx W
A E
Iz c3
w 0 0 P
O F
/*
J" /*e / MG-T/MlE AMOCO FEE No. 1 WELL
AUGUST 7-14 1981
/*' /"
,/' CALCULATED CIH METHODOLOGY)/
I" /"
r/' - ,/' Y" /"
J /" *.. - . / */"
I *Y /"ypO. 12+ 0.00622 (X) (r * =0.988) ,/'
J,' //
/' /"."' I
/ 0 FIELO MEASUREMENTS - <;.e/"
- 7 4 9 4 />'
/P - //
I I I I I I I I I I I I I I I 1 - /" 400 600 e00 100a O0 200
P cn
4
rn
n I
X 0
r
c . . .
SEPARATOR STATIC PRESSURE (psia) 0
0
4 Exhibit 1. COMPARISON OF FIELD MEASUREMENTS WITH VALUES CALCULATED WITH THE S3 ALGORITHM

solubility is temperature dependent, and this effekt is greater. for. carbon dioxide than for methane. component which is temperature dependent.
during data collection, which may account for the small positive intercept.
. The separator pressure has a water vapor pressure Brine temperature was not constant
W &e solid line in Exhibit 1 is from an algbjtithm developed by Systems
Science and Software (S3) (Ref. 4) to fit Culberson and McKetta's data for methane solubility in water (Ref. 5 ) . This algorithm has been found by IGT to
closely fit the total gas liberated by pressure reduction to 1 atmosphere from disposal brine in WOO wells. measured for the MG-T well. pressure of water in the separator being higher than on WOO tests because the brine temperature is higher (275'F). The low total gas values are not due to an insufficiency of methane, but do reflect smaller amounts of carbon dioxide.
Note that the S3 prediction is above the'valves This difference may be in part due to vapor
The amount of methane contained in the MG-T disposal brine is compared
with the amount contained in the HO&M Prairie Canal Co., Inc., Well No. 1 (Ref. 6) in Exhibit 2.
to eliminate contributions of other gases. the effect of temperature on methane solubility in this range, under these conditions, is small compared to the pressure effect. in the disposal brine is greater, at a given partial pressure, for the MG-T
well than for the Prairie Canal well.. However, the amount of total gas in the disposal brine is less for the MG-T well than for the Prairie Canal well. This difference in total gas is largely carbon dioxide, which is the only component present in quantities large enough to account for this difference. One would predict that the methane solubility in the MG-T disposal brine would be less than in the Prairie Canal brine based on the higher salinity of the MG-T well. reducing methane solubility in the Prairie Canal well VS. the MG-T well.
The x-axis is expressed as partial pressure of methane These data can be compared because
The amount of methane
Because this was not observed, another mechanism mag exist for
- - Blount (Ref. 7) has demonstrated that carbon dioxide decreases methane solubility in water when the carbon dioxide content of the dissolved gas exceeds 15%. carbon dioxide, while the Prairie Canal well disposal brine liberated gas containing -30% carbon dioxide. solubility dependent on the percentage of the gas which is carbon dioxide, it
is not unreasonable to expect the MG-T disposal brine to contain more methane
The MG-T gas liberated from the disposal brine contained -20%
With the inhibiting effect on methane
12 U
T E C H N O L O G Y I N S T I T U T E O F G A S
301
i
I

I I;!
- n
u) C \
LL -4 u m
W z
E 4 - -4
e u
-J 0 <
u) n 0 b w
0 N 0
z
. _- I
-
- MC-T/DOE AMOCO FEE No. 1 WELL 0
-
0
0
P o w > cn
-4
rn
0
I x 0
r 0
o 4
* \ I
i-
: . . .
' 1 -
00
0 e
0
0 0 0 HO&M PRAIRIE CANAL CO. INC. WELL #1 e o
0 0 q<---A- 200 400 600 800 1000
PARTIAL PRESSURE METHANE IN THE SEPARATOR (psia) COMPARISON OF AMOUNTS OF METHANE REMAINING IN DISPOSAL BRINE BETWEEN THE MG-T/DOE AMOCO FEE NO. 1 and the HO&M PRAIRIE CANAL CO., XNC. WELL # 1
Exhibit 2.

Icd
L,
than the Prairie Canal well, as observed.
discussion that the MG-T disposal brine contained less total gas than did Prairie Canal, but contained more methane at a given partial pressure than
We conclude from the above
Prairie Canal.
Another possibility is that the previously mentioned 70 psi correction to separator pressure was not the appropriate correction for the actual time of sample collection.
accurate pressure data, will reveal that total gas in solution in separator brine, rather than the methane component, will be consistent with results from WOO tests. No. 2 well collected in October, 1980 (Ref. 8).
It is conceivable that future analyses, accompanied by
This consistency was observed for samples from the Pleasant Bayou
Exhibit 3 is a plot comparing gas liberations done in the field to those performed later at IGT. to the field data presented in Exhibit 1. all had a lower GWR than those done in the field. This indicates a loss through leaks or reactions with the sample vessel. The sample vessel is Teflon-lined stainless steel, which is fairly inert to most gases and to Cog- carbonate systems, although a small amount of hydrogen gas was detected in
some samples. to look for deposited carbonates, but none were found (less than 0.1 SCF.
CO2/STB equivalent in carbonate). this occurrence. completed within 30 minutes after sampling. is not available and the analyses are necessarily postponed, this becomes a problem. The problem was still significant, and a different type valve may be required on future tests .
The line in Exhibit.3 is a least-squares linear fit The liberations performed at IGT
In addition, an acid wash was performed on one empty cylinder
Leaks apparently are the primary cause of The leaks were trivial on WOO tests whereythe analysis was
On wells where the IGT field lab
Most of the cylinders were equipped with new valves.
The conclusions pertinent to well operation are not substantially
At 1000 psi separator operating pressure, affected by these problems.. 6.3 f: 0.5 SCF/STB of gas will be lost in the disposal brine. have a-heating value of about 5000 to 6000 Btu/STB. this gas is dependent upon disposal pressure requirements and the accompanying
economic factors.
This gas will Secondary recovery of
#
. . 14
I N S T I T U T E O F G A S T E C H N O L O G Y
303

A3
01
0N
H3
31
s
v3
w
4
0
I

. . * s.11.. Gas Content of Reservoir Brine
Dktermining whether or not the reservoir brine is saturated with gas is a
major objective of DOE well tests. Unfortunately, the conventional method used to determine saturation by comparing produced gas-to-brine ratios against recombination data has had many problems. not been measured with the res meaningful comparisons to re'tombination data. On th or John Neai of Weatherly
Laboratories (Ref. 2) stated that the reservoir fluid exhibited a bubble point of 2006 psia and 299OF when recombining the "produced GWR" of 8.1 SCF/STB, and that the brine was undersaturated at reservoir conditions. It has since been found that the produced GWR is substantially above the 8.1 SCF/STB, which was considered accurate when Weatherly took their samples. that this problem exists on many well tests and is using an independent test
Gas-to-brine production ratios had
IGT has recognized
to deduce reservoir saturation conditions through other surface f -imanifestations. This has resulted in the "bubble test," the theory and
practice of which will be discussed below.
The theory is based on the premise that gas in contact with an aqueous phase will have a different composition than the dissolved gas with which it
is in equilibrium. have different fugacities and subsequently different solubilities in the.
aqueous phase. aquifers, the free gas phase has a lower COO content and higher ethane, propane, and butane contents relative to methane than does the dissolved gas. Weatherly Laboratories analyses of gases from four steps in differential liberation shown in Tgble 5. The data shown are from the Riddle-Saldana Well
No. 2 (Ref. 11) samples that had been recombined to actual reservoir pressure and temperature.
This is expected because the various gaseous components
For the natural gas-CO2 system Common in geopressured
The magnitude of variations in concentrations is illustrated by the
The compositional differences are related to reservoir behavior through the following model: reservoir pressure and temperature. the well bore drops. differentially liberated from the brine and is trapped in the pore space. accumulates in the pore space until critical saturation is reached.
point a quasi-steady state is reached in which a small amount of free gas may
Assume that a reservoir contains no free gas phase at
As brine is produced, the pressure around If the pressure falls below the bubble point, gas is
Gas At this
I N S T I T U T E
16
O F G A S T E C H N O L O G Y
305

. ,
. I . , .-. . . .
Table 5 . COMPOSITIONS DURING DIFFEREhTIAL LIBERATIOR OF GAS FRof3 BRINE, RIDDLE-SALDANA WEU NO. 2
Pressure Step, p s l a 6632-4000 4000-2500 2500-1000
6 08 7 07 10.8 Total cas, SCF/STB ,
Cas Composition, mol X - c
1.80 3.05 8.76 % co2 He thane 92.24 92.74 88.46
- Ethane 4.43
n-Butane 0.19
I-Butane 0.18
n-P en t me 0.08
I-Pent ane 0 .os
Propane 0.96
IIexanes 0.03
Heptanes+ O 004
17
I N S T I T U T E O F G A S
306
3.44
0 054
0.07
0 007
0.02
0.01
0.01
0 .os
2.44
0.26
0.02
0 002
0.01
0.01
<0.01
0.02
1000-1 5
17 03
18.64
79 018
1.85
0.10
0.01
0 003
<0.01
(0 00 1
<0.01
0.19
T E C H N O L O G Y

ctd being differentially liberated from the'brine. this free gas .which I s trapped in the reservoir contains more ethane, propane,
and butanes relative to methane that does the solution gas which is being produced.
It I s important to.note that 7 - [I
I
The free gas phiwe accumulating around the well bore thus has a
around the well bore, and the steady state condition no longer exists. gas Immediately around the well bore expands, coalesces, and flows into the well bore. As this free gas reaches the surface, it raises the GWR and the concentrations of ethane, propane, and butanes in the produced gas. This is the characteristic "bubble." If the reservoir were undersaturated such that the bottomhole pressure was above the bubble point, then the free gas phase would not have formed and the bubble phenomenon would not be seen.
Free
' This hbble of free gas is a temporary occurrence. Once a quasi-steady state is reached at the new bottomhole pressure, more qas will be differentially liberated from the brine and trapped further out in the- reservoir. The net effect is a decrease in the GWR and in the concentrations I
of ethane, propane, and butanes relative to methane in the produced, predominantly solution gas. The GWR and the ethane, propane, and butane concentrations should fall below those of the previous lower flow rate. Our test is to monitor changes in the GWR's and ethanelmethane, propane/methane, I
and butanes/methane ratios during various flow conditions.
Table 6 presents hydrocarbon ratios calculated from the flare line gas analyses presented in Table 1. Examination of these hydrocarbon ratios relation to producing conditions and the "bubble" model produces the following
i n 1 1 ; j I i
observations:
e Although variations exist because of shut-in periods, the analyses of the three samples collected on August 10 provide ratios for a brine production rate of about 1400 BPD.
The samples taken on August 11 were collected after producing 1.5 and 5.5 well volumes of fluid following increase of brine rate to more than 15,000 BPD. The higher ethane/methane and propane7methane ratios for the sample collected at 1840'hours are characteristic of the "bubble" due to production of free gas that had accumulated near the well bore during prior production at about 1400 BPD.
I!' 1 : i i e
i 18
I N S T I T U T E O F G A S T E C H N O L O G Y
307 I

I . , I
. . ,:. 1 . ... .
I
Table 6. HYDROCARBON RATIOS
Date
8-7-8 1
8-7-8 1
8-10-81
8-11-81
8-1 1-8 1
8-12-81
8-12-81
8-12-81
. Ethane 2 Propanex1$ Butanes x103 Time Methane Methane - Methane
1045 1.95 4.4 0.8
1830 1.95 3.9 1.1
1220 1.87 3.7 0.7
’ 1840 2.03 4.2 . 0.9
1937 1.92 3.9 0.6
1130 1.68 2.6 0.3
1420 1.58 2.6 0.3
1605 1.65 2.6 0.4
I N S T I T U T E
19
O F G A S T E C H N O L O G Y
308

1 I
u’
I
0 The lower values of ratios for s&*ples collected on August.12 are e6 expected due to gas liberation in the reservoir at the continuing high (>15,000 BPD) production rate.
These observations support the hypothesis that the reservoir brine is ’
near saturation with gas.
because of the following:
%e evidence is not conclusive of saturation
0 Accurate GWR data are not ivailable to support the hydrocarbon ratio changes .
0 Whether or not a reservoir is saturated 1s best determined at the beginning of the well test. only indicate that the near well-bore bottomhole pressure during the low flow rate was below the reservoir bubble point. If the reservoir was slightly undersaturated, say by only 1000 psi, the evidence given in this test would be unchanged.
Previous flow tests only cloud the issue. Our results
0 Lack of the onsite laboratory caused difficulties in sampling and analysis. The lack of an onsite gas chromatograph is a serious handicap. The changes in composition that IGT looks for are small, and storage and
% transfer of’ the samples to IGT before analysis can only be detrimental to accuracy . A copy of the report on recombination of samples collected on June 22,
1981, has been provided to IGT. Although validity of results is somewhat in question due to the reported low gas content of separator brine (0.9 SCF/STB
VS. an expected 3.4 SCF/STB), errors due to this difference should be only about 10 percent at the-extrapolated solubility of 34.3 SCF of separator gas at 15.025 psia and 60°F per bbl separator brine at 520 psig and 242OF.
Exhibit 4 provides a graphical comparison of actual recombination data points with values calculated using the algorithms of Haas (Ref. 9) and Blount (1981 version) (Ref . 7). The calculations are shown for salinities of both 166,500 m g / R and 116,900 mg/L
dissolved solids (TDS) provided by Dr. Hankins of McNeese State University (Ref. 1) during a telephone conversation on August 5, 1981. is calculated sodium chloride content of brine based upon the Na+ concentration of 46,000 mg/a provided by Dr. Hankins during the same
conversation.
The higher value is the number for total
The lower value
Plots of this type for recombination of samples collected while producing
the saturation GWR from low salinity Wells of Opportunity have consistently shown agreement within f 3.0 SCF/STB for Weatherly Laboratory data points and. values calculated using the two algorithms. This background makes it
. . 20
I H S T I T U T E O F G A S T E C H N O L O G Y
309

c
m
0
W
w c, 0
0
P cn
I I ' t
MG-TIDOE AMOCO FEE NO. 1- WELL 36 t I I I
32 1 I 1 I I L
TEMPERAfUF:E 299 dag .F 28 . I I
+ + 4 ' + 4 WEATHEFkLY LABORAl
: * 0t - I 1 I 0 2000 4000 6000 8
c .
(u c.
v
I I R I E S RECOMEhNATION
VI d Q!
I 1 It . 1
00 10000 12000 14000
PRESSURE, pc I a Exhibit 4. COMPARISON OF RECOMBINATION DATA WITH CALCULATED
GAS SOLUBILITY

I I
. . hazardous to ignore the approximate agreement between recombinations and
values calculated using 116,900 mg/L future, definitive work.reveals for solubility under reservoir conditions in
relation to the range of 31 t o 34 SCF/STB represehtative of methane solubility in the NaCl content of produced brine and the lower (22 to 27 SCF/STB) range
It will be interesting to see what
calculated using the TDS value 166,500 mg/R in the two algorithms.
111.
Results of the minimal number of brine analyses performed by IGT were
Brine Chemistry Relevant to CO,
previously presented in Table 4. These results differ from our prior experience on Wells of Opportunity in that substantial differences in
8 alkalinity, pH, and "acidity" (amount of NaOH required to produce a pH of 10) were observed from sample to sample. by Rice University, plus the complexity of inhibitor control on this well (Ref. lo), has led to the hypothesis that the observed variations in brine chemistry were largely due to undocumented variations in inhibitor concentration.
Comparison of IGT's data with analyses
The discussion below adds credibility to this hypothesis.
The analyses performed were alkalinity, "acidity," acid-liberated C02, pH, and calcium concentrations for each sample. these and many other chemical species form a complex system. carbonate combine to form scale and precipitate which subsequently affect all of the abovementioned parameters. Likewise, the inhibitors used (acetic acid and AMP-20, a phosphonate type Inhibitor) change the pH, form complex calcium ions, and change bicarbonate to dissolved COP. herein, is affected by the calcium concentrations through the formation of Ca(OH)2, which then influences all the other parameters listed. investigation into the chemistry change is beyond the scope of this work, but
one observation will be made.
The interactions between
Calcium and
The acidity, as described
A detailed
The alkalinity and the pH are both strongly tied to the amount of inhibitor, primarily acetic acid, injected into the brine. acetic acid nominally added is comparable to the alkalinity of reservoir brine
on a molar basis. The acetic acid probably almost completely dissociates into the hydronium (H+) ion and the acetate ion, because the acetate is complexed with the Ca* ions. dissolved COq as follows:
The amount of
The H+ ions react with bicarbonate to form water and
22
I N S T I T U T E O F G A S T E C H N O L O G Y
311
,I
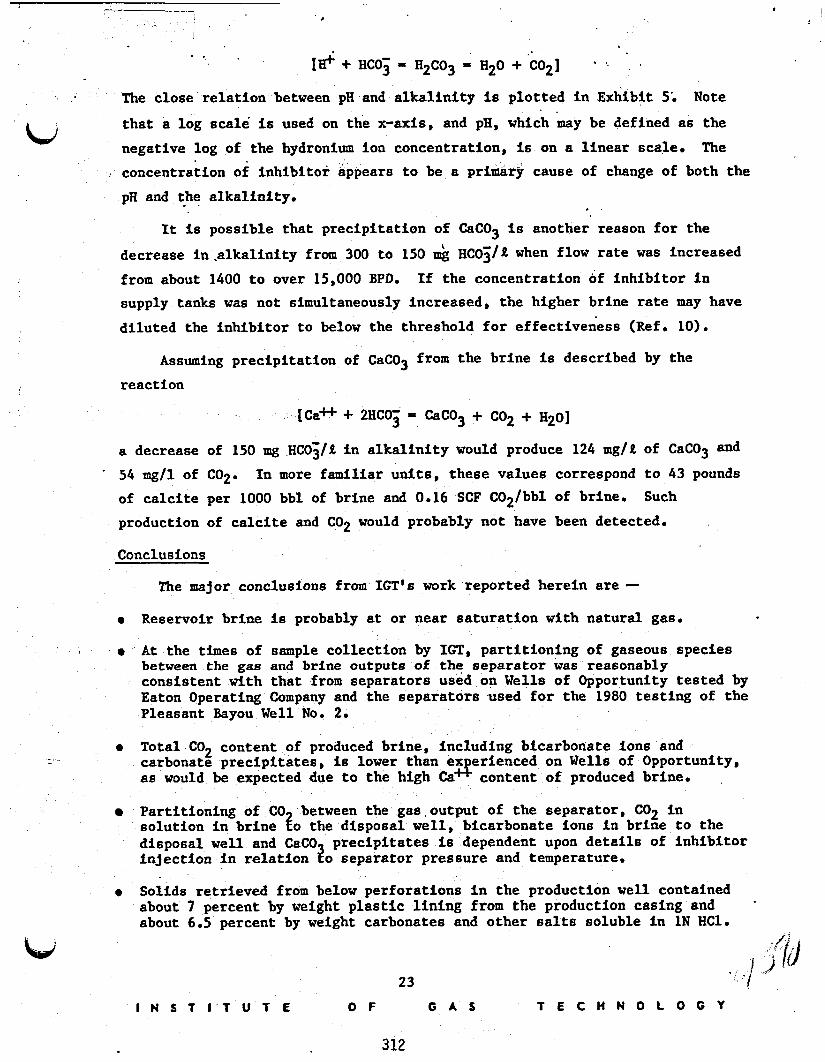
, ' *. [d + HCO; = H2CO3 = H20 + 'C021 . .
The close relation between pH and alkalinity is plotted in Exhibit 5; Note
that a log scale is used on the x-axis, and pH, which may be defined as the negative log of the hydronium ion concentration, is on a linear scale. The 'id
. concentration of inhibitor ears to be a priaarjr cause of change of both the pH and the . . alkalinity.
It is possible that precipitation of CaC03 is another reason for the
decrease in .alkalinity from 300 to 150 I& HCOZ/g when flow rate was increased from about 1400 to over 15,000 BPD. supply tanks was not simultaneously increased, the higher brine rate may have diluted the inhibitor to below the threshold for effectiveness (Ref. 10).
If the concentration of inhibitor in
Assuming precipitation of CaC03 from the brine is described by the reaction
[Ca* + 2HCO; UCO3 + C02 + E201 a decrease of 150 mg HCOi/L in alkalinity would produce 124 mg/t of CaC03 and 54 mg/l of COP. In more familiar units, these values correspond to 43 pounds of calcite per 1000 bbl of brine and 0.16 SCF COZ/bbl of brine. production of calcite and C02 would probably not have been detected.
Such
Conclusions
The major conclusions from IGT's work reported herein are - 0
0
Reservoir brine is probably at or near saturation with natural gas.
At the times of sample collection by IGT, partitioning of gaseous species between the gas and brine outputs of the separator was reasonably consistent with that from separators used on Wells of Opportunity tested by Eaton Operating Company and the separators used for the 1980 testing of the Pleasant Bayou Well No. 2.
Total C02 content of produced brine, including bicarbonate ions and carbonate precipitates, is lower than ex erienced on Wells of Opportunity, as would be expected due to the high Cad content of produced brine.
0 - _
Partitioning of CO between the gas output of the separator, C02 in solution in brine 80 the disposal well, bicarbonate ions in brine to the disposal well and CaCO injection in relation $0 separator pressure and temperature.
Solids retrieved from below perforations in the production well contained about 7 percent by weight plastic lining from the production casing and about 6.5 percent by weight carbonates and other salts soluble in 1N HC1.
precipitates is dependent upon details of inhibitor
o -
kid 23
I N S T I T U T E O F G A S T E C H N O L O G Y
312

0
0
J
= d H
t
v) 3
t3 => <
00
.
0
IN
ST
IT
UT
E
OF
24 ..
GA
S
TE
CH
NO
LO
GY
313

* i -1 i I
. . - 1 The major significance of the IGT work reported h6rein is the suggestion
that reservoir brine may well be at or near saturation with natural gas. At the same time, 'this result is not definitive due to lack of precision, time
dependent metering of gas and brine flow rates required to establish correla- b/
tion of change6 in total produced gadbrine ratio with the observed changes in chemical composition of produced gas.
The above conclusion regarding partitioning of gaseous species between separator outputs was qualified as "reasonably consistent" with prior
experience. graph and hardware for prompt acid liberation of C02 from separator brine samples, b) the discrepancy between quantities of gas liberated from brine samples in the field' VSe samples analyzed later in IGT's Chicago laboratory, and c) the change of 70 psi in separator pressure provided to IGT on the basis of calibration of the pressure gauge several days after collection of IGT's
This qualification is due to a) lack of an onsite gas chromato-
last sample.
Comparison.of recombination data by Weatherly Laboratories with expectations from laboratory studies of methane solubility in brine, in the context of prior similar comparisons for Wells of Opportunity, provided a surprising result: solubility calculated on the basis of only the NaCl content of produced brine. and consistent with differences observed on Wells of Opportunity. In contrast, expected gas solubility assuming total dissolved solids are equivalent to that weight of NaCl is less than the recombination measurement at 10,270 psia by 7 to 11 SCF/STB.
Namely, the recombination data points agreed with
Differences at actual data points were a maximum of about 3 SCF/STB
.
During mid August, operator installation of a positive displacement meter
and changes in the orifice meter run resulted in about doubling reported gas production rates. brine rate measurements is not yet adequate to warrant a conclusion regarding actual produced gadbrine ratio in comparison with the values of 23 t o
27 SCF/STB calculated on the basis of 166,500 mg/t of dissolved solids and the range of 31 to 35 SCF/STB calculated from the 117,000 mg/t NaCl content and extrapolated from recombination studies.
- However, it is IGT's judgment that accuracy of gas and
25 I N S T I T U T E O F G A S T E C H N 0 L 0 G Y '
314

. . I
Recommendations
The MG-T/DOE hoc0 Fee No. 1 Well has demonstrated over 250,000 bbl of brine production without buildup of injection pressure on the disposal well. This is in sharp contrast to prior well tests performed as-a part. of DOE'S Geopressured-Geothermal Program and is very encouraging in the context of low operating cost for energy production.
.
The major uncertainty in cost of energy production from this well is the ratio of produced gas to produced brine. effort be concentrated upon modifications of surface hardware, metering and procedures for fluid analyses, plus data interpretation to determine this
ratio .
It is therefore recommended that
The most significant recommended hardware and metering changes are -
-. . - .
0 Addition of an air cooler and small separator between the present separator and the.orifice meter to remove water vapor
Use of an orifice meter run that meets ANSI standards for natural gas metering and permits change of orifice size without disruption of flow
Addition of a brine metering skid after the main separator which permits turbine calibration and change of turbine size without disruption of flow
0
0
0 Adding 100 percent redundant instrumentation capable of 1-day turnaround in calculating gas/brine ratio in terms of SCF/STB with 1/2 hour or less time resolution.
After the recommended hardware and metering changes have been
implemented, it is recommended that field operating procedures be tailored to providing definitive conclusions regarding gadbrine ratio and whether reservoir brine is saturated with natural gas. Specific recommended procedural steps are - 0 Produce the well at a constant rate of 2000 to 2500 BPD until flow metering
and fluid sample analyses reveal that a steady state condition has been achieved. collecting separator output gas and brine samples in pressure cylinders and then promptly analyzing these on location to detedne
Fluid sampling and analysis would consist of simultaneously
composition of flare line gas
quantities of liquids from the small separator in relation to gas or - ' brine production
- quantity and composition of gas liberated by pressure reduction to 1 atmosphere after cooling liquid samples to ambient temperature
26
I N S T I T U T E O F G A S T E C H N O L O G Y
315

i
i
; . ,
I I
. . . I . .
quantity of CO liberation to f atmosphere pressure. liberated by acid plus alkalinity of.brine after gas
'
Inhibitor concentration in surface brine 'kist also be constant and known.
0 Perform stepwise variations in separator pressure between lowest prac- ticable value and 1000 psi. combine with flow meter data to calculate total produced hydrocarbons and coz. Do not proceed until total gadbrine ratio for each gaseous species is found to be independent of separator pressure.
'Analyze suites of samples at each pressure'and
a.
0 Collect separator gas and brine samples for recombination studies and comprehensive chemical analysis.
With production rate still constant, change to an orifice plate and a turbine as appropriate to accurate flow metering at a brine rate of 15,000 to 20,000 BPD.
0
0 Increase brine rate to 15,000 to 20,000 BPD during a 30-second time interval. time required for fluid transit from perforations to the wellhead. times of,sampling should be adjusted to provide samples at maxima and minima in orifice differential pressure. reveal whether free gas production contributes t o any observed fluctuations in gadbrine ratio. increased to maintain constant concentrations.
Maintain constant producing conditions until rate metering and sample analyses again clearly reveal steady-state operation.
If steady-state values of gas/brine ratio or composition of total produced gas differ from those at the lowersrate, repeat the variation of separator pressure to verify material balance and repeat sampling for recombination studies and comprehensive chemical analyses.
Reduce brine rate back to 2000 to 2500 BPD with all procedures similar to those'before, during, and after the previous rate increase.
If analysis of data from the above steps does not reveal consistency between field data and laboratory recombination studies, iterate the above steps with changes in details until such consistency is achieved.
Collect suites of samples at roughly 1.5, 3, 5, and 10 times the Exact
Analysis of these samples will
Inhibitor injection rate must be simultaneously
0
0
0
0
If the bubble point of reservoir brine exceeds the lowest bottomhole pressure previously experienced during testing of this well, the above steps in production rate e l l be accompanied by interpretable changes in both gas/brine ratio and chemical cornposition of produced gas. if no changes in gas/brine ratio or gas composition are observed, it will be clear.that the initial bubble point in the reservoir was lower than the bottomhole pressure experienced at the rate of 15,000 to 20,000 BPD.
On the other hand,
If this latter situation is experienced, the additional step of production at maximum possible rate may warrant similar detailed analysis.
27 I N S T I T U T E O F G A S T E C H N O L O G Y
316

1 .
. *. *
understanding warranting a major reduction in operating costs. Rate metering
Completion of the actions recommended above should provide a basis of
would.be automated a t h sufficient redundancy to catch discrepancies.
calculation of gas/brine ratio would continue until larger time intervals were
~
Daily I - -
cleatly warranted. Fluid sampling interval would be increased' until sampling was only in response to observed changes in gasjbrine ratio or other producing
characteristics (e.g., scaling, injection pressure increase, anomalous rates,'.
or anomalous pressures).
The understanding of producing characteristics from the above recommended
steps, in conjunction with results of reservoir engineering analysis, would
provide firm technical basis for engineering evaluation, cost estimates, and decisions regarding' gas cleanup and sale.
28 O F G A S T E C H N O L O G Y I N S T I T U T E
317
28 O F G A S T E C H N O L O G Y I N S T I T U T E
317

I I *
I
ACKNO~LED&NTS
The.author6 are grateful for the cooperation and information provided by
id the organizations performing this well test, which include Magma Gulf- Technadril, Weatherly Laboratories, McNeese State University, and Rice Engineering Design and Development Institute of Rice University. particular importance was the cooperation and assistance given in the field by La'rry Durrett and Jonne Berning, which helped make this study possible and meaningful.
Contract No. DE-ACO8-78ET27098 titled **Computer Simulation of Production From
Geopressured-Geothermal Aquifers," Gas Research Institute Contract No. 5011-321-0140 titled "Gas Saturation in Formation Waters," and Magma Gulf- Technadril P. 0. No. 1577.
Of
Portions of this work were performed under Department of Energy
.
9 3 ( 3 0 0 0) / 6 50 3 6MG-T
I N S
29
T I T U T E O F G. A S T E C H N O L O G Y
318

. - *. * ..
REFERENCES ' 1. .Hankins, B. E., McNeese State University, Lake Charles, Louisiana, Private
Communication, 1981.
Neal, J., "Reservoir Fluid Analysis for Magma Gulf-Technadril Amoco Fee Well No. 1 ," Weatherly Laboratories6 Inc., Lafayette, Louisiana, 1981 . 2.
Lid
3. Weatherly Laboratories, Inc., Data files on location, 1981.
4. Garg, S. K. et al., "Geopressured Geothermal Reservoir and Well Bore Simulation," Final Report (Year 2) SSS-R-78-3639. Software, La Jolla, Calif., 1981.
Systems Science and
5 . Culberson, 0. L. and McKetta, J. J., "Phase Equilibria in Hydrocarbon Water Systems, 111, Solubility of Methane in Water at Pressures In Excess of 10,000 psia," - Trans. -- AIME 192 (1951), 223-26.
60 Eaton Operating Co., "Testing Geopressured-Geothermal Reservoirs in Existing Wells, Final Report, HO&M Prairie Canal Co. Well No. I," Department of Energy Contract No. DE-ACO8-80ET27081 (to be published) .
7. Idaho State University, "Solubility of &thane in Waters From Pleasant Bayou Well No. 2," Report for Institute of Gas Technology under P.O. No. S542544, Idaho State University, Pocatello, 1981.
8. Randolph, P. L., and Rockar, E. M., "Do We Know Whether the Pleasant Bayou #2 is Saturated With Methane?" Technology, Chicago, Illinois, 1981.
IGT Technical Report, Institute of Gas
9. Haas, J. L., Open File Report No. 78-1004. Interior, Geological Survey, Reston, Va., n.d.
U.S. Department of the
- ..
10. Oddo, J. E. and Thornson, M. Bo, "Scale and Corrosion Report for the Magma Gulf-Technadril Amoco Fee 41 Design Well," Rice Engineering Design and Development Institute, Rice University, 1981.
11. Eaton Operating Company, "Testing Geopressured-Geothermal Reservoirs i n Existing Wells, Final Report, Riddle-Saldana Well No. 2," Vol. 11, Well Test Data, Department of Energy Contract No. DE-AC08-80ET27081 (to be published) .
30 I N S f I T U T E O F G A S T E C H N O L O G Y
319

I
sr Y
I
t
L
1
b
WELL TEST ANALYSIS
SWEET LAKE PROJECT SAND ZONE #3 .
MG-T/DOE AMOCO FEE NO. 1
January, 1984
i
I Dowdle Fairchild t? Ancell, Inc. iu

MG-T/DOE AMOCO #1 TEST ANALYSIS
Magma Gulf-Technadril contacted Dowdle Fairchild & Ancell to investigate the sand zone #3 test i n the captioned well. The charge. was to develop a description of the reservoir using reservoir simula- t i o n techniques. The work was t o be done u t i l i z i n g the background that Mr. Ancell had acquired during the analysis of the sand zone #5 t e s t i n 1981. ~
The data provided was adequate to describe the basic rock and f l u i d properties. A complete l i s t of the documents utilized is shown i n References.
The t e s t period has been comprised of (1) a one day flow tes t , (2) a nine day s h u t i n period, (3) a seven day constant rate flow t e s t , (4) an eight day variable rate flow t e s t monitored w i t h bottom hole pressure gauge and (5) a 30 plus day flow period w i t h only sur- face pressures recorded. Currently the well i s flowing a t about 2500 bpd w i t h a surface pressure of 300 psia. This is the delivery capa- b i l i t y of this zone.
The best data for describing the reservoir is the seven day constant rate flow test. Most of the effort was expended t o work w i t h that portion of the tes t . Once the simulation of the seven day t e s t was complete, the eight day t e s t and the one day t e s t were sim- ulated as a check of the description. The first one day flow t e s t was not used primarily because the flow rates were not measured through the separator. days of flow time. days.
RESERVOIR DESCRIPTION
The simulator used is a single phase, two dimensional flow model. The simulator uses radial coordinates. Included i n the formulation is a potential development that 1 inearizes the pres- sure dependent properties of compressibil i t y and viscosity.
Table 1 shows the basic parameters used for the study. The only ones that require any discussion are the water formation vol- ume factor, Bw, and rock Compressibility, Cr. The Bw used is pre- sented i n the Weatherly "Reservoir F l u i d Analysis" Report for the separator gas-water r a t io of 19.98 SCF/STB. The rock compressibil- i t y was derived from the bulk compressibility values measured by the University of Texasl, Appendix E.
Figure 1 is a Cartesian p l o t of the fifteen Figure 2 is a semi-log p l o t of the f irst seven'
322

The reservoir geometry used as a s ta r t i ng point i s t ha t described i n the paper by Gould, Clark, and Keener.2 This i s a wedge shaped reservoir bounded on two sides by l i nea r bar r ie rs wi th a f low angle o f 60 degrees a t the well. I n the sand 5 test, the f low angle was found t o be res t r i c ted out i n t o the graben but t h i s t e s t d id not reach f a r enough t o determine whether o r not the r e s t r i c t i o n i s necessary f o r sand zone 3.
These l i n e a r boundaries conform t o the angle formed by the graben f a u l t s i d e n t i f i e d by the geology and are shown on Figure 3. However, the determined distances t o the f a u l t s are much closer t o the wel l than indicated by the geology.
The ear ly t i m e rates ( f i r s t 6 t o 10 minutes) are not recorded due t o gas i n the tubing. The necessary rates were "backed out" during the simulation process. It was found tha t rates o f 3600 bpd f o r about one minute and 1000 bpd f o r f i v e minutes give reasonable pressure ca l - culat ions f o r t h i s very ear ly t ime.
When h i s to ry matching the seven day test , the parameters used were the reservoir permeability, the distance t o the faul ts, and the angle o f the fau l ts . The f i n a l descript ion and h is to ry match run are shown on Table 1 and Figure 4. The predic t ion o f the e igh t day var i -
. able ra te f low t e s t i s shown on Figure 5. A word i s i n order about t h i s run. . Days e ight and nine were simulated by specifying constant rates o f 5500 bpd and 6200 bpd and calculat ing the pressure a t the end of the day. the indicated bottom hole pressure and ca lcu lat ing the ra te f o r the day. These rates are shown as the s t a i r steps o f Figure 5.
Figure 6 shows the estimated ear ly one day t e s t and subsequent buildup. This simulation uses only a f i r s t estimate f o r br ine f low rates. The conclusion i s t ha t the rates could be adjusted w i th in the tolerance t o give an excel lent match. was not warranted.
sk in i s necessary t o describe the flow. The simulator uses an ex-' panded wel l bore t o simulate a negative skin. We had t o use a wel l bore radius o f e igh t f ee t t o match the test . ThiS i s ind ica t ive o f some anomaly w i th in a few fee t of the well. It i s possible tha t t h i s may be re la ted t o the two zones perforated which we have not seen be- fore. There may be other explanations f o r t h i s problem. Regardless, t h i s has hardly any e f fec t on the long term f low character ist ics o f the we1 1.
In analyzing the data i t may be o f i n te res t t o see the sensi t iv- i t y o f the various parameters. Table 2 shows the values used i n the various runs, and the p lo t ted resu l ts are shown on Figure 7. Notice how the distance t o the fau l t s a f fec ts the curvature o f the drawdown. The spread o f the f low angle also has an important e f f e c t on the shape o f the curve.
Days ten through f i f t e e n were simulated by specifying
Further refinement o f the rates
The only disturbing par t o f t h i s descr ipt ion i s t ha t a negative
2
323

ALTERNATE DESCRIPTION
The description above assumes tha, the rock proper ies are con- tinuous over the reservoir. An alternate idea i s t h a t there are no faults, bu t the rock changes i n characteristics. An alternate des- cription assumes a high permeability area i n the vicinity of the well bore w i t h reductions away from the well. Figure 8 is the calculated seven day tes t for this description. T h i s assumes t h a t there i s a step function i n permeability a t a distance of 175 f t from the well. The permeability i n the near-well area i s 42 md and i n the outer area i t i s 7 md.
Obviously, this description f i ts the data for this test as well as the description using linear barriers. T h i s same idea was pro- posed by the University o f Texas f o r the sand 5 test. An alternate description for the sand 5 test would have a h i g h permeability zone of about 300 md surrounded by a r i n g of about 20 md.
DISCUSSION
One is now faced w i t h choosing the proper description from the two postulated. I f . the 1 inear barrier or fau l t description is chosen, then there must be unmapped faults i n the vicinity of the well. Also, the faults must be about the same distance from the well. The fact t h a t the subject well drilled i n t o the graben i n the center w i t h o u t cutting either f a u l t above or below the sand section seems unlikely. On the other hand i t seems just as unlikely t h a t the well would h i t i n the center of a h igh permeability spot i n both the number 3 and number 5 sands, and further tha t the h i g h permeability zones are nearly exactly the same size.
If we take the two tests tosether, we f i n d some dffferences t h a t can help some. First, the receni sand-3 tes t investigated about 20 million barrels of water. If this i s contained i n a circular reser-
- voir, i t will have a radius of about 2800 f t . This size will easily f i t w i t h i n the graben as i t i s mapped i n Figure 3. However, sand3 shows two things tha t make this not possible for it t o be contained i n the graben. There were definite and repeatable barriers shown i n the early time of the flow tests. Also, tha t tes t investigated about 300 mil l ion barrels of water. If this f s contained w i t h i n a circular reservoir, it would have a radius i n excess of 9000 f t . T h i s will not f i t w i t h i n the graben.
i n the sand 3 test. This is probably due t o the early time rate variation and the fact t h a t the faults are so close and about equal distance from the well.
i n , the negative skin i s a detriment t o the description be- cause i t is thought t o be physically impossible t o explain the data t h a t way. However, this i s common t o both descriptions and cannot be used t o distinguish between the two.
L _- . 1 ;
6
LJ t i
G
I ' This raises the question of why there were no slope reflections
3
324

CONCLUSIONS
From t h i s we can conclude tha t i t i s more l i k e l y tha t the heter- ogeneities seen are some minor fau l t s not seen on seismic and d i f f i - cul t t o see i n any w e l l bore.
i; There i s reason t o bel ieve tha t the same descript ion tha t f i t s the sand 5 behavior also f i t s the sand 3 behavior. The descript ion developed f o r the sand 3 i s a l a y down copy f o r the descript ion f o r the sand 5 tests.
The permeabil ity o f sand zone 3 i s about 42 md which i s nearly an order o f magnitude less than sand 5. The resu l t i s t ha t the t o t a l d e l i v e r a b i l i t y from sand 3 has been reached during the t e s t and i s something less than 2500 bpd.
I ’ cp
325

I! !di id
1.
REFERENCES
! ,
2. ii t '
L
L 3.
I 1
4.
6. I >
b
Hoffman, K. S., "Final Report-Geopressured We1 1 Project, Sweet Lake, Cameron Parish, LA," GRI, Jan., 1983.
Gould, T. L., Keener, C. B., Clark, J. D., "Reservoir Engineering and Computer Model Analysis of Flow Tests, Sweet Lake Geothermal- Geopressured Prospect, 1981.
Durrett, L. R., "Daily Report," Period Nov. 14, .1983 through Dec. 7, 1983.
Weatherly, "Reservoir Fluid Analysis," Sand Zone No. 3.
MG-T/DOE, "Geopressured-Geothermal Testing P1 an ,'I June 1981.
Andrade, M., "Analysis of Sweet Lake Geopressure-Geothermal Aquifer," Dept. of Petroleum Engineering, University of Texas.
I '
Ir
326

. -
Rock Properties
Net Thickness Porosi ty Permeabili ty Rock Compressibility
TABLE 1
RESERVOIR PARAMETERS
20 ft 20% 42 md 3 x 10⁻⁶
F1 uid Properties
Pressure, psia Bw, ’ resbbl /STB viscosity, cp 9000 1.0560 ,323
10000 1.0532 .330 11000 1.0505 .336 11887 1.0480 .342
Reservoir Boundaries
I
327

TABLE 2 1 '
MAGNA GULF-TECHNADRI L 0
AMOCO FEE NO. 1 SWEET LAKE PROSPECT
i
SIMULATIONS RUNS
Dist. t o F1 ow Re -. Run Faults, f t Angle f t Rate Criteria - - 1 400 50 10k 2nd Drawdown Test Rates L (First Seven Days)
2 250 30 10k 2nd Drawdown Test Rates
3 225 40 10k 2nd Drawdown Test Rates
4 225 60 27 k 2nd Drawdown Test Rates
L (First Seven Days)
I ' (First Seven Days)
(First Seven Days)
G
id
328

329

330
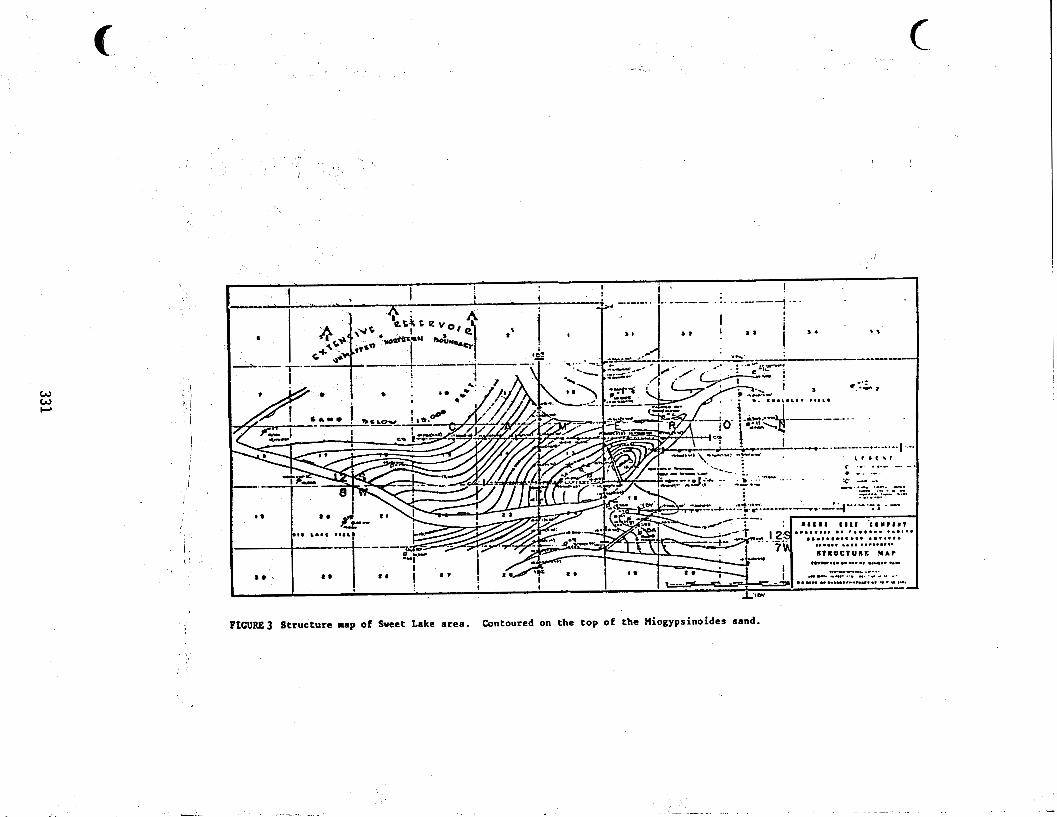
0
2 2 n
u W
.* .* m
P
M
.d E 0
)
5 ICI
0
a
Y
u 5 E
Q
l.4 2
)
Y
331
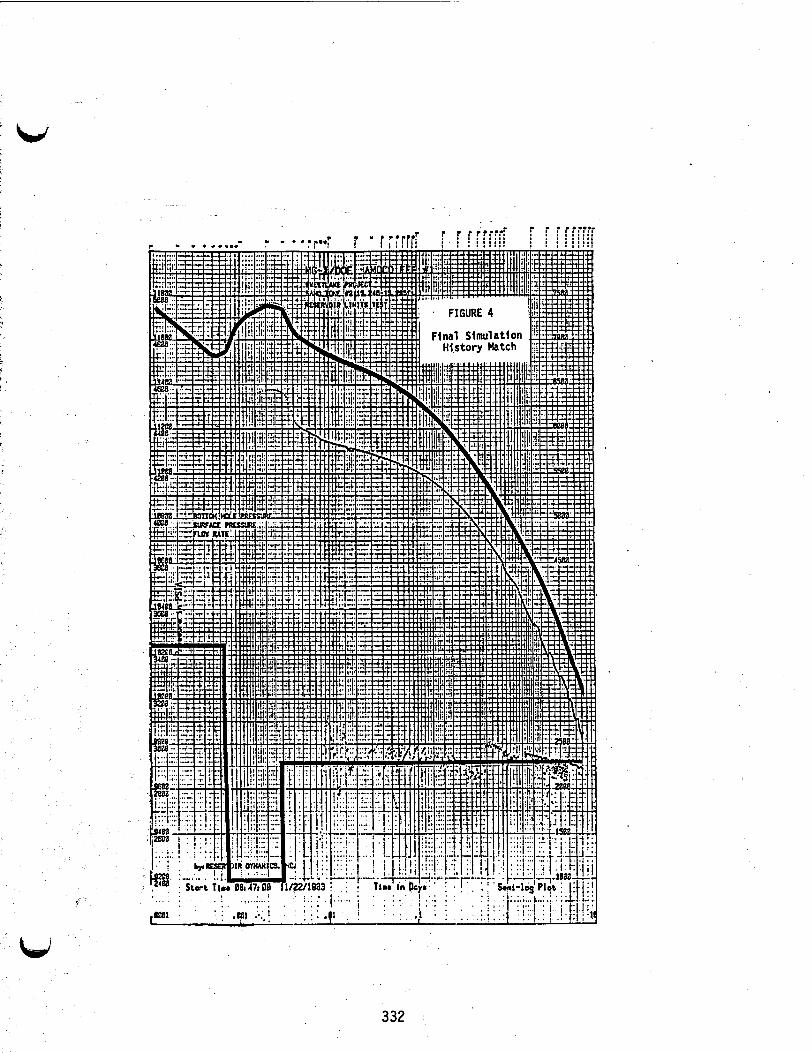
332
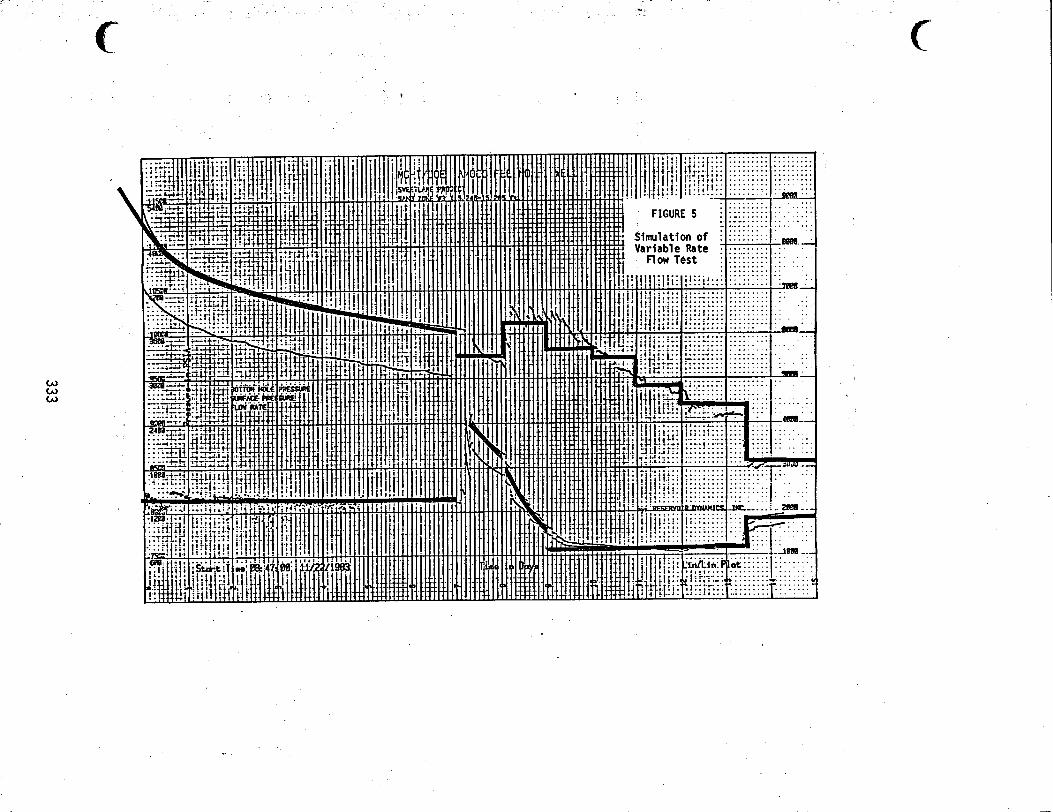
............... .
..
.
.
............... .
..
..
..
..
..
..
...
............. ...........
..
... ... ., . .... -
333

334
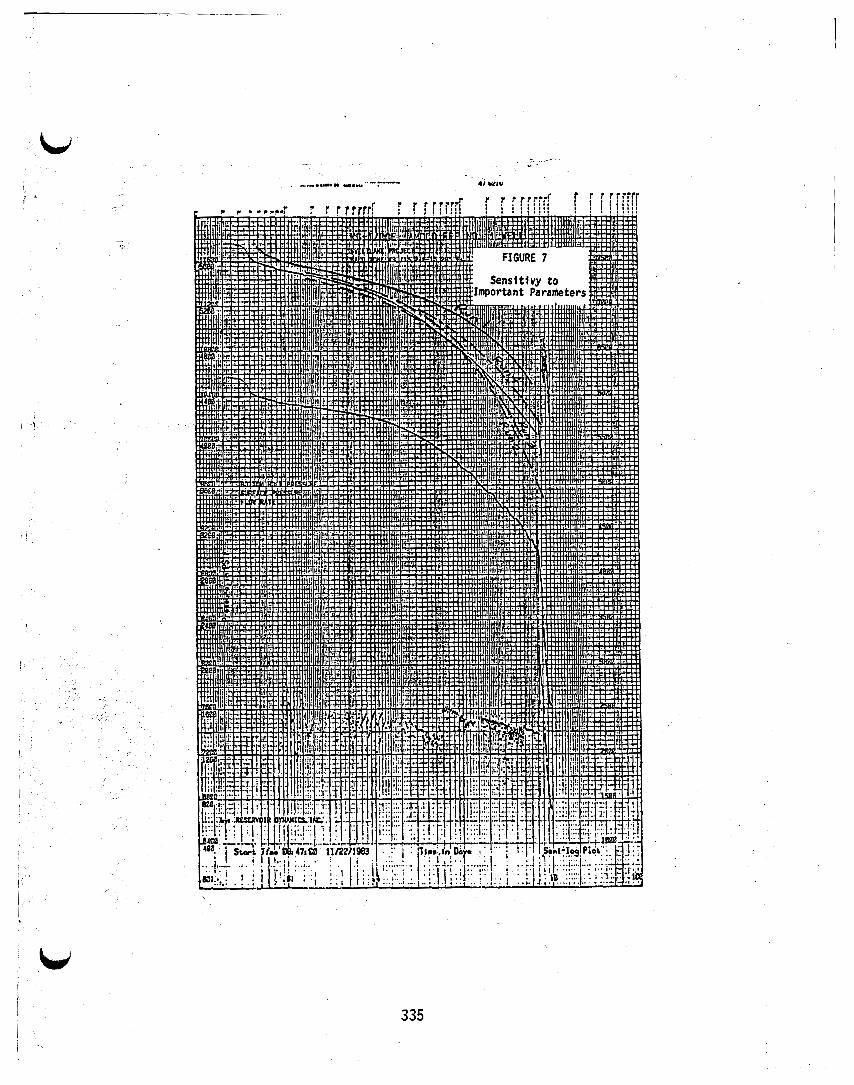
I I 335

P
336
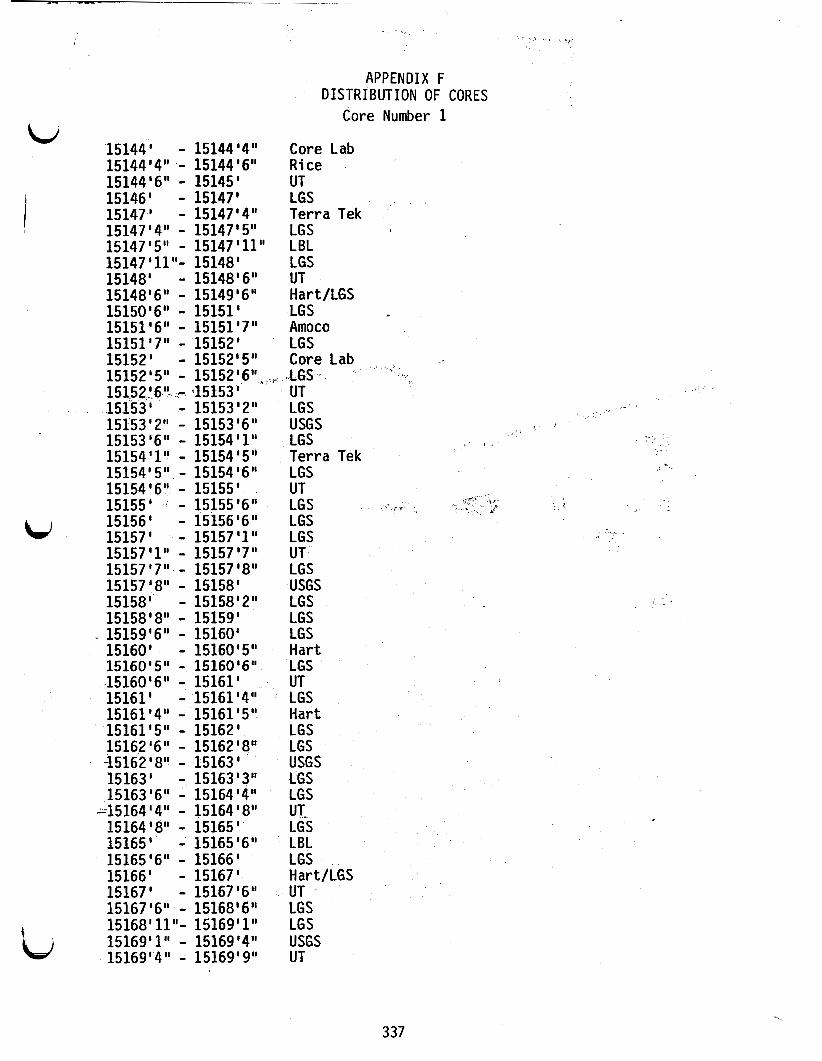
i
W
t
APPENDIX F DISTRIBUTION OF CORES
Core Number 1
15144' - 15144'4'' Core Lab 15144'4'' - 15144'6" Rice 15144'6" - 15145' UT 15146' - 15147' LGS 15147' - 15147'4" Ter ra Tek
15147'11"- 15148' LGS
15148'6'' - 15149'6" Hart/LGS 15150'6" - 15151' LGS 15151'6'' - 15151'7" Amoco 15151'7" - 15152' LGS 15152' - 15152'5" Core Lab
15 15 2.'. k15153 ' UT
15147'4" - 15147'5" LGS 15147'5" - 15147'11" LBL
15148' - 15148'6" UT
I
15152'5'' - 15152'6''=, ,716s
15153' - 15153'2" LGS 15153'2'' - 15153'6'' USGS 15153'6" - 15154'1" LGS
15154'5" - 15154'6" LGS
15155' - 15155'6" LGS 15156' - 15156'6" LGS 15157' - 15157'1" LGS 15157 '1" - 15157 '7'' 15157'7" - 15157'8" LGS
15158' - 15158'2" LGS
15154'1" - 15154'5" Terra Tek
15154'6" - 15155' UT -;4
UT
15157'8" - 15158' USGS
15158'8" - 15159' LGS - 15159'6" - 15160' LGS
15160' - 15160'5'' Har t
15160'6" - 15161' UT 15161' - 15161'4" LGS 15161'4'' - 15161'5" Har t 15161'5" - 15162' LGS
45162'8" - 15163' USGS 15163' - 15163'3" LGS
15164'8" - 15165' LGS 15165' - 15165'6" LBL 15165'6" - 15166' LGS 15166' - 15167' H ar t/LGS
15160'5" - 15160'6" LGS
15162'6'' - 15162'8" LGS
15163'6" - 15164'4" LGS *15164'4" - 15164'8" UT-
15167' - 15167'6" UT 15167'6" - 15168'6" LGS 15168' 11"- 15169'1" LGS 15169'1" - 15169'4" USGS 15169'4" - 15169'9" UT
337
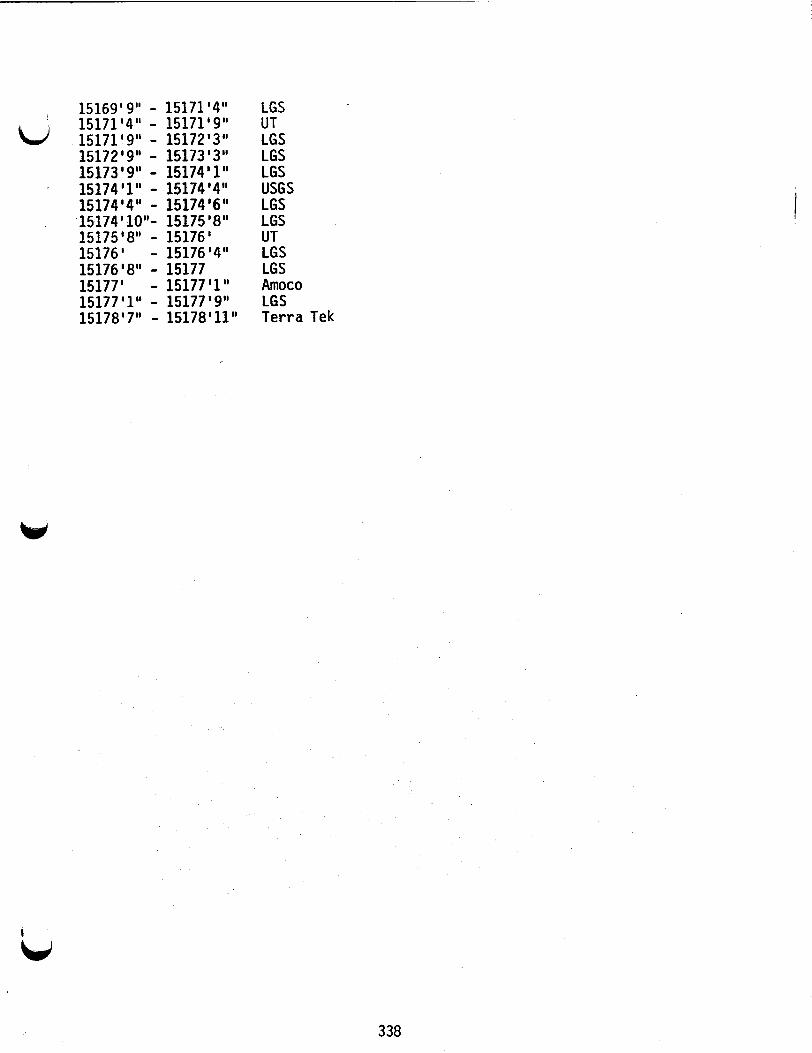
15 15 15 15 15
f 15 15 15 15 15 15 15 15 15
1
69 '9" - 15171'4" .71'4" - 15171'9" .71'9" - 15172'3" .72'9" - 15173'3" .73'9'' - 15174'1" .74'1" - 15174'4" .74'4" - 15174'6" .74'10"- 15175'8" .75'8" - 15176' .76 ' - 15176 '4" .76'8" - 15177 ,77' - 15177'1" L77'1'' - 15177'9'' 178'7'' - 15178'11"
LGS UT LGS LGS LGS USGS LGS LGS UT LGS LGS Amoco LGS Terra Tek
338

Core Number 2
W
15185' - 15185'5" 15185 '9" - 15185 ' 11" 15185'11''- 15186'5" 15186'5'' - 15186'9" 15186' 9" - 15188' 5'' 15188'5" - 15188'9" 15188'9" - 15189' 15189' - 15189'6" 15189' - 15189'11" 15189'117- 15190' 15190' J - 15190'1" 15190'7" - 15190'10" 15190'10"- 15191 '2" 15191'2" - 15191'3" 15191 '3" - 15191 ' 9" 15191'9" - 15192' 15192' - 15192'6" 15192'6" - 15193' 15193'6" - 15194' 15194'6" - 15195' 15195' - 15195'6" 15195'6" - 15196' 15196' - 15196'3" 15196'3" - 15197' 15197' - 15197'1" 15197 '1'' - 15197 '6"
LGS LGS UT Ter ra Tek LGS Ter ra Tek LGS UT LGS Amoco LGS LGS Core Lab LGS LBL LGS UT LGS LGS LGS UT LGS USGS LGS Har t LGS
339

bi
W
15189' - 15389'2" 15389'2" - 15389'8" 15389'8" - 15390' 15390'6" - 15391' 15391'6" - 15391'7" 15391 '7" - 15391 ' 10" 15391 ' 10"- 15392 ' 15392'6" - 15392'8" 15392 ' 8" - 15392 ' 11 'I 15392'11"- 15393'3" 15393'3" - 15393'9" 15393'9" - 15394'2" 15394'8" - 15395' 15395'6" - 15395 '9'' 15393'9" - 15396' 15396' - 15396'2" 15396'2" - 15396'3" 15396'3" - 15396'7" 15396'7" - 15396'10" 15396' 10"- 15397 ' 15397' - 15397'6" 15397'6" - 15398' 15398' - 15398'6" 15398 '6" - 15398' 10" 15398'10"- 15399' 15399' - 15399'6" 15399'6" - 15399'7" 15399'7" - 15400'1" 15400'7" - 15401' 15401'6" - 15402'1" 15402'1" - 15402'2" 15402 ' 2 " - 15402 ' 8" 15402'8" - 15402'10" 15402'10"- 15403' 15403' - 15403'5" 15403'5" - 15403'6" 15403'6" - 15404' 15404' - 15404'2" 15404'8" - 15405' 15405' - 15405'6"
LGS UT Ter ra Tek LGS LGS IGT LGS LGS IGT LGS UT LGS LGS LGS I GT LGS Amoco LGS IGT LGS UT LBL LGS Ter ra Tek LGS UT Amoco LGS LGS LGS Hart UT LGS USGS UT LGS UT LGS LGS UT
Core Number 3
I
340

Core Number 4 \i
15600' - 15600'6" UT 15600'6" - 15600'8" Hart/LGS 15600'8'' - 15601' LGS 15601'6'' - 15601'8" LGS 15601'8" - 15601'10" USGS
15602'6" - 15603'6" LGS 15601 ' 10"- 15602 ' LGS
15603 ' 10"- 15604 ' LGS 15604' - 15604'6" Core Lab 15604'6" - 15606' LGS
15605'6" - 15606' UT
15606'288 - 15606s6" Terra Tek
15608'618 - 15608'8" Amoco 15608'8'' - 15609' Terra Tek 15609' - 15610' LGS
15610'6" - 15611' LGS
15613'6" - 15614' UT
15615'8'' - 15616' Terra Tek
15616 '3" - 15616 '8" 15616 'lo1'- 15617 '4" Hart
15605' - 15605'4" USGS 15605'4'' - 15606'6" LGS
15606' - 15606'2" LGS
15606'6'' - *15608'6" LGS
15610' - 15610'6" UT
15611'6" - 15612'6" LGS 15613' - 15613'6" LGS
' 15614' - 15615'8'' LGS
15616' - 15616'3" LGS
15616'8" - 15616'10" LGS
15617'9" - 15618'6'' LGS 15619' - 15619'5" LGS 15619'10"- 15620'1" LGS . 15620'1" - 15620'7" UT 15620'7" - 15620'9" LGS 15620'9" - 15620'11" USGS
6,
UT
15620'11"- 15621 LGS 15621'6" - 15622' LGS 15622'6" - 15623' LGS
15624'4" - 15625' LGS 15625' - 15626' LBLILGS 15626' - 15626'8" LGS
15626 ' 10"- 15627 ' 3" LGS 15627'3'' - 15627'8'1 Terra Tek
15628'681 - 15628'8'' Amoco
15623'6" - 15623'10'' LGS 15623'10"- 15624'4" UT
15626'8" - 15626'10" USGS
I 15627'8" - 15628'6" LGS
15628'8" - 15629'5" LGS u
341

15629'5" - 15629'11" UT
15630' - 15630'4" USGS ,
15630 '4" - 15630' 11' 15629'11"- 15630' LGS u
5631'4" UT 5632 ' LGS
342
APPENDIX G I GAS WATER RATIO
MEASUREMENTS
343

MG-T/OOE AMOCO FEE N O . l WELL SWEET LAKE PROSPECT
W GAS/WATER RATIO MEASUREMENTS
SEPTEMBER, 1981
SUMMARY
I -/ /
Gas p r o d u c t i o n f r o m b r i n e f r o m t h e s u b j e c t g e o p r e s s u r e d - g e o t h e r m a l t e s t w e l l r e s u l t s i n p r o d u c e d w e t g a s / w a t e r r a t i o s o f 21-24 SCF/B, w i t h an a d d i t i o n a l 2-3 SCF/B l o s t w i t h t h e b r i n e t o t h e d i s p o s a l w e l l a t s e p a r a t o r o p e r a t i n g p r e s s u r e s o f 300-500 p s i g .
Thus, t h e b r i n e f r o m t h i s t e s t w e l l a p p e a r s t o be u n s a t u r a t e d w i t h r e s p e c t t o gas c o n t e n t ( i . e . * 23-27 SCF/B as opposed t o 34 SCF/B d e t e r m i n e d a t s a t u r a t i o n u n d e r r e s e r v o i r c o n d i t i o n s ) . However, t h e d e g r e e o f u n s a t u r a t i o n i s n o t n e a r l y as g r e a t as has been r e - p o r t e d e a r l i e r (13-15 SCFJB). The d a t a r e p o r t e d e a r l i e r were e r r o n e o u s l y l o w due t o measurement p r o b l e m s , w h i c h have now been r e s o l v e d .
. . . . . . . . . . . . . . . . . . . . . . . . . . . . . . . . . . . . . . . . . . . . . . . . . . . . . . . . . . . . . . . . . . . Wet g a s / w a t e r r a t i o s o f 13-15 SCF/B have been r e p o r t e d d u r i n g e a r l i e r t e s t i n g ( J u n e - J u l y , 1981) o f t h e s u b j e c t g e o p r e s s u r e d - g e o t h e r m a l w e l l ; i n f a c t , a v a l u e o f 8.5-9 SCF/B was r e p o r t e d d u r i n g t h e I n i t i a l Flow T e s t in mid-June. These e a r l i e r g a s / w a t e r r a t i o s have now been d e t e r m i n e d t o b e e r r o n e o u s l y l o w t h r o u g h a s y s t e m a t i c s t u d y o f b o t h gas a n d ' b r i n e measurements.
GAS MEASUREMENTS
E a r l y gas p r o d u c t i o n measurements were made o n l y w i t h c o n c e n t r i c o r i f i c e p l a t e s and s t r a i n - g a u g e d i f f e r e n t i a l p r e s s u r e i n s t r u m e n t a - t i o n . The gas p r o d u c t i o n r a t e s t h u s d e t e r m i n e d were n o t i n i t i a l l y c o n s i d e r e d s u s p e c t because c o n s i s t e n t ( a l b e i t l o w ) measurements were o b t a i n e d u s i n g s e v e r a l o r i f i c e p l a t e s o f d i f f e r e n t b o r e s as w e l l as d i f f e r e n t d i f f e r e n t i a l p r e s s u r e i n s t r u m e n t s c a l i b r a t e d a t
1 *
- __ -
I '
ti s e v e r a l d i f f e r e n t r a n g e s .
344

GAS/WATER RATIO MEASUREMENTS Page 2 .
However, a Rockwell p o s i t i v e d isp lacement meter was i n s t a l l e d f o r gas r a t e measurements on J u l y 29, and measurements t h u s ob ta ined were about 113% high-er than t h o s e ob ta ined w i t h t he o r i f i c e p l a t e s . The p o s i t i v e d isp lacement meter was t h e n removed and proven and found t o be a c c u r a t e t o w i t h i n . a b o u t 1%. T h e gas measurements w i t h t he o r i f i c e p l a t e s were t h u s .determined t o be e r roneous ly low. .
Inspec t ion and s y s t e m a t i c s tudy of ‘a11 components of t h e o r i f i c e plates-di ff e r e n t i a1 p r e s s u r e i n s t r u m e n t a t i on sys tems demonstrated t h a t t he measurement errors were a t t r i b u t a b l e t o the fo l lowing:
Ca lcu la t ion Er ro r s - 12%
Improperly Designed and Cons t ruc ted O r i f i c e P l a t e s ( P l a t e s no t beveled t o c r e a t e proper s h a r p kni fe -edge) - ’ 2 7 %
- - Steam Condensation Upstream of Orif ice P l a t e s - - 61%
B R I N E MEASUREMENTS
4 Brine f l o w r a t e measurements were made w i t h a H a l l i b u i t o n t u r b i n e meter which was p i p e d upstream of t h e s e p a r a t o r t o o b t a i n - immediate flow response from t h e wel lhead , and t o avoid the time l a g down- .
s t ream of t h e s e p a r a t o r . Unfo r tuna te ly , f u l l s t ream flow ( i . e . , f r e e gas and d i s s o l v e d gas i n a d d i t i o n t o b r i n e ) i s measured up- s t ream of t he s e p a r a t o r , and no t b r i n e only .
T h e i n d i c a t e d f u l l s t ream flow r a t e was determined t o be about 26- 44% higher than the b r ine flow r a t e from t h e s e p a r a t o r ( r e f e r t o Table 1). T h i s e r r o n e o u s l y - h i g h i n d i c a t e d flow r a t e when used I n gas lwa te r r a t i o ca - l cu la t ions will r e s u l t i n r a t i o s of 5-6 SCF/B lower than a c t u a l r a t i o s .
-
-3
345

. . .
I * ..
I
w GAS/WATER RATIO MEASUREMENTS Page' 3
.
C a l i b r a t i o n t e s t r u n d a t a for t h e H a l l i b u r t o n t u r b i n e meters I i u t i l i z e d f o r b r i n e f low r a t e measurements a r e g iven i n Table 1. I
I t can be seen from t h e s e d a t a t h a t t h e t u r b i n e meters when I
measuring b r i n e on ly a r e a c c u r a t e t o w i t h i n l ess than. 1%.
GAS/WATER RATIO
C o m p a r a t i v e wet gas /water r a t i o s determined r e c e n t l y u s i n g both . . o r i f i c e p l a t e s / d i f f e r e n t i a l p r e s s u r e i n s t r u m e n t a t i o n and p o s i t i v e
displacement me te r s f o r gas r a t e measurements, and t u r b i n e meters f o r b r ine measurements a r e g i v e n i n Table 2 . t h a t t he r a t i o s g iven i n Table 2 a r e broduct ion wet gas /water r a t i o s , and f u r t h e r t h a t gas l o s t i n t h e br ine t o t h e d i s p o s a l well ( a b o u t 2 SCF/B a t 300 ps ig s e p a r a t o r p r e s s u r e - r e f e r t o F igure 1) must b e added t o a r r i v e a t t o t a l gas /water r a t i o .
Weatherly L a b o r a t o r i e s have determined t h a t t he dry 'gas/water r a t i o i n t h e br ine from the Sweet Lake T e s t Well should be about 34 SCF/B a t s a t u r a t i o n u n d e r r e s e r v o i r c o n d i t i o n s a s may be seen i n F i g u r e 2 . I t t h u s appea r s t h a t t h e Sweet Lake b r i n e 4 s s t i l l u n s a t u r a t e d w i t h r e s p e c t t o n a t u r a l g a s ' c o n t e n t ; however, t h e deg ree o? u n s a t u r a t i o n
I t s h o u l d be noted
. . b -
346

w P w .
TABLE 1
MG-T/OOE AHOCO FEE N O . l WELL . SWEET LAKE PROSPECT
CALIBRATION OF HALLIBURTON L I q U I O TURBINE METERS SEPTEMBER, 1981
DATE 08/28/81 08/28/81 ' 08/31/81 09/02/81 09/04/61
N(EI1NAL TEST RUN RATE, B/O 2,000 2,000 . 5,000 5,000 5 S O 0 0
TEST RUN NO. 1 2 1 . 2 3
CALIBRATION TANK VOLUME, BBLS ' 158.4 152.0 152.0 152 .O 152 .O
TIRE REQUIRED TO F I L l TANK, MIN. 118.22 111.42 43.30 45.32 42 -75
BRINE PRODUCTION RATE, B/D MEASURE0 1,930 1,964 5,055 4,830 5,120
B R I E PROOUCTION RATE. B/D DETERMINED FROn TURBINE METER 1,925 1,964 5,055 4,861 5,086
1.
X ERROR - 0.26 0.0 . 0.0 + 0.64 - 0.64 . .
FULL STREAM PROOUCTION RATE, B/O* DETERMINED FROM TURBINE .METER 2,777 2,766 6,385 6,672 6,535
X ERROR + 43.9 + 40.8 + 26.3 + 38.1 + 27.6 .-
* NOTE: Full Stream Rate can only'be u t t l t z e d as an fndtcation o f r e l a t i v e brine r a t e since the Turbfne Wheel I s turnedby both free gas and dissolved gas I n addttlon t o brfne.
I

TABLE 2 . MG-TIOOE AMOCO FEE ~ 0 . 1 WELL -
SWEET LAKE PROSPECT
COMPARATIVE GAS/WATER R A T I O MEASUREMENTS SEPTEMBER, 1981
* DATE GAS PROOUCTIDN, SCF/D B R I N E PRODUCTION. STB/D GAS/WATER R A T I O - w P 03 P O S I T I V E DISPLACEMENT O R I F I C E
P O S I T I V E DISPLACEMENT O R I F I C E DP CELL OR T U R B I N E METER D P C E L L OR T U R B I N E METER
NOMINAL 2,000 B/D TEST RUN
Aug .28 42,393 ' - 40,600 1,907 22.2 21.3
Aug .30 44.735 41,205 1,892 23.6 21.8
NOMINAL 5.000 B/D TEST RUN
Sept.2 104,239 4,899 21.3 Sept.4 108,763 4,561 23.8 ,Se p t .5 113,918 4,991 22.8 Sept.6 111,305 4,858 22.9
Aug .29 42,238 39 , 574 1,867 22.6 21.2

..
, 349

.
FIGURE 2
350

APPENDIX H
SEPARATOR WATER FLASH
351

9 x WUITHERLY LABORATORIES, INC. J
4 J. E. WEATHERLY, JR. 223 GEORGETTE LAFAYETTE, LCI 70506
CHAIlWAN lWt4E 1318) 232-4877
-- NOVEMBER 29, 1983
MAGM GULF-TECHNAI3RIL ROUTE 1, BOX 1854 BELL CITY, LA 70630
ATTENTION: MR. LCIRRY DURRETT RE: ClMOCO FEE WELL NO. 1
SWEET LAKE PROSPECT FIELD SAIW ZONE NO. 3 CMERON PARISH, LOUISIANA
SEPARATOR WATER FIASH TO 0 PSI0 & 68'F
SOLUTION GCIS-WATER RATIO, DRY \= 2.64 SCF GAS B 15.025 PSI4 & 68'F -- BBL. WATER @ 8 PSI0 & 60 'F
SHRINKAGE = 0.9694 VOL. S.T. WATER C 60'F
JOHND. NEAL PRESIDENT
BRYAN SOMJIER VICE PRESIDENT
LCIB . NO. N2 1 37- 1050? PAGE 1 OF 4 / T!
352
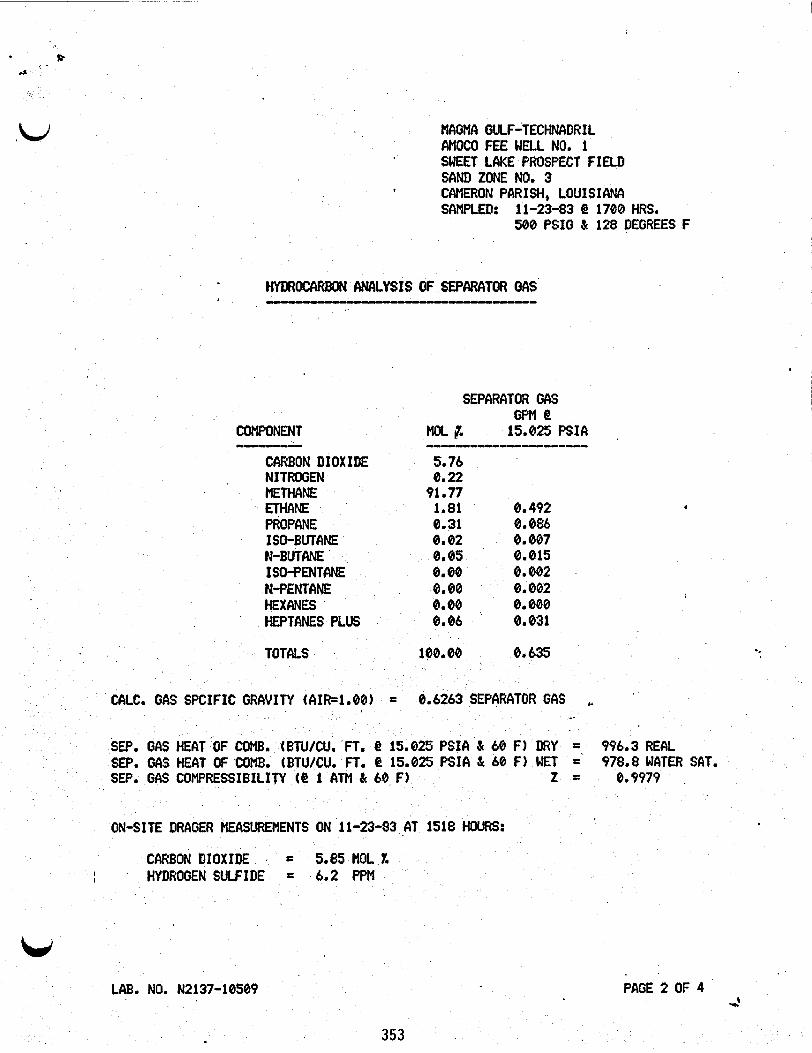
MAGMA GULF-TECHNADRIL AMOCO FEE HELL NO. 1 SWEET LAKE PROSPECT FIELD SAND ZONE NO. 3 CAMERON PARISH, LOUISIANA SAMPLED: 11-23-83 I 1700 HRS.
500 PSIG s( 128 DEGREES f
HyDRocARBoN ANALYSIS OF SEPARATOR GAS
COMPONENT - CARBON DIOXIDE NITROGEN METHANE ETHANE PROPANE ISO-BUTANE N-BUTANE ISO-FENTANE N-PENTANE HEXANES HEPTANES PLUS
SEPARATOR GAS
mi% 15.025 PSIA O P M Q
5.76 6.22
91.77 1.81 0.31 0.02 0.05 0.00 0.00 0.00 0.86
0.492 0.086 8.007 0.015 0.002 0.002 0.000 8.831
.
TOTALS 100.00 0,635
cc1LC. GAS SPCIFIC GRAVITY (AIk1.00) = 0.6263 SEPARATOR GAS ,. .- I
SEP. GAS HEAT OF COMB. (BTU/CU. F T a 4 15.025 PSIA Sr 60 F) DRY 996.3 REAL SEP. GAS HEAT OF COMB. (BTU/CU. FT. @ 15.025 PSIA & 60 F) WET = 978.8 WATER SAT. SEP. GAS COMPRESSIBILITY (4 1 bTM & 60 F) z = 0.9979
ON-SITE DRAGER MEASUREMENTS ON 11-23-83 AT 1518 HWRS:
CARBON DIOXIDE = 5.85 MOL 1: I , HYDROGEN SULFIDE = 6.2 PPM
-.
LAB. NO. N2137-10589 PAGE 2 OF 4 d
353
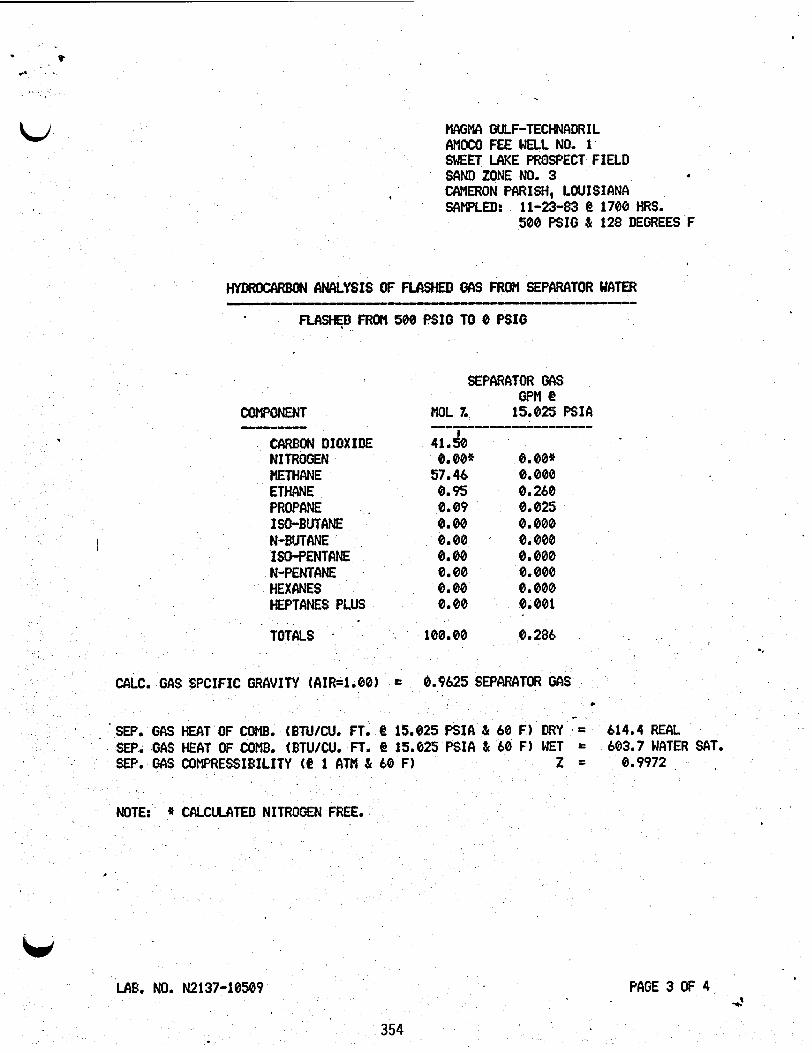
. HAGMA GULF-TECHNADRIL AMOCO FEE WELL NO. 1 SWEET LAKE PROSPECT FIELD SAND ZONE NO. 3 4
SAMPLED: 11-23-83 @ 1700 HRS. 500 PSIG s( 128 DEGREES F
, CAMERON PARISH, LOUISIANA
I
HM##IccIRBoIJ ANALYSIS OF FIASHEII GAS FROH SEPARATOR WATER - ---u
FROM 500 B I G TO 0 PSIG
SEPARATOR GAS GF’M e
COMPONENT MOL 1. 15.025 PSIA --_- ---I_---__-_------ . CARBON DIOXIDE 41.h NITROGEN 0.00+ 0.00* METHANE 57.46 0.000 ETHANE 0.95 0.260
ISO-BUTANE 0.00 0.000 I N-WANE 0.00 0.000
ISO-PENTANE 0.00 0.000 N-PENTANE 0.00 0. 000 HEXANES 0.00 0.000 HEPTANES PLUS 0.00 0.001
TOTALS . . 100.00 0.286
PROPANE 8.09 0.825
I
CALC. GAS SPCIFIC GRAVITY (AIR=1.001 = 0.9625 SEPARATOR GAS *
. ‘SEP. GAS HEAT OF COMB. (BTU/CU. FT. 15.025 PSIA t 60 614.4 REAL SEP. GAS HEAT OF COMB. (BTU/CU. FT. C 15.025 PSIA & 60 FI WET = 603.7 WATER SAT. SEP. GAS COMPRESSIBILITY (@ 1 ATM & 60 F) z = 0.9972
NOTE: * CALCULATED NITROGEN FEE.
I
u LAB, NO. N2137-10509 PAGE 3 OF 4
354
-.

c
MAGMA GULF -TECHNADRIL AMOCO FEE UELL NO. 1 SWEET LAKE PROSPECT FIELD
CAMERON PARISH, LOUISIANA SAMPLED: 11-24-83 @ 1500 HOURS
495 PSIG & 137 DEGREES F
SAND ZONE NO. 3
BY: TECHNADRIL PERSONNEL
lWiXWWM ANALYSIS [IF SEPARATOR GAS
COMPONENT
CARBON DIOXIDE NITROGEN . METHANE ETHANE PROPANE ISO-BUTANE N-BUTANE ISO-PENTANE N-PENTANE HEXANES HEPTANES PLUS
SEPARATOR GAS . I GPM Q
MOL 1. 15.025 PSIol ...................... 5.90 0.21
91 . 62 1.79 0.485 . 0.30 0.083 8.82 0.007 0.04 0.013 0.00 0.002 ' 0.00 0.002 0.00 0.000 0.12 0.059
4
-. I
TOTALS 100.00 0.654
4.
CALC. GAS SPCIFIC GRAVITY (AIR=l.00) = 0.6292 SEPARATOR GAS-
SEP. GAS HEAT OF COMB. (BTWCU. FT. t! 15.025 PSIA & 60 F) DRY = 997.3 REAL SEP. GAS HEAT OF'COMB. (BTU/(W. FT. C 15.825 PSIA & 60 F) WET = 379.9 WATER SAT. SEP. GAS COMPRESSIBILITY (e 1 ATM L 60 F) z = 0 I 9978
U I
LAB. NO. N2137-10509
355
PAGE 4 OF 4

TT RE: AMOCO FEE WELL NO. 1
SEET LAKE PROSPECT FIELD SAND ZONE NO. 3 CCullERON PCIR ISH, LOU 1 SI ANA SPlMPLED BY: EA'THERLY LAB
JOHN D. NEAL PRESIDENT
BRYAN SONNIEf? VICE PRESIDENT

M GULF-TECHNADR I L AMOCO FEE WELL NO. 1 SWEET LAKE PROSPECT FIELD SAND ZONE NO. 3 SAMPLED: 12-29-83 4 0338 HOURS
258 PSIG JC 14@ DEGREES F BY: WEATHERLY LAB
SEPARATOR GAS
Hot 1. 15.025 R I A GPM 4?
-I--__----_--------
CoMpONENT l
----- CARBON DIOXID 9.17 NITROOEN 0.20 ETHANE 88.72 ETHANE 1.47 0.402 PROPANE 0.053 ISO-BUTANE 8.004
0.005 ISO-PENTANE ' 0.081
0.800 0.028 0.876
TOTALS 100.80 0.569
PAGE 2 OF 7

MAGMA ciuLF-7ECHNADRIL AMOCO FEE WELL NO. 1 SWEET LAKE PROSPECT FIELD SAffD ZONE NO. 3 SWLED: 12-29-83 Q! 6330 HOURS
I
250 PSIG Sr 197 MGREES BY: WEATHERLY LCIB
HYDROCCIRBON ANALYSIS OF FuISHm GAS FROM SEPARATOR WATER ------.-u----------.l--u-----~------~- ,
FLCISHED FROM 258 PSI0 TO 0 PSI0 \
SEPARATOR GAS
COMWNENT MOL 1. 15.025 P S I A --..u- ......................
CARBON DIOXIDE 43.29 NI TROOEN 0.00* 0.80+ llETuANE 55.88 0.000 ETHANE 8.77 0.209 PROPANE 0.06 0.016 ISO-BUTANE 0.00 0.001
HEPTANES PLUS
PAGE 3 OF 7
*
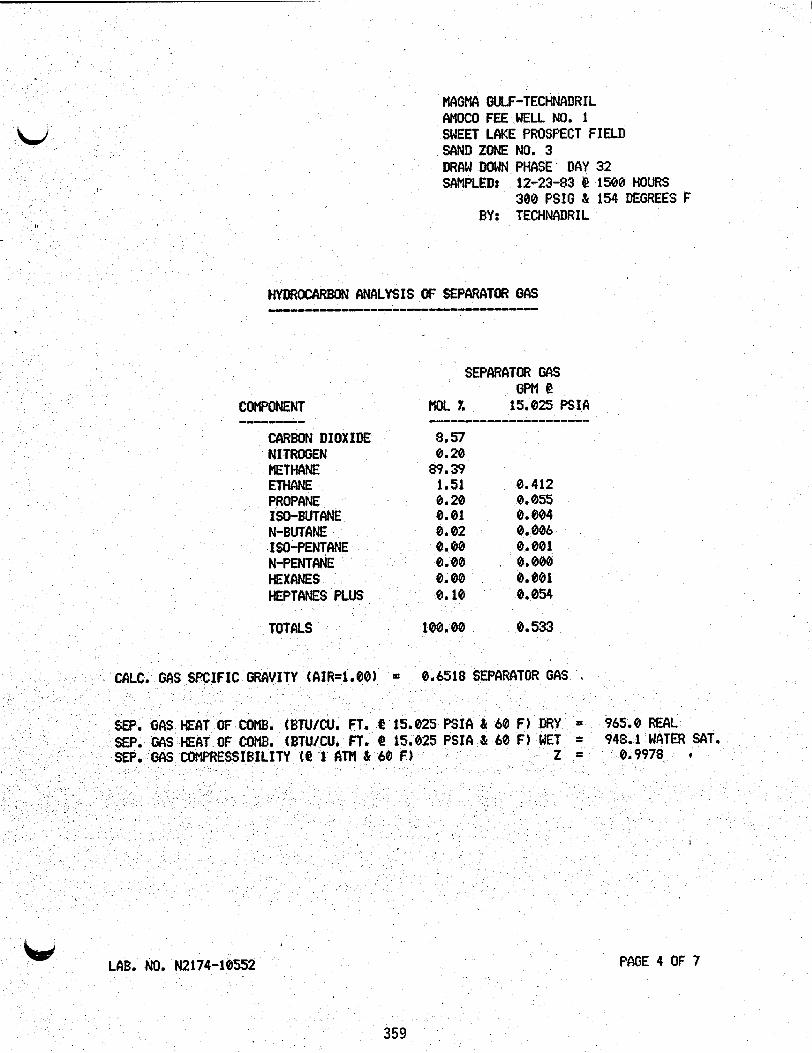
MAGMA OULF-TECHNADRIL ClMoco FEE WELL NO. 1 SWEET LWE PROSPECT FIELD SAND ZONE NO. 3 DRAW DOWN PHASE DAY 32 SAMPLED8 12-23-83 B 1500 Howls
308 PSIG s( 154 DEGREES F BY: TECHNClDRIL
HYDROUWON ANALYSIS OF SEPCIRATOR OAS ---------------------------
SEPARATOR GAS
MOL 1. 15.025 P S I A GPM @
--------I-----------
COMPONMT , ---I_-
CARBON DIOXIDE 8.57 NITROGEN 0.20 ETHANE 89.39 ETHANE 1.51 0.412 PROPClNE 0.20 0.855 ISO-BUTANE 0.01 0.004 N-BUTANE 0.02 0.006 ISO-PENTANE 0.00 0.001 N-PENTINE 0.00 0.0M HEXAFJES 0.00 8.001 HEPTANES PLUS 0.18 8.054
SEPARATOR GAS ,
'b, LaB. NO. N2174-10552 PAGE 4 OF 7
359

MAmA GULF-TECHNADRIL AMOCO FEE WELL NO. 1 SWEET LAKE PROSPECT FIELD
D R A W DOWN PHASE DAY 34 SAMPLED: 12-26-83 1588 HOWS
SAND ZONE NO. 3
300 PSI04 145 DEGREES F BY: TECHNRDRIL
*
7 ANALYSIS OF SEPWTOR OAS ---I--.----.---
I
SEPAR4TOR GAS GPM e
MOL 1. 15.025 PSIA ------------------- COMFONEElT u_----
CARBON DIOXIDE 8.54 NITfWEN 8.20 METHANE I 89.43 ETHANE 1.50 0.409 PROPCSNE 0.28 8.055 ISO-BUTMJE
= 964.5 REAL
LAB. NO. N2174-18553 PAGE 5 OF 7
360

I,
HAGMA GULF-TECHNADRIL AMOCO FEE WELL NO. 1 SWEET LAKE PROSPECT FIELD
DRAW OWN PHASE DAY 36 (SURFCICE 512 PSIA) SAMPLEDI
SAND ZONE NO. 3
12-28-83 @ 1 145 "JRS 300 PSIG 81 153 DEGREES F
BY: TECHNADRIL
HVDROCARBON ANALYSIS OF SEPARATOR GAS
SEPARATOR GAS
M o t x 15.025 PSIA GPM @
..................... COMPONENT ------ CARBON DIOXIDE 8.56 NITROGEN 0.20 m N E 89.37 ETHANE 1.. 50 0.489 PROPANE 0.19 0.054
*
I
1
LAB, NO. N2174-10554 PAGE 6 OF 7
361

W M A GULF-TECHNADRIL AMOCO FEE WELL NO. 1 WEE1 LAKE PROSPECT FIELD SAND ZONE NO. 3 DRAW DOWN PHASE DAY 36 SAMPLED: 12-28-83 @ 1506 HOURS '
250 PSIG 1 138 DEGREES F BY: TECHNADRIL
HyDRocARBoN CINALYSIS OF SEPARATOR GAS ---------~-U----------l--
I I
SEPARATOR GAS
MOL II . 15.025 PSIA GPM e
--_-_---I--_-__--_---
9.13 8.20
88.98 - ETHANE 1.48 0.405 PROPANE 0.19 0.053 ISO-BUTCINE ' 8.01 0.084
SPCIFIC GRAVIT 0,6559 SEPARATOR GAS
PAGE 7 OF 7
/
Appendix I \
RESORVOIR W I D ANALYSIS
~ l / w E ~ F E E ) J o . 1uEu. mNDzoNEtJo.3
61JEn LAKE FIELD CCIFERoN PARISH, LOUISIANA
, 363
m I). )(EAL PRESIDENT
BRYAN W I E R VICE PRESIDENT
DECM8ER 30, 1983
K4GRl-l W-TECHNAORIL 3 NDRTHPOINT DRIVE SUITE 288 WWSTON, TEXAS nae ATTENTION: R. LARRY DLRRETT
RE: RESERVOIR FLUID STUDY UG-T/UE Iu1oM) FIX NO. SAND ZONE NO. 3 SUET LAKE FIELD CAMERON PARISH, LOUISIANA
GENTLEMEN2
ATTACED ARE THE RESULTS OF THE AuluYSES OF TIlE CHEnICAL &ND PHYSICAL
SURFACE SEPILRATOR SAXPUS WERE COLLECTED FROH THIS WELL BY A REPRESENTATIVE OF UfATHRLY LABORATORIES, INC. ON NOVEHBER 2S, 1983. WEASURED ON THIS 72 HWR TEST, 19.98 CUBIC FEET OF SEPARATOR GAS PER BARREL ff SEPARATDA LIQUID, WS USED I\S THE BASIS FOR ONE RECONBIWTION. RESERVOIR FLUID EXHIBITED A BUBBLE POINT OF 8,WB P S I A AT THE RESERVOIR TDIPERATURE 293 DEGREES F W W E I T .
O W RECOIIBIMTIONS WERE DONE TO DETERtlIM A BUBBLE POINT -VS- GWR RELATIONWIP. A DIRWHTIAL LIBUZATION AND VISCOSITY -S WERE PERFORPlED USING
CHMACTERISTICS OF A RECOllBINED RESERVOIR FLUID SANPLE FROH THE SUBJECT UELL.
THE GAS-WATER RATIO (OUR)
WE RESULTANT
RESERVOIR FLUID REW~IBINELI i o THE PRODUCED GWR AT THE TIE OF SII~.IPLINO.
M UISH TO THANK YOU FOR THIS WPORNNITY OF FUWINO YOU. OLESTIONS COUCEIINING THIS REpo#I, PLEASE CONTACT US.
SHOUD THERE BE ANY
CCI m. BERNIE IWitkl GW-TECHNADRIL ROUtE 1, BOX l a BELL CITY, LA 76630
LAB. NO. ~zi i i - ies ie
364
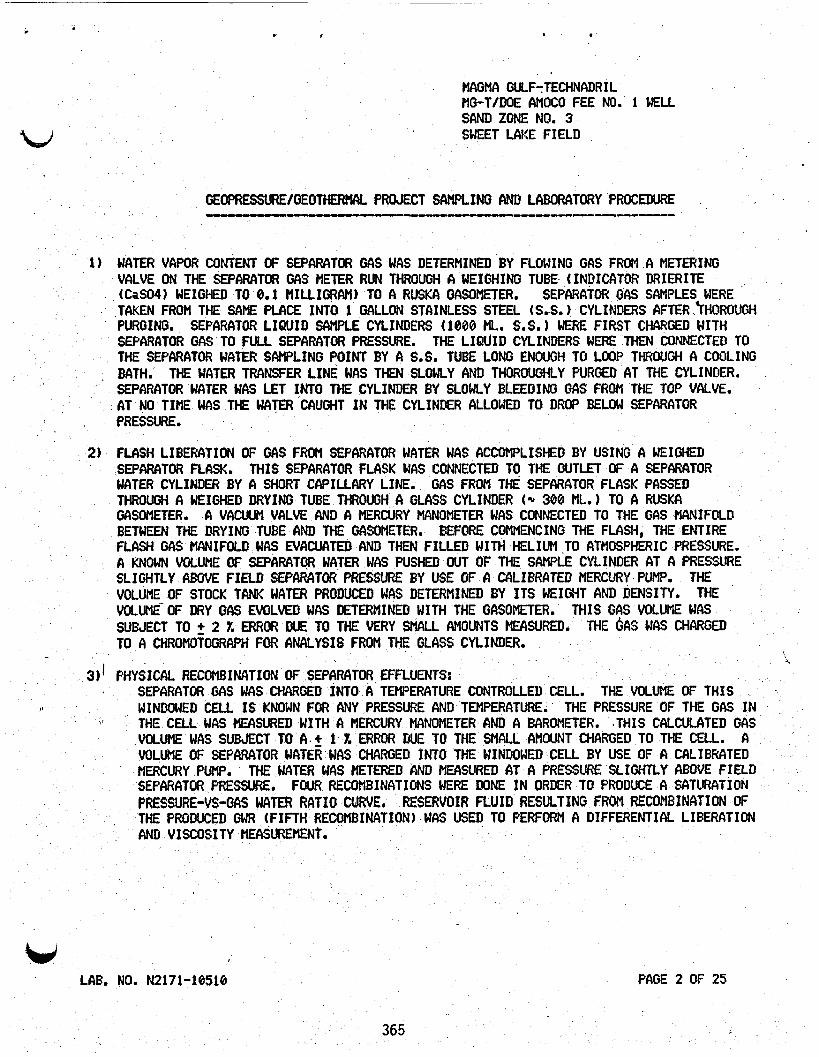
I 0
HAGMA GULF-TECHNADRIL MG-T/WE AMOCO FEE NO. 1 WELL SAND ZONE NO. 3 SWEET LAKE FIELD LJ
1) WATER VAPOR CONTENT OF SEPARATOR GAS WAS DETERMINED BY FLOWING GAS FROM A METERING VALVE ON THE SEPARATOR GAS METER RUN THROUGH A WEIGHING TUBE (INDICATOR DRIERITE (CaS04) WEIGHED TO 0.1 IIILLIGRAM) TO A RUSKA GASOMETER. SEPARATOR GAS SAMPLES WERE TAKEN FROM THE SAME PLACE INTO i GALLON STAINLESS STEEL (s..s.) CYLINDERS AFTER~HOROUGH PURGING. SEPARATOR LIQUID SAMPLE CYLINDERS (1000 ML. S.S.1 WERE FIRST CHARGED WITH SEPARATOR GAS TO FULL SEPARATOR PRESSURE. THE SEPARATOR WATER SAMPLING POINT BY A S.S. TUBE LONG ENOUGH TO LOOP THROUGH A COOLING BATH. SEPARATOR WATER WAS LET INTO THE CYLINDER BY SLOWLY BLEEDING GAS FROM THE TOP VALVE. AT NO TIflE WAS THE WTER CAUGHT I N THE CYLINDER ALLOWED TO DROP BELOW SEPARATOR PRESSURE.
THE LIQUID CYLINDERS WERE THEN CONNECTED TO
THE WATER TRANSFER LINE MAS THEN SLOWLY AND THOROUGHLY PURGED AT THE CYLINDER. .
2) FLASH LIBERATION OF GAS FROM SEPARATOR WATER WAS ACCOMPLISHED BY USING A WEIGHED SEPARATOR FLASK. UATER CYLINDER BY A SHORT CAPILLARY LINE. GAS FROM THE SEPARATOR FLASK PASSED THROUGH A WEIGHED DRYING TUBE THROUGH A GLASS CYLINDER (* 300 ML.) TO A RUSK&
BETWEEN THE DRYING TUBE AM3 THE GASOMETER. FLASH GAS P1ANIFOUI WAS EVACUATED AND THEN FILLED WITH HELIUM .TO ATMOSPHERIC PRESSURE. (I KNOWN VOLUME OF SEPARATQR WATER WAS PUSHED OUT OF THE SAMPLE CYLINDER AT A PRESSURE SLIGHTLY ABOVE FIELD SEPARATOR PRESSURE BY USE OF A CALIBRATED MERCURY PUMP.
VOLUME-OF DRY GAS EVOLVED WAS DETERMINED WITH THE GASOMETER. SUBJECT TO + 2 1. ERROR DUE TO THE VERY SMALL AMOUNTS MEASURED.
THIS SEPARATOR FLFLSK WAS CONNECTED TO THE OUTLET OF A SEPAWTCJR
GASOMETER. A VAcWm VALVE AND A MERCURY MANOMETER WAS CONNECTED TO THE GAS flANIFOLD BEFORE COI"C1NG THE FLASH, THE ENTIRE
THE
THIS GAS VOLUME WAS VOLUME OF STOCK TANK MATER PRODUCED WAS DETERMINED BY ITS WEIGHT AND DENSITY. THE
THE 6AS WAS CHARGED
'\
TO A CHROMOfOCiRAPH FOR ANALYSIS FROM THE GLASS CYLINDER.
3) J PHYSICAL RECOMBINATION OF SEPARATOR EFFLUENTS: 1 SEPARATOR GAS WAS CHARGED INTO A TEMPERATURE CONTROLLED CELL. THE VOLUME OF THIS
WINDOWED CELL I S KNOWN FOR ANY PRESSURE AND TEMPERATURE. THE PRESSURE OF THE GAS I N THE CELL WAS EASURED WITH A MERCURY MANOMETER AND A BAROMETER. .THIS CALCULATED GAS VOLUME WAS SUBJECT TO A. ,+ 1 Z, ERROR WE TO THE SMALL AMOUNT CHARGED TO THE CELL. A VOLUME OF SEPARATOR WATER WAS CHARGED INTO THE WINDOWED CELL BY USE OF A CALIBRATED MERCURY PUMf.
I '
THE WATER WAS ttETEI?€D AND MEASWED AT A PRESSURE SLIGHTLY ABOVE FIELD SEPARATOR PRESSURE. FOUR RECOMBINATIONS WERE DONE I N ORDER TO PRODUCE A SATURATION PRESSURE-VS-OAS WATER ROT IO CWRVE . THE PRODUCED GWR (FIFTH RECOMBINATION) WAS USED TO PERFORM A DIFFERENTIAL LIBERATION AND VISCOSITY tlEfWREPlENf.
RESERVOIR FLU ID RESULTING FROM RECOMB I NATI ON OF .
365

L/ MAGMA GULF-TECHNADRIL MG-T/DOE AMOCO FEE NO. 1 WELL
SWEET LAKE FIELD I SAND ZONE NO. 3
4 1 I PRESSURE-VOLUME RELATIONS OF RECOMBINED RESERVOIR' FLUID AT RESERVOIR TEMPERATURE: ECICH DATUM OF PRESSURE-VOLUME RELATIONS WAS CORRECTED FOR MERCURY PUMP CALIBRATION, MANIFOLD EXPANSION, CELL EXPANSION, MERCURY COMPRESSIBILITY AND MERCURY THERMAL EXPANSION. DATA INTERPRETCITI ON.
' LIQUID VOLUME PERCENT WAS DETERMINED BY CALIBRATED CATHETOMETER AND BY .
5 ) DIFFERENTIAL LIBERATION OF RESERVOIR FLUID AT RESERVOIR TEMPERATURE: GAS FROM EACH PRESSURE DECREMENT OF THE DIFFERENTIAL LIBERATION WAS ANALYZED I N THE SAME HANNER AS DESCRIBED I N 21, (FLASH LIBERATION). WERE NOTED.
DIFFERENTIAL LIQUID CHANGES
6 ) VISCOSITY OF RESERVOIR FLUID WAS HEASURED BY MR. J. R. COMEAU OF WEATHERLY LABORATORIES. A DESCRIPTION OF tR. COMEAU'S EXPERIMENTAL PROCEDURES I S GIVEN BELOW:
GEOTHERMAL WATER VISCOSITIES WERE tlEASURED USING A RUSKA ROLLING BALL VISCOMETER WITH AN ELECTRONIC DETECTION SYSTEM TO PREVENT ELECTROLYSIS.
OSCILUITION. . TURNED OFF, A PULSE I S PROWCTED WHICH STARTS A DIGITAL TIMER. WHEN THE BALL STRIKES
THE CONTACT AT THE O T M W D OF THE VISCOMETER THE ELECTRICAL DISTURBANCE PRODUCED I S GENERALY AMPLIFIED AND TURNS THE TIMER OFF. AND CLVERAGED. THE VISCOMETER WAS MLIBRATED AT EACH OF TWO ANGLES USING DISTILLED WATER AT SEVERAL TEMPERATURES. t p VERS u WERE PLOTTED TO OBTAIN CALIBRATION.
THE DETECTION SYSTEM CONSISTS OF A SENSITIVE AUDIO AMPLIFIER WITH POSITIVE FEEDBACK ADJUSTED JUST BELOW
THE BALL IS HELD BY AN ELEGTROMCIGNET. WHEN CURRENT TO THE MAGNET I S
TIMES WERE MEASURED TO 1/100TH OF A SECOND
t ROLL TIME, (SECONDS) .
p = DENSITY DIFFERENCE BETWEEN BALL AND RESERVOIR FLUID, (gm./ml. 1
u = VISCOSITY, (CENTIPOISE) 6
THE VISCOtlETER WAS CHARGED WITH RESERVOIR FLUID AND RUN AT. 293'F AT 1000 LE. INTERVALS. THE VISCOSITIES HAD A PROBABLE ERROR OF 0.01 CENTIPOISE.
NOTE:' ALL DATA FOR PRESSURES GREATER THAN 11 OBTAINED BY EXTRAPOLATION, 9
u LAB. NO. N2171-18510 366 PAGE 3 OF 25

COMPANY WELL FIELD PARISH AND STATE
FIELD DATA FOR M T H E R L Y UBORATORY INVESTIGATION
WELL RECORD
MAGMA GULF-TECHNADRIL HG-TIDOE AMOCO FEE NO. 1 SWEET LAKE CAMERON, LOUISIANA
FIELD CHARACTERISTICS
FORMATION NAME SAND NAtf€ AND DESIGNATION ZONE 3 DATE COMPLETED ORIGINAL RESERVOIR PRESSURE
ELL CHARACTERISTICS
ORIGINAL PRODUCED W-LIQlJID RATIO
FEf?FORATIONS 15,245-15,285 FT . ELEVATIONS TOTAL DEPTH LAST RESERVOIR PRESSURE 11,887 PSIA RESERVOIR TEMPERATURE 293 DEGREES F
* SAMPLING CONDITIONS
(72 HOUR TEST) 11-25-83 TUBING PRESSURE, FLOWING 3460 PSIG PRIPMRY SEPARATOR TEMPERAfLlRE 168'F (SEP.) , 132 DEGREES F, (METER RUN) PRIMARY SEPARATOR PRESSURE 500 PSIG PRIMRY SEPARATOR GAS RATE ' (WET GAS) 41,959 SCF/DAY SEPARATOR LIQUID RATE 2,100 BELS. /DAY ' GAS-LIQUID RATIO (SEPARATOR) 19.98 SCF/BBLo SEP. WIJTER
SHRINKAGE FACTOR (VOL. S. T. WATER ~FNOL. SEP. WATER) 0.9674
' GAS-LIQUID RATIO (STOCK TANK) 20.65 SCF/BBL. S.T. WATER
PRESSURE BASE 15.025 PSI4 CO DEGREES F
NOTE: FOR DRY GAS, 19.94 SCFIBBL. SEP. WATER e! SEP. CONDITIONS. 20.61 SCf/BEL. S.T. WATER @ 60'F. W

LJ t e-
MAGMA GULF-TECHNADRIL .MG-T/DOE A M M M FEE NO. 1 WELL SClND ZONE NO. 3 SWEET L4KE FIELD *
----- \/Hw Pf = 115.7152
CALCULATION OF GAS RATE, 11-25-83 TEST
(Factors from GPM Engineering Data Book) I 7 u__- 1-11
Hw . = 26 "H20 , Pf = 515 psia
Fb = 12.7121 D - 2.626 I' $ J = 6.250 I' -
LAB NO. N2171-10510 368 PAGE 5 OF 25.

HAGA GULF-TECHNADRIL MG-T/DOE AMOCO FEE NO. 1 WELL SAND ZONE NO. 3 SWEET M E FIELD
I
RESERVOIR FLUID StffglARY __.--_u_----
Reservoir Temperature, Degrees F , 293
Saturation Pressure at 293 Degrees, 'Psia 8880
Compressibility o f Reservoic Oil at 293 Degrees F Vol . per Vol. per Psi x 10 6
From 8300 Psia to 10000 Psia 2.61 From 10600 Psia to 11000 Psia 2.59 From 11008 Psia to 11837 Psia 2.57
I DIEF:_Ll!L
Saturated Oil at 8800 Psia, 293 Degrees F 1.0512
0.015238 0.323
1.8576
368.4 Density, Gms. per H1.
Lbs. per Bbl. Specific Volume, Cu.Ft. per Lb. Vi sco s i t y , Cent i po i se Formation Volume Factor, Bbls. per Bbl.
Solution Cias-Oil Ratio, Cu.Ft. per Bbl. 23.31 * , 25.39 W E T "Equivalent Stock Tank Oil" at 60 Degrees F 23.22 * , 24.50 DRY
"Equivalent Stock Tank Oil" at 60 Degrees F 1.0545 *
Reservoir Oil at 11887 Psia 293 De Density, Gms. per Mi. 1.0597
* q F Lbs. per Bbl. 371.4 Specfic Volume, Cu.Ft. per Lb. t 8.0151 16 Viscosity , Centipoise 0.342 Formation Volume Factor, Ebl. per B b l .
"Equivalent Stock Tank Oil" at 60 Degrees 1.0491
NOTE: REFERENCES TO 'OIL' ABOVE SHOULD READ 'WATER'.
ii EASED ON SEPARATOR WATER FLASH.
c LAB NO. N2171-10510 369 PAGE 6 Of 25
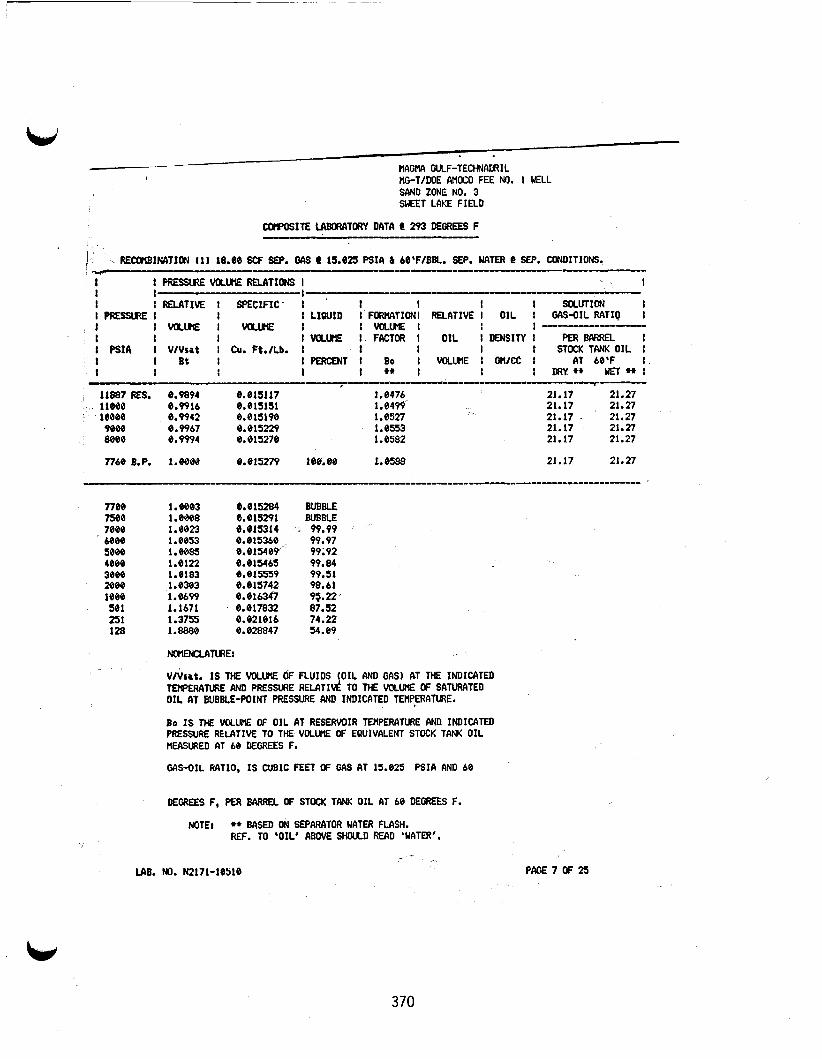
MAGMA GULF-TECHNADRIL HG-T/DOE AMOCO FEE NO. 1 WELL SAND ZONE NO. 3 SWEET LAKE FIELD
COrPOSIE LMQRATORY DATA @ 293 DEGREES F
1 x R E ~ I M T I O N (1) 18.88 SCF SEP. GAS C 15.825 PSIA L 68'F/BBL. MP. WATER @ SEP. CONDITIONS. -- I
I I 1 . I I RELI\TXvE I SPECIFIC' I I I I I SOLUTION I
I LIQUID I FORWITIONI RELATIVE I O I L I OCIS-OIL RAT19 I ; ----- I F I E S S R E I I
I I vaw I WLm I I MLUME I I I I I VOLUQ I FACTOR I O I L I DENSITY I PERBARREL I I PSI4 I VIVsa t I Cu. Ft./Lb. I I I I STOCK T M O I L I
I B t I IF€RC€NT I Bo L WKW I On/cC: I AT 68'F I 1 1 I ++ I I I DRY ++ NET++ I
I I 1
---_I------
, I I PRESSURE WLm RElATloNs I
I
-----------y-------
11887 RES. 8.9094 8.815117 1.8476 21.17 21.27 iieee e.wi6 e.eisisi 1.8499 21.17 21.27
21.17 . 21.27 100~8 8. W42 e.eisi90 1.6527 9888 8.9967 8.815229 1.8553 21.17 21.27 m e 8.9994 e. 815278 1.8582 21.17 21.27
7768 B.P. 1.8086 e . 8 1 ~ 9 ie8.e~ 1.6588 21.17 21.27
7789
7eee
sew 4eee 3eee
ieee sei
7588
6888
2808
zJ1 128
1.8883 1. ee08 1. e m i . e m 1. e m 1.8122 1 . m 3
1.8699 1.8303
1.1671 . 1.3755 1.8880
" C L I l T U R E l
BUBBLE BUBBLE 99.99 99.97 99;92 99.04 99.51 90.61 95.22 07.52 74.22 54.89
V l V m t . IS THE VOLurzE dF FLUIDS OIL AND GAS) bT THE INDICATED TMPERATURE AND PRESSURE RELATI d TO THE VMW OF SATURATED OIL AT BUBBLE-POINT PRESSURE AND INDICATED TEMPERATURE.
Bo I S THE VOLUME OF OIL AT RESERVOIR TEMPERATURE AND INDICATED PRESSURE RELATIVE TO THE VOLunE OF EQUIVALENT STOCK TANK OIL REASURED AT 68 DEGREES F.
GCIS-OIL RATIO, IS CUBIC FEET OF GAS AT 15.829 P S I A AND 68
DEGREES F, PER BCIRREL OF STOCK TANK OIL AT 60 DEGREES F.
NOTE8 ++ BASED ON SEPARATOR CSCITER FLASH. REF. TO 'OIL' MOVE WOULD READ 'WATER'.
,>
LAB. NO. ~ m i - i e m PME7OF25
370

IIAGMCI GULF-TECHNADRIL HG-T/WE AHOCO FEE NO. 1 E L L SAND ZONE NO. 3 SWEET LAKE FIELD
corwsm LASWA~ORY Mia e rn DEOREES F --- ECCtIBIKPTION (2) 15.88 SCF SEP. GAS e 15.825 PSIA 8 68'F/BBL SEP. WATER @'SEP. CONDITIONS.
_. -----I__---- -*p+-------
I I PRESSURE Wxure RELCITIONS I I --: ~----~---------------- I I
I E I A T I V E : SPECIFIC I I . I I I SOLUTION I 1 I L I W I D I FORMTION! RELATIVE : OIL : W-OIL RATIO I
I I PRsSlRE I I I mu€ I V O L M I I MLulE I I I --- I I I I MLUIE I FSTOR 1 OIL 1 DENSITY I PERBARfEL ! I PSIA I V N s a t I Cu.Ft./Lb. I I I I I STOCK TANK OIL : I I B t I I f " T I Bo I WLW I On/CC I AT 68'F : I I I I I ** I I I DRY ** WET- I
11897 ES. 8.9854 e.815115 1.8465 18.88 18.17 11088 8.9876 0.815149 1,8488 18.88 18.17 1MBB e.9902 e. ~15189 1.0516 18.08 18.17 9~ e. 9927 e.815~27 1.8542 18.88 18.17 8ae9 8.9953 e. 815267 1.8576 18.68 18.17 7888 8.9988 8.0153368 1.8599 18.08 18.17
6248 e.p. 1.~808 e.eism 108.88 1.8628 18.88 18.17
------------------
____ ____________--_-_-_____y________________--------------
1.8001
1.0822
1.8873 i . em 1.823s 1. e571
1.8888
1.@038
1.1369
BUBBLE 99.99 99.98 99.96 99.89 99.62 98-85 95.91 89.35
253 1.3188 8.820894 77.68 SJ 6.2437 8.895772 16.23
t40EMUTWKI
V I V m t . IS THE WLUK OF FLUIDS (OIL Wl GAS) AT THE INDICATED TWERANRE AND PRESSURE RELATIW TO THE VOLUME OF SAnlRATED OIL AT BUBBLE-WINT PRESSURE AND INDICATED TEWERATURE.
Bo I S THE VOLUHE OF OIL AT RESERVOIR TEMPERATURE AM) INDICATED PRESSURE RELATIVE TO THE VOLUME OF EQUIVALENT STOW TANK OIL 1IEASUREO AT 68 DEGREES F.
GAS-OIL RATIO, IS CUBIC FEET OF GAS AT 15.825 PSI6 AND 68
DECREES F, PER BARREL OF STOCK TANK OIL AT 68 DEGREES F.
WTEt ** 8ASED ON SEPMATOR UATER FLWH. REF. TO 'OIL' lBOVE SHOULD READ 'WATER'.
i
371

\ ' i, HAGMA GULF-TECHNALRIL
MG-T/DM AMOCO FEE NO. 1 WELL SAND ZONE NO. 3 SUEET LAKE FIELD
COPOSITE u\BowIToRY DATA Q 293 DEGREES F ---I
REcop lS I~T IoN (3) 12.88 SCF SEP. GAS 15.825 K I A & be'F/BBL SEP. MTER L SEP. CONDITIONS.
I
I RELATIVE I SPECIFIC I I I I I SOLUTION I PRESSLRE I I I LIQUID I FOfUIATIONI RELATIVE I OIL I GAS-OIL RATIO I
; I-*-- I VOLW I WLW 1 I VOLW I I I I I WLWE I FACTOR I OIL I DENSITY I PERBARREL I
1 E t I 1- I Bo I VOLUHE I UllCC I AT 68'F I I I I 1 - 1 I I D R Y ' * wn ** I
PSI& I V/Vsat I Cu.Ft./Lb. I I I I STOCK TANK orL I ,
11887 RES. 6.9819 8.815168 1.8455
ieem 8.9866 8.815181 1.8585 9888 8 . 9 ~ 9 1 e.eiszi9 1.8532 W 6 8.9917 e.eism 1.6568 7888 e.9942 e.ei5m 1.8586 6888 8.9969 wmm 1.8615 5688 b.9996 e.eis3si 1.8644
iiecie. e . w i 8.815142 I. e479
4x58 B.P. i . w e e.eisx17 188.88 1 6648 _____.-----------------------------------
4.8888 I. 6882 6.81~398 BUBBLE 45588 i .em e.ei5484 99.99
2884 i .aw 8.815642 99.14
see 1.1649 6 . ~ 7 8 ~ 1 1 91.59 224 ' 1.2967 8.819952 78.12 133 1.6369 8 . m i a 7 63.n
3998 i . e m 8.815438 99.96 3882 1.8876 8.815504 99.76
ieee I. 8448 8.816864 96.81
NOPIPICUITURE:
V/Vsat. I S THE MLM OF FLUIDS (OIL N O GAS) AT THE INDICATED TEWEMl'URE AND PRESSURE R U T I K TO THE VOLUME OF SATURATED OIL AT BUBBLE-POINT PRESSURE AND INDICATED TEWERATURE.
BO IS THE VOLUHE OF OIL AT RESERVOIR TEWERATLJRE AND INDIWTEO PRESSURE RELATIVE TO THE V O L W OF EQUIVALENT STOCK TANK OIL HEASWED AT 66 DEGREES F.
WS-OIL MTIO, IS CUBIC FEET OF GAS AT 15.825 RIA AND 60
DEGREES F, PER BARREL OF STOCK T W OIL AT 68 DEGREES F.
NOTE: ** BASED ON SEPARATOR WATER FLASH. REF. TO 'OIL' ABOVE StIWLD READ 'WATER'.
14.98 15.86 14.98 15.86 14.9% 15.86
14.9% 15.86 14.98 15.86 14.98 15.86 14.98 15.86
14.98 15.86
14.98 15.86
PAGE 9 OF 25
372

IWNA .GULF-TECWADRIL MG-T/DOE AHCkO FEE No. 1 WELL SAND ZONE NO. 3 SWEET LAKE FIELD
COrpOSITE LABORATORY DATA 0 293 DEGREES F
IzEoMBXNclTIol (4) 9.88 S# SEP. GAS Q 1S.bZS PSIA & MSF/BBL. SEP. WlER t SEP. CONDITIONS. -~~~~ ~~~ -~~ ~
I I I FRESSURE Vaw r n T I O N s I I I I I I - T I E t SPECIFIC I I I I I SOLUTION I
I LIQUID I F(HWATl0NI RELllTIVE I OIL I W - O I L R M I O I 1 -----I_
I P E s s u R € l I I I Va.w I VOLutE I .I WLIIQ I I I I I I V O W E I FACTOR t OIL I DENSITY I PERBARREL I I PSlA I VNSat I Cu.Ft./Lb. I I I I I STToa: TW OIL I I I B t I IPERQNT I Bo I VCLWE I €Ul/CC I AT 68'F I
I I I +* 1 I I DRY ** El** : I
1----
1-_1---1---- ------- I
11687 ES. 6.9784 e.eisem 1 8442 11.89 11.96 11689 0.9886 e.815132 1 . w ~ 11.89 11.96 lW88 8.9831 e.eisi7e 1. e493 11.89 11.96 wee e. 9857 8.ei52ie 1. 8S2B 11.89 11.96 8006 e.= e. e 15249 1.8547 11.89 11.96 7888 e. 9988 e.eism 1. e575 11.89 11.96 @de e. 9934 e.eism 1 . e ~ 11.89 11.96 see8 6.9968 e . 6 1 ~ ~ 1.8636 11.89 11.96 4888 6.9987 e. e154 i 1 1.8659 11.89 11.96
352% B.P. l.eB88 e.eis31 i e c m 1.8673 11.89 11.96 --------------__---------_l___l______________-------
BUBBLE 99.96 98.83 99.54
97.73 93.19 82.65
98. m
V/Vsrt. I S THE WLWlE OF FLUIDS (OIL MID O M ) AT 1wE INDICATED TMPERATURE WD PRESSURE RELATIM TO THE vaw OF sawam
BO IS TM VOLUME OF OIL a i RESERVOIR TEMPERATURE AND INDICATED
OIL AT BUBBLE-POINT PRESSURE AND INDICATED fuIpERIIllRE.
PRESSURE RELATIVE TO TIE VOLu(E OF EQUIVCILENT STOCK ThNK OIL CIEASURU) AT 68 DEGREES F,
GCLS-OIL MTIO, I S CUBIC FEET OF GAS AT 15.825 P S I A AND 68
DEGREES F, PER BWEL OF STKK TANK OIL AT be DEGREES F.
** BASED ON SEPARATTOR WATER FLASH, REF. TO 'OIL' IBOVE SHOULD READ 'WATER'.
PAGE 16 OF 25
373

HAOHA WLF-TECHNADRIL BG-T/W)E AMm FEE No. 1 UELL SAND ZUNE NO. 3 SWEET LAKE FIELD
con>osm LABORATORY DATA e zm DEGREES F
ECWBIWTION (5) 19.98 SCF EP. OAS C 15.929 PSIA & 68'F/BBL. SEP. WTER C SEP. C0ND.- PRODUCED GWR
I I PREssUE VOLlPE RELATIONS I I DIFFERENTIAL LIBERATION I I I I I I R E U T I M I SPECIFIC I I I I I SOLUTION t IFsSslREI I I LIQUID I FoRpvItIONI FORHATION1 OIL I GAS-OIL RATIO I
I---- I I VOLlR€ I VaLtE I 1 V O L M I VOLUME I I I 1 I MLulQ I FACTOR I FACTOR I VIsCOSITY I PER BARREL I I PSIA I V N S a t I Cu.Ft./Lb. I I t I I STOCK TANK OIL I I t B t 1 I F€RCENT I Bo I Bo : CENTIPOISEI AT 68'F I I 1 I I t ** I I I DRY E T I
----------------- --------- -
- 11__--------1-
i i m 7 RES. 8.9926 8.815116 1.8488 I 1,8491 8.342 24.58 25.39 iieee 8.9943 e.eisisi. 1.8585 I 1.8516 8.336 24.58 25.39 1W88 8.9969 e.eisi91 1.8532 I 1.8543 8.338 24.56 25.39 9860 0.9995 8.eime i . e m I 1.0571 24.58 25.39
8800 B.P. 1.8808 e.815238 100.80 1 . 8 ~ 5 I 1.8576 8.323 24.50 25.39
~ e w 3 1.8889 i .em
1.8118 i . e m
I. e779
1.0053 1.8883
1.8219 1.8353
1.1888 1.485@
e. e15243 e. e 15252 e. e 15273 8 . 8 1 ~ 1 9
e. 0154 18 e.eis47i e.eisw2
e. e 17981 e.e214e9
8.815364
8.815776 8.81 6425
NO11ENCLATWE:
BUBBLE
BUBBLE
99.95 99.89 99.81 99.44 98.42 94.78 86.70 72.85
mmE
w.m
1---
I I I I 1.8622 I I I . 1.8698 I I 1.8728 I I I I I imse
8. me 8.312 8.318 0.315 i7.w i 7 . n
8.33 11.49 12.89
8.315 z.32 23.19
8.32
0.34 p s.
6.00 e. 08
LAB. No.
V/Vsat. I S T M VOLUME # FLUIDS (OIL AND GAS) AT THE INDICATED TEtlPERATURE AND PRESSURE RELATIW TO THE VOLWlE OF SANRATED OIL AT BUBBLE-POINT PRESSURE AND INDICATED TU1PERATURE.
Bo I S THE VOLUME OF OIL AT RESERVOIR TEMPERATURE WD INDICATED PRESSURE RELATIVE TO THE WLUHE OF EQUIVALENT STOCK TANK OIL HEASURED AT 68 DEGREES F.
GAS-OIL RATIO, I S CUBIC FEET OF GAS AT 15.825 DEGWES F, PER BARREL OF STOCK TANK OIL AT 68 DEGREES F.
PSIA AND 60
NOTEX INDICATES VALUE rtEASUHED C 68'F ** BASED ON SEPARATOR WATER FLASH ALSO BASED ON SEP. WATER FLASH: SOLUTION GAS I N RES. FLD. IS
23.22 SCF DRY GAS/BBL. S.T. WATER B 68'F 23.31 SCF WET GAS/BBL. Sal. WATER 4 1B'F
REF. TO "OIL" ABOVE SHOULD READ 'WATER"
P A G E l l O F 2 5
374

MAGMA GULF-TECHNADRIL MG-TIDOE AMOCO FEE NO. 1 WELL SAND ZONE NO. 3 SWEET LAKE FIELD
OBSERVm S A M T I O N PRESSURES FROM STEPWISE RECUWNCITION 4 293 F
I .
GAS-LIQUID RATIO . SATURATION PRESSURE
(SCF, 1ST STG. GAS) (PSIFI) * ----------_- (BBL. 1ST STG. LIQ.)
375 PAGE 12 OF 25 LAB. NO. N2171-10518
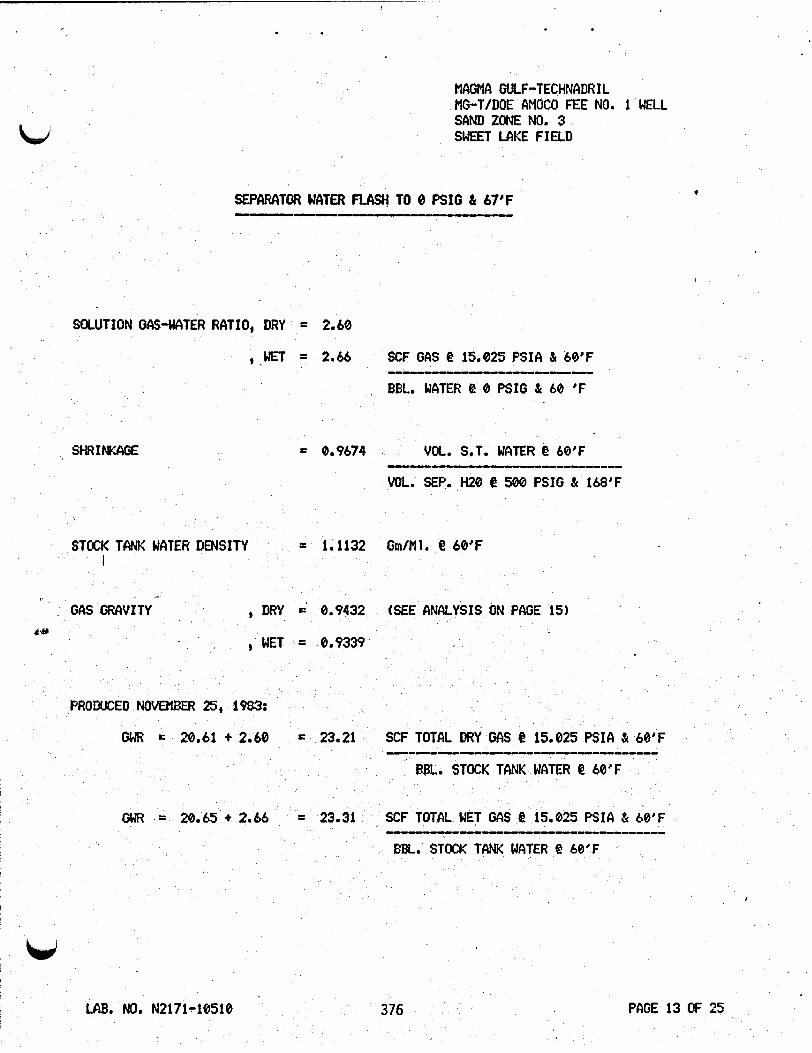
44 MAGMA GULF-TECHNADRIL MG-T/DE AMOCO FEE NO. 1 WELL SAND ZONE NO. 3 SWEET LAKE FIELD
SOLUTION GAS-WTER RATIO, DRY =
9 . E T =
SHRINKAGE L:
2.60
2.66 SCF GAS e 15.825 PSIA & 60'F
BBL. WATER e 0 PSIG J( 60 'F
0.9674 VOt. S.T. WATER 60'F ------_--_I-----
WL. SEP. H20 @ 500 PSI6 & 168'F
w LAB. NO. N2171-18510 376 PAGE 13 OF 25
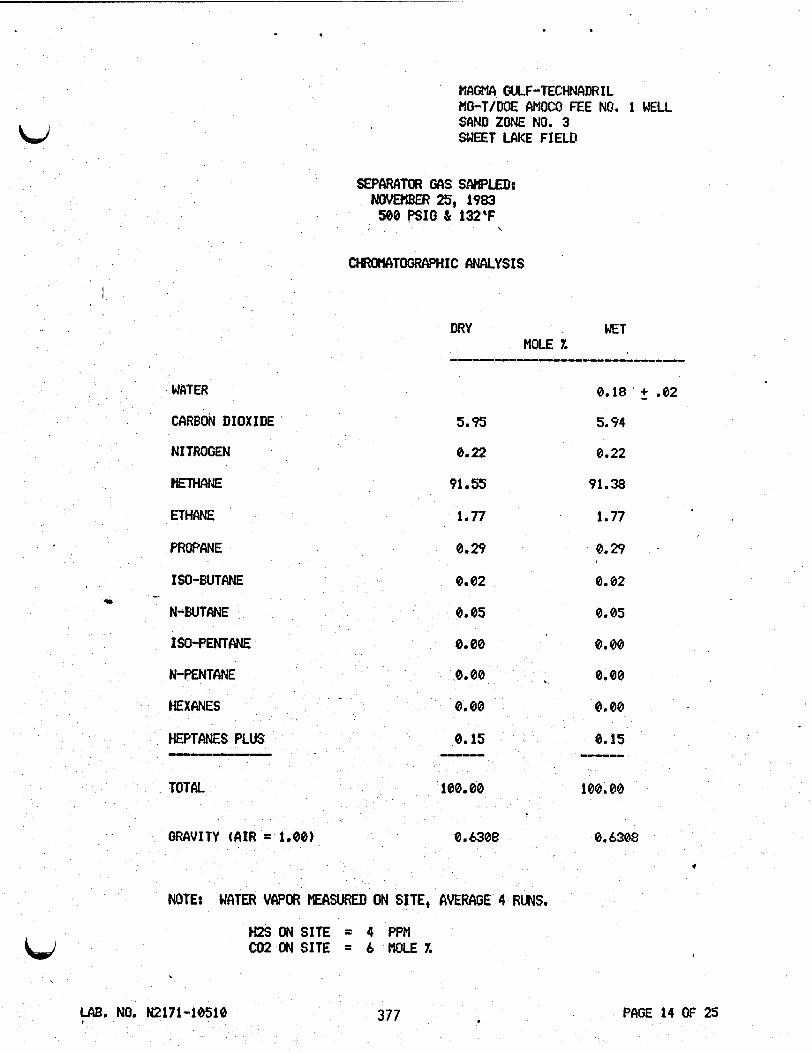
c
LJ
MAGMA GULF-TECHNADR I L MCi-T/WE AMOCO FEE NO. 1 WELL SAND ZONE NO. 3 SWEET U K E FIELD
SEPARCITOR GAS SAMPLED: " B E R 25, 1983 500 PSI0 1 132'F
,
CtRiNATOGRAPHIC ANALYSIS
WATER
CARBON DIOXIDE 5.95
NITROGEN 0.22
ETHANE 91.55
ETHANE 1.77
PROPANE 0.29
ISO-BUTANE 0.02
N-BUTANE 0.05
ISO-PENTANE 0.00
N-PENTCINE 0.00
HEXANES 0.00
0.15 HEPTANES PLUS
-
-- - , TOTAL 100.00
0.6388
0.18 ' 2 .82
5.94
0.22
91.38
1.77
0.29 .
0.02
0.05
0.80
0.00
0.00
0.6308
t
NOTE: WATER VAPOR MEASURfiD ON SITE, AVERAGE 4 RUNS.
H2S ON SITE = 4 PPH 0 2 ON SITE = & MOLE 1.
PAGE 14 OF 25 LAB. NO. H2171-10510 377

. ' .
MAGA GULF-TECMADRIL MG-T/DOE AMOCO FEE NO. 1 ELL SAND ZONE NO. 3 SWEET LAKE FIELD
SOLUTION GAS FRQM SEPARATOR UATER FLAW @ 0 PSI0 SI 67'F (CCILWLCITED NITROGEN FREE)
CHROHATOWUWIC ANALYSIS
WATER 2.22
CARBON DIOXIDE 39.25 38.38
NITROGEN
ETHANE
PROPANE -
59. b3
0.95
0.08
---- 58.30
0.93
0.09
I SO-BUTANE 0.08 0.00
N-BUTWE 0.00 0.00
. ISO-PENTANE 0.80 0.00
N-PENTANE 0.00 0.00
HEXANES 0.00 0.00
HEPTANES PLUS 0.09 8.89
TOTCIL 100.00 108.80
-- -I- uI-- - 1
GRAVITY (CIIR = 1.08) 0,9432 0.9339
b+
LAB. NO. N2171-10510 378 PAGE 15 OF 25
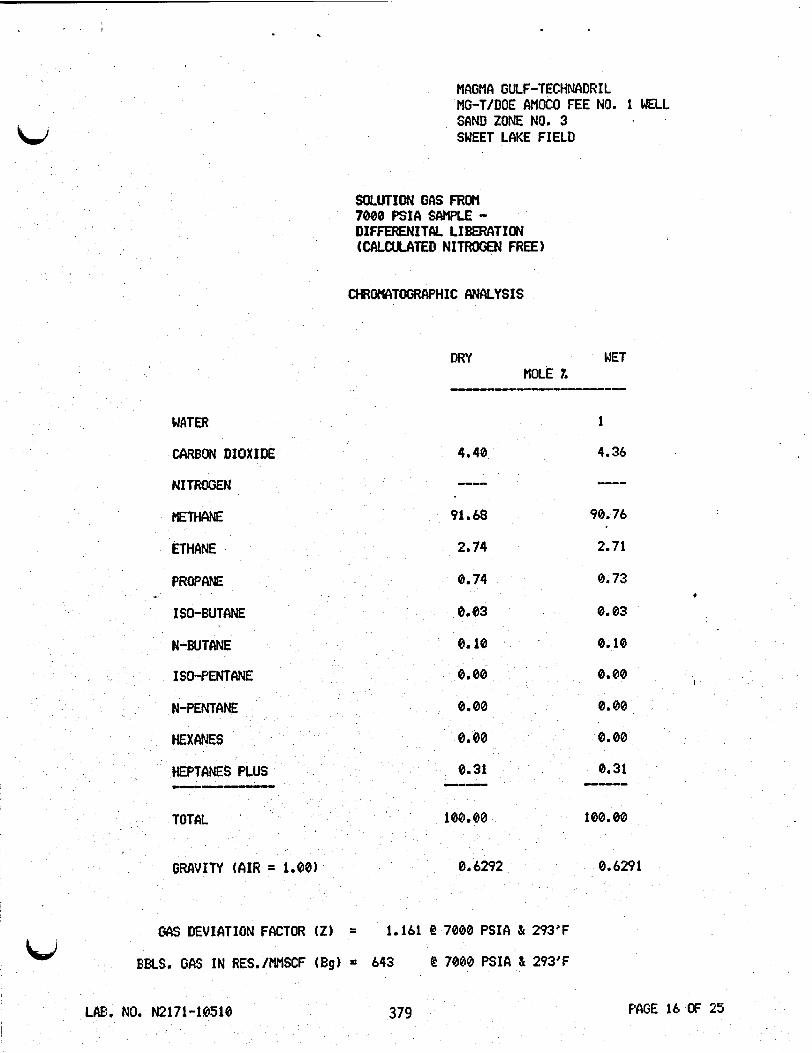
.
MAGMA GULF-TECHNADRI L MG-T/DOE AMOCO FEE NO. 1 WELL SAND ZONE NO. 3 SWEET LAKE FIELD
SOLUTION GAS FROM 7000 R I A SCIMPLE - DIFFERENITRL LIBERATION ~CALcuusTu) NITROGEN FREE)
CHROWTOGRAPHIC ANALYSIS
DRY WET MOLE X
--1_-11---
WATER 1
CARBON DIOXIDE 4.40 4.36
__-- ---- NITROGEN
METHANE 91.68 98.76
ETHANE 2.74 2.71
PROPCINE 0.74 8.73 - t
GAS DEVIATION FACTOR (2) = 1.161 e 7008 R I A d 293'F
4 7000 PSIA S 293'F EBLS. GAS I N RES./MMSCF (Bg) = 643 6J
3F 25
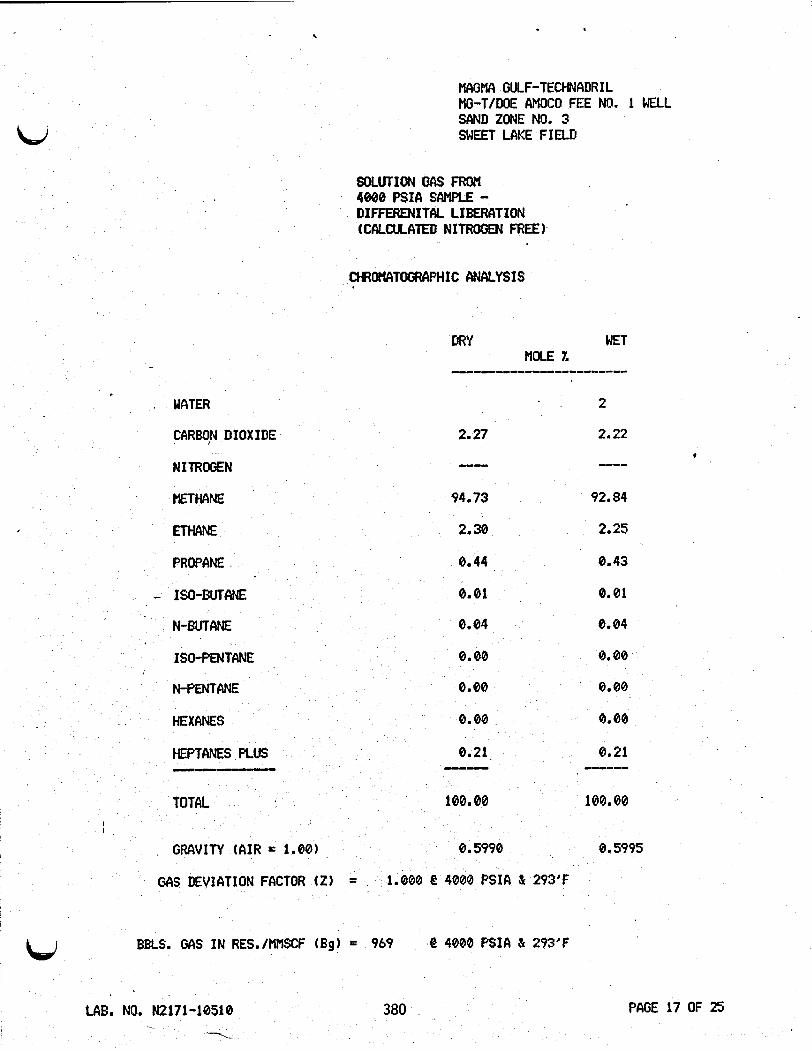
. UATER
MAGMA GULF-TECHNADRIL MG-T/DOE AMOCO FEE NO. 1 WELL SAND ZONE NO. 3 SWEET LAKE FIEUI
SOLUTION OAS FRO11 4000 PSICI SAMPLE - DIFFERENIT&. LIBERATION (CCILCULATED NITROGEN FREE)
CHROHATOGRAPHIC ANALYSIS
2
BBLS. GAS IN RES./MMSCF (Bg) = 969 @ 4800 P S I A st 293'F
ME. NO. NZ171-18518 380 PAGE . -
1
17 OF 25

I
MAm GULF-TECHNADRIL MG-T/WE AMOCO FEE NO. 1 WELL SAND ZONE NO. 3 w * SWEET LAKE FIELD
SOLUTION GAS FRm 2060 PSIA SAMPLE - DIFFERENITM. LIB€RATION (CW-CULCITED NITROGEN FREE)
CHKIWTOGRN"1C ANALYSIS
DRY WET MOLE 7. ---------_--
WATER 3 '
CARBON DIOXIDE 3.13 3.04
_--e --_- N I T m E N
METHANE 94.69 91.84
ETHANE 1.76 1.71
rnOPAN€ 0.25 0.24 -
GAS DEVIATION FACTOR (2) = 0.948 f? 2000 RIA Sr 293'F
e 2000 PSI& Sr 293'F BBLS. GM I N RES./MHSCF (Bg) = 1837 u LA3. NO. N2171-10510 381 PAGE 18 OF 25

WATER
CARBON DIOXIDE
NITROGEN
ETHANE
ETHANE
PROPANE
- ISO-BUTANE
N-BUTANE
ISO-PENTANE
N-PENTANE
HEXANES
HEPTANES PLUS - TOTAL b
ORAVITY ( A I R = 1.00)
GAS DEVIATION FACTOR (2)
MAGMA GULF-TECHNADRIL MG-T/DOE AMtrCO FEE NO. 1 WELL SAND ZONE NO. 3 SWEET LAKE FIELD
SOLUTION GAS FROM 1s e s I A SAMPLE - DIFFUIENITAL LIBERRTION NMXULAW NITROGEN FREE)
CHimCIfOGRCIPHIC ANALYSIS
DRY WET . MOLE X
18.01
5
17.11
80.75 76.70
1.05
0.06
0.02
1.00
0.06
0.02
0.04 0.04 .
0.80 0.00
0.00 0.08
0.00 0.80
0.07 0.07 .I.----- I-_--
100.00 100.00
0.7367 0.7319
1.000 @ 15 PSIA Sr 293’F - -
BBLS. GAS IN RES./HMSCF (Eg) = 257,920 e 15.025 PSIA J( 293’F
LAB. NO, N2171-10510 382 PAGE 19 OF 25

Company Mama Gulf-Technadril bwnoir Sand Zone No. 3 Field Sweet Lake
WCII MG-T/DOE h o c 0 FeeNo. 1
: *
rr)
0 d
K
. u c r( 0 P4
SCF Sep. Gas @ 15.025 psia &kOoF B b l . : t ~ a t e r ~d NU PSW4 & 108 f PaRe 20 of 25 Lab. NO. N2171-10510
383
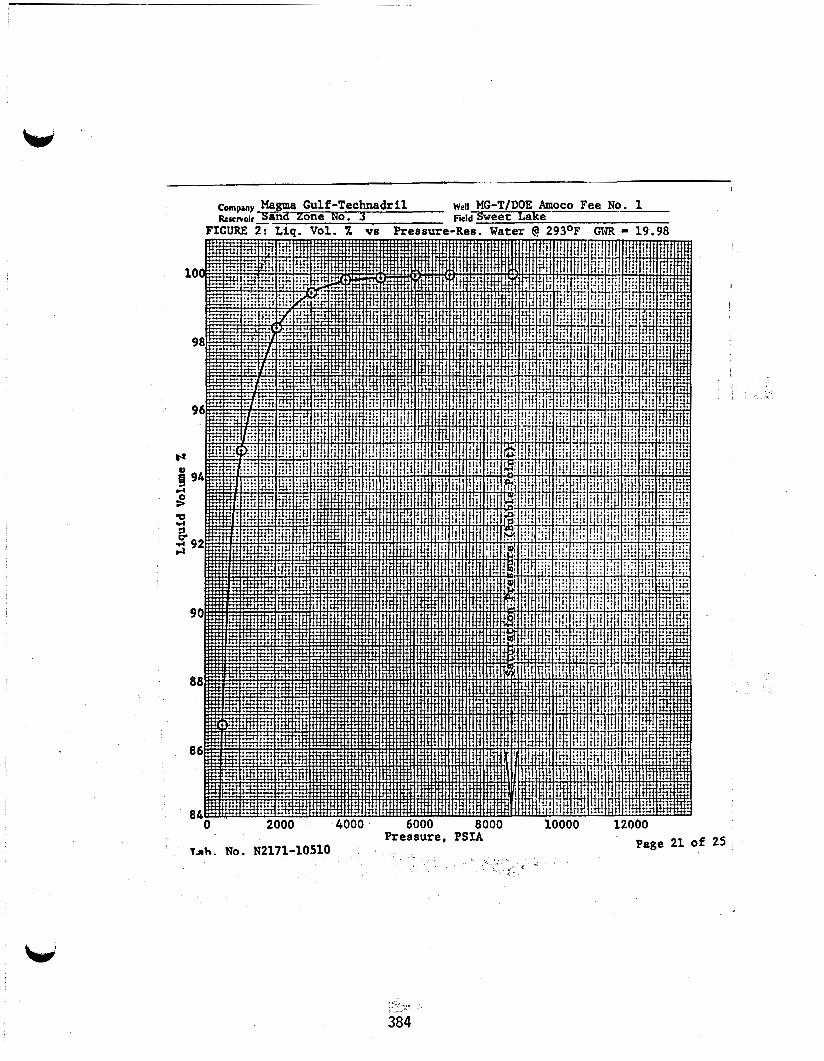
Page 21 a Pressure, PSIA . , ,
'. .- -1 * Tab. NO. N2171-1051O
( 1
if 25
7 . .
384
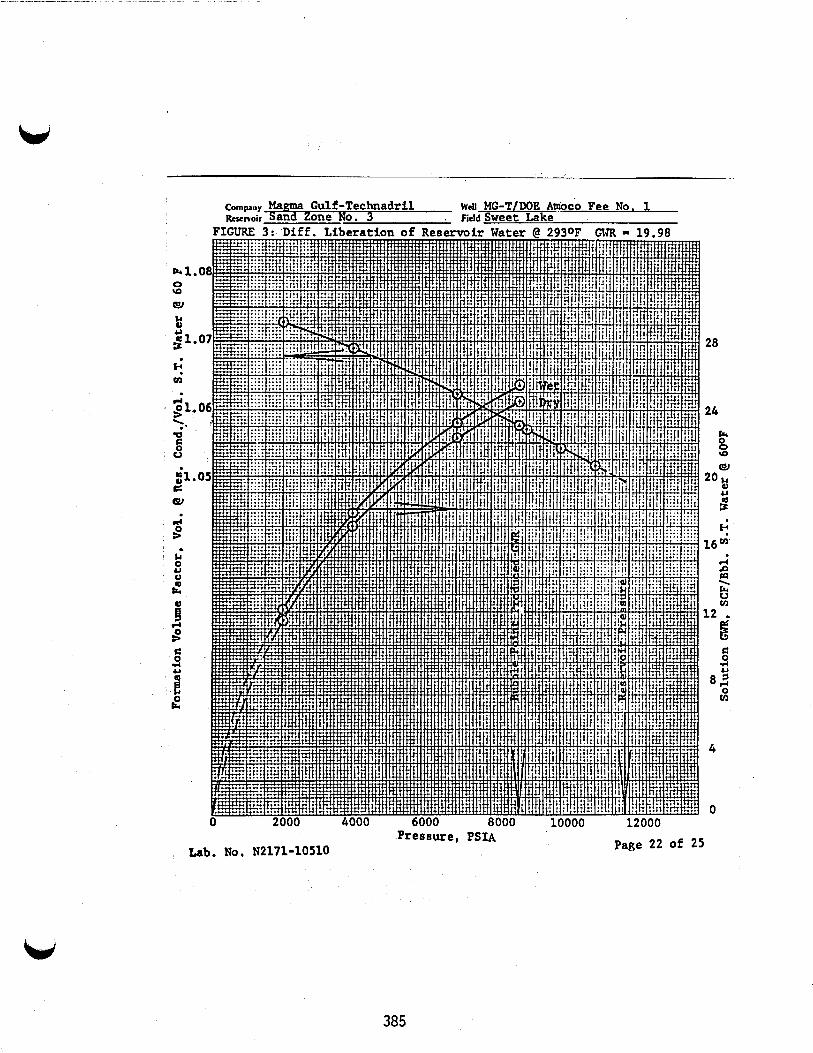
Company Magma Gulf-Technadril Reservoir Sand Zone NO. 3 . Field Sweet Lake
WCII MG-T/WE Anioco Fee No. 1
rl $1 ';* Q fi 0 0
$1 d W
t rl
Pressure, PSIA Lab. NO. 82171-10510
28
24
4
0
Page 22 of 25
385

1,
I Page 23 of 25 Lab. No. N217l-10510 Pressure, P S U
293OF
24
Ir 0 0 \D
386

I
Lab. NO. N2171-10510 Pressure, PSIA
Page 24 of 25
387

, Pressure, PSIA U
Lab. NO. N2171-10510 page 25 of 25
388
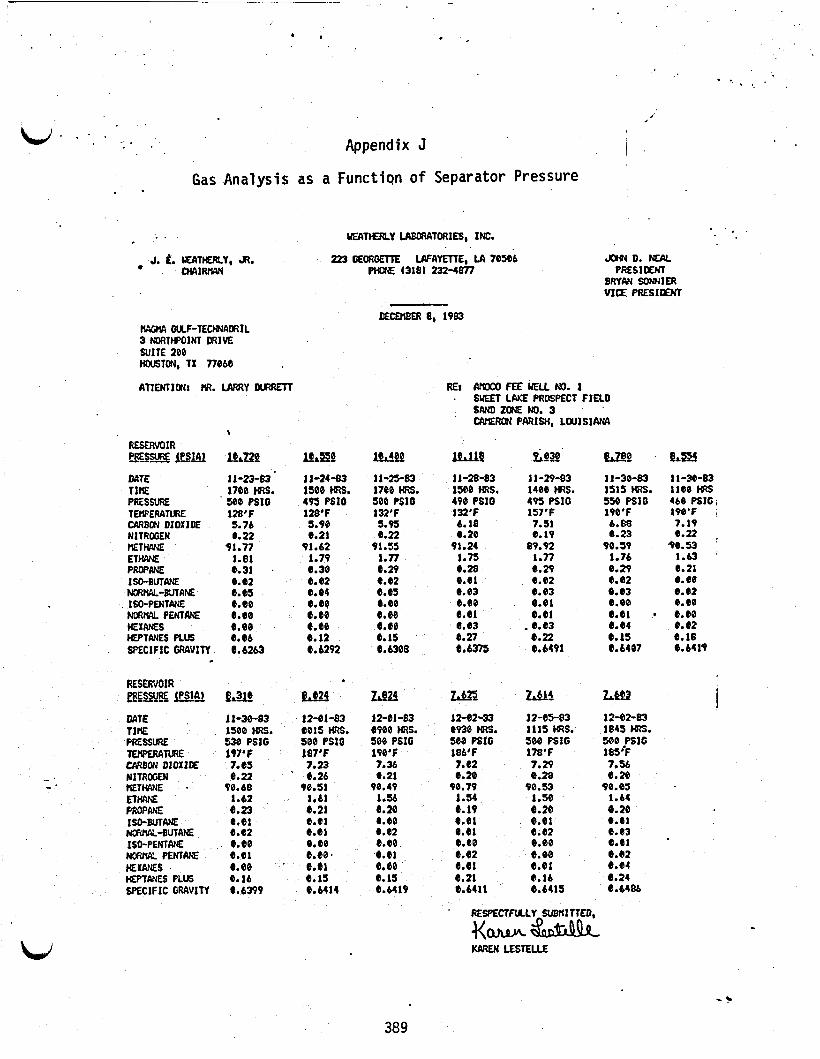
Appendix 3
Gas Analysis as a FunctiQn o f Separator Pressure . .
. . E A T E R Y IABCtMTORIES, INC.
J. t. EATUERLY, JR. 223 GEORGETIE UFAYETTE~ LA 78SB6 JOCJ D. MAL WIW PHOM (3181 232-4877 PRESlOENT
BRYAN So"1ER V I E PRESIENT
DECDlBER 8, 1983 Wrcnrr GLLF-TEUPJAWIL 3 NORTHPOINT DRIVE SUITE 260 HWSTDN, TX 77066
ATTENTION: )IR. U R R Y blRREn
RESERVOIR @-e!?€ Cpsm DATE T I E PRESSURE T EWE RA 1 lR E CARBON DIOXIDE NITROGEN IIETtWE ETHANE PROPANE ISO-BUT= NORtlAL-BUTAM Iso-PENTANE IJORW PENTAM HEXANES MPTRNES PLUS SPECIFIC GRAVITY
&rn 11-23-83' 1706 XRS.
. SQ0 PSIG 128'F 5.76 e a
91.77 1.81 6.31 . e.82 e. e5 e.e0 e a 0 @.e0 8.66 1.6263
E&= 11-24-83 1560 WS. 495 PSI0 128'F 5.96 e.21
91.62 1.79 8.30 e.62
e.w 6 . ~ 0
e. 12
e.e4
8.80
8.6292
Lhra 11-25-83 i 7 e ~ HRS. 500 PSIO 132'F 5. PJ
91.55 1.77 6.29
e.22
e.e2 8.0s ).e0 8 . ~ 0 e.80 e. 15 0.6308
RE: AROCOFEEUEU NO. I
SAND 2- No. 3 t%tiEml PARISH, LOufSIANA
. SWEET LME PROSPECT FIELD
11-28-83
496 PSI0 132'F 6.18
91.24
ise0 URS.
e.20
1.75 e.= e m e. e3 e.60
e. e3 e.n Q.61
8.6375
1 1-29-83
495 PSIG 157'F 7.51 Q. 19
89.92
1480 HRS.
1.77 6.29 8.82
e.ei e.ei
e.6491
e.e3
* 6.83 6.22
8,7e
11-38-83 151s m. 558 B I G 1W'F
8.23 90.59
1.76 8.29
6.68
e.e2 e.e3 0 0 e m
e. i s e . 6 ~
8.Q4
LZ4 i 1-38-83 11e0 I(Rs 468 BIG; 190'F !
e.= , 90.53 '
1.63 : 8.21
e.e2 e.e0 e.60 e.e2
e . 6 ~
7.19
6.60
Q. 18
RESERVOIR
DATE 11-30-83 12-81-83 iz-81-83 1-2-33 J2-BS-EQ 12-82-83 TIHE 1500 HRS. e015 HRS. e900 ms. e930 HRS. 1115 tRS. 1845 )(Rs. PRESSURE 536 PSIG 500 PSIO S08 PSI0 500 PSIG 506 B I G 9 0 PSI0 TWERAW 197'F 187'F 196'F 186'F 178'F 1Ca'F WBON DIOXIDE 7.65 7.23 7.36 7. e2 7.29 7.56
- NITROCEN e. 22 . 6.26 6.21 Q.28 8.28 e.% - t E T W E 90.68 90.S1 90.49 96.79 90.53 90 .e~ ET- 1.62 1.41 1.56 1-51 1.58 1-64 PROPANE 8.23 6.21 e a e. 19 8.20 6.20 ISO-BUTANE &e! e.e1 e.80 e m 8.81 e.ei NOWY1L-BUTANE 4.62 Q.81 e.e2 e.ei e a 2 6.83 ISO-PENWE e.60 e m 8.60 e.68 9.80 e.ei
MXANES e.00 . e m e.80 @ A t e.ei 6.84
SPECIFIC GRAVITY 8.639 e.6414 8.6419 e.6411 6.6415 6.44s
BeE_Wf!EW &e29 m w 2Ai LM
NW~IAL PEKIN e.ei e m . e.81 6.62 8. e0 Q.42
HEPTANES PLUS 6.16 8. 1s e. 1s 0.21 6.16 6.24
' RESPECTFULLY SUBnITTEO
KoJLpK& KARW LESTEUE W
389

" (WCILYSIS OF
4
MAGMA GULF-TECHNCIDRIL AMOCO FEE WELL NO. 1 SWEET LAKE PROSPECT FIELD I
SAND ZONE NO. 3 CCIMERON PARISH, LOUISIANA RESERVOIR PRESSURE: 10,720 PSIA SAMPLED: 11-23-83 @ 1700 HRS.
500 PSIG 8 128 DEGREES F BY: WECITHERLY LABORATORIES
SEPARATOR GAS
SEPARATOR GAS GF'M €!
I ' cc#1po"T MOL% 15.025 PSIA .
CARBm DIOXIDE 5.76 NITROGEN 0.22 METHANE 91 77
_------------- -----
ETHANE 1.81 . 0.492 PROPANE 0.31 0.886 ISO-BUTANE 0.02 00 007
ISO-PENTANE 0.00 0.002 N-PENTANE 0.00 0.602 HEXANES 0.00 0.000 HEPTANES PLUS 0.06 0.831
TOTALS 8.435
N-BUTCINE 8.85 . 0.815
CALC. GAS SPCIFIC SEPARATOR GAS .
SEP. GAS HEAT OF COMB. (BTWCU. F T o @ 15.025 PSIA & 60 F) DRY = 996.3 REAL SEP. GAS HEAT OF COMB. (BTU/CU. FT. @ 15,025 PSIA & 60 F) W E T = 978.8 WATER SAT.
z = 0 9979
ON-SITE DRAGER
CARBON DIOXIDE
390 PAGE 2 OF 22
4

_-
I
MAGMA GULF-TECHNADRIL AMOCO FEE WELL NO. 1 SWEET LAKE PROSPECT FIELD SAND ZONE NO. 3 CAMERON PARISH, LOUISIANA RESERVOIR PRESSURE: 10,550 PSIR SAMPLED: 11-24-83 e 1500 HWRS
495 PSIG L 137 DEGREES f BY: TECHNADRIL PERSONNEL
SEPARATOR GAS
MOL 1. 15.025 PSIA GPM @
----_-----_-_-_--- COMPONENT --e--
CARBON DIOXIDE 5.90 NI TRMjEN 0.21 METHANE 91.62 ETHANE 1.79 0.438 PROPANE 0.30 0.033 ISO-BUTANE 0.02 0.007 N-BUTANE 0.04 0.013
LAB. NO. N2149-10509 391 PAGE 3 of 22

Y
W HAcjMA GULF-TECHNADRIL 4
AMOCO FEE W E L L NO. 1 SWEET LAKE PROSPECT FIELD SAND ZONE NO. 3 CAMERON PARISH, LOUISIANA RESERVOIR PRESSURE: 10,400 PSI4 SIMPLED: 11-25-83 @ 1500 HOURS
500 PSI0 & 132 DEGREES f BY: TECHNADRIL
HMROccvzBoN AFCCILYSIS OF SEPARATOR GAS -
SEPARATOR MS GPM 4
- moNENT mI. 15.825 PSIA -- ---------_----- CARBON D I O X I D E 5.95 NITROGEN 0.22 METHCWE 91 . 55 ETHANE 1.77 0.484 PROPANE 0.29 0.882 EO-BUTANE 8.02 8.007 N-BUTCINE 8.05 0.815
- KO-PENTANE 0.00 0.002 N-PENTANE 0.00 0.002 MXCINES 0.00 8.000 HEPTCINES PLUS 8.15 0.076
TOTALS 0.668
I
CALC. SPCIFIC GRAVITY (AIR=1.00) = 8.6308 SEPARATOR GAS
GAS HEAT OF COMB. 15.025 PSIA Sr 60 F) DRY = 998.6 REAL SEP. GAS HEAT OF COMB. Sr 60 FI WET = 981.1 WATER SAT. SEP. GAS COMPRESSIBILI Z = 0.9978
ON-SITE DRAGER MEASUREMENTS:
CARBON DIOXIDE = 6 IWt. I , HYDROGEN SULFIDE 0: 4 PPM
b+
PAGE 4 OF 22 392 LAB. NO. N2149-10510
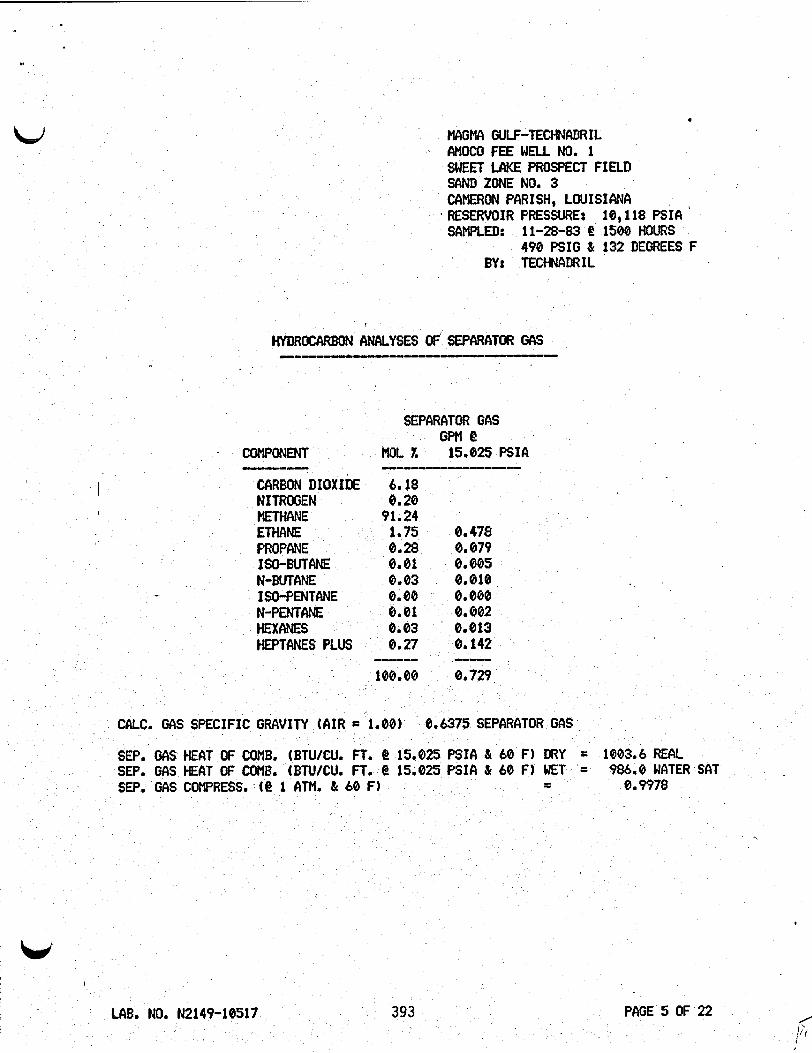
4
MAGMA GULF-TECHNADRIL MOCOFEE WELLNO. 1 SWEET M E PROSPECT FIELD SAND ZONE NO. 3 CAMERON PAR ISH, LOU IS I ANA
10,118 PSI4 ’ SAMPLED: 11-28-83 e 1500 HOURS
490 PSIG dr 132 DEGREES F BY: TECHNADRIL
* RESERVOIR PRESSWE:
I
ANCLLYSES OF‘ SEPARATOR GCIS
SEPARATOR GAS GPM 4
, . COMPWENT MOL 1. 15.825 K I A --_- ---_u__---_-__-
CARBON DIOXIDE 6.18 NITROGEN 0.20 METHANE 91.24 ETHANE le75 0.478 PROPANE 0.28 0.079 ISO-BUTANE 0.01 0.005 N-BUTANE 0.03 0.010 I SO-PENTANE 0.00 0.000 N-PENTANE 6.01 0.002 HEXANES 0.03 0.013
0.142 ---- -- 0,729
CCILC. GAS SPECIFIC
S E P e GAS HEAT OF C 1803.6 REAL SEPe GAS HEAT OF COMB. (BTU/CU. FT. @ 15.025 PSIA Sr 68 F) = 986.0 WATER SAT SEP. GAS COMPRESS. (@ 1 ATM. & 60 F) 0 e 9978
J
393 PAOE 5 OF 22 LAB. NO. N2149-10517

MAGMA GULF-TECHNADRIL AMUCO FEE WELL NO. 1 SWEET LAKE PROSPECT FIELD SAND ZONE NO. 3 CAMERON PARISH, LOUISIANA RESERVOIR PRESSURE: 9,030 PSICI SAMPLED: 11-29-83 e 1400 HOURS
U
495 PSIG & 157 DEGREES F ' EY: TECHNADAIL
HYDROCARBON ANALYSIS OF SEPARAfOR 04s - ------
SEPARATOR GAS GPM C
- COMPONENT MOL x 15.025 PSIA ---- ------I_--------_
7.51 0.19
CARBON D I OX IDE NITROGEN METHANE 89.92 ETHANE . 1.77 0.484 PROPANE. 0.29 0.080 ISO-BUTANE 0.02 0.006 N-BUTANE 0.03 0.009 ISO-PENTANE , 0.01 0.004 N -PENTANE 0.01 0.002 HEXANES 0.03 0.014
I
*
HEPTANES PLUS 0.22 0.118
TOTALS 100.00 0,717
CALL GAS SPCIFIC ORAVITY (AIR=1.00) 0.6491 SEPARATOR GAS
SEP. GAS HEAT OF COMB. (BTW . FT. 4 15.025 PSIA & 60 F) DRY = 988.0 REAL SEP. GAS HEAT OF COMB. (BTUICU. FT. e 15,025 PSI4 d( 60 F) WET = 970.7 WATER SAT. I
I SEP. GAS COMPRESSIBILITY (@ 1 ATM & 60 F) f = 0 . 9978

\
NAGMA GULF-TECMADRIL AMOCO FEE WELL NO. 1 SWEET LAKE PROSPECT FIELD SAND ZONE NO. 3 CAMERON PARISH, LOUISIANA RESERVOIR PRESSURE: 8,780 PSIA &IMPLED: 1 1-29-83 @ 1515 HOURS
550 PSIG s( 198 DEGREES F BY: TECHNADR I L
MDROCARBON ANALYSIS UF SEPARATQR OAS -------------
SEPARATOR OCIS GPM e
COMPONENT MOL 1. 15.025 PSIA ------- --------_----_----- CARBON D I O X I E ' 6088 NITROGEN 8.23 RETHANE 90.59 ETHANE 1.76 0.480 PROFANE 0.29 0.082 ISO-BUTANE 0.02 0.007 N-BUTANE 0.03 8.009 ISO-PENTANE 0.00 0.000 N-PENTANE 0.81 8. 005 HEXCINES 0.04 0.016 HEPTANES PLUS 00 076
0.675
CALC. GAS SPCIFIC
15.025 PSIA s( 60 F) DRY = 990.2 REAL SEP. GAS HEAT OF COMB. (BTU/CU. FT. @ 15.025 PSIA Sr 60 F) WET = 972.9 WATER SAT. SEP, GAS COMPRESSIBILITY (Q 1 .ATM L b0 FI 2 = 8 . 9978
- . I
I
U PAGE 7 OF 22 LAB. NO. N2149-105119 395
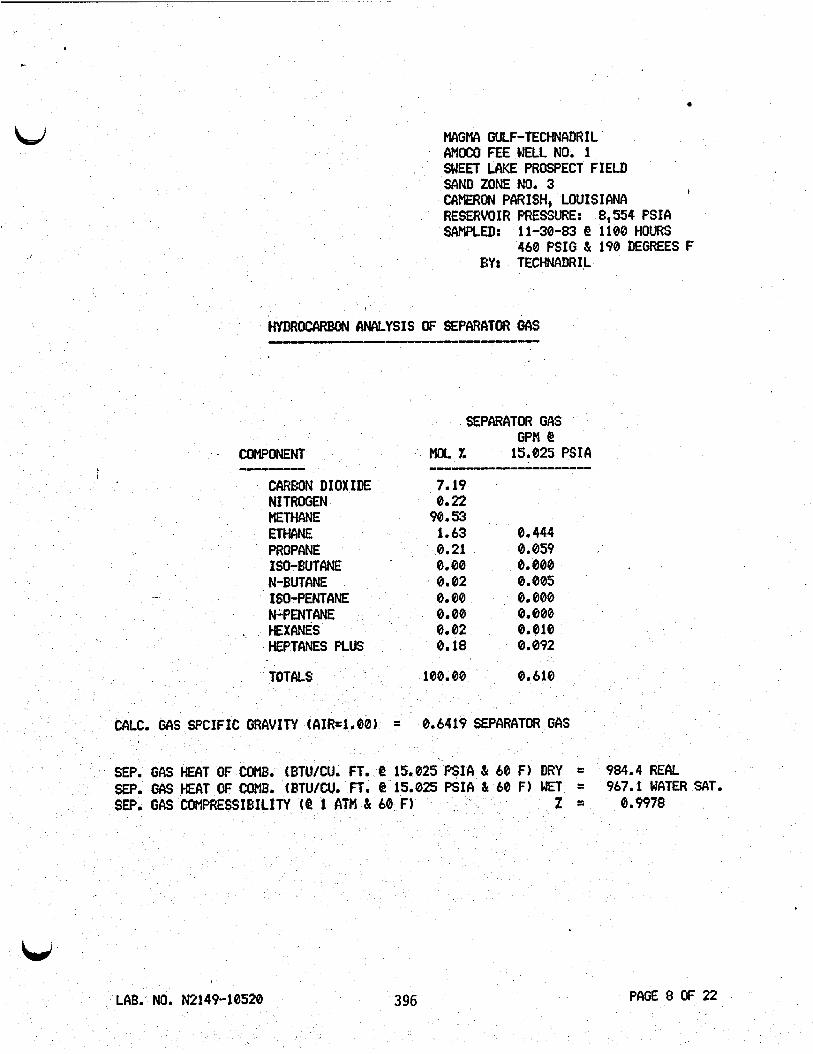
I ' .
MAGMA GULF-TECHNADRIL MOCO FEE WELL NO. 1 SWEET LAKE PROSPECT FIELD SAND ZONE NO. 3 CAMERON PARISH, LOUISIANA RESERVOIR PRESSURE: 8,554 PSIA SAMPLED: 11-30-83 e 1100 HWRS
I
460 PSIG & 190 DEGREES f BY: TECHNAIIR I L
HYDROCARBON CINAtYSIS OF SEPARATOR GAS
SEPARATOR GAS
MOL 1. 15.825 PSIA GPM @
-----__--------__ - COMPONENT -__u_
CAREON DIOXIDE 7.19
METHANE 98.53 ETHANE 1.63 0.444 PROPANE 8.21 0.059 ISO-BUTANE @De@ 0.000 N-BUTANE 0.82 0.005
NITROGEN 0.22
- 0.00 0.000 ISO-PENTANE N - P EN T A N E 0.00 0.000
HEPTANES PLUS 8.18 0.092
TOTALS 160.00 0.618
. HEXANES 0.02 0.018
CALC. GAS SPCIFIC GRAVITY (AIR=l.00) = 0.
SEP. GAS HEAT OF COMB. SBTU/CUo FT. @ 15,025 PSIA s1 60 F) DRY = 984.4 REAL SEP. GAS HEAT OF COMB. (PTU/CU. FT. B 15.025 PSI 84 40 F) WET = 967.1 WATER SAT. SEP. GAS COMPRESSIBILITY (e 1 ATM SI 60 FI P = 0.9978
W PAGE 8 OF 22 LAB. NO. N2149-10520 396

*
MAGMA GULF-TECHNADRIL MOCO FEE WELL NO. 1 SlJEET LAKE PROSECT FIELD SAM3 ZONE NO. 3 CAMERON PARISH, LOUISIANA RESERVOIR PRESSURE: 8,310 FSIA SAMPLED: 11-30-83 1500 HOURS I '
530 PSI0 t 197 DEGREES F
u
BY: TECHNADRIL
HYDROCARBON CVllALYSIS OF SEPARATOR GAS -------u--y_--
SEPMATOR GAS GPM 4!
COMPONMT MOL 1. 15.025 PSIA I---- ---------_--_----
CARBON DIOXIDE 7.05
I flETHANE 980 68 NITROGEN 0.22
ETHANE 1.62 6.443 PROPANE 0.23 0 . 064 ISO-BUTANE 0.01 8.003 N-BUTANE' 0.02 8.@06
1 ISO-PENTANE 0.00 0.000 0.01 0.004 0.00 8.000
N-PENfPdJE HEXCINES HWTANES PLUS 0.16 8.081
TOTCU-S 100.00 .68l
-
CALC. GAS SPCIFIC GRAVITY (AIR=1.80) = 0.6399 SEPARATOR GAS
GAS HEAT OF COMB. (BTWCU. FT. 15.025 PSIA 41 60 F) DRY = 984.8 REAL W HEAT OF COMB. (BTU/CU, FT. @ 15.025 PSIA Sr 60 F) WET = 967,5 HATER SAT.
SEP, GAS COMPRESSIBILITY (e 1 ATM d( 60 F) I = 0 8 9978
u LAB. NO. N2149-10521 397 PAGE 9 OF 22

MAGMA GULF-TECHNADRIL AMOCO FEE WELL NO. 1 SWEET LAKE PROSPECT FIELD SAND ZONE NO. 3 CAMERON PARISH, LOUISIANA RESERVOIR PRESSURE: 8,024 PSIA SAMPLED: 12-01-83 @ 0015 HOURS
500 PSI0 & 187 DEGREES F BY: TECHNADRIL
GPM @ 4
MOL 1. 15.025 PSIA -_-_--_--I------
- COMPONENT ------ CARBON D I OX I DE ' 7.23 NSTROGEN 0.26
90.51 1.61 0.438
METHANE ETHANE PROPCINE 0.21 0.853 ISO-BUTCINE 0.01 0.004 N-BUThNE 0.01 0.004 SSO-PENTANE 0.00 0.000 N-PENTANE 0.00 0'000 HEXCINES 0. @l 0.005 HEPTANES PLUS 0.15 0.076
\

MAGMA WLF-TECWDRIL AMOCO FEE NELL NO. 1 SWEET LAKE PROSPECT FIELD SAND ZONE NO. 3 CAMERON PARISH, LOUISIANA RESERVOIR PRESSURE: 7,824 PSIA SAMPLED: 12-01-83 4 0915 HOURS
500 PSI0 t 190 DEGREES F EYI WEATHERLY LABORATORIES
,
MDAoCARBON ANALYSIS OF SEPARATOR WS
SEPARATOR GAS GPM 4
COMPONENT MOL 1. 15.025 PSIA ----_- ---I--------
I CARBON DIOXIDE 7.36 NITROGEN 0.21 METHANE 90.49 ETHANE 1.56 0.425 PROPANE 8.20 0.056 ISO-BUTANE 0.00 0.000 N-BUTANE 0.02 0.805 ISO-PENTC1NE 0.00 0.080
_- N-PENT ANE 0.01 0.002 HEXANES 0.00 8.002 HEPTANES PLUS 0.15 0.878
TOTALS 100.00 0.568
CALC. GAS SPCIFIC GRAVITY (CIIR=1.00) = 0.6419 SEPARATOR GAS
SEP. GAS HEAT OF COMB. (BTU/CU. FT. e 15.025 PSIA SI 66 F) DRY = 980.1 REAL
SEP. GAS COMPRESSIBILITY (e 1 ATM t 60 F) z = 0.9978
ON-S I TE DRAGER MEASUREMENTS :
SEP. GAS HEAT OF COMB. (BTWCU. FT. C 15.825 PSI4 & 60 F) WET = 963.0 WATER,SAT. -
.
CARBON DIOXIDE = 6 HOL. HYtROGEN SULFIDE = 13 PPM
LAB. NO. N2149-10523 399 ' PAGE 11 OF 22
.

MAGMA WLF-TECHNADRIL AflOCO FEE WELL NO. 1 SWEET LAKE PROSPECT FIELD SAND ZONE NO. 3 CAMERON PARISH, LOUISIANA RESERVOIR PRESSURE: 7,625 PSIA SAMPLED: 12-02-83 fi 0915 HOURS
500 PSIG s( 186 DEGREES F BY: WECITHERLY LABORATORIES
HYDROCCIRBON ANALYSIS OF SEPWTOR GAS H---------u---
SEPARATOR GAS GPM @
- COMPONENT , MOL 1. 15.025 PSIA --- _---------_----u__-
CAREON DIOXIDE 7.02 NITROGEN 0.20
98.79 1.54 0.421
METHANE ETHANE PROPANE 0.19 0.054 ISO-BtlTCINE 0.01 0.003 N-BUTANE 0.01 0.003
- ISO-PENTANE , 0.00 0.000 N-P WTANE 0.02 0.006 HEXANES 0.01 0.005 HEF'TANES PLUS 0.21 0.110
TOTALS 100.00 0.602
CALC. GAS SPCIFIC GRAVITY (AIR-1.081 0.6411 SEPARhTOR GAS
EP. GAS HEAT OF COMB (BTU/CU. FT. 15.025 PSIA s( 68 F) DRY = 987.4 REAL SEP. GAS HEAT OF COMB (BTWCU. FT. t? 15.025 PSIA & 60 F) WET 970.2 WATER SAT. SEP. GAS COWRESSIBIL Y (@ 1 ATM L 60 F) z = B.9978 .
ON-S I TE DRACiER HEASUREMENTS:
CARBON DIOXIDE = 5 MOL. 1. HYDROGEN SULFIDE
J /
LCIB. NO. N2149-10525 400 PAGE 12 OF 22
J /
LCIB. NO. N2149-10525 400 PAGE 12 OF 22

MAGMA GULF-TECHNADRIL AMOCOFEE WULNO. 1 SWEET LAKE PROSPECT FIELD SAND ZONE NO. 3 CAMERON PARISH, LOUISIANA RESERVOIR PRESSURE: 7,614 PSIA SAMPLED: 12-05-83 @ 1115 HOURS
'b/
500 PSEG & 178 DEGREES F BY: TECHNADRIL
HYDROCARBON ANALYSIS OF SEPARATOR GAS --------I--
SEPARATOR WS GPM e
I COMPONENT MOL 4: 15.025 PSIA --- _-I-_----------
CARBON DIOXIDE 7.29 NITROGEN 0.28
I METHANE 90.53 ETHANE 1.50 0.410 I
PROPANE 0.20 0.056 ISO-BUTANE 0.01 0.003 N-BUTANE 0.02 0.007
- ISO-PENTANE 0.00 0.001 N-PENTANE 0.00 0.000 HEXANES 0.81 0.003 HEPTANES PLUS 0.16 0.079
I
TOTALS 100.00 0.559
C A L L GAS SPCIFIC GRAVITY (AIR=1.80) GAS
SEP. GAS HEAT OF COMB. (BTU/CU. FT. 4! 15.025 PSIA & 60 F) DRY = 980.0 REAL SEP. GAS HEAT OF COMB. (BTU/CU. FT. 15.025 PSIA Sr 60 F1 WET = 962.8 WATER SAT. SEP. GAS COMPRESSIBILITY z = 0 9978
bid
LAB. NO. N2149-18529 401 PAGE 13 OF 22

.
MAGMA GULF-TECHNADRIL AHOCO FEE WELL NO. 1 SWEET LAKE PROSPECT FIELD I
SAND ZONE NO. 3 CAMERON PARISH, LOUISIANA RESERVOIR PRESSURE: 7,603 PSIA SAMPLED: 12-02-83 @ 1845 HOLlRS
500 B I G s( 185 DEGREES F BY: TECHNADR I L
HYDROCARBON ANALYSIS OF SEPARATOR GAS
SEPARATOR GAS GPM 42
I - COMWNENT MOL. x 15.825 PSIA ,
--I---- ---------------- CARBON DIOXIDE 7.56 NITROGEN 0.20 METHANE 90.05 ETHANE 1.64 0.447 PROPANE 0.20 0.855 ISO-BUTANE 0.01 0.002 N - B UT A N E 0.03 0.011
- ISO-PENTANE 0.01 0.005 N-PENTANE 0.02 8.886 HEXANES 0.04 8.019 HEPTANES PLUS 0.24 0.119
TOTALS 100.00 00 464
CCILC. GAS SPCIFIC GRAVI AIR=1.00) = 8.6486 SEPARATOR GAS
SEP. GAS HEAT OF COMB. (BTU/C . @ 15.025 PSIA &. 60 F) DRY = 985.7 REAL SEP. GAS HEAT OF COMB. (BTUICU. FT. @ 15.025 PSIA &. 60 F) WET = 968.4 WATER SAT. SEP. GAS COMPRESSIBILITY (e 1 ATM t 60 F) 2 s 0 9978
W PAGE 14 OF 22 402 LAB. NO. N2149-10530
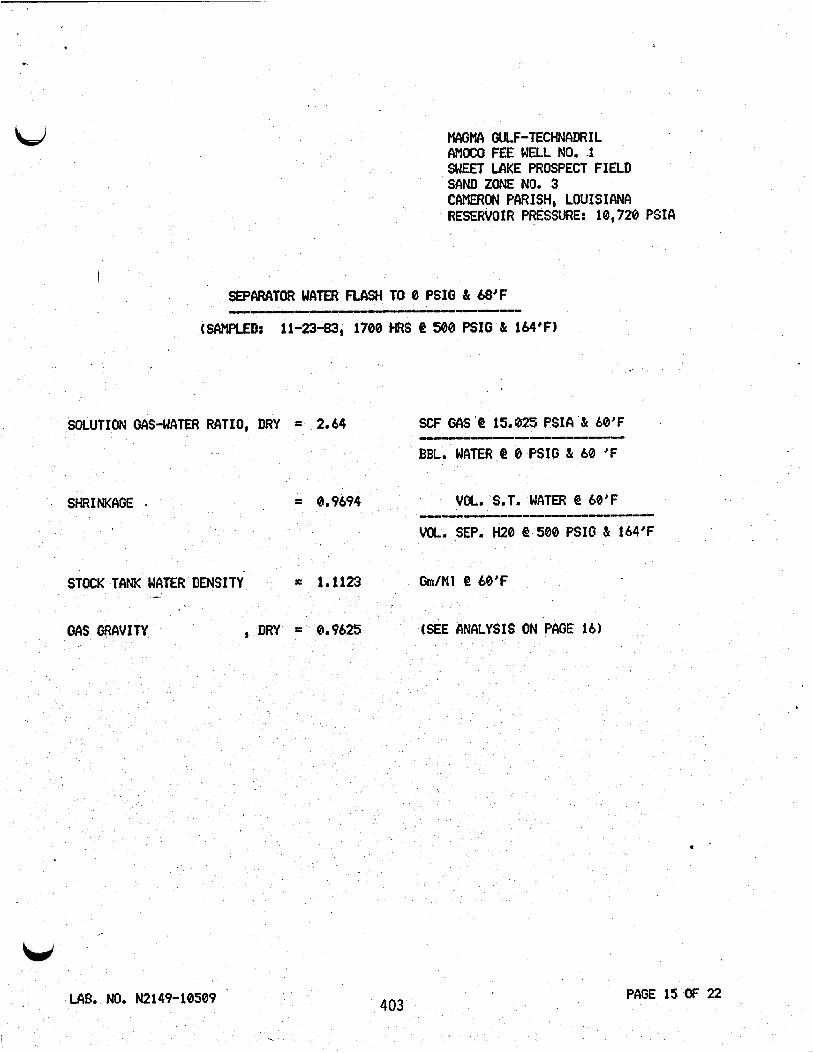
MAGMA GULF-TECHNADRIL AMOCO FEE WU-L NO. -1 SWEET LAKE PROSPECT FIELD SAND ZONE NO. 3 CAMERON PARISH, LOUISIANA RESERVOIR PRESSURE: 10,720 PSIA
SEPCIRATOR WATER FLASH TO 0 PSI0 & 68'F - -----_--_ (SAMPLED: 11-23-83, 1700 HRS 500 PSI0 t 164'FI
,
w PAGE 15 OF 22
I 403 1
LAB. NO. N2149-10509
.

4
MAGMA GULF-TECHNADRIL AMOCO FEE WELL NO. 1 SWEET LAKE PROSPECT FIELD SAND ZONE NO. 3 CAMERON PARISH: LOUISIANA RESERVOIR PRESSURE: 10,720 PSIA SAMPLED: 11-23-83 @ 1700 HRS.
hi
500 PSIG & 164 DEGREES F
HYDRoccIRBoN ANALYSIS OF FcAsHm GAS FROM SEPARATOR WATER
FLASHED FROM 500 PSI0 TO 8 R I G
COMPONENT --- I CARBON DIOXIDE
NITROGEN METHANE
I
SEPARATOR GAS
MOL 1. 15.025 PSICI
41 . 50 57.46
GPH 42
-_---*---------
0.00+
0.95 0.260 0.0P 0.025 0.00 0.000
' 0.00 0.000 0.00 0..000 0.00 0.008 0.00 0.000 0.60 0.001
100.00 0.286
ETHANE PROPANE ISO-BUTANE N-BUTANE ISO-PENTANE
HEXANES HEPTANES PLUS
TOTALS
- N-PENTANE
CALC. GAS SPCIFIC GRAVITY (AIR=1.00) 0.9625 SEPARATOR GAS
SEP. GAS HEAT OF COMB. (BTWCU. FT. @ 15,025 PSICI & 60 F) DRY = 614.4 REAL SEP. GAS HEAT OF COHB. (BTU/CU. FT. B 15.025 PSIA d( 60 F) WET = 603.7 WATER SAT. SEP. GAS COMPRESSIBILITY (Q 1 ATM t 60 F) Z = 0.9972
NOTE: * CALCULATED NITROGEN FREE.
u PAGE 16 OF 22 404 LAB. NO. N2149-10509
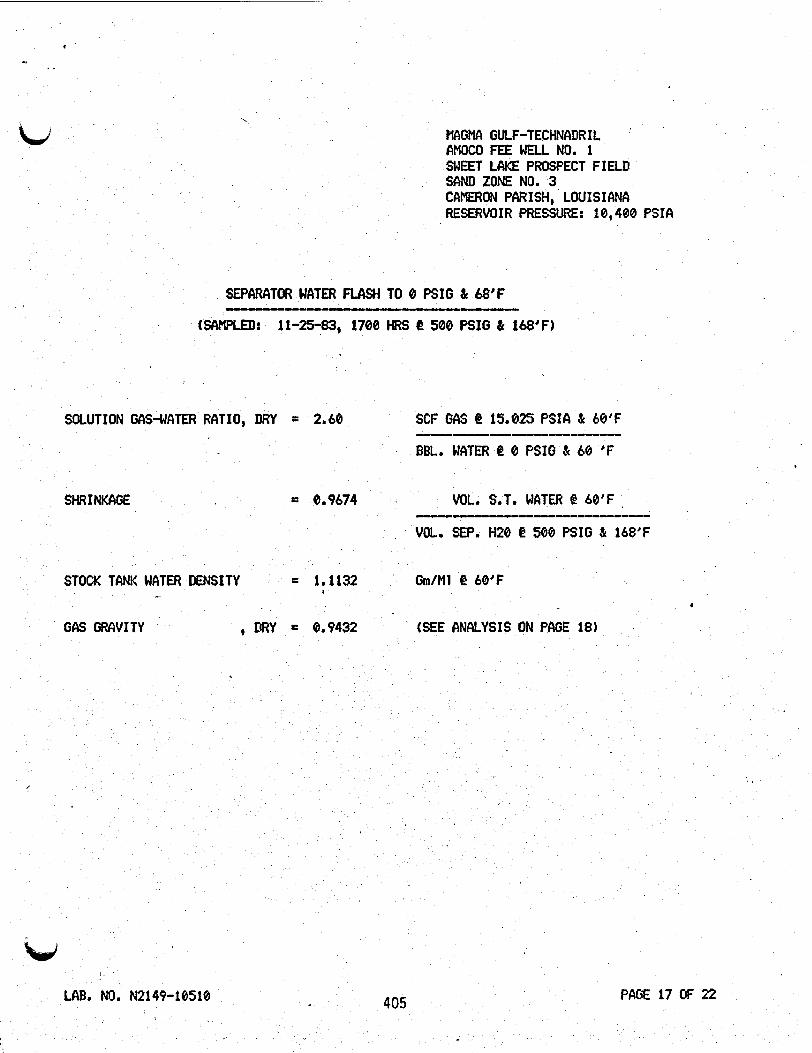
. ..

. u
I
.
" l B O N CINALYSIS OF FLASHED CiRS FROM SEPARATOR WATER
MAGMA OULF-TECHNADRIL AMOCO FEE WELL NO. 1 %€ET LAKE PROSPECT FIELD SAND ZONE NO. 3 . CCIMERON PARISH, LOUISIANA ESERVOIR PRESSURE: 10,400 PSI6 SAMPLED: 11-25-83'@ 1700 HOURS
500 PSIG s( 168 DEGREES F
FUsHm FROM 500 B I G TO 8 B I G
SEPARATOR GAS GPM 4
COMPONENT MOL 1. 15.025 PSIA --- -__I-__---------_--
CARBON DIOXIDE 39.25 NITROGEN 0.009 METHANE 59.63 ETHANE 0.95 0.259 PROPANE 0.0s 0.024 ISO-BUTANE 0.00 0.000 N-BUTANE 0.00 0.000 ISO-PENTANE 0.00 0.000 N-PENT ANE 0.00 0.000 HEXANES 0.00 0.000 HEPTANES PLUS 0.09 0.043
TOTALS 100.00 0.326
CALC. GAS SPCIFIC GRAVITY ( A I .00) = 0.9432 SEPARATOR CAS
SEP. GAS HEAT OF COMB. (BTU/CU. FT. @ 15.025 PSIA 5( 60 F) DRY = 614.8 REAL SEP. GAS HEAT OF COMB. (BTU/CU. FT. @ 15.025 PSIA 5( 60 F) WET 630.6 WATER SAT. SEP. GAS COMPRESSIBILITY (e 1 ATM s( 60 F) f = 0.9972
NOTE: * CALCULATED NITROGEN FREE.
b d I
LAB. NO. N214P-10510 406 PAGE 18 OF 22
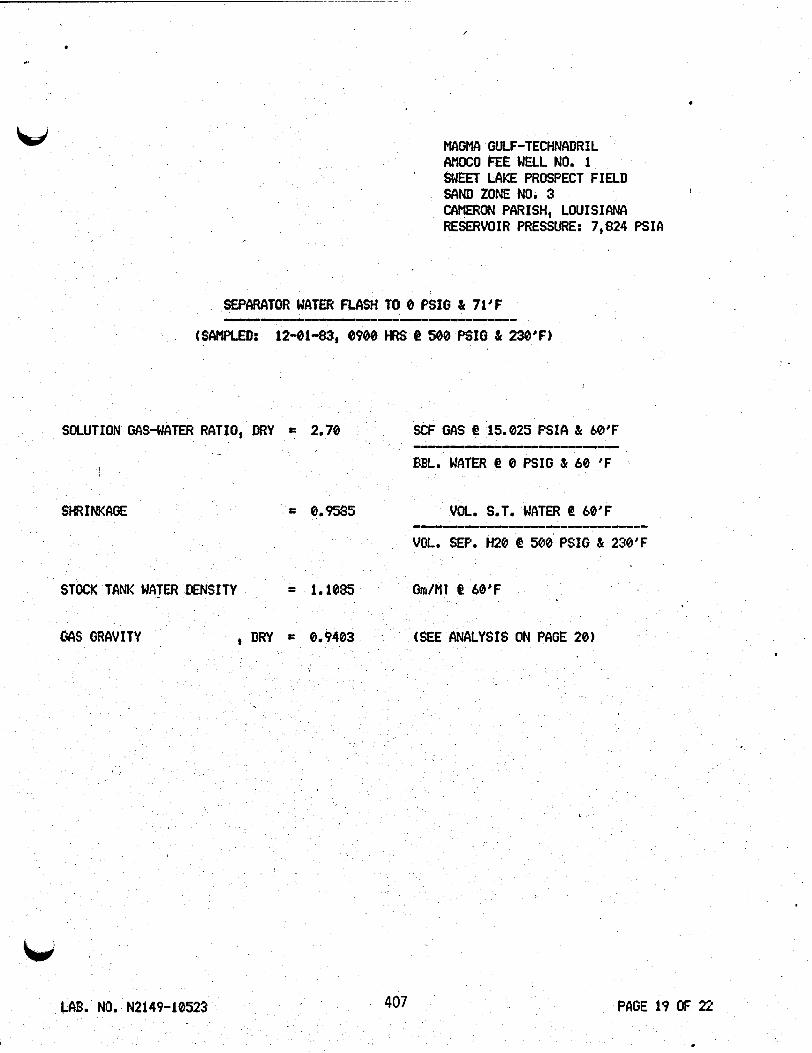
W MAGMA GULF-TECHNADRIL AMOCOFEEWELLNO. 1 SWEET LAKE PROSPECT FIELD SAND ZONE NO. 3 CAMERON PARISH, LOUISIANA RESERVOIR PRESSURE: 7,824 PSIA
SEPARATCR WATER fLcIsH TO 8 RIG t 71'F ---- -I-----
(SAMPLED: 12-01-83, 8900 HRS 8! 500 B I G t 230'F)
SOLUTION GAS-WATER RATIO, DRY = 2.70 SCF GAS e 15.025 PSIA & 60'F --- -_--I___-
.
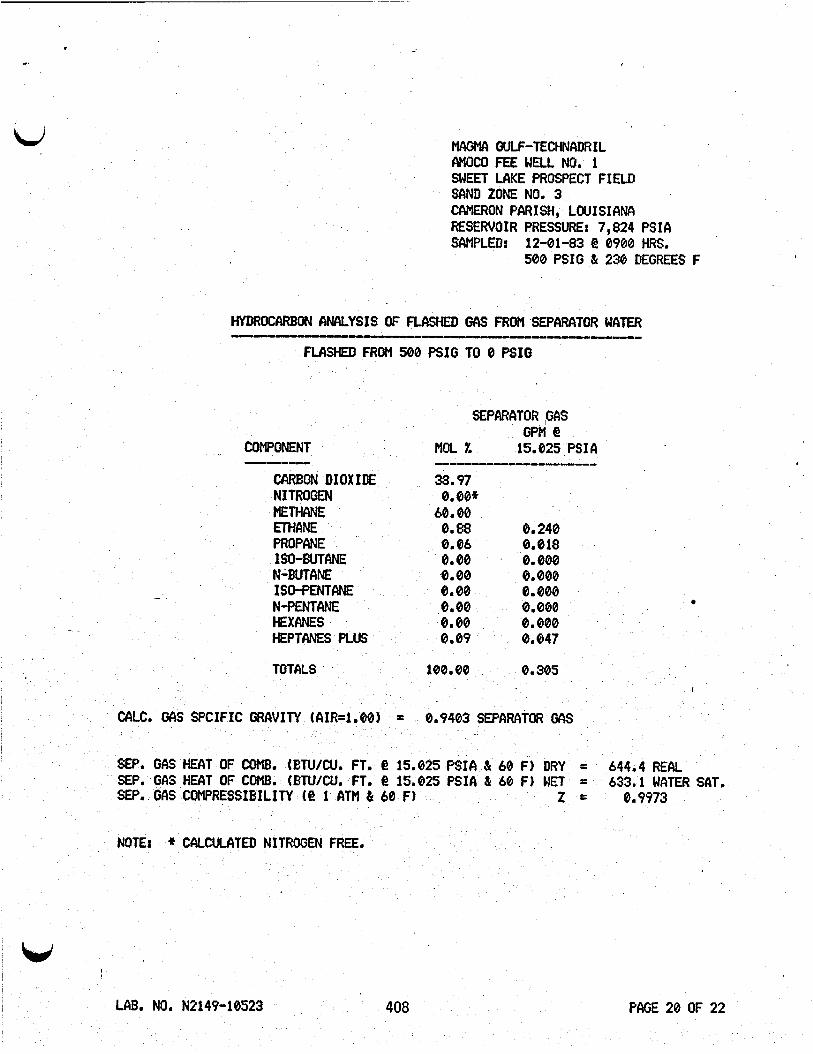
C.
MAGMA GULF-TECHNRDR IL AMOCO FEE WELL NO. 1 SWEET LAKE PROSPECT FIEUI SAND ZONE NO. 3 CAMERON PARISH, LOUISIANA RESERVOIR PRESSURE: 7,824 PSIA SAMPLED: 12-01-83 e 0900 HRS.
500 PSIG & 230 DEGREES F
HYDROCARBON ANAtYSIS OF FLAsHm GAS FROM SEPARATOR WATER
Fu1sHEI) FROM 500 B I G TO 0 PSI0
SEPARATOR ,GAS GPM t!
~ COMPONENT MOL 1. 15.025 PSIA ---_ -------_--------- CARBON DIOXIDE 38.97 NITROGEN 0.00* METHANE 68.80 mNE 0.88 0.240
ISO-BUTANE 0.00 ' 0.000 N-BUTANE 0.00 0.000
- ISO-PENTANE 0.00 0.000 N-PENTANE 0.00 8.000
- _ HEXANES 0.00 0.000 HEPTANES PLUS 0.09 8.047
PROFANE 8.86 8.018
TOTCILS 100.00 8.385 I
CALC. GAS SPCIFIC GRAVITY (AIR=1.00) 8.9403 SEPARATOR GAS
SEP. GAS HEAT OF COMB. tBTU/CU. FT. @ 15.025 PSI4 & 60 F) DRY t
SEP. GAS HEAT OF COMB. (BTU/CU. FT. @ 15.025 PSIA dl 60 F I WET = 633.1 WATER SAT. SEP. GAS COMPRESSIBILITY (4 1 ATM t 60 F)
644.4 REAL
z = 0,9973
NOTE: if CALCULATED NITROGEN FREE.
. -3 LAB. NO. N2149-10523 4 n ~ PAGE 20 OF 22
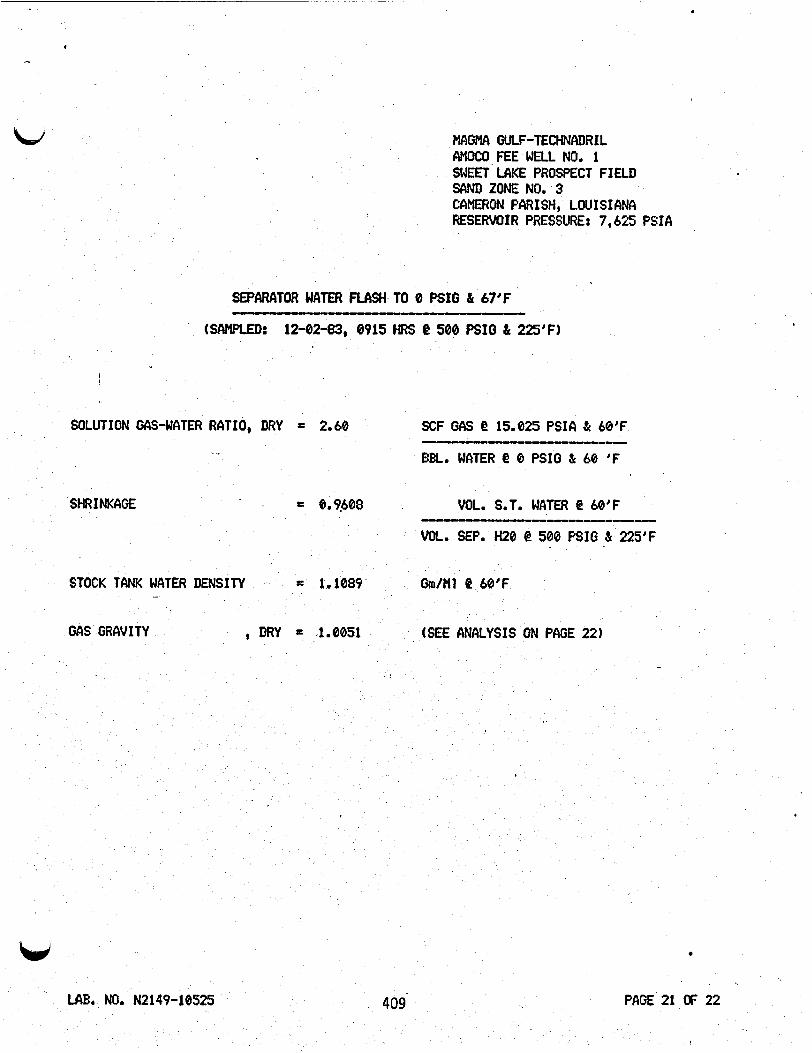
,
,
SOLUTION
MAGMA GULF-TECHNKJR I L MOCO FEE WELL NO. 1 SWEET LAKE PROSPECT FIELD SAND ZONE NO. 3 CAMERON PARISH, LOUISIANA RESERVOIR PRESSURE: 7,625 PSIA
SEPARATOR UATER FLCISH TO 0 PSIG t 67'F - WW'LED: 12-02-83, 0915 "5 4 500 PSIQ & 225'F)
GAS-WATER RATIO, DRY = 2.68 SCF GAS Q 15.825 PSIA s( 60'F
BBL. WATER @ 0 PSI0 s( 60 'F
U
PAGE 21 OF 22 I A B o NO. N2149-10525 409

,
-
MAGMA GULF-TECHNADRIL AMOCO FEE WELL NO. 1 SWEET LAKE PROSPECT FIELD SAND ZONE NO. 3 CAMERON PARISH, LOUISIANA RESERVOIR PRESSURE: 7,625 PSIA SAMPLED: 12-02-83 t 0915 HRS.
500 PSIG & 225 DEGREES F
HvDRocARsi ANALYSIS OF FLASHED GAS FROM SEPARATOR WATER ~ ~ ~ ~ _ _ ~ ~ ~ _ _ _ _ _ _ _ _ _ _
FLASHED f%Otl 500 PSIG TO 0 PSI0
SEPARATOR GAS GPM 4
COMPONENT MOL 1. 15.025 PSIA ----- -I_--------------
CARBON DIOXIDE 6% NITROGEN 0.00* METHANE 53.58 ETHANE 0.82 0.224 PROPANE 0.06 0.817 ISO-BUTANE 0.00 0.000 N-BUTANE . 8.00 0.000 ISO-PENTANE 0.00 0.000 N-PENT ANE 0.00 0.000 HEXANES 0.01 0.005 HEPTANES FLUS 0.17 0.888
TOTALS 100.00 0.334
CALC. GAS SPCIFIC GRAVITY (AIR=1.00) 1.0051 SEPARATOR GAS
SEP. GAS HEAT OF COMB. (BTU/CU. FT 4! 15.025 PSIA L 60 F) DRY = 582.5 REAL SEP. GAS HEAT OF COMB. (BTU/W. FT. @ 15.025 PSIA s( 60 F) WET = 572.3 WATER SAT. SEP. GAS COMPRESSIBILITY (f! 1 ATM L 60 F) z = 0.9971
NOTE: * CALCULATED NITROGEN FREE.
LAB. NO. NZ149-10525 4 10 PAGE 22 OF 22

Arizona Consulting Engineers Association Land Subsidence Symposium '
APPENDIX - K
. A BASE LINE FOR DETE'RMINING LOCAL, SMALL-SCALE VERTICAL MOVEMENTS
IN LOUISIANA
Drukell B. Trahan ~
Louisiana Geo log ica l Louis iana Stat e Unive r I; i t y
Baton Rouge, Lo ana J
411 7 - I-
/

ABSTRACT
U Subsidence in Lo.uisiana is a result'of 'many factors ranging from local,
man-induced to .regional , large-scale proces-ses. The measurement of local,
man-induced subsidence is especially critical 'in areas with high rates of.
land loss.
geodetic movements have been estimated by adjusting all movements along the
first-order vertical control network from northeast to southwest Louisiana
In order to measure local vertical movement, absolute historical
as related to the Monroe Uplift. The adjustment Will serve as a base line
by which local subsidence or uplift can be measured.
' A generalized trend of increasing subsidence t o the south in Louisiana
is probably a reflection of increasing sediment thickness and weight toward
the axis of the Gulf Coast Basin. Anomalous values a s . 1 0 ~ as -17.6 mm/yr
occur superjacent to the positions of Pleistocene and Holocene fluvial
elements. Positive movement, up to +4.1 nrm/yr, has been found associated
with the Iberian structural axis in south-central Louisiana.
Land subsidence due to natural causes may far outweigh subsidence
resulting from .fluid withdrawal'or depressurization of geopressured
aquifers. ' The effects of regional and local natural processes should not .be
underestimated in any systematic approach to measuring subsidence.
412
- . . I \
i
I , - I
- > ^
INTRODUCTION --
The U.S. Department of Energy is p resen t ly t e s t i n g geopressured-
geothermal energy r e ~ e r v e s i n southwestefn Louis iana. The r e se rves are i n
a reas where sandstone6 are enclosed between the s h a l e s of downthrown f a u l t
blocks i n major depocenters .
p ressure and temperature are high, 8 result of the encapsula t ion of pore
waters under a heavy overburden. During the development of these reser-
Wi th in , these sandstone r e s e r v o i r s , f l u i d
v o i r s , the hydraul ic energy-up to 13,000 psia-ie released.
reduct ion i n p re s su re may cauee dewatering and compaction of the surrounding
s h a l e s and subsidence a t t h e land su r face (Custavson and Kreitler, 1976,
The r e s u l t i n g
p* 20).
Depreseur iza t ion of deep geopressured aqu i f e r6 is one of a host of
Ground-watcr f a c t o r s which could cause subsidence of the land su r face .
withdrawal and' marsh rec lamat ion by dra inage are o t h e r p o t e n t i a l causes .
The e f f e c t of Fhese local a c t i v i t i e s on the land s u r f a c e may be det'ermined
by comparing h i s t o r i c a l subsidence rates.
subsidence must be a sce r t a ined and an attempt made to determine a b s o l u t e
movement.
I n ' a d d i t i o n , n a t u r a l causes of 8
'Subsidence is widespread i n South Louisiana. Besides the e f f e c t of
deep c r u s t a l movement and su r face compaction due to dewatering of marshy
s o i l s , the s h a l e s o€ the Gulf Coast Basin are h igh ly s u s c e p t i b l e to cornpac-
t ion r e s u l t i n g from dewatering and compression,
concern i n - c o a s t a l a r eas a l r eady *at or below sea l e v e l , w@ere c u r r e n t r a t e s
of land loss are e6ti1nated to be 129 kat /yr. 'Problems caused by
subsidence are high rates of land loss, increased urban f looding , b u i l d i n g
foundation f a i l u r e s , and ecosystem imbalances.
-
Subsidence i s a c r i t i c a l
2
.,
L i J
413

Preliminary base- l ine subsidence monitoring in the a reas of
w geopressured-geothermal energy development involved adjustment of l o c a l
l i n e s of h i s t o r i c a l f i r s t -o rde r leve l ing (Trahan, 1982). I n each case, the
*data were referenced t o a benchmark common to ' a l l epochs of l eve l ing by
numerically maintaining the common benchmark at a fixed e leva t ion . The
I
depicted r e l a t i v e movements are t rue, bu t misleading. The re ference
benchmarks, assumed t o be steady for the purpose of determining r e l a t i v e
motion, are probably' subsiding, therefore introducing an error f a c t o r i n the
da t a presented by Trahan (1982). Most of the South Louisiana c o a s t a l plain
i s subsiding a t some rate. R a t e s ranging from -0.5 t o -4.3 c m / v were
suggested by Swanson an'd !Chur,low (1973, p. 2760). Holdahl and Morrison
(1974, p. 381) ca lcu la t ed a range from -0.03 t o grea te r t han -0.05 cm/yr for
the coastal p la in in South Louisiana. In both s t u d i e s , the da t a w e r e
adjusted regionally, with assumptions based on sea l e v e l r ise, and thus do
not provide the scclle necessary t o monitor l o c a l subsidence.
Man-induced effects such as depressur iza t ion of deep geopressured
aqui fe rs w i l l r e s u l t i n l oca l subsidence over r e l a t i v e l y s m a l l areas. The
purpose of this study was t o establish a l o c a l base l i n e from which these
movements may be quant i f ied .

_ _ ~
_ .
. . between ac tua l and t h e o r e t i c a l va l ley gradien ts i nd ica t e that the area has
been upli'Pting a t an increas ing rate, from +0.4 t o +1.4 snm/yr,' for the l a s t
3500 years. Other inves t iga to r s have also found evidence f o r continued
a c t i v i t y ' o f the Monroe Upl i f t .
have 'occurred at least during the Miocene (Fisk, 1939; Spooner, 1935).
u p l i f t was a compensatory e f f e c t r e s u l t i n g from the deposi t ion of th ick
The most recent movements are believed t o
The ..-
d e l t a i c m ~ s s e s i n the Gulf Coast Basin to the south (Spooner, 1935, p. 130).
It i s unl ikely t h a t t h i s i s o s t a t i c r e l a t i o n s h i p ceased to e x i s t i n t o the
Quaternary period.
although cyc l ic , d e l t a i c progradation i n the Gulf Coast could only have
served t o continue u p l i f t -to the north.
The effects of cont inenta l g l a c i a t i o n and the continued,
A desc r ip t ion of t h i s r e l a t i o n s h i p can be provided through an a n a l y s i s
of r a t e s of vertical motion from north t o south through Louisiana;
mapping involves the f i r s t -o rde r l eve l ing network from northeastern
Louisiana t o southwestern Louisiana (Fig. l), which has been adjusted t o
movement assoc ia ted with t h e Monroe Upl i f t .
Current
Where possible , loop closure
adjustments (LCA) were made 'for. a i l epochs of l eve l ing 81Ong the network.
Where closure errors exis ted, t he loops were closed mathematically by
averaging the e l eva t ions a t the junc t ion poin t and d i s t r i b u t i n g the
r e su l t i ng d i f f e rence around the loop.
correct ing benchmark heights along the spur fo r t h e e leva t ion d i f fe rence a t
the spur-loop junction.
junct ions of l i n e s where years of leve l ing d id not coincide; the r e l a t i v e
r a t e of movement ' fo r the common benchmark served
Relative movements were p l o t t e d and a d j u s t e d t o account f o r u p l i f t ranging
from *0.4 t o +1.*4 m / y r at Winnsboro, Louisiana, which is located on the
southern f lank of the Monroe Up l i f t .
Loop spurs were adjusted by
- InterpolatEons were made, when necessary, a t
8 the ad.%istmerit;'
The r e s u l t i n g p r o f i l e s show changes i n b./
415

. /(MONROE UPLIFT I BOUNDARY ' A
N
Fig. I . The Louisiana first-order level ing nctvork showing positions of major junction8 and the boundary of the Monroe Upli f t .
416

elevat ion between epochs and show the adjusted topographic expression of the
sb, land surface (Figs. 2-7). Geomorphic and s t r u c t u r a l elements were included
i n the . p ro f i l e s fo r reference and cor re la t ion .
. . PROFILES
Winnsboro to Alexandria, Louisiana
This survey l i n e extends from Winnsboro through Jonesv i l l e t o the
south and then continues in a southwesterly d i r e c t i o n t o Alexandria,
Louiriana (Fig. 2). The benchmark at Winnsboro 5s the reference koint for
a l l movement6 depicted i n t h i s study. In the ad jus ted p r o f i l e for the
period 1934 t o 1966, u p l i f t increases t o a point above the posi t ion of the
Foules sa l t dome. To the south, u p l i f t decreases where the survey l i n e
crosses t h e Tensas River-Litt le River-Catahoula Lake drainage system. West
of t h i s f ea tu re is a sect ion of u p l i f t which corresponds t o the s t r u c t u r a l
posi t ion of the La S a l l e Arch. S t i l l f a r the r t o the west towards
Alexandria, subsidence tends t o dominate the p r o f i l e and i s greatest at a
9
posi t ion within the Red River valley. 0
W of the Red River t o Iowa, subsidence increases , corresponding presumably t o
417
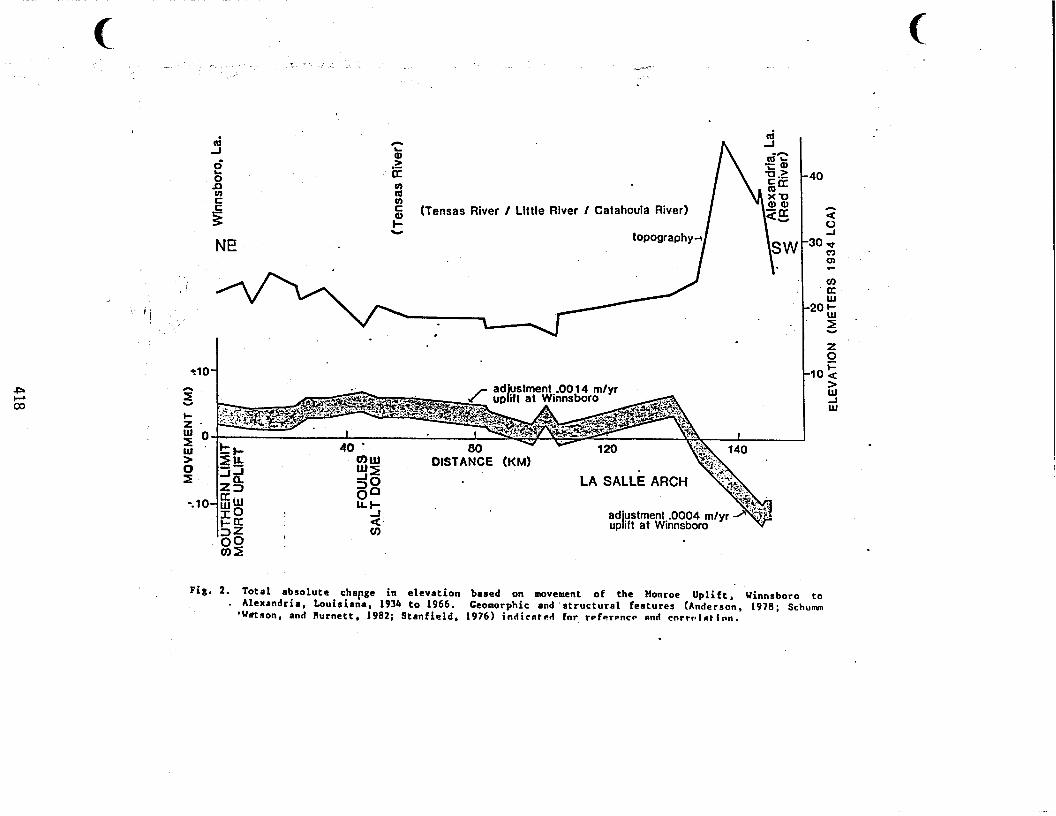
1 ... 0.
N
.
*
.I M
OV
EM
EN
T (M
) ,+
4
-L
0
0
I c
j i
0
0
A
'k
0
0
ELE
VA
TIO
N
(ME
TER
S 1
93
4 L
CA
)
A

n d n
Fig . 3. Total absolute change i n e l evat ion based on movement o f the Monroe U p l i f t , Monroe to Iowa. Geomorphic and s truc tura l fcatursa (Andrrron, 1979; S t a n f i e l d , 1076) Louisiana, 1934 t o 1966.
indicated Eat reference and corre la t ion .

Orange, Texas, to Baldwin, Louisiana
Subsidence is depicted along the major portion of t h i s p r o f i l e from
Orange, Texas, t o Lafayet te , Louisiana, for the period 1965 t o 1982 (Fig.
4). The g rea t e s t subsidence is in the shape of a trough along a segment of
the l i n e between the Hementau and Vermilion rivers, which are w e s t of and
i n Lafayette, respect ively. The l i n e turns at Lafaye t te t o the southeast
and follows t h e Ibe r i an s t r u c t u r a l a x i s (Barton, 1933) p a r a l l e l t o the
Five Is lands sa l t dome trend. U p l i f t is dominant along t h i s segment of the ~
l ine .

\i , l!
c.
Q 0
I
1
eo a
.r(
421

ZZt
..
HA
CK
S
ALT
Pra
irie
- Mar
shla
nd
Bou
ndar
y
0) \
Hol
ly B
each
, La
.
I L
0
0
ELE
VA
TIO
N (
ME
TE
RS
19
65
LCA
), _.(
..
..

z
423
Trahan - p a 7
similar.
same geomorphic pos i t ions ; co r re l a t ions between movement extremes,. however,
a r e greater .
terrace-coas t a l marshland boundary both coincide with the point where the
rate of subsidence i s lowest.
Maximum and minimum r a t e s of subsidence a re at approximately the
w The por i t i on of the Sweet,Lake s a l t dorne'and the P r a i r i e
Holly Beach, Louisiana, t o Rockefeller Refuge
In general , subsidence decreases along t h i s l i n e from Holly Beach on
the west eastward t o Rockefeller Refuge (Fig. 7). Anomalous subsidence
r a t e s occur i n areas adjacent t o the Calcasieu and Mermentau River va l leys ,
with the greatest *unt
V a l ley.
of subsidence depicted i n the Mermentau River
, DISCUSSION-
This repor t presents what i s believed t o be 8 begt est$mate'for . .
absolute geodetic movements i n Louisiana.
p. 378) based t h e i r regional a n i l y s i s on a sea l e v e l rise of 1 mm/yr.
Holdahl and Morrison (1974,
With
the adjustment of a l l movements t o the quant i f ied movement of the Monroe
Upl i f t , assumptions based on recent sea l e v e l r ise have presumably been ?
4..
circumvented.
negative movement from northeast t o southwest Louis i
area southeast of Lafayette, these movements range from +2.3 m/yr south of
Winnsboro t o -17.6 m / y r south of Iowa.
normal; r a the r , they occur as anomalous values related t o the posi t ions of
s t r u c t u r a l and geomorphic elements,
me p r o f i l e s i l l u s t . r a t e a general t rend of increasing
Except for the
These extremss, however, are not
I f the average rate of u p l i f t and
subsidence along each l i n e is Used, t h e range can be generalized from
+1.2 uan/yr adjacent to t he Monroe Up l i f t t o -6.7 mm/yr i n the coas ta l area
424

Holl
y B
each
, La.
I [Cal
casi
eu R
iver
)
Cre
ole,
La.
\
Mer
men
tau
Riv
er)
Roc
kefe
ller
Ref
uge
L
.I
0
0
ELE
VA
TIO
N
(ME
TER
S 1
96
5 L
CA
)

I
of southwestern Louisiana . axis is as grea t as +4.1 mm/yr and averages +2.8 mm/yr.
Upl i f t associated with the Iber ian s t r u c t u r a l
*
The depicted movements c o r r e l a t e with recent geomorphic elements. The
th ickes t recent sediments, such as those found
(Figs. 3 and 7), are suscept ib le to dewatering
r e l a t ed to deeper s t r u c t u r a l elements are, for
, < iri recent a l l u v i a l va l leys
and compaction. Movements
the most par t , overshadowed
by movements r e l a t e d t o recent geomorphic fea tures .
movement p r o f i l e s may serve as a use fu l t oo l f o r mapping buried va l leys and
depocenters . Figure 4 corre la te8 w e l l w i t h an area of P le i s tocene Red River a l l u v i a t i o n
(Varvaro, 1957, p. 23, pl..' 2).
movement p r o f i l e s and major s t r u c t u r a l elements, recent a c t i v i t y of these
s t ruc tu ra l elements may be subs tan t ia ted <e.g., t he Ibe r i an s t r u c t u r a l axis
I n addi t ion , the
For example, the anomalous subsidence trough depicted i n
Where strong co r re l a t ions e x i s t between the
. southeast of Lafaye t te , Fig.
t i ons which may be a product
subsidence would be
4) . Some p r o f i l e s exh ib i t negative correla-
of s t r u c t u r a l movement (Figs . 5-6). Greater
south of t h e P r a i r i e terrace-coastal marshland
boundary.
continuing water s a t u r a t i o n of sediments, s ince t h i s land sur face is at or
below sea l eve l i n most places.
cur ta i led , o r subsidence t o the north m
compaction of a buried Pleistoc
The absence of pronounced subsidence.here MY be a r e s u l t of
Sediment dewatering may have been
be an anomalous response t o
e Red River f l u
t u ra l subsidence may have been counterac by movement associated , - -
with the Hackberry-Sweet Lake s a l t ridge.
The National Geodetic Su 8 i n i t s l eve l ing work, appl ies severa l
correct ions to e l eva t ions obs i n the field (Bal and Young, 19821.
Random e r ro r s ca'used by instrument va r i a t ions o r human incons is tenc ies have
predumably been reduced by loop closure adjustments. Other cor rec t ions are
- .
426

based on natural orthometric and gravimetric va r i a t ions . These are
' theore t ica l ly constant fo r each benchmark independent of time. When
the change i n e leva t ion fo r a benchmark is documented, these va r i a t ions are
* presumably eliminated (Balazs, 1983, personal counnun. 1.
W
Other assumptions must be made when ad jus t ing l i n e s of leve l ing t o
determine movement.
movement of the Monroe U p l i f t has already been discussed.
it has been assumed, i n connecting l i n e s and making adjustments, tha t rela-
The re l i ance i n t h i s study on p o s i t i v e and measurable
Furthermore,
t i v e movements during the l a s t half-century have been incremental.
SUMMARY r
Before the - y - area of Louisiana is rap id ly i s u b m e r q ~ ~ g .
man-induced e f f e c t s uf geopressured-geothermal development or any one of a
number of causes can be ascer ta ined, i dea l ly a base l i n e of absolute
h i s t o r i c a l and na tu ra l e f f e c t s -must be determined.
study a re tha t na tu ra l e f f e c t s i n Louisiana are not t o be underestimated and
may f a r outweigh any man-induced e f f e c t s .
Indica t ions i n t h i s
-. . _ . The h c r e a s e i n negative movement rates t o the south is believed to be
re la ted to the thickening of sediments i n t h e Gulf Coast Basin.
t ionship may be a r e f l e c t i o n of grea te r dewatering in . t he th i cke r . - sediments
or i s o s t a t i c adjustments r e s u l t i n g from loads and stresses placed on the
basement by the weight of the sediment p i le . Anomalies i n the general t r e n d
are correlated with more recent geomorphic and strZlctura1 elements . tocene and Holocene f l u v i a l deposi ts and s a l t . domes c o n t r i
t o c r u s t a l motion - i n Louisiana.
The rela-
Pleis-
~
This est imate of absolute geodetic movements i n Louisiana is cons is ten t - -.
with the range of movement suggested by Holdahl and Morrison (1974). Higher
427

. . subsidence values a r e a , r e s u l t of local anomalies which were not detected i n
w t h e i r regional evaluat ion.
Future work should include an expansion of t h i s base l i n e i n t o other
p a r t s of the s ta te and a t ie - in to t i d e s t a t i o n s f o r fu r the r comparison: ,
Consolidation of the v e r t i c a l control network i n se lec ted areas with high
rates of land lo s s w i l l a l s o a i d i n the understanding of l o c a l subsidence.
ACKNOWLEDGMENTS
This work was sponsored i n i ts e n t i r e t y by the U.S. Department of
Energy under con t r ac t numb.er DE-AC08-81NV10174.
g r a t i t u d e t o the National Geodetic Survey i n Rock
valuable ass i s tance i n acquiring survey data and continued support. Addi-
t i o n a l thanks 'go t o t he cartographic and e d i t o r i a l s t a f f s of the Louisiana
Geological Survey and t o a l l the other professionals who have offered t h e i r
input during var ious phases of the study.
Babin and Steve Bennett f o r helping t o assimilate the vas t amounts of
geodet ic data i n t o a workable format.
I wish t o express f o w l
le, Mary1andD for its
Special g ra t i tude is owed to Anna
Balaes, E. I., and G. M. Young, 1982, Corrections applied by the National .
Geodetic Survey t o prec ise level ing observations: U.S. Dept. Commerce, hi
428
.. * ' . I , _ . . . e .
Nat. Oceanic and 'Atmospheric Admin., NOAA Tech. Memorandum NOS NGS 34,
12 p.
Barton, D. C., 1933, The'Iberian structural axis: Jour. Geology, vol. 41, , -
no. 3, p. 225-242. :\" I '
I Fisk, H. N., 1939, Jackson Eocene * from boring8 at Greenville, Mississippi:
Bull., Am. Assoc. Petr. Geol., vol. 23, no. 9, p. 1393-1403.
Gustavson, T. C., and C. W. .Kteitler, 1976, Geothermal resources of the
Texas Gulf Coast:
and disposal of geothermal waters:
Geology, Austin, Tex., Geol. Circ. 76-7, 35 p.
Environmental concerns arising from the production
Univ. Texas, .Austin, Bur..Econ.
Holdahl, S. R., and N. L. Wrrison, 1974, Regional investigations of
vertical crustal movements in the U.S., using precise relevelings and
mareograph data; & R. Green, ed., Recent crustal movements and
associated seismic and volcanic activity:
p. 373-390.
Tectmophysics, vol. 23,
Schumm, S. A., C. C. Watson, and A. W. Burnett, 1982, Investiga5ion of
neotectonic activity within the Lower Hississippi Valley Division:
Corps of Engineers, Contract no, DACW38-80-C-0096, 158 p.
U.S.
:Stanfield, C. P., 1976, A list of Louisiana oil and gas fields and salt
domes including the offshore areas showing code numbers and abbrevia-
tions:
137 p.
La. Geol. Survey, Baton Rouge, La., Resources Inf. Series no. 1,
Spooner, W. C., 1935, Oil an
Arkazsas:
139.
Ark. Geol. Survey, Little Rock, Ark., .Bull.- no. 2, p. 125-
429

Swanson, R. L., and C. I. Thurlow, 1973, Recent subsidence rates along the
Texas and Louisiana coasts as determined from tide measurements:
Geophysical Research,. vol. 78, no. 15, p. 266502671.
Jour. W
Trahan, D. B., 1982; Hdnitoring local subsidence in areas of potential
geopressured fluid withdrawal, southwestern Louisiana: Trans., Gulf
Coast Assoc. Geol. SOCL., vol. 32, p. 231-236.
Varvaro, G. G., 19578 Geology of Evangeline and St. Landry parishes: Dept.
Conservation, La. Geol. Survey, Baton Rouge, La., Ceol. Bull. no. 31,
p. 23, pl. 2.
430
- -

.
Appendix L
Plug and Abandon Permits

F
W
-
MAGMA GULF-TECHNADRIL 430 Highway 6 South-Suite 208
Houston. Texas 77079 Tclcphone: (7 13) 870- I480 bcc :
June 27, 1984 HO-TM-84-019
Jonne Berning John Cogar .Clay Durham Tom Goebel Carl Guillot Frank 0 ' Br ien Sweetlake Files
Lr. W. C. Wilhite Director-Lake Charles District Office of Conservation Louisiana Department of Natural Resources P . O . Box 1767 Lake Charles, LA 70601
SUBJECT: REQUESTED PERMIT FOR PLUGGING AND ABANDONMENT - MGdT/DOE AMOCO FEE NO. 1 WELL (SERIAL NO. 167759) SWEETLAKE PROJECT .
f' Dear Mr. Wilhite:
Our Sweetlake geopressured-geothermal resource evaluation program has been completed, and our client, the U.S. Department of Energy, has instructed us to plug and abandon the brine test well and its associated salt water disposal well.
We are, therefore, requesting a permit'from your office to plug and abandon the brine test well according to the attached plans, procedures, and drawings. We will be pleased to provide any additional information that you may require.
We are planning tentatively to commence with these P & A operations on July 9 , 1984, and3 ~ therefore, will appreciate your prompt attention to our permit request. We would also appreciate receiving the appropriate forms (if any) for filing with your office when plugging and abandonment of the subjeot test well has
Thank you for you cooperation in this matter.
-.
been completed. .-
Sincerely,
Manager-Production Testing
LRD/IS
Attachments
cc: Mr. James H. Welsh Mr. Bob Clarke Director-Injection And Mining Office of Conservation
Nevada Operations 0 fice U.S. Department of Energy Baton Rouge, LA -2
432

. f'
r
W MG-T/DOE AMOCO FEE NO. I WELL
SWEETLAKE PROJECT PROPOSED PLbG AND ABANDOIWENT PROCEDURE
JUNE 1984
. . Prelude: An Otis pump-through bridge plug was ,set at 14,500 feet in the seal assembly extension of the subject geopressured-geo- thermal well on April 10, 1984. Pressure was then bled off the 5-1/2-inch tubing string and the wellhead. The test ,well is shown in its present configuration in the attached Figure 1.
The desired plug and abandonment configuration is shown in Figure 2.
1) Rig up a cement pump truck to the 5-1/2-inch tubing string. Mix up 57 cubic feet of Class Hiscement with 35% -silica flour and retarder and "bullhead" same into the tubing followed by precisely 297 barrels of 17 ppg mud. This will result in a 500-foot cement plug from 14,780-15,280 feet, and cover the Sand Zone No. 3 perforations.
2) Allow the cement to set for at least one week.
3) Remove the wellhead (except the bottom master valve), flow wings and associated piping to the Willis choke valves.
4) Move in a rig, rig up, and nipple up a 5,000 psig BOP stack.
5 ) Attempt to pull the entire '14,495-foot 5-1/2-inch tubing .- string from the seal assembly and recover same. If the tubing string is stuck, pick up a mechanical cutter and a work string, cut the tubing at about 14,475 feet (or at the free point), and then recover the tubing.
6) Spot a 200-foot Class H cement (with 35% 'silica flour and retarder) plug at 14,400-14,600 feet (or at the depth of the mechanical cut) - 100-feet inside and 100-feet outside of the 5-1/2-inch tubing. This plug will require 48 cubic feet of cement .
1-
.-
w 433 .h'

,C- t
P
June 2984 Page 2
Sweet Lake Prop W
7) Cut the 7-5/8-inch cas ing a t about 5,400 feet (or h igher free -poin t ) and recover same: -
8) Spot a 200-foot cement plug at'.5,300-5,500 feet (or a t t h e depth o f t h e mechanical c u t ) - 100 feet i n s i d e and 100-feet ou t s ide t h e 7-5/8-inch casing. This plug w i l l r e q u i r e about 82 cubic feet o f cement.
9) Cut the 9-5/8-inch cas ing a t about 3,950 f e e t (or higher free poin t ) and recover same.
10) Spot a 200-foot cement plug at -3,850-4,050 feet (or a t t h e depth of t h e mechanical c u t ) - 100-feet i n s i d e and 100-feet . o u t s i d e t h e 9-5/8-inch casing. This plug w i l l r e q u i r e about 166 cubic feet o f cement. *
11) Spot a 100-foot cement plug i n t h e 13-3/8-inch cas ing a t a depth of 10-110 f e e t . This plug w i l l r e q u i r e about 83 cubic
ch, and 30-inch cas ings three - ' feet below grade -and -remove cas ing hangers; weld a 1/2-inch
s teel p l a t e with a 1/2-inch needle valve on top t o t h e 30-inch casing.
- .
. . R .-.-
.- . . - I . - . . . - . .. -__--. . . - .+ ..-. * - .
3-3/8-inch, 20
13) Load ou t a l l recovered u l a r s and equipment. . ._ . - ._ . ._
a.
.- 14) Back f i l l t h e cellar.
15) Rig down t h e rig and move o f f the s i te . I
I
I I Note - The assoc ia t ed s a l t water d i sposa l w e l l (MG-T/DOE
1) w i l l be plugged i n a similar manner, I Amoco Fee SWDW No. t h e su r face f ac i l i t i e s dismantled and moved o u t , and t h e w e l l s i t es w i l l be r e s t o r e d t o t h e i r o r i g i n a l condi t ion.
1
L R D / ~ S

. .. I
-.
--. ---- . REVISION 1 . 6120184
30" Driven to 156' Material DescriDtion *Rotary Table Elevation
m C tubing hangar BUTT on bottom C 9 Jts 169 ppf K-55 BUTT on top) @ 835" cemented to
5-112'' X-Line box connection on bottom and 6" 8-Rd thread box connection on top for 6" 8-RD thread lift joint
(inverted, pin up-box do*) 1 Jt 5-112'' 23 ppf C-95 X-Line
.1 Dbl. .pin sub. 5-112" X-Line 3 Pup ! t ~ 5-112" X-Line
361 J t s 5-112" 23 ppf X-Line
40.34'
6.53' 19-318" (45 J t s 72 ppf L-80 BUTT on bottom C 69
2.06 , 4 . 3 7 ' , i 13.46'
(301 Jtr C-95 on cop & 60 JtS P-110 on bottom)
Otis Packer Seal Assembly Straight slot locator Seal Extension R 6 R Seals (3) Mule Shpe
10.5 PPC Calcium Chloride @ 6OoF Packer,Fluid W/ D-303 inhibitor in 5-112' x 7-518" annulus
*:
Head vith lugs 0.66' 14.496. Seal bore extension 15.71' 14.512. 9-5/8" (8 J ~ s 47 PPP Ratch latch with seal 2.30' 14 J 1 5 , P-110 BUTT on bottom i 225 Jts 47 ppf N-80 Otis UBR packer for 7-5/811
39 ppf CSg, -6.39" OD x . BUTT on top) @ 10,230' 4" ID 3.88' long from 14,Sl Cement @ 15,351' on top of Pengo bridge plug @ 15,385'
cemented to 6,400' . : . . ,
OT PBR @ 1 4 , 5 5 6 ' . . : NOTE: Straight slot locator set down on the seal bore extension head vith 34,0000 weight. 5-112" i s in compression.
*All tubing end associated equipment measurements are from rotary table elevation 35.95'' above the 13-318'' caring flange.
Bottom of
'
.
Sand "5" perforaced 4 shots per foot: PBTD (top of 5-i12*1 float collar) at 15,660' e
25.54 PPf SO095 ?us,
15,387' - 15,414' Sand "3" perforated 4 rhots per foot:
15,245' - 255' and 15,260' - 280' 5-112" Liner, 30 Jts
- P R I F T - ID 15,738' LO 15,534' DIA'IETERS
Tubing tlanger 5.50" 5.50" 8.00" 5-112" 231 Tubing **4.545" **4.42" 5.50'' 5-112" 25.541 Liner **4.423" **4.298" 5.50" 5-112'' Liner Cplngs. 4.423" 4.298" 6.05" 5-112" Tubing Upsets 5.545" 4.42" 5.656" O t i s Seal Assembly 4.00" 4.00'' 4.96" Fish neck on Otis
** All tubing Is plastic.coared and therefore the ID
6-112" Hole t o 15,740'~
4.00" 4.00" 4.07" 3 Ratch Latch
and Drift are reduced by 118 (0.125 inch from nominal)
435

.I
. ._ - .
FIGURE 2 MG-T/DOE AMOCO FEE NO. 1 TEST W E U
SWEETLAKE PROJECT PROPOSED PLUG AND ABANDONMENT CONFIGURATION
JUNE 1984 - - . - - . .
30" casing to 156' 0" casing t o 835'
13-318" casing to 4,050' .
Top of cement at 5.600' *Top of cement at 6.400' . .
'. .
. . -
. . , - - . . I -.. i.. . I. 13 2.::' :-.. -.. 4 . .
/
500' cement plug (14,780' - 15,280') 7-518" casing to 15,065'
Zone No. 3 perforn (15,245'-15,255') (15.260'-15,280')
Pengo bridge plug (15,285'-15,287')
Zone No. 5 perforations ( 15,387'- 15.4 14 '
Formation sand fill PBTD at 15,660' 5-1/2" liner to 15,735'
4 . TD at 15,740'
. 5 ..
436
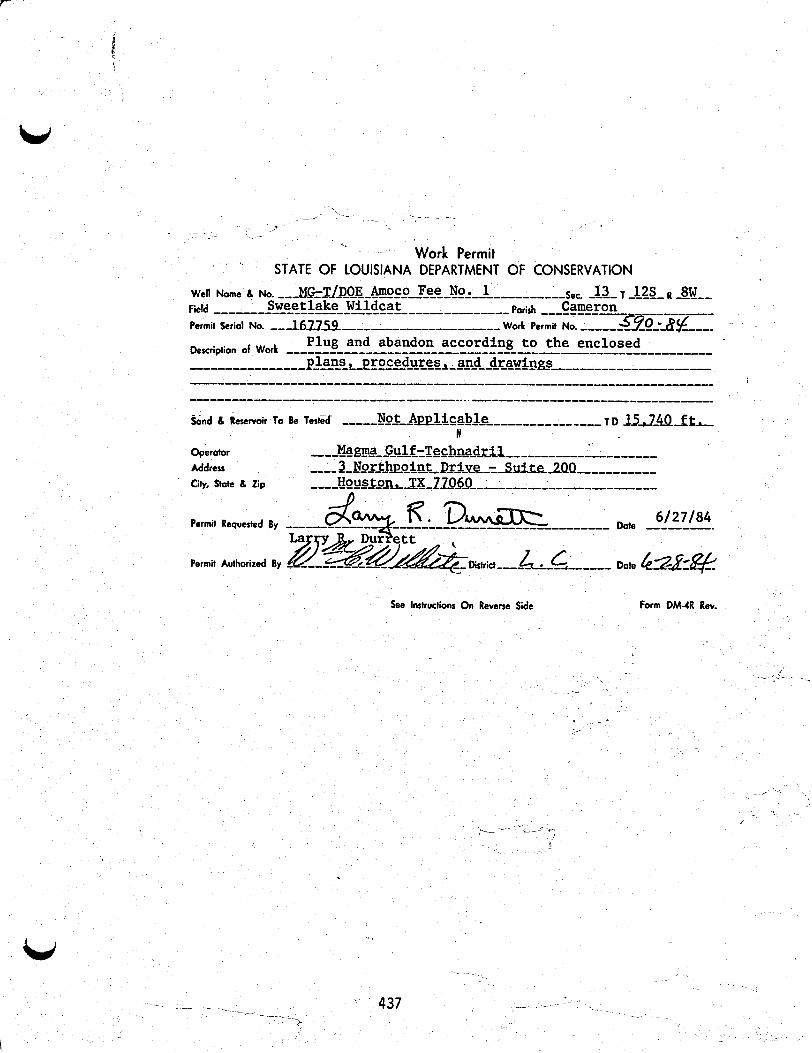

MAGMA GULF-TECHNADRJL 430 Highway 6 South-Suite 208
Houston. Texas 77079 Tclcphone: (7 13) 870- 1480
June 27, 1984 bcc: Jonne Berning John Cogar Clay Durham Tom .Goebel. Carl Guillot Frank O'Brien Sweetlake Files
HO-TM-84-018
Mr. James H. Welsh Director of Injection And Mining Office of Conservation Louisiana Department of Natural Resources P.O. Box 44725 Baton Rouge, LA 7080404275
SUBJECT: REQUESTED PERMIT FOR PLUGGING AND ABANDONMENT - MG-T/DOE AMOCO SWDW NO. 1 (SERIAL NO. 970720) - ALSO KNOWN AS MG-T/DOE AM,OCO FEE NO. 2 WELL
Dear Mr. Welsh:
Our Sweet1ake.geopressured-geothermal resource evaluation program has been completed, and our client, the U.S. Department of Energy, has instructed us to plug andaabandon the brine test well and its associated salt water disposal well.
We are, therefore, requesting a permit from your office to plug and abandon the subject salt water disposal well according to the attached plans, procedures, and drawings. We will be pleased to provide any additional information that you may require.
We are planning. tentatively to commence with these P & A -. operations on July 9, 1984, and, therefore, will appreciate your prompt attention to our permit request. We would also appreciate receiving the appropriate forms (lf any) for fi\ing with your office when plugging and abandonment of the subject disposal well has been completed.
Thank you for you cooperation in this matter. 1
Sincerely,
D ! Larry R. Durrett Manager-Production Testing
LRD/IS
Attachments
cc: Fir. Bill Wilhite Mr. Bob Clarke Director-Lake Charles District Nevada ODerations Office Office of Conservation U.S. Depirtment of Energy d
438

MG-T/DOE AMOCO FEE SWDW NO.1 ' SALT WATER DISPOSAL WELL SWEETLAKE PROJECT
PROPOSED PLUG AND ABANDONMENT CONFIGURATION JUNE 1984
The subject sa l t water disposal well i s shown i n i t s present configurat ion i n Figure 1. The desired and intended plug and abandonment configuration i s shown i n Figure 2.
Rig up a pump truck t o the 7-inch casing (used as a completion tubing s t r ing ) . Mix up 250 cubic feet of Class H cement with re ta rder and "bullhead" same in to the w e l l followed by precisely 230 ba r re l s of 9 ppg d r i l l i n g mud. This w i l l r e s u l t i n a 6OO-foot cement plug from 3,82504,425 f e e t , and w i l l cover the perforat ions. Allow the plug t o set f o r a t least one week.
Remove the wellhead (except the bottom master' valve) and associated piping.
Move i n a r i g and r i g up.
A t t e m p t t o p u l l the 2,000+ feet of 7-inch casing out of the Baker packer and recover same. If the 7-inch casing is s tuck, pick up a mechanical c u t t e r on a work s t r i n g , and cu t the casing a t about 1,950 f e e t (or a t the free point) and then recover the casing.
Spot a t 200-foot cement plug a t 1,900-2,100 feet (or o the r depth of the mechanical cut) - 100-feet ins ide and 100-feet outs ide the 7-inch casing, cubic feet of cement.
Cut the 9-5/8-inch casing a t about 1,275 f e e t ,(or higher free point) and recover same.
Spot a 200-foot cement plu a t 1,175-1,375 feet (or o the r .depth of the mechanical cut? - 100-feet ins ide and 100-feet outs ide the 9-5/8-inch casing.
Spot a 100-foot cement plug i n the 13-3/8-inch casing a t a depth of 10-110 fee t . This plug w i l l require about 83 cubic feet of cement .
This plug w i l l require about 82 --
'
-2 439

i . . .. . . .. . . _ . - 9. June 1984
Page 2 Propos&d Plug and Abandonment Configuration ' . Salt Water Disposal Well/Sweet Lake Project . _
9 ) Torch cut the 13-3/8-inch and 20-inch casings three feet below grade and remove casing hangers; weld a 1/2-inch steel plate with a 1/2-inch needle valve on top to the 20-inch casing.
10) Load out all recovered tubulars and equipment.
11) Back fill the cellar.
12) Rig down the rig and move off the site.
Note - The associated geopressured-geothermal test well (MG-T/DOE Amoco Fee No. 1 Wellj will be plugged in a similar manner, the surface facilities dismantled and moved out, and the well sites will be restored to their original condition.
440
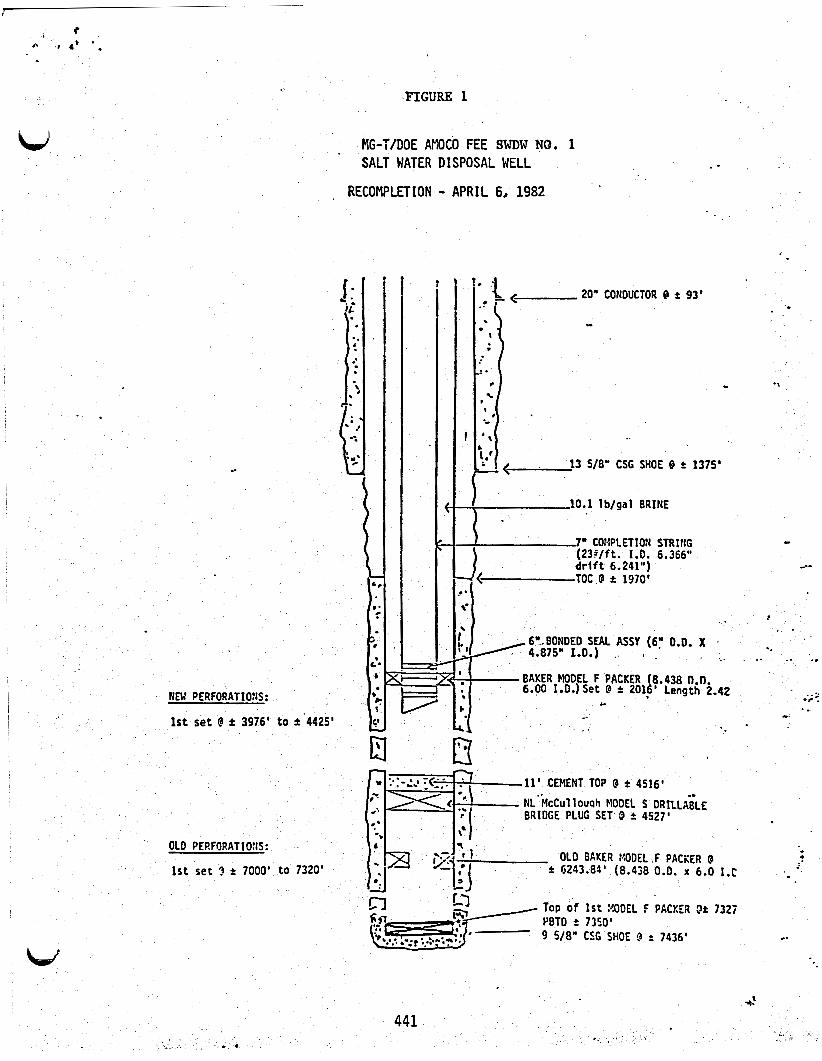
ki
,FIGURE 1
MG-T/DOE AMOCO FEE SWDW NO. 1 SALT WATER DISPOSAL WELL
RECOMPLETION - APRIL 6, 1982 .
< 20"
.. CONDUCTOR @ f 93'
. 13 5/8" CSG SHOE @ f 1375' !.'
10.1 lb/gal BRINE
- 7" COMPLETION STRING (235/ft. 1.0. 6.366"
TOC @ f 1970' P d r i f t 6.241") a-
..
*. 6"..BONDED SEAL ASSY (6: 0.0. X -
H 4 . 8 7 5 " 1.0.) . , . . i . .. .. .*
-BAKER MODEL F PACKER (8.438 0.0. . . -. 6.00 f.D.)Set @ * 201,6' Length 2.42 .r:
11' CEMENT TOP @ 2 4516'
NL'McCulloush MODEL S DRILL& BRIDGE PLUG SET 0 2 4527'
OLD BAKER XODEL,F PACKER @ OLD PERFORATIORS:
1st set 9 2 7000' t o 7320' f: rJ243.83' (8.438 0.0. x 6.0 1.f
TOP Of 1 s t :*!ODEL F PACKER 3t 7323
9 5/8" CSG SHOE 4 t 7436'
W r .
d 441

. . PICURE 2
. HG-f/DOE W C O FEk SVOU NO. 1 SALT WATER DISPOSAL WELL
JUNE 1984 PROPOSED PLUG AND ABANDONMENT CONFIGURATION
-
. ..
+20" hring to 93'
9 PPC mud
13-3/8" casing to 1,375*
(-Top of cement at 1,970*.
9 PPC mud
600' cement plug New perforntions (3,976'4'425') (3,825 * -4 . 425'
11' cement cap nt 4.516' .
9 PPG mud
Baker Packer a t 6.244'
Old perforations (7,000'-7 . 320') .. &1
Baker Packer at 7,327' 6 .0 0 0 0 P & b r . 9-5/0" caring to 7,QS'
442

.-
Larry R. DuTrett
Form DM4R Rev. I See lnstrudions On Reverse Side

EDWIN W. EDWARDS
WILllAM C. HULS OOVEUNOR
SECR€TAIY
HERBERT W. THOMPSON ASSISTAM SECRETARY
DEPARTMENT OF NATURAL RESOURCES m d
OFFICE OF CONSERVATION COMMlSSlONEl
July 5, 1984
N3gm Gulf-Technadril 3 Northpoint Dr. - Suite 200 Houston, TX 77060
A t t n : Mr. Larry R. IXIrrett
I&: tG-T/WE Pmoro Fee SWIM NO. 1 Serial No. 970720 North Sweetlake Field Cameron Parish
Gentlenen:
Approval is hereby given to perform the work in the above referenced we11 as proposed i n Work Permit No. UIC-84-514.
In accordance w i t h the requirerknts of Statewide Order No. 29-B, three (3) m a t e d copies of the W e l l History and Work R e s w Report (Fonn W-l), plug and Abandon Report (Form PSA), and the cementing report must be sent to the Injection and Mining Division a t the above address within twenty (20) days of the plugging.
Yours very truly, - c
HEmERT w. THmpsoN Cannisqioner of Conservation
f James H. Welsh Director of Injection and Mining
m:ts
Enclosure
cc: Lake olarles District
-
NATURAL RESOURCES BUILDIN0 P.0. BOX 44279 - BATON ROUGE, LOUISIANA 70804 . H)4/342-SS.v)
,
444

.
Work Permit STATE OF LOUISIANA DEPARTMENT OF CONSERVATION
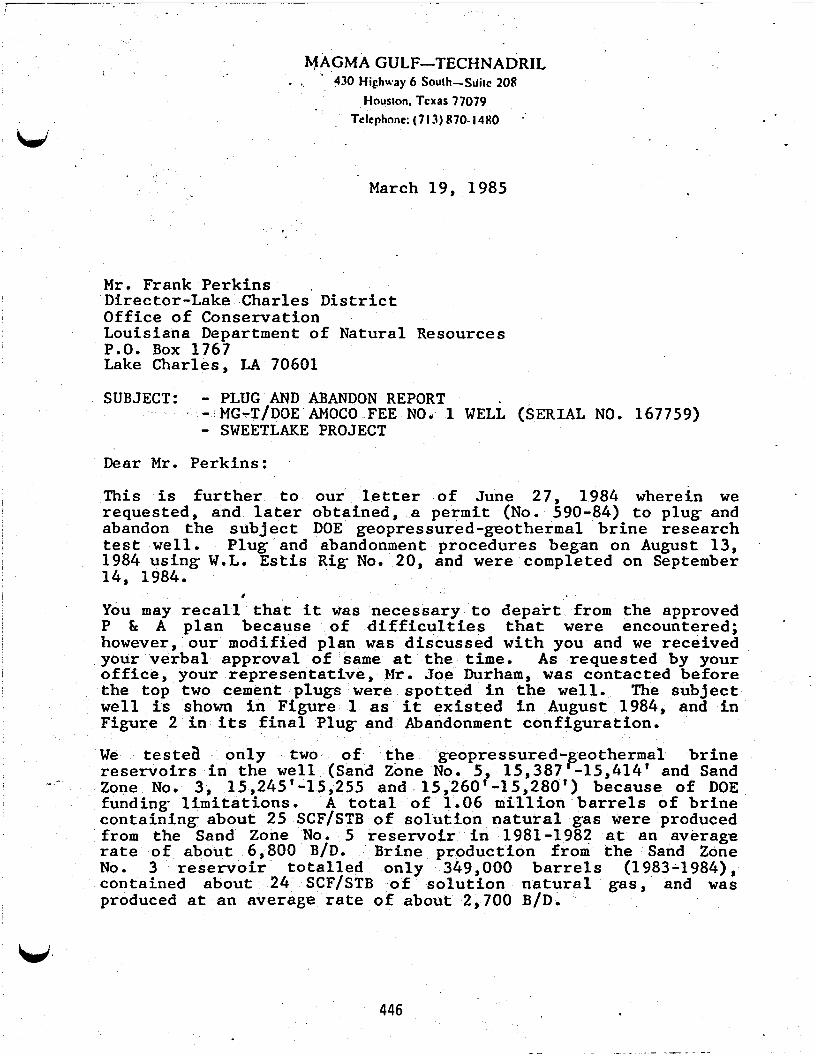
- - _I
MAGMA GULF-TECHNADRIL . . . 430 Highway 6 South-Stjiic 208
Houston. Tcxas 77079 Telephone: (7 13) 870- 1480 .
L 4
March 19, 1985
M r . Frank P e r k i n s Director-Lake Charles Distr ic t Of f i ce of Conservat ion Louisiana Department of Natural Resources P.O. Box 1767 Lake Charles , LA 70601
SUBJECT: - PLUG AND ABANDON REPORT ' - MG-TIDOE AMOCO FEE NO. 1 WELL (SERIAL NO. 167759) - SWEETLAKE PROJECT
Dear M r . Perk ins :
This i s f u r t h e r t o ou r l e t te r of June 27, 1984 wherein w e reques ted , and la te r obta ined , a permit (No. 590-84) t o plug- and abandon t h e subject DOE geopressured-geothermal b r i n e research tes t w e l l . P l u g and abandonment procedures began on August 13, 1984 u s i n g W.L. E s t i s R i g No. 20, and w e r e completed on September 14, 1984.
You may reca l l that i t was necessa ry t o d e p a r t from the approved P & A p l a n because of d i f f i c u l t i e s that w e r e encountered; however, o u r modified plan w a s d i scussed w i t h you and w e rece ived your v e r b a l approval of same a t the t i m e , A s reques ted by your off ice , your r e p r e s e n t a t i v e , Mr. Joe Durham, w a s contac ted before t h e top t w o cement plugs w e r e s p o t t e d i n the w e l l . The s u b j e c t w e l l i s shown i n F igure 1 as i t e x i s t e d i n August 1984, and i n Figure 2 i n i t s f i n a l P l u g and Abandonment c o n f i g u r a t i o n .
W e testes o n l y two of the geopressured-peothermal b r i n e r e s e r v o i r s i n t h e w e l l (Sand Zone No. 5, 15,387 -15,414' and Sand
- Zone No, 3, 15,245'-15,255 and 15,260'-15,280') because of DOE funding l i m i t a t i o n s . A t o t a l of 1.06 m i l l i o n barrels of b r i n e c o n t a i n i n g about 25 SCF/STB of s o l u t i o n n a t u r a l gas were produced from t h e Sand Zone No. 5 r e s e r v o i r i n 1981-1982 a t a n average r a t e of about 6,800 B/D. Brine product ion from the Sand Zone No. 3 reservoir t o t a l l e d o n l y 349,000 barrels (1983-1984), contained about 24 SCF/STB of s o l u t i o n n a t u r a l g a s , and w a s produced a t an average r a t e o f about 2,700 B/D.
8
446

~~ ~~~ ./
M r . Frank Perk ins March 19, 1 9 8 5 . Page 2
/ / ____ ,-
I w
The assoc ia ted s a l t water d i s p o s a l w e l l (MG-T/DOE SWDW No. 1) w a s s i m i l a r l y plugged and abandoned, a l l su r f ace f ac i l i t i e s w e r e removed, and the w e l l s i tes w e r e r e s t o r e d t o t h e i r o r i g i n a l condi t ion t o the complete s a t i s f a c t i o n of both t h e fee land owner (Amoco Production Company) and t h e su r face lessee ( M r . Char les Precht , Jr.). S i t e r e s t o r a t i o n a c t i v i t y w a s completed on o r about October 8 , 1984.
W e w i l l be p leased t o supply any a d d i t i o n a l information t h a t you may r equ i r e ; otherwise, t h i s w i l l r ep resen t our f i n a l r e p o r t on t h e sub jec t b r i n e w e l l .
S ince re ly ,
d2Jq t?s D Z x Larry R. Durre t t Manager-Production T e s t i n g
L R D / ~ S
Attachments
I
cc: M r . James Welsh - Office of Conservation (Baton Rouge) M r . B i l l Hardeman - Amoco Production Company M s . Mary Brownlee - Amoco Production Company
D r . Clay Durham - MG-T M r . Frank O'Brien M r . Carl Guillot Mr. Jonne Berning Sweetlake Permit F i l e
447
. . . , . . . - . . . . . . - - . - .
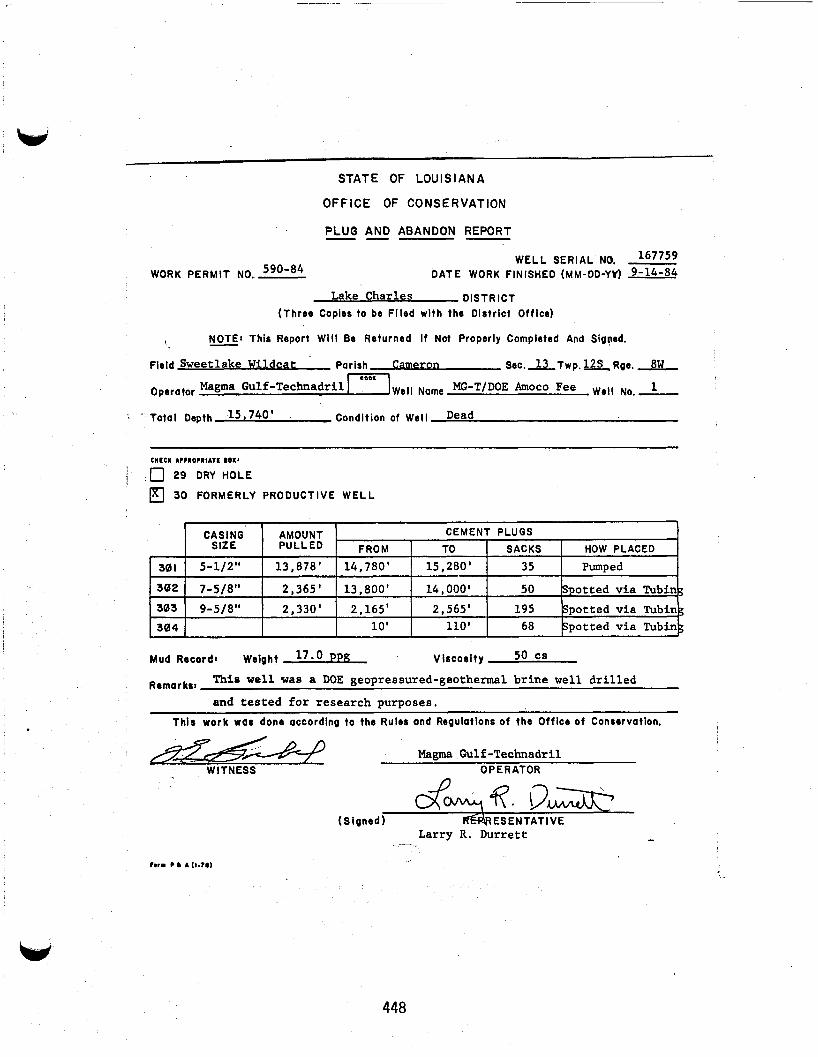
Li STATE OF LOUISIANA
OFFICE OF CONSERVATION
PLUG AND ABANDON REPORT -- - WORK PERMIT NO.- 590-84
WELL SERIAL NO. 167759 DATE WORK FINISHED (MM-OD-YY) 9-14-54
DISTRICT Lake Charles (Three Copies to be F i led w i th the D is t r i c t Office)
1 NOTE: This Report W i l l Be Returned If Not Properly Completed And Sigqed.
Flald Sweetlake Wildcat Parish Cameron Sec. A T w p . 12s Rge. 8W
i
COD.
Magma Gulf-Technadril I W e l l Name MG-T/DoE AmOcO Fee Well No.- 1 Operator
To ta l Depth Condition of Well Dead
CMCCK A P P R O C I I A l S D O X I
29 DRY HOLE
a 30 FORMERLY PRODUCTIVE W E L L
Mud Record: Weight 17-0 ppg Viscos i t y 50 cs This well was a DOE geopressured-geothermal brine well drilled Remarks: and tested for research purposes.
T h i s work was dona according to the Rules and Regulations of the Of f i ce o f Conservation.
Magma Gulf -Technadril WITNESS 0 P E R ATOR -.
( S lgned) RS& ES EN TAT I VE Larry R. Durrett
-
448

I FIGURE 1 1 , MG-TfDOE AMOCO FEE NO. 1 WELL ' , I
SWEETLAKE FIELD WILDCAT - CANERON PARISH, LOUISIANA COMPLETION OCTOBER 30, 1983 . REVISION 1, 6120184
1
I i .
I
I
/
Material Description *Rotary Table Elevation 30" Driven to 156'
RIC tubing hangar 20" (13 Jts. 133 ppf K-55 5-1 f 2'' X-Llne box connection on bottom and 6'' 8-Rd thread box connection on top for 6" 8-RD thread lift joint
BUTT on bottom 6 9 Jts
7-5/8" Tie back casing:' 39 ppf P-110 X-Line._. i Jt 5-112'' 23 ppf C-95 X-iine 40.3d'
1 Dbl. pin sub. 5-112" X-Line 6.53' 3 Pup Jts 5-112" X-Line
2.06', 4.37'. h 13.46' 361 Jts 5-112'' 23 ppf X-Line '.(301 Jts C-95 on top &
60 Jts P-110 on bottom)
(inverted, pin up-box down) 13-318" ( 4 5 Jts 1 2 ppf L-80 BUTT on bottom h 6 Jts 72 ppf N-80 BUTT on top) @ 4,050' cemented :
10.5 PPC Calcium Chloridt @ 60°F Packer Fluid W/ D-303 inhibitor in 5-1/: Otis Packer Seal Assembly
Straight slot locator x 7-518" annulus ,, Seal Extension R 6 R Seals (3) op of cement in 7-518" Mule Shpe x 9-518'' annulus at
Head with lugs 0.66' 14,496. Seal bore extension 15.71' 14,512. 9-518" (8 Jts 47 PPP Ratch latch with seal 2.30' 14 , 5 15. P-110 BUTT on bottom 6 Otis WBR packer for 1-5/8" 225 Jts 47 ppf N-80
BUTT on top) @ 10,230' cemented to 6,400' . 39 ppf csg. 6.39" OD x
4" ID 3.88' long from 14,514.12' to 14,
Cement Q 15,351' on top of Pengo bridge plug @ 15i.385'
OT PBR @ 14,556'. . : NOTE: Straight slot locator set down on the seal bore extension head with 34,0001 weight. 5-1/2" is in compression.
*All tubing and associated equipment measurements . are from rotary table elevation 35.95" above the 13-318'' casing flange.
Bottom of
'
Sand "5" perforated 4 shots per foot: PBTD (top of s-i12*' float 15,387' - 15,414'
15,245' - 255' and 15,260' - 280'
collar) at 15,660'
5-Pl2" Liner, 30 Jts Sand "3" perforated 4 shots per foot:
25-51, PPf SO095 FL4S. 15,73[1' to 15,534' DTMIETERS
Tubing Hanger 5-112" 230 Tubing * S-ll2" 25.541 Liner **4.423" **4.298" 5.50" 6-112'' Holy to 15,740'
5-112" Liner Cplngs. 4.423" 4.298" 6.05" 5-112" Tubing Upsets 5.545" 4.42" 5.656" Otis Seal Assembly 4.00'' 4.00" 4.96" Fish neck on Otis Ratch Latch 4 00" " 4 81" !* All tubing is plastlc'coated $A$Otherefoie the ID
* and Drift are reduced by 118 (0.125 _inch from nominal)
I
449
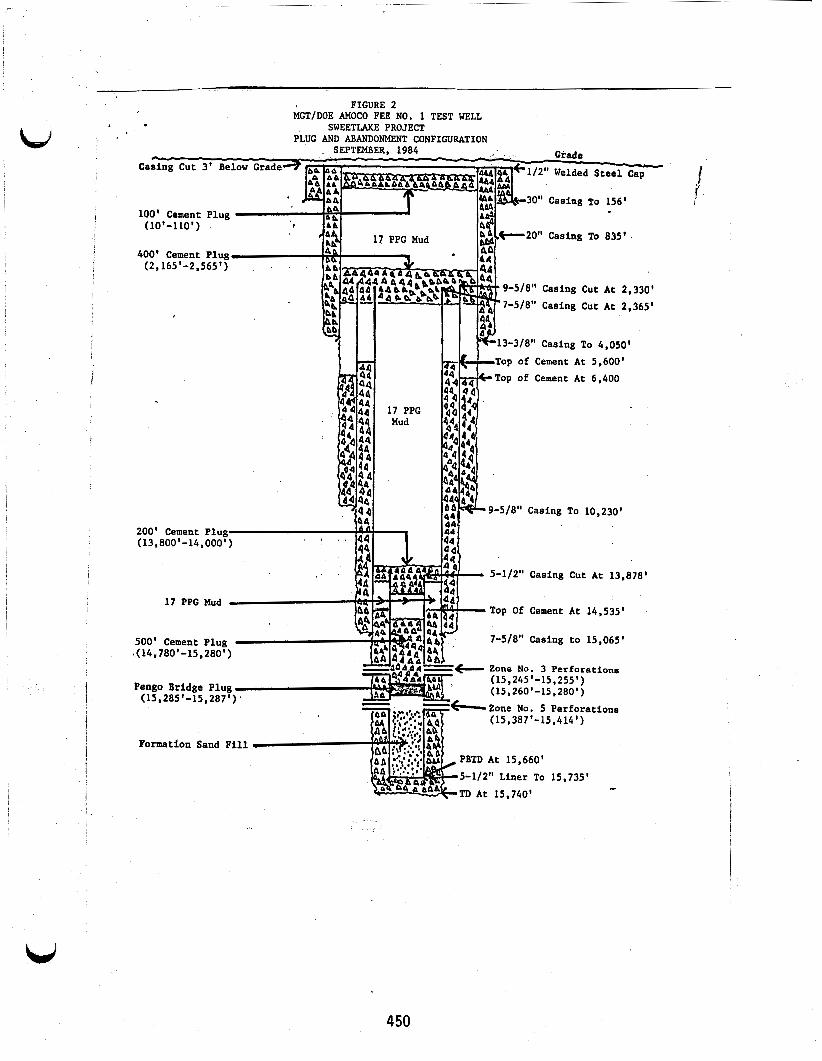
b,
i i I
FIGURE 2 MGTIDOE AMOCO FEE NO. 1 TEST WELL
PLUG AND ABANDONMENT CONFIGURATION , SWEETLAKE PROJECT
30" Casing TO 156'
20" Casing To 835'
9-518" Casing Cut At 2,330 7-518" Casing Cut At 2,365
13-318" Casing TO 4,050'
p of Cement At 5,600'
p of Cement At 6,400
5/8" Casing To 10,230'
200' Cement Plug (13,800' -14.000' )
5-112" Casing Cut At 13,878'
Top Of Cement At 14,535'
7-5/8" Casing to 15.065, 500' Cement Plug J ( 1 4 , 7aoi-15, 280'
Zone No. 3 Perforations (15 ,245 ' -15 ,255 ' )
Pengo Bridge Plug (15 ,260 ' -15 ,280 ' ) (15,285' -15,287'
(15,387 '-15.414 1
Formation Sand Fill PBTD At 15,660'
5-112" Liner To 15,735'
U
450

. * -. MAGMA GULF-TECHNADRIL
430 Highway 6 South-Suite 208 Houston. Tcxas 77079
Telephone: ( 7 13) 870- I480 '
March 20, 1985
M r . James H. Welsh Direc tor of I n j e c t i o n And Mining- Office o f Conservation Louisiana Department of Natural Resources P.O. Box 44725 Baton Rouge, LA 70804-4275
%SUBJECT: - PLUG AND ABANDONMENT REPORTS - MG-T/DOE AMOCO FEE SWDFJ NO. 1 (SERIAL NO. 970720) - SWEETLAKE PROJECT
Dear Mr. Welsh:
.
T h i s i s f u r t h e r t o our l e t te r of June 27, 1984 wherein w e requested, and received on J u l y 7, a permit t o p l u g and abandon t h e s u b j e c t salt w a t e r d i s p o s a l w e l l . This w e l l w a s a s s o c i a t e d with a DOE research geopressured-geothermal b r i n e tes t w e l l (MG-T/DOE Amoco Fee No. 1) . Plug- and abandonment procedures began on September 18, 1984 u s i n g W.L. E s t i s R i g No. 20, and w e r e completed on September 23, 1984.
It w a s necessary t o modify t h e P & A plan submitted to, a n d - . rapproved by, -your O f f i c e because of col lapsed and/or s t u c k c a s i n g that w a s encountered. W e received verbal approval of ou r modified P & A p lans from M r . F r i t z Spencer of your O f f i c e on September 18, 1984.
The sub jec t sa l t water d i s p o s a l w e l l is shown as it w a s recompleted on A p r i l 6, 1982 i n F igure 1, and -in i t s f i n a l P l u g and Abandonment conf igu ra t ion in Figure 2. P lug and Abandon and Well History and Work Resume Reports are a l s o a t t ached .
A t o t a l o f 1.06 m i l l i o n barrels of 9.2 ppg b r i n e f r o m t€ie assoc ia ted t e s t w e l l were i n j e c t e d i n t o t h e 7,000-7,320 f o o t i n t e r v a l i n t h i s w e l l i n 1981-82. A f t e r recompletion of t h e s a l t water w e l l i n 1982, some 349,000 b a r r e l s of b r i n e w e r e i n j e c t e d i n t o t h e 3,976-4,425 f o o t i n t e r v a l i n 1983-84. Thus, a t o t a l of about 1.4 m i l l i o n b a r r e l s of b r i n e were i n j e c t e d i n t o t h e
. - -
.. d i sposa l . w e l l .
451
. . -- . . .- .. . ~ , .. . .
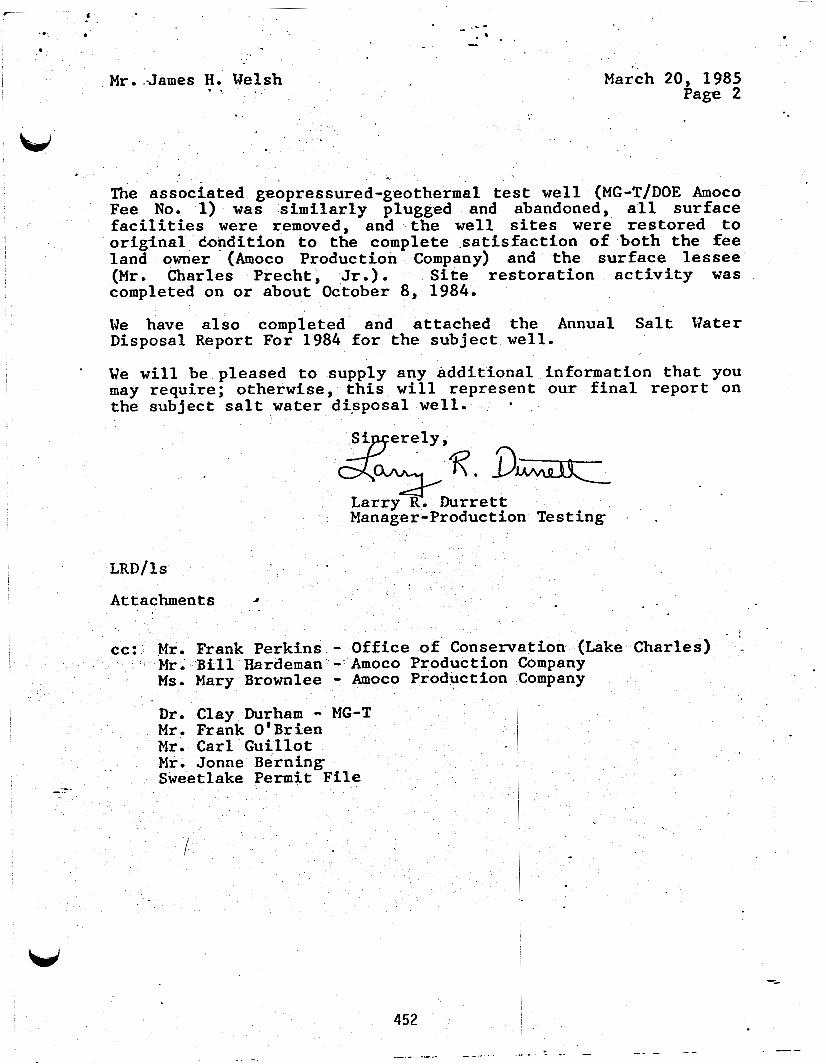
~~
7- <
b .\. - . . ..
1 ' . , - . . .
. M r . .-James H. Welsh March 20, 1985 ' *. Page 2
w. The associated geopressured-geothermal test w e l l (MG-T/DOE Amoco Fee No. 1) w a s s imi l a r ly plugged and abandoned, a l l surface f a c i l i t i e s were removed, and the w e l l s i tes were restored t o or ig ina l dondition t o the complete . sa t i s fac t ion of both the fee land owner '(Amoco Production Company) and the surface lessee (Mr. Charles Precht, Jr.). S i t e r e s to ra t ion a c t i v i t y was completed on o r about October 8 , 1984.
We have a l s o completed and attached the Annual S a l t Water Disposal Report For 1984 f o r the subject w e l l .
We w i l l be pleased t o supply any addi t ional information t h a t you may require; otherwise, t h i s w i l l represent our f i n a l report on the subject s a l t w a t e r d isposal w e l l .
*
Manager-Production T e s t i n g
L R D / ~ S
Attachments .4
. . M r . Frank Perkins - O f f 1 of Consemation (Lake Charles) . M r . B i l l Hardeman = Amoco Production Company Ms. Mary Brownlee - Amoco Production Zompany
w 452

STAT E
OFFICE
OF LOUISIANA
OF CONSERVATION
PLUG AND ABANDON REPORT -- - WORK PERMIT ~o.!!zc-84-514
WELL SERIAL NO. 970720 DATE WORK FINISHED (MM-DD-YY) 9/23/84
Injection and Mining Division (Three Copies to be F i l ed w i th the D is t r i c t Office)
NOTE: This Report W i l l Be Returned If Not Properly Completed And Signed.
Field Sweetlake North Parish Cameron S e c . x T w p . 12s Rge. 8w
Operolor
Total Depth 7 * 4 3 6 ’ Condition of Wel l Dead
CODI
l W e l l Name MG-T/DoE AmOcO Fee ‘well No.- 1 Magma Gulf-Technadril
Mud Record: Weight 9 * 0 ppg v i s c o s i t y 45 cs
, ~ ~ ~ ~ ~ k ~ ; This brine injection well was associated with a DOE research
geopressured-geothermal test well, MG-TIDOE h o c 0 Fee No.’l. T h i s work was done according to the Rules and Regulatlons o f the Off ice o f Conservation.
Magma Gulf-Technadril WITNESS OPERATOR
(S igned) Larry R. Durrett
453
T-
I

* . .
- . * - ' .FIGURE e . 1 .
. . MC-T/DOE M C O FEE SWDW NQ. 1
' SALT WATER DISPOSAL ELL . RECOMPLHION - APRIL 6, 1982
.? f 20' C0:IDUCTOR @ f 93'
c . 13 5/8" CSC SHOE @ f 1375*
10.1 lb/gal BRINE . . I
7' COWJLETION STRING (23#/ft . I.D. 6.366" d r i f t 6.241") TOC @ 3: 1970'
8
.. . . 6",BONDED SEAL ASSY (6" 0.0. X 4.875' LO.) .. . .. _. - 5 .
-BAKER MODEL F PACKER 18.438 n.n. 6.00 I.D.)SeC @ f 2016' Length 2-42
-- . - . .
-ll* CEMENT TOP Q .* 4516'
RL'McCul louah MODEL 5 DRILLA~LE BRIDGE PLUG SET 3 2 4527'
-, OLD r BAKER XODEL F PACKER @ i
f: B243.W' (8 .43 0.0. x 6.0 1.r
-- TOP Of 1 s t :*!ODiL F ?KY.E2 3: 7327 YBTD : 7150' 9 5/8" CSG SHOE 3 : 7436' -I
r - - #54
.-

FIGURE 2 MG;k/bOE AMOCO FEE SWDW NO. 1
SALT WATER DISPOSAL WELL SWEETLAKE PROJECT
PLUG AND ABANDONMENT CONFIGURATION SEPTEMBER 1984
. . I
. 455
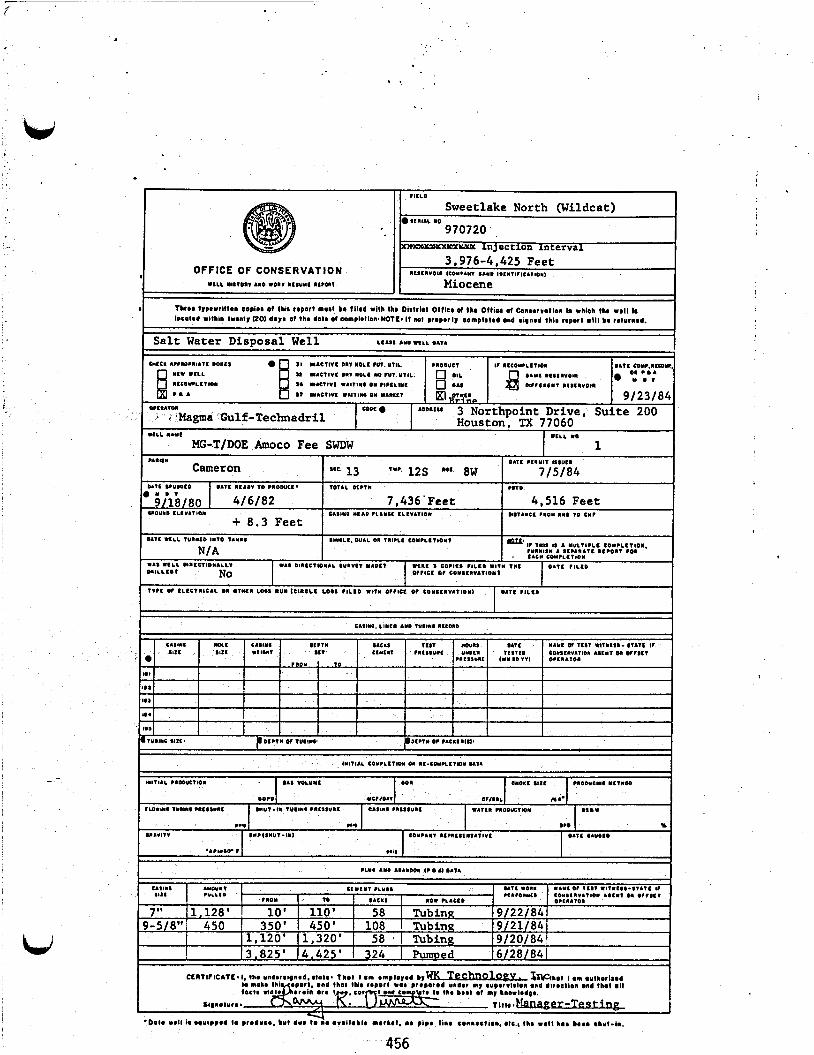
f I I flELD 1 Sweetlake North (Wildcat)
970720 SEnIAL 10
-= Injection Interval - OFFICE OF CONSERVATION
1nODUCl 1 1
U 1s W U T I V I WAIT111 OM P l P I L I I E
ST I I A C I I V E W A 1 1 1 1 OM MARME1
*ACl IVC o w MOLE PUl. YlIL
U A C T I V E OM1 IIOLI *o PUT YTIL 8 :i I CMECI A I P I O P ~ O A T E I D I E S
.I. WELL 8 atcommtvmm [XI 1 . A
If nECOMPLI l IO1 D A W COMP,nEoDV
SAME niscnvoin O : Y : a DIPP11EmT 1)ESE1VO11
9/23/84
3.976-4.425 Feet l;ESElVOln ICDMPAIT S A 1 0 lO l IT lP lCA1101) II
WELL MAME
MG-T/DOE Amoco Fee SWDW WELL ma
1 HnUW
Cameron DATE IPUDDV.0 OAT1 n f A D 1 10 PIODUCE.
4/6/82 + 8.3 Feet
@ M D V
9tiat8o #MOUND I L E V A T I O l
!
1111 P t l M l T USUEO
13 lW' 12s HE 8W 7/5/84 l O T I L DEPTII P I 1 0
7,436'Feet 4,516 Feet CASIIO * E A 0 fLAmSE E L E V A T I O I DlSlAllCE P l O Y I m I TO CBP
i
!
,
-- 456

ANNUAL SALTWATER DISPOSAL WELL moru M R CALENDAR YEAR 1984
LOVISIANA OFFICE OF CONSERVATION INJECTION AND MINING DIVISION
mPLE"E "HIS REPORT FOR W H CLASS I1 SALWATER DISPOSAL WELL YOU OPERATE, INCLUDING ANNULAR DISPOSAL IN PROWCING WELLS. (NOTE: SEE INSTRUCPIONS ON BACK)
M a m a Gulf-Technadril 3 Northpoint Drive - Suite 200 Houston, TX 77060
MG-T/DOE Amoco Fee SWDW No. 1
46
I I
-7
Canpleted by Larry R. Durrett 713/ 999 -6464 (phone)
3120185
(type or print)
(signature) ae,, , R. 0 - x - (date)
n
Form UIC-10 (11/84) 457 (Replaces Form SWD-1R-2)