UNIT I GRAPHICAL SYSTEM DESIGN ... - WordPress.com
17
Prepared By: U.Rajkanna, AP/EIE Page 1 UNIT I GRAPHICAL SYSTEM DESIGN Graphical System Design Model – Virtual Instrumentation – Virtual Instrument and Traditional Instrument – Hardware and software in virtual instrumentation – Virtual instrumentation for test, control and Design – Conventional and Graphical programming INTRODUCTION: The term “scientific computing,” or “computational science”, has been used for many years to define the use of computers (software and hardware) for solving problems related to science and engineering, usually involving experimental or applied research, modeling, and simulation. In a simplistic definition, it refers to the use of computers in solving scientific problems. Scientific computing applications usually follow a three-step process: o Data acquisition o Data analysis and o Data visualization/presentation. This three-step approach has been one of the pillars of the NI (National Instruments) virtual instrumentation model as shown in Figure 1.1 since its original conceptualization in the early 1980s, and has been expanded into a more comprehensive model known as graphical system design shown in Figure 1.2. Figure 1.1: Virtual Instrumentation Model Figure 1.2: Graphical System Design In this new model, the focus is to accelerate the research and development cycle,delivering mathematical models to embedded real-time computers faster and easier. This designflowacceleration is achieved by using NI LabVIEW software and its G programming language as acommon system-level design tool for all the different phases in the design-to-deployment flow.
-
Upload
khangminh22 -
Category
Documents
-
view
2 -
download
0
Transcript of UNIT I GRAPHICAL SYSTEM DESIGN ... - WordPress.com

Prepared By: U.Rajkanna, AP/EIE Page 1
UNIT I
GRAPHICAL SYSTEM DESIGN
Graphical System Design Model – Virtual Instrumentation – Virtual Instrument and
Traditional Instrument – Hardware and software in virtual instrumentation – Virtual
instrumentation for test, control and Design – Conventional and Graphical programming
INTRODUCTION:
� The term “scientific computing,” or “computational science”, has been used for many
years to define the use of computers (software and hardware) for solving problems
related to science and engineering, usually involving experimental or applied research,
modeling, and simulation.
� In a simplistic definition, it refers to the use of computers in solving scientific problems.
� Scientific computing applications usually follow a three-step process:
o Data acquisition
o Data analysis and
o Data visualization/presentation.
� This three-step approach has been one of the pillars of the NI (National Instruments)
virtual instrumentation model as shown in Figure 1.1 since its original conceptualization
in the early 1980s, and has been expanded into a more comprehensive model known as
graphical system design shown in Figure 1.2.
Figure 1.1: Virtual Instrumentation Model
Figure 1.2: Graphical System Design
� In this new model, the focus is to accelerate the research and development
cycle,delivering mathematical models to embedded real-time computers faster and easier.
� This designflowacceleration is achieved by using NI LabVIEW software and its G
programming language as acommon system-level design tool for all the different phases
in the design-to-deployment flow.

Prepared By: U.Rajkanna, AP/EIE Page 2
GRAPHICAL SYSTEM DESIGN MODEL:
� In reality, the virtual instrumentation model is applied in each of the three phases of the
graphical system design model as shown in Figure 1.3, because data acquisition, analysis
and presentation functions are used in the design, prototyping and deployment phases.
Figure 1.3: Graphical system design and virtual instrumentation
� Design (Model)
o In the design phase as shown in Figure 1.4, the researcher develops a
mathematical model of the system, including sensors, actuators, plants and
controllers, and simulates them under a variety of initial conditions and
constraints.
o The researcher uses different numerical methods with the objective of validating
the performance of the model and optimizing it.
Figure 1.4:The design phase of the graphical system design model

Prepared By: U.Rajkanna, AP/EIE Page 3
o In this phase, researchers can acquire reference data from files or databases and
incorporateit into the model.
o A “virtual plant/process” is created, which can be used later for hardware-in-
theloop(HIL) tests.
o Results from the simulation process are saved for post-analysis and
visualizationand can be used to introduce changes into the model.
o This is usually a software-centric processwith a strong focus on numerical
methods/analysis and mathematics.
o However, for complex orcomputationally intensive models, high-performance
computing (HPC) using grid computers,standard computers with graphical
processing units (GPUs), and multicore based computers is akey factor.
o In those cases, the hardware has an important impact on the performance of the
modelsolution and simulation. Multicore-ready software tools are scarce, but
LabVIEW is multicoreaware.
o It provides the user with a powerful yet easy-to-use programming language that
can takeadvantage of multicore processors and parallel programming.
� Prototype (Lab)
o If experimental validation of the model is required, researchers develop and test a
prototype in the laboratory.
o Signal processing and analysis as well as visualization can be implemented online
while data is being measured and acquired, or while the process is being
controlled.
o The “virtual plant/process” defined in the previous phase can be used for HIL
tests.
o The experimental results obtained in this phase can be used to modify and
optimize the original model, which in turn may require additional experiments.
o Data captured can also be used for system identification and parameter estimation.
o Usually, this experimental (prototyping) phase is executed on standard PCs or
PXI computers, using PCI/PXI data acquisition devices or external measuring
devices connected to a PC via USB, Ethernet, GPIB, or serial ports.
o This process as shown in Figure 1.5 is usually more software/hardware-centric
because sensors, actuators, data acquisition devices, controllers, and the
controlled/analyzed plant itself are all key elements in the experimental setup.
o Real-time operating systems (RTOSs) can be used when deterministic
performance or higher reliability is required.
o Also, multicore-based computers can be used when higher computational
performance is needed. Field-programmable gate arrays (FPGAs), digital signal
processors (DSPs), and GPU processors can be used with the multicore main
CPU, allowing LabVIEW to execute critical computations in specialized
processors.

Prepared By: U.Rajkanna, AP/EIE Page 4
o For example, sets of 2D or 3D differential equations can be solved in real time, or
large sets of matrices can be processed at high speed and in real time using
parallel programming in multicore computers while sharing part of the signal
processing load with an FPGA or a GPU.
o Data is shared between the multicore processors and an FPGA via DMA first-in-
first-out memory buffers (FIFOs).
o Finally, technical data mining algorithms can be implemented by combining
LabVIEW with NI DIAdem, an excellent tool for managing, analyzing, and
reporting technical data collected during data acquisition and/or generated during
the modelling, simulation or analysis phases.
Figure 1.5:The prototyping phase of the graphical system design model.
� Deployment (Field)
o Finally, the model (controller, analyzer or both) is deployed in the field or lab
using either a PC(desktop, server or industrial) or PXI, or it can be downloaded to
a dedicated embedded controller such as CompactRIO, which usually operates in
stand-alone mode and in real-time (deterministic) mode as shown in Figure 1.6.
o When using the LabVIEW Real-Time Module, symmetric multiprocessing (SMP)
techniques can be easily applied.
o For large systems, with high-channel counts or involving modular instruments
such as scopes, digital multimeters (DMMs), RF vector signal analyzers, and
dynamic signal acquisition (DSA) devices, the PXI platform is more appropriate.
Prepared By: U.Rajkanna, AP/EIE Page 5
o The transition from the prototyping phase to the deployment phase can be very
fast and efficient because the same set of tools used for prototyping can, in most
cases, be applied to the final deployment of the system in the field
Figure 1.6:The deployment phase of the graphical system design model
o In many cases, the system is deployed as a headless system (no monitors or
interfaces to the user), executing the analysis/control algorithms in real time as a
dedicated device.
o If on-the-field graphical user interfaces (GUIs) or operator interfaces (OIs) are
needed, the LabVIEW Touch-Panel Module and industrial-grade monitors with
touch-sensitive screens can be used locally.
o Remotely, data can be shared and visualized via Ethernet with applications
developed using LabVIEW and the LabVIEWDatalogging and Supervisory
Control Module running on one or more PCs distributed in a network.
VIRTUAL INSTRUMENTATION:
� Virtual instrumentation combines mainstream commercial technologies, such as the PC,
with flexible software and a wide variety of measurement and control hardware.
� Engineers use virtual instrumentation to bring the power of flexible software and PC
technology to test, control and design applications making accurate analog and digital
measurements.
� Engineers and scientists can create user-defined systems that meet their exact application
needs.
Prepared By: U.Rajkanna, AP/EIE Page 6
� Industries with automated processes, such as chemical or manufacturing plants use virtual
instrumentation with the goal of improving system productivity, reliability, safety,
optimization and stability.
� Virtual instrumentation is computer software that a user would employ to develop a
computerized test and measurement system for controlling from a computer
desktop, an external measurement hardware device, and for displaying, test or
measurement data collected by the external device on instrument-like panels on a
computer screen.
� It extends to computerized systems for controlling processes based on data collected and
processed by a computerized instrumentation system.
� The front panel control function of the existing instrument is duplicated through the
computer interface.
� The application ranges from simple laboratory experiments to large automation
application.
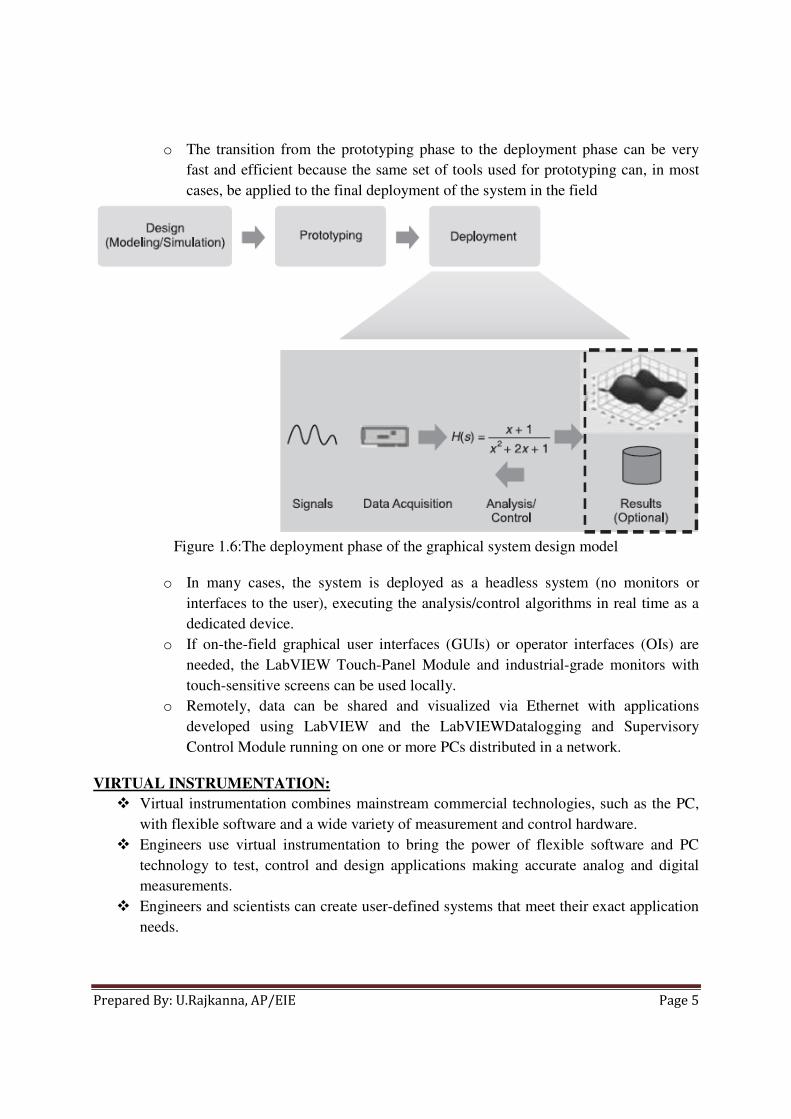
� Virtual instrumentation as shown in Figure 1.7 uses highly productive software, modular
I/O and commercial platforms.
� National Instruments LabVIEW, a premier virtual instrumentation graphical development
environment, uses symbolic or graphical representations to speed up development.
� The software symbolically represents functions.
� Consolidating functions within rapidly deployed graphical blocks further speeds up
development.
Figure 1.7:Virtual instrumentation combines productive software, modular I/O and scalable
platforms.

Prepared By: U.Rajkanna, AP/EIE Page 7
� Another virtual instrumentation component is modular I/O, designed to be rapidly
combined in any order or quantity to ensure that virtual instrumentation can both monitor
and control any development aspect.
� Using well-designed software drivers for modular I/O, engineers and scientists quickly
can access functions during concurrent operation.
� The third virtual instrumentation element using commercial platforms, often enhanced
with accurate synchronization, ensures that virtual instrumentation takes advantage of the
very latest computer capabilities and data transfer technologies.
� This element delivers virtual instrumentation on a long-term technology base that scales
with the high investments made in processors, buses and more.
� In summary, as innovation mandates use of software to accelerate a new concept and
product development, it also requires instrumentation to rapidly adapt to new
functionality.
� Because virtual instrumentation applies software, modular I/O and commercial platforms,
it delivers instrumentation capabilities uniquely qualified to keep pace with today’s
concept and product development
VIRTUAL INSTRUMENT AND TRADITIONAL INSTRUMENT:
� A traditional instrument is designed to collect data from an environment, or from a unit
under test, and to display information to a user based on the collected data.
� Such an instrument may employ a transducer to sense changes in a physical parameter
such as temperature or pressure, and to convert the sensed information into electrical
signals such as voltage or frequency variations.
� The term “instrument” may also cover a physical or software device that performs an
analysis on data acquired from another instrument and then outputs the processed data to
display or recording means.
� This second category of instruments includes oscilloscopes, spectrum analyzers and
digital millimeters.
� The types of source data collected and analyzed by instruments may thus vary widely,
including both physical parameters such as temperature, pressure, distance, light and
sound frequencies and amplitudes, and also electrical parameters including voltage,
current and frequency
� A virtual instrument (VI) is defined as an industry-standard computer equipped with
userfriendly application software, cost-effective hardware and driver software that
together perform the functions of traditional instruments.
� Simulated physical instruments are called virtual instruments (VIs).
� Virtual instrumentation software based on user requirements defines general-purpose
measurement and control hardware functionality.
� With virtual instrumentation, engineers and scientists reduce development time, design
higher quality products, and lower their design costs.

Prepared By: U.Rajkanna, AP/EIE Page 8
� In test, measurement and control, engineers have used virtual instrumentation to
downsize automated test equipment (ATE) while experiencing up to a several times
increase in productivity gains at a fraction of the cost of traditional instrument solutions.
� Virtual instrumentation is necessary because it is flexible.
� It delivers instrumentation with the rapid adaptability required for today’s concept,
product and process design, development and delivery.
� Only with virtual instrumentation, engineers and scientists can create the user-defined
instruments required to keep up with the world’s demands.
� To meet the ever-increasing demand to innovate and deliver ideas and products faster,
scientists and engineers are turning to advanced electronics, processors and software.
� Consider modern cell phones. Most of them contain the latest features of the last
generation, including audio, a phone book and text messaging capabilities.
� New versions include a camera, MP3 player, and Bluetooth networking and Internet
browsing.
� Virtual instruments are defined by the user while traditional instruments have fixed
vendor-defined functionality.
� In a conventional instrument, the set of components that comprise the instrument is fixed
and permanently associated with each other.
� Nevertheless, there is some software that understands these associations.
� Thus the primary difference between a virtual instrument and a conventional instrument
is merely that the associations within a virtual instrument are not fixed but rather
managed by software.
� Every virtual instrument consists of two parts—software and hardware.
� A virtual instrument typically has a sticker price comparable to and many times less than
a similar traditional instrument for the current measurement task.
� However, the savings compound over time, because virtual instruments are much more
flexible when changing measurement tasks.
� By not using vendor defined, prepackaged software and hardware, engineers and
scientists get maximum user-defined flexibility.
� A traditional instrument provides them with all software and measurement circuitry
packaged into a product with a finite list of fixed-functionality using the instrument front
panel.
� A virtual instrument provides all the software and hardware needed to accomplish the
measurement or control task.
� In addition, with a virtual instrument, engineers and scientists can customize the
acquisition, analysis, storage, sharing and presentation functionality using productive,
powerful software.
� Without the displays, knobs and switches of conventional, external box-based
instrumentation products, a virtual instrument uses a personal computer for all user
interaction and control.

Prepared By: U.Rajkanna, AP/EIE Page 9
� In many common measurement applications, a data acquisition board or card, with a
personal computer and software, can be used to create an instrument.
� In fact, a multiple-purpose virtual instrument can be made by using a single data
acquisition board or card.
� The primary benefits of apply data acquisition technology to configure virtual
instrumentation include costs, size, and flexibility and ease of programming.
� The cost to configure a virtual instrumentation-based system using a data acquisition
board or cards can be as little as 25% of the cost of a conventional instrument.
� Traditional instruments and software-based virtual instruments largely share the same
architectural components, but radically different philosophies as shown in Figure 1.8.
� Conventional instruments as compared to a virtual instrumentation can be very large and
cumbersome.
� They also require a lot of power, and often have excessive amounts of features that are
rarely, if ever used.
� Most conventional instruments do not have any computational power as compared to a
virtual instrument.
� Since the virtual instrument is part of a person computer configuration, the personal
computer’s computational as well as controlling capability can be applied into a test
configuration.
� Virtual instruments are compatible with traditional instruments almost without exception.
� Virtual instrumentation software typically provides libraries for interfacing with common
ordinary instrument buses such as GPIB, serial or Ethernet.
Figure 1.8: Traditional instruments (left) and software based virtual instruments (right).

Prepared By: U.Rajkanna, AP/EIE Page 10
� Except for the specialized components and circuitry found in traditional instruments, the
general architecture of stand-alone instruments is very similar to that of a PC-based
virtual instrument.
� Both require one or more microprocessors, communication ports (for example, serial and
GPIB), and display capabilities, as well as data acquisition modules.
� What makes one different from the other is their flexibility and the fact that we can
modify and adapt the instrument to our particular needs.
� A traditional instrument might contain an integrated circuit to perform a particular set of
data processing functions; in a virtual instrument, these functions would be performed by
software running on the PC processor.
� We can extend the set of functions easily, limited only by the power of the software used.
� By employing virtual instrumentation solutions, we can lower capital costs, system
development costs, and system maintenance costs, while improving time to market and
the quality of our own products.
� There is a wide variety of hardware devices available which we can either plug into the
computer or access through a network.
� These devices offer a wide range of data acquisition capabilities at a significantly lower
cost than that of dedicated devices.
� As integrated circuit technology advances, and off-the-shelf components become cheaper
and more powerful, so do the boards that use them.
� With these advances in technology, comes an increase in data acquisition rates,
measurement accuracy, precision and better signal isolation.
� Depending on the particular application, the hardware we choose might include analog
input or output, digital input or output, counters, timers, filters, simultaneous sampling,
and waveform generation capabilities.
� Virtual instrumentation has achieved mainstream adoption by providing a new model for
building measurement and automation systems.
� Keys to its success include rapid PC advancement; explosive low-cost, high-performance
data converter (semiconductor) development; and system design software emergence.
� These factors make virtual instrumentation systems accessible to a very broad base of
users.
� Virtual instruments take advantage of PC performance increase by analyzing
measurements and solving new application challenges with each new-generation PC
processor, hard drive, display and I/O bus.
� These rapid advancements combined with the general trend that technical and computer
literacy starts early in school, contribute to successful computer-based virtual
instrumentation adoption.
� The virtual instrumentation driver is the proliferation of high-performance, low-cost
analog-to-digital (ADC) and digital-to-analog (DAC) converters.

Prepared By: U.Rajkanna, AP/EIE Page 11
� Applications such as wireless communication and high-definition video impact these
technologies relentlessly.
� Virtual instrumentation hardware uses widely available semiconductors to deliver high-
performancemeasurement front ends.
� Finally, system design software that provides an intuitive interface fordesigning custom
instrumentation systems furthers virtual instrumentation.
� Various interfacestandards are used to connect external devices to the computer. PC is the
dominant computersystem in the world today.
� VI is supported on the PC under Windows, Linux, Macintosh, Sun, andHP operating
systems.
� All VI platforms provide powerful Graphical User Interfaces (GUIs) fordevelopment and
implementation of the solutions
HARDWARE AND SOFTWARE IN VIRTUAL INSTRUMENTATION:
� Role of Hardware in Virtual Instrumentation
o Input/output plays a critical role in virtual instrumentation.
o To accelerate test, control and design, I/O hardware must be rapidly adaptable to
new concepts and products.
o Virtual instrumentation delivers this capability in the form of modularity within
scalable hardware platforms.
o Virtual instrumentation is software-based; if we can digitize it, we can measure it.
o Standard hardware platforms that house the I/O are important to I/O modularity.
o Laptops and desktop computers provide an excellent platform where virtual
instrumentation can make the most of existing standards such as the USB, PCI,
Ethernet, and PCMCIA buses
� Role of Software in Virtual Instrumentation
o Software is the most important component of a virtual instrument.
o With the right software tool, engineers and scientists can efficiently create their
own applications by designing and integrating the routines that a particular
process requires.
o You can also create an appropriate user interface that best suits the purpose of the
application and those who will interact with it.
o You can define how and when the application acquires data from the device, how
it processes, manipulates and stores the data, and how the results are presented to
the user.
o With powerful software, we can build intelligence and decision-making
capabilities into the instrument so that it adapts when measured signals change
inadvertently or when more or less processing power is required.
o An important advantage that software provides is modularity.
o When dealing with a large project, engineers and scientists generally approach the
task by breaking it down into functional solvable units.

Prepared By: U.Rajkanna, AP/EIE Page 12
o These subtasks are more manageable and easier to test, given the reduced
dependencies that might cause unexpected behaviour.
o We can design a virtual instrument to solve each of these subtasks, and then join
them into a complete system to solve the larger task.
o The ease with which we can accomplish this division of tasks depends greatly on
the underlying architecture of the software.
o A virtual instrument is not limited or confined to a stand-alone PC.
o In fact, with recent developments in networking technologies and the Internet, it is
more common for instruments to use the power of connectivity for the purpose of
task sharing.
o Typical examples include supercomputers, distributed monitoring and control
devices, as well as data or result visualization from multiple locations.
o Every virtual instrument is built upon flexible, powerful software by an
innovative engineer or scientist applying domain expertise to customize the
measurement and control application.
o The result is a user-defined instrument specific to the application needs.
o Virtual instrumentation software can be divided into several different layers like
the application software, test and data management software, measurement and
control services software as shown in Figure 1.9.
o Most people think immediately of the application software layer.
o This is the primary development environment for building an application.
o It includes software such as LabVIEW, LabWindows/CVI (ANSI C),
Measurement Studio (Visual Studio programming languages), Signal Express and
VI Logger.
o Above the application software layer is the test executive and data management
software layer.
o This layer of software incorporates all of the functionality developedby the
application layer and provides system-wide data management.
o Measurement and controlservices software is equivalent to the I/O driver software
layer.

Prepared By: U.Rajkanna, AP/EIE Page 13
Figure 1.9: Layers of virtual instrumentation software
� It is one of the most crucial elements of rapid application development.
� This software connects the virtual instrumentation software and the hardware for
measurement and control.
� It includes intuitive application programming interfaces, instrument drivers,
configuration tools, I/O assistants and other software included with the purchase of
hardware.
� This software offers optimized integration with both hardware and application
development environments.
VIRTUAL INSTRUMENTATION FOR TEST, CONTROL AND DESIGN:
� Virtual instrumentation has been widely adopted in test and measurement areas.
� It has gradually increased addressable applications through continuous innovation and
hundreds of measurement hardware devices.
� The benefits that have accelerated test development are beginning to accelerate control
and design.
� Virtual Instrumentation for Test
o Test has been a long-proven field for virtual instrumentation.
o As the pace of innovation has increased, so too has the pressure to get new,
differentiated products to market quickly.
o Consumer expectations continue to increase; in electronics markets, for example,
disparate function integration is required in a small space and at a low cost.
o All of these conditions drive new validation, verification and manufacturing test
needs.

Prepared By: U.Rajkanna, AP/EIE Page 14
o A test platform that can keep pace with this innovation is not optional; it is
essential.
o The platform must include rapid test development tools adaptable enough to be
used throughout the product development flow.
o The need to get products to market quickly and manufacture them efficiently
requires high-throughput test.
o To test the complex multifunctional products that consumers demand requires
precise, synchronized measurement capabilities.
o And as companies incorporate innovations to differentiate their products, test
systems must quickly adapt to test the new features.
o Virtual instrumentation is an innovative solution to these challenges.
o It combines rapid development software and modular, flexible hardware to create
user-defined test systems.
o Virtual instrumentation delivers as shown in Figure 1.10 user-defined instruments
and customizable hardware for test systems:
� Intuitive software tools for rapid test development
� Fast, precise modular I/O based on innovative commercial technologies
� A PC-based platform with integrated synchronization for high accuracy
and throughput
Figure 1.10: User-defined instruments and customizable hardware for test systems.
o Engineers and scientists have always been able to use virtual instrumentation
software to create highly integrated user-defined systems using modular I/O, but
they can now extend custom configurability to the hardware itself.

Prepared By: U.Rajkanna, AP/EIE Page 15
o This degree of user-configurability and transparency will change the way
engineers build test systems.
� Virtual Instrumentation for Industrial I/O and Control
o PCs and PLCs both play an important role in control and industrial applications.
PCs bring greater software flexibility and capability, while PLCs deliver
outstanding ruggedness and reliability.
o But as control needs become more complex, there is a recognized need to
accelerate the capabilities while retaining the ruggedness and reliabilities.
Independent industry experts have recognized the need for tools that can meet the
increasing need for more complex, dynamic, adaptive and algorithm-based
control.
o The Programmable Automation Controllers (PACs) provide multidomain
functionality (logic, motion, drives and process) and the concept of PAC supports
multiple I/O types.
o Logic, motion and other function integrations are a requirement for increasingly
complex control approaches. PACs deliver PC software flexibility with PLC
ruggedness and reliability.
o LabVIEW software and rugged, real-time, control hardware platforms are ideal
for creating a PAC.
� Virtual Instrumentation for Design
o The same design engineers that use a wide variety of software design tools must
use hardware to test prototypes.
o Commonly, there is no good interface between the design phase and
testing/validation phase, which means that the design usually must go through a
completion phase and enter a testing/validation phase.
o Issues discovered in the testing phase require a design-phase reiteration as shown
in Figure 1.11.
o The simulation test plays a critical role in the design and manufacture of today’s
electronic devices
Figure 1.11: Simulation test plays a critical role in the design and manufacture.

Prepared By: U.Rajkanna, AP/EIE Page 16
o In reality, the development process has two very distinct and separate stages—
design andtest—which are two individual entities.
o On the design side, Electronic Design Automation (EDA)tool vendors undergo
tremendous pressure to interoperate from the increasing semiconductor designand
manufacturing group complexity requirements.
o Engineers and scientists are demanding thecapability to reuse designs from one
tool in other tools as products go from schematic design tosimulation to physical
layout.
o Similarly, test system development is evolving towards a modularapproach.
o The gap between these two worlds has traditionally been neglected, first
noticeable inthe new product prototype stage.
o Traditionally, this is the stage where the product designer uses benchtop
instruments to sanity-check the physical prototypes against their design for
correctness.
o The designer makes these measurements manually, probing circuits and looking
at the signals on instruments for problems or performance limitations.
o As designs iterate through this build-measuretweak- rebuild process, the designer
needs the same measurements again.
o In addition, these measurements can be complex—requiring frequency, amplitude
and temperature sweeps with data collected and analyzed throughout.
o Because these engineers focus on design tools, they are reluctant to invest in
learning to automate their testing.
o Systems with intrinsic-integration properties are easily extensible and adapt to
increasing product functionality.
o When new tests are required, engineers simply add new modules to the platform
to make the measurements.
o Virtual instrumentation software flexibility and virtual instrumentation hardware
modularity make virtual instruments a necessity to accelerate the development
cycle.
CONVENTIONAL (TEXT BASED) AND GRAPHICAL PROGRAMMING:
� Graphical programming is a visually-oriented approach to programming.
� Graphical programming is easier and more intuitive to use than traditional textual
programming.
� Textual programming requires the programmers to be reasonably proficient in the
programming language.
� Non-programmers can easily learn the graphical approach faster at less amount of time.
� The main advantage of textual languages like C is that they tend to have faster graphical
approach execution time and better performance than graphical programs.
� Textual programming environments are typically used in determining high throughput
virtual instrumentation systems, such as manufacturing test systems

Prepared By: U.Rajkanna, AP/EIE Page 17
� Textual programming environments are popular and many engineers are trained to use
these standardized tools.
� Graphical environments are better for nonprogrammers and useful for developing virtual
instruments quickly and need to be reconfigured rapidly.
� Virtual instrumentation is not limited to graphical programming but can be implemented
using a conventional programming language.
� In R & D design characterization or in a troubling shooting situation Microsoft Excel
(spreadsheet) or Microsoft Word (word processor) can be used.
� The most important task is to understand how to use standard analysis packages that can
directly input data from the instruments and can be used to analyze, store and present the
information in a useful format.
� Irrespective of whether it is classical or graphical environment any system with a
graphical system design can be looked at as being composed of two parts—the user
interface and the underlying code.
� The code in a conventional language like C comprises a number of routines while in the
graphical language G it is a collection of icons interconnected by multi-colored lines.
� Table 1.1 compares text-based programming and graphical programming.
TABLE 1.1Comparison of text-based and graphical programming
Text-based programming Graphical programming
Syntax must be known to do programming. Syntax is knowledge but is not required for
programming.
The execution of the program is from top to
bottom. The execution of program is from left to right.
To check for the error the program has to be
compiled or executed Errors are indicated as we wire the blocks.
Front panel design needs extra coding or needs
extra work. Front panel design is a part of programming.
Text-based programming is non interactive. Graphical programming is highly interactive.
This is text-based programming where the
programming is a conventional method. The programming is Data Flow Programming.
Logical Error finding is easy in large programs Logical Error finding in large programs is quiet
complicated.
Program flow is not visible. Data flow is visible.
It is test-based programming. It is icon-based programming and wiring.
Passing parameters to sub routine is difficult Passing parameters to sub VI is easy
REFERENCES:
� Jovitha Jerome, ‘Virtual Instrumentation using LabVIEW’ PHI Learning Private Limited,
New Delhi, Second Printing, 2011