UNIT – I –BIOTELEMETRY– SBM1401 - Sathyabama Institute ...
130
1 SCHOOL OF BIO AND CHEMICAL ENGINEERING DEPARTMENT OF BIOMEDICAL ENGINEERING UNIT – I –BIOTELEMETRY– SBM1401
-
Upload
khangminh22 -
Category
Documents
-
view
1 -
download
0
Transcript of UNIT – I –BIOTELEMETRY– SBM1401 - Sathyabama Institute ...
1
SCHOOL OF BIO AND CHEMICAL ENGINEERING
DEPARTMENT OF BIOMEDICAL ENGINEERING
UNIT – I –BIOTELEMETRY– SBM1401
2
1. INTRODUCTION TO BIOTELEMETRY
1.1 An Introduction to Telemetry
• Telemetry is defined as the sensing and measuring of information at some remote
location and then transmitting that information to a central or host location. There, it
can be monitored and used to control a process at the remote site.
• In industries for example, monitoring and control of the entire plant is now being
done from centralized control room; the launching and flight of a rocket are controlled
from the ground station; a satellite is monitored and data collected by its measurement
systems are received and decoded at a specific ground station.
• The measured data need be transmitted in some form over short to very long
distances-from ground-to-ground, ground-to orbital or even cosmic height and vice
versa so that the information do not lose any of its content while being transmitted.
• The sent coded signals are decoded at the receiving centres to be used for various
purposes
• The variables sensed or measured at sites are treated as signals which require to be
processed before being transmitted over a distance, using land link consisting of solid
(wire) or air (pneumatic) media, or radio frequency link (air or vacuum), and then
received at the receiving end for indication recording or simply display. This is called
telemetry system.
Remote sensing system
• The sensing and measurement is done from a remote place or distance, such as the
position of clouds or types of clouds or flying aircrafts measured by radar systems, or
measurement of pollution by LIDAR system etc
• The rapid developments in telemetry systems is used for large scale real-time
computation, and for monitoring and control of plants, processes, moving objects etc
• The data obtained in large quantities from transducers and signal processors are now
being easily handled by a computer-in the control room, for example, for storage and
processing and then it may be used for display or sent back with appropriate
instructions for control operation.
• For any system the data to be received by a computer need appropriate transmission
from the place of origin and the output from a computer, after due modification need
be transmitted to the appropriate location for further usage.
3
Data transmission involves digital data-coded
• Transducer outputs are generally termed as variables or measurands. When processed,
they are termed as signals. The signals are encoded into data for transmission. These
signals or data are transmitted over a distance, for which a 'link' is chosen, such as
wire, rf, microwave (air or vacuum), ultrasonic, laser beam, optical fibre etc.
• The measured parameters when ultimately received and displayed or use should be
accurate as per specification
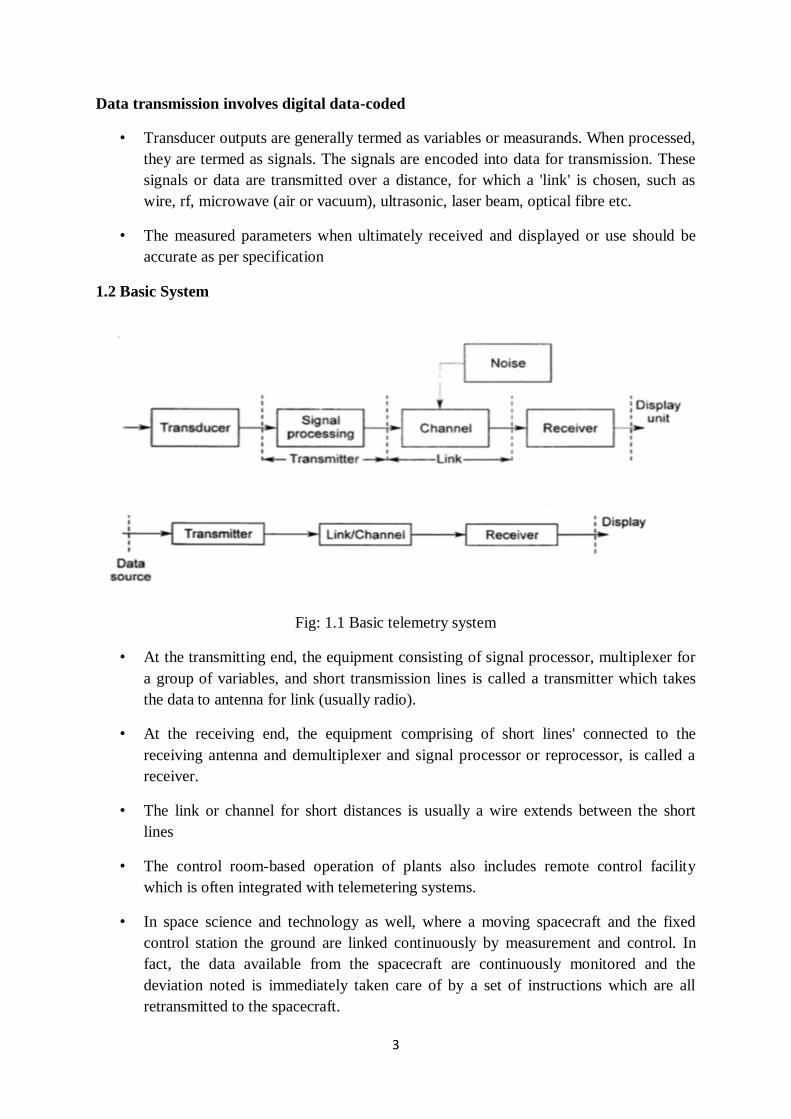
1.2 Basic System
Fig: 1.1 Basic telemetry system
• At the transmitting end, the equipment consisting of signal processor, multiplexer for
a group of variables, and short transmission lines is called a transmitter which takes
the data to antenna for link (usually radio).
• At the receiving end, the equipment comprising of short lines' connected to the
receiving antenna and demultiplexer and signal processor or reprocessor, is called a
receiver.
• The link or channel for short distances is usually a wire extends between the short
lines
• The control room-based operation of plants also includes remote control facility
which is often integrated with telemetering systems.
• In space science and technology as well, where a moving spacecraft and the fixed
control station the ground are linked continuously by measurement and control. In
fact, the data available from the spacecraft are continuously monitored and the
deviation noted is immediately taken care of by a set of instructions which are all
retransmitted to the spacecraft.
4
• These are applicable to terrestrial processes as well where remotely located plants and
objects may thus be monitored and controlled.
• The source provides sequence of digits and the transmitter assigns an electrical
waveform to each sequence of digits received by it.
• The waveform is transmitted through the channel link but usually gets corrupted by
unwanted random signals called noise.
• The receiver receives the corrupted waveform and determines which of the data
sequences might have error and consequently correct the same.
1.3 CLASSIFICATION
• The mode of telemetry system used is governed by the types of variables, their
number, and distance.
• The telemetry system for long medium distances can be broadly classified into
(i) analogue, and (ii) digital
• The transmission channel is a major factor to be considered its capacity to carry
information, power level, band width, signal-to-noise ratio and reliability are some of
the important aspects.
• Their power levels, signal conversion efficiency and noise immunity, size, weight
etc. are some of the aspects that deserve consideration in these equipment.
• Another classification can be on the basis of
(i) wired or (ii) wireless forms
• Wired is essentially for long distance service, the wireless is usually for short to
medium-distance operation.
• If the signal is not available in electrical Quantity, but in terms of air pressure
requiring to cover a shorter distance before display, pneumatic channels may be used.
• A terrestrial pneumatic channel or wired channel is often called landline.
• These telemetry systems involve direct transmission of data from source to the
receiving station through the above channels, ie, one source is connected to the
channel directly.
• In short distance wired telemetry systems, electrical quantities like voltage and current
are the transmitted variables, besides, non-electrical pneumatic variables.
• Position telemetry also involves electrical quantities but it is the position of a part of
an equipment/component, in relation to a process variable, that is metered at a
distance
5
• Short or medium distance analogue telemetry systems also transmit frequencies, other
than voltages or currents, the frequency being directly proportional the magnitude of
the variable to be transmitted.
• This system often utilizes the low-cost telephone/telegraph lines or teletype
communication channels which are available in commercial form.
• Pulse telemetering is usually employed in medium to long distance systems where the
process variables are converted, in the transmitter area, as electrical pulses following
certain coded patterns.
• The simplest of these are the pulses of equal time duration but of variable heights
proportional to the variable values concerned.
• During transmission, however they move as functions of time and advantage is that
the system is largely independent of the electrical variations of the transmission
channel. Besides these pulse amplitude (PA) types, other common forms of data
conversion are the pulse duration (PD) type, pulse position (PP) type, pulse count and
pulse code (PC) type.
• In wireless digital telemetry systems, coding is done in any of these desired formats
only after the variables are sampled at regular intervals of time. In majority of
telemetry systems involving coding formats, a number of variables are transmitted as
in data transmission system through radio link using the process of modulation and
multiplexing.
• Sometimes wireless/contactless telemetry becomes essential even for short distance
systems. If the sources of variables are in inaccessible places or are in hazardous areas
like radioactive zones, transmitters and receivers may not be placed long away but
still rf communication between them becomes necessary with specified frequency
bands.
• In space science technology, the launching pad of satellite or missiles are not far away
from control/receiving stations but monitoring and control is done using rf
communication with the transmitters at site and the receivers at control room.
• In hospitals, often a look after physician monitors patients using such a
communication system. Radio link for short distances are finding increasing use
because in many situations the erection commissioning costs of non-rf landlines are
more expensive and require more time than rf links.
• It is now almost a forgone conclusion at for data transmission separate landlines are
rarely used. Instead, telephone link and power lines are used, besides, rf link.
6
1.4 Introduction to Biotelemetry
• Biotelemetry or biomedical telemetry is the measurement of biological parameters
over distance, and transmitting the data from point of generation to the point of
reception.
• Radio telemetry is the process in which biological data is used to modulate a RF
carrier so as to be radiated by an electromagnetic field (radio transmission).
Physiological Parameters Adaptable To Biotelemetry
The biotelemetry measurements can be applied to two categories:
1. Bioelectrical variables such as ECG, EMG and EEG. Here the signal is
obtained directly in electrical form.
2. Physiological variables that require transducers such as blood pressure,
gastrointestinal pressure, blood flow and temperatures. It requires excitation because
the physiological parameters are measured as variations of resistance, inductance or
capacitance.
Biosignals that can be telemetered:
a. ECG telemetry:
• The most widespread use of biotelemetry for bioelectric potentials is in the
transmission of ECG. Instrumentation at the transmitting end is simple because only
electrodes and amplification are needed.
Examples ECG telemetry:
1. Transmission of ECGs from an ambulance or site of emergency to a hospital. A
cardiologist in the hospital, immediately interprets the ECG, instructs emergency
resuscitation procedures to the trained rescue team and arranges for any special
treatment that is necessary on arrival of the patient at the hospital. The telemetry is
also supplemented by two-way voice communication.
2. For exercise ECGs in the hospitals so that the patient can run up and down steps,
unencumbered by wires.
3. The individuals with heart problems can wear ECG telemetry units always and
relay ECG data periodically to the hospital for checking.
b. EEG telemetry:
The applications are
1. EEG electrodes are implanted in the brain of the chimpanzees in the Space biology
program in the Brain research institute at the University of California, Los Angeles. A
7
small transmitter installed on the animal’s head, transmits the EEG. Some times
instead of this, special helmets with surface electrodes are used.
2. Special helmets with surface electrodes are also used for collection of EEGs of
football players during the game.
3. For study of mentally disturbed children. The child wears specially designed
“football helmet” or “spaceman’s helmet” with built-in electrodes so that the EEG can
be monitored without traumatic difficulties during play.
c. EMG telemetry:
• The third type of bioelectrical signal that can be telemetered is the electromyogram
(EMG). It is used for studies of muscle damage and partial paralysis problems and
human performance studies.
Physiological variables that can be measured using telemetry:
The transducer circuit is designed as a separate “plug-in” module to fit into the
transmitter so that one transmitter is used for different measurements.
a. Skin or systemic body temperature by rectal or oral thermistor
b. Respiration by impedance pneumograph
c. Indirect blood pressure by contact microphone and cuff.
d. Measurement of blood pressure and heart rate research in anaesthetized
animals. The transducers are surgically implanted with leads brought out through the
animal’s skin. A male plug attached to the leads, is connected to the female socket
contained in the transmitter unit.
e. Blood flow measurement using Doppler-type and electromagnetic type
transducers.
f. Monitoring of vaginal temperature for long-term studies of natural birth
control in obstetrics and gynecology
g. Use of radiopills for monitoring stomach pressure or pH.
1.5 Non-Electrical Telemetry Systems
The non-electrical category two types
(i) Mechanical type, and (ii) Pneumatic type
8
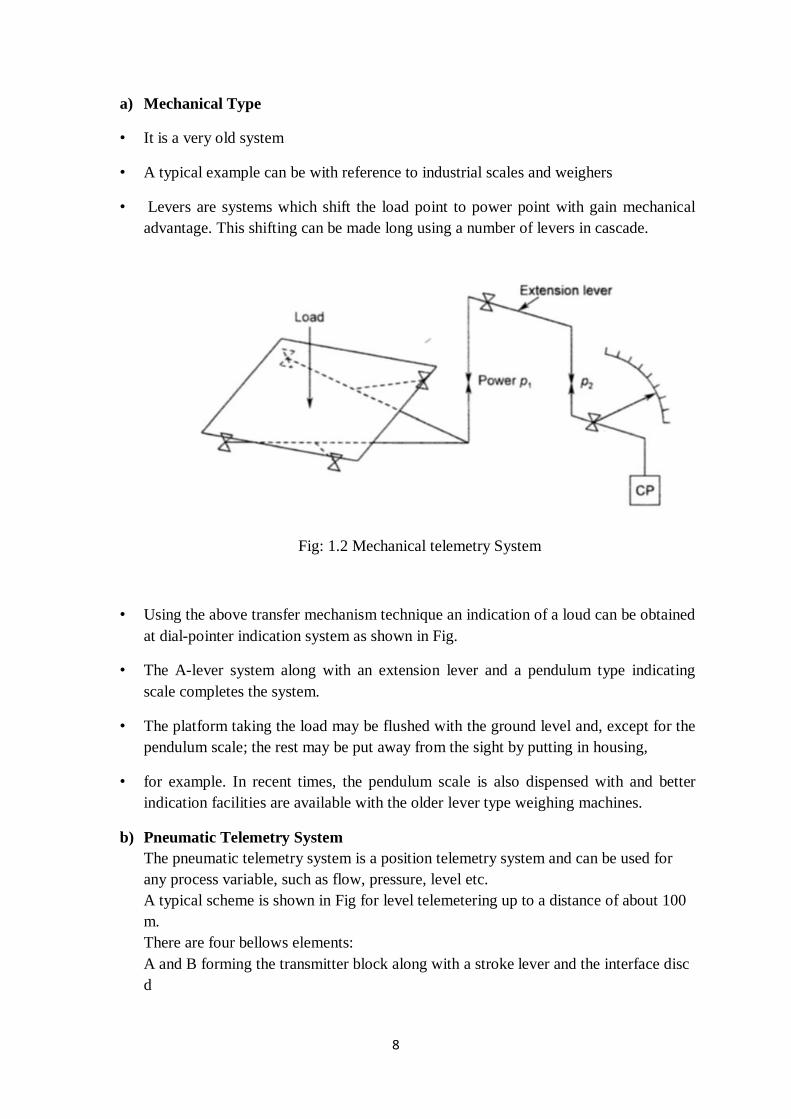
a) Mechanical Type
• It is a very old system
• A typical example can be with reference to industrial scales and weighers
• Levers are systems which shift the load point to power point with gain mechanical
advantage. This shifting can be made long using a number of levers in cascade.
Fig: 1.2 Mechanical telemetry System
• Using the above transfer mechanism technique an indication of a loud can be obtained
at dial-pointer indication system as shown in Fig.
• The A-lever system along with an extension lever and a pendulum type indicating
scale completes the system.
• The platform taking the load may be flushed with the ground level and, except for the
pendulum scale; the rest may be put away from the sight by putting in housing,
• for example. In recent times, the pendulum scale is also dispensed with and better
indication facilities are available with the older lever type weighing machines.
b) Pneumatic Telemetry System
The pneumatic telemetry system is a position telemetry system and can be used for
any process variable, such as flow, pressure, level etc.
A typical scheme is shown in Fig for level telemetering up to a distance of about 100
m.
There are four bellows elements:
A and B forming the transmitter block along with a stroke lever and the interface disc
d
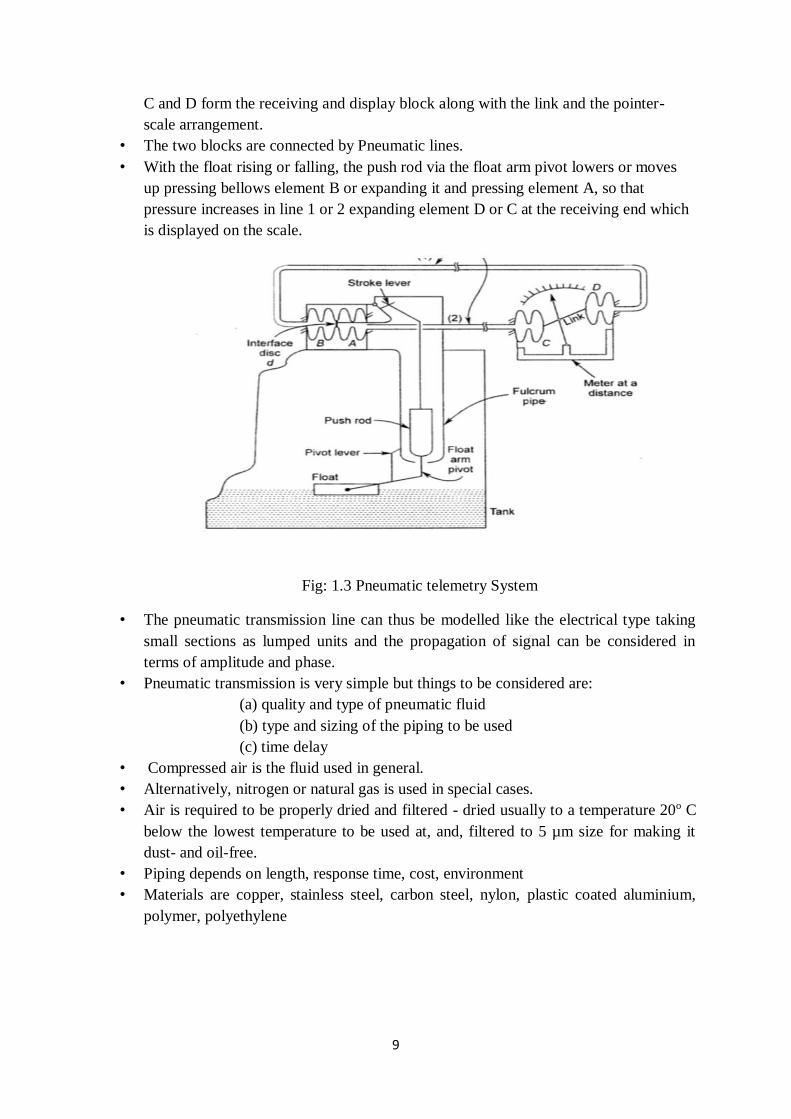
9
C and D form the receiving and display block along with the link and the pointer-
scale arrangement.
• The two blocks are connected by Pneumatic lines.
• With the float rising or falling, the push rod via the float arm pivot lowers or moves
up pressing bellows element B or expanding it and pressing element A, so that
pressure increases in line 1 or 2 expanding element D or C at the receiving end which
is displayed on the scale.
Fig: 1.3 Pneumatic telemetry System
• The pneumatic transmission line can thus be modelled like the electrical type taking
small sections as lumped units and the propagation of signal can be considered in
terms of amplitude and phase.
• Pneumatic transmission is very simple but things to be considered are:
(a) quality and type of pneumatic fluid
(b) type and sizing of the piping to be used
(c) time delay
• Compressed air is the fluid used in general.
• Alternatively, nitrogen or natural gas is used in special cases.
• Air is required to be properly dried and filtered - dried usually to a temperature 20o C
below the lowest temperature to be used at, and, filtered to 5 µm size for making it
dust- and oil-free.
• Piping depends on length, response time, cost, environment
• Materials are copper, stainless steel, carbon steel, nylon, plastic coated aluminium,
polymer, polyethylene
10
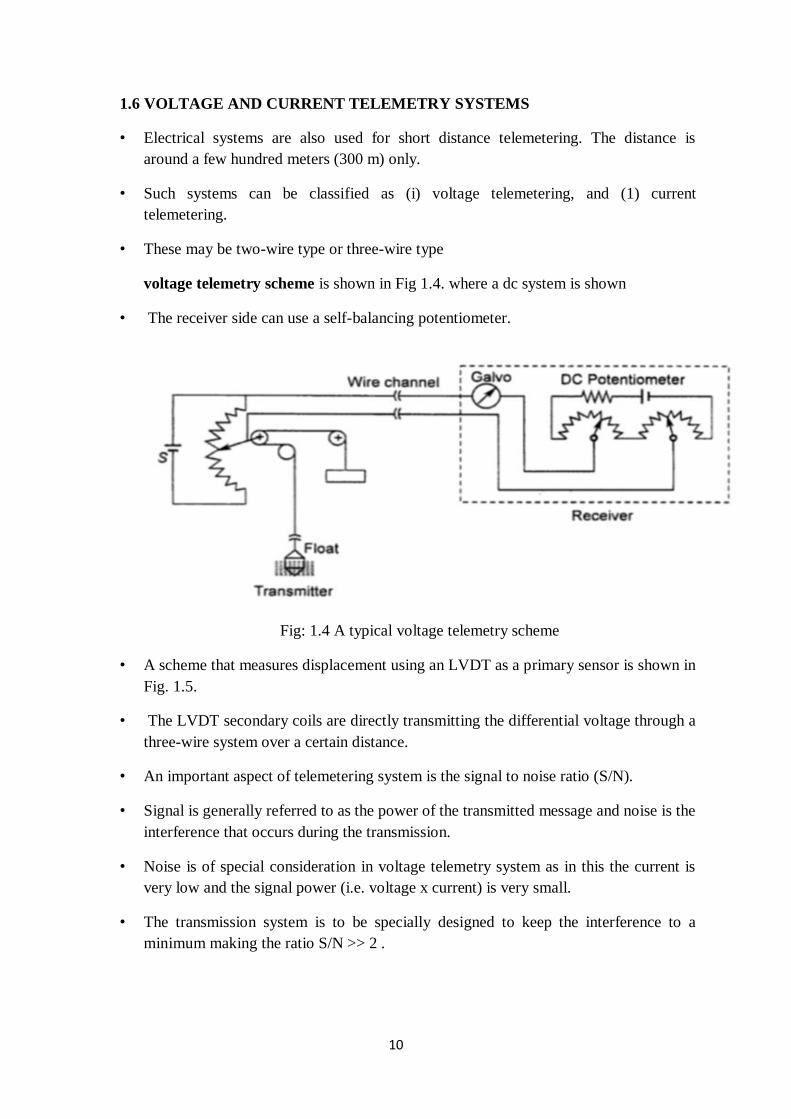
1.6 VOLTAGE AND CURRENT TELEMETRY SYSTEMS
• Electrical systems are also used for short distance telemetering. The distance is
around a few hundred meters (300 m) only.
• Such systems can be classified as (i) voltage telemetering, and (1) current
telemetering.
• These may be two-wire type or three-wire type
voltage telemetry scheme is shown in Fig 1.4. where a dc system is shown
• The receiver side can use a self-balancing potentiometer.
Fig: 1.4 A typical voltage telemetry scheme
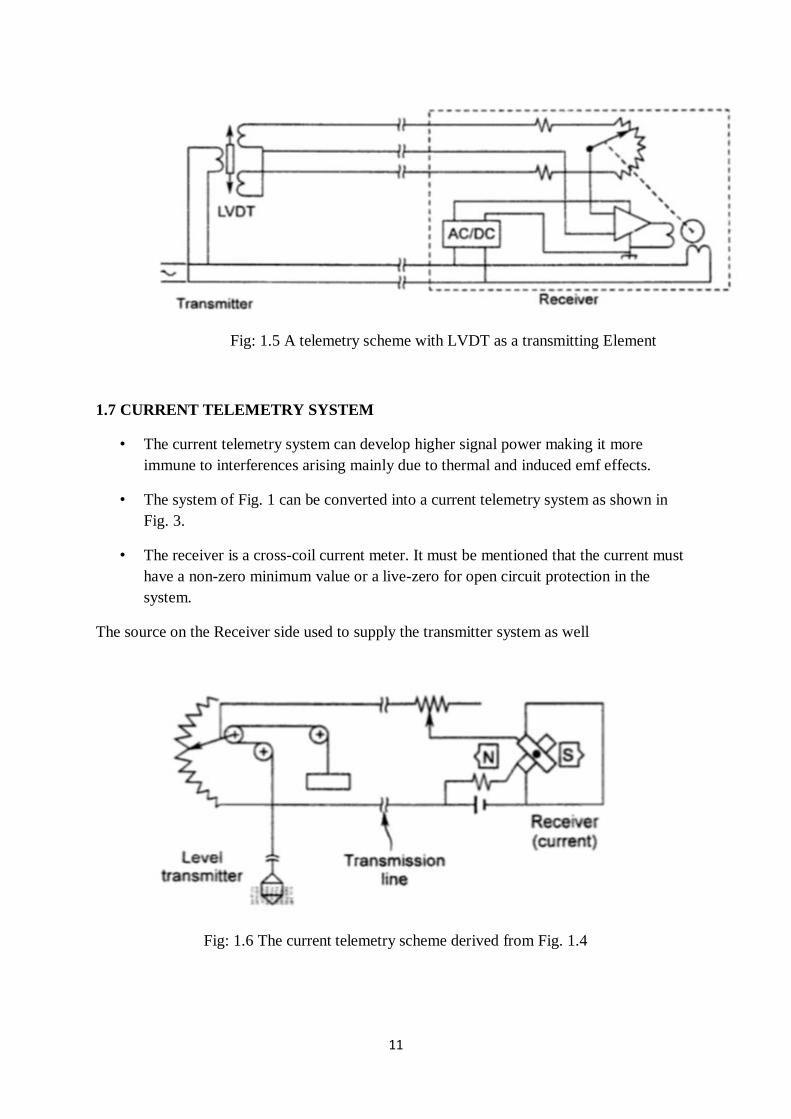
• A scheme that measures displacement using an LVDT as a primary sensor is shown in
Fig. 1.5.
• The LVDT secondary coils are directly transmitting the differential voltage through a
three-wire system over a certain distance.
• An important aspect of telemetering system is the signal to noise ratio (S/N).
• Signal is generally referred to as the power of the transmitted message and noise is the
interference that occurs during the transmission.
• Noise is of special consideration in voltage telemetry system as in this the current is
very low and the signal power (i.e. voltage x current) is very small.
• The transmission system is to be specially designed to keep the interference to a
minimum making the ratio S/N >> 2 .
11
Fig: 1.5 A telemetry scheme with LVDT as a transmitting Element
1.7 CURRENT TELEMETRY SYSTEM
• The current telemetry system can develop higher signal power making it more
immune to interferences arising mainly due to thermal and induced emf effects.
• The system of Fig. 1 can be converted into a current telemetry system as shown in
Fig. 3.
• The receiver is a cross-coil current meter. It must be mentioned that the current must
have a non-zero minimum value or a live-zero for open circuit protection in the
system.
The source on the Receiver side used to supply the transmitter system as well
Fig: 1.6 The current telemetry scheme derived from Fig. 1.4
12
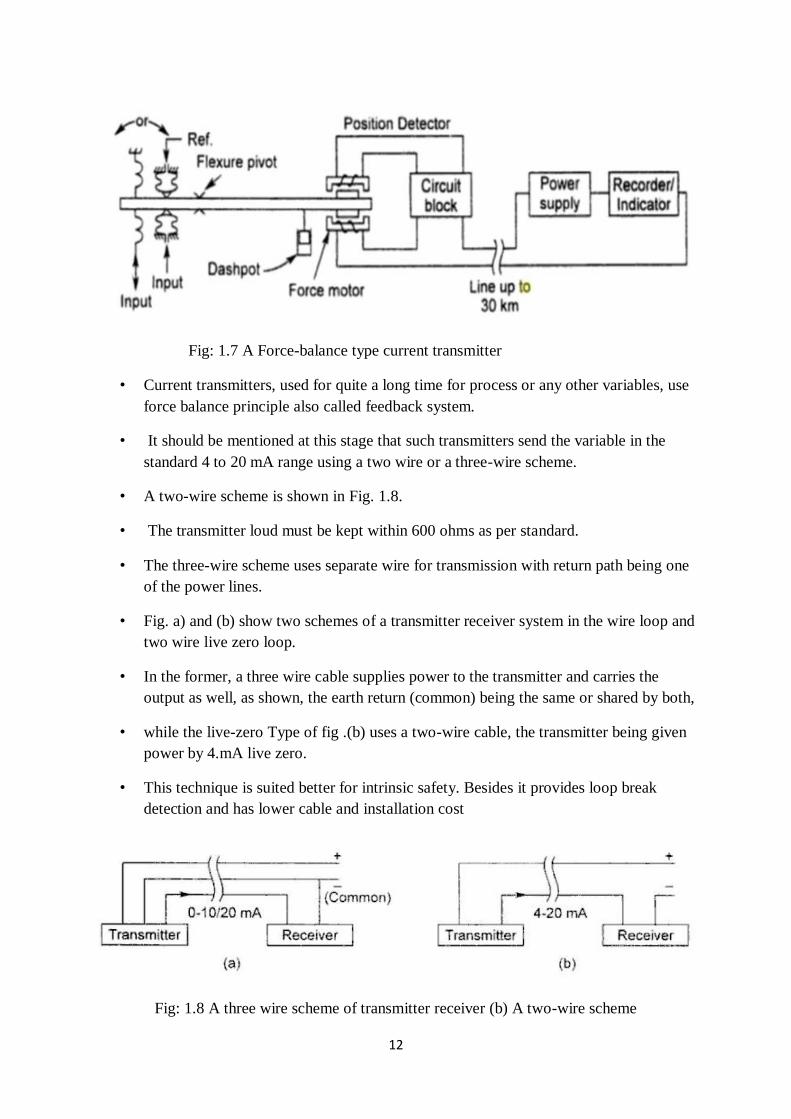
Fig: 1.7 A Force-balance type current transmitter
• Current transmitters, used for quite a long time for process or any other variables, use
force balance principle also called feedback system.
• It should be mentioned at this stage that such transmitters send the variable in the
standard 4 to 20 mA range using a two wire or a three-wire scheme.
• A two-wire scheme is shown in Fig. 1.8.
• The transmitter loud must be kept within 600 ohms as per standard.
• The three-wire scheme uses separate wire for transmission with return path being one
of the power lines.
• Fig. a) and (b) show two schemes of a transmitter receiver system in the wire loop and
two wire live zero loop.
• In the former, a three wire cable supplies power to the transmitter and carries the
output as well, as shown, the earth return (common) being the same or shared by both,
• while the live-zero Type of fig .(b) uses a two-wire cable, the transmitter being given
power by 4.mA live zero.
• This technique is suited better for intrinsic safety. Besides it provides loop break
detection and has lower cable and installation cost
Fig: 1.8 A three wire scheme of transmitter receiver (b) A two-wire scheme
13
• The signal is initially selected from the 4 to 20 mA, 0 to 10 V etc standards.
• The next step is to select the cable for which five criteria are specified:
(a) cable length.
(b) EM interference
(c) ES interference.
(d) cable routing, and
(e) intrinsically safe circuit considerations
• In fact, the cable routing would determine the cable length this is very important as
this determines the line resistance which should be added to the receiver load.
• As Two wires form a loop the resistance becomes 2Rc. Where Rc is the routed cable
length. Electromagnetic interference is reduced by reducing the separation between
the two wires of the loop which is accomplished by twisting the wires with a 25-50
mm lay.
• Electrostatic interferences a sort of capacitive Coupling and is reduced by insulated
screening
• For intrinsic safety special circuits are used, but along with that, for multicore cables,
the cable capacitance /Inductance to resistance ratios are chosen as per specification
for enhancing safety
1.8 FREQUENCY TELEMETERING
• In a frequency telemetering system, the signal processing involves derivation of
frequency in proportion to an electrical signal after it has been obtained from the
transducer
• It use an appropriate unit such as voltage-to-frequency converter or a current-to-
frequency converter
• For Example, a 4 to 20 mA signal can be transformed into frequency ranges of 5 to 15
Hz.
• The choice of these frequency ranges is governed by the commercial availability of
low cost telegraph and teletype communication channels.
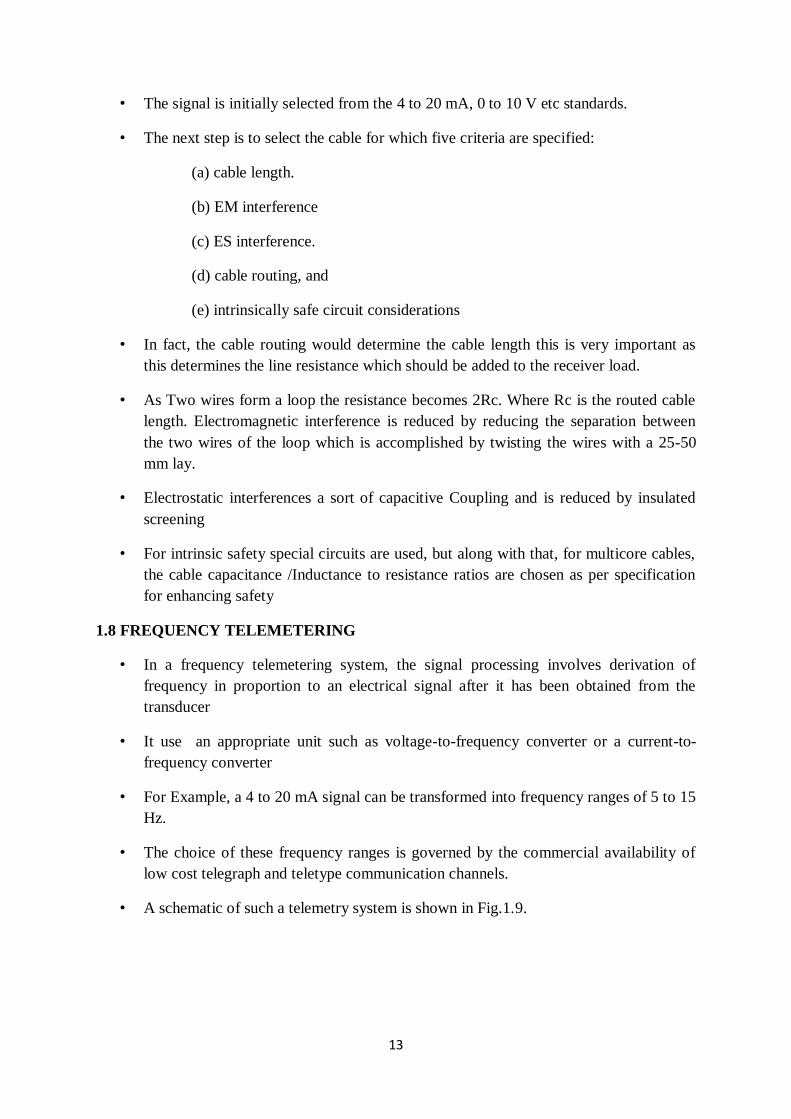
• A schematic of such a telemetry system is shown in Fig.1.9.
14
Fig: 1.9 Block diagram of a teletype channel based frequency telemetry system
Current-to-frequency converter
• Current conversion of transducer signal is well known and commercial circuits are
available.
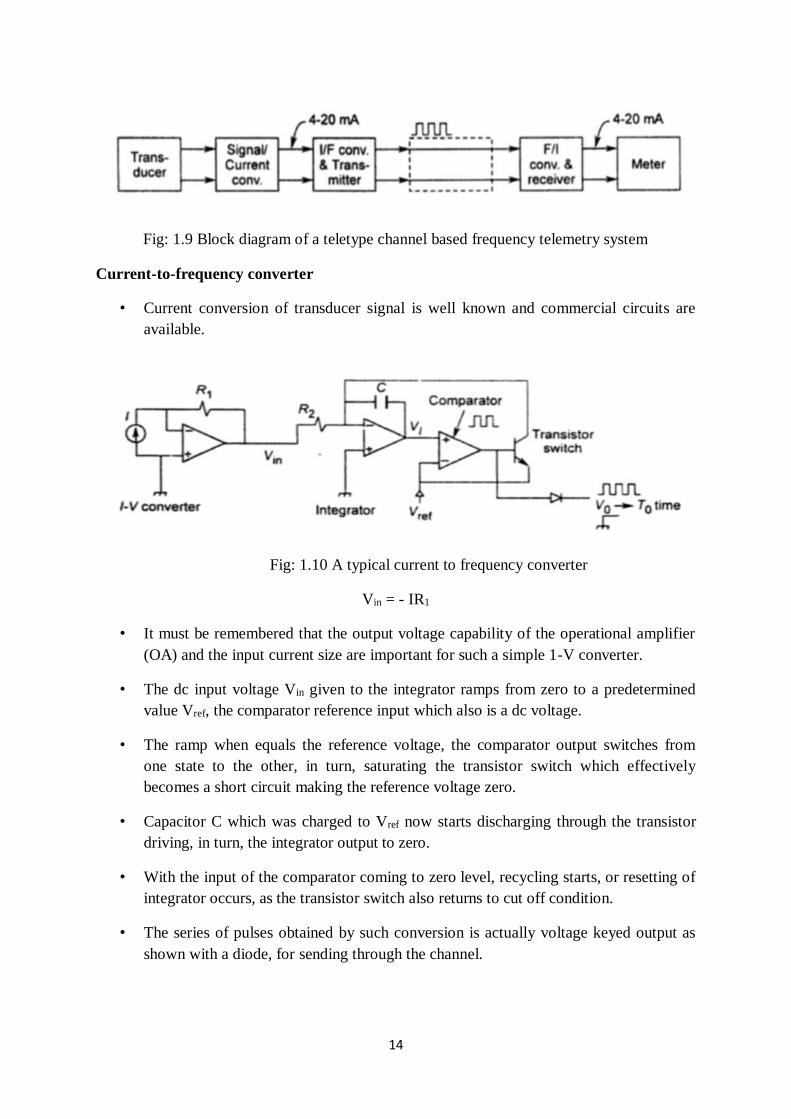
Fig: 1.10 A typical current to frequency converter
Vin = - IR1
• It must be remembered that the output voltage capability of the operational amplifier
(OA) and the input current size are important for such a simple 1-V converter.
• The dc input voltage Vin given to the integrator ramps from zero to a predetermined
value Vref, the comparator reference input which also is a dc voltage.
• The ramp when equals the reference voltage, the comparator output switches from
one state to the other, in turn, saturating the transistor switch which effectively
becomes a short circuit making the reference voltage zero.
• Capacitor C which was charged to Vref now starts discharging through the transistor
driving, in turn, the integrator output to zero.
• With the input of the comparator coming to zero level, recycling starts, or resetting of
integrator occurs, as the transistor switch also returns to cut off condition.
• The series of pulses obtained by such conversion is actually voltage keyed output as
shown with a diode, for sending through the channel.
15
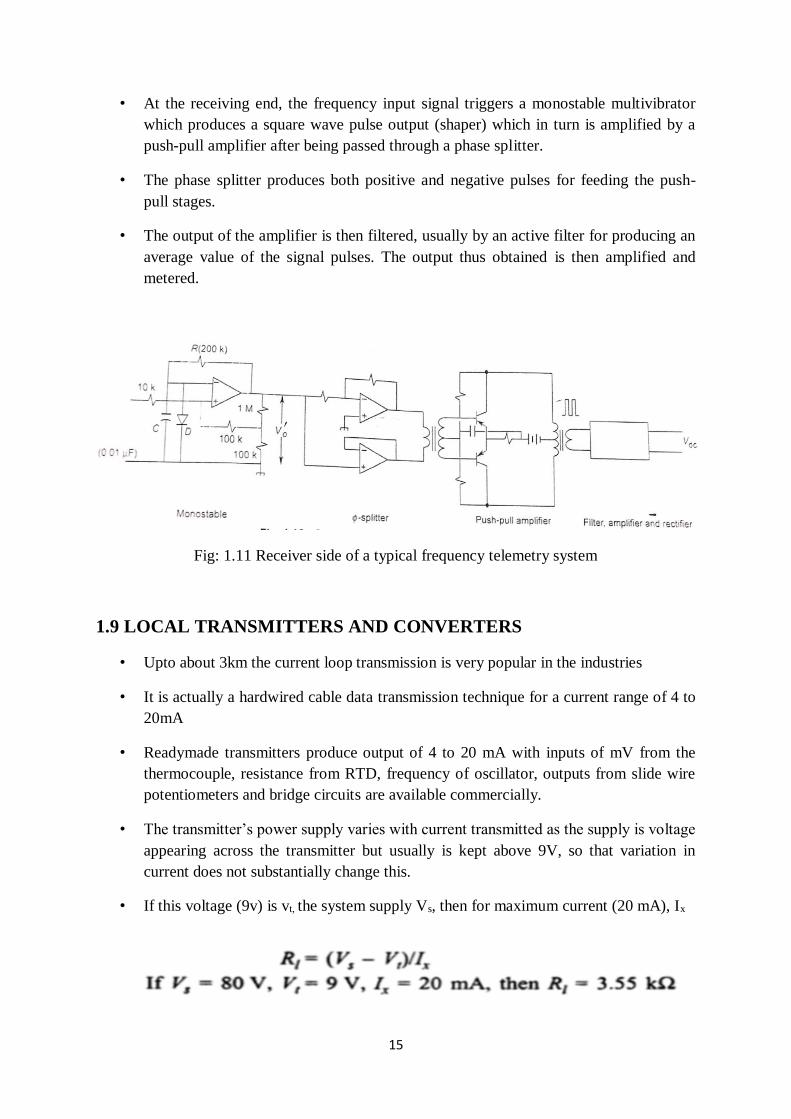
• At the receiving end, the frequency input signal triggers a monostable multivibrator
which produces a square wave pulse output (shaper) which in turn is amplified by a
push-pull amplifier after being passed through a phase splitter.
• The phase splitter produces both positive and negative pulses for feeding the push-
pull stages.
• The output of the amplifier is then filtered, usually by an active filter for producing an
average value of the signal pulses. The output thus obtained is then amplified and
metered.
Fig: 1.11 Receiver side of a typical frequency telemetry system
1.9 LOCAL TRANSMITTERS AND CONVERTERS
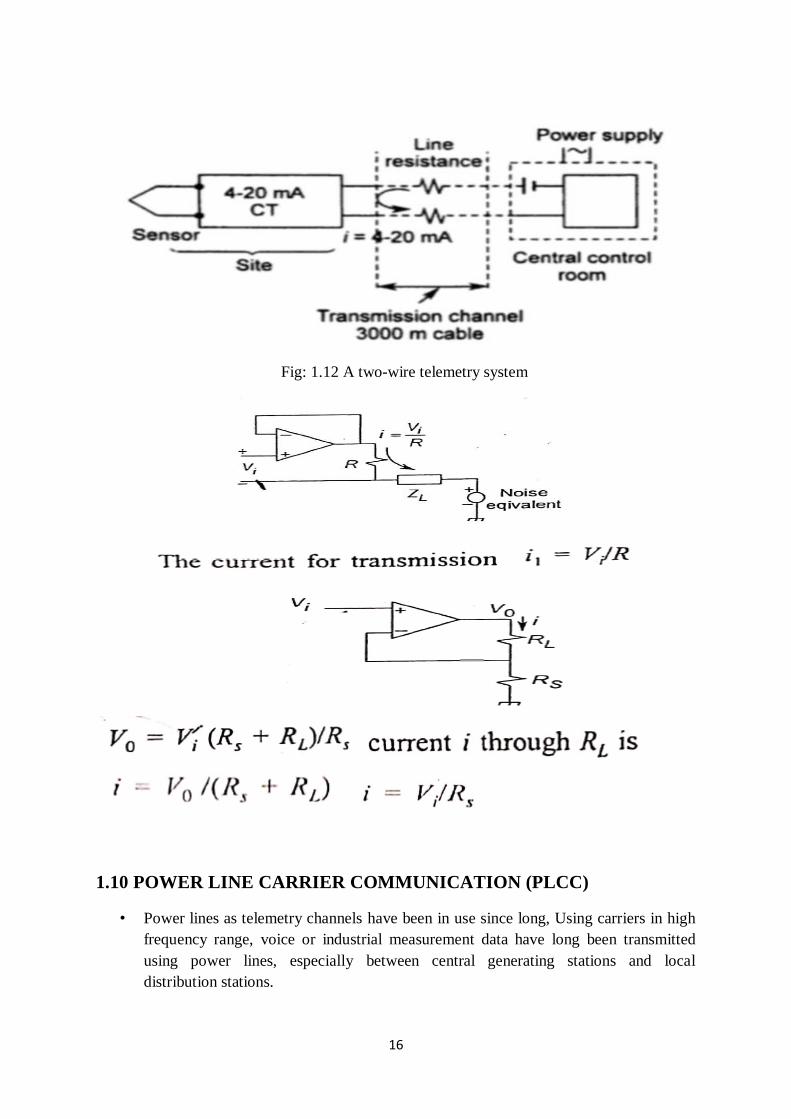
• Upto about 3km the current loop transmission is very popular in the industries
• It is actually a hardwired cable data transmission technique for a current range of 4 to
20mA
• Readymade transmitters produce output of 4 to 20 mA with inputs of mV from the
thermocouple, resistance from RTD, frequency of oscillator, outputs from slide wire
potentiometers and bridge circuits are available commercially.
• The transmitter’s power supply varies with current transmitted as the supply is voltage
appearing across the transmitter but usually is kept above 9V, so that variation in
current does not substantially change this.
• If this voltage (9v) is vt, the system supply Vs, then for maximum current (20 mA), Ix
16
Fig: 1.12 A two-wire telemetry system
1.10 POWER LINE CARRIER COMMUNICATION (PLCC)
• Power lines as telemetry channels have been in use since long, Using carriers in high
frequency range, voice or industrial measurement data have long been transmitted
using power lines, especially between central generating stations and local
distribution stations.
17
• AC carrier of the frequency range over 50 kHz is coupled to high voltage line.
• The carrier is modulated by the information to be telemetered.
• The modulated carrier is put to and stripped off the high voltage line using coupling
capacitors or resonators.
• In fact, the PLCC is employed to convey control signals, metering indication or even
speech from one station to another by the power transmission line without affecting
their normal functioning.
This method of communication requires
1. The sending terminal assembly-other than coupling, it also includes line matching
and tuning,
2. Receiving station coupling and terminal assembly
• Coupling capacitors are the most widely used and also most effective couplers -paper
capacitors being the best choice.
• The capacitors must have line voltage rating which is often attained by series
connection of capacitors of smaller values (rating)
• Typical values of units range from 46 kV 0.015 µF to 765 kV, 0.004 µF.
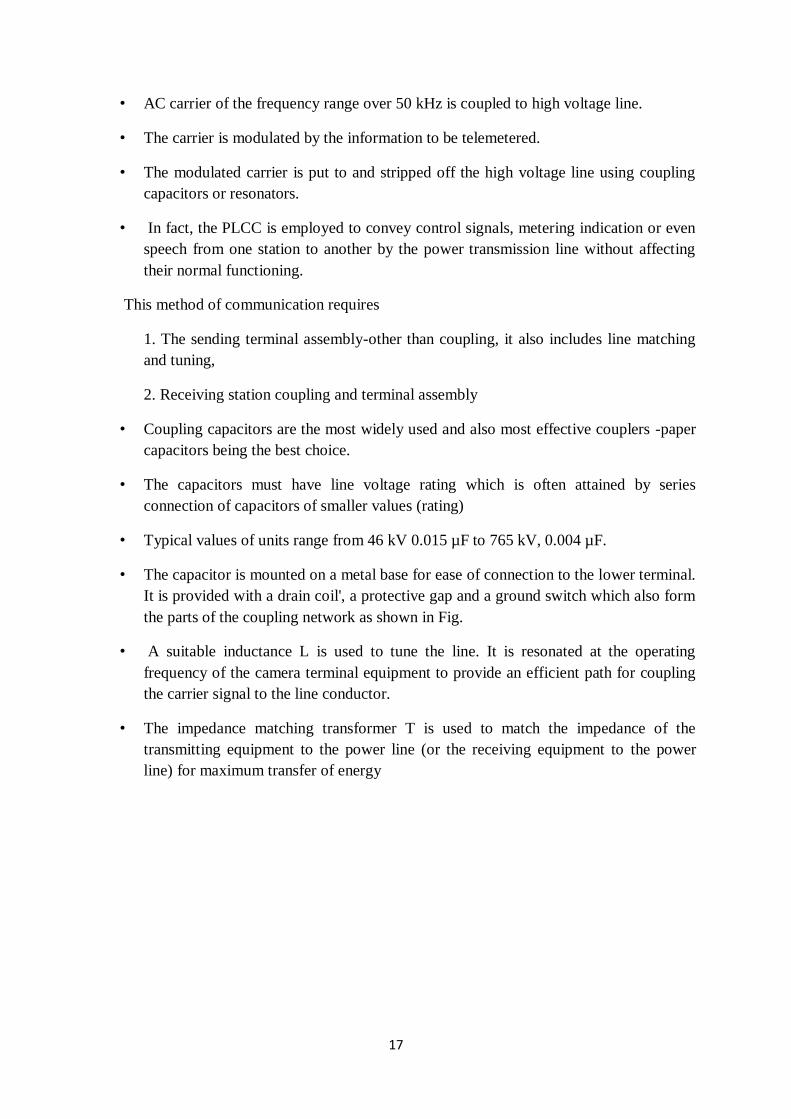
• The capacitor is mounted on a metal base for ease of connection to the lower terminal.
It is provided with a drain coil', a protective gap and a ground switch which also form
the parts of the coupling network as shown in Fig.
• A suitable inductance L is used to tune the line. It is resonated at the operating
frequency of the camera terminal equipment to provide an efficient path for coupling
the carrier signal to the line conductor.
• The impedance matching transformer T is used to match the impedance of the
transmitting equipment to the power line (or the receiving equipment to the power
line) for maximum transfer of energy
18
Fig: 1.13 coupling a carrier equipment with a transmission line
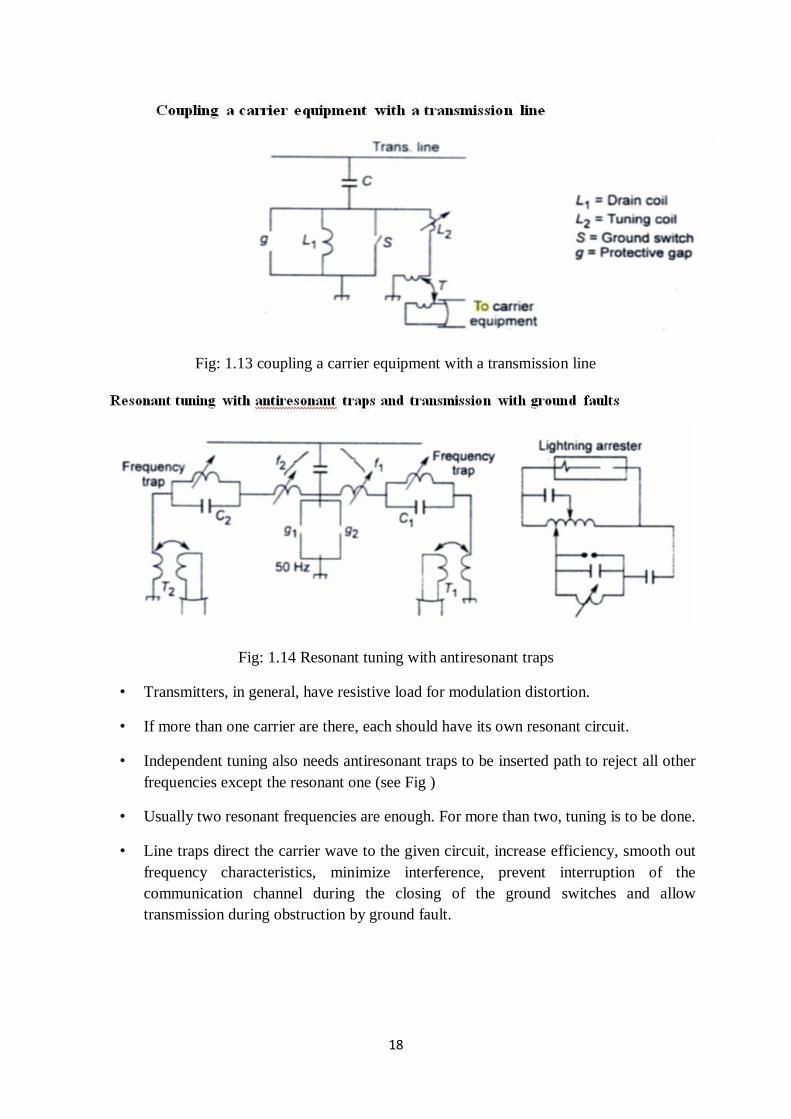
Fig: 1.14 Resonant tuning with antiresonant traps
• Transmitters, in general, have resistive load for modulation distortion.
• If more than one carrier are there, each should have its own resonant circuit.
• Independent tuning also needs antiresonant traps to be inserted path to reject all other
frequencies except the resonant one (see Fig )
• Usually two resonant frequencies are enough. For more than two, tuning is to be done.
• Line traps direct the carrier wave to the given circuit, increase efficiency, smooth out
frequency characteristics, minimize interference, prevent interruption of the
communication channel during the closing of the ground switches and allow
transmission during obstruction by ground fault.

1
SCHOOL OF BIO AND CHEMICAL ENGINEERING
DEPARTMENT OF BIOMEDICAL ENGINEERING
UNIT – II –BIOTELEMETRY– SBM1401
2
2. AMPLITUDE MODULATION
2.1 Introduction
Communication can be defined as the process of exchange of information through means
such as words, actions, signs, etc., between two or more individuals.
Need for Communication
• Whenever a need for exchange of information arises, some means of communication
should exist.
• While the means of communication can be anything such as gestures, signs, symbols,
or a language, the need for communication is inevitable.
• Language and gestures play an important role in human communication
• sounds and actions are important for animal communication
Parts of Communication System
• The Sender is the person who sends a message. It could be a transmitting station from
where the signal is transmitted.
• The Channel is the medium through which the message signals travel to reach the
destination.
• The Receiver is the person who receives the message. It could be a receiving station
where the signal transmitted is received.
What is a Signal?
• Conveying information by some means such as gestures, sounds, actions, etc., can be
termed as signaling. Hence, a signal can be a source of energy which transmits some
information.
• This signal helps to establish communication between a sender and a receiver.
• An electrical impulse or an electromagnetic wave which travels a distance to convey a
message, can be termed as a signal in communication systems.
Analog Signal
• A continuous time varying signal, which represents a time varying quantity can be
termed as an Analog Signal.
• This signal keeps on varying with respect to time, according to the instantaneous
values of the quantity, which represents it.
Example
• Let us consider, a tap that fills a tank of 100 liters capacity in an hour (6 am to 7 am).
The portion of filling the tank is varied by the varying time. Which means, after 15
mins (6:15 am) the quarter portion of the tank gets filled, whereas at 6:45 am, 3/4th of
the tank is filled.
• If you try to plot the varying portions of water in the tank, according to the varying
time, it would look like the following figure.
• As the resultant shown in this image varies (increases) according to time, this time
varying quantity can be understood as Analog quantity. The signal which represents
this condition with an inclined line in the figure, is an Analog Signal.
• The communication based on analog signals and analog values is called as Analog
Communication.
Digital Signal
• A signal which is discrete in nature or which is non-continuous in form can be termed
as a Digital signal.
• This signal has individual values, denoted separately, which are not based on the
previous values, as if they are derived at that particular instant of time.
• The binary digits which have only 1s and 0s are mostly termed as digital values.
• Hence, the signals which represent 1s and 0s are also called as digital signals.
3
• The communication based on digital signals and digital values is called as Digital
Communication.
Periodic Signal
• Any analog or digital signal, that repeats its pattern over a period of time, is called as
a Periodic Signal.
• This signal has its pattern continued repeatedly and is easy to be assumed or to be
calculated.
Example
• If we consider machinery in an industry, the process that takes place one after the
other is a continuous and repeat procedure. For example, procuring and grading the
raw material, processing the material in batches, packing a load of products one after
the other etc., follow a certain procedure repeatedly.
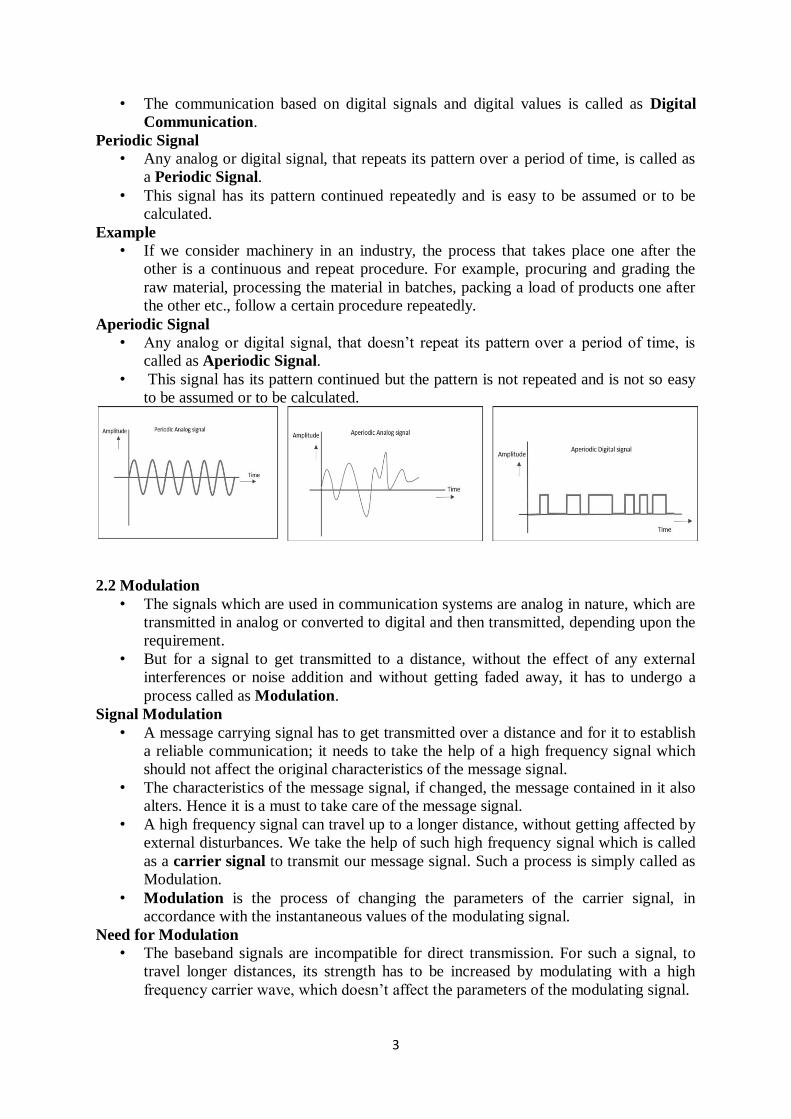
Aperiodic Signal
• Any analog or digital signal, that doesn’t repeat its pattern over a period of time, is
called as Aperiodic Signal.
• This signal has its pattern continued but the pattern is not repeated and is not so easy
to be assumed or to be calculated.
2.2 Modulation
• The signals which are used in communication systems are analog in nature, which are
transmitted in analog or converted to digital and then transmitted, depending upon the
requirement.
• But for a signal to get transmitted to a distance, without the effect of any external
interferences or noise addition and without getting faded away, it has to undergo a
process called as Modulation.
Signal Modulation
• A message carrying signal has to get transmitted over a distance and for it to establish
a reliable communication; it needs to take the help of a high frequency signal which
should not affect the original characteristics of the message signal.
• The characteristics of the message signal, if changed, the message contained in it also
alters. Hence it is a must to take care of the message signal.
• A high frequency signal can travel up to a longer distance, without getting affected by
external disturbances. We take the help of such high frequency signal which is called
as a carrier signal to transmit our message signal. Such a process is simply called as
Modulation.
• Modulation is the process of changing the parameters of the carrier signal, in
accordance with the instantaneous values of the modulating signal.
Need for Modulation
• The baseband signals are incompatible for direct transmission. For such a signal, to
travel longer distances, its strength has to be increased by modulating with a high
frequency carrier wave, which doesn’t affect the parameters of the modulating signal.
4
Advantages of Modulation
• The antenna used for transmission, had to be very large, if modulation was not
introduced. The range of communication gets limited as the wave cannot travel to a
distance without getting distorted.
Advantages for implementing modulation in the communication systems.
• Antenna size gets reduced.
• No signal mixing occurs.
• Communication range increases.
2.3 Signals in the Modulation Process
Message or Modulating Signal
• The signal which contains a message to be transmitted is called as a message signal.
It is a baseband signal, which has to undergo the process of modulation, to get
transmitted. Hence, it is also called as the modulating signal.
Carrier Signal
• The high frequency signal which has a certain phase, frequency, and amplitude but
contains no information, is called a carrier signal. It is an empty signal. It is just used
to carry the signal to the receiver after modulation.
Modulated Signal
• The resultant signal after the process of modulation, is called as the modulated
signal. This signal is a combination of the modulating signal and the carrier signal.
2.4 Modulation is the process of changing the parameters of the carrier signal, in accordance
with the instantaneous values of the modulating signal
- Modulating signal, usually low frequency signal or Audio frequency(A.F) signal i.e
message signal.
-The carrier signal (high frequency signal or Radio frequency (R.F signal)used to carry
modulating signal
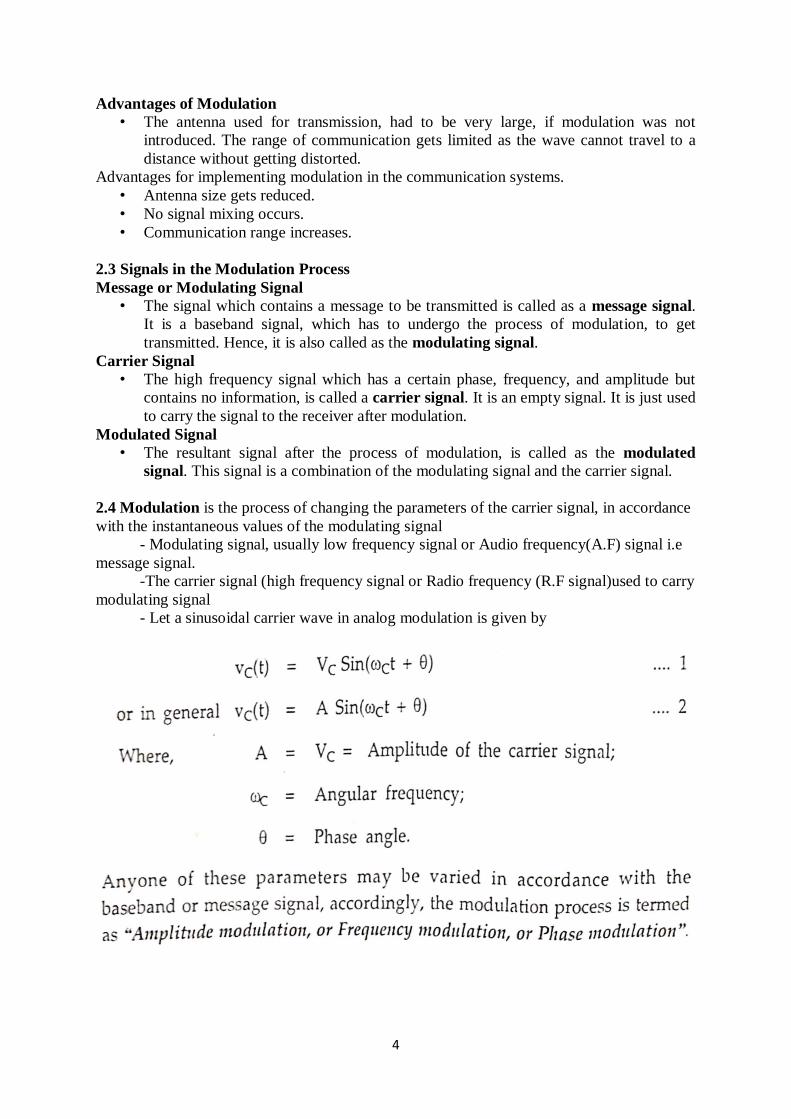
- Let a sinusoidal carrier wave in analog modulation is given by
5
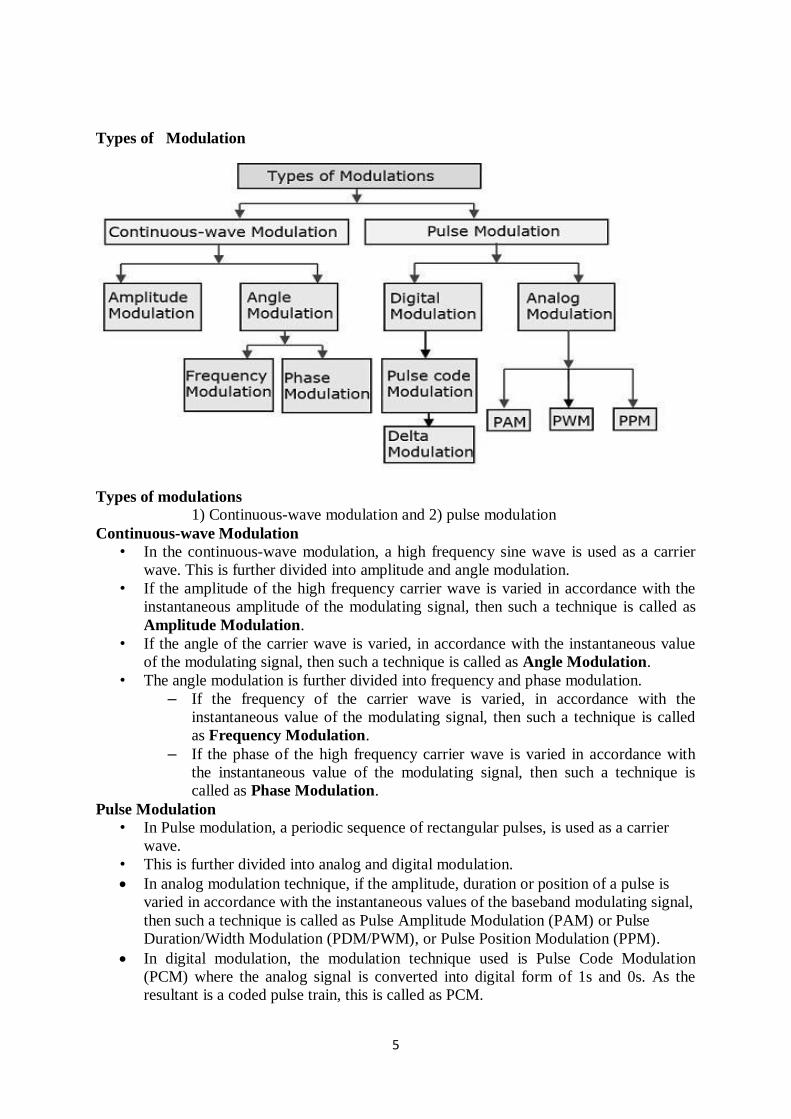
Types of Modulation
Types of modulations 1) Continuous-wave modulation and 2) pulse modulation
Continuous-wave Modulation
• In the continuous-wave modulation, a high frequency sine wave is used as a carrier
wave. This is further divided into amplitude and angle modulation.
• If the amplitude of the high frequency carrier wave is varied in accordance with the
instantaneous amplitude of the modulating signal, then such a technique is called as
Amplitude Modulation.
• If the angle of the carrier wave is varied, in accordance with the instantaneous value
of the modulating signal, then such a technique is called as Angle Modulation.
• The angle modulation is further divided into frequency and phase modulation.
– If the frequency of the carrier wave is varied, in accordance with the
instantaneous value of the modulating signal, then such a technique is called
as Frequency Modulation.
– If the phase of the high frequency carrier wave is varied in accordance with
the instantaneous value of the modulating signal, then such a technique is
called as Phase Modulation.
Pulse Modulation
• In Pulse modulation, a periodic sequence of rectangular pulses, is used as a carrier
wave.
• This is further divided into analog and digital modulation.
In analog modulation technique, if the amplitude, duration or position of a pulse is
varied in accordance with the instantaneous values of the baseband modulating signal,
then such a technique is called as Pulse Amplitude Modulation (PAM) or Pulse
Duration/Width Modulation (PDM/PWM), or Pulse Position Modulation (PPM).
In digital modulation, the modulation technique used is Pulse Code Modulation
(PCM) where the analog signal is converted into digital form of 1s and 0s. As the
resultant is a coded pulse train, this is called as PCM.
6
This is further developed as Delta Modulation (DM), which will be discussed in
subsequent chapters. Hence, PCM is a technique where the analog signals are converted into
a digital form.
2.5 Amplitude Modulation • The amplitude of the carrier signal varies in accordance with the instantaneous
amplitude of the modulating signal. Frequency and Phase of the carrier signal are not
altered during this process.
7
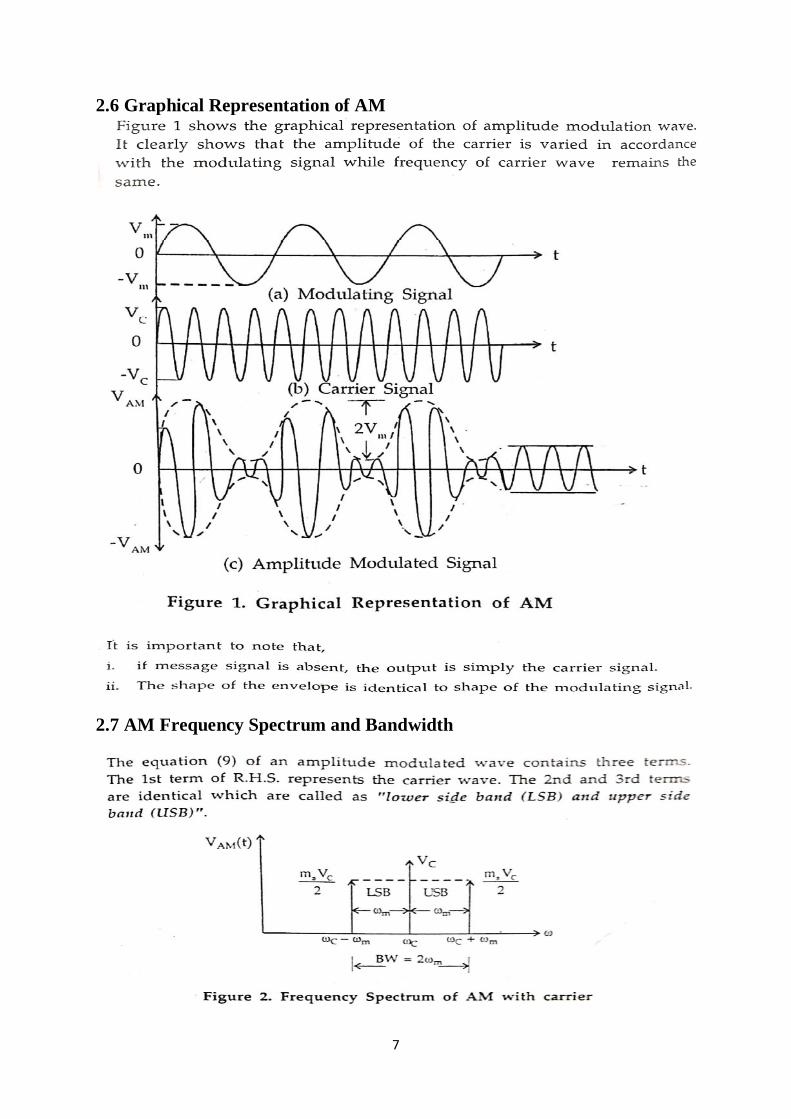
2.6 Graphical Representation of AM
2.7 AM Frequency Spectrum and Bandwidth
8
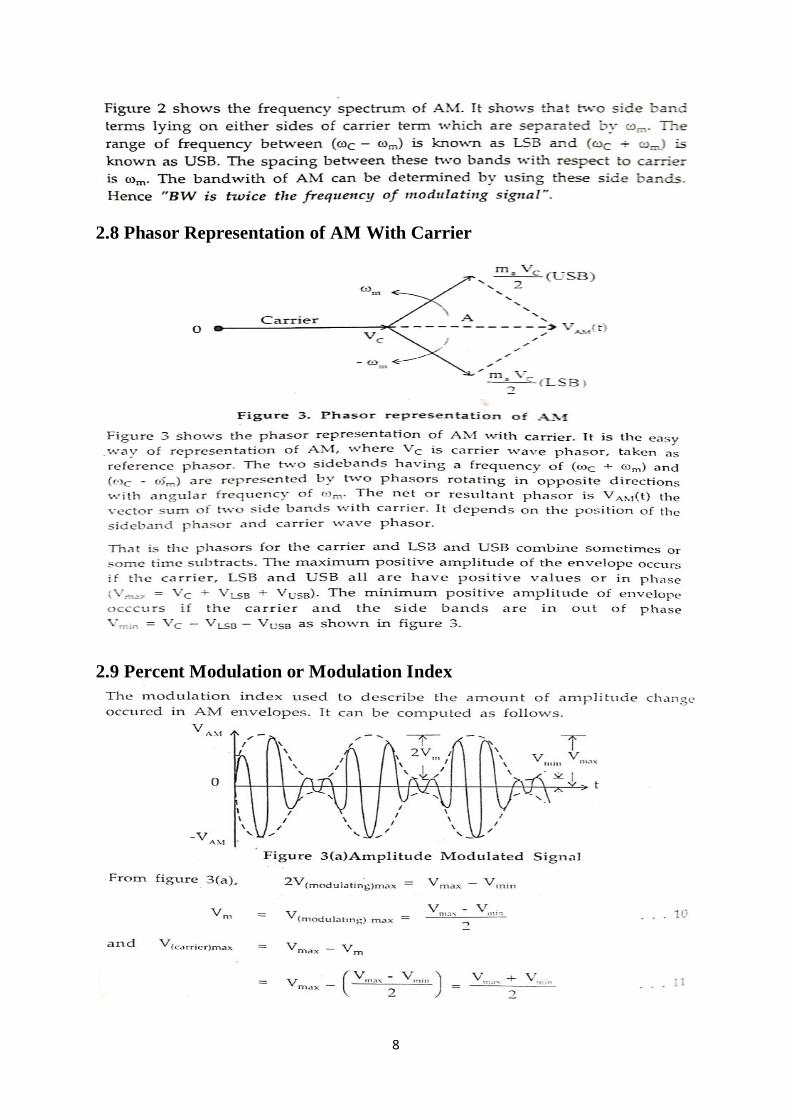
2.8 Phasor Representation of AM With Carrier
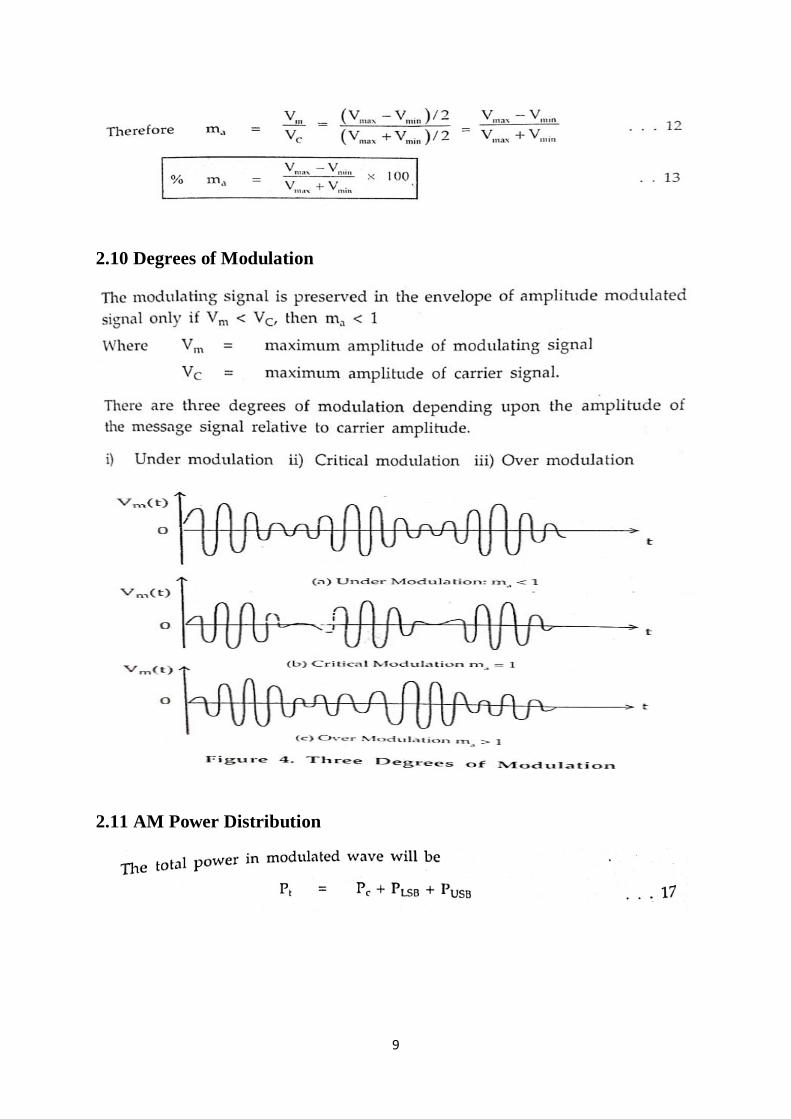
2.9 Percent Modulation or Modulation Index
9
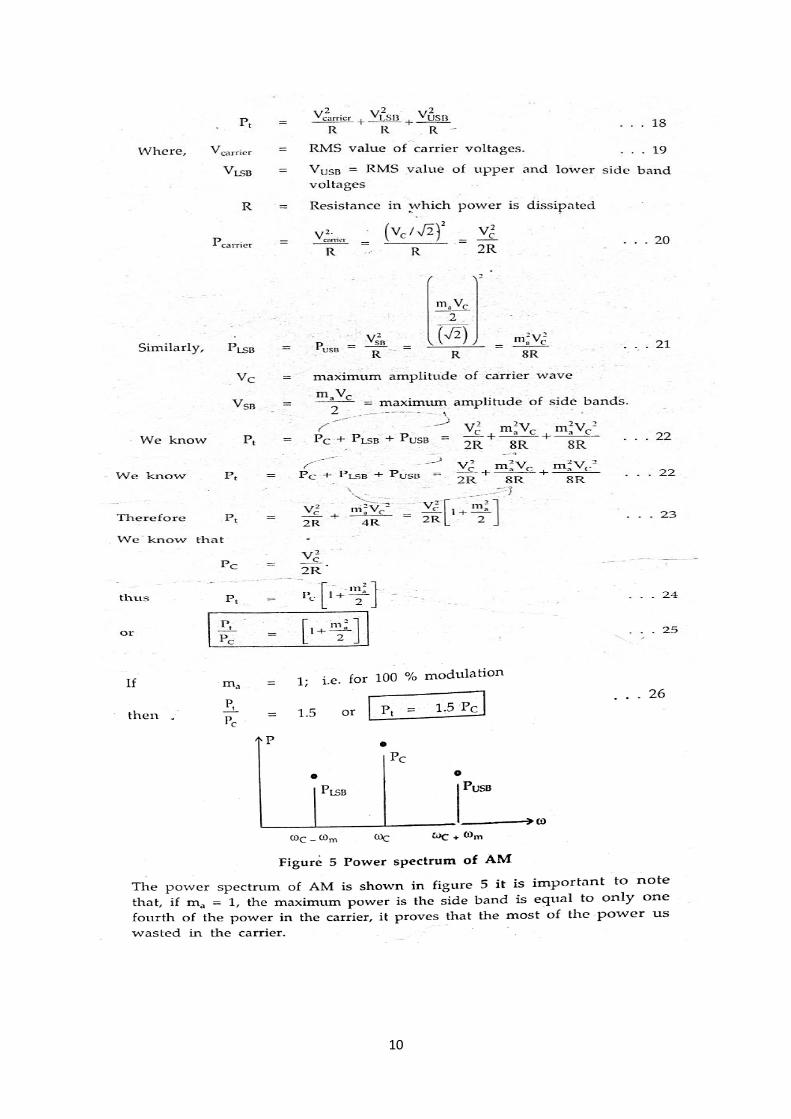
2.10 Degrees of Modulation
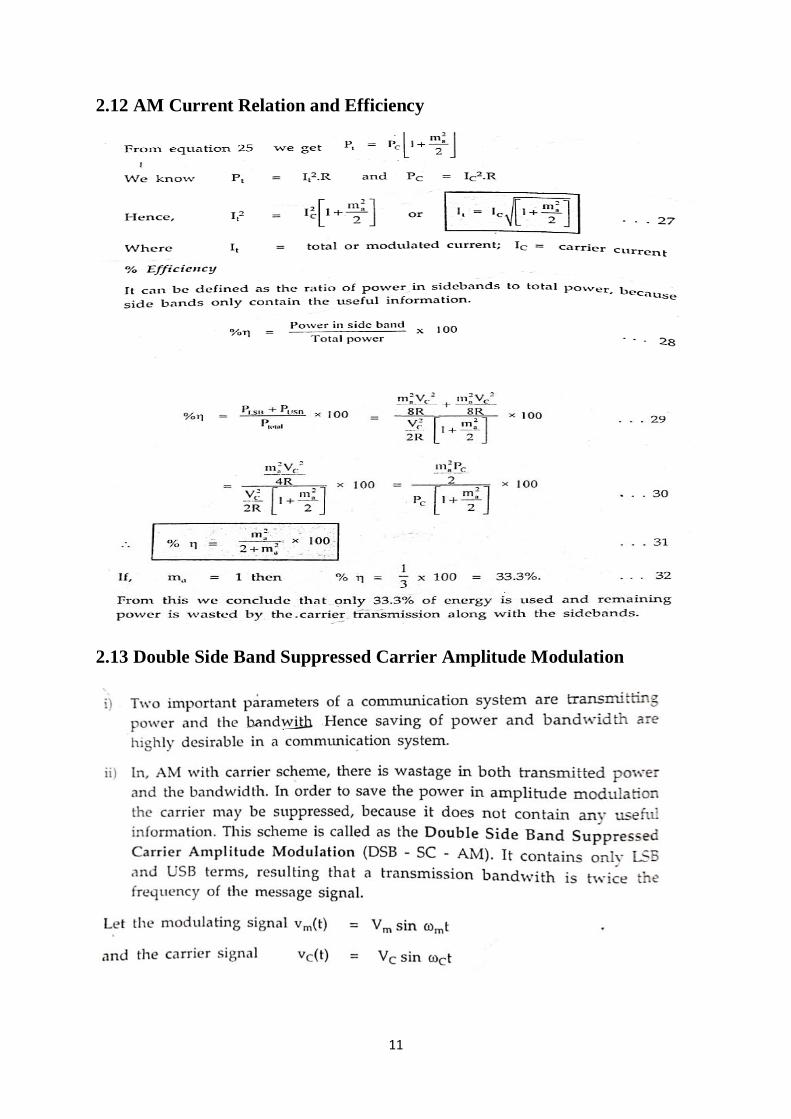
2.11 AM Power Distribution
10
11
2.12 AM Current Relation and Efficiency
2.13 Double Side Band Suppressed Carrier Amplitude Modulation
12
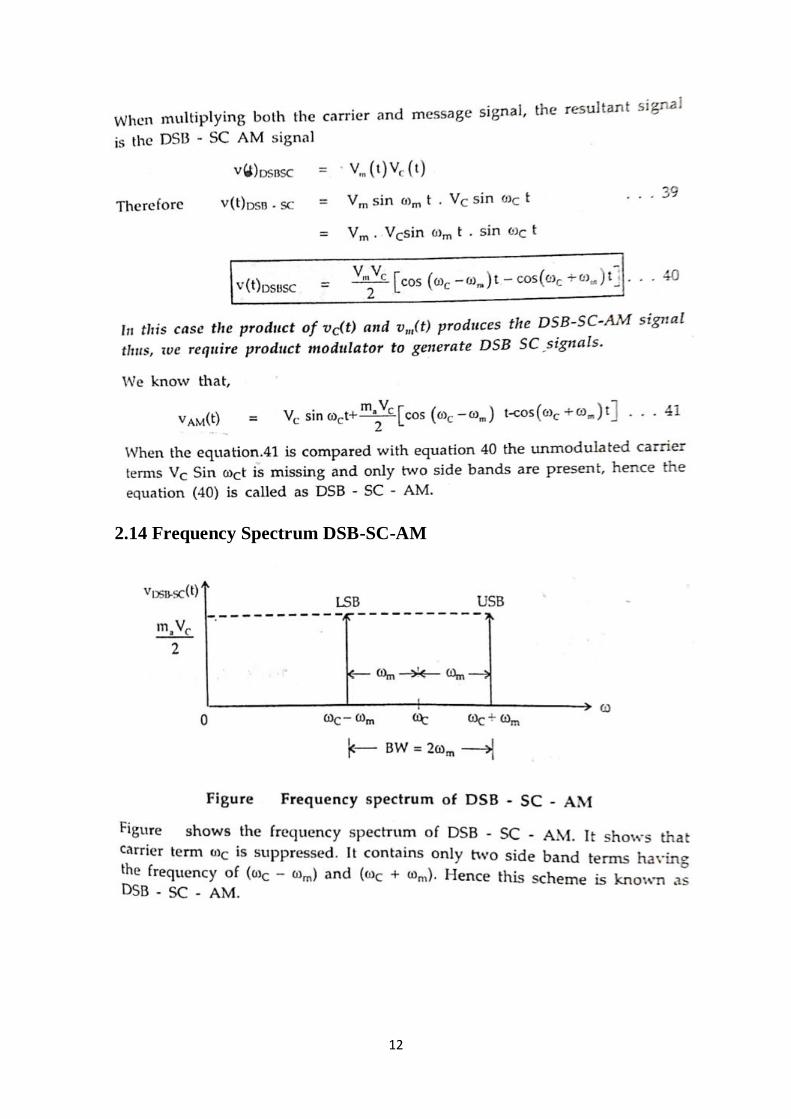
2.14 Frequency Spectrum DSB-SC-AM
13
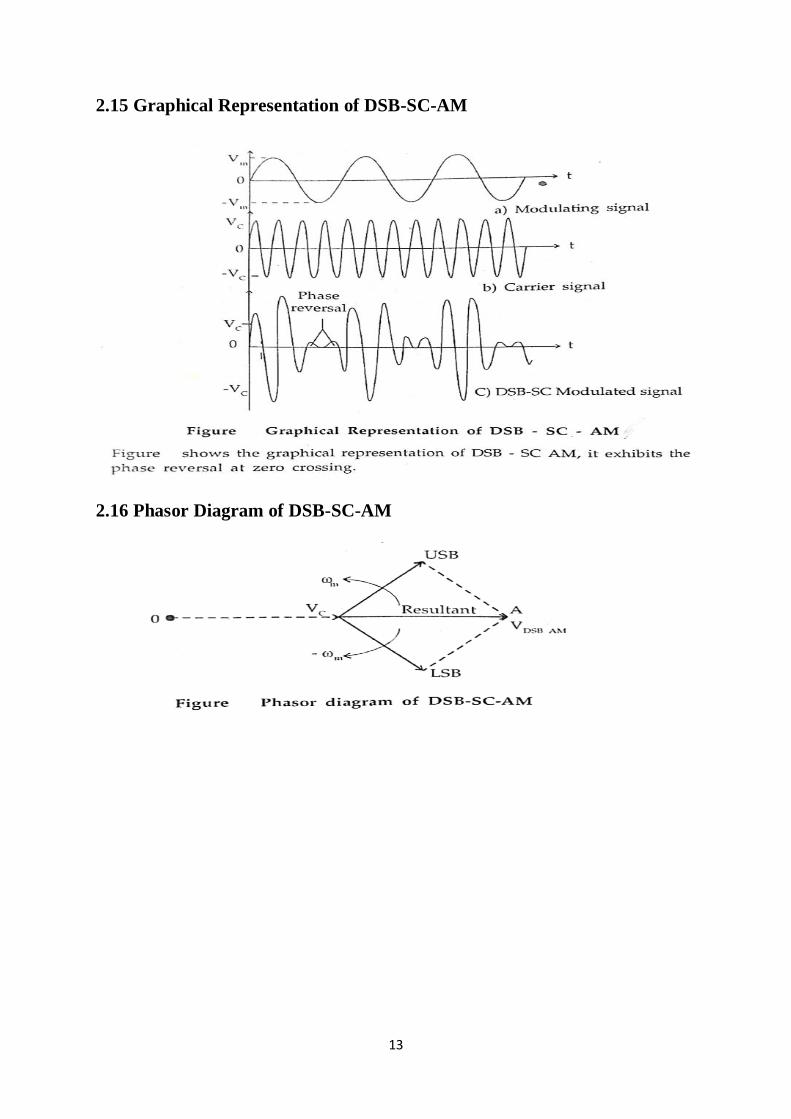
2.15 Graphical Representation of DSB-SC-AM
2.16 Phasor Diagram of DSB-SC-AM
14
2.17 Power Calculation
15
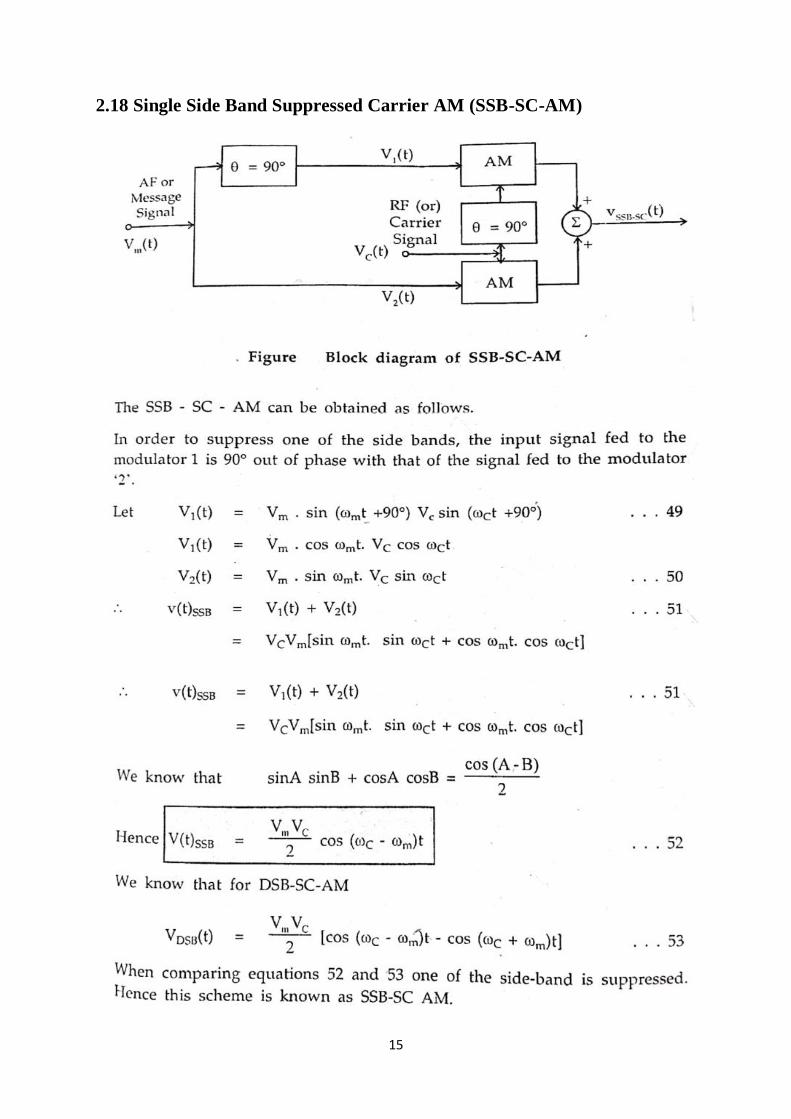
2.18 Single Side Band Suppressed Carrier AM (SSB-SC-AM)
16
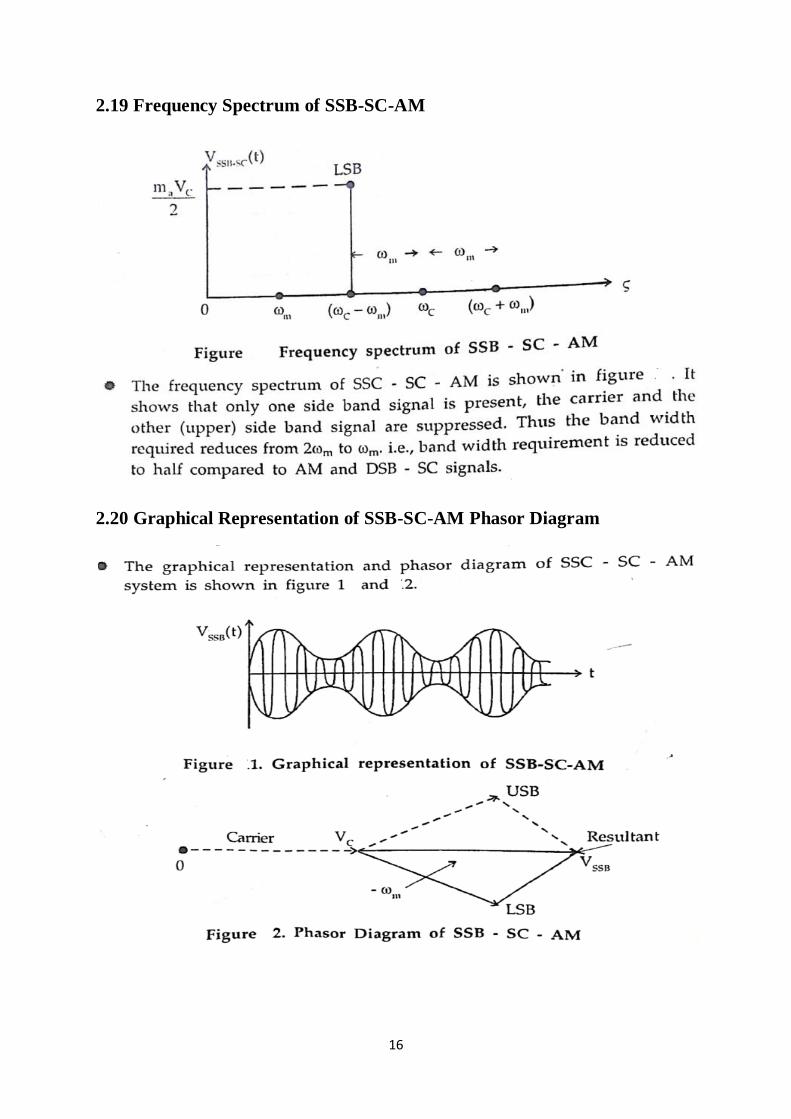
2.19 Frequency Spectrum of SSB-SC-AM
2.20 Graphical Representation of SSB-SC-AM Phasor Diagram
17
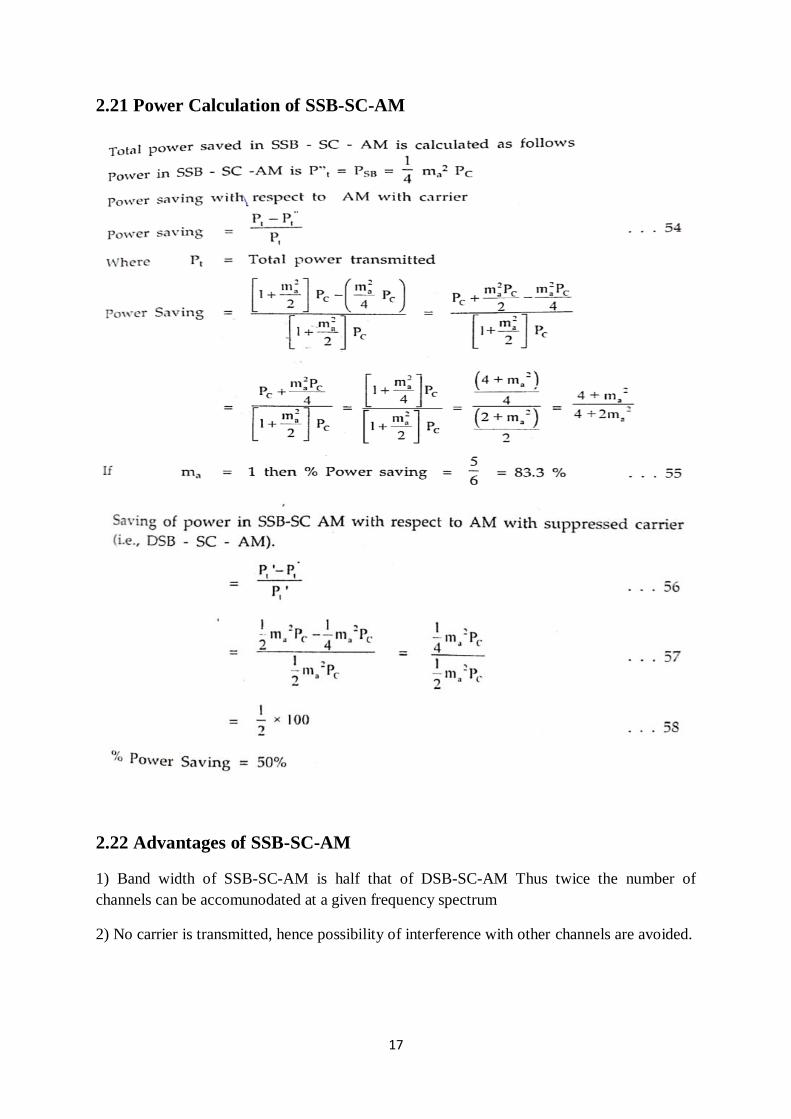
2.21 Power Calculation of SSB-SC-AM
2.22 Advantages of SSB-SC-AM
1) Band width of SSB-SC-AM is half that of DSB-SC-AM Thus twice the number of
channels can be accomunodated at a given frequency spectrum
2) No carrier is transmitted, hence possibility of interference with other channels are avoided.
18
3) There is an improvement in signal to noise ratio from to 12 db at the receiver output over
DSB-SC-AM
4) During demodulation of SSB, carrier of same frequency and phase of requisite strength is
to be inserted, and at the receiver one can get output audio signal without the knowledge of
carrier. Hence some secrecy is automatically achieved.
5) It eliminates the possibility of fading occurs due to multipath propagation of electo-
magnetic waves. Thus R.F. waves at same frequency may travel by two path which may be of
different wave lengths so that signals received by these paths may be of unequal amplitude
and phases. Which results in fading?. The fading is selective over the received band.
6) SSB provides an improvement in SNR of atleast 9db. Thus in order to get the same SNR at
the receiver but put the transmitter average power output may be reduced by 9db. Therefore
SSB transmitter requires less number of amplifying stages. Hence net volume of operating
cost is reduced.
2.23 Disadvantages of SSB-SC-AM
1) The major drawback is that the transmission and reception of SSB becomes more complex
and the required performance standard is very high.
2) For demodulation of SSB, carrier is reinserted at the receiver. The frequency of the
reinserted carrier must be within 15 cycles per second of the carrier frequency in case of
speech and 4 cycles per second in case of music. Such a requirement complicates the
demodulation process. Hence it becomes necessary to transmit the pilot signal or the carrier
voltage itself at a very low level for synchronising the receiver oscillator frequency. This
signal has to be filtered out at the receiver with the use of highly selective filters. Design of
these highly selective filters is thus involved in SSB receiver. This complexity contributes to
an addition in cost.
2.24 Applications of SSM-SC-AM
Because of complexity and cost of SSB receiver this system is not used for commercial
broadcasting. It is mainly used in
1) Police wireless communication
2) SSB telegraphs system
3) Point to point radio telephone communication
4) VHF and UHF communication systems.
19
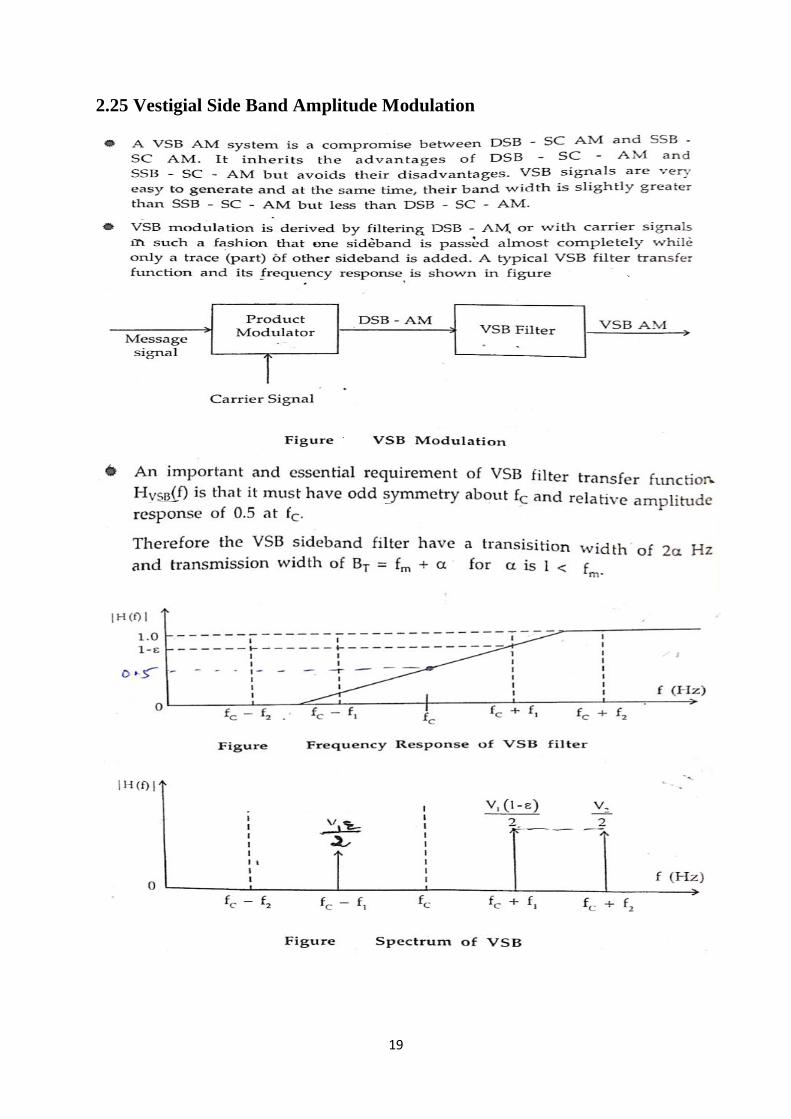
2.25 Vestigial Side Band Amplitude Modulation
20
21
2.26 AM Modulator
A device which is used to generate an amplitude modulated wave is known as
amplitude modulator. It broadly classified into two types
1. Low level modulation (or) nonlinear modulators
• Square law modulator
• Balanced modulator
• Product modulator
2. High level modulation (or) linear modulator
• Transistor modulator
• Switching modulator
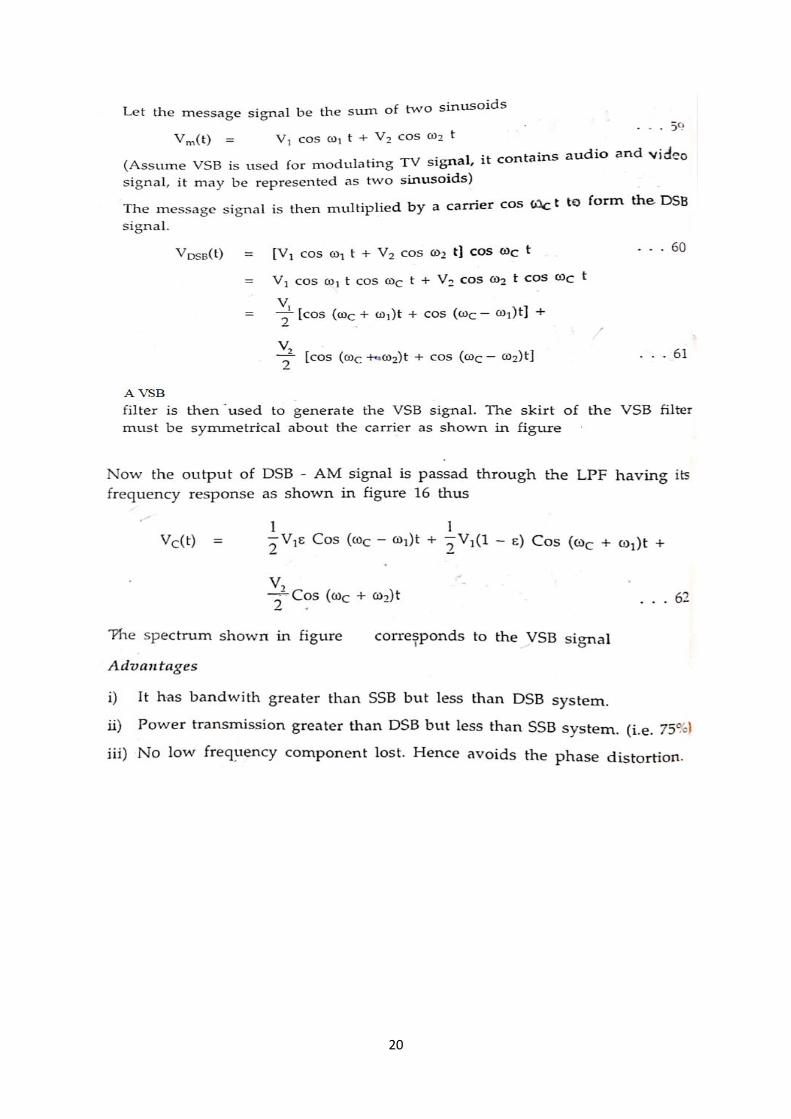
2.26.1 Square Law Modulator
Generation of AM Waves using the square law modulator
Fig: 2.26 square law modulator
It consists of the following:
• A non-linear device
• A bandpass filter
• A carrier source and modulating signal
The modulating signal and carrier are connected in series with each other and
their sum V1(t) is applied at the input of the non-linear device, such as diode,
transistor etc.
22
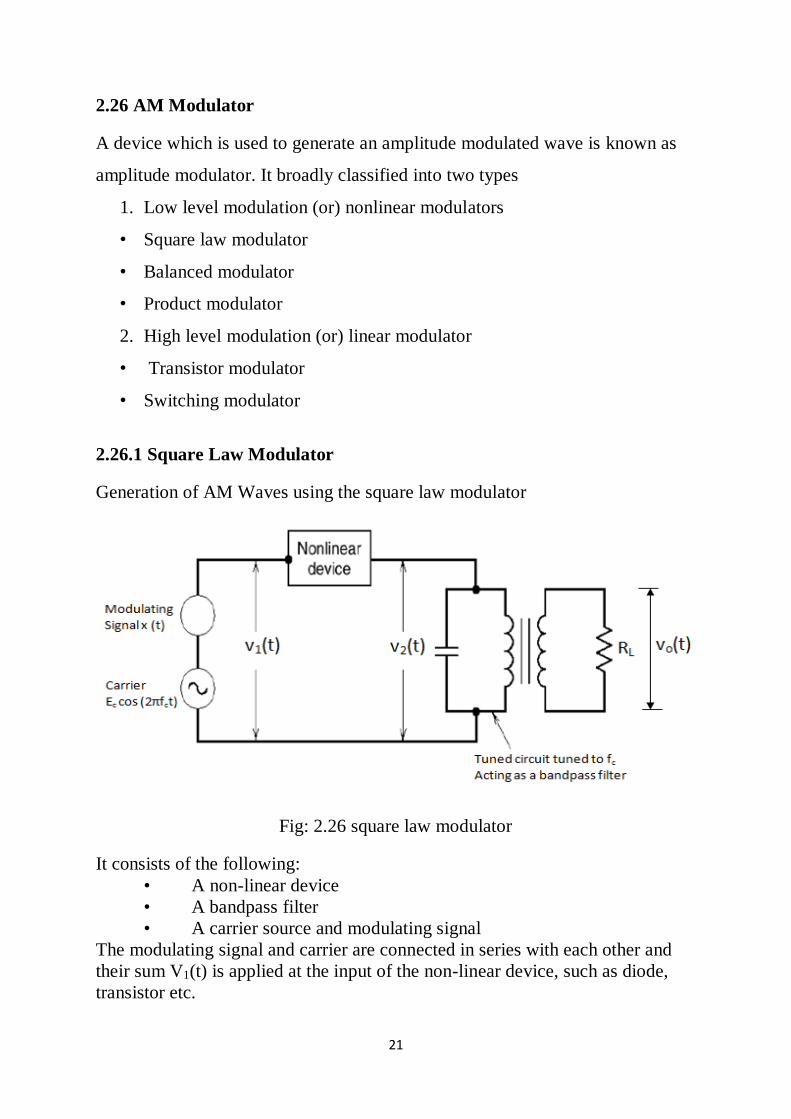
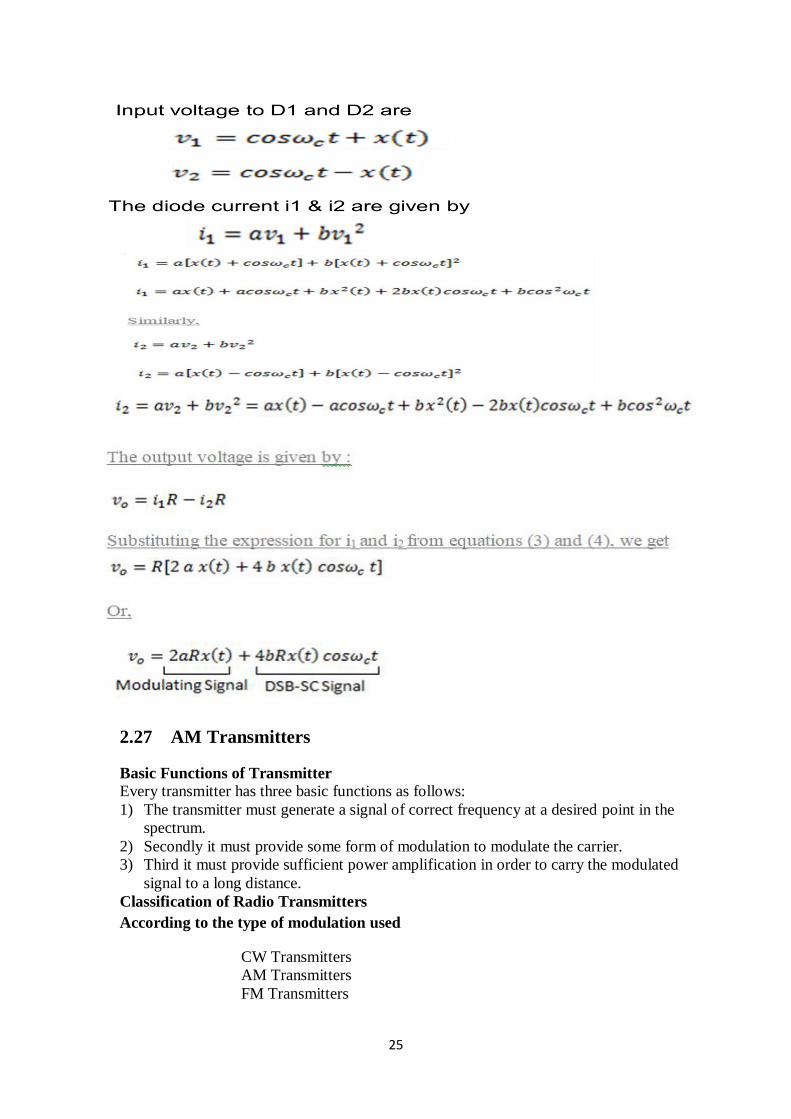
The five terms in the expression for V2(t) are as under :
• Term 1: ax(t) : Modulating Signal
• Term 2: a Ec cos (2π fct ) : Carrier Signal
• Term 3: b x2 (t): Squared modulating Signal
• Term 4: 2 b x(t) cos ( 2π fct ) : AM wave with only sidebands
• Term 5: b Ec2 cos2 (2π fct ) : Squared Carrier
• Out of these five terms, terms 2 and 4 are useful whereas the remaining
terms are not useful.
• Let us club terms 2, 4 and 1, 3, 5 as follows to get ,
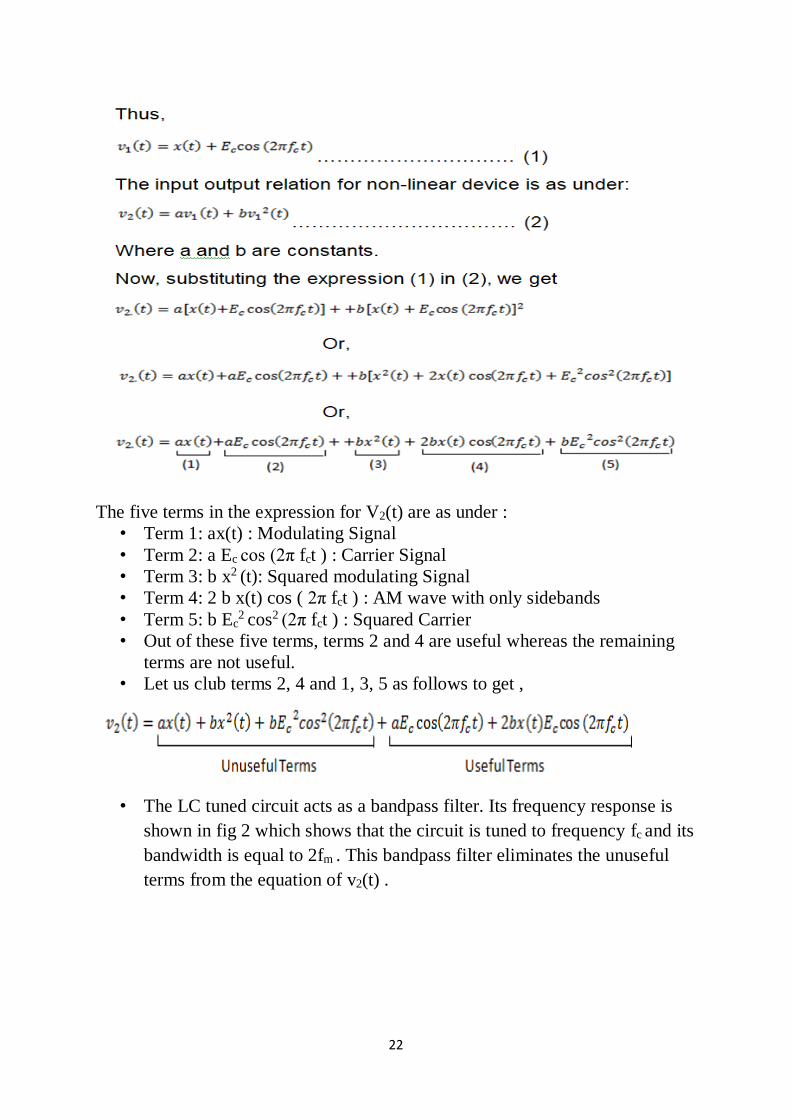
• The LC tuned circuit acts as a bandpass filter. Its frequency response is
shown in fig 2 which shows that the circuit is tuned to frequency fc and its
bandwidth is equal to 2fm . This bandpass filter eliminates the unuseful
terms from the equation of v2(t) .
23
Fig: 2.27 circuits is tuned to frequency fc and its bandwidth is equal to 2fm
2.26.2 Balanced Modulator
24
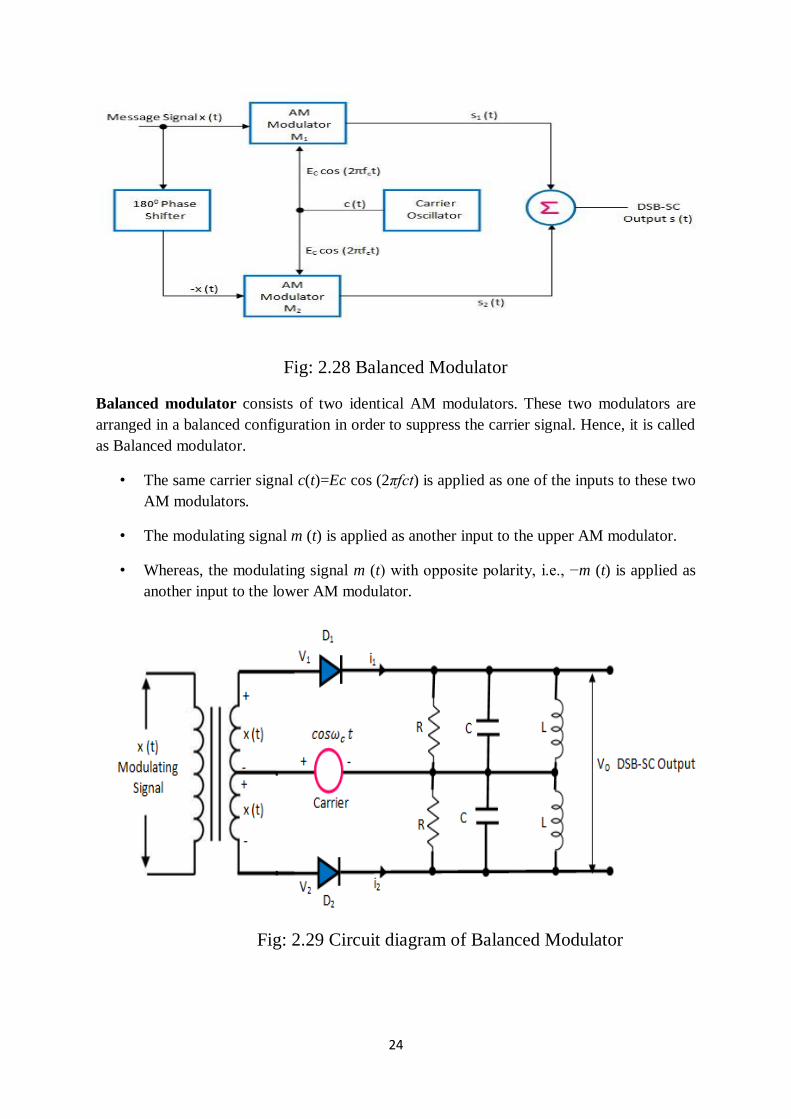
Fig: 2.28 Balanced Modulator
Balanced modulator consists of two identical AM modulators. These two modulators are
arranged in a balanced configuration in order to suppress the carrier signal. Hence, it is called
as Balanced modulator.
• The same carrier signal c(t)=Ec cos (2πfct) is applied as one of the inputs to these two
AM modulators.
• The modulating signal m (t) is applied as another input to the upper AM modulator.
• Whereas, the modulating signal m (t) with opposite polarity, i.e., −m (t) is applied as
another input to the lower AM modulator.
Fig: 2.29 Circuit diagram of Balanced Modulator
25
2.27 AM Transmitters
Basic Functions of Transmitter Every transmitter has three basic functions as follows:
1) The transmitter must generate a signal of correct frequency at a desired point in the
spectrum.
2) Secondly it must provide some form of modulation to modulate the carrier.
3) Third it must provide sufficient power amplification in order to carry the modulated
signal to a long distance.
Classification of Radio Transmitters
According to the type of modulation used
CW Transmitters
AM Transmitters
FM Transmitters
26
According to service involved
Radio broadcast transmitters
Radio telephony transmitters
Radio telegraphs transmitters
Television transmitters
Radar transmitters
Navigational transmitters
According to the frequency range involved
• Low frequency (LF) transmitters (30 KHZ- 300KHZ)
• Medium frequency (MF) transmitters (300 KHZ-3 MHZ)
• High frequency (HF) transmitters (3 MHZ- 30MHZ)
• Very high frequency (VHF) transmitters (30MHZ-300 MHZ)
• Ultra high frequency (UHF) transmitters (300 MHZ- 3GHZ)
• Microwave transmitters (>3GHZ)
According to the power used
Low Level modulation transmitters.
High Level modulation transmitters.
Amplitude modulation technique is used in AM transmitters; here the amplitude of carrier is
varied in proportion with the amplitude of the modulating signal, keeping its frequency and
phase constant.
• Used in radio & TV broadcasting.
• In AM Transmitter, AM signal is transmitted by a transmitter.
• The information is contained in its amplitude variation.
Transmitters that transmit AM signals are known as AM transmitters. These transmitters are
used in medium wave (MW) and short wave (SW) frequency bands for AM broadcast. The
MW band has frequencies between 550 KHz and 1650 KHz, and the SW band has
frequencies ranging from 3 MHz to 30 MHz’s .The two types of AM transmitters that are
used based on their transmitting powers are:
· High Level
· Low Level
High level transmitters use high level modulation, and low level transmitters use low level
modulation. The choice between the two modulation schemes depends on the transmitting
power of the AM transmitter. In broadcast transmitters, where the transmitting power may be
of the order of kilowatts, high level modulation is employed. In low power transmitters,
where only a few watts of transmitting power are required , low level modulation is used.
High-Level and Low-Level Transmitters Below figures show the block diagram of high-level
and low-level transmitters. The basic difference between the two transmitters is the power
amplification of the carrier and modulating signals.
27
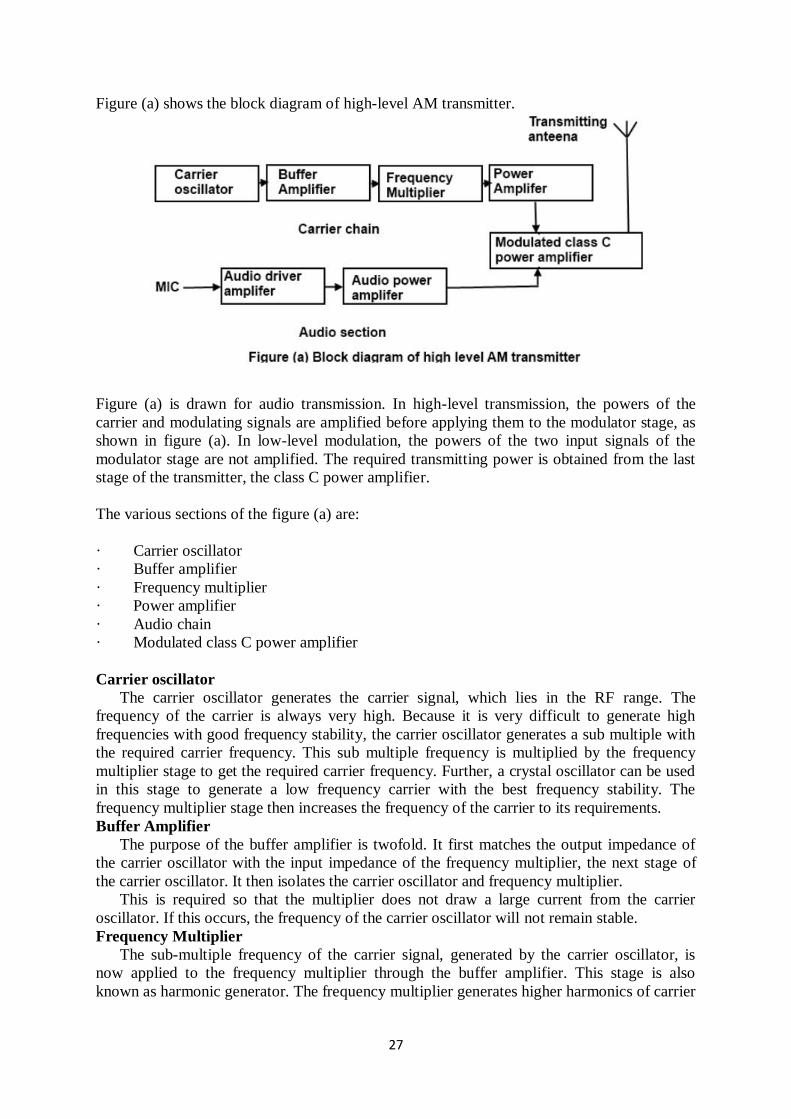
Figure (a) shows the block diagram of high-level AM transmitter.
Figure (a) is drawn for audio transmission. In high-level transmission, the powers of the
carrier and modulating signals are amplified before applying them to the modulator stage, as
shown in figure (a). In low-level modulation, the powers of the two input signals of the
modulator stage are not amplified. The required transmitting power is obtained from the last
stage of the transmitter, the class C power amplifier.
The various sections of the figure (a) are:
· Carrier oscillator
· Buffer amplifier
· Frequency multiplier
· Power amplifier
· Audio chain
· Modulated class C power amplifier
Carrier oscillator
The carrier oscillator generates the carrier signal, which lies in the RF range. The
frequency of the carrier is always very high. Because it is very difficult to generate high
frequencies with good frequency stability, the carrier oscillator generates a sub multiple with
the required carrier frequency. This sub multiple frequency is multiplied by the frequency
multiplier stage to get the required carrier frequency. Further, a crystal oscillator can be used
in this stage to generate a low frequency carrier with the best frequency stability. The
frequency multiplier stage then increases the frequency of the carrier to its requirements.
Buffer Amplifier
The purpose of the buffer amplifier is twofold. It first matches the output impedance of
the carrier oscillator with the input impedance of the frequency multiplier, the next stage of
the carrier oscillator. It then isolates the carrier oscillator and frequency multiplier.
This is required so that the multiplier does not draw a large current from the carrier
oscillator. If this occurs, the frequency of the carrier oscillator will not remain stable.
Frequency Multiplier
The sub-multiple frequency of the carrier signal, generated by the carrier oscillator, is
now applied to the frequency multiplier through the buffer amplifier. This stage is also
known as harmonic generator. The frequency multiplier generates higher harmonics of carrier
28
oscillator frequency. The frequency multiplier is a tuned circuit that can be tuned to the
requisite carrier frequency that is to be transmitted.
Power Amplifier The power of the carrier signal is then amplified in the power amplifier stage. This is the
basic requirement of a high-level transmitter. A class C power amplifier gives high power
current pulses of the carrier signal at its output.
Audio Chain The audio signal to be transmitted is obtained from the microphone, as shown in figure
(a). The audio driver amplifier amplifies the voltage of this signal. This amplification is
necessary to drive the audio power amplifier. Next, a class A or a class B power amplifier
amplifies the power of the audio signal.
Modulated Class C Amplifier
This is the output stage of the transmitter. The modulating audio signal and the carrier
signal, after power amplification, are applied to this modulating stage. The modulation takes
place at this stage. The class C amplifier also amplifies the power of the AM signal to the
reacquired transmitting power. This signal is finally passed to the antenna., which radiates the
signal into space of transmission.
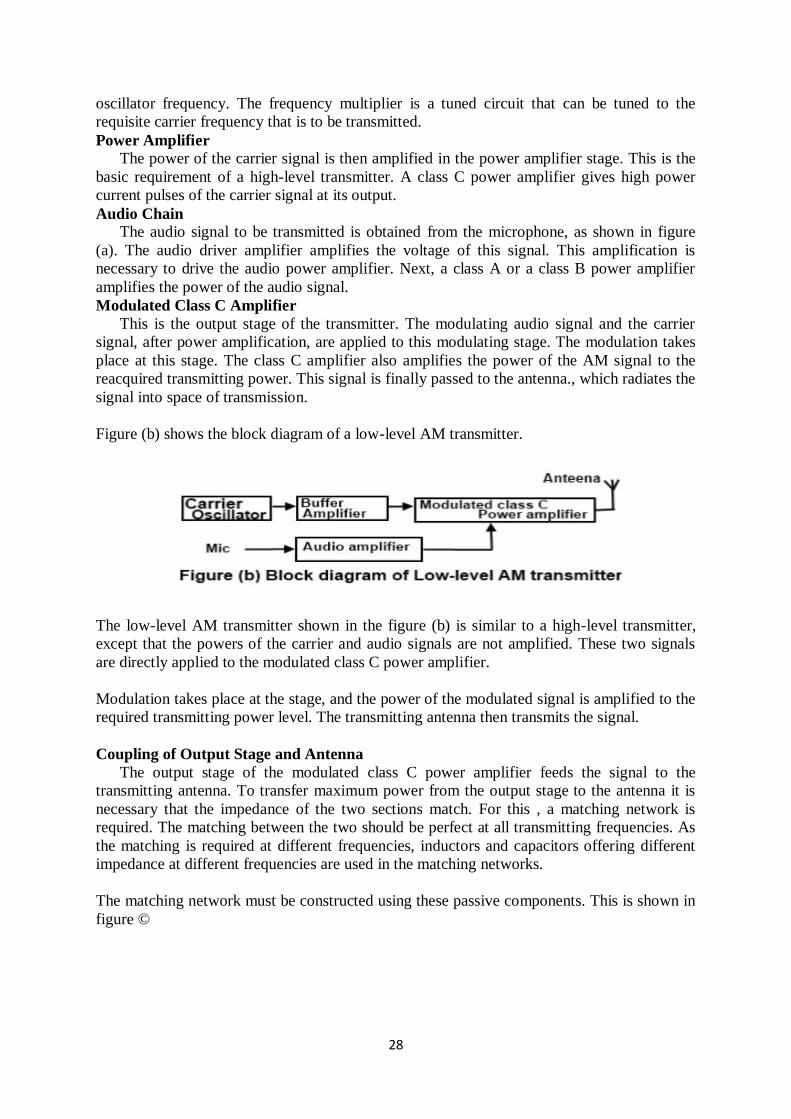
Figure (b) shows the block diagram of a low-level AM transmitter.
The low-level AM transmitter shown in the figure (b) is similar to a high-level transmitter,
except that the powers of the carrier and audio signals are not amplified. These two signals
are directly applied to the modulated class C power amplifier.
Modulation takes place at the stage, and the power of the modulated signal is amplified to the
required transmitting power level. The transmitting antenna then transmits the signal.
Coupling of Output Stage and Antenna
The output stage of the modulated class C power amplifier feeds the signal to the
transmitting antenna. To transfer maximum power from the output stage to the antenna it is
necessary that the impedance of the two sections match. For this , a matching network is
required. The matching between the two should be perfect at all transmitting frequencies. As
the matching is required at different frequencies, inductors and capacitors offering different
impedance at different frequencies are used in the matching networks.
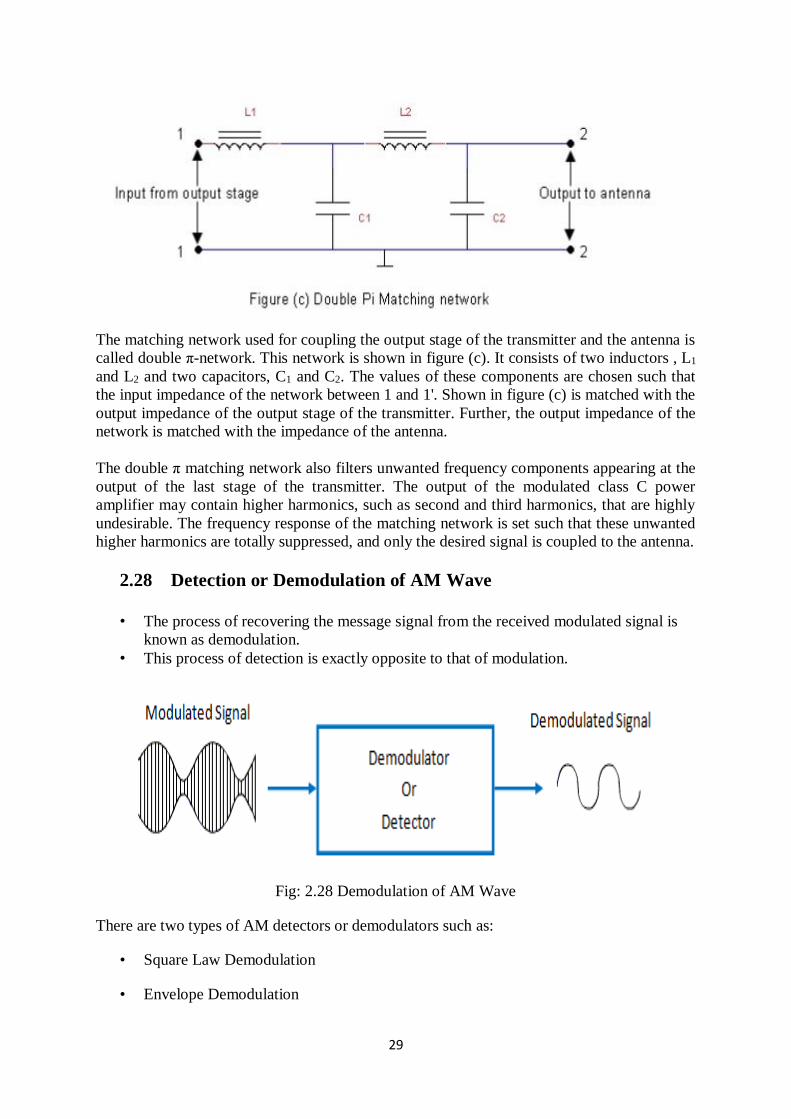
The matching network must be constructed using these passive components. This is shown in
figure ©
29
The matching network used for coupling the output stage of the transmitter and the antenna is
called double π-network. This network is shown in figure (c). It consists of two inductors , L1
and L2 and two capacitors, C1 and C2. The values of these components are chosen such that
the input impedance of the network between 1 and 1'. Shown in figure (c) is matched with the
output impedance of the output stage of the transmitter. Further, the output impedance of the
network is matched with the impedance of the antenna.
The double π matching network also filters unwanted frequency components appearing at the
output of the last stage of the transmitter. The output of the modulated class C power
amplifier may contain higher harmonics, such as second and third harmonics, that are highly
undesirable. The frequency response of the matching network is set such that these unwanted
higher harmonics are totally suppressed, and only the desired signal is coupled to the antenna.
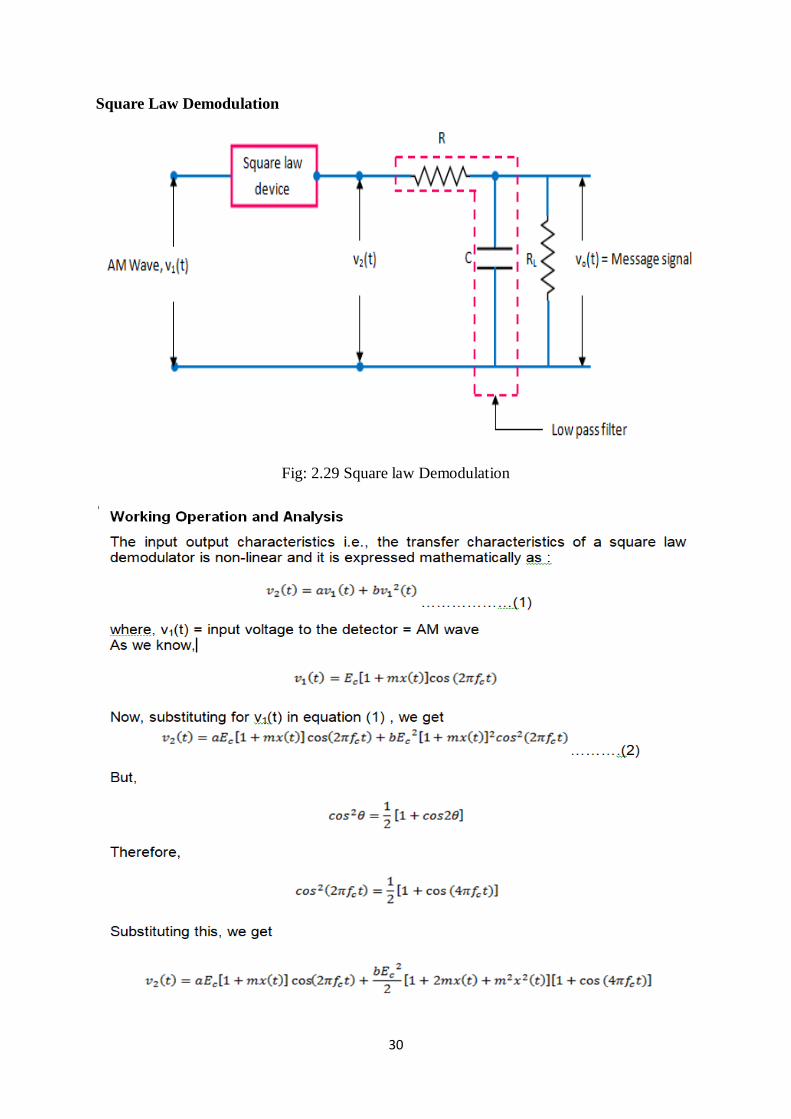
2.28 Detection or Demodulation of AM Wave
• The process of recovering the message signal from the received modulated signal is
known as demodulation.
• This process of detection is exactly opposite to that of modulation.
Fig: 2.28 Demodulation of AM Wave
There are two types of AM detectors or demodulators such as:
• Square Law Demodulation
• Envelope Demodulation
30
Square Law Demodulation
Fig: 2.29 Square law Demodulation
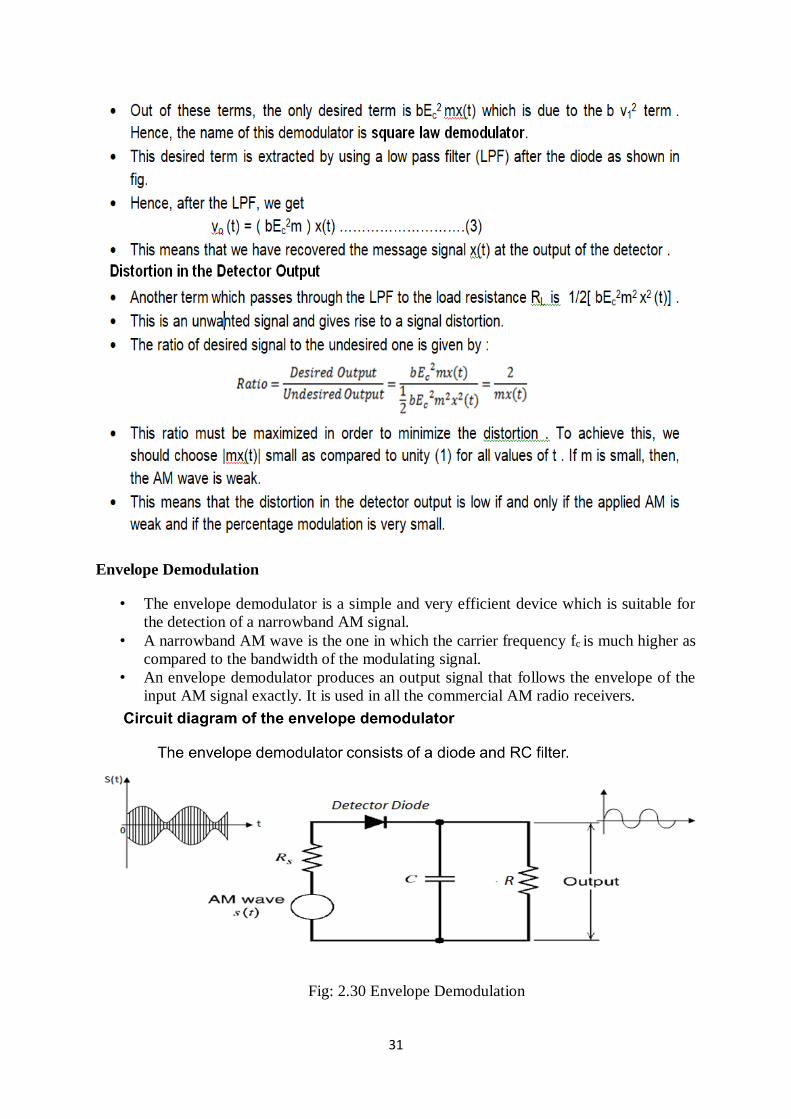
31
Envelope Demodulation
• The envelope demodulator is a simple and very efficient device which is suitable for
the detection of a narrowband AM signal.
• A narrowband AM wave is the one in which the carrier frequency fc is much higher as
compared to the bandwidth of the modulating signal.
• An envelope demodulator produces an output signal that follows the envelope of the
input AM signal exactly. It is used in all the commercial AM radio receivers.
Fig: 2.30 Envelope Demodulation
32
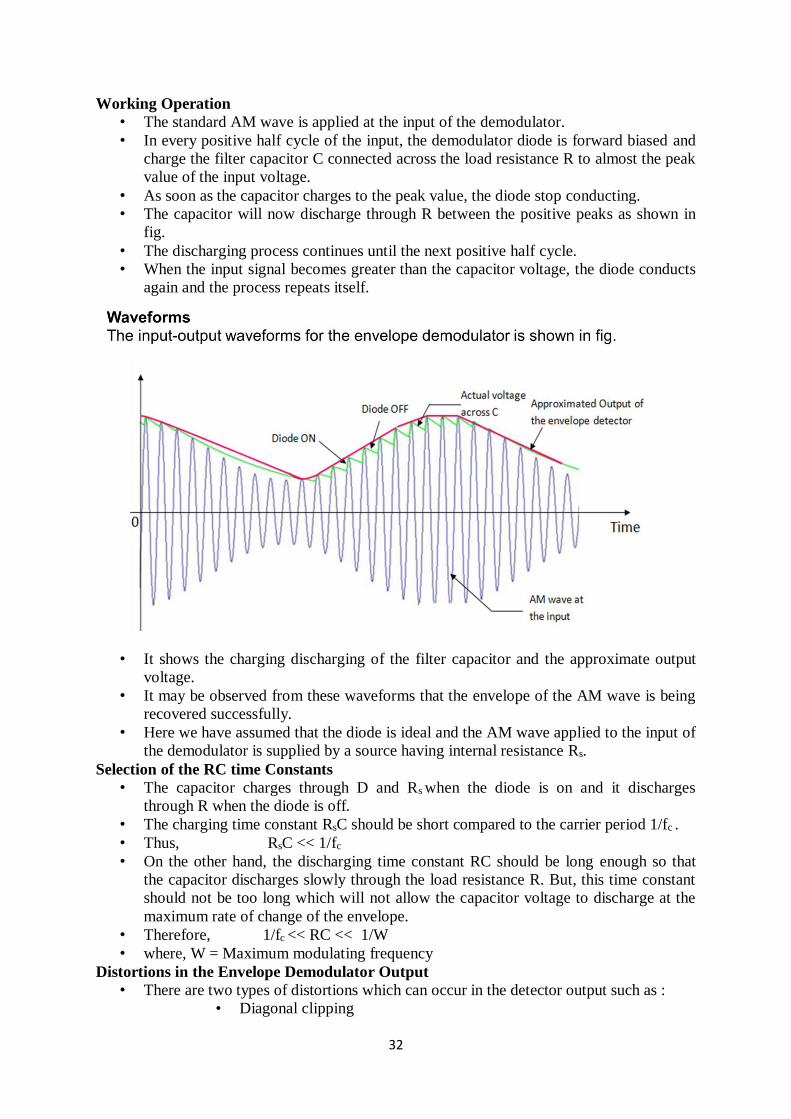
Working Operation
• The standard AM wave is applied at the input of the demodulator.
• In every positive half cycle of the input, the demodulator diode is forward biased and
charge the filter capacitor C connected across the load resistance R to almost the peak
value of the input voltage.
• As soon as the capacitor charges to the peak value, the diode stop conducting.
• The capacitor will now discharge through R between the positive peaks as shown in
fig.
• The discharging process continues until the next positive half cycle.
• When the input signal becomes greater than the capacitor voltage, the diode conducts
again and the process repeats itself.
• It shows the charging discharging of the filter capacitor and the approximate output
voltage.
• It may be observed from these waveforms that the envelope of the AM wave is being
recovered successfully.
• Here we have assumed that the diode is ideal and the AM wave applied to the input of
the demodulator is supplied by a source having internal resistance Rs.
Selection of the RC time Constants
• The capacitor charges through D and Rs when the diode is on and it discharges
through R when the diode is off.
• The charging time constant RsC should be short compared to the carrier period 1/fc .
• Thus, RsC << 1/fc
• On the other hand, the discharging time constant RC should be long enough so that
the capacitor discharges slowly through the load resistance R. But, this time constant
should not be too long which will not allow the capacitor voltage to discharge at the
maximum rate of change of the envelope.
• Therefore, 1/fc << RC << 1/W
• where, W = Maximum modulating frequency
Distortions in the Envelope Demodulator Output
• There are two types of distortions which can occur in the detector output such as :
• Diagonal clipping
33
• Negative peak clipping
•
Diagonal Clipping
• This type of distortion occurs when the RC time constant of the load circuit is too
long.
• Due to this, the RC circuit cannot follow the fast changes in the modulating envelope
.
The diagonal clipping is shown in fig.
Fig: 2.31 Diagonal Clipping
Negative Peak Clipping
• This distortion occurs due to a fact that the modulation index on the output side of the
detector is higher than that on its input side.
• Hence, at higher depth of modulation of the transmitted signal, the over modulation
may takes place at the output of the detector.
• The negative peak clipping will take place as a result of this over modulation as
shown in fig.
Fig: 2.32 Negative Clipping
34
2.29 AM Receiver
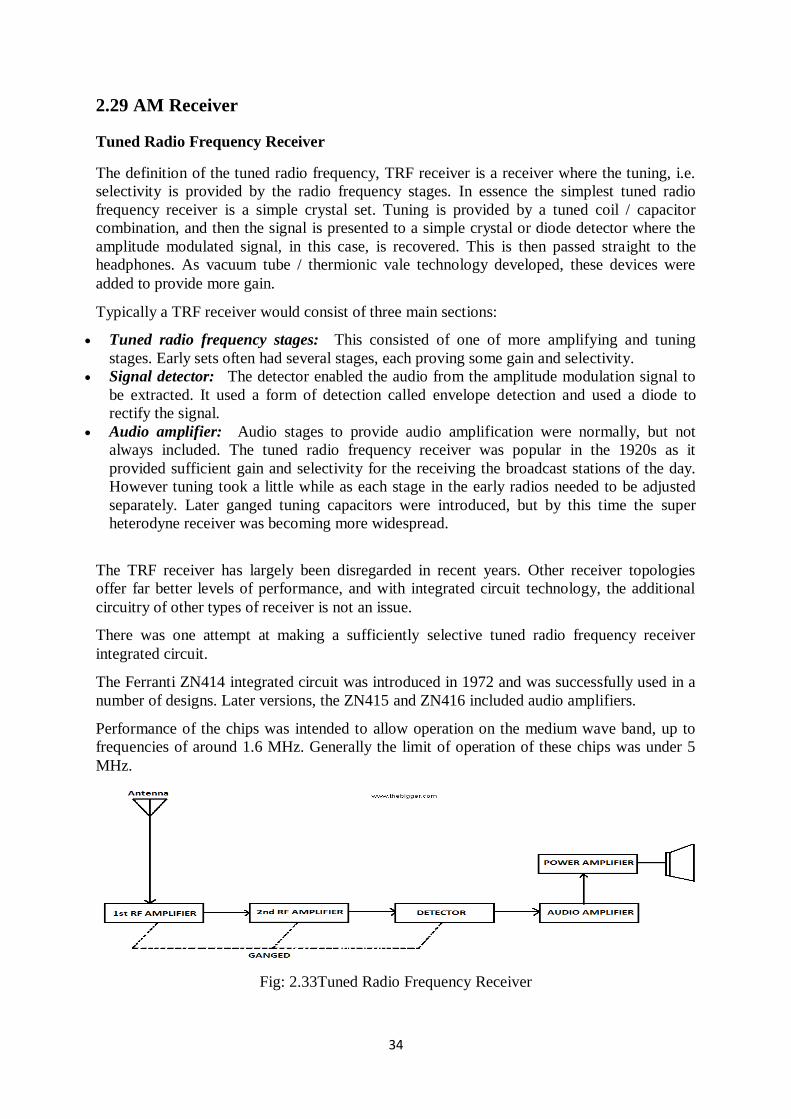
Tuned Radio Frequency Receiver
The definition of the tuned radio frequency, TRF receiver is a receiver where the tuning, i.e.
selectivity is provided by the radio frequency stages. In essence the simplest tuned radio
frequency receiver is a simple crystal set. Tuning is provided by a tuned coil / capacitor
combination, and then the signal is presented to a simple crystal or diode detector where the
amplitude modulated signal, in this case, is recovered. This is then passed straight to the
headphones. As vacuum tube / thermionic vale technology developed, these devices were
added to provide more gain.
Typically a TRF receiver would consist of three main sections:
Tuned radio frequency stages: This consisted of one of more amplifying and tuning
stages. Early sets often had several stages, each proving some gain and selectivity.
Signal detector: The detector enabled the audio from the amplitude modulation signal to
be extracted. It used a form of detection called envelope detection and used a diode to
rectify the signal.
Audio amplifier: Audio stages to provide audio amplification were normally, but not
always included. The tuned radio frequency receiver was popular in the 1920s as it
provided sufficient gain and selectivity for the receiving the broadcast stations of the day.
However tuning took a little while as each stage in the early radios needed to be adjusted
separately. Later ganged tuning capacitors were introduced, but by this time the super
heterodyne receiver was becoming more widespread.
The TRF receiver has largely been disregarded in recent years. Other receiver topologies
offer far better levels of performance, and with integrated circuit technology, the additional
circuitry of other types of receiver is not an issue.
There was one attempt at making a sufficiently selective tuned radio frequency receiver
integrated circuit.
The Ferranti ZN414 integrated circuit was introduced in 1972 and was successfully used in a
number of designs. Later versions, the ZN415 and ZN416 included audio amplifiers.
Performance of the chips was intended to allow operation on the medium wave band, up to
frequencies of around 1.6 MHz. Generally the limit of operation of these chips was under 5
MHz.
Fig: 2.33Tuned Radio Frequency Receiver
35
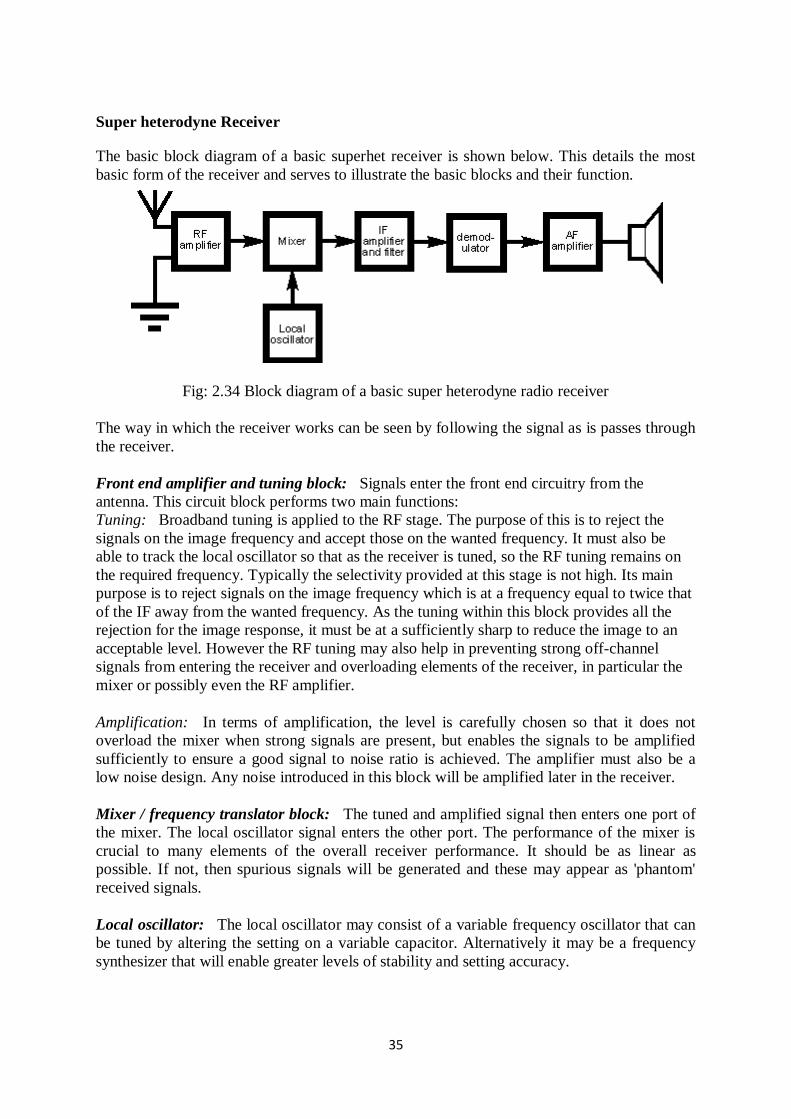
Super heterodyne Receiver
The basic block diagram of a basic superhet receiver is shown below. This details the most
basic form of the receiver and serves to illustrate the basic blocks and their function.
Fig: 2.34 Block diagram of a basic super heterodyne radio receiver
The way in which the receiver works can be seen by following the signal as is passes through
the receiver.
Front end amplifier and tuning block: Signals enter the front end circuitry from the
antenna. This circuit block performs two main functions:
Tuning: Broadband tuning is applied to the RF stage. The purpose of this is to reject the
signals on the image frequency and accept those on the wanted frequency. It must also be
able to track the local oscillator so that as the receiver is tuned, so the RF tuning remains on
the required frequency. Typically the selectivity provided at this stage is not high. Its main
purpose is to reject signals on the image frequency which is at a frequency equal to twice that
of the IF away from the wanted frequency. As the tuning within this block provides all the
rejection for the image response, it must be at a sufficiently sharp to reduce the image to an
acceptable level. However the RF tuning may also help in preventing strong off-channel
signals from entering the receiver and overloading elements of the receiver, in particular the
mixer or possibly even the RF amplifier.
Amplification: In terms of amplification, the level is carefully chosen so that it does not
overload the mixer when strong signals are present, but enables the signals to be amplified
sufficiently to ensure a good signal to noise ratio is achieved. The amplifier must also be a
low noise design. Any noise introduced in this block will be amplified later in the receiver.
Mixer / frequency translator block: The tuned and amplified signal then enters one port of
the mixer. The local oscillator signal enters the other port. The performance of the mixer is
crucial to many elements of the overall receiver performance. It should be as linear as
possible. If not, then spurious signals will be generated and these may appear as 'phantom'
received signals.
Local oscillator: The local oscillator may consist of a variable frequency oscillator that can
be tuned by altering the setting on a variable capacitor. Alternatively it may be a frequency
synthesizer that will enable greater levels of stability and setting accuracy.
36
Intermediate frequency amplifier, IF block: Once the signals leave the mixer they enter the
IF stages. These stages contain most of the amplification in the receiver as well as the
filtering that enables signals on one frequency to be separated from those on the next. Filters
may consist simply of LC tuned transformers providing inter-stage coupling, or they may be
much higher performance ceramic or even crystal filters, dependent upon what is required.
Detector / demodulator stage: Once the signals have passed through the IF stages of the
super heterodyne receiver, they need to be demodulated. Different demodulators are required
for different types of transmission, and as a result some receivers may have a variety of
demodulators that can be switched in to accommodate the different types of transmission that
are to be encountered. Different demodulators used may include:
AM diode detector: This is the most basic form of detector and this circuit block would
simple consist of a diode and possibly a small capacitor to remove any remaining RF. The
detector is cheap and its performance is adequate, requiring a sufficient voltage to overcome
the diode forward drop. It is also not particularly linear, and finally it is subject to the effects
of selective fading that can be apparent, especially on the HF bands.
Synchronous AM detector: This form of AM detector block is used in where improved
performance is needed. It mixes the incoming AM signal with another on the same frequency
as the carrier. This second signal can be developed by passing the whole signal through a
squaring amplifier. The advantages of the synchronous AM detector are that it provides a far
more linear demodulation performance and it is far less subject to the problems of selective
fading.
SSB product detector: The SSB product detector block consists of a mixer and a local
oscillator, often termed a beat frequency oscillator, BFO or carrier insertion oscillator, CIO.
This form of detector is used for Morse code transmissions where the BFO is used to create
an audible tone in line with the on-off keying of the transmitted carrier. Without this the
carrier without modulation is difficult to detect. For SSB, the CIO re-inserts the carrier to
make the modulation comprehensible.
Basic FM detector: As an FM signal carries no amplitude variations a demodulator block
that senses frequency variations is required. It should also be insensitive to amplitude
variations as these could add extra noise. Simple FM detectors such as the Foster Seeley or
ratio detectors can be made from discrete components although they do require the use of
transformers.
PLL FM detector: A phase locked loop can be used to make a very good FM demodulator.
The incoming FM signal can be fed into the reference input, and the VCO drive voltage used
to provide the detected audio output.
Quadrature FM detector: This form of FM detector block is widely used within ICs. IT is
simple to implement and provides a good linear output.
Audio amplifier: The output from the demodulator is the recovered audio. This is passed
into the audio stages where they are amplified and presented to the headphones or
loudspeaker.
1
SCHOOL OF BIO AND CHEMICAL ENGINEERING
DEPARTMENT OF BIOMEDICAL ENGINEERING
UNIT – III –BIOTELEMETRY– SBM1401
2
3. ANGLE MODULATION
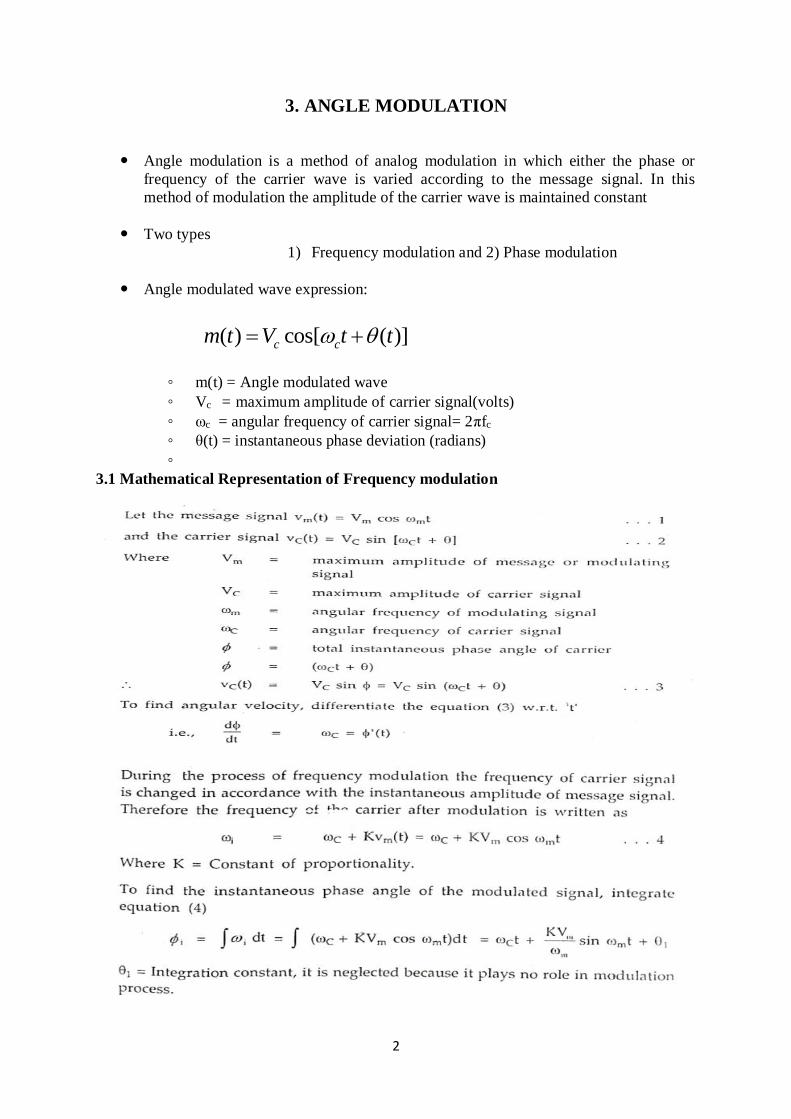
Angle modulation is a method of analog modulation in which either the phase or
frequency of the carrier wave is varied according to the message signal. In this
method of modulation the amplitude of the carrier wave is maintained constant
Two types
1) Frequency modulation and 2) Phase modulation
Angle modulated wave expression:
◦ m(t) = Angle modulated wave
◦ Vc = maximum amplitude of carrier signal(volts)
◦ ωc = angular frequency of carrier signal= 2πfc
◦ θ(t) = instantaneous phase deviation (radians)
◦
3.1 Mathematical Representation of Frequency modulation
( ) cos[ ( )]c cm t V t t
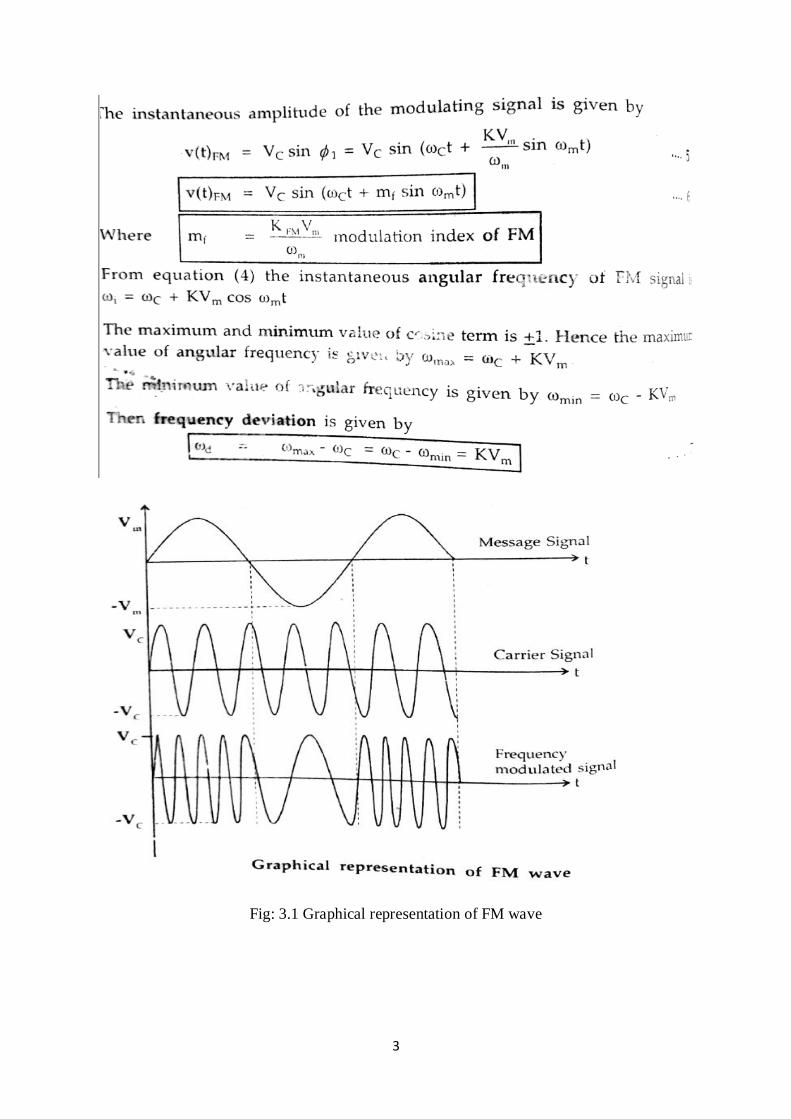
3
Fig: 3.1 Graphical representation of FM wave
4
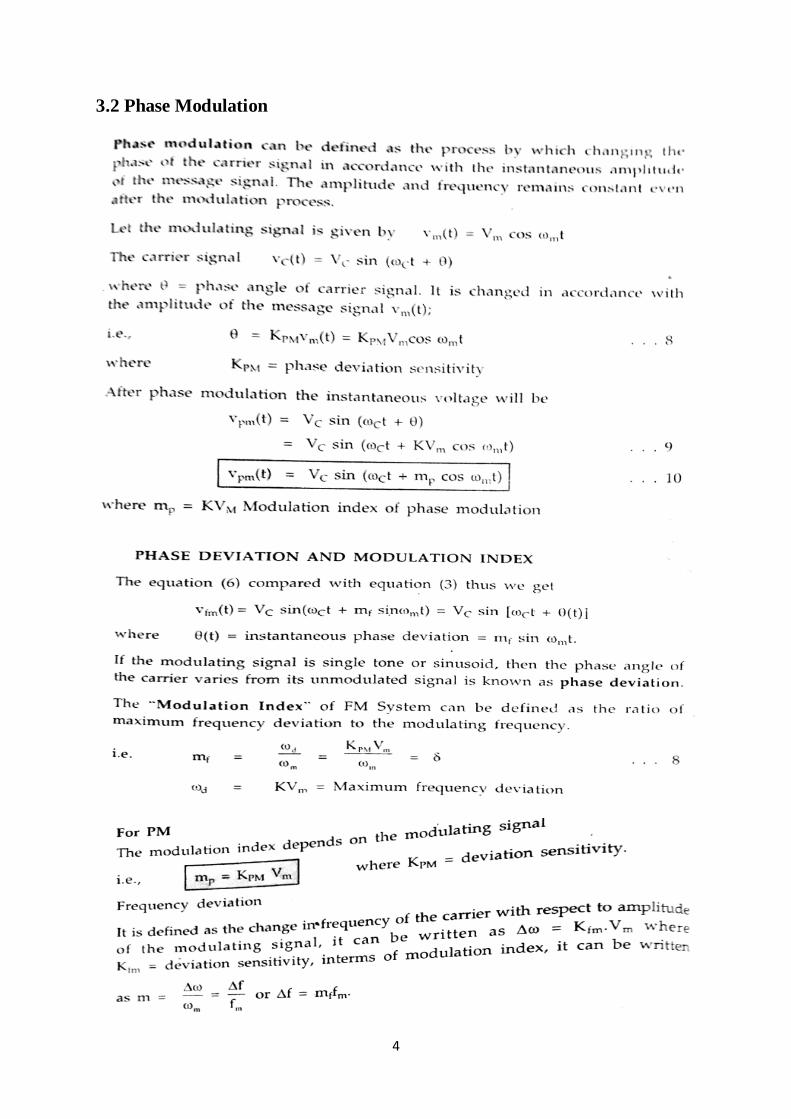
3.2 Phase Modulation
5
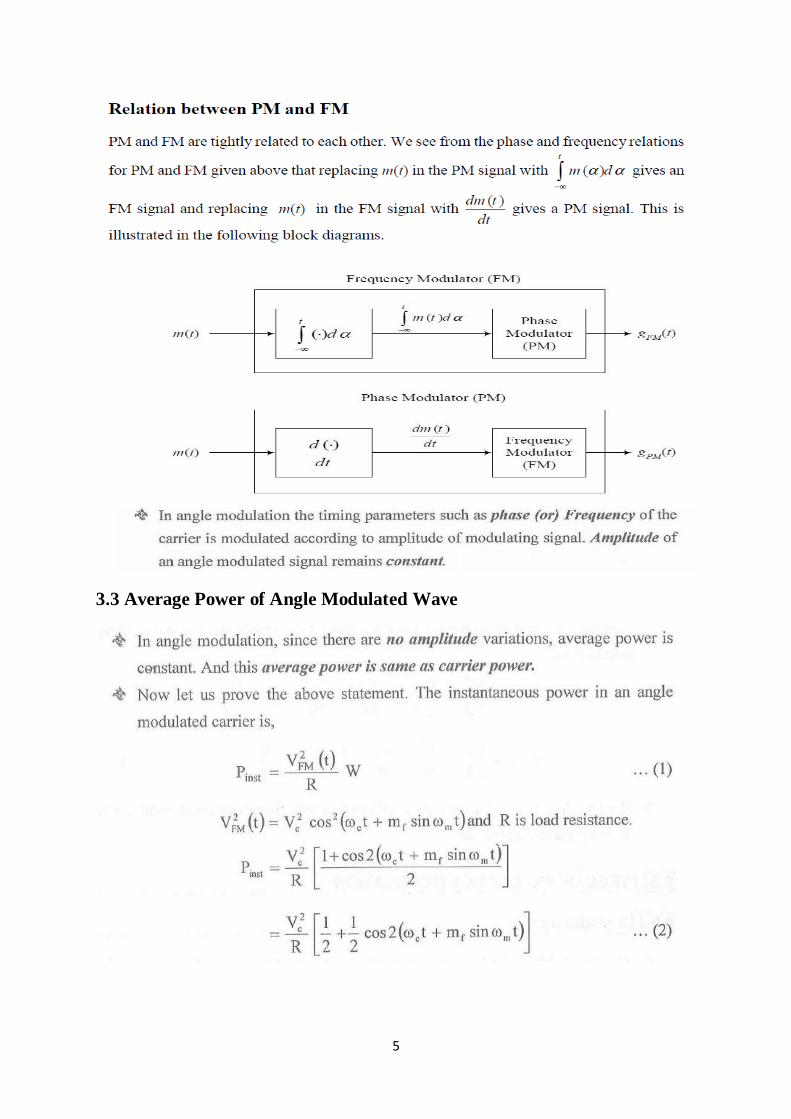
3.3 Average Power of Angle Modulated Wave
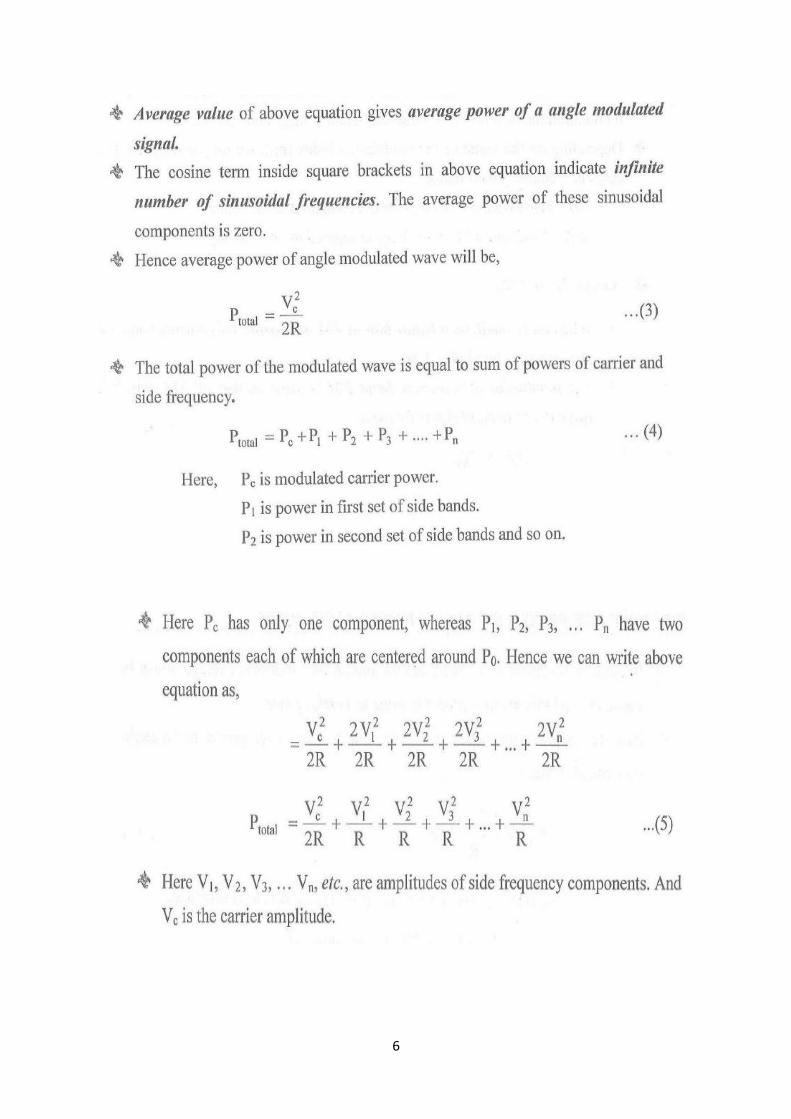
6
7
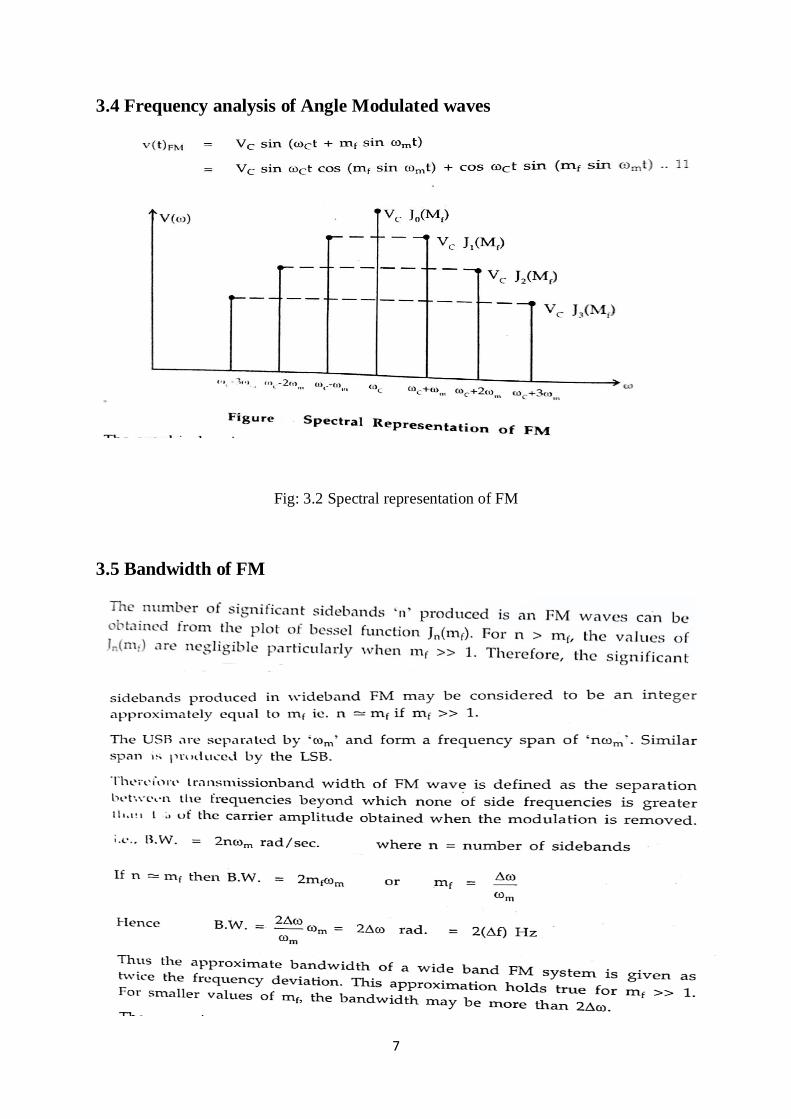
3.4 Frequency analysis of Angle Modulated waves
Fig: 3.2 Spectral representation of FM
3.5 Bandwidth of FM
8
3.6 Generation of FM
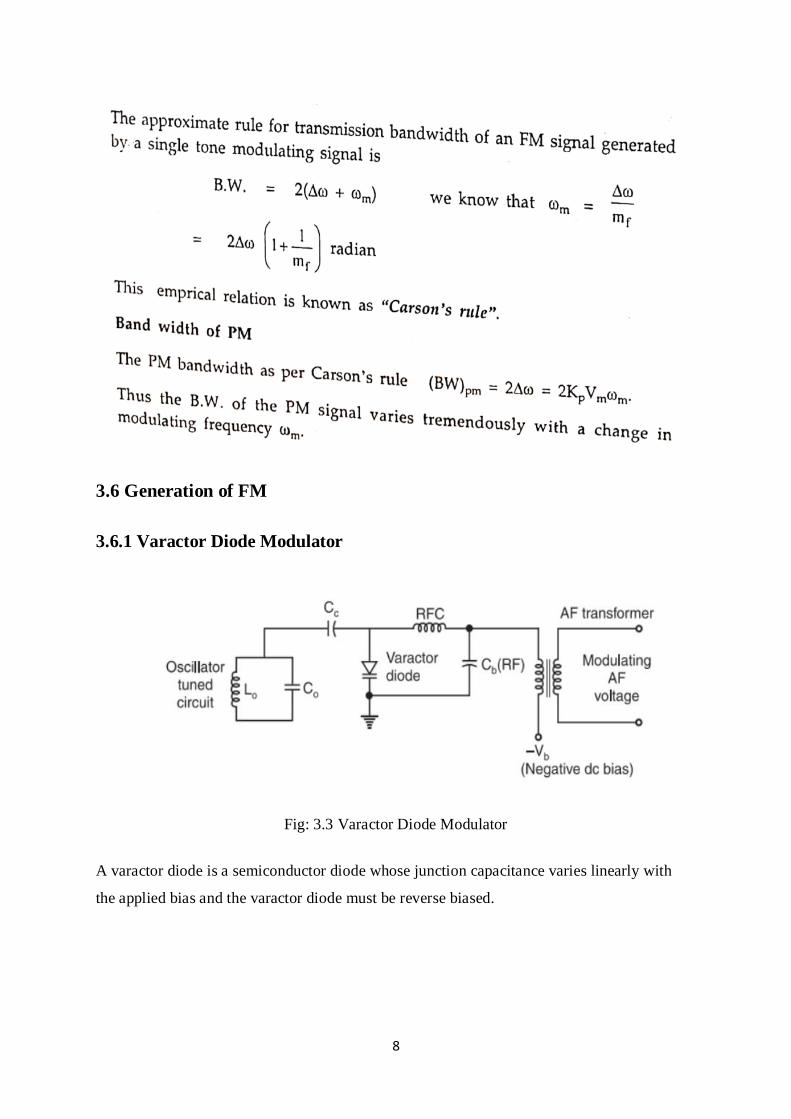
3.6.1 Varactor Diode Modulator
Fig: 3.3 Varactor Diode Modulator
A varactor diode is a semiconductor diode whose junction capacitance varies linearly with
the applied bias and the varactor diode must be reverse biased.
9
Working Operation
The varactor diode is reverse biased by the negative dc source –Vb. The modulating AF
voltage appears in series with the negative supply voltage. Hence, the voltage applied across
the varactor diode varies in proportion with the modulating voltage. This will vary the
junction capacitance of the varactor diode. The varactor diode appears in parallel with the
oscillator tuned circuit. Hence the oscillator frequency will change with change in varactor
diode capacitance and FM wave is produced. The RFC will connect the dc and modulating
signal to the varactor diode but it offers very high impedance at high oscillator frequency.
Therefore, the oscillator circuit is isolated from the dc bias and modulating signal.
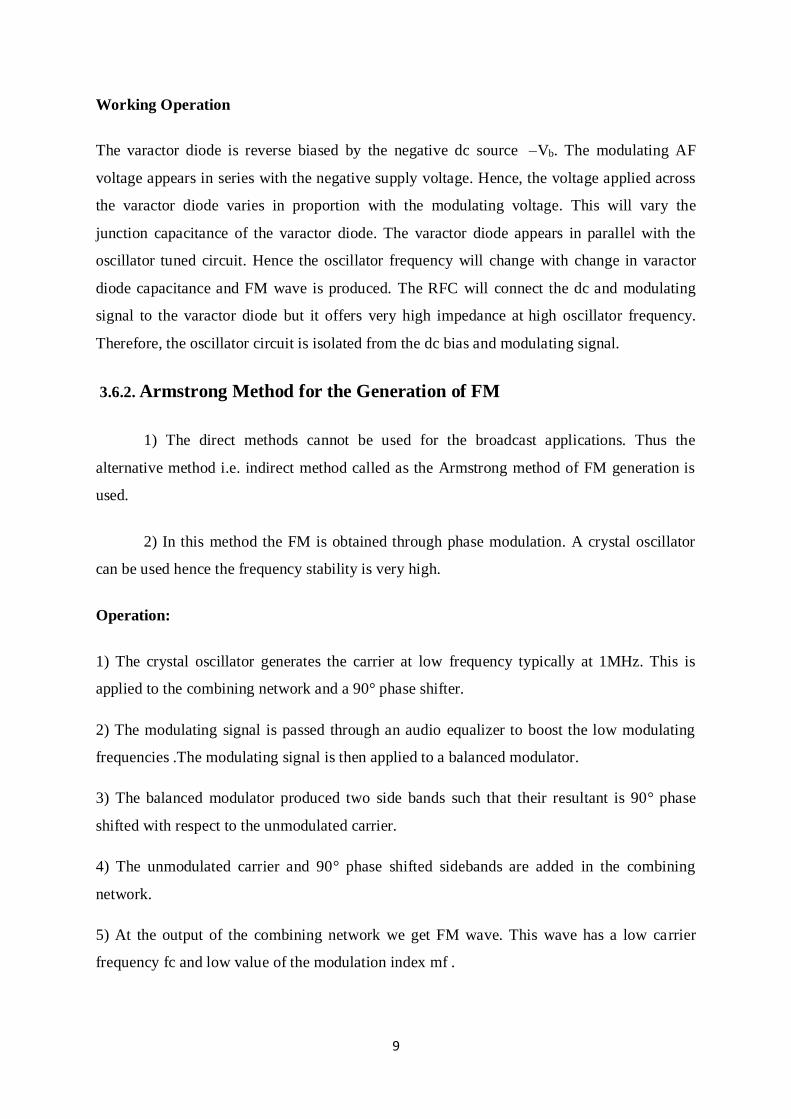
3.6.2. Armstrong Method for the Generation of FM
1) The direct methods cannot be used for the broadcast applications. Thus the
alternative method i.e. indirect method called as the Armstrong method of FM generation is
used.
2) In this method the FM is obtained through phase modulation. A crystal oscillator
can be used hence the frequency stability is very high.
Operation:
1) The crystal oscillator generates the carrier at low frequency typically at 1MHz. This is
applied to the combining network and a 90° phase shifter.
2) The modulating signal is passed through an audio equalizer to boost the low modulating
frequencies .The modulating signal is then applied to a balanced modulator.
3) The balanced modulator produced two side bands such that their resultant is 90° phase
shifted with respect to the unmodulated carrier.
4) The unmodulated carrier and 90° phase shifted sidebands are added in the combining
network.
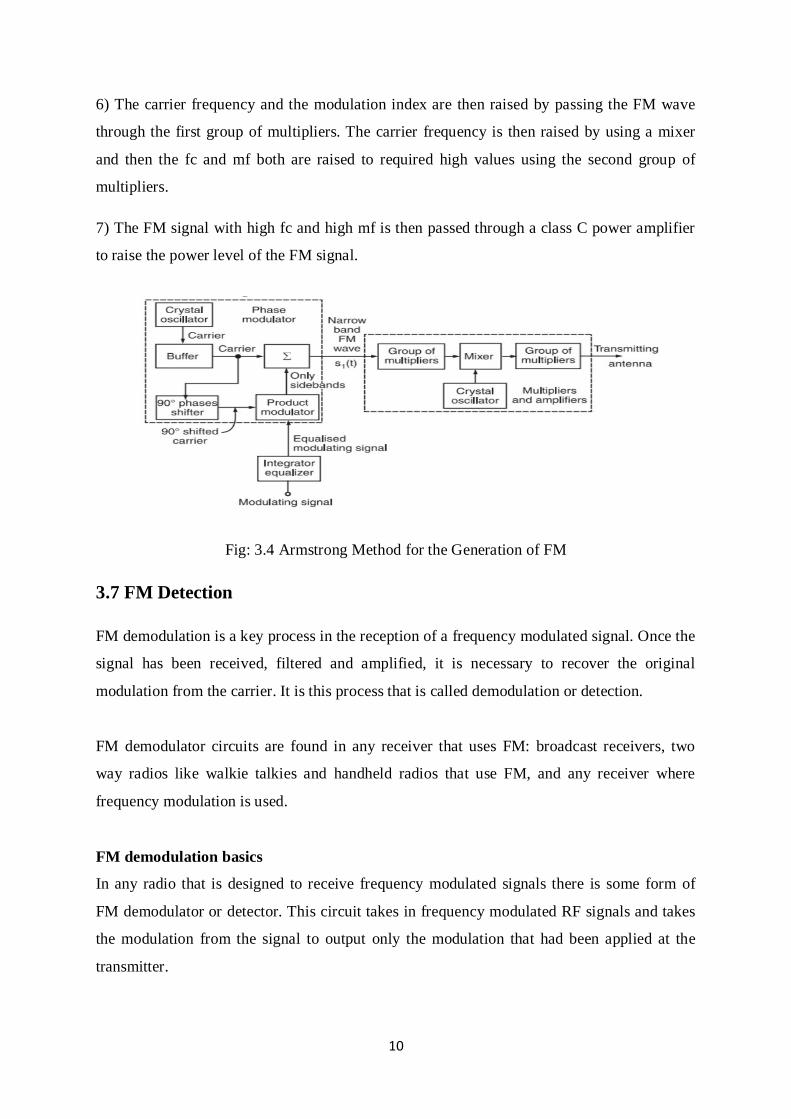
5) At the output of the combining network we get FM wave. This wave has a low carrier
frequency fc and low value of the modulation index mf .
10
6) The carrier frequency and the modulation index are then raised by passing the FM wave
through the first group of multipliers. The carrier frequency is then raised by using a mixer
and then the fc and mf both are raised to required high values using the second group of
multipliers.
7) The FM signal with high fc and high mf is then passed through a class C power amplifier
to raise the power level of the FM signal.
Fig: 3.4 Armstrong Method for the Generation of FM
3.7 FM Detection
FM demodulation is a key process in the reception of a frequency modulated signal. Once the
signal has been received, filtered and amplified, it is necessary to recover the original
modulation from the carrier. It is this process that is called demodulation or detection.
FM demodulator circuits are found in any receiver that uses FM: broadcast receivers, two
way radios like walkie talkies and handheld radios that use FM, and any receiver where
frequency modulation is used.
FM demodulation basics
In any radio that is designed to receive frequency modulated signals there is some form of
FM demodulator or detector. This circuit takes in frequency modulated RF signals and takes
the modulation from the signal to output only the modulation that had been applied at the
transmitter.
11
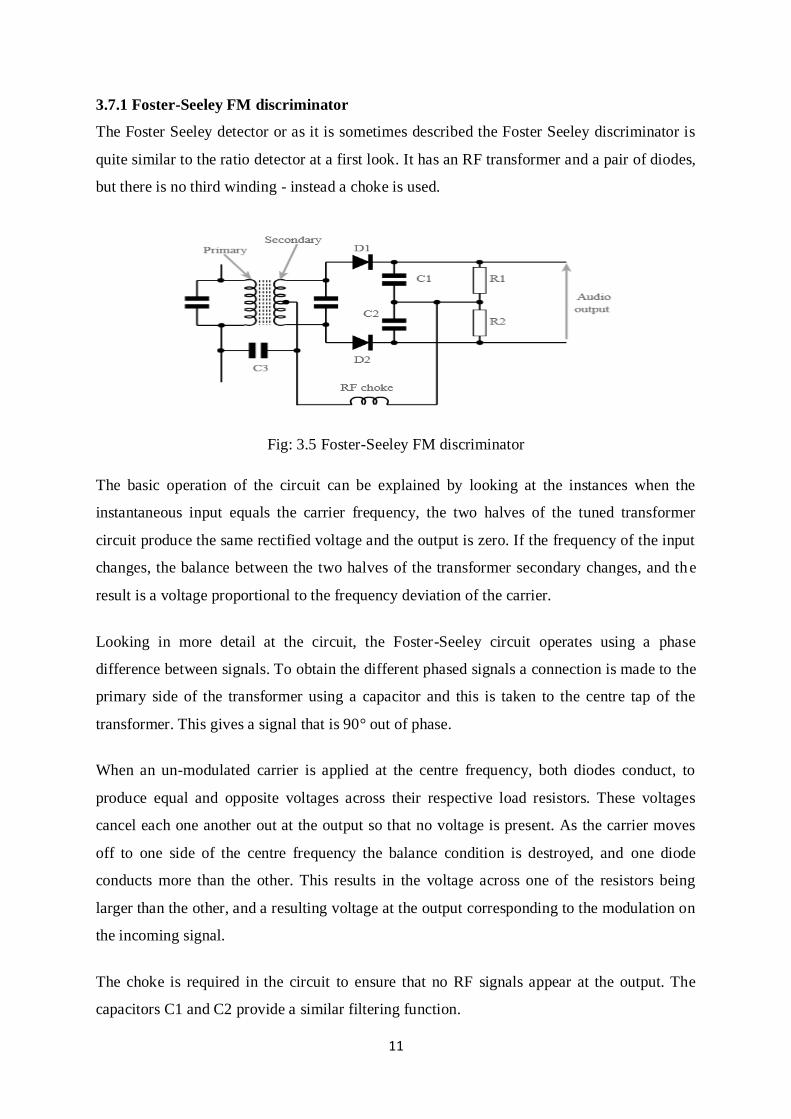
3.7.1 Foster-Seeley FM discriminator
The Foster Seeley detector or as it is sometimes described the Foster Seeley discriminator is
quite similar to the ratio detector at a first look. It has an RF transformer and a pair of diodes,
but there is no third winding - instead a choke is used.
Fig: 3.5 Foster-Seeley FM discriminator
The basic operation of the circuit can be explained by looking at the instances when the
instantaneous input equals the carrier frequency, the two halves of the tuned transformer
circuit produce the same rectified voltage and the output is zero. If the frequency of the input
changes, the balance between the two halves of the transformer secondary changes, and the
result is a voltage proportional to the frequency deviation of the carrier.
Looking in more detail at the circuit, the Foster-Seeley circuit operates using a phase
difference between signals. To obtain the different phased signals a connection is made to the
primary side of the transformer using a capacitor and this is taken to the centre tap of the
transformer. This gives a signal that is 90° out of phase.
When an un-modulated carrier is applied at the centre frequency, both diodes conduct, to
produce equal and opposite voltages across their respective load resistors. These voltages
cancel each one another out at the output so that no voltage is present. As the carrier moves
off to one side of the centre frequency the balance condition is destroyed, and one diode
conducts more than the other. This results in the voltage across one of the resistors being
larger than the other, and a resulting voltage at the output corresponding to the modulation on
the incoming signal.
The choke is required in the circuit to ensure that no RF signals appear at the output. The
capacitors C1 and C2 provide a similar filtering function.
12
Both the ratio detector and Foster-Seeley detectors are expensive to manufacture. Any wound
components like the RF transformers are expensive to manufacture when compared with
integrated circuits produced in vast numbers. As a result the Foster Seeley discriminator as
well as the ratio detector circuits is rarely used in modern radio receivers as FM
demodulators.
Foster Seeley circuit for frequency control
Prior to the introduction of very stable local oscillators within superhet radios - the universal
format for radios receiving FM, local oscillators had a tendency to drift. Drift was a major
factor in domestic radio receivers, although it was present in all radios.
When receiving FM signals the drift meant that the incoming FM signal might drift away
from being at the centre of the FM detector slope onto the non-linear portions. This meant
that the signal would become distorted.
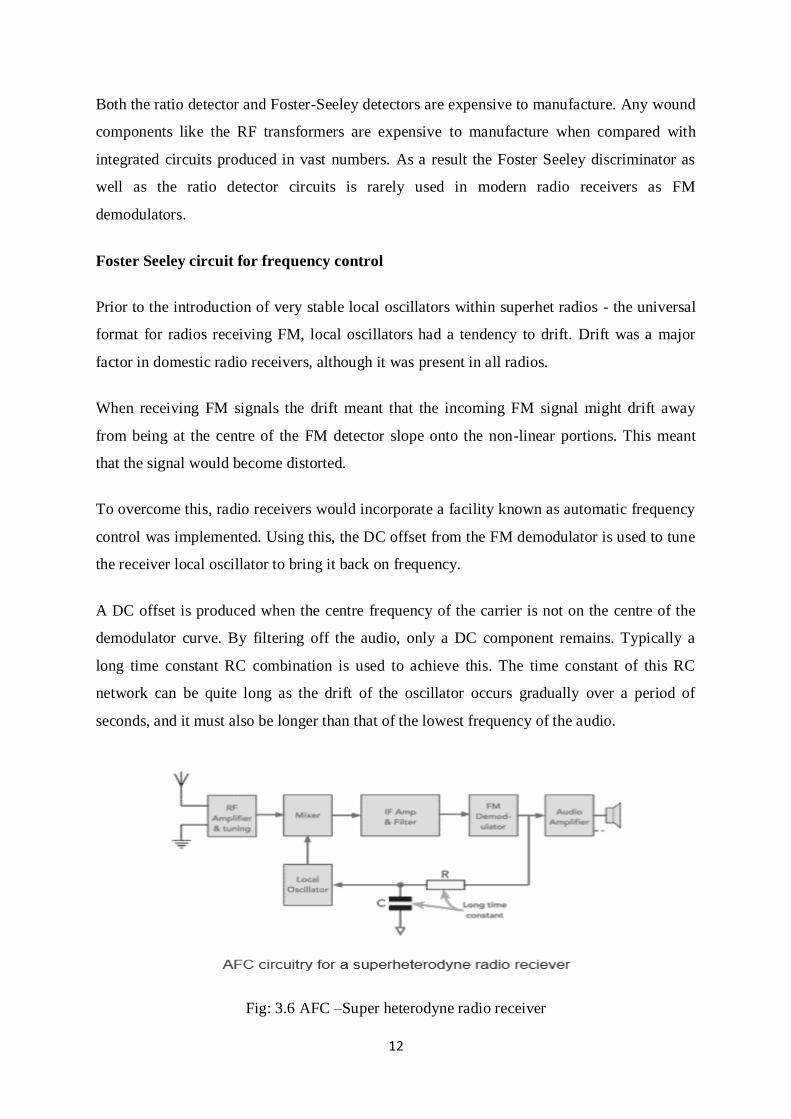
To overcome this, radio receivers would incorporate a facility known as automatic frequency
control was implemented. Using this, the DC offset from the FM demodulator is used to tune
the receiver local oscillator to bring it back on frequency.
A DC offset is produced when the centre frequency of the carrier is not on the centre of the
demodulator curve. By filtering off the audio, only a DC component remains. Typically a
long time constant RC combination is used to achieve this. The time constant of this RC
network can be quite long as the drift of the oscillator occurs gradually over a period of
seconds, and it must also be longer than that of the lowest frequency of the audio.
Fig: 3.6 AFC –Super heterodyne radio receiver
13
The filtered voltage is applied to a varactor diode within the local oscillator such that it
causes the local oscillator to remain on tune for the FM signal being received. In this way the
receiver can operate so that the signal being received is demodulated within the linear region
of the FM demodulator.
Essentially the effect of the AFC circuitry is to create a form of negative feedback loop that
seeks to keep the centre of the FM signal at the centre of the FM demodulation S curve. It is
essentially a frequency locked loop.
Most radios used for FM reception that have free running local oscillators incorporate an
automatic frequency control, AFC circuit. It uses only a few components and it provides for a
significant improvement in the performance of the receiver, enabling the FM signal to be
demodulated with minimum distortion despite the drift of the local oscillator signal.
Prior to the widespread introduction of frequency synthesizers, AFC was not always used in
radios such as walkie talkies and handhelds radios aimed at for two way radio
communications applications as they tended to use crystal controlled oscillators and these did
not drift to any major degree. Hence there was fewer requirements for an AFC
3.7.2 Ratio Detector Circuit
In the Foster-Seeley discriminator, changes in the magnitude of the input signal will
give rise to amplitude changes in the resulting output voltage. This makes prior limiting
necessary. It is possible to modify the discriminator circuit to provide limiting, so that the
amplitude limiter may be dispensed with. A circuit so modified is called a Ratio Detector
Circuit.
14
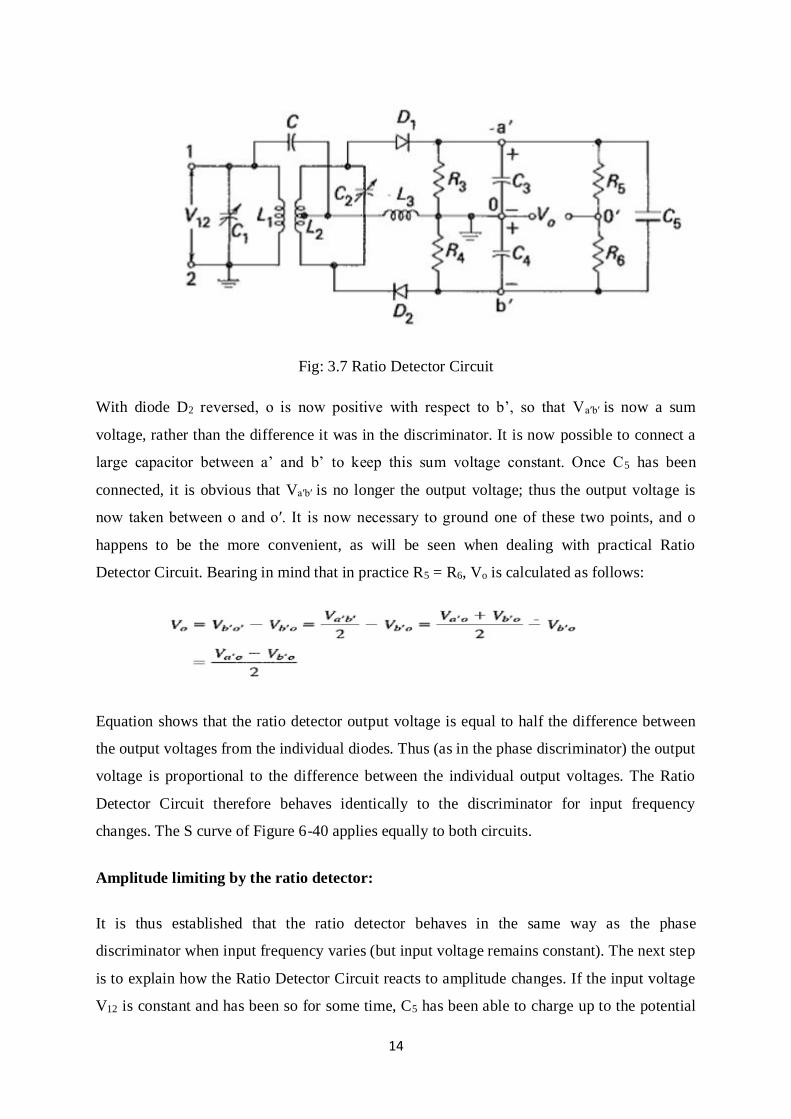
Fig: 3.7 Ratio Detector Circuit
With diode D2 reversed, o is now positive with respect to b’, so that Va′b′ is now a sum
voltage, rather than the difference it was in the discriminator. It is now possible to connect a
large capacitor between a’ and b’ to keep this sum voltage constant. Once C5 has been
connected, it is obvious that Va′b′ is no longer the output voltage; thus the output voltage is
now taken between o and o′. It is now necessary to ground one of these two points, and o
happens to be the more convenient, as will be seen when dealing with practical Ratio
Detector Circuit. Bearing in mind that in practice R5 = R6, Vo is calculated as follows:
Equation shows that the ratio detector output voltage is equal to half the difference between
the output voltages from the individual diodes. Thus (as in the phase discriminator) the output
voltage is proportional to the difference between the individual output voltages. The Ratio
Detector Circuit therefore behaves identically to the discriminator for input frequency
changes. The S curve of Figure 6-40 applies equally to both circuits.
Amplitude limiting by the ratio detector:
It is thus established that the ratio detector behaves in the same way as the phase
discriminator when input frequency varies (but input voltage remains constant). The next step
is to explain how the Ratio Detector Circuit reacts to amplitude changes. If the input voltage
V12 is constant and has been so for some time, C5 has been able to charge up to the potential
15
existing between a’ and b’. Since this is a dc voltage if V12 is constant, there will be no
current either flowing in to charge the capacitor or flowing out to discharge it. In other words,
the input impedance of C5 is infinite. The total load impedance for the two diodes is therefore
the sum of R3 and R4, since these are in practice much smaller than R5 and R6.
If V12 tries to increase, C5 will tend to oppose any rise in Vo. The way in which it does this is
not, however, merely to have a fairly long time constant, although this is certainly part of the
operation. As soon as the input voltage tries to rise, extra diode current flows, but this excess
current flow into the capacitor C5, were charging it. The voltage Va′b′ remains constant at first
because it is not possible for the voltage across a capacitor to change instantaneously. The
situation now is that the current in the diodes load has risen, but the voltage across the load
has not changed. The conclusion is that the load impedance has decreased. The secondary of
the ratio detector transformer is more heavily damped, the Q falls, and so does the gain of the
amplifier driving the Ratio Detector Circuit. This neatly counteracts the initial rise in input
voltage.
Should the input voltage fall, the diode current will fall, but the load voltage will not, at first,
because of the presence of the capacitor. The effect is that of increased diode load impedance;
the diode current has fallen, but the load voltage has remained constant. Accordingly,
damping is reduced, and the gain of the driving amplifier rises, this time counteracting an
initial fall in the input voltage. The ratio detector provides what is known as diode variable
damping. We have here a system of varying the gain of an amplifier by changing the
damping of its tuned circuit. This maintains a constant output voltage despite changes in the
amplitude of the input.
3.8 FM Receiver
3.8.1 Super heterodyne receiver
The FM receiver is the whole unit which takes the modulated signal as input and produces the
original audio signal as an output. Radio amateurs are the initial radio receivers. However,
they have drawbacks such as poor sensitivity and selectivity.
Selectivity is the selection of a particular signal while rejecting the others. Sensitivity is the
capacity of detecting a RF signal and demodulating it, while at the lowest power level.
16
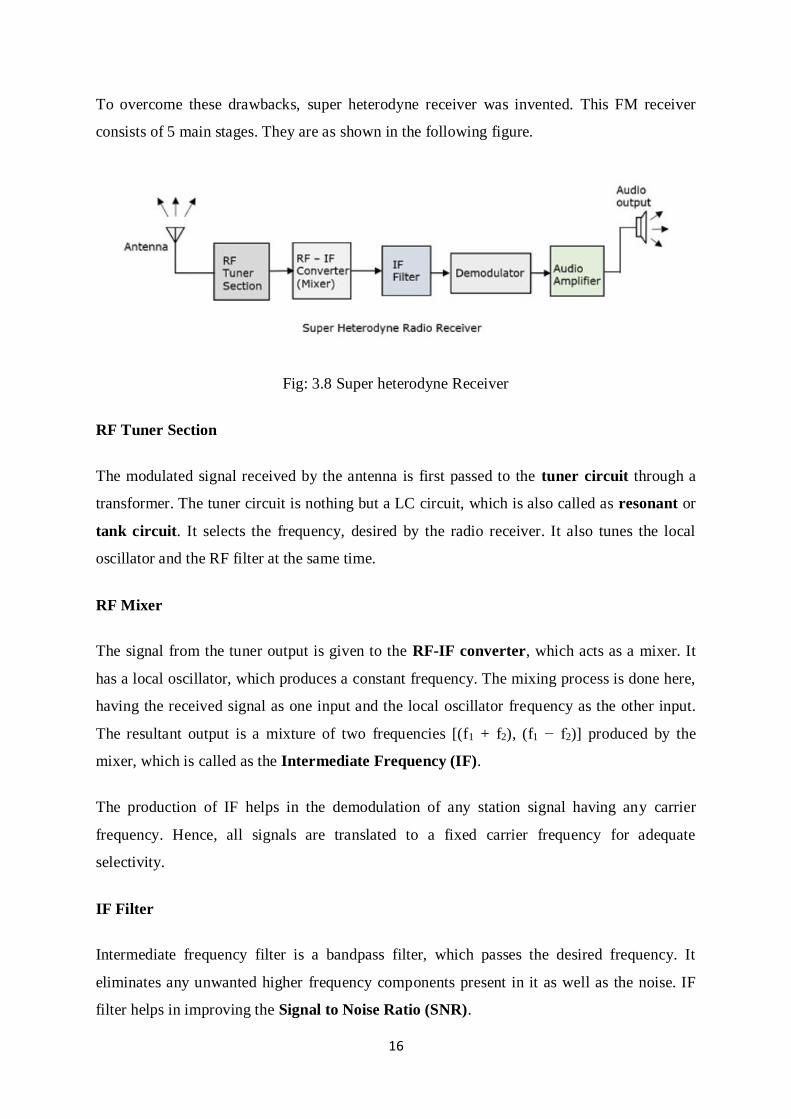
To overcome these drawbacks, super heterodyne receiver was invented. This FM receiver
consists of 5 main stages. They are as shown in the following figure.
Fig: 3.8 Super heterodyne Receiver
RF Tuner Section
The modulated signal received by the antenna is first passed to the tuner circuit through a
transformer. The tuner circuit is nothing but a LC circuit, which is also called as resonant or
tank circuit. It selects the frequency, desired by the radio receiver. It also tunes the local
oscillator and the RF filter at the same time.
RF Mixer
The signal from the tuner output is given to the RF-IF converter, which acts as a mixer. It
has a local oscillator, which produces a constant frequency. The mixing process is done here,
having the received signal as one input and the local oscillator frequency as the other input.
The resultant output is a mixture of two frequencies [(f1 + f2), (f1 − f2)] produced by the
mixer, which is called as the Intermediate Frequency (IF).
The production of IF helps in the demodulation of any station signal having any carrier
frequency. Hence, all signals are translated to a fixed carrier frequency for adequate
selectivity.
IF Filter
Intermediate frequency filter is a bandpass filter, which passes the desired frequency. It
eliminates any unwanted higher frequency components present in it as well as the noise. IF
filter helps in improving the Signal to Noise Ratio (SNR).
17
Demodulator
The received modulated signal is now demodulated with the same process used at the
transmitter side. The frequency discrimination is generally used for FM detection.
Audio Amplifier
This is the power amplifier stage which is used to amplify the detected audio signal. The
processed signal is given strength to be effective. This signal is passed on to the loudspeaker
to get the original sound signal.
This super heterodyne receiver is well used because of its advantages such as better SNR,
sensitivity and selectivity.
Noise in FM
The presence of noise is a problem in FM as well. Whenever a strong interference signal with
closer frequency to the desired signal arrives, the receiver locks that interference signal. Such
a phenomenon is called as the Capture effect.
To increase the SNR at higher modulation frequencies, a high pass circuit called
preemphasis, is used at the transmitter. Another circuit called de-emphasis, the inverse
process of pre-emphasis is used at the receiver, which is a low pass circuit. The preemphasis
and de-emphasis circuits are widely used in FM transmitter and receiver to effectively
increase the output SNR.
1
SCHOOL OF BIO AND CHEMICAL ENGINEERING
DEPARTMENT OF BIOMEDICAL ENGINEERING
UNIT – IV –BIOTELEMETRY– SBM1401
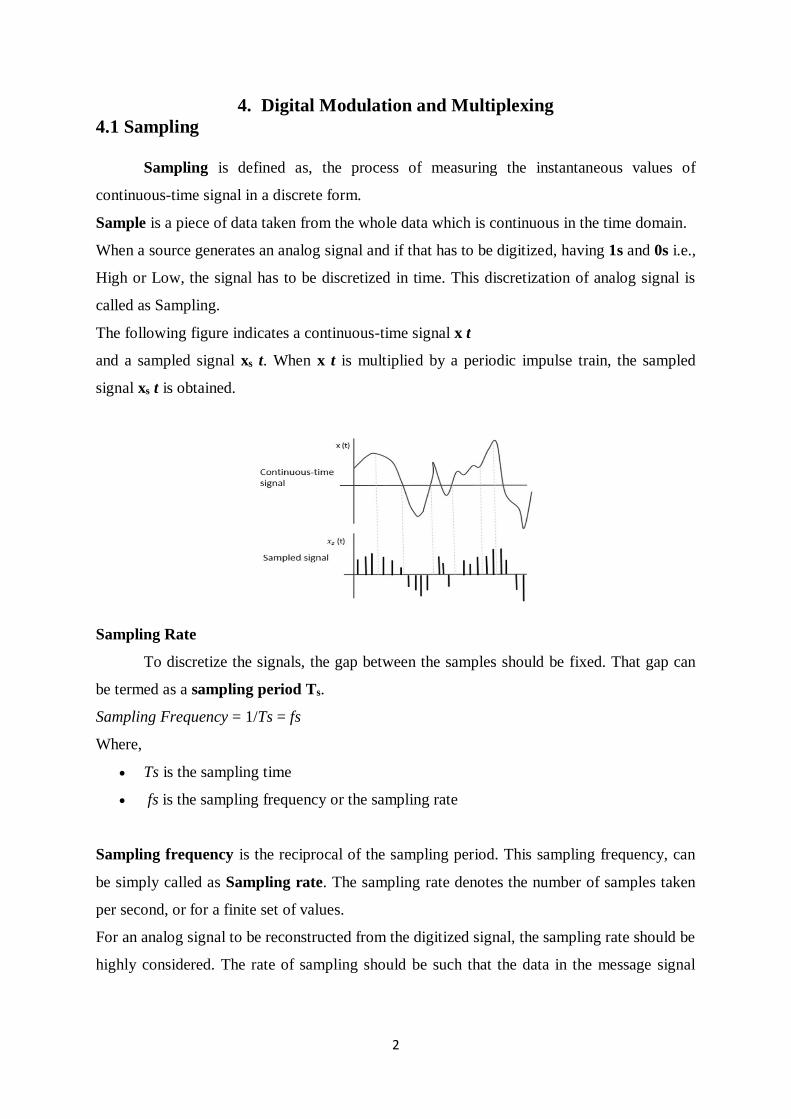
2
4. Digital Modulation and Multiplexing
4.1 Sampling
Sampling is defined as, the process of measuring the instantaneous values of
continuous-time signal in a discrete form.
Sample is a piece of data taken from the whole data which is continuous in the time domain.
When a source generates an analog signal and if that has to be digitized, having 1s and 0s i.e.,
High or Low, the signal has to be discretized in time. This discretization of analog signal is
called as Sampling.
The following figure indicates a continuous-time signal x t
and a sampled signal xs t. When x t is multiplied by a periodic impulse train, the sampled
signal xs t is obtained.
Sampling Rate
To discretize the signals, the gap between the samples should be fixed. That gap can
be termed as a sampling period Ts.
Sampling Frequency = 1/Ts = fs
Where,
Ts is the sampling time
fs is the sampling frequency or the sampling rate
Sampling frequency is the reciprocal of the sampling period. This sampling frequency, can
be simply called as Sampling rate. The sampling rate denotes the number of samples taken
per second, or for a finite set of values.
For an analog signal to be reconstructed from the digitized signal, the sampling rate should be
highly considered. The rate of sampling should be such that the data in the message signal
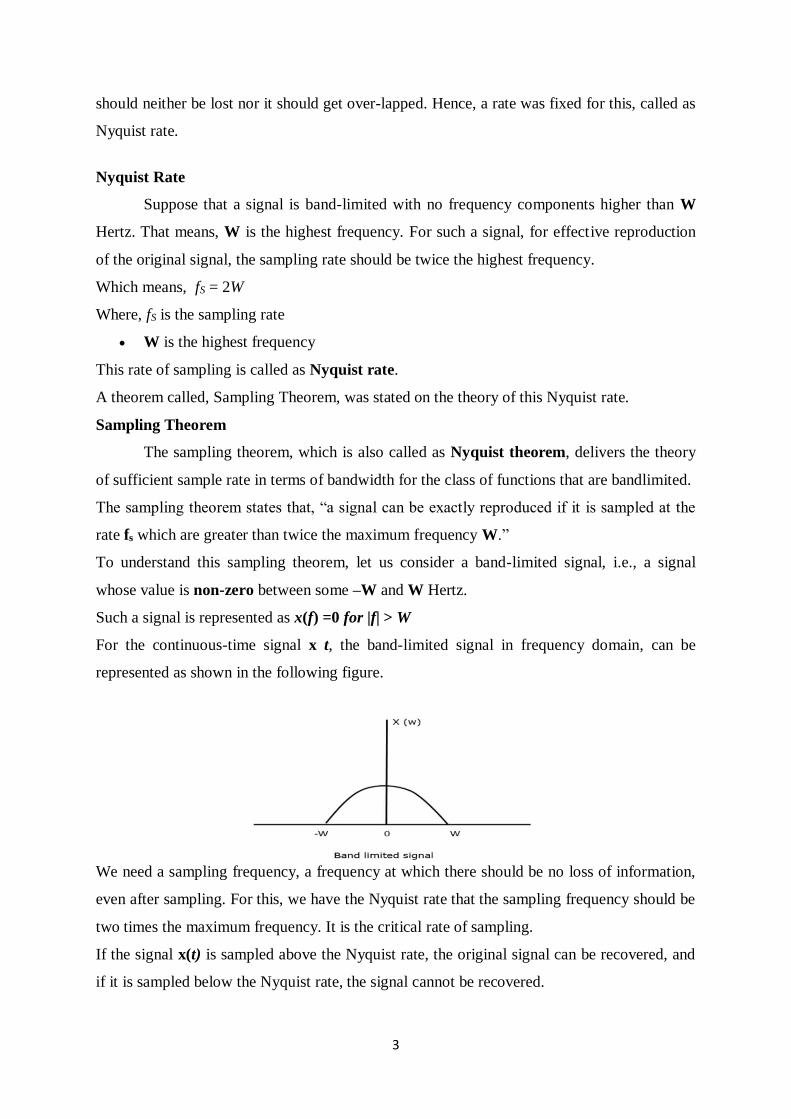
3
should neither be lost nor it should get over-lapped. Hence, a rate was fixed for this, called as
Nyquist rate.
Nyquist Rate
Suppose that a signal is band-limited with no frequency components higher than W
Hertz. That means, W is the highest frequency. For such a signal, for effective reproduction
of the original signal, the sampling rate should be twice the highest frequency.
Which means, fS = 2W
Where, fS is the sampling rate
W is the highest frequency
This rate of sampling is called as Nyquist rate.
A theorem called, Sampling Theorem, was stated on the theory of this Nyquist rate.
Sampling Theorem
The sampling theorem, which is also called as Nyquist theorem, delivers the theory
of sufficient sample rate in terms of bandwidth for the class of functions that are bandlimited.
The sampling theorem states that, “a signal can be exactly reproduced if it is sampled at the
rate fs which are greater than twice the maximum frequency W.”
To understand this sampling theorem, let us consider a band-limited signal, i.e., a signal
whose value is non-zero between some –W and W Hertz.
Such a signal is represented as x(f) =0 for |f| > W
For the continuous-time signal x t, the band-limited signal in frequency domain, can be
represented as shown in the following figure.
We need a sampling frequency, a frequency at which there should be no loss of information,
even after sampling. For this, we have the Nyquist rate that the sampling frequency should be
two times the maximum frequency. It is the critical rate of sampling.
If the signal x(t) is sampled above the Nyquist rate, the original signal can be recovered, and
if it is sampled below the Nyquist rate, the signal cannot be recovered.
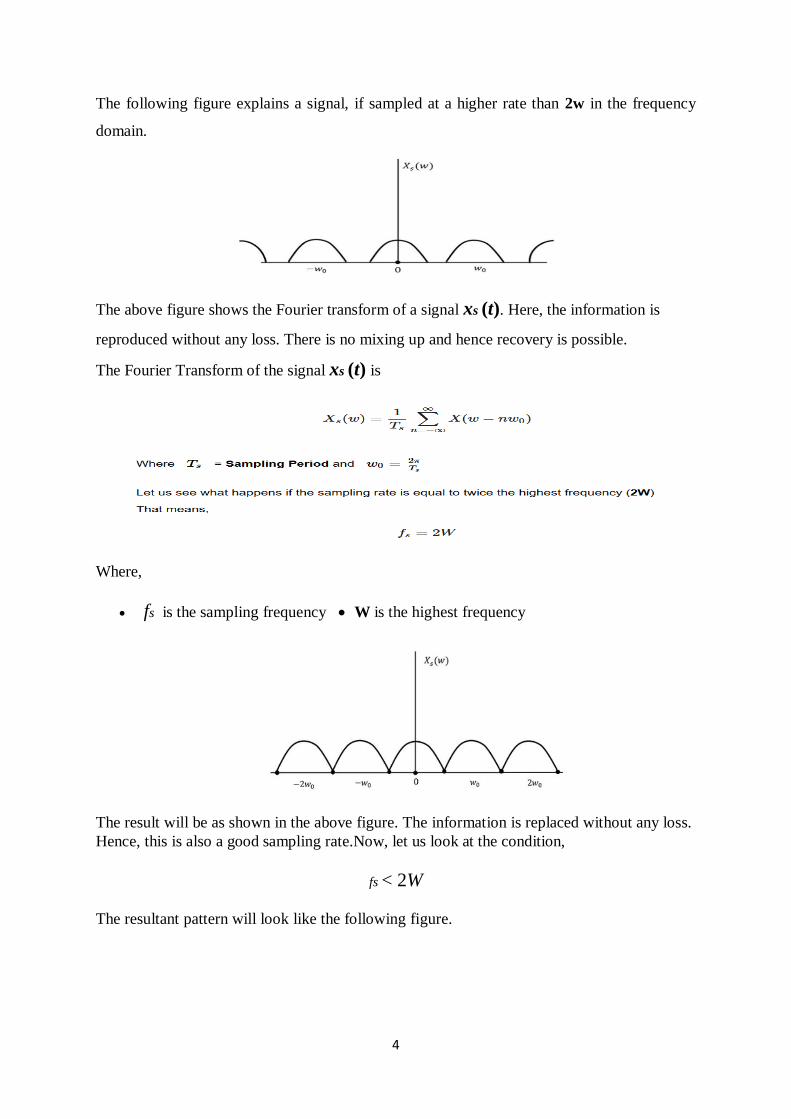
4
The following figure explains a signal, if sampled at a higher rate than 2w in the frequency
domain.
The above figure shows the Fourier transform of a signal xs (t). Here, the information is
reproduced without any loss. There is no mixing up and hence recovery is possible.
The Fourier Transform of the signal xs (t) is
Where,
fs is the sampling frequency W is the highest frequency
The result will be as shown in the above figure. The information is replaced without any loss.
Hence, this is also a good sampling rate.Now, let us look at the condition,
fs < 2W
The resultant pattern will look like the following figure.
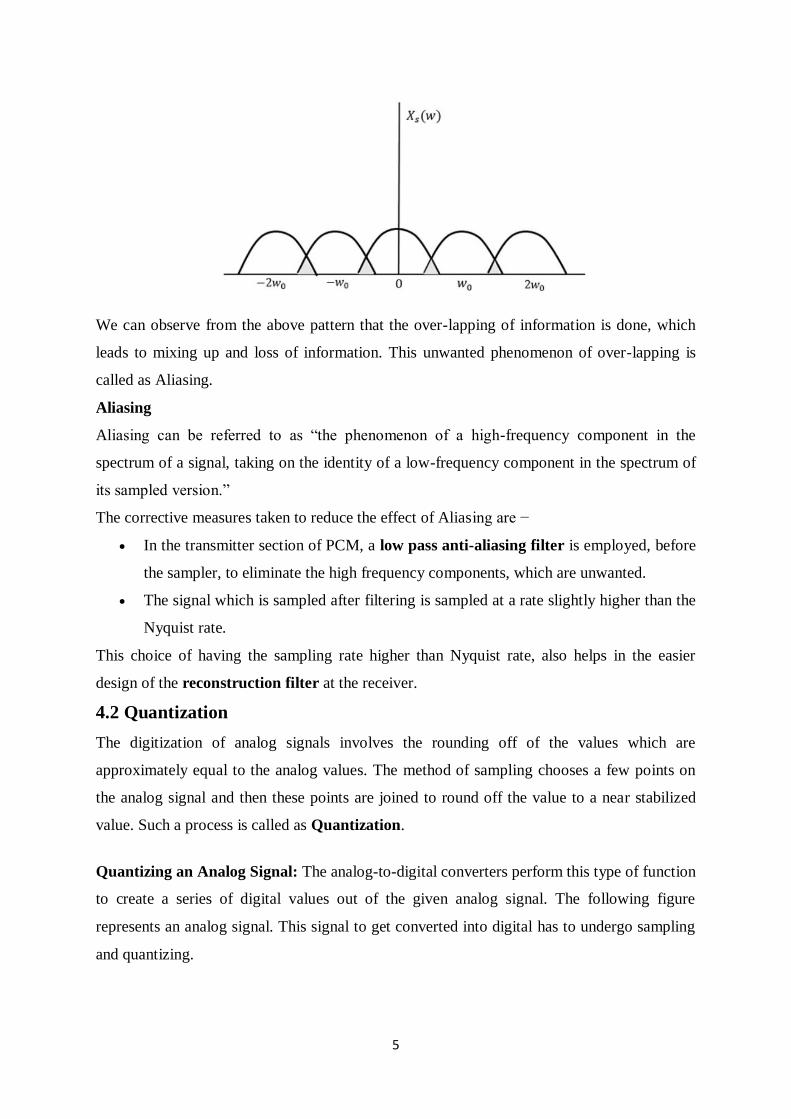
5
We can observe from the above pattern that the over-lapping of information is done, which
leads to mixing up and loss of information. This unwanted phenomenon of over-lapping is
called as Aliasing.
Aliasing
Aliasing can be referred to as “the phenomenon of a high-frequency component in the
spectrum of a signal, taking on the identity of a low-frequency component in the spectrum of
its sampled version.”
The corrective measures taken to reduce the effect of Aliasing are −
In the transmitter section of PCM, a low pass anti-aliasing filter is employed, before
the sampler, to eliminate the high frequency components, which are unwanted.
The signal which is sampled after filtering is sampled at a rate slightly higher than the
Nyquist rate.
This choice of having the sampling rate higher than Nyquist rate, also helps in the easier
design of the reconstruction filter at the receiver.
4.2 Quantization
The digitization of analog signals involves the rounding off of the values which are
approximately equal to the analog values. The method of sampling chooses a few points on
the analog signal and then these points are joined to round off the value to a near stabilized
value. Such a process is called as Quantization.
Quantizing an Analog Signal: The analog-to-digital converters perform this type of function
to create a series of digital values out of the given analog signal. The following figure
represents an analog signal. This signal to get converted into digital has to undergo sampling
and quantizing.
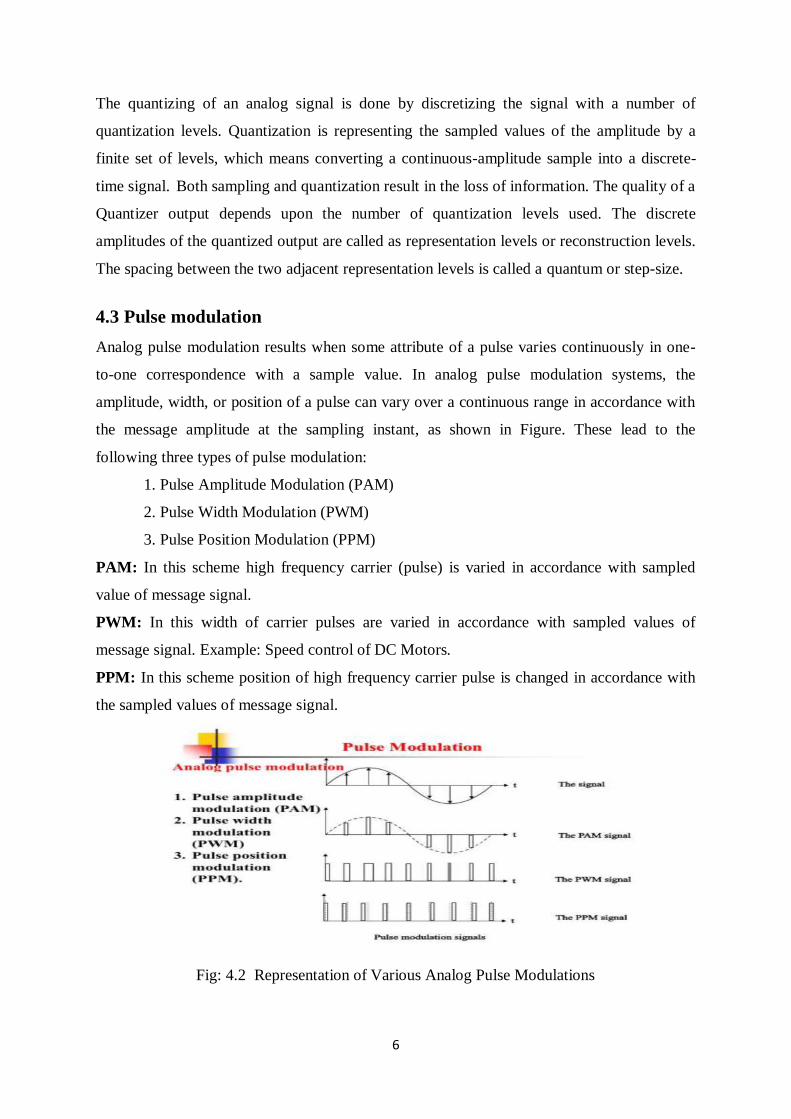
6
The quantizing of an analog signal is done by discretizing the signal with a number of
quantization levels. Quantization is representing the sampled values of the amplitude by a
finite set of levels, which means converting a continuous-amplitude sample into a discrete-
time signal. Both sampling and quantization result in the loss of information. The quality of a
Quantizer output depends upon the number of quantization levels used. The discrete
amplitudes of the quantized output are called as representation levels or reconstruction levels.
The spacing between the two adjacent representation levels is called a quantum or step-size.
4.3 Pulse modulation
Analog pulse modulation results when some attribute of a pulse varies continuously in one-
to-one correspondence with a sample value. In analog pulse modulation systems, the
amplitude, width, or position of a pulse can vary over a continuous range in accordance with
the message amplitude at the sampling instant, as shown in Figure. These lead to the
following three types of pulse modulation:
1. Pulse Amplitude Modulation (PAM)
2. Pulse Width Modulation (PWM)
3. Pulse Position Modulation (PPM)
PAM: In this scheme high frequency carrier (pulse) is varied in accordance with sampled
value of message signal.
PWM: In this width of carrier pulses are varied in accordance with sampled values of
message signal. Example: Speed control of DC Motors.
PPM: In this scheme position of high frequency carrier pulse is changed in accordance with
the sampled values of message signal.
Fig: 4.2 Representation of Various Analog Pulse Modulations
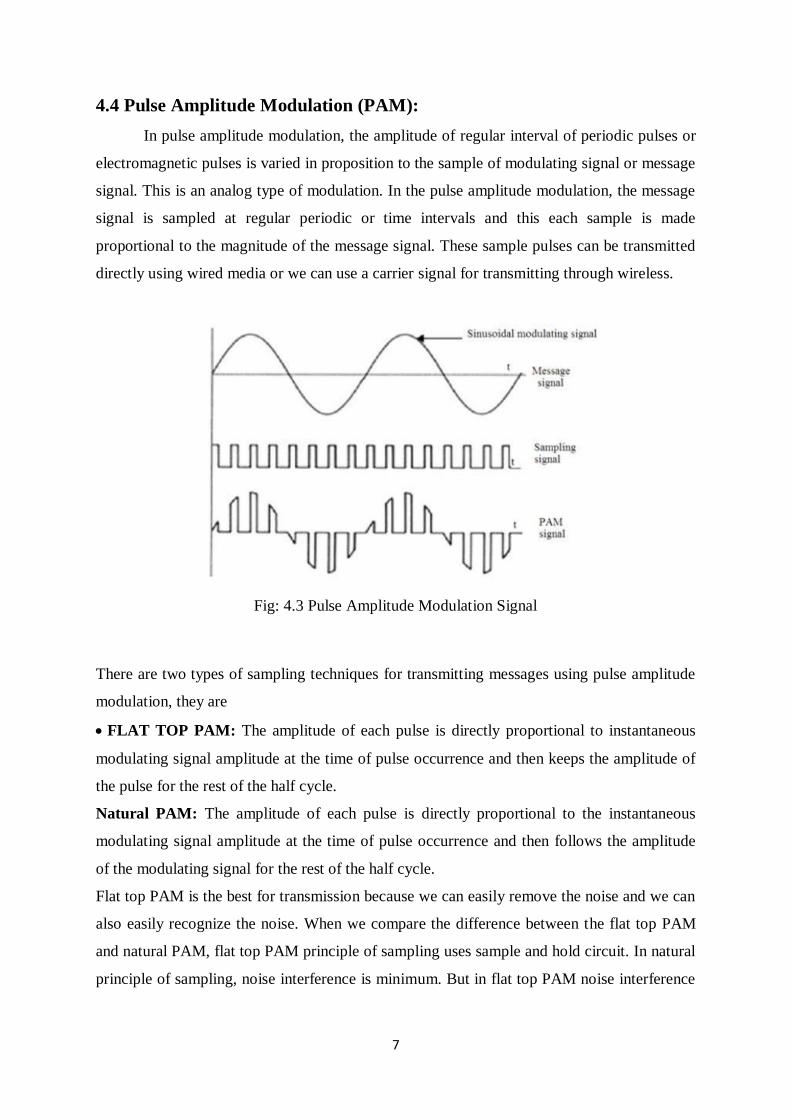
7
4.4 Pulse Amplitude Modulation (PAM):
In pulse amplitude modulation, the amplitude of regular interval of periodic pulses or
electromagnetic pulses is varied in proposition to the sample of modulating signal or message
signal. This is an analog type of modulation. In the pulse amplitude modulation, the message
signal is sampled at regular periodic or time intervals and this each sample is made
proportional to the magnitude of the message signal. These sample pulses can be transmitted
directly using wired media or we can use a carrier signal for transmitting through wireless.
Fig: 4.3 Pulse Amplitude Modulation Signal
There are two types of sampling techniques for transmitting messages using pulse amplitude
modulation, they are
FLAT TOP PAM: The amplitude of each pulse is directly proportional to instantaneous
modulating signal amplitude at the time of pulse occurrence and then keeps the amplitude of
the pulse for the rest of the half cycle.
Natural PAM: The amplitude of each pulse is directly proportional to the instantaneous
modulating signal amplitude at the time of pulse occurrence and then follows the amplitude
of the modulating signal for the rest of the half cycle.
Flat top PAM is the best for transmission because we can easily remove the noise and we can
also easily recognize the noise. When we compare the difference between the flat top PAM
and natural PAM, flat top PAM principle of sampling uses sample and hold circuit. In natural
principle of sampling, noise interference is minimum. But in flat top PAM noise interference
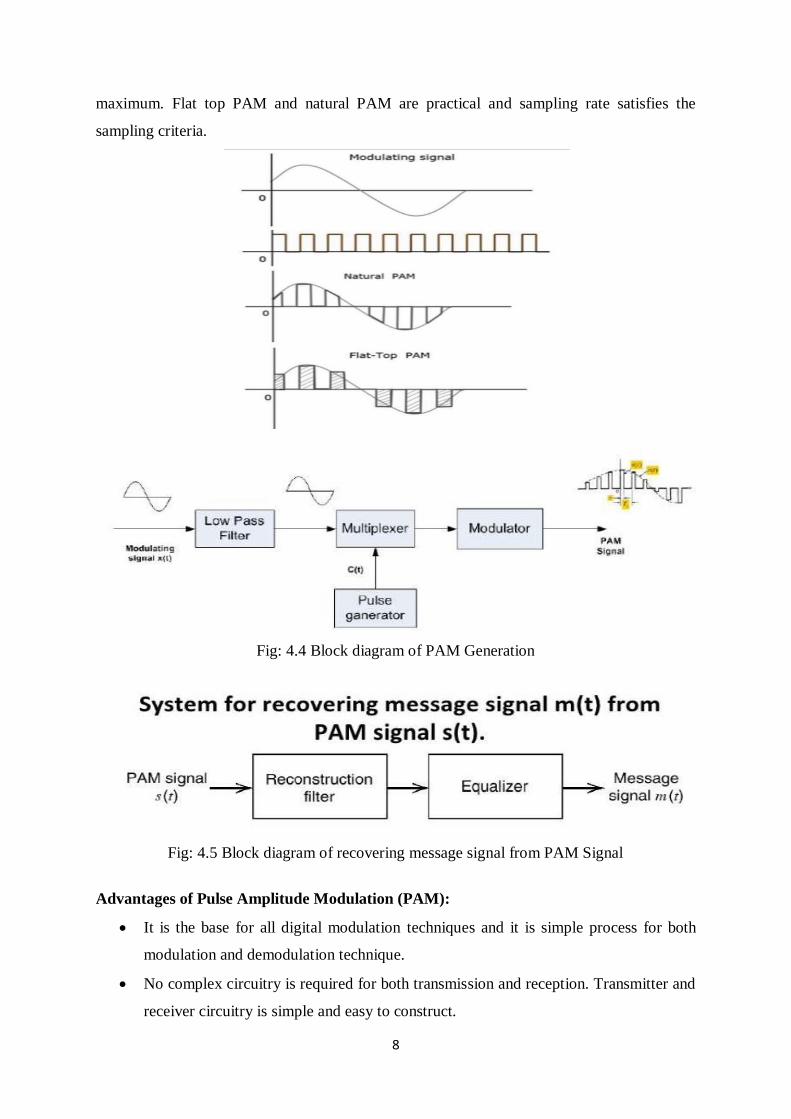
8
maximum. Flat top PAM and natural PAM are practical and sampling rate satisfies the
sampling criteria.
Fig: 4.4 Block diagram of PAM Generation
Fig: 4.5 Block diagram of recovering message signal from PAM Signal
Advantages of Pulse Amplitude Modulation (PAM):
It is the base for all digital modulation techniques and it is simple process for both
modulation and demodulation technique.
No complex circuitry is required for both transmission and reception. Transmitter and
receiver circuitry is simple and easy to construct.
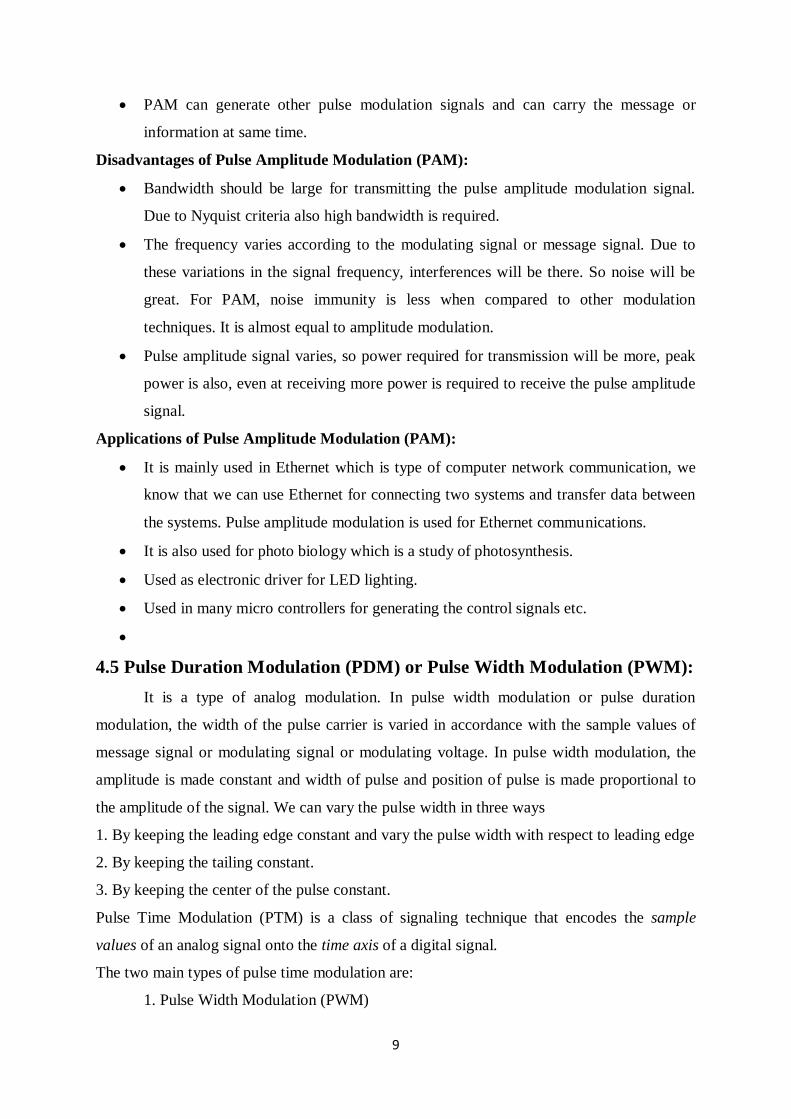
9
PAM can generate other pulse modulation signals and can carry the message or
information at same time.
Disadvantages of Pulse Amplitude Modulation (PAM):
Bandwidth should be large for transmitting the pulse amplitude modulation signal.
Due to Nyquist criteria also high bandwidth is required.
The frequency varies according to the modulating signal or message signal. Due to
these variations in the signal frequency, interferences will be there. So noise will be
great. For PAM, noise immunity is less when compared to other modulation
techniques. It is almost equal to amplitude modulation.
Pulse amplitude signal varies, so power required for transmission will be more, peak
power is also, even at receiving more power is required to receive the pulse amplitude
signal.
Applications of Pulse Amplitude Modulation (PAM):
It is mainly used in Ethernet which is type of computer network communication, we
know that we can use Ethernet for connecting two systems and transfer data between
the systems. Pulse amplitude modulation is used for Ethernet communications.
It is also used for photo biology which is a study of photosynthesis.
Used as electronic driver for LED lighting.
Used in many micro controllers for generating the control signals etc.
4.5 Pulse Duration Modulation (PDM) or Pulse Width Modulation (PWM):
It is a type of analog modulation. In pulse width modulation or pulse duration
modulation, the width of the pulse carrier is varied in accordance with the sample values of
message signal or modulating signal or modulating voltage. In pulse width modulation, the
amplitude is made constant and width of pulse and position of pulse is made proportional to
the amplitude of the signal. We can vary the pulse width in three ways
1. By keeping the leading edge constant and vary the pulse width with respect to leading edge
2. By keeping the tailing constant.
3. By keeping the center of the pulse constant.
Pulse Time Modulation (PTM) is a class of signaling technique that encodes the sample
values of an analog signal onto the time axis of a digital signal.
The two main types of pulse time modulation are:
1. Pulse Width Modulation (PWM)
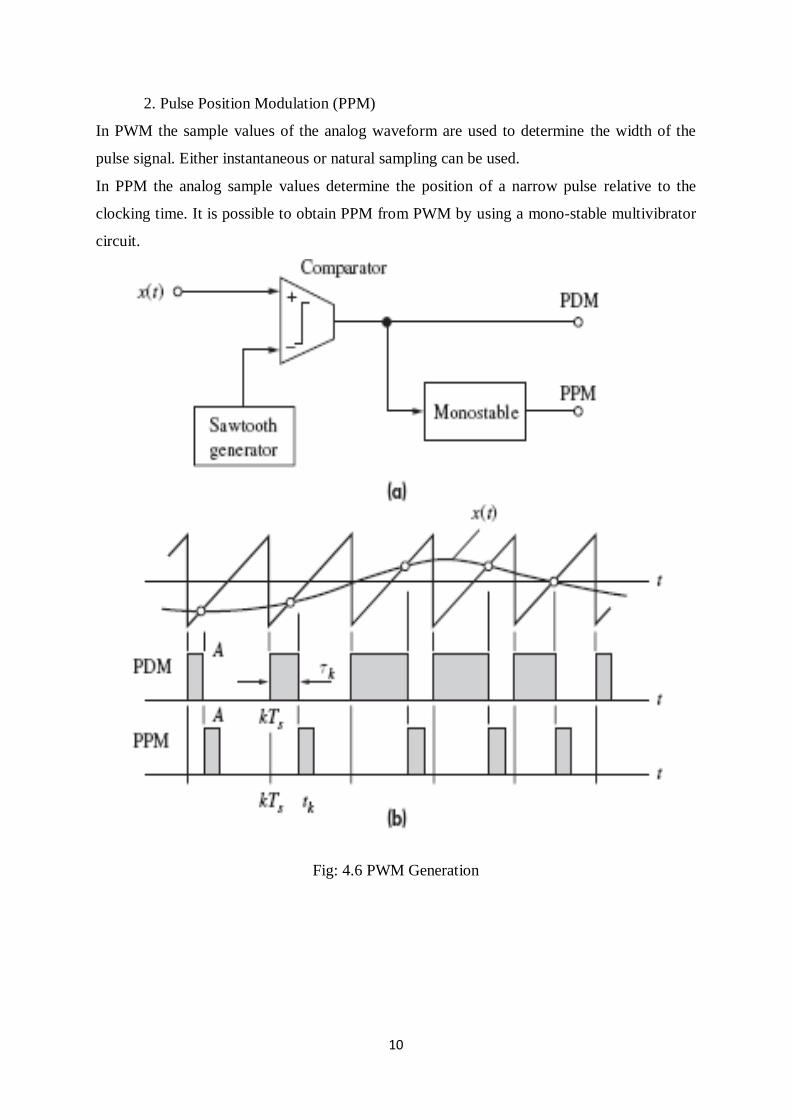
10
2. Pulse Position Modulation (PPM)
In PWM the sample values of the analog waveform are used to determine the width of the
pulse signal. Either instantaneous or natural sampling can be used.
In PPM the analog sample values determine the position of a narrow pulse relative to the
clocking time. It is possible to obtain PPM from PWM by using a mono-stable multivibrator
circuit.
Fig: 4.6 PWM Generation
11
4.6 Comparison between PAM, PWM, and PPM
4.7 Delta Modulation
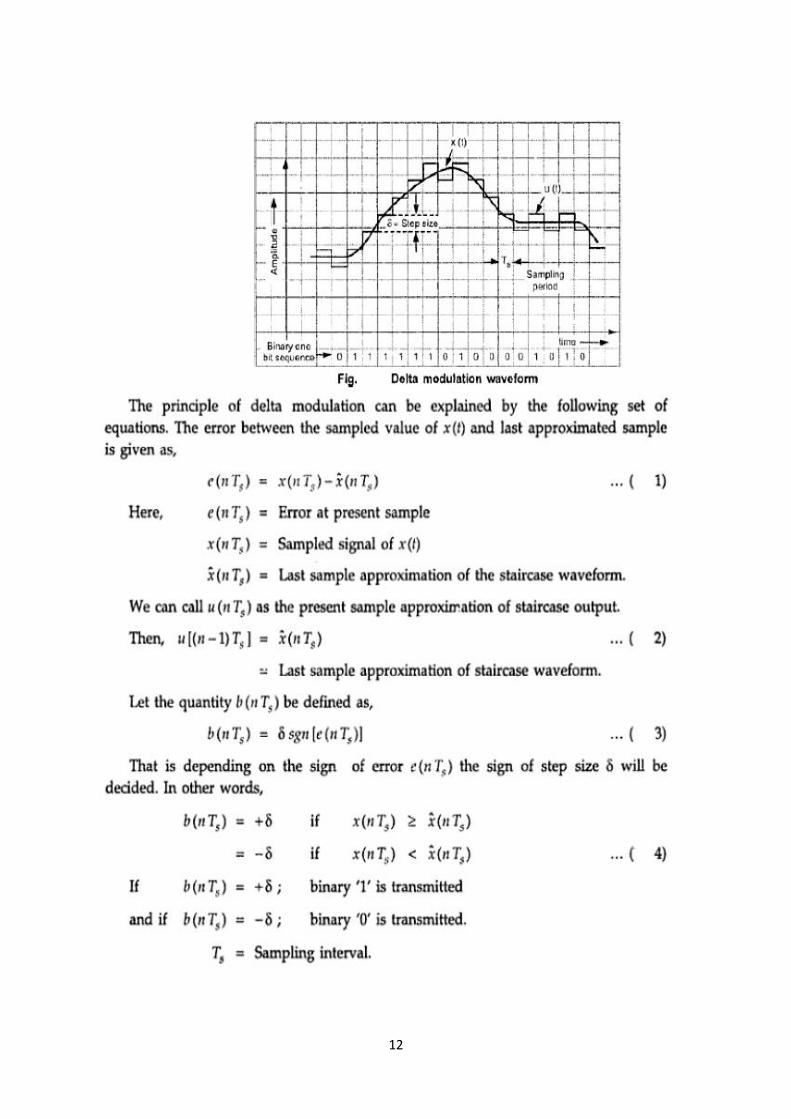
12
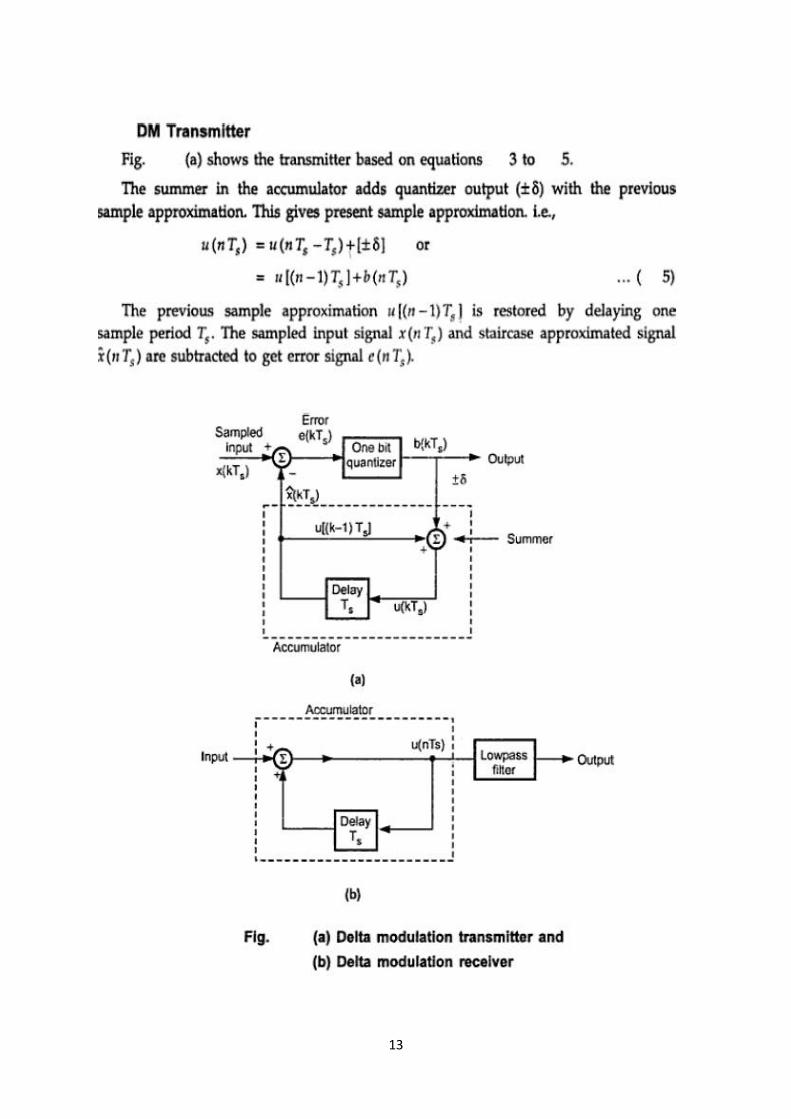
13
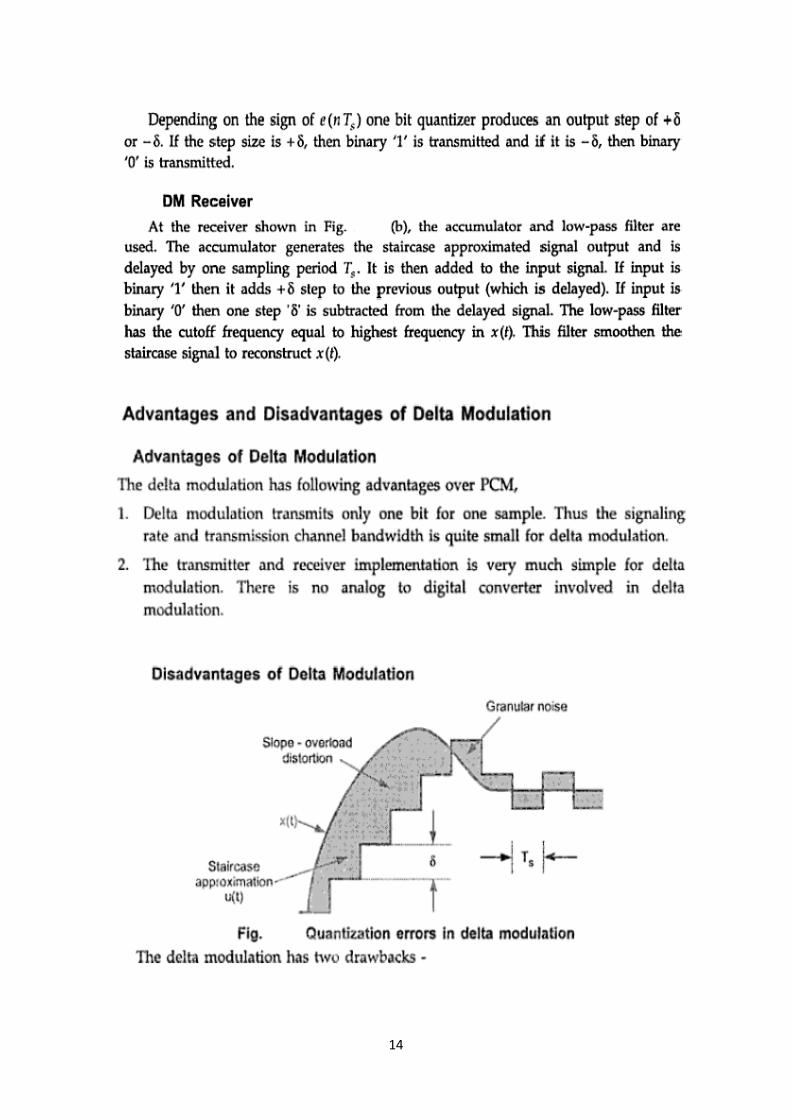
14
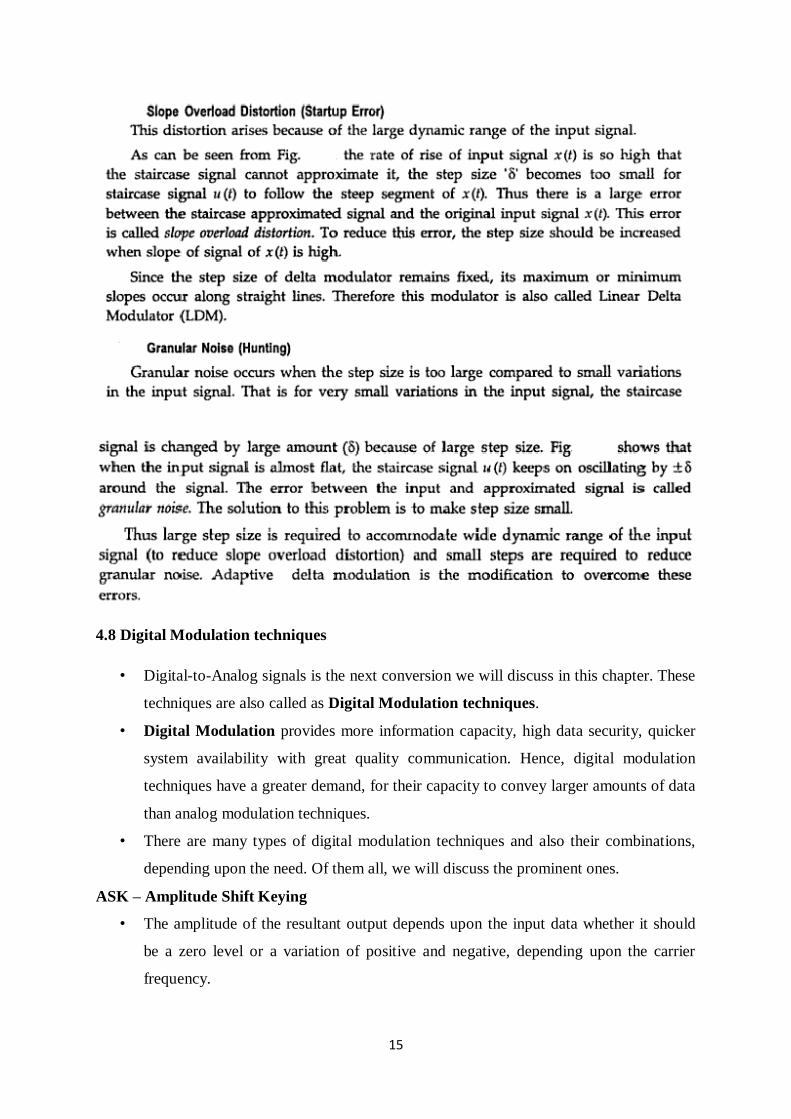
15
4.8 Digital Modulation techniques
• Digital-to-Analog signals is the next conversion we will discuss in this chapter. These
techniques are also called as Digital Modulation techniques.
• Digital Modulation provides more information capacity, high data security, quicker
system availability with great quality communication. Hence, digital modulation
techniques have a greater demand, for their capacity to convey larger amounts of data
than analog modulation techniques.
• There are many types of digital modulation techniques and also their combinations,
depending upon the need. Of them all, we will discuss the prominent ones.
ASK – Amplitude Shift Keying
• The amplitude of the resultant output depends upon the input data whether it should
be a zero level or a variation of positive and negative, depending upon the carrier
frequency.
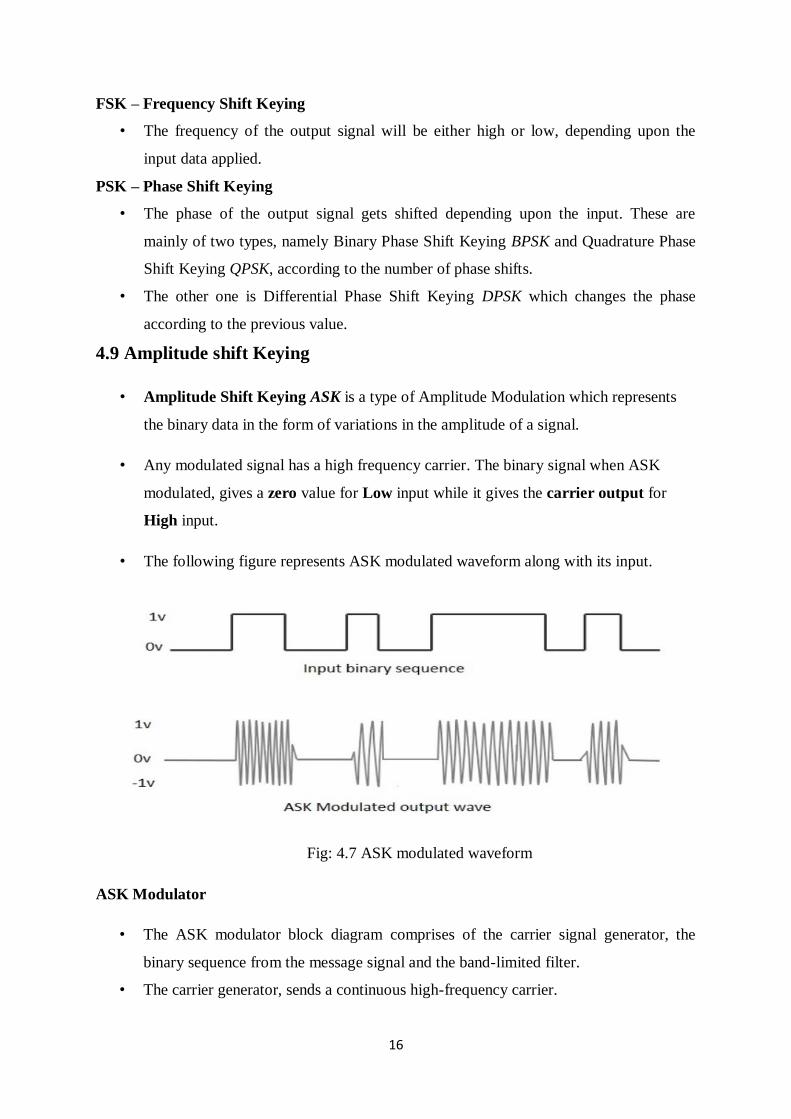
16
FSK – Frequency Shift Keying
• The frequency of the output signal will be either high or low, depending upon the
input data applied.
PSK – Phase Shift Keying
• The phase of the output signal gets shifted depending upon the input. These are
mainly of two types, namely Binary Phase Shift Keying BPSK and Quadrature Phase
Shift Keying QPSK, according to the number of phase shifts.
• The other one is Differential Phase Shift Keying DPSK which changes the phase
according to the previous value.
4.9 Amplitude shift Keying
• Amplitude Shift Keying ASK is a type of Amplitude Modulation which represents
the binary data in the form of variations in the amplitude of a signal.
• Any modulated signal has a high frequency carrier. The binary signal when ASK
modulated, gives a zero value for Low input while it gives the carrier output for
High input.
• The following figure represents ASK modulated waveform along with its input.
Fig: 4.7 ASK modulated waveform
ASK Modulator
• The ASK modulator block diagram comprises of the carrier signal generator, the
binary sequence from the message signal and the band-limited filter.
• The carrier generator, sends a continuous high-frequency carrier.
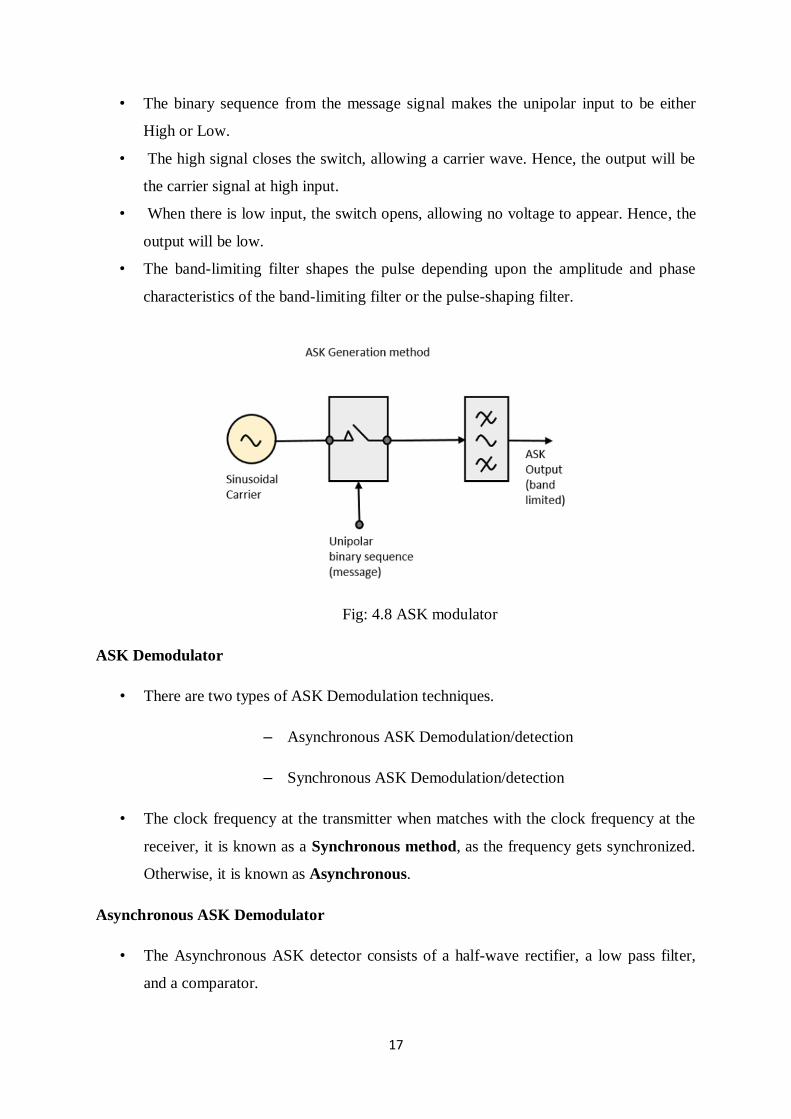
17
• The binary sequence from the message signal makes the unipolar input to be either
High or Low.
• The high signal closes the switch, allowing a carrier wave. Hence, the output will be
the carrier signal at high input.
• When there is low input, the switch opens, allowing no voltage to appear. Hence, the
output will be low.
• The band-limiting filter shapes the pulse depending upon the amplitude and phase
characteristics of the band-limiting filter or the pulse-shaping filter.
Fig: 4.8 ASK modulator
ASK Demodulator
• There are two types of ASK Demodulation techniques.
– Asynchronous ASK Demodulation/detection
– Synchronous ASK Demodulation/detection
• The clock frequency at the transmitter when matches with the clock frequency at the
receiver, it is known as a Synchronous method, as the frequency gets synchronized.
Otherwise, it is known as Asynchronous.
Asynchronous ASK Demodulator
• The Asynchronous ASK detector consists of a half-wave rectifier, a low pass filter,
and a comparator.
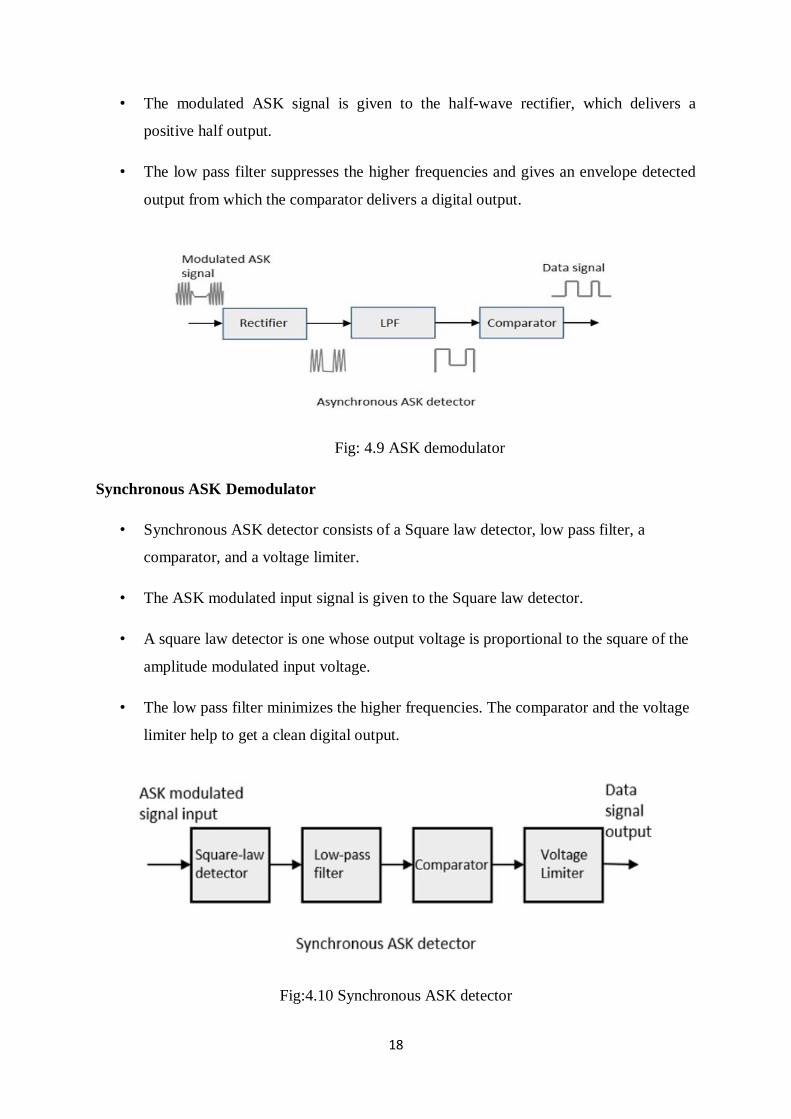
18
• The modulated ASK signal is given to the half-wave rectifier, which delivers a
positive half output.
• The low pass filter suppresses the higher frequencies and gives an envelope detected
output from which the comparator delivers a digital output.
Fig: 4.9 ASK demodulator
Synchronous ASK Demodulator
• Synchronous ASK detector consists of a Square law detector, low pass filter, a
comparator, and a voltage limiter.
• The ASK modulated input signal is given to the Square law detector.
• A square law detector is one whose output voltage is proportional to the square of the
amplitude modulated input voltage.
• The low pass filter minimizes the higher frequencies. The comparator and the voltage
limiter help to get a clean digital output.
Fig:4.10 Synchronous ASK detector
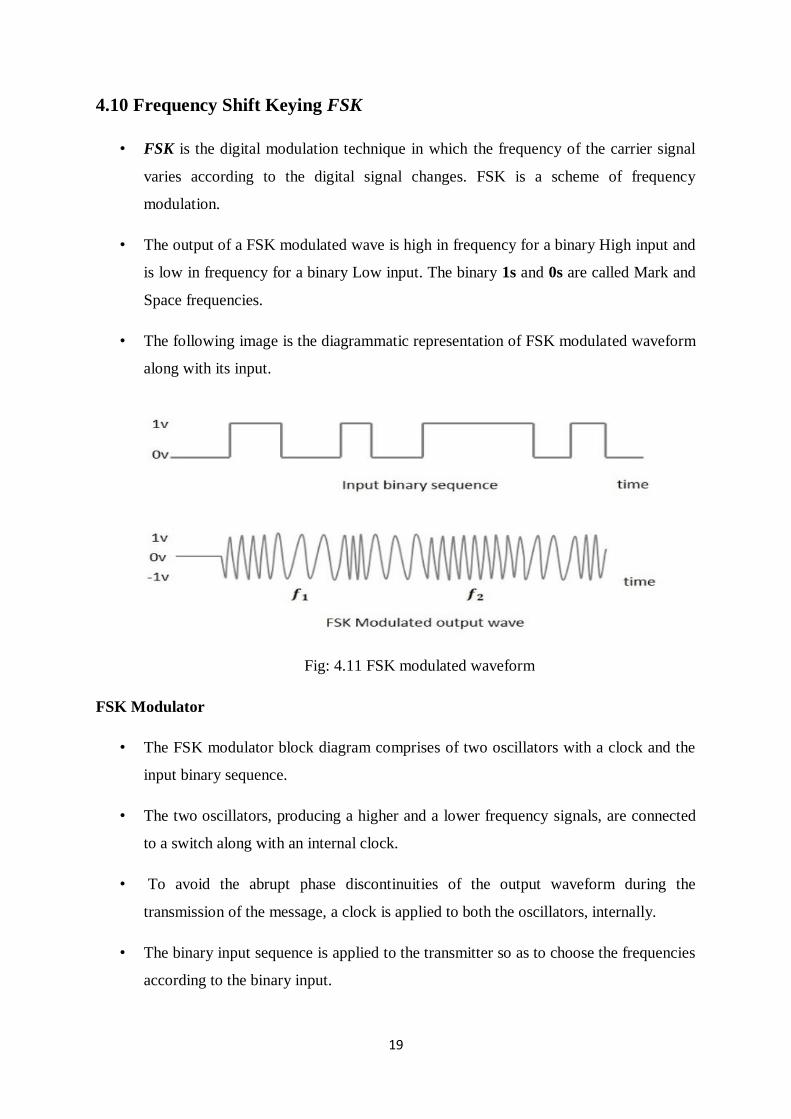
19
4.10 Frequency Shift Keying FSK
• FSK is the digital modulation technique in which the frequency of the carrier signal
varies according to the digital signal changes. FSK is a scheme of frequency
modulation.
• The output of a FSK modulated wave is high in frequency for a binary High input and
is low in frequency for a binary Low input. The binary 1s and 0s are called Mark and
Space frequencies.
• The following image is the diagrammatic representation of FSK modulated waveform
along with its input.
Fig: 4.11 FSK modulated waveform
FSK Modulator
• The FSK modulator block diagram comprises of two oscillators with a clock and the
input binary sequence.
• The two oscillators, producing a higher and a lower frequency signals, are connected
to a switch along with an internal clock.
• To avoid the abrupt phase discontinuities of the output waveform during the
transmission of the message, a clock is applied to both the oscillators, internally.
• The binary input sequence is applied to the transmitter so as to choose the frequencies
according to the binary input.
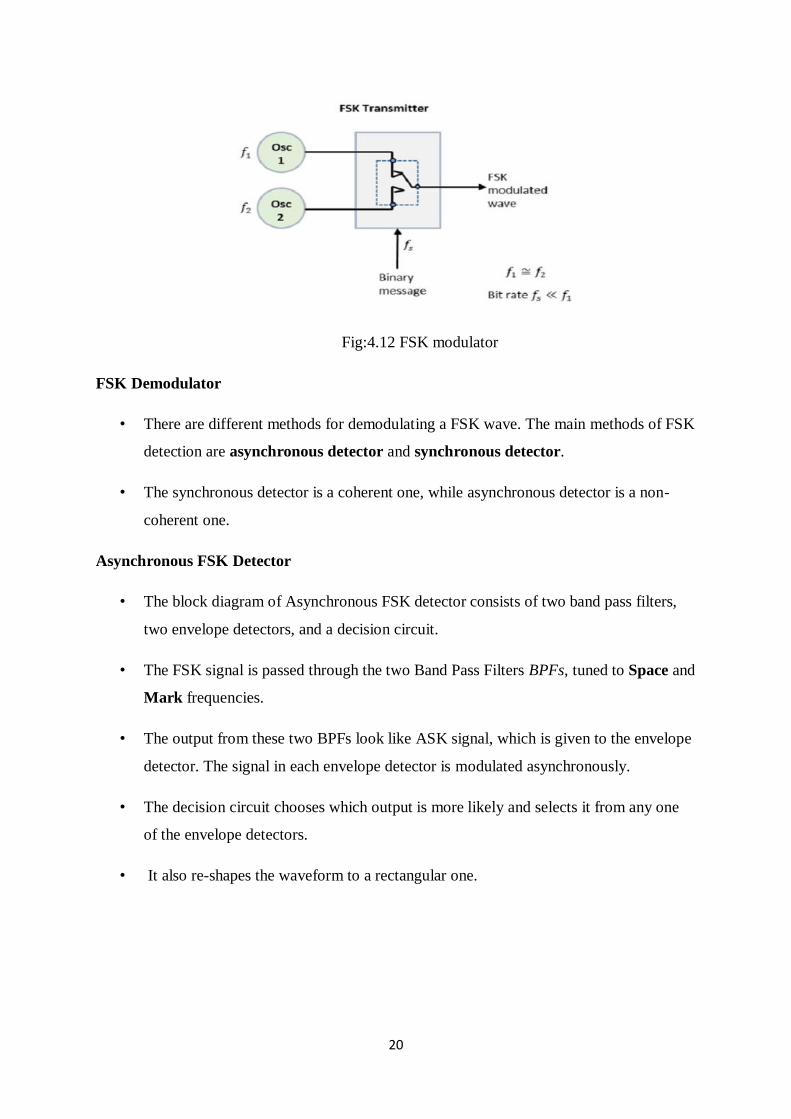
20
Fig:4.12 FSK modulator
FSK Demodulator
• There are different methods for demodulating a FSK wave. The main methods of FSK
detection are asynchronous detector and synchronous detector.
• The synchronous detector is a coherent one, while asynchronous detector is a non-
coherent one.
Asynchronous FSK Detector
• The block diagram of Asynchronous FSK detector consists of two band pass filters,
two envelope detectors, and a decision circuit.
• The FSK signal is passed through the two Band Pass Filters BPFs, tuned to Space and
Mark frequencies.
• The output from these two BPFs look like ASK signal, which is given to the envelope
detector. The signal in each envelope detector is modulated asynchronously.
• The decision circuit chooses which output is more likely and selects it from any one
of the envelope detectors.
• It also re-shapes the waveform to a rectangular one.
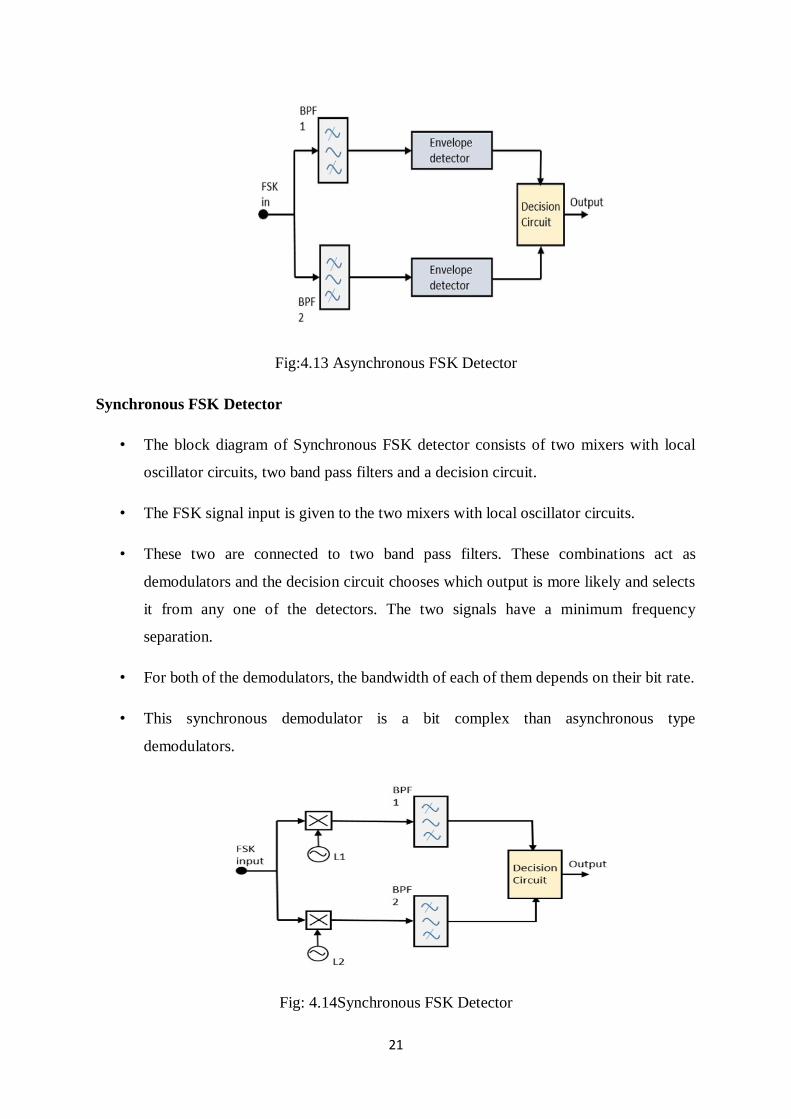
21
Fig:4.13 Asynchronous FSK Detector
Synchronous FSK Detector
• The block diagram of Synchronous FSK detector consists of two mixers with local
oscillator circuits, two band pass filters and a decision circuit.
• The FSK signal input is given to the two mixers with local oscillator circuits.
• These two are connected to two band pass filters. These combinations act as
demodulators and the decision circuit chooses which output is more likely and selects
it from any one of the detectors. The two signals have a minimum frequency
separation.
• For both of the demodulators, the bandwidth of each of them depends on their bit rate.
• This synchronous demodulator is a bit complex than asynchronous type
demodulators.
Fig: 4.14Synchronous FSK Detector
22
4.11Phase Shift Keying PSK
Phase Shift Keying PSK is the digital modulation technique in which the phase of the carrier
signal is changed by varying the sine and cosine inputs at a particular time.
• PSK technique is widely used for wireless LANs, bio-metric, contactless operations,
along with RFID and Bluetooth communications.
• PSK is of two types, depending upon the phases the signal gets shifted. They are
Binary Phase Shift Keying BPSK
• This is also called as 2-phase PSK or Phase Reversal Keying.
• In this technique, the sine wave carrier takes two phase reversals such as 0° and 180°.
• BPSK is basically a Double Side Band Suppressed Carrier DSBSC modulation
scheme, for message being the digital information.
Quadrature Phase Shift Keying QPSK
• This is the phase shift keying technique, in which the sine wave carrier takes four
phase reversals such as 0°, 90°, 180°, and 270°.
• If this kind of techniques are further extended, PSK can be done by eight or sixteen
values also, depending upon the requirement.
BPSK Modulator
• The block diagram of Binary Phase Shift Keying consists of the balance modulator
which has the carrier sine wave as one input and the binary sequence as the other
input.
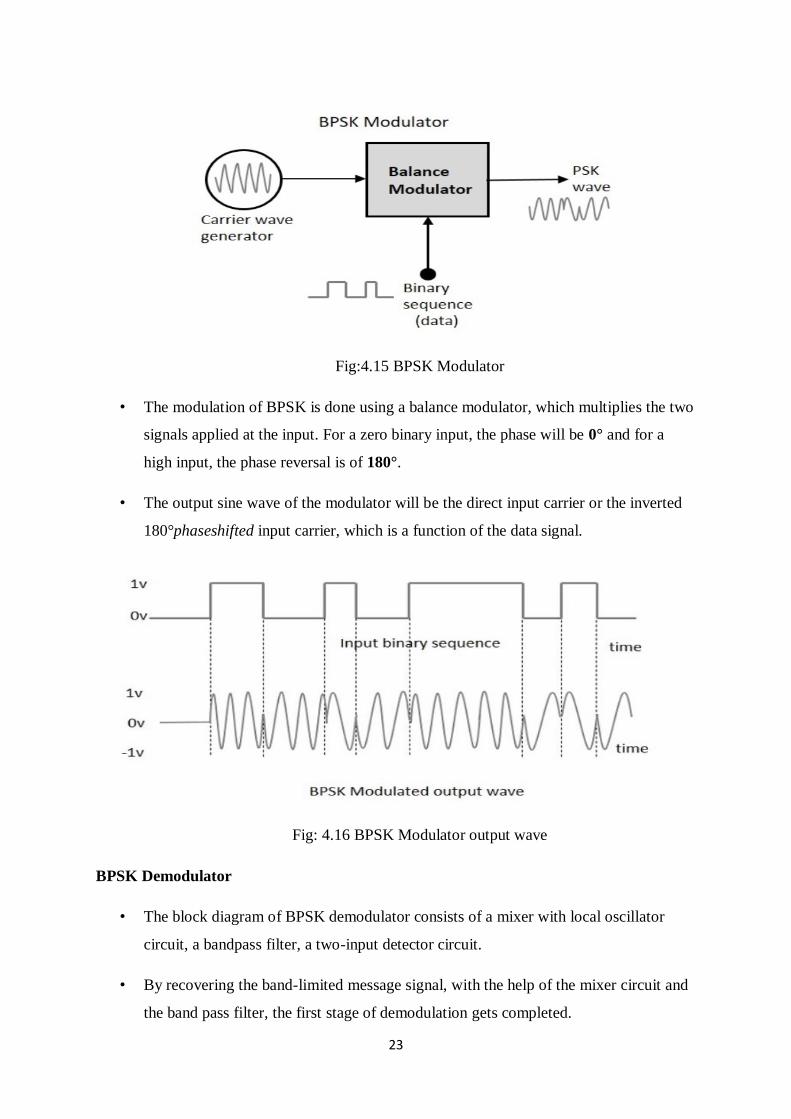
23
Fig:4.15 BPSK Modulator
• The modulation of BPSK is done using a balance modulator, which multiplies the two
signals applied at the input. For a zero binary input, the phase will be 0° and for a
high input, the phase reversal is of 180°.
• The output sine wave of the modulator will be the direct input carrier or the inverted
180°phaseshifted input carrier, which is a function of the data signal.
Fig: 4.16 BPSK Modulator output wave
BPSK Demodulator
• The block diagram of BPSK demodulator consists of a mixer with local oscillator
circuit, a bandpass filter, a two-input detector circuit.
• By recovering the band-limited message signal, with the help of the mixer circuit and
the band pass filter, the first stage of demodulation gets completed.
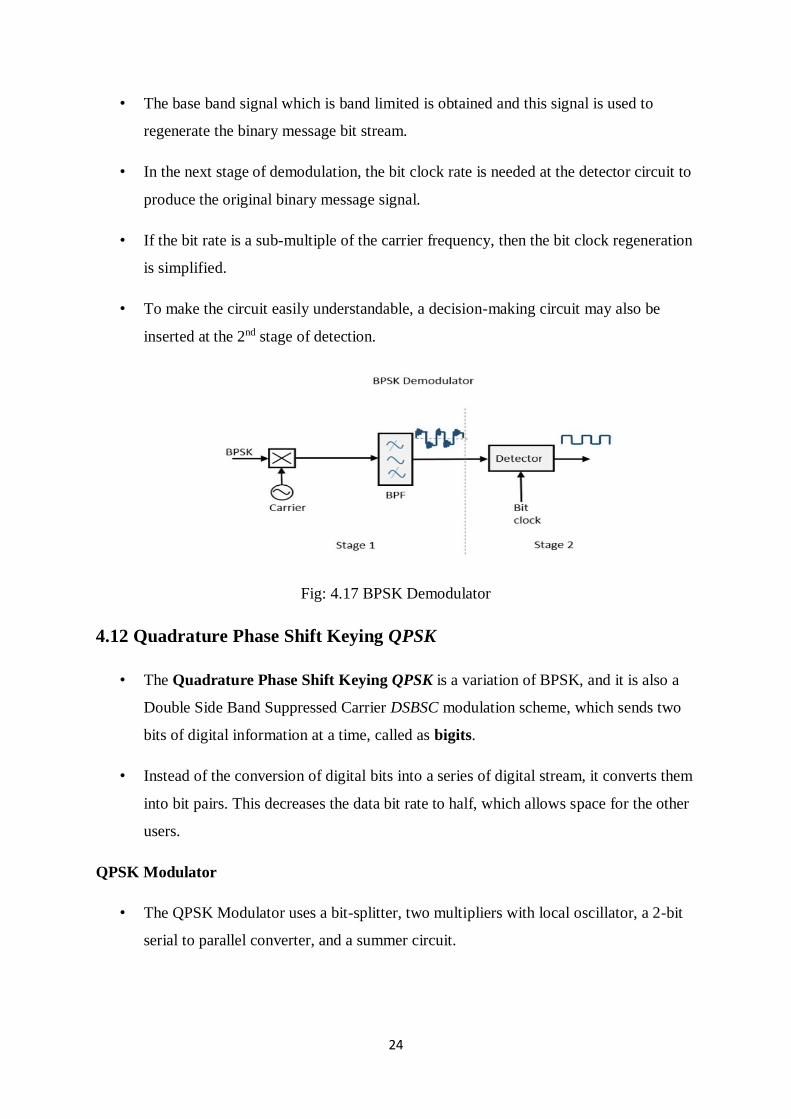
24
• The base band signal which is band limited is obtained and this signal is used to
regenerate the binary message bit stream.
• In the next stage of demodulation, the bit clock rate is needed at the detector circuit to
produce the original binary message signal.
• If the bit rate is a sub-multiple of the carrier frequency, then the bit clock regeneration
is simplified.
• To make the circuit easily understandable, a decision-making circuit may also be
inserted at the 2nd stage of detection.
Fig: 4.17 BPSK Demodulator
4.12 Quadrature Phase Shift Keying QPSK
• The Quadrature Phase Shift Keying QPSK is a variation of BPSK, and it is also a
Double Side Band Suppressed Carrier DSBSC modulation scheme, which sends two
bits of digital information at a time, called as bigits.
• Instead of the conversion of digital bits into a series of digital stream, it converts them
into bit pairs. This decreases the data bit rate to half, which allows space for the other
users.
QPSK Modulator
• The QPSK Modulator uses a bit-splitter, two multipliers with local oscillator, a 2-bit
serial to parallel converter, and a summer circuit.
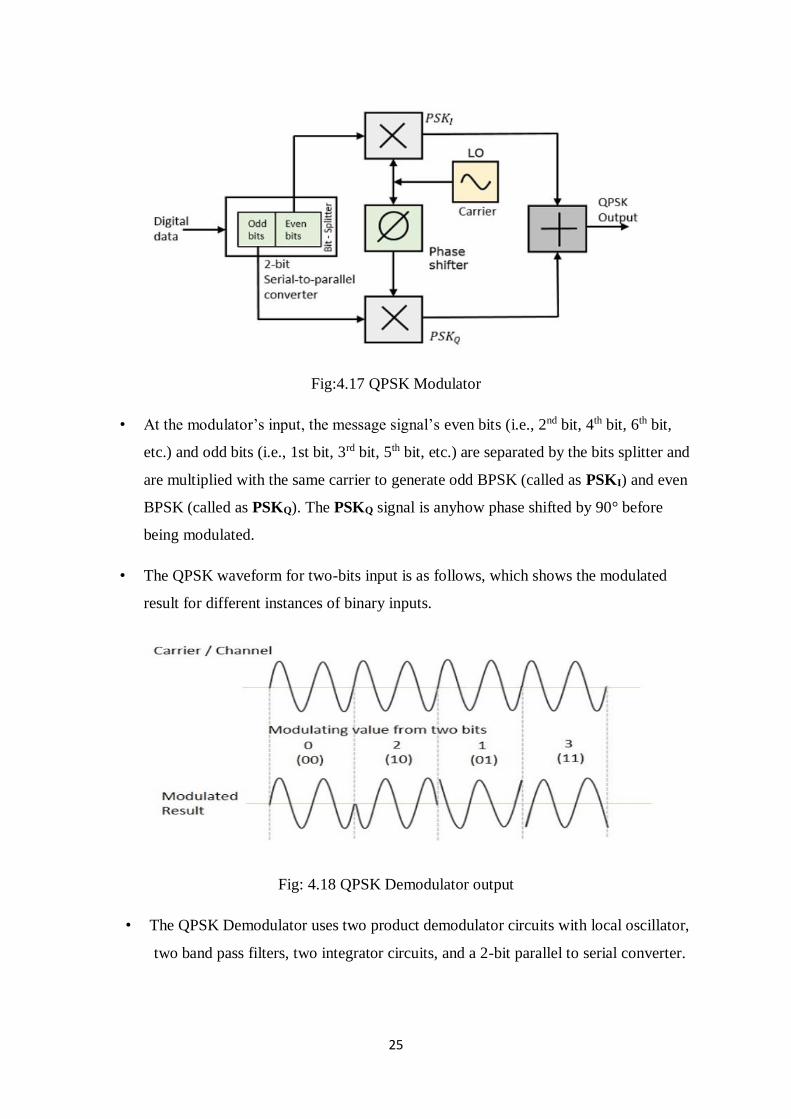
25
Fig:4.17 QPSK Modulator
• At the modulator’s input, the message signal’s even bits (i.e., 2nd bit, 4th bit, 6th bit,
etc.) and odd bits (i.e., 1st bit, 3rd bit, 5th bit, etc.) are separated by the bits splitter and
are multiplied with the same carrier to generate odd BPSK (called as PSKI) and even
BPSK (called as PSKQ). The PSKQ signal is anyhow phase shifted by 90° before
being modulated.
• The QPSK waveform for two-bits input is as follows, which shows the modulated
result for different instances of binary inputs.
Fig: 4.18 QPSK Demodulator output
• The QPSK Demodulator uses two product demodulator circuits with local oscillator,
two band pass filters, two integrator circuits, and a 2-bit parallel to serial converter.
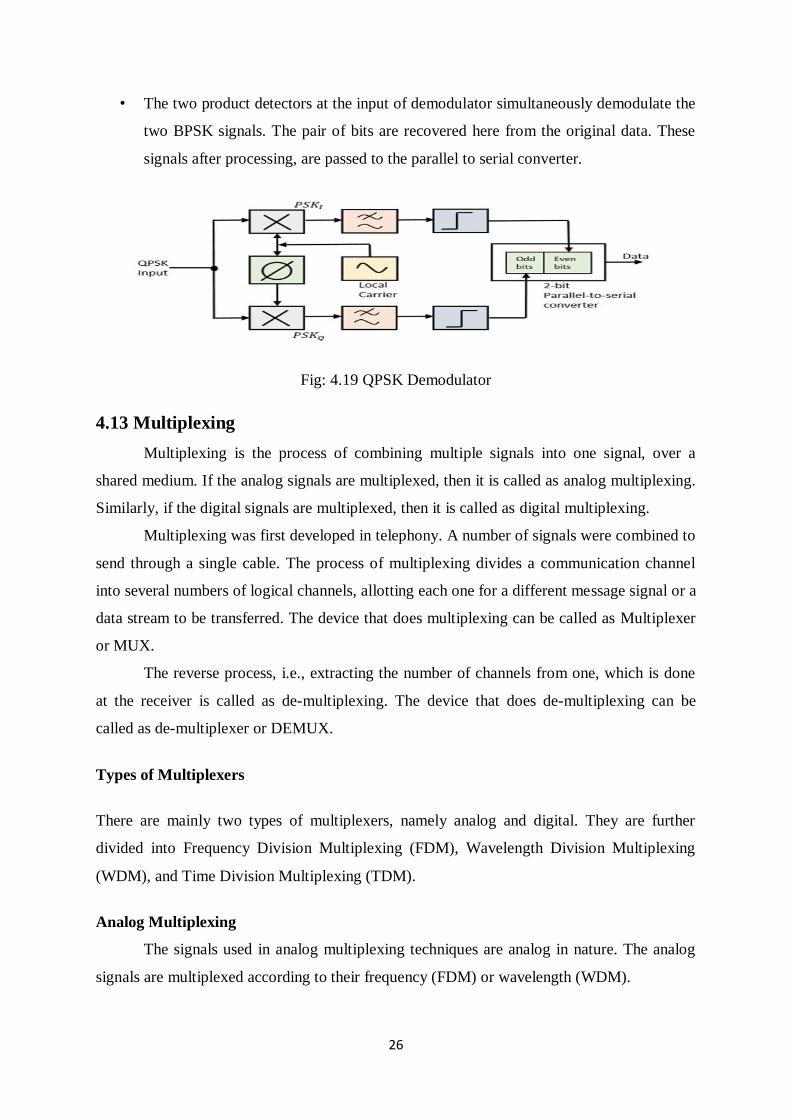
26
• The two product detectors at the input of demodulator simultaneously demodulate the
two BPSK signals. The pair of bits are recovered here from the original data. These
signals after processing, are passed to the parallel to serial converter.
Fig: 4.19 QPSK Demodulator
4.13 Multiplexing
Multiplexing is the process of combining multiple signals into one signal, over a
shared medium. If the analog signals are multiplexed, then it is called as analog multiplexing.
Similarly, if the digital signals are multiplexed, then it is called as digital multiplexing.
Multiplexing was first developed in telephony. A number of signals were combined to
send through a single cable. The process of multiplexing divides a communication channel
into several numbers of logical channels, allotting each one for a different message signal or a
data stream to be transferred. The device that does multiplexing can be called as Multiplexer
or MUX.
The reverse process, i.e., extracting the number of channels from one, which is done
at the receiver is called as de-multiplexing. The device that does de-multiplexing can be
called as de-multiplexer or DEMUX.
Types of Multiplexers
There are mainly two types of multiplexers, namely analog and digital. They are further
divided into Frequency Division Multiplexing (FDM), Wavelength Division Multiplexing
(WDM), and Time Division Multiplexing (TDM).
Analog Multiplexing
The signals used in analog multiplexing techniques are analog in nature. The analog
signals are multiplexed according to their frequency (FDM) or wavelength (WDM).
27
Frequency Division Multiplexing
In analog multiplexing, the most used technique is Frequency Division Multiplexing
(FDM). This technique uses various frequencies to combine streams of data, for sending them
on a communication medium, as a single signal.
Example − A traditional television transmitter, which sends a number of channels through a
single cable uses FDM.
Wavelength Division Multiplexing
Wavelength Division multiplexing (WDM) is an analog technique, in which many
data streams of different wavelengths are transmitted in the light spectrum. If the wavelength
increases, the frequency of the signal decreases. A prism, which can turn different
wavelengths into a single line, can be used at the output of MUX and input of DEMUX.
Example − Optical fiber communications use WDM technique, to merge different
wavelengths into a single light for communication.
Digital Multiplexing
The term digital represents the discrete bits of information. Hence, the available data
is in the form of frames or packets, which are discrete.
4.14 Time Division Multiplexing
In Time Division Multiplexing (TDM), the time frame is divided into slots. This
technique is used to transmit a signal over a single communication channel, by allotting one
slot for each message.
Time Division Multiplexing (TDM) can be classified into Synchronous TDM and
Asynchronous TDM.
Synchronous TDM
In Synchronous TDM, the input is connected to a frame. If there are ‘n’ numbers of
connections, then the frame is divided into ‘n’ time slots. One slot is allocated for each input
line.In this technique, the sampling rate is common for all signals and hence the same clock
input is given. The MUX allocates the same slot to each device at all times.
Asynchronous TDM
In Asynchronous TDM, the sampling rate is different for each of the signals and a
common clock is not required. If the allotted device for a time slot transmits nothing and sits
idle, then that slot can be allotted to another device, unlike synchronous
This type of TDM is used in Asynchronous transfer mode networks.
28
De-Multiplexer
De-multiplexers are used to connect a single source to multiple destinations. This
process is the reverse process of multiplexing. As mentioned previously, it is used mostly at
the receivers. DEMUX has many applications. It is used in receivers in the communication
systems. It is used in arithmetic and logical unit in computers to supply power and to pass on
communication, etc.
De-multiplexers are used as serial to parallel converters. The serial data is given as
input to DEMUX at regular interval and a counter is attached to it to control the output of the
de-multiplexer.
Both the multiplexers and de-multiplexers play an important role in communication systems,
both at the transmitter and the receiver sections.
1
SCHOOL OF BIO AND CHEMICAL ENGINEERING
DEPARTMENT OF BIOMEDICAL ENGINEERING
UNIT – V –BIOTELEMETRY– SBM1401
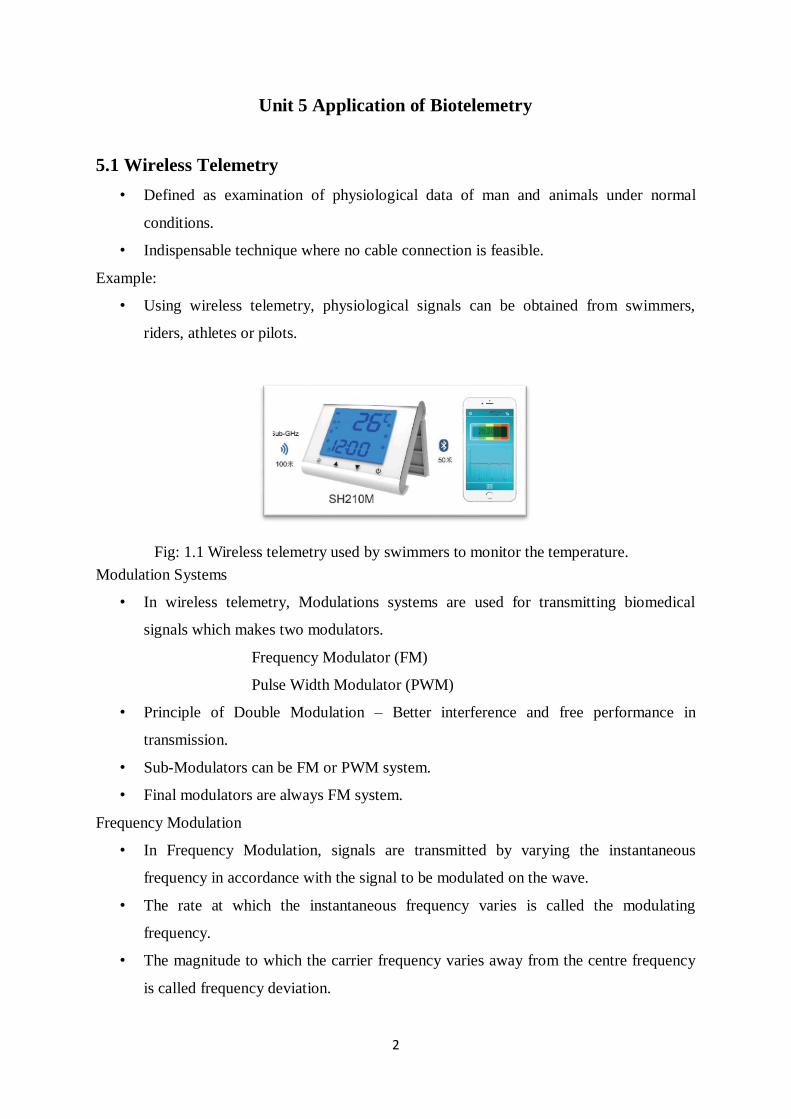
2
Unit 5 Application of Biotelemetry
5.1 Wireless Telemetry
• Defined as examination of physiological data of man and animals under normal
conditions.
• Indispensable technique where no cable connection is feasible.
Example:
• Using wireless telemetry, physiological signals can be obtained from swimmers,
riders, athletes or pilots.
Modulation Systems
• In wireless telemetry, Modulations systems are used for transmitting biomedical
signals which makes two modulators.
Frequency Modulator (FM)
Pulse Width Modulator (PWM)
• Principle of Double Modulation – Better interference and free performance in
transmission.
• Sub-Modulators can be FM or PWM system.
• Final modulators are always FM system.
Frequency Modulation
• In Frequency Modulation, signals are transmitted by varying the instantaneous
frequency in accordance with the signal to be modulated on the wave.
• The rate at which the instantaneous frequency varies is called the modulating
frequency.
• The magnitude to which the carrier frequency varies away from the centre frequency
is called frequency deviation.
Fig: 1.1 Wireless telemetry used by swimmers to monitor the temperature.
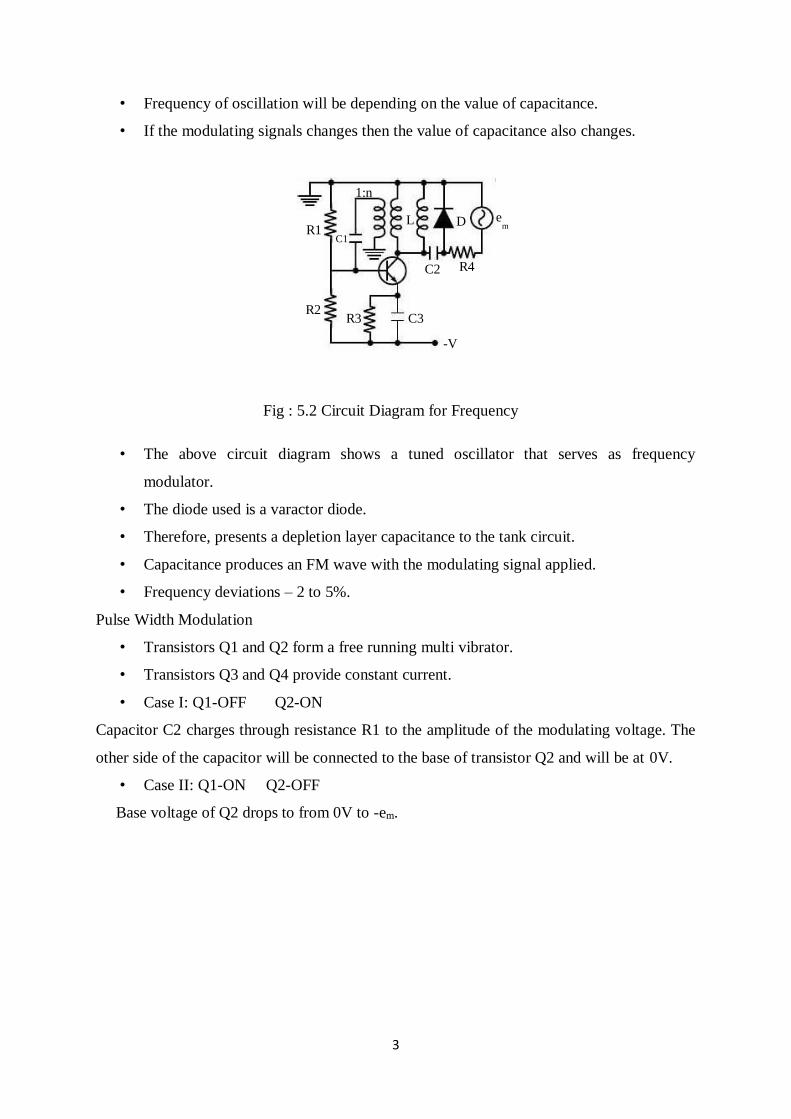
3
• Frequency of oscillation will be depending on the value of capacitance.
• If the modulating signals changes then the value of capacitance also changes.
• The above circuit diagram shows a tuned oscillator that serves as frequency
modulator.
• The diode used is a varactor diode.
• Therefore, presents a depletion layer capacitance to the tank circuit.
• Capacitance produces an FM wave with the modulating signal applied.
• Frequency deviations – 2 to 5%.
Pulse Width Modulation
• Transistors Q1 and Q2 form a free running multi vibrator.
• Transistors Q3 and Q4 provide constant current.
• Case I: Q1-OFF Q2-ON
Capacitor C2 charges through resistance R1 to the amplitude of the modulating voltage. The
other side of the capacitor will be connected to the base of transistor Q2 and will be at 0V.
• Case II: Q1-ON Q2-OFF
Base voltage of Q2 drops to from 0V to -em.
C1
1:n
R1
R2 R3 C3
C2
-V
R4
em D L
Fig : 5.2 Circuit Diagram for Frequency
Modulation
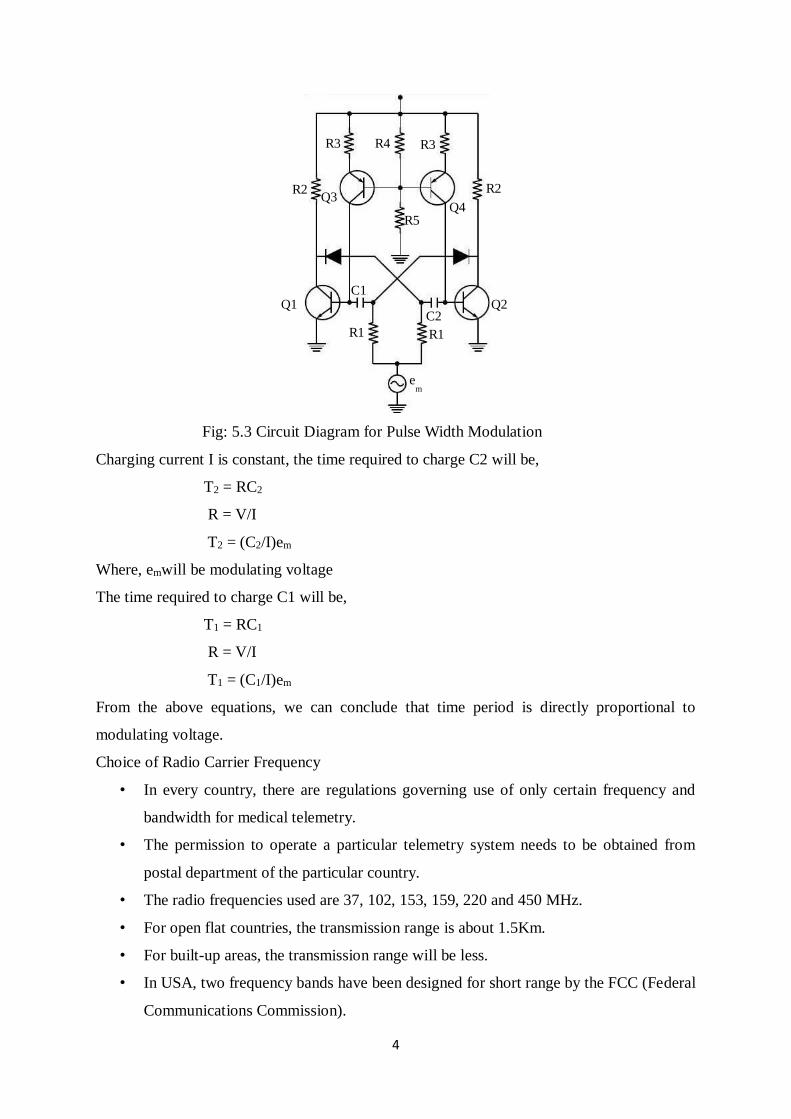
4
Charging current I is constant, the time required to charge C2 will be,
T2 = RC2
R = V/I
T2 = (C2/I)em
Where, emwill be modulating voltage
The time required to charge C1 will be,
T1 = RC1
R = V/I
T1 = (C1/I)em
From the above equations, we can conclude that time period is directly proportional to
modulating voltage.
Choice of Radio Carrier Frequency
• In every country, there are regulations governing use of only certain frequency and
bandwidth for medical telemetry.
• The permission to operate a particular telemetry system needs to be obtained from
postal department of the particular country.
• The radio frequencies used are 37, 102, 153, 159, 220 and 450 MHz.
• For open flat countries, the transmission range is about 1.5Km.
• For built-up areas, the transmission range will be less.
• In USA, two frequency bands have been designed for short range by the FCC (Federal
Communications Commission).
Fig: 5.3 Circuit Diagram for Pulse Width Modulation
R3 R4 R3
R2 R2 Q3
R5 Q4
Q2 C2
R1 R1
C1 Q1
em
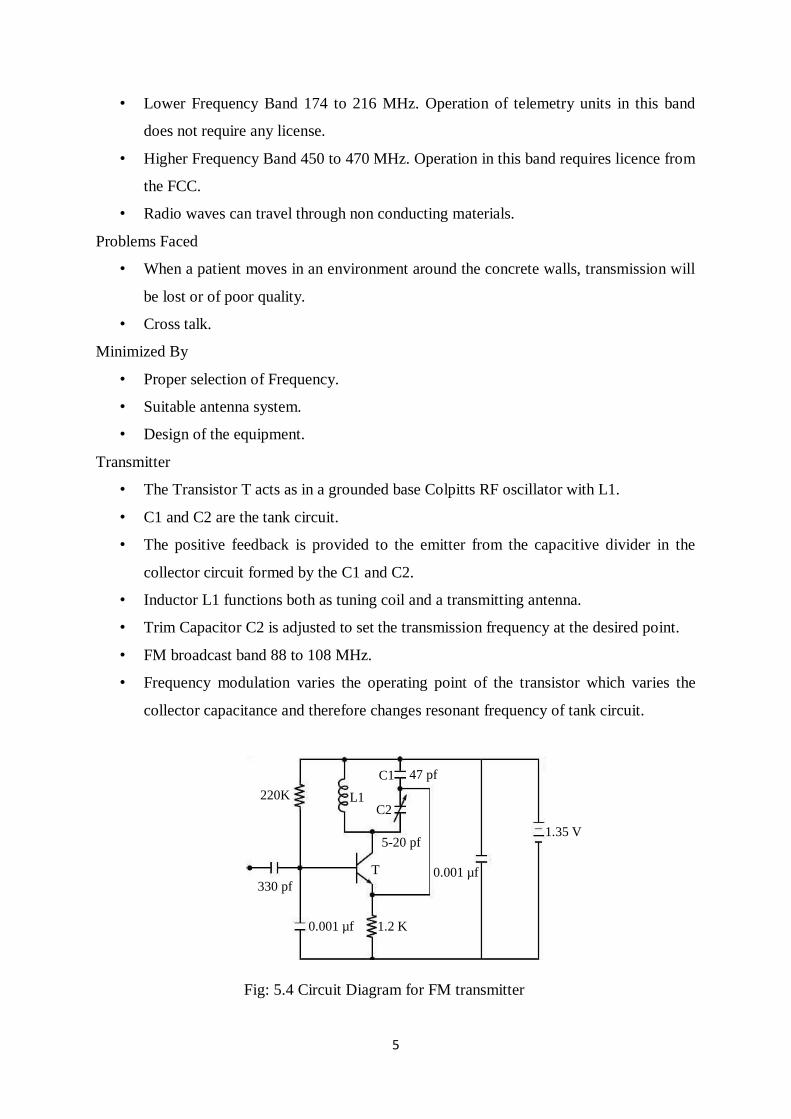
5
• Lower Frequency Band 174 to 216 MHz. Operation of telemetry units in this band
does not require any license.
• Higher Frequency Band 450 to 470 MHz. Operation in this band requires licence from
the FCC.
• Radio waves can travel through non conducting materials.
Problems Faced
• When a patient moves in an environment around the concrete walls, transmission will
be lost or of poor quality.
• Cross talk.
Minimized By
• Proper selection of Frequency.
• Suitable antenna system.
• Design of the equipment.
Transmitter
• The Transistor T acts as in a grounded base Colpitts RF oscillator with L1.
• C1 and C2 are the tank circuit.
• The positive feedback is provided to the emitter from the capacitive divider in the
collector circuit formed by the C1 and C2.
• Inductor L1 functions both as tuning coil and a transmitting antenna.
• Trim Capacitor C2 is adjusted to set the transmission frequency at the desired point.
• FM broadcast band 88 to 108 MHz.
• Frequency modulation varies the operating point of the transistor which varies the
collector capacitance and therefore changes resonant frequency of tank circuit.
Fig: 5.4 Circuit Diagram for FM transmitter
220K L1
C1 47 pf
C2
5-20 pf
T 0.001 µf
1.35 V
1.2 K 0.001 µf
330 pf
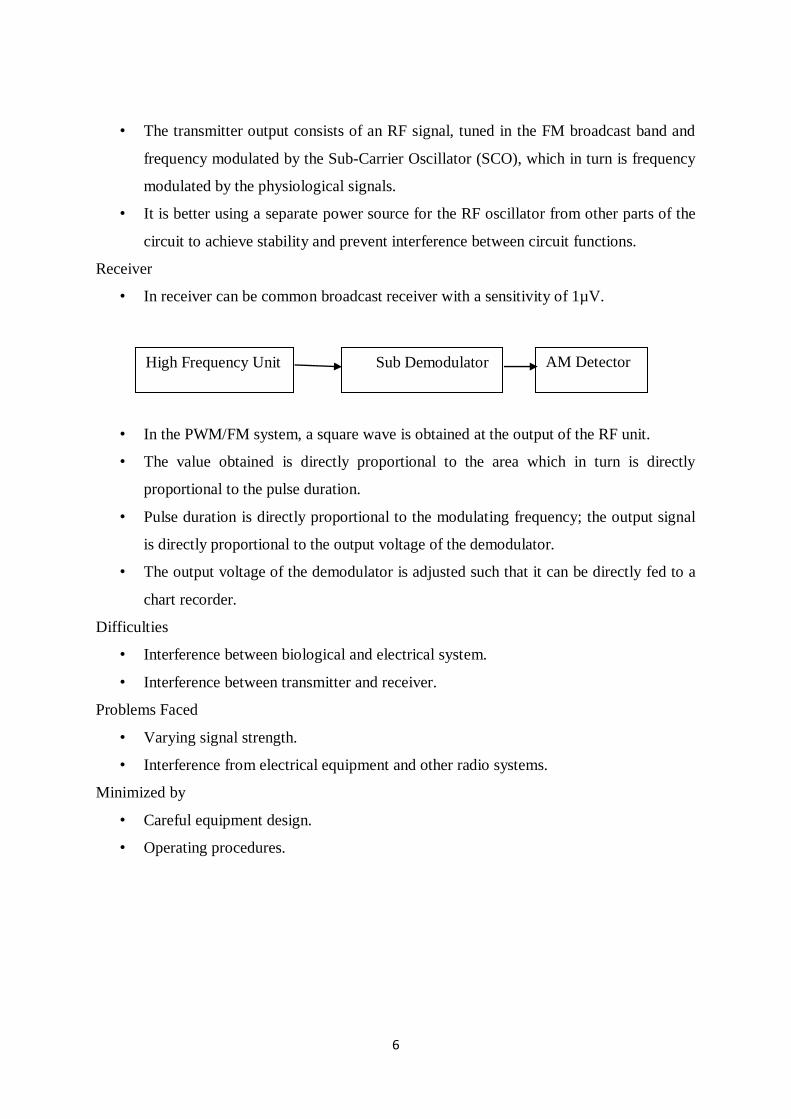
6
• The transmitter output consists of an RF signal, tuned in the FM broadcast band and
frequency modulated by the Sub-Carrier Oscillator (SCO), which in turn is frequency
modulated by the physiological signals.
• It is better using a separate power source for the RF oscillator from other parts of the
circuit to achieve stability and prevent interference between circuit functions.
Receiver
• In receiver can be common broadcast receiver with a sensitivity of 1µV.
• In the PWM/FM system, a square wave is obtained at the output of the RF unit.
• The value obtained is directly proportional to the area which in turn is directly
proportional to the pulse duration.
• Pulse duration is directly proportional to the modulating frequency; the output signal
is directly proportional to the output voltage of the demodulator.
• The output voltage of the demodulator is adjusted such that it can be directly fed to a
chart recorder.
Difficulties
• Interference between biological and electrical system.
• Interference between transmitter and receiver.
Problems Faced
• Varying signal strength.
• Interference from electrical equipment and other radio systems.
Minimized by
• Careful equipment design.
• Operating procedures.
High Frequency Unit Sub Demodulator AM Detector
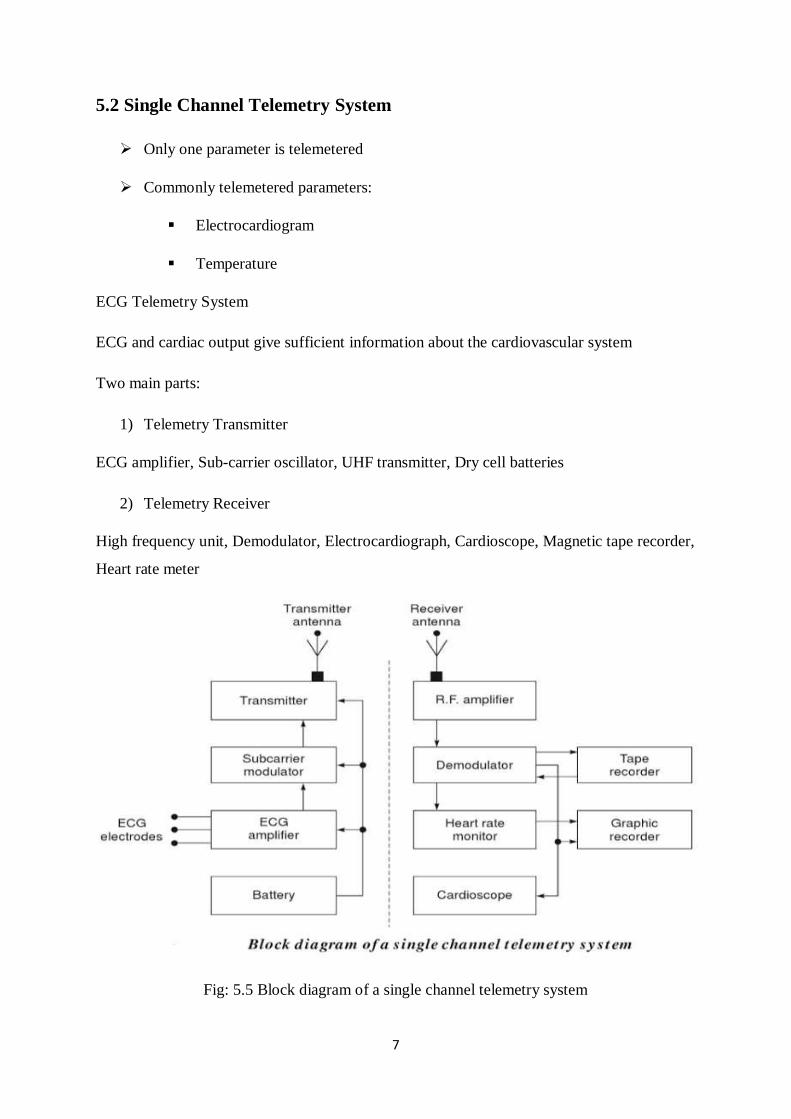
7
5.2 Single Channel Telemetry System
Only one parameter is telemetered
Commonly telemetered parameters:
Electrocardiogram
Temperature
ECG Telemetry System
ECG and cardiac output give sufficient information about the cardiovascular system
Two main parts:
1) Telemetry Transmitter
ECG amplifier, Sub-carrier oscillator, UHF transmitter, Dry cell batteries
2) Telemetry Receiver
High frequency unit, Demodulator, Electrocardiograph, Cardioscope, Magnetic tape recorder,
Heart rate meter
Fig: 5.5 Block diagram of a single channel telemetry system
8
Requirements For Distortion-Free Transmission Of ECG
Subject should able to carry out normal activities with comfort
Motion artefacts and muscle potential interference should be minimum
Battery life should be long
For paced patients, the amplitude of pacemaker pulses can be as large as 80mV
compared to 1-2mV, for typical ECG
Some ECG systems operate at 450-470 MHz band, which is well-suited for hospital
transmission and can accommodate large number of channels
Transmitter
The ECG signals picked up the three pre-gelled electrodes is amplified and used to
modulate the1 kHz sub-carrier that in turn frequency modulates the UHF carrier
The resulting signal radiated by electrode lead RL, serves as antenna
Input circuitry protected against large amplitude due to fibrillation
Input amplifier is ac coupled to succeeding stages
Coupling capacitor – eliminates dc voltage, determines the low-frequency cut-off of
the system is usually 0.4 Hz
Sub-carrier oscillator - current controlled multivibrator, Provides ± 320 Hz deviation
Sub-carrier filter - removes square wave harmonics, results in a sinusoid for
modulating the carrier
Electrode inoperative alarm - turned on when one of the electrodes fails & frequency
of the multivibrator shifted by about 400 Hz.
Crystal-controlled oscillator – generates carrier at 115 MHz
Frequency doubler stages - Class-C transistor doubler, Step recovery diode doubler
output power – 2 mW, operating range – 60 m within a hospital
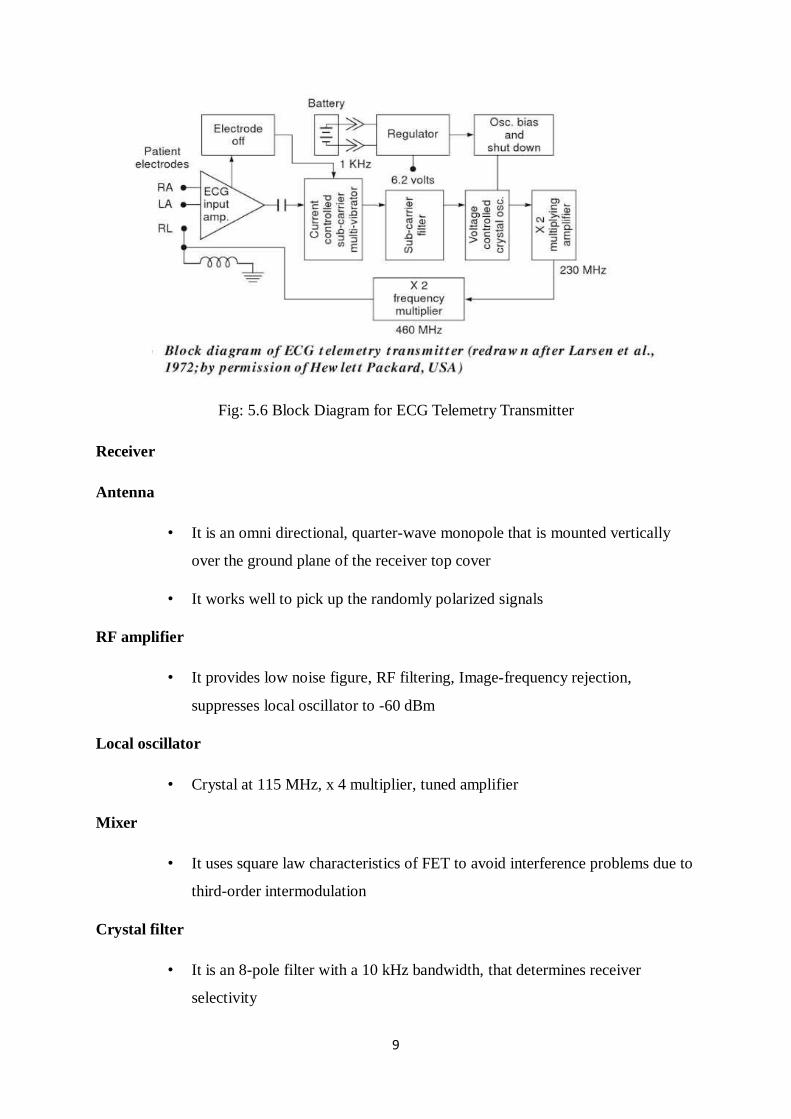
9
Fig: 5.6 Block Diagram for ECG Telemetry Transmitter
Receiver
Antenna
• It is an omni directional, quarter-wave monopole that is mounted vertically
over the ground plane of the receiver top cover
• It works well to pick up the randomly polarized signals
RF amplifier
• It provides low noise figure, RF filtering, Image-frequency rejection,
suppresses local oscillator to -60 dBm
Local oscillator
• Crystal at 115 MHz, x 4 multiplier, tuned amplifier
Mixer
• It uses square law characteristics of FET to avoid interference problems due to
third-order intermodulation
Crystal filter
• It is an 8-pole filter with a 10 kHz bandwidth, that determines receiver
selectivity
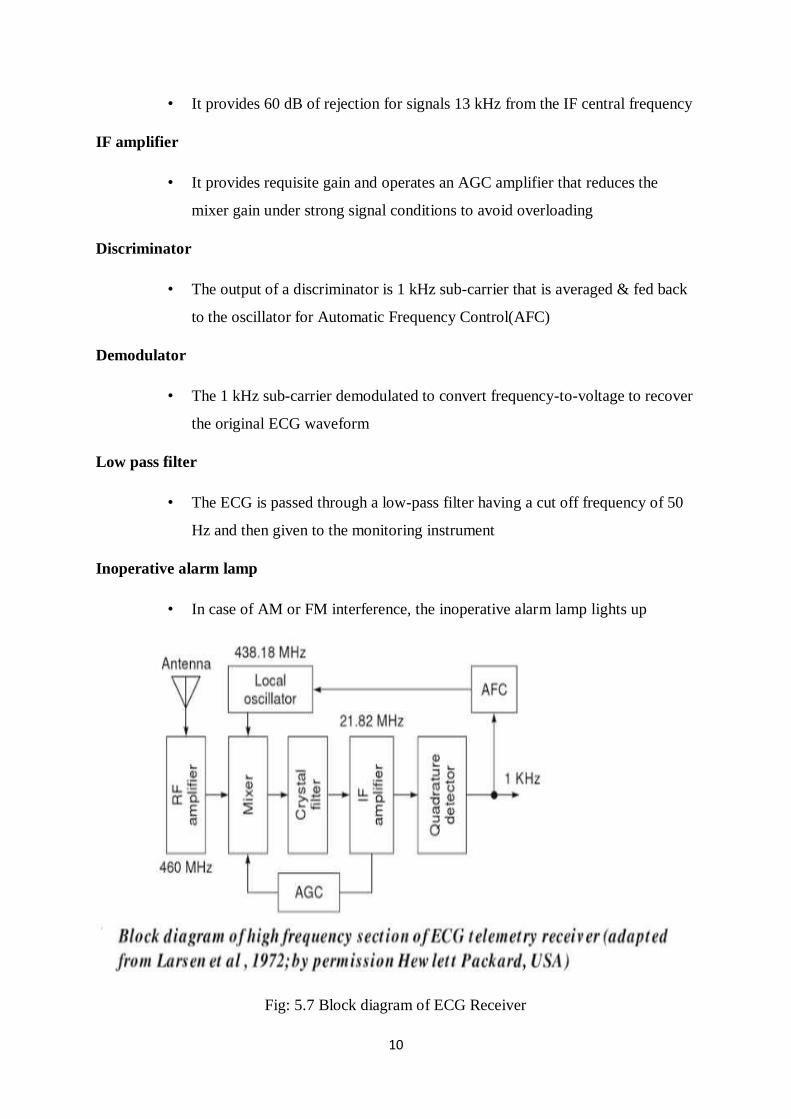
10
• It provides 60 dB of rejection for signals 13 kHz from the IF central frequency
IF amplifier
• It provides requisite gain and operates an AGC amplifier that reduces the
mixer gain under strong signal conditions to avoid overloading
Discriminator
• The output of a discriminator is 1 kHz sub-carrier that is averaged & fed back
to the oscillator for Automatic Frequency Control(AFC)
Demodulator
• The 1 kHz sub-carrier demodulated to convert frequency-to-voltage to recover
the original ECG waveform
Low pass filter
• The ECG is passed through a low-pass filter having a cut off frequency of 50
Hz and then given to the monitoring instrument
Inoperative alarm lamp
• In case of AM or FM interference, the inoperative alarm lamp lights up
Fig: 5.7 Block diagram of ECG Receiver
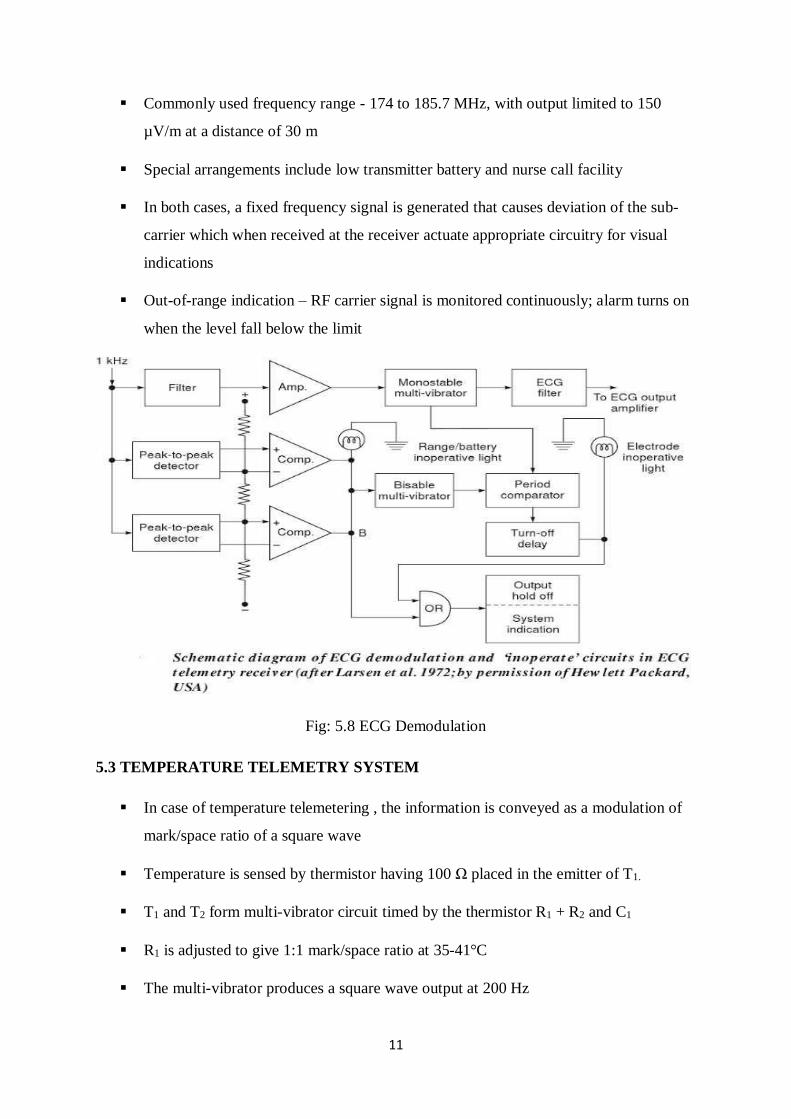
11
Commonly used frequency range - 174 to 185.7 MHz, with output limited to 150
µV/m at a distance of 30 m
Special arrangements include low transmitter battery and nurse call facility
In both cases, a fixed frequency signal is generated that causes deviation of the sub-
carrier which when received at the receiver actuate appropriate circuitry for visual
indications
Out-of-range indication – RF carrier signal is monitored continuously; alarm turns on
when the level fall below the limit
Fig: 5.8 ECG Demodulation
5.3 TEMPERATURE TELEMETRY SYSTEM
In case of temperature telemetering , the information is conveyed as a modulation of
mark/space ratio of a square wave
Temperature is sensed by thermistor having 100 Ω placed in the emitter of T1.
T1 and T2 form multi-vibrator circuit timed by the thermistor R1 + R2 and C1
R1 is adjusted to give 1:1 mark/space ratio at 35-41°C
The multi-vibrator produces a square wave output at 200 Hz
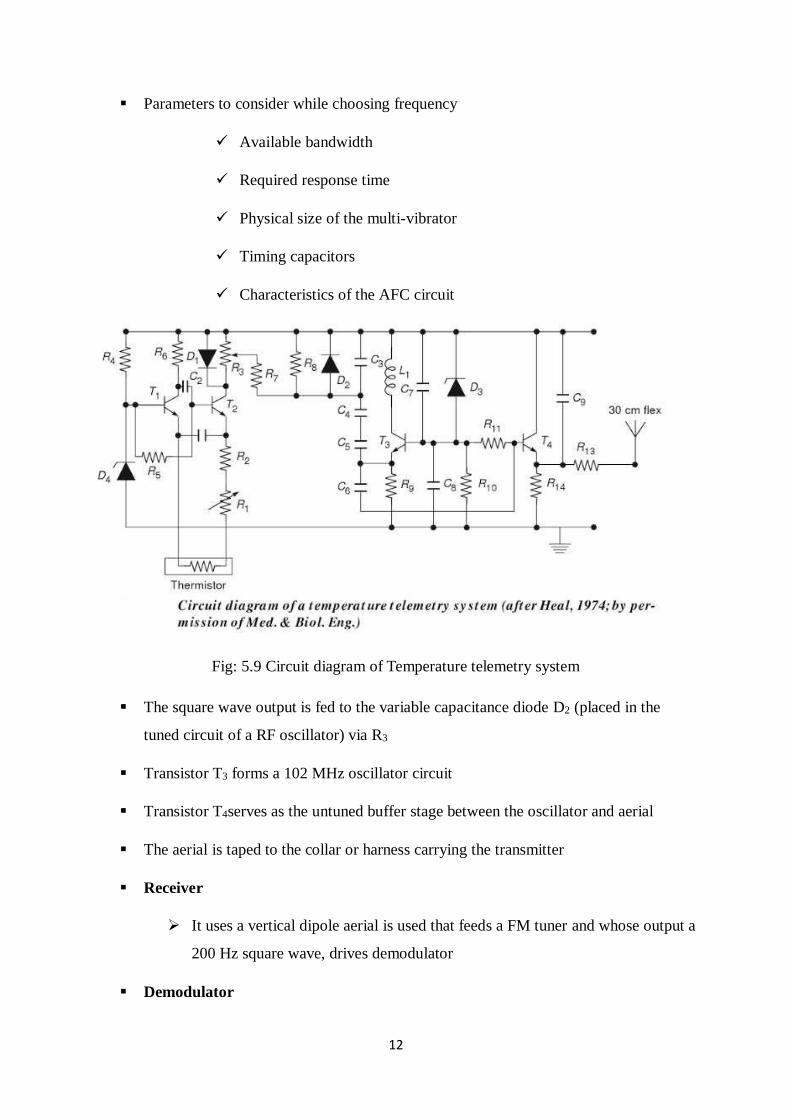
12
Parameters to consider while choosing frequency
Available bandwidth
Required response time
Physical size of the multi-vibrator
Timing capacitors
Characteristics of the AFC circuit
Fig: 5.9 Circuit diagram of Temperature telemetry system
The square wave output is fed to the variable capacitance diode D2 (placed in the
tuned circuit of a RF oscillator) via R3
Transistor T3 forms a 102 MHz oscillator circuit
Transistor T4serves as the untuned buffer stage between the oscillator and aerial
The aerial is taped to the collar or harness carrying the transmitter
Receiver
It uses a vertical dipole aerial is used that feeds a FM tuner and whose output a
200 Hz square wave, drives demodulator
Demodulator
13
The square wave is amplified, positive dc restored
RC Filter
It is filtered to eliminate high ripple content to obtain a smooth record on the
paper
A FM tuner can be used for this purpose
Thermistor
Thermistor probe having temperature coefficient of -4% per degree centigrade
It produces a mark/space ratio change of 20% over 5°C temp range
The system is linear with a span of ±3°C
The circuit operates on 5.4 V, 350mAh battery which gives a continuous operation
for 100 hours
5.4 IMPLANTABLE BIOTELEMETRY SYSTEM
Introduction
Implantable Telemetry systems allow the measurement of multiple physiological
variables over a long period of time.
There is no attachment of wires, restraint or anaesthesia to the monitored subject.
Sensors need not be attached to the body surface.
This system is exclusively used in animal research.
Both single and multichannel systems have been used to monitor ECG, EEG, blood
pressure, blood flow, temperature, etc.
These transmitters most often have to be made as small as possible, so that they do
not cause any disturbance to the subject.
They are made with sub miniature passive and active components.
This will avoid difficulties in interconnection and minimize electrical interaction
(makes the system stable).
Energy supply is another problem while designing implantable telemetry system.
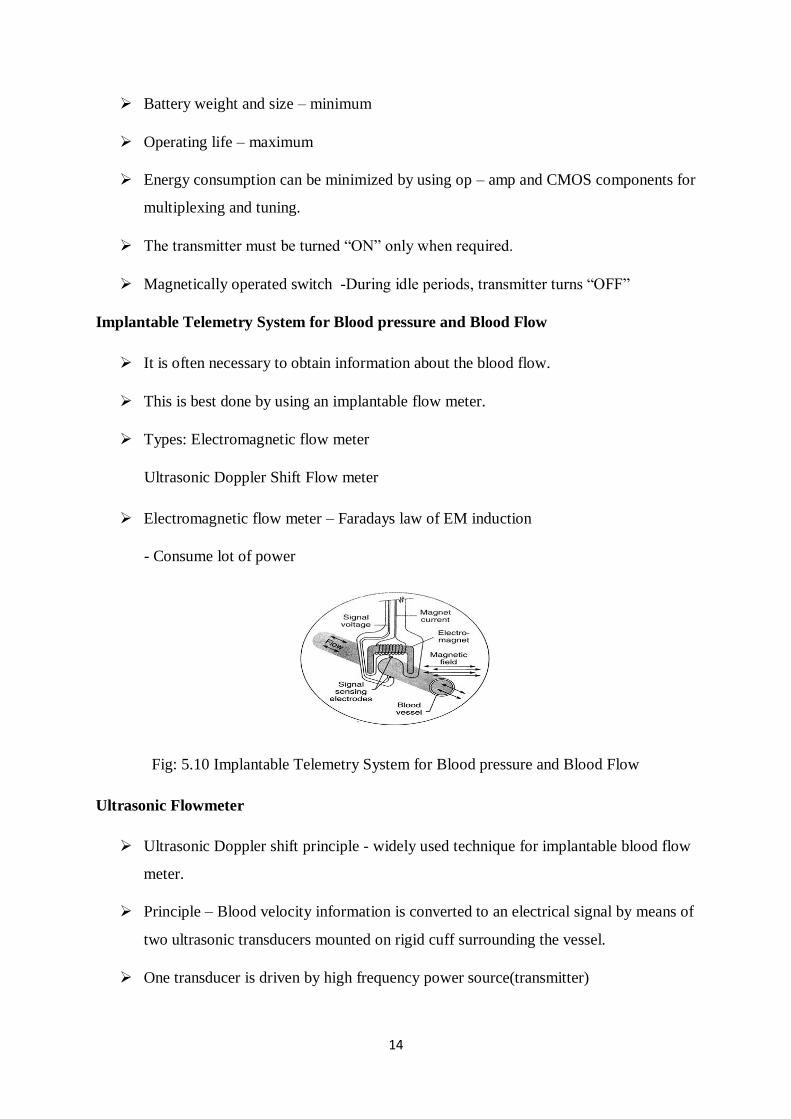
14
Battery weight and size – minimum
Operating life – maximum
Energy consumption can be minimized by using op – amp and CMOS components for
multiplexing and tuning.
The transmitter must be turned “ON” only when required.
Magnetically operated switch -During idle periods, transmitter turns “OFF”
Implantable Telemetry System for Blood pressure and Blood Flow
It is often necessary to obtain information about the blood flow.
This is best done by using an implantable flow meter.
Types: Electromagnetic flow meter
Ultrasonic Doppler Shift Flow meter
Electromagnetic flow meter – Faradays law of EM induction
- Consume lot of power
Fig: 5.10 Implantable Telemetry System for Blood pressure and Blood Flow
Ultrasonic Flowmeter
Ultrasonic Doppler shift principle - widely used technique for implantable blood flow
meter.
Principle – Blood velocity information is converted to an electrical signal by means of
two ultrasonic transducers mounted on rigid cuff surrounding the vessel.
One transducer is driven by high frequency power source(transmitter)
15
Second receives the scattered energy which a shifted frequency(receiver)
Fig: 5.11 Ultrasonic Flowmeter
Implantable portion is shown within the dashed box.
High frequency power for the flow transducer is generated by 6MHz oscillator.
The 6MHz AM receiver converts the incoming ultrasonic signal to an audio frequency
signal by synchronous detection.
Data recovery is accomplished by an internal 100 MHz FM Transmitter and an
external commercial receiver.
A demodulator converts the doppler shift frequency to a flow estimate.
It measures the zero crossing rate of the doppler signal which is proportional to blood
velocity.
Fig: 5.12 Ultrasonic Flowmeter
16
Rader (1973)
- Described miniature totally implantable FM/FM telemetry system to measure blood
flow and blood pressure simultaneously.
- Pressure is detected by miniature intravascular transducer placed directly in the blood
stream.
- Diameter – 6.5 mm, Thickness – 1mm
- 4 Semiconductor strain gauges connected in four arm bridge are bonded to the inner
surface of the small pressure sensing diaphragm.
- The flow is sensed and measured by an extra vascular interferometric ultrasonic
technique.
Barbaro and Macellari(1979)
- Explained construction of radiosonde (radio pill) for measurement of intracranial
pressures.
- A strain gauge pressure transducer is implanted epidurally and is connected flexibly to
the body of the radio pill.
- A thermistor is placed next to the pressure transducer.
- The sub carrier oscillator is essentially an astable multivibrator operating at 4 kHz,
whose time constant is determined alternately by the two transducers.
- The switching of the transducer is done at 100kHz.
- The sub carrier oscillator amplitude modulates a radio frequency carrier of 1050 kHz,
which is conveniently received by the commercial receiver.
- The tuning coil of the carrier oscillator acts as the transmitting aerial.
- The radio pill is powered from outside by electromagnetic coupling.
- The total circuit is enclosed in a polypropylene case, which is well tolerated by human
tissue.
- A film of silicon rubber covering the case further improves the stability.
17
Fig: 5.13 Construction of radiosonde
Cheng (1975)
- used Pitran transducer for telemetering intracranial pressures.
Fassbender(2008)
- Explained a system containing of an implant and an external reader station to realize a
long term monitoring for hypertonic patients.
- Implant consisted of sensor chip integrated at the head of the catheter and one
telemetric unit.
- Sensor –made of monolithically integrated capacitive CMOS pressure sensor.
- Sensor tip – implanted into femoral artery.
- Telemetric unit – Implanted into the subcutaneous tissue.
- Disturbance inside the blood vessel and distance for wireless communication are kept
as small as possible.
- The implant is supplied with energy wirelessly via inductive coupling from the
external reader station.
- Data is read out from the external station.
5.5 IMPLANTABLE MULTISENSOR RADIOTELEMETRY
Development of new technologies like MEMS, miniaturization of components, silicon
microprocessing chips and electronic hardware has enabled to design miniature
systems to be implanted into the body.
18
Biao (2009) described a multisensor radiotelemetry system for intestinal mobility
measurement.
The radiotelemetry capsule can monitor the, pH, pressure and temperature of the
intestinal tract.
The data is sent to the data logger outside the body through a wireless communication
link.
The capsule containing the transceiver is swallowed and gets naturally transported
from mouth to the anus.
The capsule is not absorbed in the body but eventually exits the patient through the
colon.
Fig: 5.14 Implantable Multisensor Radiotelemetry
Elements of radiotelemetry capsule.
Three sensors
Signal conditioning circuit
Microcontroller unit
A pair of silver oxide cells
Magnetic switch
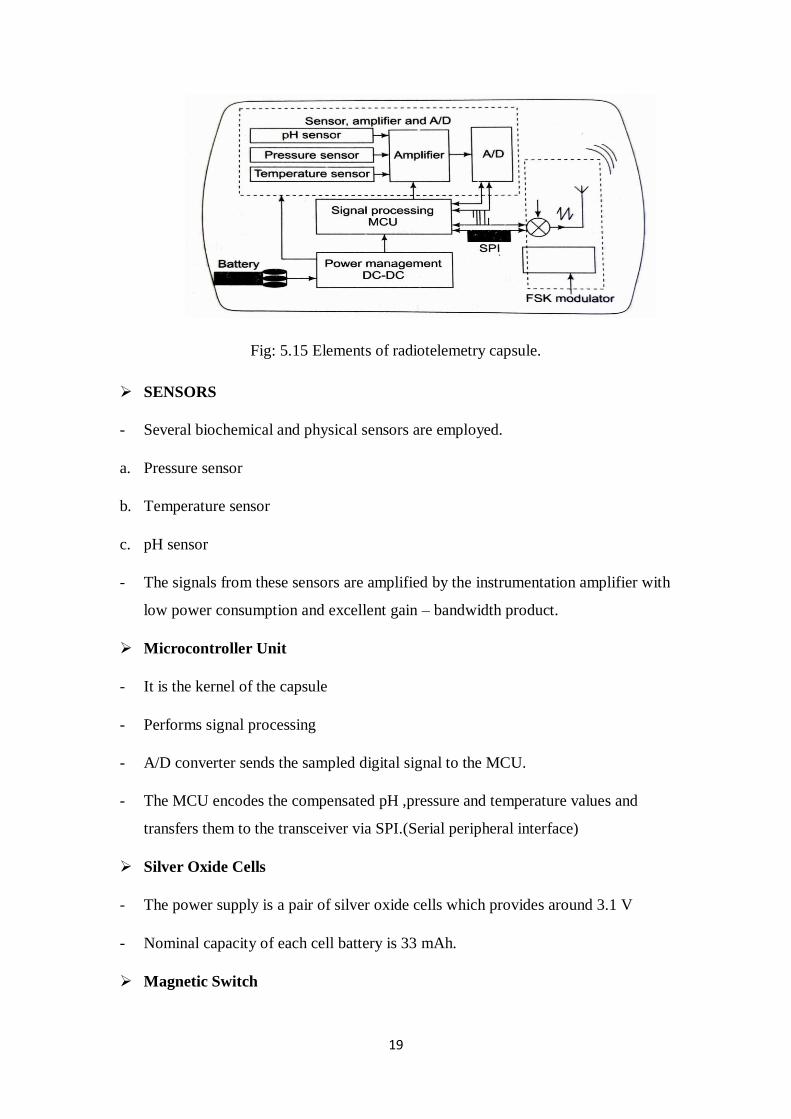
19
Fig: 5.15 Elements of radiotelemetry capsule.
SENSORS
- Several biochemical and physical sensors are employed.
a. Pressure sensor
b. Temperature sensor
c. pH sensor
- The signals from these sensors are amplified by the instrumentation amplifier with
low power consumption and excellent gain – bandwidth product.
Microcontroller Unit
- It is the kernel of the capsule
- Performs signal processing
- A/D converter sends the sampled digital signal to the MCU.
- The MCU encodes the compensated pH ,pressure and temperature values and
transfers them to the transceiver via SPI.(Serial peripheral interface)
Silver Oxide Cells
- The power supply is a pair of silver oxide cells which provides around 3.1 V
- Nominal capacity of each cell battery is 33 mAh.
Magnetic Switch
20
- Allows remote control of the on – off mode of the radiotelemetry capsule
- The radiotelemetry capsule is activated by bringing the permanent magnet close to the
capsule.(less than 20mm away).
Advantages:
- Effective for studying and testing mobility characteristics.
Xin (2010)
- Gave another approach for gastrointestinal studies.
- Usage of wireless transmission system
- The system used a Helmholtz primary coil outside and a 3 dimensional secondary coil
inside the body.
- This combination allowed the power system to transmit upto 310 mW power
regardless of the changes in the position and orientation of the capsule inside the
body.
5.6 Multi Channel Telemetry Systems
Medical measuring problems often involve the simultaneous transmission of several
parameters. For this type of application, a multi-channel telemetry system is employed.
Multi-channel telemetry is particularly useful in athletic training programs as it offers the
possibility of simultaneously surveying several physiological parameters of the person being
monitored. With appropriate preamplifiers, the multi-channel systems permit the transmission
of the following parameters simultaneously depending upon the number of channels required,
ECG and heart rate, respiration rate, temperature, intravascular and intra-cardiac blood
pressure.
In multi-channel telemetry, the numbers of sub-carriers used are the same as the
number of
signals to be transmitted. Each channel therefore has its own modulator. The RF unit—the
same for all channels—converts the mixed frequencies into the transmission band. Similarly,
the receiver unit contains the RF unit and one demodulator for each channel.
Pulse width modulation is better suited for multi-channel biotelemetry systems. Such
systems are insensitive to carrier frequency shifts and have high noise immunity. FM-FM
21
systems for similar use may have low power consumption and high baseline stability, but
they are more complicated and turn out to be more expensive. They can be troubled by
interference between different channels. Techniques for separation usually require expensive
and complex filters and even with these, cross-talk can still be a problem. Since the FM-FM
system employs a separate subcarrier frequency for each data channel, it generally involves a
high cost. Similarly, pulse-position amplitude modulation easily gets into synchronization
difficulties caused by noise and thus results in a loss of the information transmitted. On the
other hand, advantages of pulse-duration modulation include lower sensitivity to temperature
and battery voltage changes and its adaptability to miniaturization due to availability of
suitable integrated circuits. For multi-channel radiotelemetry, various channels of information
are combined into a single signal. This technique is called multiplexing. There are two basic
methods of multiplexing. These are:
• Frequency–division multiplexing: The method makes use of continuous-wave sub-carrier
frequencies. The signals frequency–modulate multiple subcarrier oscillators, each being at
such a frequency that its modulated signal does not overlap the frequency spectra of the other
modulated signals. The frequency modulated signals from all channels are added together
through a summing amplifier to give a composite signal in which none of the parts overlap in
frequency. This signal then modulates the RF carrier of the transmitter and is broadcast.
• Time–division multiplexing: In this technique, multiple signals are applied to a commutator
circuit. This circuit is an electronic switch that rapidly scans the signals from different
channels. An oscillator drives the commutator circuit so that it samples each signal for an
instant of time, thereby giving a pulse train sequence corresponding to input signals. A frame
reference signal is also provided as an additional channel to make it easy to recognize the
sequency and value of the input channels.
5.6.1 Telemetry of ECG and Respiration
An FM-FM modulated radiotelemetry transmitter (Fig. 9.10) for detecting and transmitting
ECG and respiration activity simultaneously on a single carrier frequency in the FM
broadcast band is described by Beerwinkle and Burch (1976). Respiration is detected by the
impedance pneumographic principle by using the same pair of electrodes that are used for the
ECG. A 10 kHz sinusoidal constant current is injected through electrodes E1 and E2 attached
across the subject’s thoracic cavity. The carrier signal is generated by a phase shift oscillator.
The varying thoracic impedance associated with respiration produces an ac voltage whose
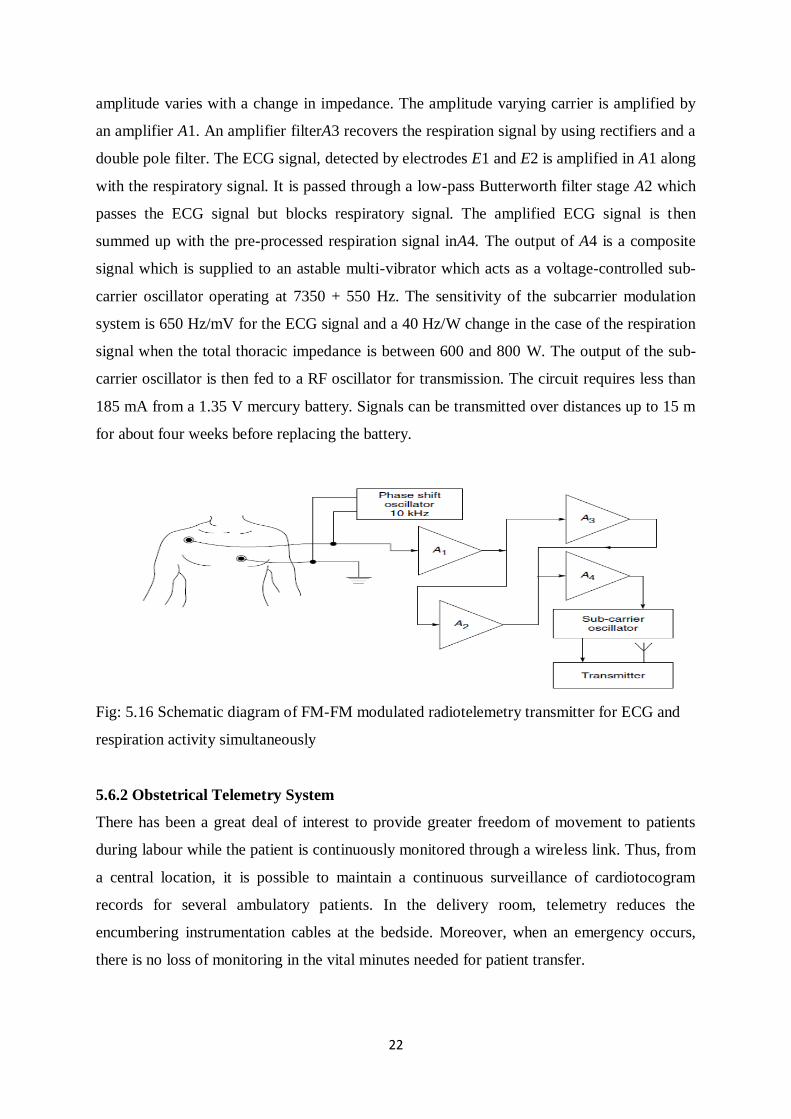
22
amplitude varies with a change in impedance. The amplitude varying carrier is amplified by
an amplifier A1. An amplifier filterA3 recovers the respiration signal by using rectifiers and a
double pole filter. The ECG signal, detected by electrodes E1 and E2 is amplified in A1 along
with the respiratory signal. It is passed through a low-pass Butterworth filter stage A2 which
passes the ECG signal but blocks respiratory signal. The amplified ECG signal is then
summed up with the pre-processed respiration signal inA4. The output of A4 is a composite
signal which is supplied to an astable multi-vibrator which acts as a voltage-controlled sub-
carrier oscillator operating at 7350 + 550 Hz. The sensitivity of the subcarrier modulation
system is 650 Hz/mV for the ECG signal and a 40 Hz/W change in the case of the respiration
signal when the total thoracic impedance is between 600 and 800 W. The output of the sub-
carrier oscillator is then fed to a RF oscillator for transmission. The circuit requires less than
185 mA from a 1.35 V mercury battery. Signals can be transmitted over distances up to 15 m
for about four weeks before replacing the battery.
Fig: 5.16 Schematic diagram of FM-FM modulated radiotelemetry transmitter for ECG and
respiration activity simultaneously
5.6.2 Obstetrical Telemetry System
There has been a great deal of interest to provide greater freedom of movement to patients
during labour while the patient is continuously monitored through a wireless link. Thus, from
a central location, it is possible to maintain a continuous surveillance of cardiotocogram
records for several ambulatory patients. In the delivery room, telemetry reduces the
encumbering instrumentation cables at the bedside. Moreover, when an emergency occurs,
there is no loss of monitoring in the vital minutes needed for patient transfer.
23
The patient carries a small pocket-sized transmitter which is designed to pick up signals for
foetal heart rate and uterine activity. The foetal heart rate is derived from foetal ECG which is
obtained via a scalp electrode attached to the foetus after the mother’s membranes are
ruptured.
Uterine activity is measured via an intra-uterine pressure transducer. If only foetal ECG is
measured, the patient herself can indicate uterine activity or foetal movement by using a
handheld push button. The receiver located away from the patient, is connected to a
conventional cardiotocograph. If the patient exceeds the effective transmission range or the
electrode has a poor contact, it is appropriately transmitted for corrective action. The
telemetry system uses FM/FM modulation, with a carrier of 450 to 470 MHz and an RF
power output of 2 mW into 50W load measured from RL electrode to a ground plane under
transmitter. The input signal range in the input for the ECG channel is 100 mV to 1 mV with
a frequency band 1 to 40 Hz. The toco channel has a sensitivity of 40 mV/ V/mmHg, and by
using a high sensitivity transducer, it can be 5 mV/ V/mmHg. The strain gauge transducer is
excited with 0.25 Vrms for 40 mV/V/mmHg at 2.4 kHz. The frequency response of this
channel is 3 Hz/0.5 Hz.
5.7 Multi Channel Telemetry Systems
The establishment of instrumented coronary care units have resulted in substantial reduction
in the mortality rates of hospitalized patients. When a patient’s condition has stabilized within
a few days, it is necessary that he is monitored during the early stages of increased activity
and exertion to determine if his heart has sufficiently recovered. This can be conveniently
done by the use of telemetry which provides a sort of intermediate stage of care that
smoothens the patient’s transition back to a normal life. It thus permits surveillance of
suspected coronaries without the unnatural constraints of confining the patient to bed. The
main advantage of a multi-patient single parameter telemetry system is that patients making
satisfactory recovery can vacate the hard wired instrument beds in the ICU/CCU units, which
provides a positive psychological effect. The patients regain mobility after an extended
period of confinement thereby improving their muscle tone and circulation. Transmitters as
small as 8 \ 6.25 \ 2.25 cm in size and weighing less than 115 g, including battery are
commercially available. Data from different patients is received at the nurses central station.
The station may have the facility of non-fade display of received waveforms, an ECG
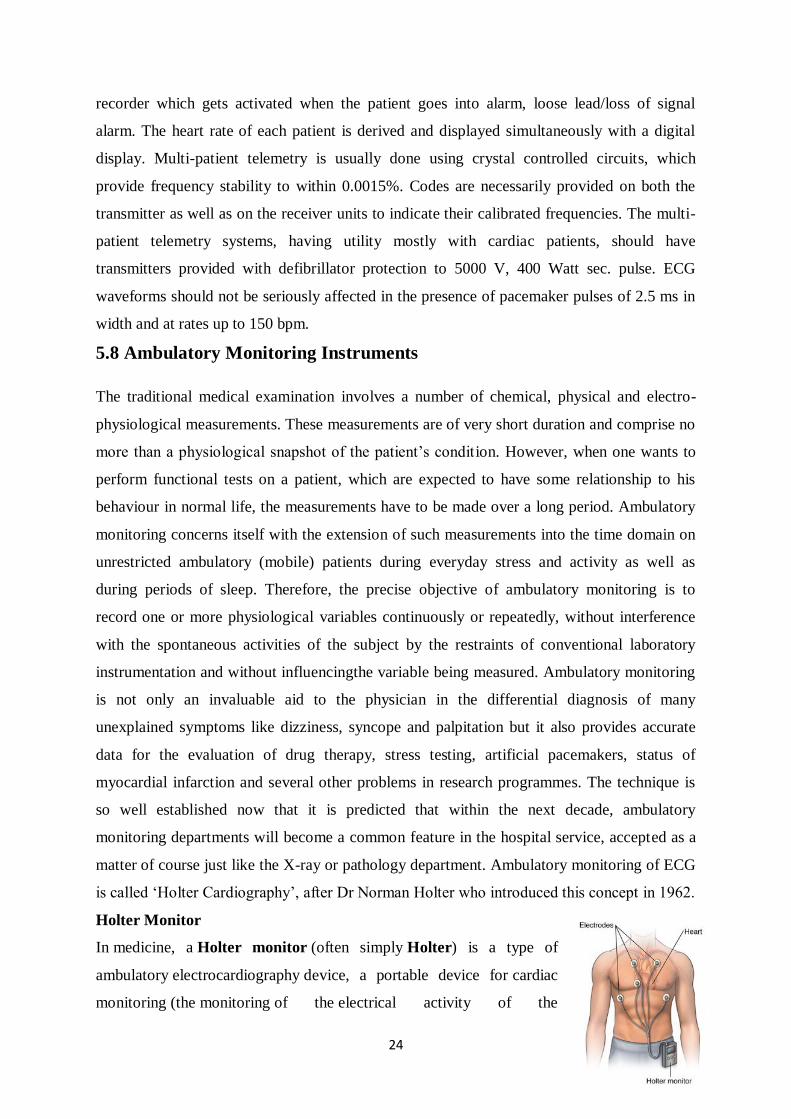
24
recorder which gets activated when the patient goes into alarm, loose lead/loss of signal
alarm. The heart rate of each patient is derived and displayed simultaneously with a digital
display. Multi-patient telemetry is usually done using crystal controlled circuits, which
provide frequency stability to within 0.0015%. Codes are necessarily provided on both the
transmitter as well as on the receiver units to indicate their calibrated frequencies. The multi-
patient telemetry systems, having utility mostly with cardiac patients, should have
transmitters provided with defibrillator protection to 5000 V, 400 Watt sec. pulse. ECG
waveforms should not be seriously affected in the presence of pacemaker pulses of 2.5 ms in
width and at rates up to 150 bpm.
5.8 Ambulatory Monitoring Instruments
The traditional medical examination involves a number of chemical, physical and electro-
physiological measurements. These measurements are of very short duration and comprise no
more than a physiological snapshot of the patient’s condition. However, when one wants to
perform functional tests on a patient, which are expected to have some relationship to his
behaviour in normal life, the measurements have to be made over a long period. Ambulatory
monitoring concerns itself with the extension of such measurements into the time domain on
unrestricted ambulatory (mobile) patients during everyday stress and activity as well as
during periods of sleep. Therefore, the precise objective of ambulatory monitoring is to
record one or more physiological variables continuously or repeatedly, without interference
with the spontaneous activities of the subject by the restraints of conventional laboratory
instrumentation and without influencingthe variable being measured. Ambulatory monitoring
is not only an invaluable aid to the physician in the differential diagnosis of many
unexplained symptoms like dizziness, syncope and palpitation but it also provides accurate
data for the evaluation of drug therapy, stress testing, artificial pacemakers, status of
myocardial infarction and several other problems in research programmes. The technique is
so well established now that it is predicted that within the next decade, ambulatory
monitoring departments will become a common feature in the hospital service, accepted as a
matter of course just like the X-ray or pathology department. Ambulatory monitoring of ECG
is called ‘Holter Cardiography’, after Dr Norman Holter who introduced this concept in 1962.
Holter Monitor
In medicine, a Holter monitor (often simply Holter) is a type of
ambulatory electrocardiography device, a portable device for cardiac
monitoring (the monitoring of the electrical activity of the
25
cardiovascular system) for at least 24 to 72 hours (often for two weeks at a time).
The Holter's most common use is for monitoring ECG heart activity (electrocardiography or
ECG). Its extended recording period is sometimes useful for observing occasional
cardiac arrhythmias which would be difficult to identify in a shorter period. For patients
having more transient symptoms, a cardiac event monitor which can be worn for a month or
more can be used.
When used to study the heart, much like standard electrocardiography, the Holter monitor
records electrical signals from the heart via a series of electrodes attached to the chest.
Electrodes are placed over bones to minimize artifacts from muscular activity. The number
and position of electrodes varies by model, but most Holter monitors employ between three
and eight. These electrodes are connected to a small piece of equipment that is attached to the
patient's belt or hung around the neck, keeping a log of the heart's electrical activity
throughout the recording period. A 12 lead Holter system is also available when
precise ECG signal information is required to analyse the exact nature and origin of the
rhythm signal.
Data Recording
The core of the modern ambulatory monitoring system is a multi-channel sub-miniature tape
recorder running normally at a speed of 2 mm/s. At this speed, a C-120 entertainment cassette
will run for 24 h. The recorders are designed to be fitted with a variety of plug-in circuit
boards adapted for different signals or transducers. The main areas of interest in ambulatory
monitoring are centred on the cardiovascular system, with particular reference to the control
of cardiac rhythm disturbances, along with treatment of hypertension and the diagnosis and
treatment of ischaemic heart disease. Another area of interest is EEG recording, with
particular reference to epilepsy. Ambulatory monitoring of respiration has also considerably
developed in the last few years into a rapidly growing area of clinical research, which is
beginning to make a substantial contribution to respiratory medicine. The main non-clinical
application of ambulatory monitoring is for studies in work physiology and environmental
health and it continues to make considerable impact on these areas. During replay, the tape is
run at 120 mm/s (60 times the recording speed) to achieve rapid manual or automatic
scanning of ambulatory records. The tape recorders used for this purpose have some special
features as compared to the usually available entertainment tape recorders. A block diagram
of a two channel recorder is shown in Fig. 7.10. The tape recorder offers singlesided 24 h
recording facility, with three recording channels—two for ECG and one for timing, for the
precise correlation of recorded events to patient activity. As in conventional circuits, the ECG
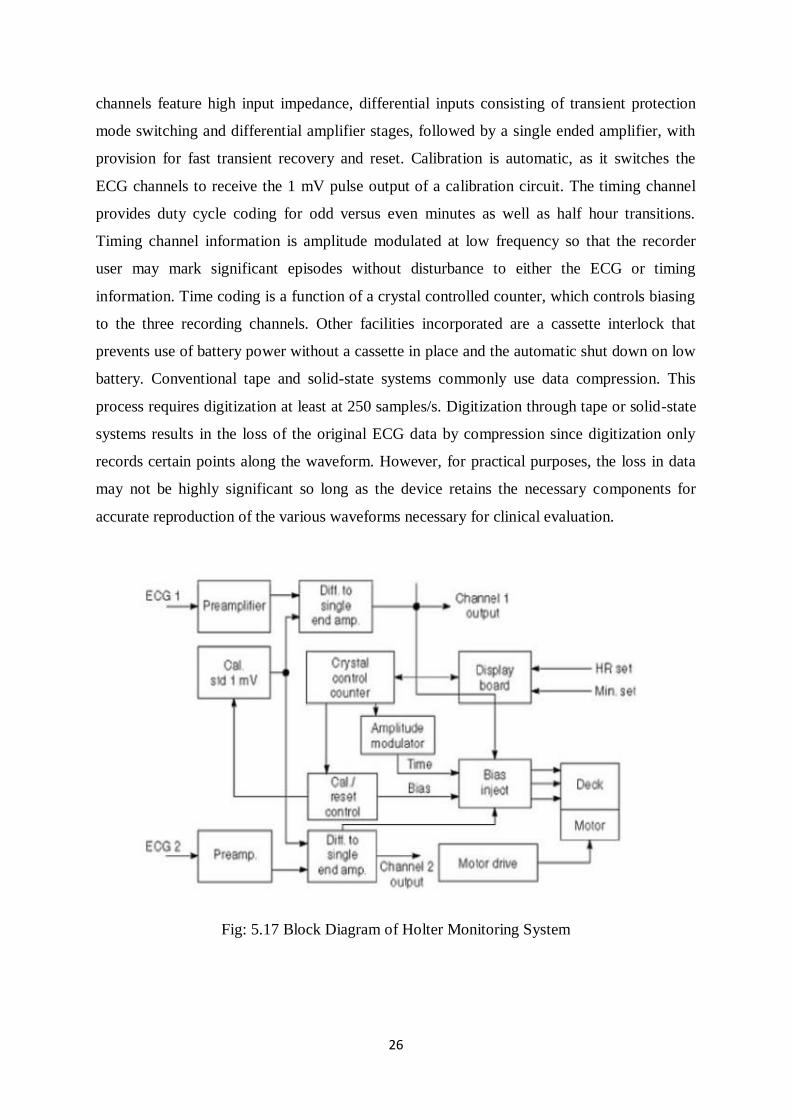
26
channels feature high input impedance, differential inputs consisting of transient protection
mode switching and differential amplifier stages, followed by a single ended amplifier, with
provision for fast transient recovery and reset. Calibration is automatic, as it switches the
ECG channels to receive the 1 mV pulse output of a calibration circuit. The timing channel
provides duty cycle coding for odd versus even minutes as well as half hour transitions.
Timing channel information is amplitude modulated at low frequency so that the recorder
user may mark significant episodes without disturbance to either the ECG or timing
information. Time coding is a function of a crystal controlled counter, which controls biasing
to the three recording channels. Other facilities incorporated are a cassette interlock that
prevents use of battery power without a cassette in place and the automatic shut down on low
battery. Conventional tape and solid-state systems commonly use data compression. This
process requires digitization at least at 250 samples/s. Digitization through tape or solid-state
systems results in the loss of the original ECG data by compression since digitization only
records certain points along the waveform. However, for practical purposes, the loss in data
may not be highly significant so long as the device retains the necessary components for
accurate reproduction of the various waveforms necessary for clinical evaluation.
Fig: 5.17 Block Diagram of Holter Monitoring System
27
Data Replay and Analysis
One difficult problem, which is inevitably faced when examining long-term recordings, is the
almost overwhelming quantity of data which becomes available. Even a single channel 24
hour ECG recording will contain in excess of 100,000 beats. Early replay and analysis
equipment relied on visual inspection of the replayed signals in accelerated time. This can
become exceedingly tedious and is subject to error. For example, many events of clinical
significance are quite transitory and may occupy less than one minute of real time, which
means that they last perhaps one or two seconds on playback and in the course of replaying, a
tape which runs for about half an hour, can easily be missed. More complex equipment now
has the ability to work largely automatically and is able to recognise abnormalities and to
write these out on a conventional pen recorder for subsequent examination. The displays in
the form of R–R interval histograms, have also been found to give important diagnostic
information. The analyser part in the automatic scanning of ambulatory records look for four
arrhythmic conditions. These are bradycardia, tachycardia, dropped beat and premature beat.
A threshold control is associated with each of these and when the appropriate threshold is
exceeded, an alarm condition is generated. A typical example of a modern two channel ECG
analysis system incorporating precise tape control and data processing is shown in Fig. 7.11.
The most prominent operational feature of this system is its dual microprocessors: control
and timing and acquisition and display CPUs. The control and timing CPU has overall system
control responsibility. It also handles individual functions such as keyboard and direct writer
interface, tape deck control, timing data processing and arrhythmia count totalizing via a high
speed interrupt system. The control and timing program is primarily resident in the 8 K
PROM with spill-over occupying additional RAM. The RAM resident program portion is
loaded during system initialization at start-up from the data acquisition and display PROM
via a bidirectional serial communications link. The acquisition and display CPU is
responsible for the scan-mode A-D conversion and storage of 72 s worth of ECG data for
each of the two channels. Digital data storage is in RAM in circular buffer fashion for ready
access to facilitate display generation. This CPU is also responsible for accessing the stored
data in order to produce a variety of system scan mode CRT displays, as well as ECG strip
and trend-mode report write-outs.
The arrhythmia processor provides arrhythmia detection sounds, ectopic count tabulation and
a trend report write-out. After adjustment of detection sensitivities, the arrhythmia detector
output can be set to either sound distinctive tones for different types of detected abnormalities
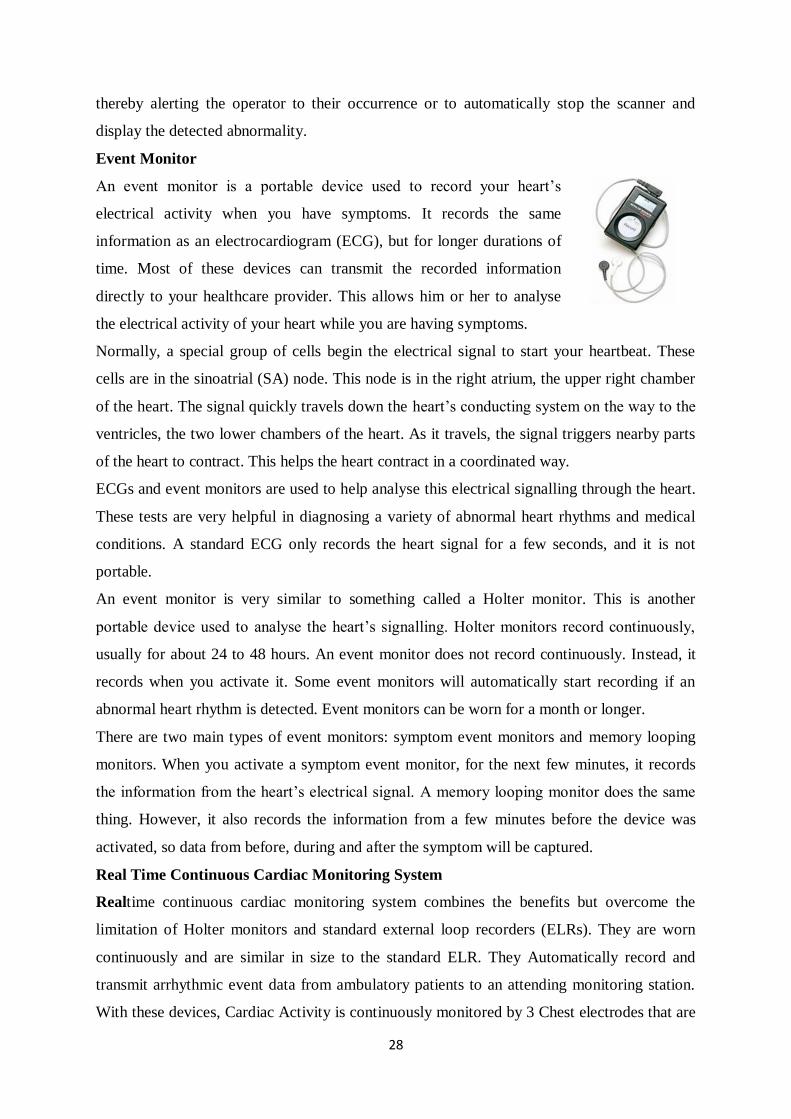
28
thereby alerting the operator to their occurrence or to automatically stop the scanner and
display the detected abnormality.
Event Monitor
An event monitor is a portable device used to record your heart’s
electrical activity when you have symptoms. It records the same
information as an electrocardiogram (ECG), but for longer durations of
time. Most of these devices can transmit the recorded information
directly to your healthcare provider. This allows him or her to analyse
the electrical activity of your heart while you are having symptoms.
Normally, a special group of cells begin the electrical signal to start your heartbeat. These
cells are in the sinoatrial (SA) node. This node is in the right atrium, the upper right chamber
of the heart. The signal quickly travels down the heart’s conducting system on the way to the
ventricles, the two lower chambers of the heart. As it travels, the signal triggers nearby parts
of the heart to contract. This helps the heart contract in a coordinated way.
ECGs and event monitors are used to help analyse this electrical signalling through the heart.
These tests are very helpful in diagnosing a variety of abnormal heart rhythms and medical
conditions. A standard ECG only records the heart signal for a few seconds, and it is not
portable.
An event monitor is very similar to something called a Holter monitor. This is another
portable device used to analyse the heart’s signalling. Holter monitors record continuously,
usually for about 24 to 48 hours. An event monitor does not record continuously. Instead, it
records when you activate it. Some event monitors will automatically start recording if an
abnormal heart rhythm is detected. Event monitors can be worn for a month or longer.
There are two main types of event monitors: symptom event monitors and memory looping
monitors. When you activate a symptom event monitor, for the next few minutes, it records
the information from the heart’s electrical signal. A memory looping monitor does the same
thing. However, it also records the information from a few minutes before the device was
activated, so data from before, during and after the symptom will be captured.
Real Time Continuous Cardiac Monitoring System
Realtime continuous cardiac monitoring system combines the benefits but overcome the
limitation of Holter monitors and standard external loop recorders (ELRs). They are worn
continuously and are similar in size to the standard ELR. They Automatically record and
transmit arrhythmic event data from ambulatory patients to an attending monitoring station.
With these devices, Cardiac Activity is continuously monitored by 3 Chest electrodes that are
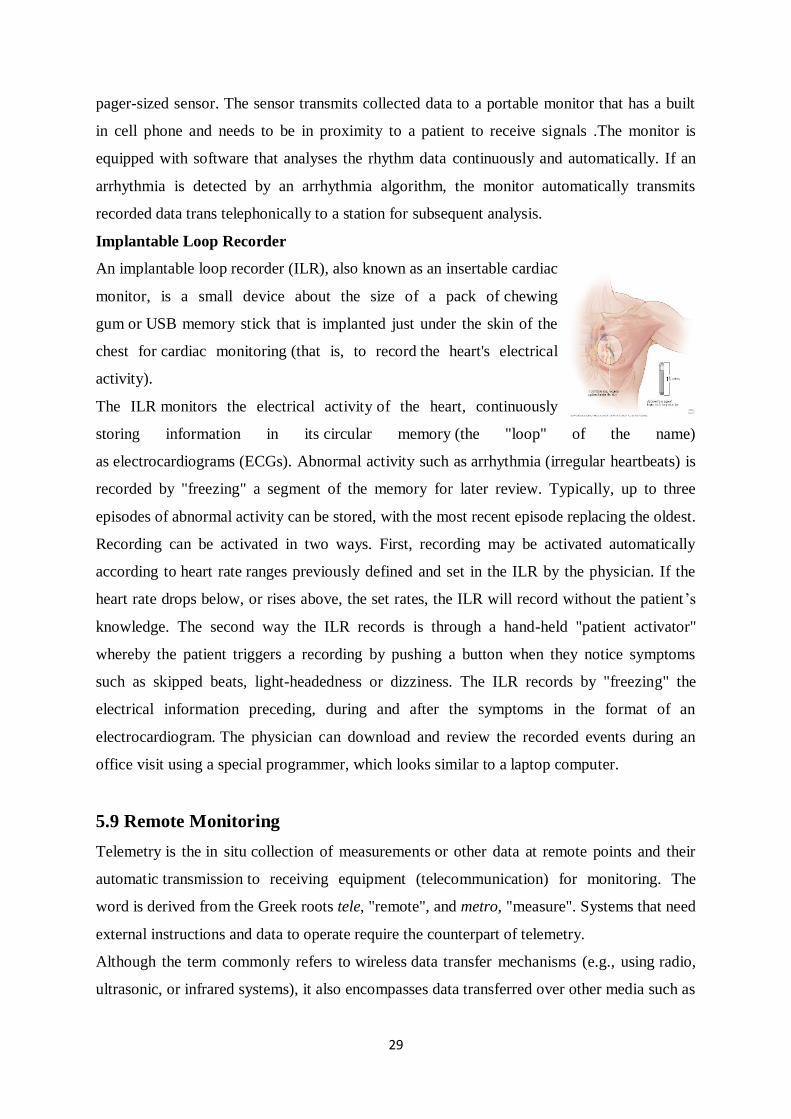
29
pager-sized sensor. The sensor transmits collected data to a portable monitor that has a built
in cell phone and needs to be in proximity to a patient to receive signals .The monitor is
equipped with software that analyses the rhythm data continuously and automatically. If an
arrhythmia is detected by an arrhythmia algorithm, the monitor automatically transmits
recorded data trans telephonically to a station for subsequent analysis.
Implantable Loop Recorder
An implantable loop recorder (ILR), also known as an insertable cardiac
monitor, is a small device about the size of a pack of chewing
gum or USB memory stick that is implanted just under the skin of the
chest for cardiac monitoring (that is, to record the heart's electrical
activity).
The ILR monitors the electrical activity of the heart, continuously
storing information in its circular memory (the "loop" of the name)
as electrocardiograms (ECGs). Abnormal activity such as arrhythmia (irregular heartbeats) is
recorded by "freezing" a segment of the memory for later review. Typically, up to three
episodes of abnormal activity can be stored, with the most recent episode replacing the oldest.
Recording can be activated in two ways. First, recording may be activated automatically
according to heart rate ranges previously defined and set in the ILR by the physician. If the
heart rate drops below, or rises above, the set rates, the ILR will record without the patient’s
knowledge. The second way the ILR records is through a hand-held "patient activator"
whereby the patient triggers a recording by pushing a button when they notice symptoms
such as skipped beats, light-headedness or dizziness. The ILR records by "freezing" the
electrical information preceding, during and after the symptoms in the format of an
electrocardiogram. The physician can download and review the recorded events during an
office visit using a special programmer, which looks similar to a laptop computer.
5.9 Remote Monitoring
Telemetry is the in situ collection of measurements or other data at remote points and their
automatic transmission to receiving equipment (telecommunication) for monitoring. The
word is derived from the Greek roots tele, "remote", and metro, "measure". Systems that need
external instructions and data to operate require the counterpart of telemetry.
Although the term commonly refers to wireless data transfer mechanisms (e.g., using radio,
ultrasonic, or infrared systems), it also encompasses data transferred over other media such as
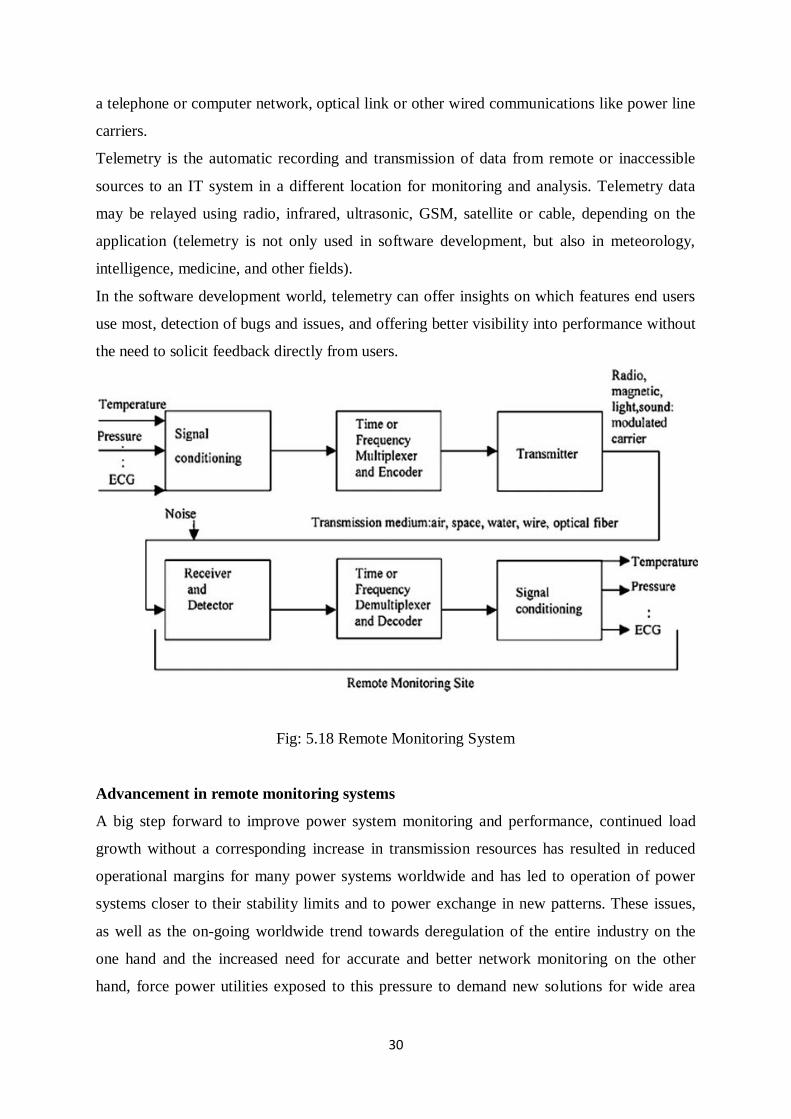
30
a telephone or computer network, optical link or other wired communications like power line
carriers.
Telemetry is the automatic recording and transmission of data from remote or inaccessible
sources to an IT system in a different location for monitoring and analysis. Telemetry data
may be relayed using radio, infrared, ultrasonic, GSM, satellite or cable, depending on the
application (telemetry is not only used in software development, but also in meteorology,
intelligence, medicine, and other fields).
In the software development world, telemetry can offer insights on which features end users
use most, detection of bugs and issues, and offering better visibility into performance without
the need to solicit feedback directly from users.
Fig: 5.18 Remote Monitoring System
Advancement in remote monitoring systems
A big step forward to improve power system monitoring and performance, continued load
growth without a corresponding increase in transmission resources has resulted in reduced
operational margins for many power systems worldwide and has led to operation of power
systems closer to their stability limits and to power exchange in new patterns. These issues,
as well as the on-going worldwide trend towards deregulation of the entire industry on the
one hand and the increased need for accurate and better network monitoring on the other
hand, force power utilities exposed to this pressure to demand new solutions for wide area
31
monitoring, protection and control. Wide-area monitoring, protection, and control require
communicating the specific-node information to a remote station but all information should
be time synchronized so that to neutralize the time difference between information. It gives a
complete simultaneous snap shot of the power system. The conventional system is not able to
satisfy the time-synchronized requirement of power system. Phasor Measurement Unit
(PMU) is enabler of time-synchronized measurement, it communicate the synchronized local
information to remote station.
This technology has been made possible by advancements in computer and processing
technologies and availability of GPS signals. We are rapidly approaching an era where all
metering devices will be time synchronized with high precision and accurate time tags as part
of any measurement. To achieve the potential benefits, advancements in time synchronization
must be matched by advancements in other areas. One example is data communications,
where communication channels have become faster and more reliable in streaming PMU data
from remote sites to a central facility.
The technology exists today to bring the PMU information into the control centers located at
remote area and present it to the operators in a graphical format. In this paper we discuss this
advanced technology (PMUs) with the help of MATLAB simulation. We design this PMU
model in MATLAB SIMULINK and then we installed this model in the start and end of
transmission line in our sample simulation of a small power system in SIMULINK. This all is
for testing of its testing valuation. Such application is made for the protection, monitoring and
control of wide power system.
• One of the most important measurement devices in Power systems is PMU. The PMU
is capable of measuring the synchronized voltage and current phasor in a power
systems. The commercialization of the GPS with accuracy of timing pulses in the
order of 1 microsecond made possible the commercial production of phasor
measurement units.
• PMU is considered to be one of the most important measuring devices in the future of
power systems. The distinction comes from its unique ability to provide synchronized
phasor measurements of voltages and currents from widely dispersed locations in an
electric power grid. Simulations and field experiences suggest that PMUs can
revolutionize the ways that power systems are monitored and controlled.