Unit Four: Global System Choices (Complete) - OSSTF
211
explore analyze act acquire ask unit four What is the best method of measuring development towards a sustainable society? global system choices • Student handout • Articles • PowerPoints • Computer with projector and internet access • Gapminder activity sheets and instruction • Class set of atlases • What is egalitarianism? • What value does society place on things you deem important? • How are statistics used as development indicators? • Debate: What development indicator is best for Venezuela? • How does development vary with time? • Different ways to measure development
-
Upload
khangminh22 -
Category
Documents
-
view
2 -
download
0
Transcript of Unit Four: Global System Choices (Complete) - OSSTF
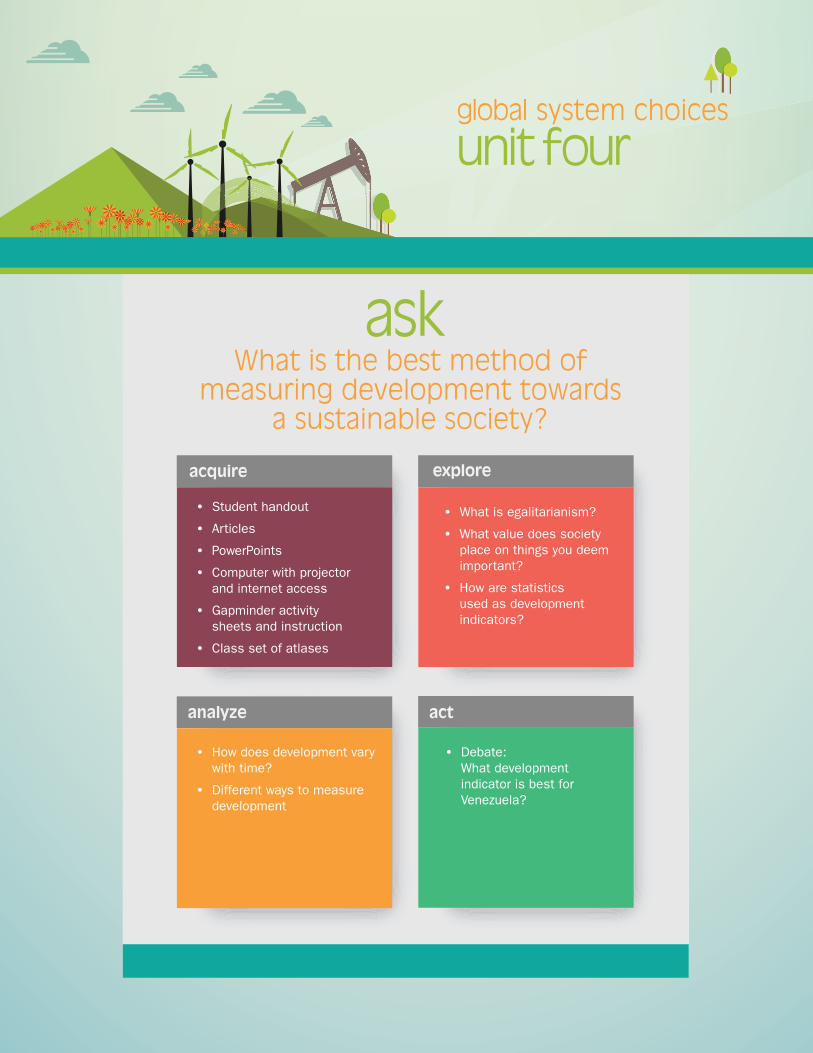
explore
analyze act
acquire
ask
unit four
What is the best method of measuring development towards
a sustainable society?
global system choices
• Student handout
• Articles
• PowerPoints
• Computer with projector and internet access
• Gapminder activity sheets and instruction
• Class set of atlases
• What is egalitarianism?
• What value does society place on things you deem important?
• How are statistics used as development indicators?
• Debate: What development
indicator is best for Venezuela?
• How does development vary with time?
• Different ways to measure development
unit fourglobal system choices
U4L1
subjects:
timing:
Economics, Politics, Geography, Science, Civics
Activity 1Egalitarianism | 75 minutes
Activity 2Statistical Analysis of Development Indicators | 75 minutes
Activity 3Examining Development over Time | 75 minutes
Activity 4Beyond GDP | 75 minutes
Activity 5Debate | 75 minutes
Development Indicators
This lesson examines how societies measure their progress and development over time. It takes a critical look at the GDP and offers other means that are more appropriate for measuring sustainable progress. Students examine the development indicators and then have the opportunity to debate which indicator is best for the country of Venezuela to use as they expand their use of resources from oil to prop up the social system.
learning goals • To understand the social, economic, and environmental impacts of the strategies used to measure development implemented by a variety of individuals, organizations, and institutions. • To evaluate and determine which measurement indicator is best for the development of a sustainable society.
success criteria • Students will be able to express and support their opinion on development indicators in a formal class debate.
askInquiry questions • What do I value most and is this value equally shared by society? • How is development measured? • How has development changed in various regions over time? • Which development indicator values the factors that you feel are most important in your life? • How can various different statistical measures give insight into the overall level of development and sustainability in a society? • What is the best indicator to measure sustainable development in Venezuela?
unit fourglobal system choices
acquireActivity 1
PowerPoint: EgalitarianismHandout: Egalitarianism
Activity 2Handout: Statistical analysis of development indicatorsClass set of atlases (i.e., Oxford Canadian Atlas 10th ed.)
Activity 3 Computer and projector with Wi-Fi access • Using the following websites obtain and print the resources listed below:
www.gapminder.org/downloads/card-game − to download the card game used in Activity 1
• www.gapminder.org/downloads/200-years − to download the teacher’s educational resource for Gapminder.
1. Gapminder Instructions2. Gapminder Teacher’s Guide3. Gapminder Card game (one per group)4. Gapminder Map (one per group)
Activity 4PowerPoint: Beyond GDPHandout: Beyond GDP
Activity 5Handout: Debate—What is the best indicator to measure sustainable development in Venezuela?
exploreActivity 1 | EgalitarianismThis lesson will help students to reconsider how society determines value and compare this with their own value system.
1. Using the PowerPoint on egalitarianism, have students examine the following scenario and discuss the enclosed questions…
Scenario: Your home town has been hit by a natural disaster. Extreme flooding has ravaged the landscape leaving it in ruins. The commercial sector is shut down. All banks and store have been shuttered tight. You have lost everything except the clothes on your back and your backpack.
Your task:
a Take an inventory of your items and calculate your net worth.
b Consider the following questions:i. What necessities do you have? ii. What are you missing? iii. Do you have anything to sell or barter? iv. What would be the new currency? v. How long do you think you can survive?
c Share your findings in a class discussion. Then as a class decide: Overall, how did the class fare? Who would survive the longest?
2. Follow the introductory lesson on the idea of Egalitarianism using the PowerPoint
U4L1 Development Indicators
unit fourglobal system choices
Activity 2 | Statistical analysis of development indicatorsThis lesson will help you to discover the how statistics can be used as development indicators to assess the well-being of a nation.
Using the handout: Statistical analysis of development indicators, students will now explore how different statistical measures vary in Canada, Norway and Venezuela.
a Students will need their handout, a recent copy of a world atlas with data sets at the back (i.e., Oxford or Pearson World Atlases), or access to the Internet to search for results.
b Students will be researching:1. Population density2. Birth rate3. Death rate4. Urbanization5. Agricultural percentage6. Life expectancy7. Health (number of people per doctor)8. Education (literacy rates male and female)9. Economic development rate
c Students will explain in their own words how they feel each indicator links to, or describes, devel-opment in a country.
d They will then find the most recent statistics for Canada, Norway, Venezuela and the global average for each. This should be recorded on their handout.
e Students will then find a group to do reflection and analysis with and answer the following questions:1. How could a government use these statistics to improve the well-being of a nation?
Give specific examples.2. Is there one statistic that you feel is more relevant or effective in measuring
development? Justify your choice. Discuss with your group.3. As a group of two–three, examine the development indicators and consider how these
would appear in a developing country like Ethiopia, Mongolia or Afghanistan.4. In what ways could countries that are more well off use these statistics to help
these regions?5. In what ways might these indicators change with the discovery and extraction of a large
source of oil?6. Check your answer from #5 by researching the indicator value before Canada,
Venezuela and Norway became an oil-producing country. What assumptions were correct and what assumptions were not? Why do you think this is the case?
f Take up the findings and reflections as a class.
analyzeActivity 3 | Examining Development over TimeThis lesson will help you to discover the how development has changed in the different regions of the world over time. Using this historical context to development you will examine and assess different methods of measuring development globally.
1. Instructions to guide this lesson are included in the Examining development over time PowerPoint
2. Play the Gapminder Game:a Divide students into small groups of three–four students.
U4L1 Development Indicators
unit fourglobal system choices
b Give each student a package of cards and instructions.c Ask the students to arrange the country cards according to the development level of the countries.
You do not have to be more specific than this, let the students come up with their own ways of grouping the countries (e.g. they might sort them into two groups, several groups or arrange them into one line).
d Ask them to explain how they arranged the cards. Does their way of sorting the countries reflect what they think the incomes of the countries are? Health? Development, in a more vague sense?
e Distribute the “Gapminder World Map” graph to the groups. Explain the graph, i.e. that each bubble is a country, the size of the bubble is the population, the colour the continent, the Y-axis is the life expectancy (i.e. health) and the X-axis is income per person. Explain quickly what the two indicators mean.
f Ask them to find and mark the countries on the graph.g Discuss whether there were any surprising results. Discuss whether the graph could be used to
divide the countries of the world into different categories.
3. In the same groups have students brainstorm at least 10 reasons as to why the developing world has not achieved economic parity with the developed world. In other words, why are we affluent and they are not? How does income disparity influence the ability of the globe to be sustainable? There is a take up slide included in the PowerPoint.
4. As a class re-visit the gapminder world graph. a Use the graph to discuss and examine how the levels of development have changed over time given
various factors that the class has listed.b Select Norway, Venezuela and Canada and watch their progress over time. c Considering what you have learned about each country note any specific changes and patterns over
time? (Think points of historical challenge or opportunity.)
5. Final thoughts…Through the PowerPoint you were introduced to different graphics that attempted to demonstrate how the regions of the world have changed since the 1800s.
a How is modelling relevant when analyzing the development of a nation?b How could these tools be used to develop the world towards sustainability?
Think people, profit and planet.
6. Time and computer access permitting: Allow students time to play with the program. It would be of value to have them use the site to revisit the data they gathered in the statistical lesson to be completed in Activity 3.
Activity 4 | Beyond GDP This lesson will help you to discover the how different development indicators can be used to assess the well-being of a nation.
Give an introductory lesson on the various development indicators using the PowerPoint Beyond GDP provided. Once the discussion of various development indicators has been completed, have students revisit their list of what they value and:
a Consult the list you made at the start of class, how many items are valued by GDP? Does this indicator value your life?
b What are some of the problems with using GDP as an overall indicator of progress and development? What are some of the benefits?
U4L1 Development Indicators
unit fourglobal system choices
c Which indicator valued the objects you valued the most?d Reflect on what the world be like if we evaluated using each indicator. Evaluate the Pros and Cons
of each indicator. Which do you feel is most and least effective? Explain your choices. Why do you think the world is slow to adapt these indicators when evaluating development?
f How might a focus by a government on sustainable development change this pattern?
act Activity 5 | Debate—What is the best indicator to measure sustainable development in Venezuela? This lesson will help students to develop and defend a personal opinion on one of the different development indicators. This will be done during a debate.
The class is to have a debate. Students will develop an understanding of how development is measured and assess which process is best suited for sustainability.
In evaluating the overall sustainability of Norway, Canada and Venezuela it can be noted that for each the access to vast quantities of oil has given different challenges and opportunities. Use the following scenario to guide the class through the debate.
Scenario:The country of Venezuela has made great strides in overcoming poverty and access to social services. This is helping the country to develop. The government, however, realizes that the focus on social programs has caused there to be a lapse in progress towards sustainability. The government has decided that the focus must change to one of sustainable development. Research has informed the government that the use of the GDP as a means of measuring development is outdated and inappropriate. In order to achieve sustainability, Venezuela must replace it with a form of measurement that includes a wider scope of criteria. In order to increase the overall sustainability of Venezuela the solution lies in…GPI, GNH, SSI, SPI or HPI.
Format of debate:This debate will take the format of a triangle debate. This means the class will be divided into five teams and a group of moderators (total six teams):
1. HPI—argue in favour of Happy Planet Index2. GPI—argue in favour of Genuine Progress Indicator3. GNH—argue in favour of Gross National Happiness4. SSI—argue in favour of the Sustainable Society Index5. SPI—argue in favour of Social Progress Index6. Moderators—develop the questions that will determine the focus of the debate and run the debate.
The debate will be ordered as follows:1. Opening Statement—two minutes each side2. Question period—two questions per side = eight questions total 3. Free debate (time permitting)4. Closing statements—two minutes per side
Structure of debate:i. Divide the class into five teams. Each team will have a relatively equal number of members. ii. You may opt to give students class time to research and prepare their arguments or you may
wish to have them prepare on their own at home.iii. The questions from the moderators will be kept secret until the debate so teams must
prepare a thorough understanding of their arguments in order to be able to argue their points effectively.
U4L1 Development Indicators
unit fourglobal system choices
iv. Moderators will be in charge of running the debate, creating questions to challenge each side (three per side), evaluating the debate teams and at the end determine the winner of the debate and give constructive feedback to both sides. Give the moderators an idea of your expectations of how the debate is to run. If you wish them to follow certain timing or structures, please make that explicit to them.
v. Debating teams will be responsible for preparing opening and closing statements and developing a body on knowledge that will allow them to answer the questions proposed by the Moderators.
vi. Inform students that team will hand in a bibliography of sources they used to develop their opinion.
vii. Rubrics for evaluation are offered in the handouts, but are a suggestion only.viii. Offer students the following idea to contemplate as a source of focus as they research and
prepare.
Think…what does your indicator offer that others cannot?
referencesAnielski, M. (2001). MEASURING THE SUSTAINABILITY OF NATIONS: THE GENUINE PROGRESS INDICATOR SYSTEM OF SUSTAINABLE WELLBEING ACCOUNTS. The Fourth Biennial Conference of the Canadian Society for Ecological Economics: Ecological Sustainability of the Global Market Place, August 2001, Montreal, Quebec. www.anielski.com/Documents/Sustainability%20of%20Nations.pdf
Data for the Happy Planet Index Global Findings: http://www.happyplanetindex.org/data
Deutsche Bank Research. (September 8,2006). Measures of well-being: There is more to it than GDP. Deutsche Bank AG, D-60262, Frankfurt am Main: Germany. www.dbresearch.com/PROD/DBR_INTERNET_EN-PROD/PROD0000000000202587.pdf
Neumayer, E. (2004). Sustainability and well-being indicators. WIDER research papers, 2004/23. UNU-WIDER. ISBN 9789291906048 http://eprints.lse.ac.uk/30851
Sustainable Development Solutions Network (SDSN). (April 23, 2015). World Happiness Report 2015, worldhappiness.report
U4L1 Development Indicators
unit fourglobal system choices
overviewThis lesson will help students to reconsider how society determines value and compare this with their own value system.
learning goal • Students will understand the concept of egalitarianism.• Students will consider the value of their wants versus their needs.• Students will examine how society determines value and compare it to their own beliefs.
success criteria• Students will develop an understanding of what they value most and if these values are equally shared by
society.
instructionsStep one: Individual and group tasks with class take-up
1. Using the PowerPoint on egalitarianism, have students examine the following scenario and discuss the enclosed questions…
Scenario: Your home town has been hit by a natural disaster. Extreme flooding has ravaged the landscape leaving it in ruins. The commercial sector is shut down. All banks and store have been shuttered tight. You have lost everything except the clothes on your back and your backpack.
Your Task:
a Take an inventory of your items and calculate your net worth.
b Consider the following questions:i. What necessities do you have? ii. What are you missing? iii. Do you have anything to sell or barter? iv. What would be the new currency? v. How long do you think you can survive?
c Share your findings in a class discussion. Then as a class decide: Overall, how did the class fare? Who would survive the longest?
2. In your own words define egalitarianism.
U4L2A1 Egalitarianism
Inquiry question • What do I value most and is this value equally shared by society?
unit fourglobal system choices
U4L2A1 Egalitarianism
3. Do you think the world will ever achieve 100 per cent egalitarianism? Why or why not?
Reflect on the scenario
4. What were the items that were most valued?
5. How would value and power changed in this scenario?
6. Is the society in this scenario experiencing egalitarianism? Why or why not?
unit fourglobal system choices
U4L2A1 Egalitarianism
7. In this scenario, what do you truly need to be sustainable?
8. How do these needs differ from those we have in today’s society?
Egalitarianism• Your home town has been hit by a natural disaster. Extreme
flooding has ravage the landscape leaving it in ruins. The commercial sector is shut down. All banks and store have been shuttered tight. You have lost everything except the clothes on your back and your backpack.
• Take an inventory of your items and calculate your net worth. What necessities do you have? What are you missing? Do you have anything to sell or barter? What would be the new currency? How long do you think you can survive?
Imagine….
• In your own words define Egalitarianism.
• Do you think the world will ever achieve 100% egalitarianism? Why or why not?
Egalitarianism• The concept of creating equality, whether on a human, social or
economic scale, for all the citizens of the planet.• Obviously, 100% egalitarianism will never be achieved.
• Focus since the 1960s has been on reducing the gap between the haves and the have nots.
• Unfortunately, this gap has widened instead.
Egalitarianism
• What were the items that were most valued?• How would value and power changed in this scenario?• Is the society in this scenario experiencing egalitarianism?• In this scenario, what do you truly need to be sustainable?
• How do these needs differ from those we have in today’s society?
Reflect on the scenario
unit fourglobal system choices
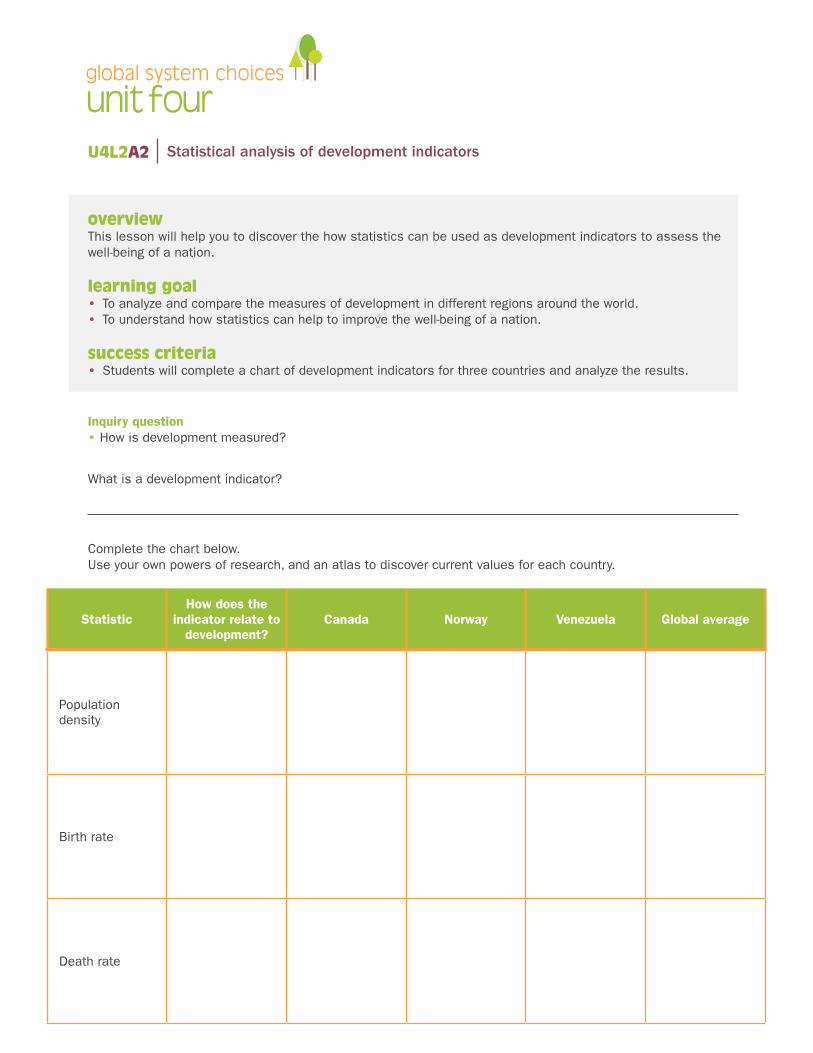
overviewThis lesson will help you to discover the how statistics can be used as development indicators to assess the well-being of a nation.
learning goal • To analyze and compare the measures of development in different regions around the world.• To understand how statistics can help to improve the well-being of a nation.
success criteria• Students will complete a chart of development indicators for three countries and analyze the results.
What is a development indicator?
Complete the chart below. Use your own powers of research, and an atlas to discover current values for each country.
U4L2A2 Statistical analysis of development indicators
Inquiry question • How is development measured?
StatisticHow does the
indicator relate to development?
Canada Norway Venezuela Global average
Population density
Birth rate
Death rate
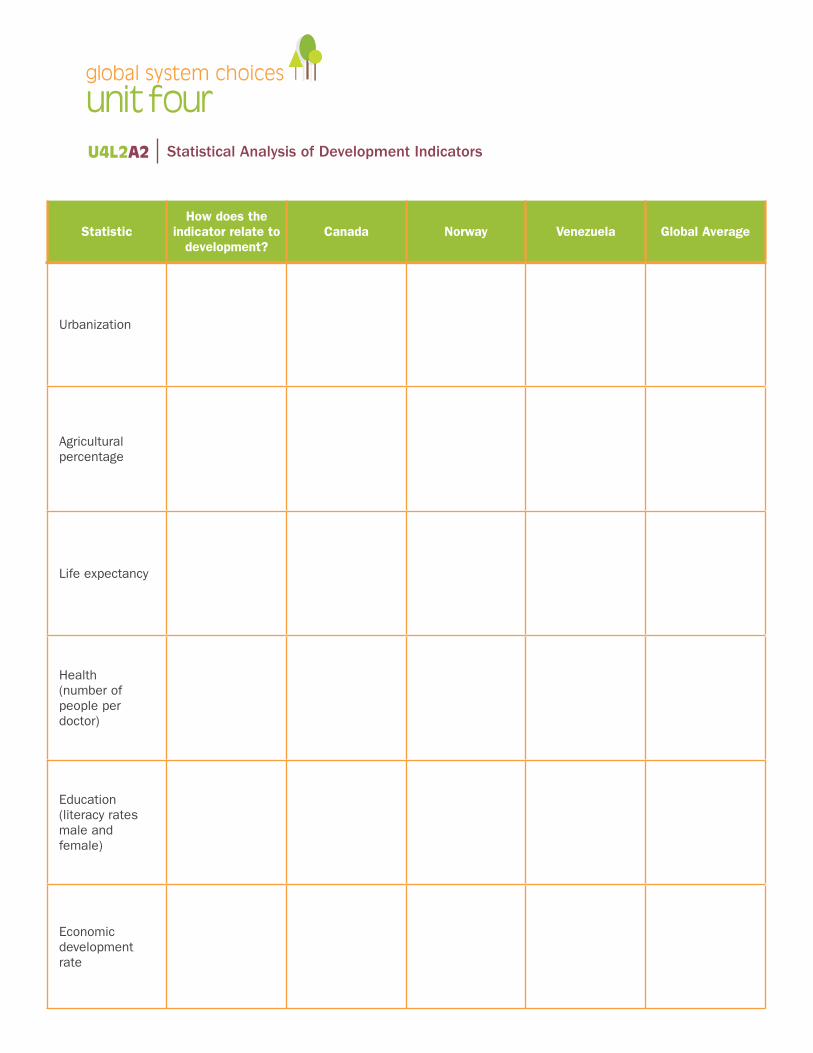
unit fourglobal system choices
StatisticHow does the
indicator relate to development?
Canada Norway Venezuela Global Average
Urbanization
Agricultural percentage
Life expectancy
Health (number of people per doctor)
Education(literacy rates male and female)
Economic development rate
U4L2A2 Statistical Analysis of Development Indicators
unit fourglobal system choices
Reflection and analysis:1. How could a government use these statistics to improve the well-being of a nation?
Give specific examples.
2. Is there one statistic that you feel is more relevant or effective in measure development? Justify your choice. Discuss with your group.
3. As a group of two–three, examine the development indicators and consider how these would appear in a developing country like Ethiopia, Mongolia or Afghanistan.
U4L2A2 Statistical Analysis of Development Indicators
unit fourglobal system choices
4. In what ways could countries that are more well off use these statistics to help these regions?
5. In what ways might these indicators change with the discovery and extraction of a large source of oil?
6. Check your answer from #5 by researching the indicator value before Canada, Venezuela and Norway became an oil-producing country. What assumptions were correct and what assumptions were not? Why do you think this is the case?
U4L2A2 Statistical Analysis of Development Indicators
unit fourglobal system choices
overviewThis lesson will help you to discover the how development has changed in the different regions of the world over time. Using this historical context to development you will examine and assess different methods of measuring development globally.
learning goal • To gain a better understanding of how progress/well-being has changed over time. • To understand how development levels in regions can be modelled and what value those models hold.
success criteria• Students will use what they learn from models of development to explain how is modelling relevant when
analyzing the development of a nation and how could these tools can be used to sustainability.
Instructions: 1. You are now going to play the Gapminder card game!!! Follow the instructions given by your
teacher. Then answer the following questions:
a How does Gapminder’s ranking of countries compare to the placement your group decided on? Explain any differences and similarities.
b Were there any surprising results? Explain them.
U4L1A3 Examining Development Over Time
Inquiry question • How has development changed in various regions over time?
unit fourglobal system choices
c How could this graph be used to divide the countries of the world into different regions? Would this be useful for governments? Why or why not?
2. Gapminder provides an animation of how society progresses over time given different variables. As you watch the animated graph consider:
a What does the graph show?
b As you watch take note of any five things that interest you or that you noticed about the animation.
U4L1A3 Examining Development Over Time
unit fourglobal system choices
3. In the same groups brainstorm at least 10 reasons as to why the developing world has not achieved economic parity with the developed world. In other words, why are we affluent and they are not? During the take up add any factors that others in the class noted, but that you may have missed.
4. How does income disparity influence the ability of the globe to be sustainable?
5. The teacher will now select Norway, Venezuela and Canada; watch their progress over time. Considering what you have learned about each country, note any specific changes and patterns over time? (Think points of historical challenge or opportunity)
U4L1A3 Examining Development Over Time
unit fourglobal system choices
6. Through the PowerPoint you were introduced to different graphics that attempted to demonstrate how the regions of the world have changed since the 1800s.
a How is modelling relevant when analyzing the development of a nation?
b How could these tools be used to develop the world towards sustainability? Think people, profit and planet.
U4L1A3 Examining Development Over Time
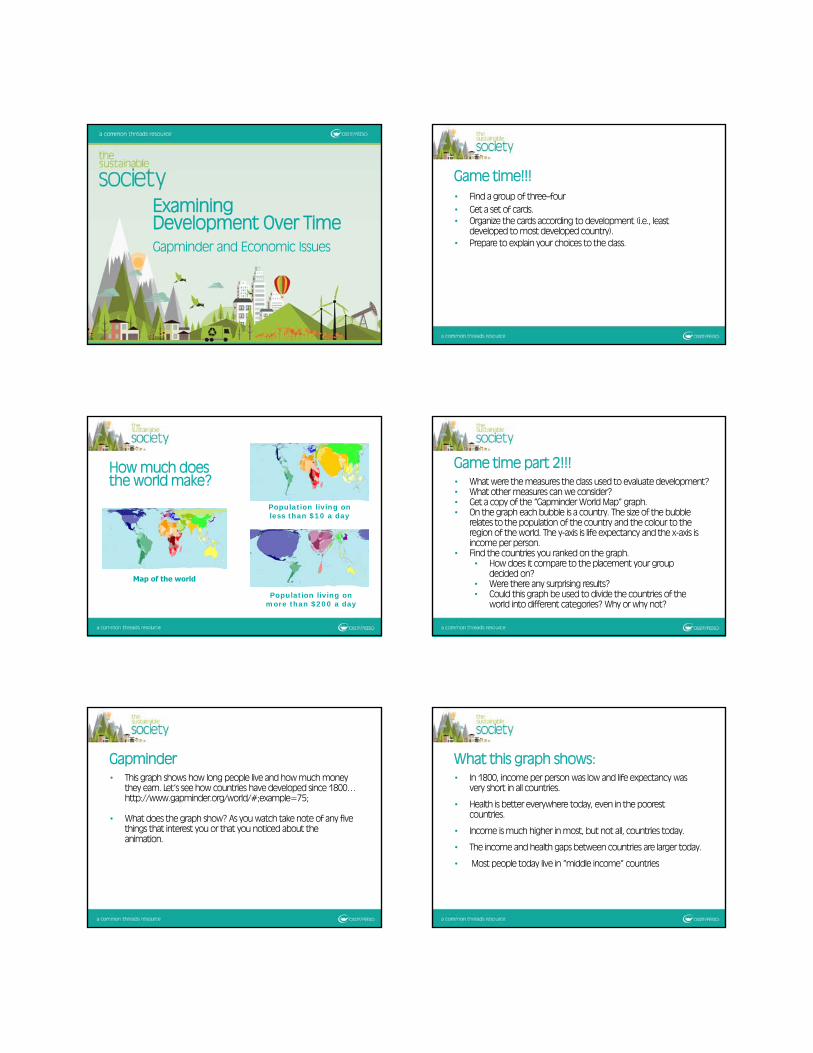
Examining Development Over TimeGapminder and Economic Issues
• Find a group of three–four• Get a set of cards.• Organize the cards according to development (i.e., least
developed to most developed country).• Prepare to explain your choices to the class.
Game time!!!
How much does the world make?
Map of the world
Population living on less than $10 a day
Population living on more than $200 a day
• What were the measures the class used to evaluate development? • What other measures can we consider?• Get a copy of the “Gapminder World Map” graph. • On the graph each bubble is a country. The size of the bubble
relates to the population of the country and the colour to the region of the world. The y-axis is life expectancy and the x-axis is income per person.
• Find the countries you ranked on the graph. • How does it compare to the placement your group
decided on? • Were there any surprising results? • Could this graph be used to divide the countries of the
world into different categories? Why or why not?
Game time part 2!!!
• This graph shows how long people live and how much money they earn. Let’s see how countries have developed since 1800… http://www.gapminder.org/world/#;example=75;
• What does the graph show? As you watch take note of any five things that interest you or that you noticed about the animation.
Gapminder• In 1800, income per person was low and life expectancy was
very short in all countries.
• Health is better everywhere today, even in the poorest countries.
• Income is much higher in most, but not all, countries today.
• The income and health gaps between countries are larger today.
• Most people today live in “middle income” countries
What this graph shows:
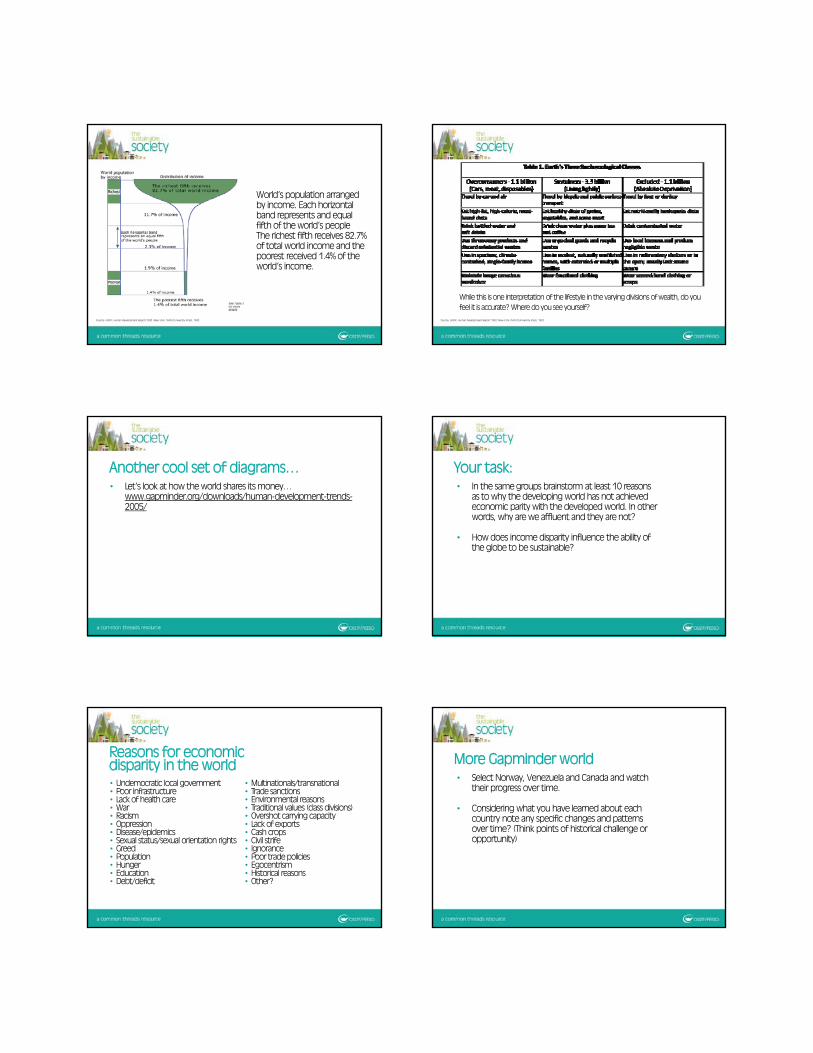
World’s population arranged by income. Each horizontal band represents and equal fifth of the world’s peopleThe richest fifth receives 82.7% of total world income and the poorest received 1.4% of the world’s income.
Source: UNDP, Human Development Report 1992 (New York: Oxford University Press, 1992. Source: UNDP, Human Development Report 1992 (New York: Oxford University Press, 1992.
While this is one interpretation of the lifestyle in the varying divisions of wealth, do you feel it is accurate? Where do you see yourself?
• Let’s look at how the world shares its money… www.gapminder.org/downloads/human-development-trends-2005/
Another cool set of diagrams…• In the same groups brainstorm at least 10 reasons
as to why the developing world has not achieved economic parity with the developed world. In other words, why are we affluent and they are not?
• How does income disparity influence the ability of the globe to be sustainable?
Your task:
• Undemocratic local government• Poor infrastructure• Lack of health care• War• Racism• Oppression• Disease/epidemics• Sexual status/sexual orientation rights• Greed• Population• Hunger• Education• Debt/deficit
Reasons for economic disparity in the world
• Multinationals/transnational• Trade sanctions• Environmental reasons• Traditional values (class divisions)• Overshot carrying capacity• Lack of exports• Cash crops• Civil strife• Ignorance• Poor trade policies• Egocentrism• Historical reasons• Other?
• Select Norway, Venezuela and Canada and watch their progress over time.
• Considering what you have learned about each country note any specific changes and patterns over time? (Think points of historical challenge or opportunity)
More Gapminder world
• Through the PowerPoint you were introduced to different graphics that attempted to demonstrate how the regions of the world have changed since the 1800s.
• How is modelling relevant when analyzing the development of a nation?
• How could these tools be used to develop the world towards sustainability? Think people, profit and planet.
Final thoughts…
unit fourglobal system choices
overviewThis lesson will help you to discover the how different development indicators can be used to assess the well-being of a nation.
learning goal • To analyze and compare the measures of development in different regions around the world.• To understand how statistics can help to improve the well-being of a nation.
success criteria• Students will be able to reflect on what the world would be like if we evaluated using different development
indictors and be able to justify their opinion of which one that they feel is best for developing sustainably.
Instructions: Think back to yesterday's scenario and consider the following:
1. What were the things you missed most? Why?
2. Use this thought to help you to list “What you value most in life?” Take a couple of minutes and make a list of the things you value most in your life. Once you have made a list, for each item give it a dollar value.
U4L1A4 Beyond GDP
Inquiry Questions • Which development indicator values the factors that you feel are most important in your life? • How can various different statistical measures give insight into the overall level of development and sustainability in a society?
unit fourglobal system choices
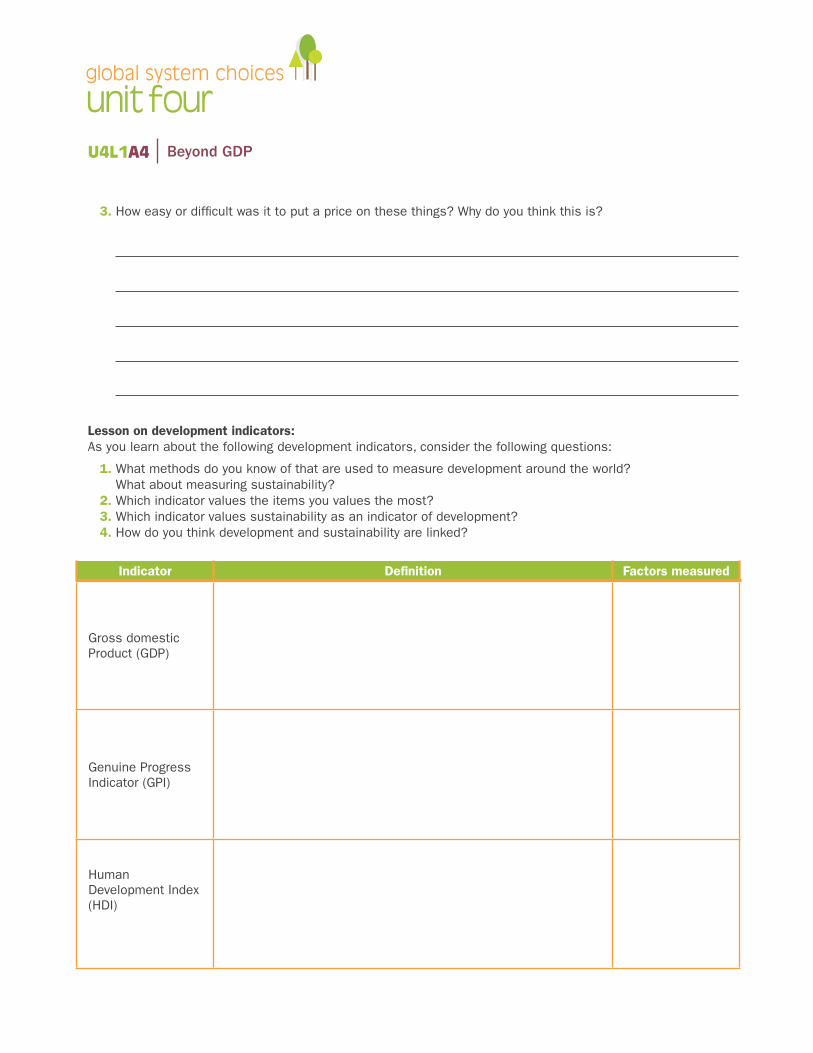
3. How easy or difficult was it to put a price on these things? Why do you think this is?
Lesson on development indicators:As you learn about the following development indicators, consider the following questions:
1. What methods do you know of that are used to measure development around the world? What about measuring sustainability?
2. Which indicator values the items you values the most?3. Which indicator values sustainability as an indicator of development?4. How do you think development and sustainability are linked?
Indicator Definition Factors measured
Gross domestic Product (GDP)
Genuine Progress Indicator (GPI)
Human Development Index(HDI)
U4L1A4 Beyond GDP
unit fourglobal system choices
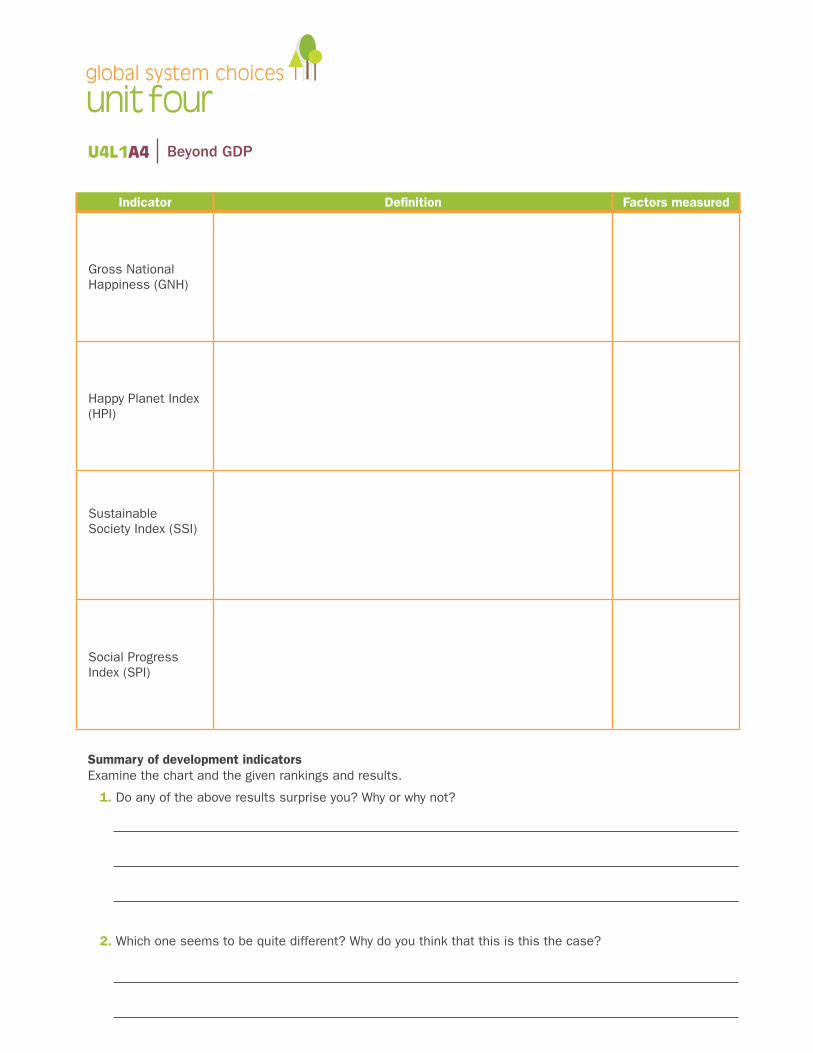
Indicator Definition Factors measured
Gross National Happiness (GNH)
Happy Planet Index (HPI)
Sustainable Society Index (SSI)
Social Progress Index (SPI)
U4L1A4 Beyond GDP
Summary of development indicatorsExamine the chart and the given rankings and results.
1. Do any of the above results surprise you? Why or why not?
2. Which one seems to be quite different? Why do you think that this is this the case?
unit fourglobal system choices
Reflection questions1. Consult the list you made at the start of class, how many items are valued by GDP?
Does this indicator value your life?
2. Given this analysis, how effective is GDP as an overall indicator of progress and development?
3. Which indicator valued the objects you valued the most?
U4L1A4 Beyond GDP

unit fourglobal system choices
4. Reflect on what the world would be like if we evaluated using each indicator. Evaluate the Pros and cons of each indicator. Which do you feel is most and least effective? Explain your choices.
5. Why do you think the world is slow to adapt these indicators when evaluating development?
U4L1A4 Beyond GDP
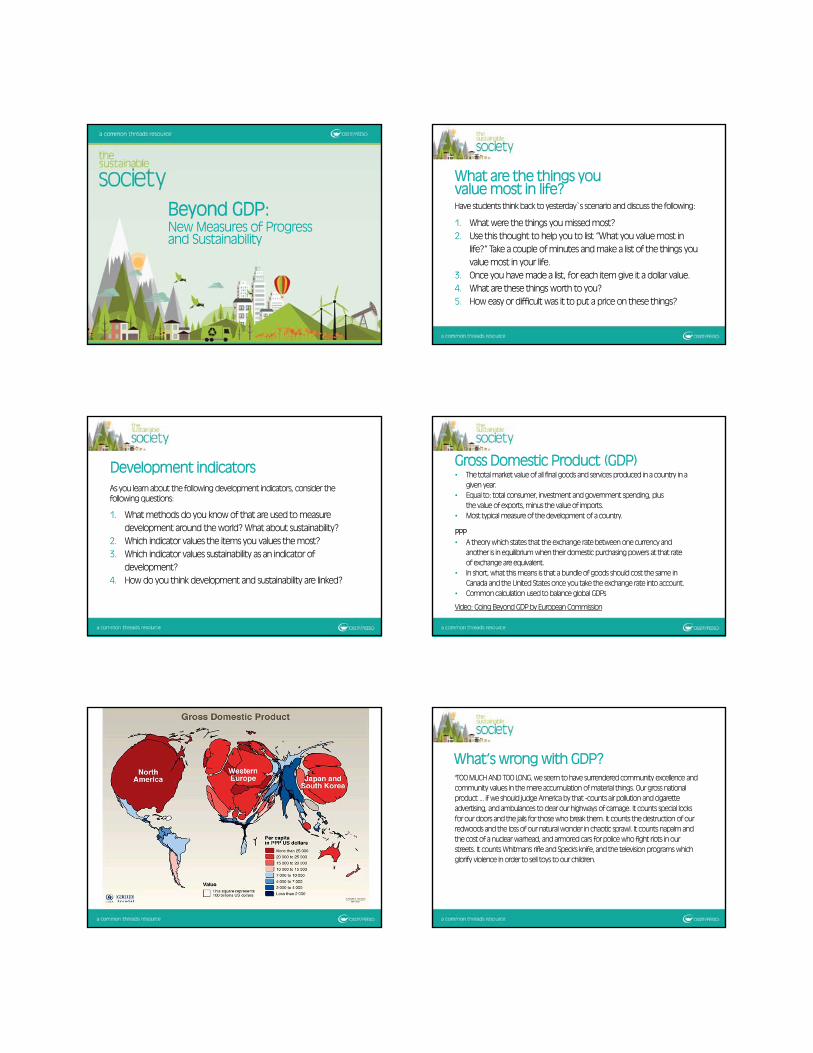
Beyond GDP: New Measures of Progress and Sustainability
Have students think back to yesterday s scenario and discuss the following:
1. What were the things you missed most?2. Use this thought to help you to list “What you value most in
life?” Take a couple of minutes and make a list of the things you value most in your life.
3. Once you have made a list, for each item give it a dollar value. 4. What are these things worth to you?5. How easy or difficult was it to put a price on these things?
What are the things you value most in life?
As you learn about the following development indicators, consider the following questions:
1. What methods do you know of that are used to measure development around the world? What about sustainability?
2. Which indicator values the items you values the most?3. Which indicator values sustainability as an indicator of
development?4. How do you think development and sustainability are linked?
Development indicators• Thetotal market valueof all finalgoodsandservices produced in a country in a
given year.• Equal to: total consumer, investment andgovernment spending, plus
thevalueofexports, minus the value of imports.• Most typical measure of the development of a country.
PPP• A theory which states that theexchange ratebetween onecurrency and
another is in equilibrium when their domestic purchasing powers at that rate of exchange are equivalent.
• In short, what this means is that a bundle of goods should cost the same in Canada and the United States once you take the exchange rate into account.
• Common calculation used to balance global GDPs
Gross Domestic Product (GDP)
Video: Going Beyond GDP by European Commission
"TOO MUCH AND TOO LONG, we seem to have surrendered community excellence and community values in the mere accumulation of material things. Our gross national product ... if we should judge America by that -counts air pollution and cigarette advertising, and ambulances to clear our highways of carnage. It counts special locks for our doors and the jails for those who break them. It counts the destruction of our redwoods and the loss of our natural wonder in chaotic sprawl. It counts napalm and the cost of a nuclear warhead, and armored cars for police who fight riots in our streets. It counts Whitman's rifle and Speck's knife, and the television programs which glorify violence in order to sell toys to our children.
What’s wrong with GDP?
Yet the gross national product does not allow for the health of our children, the quality of their education, or the joy of their play. It does not include the beauty of our poetry or the strength of our marriages; the intelligence of our public debate or the integrity of our public officials. It measures neither our wit nor our courage; neither our wisdom nor our learning; neither our compassion nor our devotion to our country· it measures everything, in short, except that which makes life worthwhile. And it tells us everything about America except why we are proud that we are Americans." Robert F. Kennedy Address, University of Kansas, Lawrence, Kansas, March 18, 1968
What’s wrong with GDP?
Source: llustration by Vincenzo Cardona Albini
According to market analysts in the USA, the 2010 Deepwater Horizon disaster-the largest oil spill in history-likely registered as a net gain in GDP. Is this improving society?
Photo credit: https://latimesphoto.files.wordpress.com/2011/04/la-oil-spill-001.jpg
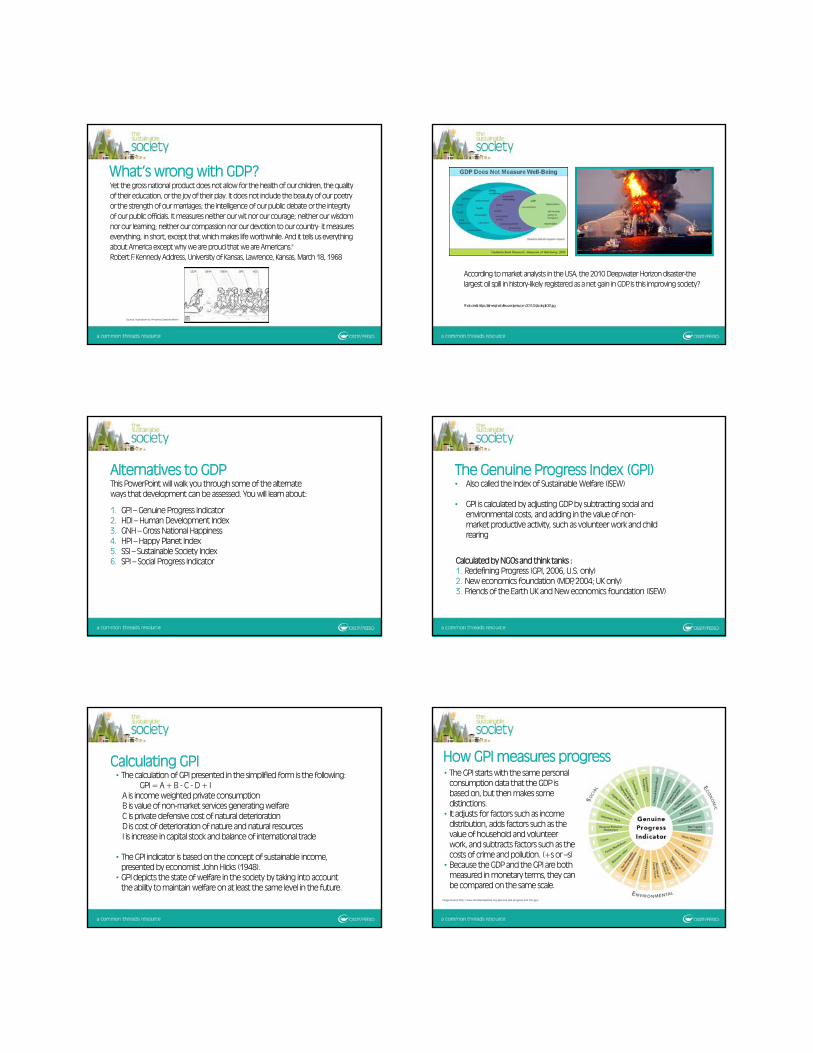
This PowerPoint will walk you through some of the alternate ways that development can be assessed. You will learn about:
1. GPI –Genuine Progress Indicator2. HDI –Human Development Index3. GNH–Gross National Happiness4. HPI –Happy Planet Index5. SSI – Sustainable Society Index6. SPI –Social Progress Indicator
Alternatives to GDP• Also called the Index of Sustainable Welfare (ISEW)
• GPI is calculated by adjusting GDP by subtracting social and environmental costs, and adding in the value of non-market productive activity, such as volunteer work and child rearing
The Genuine Progress Index (GPI)
Calculated by NGOs and think tanks :1. Redefining Progress (GPI, 2006, U.S. only)2. New economics foundation (MDP, 2004; UK only)3. Friends of the Earth UK and New economics foundation (ISEW)
• The calculation of GPI presented in the simplified form is the following:GPI = A + B -C -D + I
A is income weighted private consumptionB is value of non-market services generating welfareC is private defensive cost of natural deteriorationD is cost of deterioration of nature and natural resourcesI is increase in capital stock and balance of international trade
• The GPI indicator is based on the concept of sustainable income, presented by economist John Hicks (1948).
• GPI depicts the state of welfare in the society by taking into account the ability to maintain welfare on at least the same level in the future.
Calculating GPI• The GPI starts with the same personal
consumption data that the GDP is based on, but then makes some distinctions.
• It adjusts for factors such as income distribution, adds factors such as the value of household and volunteer work, and subtracts factors such as the costs of crime and pollution. (+s or –s)
• Because the GDP and the GPI are both measured in monetary terms, they can be compared on the same scale.
How GPI measures progress
Image Source:http://www.donellameadows.org/genuine-talk-progress-and-the-gpi/
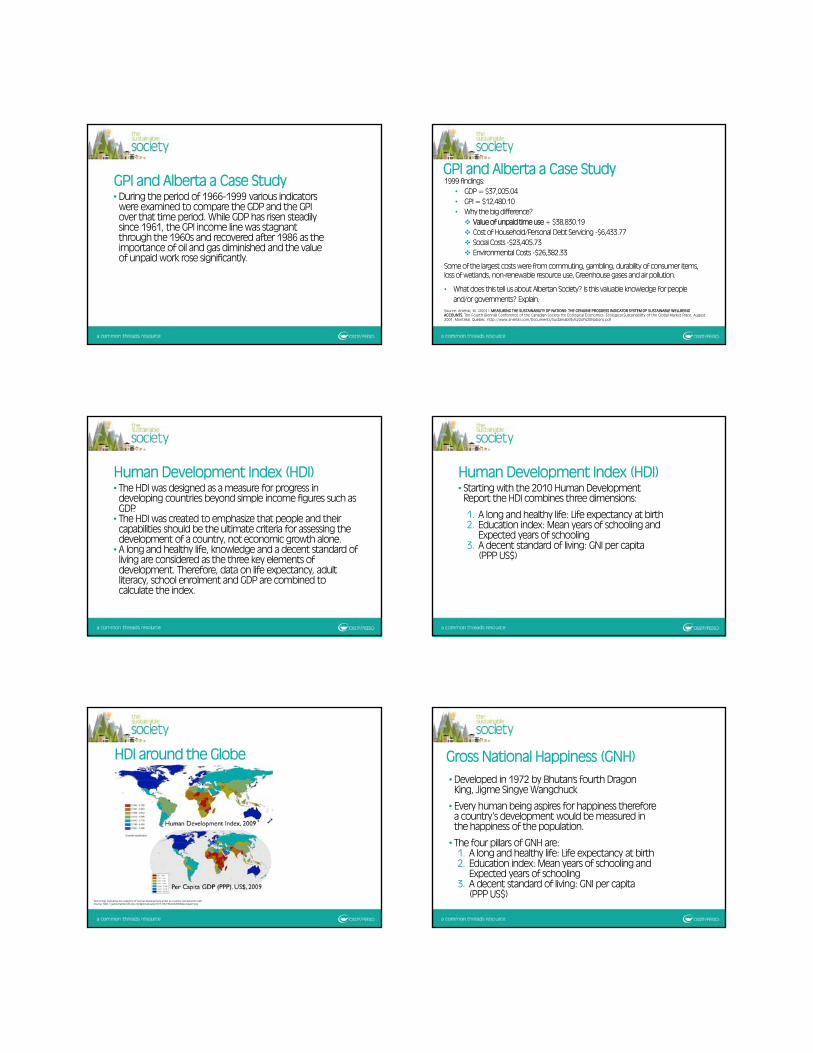
•During the period of 1966-1999 various indicators were examined to compare the GDP and the GPI over that time period. While GDP has risen steadily since 1961, the GPI income line was stagnant through the 1960s and recovered after 1986 as the importance of oil and gas diminished and the value of unpaid work rose significantly.
GPI and Alberta a Case Study 1999 findings:• GDP = $37,005.04• GPI = $12,480.10• Why the big difference? Value of unpaid time use + $38,830.19 Cost of Household/Personal Debt Servicing -$6,433.77 Social Costs -$23,405.73 Environmental Costs -$26,382.33
Some of the largest costs were from commuting, gambling, durability of consumer items, loss of wetlands, non-renewable resource use, Greenhouse gases and air pollution.
• What does this tell us about Albertan Society? Is this valuable knowledge for people and/or governments? Explain.
Source: Anielski, M. (2001). MEASURING THE SUSTAINABILITY OF NATIONS: THE GENUINE PROGRESS INDICATOR SYSTEM OF SUSTAINABLE WELLBEING ACCOUNTS. The Fourth Biennial Conference of the Canadian Society for Ecological Economics: Ecological Sustainability of the Global Market Place, August 2001, Montreal, Quebec. http://www.anielski.com/Documents/Sustainability%20of%20Nations.pdf
GPI and Alberta a Case Study
• The HDI was designed as a measure for progress in developing countries beyond simple income figures such as GDP. • The HDI was created to emphasize that people and their capabilities should be the ultimate criteria for assessing the development of a country, not economic growth alone.• A long and healthy life, knowledge and a decent standard of living are considered as the three key elements of development. Therefore, data on life expectancy, adult literacy, school enrolment and GDP are combined to calculate the index.
Human Development Index (HDI)• Starting with the 2010 Human Development Report the HDI combines three dimensions:
1. A long and healthy life: Life expectancy at birth2. Education index: Mean years of schooling and
Expected years of schooling3. A decent standard of living: GNI per capita
(PPP US$)
Human Development Index (HDI)
HDI around the Globe
World map indicating the category of Human Development Index by country compared to GDP Source: http://geocurrents.info/wp-content/uploads/2011/08/HDIandGDPstate-based1.jpg
Gross National Happiness (GNH)•Developed in 1972 by Bhutan's fourth Dragon King, Jigme Singye Wangchuck
• Every human being aspires for happiness therefore a country’s development would be measured in the happiness of the population.
• The four pillars of GNH are: 1. A long and healthy life: Life expectancy at birth2. Education index: Mean years of schooling and
Expected years of schooling3. A decent standard of living: GNI per capita
(PPP US$)
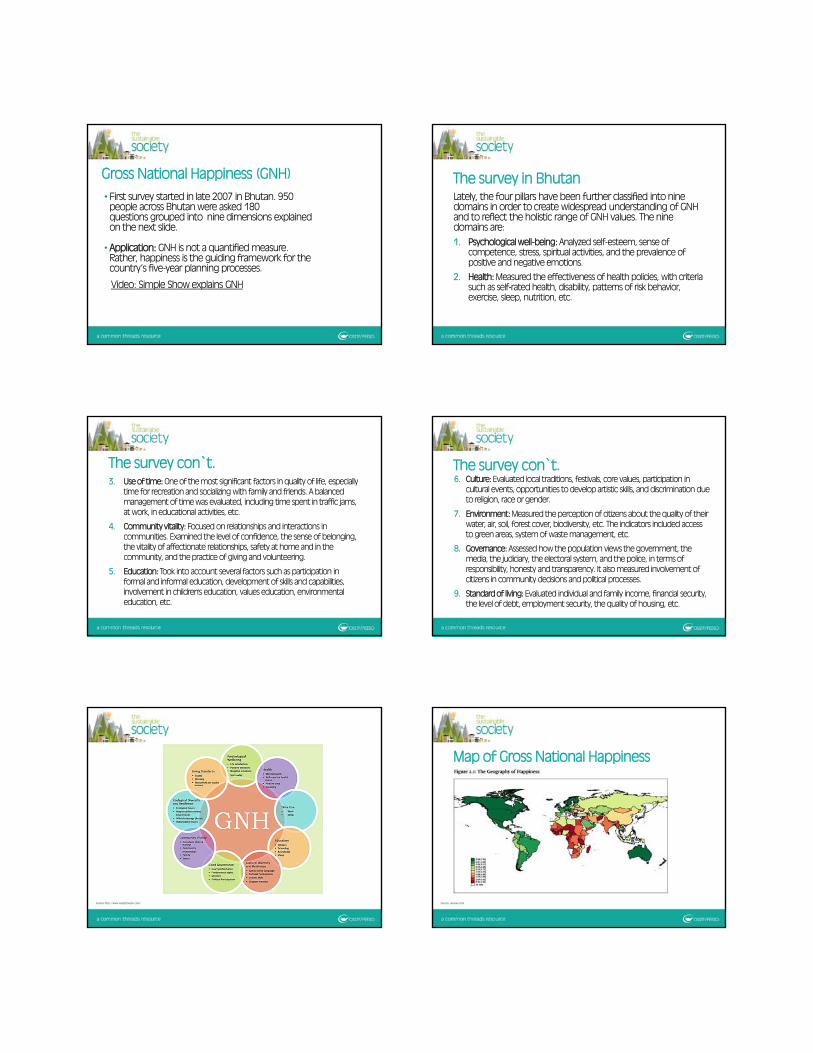
Gross National Happiness (GNH)• First survey started in late 2007 in Bhutan. 950 people across Bhutan were asked 180 questions grouped into nine dimensions explained on the next slide.
• Application: GNH is not a quantified measure. Rather, happiness is the guiding framework for the country’s five-year planning processes.
Video: Simple Show explains GNH
The survey in BhutanLately, the four pillars have been further classified into nine domains in order to create widespread understanding of GNHand to reflect the holistic range of GNH values. The nine domains are: 1. Psychological well-being: Analyzed self-esteem, sense of
competence, stress, spiritual activities, and the prevalence of positive and negative emotions.
2. Health: Measured the effectiveness of health policies, with criteria such as self-rated health, disability, patterns of risk behavior, exercise, sleep, nutrition, etc.
The survey con`t.3. Use of time: One of the most significant factors in quality of life, especially
time for recreation and socializing with family and friends. A balanced management of time was evaluated, including time spent in traffic jams, at work, in educational activities, etc.
4. Community vitality: Focused on relationships and interactions in communities. Examined the level of confidence, the sense of belonging, the vitality of affectionate relationships, safety at home and in the community, and the practice of giving and volunteering.
5. Education: Took into account several factors such as participation in formal and informal education, development of skills and capabilities, involvement in children's education, values education, environmental education, etc.
The survey con`t.6. Culture: Evaluated local traditions, festivals, core values, participation in
cultural events, opportunities to develop artistic skills, and discrimination due to religion, race or gender.
7. Environment: Measured the perception of citizens about the quality of their water, air, soil, forest cover, biodiversity, etc. The indicators included access to green areas, system of waste management, etc.
8. Governance: Assessed how the population views the government, the media, the judiciary, the electoral system, and the police, in terms of responsibility, honesty and transparency. It also measured involvement of citizens in community decisions and political processes.
9. Standard of living: Evaluated individual and family income, financial security, the level of debt, employment security, the quality of housing, etc.
Source:http://www.eyes2bhutan.com/ Source: usnews.com
Map of Gross National Happiness
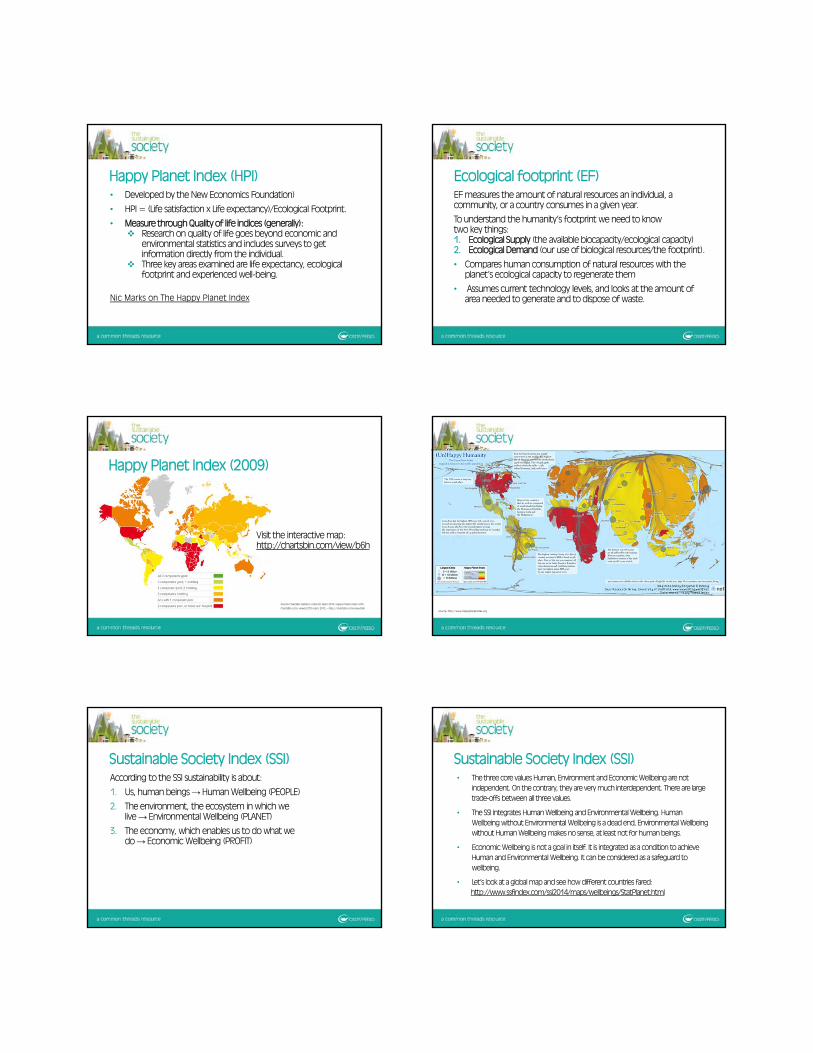
• Developed by the New Economics Foundation)
• HPI = (Life satisfaction x Life expectancy)/Ecological Footprint.
• Measure through Quality of life indices (generally): Research on quality of life goes beyond economic and
environmental statistics and includes surveys to get information directly from the individual.
Three key areas examined are life expectancy, ecological footprint and experienced well-being.
Nic Marks on The Happy Planet Index
Happy Planet Index (HPI)EF measures the amount of natural resources an individual, a community, or a country consumes in a given year.
To understand the humanity’s footprint we need to know two key things:1. Ecological Supply (the available biocapacity/ecological capacity)2. Ecological Demand (our use of biological resources/the footprint).
• Compares human consumption of natural resources with the planet’s ecological capacity to regenerate them
• Assumes current technology levels, and looks at the amount of area needed to generate and to dispose of waste.
Ecological footprint (EF)
Source:ChartsBin statistics collector team 2010, Happy Planet Index (HPI),
ChartsBin.com, viewed 27th April, 2015, <http://chartsbin.com/view/b6h
Happy Planet Index (2009)
Visit the interactive map:http://chartsbin.com/view/b6h
Source: http://www.happyplanetindex.org
According to the SSI sustainability is about:
1. Us, human beings→Human Wellbeing (PEOPLE)
2. The environment, the ecosystem in which we live→Environmental Wellbeing (PLANET)
3. The economy, which enables us to do what we do→Economic Wellbeing (PROFIT)
Sustainable Society Index (SSI)• The three core values Human, Environment and Economic Wellbeing are not
independent. On the contrary, they are very much interdependent. There are large trade-offs between all three values.
• The SSI integrates Human Wellbeing andEnvironmental Wellbeing. Human Wellbeing without Environmental Wellbeing is a dead end, Environmental Wellbeing without Human Wellbeing makes no sense, at least not for human beings.
• Economic Wellbeing is not a goal in itself. It is integrated as a condition to achieve Human and Environmental Wellbeing. It can be considered as a safeguard to wellbeing.
• Let’s look at a global map and see how different countries fared:http://www.ssfindex.com/ssi2014/maps/wellbeings/StatPlanet.html
Sustainable Society Index (SSI)
• Where are these countries successful? • Where do they need work?
SSI Samples
Source: http://www.ssfindex.com/
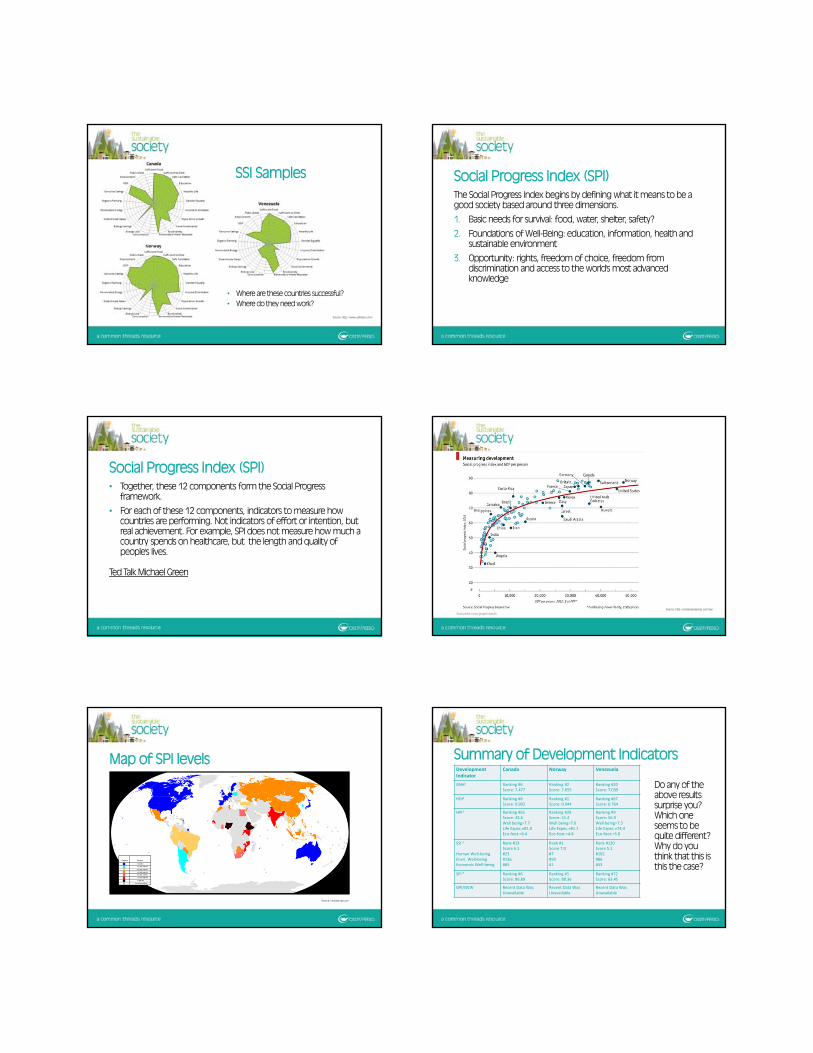
The Social Progress Index begins by defining what it means to be a good society based around three dimensions.
1. Basic needs for survival: food, water, shelter, safety?
2. Foundations of Well-Being: education, information, health and sustainable environment
3. Opportunity: rights, freedom of choice, freedom from discrimination and access to the world's most advanced knowledge
Social Progress Index (SPI)
• Together, these 12 components form the Social Progress framework.
• For each of these 12 components, indicators to measure how countries are performing. Not indicators of effort or intention, but real achievement. For example, SPI does not measure how much a country spends on healthcare, but the length and quality of people's lives.
Ted Talk Michael Green
Social Progress Index (SPI)
Source: http://progressivepress.com/pix/
Map of SPI levels
Source: NuclearVacuum
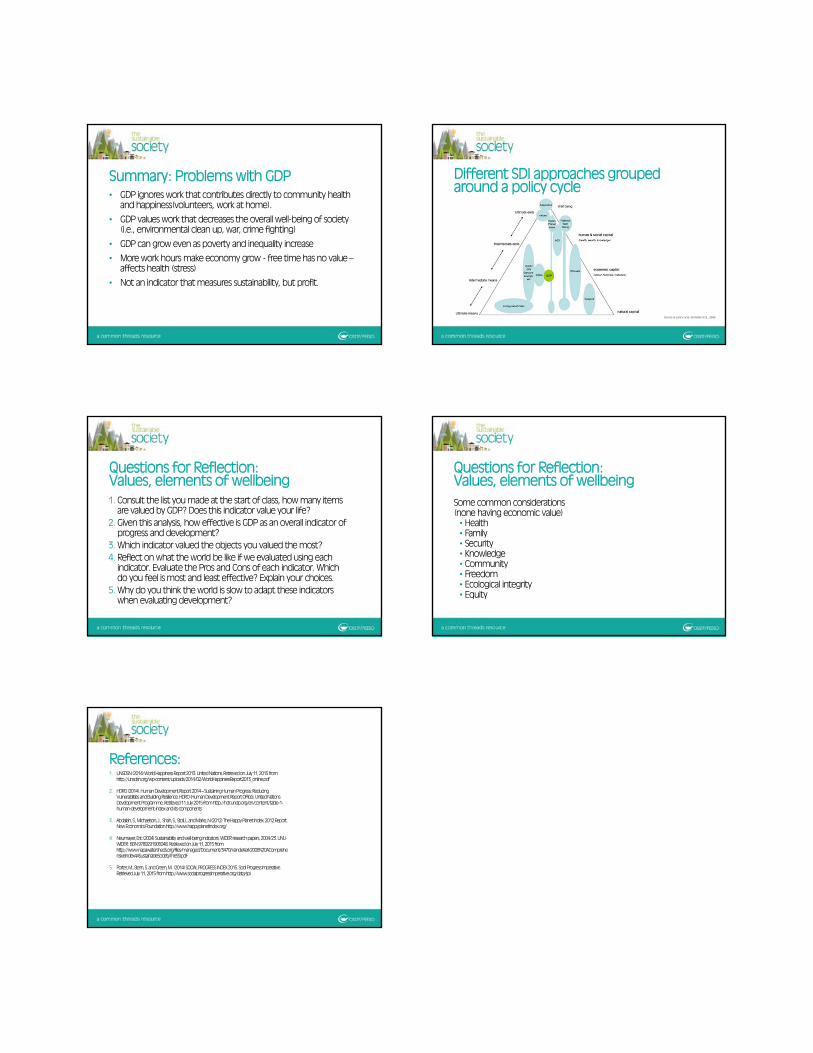
Summary of Development IndicatorsDevelopment Indicator
Canada Norway Venezuela
GNH1 Ranking #6Score: 7.477
Ranking #2Score: 7.655
Ranking #20Score: 7.039
HDI2 Ranking #8Score: 0.902
Ranking #1Score: 0.944
Ranking #67Score: 0.764
HPI3 Ranking #65Score: 43.6Well being=7.7Life Expec.=81.0Eco‐foot.=6.4
Ranking #29Score: 51.4Well being=7.6Life Expec.=81.1Eco‐foot.=4.8
Ranking #9Score: 56.9Well being=7.5Life Expec.=74.4Eco‐foot.=3.0
SSI 4
Human Well‐beingEnvir. Well‐beingEconomic Well‐being
Rank #13Score 6.1#23#136#65
Rank #1Score 7.0#7#99#1
Rank #120Score 5.1#102#86#53
SPI 5 Ranking #6Score: 86.89
Ranking #1Score: 88.36
Ranking #72Score: 63.45
GPI/ISEW Recent Data Was Unavailable
Recent Data Was Unavailable
Recent Data Was Unavailable
Do any of the above results surprise you? Which one seems to be quite different? Why do you think that this is this the case?
• GDP ignores work that contributes directly to community health and happiness(volunteers, work at home).
• GDP values work that decreases the overall well-being of society (i.e., environmental clean up, war, crime fighting)
• GDP can grow even as poverty and inequality increase
• More work hours make economy grow - free time has no value –affects health (stress)
• Not an indicator that measures sustainability, but profit.
Summary: Problems with GDP Different SDI approaches grouped around a policy cycle
(Source of policy cycle: de Ridder et al., 2006)
1. Consult the list you made at the start of class, how many items are valued by GDP? Does this indicator value your life?
2. Given this analysis, how effective is GDP as an overall indicator of progress and development?
3. Which indicator valued the objects you valued the most? 4. Reflect on what the world be like if we evaluated using each
indicator. Evaluate the Pros and Cons of each indicator. Which do you feel is most and least effective? Explain your choices.
5. Why do you think the world is slow to adapt these indicators when evaluating development?
Questions for Reflection:Values, elements of wellbeing
Some common considerations (none having economic value)• Health• Family• Security• Knowledge• Community• Freedom• Ecological integrity• Equity
Questions for Reflection:Values, elements of wellbeing
1. UNSDSN(2014) World Happiness Report 2013. United Nations. Retrieved on July 11, 2015 from http://unsdsn.org/wp-content/uploads/2014/02/WorldHappinessReport2013_online.pdf
2. HDRO(2014). Human Development Report 2014 –Sustaining Human Progress: Reducing Vulnerabilities and Building Resilience.HDRO(Human Development Report Office),United Nations Development Programme. Retrieved11 July2015 from http://hdr.undp.org/en/content/table-1-human-development-index-and-its-components
3. Abdallah, S., Michaelson, J., Shah, S., Stoll, L. and Marks, N (2012) The Happy Planet Index: 2012 Report. New Economics Foundation http://www.happyplanetindex.org/
4. Neumayer, Eric (2004) Sustainability and well-being indicators. WIDER research papers, 2004/23. UNU-WIDER. ISBN 9789291906048. Retrieved on July 11, 2015 from http://www.napawatersheds.org/files/managed/Document/3470/VandeKerk2008%20AComprehensiveIndex4ASustainableSocietyTheSSI.pdf
5. Porter, M., Stern, S. and Green, M. (2014) SOCIAL PROGRESS INDEX 2015. SocilProgress Imperative. Retrieved July 11, 2015 from http://www.socialprogressimperative.org/data/spi
References:
unit fourglobal system choices
overviewThis lesson will help students to develop and defend a personal opinion on one of the different development indicators. This will be done during a class debate.
learning goal • Students will develop an understanding of how development is measured and assess which process is
best suited for sustainability. They will also then formulate and defend an opinion on the topic.
success criteria• Students will defend one development indicator in a debate over which is best for measuring the
development of Venezuela.• Students will complete an exit card assessing their learning and the best arguments from the debate.
Instructions: TopicThe country of Venezuela has made great strides in overcoming poverty and access to social services. This is helping the country to develop. The government, however, realizes that the focus on social programs has caused there to be a lapse in progress towards sustainability. The government has decided that the focus must change to one of sustainable development. Research has informed the government that the use of the GDP as a means of measuring development is outdated and inappropriate. In order to achieve sustainability, Venezuela must replace it with a form of measurement that includes a wider scope of criteria. In order to increase the overall sustainability of Venezuela the solution lies in…GPI, GNH, SPI or HPI.
Format of debate:This debate will take the format of a triangle debate. This means the class will be divided into 5 teams and a group of moderators (total 6 teams):
1. HPI—argue in favour of Happy Planet Index2. GPI—argue in favour of Genuine Progress Indicator3. GNH—argue in favour of Gross National Happiness4. SSI—argue in favour of the Sustainable Society Index5. SPI—argue in favour of Social Progress Index6. Moderators—develop the questions that will determine the focus of the debate and run the debate.
The debate will be ordered as follows:1. Opening Statement—2 minutes each side2. Question period—2 questions per side = 8 questions total 3. Free debate (time permitting)4. Closing statements—2 minutes per side
U4L1A5 Debate
Inquiry Question • What is the best indicator to measure sustainable development in Venezuela?
unit fourglobal system choices
Structure of Debate:i. Divide the class into five teams. Each team will have a relatively equal number of members. ii. You may opt to give students class time to research and prepare their arguments or you may wish to have
them prepare on their own at home.iii. The questions from the moderators will be kept secret until the debate so teams must prepare a thorough
understanding of their arguments in order to be able to argue their points effectively. iv. Moderators will be in charge of running the debate, creating questions to challenge each side (three
per side), evaluating the debate teams and at the end determine the winner of the debate and give constructive feedback to both sides. Give the moderators an idea of your expectations of how the debate is to run. If you wish them to follow certain timing or structures, please make that explicit to them
v. Debating teams will be responsible for preparing opening and closing statements and developing a body on knowledge that will allow them to answer the questions proposed by the Moderators.
vi. Inform students that team will hand in a bibliography of sources they used to develop their opinion.vii. Rubrics for evaluation are offered in the handouts, but are a suggestion only.viii. Offer students the following idea to contemplate as a source of focus as they research and
prepare.
Think…what does your indicator offer that others cannot?
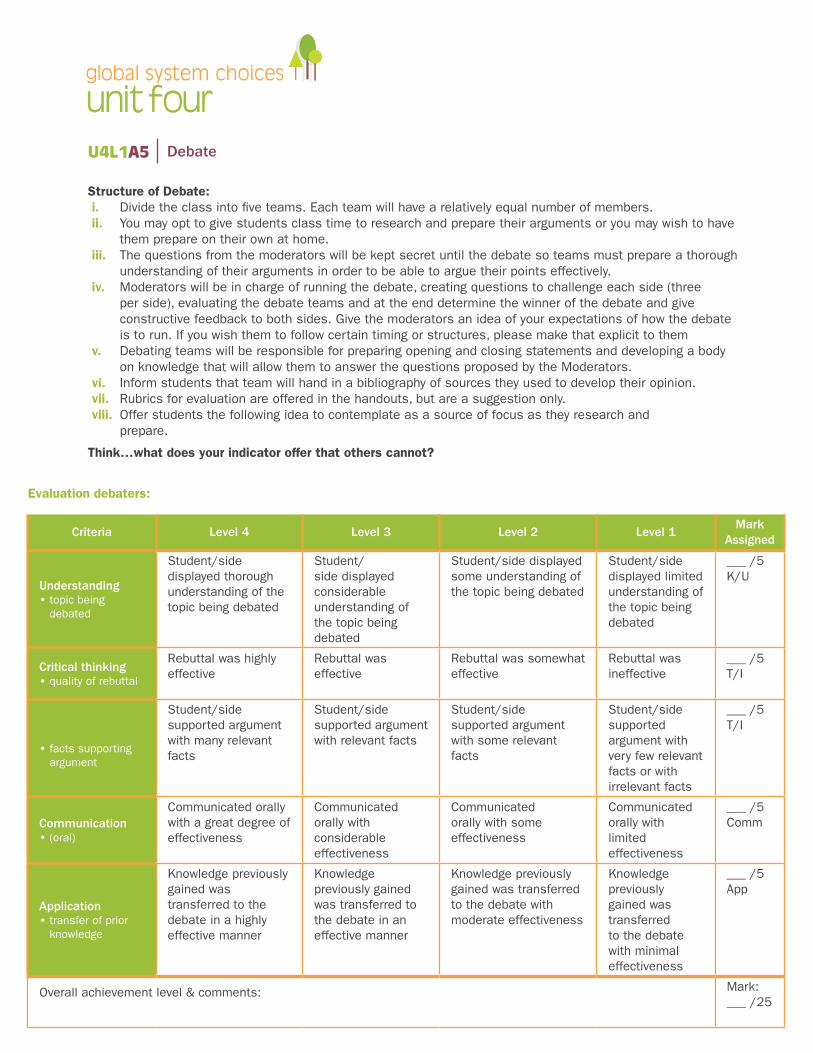
Criteria Level 4 Level 3 Level 2 Level 1Mark
Assigned
Understanding • topic being debated
Student/side displayed thorough understanding of the topic being debated
Student/side displayed considerable understanding of the topic being debated
Student/side displayed some understanding of the topic being debated
Student/side displayed limited understanding of the topic being debated
___ /5K/U
Critical thinking • quality of rebuttal
Rebuttal was highly effective
Rebuttal was effective
Rebuttal was somewhat effective
Rebuttal was ineffective
___ /5T/I
• facts supporting argument
Student/side supported argument with many relevant facts
Student/side supported argument with relevant facts
Student/side supported argument with some relevant facts
Student/side supported argument with very few relevant facts or with irrelevant facts
___ /5T/I
Communication • (oral)
Communicated orally with a great degree of effectiveness
Communicated orally with considerable effectiveness
Communicated orally with some effectiveness
Communicated orally with limited effectiveness
___ /5Comm
Application • transfer of prior knowledge
Knowledge previously gained was transferred to the debate in a highly effective manner
Knowledge previously gained was transferred to the debate in an effective manner
Knowledge previously gained was transferred to the debate with moderate effectiveness
Knowledge previously gained was transferred to the debate with minimal effectiveness
___ /5App
Overall achievement level & comments: Mark:___ /25
Evaluation debaters:
U4L1A5 Debate
unit fourglobal system choices
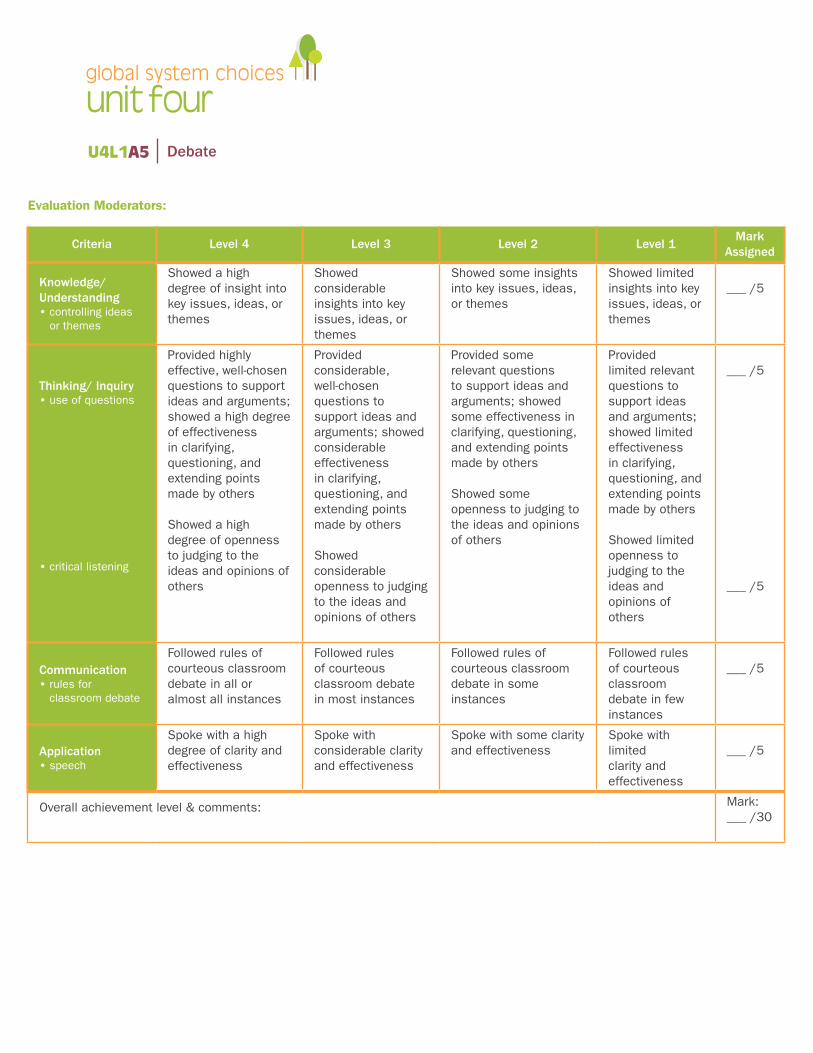
Criteria Level 4 Level 3 Level 2 Level 1Mark
Assigned
Knowledge/ Understanding • controlling ideas or themes
Showed a high degree of insight into key issues, ideas, or themes
Showed considerable insights into key issues, ideas, or themes
Showed some insights into key issues, ideas, or themes
Showed limited insights into key issues, ideas, or themes
___ /5
Thinking/ Inquiry • use of questions
• critical listening
Provided highly effective, well-chosen questions to support ideas and arguments; showed a high degree of effectiveness in clarifying, questioning, and extending points made by others
Showed a high degree of openness to judging to the ideas and opinions of others
Provided considerable, well-chosen questions to support ideas and arguments; showed considerable effectiveness in clarifying, questioning, and extending points made by others
Showed considerable openness to judging to the ideas and opinions of others
Provided some relevant questions to support ideas and arguments; showed some effectiveness in clarifying, questioning, and extending points made by others
Showed some openness to judging to the ideas and opinions of others
Provided limited relevant questions to support ideas and arguments; showed limited effectiveness in clarifying, questioning, and extending points made by others
Showed limited openness to judging to the ideas and opinions of others
___ /5
___ /5
Communication • rules for classroom debate
Followed rules of courteous classroom debate in all or almost all instances
Followed rules of courteous classroom debate in most instances
Followed rules of courteous classroom debate in some instances
Followed rules of courteous classroom debate in few instances
___ /5
Application • speech
Spoke with a high degree of clarity and effectiveness
Spoke with considerable clarity and effectiveness
Spoke with some clarity and effectiveness
Spoke with limited clarity and effectiveness
___ /5
Overall achievement level & comments: Mark:___ /30
Evaluation Moderators:
U4L1A5 Debate
unit fourglobal system choices
Debater organizer:A Opening statement:
B Supporting arguments:
U4L1A5 Debate
1.
2.
3.
4.
unit fourglobal system choices
C Arguments my opponents will make:
D Counterpoints to arguments in part C.
1.
2.
3.
1.
2.
3.
U4L1A5 Debate

unit fourglobal system choices
U4L1A5 Debate
E Concluding remarks:
unit fourglobal system choices
U4L1A5 Debate
Moderators debate organizer:The main job of the moderator is to control and run the debate. As moderators you will be in charge of:
• Start the debate on time • Welcome everyone • Introduce the topic to be discussed • Determine the order of debate • Remind participants to be respectful in demeanor and use of language • Keep speakers to their allotted times and to focus on the issue at hand • Thank everyone for attending • Assess the arguments and behaviour of each side and decide on a winner • What are the roles of each moderator during the debate?
What are the main arguments for each side?
What are the ideas you wish the debate to cover?
Pros Cons

unit fourglobal system choices
U4L1A5 Debate
What are the questions you want to ask the opposing teams during the debate?Questions for each team:
Team 1—HPI
1.
2.
Team 2—GPI
1.
2.
Team 3—GNH
1.
2.
Team 4—SPI
1.
2.
Things we will look for in our winning team:
Infractions/errors to warn the teams about:
unit fourglobal system choices
U4L1A5 Debate
Who is in charge of the following?
Timing the debate
Issuing warnings re: infractions
Delivering our verdict
**All members must read a minimum of one question or present the overall verdict on the debate. This ensures that all team members present at some point during the debate.**
unit fourglobal system choices
U4L1A5 Debate
Debate Topic: Name:
Debate Exit CardComplete the following questions and hand in your card to gain exit to the free world.
1. What were the strongest arguments made? List and explain two.
2. List some (two–three) ideas you learned about this topic.
3. What is something that made you go hmmmm (i.e., you found interesting)? Explain.
unit fourglobal system choices
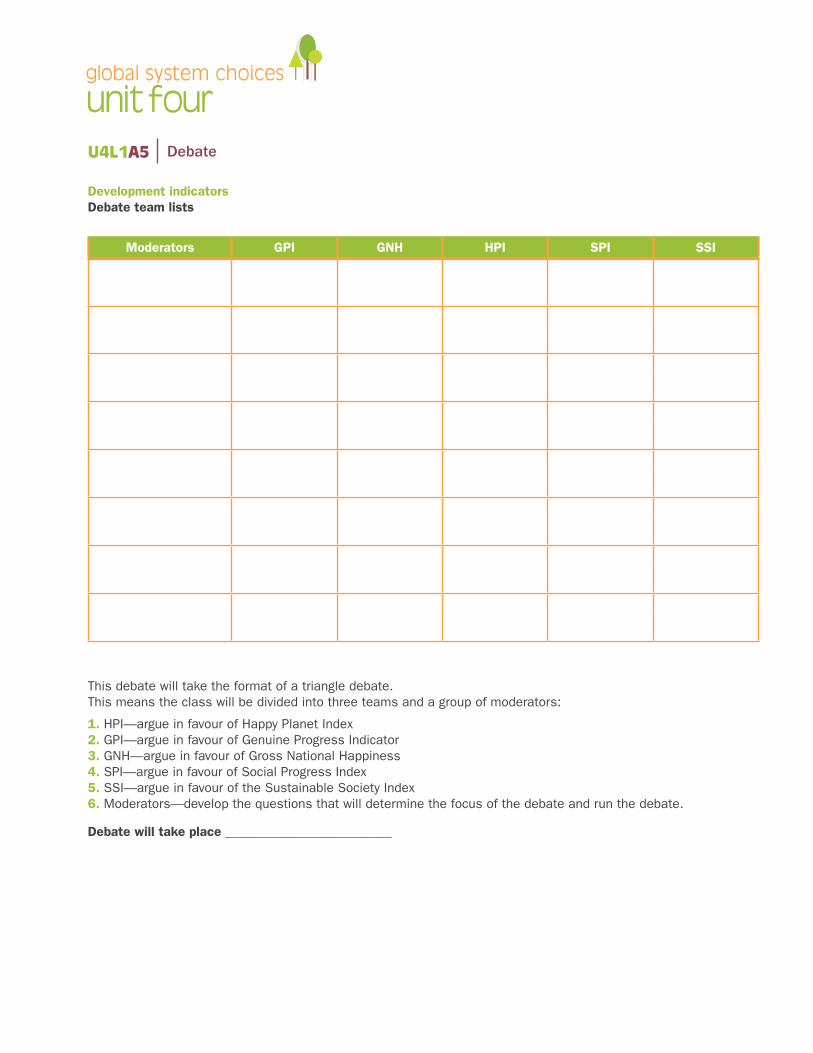
Development indicatorsDebate team lists
This debate will take the format of a triangle debate. This means the class will be divided into three teams and a group of moderators:
1. HPI—argue in favour of Happy Planet Index2. GPI—argue in favour of Genuine Progress Indicator3. GNH—argue in favour of Gross National Happiness4. SPI—argue in favour of Social Progress Index5. SSI—argue in favour of the Sustainable Society Index6. Moderators—develop the questions that will determine the focus of the debate and run the debate.
Debate will take place _________________________
U4L1A5 Debate
Moderators GPI GNH HPI SPI SSI
explore
analyze act
acquire
ask
unit four
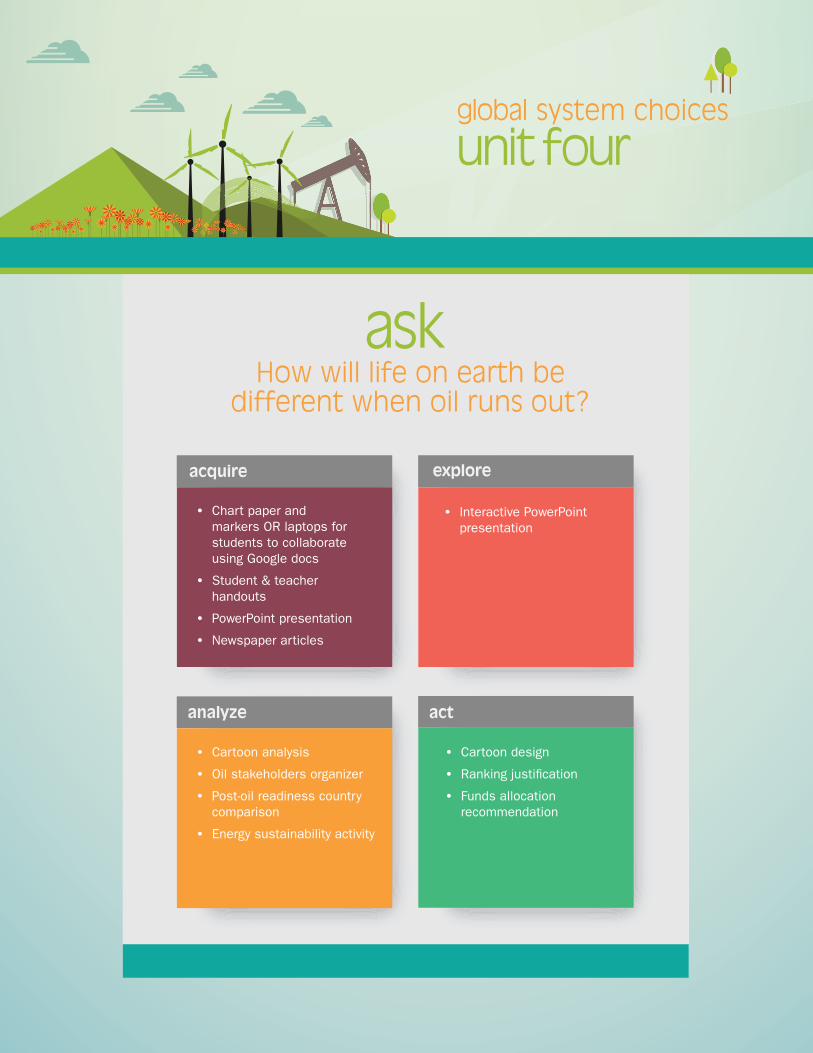
How will life on earth be different when oil runs out?
global system choices
• Chart paper and markers OR laptops for students to collaborate using Google docs
• Student & teacher handouts
• PowerPoint presentation
• Newspaper articles
• Interactive PowerPoint presentation
• Cartoon design
• Ranking justification
• Funds allocation recommendation
• Cartoon analysis
• Oil stakeholders organizer
• Post-oil readiness country comparison
• Energy sustainability activity
unit fourglobal system choices
U4L2
subjects:
timing:
Economics, Politics, Geography, Science, Civics English
Activity 1Cartoon analysis | 10–15 minutes per cartoon x four cartoonsNote: follow-up with Activity 5
Activity 2Oil stakeholders organizer | 75 minutesNote: follow-up with Activity 5
Activity 3Post-oil readiness country | 75 minutesNote: follow-up with Activity 6
Activity 4Energy sustainability activity | 150 minutesNote: follow-up with Activity 7
Activity 5Cartoon design | 75 minutes
Activity 6Ranking justification | 75 minutes
Activity 7Recommendation to Prime Minister | 70 minutes
Life after oil
This lesson builds on concepts learned in the introductory lesson, ‘Oil addiction’ (Unit 1: Sustainability). Students will begin to visualize how different the world will be once oil reserves are exhausted. They will assess the positions of key stakeholders in the oil scarcity issue and critique the sustainability of seven major energy sources. Students will also consider the actions of governments in regards to transitioning to world without oil.
unit fourglobal system choices
learning goals • To recognize and understand the techniques used to create effective social/political/economic cartoons. • To understand the complicated and conflicting positions of major stakeholders on the issue of oil scarcity. • To understand the necessity of post-oil planning and preparation. • To gain insight as to how different countries are preparing to transition to a world without oil. • To understand that all energy sources have pros and cons which determine their degree of sustainability. • To effectively communicate a message in the visual format of a cartoon. • To understand that different countries are at different stages of readiness to transition to a post-oil world. • To effectively support an opinion on an issue with evidence. • To develop and defend an informed position on the issue of energy sustainability.
success criteria • Detailed and accurate cartoon analysis. • Completion of Oil stakeholders organizer. • Comprehensive analysis and sound reasoning used to support post-oil readiness country rankings. • Detailed analysis and deep thinking demonstrated in assessment of advantages and disadvantages of seven major energy sources. • Use of the five elements of a cartoon to create an original cartoon that clearly illustrates the topic of oil scarcity. • Completion of post-oil readiness ranking justification. • Completion of funds allocation recommendation to Prime Minister.
askInquiry questions • How do cartoons make effective social/political/economic commentaries? • What are the potential impacts of oil depletion on major stakeholders? • What steps are different countries taking to prepare for the transition to a post-oil world? • Which energy sources are the most sustainable? • How can I design a visually impactful cartoon which sends a clear message about oil scarcity? • How can I use research to effectively support and justify my position on an issue? • How can I use research to persuade my audience to side with my position?
U4L2 Life after oil
unit fourglobal system choices
acquireLife after oil PowerPoint presentation
Activity 1 Cartoon analysis worksheet
Activity 2Oil stakeholders organizer student worksheetOil stakeholders organizer teacher answer key (appended to lesson plan)
Activity 3 Package #1: Norway • “Norway’s sovereign wealth holds lessons for Canada” • “Norway’s oil fund heads for $1 trillion; so where is Alberta’s pot of gold?” • “What Norway did with its oil and we didn’t”
Package #2: Venezuela • “Oil cash waning, Venezuelan shelves lie bare” • “Venezuela’s government is sinking in a sea of oil” • “Hugo Chavez leaves Venezuela in economic muddle”
Package #3: Canada • “Alberta should learn from Norway on managing oil” • “Peak oil? More like peak Canada” • “Why every Norwegian is a (kroner) millionaire”
Activity 4Energy sustainability activity teacher answer key (appended to lesson plan) • Laptops and Internet access
Activity 5Cartoon design worksheet
Activity 6Ranking justification worksheet
Activity 7Recommendation to Prime Minister worksheet
exploreTeacher presents interactive life after oil PowerPoint
U4L2 Life after oil
unit fourglobal system choices
analyzeActivity 1 | Cartoon analysisIn this activity students will analyze a cartoon via five techniques: symbolism, exaggeration, labelling, analogy and irony. They will become experts in identifying and analyzing the tools cartoonists use to effectively deliver their message.
Students will analyse four cartoons embedded in the the Life after oil PowerPoint.
• Analysis can be done in pairs or small groups • Students can use the cartoon analysis worksheet to complete their analysis (can also be done on chart paper or Google doc) • Each group informally shares findings with the class
Note: follow up with Activity 5
Activity 2 | Oil stakeholders organizerIn this activity students will work collaboratively in a small group to complete the oil stakeholders organizer. Each group will identify the potential impacts of oil depletion on the major stakeholders, and identify each stakeholder as a winner or loser. Students will begin to contemplate the realities of life after oil.
• Students will work in small groups (three–four students) to complete oil stakeholders organizer, identifying the potential impacts of oil depletion on major stakeholders • Students will identify stakeholders as winners or losers • Each group will informally share findings with the class
Note: follow up with Activity 5
Activity 3 | Post-oil readiness country comparisonIn this activity students will work in a group of three to investigate the post-oil readiness of three petroleum producing countries. Each group member will investigate a different country (Norway, Venezuela, or Canada) and share their findings with the group. Once all findings have been shared, group members will work collaboratively to rank the countries from most to least prepared.
• Students will work in groups of three to investigate how three petroleum rich countries (Canada, Venezuela, Norway) are preparing to transition to a world without oil • Each student receives one set of articles to read:
Package #1: Norway • “Norway’s sovereign wealth holds lessons for Canada” • “Norway’s oil fund heads for $1 trillion; so where is Alberta’s pot of gold?” • “What Norway did with its oil and we didn’t”
Package #2: Venezuela • “Oil cash waning, Venezuelan shelves lie bare” • “Venezuela’s government is sinking in a sea of oil” • “Hugo Chavez leaves Venezuela in economic muddle”
Package #3: Canada • “Alberta should learn from Norway on managing oil” • “Peak oil? More like peak Canada” • “Why every Norwegian is a (kroner) millionaire”
U4L2 Life after oil
unit fourglobal system choices
• Students will record findings in a three–way Venn diagram (can be done on the handout, chart paper or Google doc) • Each group will rank the countries from most to least prepared • Each group will informally share decision with the class
Note: follow up with Activity 6
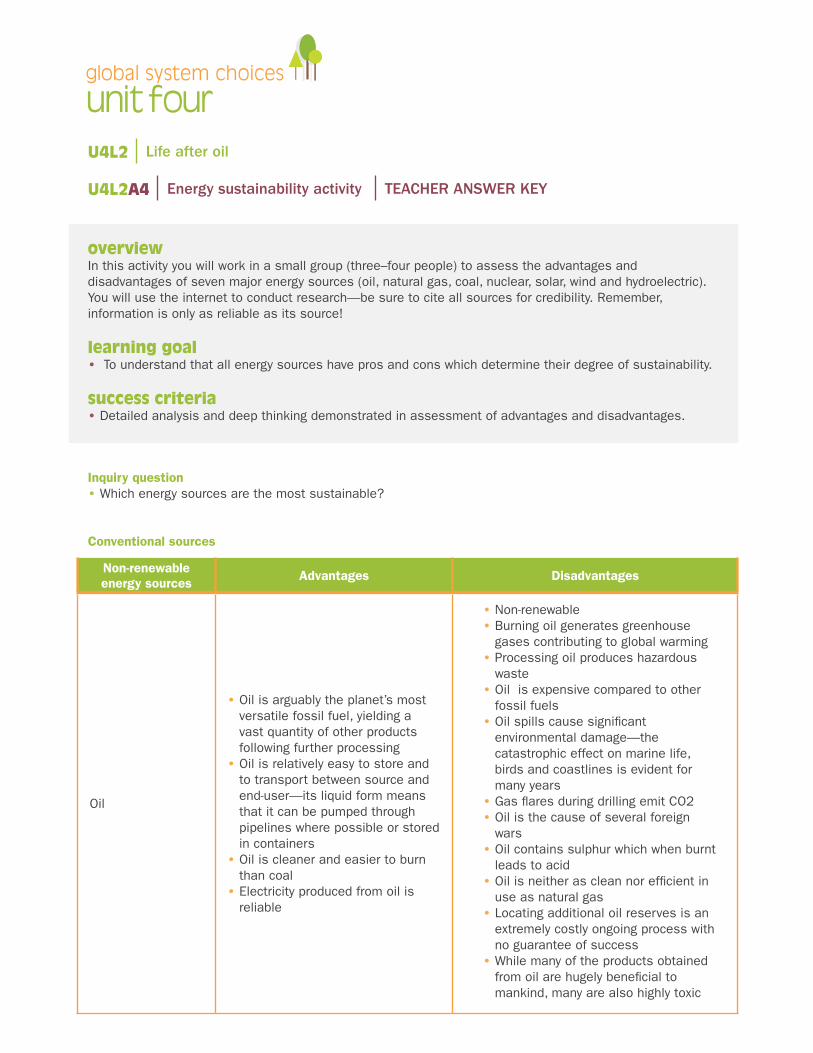
Activity 4 | Energy sustainability activityIn this activity students will work in a small group (three–four people) to assess the advantages and disadvantages of seven major energy sources (oil, natural gas, coal, nuclear, solar, wind and hydroelectric). They will use the internet to conduct research.
• Students work in small groups (three–four students) to research the advantages and disadvantages of seven major energy sources (oil, natural gas, coal, nuclear, solar, wind and hydroelectric) • Students will record findings using table provided on handout, chart paper or Google docs • Each group will informally share findings with the class
Note: follow up with Activity 7
act Activity 5 | Cartoon designIn this activity students will design an original cartoon (by hand) on the topic of oil scarcity using the five elements of a social/political/economic cartoon: symbolism, exaggeration, labelling, analogy and irony. Their message must be clear and easy to understand. They will also submit a brief written explanation of how their cartoon illustrates the five elements of a cartoon.
• Students design an original cartoon (by hand) on the topic of oil scarcity using the five elements of a political cartoon (symbolism, exaggeration, labelling, analogy and irony). • Students also submit a brief written analysis explaining how all five elements of a cartoon are illustrated in their drawing.
Activity 6 | Ranking justificationIn this activity students will individually justify how they ranked the post-oil readiness of Canada, Norway and Venezuela in Activity 3 (i.e. “X” country is most prepared because…).
• Students individually justify how they ranked the post-oil readiness of Canada, Norway and Venezuela in Activity #3 (i.e. “X” country is most prepared because…). • Justification should be approx. one page typed, double-spaced. • In-text citations and a full reference list required, submit to turnitin.com
Activity 7 | Recommendation to Prime MinisterIn this activity students will individually make a recommendation to the Prime Minister as to how funds should be allocated to ensure a sustainable energy future for Canada. They should refer to the advantages and disadvantages of major energy sources recorded in their energy sustainability organizer from activity 4.
U4L2 Life after oil
unit fourglobal system choices
• In the role of Minister of Natural Resources, students will individually make a recommendation to the Prime Minister as to how funds should be allocated to promote a sustainable energy future for Canada. (students should refer to the advantages and disadvantages of major energy sources recorded in their Energy Sustainability organizer from Activity 4) • Mandatory APA bibliography with minimum three sources, submitted to turnitin.com. • Approx. 500 words
referencesBurn: an Energy Journal (2012). Major sources of energy: Their advantages and disadvantages. Retrieved March 21 2015, fromburnanenergyjournal.com/major-sources-of-energy-their-advantages-and-disadvantages
Campbell, Bruce. (2013, January 6). Alberta should learn from Norway on managing oil. The Star. Retrieved from www.thestar.com/opinion/editorials/2013/01/16/alberta_should_learn_from_norway_on_managing_oil.html
Conserve Energy Future (2015). Advantages and disadvantages of natural gas. Retrieved March 21, 2015, from www.conserve-energy-future.com/advantages-and-disadvantages-of-natural-gas.php
Conserve Energy Future (2015). Pros and cons of nuclear energy. Retrieved March 21, 2015, from www.conserve-energy-future.com/pros-and-cons-of-nuclear-energy.php
Conserve Energy Future (2015). Pros and cons of wind energy. Retrieved March 21, 2015, from www.conserve-energy-future.com/pros-and-cons-of-wind-energy.php
Conserve Energy Future (2015). Pros and cons of solar energy. Retrieved March 21, 2015, from <http://www.conserve-energy-future.com/pros-and-cons-of-solar-energy.php
Conserve Energy Future (2015). Pros and cons of hydroelectric power. Retrieved March 21, 2015, from www.conserve-energy-future.com/pros-and-cons-of-hydroelectric-power.php
Conserve Energy Future (2015). Coal as fossil fuel. Retrieved March 21, 2015, from <http://www.conserve-energy-future.com/CoalAsFossilFuel.php
Daly, John. (2014, October 29). Why every Norwegian is a (kroner) millionaire. The Globe and Mail. Retrieved from www.theglobeandmail.com/report-on-business/rob-magazine/why-every-norweigian-is-a-kroner-millionaire/article21353835
Fossil Fuel (2015). Advantages of coal. Retrieved March 21, 2015, fromfossil-fuel.co.uk/coal/advantages-of-coal
Fossil Fuel (2015). Advantages of oil. Retrieved March 21, 2015, fromfossil-fuel.co.uk/oil/the-advantages-of-oil
Fossil Fuel (2015). Disadvantages of oil. Retrieved March 21, 2015, fromfossil-fuel.co.uk/oil/the-disadvantages-of-oil
Greenpeace International (2014). The case against coal. Retrieved March 21, 2015, fromwww.greenpeace.org/international/en/campaigns/climate-change/coal/The-case-against-coal
Hsieh, Esther. (2013, May 16). What Norway did with its oil and we didn’t. Globe and Mail. Retrieved fromwww.theglobeandmail.com/report-on-business/economy/canada-competes/what-norway-did-with-its-oil-and-we-didnt/article11959362
U4L2 Life after oil
unit fourglobal system choices
Hopkins, Rob. (2009). Ted Talk: Transition to a world without oil. Retrieved March 21, 2015, fromwww.ted.com/playlists/58/the_end_of_oil
Moran, Michael. (2014, March 26). Venezuela’s government is sinking in a sea of oil. Global Post. Retrieved from http://www.globalpost.com/dispatches/globalpost-blogs/the-unraveler/venezuela-oil-exports-imports-united-states
Neuman, William. (2015, January 29). Oil cash waning, Venezuelan shelves lie bare. New York Times. Retrieved from /www.nytimes.com/2015/01/30/world/americas/strict-rationing-in-venezuela-as-plunging-oil-prices-hurt-economy.html?_r=0
Ormiston, Susan. (2015, March 23). Norway’s sovereign wealth holds lessons for Canada. CBC News. Retrieved from www.cbc.ca/news/business/norway-s-sovereign-wealth-holds-lessons-for-canada-1.3002803
Plummer, Robert. (2013, March 5). Hugo Chavez leaves Venezuela in economic muddle. BBC News. Retrieved from www.bbc.com/news/business-20795781
Saunders, Doug. (2012, November 17). Peak oil? More like peak Canada. The Globe and Mail. Retrieved from www.theglobeandmail.com/globe-debate/doug-saunders-peak-oil-more-like-peak-canada/article5370334/
Tencer, Daniel. (2014, January 11). Norway’s oil fund heads for $1 trillion; so where is Alberta’s pot of gold? Huffington Post. Retrieved from www.huffingtonpost.ca/2014/01/11/oil-fund-norway-millionaires_n_4576887.html
U4L2 Life After Oil
unit fourglobal system choices
overviewIn this activity you will work collaboratively in a small group to complete the oil stakeholders organizer.Your group will identify the potential impacts of oil depletion on the major stakeholders, and identify each stakeholder as a winner or loser. You will begin to contemplate the realities of life after oil.
learning goal • To understand the complicated and conflicting positions of major stakeholders on the issue of oil scarcity.
success criteria• Thoroughly and thoughtfully complete organizer and informally share findings with the class—each group
must justify their winner/loser designation.
When change occurs there are winners and losers. How will each of these stakeholders be affected by the end of oil?
Form a small group of three–four students and work collaboratively identify potential impacts of oil depletion on each stakeholder. Record your answers in the table that follows. Be prepared to share and justify your opinion.
U4L2A2 Oil stakeholders organizer TEACHER ANSWER KEY
U4L2 Life after oil
Inquiry Question • What are the potential impacts of oil depletion on major stakeholders?
unit fourglobal system choices
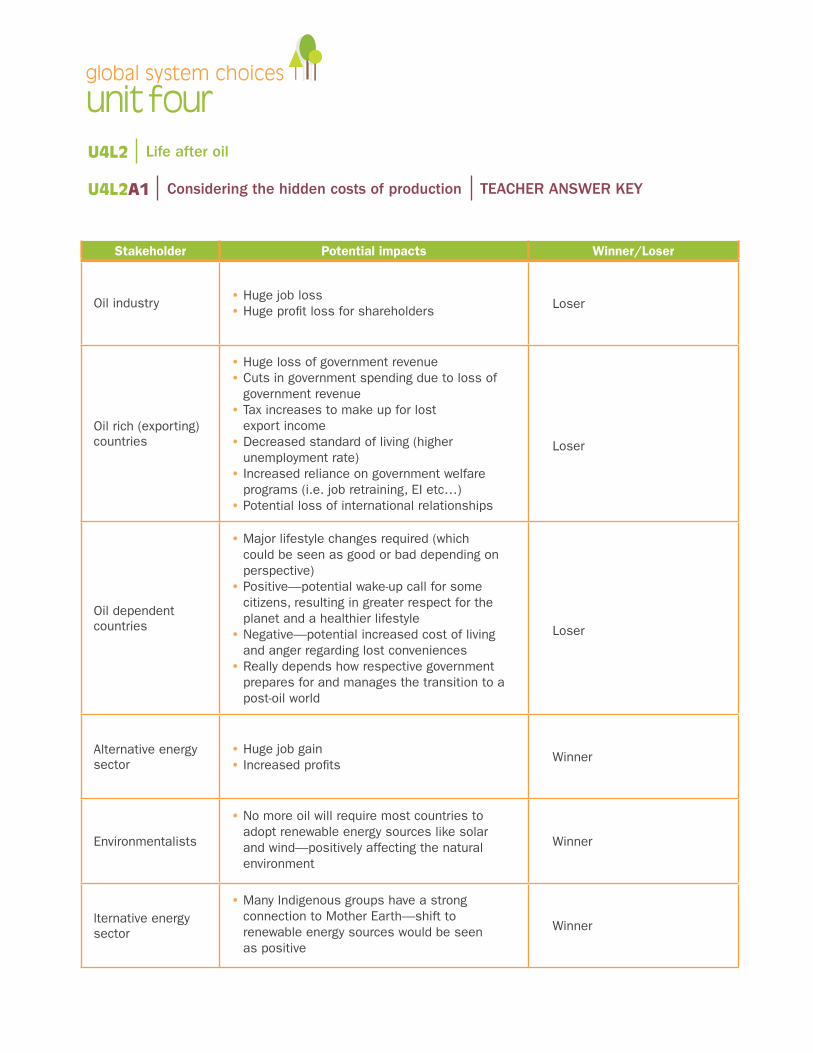
Stakeholder Potential impacts Winner/Loser
Oil industry • Huge job loss • Huge profit loss for shareholders Loser
Oil rich (exporting) countries
• Huge loss of government revenue • Cuts in government spending due to loss of government revenue • Tax increases to make up for lost export income • Decreased standard of living (higher unemployment rate) • Increased reliance on government welfare programs (i.e. job retraining, EI etc…) • Potential loss of international relationships
Loser
Oil dependent countries
• Major lifestyle changes required (which could be seen as good or bad depending on perspective) • Positive—potential wake-up call for some citizens, resulting in greater respect for the planet and a healthier lifestyle • Negative—potential increased cost of living and anger regarding lost conveniences • Really depends how respective government prepares for and manages the transition to a post-oil world
Loser
Alternative energy sector
• Huge job gain • Increased profits
Winner
Environmentalists
• No more oil will require most countries to adopt renewable energy sources like solar and wind—positively affecting the natural environment
Winner
lternative energy sector
• Many Indigenous groups have a strong connection to Mother Earth—shift to renewable energy sources would be seen as positive
Winner
U4L2A1 Considering the hidden costs of production TEACHER ANSWER KEY
U4L2 Life after oil
unit fourglobal system choices
U4L2A4 Energy sustainability activity TEACHER ANSWER KEY
U4L2 Life after oil
overviewIn this activity you will work in a small group (three–four people) to assess the advantages and disadvantages of seven major energy sources (oil, natural gas, coal, nuclear, solar, wind and hydroelectric). You will use the internet to conduct research—be sure to cite all sources for credibility. Remember, information is only as reliable as its source!
learning goal • To understand that all energy sources have pros and cons which determine their degree of sustainability.
success criteria• Detailed analysis and deep thinking demonstrated in assessment of advantages and disadvantages.
Inquiry question • Which energy sources are the most sustainable?
Conventional sources
Non-renewable energy sources Advantages Disadvantages
Oil
• Oil is arguably the planet’s most versatile fossil fuel, yielding a vast quantity of other products following further processing • Oil is relatively easy to store and to transport between source and end-user—its liquid form means that it can be pumped through pipelines where possible or stored in containers • Oil is cleaner and easier to burn than coal • Electricity produced from oil is reliable
• Non-renewable • Burning oil generates greenhouse gases contributing to global warming • Processing oil produces hazardous waste • Oil is expensive compared to other fossil fuels • Oil spills cause significant environmental damage—the catastrophic effect on marine life, birds and coastlines is evident for many years • Gas flares during drilling emit CO2 • Oil is the cause of several foreign wars • Oil contains sulphur which when burnt leads to acid • Oil is neither as clean nor efficient in use as natural gas • Locating additional oil reserves is an extremely costly ongoing process with no guarantee of success • While many of the products obtained from oil are hugely beneficial to mankind, many are also highly toxic
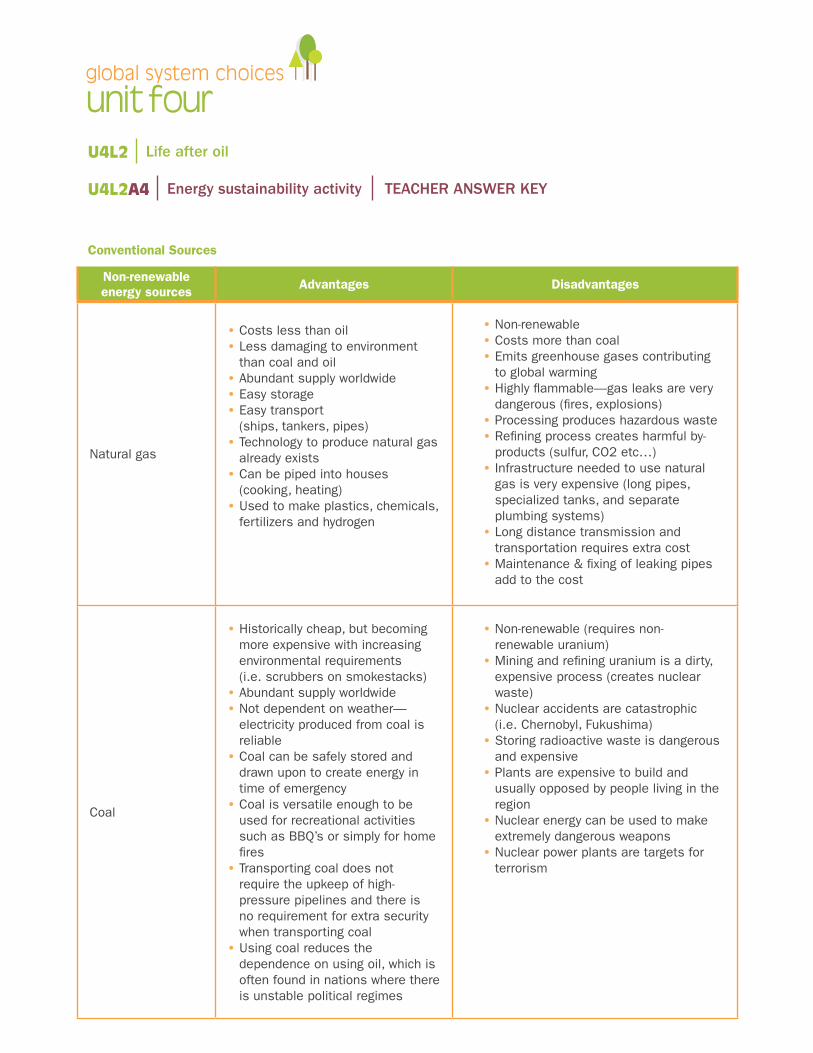
unit fourglobal system choices
Non-renewable energy sources Advantages Disadvantages
Natural gas
• Costs less than oil • Less damaging to environment than coal and oil • Abundant supply worldwide • Easy storage • Easy transport
(ships, tankers, pipes) • Technology to produce natural gas already exists • Can be piped into houses (cooking, heating) • Used to make plastics, chemicals, fertilizers and hydrogen
• Non-renewable • Costs more than coal • Emits greenhouse gases contributing to global warming • Highly flammable—gas leaks are very dangerous (fires, explosions) • Processing produces hazardous waste • Refining process creates harmful by-products (sulfur, CO2 etc…) • Infrastructure needed to use natural gas is very expensive (long pipes, specialized tanks, and separate plumbing systems) • Long distance transmission and transportation requires extra cost • Maintenance & fixing of leaking pipes add to the cost
Coal
• Historically cheap, but becoming more expensive with increasing environmental requirements (i.e. scrubbers on smokestacks) • Abundant supply worldwide • Not dependent on weather—electricity produced from coal is reliable • Coal can be safely stored and drawn upon to create energy in time of emergency • Coal is versatile enough to be used for recreational activities such as BBQ’s or simply for home fires • Transporting coal does not require the upkeep of high-pressure pipelines and there is no requirement for extra security when transporting coal • Using coal reduces the dependence on using oil, which is often found in nations where there is unstable political regimes
• Non-renewable (requires non-renewable uranium) • Mining and refining uranium is a dirty, expensive process (creates nuclear waste) • Nuclear accidents are catastrophic (i.e. Chernobyl, Fukushima) • Storing radioactive waste is dangerous and expensive • Plants are expensive to build and usually opposed by people living in the region • Nuclear energy can be used to make extremely dangerous weapons • Nuclear power plants are targets for terrorism
U4L2A4 Energy sustainability activity TEACHER ANSWER KEY
U4L2 Life after oil
Conventional Sources
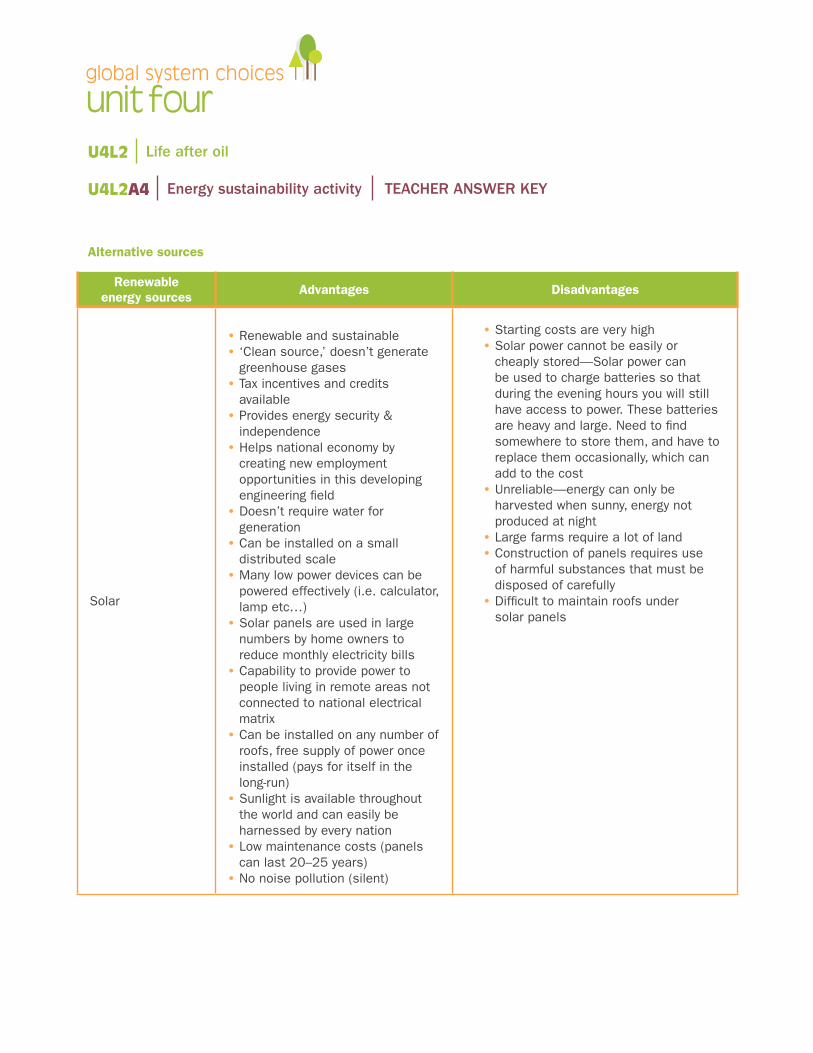
unit fourglobal system choices
U4L2A4 Energy sustainability activity TEACHER ANSWER KEY
U4L2 Life after oil
Alternative sources
Renewable energy sources Advantages Disadvantages
Solar
• Renewable and sustainable • ‘Clean source,’ doesn’t generate greenhouse gases • Tax incentives and credits available • Provides energy security & independence • Helps national economy by creating new employment opportunities in this developing engineering field • Doesn’t require water for generation • Can be installed on a small distributed scale • Many low power devices can be powered effectively (i.e. calculator, lamp etc…) • Solar panels are used in large numbers by home owners to reduce monthly electricity bills • Capability to provide power to people living in remote areas not connected to national electrical matrix • Can be installed on any number of roofs, free supply of power once installed (pays for itself in the long-run) • Sunlight is available throughout the world and can easily be harnessed by every nation • Low maintenance costs (panels can last 20–25 years) • No noise pollution (silent)
• Starting costs are very high • Solar power cannot be easily or cheaply stored—Solar power can be used to charge batteries so that during the evening hours you will still have access to power. These batteries are heavy and large. Need to find somewhere to store them, and have to replace them occasionally, which can add to the cost • Unreliable—energy can only be harvested when sunny, energy not produced at night • Large farms require a lot of land • Construction of panels requires use of harmful substances that must be disposed of carefully • Difficult to maintain roofs under solar panels
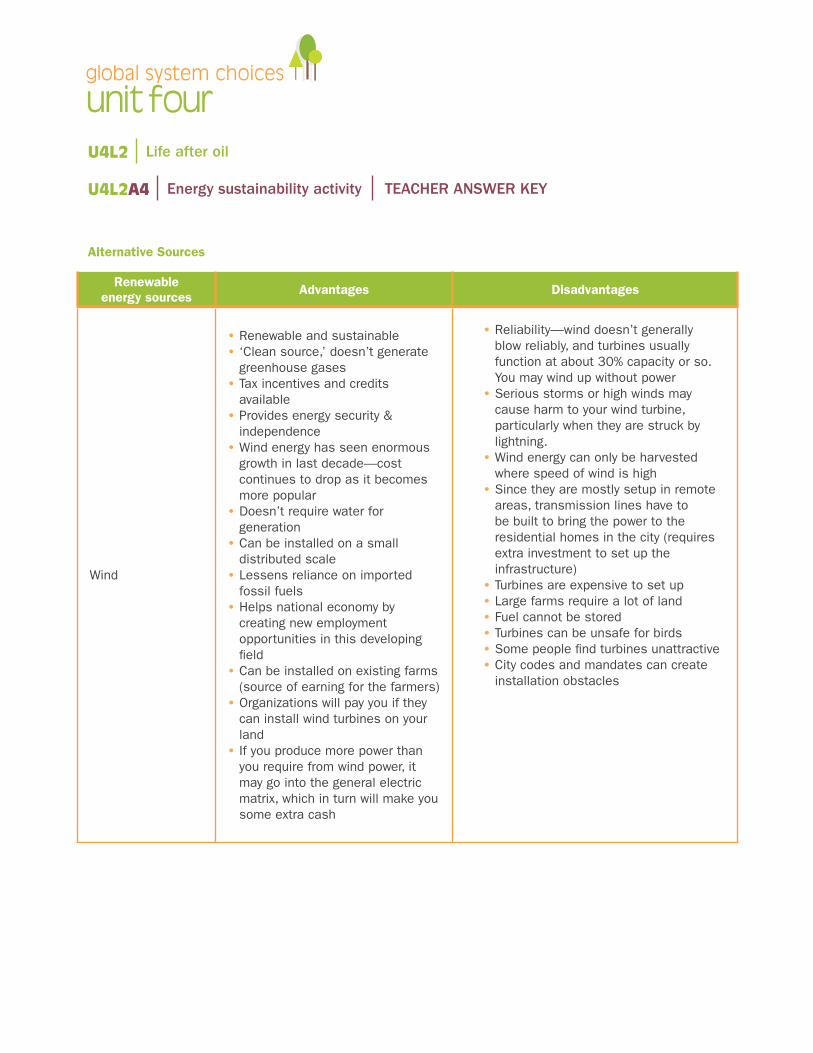
unit fourglobal system choices
U4L2A4 Energy sustainability activity TEACHER ANSWER KEY
U4L2 Life after oil
Alternative Sources
Renewable energy sources Advantages Disadvantages
Wind
• Renewable and sustainable • ‘Clean source,’ doesn’t generate greenhouse gases • Tax incentives and credits available • Provides energy security & independence • Wind energy has seen enormous growth in last decade—cost continues to drop as it becomes more popular • Doesn’t require water for generation • Can be installed on a small distributed scale • Lessens reliance on imported fossil fuels • Helps national economy by creating new employment opportunities in this developing field • Can be installed on existing farms (source of earning for the farmers) • Organizations will pay you if they can install wind turbines on your land • If you produce more power than you require from wind power, it may go into the general electric matrix, which in turn will make you some extra cash
• Reliability—wind doesn’t generally blow reliably, and turbines usually function at about 30% capacity or so. You may wind up without power • Serious storms or high winds may cause harm to your wind turbine, particularly when they are struck by lightning. • Wind energy can only be harvested where speed of wind is high • Since they are mostly setup in remote areas, transmission lines have to be built to bring the power to the residential homes in the city (requires extra investment to set up the infrastructure) • Turbines are expensive to set up • Large farms require a lot of land • Fuel cannot be stored • Turbines can be unsafe for birds • Some people find turbines unattractive • City codes and mandates can create installation obstacles
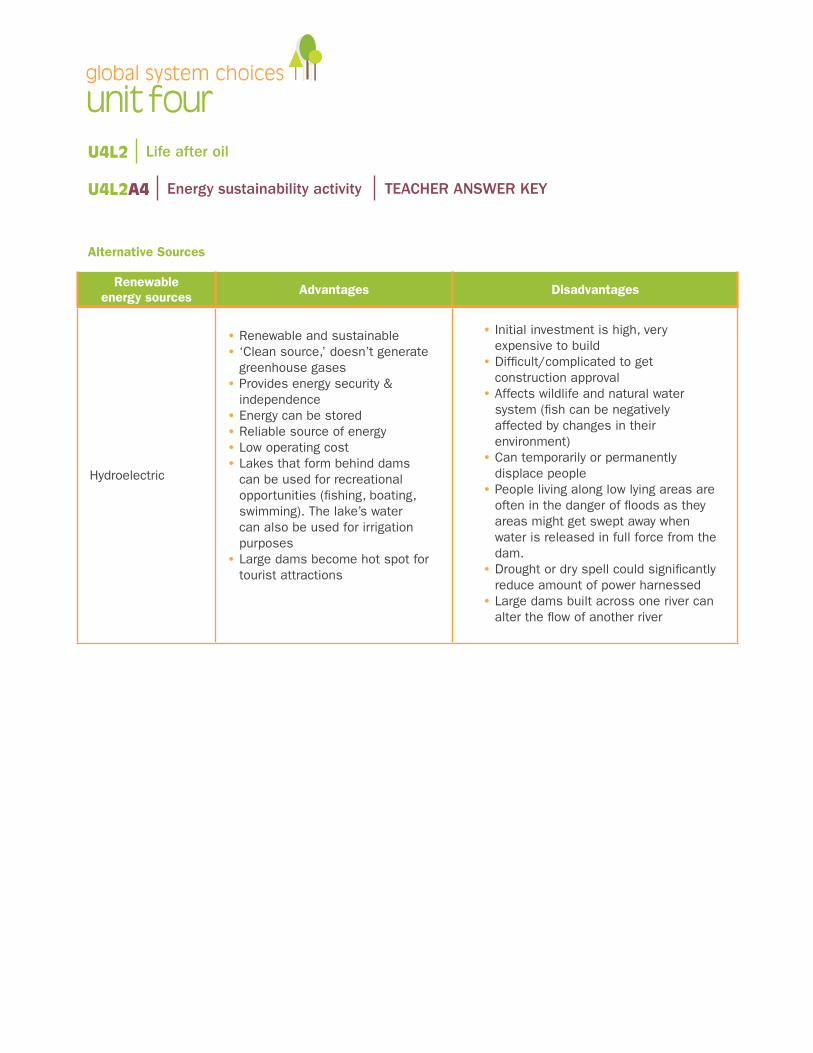
unit fourglobal system choices
U4L2A4 Energy sustainability activity TEACHER ANSWER KEY
U4L2 Life after oil
Alternative Sources
Renewable energy sources Advantages Disadvantages
Hydroelectric
• Renewable and sustainable • ‘Clean source,’ doesn’t generate greenhouse gases • Provides energy security & independence • Energy can be stored • Reliable source of energy • Low operating cost • Lakes that form behind dams can be used for recreational opportunities (fishing, boating, swimming). The lake’s water can also be used for irrigation purposes • Large dams become hot spot for tourist attractions
• Initial investment is high, very expensive to build • Difficult/complicated to get construction approval • Affects wildlife and natural water system (fish can be negatively affected by changes in their environment) • Can temporarily or permanently displace people • People living along low lying areas are often in the danger of floods as they areas might get swept away when water is released in full force from the dam. • Drought or dry spell could significantly reduce amount of power harnessed • Large dams built across one river can alter the flow of another river
unit fourglobal system choices
overviewIn this activity you will analyze a cartoon via five techniques: symbolism, exaggeration, labelling, analogy and irony. You will become an expert in identifying and analyzing the tools cartoonists use to effectively deliver their message.
learning goal • To recognize and understand the techniques used to create effective social/political/economic cartoons.
success criteria• Detailed and accurate explanation of how each technique is employed in the cartoon.
1. Identify the persuasive techniques that the cartoonist used (cartoonist may not use all techniques).
U4L2 Cartoon analysis worksheet
Inquiry question • How do cartoons make effective social/political/economic commentaries?
Technique Explanation
Symbolism(Objects are used to stand for larger concepts or ideas)
Exaggeration(Cartoonists will overdo physical characteristics of people or things in order to make a point)
Labelling(Objects or people are often labeled by cartoonists to make it clear exactly what they stand for)
Analogy(Cartoonists will make a comparison between two unlike things)
Irony (The difference between the way things are and the way things should be)
unit fourglobal system choices
U4L2 Cartoon analysis worksheet
2. What issue is this cartoon about?
3. What is the cartoonist’s opinion on this issue?
4. What other opinion can you imagine another person having on this issue?
unit fourglobal system choices
U4L2 Cartoon analysis worksheet
5. Did you find this cartoon persuasive? Why or why not?
6. What other techniques could the cartoonist have used to make this cartoon more persuasive?
unit fourglobal system choices
overviewIn this activity you will work collaboratively in a small group to complete the oil stakeholders organizer.Your group will identify the potential impacts of oil depletion on the major stakeholders, and identify each stakeholder as a winner or loser. You will begin to contemplate the realities of life after oil.
learning goal • To understand the complicated and conflicting positions of major stakeholders on the issue of oil scarcity.
success criteria• Thoroughly and thoughtfully complete organizer and informally share findings with the class—each group
must justify their winner/loser designation.
taskWhen change occurs there are winners and losers. How will each of these stakeholders be affected by the end of oil? Form a small group of three–four students and work collaboratively identify potential impacts of oil depletion on each stakeholder. Record your answers in the table that follows. Be prepared to share and justify your opinion.
U4L2A2 Oil stakeholders organizer
Inquiry Question • What are the potential impacts of oil depletion on major stakeholders?
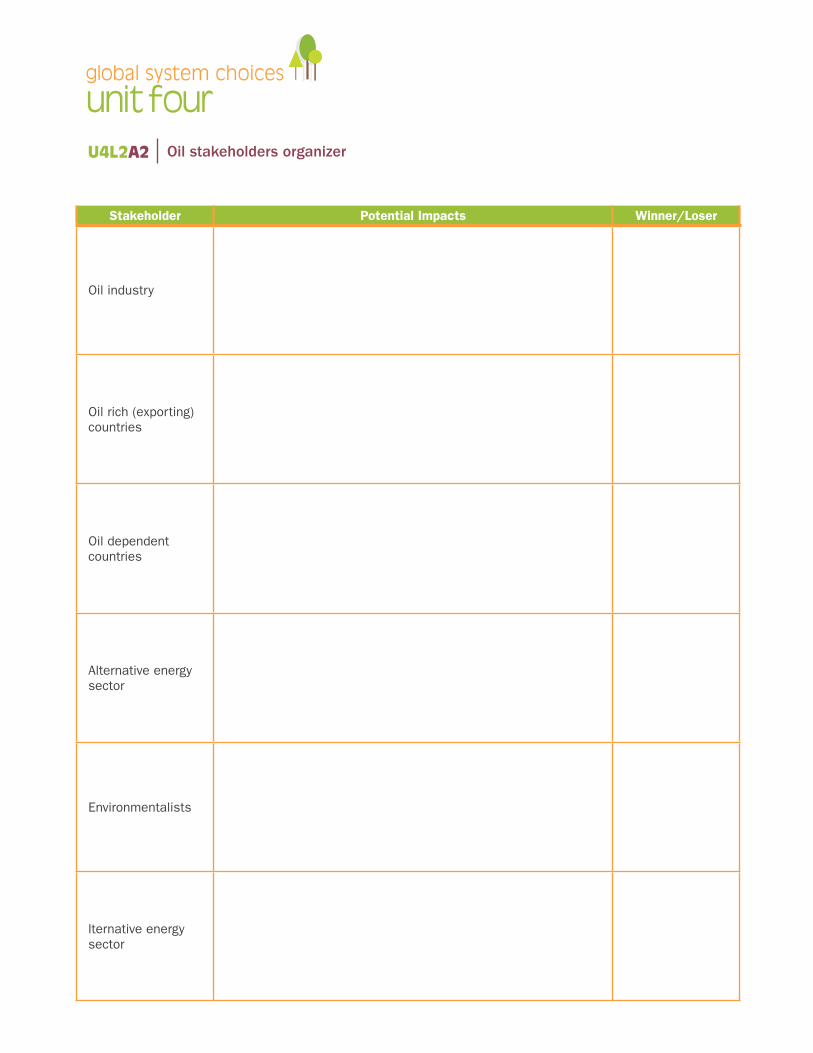
unit fourglobal system choices
Stakeholder Potential Impacts Winner/Loser
Oil industry
Oil rich (exporting) countries
Oil dependent countries
Alternative energy sector
Environmentalists
lternative energy sector
U4L2A2 Oil stakeholders organizer
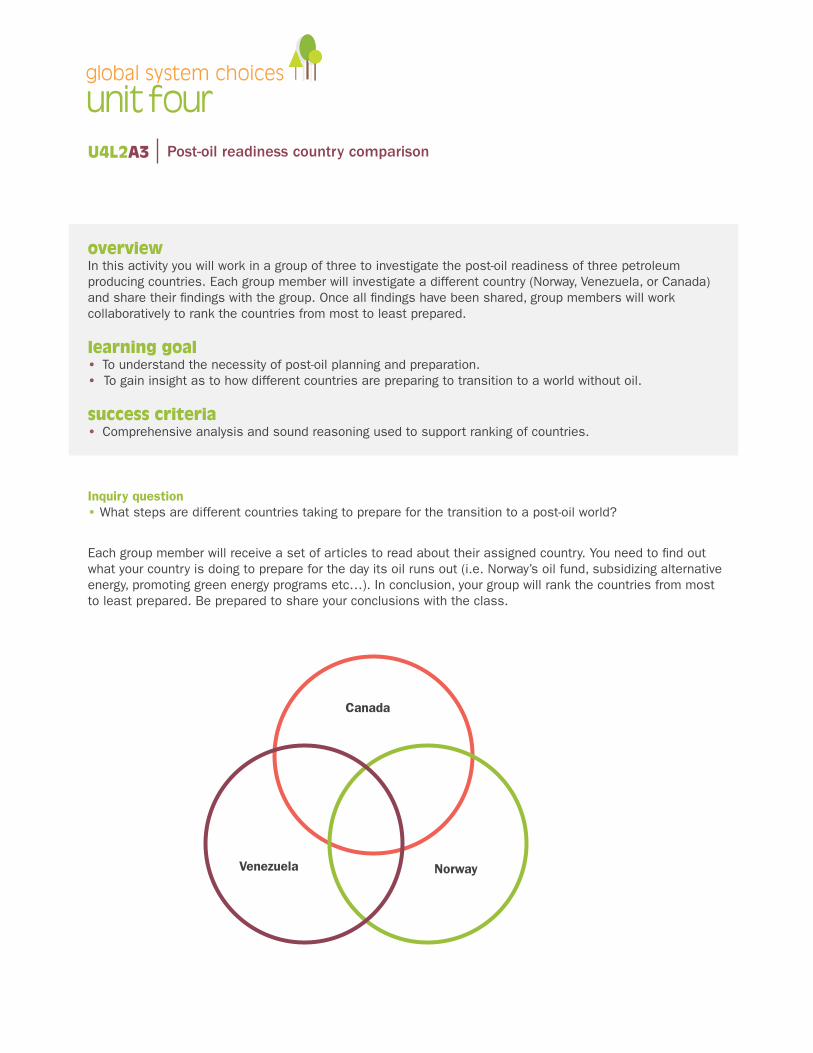
unit fourglobal system choices
overviewIn this activity you will work in a group of three to investigate the post-oil readiness of three petroleum producing countries. Each group member will investigate a different country (Norway, Venezuela, or Canada) and share their findings with the group. Once all findings have been shared, group members will work collaboratively to rank the countries from most to least prepared.
learning goal • To understand the necessity of post-oil planning and preparation. • To gain insight as to how different countries are preparing to transition to a world without oil.
success criteria• Comprehensive analysis and sound reasoning used to support ranking of countries.
Each group member will receive a set of articles to read about their assigned country. You need to find out what your country is doing to prepare for the day its oil runs out (i.e. Norway’s oil fund, subsidizing alternative energy, promoting green energy programs etc…). In conclusion, your group will rank the countries from most to least prepared. Be prepared to share your conclusions with the class.
U4L2A3 Post-oil readiness country comparison
Inquiry question • What steps are different countries taking to prepare for the transition to a post-oil world?
Canada
NorwayVenezuela
unit fourglobal system choices
U4L2A3 Post-oil readiness country comparison Article 1
Norway’s sovereign wealth holds lessons for CanadaEstablished in 1990, Norway’s heritage fund is now worth $1 trillion
Susan Ormiston, Mar 20, 2015
In Stavanger, a quaint, seaside city on Norway’s coast, a local newspaper publishes a series called “The Oil Kids” that reports on the lifestyles of wealthy second-generation beneficiaries of Norway’s offshore oil riches.
“If you compare to our parents or grandparents which built this country, I think we’re a little bit spoiled,” admits Bjorn Knudsen, whose father worked for a large North Sea oil company.
Fifty years ago, Stavanger’s biggest industry was canning herring. Now, this city is the country’s de facto oil capital.
“We are extremely lucky,” says Bjorn’s wife, Kristin Alne, a production engineer for Det Norske Olije-selsksap, an offshore oil company. “There are only five million of us [in Norway], and someone several decades ago was really smart to deal with the income from the oil industry to generate the welfare of this country as a whole.”
They are lucky and Norway was smart. So smart that decisions made decades ago to bank the taxes from rich oil fields are now paying for their future at a time when oil-rich Alberta faces a multibillion-dollar deficit.
unit fourglobal system choices
In the middle of Stavanger, a hulking oil museum charts oil’s legacy and how it turned Norway from poor to prosperous. A real-time ticker counts up the Krone in the oil fund.
Norway today sits on top of a $1-trillion Cdn pension fund established in 1990 to invest the returns of oil and gas. The capital has been invested in over 9,000 companies worldwide, including over 200 in Canada. It is now the largest sovereign wealth fund in the world.
By contrast, Alberta’s Heritage Savings Fund, established in 1976 by premier Peter Lougheed, sits at only $17 billion Cdn and has been raided by governments and starved of contributions for years.
“For the last 10 years, when nothing went into the Alberta fund, and we put a lot of money aside, the profit went out of Canada,” says Rolf Wiborg, a petroleum engineer who recently retired from Nor-way’s public service.
Norway’s ethos
Kristin Alne, an engineer with the oil company Det Norske Olijeselskap, admits that Norwegians have been ‘extremely lucky’ to reap the rewards of their oil resources. (Kristan Alne)
Wiborg, who studied at the University of Alberta and worked for a Norwegian oil company before joining Norway’s Petroleum Directorate, says the key to success has been Norway’s ethos of sharing and a commitment to never waver from that goal.
“We don’t change our policies in Norway, with changes in the oil price – you can’t do that,” he says. “Lougheed’s government in Alberta knew that, they made policies and then they left them behind.”
Oil and gas make up 25 per cent of Norway’s GDP, so the recent plunge in oil prices should have set off alarm bells in Oslo. Thousands of workers have indeed been laid off, but parliament is not painting a dire forecast for 2015.
U4L2A3 Post-oil readiness country comparison Article 1
unit fourglobal system choices
U4L2A3 Post-oil readiness country comparison Article 1
“We all agree we’re not facing a crisis,” says Siv Jensen, Norway’s finance minister.
Twenty-five years ago, when Norway set up its oil fund, it demanded high taxes from oil companies – 78 per cent after profits and the costs of research and exploration. One hundred per cent of those taxes were banked.
The government is allowed to tap into the fund, but only up to four per cent. That leaves the principal untouched.
“We have low unemployment, we have growth, we have a huge surplus – that’s a very robust start in the face of declining oil prices”, she says confidently.
The Canadian story
Norway did well by those rules. In contrast, Alberta and Saskatchewan – both endowed with oil and other mineral resources – took different routes with vastly different results.
Alberta and Saskatchewan both set up heritage funds (in 1976 and 1978, respectively), but Alberta, for example, only put in 30 per cent of royalties. The funds were consistently raided by governments of the day, and in Alberta, contributions petered out altogether by 1987. The Saskatchewan fund was terminated in 1992.
Those two provinces reveal important failures in the Canadian experience, says Greg Poelzer, a profes-sor at the University of Saskatchewan and author of a recent paper on lessons from Norway.
“First, the failure to contribute annually means the fund will not grow and one-time earnings from non-renewable resources are lost forever,” he says.
“Second, governments should only use the interest, otherwise governments will overspend, putting programs at risk when the prices fall, as they always do.”
unit fourglobal system choices
U4L2A3 Post-oil readiness country comparison Article 1
Norway is not immune to oil’s fluctuations. Statoil, a Norwegian company that is 67 per cent owned by Norwegians (another fiscally wise decision, according to Rolf Wiborg), has shed eight per cent of its workforce, with more to come.
“This is the lean approach, fundamentally,” says Statoil CEO Eldar Saetre, explaining that the big oil companies have to bring down the costs of production, and automate more of it.
Saetre says the industry is in a phase of permanent reduction and downsizing. “This is not about tak-ing down activity and then thinking it will come back,” he says.
Diminishing resources
Norway’s conventional oil reserves – like those in most of the world – are diminishing. Bente Ny-land, head of Norway’s Petroleum Directorate, says development will continue on a large, promis-ing new find, Johan Sverdrup, but many of the North Sea fields are maturing.
“The main impact we see is that exploration is put on hold,” she says. All the more reason to be vigi-lant about what comes out of existing fields. “Our goal is to ensure the benefit from the oil activity goes into the Norwegian pension fund.”
Like petro-economies around the world, Norway is facing a future where oil is not the golden goose it once was.
“We are facing a turning point where oil and gas will no longer be the engine of growth,” warns Finance Minister Jensen. “We need to make sure that we are able to transform our economy towards broader markets.”
But for now, the country’s smart planning is a significant hedge against an uncertain future, says Farouk al Kasim, an Iraqi geologist who emigrated to Norway in 1968.
unit fourglobal system choices
U4L2A3 Post-oil readiness country comparison Article 1
The Norwegians asked the former senior executive with Iraq’s Petroleum Company to evaluate some early seismic data. Convinced Norway would soon become a major oil player, Al Kasim helped design the management of the resource.
“They were very determined that the major share of the profit would have to be to the citizens of the country, and that’s how it is today,” says al Kasim, who was knighted in 2012 by the Norwegian king for his expertise managing Norway’s resource.
But what about today, with the price of oil half of what it was six months ago?
“It is nice to have the fund behind us, because without it, we would have been a very worried nation.”
unit fourglobal system choices
U4L2A3 Post-oil readiness country comparison Article 2
Norway’s Oil Fund Heads For $1 Trillion; So Where Is Alberta’s Pot Of Gold?Daniel Tencer, January 2014
Every man, woman and child in oil-rich Norway became a theoretical millionaire this week.
The country’s oil fund — which collects taxes from oil profits and invests the money, mostly in stocks — exceeded 5.11 trillion crowns ($905 billion) in value this week, making it worth a million crowns per person, or about $177,000 per Norwegian.
That’s right. Norway, the “socialist paradise,” is effectively running a surplus of nearly a tril-lion dollars, thanks to oil revenue.
About the same time this happened, the Canadian Taxpayers Federation released calculations show-ing that the taxpayers of Alberta are on the hook for $7.7 billion in debt, or about $1,925 per person. It expects the debt to spike to $17 billion by the end of the 2015-2016 fiscal year. The CTF is so alarmed by the province’s descent into deficits that it has launched a debt clock specifically for Al-berta.
What’s wrong with this picture? Norway, with an economy and population somewhat larger but on the same scale as Alberta’s, has managed to guarantee its citizens’ prosperity for decades to come. Norway’s oil production is declining, down to one-half what it was in 2001. Alberta, where oil pro-duction keeps growing and growing, is writing IOUs.
Norway isn’t the only one, though its fund is the largest. The United Arab Emirates’ funds are val-ued in excess of US$800 billion, Kuwait has about US$400 billion, and Russia and Kazakhstan have accumulated about US$180 billion each.
unit fourglobal system choices
U4L2A3 Post-oil readiness country comparison Article 2
These facts should renew the long-running debate about whether the federal government or the pro-vincial governments of oil-rich provinces should set up the sort of sovereign wealth fund that has made Norway stupendously, incomprehensibly rich.
But are Albertans, or other Canadians, ready for the sort of reforms that would turn Alberta into the new Norway?
In socialist-leaning Norway, oil profits — including from state-run Statoil — are taxed up to a whopping 78 per cent, and that’s where the seed money for the fund comes from.
Alberta, meanwhile, never even had a provincial sales tax. Albertans pay far, far lower taxes than
Norwegians, and if conventional economic theory is right, this should give Alberta the advantage.
But does it?
The average total income in Alberta is around $53,000, well below the province’s (stunning) eco-nomic output of $80,000 per person. Norway’s economic output is actually much lower than Alber-ta’s, at $65,000 per person, but its average income is about the same, at $58,000. Norwegians take home a much larger chunk of the economy’s wealth than Albertans do.
The Alberta government blames its deficit on the “bitumen bubble.” Oilsands product is selling for considerably less than conventional crude, mostly because of the boom in shale oil production in the U.S. It was selling for 22 per cent less than West Texas Intermediate oil as of this week, and this, apparently, is putting pressure on Alberta’s finances.
But this is a sad excuse. Norway, too, has had to deal with low oil prices over the decades, but al-ways found the political will to feed its rainy day fund.
Alberta “was just greedy and decided that a drunken, blow-out dance party today was better than a string of candle-lit dinner parties down the road,” writes noted economics reporter Eric Reguly in Corporate Knights.
unit fourglobal system choices
U4L2A3 Post-oil readiness country comparison Article 2
Had Alberta set up a proper sovereign wealth fund decades ago as Norway had — or even if it were simply willing to draw higher royalties — it could use that money to stay out of deficits. It wouldn’t have to go begging to the federal government for aid when flooding hits.
This isn’t news to policymakers. The IMF, the Canadian International Council (CIC), and a recent University of Saskatchewan report are among those recommending Canadian governments set up sovereign wealth funds.
“The arguments in favour were just so logical,” said Melanie Drohan, co-author of a CIC report fa-vouring oil funds, in an interview with iPolitics.
It would insulate the economy from commodity price busts, allow governments to save for future gen-erations, and perhaps best of all, “it would keep government spending within their means,” she said. “We wouldn’t have these huge surpluses going into huge deficits.”
Some parts of the country are listening. British Columbia Premier Christy Clark last year announced the creation of a wealth fund that will collect profits from the proposed development of the liquified natural gas (LNG) industry on the west coast.
It won’t be anywhere near the size of Norway’s fund; the B.C. government projects it will collect $100 billion of a projected $1 trillion in LNG wealth generated over the next 30 years. Then again, the LNG business in B.C. isn’t expected to be as large as Norway’s oil business.
But aside from B.C., there is little interest among elected officials. The Harper government has round-ly rejected the creation of a federal sovereign wealth fund.
And in Alberta, the idea of a sovereign wealth fund appears to have come and gone. The province came close when then-Premier Peter Lougheed set up the Heritage Savings Fund back in 1976. But the province didn’t take it seriously at all. After a decade in operation, Alberta’s government basically stopped paying into it, instead drawing on it as another source of revenue. It stands today at a measly $16.7 billion, a tiny fraction of what Norway has accumulated.
unit fourglobal system choices
U4L2A3 Post-oil readiness country comparison Article 2
Incidentally, the fund’s size is about what Alberta’ debt is projected to be in a couple years. The prov-ince could just give up the ghost, raid the fund and pay off the debt.
It won’t help make Alberta a more fiscally responsible place in the future, but at least it will tempo-rarily eliminate the unforgivable embarrassment of Canada’s wealthiest, most economically dynamic province showing the world how to waste its wealth.
unit fourglobal system choices
U4L2A3 Post-oil readiness country comparison Article 3
What Norway did with its oil and we didn’tESTHER HSIEH, May. 16 2013
When oil was discovered in the Norwegian continental shelf in 1969, Norway was very aware of the finite nature of petroleum, and didn’t waste any time legislating policies to manage the new-found resource in a way that would give Norwegians long-term wealth, benefit their entire society and make them competitive beyond just a commodities exporter.
“Norway got the basics right quite early on,” says John Calvert, a political science professor at Simon Fraser University. “They understood what this was about and they put in place public policy that they have benefited so much from.”
This is in contrast to Canada’s free-market approach, he contends, where our government is discour-aged from long-term public planning, in favour of allowing the market to determine the pace and scope of development.
“I would argue quite strongly that the Norwegians have done a much better job of managing their [pe-troleum] resource,” Prof. Calvert says.
While No. 15 on the World Economic Forum’s global competitiveness rankings, Norway is ranked third out of all countries on its macroeconomic environment (up from fourth last year), “driven by windfall oil revenues combined with prudent fiscal management,” according to the Forum.
unit fourglobal system choices
U4L2A3 Post-oil readiness country comparison Article 2
Before oil was discovered, the Act of 21 June 1963 was already in place for managing the Norwegian continental shelf. This legislation has since been updated several times, most recently in 1996, now considered Norway’s Petroleum Act, which includes protection for fisheries, communities and the en-vironment.
In 1972, the government founded the precursor of Statoil ASA, an integrated petroleum company. (In 2012, Statoil dividends from government shares was $2.4-billion). In the same year, the Norwegian Petroleum Directorate was also established, a government administrative body that has the objective of “creating the greatest possible values for society from the oil and gas activities by means of prudent resource management.”
In 1990, the precursor of the Government Pension Fund – Global (GPFG), a sovereign wealth fund, was established for surplus oil revenues. Today the GPFG is worth more than $700-billion.
While there’s no question that Norway has done well from its oil and gas, unlike many resource-based nations, Norway has invested its petro dollars in such a way as to create and sustain other industries where it is also globally competitive.
The second largest export of Norway is supplies for the petroleum industry, points out Ole Anders Lindseth, the director general of the Ministry of Petroleum and Energy in Norway.
“So the oil and gas activities have rendered more than just revenue for the benefit of the future genera-tions, but has also rendered employment, workplaces and highly skilled industries,” Mr. Lindseth says.
Maximizing the resource is also very important.
Because the government is highly invested, (oil profits are taxed at 78 per cent, and in 2011 tax rev-enues were $36-billion), it is as interested as oil companies, which want to maximize their profits, in extracting the maximum amount of hydrocarbons from the reservoirs. This has inspired technological advances such as parallel drilling, Mr. Lindseth says.
“The extraction rate in Norway is around 50 per cent, which is extremely high in the world average,” he adds.
unit fourglobal system choices
U4L2A3 Post-oil readiness country comparison Article 3
Norway has also managed to largely avoid so-called Dutch disease (a decline in other exports due to a strong currency) for two reasons, Mr. Lindseth says. The GPFG wealth fund is largely invested outside Norway by legislation, and the annual maximum withdrawal is 4 per cent. Through these two measures, Norway has avoided hyper-inflation, and has been able to sustain its traditional industries.
In Norway, there’s no industry more traditional than fishing.
“As far back as the 12th century they were already exporting stock fish to places in Europe,” explains Rashid Sumaila, director of the Fisheries Economics Research Unit at the University of British Colum-bia Fisheries Centre.
Prof. Sumaila spent seven years studying economics in Norway and uses game theory to study fish stocks and ecosystems. Fish don’t heed international borders and his research shows how co-operative behaviour is economically beneficial.
“Ninety per cent of the fish stocks that Norway depends on are shared with other countries. It’s a coun-try that has more co-operation and collaboration with other countries than any other country I know,” Prof. Sumaila says.
“That’s [partly] why they still have their cod and we’ve lost ours,” he adds, pointing out that not only are quotas and illegal fishing heavily monitored, policy in Norway is based on scientific evidence and consideration for the sustainability of the ecosystem as a whole.
Prof. Sumaila cites the recent changes to Canada’s Fisheries Act, as a counter-example: “To protect the habitat, you have to show a direct link between the habitat, the fish and the economy,” he says, adding, “That’s the kind of weakening that the Norwegians don’t do.”
Svein Jentoft is a professor in the faculty of Bioscience, Fisheries and Economics at the University of Tromso. He adds that Norway’s co-operative management style, particularly domestically, has been key to the continued success of the fisheries.
unit fourglobal system choices
U4L2A3 Post-oil readiness country comparison Article 3
“The management system [for fish stock] is an outcome of the positive, constructive and trustful re-lationship between the industry on the one hand and the government on the other hand,” Prof. Jentoft says. “They have been able to agree on issues that you and many other countries haven’t been able to, largely because the government has listened to the fishermen.”
However, Prof. Jentoft isn’t on board with all of his government’s policies. He’s concerned about how the quota and licensing system is concentrating wealth and the impact that this will have on fishing communities.
He predicts that Norway’s wild stocks will remain healthy in the foreseeable future and that the aqua-culture industry (fish farms), where Norwegians are world leaders, will continue to grow.
In 2009, Norway’s total fish and seafood export was $7.1-billion, $3.8-billion was in aquaculture. By 2011, Norwegian aquaculture exports grew to $4.9-billion. In Canada, total fish and seafood exports in 2011 were $3.6-billion, with approximately one-third from aquaculture.
Norway’s forests are another important natural resource, and its pulp-and-paper industry has many parallels to Canada’s. Both nations are heavy exporters of newsprint. With much less demand since the wide adoption of the Internet and competition from modern mills from emerging markets, both nations have suffered through down-sizing and mill closures over the past decade. Both have been looking for ways to adapt.
The Borregaard pulp and paper mill in Sarpsborg has become one of the world’s most advanced bio-refineries. From wood, it creates four main products: specialty cellulose, lignosuphonates, vanillin and ethanol, along with 200 GWh a year of bioenergy.
“You have a diversified portfolio of products,” explains Karin Oyaas, research manager at the Paper and Fibre Research Institute in Trondheim. “The Borregaard mill uses all parts of the wood and they have a variety of products, so if one of the products is priced low for a few years, then maybe some of the other products are priced high.”
She feels this is a key change in direction for the industry in Norway. She doesn’t want to see the indus-try putting all of its eggs in one basket, as it did with newsprint.
unit fourglobal system choices
U4L2A3 Post-oil readiness country comparison Article 3
Dr. Oyaas also thinks that rebranding the industry is key to its survival and success in Norway. The forestry industry doesn’t get the same kind of attention as the oil industry, nor does it have the high-tech image. But it is just as high-tech, and it has the bonus of being a renewable resource.
“You can make anything from the forest. You can make the same products that you can make from oil,” explains Dr. Oyaas.
unit fourglobal system choices
U4L2A3 Post-oil readiness country comparison Article 4
Oil Cash Waning, Venezuelan Shelves Lie Bare WILLIAM NEUMAN, JAN. 29, 2015
CARACAS, Venezuela — Mary Noriega heard there would be chicken.
She hated being herded “like cattle,” she said, standing for hours in a line of more than 1,500 people hoping to buy food, as soldiers with side arms checked identification cards to make sure no one tried to buy basic items more than once or twice a week.
But Ms. Noriega, a laboratory assistant with three children, said she had no choice, ticking off the inventory in her depleted refrigerator: coffee and corn flour. Things had gotten so bad, she said, that she had begun bartering with neighbors to put food on the table.
“We always knew that this year would start badly, but I think this is super bad,” Ms. Noriega said.
Venezuelans have put up with shortages and long lines for years. But as the price of oil, the coun-try’s main export, has plunged, the situation has grown so dire that the government has sent troops to patrol huge lines snaking for blocks. Some states have barred people from waiting outside stores overnight, and government officials are posted near entrances, ready to arrest shoppers who cheat the rationing system.
Because Venezuela is so dependent on oil sales to buy imports of food, medicine and many other basics, the drop in oil prices means that there is even less hard currency to buy what the country needs.
Even before oil prices tumbled, Venezuelawas in the throes of a deep recession, with one of the world’s highest inflation rates and chronic shortages of basic items.
One of the nation’s most prestigious public hospitals shut down its heart surgery unit for weeks be-cause of shortages of medical supplies. Some drugs have been out of stock for months, and at least one clinic performed heart operations only by smuggling in a vital drug from the United States. Diapers are so coveted that some shoppers carry the birth certificates of their children in case stores demand them.
unit fourglobal system choices
U4L2A3 Post-oil readiness country comparison Article 4
Now economists predict that shortages will get even more acute and inflation, already 64 percent, will climb further. The price of Venezuelan oil dropped this month to $38 a barrel, down from $96 in September.
“Things are going to be even worse because oil keeps Venezuela going,” said Luis Castro, 42, a nurse, standing in line with hundreds of others at a grocery store. He had arrived with his wife and 6-year-old son at 6 a.m., but by 11:30 a.m., they had still not entered. “We’re getting used to standing on line,” he said, “and when you get used to something, they give you only crumbs.”
The shortages and inflation present another round of political challenges for President Nicolás Mad-uro, who has vowed to continue the Socialist-inspired revolution begun by his predecessor, the charismatic leftist Hugo Chávez.
“I’ve always been a Chavista,” said Ms. Noriega, using a term for a loyal Chávez supporter. But “the other day, I found a Chávez T-shirt I’d kept, and I threw it on the ground and stamped on it, and then I used it to clean the floor. I was so angry. I don’t know if this is his fault or not, but he died and left us here, and things have been going from bad to worse.”
Thousands waited last week to buy basic goods at subsidized prices in Caracas. Those who cheat on rationing risk arrest. (Meridith Kohut for The New York Times)
Venezuela has the world’s largest estimated petroleum reserves, and when oil prices were high, oil exports made up more than 95 percent of its hard currency income. Mr. Chávez used the oil riches to fund social spending, like increased pensions and subsidized grocery stores. Now that income has been slashed.
“If things are so bad now, I really cannot imagine how they will be in February or March” when some of the lowest oil prices “materialize in terms of cash flow,” said Francisco J. Monaldi, a profes-sor of energy policy at the Harvard Kennedy School of Government.
unit fourglobal system choices
U4L2A3 Post-oil readiness country comparison Article 4
Mr. Maduro spent 14 straight days in January traveling the globe in an effort to court investment and persuade other oil-producing nations to cut production and push the price back up.
“We have serious economic difficulties regarding the country’s revenue,” Mr. Maduro said to the legislature during his annual address, which had to be pushed back because of the trip. “But God will always be with us. God will provide. And we will get, and we have gotten, the resources to maintain the country’s rhythm.”
After months of toying with the politically taboo idea of raising the price of gasoline sold at pumps here, the cheapest in the world, he said that the time had finally come to do so.
And he reiterated his position that the country’s economic ills are the fault of an economic war being waged against his government by right-wing enemies.
Many economists argue that government policies are a big part of the problem, including a highly overvalued currency, price controls that dissuade manufacturers and farmers, and government re-strictions on access to dollars that have led to a steep drop in imports.
Some investors fear Venezuela will default on billions of dollars in bonds, but Mr. Maduro has said the country will pay its debts.
Typically, in an election year like this one, when voters will choose a new legislature, the govern-ment showers supporters with goods, like refrigerators and washing machines, or other benefits, like free housing. But now there may not be enough foreign currency to import appliances and con-struction materials.
In interviews, shoppers did not say they were going hungry. Rather, many said the economic crisis meant eating canned sardines instead of chicken, or boiled food instead of fried because vegetable oil is so hard to get. Many said they ate meat less frequently because it is out of stock or too expen-sive. Fresh fish can be harder to find, in part, fishermen said, because they find it more profitable to use their boats to sell subsidized Venezuelan diesel on the black market in a high-seas rendezvous instead of hauling in a catch.
But social media in Venezuela is full of urgent pleas from patients trying to find prescription medi-cine.
Dr. Gastón Silva, the head of cardiovascular surgery at the University Hospital of Caracas, said that because of medical shortages, only about 100 heart operations were performed there last year, down from 300 or more in previous years.
Some patients who had been hospitalized awaiting surgery for a month or more were sent home in November because there were not enough supplies, and the operating rooms remained shut for more than eight weeks, Dr. Silva said, despite a list of hundreds of people awaiting heart operations.
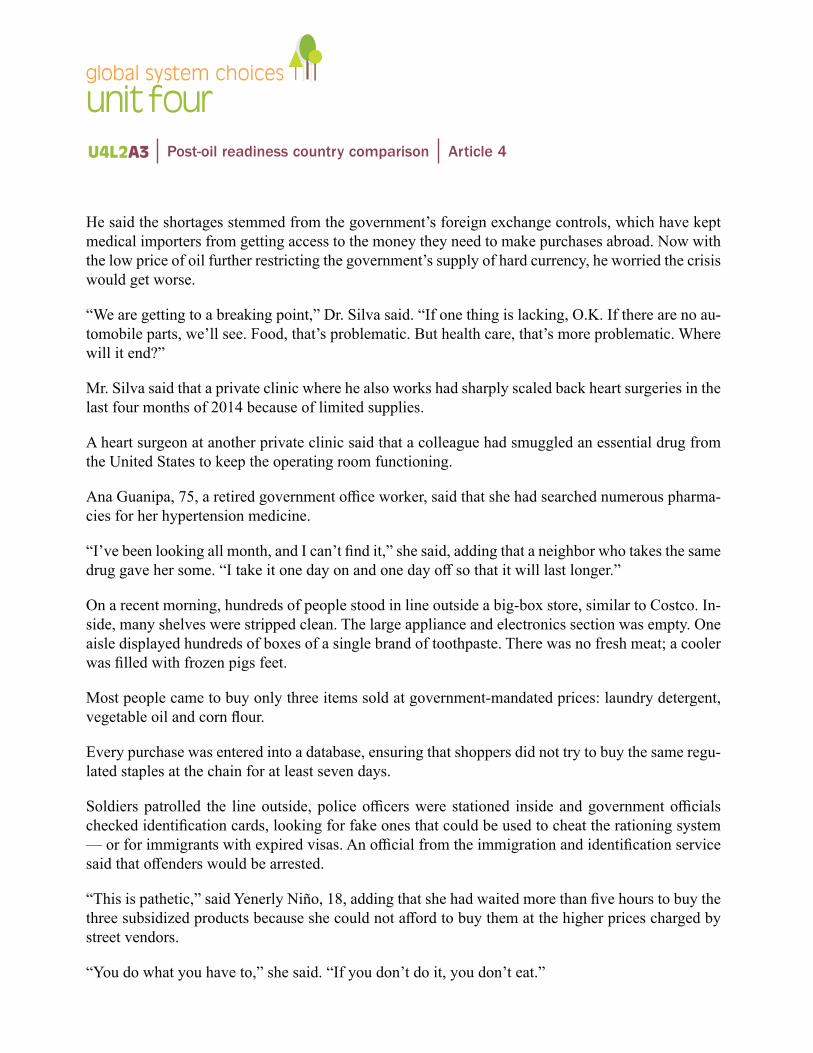
unit fourglobal system choices
U4L2A3 Post-oil readiness country comparison Article 4
He said the shortages stemmed from the government’s foreign exchange controls, which have kept medical importers from getting access to the money they need to make purchases abroad. Now with the low price of oil further restricting the government’s supply of hard currency, he worried the crisis would get worse.
“We are getting to a breaking point,” Dr. Silva said. “If one thing is lacking, O.K. If there are no au-tomobile parts, we’ll see. Food, that’s problematic. But health care, that’s more problematic. Where will it end?”
Mr. Silva said that a private clinic where he also works had sharply scaled back heart surgeries in the last four months of 2014 because of limited supplies.
A heart surgeon at another private clinic said that a colleague had smuggled an essential drug from the United States to keep the operating room functioning.
Ana Guanipa, 75, a retired government office worker, said that she had searched numerous pharma-cies for her hypertension medicine.
“I’ve been looking all month, and I can’t find it,” she said, adding that a neighbor who takes the same drug gave her some. “I take it one day on and one day off so that it will last longer.”
On a recent morning, hundreds of people stood in line outside a big-box store, similar to Costco. In-side, many shelves were stripped clean. The large appliance and electronics section was empty. One aisle displayed hundreds of boxes of a single brand of toothpaste. There was no fresh meat; a cooler was filled with frozen pigs feet.
Most people came to buy only three items sold at government-mandated prices: laundry detergent, vegetable oil and corn flour.
Every purchase was entered into a database, ensuring that shoppers did not try to buy the same regu-lated staples at the chain for at least seven days.
Soldiers patrolled the line outside, police officers were stationed inside and government officials checked identification cards, looking for fake ones that could be used to cheat the rationing system — or for immigrants with expired visas. An official from the immigration and identification service said that offenders would be arrested.
“This is pathetic,” said Yenerly Niño, 18, adding that she had waited more than five hours to buy the three subsidized products because she could not afford to buy them at the higher prices charged by street vendors.
“You do what you have to,” she said. “If you don’t do it, you don’t eat.”
unit fourglobal system choices
U4L2A3 Post-oil readiness country comparison Article 5
U4L2A3 Article 5
Venezuela’s government is sinking in a sea of oilMichael Moran, Mar 26, 2014
NEW YORK — Lurking behind the barricades in Venezuela, where pro- and anti-government forces have battled on and off for more than five weeks, one of the biggest contradictions on the planet helps explain what’s gone wrong with Hugo Chavez’s Bolivarian revolution.
Over the past decade, discoveries of vast quantities of oil have vaulted the South American nation from seventh to first in the world in terms of proven oil reserves — i.e., oil that can be extracted from the ground. The US Energy Information Administration now reckons Venezuela’s reserves hold 298 billion barrels (bb) worth. That’s like adding the current estimate of total US reserves (26bb) to that of Saudi Arabia (267bb).
And yet, Venezuela’s oil production and export revenue during the same period have dropped pre-cipitously.
The country that President Nicolas Maduro, Chavez’s successor, inherited has seen oil production sink nearly 25 percent since 2000, most of it due to a lack of investment in new exploration, a mas-sive brain drain and poor maintenance at older fields.
This is particularly apparent in the drop in barrels destined for the United States, whose Gulf Coast refineries are uniquely geared to deal with the heavy, sour crude Venezuela produces.
Venezuelan oil exports to the US peaked in the mid-1990s at over 1.3 million barrels per day (bpd). By 2013 it had fallen below 775,000 bpd.
unit fourglobal system choices
U4L2A3 Post-oil readiness country comparison Article 5
Oil troubles have helped drain Venezuela’s hard currency reserves and exacerbate shortages of basic goods, leading to price gouging and fueling public anger.
The US and Venezuela differ ideologically, and the latter’s leaders regularly accuse the former of compounding their country’s woes. But Venezuela’s economic problems are mostly self-inflicted.
Venezuela uses its oil as a political reward to likeminded governments in the region — hardly a way to close fiscal gaps. And the state takeover of the oil industry has proven a disaster, with production plummeting and investment lagging.
Meanwhile, the US is using less oil overall, and more of what it does use comes from beneath US soil.
Chavez saw some of this coming. Before he died of cancer one year ago, he oversaw efforts to di-versify away from the US market and toward China, a somewhat less prickly customer ideologically and one with an insatiable thirst. But that pivot has been excruciatingly slow and clumsily handled. Because of the poor quality of Venezuela’s oil, it’s not merely a matter of oil tankers plotting a new course. New refineries and ports are needed.
While Venezuela’s oil exports to China have risen (to about 60,000 bpd in 2013) and several large joint projects with Chinese state oil firms are underway in Venezuela, that by no means covers the shortfall of lost American business.
What’s more, Venezuela is providing over 200,000 bpd more to Beijing at no charge as a down pay-ment on more than $40 billion in Chinese loans extended during the Chavez years, according to the EIA.
Add another 400,000 bpd transferred at below-market prices to regional Bolivarian brethren — in-cluding Cuba, Nicaragua and a host of small Caribbean islands — and it’s no wonder the Venezuelan currency, the bolivar, fell 73 percent against the dollar in 2013.
unit fourglobal system choices
U4L2A3 Post-oil readiness country comparison Article 5
Both Chavez and Maduro have taken steps domestically that make the problem even worse. Besides driving away foreign investment and shedding hard-to-replace energy expertise with expropriations of foreign assets, their governments have heavily subsidized domestic fuel prices, resulting in a jump in the amount of the country’s production that’s consumed internally from 36 percent to 47 percent.
Think about it: A government in the tropics floating on the world’s largest sea of oil is consuming nearly half of it domestically and squandering much of the revenue that could be derived from ex-porting the rest.
This was not preordained, nor is it all a case of inefficient state monopoly. Norway’s Statoil, state-owned for decades, is one of the best-run energy firms in the world.
Nationalized in the 1970s, Venezuela’s state-owned oil monopoly, Petroleos de Venezuela SA (PD-VSA), managed a highly successful and lucrative sector through the 1990s. But when state workers went on strike in 2002 over plans to politicize the company further, Chavez fired some 180,000 ex-perienced oil workers, leading to a production collapse.
America’s Iraq invasion came to his rescue in 2003, spawning historic high-energy prices that helped plug the Venezuelan state’s coffers. Emboldened, Chavez spread subsidies around to quell dissent. Then in 2006, he ordered a state takeover of exploration activities from foreign oil companies, driv-ing out additional expertise, and announced a wave of below-market energy supply deals with like-minded regional leaders that continue to this day. (Cuba, for instance, sends state-trained doctors to Venezuela to do community service in exchange for its steep discount).
The same malaise afflicts its natural gas. Venezuela ranks second in the hemisphere behind the US in natural gas reserves, but the South American country uses it all used to support its rickety PDVSA monopoly.
Because Venezuela’s oil fields are older and in decline, they require a process known as enhanced oil recovery whereby natural gas is pumped into the oil wells do drive crude out. All of Venezuela’s gas production is used this way — an enormous waste of a critical resource.
unit fourglobal system choices
U4L2A3 Post-oil readiness country comparison Article 5
Indeed, for the past several years, the country has imported natural gas from Colombia to make up for a shortfall.
With world oil prices moderating, US shale gas and tight oil increasing and Venezuela’s efforts to pivot exports toward China stalled, Venezuela’s oil monopoly is showing scant evidence it can con-vert the massive new reserves into revenue.
This is seriously denting sales of Venezuelan government bonds — which, besides more loans from China, are the only way for the government to support its deficit spending.
The standoff in the streets of Valencia, San Cristobal and Merida continue, and few analysts see Maduro facing a Ukrainian exit any time soon.
But the death of Chavez saddled his successor without a compass, with a broken patronage machine, a rickety oil industry and an exhausted national treasury.
Venezuela’s Bolivarians are literally running short on fuel.
unit fourglobal system choices
U4L2A3 Post-oil readiness country comparison Article 6
Hugo Chavez leaves Venezuela in economic muddleRobert Plummer, March 2013
One of the most damning verdicts on the late Hugo Chavez’s leadership of Venezuela came from a doctor who made a name for himself by claiming to have inside knowledge of the cancer that eventually killed the president.
Dr Jose Rafael Marquina, a Venezuelan based in Miami, repeatedly predicted that Mr Chavez’s ill-ness would prove terminal, providing detailed accounts of what he said was the president’s course of treatment.
His statements were given extensive coverage by the opposition media in Venezuela, eager to fill the vacuum left by the lack of official information about Mr Chavez’s condition.
But whatever the truth of Dr Marquina’s medical diagnosis, his broader criticism of the president’s record hits home. As he said during an interview with the Tal Cual newspaper in December 2012: “Chavez dealt with his illness the way he dealt with the country - in an improvised fashion.”
That habit of impromptu policymaking was integral to Mr Chavez’s style, right from the start of his 14 years in power.
unit fourglobal system choices
U4L2A3 Post-oil readiness country comparison Article 6
Time and again, the president would make major decisions on an ad hoc basis, often during the course of his rambling and unscripted weekly TV broadcast to the nation, known as Alo Presidente.
He was particularly prone to quick-fix solutions in economic policy, resorting to regular currency devaluations, expropriations of private firms and inflation-busting public-sector pay rises rather than tackling the economy’s underlying structural problems.
This fire-fighting approach continued even as Mr Chavez lingered on his Cuban sickbed, with Vice-President Nicolas Maduro implementing a 32% devaluation of the bolivar in February.
As a result, Mr Chavez bequeaths a nation beset by crumbling infrastructure, unsustainable public spending and underperforming industry.
Thanks to his social programmes, poorer Venezuelans have certainly benefited from the country’s oil wealth more than they did under what he called the rotten elites that used to be in charge.
But there are strong suspicions that much money has been wasted - not just through corruption, but also sheer incompetence.
Are you better off than in 1998?
During Hugo Chavez’s time in office, from 1999 to the present day, income inequality in Venezuela gradually declined, as it did in most of the region.
The country now boasts the fairest income distribution in Latin America, as measured by the Gini coef-ficient index.
Brazil’s economy has grown faster than Venezuela’s
unit fourglobal system choices
U4L2A3 Post-oil readiness country comparison Article 6
In 2011, Venezuela’s Gini coefficient fell to 0.39. By way of comparison, Brazil’s was 0.52, in itself a historic low.
So every Venezuelan now has a more equal slice of the cake. The trouble is, that cake has not been getting much bigger.
“Venezuela is the fifth largest economy in Latin America, but during the last decade, it’s been the worst performer in GDP per capita growth,” says Arturo Franco of the Center for International De-velopment at Harvard University.
As Mr Franco says, it depends on how you measure Venezuela’s progress.
If you compare life under Mr Chavez with the previous 20 years, under a now discredited two-party system widely blamed for rampant corruption, the Chavez era is preferable.
But if you look at the superior economic performance of neighbouring Brazil and Colombia during the same period, it suddenly doesn’t look so rosy.
And given that the price of a barrel of oil is now roughly 10 times what it was when Mr Chavez was first elected, his opponents say that he could and should have done more.
Venezuela’s economy: Oil takes the strain
Mr Chavez’s failure to diversify Venezuela’s economy means that oil is still its mainstay. In fact, it accounts for more than 90% of the country’s foreign currency inflows.
About 50% of government revenues come from the petroleum industry, mostly from state company PDVSA. Venezuela’s oil sector
Mr Chavez’s government took firm control of PDVSA in 2003, when it fired 40% of the workforce in the aftermath of a general strike aimed at forcing him from power.
unit fourglobal system choices
U4L2A3 Post-oil readiness country comparison Article 6
But critics have accused the firm of neglecting maintenance while it funnelled oil revenue into gov-ernment social programmes, especially after an explosion in August 2012 at the Amuay refinery, the country’s largest, in which 42 people were killed.
Instead of investing in PDVSA to increase production, Mr Chavez treated it as a cash cow, milking its funds to finance his social spending on housing, healthcare and transport.
Finding out just how that money has been dispensed is not easy. But the government has become steadily more involved in every sector of the economy, to the detriment of the private sector.
In September 2012, Reuters news agency published a special report into a state corporation, Fon-den, that now accounts for one-third of all investment in Venezuela.
It found a string of abandoned or half-built facilities, including a paper factory, an aluminium mill and a fleet of unused buses - all of which apparently received money from Fonden.
Fonden has absorbed $100bn of Venezuela’s oil revenues since it was founded in 2005.
At the end of January, the government cut PDVSA’s contribution to Fonden by 19%, a move which seems to presage a round of public spending cuts. But until the post-Chavez political landscape is clearly established, the president’s successors can hardly afford to alienate the people with austerity programmes.
Public spending: Can the boom last?
In the run-up to his presidential election victory last October, Mr Chavez made low-income and social housing a priority, launching a plan to build three million homes by 2018.
-building in the run-up to the election
The housing drive fuelled big increases in public spending - and big expectations among those yet to be housed under the programme.
unit fourglobal system choices
U4L2A3 Post-oil readiness country comparison Article 6
According to Bank of America-Merrill Lynch, government expenditure rose 30% in real terms as a result over the 12 months leading up to the election.
But all that largesse took its toll on the public finances. Capital Economics, a research company, esti-mates that Venezuela’s fiscal deficit widened to 9% of GDP in 2012, while Morgan Stanley reckons it could have reached 12% by now.
According to the World Bank, the Venezuelan economy is estimated to have grown by more than 5% during 2012. However, it forecasts a slowdown in 2013, with just 1.8% growth expected, while many analysts are expecting the country to fall into recession this year.
The latest maxi-devaluation of the Venezuelan currency will help the government’s financial position. Since oil is priced in dollars, a weaker bolivar increases the local value of oil revenues, giving the gov-ernment more cash.
In theory, it should also help Venezuela to export more goods from other sectors of the economy. But observers reckon the country’s manufacturing sector is too small to benefit much - another consequence of Venezuela’s concentration on oil to the exclusion of all else.
In the words of Michael Henderson at Capital Economics: “The current malaise is the product of years of capital flight and under-investment, which has hollowed out the country’s productive base.”
Borrowing against oil
So how did the government finance its pre-election spending spree? Foreign private investors have certainly stayed away since Mr Chavez’s nationalisation drive began.
High inflation, still nudging 20% a year, doesn’t help either.
Will the Venezuelan capital see brighter times ahead?
unit fourglobal system choices
U4L2A3 Post-oil readiness country comparison Article 6
As survey organisation Consensus Economics says: “Soaring inflation and government spending - cou-pled with currency and capital controls - have created a widening fiscal deficit.
“The authorities are increasingly reliant on external debt to finance this.”
For “external debt”, read loans from China. According to Bloomberg news agency, the state-run China Development Bank has lent Venezuela $42.5bn over a five-year period.
Oil Minister Rafael Ramirez said in September 2012 that of the 640,000 barrels of oil a day that Venezu-ela exports to China, 200,000 went towards servicing the country’s debt to Beijing.
Unless PDVSA’s underperformance can be remedied, those debts will remain and will probably grow as the country’s gap between spending and income widens.
The impact for the region
It certainly doesn’t seem hard to uncover evidence of waste in government expenditure during the Chavez years.
But the overspending doesn’t stop at home. In an effort to spread the influence of his Bolivarian revolu-tion, Mr Chavez allowed Cuba and other countries in the region to benefit from cheap deals and soft loans under the Alba and Petrocaribe programmes.
The next administration will have to decide whether or not to continue funding that extensive network of petro-diplomacy.
In the meantime, most countries in the Caribbean, already suffering from a decline in tourism because of the global economic downturn, will be hoping that Venezuela’s economic lifeline is not about to disap-pear.
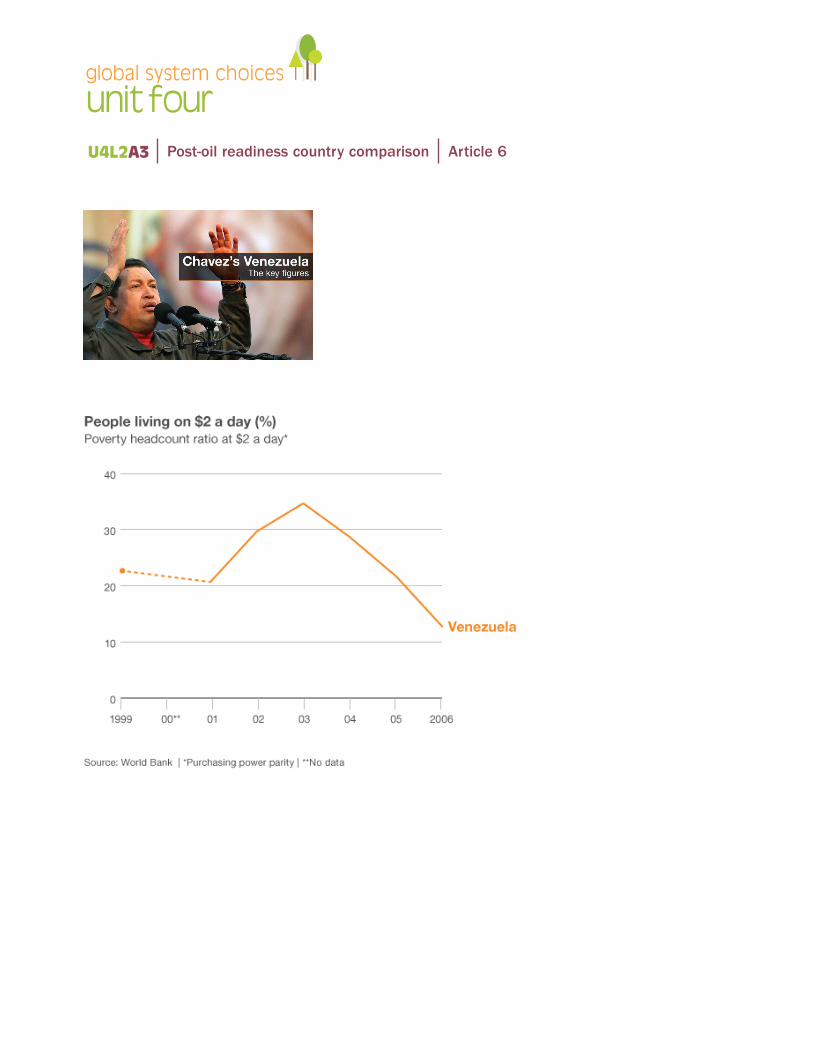
unit fourglobal system choices
U4L2A3 Post-oil readiness country comparison Article 6
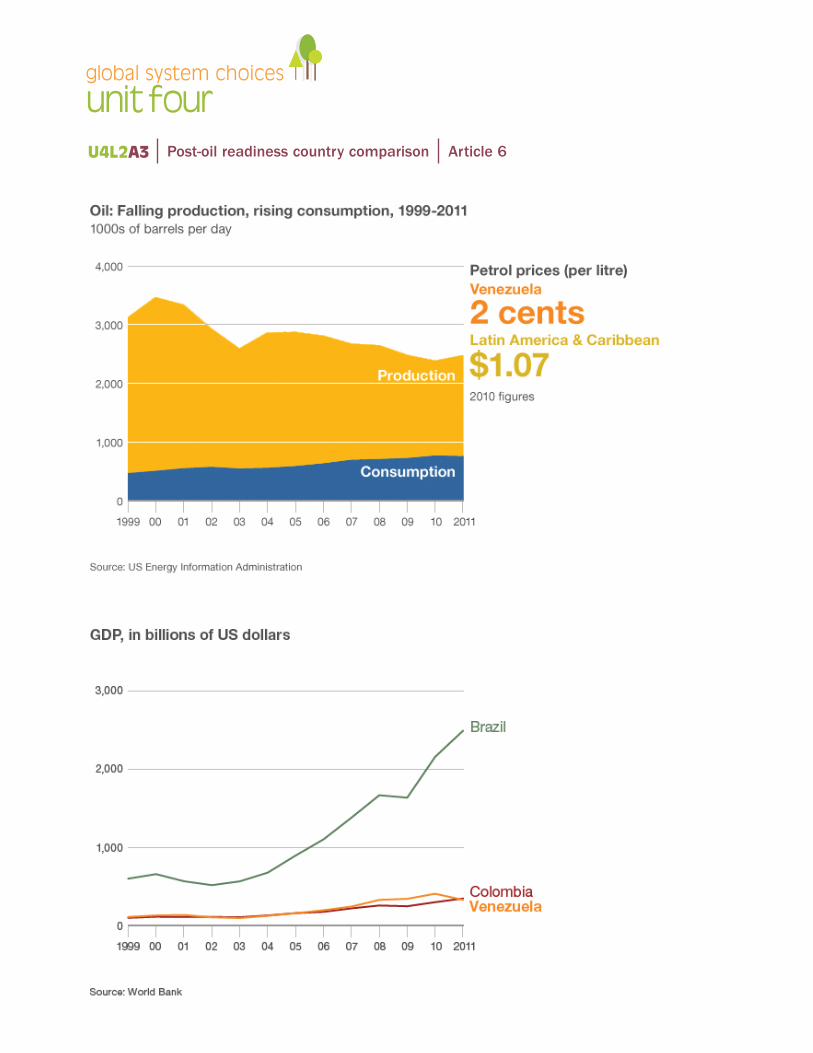
unit fourglobal system choices
U4L2A3 Post-oil readiness country comparison Article 6
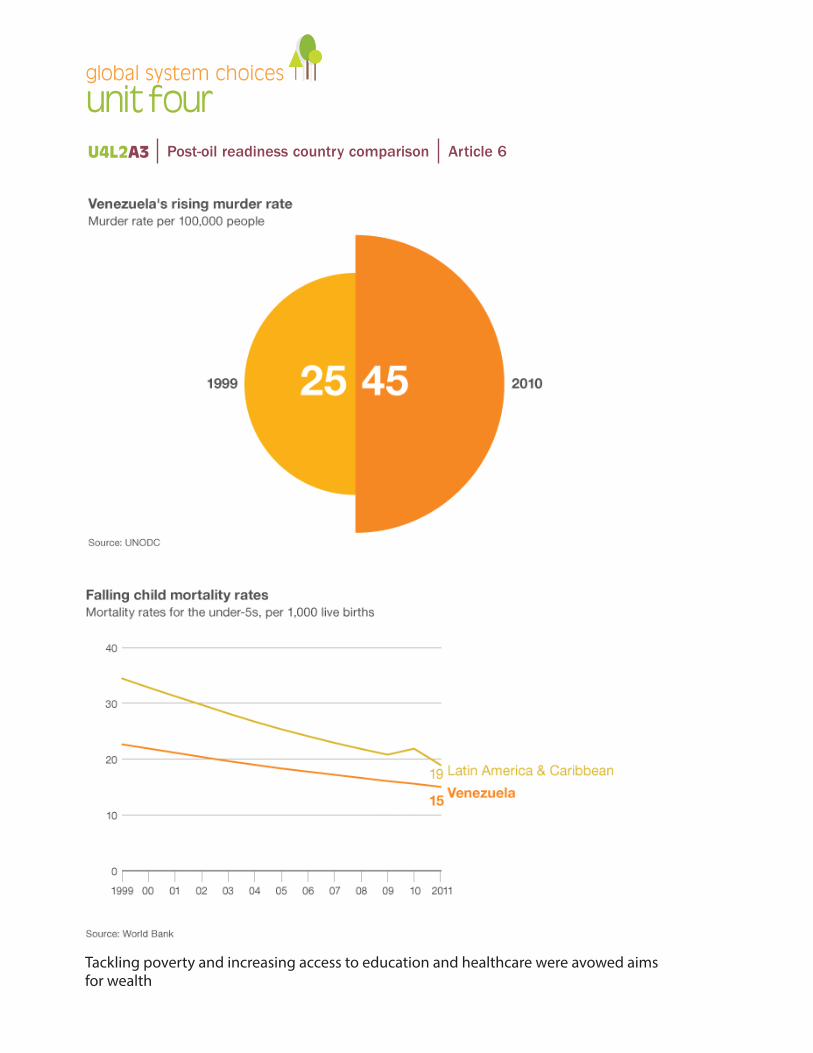
unit fourglobal system choices
U4L2A3 Post-oil readiness country comparison Article 6
Tackling poverty and increasing access to education and healthcare were avowed aims for wealth
unit fourglobal system choices
Alberta should learn from Norway on managing oilCanada and Alberta, its main petro-province, have much to learn from another major petroleum
By: Bruce Campbell Published on Wed Jan 16 2013
Momentum is building across Canada on the need to develop a sustainable national energy strategy.
On this front, Canada and Alberta, its main petro-province, have much to learn from another major petroleum-producing and exporting country, Norway.
Canada and Norway are advanced industrialized countries with highly developed political, bureau-cratic and economic institutions.
Norway and Alberta have similar population size, similar production profiles, and similar levels of dependence on petroleum exports and government petro-revenues.
During my recent trip to Norway, I found they have taken very different paths, and with very dif-ferent outcomes.
In Norway, there was from the outset, a societal consensus that the government should play the dominant role in the petroleum industry, both as owner and regulator.
The Norwegian government owns 80 per cent of petroleum production, and retains roughly 85 per cent of the net petroleum revenues mainly through a 78-per-cent company tax and through direct access mechanisms.
In Alberta and Canada, ownership and control have been controversial issues. At present, virtually the entire industry is owned by foreign and domestic private interests, which have taken the lion’s share of the petroleum wealth.
U4L2A3 Post-oil readiness country comparison Article 7
unit fourglobal system choices
According to one estimate, the Alberta government has averaged just 9 per cent of the economic rent from the oilsands over the last 15 years, and the federal government now takes (after tax breaks) a paltry 7 per cent of oil company revenues through the general corporate income tax.
The Norwegian government has been very effective in distributing the benefits of oil wealth both regionally and throughout its population, thanks to a generous social welfare system, an equitable labour relations system and a progressive tax system. It has maintained one of the lowest levels of income inequality in the world.
Inequitable petrodollar recycling mechanisms explain, in large part, why inequality is substantially higher in Alberta than the Canadian average (which in turn is among the highest in the OECD), and why it has grown dramatically over the last decade.
Alberta’s richest 1 per cent have a much larger share of the provincial income pie than the one percenters’ share of income nationwide. And Canada’s super-rich are increasingly concentrated in Alberta.
Norway, which had very high taxes even before the discovery of oil, chose not to reduce them. Norway has maintained a steady 42 per cent of GDP tax level, among the highest in the industrial world.
Canada, on the other hand, has lowered overall taxes levels since the late 1990s from 36 per cent to 31 per cent of GDP, placing it in the bottom third of OECD countries.
Alberta has lowered its non-petroleum taxes to the point where they are by far the lowest in Canada.
Interprovincial disparities are growing in the wake of the petro-boom. Alberta’s revenue raising, or fiscal capacity, will likely exceed 180 per cent or more of the national average over the next eight years even as federal provincial redistribution measures have been weakened.
Norway’s Petroleum Savings Fund has amassed more than $664 billion in assets, all invested abroad, with only the return used for domestic spending. It not only ensures the future of social welfare benefits, but also helps to offset upward pressure on its currency and mitigate potential Dutch Disease effects.
Alberta’s Heritage Savings Fund now contains $16 billion, just 2 per cent of Norway’s fund, and a minuscule share of the petroleum revenue that has flowed into Alberta over the past 36 years.
U4L2A3 Post-oil readiness country comparison Article 7
unit fourglobal system choices
U4L2A3 Post-oil readiness country comparison Article 7
Canada has not been able to maintain a stable dollar during the petro-boom. The 60 per cent rise against the U.S. dollar has wreaked havoc with manufacturing and other noncommodity exports, resulting in a huge loss of output and jobs.
As two of the world’s largest petroleum producers and exporters, Norway and Canada-Alberta have a major responsibility to reduce greenhouse gas emissions that are threatening the planet.
Norway is a leader in carbon emissions reduction, both at home and internationally. Under the Co-penhagen Accord, Norway’s carbon reduction targets are the most ambitious in the industrial world.
In contrast, Canada’s federal government and its counterpart in Alberta are climate skeptics. Their actions show they do not view carbon emissions reduction as a high priority, especially when com-pared to development of its oilsands. Canada has broken its Kyoto commitments and will likely not even meet its much weaker Copenhagen commitments. It refuses to put a price on carbon and its regulations are weak.
Notwithstanding the differences between the two countries, lessons can be drawn from the Norwe-gian experience.
First and foremost, the federal government needs to take the lead, collaborating with provincial, territorial and First Nations governments, in building public consensus around a national energy strategy.
One that addresses concerns about economic development, energy security, inequality, interprovin-cial disparities, and climate change; and outlines a plan for the transition to a low carbon economy.
Failure to do so will only heighten existing tensions within the Canadian federation.
unit fourglobal system choices
U4L2A3 Post-oil readiness country comparison Article 8
Peak Oil? More like Peak CanadaDoug Saunders, November, 2012
Good morning, students. The results from last week’s history test have been transconducted into your NeuroPads. Now, if you’ll all please disengage your BrainFeeds and start listening, I’ll be talking today about one of the most misunderstood episodes in Canadian history.
This occurred over the first decade and a half of the 21st century. It was Canada’s global moment of arrogant pride – the Great Hubris, as it’s remembered today – our country’s moment of squandered opportunity. In those heady years, Canadian leaders and citizens alike became convinced that their country was an energy superpower possessed of powers unique in the world.
Canada, for a while, went mad. We believed we were above the laws of economics and politics and energy – a country that had magically resisted the First New Depression of 2008, and had an export so desirable that we could ignore ecological warnings and well-established international partnerships and blacken the good name Canada had earned the previous century. Our leaders bossed around the world, believing everyone wanted their controversial oil and would ignore its many serious problems if they simply branded it “ethical.”
Ordinary Canadians embraced the hubris, spending far beyond their means, believing that our oil-boosted economy was permanent and invincible. In November of 2012, the peak of the Great Hubris, Canadians reported record levels of personal non-mortgage debt, piling on expensive cars and credit card bills – everyone believed theirs was a rich petro-state and it would last forever.
But Canadians were ignoring the reality outside. “The walls were closing in on us, and we were falling back down to earth,” as Prime Minister Bieber used to say. Excessive pride was leading to a harsh fall.
unit fourglobal system choices
U4L2A3 Post-oil readiness country comparison Article 8
Those Canadians should have seen what was coming. That fateful November, just as their personal debts were red-lining, most Canadians failed to notice the annual World Energy Outlook, published by the Paris-based International Energy Agency.
It predicted what we all know now – that the U.S. would become the world’s largest petroleum pro-ducer by 2017 and a major world exporter not long afterward, exceeding Saudi Arabia, Libya and Iran and dwarfing Alberta, and that, by 2015, it would overtake Russia as the world’s largest producer of natural gas. “An energy renaissance in the United States is redrawing the global energy map, with implications for energy markets and trade,” the report concluded.
Indeed, that very month, The Washington Post accurately predicted that the U.S. natural gas boom and the resulting low energy prices and spinoff industries were fuelling an “American industrial re-vival.” It would be aided by a reversal of fortunes in the Great Chinese Stall, triggering the Second American Century.
But Canadian leaders were still working on the assumption that the world would want our Athabasca crude. Little did we know that Canada, along with much of the world, would soon be buying North Dakota’s far cleaner and more popular Democracy Gas.
There were victims galore. The politicians in Ottawa and Edmonton squandered a generation’s worth of political capital trying to force pipelines on national and provincial governments. A few went ahead, but, by then, the energy picture had shifted so much that it hardly seemed worth it. The Canada of the 2010s was largely remembered for having briefly underwritten Chinese authoritarianism with petroleum deals that didn’t do it any good. Our oil proved to be rather unethical.
Of course, the ecological consequences of this were horrendous. That’s why we don’t talk about that shameful era, or the politicians who turned “Canadian” into a swear word in many countries. Who’d want to be reminded of that when we’re getting our January suntans on Churchill Beach?
But the biggest victims were Canadians themselves, who never fully realized that their energy-dom-inance moment would be so fleeting. They spent exorbitantly but invested little. Alberta got some decent universities and hospitals, but there was never any major national program to become lead-ers in any sector, educational or industrial. Economists in those days told us that a dollar earned by
unit fourglobal system choices
U4L2A3 Post-oil readiness country comparison Article 8
hauling raw materials out of the ground was as good as a dollar earned by making things. But, as we learned the hard way, there was more to it than macroeconomics.
Those were days when some people talked about Peak Oil. It never worked out that way, sadly. It was perhaps better to talk about Peak Canada. Next week, we’ll learn about the trough that followed. Yes, it will be on the test, so set your RetinaReminders. Class dismissed.
unit fourglobal system choices
U4L2A3 Post-oil readiness country comparison Article 9
Why every Norwegian is a (kroner) millionaireJOHN DALY Oct. 29 2014
Canada has staked its future on the oil sands. In November, Report on Business magazine together with Thomson Reuters examine what that means both at home and abroad.
Should governments siphon off profits from massive oil and gas reserves and invest them for the long term? Or should they let the free market grip it and rip it, and keep taxes and regulations to a minimum?
Alberta and Norway provide two strikingly different answers to those questions. Norway began ex-tracting oil and gas from the North Sea in 1971, and since then it has produced the equivalent of more than 38 billion barrels of oil. Over the same period, Alberta has produced about 54 billion barrels.
In 1976, under Conservative Premier Peter Lougheed, Alberta created the Heritage Savings Trust Fund, and began depositing 30% of its oil royalties in it. Lougheed wanted to diversify the province’s economy; in the early years, he spent much of the money on things like hospitals, education and rail transport for grain. But in the 1980s and 1990s, oil prices sank and provincial revenues were squeezed. In 1987, Alberta stopped adding new royalty money to the Heritage Fund. In the mid-1990s, the prov-ince began withdrawing yearly investment income and putting it in general revenue. In 2008, Alberta turned management of the fund over to the new Alberta Investment Management Corp.
In 1972, Norway created Statoil, hoping to build a domestic oil industry. It is now the 10th-largest oil company in the world, and still 67% state-owned. In 1990, Norway created the Petroleum Fund to try to smooth out the impact of fluctuating oil prices and tax receipts. The government began deposit-ing tax and licensing revenues from private oil companies, as well as the interest and dividends from Statoil. In 1998, it gave the fund permission to invest up to 40% of its money in stock markets. In 2006, the fund was renamed the Government Pension Fund Global, and it is now the world’s largest sovereign wealth fund. As of January, 2014, every one of Norway’s 5.1 million citizens was a mil-lionaire in kroners (worth about 17 Canadian cents each).
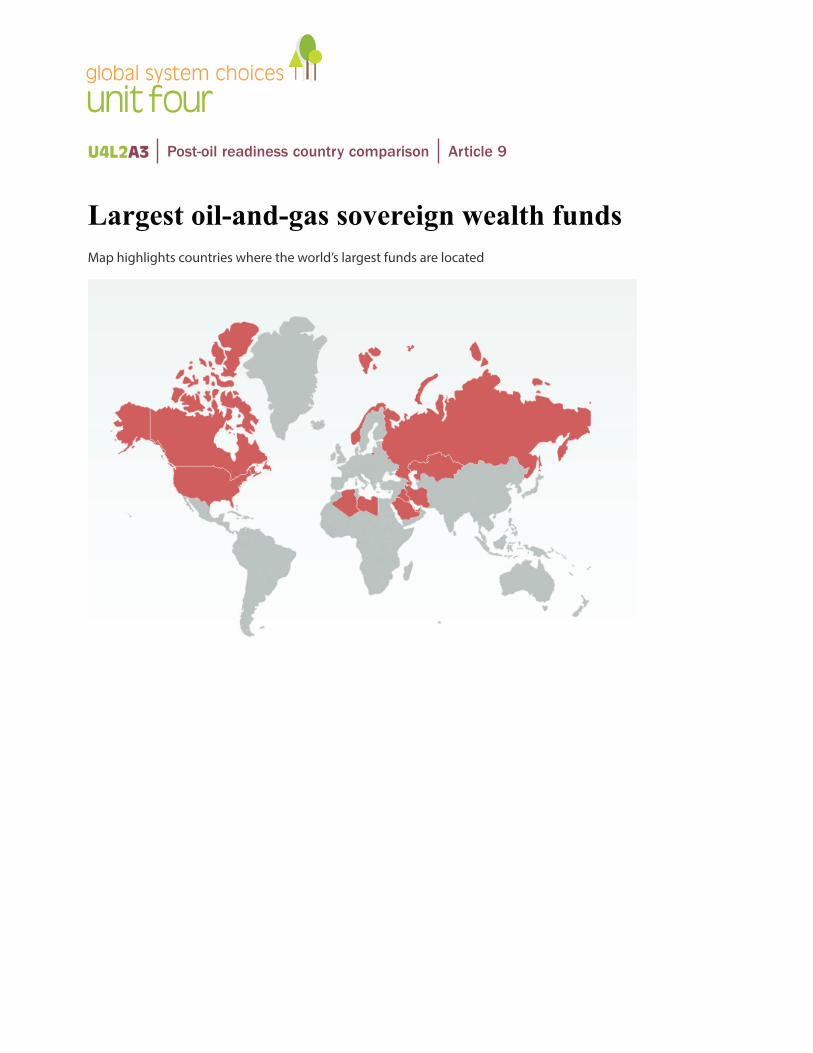
unit fourglobal system choices
U4L2A3 Post-oil readiness country comparison Article 9
Largest oil-and-gas sovereign wealth fundsMap highlights countries where the world’s largest funds are located
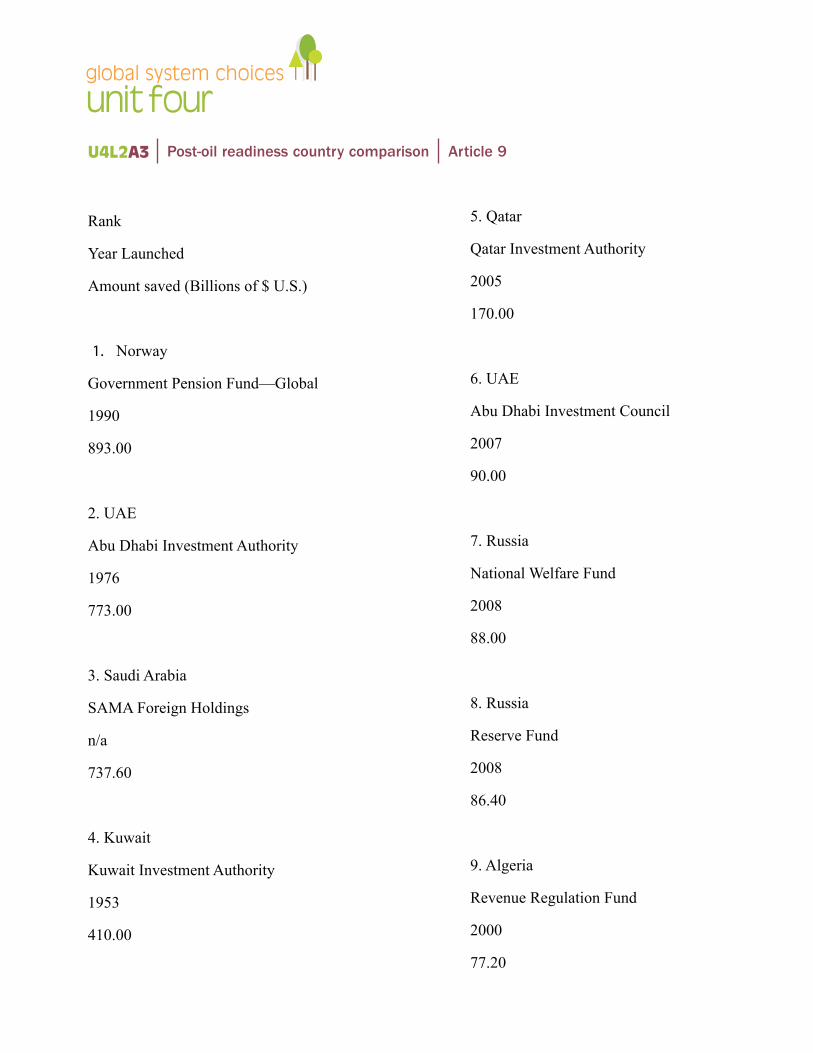
unit fourglobal system choices
U4L2A3 Post-oil readiness country comparison Article 9
Rank
Year Launched
Amount saved (Billions of $ U.S.)
1. Norway
Government Pension Fund—Global
1990
893.00
2. UAE
Abu Dhabi Investment Authority
1976
773.00
3. Saudi Arabia
SAMA Foreign Holdings
n/a
737.60
4. Kuwait
Kuwait Investment Authority
1953
410.00
5. Qatar
Qatar Investment Authority
2005
170.00
6. UAE
Abu Dhabi Investment Council
2007
90.00
7. Russia
National Welfare Fund
2008
88.00
8. Russia
Reserve Fund
2008
86.40
9. Algeria
Revenue Regulation Fund
2000
77.20
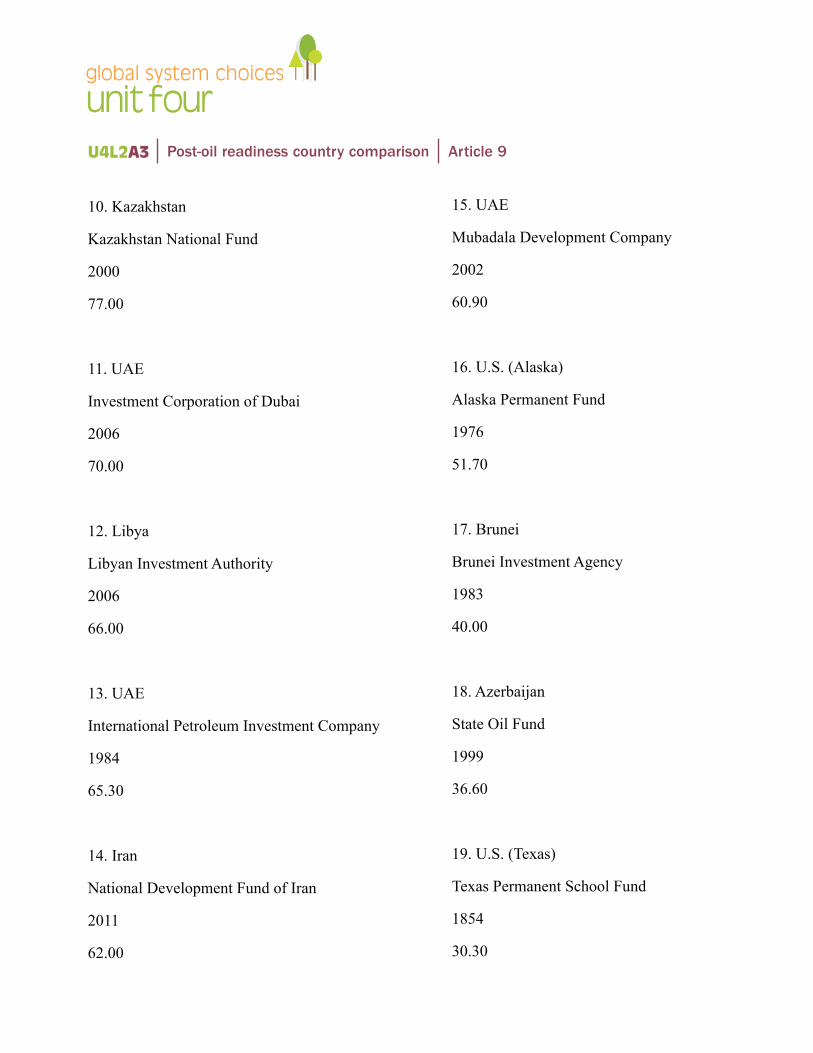
unit fourglobal system choices
U4L2A3 Post-oil readiness country comparison Article 9
10. Kazakhstan
Kazakhstan National Fund
2000
77.00
11. UAE
Investment Corporation of Dubai
2006
70.00
12. Libya
Libyan Investment Authority
2006
66.00
13. UAE
International Petroleum Investment Company
1984
65.30
14. Iran
National Development Fund of Iran
2011
62.00
15. UAE
Mubadala Development Company
2002
60.90
16. U.S. (Alaska)
Alaska Permanent Fund
1976
51.70
17. Brunei
Brunei Investment Agency
1983
40.00
18. Azerbaijan
State Oil Fund
1999
36.60
19. U.S. (Texas)
Texas Permanent School Fund
1854
30.30
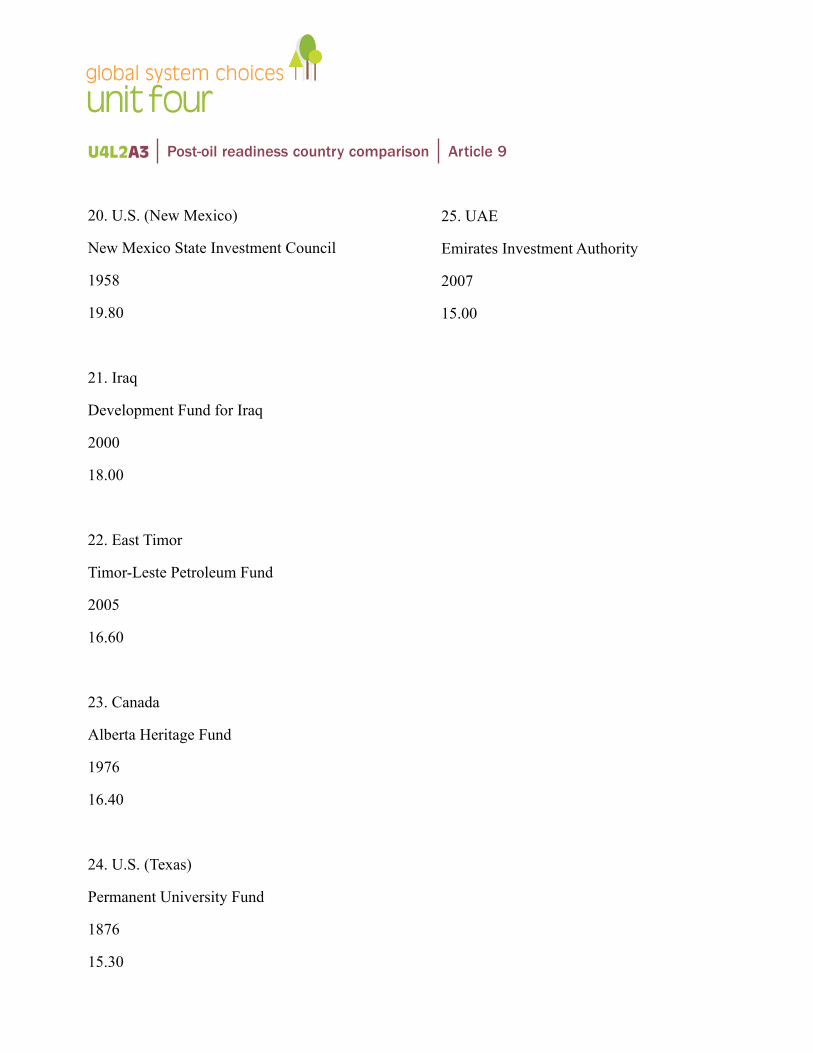
unit fourglobal system choices
U4L2A3 Post-oil readiness country comparison Article 9
20. U.S. (New Mexico)
New Mexico State Investment Council
1958
19.80
21. Iraq
Development Fund for Iraq
2000
18.00
22. East Timor
Timor-Leste Petroleum Fund
2005
16.60
23. Canada
Alberta Heritage Fund
1976
16.40
24. U.S. (Texas)
Permanent University Fund
1876
15.30
25. UAE
Emirates Investment Authority
2007
15.00
unit fourglobal system choices
U4L2A4 Energy sustainability activity
overviewIn this activity you will work in a small group (3–4 people) to assess the advantages and disadvantages of seven major energy sources (oil, natural gas, coal, nuclear, solar, wind and hydroelectric). You will use the internet to conduct research—be sure to cite all sources for credibility. Remember, information is only as reliable as its source!
learning goal • To understand that all energy sources have pros and cons which determine their degree of sustainability.
success criteria• Detailed analysis and deep thinking demonstrated in assessment of advantages and disadvantages.
Inquiry question • Which energy sources are the most sustainable?
Conventional sources
Non-renewable energy sources Advantages Disadvantages
Oil
unit fourglobal system choices
Non-renewable energy sources Advantages Disadvantages
Natural gas
Coal
Conventional sources
U4L2A4 Energy sustainability activity
unit fourglobal system choices
Alternative sources
Renewable energy sources Advantages Disadvantages
Solar
U4L2A4 Energy Sustainability Activity

unit fourglobal system choices
Alternative sources
Renewable energy sources Advantages Disadvantages
Wind
U4L2A4 Energy sustainability activity
unit fourglobal system choices
Alternative sources
Renewable energy sources Advantages Disadvantages
Hydroelectric
U4L2A4 Energy sustainability activity
unit fourglobal system choices
U4L2A5 Design a cartoon
overviewIn this activity you will design an original cartoon (by hand) on the topic of oil scarcity using the five elements of a social/political/economic cartoon: symbolism, exaggeration, labelling, analogy and irony. Your message must be clear and easy to understand. You will not be marked on artistic ability. You will also submit a brief written explanation of how your cartoon illustrates the five elements of a cartoon.
learning goal • To effectively communicate a message in the visual format of a cartoon.
success criteria• Use of the five elements of a cartoon to create an original image that clearly illustrates the topic of
oil scarcity.
Inquiry Question • How can I design a visually impactful cartoon which sends a clear message about oil scarcity?
Complete this cartoon planner before you begin sketching to ensure you have a clear idea of what you plan to draw.
What is the issue addressed by your cartoon?
Why is this issue important?
What is the message of your cartoon (what are you trying to tell people)?
unit fourglobal system choices
Symbolism Advantages
Exaggeration
Labelling
Analogy
Irony
U4L2A5 Design a cartoon
How will you demonstrate…
unit fourglobal system choices
U4L2A6 Ranking justification
overviewIn this activity you will individually justify how you ranked the post-oil readiness of Canada, Norway and Venezuela in Activity 3 (i.e. “X” country is most prepared because…). Your justification should be approx. one page typed, double-spaced.
learning goal • To understand that different countries are at different stages of readiness to transition to a post-oil world.• To effectively support your opinion on an issue with evidence.
success criteria• Completion of planner and one-page ranking justification.
Inquiry question • How can I use research to effectively support and justify my position?
Review your venn diagram from Activity 3 to recall reasons for ranking. Ensure that you support your rank designation with evidence (provide in-text citations and a full reference list to cite any sources, including articles provided by your teacher in Activity 3).
Planner (point form is fine)*Final copy to be handed in should be typed and submitted to turnitin.com.
Country that is most prepared
Actions taken…
Country in the middle
Actions taken…
Country that is least prepared
Actions taken…
unit fourglobal system choices
U4L2A7 Recommendation to Prime Minister
overviewIn this activity you will individually make a recommendation to the Prime Minister as to how funds should be allocated to ensure a sustainable energy future for Canada. Refer to the advantages and disadvantages of major energy sources recorded in your Energy Sustainability organizer from Activity 4.
learning goal • To develop and defend an informed position on the issue of energy sustainability.
success criteria• Completion of recommendation.
Inquiry question • How can I use research to persuade my audience to side with my position?
TaskCongratulations! You have been appointed Minister of Natural Resources. One of the biggest responsibilities in your portfolio is managing your country’s energy sector. You have a multibillion dollar budget and have been instructed to invest in the energy source which is most sustainable.
The Prime Minister requires you to justify your allocation of funds. You can allocate 100 per cent of the funds to one energy source, 50 per cent to two sources, or 25 per cent to four sources etc…the funds do not have to be equally divided. For each recommended energy source, you must explain why it is a sustainable option to invest in. All justifications must connect back to the concept of sustainability or they are considered irrelevant.
This assignment requires you to conduct research. Minimum of three credible sources cited in APA format (in-text and reference list), submitted to turnitin.com. Approx. 500 words.
Life after oil
Humans know oil is a non-renewable resource. We also know we have an oil addiction.
There are an extensive number of books, articles, blogs and documentaries on the topic of oil scarcity. How will we adapt to an oil free world?
It’s no longer a question of ‘if,’ but a question of ‘when.’
How will life on earth be different after oil?
Throughout this power point presentation you will analyze four cartoons.
For each cartoon you will identify these five elements:
1. Symbolism: using an object to stand for an idea.2. Captioning & Labels: used for clarity and emphasis. 3. Analogy: a comparison between two unlike things that share some characteristics.4. Irony: the difference between the way things are and the way things are expected to be. 5. Exaggeration: overstating or magnifying a problem or a physical feature or habit.
Cartoon #1
Source: Carol Simpson
Nobody knows exactly when the world will run out of oil, but a commonly accepted reference point does exist which helps us get a general sense of how much time we have left.
This reference point is known as ‘Peak Oil.’
Predictions of when we will reach global ‘Peak Oil’ vary. Some experts believe it has already happened, some believe it will happen in the near future, and some believe we can avoid it by investing in alternative energy sources.
‘Hubbert Peak Theory’ was developed by American geologist M. King Hubbert (1903–1989).
The term ‘Peak Oil’ refers to the point of maximum oil production on earth.
Hubbert used a bell shaped curve to illustrate his observation–the amount of oil under the ground in any region is finite (non-renewable), therefore the rate of production must reach a maximum and decline.
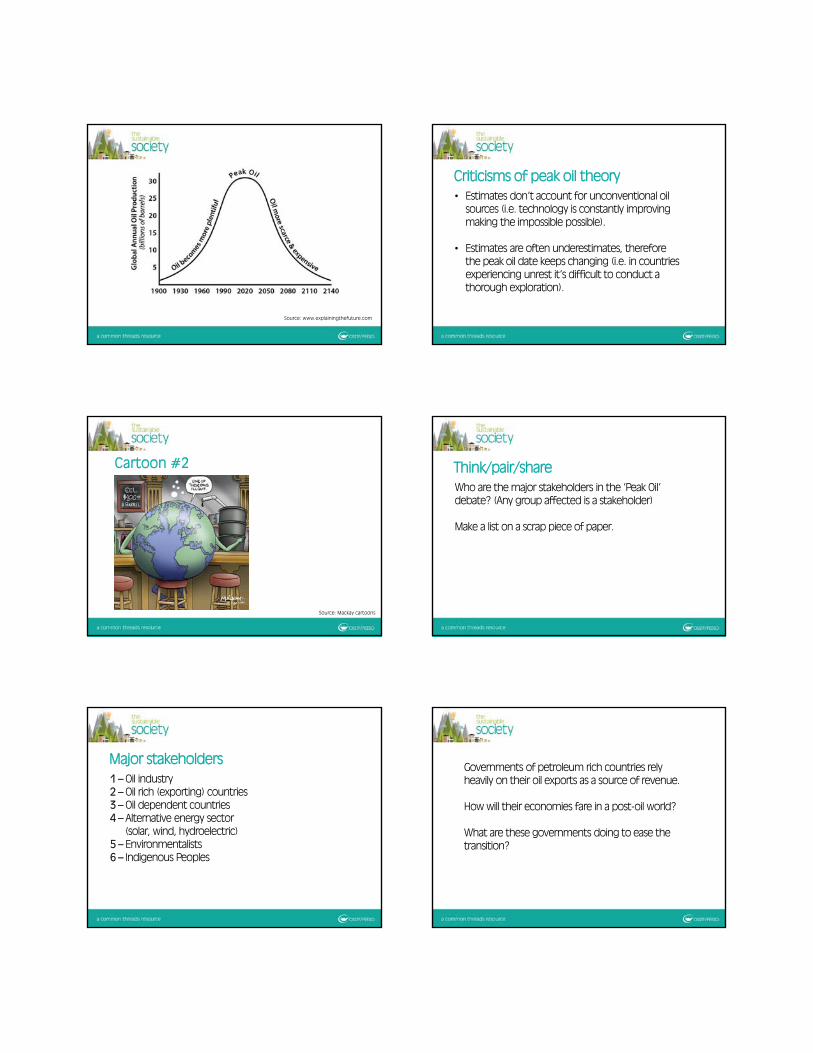
Source: www.explainingthefuture.com
• Estimates don’t account for unconventional oil sources (i.e. technology is constantly improving making the impossible possible).
• Estimates are often underestimates, therefore the peak oil date keeps changing (i.e. in countries experiencing unrest it’s difficult to conduct a thorough exploration).
Criticisms of peak oil theory
Cartoon #2
Source: Mackay cartoons
Who are the major stakeholders in the ‘Peak Oil’ debate? (Any group affected is a stakeholder)
Make a list on a scrap piece of paper.
Think/pair/share
1 – Oil industry2 – Oil rich (exporting) countries3 – Oil dependent countries4 – Alternative energy sector
(solar, wind, hydroelectric)5 – Environmentalists6 – Indigenous Peoples
Major stakeholdersGovernments of petroleum rich countries rely heavily on their oil exports as a source of revenue.
How will their economies fare in a post-oil world?
What are these governments doing to ease the transition?
Cartoon #3
Source: The Chattanooga Times
Other than oil, what are some other significant energy sources?
Make a list on a scrap piece of paper.
Think/pair/share
1 – Oil2 – Coal3 – Natural Gas4 – Nuclear5 – Solar 6 – Wind7 – Hydroelectric
Major energy sourcesOil
Source: http://www.calenergyinvestment.com/project_fueloil.php1 Source: http://www.theguardian.com/business/2010/mar/07/oil-gas-production-north-sea
Coal
Source: http://www.chinacoalintl.com/news-735 Source: http://www.miningaustralia.com.au/news/hearing-into-hunter-miner-death-to-begin-next-week
Natural gas
Source: http://www.scientificamerican.com/article/drill-for-natural-gas-pollute-water/
Source: http://www.totalenergy.com/SNGPlant/SNGPlant.htm
Nuclear energy
Source: http://www.acfonline.org.au/be-informed/northern-australia-nuclear/uranium-mining-australia
Source: http://www.britannica.com/EBchecked/topic/421763/nuclear-reactor/302452/History-of-reactor-development
Solar power
Source: http://www.solarpowernrg.com/index.php/projects/featured-projects/146-tien-sher-richmond-project.html
Source: http://www.solar.excluss.com/solar-equipment/solar-panels/
Wind power
Source: http://silverford.com/blog/?p=2555 Source: http://www.aedve.info/wind-turbines-to-provide-renewable-energy-at-honda-transmission-plant-in-ohio/
Hydroelectric power
Source: http://www.ucsusa.org/clean_energy/our-energy-choices/renewable-energy/environmental-impacts-hydroelectric-power.html#.VT5x_yFViko
Source: http://www.energydigital.com/renewables/3467/Hydroelectric-Power-Leading-the-Way-in-Pakistan
Cartoon #4Describe how a world without oil would be different from life as we know it.
Compile a list of at least three significant changes.
Be prepared to share with the class.
Think/pair/share
“When resources are degraded, we start competing for them, whether it is at the local level in Kenya, where we had tribal clashes over land and water, or at the global level where we’re fighting over water, oil, and minerals. So one way to promote peace is to promote sustainable management and equitable distribution of resources.” – Wangari Maathi
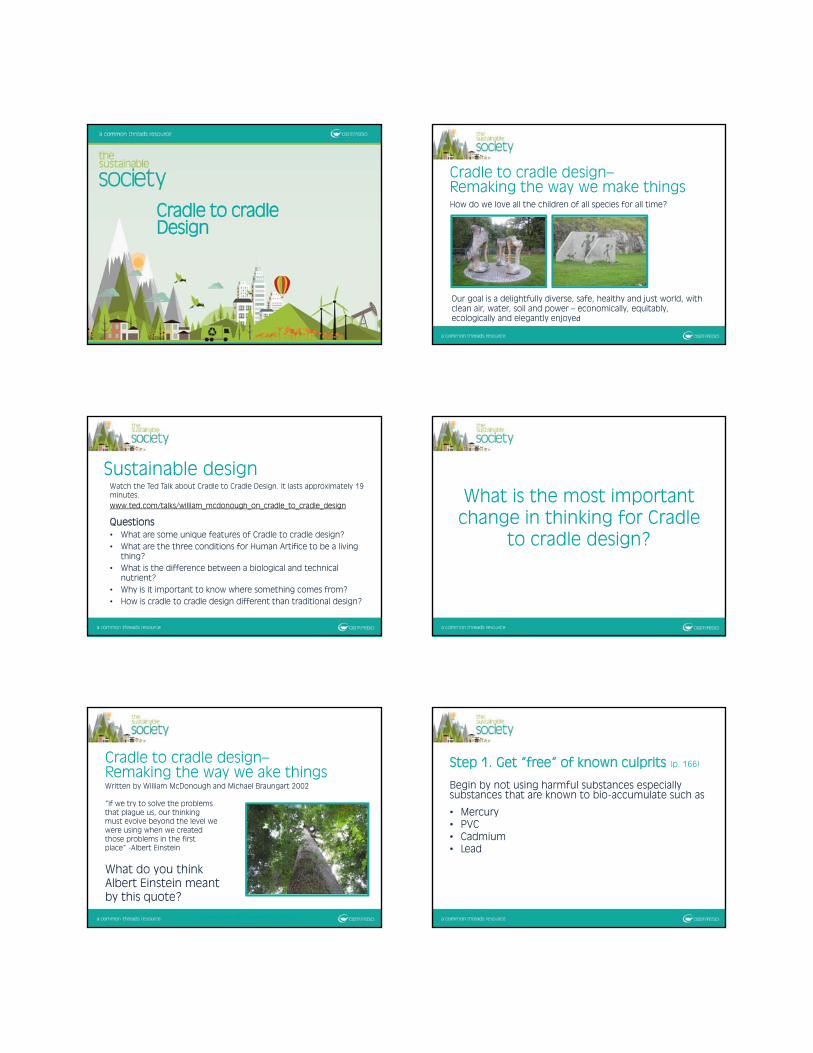
Cradle to cradleDesign
Sustainable design
Questions• What are some unique features of Cradle to cradle design?• What are the three conditions for Human Artifice to be a living
thing?• What is the difference between a biological and technical
nutrient?• Why is it important to know where something comes from?• How is cradle to cradle design different than traditional design?
Watch the Ted Talk about Cradle to Cradle Design. It lasts approximately 19 minutes. www.ted.com/talks/william_mcdonough_on_cradle_to_cradle_design
Cradle to cradle design–Remaking the way we ake thingsWritten by William McDonough and Michael Braungart 2002
“If we try to solve the problems that plague us, our thinking must evolve beyond the level we were using when we created those problems in the first place” -Albert Einstein
What do you think Albert Einstein meant by this quote?
(Open World Foundation, 2012)
Our goal is a delightfully diverse, safe, healthy and just world, with clean air, water, soil and power – economically, equitably, ecologically and elegantly enjoyed
How do we love all the children of all species for all time?
Cradle to cradle design–Remaking the way we make things
What is the most important change in thinking for Cradle
to cradle design?
Step 1. Get “free” of known culprits (p. 166)
Begin by not using harmful substances especially substances that are known to bio-accumulate such as
• Mercury • PVC• Cadmium • Lead
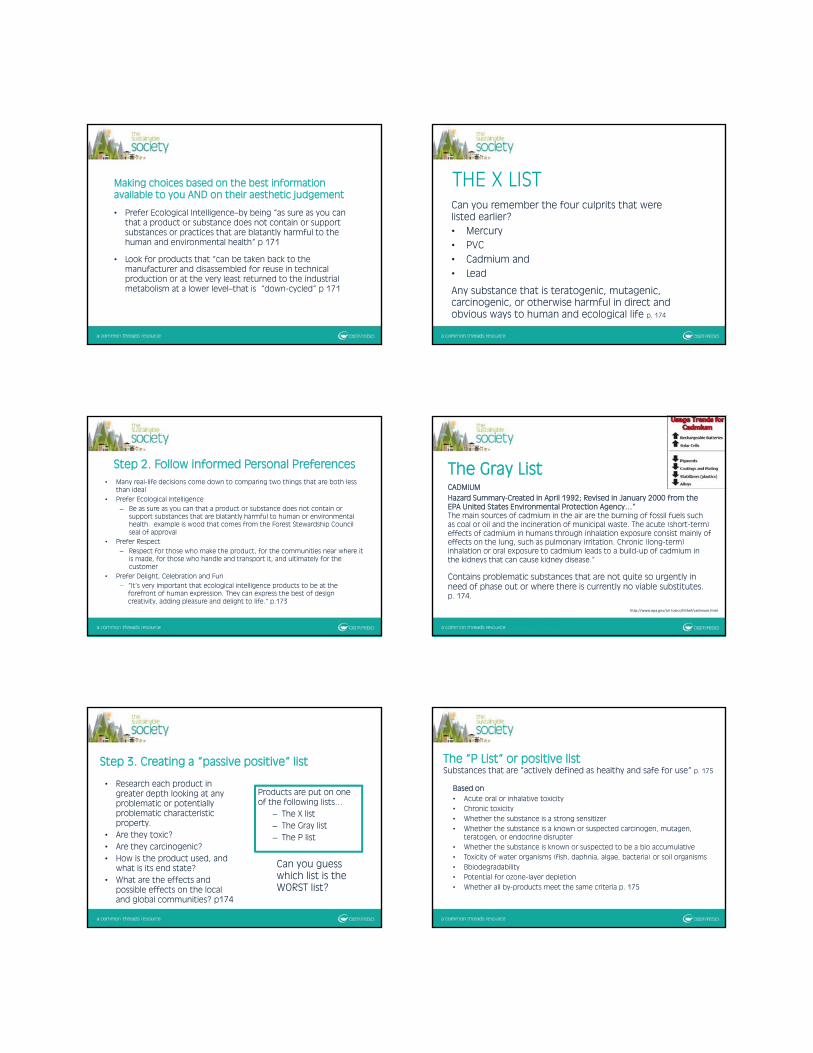
Making choices based on the best information available to you AND on their aesthetic judgement
• Prefer Ecological Intelligence–by being “as sure as you can that a product or substance does not contain or support substances or practices that are blatantly harmful to the human and environmental health” p 171
• Look for products that “can be taken back to the manufacturer and disassembled for reuse in technical production or at the very least returned to the industrial metabolism at a lower level–that is “down-cycled” p 171
Step 2. Follow informed Personal Preferences• Many real-life decisions come down to comparing two things that are both less
than ideal• Prefer Ecological Intelligence
– Be as sure as you can that a product or substance does not contain or support substances that are blatantly harmful to human or environmental health. example is wood that comes from the Forest Stewardship Council seal of approval
• Prefer Respect – Respect for those who make the product, for the communities near where it
is made, for those who handle and transport it, and ultimately for the customer
• Prefer Delight, Celebration and Fun− “It’s very important that ecological intelligence products to be at the
forefront of human expression. They can express the best of design creativity, adding pleasure and delight to life.” p.173
Step 3. Creating a “passive positive“ list
Products are put on one of the following lists…
– The X list– The Gray list– The P list
• Research each product in greater depth looking at any problematic or potentially problematic characteristic property.
• Are they toxic?• Are they carcinogenic?• How is the product used, and
what is its end state?• What are the effects and
possible effects on the local and global communities? p174
Can you guess which list is the WORST list?
THE X LIST
Any substance that is teratogenic, mutagenic, carcinogenic, or otherwise harmful in direct and obvious ways to human and ecological life p. 174
Can you remember the four culprits that were listed earlier?• Mercury • PVC • Cadmium and • Lead
The Gray ListCADMIUM
Contains problematic substances that are not quite so urgently in need of phase out or where there is currently no viable substitutes. p. 174.
Hazard Summary-Created in April 1992; Revised in January 2000 from the EPA United States Environmental Protection Agency…”The main sources of cadmium in the air are the burning of fossil fuels such as coal or oil and the incineration of municipal waste. The acute (short-term) effects of cadmium in humans through inhalation exposure consist mainly ofeffects on the lung, such as pulmonary irritation. Chronic (long-term) inhalation or oral exposure to cadmium leads to a build-up of cadmium in the kidneys that can cause kidney disease.”
http://www.epa.gov/air toxics/hlthef/cadmium.html
Image taken from https://www.osha.gov/SLTC/cadmium/
The “P List” or positive listSubstances that are ”actively defined as healthy and safe for use” p. 175
Based on• Acute oral or inhalative toxicity• Chronic toxicity• Whether the substance is a strong sensitizer• Whether the substance is a known or suspected carcinogen, mutagen,
teratogen, or endocrine disrupter• Whether the substance is known or suspected to be a bio accumulative• Toxicity of water organisms (fish, daphnia, algae, bacteria) or soil organisms• Bbiodegradability• Potential for ozone-layer depletion• Whether all by-products meet the same criteria p. 175
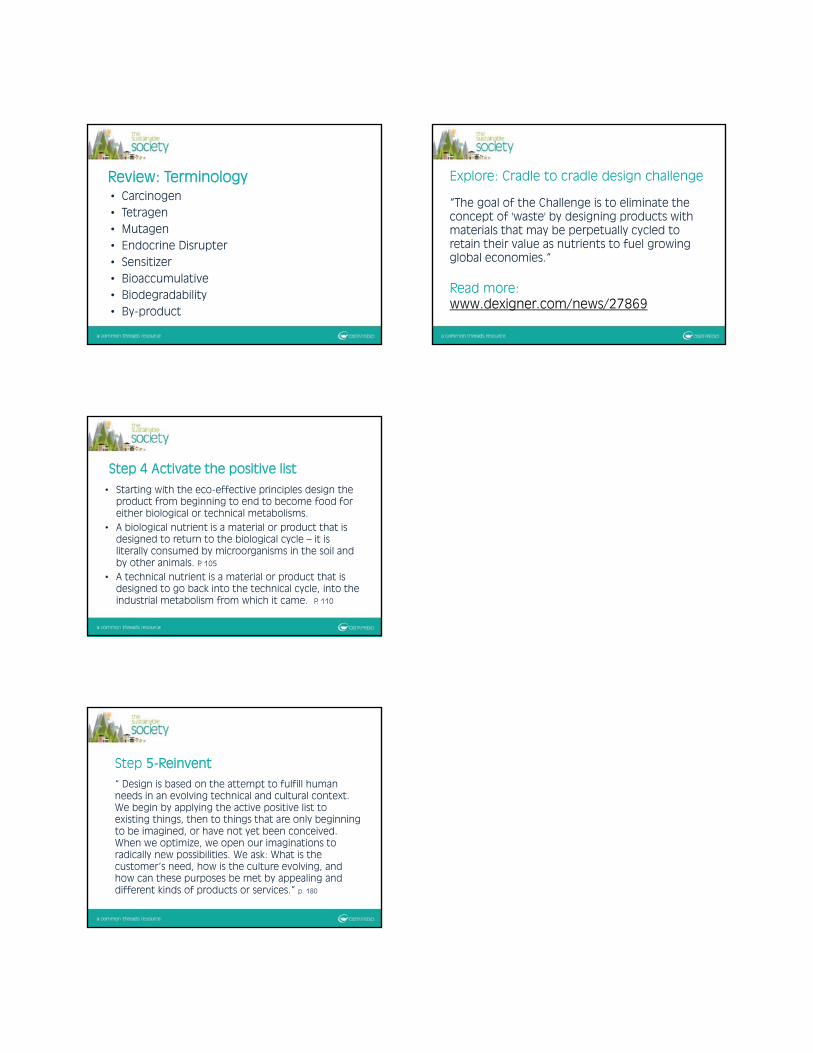
Review: Terminology• Carcinogen• Tetragen• Mutagen• Endocrine Disrupter• Sensitizer• Bioaccumulative• Biodegradability• By-product
Step 4 Activate the positive list
• Starting with the eco-effective principles design the product from beginning to end to become food for either biological or technical metabolisms.
• A biological nutrient is a material or product that is designed to return to the biological cycle – it is literally consumed by microorganisms in the soil and by other animals. P. 105
• A technical nutrient is a material or product that is designed to go back into the technical cycle, into the industrial metabolism from which it came. P. 110
Step 5-Reinvent“ Design is based on the attempt to fulfill human needs in an evolving technical and cultural context. We begin by applying the active positive list to existing things, then to things that are only beginning to be imagined, or have not yet been conceived. When we optimize, we open our imaginations to radically new possibilities. We ask: What is the customer’s need, how is the culture evolving, and how can these purposes be met by appealing and different kinds of products or services.” p. 180
Explore: Cradle to cradle design challenge
“The goal of the Challenge is to eliminate the concept of 'waste' by designing products with materials that may be perpetually cycled to retain their value as nutrients to fuel growing global economies.”
Read more: www.dexigner.com/news/27869
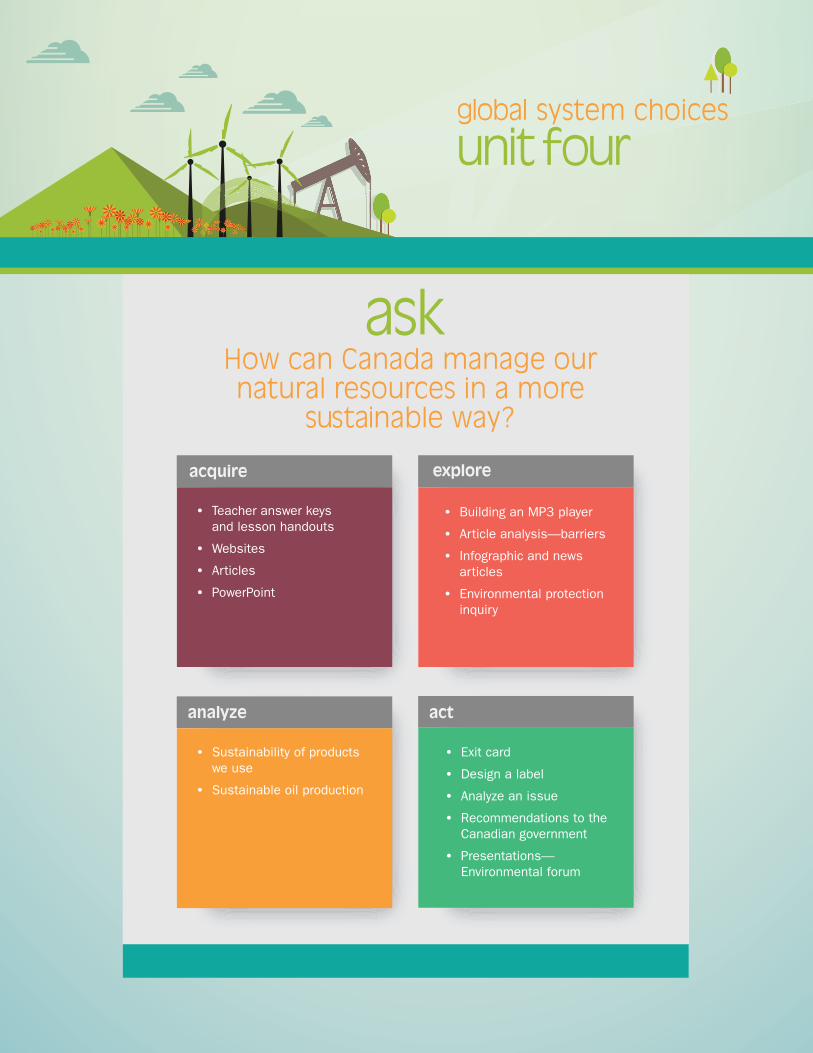
explore
analyze act
acquire
ask
unit four
How can Canada manage our natural resources in a more
sustainable way?
global system choices
• Teacher answer keys and lesson handouts
• Websites
• Articles
• PowerPoint
• Building an MP3 player
• Article analysis—barriers
• Infographic and news articles
• Environmental protection inquiry
• Exit card
• Design a label
• Analyze an issue
• Recommendations to the Canadian government
• Presentations—Environmental forum
• Sustainability of products we use
• Sustainable oil production
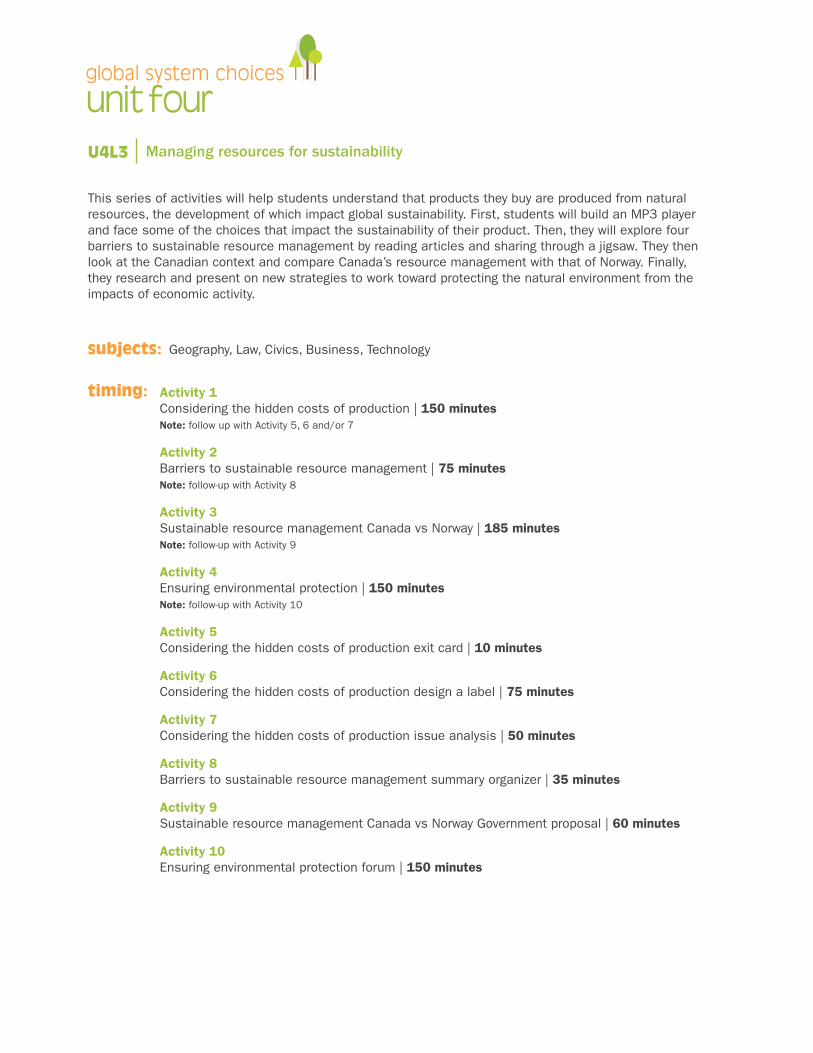
unit fourglobal system choices
U4L3
subjects:
timing:
Geography, Law, Civics, Business, Technology
Activity 1Considering the hidden costs of production | 150 minutesNote: follow up with Activity 5, 6 and/or 7
Activity 2Barriers to sustainable resource management | 75 minutesNote: follow-up with Activity 8
Activity 3Sustainable resource management Canada vs Norway | 185 minutesNote: follow-up with Activity 9
Activity 4Ensuring environmental protection | 150 minutesNote: follow-up with Activity 10
Activity 5Considering the hidden costs of production exit card | 10 minutes
Activity 6Considering the hidden costs of production design a label | 75 minutes
Activity 7Considering the hidden costs of production issue analysis | 50 minutes
Activity 8Barriers to sustainable resource management summary organizer | 35 minutes
Activity 9Sustainable resource management Canada vs Norway Government proposal | 60 minutes
Activity 10Ensuring environmental protection forum | 150 minutes
Managing resources for sustainability
This series of activities will help students understand that products they buy are produced from natural resources, the development of which impact global sustainability. First, students will build an MP3 player and face some of the choices that impact the sustainability of their product. Then, they will explore four barriers to sustainable resource management by reading articles and sharing through a jigsaw. They then look at the Canadian context and compare Canada’s resource management with that of Norway. Finally, they research and present on new strategies to work toward protecting the natural environment from the impacts of economic activity.
unit fourglobal system choices
U4L3 Managing resources for sustainability
learning goals • To understand that manufactured items are produced through decision-making that impacts global sustainability. • To understand that there are barriers, nationally and globally, to sustainable resource management. • To understand the Canadian government’s policies on environmental protection. • To analyse the validity of these policies using the Alberta oil sands as a case study • To compare Canada’s perspective on oil extraction with that of Norway. • To evaluate progressive strategies used globally to ensure environmental protection.
success criteria • To complete an MP3 production organizer to demonstrate critical thinking with respect to decision making. • To describe one barrier to a peer group. • To accurately complete a summary organizer to explain the four main barriers to sustainable resource management. • To investigate a variety of materials and complete assigned activities. • To work cooperatively with group members to explore and share information. • To prepare a presentation to share learning with my classmates on a related topic of my choice.
askInquiry questions • How do companies balance social and environmental sustainability with the need for profit when producing consumer goods? • What are the barriers to sustainable resource management? • How do Canada’s sustainable resource management practices compare to those of Norway, another wealthy oil producing nation? • How do we protect the natural environment from the negative impacts of economic development?
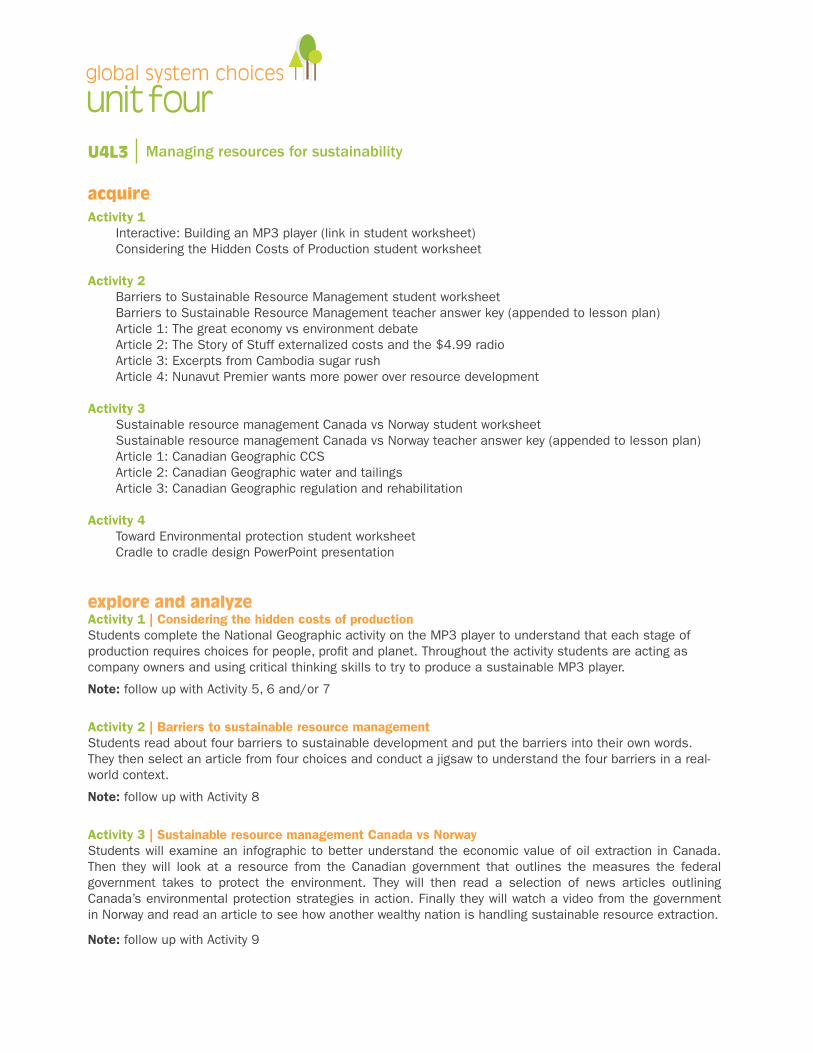
unit fourglobal system choices
acquireActivity 1
Interactive: Building an MP3 player (link in student worksheet)Considering the Hidden Costs of Production student worksheet
Activity 2Barriers to Sustainable Resource Management student worksheetBarriers to Sustainable Resource Management teacher answer key (appended to lesson plan)Article 1: The great economy vs environment debateArticle 2: The Story of Stuff externalized costs and the $4.99 radioArticle 3: Excerpts from Cambodia sugar rushArticle 4: Nunavut Premier wants more power over resource development
Activity 3 Sustainable resource management Canada vs Norway student worksheetSustainable resource management Canada vs Norway teacher answer key (appended to lesson plan)Article 1: Canadian Geographic CCSArticle 2: Canadian Geographic water and tailingsArticle 3: Canadian Geographic regulation and rehabilitation
Activity 4Toward Environmental protection student worksheetCradle to cradle design PowerPoint presentation
explore and analyzeActivity 1 | Considering the hidden costs of productionStudents complete the National Geographic activity on the MP3 player to understand that each stage of production requires choices for people, profit and planet. Throughout the activity students are acting as company owners and using critical thinking skills to try to produce a sustainable MP3 player.
Note: follow up with Activity 5, 6 and/or 7
Activity 2 | Barriers to sustainable resource managementStudents read about four barriers to sustainable development and put the barriers into their own words. They then select an article from four choices and conduct a jigsaw to understand the four barriers in a real-world context.
Note: follow up with Activity 8
Activity 3 | Sustainable resource management Canada vs NorwayStudents will examine an infographic to better understand the economic value of oil extraction in Canada. Then they will look at a resource from the Canadian government that outlines the measures the federal government takes to protect the environment. They will then read a selection of news articles outlining Canada’s environmental protection strategies in action. Finally they will watch a video from the government in Norway and read an article to see how another wealthy nation is handling sustainable resource extraction.
Note: follow up with Activity 9
U4L3 Managing resources for sustainability
unit fourglobal system choices
Activity 4 | Toward environmental protectionStudents conduct an inquiry individually or in groups (depending on time and class sizes) on a progressive strategy to promote environmental protection. They share their learning with the class in a presentation, summarized by the class into an organizer. One of the resources available to students in this activity is the Cradle to Cradle Design powerpoint.Note: follow up with Activity 10
act Activity 5 | Considering the hidden costs of production exit card Students complete two questions as an exit card for the MP3 lesson.
Activity 6 | Considering the hidden costs of production design a label Students answer questions and design a label to inform consumers about the sustainability of the MP3 player.
Activity 7 | Considering the hidden costs of production issue analysis This activity will have students learn about the fossil fuel industry globally and within Canada.
Activity 8 | Barriers to sustainable resource management summary organizer Students complete and submit their summary organizer on the four barriers to sustainable resource management using examples from their research.
Activity 9 | Sustainable resource management Canada vs Norway government proposal Students draft a proposal to the Canadian Government outlining five recommendations for more sustainable management of Canadian oil resources.
Activity 10 | Ensuring environmental protection forum Students will share their learning and presentations by preparing a Toward Environmental Protection forum for the class, school or for another public venue (library, community centre).
referencesBrocki, L. and Smart, S. (2014, February 26). Taseko New Prosperity mine at Fish Lake rejected again. CBC News. Retrieved from www.cbc.ca/news/canada/british-columbia/taseko-new-prosperity-mine-at-fish-lake-rejected-again-1.2553002
Canadian Arctic Research Committee. (2010). Arctic science. Retrieved from http://www.carc.org/index.php?option=com_content&view=article&id=160:arctic-science&catid=57:recommendations-for-canadian-foreign-policy
Canadian oilsands made massive contributions to economy in 2012: Study. (2014, February 12). Huffpost Alberta. Retrieved from www.huffingtonpost.ca/2014/02/12/canadian-oilsands-economic-impact_n_4776472.html
Carey, I. (2012, May 6). The great economy versus the environment myth. Huffington Post. Retrieved from www.huffingtonpost.com/ian-carey/the-great-economy-versus-_b_1398439.html
U4L3 Managing resources for sustainability
unit fourglobal system choices
Cradle to Cradle Products Innovation Institute. (2014). Drive change. Retrieved from www.c2ccertified.org/drive-change
Czech, B. (n.d.). Climate change: the wrong top priority for environmentalists and conservation professionals. Centre for the Advancement of Steady State Economics (CASSE). Retrieved from steadystate.org/climate-change-the-wrong-top-priority-for-environmentalists-and-conservation-professionals/
Gillespie, C. (2008, June). Scar sands. Canadian Geographic. Retrieved from www.canadiangeographic.ca/magazine/jun08/feature_tar_sands.asp
Government of Canada. (2014). Enhancing Environmental Protection. Retrieved from actionplan.gc.ca/en/backgrounder/r2d-dr2/enhancing-environmental-protection
Hager, M. (2015, April 17). Canada failing to learn from ‘world class’ oil-spill cleanups. The Globe and Mail. Retrieved from www.theglobeandmail.com/news/british-columbia/canada-failing-to-learn-from-world-class-oil-spill-cleanups/article24017204
Hodal, K. (2013, July 9). Cambodia’s sugar rush leaves farmers feeling bitter at ‘land grab’. The Guardian. Retrieved from www.theguardian.com/world/2013/jul/09/cambodia-sugar-land-grab-claims
Kelman, I. (2014, March 17). Looking beyond the oil horizon. The Foreigner. Retrieved from http://theforeigner.no/pages/columns/looking-beyond-the-oil-horizon
Krugel, L. (2013, January 16). Oil industry Canada: Norway offers lessons on how to manage resource wealth, CCPA says. Huffington Post. Retrieved from http://www.huffingtonpost.ca/2013/01/16/oil-industry-canada-norway_n_2491761.html
Leonard, A. (2011, May 25). The story of stuff: externalized costs and the $4.99 radio. Huffington Post. Retrieved from http://www.huffingtonpost.com/annie-leonard/the-story-of-stuff-extern_b_490351.html
Linnitt, C. (2014, December 13). 10 things Canada would be doing if we were serious about climate change. Desmog Canada. Retrieved from http://www.desmog.ca/2014/12/13/10-things-canada-would-be-doing-if-we-were-serious-about-climate-change
Luther, B. (2014, June 24). Study looks at business benefits from cradle to cradle certification. The Guardian. Retrieved from http://www.theguardian.com/sustainable-business/cradle-to-cradle-certification-benefit-business-study
McDonough, W. (2005, February). Cradle to cradle design. [Video file]. Retrieved from https://www.ted.com/talks/william_mcdonough_on_cradle_to_cradle_design
McKenna, B. (2014, November 10). Norway proves oil-rich nations can be both green and prosperous. The Globe and Mail. Retrieved from www.theglobeandmail.com/report-on-business/international-business/european-business/norway-proves-oil-rich-nations-can-be-both-green-and-prosperous/article21514455
Miller Llana, S. (2012, May 12). Brazil, Venezuela and Mexico: three ways to nationalize oil. Christian Science Monitor. Retrieved from http://www.csmonitor.com/World/Americas/2012/0512/Brazil-Venezuela-and-Mexico-three-ways-to-nationalize-oil
National Geographic Education. (2015). Global closet calculator. [Interactive game]. Retrieved from education.nationalgeographic.com/education/media/globalcloset/?ar_a=1
Nunavut premier wants more power over resource development. (2013, September 1). CBC News. Retrieved from www.cbc.ca/news/canada/nunavut-premier-wants-more-power-over-resource-development-1.1310321
Paramaguru, K. (2014, January 29). Tunisia recognizes climate change in its constitution. Time. Retrieved from science.time.com/2014/01/29/tunisia-recognizes-climate-change-in-its-constitution
U4L3 Managing resources for sustainability
unit fourglobal system choices
U4L3 Managing resources for sustainability
Ryan, J. (2015, July 8). Movement makes case for right to healthy environment. Camrose Canadian. Retrieved from www.camrosecanadian.com/2015/07/08/movement-makes-case-for-right-to-healthy-environment
Suzuki, D. (2013, January 9). What if Mother Nature had rights? She does in Ecuador. The Globe and Mail. Retrieved from www.theglobeandmail.com/globe-debate/what-if-mother-nature-had-rights-she-does-in-ecuador/article7039202/
Schmeiser, D. (2015, April 10). Lessons from the Maldives: Constitutionally protected environmental rights. Bluedot. Retrieved from bluedot.ca/stories/lessons-from-the-maldives-constitutionally-protected-environmental-rights/
The rich cousin. (2013, Feb. 2). The Economist. Retrieved from www.economist.com/news/special-report/21570842-oil-makes-norway-different-rest-region-only-up-point-rich
United Nations. (n.d.). Rights of nature law and policy. Retrieved from www.harmonywithnatureun.org/rightsofnature.html
van Huttum, R. (2010). Waste = Food. [Documentary]. United States. Icarus Films. Retrieved from topdocumentaryfilms.com/waste-food
Ward, H. (2009). Resource nationalism and sustainable development: a primer and key issues. Retrieved from pubs.iied.org/pdfs/G02507.pdf
Why we need to nationalize oil and gas. (2006, January). Canadian Dimension. Retrieved from canadiandimension.com/articles/view/why-we-need-to-nationalize-oil-and-gas-editorial-januaryfebruary-2006
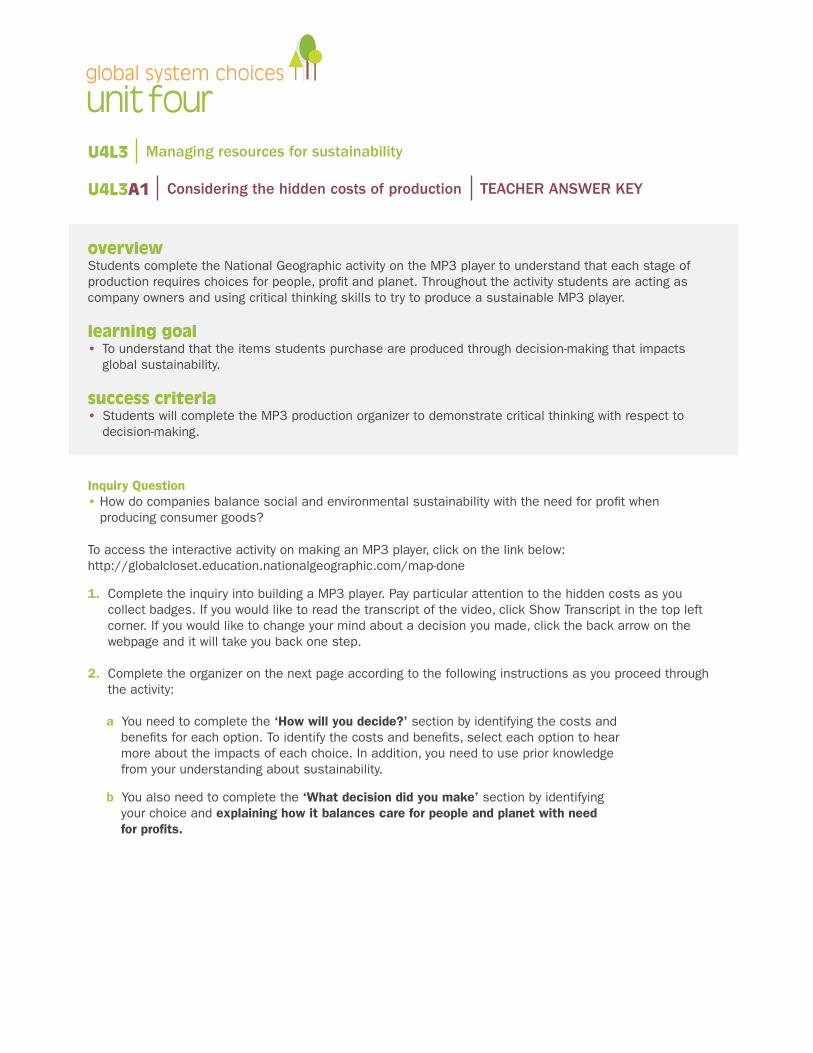
unit fourglobal system choices
Inquiry Question • How do companies balance social and environmental sustainability with the need for profit when producing consumer goods?
overviewStudents complete the National Geographic activity on the MP3 player to understand that each stage of production requires choices for people, profit and planet. Throughout the activity students are acting as company owners and using critical thinking skills to try to produce a sustainable MP3 player.
learning goal • To understand that the items students purchase are produced through decision-making that impacts
global sustainability.
success criteria• Students will complete the MP3 production organizer to demonstrate critical thinking with respect to
decision-making.
To access the interactive activity on making an MP3 player, click on the link below:http://globalcloset.education.nationalgeographic.com/map-done
1. Complete the inquiry into building a MP3 player. Pay particular attention to the hidden costs as you collect badges. If you would like to read the transcript of the video, click Show Transcript in the top left corner. If you would like to change your mind about a decision you made, click the back arrow on the webpage and it will take you back one step.
2. Complete the organizer on the next page according to the following instructions as you proceed through the activity:
a You need to complete the ‘How will you decide?’ section by identifying the costs and benefits for each option. To identify the costs and benefits, select each option to hear more about the impacts of each choice. In addition, you need to use prior knowledge from your understanding about sustainability.
b You also need to complete the ‘What decision did you make’ section by identifying your choice and explaining how it balances care for people and planet with need for profits.
U4L3A1 Considering the hidden costs of production TEACHER ANSWER KEY
U4L3 Managing resources for sustainability
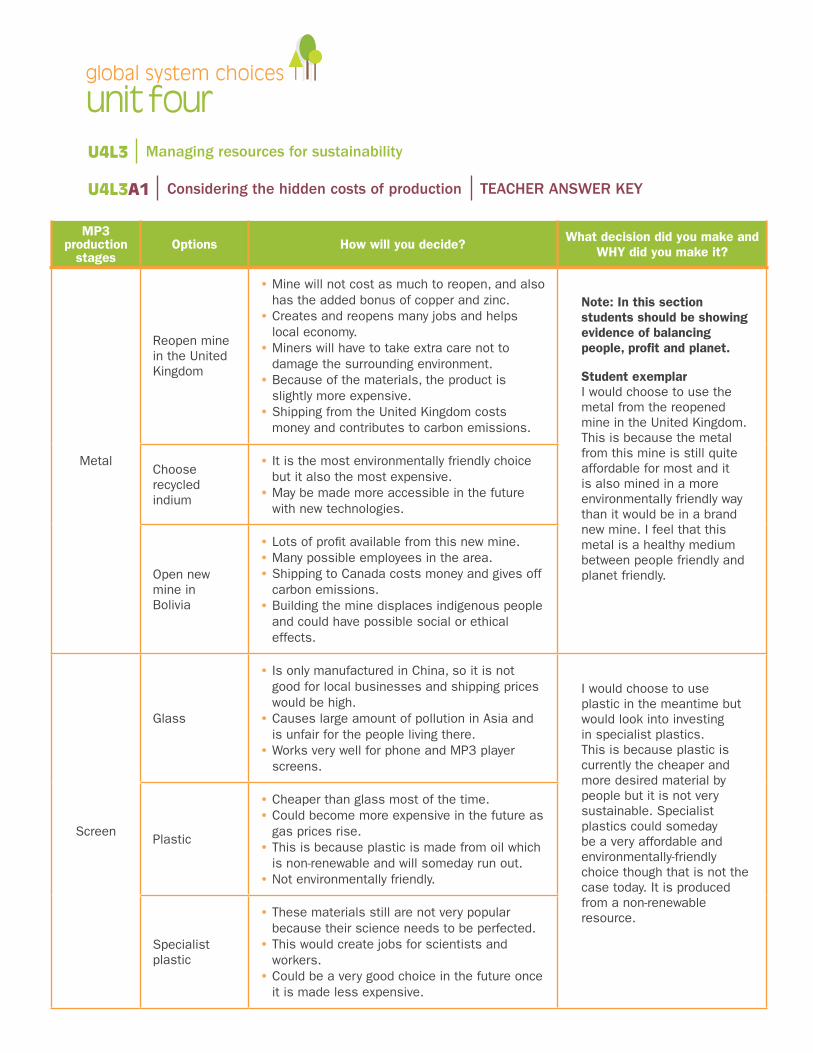
unit fourglobal system choices
MP3 production
stagesOptions How will you decide? What decision did you make and
WHY did you make it?
Metal
Reopen mine in the United Kingdom
• Mine will not cost as much to reopen, and also has the added bonus of copper and zinc. • Creates and reopens many jobs and helps local economy. • Miners will have to take extra care not to damage the surrounding environment. • Because of the materials, the product is slightly more expensive. • Shipping from the United Kingdom costs money and contributes to carbon emissions.
Note: In this section students should be showing evidence of balancing people, profit and planet.
Student exemplarI would choose to use the metal from the reopened mine in the United Kingdom. This is because the metal from this mine is still quite affordable for most and it is also mined in a more environmentally friendly way than it would be in a brand new mine. I feel that this metal is a healthy medium between people friendly and planet friendly.
Choose recycled indium
• It is the most environmentally friendly choice but it also the most expensive. • May be made more accessible in the future with new technologies.
Open new mine in Bolivia
• Lots of profit available from this new mine. • Many possible employees in the area. • Shipping to Canada costs money and gives off carbon emissions. • Building the mine displaces indigenous people and could have possible social or ethical effects.
Screen
Glass
• Is only manufactured in China, so it is not good for local businesses and shipping prices would be high. • Causes large amount of pollution in Asia and is unfair for the people living there. • Works very well for phone and MP3 player screens.
I would choose to use plastic in the meantime but would look into investing in specialist plastics. This is because plastic is currently the cheaper and more desired material by people but it is not very sustainable. Specialist plastics could someday be a very affordable and environmentally-friendly choice though that is not the case today. It is produced from a non-renewable resource.
Plastic
• Cheaper than glass most of the time. • Could become more expensive in the future as gas prices rise. • This is because plastic is made from oil which is non-renewable and will someday run out. • Not environmentally friendly.
Specialist plastic
• These materials still are not very popular because their science needs to be perfected. • This would create jobs for scientists and workers. • Could be a very good choice in the future once it is made less expensive.
U4L3A1 Considering the hidden costs of production TEACHER ANSWER KEY
U4L3 Managing resources for sustainability
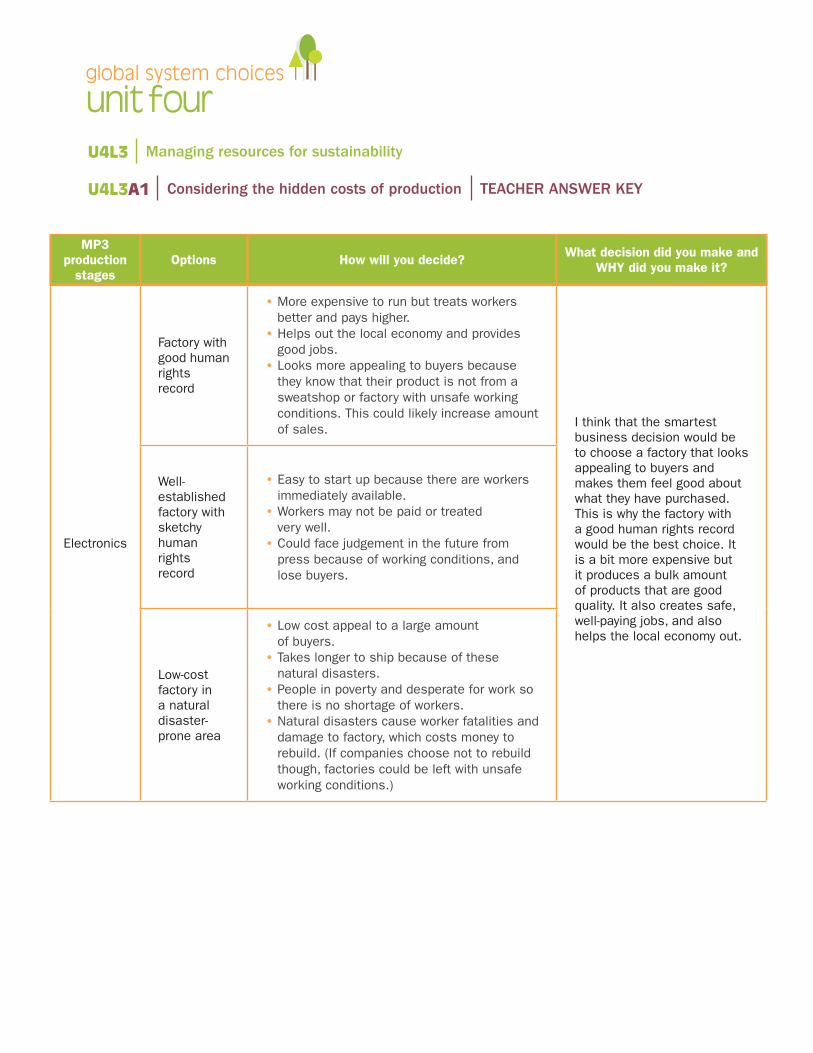
unit fourglobal system choices
MP3 production
stagesOptions How will you decide? What decision did you make and
WHY did you make it?
Electronics
Factory with good human rights record
• More expensive to run but treats workers better and pays higher. • Helps out the local economy and provides good jobs. • Looks more appealing to buyers because they know that their product is not from a sweatshop or factory with unsafe working conditions. This could likely increase amount of sales. I think that the smartest
business decision would be to choose a factory that looks appealing to buyers and makes them feel good about what they have purchased. This is why the factory with a good human rights record would be the best choice. It is a bit more expensive but it produces a bulk amount of products that are good quality. It also creates safe, well-paying jobs, and also helps the local economy out.
Well-established factory with sketchy human rights record
• Easy to start up because there are workers immediately available. • Workers may not be paid or treated very well. • Could face judgement in the future from press because of working conditions, and lose buyers.
Low-cost factory in a natural disaster-prone area
• Low cost appeal to a large amount of buyers. • Takes longer to ship because of these natural disasters. • People in poverty and desperate for work so there is no shortage of workers. • Natural disasters cause worker fatalities and damage to factory, which costs money to rebuild. (If companies choose not to rebuild though, factories could be left with unsafe working conditions.)
U4L3A1 Considering the hidden costs of production TEACHER ANSWER KEY
U4L3 Managing resources for sustainability
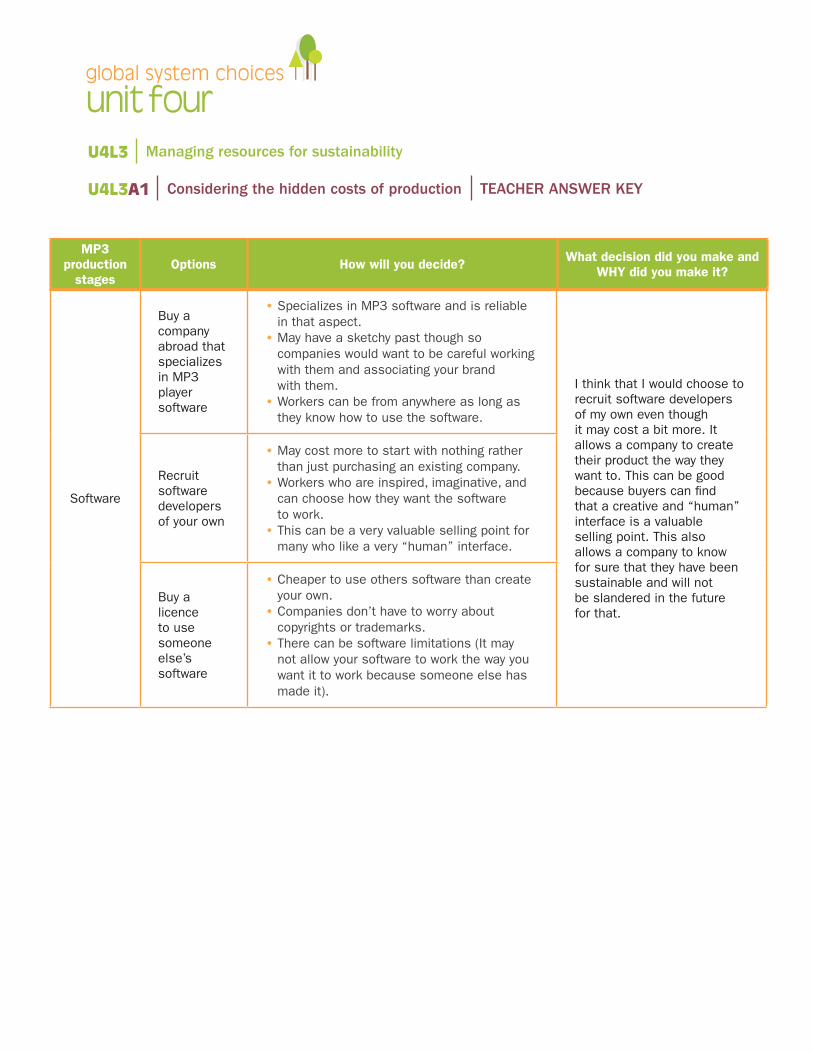
unit fourglobal system choices
Software
Buy a company abroad that specializes in MP3 player software
• Specializes in MP3 software and is reliable in that aspect. • May have a sketchy past though so companies would want to be careful working with them and associating your brand with them. • Workers can be from anywhere as long as they know how to use the software.
I think that I would choose to recruit software developers of my own even though it may cost a bit more. It allows a company to create their product the way they want to. This can be good because buyers can find that a creative and “human” interface is a valuable selling point. This also allows a company to know for sure that they have been sustainable and will not be slandered in the future for that.
Recruit software developers of your own
• May cost more to start with nothing rather than just purchasing an existing company. • Workers who are inspired, imaginative, and can choose how they want the software to work. • This can be a very valuable selling point for many who like a very “human” interface.
Buy a licence to use someone else’s software
• Cheaper to use others software than create your own. • Companies don’t have to worry about copyrights or trademarks. • There can be software limitations (It may not allow your software to work the way you want it to work because someone else has made it).
MP3 production
stagesOptions How will you decide? What decision did you make and
WHY did you make it?
U4L3A1 Considering the hidden costs of production TEACHER ANSWER KEY
U4L3 Managing resources for sustainability
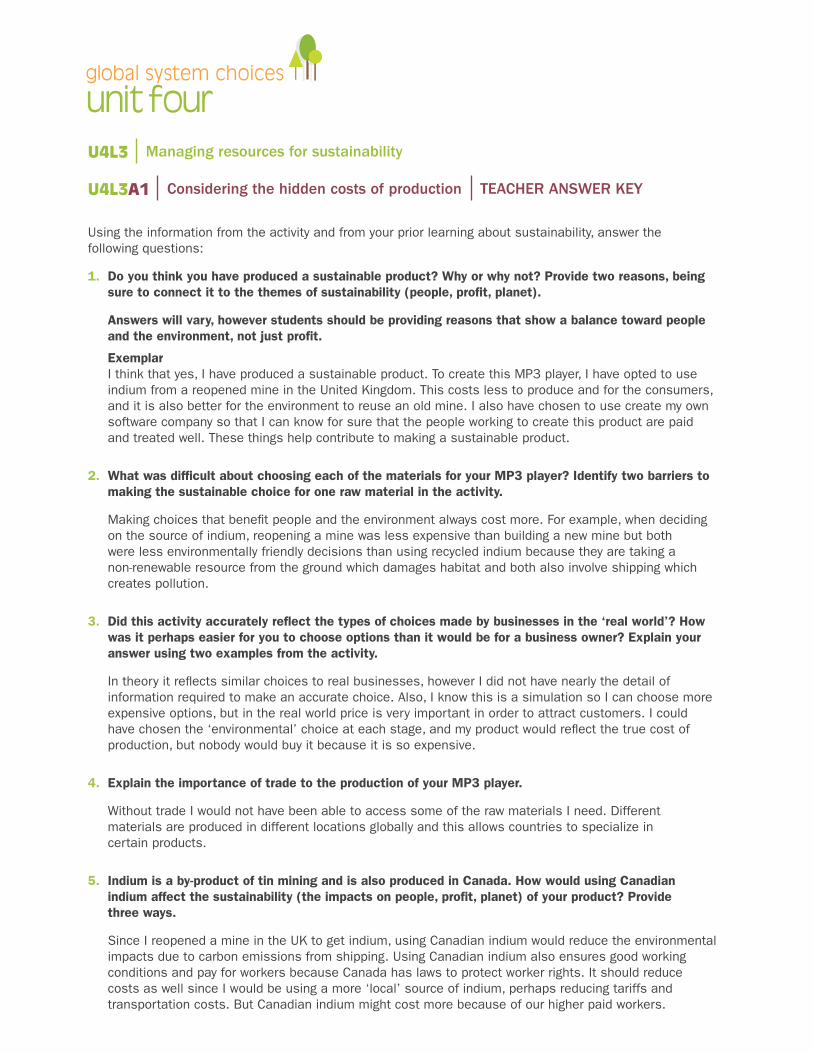
unit fourglobal system choices
Using the information from the activity and from your prior learning about sustainability, answer the following questions:
1. Do you think you have produced a sustainable product? Why or why not? Provide two reasons, being sure to connect it to the themes of sustainability (people, profit, planet).
Answers will vary, however students should be providing reasons that show a balance toward people and the environment, not just profit.
Exemplar I think that yes, I have produced a sustainable product. To create this MP3 player, I have opted to use
indium from a reopened mine in the United Kingdom. This costs less to produce and for the consumers, and it is also better for the environment to reuse an old mine. I also have chosen to use create my own software company so that I can know for sure that the people working to create this product are paid and treated well. These things help contribute to making a sustainable product.
2. What was difficult about choosing each of the materials for your MP3 player? Identify two barriers to making the sustainable choice for one raw material in the activity.
Making choices that benefit people and the environment always cost more. For example, when deciding on the source of indium, reopening a mine was less expensive than building a new mine but both were less environmentally friendly decisions than using recycled indium because they are taking a non-renewable resource from the ground which damages habitat and both also involve shipping which creates pollution.
3. Did this activity accurately reflect the types of choices made by businesses in the ‘real world’? How was it perhaps easier for you to choose options than it would be for a business owner? Explain your answer using two examples from the activity.
In theory it reflects similar choices to real businesses, however I did not have nearly the detail of information required to make an accurate choice. Also, I know this is a simulation so I can choose more expensive options, but in the real world price is very important in order to attract customers. I could have chosen the ‘environmental’ choice at each stage, and my product would reflect the true cost of production, but nobody would buy it because it is so expensive.
4. Explain the importance of trade to the production of your MP3 player.
Without trade I would not have been able to access some of the raw materials I need. Different materials are produced in different locations globally and this allows countries to specialize in certain products.
5. Indium is a by-product of tin mining and is also produced in Canada. How would using Canadian indium affect the sustainability (the impacts on people, profit, planet) of your product? Provide three ways.
Since I reopened a mine in the UK to get indium, using Canadian indium would reduce the environmental impacts due to carbon emissions from shipping. Using Canadian indium also ensures good working conditions and pay for workers because Canada has laws to protect worker rights. It should reduce costs as well since I would be using a more ‘local’ source of indium, perhaps reducing tariffs and transportation costs. But Canadian indium might cost more because of our higher paid workers.
U4L3A1 Considering the hidden costs of production TEACHER ANSWER KEY
U4L3 Managing resources for sustainability
unit fourglobal system choices
overviewStudents read about four barriers to sustainable development and put the barriers into their own words. They then select an article from four choices and conduct a jigsaw to understand the four barriers in a real-world context.
learning goal • To understand that there are barriers, nationally and globally, to sustainable resource management.
success criteria• Students will be able to describe one barrier to a peer group.• Students will accurately complete a summary organizer to explain the main barriers to sustainable
resource management.
acquireThe Great economy vs environment mythwww.huffingtonpost.com/ian-carey/the-great-economy-versus-_b_1398439.html
Story of Stuff —the Externalization of Costs www.huffingtonpost.com/annie-leonard/the-story-of-stuff-extern_b_490351.html
Cambodia’s sugar rush leaves farmers frustrated at ‘land-grab’—The Guardian www.theguardian.com/world/2013/jul/09/cambodia-sugar-land-grab-claims
Nunavut premier wants more power over resource development www.cbc.ca/news/canada/nunavut-premier-wants-more-power-over-resource-development-1.1310321
exploreIn a working paper from the International Institute for the Environment and Development, Halina Ward describes the following four obstacles to sustainable development (2009).
• “Dominant economic growth models—too often it is these models which are considered inviolable, not people’s rights and welfare, or environmental processes and limits. • Environmental costs and benefits of human activity are externalised (i.e. the environmental impacts of transactions of various kinds are not reflected in market prices, so they tend not to be taken account of in decision-making). • Poor people are marginalized, and inequities entrenched • Governance regimes are inadequately designed in terms of internalising environmental factors, ironing out social inequities, and developing better economic models (2009).”
U4L3A2 Barriers to sustainable resource management TEACHER ANSWER KEY
U4L3 Managing resources for sustainability
Inquiry Question • What are the barriers to sustainable resource management?
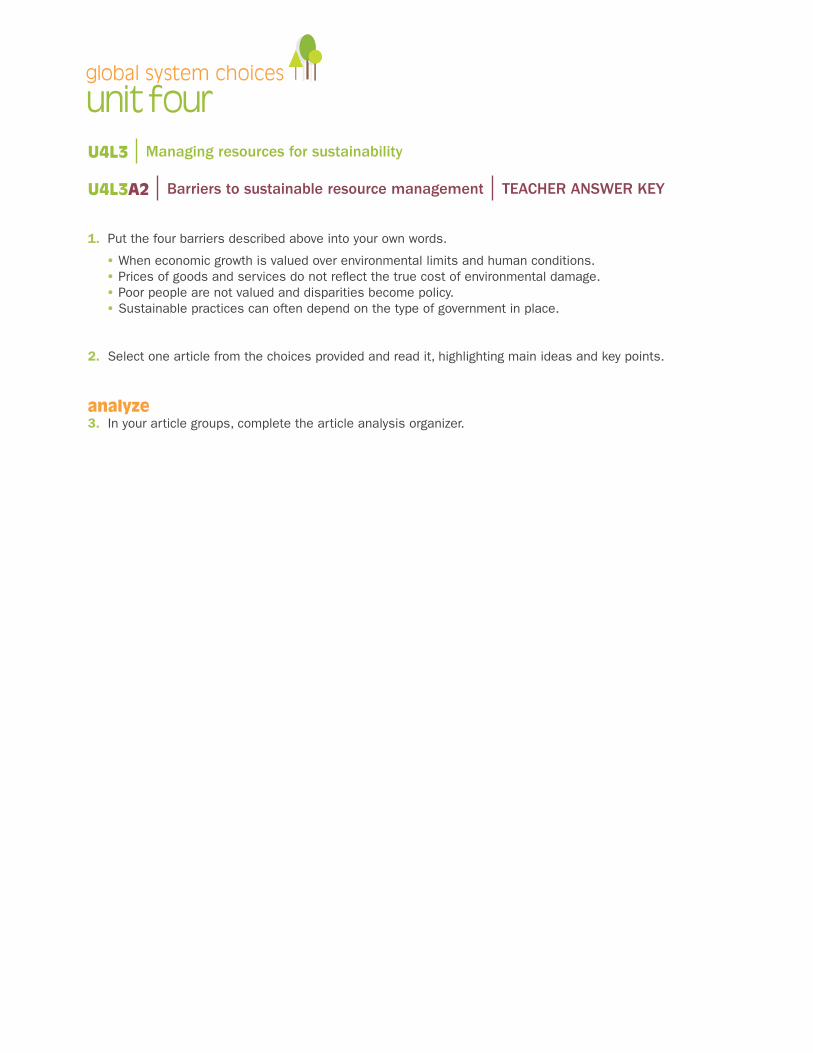
unit fourglobal system choices
1. Put the four barriers described above into your own words.
• When economic growth is valued over environmental limits and human conditions. • Prices of goods and services do not reflect the true cost of environmental damage. • Poor people are not valued and disparities become policy. • Sustainable practices can often depend on the type of government in place.
2. Select one article from the choices provided and read it, highlighting main ideas and key points.
analyze3. In your article groups, complete the article analysis organizer.
U4L3A2 Barriers to sustainable resource management TEACHER ANSWER KEY
U4L3 Managing resources for sustainability
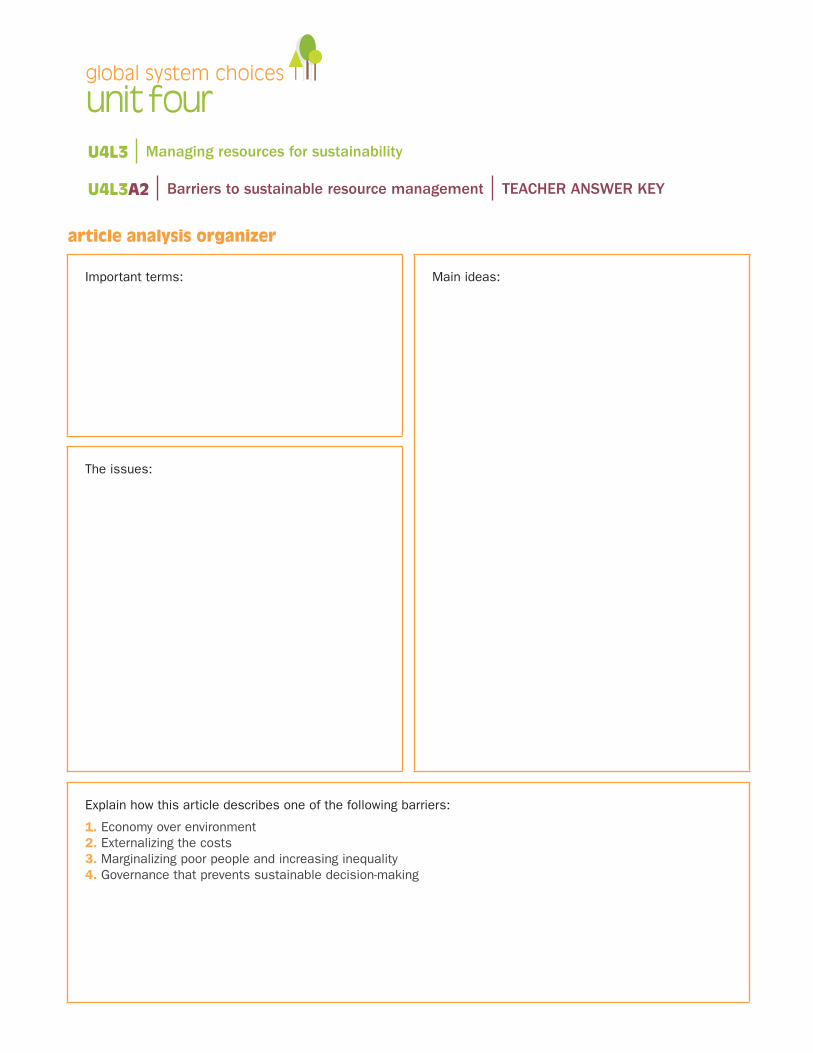
unit fourglobal system choices
Important terms:
Explain how this article describes one of the following barriers:
1. Economy over environment2. Externalizing the costs3. Marginalizing poor people and increasing inequality4. Governance that prevents sustainable decision-making
The issues:
Main ideas:
article analysis organizer
U4L3A2 Barriers to sustainable resource management TEACHER ANSWER KEY
U4L3 Managing resources for sustainability
unit fourglobal system choices
U4L3A3 Sustainable resource management: Canada vs Norway TEACHER ANSWER KEY
U4L3 Managing resources for sustainability
overviewStudents will examine an infographic to better understand the economic value of oil extraction in Canada. Then they will look at a resource from the Canadian government that outlines the measures the federal government takes to protect the environment. They will then read a selection of news articles outlining Canada’s environmental protection strategies in action. Finally they will watch a video from the government in Norway and read an article to see how another wealthy nation is handling sustainable resource extraction.
learning goal • To understand the Canadian government’s policies on environmental protection.• To analyse the validity of these policies using the Alberta oil sands as a case study.• To compare Canada’s perspective on oil extraction with that of Norway.
success criteria• To investigate a variety of materials and complete assigned activities.• To work cooperatively with group members to explore and share information.
The following activities will help you gain an understanding of the economic benefits and the environmental issues around the oil sands in Canada.
1. Understanding why the Canadian government continues to promote the oil sands at home in Canada and abroad in the United States and Asia is important when analysing the Canadian perspective on environmental protection in this region.
a Read the following article and infographic on the economic benefits of oil sands production in Alberta and Canada.
www.huffingtonpost.ca/2014/02/12/canadian-oilsands-economic-impact_n_4776472.html
2. Complete the following organizer to summarize the economic value of the oil sands.
Inquiry question • How do Canada’s sustainable resource management practices compare to that of Norway, another wealthy oil producing nation?
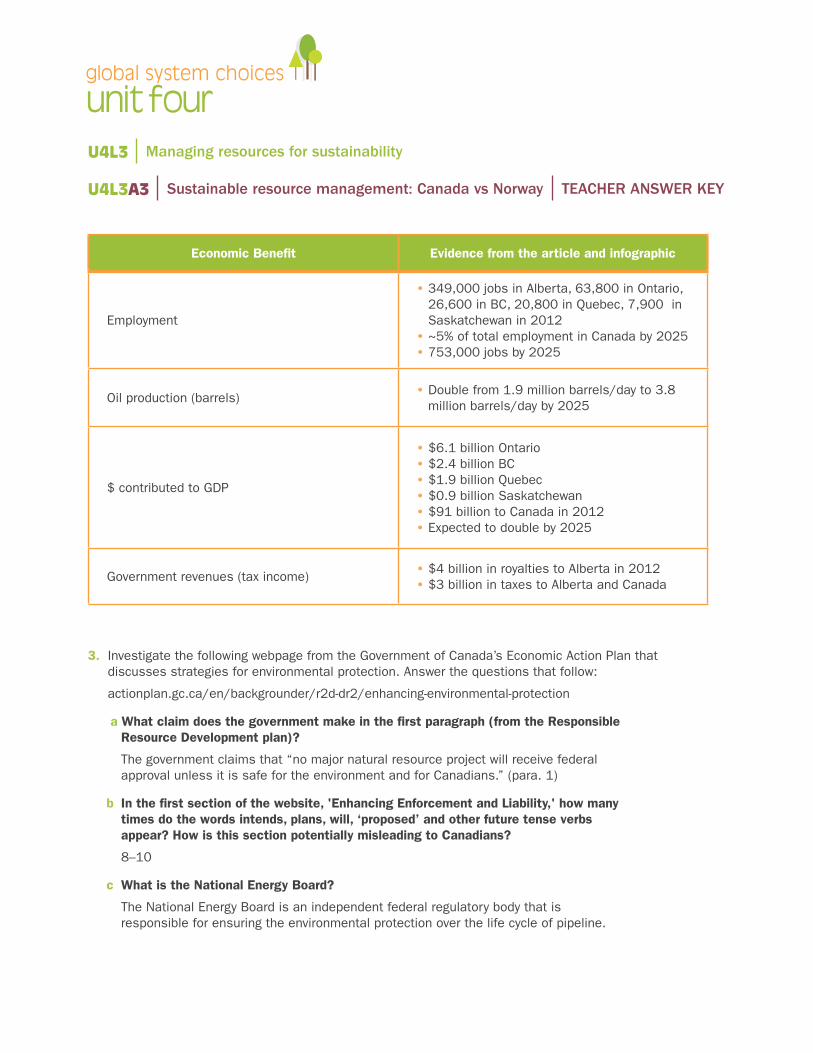
unit fourglobal system choices
U4L3A3 Sustainable resource management: Canada vs Norway TEACHER ANSWER KEY
U4L3 Managing resources for sustainability
Economic Benefit Evidence from the article and infographic
Employment
• 349,000 jobs in Alberta, 63,800 in Ontario, 26,600 in BC, 20,800 in Quebec, 7,900 in Saskatchewan in 2012 • ~5% of total employment in Canada by 2025 • 753,000 jobs by 2025
Oil production (barrels) • Double from 1.9 million barrels/day to 3.8 million barrels/day by 2025
$ contributed to GDP
• $6.1 billion Ontario • $2.4 billion BC • $1.9 billion Quebec • $0.9 billion Saskatchewan • $91 billion to Canada in 2012 • Expected to double by 2025
Government revenues (tax income) • $4 billion in royalties to Alberta in 2012 • $3 billion in taxes to Alberta and Canada
3. Investigate the following webpage from the Government of Canada’s Economic Action Plan that discusses strategies for environmental protection. Answer the questions that follow:
actionplan.gc.ca/en/backgrounder/r2d-dr2/enhancing-environmental-protection
a What claim does the government make in the first paragraph (from the Responsible Resource Development plan)?
The government claims that “no major natural resource project will receive federal approval unless it is safe for the environment and for Canadians.” (para. 1)
b In the first section of the website, 'Enhancing Enforcement and Liability,' how many times do the words intends, plans, will, ‘proposed’ and other future tense verbs appear? How is this section potentially misleading to Canadians?
8–10
c What is the National Energy Board?
The National Energy Board is an independent federal regulatory body that is responsible for ensuring the environmental protection over the life cycle of pipeline.
unit fourglobal system choices
U4L3A3 Sustainable resource management: Canada vs Norway TEACHER ANSWER KEY
U4L3 Managing resources for sustainability
d Identify one strategy that the Canadian government is implementing to ensure oil pipeline safety.
The government is increasing the number of annual inspections of pipelines by 50 per cent.
e How is the government protecting coastal regions in Canada against tanker spills?
The Canadian government is implementing a tanker safety system that will help prevent accidents through eight new measures including increasing inspections, monitoring and surveillance, establishing a Coast Guard command system, and an improved navigation system.
4. Read the following two articles from the news on current environmental protection regulation issues in Canada.
a Describe the main issue outlined in each article.
b Evaluate the government response in each situation, based on evidence from the articles.
www.cbc.ca/news/canada/british-columbia/taseko-new-prosperity-mine-at-fish-lake-rejected-again-1.2553002
www.theglobeandmail.com/news/british-columbia/canada-failing-to-learn-from-world-class-oil-spill-cleanups/article24017204
5. Oil extraction from the Alberta oil sands is a highly controversial environmental issue in Canada. The environmental impact of this energy project is debated internationally and has the potential to interfere with Canadian economic growth through rejected international pipeline initiatives and potential moratoriums on continued oil extraction in the region.
a In groups of three, read the accompanying article from Canadian Geographic. The article has been broken into three sections due to length. Each section has the introduction and the concluding paragraphs which will allow each member of the group to have the context.
b Complete the organizer together using point-form notes.
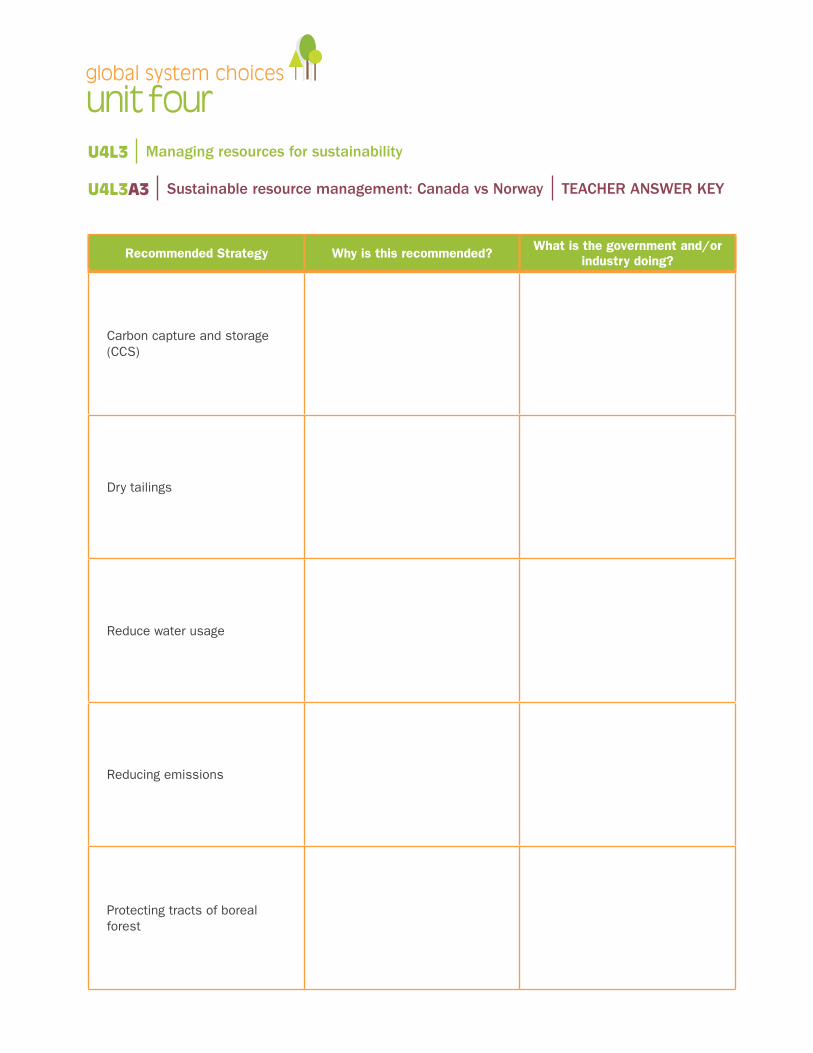
unit fourglobal system choices
U4L3A3 Sustainable resource management: Canada vs Norway TEACHER ANSWER KEY
U4L3 Managing resources for sustainability
Recommended Strategy Why is this recommended? What is the government and/or industry doing?
Carbon capture and storage (CCS)
Dry tailings
Reduce water usage
Reducing emissions
Protecting tracts of boreal forest
unit fourglobal system choices
U4L3A3 Sustainable resource management: Canada vs Norway TEACHER ANSWER KEY
U4L3 Managing resources for sustainability
6. Understanding how Norway, another wealthy oil-producing nation is sustainably managing their resource can provide leadership to Canada.
a Watch the video titled Sustainability: A Norwegian Perspective
b Read the following article on Norway’s strategies for economic growth within the context of environmental protection
www.theglobeandmail.com/report-on-business/international-business/european-business/norway-proves-oil-rich-nations-can-be-both-green-and-prosperous/article21514455
c Describe three strategies Norway is using, that Canada is not, that has allowed Norway to be one of the wealthiest, most productive countries in the world while still meeting targets for environmental protection.
unit fourglobal system choices
U4L3A5 Considering the hidden costs of production: exit card TEACHER ANSWER KEY
U4L3 Managing resources for sustainability
overviewIn this activity you will act on your learning from Activity 1. In Activity 1, you conducted an inquiry by acting as a company trying to produce an MP3 player in a sustainable way, according to the learning goals and success criteria below. Now, you will reflect on your learning by answering the questions that follow.
learning goal • To understand that the items I purchase are produced through decision-making that impacts
global sustainability.
success criteria• To be able to describe how I can be better informed on the sustainability of a product.
Complete the following questions as an exit card for the lesson.
Student exemplars
As a consumer, what information do you need to make sustainable choices when purchasing new items?
It would be helpful to have information about the carbon footprint of a product, including distance traveled (for all parts) and the carbon emissions. Also, I would like to know whether it was produced in a factory with good working conditions (pay, safety). Lastly, I would want to know whether the community that produced the goods benefitted (like fair trade products).
What strategies could companies use to keep consumers better informed about working conditions and the environmental impacts of the products they produce? Identify and explain two ways.
I think companies should be much better about advertising the good about their products. For example, H&M has quite a good sustainability policy, but unless you look it up online you might not know. So definitely the internet is helpful, but I think it should be on the label as well so you know right away without having to google it.
Inquiry question • How do companies balance social and environmental sustainability with the need for profit when producing consumer goods?
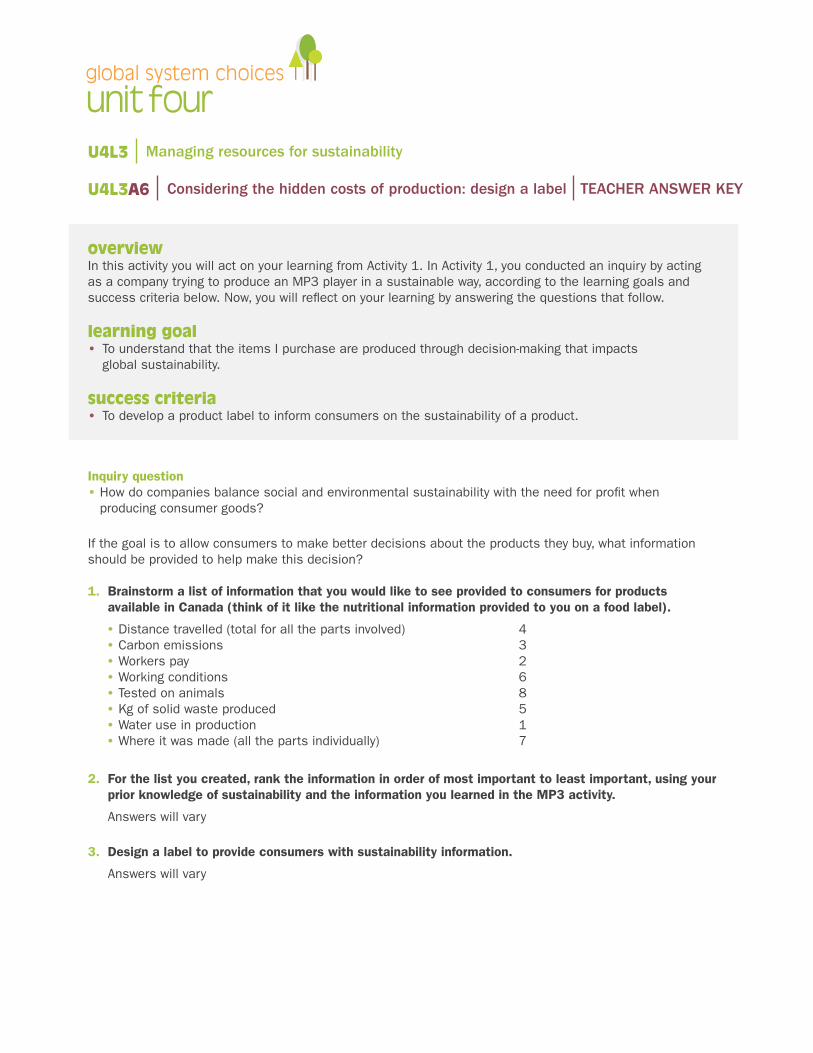
unit fourglobal system choices
U4L3A6 Considering the hidden costs of production: design a label TEACHER ANSWER KEY
U4L3 Managing resources for sustainability
overviewIn this activity you will act on your learning from Activity 1. In Activity 1, you conducted an inquiry by acting as a company trying to produce an MP3 player in a sustainable way, according to the learning goals and success criteria below. Now, you will reflect on your learning by answering the questions that follow.
learning goal • To understand that the items I purchase are produced through decision-making that impacts
global sustainability.
success criteria• To develop a product label to inform consumers on the sustainability of a product.
If the goal is to allow consumers to make better decisions about the products they buy, what information should be provided to help make this decision?
1. Brainstorm a list of information that you would like to see provided to consumers for products available in Canada (think of it like the nutritional information provided to you on a food label).
• Distance travelled (total for all the parts involved) 4 • Carbon emissions 3 • Workers pay 2 • Working conditions 6 • Tested on animals 8 • Kg of solid waste produced 5 • Water use in production 1 • Where it was made (all the parts individually) 7
2. For the list you created, rank the information in order of most important to least important, using your prior knowledge of sustainability and the information you learned in the MP3 activity.
Answers will vary
3. Design a label to provide consumers with sustainability information.
Answers will vary
Inquiry question • How do companies balance social and environmental sustainability with the need for profit when producing consumer goods?
unit fourglobal system choices
U4L3A7 Considering the hidden costs of production: issue analysis TEACHER ANSWER KEY
U4L3 Managing resources for sustainability
overviewIn this activity you will act on your learning from Activity 1. In Activity 1, you conducted an inquiry by acting as a company trying to produce an MP3 player in a sustainable way, according to the learning goals and success criteria below. Now, you will reflect on your learning by answering the questions that follow.
learning goal • To understand that the items I purchase are produced through decision-making that impacts
global sustainability.
success criteria• To apply my learning about sustainability to a case study in Venezuela.
Read the accompanying article on a Venezuelan initiative and answer the questions that follow:venezuelanalysis.com/news/5792
1. What is the Venezuelan government initiative described in this article?
The Venezuelan government is distributing laptops to children in elementary school. This article discusses the latest installment (109 of 350,000) but they have already distributed 228,000.
2. How is this project being funded, and what is the total cost?
It is being funded from the profits from oil produced in the country (in an agreement with Portugal, who is producing the computers). The total cost is $163 million USD.
3. How does this initiative improve social sustainability in Venezuela?
Providing computers to school children should improve their access to information, which should elevate the education level of the country and making it more competitive globally.
4. Based on your learning from the MP3 activity, explain how this initiative impacts environmental sustainability, both in Venezuela and globally.
A laptop is a product. The production of 525,000 computers in Portugal requires raw materials and resources and energy to produce them. In addition, these computers need to be shipped from southern Europe to South America, requiring fuel and producing waste emissions. In addition, after they are no longer functioning, they will need to be disposed of, creating electronic waste which is highly toxic to the environment if not disposed of properly.
Inquiry Question • How do companies balance social and environmental sustainability with the need for profit when producing consumer goods?
unit fourglobal system choices
5. The Venezuelan Minister of Education, Jennifer Gil, is quoted in the article as saying:
“Only in socialism is it possible to make real the rights of children, the rights of the people, to an improved quality of education and standard of living.”
Based on your prior knowledge of the Venezuelan government and the drive to improve the quality of life in Venezuela, explain what Jennifer Gil means by this statement.
The government of Venezuela controls much of the country’s infrastructure and in this case, has nationalized oil production. This means that the profits from oil can be spent on social development, like the laptop initiative. Her statement implies that social spending like the laptop initiative could not have occurred without the money from oil and a directive from the then President Hugo Chavez to improve the quality of life of Venezuelan people.
U4L3A7 Considering the hidden costs of production: issue analysis TEACHER ANSWER KEY
U4L3 Managing resources for sustainability

Inquiry Question • How do companies balance social and environmental sustainability with the need for profit when producing consumer goods?
overviewIn this activity you will complete the National Geographic activity on an MP3 player to understand that each stage of production requires choices for people, profit and planet. Throughout the activity you are acting as company owners and using critical thinking skills to try to produce a sustainable MP3 player.
learning goal • To understand that the items I purchase are produced through decision-making that impacts
global sustainability.
success criteria• Complete the MP3 production organizer to demonstrate critical thinking with respect to decision-making.
To access the interactive activity on making an MP3 player, click on the link below:globalcloset.education.nationalgeographic.com/map-done
1. Complete the inquiry into building a MP3 player. Pay particular attention to the hidden costs as you collect badges. If you would like to read the transcript of the video, click Show Transcript in the top left corner. If you would like to change your mind about a decision you made, click the back arrow on the webpage and it will take you back one step.
2. Complete the organizer on the next page according to the following instructions as you proceed through the activity:
a You need to complete the ‘How will you decide?’ section by identifying the costs and benefits for each option. To identify the costs and benefits, select each option to hear more about the impacts of each choice. In addition, you need to use prior knowledge from your understanding about sustainability.
b You also need to complete the ‘What decision did you make’ section by identifying your choice and explaining how it balances care for people and planet with need for profits.
unit fourglobal system choices
U4L3A1 Considering the hidden costs of production
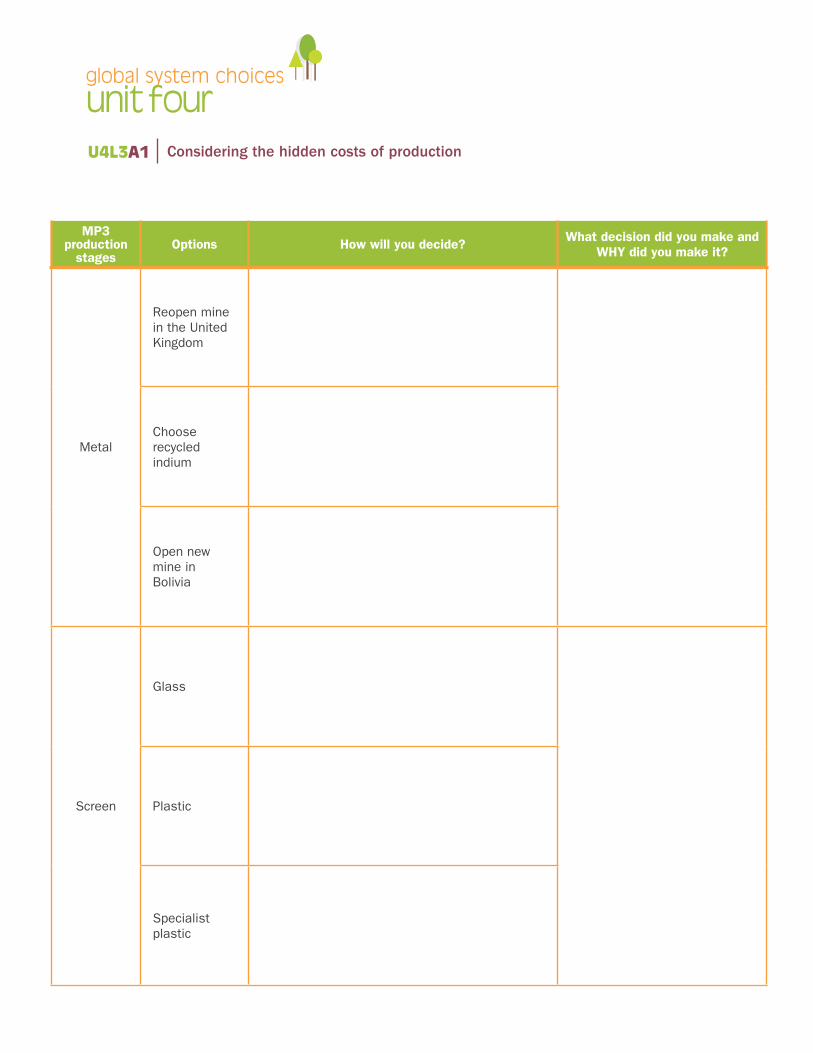
MP3 production
stagesOptions How will you decide? What decision did you make and
WHY did you make it?
Metal
Reopen mine in the United Kingdom
Choose recycled indium
Open new mine in Bolivia
Screen
Glass
Plastic
Specialist plastic
unit fourglobal system choices
U4L3A1 Considering the hidden costs of production

MP3 production
stagesOptions How will you decide? What decision did you make and
WHY did you make it?
Electronics
Factory with good human rights record
Well-established factory with sketchy human rights record
Low-cost factory in a natural disaster-prone area
unit fourglobal system choices
U4L3A1 Considering the hidden costs of production

Software
Buy a company abroad that specializes in MP3 player software
Recruit software developers of your own
Buy a licence to use someone else’s software
MP3 production
stagesOptions How will you decide? What decision did you make and
WHY did you make it?
unit fourglobal system choices
U4L3A1 Considering the hidden costs of production
Using the information from the activity and from your prior learning about sustainability, answer the following questions:
1. Do you think you have produced a sustainable product? Why or why not? Provide two reasons, being sure to connect it to the themes of sustainability (people, profit, planet).
2. What was difficult about choosing each of the materials for your MP3 player? Identify two barriers to making the sustainable choice for one raw material in the activity.
3. Did this activity accurately reflect the types of choices made by businesses in the real world? How was it perhaps easier for you to choose options than it would be for a business owner? Explain your answer using two examples from the activity.
unit fourglobal system choices
U4L3A1 Considering the hidden costs of production

unit fourglobal system choices
U4L3A1 Considering the hidden costs of production
4. Explain the importance of trade to the production of your MP3 player.
5. Indium is a by-product of tin mining and is also produced in Canada. How would using Canadian indium affect the sustainability (the impacts on people, profit, planet) of your product? Provide three ways.
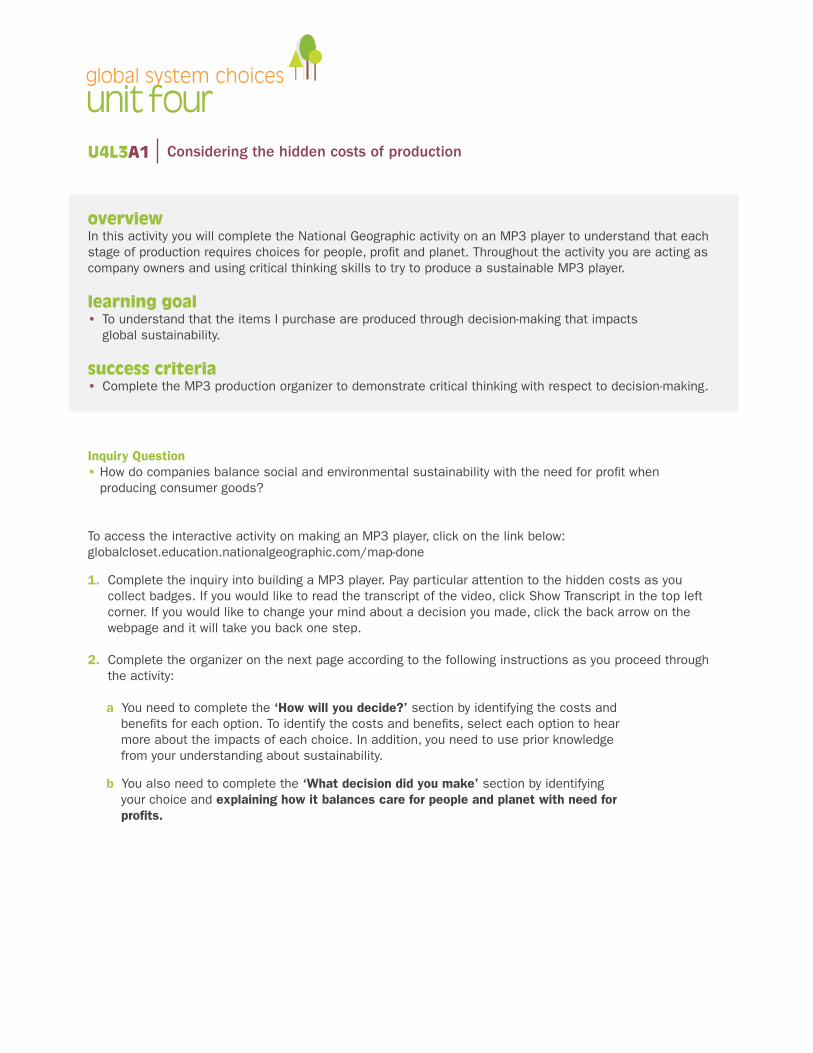
Inquiry Question • How do companies balance social and environmental sustainability with the need for profit when producing consumer goods?
overviewIn this activity you will complete the National Geographic activity on an MP3 player to understand that each stage of production requires choices for people, profit and planet. Throughout the activity you are acting as company owners and using critical thinking skills to try to produce a sustainable MP3 player.
learning goal • To understand that the items I purchase are produced through decision-making that impacts
global sustainability.
success criteria• Complete the MP3 production organizer to demonstrate critical thinking with respect to decision-making.
To access the interactive activity on making an MP3 player, click on the link below:globalcloset.education.nationalgeographic.com/map-done
1. Complete the inquiry into building a MP3 player. Pay particular attention to the hidden costs as you collect badges. If you would like to read the transcript of the video, click Show Transcript in the top left corner. If you would like to change your mind about a decision you made, click the back arrow on the webpage and it will take you back one step.
2. Complete the organizer on the next page according to the following instructions as you proceed through the activity:
a You need to complete the ‘How will you decide?’ section by identifying the costs and benefits for each option. To identify the costs and benefits, select each option to hear more about the impacts of each choice. In addition, you need to use prior knowledge from your understanding about sustainability.
b You also need to complete the ‘What decision did you make’ section by identifying your choice and explaining how it balances care for people and planet with need for profits.
unit fourglobal system choices
U4L3A1 Considering the hidden costs of production

MP3 production
stagesOptions How will you decide? What decision did you make and
WHY did you make it?
Metal
Reopen mine in the United Kingdom
Choose recycled indium
Open new mine in Bolivia
Screen
Glass
Plastic
Specialist plastic
unit fourglobal system choices
U4L3A1 Considering the hidden costs of production
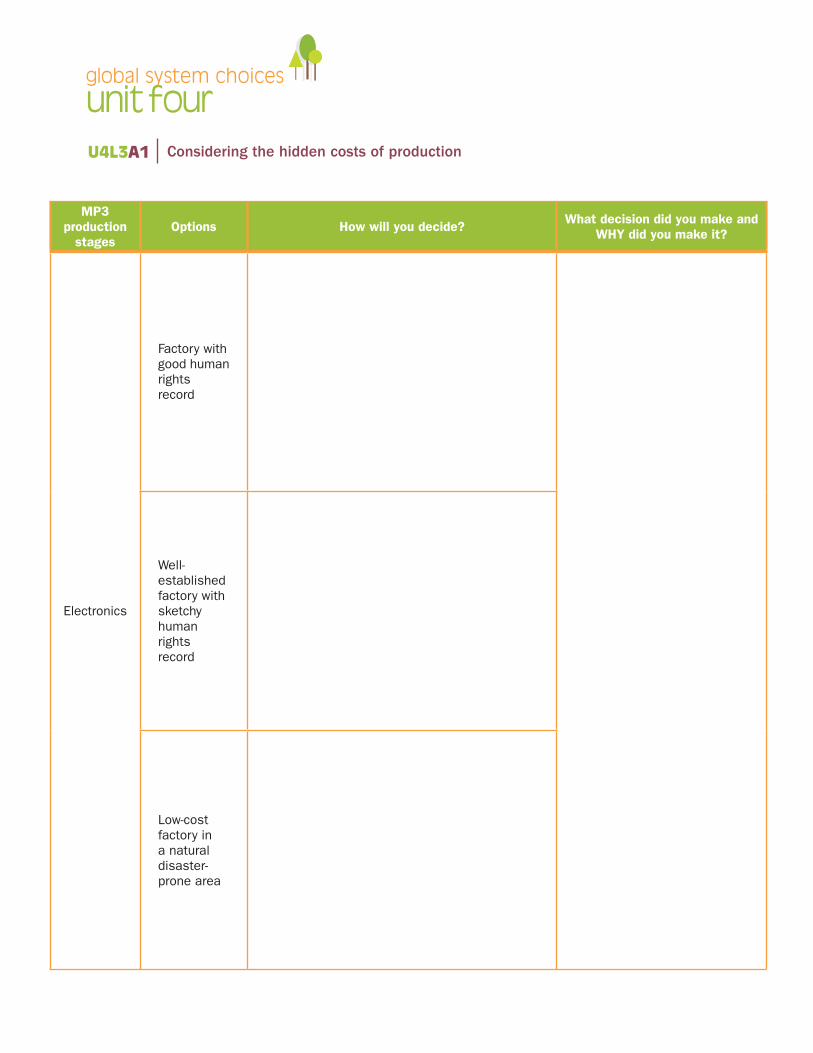
MP3 production
stagesOptions How will you decide? What decision did you make and
WHY did you make it?
Electronics
Factory with good human rights record
Well-established factory with sketchy human rights record
Low-cost factory in a natural disaster-prone area
unit fourglobal system choices
U4L3A1 Considering the hidden costs of production
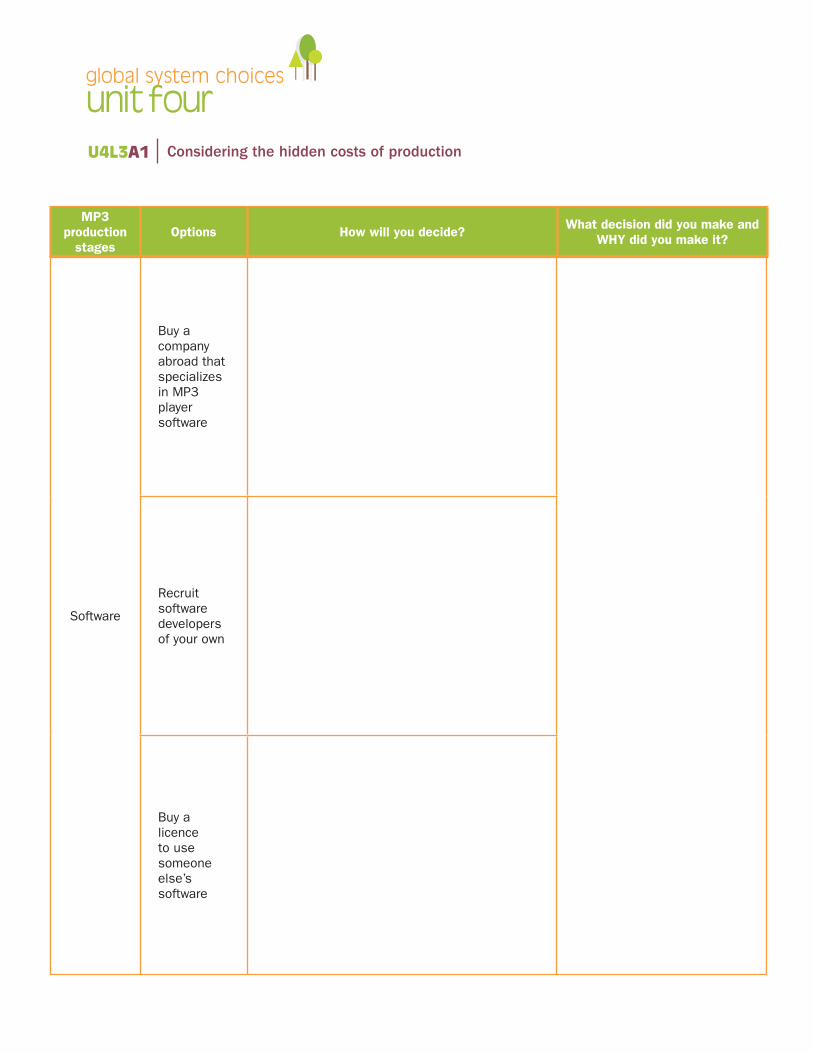
Software
Buy a company abroad that specializes in MP3 player software
Recruit software developers of your own
Buy a licence to use someone else’s software
MP3 production
stagesOptions How will you decide? What decision did you make and
WHY did you make it?
unit fourglobal system choices
U4L3A1 Considering the hidden costs of production

Using the information from the activity and from your prior learning about sustainability, answer the following questions:
1. Do you think you have produced a sustainable product? Why or why not? Provide two reasons, being sure to connect it to the themes of sustainability (people, profit, planet).
2. What was difficult about choosing each of the materials for your MP3 player? Identify two barriers to making the sustainable choice for one raw material in the activity.
3. Did this activity accurately reflect the types of choices made by businesses in the real world? How was it perhaps easier for you to choose options than it would be for a business owner? Explain your answer using two examples from the activity.
unit fourglobal system choices
U4L3A1 Considering the hidden costs of production
unit fourglobal system choices
U4L3A1 Considering the hidden costs of production
4. Explain the importance of trade to the production of your MP3 player.
5. Indium is a by-product of tin mining and is also produced in Canada. How would using Canadian indium affect the sustainability (the impacts on people, profit, planet) of your product? Provide three ways.
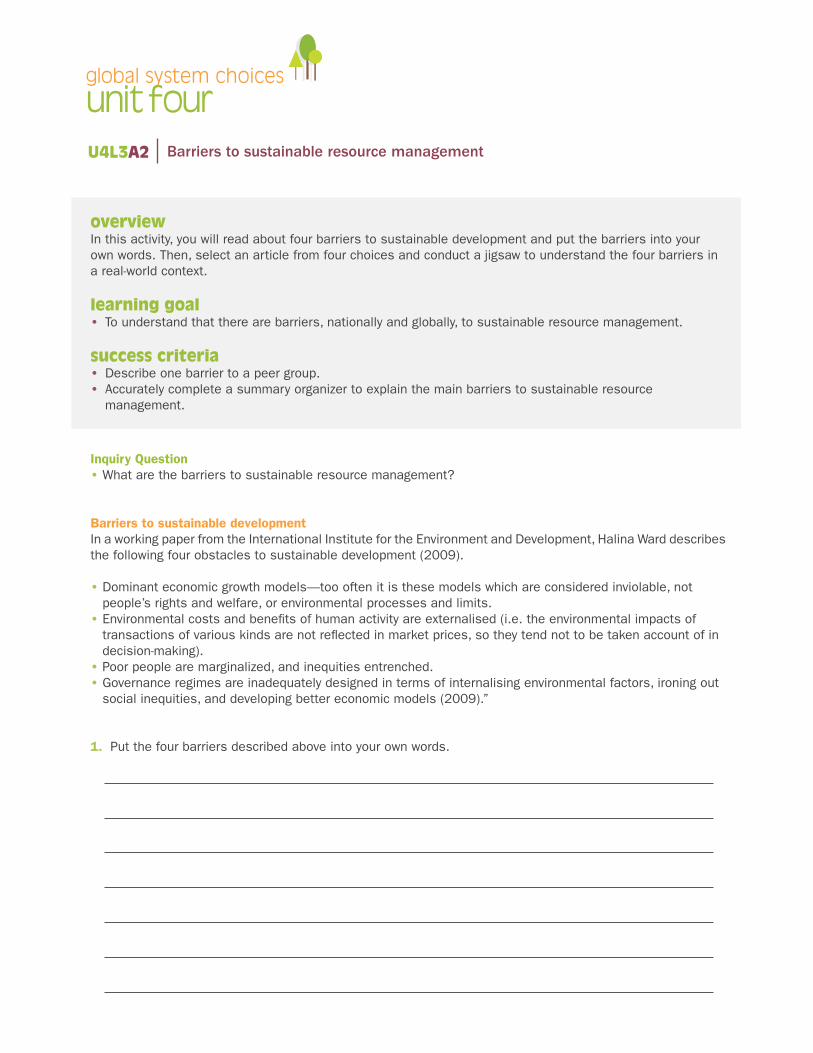
overviewIn this activity, you will read about four barriers to sustainable development and put the barriers into your own words. Then, select an article from four choices and conduct a jigsaw to understand the four barriers in a real-world context.
learning goal • To understand that there are barriers, nationally and globally, to sustainable resource management.
success criteria• Describe one barrier to a peer group.• Accurately complete a summary organizer to explain the main barriers to sustainable resource
management.
Barriers to sustainable developmentIn a working paper from the International Institute for the Environment and Development, Halina Ward describes the following four obstacles to sustainable development (2009).
• Dominant economic growth models—too often it is these models which are considered inviolable, not people’s rights and welfare, or environmental processes and limits. • Environmental costs and benefits of human activity are externalised (i.e. the environmental impacts of transactions of various kinds are not reflected in market prices, so they tend not to be taken account of in decision-making). • Poor people are marginalized, and inequities entrenched. • Governance regimes are inadequately designed in terms of internalising environmental factors, ironing out social inequities, and developing better economic models (2009).”
1. Put the four barriers described above into your own words.
unit fourglobal system choices
U4L3A2 Barriers to sustainable resource management
Inquiry Question • What are the barriers to sustainable resource management?
unit fourglobal system choices
U4L3A2 Barriers to sustainable resource management
2. Select one article from the choices provided and read it, highlighting main ideas and key points.
3. In your article groups, complete the article analysis organizer on the next page.
Important terms:
Explain how this article describes one of the following barriers:
1. Economy over environment2. Externalizing the costs3. Marginalizing poor people and increasing inequality4. Governance that prevents sustainable decision-making
The issues:
Main ideas:
article analysis organizer
unit fourglobal system choices
U4L3A2 Barriers to sustainable resource management
unit fourglobal system choices
U4L3A2 Barriers to sustainable resource management Article 1
The Great Economy Versus Environment MythIan Carey Huffington PostPosted: 04/05/2012 1:03 pm EDT Updated: 06/05/2012 5:12 am EDT
To many people the most prominent debate of the day is seemingly between the economy and the environment, and in today's economic climate the health of the economy is often deemed more important.Environmentalism, in some circles, is still thought to be only about protecting trees and cuddly animals instead of trying to protect the environmental conditions necessary to ensure the health of people all over the world. While environmentalists and environmental NGOs actually spend a great deal of time studying and reporting on how climate change will impact human and economic health, many people consider environmentalists to be critical and dismissive of any type of resource extraction or energy production and as never giving a thought to job creation or the impact environmental regulations would have on the profitability of certain industries.
In similar fashion, any action taken to protect the environment is seen by many as detrimental to the health of the economy. In the short term this perception is often correct: stricter pollution regulations hurt the profitability of companies and decrease the speed at which they are able to expand their operations while renewable energy is, at the moment, more costly to produce and will need continued government support to become as viable as its more polluting alternatives.
The problem with this perception is that the economy and environment are not in opposition with one another. In fact, environmental issues are not separate from any issue we face but actually a component of them all. You cannot combat poverty, disease, or suffering without a stable climate and a healthy environment for which people to live in and you cannot improve a struggling economy either.
A healthy environment is a prerequisite for a healthy economy. The economy relies on the planet's ability to provide resources and the necessities of life, if the pollution we produce is reducing its ability to do that it becomes catastrophic for the economy. In fact, climate change has the potential to (and most likely will) send us into one of the biggest global recessions ever.
"Climate change presents a growing, long-term economic burden for Canada," said the National Round Table of the Environment and Economy (NRTEE) in September of last year. The NRTEE is an independent agency created by the federal government in 1988 with the mandate to show "leadership in the new way we must think of the relationship between the environment and the economy and the new way we must act." According to their report last fall, climate change will start costing Canada in the billions by 2020 but that number could balloon up to as much as $43 billion a year by 2050. The economic burdens climate change creates come from a disruption to Canada's timber industry arising from changing environmental conditions, a drain on our health care system from warmer weathers and increased premature deaths, flooding in coastal areas and many other factors.
The report did not go into the impacts felt from global affects such as a rise in the cost of food, and an increase in the need for humanitarian funds to help those affected by the drastic increase projected for extreme weather patterns. Take that into consideration as well and the future looks grim for Canada's economy if runaway climate change is allowed to continue.
unit fourglobal system choices
U4L3A2
Last year a report showed that climate change is to blame for the rise in the cost of food. Food prices, as with energy, have a trickle-down effect on the rest of the economy, when people have to pay more for food it causes inflation and means everyone spends less on everything else. The more climate change creates harsher conditions that are detrimental to global food production the more the global economy suffers.
The increase in extreme weather patterns that we have seen in the last few years are projected to increase in quantity and size as climate change progresses, and in addition to causing massive amounts of human suffering they are also quite costly. In 2011 the United States experienced 14 extreme weather events, all of them costing more than a billion dollars each.
The impacts of climate change have far greater consequences than sheer economics, however. While it may be possible to put a dollar figure on the costs involved in relocating people, providing humanitarian aid to countries experiencing drought, and the cleanup of areas that have experienced extreme weather or flooding, calculating the cost of human suffering involved in those occurrences and putting a dollar figure on it is of course impossible.
There is nothing more threatening to the health of our economy than climate change, yet frequently there are those defending environmentally destructive activities by claiming they are doing so for the sake of the economy. The truth is actually that the action they are defending would most likely be good for the economy in the short term but in the long term would also contribute to future economic hardship and the risk of massive global recession, not to mention the incalculable costs of human suffering. Perhaps it's time for Canada, and much of the rest of the world, to start looking at the long term implications of a damaged environment when mapping out their current economic strategies.
Barriers to sustainable resource management Article 1
unit fourglobal system choices
U4L3A2
The Story of Stuff: Externalized Costs and the $4.99 RadioAnnie Leonard Executive Director, Greenpeace USAPosted: 05/09/2010 5:12 am EDT Updated: 05/25/2011 3:45 pm EDT
Walking to work one day I wanted to listen to the news, so I popped into Radio Shack. I found a cute little green radio for $4.99. Pleased with my bargain, I stood in line to pay, but then started wondering: how could $4.99 cover the cost of extracting the raw materials, manufacturing the parts, assembling the radio, and getting it into my hands?
Whenever I go to buy something I get sidetracked, thinking of how it got here. It's an occupational hazard. I spent a decade traveling around the world, visiting the factories where our stuff is made and the dumps where it goes when we don't want it any more. What I learned makes it impossible for me to look at anything and not see the journey it made through the global take-make-waste system.
The metal in that $4.99 radio was probably mined in Africa. The petroleum that went into the plastic probably was pumped from Iraq, and the plastic itself produced in China. The packaging came from forests in Brazil or Canada. Maybe the parts were then shipped across the ocean to Mexico, where some 15-year-old in a maquiladora assembled the radio. There it was put on a truck or a train and shipped to a distribution center in Southern California, then 500 miles north to my local store.
Four-ninety-nine? That wouldn't pay for the shelf space it took up until I came along, let alone the salary for the guy who helped me pick it out.
That's when I realized: I didn't pay for the radio. So who did?
A study currently underway for the United Nations is calculating the cost of pollution and other environmental damage caused by the 3,000 largest publicly held corporations in the world. The study, which will be published this summer, has found that the cost of environmental damage by these companies is $2.2 trillion, or more than one-third of their profits if they were held financially accountable. This includes greenhouse gas emissions, other pollution, and water degradation. The final amount is likely to increase once additional costs -- like toxic waste -- are incorporated.
The Guardian newspaper wrote: "The report comes amid growing concern that no one is made to pay for most of the use, loss and damage of the environment, which is reaching crisis proportions in the form of pollution and the rapid loss of freshwater, fisheries and fertile soils." Economists call that externalizing costs, and it's how corporations hide the true cost of making and selling cheap stuff -- costs that are never recorded on the balance sheets and consumers never see. As David Korten writes in When Corporations Rule the World, "Externalized costs don't go away -- they are simply ignored by those who benefit from making the decisions that result in others incurring them."
What the UN report means is that a big chunk of the profits these big companies are making is due not paying the full cost of extraction, production, distribution and disposal. They are shoving a whole range of costs -- from pollution to climate change to water depletion -- onto us. Communities around the world are bearing the costs with degraded health, soil, water and climate change. That's just not fair.
Barriers to sustainable resource management Article 2
unit fourglobal system choices
U4L3A2
Which takes us back to the original question: Who paid for that $4.99 radio? Some people paid with the loss of their natural resources. Some paid with the loss of clean air, with increased asthma and cancer rates. Some workers paid by having to cover their own health insurance. Kids in Africa paid with their future: a third of the school-age children in parts of the Congo now drop out to mine metals for electronics. All along the way, people pitched in, or were forced to, so I could buy a radio for $4.99 -- so cheap that if it broke I could just throw it away.
The UN report is a good first step at showing the global scale of externalized costs. If we're going to get our economy and environment back in order, a top priority must be forcing companies to pay the full costs of production. In economist-speak, this means internalizing externalities. That would be a strong motivator to get companies to invest in the cleaner, less polluting approaches and encourage all of us to avoid superfluous consumption.
If the true cost of that cotton t-shirt or iPod was included in the price tag, we might think twice before throwing it out and replacing it before we really need to. Think about that next time you look at those insanely low prices on so much consumer stuff -- who is really paying the full cost of producing all this? Not the companies that sell it.
Annie Leonard is author of The Story of Stuff: How Our Obsession With Stuff is Trashing the Planet, Our Communities and Our Health - and a Vision for Change, just published by Free Press, please see www.storyofstuff.org for more information.
Barriers to sustainable resource management Article 2
unit fourglobal system choices
U4L3A2
Excerpts from “Cambodia's sugar rush leaves farmers feeling bitter at 'land grab'”Kate Hodal in Koh KongTuesday 9 July 2013 21.10 BSTLast modified on Thursday 22 May 201401.20 BST
The plantation extends as far as the eye can see, row after row of green leaves swaying against the dusky blue light until, finally, it merges with the horizon. There are no houses, no animals, no people. Just sugar.Standing by a rickety wooden fence that separates her clapboard home from the field in front of us, Yoen Sarin, 29, waves her hand in an arc. "My land extended from there to just over there." She narrows her eyes. "The company tried to bulldoze their way closer but I built this fence, and even though they've already knocked it down twice, I'm not moving. I keep rebuilding it."
Yoen Sarin is just one of thousands of Cambodian farmers who claim they are losing their land and livelihoods to big sugar plantations, some of which are directly supplying the EU through companies such as Tate & Lyle Sugars.
Nearly 100,000 hectares (250,000 acres) have been cleared in three provinces to make way for sugar plantations since 2006, activists allege – and most of that land, they argue, has been stolen from subsistence farmers.
Sugar is big business in Cambodia, thanks to a preferential EU trade scheme called Everything But Arms (EBA), which allows Cambodian sugar to be sold duty-free on the European market at a minimum price per tonne. Official figures show that 97% of Cambodia's €10m (£8.5m) sugar exports went to the EU last year, and Tate & Lyle bought 99% of them.
Although the initiative is intended to bolster the world's least-developed countries, the villagers say they have not profited from the deal at all.
"When the company came in May 2006, they bulldozed without consultation or any environmental impact assessment," said Teng Kao, 52, a village representative from Koh Kong province who lost nearly 10 hectares to the plantations. "They bulldozed the fields and streams. They shot our animals. After about 100 families' land was taken away, we started taking pictures."
The "company" Teng Kao refers to is one of two Cambodian entities owned by the Thai group KSL. For the past two years, these companies have sold all of their sugar cane to Tate & Lyle. Now, Teng Kao and some 200 other villagers are taking their fight to the high court in London.
Criminal violenceBacked by British law firm Jones Day, the villagers have filed a lawsuit against Tate & Lyle, claiming that KSL were complicit in government moves to evict them to make way for the plantations. They also say they were insufficiently compensated for the land they lost, and faced "multiple instances of battery and criminal violence" during which villagers were shot at and wounded, with one activist murdered.
The villagers are claiming compensation for some of the 48,000 tonnes – or roughly €24m worth – of sugar that Tate & Lyle's London refinery has allegedly received since 2010. Tate & Lyle denies that its supplier, KSL, was involved in land clearances and claims that the land was owned by the government when it was sold to KSL.
Barriers to sustainable resource management Article 3
unit fourglobal system choices
U4L3A2
Land rights are a highly contentious issue in Cambodia. Private deeds were abolished under the communist Khmer Rouge, leaving subsistence farmers vulnerable to recent surges in land-grabs and mining and property developments. Campaigners estimate that nearly three-quarters of the country's arable farmland has been granted to private companies as economic land concessions, resulting in the displacement of more than 400,000 people since 2003.
Under Cambodian law, land possession can be established using various legal documents, not just land deeds. As many of the villagers in Koh Kong claim to have such papers, they say their land was stolen from beneath their feet. "I've been living here since I was born – this is my ancestral land," said Teng KaoTate & Lyle contends that it engaged a third-party organisation to ensure that KSL complied with legal, ethical and sustainability standards. The auditors concluded that land concessions were legitimate and that villagers who occupied the land "were given compensation and resettled by the Cambodian government prior to the concessions being granted".
Tate & Lyle says KSL provided documentation to prove that compensation had been paid and alternative land parcels provided to the villagers affected, and says it is confident that the sugar it has purchased from Cambodia "is free of breaches of human rights". But it also says it is ready to break its contract with KSL if "evidence is forthcoming of any wrongdoing by our supplier".
Since they lost their farmland to the plantations, many villagers say they have been forced to seek work from the very company they are now suing. "I had to pull my kids out of school and send them to work on the plantation after they took our land away because we couldn't afford to eat," said Chea Sok, 38, a claimant in the lawsuit.
"We work together in the plantation now cutting 1,000 stems of sugar cane a day [for 79p]. It's exhausting and hot and the bundles are so heavy for [my children], they get fever working in the field. They've hardly grown at all – sometimes we don't even have enough rice to eat."
While visiting one of the KSL plantations in January the Guardian saw at least a dozen underage children cutting sugar cane, including some as young as nine years old. The Guardian also filmed children receiving payment for their work on the plantation, and interviewed parents who confirmed that their children worked in the fields and received payment for their labour. While it is difficult to establish just how many children may be working in the fields at any given time, campaigners say that hundreds may cut sugar cane on the KSL plantations during harvest, based on their interviews with families affected by the concessions.
Tate & Lyle Sugars says it does not condone or authorise child labour and would investigate any evidence that its supplier was using it. It says it would take steps to remedy the situation if it found KSL had been using children on its plantations, and would terminate its contract with KSL if the situation could not be resolved. KSL did not respond to multiple requests for comment.
The villagers suing Tate & Lyle are only a small number of those affected by the EU's demand for Cambodian sugar. Activists from the Clean Sugar Campaign, a coalition of NGOs and villagers affected by the concessions, report widespread allegations of human rights abuses, including forced evictions across three provinces – Koh Kong, Kampong Speu and Oddar Meanchey – state-sanctioned violence, destruction of farmland and cattle, relocations to non-arable land, child labour, destruction of protected forest and little-to-no compensation paid to villagers. Those who have resisted being moved off their land have been beaten, shot at and imprisoned, activists claim.
Barriers to sustainable resource management Article 3
unit fourglobal system choices
U4L3A2
"We see really only one benefit to the country, and that's for the sugar companies," said Eang Vuthy, of Equitable Cambodia, an NGO supporting the estimated 3,000 families who have lost land or community forest due to sugar concessions. "There are very few jobs at the plantations, the conditions are bad and the work is cyclical. This [deal] is actually making the people poorer."
Tracing the sugar is difficult, but official figures show that in 2012 Tate & Lyle imported 15,385 tonnes of Cambodian sugar – 99% of the total Cambodian sugar imported by the EU.
The company would not confirm how it sells that sugar on to its customers. But as Tate & Lyle is the EU's leading cane sugar producer, and cane sugar is a key component in retail and industrial goods, campaigners argue that Cambodian sugar probably ends up in many of the soft drinks, yoghurts, cakes and confectionery that we consume daily.
Most importantly, say campaigners, a victory would strengthen a sector of Cambodian society that has felt voiceless and powerless for far too long.
"I'm poor and not knowledgeable, and have been threatened by district and other provincial officials to not talk out, to not protect others and to remember I'm at risk of being evicted at any time because this land now 'belongs' to the company," said Yoen Sarin, as she looked out at the sugar plantation that replaced her crops.
"As long as the company gives us our land back, we won't protest anymore."
Barriers to sustainable resource management Article 3
unit fourglobal system choices
U4L3A2
Nunavut premier wants more power over resource developmentMining a hot-button issue for Nunavut's Eva AariakCBC News Posted: Sep 01, 2013 2:10 PM ET Last Updated: Sep 01, 2013 2:12 PM ET
Mining activity in Canada's north is set to boom, with 140,000 new jobs forecast in the next few years.In anticipation of the forecast growth, Nunavut Premier Eva Aariak is pushing the federal government for a "devolution" of powers which would allow the territory more control over resource development.
Nunavut, created in 1999, is the last jurisdiction in Canada in which major decisions about its land and resources are made in Ottawa.
"It makes economic sense," says Aariak, speaking to Sunday Editionguest host Karin Wells. "Right now, none of the royalities goes to Nunavut. Under devolution, we would be able to share in that."
Currently, Nunavut has one mine operating. The Agnico-Eagles Meadowbank gold mine contributes to about 30 per cent of the territory's GDP last year. Another four mines are being developed in the region.
While environmental assessments are conducted under the aegis of the Nunavut land claims agreement, it's Ottawa that gets final say on whether a mine is given the green light.
"Soon we will see an ice-free Northwest Passage," Aariak said. "Before long, the world will be at our doorsteps."
Aariak said negotiations for devolution need to start immediately. More than half of the territory's population is under 25 years old, and Aariak said she would like to have a say in what kind of opportunities residents will have in the future.
"Devolution will provide us the power for controlling the pace of development and allow us to have environmental stewardship," she said.
Aariak said in the end, it's about "self-reliance" and making sure the territory can "stand on its own two feet."
Diversification better than miningHowever, Catherine Coumans of MiningWatch Canada cautions Aariak about moving so quickly towards having Nunavut govern its own resources. The non-profit watchdog tracks environmental and sustainability issues around mining.
Coumans, in an interview on Sunday Edition, said the premier would do better to concentrate on diversifying instead of relying on mining exploration.
"There's no promise those mining jobs would go to people in the territory," Coumans said. "In fact, a mining company says it's bringing back Chinese foreign temporary workers to a mine in B.C."
Coumans said if you examine how mining has affected developing countries — such as Ghana and Zambia — you'll find none of them have benefitted from that type of resource development.
Barriers to sustainable resource management Article 4
unit fourglobal system choices
U4L3A2
"The Oxford Policy Management group [which works with the World Bank, NGOs and UNICEF] examined that issue and found that in 10 years, countries that only developed its natural resources were worse off," Coumans said.
Coumans said that the level of governance needed to make sure the territory doesn't end up worse off than when it began developing its resources is "quite costly."
'Mining companies will siphon money off through transfer pricing...profits are made by the subsidiary so no taxes are paid.'—Catherine Coumans, MiningWatch Canada
Regulating mining companies and making sure their profits remain within the country's borders involve creating institutions for governance prior to any development.
"Mining companies will siphon money off through transfer pricing," explained Coumans. "They set up subsidiaries in tax havens around the world and they enter into transactions in which profits are made by the subsidiary so no taxes are paid [where the mine exists]."
Coumans said Nunavut would be better off spending what money it has on education and infrastructure rather than having to regulate mining concerns.
She also points out that mines have a short life and in the end, it's left up to taxpayers to pay for the resulting legacy costs — dealing with the toxic waste left behind.
"There needs to be more critical awareness around the costs associated with mining and not just the benefit," Coumans said.
Barriers to sustainable resource management Article 4
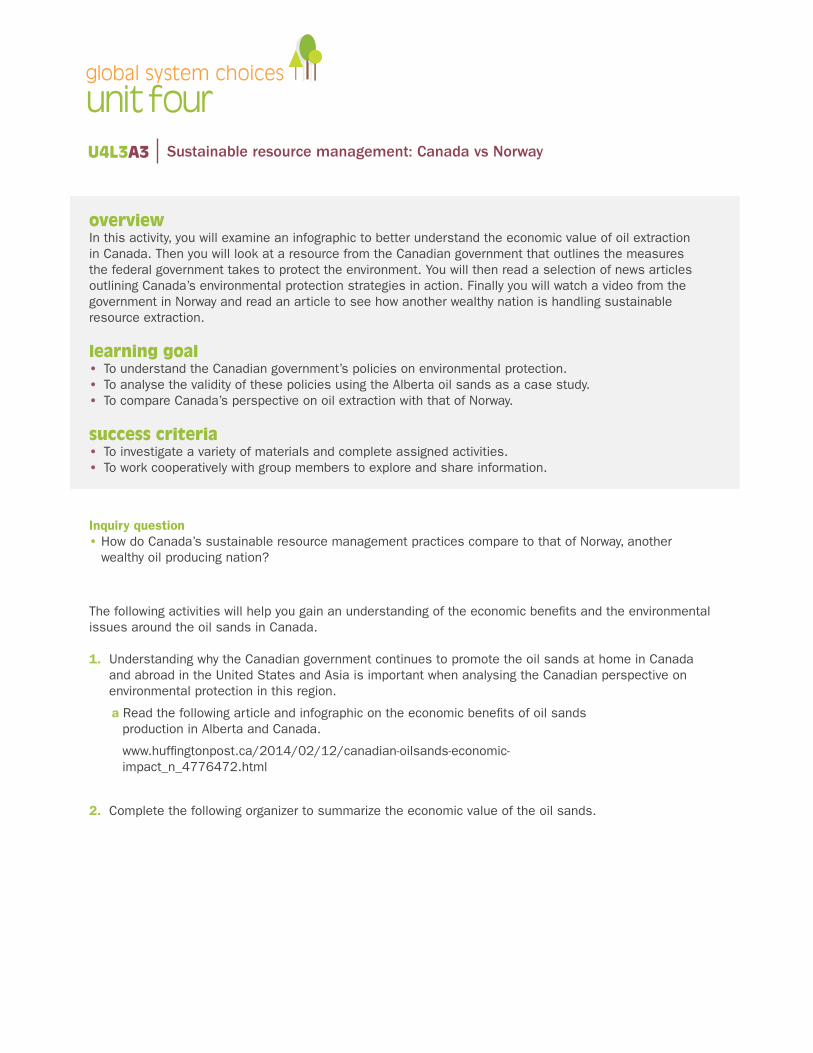
unit fourglobal system choices
overviewIn this activity, you will examine an infographic to better understand the economic value of oil extraction in Canada. Then you will look at a resource from the Canadian government that outlines the measures the federal government takes to protect the environment. You will then read a selection of news articles outlining Canada’s environmental protection strategies in action. Finally you will watch a video from the government in Norway and read an article to see how another wealthy nation is handling sustainable resource extraction.
learning goal • To understand the Canadian government’s policies on environmental protection.• To analyse the validity of these policies using the Alberta oil sands as a case study.• To compare Canada’s perspective on oil extraction with that of Norway.
success criteria• To investigate a variety of materials and complete assigned activities.• To work cooperatively with group members to explore and share information.
The following activities will help you gain an understanding of the economic benefits and the environmental issues around the oil sands in Canada.
1. Understanding why the Canadian government continues to promote the oil sands at home in Canada and abroad in the United States and Asia is important when analysing the Canadian perspective on environmental protection in this region.
a Read the following article and infographic on the economic benefits of oil sands production in Alberta and Canada.
www.huffingtonpost.ca/2014/02/12/canadian-oilsands-economic-impact_n_4776472.html
2. Complete the following organizer to summarize the economic value of the oil sands.
Inquiry question • How do Canada’s sustainable resource management practices compare to that of Norway, another wealthy oil producing nation?
U4L3A3 Sustainable resource management: Canada vs Norway
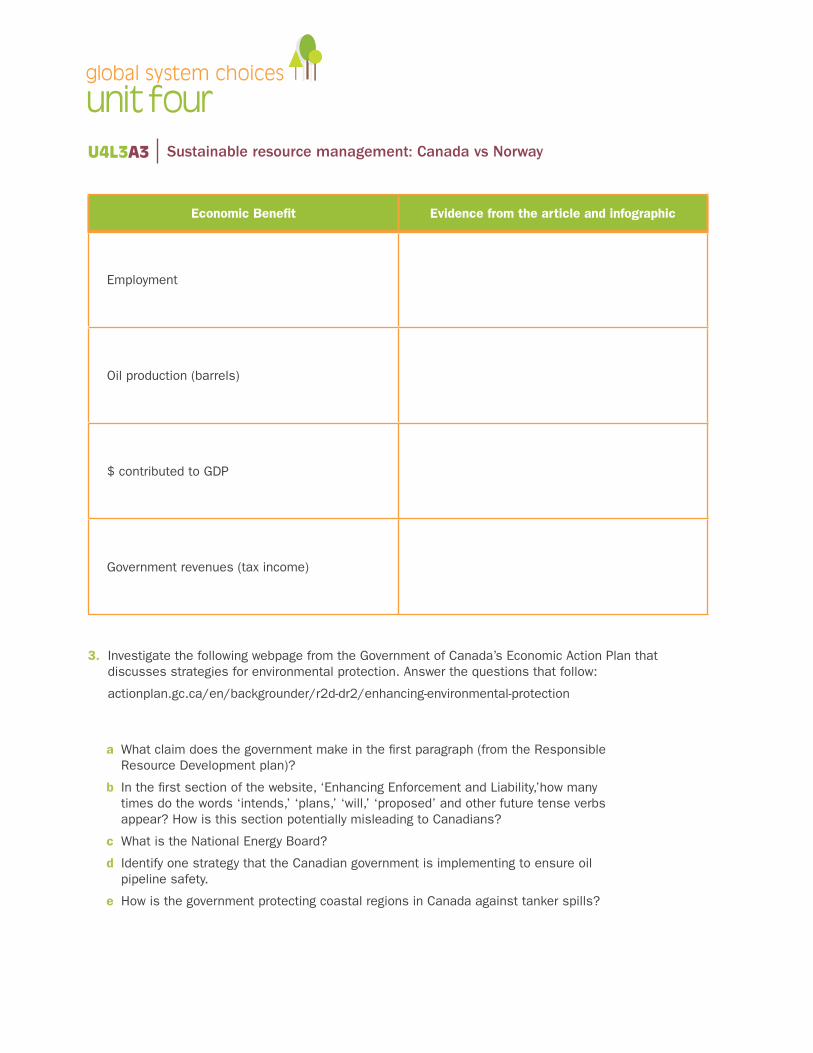
unit fourglobal system choices
Economic Benefit Evidence from the article and infographic
Employment
Oil production (barrels)
$ contributed to GDP
Government revenues (tax income)
3. Investigate the following webpage from the Government of Canada’s Economic Action Plan that discusses strategies for environmental protection. Answer the questions that follow:
actionplan.gc.ca/en/backgrounder/r2d-dr2/enhancing-environmental-protection
a What claim does the government make in the first paragraph (from the Responsible Resource Development plan)?
b In the first section of the website, ‘Enhancing Enforcement and Liability,’how many times do the words ‘intends,’ ‘plans,’ ‘will,’ ‘proposed’ and other future tense verbs appear? How is this section potentially misleading to Canadians?
c What is the National Energy Board?
d Identify one strategy that the Canadian government is implementing to ensure oil pipeline safety.
e How is the government protecting coastal regions in Canada against tanker spills?
U4L3A3 Sustainable resource management: Canada vs Norway
unit fourglobal system choices
4. Read the following two articles from the news on current environmental protection regulation issues in Canada.
a Describe the main issue outlined in each article.
b Evaluate the government response in each situation, based on evidence from the articles.
www.cbc.ca/news/canada/british-columbia/taseko-new-prosperity-mine-at-fish-lake-rejected-again-1.2553002
www.theglobeandmail.com/news/british-columbia/canada-failing-to-learn-from-world-class-oil-spill-cleanups/article24017204/
5. Oil extraction from the Alberta oil sands is a highly controversial environmental issue in Canada. The environmental impact of this energy project is debated internationally and has the potential to interfere with Canadian economic growth through rejected international pipeline initiatives and potential moratoriums on continued oil extraction in the region.
a In groups of three, read the accompanying article from Canadian Geographic. The article has been broken into three sections due to length. Each section has the introduction and the concluding paragraphs which will allow each member of the group to have the context.
b Complete the organizer together using point-form notes.
U4L3A3 Sustainable resource management: Canada vs Norway
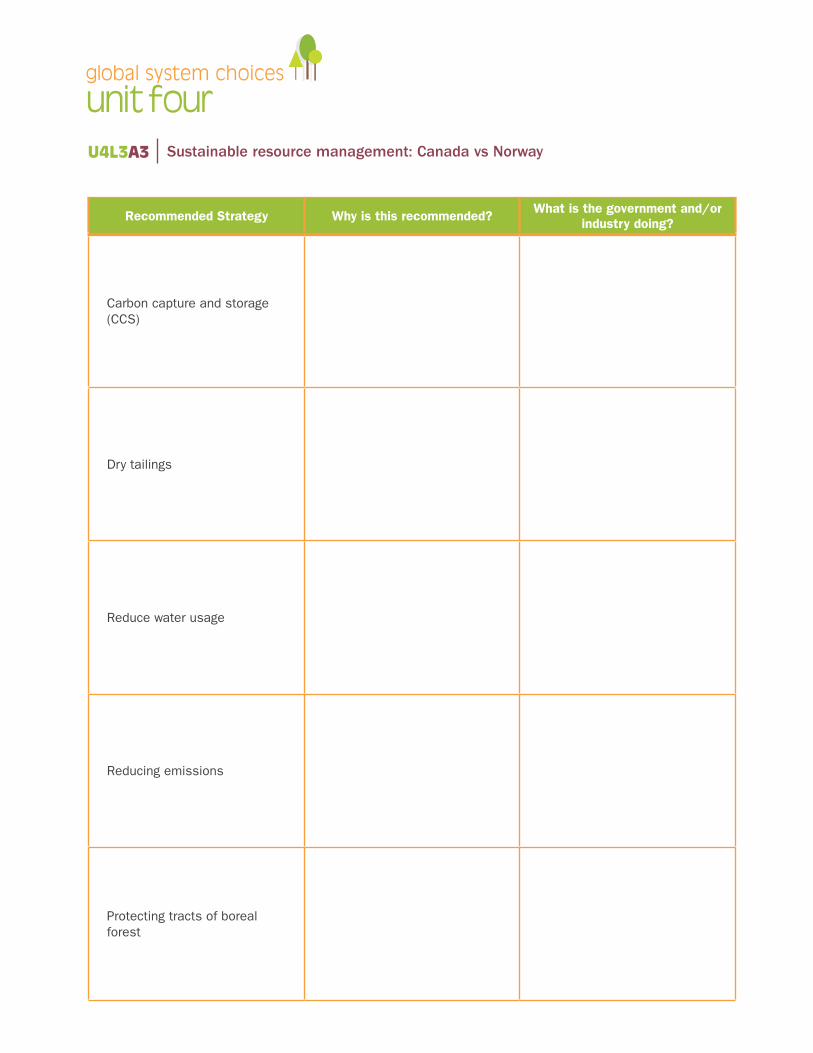
unit fourglobal system choices
Recommended Strategy Why is this recommended? What is the government and/or industry doing?
Carbon capture and storage (CCS)
Dry tailings
Reduce water usage
Reducing emissions
Protecting tracts of boreal forest
U4L3A3 Sustainable resource management: Canada vs Norway
unit fourglobal system choices
6. Understanding how Norway, another wealthy oil-producing nation is sustainably managing their resource can provide leadership to Canada.
a Watch the video titled ‘Sustainability: A Norwegian Perspective’
b Read the following article on Norway’s strategies for economic growth within the context of environmental protection
www.theglobeandmail.com/report-on-business/international-business/european-business/norway-proves-oil-rich-nations-can-be-both-green-and-prosperous/article21514455
c Describe 3 strategies Norway is using, that Canada is not, that has allowed Norway to be one of the wealthiest, most productive countries in the world while still meeting targets for environmental protection.
U4L3A3 Sustainable resource management: Canada vs Norway

unit fourglobal system choices
U4L3A3 Sustainable resource management: Canada vs Norway Article 1
Scar sandsCanadian Geographic June 2008
More than a million barrels of crude flow out of Alberta’s oil-sands plants every day. Environmentally, it’s a disaster zone. There’s no turning off the tap, but improvements in five areas could limit the staggering scale of the ecological damage.By Curtis Gillespie with photography by Garth Lenz
“HARD TO BELIEVE, HEY?” says Scott Kinnee, the helicopter pilot flying me over the Athabasca oil sands north of Fort McMurray, Alta. “You don’t really get a sense of the scale of things unless you come up top.” Up top being 500 metres above ground level, high enough to see 70 to 80 kilometres in any direction; that is, until the sky closes over as we near the dozens upon dozens of emissions towers and flare stacks of the Suncor, Syncrude and Albian Sands plants. The limpid winter sunshine we’d had at the airport hangar 30 kilometres to the south is gone, and the sun is now a dull white bulb wobbling unsteadily behind a motionless sooty haze. “Yeah,” says Kinnee, nodding as I remark upon the sun’s enervation. “These plants are so huge, they basically create their own weather system.”
The beauty of the boreal forest that surrounds Fort McMurray and covers most of northern Alberta lies in its magnitude, but once you arrive at oil-sands central, what you see is a landscape erased, a terrain stretching in a radius of many hundreds of square kilometres that is not so much negatively impacted as forcibly stripped bare and excavated. Dominating this landscape are half a dozen giant extraction and refining plants with their stacks and smoke and fire, disorienting wide and deep mines, and tailings ponds held in check by some of the world’s largest dams. As a panoramic vision, it’s all rather heartbreaking but, if one is forced to be honest, also awe-inspiring, such is the energy and the damage produced by human ambition.
Yet despite how important, and how environmentally divisive, the oil sands have become in today’s politically charged energy domain, the early and even fairly recent days of this resource were decidedly humble. In fact, although it’s been a century or so since people first began trying to exploit the resource, it wasn’t until the mid-1990s that the Athabasca oil sands were launched on today’s bitumen mega-arc, bitumen being the thick, tarlike hydrocarbon extracted from the sands and refined into synthetic crude oil.
‘There are five major things that the oil sandscompanies need to do if they really truly do care about the environment and the amazing thing is that all five are achievable, not all that expensive, and all use already existing technology.’
1 Carbon capture and storage
2 Dry tailings instead of wet
3 Reducing the overall water usage of the plants
4 Clamping down on the level of acidifying emissions
5 Establishing large areas of boreal forest that are off limits
Predictions vary slightly, but production is expected to at least quadruple to four or five million barrels of refined oil a day by 2020. From the start of the major expansions that kicked off in 1996 to the conclusion of current planned construction in 2011, close to $100 billion will be spent by industry on the Alberta oil sands. All of this is staggering given that in the early 1990s, not a single dollar of new investment was planned for the region and that oil was selling for less than $20 a barrel. As this issue went to press, it was going for $119 a barrel.
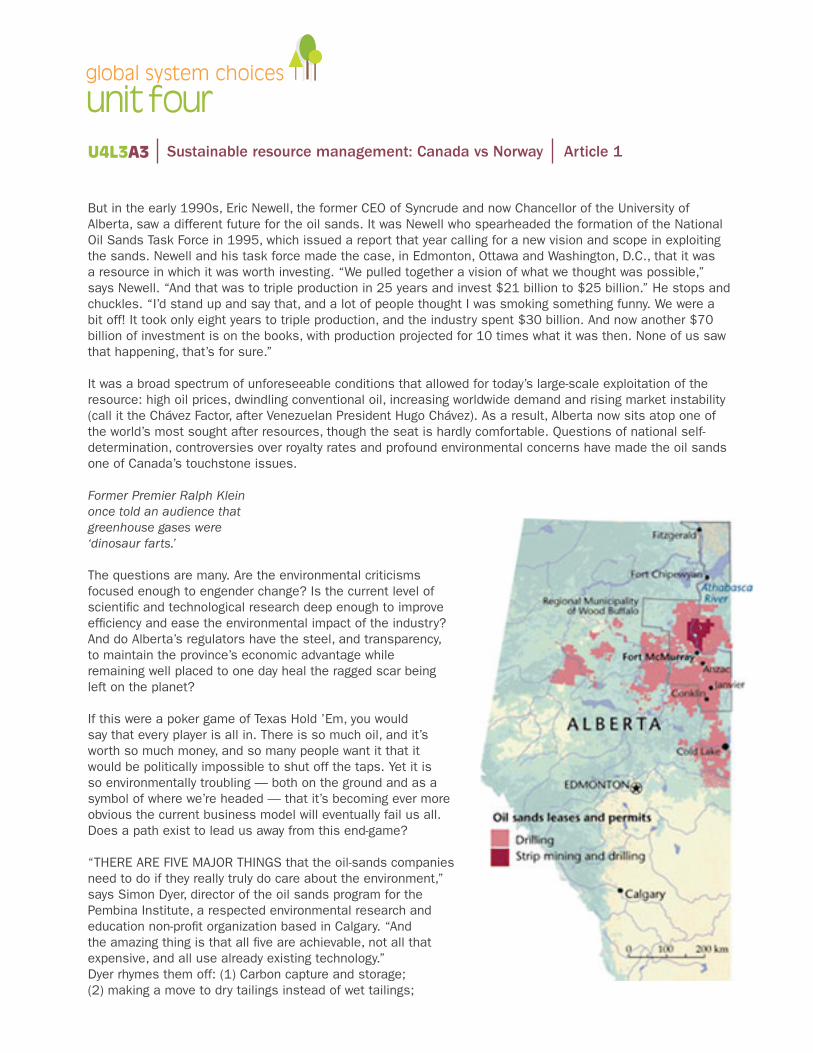
unit fourglobal system choices
U4L3A3
But in the early 1990s, Eric Newell, the former CEO of Syncrude and now Chancellor of the University of Alberta, saw a different future for the oil sands. It was Newell who spearheaded the formation of the National Oil Sands Task Force in 1995, which issued a report that year calling for a new vision and scope in exploiting the sands. Newell and his task force made the case, in Edmonton, Ottawa and Washington, D.C., that it was a resource in which it was worth investing. “We pulled together a vision of what we thought was possible,” says Newell. “And that was to triple production in 25 years and invest $21 billion to $25 billion.” He stops and chuckles. “I’d stand up and say that, and a lot of people thought I was smoking something funny. We were a bit off! It took only eight years to triple production, and the industry spent $30 billion. And now another $70 billion of investment is on the books, with production projected for 10 times what it was then. None of us saw that happening, that’s for sure.”
It was a broad spectrum of unforeseeable conditions that allowed for today’s large-scale exploitation of the resource: high oil prices, dwindling conventional oil, increasing worldwide demand and rising market instability (call it the Chávez Factor, after Venezuelan President Hugo Chávez). As a result, Alberta now sits atop one of the world’s most sought after resources, though the seat is hardly comfortable. Questions of national self-determination, controversies over royalty rates and profound environmental concerns have made the oil sands one of Canada’s touchstone issues.
Former Premier Ralph Klein once told an audience that greenhouse gases were ‘dinosaur farts.’
The questions are many. Are the environmental criticisms focused enough to engender change? Is the current level of scientific and technological research deep enough to improve efficiency and ease the environmental impact of the industry? And do Alberta’s regulators have the steel, and transparency, to maintain the province’s economic advantage while remaining well placed to one day heal the ragged scar being left on the planet?
If this were a poker game of Texas Hold ’Em, you would say that every player is all in. There is so much oil, and it’s worth so much money, and so many people want it that it would be politically impossible to shut off the taps. Yet it is so environmentally troubling — both on the ground and as a symbol of where we’re headed — that it’s becoming ever more obvious the current business model will eventually fail us all. Does a path exist to lead us away from this end-game?
“THERE ARE FIVE MAJOR THINGS that the oil-sands companies need to do if they really truly do care about the environment,” says Simon Dyer, director of the oil sands program for the Pembina Institute, a respected environmental research and education non-profit organization based in Calgary. “And the amazing thing is that all five are achievable, not all that expensive, and all use already existing technology.”Dyer rhymes them off: (1) Carbon capture and storage; (2) making a move to dry tailings instead of wet tailings;
Sustainable resource management: Canada vs Norway Article 1
unit fourglobal system choices
U4L3A3
(3) reducing the overall water usage of the plants, particularly during winter’s low flow, for the sake of the ecological health of the Athabasca River and for downstream communities; (4) clamping down on the level of acidifying emissions released through the stacks; (5) establishing large areas of boreal forest that are off limits, which even some oil companies themselves have called for in recent months.
“Don’t get me wrong,” says Dyer, “there are many, many more things I could list. But these five would demonstrate a huge commitment on industry’s part toward the environment.”
Although Dyer personally believes tailings and water usage are the highest priority, a combination of urgency, level of damage and “do-ability” makes carbon capture and storage (CCS) the most immediate step the industry could take to at least start reducing its environmental imprint. In its broad outlines, CCS is not complicated. Carbon emissions are captured at their release location, piped to a different location, then injected into the cracks and strata of deep formations for long-term “storage,” often using old oil or gas wells as entry points.
Industry and environmentalists are talking about CCS, as is the federal government (in March, Environment Minister John Baird announced a plan to make CCS mandatory as of 2018), but the technology, and even the industry’s willingness to experiment with it, has been available for decades. One of the largest CCS projects in the world is in Weyburn, Sask. (see “Carbon cemetery,” Jan/Feb 2008). Operating since 2000, it has allowed scientists and industry to develop considerable expertise in the technology, an expertise that is taking shape despite years of governmental foot-dragging.
“Industry isn’t doing any carbon capture and storage right now,” says Dyer, “because nobody’s forcing it to, so it’s hard for industry to justify the cost to its shareholders. But the oil sands are so high in emissions and operate in such a concentrated area that it’s actually the perfect place to do carbon capture.”
There is increasingly little argument about the utility of CCS as a short-term solution, since there is also increasingly little argument that it’s but a stop-gap to, in the longer term, deep reductions in carbon emissions. In fact, says Dyer, “it’s inexcusable to approve any new project without making CCS mandatory. Becoming zero net emitters would be a huge help, and it’s economically viable. If anyone ever says that it’s a choice between having no greenhouse gases and shutting down the oil sands, that’s a false discussion.”
Even industry champions like Eric Newell believe it ought to be happening right now. “The biggest thing we’ve got to do today is carbon capture and storage,” he says. “It’s not going to be cheap, but with my peers in the industry, I have been pushing to get this thing going. We need to stop arguing about who’s going to pay for it, and as a province and a country, we need to get people excited, see what’s possible, create a task force. Once we get that, we’ll figure out how to make it happen.”
The standard industry defence on greenhouse gases in the past few years has been its “success” in reducing intensity based emissions (fewer greenhouse gases per barrel of oil produced). Many scientists, such as Murray Gray, the scientific director of the Centre for Oil Sands Innovation (COSI) at the University of Alberta, and David Keith, a climate-change expert at the University of Calgary who was named Canadian Geographic’s Environmental Scientist of the Year in 2006, suggest that the oil-sands industry isn’t all wrong when it claims to be unfairly maligned as the sole carbon devil roaming the land. But industry arguments have nothing to do with the inherent fraudulence of intensity-based emissions. If your company puts 100 tonnes of carbon into the atmosphere and, through efficiencies and scientific advance, reduces that number to 85 tonnes, this is a good thing. But quadrupling your production means you are now putting 340 tonnes of carbon into the atmosphere, an extra 255 tonnes, three times the 85-tonne mark for which you want reduction recognition. Intensity-based targets, which very few global jurisdictions even use anymore, are simply a platform for industry to say that what’s worse is better. It defies rudimentary standards of logic.
Sustainable resource management: Canada vs Norway Article 1
unit fourglobal system choices
U4L3A3
The Alberta government has acknowledged that CCS is on its radar but has yet to make any serious moves on the issue. In 2002, then Premier Ralph Klein explained to an audience that greenhouse gases were “dinosaur farts.” Earlier this year, current Premier Ed Stelmach suggested that to reduce greenhouse gases, Albertans would have “to stop breathing.” Despite widespread public opinion that the pace of development in the oil sands needs slowing and even in the face of sentiment among a consortium of industry players asking for the same thing (though largely for reasons of labour shortages and cost control, rather than environmental protection), the provincial government has vowed, in Stelmach’s words, to not “touch the brake.” Further, the Stelmach government’s recent plan on climate change has been roundly criticized as meaningless, in that it does not call even for a levelling off of emissions until 2020, which will ultimately result in a paltry 14 percent reduction in 2005-level emissions by 2050.
In many ways, says Dyer, the oil-sands industry (which is now largely foreign-owned) is not even necessarily to blame for being sometimes less than zealous in pursuing new and better technologies to reduce greenhouse gases, or any other area, unless it’s going to save or make money. Yes, there are ways to do better, from tailings to emissions to reclaiming the massive land disturbance caused by the mining operations, but most of this is unlikely to happen if the deciding factor remains the goodness at the heart of a multinational corporation. “They’re just doing what companies do,” he says. “It is government — federal and provincial — that needs to step up, because the necessary regulatory environment simply does not exist here.”
‘This is not a government capable of dealing with the bigger picture. I think it’s paralyzed.’
SCOTT KINNEE TURNS our helicopter south. Directly beneath us is the Millennium Mine, an open pit perhaps 40 square kilometres in area, though it is hard to gauge through the miasma. Shovels are working away at a mine face, and a procession of trucks, each weighing close to 650 tonnes when full, makes its way like an ant army back and forth from the mine-face shovel to the hopper dump. I lose count at 38 trucks. A vast tailings pond appears directly beneath us. “Another sludge pond,” says Kinnee, pointing straight down. A blackish slime oozes into a stream that fingers out across the snow and ice, steaming as it goes. We drop another 50 metres, and I look across the river, perhaps a kilometre to the west, where the Suncor plant burns and smokes and steams. The sun, to the extent we can make it out, is now drooping low in the sky.
Our energy destination, if we leave the oil-sands industry alone at the wheel, is unclear at best. To fully arrest all development, to argue against prosperity, is foolish, but to pull out all the stops would be a kind of deferred suicide, which means the only pertinent question is, How can we engineer a socio-economic matrix that intersects the most efficient exploitation of the resource with the smallest environmental cost? That intersection exists, somewhere, but we’re not using the right map by which to navigate. The current approach is so badly flawed, says University of Calgary’s David Keith, “that whether you look at this from an economic perspective or an environmental perspective, we’re walking toward a cliff here.”
“So let us not talk falsely now,” sang Bob Dylan, “the hour is getting late.” Much of the talk in Alberta remains rhetoric and sophistry, despite the fact that environmentalists such as Simon Dyer can provide rather practical starting points for making the industry and the landscape cleaner. Industry, if you were to accept its spin, has more feel-good positions than the Kama Sutra, but the only position it truly cares for is the one it’s legally bound to pursue, and that’s how best to turn oil sands into money. And for the past decade at least, the Alberta government has shown, through both manifest incompetence and a not-very-well camouflaged capitulation to domestic and foreign corporate interests, that it can’t be trusted to handle a backyard sandbox, let alone a sandbox the size of Japan. “We need to tighten up in terms of regulation,” says Murray Gray. “We
Sustainable resource management: Canada vs Norway Article 1
unit fourglobal system choices
U4L3A3
need to look at ecosystem impact and region management, and the province has not been active enough in that regard. It’s been lagging, and to my mind, there’s no excuse.”
“Mismanagement is the word that comes to mind,” says Dyer.
Even industry veterans believe the industry could use more guidance. “Make the approvals rigorous,” says Eric Newell, because “industry needs to be more proactive than it is, I’ll allow that. We’ve got some good stories to tell, but we have a long way to go.”
‘We’ve got enough dirty fuel out there to turn the planet into Venus if we want to.’
“The weak link is the provincial government,” says Keith. “This is not a government capable of dealing with the bigger picture. I think it’s paralyzed. Some of them might not even believe the science of climate change, and the ones who do are paralyzed. Almost all their legislation is utterly hollow. And there needs to be a conversation about where to slow production, instead of this government’s hands-off policy, which makes no sense on any grounds. We have a kind of global responsibility, an exciting possibility, really, to think about how to manage what’s happening with unconventional hydrocarbons and higher emissions, because Alberta is one of the leading places in the world where that’s happening. This conversation has to happen, because, trust me, there isn’t going to be a slowdown or any help for the climate because of a lack of supply. There is a huge amount of fuel out there, dirty fuel. We have 10,000 gigatonnes of carbon on this planet and we’ve burned only 1,000. We’ve got enough to turn the planet into Venus if we want to.”
The hour is getting late, indeed.
My flight is nearly over. Kinnee circles once, then touches down back at the hangar at the Fort McMurray Airport. As we’d passed the confluence of the Athabasca and Clearwater rivers, the day had reverted back to its previous condition. The sun now shines in the west, as if freed of its hood, and the sky overhead is a robin’s egg blue. There is no wind, no cloud, no smoke. The air tastes clean, though I know that is nothing to put my faith in. As the rotor winds down and we remove our headsets, I realize there is nothing I want more than to be home in Edmonton, away from the stacks, the emissions, the tailings, the mines. But with one foot back on the ground, it strikes me that, of course, this is home.
Curtis Gillespie is a writer based in Edmonton.Garth Lenz lives in Victoria and is a member of the International League of Conservation Photographers, the world’s premier association of wildlife and nature photographers committed to conservation.
Sustainable resource management: Canada vs Norway Article 1
unit fourglobal system choices
U4L3A3
Scar sandsCanadian Geographic June 2008
More than a million barrels of crude flow out of Alberta’s oil-sands plants every day. Environmentally, it’s a disaster zone. There’s no turning off the tap, but improvements in five areas could limit the staggering scale of the ecological damage.By Curtis Gillespie with photography by Garth Lenz
“HARD TO BELIEVE, HEY?” says Scott Kinnee, the helicopter pilot flying me over the Athabasca oil sands north of Fort McMurray, Alta. “You don’t really get a sense of the scale of things unless you come up top.” Up top being 500 metres above ground level, high enough to see 70 to 80 kilometres in any direction; that is, until the sky closes over as we near the dozens upon dozens of emissions towers and flare stacks of the Suncor, Syncrude and Albian Sands plants. The limpid winter sunshine we’d had at the airport hangar 30 kilometres to the south is gone, and the sun is now a dull white bulb wobbling unsteadily behind a motionless sooty haze. “Yeah,” says Kinnee, nodding as I remark upon the sun’s enervation. “These plants are so huge, they basically create their own weather system.”
The beauty of the boreal forest that surrounds Fort McMurray and covers most of northern Alberta lies in its magnitude, but once you arrive at oil-sands central, what you see is a landscape erased, a terrain stretching in a radius of many hundreds of square kilometres that is not so much negatively impacted as forcibly stripped bare and excavated. Dominating this landscape are half a dozen giant extraction and refining plants with their stacks and smoke and fire, disorienting wide and deep mines, and tailings ponds held in check by some of the world’s largest dams. As a panoramic vision, it’s all rather heartbreaking but, if one is forced to be honest, also awe-inspiring, such is the energy and the damage produced by human ambition.
Yet despite how important, and how environmentally divisive, the oil sands have become in today’s politically charged energy domain, the early and even fairly recent days of this resource were decidedly humble. In fact, although it’s been a century or so since people first began trying to exploit the resource, it wasn’t until the mid-1990s that the Athabasca oil sands were launched on today’s bitumen mega-arc, bitumen being the thick, tarlike hydrocarbon extracted from the sands and refined into synthetic crude oil.
‘There are five major things that the oil sandscompanies need to do if they really truly do care about the environment and the amazing thing is that all five are achievable, not all that expensive, and all use already existing technology.’
1 Carbon capture and storage
2 Dry tailings instead of wet
3 Reducing the overall water usage of the plants
4 Clamping down on the level of acidifying emissions
5 Establishing large areas of boreal forest that are off limits
Predictions vary slightly, but production is expected to at least quadruple to four or five million barrels of refined oil a day by 2020. From the start of the major expansions that kicked off in 1996 to the conclusion of current planned construction in 2011, close to $100 billion will be spent by industry on the Alberta oil sands. All of this is staggering given that in the early 1990s, not a single dollar of new investment was planned for the region and that oil was selling for less than $20 a barrel. As this issue went to press, it was going for $119 a barrel.
Sustainable resource management: Canada vs Norway Article 2
unit fourglobal system choices
U4L3A3
But in the early 1990s, Eric Newell, the former CEO of Syncrude and now Chancellor of the Uni-versity of Alberta, saw a different future for the oil sands. It was Newell who spearheaded the formation of the National Oil Sands Task Force in 1995, which issued a report that year calling for a new vision and scope in exploiting the sands. Newell and his task force made the case, in Edmonton, Ottawa and Washington, D.C., that it was a resource in which it was worth invest-ing. “We pulled together a vision of what we thought was possible,” says Newell. “And that was to triple production in 25 years and invest $21 billion to $25 billion.” He stops and chuckles. “I’d stand up and say that, and a lot of people thought I was smoking something funny. We were a bit off ! It took only eight years to triple production, and the industry spent $30 billion. And now another $70 billion of investment is on the books, with production projected for 10 times what it was then. None of us saw that happening, that’s for sure.”
It was a broad spectrum of unforeseeable conditions that allowed for today’s large-scale exploi-tation of the resource: high oil prices, dwindling conventional oil, increasing worldwide demand and rising market instability (call it the Chávez Factor, after Venezuelan President Hugo Chávez). As a result, Alberta now sits atop one of the world’s most soughtafter resources, though the seat is hardly comfortable. Questions of national self-determination, controversies over royalty rates and profound environmental concerns have made the oil sands one of Canada’s touchstone is-sues.
Former Premier Ralph Klein once told an audience that greenhouse gases were ‘dinosaur farts.’
The questions are many. Are the environmental criticisms focused enough to engender change? Is the current level of scientific and technological research deep enough to improve efficiency and ease the environmental impact of the industry? And do Alberta’s regulators have the steel, and transparency, to maintain the province’s economic advantage while remaining well placed to one day heal the ragged scar being left on the planet?
If this were a poker game of Texas Hold ’Em, you would say that every player is all in. There is so much oil, and it’s worth so much money, and so many people want it that it would be politically impossible to shut off the taps. Yet it is so environmentally troubling — both on the ground and as a symbol of where we’re headed — that it’s becoming ever more obvious the current business model will eventually fail us all. Does a path exist to lead us away from this end-game?
“THERE ARE FIVE MAJOR THINGS that the oil-sands companies need to do if they really truly do care about the environment,” says Simon Dyer, director of the oil sands program for the Pembina Institute, a respected environmental research and education non-profit organization based in Calgary. “And the amazing thing is that all five are achievable, not all that expensive, and all use already existing technology.”
Sustainable resource management: Canada vs Norway Article 2

unit fourglobal system choices
U4L3A3
Dyer rhymes them off: (1) Carbon capture and storage; (2) making a move to dry tailings instead of wet tailings; (3) reducing the overall water usage of the plants, particularly during winter’s low flow, for the sake of the ecological health of the Athabasca River and for downstream communi-ties; (4) clamping down on the level of acidifying emissions released through the stacks; (5) estab-lishing large areas of boreal forest that are off limits, which even some oil companies themselves have called for in recent months.
“Don’t get me wrong,” says Dyer, “there are many, many more things I could list. But these five would demonstrate a huge commitment on industry’s part toward the environment.”
The amount of water the oil-sands plants use is equal to about 40 percent of Toronto’s yearly water consumption.
“WATER IS THE ENEMY OF WHAT WE DO,” says Alan Fair, the man-ager of research and development at Syncrude’s Edmonton Re-search Centre. “I’ve spent most of my working life on tailings, and how to manage them, and there’s a real understanding now that we need to take a more pro-active approach to managing tailings. If we could remove water from every single aspect of what we do, I couldn’t be happier.”
The overall amount of water used by the oil-sands companies is currently estimated to be just under 200 million cubic metres, in-cluding groundwater and surface runoff. That’s the equivalent to about 40 percent of the yearly water consumption of the City of Toronto.
About half of the total water the oil-sands companies use is drawn directly from the Athabasca River. Given the projected rate of ex-pansion of oil-sands production, those withdrawals will double, at minimum, and could easily quadruple. During low-flow seasons, that could amount to as much as eight percent of the river’s vol-ume — and this with the recycling efforts already under way at the plants.
The amount of water required is vast because of the scale of operations (currently, between two and five barrels of water are used to produce one barrel of oil), and because the essential technol-ogy simply hasn’t deviated that much from its infancy — you still have to wash the oil out of the sand. That takes enormous amounts of water when you are an industry that scrapes an estimated 5,000 tonnes of material, both overburden and sand, off the Earth’s surface every single minute of every single day. This scale leads to tailings ponds that cover nearly 50 square kilometres in area, and with a volume that will, according to the Oil Sands Tailings Research Facility, reach one billion cubic metres by 2010. Right now, the world’s largest man-made dam, in terms of material volume, is the Syncrude tailings pond. Tailings, a mix of water, fine clay and toxins such as naphthenic ac-ids, are a by-product of the process used to extract the bitumen from the sand. They are one of
Sustainable resource management: Canada vs Norway Article 2
unit fourglobal system choices
U4L3A3
the industry’s greatest headaches, because the minuscule clay particles resist settling and remain suspended in the water for decades, making the tailings ponds vast pools with the consistency of watery porridge.
The oil-sands industry is aware of the public concern about its water withdrawals and is nervous about what it’s going to do with tailings. “Managing tailings is clearly something the industry has not come to grips with,” says Gray at the COSI, which is partially funded by Imperial Oil. “Our view here at the centre is don’t try and fix the problem after you’ve made it, but try to avoid the head-ache to begin with.”
In addition to their concern about the volume of water extracted from the river, many critics of the oil-sands industry are worried about toxic seepage into the Athabasca River and its impact on downstream communities. The tailings ponds, some of which are within mere metres of the river, are not plastic-lined, and industry does not dispute that seepage occurs. But Gray says there isn’t really anything present in the tailings ponds that isn’t biodegradable. “Toxins are there, for sure. But the water would detoxify over time, if left alone. Now I’m not saying that a significant leak-age from the tailings ponds wouldn’t be catastrophic. I’m just saying that if you’re talking about leakage through the groundwater, at a certain rate, it’s not a problem. If Suncor’s dikes burst and poured sludge into the river, it would have a major impact. It might not kill Lake Athabasca 250 kilometres downstream, but it would kill the river ecosystem. But it’s not the toxins that worry me — it’s the clay.”
Industry’s goal is to move to a system of dry tailings or no tailings at all, completely removing wa-ter from the extraction process. Gray’s team is working with solvents and chemicals to “get out of the tailings box and avoid them in the first place.” And a number of private companies have realized some success with compounds to release the bitumen from the sand with a surfactant to keep the components separate once they’ve been released. One company, Earth Energy Re-sources, has pioneered a process using an environmentally friendly organic agent and water emul-sion as its releasing agent. The resulting by-products are bitumen, sand, water and the recovered organic agent. The water is recyclable, and there are no tailings. Other companies are developing waterless technologies in which the conditioning agent changes the magnetic charge between the hydrocarbon molecule and the inorganic material to which it clings. These new “dry” technologies have yet to be commercialized at scale for a variety of reasons, one being that the extraction facili-ties would need to be refitted and the other being that no one’s forcing them to do it.
As for water extractions from the Athabasca River, there is divided opinion on precisely how much water the industry actually uses. No one disputes that a great deal of the water is recycled (some estimates are up to 90 percent), although increases in production will clearly mean a raw-amount increase, regardless of how much water is recycled. Alan Fair claims that Syncrude has never even come close to utilizing its allotted water ration from the Athabasca River, but one of the warranted misgivings environmentalists have is about industry’s water withdrawal during the winter’s low-flow season. During summer’s peak flow, there is less impact on the river, but in winter, when the water dips into the “red zone,” environmentalists would like to see industry refrain altogether from drawing from the river.
Sustainable resource management: Canada vs Norway Article 2
unit fourglobal system choices
U4L3A3
“What many people think needs to happen,” says Gray, “is that they should just use the river dur-ing peak flow and fill up an abandoned mine, then use that water in the winter. It’ll even out the water consumption. The province simply needs to be much more active than it’s been in the past, ensuring water quality and that flow is sufficient for the downstream ecosystem. It’s basically just a simple engineering fix. But I still think the best solution is for the industry to use less water in the first place.”
SCOTT KINNEE TURNS our helicopter south. Directly beneath us is the Millennium Mine, an open pit perhaps 40 square kilometres in area, though it is hard to gauge through the miasma. Shovels are working away at a mine face, and a procession of trucks, each weighing close to 650 tonnes when full, makes its way like an ant army back and forth from the mine-face shovel to the hopper dump. I lose count at 38 trucks. A vast tailings pond appears directly beneath us. “Another sludge pond,” says Kinnee, pointing straight down. A blackish slime oozes into a stream that fingers out across the snow and ice, steaming as it goes. We drop another 50 metres, and I look across the river, perhaps a kilometre to the west, where the Suncor plant burns and smokes and steams. The sun, to the extent we can make it out, is now drooping low in the sky.
Our energy destination, if we leave the oil-sands industry alone at the wheel, is unclear at best. To fully arrest all development, to argue against prosperity, is foolish, but to pull out all the stops would be a kind of deferred suicide, which means the only pertinent question is, How can we engineer a socio-economic matrix that intersects the most efficient exploitation of the resource with the smallest environmental cost? That intersection exists, somewhere, but we’re not using the right map by which to navigate. The current approach is so badly flawed, says University of Calgary’s David Keith, “that whether you look at this from an economic perspective or an environ-mental perspective, we’re walking toward a cliff here.”
‘This is not a government capable of dealing with the bigger picture. I think it’s paralyzed.’
“So let us not talk falsely now,” sang Bob Dylan, “the hour is getting late.” Much of the talk in Al-berta remains rhetoric and sophistry, despite the fact that environmentalists such as Simon Dyer can provide rather practical starting points for making the industry and the landscape cleaner. Industry, if you were to accept its spin, has more feel-good positions than the Kama Sutra, but the only position it truly cares for is the one it’s legally bound to pursue, and that’s how best to turn oil sands into money. And for the past decade at least, the Alberta government has shown, through both manifest incompetence and a not-very-well camouflaged capitulation to domestic and foreign corporate interests, that it can’t be trusted to handle a backyard sandbox, let alone a sandbox the size of Japan. “We need to tighten up in terms of regulation,” says Murray Gray. “We need to look at ecosystem impact and region management, and the province has not been active enough in that regard. It’s been lagging, and to my mind, there’s no excuse.”
Sustainable resource management: Canada vs Norway Article 2
unit fourglobal system choices
U4L3A3
“Mismanagement is the word that comes to mind,” says Dyer.
Even industry veterans believe the industry could use more guidance. “Make the approvals rig-orous,” says Eric Newell, because “industry needs to be more proactive than it is, I’ll allow that. We’ve got some good stories to tell, but we have a long way to go.”
‘We’ve got enough dirty fuel out there to turn the planet into Venus if we want to.’
“The weak link is the provincial government,” says Keith. “This is not a government capable of dealing with the bigger picture. I think it’s paralyzed. Some of them might not even believe the science of climate change, and the ones who do are paralyzed. Almost all their legislation is ut-terly hollow. And there needs to be a conversation about where to slow production, instead of this government’s hands-off policy, which makes no sense on any grounds. We have a kind of global responsibility, an exciting possibility, really, to think about how to manage what’s happening with unconventional hydrocarbons and higher emissions, because Alberta is one of the leading places in the world where that’s happening. This conversation has to happen, because, trust me, there isn’t going to be a slowdown or any help for the climate because of a lack of supply. There is a huge amount of fuel out there, dirty fuel. We have 10,000 gigatonnes of carbon on this planet and we’ve burned only 1,000. We’ve got enough to turn the planet into Venus if we want to.”
The hour is getting late, indeed.
My flight is nearly over. Kinnee circles once, then touches down back at the hangar at the Fort McMurray Airport. As we’d passed the confluence of the Athabasca and Clearwater rivers, the day had reverted back to its previous condition. The sun now shines in the west, as if freed of its hood, and the sky overhead is a robin’s egg blue. There is no wind, no cloud, no smoke. The air tastes clean, though I know that is nothing to put my faith in. As the rotor winds down and we remove our headsets, I realize there is nothing I want more than to be home in Edmonton, away from the stacks, the emissions, the tailings, the mines. But with one foot back on the ground, it strikes me that, of course, this is home.
Curtis Gillespie is a writer based in Edmonton.Garth Lenz lives in Victoria and is a member of the International League of Conservation Photographers, the world’s premier association of wildlife and nature photographers committed to conservation.
Sustainable resource management: Canada vs Norway Article 2

unit fourglobal system choices
U4L3A3
Scar sandsCanadian Geographic June 2008
More than a million barrels of crude flow out of Alberta’s oil-sands plants every day. Environmentally, it’s a disaster zone. There’s no turning off the tap, but improvements in five areas could limit the staggering scale of the ecological damage.By Curtis Gillespie with photography by Garth Lenz
“HARD TO BELIEVE, HEY?” says Scott Kinnee, the helicopter pilot flying me over the Athabasca oil sands north of Fort McMurray, Alta. “You don’t really get a sense of the scale of things unless you come up top.” Up top being 500 metres above ground level, high enough to see 70 to 80 kilometres in any direction; that is, until the sky closes over as we near the dozens upon dozens of emissions towers and flare stacks of the Suncor, Syncrude and Albian Sands plants. The limpid winter sunshine we’d had at the airport hangar 30 kilometres to the south is gone, and the sun is now a dull white bulb wobbling unsteadily behind a motionless sooty haze. “Yeah,” says Kinnee, nodding as I remark upon the sun’s enervation. “These plants are so huge, they basically create their own weather system.”
The beauty of the boreal forest that surrounds Fort McMurray and covers most of northern Alberta lies in its magnitude, but once you arrive at oil-sands central, what you see is a landscape erased, a terrain stretching in a radius of many hundreds of square kilometres that is not so much negatively impacted as forcibly stripped bare and excavated. Dominating this landscape are half a dozen giant extraction and refining plants with their stacks and smoke and fire, disorienting wide and deep mines, and tailings ponds held in check by some of the world’s largest dams. As a panoramic vision, it’s all rather heartbreaking but, if one is forced to be honest, also awe-inspiring, such is the energy and the damage produced by human ambition.
Yet despite how important, and how environmentally divisive, the oil sands have become in today’s politically charged energy domain, the early and even fairly recent days of this resource were decidedly humble. In fact, although it’s been a century or so since people first began trying to exploit the resource, it wasn’t until the mid-1990s that the Athabasca oil sands were launched on today’s bitumen mega-arc, bitumen being the thick, tarlike hydrocarbon extracted from the sands and refined into synthetic crude oil.
‘There are five major things that the oil sandscompanies need to do if they really truly do care about the environment and the amazing thing is that all five are achievable, not all that expensive, and all use already existing technology.’
1 Carbon capture and storage
2 Dry tailings instead of wet
3 Reducing the overall water usage of the plants
4 Clamping down on the level of acidifying emissions
5 Establishing large areas of boreal forest that are off limits
Predictions vary slightly, but production is expected to at least quadruple to four or five million barrels of refined oil a day by 2020. From the start of the major expansions that kicked off in 1996 to the conclusion of current planned construction in 2011, close to $100 billion will be spent by industry on the Alberta oil sands. All of this is staggering given that in the early 1990s, not a single dollar of new investment was planned for the region and that oil was selling for less than $20 a barrel. As this issue went to press, it was going for $119 a barrel.
Sustainable resource management: Canada vs Norway Article 3
unit fourglobal system choices
U4L3A3
The beauty of the boreal forest that surrounds Fort McMurray and covers most of northern Al-berta lies in its magnitude, but once you arrive at oil-sands central, what you see is a landscape erased, a terrain stretching in a radius of many hundreds of square kilometres that is not so much negatively impacted as forcibly stripped bare and excavated. Dominating this landscape are half a dozen giant extraction and refining plants with their stacks and smoke and fire, disorienting wide and deep mines, and tailings ponds held in check by some of the world’s largest dams. As a pan-oramic vision, it’s all rather heartbreaking but, if one is forced to be honest, also awe-inspiring, such is the energy and the damage produced by human ambition.
Yet despite how important, and how environmentally divisive, the oil sands have become in to-day’s politically charged energy domain, the early and even fairly recent days of this resource were decidedly humble. In fact, although it’s been a century or so since people first began trying to exploit the resource, it wasn’t until the mid-1990s that the Athabasca oil sands were launched on today’s bitumen mega-arc, bitumen being the thick, tarlike hydrocarbon extracted from the sands and refined into synthetic crude oil.
Predictions vary slightly, but production is expected to at least quadruple to four or five million barrels of refined oil a day by 2020. From the start of the major expansions that kicked off in 1996 to the conclusion of current planned construction in 2011, close to $100 billion will be spent by industry on the Alberta oil sands. All of this is staggering given that in the early 1990s, not a single dollar of new investment was planned for the region and that oil was selling for less than $20 a barrel. As this issue went to press, it was going for $119 a barrel.
But in the early 1990s, Eric Newell, the former CEO of Syncrude and now Chancellor of the Univer-sity of Alberta, saw a different future for the oil sands. It was Newell who spearheaded the forma-tion of the National Oil Sands Task Force in 1995, which issued a report that year calling for a new vision and scope in exploiting the sands. Newell and his task force made the case, in Edmonton, Ottawa and Washington, D.C., that it was a resource in which it was worth investing. “We pulled together a vision of what we thought was possible,” says Newell. “And that was to triple produc-tion in 25 years and invest $21 billion to $25 billion.” He stops and chuckles. “I’d stand up and say that, and a lot of people thought I was smoking something funny. We were a bit off ! It took only eight years to triple production, and the industry spent $30 billion. And now another $70 billion of investment is on the books, with production projected for 10 times what it was then. None of us saw that happening, that’s for sure.”
It was a broad spectrum of unforeseeable conditions that allowed for today’s large-scale exploita-tion of the resource: high oil prices, dwindling conventional oil, increasing worldwide demand and rising market instability (call it the Chávez Factor, after Venezuelan President Hugo Chávez). As a result, Alberta now sits atop one of the world’s most soughtafter resources, though the seat is hardly comfortable. Questions of national self-determination, controversies over royalty rates and profound environmental concerns have made the oil sands one of Canada’s touchstone issues.
Sustainable resource management: Canada vs Norway Article 3
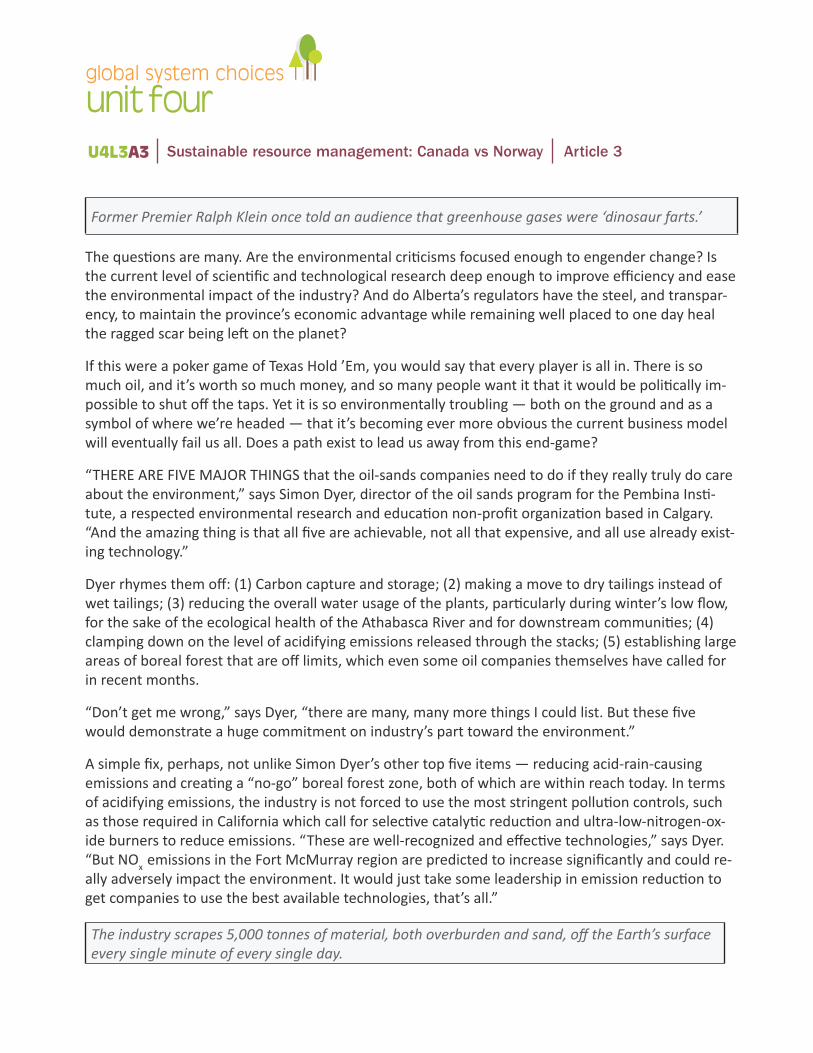
unit fourglobal system choices
U4L3A3
Former Premier Ralph Klein once told an audience that greenhouse gases were ‘dinosaur farts.’
The questions are many. Are the environmental criticisms focused enough to engender change? Is the current level of scientific and technological research deep enough to improve efficiency and ease the environmental impact of the industry? And do Alberta’s regulators have the steel, and transpar-ency, to maintain the province’s economic advantage while remaining well placed to one day heal the ragged scar being left on the planet?
If this were a poker game of Texas Hold ’Em, you would say that every player is all in. There is so much oil, and it’s worth so much money, and so many people want it that it would be politically im-possible to shut off the taps. Yet it is so environmentally troubling — both on the ground and as a symbol of where we’re headed — that it’s becoming ever more obvious the current business model will eventually fail us all. Does a path exist to lead us away from this end-game?
“THERE ARE FIVE MAJOR THINGS that the oil-sands companies need to do if they really truly do care about the environment,” says Simon Dyer, director of the oil sands program for the Pembina Insti-tute, a respected environmental research and education non-profit organization based in Calgary. “And the amazing thing is that all five are achievable, not all that expensive, and all use already exist-ing technology.”
Dyer rhymes them off: (1) Carbon capture and storage; (2) making a move to dry tailings instead of wet tailings; (3) reducing the overall water usage of the plants, particularly during winter’s low flow, for the sake of the ecological health of the Athabasca River and for downstream communities; (4) clamping down on the level of acidifying emissions released through the stacks; (5) establishing large areas of boreal forest that are off limits, which even some oil companies themselves have called for in recent months.
“Don’t get me wrong,” says Dyer, “there are many, many more things I could list. But these five would demonstrate a huge commitment on industry’s part toward the environment.”
A simple fix, perhaps, not unlike Simon Dyer’s other top five items — reducing acid-rain-causing emissions and creating a “no-go” boreal forest zone, both of which are within reach today. In terms of acidifying emissions, the industry is not forced to use the most stringent pollution controls, such as those required in California which call for selective catalytic reduction and ultra-low-nitrogen-ox-ide burners to reduce emissions. “These are well-recognized and effective technologies,” says Dyer. “But NO
x emissions in the Fort McMurray region are predicted to increase significantly and could re-
ally adversely impact the environment. It would just take some leadership in emission reduction to get companies to use the best available technologies, that’s all.”
The industry scrapes 5,000 tonnes of material, both overburden and sand, off the Earth’s surface every single minute of every single day.
Sustainable resource management: Canada vs Norway Article 3
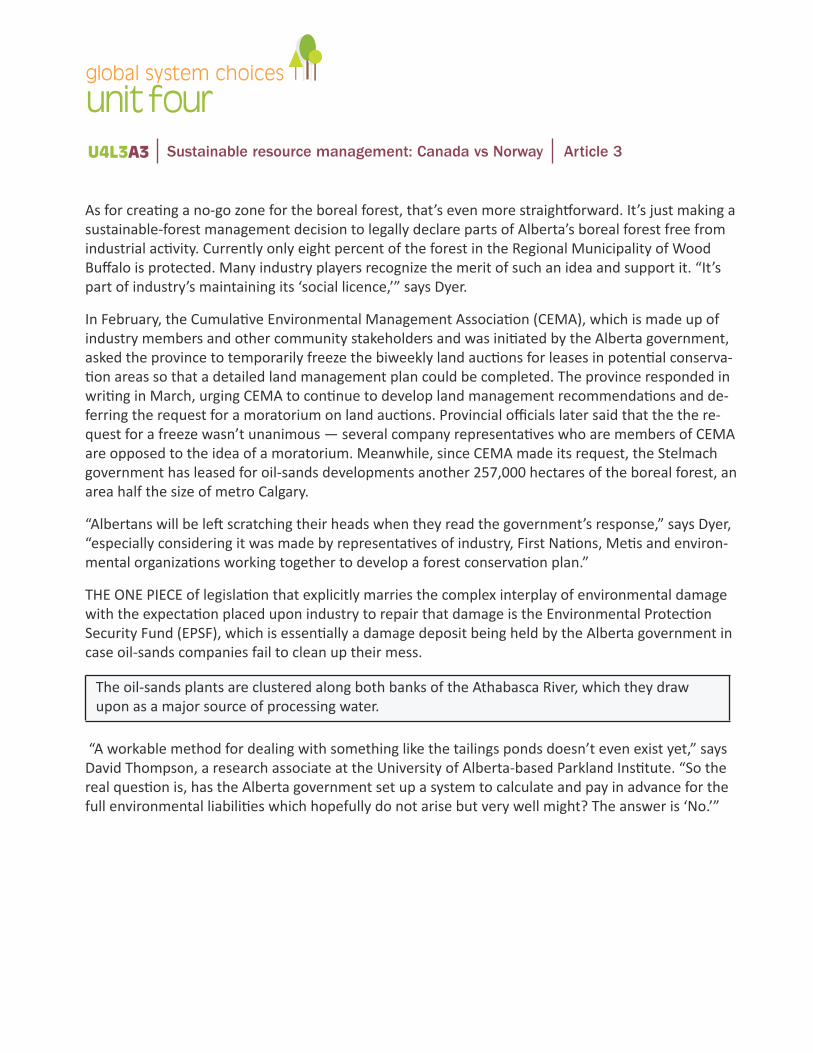
unit fourglobal system choices
U4L3A3
As for creating a no-go zone for the boreal forest, that’s even more straightforward. It’s just making a sustainable-forest management decision to legally declare parts of Alberta’s boreal forest free from industrial activity. Currently only eight percent of the forest in the Regional Municipality of Wood Buffalo is protected. Many industry players recognize the merit of such an idea and support it. “It’s part of industry’s maintaining its ‘social licence,’” says Dyer.
In February, the Cumulative Environmental Management Association (CEMA), which is made up of industry members and other community stakeholders and was initiated by the Alberta government, asked the province to temporarily freeze the biweekly land auctions for leases in potential conserva-tion areas so that a detailed land management plan could be completed. The province responded in writing in March, urging CEMA to continue to develop land management recommendations and de-ferring the request for a moratorium on land auctions. Provincial officials later said that the the re-quest for a freeze wasn’t unanimous — several company representatives who are members of CEMA are opposed to the idea of a moratorium. Meanwhile, since CEMA made its request, the Stelmach government has leased for oil-sands developments another 257,000 hectares of the boreal forest, an area half the size of metro Calgary.
“Albertans will be left scratching their heads when they read the government’s response,” says Dyer, “especially considering it was made by representatives of industry, First Nations, Metis and environ-mental organizations working together to develop a forest conservation plan.”
THE ONE PIECE of legislation that explicitly marries the complex interplay of environmental damage with the expectation placed upon industry to repair that damage is the Environmental Protection Security Fund (EPSF), which is essentially a damage deposit being held by the Alberta government in case oil-sands companies fail to clean up their mess.
The oil-sands plants are clustered along both banks of the Athabasca River, which they draw upon as a major source of processing water.
“A workable method for dealing with something like the tailings ponds doesn’t even exist yet,” says David Thompson, a research associate at the University of Alberta-based Parkland Institute. “So the real question is, has the Alberta government set up a system to calculate and pay in advance for the full environmental liabilities which hopefully do not arise but very well might? The answer is ‘No.’”
Sustainable resource management: Canada vs Norway Article 3
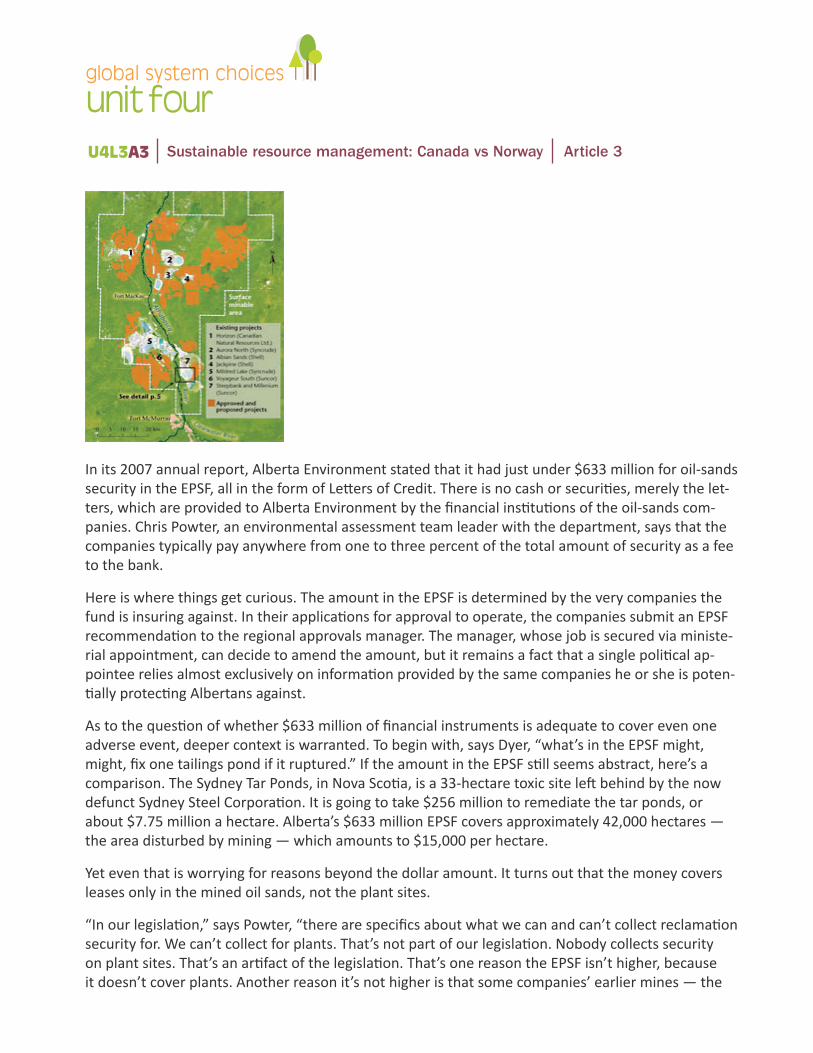
unit fourglobal system choices
U4L3A3
In its 2007 annual report, Alberta Environment stated that it had just under $633 million for oil-sands security in the EPSF, all in the form of Letters of Credit. There is no cash or securities, merely the let-ters, which are provided to Alberta Environment by the financial institutions of the oil-sands com-panies. Chris Powter, an environmental assessment team leader with the department, says that the companies typically pay anywhere from one to three percent of the total amount of security as a fee to the bank.
Here is where things get curious. The amount in the EPSF is determined by the very companies the fund is insuring against. In their applications for approval to operate, the companies submit an EPSF recommendation to the regional approvals manager. The manager, whose job is secured via ministe-rial appointment, can decide to amend the amount, but it remains a fact that a single political ap-pointee relies almost exclusively on information provided by the same companies he or she is poten-tially protecting Albertans against.
As to the question of whether $633 million of financial instruments is adequate to cover even one adverse event, deeper context is warranted. To begin with, says Dyer, “what’s in the EPSF might, might, fix one tailings pond if it ruptured.” If the amount in the EPSF still seems abstract, here’s a comparison. The Sydney Tar Ponds, in Nova Scotia, is a 33-hectare toxic site left behind by the now defunct Sydney Steel Corporation. It is going to take $256 million to remediate the tar ponds, or about $7.75 million a hectare. Alberta’s $633 million EPSF covers approximately 42,000 hectares — the area disturbed by mining — which amounts to $15,000 per hectare.
Yet even that is worrying for reasons beyond the dollar amount. It turns out that the money covers leases only in the mined oil sands, not the plant sites.
“In our legislation,” says Powter, “there are specifics about what we can and can’t collect reclamation security for. We can’t collect for plants. That’s not part of our legislation. Nobody collects security on plant sites. That’s an artifact of the legislation. That’s one reason the EPSF isn’t higher, because it doesn’t cover plants. Another reason it’s not higher is that some companies’ earlier mines — the
Sustainable resource management: Canada vs Norway Article 3
unit fourglobal system choices
U4L3A3
Syncrude Mildred Lake Mine and the original Suncor Mine, for example — were grandfathered in at the old rate we used to collect security at, three cents per barrel of production, and that’s the rate they’re still paying on those mines.”
What all this means is that the Alberta government has exempted the oil-sands mining companies from having to provide security for their pipelines, processing plants, tailings ponds and sulphur piles. If a company goes bankrupt, leaving behind derelict plants, pipelines, housing camps, rusting equipment and tailings ponds visible from space, the Alberta government will not have a penny set aside to clean up the mess, and the cost will fall exclusively to taxpayers. A wildly unlikely scenario, perhaps, but you don’t buy fire insurance for your house because you’re expecting to see it go up in flames.
Essentially, the Alberta government has no mechanisms in place to pursue industry for environ-mental problems that may arise related to oil-sands plants, tailings ponds, pipelines or the entirety of conventional and in situ oil-sands exploration, drilling, extraction or upgrading. Alberta Environ-ment’s website does state its expectations for remediation, but these expectations are empty given that they are not backed up in legislation. “If there’s a problem, somebody is going to be left holding the environmental and financial bag at the end of the day,” says Thompson of the Parkland Institute, “and it doesn’t look like it is going to be the industry.”
The rich irony in all this, despite regular industry claims of success in landscape reclamation, is that until March of this year, there had not been a single square metre of land certified by the Alberta Government as reclaimed. (Although Alberta Environment has frequently reimbursed companies for reclamation work done “in stages,” it claims not to know, or even track, how much it has reimbursed industry to date).
Industry executives will tell you, not without some justification, that the negligible certification rate is because the government, as Eric Newell says, “is so darned conservative, it just doesn’t want to give us a certificate.” The “conservative” defence is frequently used to rebut the environmentalists’ accusation that for all the industry’s claims of being environmentally sensitive, even the proudly un-reconstructed Alberta government won’t side with industry and recognize the reclamation work. “It’s because industry is doing a terrible job” is the refrain of the environmentalists. “It’s because the gov-ernment is playing it safe,” says industry. Newell says that Syncrude is reclaiming land faster than it’s using it —and here he’s largely referring to the planting of grass and trees on overburden sites, which is where companies dump the topsoil they strip off the land. Of course, this brings the definition of reclaimed into play, since it’s defined in Alberta’s Environmental Protection and Enhancement Act as returning disturbed areas to an “equivalent land capability” that is “similar” but not “identical” to the original state, a definition equal in clarity to the rest of the act. Scientists in the field, people like Murray Gray at COSI, see both sides. It’s not going to hurt government to play it safe, if that’s what it’s doing, says Gray, but on the other hand, “one criticism I have of industry is that it has yet to suc-cessfully close out an active mine and remediate it, and it has yet to successfully close out an active tailings pond and remediate it. Until it does, it’s going to have a hard time convincing people that it
Sustainable resource management: Canada vs Norway Article 3
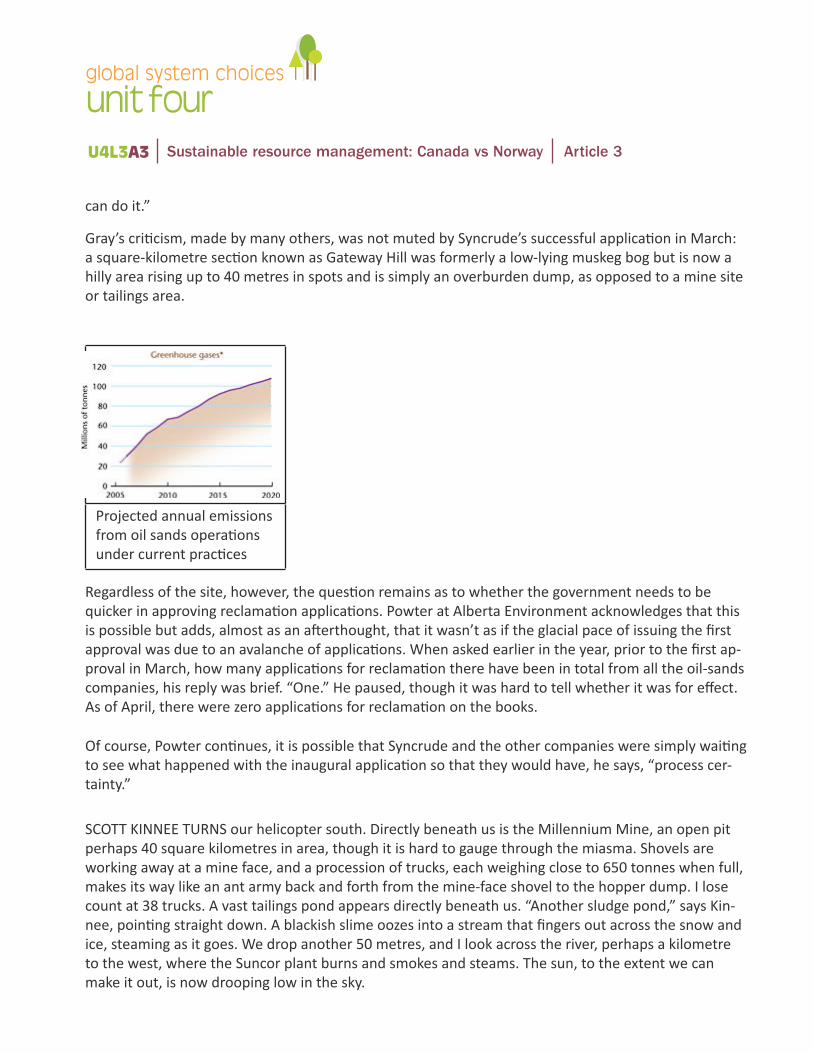
unit fourglobal system choices
U4L3A3
can do it.”
Gray’s criticism, made by many others, was not muted by Syncrude’s successful application in March: a square-kilometre section known as Gateway Hill was formerly a low-lying muskeg bog but is now a hilly area rising up to 40 metres in spots and is simply an overburden dump, as opposed to a mine site or tailings area.
Projected annual emissions from oil sands operations under current practices
Regardless of the site, however, the question remains as to whether the government needs to be quicker in approving reclamation applications. Powter at Alberta Environment acknowledges that this is possible but adds, almost as an afterthought, that it wasn’t as if the glacial pace of issuing the first approval was due to an avalanche of applications. When asked earlier in the year, prior to the first ap-proval in March, how many applications for reclamation there have been in total from all the oil-sands companies, his reply was brief. “One.” He paused, though it was hard to tell whether it was for effect. As of April, there were zero applications for reclamation on the books.
Of course, Powter continues, it is possible that Syncrude and the other companies were simply waiting to see what happened with the inaugural application so that they would have, he says, “process cer-tainty.”
SCOTT KINNEE TURNS our helicopter south. Directly beneath us is the Millennium Mine, an open pit perhaps 40 square kilometres in area, though it is hard to gauge through the miasma. Shovels are working away at a mine face, and a procession of trucks, each weighing close to 650 tonnes when full, makes its way like an ant army back and forth from the mine-face shovel to the hopper dump. I lose count at 38 trucks. A vast tailings pond appears directly beneath us. “Another sludge pond,” says Kin-nee, pointing straight down. A blackish slime oozes into a stream that fingers out across the snow and ice, steaming as it goes. We drop another 50 metres, and I look across the river, perhaps a kilometre to the west, where the Suncor plant burns and smokes and steams. The sun, to the extent we can make it out, is now drooping low in the sky.
Sustainable resource management: Canada vs Norway Article 3
unit fourglobal system choices
U4L3A3
Our energy destination, if we leave the oil-sands industry alone at the wheel, is unclear at best. To fully arrest all development, to argue against prosperity, is foolish, but to pull out all the stops would be a kind of deferred suicide, which means the only pertinent question is, How can we engineer a socio-economic matrix that intersects the most efficient exploitation of the resource with the smallest environmental cost? That intersection exists, somewhere, but we’re not using the right map by which to navigate. The current approach is so badly flawed, says University of Calgary’s David Keith, “that whether you look at this from an economic perspective or an environmental perspective, we’re walk-ing toward a cliff here.”
‘This is not a government capable of dealing with the bigger picture. I think it’s paralyzed.’
“So let us not talk falsely now,” sang Bob Dylan, “the hour is getting late.” Much of the talk in Alberta remains rhetoric and sophistry, despite the fact that environmentalists such as Simon Dyer can provide rather practical starting points for making the industry and the landscape cleaner. Industry, if you were to accept its spin, has more feel-good positions than the Kama Sutra, but the only position it truly cares for is the one it’s legally bound to pursue, and that’s how best to turn oil sands into money. And for the past decade at least, the Alberta government has shown, through both manifest incompetence and a not-very-well camouflaged capitulation to domestic and foreign corporate interests, that it can’t be trusted to handle a backyard sandbox, let alone a sandbox the size of Japan. “We need to tighten up in terms of regulation,” says Murray Gray. “We need to look at ecosystem impact and region manage-ment, and the province has not been active enough in that regard. It’s been lagging, and to my mind, there’s no excuse.”
“Mismanagement is the word that comes to mind,” says Dyer.
Even industry veterans believe the industry could use more guidance. “Make the approvals rigorous,” says Eric Newell, because “industry needs to be more proactive than it is, I’ll allow that. We’ve got some good stories to tell, but we have a long way to go.”
‘We’ve got enough dirty fuel out there to turn the planet into Venus if we want to.’
“The weak link is the provincial government,” says Keith. “This is not a government capable of deal-ing with the bigger picture. I think it’s paralyzed. Some of them might not even believe the science of climate change, and the ones who do are paralyzed. Almost all their legislation is utterly hollow. And there needs to be a conversation about where to slow production, instead of this government’s hands-off policy, which makes no sense on any grounds. We have a kind of global responsibility, an exciting possibility, really, to think about how to manage what’s happening with unconventional hydrocarbons and higher emissions, because Alberta is one of the leading places in the world where that’s happen-ing. This conversation has to happen, because, trust me, there isn’t going to be a slowdown or any help for the climate because of a lack of supply. There is a huge amount of fuel out there, dirty fuel. We have 10,000 gigatonnes of carbon on this planet and we’ve burned only 1,000. We’ve got enough to turn the planet into Venus if we want to.”
Sustainable resource management: Canada vs Norway Article 3
unit fourglobal system choices
U4L3A3
The hour is getting late, indeed.
My flight is nearly over. Kinnee circles once, then touches down back at the hangar at the Fort McMur-ray Airport. As we’d passed the confluence of the Athabasca and Clearwater rivers, the day had reverted back to its previous condition. The sun now shines in the west, as if freed of its hood, and the sky over-head is a robin’s egg blue. There is no wind, no cloud, no smoke. The air tastes clean, though I know that is nothing to put my faith in. As the rotor winds down and we remove our headsets, I realize there is nothing I want more than to be home in Edmonton, away from the stacks, the emissions, the tailings, the mines. But with one foot back on the ground, it strikes me that, of course, this is home.
Curtis Gillespie is a writer based in Edmonton.Garth Lenz lives in Victoria and is a member of the Interna-tional League of Conservation Photographers, the world’s premier association of wildlife and nature pho-tographers committed to conservation.
Sustainable resource management: Canada vs Norway Article 3
overviewIn this activity, you will conduct an inquiry individually or in groups on a progressive strategy to promote environmental protection. You will share your learning with the class in a presentation, summarized by the class into an organizer.
learning goal • To evaluate progressive strategies used globally to ensure environmental protection.
success criteria• To prepare a presentation to share my learning with my classmates on a related topic of my choice.
Government regulations are not proving to be enough to protect our natural environment from the negative impacts of a national economic model that promotes unlimited growth. Below are four strategies that could revolutionize the way we think about and value our environment.
1. Peruse the first link for each topic below to gain a general overview of each topic.2. Based on your personal interest and prior knowledge, select a topic from the list to research.3. Use the links provided to research the topic in detail. Feel free to explore other resources from the
Internet—these are just to get you started.4. Prepare a PowerPoint, Powtoon, Prezi or other presentation method to share your learning (and answer
the inquiry question!) 5. Present to your classmates and teacher. 6. As your classmates present, complete the organizer on the last page as a summary of each strategy.
Start with Design—Cradle to Cradle as a mindset and a certification for proactive companieswww.c2ccertified.org/drive-changewww.ted.com/talks/william_mcdonough_on_cradle_to_cradle_designtopdocumentaryfilms.com/waste-foodwww.theguardian.com/sustainable-business/cradle-to-cradle-certification-benefit-business-study
Read the Cradle to Cradle Design powerpoint.
Managing our own Resources through Nationalizationcanadiandimension.com/articles/view/why-we-need-to-nationalize-oil-and-gas-editorial-januaryfebruary-2006www.economist.com/news/special-report/21570842-oil-makes-norway-different-rest-region-only-up-point-rich www.csmonitor.com/World/Americas/2012/0512/Brazil-Venezuela-and-Mexico-three-ways-to-nationalize-oilwww.huffingtonpost.ca/2013/01/16/oil-industry-canada-norway_n_2491761.html
Inquiry question • How do we protect the natural environment from the negative impacts of economic development?
U4L3A4 Toward environmental protection
unit fourglobal system choices
Putting Climate Change First (or reaching a steady state economy)www.desmog.ca/2014/12/13/10-things-canada-would-be-doing-if-we-were-serious-about-climate-changetheforeigner.no/pages/columns/looking-beyond-the-oil-horizonwww.carc.org/index.php?option=com_content&view=article&id=160:arctic-science&catid=57:recommendations-for-canadian-foreign-policy, steadystate.org/climate-change-the-wrong-top-priority-for-environmentalists-and-conservation-professionals
Constitutional Reform—Enshrining rights to a healthy environment in our Constitutionwww.theglobeandmail.com/globe-debate/what-if-mother-nature-had-rights-she-does-in-ecuador/article7039202science.time.com/2014/01/29/tunisia-recognizes-climate-change-in-its-constitutionwww.harmonywithnatureun.org/rightsofnature.htmlbluedot.ca/stories/lessons-from-the-maldives-constitutionally-protected-environmental-rightswww.camrosecanadian.com/2015/07/08/movement-makes-case-for-right-to-healthy-environment
U4L3A4 Toward environmental protection
unit fourglobal system choices
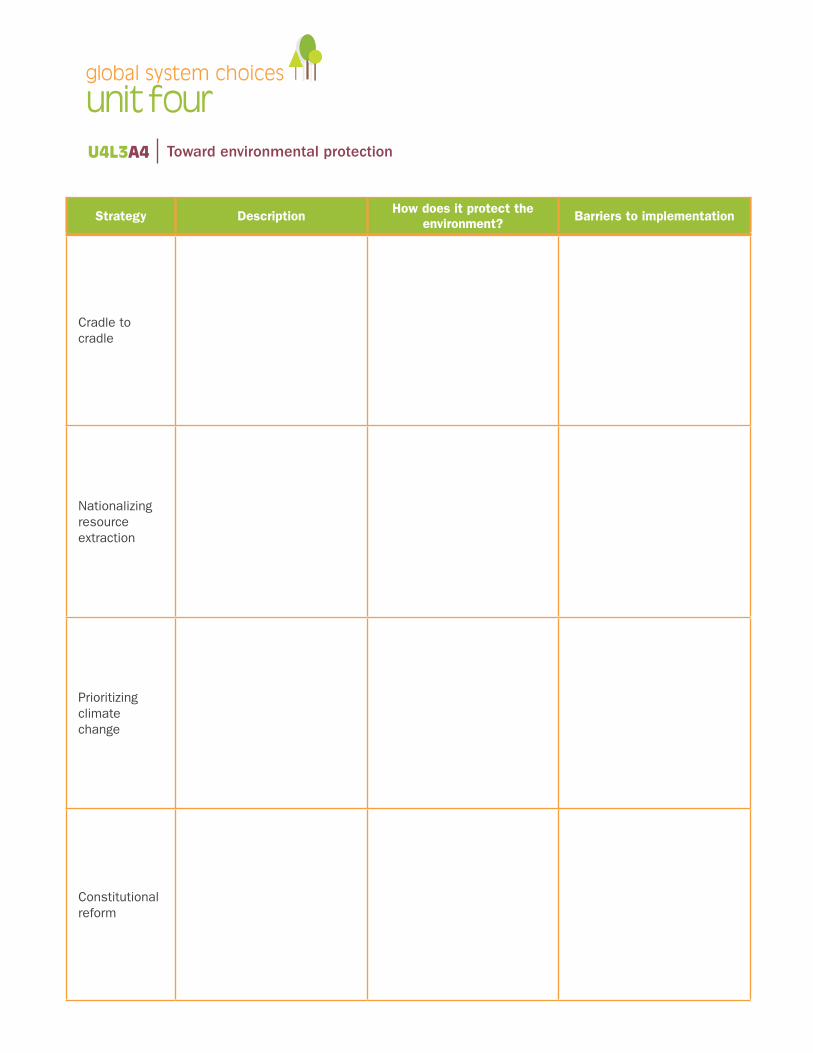
U4L3A4 Toward environmental protection
Strategy Description How does it protect the environment? Barriers to implementation
Cradle to cradle
Nationalizing resource extraction
Prioritizing climate change
Constitutional reform
unit fourglobal system choices
overviewIn this activity you will act on your learning from Activity 1. In Activity 1, you conducted an inquiry by acting as a company trying to produce an MP3 player in a sustainable way, according to the learning goals and success criteria below. Now, you will reflect on your learning by answering the questions that follow.
learning goal • To understand that the items I purchase are produced through decision-making that impacts
global sustainability.
success criteria• To be able to describe how I can be better informed on the sustainability of a product
As a consumer, what information do you need to make good choices when purchasing new items?
What strategies could companies use to keep consumers better informed about working conditions and the environmental impacts of the products they produce? Identify and explain two ways.
Inquiry question • How do companies balance social and environmental sustainability with the need for profit when producing consumer goods?
U4L3A5 Considering the hidden costs of production: exit card
unit fourglobal system choices
overviewIn this activity you will at on your learning from Activity 1. In Activity 1, you conducted an inquiry by acting as a company trying to produce an MP3 player in a sustainable way, according to the learning goals and success criteria below. Now, you will reflect on your learning by answering the questions that follow.
learning goal • To understand that the items I purchase are produced through decision-making that impacts
global sustainability.
success criteria• To develop a product label to inform consumers on the sustainability of a product.
If the goal is to allow consumers to make better decisions about the products they buy, what information should be provided to help make this decision?
1. Brainstorm a list of information that you would like to see provided to consumers for products available in Canada (think of it like the nutritional information provided to you on a food label).
• • • • • • •
2. For the list you created, rank the information in order of most important to least important, using your prior knowledge of sustainability and the information you learned in the MP3 activity.
• • • • • • •
3. Design a label to provide consumers with sustainability information.
Inquiry question • How do companies balance social and environmental sustainability with the need for profit when producing consumer goods?
unit fourglobal system choices
U4L3A6 Considering the hidden costs of production: Design a label
overviewIn this activity you will act on your learning from Activity 1. In Activity 1, you conducted an inquiry by acting as a company trying to produce an MP3 player in a sustainable way, according to the learning goals and success criteria below. In this activity, you will act on your learning by answering the questions that follow.
learning goal • To understand that the items I purchase are produced through decision-making that impacts global
sustainability.
success criteria• To apply my learning about sustainability to a case study in Venezuela.
Read the accompanying article on a Venezuelan initiative and answer the questions that follow:venezuelanalysis.com/news/5792
1. What is the Venezuelan government initiative described in this article?
2. How is this project being funded, and what is the total cost?
Inquiry Question • How do companies balance social and environmental sustainability with the need for profit when producing consumer goods?
U4L3A7 Considering the hidden costs of production: Issue analysis
unit fourglobal system choices
3. How does this initiative improve social sustainability in Venezuela?
4. Based on your learning from the MP3 activity, explain how this initiative impacts environmental sustainability, both in Venezuela and globally.
5. The Venezuelan Minister of Education, Jennifer Gil, is quoted in the article as saying:
“Only in socialism is it possible to make real the rights of children, the rights of the people, to an improved quality of education and standard of living.”
Based on your prior knowledge of the Venezuelan government and the drive to improve the quality of life in Venezuela, explain what Jennifer Gil means by this statement.
U4L3A7 Considering the hidden costs of production: Issue analysis
unit fourglobal system choices
overviewIn Activity 2, you conducted an inquiry into the barriers to sustainable development, according to the learning goals and success criteria below. You conducted a jigsaw to understand the four barriers in a real-world context. In this activity, you will act by summarizing your learning from the jigsaw and submitting it to your teacher.
learning goal • To understand that there are barriers, nationally and globally, to sustainable resource management.
success criteria• Describe one barrier to a peer group.• Accurately complete a summary organizer to explain the main barriers to sustainable
resource management.
Activity1. In your home groups, share the issues from your article and how these demonstrate barriers to
sustainable resource management. 2. Listen to your group members as they share their learning with you.3. Complete the organizer below to compile a summary of all four barriers.4. Submit your organizer to the teacher to demonstrate your understanding of the four barriers in a real-
world situation.
Inquiry question • What are the barriers to sustainable resource management?
U4L3A8 Barriers to sustainable resource management: Summary organizer
unit fourglobal system choices
U4L3A8 Barriers to sustainable resource management: Summary organizer
unit fourglobal system choices
Explanation using example from article:
Explanation using example from article:
Explanation using example from article:
Barrier:
Barrier:
Barrier:
overviewThis is a follow-up to Activity 4. In Activity 4, you conducted an inquiry on a progressive strategy to promote environmental protection, according to the learning goals and success criteria below. In this activity, you will act by sharing your learning with the class in a presentation, summarized by the class into an organizer.
learning goal • To evaluate progressive strategies used globally to ensure environmental protection.
success criteria• To prepare a presentation to share my learning with my classmates on a related topic of my choice.
ActivityAs part of the inquiry process, it is important to be able to act on the information you have collected. In addition, educating others on the current issues in Canada will help us move forward as a nation to a more sustainable future.
To share your learning with others you will prepare a display to accompany your presentation. You and your classmates will present your research in a public forum – in your school, the local library, city hall or in an evening event.
To prepare, remember that you need to make the information you have collected accessible to others who may not have the same background information as you. Find engaging ways to draw visitors to your display, so you can then talk to them about your research.
Good luck!
Inquiry question • How do we protect the natural environment from the negative impacts of economic development?
U4L3A10 Ensuring environmental protection: Forum
unit fourglobal system choices
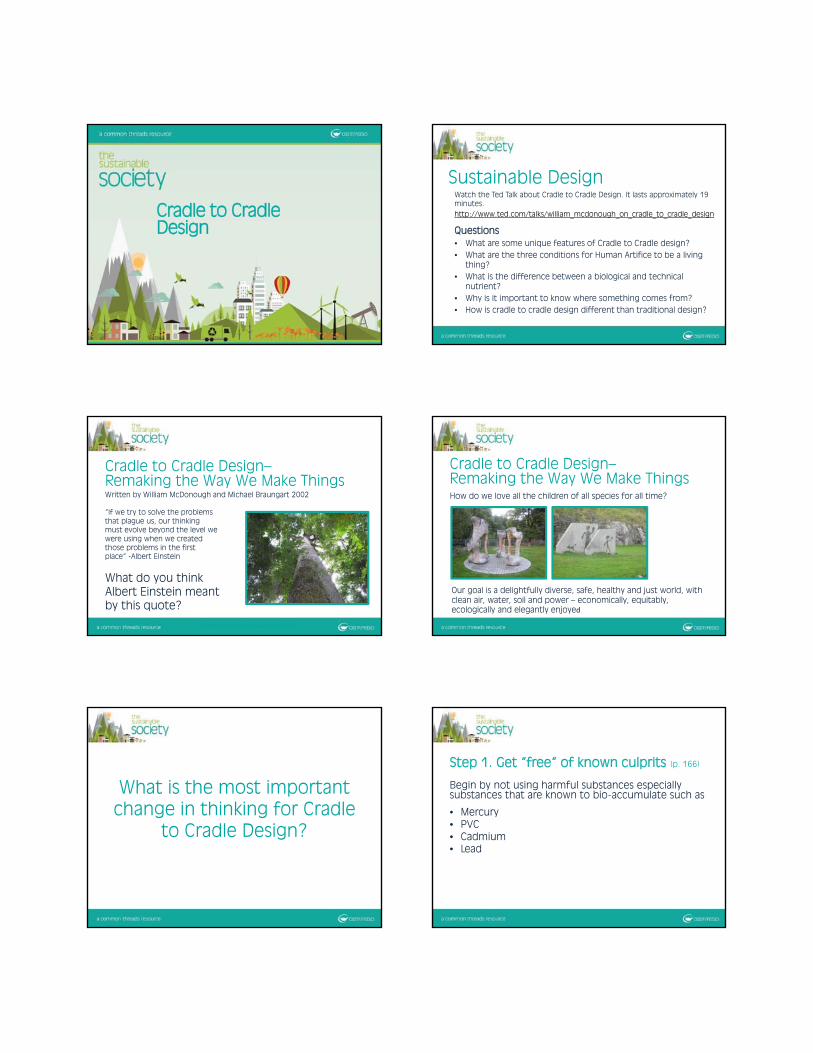
Cradle to CradleDesign
Sustainable Design
Questions• What are some unique features of Cradle to Cradle design?• What are the three conditions for Human Artifice to be a living
thing?• What is the difference between a biological and technical
nutrient?• Why is it important to know where something comes from?• How is cradle to cradle design different than traditional design?
Watch the Ted Talk about Cradle to Cradle Design. It lasts approximately 19 minutes. http://www.ted.com/talks/william_mcdonough_on_cradle_to_cradle_design
Cradle to Cradle Design–Remaking the Way We Make ThingsWritten by William McDonough and Michael Braungart 2002
“If we try to solve the problems that plague us, our thinking must evolve beyond the level we were using when we created those problems in the first place” -Albert Einstein
What do you think Albert Einstein meant by this quote?
(Open World Foundation, 2012)
Our goal is a delightfully diverse, safe, healthy and just world, with clean air, water, soil and power – economically, equitably, ecologically and elegantly enjoyed
How do we love all the children of all species for all time?
Cradle to Cradle Design–Remaking the Way We Make Things
What is the most important change in thinking for Cradle
to Cradle Design?
Step 1. Get “free” of known culprits (p. 166)
Begin by not using harmful substances especially substances that are known to bio-accumulate such as
• Mercury • PVC• Cadmium • Lead
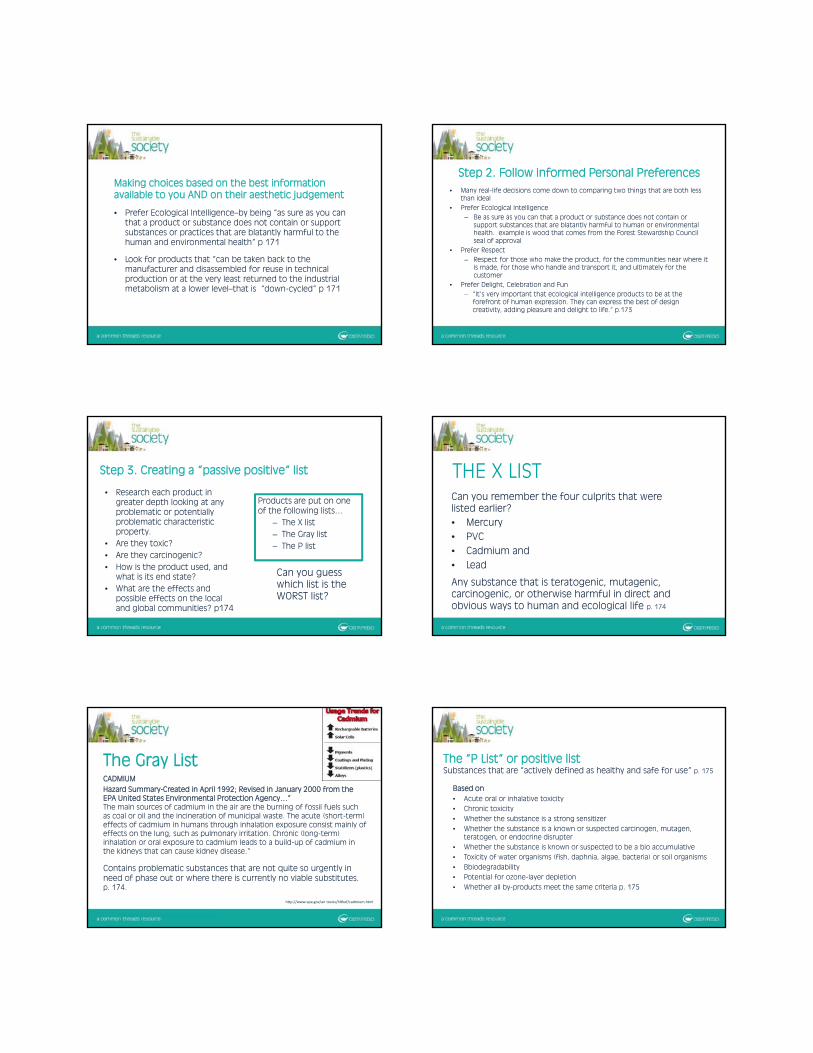
Making choices based on the best information available to you AND on their aesthetic judgement
• Prefer Ecological Intelligence–by being “as sure as you can that a product or substance does not contain or support substances or practices that are blatantly harmful to the human and environmental health” p 171
• Look for products that “can be taken back to the manufacturer and disassembled for reuse in technical production or at the very least returned to the industrial metabolism at a lower level–that is “down-cycled” p 171
Step 2. Follow informed Personal Preferences• Many real-life decisions come down to comparing two things that are both less
than ideal• Prefer Ecological Intelligence
– Be as sure as you can that a product or substance does not contain or support substances that are blatantly harmful to human or environmental health. example is wood that comes from the Forest Stewardship Council seal of approval
• Prefer Respect – Respect for those who make the product, for the communities near where it
is made, for those who handle and transport it, and ultimately for the customer
• Prefer Delight, Celebration and Fun− “It’s very important that ecological intelligence products to be at the
forefront of human expression. They can express the best of design creativity, adding pleasure and delight to life.” p.173
Step 3. Creating a “passive positive“ list
Products are put on one of the following lists…
– The X list– The Gray list– The P list
• Research each product in greater depth looking at any problematic or potentially problematic characteristic property.
• Are they toxic?• Are they carcinogenic?• How is the product used, and
what is its end state?• What are the effects and
possible effects on the local and global communities? p174
Can you guess which list is the WORST list?
THE X LIST
Any substance that is teratogenic, mutagenic, carcinogenic, or otherwise harmful in direct and obvious ways to human and ecological life p. 174
Can you remember the four culprits that were listed earlier?• Mercury • PVC • Cadmium and • Lead
The Gray ListCADMIUM
Contains problematic substances that are not quite so urgently in need of phase out or where there is currently no viable substitutes. p. 174.
Hazard Summary-Created in April 1992; Revised in January 2000 from the EPA United States Environmental Protection Agency…”The main sources of cadmium in the air are the burning of fossil fuels such as coal or oil and the incineration of municipal waste. The acute (short-term) effects of cadmium in humans through inhalation exposure consist mainly ofeffects on the lung, such as pulmonary irritation. Chronic (long-term) inhalation or oral exposure to cadmium leads to a build-up of cadmium in the kidneys that can cause kidney disease.”
http://www.epa.gov/air toxics/hlthef/cadmium.html
Image taken from https://www.osha.gov/SLTC/cadmium/
The “P List” or positive listSubstances that are ”actively defined as healthy and safe for use” p. 175
Based on• Acute oral or inhalative toxicity• Chronic toxicity• Whether the substance is a strong sensitizer• Whether the substance is a known or suspected carcinogen, mutagen,
teratogen, or endocrine disrupter• Whether the substance is known or suspected to be a bio accumulative• Toxicity of water organisms (fish, daphnia, algae, bacteria) or soil organisms• Bbiodegradability• Potential for ozone-layer depletion• Whether all by-products meet the same criteria p. 175
Review: Terminology• Carcinogen• Tetragen• Mutagen• Endocrine Disrupter• Sensitizer• Bioaccumulative• Biodegradability• By-product
Step 4 Activate the positive list
• Starting with the eco-effective principles design the product from beginning to end to become food for either biological or technical metabolisms.
• A biological nutrient is a material or product that is designed to return to the biological cycle – it is literally consumed by microorganisms in the soil and by other animals. P. 105
• A technical nutrient is a material or product that is designed to go back into the technical cycle, into the industrial metabolism from which it came. P. 110
Step 5-Reinvent“ Design is based on the attempt to fulfill human needs in an evolving technical and cultural context. We begin by applying the active positive list to existing things, then to things that are only beginning to be imagined, or have not yet been conceived. When we optimize, we open our imaginations to radically new possibilities. We ask: What is the customer’s need, how is the culture evolving, and how can these purposes be met by appealing and different kinds of products or services.” p. 180
Explore: Cradle to Cradle Design Challenge
“The goal of the Challenge is to eliminate the concept of 'waste' by designing products with materials that may be perpetually cycled to retain their value as nutrients to fuel growing global economies.”
Read more: http://www.dexigner.com/news/27869