Bayesian inference for the generalized exponential distribution
Upload
khangminh22Category
view
4download
0
Algebra 2 – Unit 5
Exponential and Logarithmic Functions
Investigation 1
Activity 5.1.1 New Beginnings – Introduction to Logarithms
Activity 5.1.2 Using the Definition of Logarithm
Activity 5.1.3A Exploring Log Functions with the TI-Graphing Calculator
Activity 5.1.4 Product and Quotient Rule
Activity 5.1.5 Power Rule
Activity 5.1.6 How High is the Stack of Paper and How Many Folds
Activity 5.1.7 Logarithmic Scavenger Hunt (optional)
Activity 5.1.8A Inverse Property
Investigation 2
Activity 5.2.1 Compounding Interest
Activity 5.2.2 Introduction to Base e
Activity 5.2.4 Equations Involving Logarithms
Investigation 3
Activity 5.3.1 Exponential Growth
Activity 5.3.2 Earthquakes
Activity 5.3.3 pH
Activity 5.3.4 Sound Intensity
Activity 5.3.5 Problem Solving Using Logarithms
End of Unit Investigations
Activity 5.5.1 Analyzing Data
Activity 5.5.2 (+) Piecewise Exponential
Activity 5.7.1 Down Payment

Name: Date: Page 2 of 68
Activity 5.1.1 Hamden Public Schools 2016-2017 adapted from
Connecticut Core Algebra 2 Curriculum Version 3.0
Activity 5.1.1 New Beginnings
This story is a modern day adaptation of the King’s Chessboard, a story with a mathematical
twist from ancient India.
On New Year’s Eve, December 31, Sam is attending a celebration with his family, including
aunts, uncles, grandparents, cousins, and more! Sam’s favorite uncle knows that Sam is planning
to go away to college next year. His uncle has come to the party with ten crisp new $100 bills to
give to Sam to help finance his education. As the evening wears on, Sam and his uncle begin
chatting. Sam’s uncle decides to have a little fun with Sam.
Uncle Charlie: Sam, I want to help you out with paying for college. I’ve got two options
and you can pick whichever one you want.
Sam: Thanks! I have been a little worried about paying for school. What are the options?
Uncle Charlie: Well, here is $1000.
He pulls out the ten brand new $100 bills and puts them in front of Sam. Sam’s eyes open wide –
he had never seen that much money in one place before!
Sam: Whoa….
Uncle Charlie: And here is the second option.
Uncle Charlie proceeds to toss a dull, dirty penny on the table. Sam looks confused but his uncle
begins to explain.
Uncle Charlie: This penny symbolizes an agreement. If you take the penny, I will give
you double that tomorrow, the first day of the New Year. Then on the second day of the
New Year, I will give you double what I did on the first day. I will continue with this
pattern for 64 days.
Sam starts to reach for the $1000 but then thinks more carefully about the penny. On day 1, he
would receive 2¢. On day 2 he would get 4¢, on day 3 he would get 8¢, on day 4 he would get
16¢, and so on. This would be less than $3 total in the first week! But Sam had paid attention in
math class. This was not a linear pattern. Why? ___________________ This is a(n)
_____________ pattern! Did his uncle really know what he was offering? This deal was too
good to be true! Sam smiled slyly and slid the penny toward him. Why? ___________________
Uncle Charlie lived up to his end of the deal for as long as possible.
1. How much money did Uncle Charlie give Sam on the 21st day of the year?

Name: Date: Page 3 of 68
Activity 5.1.1 Hamden Public Schools 2016-2017 adapted from
Connecticut Core Algebra 2 Curriculum Version 3.0
2. How much money was Uncle Charlie supposed to give Sam on the 64th
day of the year?
3. As you saw in the paper folding activity and in Algebra 1, this type of pattern can be
represented by an exponential function. In this example, if you know the day of the year,
you can substitute that value into the exponential function and then figure out how much
money Sam’s uncle gave him that day. But what if the question is reversed?
Describe the process you would use to determine the answer to this question and then put
that process into action to answer the question.
4. On what day of the year did Sam’s uncle give him 2097152¢ or $_____________?
5. On what day of the year did Sam’s uncle give him $335544.32?
6. On what day of the year did Sam’s uncle give him 2,147,483,648¢ or $_____________?

Name: Date: Page 4 of 68
Activity 5.1.1 Hamden Public Schools 2016-2017 adapted from
Connecticut Core Algebra 2 Curriculum Version 3.0
Your process for determining the day on which Sam received that amount of money probably
involved some calculations and a little trial and error to get to the correct day. If you use the idea
of inverse functions, you can figure out the day without trial and error. Let’s start with graphing
an exponential function and then working towards developing the inverse function.
Graphing the Exponential Function 𝒇(𝒙) = 𝟐𝒙
1. Complete the following table.
𝒙 𝒚 = 𝒇(𝒙)
-2
-1
0
1
2
3
2. On the graph paper provided, graph the function 𝑓(𝑥) = 2𝑥. On your graph, clearly
indicate the six points from the table. (Hint: You might want each unit on the axes to
represent 1
2 in order to have an easier time graphing the fractions.)
3. By looking at your graph, how can you tell that 𝑓(𝑥) = 2𝑥 has an inverse (function)?
4. What is the domain of the exponential function 𝑓(𝑥) = 2𝑥?
5. What is the range of the exponential function 𝑓(𝑥) = 2𝑥?
6. State the asymptotes of graph of the function 𝑓(𝑥) = 2𝑥. Make sure you give an equation
for the asymptote and also state whether it is a vertical or a horizontal asymptote.

Name: Date: Page 5 of 68
Activity 5.1.1 Hamden Public Schools 2016-2017 adapted from
Connecticut Core Algebra 2 Curriculum Version 3.0
Graphing the Inverse of the Exponential Function 𝒇(𝒙) = 𝟐𝒙
1. Do you remember how functions and their inverses are related? Use the table below to
list six ordered pairs on the graph of the inverse function. Next to the table, describe
how you obtained these ordered pairs.
𝒙 𝒚
2. On the graph paper provided, graph the six points from the table.
3. Keep in mind that inverses are reflections over the line 𝑦 = 𝑥. Graph the line 𝑦 = 𝑥. Use
the points that you have already graphed as well as the reflection property of inverses to
completely sketch the graph of the inverse of 𝑓(𝑥) = 2𝑥. (Hint: Check that your graph is
correct by folding your paper on the line 𝑦 = 𝑥.)
4. What is the domain of this inverse function that you just graphed?
5. What is the range of the inverse function?
6. State the asymptotes of graph of the inverse function. Make sure you give an equation for
the asymptote and also state whether it is a vertical or a horizontal asymptote.

Name: Date: Page 6 of 68
Activity 5.1.1 Hamden Public Schools 2016-2017 adapted from
Connecticut Core Algebra 2 Curriculum Version 3.0
Writing an Equation for the Inverse of the Exponential Function 𝒇(𝒙) = 𝟐𝒙
You know the inverse of 𝑦 = 2𝑥 exists and you even know what the graph of the inverse looks
like. Now it is time to get an equation for the inverse of an exponential function. Remember that
to get the inverse function, you swap the 𝑥 and 𝑦 values in the original equation (that’s where the
idea of reflection across the line 𝑦 = 𝑥 comes into play) and then solve for 𝑦.
Original Exponential Equation: 𝑦 = 2𝑥
Inverse Equation: 𝑥 = 2𝑦
Notice the location of y in the inverse equation! The y is in the exponent and you currently do
not have a way to solve for y and get it out of the exponent. This is where the logarithm function
comes in.
The equation of the inverse of 𝑓(𝑥) = 2𝑥 is 𝑓−1(𝑥) = log2 𝑥.
Define the inverse of each function by rule.
1. f(x) = 8x.
2. g(x) = log3x
3. p(x) = 10x
4. r(x) = log5x
Definition of a Logarithm(Base 2)
𝑦 = log2 𝑥 is equivalent to 𝑥 = 2𝑦

Name: Date: Page 7 of 68
Activity 5.1.2 Hamden Public Schools 2016-2017 adapted from
Connecticut Core Algebra 2 Curriculum Version 3.0
Activity 5.1.2 Using the Definition of a Logarithm
1. Using the definition
log𝑏 𝑦 = 𝑥 if and only if 𝑏𝑥 = 𝑦
rewrite the following exponential equations as logarithmic equations.
a. 52 = 25
b. 5−3 =1
125
c. 34 = 81
d. 30 = 1
e. 4−2 =1
16
f. 105 = 100000
g. 811
2 = 9
h. 2433
5 = 27
2. Using the relationship
log𝑏 𝑦 = 𝑥 if and only if 𝑏𝑥 = 𝑦
rewrite the following logarithmic equations into exponential equations.
a. log2 16 = 4
b. log31
3= −1

Name: Date: Page 8 of 68
Activity 5.1.2 Hamden Public Schools 2016-2017 adapted from
Connecticut Core Algebra 2 Curriculum Version 3.0
c. log3 243 = 5
d. log10 1 = 0
e. log101
1000= −3
f. log51
3125= −5
g. log16 4 =1
2
h. log125 25 =2
3
3. Determine 𝑦 by rewriting the logarithmic equation as an exponential equation.
a. 𝑦 = log2 16
b. 𝑦 = log3 729
c. 𝑦 = log31
9
d. 𝑦 = log6 1296
e. 𝑦 = log101
100000000
f. 𝑦 = log7 49
g. 𝑦 = log16 2

Name: Date: Page 9 of 68
Activity 5.1.2 Hamden Public Schools 2016-2017 adapted from
Connecticut Core Algebra 2 Curriculum Version 3.0
4. (a)Find y: y = log 90. First estimate the answer your calculator should give you. At the
very least you should be able to capture it between 2 consecutive whole numbers. What
are those whole numbers? Remember base 10 is the common base so we do not have to
write it. (b)There is an index with roots we do not have to write explicitly. What is it?
5. Returning to the folding paper in class. How many folds will produce 512 rectangles?
6. In 2e above log101
1000= −3 could also have been written as log 10−3 = −3
Look at a few more problems
log 10000 = log 104 =
log 1000 = log 103 =
log 100 = log 102 =
log 10 = log 101 =
log 1 = log 100 =
log 0.1= log 10-1
=
log 0.01 = log 10 -2
=
a. Do you see a pattern developing? What is it?
b. Will the same pattern work for log2 8 = log2 23 = ?
Since the logarithm base b function is the inverse of the exponential function with base b, the
logarithm undoes the exponential function. It should seem reasonable that the log 10a = a for any
value of a. Did you see this pattern in part a? ____ We will return to this pattern and investigate
another related pattern in a later activity.

Name: Date: Page 10 of 68
Activity 5.1.3A Hamden Public Schools 2016-2017 adapted from
Connecticut Core Algebra 2 Curriculum Version 3.0
Activity 5.1.3A Exploring Log Functions with TI-Grapher
Directions: To investigate how the variables of a, b, c and d effect the graph of y = log x we will
use you graphing calculator and the Transformation application. Press APPS and choose
Transfrm.
In Y1 enter 𝑎 log(𝑏(𝑥 − 𝑐)) + 𝑑. Press WINDOW and key cursor over to SETTINGS:
Set A = 1, B = 1, C = 0, D = 0, step = .25
Set the window to the ZStandard by pressing ZOOM 6.
Manipulate the sliders for a, b, c and d to get an idea of how they impact the function.
1. Assuming the logarithmic family graphs acts like the earlier functions we have studied and
given that the standard form of the equation for a logarithmic function is:
𝑦 = 𝑎 log(𝑏(𝑥 − 𝑐)) + 𝑑, identify which variable represents the following translations:
a) translates the function up and down: b) vertically stretches the function:
c) horizontally stretches the function: d) translates the function left and right:
2. Put the function back into standard form by resetting a = 1, b = 1, c = 0, and d = 0. Now, with
cursor on “A” left arrow to 0. Notice the changes to the log function when 0 < a < 1. Next
notice the changes to the log function when -1 < a < 0. What is happening to the graph of
log x? Next, right arrow to see the changes to the log function when a > 1. Then left arrow to
values where a < -1. What is happening to the graph of log x? Pay particular attention to and
write about: the domain, the end behavior and the asymptotes.
Did a control what you thought from number 1 above?

Name: Date: Page 11 of 68
Activity 5.1.3A Hamden Public Schools 2016-2017 adapted from
Connecticut Core Algebra 2 Curriculum Version 3.0
3. Put the function back into standard form and with cursor on “B” left arrow to 0. Notice the
impact on the function of multiplying x by a constant 0 < b <1. Next left arrow to values
where -1 < b < 0. Notice the impact on the function when multiplying x by a constant -1 < b
< 0. Describe what is happening to the graph of log x? Next right arrow to see the changes to
the log function when b > 1 and left arrow to see the changes to the log function when b < 1.
What is happening to the graph of log x? Pay particular attention to and write about: the
domain, the end behavior and the asymptotes.
Did b control what you thought from number 1 above?
Put the function back into standard form and Press WINDOW and key cursor over to
SETTINGS: Change Step = 1
4. With cursor on “C” right arrow from 0 to 5. Notice what is happening to the graph of log x
when c > 0. Next left arrow from 5 to – 5 and notice what is happening when c < 0. Describe
the changes made to the log function. Pay particular attention to and write about: the domain,
the end behavior and the asymptotes.
Did c control what you thought from number 1 above?

Name: Date: Page 12 of 68
Activity 5.1.3A Hamden Public Schools 2016-2017 adapted from
Connecticut Core Algebra 2 Curriculum Version 3.0
5. Put the function back into standard form and with cursor on “D” right arrow from 0 to 5.
Then left cursor from 5 to – 5. Describe the changes to the function when you add a constant
to the function. Pay particular attention to and write about: the domain, the end behavior and
the asymptotes.
Did d control what you thought from number 1 above?
6. Sketch the following functions and describe the transformations. Additionally include in your
description information about: the domain, range, asymptotes, increasing or decreasing, and
end behavior.
a. 𝑓(𝑥) = −2 log(𝑥) + 5

Name: Date: Page 13 of 68
Activity 5.1.3A Hamden Public Schools 2016-2017 adapted from
Connecticut Core Algebra 2 Curriculum Version 3.0
b. 𝑓(𝑥) = 3log (𝑥 − 4)
c. (𝑥) = −5 log(𝑥 + 2) − 8
7. Describe any similarities or differences between the translations you’ve learned about with
the log functions to the functions you’ve previously learned about.

Name: Date: Page 14 of 68
Activity 5.1.3A Hamden Public Schools 2016-2017 adapted from
Connecticut Core Algebra 2 Curriculum Version 3.0
8. The log function has a unique parameter to its family, its base. You just studied the family
with base 10. What difference would there be between the graph of f(x) = log x and g(x) =
log2 x? How about r(x) = log20 x? Make a table of values and then sketch the graphs on one
set of axes below.
x g(x) = log2 x f(x) = log x r(x) = log20 x
1
2
4
8
10
16
20

Name: Date: Page 15 of 68
Activity 5.1.4 Hamden Public Schools 2016-2017 adapted from
Connecticut Core Algebra 2 Curriculum Version 3.0
Activity 5.1.4: The Product Rule and Quotient Rule for Logarithms
The 16th
and 17th
centuries were centuries of immense scientific progress. Copernicus, Magellan,
Mercator, Galileo, Kepler are just a few giants of those centuries. But the advancements were
slowed because scientists had to spend an immense portion of their time making tedious
numerical computations using the ever increasing amount of data they were collecting and the
very large and small numbers they had to work with, for example in astronomy. John Napier
decided to see if there was some way to facilitate computations especially multiplication so that
scientists could spend more of their time doing scientific work rather than laboring over
computations. Although there is some evidence that logarithms were known in 8th
century India,
the credit for their invention as an aid to calculating is given to John Napier.
We do not know how he came up with his idea. We do know he developed logarithms for “use in
the extensive plane and spherical trigonometrical calculations necessary for astronomy” (Katz,
1995, Napier’s Logarithms Adapted for Today’s Classroom, pg.49) and that he was aware of
trigonometric identities that changed products of sine and cosine values into sums and
differences of sine and cosine values. You will study those identities later in your mathematics
career. Of course addition and subtraction were much easier to work with then. No TI calculators
were available of course but you might research to see if there was any type of calculating device
in the 1500s and 1600s. Unlike the logarithms of today, Napier’s logarithms are not really to any
base. They do involve the constant 107, based on the fact that the sine tables available in those
days had decimal values to 7 places. We do know he was familiar with geometric sequences and
with the Laws of Exponents. Consider the following table which could represent the growth of
bacteria or the classic grains of sand doubling or you uncle’s penny problem in an earlier
activity.
Row 1 0 1 2 3 4 5 6 7 8 9 10 11
Row 2 1 2 4 8 16 32 64 128 256 512 1024 2048
Suppose you select 8 and 128 from Row 2 and want their product. Note in Row 1, 3 corresponds
to 8 and 7 corresponds to 128. If you add 3 and 7 you will get 10 and 10 corresponds to 1024
which is the desired product. So a multiplication in Row 2 corresponds to an addition in Row 1.
A. Try multiplying 16 by 64 using the table
B. Try multiplying 4 by 256 using the table
Because they are exponents, the numbers in Row 1 are called logarithms of the
corresponding numbers in Row 2. Note the numbers in row 2 were generated by the
function f(x) = 2x.
You can do some research on Napier and how he constructed his tables. Henry Briggs was very
impressed with Napier’s tables and more importantly the idea behind their construction: the
reduction in time for calculating with scientific data. He traveled more than 400 miles which was
quite a feat in those days to meet Napier.

Name: Date: Page 16 of 68
Activity 5.1.4 Hamden Public Schools 2016-2017 adapted from
Connecticut Core Algebra 2 Curriculum Version 3.0
The Napier logarithm of 1 was not 0 and that was a problem. Brigg’s suggested using 10 as a
base so the logarithm of 1 would be 0. Napier agreed but because of his age, ill health and
because he had already spent so much of his life making his tables that task fell to Briggs. Briggs
developed tables for the integers from 1 to 20000 and 90000 to 100000. Briggs developed tables
for integers from 1 to 20000 and 90000 to 100000. Another mathematician, Vlacq filled in the
gaps. The tables held decimals to 14 places. Use your calculator to get the log 11 or log 55. Note
the answers are not nice. Tables with 20 places of accuracy were not completed unit 1924.
1. Evaluate the following pairs of expressions:
a. log2 4 + log2 32 and log2 128
b. log2 8 + log2 16 and log2 128
c. log 100 + log 10000 and log 1000000
d. log 0.1 + log 10 and log 1
e. log 0.01 + log 1000 and log 10
2. Do you see a potential relationship between the two expressions in number 1? If you do,
please make a general conjecture. _______________________ If you do not, talk with a
neighbor.
3. Now let us see if we can prove your conjecture. Does log A + log B = log (AB)? Also
what must be true about A and B? Think of the domain of the graph of the logarithm
function.__________________
a. Let log A = M and log B = N
b. Log A = M can be written as 10M
= A, Why?
c. Log B = N can be written as 10N = B, Why?
d. AB = 10M
10N, Why?
e. AB = 10M+N
, Why?
f. log (AB) = log 10M+N
= M + N, Why?
g. BUT log A = M and log B = N so log AB = log A + log B, Why?
4. Rewrite as the sum of logarithms using your rule.
a. log2(3 ∙ 6)
b. log2 10

Name: Date: Page 17 of 68
Activity 5.1.4 Hamden Public Schools 2016-2017 adapted from
Connecticut Core Algebra 2 Curriculum Version 3.0
c. log10 50
d. log3 9𝑥
5. Write as a single logarithm.
a. log2 7 + log2 5
b. log3𝑥
3+ log3
9
𝑦
c. log2 3 + log3 2
d. log10 25 + log10 2 + log10 4
6. Evaluate the following pairs of expressions:
a. log 1000 – log 10 and log 100
b. log 10000 – log 100 and log 100
c. log3 81 – log3 27 and log3 3
d. log2 32 – log2 4 and log2 8
7. Do you see a potential relationship between the two expressions in number 6? If you do,
please make a conjecture. If you do not, talk to a neighbor.
__________________________
8. Now let us see if we can prove your conjecture. Does: log A - log B = log (A/B)?
a. Let log A = M and log B = N, Why?
b. _____________________________
c. _____________________________
d. _____________________________
e. _____________________________
f. _____________________________
g. _____________________________
Name: Date: Page 18 of 68
Activity 5.1.4 Hamden Public Schools 2016-2017 adapted from
Connecticut Core Algebra 2 Curriculum Version 3.0
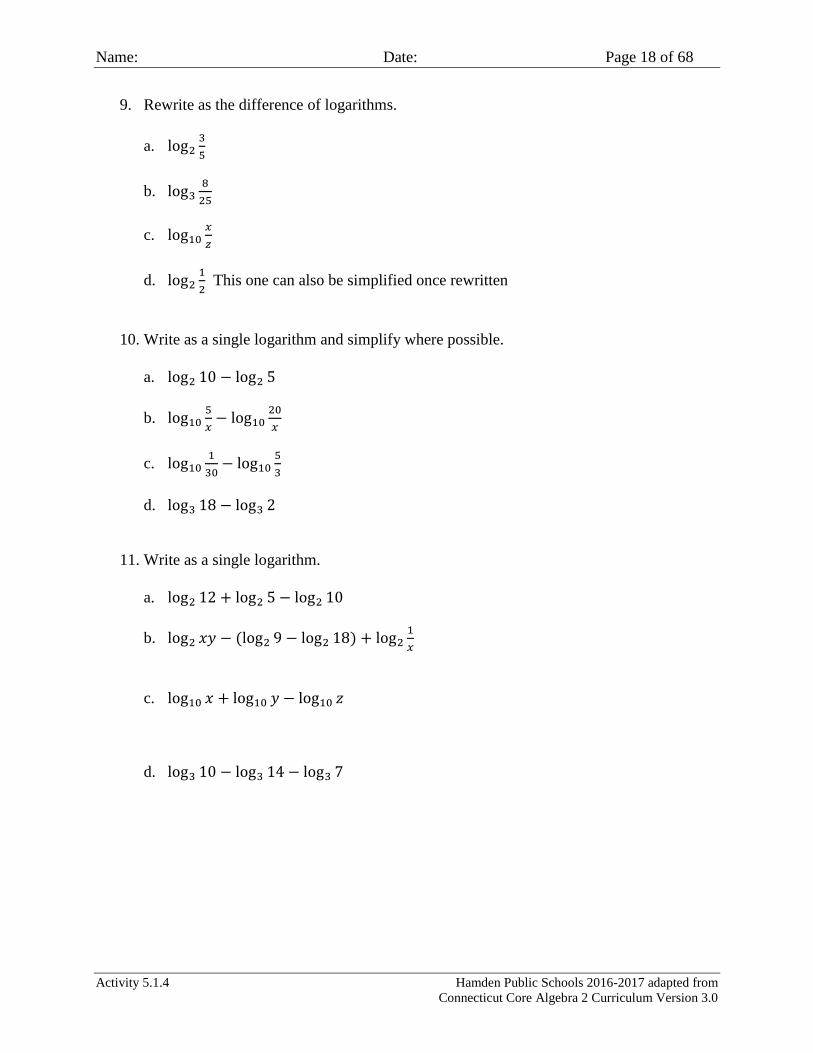
9. Rewrite as the difference of logarithms.
a. log23
5
b. log38
25
c. log10𝑥
𝑧
d. log21
2 This one can also be simplified once rewritten
10. Write as a single logarithm and simplify where possible.
a. log2 10 − log2 5
b. log105
𝑥− log10
20
𝑥
c. log101
30− log10
5
3
d. log3 18 − log3 2
11. Write as a single logarithm.
a. log2 12 + log2 5 − log2 10
b. log2 𝑥𝑦 − (log2 9 − log2 18) + log21
𝑥
c. log10 𝑥 + log10 𝑦 − log10 𝑧
d. log3 10 − log3 14 − log3 7

Name: Date: Page 19 of 68
Activity 5.1.4 Hamden Public Schools 2016-2017 adapted from
Connecticut Core Algebra 2 Curriculum Version 3.0
12. The fifteenth century mathematician John Napier invented logarithms to simplify the
calculations of complex expressions involving multiplications and divisions by changing
them to additions and subtractions. Explain how the logarithm properties he created
accomplished this by looking at several examples.
13. The two laws you have discovered are stated in the box. BUT there are restrictions on b,
A and B. What are they? Add them in the box.
log𝑏 𝐴 ∙ 𝐵 = log𝑏 𝐴 + log𝑏 𝐵
log𝑏
𝐴
𝐵= log𝑏 𝐴 − log𝑏 𝐵

Name: Date: Page 20 of 68
Activity 5.1.5 Hamden Public Schools 2016-2017 adapted from
Connecticut Core Algebra 2 Curriculum Version 3.0
Activity 5.1.5 The Power Rule for Logarithms
1. log𝑏 𝑥2 has been rewritten below. Justify each step.
log𝑏 𝑥2 = log𝑏 𝑥 ∙ 𝑥
= log𝑏 𝑥 + log𝑏 𝑥
= 2 log𝑏 𝑥
2. Using the Product Rule for Logarithms, rewrite log𝑏 𝑥3, justifying each step.
log𝑏 𝑥3 =
=
=
3. Using the Product Rule for Logarithms, rewrite log𝑏 𝑥4, justifying each step.
log𝑏 𝑥4 =
= =
4. Using the Product Rule for Logarithms, rewrite log𝑏 𝑥𝑛, where 𝑛 is a natural number,
justifying each step.
log𝑏 𝑥𝑛 =
=
=
You have stated the Power Rule for Logarithms.
5. Use Proof by Counter Example to show that log𝑏 𝑥𝑛 ≠ (log𝑏 𝑥)𝑛 Hint: Choose values
for 𝑏, 𝑥 and 𝑛.
6. The general power rule is for any real number 𝑟, is log𝑏 𝑥𝑟 = 𝑟 log𝑏 𝑥. Use the law to
help rewrite the following.
a. log𝑏 25
b. log𝑏 1000
c. logb 0.001
d. log𝑏 √10

Name: Date: Page 21 of 68
Activity 5.1.5 Hamden Public Schools 2016-2017 adapted from
Connecticut Core Algebra 2 Curriculum Version 3.0
e. log𝑏 √1
3
f. log𝑏 √𝑏
g. log𝑏 𝑏3
7. Using the general power rule, rewrite the following.
a. log2 8
b. log21
16
c. log10 10000
d. log101
1000
e. log31
81
8. Now be prepared to use all your rules. Find an equivalent expression for each expression
below using properties of logarithms. Aim for new expressions that are “simpler” than
the ones given below.
a. log x + log x3 + log x
5
b. log x + log √x – log 5
c. log3 27 + log3 27
9. Find an equivalent expression for each expression properties of logarithms. Your new
expressions may not appear to be “simpler.” They may appear to be expanded.
a. log2 (10x)
b. log (x5y
7)

Name: Date: Page 22 of 68
Activity 5.1.5 Hamden Public Schools 2016-2017 adapted from
Connecticut Core Algebra 2 Curriculum Version 3.0
c. log 2𝑥𝑦
𝑧3 .
10. You have a Product Rule, Quotient Rule and Power Rule for Logarithms. Is there a Sum
Rule? Does the log (a + b) = log a + log b? Justify your answer.
11. Below are four more possible properties or rules for logarithms. Decide if each statement
is always true. If it is not, provide a counterexample.
a. log(a – b) = log a – log b
b. log(ab) = (log a)(log b)
c. log(a/b) = (log a)/(log b)
d. log(1/a) = 1/(log a)
12. A common error is to write log (10x3) = 3 log (10x). If a student writes this, what mistake
is he making? How can you correctly rewrite log(10x3)?
13. When evaluating the log of a quotient using technology use care. The parentheses in
log (87/4) may be essential. Does your calculator give you the answer for (log 87)/4 or
log (87/4) if you do not put in the parentheses? _______ Explain. __________________
14. A. In Algebra 1 you considered a problem such as “Jose invested $7000 in a compound
interest account with a yearly interest rate of 4%. When will he have $14000?” In
Algebra 1 you used trial and error to find an approximate answer. Do so again now.
______ You hopefully are finding by trial and error the value of t that will satisfy the
equation 2 = 1.04t.
B. Now use the Power Rule to rewrite the equation as log 2 = t log 1.04 and now solve
for t. How close are your answers? ______________
We will continue to expand our ability to solve equations that need the Power Rule in our
next activity.

Name: Date: Page 23 of 68
Activity 5.1.6 Hamden Public Schools 2016-2017 adapted from
Connecticut Core Algebra 2 Curriculum Version 3.0
Activity 5.1.6 How High is the Stack of Paper and How Many Folds?
We can use the Power Rule to help us examine additional questions from the opener of
this investigation. Suppose the piece of paper you were folding is .003 inches thick. Let
f(n) represent the thickness of the paper when it has been folded n times.
1. Find an equation for f(n). You might make a table to assist with this task.
folds Thickness in inches
0 .003
1 2(.003) = .006
2 4(.003) = .012
3
2. Suppose you fold the paper 8 times. How thick will it be?
3. Suppose you fold the paper 12 times. How thick will it be?
4. Now suppose we know the thickness is the length of a football field – 100 yards not
including the end zones. Or, if you want use 120 yards and include the end zones. (a)
How many times would you need to fold the paper for the thickness to be 100 yards?
_________ (b) 120 yards?
5. Now let us change the conditions a bit for if you did the research in activity 5.1.1 you
know we can only fold a piece of paper a limited number times. Since at some point
you cannot fold the paper again, instead, consider cutting the paper in two halves. So

Name: Date: Page 24 of 68
Activity 5.1.6 Hamden Public Schools 2016-2017 adapted from
Connecticut Core Algebra 2 Curriculum Version 3.0
cut in half and then place one piece on top of the other. Repeat, cut in half, stack one
half on top of the other to make a new stack. If the paper gets too thick for your
scissor then cut fewer sheets at a time and then stack in one big pile. So you will have
one sheet, then 2 sheets, 4 sheets, 8 sheets, and so on. Continue until you have cut in
half 50 times. How high will the stack of paper be? Make an estimate here
______________ Be sure if the number of inches is large to convert to miles.
_______________
6. How far is it from the earth to the moon? _____________You may have to look this
up. Look at your answer to 5 above. How many earth to moon distances is your stack
of paper? _____________
7. Now look of the distance from the earth to the sun and write down here.
______________ How many cuts would you have to make to have a stack of paper
that tall? _______________________
8. The Power Rule for Logarithms lets us solve problems like 8x = 25. We take the log
of both sides. Why can we do this? _______ We replace log 8x with x log 8 and have
x log 8 = log 25 and divide both sides by the number log 8. So the solution is exactly
(log 25)/(log 8). What is an approximate solution to two decimal places? _____
9. Now try some yourself.
a. 1.7x = 25
b. 0.5x = 11

Name: Date: Page 25 of 68
Activity 5.1.6 Hamden Public Schools 2016-2017 adapted from
Connecticut Core Algebra 2 Curriculum Version 3.0
c. 1.7x + 4 = 25
d. 2 (1.7x) = 25
e. 1.7x/3 = 25
f. 1.72x
= 25
g. 1.7(2x + 1)
= 25
h. 4(1.8)x = 7(1.07)
x
10. A teacher put the following problem on a quiz. Solve 9(2)x = 4(11)
x. When she made
her answer key she had log(9/4)/log(11/2) as the exact answer. As she continued to
grade the papers a student had log(4/9)/log(2/11). Is this student correct? ___ Explain.
____________________ As she continued to grade papers she also found
(log 9 - log 4)/(log 11 – log 2). Should this last student receive credit? Explain.
____________________
11. We can also use our ability to take the logarithm of both sides of an equation to find
the logarithm of a number to any base. Find log20 8. Let y = log20 8. Then 20y = 8.

Name: Date: Page 26 of 68
Activity 5.1.6 Hamden Public Schools 2016-2017 adapted from
Connecticut Core Algebra 2 Curriculum Version 3.0
Now take the log of both sides. log 20y = log 8 and use the power rule. What is y?
________ Now check number 8 of activity 5.1.3 when you used trial and error to find
log20 8. Were you close?
Now find log2 75. Let y = log2 75. Then 2y = 75. Finish the problem. ________
Now find log𝑏 𝑐.

Name: Date: Page 27 of 68
Activity 5.1.8A Hamden Public Schools 2016-2017 adapted from
Connecticut Core Algebra 2 Curriculum Version 3.0
Activity 5.1.8A Consequences of Being Inverse Functions
In this activity, we will use your study of inverse functions from unit 1 to verify two important
properties of exponents and logarithms,
log𝑏 𝑏𝑥 = 𝑥 and 𝑏log𝑏 𝑥 = 𝑥.
In activity 5.1.2 you noticed a pattern: that log 10a = a. Now that we have the Power Rule for
Logarithms we can see that log 10a = a log 10 = a(1) = a.
1. Study the completed rows and fill in the two empty rows
x f(x)=10x
x ( column 2 outputs of f) will
be the inputs for g(x)= log x
g(x)=log x, the
exponent
-1 0.1 0.1 -1
0 1 1 0
1 10 10 1
2 100 100 2
3 1000 1000 3
5
6
a 10a
10a
So when 𝑓(𝑥) = 10𝑥 and 𝑔(𝑥) = log10 𝑥. then 𝑔(𝑓(𝑥)) = 𝑥.
For what values 𝑥 does the above statement hold?
2. Simplify the following
a. log3 32 =
b. log2 25
c. log41
16=
d. log3 27 =
e. log10 10000000 =

Name: Date: Page 28 of 68
Activity 5.1.8A Hamden Public Schools 2016-2017 adapted from
Connecticut Core Algebra 2 Curriculum Version 3.0
f. log101
10=
3. Complete the table
x g(x)=log x
x (the outputs of g from column
2) will be the inputs for f
f(x)= 10x
-10
0
10 1 1 10
100 2 2 100
1000 3 3 1000
10000
189999
a log a
log a
4. Let 𝑓(𝑥) = 10𝑥 and 𝑔(𝑥) = log10 𝑥 then 𝑓(𝑔(𝑥)) = 𝑥.
For what values 𝑥 does this equation hold?
5. Simplify the following
a. 2log2 𝑥 =
b. 10log10 𝑥 =
c. 1
2
log12
𝑥=
You have verified two important properties of exponents and logarithms,
𝐥𝐨𝐠𝒃 𝒃𝒙 = 𝒙 and 𝒃𝐥𝐨𝐠𝒃 𝒙 = 𝒙.
The logarithm function undoes the exponential function and the exponential undoes the
logarithm function (for the same base of course).You will need to use these properties in future
exercises.
Because these two functions are inverses of each other let us stress that these functions undo
each other. That is, if (a, b) is on the graph of f then (b, a) is on the graph of f -1
. So if we input a
into the formula for f and get the output b and then use b as an input for f -1
the output must be a.

Name: Date: Page 29 of 68
Activity 5.2.1 Hamden Public Schools 2016-2017 adapted from
Connecticut Core Algebra 2 Curriculum Version 3.0
Activity 5.2.1 How Many Compounding Periods Should I Try to Get?
In unit 7 of Algebra 1 you examined compound interest on a bank savings account. You
found that you will get more interest if you compound more frequently. Let us review.
Suppose you can get 12% interest. That is not possible now in a bank but it will keep our
computations a bit simpler. Let us pretend our parents have won a big state lottery and
you want to help them invest the money. So let us pretend your parents won 10 million
dollars. We will be solving a few problems and to look for patterns, it will be helpful to
organize our work in a table. We will include a column for simple interest too just to
remind us that with simple interest we do not earn interest on interest.
1. Suppose you convince your parents to invest the 10 million dollars (after taxes) in a
bank that offered 12% interest compounded once a year.
A. How much money will you have after a year? ___________ Place your
answer in the table found in problem 9.
B. How much simple interest will you earn? ________ What will be the
amount in the bank if you went with a bank promising 12% simple
interest. ___________________
C. Now let the money stay in the bank promising 12% compound interest
once a year for 5 years. ______________ Compare with the bank that
promises 12% simple interest for the 5 years. ___________
D. If you left your money in each bank for t years, what functions (for simple
and compound) would you use to find the amount in the bank after t
years? _________________
2. Suppose you convince your parents to invest the 10 million dollars (after taxes) in a
bank promising 12% compounded twice a year.
E. How much money will you have after a year? ________ Place your
answer in the table in number 9.
F. How much simple interest will you earn?
What will be the amount in the bank if you went with a bank promising
12% simple interest? ____________________

Name: Date: Page 30 of 68
Activity 5.2.1 Hamden Public Schools 2016-2017 adapted from
Connecticut Core Algebra 2 Curriculum Version 3.0
G. Now let the money stay in the bank promising 12% compound interest
twice a year for 5 years. _________________ Compare with the bank that
promises 12% simple interest for the 5 years.________________
H. If you leave your money in each bank for t years, what functions would
give you the amount you would have after t years?
3. Suppose you convince your parents to invest the 10 million dollars (after taxes) in a
bank promising 12% compounded 4 times a year.
I. How much money will you have after a year? Place your answer in the
table in number 9. _____________ Did you make a lot more interest than
you did with the once or twice a year compounding? _____ Explain.
J. How much simple interest will you earn? ________ What will be the
amount in the bank if you went with a bank promising 12% simple
interest. ____________
K. Now let the money stay in the bank promising 12% compound interest
quarterly for 5 years. ________________ Compare with the bank that
promises 12% simple interest for the 5 years ._________________
L. If you leave your money in each bank for t years, what functions would
give you the amount you would have after t years?
_______________________________________________________
4. Suppose you convince your parents to invest the 10 million dollars (after taxes) in a
bank promising 12% compounded 12 times a year.
M. How much money will you have after a year? _____________ Place your
answer in the table in number 9. Did you make a lot more interest than you
did with the once or twice a year compounding? _______ Explain
________________________________________________________
N. How about how much simple interest will you earn? __________ What
will be the amount in the bank if you went with a bank promising 12%
simple interest. ______________
O. Now let the money stay in the bank promising 12% compound interest
monthly for 5 years. _______________ Compare with the bank that
promises 12% simple interest for the 5 years. _________

Name: Date: Page 31 of 68
Activity 5.2.1 Hamden Public Schools 2016-2017 adapted from
Connecticut Core Algebra 2 Curriculum Version 3.0
P. If you leave your money in each bank for t years, what functions would
give you the amount you would have after t years?
____________________
5. Suppose you convince your parents to invest the 10 million dollars (after taxes) in a
bank promising 12% compounded 365 times a year.
Q. How much money will you have after a year? $____________ Place your
answer in the table in number 9. Did you make a lot more interest than you
did with the once or twice a year compounding? ________. Explain.
R. How about how much simple interest will you earn? ___________ What
will be the amount in the bank if you went with a bank promising 12%
simple interest. _______________
S. Now let the money stay in the bank promising 12% compound interest
daily for 5 years. $______________ Compare with the bank that promises
12% simple interest for the 5 years. __________
T. If you leave your money in each bank for t years, what functions would
give you the amount you would have after t years? _________________
6. Suppose you convince your parents to invest the 10 million dollars (after taxes) in a
bank promising 12% compounded every hour.
U. How much money will you have after a year? ___________ Place your
answer in the table below.
V. How about how much simple interest will you earn? __________ What
will be the amount in the bank if you went with a bank promising 12%
simple interest. _____________
7. Suppose you convince your parents to invest the 10 million dollars (after taxes) in a
bank promising 12% compounded every minute.
W. How much money will you have after a year? ____________ Place your
answer in the table below.
X. Fill in the remainder of the row.

Name: Date: Page 32 of 68
Activity 5.2.1 Hamden Public Schools 2016-2017 adapted from
Connecticut Core Algebra 2 Curriculum Version 3.0
8. Suppose you convince your parents to invest the 10 million dollars (after taxes) in a
bank promising 12% compounded every second.
Y. How much money will you have after a year? __________ Place your
answer in the table below.
Z. Fill in the remainder of the row.
9. Examine your table. Does it make much difference if you compound 12 or 365 or
every minute or second? ______________ Explain what is happening? _______
Frequency of
Compounding
Amount at the End
of one year
Simple Interest
at the end of one
year
Once a year
Semiannually
Quarterly
Monthly
Weekly
Daily
Hourly
Every Minute
Every Second
Continuously
10. Now use you calculator to find e (over ln on a TI). What decimal approximation do
you get ____________ You have found another number that is like π. You have
found another irrational number whose decimal expansion does not repeat nor does it
terminate (even though it looks like it might).
11. You were using the formula A = P ( 1 + 0.12/n)nt
to obtain your values in the first
column above. Of course t is one for number 9 above. Let n be very large say
10,000,000 and compute 10000000(1 + 0.12/n)n. ___________ Compare that value to
10000000e0.12
. ___________________
When banks promise continuous compounding they are using the formula A = Pert. P is the
amount invested, r is the annual rate of interest promised and t is the number of years.
12. Fill in the last row of the table in number.
13. Did your parents make more money with continuous compounding versus
compounding every second? _____________

Name: Date: Page 33 of 68
Activity 5.2.1 Hamden Public Schools 2016-2017 adapted from
Connecticut Core Algebra 2 Curriculum Version 3.0
14. We do not know who, but someone noticed the curious fact that if a principal amount
is compounded many times a year for t years that the amount of money approaches a
certain amount or limit—that compounding more often does not increase the amount
of money. Let us see what this limit is for one dollar. Suppose you will get a rate of
100% and your principle is $1. Fill in the table below in number 15. It appears if n is
very large 1(1 + 1/𝑛)𝑛 = __________ You have discovered that each $1 when
compounded continuously at an annual rate of 100% is worth $2.718 to 3 decimal
places. The formula A = Pert allows us to compound continuously for rates other than
100%, useful in many applications as you will see in future activities.
Frequency of
Compounding
Amount at the End
of one year
Simple Interest
at the end of one
year
Once a year
Semiannually
Quarterly
Monthly
Weekly
Daily
Hourly
Every Minute
Every Second
100 million
Continuously

Name: Date: Page 34 of 68
Activity 5.2.2 Hamden Public Schools 2016-2017 adapted from
Connecticut Core Algebra 2 Curriculum Version 3.0
Activity 5.2.2 Revisiting 𝒆 and Compound Interest
1. Using your calculator, fill in the following table. You used the expression 1(1 + 1/𝑛)𝑛 in Activity 5.2.1. Be sure to write down all the decimal places given by
your calculator. What is the annual interest rate? _______
What does n represent? _____________
2. On your calculator, find and select the number 𝑒 key. Write down all the decimal
places given by your calculator.
𝑒 ≈ _______________________________________
3. How does it appear that the number 𝑒 is related to the numbers from your table?
___________________________________________
What can you say about the formula (1 + 1/𝑛)𝑛 and the number 𝑒?
____________________________________________________
𝑛 1(1 + 1/𝑛)𝑛
1
2
4
6
8
10
12
25
50
100
365
100000
1000000

Name: Date: Page 35 of 68
Activity 5.2.2 Hamden Public Schools 2016-2017 adapted from
Connecticut Core Algebra 2 Curriculum Version 3.0
4. Suppose you have $2000 in a savings account that has a 4% interest rate compounded
once each year. How much would you have at the end of 1 year? Let 𝐴 represent the
total amount of money.
5. Again suppose that you have $2000 in a savings account that has an interest rate of 4%
but is now compounded twice a year. This means that you would have a return of
(4%/2) = 2% twice a year. How much would you have at the end of one year
6. Now again suppose that you have $2000 in a savings account that has an interest rate
of 4% but is now compounded four times a year. This means that you would have a
return of (4%/4) = 1% four times a year. How much would you have at the end of one
year?
7. Using your calculator, fill in the following table. Be sure to write down all the decimal
places given by your calculator.
n 1(1 + .04/𝑛)𝑛
1
2
4
12
365
100000
1000000
8. On your calculator, find the number 𝑒 .04. Write down all the decimal places given by
your calculator.
𝑒 .04 = _______________________________________
Name: Date: Page 36 of 68
Activity 5.2.2 Hamden Public Schools 2016-2017 adapted from
Connecticut Core Algebra 2 Curriculum Version 3.0
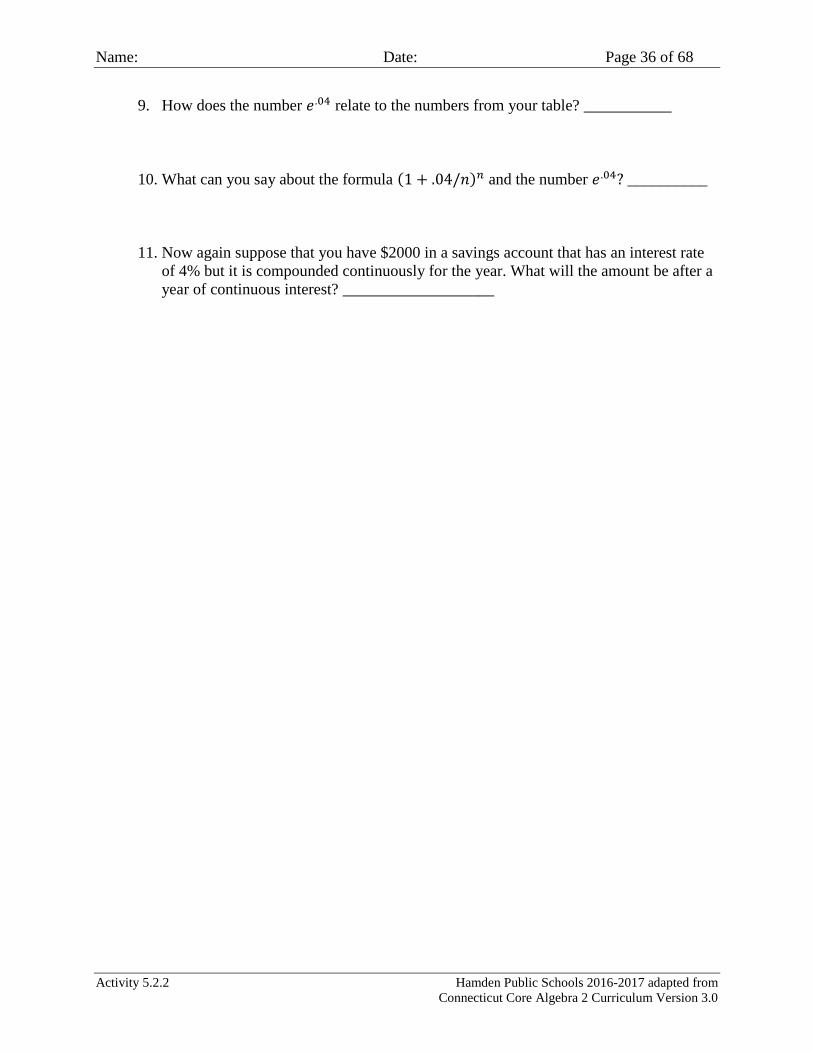
9. How does the number 𝑒 .04 relate to the numbers from your table? ___________
10. What can you say about the formula (1 + .04/𝑛)𝑛 and the number 𝑒 .04? __________
11. Now again suppose that you have $2000 in a savings account that has an interest rate
of 4% but it is compounded continuously for the year. What will the amount be after a
year of continuous interest? ___________________
Name: Date: Page 37 of 68
Activity 5.2.4 Hamden Public Schools 2016-2017 adapted from
Connecticut Core Algebra 2 Curriculum Version 3.0
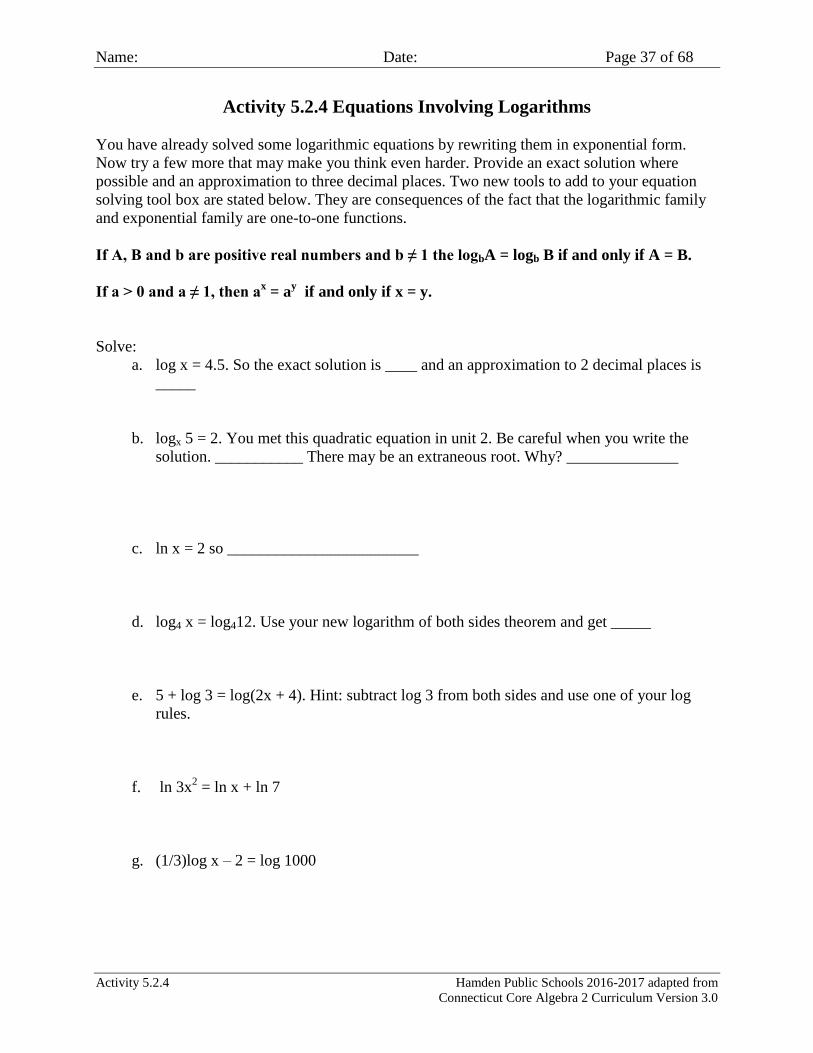
Activity 5.2.4 Equations Involving Logarithms
You have already solved some logarithmic equations by rewriting them in exponential form.
Now try a few more that may make you think even harder. Provide an exact solution where
possible and an approximation to three decimal places. Two new tools to add to your equation
solving tool box are stated below. They are consequences of the fact that the logarithmic family
and exponential family are one-to-one functions.
If A, B and b are positive real numbers and b ≠ 1 the logbA = logb B if and only if A = B.
If a > 0 and a ≠ 1, then ax = a
y if and only if x = y.
Solve:
a. log x = 4.5. So the exact solution is ____ and an approximation to 2 decimal places is
_____
b. logx 5 = 2. You met this quadratic equation in unit 2. Be careful when you write the
solution. ___________ There may be an extraneous root. Why? ______________
c. ln x = 2 so ________________________
d. log4 x = log412. Use your new logarithm of both sides theorem and get _____
e. 5 + log 3 = log(2x + 4). Hint: subtract log 3 from both sides and use one of your log
rules.
f. ln 3x2 = ln x + ln 7
g. (1/3)log x – 2 = log 1000

Name: Date: Page 38 of 68
Activity 5.2.4 Hamden Public Schools 2016-2017 adapted from
Connecticut Core Algebra 2 Curriculum Version 3.0
h. ln e4 + 5 ln x = 9
i. 4 log x = 10log 6 – log x
j. ln 12 + ln x = 8
k. The world population reached 6 billion on October 12, 1999. If we assume a growth
rate of 1.4% when will the population reach 7 billion? Find out when the world
population did reach 7 billion. How good was your prediction? Hint: This is a
continuous compounding situation.
l. Carbon - 14 which is used for archaeological dating, has a half-life of 5730 years. What
is its decay rate? ________ (Hint: If you have 50 mg present now, then in 5,730 years
how much will be present? Use this information and the fact that we need a continuous
growth/decay model to find r.)
m. Three finely made ancient spears were found in a coal mine excavation near Hanover,
Germany in 1997. Until this discovery was made it had been thought that humans
began hunting about 40,000 years ago. These 6 to 7.5 foot spears were used to hunt
horses, elephants and deer in the area. Only 9.676 X 10⁻²⁰
percent of the carbon-14
remained in the spears. When were the hunters using them to hunt horses? ______
Note: in 1911 a spear was found in England that dates more the 40,000 years ago but it
was thought this was an isolated find. The discovery in Schoningen, Germany in 1997
provided evidence that early ancestors were hunting much earlier than 40000 years ago
and the theory has now been changed to ___________ (you fill in the number of years
you found).

Name: Date: Page 39 of 68
Activity 5.2.4 Hamden Public Schools 2016-2017 adapted from
Connecticut Core Algebra 2 Curriculum Version 3.0
n. Suppose that a rumor is spreading in the United States that the Airlines because of all
the fees and other charges and potential ticket price collusion, are soon going to give
away some free promotional tickets to fly anywhere in the continental U.S. Assume 20
people as of today have heard it and that it is reasonable to assume that the rumor will
triple each day.
(1) Let f(t) be the function that represents the number of people that have heard the
rumor t days from today. Find an equation for f(t).
(2) How many Americans will have heard the rumor 10 days from now?
(3) Predict when all Americans will have heard the rumor. Use the population as of July
5, 2015 which was 321,223,158 or go to www.census.gov/popclock/ to get today’s
population.
(4) Suppose instead of tripling the rumor will only double each day. Predict when all
Americans will have heard the rumor.
o. The U.S. population in the 1900 Census was 76 million. In the 2000 Census, the U.S.
population was 282 million. Assuming that the growth rate remained the same over that
century, what year was the population of the U.S. double that from the 1900? Model the
population with the equation 𝑃 = 𝑃0𝑒𝑘𝑡, where 𝑃0 is the initial population. When you
find the year the model predicts for doubling the population of the U.S. look up on the
internet and see what the population actually was. Did our model predict well? Explain.
p. Suppose your new car, purchased this year for $30,000, depreciates at a rate of 12%
each year.
1) When will your car be worth $10,000? Model the car value with the equation
𝑃 = 𝑃0 (1 − 𝑟)𝑡, where 𝑃0 is the initial price value.

Name: Date: Page 40 of 68
Activity 5.2.4 Hamden Public Schools 2016-2017 adapted from
Connecticut Core Algebra 2 Curriculum Version 3.0
2) Mathematically, is it possible for your car to be worth zero dollars?
3) Practically, is it possible for your car to be worth zero dollars?
q. Returning to part k above, The UN Population Fund states the world reached 7 billion
people on Oct. 31, 2011 so it took about 12 years to go from 6 billion to 7 billion. What
was the growth rate instead of the assumed 1.4% in part k?
r. Assume $20000 is invested at 4% compounded quarterly. What will it be worth in 5
years? _________. If you can invest it at 4% compounded continuously for the 5 years
how much more interest will you make?

Name: Date: Page 41 of 68
Activity 5.3.1 Hamden Public Schools 2016-2017 adapted from
Connecticut Core Algebra 2 Curriculum Version 3.0
Activity 5.3.1 Can We Eat the Chicken?
Suppose you go over to a friend’s house and they have raw chicken on their counter. When you
inquire why the chicken is on the counter looking warm, your friend’s mom is upset for she says
she forgot to refrigerate the chicken and must now discard it. You ask why and your friend’s
mom, Mrs. Lee responds that poultry is a high risk food for food poisoning because it is a moist
food and it was a warm day. You went on the web and one source stated a single bacterium could
multiply to 2,000,000 in just 7 hours and a second source stated under ideal conditions you could
have 70,000,000 in just 12 hours. You know from science and math class that it is reasonable to
assume exponential growth for bacteria at least in the short term.
1. Verify that for the first source the bacteria double about every 20 minutes.
2. Complete the table of values for the bacteria that double every half hour to verify that in
12 hours there will be about 70 million bacteria.
t bacteria t bacteria t bacteria
0
30 min
1
1 hr
1 hr 30 min
2 hr
2 hr 30 min
3. Make a graph on the graph paper provided by your teacher for the number of cells vs
hours for the second source. On the horizontal axis place the hours through 12 and on the
vertical scale from up to 17,000,000 cells using at least two block for each 1,000,000.
As you make your graph you should have a problem. What is it? Hint: Each axis has a
linear scale. Consider the points (0, 1), (.5, 2), (1,4), (1.5, 8), (2, 16) at the beginning of
your graph and (12, 70,000,000).

Name: Date: Page 42 of 68
Activity 5.3.1 Hamden Public Schools 2016-2017 adapted from
Connecticut Core Algebra 2 Curriculum Version 3.0
The problem with using a uniform scale is it does not depict numbers over several
magnitudes well. A small scale will show every value well BUT the grid needs to be too
big to show the very large values and a large scale interval makes all the small values fall
on top of each other near zero.
4. To correct the problem we have with our first graph we can use a different scale. A
logarithmic scale is one in which the units on an axis are the exponents or logarithms of a
base number and it is typically used when the increase or decrease in value on that axis is
exponential. Let us change the vertical scale. Redraw the chart this time on a new piece
of graph paper with a vertical axis that has log (# of cells). Your horizontal scale will still
go from 1 to 12 but your vertical scale will now go from 0 to 8 since it is log (number of
bacteria). If you look at just columns 1 and 3, why do you not have to look up the
logarithm of every number in column 2? _______________________
What do you notice about your new graph? How does it differ from the first graph?
T
in
hr.
bacteria log(bacteria) T in
hr.
bacteria log(bacteria) T in
hr.
bacteria log(bacteria)
0 1 0 5 2056 10 2,105,344
.5 2 5.5 4112 10.5 4,210,688
1 4 6 8224 11 8,421,376
1.5 8 6.5 16448 4.2 11.5 16,842,752
2 16 1.2 7 32896 12 33,685,504
2.5 32 7.5 65792 12.5 67,371,008
3 64 8 131,584
3.5 128 8.5 263,168
4 512 2.7 9 526,336
4.5 1024 3 9.5
5. You may have modeled the problem in number 1 with the function f(t) = 1 (23t
), t in
hours. If you did not, now evaluate the function for a few values to convince yourself the
model is a good one. Graph this function on your grapher and then also graph g(x) = 8x.
a. Explain why you are getting the graphs you are.
b. How do the graphs compare to the graph of k(x) = 2x.

Name: Date: Page 43 of 68
Activity 5.3.1 Hamden Public Schools 2016-2017 adapted from
Connecticut Core Algebra 2 Curriculum Version 3.0
6. You may have modeled the problem in number 2 with the function f(t) = 1 (22t
), t in
hours. Using your grapher, graph f(t) = 1 (22t
), and k(x) = 2t. Earlier in this course you
considered the transformation r(x) = f(ax) when f was a quadratic or polynomial or
absolute value function. What is the role of the parameter a? In the next unit on
trigonometric functions, the role of a will become even more clear.

Name: Date: Page 44 of 68
Activity 5.3.2 Hamden Public Schools 2016-2017 adapted from
Connecticut Core Algebra 2 Curriculum Version 3.0
Activity 5.3.2 Earthquakes!
In 1935, Charles Richter (http://en.wikipedia.org/wiki/Charles_Francis_Richter) and Beno
Gutenberg created the Richter scale to measure the magnitude of earthquakes. The formula is
based on the largest wave recorded on one particular kind of seismometer that was located 100
kilometers from the epicenter of that quake in California. Scientists quantify the size of an earth
quake by magnitude and intensity. Magnitude is a measure of the amount of energy released at
the source of an earthquake. It is a quantitative measure of the actual size of the earthquake. It is
determined by the logarithm of the amplitudes of waves recorded by seismographs. Adjustments
must be made for the distances between the various seismographs and the center of the
earthquake. A seismometer, sort of like a sensitive pendulum, records the shaking of the earth.
Intensity of an earthquake measures the actual shaking produced by the earthquake at a given
location. So an earthquake has just one magnitude but the intensity will differ from location to
location. It is determined by the effects of the earthquake on people, buildings, and the natural
environment. It may be recorded by the Modified Mercalli Intensity Scale. At the end of this
activity a bit of that scale can be found. A simplified version of the Richter model is 𝑀 =
log (𝐴
𝐴0), where M is the magnitude on the Richter scale of the earthquake, A is the amplitude of
earthquake measured by the amplitude of the wave on the seismograph at the fixed location but
today adjusted with readings from other seismographs, and 𝐴0 is the “reference” amplitude of the
smallest earth movement that can be recorded by a seismograph. Amplitude measurements are
given in multiples of 𝐴0.
For each increase of 1 on the Richter scale, meaning an increase of 1 unit of magnitude, there be
10 times the amplitude on the seismograph. To see this, consider an earthquake that measures 5
on the Richter scale. The amplitude of the measured earthquake is 105, since 5 = log(105). Also,
105 = 10(104), indicating a factor of 10 times the amplitude of an earthquake that measures 4 on
the Richter scale. The Richter scale is still used for smaller earthquakes but for larger ones the
moment magnitude scale is now commonly used.
A. On December 26, 2004, the Indian Ocean earthquake had an amplitude of 1,999,262,315
A0. What was the magnitude of this earthquake?
𝑀 = log (𝐴
𝐴0)
M = log(1,999,262,315 A0/ A0)
SO M = log(1,999,262,315)= 9.3
B. The 1906 San Francisco earthquake is estimated to be 7.8 on the Richter scale. How
many times bigger was the Indian Ocean earthquake than the San Francisco earthquake?
The difference in the two Richter scale measurements is 9.3 − 7.8 = 1.5, therefore the
Indian Ocean earthquake is 𝟏𝟎𝟏.𝟓 or almost 32 times bigger than the San Francisco
earthquake.

Name: Date: Page 45 of 68
Activity 5.3.2 Hamden Public Schools 2016-2017 adapted from
Connecticut Core Algebra 2 Curriculum Version 3.0
Now the magnitude scale is really comparing the amplitudes of the waves on a seismogram
(you will study waves and amplitudes in the next unit) but not the strength (energy) of the
earthquakes. So for example, although the Indian Ocean earthquake is 32 times bigger than
the San Francisco earthquake as measured on the seismograms, how much stronger was it. It
is the strength or energy that knocks down structures and does the other damage. To
determine this we need another formula that says the log E is proportional to 1.5 M where
E is energy and M is magnitude. So therefore E is proportional to 101.5M
and 10(1.5(1.5))
so
the Indian Ocean earthquake was about 178 times stronger.
Now you try.
1. What is the magnitude of an earthquake that has a measured intensity of 57,000 A0?
2. What is the amplitude of an earthquake that has a magnitude of 6.3 on the Richter scale?
3. If one earthquake’s amplitude is 10 times that of another earthquake, how much larger is
its magnitude on the Richter scale?
4. If an earthquake has a magnitude of 2.6 on the Richter scale, what is the magnitude on
the Richter scale of an earthquake that has an amplitude 15 times greater?
5. In April, 2015, Nepal was devastated by an earthquake that measured 7.9 on the Richter
scale. In May of the same year, another earthquake measuring 7.3 hit the region. How
much larger was the April earthquake compared to the one the following month?
6. How much stronger was the bigger earthquake?
7. The location and Intensity of some big earthquakes are listed below. Today these large
quakes would be measured using the Moment Magnitude Scale. What was their
magnitude on the Richter Scale?
a. Iran 2003, 106.6
I0
b. China 2008, 107.9
I0
c. Peru 2007, 108.0
I0

Name: Date: Page 46 of 68
Activity 5.3.2 Hamden Public Schools 2016-2017 adapted from
Connecticut Core Algebra 2 Curriculum Version 3.0
8. Find the Richter Scale ratings for earth quakes having the following amplitudes or
intensity
a. 10000 I0
b. 1000000 I0
c. 1500 I0
Brief part of the Modified Mercalli Intensity Scale
Magnitude Intensity
1.0 – 3.0 I Not felt except maybe by a very few
individuals under the best of circumstances
3.0 – 3.9 II - III Felt perhaps by a few in upper floors
of buildings if they are at rest to noticeable
indoor especially if upstairs of buildings.
May feel like a truck went by outside your
building. Most do not recognize it is an
earthquake.
5.0 -5.9 VI – VII Many frightened. Moving of
heavy furniture. Some plaster falls from the
ceiling to some damage to chimneys and
poorly constructed dwellings. Damage
slight to well-constructed buildings.
6.0 – 6.9 VII – IX Damage slight to specially
designed buildings but ordinary buildings
may partially collapse. Monuments,
chimneys walls fall to buildings shifted off
their foundations and even specially
designed buildings will have considerable
damage.
7 or greater X – XII Most structures and their
foundations destroyed to bridges destroyed
to total destruction.

Name: Date: Page 47 of 68
Activity 5.3.3 Hamden Public Schools 2016-2017 adapted from
Connecticut Core Algebra 2 Curriculum Version 3.0
Activity 5.3.3 Basic or Acidic?
The measure of acidity or alkalinity of water soluble substances is called the pH of the liquid.
This is based on the number of hydrogen ions (H+) in the liquid. In pure water there is an equal
number of hydrogen ions and hydroxide ions. So water is neutral, neither acidic nor basic. A pH
value (pH stands for power of Hydrogen) is a number between 0 and 14, with 7, the pH of water,
being neutral. When an acid is dissolved in water there are more hydrogen ions than hydroxide
ions so it is acidic. When a base is dissolved in water there are more hydroxide ions than
hydrogen ions so it is basic or alkaline. Each whole pH value below 7 is 10 times more acidic
than the higher value and each whole pH value above 7 is 10 times less acidic than the one below
it. For example a pH of 2 is 10 times more acidic than a pH of 3 and 1000 times more acidic than
a pH of 5. A pH of 11 is 10 times more alkaline than a pH of 10. So values above 7 indicate
alkalinity which increases as the number increases, 14 being the most alkaline. But values below
7 indicating acidity increase as the number decreases, 1 being the most acidic.
The formula for pH is:
pH = -log[H+]
where [H+] is the concentration of hydrogen ions in moles per liter, M/L. One mole = 6.022 X
1023
molecules or atoms. The brackets mean “the concentration of.” Typical concentrations range
from 10-15
M to 1010
M. The pH scale was invented by the Danish biochemist S. P. Sorensen in
1909.
If you were to graph pH on the y axis and [H+] on the x axis you would get a base 10
logarithmic curve that has been reflected across the x axis.
Liquids with a low pH (as low as 0) are more acidic than those with a high pH. Water is neutral
and has a pH of 7.0. A substance with a pH > 7 is called basic or alkaline. If the pH < 7 the
substance is acidic. Note the lower the pH the higher the acidity and the higher the concentration
of hydrogen ions. It is customary to round pH values to the nearest tenth.
1. Complete the following table
pH value H+ Concentration H+ Concentration
Relative to Pure
Water
Substance
100 = 1 10,000,000 Battery acid
2 Lemon juice
10-3
= .001 1000 Acid rain
100 Black coffee
7 10-7
=.000 000 1 1 Pure water
0.1 Sea water
11 10-11
= .000 000 000 01 Ammonia
.000001 Bleach
14 Liquid drain cleaner

Name: Date: Page 48 of 68
Activity 5.3.3 Hamden Public Schools 2016-2017 adapted from
Connecticut Core Algebra 2 Curriculum Version 3.0
Example: Find the pH of a solution with [H+] = 2.5X 10⁻⁵
and state whether it is acidic or basic.
pH = -log[H+]
= -log ( 2.5X 10⁻⁵
) = -(log 2.5 + log 10-5
) why?
≈ -(.3979 + -5) why?
≈ -.3979 + 5 why?
≈ 4.6 so the pH = 4.6 so the solution is acidic
2. Now find the concentration of hydrogen atoms for the example.
3. Vinegar has a pH of 2. Compare its acidity to that of water.
4. Lime juice has a pH of 1.7. What is the concentration of hydrogen ions to the nearest
thousandth?
5. Suppose that you test orange juice and find that the hydrogen ion concentration is [H+] =
7.94 × 10⁻⁵. Find the pH value and determine whether the juice is basic or acidic.
6. How much more acidic is cranberry juice, with a pH of 2.35, compared to apple juice,
with a pH of 3.5?

Name: Date: Page 49 of 68
Activity 5.3.4 Hamden Public Schools 2016-2017 adapted from
Connecticut Core Algebra 2 Curriculum Version 3.0
Activity 5.3.4 Measuring Sound Intensity
Have you ever had to cover your ears because the sound was too loud? Perhaps outside an airport
or near a jackhammer? How loud a sound seems to be depends upon who is listening to the
sound. How loud something seems is subjective and not easily measured. What music seems fine
to you may bring a very different response from your parents! However what makes one sound
seem louder than another is the AMOUNT of energy that the sound source is sending toward the
listener in the form of pressure variations in the air. This is the intensity of the sound and it can
be measured--- it is objective. A meter that measures sound levels must calculate the pressure of
the sound waves traveling through the air. These will give a measurement of sound intensity
called decibels, a scale that Alexander Graham Bell first devised. Mr. Bell is known for another
invention. What is it?
The decibel scale is logarithmic scale that goes up by powers of ten. Every increase in 10
decibels (dB) on the scale is equivalent to a tenfold increase in sound intensity, which roughly
corresponds with loudness. So a 30 dB sound is 100 times louder than a 10 dB sound. A sound
that is 100 dB (for example a jackhammer) is 1,000,000,000 times louder than a sound of 10 dB
(leaves falling to the ground).
1. Sound intensity is another difficult measure to graph. Try making a bar graph for the
following table.
Average Perception Relative Intensity I/I0
Threshold of hearing 1
Whisper 100
Quiet home, private office 10000
Average conversation 100,000
Noisy home, average office 1,000,000
Average street noise 100,000,000
Noisy factory 10,000,000,000
Elevated train, deafening 100,000,000,000
Threshold of pain for ears 10,000,000,000,000

Name: Date: Page 50 of 68
Activity 5.3.4 Hamden Public Schools 2016-2017 adapted from
Connecticut Core Algebra 2 Curriculum Version 3.0
2. What happened to most of the bars?
3. Now make a bar graph for the table below.
4. Which bar graph do you prefer and why?
Noise level in decibels = 𝑑𝐵 = 10 log𝐼
𝐼0, where I0 is the intensity of a sound that can barely be
heard. Assume 𝐼0 = 10−12watts/meter2 or 10-16
watts/cm2. The expression
𝐼
𝐼0 gives the relative
intensity of sound. This is similar to the way in which we compare the amplitude of an
earthquake to a reference value.
Average Perception Decibels (dB)
Threshold of hearing 0
Whisper 20
Quiet home, private office 40
Average conversation 50
Noisy home, average office 60
Average street noise 80
Noisy factory 100
Elevated train, deafening 110
Threshold of pain for ears 130

Name: Date: Page 51 of 68
Activity 5.3.4 Hamden Public Schools 2016-2017 adapted from
Connecticut Core Algebra 2 Curriculum Version 3.0
5. The typical loud band of today plays with an intensity of 10-5
watts per cm2.
a. What is the decibel level of a loud band?
b. How much more intense is loud music than average conversation?
c. If a sound doubles in intensity, by how many units does its decibel rating increase?
6. An elevated train makes 110 decibels of noise. If you are standing on the platform and a train
is arriving from both directions does that mean there will be 220 decibels of noise?
7. The intensity of the sound of rustling leaves is 10−10 watts/meter2. What is the decibel level?

Name: Date: Page 52 of 68
Activity 5.3.4 Hamden Public Schools 2016-2017 adapted from
Connecticut Core Algebra 2 Curriculum Version 3.0
8. A slamming door has a decibel level of 80. What is the intensity of the sound?
About 10 million Americans suffer from noise-induced hearing loss. It can be caused by a one-
time exposure to a loud sound or repeated exposure to loud sounds over time. The amount of
time your hearing is exposed to a sound affects how much damage will be caused. A bulldozer
idling is loud enough at 85 dB to cause permanent damage to a person using it for just an 8-hour
workday. A gunshot ranges from 140 to 190 dB and can cause immediate hearing damage.
9. A sound with a decibel level of 85 or higher is likely to cause a person permanent ear damage
and hearing loss. Which of the following sounds will likely cause hearing loss?
a. A vacuum cleaner with a sound intensity of 10−5 watts/meter2
b. An airplane at takeoff with a sound intensity of 1200 watts/meter2
c. A lawn mower with a sound intensity of 2 × 10⁻² watts/meter2

Name: Date: Page 53 of 68
Activity 5.3.5 Hamden Public Schools 2016-2017 adapted from
Connecticut Core Algebra 2 Curriculum Version 3.0
Activity 5.3.5 Problems Using Logarithmic Scales
Helpful formulas:
pH = -log[H+]
M = log(I/I0)
𝒅𝑩 = 𝟏𝟎 𝐥𝐨𝐠𝑰
𝑰𝟎, Assume 𝑰𝟎 = 𝟏𝟎−𝟏𝟐watts/meter𝟐 or 10
-16 watts/cm
2 depending upon the
units used in the problem.
Section I
Numbers 4 – 6 can only be assigned if activity 5.3.3 was completed.
1. A magnitude scale for brightness started with a Greek astronomer Hipparchus and
Ptolemy. They started with just 6 star magnitudes. But with the invention of the telescope
the star magnitude scale has been extended in both directions. The scale may seem
backwards to you for the brightest objects have the smaller numbers and the faintest the
larger magnitudes. The Hubble Space Telescope can pick up faint galaxies as faint as
magnitude 30. At is brightest, the planet Venus has a magnitude -4.6. The faintest star
that can be seen with the eye is about magnitude +7.2 How much brighter is Venus than
that faint star?
2. The magnitudes of two stars M1 and M2 are related to the corresponding brightness b1
and b2 by the equation M2 - M1 = 2.5 (log b2 - log b1). Each step by 1 unit in magnitude
equals a brightness change of 2.5 times so a star with magnitude 5.0 is 2.5 times fainter
than a star with magnitude +4.0. And if they differ by 5 magnitudes then 2.5 ∙ 2.5 ∙ 2.5 ∙2.5 ∙ 2.5 =2.5
5 is almost 100 so the brightness is 100 times different. How much fainter
than Venus is the faintest star from number 4 above?
Astronomers also must distinguish between apparent and the true brightness. Remember
that distance has an impact on observed brightness because the intensity of the light from
the source decreases by the inverse square law which you saw in investigation 4.1. You
can always research measuring stellar magnitudes further.
3. Geographers are interested in areas ranging from the surface area of the earth down to a
few square meters in a backyard. For their scale the 0 is the surface area of the earth
Ga = 5.1 X 10⁸ km
2. Next they assign a 1 to 5.1 X 10
7 km
2 obtained by Ga/10
1and a 2 to
5.1 X 10⁶ km
2 obtained by Ga/10
2 and so on to n which is assigned Ga / 10
n . The numbers
1, 1, 2 ,n are called G-values. To find a G-value for an area Ra, the formula
G = log (Ga/Ra) is used.

Name: Date: Page 54 of 68
Activity 5.3.5 Hamden Public Schools 2016-2017 adapted from
Connecticut Core Algebra 2 Curriculum Version 3.0
a. Find the G value for 100 km2.
b. Suppose you know the G value of a square area is 7.7076. Find the square area.
4. Find the pH of the following substances:
a. Pineapple juice, [H+] = 1.6 X 10⁻⁴
b. Mouthwash, [H+] = 6.3 X 10⁻⁷
c. Tomatoes, [H+] = 6.3 X 10⁻⁵
5. Find the hydrogen ion concentration of each substance and express the answer in
scientific notation
a. pH of lemon juice is 2.3
b. pH of stomach acid could be as large as 3.
6. If you make a small batch of lemonade and it needs 8 ounces (1 cup) of lemon juice , how
many hydrogen ions will be in the juice? One mole of hydrogen atoms is 6.02 X 10²³
hydrogen ions. A liter is 30.3 ounces.
Section II: Some practice.
Solve each equation.
1. 20ex-1
= 100
2. 3(6)x = 120

Name: Date: Page 55 of 68
Activity 5.3.5 Hamden Public Schools 2016-2017 adapted from
Connecticut Core Algebra 2 Curriculum Version 3.0
3. 2ln(3x) + ln(4x2) = 6
4. 4 + 2 log x = 10
5. log(log x) = 2
6. log x + log 4 = 20
7. 8 + log 10x = 20
8. log 6x3 – log 2x = 6

Name: Date: Page 56 of 68
Activity 5.5.1 Hamden Public Schools 2016-2017 adapted from
Connecticut Core Algebra 2 Curriculum Version 3.0
Activity 5.5.1: United States Census
Every 10 years, the United States conducts a census to count the number of people in the
country. The first Census occurred in 1790. In Algebra 1, when you first learned about
exponential functions, you saw that population growth often can be represented by exponential
models. For now, assume that the population growth of the United States is exponential with
respect to time (𝑡).
Part 1 – Create a Model
According to the U.S. Census, the population in 1790 was 3.929 million. By 1800, the
population had grown to 5.308 million.
1. What value of 𝑡 corresponds to the year 1790? Why is this a good choice?
2. What value of 𝑡 corresponds to the year 1800?
3. What does the variable 𝑡 represent?
4. Keep in mind that population is a function of time and you are assuming that the
function is exponential. Using the given data points (0, 3.929) and (1, 5.308) where the
input variable represent time in decades since 1790,, write two equations of the form
𝑃 = 𝑎 ∙ 𝑒𝑘𝑡
and solve them to find values for 𝑎 and 𝑘.
5. What is the value of 𝑎? What does a represent in the situation?
6. What is the value of 𝑘? How does this number relate to the situation?
7. Write an exponential function relating population (𝑃) and time (𝑡).

Name: Date: Page 57 of 68
Activity 5.5.1 Hamden Public Schools 2016-2017 adapted from
Connecticut Core Algebra 2 Curriculum Version 3.0
Part 2 – Use the Model
1. Using the function you created in Part 1 number 7, predict the population in the year
1830.
2. Using the function from Part 1 number 7, predict the population in 1880.
3. Which do you think will be a more accurate prediction, the 1830 population or the 1880
population? Why?

Name: Date: Page 58 of 68
Activity 5.5.1 Hamden Public Schools 2016-2017 adapted from
Connecticut Core Algebra 2 Curriculum Version 3.0
Part 3 – Evaluate the Model
Based on just two data points you created an exponential model for population growth in the
United States. Was it safe to assume that population growth in the U.S. would follow an
exponential trend? Examine more data to see if it was a good assumption.
1. Graph your exponential model from part 1 and the following data on the same coordinate
system.
Year Population
(in millions)
1810 7.240
1820 9.638
1830 12.866
1840 17.069
Explain whether or not your model appears to give a good prediction of future
population.
2. Add the following to the data set and graph.
Year Population
(in millions)
1850 23.192
1860 31.443
1870 38.558
1880 50.156
1890 62.948
Year Population
(in millions)
1900 75.996
1910 91.972
1920 105.711
1930 122.775
1940 131.669
Explain whether or not the original model appears to be a good fit for the data? If the
graph does not appear to fit an exponential model over the domain from 1790 on,
describe the shape of the graph.

Name: Date: Page 59 of 68
Activity 5.5.1 Hamden Public Schools 2016-2017 adapted from
Connecticut Core Algebra 2 Curriculum Version 3.0
3. Add the following to the data set and graph.
Explain whether or not the original model appears to be a good fit for the data? If the
graph does not appear to fit an exponential model, describe the shape of the graph.
Part 4 – Evaluate the Assumptions
In the initial problem description, you were told to assume that the population growth was
exponential and to create a mathematical model. Evaluate this assumption. Specifically, was this
a good assumption or did the model eventually breakdown? Give a detailed reply and include
possible reasons for the trends in population growth.
Year Population
(in millions)
1950 150.697
1960 179.323
1970 203.185
1980 226.546
1990 248.710

Name: Date: Page 60 of 68
Activity 5.5.1 Hamden Public Schools 2016-2017 adapted from
Connecticut Core Algebra 2 Curriculum Version 3.0
Part 5 – Further Evaluate the Assumptions (Extension)
Quite often, math text book writers create data that will “nicely” model a mathematical topic.
1. Is the data given in this activity real data from the United States Census or has it been
modified to fit the purpose of the author?
2. If the data is real, describe whether or not Census data reflects the total population of the
United States?
3. If the data is real, how might we improve the model?
4. If the data is not real, does the real data follow a different trend than the made up data?

Name: Date: Page 61 of 68
Activity 5.5.2 Hamden Public Schools 2016-2017 adapted from
Connecticut Core Algebra 2 Curriculum Version 3.0
Activity 5.5.2: Modeling the Population of the United States
In the last activity, you determined that the exponential function 𝑃 = 3.929𝑒0.3008𝑡 was a good
model for the population of the United States for the years close to 1790 (𝑡 = 0). In later years
such as 1950 (𝑡 = 16), the original exponential function was no longer a good representation of
the population. The population still appeared to be growing exponentially in later years but with
a lower growth rate.
Let’s develop a piecewise function to model the early exponential growth and the later
exponential growth. Here is the population data.
Year Population
(in millions)
1790 3.929
1800 5.308
1810 7.240
1820 9.638
1830 12.866
1840 17.069
1850 23.192
1860 31.443
1870 38.558
1880 50.156
1890 62.948
Year Population
(in millions)
1900 75.996
1910 91.972
1920 105.711
1930 122.775
1940 131.669
1950 150.697
1960 179.323
1970 203.185
1980 226.546
1990 248.710
Part 1 – The First Piece
You have already created an exponential function representing the population for the early
decades.
𝑃 = 3.929𝑒0.3008𝑡 Graph the function and the data points.
For which values of 𝑡 is this exponential function a good fit?
0 ≤ 𝑡 < _______
You have just completely defined the first part of the piecewise function. Fill in the missing 𝑡-
value below.
𝑃 = {3.929𝑒0.3008𝑡 𝑓𝑜𝑟 0 ≤ 𝑡 < _________
𝑎 ∙ 𝑒𝑘𝑡 𝑓𝑜𝑟 ________ ≤ 𝑡 < 21

Name: Date: Page 62 of 68
Activity 5.5.2 Hamden Public Schools 2016-2017 adapted from
Connecticut Core Algebra 2 Curriculum Version 3.0
Part 2 – The Second Piece
Now you have to find an exponential function that models the rest of the data. The plan is to
choose two points, fit an exponential function to those two points, and then graphically
determine if the function is a good fit for the second part of the data. This involves solving a
system of non-linear equations so let’s try it a couple of times. You will get practice solving
systems and you will have a couple of exponential models to choose from.
First Attempt – 1930 and 1940
1. Use the data from 1930 and 1940 to write two ordered pairs of the form (𝑡, 𝑃).
2. Using each ordered pair, substitute 𝑡 and 𝑃 into the equation 𝑃 = 𝑎 ∙ 𝑒𝑘𝑡. This will give you
two equations with two unknowns (𝑎 and 𝑘). Label one Equation 1 and the other Equation 2.
You have prior experience solving systems of linear equations. One technique that you used was
substitution. You solved one equation for one variable and then substituted into the other
equation. You can also use substitution with non-linear systems! Let’s try it.
3. Solve Equation 1 for 𝑎.
4. Substitute this expression into Equation 2 and simplify.
5. You should now have a one variable equation. Solve this equation.
6. You have the value of the parameter 𝑘. Substitute this value in to either Equation 1 or
Equation 2 and determine the value of parameter 𝑎.

Name: Date: Page 63 of 68
Activity 5.5.2 Hamden Public Schools 2016-2017 adapted from
Connecticut Core Algebra 2 Curriculum Version 3.0
7. You have values for both parameters. What is the exponential function?
8. Graph this function with the original data points. How well does this function match the data
points?
Why?
9. When using substitution to solve a system of 2 equations in 2 variables, you solve one
equation for one variable and substitute into the other equation. Could you have solved the
system if you chose to initially solve for 𝑘 instead of 𝑎? Why were you directed to solve for
𝑎 rather than 𝑘 in question 3?
10. Earlier in this unit, you saw that exponential equations could be written as 𝑦 = 𝑎 ∙ 𝑏𝑡 or
𝑦 = 𝑎 ∙ 𝑒𝑘𝑡. The variables 𝑦 and 𝑡 are the same in both versions of the equation and the
parameter 𝑎 is the same in both versions. Recall 𝑏 is the growth factor of the exponential
function. How is 𝑘 related to 𝑏?
Using the population from 1930 and 1940, what is the growth factor 𝑏?
Using the growth factor, b, determine the value of 𝑘.
In question 5, you found 𝑘 through substitution and solving a one variable equation. Does
the value from question 5 match the value you just found?

Name: Date: Page 64 of 68
Activity 5.5.2 Hamden Public Schools 2016-2017 adapted from
Connecticut Core Algebra 2 Curriculum Version 3.0
Second Attempt – 1940 and 1950
Try this with a different set of data points. You are going to find another exponential function
using the data from 1940 and 1950. Once you have a function, graph the function with the data
points to determine if the function better fits the data.
11. Use the data from 1940 and 1950 to write two ordered pairs of the form (𝑡, 𝑃) and two
equations of the form 𝑃 = 𝑎 ∙ 𝑒𝑘𝑡. Solve the system of equations.
12. What is the exponential function?
13. Does the graph of this function fit the data? Is the fit better or worse than the exponential
model from the first attempt?
Part 3 – The Piecewise Function
14. You can now write the entire piecewise function. Fill in the missing parts below.
𝑃 = { 3.929𝑒0.3008𝑡 𝑓𝑜𝑟 0 ≤ 𝑡 < _________
𝑓𝑜𝑟 ________ ≤ 𝑡 < 21

Name: Date: Page 65 of 68
Activity 5.7.1 Hamden Public Schools 2016-2017 adapted from
Connecticut Core Algebra 2 Curriculum Version 3.0
Activity 5.7.1 Saving for a Down Payment (Part 1)
Earlier in the unit, you saw the compound interest formula.
𝐹 = 𝑃 (1 +𝑟
𝑛)
𝑛𝑡
Keep in mind some of the assumptions you need when you plan to use that formula: you make an
initial deposit, you make no other deposits or withdrawals, and interest is based on both the
initial deposit and the accumulated interest.
What happens if you can’t deposit one big sum of money at the beginning and let it sit in the
bank? For most people, savings happen gradually over time. For each compounding period, a
regular deposit is made into the account. Let’s see how this works.
Situation: Aaron has six months to save money for a down payment on a car. He can put $100
per month in the bank on the last day of each month. His bank offers a savings account with 6%
annual interest compounded monthly. (This is not a realistic interest rate for a savings account
right now for rates are very low, but it will allow you to focus on the ideas behind the process
rather than worrying about decimals that get too messy. Don’t worry, we will encounter more
realistic values soon!)
Right now we don’t have a formula to figure out how much will be in his bank account after 6
months. We will first do a problem concretely and then return to the process to see if we can
develop a formula. We know he will deposit $600 over the 6 months starting on July 31, but we
need to also figure out how much interest is earned each month. Let’s make a table and
investigate. Make sure you calculate the interest before you add the new deposit for the
month. If a deposit of $100 is made on July 31 and interest is compounded on July 31, the bank
will not give you interest on that $100. Why? ______________________ That means for the
first month of Aaron’s savings, he doesn’t earn any interest because that deposit was made at the
end of the month. But for month two he will have had $100 in the bank long enough to get 0.5%
interest which is________. So on August 31, $______ will post to his account and he will then
also make his 100 dollar deposit for the month of August. Fill in the last cell in row two for his
new amount as of August 31. The complete the rows for the remaining 4 months.
Interest
Earned
Amount in Account from
the Previous Month plus
Accrued Interest
Deposit
Total Amount in
the Account at the
End of the Month
Month 1 $0 $0 $100 $0 + $100 = $100
Month 2 $100
Month 3
P = principal (initial deposit)
r = annual interest rate (written as a decimal)
n = number of compounding periods per year
t = number of years
F = amount in the account after t years

Name: Date: Page 66 of 68
Activity 5.7.1 Hamden Public Schools 2016-2017 adapted from
Connecticut Core Algebra 2 Curriculum Version 3.0
Month 4
Month 5
Month 6
Questions: Hopefully the process that you just went through to figure out the amount in the
account after 6 months reminded you of some of your earlier work with the compound interest
formula.
1. How much did Aaron have in the bank after 6 months?
2. Why do you think you were only asked to make a table for a 6 month savings plan rather
than a 2 years or ten years?
3. Without doing the calculations, in which scenario would Aaron earn more interest: the
given scenario or a situation where he could deposit $600 right away and let it sit for 6
months. Explain your reasoning and include the amount of interest he would have earned
if he could have put the $600 in the bank on July 1 instead of putting in 100 dollars a
month for the 6 months.
Now let us look at the problem in one other way.
The first deposit of $100 will earn 5 months’ interest 100(1+.005)5 = 102.53
The second deposit will earn 4 months’ interest 100(1+.005)4 = 102.02
The third deposit will earn 3 months’ interest 100(1+.005)3 = 101.51
The fourth deposit will earn 2 months’ interest 100(1+.005)2 = 101.00
The fifth deposit will earn 1 months’ interest 100(1+.005)1 = 100.50
The sixth deposit will earn no interest 100.00
Total: $607.56
Note then:
F the future value or amount = C + C(1 + i) + C(1 + i)2 + C(1 + i)
3 + C(1 + i)
4+ C(1 + i)
5
where i = r/n and r is the annual rate expressed as a decimal and n is the number of
compounding periods.
For the total after nt periods where n is the number of compounding periods per year and t is the
number of years, you should recognize that you have a ______________ whose sum in general
is given by

Name: Date: Page 67 of 68
Activity 5.7.1 Hamden Public Schools 2016-2017 adapted from
Connecticut Core Algebra 2 Curriculum Version 3.0
Equation (1) 𝑆 =𝑎1(𝑟𝑛−1)
𝑟−1
We can replace 𝑎1 with C, r with 1 + i and our exponent will be nt. But remember i = r/n.
Make the substitutions now in equation 1 so you can have a formula for the Future value of an
annuity.
Concept: The situation you just looked at is a form of annuity. An annuity is a sum of money
payable at regular intervals (www.merriam-webster.com). Just adding that regular payment per
period changes the equation significantly.
Keep in mind some of the requirements for using this formula:
the deposit is made at the end of the period,
interest is compounded at the end of the period before the deposit, and
the deposit is made for a set amount and must be made every period.
Try These:
1. Use the Future Value of an Annuity formula to determine how much Aaron has in the
bank after 6 months. Just as a reminder, Aaron has six months to save money for a down
payment on a car. He can put $100 per month in the bank at the end of the month. His
bank offers a savings account with 6% annual interest compounded monthly.
𝐹 = 𝐶 [(1+
𝑟
𝑛)
𝑛𝑡−1
𝑟
𝑛
]
Why do you think we obtained $607.56 in our second table?
𝐹 = 𝐶 [(1 +
𝑟𝑛
)𝑛𝑡
− 1
𝑟𝑛
]
Future Value of an Annuity (Savings) C = amount of regular deposit
r = annual interest rate (written as a decimal)
n = number of compounding periods per year
t = number of years
F = amount in the account after t years

Name: Date: Page 68 of 68
Activity 5.7.1 Hamden Public Schools 2016-2017 adapted from
Connecticut Core Algebra 2 Curriculum Version 3.0
2. Hilary is planning to open an account at her local bank to save for a vacation. She is
saving to take a cruise. She wants to have $3000 saved in two years. Her local bank is
offering a special 1.05% annual interest rate on a savings account compounded monthly.
How much should she save per month in order to have $3000 at the end of two years?
𝐹 = 𝐶 [(1 +
𝑟𝑛)
𝑛𝑡
− 1
𝑟𝑛
]
3. Finbar has looked at his monthly budget and decided that he can deposit $35 per month
into a savings account with 0.97% annual interest rate (APR) compounded monthly. His
goal is to save $950 for a security deposit on a new apartment. At this rate, how long will
it take him to save $950?
𝐹 = 𝐶 [(1+
𝑟
𝑛)
𝑛𝑡−1
𝑟
𝑛
]
Copyright © 2022 FDOKUMEN