une approche centrée sur les Patrons de Gestion de la Qualité
335
HAL Id: tel-00922995 https://tel.archives-ouvertes.fr/tel-00922995 Submitted on 1 Jan 2014 HAL is a multi-disciplinary open access archive for the deposit and dissemination of sci- entific research documents, whether they are pub- lished or not. The documents may come from teaching and research institutions in France or abroad, or from public or private research centers. L’archive ouverte pluridisciplinaire HAL, est destinée au dépôt et à la diffusion de documents scientifiques de niveau recherche, publiés ou non, émanant des établissements d’enseignement et de recherche français ou étrangers, des laboratoires publics ou privés. Conception des Systèmes d’Information : une approche centrée sur les Patrons de Gestion de la Qualité Kashif Mehmood To cite this version: Kashif Mehmood. Conception des Systèmes d’Information : une approche centrée sur les Patrons de Gestion de la Qualité. Informatique. Conservatoire national des arts et metiers - CNAM, 2010. Français. NNT : 2010CNAM0721. tel-00922995
-
Upload
khangminh22 -
Category
Documents
-
view
2 -
download
0
Transcript of une approche centrée sur les Patrons de Gestion de la Qualité

HAL Id: tel-00922995https://tel.archives-ouvertes.fr/tel-00922995
Submitted on 1 Jan 2014
HAL is a multi-disciplinary open accessarchive for the deposit and dissemination of sci-entific research documents, whether they are pub-lished or not. The documents may come fromteaching and research institutions in France orabroad, or from public or private research centers.
L’archive ouverte pluridisciplinaire HAL, estdestinée au dépôt et à la diffusion de documentsscientifiques de niveau recherche, publiés ou non,émanant des établissements d’enseignement et derecherche français ou étrangers, des laboratoirespublics ou privés.
Conception des Systèmes d’Information : une approchecentrée sur les Patrons de Gestion de la Qualité
Kashif Mehmood
To cite this version:Kashif Mehmood. Conception des Systèmes d’Information : une approche centrée sur les Patronsde Gestion de la Qualité. Informatique. Conservatoire national des arts et metiers - CNAM, 2010.Français. �NNT : 2010CNAM0721�. �tel-00922995�

PhD THESIS
A dissertation submitted in partial fulfilment of the requirements
to obtain the title of
Doctor of Conservatoire National des Arts et Métiers
Centre d‟Etudes et De Recherche en Informatique du CNAM (CEDRIC)
A Quality Pattern Based Approach for
the Analysis and Design of Information
Systems
By
Kashif MEHMOOD
2010
Defended on 03rd
September 2010 in front of the following jury:
Geert Poels Professor Ghent University Reviewer
Oscar Pastor Professor Universidad Politécnica de Valencia Reviewer
Jacky Akoka Professor CEDRIC-CNAM Examiner
Mokrane Bouzeghoub Professor PRiSM Examiner
Camille Rosenthal-Sabroux Professor Université Paris-Dauphine Examiner
Nicolas Prat Associate Professor ESSEC Business School Examiner
Isabelle Comyn-Wattiau Professor CNAM & ESSEC Business School Supervisor
Samira Si-Said Cherfi Maître de Conférences CEDRIC-CNAM Supervisor

ESSEC Ph.D. PROGRAM
A Quality Pattern Based Approach for the Analysis
and Design of Information Systems
A dissertation submitted in fulf ilment of the requirements
for the degree of
DOCTOR OF PHILOSOPHY
(Business Administration)
Presented and defended publ icly the 3rd of September 2010 by
By
Kashif MEHMOOD
COMMITTEE
Geert Poels Professor Ghent University Reviewer
Oscar Pastor Professor Universidad Politécnica de Valencia Reviewer
Jacky Akoka Professor CEDRIC-CNAM Examiner
Mokrane Bouzeghoub Professor PRiSM Examiner
Camille Rosenthal-Sabroux Professor Université Paris-Dauphine Examiner
Nicolas Prat Associate Professor ESSEC Business School Examiner
Isabelle Comyn-Wattiau Professor CNAM & ESSEC Business School Supervisor
Samira Si-Said Cherfi Maître de Conférences CEDRIC-CNAM Supervisor

To my parents,
To my wife Sameet.


v | P a g e
Acknowledgements
This thesis is the result of four years of devoted work which would not have been possible
without the support of many. Here, I would like to express my thanks to people who have been
very helpful to me during the course of this work.
First of all, I would like to thank almighty Allah for giving me the strength and showing me
the path to successfully complete this thesis. Secondly, I would take this opportunity to gratefully
acknowledge the wholehearted supervision of my very learned advisors, Dr. Isabelle Comyn-
Wattiau and Dr. Samira Si-Said Cherfi, who complemented each other wonderfully well. I
count myself very lucky to have these two, who are ranked amongst the best in the domain, as my
supervisors. I was always led by their skillful guidance and helpful suggestions, which made it
possible for me to go this far. Dr. Samira Si-Said Cherfi, being my co-supervisor, was always
there for help and long discussions whenever I got stuck in something. The patience, dedication,
and constant encouragement of my supervisors made it possible for me to deliver a dissertation of
appreciable quality and standard.
I would also like to thank Dr. Geert Poels and Dr. Oscar Pastor for accepting to review my
dissertation. Also many thanks to Dr. Jacky Akoka, Dr. Mokrane Bouzeghoub, Dr. Camille
Rosenthal-Sabroux and Dr. Nicolas Prat for accepting to be a part of jury to evaluate my work.
Special thanks are due to the head of research group ISID, Dr. Jacky Akoka for providing me
with valuable guidance and support at various stages of my work. He welcomed me, to his
research group, with an open heart and always helped whenever I needed it. His continual
encouragement provided the much needed motivation, at every step, during the four years of my
stay in the lab.
My cordial appreciation extends to all the members of the research group ISID for providing a
good research environment and extending support and constructive suggestions. My stay at ISID
would not have been such a pleasurable one without the presence of friendly colleagues, and here
I have to specially mention Jean-Sylvain Bucumi, Ando Ratsimanohatra, Yasmine Mouhoubi
and Ryme Chelouah who helped me out in one way or another and exchanged fructuous views
from time to time.
My gratitude to all the professors and colleagues at ESSEC-Business School. Here I would
like to mention Dr. David Avison, Dr. Raymond-Alain Thietart , Dr. Anca Metiu and Pietro
De Giovanni for their continuous support and useful suggestions. Above all, many thanks to Lina
Prevost and Catherine Noblesse for their untiring support in all administrative tasks at ESSEC.

vi | P a g e
I owe my special thanks to my wife (Sameet Kashif), my mother (Iqbal Fatima), my in-laws
(Farrukh Salman, Bina Farrukh, Khushbakht Farrukh ), my brothers and sisters and all of my
family members for helping me get through difficult times, and for all the support, love and care
they provided. I would not have succeeded in completing this thesis without the continuous
support and love of my wife.
Many thanks to all my friends including ,in no particular order, Asad, Kamran, Faisal, Saif,
Imran, Ammad, Hussain, Shoaib, Hussain, Kashif, Khurram, Shehzad, Imran, Rauf ,
Shiraz, Masood, etc. for helping me get through difficult times, and for all the support,
camaraderie and care they provided.
I will always be thankful to all my teachers specially Mrs . Rauf, Mrs Alvi and Mr. Abdul
Samad for all the hard work and efforts they have put in, for educating me.
I would also like to express my deepest gratitude to ESSEC – Business School for financially
supporting the study and to Higher Education Commission of Pakistan for helping me in
pursuing my higher education in France and for providing me their full support and backing as
well as time, thus making it possible for me to pursue my research in prestigious institutions of
esteemed repute.
And finally, I am forever indebted to my extremely loving wife for her patience, understanding
and immense love, alleviating my family responsibilities and encouraging me to concentrate on
my study.
Thank you all !

vii | P a g e
Abstract
Conceptual models (CM) serve as the blueprints of information systems and their quality plays decisive
role in the success of the end system. It has been witnessed that majority of the IS change-requests result
due to deficient functionalities in the information systems. Therefore, a good anal ysis and design method
should ensure that CM are correct and complete, as they are the communicating mediator between the users
and the development team. Our approach targets the problems related to conceptual modeling quality by
proposing a comprehensive solution. We designed multiple artifacts for different aspects of CM quality.
These artifacts include the following:
i. Formulation of comprehensive quality criteria (quality attributes, metrics, etc.) by federating the
existing quality frameworks and identifying the quality criteria for gray areas. Most of the existing
literature on CM quality evaluation represents disparate and autonomous quality frameworks
proposing non-converging solutions. Thus, we synthesized (existing concepts proposed by
researchers) and added the new concepts to formulate a comprehensive quality approach for
conceptual models that also resulted in federating the existing quality frameworks.
ii. Formulation of quality patterns to encapsulate past-experiences and good practices as the select ion
of relevant quality criteria (including quality attributes and metrics) with respect to a particular
requirement (or goal) remains trickier for a non-expert user. These quality patterns encapsulate
valuable knowledge in the form of established and better solutions to resolve quality problems in
CM.
iii. Designing of the guided quality driven process encompassing methods and techniques to evaluate
and improve the conceptual models with respect to a specific user requirement or goal. Our
process guides the user in formulating the desired quality goal, helps him/her in identifying the
relevant quality patterns or quality attributes with respect to the quality goal and finally the process
helps in evaluating the quality of the model and propose relevant recommendations for
improvement.
iv. Development of a software prototype “CM-Quality”. Our prototype implements all the above
mentioned artifacts and proposes a workflow enabling its users to evaluate and improve CMs
efficiently and effectively.
We conducted a survey to validate the selection of the quality attributes through the above mentioned
federating activity and also conducted three step detailed experiment to evaluate the efficacy and efficiency
of our overall approach and proposed artifacts.
Keywords: Conceptual Model Quality, Quality Evaluation, Quality Assessment, Quality Improvement,
Quality Criteria, Quality Framework, Quality Patterns, Quality Attributes, Metrics.


Table of Contents
ix | P a g e
Table of Contents
Acknowledgements ............................................................................................................................ v
Abstract ............................................................................................................................................vii
Table of Contents .............................................................................................................................. ix
List of Figures .................................................................................................................................. xv
List of Tables .................................................................................................................................. xvii
List of Abbreviations and Terminologies ...................................................................................... xix
Chapter 1 Introduction ...................................................................................................................... 1
1.1 Domain of the thesis............................................................................................................. 1
1.2 Problem statement ................................................................................................................ 4
1.3 Objective of the Thesis ......................................................................................................... 8
1.4 Overview of the Solution ..................................................................................................... 9
1.5 Organization of the thesis ................................................................................................... 14
Chapter 2 State of the Art ............................................................................................................... 17
2.1 Software Quality ................................................................................................................ 18
2.1.1 Evaluation Approaches for Information Systems ......................................................... 19
2.1.2 Defect Detection and Rectification .............................................................................. 20
2.1.3 Identification of Quality Criteria (Dimensions, Attributes, Metrics, etc.) for Evaluation
............................................................................................................................................. 21
2.1.4 Evaluation of service quality ....................................................................................... 23
2.1.5 Standards ..................................................................................................................... 24
2.1.5.1 ISO/IEC-9126....................................................................................................... 24
2.2 Data Quality ....................................................................................................................... 29
2.2.1 Standards ..................................................................................................................... 31
2.3 Conceptual Model Quality ................................................................................................. 33
2.3.1 Conceptual Models (CM) ............................................................................................ 33
2.3.1.1 Unified Modeling Language (UML) ..................................................................... 34
2.3.1.2 Entity Relationship Diagrams (ER) ...................................................................... 34
2.3.2 Conceptual Modeling Quality ...................................................................................... 35
2.3.2.1 Quality Dimensions .............................................................................................. 37
2.3.2.2 Quality Attributes ................................................................................................. 37
2.3.2.3 Quality Metrics ..................................................................................................... 38
2.4 Software Tools for Modeling and Quality Evaluation ........................................................ 43

Table of Contents
x | P a g e
2.4.1 Objecteering ................................................................................................................ 43
2.4.2 Rational Rose .............................................................................................................. 44
2.4.3 Star UML .................................................................................................................... 44
2.4.4 UMLQuality ................................................................................................................ 45
2.5 Towards an Instrumented Approach for Quality Management ........................................... 46
2.5.1 Krogstie‟s Framework for Quality of Conceptual Models ........................................... 47
2.5.2 Instrumentalisation of the Conceptual Modeling Quality Framework .......................... 48
2.5.2.1 Syntactic quality measurement ............................................................................. 49
2.5.2.2 Physical quality .................................................................................................... 49
2.5.2.3 Semantic quality measurement ............................................................................. 50
2.5.2.4 Pragmatic Quality Measurement........................................................................... 51
2.5.2.5 Social Quality Measurement ................................................................................. 52
2.5.2.6 Empirical Quality Measurement ........................................................................... 53
2.6 Conclusion ......................................................................................................................... 53
Chapter 3 Proposed Solution........................................................................................................... 55
3.1 A Multi-Faceted Quality Approach for Conceptual Modeling ............................................ 57
3.1.1 Theoretical Foundations .............................................................................................. 58
3.1.2 Practical Foundations .................................................................................................. 61
3.1.3 Epistemological Foundations....................................................................................... 62
3.2 Quality Model Overview .................................................................................................... 65
3.2.1 Quality Goal: ............................................................................................................... 68
3.2.2 Questions:.................................................................................................................... 70
3.2.3 Quality Pattern: ........................................................................................................... 72
3.3 Example of approach:......................................................................................................... 73
3.4 Quality Pattern Meta-Model ............................................................................................... 75
3.5 Quality pattern ................................................................................................................... 76
3.5.1 Quality Attributes ........................................................................................................ 78
3.5.2 Quality Metrics............................................................................................................ 82
3.5.3 Recommendations ....................................................................................................... 87
3.5.3.1 Textual Recommendations ................................................................................... 88
3.5.3.2 Transformations ................................................................................................... 90
3.5.3.3 Design patterns ..................................................................................................... 92
3.5.4 An example of quality pattern: Model Complexity Quality Pattern ............................. 94
Table of Contents
xi | P a g e
3.5.4.1 Details about Textual Recommendations/Transformation/Design Patterns ........... 96
3.6 Conclusion ....................................................................................................................... 100
Chapter 4 Quality Driven Development Process (Q2dP) ............................................................ 101
4.1 Introduction ...................................................................................................................... 101
4.2 Constructing a Quality vision ........................................................................................... 103
4.2.1 Identifying New Quality Pattern ................................................................................ 103
4.2.2 Identifying New Attributes ........................................................................................ 104
4.2.3 Formulating Metrics to Measure Quality Attribute .................................................... 106
4.3 Applying a quality vision ................................................................................................. 108
4.3.1 The Generic Quality Process ..................................................................................... 109
4.3.1.1 Defining a Quality Goal ..................................................................................... 111
4.3.1.2 Identifying Quality Patterns ................................................................................ 117
4.3.1.3 Identifying Quality Attributes ............................................................................. 119
4.3.1.4 Evaluate Quality ................................................................................................. 119
4.3.1.5 Improve Quality ................................................................................................. 120
4.4 Conclusion ....................................................................................................................... 121
Chapter 5 Case-Study: Goal-Based Evaluation/ Improvement .................................................. 123
5.1 Introduction to the Case Study ......................................................................................... 123
5.2 Formulation of Quality Goal ............................................................................................ 124
5.3 Selection of Relevant Quality Criteria for Formulated Quality Goal ................................ 127
5.3.1 Selected Quality Patterns ........................................................................................... 128
5.3.1.1 Model Completeness Quality Pattern.................................................................. 128
5.3.1.2 Model Complexity Quality Pattern ..................................................................... 129
5.3.2 Associated Quality Attributes for Evaluation Project ................................................ 130
5.3.3 Associated Quality Metrics for Quantification........................................................... 131
5.3.3.1 Metrics for Completeness Quality Attribute ....................................................... 131
5.3.3.2 Metrics for Size Quality Attribute ...................................................................... 132
5.3.3.3 Metrics for Structural Complexity Quality Attribute .......................................... 132
5.3.3.4 Metrics for Semantic Complexity Quality Attribute ........................................... 133
5.4 Model Evaluation ............................................................................................................. 134
5.5 Post Evaluation Propositions for Quality Improvement .................................................... 135
5.6 Application of Recommendations to the Original Model.................................................. 136
5.6.1 To Improve Model Completeness .............................................................................. 136

Table of Contents
xii | P a g e
5.6.1.1 Incorporate missing requirements ....................................................................... 136
5.6.1.2 Define missing multiplicities .............................................................................. 137
5.6.1.3 Define missing associations labels ...................................................................... 137
5.6.2 Improve Model Complexity ...................................................................................... 137
5.6.2.1 Factorize associations (to remove redundant associations) ................................. 138
5.6.2.2 High Cohesion GRASP design pattern (to increase cohesion) ............................ 138
5.6.2.3 Polymorphism GRASP design pattern (to increase cohesion) ............................. 138
5.6.2.4 Divide the model (to reduce semantic complexity) ............................................. 139
5.6.2.5 Evaluate all cycles to remove redundant concepts .............................................. 140
5.7 Re-evaluation of the Transformed Model ......................................................................... 143
5.8 Conclusion ....................................................................................................................... 146
Chapter 6 CM-Quality: Software Prototype Implementing the Proposed Approach ............... 147
6.1 General Architecture ........................................................................................................ 147
6.1.1 Functional View for Quality Expert........................................................................... 148
6.1.2 Functional View for Analyst/User ............................................................................. 150
6.2 Detailed Architecture ....................................................................................................... 151
6.2.1 The quality definition module.................................................................................... 151
6.2.1.1 Pattern definition tool ......................................................................................... 152
6.2.1.2 Attribute definition tool ...................................................................................... 152
6.2.1.3 Metric definition tool .......................................................................................... 152
6.2.1.4 Recommendation definition tool......................................................................... 153
6.2.2 The quality evaluation module .................................................................................. 153
6.2.2.1 Quality Parameters Selection Tool ..................................................................... 153
6.2.2.2 Goal Definition Tool .......................................................................................... 153
6.2.2.3 Quality Evaluation Tool ..................................................................................... 154
6.2.2.4 Quality Improvement Tool ................................................................................. 154
6.2.3 The knowledgebase structure..................................................................................... 154
6.2.4 Package Diagram....................................................................................................... 155
6.2.4.1 CM Quality Core ................................................................................................ 156
6.2.4.2 XMI Parser ......................................................................................................... 156
6.2.4.3 Interface Manager............................................................................................... 157
6.2.4.4 Knowledgebase Manager.................................................................................... 157
6.2.4.5 Quality Evaluator ............................................................................................... 157

Table of Contents
xiii | P a g e
6.2.4.6 Quality Improver ................................................................................................ 157
6.2.4.7 Reports Generator............................................................................................... 158
6.3 Quality Definition in CM-Quality .................................................................................... 158
6.3.1 Quality pattern definition........................................................................................... 158
6.3.2 Quality attributes definition ....................................................................................... 160
6.3.3 Metric definition ........................................................................................................ 162
6.3.4 Recommendation Definition ...................................................................................... 164
6.4 Quality Evaluation in CM-Quality ................................................................................... 166
6.4.1 Goal Expression and Resolution ................................................................................ 167
6.4.2 Matching Formulated Goal to Quality Patterns.......................................................... 169
6.4.2.1 Step-1: Generating Questions to Identify the Domain of the Formulated Goal ... 169
6.4.2.2 Step-2: Validation of Proposed Quality Patterns ................................................. 171
6.4.2.3 Step-3: Validation of the Selected Quality Attributes ......................................... 172
6.4.2.4 Step-4: Validation of the Selected Quality Metrics ............................................. 173
6.4.3 Model Evaluation & Improvement ............................................................................ 174
6.5 Comparison of CM-Quality with Other Existing Softwares ............................................. 174
6.6 Conclusion ....................................................................................................................... 176
Chapter 7 Validation ..................................................................................................................... 177
7.1 Validating the Selected Quality Attributes ....................................................................... 179
7.1.1 Sample ...................................................................................................................... 182
7.1.2 Data Analysis ............................................................................................................ 186
7.2 Validating the Proposed Quality Approach ...................................................................... 190
7.2.1 Sample ...................................................................................................................... 191
7.2.2 Data analysis: ............................................................................................................ 194
7.2.2.1 Step-1: ................................................................................................................ 195
7.2.2.2 Step-2 ................................................................................................................. 197
7.2.2.3 Step3 .................................................................................................................. 201
7.3 Conclusion ....................................................................................................................... 204
Chapter 8 Conclusion .................................................................................................................... 207
8.1 Contributions.................................................................................................................... 208
8.2 Future Work – Perspectives.............................................................................................. 209
Appendix A Quality Attributes ..................................................................................................... 211
Appendix B Quality Patterns ........................................................................................................ 217

Table of Contents
xiv | P a g e
Appendix C Human Resource Ontology ...................................................................................... 261
Appendix D User Requirements for Case Study .......................................................................... 265
Appendix E CM-Quality Evaluation Report ................................................................................ 267
Appendix F Résumé (Thesis Summary in French) ...................................................................... 275
Bibliography ................................................................................................................................... 297
Author’s Publications .................................................................................................................... 313

List of Figures
xv | P a g e
List of Figures
Figure - 1. ISO/IEC 9126-Model of quality. Source: [Suryn et al., 2003] .................................... 25
Figure - 2. Proposed characterstics in ISO-9126. Source: [ISO9126] ........................................... 26
Figure - 3 Characteristics and sub-characteristics proposed in ISO-9126. .................................... 27
Figure - 4. [Krogstie‟s et al., 1995] Framework for quality of models .......................................... 48
Figure - 5. An iterative quality improvement based approach ...................................................... 68
Figure - 6. An example of our quality improvement approach ..................................................... 74
Figure - 7. Quality Pattern Meta-Model ....................................................................................... 76
Figure - 8. Quality Attributes ....................................................................................................... 81
Figure - 9. Model for metrics ....................................................................................................... 84
Figure - 10. SPEM 2.0 Guidance Kinds ....................................................................................... 88
Figure - 11 Model for textual recommendations .......................................................................... 90
Figure - 12. Model for transformations ........................................................................................ 91
Figure - 13. A quality driven development process .................................................................... 102
Figure - 14. Process to Identify New Quality Patterns ................................................................ 103
Figure - 15. Process to identify new quality attributes ................................................................ 105
Figure - 16. Process to formulate metrics for measuring quality attributes ................................. 107
Figure - 17. Quality Driven Development Process (Q2dP): Roles and Aims .............................. 108
Figure - 18. Quality Pattern Driven Process Workflow .............................................................. 110
Figure - 19. “Define a Quality Goal” Work definition ............................................................... 111
Figure - 20. An Extract from the Glossary ................................................................................. 113
Figure - 21. Mapping Goals to Relevant Evaluation Criteria (through Questions) ..................... 116
Figure - 22. Process to Identify Quality patterns ........................................................................ 118
Figure - 23. Quality Evaluation Process ..................................................................................... 120
Figure - 24. Model to be evaluated ............................................................................................. 125
Figure - 25. Structure of Model Completeness Quality Pattern .................................................. 129
Figure - 26. Structure of Model Complexity Quality Pattern ...................................................... 130
Figure - 27. Post Transformation Resulting Module for Personnel ............................................. 141
Figure - 28. Post Transformation Resulting Module for Pay ...................................................... 143
Figure - 29.General architecture of the solution ......................................................................... 148
Figure - 30. Use Case Diagram: Define the Quality Concepts .................................................... 149
Figure - 31. Use Case Diagram: Evaluate the Quality ................................................................ 151
Figure - 32. Knowledgebase Structure ....................................................................................... 155

List of Figures
xvi | P a g e
Figure - 33. CM-Quality Package Diagram ................................................................................ 156
Figure - 34. CM-Quality Screen: Managing quality patterns ...................................................... 159
Figure - 35. CM-Quality Screen: Associate Quality Patterns with Quality Attributes ................ 160
Figure - 36. CM-Quality Screen: Manage Quality Attributes ..................................................... 161
Figure - 37. CM-Quality Screen: Associating Quality Attributes with Metrics .......................... 161
Figure - 38. CM-Quality Screen: Defining Automatable Metric ................................................ 163
Figure - 39. CM-Quality Screen: Defining Non-Automatable Metric ........................................ 164
Figure - 40. CM-Quality Screen: Managing Recommendations ................................................. 165
Figure - 41. CM-Quality Screen: Associating Recommendations with Metrics.......................... 166
Figure - 42. CM-Quality Screen: Quality Goal Formulation Screen ........................................... 168
Figure - 43. Goal Creation Step-1: Generating questions to identify the domain of the formulated
goal .................................................................................................................................... 170
Figure - 44. Goal Creation Step-2: Validating the selection of proposed quality patterns ........... 172
Figure - 45. Goal Creation Step-3: Validating the attributes selection for evaluation ................. 172
Figure - 46. Goal Creation Step-4: Validating the metrics selection for evaluation .................... 173
Figure - 47. Experiment 1: Classification of respondents with respect to modeling experience.. 184
Figure - 48. Experiment 1: Respondents with respect to organization size ................................ 186
Figure - 49. Experiment 1: Bar chart depicting respondents‟ feedback on the selected quality
attributes ............................................................................................................................ 189
Figure - 50. Experiment 2: Respondents' division with respect to modeling experience ............. 193
Figure - 51. Experiment 2: Respondents' division with respect to occupation ............................ 194
Figure - 52. Experiment 2: Respondents' feedback to questions asked in step-2......................... 198
Figure - 53. Experiment 2: Respondents' feedback to questions asked in step-2 with respect to
occupation .......................................................................................................................... 200
Figure - 54. Experiment 2: Respondents' feedback to questions asked in step-2 grouped by
modeling experience .......................................................................................................... 201
Figure - 55. Experiment 2: Respondents' feedback to questions asked in step-3......................... 202
Figure - 56. Comparision of identified problems in original model and transformed model ....... 204

List of Tables
xvii | P a g e
List of Tables
Table - 1. Proposed quality model for software components. Source: [Andreas et al., 2007] ....... 28
Table - 2. SPDQM for web portal data. Source: [Moraga et al., 2009] ......................................... 32
Table - 3. Comparison between evaluation methodologies proposed in different tools ................ 46
Table - 4. Summary of Findings by [Moody2005] ....................................................................... 56
Table - 5. Goal formulation template ........................................................................................... 70
Table - 6. Guidelines to formulate questions related to conceptual models .................................. 71
Table - 7. Dimensions proposed by researhers ............................................................................. 79
Table - 8. Some of the existing automatable metrics .................................................................... 83
Table - 9. Computed Metrics for Initial Model........................................................................... 135
Table - 10. Post transformation metrics result ............................................................................ 145
Table - 11. Comparing CM-Quality with existing evaluation software ...................................... 174
Table - 12. Experiment 1: General information about the respondents ....................................... 183
Table - 13. Experiment 1: Classification of respondents with respect to occupation .................. 185
Table - 14. Experiment 1: Respondents with respect to organization size ................................. 185
Table - 15. Experiment 1: Respondents‟ feedback on the selected quality attributes ................. 188
Table - 16 . Experiment 2: General information about the respondents ...................................... 192
Table - 17 . Experiment 2: Classification of respondents with respect to occupation ................. 193
Table - 18. Experiment 2: Identified problems in the original model by the respondents .......... 195
Table - 19. Experiment 2: Respondents‟ identified solution to the problems in the original model
........................................................................................................................................... 196
Table - 20. Experiment 2: Respondents‟ suggested corrective actions in response to selected
solution .............................................................................................................................. 197
Table - 21. Experiment 2: Responses to questions asked in step-2 with respect to respondents‟
occupation .......................................................................................................................... 199
Table - 22. Experiment 2: Response to questions asked in step-2 with respect to modeling
experience .......................................................................................................................... 201
Table - 23. Comparison between problems indetified in original and transformed model .......... 203


xix | P a g e
List of Abbreviations and Terminologies
A list of commonly used abbreviations and the different terminologies that frequently are used
throughout the thesis:
CM: Conceptual Model
ER: Entity-Relationship
ERP: Enterprise Resource Planning
GQM: Goal-Question-Metric
HR: Human Resource
IS: Information System
ISO: International Organization for Standardization
Model: Conceptual Model
UML: Unified Modeling Language
XML: Extensible Markup Language
XMI: XML Metadata Interchange


Chapter 1: Introduction
1 | P a g e
Chapter 1
Introduction
1.1 Domain of the thesis
Information systems (IS) create, process, store, and generate information to help individuals
make meaningful decisions [Gupta 01]. These systems can be at personal, workgroup and
enterprise levels depending upon their usage and implementation. For example, enterprise wide
systems support the entire organization by providing them with comprehensive and processed
information for taking decision at the enterprise level. However, IS are useful only if they bring
the required information and functionalities they are conceived for. If IS are not able to furnish the
information required by different stakeholders then their strategic position in the decision making
process will be questionable and users might not utilize it.
Incorporation of missing/new requirements or functionalities to the information systems comes
under its evolution or maintenance. Such change requests (both for missing and new
requirements/functionalities) can be minimized or avoided by careful analysis and design
activities during the system development lifecycle. The major problem with maintenance and
evolution activities is their high costs depending on the lifecycle stage at which these miss ing
requirements were identified or new requirements were generated. These high
maintenance/evolution costs can play a decisive role in deciding the fate of future information
systems. Information systems projects failure is a common story. Most of these failures were
resulted due to increase cost induced by rapidly changing requirements. Even if the information
system was successfully developed and deployed, its maintenance cost can darken its future.
[Erlikh 00] reported that the relative cost for maintaining IS and managing its evolution represents
more than 90% of the total cost.
It is due to the above mentioned reasons that software quality is considered as an important
issue in research laboratories and in IS firms. Quality problems can inflate system development
cost and consume scarce resources in addition to increase error detection and correction costs
[Thiagarajan et al., 1994]. Moreover, [Ackoff 67] found that the existence of defects or

Chapter 1: Introduction
2 | P a g e
deficiencies can hamper IS quality and put its adoption at stake as IS adoption is linked to IS
quality, satisfaction and usage as reported by [Nelson et al., 2005].
Information systems evaluation has always been a hot issue. Many efforts are devoted towards
the research and development of methods to improve the software quality. Different researchers
have proposed different perspectives and methods to evaluate IS. Similarly, IS industry has
appreciated the benefits of employing software quality assurance (SQA) activities to improve the
software quality and reduce the modification cost. However, the major problem with the existing
SQA or software evaluation activities is that it is performed at the last stage of development i.e.
usually SQA activities are placed as the last stage of software development lifecycle. The famous
alpha testing is done once the software is fully developed and just prior to its deployment. It‟s too
late to identify the defects and deficiencies if the software is already developed, as the
maintenance cost of these defects could be enormous and might require major design or
architectural modifications. It is witnessed that most of the missing requirements are identified
during the beta testing by the clients (testing done at the client site before IS acceptance) or post
deployment after the acceptance. It has been noticed that majority of the IS change-requests
results from deficient functionalities in the information systems such as the lack of desired
functionalities within a system, etc. However, as mentioned above, these change order requests
will be expensive to fix as the system is already developed. In the early stages of development, it
is emphasized that the resulting system should work (in terms of execution) whereas once the
systems works, it is deemed that it should work correctly. But now it is too late to hope for a
correctly working system, if correctness has not been taken care of in all the steps of the
development lifecycle process. Studies show that defect detection in the early stages of the
application development can be thirty three times more cost effective than testing done at the end
of development [Walrad et al., 1993]. More precisely, the earlier we can measure the quality of
future software, the more we can improve it by being able to correct errors at the specifications
level and the less will be the cost of these corrections, thus improving software quality.
Therefore, it is imperative to emphasize the need of introducing quality mechanisms at the
earlier stages of development such as during analysis and design. It has now been widely agreed
that the quality of the end-system depends on the quality of the design deliverables such as
conceptual models (CM). CMs serve as the blueprints of information systems and their quality
plays a decisive role in the success of the end-system. CMs are designed as part of the analysis
phase and are the basis for further design and implementation. As CM precede the other
development activities, therefore it will be more effective to catch requirements defects as soon as
they occur [Moody et al., 2003].
Chapter 1: Introduction
3 | P a g e
As mentioned above, majority of the IS change-requests results due to deficient functionalities
in the IS. Therefore, a good analysis and design method should ensure that CMs must adhere to
some quality criteria, as they are the communicating mediator between the users and the
development team. Hence if the conceptual models are scanned for defects and the defects be
corrected then it is likely to reduce the number of change requests for the end system. Moreover,
these errors and deficiencies in the CMs will not be propagated along the development process.
Improvements in the quality of the conceptual models lead towards the improvements in the
overall quality of the delivered systems [Moody 05]. Thus a higher quality CM will yield a higher
quality IS and will affect the efficiency (time, cost, effort) and effectiveness (quality of results) of
IS development and maintenance.
For these reasons, different methodologies propose different methods and guidelines to ensure
a certain degree of quality to the produced deliverables. However there exist numerous difficulties
and problems in evaluating the quality of conceptual models. They are discussed in the next
section.
In order to illustrate the importance of implementing quality at the conceptual models, let us
consider an example in a totally different industry and domain. Architectural diagrams such as
floor plans can be regarded as CMs of the construction industry. If these architectural diagrams
contain errors that are diagnosed once the building is already constructed then the cost of
rectifying these errors will be enormous. For example, if the client wants a parking in the
underground area and showrooms on the ground floor whereas the architectural diagrams models
parking on the ground floor and showrooms on the first floor. If the building is constructed based
on the architectural models, then adding an underground parking over the constructed building
will be almost impossible. Even if it‟s possible then the cost will be enormous or perhaps its
incorporation poses severe threats to the already constructed building. However, if this design
flaw was found before the construction then the cost of incorporating these modifications would
be marginal. The same situation holds for CM in IS. Sometimes basic changes in IS require major
architectural and design modifications or can pose threats to the overall system. Analogously the
cost of incorporating post development modifications is higher than the cost of redeveloping the
entire system from scratch.
The problems addressed during this thesis are discussed in the next section.

Chapter 1: Introduction
4 | P a g e
1.2 Problem statement
The domain of software quality evaluation is more than three decades old and is well matured.
This can be witnessed by the fact that multiple quality standards have been proposed by different
autonomous bodies for information systems such as ISO/IEC-9126 for software product quality,
ISO/IEC-14598 for software product evaluation, ISO/IEC 15504 for software process assessment,
etc. ISO/IEC-9126 (2001) has widely been employed for evaluating information systems. This
standard defines a set of six characteristics (functionality, reliability, usability, efficiency,
maintainability and portability) to evaluate software quality. The biggest shortfall with these
evaluation methods is that they are applied on the already developed software. All the
characteristics described in ISO/IEC-9126 (2001) make sense if the software is already developed.
Once the software is developed, we can employ these evaluation methods or standards to identify
the errors or shortcoming and may be to classify the errors but the rectification of these errors is
expensive and difficult [Boehm 84].
In response to the above issue, ensuring the quality at the elicitation, analysis and design levels
becomes essential. Within the context of this thesis we are concerned with the quality of
conceptual models that are designed during the design phase to model the end-system based on
the requirements gathered during the requirements elicitation phase. The quality of conceptual
models can play a decisive role in the success of the end system.
The problem in evaluating conceptual models is due to the fact that they are an abstraction of
the future solution and not the solution itself. Indeed, in order to test information systems, we can
execute the program and run test cases on it to obtain the system‟s response. Whereas in order to
evaluate the model, we have to execute the test cases manually to check if the model remains
valid. Moreover, there is a population who considers conceptual modeling as a time wasting
activity. Thus demonstrating the importance of implementing quality approach for CM to this
population is out of question. Even for populations who regard conceptual modeling as an
important design activity, it gets difficult to demonstrate the importance of incorporating a quality
mechanism on CM as it is difficult to visualize the problem and solution since CM are not
physical.
Another class of problems is related to the fact that researchers treat conceptual models as
objects and thus try to measure them by defining different metrics whereas conceptual models are
imperfect, incomplete and abstract representations of the future system. Thus they are difficult to
predict and calculate. Even if we measure the quality of these CMs, then how will we define
“quality” so that different measures can be compared with each other? For example, different

Chapter 1: Introduction
5 | P a g e
researchers have evaluated the models based on their complexities then how can we compare their
results? How can we predict that the value assessed by one researcher is comparable to the value
computed by another researcher? Or which measure is better since literature lacks such
classifications?
The domain of CM quality evaluation is rather young and thus unlike the software engineering
discipline where there is a proliferation of the methods and metrics for evaluating the quality of
the product, there is significantly little literature devoted towards the quality of the conceptual
models [Cherfi et al., 2002b]. This literature includes several quality frameworks for evaluating
the quality of the conceptual models. However, there are no generally accepted guidelines for
evaluating the quality of the conceptual models and little agreement exists among the experts as to
what makes a “good” conceptual model. Moreover, despite the wide agreement among the
research community and industry leaders, to date there is neither a standard nor an agreed
framework for managing quality of the conceptual models.
[Moody 05] reviewed existing work on conceptual modeling quality and found lack of
generalizability among the frameworks and lack of collaboration between researchers and
practitioners. He identified that only a handful of quality frameworks have been empirically
validated.
The main problems targeted within the context of this thesis are listed in the following.
Disparity among existing autonomous quality frameworks
One of the major reasons behind lack of adopting quality framework(s) for CM in practice is
due to the fact that existing frameworks on CM quality are independent of other and don‟t draw
conclusions from other works. Most of the existing quality frameworks propose their vision of
CM quality and emphasize on their identified characteristics as relevant to quality. This leads to
the existence of disparate and autonomous quality frameworks proposing non-converging
solutions. Thus a designer is left with a perplexed vision of problems related to CM quality and
existing solutions to cater them.
Moreover, there doesn‟t exist any approach (or an ontology) that can help in the identification
of these existing evaluation criteria or quality frameworks. Thus it is left to analysts/designers to
identify and use the relevant criteria individually. The absence of consolidated and agreed quality
criteria for CM has de-motivated the acceptance and adoption of evaluation based strategies for
CM.

Chapter 1: Introduction
6 | P a g e
The presence of these autonomous and independent quality frameworks has resulted in the
existence of multiple definitions for the same concept and different names for semantically same
concepts. For example [Nelson et al., 2005] have identified nine different definitions for quality
attribute “completeness”. Such issues have also restricted the adoption of the existing quality
frameworks in practice [Moody 05].
Another related problem is associated to the classification of the identified quality concepts.
All existing criteria proposed by researchers have been classified by themselves into their self
identified dimensions, attributes, characteristics, properties, etc. that are not even at the same level
of abstraction as their other counterparts. Thus same criteria have been placed by different
researchers at different levels of abstraction. For example, completeness for some researchers is a
quality attribute whereas for others it is a dimension or even a metric. Moreover, the reader gets
confused by the existence of different classification vocabularies such as dimensions,
characteristics, properties, attributes, concepts, etc. and what differentiates each one of them.
Lack of validation
Most of the existing work on CM quality can be categorized into two types:
i. Frameworks having theoretical basis but no practical validation and viability and
ii. Frameworks having practical validation and viability but no theoretical basis.
Both types are not good for wide acceptability as usually the practically viable frameworks
lack substance and thus don‟t cover difficult areas whereas theoretical frameworks are difficult to
understand and implement. [Moody 05] have reported that most of the existing quality
frameworks in CM quality have never been validated. He found that approximately 18% of the
total quality frameworks have been validated.
Absence of practical validation questioned the applicability and feasibility of the quality
frameworks. Usually if validation or experimental results are demonstrated along with the
frameworks then they are considered as practically viable and readers can analyze the results to be
sure of their benefits.
Absence of capitalization of experiences
With the existence of multiple quality criteria, the process for selecting the relevant quality
criteria (including quality attributes) with respect to a particular requirement remains trickier for a
non-expert analyst/designer as it requires in-depth knowledge about each of these attributes and
what they propose. We found that there is a lack of methodologies putting together the evaluation

Chapter 1: Introduction
7 | P a g e
of CMs through a guidance process. Often the readers are left with a proposed set of evaluation
criteria that can be used for evaluation. And since these evaluation criteria are independent of
other proposed criteria thus the reader can only think of employing the proposed set of criteria in
hand. Moreover, in the domain of CM quality there doesn‟t exist any approach that capitalizes
existing knowledge and past experiences so that it can utilized by analyst/designer to identify the
best set of evaluation criteria for the problem in hand and a set of recommendations for its
improvement. Thus if someone is interested in evaluating the CMs then he/she must have in depth
knowledge about each and every available quality criterion so that the best set of evaluation
criteria can be selected for the problem.
Lack of guided process
Quality evaluation is only a step to improve the conceptual models but most of the quality
frameworks focus exclusively on defect detection (quality evaluation) and ignore the defect
correction (quality improvement) aspects. Thus they may help in identifying the problem but the
analysts must rely on themselves for the solution [Moody 05]. Similarly, the domain of CM
quality lacks a guided process helping analysts/designers to identify the relevant quality criteria
with respect to their needs and also help them in improving their models.
Lack of automation in quality evaluation
One of the major hurdles in evaluating the quality of conceptual models is the lack of tools
automating the evaluation process. Most of the existing modeling software tools such as Rational
Rose, Objecteering, etc. don‟t provide a comprehensive evaluation mechanism. Following are
some of the problems related to the absence of automation tool:
i. Rational Rose, Objecteering, etc. incorporate some basic metrics for evaluation that can
neither be added nor edited.
ii. Since they evaluate the models based on metrics thus their interpretation is difficult for a
non-expert analyst/designer due to lack of abstraction as metrics results are difficult to
interpret and require in-depth knowledge about metrics.
iii. None of the existing utility supports goal-based quality evaluations or customizable
evaluation processes.
iv. None of the softwares provide post evaluation recommendations for improvements with
an exception to UMLQuality (evaluation software) that proposes limited
recommendations in an add-on.

Chapter 1: Introduction
8 | P a g e
1.3 Objective of the Thesis
The primary objective of a conceptual model is to provide the developer with a semi-formal
vision of user requirements. However, there are various ways to model the universe of discourse.
Although these various formulations can be correct, they might not necessarily be equal in terms
of their usage. The core objective of this thesis is to develop a comprehensive quality approach for
conceptual models. But this objective can be divided into the following goals.
Federate the existing work
One of the major problems in the domain of CM quality is linked with the existence of
independent and autonomous quality frameworks not drawing conclusions from other works. This
has resulted in a non-optimal and non-converging solution. Most of the existing work is
concentrated on complexity and maintainability of conceptual models thus creating gray areas.
At this stage, it becomes essential to perform a thorough literature review to federate the
existing works so that a comprehensive quality framework can be formulated and gray areas can
be identified. This will help us in targeting the gray areas so that a more crisp and clear picture of
CM quality can be obtained.
Structure quality knowledge
One of the problems with the existing quality frameworks is that they are generally only
applicable to a particular CM type such as class diagrams, ER diagrams, etc. If we classify the
existing literature then we will find that most of the literature on quality evaluation is valid only
on class diagrams, ER diagrams or Use-cases as these frameworks were formulated with respect
to these specific model types. [Moody 05] reported that only 5% of the existing quality
frameworks are generalizable (that is they can be applied on multiple types of conceptual models)
whereas the remaining 95% are valid for a certain model type only.
In view of the above, it becomes imperative that the formulated/proposed quality approach
should encompass evaluation criteria that should be generic and remains valid for different types
of conceptual models. Moreover, this formulated quality approach should be easy to use so that
more and more designers use it while evaluating their models.
Similarly, in order to measure the formulated quality criteria, relevant and effective metrics
should be proposed or devised so that the impact can be quantified.
Propose a guided process for quality evaluation and improvement

Chapter 1: Introduction
9 | P a g e
Another problem with existing quality approaches is that they don‟t propose a guided process.
They merely identify and propose evaluation criteria and leave the analyst/designer on his/her
own for evaluation. Similarly, majority of the quality frameworks fails to provide post-evaluation
recommendations for improvement. Thus once the analyst/designer is done with evaluation,
he/she is left without any guidelines for improvement.
It is therefore required that the proposed quality approach should encompass a complete
guidance process helping analysts/designers in selecting the relevant quality criteria with respect
to their goals, evaluate the model and guide them in improving the quality of their CM based on
the evaluation results and quality goals.
Develop a software utility to automate the evaluation and improvement process
Quality evaluation in CM doesn‟t attract many users as it is difficult to evaluate the model
manually. People find it difficult to calculate the metrics by hand. This situation gets worse if the
metrics or model is complex. Similarly, identifying the relevant quality criteria with respect to a
quality goal is a time consuming activity.
CM quality evaluation can become much easier and efficient if the proposed quality approach
is supported by a software tool able to perform the following:
i. Implement a guidance system
ii. Manage a hierarchy of quality criteria such as attributes, metrics, etc.
iii. Maintain a knowledgebase of evaluation criteria
iv. Define new quality criteria
v. Calculate metrics automatically on the model
vi. Provide post-evaluation recommendations for improvement
vii. Implements a mechanism for capitalizing knowledge or past experience so that it can be
reused in future to guide non-expert analysts/designers in evaluating and improving their
models.
1.4 Overview of the Solution
Conceptual modeling is still considered as an art which is poorly supported by methods and
tools. The subject of CM quality evaluation has occupied a substantial part of the effort devoted
towards conceptual modeling. The impact of CM quality is of central concern to computer
scientists, as well as to end-users, and more generally to those who seek to evaluate software

Chapter 1: Introduction
10 | P a g e
quality. The literature provides lists of desirable properties of CM. The formalization of these
properties is not yet sufficiently well understood and there is no general agreement on the list of
desired properties and on the way they could be measured.
The domain of CM quality is rather young and is fighting with the problems mentioned in
Section-1.2. During this thesis we tried to address these problems in the following way.
Formulation of comprehensive quality criteria by federating existing quality
frameworks
In order to reply to the problems mentioned in Section-1.2 and to provide a common yet
comprehensive basis for quality evaluation, we have relied on the proposition by [Moody 05] and
considered synthesizing existing concepts proposed by researchers and adding new concepts to
formulate a comprehensive quality approach for conceptual models.
In order to formulate a consolidated set of criteria for CM quality evaluation, different quality
criteria from the previously existing quality frameworks or literature were extracted and filtered.
This aggregation activity used the philosophy behind conceptual modeling and quality as its basis
and enriched the model by extracting different concepts from the previously existing literature.
This activity involved the selection of numerous metrics and various attributes from the literature,
selecting generic quality attributes (quality attributes that are generic to every conceptual model)
and merging non-generic attributes into generic attributes that are closest with respect to
semantics.
This consolidation activity resulted in the selection/identification of a set of quality attributes
that were generic and represent different aspects of the conceptual models such as complexity,
maintainability, etc. Moreover, the advantage of this process was the elimination of redundant
concepts in addition to unification of different frameworks and identification of grey areas. This
can be regarded as an important step in our approach. This enrichment activity contributed in the
literature by providing a more comprehensive and flexible set of quality criteria for conceptual
models. We identified a set of quality attributes that incorporates a wide range of quality criteria
already existing in the literature. Moreover, this comprehensive view helped in the identification
of uncovered/gray areas of conceptual modeling quality. For example, we identified that only a
handful of researchers have addressed the notion of social quality in models. Social quality is
linked with the stakeholders agreement about the model (Social quality is discussed in Section-
2.5.2.5)

Chapter 1: Introduction
11 | P a g e
In order to cater the issues related to the existence of multiple definitions for the same concept
and different names for semantically same concepts, our solution incorporates these concepts as
attributes and their different definitions as metrics. For example, as per our approach
completeness is equivalent to a quality attribute and thus we combined all the definitions of
completeness within a single quality attribute named as “completeness” and formulated different
metrics to cater the dissimilar requirements of the existing nine definitions. Thus, completeness
will have different meaning in different contexts with respect to different metrics.
The existing work on CM quality has classified its evaluation criteria into dimensions,
characteristics, properties, attributes, metrics, etc. There is a clear distinction between metrics and
other classification categories due to the widely accepted format of metrics. However, there exists
a huge confusion among the definitions of attributes, dimensions, properties, etc. In order to
address this issue, we merged all the attributes, dimensions, properties, etc. into either attributes or
metrics. A quality attribute in our approach aggregates all the dimensions, attributes,
characteristics/sub-characteristics, criteria, properties, etc. Whereas if an existing concept is a
measurement criterion or a formula then it is classified as a metric. This simple distinction among
different concepts helped us in facilitating the comparison between different concepts by reducing
it at concepts on the same level.
Identification of quality patterns to encapsulate past-experiences and good practices
Design patterns can be regarded as a good example for storing past experiences as they
encapsulate valuable knowledge in the form of established and better solution to resolve design
problems. However, design patterns were not meant to explicitly target the quality.
We adapted the idea behind design patterns to propose a set of quality patterns targeting
quality problems in conceptual models. We identified the recurring problems in CM and proposed
the best set of quality criteria for their evaluation and improvement and encapsulated this
information in the form of quality patterns. Thus whenever someone has the same type of
problem, he/she can easily employ our proposed quality pattern to evaluate and improve his/her
models.
Propose a guided evaluation and improvement process
We proposed a quality driven process encompassing methods and techniques to evaluate and
improve the conceptual models with respect to a specific analyst/designer requirement or goal.
Our approach guides the analyst/designer during each step of the process. The analyst/designer
starts by formulating the desired quality goal. Our approach helps the analyst/designer in

Chapter 1: Introduction
12 | P a g e
identifying the relevant quality patterns or quality attributes for CM evaluation. Once the relevant
quality patterns or attributes are identified, the process evaluates the model and proposes
recommendations, based on the evaluation results, to improve the model.
The strength of our guided process lies in the fact that every analyst/designer (including
experienced and inexperienced) can employ our process to evaluate and improve the model
without any prior knowledge about any evaluation criterion or quality framework. Our process
employs a knowledgebase containing all the identified quality criteria including quality patterns,
quality attributes, metrics, etc.
Software tool automating our proposed approach
We implemented our proposed approach in a software prototype CM-Quality. CM-Quality
incorporates a complete guidance process for evaluating and improving CMs. The following
functionalities are proposed through CM-Quality:
i. It implements and stores a hierarchy of quality concepts including quality patterns, quality
attributes, metrics, recommendations, etc. in a knowledgebase. All these quality concepts
can be added/edited/deleted from the knowledgebase.
ii. It can be used to evaluate CM based on an analyst/designer specific quality goal.
iii. It helps the analyst/designer in identifying the relevant quality criteria with respect to their
formulated quality goal.
iv. It can even evaluate dynamic models.
v. It proposes post-evaluation feedback in the form of recommendations for model
improvement.
vi. It provides three different levels of abstractions i.e. quality goals, quality patterns and
quality attributes. Therefore the understandability of evaluation results is fairly simpler.
vii. Multiple models can be evaluated or compared using CM-Quality.
viii. It can be used to evaluate models designed using any existing modeler such as Rational
Rose, Objecteering, etc. as long as they are capable of exporting their models in XMI
(XML Metadata Interchange) standard.
Validation of proposed quality approach

Chapter 1: Introduction
13 | P a g e
Our approach involves practitioners‟ viewpoint as its practical foundation. The basic idea was
twofold: one to study the evaluation strategy employed in practice and second to validate our
approach. We involved experts both academics and practitioners using surveys, interviews, etc.
For example, in order to be sure that the resultant set of quality attributes (identified from the
literature or defined as new concepts) represents most of the important aspects (if not entirely) in
the evaluation of CM, an interim validation exercise was planned and performed having
professionals including practitioners as the respondents. This validation exercise tried to collect
the responders‟ views on the holistic quality of the conceptual models in addition to their
feedback over the identified/selected set of quality criteria. Their feedback was evaluated and
modifications were made to selected set of evaluation criteria.
Similarly, we also tried to extract knowledge about the practices by asking them feedback
questions such as to identify the quality aspects that are important to them in a conceptual model.
Such questions enabled us to study their practices and also to find the quality criteria that had
been used in practice but are unknown to theory. For example, a lot of our respondent listed the
aspects related to practicability of the model to be relevant to quality. They consider that if models
are not practicable due to implementation difficulties (such as unprocurable technology, scarce
resources, etc.), design difficulties or time constraints then it is not good. Thus we selected
practicability into our set of quality attributes. Practicability is different from the already existing
implementability quality attribute as implementability is related only to the efforts needed for
implementing a model meaning that model is feasible and implementable. Whereas practicability
is related to the factors that signifies that the model is not feasible and implementable.
Such large scale experiment has never been performed with academics and practitioners as
respondents. We have carefully selected the respondents for this validation experiment and the
average modeling experience among our respondents turned out to be of four years. Whereas most
of the previously reported experiments were conducted on students and thus lacked the
experience.
Another validation exercise in this regard involved an experiment to assess the efficiency of
employing our approach to improve the conceptual models. This experiment consisted of three
steps in which respondents were required to do the following:
i. Improve the quality of a model using their existing knowledge or cognition. With this
exercise, we tried to study the cognitive efforts put in by respondents and the criteria
employed by them to evaluate and improve the CM using their existing knowledge.

Chapter 1: Introduction
14 | P a g e
Moreover, this step served as an interesting source of knowledge for identifying and
enriching our proposed quality patterns.
ii. Improve the quality of a model using proposed quality pattern concept. This step helped
in validating the quality patterns‟ understandability and ease of use.
iii. Evaluate the results of quality improvement obtained by applying quality patterns on the
given CM. This step helped in validating the efficiency of using quality patterns.
1.5 Organization of the thesis
The thesis is organized in a sequential way starting with a thorough state of the art in chapter-
2. Different existing evaluation methodologies and quality frameworks are categorized and
discussed in detail to obtain an overall idea of current state of the target domain. We have also
discussed the other aspects of information systems quality and data quality.
In chapter-3, we discuss our proposed solution in detail. It starts with the formulation of a
multi-faceted quality approach for conceptual models where we outlined the theoretical, practical
and epistemological foundations of our work. It is followed by the description about our quality
model including the descriptions about each of its components such as goals (including details
about formulating structured goals), questions and quality patterns. This complete data model is
illustrated by a brief example. As our solution is based on quality pattern and it is one of our
major contributions therefore we describe the concept of quality pattern in details along with all of
its components such as quality attributes, metrics and recommendations. Lastly we include a
complete quality pattern description along with all the relevant details as an example.
In chapter-4, we discuss the quality driven development process (Q2dP). This chapter is
divided into two main parts. In the first part, we discuss the processes involved in the creation of
the quality vision such as the identification of new quality patterns, quality attributes and metrics
whereas in the second part, we describe the processes involved in applying our quality vision on
the CMs. It includes the processes to formulate analyst/designer specific quality goals (in a
structured way), mapping of these goals onto quality patterns, attributes and metrics for
evaluation. In the last section of this chapter we discuss the evaluation and improvement process
proposed by our approach.
In chapter-5, we applied our proposed solution and process on a case study to evaluate their
efficacy. We took a real world class diagram of a Human Resource (HR) system for evaluation
and improvement with respect to a quality goal. This class diagram is extracted from a model that
was used to develop the HR module for a huge Enterprise Resource Planning (ERP) software. The
Chapter 1: Introduction
15 | P a g e
original model was approximately ten times bigger than the selected one and contains several
organization specific concepts that were difficult to understand by normal readers. Therefore we
selected only those classes and concepts, for our case-study model, that are common among
different organizations and thus might be easier for readers to understand. Next we formulated a
quality goal and identified the relevant quality patterns and attributes with respect to the
formulated goal. All the metrics were calculated and recommendations were generated following
the processes described in chapter-4. In the next step, we applied all the recommendations on the
target class diagram and re-evaluated the transformed model to check if the proposed
recommendations actually improved the model or not. Lastly, the initial results were compared
with the post-implementation results and the findings were discussed.
In chapter-6, we presented our software prototype “CM-Quality” implementing our proposed
solution and process. In the first part of the chapter we describe the application architecture at
multiple levels of granularities whereas in the second part we presented different interfaces
available in CM-Quality for quality definition and quality evaluation operations. We have taken
small examples to demonstrate the flow of the application and also described the searching
process for automatic detection of relevant quality patterns with respect to a formulated quality
goal.
In chapter-7, we discuss the two validation experiments conducted for our approach. In the
first section, we describe on first experiment and the results aiming at validating the selection of
the quality attributes from a thorough literature review. In the second section, we discuss our
second experiment that was conducted to validate the efficacy of our complete approach including
quality patterns.
In chapter-8 some perspectives of the work are discussed along with the conclusions of the
thesis.
Six appendixes are given at the end. Appendix-A describes the twenty one quality attributes
that were federated through the literature review. Appendix-B describes the different quality
patterns. Appendix-C illustrates the human resource ontology used in chapter-5 to identify
different clusters for improving model complexity. Appendix-D lists the excerpts from the user
requirement document (for HR system, as mentioned above) that are used in Chapter 5 for
evaluation. Appendix-E is the evaluation report generated by our prototype and Appendix-F is the
summary of the thesis in French language.
Bibliography is given after the appendixes. A list of author‟s publications is provided in the
last part of the thesis.


Chapter 2: State of the Art
17 | P a g e
Chapter 2
State of the Art
Quality is defined differently by different researchers as quality is highly contextual and is
dependent on multiple view points (consumer, producer, etc.). Quality is not an absolute measure
but approximated on the factors considered important for an object (product, process, services,
etc.) from a particular viewpoint. Thus, the notion of quality for an object from one viewpoint
might not hold for another viewpoint. [Reeves et al. 1994] defined four views of quality:
i. Quality as an excellence i.e. quality accessed on some absolute standards.
ii. Quality as value i.e. assessment of standards of excellence with respect to the cost of
achieving it.
iii. Quality as conformance with specifications i.e. consistent and quantifiable delivery of
value in relation to specific design ideal.
iv. Quality as meeting expectations i.e. conformance with respect to customer expectations.
Quality is considered as an integral part of every object (product, process, services, etc.).
Different methodologies or factors have been identified by different societies or bodies to ensure
the quality of these objects within their domain. For example, International Organization for
Standardization (ISO) has formulated more than 500 standards for ensuring standardized
processes (production, distribution, etc.). These standards are widely adopted in every industry
and bring prestige to its implementing organization. These standards incorporate the best practices
and tend to propose the criteria to evaluate objects (product, process, services, etc.) with respect to
best practices. Thus, conformance of a process or product with respect to the best practices in ISO
standards is considered to be of good quality. Thus, inherent quality related to ISO standards
implements the “quality as an excellence” as defined by [Reeves et al. 1994].
In the field of computer science, the notion of quality is defined and evaluated for the
following objects (but not limited to):
i. Quality of Requirements Engineering (both process and product such as documents, etc.)
ii. Quality of Models (conceptual models such as class diagrams, entity-relationship
diagrams, etc.)

Chapter 2: State of the Art
18 | P a g e
iii. Quality of Computer Systems
iv. Quality of Data
v. Quality of services
As this thesis is concerned with the quality of models, therefore we will be discussing quality
of computer systems and quality of data in this chapter in addition to quality of models. We chose
to review literature on quality of computer systems as there is a group of researchers who consider
that model quality is computer systems quality as models represents computer systems. Similarly,
another group of researchers considers model quality as information quality and thus we chose to
review literature on quality of data to identify if indeed model quality is information quality.
In the next section, we review existing literature on software quality.
2.1 Software Quality
Information Systems (IS) require high cost for their maintenance activities and therefore
software quality is considered as an important issue in research laboratories and in IS firms. The
relative cost for maintaining software and managing its evolution represents more than 90% of the
total cost [Erlikh 00]. Quality problems inflate system development cost and consume scarce
resources in addition to increase error detection and correction cost [Thiagarajanet al., 1994].
Similarly, successful adoption of an information system is linked to its quality, satisfaction and
usage [Nelson et al., 2005].
Information systems evaluation has always been a hot issue. Many efforts are devoted towards
the research and development of the methods to improve the software quality. Different
researchers have proposed different perspectives and methods to evaluate IS. However,
importantly the evaluation of IS must be based on the criteria acceptable to users. For example, if
a user demands a graphical interface then he will not accept command line software (like UNIX,
DOS). [Boehm 81] considers high user satisfaction levels, portability, maintainability, robustness
and fitness of use to be the constituents of systems quality. Whereas, [Elion 93] argues that user
satisfaction levels are inappropriate measures of quality as user satisfaction is subjective and
varies from person to person and thus cannot yield stable results. Similarly, [Hamilton et al.,
1981] also argued about the evaluation of IS based on the user satisfaction level. He highlighted
the need to consider different viewpoints for evaluating an IS and thus regards the user
satisfaction to be just one view point.
Literature on software evaluation can be divided into four broad streams:

Chapter 2: State of the Art
19 | P a g e
i. General (abstract) evaluation approaches for information systems
ii. Defect detection and its rectification
iii. Identification of quality criteria (dimensions, attributes, metrics, etc.) for evaluation
iv. Evaluation of service quality
2.1.1 Evaluation Approaches for Information Systems
[Avison et al., 1993] identified that existing IS evaluation approaches can be classified into the
following:
i. Cost substitution: Comparison between the procurement cost of old systems and new
system.
ii. The value added approach: Effects of the systems on the organization‟s performance.
iii. Organizational evaluation: Impact on organization structure and user attitudes.
iv. Evaluation of the process by which systems are produced.
However, rapid development and changes in the IS industry have strongly affected the above
mentioned approaches. For example, the procurement cost of IS is much less now as compared to
previous times due to abundance of software development firms and outsourcing. [Avison et al.,
1993] has proposed different approaches to evaluation. Such as:
i. Impact Analysis: IS impact on the operations and functions of the organization.
ii. Measures of effectiveness: Economic effectiveness (cost benefit analysis), satisfaction of
system objectives, the extent of system use and the opinions of the systems and
information users.
iii. Economic Approaches: Economic benefits attained by the organizations due to IS such as
decrease in costs, etc.
iv. Objectives: Extent to which the system has satisfied its objectives.
v. User satisfaction: Individual users‟ opinions or satisfaction about the functionality of the
IS.
vi. Usage: Effective systems are frequently used by users.
vii. Standards: Achievement of the satisfactory standards as opposed to the attainment of the
objectives.

Chapter 2: State of the Art
20 | P a g e
viii. Usability: Deficiencies of the system for example, if the latter lacks functionality then
user opinion about the usefulness of the system might hurt.
2.1.2 Defect Detection and Rectification
[Ackoff 67] took a different direction and regarded existence of defects to hamper IS quality.
He can be seen as a pioneer to identify the reasons behind deficiencies in information system
rather than discussing deficiencies alone. He identified five assumptions, made by IS-Designers,
which trigger deficiencies in IS. These assumptions are:
i. The critical deficiency under which most managers operate is the lack of relevant
information (whereas current IS provide so much information that its management
becomes a difficult task for managers and the latter are left with confused minds as to
what should be appropriate for their requirements).
ii. The manager needs the information he wants (Thus implying that managers are aware of
their needs whereas in reality managers have only a fraction of idea about their needs and
thus new requirements emerge over the evolution of IS thus resulting the change order
requests).
iii. If a manager has the information he needs his decision making will improve.
iv. Better communication between managers improves organizational performance.
v. A manager does not have to understand how his/her information system works, only how
to use it. Whereas, an IS must never be installed unless the managers, for whom it is
intended, are trained to evaluate and hence control it rather than be controlled by it.
Thus, as per [Ackoff 67] if IS designers get over these assumptions, they are likely to design
information systems that have limited deficient functionalities and thus reducing the maintenance
cost and improving the quality of the information system. Carnegie Mellon report [Florac 92]
contrasts the above findings and classified the software defects to be either of the following type:
i. Requirements Defect: Errors made in the definition or specification of the customer‟s
requirements. This includes defects found in functional specifications such as interface,
design, and test requirements; and specified standards.
ii. Design Defect: It includes all the defects made in the design of a software product such as
defects found in functional descriptions (interfaces, control logic, data structures, error
checking etc)

Chapter 2: State of the Art
21 | P a g e
iii. Code defect: A mistake made in the implementation or coding of a program. It includes
all the defects found in program logic, interface handling, data definitions, computation,
and coding standards.
iv. Document defect: These include defects made to software product publication but doesn‟t
include mistakes made to requirements, design, or coding documents.
v. Test case defect: A mistake in the test case that causes the software product to give
unexpected results.
vi. Other work product defect: These defects include the errors found in software artifacts
that are used to support the development or maintenance activities of a software product
such as defects in test tools, compilers, configuration libraries, computer-aided software
engineering tools, etc.
[Lausen et al., 2001] chose a narrower definition and proposed that IS defects can be divided
into either implementation defects or requirements defects. They have empirically shown the
impact of these defects on the system development and have also identified some prevention
techniques.
2.1.3 Identification of Quality Criteria (Dimensions, Attributes, Metrics, etc.) for
Evaluation
Another stream of literature targets the identification of quality criteria to evaluate the quality
of information systems. For example, [Stylianou et al., 2000] have identified six dimensions of
information system quality:
i. Infrastructure Quality: The quality of the infrastructure both hardware and software
(operating system and other utilities required by the built software).
ii. Software Quality: The quality of the developed/maintained/supported application or
software by IS.
iii. Data Quality: The overall quality of the data entering to the information systems through
all sources.
iv. Information Quality: The quality of the output or reports originating from the information
systems.
v. Administrative Quality: The quality of the management of the IS functions such as
budgeting, planning, and scheduling.

Chapter 2: State of the Art
22 | P a g e
vi. Service Quality: The quality of the service component of the IS such as customer support
processes, help desk, etc.
Whereas, [Thiagarajanet al., 1994] divides the system quality into two dimensions: product
quality (system quality and information quality) and process quality (productivity and
development cycle time). [Nelson et al., 2005] proposed and empirically validated five
dimensions of systems quality: Accessibility i.e. the ease with which information can be accessed
from the system, Reliability or uptime, response time, flexibility i.e. the degree to which a system
can adapt to variety of user needs, and integration i.e. provision of information from different
sources. Similarly, [Chang et al., 2000] has assessed the performance of an information system
along three dimensions: System performance, information effectiveness and service performance
and three perspectives: IS effectiveness/Success, IS function evaluation and IS service quality.
[Iivari et al., 1987] identified three constructs, informativeness, accessibility and adaptability
to be the measure of systems quality. Informativeness can be measured by employing relevance,
comprehensiveness, recentness, accuracy and credibility whereas accessibility can be measured
by convenience, timeliness and interpretability.
[Florac 92] proposed a structure for deriving and describing measurable attributes for software
problems and defects to quantify software quality. This report proposed a Problem Count
Definition Checklist and numerous supporting forms to organize software problem and defect
measurements. The report lists the following five activities that should be checked for possible
defects to improve the quality: Product synthesis, Inspections, formal review, testing (Modules,
Components, Products, Systems, User publications, and Installation procedures) and customer
service. [Garcia et al. 2006] propose a software measurement ontology and provides a framework
that integrates the modeling and measurement of software processes. They also propose a model
driven software utility that can be used to evaluate different aspects of conceptual models.
[Stylianou et al., 2000] have identified multiple attributes to evaluate quality for two IS
processes. Such as for System Development, he regards cost, time, bugs, ease of use, user
satisfaction and ease of fixing problems to be related to quality. Similarly, for system maintenance
he proposes problem resolution time, service quality, cycle time and responsiveness to changes.
Likewise, [Hamilton et al., 1981] regards compliance to design, completeness of controls, data
currency, response time, and turnaround time as the criteria important for the quality of a system.
Whereas, [Thiagarajanet al., 1994] emphasizes the impact of reusability on the quality of systems
as reusable components carry maturity and have been tested over the time.

Chapter 2: State of the Art
23 | P a g e
There exist several articles discussing the use of different quantitative measures such as
metrics to quantify the impact of quality attributes. Such as, [Purao et al., 2003] performed a
thorough review about different types of metrics that can be used to evaluate object oriented
systems. They presented a survey about existing metrics for object oriented systems. For example,
they analyzed the metrics for the coverage of entities, attributes and development states (or
stages). They classified these metrics in multiple ways such as each metric belongs to either direct
metric type (i.e. metrics that are simple and doesn‟t require any interpretations such as number of
classes) or indirect metric type (i.e. metrics requiring interpretations). Moreover, they also
provided the evolution of different metrics over the time.
2.1.4 Evaluation of service quality
Another stream exists for evaluating the service quality of information systems. [Parasuraman
et al., 1988] can be regarded as the most influential article for evaluating the service quality. They
proposed a 22-item instrument (SERVQUAL) to access customer perception of service quality in
service and retail organizations. However, SERVQUAL has received equal appreciation and
adoption into the information system domain. Several researchers have used SERVQUAL to
measure IS service quality such as [Jiang et al., 2002]. SERVQUAL classifies the 22-items
instruments into five dimensions:
i. Tangible i.e. physical facilities, equipment and appearance of personnel
ii. Reliability i.e. the ability to perform promised service dependably and accurately
iii. Responsiveness i.e. willingness to help customers and provide prompt services
iv. Assurance i.e. knowledge and courtesy of employees and their ability to inspire trust and
confidence
v. Empathy i.e. providing caring and individualized attention to customers
Different researchers have applied SERVQUAL model on the information systems domain.
For example, [Jiang et al., 2002] has used SERVQUAL items to examine its validity in IS
professional population. Their empirical results shows that SERVQUAL can be usefully applied
on IS service evaluation systems. Contrary, several researchers have criticized the adoption of
SERVQUAL model in information systems. [Van-Dyke et al., 1997] provides a review of
different problems and issues regarding SERVQUAL that are highlighted by different IS
researchers.

Chapter 2: State of the Art
24 | P a g e
Similarly, a lot of research has been done in devising methods and approaches to evaluate the
software quality automatically. For example, [Akoka et al., 1996] proposed an expert system for
evaluating the information systems in a semi-automatic way. Their system combines qualitative
and quantitative techniques to propose domain specific evaluation of information systems.
After going through the literature one can be ascertain about the abundance of different
approaches to evaluate the information systems. However, it is evident that none approach will be
sufficient to evaluate the system. Therefore, it will be important to formulate a comprehensive and
multi-perspective evaluation approach for implementing the notion of quality on information
systems. Here it will be important to re-emphasize the [Hamilton et al., 1981] argument about the
importance of different viewpoints. That is if the system is evaluated only on one viewpoint then
this clearly shows that all the other viewpoints are either neglected or are not being discovered.
2.1.5 Standards
Different standards have been proposed by different autonomous bodies for information
systems such as ISO/IEC-9126 for software product quality, ISO/IEC-14598 for software product
evaluation, ISO/IEC 15504 for software process assessment, etc. Similarly, standards such as ISO
9001 and ISO 9000-3 can be applied on software quality systems for certifying processes,
products and services within a software development organization according to the ISO 9000
model [Wang 02]. However, ISO/IEC-9126 (2001) has widely been employed for evaluating
information systems within the IS community.
2.1.5.1 ISO/IEC-9126
ISO/IEC-9126 is an international standard formulated by ISO for evaluating software product
quality. Its first version was proposed in 1991 and defined software quality through six quality
characteristics and proposed software product evaluation process model. Current version of
ISO/IEC-9126(2001) is a revision of ISO/IEC 9126 (1991), and retains the same software quality
characteristics. The major differences, as mentioned in [ISO9126, 2001], are:
i. The specification of a quality model;
ii. The introduction of quality in use;
iii. The Removal of evaluation process (which is now specified in the ISO/IEC 14598
standards);
iv. The Co-ordination of the content with ISO/IEC 14598-1.

Chapter 2: State of the Art
25 | P a g e
ISO/IEC 9126: Software Engineering – Product Quality (Year 2001) has been divided into
four parts:
i. Quality Model: This is the first, the most influential and widely renowned part of ISO
9126 standard. This document contains the set of characteristics and the relationships
between them which provide the basis for specifying quality requirements and evaluating
quality [ISO9126, 2001], [ISO25030, 2007].
ii. External Metrics: This document contains all the metrics that are used to measure
attributes or characteristics of a software product. These metrics can only be applied on
the executable software i.e. in later stages of development.
iii. Internal Metrics: This document contains all the metrics that are derived from the product
itself. These metrics are applicable to non-executable software products i.e. during
designing and coding [Zeiss et al., 2007].
iv. Quality in use Metrics: This document contains the metrics that can be employed only if
the software product is used in real conditions.
[Suryn et al., 2003] summarized the ISO/IEC-9126 quality model with respect to product life
cycle. Relationships among each of the four parts, mentioned above, can be understood easily
from Figure - 1.
Figure - 1. ISO/IEC 9126-Model of quality. Source: [Suryn et al., 2003]
ISO/IEC-9126 classified software quality into six characteristics and multiple sub-
characteristics. Each of the sub-characteristics can be further divided into attributes that can be
quantified employing multiple metrics. However, the ISO standard doesn‟t include any
information about the attributes and metrics as the standard is generic for all type of software

Chapter 2: State of the Art
26 | P a g e
products whereas, these two criteria tend to be software product specific as mentioned in the
standard. The six characteristics include the following:
i. Functionality: This characteristic includes the set of attributes that verifies the existence
of required or specified functions or functionalities within the software product.
ii. Reliability: Set of attributes that are used to test the performance of the software product
under stated conditions verifying its reliability.
iii. Usability: This characteristic is related to evaluating the software with respect to the easy
with which it can be learned and used.
iv. Efficiency: This includes the attributes to evaluate the level of performance with respect
to the usage of resources under stated conditions.
v. Maintainability: It includes the attributes to evaluate the efforts needed to modify the
software product.
vi. Portability: This characteristic includes the attributes to evaluate the software product for
its transferability among multiple environments.
Figure - 2. Proposed characterstics in ISO-9126. Source: [ISO9126]

Chapter 2: State of the Art
27 | P a g e
Figure - 2 briefly explains each of the above listed characteristics using simple questions.
Whereas, Figure - 3 lists the proposed characteristics and sub-characteristics available in
ISO/IEC-9126.
ISO-9126
Functionality
Usability
Reliability
Maintainability
Efficiency
Portability
Suitability
Accurateness
Interoperability
Compliance
Security
Understandab
ility
Maturity
Recoverability
Learnability
Fault tolerance
Operability
Changeability
Time
behaviour
Analyzability
Stability
Resource
behavior
Testability
Installability
Adaptability
Conformance
Replaceability
Figure - 3 Characteristics and sub-characteristics proposed in ISO-9126.
[Andreas et al., 2007] applied and extended the ISO/IEC-9126 standard to evaluate the quality
of software components. The Table - 1 shows their proposed quality model. The authors have
identified multiple attributes against each sub-characteristic of the model. Similarly, they have
formulated numerous metrics to quantify attributes. Their suggestions and experimental
modifications to ISO/IEC-9126 improve the understandability of the ISO quality model. They
have proposed this new quality model for software components only. However with some efforts,
this model can be generalized for quality of software in general. This model can serve as a good
example to apply and extend the standard to other types of software products.

Chapter 2: State of the Art
28 | P a g e
Table - 1. Proposed quality model for software components. Source: [Andreas et a l., 2007]
Characteristics Sub-characteristics Attributes
Functionality
Interoperability
Platform Independence OS Independence Hardware Compatibility Data open-format compatibility
Completeness User satisfaction Service Satisfaction Achievability
Security
Access Control Resistance to privilege Auditing Data Encryption
Reliability Service Stability
Error Prone Error Handling Recoverability Availability
Result Set Correctness Transactional
Usability
Learnability Time to use Time to configure Time to administer
Help tools
Help completeness User Manual Installation and Administration Documentation Support Tools
Operability Operation effort Customizability effort Administration effort
Identifiability-Reachability
Directory Listing Search & Retrieve Categorization Explainability
Efficiency
Response Time Throughput Capacity Parallelism
System Overhead Memory Utilization Processor Utilization Disk Utilization
Maintainability
Changeability Upgradeability Debugging Backward compatibility
Testability Trial version Test Materials
Customizability Parameterization Adaptability Priority

Chapter 2: State of the Art
29 | P a g e
Similarly, there have criticisms to ISO/IEC-9126 standard as well. For example, [Cherfi et al.
2007] regarded it as a poor standard for effective quality assessment. They argue that the quality
characteristics defined by the standard have different meanings for every life-cycle phase. Thus
they should use different metrics for every characteristic at each lifecycle stage for evaluating the
quality. [Kilidar et al., 2005] performed some experiment and found ISO/IEC-9126 ambiguous in
meaning, incomplete with respect to quality characteristics and overlapping with respect to
measured properties. They considered the standard unsuitable for measuring design quality of
software products.
Another important stream of literature in the field of computer science, on the notion of
quality, involves the literature on data quality. The researchers in data quality domain regards the
above mentioned quality evaluation approaches to be very general for their domain. They
formulated their domain specific quality frameworks for evaluating data quality. In the next
section, we discuss some of the existing quality evaluation frameworks for data quality. We also
discuss the [ISO25012, 2008] standard as it defines a general quality model for data retained in a
structured format within a computer system.
2.2 Data Quality
Data quality can best be defined as “fitness for use” implying that the concept of data quality is
relative. Thus, data with quality appropriate for one usage might not possess sufficient quality for
another usage .Therefore, data quality should be evaluated along multiple dimensions and go
beyond the famous quality measure of “data accuracy” [Tayi et al., 1998]. Bad data quality leads
to issues such as relevancy, granularity, accuracy, consistency, currency, completeness, privacy
and security [Redman98]. He identified numerous impacts inherent to bad data quality and
classified them into three types: Operational Impacts such as reduced customer satisfaction,
increased cost, lowered employee satisfaction, etc.; Typical Impacts such as poor decision
making, more difficult to reengineer, increased organizational mistrust etc; and Strategic impacts
such as difficulty to set and execute strategy, issues of data ownerships, etc.
[Wang et al., 1996] categorized data quality into four categories and identified quality
dimensions for each one of them. [Wang 98] employed the same categories and dimensions for
information quality:
i. Accuracy of data: Dimensions include Accuracy, Objectivity, Believability and
Reputation

Chapter 2: State of the Art
30 | P a g e
ii. Accessibility of data: Dimensions include Access and Security
iii. Relevance of data: Dimensions include Relevancy, Value-Added, Timeliness,
Completeness and Amount of data
iv. Representation of data: Dimensions include Interpretability, Ease of understanding,
Concise representation and Consistent representation
[Nelson et al., 2005] proposed four dimensions of information quality: Accuracy of
information, Completeness of information, Currency of information and Format or presentation of
information. [Pipino et al., 2002] took a broader picture and proposed an approach employing 16
data quality dimensions: Accessibility, appropriate amount of data, believability, completeness,
concise representation, consistent representation, ease of manipulation, free-of-error,
interpretability, objectivity, relevancy, reputation, security, timeliness, understandability and
value-added.
Another stream of literature proposes different quality attributes and metrics for evaluating
data quality. For example, [Bouzeghoub et al., 2004], [Peralta et al., 2004], [Peralta 06b] regards
data freshness to be the most important attribute of data quality for data consumers. They
classified data freshness into two factors and used multiple metrics to measure them. Their factors
include currency and timeliness. They have employed metrics such as currency, obsolescence and
freshness rate to measure the currency factor and timeliness metric to measure timeliness quality
factor. Similarly, [Peralta 06a] used surveys and empirical studies to prove that data freshness is
linked to information system success. They regard data freshness and data accuracy (correctness,
reliability and error-freeness of the data) to be the two main dimensions of data quality and
provide a review of both quality criteria from multiple perspectives and identified multiple
metrics for their quantification.
[Peralta 06a] and [Peralta 06b] employed semantic correctness, syntactic correctness and
precision factors to evaluate data accuracy. Each of these three factors utilizes multiple quality
metrics such as semantic correctness ratio, syntactic correctness ratio, granularity, etc. to calculate
data accuracy. [Cherfi et al., 2002a] found attributes such as accuracy, timeliness, precision,
reliability, currency, completeness, accessibility and relevancy to be extensively studied for data
quality evaluation. [Wang 98] presented a Total Data Quality Management methodology, and
illustrated how it can be applied in practice. They developed concepts, principles, and procedures
for defining, measuring, analyzing, and improving information products. Their methodology is
based on the notion that organizations must treat information as a product that moves through an
information manufacturing system, much like a physical product. Similarly, [Mecella et al., 2002]

Chapter 2: State of the Art
31 | P a g e
proposed a framework to support data quality management in cooperative information systems.
This framework includes the design of an infrastructure service for brokering and improving data
quality. They used factors such as accuracy, completeness, currency and internal consistency to
evaluate data quality.
[Bouzeghoub et al., 2004], [Peralta 06] analyzed different definitions and metrics of data
freshness that evolved over time in addition to factors that influences it. This taxonomy is based
on the nature of data, type of application and synchronization policies underlying the multisource
information system. [Peralta et al., 2004] employed their proposed framework to evaluate data
quality in data integration systems to evaluate data freshness in different scenarios. [Pipino et al.,
2002] presents a subjective and objective assessment of data quality. They employed simple ratio,
min-max operators and weighted average to develop multiple metrics to evaluate data quality.
They also demonstrated how their approach can be applied in practice.
2.2.1 Standards
[ISO25012, 2008] is a first version of a new standard and defines a general quality model for
data retained in a structured format within a computer system. It can be used to establish data
quality requirements, define data quality measures, or plan and perform data quality evaluations.
ISO/IEC-25012 considers two view points (inherent and system dependent) and classifies quality
attributes into fifteen characteristics.
[Moraga et al., 2009] extended the ISO/IEC-25012 and proposed a quality model, SPDQM
(SQuaRE-Aligned Portal Data Quality Model), for web portal data. Their model includes 42
quality characteristics classified under the two proposed viewpoints of ISO/IEC-25012 and four
categories of PDQM (Portal Data Quality Model) i.e. “Intrinsic”, “Operational”, “Contextual” and
“Representational”. Proposed SPDQM is illustrated in Table - 2.

Chapter 2: State of the Art
32 | P a g e
Table - 2. SPDQM for web portal data. Source: [Moraga et al., 2009]
Point of view Category Characteristic Sub-Characteristic
Inherent
Intrinsic: This denotes that data have quality in their own right
Accuracy
Credibility Objectivity Reputation
Traceability Correctness Expiration Completeness Consistency Accessibility Compliance Confidentiality Efficiency Precision Understandability Availability
Operational: This emphasizes the importance of the role of systems that is, the system must be accessible but secure
Accessibility Interactive Ease of operation Customer Support
Verifiability Confidentiality Portability Recoverability
Validity Reliability Scope Applicability
System Dependent
Contextual: This highlights the requirement which states that data quality must be considered within the context of the task in hand
Value-added: Flexibility
Relevancy Novelty Timeliness
Specialization Usefulness Traceability Compliance Precision
Representational: This denotes that the system must present data in such a way that they are interpretable, easy to understand, and concisely and consistently represented
Concise Representation
Consistent Representation
Understandability
Interpretability Amount of data Documentation Organization
Attractiveness Readability Efficiency Effectiveness

Chapter 2: State of the Art
33 | P a g e
2.3 Conceptual Model Quality
Systems quality was initially thought to have achieved by improving the programming quality
and productivity. Later it was revealed that these two dimensions have very marginal impact on
systems quality [Akoka et al., 2007] proposed as compared to design quality that accounts to 72%
errors in systems development activity [Thiagarajanet al., 1994]. [Avison et al., 1993] argued that
the evaluation of information systems should be done at every stage of the lifecycle to improve its
quality. He has also emphasized the need of evaluation at a broad range of factors including those
of social and organizational. Similarly, [Akoka et al., 2007] proposed interesting notion of
interdependencies between model quality and data quality. They formulated a quality meta-model
encompassing both data quality and model quality. They propose a three level evaluation model
for quality consisting of dimensions, factors and metrics for quantif ication. [Bansiya et al., 1999]
argued that most of the existing available metrics can only be applied on the completed systems
and there is a huge need for designing quality metrics that can be used early in the stages of
requirements and design to improve the quality.
[Booch 91] have outlined four steps involved in Object-Oriented (OO) Design process:
i. Identification of different objects or classes
ii. Identification of the semantics of those objects or classes
iii. Identification of relationships among those objects or classes
iv. Implementation of those objects or classes
Thus, it can be hypothesized that if all of the four steps of OO design process are carried out
with care and caution and hold a certain degree of quality then perhaps the resulting system be of
good quality.
2.3.1 Conceptual Models (CM)
Conceptual Models (CM) are the abstraction of the universe of discourse under consideration
[Cherfi et al., 2002b]. They are designed as part of the analysis phase and serve as a
communicating mediator between the users and the development team. They provide abstract
descriptions and hide the implementation details. CM are widely used in organizations to design
information systems. [Davies et al., 2006] studied the conceptual modeling in different
organizations. They identified different modeling techniques employed by them and measured the
practitioners‟ interest in conceptual modeling.

Chapter 2: State of the Art
34 | P a g e
Within the context of this thesis we will be using the term conceptual models to denote the
following:
i. Unified modeling language (UML) Diagrams such as class diagram, use case diagram,
etc.
ii. Entity Relationship Diagrams (ER).
2.3.1.1 Unified Modeling Language (UML)
Unified modeling language (UML) was proposed by Booch, Rumbaugh and Jacobson [RSC
1997] and has become a standard in the IS industry for object oriented analysis and design models
[Marchesi 98]. UML 2.0 proposes 14 types of diagrams to design a system. These diagrams can
be classified into three categories:
i. Structure Diagrams: they include class diagram, component diagram, composite structure
diagram, deployment diagram, object diagram, package diagram and profile diagram.
ii. Behavior Diagrams: they include use case diagram, activity diagram and state machine
diagram.
iii. Interaction Diagrams: they include sequence diagram, communication diagram,
interaction overview diagram, and timing diagrams.
However, UML diagrams have received some criticism on the basis of their inherent
complexity. [Siau et al., 2001] employed complexity metrics to evaluate the complexity of UML
diagrams with respect to other object oriented methods. Their investigation concluded that the
UML diagrams are approximately between 2 and 11 times more complex than other object
oriented diagrams.
2.3.1.2 Entity Relationship Diagrams (ER)
Entity-Relationship (ER) diagrams were originally proposed by Peter Chen [Chen 76] to
model data. ER-diagrams are widely used by researchers as well as practitioners to formulate a
conceptual model or semantic data model of a system. They consist of entities and associations
among entities.
Different researchers have proposed evaluation models to evaluate and improve ER-diagrams.
For example, [Batini et al., 1992] can be considered as pioneers for introducing the first structured
approach for conceptual schema evaluation mainly for databases. They have ident ified
completeness, correctness, minimality, expressiveness, readability, self explanation, extensibility
and normality as the criteria to evaluate the schemas. However, their approach doesn‟t include

Chapter 2: State of the Art
35 | P a g e
any metrics for precise quantification of these criteria whereas their approach encompasses some
transformations for improving the conceptual schemas. [Moody 98] extended the work of [Batini
et al., 1992] by identifying a set of 25 metrics to quantify eight quality factors for entity
relationship models. He categorized each of the eight quality factors into four types of actors:
business users (understandability, flexibility, integrity, and completeness), data analysts
(correctness, simplicity), data administrators (integration) and application developers
(implementability). However, these metrics have never been implemented in any tool nor
validated by some research.
Similarly, [Assenova et al., 1996] identified a set of seven quality criteria for evaluation in
addition to providing a set of transformations for improving the quality of conceptual schemas.
Their evaluation criteria include homogeneity, explicitness, size, rule simplicity, rule-uniformity,
query-simplicity and stability. In [Cherfi et al., 2003b], the authors have proposed quality criteria
for multidimensional database models. They defined six metrics to quantify analyzability and
complexity in these models. Their main objective was to propose quality criteria to increase the
analyzability and reduce the complexity of these multidimensional database models. [Genero et
al., 2005] concentrated on ER-Diagram complexity and proposed a set of automatable metrics for
its evaluation. [Garcia et al., 2007] proposed a meta-model driven measurement process and uses
relational models as an example to evaluate the quality. They used measures such as number of
tables, number of attributes, tables maintenance index, depth of relational tree, number of foreign
keys, schema connectivity index, etc. to evaluate the quality of relational models. However, they
claim that their approach and method can be used for other type of conceptual models as it is
generic and based on UML‟s MOF (Meta Object Facility) standard. In [Cherfi et al. 2007], the
authors conducted an experiment with a sample of 120 participants and have identified a strong
relationship between measured quality and perceived quality. They have used quality metrics such
as clarity, minimality, expressiveness and simplicity to quantify the measured quality of the
models. They provided 8 models to the participants and ask them to rank those 8 ER models on
the same quality criteria used for measurement purpose.
2.3.2 Conceptual Modeling Quality
Although a CM may be consistent with the universe of discourse, it might not necessarily be
correct. Since CM are designed before the actual implementation of the system, therefore errors in
them are propagated throughout the development cycle and thus heavily impact the development
and quality of an information system [Lausen et al., 2001]. This suggests that there is a strong
urge for a quality-oriented approach that can help in ensuring the consistency and correctness of

Chapter 2: State of the Art
36 | P a g e
the conceptual models. Research in software quality is rather mature and produced several
standards such as ISO 9126 and ISO 25030:2007 whereas, in the domain of CM, research on
quality evaluation is rather young. The first structured approach dates back to the contribution of
[Batini et al., 1992]. They were the pioneers in proposing quality criteria relevant to CM
evaluation. In [Lindland et al., 1994], the quality of models is evaluated along the three
dimensions: syntax, semantics and pragmatics. [Kaiya et al., 2004] compared different use
diagrams to deal with non functional requirements and [Yu et al., 2004] proposed a method and
tool to refactor use case models.
Another approach on the evaluation of CM quality puts light on the importance of aesthetics.
For example, [Eichelberger 02], [Purchase et al., 2002], [Purchase et al., 2001b], [Purchase et al.,
2000] have insisted on the importance of aesthetics within a model. [Cherfi et al. 2007] and
[Cherfi et al., 2002a] have also employed some aspects of aesthetics such as clarity, legibility to
evaluate the understandability of their models. [Purchase et al., 2002], [Purchase et al., 2001b],
[Purchase et al., 2000] have identified criteria such as minimization of bends, minimization of
edge crossing, orthogonality, etc. to improve the aesthetics of UML diagrams or ER diagrams.
Their approach evaluates the aesthetics and provides algorithms or transformations to improve it.
[Eichelberger 02] also provides an implementation of their approach by proposing a utility that
helps in the evaluation of these aesthetics criteria automatically. However, they haven‟t formally
defined any metrics for the evaluation purpose [Cherfi et al. 2007] and [Cherfi et al., 2002a]
provided clear definitions of metrics to evaluate some aspects of model aesthetics.
Similarly, another research stream consists of proposing automatable approach or utility driven
evaluation approach to ease the evaluation process by an automatic computation of metrics. For
example, [Ali et al., 2007a], [Ali et al., 2007b], proposed software driven automated
methodologies to evaluate different aspects of UML class diagrams such as structure, correctness
and syntax. Their work was inspired from the automated tool presented in [Forsythe et al., 1965]
to evaluate the different diagrams designed by students. Similarly, they have also taken ideas from
[Shukur et al., 2004] who have proposed computer-aided marking systems for engineering
drawings. However, the major shortfall in [Ali et al., 2007a] and [Ali et al., 2007b] approach is
due to the fact that they evaluate the models with respect to one model designed by an expert.
Thus, their approach or utility can only be applied on class diagrams that have a version designed
by an expert. Similarly, the criteria they have used for evaluation is not exhaustive for example,
they compare number of attributes in a class designed by an expert to the class designed by non-
experts to evaluate the completeness of a model. Thus, their approach could yield wrong results if
non-experts have captured the missing information in some other class.

Chapter 2: State of the Art
37 | P a g e
Another big problem in the area of CM quality is due to the presence of autonomous quality
models. Most of the research done in this area is independent and doesn‟t draw their thesis from
other work or doesn‟t extend what has already been done in the field. This has led to two issues:
i. Most of the work done in CM quality evaluation is concentrated on model complexity and
its maintenance.
ii. There exist multiple definitions of the same concept and different names for semantically
same concepts. For example, [Nelson et al., 2005] identified different definitions of the
same quality concepts e.g. there exist nine different definitions for quality attribute
“completeness”. Similarly, there exist numerous definitions for the same quality concept
and identical names for some semantically different metrics [Purao et al., 2003]. Such
issues have restricted the adoption of the existing quality frameworks in practice [Moody
05].
The existing work on CM quality classified the evaluation criteria into dimensions, attributes
or metrics. Therefore, we will be discussing CM quality criteria for each of these types to have a
broader and crisper picture.
2.3.2.1 Quality Dimensions
Different researchers have classified CM quality into different dimensions based on their
viewpoint. For example, in [Lindland et al., 1994] the quality of CM is evaluated along three
dimensions: syntax, semantics and pragmatics. [Cherfi et al., 2002a] proposed a three dimensional
(specification, usage and Implementation) quality framework for conceptual models. They have
regarded model quality through users‟ point of view and demonstrated that conceptual models
should be supported by facilities for accessing, developing, analyzing, changing and maintaining
concepts used in their construction. [Bajaj 02] zoomed within the different dimensions and
defined readability in CM along three dimensions: Effectiveness, efficiency and learnability.
2.3.2.2 Quality Attributes
Most of the evaluation approaches in CM classify their quality criteria into multiple quality
attributes that can be quantified employing multiple numeric metrics. For example, [Cherfi et al.,
2002a] [Cherfi et al., 2002b] divided their three dimensional quality framework into the following
quality attributes:
i. Legibility (the ease with which a conceptual schema can be read)

Chapter 2: State of the Art
38 | P a g e
ii. Expressiveness (representation of requirements in a natural way so that it can be easily
understood without additional explanation)
iii. Simplicity (A schema is said to be simple if it contains the minimum possible constructs)
iv. Correctness
v. Completeness (degree of coverage of user requirements within the model)
vi. Understandability (ease with which the data model can be interpreted by the user)
vii. Implementability (amount of effort needed to implement the model)
viii. Maintainability (the ease with which a model can evolve)
Similarly, we performed a thorough literature review and identified multiple quality attributes
for CM quality evaluation. These attributes include: structural complexity, modularity,
modifiability, understandability, readability, etc. Quality attributes are not independent from one
another and thus they can affect other quality attributes. For example in [Cherfi et al., 2008], the
authors mentioned that expressiveness quality attribute can affect simplicity quality attributes as
increasing the expressiveness of the model will lead to the inclusion of numerous model elements
for explicit knowledge addition. Thus the model will contain more elements which can increase
complexity that in turn will influence the understandability and maintainability as shown by
[Genero et al., 2002a], [Genero et al., 2001b], [Genero et al., 2001c], [Genero et al., 2000b],
[Manso et al., 2003].
2.3.2.3 Quality Metrics
Most of the research done in the field of CM quality evaluation was devoted to the definition
of numeric metrics for quantifying different characteristics of model. A metric is a specific
instrument that can be used to measure a given quality factor. There might be several metrics for
the same quality factor [Bouzeghoub et al., 2004]. The aims of metrics are essentially to provide
hints about the quality such as to estimate development and maintenance cost [Marchesi 98].
Some of these metrics can be calculated automatically whereas some can‟t because the definition
of these metrics (non automatable metrics) is not based on the structural characteristics of the
model or those semantic characteristic that are easy to calculate. In the literature, there exist
numerous metrics to evaluate UML class diagram, use-case diagrams and ER-diagrams. For
example, [Chidamber et al., 1994] have developed and empirically tested a set of six metrics to
measure the three non-implementation deliverables (Identification of different objects/classes,
Identification of the semantics of those objects/classes, Identification of relationships among those

Chapter 2: State of the Art
39 | P a g e
objects/classes) identified by [Booch 91]. These metrics include: weighted methods per class,
depth inheritance tree, number of children, coupling between objects, responses for a class and
lack of cohesion in methods. The development of these metrics received huge appreciation from
the researchers and triggered a stream of research on using these metrics to evaluate complexity at
different levels and models of design. Similarly, several empirical studies were carried out to
evaluate the efficacy of these metrics. However, these metrics received some critiques as well.
For example, [Churcher et al., 1995] argued about the level of abstractness these metrics carry and
failure to provide implementation details, such as which components should be included in the
calculation of these metrics. They take an example of number of methods metrics and argued that
the metric doesn‟t provide details about what should be included in its calculation and thus can
lead to multiple interpretations of the same model.
[Cherfi et al., 2002a] and [Cherfi et al., 2002b] have proposed following quality metrics for
quantifying their quality attributes:
i. Clarity: computed as a ratio between number of line crossings to the total links in the
schema
ii. Minimality: calculated as the ratio of non-redundant concepts to the total concepts
iii. Concept expressiveness: ratio between the expressive concepts (e.g. Inheritance link as it
is more expressive than association) and all the concepts present in the model
iv. Schemas expressiveness: compares model expressiveness with respect to other models
representing the same reality
v. Syntactic Correctness: A Schema is syntactically correct if the concepts are properly
defined in the schema
vi. Semantic Correctness: A Schema is semantically correct if the concepts are used
according to their definition (grammar).
[Siau et al., 2001] employed complexity metrics to evaluate the complexity of UML diagrams
with respect to other object oriented methods. They proposed quantitative measures to compute
UML complexity. [Cherfi et al., 2006] proposed a set of metrics to measure entropy and lack of
cohesion in use cases. These metrics are use case specific and cannot be generalized to other
models within the UML. Moreover, they also propose a set of rules that can be used by model
designers to decrease complexity in use cases. Similarly, [Cherfi et al., 2003a] proposed a
documentation degree metric to evaluate the understandability of models.
Chapter 2: State of the Art
40 | P a g e
In the next sub-sections, we have classified some of the existing metrics into automatable
metrics or non-automatable metrics. Automatable metrics are usually based on structural
characteristics, or some semantic characteristics that are easy to automate, and thus can be
measured using some software utility. Non-automatable metrics represents all the metrics that
require manual input for computation and thus can‟t be computed using a software utility.
2.3.2.3.1 Automatable Metrics
[Ojha et al., 1994] proposed some really good metrics to evaluate different aspects of code
complexity such as number of classes, number of attributes, etc. Most of these metrics are
transferred to CM quality domain and have been used by multiple researchers for automatic
evaluation of CM. For example, In [Genero et al., 2004], [Genero et al., 2003], [Genero et al.,
2002a], [Genero et al. 2002b], [Genero et al., 2001a], [Genero et al., 2001b], [Genero et al.,
2001c], [Genero et al., 2000a], [Genero et al., 2000b], [Manso et al., 2003] the authors have used
two sets of automatable metrics (which they referred to as size and structural complexity metrics)
to evaluate different quality attributes in UML Class diagram. These sets of metrics are:
i. Size Metrics such as: Number of Classes(NC), Number of Attributes(NA), Number of
Methods(NM)
ii. Structural Complexity Metrics such as: Number of Associations (NAssoc), Number of
Aggregations (NAgg), Number of Aggregation Hierarchies (NAggH), Number of
Generalizations(NGen), Number of Generalizations Hierarchies(NGenH), Number of
Dependencies(NDep), Maximum Depth Inheritance Tree(Max DIT) and Maximum
Aggregation Hierarchies(Max AggH).
The authors have used these metrics and applied different research methodologies and
conducted different sorts of experimentation to conclude the following:
i. There is a significant correlation between the structural complexity metrics and the three
maintainability sub-characteristics (understandability, analyzability and modifiability).
ii. There is a significant correlation between structural complexity metrics and maintenance
time.
iii. The structural and size metrics of class diagrams can be used as good predictors of class
diagram maintainability.
[Marchesi 98] have identified multiple metrics for use-case diagrams and class diagrams that
can be automated. For example, he proposed simple metrics such as number of use cases, number

Chapter 2: State of the Art
41 | P a g e
of communications among use cases and actors, etc. whereas sophisticated metrics include a
metric to calculate the total number of communications among use cases and actors but without
the redundancies that are introduced due to „extend‟ and „use‟ relationships. Similarly, his
proposed metrics for class diagrams include:
i. Total number of classes, total number of inheritance hierarchies
ii. Weighted number of responsibilities of a class (inherited or not)
iii. Weighted number of dependencies
iv. Percentage of inherited responsibilities with respect to total number, etc.
However, from the above metrics we can notice that [Marchesi 98] emphasizes more on the
inheritance and dependency relationships than on associations, aggregation, composition, etc.
Similarly, the proposed metrics are related to the complexity of conceptual models, thus
narrowing the scope of quality evaluation to one dimension. [In et al., 2003] also employed
metrics such as total number of classes, total number of inheritance relationships, total number of
use relationships, total number of parameters etc to calculate the architectural complexity of the
models in the early stage of development lifecycle.
[Rufai 03] has used multiple criteria to evaluate the similarity between a pair of UML models.
He proposed two interesting metrics Shallow Semantic Similarity Metr ic (SSSM) and Deep
Semantic Similarity Metrics (DSSM) to compare the names of the classes (SSSM) and the
attributes and methods (DSSM) of two UML models representing the same reality. He also
proposed to match the signatures of the classes to find the similarity between the classes of two
models. Likewise [Zhou et al., 2003] have proposed an entropy based structure complexity
metrics to evaluate the complexity of class diagrams. This metric employs the structural
complexity metrics defined in [Genero et al., 2002a], [Genero et al., 2000a], [Manso et al., 2003]
to calculate the entropy.
[Yi et al., 2004] provides a limited review of the available metrics for evaluating the
complexity of UML class diagrams. The authors have compared some of the above mentioned
metrics from different viewpoints and found that most of the chosen metrics have their
shortcomings while being effective or efficient for some special characteristics of systems. The
acceptance of metrics in practice depends on its consistency with their view of complexity.
2.3.2.3.2 Non-Automatable Metrics

Chapter 2: State of the Art
42 | P a g e
Another set of proposed metrics in the domain of CM evaluation cannot be automated due to
the following reasons:
i. Inherent complexity of the metrics.
ii. Model properties that aren‟t exported in XMI (XML metadata in terchange). For example,
XMI doesn‟t contain layout information about model elements and thus metrics related to
aesthetics (line crossings, etc.) can‟t be automated.
iii. Absence of technology to automate parts of the metrics (lack of sophisticated natural
language processing (NLP) tools to extract important information from textual
documents).
Some of the metrics that are not automatable (now, perhaps possible in the future) include the
following metrics proposed by [Cherfi et al., 2003a] for quantifying their quality attributes:
i. Requirements coverage degree: Comparison between the concepts covered by the
modeling element of the conceptual schema and the ones expressed by the users through
the requirements.
Reasons: The automation of this metrics is significantly difficult as it is difficult to
identify if the mapped concept is the same concept depicted in user requirements. Perhaps
by employing advanced NLP techniques we can have some confidence on the result of
this metrics.
ii. Cross modeling completeness: Compares completeness among several schemas modeling
the same reality i.e. ratio between the number of concepts present in the model and the
union of all the distinct concepts present in all the schemas representing the same reality.
Reasons: Difficult to design multiple models for same problem.
iii. Documentation degree: Every model element (classes, attributes, etc.) should have
comments associated with it.
Reasons: Most of the model elements have documentation available as a separate
document. For example, entities are modeled in ER-Diagram whereas described in High
Level Documents.
iv. User vocabulary rate: Users can make easy correspondence between the modeling
elements contained in the model and the requirements in the textual description.
Reasons: Difficulty in identifying which model element corresponds to which textual
description.

Chapter 2: State of the Art
43 | P a g e
v. Cohesion & Coupling: These metrics are usable only in case of multiple modules of
conceptual models. It is deemed to have high cohesion for every module and low
coupling among modules.
Reasons: There exist some metrics to calculate cohesion and coupling of modules and
some of them might be calculated but most of them are very complex and require manual
input.
In the next section, we assess some of the leading software applications that propose quality
evaluation for conceptual models. We selected Objecteering, Rational Rose and StarUML
modeling software for assessment as all they are widely used in the industry for designing
different CMs and also offers functionalities for CM evaluation. Moreover, we selected
UMLQuality as it is the only application that is dedicated to CM evaluation alone.
2.4 Software Tools for Modeling and Quality Evaluation
There exist numerous modeling tools for designing different types of conceptual models based
on different notations/standards such as UML, Entity Relationship, etc. These tools include
Enterprise Architect, Objecteering, Rational Rose, Star UML, Visio, etc. However, only a handful
among them provides any means to evaluate the quality of the models designed through them. In
this section we will assess some of these modeling tools and the evaluation methodology
proposed by them. We will only consider the evaluation methodology proposed for conceptual
models and thus will not take into account those for codes or object-oriented programs.
In addition to assessing the above mentioned modeling tools, we will also assess a tool called
UMLQuality. This tool doesn‟t provide modeling capabilities and was conceived for model
evaluation only. Some of the literature used in this section is adapted from [Kersulec 08].
2.4.1 Objecteering
Objecteering is a commercial modeling tool widely used in the industry. It supports UML
(Unified Modeling Language) and MDA (Model Driven Architecture). It can be used to design
UML diagrams such as use case diagrams, class diagrams, sequence diagrams, state transition
diagrams, etc. In addition to its modeling capabilities, Objecteering also provides an evaluation
methodology for static elements such as classes, packages, etc. However, most of the evaluation
criteria are based on syntactic quality of the models. Following are some of the short comings in
Objecteering‟s evaluation method:
i. It doesn‟t provide any evaluation methodology for dynamic diagrams such as use case
diagrams, sequence diagrams or state transition diagrams.

Chapter 2: State of the Art
44 | P a g e
ii. The evaluation metrics can‟t be defined or edited by the user. Thus, the user is
constrained to use the existing set of metrics.
iii. The user can‟t choose the criteria important for his/her particular needs. All the metrics
will be calculated automatically whether required or not.
iv. Users have to interpret the metrics results by themselves and have to imagine the ways to
improve the model.
v. There is no post evaluation guidance process or mechanism for model improvement.
2.4.2 Rational Rose
Rational Rose can be regarded as one of the oldest and widely used modeling tool in the
industry. It supports UML diagrams such as use case diagrams, class diagrams, sequence
diagrams, state transition diagrams, collaboration diagrams, etc. However, as compared to
Objecteering‟s evaluation capabilities, Rational Rose provides a very limited set of metrics for the
verification of models. Following are some of the short comings in Rational Rose‟s evaluation
methodology:
i. It doesn‟t provide any evaluation report.
ii. It doesn‟t provide an evaluation method for dynamic diagrams.
iii. The evaluation metrics can‟t be defined or edited by the user.
iv. Users can‟t choose the metrics with respect to their needs. All the metrics are calculated
automatically.
v. There is no post evaluation guidance process or mechanism for model improvement.
2.4.3 Star UML
StarUML is an open source modeling tool designed to replace commercial applications such as
Objecteering and Rational Rose. It supports UML diagrams such as use case diagrams, class
diagrams, sequence diagrams, state transition diagrams, collaboration diagrams, etc. However, it
doesn‟t provide support for object diagrams and package diagrams. Similar to Rational Rose,
StarUML provides a very limited set of metrics for the verification of models. Following are some
of the short comings of StarUML evaluation methodology:
i. It doesn‟t provide any evaluation report.
ii. It doesn‟t provide an evaluation method for dynamic diagrams.
Chapter 2: State of the Art
45 | P a g e
iii. The evaluation metrics can‟t be defined or notified by the user.
iv. Users can‟t choose the metrics with respect to their needs. All the metrics are calculated
automatically.
v. There is no post evaluation guidance process or mechanism for improvement.
2.4.4 UMLQuality
UMLQuality est un outil puissant qui s'adresse essentiellement aux experts qualité ou bien
encore aux responsables désireux d'améliorer au plus tôt la qualité des produits qu'ils
construisent.UMLQuality is a powerful tool designed to work with existing modeling tools such
as Rational Rose, etc. to evaluate the quality of models instead of designing the models. It is
intended for quality experts aiming to target the quality of their models. UMLQuality utilizes
XMI to evaluate models designed using other modelers. However, following are some of the
shortcomings in UMLQuality:
i. Absence of any interface for metrics definition
ii. Absence of adequate level of abstraction. Users are left with metrics results and thus it
gets difficult for them to interpret.
iii. There is no guidance process for the users enabling them to choose the metrics with
respect to their requirements. Either the user selects the metrics by himself/herself or all
the metrics are calculated automatically.
iv. Two models can‟t be compared to each other
v. Recommendations are not incorporated within the tool. A plug-in must be installed in
order to have an access to the recommendations.
Despite the above mentioned short-comings, UMLQuality is the best existing tool for
evaluating the quality of models as mentioned in [Kersulec 08]. Table - 3 summarizes the above
mentioned points about the four evaluated tools.

Chapter 2: State of the Art
46 | P a g e
Table - 3. Comparison between evaluation methodologies proposed in different tools
Criteria Objecteering Rational Rose
StarUML UMLQuali ty
Evaluate Static Diagrams Yes Yes Yes Yes Evaluate Dynamic Diagrams No No No Yes Granularity of evaluation criteria Metrics Metrics Metrics Metrics Possibility to Add/edit evaluating criteria
No No No Yes
Interface for defining/modifying the evaluation criteria
No No No No
Guidance process for selecting the requirement/project specific evaluation
No No No No
Comparison of multiple models No No No No Provision of evaluation report Yes No No Yes Provision of post evaluation recommendations
No No No Yes (limited with plug-in)
In the next section, we classified the existing literature on conceptual model quality into the
different types of qualities (such as syntactic quality, semantic quality, pragmatic quality, physical
quality, etc.) proposed in [Krogstie et al., 1995]. We chose to use Krogstie‟s framework for
conceptual modeling quality for the following reasons:
i. It is an extended version of the famous quality framework proposed by [Lindland et al.,
1994] and so can be considered a bit matured.
ii. It is richer than the preceding quality frameworks as it identified additional types of
qualities in conceptual models such as physical quality, social quality, empirical quality,
etc.
iii. It is well known among the CM quality community as it has been employed by multiple
researchers such as [Cherfi et al., 2007], [Maes et al., 2007], [Nelson et al. 2005],
[Schuette 91], etc.
2.5 Towards an Instrumented Approach for Quality Management
Considering the literature review presented above, we could summarize the situation as
follows:
i. On the one hand we have frameworks. Their main advantages are their global vision of
quality assessment and their ability to structure the reasoning about what to assess and
how to do it. However, they lack agreement about the definition and the meaning of the
quality concepts they use. These frameworks are also cross grained and contain very few
Chapter 2: State of the Art
47 | P a g e
details on how to use them. This is why they are difficult to understand and even to use
for quality assessment.
ii. On the other hand we have quality assessment approaches defining quality characteristics
and/or metrics. Their main advantage is the fact that they are fine grained and could be
operationalized for quality assessment. However, as they propose no global vision of the
quality, the exploitation of the assessment results is difficult to analyze and to generalize.
As for frameworks, they also lack agreement on the quality concepts they define.
In view of the above, we propose to combine the two above mentioned visions of quality in an
attempt to exploit the advantage of both. We propose to enrich a quality framework with
guidelines and measurement methods to make the framework usable for quality understanding,
quality measurement and quality improvement. We have chosen the generic quality framework
proposed in [Krogstie et al., 1995]. This work will first provide a synthesized vision of the
existing literature and second by enrich the framework by proposing suitable metrics for the
evaluation of conceptual modeling quality facets.
2.5.1 Krogstie’s Framework for Quality of Conceptual Models
Krogstie‟s framework for conceptual modeling quality extends the framework proposed by
[Lindland et al., 1994]. Krogstie pointed out some deficiencies in the original framework
concerning the difficulty of quality evaluation based only on the model and introduced the
consideration of participant‟s domain knowledge. The resulting framework is depicted in Figure -
4.

Chapter 2: State of the Art
48 | P a g e
Participant knowledge
Model externalization
Modeling domain
Language extension
Technical actor
interpretation
Social actor interpretation
Technical
pragmatic
quality
Syntactic
quality
Physical
qualitySocial pragmatic quality
Perceived
semantic
quality
Semantic
quality
empirical quality
Figure - 4. [Krogstie’s et al., 1995] Framework for quality of models
In Figure - 4 quality aspects are described as the correspondence between two statements
represented by boxes. Modeling domain refers to the set of statements describing the problem in
hand. Language extension contains all the statements that could be expressed given a modeling
language. Model externalization is the conceptual model representing the domain. Social actor
interpretation is the knowledge perceived by the audience about the model. Technical actor
interpretation is the interpretation of the model by the tools. Finally, participant knowledge is
related to the statements made by persons involved in the modeling process to represent the
domain.
The framework defines also seven quality dimensions defined as the correspondence between
pairs of statements. For example, semantic quality checks the model and the domain by verifying
the validity of the represented knowledge and its completeness regarding the domain.
2.5.2 Instrumentalisation of the Conceptual Modeling Quality Framework
In this section we will present for each quality dimension:
i. A clear and precise description of means associated to quality dimensions. Means could
be guides, methodological advices, tools or any other kind of knowledge aiming to
facilitate both the dimension understanding and the measurement of quality values;
ii. A set of references from the literature to quality attributes and metrics containing both the
detail of attributes description and metrics definition enabling a precise characterization
of quality dimensions as well as their assessment.

Chapter 2: State of the Art
49 | P a g e
2.5.2.1 Syntactic quality measurement
Syntactic quality requires a correspondence between the notation used and the model
produced. The quality attributes related to this quality dimension deal with correctness regarding
the concepts and constraints of the notation. In the literature this dimension is measured through
syntactic correctness (the model is syntactically correct), syntactic completeness (the model is
syntactically correct regarding the notation) and eventually normalized (when the notation
requires normalization). To achieve this quality we methods and tools dedicated to the notation
should develop mechanisms for error prevention, detection and correction. For example, an entity
relationship diagrams editor should not allow the definition of a relationship among relationships
and should enforce the completion of cardinalities and identifiers definition.
Quality means: Error prevention, detection and correction Quality attributes Proposal Syntactic Correctness [Ali et al., 2007a], [Ali et al., 2007b], [Cherfi et al., 2002a],
[Cherfi et al., 2002b], [Moody et al., 2003], [Moody et al., 2000], [Moody 98], [Moody et al., 1998], [Shanks et al., 1997] , [Zamperoni et al., 1993], [Zhou et al., 2003]
Syntactic completeness [Briand et al., 1997], [Cherfi et al., 2006], [Cherfi et al., 2003a], [Chidamber et al., 1994], [Harrison et al., 1998], [Lange et al., 2004], [Li et al., 1993], [Marchesi 98]
Normality [Batini et al., 1992]
2.5.2.2 Physical quality
Physical quality refers to the possibility to access the model. The model should be visible
somewhere and in a given form. This requires two things. Firstly, the language or the notation
used should have a mean for model externalization such as the possibility to display or to print a
graphical or a textual description of the model. Secondly, the produced model should be available
and accessible in the adequate form for the audience.
At the language level, this requires an adequate choice of the notation used. This is captured by
language expressiveness language adequacy and suitability quality attributes that enable the
measurement of externalization capabilities of a language. For internalization evaluation,
implementability allows measurement of the effort needed to implement a model in a target
technology (database, web pages, programming language etc).
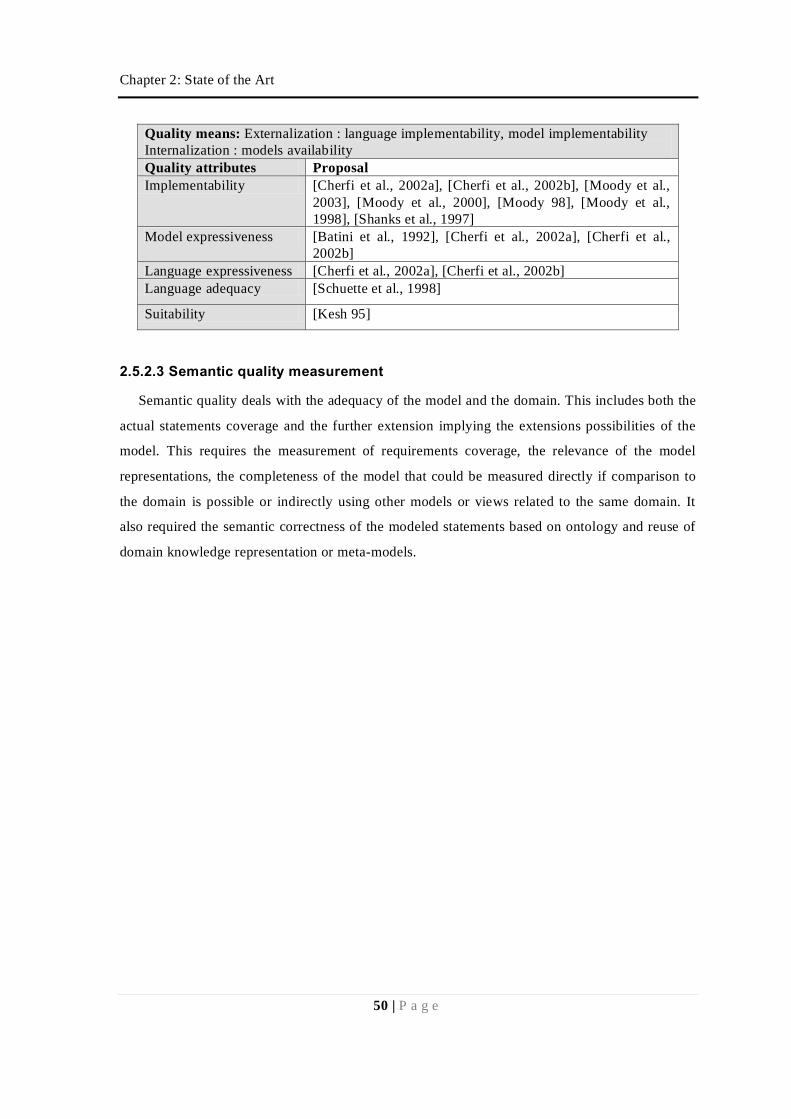
Chapter 2: State of the Art
50 | P a g e
Quality means: Externalization : language implementability, model implementability Internalization : models availability Quality attributes Proposal Implementability [Cherfi et al., 2002a], [Cherfi et al., 2002b], [Moody et al.,
2003], [Moody et al., 2000], [Moody 98], [Moody et al., 1998], [Shanks et al., 1997]
Model expressiveness [Batini et al., 1992], [Cherfi et al., 2002a], [Cherfi et al., 2002b]
Language expressiveness [Cherfi et al., 2002a], [Cherfi et al., 2002b] Language adequacy [Schuette et al., 1998]
Suitability [Kesh 95]
2.5.2.3 Semantic quality measurement
Semantic quality deals with the adequacy of the model and the domain. This includes both the
actual statements coverage and the further extension implying the extensions possibilities of the
model. This requires the measurement of requirements coverage, the relevance of the model
representations, the completeness of the model that could be measured directly if comparison to
the domain is possible or indirectly using other models or views related to the same domain. It
also required the semantic correctness of the modeled statements based on ontology and reuse of
domain knowledge representation or meta-models.

Chapter 2: State of the Art
51 | P a g e
Quality means: Consistency Checking, Completeness Checking, Relevancy Checking Quality attributes Proposal Completeness [Batini et al., 1992], [Cherfi et al., 2002a], [Cherfi et al.,
2002b], [Kesh 95], [Lange et al., 2005], [Lange et al., 2004], [Moody et al., 2003], [Moody et al., 2000], [Moody 98], [Moody et al., 1998], [Shanks et al., 1997], [Simsion 94], [Solheim et al., 2006]
Compliance To Meta-model
[Solheim et al., 2006]
Cross Modeling Completeness
[Cherfi et al., 2003a]
Extensibility [Batini et al., 1992], [Kesh 95]
Flexibility [Levitin et al., 1995], [Moody et al., 2003], [Moody et al., 2000], [Moody 98], [Moody et al., 1998], [Shanks et al., 1997], [Simsion 94]
Maintainability [Cherfi et al., 2002a], [Cherfi et al., 2002b], [Genero et al., 2005], [Genero et al., 2003]
Modifiability [Solheim et al., 2006]
Relevance [Levitin et al., 1995], [Solheim et al., 2006]
Requirements Coverage [Cherfi et al., 2003a]
Reusability [Simsion 94]
Semantic Correctness [Ali et al., 2007a], [Ali et al., 2007b], [Batini et al., 1992], [Cherfi et al., 2002a], [Cherfi et al., 2002b], [Moody et al., 2003], [Moody et al., 2000], [Moody 98], [Moody et al., 1998], [Shanks et al., 1997], [Zamperoni et al., 1993]
Semantic Robustness [Levitin et al., 1995]
Soundness [Kesh 95]
2.5.2.4 Pragmatic Quality Measurement
Pragmatic quality is related to the understanding of models by audience. There have been
several empirical studies on the factors having a direct impact on understandability. These studies
demonstrated that there are several factors impacting directly the understandability of models. The
most cited one is complexity related to both structure and size of models. However the
understandability could also be impacted by the usage of simple concepts, the documentation, the
naming conventions or simply by choosing model elements names from a vocabulary close to the
audience vocabulary (domain vocabulary for example).In order to help pragmatic quality
improvement some means or techniques such as visualization at different levels of abstraction or
detail, animation techniques, prototyping, translation, etc. could be used.
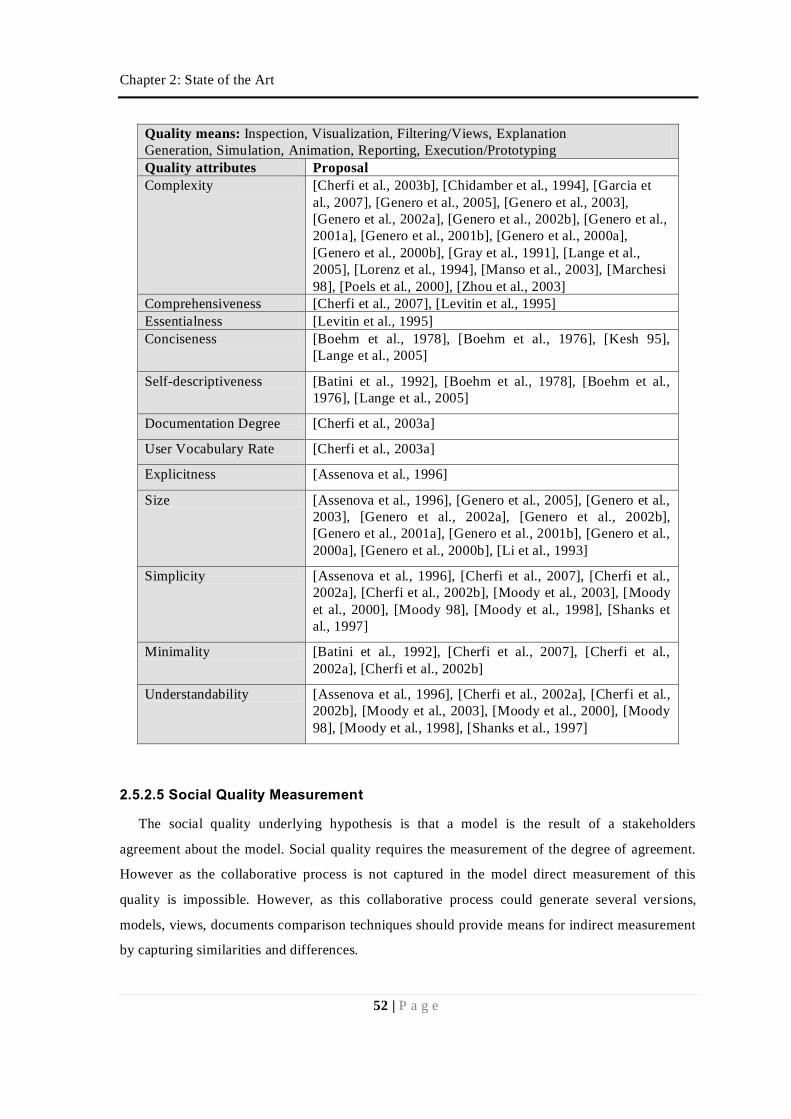
Chapter 2: State of the Art
52 | P a g e
Quality means: Inspection, Visualization, Filtering/Views, Explanation Generation, Simulation, Animation, Reporting, Execution/Prototyping Quality attributes Proposal Complexity [Cherfi et al., 2003b], [Chidamber et al., 1994], [Garcia et
al., 2007], [Genero et al., 2005], [Genero et al., 2003], [Genero et al., 2002a], [Genero et al., 2002b], [Genero et al., 2001a], [Genero et al., 2001b], [Genero et al., 2000a], [Genero et al., 2000b], [Gray et al., 1991], [Lange et al., 2005], [Lorenz et al., 1994], [Manso et al., 2003], [Marchesi 98], [Poels et al., 2000], [Zhou et al., 2003]
Comprehensiveness [Cherfi et al., 2007], [Levitin et al., 1995] Essentialness [Levitin et al., 1995] Conciseness [Boehm et al., 1978], [Boehm et al., 1976], [Kesh 95],
[Lange et al., 2005]
Self-descriptiveness [Batini et al., 1992], [Boehm et al., 1978], [Boehm et al., 1976], [Lange et al., 2005]
Documentation Degree [Cherfi et al., 2003a]
User Vocabulary Rate [Cherfi et al., 2003a]
Explicitness [Assenova et al., 1996]
Size [Assenova et al., 1996], [Genero et al., 2005], [Genero et al., 2003], [Genero et al., 2002a], [Genero et al., 2002b], [Genero et al., 2001a], [Genero et al., 2001b], [Genero et al., 2000a], [Genero et al., 2000b], [Li et al., 1993]
Simplicity [Assenova et al., 1996], [Cherfi et al., 2007], [Cherfi et al., 2002a], [Cherfi et al., 2002b], [Moody et al., 2003], [Moody et al., 2000], [Moody 98], [Moody et al., 1998], [Shanks et al., 1997]
Minimality [Batini et al., 1992], [Cherfi et al., 2007], [Cherfi et al., 2002a], [Cherfi et al., 2002b]
Understandability [Assenova et al., 1996], [Cherfi et al., 2002a], [Cherfi et al., 2002b], [Moody et al., 2003], [Moody et al., 2000], [Moody 98], [Moody et al., 1998], [Shanks et al., 1997]
2.5.2.5 Social Quality Measurement
The social quality underlying hypothesis is that a model is the result of a stakeholders
agreement about the model. Social quality requires the measurement of the degree of agreement.
However as the collaborative process is not captured in the model direct measurement of this
quality is impossible. However, as this collaborative process could generate several versions,
models, views, documents comparison techniques should provide means for indirect measurement
by capturing similarities and differences.

Chapter 2: State of the Art
53 | P a g e
Quality means: Agreement, Cross modeling comparison Quality attributes Proposal Cross Modeling Completeness
[Cherfi et al., 2003]
Integration [Moody et al., 2003], [Moody et al., 2000], [Moody 98], [Moody et al., 1998], [Shanks et al., 1997]
Model Similarity [Rufai 03]
2.5.2.6 Empirical Quality Measurement
An empirical quality measures how easy to read the model is. It is related to aesthetics.
Quality means: Expressive economy, Use of emphasis, Graph and document layout, use of color Quality attributes Proposal Language Aesthetic [Eichelberger 02], [Lange et al., 2005], [Lange et al., 2004] Minimization Of Bends [Purchase et al., 2002], [Purchase et al., 2001a], [Purchase et
al., 2001b], [Purchase et al., 2000] Minimization Of Edge Crossing
[Purchase et al., 2002], [Purchase et al., 2001a], [Purchase et al., 2001b], [Purchase et al., 2000]
Orthogonality [Purchase et al., 2002], [Purchase et al., 2001a], [Purchase et al., 2001b], [Purchase et al., 2000]
Clarity [Cherfi et al., 2007], [Cherfi et al., 2002a], [Cherfi et al., 2002b], [Schuette et al., 1998]
Legibility [Cherfi et al., 2007], [Cherfi et al., 2003], [Cherfi et al., 2002a], [Cherfi et al., 2002b]
Communicativeness [Boehm et al., 1978], [Lange et al., 2005], [Lange et al., 2004]
Readability [Batini et al., 1992]
Structure [Ali et al., 2007a], [Ali et al., 2007b]
2.6 Conclusion
One of the major problems in the domain of CM Quality is the existence of independent and
disparate quality frameworks. Most of the existing quality frameworks propose their vision of CM
quality and emphasize on their identified characteristics as pertinent to quality. Thus a reader (or
may be user) is left with a list of different frameworks each proposing different quality criteria for
evaluation and he/she has to rely on his cognition to identify the relevant quality criteria among
that list for his problem. But the quality of CMs can‟t be improved by employing just one or two
perspectives leaving all other perspectives. Quality is multidimensional problem and thus must be

Chapter 2: State of the Art
54 | P a g e
addressed through multiple perspectives. This requires that the user must know all the existing
literature to find a better solution for his/her quality problems. But this requirement will restrict
the evaluation and improvement activities to quality experts only. However, if some guidance
process can be proposed to users that helps them in identifying the relevant quality criteria for
their problem and then guides them through the evaluation and improvement of the CMs then
perhaps non-experts users might be able to integrate evaluation and improvement activities as part
of designing phase. In the following chapters, we present our solution for the above mentioned
problems. Our solution includes the following:
i. Federation of existing quality frameworks to formulate a comprehensive quality approach
incorporating different evaluation criteria.
ii. Identification of quality patterns, a concept similar to design patterns but dedicated to
quality, to encapsulate past experiences and good practices. We describe the concept of
quality patterns in details along with all of its components such as quality attributes,
metrics and recommendations.
iii. Description about our quality model including the descriptions about each of its
components such as goal (including details about formulating structured goals), questions
and quality patterns.
iv. Details about the guidance process helping the users to evaluate their CM with the least
possible efforts. This process includes the processes to formulate quality goal, mapping of
relevant quality criteria (quality patterns, quality attributes) with the formulated goal,
evaluation of CM and finally propositions or recommendations for CM improvement.
v. Designing of the software utility automating our proposed approach along with all the
processes for guiding a user.

Chapter 3: Proposed Solution
55 | P a g e
Chapter 3
Proposed Solution
A lot of researchers have proposed numerous metrics to quantify the different aspects of
conceptual modeling such as [Cherfi et al., 2002a], [Cherfi et al., 2002b], [Genero et al., 2004],
[Genero et al., 2002a], [Genero et al., 2001a], [Genero et al., 2001b], [Genero et al., 2000a],
[Marchesi 98], [Moody et al., 2003], [Moody et al., 2000], [Moody et al., 1998], etc.. These
quantifying metrics tends to help the modelers in identifying the sensitivity of the problem. Some
of these metrics can be computed automatically such as Depth inheritance tree, cohesion,
coupling, and numerous size and structural complexity metrics as defined in [Genero et al., 2004],
[Genero et al., 2001a], [Genero et al., 2001b], [Genero et al., 2000a], [Moody et al., 2003],
[Moody et al., 2000], [Moody et al., 1998], etc. Similarly, some of the metrics are difficult to
automate and require human interference or manual input, such as to calculate the number of line
crossings or to compute the requirements coverage within a model as proposed in [Cherfi et al.,
2002a], [Cherfi et al., 2002b]. However, the common problem among all of these metrics is that
they are at a very low level implementation and thus their understanding alone is a cumbersome
and time consuming task. On the one side, the mathematical formulation tends to complicate their
understanding while on the other side their manual calculation is regarded as repetitive and
fastidious task. Metrics can be compared to low level programming module (such as modules
written in assembly language). They don‟t carry any abstraction and thus are difficult to
understand and compute manually. It is due to this that their adoption is not widely acknowledged
in practice. Similarly, it gets difficult for inexperienced modelers to choose the relevant metrics
for evaluating their models from the list of numerous metrics proposed by the researchers. For
example consider the following list of metrics: shallow semantic similarity metric, deep semantic
similarity metrics, total number of classes, total number of inheritance hierarchies, weighted
number of responsibilities of a class, weighted number of dependencies, percentage of inherited
responsibilities, weighted methods per class, depth inheritance tree, number of children, responses
for a class, coupling between objects, lack of cohesion in methods, rule simplicity, query-
simplicity, rule-uniformity, etc. Now if the modeler is interested in checking if his/her model is
easy to maintain or not, it gets very difficult for him/her to identify the relevant metrics from this
list. He/she would require additional support and documentation to choose the relevant metrics.

Chapter 3: Proposed Solution
56 | P a g e
Thus, he/she will only be interested in employing the set of few metrics supported by some
modeling tool such as Objecteering.
In reply to these issues, researchers introduced a level of abstraction and proposed quality
attributes that employ different metrics for quantification. For example, [Cherfi et al., 2002a] and
[Cherfi et al., 2002b] have defined quality attributes such as: clarity, legibility, readability and
maintenance and employed different metrics for their quantification. Similarly, [Genero et al.,
2002a], [Genero et al., 2001b], [Genero et al., 2001c], [Genero et al., 2000b], [Manso et al., 2003]
have used numerous metrics to calculate complexity related to size and structure of the model.
[Moody et al., 2003], [Moody et al., 2000], [Moody et al., 1998], have also proposed different
attributes and metrics for evaluation. However, despite the existence of different attributes or
metrics for quality evaluation, there are no generally accepted guidelines for evaluating the
quality of the conceptual models and little agreement exists among the experts as to what makes a
“good” conceptual model [Moody 05].
[Moody 05] performed a review of the existing quality frameworks (complete and partial) on
conceptual models, his findings can be summarized as Table - 4.
Table - 4. Summary of Findings by [Moody2005]
Research1 Practice1 Collaboration1,2 Number of proposals 29 8 2 Percentage of Total 74 % 21 % 5 % Empirically Validated 6 0 1 Percentage 20 % 0 % 50 % Generalizable3 5 0 0 Percentage 17 % 0 % 0 % Non Generalizable 24 8 2 Percentage 83 % 100 % 100 %
Following are some of the findings inferred from Table - 4:
i. Researchers did not converge towards one quality framework (due to the proliferation of
quality frameworks).
1 Research, Practice and Collaboration represent the source of the framework. 2 Collaboration means that the researchers and practitioners formulated the framework in mutual agreement. 3 Generalizable: This implies that the framework can be applied on to conceptual models in general and is
not specific to a particular class of models (e.g. data models) or a particular notation (e.g. ER models).

Chapter 3: Proposed Solution
57 | P a g e
ii. Practitioners are not actively involved in evaluating the quality of the conceptual models
(due to the scarcity of quality proposals originating from the practice).
iii. There is a lack of collaboration between researchers and practitioners (Just 5% of the
quality frameworks were the result of mutual efforts from the researchers and the
practitioners).
iv. There are few frameworks that have been empirically validated (Approximately 18% of
the total).
v. There is a lack of generalization since there exist only 5 frameworks that can be
generalizable while others are specific to some class of models (e.g. data models) or to
any particular notation (e.g. ER models).
Moreover, the literature review on the quality of the conceptual models suggests that the
researchers have a very little agreement on a “standardized” set of quality criteria for conceptual
models [Moody 05]. Therefore, there is abundance of quality frameworks for conceptual models
and only few of them inherit the ideas from the other frameworks. This has resulted in the
existence of several definitions for the same concept. [Nelson et al., 2005] have identified
different definitions of the same quality concepts e.g. there exist nine different definitions for
“completeness”. Similarly, there exist numerous definitions for the same quality concept and
identical names for some semantically different metrics [Purao et al., 2003]. Such issues have
restricted the adoption of the existing quality frameworks in practice [Moody 05].
Thus the task to evaluate a conceptual model gets difficult for a non-expert due to the absence
of any standardized set of criteria. Moreover, as mentioned above, the existence of similar
concepts with different names or same names for semantically different concepts worsen the
situation. In order to reply to the above evidences and to provide a common yet comprehensive
basis for quality evaluation, we have relied on the proposition by [Moody 05] and considered
synthesizing existing concepts proposed by researchers and adding the new concepts to formulate
a comprehensive quality approach for conceptual models.
3.1 A Multi-Faceted Quality Approach for Conceptual Modeling
The goal of above mentioned enrichment activity was to propose a multi-faceted quality
approach for conceptual modeling that should be generic, flexible and remains valid for different
types of conceptual notations (ER models, UML diagrams, etc.). This proposition aggregates the
existing quality proposals and provides some suggestions to complete missing elements or

Chapter 3: Proposed Solution
58 | P a g e
concepts. We identified a set of 21 quality attributes through this activity. The approach
encompassed theoretical, practical and epistemological foundations.
3.1.1 Theoretical Foundations
Information systems represent a perceived real-world system and conceptual models are the
first step in their development as they model these systems. In order to create a CM, we need a set
of constructs to model these systems. To determine which constructs should be needed, different
researchers have proposed different approaches as theoretical guidelines. These approaches
include the use of ontology (for ordering and structuring the reality), classificat ion theory (for
categorizing knowledge) [Wand et al., 1995], etc. There are reviews on understanding the use of
CM and their constructs. Similarly, a lot of researchers talk about employing ontology for helping
the creation of realistic models for real-world information systems.
Likewise, in the field of conceptual modeling quality evaluation, there exist
methodologies/approaches for evaluation. But the problem lies in their disparity and non-
converging solutions. The existing work on CM quality is independent of one another and thus it
gets difficult to have a comprehensive and complete picture.
In order to evaluate a CM, we need a set of criteria and a mechanism to structure and classify
these criteria so that they can be identified for usage in future. As mentioned above, researchers
have proposed different criteria for evaluation but they are independent from one another.
Moreover, there doesn‟t exist any approach (or an ontology) that can help in the identification of
these evaluation criteria. Thus it is left on analyst/designer to identify and use the relevant criteria
individually. The absence of consolidated and agreed quality criteria for CM has demotivated the
acceptance and adoption of evaluation based strategies for CM. We have shown that
analysts/modelers acknowledge the importance of implementing an evaluation strategy for CM
but most of them don‟t know if any of such material existed despite their existence. This gap
between existing literature on CM evaluation and its usage in practice is due to the fact that
neither a standardized set of criteria exists in the literature nor a consolidated quality approach has
been proposed and diffused on a wide level.
Two streams of literature can be witnessed within the CM evaluation domain:
i. Evaluation literature on a higher level of abstraction such as identifying different types of
qualities, etc. For example, [Lindland et al., 1994] identified and proposed three different
types of quality for CM. Similarly, [Krogstie et al., 1995], [Siau et al., 2001], etc.
extended his framework and identified additional types of qualities.

Chapter 3: Proposed Solution
59 | P a g e
ii. Literature proposing different evaluation criteria at different levels of abstraction and
granularities such as proposing different quality concepts, attributes, characteristics, sub-
characteristics, metrics, etc.
The main problem with these two independent streams is that they don‟t converge at a point.
For example, there doesn‟t exist any literature classifying the quality criteria into the quality types
proposed by [Krogstie et al., 1995], [Lindland et al., 1994], etc. All the criteria proposed by
researchers have been classified by themselves into their self identified dimensions or quality
types, etc. This has led to several issues, for example:
i. Same criteria have been placed by different researchers at different levels of abstraction.
For example, completeness for some researchers is a quality attribute whereas for some it
is a dimension or even a metric.
ii. Everyone defines the narrower version of these quality criteria to accommodate his/her
vision of it and thus the same concept has been defined numerous times by different
researchers differently.
iii. Similarly, the widely accepted quality types by [Krogstie et al., 1995] and [Lindland et
al., 1994] have pre-defined and fixed boundaries. And thus, if existing criteria are
classified into these types then most of the criteria would be left unclassified. For
example, [Krogstie et al., 1995] version of pragmatic quality takes into account only the
concepts related to the fact that the model is being understood and not understandable.
Thus, all the concepts that are related to improving the understandability of the models
couldn‟t be included in this dimension. Whereas, [Siau et al., 2001] considers pragmatic
quality to be related to the fact that only one meaning of the model can be extracted with
the least possible cognitive efforts. Thus, implicitly incorporating all the concepts that
improve the understandability of the model within this dimension. We adopted this
extension of [Siau et al., 2001] to [Krogstie et al., 1995] pragmatic quality and included
all the concepts that improve the understandability of the model to be related to pragmatic
quality as well. For example, in Section-2.5.2.4, we included quality attributes such as
user vocabulary rate, documentation degree, etc. to the pragmatic quality as they help in
the understandability of the model whereas if we would have remained within the
boundaries laid by [Krogstie et al., 1995] then such attributes have been left unclassified
despite their importance.
In view of the above issues, it becomes imperative that the existing literature should be
consolidated and classified accordingly employing some existing framework such as that of

Chapter 3: Proposed Solution
60 | P a g e
[Krogstie et al., 1995] and [Lindland et al., 1994] as was done in conceptual modeling domain or
any other domain.
Thus, in order to formulate a consolidated set of criteria for CM quality evaluation, we used
existing literature on CM as its theoretical foundation to formulate the following:
i. Identify the hierarchy of evaluation criteria such as dimensions, attributes, metrics, etc.
ii. Define each identified evaluation criteria clearly and comprehensively such that there
should be one and only one definition associated to it. Moreover, these criteria can be
classified to only one place at a hierarchy. For example, completeness must fit only to the
definition of one of the following: dimension, attributes, metrics, etc.
iii. Devise a mechanism to incorporate or merge different flavors of the same concepts within
the newly formulated criteria. For example, a way to merge nine different definitions of
completeness into one.
iv. Identify existing or formulate new quantifiable measures for higher level concepts such as
attribute, etc. so that their impact can be calculated.
In order to achieve all of the above, different quality criteria, from the previously existing
quality frameworks or literature, were extracted and filtered. This aggregation activity used the
philosophy behind conceptual modeling and quality as its basis and enriched the model by
extracting different concepts from the previously existing literature. The process consists of the
following steps:
i. Selection of various attributes from the literature (details are discussed in Section-3.5.1).
ii. Identification and classification of relevant metrics into respective quality attributes for
measurements. For example, metrics such as number of classes, number of attributes, etc.
are used for measuring complexity quality attribute.
iii. Grouping of quality attributes with respect to commonality
iv. Selecting generic quality attributes (quality attributes that are generic to every conceptual
model)
v. Merging non-generic attributes into generic attributes that are closest with respect to
semantics
This process resulted in the selection/identification of a set of quality attributes that were
generic and represent different aspects of the conceptual models such as complexity,
maintainability, etc. Moreover, the advantage of this process was the elimination of redundant

Chapter 3: Proposed Solution
61 | P a g e
concepts in addition to unification of different frameworks and identification of grey areas. This
can be regarded as an important step in our approach. This enrichment activity contributed in the
literature by providing a more comprehensive and flexible set of quality criteria for conceptual
models. We proposed 21 quality attributes that incorporate a wide range of quality criteria already
existing in the literature. Moreover, this comprehensive view helped in the identification of
uncovered areas of conceptual modeling quality.
3.1.2 Practical Foundations
The above mentioned strategy to formulate a consolidated and comprehensive quality
evaluation approach is incomplete without incorporating the insights from the practice and can be
questionable without exercising a proper validation. Most of the work done in the field of CM
quality evaluation has originated from research and only a handful of the proposals have been
initiated from the practice [Moody 05]. Software Quality Assurance (SQA) activity is regarded as
of utmost importance in any organization developing or implementing software commodity.
Similarly, the strategic importance of SQA operations can be witnessed by the following two
facts:
i. SQA team works in the same fashion as that of auditors isolating themselves from other
teams involved in the development activities.
ii. SQA team is headed by the manager of managers or senior executives. Thus, SQA can
influence decision process.
It has been widely accepted in research and practice fields that the quality of the CM has a
severe impact on the quality of the final product. Similarly, [Avison et al., 1993] also emphasized
on the extension of SQA scope to all the activities of the software development life cycle. We
conducted a survey to study the modeling practices of different populations (including
practitioners) of IS domain and also to validate the selection of quality criteria from the literature.
Almost all the participants from the practice responded that their conceptual models are evaluated
and checked by either of the following: analyst, designer, software engineer and even project
manager. This implies that the evaluation strategy for CM is an integral part of testing (could be
within SQA) yet there exist only a handful of proposals originating from the practice. Following
can be inferred from the above findings:
i. There is no formal mechanism of CM evaluation in practice
ii. If there exist some formal mechanisms, then either they are confidential or proprietary
Chapter 3: Proposed Solution
62 | P a g e
However, the commonality in both of the above mentioned cases is that there is knowledge out
there in practice that has not been solicited, formalized and published in the research. Similarly,
these practices have never been studied in depth and communicated. Thus, we planned to study
those practices and to incorporate them into our consolidated quality approach.
Our approach involves practitioners‟ viewpoint as its practical foundation. The basic idea was
twofold: one to study the evaluation strategy employed in practice and second to validate our
approach. We involved professionals including practitioners using surveys, interviews, etc. For
example, in order to be sure that the resultant set of quality attributes (identified from the
literature or defined as new concepts) represent most of the important aspects (if not entirely) in
the evaluation of CM, an interim validation exercise was planned and performed having
professionals including practitioners as the respondents. This validation exercise tried to collect
the responders‟ views on the holistic quality of the conceptual models in addition to their
feedback over the identified/selected set of quality criteria. Their feedback was evaluated and
modifications were made to select a set of evaluation criteria (Details about this experiment can
be consulted from the Chapter 7). Their feedback/viewpoint can be considered as a practical
foundation to our approach.
Similarly, we also tried to extract knowledge about their practices by asking them feedback
questions such as to identify the quality aspects that are important to them in a conceptual model.
Such questions enabled us to study their practices and also to find the quality criteria that have
been used in practice but are unknown to theory.
Another approach in this regard involved a set of experiments conducted on post graduate
students over the efficiency of employing our approach to improve the conceptual models. We
tried to study the cognitive efforts put in by these students and the criteria employed by them to
evaluate and improve the CM without any prior knowledge about existing CM evaluation
methodology. All such activities serve as practical foundations to our approach.
3.1.3 Epistemological Foundations
Epistemology is the branch of philosophy concerned with knowledge (nature and its sources),
and the acquisition of knowledge [Hirschheim 85]. It can be considered as the theory of
knowledge seeking answers to questions such as what is knowledge and how is it acquired? What
differentiates between adequate and inadequate knowledge? etc.
Many studies in the domain of conceptual models evaluation address the problem of
miscommunication between business and IT actors. One of the research directions aiming to
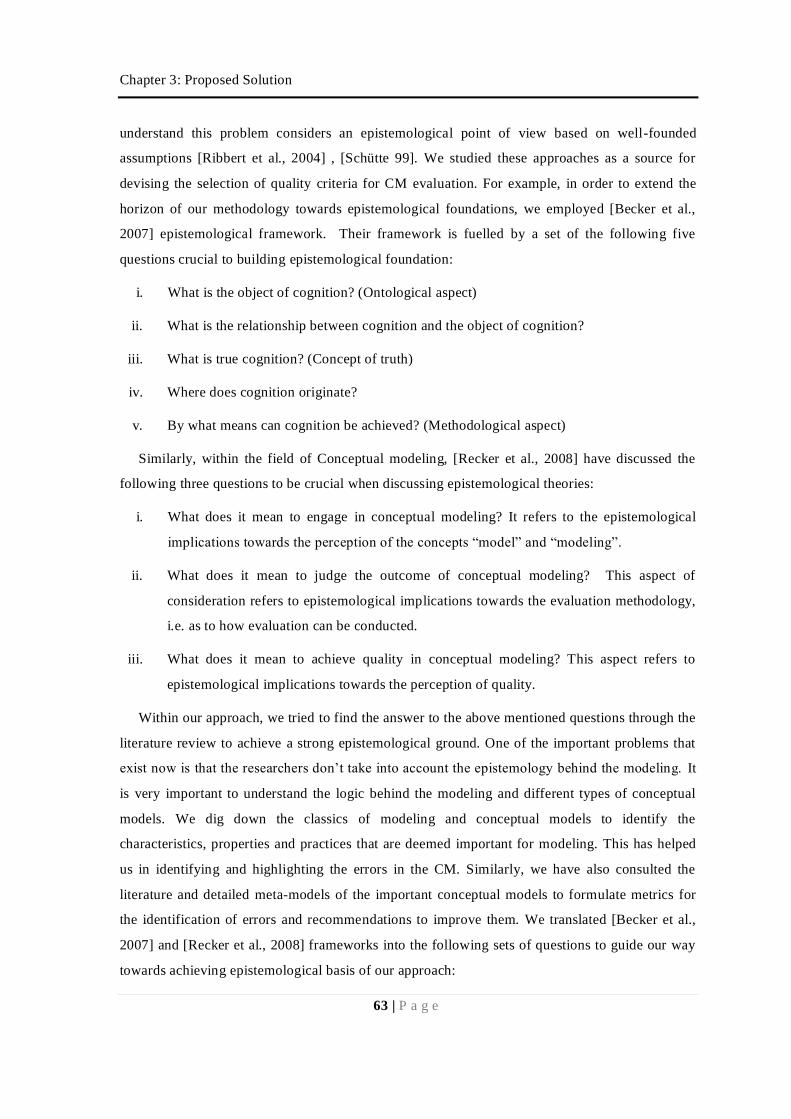
Chapter 3: Proposed Solution
63 | P a g e
understand this problem considers an epistemological point of view based on well-founded
assumptions [Ribbert et al., 2004] , [Schütte 99]. We studied these approaches as a source for
devising the selection of quality criteria for CM evaluation. For example, in order to extend the
horizon of our methodology towards epistemological foundations, we employed [Becker et al.,
2007] epistemological framework. Their framework is fuelled by a set of the following five
questions crucial to building epistemological foundation:
i. What is the object of cognition? (Ontological aspect)
ii. What is the relationship between cognition and the object of cognition?
iii. What is true cognition? (Concept of truth)
iv. Where does cognition originate?
v. By what means can cognition be achieved? (Methodological aspect)
Similarly, within the field of Conceptual modeling, [Recker et al., 2008] have discussed the
following three questions to be crucial when discussing epistemological theories:
i. What does it mean to engage in conceptual modeling? It refers to the epistemological
implications towards the perception of the concepts “model” and “modeling”.
ii. What does it mean to judge the outcome of conceptual modeling? This aspect of
consideration refers to epistemological implications towards the evaluation methodology,
i.e. as to how evaluation can be conducted.
iii. What does it mean to achieve quality in conceptual modeling? This aspect refers to
epistemological implications towards the perception of quality.
Within our approach, we tried to find the answer to the above mentioned questions through the
literature review to achieve a strong epistemological ground. One of the important problems that
exist now is that the researchers don‟t take into account the epistemology behind the modeling. It
is very important to understand the logic behind the modeling and different types of conceptual
models. We dig down the classics of modeling and conceptual models to identify the
characteristics, properties and practices that are deemed important for modeling. This has helped
us in identifying and highlighting the errors in the CM. Similarly, we have also consulted the
literature and detailed meta-models of the important conceptual models to formulate metrics for
the identification of errors and recommendations to improve them. We translated [Becker et al.,
2007] and [Recker et al., 2008] frameworks into the following sets of questions to guide our way
towards achieving epistemological basis of our approach:

Chapter 3: Proposed Solution
64 | P a g e
i. What are conceptual models (CM)?
ii. Why do we make CM?
iii. How do CM originate?
iv. What was the rationale behind CM origin?
v. What are the alternatives to CM?
vi. Why do people use their cognition while designing CM?
vii. How do people translate their cognition into CM?
viii. What is the notion of quality for CM?
ix. Why do we need quality for CM?
x. How can we distinguish between good and bad models?
xi. How can we prevent bad modeling? etc.
All of the above questions (or similar types of questions) helped us in identifying the
epistemological foundation of our approach that in turn enabled us in devising effective
evaluation and improvement approach for conceptual modeling quality. For example, we tried to
seek the answer to question “Why do we make CM?” We identified all the reasons that led to the
employment of CM for designing the system such as CMs are used to translate end-users
requirements to developers. Thus this leads us to identify two important things about CMs:
i. CMs communicate users requirements to developers (or any other recipient) and thus they
should be complete otherwise the missing requirements will not be included in the final
system.
ii. Since CMs are designed for subsequent stages of development and very often for
developers so that they can know about the users‟ requirements. Thus if CMs are not
understandable then the developers might not interpret them correctly or their
interpretation might be wrong.
In view of the above findings, we identified the existing literature that talked about
completeness and understandability aspect of CM and included them in our approach. This
enrichment process is described in detail in Chapter 7

Chapter 3: Proposed Solution
65 | P a g e
3.2 Quality Model Overview
Our approach encompasses methods and techniques to evaluate and improve the conceptual
models with respect to a certain aim or more precisely a goal and thus this goal oriented approach
relies partially on the famous Goal Question Metric (GQM) approach proposed in [Basili et al.,
1994] and [Basili et al., 1984] can be regarded as pioneers to employ goal based evaluation
methodology. [Basili et al., 1988] developed an improvement-oriented software engineering
process model that employs the goal question metric paradigm to integrate the constructive and
analytic aspects of software development. They defined GQM to be a mechanism for fo rmalizing
the characterization, planning, construction, analysis, learning and feedback tasks. Moreover,
GQM represents a systematic approach for setting need-specific project goals of an organization
and defining them in an operational and tractable way. [Basili et al., 1987] found goal oriented
approach to be feasible and beneficial. Goals are refined into a set of quantifiable questions that
can use multiple metrics for quantification. [Basili et al., 1994] provides more details about how
goals are formulated and how the GQM approach can be employed. They aim to specify a
measurement model for GQM at the following three levels:
i. Conceptual level (Goal): A goal can be defined for an object (such as product, process
and resource) for any reason such as with respect to quality, or different points of views,
etc.
ii. Operational level (Questions): In GQM, set of questions are employed to characterize the
assessment or achievement of a specific goal. Questions characterize the object of
measurement with respect to a selected quality issue from a selected view point.
Similarly, questions can also be used to elaborate the vague goals.
iii. Quantitative level (Metric): a quantitative measure is required to answer the questions
related to a goal using a set of data associated to it.
[Wernick 00] employed GQM and formally elaborated the four steps in a GQM-based study:
i. The definition of goals
ii. Posing of relevant, objective questions to determine the attainment of goals
iii. The definition of collectable metrics which relate to questions
iv. The analysis of the results to determine the answers to the questions and their relationship
to the goals.

Chapter 3: Proposed Solution
66 | P a g e
There are several research papers that have used GQM approach for evaluation. For example,
[Cherfi et al., 2008] and [Cherfi et al., 2002b] employed GQM approach to evaluate different
dimensions of quality in conceptual models. [Bouzeghoub et al., 2001] used GQM as a basis to
construct a quality model for data warehouse. Similarly, [Vassiliadis et al., 1999] extended GQM
to capture the interrelationships between different quality factors with respect to a specific quality
goal to evaluate and improve the quality in data warehouse. [Nick et al., 2001] and [Nick et al.,
1999] use GQM technique to systematically develop a measurement program for the evaluation of
an experience base (an organizational memory for software engineering knowledge). They also
demonstrated the practical benefit of GQM through a case study where GQM was applied to an
existing case-based reasoning system/application. [Deprez et al., 2007] applied GQM to create an
assessment methodology specifically tailored to evaluate the evolvability and robustness of Free
and Open-Source Software (FlOSS) endeavors. Similarly, [Wernick 00] used GQM to derive
relevant metrics from their FEAST (Feedback, Evolution and Software Technology) goals to be
used as the basis for data collection programs. [Bouzeghoub et al., 1999], haven‟t explicitly
employed GQM approach but have used quality goal based evaluation and improvement approach
for data warehouse.
GQM has been widely used in the industry for different evaluation tasks. We employed GQM,
as our approach is based on an analyst/designer specific evaluation i.e. an evaluation method
adopted for a particular requirement or formally a particular goal. Moreover, our approach
encompasses different evaluation criteria at different levels of abstraction and thus we require a
method to map these evaluation criteria to the analyst/designer specific needs or goals. However,
our adoption of GQM is slightly different from the traditional GQM adoption as in the original
version Goals are translated into metrics via questions whereas in our approach metrics are
numerous and are at the lowest level of abstraction. Thus we need to map these goals to quality
criteria that are at a higher level of abstraction. Another main reason to link goals with some
higher abstraction criteria is due to the fact that our approach is applicable to all types of
conceptual models and thus there can exist numerous metrics for different aspects of different
types of conceptual models. However, the same aspect might hold for a particular quality concern
for all types of models. For example, in order to evaluate the complexity of any model, we can
evaluate the structural complexity (complexity related to the structure of the model) of the model.
This aspect of structural complexity will hold for every type of conceptual models. If we would
have opted for direct mapping of goals to metrics then the resolution of this complexity goal
would differ for every type of conceptual models as most of the metrics are specific to model
types.

Chapter 3: Proposed Solution
67 | P a g e
Our approach also employs questions, as proposed by GQM, to map goals to quality criteria as
sometimes analysts/designers specified goals are vague statements and it is difficult to predict the
domain of goals. Our approach lets analysts/designer evaluate conceptual models with respect to
their desired quality goal. These goals can be vague and thus, as proposed by GQM, questions are
used to transform these goals into more concrete statements. These questions help in narrowing
the domain of the evaluation. In our adoption of GQM, goals are translated into quality patterns
through questions. These quality patterns are at the higher level of abstraction and are responsible
for finding answers to the questions raised in the goal. Quality patterns are discussed in detail in
the following sections.
Figure - 5 depicts the adoption of GQM to our approach. It can be seen that different goals are
formulated for evaluating different aspects of conceptual models. These quality goals are
generally vague and need to be précised in order to operationalize their achievement. Even if
goals are not vague then it is important to interpret them in the same way as was deemed by the
analyst/designer. Thus in order to map the goal into relevant quality criteria that is relevant to the
analyst‟s vision (or any other who formulated the goal) of quality goal, our approach employs
questions. These questions help in identifying the relevant quality patterns with respect to
formulated goal. Our approach maps the quality goal on to quality patterns rather than metrics.
The identified quality patterns are responsible for evaluating the CMs and later help in their
improvement. The next sections describe each of the components depicted in Figure - 5.

Chapter 3: Proposed Solution
68 | P a g e
Figure - 5. An iterative quality improvement based approach
3.2.1 Quality Goal:
Quality goal is the objective desired by an analyst/designer to attain for the object of interest.
As mentioned above, quality goals may be defined for any object, for a variety of reasons, with
respect to various quality models, from various points of views and relative to a particular
environment. Goals can be defined for the following types of objects [Basili et al., 1994]:
i. Products: Artifacts, deliverables and documents such as specification documents,
conceptual models, design diagrams or documents, programs, test suites, etc.
ii. Processes: Time constrained activities related to software such as specifying, designing,
developing, testing, etc.
iii. Resources: Items used by processes in order to produce their outputs such as personnel,
hardware, software, etc.
For example, an analyst/designer might be interested to check his/her conceptual model for its
correctness, thus the goal in this scenario is correctness and the object of interest is the conceptual
model. This goal can be used to evaluate and improve the object under consideration (conceptual
model in this case).
Improves
Related to Matches
Arises
Chapter 3: Proposed Solution
69 | P a g e
However, sometimes a goal statement could be vague and thus needs to be translated into more
concrete statements. Thus, in order to obtain these concrete statements from the goal, we propose
to employ a Goal Question Metrics (GQM) approach proposed by [Basili et al., 1988] and [Basili
et al., 1984] can be regarded as pioneers to employ goal based evaluation methodology. They
categorized goals into two categories:
i. Goals that may be used to evaluate a particular software development methodology
relative to the claims made for it;
ii. Goals common to all methodologies.
GQM represents a systematic approach for setting need-specific project goals of an
organization and defining them in an operational and tractable way. Similarly, [Basili et al., 1987]
employed the notion of goals to implement the improvement process by setting project
improvement goals, characterizing those goals and the environment via defect profiles in a
quantitative way, choosing methods and tools to evaluate the actual behavior and refining the
project goals based on the evaluation results. Goals are refined into a set of quantifiable questions
that can use multiple metrics for quantification.
[Basili 93], [Basili 92], [Basili et al., 1988] proposed a set of templates for formulating goals
and a set of guidelines for deriving questions and metrics for non-experience analyst/designer as
the process of setting goals and refining them into quantifiable questions is a complex task and
requires adequate experience. The authors proposed that every goal should have purpose,
perspective and is valid for an environment. The purpose of the goal is to define the object(s) of
study. There can be several object(s) of study from multiple perspectives within a same goal but it
might be wise to break such complex goals into several simpler goals. Similarly, perspective of a
goal is meant to position it for evaluating the object(s) of study at a particular angle or set of
angles. The purpose of environment is to define the context of study by defining all aspects of the
project. The environment should include all those factors that may be common among all similar
projects and must be stored for future comparison. However, in the absence of any storage
mechanism or for independent goals, this aspect can be ignored.
The scope of each of the above mentioned components for formulating a goal are as follows (
Table - 5), formally defined by [Basili 93]. These categorizations or guidelines can be used to
structure goals or help the analyst/designer in formulating their goals effectively and efficiently:

Chapter 3: Proposed Solution
70 | P a g e
Table - 5. Goal formulation template
Purpose to analyze objects such as products, processes, resources for (or why) characterization, evaluation, prediction, motivation,
improvement Perspective with respect to
(focus) cost, correctness, defect removal, changes, reliability, effectiveness, user friendliness, etc.
from the point of view of (who)
user, developer, manager, customer, corporation, etc.
Environment in context of process factors, people factors, problem factors, resource factors, methods, tools, constraints, etc.
For example, the goal to evaluate the completeness of conceptual models can be structured
using the above guidelines in the following way:
Purpose to analyze Conceptual model
for Evaluation
Perspective
with respect to Completeness
from the point of view of
Analyst
In the above example, we can notice that an analyst/designer specific goal in natural language
can easily be transformed into structured goals using the guidelines proposed in [Basili 93].
Next step in our approach involves the employment of GQM‟s questions to translate vague
goals for evaluation.
3.2.2 Questions:
Quality goals are translated into questions. These questions help analysts/designers in
narrowing the scope of goals yet specifying its domain and increasing the details about it.
Moreover, these questions also help in identifying the evaluation criteria with respect to the
formulated goal. If the goal is clearly formulated, then this translation process could be effective
and easy. However, if the goals are vaguely defined then the introduction of questions will
enhance its mapping onto the appropriate evaluation criteria for quality estimation and possible
improvement.
The process of setting goals and refining them into quantifiable questions is a complex task
and requires adequate experience. [Basili 93], [Basili 92], [Basili et al., 1988] identified
guidelines to formulate product and process related questions from the formulated goal. For each

Chapter 3: Proposed Solution
71 | P a g e
target product/process there are three major sub goals that need to be addressed: definition of the
product/process, definition of the quality perspectives of interest and the feedback related to the
quality perspectives of interest. The summary of each of these guidelines are presented at Table -
6. Since we are interested in formulating questions for conceptual models, therefore we adopted
only the propositions with respect to models.
Table - 6. Guidelines to formulate questions related to conceptual models
Sub-goals Type of Questions (Specific to Conceptual Models) Definition It includes questions related to:
i. Physical attributes such as size, complexity, etc. ii. Modifiability or maintainability of the model
iii. Defects such as errors, missing requirements, etc. iv. Context of the model
Quality Perspectives of Interest
It includes questions related to the following: i. Readability, understandability, etc. ii. Aesthetics of the model
iii. Conformance to the syntactic requirements of the modeling language
iv. Validity of the model for a target domain (semantic validity) v. Semantic completeness of the model vi. Model effectiveness
vii. Substantiation of the model (i.e. whether results are reasonable from various perspectives)
Feedback It includes the questions related to improving the model relative to the quality perspective of interest and suggestions for improvement
For example, the following set of questions can be generated through the above mentioned
guidelines for the quality goal presented in the previous section about model completeness:
i. Is completeness related to syntax?
ii. Is completeness related to semantics?
iii. Is completeness related to requirements coverage? Etc.
Each of the questions helps in the identification of evaluation criteria relevant for the quality
goal in context. In the above set of questions, if the answer to the three questions is “yes”, then it
means that the model must be evaluated for completeness with respect to:
i. Syntactic requirements by the modeling language
ii. Semantics requirements by the modeled domain and
iii. The user specified requirements.

Chapter 3: Proposed Solution
72 | P a g e
In our approach, questions help in the identification of relevant quality patterns for model
evaluation and improvement. These quality patterns are at a higher level of abstraction as
compared to metrics. Quality patterns are described in the next section.
3.2.3 Quality Pattern:
As mentioned in Section 3.1.1, we performed a thorough review to capitalize knowledge and
we formulated a set of 21 quality attributes. This process of knowledge capitalization involved a
thorough literature review and identification of new quality attributes for the gray areas. However,
the selection of the above mentioned quality attributes for any evaluation project can be trickier
for a non-expert analyst/designer. Even though it will be much simpler if compared with the direct
selection of employing metrics for evaluation due to the following reasons:
i. There exist numerous metrics to measure diverse aspects of different types of conceptual
models. Thus it is difficult to remember all the metrics and finding the relevant metrics
from the directory of metrics can be a difficult task and might incur errors.
ii. Attributes serve as an abstraction and consolidate a set of all metrics relevant to a
particular aspect of conceptual modeling. For example, “structural complexity” attribute
will contain all the metrics relevant to the complexity of every type of models due to their
structure.
The process for selecting the relevant quality attributes with respect to desired goal remains
trickier for a non-expert analyst/designer and thus requires in-depth knowledge about each of
these attributes and what they propose. We found that there is a lack of methodologies putting
together the evaluation of conceptual models and their improvement through a real guidance
process. Often the readers are left with a proposed set of evaluation criteria (dimensions,
attributes, metrics, etc.) that can be used for evaluation. And since these evaluation criteria are
independent of other proposed criteria, as mentioned above, thus the reader can only think of
employing the proposed set of criteria in hand. This can lead to three problems:
i. Either the readers find an incomplete solution due to the limited amount of information
provided by propositions in hand, as most proposals tend to be autonomous.
ii. The reader finds a non-optimal solution to a problem for which perhaps a better solution
is proposed by some other proposal.
iii. It gets difficult for the readers to interpret the evaluation results in order to improve their
models, as most of the proposals fail to provide post evaluation improvement guides
[Moody 05].

Chapter 3: Proposed Solution
73 | P a g e
From the above problems, it can be noticed that the domain of conceptual modeling quality
lacks a consolidated approach that capitalizes existing knowledge and past experiences and fails
to provide a guidance process incorporating both evaluation and improvement aspects.
The above mentioned problem in conceptual modeling can be compared to problems incurred
by programmers in the early days of software development discipline as it lacked capitalizations
of knowledge, sharing of experiences, etc. back then. Thus, everyone sought his/her particular
solution to a common set of problems indulging into recurring and redundant activities. The main
shortfall in their autonomous effort was the absence of reusing existing experiences i.e. devising a
not-so-good solution for a problem where a better solution existed. The same scenario holds for
design activity. The remedy to this was the proposition of design patterns addressing recurring
problems by proposing a fairly good solution and most importantly devis ing an approach to
capitalize experiences. Design patterns encapsulate valuable knowledge in the form of established
and better solution to resolve design problems for addressing design quality [Hsueha et al., 2008].
However, design patterns don‟t explicit ly target the quality but propose an established solution to
a common problem. In order to incorporate the notion of quality evaluation or improvement
within the design patterns, a new concept (named as quality patterns) has recently emerged. It
uses the epistemology of design patterns and includes criteria to guide the evaluation of
conceptual models and suggestions to improve them. The concept of quality patterns was first
proposed by [Houdek et al., 1997] and it targets the software engineers.
[Cherfi et al., 2008] argues for employing quality patterns to guide the evaluation process.
They proposed a quality pattern meta-model and a three phase evaluation process. Their proposed
phases include, quality specification phase, quality measurement phase and quality improvement
phase. They have also tried to find a relationship between design patterns and proposed quality
patterns. Their work can be regarded as a ground breaking for quality pattern driven modeling
process. We adopted this concept of quality patterns, to incorporate the guidance process in the
selection of the relevant and related quality attributes for evaluation process. Thus, next portion of
our approach is based on the idea proposed by [Cherfi et al., 2008]. We extend their approach and
present a more comprehensive quality pattern driven evaluation and improvement process for
conceptual models.
3.3 Example of approach:
We will use a simple example to demonstrate each of the four components of our approach,
For example, consider an analyst/designer interested in evaluating and improving his/her
conceptual model. He/she defines the following goal: “Is my model easy to change?” We can

Chapter 3: Proposed Solution
74 | P a g e
structure this goal by employing the guidelines specified in [Basili 93] and demonstrated in the
above sub-section. In this goal, we can identify that the purpose of the defined goal is to analyze
the CM for evaluation and the context of the goal is to target the problems related to future
extension and evolution of the CM from the analyst‟s point of view.
GoalPerspective: Ease of Change
from Analyst’s Point of View
Purpose: To analyze the
Model for Evaluation
Question
Is is ease of change related to
model maintainability?
Is ease of change related to
new requirements?
Is ease of change related to
model understandability?
Quality PatternModel Understandability
Model Maintainability
Model to be evaluated
Emp_Bank_Info
Emp_Bank_ID
Emp_ID (FK)
Branch_ID (FK)
Account_No
Branch_Info
Branch_ID
Bank_ID (FK)
City_ID (FK)
Branch_Name
Bank_Info
Bank_ID
Bank_Name
City_Info
City_ID
Bank_Name
Per_Promotion
Promotion_ID
Emp_ID (FK)
Old_Emp_Pay _Fixation_ID (FK)
New_Emp_Pay_Fixation_ID
Present_Desig
OT_Authority
Authority_ID
Desc
Per_Attendanc e
Att_ID
Emp_ID
Atten_Leave_ID
Dt_In
Update_Chec k
Remarks
Dt_Out
Time_Out
Time_In
nit_Period
ation_ID
ation_Des c
Per_Employee
Emp_ID
P_No
First_Name
Middle_Name
Last_Name
Father_Name
WC_ID
Dept_ID
Qual_ID
Trade_ID
Domicile_ID
Emp_Type_ID
Country_ID
Desg_ID
Employment_Dt
Maritial_Status
Exit_Dt
Blood_Group
New_NIC
DOB
Old_NIC
Height
Gender
Religion
Sect
Joining_Dt
NTN_No
ID_Mark
Pr_Street
Per_Street
Phone1
Phone2
Mobile
Emp_Clist_No
Emp_Clist_Dt
Exit_Reason
Exit_Clist_No
Exit_Clist_Dt
NOK_Name
NOK_Old_NIC
NOK_New_NIC
NOK_Addr
Pay_Component
Com_ID
Percent_On_ID (FK)
Criteria_ID (FK)
Com_Type_ID (FK)
Com_Name
Is_Deduct
Sequence
From_Dt
Effective_Dt
Percent_Ratio
Fixed_Amount
Is_Taxable
Is_Rent
Is_Deleted
Pay_Misc
Misc_ID
Emp_ID (FK)
Misc_Dt
Arrears
Is_Processed
Is_Deleted
Pay_Monthly_Detail
Pay_Monthly_ID
Emp_ID (FK)
Com_ID (FK)
Pay_Month
Compo_Dr
Compo_Cr
Is_Valid
Is_Deleted
Pay_Monthly_Basic
Pay_Basic_ID
Emp_ID (FK)
Pay_Month
Curr_Pay
OT_Hr
OT_Amount
Late_Hr
Late_Amount
CL
LAP
Absent
Absent_Amount
Total_Allowanc e
Toatal_Deduc tion
Gross_Salary
Net_Salary
Tax_Salary
GPF_Accumulated
Income_Tax
Arrears
Is_Valid
Is_Deleted
Pay_Rule
Rule_ID
Com_ID (FK)
Payscale_ID (FK)
Is_Deleted
Pay_Emp_Loan
Emp_Loan_ID
Emp_ID (FK)
Duration_ID (FK)
Loan_ID (FK)
Loan_Amount
Loan_Period
Loan_Rate
Loan_Installment
Loan_Balance
Is_Deleted
Pay_Process
Process_ID
Process_Dt
Sys_Dt
Is_Deleted
Com_Type
Com_Type_ID
Com_Desc
Percent_On
Percent_On_ID
Desc
_PUNISHMENT_SETUP
N_ID
N_DESC
N_REMARKS
_DEL
PER_LEAVE_APPLICATION
LEAVE_APP_ID
EMP_ID (FK)
APPLICATION_NO
APPLICATION_DT
LEAVE_DT
LEAVE_START_DT
RIMARKS
LEAVE_SUBTYPE_ID (FK)
IS_PRE_SANC
LEAVE_DAYS
LEAVE_HOUR
IS_DELETED
PER_DESIGNATION
DESG_ID
PAYSCALE_ID (FK)
DESG_DESC
IS_DEL
PER_CHILDREN
CHILD_ID
SPOUSE_ID (FK)
CHILD_NAME
ISDELETED
GENDER
CHILD_DOB
PER_ATTEND
ATTEN_ID
EMP_ID (FK)
ATTEN_DT_TIME
SYS_DT_TIME
REMARKS
OVER_TIME PER_DEPT
DEPT_ID
DEPT_NAME
IS_DELETED
DEPT_CODE
PARENT_ID
PAY_SCALE
PAYSCALE_ID
PAYSCALE_TITLE
IS_DELETED
INIT
INC
FINAL
PER_WORKCENTER
WC_ID
WC_NO
WC_NAME
IS_DELETED
DEPT_ID (FK)
*
Model
Figure - 6. An example of our quality improvement approach
However this defined goal could lead to multiple solutions. To precise the analyst‟s/designer‟s
requirement, we can employ the following questions to narrow the scope yet précising the exact
requirements:
Q1: is ease of change need related to new requirements considerations?
Q2: is ease of change need related to model maintainability?
Q3: is ease of change need related to understandability of the model?
It can be noted from the above questions that Questions 1 and 2 are directly related to change
with respect to incorporating and/or modifying the existing requirements, whereas question 3 is
related to understandability of model that is indirectly related to the ease of change. Thus by
answering to these questions, the direction or domain of the goal can be narrowed to modifiability

Chapter 3: Proposed Solution
75 | P a g e
and/or understandability. The final decision will help the analyst/designer in choosing the
respective quality patterns for evaluation.
In this example, we can see from the Figure - 6 that the analyst/designer is interested in both
aspects of the goal i.e. modifiability and understandability of the model. Thus, only those quality
patterns will be employed for evaluation and improvement that are related to these two aspects of
the model.
3.4 Quality Pattern Meta-Model
Quality patterns can be identified and formulated using the generic and simple quality pattern
meta-model presented in Figure - 7. A Quality pattern uses multiple quality attributes for quality
evaluation. Each of the quality attributes can employ multiple metrics for quantification. These
metrics can be dependent on model type (ER-diagram, class diagram, etc.) or model element
(entities, classes, etc.). For example, “Number of class” metrics can only be applied on the classes
(model element) of UML class diagram (model type). However, similar or equivalent metrics can
be devised for other model elements of different types of model. For example, an equivalent of
“Number of class” metric for ER-diagram would be “Number of entities” metric so on and so
forth.
The strength of our approach lies in the post evaluation feedback in the form of predefined
transformations, textual recommendations and/or appropriate design patterns for improvement.

Chapter 3: Proposed Solution
76 | P a g e
DesignPattern
0..n+Related Patterns0..n
Transformation
QualityMetric
ModelElement
Calculated on
QualityAttribute
0..*0..*
Measures
RecommendationIs applied on
QualityPattern
0..n1..n 0..n1..n
Uses
Related patterns
Suggests
TextualRecommendation
Figure - 7. Quality Pattern Meta-Model
3.5 Quality pattern
From the above quality pattern meta-model (Figure - 7), it can be noted that a quality pattern
can use multiple quality attributes to solve a problem within a context. Similarly, a quality
attribute can be used by multiple quality patterns. A Quality attribute in turn employs multiple
metrics for quantification. All quality attributes are generic and thus remain valid for all model
types. However, the metrics are dependent on elements (classes, entities, etc.) of different
conceptual models (Class diagram, ER-diagram, etc.). For example, “Structural Complexity”
attribute can be used for class diagrams, ER-diagrams, etc. However, the selection of metrics will
depend on model type. In case of class diagram, this attribute will use metrics such as number of
associations, number of aggregations, etc. whereas in case of ER-diagram the metrics will be the
number of identifying relationships, the number of many-to-many relationships, etc.
Based on the results of different metrics, numerous recommendations are proposed for
improvement. These recommendations could be in the form of textual recommendations,
transformations (automatable or non-automatable) and/or design patterns. As visible from the

Chapter 3: Proposed Solution
77 | P a g e
model, a metric can propose multiple recommendations. Similarly a recommendation can be
proposed by multiple metrics.
Quality patterns capitalize the experience and provide an established solution to a recurring
problem. In order to define the structure of quality patterns, we merged the propositions of
[DeLano et al., 1998] and [Gamma et al., 1995] for design patterns and add additional information
for helping the automatic searching. Quality patterns are composed of:
i. Name: A significant name summarizing the pattern objective. The name is very important
as it is used to communicate the usage of the quality pattern to analysts/designers. If the
name doesn‟t clearly identify the quality pattern then it might not be found and employed
by the implementer.
ii. Context: Characterization of the situation in which the pattern applies. The context must
be defined clearly in order to apply the pattern on the situations it is deemed for. Every
quality pattern can‟t be applied to all the situations. Most patterns are specific to a
situation or a class of situations.
iii. Problem: Description of the problem to solve or the challenge to be addressed. Problems
should be mentioned clearly so as to help the implementer in identifying the problems that
can be solved using this pattern. The problem definition is an important part of quality
patterns as it educates the implementers about the types of problems and how such
problems can be solved.
iv. Solution: The recommendation to solve the problem. The solution should be well
explained so that the problem can be rectified with ease by the implementer. If a quality
pattern proposes a better solution for a recurring problem and if the solution is well
defined then it can be deemed that this quality pattern will be employed frequently for
improving the quality.
v. Keywords: A list of keywords related to the pattern content. These sets of words are
included in the quality pattern so as to ease the efficient searching of quality patterns.
Every quality pattern should have relevant, self explanatory and as many keywords as
possible so that the quality pattern be found by the implementer or software utility
efficiently and with ease.
vi. Related Patterns: Patterns that are closely related to the one described. The identification
of related patterns can bring significant improvement in the quality process as the scope
of evaluation can extend after including the relevant related quality patterns to the

Chapter 3: Proposed Solution
78 | P a g e
evaluation process. Similarly, related patterns can also help the implementers in
understanding the different problem dimensions and other types of problems related to the
one they are targeting.
3.5.1 Quality Attributes
Quality attributes can be defined as the group of properties observable over the product
lifecycle [Preiss et al., 2001] or the group of properties of the service delivered by the system to
its users. The service delivered by a system is its behavior as it is perceived by its user(s)
[Barbacci et al., 1995]. Similarly, [SEI, CMU] defined quality attributes to be the benchmarks that
describe system‟s intended behavior within the environment for which it was built. The quality
attributes provide the means for measuring the fitness and suitability of a product. Within system
engineering domain, quality attributes can also be regarded as the non-functional requirements for
evaluating the performance of the system. These attributes are also referred to as “ility” due to
suffix of many of the quality attribute such as “compatibility, extensibility, modifiability, etc.”
[Manola 91] defines "ility" as a characteristic or quality of a system that applies across a set of
functional or system requirements.
There exist numerous definitions of quality attributes specific to different domains and
applications. Similarly, the semantically equivalent concept of term „quality attribute‟ has been
synonymized into different terms such as characteristics (as in ISO-9126, etc.), dimensions,
factors, etc.
Quality attributes provide an abstraction to a set of closely related and similar metrics. In our
approach they are at the second level of abstraction after quality patterns. Different aspects of
conceptual modeling quality are identified and classified into multiple attributes. Each attribute
has to be generic and should remain valid for all types of conceptual models. Thus attributes
related to some specific notation (UML, ER, etc.) can‟t be selected. Different researchers have
placed attributes at different levels of abstraction and thus there exist numerous attributes in the
literature that are specific to a particular notation.
Similarly, the existing work on CM quality has classified the evaluation criteria into
dimensions, attributes and/or metrics. There is a clear distinction between metrics and other
classification categories due to the widely accepted format of metrics. However, there exists a
huge confusion among the definitions of attributes and dimensions. Some researchers have
defined a concept as a dimension whereas some other researchers have used the same definition
and called this concept an attribute. Consider the following table (Table - 7) listing numerous
dimensions proposed by different researchers:

Chapter 3: Proposed Solution
79 | P a g e
Question: What are Quality Attributes?
Answer: Quality attributes are the group of properties observable over the product lifecycle [Preiss et al., 2001] or the group of
properties of the service delivered by the system to its users.
The service delivered by a system is its behavior as it is
perceived by its user(s) [Barbacci et al., 1995]. Similarly,
[SEI, CMU] defined quality attributes to be the benchmarks that
describe system’s intended behavior within the environment for which it was built. Within system engineering domain, quality
attributes can also be regarded as the non-functional
requirements for evaluating the performance of the system. For us
quality attributes provide an abstraction to a set of closely
related and similar metrics relevant to some property or
characteristic of CM evaluation. Every quality attribute must be
generic i.e. it should remain valid for all types of conceptual
models.
Table - 7. Dimensions proposed by researhers
Proposal Dimensions [Bajaj 02] Effectiveness, efficiency, learnability [Unhelkar 05] syntactical correctness, semantic correctness and consistency, and
aesthetics [Moody et al., 2003], [Moody et al., 2000], [Moody et al., 1998]
Flexibility, integration, implementability, correctness, completeness, integrity, simplicity and understandability
[Levitin et al., 1995] Relevance, unambiguous definition, obtainability of value, comprehensiveness, essentialness, attribute granularity, domain precision, naturalness, occurrence identifiability, homogeneity, semantic consistency, structural consistency, robustness, flexibility
[Ballou et al., 1985] Accuracy, timeliness, completeness and consistency [Pipino et al., 2002] Accessibility, appropriate amount of data, believability, completeness,
concise representation, consistent representation, ease of manipulation, free-of-error, interpretability, objectivity, relevancy, reputation, security, timeliness, understandability and value-added
[Wang et al., 1996] Identified four categories, each having multiple dimensions: i. For data accuracy: Dimensions include Accuracy, Objectivity,
Believability and Reputation ii. For data accessibility: Dimensions include Access and Security
iii. For data relevance: Dimensions include Relevancy, Value-Added, Timeliness, Completeness and Amount of data
iv. For data Representation: Dimensions include Interpretability, Ease of understanding, Concise representation and Consistent representation
Chapter 3: Proposed Solution
80 | P a g e
The above mentioned dimensions can be directly quantified employing metrics. For example,
completeness can be easily quantified using metrics such as requirements coverage degree,
semantic completeness, etc. Thus these dimensions are not at the same level of abstraction as
being the quality dimensions/types proposed by [Lindland et al., 1994] (syntactic, semantic,
pragmatic), [Krogstie et al., 1995] (syntactic, semantic, pragmatic, perceived semantic, social) or
[Cherfi et al., 2002a] (specification, usage, implementation), etc.
In our approach, we combine all the dimensions in Table - 7 (and similar dimensions) as
attributes. However, the dimensions proposed by [Lindland et al., 1994], [Krogstie et al., 1995],
[Cherfi et al., 2002a], etc. are not at the same level of abstraction as the above mentioned
dimensions and thus can‟t be considered as attributes. Moreover, these dimensions are just a way
of classifying different criteria.
Similarly, ISO-9126 standard classified the quality criteria into characteristics (such as
maintainability) and sub-characteristics (such as changeability, testability, customizability).
However, these quality characteristics are variously called quality dimensions, factors, principles,
criteria, categories, goals, etc. Curiously, none of the proposals uses the ISO terminology [Moody
05]. In our approach ISO sub-characteristics are equivalent to quality attributes and thus we have
also merged some important concepts from this standard into our attribute set such as
maintainability.
Another problem in the area of CM quality is the presence of independent and autonomous
quality frameworks. These frameworks does not position and contrast themselves with existing
frameworks or use them as basis for extension. Thus the literature on CM quality evaluation is not
converging to a set of agreed concepts and this divergence has resulted in the existence of
multiple definitions for the same concept and different names for semantically same concepts.
[Nelson et al., 2005] have identified different definitions of the same quality concepts e.g. they
have identified nine different definitions for quality attribute “completeness”. Similarly, there
exist numerous definitions for the same quality concept and identical names for some
semantically different metrics [Purao et al., 2003]. Such issues have restricted the adoption of the
existing quality frameworks in practice [Moody 05]. Our approach also incorporates these issues
and includes these concepts as attributes and their different definitions as metrics. For example, as
per our approach completeness is equivalent to a quality attribute and thus we combine all the
definitions of completeness within a single quality attribute named as “completeness” and
formulated different metrics to cater the dissimilar requirements of the existing nine definitions.
Thus, completeness will have different meaning in different contexts.

Chapter 3: Proposed Solution
81 | P a g e
Summing up, a quality attribute in our approach aggregates all the dimensions that are at the
lower level of abstraction (as explained above), attributes, characteristics or sub-characteristics,
criteria, etc. However, all the high level criteria (those that can‟t be directly quantified by metrics
such as specification) are accommodated as goals.
As mentioned in Section 3.1.1, we performed a review and formulated a set of 21 quality
attributes from a thorough literature review and identification of new quality attributes for the
gray areas. We also employed a web-based survey to validate the selection of these quality
attributes from professionals including practitioners. Details about selected attributes and their
definitions can be consulted from Appendix-A, whereas the details about validation can be
consulted from the Chapter 7.
Figure - 8. Quality Attributes
In our model, each attribute has a name and description associated to it. We have also kept the
keywords along with every attribute to help the automatic searching during the implementation
phase (Figure - 8 depicts the structure of a quality attribute). As mentioned above, concepts such
as sub-characteristics, characteristics, factors, properties etc are all quality attributes in our
approach.
Following are some of the selected quality attributes (the details about all the selected
attributes can be consulted from Appendix-A).

Chapter 3: Proposed Solution
82 | P a g e
Name Completeness Description This quality attribute evaluates the model completeness with respect to both
syntactic and semantic completeness. Syntactic completeness relates to the notation used (e.g. verifying that multiplicities are defined for associations in a class diagram). Semantic completeness is related to the coverage of user requirements. It could be checked by verifying conformance between concepts depicted in the conceptual model and the ones expressed by the users through the requirements or even by comparing the concepts appearing in several specifications related to the same reality).
Keywords Completeness, requirements coverage, semantic completeness, syntactic completeness
Name Structural complexity Description This attribute represents the model complexity due to the existence of different
relational elements within the model. These elements can include associations, aggregations, generalizations, dependencies for class diagram and number of transitions, etc. for state diagrams and number of identifying and non identifying relationships, etc. for ER diagrams. This attribute contains several metrics that are proposed in literature and have been tested for their efficacy in model complexity and maintainability.
Keywords Complexity, structural complexity, maintainability
3.5.2 Quality Metrics
Measurements provide data or basis for comparable evaluations to assess the static and
operational qualities of software or application artifacts. Metrics are the measures or evaluation
processes that assign comparable numeric or symbolic values to entities in order to characterize
selected qualities or features of the entities. Each metric has a scope, the set of entities/objects to
which it is applicable; a range, the set of possible measurement results; and the measurable
property or feature or behavior which the measure characterizes. For example, programming code
line count has software applications as one of its scope with line length as one of its measurable
feature. Explicitly representing the scope and the measurable property/feature/behavior allows for
the consideration of different metrics which characterize the same attribute for the same set of
entities. Each measurable property/feature/behavior may have multiple, identifiably distinct
metrics [ADM-OMG, 2009]. Similarly, [SPEM-OMG, 2008] defines metrics to be an instrument
containing one or more constraints to provide measurements for any model element.
Most of the work done in the field of conceptual modeling quality is based on the formulation
or proposition of different sets of metrics. Metrics in conceptual models are the measures of their
properties, features, behaviors, characteristics or other important aspects. It is a specific
instrument that can be used to measure a given quality attribute. There might be several metrics
for the same quality attribute [Bouzeghoub et al., 2004]. Researchers started devising metrics to

Chapter 3: Proposed Solution
83 | P a g e
quantify the impact due to the existence of different properties, characteristics, etc. of models so
that these aspects can be controlled to improve the quality. Some of these metrics can be
calculated automatically whereas some can‟t. In the literature, there exist numerous metrics to
evaluate various types of models such as UML class diagrams, use-case diagrams, ER-diagrams,
etc. Table - 8 lists some of the existing automatable metrics.
Table - 8. Some of the existing automatable metrics
Proposal Target Metrics [Genero et al., 2002a], [Genero et al., 2001b], [Genero et al., 2001c], [Genero et al., 2000b], [Manso et al., 2003]
Complexity for class diagram
Number of Attributes, Number of Methods, Number of Associations, Number of Aggregations, Maximum Depth Inheritance Tree(Max DIT), etc.
[Marchesi 98] Complexity metrics for use case diagram
Number of use cases, Number of communications among use cases and actors, Non-redundant number of communications among use cases and actors
[Marchesi 98] Complexity metrics for class diagram
Number of classes, Number of inheritance hierarchies, Weighted number of responsibilities of a class, etc.
[Rufai 03] Similarity between UML models
Shallow Semantic Similarity Metric (SSSM), Deep Semantic Similarity Metrics (DSSM).
Question: What are Quality Metrics?
Answer: Metrics are the measures or evaluation processes that
assign comparable numeric or symbolic values to entities in order
to characterize selected qualities or features of the entities.
Each metric has a scope, the set of entities/objects to which it
is applicable; a range, the set of possible measurement results;
and the measurable property or feature or behavior which the
measure characterizes. Explicitly representing the scope and the
measurable property/feature/behavior allows for the consideration
of different metrics which characterize the same attribute for
the same set of entities. Metrics in conceptual models are the
measures of their properties, features, behaviors,
characteristics or other important aspects. It is a specific
instrument that can be used to measure a given quality attribute.
A quality attribute can employ multiple metrics to measure
different aspects of CMs.
Similarly, some of the non-automatable metrics include requirements coverage degree, Cross
modeling completeness, documentation degree, user vocabulary rate, etc. [Cherfi et al., 2003a] or

Chapter 3: Proposed Solution
84 | P a g e
aesthetics metrics such as minimization of bends, minimization of edge crossing, orthogonality
[Purchase et al., 2002], [Purchase et al., 2001b], [Purchase et al., 2000].
In our approach, we have used metrics to quantify different quality attributes. We employed
both automatable and non-automatable metrics to measure the different aspects of an attribute.
Based on the values of those metrics, different recommendations can be proposed for
improvement.
Figure - 9. Model for metrics
Figure - 9 presents the formal model for metrics. Each metric has a name, description and
measurement formula associated to it. A Measurement formula represents the algorithm to
compute the metrics. We have also kept the keywords along with every metrics to help the
automatic searching during the implementation phase. It can be seen that every metrics is
calculated on model elements such as classes, entities, attributes, etc. Moreover, our model
proposes the following two types of metrics:
i. Basic Metric: It is an atomic metric i.e. a basic metric is a metric that doesn‟t employ
other metrics for measurement. For example, the metric to calculate “number of classes”
in a class diagram is a basic metric.
ii. Complex Metric: These types of metrics use at least one additional metric for
measurement i.e. a metric depending on other metrics for measurement is a complex
metric. For example, the metric to calculate “number of model elements” in a class
diagram is a complex metric as it is dependent on other metrics such as number of classes,
number of associations, number of association classes, etc. for measurement.

Chapter 3: Proposed Solution
85 | P a g e
Similarly, we classify each of the metrics (basic or complex) to be either automatable, i.e.
those that can be calculated automatically without requiring human input, or non-automatable. For
example, a metric to calculate “number of line crossings” in a class diagram is a non-automatable
metric since we can‟t calculate the line intersections automatically as this information is not
available in the exported model file. Whereas, metrics such “number of classes”, “number of
associations”, etc. can be calculated automatically and are thus automatable metrics.
We have performed a thorough literature review and classified the different concepts into a set
of quality attributes and classified different existing metrics into each of those attributes for
quantification. Similarly, we also identified the grey or left-over areas and thus have also
formulated some new metrics to quantify those left-over areas. Some of the newly formulated
metrics includes the following:
i. Degree of defined multiplicities: This metric calculates the ratio between the total
numbers of defined multiplicities within a model to the total number of associations in a
model.
Let:
X = Number of defined (or existing) multiplicities or
cardinalities;
Y = Number of association links;
Z = Number of composition and aggregation links;
Then:
Z Y *2
X tiesMultiplici Defined of Degree
Range:
Degree of Defined Multiplicities=1, if both ends of the association links, compositions links and aggregation
links are defined.
Degree of Defined Multiplicities=0, if no multiplicities
are defined in the model.
ii. Degree of named associations: If proper naming is assigned to every relationship or
association then it enhances the understandability of the model. This metric calculates the
ratio between the number of named associations and the total associations.

Chapter 3: Proposed Solution
86 | P a g e
Let:
W = Number of named relationships or associations;
X = Number of association links;
Y = Number of association classes;
Z = Number of composition and aggregation links;
Then:
Z Y X
W nsAssociatio Named of Degree
Range:
Degree of Named Associations = 1, if all the association links, compositions links and aggregation links are defined except those association links that have
association classes.
Degree of Named Associations = 0, if no associations are
named in the model.
iii. Technical vocabulary rate: It is based on the assumption that the understandability of a
model will be enhanced if the reader can make easy correspondence between the
modeling elements contained in the conceptual schema and the requirements in the textual
description.
Let:
X = Number of technical labels in the model;
Y = Total number of labels in the model
Then:
Y
X Rate Vocabulary Technical
Range:
Technical Vocabulary Rate = 1, if all the employed labels including the associations names are technical
terms instead of common language terms.
Technical Vocabulary Rate = 0, if all the employed labels are common language terms instead of technical
terms.
iv. Overall model reuse. This metric is adopted from [Basili et al., 1990]. It calculates the
aggregated reuse of the whole model by summing the reuse of every individual concept in
the model. This metric uses the following formula for calculation:

Chapter 3: Proposed Solution
87 | P a g e
Let:
X = Any concept present in the model;
Reuse(X) = Count of all the ancestors of the concept “X” and the concepts inherited by concept “X” I = Number of all the distinct concepts in the model
Then:
)(X Reuse (Model) Reuse I
I
Range:
Overall Model Reuse = ∞, if all the concepts have
multiple ancestors and numerous inherited concepts.
Overall Model Reuse = 0, if none of the concept has any
ancestor or any children.
3.5.3 Recommendations
Quality evaluation is only a step to improve the conceptual models but most of the quality
frameworks focus exclusively on defect detection (quality evaluation) and ignore the defect
correction (quality improvement) aspects. Thus they may help in identifying the problem but the
analysts must rely on themselves for the solution [Moody 05].
Question: What are Recommendations?
Answer: Recommendations are the suggestions,
propositions or corrective advices in the form of text,
transformations or design patterns for improving the
quality of CMs. Analysts/designers can employ the
suggested/proposed recommendations for improving the
quality of CMs as recommendations are dependent on the
evaluation results or more precisely on metrics values.
For many software development approaches and methods, documentation providing
understandable guidance for best practices is more important than precise models [SPEM-OMG,
2008]. SPEM 2.0 combines a guidance mechanism with a process structure. Its architecture
allows associating guidance elements with process structure elements. [SPEM-OMG, 2008]
provides semantics for the following guidance kinds: Checklist, Concept, Estimate, Example,
Guideline, Practice, Report, Reusable Asset, Roadmap, Supporting Material, Template, Term
Definition, etc. Figure - 10 provides the guidance model specified in [SPEM-OMG, 2008].

Chapter 3: Proposed Solution
88 | P a g e
Figure - 10. SPEM 2.0 Guidance Kinds
SPEM 2.0 provides a good mechanism to incorporate the notion of guidance with the process
structure elements. However, all the guidance kinds provide textual descriptions and thus they can
lead to different interpretations. Moreover, some guidance kinds will be beneficial in some
scenarios whereas not so useful in some other. Thus, it can get trickier for an analyst/designer to
identify the best set of guidance kinds for the problem in hand.
Corrective actions (quality improvement) are the essence of our proposed solution. The last
level of our quality aware approach suggests the recommendations for quality improvement. As
quality patterns encapsulated both researcher‟s and practitioner‟s quality practices thus they
provide good solutions to recurring problems.
The recommendations for improvements are dependent on metrics values. Thus upon metrics
calculation, relevant recommendations are proposed to improve the model through a guided
process. These recommendations can be in the form of any of the following three types:
i. Textual recommendations (in the form of descriptions)
ii. Transformations (in the form of rules for improvement)
iii. Design patterns (proposing a recommended solution to a recurring problem)
3.5.3.1 Textual Recommendations
Quality patterns can propose recommendations in the form of textual descriptions for quality
improvement. Textual recommendations are proposed in situations such as:
i. When the domain of the problem can‟t be formalized

Chapter 3: Proposed Solution
89 | P a g e
ii. When the improvement actions can‟t be formalized into step-wise transformations and
require detailed information about the problem and its resolution
For example consider the following problems and their textual recommendations for
resolution:
Problem: Missing Requirements i. Identify all the requirements that are communicated by the user but don‟t exist in the model. ii. Identify the existing concepts that can accommodate the missing requirements. For example,
if date of birth information of an employee is missing then identify if an Employee class exists in the model. If it exists then add this missing requirement within the existing concept.
iii. If existing concepts don‟t exist that can incorporate the missing requirements, then add the new concept(s) to incorporate the missing requirements. For example, if Employee class doesn‟t exist then add this class and then add the date of birth information within the class.
iv. Verify that the model contains all the requirements else post implementation modification will be difficult and expensive.
The following recommendation is applicable only to a class diagram and can be modified for
ER diagram.
Problem: Missing Multiplicities Following steps can be performed: i. Identify proper multiplicities for both ends of the normal associations. ii. Identify proper multiplicities for composition and aggregation relationships.
iii. If a many-to-many relationship exists between two classes/entities, verify that an associating class or entity exists for its resolution.
iv. Multiplicities must not exist for generalizations.
From the above two examples, it can be noticed that the recommendations are dependent on
model types (class diagrams, etc.) and sometimes even model elements (such as classes) as they
are associated to metrics and metrics are calculated on model elements (see quality pattern
model).

Chapter 3: Proposed Solution
90 | P a g e
Figure - 11 Model for textual recommendations
Figure - 11 presents the model for textual recommendations. Each textual recommendation has
a name and description associated to it. Moreover, a textual recommendation can associate
multiple textual recommendations to cater the requirements of a compound recommendation.
Each textual recommendation can have multiple supported documents as references. These
supported documents can help the analyst/designer in understanding the recommendations easily.
Supported documents can be of the following types: checklist, guidelines, examples, publications,
etc. Publications can be either a white paper or a research article publication. We have adopted
this classification of supported documents from [SPEM-OMG, 2008].
3.5.3.2 Transformations
Quality patterns can also propose recommendations in the form of transformations to be
applied on the model for improvement. Some of these transformations can be applied
automatically on the model via a software tool while some can‟t due to complexity or lack of
information about the model elements. For example, a transformation to divide a model in to small
modules can be performed semi-automatically (requiring inputs from analyst/designer) whereas
the transformation to reduce the line crossings within a class diagram can‟t be automated since the
information about line intersections is not necessarily available in the exported model.
Transformations can only be formulated when the domain of the problem and solutions can be
formalized. Following are some of the examples of the transformations recommended through our
approach:

Chapter 3: Proposed Solution
91 | P a g e
Problem: Model complexity due to the existence of numerous objects (classes, attributes, etc.) within a model. In order to reduce the structural and relational complexity within a model, they must be divided into smaller modules. Model division can be done in two ways: Structural Division and Semantic Division. Following transformations can be performed: i. Structural Division is an easier but non-efficient method. Randomly select the model
elements and divide them into multiple modules. But bad selection of elements can lead to low cohesion and high coupling among the resulting modules.
ii. Semantic Division is a difficult but efficient method. Read the model carefully and classify the model elements with respect to some similarity or relationship. For example, classify the elements with respect to common functionality or interdependency. The elements with a common set of goals or functionalities should be grouped together as a module. Such a division will increase the cohesion and reduce the coupling.
iii. Another possible type of division is to identify the complex parts of the model and divide them into multiple modules to reduce the complexity.
The following transformation is applicable only to the class diagrams.
Problem: Complexity in classes If classes are complex due to the existence of numerous attributes or methods within a class, the following transformations can be performed: i. Identify the attributes or functions that are irrelevant within the scope of the class (to increase
cohesion). ii. Try adding these attributes/functions to the existing relevant class.
iii. If no class exists that is relevant for these attributes/functions, then add these attributes and functions in a new class and define the associations.
iv. If all the attributes/functions are relevant to the class then classify them into mandatory and optional and then split the class into two classes one containing all the mandatory attributes/functions and the other containing all the optional attributes/functions.
Figure - 12. Model for transformations
Figure - 12 presents the model for transformations. Each transformation has a name and
description associated to it. A transformation can be composed of multiple steps. These

Chapter 3: Proposed Solution
92 | P a g e
transformation steps can be automatable or non-automatable. A transformation is applied on a
model element.
3.5.3.3 Design patterns
The use of design patterns to improve the software quality has attracted an increasing attention
in the area of software engineering. Design patterns encapsulate valuable knowledge in the form
of an established and recurring solution to resolve design problems to improve design quality
[Hsueha et al., 2008]. A design pattern can be defined as a particular recurring design problem
that arises in specific design contexts, and presents a well-proven generic scheme for its solution
to have a certain level of confidence on the reliability of the solution [Buschmann et al., 1996].
In software engineering, patterns are designed to facilitate reusability and capitalize well
known and agreed practices. [DeLano et al., 1998] and [Gamma et al., 1995] and proposes the
GoF (Gang of Four) and AGCS templates for describing design patterns. Some of the most
commonly employed design patterns include Model-View-Controller (MVC), Façade Pattern,
Proxy pattern, Singleton, Wrapper Pattern, etc.
Similarly, GRASP (General Responsibility Assignment Software Patterns) patterns also
received much attention in object-oriented design as it provides guidelines about assigning
responsibilities to classes and objects. GRASP patterns consists of Information Expert, Creator,
Controller, Low Coupling, High Cohesion, Polymorphism, Pure Fabrication, Indirection and
Protected Variations patterns. There also exist evaluation methodologies to verify the quality of
design patterns such as the ones described in [Chatzigeorgiou et al., 2008] and [Hsueha et al.,
2008].
In addition to textual recommendations and transformations, quality patterns can also propose
design patterns as recommendations for quality improvement. Design patterns provide established
solution to recurring problems. However, employing design patterns for model improvement is a
manual process. Our approach is unique in a way that, on the one hand, it helps in the
identification of relevant design patterns to non-expert analyst/designer as employed by [Berdún
et al., 2008] and, on the other hand, the inherent problem in conceptual model is resolved using
better solutions.
For example consider the following problems and proposed design patterns for their
rectification through our approach:

Chapter 3: Proposed Solution
93 | P a g e
Problem: Complex classes i. Use High Cohesion Pattern to reduce the complexity of the source class. As in-cohesive
classes are inefficient, large and complex. Thus perform the following tasks: a. Assign class the responsibilities related to other responsibilities of the class. b. Find if the class contains methods that this class shouldn‟t be responsible for and
delegate the responsibility of this method to the suitable class.
ii. Use High Polymorphism Pattern to reduce the complexity and increase the cohesion of the class. Following tasks can be performed:
a. Check if a class contains responsibilities that vary by class type. If yes, then these responsibilities should be assigned polymorphically to the specialization classes. For example, different shapes can use overrided polymorphic Draw() function to draw their shapes by themselves instead of one complex generic function to draw all types of shapes.
From the above examples, it can be witnessed that even though the design patterns are
identified and proposed, their application is a manual process and requires knowledge about
design patterns.

Chapter 3: Proposed Solution
94 | P a g e
3.5.4 An example of quality pattern: Model Complexity Quality Pattern
Pattern Name: Model Complexity
Context:
i. To check the overall complexity of the model with respect to the number of instances of
different elements (number of classes/entities/attributes etc) present in the model. This
pattern is suitable for models containing numerous elements.
Problem:
i. Sometimes models contain several classes/entities/uses-cases, etc. This can hamper the
understandability of the model. Miller ("The Magical Number Seven, Plus or Minus Two:
Some Limits on Our Capacity for Processing Information", 1956) proved that adults can
hold 7 ± 2 objects in their working memory.
ii. Similarly, the existence of numerous elements can induce complexity.
iii. This induced complexity can hamper the maintainability as complex models are difficult
to maintain.
iv. Calculate the following metrics (following metrics are applicable to class diagrams only)
to check if this pattern is relevant for the current problems of the model:
a. Number of Classes: Total number of classes in a model.
b. Number of Attributes: Total number of attributes in a model.
c. Number of Methods: Total number of methods or functions in a model.
d. Number of cycles: Total number of cycles within a model.
e. Degree of non-redundancy: This metric calculates the ratio between the non-
redundant concepts and the total concepts present in the model.
f. Number of Associations: Total number of associations in a model.
g. Number of Aggregations: It calculates the number of aggregation relationships within
a class diagram.
h. Number of Compositions: It calculates the number of composition relationships
within a class diagram.
i. Number of Generalizations: It calculates the total number of generalization
relationships in a model.

Chapter 3: Proposed Solution
95 | P a g e
j. Depth Inheritance Tree: It calculates the longest path from the class to the root of the
hierarchy in a generalization hierarchy.
Solution:
i. Models can be made simpler if they are divided into small independent modules, each one
with a limited number of concepts and functionalities.
ii. Following transformations can be employed for improvement (details about
transformations are on the next page):
a. Remove redundant elements
b. Factorize associations to remove redundant associations
c. Divide the model
d. Merge classes
e. Divide a class
iii. The following design pattern can be employed to improve the quality of the model
(details about transformations are on the next page):
a. GRASP high cohesion pattern
b. GRASP polymorphism pattern
Keywords: Complexity; Maintainability; Modify; Understandability; Size; Number of
classes/entities, etc.; Number of concepts; Number of attributes;
Related patterns:
i. Model Maintainability (Complex models are difficult to maintain)
ii. Model clarity (models containing numerous elements can be difficult to read)

Chapter 3: Proposed Solution
96 | P a g e
3.5.4.1 Details about Textual Recommendations/Transformation/Design Patterns
a. Remove redundant elements
i. Check the model to identify redundant elements such as classes, associations etc
that have the same names or are semantically equivalent.
ii. Remove the redundant elements in a way that no information is lost.
iii. Similarly, if two associations have the same names then verify if they can be
factorized.
iv. For example: In the following model, there are four classes representing different
types of doctors (Practitioner, IndependentConsultant, Researcher and
PractitionerResearcher). Since there is no generalization, therefore there are
multiple redundant associations (three redundant association classes named as
“Prescription”, three redundant associations named as “Details” and two redundant
associations named as “Attached”). However, if a generalization is introduced for
these four types of doctors then the redundant associations can be removed.
Researcher
DoctorName
Address
Speciality
Laboratory
LabName
1
1..*
1
1..*
Research
Service
ServiceName
Practitioner
DoctorName
Address
Speciality1..*1 1..*1
Attached
PractitionerResearcher
DoctorName
Address
Speciality
1
1..*
1
1..*
Research Attached
Hospital
Name
Address
0..*0..*
has lab
1..*1..*
has service
IndependantConsultant
DoctorName
Address
Speciality
1 0..*1 0..*Works
Patient
PatientName
Address
0..*
1..*
0..*
1..*
Prescription
0..* 1..*0..* 1..*
Prescription
0..*
1..*
0..*
1..*
Prescription
Drug
DrugName
PrescriptionDate
PrescriptionDate
PrescriptionDate
PrescriptionDetail
Frequency
Duration1 0..*1 0..*
Prescribe
1..*1..*
Details1..*1..*
Details
1..*1..*
Details

Chapter 3: Proposed Solution
97 | P a g e
b. Factorize associations to remove redundant associations
i. Check the model to identify same or redundant associations for example
associating having same name.
ii. Now if these associations are within the same level of hierarchy and are present for
all the classes of that hierarchy then this association can be moved up in the
hierarchy i.e. to the parent class.
iii. For example, if Lecturer and Professor have the same relationship with course and
since they are the only two children of their parent thus this association can be
taken up in the hierarchy i.e. we can remove these two associations and instead
relate Teacher with Course (See the model below).
c. Divide the model
i. Model division can be done in two ways: Structural Division and Semantic
Division
ii. Structural division is an easier but non-efficient method. It randomly selects the
model elements and divides them into multiple modules. But bad selection of
elements can lead to low cohesion and high coupling among the resulting modules.
iii. Semantic division is a difficult but efficient method. Read the model carefully and
classify the model elements with respect to some similarity or relationship. For
example, classify the elements with respect to common functionality or
interdependency. The elements with a common set of goals or functionalities
should be grouped together as a module. Such division will increase the cohesion
and reduce the coupling.
iv. Identify if the model contains functionalities or concepts that can be grouped
together or if the model represents two separable modules. If yes then divide them

Chapter 3: Proposed Solution
98 | P a g e
into individual modules. For example: if the model contains concepts to manage the
sale of items and also contains information about the security of the application
then they clearly represent two different modules and thus they can be split into two
modules, one for sale of items and the other for application security.
v. Another possible type of division is to identify the complex parts of the model and
divide them into multiple modules to reduce the complexity.
d. Merge Classes
i. Concepts with similar functionalities can be merged as one or can be removed to
reduce redundant concepts.
ii. Sort all the relevant and related attributes/functions among different classes.
iii. Package related attributes and functions within the same class to increase cohesion.
e. Divide a class if it contains numerous attributes and methods
i. If there are numerous attributes within a single class then perform the following
steps:
a. Identify the attributes or functions that are irrelevant within the scope of the class
(to increase cohesion).
b. Try adding these attributes/functions to the existing relevant class.
c. If no class exists that is relevant for these attributes/functions, then add these
attributes and functions in a new class and define the associations.
d. If all the attributes/functions are relevant to the class then classify them into
obligatory and optional and then split the class into two classes one containing all
the mandatory attributes/functions and the other containing all the optional
attributes/functions.
The following design pattern can be employed to improve the quality of the model:
f. GRASP high cohesion pattern
i. Classes must be identified with care such that all the relevant attributes and
functions must be packaged within the same class.

Chapter 3: Proposed Solution
99 | P a g e
ii. Verify that a class contains all the related responsibilities. For example, if a sale
contains multiple items then the total of the sale should be calculated by the class
sale and not by SalesLineItem class. So check and delegate the responsibilities to
the concerned class only (See the figure below).
iii. Incohesive classes are complex to manage and implement
Give this class the responsibility
to get sales total.
This class has a simple
responsibility to return the price.
This class should be responsible to calculate the
total of the line item i.e. it should get the price and
calculate the line total.
Sale
Date
Time
Product
ProductID
Description
Price
SalesLineItem
Quantity
1
1..*
1
1..*
Contains
11..* 11..*
Described by
g. GRASP polymorphism pattern
i. When related behaviors vary by class type then the responsibilities should be
assigned polymorphically to the specialization classes. Polymorphism Pattern
increases the cohesion.
ii. Identify all the hierarchies in the model.
iii. Within each hierarchy, identify if a parent class implements a method that could
have different implementations for its children. If yes, then this method should be
assigned to all the specialized classes to reduce the complexity of the class.
iv. For example, different shapes can use overrided polymorphic Draw() function to
draw their shape by themselves instead of one complex generic function to draw all
types of shapes.

Chapter 3: Proposed Solution
100 | P a g e
Draw() function implemented
by the parent and thus will be
complex.
By polymorphism each shape
implements its own Draw()
function and thus the
implementation is simple
3.6 Conclusion
In this chapter, we presented our proposed solution to evaluate and improve the conceptual
models. We define the employed theoretical, practical and epistemological foundations for
formulating multi-faceted quality approach. Next, we describe each component of our quality
model such as goal, questions and quality patterns. We adopted [Basili 93], [Basili 92], [Basili et
al., 1988] propositions to help the analysts/designer in formulating structured goal with least
efforts. One of our major contributions includes the identification of quality patterns to guide the
evaluation and improvement of CMs. Therefore we presented the concept of quality patterns in
details along with all of its components such as quality attributes, metrics and recommendations.
Lastly we include a complete quality pattern along with all the relevant details as an example.
In the next chapter, we present the quality driven development process (Q2dP). We describe
different processes involved in the identification/creation of the quality concepts such as the
processes to identify new quality patterns, quality attributes and metrics. Similarly, we also
describe the complete evaluation and improvement process for CMs starting from the formulation
of analysts/designer specific quality goals to the evaluation of the CMs and finally to the
recommendations/propositions for quality improvement.

Chapter 4: Quality Driven Development Process (Q2dP)
101 | P a g e
Chapter 4
Quality Driven Development Process
(Q2dP)
4.1 Introduction
In preceding chapter, we presented our approach for quality evaluation and improvement of
conceptual models. The presented concepts could be seen as a set of methodological tools able to
help analysts and designers in evaluating the quality of their models and even its improvement.
However these concepts require:
i. Expertise for efficient usage
ii. Efforts for selecting a suitable or a set of suitable concepts such as quality pattern, quality
attribute or metric
iii. Experience for selecting the relevant concepts under the given situation
Indeed, as the concept of quality is considered as a non-functional goal, the existing
development processes and methods do not explicitly consider the quality during the early stages.
However, it is widely agreed that mastering quality during the early stages affects, heavily, the
quality of the final system. This explains the efforts devoted to the development of good practices
(Unified Process (UP) [Jacobson et al., 1999], [Kruchten 00], [Larman 97]; design patterns
[Buschmann et al., 1996], [DeLano et al., 1998], [Gamma et al., 1995], [Hsueha et al., 2008]).
We propose to integrate quality as part of the development process. Indeed, we believe that if
developers are delegated the sole responsibility of the quality management, we cannot be sure if it
is done rigorously and thus we have no guarantee on the quality of the obtained results. This
chapter aims to propose a quality driven development process (Q2dP). Our approach could be
seen as a transplantation operation with an aim to relocate quality concerns to the existing
development processes at a much earlier stage. The approach is illustrated by Figure - 13.

Chapter 4: Quality Driven Development Process (Q2dP)
102 | P a g e
Figure - 13. A quality driven development process
The process encompasses two important phases: the quality vision development and the
quality vision application.
The definition of quality concepts is a hard task requiring high level expertise in quality
management. To guide this activity, our approach proposes a set of methodological tools to assist
the quality expert:
i. A quality meta-model presented in Chapter 3.
ii. A set of structured processes for quality concepts definition (detailed in this chapter).
iii. A knowledge base containing predefined quality concepts and their explanations (detailed
in Chapter 6).
iv. And the trace of previous quality guided IS developments as an input for quality vision
adjustment and/or correction. Indeed, we believe that the best validation of the concepts
and of the whole approach requires its application on several case studies and the analysis
of the reaction analysts.
The deliverable of this phase is the set of quality concepts (patterns, attributes, metrics and
recommendations) that are used by the second phase devoted to a quality driven IS development
process detailed in Section-4.3 of this chapter.

Chapter 4: Quality Driven Development Process (Q2dP)
103 | P a g e
4.2 Constructing a Quality vision
As mentioned in Chapter 3, our quality vision encompasses quality concepts such as quality
patterns, quality attributes and metrics. The identification of these concepts requires expertise and
knowledge about quality in conceptual models. However, we proposed a set of processes to
identify new quality patterns, attributes and metrics to guide the quality experts. These processes
are formulated with intent to formalize the identification of these quality concepts. The
subsequent sub-sections describe processes to identify different quality concepts.
4.2.1 Identifying New Quality Pattern
Our quality approach is based on the concept of quality patterns. Quality patterns incorporate
the guidance process for quality evaluation and improvement of conceptual models. However,
identification of quality patterns remains a highly skilled and difficult task. Similar to design
patterns, quality patterns are also identified for recurring problems and tend to propose better
solutions.
Figure - 14. Process to Identify New Quality Patterns
Despite the difficulties in identifying new quality patterns, we intend to help the quality
experts by proposing the following process (depicted as Figure - 14):

Chapter 4: Quality Driven Development Process (Q2dP)
104 | P a g e
i. Quality patterns are identified for recurring problems. Thus, if the problem is recurring
then a quality pattern should be identified. For example, complexity in conceptual models
is a frequent and common problem. Most of the time complexity exists due to the
numerous model elements within a single model depicting a pattern of common and
repetitive problems and so quality pattern can be identified for this problem.
ii. Once the problem is identified, it is important to determine if a solution (in the form of
quality attribute, metrics or recommendations) can be drawn for this problem. If a
solution can‟t be proposed then a quality pattern can‟t be identified as a quality pattern
must propose a solution.
iii. After the above two initial checks, the detailed problem statement and the context of the
quality pattern should be identified.
iv. Respective quality attributes must then be identified to solve the problem. For example, in
case of complexity, quality attributes such as structural complexity can be used to solve
the problem.
v. Once the quality attributes are identified for the quality pattern, it is important to present
the solution. Our proposed quality approach presents the results in two parts: in the first
part, the evaluation results are presented and in the second part recommendations are
presented to rectify/resolve the problem.
4.2.2 Identifying New Attributes
As mentioned in Chapter 3, quality attributes in our approach stands as a single concept
incorporating the existing classification terminologies such as dimensions, attributes,
characteristics, sub-characteristics, criteria, properties, etc. Different aspects of conceptual
modeling quality are identified and classified into attributes. Each attribute has to be generic and
should remain valid for all types of conceptual models. Thus, attributes related to some specific
notation (UML, ER, etc.) can‟t be selected. Different researchers have placed attributes at
different levels of abstraction and thus there exists numerous attributes in the literature that are
specific to a particular notation only.

Chapter 4: Quality Driven Development Process (Q2dP)
105 | P a g e
Figure - 15. Process to identify new quality attributes
In our approach, the selection of quality concept (existing or new) as quality attribute must
adhere to the following process (depicted as Figure - 15):
i. The concept (or candidate criterion) should be verified if it is a metric or not. A metric is
a measure of a particular property or characteristics of the CM. Thus, if the candidate
concept is a measurement criterion or a formula then it is a metric and it can‟t become an
attribute as quality attribute is a higher level concept. For example, Cohesion can‟t be
identified as an attribute since it is a measure to calculate the relatedness of various
responsibilities of the class or a module.
ii. If the candidate criterion is not a metric then verify if this criterion is valid for all types of
conceptual models i.e. it is not limited to a certain notation such as class diagram or ER-
diagram. For example, data completeness can‟t be selected as a quality attribute, despite
the fact that it is not a metric, since it is valid for data models only and is invalid for other
conceptual models such as sequence diagrams, state diagrams, etc.
iii. If the candidate criterion is not a metric and is valid for all types of conceptual models
then it should be verified that a similar or semantic equivalent concept doesn‟t exist as an

Chapter 4: Quality Driven Development Process (Q2dP)
106 | P a g e
attribute. This check is important in ensuring that different attributes for semantically
equivalent concepts must not exist. For example, correctness of requirements, correctness
of syntax, and correctness of domain are three different definitions of similar concept
Correctness. Thus, there should be just one quality attribute Correctness while its different
definitions should be incorporated through different measures or metrics.
4.2.3 Formulating Metrics to Measure Quality Attribute
Quality attributes provides an abstraction to a set of closely related and similar metrics.
Moreover, semantically close concepts are grouped within a same quality attribute. Thus their
differences must be incorporated by enhancing the domain/definition of the attribute and/or by
formulating corresponding metrics. For example, in case of correctness of requirements,
correctness of syntax, and correctness of domain, we merged these concepts into one quality
attribute as Correctness. Thus, the domain/definition of Correctness attribute should incorporate
the above mentioned three types of correctness. Moreover, corresponding metrics should be
formulated to measure the respective aspects related to each of the three concepts.
In our approach, quality attributes are associated to a set of metrics for measurement. These
metrics could vary with respect to different types of conceptual models and different model
elements within the same model type. For example, in case of correctness, there will be a set of
metrics to ensure the syntactic correctness of class diagrams and a different set of metrics for ER-
Diagrams as the syntactic requirements are different for both types of models.

Chapter 4: Quality Driven Development Process (Q2dP)
107 | P a g e
Figure - 16. Process to formulate metrics for measuring quality attributes
In order to identify new metrics or to associate existing metrics to a quality attribute, we
propose the following process (depicted as Figure - 16):
i. Domain or definition of the quality attribute must be identified clearly. For example, in
the case of three types of correctness, the domain/definition of correctness should
encompass the requirements of all the three types.
ii. All the concerned model elements (such as classes, associations, entities, etc.) should be
identified for the concerned model type (Class diagram, ER-diagram, etc.). For example
in the case of a quality attribute Complexity, researchers have formulated different
metrics for model elements such as classes, associations, entities, etc. Similarly for other
quality attributes, concerned model elements can be identified for measurement.
iii. Once the model elements are identified, corresponding metrics can be formulated within
the domain/definition of the quality attribute. For example, in case of Complexity quality
attribute, following metrics were proposed by researchers for class diagrams: number of
Classes, number of associations, etc. It can be noted that these metrics depend on model

Chapter 4: Quality Driven Development Process (Q2dP)
108 | P a g e
elements i.e. in this case these metrics are applicable only to class diagram whereas
Complexity quality attribute is valid for all types of conceptual models. Thus, metrics
should be formulated for model elements of other model types such as ER-diagram. For
example the metrics related to the structural complexity of ER-diagrams could include
number of entities, number of relationships, etc.
iv. Once the metric is formulated, it must be associated to the target quality attribute for the
concerned model type.
4.3 Applying a quality vision
It can be witnessed from Figure - 17, that our proposed process can be integrated to any
development process. Our process is generic and thus can be applied to any level of development
cycle. However, their adoption requires expertise and thus must be managed by quality experts.
This customization results in the selection of suitable quality concepts leading to a more effective
quality guidance. The implementation of Q2dP helps the IS analysts in guiding their development
process in a quality aware way.
Figure - 17. Quality Driven Development Process (Q2dP): Roles and Aims
The proposed generic quality process has two main characteristics:
i. It could be applied on any IS development step as it is generic.
IS Analyst
The generic Process
A development process
Integration Q dP Customizes
The generic process
A Development process
Integration Q2dp
Method Engineer
and/or
Quality Expert
Guides

Chapter 4: Quality Driven Development Process (Q2dP)
109 | P a g e
ii. It is flexible. The quality expert responsible for integration decides about the quality
concepts to be used and even how and when to refer to them.
4.3.1 The Generic Quality Process
Our quality driven process encompasses methods and techniques to evaluate and improve the
conceptual models with respect to a specific quality goal. As mentioned in the previous chapter,
we employ a widely accepted GQM approach, with a slight modification as we map the
formulated quality goals to quality criteria that are at a higher level of abstraction then metrics.
We propose designer/analysts to formulate quality goals in a structured way but still some goals
can be vague and complex. Thus we use questions, as proposed by GQM, to transform these goals
into more concrete statements. These questions also help in narrowing the domain of the
evaluation and map goals to quality criteria. In our process, goals are translated either into quality
patterns or quality attributes through questions. These quality patterns and quality attributes are at
the higher level of abstraction and are responsible for finding answers to the questions raised in
the goal.
Our proposed quality driven process aims at helping the achievement of a quality goal
formulated by an IS designer and encompasses the following steps (as depicted in Figure - 18,
details about each step are included later in the chapter):
i. The process starts with the formulation of a quality goal (by the IS designer). We employ
the goal formulating templates proposed in [Basili 93] to help the user in formulating
their goals with a least amount of efforts in a structured way. For example, a user is
interested in evaluating a conceptual model with respect to the ease with which it could be
changed. Thus, the quality goal in this case is modifiability with it being the perspective
or focus of the goal (refer to goal formulation Section-3.2.1)
ii. As our approach employs GQM, therefore questions are used to translate the formulated
goals into relevant evaluation criteria.
iii. These questions help mapping the goal to quality patterns or quality attributes. Thus, once
the goal is formulated, different questions are asked from the user to help its translation
into the relevant evaluation criteria. If no relevant quality criteria could be identified then
the goal should be modified.
iv. The next step involves the identification of quality attributes as we only have a limited set
of quality patterns for recurring problems. Thus if relevant quality attributes exist, then
they are selected.

Chapter 4: Quality Driven Development Process (Q2dP)
110 | P a g e
v. Target conceptual model is evaluated employing the selected quality patterns and quality
attributes.
vi. The interpretation of quality patterns and quality attributes propose a set of
recommendations leading to the improvement of the CM according to the formulated
quality goal.
vii. These recommendations can propose to use an existing domain ontology for rectifying
particular set of problems. For example in order to reduce model complexity, one of the
recommendations includes the division of the model into multiple smaller modules. Thus
in order to divide the model, the usage of some existing domain ontology can help
implementing the recommendations by identifying different clusters or modules from the
model. One example using domain ontology during our approach is demonstrated in the
next chapter (Section-5.6.2.4)
viii. However, in our approach a goal can be composed of multiple sub-goals or a hierarchy of
goals. Thus the same approach, above mentioned, will be followed for all the sub-goals.
Figure - 18. Quality Pattern Driven Process Workflow

Chapter 4: Quality Driven Development Process (Q2dP)
111 | P a g e
4.3.1.1 Defining a Quality Goal
As mentioned in the previous chapter, quality goal is the objective desired by a user to attain
the object of interest. Quality goals may be defined for any object (such as products, processes,
resources, etc.), for a variety of reasons (such as characterization, evaluation, prediction,
motivation, improvement, etc.), with respect to various quality models (such as cost, correctness,
defect removal, changes, etc.), from various points of views (such as analysts, managers, users,
etc.). Thus we employ the goal formulating templates proposed in [Basili 93] to help the user in
formulating their goals with least amount of efforts in a structured way. This structured process
will enable users to clearly identify the purpose, motivation, perspective and point of view behind
every quality goal. Moreover, this structured goal formulation process will reduce the vagueness
in goal statements written in natural language by the users.
Goal Structure
IS Analyst
Quality expert
Formulate a Quality Goal
Refine a Quality Goal
Glossary
Refined Quality GoalVocabulary Terms
IS Analyst
Quality expert
Formulate a Quality Goal
Refine a Quality Goal
Goal taxonomies
Figure - 19. “Define a Quality Goal” Work definition
In order to formulate a quality goal, we propose to use a set of artifacts such as goal structure
artifact, glossary artifact and goal taxonomy artifact.
4.3.1.1.1 Goal Structure Artifact
[Basili 93] suggests expressing measurement goals using five facets of information. Each goal
statement explicitly contains these facets. We adopt these facets as per our approach for
conceptual models:
Chapter 4: Quality Driven Development Process (Q2dP)
112 | P a g e
i. Object: The product or process under study; e.g., analysis class model, use case model.
For example consider the quality goal to evaluate the modifiability of conceptual models,
within this goal the object of analysis is conceptual model.
ii. Purpose: Motivation behind the goal (i.e. why we formulate this goal); e.g., better
understanding, better change consideration. For example in a quality goal to evaluate the
modifiability of conceptual models, the motivation of analysis is evaluation.
iii. Focus: The quality attribute of the object under study (what); e.g., correctness, defect
removal, changes, effectiveness, etc. For example the perspective of the above mentioned
goal is to focus on the modifiability of conceptual model.
iv. Viewpoint: Perspective of the goal (who‟s viewpoint); e.g., project manager,
programmer, analyst, customer. In the above mentioned goal the target viewpoint is not
mentioned. However within the context of conceptual modeling evaluations, the target
point of view is that of analysts/designers. However, a goal can be composed of multiple
perspectives or can focus on multiple aspects of quality. For example a quality goal “to
analyze conceptual model for evaluating correctness, completeness and modifiability”
represents three different perspectives or may be decomposed in three different sub-goals.
Our approach encompasses such complex goals and users have the possibility to define
multiple perspectives or sub-goals with one goal. However, within one goal the object of
analysis (such as conceptual models, processes, etc.) and the target point of view (users,
analysts, etc.) will remain the same while different motives (evaluation, prediction, etc.)
and perspectives (completeness, correctness, etc.) can be defined.
v. Environment: Context or scope of the measurement program; e.g., project X
4.3.1.1.2 The Glossary Artifact
The Glossary gathers predefined terms useful for quality goals expression. These terms
correspond to the five facets used for goals expression. They are collected from literature and are
organized in a way to help expression of quality goals within a given context.

Chapter 4: Quality Driven Development Process (Q2dP)
113 | P a g e
Object
• class analysis model,•use case requirementsmodel,•…
ObjectObject
• class analysis model,•use case requirementsmodel,•…
Focus
• correctness, • defect,• change, • effectiveness•…
FocusFocus
• correctness, • defect,• change, • effectiveness•…
Purpose
• understanding, • reducing,• improving,•…
PurposePurpose
• understanding, • reducing,• improving,•…
Viewpoint
• project manager, • programmer,• analyst, • customer•…
ViewpointViewpoint
• project manager, • programmer,• analyst, • customer•…
Figure - 20. An Extract from the Glossary
During the goal expression, the glossary content is used to suggest suitable terms. This doesn‟t
mean that only glossary terms are allowed, the analyst/ quality expert can use his/her own terms.
4.3.1.1.3 Goal Taxonomies Artifact
The refinement of a goal aims to precise abstract and high level goals allowing matching with
quality patterns, attributes and/or metrics. The refinement process is usually complex and needs to
be helped. This guidance is provided in our approach by questions exploring the “Why” of the
initial goal. The answer to this question could be assisted by assets of quality goal taxonomies
constructed from several sources: quality standards, quality attributes and factors definition, etc.
For example, for evaluating the functionality of conceptual models we have built the following
taxonomy:
Functionality
Completeness Practicability ReusabilityExpressiveness ReliabilityRelevancy to
Requirements
Functionality consists of the set of attributes responsible for evaluating the model quality
based on functional aspects. These attributes are, directly or indirectly, related to the functional
quality of the future product and address issues that could lead to functional changes in the final

Chapter 4: Quality Driven Development Process (Q2dP)
114 | P a g e
product. Furthermore, these attributes tries to identify the key problems that can hamper the
functionality of the final product.
Completeness: This attribute is based on the coverage of user requirements. It evaluates the
quality by comparing the conformance between concepts depicted in the conceptual model and
the ones expressed by the users through the requirements. Furthermore, this attribute can be used
to compare completeness among several schemas modeling the same reality. A schema is
considered complete if it covers all the modeling elements present in other schemas representing
the same reality. This attribute can use collaboration patterns [Bolloju 04] to enhance the chances
of model completeness. Moreover, this attribute can also evaluate whether the number of concepts
present in the model corresponds to the number of concepts demanded by the user in their
requirements.
Reusability: This attribute has been widely recognized and appreciated in the Object Oriented
Paradigm. Reusability is considered as a major opportunity for improving quality and productivity
of systems development [Thiagarajan et al., 1994]. We choose this attribute to evaluate the quality
of the model in twofold: First, to check whether the model employs the previously developed
models (e.g. use of existing modules) and secondly to check whether this model can be reused in
future (for example to check if this model is specific or generic). Such an attribute can take into
consideration the use of collaboration patterns to reduce the chances of errors [Bolloju 04] and
will help in speeding up the process of modeling. Some studies suggest that reusability is feasible
only if planned at the design stage because of loss of generalizability at subsequent stages
[Thiagarajan et al., 1994]. Reusability is important in our model since it enhances the system‟s
functional reliability since the reused component/module has been tested multiple times; therefore
errors and deficiencies would have been rectified during its maturity cycle.
Relevancy to requirements: This attribute is different from “Completeness” in a way that it is
employed for finding the relevancy between the concepts present in the model and the ones
required by the users. It will help in removing the irrelevant concepts from the model; thus it will
implicitly affect the complexity and functionality dimensions.
Practicability: This attribute is based on the notion of feasibility of the model. It ver ifies whether
the model employs concepts or elements that are realistic and can be materialized. For example,
there can be some models that require unprocurable sophisticated technology for implementation.
Reliability: A system is reliable if it is not prone to failure. It is important to consider this attribute
at the conceptual level as a failure could be a hardware or a software failure. The software failures
are generally caused by errors that could result from analysis decisions. Consequently, designers
Chapter 4: Quality Driven Development Process (Q2dP)
115 | P a g e
must design reliability in the system by reusing reliable components, designing integrity
constraints to ensure data integrity, facilitating its testability, etc.
Expressiveness: This attribute evaluates the expressiveness of a model. A model is expressive if it
represents users‟ requirements in a natural way and is understandable without additional
explanation. This attribute evaluates whether the employed concepts are expressive enough to
capture the main aspects of the reality. E.g. an inheritance link is more expressive than an
association. So the more expressive concepts are used, the more the schema will be expressive.
Furthermore, this attribute evaluates the expressiveness by validating whether the existing
notations are used to increase the expressiveness or not. For example, it can verify whether the
cardinalities are defined in a model or not.
4.3.1.1.4 Refining Quality Goals
Our approach is based on GQM. Thus we employ questions to help users in narrowing the
scope of their goals yet specifying its domain and increasing the details about it. Sometimes goals
contain vague statements that are difficult to interpret. It may be due to the fact that perhaps users
were unable to clearly translate their requirements into goal statements or may be users are
unaware of the proper aspects of the quality in which they are interested in. For example, consider
a user interested in evaluating the easiness with which a model can be changed. Thus he/she is
interested in modifiability of the model. Similarly, there are multiple factors that are involved in
modifiability of the models such as understandability, complexity, modularity, etc. So it gets
difficult from the goal statements alone to identify the factor that are important to user. For
example, is the user interested in complexity or modularity or understandability or any two or all
of the three factors? Thus if we simply try to map this goal onto evaluation criteria then perhaps
our perceived domain of the goal might be narrow or might not be in the right path. However,
usage of questions can clarify the motives behind the goal. Thus asking users relevant questions at
this stage will help us in reducing the gap between our perception of the goal and the requirements
of the user. In addition to this, relevant questions will also enable us to clearly define or border the
domain of the goal along with identifying the relevant quality criteria with respect to the
formulated goal. This process is illustrated in Figure - 21.

Chapter 4: Quality Driven Development Process (Q2dP)
116 | P a g e
Figure - 21. Mapping Goals to Relevant Evaluation Criteria (through Questions)
Questions are used to refine the quality goal. We employ the perspective or focus from the
formulated quality goal to generate questions. We have proposed a structured way to formulate
quality goals (refer to Section-4.3.1.1) and perspectives or focus from such goals can be easily
identified. For example, perspective or focus of the goal could be correctness, effectiveness,
modifiability, defect removals, changes, etc. Questions are generated under the following
scenarios:
i. When relevant quality patterns (with respect to perspective or focus of the goal) exist,
generate questions for all the relevant quality patterns and their related quality patterns.
ii. When relevant quality attributes (with respect to perspective or focus of the goal) exist but
relevant quality patterns couldn‟t be identified, generate questions for quality patterns
employing these quality attributes.

Chapter 4: Quality Driven Development Process (Q2dP)
117 | P a g e
iii. When neither relevant quality patterns nor quality attributes exist. This implies that the
goal is difficult to refine employing the defined perspective or focus alone. Thus
questions must be generated for all the problems solved by all the existing quality patterns
so as to help the user in relating his goal with the existing quality evaluation criteria.
However, heuristics can be used to order the quality patterns for formulating questions.
4.3.1.2 Identifying Quality Patterns
Quality patterns can be identified either through the formulated quality goal (goal guided) or
quality experts, having in-depth knowledge about evaluation criteria including quality patterns,
can directly identify and employ the patterns for evaluation (pattern guided). Pattern guided
evaluation process is not complex. Quality experts manually select and employ the relevant
quality patterns that they think are important for them. However in a goal guided process,
identification of relevant quality patterns is linked to the refining of quality goals through
questions. Quality goals are mapped to quality patterns for evaluation and improvement.
Identification of quality patterns is possible through the following three ways (Figure - 22):
4.3.1.2.1 Direct identification:
i. Select the perspective/focus of the goal.
ii. Search the selected perspective/focus in existing quality patterns to identify the relevant
quality patterns.
iii. Select all the identified quality patterns along with all of their related quality patterns.
iv. For ensuring the consistency between the quality goal and the identified quality patterns,
generate questions about every identified quality pattern and all quality patterns that are
related to them (quality patterns are related to each other) and query the user.

Chapter 4: Quality Driven Development Process (Q2dP)
118 | P a g e
Figure - 22. Process to Identify Quality patterns
4.3.1.2.2 Indirect identification via quality attributes:
i. If no relevant quality patterns are identified then search the relevant quality attributes
using the selected perspective/focus (described in the next sub-section).
ii. For all the identified quality attributes, select the quality patterns employing those quality
attributes.
iii. Also select all the related quality patterns of the selected quality patterns.
iv. Generate questions regarding every identified and all of their related quality patterns.
4.3.1.2.3 Assisted identification via user:

Chapter 4: Quality Driven Development Process (Q2dP)
119 | P a g e
i. If neither relevant quality patterns nor quality attributes are identified, then generate
questions about all the problems solved by all the existing quality patterns and query user.
ii. Identify the relevant quality patterns with respect to users‟ response to questions.
4.3.1.3 Identifying Quality Attributes
Similar to the identification of quality patterns, there are two ways to identify relevant quality
attributes:
i. Direct selection of quality attributes (quality attribute guided). It can only be employed by
quality experts as it requires in-depth knowledge about the quality attributes. Quality
experts manually select and employ the quality attributes on their discretion for
evaluation.
ii. Through the selected quality patterns since quality patterns are linked to quality attributes.
Once the relevant quality patterns are identified via the process mentioned in the previous
sub-section, different quality attributes are employed by the selected quality patterns for
evaluation.
4.3.1.4 Evaluate Quality
As described in the Chapter 3, quality attributes employ multiple metrics for evaluating the
quality of the conceptual models. Once quality attributes are identified (following the above
mentioned process), the following process (illustrated in Figure - 23) can be employed to evaluate
quality:
i. Select all the identified quality attributes.
ii. Select all the associated metrics with respect to the target model type such as class
diagram, etc. This includes all types of metrics such as basic/complex or
automatable/non-automatable metrics.
iii. Employ the metrics formulae to evaluate desired aspects of quality.
iv. Identify all the relevant recommendations based on measurement results.
v. Present the computed metrics results
vi. Propose recommendations

Chapter 4: Quality Driven Development Process (Q2dP)
120 | P a g e
Figure - 23. Quality Evaluation Process
4.3.1.5 Improve Quality
Quality evaluation is only a step to improve quality as it only identifies the problems.
However, it‟s important to find the solution to solve the identified problems. As mentioned in
Chapter 3, corrective actions (quality improvement) are the essence of our proposed solution. The
last level of our quality aware approach suggests the recommendations for quality improvement.
As quality patterns encapsulate both researcher‟s and practitioner‟s quality practices thus they
provide solutions to recurring problems. Once the metrics are calculated, relevant
recommendations are proposed for further improvements through a guided process. These
recommendations could be any of the following three types:
i. Textual recommendations
ii. Transformations
iii. Design patterns.
Once the relevant recommendations are identified, the following process can be employed to
improve the quality:

Chapter 4: Quality Driven Development Process (Q2dP)
121 | P a g e
i. Follow the guidelines or description provided with all the textual recommendations to
improve the model.
ii. For transformations, implement all the steps required to eliminate the identified problems
by transforming the initial model into the final model following all the recommended
transformations.
iii. Applying recommended design patterns is a manual and difficult process. In order to
apply design patterns, we have to manually search the whole model to identify the
elements that can be improved by applying those patterns. For example if GRASP‟s high
cohesion pattern is recommended for a model, then we have to manually search for
classes lacking cohesion. In order to achieve this goal, we might have to look at the
description of the classes, their attributes, methods, etc. to identify the elements
hampering cohesion. Similarly for polymorphism design pattern, we have to manually
identify the methods that can reduce the complexity by implementing polymorphic
functions.
iv. Existing ontologies can also help in implementing the recommendations effectively. For
example in Chapter 5, we employ an existing Human Resource Ontology to identify
different modules from a complex model in order to implement a recommendation for
dividing a complex model.
4.4 Conclusion
In this chapter, we presented our proposed quality driven development process (Q2dP)
encompassing methods and techniques to evaluate and improve the conceptual models with
respect to a specific analyst/designer requirement or goal. In the first part, we discuss the
processes involved in the creation of the quality vision such as the identification of new quality
patterns, quality attributes and metrics whereas in the second part, we describe the processes
involved in applying our quality vision on the CMs. It includes the processes to formulate
analyst/designer specific quality goals (in a structured way), mapping of these goals onto quality
patterns, attributes and metrics for evaluation.
The strength of our guided process lies in the fact that every analyst/designer (including
experienced and inexperienced) can employ our processes to evaluate and improve the model
without any prior knowledge about any evaluation criterion or quality framework.

Chapter 4: Quality Driven Development Process (Q2dP)
122 | P a g e
In the next chapter, we applied our proposed solution and process on a case study to evaluate
their efficacy. We executed all the steps of our proposed approach to evaluate and improve the
case study CM.
Chapter 5:Case-Study: Goal-Based Evaluation/ Improvement
123 | P a g e
Chapter 5
Case-Study: Goal-Based Evaluation/
Improvement
This chapter applies the quality evaluation and improvement process, discussed in previous
chapters, over a conceptual model as a case study. We selected a real world class diagram from an
existing Enterprise Resource Planning (ERP) system that was developed for a huge organization
in Pakistan. This model is only an extract of the original model on human resource module of that
ERP system. The original class diagram (or model) is approximately ten times the size of this
model. We selected this class diagram as a case study since we had several difficulties in
maintaining the original class diagram due to its complexity and size. Thus we considered testing
our approach using this class diagram as the case study. However, we modified the original class
diagram and selected only those concepts that are common among different organization and easy
to understand. We evaluated this class diagram with respect to a specific goal employing the
proposed quality pattern driven evaluation process. The set of proposed metrics, through selected
quality patterns, were calculated and all the resulting recommendations were applied on the
model. The resulting transformed model was re-evaluated employing the same metrics. Results
were compared to highlight the improvements due to the applied evaluation process. The case
study is explained in the next section.
5.1 Introduction to the Case Study
The conceptual model (class diagram) for this case study represents information on a human
resource management domain. All the concepts represented in this model (Figure - 24) revolve
around an organizational employee referred to as “Personnel”. This model is designed for a
system capable of managing different aspects of Personnel.
Broadly speaking, this model includes the following type of information:
i. Personnel related information such as name, address, employment date, marital status,
etc.
ii. Personnel‟s Spouse and children information.
iii. Awards or punishments received by the personnel.

Chapter 5:Case-Study: Goal-Based Evaluation/ Improvement
124 | P a g e
iv. Overtime performed by personnel.
v. Leaves related information such as type and number of authorized leaves.
vi. Bank account information for salary transfer.
vii. Salary related information such as different types of pay scales and their structures,
different pay components, etc.
viii. Personnel loan information or advances taken by personnel.
5.2 Formulation of Quality Goal
Consider the following user goal in natural language “check my model if it is complete and
easy to understand”. In order to better understand this quality goal, we will transform it into the
structured goal employing the template proposed by [Basili 93] and described in Section-4.3.1.1.
The above mentioned goal is decomposed into fields such as purpose, perspectives, etc. as shown
below:
Purpose to analyze Conceptual model
for Evaluation
Perspective
with respect to Completeness &
Understandability
from the point of
view of
Analyst
The point of view can‟t be predicted from the goal specified in the natural language. We
supposed that the goal was formulated by the Analyst. In any case this information doesn‟t
influence the evaluation process whereas we selected the “purpose for” as “Evaluation” since the
goal says “check my model” meaning the analyst is interested in evaluation only.
As demonstrated in Chapter 3, the interpretation of this goal can lead to multiple solutions.
Thus to precise the domain of the quality goal, we employ questions. It will help in translating
this goal into equivalent sub-goals or concrete statements that can be mapped onto our formulated
quality patterns or quality attributes for evaluation and improvement.

Chapter 5:Case-Study: Goal-Based Evaluation/ Improvement
125 | P a g e
AppointmentHistory
AppointmentStartDtAppointmentEndDt
Add()Modify ()
PersonnelAward
AwardDtReferenceLetterNoReferenceLetterDt
Add()Modify ()Delete()
Regular
MinimumServiceDurationConvertableToPermanent
Contract
ContractStartDateDuration
Permanent
MinServ iceForRetirement
Management
Administrative
SupportAndServices
PersonnelPunishment
PunishmentStartDtPunishmentEndDtReferenceLetterNoReferenceLetterDt
Add()Modify ()Delete()
PayComponentRule
ComponentRuleIDMinSalaryRequiredMaxSalaryRequiredRatioIsFix : BooleanFixAmountIsDeductible : Boolean
Add()Modify ()
PersonnelPayIncrement
PerIncrIDIncrDateIncrAmount
Add()Modify ()
PersonnelLoan
PersonnelLoanIDLoanDateApprovalLetterNoApprovalLetterDateLoanAmountLoanInstallementLoanDurationLoanBalance
Add()Modify ()Delete()
PersonnelPayFix
PayFixIDPayFixDateCurrentBasicPayPaySteps
Add()Modify ()
PersonnelMonthPayDetails
PersonnelMonthPayDescIDAmountCreditAmountDebit
Add()Modify ()
LeavePriorRetirement
MaximumLPRAllowed
ExtraOrdinaryLeaves
PayFactorISWithoutPay : Boolean
CasualLeaves
LapseDate
EarnedLeaves
AllowancesAdmissable : Boolean
LeavePolicy
PolicyReferenceLetterNoPolicyReferenceLetterDtpolicyDescription
Add()Modify ()Delete()
Adheres
AdheresAdheres Adheres
Software
LicensingBody
Name
Has license
HardwareHas license
Technical
ExpertiseDomainTechnology
ProfessionalDiploma
DiplomaNameIsAccredited
LastDiploma
NonTechnical
LastDiploma
LeaveApplication
LeaveApplicationDtDecisionDtIsApproved
Add()Modify ()Delete()
OvertimeSanction
OvertimeSanctionIDLetterNumberLetterDateRemarks
Add()Modify ()Delete()
PayComponents
ComponentIDComponentNameComponentDescIsTaxable : Boolean
Add()Modify ()Delete()
WorkShiftPolicy
ShiftPolicyIDDescriptionEffectiveDateStartTimeEndTimeOvertimeStartOvertimeEnd
Add()Modify ()Delete()
WCCode
WCIDWCNamename
Add()Modify ()Delete()
Des ignation
DesignationIDDesignationName
Add()Modify ()Delete()
Punishment
PunishmentIDPunishmentNameServiceReferenceManual
Add()Modify ()Delete()
Award
AwardIDAwardNameServiceReferenceManualIsMonetary : Boolean
Add()Modify ()Delete()
Promotion
PromotionAnnounceDtPromotionEffectiveDtReferenceLetterNoReferenceLetterDt
Add()Modify ()Delete()
Transfer
TransferAnnounceDtTransferEffectiveDtReferenceLetterNoReferenceLetterDtPreviousWCIDNewWCIDPreviousDeptIDNewDeptID
Add()Modify ()Delete()
PersonnelSpouse
NameDtOfBirthGenderDtOfMarriage
Add()Modify ()Delete()
PersonnelChildren
NameDtOfBirthGender
Add()Modify ()Delete()
Appointment
AppointmentIDAppointmentNameIsPermanentPosition : Boolean
Add()Modify ()
Attendance
AttendanceDateArrivalTimeDepartureTime
Add()Modify ()
Leave
LeaveIDLeaveNameLeaveDescIsCummulable : BooleanCummulatingFactorMaximumAllowedPriorApprovalRequired : Boolean
Add()Modify ()Delete()OnNewFiscalYearUpdate()
PersonnelLeaves
LeaveStartDtLeaveEndDtLeaveApprovalLetterNoLeaveApprovalLetterDt
Add()Modify ()Delete()
Branch
BranchIDBranchNameBranchDesc
Add()Modify ()Delete()
Overtime
OvertimeIDFromDateToDate
Add()Modify ()Delete()
Overtime approval
PayScaleStruct
StructIDEffectiveDateMinimumWageAnnualIncrementMaximumWage
Add()Modify ()
Payscale
PayscaleIDPayscaleName
Add()Modify ()
PayIncrement
IncrementIDIncrementDescIncrementDate
Add()Modify ()Delete()
PayLoan
LoanIDLoanDesc
Add()Modify ()Delete()
PersonnelMonthlyPay
PersonnelMonthPayIDPayMonthPayYearTotalCreditTotalDebitTotalOvertime
Add()Modify ()
Arrears
ArrearsIDDateAmountDrAmountCr
Add()Modify ()Delete()
Advance
AdvanceIDDateAmount
Add()Modify ()Delete()
Department
DeptIDDeptNameDeptCode
Bank
BankIDBankName
Add()Modify ()
WorkShift
ShiftIDDescription
Add()Modify ()Delete()
Personnel
PIDFirstNameMiddleNameLastNameFatherNameEmploymentDateMaritalStatusDateOfBirthIdentificationCardNoGenderReligionAddressPhoneEmailNOKNameNOKAddressNOKPhoneNationality
AddPersonnel()ModifyPersonnel()DeletePersonnel()CalculateLoanBal()UpdateLoanBal()CheckLeaveBal()UpdateLeaveBal()CheckLateArrival()CalculatePerfomedOvertime()CalculateNonApprovedOvertime()SetNewAppointmentActive()
1
0..*
1
0..*
Is promoted
0..11
0..11
Is married
0..*
1
0..*
1
Can have children
1..*
0..*
1..*
0..*
Is authorized
1
0..*
1
0..*
Has account
Works overtime
1
0..*
1
0..*
Receive increments
0..*
1
0..*
1
Works in shift
Figure - 24. Model to be evaluated


Chapter 5:Case-Study: Goal-Based Evaluation/ Improvement
127 | P a g e
Following are some of the questions that are generated employing the process described in
Section-4.3.1.1.4.
- Q1: is completeness related to syntactic completeness?
- Q2: is completeness related to semantic completeness?
- Q3: is completeness related to requirements coverage?
- Q4: is understandability related to complexity?
- Q5: is understandability related to the absence of documentation?
- Q6: is understandability related to readability difficulties?
Questions 1, 2 and 3 are formulated for completeness whereas questions 4, 5 and 6 are
formulated for understandability. For demonstration, we suppose that the user answers the first 4
questions as YES whereas the last two questions as NO. Thus, the domain of evaluation will
encompass the directions identified in questions 1, 2, 3 and 4.
5.3 Selection of Relevant Quality Criteria for Formulated Quality Goal
In order to evaluate the case-study, evaluation criteria including quality patterns, quality
attributes and metrics should be used. In order to identify the relevant quality criteria with respect
to the formulated quality goal and the responses of the asked questions, following steps are
performed:
i. Search the perspective/focus of the goal and their related terms (related terms are asked as
questions such as completeness is related to syntactic completeness and semantic
completeness) in the name, description and keywords of the existing quality patterns to
identify the relevant quality patterns. For example, in this case we will search
completeness, syntactic completeness, semantic completeness, requirements coverage,
understandability and complexity in the above mentioned information of the existing
quality patterns to identify the relevant quality patterns.
ii. If no quality pattern is identified then the same set of terms will be used to search through
the information contained in the existing quality attributes.
iii. If relevant quality attributes are identified then we will select all the quality patterns that
use these quality attributes for evaluation.

Chapter 5:Case-Study: Goal-Based Evaluation/ Improvement
128 | P a g e
The details about searching process are discussed in Section-4.3.1.2. Once the relevant quality
patterns are identified, all the associated quality attributes (quality attributes are associated to
quality patterns) and their metrics will be selected for evaluation. The mapping process for
identifying the relevant quality criteria with respect to the above mentioned quality goal resulted
in the identification of the following quality criteria:
5.3.1 Selected Quality Patterns
From the existing quality patterns, the mapping process identified model completeness and
model complexity quality patterns to be relevant. Thus these two patterns can be employed to
evaluate and improve the given model with respect to the above formulated quality goal. The
details about these quality patterns are as follows:
5.3.1.1 Model Completeness Quality Pattern
Pattern Name: Model Completeness
Context: i. To check if the model is complete with respect to syntactic
and semantics. This pattern should be employed to validate and improve the model for its completeness.
Problem: i. Incomplete conceptual models (CM) pose threats to the later
stages of development as they will result in an end system that doesn‟t provide all the functionalities it was conceived for. So the CM should be evaluated for any missing user requirements.
ii. Similarly, if CM is not syntactically complete then it can hamper the understandability of the model. Syntactic completeness relates to the notation used (e.g. verifying that multiplicities are defined for associations or that associations have a valid name in a class diagram)
iii. Use the completeness quality attribute to identify the exact problem.
iv. The following metrics, associated to complexity quality attribute, can be calculated to check if this pattern is relevant for the current problems of the model (metrics b and c are applicable to class diagrams only): a. Requirements Coverage Degree b. Degree of defined multiplicities c. Degree of named associations
Solution: i. CM should incorporate all the requirements demanded by
users.

Chapter 5:Case-Study: Goal-Based Evaluation/ Improvement
129 | P a g e
ii. CM should contain all the syntactic elements required by the target modeling notation.
iii. Following recommendations can be used for improvement: a. Incorporate missing requirements b. Define missing multiplicities c. Define missing associations labels
Keywords: completeness; syntactic completeness; semantic completeness; requirements coverage; Related patterns:
i. Model Maintainability (incomplete models need to be modified)
The structure of the completeness quality pattern can be seen from the following Figure - 25.
However, this structure is adopted for this case-study alone as it includes only those metrics that
are applicable to class diagrams and employed in this case-study for evaluation. For example,
completeness quality attribute also contains metrics for ER-diagrams or other conceptual models
but are not listed in Figure - 25. The first level contains the name of the pattern, the second level
contains the quality attributes employed by the quality pattern, the third level contains the metrics
for quantification and the last level contains the recommendations (in the form of textual
recommendations, transformations and design patterns).
Model
Completeness
Completeness
Requirements
Coverage Degree
Incorporate missing
requirements
Degree of named
associations
Name associations
Degree of defined
multiplicities
Define missing
multiplicities
Quality Pattern
Quality Attribute
Metrics
Recommendations
Figure - 25. Structure of Model Completeness Quality Pattern
5.3.1.2 Model Complexity Quality Pattern
The details about model complexity quality pattern can be referred from Section-3.5.4.
However, the structure of the complexity quality pattern can be seen from Figure - 26.

Chapter 5:Case-Study: Goal-Based Evaluation/ Improvement
130 | P a g e
Model
Complexity
Structural
Complexity
Number of Associations/
Generalizations..
Max DIT/
Number of cycles..
Remove
cycles
Remove redundant
associations
Factorize
associations
Size
Number of Classes/
Entities/Usecases..
Number of
attributes/Methods..
Split
classes
Divide the
model
Merge
classes
Semantic
Complexity
Quality Pattern
Quality Attributes
Metrics
Recommendations
Figure - 26. Structure of Model Complexity Quality Pattern
5.3.2 Associated Quality Attributes for Evaluation Project
The selected complexity and completeness quality patterns employ the following quality
attributes for evaluation:
i. Completeness: This quality attribute evaluates the model completeness with respect to
both syntactic and semantic completeness. Syntactic completeness relates to the notation
used (e.g. verifying that multiplicities are defined for associations in a class diagram).
Semantic completeness is related to the coverage of user requirements. It could be
verified by checking the conformance between concepts depicted in the conceptual model
and the ones expressed by the users through the requirements or even by compar ing the
concepts appearing in several specifications related to the same reality [Cherfi et al.,
2003].
ii. Size: This attribute evaluates the overall complexity of the model with respect to the
number of instances of different elements present in the model. It is based on the
hypothesis that the more there are structural elements in the model the more it gets
complex. These elements can include entities, classes, use cases, actors, attributes,
methods, etc.
iii. Structural complexity: This attribute represents the model complexity due to the existence
of different relational elements within the model. These elements can include
associations, aggregations, generalizations, dependencies, transitions, relationships, etc.
This attribute contains several metrics that are proposed in literature and have been tested
for their efficacy in representing model complexity and maintainability as shown in
[Genero et al., 2002].

Chapter 5:Case-Study: Goal-Based Evaluation/ Improvement
131 | P a g e
iv. Semantic Complexity: In Natural Language Processing, the concept of semantic
complexity is related to the number of things to "talk about" in the domain. In our
approach, we propose to relate semantic complexity to the variety of “subjects”
represented within the same model. Intuitively, a model representing both stock control
and clients‟ accounts information is complex to understand as it refers to two distinct
domain subjects.
5.3.3 Associated Quality Metrics for Quantification
The above mentioned quality attributes employ multiple metrics for quantification. Following
are some of the metrics that are designed for class diagrams and will be used to evaluate the case
study model. However, in case of other types of models (such as ER-models or use cases, etc.),
some of the metrics mentioned below might not be applicable and similarly some new or
additional metrics can be applied. For example, if we are to evaluate an ER-Model then the
metrics such as number of classes, numbers of methods etc are not valid however metrics such as
number of entities, number of associations etc can be used.
5.3.3.1 Metrics for Completeness Quality Attribute
i. Requirements Coverage Degree [Cherfi et al., 2003]: This metric is based on the notion of
completeness of user requirements. It has been widely accepted that if the requirements
errors are detected earlier in the designing phase then the cost of their correction gets
much lower. This metric calculates the ratio between the concepts covered by the
modeling elements in the conceptual schema and the ones expressed by the users through
the requirements.

Chapter 5:Case-Study: Goal-Based Evaluation/ Improvement
132 | P a g e
Let:
X = Number of requirements covered by modeling elements;
Y = Total number of requirements;
Then:
Y
x Degree Coverage tsRequiremen
Range:
Requirements Coverage Degree = 1, if all the requirements expressed by user are covered in the
conceptual model.
Requirements Coverage Degree = 0, if none of the requirements expressed by user are covered in the
conceptual model.
ii. Degree of defined multiplicities: This metric calculates the ratio between the total number
of defined multiplicities within a model to the total number of associations in a model.
This metric is described in Section-3.5.2.
iii. Degree of named associations: If proper naming is assigned to every relationship or
association then it enhances the understandability of the model. This metric calculates the
ratio between the number of named associations and the total associations. This metric is
described in Section-3.5.2.
5.3.3.2 Metrics for Size Quality Attribute
Following sets of metrics are proposed in [Assenova et al., 1996], [Genero et al., 2005],
[Genero et al., 2003], [Genero et al., 2002], [Genero et al., 2001], [Genero et al., 2000], [Li et al.,
1993]:
i. Number of Classes: Total number of classes in a model.
ii. Number of Attributes: Total number of attributes in model.
iii. Number of Methods: Total number of methods or functions in the model.
5.3.3.3 Metrics for Structural Complexity Quality Attribute
Following are the lists of metrics to evaluate the structural complexity of the model. Metrics
iii-vii are proposed by [Genero et al., 2005], [Genero et al., 2003], [Genero et al., 2002], [Genero
et al., 2001], [Genero et al., 2000]:
i. Number of cycles: Total number of cycles within a model.

Chapter 5:Case-Study: Goal-Based Evaluation/ Improvement
133 | P a g e
ii. Degree of non-redundancy [Cherfi et al., 2002b]: This metric calculates the ratio between
the non-redundant concepts and the total concepts present in the model.
Let:
Xi belongs to class, association, inheritance link,
association class, aggregation link, composition link;
NB(Xi) = Number of elements of type Xi;
NBR(Xi) = Number of redundant elements of type Xi in the
model;
Then:
i
i
NB(Xi)
NBR(Xi)NB(Xi)
Range:
Degree of Non-Redundancy = 1, if the model doesn‟t contain any redundant concept.
Degree of Non-Redundancy = 0, if the model contains all
the concepts that are redundant.
iii. Number of Associations: Total number of associations in a model.
iv. Number of Aggregations: It calculates the number of aggregation relationships within a
class diagram.
v. Number of Compositions: It calculates the number of composition relationships within a
class diagram.
vi. Number of Generalizations: It calculates the total number of generalization relationships
in a model.
vii. Maximum Depth Inheritance Tree: It calculates the longest path from the class to the root
of the hierarchy in a generalization hierarchy.
5.3.3.4 Metrics for Semantic Complexity Quality Attribute
To measure semantic complexity, we propose to use domain ontology or a thesaurus. For the
given case dealing with Human Resource (HR) management domain, we have used an ontology
(attached as Annex-B) extracted from the documentation of the ERP systems (same ERP as
mentioned above). This ontology is only an extract of the original ontology used to structure

Chapter 5:Case-Study: Goal-Based Evaluation/ Improvement
134 | P a g e
different concepts of HR management activities. This ontology provides information about
different HR areas such as payroll, work time, personnel data, training, skills and competencies,
etc.
A thorough and much detailed ontology for HR activities can be created using [OPM 10],
[OPM 06] standards and HR-XML vocabularies4. But creating an ontology isn‟t the central point
of our thesis. We wanted to demonstrate the feasibility of using existing ontology to improve the
model. We propose to measure the semantic complexity as the number of clusters in the model.
Thus we relied on the available ontology to identify different clusters from the original model
(Figure - 24). Similarly, there are numerous research articles proposing different methods for
identifying clusters. We have manually mapped the original model on this ontology to identify
different clusters.
5.4 Model Evaluation
The above mentioned selected metrics for this case-study are computed for the original model
(Figure - 24). The results are presented in Table - 9. All the metrics employ the computation
formulae as defined above. However, in order to calculate the requirement coverage degree
metric, we have employed the requirements mentioned in Appendix-D for calculation.
4 HR-XML Consortium Library, 2007 (http://ns.hr-xml.org/2_5/HR-XML-2_5/index.php)

Chapter 5:Case-Study: Goal-Based Evaluation/ Improvement
135 | P a g e
Table - 9. Computed Metrics for Initial Model
Quality Attribute Metric Value
Completeness Requirements Coverage Degree 0.7 Degree of defined multiplicities 0.1818 Degree of named associations 0.5
Size Number of Classes 46 Number of Attributes 174 Number of Methods 120
Structural Complexity
Number of Associations 35 Number of Association classes 8 Number of Aggregations 1 Number of Compositions 6 Number of Generalizations 14 Maximum Depth Inheritance Tree 2 Number of Cycles 7 Degree of non-redundancy 0.927
Semantic complexity Number of clusters 2
From Table - 9, we can see that the requirements coverage degree metric is 0.7 since among
the set of 10 chosen requirements, following three requirements are not fulfilled in the model
(consult Appendix-D for the stated requirements):
i. Software personnel are not further specialized into any of the four sub types (analyst,
programmer, tester or documenter).
ii. Hardware personnel are not further specialized to any sub type (network support,
hardware maintenance, installations) either.
iii. Requirements states that the leaves are of six types whereas the model classifies the
leaves into four types only.
Similarly, only 18% multiplicities are defined and only 50% associations are labeled in the
model. Thus, the model is incomplete with respect to all of the three chosen metrics. Furthermore,
the size and structural complexity metrics values are very high predicting the inherent complexity
of model.
5.5 Post Evaluation Propositions for Quality Improvement
As demonstrated in the Chapter 3, quality patterns propose recommendations for quality
improvement. These recommendations are the essence of our proposed solution. Once the metrics
are calculated, corresponding corrective actions or transformations can be proposed to optimize
the model. Thus, in view of the above metrics results (Table - 9) and their interpretations, the

Chapter 5:Case-Study: Goal-Based Evaluation/ Improvement
136 | P a g e
following recommendations can be applied to improve the model, as proposed by the selected
quality patterns:
For improving model completeness:
i. Incorporate missing requirements
ii. Define missing multiplicities
iii. Define missing associations labels
For reducing model complexity:
i. Factorize associations (to remove redundant associations)
ii. Use high cohesion GRASP design pattern (to increase cohesion)
iii. Use polymorphism GRASP design pattern (to increase cohesion)
iv. Divide the model (to reduce semantic complexity)
v. Evaluate all cycles to remove redundant concepts
5.6 Application of Recommendations to the Original Model
All the above mentioned resulting recommendations are applied to the case-study model. The
resulting modules (the original model is divided into two independent modules as per the above
mentioned recommendation) are placed as Figure - 27 and Figure - 28. The details about how
these recommendations are applied to the model are described below.
5.6.1 To Improve Model Completeness
Following recommendations are proposed through the model completeness quality pattern and
address the issues related to incomplete models. As recommendations are dependent on metrics,
thus some of the recommendations are applicable only to class diagrams. However it must be
noted that these are not the only recommendations proposed by the completeness quality pattern.
These are the recommendations resulting from to our selection of metrics in the quality pattern.
5.6.1.1 Incorporate missing requirements
Missing requirements pose threats to the success of the developing system. Moreover, it is
widely accepted that the earlier identification and the incorporation of the missing requirements
reduce the systems correction cost to a greater extent. As we identified that the case-study model
was unable to cater three requirements, we incorporated all the missing requirements in the
following way.
Chapter 5:Case-Study: Goal-Based Evaluation/ Improvement
137 | P a g e
i. We added four classes (analyst, programmer, tester and documenter) inheriting from the
Software class to further classify software personnel into the four sub-types.
ii. Similarly, we added three more classes (network, maintenance and installation) inheriting
from the Hardware class to further classify hardware personnel into the required three
sub-types.
iii. Requirements state that the leaves are of six types whereas the model classifies the leaves
into four types only. Thus we added the missing two types of leaves (Study Leaves and
Medical Leaves) as classes inheriting parent Leave class.
5.6.1.2 Define missing multiplicities
Multiplicity defines the number of objects taking part in the relationship. Multiplicities are
important to understand the semantics behind the relationship of the related classes. We can
notice from the case study model that only 18% of the multiplicities are defined. For example,
multiplicities are not defined for the association between Personnel class and WorkShift class thus
the developer will not know if Personnel are allowed to work in multiple shifts. We identified the
correct multiplicities for this association in the transformed model (Figure - 27) and now
developer can see that Personnel can work in one and only one work shift. Similarly, we define
all the unidentified multiplicities for all the associations.
5.6.1.3 Define missing associations labels
Proper and expressive association names enhance the understandability of the model. These
names tend to help the reader in understanding the nature/type of association between the
associated classes. In the case-study model, only 50% of the associations are named. For example,
the association between Personnel class and Transfer class is not named thus the reader of the
model might not understand the description of this association. He/she can‟t identify what
Personnel can transfer or what is transferred? We identified the proper name for this association
in the transformed model (Figure - 27) and now reader can understand that Personnel can be
transferred to other work centers. Thus it is clear now that personnel are the ones who are
transferred rather than personnel transferring something or someone. Similarly, we defined
expressive names for all the associations.
5.6.2 Improve Model Complexity
Model complexity quality pattern proposed the following recommendations to elevate the
complexity and address its inherent factors in conceptual models. These recommendations are

Chapter 5:Case-Study: Goal-Based Evaluation/ Improvement
138 | P a g e
adopted for our case-study model and thus most of them are applicable to class diagrams only
with an exception of “Divide the model” recommendation that can be applied to other models as
well. As mentioned above, the listed recommendations are not the only recommendations
proposed by the complexity quality pattern. These are the recommendations resulting due to our
selection of metrics from this quality pattern with respect to our case-study model.
5.6.2.1 Factorize associations (to remove redundant associations)
In any conceptual model, redundant concepts increase the complexity and waste resources.
Similarly, redundant associations increase the structural complexity of the models and thus they
must be identified and removed from the model. There are number of ways to identify redundant
associations. The simplest one is to identify the association having same name. For example, in
the case-study model we can see that two associations have the same name “Has License” and we
can also notice that this set of associations can be reduced to one single association if we move
this association to the parent class. In this case, we can see that both children of “Technical” class
have this association thus if we move this association to the parent class (Technical) then both
children will participate to the association due to inheritance whereas the redundant concept will
be eliminated. We performed the same operation with another association named “Last Diploma”
as it was also redundant.
5.6.2.2 High Cohesion GRASP design pattern (to increase cohesion)
As demonstrated in Chapter 3, quality patterns propose three types of recommendations
including the recommendations to employ proposed design patterns for improving the model
quality. However, employing design patterns for model improvement is a manual process. In
response to complexity in our case-study model, the model complexity quality pattern proposed to
employ high cohesion pattern to reduce model complexity. Thus in order to identify the model
elements where this design pattern can be applied, we scanned the complete case-study model and
found that “Personnel” class contains 8 methods that this class shouldn‟t be responsible for. Such
as, it contains “CalculatePerfomedOvertime” and “CalculateNonApprovedOvertime” methods
that should be implemented in “Overtime” class rather than “Personnel” class. Thus, by
delegating the responsibilities to proper classes, we can reduce the complexity of the source class.
5.6.2.3 Polymorphism GRASP design pattern (to increase cohesion)
Similarly in order to apply the recommended polymorphism design pattern, we scanned the
model to identify the elements where this design pattern can be applied. For example, we found
that “Leave” class implements a method “OnNewFiscalYearUpdate” that updates the leaves on

Chapter 5:Case-Study: Goal-Based Evaluation/ Improvement
139 | P a g e
every new fiscal year. However, some leaves can be cumulated (annually) whereas some cannot
(lapse on yearend) such as casual leaves can‟t be cumulated. Thus, if we implement this method
within the super class “Leave” then we will increase the complexity of this method by including
multiple checking criteria for each type of leaves. However, it would be much feasible in this case
to use GRASP‟s polymorphism pattern (as proposed through our approach) and implement this
method within each type of leave to reduce the complexity.
5.6.2.4 Divide the model (to reduce semantic complexity)
We employed HR ontology (Annex-B) and identified that the original model contains elements
to manage personnel and elements to generate pay. Thus, in order to reduce the complexity, we
divided the initial model into two modules: Personnel and Pay. For example, the classes such as
Spouse, Children, Designation, Transfer, Attendance, Appointment etc are clearly related to
Personnel and thus are placed in Personnel module whereas the classes such as Payscale,
PayscaleStruct, PayLoan, PersonnelMonthlyPay, Advance etc are related to pay generation and
thus are placed in Pay module. Moreover, the classes such as Overtime, Punishment, Awards, etc.
are also placed in Pay module as all of these classes affect the generation of pay. For example, if
personnel works overtime then he/she will receive additional salary similarly if personnel receive
a punishment (let say 20% deduction in salary) then he will receive 20 % less pay. By including
related classes to the relevant module will cohesion and reduce the coupling among modules. If
classes such as Overtime, Punishment, Awards, etc. were placed in Personnel module then every
time a pay is generated, these classes were used by the Pay module and thus the dependency of
Pay module on Personnel module would increase.
The two newly formulated modules are depicted as Figure - 27 and Figure - 28. All the metrics
are recalculated for both the modules and the new values are listed as Table - 10. However, it
must be noted here that if we could find a more comprehensive ontology then perhaps additional
semantic groups could be identified.
The Following guidelines, as proposed through our approach, were employed for model
division:
i. The model division can be done in two ways: Structural Division and Semantic Division
ii. The structural division is an easier but non-efficient method. Randomly select the model
elements and divide them into multiple modules. But bad selection of elements can lead
to low cohesion and high coupling among the resulting modules.

Chapter 5:Case-Study: Goal-Based Evaluation/ Improvement
140 | P a g e
iii. The semantic division is a difficult but efficient method. Read the model carefully (or use
some existing domain ontology) and classify the model elements with respect to some
similarity or relationship. For example, classify the elements with respect to common
functionality or interdependency. The elements with common set of goals or
functionalities should be grouped together as a module. Such a division will increase the
cohesion and reduce the coupling. Similarly, an existing ontology can be used to identify
different semantic groups.
iv. Another possible type of division is to identify the complex parts of the model and to
divide them into multiple modules to reduce the complexity.
5.6.2.5 Evaluate all cycles to remove redundant concepts
In conceptual modeling, existence of cycles signifies that information is duplicated. In class
diagrams, sometimes cycles are inevitable whereas sometimes it‟s just a design error. So
whenever there are cycles in the class diagram they should be revisited to check weather some
redundant information exists and if yes then it can be eliminated. For example, in our case-study
model we can identify a cycle between “Personnel”, “Bank” and “Branch” classes. However we
can notice that all branches are associated to banks, thus if a personnel is attached to a branch then
we can identify the bank of that branch through the association between “Bank” and “Branch”
classes and thus we don‟t require the association between the “Personnel” and “Bank” classes and
so we deleted this association. Similarly we also deleted the association between the
“PersonnelSpouse” class and “PersonnelChildren” class.

Chapter 5:Case-Study: Goal-Based Evaluation/ Improvement
141 | P a g e
AppointmentHistory
AppointmentStartDtAppointmentEndDt
Add()Modify()Delete()SetNewAppointmentActive()
NonTechnical
Regular
MinimumServiceDurationConvertableToPermanent
Contract
ContractStartDateDuration
Permanent
MinServiceForRetirement
Hardware
Software
Management
Administrative
SupportAndServices
Analyst TesterProgrammer
Network Maintenance
Documenter
Installations
Department
DeptIDDeptNameDeptCode
Bank
BankIDBankName
Add()Modify()Delete()
WorkShiftPolicy
ShiftPolicyIDDescriptionEffectiveDateStartTimeEndTimeOvertimeStartOvertimeEnd
Add()Modify()Delete()
WCCode
WCIDWCNamename
Add()Modify()Delete()
1..*1..*
Attached to
Designation
DesignationIDDesignationName
Add()Modify()Delete()
Promotion
PromotionAnnounceDtPromotionEffectiveDtReferenceLetterNoReferenceLetterDt
Add()Modify()Delete()
Transfer
TransferAnnounceDtTransferEffectiveDtReferenceLetterNoReferenceLetterDtPreviousWCIDNewWCIDPreviousDeptIDNewDeptID
Add()Modify()Delete()
PersonnelSpouse
NameDtOfBirthGenderDtOfMarriage
Add()Modify()Delete()
PersonnelChildren
NameDtOfBirthGender
Add()Modify()Delete()
Appointment
AppointmentIDAppointmentNameIsPermanentPosition : Boolean
Add()Modify()Delete()
Attendance
AttendanceDateArrivalTimeDepartureTime
Add()Modify()Delete()CheckLateArrival()
Branch
BranchIDBranchNameBranchDesc
Add()Modify()Delete()
1..*1..*Associated to
WorkShift
ShiftIDDescription
Add()Modify()Delete()
1..*1..*Adheres to
Personnel
PIDFirstNameMiddleNameLastNameFatherNameEmploymentDateMaritalStatusDateOfBirthIdentificationCardNoGenderReligionAddressPhoneEmailNOKNameNOKAddressNOKPhoneNationality
AddPersonnel()ModifyPersonnel()DeletePersonnel()
1
*
1
*
Works in
*
1
*
1
holds
1
0..*
1
0..*
Is promoted
1
0..*
1
0..*
Can be transferred
0..1
1
0..1
1
Is married
0..*
1
0..*
1
Can have children
1..*
0..*
1..*
0..*
**
Stamps attendance card
1
0..*
1
0..*
Has account
1
0..*
1
0..*
Works in shift
ProfessionalDiploma
DiplomaNameIsAccredited
0..*
0..1
0..*
0..1
Last diploma
LicensingBody
Name
Technical
ExpertiseDomainTechnology
0..1
0..*
0..1
0..*
Has license
Figure - 27. Post Transformation Resulting Module for Personnel


Chapter 5:Case-Study: Goal-Based Evaluation/ Improvement
143 | P a g e
PersonnelAward
AwardDtReferenceLetterNoReferenceLetterDt
Add()Modify ()Delete()
EarnedLeaves
AllowancesAdmissable : Boolean
ExtraOrdinaryLeaves
PayFactorISWithoutPay : Boolean
OnNewFiscalYearUpdate()
CasualLeaves
LapseDate
OnNewFiscalYearUpdate()
LeavePriorRetirement
MaximumLPRAllowed
OnNewFiscalYearUpdate()
PersonnelPunishment
PunishmentStartDtPunishmentEndDtReferenceLetterNoReferenceLetterDt
Add()Modify ()Delete()
PayComponentRule
ComponentRuleIDMinSalaryRequiredMaxSalaryRequiredRatioIsFix : BooleanFixAmountIsDeductible : Boolean
Add()Modify ()Delete()
PersonnelPay Inc rement
PerInc rIDIncrDateIncrAmount
Add()Modify ()Delete()
PersonnelLoan
PersonnelLoanIDLoanDateApprovalLetterNoApprovalLetterDateLoanAmountLoanInstallementLoanDurationLoanBalance
Add()Modify ()Delete()CalculateLoanBal()UpdateLoanBal()
PersonnelPayFix
PayFixIDPayFixDateCurrentBasicPayPaySteps
Add()Modify ()Delete()
PersonnelMonthPayDetails
PersonnelMonthPayDesc IDAmountCreditAmountDebit
Add()Modify ()Delete()
StudyLeaves
ProgramOfStudy
OnNewFiscalYearUpdate()
MedicalLeaves
IsPregnancy
OnNewFiscalYearUpdate()
LeavePolicy
PolicyReferenceLetterNoPolicyReferenceLetterDtpolicyDescription
Add()Modify ()Delete()
LeaveApplication
LeaveApplicationDtDecisionDtIsApproved
Add()Modify ()Delete()
OvertimeSanc tion
OvertimeSanc tionIDLetterNumberLetterDateRemarks
Add()Modify ()Delete()
Payscale
PayscaleIDPayscaleName
Add()Modify ()
PayComponents
ComponentIDComponentNameComponentDescIsTaxable : Boolean
Add()Modify ()
0..*
1..*
0..*
1..*
Punishment
PunishmentIDPunishmentNameServiceReferenceManual
Add()Modify ()Delete()
Award
AwardIDAwardNameServiceReferenceManualIsMonetary : Boolean
Add()Modify ()Delete()
Leave
LeaveIDLeaveNameLeaveDescIsCummulable : BooleanCummulatingFactorMaximumAllowedPriorApprovalRequired : Boolean
Add()Modify ()Delete()
1..*
1
1..*
1
Adhere to
PersonnelLeaves
LeaveStartDtLeaveEndDtLeaveApprovalLetterNoLeaveApprovalLetterDt
Add()Modify ()Delete()CheckLeaveBal()UpdateLeaveBal()
11ApplyLeave
Overtime
OvertimeIDFromDateToDate
Add()Modify ()Delete()CalculatePerfomedOvertime()CalculateNonApprovedOvertime()
0..*0..*
Overtime approval
PayScaleStruct
StructIDEffectiveDateMinimumWageAnnualIncrementMaximumWage
Add()Modify ()Delete()
1..*1..*
Have
PayIncrement
IncrementIDIncrementDescIncrementDate
Add()Modify ()Delete()
PayLoan
LoanIDLoanDesc
Add()Modify ()Delete()
PersonnelMonthlyPay
PersonnelMonthPayIDPayMonthPayYearTotalCreditTotalDebitTotalOvertime
Add()Modify ()Delete()
1..*
0..*
1..*
0..*
Advance
AdvanceIDDateAmount
Add()Modify ()Delete()
Arrears
ArrearsIDDateAmountDrAmountCr
Add()Modify ()Delete()
Personnel
PIDFirstNameMiddleNameLastNameFatherNameEmploymentDateMaritalStatusDateOfBirthIdentificationCardNoGenderReligionAddressPhoneEmailNOKNameNOKAddressNOKPhoneNationality
AddPersonnel()ModifyPersonnel()DeletePersonnel()
0..*
0..*
0..*
0..*
0..*
0..*
0..*
0..*
0..*
1
0..*
1
Is authorized
1
0..*
1
0..*
Took leaves
1
0..*
1
0..*
Works overtime
1
0..*
1
0..*
0..*
0..*
0..*
0..*
0..*
0..*
0..*
0..*
1
0..*
1
0..*
Receives
0..*
1
0..*
1
Took
0..*
1
0..*
1
have
Figure - 28. Post Transformation Resulting Module for PayRe-evaluation of the Transformed Model


Chapter 5:Case-Study: Goal-Based Evaluation/ Improvement
145 | P a g e
Once all the recommendations are applied to the original case-study model, the same set of
metrics is recalculated to demonstrate the improvement due to our proposed quality evaluation
and improvement process. The results are placed in Table - 10.
Table - 10. Post transformation metrics result
Quality Attribute
Metric Original Model
Post transformation modules Personnel Module Pay Module
Completeness Requirements Coverage Degree 0.7 1 1 Degree of defined multiplicities 0.18 1 1 Degree of named associations 0.5 1 1
Size No. of Classes 46 33 23 No. of Attributes 174 77 117 No. of Methods 120 44 84
Structural Complexity
No. of Association 35 11 14 No. of Association classes 8 1 7 No. of Aggregation 1 1 0 No. of Composition 6 3 3 No. of Generalizations 14 17 6 Maximum DIT 2 3 1 No. of Cycles 7 0 1 Degree of non-redundancy 0.93 1 1
Semantic complexity
Number of clusters 2 1 1
From Table - 10, we can see that the requirements coverage degree metric was “0.7” in the
original model whereas it is “1” in the transformed models meaning that all the missing
requirements are covered in the transformed models. Similarly, degree of defined multiplicities
and degree of named associations metrics are equal to “1” as well signifying that all the
multiplicities are identified and all the associations are named in the transformed models.
We can also compare that all the metrics (except number of generalizations metric) associated
to the size and structural complexity quality attributes such as number of classes, number of
attributes, number of associations, etc. have significantly low values compared to the original
model implying that the transformed models are comparatively less complex as compared to the
original model.
The value of the Number of generalizations metric is higher in the transformed model as the
original model failed to divide the software personnel and hardware personnel into sub types.
Similarly the original model classified the leaves into four types whereas the requirements states
Chapter 5:Case-Study: Goal-Based Evaluation/ Improvement
146 | P a g e
that the leaves are of six types. Thus after incorporating these missing requirements, the number
of generalizations increased in the transformed model.
5.7 Conclusion
In this chapter, we applied our proposed solution and processes on a real world model as a case
study to evaluate their efficacy. We took a class diagram of a Human Resource (HR) system for
evaluation and improvement with respect to a quality goal. We identified the relevant quality
patterns and attributes with respect to the formulated goal. All the metrics were calculated;
recommendations were generated and applied to the original model. The resulting transformed
models were re-evaluated to check if the proposed recommendations actually improved the model
or not. In the end, the initial results were compared with the post-transformation results. We
identified that the transformed models have significantly better metrics results than the original
models suggesting that the proposed approach has helped in improving the original model.
In the next chapter, we present our software prototype “CM-Quality” that implements our
proposed solution and processes. We discuss the architecture of the prototype along with different
interfaces available in CM-Quality.

Chapter 6: CM-Quality: Software Prototype Implementing the Proposed Approach
147 | P a g e
Chapter 6
CM-Quality: Software Prototype
Implementing the Proposed Approach
We designed and developed a prototype, “CM-Quality”, which implements our quality
approach. This implementation has two core objectives. It first helps in demonstrating the
feasibility of the approach. The second objective is related to the validation of the approach as we
made the prototype available to students, researchers, and practitioners to collect their feedbacks.
CM-Quality integrates an independent software tool, Qualis [Kersulec et al., 2009] to use the
services related to metrics definition and calculation. CM-Quality has an import functionality
based on XML allowing the evaluation of quality of IS specifications generated by existing
commercial and open source CASE tools (Rational Rose, Objecteering, StarUML etc).
6.1 General Architecture
Figure - 29 illustrates the general architecture of the solution. CM-Quality is able to accept
conceptual models designed using any modeling tool such as Rational Rose, Objecteering, etc.
However, these models must be exported into OMG‟s XMI standard format. CM -Quality is
capable of accepting models in XMI version 1.x and 2.0 formats. It is important to mention here
that XMI contains all the model elements and their association information. However, XMI
doesn‟t contain information about the graphical objects and their graphical position in the file.
This leads to two issues:
i. We can‟t evaluate model based on graphical objects or their placement. For example, we
can‟t calculate the number of line crossings metrics using models in XMI file as this
information is not available in XMI.
ii. If XMI file is exported back to respective model file for a target modeling software such
as Rational Rose, then the model will appear in a bad aesthetic form as modeling software
will tend to place the objects randomly on the screen since no positioning information is
contained in XMI.

Chapter 6: CM-Quality: Software Prototype Implementing the Proposed Approach
148 | P a g e
Figure - 29.General architecture of the solution
CM-Quality is conceived for two types of users Quality Expert and Analyst. Quality expert is a
user having in depth knowledge about quality concepts. He is responsible for defining the quality
concepts such as quality patterns, attributes, metrics, etc. and their relationships with each other in
CM-Quality. In contrast the IS analyst is a normal user who is familiar with modeling notations
and is responsible for designing different conceptual models. Analysts can only evaluate the
models employing the quality concepts defined by quality expert.
CM-Quality contains a knowledgebase storing different quality concepts such as quality
patterns, attributes, metrics, etc. defined by quality experts. Moreover, the knowledgebase also
stores the evaluation sessions. CM-Quality‟s knowledgebase uses multiple XML file that
collectively act as database repository.
CM-Quality applies the selected quality concepts stored in the knowledgebase on the target
model for evaluation and furnish evaluation results along with recommendations for improvement
as an output report.
6.1.1 Functional View for Quality Expert
CM-Quality is conceived for two types of user: Quality Experts and IS Analysts. Figure - 30
illustrates the systems behavior with respect to quality expert. It can be noticed that quality
experts interact with CM-Quality with an aim to define the quality concepts in the following way:
i. To add, remove or modify quality patterns
ii. To add, remove or modify quality attributes
iii. To add, remove or modify metrics
IS analyst
Existing Case tool
Quality
Metamodel Quality Patterns, Attributes, Metrics, recommendations
Evaluation sessions Pattern
definition Attributes definition
Metrics definition
Recommendations definition
Pattern definition Attributes definition
Metrics definition
Recommendations definition
Goal definition
Quality parameters selection
Quality evaluation
Recommendations application
Goal definition
Quality parameters selection
Quality evaluation
Recommendations application Knowledge Base
IS Analyst
Interface
Quality expert
Interface
Quality evaluation
Quality definition
CM Quality
Quality Expert

Chapter 6: CM-Quality: Software Prototype Implementing the Proposed Approach
149 | P a g e
iv. To add, remove or modify recommendations
v. To define or delete associations between quality patterns and quality attributes. This
requires that both quality patterns and quality attributes are already defined.
vi. To define or delete associations between quality attributes and metrics. This requires that
both quality attributes and metrics already exist.
vii. To define or delete associations between metrics and recommendations. This requires that
both metrics and recommendations are already defined.
Add/Remove/Modify Quality Attributes
Add/Remove/Modify Metrics
Associate/Disassociate Quality Attributes
with Metrics
Add/Remove/Modify Recommendations
Associate/Disassociate Metrics with Recommendations
Add/Remove/Modify Quality Patterns
Associate/Disassociate Quality Patterns with Attributes
Quality Expert
CM-Quality
Figure - 30. Use Case Diagram: Define the Quality Concepts

Chapter 6: CM-Quality: Software Prototype Implementing the Proposed Approach
150 | P a g e
6.1.2 Functional View for Analyst/User
Figure - 31 illustrates the use case diagram to evaluate quality. This use case describes the
systems behavior with respect to IS Analyst. It can be noticed that analysts interact with CM-
Quality to evaluate and improve their models. Their interactions include the following:
i. They use CM-Quality to select the target model for evaluation.
ii. They can browse existing quality goals to evaluate the model with respect to this goal
thus bypassing the automatic detection and selection of relevant quality concepts.
iii. Formulate new quality goals in a structured way
iv. Select the relevant quality patterns for evaluation
v. Select the quality attributes
vi. Select the metrics for measurement
vii. They can execute the evaluation process on the selected model. This implies that the
system evaluates the model by computing the selected metrics and then presents the
evaluation results along with relevant recommendations for improvement.

Chapter 6: CM-Quality: Software Prototype Implementing the Proposed Approach
151 | P a g e
Prepare Evaluation Results
Browse Existing Quality Goals
Formulate New Quality Goals
Select Quality Patterns
Select Quality Attributes
Select Metrics
Execute Evaluation Process
Query Knowledgebase
Select Model for Evaluation
Evaluate the Model
Calculate Metrics
<<include>>
<<include>>
<<include>>
<<include>>
<<include>>
Propose Recommendations
<<include>>
<<include>>
Analyst
CM-Quality
Figure - 31. Use Case Diagram: Evaluate the Quality
6.2 Detailed Architecture
CM-Quality is divided into two core modules for two types of users: quality experts and IS
analysts. The quality expert is responsible for defining and managing quality concepts such as
quality patterns, attributes, metrics, etc. through a quality driven methodology whereas the IS
analyst applies these concepts for evaluating the conceptual models. The quality expert is also
responsible for establishing the relationships among these quality concepts. For example, the
quality expert identifies the quality attributes employed by each quality pattern. Similarly, he/she
also associates the relevant metrics for measuring these quality attributes.
The quality expert can also evaluate the models but IS analysts can‟t define or manage the
quality concepts due to their lack of knowledge. The two modules access a common
knowledgebase Figure - 29.
6.2.1 The quality definition module
The quality definition module in CM-Quality is responsible for defining the “house-keeping”
information such as quality concepts including quality patterns, attributes, metrics and

Chapter 6: CM-Quality: Software Prototype Implementing the Proposed Approach
152 | P a g e
recommendations. This module is also responsible for establishing the relationships among
different concepts. For example, the association between quality patterns and quality attributes is
defined through this model. This module is available only to quality expert users as identification
of erroneous quality concepts may lead to misleading evaluation results. This module incorporates
four different utilities to define quality patterns, quality attributes, metrics and recommendations.
6.2.1.1 Pattern definition tool
Pattern definition tool implements the quality pattern identification process described in
Section-4.3.1.2 to guide the quality expert in defining new quality patterns. The quality pattern
identification is a difficult and time consuming task. However the scope of this tool doesn‟t
incorporate the identification of quality patterns but merely their definition to CM-Quality. The
quality experts are provided with editors helping the patterns definition according to the pattern
definition structure defined in Chapter 3.
This tool is also the means for linking quality patterns with relevant and existing quality
attributes for evaluation.
6.2.1.2 Attribute definition tool
The attribute definition tool includes a rich set of predefined quality attributes with their
definition and reference to the literature. It also offers the possibility to add new attributes in a
guided and structured way using the specialized interface in CM-Quality. This tool is also
responsible for associating quality attributes with relevant and existing metrics for their
measurement. It is important to mention here that quality attributes are generic for all types of
conceptual models whereas most of the metrics are dependent on model types (such as class
diagrams, etc.) and model elements (such as classes, attributes, etc.). Thus in order to measure
quality attributes, all the relevant metrics for all model types must be associated with it else the
attribute will be limited to certain model types for which metrics exist.
6.2.1.3 Metric definition tool
The metric definition tool is a complete and complex set of utilities providing both a language
and a set of editors for metrics definition. This tool provides a GUI based approach for defining
new metrics to measure every possible criterion that is based on the model elements of different
models types. For example, this tool can be used to define a metric for calculating the number of
classes in a class diagram. Similarly, the same tool is capable of defining complex metrics such as
to calculate the cohesion in a model. This tool also provides the expert with a set of predefined
quality metrics that could be browsed and modified.

Chapter 6: CM-Quality: Software Prototype Implementing the Proposed Approach
153 | P a g e
6.2.1.4 Recommendation definition tool
Recommendation definition tool allows the definition of recommendations in CM-Quality for
model improvement. Similarly, this tool is also responsible for associating recommendations with
metrics as these recommendations are proposed according to a given quality threshold of metrics.
These recommendations correspond to best practices extracted from literature or proposed by
quality experts.
6.2.2 The quality evaluation module
This module provides an IS analyst with a set of utilities for quality evaluation and
improvement. It implements the quality driven process presented in Chapter 4. This module
performs the following tasks through different utilities:
i. It helps the analysts in formulating their quality goal.
ii. It helps in identifying the relevant quality concepts (quality patterns and attributes) for
model evaluation with respect to the formulated quality goal.
iii. It performs the evaluation by measuring different metrics associated to the selected
quality concepts.
iv. It proposes the recommendations for model improvement.
6.2.2.1 Quality Parameters Selection Tool
The quality parameters selection tool initializes the quality evaluation session. This
initialization includes the following:
i. The information about the modeling notation used (ER, UML, etc.).
ii. The specification to evaluate (class diagram, ER diagram, etc.).
iii. The selection of the target model in XMI standard.
iv. The validation of the selected XMI file with respect to OMG‟s specifications.
6.2.2.2 Goal Definition Tool
The goal definition tool enables the IS analysts to formulate their quality goal with least
amount of effort following the standardized process illustrated in Chapter 4. This tool implements
the goal template proposed by [Basili 93] to formulate a structured goal in order to enhance its
understandability and to reduce the vagueness characterizing natural language.

Chapter 6: CM-Quality: Software Prototype Implementing the Proposed Approach
154 | P a g e
6.2.2.3 Quality Evaluation Tool
The quality evaluation tool offers three main functionalities:
i. Identification of goal‟s domain through generated questions.
ii. Identification of relevant quality criteria.
iii. Quality evaluation.
Quality evaluation tool identifies the relevant quality concepts (quality patterns and attributes)
and generates a list of questions to map the analysts‟ perception of formulated goal to the Quality
evaluation tool‟s perception. This identification uses text matching techniques based on the goal
expression and quality patterns components such as key words, context description, related
patterns, etc.
Based on the responses to the questions, relevant quality patterns and attributes will be
proposed to the analysts. Quality evaluation tool helps the analysts in selection of the appropriate
quality patterns, quality attributes and metrics from the automatically proposed concepts for
evaluation. After the selection, Quality evaluation tool evaluates the model by computing the
selected metrics.
6.2.2.4 Quality Improvement Tool
Finally, based on the obtained quality values, the quality improvement tool proposes quality
improvement advices in the form of recommendations. In the current version, this module does
not automatically apply the proposed transformation rules associated to the recommendations.
6.2.3 The knowledgebase structure
Figure - 32 illustrates that CM-Quality‟s knowledgebase is composed of three abstraction
levels. The highest level contains the quality meta-model implementation. The intermediate level
is dedicated to quality concepts defined by the quality expert. It contains the quality attr ibutes,
metrics and recommendations created through CM-Quality. Finally, the lowest level stores the
results of the evaluation sessions.

Chapter 6: CM-Quality: Software Prototype Implementing the Proposed Approach
155 | P a g e
- Quality Goal Based
Evaluation & Improvement
Sessions
- Quality Patterns
- Attribute
- Metrics
- Recommendations
- Quality Meta Model
Figure - 32. Knowledgebase Structure
CM-Quality‟s knowledgebase is implemented using independent XML files. However, these
files act as a database management system and reduce the deployment efforts due to their reduced
dependencies.
6.2.4 Package Diagram
Functionalities in CM-Quality are divided into seven packages. The package diagram in Figure
- 33 illustrates the different packages and interactions between the packages. Different
functionalities of the prototype are grouped into different packages. For example, the Quality
Evaluator Package encapsulates all the classes responsible for evaluating the conceptual model.
Similarly, the Quality Improver Package encapsulates the classes responsible for model
improvement.
As CM-Quality incorporates an existing prototype Qualis [Kersulec et al., 2009] for defining
and calculating metrics, therefore this package diagram also includes the functionalities of this
incorporated prototype. For example, the Quality Evaluator Package evaluates the CM by
calculating different metrics. This metric calculation functionality was originally implemented in
[Kersulec et al., 2009] and is part of our Quality Evaluator Package in addition to other
functionalities. In the following sub-sections, we define the responsibilities of each package
designed in CM-Quality.

Chapter 6: CM-Quality: Software Prototype Implementing the Proposed Approach
156 | P a g e
6.2.4.1 CM Quality Core
CM Quality Core is the main package responsible for managing all other packages. It
implements the main functions and employs all other packages to perform the desired operations.
For example, this package calls the routines implemented in Interface Manager Package to design
the different types of interfaces and to incorporate different types of validation on user input
fields. Similarly, this package employs XMI Parser Package to extract the model information
from the exported XMI files and uses this information to evaluate the model employing the
functions implemented in Quality Evaluator Package. However, it is important to mention here
that packages, other than CM Quality Core Package, can‟t access the functionalities of other
packages directly. Every package is designed in such a way that they work as an independent
entity and CM Quality Core Package manages all the access. In the above example, CM Quality
Core Package employs XMI Parser Package to extract the model information and then send this
information to Quality Evaluator Package for evaluation. Briefly speaking, this package functions
as the central unit and delegates responsibilities to the concerned packages and controls the
overall system.
Quality
Evaluator
Quality
Improver
Interface
Manager
Reports
Generator
CM Quality
Core
Knowledgebase
Manager
XMI Parser
Figure - 33. CM-Quality Package Diagram
6.2.4.2 XMI Parser
As mentioned before, CM-Quality incorporates an existing prototype Qualis that was capable
of defining and calculating metrics on models exported in XMI format. XMI Parser Package

Chapter 6: CM-Quality: Software Prototype Implementing the Proposed Approach
157 | P a g e
offers these functionalities, implemented in Qualis, for parsing the XMI models in order to extract
different information about the models. This information is used to calculate different metrics
through the functionalities implemented in Quality Evaluator Package and to generate relevant
improvement strategy employing the classes in the Quality Improver Package.
6.2.4.3 Interface Manager
Interface Manager Package encapsulates all the classes required to generate and manage
different types of interface components for CM-Quality. For example, this package includes the
classes to manage different tables in CM-Quality such as it manages how to bind data to different
columns in a table or how table should be formatted, etc. This package also incorporates the
different validation functions employed by CM-Quality for on-form verification of user inputs.
For example, it ensures that the numeric values are not entered in the non-numeric fields.
6.2.4.4 Knowledgebase Manager
In CM-Quality, we have not used the traditional Database Management System (DBMS) for
storing the knowledgebase contents due to deployment and licensing issues while portability.
However, we have used multiple XML files to store the knowledgebase contents. Thus,
manipulating knowledgebase contents from multiple XML files requires a sort of DBMS. XML
DB Manager Package encapsulates all the functionalities that helps in manipulating the data
stored in XML. This package also includes the functions to parse and execute different queries
including complex ones with multiple joins.
6.2.4.5 Quality Evaluator
Quality Evaluator Package is of high importance in CM-Quality as this package encapsulates
all the classes responsible to evaluate conceptual models. This package is responsible for
formulating the quality goal, identification of relevant quality criteria (quality patterns, attributes
and metrics) through sophisticated and efficient searching process (described later) and
calculation of all the relevant metrics. It is important to mention here that metric calculation
functionalities were originally implemented in Qualis but after integration they are included in
this package.
6.2.4.6 Quality Improver
Quality Improver Package encapsulates all the functionalities responsible for generating
relevant recommendations with respect to measured metrics results. These recommendations

Chapter 6: CM-Quality: Software Prototype Implementing the Proposed Approach
158 | P a g e
include textual recommendations, transformations and proposed design patterns as described in
Section-3.5.3.
6.2.4.7 Reports Generator
CM-Quality can be regarded as the only model evaluation software that provides proper
printable reports, in the form of Portable Document Format (PDF), incorporating both quality
evaluation results and improvement recommendations. Reports Generator Package encapsulates
all the classes required to generate PDF files from XML result set. These classes include functions
to design the report layout. CM-Quality employs Java API for XML Processing (JAXP) and
Formatting Objects Processor (FOP) for generating the PDF reports. Thus, Reports Generator
Package includes functions to generate reports using JAXP and FOP.
6.3 Quality Definition in CM-Quality
CM-Quality is a user-friendly tool aiming to implement the quality evaluation approach
described in Chapter 3. As depicted in the meta-model (Figure - 7), quality patterns are
formulated by using the existing quality attributes in the knowledgebase. Quality patterns serve as
guidelines helping IS analysts (naïve or expert) to achieve a quality goal.
CM-Quality offers two interfaces; the first one, dedicated to quality experts aims to maintain
and enrich the knowledgebase content. Whereas the second, dedicated to quality evaluation and
improvement by IS analysts, attempts to match a quality goal with the quality patterns and/or
quality attributes stored in the knowledgebase.
6.3.1 Quality pattern definition
As described in Chapter 3, defining a new quality pattern needs to answer the following three
questions:
i. What is the context of the quality pattern or when can this pattern be used?
ii. What is the problem that this pattern can solve?
iii. How can this pattern solve the problem?
Once the quality expert answered the three questions, he/she can use the Quality Pattern
interface (Figure - 34) to add a new quality pattern to the knowledgebase. The screen follows the
process described in Section-4.2.1. Similarly, the same interface can be used to edit or delete the
quality patterns from the knowledgebase. The Information defined through this interface is
required to formulate the body of the quality pattern. As mentioned in the preceding chapter, a

Chapter 6: CM-Quality: Software Prototype Implementing the Proposed Approach
159 | P a g e
quality pattern can be related to other predefined quality patterns. These related patterns help in
identifying and elaborating the domain of the defined quality goal (details are discussed in the
Section-6.4) and can be added using the button on the Quality Pattern Screen (Figure - 34).
Figure - 34. CM-Quality Screen: Managing quality patterns
Once the quality pattern is added to the knowledgebase, corresponding or related quality
attributes can be associated to it from the knowledgebase. The knowledgebase contains numerous
quality attributes that are ready to use. Figure - 35 shows the association screen responsible for
associating quality patterns with the existing quality attributes.

Chapter 6: CM-Quality: Software Prototype Implementing the Proposed Approach
160 | P a g e
Figure - 35. CM-Quality Screen: Associate Quality Patterns with Quality Attributes
6.3.2 Quality attributes definition
Section-3.5.1 defines the concept of quality attributes in our approach and details how existing
equivalent concepts such as dimensions, properties, characteristics, etc. are merged into the
unified concept of quality attribute. Moreover, Section-4.2.2 describes the process for identifying
new quality attributes. This process is implemented in the Quality Attribute interface (Figure - 36)
of our software prototype. Users can add/edit/delete quality attributes from the knowledgebase
using this interface. Keywords are identified for each quality attribute to help their identification
during the evaluation process.

Chapter 6: CM-Quality: Software Prototype Implementing the Proposed Approach
161 | P a g e
Figure - 36. CM-Quality Screen: Manage Quality Attributes
As mentioned before, quality attributes employ multiple metrics for their measurement. These
metrics can be computed automatically or might require manual calculation. Thus, adding a new
quality attribute requires its association with the appropriate quality metrics for its measurement.
This association between quality attributes and metrics (both automatable and manual) can be
defined using the separate screen as shown in Figure - 37.
Figure - 37. CM-Quality Screen: Associating Quality Attributes with Metrics

Chapter 6: CM-Quality: Software Prototype Implementing the Proposed Approach
162 | P a g e
6.3.3 Metric definition
Metrics are an important part of the evaluation process as they measure the aspects deemed
important to users with respect to their vision of quality. In our approach, metrics are used to
measure quality attributes. However, there are two types of metrics:
i. Metrics that can be calculated automatically such as calculating number of
classes/attributes, etc.
ii. Metrics that are not automatable due to any reason such as number of l ine crossings,
requirements coverage degree (see details in Chapter 5), etc.
In our approach, we employ both types of metrics and thus we incorporate them in our
prototype. An important strength of our approach is the fact that we have developed in a previous
work a prototype (Qualis) for metrics definition and evaluation [Kersulec et al., 2009]. Qualis
implements a metrics definition language and so metrics don‟t need to be hard coded providing
more flexibility in their definition. This also allows a simple enrichment of metrics. Our prototype
integrates this metrics definition language to define automatable metrics. Here is an example of
metric definition calculating the number of classes in a class diagram:
<metric name="NB_Classes_Metric" domain="model" >
<description>The number of classes belonging to a
model.</description>
<projection globalrelation="true" target="class" condition="id!=''" />
</metric>
The above mentioned metric definition is performed using the Metric Definition interface
(Figure - 38).

Chapter 6: CM-Quality: Software Prototype Implementing the Proposed Approach
163 | P a g e
Figure - 38. CM-Quality Screen: Defining Automatable Metric
However, the above interface can‟t be utilized to create non-automatable metrics. Our
approach employs several metrics that can‟t be computed automatically but are important for
evaluation and subsequent improvement. We tested several quality evaluation utilities such as
StarUML, Objecteering, UMLQuality, etc. but none of them provides any support for non-
automatable metrics and thus they discard several important evaluation criteria that for the
moment require manual computations. Our quality aware approach provides corrective actions for
model improvement and thus we kept these non-automatable metrics in our knowledgebase so
that relevant recommendations can be proposed to user for model improvement. Figure - 39
depicts the Non-Automatable Metrics Definition Interface. All the metrics defined using this
interface are treated as equivalent to automatable metrics i.e. they can be associated to quality
attributes, can be employed for any evaluation project and will propose relevant
recommendations. The only difference between these metrics and automatable metrics is that they
will not be computed by our prototype during the evaluation.

Chapter 6: CM-Quality: Software Prototype Implementing the Proposed Approach
164 | P a g e
Figure - 39. CM-Quality Screen: Defining Non-Automatable Metric
6.3.4 Recommendation Definition
As mentioned in Chapter 3, one strength of our approach lies in the post evaluation feedbacks
in the form of recommendations. These recommendations are part of the knowledgebase and are
proposed to the user for improving their models. Figure - 40 depicts the Recommendations
Definition Interface. This interface can be used to add/edit/delete recommendations from the
knowledgebase. Moreover, our knowledgebase is capable of storing relevant supporting
documents for the recommendations to help users in understanding the details about such
recommendations. These supported documents are available to the user along with the
recommendations for reference. For example, we can store existing human resource ontology
(that was used in Chapter 5) as a reference for helping users in identifying different clusters from
their complex models in order to divide them, as was demonstrated through our case study in
Chapter 5.

Chapter 6: CM-Quality: Software Prototype Implementing the Proposed Approach
165 | P a g e
Figure - 40. CM-Quality Screen: Managing Recommendations
In our approach, recommendations are dependent on metric results i.e. they are proposed for
improvement based on the measured values of the metrics. Thus, each recommendation must be
associated to at least one metric and proper application criteria should be defined with respect to
each metric so that they can be proposed effectively. This association between recommendations
and metrics can be established using our prototype‟s interface as depicted in Figure - 41. In our
approach, the relationship between metrics and recommendations is many-to-many.

Chapter 6: CM-Quality: Software Prototype Implementing the Proposed Approach
166 | P a g e
Figure - 41. CM-Quality Screen: Associating Recommendations with Metrics
6.4 Quality Evaluation in CM-Quality
The scenario presented in this section illustrates how the CM-Quality can be used to evaluate
and improve the models. The quality definition module is conceived for quality experts only as it
requires in depth knowledge about quality concepts. However as mentioned in Chapter 4, we
provide two types of mechanisms to accommodate both basic analysts and quality experts for
quality evaluation module. Quality experts can skip the goal formulation and directly start the
evaluation process by selecting the quality patterns or quality attributes from the knowledgebase.
However, it requires that they are aware of all the existing contents of knowledgebase and what
each concept proposes.
The quality evaluation process starts by selecting the model to be evaluated. The model must
first be exported to the XMI (XML Metadata Interchange) file format. XMI is the standard
proposed by Object Management Group (OMG) for exchanging metadata information via XML.
XMI has widely been used in the industry for enhancing the portability of conceptual models
among different modeling tools. Our prototype is based on XMI and thus it can be used to
evaluate models designed using any modeling tool capable of exporting its models into XMI.
Thus, the user selects the model to be evaluated. Once the model is selected, the user is proposed
the following four options:

Chapter 6: CM-Quality: Software Prototype Implementing the Proposed Approach
167 | P a g e
i. Formulate new quality goal (for all type of users) i.e. start from the scratch.
ii. Use existing quality goal i.e. the quality goals that were previously used for evaluation
(for all types of users).
iii. Select quality patterns directly (for quality experts only) i.e. the evaluation process starts
by manually selecting the quality patterns thus skipping the goal formulation process and
the process to map the formulated quality goals on to quality patterns.
iv. Select quality attributes directly (for quality experts only) i.e. start the process by
manually selecting the desired quality attributes thus skipping the goal formulation
process, the process to map the formulated quality goals on to quality patterns and the
selection of quality patterns.
Since most users have limited knowledge about the different quality concepts therefore they
are required to start the evaluation process by formulating the quality goal. Both the quality
evaluation modes for quality experts are different with respect to their starting point only. The
complete evaluation process encompasses all the steps from goal formulation to the generation of
evaluation results with recommendations. In the next section we will describe the complete
evaluation scenario that demonstrates the complete flow of the CM-Quality application starting
from goal formulation to the generation of evaluation results. However, we will explicitly
mention the starting point of each of the two modes of evaluation for quality experts.
This scenario doesn‟t include the housekeeping of knowledgebase i.e. it doesn‟t discuss about
the insertion, modification or deletion of quality patterns, quality attributes, metrics, etc to the
knowledgebase. It uses the existing contents of the knowledgebase for evaluation and
propositions. However, CM-Quality contains numerous screens for manipulating the
knowledgebase including the screens to manage quality patterns, quality attributes, metrics, etc. as
shown above.
6.4.1 Goal Expression and Resolution
As described in Chapter 3, we have used the goal formulation templates proposed by [Basili
93] to help the user in formulating a structured goal with the least amount of effort. [Basili 93]
divided the goal into four components:
i. Purpose of the goal i.e. object of analysis such as conceptual models, processes, etc.
ii. Intention of the goal. For example is it for evaluation, improvement, etc.
iii. Perspective or focus of the goal such as completeness, complexity, etc.

Chapter 6: CM-Quality: Software Prototype Implementing the Proposed Approach
168 | P a g e
iv. Target point of view i.e. is this goal intended for analysts, users, etc.
We found that dividing the goal into these four components will help the users in formulating
their quality goal more efficiently, effectively and with the least amount of effort. We have
incorporated this template in our prototype. Figure - 42 depicts the interface responsible for goal
formulation. The user can select as many sub goals as required. However a quality goal can have
one and only one purpose and one point of view. The contents of the four combo-boxes are
mentioned in Section-4.3.1.1. The text box in the interface provides a preview of the formulated
quality goal in natural language to help the users in visualizing their formulated quality goals.
In this example (Figure - 42), the user is interested in evaluating the complexity and
completeness of conceptual models (we will use this goal throughout this chapter as an example).
Structured goals have enabled us to perform efficient searching as in this case we will search for
relevant quality concepts corresponding to complexity and completeness only. The CM-Quality
tool integrates a searching engine for identifying relevant quality concepts (quality patterns or
attributes) with respect to the user defined quality goal. Searching process is discussed in the next
section.
Figure - 42. CM-Quality Screen: Quality Goal Formulation Screen

Chapter 6: CM-Quality: Software Prototype Implementing the Proposed Approach
169 | P a g e
6.4.2 Matching Formulated Goal to Quality Patterns
The incorporated search engine in CM-Quality uses information contained in quality patterns,
quality attributes and their associated metrics to match a quality goal. This matching could take a
lot of time. However, in order to accelerate the searching, the user has the option to select the
target fields for searching. The user can choose the searchable fields from quality patterns,
attributes and metrics.
In the previous section, we formulated a quality goal with intent to evaluate a conceptual
model with respect to correctness and complexity. Once the quality goal is formulated and target
searchable fields have been selected, the user launches the searching process. In our prototype,
CM-Quality, the mapping of this goal onto relevant quality concepts involves four steps:
i. In the first step the user will answer the questions, demanded by CM-Quality‟s search
engine, to narrow the domain of the formulated goal, as was proposed by GQM (refer to
Section-3.2.1 for more information about the generation of questions and GQM).
ii. Based on the responses of the questions, CM-Quality will propose a set of relevant quality
patterns. In the second step, the user will validate the selection of the quality patterns. In
this step the user can also manually select the quality patterns if it was not proposed by
the prototype. However, this manual selection necessitates expertise in quality concepts.
iii. In the third step, the user will validate the selection of the quality attributes i.e. he/she will
confirm the selection of quality attributes that should be used for evaluation. By default,
all the quality attributes associated to all the validated quality patterns (from the second
step) will be used for evaluation.
iv. In the last step, the user will choose the quality metrics that should be used for
quantifying the quality attributes. By default, all the quality metrics that are associated
with all the quality attributes validated in step-3 will be used for evaluation.
6.4.2.1 Step-1: Generating Questions to Identify the Domain of the Formulated
Goal
As mentioned in Section-3.2, quality goals are translated into questions. These questions help
users in narrowing the scope of goals yet specifying its domain and increasing the details about it.
Questions also help in identifying the evaluation criteria with respect to the formulated goal. In
CM-Quality, the search engine identifies the relevant quality concepts, with respect to the

Chapter 6: CM-Quality: Software Prototype Implementing the Proposed Approach
170 | P a g e
formulated goal, and generates questions so as to map the search engine‟s perception of the goal
with respect to users. For example, completeness can be related to requirements coverage whereas
it can also be related to syntactic completeness (refer to Section-3.5.1 for details about these
terms). In this case, CM-Quality will generate two questions asking the user if completeness is
related to requirements coverage or semantic completeness.
CM-Quality incorporates a sophisticated search engine that helps the automatic identification
of quality concepts that are in-line with the user defined quality goal. However, in order to
facilitate the searching, the user has the option to select the target fields for searching. The user
can launch searching on all the fields of quality patterns (such as name, context, problem, etc.),
quality attributes (such as name, keywords, etc.) and quality metrics.
Upon selecting the target fields, the user will press the Next button on the goal formulation
screen (Figure - 42) to launch the search process. The system will search perspective/focus of the
goal, in our example completeness and complexity, in all the selected fields for possible
matching.
Figure - 43. Goal Creation Step-1: Generating questions to identify the domain of the
formulated goal
Questions will be generated for all the resulting quality patterns matching the quality goal.
However, these search results are constituted thanks to three different kinds of search:

Chapter 6: CM-Quality: Software Prototype Implementing the Proposed Approach
171 | P a g e
i. If the quality goal matches the selected fields of the quality patterns, then a question will
be generated for that quality pattern and added to the resulting table (Figure - 43). For
example, one of the quality patterns in knowledgebase is named as “model complexity”,
thus the search will include questions about this quality pattern in the result.
ii. Similarly, the search will look for the goal terms in the selected fields of the quality
attributes and if some matching quality attributes are found, then the system will look for
all the quality patterns that are associated with this quality attribute and will generate and
display the questions about the associated quality patterns in the result table. For example,
knowledgebase contains a quality attribute that has complexity as a term in its name and
similarly another quality attribute that has complexity as a term in its keywords. Thus the
system will look for their associating quality patterns and will generate and display the
questions about those quality patterns and not the quality attributes.
iii. Searching tool will also look for the matching terms in the selected fields of the quality
metrics. And similarly to quality attributes, if some metrics exist that are in-line with the
quality goal in question, the system will first look for the quality attributes that are
responsible for these metrics and then will look for the quality patterns containing those
quality attributes and include questions about those quality pattern in the resulting table
(Figure - 43).
6.4.2.2 Step-2: Validation of Proposed Quality Patterns
Based on the user‟s response to the questions generated in Step-1, relevant quality patterns will
be proposed. However, the user can change the selection based on his/her choice. Figure - 44
depicts the interface proposing the quality patterns relevant to the formulated quality goal and
user‟s response to the questions.

Chapter 6: CM-Quality: Software Prototype Implementing the Proposed Approach
172 | P a g e
Figure - 44. Goal Creation Step-2: Validating the selection of proposed quality patterns
In addition to the proposed quality patterns, the user can also manually select the quality
patterns that he/she thinks can be important for the quality goal and that were not identified by the
search engine. Similarly, the user can also discard the quality patterns, resulted by the system, that
he/she thinks are not relevant to the quality goal.
Once the user validates his/her selection of the quality patterns, he/she will press the Next
button to go to the next step.
6.4.2.3 Step-3: Validation of the Selected Quality Attributes
The structure of a quality pattern contains a set of quality attributes i.e. quality patterns employ
quality attribute(s) for evaluation. However, if a quality pattern is selected for evaluation then this
doesn‟t require that all of its associating quality attributes will be employed for evaluation. The
user can change the selection and decide the quality attributes to be used from each quality pattern
for his/her goal specific evaluation project.
Figure - 45. Goal Creation Step-3: Validating the attributes selection for evaluation

Chapter 6: CM-Quality: Software Prototype Implementing the Proposed Approach
173 | P a g e
In the third step, the user will see the screen shown in Figure - 45. The combo box on top of
the screen contains all the quality patterns selected in step-2. Upon selection of quality pattern
from the combo box, the table below will list all the quality attributes that are associated with the
selected quality pattern. By default, all the quality attributes will be selected for evaluation.
However, the user can change the selection and decide the quality attributes to be used from each
quality pattern for his/her goal specific evaluation project. For example, Figure - 45 shows the
“Model Details” quality pattern and the three quality attributes associated with this quality
pattern. We can notice that only one quality attribute has been selected.
6.4.2.4 Step-4: Validation of the Selected Quality Metrics
Figure - 46 displays the last screen of the goal creation. The first combo box on the screen
contains all the quality patterns selected in step-2 whereas the second combo box contains all the
quality attributes selected in step-3. Upon selection of quality pattern from the combo box, the
second combo box will list all the quality attributes that are associated with the selected quality
patterns and were selected by the user in step-3. Once the user selects a quality attribute from the
combo box, the table will list all the metrics that are associated with the selected quality attribute.
By default, all the metrics will be used for evaluation. However, the user can choose the metrics
on his/her discretion for his/her goal specific evaluation project. This list will also contain manual
metrics but as mentioned above, manual metrics will not be calculated but will appear in the
evaluation report along with recommendations.
Figure - 46. Goal Creation Step-4: Validating the metrics selection for evaluation

Chapter 6: CM-Quality: Software Prototype Implementing the Proposed Approach
174 | P a g e
For example, in Figure - 46, “Model Structural Complexity” is selected as the quality pattern
and “Structural Complexity” is selected as the quality attribute. The table displays all the metrics
associated with the selected quality attribute. Among all listed, only seven metrics are selected for
evaluation.
6.4.3 Model Evaluation & Improvement
The model evaluation consists in assessing the quality of the target conceptual model by
employing the selected quality criteria. The model evaluation is dependent on the calculation of
the selected metrics as all other quality concepts are the abstractions for classification. The model
evaluation process starts by calculating the metrics on the target model. Once the metrics are
calculated, corresponding recommendations are proposed to the user for improvement. Our
knowledgebase contains numerous recommendations depending on the metrics values. These
recommendations can be textual recommendations, transformations or proposed design patterns
(details about recommendations and their types can be consulted from Section-3.5.3)
CM-Quality is the only evaluation software that provides an independent evaluation report
listing details about following:
i. User defined goal
ii. Employed quality patterns, attributes and metrics
iii. Detailed results of every metrics
iv. Detailed recommendations with metric for improving the model
The resultant report generated for the quality goal, used in this chapter as an example, is
attached as Appendix-E.
6.5 Comparison of CM-Quality with Other Existing Softwares
In Chapter 2, we used the Table - 3 to compare existing evaluation tools. Now we will use the
same criteria to position our prototype with respect to existing evaluation tools.
Table - 11. Comparing CM-Quality with existing evaluation software

Chapter 6: CM-Quality: Software Prototype Implementing the Proposed Approach
175 | P a g e
Criteria Objecteering Rational Rose
Star UML UML Quality
CM- Quality
Evaluate Static Diagrams Yes Yes Yes Yes Yes Evaluate Dynamic Diagrams No No No Yes Yes Granularity of evaluation criteria
Metrics Metrics Metrics Metrics Quality Patterns, Attributes & Metrics
Possibility to Add/edit evaluating criteria
No No No Yes Yes
Interface for adding/editing the evaluation criteria
No No No No Yes
Guidance process for selecting the requirement/project specific evaluation
No No No No Yes
Comparison of multiple models No No No No Yes Provision of evaluation report Yes No No Yes Yes Provision of post evaluation recommendations
No No No Yes (limited with plug-in)
Yes
Following findings can be deduced from Table - 11:
i. Only UML-Quality and CM-Quality (our prototype) provide possibilities to manage the
evaluation criteria but only CM-Quality provides a graphical user interface for managing
these criteria. In UML-Quality, the absence of dedicated user interface makes it difficult
to manage (add/edit/delete) the evaluation criteria.
ii. Only CM-Quality implements a guidance process for selecting the requirement specific
evaluation criteria. CM-Quality also incorporates a sophisticated search engine for
automatic detection and subsequent proposition of relevant quality concepts with respect
to the formulated goal.
iii. CM-Quality is the only evaluation tool that supports the comparison of multiple models
on the same evaluation criteria. Thus users can identify a better model among multiple
version of the same model.
iv. CM-Quality is the only evaluation tool that generates an independent report in printable
format (PDF) and includes both the evaluation results and the recommendations for
improvement.
In view of the above findings, we can say that CM-Quality incorporates several shortcomings
present in other existing evaluation applications. Moreover, CM-Quality is completely

Chapter 6: CM-Quality: Software Prototype Implementing the Proposed Approach
176 | P a g e
customizable. It can be used for other types of conceptual models (from other domains) by
formulating the relevant quality concepts for the target domain.
6.6 Conclusion
In this chapter, we presented our software prototype “CM-Quality” that implements our
proposed solution and process. We started by illustrating the application architecture at multiple
levels of granularities whereas in the last part we presented different interfaces available in CM-
Quality for quality definition and quality evaluation operations. We took examples to demonstrate
the flow of CM-Quality and described the searching process for automatic detection of relevant
quality criteria with respect to a formulated quality goal. We also attached the generated
evaluation report as Appendix-E. Following are the limitation of CM-Quality:
i. CM-Quality evaluates the complete model and proposes recommendations for the entire
model thus if user is interested in evaluating only certain parts of the model then he can
only do that by turning those parts into an independent model.
ii. Proposed transformations can‟t be applied automatically.
iii. CM-Quality can‟t be integrated to other modelers as an add-on. Thus it can work with
other modelers through XMI only.
In the next chapter, we present the two validation experiments conducted for our approach. In
the first experiment, we validated the selection of the quality attributes (from a thorough literature
review) whereas in the second experiment, we validated the efficacy of our proposed quality
approach including quality patterns.

Chapter 7: Validation
177 | P a g e
Chapter 7
Validation
As mentioned in Chapter 3, our approach involves practitioners‟ viewpoint as its practical
foundation. The main objective of our validation was twofold: one to study the evaluation strategy
employed in practice and second to validate our approach at different stages. We involved experts
both academics and practitioners using surveys, interviews, etc. To the best of our knowledge
such a large scale experiment has never been performed with academics and practitioners as
respondents. We conducted two experiments to validate our proposed approach at different stages.
We have carefully selected the respondents for both the validation experiment such that all the
respondents have prior knowledge about CM and some modeling experience.
We performed a thorough literature review and selected a set of quality attributes by federating
the existing quality frameworks or literature (explained in Section- 3.5.1). Thus, a first experiment
was performed to ensure that the resultant set of quality attributes (identified from the literature or
defined as new concepts) represents most of the important aspects (if not entirely) in the
evaluation of CM. This interim validation exercise (or experiment) was performed having experts
from academics and practice as respondents. The main objectives behind this first validation were
the following:
i. To collect respondents‟ feedback over the identified/selected set of quality attributes.
ii. To find the quality criteria that had been used in practice but are unknown to theory.
iii. To study the general practices and views of the respondents over the quality of CM.
iv. To study respondents knowledge about the existing evaluation methods and/or their
employment of these methods for CM.
v. To collect respondents‟ views on the quality of CM.
vi. To study if CM is actually evaluated in practice for ensuring its quality.
The results of the above experiment helped us in validating the selection of our quality
attributes and provided us with useful insights about the evaluation criteria considered important
in practice.

Chapter 7: Validation
178 | P a g e
We performed the second experiment to validate the efficacy of our complete approach
including quality patterns. This experiment consisted of three steps and every respondent was
required to complete all the three steps. We were interested in seeking the answers to the
following questions through this experiment:
i. Are the respondents sensitive to CM quality?
ii. Can they improve bad or complex CM by themselves?
iii. Are the proposed quality patterns easy to understand?
iv. Are the quality patterns useful in evaluating the CM?
v. Is the transformed model, by applying quality patterns, really better than the original
model?
The second experiment helped us in validating the strengths and benefits of employing our
proposed approach and quality patterns in evaluating and improving the conceptual model. Both
experiments are based on our proposed solutions to evaluate and improve the CMs. The results of
both experiments represent qualitative data. For example, in the second experiment respondents
were asked different questions after each step and they had to answer by yes/no. The questions
were designed in such a way so as to serve as a feedback to our approach and can help us in
ensuring the viability of our approach. Moreover, the collected data could be used to identify
different trends rather than proving or disproving a hypothesis.
In order to answer these requirements, we found that it would be much more useful to
emphasize on Exploratory Data Analysis (EDA) rather than traditional inferential statistics.
Inferential statistics relies heavily on probability models that sometime provide deceptive notion
of precision in not so ideal circumstances and most importantly the analysis is driven by
preconceived ideas. On the other hand EDA provides a descriptive statistics to examine the data
without preconceptions. It relies on graphical displays (different charts and graphs) to extract
meaningful information from the data. Most importantly it doesn‟t seek more that what data can
provide, as is the case with inferential statistics. EDA is an approach to analyze and understand
data employing different graphical techniques or charts. [Hoaglin et al., 1983] argued that too
much emphasis in statistics is placed on hypothesis testing and there is a dire need to understand
data at first. EDA techniques and charts are extensively used in different ERP and customer
relationship management (CRM) applications to identify different trends and predict different
models from data.

Chapter 7: Validation
179 | P a g e
In both experiments, we have used multiple charts and tables to analyze the respondents‟
responses to our questions. We were more interested in understanding our respondents feedback
about our selected quality attributes and our approach then on testing some hypothesis. We were
interested in detecting different trends among our respondents. Thus we divided the respondents‟
responses with respects to occupation and modeling experience to understand and identify
different patterns of data. This view enabled us to analyze the data using multiple lenses such as
comparing the responses from academics and practitioners.
In the next sections, we describe the two experiments.
7.1 Validating the Selected Quality Attributes
As discussed in preceding chapters, quality evaluation for CM requires a set of criteria along
with a mechanism for their classification. In the domain of CM quality, researchers have proposed
different criteria for evaluation but the main problem lies in their disparity and non-converging
solutions. The proposed quality criteria or quality frameworks are independent of one another and
thus it gets difficult to have a comprehensive and complete picture. Moreover, there doesn‟t exist
any approach that can help in the identification of these evaluation criteria. The absence of
consolidated and agreed quality criteria for CM has demotivated the acceptance and adoption of
evaluation based strategies for CM. We conducted a survey, discussed later in this chapter, and
found that analysts/modelers acknowledge the importance of implementing an evaluation strategy
for CM but most of them don‟t know if any of such material existed in research. This gap between
existing literature on CM evaluation and its usage in practice is due to the fact that neither a
standardized set of criteria exists in the literature nor a consolidated quality approach has been
proposed and diffused on a wide level.
In Section-3.5.1, we discussed the problems related to the existence of independent and
autonomous quality frameworks and proposed to federate the existing literature to formulate a
consolidated set of criteria for CM quality evaluation. In order to identify this consolidated set,
different quality criteria from the previously existing quality frameworks or literature were
extracted. Following guidelines were used for this activity:
i. Selection of various quality attributes from the literature such that each attribute must be
generic and should remain valid for all types of conceptual models such as UML models,
ER models, etc. Thus attributes specific to a particular notation (UML, ER etc,) can‟t be
selected. However such attributes are merged into generic attributes that are closest with
respect to semantics.

Chapter 7: Validation
180 | P a g e
ii. All the existing dimensions, characteristics, properties, attributes, categories, etc. that can
be directly quantified employing metrics can be selected as attributes. For example,
completeness can be quantified using metrics such as requirements coverage degree,
semantic completeness, etc. therefore it can be selected as an attribute. However, the
dimensions (such as syntactic quality, semantic quality, pragmatic quality, etc.) proposed
by [Krogstie et al., 1995], [Lindland et al., 1994], etc. are not at the same level of
abstraction and thus can‟t be considered as attributes. Moreover, these dimensions are just
a way of classifying different criteria.
iii. Identification and classification of relevant metrics into respective quality attributes for
measurements. For example, metrics such as number of classes, number of attributes, etc.
are used for measuring complexity quality attribute.
iv. As mentioned before, the same quality concept has been defined differently by different
researchers. For example, [Nelson et al., 2005] identified nine different definitions for
“completeness”. Thus as per our approach, completeness is equivalent to a quality
attribute and thus we combine all the definitions of completeness within a single quality
attribute named as “completeness” and formulated different metrics to cater the dissimilar
requirements of the existing nine definitions.
v. [Purao et al., 2003] identified identical names for some semantically different metrics and
different names for semantically same concepts. In our approach, we merged all the
semantically similar concepts as one quality attribute. Similarly for semantically different
concepts having identical names, we merged them into the relevant concepts.
vi. Identification or enrichment of different quality attributes to incorporate different
epistemological foundations/questions for CM. As mentioned in Section-3.1.3, we tried to
seek the answer to epistemological question such as “Why do we make CM?” We
identified all the reasons that led to the employment of CM for designing the system and
enriched the definition of completeness and understandability quality attributes to include
these reasons. For example, we included the semantic and syntactic aspects to the
completeness quality attributes by formulating or identifying relevant metrics. Similarly,
we included all the aspects related to enhancing the understandability of the CM and its
correct interpretation into the understandability quality attribute.
The above mentioned activity resulted in the selection/identification of a set of quality
attributes that were generic and represent different aspects of the conceptual models such as
complexity, maintainability, etc. Moreover, the advantage of this activity was the elimination of

Chapter 7: Validation
181 | P a g e
redundant concepts in addition to unification of different frameworks, identification of grey areas
and provision of a more comprehensive and flexible set of quality criteria for conceptual models.
We identified twenty one quality attributes that incorporate a wide range of quality criteria
already existing in the literature. These attributes can be consulted from Table - 15.
The above mentioned federation activity is incomplete without incorporating the insights from
the practice and can be questionable without exercising a proper validation. For example, in order
to be sure that the resultant set of quality attributes represents the most important aspects (if not
entirely) in the evaluation of CM, an interim validation exercise was planned and performed
having experts, both academics and practitioners as the respondents. Therefore, a web-based
survey, built on the above mentioned selected quality attributes, was formulated. This validation
exercise tried to collect the responders‟ views on the holistic quality of the conceptual models in
addition to their feedback over the identified/selected set of quality attributes.
Following purposes were envisaged from survey:
i. To observe if practitioners also regard quality evaluation as an important aspect in CM
and, if they do then, to study their knowledge about the existing evaluation methods
and/or their employment of these methods for CM.
ii. To study if actually CM is evaluated in practice for quality as the software.
iii. To serve as a validation exercise in providing feedback from experts both academics and
practitioners over the efficacy of the selected quality attributes.
iv. To study the general practices and views of the professionals over the quality of
conceptual models. This includes the identification of attributes or other criteria that had
been used in practice but are unknown to theory.
As mentioned above, a web-based survey was formulated to conduct this study. To the best of
our knowledge, such a large scale experiment has never been performed with academics and
practitioners as respondents. This was a closed survey and was accessible through a special link,
provided to the invited participants only to avoid unintended participants. We have carefully
selected the respondents for this validation experiment. This was a comprehensive survey
containing 42 general questions and our selected quality attributes specific questions. However,
all the questions were directly related to the quality of conceptual models. These questions
include the two feedback questions where the participants were required to mention:
i. Attributes that in their view are crucial to the quality of conceptual models (they can
identify up to seven attributes).

Chapter 7: Validation
182 | P a g e
ii. How do they compare two conceptual models representing the same reality or modeling
the same problem? They were required to identify and mention up to seven
attributes/properties that they think they will employ in choosing the best model with
respect to their perception of quality.
The survey consists of the following four sections to target the different types of information:
i. General Information about the respondents.
ii. Respondents‟ knowledge about CM.
iii. Respondents‟ knowledge about CM quality and their feedback over the selected quality
attributes.
iv. Respondents‟ general practices about conceptual modeling quality.
The survey provides the respondents with the dictionary and an instant help about the
definitions and details of all the terms and concepts used in the survey including the definitions of
all the selected quality attributes.
7.1.1 Sample
In total 179 professionals (including IS managers, IS developers, researchers, etc.) were
contacted to complete the survey. These respondents were carefully selected in a way that they
should have prior knowledge and experience about CM. For example, we selected the authors of
those research articles that were based on quality evaluation aspects of CM. These researchers
include some well known researchers in the field of CM quality such as Daniel Moody, Geert
Poels, Islay Davies, Andrew Burton-Jones, etc. Similarly, this survey was sent to analysts/project
managers/developers of a big software development firm where I had worked in the past for about
four years. However among the 179 contacted respondents, 57 completed the survey that resulted
in the response rate of 31.8%. Among the received 57 responses, three were discarded due to
errors in the provided data or incomplete information about the important parts of the survey.
Table - 12 provides the basic information about the respondents. It can be seen that our
respondents come with a wide range of experience encompassing between one and twenty six
years of experience with a mean of 6.4 years. Similarly, the respondents have an average
modeling experience of 4.25 years including respondents between one year and fifteen years of
modeling experience.

Chapter 7: Validation
183 | P a g e
Table - 12. Experiment 1: General information about the respondents
Total Respondents 54 Male 49
Female 5 Average Age 30.3 years
Min Age 27.5 years
Max Age 50 years Average Experience 6.4 years
Min Experience 1 years Max Experience 26 years
Average Modeling Experience 4.25 years Min Modeling Experience Less than or equal to 1 year
Max Modeling Experience Between 10 & 20 years
Respondents were required to select their modeling experience from six classes ( listed below).
These classes don‟t have an equal interval as we wanted to have a more precise detail about our
respondents with the least possible classes. We knew in advance that more than 90% of our
respondents will have a modeling experience of less than 10 years (as the survey was sent to
selected respondents only). Thus we formulated the classes in such a way to get more precise
information about these 90% respondents. This classification has also helped us in calculating a
more precise weighted arithmetic mean about our respondents since we took the mean of each
class and multiplied it with its frequency. For example, we have ten respondents that belong to
class “Between 1 & 3 years” thus we took the mean of this class i.e. 2 and multiply it with 10 and
used it to calculate the mean listed in Table - 12 or later in this chapter. Such short interval classes
enabled us to get a more precise estimate about majority of our respondents and have also helped
in reducing the number of classes. The different classes are:
i. Less than or equal to 1 year
ii. Between 1 & 3 years
iii. Between 3 & 5 years
iv. Between 5 & 10 years
v. Between 10 & 20 years
vi. More than 20 years
Figure - 47 depicts the division of respondents with respect to their modeling experience. It
can be seen that the majority of our respondents belongs to a class having a modeling experience
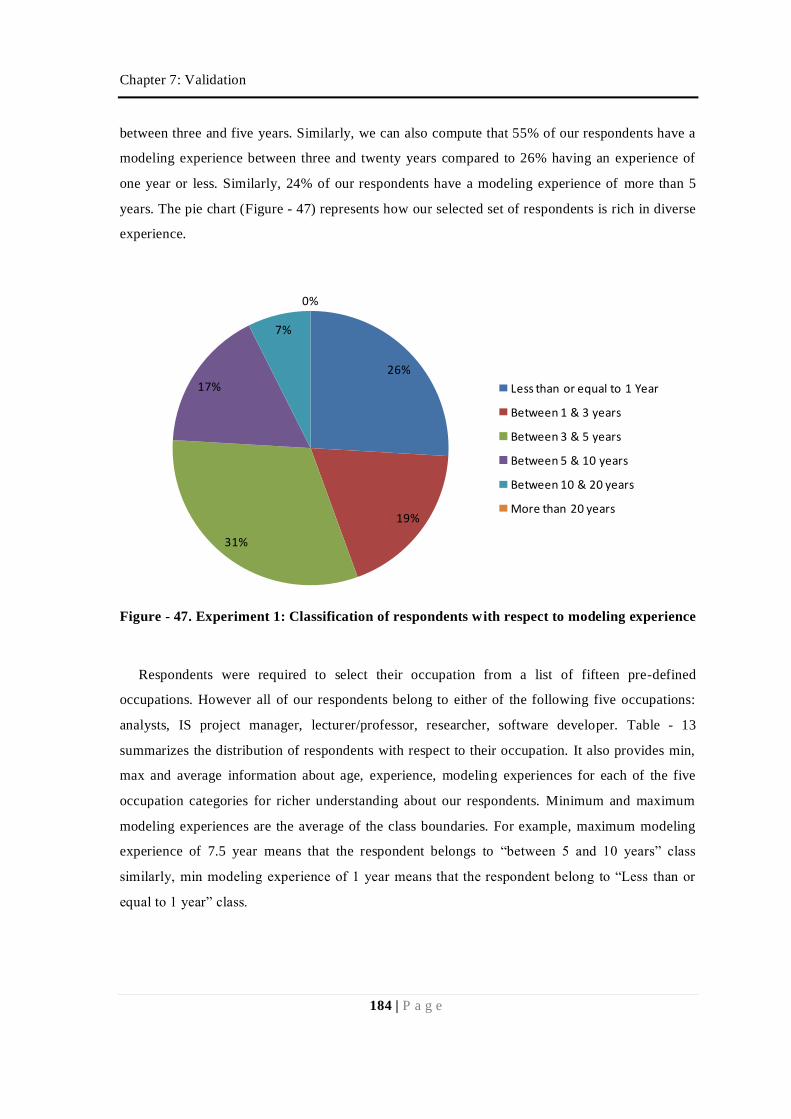
Chapter 7: Validation
184 | P a g e
between three and five years. Similarly, we can also compute that 55% of our respondents have a
modeling experience between three and twenty years compared to 26% having an experience of
one year or less. Similarly, 24% of our respondents have a modeling experience of more than 5
years. The pie chart (Figure - 47) represents how our selected set of respondents is rich in diverse
experience.
26%
19%
31%
17%
7%
0%
Less than or equal to 1 Year
Between 1 & 3 years
Between 3 & 5 years
Between 5 & 10 years
Between 10 & 20 years
More than 20 years
Figure - 47. Experiment 1: Classification of respondents with respect to modeling experience
Respondents were required to select their occupation from a list of fifteen pre-defined
occupations. However all of our respondents belong to either of the following five occupations:
analysts, IS project manager, lecturer/professor, researcher, software developer. Table - 13
summarizes the distribution of respondents with respect to their occupation. It also provides min,
max and average information about age, experience, modeling experiences for each of the five
occupation categories for richer understanding about our respondents. Minimum and maximum
modeling experiences are the average of the class boundaries. For example, maximum modeling
experience of 7.5 year means that the respondent belongs to “between 5 and 10 years” class
similarly, min modeling experience of 1 year means that the respondent belong to “Less than or
equal to 1 year” class.

Chapter 7: Validation
185 | P a g e
Table - 13. Experiment 1: Classification of respondents with respect to occupation
Occupation Analysts
IS Project Manager
Lecturer/ Professor Researcher
Software Developer
Number of Respondents 7 12 7 9 19
Average Age 31.4 30.42 33.2 30.3 28.9
Min Age 27.5 27.5 27.5 27.5 27.5 Max Age 50 40 50 40 40
Average Experience 9.7 7.9 8.7 3.6 4.8 Min Experience 4 4 2 1 1
Max Experience 26 15 26 7.5 15 Average Modeling Experience 6.8 4.1 8.8 2.1 2.7
Min Modeling Experience 2 1 1 1 1
Max Modeling Experience 15 7.5 15 4 7.5
We were also interested in understanding the different quality evaluation practices for CM
employed by various organizations with respect to their sizes. Thus, the respondents were
required to select the size of their organization from a list of six groups. These groups range from
small organizations having less than 50 employees to as big as having more than 1000 employees.
The distribution of respondents with respect to their organizational strength is shown in Table -
14.
Table - 14. Experiment 1: Respondents with respect to organization size
Company Size: Count Less than 50 employees 15 Between 50 & 100 employees 7 Between 101 & 200 employees 8 Between 201 & 500 employees 11 Between 501 & 1000 employees 2 More than 1000 employees 9 Not answered 2 TOTAL 54
It can be observed from Figure - 48 that 20% of our respondents belong to large organizations
having more than 500 employees including 16% respondents that belong to organizations having
more than 1000 employees. Similarly, 4% of the respondents didn‟t provide this information.

Chapter 7: Validation
186 | P a g e
28%
13%
15%
20%
4%
16%
4%
Less than 50 employees
Between 50 & 100 employees
Between 101 & 200
employees
Between 201 & 500
employees
Between 501 & 1000
employees
More than 1000 employees
Not answered
Figure - 48. Experiment 1: Respondents with respect to organization size
7.1.2 Data Analysis
The collected data shows that all of our respondents knew about CMs and 83% of these
respondents use CM at the time of the survey. We also enquired from the respondents about their
knowledge on the existence of any standards for evaluating the quality of conceptual models. The
respondents were required to answer the questions in yes/no. If they knew about some standard
then they were required to provide the name of that standard. We asked this information to extend
our horizon on the existence of any evaluation standard for CM that is in the market or used in the
practice but is unknown to us. To our surprise nine respondents (16%) claimed that they knew a
standard and six provided the name of the standards. The provided names include: IEEE standard
(without any reference), object modeling technique (OMT), UML, object management group
(OMG). However none of these are standards for CM quality evaluation.
In the next section of the survey, we asked the respondents if they consider the imposition of
quality approach on the conceptual models to directly influence the quality of the final product.
85% of the respondents replied in affirmation. However, it is interesting to note that 90% of the
respondents have never used any method or framework to evaluate the quality of conceptual
models (two of the respondents didn‟t answer this question so we didn‟t include them in
calculating the percentage). Among the five respondents who employ any quality evaluation
method for CM, two respondents can be regarded as quality experts as they have published at
least one article in the field of CM quality evaluation. This shows that despite the appreciation of

Chapter 7: Validation
187 | P a g e
importance of implementing a quality approach, professionals do not employ any methods to
improve the quality. Such a behavior has resulted due to the gap between research and practice.
To date there does not exist any quality framework that is standardized, simple and
comprehensive enough to accommodate the requirements of the practitioners.
In the next part of the survey, we intended to collect the respondents‟ feedback over the
efficacy of the selected quality attributes. All the attributes were put in one table and respondents
were required to mark all the attributes into either „not related to quality‟, „I am not sure‟,
„directly related to quality‟ or „indirectly related to quality‟ using radio buttons. However there
was not a real difference between the answers of the last two options as respondents have to rely
on their cognition to categories the attributes into what is directly related to quality and what is
not. Thus, we found it more interesting to merge these two options as one so that we can have a
clear distinction between the attributes that are related to and not related to quality. Moreover, we
were not interested in classifying the attributes into being directly related or not but to validate if
the selected attributes is related to quality or not. The responses are summarized in the Table - 15
and attributes are sorted with respect to “Related to Quality”. All the values are in percentages of
the responses and are rounded off to the nearest tenth digit. Table - 15 should be read as, for
example, 88.9 % of the respondents think that „Documentation‟ quality attribute is related to
quality against 0% that think it is not related to quality. Similarly, 11.1% of the respondents
declare their inability to categorize „Documentation‟ quality attribute in any of four classes.

Chapter 7: Validation
188 | P a g e
Table - 15. Experiment 1: Respondents’ feedback on the selected quality attributes
Attributes NOT Related to Quality
Related to Quality
Not answered
I am not sure
Documentation 0 88.9 0 11.1 Naming Convention 7.4 87 3.7 1.9 Minimality 3.7 87 1.9 7.4 Understandability 7.4 87 3.7 1.9 Relevancy 3.7 83.3 3.7 9.3 Extendibility 3.7 83.3 3.7 9.3 Semantic Correctness 1.9 81.5 3.7 13 Reliability 11.1 79.6 3.7 5.6 Usage of standard notations 3.7 79.6 3.7 13 Clarity 22.2 75.9 0 1.9 Completeness 7.4 75.9 3.7 13 Structural complexity 11.1 75.9 1.9 11.1 Expressiveness 0 74.1 3.7 22.2 Syntactic Correctness 13 74.1 3.7 9.3 Currency 3.7 74.1 3.7 18.5 Modularity 5.6 72.2 1.9 20.4 Size 16.7 70.4 3.7 9.3 Modifiability 11.1 70.4 1.9 16.7 User Vocabulary 11.1 64.8 3.7 20.4 Reusability 16.7 64.8 3.7 14.8 Implementability 22.2 63 3.7 11.1
It is clear from the Table - 15 and the bar chart (Figure - 49) above that there exist only three
attributes in our selected set of quality attributes for which less than 70% of the respondents think
that they are related to quality. Similarly, there are only two attributes (Clarity and
Implementability) for which 22.2% of the respondents think that they are not related to quality.
Thus, we can say that the selected set of quality attributes are well identified and represents the
attributes that are also considered important by other populations.

Chapter 7: Validation
189 | P a g e
0
10
20
30
40
50
60
70
80
90
100
NOT Related to Quality Related to Quality Not answered I am not sure
Figure - 49. Experiment 1: Bar chart depicting respondents’ feedback on the selected
quality attributes
In the last part of our survey, we tried to study the general practices and views of the
professionals over the quality of conceptual models. We asked the respondents to list attributes
that in their view are crucial to the quality of conceptual models. Similarly, we also asked them to
identify attributes/properties that they might employ in choosing the best CM among multiple CM
representing the same reality or modeling the same problem. This activity helped us in identifying
a new quality attribute and also helped in extending the domain of the existing quality attributes.
For example, a lot of our respondents listed the aspects related to practicability of the model to be
relevant to quality. They consider that if models are not practicable due to implementation
difficulties (such as unprocurable technology, scarce resources, etc.), design difficulties or time
constraints then it is not good. Thus we selected practicability into our set of quality attributes.
Practicability is different from the already existing implementability quality attribute as
implementability is related only to the efforts needed for implementing a model meaning that the
model is feasible and implementable. Whereas practicability is related to the factors that signify
that the model is not feasible and implementable.
In the next section, we describe the experiment that was used to validate our proposed quality
approach.

Chapter 7: Validation
190 | P a g e
7.2 Validating the Proposed Quality Approach
In Chapter 3 we proposed quality patterns to capitalize existing knowledge and past
experiences so that they can be reused in future. However, the viability of our proposed quality
patterns can only be assessed/validated through an experiment. Thus, we used the class diagrams
presented in Chapter 5 to formulate an experiment. This experiment consists of the following
three steps:
i. In the first step, respondents were given the original class diagram in Chapter 5 and the
set of requirements (Appendix-D) that was followed to make this class diagram.
Respondents were required to analyze this CM (class diagram) to identify the problems in
the model from the provided list. Later they were asked about their proposed solution to
remove the identified problems. In this step, respondents were not provided with any
information about any quality attributes or metrics. Thus, they had to use their cognition
and/or previous knowledge/experience to identify the problems and solutions.
ii. In the second step, respondents were provided with a documentation that explains two
quality patterns: model complexity quality pattern and model completeness quality
pattern (described in Section-3.5.4 and Section-5.3.1.1). This documentation includes the
problems targeted by these quality patterns and the proposed solution to answer these
problems. The respondents were also provided the list of the calculated metrics so that
relevant recommendations can be adapted by the respondents to improve the model. In
the end respondents were required to answer the set of questions. Respondents were not
required to actually do all the modifications in the model but to understand the provided
quality patterns and apply them.
iii. In the third step, respondents were explained the problems that can be identified in the
original model employing the two quality patterns given in the second step. Similarly, the
solution to these problems was also explained to them that were proposed through these
quality patterns. In addition, respondents were provided with the transformed models that
resulted after applying all the recommendations, proposed through the quality patterns, on
the original model provided in step1 (these models can be consulted from Chapter 5).
Respondents were required to evaluate the transformed models and answer the questions.
In short this experiment consisted of three steps in which respondents were required to do the
following:

Chapter 7: Validation
191 | P a g e
i. Improve the quality of a model using their existing knowledge or cognition. With this
exercise, we tried to study the cognitive efforts put in by respondents and the criteria
employed by them to evaluate and improve the CM using their existing knowledge.
Moreover, this step served as an interesting source of knowledge for identifying and
enriching our proposed quality patterns.
ii. Improve the quality of a model using our proposed quality pattern concept. This step
helped in validating the quality patterns‟ understandability and ease of use.
iii. Evaluate the results of quality improvement obtained by applying quality patterns on the
given CM. This step helped in validating the efficiency of using quality patterns.
7.2.1 Sample
This experiment was given to evening M.Sc. students (in printed and/or electronic form) who
have prior knowledge and experience about CM. Most of these students are currently employed in
an organization. Moreover, this experiment was also sent to some professors and researchers
from academics along with some analysts, project managers, developers, etc. from practice.
Twenty five respondents submitted all the three steps of the experiment. The low response rate
was due to the length of the experiment. The experiment took approximately one hour (as
communicated by some of our respondents). This experiment was sent to experienced respondents
and most of them were employed. Therefore responding to such a lengthy experiment by a
majority was a bit difficult. However, these 25 respondents came with different profiles and vast
experiences. This sample size can be considered as sufficient to validate our approach due to the
following reasons:
i. This was a very detailed and comprehensive experiment that demanded the respondents to
actually understand the provided quality patterns and our approach, then apply these
quality patterns on a complex model (provided) and finally respond to our questions.
Thus the experiment didn‟t consist of questions that can be answered just by having an
overview of the approach. The respondents can‟t answer to our questions without actually
understanding all the provided material. We analyzed the collected data carefully to
identify non-serious responses. We found that all the respondents completely read the
provided material, understood our approach and carefully responded to our questions.
ii. All the respondents took part in the experiment voluntarily. They were told in advance
that this experiment will take less than one hour. They were not offered any reward or gift

Chapter 7: Validation
192 | P a g e
for taking part in this detailed experiment. So all the respondents submitted their
responses purely on their will and interest in the experiment.
iii. All of our respondents knew about CM especially class diagrams (as the provided models
were class diagrams) and most of them have prior experience in modeling.
iv. The responses to asked questions are converging and not dispersed. There is a clear
convergence of respondents towards every question. For example 88% of our respondents
think that quality patterns were easy to understand whereas only 12% consider they were
not easy to understand. It would have been difficult to rely on this sample size if the
responses of our respondents were very balanced for example, 55% would have
responded in affirmation whereas the 45% in negation.
Respondents were required to provide information about their age and modeling experience.
They have to select the modeling experience from the following six classes: Less than or equal to
1 year, between 1 & 3 years, between 3 & 5 years, between 5 & 10 years, between 10 & 20 years
and more than 20 years. The details about selecting these classes for modeling experience and the
method of calculating average modeling experience is the same as in the first experiment.
Table - 16 provides the basic information about the respondents. It can be seen that the
respondents have an average modeling experience of 3.1 years.
Table - 16 . Experiment 2: General information about the respondents
Total Respondents 25
Average Age 31.1 years Min Age 22.5 years
Max Age 50 years
Average Modeling Experience 3.1 years Min Modeling Experience Less than or equal to 1 year
Max Modeling Experience Between 5 & 10 years
Figure - 50 illustrates the division of respondents with respect to their modeling experience. It
can be seen that the majority of our respondents belong to a class having a modeling experience
between three and five years. Similarly, we can also compute that 44% of our respondents have a
modeling experience between three and twenty years including 12% having a modeling
experience between 5 and 10 years. Moreover, we don‟t have any respondent having a modeling
experience of more than 10 years.

Chapter 7: Validation
193 | P a g e
20%
36%
32%
12%
0% 0%
Less than or equal to 1 Year
Between 1 & 3 years
Between 3 & 5 years
Between 5 & 10 years
Between 10 & 20 years
More than 20 years
Figure - 50. Experiment 2: Respondents' division with respect to modeling experience
Respondents were required to provide information about their occupation so that different
profiles of responses can be identified from the results or results can be interpreted based on
occupation. Most of our respondents belong to either of the following five occupations: analysts,
IS project managers, lecturers/professors, researchers, software developers with an exception of
three who were respectively a technician, an IT-auditor and a chief technical officer (CTO) and
are placed under “others”. Table - 17 illustrates the division of respondents with respect to their
occupation.
Table - 17 . Experiment 2: Classification of respondents with respect to occupation
Occupation Student Lecturer/ Professor Researcher
Software Developer
Project Manager
Analyst Other
Number of Respondents 9 1 2 4 5 1 3 Average Age 25.3 32.5 30 30 37.5 50 33.3
Min Age 22.5 32.5 27.5 27.5 32.5 50 27.5 Max Age 27.5 32.5 32.5 32.5 50 50 40
Average Modeling Experience 2.2 2 3 4.4 3.7 1 4.2 Min Modeling Experience 1 2 2 2 1 1 1
Max Modeling Experience 4 2 4 7.5 7.5 1 7.5

Chapter 7: Validation
194 | P a g e
Pie chart in Figure - 51 displays the division of respondents with respect to their occupation. It
can be seen that 12% of our respondents are academics (professors and researchers) compared to
52% from practice (including respondents classified under “other” as all the three are
practitioners). However, 36% of our respondents were post graduate students. Minimum and
maximum modeling experience are the average of the class boundaries. For example, maximum
modeling experience of 7.5 year means that the respondent belongs to “between 5 and 10 years”
class similarly, min modeling experience of 1 year means that the respondents belongs to “Less
than or equal to 1 year” class.
36%
4%8%16%
12%
4%
20%Student
Professor
Researcher
Software Developer
Other
Analyst
Project Manager
Figure - 51. Experiment 2: Respondents' division with respect to occupation
7.2.2 Data analysis:
This experiment consists of three steps. Respondents were provided with a different material
for each step. They were required to follow the sequence of the steps and not to consult the
documents of the next steps in advance. Neither can they modify their responses of the previous
steps after consulting the documents of the next step. Each of the three steps were dependent on
each other as we intended to compare the three different results sets to evaluate the efficacy of our
proposed approach. For example, if the respondents read the documentation provided in the
second step then they will know about the different quality attributes, metrics, recommendations
for evaluating and improving the model. Thus their responses to the first step may be biased by
this knowledge as we intend to test the respondent‟s cognition, past knowledge and past
experience to identify the problems in the model without having any knowledge about our
proposed approach or quality patterns.
In the next sub-sections we will analyze the results of each step.

Chapter 7: Validation
195 | P a g e
7.2.2.1 Step-1:
Respondents were given a complex class diagram and an extract of requirements in the first
step. This is the same class diagram (original model) that was used in Chapter 5 to test our
proposed evaluation and improvement approach. Respondents were required to identify different
problems or errors in the provided model. In this step, respondents were not provided with any
information about any quality attribute or metrics. Thus, they have to use their cognition and/or
previous knowledge/experience to identify the problems and solutions. There was no time limit so
the respondents could take as much time as they want to understand the model and identify the
problems. In the end, they were required to respond to the following two sets of information:
i. To select the problems in the provided model from the list
ii. To select the actions that they think should be used to modify the model to remove the
identified problems
Table - 18 summarizes the respondents‟ responses to the provided list of problems. It can be
seen that 10/25 (10 out of 25) respondents consider that numerous line crossings are a problem in
the provided model. Similarly, 19/25 respondents think that the model contains numerous classes,
attributes, etc. that increase the complexity of the model. However, it is interesting to note that all
the respondents (25/25) consider the missing cardinalities, un-named associations, etc. (syntactic
completeness) to be a problem in the model.
Table - 18. Experiment 2: Identified problems in the original model by the respondents
Understandability Numerous line crossings 10/25 Used language in the model 4/25
Complex Number of classes, attributes, methods, etc. in the model 19/25 Number of associations, aggregations, generalizations, etc. in the model 14/25 Usage of standard notations 1/25
Incomplete Missing requirements 10/25 Syntactic completeness (missing cardinalities, un-named associations, etc.) 25/25
Remaining errors Syntactic errors 10/25 Semantic errors 13/25
Similarly, Table - 19 sums up the respondents‟ selection of actions to solve the problems
identified in Table - 18. For example, twenty two respondents think that they would have
improved the model by completing all the syntactic requirements. However, it is interesting to
note that only 4 out of 25 respondents consider that factorizing associations can be of any help in

Chapter 7: Validation
196 | P a g e
improving the model. The lower selection of this solution can be due to the incapability of the
respondent to understand the concept of factorization of associations. Moreover, the most popular
employed solution is to complete the syntactic requirements such as identifying the cardinalities
and naming the associations.
Table - 19. Experiment 2: Respondents’ identified solution to the problems in the original
model
Our proposed solution Selected as solution
Redraw the Diagram 6 Delete the classes arbitrarily 7 Merge the classes 13 Divide the model arbitrarily 6 Divide the model wrt some semantics 15 Factorize the associations 4 Complete all the requirements 10 Complete all the syntactic requirements 22 Remove all the syntactic errors 12 Remove all the semantic errors 14
For each of the above mentioned solution selected by the respondents, they were asked to
provide details about their suggested actions or transformations that they might have employed as
a solution. For example, as mentioned in Table - 19, thirteen respondents think that they would
have improved the model by merging the classes. Thus each of these thirteen respondents was
required to provide the details about the classes they think might be merged or how they would
have merged the classes. But as mentioned in Table - 20, only 5 respondents completed the
respected section for this solution and, among these 5 respondents, only 4 actually identified the
classes that can be merged or suggested a way to merge the classes whereas one respondent just
proposed to “merge the classes”. Among all the received suggestions, two were discarded as they
were not related to any of the solution mentioned in Table - 19.

Chapter 7: Validation
197 | P a g e
Table - 20. Experiment 2: Respondents’ suggested corrective actions in response to selected
solution
Our proposed solution Selected as solution
Responded to details
Actually Suggested details about transformation
Redraw the Diagram 6 0 0
Delete the classes arbitrarily 7 4 1
Merge the classes 13 5 4
Divide the model arbitrarily 6 0 0
Divide the model wrt some semantics
15 12 4
Factorize the associations 4 2 1
Complete all the requirements 10 6 2
Complete all the syntactic requirements
22 10 3
Remove all the syntactic errors 12 2 1
Remove all the semantic errors 14 0 0
7.2.2.2 Step-2
In the second step respondents were provided with details about model complexity and model
completeness quality patterns (described in Section-3.5.4 and Section-5.3.1.1). These details
include the problems targeted by these quality patterns and the proposed solution to solve these
problems. Moreover, all the metrics that are used by these quality patterns for evaluation were
calculated for the original model (provided in the first step) and were provided to the respondents.
These metrics results helped the respondents in choosing the relevant recommendations from the
provided quality patterns to improve the model. Respondents were not required to actually do all
the modifications but to understand the evaluation and improvement process described in these
two patterns so that they can realize the advantage/disadvantage of employing quality patterns for
evaluating and improving the model. In the end respondents were required to answer the
following seven questions (we have numbered the questions and these numbers will be used in the
charts to represent these questions):
- Q1: Were the quality patterns easy to understand?
- Q2: Were the quality patterns easy to use?
- Q3: Did they help in identifying the problems?
- Q4: Did they identify the problems that you didn‟t identify before?

Chapter 7: Validation
198 | P a g e
- Q5: Was the proposed solution good?
- Q6: Did they help in improving the initial model?
- Q7: Will you use the quality patterns in future?
Figure - 52 illustrates the respondents‟ answers to the above mentioned questions. It can be
seen that 88% of the respondents think that quality patterns were easy to understand, 92% think
that quality patterns helped in identifying the problems, 72% believed that quality patterns
detected the problems that they couldn‟t detect in the step-1. Moreover, 88% of the respondents
regard the proposed solution by quality patterns to be good and that it helped in improving the
initial model. Similarly, 92% of the respondents want to use quality patterns in the future to
evaluate and improve their models.
88%
72%
92%
72%
88%
88%
92%
Q1
Q2
Q3
Q4
Q5
Q6
Q7
ies5
Figure - 52. Experiment 2: Respondents' feedback to questions asked in step-2
Table - 21 and Figure - 53 decompose the responses illustrated in Figure - 52 with respect to
respondents‟ occupation. This decomposition will enable us in identifying the different profiles of
responses. For example from Figure - 52, we learned that 92% of the respondents think that
quality patterns helped in identifying the problems whereas from Figure - 53 we can see that this
92% is composed of 28% weightage from students and 64% from all others. However, it is
interesting to note from Table - 21 that this 28% weightage actually represents 77% (7 out of 9) of
the students. Similarly, the 64% weightage of all others represent 100% of the responses from all

Chapter 7: Validation
199 | P a g e
other respondents. This can also be interpreted as that other than 23% students all other
respondents considered that quality patterns actually helped in identifying the problems.
Table - 21. Experiment 2: Responses to questions asked in step-2 with respect to
respondents’ occupation
Student Professor Researcher Software Developer Analyst
Project Manager Other Total
Q1 9/9 1/1 2/2 3/4 1/1 5/5 1/3 22/25
Q2 8/9 0/1 2/2 3/4 0/1 3/5 2/3 18/25
Q3 7/9 1/1 2/2 4/4 1/1 5/5 3/3 23/25
Q4 5/9 0/1 2/2 4/4 0/1 4/5 3/3 18/25
Q5 7/9 1/1 2/2 4/4 0/1 5/5 3/3 22/25
Q6 7/9 1/1 2/2 4/4 0/1 5/5 3/3 22/25 Q7 8/9 1/1 2/2 4/4 1/1 5/5 2/3 23/25
Total 9 1/1 2 4 1 5 3
Let us take another example. Figure - 52 illustrates that 88% of the respondents regard the
proposed solution by quality patterns to be good. Now if we look at chart on Figure - 53, we can
notice that this 88% affirmation response is composed of 28% weightage from students, 0%
weightage from analysts and 60% from all others. However, if we refer to detailed statistics in
Table - 21 then we notice that this 28% weightage actually represent 77% (7 out of 9) of the
students. Similarly, the 0% weightage from analysts represents 0% (0 out 1) positive response
from analysts.

Chapter 7: Validation
200 | P a g e
36%
32%
28%
20%
28%
28%
32%
4%
0%
4%
0%
4%
4%
4%
8%
8%
8%
8%
8%
8%
8%
12%
12%
16%
16%
16%
16%
16%
4%
0%
4%
0%
0%
0%
4%
20%
12%
20%
16%
20%
20%
20%
4%
8%
12%
12%
12%
12%
8%
Q1
Q2
Q3
Q4
Q5
Q6
Q7
Student Professor Researcher Soft Developer Analyst Project Manager Others
Figure - 53. Experiment 2: Respondents' feedback to questions asked in step-2 with respect
to occupation
We decomposed the responses illustrated in Figure - 52 with respect to respondents‟ modeling
experience into Figure - 54 and Table - 22 . This view will help us in analyzing the responses with
respect to modeling experience. It is evident that if more experienced respondents think that our
quality patterns don‟t help in identifying the problem then the weightage of their response should
be of more importance to less experienced respondents. Let us analyze the responses for Q6 that
enquires the respondents if the quality patterns helped in improving the initial model. From Figure
- 52, we can see that 88% of the respondents think that quality patterns helped in improving the
initial model. Whereas from Figure - 54, we can see that this 88% is composed of 32% weightage
from respondents having modeling experience between 3 and 5 years whereas 12% have a
modeling experience between 5 and 10 years and the remaining 44% includes the respondents
having one to two years of modeling experience. However, it is interesting to note from Table -
22 that the 44% weightage from experienced respondents (with modeling experience between 3
and 10 years) actually represent 100% of respondents in these two classes (“between 3 and 5
years” and “between 5 and 10 years). Thus 12% reduction in the response of Q6 is due to the less
experienced respondents (belonging to two lower experienced classes). From these views it can be
thought that perhaps the proposed solution through quality patterns is better understood by more
experienced respondents than less experienced due to their limited experience.

Chapter 7: Validation
201 | P a g e
Table - 22. Experiment 2: Response to questions asked in step-2 with respect to modeling
experience
Less than or equal to 1 year
Between 1 & 3 years
Between 3 & 5 years
Between 5 & 10 years Total
Q1 5/5 9/9 6/8 2/3 22/25
Q2 3/5 6/9 6/8 3/3 18/25
Q3 4/5 8/9 8/8 3/3 23/25
Q4 2/5 7/9 7/8 2/3 18/25
Q5 4/5 7/9 8/8 3/3 22/25
Q6 4/5 7/9 8/8 3/3 22/25
Q7 5/5 8/9 7/8 3/3 23/25
Total 5 9 8 3
20%
12%
16%
8%
16%
16%
20%
36%
24%
32%
28%
28%
28%
32%
24%
24%
32%
28%
32%
32%
28%
8%
12%
12%
8%
12%
12%
12%
0
0
0
0
0
0
0
0
0
0
0
0
0
0
Q1
Q2
Q3
Q4
Q5
Q6
Q7
Less than or equal to 1 Year Between 1 & 3 years Between 3 & 5 years
Between 5 & 10 years Between 10 & 20 years More than 20 years
Figure - 54. Experiment 2: Respondents' feedback to questions asked in step-2 grouped by
modeling experience
7.2.2.3 Step3
In the third step respondents were explained the problems that were identified in the original
model employing the two quality patterns given in the second step. Similarly, the solution to these
problems was also explained that were proposed through these quality patterns. In addition,
respondents were given the transformed models that resulted after applying all the
recommendations, proposed through the quality patterns, on the original model provided in step1
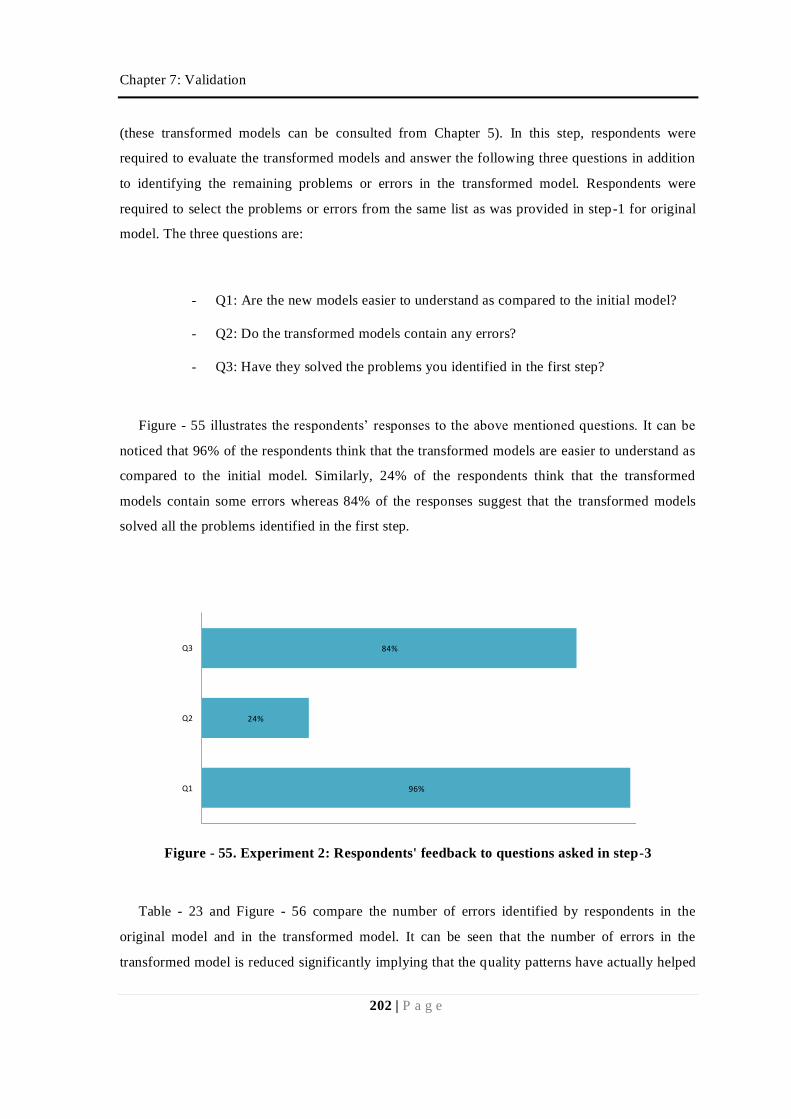
Chapter 7: Validation
202 | P a g e
(these transformed models can be consulted from Chapter 5). In this step, respondents were
required to evaluate the transformed models and answer the following three questions in addition
to identifying the remaining problems or errors in the transformed model. Respondents were
required to select the problems or errors from the same list as was provided in step-1 for original
model. The three questions are:
- Q1: Are the new models easier to understand as compared to the initial model?
- Q2: Do the transformed models contain any errors?
- Q3: Have they solved the problems you identified in the first step?
Figure - 55 illustrates the respondents‟ responses to the above mentioned questions. It can be
noticed that 96% of the respondents think that the transformed models are easier to understand as
compared to the initial model. Similarly, 24% of the respondents think that the transformed
models contain some errors whereas 84% of the responses suggest that the transformed models
solved all the problems identified in the first step.
96%
24%
84%
Q1
Q2
Q3
ies5
Figure - 55. Experiment 2: Respondents' feedback to questions asked in step-3
Table - 23 and Figure - 56 compare the number of errors identified by respondents in the
original model and in the transformed model. It can be seen that the number of errors in the
transformed model is reduced significantly implying that the quality patterns have actually helped

Chapter 7: Validation
203 | P a g e
in improving the CM. For example, 10 respondents identified the missing requirements in the
original model whereas 5 respondents identified the missing requirements in the transformed
model. However it must be stated here that we have rechecked the transformed model with
respect to the provided requirements (step-1) and found that the model represents all the
requirements. Thus we are not sure about the requirements that are identified as missing by the 5
respondents.
Table - 23. Comparison between problems indetified in original and transformed model
Original Model
Transformed Model
Understandability Line crossings 10 2 Used language 4 4
Complex Numerous classes, attributes, etc. 19 8 Numerous associations, generalizations, etc. 14 6
Incomplete
Usage of standard notations 1 1 Missing requirements 10 5 Syntactic incompleteness 25 5
Remaining errors Syntactic errors 10 5 Semantic errors 13 5
Similarly it is important to mention here that when the respondents identified the problems and
errors in the original model (step-1), they have to rely on their cognition and past knowledge
whereas when they identified the problems in the transformed model (step-3), they have sufficient
knowledge about different quality attributes, metrics and recommendations. Thus it is for sure that
they are more trained to identify errors now than in the first step. Thus this factor must be kept in
mind while comparing the results of step-1 and step-3.

Chapter 7: Validation
204 | P a g e
20%
20%
20%
20%
4%
24%
32%
16%
8%
52%
40%
100%
40%
4%
56%
76%
16%
40%
Semantic errors
Syntactic errors
Syntactic incompleteness
Missing requirements
Usage of standard notations
Numerous associations, generalizations etc.
Numerous classes, attributes, etc.
Used language
Line crossings
Original Model Transformed Model
Figure - 56. Comparision of identified problems in original model and transformed model
7.3 Conclusion
In this chapter, we presented the two experiments that were conducted to validate our approach
at different stages. We start by discussing our approach to federate the existing literature and to
formulate a consolidated set of criteria for CM quality evaluation. We describe the first
experiment and analyzed the results to validate the selection of the quality attributes federated
thorough literature review. For both experiments, we employed Exploratory Data Analysis (EDA)
[Hoaglin et al., 1983] approach for analyzing the data using multiple tables and charts.
In the next section, we discussed our second experiment that was conducted to validate the
efficacy of our complete approach including quality patterns. This experiment consisted of three
steps and respondents had to complete all the three steps and respond to our questions asked after
each step. We analyzed the respondents‟ responses using multiple charts and tables. We also
analyzed the different responses with respect to respondents‟ occupation and modeling experience
classes. These different lenses helped us in identifying different trends and groups of responses
and have also helped us in understanding the responses in a better way.
However following are the limitations of our experiments:
i. Most of the quality criteria provided by respondents as a feedback in first experiment
consisted of those quality attributes that were already in the survey.
ii. The sample size of the second experiment is twenty five which is sufficient for our
requirements but the results could be reinforced by a wider experiment.

Chapter 7: Validation
205 | P a g e
iii. In step-1 of the second experiment, we intended to identify new solutions to the selected
problems from the respondents but most of the respondents just provided the names of
solution that were mentioned in the questions.
iv. Some of the problems identified, by respondents, in the transformed model don‟t exist in
the model. For example, 8% respondents consider that the transformed model has line
crossings whereas it doesn‟t have any line crossings.
v. The experiment was performed using two quality patterns only. So other quality patterns
can be tested to identify different trends or responses.
vi. The quality patterns were applied only on one class diagram and thus they must be tested
on multiple models to compare the results.
In the next chapter, we conclude the thesis and provide some perspectives and future
extensions of the work.


Chapter 8: Conclusion
207 | P a g e
Chapter 8
Conclusion
It has now been widely agreed that the quality of the end-system depends on the quality of the
conceptual models (CM). Therefore, a good analysis and design method should ensure that CMs
must adhere to some quality criteria, as they are the communicating mediator between the users
and the development team. Hence if the conceptual models are scanned for defects and the defects
be corrected then it is likely to reduce the number of change requests for the end system.
Moreover, these errors and deficiencies in the CMs will not be propagated along the development
process.
Research on CM quality evaluation is rather young and without any known standards. Due to
the absence of any standards or guidelines for CM, different researchers have proposed different
quality criteria or frameworks to evaluate CM quality. However, most of these frameworks are
independent of one another [Moody 05] and emphasize on their identified characteristics as
relevant to quality. This leads to the existence of disparate and autonomous quality frameworks
proposing non-converging solutions and resulting in the existence of multiple definitions for the
same concept and different names for semantically same concepts. Moreover, all existing criteria
proposed by researchers have been classified by themselves into their self identified dimensions,
attributes, characteristics, properties, etc. that are not even at the same level of abstraction as their
other counterparts. Thus, the reader gets confused by the existence of different classification
vocabularies such as dimensions, characteristics, properties, attributes, concepts, etc. and what
differentiates each one of them.
We found that there is a lack of methodologies putting together the evaluation of CMs through
a guidance process. Often the readers are left with a proposed set of evaluation criteria that can be
used for evaluation. Thus if someone is interested in evaluating the CMs then he/she must have in
depth knowledge about each and every available quality criterion so that the best set of
evaluation criteria can be selected for the problem. Moreover, most of the existing quality
frameworks help in identifying the problems rather than helping in removing those problems.
Another major hurdle in evaluating the quality of conceptual models is the lack of tools
automating the evaluation process and proposing corrective actions for improvements.

Chapter 8: Conclusion
208 | P a g e
8.1 Contributions
Our solution targets the problems related to conceptual modeling quality in a comprehensive
way. In order to formulate a complete solution, we designed multiple artifacts for different aspects
of CM quality. These artifacts include the formulation of comprehensive quality criteria (quality
attributes, metrics, etc.) by federating the existing quality frameworks and identifying the quality
criteria for gray areas, formulation of quality patterns to encapsulate past-experiences and good
practices, designing of the guided evaluation and improvement process for conceptual modeling
quality and finally the development of a software prototype implementing our proposed quality
aware approach and guided evaluation-cum-improvement process.
Most of the existing quality frameworks on CM are independent of one another and propose
their vision of CM quality. This has resulted in the existence of disparate and autonomous quality
frameworks proposing non-converging solutions. In reply, we synthesized (existing concepts
proposed by researchers) and added the new concepts to formulate a comprehensive quality
approach for conceptual models that also resulted in federating the existing quality frameworks.
This activity enabled us in identifying a set of quality attributes that were generic (applicable to
different types of conceptual model) and represent different aspects of the conceptual models such
as complexity, maintainability, etc. Moreover, we were also able to eliminate the redundant
concepts and issues related to the existence of multiple definitions for the same concept and
different names for semantically identical concepts. After the formulation of this set of
comprehensive quality criteria, we conducted a validation experiment on professionals to collect
their feedback over the identified/selected set of quality criteria.
Even after the formulation of the above mentioned comprehensive quality criteria, we
identified that the process for selecting the relevant quality criteria (including quality attributes
and metrics) with respect to a particular requirement remains trickier for a non-expert user. Thus
we proposed to adopt the concept of design patterns to store past-experiences and good practices
and formulated a set of quality patterns. These quality patterns encapsulate valuable knowledge in
the form of established and better solutions to resolve quality problems in CM. We identified
different recurring problems in CM and proposed the best set of quality criteria for their
evaluation and improvement and encapsulated this information in the form of quality patterns.
Thus, we hope that efforts will not be duplicated in finding a good solution for the recurring
problems for which a quality pattern exists.
In order to help the analysts (or anyone) in evaluation the quality of their CM, we designed a
guided quality driven process encompassing methods and techniques to evaluate and improve the

Chapter 8: Conclusion
209 | P a g e
conceptual models with respect to a specific user requirement or goal. Our process guides the user
in formulating the desired quality goal, helps him/her in identifying the relevant quality patterns
or quality attributes with respect to the quality goal and finally the process helps in evaluating the
quality of the model and propose relevant recommendations for improvement.
We developed a software prototype “CM-Quality” implementing our proposed quality
approach and guidance process for evaluating and improving CMs. Our prototype automates all
the above mentioned steps of our approach and implements a workflow enabling its users to
evaluate and improve CMs efficiently and effectively. CM-Quality maintains a knowledgebase
storing different quality concepts such as quality patterns, quality attributes, metrics,
recommendations, etc. It helps the users in formulating their quality goals in a structured manner.
It then helps the users in identifying the relevant quality criteria with respect to their formulated
quality goal by automatically searching the contents of the knowledgebase. After the selection of
the quality concepts (quality patterns and quality attributes), CM-Quality evaluates the model by
automatically calculating the different metrics associated to the selected quality concepts. It then
proposed the post-evaluation feedback in the form of recommendations for model improvement.
8.2 Future Work – Perspectives
Our thesis opens multiple directions for future research. This future work could be extensions
to the actual work or new perspectives that are new work.
The first research direction aiming at extending our work includes the enrichment of quality
criteria such as identifying new quality patterns, new quality attributes and new metrics. For
example, we have included numerous metrics for class diagrams in our knowledgebase. Therefore
different metrics can be formulated for other types of conceptual models such as use case
diagrams, sequence diagrams, etc. Similarly, some new and more effective metrics could be
formulated to replace the existing metrics.
The second research direction, for improving the actual work, includes the extension of our
prototype in the following ways:
i. To integrate an ontology of quality concepts (if exists) to help the identification of
relevant quality concepts efficiently.
ii. To include the automatic application of proposed transformations. In our approach
transformation are a kind of recommendations. The current version of our prototype
provides details about the relevant transformations whereas the application of these
transformations is a manual process. However, if transformations can be applied

Chapter 8: Conclusion
210 | P a g e
automatically then perhaps a good model can be extracted from a crude one in a short
span of time.
iii. In the current state, CM-Quality evaluates the complete model and proposes
recommendations for the entire model. For example, it can propose recommendations
related to model‟s complexity if the entire model is complex or it can recommend
employing the polymorphism pattern to manage the complexity but it can‟t identify the
exact portion of model where this recommendation or pattern must be applied. It will be a
milestone achievement if an extension in this direction can be made. This will help the
user in identifying the exact problem areas of the model so that they can be targeted to
improve the overall model.
iv. To integrate CM-Quality to existing modelers as an add-on so that quality evaluation is
available on the same time as modeling. At the current stage, users have to first design the
model and then do the evaluation whereas if quality evaluation is available at runtime or
during the designing of the models, then it will be frequently used by users to evaluate
and improve their models.
The third research direction could be to formulate an ontology of quality concepts for CM. As
of today there doesn‟t exist any such ontology. With the advent of such ontology, the
identification of relevant quality criteria or quality concepts will be much easier. This ontology
will also help to consolidate the existing quality frameworks at one place and can be used to
identify relationships among these concepts.
The fourth research direction can be to provide the analysts with a means to improve the CM
with respect to desired value of a quality attribute. For example, if the user wants that his/her
model should have complexity=0 then the model should be evaluated and recommendations
should be proposed in a way that the value of complexity attribute becomes 0 if all the
recommendations are applied. Now consider an example when a user wants to have
complexity=0% and maintainability=90%, thus the recommendations should be proposed in a
way that when the model is transformed, the new model will have exact values for complexity
and maintainability.

Appendix A:
Quality Attributes
211 | P a g e
Appendix A
Quality Attributes
Following are the details about quality attributes.
1. Clarity
This attribute is based on the graphical arrangement of the elements within a model. It
evaluates the model quality by referring to the number of elements (such as classes, use cases,
attributes, etc.) present in the model and the number of line crossings they have. This attribute is
based on the hypothesis that the greater the number of elements present in a model the less clearer
it gets and thus poses difficulty in reading the model. Similarly if there are more line-crossings in
a model (such as ER diagram or class diagram) then it might be difficult to track the links and
thus it might gets difficult to understand the concept.
2. Completeness
This attribute is based on the coverage of user requirements. It will try to evaluate the quality
by comparing the conformance between concepts depicted in the conceptual model and the ones
expressed by the users through the requirements. Furthermore, this attribute can be used to
compare completeness among several schemas modeling the same reality. A schema is considered
complete if it covers all the modeling elements present in other schemas representing the same
reality.
3. Currency
This attribute evaluates the quality based on the currency of the model. With currency we
means to check whether the model represent the actual implemented version of the model. For
example, a database administrator has added a new attribute in the table without updating the
database model then this model does not represent the actual underlying structure.
4. Documentation

Appendix A:
Quality Attributes
212 | P a g e
It is based on the assumption that well documented models will be easily readable and
understandable. If documentation is provided for every modeling element (such as classes,
attributes, etc.) then it will help the reader in understanding the model quickly and easily.
5. Extendibility
Software extension is an important and recurring activity as new requirements continue to
emerge within the organization. Therefore, if conceptual models are designed in such a way that
they can be extended to accommodate the new requirements then it will ease the software
extension process. This attribute is based on the ease with which a model can be extended to
include new concepts or functionality. However, we hypothesize that if conceptual models have
high degree of modularity then they can accommodate new concepts easily and thus have highly
extendible.
6. Expressiveness
This attribute evaluates the expressiveness of a model. A model is expressive if it represents
users‟ requirements in natural way and is understandable without additional explanation. It
evaluates whether the employed concepts are expressive enough to capture the main aspects of the
reality. E.g. Inheritance link is more expressive then association. So the more the expressive
concepts are used, the more the schema will be expressive.
7. Modifiability
This dimension is based on the attributes that evaluates the ease with which a model can be
maintained. This dimension is based on the hypothesis that the quality of the model can be
represented by its degree of maintainability. Several researchers have showed that complexity in
models affect its maintainability or modifiability. Similarly, the ability to understand a model
contributes towards its maintainability. However, understandability can be ameliorated by the use
of standard notations or guidelines.
8. Minimality
This attribute is based on the notion of the redundant elements and is directly or indirectly
related to other attributes. It is based on the hypothesis that the model gets more and more

Appendix A:
Quality Attributes
213 | P a g e
complex if it contains redundant concepts. Similarly, it is equally based on the notion of
reusability. If the concepts are reused in the model then it will decrease the size and structural
complexity of the model and thus will contribute towards decreasing its complexity.
9. Modularity
This attribute is based on the object-oriented practices and hypothesize that high modularity
leads to ease in maintainability. However, this attribute extends its domain and evaluates the
modularity by verifying the cohesion and coupling of the modules. Cohesion can be defined as a
measure to calculate the grouping of the common responsibilities or functionalities within one
module. It is deemed to have high cohesion in the module to have the common responsibilities
grouped in the same class. Similarly, coupling can be defined as the dependency of the module to
rely on other existing modules. Coupling is deemed to be as low as possible to have less reliance
on other modules and thus to have ease in maintainability.
10. Naming Convention
It is based on the assumption that the clear and consistent naming will result in the high
readability of a model. For example if a model uses “FN” to denote a First Name of an Employee
then it will require more effort to decode the abbreviated variable than if it would have used
“FirstName” as the variable. Moreover, this attribute will try to evaluate the different aspects
related to naming such as it will try to check whether the associations are named or not in a class
diagram.
11. Practicability
This attribute is based on the notion of feasibility of the model. It verifies whether the model
employs the concepts or elements that are realistic and can be materialized. For example, there
can be some models that require unprocurable sophisticated technology for implementation.
12. Relevancy to requirements
This attribute is different from “Completeness” in a way that it is employed for finding the
relevancy between the concepts present in the model and the ones required by the users. It will

Appendix A:
Quality Attributes
214 | P a g e
help in removing the irrelevant concepts present in the model thus will implicitly affect the
complexity and functionality dimensions.
13. Reliability
This attribute is crucial to quality in a way that if the model is not reliable then it can
jeopardize all the later stages of the system development. This is a composite attribute and
depends on almost all of the above-mentioned functionality attributes. In simple words, we can
say that a model is reliable if it covers all the requirements of the users, does not cover any
irrelevant concepts i.e. it is minimal and is practicable.
14. Reusability
This attribute has been widely recognized and appreciated in the Object Oriented Paradigm.
Reusability is considered a major opportunity for improving quality and productivity of systems
development. This attribute evaluates the quality of the model in twofold: First, it checks whether
the model employs the previously developed models (e.g. use of existing modules) and secondly
it helps in evaluating the chances of this model to be reused in the future (e.g. is it very specific or
generic?). Some studies suggest that reusability is feasible only if planned at the design stage
because of loss of generalizability at subsequent stages.
15. Semantic Correctness
Schema is semantically correct if the concepts are used according to their definition. This
attribute takes into account the semantic quality dimension defined in [Lindland et al., 1994]. We
hypothesize that if we have formalized knowledge about the problem domain then we can
evaluate this attribute by measuring differences between the model and the knowledge domain.
Semantic correctness can also be measured by comparing the model with available and validated
models representing the same reality. This attribute can use collaboration patterns to improve the
evaluation process.
16. Size
This attribute evaluates the overall complexity of the model with respect to the number of
instances of different elements present in the model. It is based on the hypothesis that the more

Appendix A:
Quality Attributes
215 | P a g e
there are structural elements in the model the more it gets complex. These elements can include
entities, classes, use cases, actors, attributes, methods, etc. This attribute does not take into
account elements such as associations, generalization relationships, dependencies, etc. as they
relate to the structural complexity of the model.
17. Structural Complexity
This attribute represents the model complexity due to the existence of different relational
elements within the model. These elements can include associations, aggregations,
generalizations, dependencies, transitions, relationships, etc. This attribute will contain several
metrics that will measure the different aspects of the structural complexity of the model.
18. Syntactic Correctness
Schema is syntactically correct if the concepts are properly defined in the schema. This
attribute takes into account the syntactic quality dimension defined in [Lindland et al., 1994].
Though [Purao et al., 2003] mentions about the maturity of the controls over the syntactic quality
issues in conceptual models, this attribute will make sure that every concept is defined as per the
valid syntactic rules of the employed grammar.
19. Understandability
This attribute is based on the hypothesis that the ease in model understanding leads to ease in
its maintenance. This attribute will try to evaluate the ease with which the model can be
understood. However, understandability is dependent on other attributes such as those in
Readability and Complexity dimension. The authors in [Genero et al., 2004] have shown that
complexity in models leads to low understandability and thus affect the maintainability of the
model.
20. Usage of Standard Notations
This attribute evaluate the model on its usage of standard language or notations. Here by
„standard language or notations‟ we mean the use of widely acceptable notations to represent the
models such as the use of Unified Modeling Language or Entity Relationship notations. Here we

Appendix A:
Quality Attributes
216 | P a g e
hypothesize that the use of standard notation for the formulation of models will lead to higher
understandability and analyzability and thus will contribute in the easy in maintenance.
21. User Vocabulary
It is based on the assumption that the readability of a model will enhance if the reader can
make easy correspondence between the modeling elements contained in the conceptual schema
and the requirements in the textual description. Such as using „Employee‟ label to represent
employees of the company rather than using „Emp‟ label.

Appendix B:
Quality Patterns
217 | P a g e
Appendix B
Quality Patterns
Following are the identified quality patterns.
1. Model Completeness Quality Pattern
Pattern Name: Model Completeness
Context:
i. To check if the model is complete with respect to syntactic and semantics. This pattern
should be employed to validate and improve the model for its completeness.
Problem:
i. Incomplete conceptual models (CM) pose threat to the later stages of development as they
will result in an end system that doesn‟t provide all the functionalities it was conceived
for. So the CM should be evaluated for any missing user requirements.
ii. Similarly, if CM is not syntactically complete then it can hamper the understandability of
the model. Syntactic completeness relates to the notation used (e.g. verifying that
multiplicities are defined for associations or associations have a valid name in a class
diagram)
iii. Calculate the following metrics (metrics 2 and 3 are applicable to class diagram only) to
check if this pattern is relevant for the current problems of the model:
d. Requirements Coverage Degree [Cherfi et al., 2003]: This metric is based on the
notion of completeness of user requirements. It has been widely accepted that if the
requirements errors are detected earlier in the designing phase then the cost of their
correction gets much lower. This metric calculates the ratio between the concepts
covered by the modeling elements in the conceptual schema and the ones expressed
by the users through the requirements.

Appendix B:
Quality Patterns
218 | P a g e
Let:
X = Number of requirements covered by modeling elements;
Y = Total number of requirements;
Then:
Y
x Degree Coverage tsRequiremen
Range:
Requirements Coverage Degree = 1, if all the requirements expressed by user are covered in the
conceptual model.
Requirements Coverage Degree = 0, if none of the requirements expressed by user are covered in the
conceptual model.
e. Degree of defined multiplicities: This metric calculates the ratio between the total
numbers of defined multiplicities within a model to the total number of associations
in a model.
Let:
X = Number of defined (or existing) multiplicities or
cardinalities;
Y = Number of association links;
Z = Number of composition and aggregation links;
Then:
Z Y *2
X tiesMultiplici Defined of Degree
Range:
Degree of Defined Multiplicities=1, if both ends of the association links, compositions links and aggregation
links are defined.
Degree of Defined Multiplicities=0, if no multiplicities
are defined in the model.

Appendix B:
Quality Patterns
219 | P a g e
f. Degree of named associations: If proper naming is assigned to every relationship or
association then it enhances the understandability of the model. This metric calculates
the ratio between the number of named associations and the total associations.
Let:
W = Number of named relationships or associations;
X = Number of association links;
Y = Number of association classes;
Z = Number of composition and aggregation links;
Then:
Z Y X
W nsAssociatio Named of Degree
Range:
Degree of Named Associations = 1, if all the association links, compositions links and aggregation links are defined except those association links that have
association classes.
Degree of Named Associations = 0, if no associations are
named in the model.
Solution:
i. CM should incorporate all the requirements demanded by users.
ii. CM should contain all the syntactic elements required by the target modeling notation.
iii. Following transformations can be used for improvement:
a. Incorporate missing requirements
b. Define missing multiplicities
c. Define missing associations labels
Keywords: completeness; syntactic completeness; semantic completeness; requirements
coverage;
Related patterns:

Appendix B:
Quality Patterns
220 | P a g e
2. Model Complexity Quality Pattern
Pattern Name: Model Complexity
Context:
v. To check the overall complexity of the model with respect to the number of instances of
different elements (number of classes/entities/attributes etc) present in the model. This
pattern is suitable for models containing numerous elements.
Problem:
i. Sometimes models contain several classes/entities/uses-cases etc. This can hamper the
understandability of the model. Miller ("The Magical Number Seven, Plus or Minus Two:
Some Limits on Our Capacity for Processing Information", 1956) have proved that adults
can hold 7 ± 2 objects in their working memory.
ii. Similarly, the existence of numerous elements can induce complexity.
iii. This induced complexity can hamper the maintainability as complex models are difficult
to maintain.
iv. Calculate the following metrics (following metrics are applicable to class diagram only)
to check if this pattern is relevant for the current problems of the model:
k. Number of Classes: Total number of classes in a model.
l. Number of Attributes: Total number of attributes in model.
m. Number of Methods: Total number of methods or functions in the model.
n. Number of cycles: Total number of cycles within a model.
o. Degree of non-redundancy [Cherfi et al., 2002b]: This metric calculates the ratio
between the non-redundant concepts and the total concepts present in the model.
p. Number of Associations: Total number of associations in a model.
q. Number of Aggregations: It calculates the number of aggregation relationships within
a class diagram.
r. Number of Compositions: It calculates the number of composition relationships
within a class diagram.

Appendix B:
Quality Patterns
221 | P a g e
s. Number of Generalizations: It calculates the total number of generalization
relationships in a model.
t. Depth Inheritance Tree: It calculates the longest path from the class to the root of the
hierarchy in a generalization hierarchy.
Let:
Xi belongs to class, association, inheritance link,
association class, aggregation link, composition link;
NB(Xi) = Number of elements of type Xi;
NBR(Xi) = Number of redundant elements of type Xi in the
model;
Then:
i
i
NB(Xi)
NBR(Xi)NB(Xi)
Range:
Degree of Non-Redundancy = 1, if the model doesn‟t contain any redundant concept.
Degree of Non-Redundancy = 0, if the model contains all
the concepts that are redundant.
Solution:
i. Models can be made simpler if they are divided into small independent modules each
with limited number of concepts and functionalities.
ii. Following transformations can be employed for improvement:
a. Remove redundant elements
b. Factorize associations to remove redundant associations
c. Divide the model
d. Merge classes
e. Divide a class
iii. Following design pattern can be employed to improve the quality of the model:

Appendix B:
Quality Patterns
222 | P a g e
c. GRASP high cohesion pattern
d. GRASP polymorphism pattern
Keywords: complexity; maintainability; modify; understandability; size; number of
classes/entities etc.; number of concepts; number of attributes;
Related patterns:
i. Model Evolution (Complex model are difficult to maintain)
ii. Model Readability (models containing numerous elements can be difficult to read)

Appendix B:
Quality Patterns
223 | P a g e
3. Model Correctness Quality Pattern
Pattern Name: Model Correctness
Context:
ii. To check if the model is syntactically correct i.e. every concept in the model is defined as
per the valid syntactic rules of the employed grammar and semantically correct i.e. the
concepts are used as per their definition in the target domain. This pattern can be used to
evaluate and improve the model for its correctness.
Problem:
v. Syntactically incorrect CM doesn‟t model the concepts correctly with respect to the
employed grammar and are thus difficult to understand by different users.
vi. Semantically incorrect conceptual models (CM) can jeopardize the development of the
end system as if the requirements are not correctly depicted in the CM then the system
will not perform the functions in the same way as it should be.
vii. Similarly, if the requirements are wrongly modeled then the developed system will be
unacceptable to the user (e.g. if client follows American accounting principles then he/she
will not accept the systems based on British accounting principles).
viii. Calculate the following metrics to check if the model is incorrect or contains errors:
d. Degree of syntactic correctness: This metric is based on the syntactic correctness of
the CM. This metric calculates the ratio between the syntactic errors and the total
errors identified in the CM.

Appendix B:
Quality Patterns
224 | P a g e
Let:
X = Number of existing syntactic errors;
Y = Total number of errors identified in the model;
Then:
Y
X sCorrectnes Syntactic of Degree
Range:
Degree of Syntactic Correctness=1, if CM contains only
syntactic errors.
Degree of Syntactic Correctness=0, if CM doesn‟t contain any syntactic errors.
e. Degree of semantic correctness: This metric calculates the ratio between the number
of semantic errors and the total number of errors identified in the model.
Let:
X = Number of existing semantic errors;
Y = Total number of errors identified in the model;
Then:
Y
X sCorrectnes Semantic of Degree
Range:
Degree of Semantic Correctness=1, if CM contains only
semantic errors.
Degree of Semantic Correctness=0, if CM doesn‟t contain any semantic errors.
f. Degree of relevant requirements: This metric is based on the notion of relevancy between
the concepts present in the model and the ones required by the users. Irrelevant concepts
in the model affect the complexity and functionality. This metric calculates the ratio

Appendix B:
Quality Patterns
225 | P a g e
between the number of irrelevant requirements modeled in the CM and the total number
of the requirements communicated by the user.
Let:
X = Number of irrelevant requirements identified from
the model;
Y = Total number of requirements communicated by the
user;
Then:
Y
X tsRequiremen Relevant of Degree
Range:
Degree of Relevant Requirements=1, if CM modeled all the
irrelevant requirements.
Degree of Relevant Requirements=0, if CM contains all
the relevant requirements.
Solution:
i. Remove all the syntactic errors from the CM.
ii. Remove all the semantic errors from the CM i.e. all the concepts modeled in the CM
should be defined with respect to the target domain.
iii. Remove all the irrelevant concepts from the model.
iv. Add all the missing relevant concepts.
Keywords: correctness; syntactic correctness; semantic correctness; relevant requirements;
irrelevant requirements;
Related patterns:

Appendix B:
Quality Patterns
226 | P a g e
4. Model Evolution Quality Pattern
Pattern Name: Model Evolution
Context:
i. To check whether the model is easy to modify or extend for future or changing
requirements. This pattern can be used to validate and improve the model with respect to
modifiability and extension.
Problem:
i. Modification or extension is a continuous and important activity for any software project.
They account the most in any maintenance contract. However, sometimes it gets difficult
to incorporate the required changes into models due to the complexity of the models.
Different researchers have empirically shown that complexity in models hampers their
modifiability or extension.
ii. Similarly, if the models are not modular or the defined modules have high values of
coupling then the modification to one module can pose problems to other modules and
might require extensive modifications.
iii. Following metrics can be calculated to check if this pattern is relevant for the current
problems of the model:
a. Cohesion: Cohesion can be defined as a measure to calculate the grouping of the
common responsibilities or functionalities within one module. It is deemed to have
high cohesion in the module to have the common responsibilities grouped in the same
class. This metric is defined in [Cherfi et al., 2003a].

Appendix B:
Quality Patterns
227 | P a g e
Let:
X(i) = Number of links within a module i;
Y(i) = Number of couples of modeling elements that can
be constructed from module i;
Z = Number of modules in a model;
Then:
Z
X(i)/Y(i)
Cohesion 1i
Z
Range:
Cohesion =1, if all modules have the same number of
links as the number of couples.
b. Coupling: Coupling can be defined as the dependency of the module to rely on other
existing modules. Coupling is deemed to be as low as possible to have less reliance on
other modules and thus to have ease in maintainability. This metric calculates the
number of other concepts to which a concept is coupled. Low value for this metric
signifies that the model is modular and promotes encapsulation. This metric is defined
in [Cherfi et al., 2003a].
Let:
X = Number of links relating different modules;
Then:
X Coupling
Range:
Coupling = 0, if all the modules are independent of one
another.
Coupling > 0, if at least two modules are dependent on
each other.

Appendix B:
Quality Patterns
228 | P a g e
c. Calculate the following metrics for complexity (following metrics are applicable to class
diagram only and these metrics are defined in Model Complexity Quality Pattern):
number of classes, number of attributes, number of methods, number of cycles, degree of
non-redundancy, number of associations, number of aggregations, number of
compositions, number of generalizations, depth inheritance tree.
Solution:
i. Models should be divided into smaller modules with limited number of modeling
elements to reduce complexity as structural complexity in models leads to low
modifiability and thus directly affects the maintainability of the model.
ii. Modules should be identified in such a way that all the related functionalities and
responsibilities are grouped into the same module to increase the cohesion.
iii. Modules must be independent of each other and must be loosely coupled with other
modules.
iv. Following transformations can be employed for reducing the model complexity:
a. Remove redundant elements
b. Factorize associations to remove redundant associations
c. Divide the model
d. Merge classes
e. Divide a class
v. Following design pattern can be employed to improve the quality of the model:
a. GRASP high cohesion pattern
b. GRASP polymorphism pattern
Keywords: maintainability; modifiability; extendibility; modularity;
Related patterns:
i. Model Complexity

Appendix B:
Quality Patterns
229 | P a g e
5. Model Feasibility Quality Pattern
Pattern Name: Model Feasibility
Context:
i. To validate if the model is the feasible and practical to implement.
ii. To validate if the model employs the concepts or elements that are realistic and can be
materialized. This pattern should be employed to validate and improve the feasibility and
practicability of the model.
Problem:
i. CM can employ the concepts or elements that are not realistic and can be difficult to
materialize. For example, there can be some models that require unprocurable
sophisticated technology for implementation such as asking for an automatic feed from a
manual system.
ii. In the current age, technology is changing rapidly hence systems tends to upgrade to new
platforms or supports new technologies. For example, previously softwares were designed
to work on computers whereas with the advent of smart phones, most of the software
vendors tend to provide their software for mobile devices. Thus if CM are specific to
some target technology then they can‟t be used to develop systems for other technologies
and the efforts will be duplicated. However, if the CM be made as generic as possible
then they can be implementation using any technology.
iii. Similarly, models might incorporate irrelevant requirements or semantically different but
relevant requirements. If the requirements are wrongly modeled then the developed
system will be unacceptable to the user. Thus all the functionalities should conform to
users‟ requirements.
iv. Calculate the following metrics to check if this pattern is relevant for the current problems
of the model:
a. Degree of conformance to target technology: This metric verifies if the concepts
depicted in the model can be implemented in the target language. It calculates the
ratio between the number of concepts that can be implemented in the target language
and the total number of concepts in the model.

Appendix B:
Quality Patterns
230 | P a g e
Let:
X = Number of concepts that can be implemented in the
target language;
Y = Total number of concepts in a model;
Then:
Y
X technology target to econformanc of Degree
Range:
Degree of conformance to target technology=1, if all the
concepts can be implemented in the target technology.
Degree of conformance to target technology=0, if none of the concepts can be implemented in the target
technology.
b. Degree of tool dependant functionality: This metric is based on the notion of generic
models. If models are generic then they can be implemented in any target technology
whereas if the models are specific to some target technology then they might not
remain valid for other technologies. This metric calculates the ratio between the
concepts that are specific to some target technology to the total number of concepts.

Appendix B:
Quality Patterns
231 | P a g e
Let:
X = Number of concepts that are specific to some target
technology;
Y = Total number of concepts in a model;
Then:
Y
X ityfunctional dependant tool of Degree
Range:
Degree of tool dependant technology=1, if all the
concepts are specific to some target technology.
Degree of tool dependant technology=0, if none of the
concept is specific to some target technology.
c. Calculate the degree of relevant requirements metrics. This metrics is defined in Model
Correctness Quality Pattern.
Solution:
i. CM must try to be as generic as possible. Thus, if possible, replace all the tool specific (or
language specific) concepts by the generic concepts.
ii. As mentioned above, it is beneficial to have generic CM. However, if model contains
some language specific concepts then ensure that those concepts are implementable in the
desired target language. If not then replace all those concepts with the desired target
language specific concepts.
iii. Remove all the irrelevant concepts from the model.
iv. Model must incorporate the relevant requirements in their true sense and there must not
be any difference between the concepts present in the model and the ones expressed in
user requirements.
v. Add all the missing relevant concepts.

Appendix B:
Quality Patterns
232 | P a g e
Keywords: practicability; feasibility; relevancy to requirements; irrelevant requirements; tool
dependency; conformance with target technology;
Related patterns:

Appendix B:
Quality Patterns
233 | P a g e
6. Model Readability Quality Pattern
Pattern Name: Model Readability
Context:
i. To check if the model is easy to read i.e. the model must not demand additional efforts to
read. These efforts can be due to any reasons such as bad graphical arrangements,
aesthetics, language barrier etc. For example, if the model contains numerous line
crossings then it demands additional efforts to identify the linking objects (such as classes
in a class diagram). This pattern can be used to evaluate and improve the model for its
readability.
Problem:
i. Models can have poor arrangement of graphical objects within them and thus increases
the number of line crossings and hampers the clarity of the model. Similarly, a model can
contain several concepts and object within them (lack of modularity) and can also use
inappropriate font size thus making it difficult to read.
ii. Similarly, due to increasing outsourcing or offshore procurement projects, it has been
observed that the technical documents or CM are written in the language chosen by the
vendor. This language might not be acceptable to the end-user. For example, technical
document or models written in English language might not be acceptable to French
speaking end user. The situation gets worse if the user is unfamiliar with the character-set
of the model language such as Chinese character-set for English speaking user. Such
language barriers require additional efforts for readability.
iii. Calculate the following metrics to check if the model is difficult to read:
a. Graphical Objects per Model: This metrics calculates the total number of graphical
objects per model (such as classes, entities, associations etc.). It has been argued by
the researchers that structural complexity increases when the number of model
elements increases. Thus the greater the number of graphical objects in a model, the
greater the efforts required to read and understand it.
b. Degree of line crossings: This metric is based on the graphical arrangement of the
elements within a model. If model elements are not well arranged or if model contains

Appendix B:
Quality Patterns
234 | P a g e
numerous elements then the number of line crossings may increase and it gets
difficult to read the model. This metric calculates the ratio between the number of line
crossings and the total number of links (such as associations, relationships, etc.).
Let:
X = Number of line crossings in a model;
Y = Total number of links such as relationships,
associations, etc. within a model;
Then:
Y
X Crossings Line of Degree
Range:
Degree of Line crossings = 0, if CM doesn‟t contain any line crossing.
Degree of Line crossings > 0, if CM contains at least
one line crossing.
c. Degree of legible font size: This metrics is used to evaluate the font size of different
texts on the model. It calculates the ratio between the number of text objects that are
below the optimum font size (i.e. difficult to read) to the total number of text objects.

Appendix B:
Quality Patterns
235 | P a g e
Let:
X = Number of text objects below the optimum font size;
Y = Total number of text objects in the model;
Then:
Y
X Size Font Legible of Degree
Range:
Degree of Legible Font Size=1, if all the text objects are below the optimum font size i.e. all text objects
are difficult to read.
Degree of Legible Font Size=0, if all the text objects are equal and above the optimum font size i.e. all text
objects are easy to read.
d. Language vocabulary rate: This metrics is based on the assumption that the
readability of a model will enhance if the model is written in a language known to
user. For example, if CM is written in Chinese language then it is difficult to read by
the user who doesn‟t know Chinese character-set. This metric calculates the ratio
between the number of text items that are in an unfamiliar language and the total
number of text items in the model

Appendix B:
Quality Patterns
236 | P a g e
Let:
X = Number of text items in an unfamiliar language;
Y = Total number of text items in the model;
Then:
Y
X Rate Vocabulary Language
Range:
Language Vocabulary Rate=1, if all the text items are in
an unfamiliar language.
Language Vocabulary Rate=0, if all the text items are in a familiar language.
Solution:
i. Models should be divided into small modules with limited number of concepts and
objects per model to improve the clarity. Following transformations can be employed for
improvement:
f. Divide the model
g. Merge classes
h. Remove redundant elements
i. Factorize associations to remove redundant associations
ii. Graphical objects in the model must be arranged in a way to reduce the number of line
crossings. This can be done in the following way:
a. Place the objects (such as classes) with the most links (such as associations in class
diagram) in the center of the model and all the associating objects (other classes)
surrounding them.
b. Try bending the lines (instead of straight lines) to reduce the line crossings.
c. If intersection is unavoidable then use bridge symbol (ᴖ) to maintain the distinction
between the two lines.

Appendix B:
Quality Patterns
237 | P a g e
iii. All the text objects should employ proper font size to increase the legibility of the model.
iv. CMs should use the language acceptable to user.
Keywords: clarity; legibility; line crossings; font size; graphical objects per model;
Related patterns:

Appendix B:
Quality Patterns
238 | P a g e
7. Model Reception Quality Pattern
Pattern Name: Model Reception
Context:
i. This pattern can be used to evaluate and improve the CM with respect to its reception by
the user.
ii. To check whether the model uses terms and language that are end-user friendly.
Problem:
i. If CM uses texts/labels in an unknown language or character-set, with respect to the user,
then the benefits of CM might not be attained.
ii. If models use difficult terms or labels then they might not be perceived correctly by the
user.
iii. Similarly, if a lot of technical vocabulary is used in the models then the non-technical
users might fail to perceive the model‟s objective correctly.
a. Calculate the following metrics to check if the model can be perceived correctly by
the end user: user vocabulary rate, technical vocabulary rate, language vocabulary
rate, etc. These metrics are explained in the “Model Understandability Quality
Pattern”.
Solution:
i. Utilize basic and simple terms as much as possible.
ii. Replace the terms unknown to user by the known terms.
iii. Replace the technical terms/labels from the model to the common/non-technical
terms/labels.
iv. CMs should use the language acceptable to user.
Keywords: model perception; reception; user vocabulary; used language; technical vocabulary;
target language;
Related patterns:
i. Model understandability

Appendix B:
Quality Patterns
239 | P a g e
ii. Model readability
8. Model Reliability Quality Pattern
Pattern Name: Model Reliability
Context:
i. To validate if the model can be relied for later stages of development.
ii. To validate if the model is up-to-date with respect to the implemented model or other
developed models.
Problem:
i. Software failures are generally caused by errors that could result from decisions during
analysis. Every concepts depicted in the model must be verifiable through some
requirement document. If the concepts can‟t be verified then either they are irrelevant or
misunderstood.
ii. Versioning issues are very common in ISD and it has been witnessed that upcoming
modifications are directly incorporated into the system without updating the model thus
users are left with two different versions of same model.
iii. Similarly, during the alpha or beta testing, new or changing requirements are directly
implemented into the systems without updating the CMs thus jeopardizing the future
maintenance operations.
iv. Following metrics can be calculated to check if this pattern is relevant for the current
problems of the model:
a. Verifiability: This metric verifies if the concepts depicted in the model can be relied
for future development. This metric calculates the ratio between the number of
concepts that can be verified from the user requirements and the total number of
concepts.

Appendix B:
Quality Patterns
240 | P a g e
Let:
X = Number of concepts that can be verified from the
user requirements;
Y = Total number of concepts in a model;
Then:
Y
X ityVerifiabil
Range:
Verifiability=1, if all the concepts are verifiable
through user requirements.
Verifiability=0, if none of the concept is verifiable
through user requirements.
b. Versioning Control: This metric ensures that the CM is up-to-date with respect to the
implementation model. It calculates the ratio between the implemented concepts that
are not modeled in the CM and the total number of concepts.
Let:
X = Number of implemented concepts not present in the
model;
Y = Total number of implemented concepts;
Then:
Y
X Control Versioning
Range:
Versioning Control=1, if none of the implemented concepts are present in the CM i.e. CM is totally
different from the implemented model.
Versioning Control=0, if all the implemented concepts
are present in the CM.

Appendix B:
Quality Patterns
241 | P a g e
c. Recency: This metric ensures that the CM is up-to-date with respect to the upcoming
new/modified requirements (through change order requests). It calculates the ratio
between the concepts that can be extracted from the new/changing requirements
(through change order request or other documents) and are implemented to the system
but are absent from the CM and the total number of concepts extracted from these
new/changing requirements.
Let:
X = Number of implemented concepts, from new / changing
requirements, that are absent from the CM;
Y = Total number of concepts extracted from the new /
changing requirements;
Then:
Y
X Recency
Range:
Recency=1, if none of the concepts from the new/changing requirements are also modeled in the CM i.e. CM is out-of-date after the modifications.
Recency=0, if All the concepts from the new/changing requirements are also modeled in the CM i.e. CM is up-
of-date.
Solution:
i. Recheck if the concepts present in CM and missing from the requirements documents are
not irrelevant or misunderstood. If they are irrelevant then they should be removed from
the model whereas if they are misunderstood then they should be implemented correctly.
ii. All the concepts that are implemented during the modifications must also be updated in
the CM.

Appendix B:
Quality Patterns
242 | P a g e
iii. All the concepts from the new/changing requirements must also be implemented in the
CM.
Keywords: reliability; currency; recency; verifiability; versioning control;
Related patterns:

Appendix B:
Quality Patterns
243 | P a g e
9. Model Reusability Quality Pattern
Pattern Name: Model Reusability
Context:
i. The context of this quality pattern is twofold. First it verifies if the model employs the
previously developed models (e.g. use of existing modules) and secondly it checks if this
model can be reused in future (for example to check if this model is specific or generic).
Problem:
i. Reusability is considered a major opportunity for improving quality and productivity of
systems development. Studies suggest that reusability is feasible only if planned at the
design stage because of loss of generalizability at subsequent stages. Thus, it is important
to verify the reusability of the models.
ii. Evaluating and improving reusability in model is important since it enhances the system‟s
functional reliability because the reused component/module has been tested multiple
times therefore errors and deficiencies would have been rectified during its maturity
cycle.
iii. Similarly, some models are designed in a way that they get very specific and cannot be
reused in future thus can waste future resources.
iv. Moreover, if the models are not modular or the modules are not properly identified then
the reusability of the model will be compromised.
v. Following metrics can be calculated to check if this pattern is relevant for the above
mentioned problems:
a. Reusability Degree: This metric calculates the ratio between the number of reused
concepts and the total concepts present in the model.
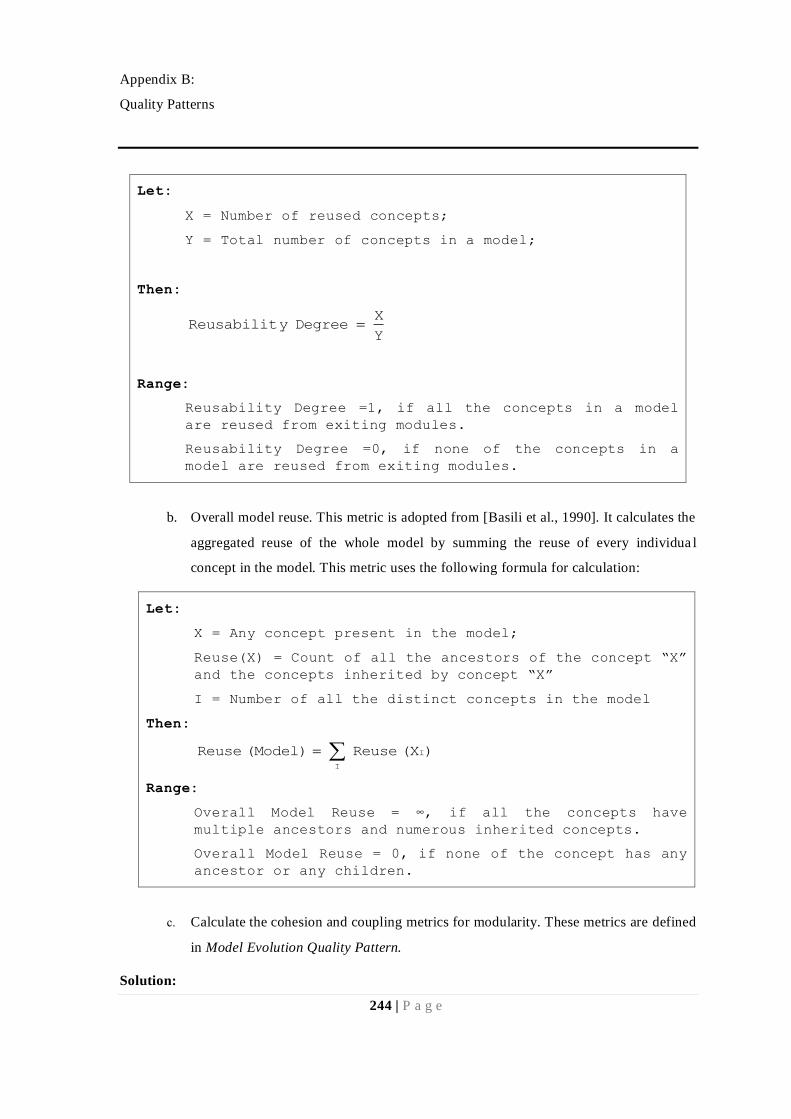
Appendix B:
Quality Patterns
244 | P a g e
Let:
X = Number of reused concepts;
Y = Total number of concepts in a model;
Then:
Y
X Degree yReusabilit
Range:
Reusability Degree =1, if all the concepts in a model
are reused from exiting modules.
Reusability Degree =0, if none of the concepts in a
model are reused from exiting modules.
b. Overall model reuse. This metric is adopted from [Basili et al., 1990]. It calculates the
aggregated reuse of the whole model by summing the reuse of every individual
concept in the model. This metric uses the following formula for calculation:
Let:
X = Any concept present in the model;
Reuse(X) = Count of all the ancestors of the concept “X” and the concepts inherited by concept “X” I = Number of all the distinct concepts in the model
Then:
)(X Reuse (Model) Reuse I
I
Range:
Overall Model Reuse = ∞, if all the concepts have multiple ancestors and numerous inherited concepts.
Overall Model Reuse = 0, if none of the concept has any
ancestor or any children.
c. Calculate the cohesion and coupling metrics for modularity. These metrics are defined
in Model Evolution Quality Pattern.
Solution:

Appendix B:
Quality Patterns
245 | P a g e
i. Search the model to identify the concepts for which equivalent concepts exists in the
repository for reusability.
ii. Decompose the model into multiple independent modules to facilitate the reusability.
iii. Modules should be identified in such a way that all the related functionalities and
responsibilities are grouped into the same module to increase the cohesion.
iv. Modules must be independent of each other and must be loosely coupled with other
modules.
v. Following design pattern can be employed to improve the modularity of the model that
will enhance the reusability of the model:
a. GRASP high cohesion pattern
b. GRASP polymorphism pattern
Keywords: reusability; reusability degree; model reuse; modularity;
Related patterns:
ii. Model Evolution

Appendix B:
Quality Patterns
246 | P a g e
10. Model Semantic Completeness Quality Pattern
Pattern Name: Model Semantic Completeness
Context:
i. To check if the model incorporates all the requirements demanded by the user and the
domain of the model. This pattern should be employed to validate and improve the model
for its semantic completeness.
Problem:
i. Incomplete CM poses threat to the later stages of development as they will result in an
end system that doesn‟t provide all the functionalities it was conceived for. So the CM
should be evaluated for any missing user requirements.
ii. Similarly, CM should also take into account the specific requirements of the modeled
domain otherwise the developed system will not work properly. Most of the time user
requirements don‟t incorporate the domain specific requirements. For example, user
requirements can state that the future system should be based on American accounting
principles but it will not state the details about the Accounting principles. This
supplementary information is critical to the success of the system and must be taken care
in the CM.
iii. Calculate the requirements coverage degree metric to check if this pattern is relevant for
the current problems of the model. This metric is described in Model Completeness
Quality pattern.
Solution:
i. CM should incorporate all the requirements demanded by users.
ii. CM should contain all the domain specific required.
iii. Following transformations can be used for improvement:
a. Incorporate missing requirements
b. Incorporate the missing domain specific requirements

Appendix B:
Quality Patterns
247 | P a g e
Keywords: semantic completeness; completeness; requirements coverage;
Related patterns:
i. Model completeness
ii. Model syntactic completeness

Appendix B:
Quality Patterns
248 | P a g e
11. Model Semantic Correctness Quality Pattern
Pattern Name: Model Semantic Correctness
Context:
i. To check if the model is semantically correct i.e. the concepts are used as per their
definition in the target domain. This pattern can be used to evaluate and improve the
model with respect to semantic correctness.
Problem:
i. Semantically incorrect conceptual models (CM) can jeopardize the development of the
end system as if the requirements are not correctly depicted in the CM then the system
will not perform the functions in the same way as it should be.
ii. Similarly, if the requirements are wrongly modeled then the developed system will be
unacceptable to the user (e.g. if client follows American accounting principles then he/she
will not accept the systems based on British accounting principles).
iii. Metrics such as degree of semantic correctness, degree of relevant requirements etc. can
be calculated to check if the model is semantically incorrect or contains semantic errors:
Solution:
i. Remove all the semantic errors from the CM.
ii. All the modeled concepts should adhere to their definition in the target domain.
iii. Remove all the irrelevant concepts from the model.
iv. Add all the missing relevant concepts.
Keywords: correctness; semantic correctness; relevant requirements; irrelevant requirements;
Related patterns:
i. Model Correctness
ii. Model Syntactic correctness

Appendix B:
Quality Patterns
249 | P a g e
12. Model Size Quality Pattern
Pattern Name: Model Size
Context:
i. To check the complexity of the model with respect to the number of instances of
numerous classes/entities/attributes etc present in the model. This pattern is suitable for
models containing several classes/entities/attributes etc. However, this pattern does not
take into account elements such as associations, generalization relationships,
dependencies etc. as they relate to the structural complexity of the model.
Problem:
i. Large CM contains several classes/entities/uses-cases etc. that hampers the
understandability and induce complexity.
ii. This induced complexity can hamper the maintainability as complex models are difficult
to maintain.
iii. Calculate the following metrics to check if this pattern is relevant for the current problems
of the model: number of classes, number of entities, number of use-cases, number of
attributes, number of methods, etc. Some of these metrics are described in Model
Complexity Quality pattern.
Solution:
i. Models can be made simpler if they are divided into small independent modules each
with limited number of classes/entities/attributes/methods etc.
ii. Following transformations can be employed for improvement:
a. Remove redundant elements
b. Divide the model
c. Merge classes/entities
Keywords: size; complexity; maintainability; understandability; number of classes/entities etc.;
number of concepts; number of attributes;
Related patterns:

Appendix B:
Quality Patterns
250 | P a g e
i. Model structural complexity
ii. Model complexity
iii. Model evolution
13. Model Structural Complexity Quality Pattern
Pattern Name: Model Structural Complexity
Context:
i. To check the structural complexity of the model with respect to the number of
associations/relationships/depth inheritance tree etc. present in the model. This pattern is
suitable for models containing numerous associations/ relationships/ generalizations/
compositions/aggregations etc. However, this pattern does not take into account elements
such as classes, attributes, methods etc. as they relate to the size of the model.
Problem:
i. CM gets complex due to the existence of numerous different relational elements within
the model. These elements can include associations, aggregations, generalizations,
dependencies, transitions, relationships etc. that hampers the understandability and induce
complexity.
ii. Similarly, complexity also can be increased due to the existence of multiple level of
inheritance.
iii. Calculate the following metrics to check if this pattern is relevant for the current problems
of the model: number of relationships, number of associations, number of aggregations,
number of compositions, number of generalizations, depth inheritance tree, etc. Some of
these metrics are described in Model Complexity Quality pattern.
Solution:
i. Models can be made simpler if they are divided into small independent modules each
with limited number of concepts and functionalities.
ii. Following transformations can be employed for improvement:
a. Remove redundant elements
b. Factorize associations to remove redundant associations

Appendix B:
Quality Patterns
251 | P a g e
c. Divide the model
d. Merge classes
iii. GRASP high cohesion pattern can be employed to improve the quality of the model.
Keywords: structural complexity; maintainability; modify; understandability; number of
associations/relationships etc.; depth inheritance tree;
Related patterns:
i. Model size
ii. Model complexity
iii. Model evolution

Appendix B:
Quality Patterns
252 | P a g e
14. Model Syntactic Completeness Quality Pattern
Pattern Name: Model Syntactic Completeness
Context:
i. To check if the model is syntactically complete i.e. to check if associations have proper
labels, multiplicities or cardinalities are defined, data types are defined for attributes, etc.
Problem:
i. If CM is not syntactically complete then it can hamper the understandability of the model.
ii. Syntactic completeness relates to the notation used (e.g. verifying that multiplicities are
defined for associations or associations have a valid name in a class diagram etc.)
iii. If the information such as attribute data type, function return type, parameters etc. are
missing from the model then the chances of errors can enhance during the
implementation.
iv. Calculate the following metrics to check if this pattern is relevant for the current problems
of the model: degree of defined multiplicities, degree of named associations, percentage
of defined attribute types, etc. Some of these metrics are described in Model
Completeness Quality pattern.
Solution:
i. CM should contain all the syntactic elements proposed by the target modeling notation.
ii. Following transformations can be used for improvement:
a. Define missing multiplicities
b. Define missing associations labels
c. Declare the data types of all the attributes
d. Define all the parameter of the functions
e. Declare the return type of all the functions

Appendix B:
Quality Patterns
253 | P a g e
Keywords: syntactic completeness; completeness; named associations; defined cardinalities;
Related patterns:
i. Model semantic completeness
ii. Model completeness

Appendix B:
Quality Patterns
254 | P a g e
15. Model Syntactic Correctness Quality Pattern
Pattern Name: Model Syntactic Correctness
Context:
i. This pattern can be used to check if the model is syntactically correct i.e. every concept in
the model is defined as per the valid syntactic rules of the employed grammar.
Problem:
i. Syntactically incorrect CM doesn‟t model the concepts correctly with respect to the
employed grammar or notations.
ii. Syntactically incorrect models are thus confusing and difficult to understand by different
users.
iii. Metrics such as degree of syntactic correctness and degree of single notation can be
calculated to check if this pattern can be used for the problem in hand. These metrics are
described in Model Completeness Quality pattern and Model Understandability Quality
Pattern respectively.
Solution:
i. Remove all the syntactic errors from the CM.
ii. If model employs more than one notation then model should be redesigned employing a
single notation.
Keywords: correctness; syntactic correctness;
Related patterns:
i. Model correctness
ii. Model semantic correctness

Appendix B:
Quality Patterns
255 | P a g e
16. Model Understandability Quality Pattern
Pattern Name: Model Understandability
Context:
i. To check whether model is easy to understand.
ii. To verify that the model employs widely accepted and standard notations such as UML,
ER models etc to increase understandability.
iii. To verify that the model employs concepts that is more expressive in defining the
relationships between different concepts. Such as using inheritance relationships where
applicable instead of associations.
iv. To check whether the model employ terms and language that are easy to understand by
the end-user.
v. To check whether the model elements are documented to help better understanding.
vi. To check whether the model uses consistent naming throughout the model.
Problem:
i. If models are not understandable then they are difficult to maintain or modify.
ii. If CM employs notations that are not standardized or common, it affects its
understandability. Similarly, a model can contain different notations such as using UML
and ER notations in one model that is syntactically wrong.
iii. Models frequently use concepts that are easy to manage but are less expressive. Such as
using multiple associations to denote an inheritance relationship. However, if expressive
concepts are used then they simplify their understanding.
iv. Understandability of a model is enhanced if the reader can make easy correspondence
between the modeling elements contained in the conceptual schema and the requirements
in the textual description. Similarly, if a lot of technical vocabulary is used in the models
then it might be difficult for others to understand the model without additional efforts.
v. Each of the model elements (or concepts) should be documented to provide additional
information to its user for enhancing their understandability. Whereas, several model
elements are left with no documentation thus causing difficulties in their understanding.
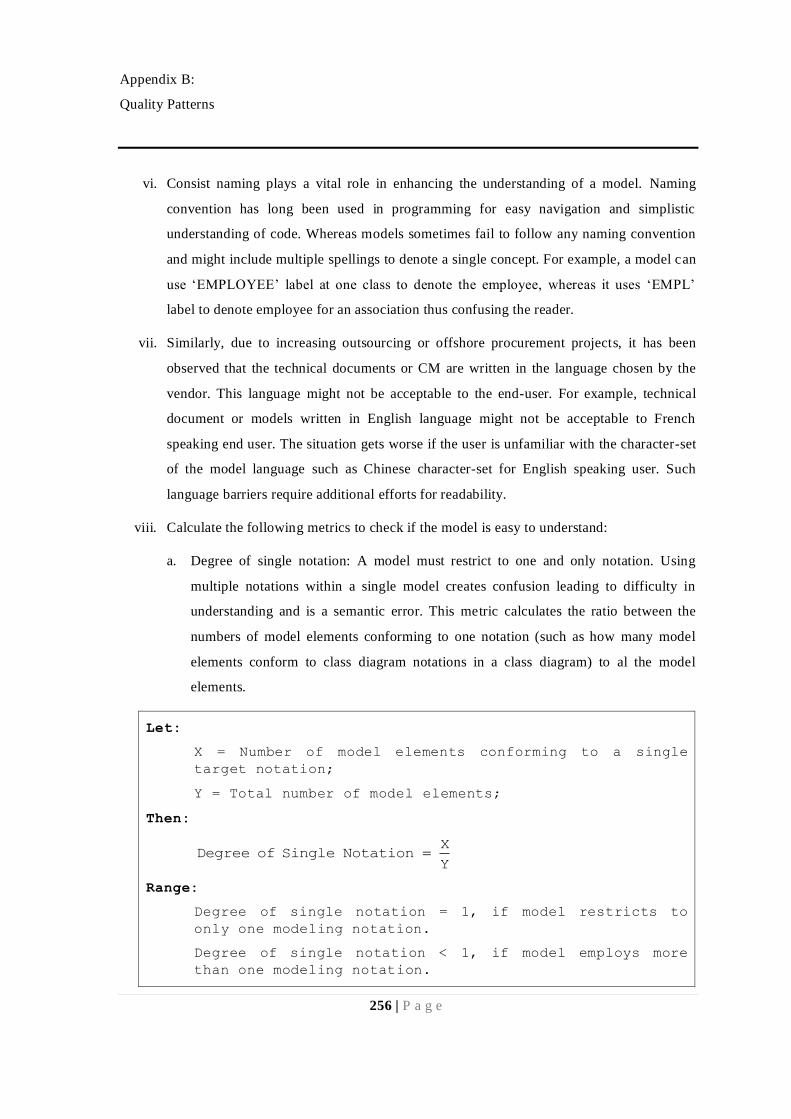
Appendix B:
Quality Patterns
256 | P a g e
vi. Consist naming plays a vital role in enhancing the understanding of a model. Naming
convention has long been used in programming for easy navigation and simplistic
understanding of code. Whereas models sometimes fail to follow any naming convention
and might include multiple spellings to denote a single concept. For example, a model can
use „EMPLOYEE‟ label at one class to denote the employee, whereas it uses „EMPL‟
label to denote employee for an association thus confusing the reader.
vii. Similarly, due to increasing outsourcing or offshore procurement projects, it has been
observed that the technical documents or CM are written in the language chosen by the
vendor. This language might not be acceptable to the end-user. For example, technical
document or models written in English language might not be acceptable to French
speaking end user. The situation gets worse if the user is unfamiliar with the character-set
of the model language such as Chinese character-set for English speaking user. Such
language barriers require additional efforts for readability.
viii. Calculate the following metrics to check if the model is easy to understand:
a. Degree of single notation: A model must restrict to one and only notation. Using
multiple notations within a single model creates confusion leading to difficulty in
understanding and is a semantic error. This metric calculates the ratio between the
numbers of model elements conforming to one notation (such as how many model
elements conform to class diagram notations in a class diagram) to al the model
elements.
Let:
X = Number of model elements conforming to a single
target notation;
Y = Total number of model elements;
Then:
Y
X Notation Single of Degree
Range:
Degree of single notation = 1, if model restricts to
only one modeling notation.
Degree of single notation < 1, if model employs more
than one modeling notation.

Appendix B:
Quality Patterns
257 | P a g e
b. Expressiveness. This metric is described in [Cherfi et al., 2002b]. It measures whether
the used concepts are expressive enough to capture the main aspects of the reality. For
example, Inheritance link is more expressive then association. So the more the
expressive concepts are used, the more the schema will be expressive and easy to
understand. Similarly we can also calculate the expressiveness of the schema as a
whole. A schema is said to be expressive when it represents users‟ requirements in
natural way and can be easily understood without additional explanation. This metric
assigns the weights of every concept and then takes the ratio between the calculated
total value of the schema and the union of all the schemas describing the same reality.
c. User Vocabulary Rate: It is based on the assumption that the understandability of a
model will be enhanced if the reader can make easy correspondence between the
modeling elements contained in the conceptual schema and the requirements in the
textual description. This metric calculates the ratio between the number of user
specific labels (those labels/terms that are also present in requirements documents) to
the total number of labels.
Let:
X = Number of user specific labels in the model;
Y = Total number of labels in the model
Then:
Y
X Rate Vocabulary User
Range:
User Vocabulary Rate = 1, if all the employed labels including the associations names are also found in the requirements documents so user can make easy
correspondence.
User Vocabulary Rate = 0, if all the employed labels are new to user and is not present in the requirements
documents.
d. Technical vocabulary rate: It is based on the assumption that the understandability of
a model will be enhanced if the reader can make easy correspondence between the

Appendix B:
Quality Patterns
258 | P a g e
modeling elements contained in the conceptual schema and the requirements in the
textual description.
Let:
X = Number of technical labels in the model;
Y = Total number of labels in the model
Then:
Y
X Rate Vocabulary Technical
Range:
Technical Vocabulary Rate = 1, if all the employed labels including the associations names are technical terms instead of common language terms.
Technical Vocabulary Rate = 0, if all the employed labels are common language terms instead of technical
terms.
e. Documentation Degree: It is based on the assumption that well defined schemas have
comments associated with each of the modeling elements (classes, attributes etc.).
Let:
X = Number of documented modeling elements in the model;
Y = Total number of modeling elements in the model
Then:
Y
X Degree ionDocumentat
Range:
Documentation Degree = 1, if all the modeling elements
have documentation or comments attached to it.
Documentation Degree = 0, if none of the modeling
elements have documentation or comments attached to it.
f. Degree of conformed names: If all modeling elements conform to a proper naming
convention then it enhances the understandability of the model. Users can easily
identify the type and other information about that modeling element just by looking at

Appendix B:
Quality Patterns
259 | P a g e
its name. This metric calculates the ratio between the numbers of the conformed
names in a model to the total number of names within a model.
Let:
X = Number of conformed names in a model;
Y = Total number of names in the model;
Then:
Y
X Names Conformed of Degree
Range:
Degree of conformed names = 1, if all the names conform
to a single naming convention.
Degree of conformed names = 0, if none of the name
conform to a single naming convention.
g. Language vocabulary rate: familiarity with the model‟s language and character-set
enhances its understandability. This metrics is explained in the “Model Readability
Quality Pattern”.
Solution:
i. CM must employ a widely accepted and standard notation for ease in understandability
such as UML or ER. Thus if CM is designed using some non standard notations then it
should be redesigned employing an appropriate standard notation.
ii. Model must employs one and only one notation that must be acceptable to user. Thus, if
model employs more than one notation then model should be redesigned employing a
single notation.
iii. Identify all the portions and relationships where a less expressive concept has been
employed and that can be substituted by more expressive concepts. This will help in
communicating the user requirements in a more natural way and with less concepts.
iv. Replace the terms unknown to user by the known terms. Use the same terms as in the
requirement document to enhance the end-user understandability.
v. Utilize basic and simple terms as much as possible.

Appendix B:
Quality Patterns
260 | P a g e
vi. Replace the technical terms/labels from the model to the common/non-technical
terms/labels.
vii. Provide additional documentation and comments for every model elements.
viii. Models should use clear and consistent naming to enhance the understandability of a
model. For example, programmers frequently use small “m” before naming any method
and uses small “v” before naming any variable. Similarly, models should use same
spelling to denote one concept throughout the model.
ix. CMs should use the language acceptable to user.
Keywords: standard notations; expressiveness; schema expressiveness; concept expressiveness;
user vocabulary; used language; technical vocabulary; target language; naming convention;
conformed names; multiple spellings.
Related patterns:
i. Model complexity
ii. Model readability
iii. Model reception

Appendix C:
Human Resource Ontology
261 | P a g e
Appendix C
Human Resource Ontology


Appendix C:
Human Resource Ontology
263 | P a g e
Personnel
Management
Payroll
Personnel
Information
Loan
Management
Appointment
Management
Overtime
Management
Salary
Leave
Management
Performance
Management
Punishment
Award
Leave
Leave Policy
Leave Application
Overtime
Overtime
Approval
Overtime
Performed
Loan
Loan Approval
Pay Group
Pay Structure
Pay Component
Allowance
Deduction
Professional
Courses
Professional
Trainings
Appointment
Designation
Joining Type
Department
Sub Department
Promotion
Demotion
Work Centre
Team
Personnel
Information
Family
Information
Professional
Development
Trade
Non-Technical
Management
Administration
Support
Technical
Electrical
Mechanical
Software
Transfer
Temporary
Attachment
Family Claims
Medical Claims
Personnel
Welfare
Displacement
Claims
Retirement Claim
Pension Claim
Family Medical
Claim
Laboratory
Charges
Pharmacy
Charges
Hospital Charges
Food Bill Claim
Hotel Claim
Transport Claim
Transport Charges
Maintenance
Fabrication
Power Generation
Quality Assurance
Programming
Software
Engineering
CAD/CAM
Circuit Designing
Electronics
Power
Pay Structure 1
XX-YY-ZZ
Initial – Increment
- Maximum
Pay Scale 2..X
Pay Scale 1
Standard
Deductions
Variable
Deduction
Provident Fund
Social Security
Income Tax
Benevolent Fund
Spouse
Father
Mother
Children
Loan Instalment
Amenity
Medical Charges
Arrears Debit
Advance
Instalment
House Rent
Project Allowance
Basic Pay
Medical Allowance
Overtime Charges
Arrears Credit
Conveyance
Allowance
Honorarium
Education Loan
House Loan
Car Loan
Other Loan
Medical Leave
Earned Leave
Casual Leave
Study Leave
Maternity Leave
Leave Prior
Retirement
Extra Ordinary
Leave
Honorarium
Demotion
Salary Deduction
Promotion
Gifts
Contract
Daily Wage
Regular
Permanent
Daily Attendance
Human Resource
Management
Class
Instance
Double bordered rectangles
are the classes
Single bordered rectangles
are the instances


Appendix D:
User Requirements for Case Study
265 | P a g e
Appendix D
User Requirements for Case Study
The Following requirements, as specified by the user, will be employed to calculate the
requirement coverage degree metric. These are only parts of the requirements:
i. Each personnel (employees are referred to as personnel) has a unique identification number.
ii. Information such as name, address, employment date, marital status, etc. should be included
into the system.
iii. Personnel could be either a regular employee or a permanent employee or on contract basis.
iv. Personnel should belong to either of the two categories: technical or non technical
a. Technical personnel could be either related to software or hardware trade.
Software personnel must belong to either of the following specializations: analyst,
programmer, tester or documenter.
Hardware personnel must be either of the following: Network support, hardware
maintenance, installations.
b. Similarly, non technical personnel must be either of the following: Management,
administrative, support and services.
v. Every personnel is authorized with a limited amount of leaves.
vi. Leaves are of the following six types: Earned leaves, casual leaves, study leaves extra
ordinary leaves, leave prior retirement and medical leaves.


Appendix E:
CM-Quality Evaluation Report
267 | P a g e
Appendix E
CM-Quality Evaluation Report
CM -Quality Evaluation Report
Formulated Goal: Purpose of the goal is to analyze Product (Conceptual Model) For Evaluation with Respect to Correctness, For Evaluation with Respect to Complexity From the Manager point of view
Results:
Pattern Name: Model Complexity Quality Pattern
Attribute Name Size Metric Name: Number of Classes
Model Element Values
Complete Conceptual Model 46
Recommendation: Divide the model (to reduce semantic complexity)
Application Criteria (Metric Value):
Description: Model division can be done in two ways: Structural Division and Semantic Division
i. Structural division is an easier but non-efficient method. Randomly select the model
elements and divide them into multiple modules. But bad selection of elements can
leads to low cohesion and high coupling among the resulting modules.
ii. Semantic division is a difficult but efficient method. Read the model carefully (or use
some existing domain ontology) and classify the model elements with respect to some
similarity or relationship. For example, classify the elements with respect to common

Appendix E:
CM-Quality Evaluation Report
268 | P a g e
functionality or interdependency. The elements with common set of goals or
functionalities should be grouped together as a module. Such division will increase the
cohesion and reduces the coupling. Similarly, existing ontology can be used to identify
different semantic groups.
iii. Another possible type of division is to identify the complex parts of the model and divide
them into multiple modules to reduce the complexity.
Related References: Asunción Gómez-Pérez, Jaime Ramírez and Boris Villazón-Terrazas: An
Ontology for Modelling Human Resources Management based on standards. KES (1) 2007:
534-541.
Recommendation: Merge Classes
Application Criteria (Metric Value):
Description: Concepts with similar functionalities can be merged as one or can be removed to
reduce redundant concepts.
i. Sort all the relevant and related attributes/functions among different classes.
ii. Package related attributes and functions within same class to increase cohesion.
Related References: NIL
Recommendation: High Cohesion GRASP design pattern (to increase cohesion)
Application Criteria (Metric Value):
Description: We propose to employ high cohesion GRASP pattern to reduce model complexity
by reducing the complexity of the source class as in-cohesive classes are inefficient, large and
complex. Thus perform the following tasks:
i. Assign class the responsibilities related to other responsibilities of the class.
ii. Find if the class contains methods that this class shouldn’t be responsible for and
delegate the responsibility of this method to the suitable class.
Related References: http://en.wikipedia.org/wiki/GRASP_(object-oriented_design)
Recommendation: Polymorphism GRASP design pattern
Application Criteria (Metric Value):
Description: Use High Polymorphism Pattern to reduce the complexity and increase the
cohesion of the class. Following steps can be performed:
iv. When related behaviors vary by class type then the responsibilities should be assigned
polymorphically to the specialization classes. Polymorphism Pattern increases the
cohesion.
v. Identify all the hierarchies in the model.

Appendix E:
CM-Quality Evaluation Report
269 | P a g e
vi. Within each hierarchy, identify if a parent class implements a method that could have
different implementation for its children. If yes, then this method should be assigned to
all the specialized classes to reduce the complexity of the class.
vii. For example, different shapes can use overrided polymorphic Draw() function to draw
their shape by themselves instead of one complex generic function to draw all types of
shapes.
Related References: http://en.wikipedia.org/wiki/GRASP_(object-oriented_design)
Metric Name: Number of Attributes
Model Element Values
Complete Conceptual Model 174
Recommendations: Divide a class
Application Criteria (Metric Value):
Description: If there are numerous attributes within a single class then perform the following
steps:
i. Identify the attributes or functions that are irrelevant within the scope of the class (to
increase cohesion).
ii. Try adding these attributes/functions to the existing relevant class.
iii. If no class exists that is relevant for these attributes/functions, then add these attributes
and functions in a new class and define the associations.
iv. If all the attributes/functions are relevant to the class then classify them into obligatory
and optional and then split the class into two classes: one containing all the obligatory
attributes/functions and the other containing all the optional attributes/functions.
Related References: NIL
Metric Name: Number of Methods
Model Element Values
Complete Conceptual Model 120
Recommendations: Divide a class

Appendix E:
CM-Quality Evaluation Report
270 | P a g e
Application Criteria (Metric Value):
Description: If there are numerous attributes within a single class then perform the following
steps:
i. Identify the attributes or functions that are irrelevant within the scope of the class (to
increase cohesion).
ii. Try adding these attributes/functions to the existing relevant class.
iii. If no class exists that is relevant for these attributes/functions, then add these attributes
and functions in a new class and define the associations.
iv. If all the attributes/functions are relevant to the class then classify them into obligatory
and optional and then split the class into two classes: one containing all the obligatory
attributes/functions and the other containing all the optional attributes/functions.
Related References: NIL
Attribute Name Structural complexity Metric Name: Degree of non-redundancy
Model Element Values
Complete Conceptual Model 0.927
Recommendation: Remove redundant elements
Application Criteria (Metric Value):
Description: Following steps can be performed:
i. Check the model to identify redundant elements such as classes, associations etc that
have the same name or are semantically equivalent.
ii. Remove the redundant elements in a way that no information is lost.
iii. For example: if a model contains two classes named as professor and lecturer such that
they are not the child of the same parent (implying that they don’t specialize the
distinction between the professor and lecturer) then they both represent the same
concepts and thus we have a redundant concept. However, if both the concepts have
different attributes and methods then verify if the attributes and methods are
semantically same if not then both of these concepts are non-redundant.
iv. In the first class diagram (Figure-1), lecturer and professor inherit from teacher so they
might have some distinct properties. Whereas in the second class diagram (Figure-1)

Appendix E:
CM-Quality Evaluation Report
271 | P a g e
both the classes looks similar and thus can be redundant
Related References: NIL
Recommendation: Evaluate all cycles to remove redundant concepts
Application Criteria (Metric Value):
Description: Existence of cycles signifies that information is duplicated. In class diagrams
sometimes cycles are inevitable whereas sometimes it’s just the design error. So whenever
there are cycles in the class diagram they should be revisited to check if some redundant
information exists and if yes then they can be eliminated.
Related References: NIL
Recommendation: Factorize associations (to remove redundant associations)
Application Criteria (Metric Value):
Description: In any conceptual model, redundant concepts increase the complexity and wastes
resources. Similarly, redundant associations increase the structural complexity of the models
and thus they must be identified and removed from the model. There are number of ways to
identify redundant associations with simplest being to identify the association having same
name. Thus, all the redundant association must be removed.
Related References: NIL
Metric Name: Number of Associations
Model Element Values
Complete Conceptual Model 35
Recommendation: Factorize associations (to remove redundant associations)
Application Criteria (Metric Value):
Description: In any conceptual model, redundant concepts increase the complexity and wastes
resources. Similarly, redundant associations increase the structural complexity of the models
and thus they must be identified and removed from the model. There are number of ways to
identify redundant associations with simplest being to identify the association having same
name. Thus, all the redundant association must be removed.
Related References: NIL
Metric Name: Number of Aggregations

Appendix E:
CM-Quality Evaluation Report
272 | P a g e
Model Element Values
Complete Conceptual Model 1
Recommendation: NIL Metric Name: Number of Compositions
Model Element Values
Complete Conceptual Model 6
Recommendation: NIL Metric Name: Number of Generalizations
Model Element Values
Complete Conceptual Model 14
Recommendation: NIL Metric Name: Depth Inheritance Tree
Model Element Values
Complete Conceptual Model 2
Recommendation: NIL Manual Metric Name: Number of cycles
Recommendation: Evaluate all cycles
Application Criteria (Metric Value): >0
Description: Existence of cycles signifies that information is duplicated. In class diagrams
sometimes cycles are inevitable whereas sometimes it’s just the design error. So whenever
there are cycles in the class diagram they should be revisited to check if some redundant
information exists and if yes then they can be eliminated.

Appendix E:
CM-Quality Evaluation Report
273 | P a g e
Related References: NIL
Attribute Name Semantic Complexity Manual Metric Name: Number of clusters
Recommendation: Split the model into identified clusters
Application Criteria (Metric Value): >0
Description: If different clusters are identified in the model. Then the model should be divided in
such a way that each cluster becomes an independent module. This will help in managing the
semantic complexity of the model.
Related References: NIL
Pattern Name: Model Completeness Quality Pattern
Attribute Name Completeness
Metric Name: Degree of Named Associations
Model Element Values
Complete Conceptual Model 0.5
Recommendation: Define missing associations labels
Application Criteria (Metric Value): 0.0 TO 0.99
Description: Proper and expressive association names enhance the understandability of the
model. These names tend to help the reader in understanding the nature/type of associat ion
between the associated classes. Thus if there are unnamed associations in the model, then
expressive names must be defined for all the associations.
Related References: NIL
Manual Metric Name: Requirements Coverage Degree
Recommendation: Incorporate missing requirements

Appendix E:
CM-Quality Evaluation Report
274 | P a g e
Application Criteria (Metric Value): 0.0 TO 0.99
Description: Missing requirements pose threat to the success of the developing system. It is
widely accepted that the earlier identification and incorporation of the missing requirements
reduces the systems correction cost to a greater extent. It is advised that all the missing
requirements must be identified and incorporated to the conceptual model.
Related References: NIL
Manual Metric Name: Degree of defined multiplicities
Recommendation: Define missing multiplicities
Application Criteria (Metric Value): 0.0 TO 0.99
Description: Multiplicity defines the number of objects taking part in the relationship.
Multiplicities are important to understand the semantics behind the relationship of the related
classes. Thus, if there are undefined multiplicities in the model, they must all be defined.
Related References: NIL

Appendix F:
Résumé
275 | P a g e
Appendix F
Résumé
Les systèmes d‟Information (SI) créent, traitent et stockent l‟information pour aider leurs
utilisateurs à prendre les décisions adéquates [Gupta 01]. Ces systèmes peuvent être à caractère
personnel ou professionnel ; ils peuvent aussi bien concerner des individus, des groupes de travail
ou des entreprises en fonction de leur usage et de leur implémentation. Par exemple un SI
d‟entreprise s‟adresse à l‟intégralité de l‟organisation en fournissant une information utile et
précise nécessaire à la prise de décisions au niveau de l‟entreprise. Cependant, les SI ne peuvent
être utiles que s‟ils sont capables de fournir l‟ensemble des informations et des services pour
lesquels ils ont été conçus. Dans le cas contraire c‟est la position stratégique de toute l‟entreprise
qui est mise en péril et le système d‟information est alors remis en cause et abandonné par ses
utilisateurs.
L‟autre aspect concerne l‟évolution du SI à travers la prise en compte de nouveaux besoins
et/ou l‟évolution des ses fonctionnalités. Les opérations de maintenance sont coûteuses et leur
coût dépend de l‟ampleur des changements qu‟elles induisent. Ce coût dépend également du stade
du cycle de vie dans lequel elles interviennent. D‟ailleurs, l‟expérience a montré que le coût des
opérations de maintenance peut avoir un impact décisif sur le sort du SI. En effet, l‟échec des
projets informatiques est un problème qui a été longuement étudié et des études montrent que,
même si un projet a été conduit à son terme, la vie du SI peut s‟arrêter prématurément si les coûts
de sa maintenance sont élevés. Une étude a montré que le coût relatif aux opérations de
maintenance peut atteindre 90% du coût total du projet [Erlikh 00].
En considérant les raisons citées précédemment et la position stratégique d‟un SI, la qualité
des SI est considérée comme un problème important aussi bien pour les équipes de recherche que
pour les entreprises. Les problèmes liés à la qualité peuvent augmenter considérablement les coûts
et les ressources nécessaires au développement et au fonctionnement d‟un SI en plus des risques
de défaillance qu‟ils peuvent engendrer [Thiagarajan et al., 1994]. De plus, [Ackoff 67] et [Nelson
et al., 2005] ont rapporté que la qualité d‟un système d‟information peut affecter la confiance des
utilisateurs et avoir ainsi un impact direct sur son utilisation et son adoption.

Appendix F:
Résumé
276 | P a g e
L‟évaluation des systèmes d‟information a toujours été un sujet important et sensible.
Beaucoup d'efforts sont consacrés à la recherche et au développement de méthodes visant à
améliorer la qualité du logiciel. Divers chercheurs ont proposé des visions différentes et des
méthodes pour évaluer le SI. De même, dans l‟industrie on s‟appuie de plus en plus sur des
approches d‟assurance qualité (Software Quality Assurance ou SQA) visant à améliorer la qualité
du logiciel et à réduire le coût des changements. Toutefois, le problème majeur avec les approches
SQA existantes est lié au fait que l‟évaluation du logiciel est effectuée tardivement dans le
processus de développement à un moment où le coût du changement est élevé. Le fameux test
alpha est fait une fois le logiciel entièrement développé juste avant son déploiement. De plus les
besoins manquants ou émergents sont souvent identifiés au cours des tests effectués sur le site du
client avant l'acceptation du produit. Ces tests montrent que la majorité des changements
concernent une mauvaise implémentation des fonctionnalités due essentiellement à une mauvaise
compréhension des besoins. Des études montrent aussi que la détection de défauts dans les
premiers stades du processus de développement peut être trente-trois fois plus rentable que les
tests effectués à la fin du développement [Walrad et al., 1993]. Plus précisément, plus tôt nous
pouvons mesurer la qualité du futur système, mieux nous pourrons l'améliorer en étant en mesure
de corriger les erreurs au niveau des spécifications et moins élevé sera le coût de ces corrections.
Par conséquent, il est impératif d'introduire des mécanismes de mesure et d‟amélioration de la
qualité dès les premières phases du développement, donc dès l'analyse et la conception. Le
principal livrable de ces phases que nous désignons par les modèles conceptuels (MC), sert de
base à toute la suite du processus de développement. La qualité des MC a par conséquent un
impact direct sur le futur système à produire. De plus, le fait que la génération des MC se fasse
très tôt dans le processus développement rend ces modèles plus adaptés à la détection des erreurs
liées à l‟acquisition et la compréhension des besoins et à leur correction [Moody et al., 2003].
En considérant l‟importance des MC, il devient crucial pour une méthode d‟analyse et de
conception d‟assurer la qualité des modèles qu‟elle produit. En effet, si une méthode est capable
de détecter les erreurs à travers l‟analyse des MC qu‟elle produit et si elle propose ensuite les
moyens de les corriger, alors elle pourrait prétendre réduire le nombre de demandes de
changements pouvant survenir à la livraison du système et assurer ainsi une meilleure qualité de
ses livrables. De plus, la détection de ces erreurs très tôt dans le processus de développement évite
leur propagation tout au long du processus de développement impliquant ainsi une amélioration
de la qualité de tout le SI et pas seulement des MC sous-jacents [Moody 05]. Par conséquent,

Appendix F:
Résumé
277 | P a g e
l‟amélioration de la qualité des MC est la garantie d‟une meilleure qualité du SI affectant sa
performance (temps, coût, effort) et son efficacité (qualité des résultats).
Pour ces raisons, les méthodes de développement intègrent des guides pour assurer une
certaine qualité des livrables. Dans le cadre de cette thèse nous proposons d‟aller plus loin en
intégrant le concept de qualité des SI (son évaluation et son amélioration) au processus de
développement. Commençons par le problème de l‟évaluation de la qualité qui n‟est pas un
problème facile et qui a été abordé à différents niveaux dans la littérature.
1. Revue de la littérature
Différentes propositions ont été faites afin d‟assurer la qualité des SI dans les organisations.
Par exemple, l'Organisation internationale de normalisation (ISO) a formulé plus de 500 normes
pour assurer la standardisation des procédés dans divers domaines (production, distribution, etc.).
Ces normes lorsqu‟elles sont adoptées par un secteur, offrent une garantie de la qualité des
services proposés. Ces normes intègrent les meilleures pratiques et ont tendance à proposer des
critères d'évaluation de la qualité. Ainsi, la conformité d'un procédé ou d‟un produit à une norme
ISO est généralement garante de sa qualité et est considérée comme une adhésion à l‟excellence
“quality as an excellence” comme ça a tété défini par [Reeves et al. 1994].
Dans le domaine informatique, la qualité est traitée selon divers angles dont voici une liste non
exhaustive:
i. Qualité de l'ingénierie des exigences (les processus et les produits tels que documents,
etc.)
ii. Qualité des modèles (modèles conceptuels tels que les diagrammes de classes,
diagrammes entité-relation, etc.)
iii. Qualité des systèmes informatiques
iv. Qualité des données
v. Qualité des services
Cette thèse s'intéresse à la qualité des modèles conceptuels mais l‟étude de l‟état de l‟art a
porté sur l‟étude plus générale de la qualité dans un SI incluant la qualité des logiciels et la qualité
des données.

Appendix F:
Résumé
278 | P a g e
Les Systèmes d'information (SI) sont caractérisés par des coûts élevés de leurs activités de
maintenance. Par conséquent la qualité des logiciels est une question importante aussi bien pour
les chercheurs que pour les entreprises.
Divers chercheurs ont proposé des méthodes d‟évaluation des SI fondées sur des critères
d‟acceptation par les utilisateurs. Par exemple, si un utilisateur demande un logiciel pouvant être
manipulé via une interface graphique, il n'acceptera pas un logiciel en ligne de
commande. [Boehm 81] inclut, dans la satisfaction des utilisateurs, des facteurs comme la
portabilité, la maintenabilité, la robustesse et la remise en forme en tant que composants
prioritaires de la qualité ; alors que [Elion 93] soutient que la prise en compte des niveaux de
satisfaction des utilisateurs est une mesure insuffisante de la qualité puisque la satisfaction des
utilisateurs est subjective, varie d'une personne à l‟autre et ne peut donc pas donner des résultats
stables. De même, [Hamilton et al., 1981] soulignent l‟insuffisance de cette mesure qui devrait,
selon eux, être considérée comme un élément parmi d‟autres dans la mesure de la qualité.
La littérature sur l‟évaluation de la qualité des logiciels peut être subdivisée en quatre grandes
classes:
i. Les approches sommaires d'évaluation des systèmes d'information. Par exemple, [Avison
et al., 1993] a recensé différents modes d'évaluation tels que l'analyse d'impact, les
mesures d'efficacité, les approches économiques, les objectifs, la satisfaction des
utilisateurs, etc.
ii. Les approches de détection et de rectification des erreurs. Par exemple, [Ackoff 67]
considère le nombre d‟erreurs détectées comme un indicateur de la qualité. De même, le
rapport Carnegie Mellon [Florac 92] tenant compte des résultats de [Ackoff 67] a proposé
une classification des erreurs logicielles en plusieurs catégories qui sont les erreurs sur les
exigences, les erreurs de conception, les erreurs de code, les erreurs de documentation,
etc. Une autre classification des erreurs en erreurs d‟exigences ou erreurs
d‟implémentation a aussi été proposée par [Lausen et al., 2001].
iii. L‟identification des critères de qualité (dimensions, attributs, paramètres, etc.) pour
l'évaluation. Par exemple, [Thiagarajanet al., 1994] distingue le système de qualité dans la
qualité des produits et la qualité des processus. [Nelson et al., 2005] a proposé et validé
empiriquement cinq dimensions des systèmes de qualité: accessibilité, fiabilité ou
disponibilité, temps de réponse, flexibilité et intégration. De même, [Chang et al., 2000] a

Appendix F:
Résumé
279 | P a g e
évalué la performance d'un système d'information selon trois dimensions : la performance
du système, l'efficacité et la performance des services d'information. [Stylianou et al.,
2000] a identifié plusieurs attributs pour évaluer la qualité des produits et des
processus. Comme pour le système de développement, il concerne le coût, le temps, les
bugs, la facilité d'utilisation de satisfaction des utilisateurs, et la facilité de résoudre les
problèmes liés à la qualité. De même, pour la maintenance du système, il propose le
temps de résolution de problèmes, la qualité du service, le temps de cycle et la sensibilité
aux changements.
iv. L‟évaluation de la qualité de services. Par exemple, [Parasuraman et al., 1988] a proposé
un instrument de mesure composé de 22 critères (SERVQUAL) pour évaluer la qualité de
service perçue par les clients dans le domaine de la vente au détail. Divers chercheurs ont
appliqué le modèle SERVQUAL aux systèmes d‟information. Par exemple, [Jiang et al.,
2002] a utilisé les critères proposés par SERVQUAL dans un contexte professionnel pour
vérifier la validité de ces critères. Les résultats empiriques obtenus montrent que
SERVQUAL peut être appliqué à l‟évaluation de la qualité de services dans les SI mais
cet avis n‟est pas unanimement partagé. [Van-Dyke et al., 1997] donne un aperçu des
différents problèmes concernant SERVQUAL qui sont mis en évidence par différents
chercheurs.
Ces travaux ont abouti à la proposition de plusieurs normes telles que ISO/IEC-9126 pour la
qualité du produit logiciel, ISO/IEC-14598 pour l'évaluation de produits logiciels etc. De même,
des normes telles que ISO 9001 et ISO 9000-3 peuvent être appliqués pour la certification des
processus, produits et services au sein d'une organisation [Wang 02]. Cependant, les normes
proposées ne comprennent pas les informations sur les attributs et les métriques de mesure de la
qualité puisqu‟elles sont génériques et que les métriques ont tendance à être spécifiques aux
logiciels.
De plus, en analysant ces normes, on se rend compte que les caractéristiques de qualité
définies sont peu précises et souvent ambigües, rendant leur utilisation difficile [Cherfi et
al. 2007]. Dans [Kilidar et al., 2005] les auteurs ont mené une expérience qui a montré que la
norme ISO/IEC-9126 est incomplète à l‟égard des caractéristiques de qualité à mesurer et qu‟elle
renferme des redondances en ce qui concerne les propriétés mesurées.
Appendix F:
Résumé
280 | P a g e
Concernant la qualité des données, les approches proposées s‟intéressent à la qualité de la
donnée tout au long de sa vie. Dans [Wang et al., 1996] les auteurs ont identifié quatre dimensions
de qualité : la précision, l'accessibilité, la pertinence et la représentation des données. [Nelson et
al., 2005] ont proposé d‟autres dimensions: la précision, la complétude, la qualité et le format de
présentation des données. [Pipino et al., 2002] a eu une vision plus large et a proposé une
approche employant 16 dimensions de la qualité des données: l'accessibilité, la quantité de
données appropriées, la crédibilité, l‟exhaustivité ou la complétude, la concision de la
représentation, la cohérence de la représentation, la facilité de manipulation, la correction, la
facilité d‟interprétation etc. Ces approches se sont attachées à définir le sens associé aux
dimensions de qualité ainsi définies et à la définition de métriques permettant de les mesurer.
Par exemple, [Bouzeghoub et al., 2004], [Peralta et al., 2004], [Peralta 06b] se sont
particulièrement intéressés à la fraicheur des données comme un attribut de qualité important du
point de vue des consommateurs des données. Ils ont proposé plusieurs métriques pour la
mesurer, par exemple l‟actualité (currency) ou la promptitude (timeliness) des données.
En plus des approches mentionnées ci-dessus, [ISO25012, 2008] est une première version
d'une nouvelle norme pour la qualité de données structurées. Cette norme est prévue pour définir
les besoins en qualité des données, définir les métriques de mesure de la qualité ou planifier des
évaluations de la qualité.
La qualité des SI a tout d‟abord été considérée comme atteignable en améliorant la qualité de
la programmation et la productivité. Plus tard, on s‟est rendu compte que ces deux aspects n‟ont
qu‟un impact limité sur la qualité des systèmes. [Thiagarajanet al., 1994]. [Avison et al., 1993]
ont souligné l‟importance de la prise en compte de la qualité à chaque étape du cycle de vie. Il s
ont également insisté sur la nécessité de l'évaluation suivant un large éventail de facteurs, y
compris ceux concernant les aspects sociaux et organisationnels. Dans [Bansiya et al., 1999] les
auteurs ont souligné le fait que la plupart des métriques proposées dans la littérature ne peuvent
s‟appliquer qu‟une fois le système fini et qu‟il y a un besoin urgent et important de concevoir des
métriques de qualité qui peuvent être utilisées dès les premières étapes du développement.
Les Modèles conceptuels (MC) sont l'abstraction de l'univers du discours [Cherfi et al.,
2002b]. Ils sont conçus lors de l'analyse et servent de moyen de communication entre les
utilisateurs et l'équipe de développement. Ils fournissent des descriptions abstraites et masquent
les détails d'implémentation. Dans le contexte de cette thèse, nous avons utilisé le terme de

Appendix F:
Résumé
281 | P a g e
modèle conceptuel pour désigner toute spécification conceptuelle, quelle que soit la notation
utilisée (modèles de classes, de cas d‟utilisation, etc. en UML ou modèle de données en ER ou
toute autre spécification).
Les problèmes de qualité dans un modèle conceptuel peuvent être très divers (cohérence avec
l‟univers du discours, conformité à la notation, etc.). Cependant les erreurs survenant au niveau
des MC peuvent impacter lourdement tout le processus de développement et la qualité du système
Les premiers travaux structurés sur la question remontent à la proposition de [Batini et al.,
1992]. Ils ont été les pionniers en proposant des critères de qualité pertinents pour l'évaluation des
MC. Dans [Lindland et al., 1994], la qualité des modèles est évaluée selon les trois dimensions:
syntaxique, sémantique et pragmatique.
Une autre approche sur l'évaluation de la qualité de CM met en lumière l'importance de
l'esthétique. Par exemple, [Achat et al., 2002], [Achat et al., 2001b], [Achat et al., 2000],
[Eichelberger 02] ont insisté sur l'importance de l'esthétique dans un modèle. [Cherfi et al. 2007]
et [Cherfi et al., 2002a] ont également utilisé certains aspects de l'esthétique comme la clarté et la
lisibilité pour évaluer la compréhension des modèles.
Divers travaux se sont concentrés sur la définition de propriétés observables pour qualifier la
qualité d‟un modèle et sur la façon de mesurer ces propriétés. Dans [Cherfi et al., 2002a] les
auteurs ont proposé trois dimensions (spécification, usage et implémentation) qui correspondent
aux points de vue selon lesquels la qualité d‟un modèle peut être considérée. Ils ont défini ensuite
des attributs de qualité et des métriques pour les mesurer selon chacune des dimensions. [Bajaj
02] s‟intéresse particulièrement à la lisibilité d‟un modèle et définit pour cela trois dimensions:
l'efficacité, l'efficience et la facilité d'apprentissage.
La plupart des recherches effectuées dans le domaine de l'évaluation de la qualité des modèles
ont été consacrées à la définition de critères ou d‟attributs de la qualité et la manière de les
mesurer [Genero et al., 2004], [Genero et al., 2003], [Manso et al., 2003], [Marchesi 98], [En al.,
2003], [Rufai 03], [Zhou et al., 2003], [Yi et al., 2004], etc.
Cependant, et après avoir analysé tous ces travaux et d‟autres, nous arrivons aux constats
suivants :
i. La plupart des travaux réalisés dans l'évaluation de la qualité des modèles sont concentrés
sur la mesure de la complexité des modèles.

Appendix F:
Résumé
282 | P a g e
ii. Ces travaux souffrent d‟un manque d‟ effort de fédération et de consensus. Par exemple,
[Nelson et al., 2005] ont identifié différentes définitions des mêmes concepts de qualité.
Par exemple, il existe neuf définitions différentes pour la "complétude". De même, on
trouve les mêmes appellations pour des concepts sémantiquement différents [Purao et al.,
2003]. Ces questions ont limité l'adoption des cadres de qualité existant dans la pratique
[Moody 05].
iii. L‟absence d‟une démarche globale qui tiendrait compte de la qualité sous tous ses
aspects.
iv. L‟absence d‟une aide outillée qui faciliterait l‟usage des concepts existants (attributs,
métriques etc.) surtout au vu de la diversité des propositions.
Dans ce manuscrit de thèse, nous avons tenté d‟apporter un peu plus de visibilité aux diverses
et nombreuses propositions de la littérature. Nous avons proposé une classification de ces
propositions en s‟appuyant sur un cadre proposé par [Krogstie et al., 1995]. Nous avons choisi
d'utiliser ce cadre pour les raisons suivantes :
i. Il s'agit d'une version améliorée d‟un autre cadre déjà proposé par [Lindland et al., 1994]
et largement diffusé. Le cadre de Krogstie est une évolution qui tient compte de diverses
critiques et il a, de ce fait, un certain niveau de maturité.
ii. Il est bien connu dans la communauté de la qualité des modèles et il a été employé par
plusieurs chercheurs tels que [Schuette 91], [Cherfi et al., 2007], [Maes et al., 2007],
[Nelson et al. 2005], etc.
iii. Il a été utilisé dans d‟autres domaines tels que l‟ingénierie des besoins ou l‟ingénierie des
processus d‟entreprise.
Compte tenu des problèmes ci-dessus, nous proposons une solution qui englobe les éléments
suivants :
i. Fédération des cadres existants de la qualité pour formuler une démarche de qualité
globale intégrant différents critères d'évaluation.
ii. Proposition d‟un moyen permettant de capitaliser les connaissances et pratiques dans le
domaine de la qualité des modèles à travers le concept de Patron de Qualité (Quality
Pattern). Ce concept a permis l‟encapsulation des concepts tels que attributs de qualité,

Appendix F:
Résumé
283 | P a g e
métrique de qualité, amélioration de la qualité et aide à la mise en œuvre. Il a également
été instancié en identifiant quelques patrons (16 patrons).
iii. Définition d‟un processus pour l‟évaluation et l‟amélioration de la qualité. Ce processus
est guidé de manière flexible, permettant à un analyste concepteur de définir un besoin de
qualité par rapport à sa spécification conceptuelle et d‟être guidé pas à pas jusqu‟à
l‟amélioration de cette qualité conformément au besoin exprimé.
iv. Conception d‟un prototype logiciel qui propose une aide outillée à l‟application de
l‟approche proposée.
Nous décrivons ci-après la solution ainsi proposée.
2. La solution proposée
L‟étude de l‟état de l‟art a révélé l‟importance de prendre en compte la qualité des SI dès
l‟acquisition des besoins. Dans le cadre de cette thèse nous nous intéressons à la qualité des
modèles conceptuels conçus au cours de la phase d‟analyse et conception. La qualité des modèles
conceptuels est cruciale et décisive dans le succès du système final. L'objectif principal de cette
thèse est de développer une approche complète de la qualité des modèles conceptuels qui englobe
les objectifs suivants:
i. Fédérer les travaux existants,
ii. Organiser et structurer la connaissance liée à l‟évaluation de la qualité des modèles,
iii. Proposer un processus guidé pour l'évaluation et l'amélioration de la qualité,
iv. Proposer un outillage pour l‟évaluation et l'amélioration de la qualité,
v. Valider l'approche proposée
Nous allons décrire chacun des objectifs énumérés ci-dessus, les problèmes associés et la
solution proposée.
Le domaine de l'évaluation de la qualité des MC est assez jeune. Contrairement à la discipline
du génie logiciel où il y a une prolifération de méthodes et standards pour évaluer la qualité du
produit, il y a peu de littérature consacrée de manière significative à la qualité des modèles
conceptuels [Cherfi et al., 2002b]. De plus, il manque de consensus sur les concepts proposés. Ce
manque se traduit par l‟absence de standards ou normes pour la gestion de la qualité au niveau des
modèles conceptuels.

Appendix F:
Résumé
284 | P a g e
Même si l‟on constate un certain nombre de propositions sous forme de cadres structurants, de
métriques, de critères de qualité, ces travaux sont menés indépendamment les uns des autres. La
conséquence est l‟apparition d‟une diversité de termes pour désigner les mêmes concepts ou, plus
gênant encore, l‟utilisation d‟un même terme pour désigner des concepts différents. Cette
situation rend complexe l‟adoption d‟une approche de qualité au niveau conceptuel [Moody
05]. .Par exemple, [Nelson et al., 2005] a identifié neuf définitions différentes pour qualifier la
"complétude". Un autre problème connexe est lié à l‟organisation des concepts de qualité
identifiés. En effet, la mesure de la qualité nécessite l‟identification de l‟attribut de qualité à
mesurer, un moyen de le mesurer, une façon d‟appliquer cette mesure, etc. Cette caractéristique
nécessite l‟organisation de ces connaissances en utilisant des concepts clairs, identifiables et
compréhensibles. La réalité est toute autre puisque l‟absence de consensus a conduit à des
modèles différents et indépendants. On trouve par exemple les termes de : attribut de qualité,
critère de qualité, facteur de qualité, caractéristique de qualité, etc. qui sont pour certains des
synonymes, pour d‟autres des termes désignant un concept et ses affinements à des niveaux
d‟abstraction différents. A cette diversité du vocabulaire et surtout face à cette imprécision des
concepts, il est important de faire une proposition d‟un modèle permettant d‟organiser les
concepts liés à l‟évaluation et à l‟amélioration de la qualité qui soit clair, complet et facile à
utiliser.
Un tel travail a nécessité un examen approfondi de la littérature afin de fédérer les travaux
existants en un cadre global de qualité. Nous nous sommes appuyés pour cela sur la proposition
de [Moody 05] qui fournit une synthèse des travaux existants. Nous avons mis à jour cette analyse
et avons fait des propositions là où les approches existantes n‟apportent pas de solution.
Ce travail de fédération a nécessité tout d‟abord l‟extraction la plus exhaustive possible des
concepts proposés dans la littérature. Il a ensuite fallu analyser, organiser et filtrer ces concepts en
s‟appuyant sur les théories régissant la modélisation conceptuelle et la qualité, en tenant compte
des sens attribués aux concepts par leurs auteurs lorsque des définitions claires et exploitables
sont fournies.
Ce travail a abouti à la proposition d'un ensemble d'attributs de qualité génériques et qui
représentent différents aspects des modèles conceptuels tels que la complexité, la maintenabilité,
etc. .En outre, l'avantage de ce processus a été l'élimination des concepts redondants en plus de la
proposition de nouveaux concepts pour les aspects de l‟évaluation des MC non couverts par la

Appendix F:
Résumé
285 | P a g e
littérature. Ce travail a été validé par une étude menée auprès de professionnels. Un autre travail
important a été celui de classer les travaux existants dans un même cadre issu de la littérature et
largement utilisé. Ce travail difficile nous a permis par exemple de constater que seulement une
poignée de chercheurs ont abordé la notion de qualité sociale dans les modèles. La qualité sociale
est liée au consensus des parties prenantes sur les spécifications produites (développeurs et
utilisateurs) qui est un point très important et qui conditionne lourdement toute la suite du
processus de développement.
Structurer la connaissance sur la qualité
Un des problèmes avec les cadres de qualité existants est qu'ils ne sont généralement pas
applicables à un type de MC particulier tel que les diagrammes de classes, diagrammes ER, etc.
Selon [Moody 05], seulement 5% des cadres de qualité existants sont généralisables (ils peuvent
être appliqués à plusieurs types de modèles conceptuels). Nous nous sommes souciés du caractère
générique des concepts proposés tout en conservant la simplicité du modèle proposé afin d‟en
faciliter l‟utilisation.
Le deuxième problème soulevé est la complexité de la gestion de la qualité face à la diversité
des concepts. Nous avons pour cela proposé un méta-modèle qui permet de structurer les
divers concepts de la qualité. Nous avons aussi proposé une aide
méthodologique et outillée pour assister non seulement l‟analyste dans
l‟évaluation des modèles mais aussi un expert de la qualité souhaitant
faire évoluer les concepts définis. Nous avons aussi organisé ces connaissances dans une base de
connaissance unique qui s‟appuie sur le modèle de qualité proposé.
Notre proposition est générique et complète puisqu‟elle permet de tenir compte de diverses
notations (modèles ER, diagrammes UML, etc.). Elle intègre aussi les diverses facettes de
l‟évaluation de la qualité : théorique, épistémologique et pratique.
Proposer une démarche guidée et flexible
Pour compléter le modèle de la qualité et répondre à la complexité inhérente à l‟évaluation de
la qualité qui nécessite à la fois une expertise et une connaissance des propositions faites dans la
littérature, nous avons proposé une démarche d‟aide à l‟évaluation de la qualité. La spécificité de
cette approche est de guider son utilisateur depuis l‟objectif de qualité souhaité, le dispensant
ainsi de la connaissance précise du vocabulaire attendu. Cette approche s‟inspire de l‟approche

Appendix F:
Résumé
286 | P a g e
GQM (Goal- Question-Metric) proposée dans [Basili et al., 1994], [Basili et al., 1984]. GQM a
été largement utilisée dans l'industrie pour de nombreux projets d‟évaluation.
La démarche consiste à faire exprimer, par un utilisateur (un concepteur de SI), un objectif de
qualité à atteindre lors de l‟élaboration d‟un modèle conceptuel. La démarche d‟évaluation se
charge du reste puisqu‟elle guidera pas à pas l‟appariement de ce but aux concepts de qualité
contenus dans la base de connaissance, l‟évaluation de la qualité ainsi que la proposition d‟actions
correctrices. Ce dernier point est d‟ailleurs novateur puisque la majorité des approches étudiées
s‟intéresse essentiellement à l‟évaluation de la qualité par rapport à un critère précis.
Les principaux concepts de notre approche sont: Objectif de qualité, Question, Patron de
qualité, Attribut de qualité, Métrique et recommandation.
Objectif de Qualité
Un objectif de qualité est l'objectif recherché par un analyste / concepteur pour atteindre l'objet
d'intérêt. Comme mentionné ci-dessus, un objectif de qualité peut être défini pour un modèle
conceptuel dans sa totalité ou pour une partie de ce modèle. Cet objectif précise la raison ou le
pourquoi de l‟évaluation et intègre le point de vue de celui qui souhaite faire l‟évaluation. Par
exemple, un analyste / concepteur peut-être intéressé de vérifier son modèle conceptuel pour son
exactitude, l'objectif dans ce cas est la vérification de la correction du modèle conceptuel.
Question
L‟autre caractéristique empruntée à GQM est l'emploi de questions permettant de préciser
l‟objectif de qualité exprimé. Ces questions aident les analystes / concepteurs à cibler les critères
d'évaluation vis-à-vis de l'objectif formulé. Les questions sont indispensables puisque
l‟analyste/concepteur formulera le plus souvent des objectifs avec un vocabulaire éloigné de celui
des concepts de la base de connaissance. Ces questions permettent donc l‟appariement entre
objectifs de qualité et concepts de qualité (patrons de qualité, critères, métriques etc.).
Attribut de qualité
Un attribut de qualité désigne un groupe de propriétés observables sur le cycle de vie du
produit [Preiss et al., 2001] ou un groupe de propriétés du service rendu par le système à ses
utilisateurs. Le service rendu par un système est son comportement tel qu'il est perçu par ses
utilisateurs [Barbacci et al., 1995]. De même, [SEI, CMU] lie les attributs de qualité à des repères
qui décrivent le comportement du système au sein de l'environnement pour lequel il a été
construit. Dans le domaine de l‟ingénierie des systèmes, les attributs de qualité peuvent aussi

Appendix F:
Résumé
287 | P a g e
concerner les exigences non-fonctionnelles pour évaluer la performance du système. Dans notre
approche, un attribut de qualité fournit l‟abstraction d‟un ensemble de métriques étroitement liées
et mesurant la même caractéristique souhaitée du MC. Chaque attribut de qualité doit être
générique dans le sens où sa définition ne doit pas dépendre de la notation utilisée pour le MC.
Nous avons choisi d‟utiliser le terme “Attribut de Qualité” pour désigner les concepts de la
littérature tels que : attribut de qualité, dimension, facteur, caractéristique, sous-caractéristique,
critères, etc. Quelques exemples d‟attributs de qualité sont: la complexité, la complétude, etc.
Métrique de Qualité
Les métriques sont les mesures ou les procédures d'évaluation qui attribuent des valeurs
numériques ou symboliques afin de caractériser les qualités ou les caractéristiques des objets.
Chaque métrique a une portée définie par l'ensemble des entités et des objets auxquels elle est
applicable, une plage de valeurs décrivant l'ensemble des résultats de mesure possibles, et la
propriété mesurée qui correspond à la caractéristique mesurée. La représentation explicite des
propriétés des métriques permet de distinguer les métriques les unes par rapport aux autres,
surtout lorsqu‟elles permettent de mesurer le même attribut. En effet, un attribut de qualité peut
employer plusieurs paramètres pour mesurer les différents aspects d‟un modèle conceptuel. Par
exemple, la complexité structurelle comme attribut de qualité emploie des métriques telles que le
nombre d'associations, le nombre d‟agrégations, la profondeur de hiérarchies maximale, etc.
Les recommandations
Nous considérons que l‟évaluation de la qualité n'est pas un objectif mais que l‟objectif est de
pouvoir améliorer, si nécessaire et si possible, cette qualité. En effet, la majorité des approches
étudiées se concentrent sur l‟évaluation de la qualité en proposant des indicateurs et des métriques
permettant de cibler les erreurs ou manques dans les MC. Peu d‟approches s‟attaquent au
problème difficile de l‟amélioration de cette qualité [Moody 05].
Les recommandations sont des suggestions, des propositions ou des conseils sur la façon de
modifier les MC afin d‟en améliorer la qualité. Les recommandations sont proposées dans notre
approche en fonction des résultats obtenus par l‟application des métriques. Les analystes /
concepteurs peuvent employer les recommandations proposées pour améliorer la qualité des MC.
Les recommandations peuvent être :
i. Textuelles, elles donnent dans ce cas des conseils que l‟analyste/concepteur choisit
d‟appliquer ou non.

Appendix F:
Résumé
288 | P a g e
ii. Sous forme de règles de transformation. Dans ce cas, les améliorations sont précises et
s‟expriment sous la forme d‟actions de transformation du modèle.
iii. Des propositions de patron de conception (design patterns) pouvant apporter une solution
satisfaisante. L‟analyste/concepteur a la responsabilité d‟appliquer le patron.
Patron de Qualité (Quality Pattern)
Après l‟étude approfondie des travaux de la littérature, nous avons retenu 21 attributs de
qualité. Mais ces attributs permettent tout au plus la qualification de la caractéristique à mesurer.
L‟évaluation de la qualité nécessite la définition d‟une métrique de qualité et il existe diverses
métriques pour un même critère. Pour atteindre un objectif de qualité, plusieurs critères de qualité
sont possibles, pour lesquels plusieurs métriques sont possibles ainsi que plusieurs actions
correctrices. Manipuler et faire le choix parmi tous ces concepts nécessite un degré d‟expertise
qui explique l‟utilisation jusqu‟ici limitée des approches de qualité proposées dans la littérature.
Notre réponse a été de proposer un mécanisme qui permettrait la capitalisation de l‟expertise dans
ce domaine. Ce mécanisme est le Patron de Qualité (Quality Pattern). Ce concept se rapproche du
concept de Patron de Conception (Design Pattern) qui encapsule les bonnes pratiques de
conception afin d‟améliorer le résultat de la conception [Hsueha et al., 2008]. Nous avons donc
proposé une solution similaire cette fois-ci pour le problème de l‟évaluation et de l‟amélioration
de la qualité. Le concept de patron de qualité a été proposé pour la première fois par [Houdek et
al., 1997] pour l‟ingénierie des logiciels. Dans [Cherfi et al., 2008] une première proposition de ce
concept pour la gestion de la qualité des modèles conceptuels a été faite. Le travail de cette thèse
a été d‟approfondir et de définir dans le détail ce concept et de le rendre opérationnel. Nous avons
également entamé la délicate tâche d‟identification de patterns de qualité ,tâche très délicate dans
un domaine qui est récent et pour lequel les connaissances et les expertises sont peu structurées.
Un patron de qualité peut être formulé en utilisant notre modèle de qualité. Chaque patron de
qualité adresse un problème, a un contexte d‟utilisation et des mots clés qui permettent de le
rapprocher d‟un objectif de qualité lors de l‟évaluation. Il décrit une solution sous la forme d‟un
ensemble de critères de qualité à évaluer et englobe les métriques permettant leur évaluation et les
recommandations d‟amélioration de la qualité appropriées.
Plus précisément chaque patron de qualité contient les informations suivantes: nom, contexte,
problème, solution, mots-clés et patrons connexes.
Voici un exemple d'un modèle de qualité défini par notre approche.

Appendix F:
Résumé
289 | P a g e
Nom du patron: la complexité du modèle Contexte:
i. La vérification de la complexité globale d‟un modèle conceptuel, en respectant le nombre d„éléments (nombre de classes / entités / attributs, etc.) présents.
Problèmes:
i. Il est largement reconnu que la multiplication des éléments dans un modèle ( classes / entités / cas d‟utilisation, etc.) peut gêner la lisibilité du modèle. Miller ("The Magical Number Seven, Plus or Minus Two: Some Limits on Our Capacity for Processing Information", 1956) présente une étude défendant l‟idée selon laquelle la mémoire humaine (pour un évènement récent) peut contenir 7 ± 2 objets rendant la compréhension d‟une plus grande collection d‟objets plus difficile.
ii. De même, l'existence de nombreux éléments peut augmenter la complexité.
iii. Cette complexité peut nuire à la maintenabilité, parce que maintenir ou corriger un modèle nécessite au préalable sa compréhension.
iv. Pour vérifier si le pattern est pertinent pour les problèmes actuels du modèle: Les métriques suivantes sont applicables aux diagrammes de classe seulement : a. Nombre de classes: nombre total de classes dans un
modèle. b. Nombre d'attributs: nombre d'attributs dans le modèle. c. Nombre de méthodes: nombre total de méthodes ou de
fonctions dans le modèle. d. Nombre de cycles: nombre total de cycles dans un modèle. e. Degré de non-redondance: Cet indicateur de mesure
calcule le rapport entre les concepts non- redondant et les concepts totaux présents dans le modèle.
Ci peut être {classe, association, un lien d'héritage, classe d'association, liens de agrégation, lien de composition}, NB (Ci) correspond au nombre d'éléments de type Ci et NBR (Ci) concerne le nombre d'éléments redondants de type Ci dans le modèle M.
f. Nombre d'associations: Nombre total d'associations dans un modèle.
g. Nombre d'agrégations: Il calcule le nombre d'agrégations dans un diagramme de classes.
h. Nombre de compositions: Il calcule le nombre de compositions dans un diagramme de classes.
i. Nombre de généralisations: Il calcule le nombre total de généralisations dans un modèle.

Appendix F:
Résumé
290 | P a g e
j. Profondeur d'héritage (Maximale): Il calcule le plus long chemin de la classe à la racine de la hiérarchie dans une hiérarchie de généralisation.
Solution:
i. La division des modèles complexes en modèles plus simples peut contribuer à améliorer la compréhension
ii. La proximité sémantique des éléments contenus dans un modèle diminue la complexité de celui-ci en minimisant la multiplication des sujets et problèmes à assimiler. Par exemple, si l‟on mélange dans un même modèle la gestion des formations et celle du recrutement des formateurs, on augmente la complexité du modèle et l‟on diminue aussi probablement sa compréhension. Il est donc important de séparer les modèles en sous modèles dans certains cas pour en améliorer la compréhension.
iii. Les transformations suivantes peuvent être employées pour l'amélioration (Détail sur les transformations joint en annexe-C): a. Supprimer les éléments redondants b. Pour faciliter la suppression des associations
redondantes il faut les factoriser. c. Diviser le modèle d. Fusionner les classes e. Diviser une classe
iv. Les patrons de conception suivants (design patterns) peuvent être utilisés pour améliorer la qualité du modèle: a. GRASP haute cohésion b. GRASP Polymorphisme
Mots clés: complexité; maintainabilité; modifiabilité; compréhension; taille.
Patrons connexes: i. Maintenabilité des modèles (la complexité rend la
maintenance des modèles difficile) ii. Clarité des modèles (les modèles complexes sont difficiles
à lire)
Un processus guidé pour l’évaluation et l’amélioration de la qualité
Une lacune constatée dans les approches étudiées est l‟absence d‟un processus structuré
permettant la mise en œuvre des concepts proposés. Les approches laissent aux
analystes/concepteurs la charge de sélectionner les concepts adéquats, de les appliquer et d‟en
exploiter les résultats.

Appendix F:
Résumé
291 | P a g e
Un des apports de cette thèse est de proposer un processus complet et flexible qui guide pas à
pas le processus de gestion de la qualité conformément à un objectif de qualité que formulera
l‟analyste/concepteur. Le processus proposé commence par rapprocher cet objectif des concepts
de qualité contenus dans la base de connaissance. Puis, il a pour but de guider l‟évaluation et
l‟amélioration de la qualité conformément au but souhaité. Il utilise les attributs, métriques,
patrons et recommandations de la qualité prédéfinis tout en offrant une certaine flexibilité dans le
choix des concepts à utiliser et du mode de guidage souhaité. Il ne s‟agit pas d‟un processus
automatique mais d‟une aide outillée facilitant le bon usage de la connaissance capitalisée et
stockée dans la base de connaissance.
Une aide outillée pour le processus d’évaluation et d’amélioration de la qualité
Nous avons constaté que malgré la multiplication des propositions concernant la mesure de la
qualité dans la littérature, leur adoption et leur application restent très limitées. Malgré
l‟importance qu‟avouent accorder les professionnels à la qualité des spécifications, ils n‟adoptent
pas pour autant ces approches. Nous pensons que cela est dû à la difficulté de maîtriser à la fois
tous ces concepts et de les appliquer. A cela s‟ajoutent la complexité des spécifications elles
mêmes et la diversité des notations utilisées. Les expériences vécues dans d‟autres domaines
montrent que l‟existence d‟aides outillées peut aider à l‟adoption des méthodes et techniques.
Nous avons analysé ce que proposent les ateliers de génie logiciel du marché pour la prise en
charge de la qualité. Voici nos conclusions :
i. Certains ateliers du marché intègrent quelques mesures très simples d‟évalua tion. Ces
mesures ne peuvent cependant pas être modifiées ni enrichies.
ii. Ces outils ne proposent aucune aide à l‟interprétation des valeurs obtenues.
iii. Les mesures proposées par ces outils ne sont pas toujours rattachées à des attributs de
qualité et sont par conséquent difficiles à utiliser.
iv. Aucun des logiciels ne fournit de recommandations après l‟évaluation, à l'exception de
UMLQuality (logiciel d'évaluation) qui propose des recommandations succinctes.
Nous avons proposé, dans notre approche, un outil CM-quality qui prend en charge la totalité
de la démarche proposée. Il offre un ensemble d‟aides outillées pour la définition des concepts de
la qualité (attributs, métriques, patrons, recommandations) mais aussi la prise en charge du
processus d‟évaluation et d‟amélioration de la qualité dans son intégralité. Il a aussi l‟avantage de

Appendix F:
Résumé
292 | P a g e
pouvoir s‟interfacer avec les ateliers de génie logiciel du marché (les plus répandus comme
Rational Rose, Objecteering, StarUML etc.).
CM-quality a deux objectifs principaux. Il permet, dans un premier temps, de démontrer la
faisabilité de l'approche. Dans un travail futur, nous espérons l‟utiliser à des fins de validation en
le mettant à disposition d‟étudiants et de chercheurs impliqués dans la qualité des MC.
CM-Quality est conçu pour deux types d'utilisateurs : les experts qualité et les
analystes/concepteurs. Un expert qualité est un utilisateur ayant une connaissance approfondie des
concepts de qualité. Il est chargé de définir les concepts de qualité tels que les attributs, les
patrons de qualité etc. . L‟analyste lui a la charge d‟établir des spécifications conceptuelles et
souhaite en étudier et améliorer la qualité. Les analystes ne peuvent qu‟utiliser la connaissance
définie par l'expert qualité. CM-quality contient une base de connaissances qui sert au stockage
des différents concepts de qualité. La base de connaissances stocke également des sessions
d'évaluation à des fins de trace, en vue notamment de l‟amélioration des concepts déjà définis.
Les fonctionnalités suivantes sont proposées par CM-quality:
i. Il met en œuvre et stocke une hiérarchie des concepts de qualité, incluant les patrons de
qualité, les attributs de qualité, les métriques, les recommandations, etc. dans une base de
connaissances. Tous ces concepts de qualité peuvent être ajoutés / modifiés / supprimés
de la base de connaissances.
ii. Il peut être utilisé pour évaluer un MC par un analyste / concepteur conformément à un
objectif de qualité spécifique.
iii. Il aide l'analyste / concepteur dans l'identification des critères de qualité pertinents par
rapport à l‟objectif de qualité formulé.
iv. Il propose des informations post-évaluation sous forme de recommandations pour
l'amélioration du modèle.
v. Plusieurs modèles peuvent être évalués ou comparés à l'aide de CM-Quality.
vi. Il peut être utilisé pour évaluer les modèles conçus en utilisant les ateliers de génie
logiciel du marché, tels que Rational Rose, Objecteering, etc.
Il n‟est cependant qu‟une première implémentation de l‟approche et comporte certaines
limitations ou voies d‟amélioration :

Appendix F:
Résumé
293 | P a g e
i. CM-Quality évalue la qualité du modèle complet et propose des recommandations pour
l'ensemble du modèle. Ainsi si l'utilisateur est intéressé par l‟évaluation d‟une partie du
modèle, il doit extraire un modèle partiel.
ii. Les transformations proposées ne sont pas exécutables sur le modèle et doivent être
appliquées « manuellement » par l‟analyste.
iii. CM-quality ne peut pour le moment communiquer avec les ateliers de génie logiciel que
par l‟import des spécifications. Une solution plus intégrée pourrait faciliter son utilisation.
Validation de l’approche proposée
La plupart des travaux existants sur la qualité des MC peuvent être catégorisées en deux types:
i. Des propositions ayant une base théorique, mais sans validation pratique associée
ii. Des propositions avec des fondements pratiques et expérimentaux sans fondement
théorique.
Les approches théoriques sont jugées difficiles à mettre en pratique et non exploitables alors
que les propositions issues de l‟expérimentation sont généralement considérées comme manquant
de substance et difficilement généralisables. [Moody 05] rapporte que la plupart des cadres de
qualité proposés pour la qualité de CM manquent de validation. Seulement 18% environ des
propositions ont été validées.
Notre approche utilise comme fondement pratique le point de vue des professionnels. En effet
nous avons mené une étude auprès de professionnels, étude dont le but était double. Le premier
s‟intéressait à étudier la stratégie d'évaluation de la qualité employée en pratique et le second
visait la validation de nos propositions. Nous avons fait participer des experts universitaires et des
professionnels au moyen d'enquêtes, interviews, etc. Par exemple, afin d'être sûr que l'ensemble
des attributs de qualité retenus par l‟approche sont des caractéristiques considérées comme
importantes dans l‟évaluation de spécifications conceptuelles, nous avons procédé à une enquête.
Cette dernière consistait à recueillir les opinions des interviewés sur la qualité globale des
modèles conceptuels, en plus de leurs commentaires sur un ensemble d‟attributs de qualité extraits
de la littérature. Leurs commentaires ont été analysés et des modifications ont été apportées à
certains attributs et critères d'évaluation.

Appendix F:
Résumé
294 | P a g e
De même, nous avons essayé d'extraire des connaissances sur leurs pratiques en leur posant
des questions ciblées, par exemple d‟exprimer leur opinion sur ce qu‟ils considèrent comme les
caractéristiques importantes dans un modèle conceptuel sans orienter leur réponses. Cette partie
de l‟enquête a été intéressante puisqu‟elle nous a permis de considérer les attributs de la qualité
d‟un point de vue purement pratique. Par exemple, plusieurs participants ont mentionné le fait que
l‟aspect pratique d‟un modèle est important. Ils considèrent que certain modèles ne sont pas
pratiques par le fait qu‟ils exigent, pour leur implémentation, des ressources ou des technologies
indisponibles ou difficiles à acquérir. La praticité a donc été ajoutée à nos attributs de qualité. Cet
attribut est différent de l‟implémentabilité que l‟on rencontre dans la littérature et qui est
essentiellement lié à l‟effort d‟implémentation alors que la praticité est liée à l‟environnement du
projet dans lequel est proposée la solution conceptuelle.
L‟originalité de cette enquête réside aussi dans le fait qu‟elle a impliqué des professionnels
issus du monde de l‟entreprise alors que les travaux de validations et les enquêtes concernant les
travaux de la littérature sont essentiellement faits avec des universitaires et majoritairement avec
des étudiants.
Le deuxième effort de la validation visait l‟approche d‟évaluation et d‟amélioration de la
qualité. Il a consisté en un travail en trois étapes :
i. La première étape a consisté à proposer aux participants un modèle conceptuel
(diagramme UML) issu d‟une application réelle. Ils devaient, en utilisant leurs
connaissances en modélisation, analyser la qualité de ce modèle. Ils devaient ensuite
relever les problèmes de qualité qu‟ils détectaient et proposer un résumé des actions
correctives qu‟ils estimaient nécessaires à l‟amélioration du modèle.
ii. Pour la deuxième étape, nous avons fourni aux participants 1) des valeurs de mesures de
qualité que nous avions au préalable calculées sur le modèle et 2) des patrons de qualité.
Ils devaient essayer d‟exploiter ces nouvelles informations pour tenter d‟améliorer le
modèle initial. Le but de cette étape est d‟évaluer la facilité de compréhension et
d‟utilisation des patrons de qualité.
iii. Enfin, lors de la dernière étape, les participants ont eu à évaluer le résultat de l'application
de l‟approche proposée sur le modèle initial et ils devaient donner leur avis sur la qualité
du modèle obtenu et sur son amélioration. Le but de cette étape était de mesurer l‟utilité
des patrons de qualité et des actions correctives.

Appendix F:
Résumé
295 | P a g e
Pour les deux expériences, nous avons analysé les réponses. Nous avons également analysé les
profils des participants (domaine, expérience en modélisation, etc.). Toutefois, ces deux
expériences ont leurs limites que nous avons tenté de résumer ci-dessous :
i. La plupart des critères de qualité fournis par les participants en retour de la première
expérience étaient déjà dans l'enquête et ces retours n‟ont que peu enrichi la liste initiale.
ii. La taille de l'échantillon de la deuxième expérience est de vingt cinq participants. Ceci
s‟explique par la difficulté de l‟expérience et sa longueur. Les résultats obtenus sont donc
difficilement généralisables mais ils nous ont permis d‟avoir un premier retour et aideront
à organiser ultérieurement une autre expérimentation.
iii. A travers les retours attendus par la deuxième expérience, nous espérions avoir des
connaissances complémentaires pouvant enrichir nos patrons de qualité. Ceci n‟a pas pu
être atteint essentiellement à cause du degré d‟expertise élevé nécessaire en modélisation
conceptuelle parmi les participants.
iv. Quelques-uns des problèmes identifiés par les participants n'existaient pas. Nous pensons
que cela est dû au vocabulaire utilisé dans l‟enquête qu‟il faut revoir en fonction de la
population interrogée.
v. La deuxième expérience s‟appuie sur un seul modèle, ce qui est limité.
vi. La deuxième expérience a utilisé une seule notation de modélisation, ce qui est aussi une
voie d‟amélioration.
3. Conclusion
La solution proposée vise des problèmes liés à la qualité de la modélisation conceptuelle d'une
manière globale. Afin de formuler une solution complète, nous avons proposé des concepts
ciblant divers aspects liés à la qualité au niveau des spécifications conceptuelles. Ces concepts
comprennent la formulation de critères de qualité (attributs de qualité, métriques, etc.) qui ont
l‟avantage de fédérer les travaux existants revus et corrigés à la lumière d‟une expérience de
validation. Nous avons aussi proposé et détaillé un concept novateur, le patron de qualité, visant à
encapsuler les connaissances et les pratiques dans l‟évaluation de la qualité des modèles
conceptuels. Nous avons également proposé une approche complète qui guide l‟utilisation de ces
concepts de manière flexible et assistée. Enfin, nous avons développé un prototype qui met en
œuvre la solution proposée.


Bibliography
297 | P a g e
Bibliography
Ackoff R.L., “Management Misinformation Systems”, Management Science, vol. 14, no. 4, 1967.
Akoka J., Berti-Équille L., Boucelma O., Bouzeghoub M., Comyn-Wattiau I., Cosquer M.,
Goasdoué V., Kedad Z., Nugier S., Peralta V., Sisaïd-Cherfi S., “A Framework for Quality
Evaluation in Data Integration Systems”, In Proceeding of the 9th Intl. Conf. on Enterprise
Information Systems (ICEIS 2007), 2007, Madeira, Portugal.
Akoka J., Comyn-Wattiau I., “A Knowledge-Based System for Auditing Computer and
Management Information Systems”, Expert Systems with Applications, vol. 11, no. 3, 1996, p.
361-375.
Ali N.H., Shukur Z., Idris S., "A Design of an Assessment System for UML Class Diagram",
International Conference on Computational Science and its Applications, 26-29 Aug. 2007a, p.
539-546.
Ali N.H., Shukur Z., Idris S., “Assessment system for UML class diagram using notations
extraction”, International Journal on Computer Science Network Secur ity, vol. 7, 2007b, p.
181-187.
Andreou A.S., Tziakourisa M., “A quality framework for developing and evaluating original
software components”, Information and Software Technology, vol. 49, no. 2, 2007, p. 122 -
141.
Architecture-Driven Modernization (ADM): Software Metrics Meta-Model (SMM), FTF - Beta 1,
OMG Document Number: ptc/2009-03-03, 2009.
Assenova P., Johannesson P., “Improving Quality in Conceptual Modelling by the Use of Schema
Transformations”, In Proceedings of the 15th international Conference on Conceptual
Modeling, October 07 – 10 1996, Lecture Notes In Computer Science, vol. 1157, Springer-
Verlag, p. 277-291.
Avison D., HORTON J., “Evaluation and Information Systems Development”, Arduini, R.
Investimenti in Information Technology nel settore bancario, Franco Angeli, 1993, p. 248-279.

Bibliography
298 | P a g e
Bajaj A., “Measuring the Effect of Number of Concepts on the Readability of Conceptual
Models”, In proceedings of the Workshop on the Evaluation of Modeling Methods in Systems
Analysis and Design (EMMSAD) in conjunction with CAiSE, Toronto, Canada, 2002.
Ballou D.P., Pazer H.L., “Modeling data and process quality in multi-input, multi-output
Information systems”, Management science, vol. 31, no. 2, 1985.
Bansiya J., Davis C., Etzkorn L., “An Entropy-Based Complexity Measure for Object-Oriented
Designs”, Theory and Practice of Object Systems, vol. 5 no. 2, 1999, p. 111-118.
Barbacci M., Klein M.H., Longstaff T.A., Weinstock C.B., “Quality Attributes”, Technical
Report CMU/SEI-95-TR-021, ESC-TR-95-021, Carnegie Mellon University, 1995.
Basili V.R., Caldiera G., Rombach H.D., “The Goal Question Metric Approach”. Encyclopedia of
Software Engineering, vol. 2, September 1994, p. 528-538.
Basili V.R., “Applying the Goal/Question/Metric Paradigm in the Experience Factory”, Presented
at the 10th Annual CSR Workshop in Amsterdam, October 1993.
Basili V.R., “Software Modeling and Measurement: The Goal/Question/Metric Paradigm”,
University of Maryland, CS-TR-2956, UMIACS-TR-92-96, September 1992.
Basili V.R., Rombach H.D., Bailey J., Delis A., “Ada Reusability and Measurement”, Technical
Report, Institute for Advanced Computer Studies and Department of Computer Science at the
University of Maryland College Park, 1990.
Basili V.R., Rombach H.D., “The TAME Project: Towards Improvement-Oriented Software
Environments”, IEEE Transactions on Software Engineering, vol.SE-14, no.6, 1988, p.758-
773.
Basili V.R., Rombach H.D., “Tailoring the software process to project goals and environments”,
Proceedings of the 9th international conference on Software Engineering, March 1987,
Monterey, California, US, p.345-357.
Basili V.R., Weiss D.M., “A Methodology for Collecting Valid Software Engineering Data”,
IEEE Transactions on Software Engineering, vol. SE-10, no.3, 1984, p. 728-738.
Batini C., Ceri S., Navathe S.B., Conceptual Database Design: an Entity-Relationship Approach,
Benjamin-Cummings Publishing Co., Inc, 1992.

Bibliography
299 | P a g e
Becker J., Niehaves B., “Epistemological perspectives on IS research: a framework for analysing
and systematizing epistemological assumptions”, Information Systems Journal, no. 17, 2007,
p. 197–214.
Berdún L., Díaz Pace J.A., Amandi A., Campo M., “Assisting novice software designers by an
expert designer agent”, Expert System Application, vol. 34, no. 4, 2008, p. 2772-2782.
Boehm B., “Software engineering economics”, IEEE transactions on Software Engineering, vol.
SE-10, no. 1, 1984, p. 4-21.
Boehm B., Software Engineering Economics, Prentice-Hall, NJ, 1981.
Boehm B.W., Brown J.R., Kaspar H., Lipow M., Macleod G.J., Merrit M.J., Characteristics of
Software Quality, TRW Series of Software Technology, vol. 1, North-Holland Publishing
Company, Amsterdam, 1978.
Boehm B.W., Brown J.R., Lipow M., “Quantitative evaluation of software quality”, In the
proceedings of the 2nd IEEE International Conference on Software Engineering, San
Francisco, CA, USA, 1976, p. 592–605.
Bolloju N., “Improving the Quality of Business Objects Models Using Collaboration Patterns”,
Communications of the ACM, vol. 47, no. 7, 2004, p. 81-86.
Booch G., Object-oriented design with applications, Redwood city, CA: Benjamin/cummings,
1991.
Bouzeghoub M., Peralta A., “Framework for Analysis of Data Freshness”, International workshop
on Information Quality in Information Systems (IQIS‟2004), 2004.
Bouzeghoub M., Kedad Z., “Quality in data warehousing”, In M. Piattini, C. Calero, & M.
Genero (Eds.), Information and Database Quality, Kluwer Academic Publishers, 2001.
Bouzeghoub M., Theodoratos D., “Data Currency Quality Factors in Data Warehouse Design”, In
proceedings of the International Workshop on Design and Management of Data Warehouses
(DMDW'99), Heidelberg, Germany, 1999.
Briand L., Devanbu W., Melo W., “An investigation into coupling measures for C++”, 19th
International Conference on Software Engineering (ICSE 97), Boston, USA, 1997, p. 412-421.

Bibliography
300 | P a g e
Burrell, G. and Morgan, G. (1979). Sociological Paradigms and Organizational Analysis:
Elements of the Sociology of Corporate Life. Ashgate Publishing, Brookfield, Vermont.
Buschmann F., Meunier R., Rohnert H., Sommerlad P., Stal M., Pattern-Oriented Software
Architecture: A System of Patterns, Wiley, New York, 1996.
Chang J.C.J., King W.R., “The development of measures to assess the performance of the
information systems function: a multiple-constituency approach”, Proceedings of the twenty
first international conference on Information systems, Brisbane, Queensland, Australia, 2000,
p. 640-646.
Chatzigeorgiou A., Tsantalis N., Deligiannis I., “An empirical study on students‟ ability to
comprehend design patterns”, Computers & Education, vol. 51, no. 3, 2008, p. 1007-1016.
Chen P. P., “The entity-relationship model - toward a unified view of data”, ACM Transaction
Database Systems, vol. 1, March 1976, p. 9-36.
Cherfi S.S., Akoka J., Comyn-Wattiau I., “Quality Patterns for Conceptual Modeling”, In ER'06-
27 International Conference on Conceptual Modeling, Springer LNCS vol. 5231, 2008, p. 142-
153.
Cherfi S.S., Akoka J., Comyn-Wattiau I., “Perceived vs. measured quality of conceptual schemas:
an experimental comparison”, In Tutorials, Posters, Panels and industrial Contributions At the
26th international Conference on Conceptual Modelling, vol. 83, 2007, p. 185-190.
Cherfi S.S., Akoka J., Comyn-Wattiau I., "Use Case Modeling and Refinement: A Quality-Based
Approach", Conceptual Modeling - ER 2006, Lecture Notes in Computer Science, vol. 4215,
2006, p. 84-97.
Cherfi S.S., Akoka J., Comyn-Wattiau I., "A Framework for Conceptual Modeling Quality
Evaluation", In the Proceedings of ICSQ'03, October 6-9 2003a.
Cherfi S.S, Prat N., "Multidimensional Schemas Quality: Assessing and Balancing Analyzability
and Simplicity", Conceptual Modeling for Novel Application Domains, Lecture Notes in
Computer Science, vol. 2814, 2003b, p. 140-151.
Bibliography
301 | P a g e
Cherfi S.S, Akoka J., Comyn-Wattiau I., "Conceptual Modeling Quality - from EER to UML
Schemas Evaluation", Proceedings of the 21st International Conference on Conceptual
Modeling, Lecture Notes In Computer Science, vol. 2503, 2002a, p. 414-428.
Cherfi S.S., Akoka J., Comyn-Wattiau I., “Measuring UML Conceptual Modeling Quality-
Method and Implementation”, In the Proceedings of the BDA Conference, Ed. P. Pucheral,
Collection INT, France, 2002b.
Chidamber S.R., Kemerer C.F., "A Metrics Suite for Object Oriented Design", IEEE Transaction
Software Engineering, vol. 20 no. 6, 1994, p. 476-493.
Churcher N.I., Shepperd M.J., "Comments on: a Metrics Suite for Object Oriented Design”, IEEE
Transactions on Software Engineering, vol. 21 no. 3, 1995.
Davies I., Green P., Rosemann M., Indulska M., Gallo S., “How Do Practitioners Use Conceptual
Modelling in Practice?”, Data & Knowledge Engineering, vol. 58, 2006, p. 358-380.
DeLano D.E., Rising L., “Patterns for system testing”, In D.R.R. Martin, F. Buschmann (Eds.),
Pattern Languages of Program Design, vol. 3, Addison-Wesley, Reading, MA, 1998, p. 503–
527.
Deprez J.C., Monfils F., Ciolkowski M., Soto M., “Defining software evolvability from a
free/open-source software perspective”, In Proceedings of the Third International IEEE
Workshop on Software Evolvability, 2007.
Elion S., “Measuring quality of Information systems”, Omega, vol. 12, 1993, p. 135-138.
Eichelberger H., "Aesthetics of Class Diagrams", Proceedings of the First International Workshop
on Visualizing Software for Understanding and Analysis (VISSOFT'02), 2002, p. 23-31.
Erlikh L., “Leveraging Legacy System Dollars for E-Business”, IEEE IT Pro, May/June 2000, p.
17-23.
Florac W.A., “Software Quality Measurement: A Framework for Counting Problems and
Defects”, Technical Report CMU/SEI-92-TR-022 (ESC-TR-92-022), Software Engineering
Institute, Carnegie Mellon University, 1992.
Forsythe G., Wirth N., “Automatic grading of programs”, Communication of the ACM, Issue 8,
1965, p. 275- 278.

Bibliography
302 | P a g e
Gamma E., Helm R., Johnson R., Vlissides J., Design Patterns: Elements of Reusable Object-
Oriented Software, Addison-Wesley, Reading, MA, 1995.
Garcia F., Serranoa M., Cruz-Lemusa J., Ruiz F., Piattini M., "Managing software process
measurement: A metamodel-based approach", Information Sciences, vol. 177 no. 12, 2007, p.
2570-2586.
Garcia F., Piattini M., Ruiz F., Canfora G., Visaggio C.A., “FMESP: Framework for the
Modeling and Evaluation of Software Processes”, Journal of Systems Architecture, vol. 52,
2006, p. 627-639.
Genero M., Piattini M. Calero C., "Metrics for Software conceptual models”, Imperial College
Press, 2005.
Genero M., Piatini M., Manso E., "Finding Early Indicators of UML Class Diagrams
Understandability and Modifiability", Proceedings of the 2004 International Symposium on
Empirical Software Engineering (ISESE‟04), IEEE Computer Society, 2004.
Genero M., Piattini M., Manso E., Cantone G., "Building UML Class Diagram Maintainability
Prediction Models Based on Early Metrics", In the Proceedings of the 9th International
Symposium on Software Metrics, September 03-05 2003, p. 263-275.
Genero M., Jiménez L., Piattini M., "A Controlled Experiment for Validating Class Diagram
Structural Complexity Metrics", Proceedings of the 8th International Conference on Object-
Oriented Information Systems, September 02-05 2002a, p. 372-383.
Genero M., Piattini M., Calero C., "Empirical Validation of Class Diagram Metrics", In the
Proceedings of the 2002 International Symposium on Empirical Software Engineering,
October 03-04 2002b, p. 195-203.
Genero M., Olivas J., Piattini M., Romero F., "Using Metrics to Predict OO Information Systems
Maintainability", Proceedings of the 13th International Conference on Advanced Information
Systems Engineering, June 04-08 2001a, p. 388-401.
Genero M., Piattini M., "Empirical Validation of Measures for Class Diagram Structural
Complexity through Controlled Experiments", In Proceedings of 5th International ECOOP
Workshop on Quantitative Approaches in object-oriented Software Engineering (QAOOSE
2001), June 2001b.

Bibliography
303 | P a g e
Genero M., Piattini M., Jimenez L., "Empirical Validation of Class Diagram Complexity
Metrics", In Proceedings of 21st International Conference of the Chilean Computer Science
Society, November 2001c, p. 95-104.
Genero M., Piattini M., Calero C., "Early Measures for UML Class Diagrams", L'Objet Hermes
Science Publications, vol. 6 no. 4, 2000a, p. 489-515.
Genero M., Piattini M., Manso M.E., Garcia F., "Early Metrics for Object Oriented Information
Systems", Proceedings of the 6th International Conference on Object Oriented Information
Systems, December 18-20 2000b, p. 414-425.
Gray R., Carey B., McGlynn N., Pengelly A., “Design metrics for database systems”, BT
Technology Journal, vol. 9 no. 4, 1991, p. 69–79.
Gupta U., Information Systems Success in the 21st Century, Prentice-Hall, 2001.
Hamilton S., Chervany N.L., “Evaluating Information System Effectiveness - Part II: Comparing
Evaluator Viewpoints”, MIS Quarterly, vol. 5, no. 4, 1981, p. 79-86.
Hamilton S., Chervany N.L., “Evaluating Information System Effectiveness - Part I: Comparing
Evaluation Approaches, MIS Quarterly, vol. 5, no. 3, 1981, p. 55-69.
Harrison R., Counsell S., Nithi R., “Coupling Metrics for Object-Oriented Design”, 5th
International Software Metrics Symposium Metrics, 1998, p. 150-15.
Hirschheim R., “Information systems epistemology: An historical perspective”, In Mumford, E.,
Hirschheim, R., Fitzgerald, G., and Wood-Harper, A. T., editors, Research Methods in
Information Systems, North Holland, Amsterdam, 1985, p. 13–35.
Hoaglin D.C., Mosteller F., Tukey J.W., Understanding Robust and Exploratory Data Analysis,
1983, ISBN 0-471-09776-4.
Houdek F., Kempter H., “Quality Patterns – An approach to packaging software engineering
experience”, ACM SIGSOFT Software Engineering Notes, vol. 22, no. 3, 1997.
Hsueha N. Lin., Chua P. Hua., Chub W., “A quantitative approach for evaluating the quality of
design patterns”, Journal of Systems and Software, vol. 81, no. 8, 2008, p. 1430-1439.

Bibliography
304 | P a g e
Iivari J., Koskela E., “The PIOCO model for information systems design”, MIS Quarterly, Sep
1987, p. 401-419.
In P., Kim S., Barry M., “UML-Based Object-Oriented Metrics for Architecture Complexity
Analysis”, In Proceedings of Ground System Architectures Workshop (GSAW‟03), 2003.
ISO/IEC 9126, Software Engineering - Product quality - Part 1: Quality model, 2001.
ISO 9126: The Standard of Reference, source: http://www.cse.dcu.ie/essiscope/sm2/9126ref.html
ISO/IEC 25030:2007, Software Engineering - Software Product Quality Requirements and
Evaluation (SQuaRE) - Quality Requirements, 2007.
ISO/IEC 25012, Software engineering - Software product Quality Requirements and Evaluation
(SQuaRE) - Data quality model, 2008
Jacobson I., Bylund S., The Unified Software Development Process, Addison Wesley, Reading,
Massachusetts, 1999.
Jiang J.J., Klein G., Carr C.L., “Measuring Information System Service Quality: SERVQUAL
from the Other Side”, MIS Quarterly, vol. 26, no. 2, 2002, p. 145-166.
Kaiya H., Osada A., Kaijiri K., “Identifying Stakeholders and their preferences about NFR by
comparing use case diagrams of several existing systems”, IEEE International Conference on
Requirements Engineering, 2004, p. 112-121.
Kersulec G., Cherfi S.S., Akoka J., Comyn-Wattiau I., “Un environnement pour l'évaluation et
l'amélioration de la qualité des modèles de systèmes d'information", In INFORSID'09, 2009, p.
321-344
Kersulec G., “Vers une approche de conception des systèmes d‟information centrée sur la
qualité", MEMOIRE d‟ingénieur C.N.A.M., 2008.
Kesh S., “Evaluating the quality of entity relationship models”, Information and Software
Technology, vol. 37 no. 12, 1995.
Kilidar H.A., Cox K., Kitchenham B., “The use and usefulness of the ISO/IEC 9126 quality
standard”, In International Symposium on Empirical Software Engineering (ISESE 2005),
2005, Noosa Heads, Australia, p. 126–132.

Bibliography
305 | P a g e
Krogstie J., Lindland O., Sindre G., “Defining quality aspects for conceptual models”, In
proceeding IFIP8.1 Working Conference on Information Systems Concepts: Towards a
Consolidation of Views, Marburg, Germany, 1995.
Kruchten P., The Rational Unified Process: An Introduction, (2nd ed.), Addison-Wesley, Inc.,
Reading, MA, 2000.
Lange C.F.J., Chaudron M.R.V., “An empirical assessment of completeness in UML designs”, In
Proceedings of the 8th International Conference on Empirical Assessment in Software
Engineering (EASE„04), 2004, p. 111–121.
Lange C.F.J., Chaudron M.R.V., “Managing Model Quality in UML-based Software
Development”, In Proceedings of 13th International Workshop on Software Technology and
Engineering Practice (STEP‟05), 2005, p. 7-16.
Larman C., Applying UML and Patterns: An Introduction to Object-Oriented Analysis and
Design and the Unified Process, Prentice Hall, 1997.
Lausen S., Vinter O., “Preventing Requirement Defects: An Experiment in Process
Improvement”, Requirements Engineering, vol. 6 no. 37, 2001.
Levitin A., Redman T., “Quality dimensions of a conceptual view”, Information Processing and
Management, vol. 31 no. 1, 1995, p. 81–88.
Li W., Henry S., “Object-Oriented Metrics that Predict Maintainability”, Journal of Systems and
Software, vol. 23 no. 2, 1993, pp. 111-122.
Lindland O.I., Sindre G., Sølvberg A., “Understanding quality in conceptual modelling” IEEE
Software, vol. 11 no. 2, 1994, p. 42-49.
Lorenz M., Kidd J., Object-Oriented Software Metrics: A Practical Guide, Prentice Hall,
Englewood Cliffs, New Jersey, 1994.
Maes A., Poels G., "Evaluating quality of conceptual modelling scripts based on user
perceptions”, Data & Knowledge Engineering, vol. 63, no. 3, 2007, p. 701-724.
Manola F., “Providing Systemic Properties (Ilities) and Quality of Service in Component-Based
Systems”, Object Services and Consulting, Inc., Technical Report, 1999

Bibliography
306 | P a g e
Manso E., Genero M., Piattini M., "No-Redundant Metrics for UML Class Diagram Structural
Complexity," Lecture Notes on Computer Science, vol. 2681, 2003, p. 127-142.
Marchesi M., "OOA Metrics for the Unified Modeling Language", In the Proceedings of the 2nd
Euromicro Conference on Software Maintenance and Reengineering (CSMR'98), IEEE
Computer Society, 1998, p. 67-73
Mecella M., Scannapieco M., Virgillito A., Baldoni R., Catarci T., Batini C. , “Managing data
quality in cooperative information systems”, In Proc. of the 10th International Conference on
Cooperative Information Systems (CoopIS), Irvine CA, USA, 2002.
Moody D.L., “Theoretical and Practical Issues in Evaluating the Quality of Conceptual Models:
Current State and Future Directions”, Data & Knowledge Engineering, vol. 55, 2005, p. 243-
276.
Moody D.L., Shanks G.G., “Improving the quality of data models: empirical validation of a
quality management Framework”, Information Systems, vol. 28 no. 6, 2003, p. 619–650.
Moody D.L., Sindre G., Brasethvik T., Sølvberg A., “Evaluating the Quality of Information
Models: Empirical Testing of a Conceptual Model Quality Framework”, In Proceedings of the
25th international Conference on Software Engineering, 2003, p. 295-305.
Moody D.L., Shanks G.G., Darke P., “Strategies for improving the quality of entity relationship
models”, In Information Resource Management Association (IRMA) Conference, 2000, Idea
Group Publishing.
Moody D.L., “Metrics for Evaluating the Quality of Entity Relationship Models”, In Proceedings
of the Seventeenth International Conference on Conceptual Modelling, Singapore, 16-19
November 1998.
Moody D.L., Shanks G.G., “What makes a good data model? A framework for evaluating and
improving the quality of entity relationship models”, Australian Computer Journal, 1998.
Moraga C., Moraga A., Calero C., Caro A., “SQuaRE-aligned data quality model for web
portals”, Ninth International Conference on Quality Software, 2009
Bibliography
307 | P a g e
Nelson R.R., Todd P.A., “Antecedents of Information and System Quality: An Empirical
Examination within the Context of Data Warehousing”, Journal of Management Information
Systems, vol. 21 no. 4, 2005, p. 199-235.
Nelson H.J., Poelsa G., Generoa M., Piattini, M., “Quality in conceptual modeling: Five examples
of the state of the art”, Data & Knowledge Engineering, vol. 55, no. 3, 2005, p. 237-242.
Nick M., Althoff K.D., Tautz C., “Systematic Maintenance for Corporate Experience
Repositories”, Computational Intelligence, vol. 17, no. 2, 2001, p. 364-386.
Nick M., Althoff K.D., Tautz C., “Facilitating the practical evaluation of organizational memories
using the goal-question-metric technique”, In Proceedings of the Twelfth Workshop on
Knowledge Acquisition, Modeling and Management, Banff, Alberta, Canada, 1999.
Ojha N., McGregor J.D., “Object oriented metrics for early system characterization: A CRC card
based approach”, Dept. of Computer Science, Clemson University, Technical report No. 94 -
107, USA, 1994.
OPM (Office of Personnel Management), “The Guide to Data Standards: Part B - Payroll”, 2010.
OPM (Office of Personnel Management), “The Guide to Personnel Data Standards”, 2006.
Parasuraman A., Zeithaml V.A., Berry L.L., “SERVQUAL: a multiple-item scale for measuring
consumer perceptions of service quality”, Journal of Retailing, vol. 64, no. 1, 1988, p. 12-37.
Peralta V., “Data freshness and data accuracy: A state of the art”. Technical Report TR13-06, In.
Co., Universidad de la República, Uruguay, Marzo de 2006a.
Peralta V., “Data quality evaluation in data integration systems”, PhD Thesis, Université de
Versailles, France & Universidad de la República, Uruguay, November 2006b.
Peralta V., Ruggia R., Kedad Z., Bouzeghoub M.,”A framework for data quality evaluation in a
data integration system”, Simposio Brasilero de Bases de Datos (SBBD'2004), Brazil, p. 137-
147.
Pipino L.L., Lee Y.W., Wang R.Y., “Data quality assessment”, Communication of the ACM, vol.
45, no. 4, 2002, p. 211-218.

Bibliography
308 | P a g e
Poels G., Dedene G., “Measures for assessing dynamic complexity aspects of object-oriented
conceptual schemes”, In proceedings of the 19th International Conference on Conceptual
Modeling, ER2000, USA, 2000, p. 513–526.
Preiss O., Wegmann A., Wong J., “On Quality Attribute Based Software Engineering”, In
proceedings of the 27th EUROMICRO Conference, 2001
Purao S., Vaishnavi V., “Product Metrics for Object-Oriented Systems”, ACM Computing
Surveys, vol. 35 no. 2, 2003, p. 191-221.
Purchase H.C., Allder J.A., Carrington D., “Graph Layout Aesthetics in UML Diagrams: User
Preferences”, Journal of Graph Algorithms and Applications, vol. 6 no. 3, 2002, p. 255-279.
Purchase H.C., Colpoys L., McGill M., Carrington D., Britton C., “UML class diagram syntax: an
empirical study of comprehension”, In Australian symposium on Information visualisation,
vol. 9, 2001a, p. 113–120.
Purchase H.C., McGill M., Colpoys L., Carrington D., “Graph drawing aesthetics and the
comprehension of UML class diagrams: an empirical study”, Proceedings of the Australian
Symposium on Information Visualisation, vol. 9, 2001b.
Purchase H.C., Allder J.A., Carrington D., “User Preference of Graph Layout Aesthetics: A UML
Study”, LNCS 1984: Graph Drawing - 8th Internation Symposium, J. Marks, Springer, Berlin,
2000, p. 5-18.
Rational Software Corporation (RSC), “Unified Modeling language notation guide”, 1997.
Recker J.C., Niehaves B., “Epistemological perspectives on ontology-based theories for
conceptual modelling”, Applied Ontology , vol. 3, 2008, p. 111-130.
Redman T.C., “The impact of poor data quality on the typical enterprise”, Communications of the
ACM, vol. 41, no. 2, 1998, p. 79-82.
Reeves C., Bednar D.A., “Definining quality: Alternatives and implications”, Academy of
Management Review, vol. 19 no 3, 1994, p. 419-445.
Ribbert M., Niehaves B., Dreiling A., Holten R., “An Epistemological Foundation of Conceptual
Modeling”, In the Proceedings of the 12th European Conference on Information Systems,
Turku, Finland, 2004.

Bibliography
309 | P a g e
Rufai R., New structure similarity metrics for UML models, Master Thesis, Computer Science,
King Fahd University of Petroleum & Minerals, 2003.
Schuette R., Rotthowe T., “The guidelines of modelling: an approach to enhance the quality in
information models”, In proceedings of the 17th International Conference on Conceptual
Modelling, ER98, Singapore, 1998.
Shanks G.G., Darke P., “Quality in conceptual modelling: linking theory and practice”, In
Proceedings of the Pacific Asia Conference on Information Systems, PACIS97, Queensland
University of Technology, Australia, 1997, p. 805–814.
Shukur Z., Away Y., Dawari M.A., “Computer-aided marking system for engineering”, In
proceeding of Society for Information Technology and Teacher Education International
Conference, March 2004, Atlanta, US, p. 1852-1857.
Siau K., Cao Q., “Unified Modeling Language: A Complexity Analysis”, Journal of Database
Management, vol. 12 no. 1, 2001, p. 26-34.
Simsion G.C., Data Modeling Essentials: Analysis, Design, and Innovation, Van Nostrand
Reinhold, New York, 1994.
Software Engineering Institute (SEI), Carnegie Mellon University,
http://www.softwarearchitectures.com.
Software & Systems Process Engineering Meta-Model (SPEM) Specification, Version 2.0, OMG
Document Number: formal/2008-04-01, 2008.
Solheim I., Neple T., “Model Quality in the Context of Model-Driven Development”, In the
proceeding of 2nd International Workshop on Model-Driven Enterprise Information Systems
(MDEIS‟06), 2006, p. 27-35.
Stylianou A.C., Kumar R.L., “An integrative Framework for IS quality Management”,
Communications of the ACM, vol. 43, no. 9, 2000.
Suryn W., Abran A., April A., “ISO/IEC SQuaRE: The Second Generation of Standards for
Software Product Quality”, 7th IASTED International Conference on Software Engineering
and Applications, California, USA, 2003.

Bibliography
310 | P a g e
Tayi G. K., Ballou D.P., “Examining data quality”, Communications of the ACM, vol. 41, no. 2,
1998, p. 54-57.
Thiagarajan R., Rai A., “The Dimensions and Correlates of Systems Development Quality", In
the Proceedings of the 1994 Association for Computing Machinery SIGCPR Conference,
March 24-26 1994, p. 272-282.
Unhelkar B., Verification and Validation for Quality of UML 2.0 Models, Wiley, 2005.
Van Dyke T.P., Kappelman L.A., Prybutok V.R., “Measuring Information Systems Service
Quality: Concerns on the Use of the SERVQUAL Questionnaire”, MIS quarterly, June 1997
Vassiliadis P., Bouzeghoub M., Quix C., “Towards quality-oriented data warehouse usage and
evolution”, In Proceedings of the International Conference on Advanced Information Systems
Engineering (CAiSE ‟99), Heidelberg, Germany), 1999, p. 164–179.
Walrad C., Moss E., “Measurement: The Key to Application Development Quality”, IBM
Systems Journal, vol. 32, no. 3, 1993, p. 445-460.
Wand Y., Monarchi D.E., Parsons J., Woo C.C., “Theoretical foundations for conceptual
modelling in information systems development”, Decision Support Systems, vol. 15, 1995, p.
285-304.
Wang Y., Software Engineering Standards: Review and Perspectives, World Scientific
Publishing, 2002.
Wang R.Y., “A product perspective on total data quality management”, Communication of the
ACM, vol. 41, no. 2, 1998, p. 58-65.
Wang R.Y., Strong D.M., “Beyond accuracy: what data quality means to data consumers”,
Journal of Management Information System, vol. 12, no. 4, 1996, p. 5-33.
Wernick P., “Identifying and Justifying Metrics for Software Evolution Investigations Using the
Goal-Question Metric Method”, FEAST 2000 Workshop, Imperial College, London, 10-12
July 2000.
Yi T., Wu F., Gan C., “A Comparison of Metrics for UML Class Diagrams”, ACM SIGSOFT
Software Engineering Notes, vol. 29, no. 5, 2004, p. 1-6.

Bibliography
311 | P a g e
Yu W., Li J., Butler G., “Refactoring Use Case Models on Episodes”, In proceedings of the 19th
IEEE international Conference on Automated Software Engineering, September 20 - 24, 2004,
Washington, DC, p. 328-331.
Zamperoni A., Lohr-Richter P., “Enhancing the quality of conceptual database specifications
through validation”, In proceedings of the 12th International Conference on the Entity
Relationship Approach, Dallas-Arlington, USA, 1993.
Zeiss B., Vega D., Schieferdecker I., Neukirchen H., Grabowski J., “Applying the ISO 9126
Quality Model to Test Specifications”, In Proceedings of SE 2007, vol. 105, 2007, Lecture
Notes in Informatics (LNI). Köllen Verlag.
Zhou Y., Xu B., “Measuring structure complexity of UML class diagrams”, Journal of Electronics
(China), vol. 20 no. 3, 2003, p. 227-231.


Author‟s Publications
313 | P a g e
Author’s Publications
Kashif Mehmood, Samira Si-Said Cherfi, Isabelle Comyn-Wattiau, “CM-Quality: A Pattern-
Based Method and Tool for Conceptual Modeling Evaluation and Improvement”, In 14th
Conference on Advances in Databases and Information Systems (ADBIS'10), 2010, Novi Sad,
Serbia.
Kashif Mehmood, Samira Si-Said Cherfi, Isabelle Comyn-Wattiau, “Data Quality through
Conceptual Model Quality - Reconciling Researchers and Practitioners through a Customizable
Quality Model”, In ICIQ (Intl. Conference on Information Quality), November 2009, Germany.
Kashif Mehmood, Samira Si-Said Cherfi, “Evaluating the Functionality of Conceptual
Models”, In Fourth workshop on Quality of Information Systems (QoIS 2009) in conjunction with
the 28th International Conference on Conceptual Modeling (ER2009), 2009, Gramado, Brazil
Kashif Mehmood, Samira Si-Said Cherfi, Isabelle Comyn-Wattiau, “Data Quality Through
Model Quality: A Quality Model for Measuring and Improving the Understandability of
Conceptual Models”, In DQS'09, International Workshop on Data Quality and Security in
conjunction with (CIKM'09), November 2009, Hong Kong.
Kashif Mehmood, Samira Si-Said Cherfi, Isabelle Comyn-Wattiau, “A Quality Based
Approach for the Analysis and Design of Information Systems”, In Proceedings of the ER 2009
PhD Colloquium (ERPhD-2009) in conjunction with the 28th International Conference on
Conceptual Modeling (ER2009), vol. 597, URN:nbn:de:0074-597-7, 2009, Gramado, Brazil
Working Papers
Kashif Mehmood, Samira Si-Said Cherfi, “Conceptual Modelling Quality: Current state and
future directions”, Submitted to Ingénierie des systèmes d'information – ISI Journal, Hermès
Lavoisier.

Author‟s Publications
314 | P a g e
Kashif Mehmood, Samira Si-Said Cherfi, Isabelle Comyn-Wattiau, “A Pattern-Oriented
Methodology for Conceptual Modeling Evaluation and Improvement”, Submitted to 15th
International Conference on Information Quality – ICIQ 2010.