
Contribution à une approche sociologique de la genèse partisane
Upload
khangminh22Category
view
2download
0
Préparée à École Nationale Supérieure de Chimie de Paris
Approche multi-échelle de l'interaction des biocarburants avec
les surfaces métalliques des circuits carburants des transports
terrestres et aéronautiques
Soutenue par
Claudia CANTARELLI Le 17 novembre 2021
Ecole doctorale n° 388
Chimie Physique et Chimie
Analytique de Paris centre
Spécialité
Chimie physique
Composition du jury :
M. André NICOLLE Président de jury Ingénieur de recherche HDR, Aramco Fuel
Mme. Anne HEMERYCK Rapporteuse Chargé de Recherche, CNRS-LAAS
Mme. Corinne DUFAURE Rapporteuse Professeure, ENSIACET
M. Anton KOKALJ Examinateur Professeur, Institut "Jožef Stefan"
Mme. Dominique COSTA Directrice de thèse Directrice de recherche, ENSCP

1
This page is intentionally left blank
2
Abstract
The use of biofuels is one of the main levers for the transport industry to meet the ambitious
environmental targets. However, one of their major drawbacks is their thermal and chemical
stability towards oxidation. Indeed oxidation causes hydrocarbon degradation, which results in
the formation of insoluble aggregates and deposits in the fuel system of automobiles and aircraft
that consequently leads to mechanical engine failures, such as injector blockage or filter
plugging.
The objective of this thesis is to better understand the phenomenology related to the formation of
deposits produced by the autoxidation process that occurs for fossil and renewable fuels and the
impact of the metal surface in contact with the fuel. To achieve this goal, the methodology
adopted for this thesis is based on the combination of two different numerical approaches: ab
initio Density Functional Theory (DFT) and an empirical atomistic reactive force field
simulations.
Using DFT we calculated the reaction energies of a set of representative reactions describing the
toluene autoxidation. Furthermore, we studied the interaction between small representative
organic molecules (i.e. models of deposit precursors) and representative models for both
aluminum, i.e. α-Al2O3 and stainless-steel surfaces (α-Cr2O3). Both anhydrous and hydrated
surface states were considered. For the anhydrous surfaces, the alumina surface was found to be
more reactive than the chromia surface, but the same ordering in adsorption energies was
calculated: oxygenated molecules > aromatics > linear alkanes. Generally, the adsorption
energies attenuated for the hydroxylated surfaces and hydroxylated alumina and chromia showed
practically equal reactivity. Hence, the DFT calculations evidence the influence of the surface
state on the adhesion properties.
The DFT results were subsequently used as reference data to train the force field parameters of
the ReaxFF force field. Two different force fields were considered: one describing alumina-
based systems (FFA) and the other of chromia-based systems (FFB). The quality of the optimized
force field parameters was evaluated against the reproduction of the data of the training set and a
validation set that includes cell parameters of the bulk oxides, adsorption energies and energy
curves of organic molecules, representative reactions of the autoxidation of toluene, and the

3
dynamic structuration of pure organic liquids (mass/volume density, radial distribution
functions). Only FFA (for alumina-based systems) could be validated and was retained to a
model fuel blend in contact with alumina.
The model blend, consisting of 95 mol% toluene and 5 mol% benzyl hydroperoxide, was firstly
modeled in absence of a solid phase. From NPT simulations it resulted that the liquid density
corresponds reasonably well the experimental value. Moreover, the benzyl hydroperoxide was
chemically stabled, although these molecules tend to aggregate to form di- and trimers.
Next, the interaction between model blend and anhydrous alumina was studied, by putting a
small “drop” of the model mixture on the surface. A dense toluene monolayer is formed that is
stable at T=400 K, a result confirmed by DFT BOMD calculations, issue of a strong adsorption
energy. However, if alumina is completely hydroxylated, a 0.2 ML is formed. This is in
accordance with the DFT calculated, smaller interaction energies between hydroxylated alumina
and toluene.
Finally, the blend was put in contact with both anhydrous and hydroxylated alumina. We
observed a toluene structuration as a monolayer on the hydroxylated Al2O3 surface and a bilayer
for the dry Al2O3 surface. Yet, a tendency to aggregation of benzyl hydroperoxides was observed
on both surface types. Importantly, only on the anhydrous alumina surface the benzyl
hydroperoxides undergo O-O bond cleavage after adsorption on a terminal surface Al atom,
thereby showing that the degree of hydroxylation of the aluminium surface plays a key role in the
molecule-surface reactivity. As expected, at larger distances from the surface, the influence of the
alumina surface quickly diminishes and the blend behaves as a “homogeneous” liquid phase as
described above where benzyl hydroperoxides aggregate but no bond dissociation has been
registered.

4
Résumé
L'utilisation des biocarburants est l'un des principaux leviers permettant à l'industrie des
transports de faire face aux objectifs environnementaux ambitieux qui lui sont assignés en
général. Dans les dernières études statistiques européennes concernant l'énergie, les transports et
l'environnement, il a été signalé que les transports représentent actuellement un quart des
émissions de gaz à effet de serre (GES) de l'UE. Au cours des dernières années, la Commission
européenne a annoncé de nombreux objectifs ambitieux concernant la question des GES, tels que
leur réduction de 60 % par rapport à 1990 d'ici 2050 et l'adoption du "Green Deal" européen, qui
définit un cadre stratégique pour une économie européenne climatiquement neutre d'ici 2050.
Pour atteindre tous ces objectifs ambitieux, il sera nécessaire, selon ces rapports, de parvenir à
une réduction de 90 % des émissions du secteur des transports d'ici à 2050.
Les biocarburants ont une composition chimique et des propriétés physiques qui, tout en
respectant les normes internationales de qualité des carburants, peuvent présenter des différences
chimiques et physiques par rapport aux carburants fossiles classiques.
Cependant, cette plus grande variété de composition chimique conduit à l'un de leur principal
inconvénient, à savoir leur stabilité thermique et d'oxydation. Leur susceptibilité à l'oxydation
conduit à l'activation de la dégradation des hydrocarbures, qui aboutit finalement à la formation
d'agrégats insolubles et de dépôts dans le système de carburant des automobiles et des avions. Ce
phénomène est très problématique car il peut provoquer des défaillances mécaniques du moteur,
telles que le blocage des injecteurs ou le colmatage des filtres.
L'objectif de cette thèse est de mieux comprendre la phénoménologie liée à la formation de
dépôts produits par le processus d'autoxydation qui se produit pour les combustibles fossiles et
renouvelables stockés dans les systèmes d'injection des moteurs diesel. Il est également
primordial pour cette étude de déterminer quels sont les paramètres et les conditions de
fonctionnement qui peuvent avoir le plus d'impact sur le processus d'adhésion/précipitation de ces
dépôts, en particulier dans le cas des surfaces métalliques du système d'injection puisqu'elles sont
constamment en contact avec le carburant stocké.

5
Cette thèse consiste en une étude computationnelle multi-échelle de l'interaction
biocarburant/métal. L'idée derrière une approche multi-échelle est de décomposer le système
entier et les phénomènes pertinents en plusieurs domaines (par exemple, la phase solide
métallique, la couche d'oxyde, l'interface liquide-solide et la masse liquide). Dans chacun de ces
domaines, la décomposition en facteurs opérant à différentes échelles peut être envisagée et
décrite par divers modèles. Le modèle intégré multi-échelles prend en compte des processus tels
que l'autoxydation des molécules en solution, la migration des agrégats vers la surface du métal,
le rôle de la surface dans l'oxydation des produits et la formation des agrégats. A notre
connaissance, une telle approche intégrée appliquée à l'interaction combustible-surface n'a pas
encore été réalisée.
Dans une approche multi-échelle, les méthodes atomistiques devraient apporter des informations
importantes qui ne sont pas accessibles par l'expérience.
Ainsi, les méthodes atomistiques DFT et ReaxFF sont utiles pour les études suivantes: les calculs
quantiques peuvent être effectués pour estimer les énergies de déprotonation et de solvatation des
molécules dans le carburant et les calculs ReaxFF peuvent aider à estimer la tendance des
molécules à former des agrégats. Les calculs MD ReaxFF peuvent apporter un éclairage sur les
tensions de surface et d'interface, les données de diffusivité de diverses espèces dans les phases
liquides. Les calculs de premiers principes associés à la thermodynamique atomistique (qui
permet de calculer les énergies de réaction d’autoxydation) sont utiles pour construire des
diagrammes de phase de surface et pour prédire, dans des conditions thermodynamiques données,
la terminaison de surface et la composition du film d'oxyde. Les calculs DFT sont l'outil principal
pour modéliser les réactions entre les molécules dans un liquide et sur une surface donnée.
Cependant, les simulations de mécanique quantique DFT peuvent présenter une limitation
significative en termes de temps de calcul, en particulier lorsque la taille des systèmes chimiques
est supérieure à 100-200 atomes. Un autre facteur pertinent qui peut sûrement avoir un impact sur
cet aspect est la complexité des systèmes où différentes espèces chimiques sont impliquées,
puisque les prédictions de leurs propriétés en plus de leurs interactions peuvent ralentir
considérablement les simulations DFT.
L'un des concepts fondamentaux de la chimie et de la science des matériaux est sans aucun doute
la "rupture et la formation de liaisons". La modélisation précise des processus de rupture de

6
liaison continue d'être un défi informatique, en particulier dans la description de grandes
molécules. Les progrès récents dans l'implémentation de la DFT de Kohn-Sham non restreinte
(spin polarisée) ont permis de prendre en compte la rupture homolytique des liaisons, rendant
possible la description des réactions se produisant entre des molécules avec des électrons non
appariés (c'est-à-dire des radicaux libres). Puisque dans cette étude, nous voulions simuler les
processus associés à l'autoxydation des molécules, où des espèces très réactives comme les
radicaux sont formées, des calculs DFT polarisés en spin étaient nécessaires.
Des champs de force réactifs paramétrés empiriquement, basés sur des concepts d'ordre des
liaisons (comme ReaxFF) et permettant de modéliser la rupture des liaisons, ont été développés
ces dernières années. Les champs de force réactifs incluent des résultats de DFT dans des
ensembles d'entraînement, ce qui permet de les paramétrer afin de mieux modéliser la rupture de
liaison des molécules qui se produit au cours d'un processus chimique.
C'est la méthodologie adoptée pour cette thèse, qui est basée sur la combinaison de ces deux
approches numériques différentes: une étude ab initio menée via la Théorie de la Fonctionnelle
de la Densité (DFT) et une approche successive de Dynamique Moléculaire (MD) réalisée via
l'implémentation d'un Champ de Force Réactif (ReaxFF). L'étude théorique préliminaire DFT a
été réalisée pour acquérir des données thermodynamiques utiles (c'est-à-dire les énergies
d'adsorption, les énergies de réaction de l’autoxydation, etc.) à partir de l'optimisation de la
géométrie des systèmes gazeux/solides d'intérêt dans l'intention de les utiliser comme données
d'entrée pour entraîner le champ de force empirique afin d'obtenir un champ de force capable de
prédire correctement le comportement des espèces chimiques impliquées, à la fois dans les
phases homogènes et hétérogènes. Une fois le champ de force validé, l'objectif principal est
d'obtenir des informations utiles sur les processus d'adsorption et de dépôt tout en considérant les
phénomènes de dégradation/oxydation qui se produisent dans la phase liquide du combustible.
Avec ces prémisses, nous commençons notre discussion sur la méthodologie choisie en
présentant d'abord la méthode de mécanique quantique DFT, suivie par la description des
principes de dynamique moléculaire définissant la méthode ReaxFF (Chapitre 2).
Dans le cadre de cette thèse, nous avons choisi d'utiliser les résultats DFT obtenus lors de l'étude
théorique préliminaire comme données d'entrée pour paramétrer ReaxFF en les ajoutant à
l'ensemble d'entraînement. Pour obtenir un champ de force capable de décrire correctement les

7
propriétés et les caractéristiques des systèmes moléculaires d'intérêt, le training set doit inclure
l'ensemble des configurations DFT optimisées qui représentent le mieux le système chimique
analysé. Dans notre cas, puisque nous étions intéressés par la description du phénomène lié à la
formation de dépôts de carburant, nous avons choisi d'ajouter à notre ensemble d'entraînement
principalement les configurations d'adsorption optimisées par DFT des molécules modèles
représentant les précurseurs de dépôts sur le dessus des substituts d'aluminium et d'acier
inoxydable dans des conditions anhydres et hydroxylées.
Notre training set était composé principalement des configurations d'adsorption d'une grande
variété de molécules modèles afin d'assurer une plus grande possibilité pour le champ de force
réactif d'être bien ajusté pour prédire correctement les systèmes moléculaires analysés. Cette
méthodologie mise en œuvre pour l'amélioration du ReaxFF dans la description des propriétés
chimiques et des réactivités de nos systèmes a envisagé un cycle itératif, dont les deux parties
principales peuvent être définies comme la "paramétrisation du ReaxFF" et la "validation du
ReaxFF". Pour la première partie, l'objectif était de définir un ensemble d'entraînement approprié
qui nous aiderait à améliorer les champs de force implémentés, tandis que la deuxième partie de
ce cycle a été conçue pour les valider.
L'intérêt majeur de cette thèse est l'étude des interactions se produisant entre une phase liquide
organique, substitut des précurseurs de dépôts, et une phase solide d'oxyde métallique,
représentative des matériaux métalliques recouvrant couramment les systèmes d'injection des
moteurs.
Comme surfaces métalliques, nous avons opté pour l'aluminium et l'acier inoxydable car ces deux
matériaux sont très utilisés comme revêtements dans le secteur des transports. Ils présentent tous
deux une résistance à la corrosion grâce à la présence d'un film d'oxyde passif protecteur
(Chapitre 3).
En ce qui concerne les substituts des précurseurs de dépôts, les principaux produits issus de
l'autoxydation des carburants sont des composés oxygénés comme les alcools, les aldéhydes, les
cétones, les époxydes et les acides carboxyliques. Pour ces raisons, dans la présente étude, de
petites molécules oxygénées ont été préférées comme molécules modèles sur la base de leur
groupe fonctionnel chimique, c'est-à-dire l'éthanol pour la famille des alcools, l'acétaldéhyde et
l'acétone pour représenter respectivement les aldéhydes et les cétones, le 2-éthyle-3-

8
méthyloxirane pour les époxydes et l'acide acétique pour les acides carboxyliques. En outre, trois
autres types de familles chimiques ont été considérés:
(1) les espèces aromatiques puisqu'elles constituent l'un des composants du diesel raffiné à partir
du pétrole brut et qu'elles sont donc présentes dans les mélanges diesel/biodiesel sur le marché,
nous considérons ici le benzène et le toluène comme des composés aromatiques modèles.
(2) les esters: propionate de méthyle, esters méthyliques insaturés (par exemple, acrylate de
méthyle et 3-trans-hexénoate de méthyle), en tant que représentants des dépôts dérivés des
mélanges biodiesel.
(3) alcanes puisqu'ils sont le principal composant des carburants en général, nous considérons ici
le n-propane comme substitut des dépôts de chaînes alkyles produits par la dégradation des n-
alcanes.
Pour améliorer notre compréhension des formations de dépôts indésirables observées pour les
biodiesels dans les circuits de carburant des moteurs, nous avons effectué des calculs DFT sur des
molécules modèles de différents produits d’autoxydation. Une analyse thermodynamique nous a
permis de calculer les facteurs entropiques en phase gaz de ces molécules. Nous avons aussi
étudié plusieurs réactions d’autoxydation du toluène par DFT. Ces travaux font l’objet du
Chapitre 4. Les résultats serviront de première base à l’élaboration des champs de force.
L'adsorption des petites molécules organiques représentatives susmentionnées sur des surfaces
représentatives d'aluminium et d'acier inoxydable a ensuite été étudiée par DFT (Chapitre 4). Le
circuit de carburant en acier inoxydable a été représenté par α-Cr2O3 et les circuits à base
d'aluminium par α-Al2O3, dans lesquels chaque orientation de surface étudiée était soit anhydre,
soit totalement hydroxylée (Chapitre 3).
A partir de cette étude DFT, nous avons constaté que les circuits en acier inoxydable, qui est la
surface la plus problématique puisqu'elle est le matériau des injecteurs, ne joueraient pas un rôle
plus important dans les réactions d'autoxydation par rapport aux circuits à base d'aluminium. Ce
résultat est important car il corrobore le fait que les agrégats de produits d'oxydation du carburant
semblent être principalement formés dans la phase liquide et se déposer ensuite sur une surface
par différents mécanismes. De plus, les interactions relativement faibles (-30 à -70 kJ/mol) entre
la surface et la molécule semblent être insuffisantes pour provoquer des distorsions significatives

9
dans la molécule organique elle-même, ce qui pourrait conduire à une plus grande réactivité et
rendre la molécule plus encline aux réactions d'autoxydation en phase liquide.
Pour obtenir un champ de force capable de décrire correctement les propriétés et les
caractéristiques des systèmes moléculaires d'intérêt, nous avons choisi d'utiliser nos résultats DFT
comme données d'entrée pour paramétrer ReaxFF en les ajoutant au training set. Ainsi, nous
avons ajouté à notre training set principalement les configurations d'adsorption optimisées par la
DFT des molécules modèles représentant les précurseurs de dépôt sur le dessus des substituts
d'aluminium et d'acier inoxydable dans des conditions anhydres et hydroxylées.
Dans cette étude, nous avons mis en œuvre deux champs de force réactifs différents à optimiser, à
savoir FFA et FFB pour la description de surfaces α-Al2O3et α-Cr2O3, respectivement. C’est
l’objet du Chapitre 5. Ce chapitre représente le cœur du travail de cette thèse.
Pour vérifier le résultat des simulations d'optimisation ReaxFF, nous avons choisi de rapporter les
comparaisons entre les résultats DFT et les prédictions ReaxFF obtenues à partir de ces
simulations. À partir de ces comparaisons, nous avons constaté que FFA et FFB reproduisaient
discrètement les valeurs DFT correspondantes.
Notons de plus que le training set contenant à la fois des réactions en phase homogène (solide ou
gaz) et d’interface, nous avons ainsi calibré le champ de force pour l’ensemble des parties du
système, solide, gaz et interface solide-gaz. Toutefois, pour mieux confirmer ce résultat, une
étape de validation de deux champs de force a été aussi considérée. Dans cette partie, nous avons
décidé de diviser cette étape de validation dans deux sous-études différentes, notamment une
étude « statique » et une étude « dynamique ». Pour la première étude « statique », trois aspects
ont été considérés et comparés entre les deux approches DFT et ReaxFF, respectivement: l’étude
des deux phases de bulk pour α-Al2O3 et α-Cr2O3, les énergies de réactions d’autoxydation
(décrites dans le Chapitre 4) et les énergies d’adsorption de nouvelles molécules modèles du
dépôts adsorbés au-dessus des deux surface d’alumine et oxyde de chrome (anhydre et
hydroxylée). Dans cette étude « statique » de validation de ReaxFF nous avons obtenu une bonne
description des résultats issus de la DFT de la part de deux champs de force FFA et FFB, et nous
avons pu les valider en tant que corrects pour ces systèmes.La deuxième étude « dynamique » de
validation a été faite par comparaison des phases homogènes liquides. Nous avons obtenu des
densités de liquide pur proches des valeurs expérimentales (écart < 9%) pour α-Al2O3. La

10
comparaison par exemple de la fonction de distribution radiale de l’eau est très proche de la
fonction expérimentale.
Ces valeurs sont malheureusement très erronées pour α-Cr2O3, ce qui nous a conduit à
abandonner les calculs sur ce système pour la suite de la thèse.
Après avoir finalement validé le champ de force réactifFFA, nous procédons dans le Chapitre 6à
l'analyse MD d'un système en phase liquide représenté par un mélange de substitution
"combustible-oxygène", où le combustible (c'est-à-dire le solvant) est modélisé par des molécules
de toluène, tandis que l'oxygène (c'est-à-dire le soluté) est plutôt modélisé par des molécules
d'hydroperoxyde de benzyle.
Le choix de ces molécules définissant notre mélange de substitution "carburant-oxygène" est
donné par le fait que d'une part nous voulions simuler un mélange organique qui serait une bonne
représentation d'un carburant en phase liquide subissant déjà une dégradation oxydative et d'autre
part nous voulions lier ce phénomène au processus d'autoxydation du toluène. Pour cette raison,
nous avons choisi le toluène comme solvant et l'hydroperoxyde de benzyle, un intermédiaire bien
connu dans le processus d'autoxydation du toluène, comme soluté.
Le mélange "carburant-oxygène" simulé dans cette étude est composé de 95% molaire de toluène
et 5% molaire d'hydroperoxyde de benzyle. Le choix de cette composition est dû à notre objectif
d'observer le comportement du carburant lorsque le processus d'autoxydation est déjà vu à son
état de propagation (c'est-à-dire que les intermédiaires pertinents sont déjà formés, par exemple
l'hydroperoxyde de benzyle).
Notre étude MD visait à décrire le comportement d'un substitut de mélange "carburant-oxygène"
d'abord comme un système homogène et ensuite dans des conditions hétérogènes lorsqu'il est
adsorbé au-dessus de la surface d'alumine. Pour tous les systèmes hétérogènes, nous avons
considéré les surfaces d'alumine à l'état anhydre et entièrement hydroxylées, respectivement.
Nous avons analysé le comportement du mélange " carburant-oxygène " en phase liquide dans
des conditions ambiantes (T = 25°C et P = 1 atm). Nous avons choisi comme modèle pour ce
mélange organique un rapport molaire 95:5 de toluène (comme solvant) et d'hydroperoxyde de
benzyle (comme soluté oxygéné) puisque les composés aromatiques représentent un composant
majeur des carburants liquides de transport.

11
Dans un premier temps, une « goutte » du mélange a été déposée sur les surfaces α-Al2O3 et α-
Al2O3-HY (c'est-à-dire l’alumine complètement hydroxylée), de façon à estimer le « mouillage »
de la surface par cette gouttelette. Nous observons un comportement radicalement différent en
surface anhydre et hydroxylée: la goutte s’étale sur la surface anhydre, et forme une couche dense
auto assemblée de densité 3.7 molecule/nm2, stable jusqu’à 450K. Une étude parallèle de
dynamique en DFT (Born Oppenheimer Molecular Dynamics) confirme la stabilité de cette
monocouche dense de toluène en surface. Il y a très peu de mobilité en surface
(adsorption/désorption ou diffusion).
La situation est très différente sur surface α-Al2O3 hydroxylée: il y a peu de mouillage de la
surface, les molécules commençant à diffuser et à désorber/réadsorber sans former de couche
dense. La proportion de molécules adsorbées sur surface hydroxylée est seulement de 20% de
celle formée sur la surface anhydre.
Cette première étude par champ de force permet de mettre en évidence l’effet majeur de l’état de
la surface (hydroxylée ou anhydre) sur les processus d’adsorption, diffusion de surface et auto-
organisation de toluène.
L’étape suivante consiste à considérer la phase liquide dans son ensemble, cette fois ci en phase
homogène, en interaction avec α-Al2O3anhydre et hydroxylée.
Ici aussi, on observe une grande différence de réactivité entre l’alumine anhydre et hydroxylée: il
y a agrégation des molécules oxygénées sur la surface anhydre et aussi des phénomènes de
dissociation des liaisons O-O des hydroperoxydes de benzyle qui ne se manifestent pas à
l’interface avec la surface hydroxylée. Toutefois, dans les deux cas, nous avons observé des
phénomènes de « clusterisation » des hydroperoxydes de benzyle dans le milieu organique
liquide. Il est probable que cette clusterisation de molécules réactives mène à une augmentation
des phénomènes d’autoxidation.
.

12
Acknowledgements
The redaction of this thesis represents for me not only the end of my PhD, but rather what I
would describe as the end of a journey. A journey of learning, but more specifically of
growth.For most of the cases, the concepts of learning and growth are intertwined between them,
a real growth comes from experience, experience comes from learning one or multiple lessons.
In these three years, I was able to achieve a higher level of knowledge and experience mostly
thanks to the incredible support of my IFPEN supervisors Mrs. Maira Alves Fortunato and Mr.
Theodorus de Bruin and my thesis director Mrs. Dominique Costa. The growth that I’m able to
perceive now is certainly thanks to their help and teaching, of which I will be always grateful.On
the same length, I cannot thank enough the R104 and R10 department chiefs Mr. Julian Kashdan,
Mr. Christian Angelberger and Mr. Richard Tilagone for having accepted me as a good candidate
for this thesis together with my IFPEN supervisors three years ago. Of course, I cannot forget
how grateful I am to the honorable jury members: Mrs. Anne Hemeryck, Mrs. Corinne Dufaure,
Mr. Anton Kokalj and Mr. André Nicolle, for having accepted to evaluate this work and to
participate as jury members for my thesis defense.
These three years have not been easy: between emerging work difficulties and the pandemic,
there have been many moments where I’ve sincerely (and sadly) thought that I could not be able
to finish my thesis. Luckily, I was able to face and, more importantly, to overcome these negative
thoughts thanks to not only my supervisors’ aid, but also thanks to the crucial support that all my
dears have shared with me, never renouncing to always remind me to trust more myself and my
own capabilities. I will be always grateful to them for being so patient and present with my
struggles, but even more for having been with me in the moments of joy and satisfaction that I
did not hesitate to share with them.
I will never thank enough my parents Agostino and Franca, who have always believed in me
without any hesitation even when for me everything seemed to fall apart and of course my
boyfriend Vittorio, for simply being present with his support and wise guidance, as it has always
been since the start of everything. I cannot forget the enjoyable moments passed together with my
dear PhD colleagues, in particular with Ivano, Erwan, Mouad and Daniel, which I will always

13
treasure as fond memories. A special thanks is for Lucia, a dear friend before being a valuable
colleague, who never ceased to encourage and guide me as a real supervisor, which I am sure she
will become very soon.
From the bottom of my heart, thank you very much to everyone. Just one last reminder:
“Per aspera, ad astra”.

14
Table of contents
Abstract .......................................................................................................................................................................... 2
Résumé ........................................................................................................................................................................... 4
Acknowledgements ...................................................................................................................................................... 12
Chapter 1. State of the art ............................................................................................................................................. 19
1.1. Context of the study .................................................................................................................................... 19
1.1.1 Fuel stability and deposits ...................................................................................................................... 22
1.2. Motivation of the study ............................................................................................................................... 24
1.3. Liquid Phase Autoxidation process ............................................................................................................ 26
1.3.1. Chemical kinetics of autoxidation ...................................................................................................... 26
1.3.2. Key parameters in liquid phase autoxidation ..................................................................................... 29
1.3.3. Deposits formation from fuel autoxidation ........................................................................................ 34
1.3.4. Deposits typologies and chemical composition ................................................................................. 34
1.3.5. Deposits interaction with the metallic surface ................................................................................... 35
1.4. Adsorption of organic molecules on metallic surfaces ............................................................................... 37
1.4.1. Experimental studies .......................................................................................................................... 37
1.4.2. Theoretical DFT studies ..................................................................................................................... 38
1.4.3. ReaxFF studies of the homogeneous phase ....................................................................................... 41
1.4.4. ReaxFF studies of the liquid-surface interactions .............................................................................. 45
1.5. Conclusion .................................................................................................................................................. 55
References .................................................................................................................................................................... 57
Chapter 2. Methodology............................................................................................................................................... 63
2.1 Introduction ..................................................................................................................................................... 63
2.2 Quantum mechanics basics ............................................................................................................................. 65
2.2.1 Born-Oppenheimer approximation ......................................................................................................... 66
2.2.2 Hartree-Fock approximation .................................................................................................................. 67
2.2.3 LCAO approximation ............................................................................................................................. 67
2.2.4 Correlated models .................................................................................................................................. 68
2.3 Density Functional Theory (DFT) .................................................................................................................. 69
2.3.1 Kohn-Sham formalism ........................................................................................................................... 69
2.3.2 Generalized Gradient Approximation (GGA) ........................................................................................ 71
2.4 DFT calculations for periodic systems ............................................................................................................ 72
2.4.1 Bloch’s Theorem .................................................................................................................................... 73
2.4.2 Pseudopotentials ..................................................................................................................................... 73
2.4.3 DFT+U method ...................................................................................................................................... 74
2.4.4 DFT-D dispersion corrections ................................................................................................................ 75

15
2.4.5 DFT calculation of the total electron energy .......................................................................................... 78
2.4.6 Geometry optimization of molecular structures ..................................................................................... 79
2.4.7 Nudged Elastic Band method ................................................................................................................. 81
2.5 Relative energy calculations ........................................................................................................................... 82
2.6 Thermodynamic calculations .......................................................................................................................... 83
2.7 Implemented QM based softwares .................................................................................................................. 86
2.8 Bader charge calculation ................................................................................................................................. 87
2.9 From ab-initio to empirical molecular dynamics ............................................................................................ 87
2.10 Force field (FF) methods................................................................................................................................. 88
2.11 ReaxFF (Reactive Force Field) methods ......................................................................................................... 89
2.11.1 ReaxFF parametrization ......................................................................................................................... 91
2.11.2 ReaxFF optimization algorithms ............................................................................................................ 95
2.11.3 ReaxFF optimization via CMA-ES optimizer ........................................................................................ 96
2.11.4 Required files for ReaxFF training-set ................................................................................................... 98
2.11.5 ReaxFF validation-set ............................................................................................................................ 99
2.11.6 ReaxFF validation .................................................................................................................................. 99
2.12 Molecular Dynamics ..................................................................................................................................... 101
2.12.1 Radial distribution function (RDF) ...................................................................................................... 103
References .................................................................................................................................................................. 105
Chapter 3. Studied surfaces ........................................................................................................................................ 109
3.1 Choice of corundum α-Al2O3 and α-Cr2O3 surfaces ...................................................................................... 109
3.2 Introduction to α-(0001) Al2O3 and α-Cr2O3 surfaces ................................................................................... 110
3.2.1 Bulk structures of α-Al2O3 and α-Cr2O3 ............................................................................................... 110
3.2.2 Surface terminations of α-(0001) Al2O3 and Cr2O3 .............................................................................. 112
3.2.3 Experimental studies of α-(0001) Al2O3 and Cr2O3 surfaces ................................................................ 114
3.2.4 DFT modeling of α-(0001) Cr2O3 and Al2O3 surfaces .......................................................................... 115
3.2.5 Hydration condition.............................................................................................................................. 118
References .................................................................................................................................................................. 129
Chapter 4. DFT study: analysis of gas-phase reactions and gas-solid interface interactions ..................................... 132
4.1 Introduction ................................................................................................................................................... 132
4.2 Model of deposit surrogate ........................................................................................................................... 133
4.3 Gas phase autoxidation reactions .................................................................................................................. 135
4.3.1 Computational details ........................................................................................................................... 136
4.3.2 Results and discussion .......................................................................................................................... 138
4.4 Adsorption on α-(0001) Al2O3 and α-(0001) Cr2O3 surfaces ............................................................................. 139
4.4.1 Computational details ........................................................................................................................... 139
4.4.2 Results and discussion .......................................................................................................................... 141
4.5 Surface impact on intramolecular distortion ................................................................................................. 149
4.6 Water/OH substitution on corundum surfaces .............................................................................................. 150

16
4.6.1 Implemented scheme ............................................................................................................................ 150
4.6.2 Results and discussion .......................................................................................................................... 153
4.7 Conclusion .................................................................................................................................................... 155
References .................................................................................................................................................................. 157
Chapter 5. ReaxFF development and validation ........................................................................................................ 159
5.1 Introduction ................................................................................................................................................... 159
5.2 FFA and FFB reparametrizations .................................................................................................................. 160
5.2.1 Computational details ........................................................................................................................... 161
5.2.2 Results and discussion .......................................................................................................................... 163
5.3 FFA and FFB validation: “Static” study ....................................................................................................... 167
5.3.1 Comparison of the lattice parameters ................................................................................................... 169
5.3.1.1 Computational details ........................................................................................................................... 169
5.3.1.2 Results and discussion .......................................................................................................................... 169
5.3.2 Comparison of the energies .................................................................................................................. 172
5.3.2.1 Computational details ........................................................................................................................... 172
5.3.2.2 Results and discussion .......................................................................................................................... 173
5.3.3 Conclusion of the “static” study ........................................................................................................... 180
5.4 FFA and FFB validation: “Dynamic” study .................................................................................................. 182
5.4.1 Liquid-phase solvents at ambient conditions........................................................................................ 183
5.4.1.1 Computational details ........................................................................................................................... 183
5.4.1.2 Results and discussion .......................................................................................................................... 184
5.5 Final conclusion ............................................................................................................................................ 187
References .................................................................................................................................................................. 190
Chapter 6. ReaxFF study of biofuel-alumina interactions .......................................................................................... 193
6.1 Liquid-phase “fuel-oxygen” mixture ............................................................................................................ 193
6.1.1 Computational details ........................................................................................................................... 194
6.1.2 Results and discussion: physico-chemical analysis .............................................................................. 194
6.1.3 Results and discussion: reactivity analysis ........................................................................................... 196
6.2 Heating of hydroxylated alumina up to 500 K .............................................................................................. 198
6.2.1 Computational details ........................................................................................................................... 198
6.2.2 Results and Discussion ......................................................................................................................... 199
6.3 Droplets of liquid “fuel-oxygen” mixture adsorbed on alumina ................................................................... 203
6.3.1 Computational details ........................................................................................................................... 203
6.3.2 Results and Discussion ......................................................................................................................... 204
6.4 Liquid-phase “fuel-oxygen” mixture adsorbed on alumina .......................................................................... 214
6.4.1 Computational details ........................................................................................................................... 215
6.4.2 Results and discussion: toluene-surface interaction ............................................................................. 217
6.4.3 Results and Discussion: benzyl hydroperoxides-surface interaction .................................................... 221
6.4.4 Results and discussion: chemical reactivity ......................................................................................... 224

17
6.4.5 Conclusion of ReaxFF study of liquid-phase “fuel-oxygen” mixture-Al2O3 system ........................... 228
6.5 Conclusions ................................................................................................................................................... 229
References .................................................................................................................................................................. 232
General conclusions and Perspectives ........................................................................................................................ 233
Annexes...................................................................................................................................................................... 237
Chapter 4 .................................................................................................................................................................... 237
Bulk oxides ................................................................................................................................................................ 237
Comparison between Gaussian and VASP results for the reaction energies .............................................................. 239
Water/OH substitution on corundum surfaces ........................................................................................................... 239
Thermodynamic data .................................................................................................................................................. 240
Desorption temperature calculations .......................................................................................................................... 241
Computational details ............................................................................................................................................ 241
Results and discussion ........................................................................................................................................... 243
Chapter 5 .................................................................................................................................................................... 245
CMA-ES algorithm .................................................................................................................................................... 245
Binding energy calculations: dissociation curves ...................................................................................................... 246
Preliminary ReaxFF study.......................................................................................................................................... 247
5.1 First “static” test: adsorption energies ........................................................................................................... 247
5.1.1 Computational details ........................................................................................................................... 247
5.1.2 Results and discussion of the 1st static test ........................................................................................... 248
5.2 First “dynamic” test: acetic acid desorption from α-Cr2O3 ........................................................................... 249
5.2.1 Computational details ........................................................................................................................... 249
5.2.2 Results and discussion of dynamic test for acetic acid desorption from α-Cr2O3 ................................ 249
5.3 DFT study of the lactone intermediate .......................................................................................................... 252
5.3.1 Computational details ........................................................................................................................... 252
5.3.2 Results and discussion for lactone formation ....................................................................................... 252
5.4 First ReaxFF parametrization test ................................................................................................................. 253
5.4.1 Computational details ........................................................................................................................... 253
5.4.2 Results and discussion .......................................................................................................................... 255
5.5 First ReaxFF MD test of a surrogate “fuel-oxygen” blend: Production set .................................................. 256
5.5.1 Computational details ........................................................................................................................... 257
5.5.2 Results and discussion of ReaxFF MD test: “fuel-oxygen” blend ....................................................... 258
5.6 Second “static” test: adsorption energies ...................................................................................................... 260
5.6.1 Computational details ........................................................................................................................... 260
5.6.2 Results and discussion of 2nd static test ................................................................................................ 262
5.7 Conclusion of the preliminary ReaxFF study ............................................................................................... 264
5.8 Heterogeneous systems: Desorption temperature analysis............................................................................ 265
5.8.1 Computational details ........................................................................................................................... 265
5.8.2 Results and discussion .......................................................................................................................... 266

18
Chapter 6 .................................................................................................................................................................... 272
Liquid-phase “fuel-oxygen” mixture ......................................................................................................................... 272
Droplets of liquid “fuel-oxygen” mixture adsorbed on alumina ................................................................................ 273
Liquid-phase “fuel-oxygen” mixture adsorbed on alumina ....................................................................................... 274

19
Chapter 1. State of the art
1.1. Context of the study
The use of biofuels is one of the main levers for the transportation industry to face the ambitious
environmental targets for the transportation industry in general [1, 2]. In the last European
statistical studies concerning energy, transport and environment, it has been reported that
transportation currently accounts for a quarter of the EU’s greenhouse gas (GHG) emissions[3].
In the last years, the European Commission has announced many ambitious targets concerning
the GHG issue, such as their reduction by 60% compared to 1990 by 2050 and the adoption of the
European Green Deal, which sets a strategic framework for a climate-neutral EU economy by
2050. To reach all these challenging objectives, according to these reports it will be necessary to
reach a 90% reduction in transport emission by 2050 [3]. The aviation sector is also concerned by
the GHG issue, since the International Civil Aviation Organization (ICAO) has agreed a carbon-
neutral growth from 2020[4]. The International Air Transport Association (IATA) has also
proposed a roadmap for carbon-neutral growth from 2020, and a reduction in net aviation CO2
emissions of 50% by 2050 from 2005 levels[3].
Several biofuels and sustainable fuels (SF), for road and aviation transport, are already available
in the market such as fuel ethers like ethyl-tert-butyl ether (ETBE), ethanol (e.g. E10, E15 and
E85 blends), hydrotreated vegetable oils (HVO), alcohol-to-jet (ATJ) synthetic fuel, fatty acid
methyl esters (FAMEs), hydroprocessed esters and fatty acids (HEFA) fuels among others.
The introduction of this large variety of fuels in the market leads to a larger range of fuels
suppliers, quality, logistics and chemical composition than the industries were used to handle;
indeed, the market has now very broad range of fuels properties and possible fuels-systems
interaction. Biofuels have a chemical composition and physical properties that, while complying
with international fuel quality standards, may have chemical and physical differences from
conventional fossil fuels.
This is the case of diesel and biodiesel fuels. We define as “biodiesel” a fuel constituted of mono-
alkyl esters of long-chain fatty acids derived from vegetable oils or animal fats [2] and it is

20
designated “B100” as formulated in the biodiesel standard ASTM D6751 [5], with the European
standard EN 14214 [6] referring to fatty acid methyl esters (FAME) as fuel.
Diesel fuel is obtained through the fractional distillation of crude oil. It contains hydrocarbon
molecules that range in size from 8 to 21 carbon atoms. Instead, FAME fuels contain long chain
of hydrocarbons, but with an additional ester functional group (-COOR).
Depending on the feedstock, the produced biodiesel presents a different fatty acid composition, as
reported in Table 1.
Table 1: Fatty acid composition of biodiesel from various feedstock. Table taken from ref.[7].
The difference in chemical composition can be also observed between diesel and HVO fuels as
reported in the work of Bhardwaj et al. [8] (Figure 1),where in case of HVO fuels of C14-C16
carbon chain the iso-paraffinic content can be in the range of 20-25% of the total mass fraction,
while for diesel fuels with the same hydrocarbon chain content the maximum value is up to 0,5-
1%. On the contrary for the n-paraffinic content, the HVO fuels show very low values (less than
1%), while for diesel values can arrive up to 9% of the mass fraction.
A comparison in terms of chemical composition can be also found for the jet-fuels and the
sustainable aviation fuels (SAF), as shown in Figure 2. We have an almost 100% iso-paraffinic
composition for the ATJ fuel and a slightly above 80% similar chemical composition for the
HEFA fuels compared to the classic jet-fuel Jet-A1, while the CHCJ fuel show an almost double
naphthene content compared to the Jet-A1 reference.

21
Figure 1:Carbon atom distribution of petroleum diesel and HVO as reported in ref. [8].
Figure 2: Comparison in terms of chemical composition of different jet-fuels and SAFs [9].

22
Therefore, the gradual introduction of biofuels has had a significant impact on the intrinsic
chemistry of fuels, and therefore on fuel quality and stability.
1.1.1 Fuel stability and deposits
Fuel stability refers to the ability of the fuel to resist degradation [10]. It is possible to distinguish
between different mechanisms of fuel degradation: autoxidation, from room temperature to
300°C; cracking or pyrolysis, for temperatures above 400°C; hydrolysis from water condensation
in tanks and transport systems; and microbiological contamination from bacteria and fungi in
water or dust [11].
This thesis is interested mainly by the autoxidation process since it is one of the main concerns
for the transportation industry. Autoxidation stability refers to the tendency of a fuel to degrade
from the oxidation of its compounds. The autoxidation process in fuel compounds results in the
formation of insolubles and deposits (also commonly named “lacquer” deposits) [12] in fuel
system of automobiles and aircrafts.
This phenomenon is very problematic since it can provoke engine mechanical failure, such as
injector blockage or filter plugging [13, 14].
To solve these old and well-known degradation process [15, 16], antioxidants are added to the
fuel in order to prevent this issue. However according to Zabarnick et al. [15] antioxidants seem
to effectively present a bivalent behavior depending on their low or high concentration, thus they
can either inhibit or promote these autoxidation processes. The use of different anti-oxidation or
anti-adherence coatings has been also investigated [16, 17]; nevertheless, it has been shown that
material coating can delay the deposits appearance but not completely avoid it.
The formation of deposits was observed for all type fuels, starting from the common fossil diesel
(standardized as EN 590 [18]) to the renewable biofuels like biodiesel and HVO and also for
fuels where additives were added to prevent fuel oxidation. The main objectives of their work
were to identify the inclination of different types of fuels or additives to deposit formation and to
find a method that would help them to distinguish the different deposits on the basis of the fuel
formulation.

23
Fortunato et al. [19] showed that fuels can be distinguished in terms of their tendency to from
deposits at the same operating conditions; they reported that high aromatic fuels (B10Aro)
presents the same propensity to deposit formation as 100% RME (Rapeseed-oil Methyl Esters),
with the only difference being the fact that the B10Aro forms only a very thin deposit film,
whereas the RME (B100, rapeseed methyl ester) showed a high deposits thickness around 1 μm
(Figure 3). Plus, in their test conditions the highly paraffinic 100% HVO (hydrotreated vegetable
oils) fuel presented higher propensity to block the injector than the RME fuel; however, when
mixed with 50% diesel (becoming so B50HVO fuel), it was showed that the HVO deposits
formation was drastically reduced and that its deposits present similarities with B0 deposits.
According to several studies in the literature, the fuel chemical composition represents a keen
factor for the deposit formation. Another parameter that is not negligible in this subject is the role
of the surfaces in fuel systems. The study conducted by Bacha [16] discussed the role of different
substrates in the formation and adhesion of fuel deposits. From this study, it seems that the nature
of the substrate could influence the deposit thickness and chemical composition.
Figure 3: Injector needle deposits morphology at 1mm as well as the enlargement of the red zones at 10 μm
and 1 μm [19].

24
It is noteworthy that fuel deposits above different coatings, such as the high temperature resistant
thermoplasticPolyEtherEtherKetone (PEEK), aluminium, aluminium coated in gold, stainless
steel and stainless steel treated with silcoklean1000 (i.e. high temperature precision anti-coking
coating process) were compared and it was found out that the quantity of deposits formed on the
PEEK substrate was lower than the one observed on the metallic surfaces (aluminium, stainless
steel and gold-coated aluminium), while the deposits revealed above the silcoklean coating was
observed to be thinner and distributed on the whole surface. This feature demonstrate that the
surface in contact with the fuel can play a role in the deposits formation process.
In the same study, it was hypothesized that the deposit precursors are composed by polar
oxidation products that are closer to an amphiphilic structures resembling an inverted micelles;
these new-formed micellar structures start forming nanoparticles in the liquid phase through their
agglomeration, leading to the constitution of deposit agglomerates above the surfaces. However
this hypothesis was not further studied.
Thus, there is a gap in the understanding of the interaction fuel-material leading to the deposits
formation and the chemical mechanisms involved as well as the role of the surfaces in this
process.
1.2. Motivation of the study
Given the lack of understanding of the interface interactions occurring between the fuel liquid
phase and the metallic solid phase, the objective of this thesis is to better comprehend the
phenomenology linked to this fuel degradation process ─ focused in the autoxidation mechanism
[20]─ where the so-formed liquid deposits start aggregating in liquid phase forming small
polymers that are considered to be the precursors of the “lacquer” deposits on the metallic
surfaces of the real systems. For this study in fact, what is paramount to find out is how the
interactions between the deposits precursors and the metallic walls actually play a role in this
precipitation/adsorption process.
In their recent works Fortunato et al. [21, 22] have investigated on the fuel oxidation process
where the characterization of oxidation products was conducted to identify the main factors that

25
could prevent deposit formation in engines. They found that during the oxidation process of
biofuel surrogate (methyl oleate/n-dodecane) small aggregates are formed and, as consequence,
fuel color changes and a phase separation occurs. Plus, they pointed out that the deposit observed
in injector systems would be formed when polarity of the autoxidation products in suspension is
high enough to induce precipitation of polymeric deposit. This polarity factor was also reported
in the already mentioned study [16], where it was pointed out that the chemical composition of
aged biofuels is mainly composed of oxygenated products (i.e. polarity) and that the molecular
weights of these products were observed to be higher than the fuel initial products.
From their FTIR results, Fortunato et al. [21] showed that deposit formation seems to be mainly
related to the polarity (i.e. oxygenated products) content differences of both sediment and
supernatant phases leading a phase separation process. This characteristic may imply the
formation of deposits already in the fuel liquid phase, in this way alluding that it might not be
initiated by the surface being in contact with the fuel. In connection with their results, they
proposed a mechanism for deposit formation where the two main pathways were highlighted
according to which deposit precursors could later become liquid deposits precipitated above the
engine metallic surface.
Figure 4: Scheme of the deposits formation mechanism proposed in ref. [21].
As showed above in Figure 4, deposit formation could follow two possible pathways, one
implying that the liquid film deposits comes from a previous adsorption process of the precursors

26
and the other instead implying an agglomeration step of deposit precursors directed towards a
consequent precipitation and formation of liquid deposits above the metallic substrate. Both
proposed mechanism pathways may be valid and further investigation is required to
understanding the mechanisms involved.
To better understand how the phenomenology of the oxidative fuel degradation is linked to the
investigation of the biofuel-surface interactions, in the next paragraphs we will first introduce the
“Liquid Phase Autoxidation” (LPA) process and its key factors, successively we will describe the
state of the art of the experimental and theorical studies aimed to the investigation of interface
interactions occurring between the organic compounds produced from biofuel autoxidation and
the metallic surfaces coating the fuel injection systems of diesel engines.
1.3. Liquid Phase Autoxidation process
Phenomena related to fuel autoxidation have been studied in several industrial contexts in the last
decades, starting from studies on crude oil for exploring refinery fouling [20] to fuel aging [23]
arising in engines injection systems. The first part of this state of the art review will be dedicated
to the chemical kinetics and chain mechanisms describing the Liquid Phase Autoxidation (LPA);
then major researches conducted on this topic will be mentioned to identify the key parameters
and species involved in this process.
1.3.1. Chemical kinetics of autoxidation
As it has consistently been assessed in many several studies concerning fuel autoxidation, oxygen
presence is a prerequisite for low temperature deposit formation in the liquid phase [20].
In these previous studies it has been assumed that autoxidation processes proceed through a chain
mechanism [10, 20]. In literature, many global chemical mechanisms [24, 25]for fuel
autoxidation have been proposed and in Figure 5 below we report the one proposed by
Watkinson and Wilson [20].

27
The choice of specifically reporting this mechanism is because of its clarity for showing the
formation of hydroperoxides as intermediates and the final production obtained from
hydroperoxides decomposition (e.g. alcohols, carbonyl compounds, epoxides, etc.). The
autoxidation mechanism is commonly divided in three main phases: initiation, propagation and
termination as indicated in the Figure 5 and which are described below.
Figure 5: Global mechanism for liquid phase autoxidation proposed by ref. [20].
In LTO (i.e. Low Temperature Oxidation) regime, the thermal energy registered in the fuel liquid
phase appear to be modest and the initiation step has several different pathways (Equation 1-
Equation 2-Equation 3).

28
One route considers the initiation step coming from traces of hydroperoxides decomposition via
H abstraction with O2[15, 20], but it can also be interpreted as a photochemical initiation (which
however cannot be considered in case of tanks being opaque to UV-visible light).
Another route considers instead the first step as being any compound able to carry out an H-
abstraction from the alkyl molecule and tries to describe it as an activated initiator that becomes
the first alkyl radical. 𝑅𝐻 + 𝑂2 → 𝑅° + 𝐻𝑂2°
Equation 1 𝑅𝐻 + 𝐼 → 𝑅° + 𝐼𝐻
Equation 2 𝐼𝑛𝑖𝑡𝑖𝑎𝑡𝑜𝑟 → 𝑅°
Equation 3
In addition, initiation step may be catalytically enhanced by dissolved metals, surface effects,
acid catalyzed, ionic reactions [12, 20, 24] (Equation 4-Equation 5).
HRRH
Equation 4
nnMHRMRH
)1(
Equation 5
The first propagation step (Equation 6) where alkyl radicals react with molecular oxygen
represents the main propagation path due to its low energy barrier (close to 0 kJ/mol) [26]. Then
this chain mechanism proceeds through the second propagation step (Equation 7) where the
peroxi-radical species reacts with the initial hydrocarbon, resulting into new hydroperoxide and
alkyl radical. 𝑅° + 𝑂2 → 𝑅𝑂2
Equation 6

29
𝑅𝑂2° + 𝑅𝐻 → 𝑅𝑂2𝐻 + 𝑅°
Equation 7
This chain mechanism is now well established in literature [24–26] from the 1930’s with
Semenov’s theory [27].
The conclusive termination step (Equation 8-Equation 9-Equation 10) can be simplified as a
sum of all the intermediates reaction paths and can go towards dimerization [28]; particularly in
case of biofuel blends, oxygenated products such as epoxides, aldehydes, carboxylic acids and
alcohols have been found [12, 22]. 𝑅𝑂𝑂° + 𝑅𝑂𝑂° → 𝑓𝑖𝑛𝑎𝑙 𝑝𝑟𝑜𝑑𝑢𝑐𝑡𝑠
Equation 8 𝑅𝑂𝑂° + 𝑅° → 𝑓𝑖𝑛𝑎𝑙 𝑝𝑟𝑜𝑑𝑢𝑐𝑡𝑠
Equation 9 𝑅° + 𝑅° → 𝑓𝑖𝑛𝑎𝑙 𝑝𝑟𝑜𝑑𝑢𝑐𝑡𝑠
Equation 10
1.3.2. Key parameters in liquid phase autoxidation
The first key parameter truly impacting in liquid phase autoxidation issues is the reactant itself or,
to be more precise, the fuel chemical composition; in fact, the system reactivity is highly
correlated with the fuel chemical formulation. Its impact on the reactivity is well-defined by the
C-H bond breaking energy, which can be certainly different depending on the given chemical
species involved in the process [29].
This behavior is well-illustrated in Figure 6 taken from the work of Corporan et al. [30],where
they studied the chemical and thermal stability of six alternative jet-fuels, among which three of
the fuels were produced via Fischer-Tropsch (FT) synthesis (e.g. Shell FT, Sasol FT and Rentech
FT) while the other three were “hydroprocessed renewable jet” (HRJ) fuels produced via the
hydroprocessing of animal fat/vegetable oils (e.g. R-8 HRJ, tallow RHJ, cameline HRJ). In their
work, Corporan et al. [30] reported a comparison of the surface deposition profiles between these

30
six alternative fuels and the standard JP-8 (“Jet Propellant 8”) fuel. Figure 6 shows that all
alternative fuels depicted excellent oxidative stability characteristics during the tests resulting in
minimal surface deposition and, according to them, the improved stability features of the
alternative fuels relative to the specification JP-8 were most likely due to the absence of
heteroatomic-containing species in these fuels, which have previously been implicated as
promoters of undesirable deposit formation in the oxidative regime.
This composition effect is also showed in Figure 7 taken from ref. [31], where the oxidation
stability of four different blends of methyl oleate (MO) and n-dodecane (n-C12H16) was
considered. The parameter representing the oxidation stability of the MO/n-C12H16 blends is the
induction period (IP), which defines the time corresponding to the onset of the oxidation regime.
We can imagine that the more oxygenated the system is in terms of chemical composition, the
lower the IP value can be at the same thermal conditions.
Figure 6: Comparison of carbon deposition and wall temperature profiles for oxidative stability of the alternative fuels and a specification of JP-8 fuel of ref. [30].
This is confirmed in Figure 7, where we can see the lowest IP is indicated for the 30% v/v
MO/n-C12H16 blend when considering a fixed temperature. On the other hand we can also notice

31
that, when considering a specific MO/n-C12H16 blend (i.e. fixed molecular oxygen content) the
increase in temperature implies a reduction in IP, which is to be expected.
The second key parameter which affects autoxidation and especially the deposition process is the
oxygen availability in the liquid phase [12, 32] From the deposition rate presented in Figure 8, it
is possible to identify two different reaction regimes: a pyrolytic regime (common to both
oxygenated and de-oxygenated fuels) and an oxidative regime (which is driven by the oxygen
concentration in the system).
The Figure 8 illustrates a) that there are two possible chain mechanisms leading to deposits (one
is the oxidative route, the other the pyrolytic route) and b) that some diffusion limitation may be
encountered under specific operating conditions. As the temperature range considered for this
thesis lies under 750 K, it confirms that the oxygen concentration present in the system is indeed
not all negligible, rather it represents an important parameter to be considered.
Figure 7: Induction period measurements from Ben Amara et al. [31] for different n-dodecane/methyl oleate
mixture as function of temperature.

32
Heteroatomic species (like nitrogen, sulfur or oxygen containing molecules) present in the fuel
can also promote deposits formation [24, 33]. Without any distinction of chemical groups in the
fuel, polar species have shown to promote deposit formation [34]. In particular, the most
impacting heteroatomic species have been identified with the hydroperoxides, which were found
to be key species in LPA [10, 20].
The last promoting effect underlined in literature is identified with the homogeneous catalytic
effect of dissolved metals [35] and the heterogeneous catalytic effect of the walls [20]. To reduce
heterogeneous catalytic effects, passivation processes have been investigated in literature and
demonstrated a reactivity decrease [36]. Being dissolved metals already present in fuels liquid
phases [24], initiation steps involving dissolved metals should be considered as preferential when
studying real fuel autoxidation.
Figure 8: Deposition rate as function of temperature for oxygenated and de-oxygenated fuel from ref. [37].
In conclusion, reactivity can be highly enhanced by trace level species. To reduce all those
impacts, stabilizing species called “antioxidants” (AH) are added into (bio)fuels to limit their low
temperature reactivity [38, 39] and their deposit formation tendency. Several families of
antioxidants are commonly added to fuels, generally identified with peroxy inhibitors species,
hydrogen donors and complexing agents. However Zabarnick [15] pointed out a somewhat
ambivalent behavior of antioxidants in oxidative fuel stability, as it is also shown in Figure 9.

33
In his work Zabarnick [15] was able to find out that the introduction of antioxidants at low
concentrations (< 0.0001 mol/L) resulted in the increase of fuel stability and a maximum stability
was reached at 60 ppm; however, at higher concentrations (> 0,0001 mol/L) the introduction of
antioxidant contributes to accelerate the oxidation process as shown in Figure 9.
Figure 9: Autoxidation effect on O2 decay rate constant. Data were obtained with n-dodecane at 200°C from
ref. [15]. The arrow illustrates the O2 decay without antioxidant.
1.3.3. Deposits formation from fuel autoxidation
In order to study how (bio)fuels undergo the deposition process caused by their autoxidation, it is
paramount to identify the nature of the deposits precursors. This analysis will start from the
consideration of the major factors contributing to deposits formation, namely the deposits
chemical composition and how they interact with the surfaces with whom they enter in contact
inside the engines injection circuits.
Also, in this analysis the given fuel nature (oxygenated or de-oxygenated) has to be necessarily
considered, since for this thesis the interest is focused on the deployment of both fossil and
renewable fuels being injected inside vehicles and aircrafts engines.

34
1.3.4. Deposits typologies and chemical composition
As it has already been mentioned before, these formed liquid deposits can provoke some failures
on many spots of the injection circuit, so investigating the interactions between the injected fuel
blend and the surfaces of the injection systems components represents indeed a fundamental task.
What happens in fact is that some liquid deposits are likely to be found especially at the injector
level (needle) and pump inside the injection circuit.
However, it should be mentioned beforehand that actually there are two kinds of deposits that can
be found inside injection systems: the soap-type and wax-type deposits respectively. In this
thesis, we chose to focus on lacquer type deposits since they are the main type of deposits formed
from hydrocarbons autoxidation mechanism. The lacquer type deposits are polymeric (usually
brown dark-colored) and they present tendency to adhere on surfaces. They are generally
insoluble in the usual used solvents and they can be divided in two different categories: a) the
deposits with an amide function coming from the presence of the PIBSI additive and b) the
deposits coming from the biofuels oxidation and from the formation of the derived polymers [22,
40].
According to Singer et al. [41] the heavy polar products coming from (bio)fuels autoxidation
have the tendency to form deposits that resemble polymers of heavy molecular weight; these
polymers also can generate intertwined systems and, when a so-called critic temperature is
reached, they transform into an insoluble reticular network.
About the petroleum-derived fuels (like diesel and jet-fuels), the reference [42, 43] shows that the
deposits produced from diesel and jet-fuel oxidation are mainly composed of polar polycyclic
aromatic species, although polar aliphatic species were also detected as oxidation products.
1.3.5. Deposits interaction with the metallic surface
The second aspect to analyze about the nature of deposits precursors is identified with the surface
effect of the used material in regards of the formation of deposits.

35
This aspect can be considered under two different perspectives: the first related to the material
catalytic effect on the fuel oxidation and the second instead related to the material effect on the
morphology and adhesion tendency of the deposits on the given surfaces.
As shown in Figure 10, deposits formation can happen on the basis of three different
mechanisms:
1. Precipitation of insoluble particles produced from the fuel oxidation over hot surface,
followed by the generation of agglomerates.
2. Formation of insoluble particles directly at the surface level via a catalytic effect of the
same surface.
3. A combination of the two aforementioned mechanisms.
Figure 10: Mechanisms of deposits formation as illustrated in Ref. [2].
The comprehension of these deposits adhesion mechanisms occurring on the surface may allow
to better identify the typologies of bonds and energies involved in their adsorption processes,
which can be distinguished into the following mechanisms: physisorption, chemisorption and
formation of organometallic complexes.
These information could provide useful insights to solve deposits issues, like for example the
possibility to re-solubilize completely or partially the deposits in the fuel or in a suitable solvent;
in fact according to the reference [44], the injected fuel presented a solvent power over the
formed autoxidation deposits.

36
A good solution could be represented for example by the implementation of special coatings on
the surfaces in order to reduce the number of active sites on their substrates, like the DLC coating
(Diamond Like Carbon), which has been found to minimize the adhesion of deposits at the
injector level [44].
Interesting results about the depiction of the interactions between the precursors deposits and
metallic surfaces have been achieved in the two references [45, 46]; in these works it had been
found that, when FAME fuel undergoes oxidation on aluminum, copper and stainless steel
surfaces, covalent bonds [COO-Metal] between the deposits and the metallic substrates are
formed.
This result proves to be very meaningful for this thesis, since it gives a very useful picture of the
bonds that can be established between ester molecules coming from biofuels blends and stainless
steel surfaces, which is the reference model for the walls of the injection circuit.
1.4. Adsorption of organic molecules on metallic surfaces 1.4.1. Experimental studies
Biodiesel oxidation products are mainly composed of molecules containing methyl esters,
carboxylic acids, ketones, aldehydes, alcohols or epoxides as the main chemical functions [12,
22, 47]. Some of these oxygenated species seem to be the precursors of deposits observed in
aluminum and stainless steel surfaces [19, 48].
Interaction of oxygenated species on aluminium surfaces have been widely studied in the
literature. Alexander et al. identified via Fourier-transform infrared spectroscopy (FTIR) the
formation of bonds between carboxylic acids and hydroxylated AlOOH surfaces [49].
Soo Lim et al. studied the adsorption and desorption of stearic acid self-assembled monolayers on
aluminium oxide via XPS and IR spectroscopy analyses [50]. They found that stearic acid makes
both monodentate and bidentate bonds with the alumina surface.
Hafidi et al. studied the interactions between vegetable oils (containing methyl esters) and
alumina membranes by FTIR [51]. They found that all selected lipids in their study adsorbed on
alumina. The adsorption proceeds by the surface hydroxyl groups and the polar groups of the

37
lipids, in particular tri- and di-acylglycerols species adsorb physically via H bonds through the
carbonyl ester group (C=O). Oleic acid is chemically adsorbed by ionic interaction between the
carboxylate anion (RCOO-) and the metal oxide.
Esters are known to adsorb to stainless steel surfaces and are used as lubricants. Yan et al. [52]
have studied the interactions between metals and oil-in-water (o/w) emulsions, where the metallic
surfaces were modeled by the stainless steel and a CoCrMo alloy, while the selected lubricant
was a commercial rapeseed oil (RME). From the XPS analyses they were able to observe that,
under boundary lubrication conditions, the active additive components of the lubricant adsorb on
the metal surface after the oil droplet of the emulsion is broken, forming a protective layer on the
surfaces.
1.4.2. Theoretical DFT studies
Understanding the role of molecular interactions between biodiesel molecules with the metallic
surfaces is of ubiquitous importance to predict and enhance fuel system performances. The
metal/alloy surfaces of our concern are stainless steel and aluminum as they are largely used in
the injection systems.
The DFT method can be a valid tool for the detailed investigation of the interface interactions
occurring on metal/alloy surfaces. At the same time, we have to select suitable surface models
that can better represent the specific properties of these types of materials. In our case, we wanted
to be as close as possible to the real conditions at which deposit formation may occur inside the
injection systems, thus we chose to model and study via DFT the aluminium and stainless steel
with the (0001) αAl2O3 and αCr2O3 surfaces respectively, with a particular focus on their
hydration states. We sustained this choice because the temperature of the injector in fuel systems
can achieve 150 °C with a water residual content of 1000 ppm under engine working conditions
and, in this conditions, aluminum is covered with an oxide and a hydrated film [53]. The same is
observed for the stainless steel, as shown by experimental [54–57] and theoretical studies [58–
62]. The oxides covering the aluminum surfaces are generally simulated by model oxides like α-
[63–65] or γ- [66] alumina (Al2O3).

38
Seminal works on water adsorption on α-Al2O3 and γ-Al2O3 provided useful models, which will
be used here. The (100) and (110) gamma alumina models, developed by Digne et al. [67] have
become one of the reference models as shown by the fact that several works have reused them
[68–71]. Digne et al. [67], followed by Arrouvel et al. [72–74] have tried to understand water
adsorption and predict the water coverage as a function of the thermodynamical conditions
(temperature and partial water pressure). They highlighted that the (100) facet dehydrated at
lower temperatures as compared to the (110) for a given partial water pressure.
The adsorption of molecules on alumina surfaces has been widely studied with DFT [59, 67–69,
72–90].
Many theoretical works have been published regarding adsorption on Al2O3 surfaces. Wang et al.
[87] have investigated the adsorption of methyl nitrate on dry (0001) α-Al2O3 and (110) γ-Al2O3.
They found that the adsorption on (110) surface is more stable than on α-Al2O3.
A DFT study by Kistamurthy et al. [89] showed the dissociative adsorption of acetic acid on the
(100) and (110) γ-Al2O3 anhydrous surfaces, where both oxygen atoms of the acetate coordinate
to the surface.
Heiden et al. [91] calculated with PBE-D3 a value of -157.3 kJ/mol for the dissociative and -
124.5 kJ/mol for molecular water adsorption on α-Al2O3 (0001) (1/4 ML coverage on a (2x2)
surface). Borck et al. [84]studied the methanol adsorption at the (0001) surface of α-Al2O3. They
found that the adsorption mechanism is a donor–acceptor interaction, where the methanol’s
oxygen lone pair orbital donates electron density into Al conduction band.
Arrouvel et al. [59] have studied the glycine adsorption on anhydrous and hydroxylated (0001)
surfaces of α-Al2O3 showing that on the dry surface, the glycinate anion forms an iono-covalent
Al−OC bond and it is stabilized in a unidentate perpendicular configuration with an adsorption
energy of -214 kJ/mol. In the case of the hydroxylated surface, it is observed that the substitution
of a surface OH group by glycine is thermodynamically favored (ΔEads = -213 kJ/mol). The
adsorption of CO2 on γ-alumina using DFT has been studied by Pan et al. [85] they also found
that the adsorption energy decreased when the water coverage increased in agreement the
previously mentioned studies.
Recently, Blanck et al [92] studied the solvation and adsorption properties of various species of
lubricant additives to investigate the most suitable among them that favors the wetting of γ-

39
alumina surface. From the results, they concluded that the adsorption of protic molecules (e.g.
water, amines, alcohols and carboxylic acids) on the (100) γ-alumina surface leads in most cases
to a dissociative adsorption for acidic molecules, where their adsorption energies decrease with
increasing pKa values of the functional groups.
Xu et al. [90] studied the adsorption of oleate methyl ester on diaspore and kaolinite crystals with
the generic UFF force field combined with an experimental study. They found that the oleate
chemisorbs on the surface of diaspore and kaolinite rendering the mineral surface hydrophobic.
Concerning stainless steel surfaces, less literature data is available and studied by DFT/ab-initio
principles approaches. The adsorption of CO2 on different Cr2O3 surfaces terminations (0001),
(01¯12) and (10¯12) was studied by Kumar et al. [93]. They found that CO2 can either physisorb
or chemisorb on Cr2O3 surfaces, in the first case conserving its linear structure while in the
second case a “bent-like” structure was observed. Also, CO2 chemisorption on the Cr2O3 (1012)
surfaces exhibits an Eads = -103.2 kJ/mol that is very close to the experimental values (-104.2
kJ/mol).
Costa et al. [60] studied water adsorption on the (0001)-Cr2O3-Cr terminated facet, and found that
molecular and dissociative adsorption were isoenergetics with values of -82.2 (dissociative) and -
82.6 (molecular) kJ/mol. For three water molecules adsorbed per Cr, the average adsorption
energy was calculated as -93.2 kJ/mol.
Souvi et al. [58] calculated an adsorption energy of −80.3 kJ/mol for dissociative water
adsorption (more stable than the molecular one). At saturation (3 water molecules per Cr), the
average adsorption energy was calculated as -87.9 kJ/mol. Matthew et al. studied water
adsorption on Cr2O3 with DFT + U and found that the adsorption energy of the first water is 96.5
kJ/mol, for 80.1 kJ/mol average adsorption energy at saturation [94].
Gouron et al. [61] studied by DFT the adsorption of monoethanolamine on the hydroxylated
Cr2O3 (0001) orientation where it follows that MEA adsorbs in a bidentate fashion, preferentially
on top of the water molecules forming the hydroxylated surface, while the water substitution is
thermodynamically not favorable at room temperature.

40
Ethanol adsorption on Cr2O3(0001) was studied by Zhang et al. and found to be exothermic by
90.7 kJ/mol [95]. However, the authors performed DFT calculations without explicit dispersion
corrections.
Huš et al. [96] studied the adsorption of propane on dry (0001) Cr2O3 with DFT+U including van
der Waals forces described by Grimme D3 method [97]. According to their results, the adsorption
energy for propane on dry (0001) Cr2O3 is -34.7 kJ/mol. Benzene was adsorbed on corundum-
type surfaces [98]. The adsorption energy was calculated as -50.2 kJ/mol and -53.1 kJ/mol for dry
Cr2O3 and Al2O3, respectively.
According to Garrain’s work on the glycine adsorption on hydroxylated α-Cr2O3, the major
contribution to the adsorbate/surface interaction comes from the H-bonds between the COOH
function and the surface OH groups. Two scenarios have been envisaged: the adsorption of the
amino-acid on the surface OH groups labeled as “outer sphere adsorption” and the substitution of
a surface OH group with the glycine molecule in its anionic form labeled as “inner sphere
adsorption”. They found that outer-sphere adsorption of amino-acids like glycine is poorly
surface site-specific, where they molecularly adsorb above the surface hydroxyls, while the inner-
sphere adsorption of these biomolecules is site specific.
1.4.3. ReaxFF studies of the homogeneous phase
Most of the ReaxFF studies about fuels are related to gas phase reactions, combustion and soot
formation. There is a lack of studies in fuel liquid phase at the best of our knowledge.
Nevertheless, among the ReaxFF studies related to a fluid homogeneous phase, an interesting
work is the one conducted by Chen et al. [99] which was centered on the investigation of the soot
formation process of diesel combustion using ReaxFF by examining the effects of oxygenated
additives on diesel root reduction. The ReaxFF employed in their study allowed them to model
the kinetics of large hydrocarbons fuels and to describe the chemistry of carbon condensed phase.
In their study, they employed a diesel surrogate proposed by Qian et al. [100] that could
accurately reproduce the gaseous emission of the target diesel fuel under actual engine
combustion conditions. Their reactive system consisted in 149 pure diesel surrogates molecules
with 150 oxygen molecules to model fuel-rich combustion. Also, to study the effect of fuel

41
additives, oxygenated fuel molecules were doped into their simulation boxes containing their
diesel model.
In their work, Chen et al. [99] chose to implement two different sets of widely used reactive force
field parameters for combustion reactions, CHO2016 and CHO2008 force field parameters
respectively. Between these two sets of parameters, the first retained the capability of the second
for predicting complex hydrocarbon pyrolysis and oxidation reactions but was capable to
reproduce more accurate chemical pathways important for soot formation. Despite their work was
centered exclusively on the hydrocarbons homogeneous phase, in gas phase, is worth mentioning
since it is linked to the description of decomposition phenomena occurring to hydrocarbons
species with oxygenated additives, which could be interesting to this thesis.
The feasibility of these two sets of ReaxFF parameters in predicting particle growth during soot
inception process was evaluated and shown in Figure 11 below. The carbon number of the
largest particle in CHO2016 can be as large as 1000 after the initial fuel decomposition, whereas
CHO2008 fails to predict the particle growth with the carbon number remaining at an extremely
low level. Chen et al. [99] observed that, after 1.6 ns, the C:H ratio of the largest molecule in
CHO2016 started to increase and became much higher than that of CHO2008, indicating that
CHO2016 was able to describe the continuous dehydrogenation reasonably during soot inception.
As a consequence, CHO2016 parameters were employed in their following study.
Figure 11: Evaluation of CHO2008 and CHO2016 force field parameters in predicting diesel incipient soot formation in terms of the number of carbon atoms in the largest molecule and the C:H ratio of the largest
molecule, where the solid cycle represents CHO2016 while the hollow cycle represents CHO2008. Image taken from ref.[99].

42
From their ReaxFF simulations, they found that large hydrocarbons clusters undergo coalescence
through aliphatic chain connection and that this process results in rapid mass growth eventually
leading to the condensed nascent root particle. Plus, they observed that the effects of the
oxygenated molecular structures on soot formation are quantified and reflected in two aspects,
i.e. removing C-atoms from the soot precursor pool through combination with O-atoms and
contributing to soot precursor formation due to the existence of C-C bonds simultaneously.
On a similar page, Cheng, Wang et al. [101] studied the high-temperature oxidation mechanisms
of toluene at different temperatures and densities by employing the ReaxFF reactive force field.
To validate their reactive force field and its transferability, they performed QM calculations on
the key intermediates and reactions observed during the ReaxFF MD simulations. Geometry
optimization of the heats of formation for key reactions at 298 K were calculated by using the
Gaussian 03 program[102].
Figure 12: Simplified scheme of toluene partial oxidation pathway observed in the ReaxFF NVT-MD
simulation at T = 2700 K performed by Cheng et al. [101].

43
To investigate the initial reaction mechanisms of toluene oxidation, Cheng et al. [101] performed
a series of NVT-MD simulations on unimolecular combustion models (which contained 100
oxygen molecules and 1 toluene molecule) and multimolecular combustion models (which
instead contained 90 oxygen molecules and 10 toluene molecules). These simulations were
performed at 0.35 g/cm3 with temperature ranging from 2500 to 3000 K in 100 K intervals. These
two independent sets of simulations showed that benzyl radical (C7H7°) was a dominant
intermediate at different temperatures and this was found as reasonable since the methyl C-H
bond is the weakest (89.2 kcal/mol). Cheng et al. [101] reported a simplified scheme of toluene
oxidation shown in Figure 12 below, where dash cycles indicate the final carbon dioxide.
They also found that the extended simulation time of 1 ns for high temperature simulation (3000
K) did not result in further oxidation of carbon monoxide to carbon dioxide and they attributed
this possibility to a longer simulation time required for the further oxidation of carbon monoxide
to occur.
From their MD simulations, they found that the consumption of toluene mainly happens in three
ways: (1) the hydrogen abstraction reactions by oxygen molecules or other small radicals to form
benzyl radical, (2) the cleavage of the C-H bond to form benzyl and hydrogen radicals and (3) the
cleavage of the C-C bond to form phenyl and methyl radicals. All these basic reaction
mechanisms were observed to be in good agreement with available chemical kinetic models.
1.4.4. ReaxFF studies of the liquid-surface interactions
In the work of Chia et al. [103] the liquid adsorption of organic compounds on hematite α-Fe2O3
using ReaxFF was discussed. The adsorbed species were small molecules like ethanol (C2H6O),
toluene (C7H8) and iso-octane (C8H18) and hematite (α-Fe2O3) as surface since it is often formed
on the surface of iron-containing alloys [104, 105].
The objective of this research was to study the effect that organic molecules of different polarity
can have on the structure of a crystal surface; their aim was to assess the impact that the surface
distortions can have on the properties of this adsorbed liquid phase, as well as the ability of this
solvent to affect both the structure and properties of the solid surface. To validate their force

44
field, they calculated the structure of bulk hematite by using a MD-NVT simulations with the
ReaxFF parameters at 298 K and 1 atm and then compared the obtained results with experimental
crystallographic data. From this comparison, they found their ReaxFF results to be in agreement
with the reference experimental data.
Their ReaxFF study showed that, when ethanol and toluene were adsorbed on the surface in the
flexible slab case, they were shift to slightly larger distances than the rigid slab case as
consequence of an expansion occurred at the outermost surface atoms of the hematite surface
(Figure 13). Plus, from their calculations resulted that the first layer of adsorbed ethanol have
shown a parallel configuration to the surface, while the toluene molecule adsorbed tilted on the
surface, with an average tilt angle of approximately 35° with respect to the normal direction of
the slab; for the iso-octane case, results have confirmed that the polarity of the molecules indeed
has an effect on the structure of hematite near the surface [103].
Figure 13: Density profiles along the z axis normalized by the bulk liquid density ρ0 and visualization of a
typical molecule’s orientation for (a) ethanol, (b) toluene and (c) iso-octane. Results obtained for the flexible slab are shown in red and the results for the rigid slab are in black. Image taken from ref.[103].

45
To validate the influence of the adsorbate polarity on the outermost layers of the hematite
surface, Chia et al. showed from their results that significant differences in the bond lengths of
the surface atoms were found by comparing the rigid and the flexible solid models. The Figure
14 below shows the bond lengths of the outermost layer of the flexible hematite slab in contact
with different fluids. It was observed that the Fe-O bond length distributions in the presence of
ethanol is nonsymmetrical and slightly wider than for the other fluids. According to Chia et al,
the stronger attraction of liquid molecules to the surface is a result of the increase in nonbonded
electrostatic interactions.
As conclusion of their work, they showed that the polarity of the liquid has indeed a strong
influence on the structure of the iron oxide surface model since it modified the positions of the
outermost surface atoms together with their partial charges; this result is not to be underestimated
since the change in position and charge can actually lead towards larger electrostatic interactions
and a stronger liquid adsorption, even in the absence of chemical reactions.
Figure 14: Probability distribution function of the Fe-O bond length in the outermost layer of flexible solid in contact with ethanol (solid line), toluene (dotted line), iso-octane (dashed line) and vacuum (red).Image taken
from ref.[103].
It is worthy to highlight their research contribution since in this thesis it has similarly been
considered a liquid phase in which they are present fuel oxidation precursors, most likely in the
form of alcohols, esters and epoxides which can add polarity to the system; plus, being the
hematite α-Fe2O3 analyzed in this work a corundum-type oxide exactly as the chromia α-Cr2O3,

46
similar structural and electronic properties are expected. For these reasons, seen the similarities
between the two systems, their results could be eventually considered as future reference for the
ReaxFF parameterization of this study.
Another interesting work related to ReaxFF is the research conducted by Shin, Kwak et al. [106],
where they were able to develop a ReaxFF force field for the Fe/Cr/O/S system by ReaxFF
parameterization via QM calculation data. For ReaxFF parameterization, they opted to compare
the QM values for the lattice parameters and cohesive energy of Cr for three different crystal
structures (bcc, fcc and a15) since the energy-volume relationship of metals and alloys was
considered of great importance for predicting phase stability of the crystal structures and
structural phase transitions under pressure and temperature.
The objective of this study was to investigate about the Cr-oxide catalytic activity regarding the
butane oxidation reaction carried out at 1600 K. To validate their ReaxFF force field for
describing the catalytic oxidation reactions, Shin et al. performed NVT-MD oxidation
simulations of butane on Cr2O3 and Cr2O3/pyrite surfaces and then compared the obtained
reactions with these catalysts to the oxidation of with O2 oxidant. They investigated the reaction
mechanisms in small model systems and then analyzed the product distribution in large-scale
simulations.
From Figure 15 below reports the energy barriers required for the first dehydrogenation of the
terminal carbon investigated at different oxygen sites. The potential energy curve calculated by
Shin et al. along the dehydrogenation reaction reveals that the energy barriers are 6.7 kcal/mol at
the terminal oxygen sites, 6.9 kcal/mol at the peroxo oxygen site and 17 kcal/mol at the bridging
oxygen site. All these energy barriers agree that binding the H atom to the terminal oxygen is
easier kinetically and thermodynamically than that to the bridging and peroxo oxygens and in
their simulations, Shin et al. observed that the abstraction of hydrogen from butane is carried out
by all three oxygen types (e.g. the terminal oxygen, the bridging oxygen and the peroxo oxygen).
In fact, thanks to their simulations results, they were able to demonstrate that the active oxygen
species present on the oxide surface actually play an important role regarding this oxidation
reaction, since they appeared to be very reactive by readily interacting with the butane molecules.

47
Indeed, Cr-oxide is able to catalyze several chemical reactions, e.g. dehydrogenation, oxidation
and polymerization [107–110]. Plus, the Cr-oxide is a highly efficient catalyst for full combustion
[111].
Figure 15: Energy barrier and reaction energy for the dehydrogenation of a butane terminal carbon at active oxygen sites on Cr2O3 (1000) surface. Image taken from ref.[106].
It is certainly well-known that in oxidation processes the active oxygen species present on these
metal oxides surfaces play an important role in their catalytic activity [112]. Indeed, this aspect
should not be overlooked in this thesis, since in the future molecular simulations a catalytic
behavior from chromia α-Cr2O3 could happen to be detected.
Another interesting work is the one conducted by Soleymanibrojeni M. et al. [113], where MD
ReaxFF simulations have been computed for the study of epoxy/water/alumina systems; these
system, similarly as the one considered for this thesis, can be divided into three parts: (i) organic
phase, (ii) substrate, (iii) interface between the organic phase and the substrate. In particular, in
this work the interaction energies of different configuration of epoxy and water over an alumina
substrate was studied.

48
In their work, Soleymanibrojeni M. et al. [113] compared ReaxFF results against the density
functional tight binding (DFTB) calculations. The simulations were implemented for three
different systems: the organic system (C/H/N/O), the organic phase on hydroxylated γ-alumina
substrate (C/H/O/Al) and the reaction of aluminum with water (Al/H/O).
The force fields used in their study were labeled as ReaxFF-13, ReaxFF-15 and ReaxFF-18; to
compare and validate them, density and structural analysis of four crystalline organic compounds
were used. The selected compounds are Trimethylamine, (20R,24S)-20,24-Epoxy dammarane-
3β,12β,25-triol (EDT), Diglycidyl Ether of Bisphenol-A (DGEBA), (S)-3-Hydroxymethyl-
1,2,3,4-tetrahydroisoquinoline (HMTQ). The density of each compound was measured with
Nosé-Hoover method at constant particle number, pressure and temperature (NPT) at 298.2 K for
200 ps. The density is the average of the final 50 ps values and the simulation boxes were made
by 4x4x4 replication of the crystalline unit cells.
From their results on the description of the organic molecules, the ReaxFF-18 gave the most
accurate reproduction of the experimental values of densities, with errors between the 0.1%-7%,
while the least accurate prediction was given by ReaxFF-13, which gave errors between 18.5%-
45.1% [113]. To complete their structural analyses on these selected compounds,
Soleymanibrojeni et al. also calculated the radial distribution functions g(r) and its integral, which
gave the mean number of atoms around a specific type of atom at distance r. The g(r) and its
integral for C-N pairs of Trimethylamine, and C-C pairs of EDT, DGEBA and HMTQ were
calculated.
Plus, they also calculated the self-diffusion, density and structure of 864 water molecules by
using 100 ps Nosé-Hoover NPT simulations at 298.2 K with each force field and the results from
the final 50 ps were used for calculation of density. In particular, the RDF of O-O, O-H and H-H
pairs of water molecules were obtained and compared with experimental data.
About their study on the interface interactions of the epoxy/water/surface system, they calculated
the interaction energies of DGEAB molecules with a hydroxylated (001) γ-alumina substrate with
and without adsorbed water molecules with each force-field.
For these calculations, they created the following systems: six DGEBA molecules (Epoxy) were
placed on a 27.9 Å x 24.9 Å hydroxylated (001) γ-alumina interface (Al2O3) with 70, 140 or 210

49
surface adsorbed water molecules (H2O). The Al2O3 and surface H2O together is considered as
the Substrate, defining in this way the Epoxy/Substrate-(70 H2O), the Epoxy/Substrate-(140 H2O)
and the Epoxy/Substrate-(210 H2O). Direct interaction energies of Epoxy with Al2O3 for different
systems (70 H2O, 140 H2O and 210 H2O) were also measured (i.e. Epoxy/Al2O3-70 H2O, Epoxy/
Al2O3-140 H2O and Epoxy/Al2O3-210 H2O). Finally, direct interaction energies between Epoxy
and different number of water molecules were additionally calculated: Epoxy/Water-(70 H2O),
Epoxy/Water-(140 H2O) and Epoxy/Water-(210 H2O).
Figure 16: Interactions energies of DGEBA and hydroxylated alumina with DFTB and ReaxFF methods. Image taken from ref.[113].
The ReaxFF results were compared with DFTB calculations and reported below in Figure 16.
Figure 16 shows that the interaction energies generally decrease as the number of water
molecules increase. From their results, they came to the following conclusions: i) interaction
energies of the Epoxy with water are greater than those of Epoxy with Al2O3; ii) interaction
energies of Epoxy with Substrate decrease by increasing the number of water molecules; iii)

50
DFTB interaction energies of Epoxy with Al2O3 decreased by increasing the number of water
molecules, but ReaxFF interaction energies showed less sensitivity to this parameter [113].
The behavior of the epoxy with the water and alumina substrate found from their work could be
helpful for this thesis, since it gives insights of how this molecule seems to interact when in
contact with a hydroxylated metal oxide substrate with additional water molecules.
In the work of Sengul et al. [114] the reaction dynamics of liquid-solid interface with the example
of an acetic acid/ water solution interacting with a ZnO(1010) surface was investigated using
ReaxFF reactive force field-based molecular dynamics. Even though the ZnO(1010) surface is
not treated in our study, the study of the interface interactions of organic molecule/water/metal-
oxide systems is a topic of major interest in this thesis framework.
To conduct their dynamic study, Sengul et al. [115] opted to use a new ReaxFF potential to
model the acetic acid/water/ZnO interfacial reactions by combining two previously developed
potentials, the potential for H/O/Zn interaction [116] and the potential for C/H/O interaction
[117], respectively. They investigated the interaction between solvent molecules and surfaces
through the adsorption energies, thus they conducted energy minimization simulations in order to
obtain data on the adsorption. In their minimization calculations, they used 12 layers of ZnO
slabs, each of them composed of 360 zinc (Zn) and oxygen (O) atoms. The amount of coverage
on the surface by the acetic acid molecules was indicated as θ, where the number of the acetic
molecules for θ = 1.0was 30 (one molecule per surface Zn) and θ = 0.5 (half monolayer) was 15.
In their work, Sengul et al. [115] reported the minimum energy configurations that are shown in
Figure 17. They observed that a dissociative adsorption is favored for acetic acid molecules on
ZnO(1010) surface and that, in the case of full coverage (θ = 1.0), the hydrogen bonds with
oxygens of other acetates affected the orientation of acetates with respect to the surface normal.
Sengul et al. [115] calculated the adsorption energies values using ReaxFF and these results were
compared with DFT calculations results provided by ref. [118] and were found to be in a very
good agreement with this reference.
To investigate the reaction dynamics between acetic acid molecules and ZnO (1010) surface in
the presence of water, ReaxFF MD simulations were performed at effective temperatures ranging

51
between 300 K and 1200 K to drive the reactions within the computational time. The population
of the molecular species were calculated in the bulk phase and on the surface separately.
The molecules with a distance of 3.0 Å or less from surface cations were counted as surface
species and the rest were counted as bulk species. The fractions were calculated by dividing by
the total number of corresponding species: the fraction of acetate, acetic acid and carbon species
were calculated with respect to the total number of acetic acids in the system; the relative surface
coverage was calculated with respect to the total number of available sites for adsorption on
surface. The results obtained for the case run at T = 300 K are reported in the Figure 18 below.
[115]
Figure 17: Minimum energy configurations of ZnO(1010) covered by acetic acid molecules reported in ref. [115]. Top: [0001] view, bottom: [1210] view. Oxygen, hydrogen, carbon and zinc atoms are visualized as red, white, cyan and silver spheres, respectively. (a) 100% coverage (θ = 1,0) configuration, (b) 50% coverage (θ =
0,5) configuration.

52
According to their results at T = 300 K, Sengul et al. [115] found that 33% of water molecules
were adsorbed on the surface either molecularly or dissociatively and the remaining 66.7% were
in the bulk phase. Similar dissociation ratios have been reported by DFT and previous ReaxFF
studies.
Figure 18: Fractions of populations of the species in the gas phase and on the surface at room temperature according to ref. [115].
For the acetic acid molecules, approximately 58% of the molecules in the system were adsorbed
on the surface and a dissociation of Brønsted acids (i.e. acetic acid) mechanism on this metal
oxide surface was also observed in their simulations, as reported in Figure 19 below.
Figure 19: Snapshots of ReaxFF MD simulations from ref. [115] showing the different adsorption states of water and acetic acid on ZnO surface. (a) Bridging and surface hydroxyls, (b) molecularly adsorbed water, (c) adsorbed acetate and surface hydroxyl. Oxygen, hydrogen, carbon and zinc atoms are visualized as red, white,
cyan and silver spheres, respectively. Oxygen and hydrogen atoms that are of interest are visualized as blue and yellow, respectively.
In their work, Sengul et al. found that the acetic acid dissociation mechanisms are observed in the
simulations: (1) deprotonation to surface cation, which produces a terminal hydroxyl and (2)

53
deprotonation to a bridging hydroxyl, which results in water production. According to them, an
increase in temperature promotes the dissociation of acetic acids and its adsorption surface at
first, but as temperature increase continues, the surface coverage by acetates decreases due to
evaporation from the surface or decomposition.
1.5. Conclusion
Fuel degradation is a major concern to the transportation industry since it can lead to liquid and
insoluble deposits in several parts of the engine in contact with the fuel, and in particular they are
one of the major causes for the malfunctioning and failures of engine injectors. This bibliographic
study shows that these deposits are directly linked to the hydrocarbons autoxidation occurring in
the liquid phase and to their interaction with the metallic surfaces in contact with the fuel.
Experimental data have shown that the small oxygenated molecules obtained from the
autoxidation process such as alcohols, aldehydes, ketones, epoxides and carboxylic acids are
considered as deposits precursors. The oxygenated polar “head” of these molecules seems to
form chemical bonds with different metal-oxide surfaces, but also with polymers and coatings.
Two mechanisms were proposed for understanding the deposits formation observed in engines
parts: (1) the adsorption of these precursors directly to the surfaces forming a first liquid film
layer; or (2) the aggregation and coalescence process in the liquid phase and depending on the
polarity, weight and operation conditions, these aggregates would precipitate adsorbing on the
different surfaces. Both mechanisms are not completely understood.
Several numerical works focused on the investigation of organic condensed phase or
organic/metal-oxides surfaces by using DFT and/or ReaxFF method. However, the theoretical
studies with focus on fuels are mostly dedicated to homogeneous gas phase and combustion.
There is a lack of data available for fuels in liquid phase in low temperature range (<300°C),
which would be more pertinent for studying fuels autoxidation process. Some theoretical studies
dedicated to heterogeneous phases, i.e. organic molecules in liquid phase/metal-oxides surfaces
interfaces are quite interesting. They have shown that the hydration state of the surface may play
an important role for the adsorption of oxygenated molecules such as epoxides and carboxylic
acids on the oxide surface. However, despite the literature available, there is still a lack of
understanding about the interactions of organic molecules over metallic surfaces like aluminum

54
and stainless steel in conditions that are closer to real engine systems, (e.g. surface hydration
variation), as well as to evaluate molecules that are better representing fuels oxidation products
and not yet studied in the literature, such as acetaldehyde, ketones, epoxides and acetic acid, at
the best of our knowledge.
Therefore, the objective of this thesis is to obtain a reactive force field able to handle the
reactions of organic molecules representative of the fuel in the liquid phase and their interaction
with two metallic surfaces representative of engine materials. The developed reactive force field
will be used to study deposits formation process. To achieve this goal this thesis is structured as
follows:
Chapter 2 describes in detail the methodology used during this thesis which is based in a
multiscale approach combining two different numerical approaches: a preliminary ab
initio study conducted via DFT (Density Functional Theory) and a successive MD
(Molecular Dynamics) approach carried out via the implementation of a reactive force
field (ReaxFF). The theoretical notions behind both numerical approaches are also
discussed.
The choice of model surfaces representing aluminum and stainless steel as well as the
different hydration conditions (partial pressure of water in the system) is presented in
Chapter 3.
Chapter 4 is dedicated to the quantum mechanical (QM) study using DFT calculations to
study the toluene autoxidation reactions in the gas phase and the adsorption of small
organic molecules (models of deposit precursors) on representative aluminum and
stainless-steel surfaces. All DFT parameters about the system energy of reaction,
adsorption, charge transfers, and the reactivity of the molecules over surfaces in which
each studied surface orientation was either anhydrous or fully hydroxylated was studied.
All these data are necessary to calibrate the reactive force field.
Once the DFT data are available, a ReaxFF study was carried out and presented in
Chapter 5 with the objective to build a solid ReaxFF methodology suitable for our
research. In this chapter, we thoroughly describe the ReaxFF reparametrization and
validation steps of two different force fields, one exclusively for the description of

55
alumina configurations and the other for the description of chromia configurations,
respectively.
Chapter 6 focus is then to present the application of the obtained reactive force field to
the autoxidation reaction of toluene in both homogeneous (i.e. liquid phase) and
heterogeneous (i.e. liquid/solid interface) conditions.
Finally, the conclusion and perspectives are discussed in Chapter 7.

56
References
1 Office P. Directive 2009/28/EC of the European Parliament and of the Council of 23 April 2009 on the
promotion of the use of energy from renewable sources and amending and subsequently repealing Directives 2001/77/EC and 2003/30/EC.
2 Knothe G., Krahl J., van Gerpen J.The Biodiesel Handbook, Elsevier (2015). ISBN: 9780983507260. 3 Energy, transport and environment statistics, Imprimeries Bietlot Frères, Belgium, Luxembourg (2020). ISBN:
978-92-76-20736-8. 4 Resolution A40-18 Climate change: https://www.icao.int/environmental-protection/pages/climate-change.aspx. 5 American Society for Testing and Materials (ASTM) standard D6751. Standard specification for biodiesel fuel
blend stock (B100) for middle distillate fuels.,ASTM. 6 European Committee for Standardization. Standard EN 14214. Automotive fuels – fatty acid methyl esters
(FAME) for diesel engines – requirements and test methods. 7 Anand P. Dahiya, A. K. Berwal, B. K. Khan Combustion analysis in a compression ignition engine powered by
biodiesel,Int. J. Eng. Technol. Manag. Appl. Sci.3, 9 (2015), 40–53. 8 Bhardwaj O.P., Lüers B., Holderbaum B., Koerfer T., Pischinger S., Honkanen M. Utilization of HVO Fuel
Properties in a High Efficiency Combustion System: Part 2: Relationship of Soot Characteristics with its Oxidation Behavior in DPF,SAE Int. J. Fuels Lubr.7, 3 (2014), 979–994. DOI: 10.4271/2014-01-2846.
9 The EU Framework Programme for Research and Innovation Horizon 2020: H2020 Programme AGA - Annotated Model Grant Agreement. Available at: https://ec.europa.eu/research/participants/data/ref/h2020/grants_manual/amga (2019).
10 Pullen J., Saeed K. An overview of biodiesel oxidation stability,Renewable and Sustainable Energy Reviews16, 8 (2012), 5924–5950. DOI: 10.1016/j.rser.2012.06.024.
11 Dunn R.O. Antioxidants for improving storage stability of biodiesel,Biofuels, Bioprod. Bioref.2, 4 (2008), 304–318. DOI: 10.1002/bbb.83.
12 Bacha K., Ben-Amara A., Vannier A., Alves-Fortunato M., Nardin M. Oxidation Stability of Diesel/Biodiesel Fuels Measured by a PetroOxy Device and Characterization of Oxidation Products,Energy Fuels29, 7 (2015), 4345–4355. DOI: 10.1021/acs.energyfuels.5b00450.
13 Ullmann J., Geduldig M., Stutzenberger H., Caprotti R., Balfour G. Investigation into the Formation and Prevention of Internal Diesel Injector Deposits,SAE Int. J. Fuels Lubr., 2008-01-0926 (2008). DOI: 10.4271/2008-01-0926.
14 J Barker, P Richards, C Snape, W Meredith Diesel injection deposits - An issue that has evolved with engine technology,SAE Int. J. Fuels Lubr. (2011).
15 Zabarnick S. Chemical kinetic modeling of jet fuel autoxidation and antioxidant chemistry,Ind. Eng. Chem.
Res.32 (1993), 1012–1017. 16 Bacha K. These de Doctorat "Etude de l'interaction entre le carburant diesel et les composants su systèmes
d'injection diesel,Physique des matériaux, Université de Haute Alsace (2016). 17 Jones E.G., Balster L.M. Interaction of a Synthetic Hindered-Phenol with Natural Fuel Antioxidants in the
Autoxidation of Paraffins,Energy Fuels14, 3 (2000), 640–645. DOI: 10.1021/ef990216q. 18 EN 590: Automotive fuels-Diesel-Requirements and test methods. 2009. 19 Alves Fortunato M., Lenglet F., Ben Amara A., Starck L. Are Internal Diesel Injector Deposits (IDID) Mainly
Linked to Biofuel Chemical Composition or/and Engine Operation Condition?,SAE Int. J. Fuels Lubr., 2019-01-0061 (2019). DOI: 10.4271/2019-01-0061.
20 Watkinson A.P., Wilson D.I. Chemical reaction fouling: A review,Experimental Thermal and Fluid Science14, 4 (1997), 361–374. DOI: 10.1016/S0894-1777(96)00138-0.
21 Alves-Fortunato M., Ayoub E., Bacha K., Mouret A., Dalmazzone C. Fatty Acids Methyl Esters (FAME) autoxidation: New insights on insoluble deposit formation process in biofuels,Fuel268 (2020), 117074. DOI: 10.1016/j.fuel.2020.117074.
57
22 Alves-Fortunato M., Labaume J., Cologon P., Barré L. Biofuel Surrogate Oxidation: Insoluble Deposits Formation Studied by Small-Angle X-ray Scattering and Small Angle Neutron Scattering,Energy Fuels32, 9 (2018), 9559–9567. DOI: 10.1021/acs.energyfuels.8b02055.
23 Thomas R. Sem Investigation of injector tip deposits on transport refrigeration units running on biodiesel fuel,SAE Int. J. Fuels Lubr.1801 (2004).
24 Kuprowicz N.J., Zabarnick S., West Z.J., Ervin J.S. Use of Measured Species Class Concentrations with Chemical Kinetic Modeling for the Prediction of Autoxidation and Deposition of Jet Fuels,Energy Fuels21, 2 (2007), 530–544. DOI: 10.1021/ef060391o.
25 W. Mathieu Zongo Etude de l'oxydation des huiles de poisson microencapsulées par DSC sous pression,Chimie
Analytique (2009). 26 Pfaendtner J., Broadbelt L.J. Mechanistic Modeling of Lubricant Degradation. 1. Structure−Reactivity
Relationships for Free-Radical Oxidation,Ind. Eng. Chem. Res.47, 9 (2008), 2886–2896. DOI: 10.1021/ie0714807.
27 Nikolai N. Semenov: Nobel Lecture (1956). 28 K. T. Reddy, Nicholas P. Cernansky, and R. S. Cohen Modified reaction mechanism of aerated n-dodecane
liquid flowing over heated metal tubes (1987). 29 Evgeny T. Denisov Igor B. Afanas’ev (ed.)Oxidation and Antioxidants in Organic Chemistry and Biology.
ISBN: ISBN 0-8247-5356-9 (alk. paper). 30 Corporan E., Edwards T., Shafer L., DeWitt M.J., Klingshirn C., Zabarnick S., West Z., Striebich R., Graham
J., Klein J. Chemical, Thermal Stability, Seal Swell, and Emissions Studies of Alternative Jet Fuels,Energy
Fuels25, 3 (2011), 955–966. DOI: 10.1021/ef101520v. 31 Ben Amara A., Nicolle A., Alves-Fortunato M., Jeuland N. Toward Predictive Modeling of Petroleum and
Biobased Fuel Stability: Kinetics of Methyl Oleate/ n -Dodecane Autoxidation,Energy Fuels27, 10 (2013), 6125–6133. DOI: 10.1021/ef401360k.
32 Balamurali Navaneetha Sundaram The effects of oxygen on synthetic crude oil fouling,Master of Applied
Science, Annamalai University (1998). 33 Balster L.M., Zabarnick S., Striebich R.C., Shafer L.M., West Z.J. Analysis of Polar Species in Jet Fuel and
Determination of Their Role in Autoxidative Deposit Formation †,Energy Fuels20, 6 (2006), 2564–2571. DOI: 10.1021/ef060275l.
34 Balster L.M., Corporan E., DeWitt M.J., Edwards J.T., Ervin J.S., Graham J.L., Lee S.-Y., Pal S., Phelps D.K., Rudnick L.R., Santoro R.J., Schobert H.H., Shafer L.M., Striebich R.C., West Z.J., Wilson G.R., Woodward R., Zabarnick S. Development of an advanced, thermally stable, coal-based jet fuel,Fuel Processing Technology89, 4 (2008), 364–378. DOI: 10.1016/j.fuproc.2007.11.018.
35 B. D. Batts and A. Zuhdan Fathoni A literature review on fuel stability studies with particular emphasis on diesel oil,Energy Fuels5 (1991), 2–21.
36 Ervin J.S., Ward T.A., Williams T.F., Bento J. Surface Deposition within Treated and Untreated Stainless Steel Tubes Resulting from Thermal-Oxidative and Pyrolytic Degradation of Jet Fuel,Energy Fuels17, 3 (2003), 577–586. DOI: 10.1021/ef020180t.
37 L.J. Spadaccini, R.A. Meinzer, He Huang Membrane based fuel deoxygenator, US 6,315,815 B1. 38 Karavalakis G., Hilari D., Givalou L., Karonis D., Stournas S. Storage stability and ageing effect of biodiesel
blends treated with different antioxidants,Energy36, 1 (2011), 369–374. DOI: 10.1016/j.energy.2010.10.029. 39 Grinstead B., Zabarnick S. Studies of Jet Fuel Thermal Stability, Oxidation, and Additives Using an Isothermal
Oxidation Apparatus Equipped with an Oxygen Sensor,Energy Fuels13 (1999), 756–760. DOI: 10.1021/ef980252+.
40 Arondel M., Rodeschini H., Lopes M., Dequenne B. Fuel Additives for Reduction of Internal Diesel Injectors Deposits (IDID, “lacquering”): A Critical and Priority Route,SAE Int. J. Fuels Lubr. (2012). DOI: 10.4271/2012-01-1687.
41 Singer P., Rühe J. On the mechanism of deposit formation during thermal oxidation of mineral diesel and diesel/biodiesel blends under accelerated conditions,Fuel133 (2014), 245–252. DOI: 10.1016/j.fuel.2014.04.041.
42 Jones C.C., Chughtai A.R., Murugaverl B., Smith D.M. Effects of air/fuel combustion ratio on the polycyclic aromatic hydrocarbon content of carbonaceous soots from selected fuels,Carbon42, 12-13 (2004), 2471–2484. DOI: 10.1016/j.carbon.2004.04.042.

58
43 Wong O. Design and Development of an Apparatus to Study Aviation Jet Fuel Thermal Stability,Master of
Applied Science and Engineering (2010). 44 Bouilly J., Mohammadi A., Iida Y., Hashimoto H., Geivanidis S., Samaras Z. Biodiesel Stability and its Effects
on Diesel Fuel Injection Equipment,SAE Int. J. Fuels Lubr. (2012). DOI: 10.4271/2012-01-0860. 45 Hu E., Xu Y., Hu X., Pan L., Jiang S. Corrosion behaviors of metals in biodiesel from rapeseed oil and
methanol,Renewable Energy37, 1 (2012), 371–378. DOI: 10.1016/j.renene.2011.07.010. 46 Norouzi S., Eslami F., Wyszynski M.L., Tsolakis A. Corrosion effects of RME in blends with ULSD on
aluminium and copper,Fuel Processing Technology104 (2012), 204–210. DOI: 10.1016/j.fuproc.2012.05.016. 47 Chatelain K., Nicolle A., Ben Amara A., Catoire L., Starck L. Wide Range Experimental and Kinetic Modeling
Study of Chain Length Impact on n -Alkanes Autoxidation,Energy Fuels30 (2016), 1294–1303. DOI: 10.1021/acs.energyfuels.5b02470.
48 Richter B, Crusius S., Schümann U., Handorf H. Characterisation of Internal Deposits in Common-Rail Injectors,MTZ worldwide74 (2013), 50–56.
49 Alexander M. R., Beamson G., Blomfield C. J., Leggett G., Duc T. M. Interaction of carboxylic acids with the oxyhydroxide surface of aluminium : poly(acrylic acid), acetic acid and propionic acid on pseudoboehmite,J
Electron Spectros Relat Phenomena121 (2001), 19–32. DOI: 10.1016/S0368-2048(01)00324-3. 50 Lim M.S., Feng K., Chen X., Wu N., Raman A., Nightingale J., Gawalt E.S., Korakakis D., Hornak L.A.,
Timperman A.T. Adsorption and desorption of stearic acid self-assembled monolayers on aluminum oxide,Langmuir (2007), 2444–2452. DOI: 10.1021/la061914n.
51 Hafidi A., Anglaret E., Pioch D., Ajana H. Characterization of vegetable oils-alumina membranes interactions by diffuse reflectance Fourier transform infrared spectroscopy,Eur. J. Lipid Sci. Technol.106, 1 (2004), 11–21. DOI: 10.1002/ejlt.200300851.
52 Yan J., Zeng X., Ren T., van der Heide E. Boundary lubrication of stainless steel and CoCrMo alloy based on phosphorous and boron compounds in oil-in-water emulsion,Appl. Surf. Sci.315 (2014), 415–424. DOI: 10.1016/j.apsusc.2014.07.160.
53 Łodziana Z., Nørskov J.K., Stoltze P. The stability of the hydroxylated (0001) surface of α-Al2O3,The Journal
of Chemical Physics118, 24 (2003), 11179–11188. DOI: 10.1063/1.1574798. 54 Massoud T., Maurice V., Klein L. H., Seyeux A., Marcus P. Nanostructure and local properties of oxide layers
grown on stainless steel in simulated pressurized water reactor environment,Corros. Sci.84 (2014), 198–203. DOI: 10.1016/j.corsci.2014.03.030.
55 Bikondoa O., Moritz W., Torrelles X., Kim H.J., Thornton G., Lindsay R. Impact of ambient oxygen on the surface structure of α-Cr2O3(0001),Phys. Rev. B81, 205439 (2010). DOI: 10.1103/PhysRevB.81.205439.
56 Lübbe M., Moritz W. A LEED analysis of the clean surfaces of α-Fe(2)O(3)(0001) and α-Cr(2)O(3)(0001) bulk single crystals,J. Phys.: Condens. Matter21, 134010 (2009). DOI: 10.1088/0953-8984/21/13/134010.
57 M. Bender et al. Structural rearrangement and surface magnetism on oxide surfaces : a temperature-dependent low-energy electron diffraction-electron energy loss spectroscopy study of Cr2O3(111)/Cr(110),J. Phys.:
Condens. Matter7, 27 (1995), 5289–5302. DOI: 10.1088/0953-8984/7/27/014. 58 Souvi S.M., Badawi M., Virot F., Cristol S., Cantrel L., Paul J.-F. Influence of water, dihydrogen and dioxygen
on the stability of the Cr 2 O 3 surface: A first-principles investigation,Surf. Sci.666 (2017), 44–52. DOI: 10.1016/j.susc.2017.08.005.
59 Arrouvel C., Diawara B., Costa D., Marcus P. DFT Periodic Study of the Adsorption of Glycine on the Anhydrous and Hydroxylated (0001) Surfaces of α-Alumina,J. Phys. Chem. C111, 49 (2007), 18164–18173. DOI: 10.1021/jp0741408.
60 Costa D., Sharkas K., Islam M.M., Marcus P. Ab initio study of the chemical states of water on Cr2O3(0001): From the isolated molecule to saturation coverage,Surf. Sci.603, 16 (2009), 2484–2493. DOI: 10.1016/j.susc.2009.05.037.
61 Gouron A., Kittel J., Bruin T. de, Diawara B. Density Functional Theory Study of Monoethanolamine Adsorption on Hydroxylated Cr 2 O 3 Surfaces,J. Phys. Chem. C119, 40 (2015), 22889–22898. DOI: 10.1021/acs.jpcc.5b05375.
62 Nigussa K.N., Nielsen K.L., Borck Ø., Støvneng J.A. Adsorption of hydrogen, chlorine, and sulfur atoms on α-Cr2O3(0001) surfaces: A density functional theory investigation,Corros. Sci.53, 11 (2011), 3612–3622. DOI: 10.1016/j.corsci.2011.07.005.

59
63 Baran J.D., Grönbeck H., Hellman A. Mechanism for limiting thickness of thin oxide films on aluminum,Phys.
Rev. Lett.112 (2014), 146103-1 -146103-5. DOI: 10.1103/PhysRevLett.112.146103. 64 Siegel D.J., Hector L.G., Adams J.B. Adhesion, atomic structure, and bonding at the Al(111)/α−Al2O3(0001)
interface: A first principles study,Phys. Rev. B65, 8 (2002). DOI: 10.1103/PhysRevB.65.085415. 65 Renaud G. Oxide surface and metal/oxide interfaces studied by grazing incidence X-ray scattering,Surf. Sci.
Rep.32 (1998), 1–90. 66 Costa D., Ribeiro T., Mercuri F., Pacchioni G., Marcus P. Atomistic Modeling of Corrosion Resistance: A First
Principles Study of O 2 Reduction on the Al(111) Surface Covered with a Thin Hydroxylated Alumina Film,Adv. Mater. Interfaces1, 3 (2014), 1300072. DOI: 10.1002/admi.201300072.
67 Digne M., Sautet P., Raybaud P., Euzen P., Toulhoat H. Hydroxyl Groups on γ-Alumina Surfaces: A DFT Study,J. Catal.211, 1 (2002), 1–5. DOI: 10.1006/jcat.2002.3741.
68 Jenness G.R., Christiansen M.A., Caratzoulas S., Vlachos D.G., Gorte R.J. Site-Dependent Lewis Acidity of γ-Al 2 O 3 and Its Impact on Ethanol Dehydration and Etherification,J. Phys. Chem. C118, 24 (2014), 12899–12907. DOI: 10.1021/jp5028349.
69 Wischert R., Laurent P., Copéret C., Delbecq F., Sautet P. γ-Alumina: the essential and unexpected role of water for the structure, stability, and reactivity of "defect" sites,J. Am. Chem. Soc. (2012), 14430–14449. DOI: 10.1021/ja3042383.
70 Valero M.C., Raybaud P., Sautet P. Influence of the hydroxylation of gamma-Al2O3 surfaces on the stability and diffusion of single Pd atoms: a DFT study,J. Phys. Chem. B110, 4 (2006), 1759–1767. DOI: 10.1021/jp0554240.
71 Ngouana-Wakou B.F., Cornette P., Corral Valero M., Costa D., Raybaud P. An Atomistic Description of the γ-Alumina/Water Interface Revealed by Ab Initio Molecular Dynamics,J. Phys. Chem. C121, 19 (2017), 10351–10363. DOI: 10.1021/acs.jpcc.7b00101.
72 Arrouvel C., Digne M., Breysse M., Toulhoat H., Raybaud P. Effects of morphology on surface hydroxyl concentration: a DFT comparison of anatase–TiO2 and γ-alumina catalytic supports,J. Catal.222, 1 (2004), 152–166. DOI: 10.1016/j.jcat.2003.10.016.
73 Arrouvel C., Breysse M., Toulhoat H., Raybaud P. A density functional theory comparison of anatase (TiO2)- and γ-Al2O3-supported MoS2 catalysts,J. Catal.232, 1 (2005), 161–178. DOI: 10.1016/j.jcat.2005.02.018.
74 Arrouvel, C., Toulhoat H., Breysse M., Raybaud P. Effects of PH2O, PH2S, PH2 on the surface properties of anatase -TiO2 and γ-Al2O3: a DFT study,J. Catal.226, 2 (2004), 260–272. DOI: 10.1016/j.jcat.2004.05.019.
75 J. M. Wittbrodt, W. L. Hase, and H. B. Schlegel Ab initio study of the interaction of water cluster models of the aluminum terminated (0001) α-aluminum oxide surface,J. Phys. Chem. B102 (1998), 6539–6548. DOI: 10.1021/jp981516w.
76 X-G. Wang, A. Chaka, M. Scheffler Effect of the Environment on alpha-Al2O3 (0001) Surface Structures,Phys.
Rev. Lett.84, 16 (2000), 3650–3653. DOI: 10.1103/PhysRevLett.84.3650. 77 Di Felice R., Northrup J. E Theory of the clean and hydrogenated Al2O3 (0001) - (1x1) surfaces,Phys. Rev.
B60, Iss. 24 - 15 (1999). DOI: 10.1103/PhysRevB.60.R16287. 78 Tepesch P. D., Quong A. A First‐Principles Calculations of α‐Alumina (0001) Surfaces Energies with and
without Hydrogen,Phys. Stat. Sol (b)217 (2000), 377–387. DOI: 10.1002/(SICI)1521-3951(200001)217:1%3C377:AID-PSSB377%3E3.0.CO;2-B.
79 Hass, Schneider, Curioni, Andreoni The chemistry of water on alumina surfaces: reaction dynamics from first principles,Science282, 5387 (1998), 265–268. DOI: 10.1126/science.282.5387.265.
80 Hass K.C., Schneider W.F., Curioni A., Andreoni W. First-Principles Molecular Dynamics Simulations of H 2 O on α-Al 2 O 3 (0001),J. Phys. Chem. B104, 23 (2000), 5527–5540. DOI: 10.1021/jp000040p.
81 Borck Ø., Hyldgaard P., Schröder E. Adsorption of methylamine on α−Al2O3(0001) and α−Cr2O3(0001) : Density functional theory,Phys. Rev. B75, 3 (2007). DOI: 10.1103/PhysRevB.75.035403.
82 Borck Ø., Schroder E. Adsorption of Methanol on Aluminum Oxide : A Density Functional Study,Phys. Rep. (2003), 1–11.
83 Chakarova-Käck S.D., Borck Ø., Schröder E., Lundqvist B.I. Adsorption of phenol on graphite(0001) and α−Al2O3(0001) : Nature of van der Waals bonds from first-principles calculations,Phys. Rev. B74, 15 (2006). DOI: 10.1103/PhysRevB.74.155402.

60
84 Borck Ø., Schröder E. First-principles study of the adsorption of methanol at the α-Al 2 O 3 (0001) surface,J.
Phys.: Condens. Matter18, 1 (2006), 1–12. DOI: 10.1088/0953-8984/18/1/001. 85 Pan Y., Liu C., Ge Q. Adsorption and protonation of CO2 on partially hydroxylated gamma-Al2O3 surfaces: a
density functional theory study,Langmuir (2008), 12410–12419. DOI: 10.1021/la802295x. 86 Pan Y., Liu C., Ge Q. Effect of surface hydroxyls on selective CO2 hydrogenation over Ni4/γ-Al2O3: A density
functional theory study,J. Catal.272, 2 (2010), 227–234. DOI: 10.1016/j.jcat.2010.04.003. 87 Wang Y., Yan X., Xiao W., Shao Y. DFT Analysis of the Adsorption of Methyl Nitrate on Al 2 O 3
Surfaces,Bull. Korean Chem. Soc.38, 6 (2017), 625–631. DOI: 10.1002/bkcs.11136. 88 Shukla M.K., Hill F. Computational Investigation of Adsorption of 2,4,6-Trinitrotoluene on (0001) Surface of
(4 × 4) α-Alumina,J. Phys. Chem. C117, 25 (2013), 13136–13142. DOI: 10.1021/jp403499p. 89 Kistamurthy D., Saib A.M., Moodley D.J., Preston H., Ciobîcă I.M., van Rensburg W.J., Niemantsverdriet J.W.,
Weststrate C.J. The role of carboxylic acid in cobalt Fischer-Tropsch synthesis catalyst deactivation,Catal.
Today275 (2016), 127–134. DOI: 10.1016/j.cattod.2015.11.012. 90 Xu L., Hu Y., Dong F., Gao Z., Wu H., Wang Z. Anisotropic adsorption of oleate on diaspore and kaolinite
crystals: Implications for their flotation separation,Appl. Surf. Sci.321 (2014), 331–338. DOI: 10.1016/j.apsusc.2014.10.042.
91 Heiden S., Usvyat D., Saalfrank P. Theoretical Surface Science Beyond Gradient-Corrected Density Functional Theory: Water at α-Al 2 O 3 (0001) as a Case Study,J. Phys. Chem. C123, 11 (2019), 6675–6684. DOI: 10.1021/acs.jpcc.9b00407.
92 Blanck S., Loehlé S., Steinmann S.N., Michel C. Adhesion of lubricant on aluminium through adsorption of additive head-groups on γ-alumina: A DFT study,Tribol. Int.145 (2020), 106140. DOI: 10.1016/j.triboint.2019.106140.
93 Kumar A., Ropital F., Bruin T. de, Diawara B. Effects of surface orientations of Cr2O3 on CO2 adsorption: A DFT approach,Appl. Surf. Sci.529 (2020), 147127. DOI: 10.1016/j.apsusc.2020.147127.
94 J. Matthew D Lane, K. Leung, A. P. Thompson, M. E. Cuneo Water Desorption from Rapidly-Heated Metal Oxide Surfaces - First Principles Molecular Dynamics and the Temkin Isotherm,J. Phys.: Condens. Matter30, 46 (2018), 1–32. DOI: 10.1088/1361-648X/aae4af.
95 Zhang M., Huang Y., Li R., Li G., Yu Y. A DFT Study of Ethanol Adsorption and Dehydrogenation on Cu/Cr2O3 Catalyst,Catal Lett144, 11 (2014), 1978–1986. DOI: 10.1007/s10562-014-1356-8.
96 Huš M., Kopač D., Likozar B. Kinetics of non-oxidative propane dehydrogenation on Cr2O3 and the nature of catalyst deactivation from first-principles simulations,J. Catal.386 (2020), 126–138. DOI: 10.1016/j.jcat.2020.03.037.
97 Grimme S., Antony J., Ehrlich S., Krieg H. A consistent and accurate ab initio parametrization of density functional dispersion correction (DFT-D) for the 94 elements H-Pu,J. Chem. Phys.132, 15 (2010), 154104. DOI: 10.1063/1.3382344.
98 Dabaghmanesh S., Neyts E.C., Partoens B. van der Waals density functionals applied to corundum-type sesquioxides: Bulk properties and adsorption of CH3 and C6H6 on (0001) surfaces,Phys.Chem.Chem.Phys.18, 33 (2016), 23139–23146. DOI: 10.1039/c6cp00346j.
99 Chen C., Jiang X. Molecular dynamics simulation of soot formation during diesel combustion with oxygenated fuel addition,Phys. Chem. Chem. Phys.61 (2020), 113. DOI: 10.1039/D0CP01917H.
100 Qian Y., Yu L., Li Z., Zhang Y., Xu L., Zhou Q., Han D., Lu X. A new methodology for diesel surrogate fuel formulation: Bridging fuel fundamental properties and real engine combustion characteristics.
101 Cheng X.-M., Wang Q.-D., Li J.-Q., Wang J.-B., Li X.-Y. ReaxFF molecular dynamics simulations of oxidation of toluene at high temperatures,J. Phys. Chem. A116, 40 (2012), 9811–9818. DOI: 10.1021/jp304040q.
102 Frisch M.J., Trucks G.W., Schlegel H.B., Scuseria G.E., Robb M.A., Cheeseman J.R., Montgomery, J. A., Jr., Vreven T., Kudin K.N., Burant J.C., Millam J.M., Iyengar S.S., Tomasi J., Barone V., Mennucci B., Cossi M., Scalmani G., Rega N., Petersson G.A., Nakatsuji H., Hada M., Ehara M., Toyota K., Fukuda R., Hasegawa J., Ishida M., Nakajima T., Honda Y., Kitao O., Nakai H., Klene M., Li X., Knox J.E., Hratchian H.P., Cross J.B., Bakken V., Adamo C., Jaramillo J., Gomperts R., Stratmann R.E., Yazyev O., Austin A.J., Cammi R., Pomelli C., Ochterski J.W., Ayala P.Y., Morokuma K., Voth G.A., Salvador P., Dannenberg J.J., Zakrzewski V.G., Dapprich S., Daniels A.D., Strain M.C., Farkas O., Malick D.K., Rabuck A.D., Raghavachari K., Foresman J.B., Ortiz J.V., Cui Q., Baboul A.G., Clifford S., Cioslowski J., Stefanov B.B., Liu G., Liashenko A., Piskorz P., Komaromi I., Martin R.L., Fox D.J., Keith T., Al-Laham M.A., Peng C.Y., Nanayakkara A., Challacombe

61
M., Gill P.M.W., Johnson B., Chen W., Wong M.W., Gonzalez C., Pople J.A.Gaussian 03, Revision C. 02.
Wallingford, CT: Gaussian (2004). 103 Chia C.-L., Avendaño C., Siperstein F.R., Filip S. Liquid Adsorption of Organic Compounds on Hematite α-
Fe2O3 Using ReaxFF,Langmuir33, 42 (2017), 11257–11263. DOI: 10.1021/acs.langmuir.7b02374. 104 Olsson C.-O., Landolt D. Passive films on stainless steels—chemistry, structure and growth,Electrochimica
Acta48, 9 (2003), 1093–1104. DOI: 10.1016/S0013-4686(02)00841-1. 105 Dwivedi D., Lepková K., Becker T. Carbon steel corrosion: A review of key surface properties and
characterization methods,RSC Adv.7, 8 (2017), 4580–4610. DOI: 10.1039/C6RA25094G. 106 Shin Y.K., Kwak H., Vasenkov A.V., Sengupta D., van Duin A.C. Development of a ReaxFF Reactive Force
Field for Fe/Cr/O/S and Application to Oxidation of Butane over a Pyrite-Covered Cr 2 O 3 Catalyst,ACS
Catal.5, 12 (2015), 7226–7236. DOI: 10.1021/acscatal.5b01766. 107 Kim D S Tatibouet J-M Wachs I E Surface Structure and Reactivity of CrO3/SiO2 Catalysts,Journal of
Catalysis136 (1992), 209–221. 108 De Rossi S, Ferraris G, Fremiotti S, Cimino A, Indovina V Propane dehydrogenation on chromia/zirconia
catalysts,Applied Catalysis A: General81 (1992), 113–132. 109 Chatterjee S, Greene H L, Park J Y Comparison of Modified Transition Metal-Exchanged Zeolite Catalysts for
Oxidation of Chlorinated Hydrocarbons,Journal of Catalysis138, 179-194 (1992). 110 Chen J D, Dakka J, Sheldon R A Selective decomposition of cyclohexyl hydroperoxide to cyclohexanone
catalyzed by chromium aluminophosphate-5,Applied Catalysis A: General108 (1994), L1-L6. 111 Pradier C M, Rodrigues F, Marcus P, Landau M V, Kaliya M L, Gutman A, Herskowitz Supported chromia
catalysts for oxidation of organic compounds: The state of chromia phase and catalytic performance,Applied
Catalysis B: Environmental27 (2000), 73–85. 112 Tokarz-Sobieraj R., Witko M., Gryboś R. Reduction and re-oxidation of molybdena and vanadia: DFT cluster
model studies,Catalysis Today99, 1-2 (2005), 241–253. DOI: 10.1016/j.cattod.2004.09.046. 113 Soleymanibrojeni M., Shi H., Liu F., Han E.-H. Atomistic simulations of Epoxy/Water/Aluminum systems
using the ReaxFF method,Comput. Mater. Sci.173 (2020), 109424. DOI: 10.1016/j.commatsci.2019.109424. 114 Sengul M.Y., Randall C.A., van Duin A.C.T. ReaxFF molecular dynamics simulation of intermolecular
structure formation in acetic acid-water mixtures at elevated temperatures and pressures,J. Chem. Phys. DOI: 10.1063/1.5025932.
115 Sengul M.Y., Randall C.A., van Duin A.C.T. ReaxFF Molecular Dynamics Study on the Influence of Temperature on Adsorption, Desorption, and Decomposition at the Acetic Acid/Water/ZnO(101̅0) Interface Enabling Cold Sintering,ACS Appl. Mater. Interfaces10, 43 (2018), 37717–37724. DOI: 10.1021/acsami.8b13630.
116 Raymand D., van Duin A.C., Baudin M., Hermansson K. A reactive force field (ReaxFF) for zinc oxide,Surface
Science602, 5 (2008), 1020–1031. DOI: 10.1016/j.susc.2007.12.023. 117 Monti S., Corozzi A., Fristrup P., Joshi K.L., Shin Y.K., Oelschlaeger P., van Duin A.C.T., Barone V.
Exploring the conformational and reactive dynamics of biomolecules in solution using an extended version of the glycine reactive force field,Phys. Chem. Chem. Phys.15, 36 (2013), 15062–15077. DOI: 10.1039/c3cp51931g.
118 Moreira N.H., Domıinguez A., Frauenheim T., Da Rosa A.L. On the stabilization mechanisms of organic functional groups on ZnO surfaces,Physical chemistry chemical physics : PCCP14, 44 (2012), 15445–15451. DOI: 10.1039/c2cp42435e.

62
Chapter 2. Methodology
2.1 Introduction
To better understand the phenomenology related to the formation of deposits produced from the
autoxidation process, it is paramount to identify which parameters and operating conditions can
mostly impact on these deposits adhesion/precipitation process, especially concerning the case of
metallic surfaces of the injection system since they are constantly in contact with the stored fuel.
This thesis consists in a multi-scale computational study of the biofuel/metal interaction. The idea
behind a multi-scale approach is to decompose the whole system and relevant phenomena in
multiple domains (e.g. metallic solid phase, oxide film layer, liquid-solid interface and the liquid
bulk). In each of these domains, decomposition into factors operating at different length scales
can be considered and described by various models. The integrated multi-scale model considers
processes, such as autoxidation of molecules in solution, migration of the aggregates to the metal
surface, the role of the surface in products oxidation and aggregates formation. To our
knowledge, such an integrated approach applied to fuel-surface interaction is still to be done.
In a multi-scale approach, atomistic methods are expected to bring important insight and
information that is not reachable by experiment.
Thus, atomistic DFT and FF methods are useful for the following studies: quantum calculations
can be done to estimate deprotonation and solvation energies of molecules in fuel, and FF
calculations can help estimate the tendency of molecules to form aggregates. FF MD calculations
can bring insight into surface and interface tensions, diffusivity data of various species in liquid
phases. First principles calculations associated with atomistic thermodynamics (that allows
calculating Gibbs free energies) are useful to construct surface phase diagrams and to predict
under given thermodynamic conditions surface termination and composition of the oxide film.
DFT calculations are the major tool to model the reactions between molecules in liquid and on a
given surface. From adsorption energies, completed with evaluation of vibrational and rotational
energies, the Gibbs free energy of the molecule adsorption can be calculated.

63
However, DFT quantum-mechanical simulations may present a significant limitation in terms of
computational time, in particular when the size of the chemical systems consists of more than
100-200 atoms. Another relevant factor that can surely impact on this aspect is the complexity of
the systems where different chemical species are involved, since the predictions of their
properties in addition to their interactions may slow down significantly DFT simulations.
One of the fundamental concepts of chemistry and materials science is undoubtedly the “bond
breaking and forming”. The accurate modeling of bond-breaking processes continues to be a
computational challenge, especially in the description of large molecules. Recent progresses on
the implementation of unrestricted (spin-polarized) Kohn-Sham DFT allowed to account for
homolytic bond breaking, making it possible the description of reactions occurring between
molecules with unpaired electrons (i.e. free radicals). Since in this study we wanted to simulate
the processes associated with the autoxidation of molecules, where very reactive species like
radicals are formed, DFT spin-polarized calculations were required. However, DFT recent studies
have been focused on heterolytic bond cleavage, as mentioned in the work of Kim et al. [69],
where they overviewed the DFT major applications in the merits of iron-containing molecules of
bioorganic interest.
Empirically parameterized reactive force fields based on bond-order concepts (like ReaxFF) that
include the ability to model bond breaking have been developed in the last years. The reactive
force fields include DFT results in training sets, which allow them to be parameterized in order to
better model the molecules bond breaking occurring during a chemical process.
Therefore the methodology adopted for this thesis is based on the combination of these two
different numerical approaches: an ab initio study conducted via Density Functional Theory
(DFT) and a successive Molecular Dynamics (MD) approach carried out via the implementation
of a reactive force field (ReaxFF). The preliminary theoretical DFT study will be carried out to
acquire useful energetic data (i.e. reaction and adsorption energies) from the geometry
optimization of gas-phase and gas/solid systems of interest with the intention to use them as input
data to train the empirical force field to obtain a force field able to correctly predict the behavior
of the chemical species involved, in both homogeneous and heterogeneous phases. Once
validated the force field, the main objective is to obtain useful insights into the adsorption and

64
deposition processes while considering the degradation/oxidation phenomena occurring in the
fuel liquid phase.
With this premise, this chapter first introduces the DFT quantum mechanical method, followed
by the description of the molecular dynamics principles defining the ReaxFF method that was
used for this thesis.
2.2 Quantum mechanics basics
As reported in the “Schrödinger Equation” paragraph of ref. [1], quantum mechanics describes
the behavior of molecules in terms of interactions among nuclei and electrons and molecular
geometry in terms of minimum energy of particles nuclei. All the quantum mechanical methods
known so far are based on the resolution of the Schrödinger equation, of which below we report
the particular case of the hydrogen atom as a single electron in three dimensions:
[− 12 𝛻2 − 𝑍𝑟] 𝜓(𝒓) = 𝐸 𝜓(𝒓)
Equation 11
Where the quantity in square brackets represents the kinetic and potential energy of an electron at
a distance𝑟 from a nucleus of charge 𝑍 (1 for hydrogen). The terms 𝐸 and 𝜓(𝒓) respectively
represent the electronic energy of the system and the wave function (in function of the electron
coordinates 𝒓) describing the motion of the electrons.
The generalization of the Schrödinger equation for a multinuclear, thus multielectron system may
be described with the following equation below: Ĥ 𝛹 = 𝐸 𝛹
Equation 12
Where the 𝛹 is a many-electron wavefunction andĤ is the so-called Hamiltonian operator (or
more simply the Hamiltonian), which in the atomic units is given by the following expression:

65
Ĥ = − 12 ∑ 𝛻𝑖2𝑒𝑙𝑒𝑐𝑡𝑟𝑜𝑛𝑠𝑖 − 12 ∑ 1𝑀𝐴
𝑛𝑢𝑐𝑙𝑒𝑖𝐴 𝛻𝐴2 − ∑ ∑ 𝑍𝐴𝑟𝑖𝐴
𝑛𝑢𝑐𝑙𝑒𝑖𝐴
𝑒𝑙𝑒𝑐𝑡𝑟𝑜𝑛𝑠𝑖 + ∑ ∑ 1𝑟𝑖𝑗
𝑒𝑙𝑒𝑐𝑡𝑟𝑜𝑛𝑠𝑖<𝑗 + ∑ ∑ 𝑍𝐴𝑍𝐵𝑅𝐴𝐵
𝑛𝑢𝑐𝑙𝑒𝑖𝐴<𝐵
Equation 13
Where we define 𝑍as the nuclear charge, 𝑀𝐴 as the ratio of the mass of nucleus 𝐴 to the mass of
an electron, 𝑅𝐴𝐵 as the distance between nuclei 𝐴 and 𝐵, 𝑟𝑖𝑗 as the distance between electrons 𝑖and 𝑗and 𝑟𝑖𝐴 as the distance between electron 𝑖and nucleus 𝐴.
The many-electron Schrödinger equation cannot be solved exactly, not even in for a simple two-
electron system such as the hydrogen molecule. Thus, numerical approximations need to be
introduced to provide possible resolutions to this equation.
2.2.1 Born-Oppenheimer approximation
As reported in the homonymous paragraph of ref. [1], one way to simplify the Schrödinger
equation for molecular systems is to assume that the electronic motion and the nuclear motion in
molecules can be separated. This leads to a molecular wave function in terms of electron
positions and nuclear positions and, as consequence, the Hamiltonian can be split into an
electronic part and nuclei part. This statement is known as the Born-Oppenheimer approximation
that defines an “electronic” Schrödinger equation: Ĥ𝑒𝑙𝛹𝑒𝑙 = 𝐸𝑒𝑙𝛹𝑒𝑙 Equation 14
Ĥ𝑒𝑙 = − 12 ∑ 𝛻𝑖2𝑒𝑙𝑒𝑐𝑡𝑟𝑜𝑛𝑠𝑖 − ∑ ∑ 𝑍𝐴𝑟𝑖𝐴
𝑛𝑢𝑐𝑙𝑒𝑖𝐴
𝑒𝑙𝑒𝑐𝑡𝑟𝑜𝑛𝑠𝑖 + ∑ ∑ 1𝑟𝑖𝑗
𝑒𝑙𝑒𝑐𝑡𝑟𝑜𝑛𝑠𝑖<𝑗
Equation 15
The term defining the nuclear kinetic energy in Equation 13 is absent in the Equation 15 above
since it is zero, while the nuclear-nuclear Coulomb term present in Equation 13 is a constant and
needs to be added to the electronic energy 𝐸𝑒𝑙 to define the total energy, 𝐸, for the system:

66
𝐸 = 𝐸𝑒𝑙 + ∑ ∑ 𝑍𝐴𝑍𝐵𝑍𝐴𝐵𝑛𝑢𝑐𝑙𝑒𝑖
𝐴<𝐵
Equation 16
It should be noticed that the nuclear mass does not appear in the electronic Schrödinger equation;
so that the Born-Oppenheimer approximation may be valid, the mass effects on molecular
properties and chemical reactivities should be seen of different origins.
2.2.2 Hartree-Fock approximation
As mentioned in the homonymous paragraph of ref. [1], the electronic Schrödinger equation is
still intractable and further approximations are required. According to the variational Hartree-
Fock (HF) method, the wave functions of a many-body system are assumed to be in the form of a
Slater determinant. The variational parameters of the method are the single-particle wave
functions composing the many-body wave function. The simplest approximation is a single Slater
determinant. The ground state energy might be poorly approximated if an arbitrary single-particle
basis were chosen. The Hartree-Fock (HF) approximation enables one to determine the best—in
the meaning of giving the lowest energy—set of single particle states that is optimized for each
Hamiltonian and for a given number of particles. Since a single Slater determinant corresponds to
non-interacting particles, the method is also called the “independent-particle model”. In practice,
individual electrons are confined to functions known as molecular orbitals, each of which is
determined by assuming that the electron is moving within an average field of all the other
electrons. The set of molecular orbitals leading to the lowest energy are obtained by a process
referred as a self-consistent-field or SCF procedure.
2.2.3 LCAO approximation
As stated in the homonymous paragraph of ref. [1], the Hartree-Fock approximation leads to a set
of coupled differential equations (the Hartree-Fock equations), each involving the coordinates of

67
a single electron. While they may be solved numerically, it is advantageous to introduce an
additional approximation to transform the Hartree-Fock equations into a set of algebraic
equations.
Practically, the molecular orbitals are expressed as linear combinations of a finite set (a basis set)
of prescribed functions known as basis functions 𝜙:
𝛹𝑖 = ∑ 𝑐𝜇𝑖𝑏𝑎𝑠𝑖𝑠 𝑓𝑢𝑛𝑐𝑡𝑖𝑜𝑛𝑠𝜇 𝜙𝜇
Equation 17
Here we introduce c as the (unknown) molecular orbital coefficients, often referred to simply
(and incorrectly) as the molecular orbitals. Because the localized basis functions are usually
centered at the nuclear positions, they are referred to as atomic orbitals and the equation above is
known as the Linear Combination of Atomic Orbitals (or LCAO approximation).
2.2.4 Correlated models
As described in homonymous paragraph of ref. [1], Hartree-Fock models treat the motions of
individual electrons as independent of one another. To do this, they replace “instantaneous
interactions” between single electrons by interactions between a particular electron and the
average field created by all the other electrons. Because of this, electrons “get in each other way”
to greater extent than they should, causing an overestimation of the electron-electron repulsion
energy and to a too high total energy. Electron correlation, as it is defined, accounts for coupling
or “correlation” of electron motions and leads to a lessening of the electron-electron repulsion
energy (thus to a lowering of the total energy). The correlation energy is defined as the difference
between the Hartree-Fock energy and the exact energy.
Among known correlated models, the density functional models introduce an “approximate”
correlation term in an explicit manner. Although they offer the advantage to be less costly than
Hartree-Fock models, the “quality” of density functional models strongly depends on the choice
of the specific correlation term.

68
A detailed overview of the density functional model implemented in this thesis, known as Density
Functional Theory (DFT), is proposed in the next following paragraph.
2.3 Density Functional Theory (DFT)
Density Functional Theory (DFT) is a computational quantum-mechanical modeling method
widely used in both physics and chemistry to investigate the electronic (and magnetic) properties
of the so-called “many-body systems”. Depending on the case, these quantum-mechanical
systems can be identified either as atoms, molecules or ultimately as condensed phases.
Particularly about the latter, DFT currently represents the most popular approach for the
description of the electronic structure of solid materials since its ratio precision/CPU cost is
relatively favorable with respect to other QM methods. Hence, it is largely used in scientific
disciplines like condensed-matter physics, computational physics and computational chemistry.
2.3.1 Kohn-Sham formalism
As mentioned in the “Kohn-Sham Equations and Density Functional Models” paragraph of ref.
[1], one approach to the treatment of electron correlation is referred to as Density Functional
Theory (DFT). Density functional models are identified by the electron density, 𝜌(𝒓), as opposed
to the many-electron wave function, 𝛹(𝑟1, 𝑟2, … ). There are both distinct similarities and distinct
differences between traditional wave function-based approaches and electron-density-based
approaches. First, the essential building blocks of a many-electron wavefunction are single-
electron (molecular) orbitals, which are directly analogous to the orbitals used in density
functional methodologies. Second, both the electron density and the many-electron wave function
are constructed from an SCF approach which requires nearly identical matrix elements.
The density functional theory of Hohenberg, Kohn and Sham is based on the fact that the sum of
the exchange and correlation energies of a uniform electron gas can be calculated exactly
knowing only its density. In the Kohn-Sham formalism, the ground-state electronic energy, 𝐸, is

69
written as a sum of the kinetic energy, 𝐸𝑇, the electron-nuclear interaction energy, 𝐸𝑉, the
Coulomb energy, 𝐸𝐽, and the exchange/correlation energy, 𝐸𝑥𝑐. 𝐸 = 𝐸𝑇 + 𝐸𝑉 + 𝐸𝐽 + 𝐸𝑥𝑐
Equation 18
Except for 𝐸𝑇, all components depend on the total electron density, 𝜌(𝒓), defined as follows:
𝜌(𝒓) = 2 ∑ |𝛹𝑖(𝒓)|2𝑜𝑟𝑏𝑖𝑡𝑎𝑙𝑠𝑖
Equation 19
Here, 𝛹𝑖 are the so-called Kohn-Sham orbitals and the summation is carried out over pairs of
electrons. If we adopt an unrestricted format, the α and β total electron densities can be written
as:
𝜌𝛼(𝒓) = ∑|𝛹𝑖𝛼|2𝑛𝛼𝑖 = 1
Equation 20 𝜌𝛽(𝒓) = ∑|𝛹𝑖𝛽|2𝑛𝛽
𝑖 = 1
Equation 21
Where the 𝑛𝛼 and 𝑛𝛽 are the number of α and β electrons respectively and 𝛹𝑖 are the Kohn-Sham
orbitals. Thus, the total electron density is: 𝜌(𝒓) = 𝜌𝛼(𝒓) + 𝜌𝛽(𝒓)
Equation 22
The various energy components in Equation 18 can now be written:

70
𝐸𝑇 = ∑ ⟨𝛹𝑖𝛼 |− 12 𝛻2| 𝛹𝑖𝛼⟩ + ∑ ⟨𝛹𝑖𝛽 |− 12 𝛻2| 𝛹𝑖𝛽⟩𝑛𝛽𝑖=1
𝑛𝛼𝑖=1
Equation 23
𝐸𝑉 = ∑ 𝑍𝐴𝑀𝐴=1 ∫ 𝜌(𝒓)|𝒓 − 𝑹𝐴| 𝑑(𝒓)
Equation 24 𝐸𝐽 = 12 ⟨𝜌(𝒓1) | 1|𝒓1 − 𝒓2|| 𝜌(𝒓2)⟩
Equation 25
𝐸𝑥𝑐 = ∫ 𝑓[𝜌(𝒓), 𝛻𝜌(𝒓), … ]𝜌(𝒓) 𝑑𝒓
Equation 26
From the equations above we define 𝑍as the nuclear charge,𝒓 − 𝑹𝐴 as the distance between the
nucleus and the electron, 𝒓1 − 𝒓2as the distance between two electrons defined by their
corresponding electron densities 𝜌(𝒓1) and 𝜌(𝒓2).
There are two types of exchange/correlation functionals that can be employed in the DFT:
i. Functionals based on the local density approximation (LDA).
ii. Functionals based on the generalized gradient approximation (GGA).
The first functional typology is referred as local density models, while the second category is
referred to as semi non-local models or alternatively as gradient-corrected models.
2.3.2 Generalized Gradient Approximation (GGA)
An improvement to LDA local density approximation (or LDA) proposed by Parr and Yang [2]
functionals can be made by considering the gradient of the electron density, the so-called

71
generalized gradient approximation (GGA). This exchange/correlation functional can be written
as follows: 𝐸𝑥𝑐𝐺𝐺𝐴 = 𝐸𝑥𝑐[𝜌(𝒓), 𝛻𝜌(𝒓)] Equation 27
There are several different parameterizations of the GGA functionals. Some of these are semi-
empirical, where experimental data (e.g. atomization energies) are used in their derivation;
however, other GGA parameterizations may be found entirely from first principles. Very
commonly used GGA functionals nowadays are the PW91 (by Perdew and Wang) [3] and the
PBE functionals (by Perdew, Burke and Ernzerhof) [4], the latter being used for the DFT
calculations implemented in this thesis.
The GGA corrects the overbinding tendency inherent in the LDA, albeit with a certain tendency
to overcorrect: lattice constants are on average underestimated in the LSDA by about 1%, PBE
overestimates them by nearly the same amount [5]. However, it must also be pointed out that the
GGA produces the correct ground state for magnetic transition metals where the LSDA fails quite
badly: in the LSDA, Fe is predicted to be hexagonal close-packed and nonmagnetic instead of
body-centered cubic and ferromagnetic [6], and body-centered cubic Cr is predicted to be
nonmagnetic instead of antiferromagnetic. [7] For the adsorption energies of small molecules on
solid surfaces, the values predicted by GGA are definitely superior to the LSDA results.
However, even if these GGA functionals work better than LDA, they still present an inaccuracy
in terms of overestimation of bond lengths and on the evaluation of the intermolecular
interactions like van der Waals forces and hydrogen bonds.
2.4 DFT calculations for periodic systems
In condensed matter physics, realistic systems are composed by ≈ 1020 atoms in a cubic
millimeter, thus we can easily imagine that this task could be impossible to treat by any
numerical known method. However, at this scale systems are often made of repeating units
(crystals), making systems be seen as periodic. For this reason, we can decide to numerically

72
describe these kinds of systems in two distinct ways: either through periodic boundary conditions
or as isolated (saturated) cluster.
2.4.1 Bloch’s Theorem
Bloch’s theorem states that solutions to the Schrödinger equation in a periodic potential take the
form of a plane wave modulated by a periodic function, which can be described as below: 𝛹(𝒓) = 𝑒𝑖𝒌∗𝒓𝑢(𝒓)
Equation 28
Where𝒓is position, 𝛹 is the wave function, 𝑢 is the periodic function with the same periodicity
as the crystal, the wave vector 𝒌 is the crystal momentum vector, 𝑒 is the Euler’s number, 𝑖 is the
imaginary unit. Functions of this form are known as Bloch functions or Bloch states and serve as
a suitable basis for the wave functions or states of electrons in crystalline solids.
The description of electrons in terms of Bloch functions, termed Bloch electrons underlies the
concept of the electronic band structures.
2.4.2 Pseudopotentials
As described in the homonymous paragraph of ref. [8], core electrons present inside atoms or
molecules are not especially important in defining chemical bonding and other physical
characteristics of materials; these properties are dominated by less tightly bound valence
electrons. From the beginning of the development of plane-wave methods, it was clear that there
could be great advantages in calculations that approximated the properties of core electrons in a
way that could reduce the number of plane waves necessary in a calculation.
The most important approach to minimizing this limitation due to the core electrons is identified
by the use of pseudopotentials. Theoretically, a pseudopotential replaces the electron density
from a chosen set of core electrons with a smoothed density chosen to match various important
physical properties of the true ion core. The properties of the core electrons are then fixed in this

73
approximate fashion in all subsequent calculations. This approach is known as the frozen core
approximation.
A pseudopotential is developed by considering an isolated atom of one element, but the resulting
pseudopotential can then be used reliably for calculations that place this atom in any chemical
environment without further adjustment of the pseudopotential. This desirable property is
referred to as the transferability of the pseudopotential.
Even though the pseudopotentials offer an important reduction of the number of plane waves for
a certain calculation, it is also true that the more plane waves are included in a basis set for
describing the wavefunction, the more accurate would be the wave function representation. In
these calculations, the functions are discretized on numerical grids, meaning that plane waves
with higher frequency (e.g. higher energy) require increasingly finer grid points to be described.
However, with finer grid points comes a higher computational cost. For this reason, it is
necessary to establish an energetic threshold value beyond which plane waves with higher energy
would not be considered in these calculations. This threshold is defined as the cutoff energy.
The details of a particular pseudopotential define a minimum energy cutoff that should be used in
calculations including atoms associated with that pseudopotential. The most widely used method
of defining pseudopotentials is based on the work by Vanderbilt [9] and these are known as
ultrasoft pseudopotentials (USPPs). As it is suggested by their name, these pseudopotentials
require substantially lower cutoff energies than alternative approaches. However, another well-
known frozen core approach which overcomes some of the USPPs is given by the projector
augmented-wave (PAW) method, which was originally introduced by Blöchl [10] and later
adapted for plane-wave calculations by Kresse and Joubert [11]. A major advantage of the PAW
method (which is implemented in VASP) is that it is more suitable than USPPs for the
description of materials with very strong magnetic moments (like for Fe and Cr atoms) or with
atoms that have a large difference in electronegativity.
2.4.3 DFT+U method
In the last decades, DFT method has achieved a substantial progress for the investigation of the
physical properties of various compounds. In fact, for the description of the properties related to

74
metals, semiconductors and insulators, density functionals like LSDA proved to provide a
reliable variational description of the ground state of the electronic structure of the solid.
However, difficulties have arisen when a conventional DFT-LSDA approach is applied to the
treatment of the electronic structure of the material where some of the ions contain partly filled
valence 𝑑 or 𝑓shells. This issue especially surges in regards of the transitional metal oxides (like
chromia), since DFT-LSDA approach predicts metallic ground states instead of experimentally
observed insulating ones.
The origin of this failure is because DFT-LSDA is not able to adequately describe the strong
Coulomb repulsion between 3𝑑 electrons localized on metal ions. In addition to making incorrect
predictions on the nature of the ground start of transition metals, the DFT-LSDA systematically
underestimates their equilibrium lattice constants and overestimates binding energy. To overcome
this issue, Dudarev et al. [12] coupled the DFT-LSDA with the unrestricted Hartree-Fock (UHF)
approximation, which is known as the LSDA+U method and representing one of the mostly
implemented in the DFT+U realm.
According to DFT+U theory, the interactions between electrons in states localized on the same
atomic center (i.e. on-site interactions) are treated in an Hartree-Fock-like manner (where HF
calculations contain exact exchange), while the remaining interactions are treated with DFT. In
this way, the errors incurred by DFT largely due to the intra-atomic self-interaction error would
be corrected by an HF description. In practice, the on-site interaction energy is evaluated with a
parametrized Hamiltonian, whose parameters correspond to the average Coulomb and exchange
interactions between electrons of the same angular momentum localized on the same atom. These
parameters are designated as UIℓ and JIℓ, respectively, where I indicate the atomic center on which
the electrons are localized and ℓ denotes their angular momentum. The key to performing an
accurate DFT+U calculation lies in selecting suitable values for these parameters.
2.4.4 DFT-D dispersion corrections
Despite DFT currently represents the most widely used approach to describe the electronic
structure and properties of materials, it is well-known that the correct description of systems in
which dispersion forces are prominent still results in a major challenge. In fact, the contribution

75
of vdW forces is absent in commonly-used density functionals like both LDA and GGA, thus
imposing a limitation on their study. For this reason, in the last decades many adjustments have
been attempted in order to attain more insights and better descriptions on the major role of vdW
and dispersion forces, one of them being represented by the DFT dispersion correction method
created by Grimme et al. [13], known as the DFT-D method. This method can be expressed
through the equation below: 𝐸𝐷𝐹𝑇−𝑑𝑖𝑠𝑝 = 𝐸𝐾𝑆−𝐷𝐹𝑇 + 𝐸𝑑𝑖𝑠𝑝
Equation 29
From Eq.28 we can see that the DFT-D dispersion method consists into the addition of a
correction to the conventional Kohn-Sham DFT energy 𝐸𝐾𝑆−𝐷𝐹𝑇 through the 𝐸𝑑𝑖𝑠𝑝 term which
can be identified by the implemented vdW correction.
DFT-D method accounts for the missing dispersion energy in DFT that includes the proper
description of non-covalent interactions that require the inclusion of long-term electron
correlation effects, like for example the treatment of the weak London forces.
In the DFT-D2 method of Grimme [14], the correction term 𝐸𝑑𝑖𝑠𝑝 takes the form:
𝐸𝑑𝑖𝑠𝑝 = − 12 ∑ ∑ ∑ (𝐶6𝑖𝑗𝑟𝑖𝑗,𝐿6 𝑓𝑑,6(𝑟𝑖𝑗,𝐿))𝐿𝑁𝑎𝑡𝑗=1
𝑁𝑎𝑡𝑖=1
Equation 30
where the summations are over all atoms 𝑁𝑎𝑡 and in calculations, the sum is truncated. The
number indicates that i ≠ j for L = 0, 𝐶6𝑖𝑗 denotes the dispersion coefficient for the atom pair ij, 𝑟𝑖𝑗,𝐿 is the distance between atom i located in the reference cell L=0 and atom j in the cell L and
the term 𝑓(𝑟𝑖𝑗)is a damping function whose role is to scale the force field such as to minimize the
contributions from interactions within typical bonding distances. In practice, the terms in the
equation for 𝐸𝑑𝑖𝑠𝑝corresponding to interactions over distances longer than a certain suitably
chosen cutoff radius contribute only negligibly to 𝐸𝑑𝑖𝑠𝑝 and can be ignored. Parameters 𝐶6𝑖𝑗 and 𝑅0𝑖𝑗 are computed using the following combination rules:

76
𝐶6𝑖𝑗 = √𝐶6𝑖𝑖𝐶6𝑗𝑗
Equation 31 and 𝑅0𝑖𝑗 = 𝑅0𝑖 + 𝑅0𝑗
Equation 32
The values for 𝐶6𝑖𝑗 and 𝑅0𝑖𝑗 are tabulated for each element and are insensitive to the particular
chemical situation. In the original method described by Grimme et al. [14], a Fermi-type damping
function is used:
𝑓𝑑,6(𝑟𝑖𝑗) = 𝑠61 + 𝑒−𝑑( 𝑟𝑖𝑗𝑠𝑅𝑅0𝑖𝑗−1)
Equation 33
whereby the global parameter 𝑠6 has been optimized for several different DFT functionals. The 𝑠𝑅 is usually fixed at 1.
For the DFT-D3 method of Grimme [13], the following vdW energy expression is used instead:
𝐸𝑑𝑖𝑠𝑝 = − 12 ∑ ∑ ∑ (𝑓𝑑,6(𝑟𝑖𝑗,𝐿) 𝐶6𝑖𝑗𝑟𝑖𝑗,𝐿6 + 𝑓𝑑,8(𝑟𝑖𝑗,𝐿) 𝐶8𝑖𝑗𝑟𝑖𝑗,𝐿8 )𝐿𝑁𝑎𝑡𝑗=1
𝑁𝑎𝑡𝑖=1
Equation 34
Unlike in the method DFT-D2 reported in previous Equation 30, this time the dispersion
coefficients 𝐶6𝑖𝑗 are geometry-dependent as they are adjusted on the basis of local geometry
(coordination number) around atoms i and j. In the zero damping DFT-D3 method, the damping
function is expressed as follows:
𝑓𝑑,𝑛(𝑟𝑖𝑗) = 𝑠𝑛1 + 6 ( 𝑟𝑖𝑗𝑠𝑅,𝑛𝑅0𝑖𝑗)−𝛼𝑛
Equation 35

77
where 𝑅0𝑖𝑗 = √𝐶8𝑖𝑗𝐶6𝑖𝑗, the parameters 𝛼6, 𝛼8, 𝑠𝑅,𝑠, 𝑠6 are fixed at values of 14, 16, 1 and 1
respectively, and 𝑠8 and 𝑠𝑅,6 are adjustable parameters whose values depend on the choice of
exchange-correlation functional.
For this thesis, we chose to employ the zero damping DFT-D3 of Grimme [13] reported in
Equation 34-Equation 35.
2.4.5 DFT calculation of the total electron energy
The most basic type of DFT calculation is to compute the total energy of a set of atoms at
prescribed positions in space. The main aim of a DFT calculation is to find the electron density
that corresponds to the ground state configuration of the system, 𝜌(𝒓). Below we introduce an
alternative form of the electron density and of the Kohn-Sham formalism (§2.3.1), defining the
first in terms of the solutions to the latter as follows:
𝜌(𝒓) = ∑ 𝛹𝑗(𝒓)𝛹𝑗∗𝑗 (𝒓)
Equation 36
The Kohn-Sham equations being:
− ћ22𝑚 𝛻2𝛹𝑗(𝒓) + 𝑣𝑒𝑓𝑓(𝒓)𝛹𝑗(𝒓) = 𝜀𝑗𝛹𝑗(𝒓)
Equation 37
The fact that makes these equations difficult to solve directly is that the effective potential is
itself a complicated function of 𝜌(𝒓). Therefore, a commonly-used general strategy for solving
this problem would be the attempt to solve it iteratively. We start this iterative process by
estimating the overall electron density, then use this trial density to define the effective potential.
The Kohn-Sham equations with this effective potential are then solved numerically with this
effective potential, defining a new electron density. If the new electron density and the old
electron density do not match, then we have not solved the overall problem. The old and new

78
electron densities are then combined in some way to give a new trial electron density. This new
trial density is then used to define a new effective potential from which an updated electron
density is found, and so on. If successful, this iterative process will lead to a self-consistent
solution. However, we need to think about how to start our iterative process; in fact, in absence of
other information, the electron density can be initially approximated by superimposing the
electron densities appropriate for each atom in its isolated state. This is typically the default
initialization used in most DFT packages. If a better initial approximation is available, a self-
consistent solution should be reached more quickly (i.e. in fewer iterations).
Another important aspect of this iterative procedure is to understand how we stop it. However, it
is not always convenient to directly compare two solutions for the electron density and determine
their similarity, even though this may represent the most direct way to find out if a self-consistent
solution is reached. In fact, a method that is easier to interpret is to calculate the energy
corresponding to the electron density after each iteration. After all, this coincides precisely with
the quantity which we are interested in finding. If our iterations are converging, then the
difference in energy between consecutive iterates will approach to zero. This suggests that the
iterations can be stopped once the magnitude of the energy difference between iterates falls
below an appropriately chosen tolerance parameter.
2.4.6 Geometry optimization of molecular structures
In the field of computational chemistry, energy minimization represents the process of finding an
arrangement in space of a collection of atoms where, according to the implemented QM
computational model, the net interatomic force on each atom is acceptably close to zero and the
position on the potential energy surface (PES) is a stationary point. The collection of atoms may
be identified by a single molecule, a condensed phase, a transition state or even a collection of
any of these.
The motivation for performing a geometry optimization is the physical significance of the
obtained structure; in fact, optimized structures often correspond to a substance as it is found in
nature and the geometry of such a structure can be used in a variety of experimental and

79
theoretical investigation in the fields of chemical structure, thermodynamics, chemical kinetics,
spectroscopy and others.
Typically, the process seeks to find the geometry of a particular arrangement of the atoms that
represents a local or global energy minimum. Instead of searching for global energy minimum, it
might be desirable to optimize to a transition state.
The principal terms describing a PES are: the gradient, which represents the first derivative of the
energy with the respect to geometry (x,y,z), in particular the negative of the gradient is termed the
force; the stationary points, which identify the points on the PES where the force is zero,
corresponding to maxima, minima, transition states (corresponding to first order saddle points)
and higher order saddle points.
Figure 20 : 3D scheme of features of Potential Energy Surface (PES) [70].
In order to distinguish among the latter, one must examine the second derivatives of the PES with
respect to geometry. The matrix of the second derivatives is termed a Hessian (or force constant)
matrix. The diagonalization of this matrix yields eigenvectors which are normal modes of
vibration; their eigenvalues are proportional to the square of the vibrational frequency (from
which IR spectra can be derived).
Through the sign of the second derivative, it is possible to distinguish between the maxima and
minima on the PES; minima on the PES have only positive eigenvalues (vibrational frequencies),
while maxima or saddle points (i.e. maximum in one direction and minimum in the other
direction) have one or more negative (imaginary) frequencies.

80
From a mathematical point of view, the geometry of a set of atoms or molecules can be described
by Cartesian coordinates of the atoms or internal coordinates formed from a set of bond lengths,
bond angles and dihedral angles. Given a set of atoms and a vector r describing the atoms
positions, one can introduce the concept of the energy as a function of the positions, E(r).
Geometry optimization is then a mathematical optimization problem, in which it is desired to find
the value of r for which E(r) is at a local minimum, that is, the derivative of the energy with the
respect to the position of the atoms, 𝜕𝐸𝜕𝒓, is the zero vector.
The computational model that provides an approximate E(r) could be based on quantum-
mechanics (like DFT or semi-empirical methods), force fields or a combination of both in case of
QM/MM models.
Some methods such as quantum-mechanics methods can be used to calculate the energy, E(r), the
gradient of the PES, that is, the derivative of the energy with the respect to the position of the
atoms, 𝜕𝐸𝜕𝒓. An optimization algorithm can use some or all of E(r),
𝜕𝐸𝜕𝒓 and 𝜕𝜕𝐸.𝜕𝒓𝒊𝒓𝒋 to try to minimize
the forces and this could in theory be any method, such as gradient descent, conjugate gradient or
Newton’s method.
2.4.7 Nudged Elastic Band method
The Nudged Elastic Band (NEB) [15] is an efficient method for finding the minimum energy path
(MEP) for a transition between a given initial and final states[16]. This method has been used
both in conjunction with electronic structure calculations (in particular plane wave based DFT
calculations [17, 18] and in combination with empirical potentials [19, 20]).
The MEP is found by constructing a set of images (replicas) of the system, typically on the order
of 4-20, between the initial and final images. A spring interaction between adjacent images is
added to ensure that images are held equidistant, thus mimicking an elastic band.
Practically, the NEB method is implemented for finding saddle points and minimum energy paths
between known reactants and products. The NEB method works by optimizing a number of
intermediate images along the reaction path. Each image finds the lowest energy possible while

81
maintaining equal spacing to neighboring images. This method is implemented in the VASP
package [5].
2.5 Relative energy calculations
Within our DFT simulations, we used the Vienna Ab initio Simulation Package (VASP 5.4.1) and
calculated the adsorption energy (𝛥𝐸𝑎𝑑𝑠) according to the following equation:
𝜟𝑬𝒂𝒅𝒔 = 𝑬𝒎𝒐𝒍𝒆𝒄𝒖𝒍𝒆+𝒔𝒍𝒂𝒃 − 𝑬𝒔𝒍𝒂𝒃 − 𝑬𝒎𝒐𝒍𝒆𝒄𝒖𝒍𝒆
Equation 38
Where𝐸𝑚𝑜𝑙𝑒𝑐𝑢𝑙𝑒+𝑠𝑙𝑎𝑏 represents the total energy of the optimized structure formed after the
molecule is (chemically) absorbed on the oxide slab and 𝐸𝑚𝑜𝑙𝑒𝑐𝑢𝑙𝑒 and 𝐸𝑠𝑙𝑎𝑏 are the total energies
of the non-interacting molecule and the slab, respectively.
Furthermore, the adsorption energy was decomposed in two contributions: the 𝐸𝑎𝑑𝑠𝑣𝑑𝑊 energy
resulting from the dispersion interactions (as calculated using Grimme’s zero damping DFT-
D3 method [13]), and the “pure” DFT energy (𝐸𝑎𝑑𝑠𝐷𝐹𝑇), corresponding to DFT total energy
computed using a given exchange-correlation functional as defined in Equation 39 below :
𝜟𝑬𝒂𝒅𝒔𝑫𝑭𝑻 = 𝜟𝑬𝒂𝒅𝒔 − 𝜟𝑬𝒂𝒅𝒔𝒗𝒅𝑾
Equation 39
In this thesis, we also considered the case study where an adsorbate species 𝑅𝐻 is substituted
with a water molecule 𝐻2𝑂, as defined below: 𝑅𝐻 + 𝑆𝑙𝑎𝑏(−𝑂𝐻𝑠) → 𝑆𝑙𝑎𝑏 − 𝑅 + 𝐻2𝑂
Equation 40
Where (−𝑂𝐻𝑠) represents a hydroxyl group of the hydroxylated surface that picks up the proton
from the adsorbate in the exchange reaction. The substitution energy was calculated as:

82
𝜟𝑬𝒔𝒖𝒃𝒔𝒕 (𝑹𝑯) = 𝑬𝒔𝒍𝒂𝒃−𝑹 − 𝑬𝑹𝑯 − 𝑬𝒔𝒍𝒂𝒃(−𝑶𝑯𝒔) + 𝑬𝑯𝟐𝑶
Equation 41
It is to be noticed that the absolute and relative electronic energies do not take into temperature
effects nor entropies. Such thermodynamic corrections can be calculated using statistical
mechanics and more particularly the partition functions, which will be described in the next
paragraph.
2.6 Thermodynamic calculations
The calculated energy mentioned in the previous paragraph are considered for systems at 0 K.
However, we are usually interested in the study of molecular systems which undergo physical or
chemical processes at different temperature than 0 K, thus it is essential to consider standard
thermodynamic relationships in order to provide the necessary connections: ∆𝐺 = ∆𝐻 − 𝑇∆𝑆
Equation 42
∆𝐻 = ∆𝑈 + 𝑃∆𝑉
Equation 43
Where 𝐺 is the free energy, 𝐻 is the enthalpy, 𝑆 is the entropy, 𝑈 is the internal energy and 𝑇, 𝑃
and 𝑉 are the temperature, pressure and volume, respectively. The absolute entropy may be
written as a sum of multiple terms as follows: 𝑆 = 𝑆𝑡𝑟 + 𝑆𝑟𝑜𝑡 + 𝑆𝑣𝑖𝑏 + 𝑆𝑒𝑙 − 𝑛𝑅[𝑙𝑛(𝑛𝑁0) − 1]
Equation 44
𝑆𝑡𝑟 = 𝑛𝑅 {32 + 𝑙𝑛 [(2𝜋𝑚𝑘𝑇ℎ2 )3/2 (𝑛𝑅𝑇𝑃 )]}
Equation 45

83
𝑆𝑟𝑜𝑡 = 𝑛𝑅 {32 + 𝑙𝑛 [(𝜋𝑣𝐴𝑣𝐵𝑣𝐶)1/2𝑠 ]}(valid for non linear molecules)
Equation 46 S𝑣𝑖𝑏 = nR ∑ {(𝑢𝑖𝑒𝑢𝑖 − 1)−1 − 𝑙𝑛(1 − 𝑒−𝑢𝑖)}𝑖
Equation 47 𝑆𝑒𝑙 = 𝑛𝑅𝑙𝑛(𝜔𝑒𝑙)
Equation 48
Where 𝑣𝐴 = ℎ28𝜋𝐼𝐴𝑘𝑇 ; 𝑣𝐵 = ℎ28𝜋𝐼𝐵𝑘𝑇 ; 𝑣𝐶 = ℎ28𝜋𝐼𝐶𝑘𝑇
Equation 49 𝜇𝑖 = ℎ𝑣𝑖𝑘𝑇
Equation 50
𝑛 is the number of moles, 𝑀 is the molecular mass,𝐼𝐴, 𝐼𝐵, 𝐼𝐶 are the principal moments of inertia, 𝑠 is the rotational symmetry number, 𝑣𝑖are the vibrational frequencies and 𝜔𝑒𝑙is the degeneracy
of the electronic ground state. 𝑅, 𝑘 and ℎ are the gas constant, Boltzmann’s constant and Planck’s
constant respectively, and 𝑁0 is the Avogadro’s number.
Molecular structure enters the rotational entropy component and vibrational frequencies into the
vibrational entropy component.
In case our system is at a finite temperature, we must adopt a correction for the expression of the
enthalpy to change it from 0 K at the aforementioned finite 𝑇, given by: ∆𝐻(𝑇) = 𝐻𝑡𝑟𝑎𝑛𝑠(𝑇) + 𝐻𝑟𝑜𝑡(𝑇) + ∆𝐻𝑣𝑖𝑏(𝑇) + 𝑅𝑇
Equation 51 𝐻𝑡𝑟𝑎𝑛𝑠(𝑇) = 32 𝑅𝑇
Equation 52
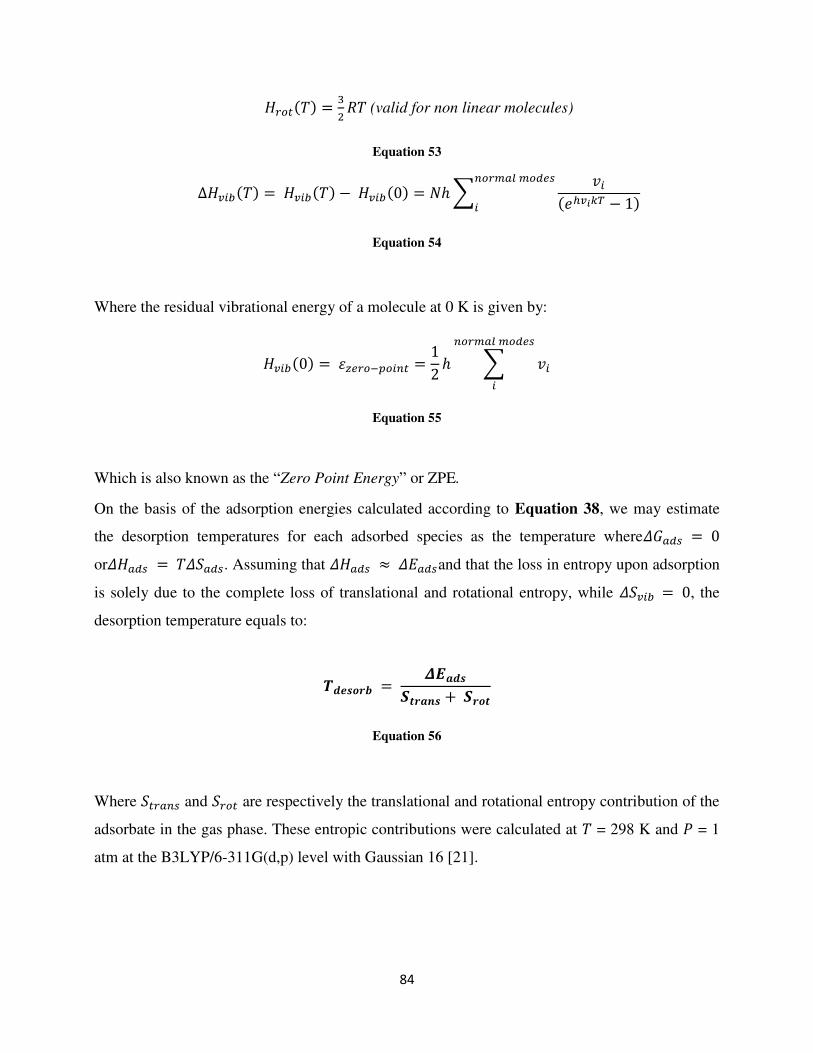
84
𝐻𝑟𝑜𝑡(𝑇) = 32 𝑅𝑇 (valid for non linear molecules)
Equation 53 ∆𝐻𝑣𝑖𝑏(𝑇) = 𝐻𝑣𝑖𝑏(𝑇) − 𝐻𝑣𝑖𝑏(0) = 𝑁ℎ ∑ 𝑣𝑖(𝑒ℎ𝑣𝑖𝑘𝑇 − 1)𝑛𝑜𝑟𝑚𝑎𝑙 𝑚𝑜𝑑𝑒𝑠𝑖
Equation 54
Where the residual vibrational energy of a molecule at 0 K is given by:
𝐻𝑣𝑖𝑏(0) = 𝜀𝑧𝑒𝑟𝑜−𝑝𝑜𝑖𝑛𝑡 = 12 ℎ ∑ 𝑣𝑖𝑛𝑜𝑟𝑚𝑎𝑙 𝑚𝑜𝑑𝑒𝑠𝑖
Equation 55
Which is also known as the “Zero Point Energy” or ZPE.
On the basis of the adsorption energies calculated according to Equation 38, we may estimate
the desorption temperatures for each adsorbed species as the temperature where𝛥𝐺𝑎𝑑𝑠 = 0
or𝛥𝐻𝑎𝑑𝑠 = 𝑇𝛥𝑆𝑎𝑑𝑠. Assuming that 𝛥𝐻𝑎𝑑𝑠 ≈ 𝛥𝐸𝑎𝑑𝑠and that the loss in entropy upon adsorption
is solely due to the complete loss of translational and rotational entropy, while 𝛥𝑆𝑣𝑖𝑏 = 0, the
desorption temperature equals to:
𝑻𝒅𝒆𝒔𝒐𝒓𝒃 = 𝜟𝑬𝒂𝒅𝒔𝑺𝒕𝒓𝒂𝒏𝒔 + 𝑺𝒓𝒐𝒕
Equation 56
Where 𝑆𝑡𝑟𝑎𝑛𝑠 and 𝑆𝑟𝑜𝑡 are respectively the translational and rotational entropy contribution of the
adsorbate in the gas phase. These entropic contributions were calculated at 𝑇 = 298 K and 𝑃 = 1
atm at the B3LYP/6-311G(d,p) level with Gaussian 16 [21].

85
2.7 Implemented QM based softwares
Modern electronic structure methods fall into two broad classes, depending on the choice of the
basis set for the expansion of the valence orbitals, charge densities and potentials: plane-wave
methods (e.g. VASP [22, 23]) or methods using some kind of localized basis functions (e.g.
Gaussian 16 [21]).
The Vienna Ab initio Simulation Package (VASP) developed by Kresse et al. [22, 23] is a plane-
wave code for ab initio density functional calculations. It attempts to match the accuracy of the
most advanced all-electron codes by using a projector-augmented-wave approach (PAW [10]) for
describing the electron-ion interaction. A stable and accurate solution of the Kohn-Sham
equations, as well as a favorable scaling of the computational effort with system size, are
achieved by adopting iterative diagonalization techniques. This code uses fast iterative techniques
for the diagonalization of the DFT Hamiltonian and allows to perform total-energy calculations
and structural optimization for systems with thousands of atoms. In VASP the following GGA
functionals are implemented: the PW91 proposed by Perdew et al. [3], the Perdew-Burke-
Ernzerhof (PBE) [4] functional (which was implemented in the DFT calculations of this thesis),
its revised form proposed by Hansen et al. (RPBE) [24] and the functional proposed by Armiento
and Mattson (AM05) [25].
The Gaussian 16 [21] is a quantum-mechanical computational software package that is mostly
used for the predictions of the energies, molecular structures, vibrational frequencies and
molecular properties of compounds and reactions in a wide variety of chemical environments.
This software offers a wide range of methods for modeling compounds and chemical processes,
including the DFT method.
In the framework of this thesis, we chose to implement VASP for the obtention of the optimized
molecular structures (since our heterogeneous systems counted more than 500 atoms), while we
preferred to implement Gaussian 16 for the acquisition of the thermodynamic data obtained for
each one of the examined adsorbed species on the basis of the substrate (i.e. dry or fully-
hydroxylated alumina/chromia surfaces).

86
2.8 Bader charge calculation
In this thesis, charge analyses were implemented through the Bader’s charge analysis program,
developed by the research Henkelman group [26]. This program (which reads electronic density
reported in the VASP CHGCAR file) consists into an intuitive way of dividing molecules into
atoms through the identification of an atom based purely on the electronic charge density.
Bader’s charge analysis uses what are called zero flux surfaces to divide atoms. A zero-flux
surface is a 2-D surface on which the charge density is a minimum perpendicular to the surface.
Typically, in molecular systems the charge density reaches a minimum between atoms and this is
a natural place to separate atoms from each other.
Bader's definition is often useful for charge analysis and it was used in this thesis. For this
method, the charge enclosed within the Bader volume is a good approximation to the total
electronic charge of an atom. The charge distribution can be used to determine multipole
moments of interacting atoms or molecules.
2.9 From ab-initio to empirical molecular dynamics
Simulations methods based on quantum-mechanics have proven to be particularly relevant to
explore structural material properties and in recent years they have been used for this means
mostly as theoretical guide and screening tool [27–29].
From Figure 21 it is noticed that indeed quantum-mechanical (QM) calculations performed via
DFT are the slowest compared to semi-empirical methods (e.g. PM3) and empirical in spite being
the most accurate in the description of geometries, energies and vibrational energies for
characterized systems.
Furthermore, the empirical MD method provides a means to explore the phase space of a system
without a priori knowledge of the phase diagram of the given system, thus making it a powerful
low-CPU-cost tool when searching for novel system properties.
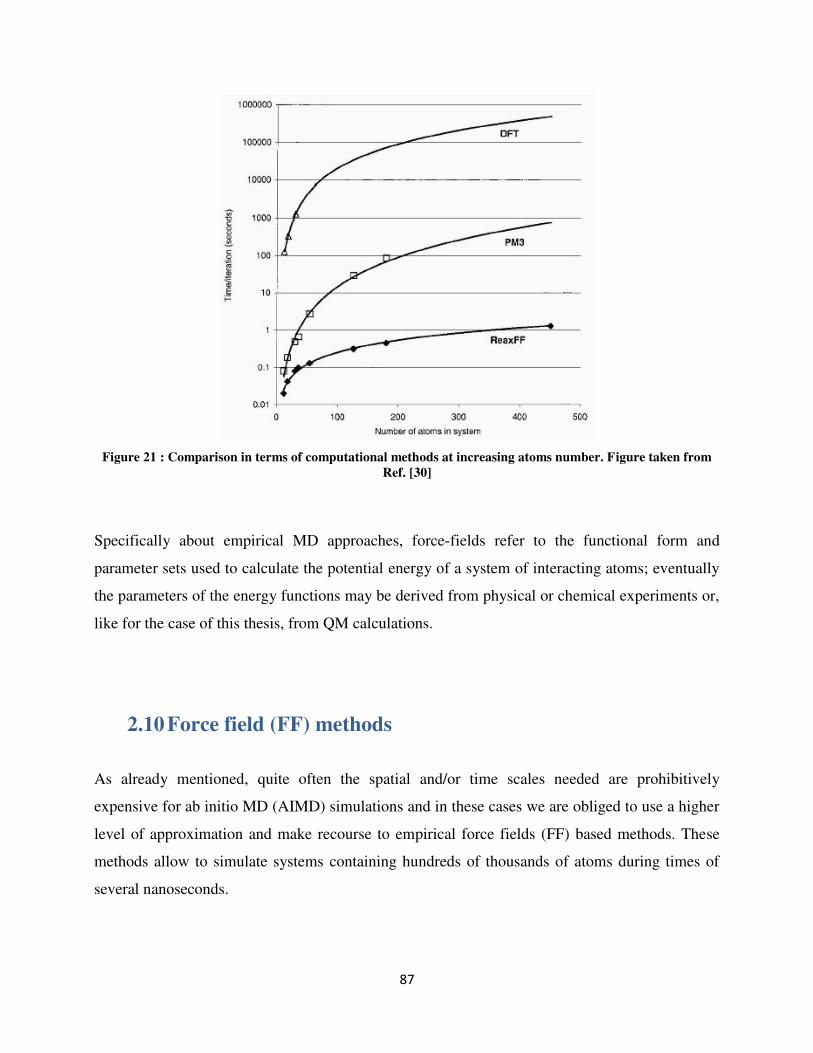
87
Figure 21 : Comparison in terms of computational methods at increasing atoms number. Figure taken from Ref. [30]
Specifically about empirical MD approaches, force-fields refer to the functional form and
parameter sets used to calculate the potential energy of a system of interacting atoms; eventually
the parameters of the energy functions may be derived from physical or chemical experiments or,
like for the case of this thesis, from QM calculations.
2.10 Force field (FF) methods
As already mentioned, quite often the spatial and/or time scales needed are prohibitively
expensive for ab initio MD (AIMD) simulations and in these cases we are obliged to use a higher
level of approximation and make recourse to empirical force fields (FF) based methods. These
methods allow to simulate systems containing hundreds of thousands of atoms during times of
several nanoseconds.

88
Although the empirical force field present conspicuous advantages in terms of affordable sizes
and time scales compared to the AIMD simulations, their implementation show some intrinsic
limitations that are not negligible. In particular, they cannot provide any information about the
electronic structure and they are unable to handle reactions such as the breaking and formation of
bonds, electron excitations, charge transfers, etc.
In the last years, several specialized groups have started working actively in developing new
methods to overcome some of the limitations of the empirical force fields, a good example being
the development of the reactive force field (ReaxFF).
2.11 ReaxFF (Reactive Force Field) methods
The reactive Force Field (ReaxFF) method developed by van Duin et al. [30] represents a new
generation force field for modeling reactive chemical systems. The dynamic chemical bonds in a
reactive system are modeled based on a the physically intuitive concept of bond order of a
chemical bond. By making each atomic interaction bond order dependent, it can be possible to
attain a dynamic description of each atomic and molecular interaction; to do so, a detailed
parameterization of the atomic, bonding, angle and torsion properties of each particle and
interaction within the system against quantum mechanical and experimental data is necessary. In
this way, the implementation of ReaxFF allows to obtain a highly accurate, reactive and dynamic
model of atomic systems that can be in the order of hundreds of thousands particles and
timescales on the order of nanoseconds; this features acts as discriminator between ReaxFF and
DFT methods because simulating so large systems would be computationally impractical or even
impossible by using QM methods[31]. ReaxFF allows to describe non-reactive interactions
between all atoms of the given system, thanks to the integration of Coulomb and Morse (van der
Waals) potentials.
Furthermore, ReaxFF enables simulations involving reactive events at the interface between
solid, liquid and gas phases [32] and this aspect is crucial for this thesis, since the interactions
occurring at the liquid/solid interface are to be explored in depth in this study.

89
The description of the bond-order formalism that ReaxFF uses to describe each atomic interaction
occurring within the system through the calculation of the forces acting on each atom, can be
derived from the energy expression given in the following equation: 𝐸𝑠𝑦𝑠𝑡𝑒𝑚 = 𝐸𝑏𝑜𝑛𝑑 + 𝐸𝑎𝑛𝑔𝑙𝑒 + 𝐸𝑙𝑝 + 𝐸𝑜𝑣𝑒𝑟 + 𝐸𝑢𝑛𝑑𝑒𝑟 + 𝐸𝑣𝑎𝑙 + 𝐸𝑡𝑜𝑟𝑠 + 𝐸𝑣𝑑𝑊 + 𝐸𝐶𝑜𝑢𝑙𝑜𝑚𝑏 Equation 57
In this empirical many-body description of energy𝐸𝑏𝑜𝑛𝑑 , 𝐸𝑎𝑛𝑔𝑙𝑒 and 𝐸𝑡𝑜𝑟𝑠 are bond, angular and
torsional energy terms, respectively. The terms 𝐸𝑣𝑑𝑊 , 𝐸𝐶𝑜𝑢𝑙𝑜𝑚𝑏 are the two-body van der Waals
and Coulombic contributions that are calculated for all pairs, regardless of their connectivity. The
terms 𝐸𝑜𝑣𝑒𝑟 and 𝐸𝑢𝑛𝑑𝑒𝑟 contain the energy penalties for over or under- coordination of atoms,
while the terms 𝐸𝑙𝑝 and 𝐸𝑣𝑎𝑙 define the contributions of lone-pair and valence angle energies,
respectively. [30, 33, 34] The general scheme of how each computational iteration is performed
during the ReaxFF simulation is illustrated in the scheme reported below:
Figure 22: schematic of the ReaxFF iteration. The non-bonded interactions are on the left and the covalent/bonded interactions are on the right. Figure taken from Ref. [31]

90
As depicted in Figure 22, the potential is divided into bond-order-dependent and independent
contributions.
A fundamental assumption of ReaxFF is that bond order (BO) between a pair of atoms can be
obtained directly from the interatomic distance as given by Equation 58. In calculating the bond
orders, ReaxFF distinguishes between contributions from sigma bonds, pi-bonds and double pi-
bonds. 𝐵𝑂′𝑖𝑗 = 𝐵𝑂𝑖𝑗𝜎 + 𝐵𝑂𝑖𝑗𝜋 + 𝐵𝑂𝑖𝑗𝜋𝜋 = 𝑒𝑥𝑝 [𝑝𝑏𝑜,1 ∗ (𝑟𝑖𝑗𝑟0𝜎)𝑝𝑏𝑜,2] + 𝑒𝑥𝑝 [𝑝𝑏𝑜,3 ∗ (𝑟𝑖𝑗𝑟0𝜋)𝑝𝑏𝑜,4] + 𝑒𝑥𝑝 [𝑝𝑏𝑜,5 ∗ ( 𝑟𝑖𝑗𝑟0𝜋𝜋)𝑝𝑏𝑜,6]
Equation 58
The term 𝐵𝑂′𝑖𝑗 is the bond order between atoms i and j,rijis their interatomic distance, r0 terms
are equilibrium bond lengths and pbo terms are empirical parameters.
The “bo” subscript in the pbo terms stands for “bond order” and these empirical parameters are
necessary in order to obtain the “corrected” bond orders (𝐵𝑂𝑖𝑗) from the “uncorrected” bond
order term 𝐵𝑂′𝑖𝑗 as defined in Equation 58. From these empirical parameters, it is possible to
calculate the corrected 𝐵𝑂𝑖𝑗𝜎 , 𝐵𝑂𝑖𝑗𝜋 and 𝐵𝑂𝑖𝑗𝜋𝜋 defining the σ, π and ππ bonds (Equation 58) that
are consequently implemented to calculated all the energetic terms defined in Equation 57.
2.11.1 ReaxFF parametrization
In the recent years, many research works that envisaged the use and development of ReaxFF
provided new ReaxFF parameter sets for a large number of elements of the periodic table [30,
35–39], as we can see from Figure 23.
Although a ReaxFF description exists for these elements, it is also true that one cannot simply use
these parameter sets in any combination and expect to obtain a satisfactory transferability.
To better comprehend the concept of ReaxFF transferability, we will briefly introduce an
overview of ReaxFF parameterization and development branches.

91
Figure 23: Elements currently described in available parameter sets. Image taken from ref. [32]
Firstly, we should precise that there are currently two major groupings (i.e. ReaxFF branches) of
parameter sets that are intra-transferable with one another: (1) the combustion branch and (2) the
aqueous branch. To explain the existence of branches within a common functional form, we must
consider that ReaxFF does not employ atom typing strategy, in contrast to popular non-reactive
force-fields like AMBER [40] and CHARMM [41].
For example, there is only one oxygen type in ReaxFF regardless of the chemical environment in
which the oxygen atom finds itself. On one hand, this feature is quite helpful because it allows
atoms to migrate between phases during a simulation. On the other hand, this results in a
significantly more complex force-field development process. The lack of transferability between
branches is evident in the performance of the 2008-C/H/O combustion force field developed by
Chenoweth et al. [35], which accurately describes water as a gas-phase molecule yet fails to
describe water as a liquid. This happens because, during the development at that time, describing
liquid water was not a particular aim for ReaxFF and, since all intended applications were at
temperatures well above the water boiling point, this was not a major development concern. In
2009, efforts were initiated to redevelop ReaxFF for aqueous chemistry and it became clear that
the 2008-C/H/O combustion force field, which at that time was extended to a significant range of
metal oxide (Me = V/Bi/Mo/Nb/Si) materials and catalysts [42–44] could not be parametrized to
the liquid water without changing general-ReaxFF and atomic-specific parameters. As such, the
decision was made to initiate a new branch (e.g. the aqueous branch) that employs the same

92
functional form of the 2008-C/H/O description, but with different O/H atom and bond
parameters.
This resulted in the creation of a number of parameter sets that are not directly transferable with
those on the pre-existing combustion branches, thus leading to the new aqueous branch.
Parameter sets on the same development branch can be directly combined, where the required
force-field fitting consists only of parameterizing bond and angular terms between newly
combined elements. Transferring parameters between branches, however, requires more
extensive refitting.
We can then conclude that, given the difficulty to have a reparametrized force field able to
reproduce the description of different molecular systems (even when sharing similar atomic
compositions) it emerges the necessity to reparametrize a suitable reactive force field in order to
reach an accurate representation of the physics and chemistry of a molecular system of interest.
In the framework of this thesis, our main interest falls in finding a way to correctly describe the
interface interactions between a liquid organic phase and a solid phase represented by aluminium
and stainless steel materials. We acknowledge a certain difficulty in this scope since in literature
the number of available force field that can describe aluminum and chromium-based systems is
still very limited [45–49].
For this reason, we chose to use the DFT results obtained from the preliminary theoretical study
as input data to parametrize ReaxFF through their addition to the training-set. To attain a force
field able to correctly describe the properties and features of the molecular systems of interest,
the training-set must include the ensemble of the optimized DFT configurations that better
represent the overall analyzed chemical system. In our case, since we were interested in the
description of the phenomena related to the fuel deposit formation, we chose to add to our
training-set mainly the DFT optimized adsorption configurations of the model molecules
representing the deposit precursors on the top of the aluminum and stainless steel surrogates in
both anhydrous and hydroxylated conditions.
For this thesis, the training-set was composed mainly of the adsorption configurations of a large
variety of model molecules to ensure a higher possibility for the reactive force field to be well
fitted for correctly predicting the analyzed molecular systems. This implemented methodology
for the improvement of the ReaxFF into describing the chemical properties and reactivities of our
systems envisaged an iterative cycle, where we can say that the two major parts may be defined

93
as the “ReaxFF parameterization” and the “ReaxFF validation”. The first part, as it was already
mentioned above, the objective was to define a suitable training-set that would aid us to improve
the implemented force fields, while the second part of this cycle was conceived to validate them.
This iterative scheme can be described in the following Figure 24 reported below; from this
simplified scheme, we can easily understand that the first part of this methodology consisting in
the ReaxFF parameterization is crucial. In fact, if at the end of the ReaxFF parametrization we
observe that after the optimization step the reactive force field is not yet able to predict the
inserted DFT data in the training-set, we cannot access to the second part of this methodology.
Figure 24: Simplified scheme of the ReaxFF methodology implemented in this thesis.

94
In the following paragraphs, each of the steps shown in Figure 24 will be addressed following
the order of the used methodology. In this section of our work, we chose to implement the AMS
2019 [50] modeling package for the ReaxFF calculations.
2.11.2 ReaxFF optimization algorithms
To find new parameters in ReaxFF, a new training-set must be constructed, which consists of
reference properties, 𝑥𝑖,𝑟𝑒𝑓, of molecules relevant to the chemistry interest. The standalone
ReaxFF provides an optimization scheme consisting of successive one-parameter parabolic
extrapolation (SOPPE) [51], in which the calculated predictions for these properties, 𝑥𝑖,𝑐𝑎𝑙𝑐({𝑝𝑗}), are determined by parameters, 𝑝𝑗, which can be adjusted to minimize the deviation
from the training data. The quality of a parameter vector is quantified by an objective function,
from this point referred to as error and given by:
𝑒𝑟𝑟𝑜𝑟({𝑝𝑗}) = ∑ (𝑥𝑖,𝑐𝑎𝑙𝑐({𝑝𝑗}) − 𝑥𝑖,𝑟𝑒𝑓𝜎𝑖 )2𝑛𝑖=1
Equation 59
Where the sum runs over all the training data points. In each term,𝜎𝑖 is an estimate of acceptable
deviations between a ReaxFF calculation and its corresponding reference value. Note that
reference values can be obtained either from experiment or from ab initio calculations (as in this
thesis). The aim of the optimization is to find a parameter set that minimizes the objective
function (error) defined in Equation 59.
The SOPPE algorithm attempts to arrive at an optimally configured parameter set by fine tuning
each parameter individually. However, using this optimization method becomes laborious as
parameters in the potential energy model are often related, such that the optimal value of each
parameter may shift if another one is changed.
Another solution for better parameter optimization is represented by the class of stochastic-
heuristic global optimization methods known as the genetic algorithm (GA) [52]. Next to GA,
many other techniques were proposed, such as multi-objective evolutionary strategy [53], a

95
parallel local search algorithm[54], Taguchi method-based optimization[55], a Monte-Carlo FF
optimizer (MCFF) [56, 57] and a covariance matrix adaptation evolutionary strategy (CMA-ES)
[58, 59].
2.11.3 ReaxFF optimization via CMA-ES optimizer
Once the training-set data is constructed, the next step is the force field optimization. In the AMS
2019 software, the implementation of this operation is run by the FF Optimizer module. The base
FFOptimizer module offers methods to compute the cost function (Equation 59) and its first and
second derivatives with respect to the force-field parameter values. Besides that, there are two
extensions available that implement global optimization methods: Monte-Carlo (MCFF) and
Covariance Matrix Adaptation Evolution Strategy (CMA-ES), the second being employed in this
thesis framework. This choice may be justified by the fact that the CMA-ES optimizer proves to
be more efficient that the MCFF if we compare them in terms of computational cost, as reported
in the work of Shchygol et. al [60], where they conducted a comparative study of the MCFF, the
CMA-ES and GA optimizations methods.
The CMA-ES (Covariance Matrix Adaptation Evolution Strategy) is an evolutionary algorithm
for difficult non-linear non-convex black-box optimization problems in continuous domain. The
CMA-ES is considered as state-of-the-art in evolutionary computation and has been adopted as
one of the standard tools for continuous optimization in various research and industrial
environments. The CMA-ES is typically applied to unconstrained or bounded constraint
optimization problems and search space dimensions between three and a hundred. The method
should be applied if derivative based methods (e.g. quasi-Newton, BFGS or conjugate gradient)
supposedly fail due to a rugged search landscape (such as discontinuities, sharp bends or ridges,
noise, local optima, outliers). If second order derivative based methods are successful, they are
usually faster than the CMA-ES.
Similar to quasi-Newton methods, the CMA-ES is a second order approach estimating a positive
definite matrix within an iterative procedure (more precisely: a covariance matrix, that is, on
convex-quadratic functions, closely related to the inverse Hessian). This makes the method
feasible on non-separable and/or badly conditioned problems. In contrast to quasi-Newton

96
methods, the CMA-ES does not use or approximate gradients and does not even presume or
require their existence. This makes the method feasible on non-smooth and even non-continuous
problems, as well as on multimodal and/or noisy problems. It turns out to be a particularly
reliable and highly competitive evolutionary algorithm for local optimization [61] and, surprising
at first sight, also for global optimization [62].
The CMA-ES has several invariance properties; two of them, inherited from the plain evolution
strategy, are (i) invariance to order preserving (i.e. strictly monotonic) transformations of the
objective function value and (ii) invariance to angle preserving (rigid) transformations of the
search space (including rotation, reflection, and translation), if the initial search point is
transformed accordingly. Invariances are highly desirable: they imply uniform behavior on
classes of functions and therefore imply the generalization of empirical results.
In addition, the CMA-ES does not require a tedious parameter tuning for its application. In fact,
the choice of strategy internal parameters is not left to the user (arguably with the exception of
population size λ). Finding good (default) strategy parameters is considered as part of the
algorithm design, and not part of its application—the aim is to have a well-performing algorithm
as is. The default population size λ is comparatively small to allow for fast convergence. Restarts
with increasing population size [63] improve the global search performance. For the application
of the CMA-ES, an initial solution, an initial standard deviation (step-size, variables should be
defined such that the same standard deviations can be reasonably applied to all variables, see also
here) and, possibly, the termination criteria (e.g. a function tolerance) need to be set by the user.
The most common applications are model calibration (e.g. curve fitting) and shape optimization.
In regards of FF parametrization [59, 64–66], the CMA-ES FF optimizer is implemented to find
the best fit force field for the given training-set. This FF optimizer represents a stochastic
gradient-free optimization algorithm proposed by Hansen et al. [58]. Starting from a user-
provided initial guess, CMA-ES iteratively tries to estimate the reference values of each training-
set parameter in order to reach the lowest error function value (Equation 59) of the implemented
force field. To achieve an efficient force field optimization, multiple parallel runs by the CMA-
ES optimizer are suggested, because in this way we could reduce the risk of reaching a
convergence on a higher local minimum. A good example of ReaxFF optimization via multiple
runs of the CMA-ES optimizer is reported in the Figure 25 below taken from the work of

97
Shchygol et al. [60], where the error function values produced by 10 different CMA-ES
optimization runs were plotted against the number of calculated iterations. From Figure 25 we
can see that all the error function values started as very high (106-108 order) but lowered of many
orders already after the first thousands of iterations. We can see that most of the runs gave an
error value around the 104 order, which is not so negligible compared to the first error values.
Figure 25: Plots of the error as a function of the number of error evaluations for the CMA-ES optimizer taken from ref. [60]
In our adopted methodology, we chose to verify the good fit of the optimized force field showing
the lowest error function value through the run of a new type of optimization run, in which this
time the force field had to predict different reference data from the training-set.
2.11.4 Required files for ReaxFF training-set
As stated before, the construction of a suitable training-set is fundamental to ensure a good force
field optimization. In the AMS 2019 modeling package that we employed for this thesis, the
training-set data (which is defined in the training_data dossier) requires four different files,
namely the .trainset.in, the .ffield, the .geo and the .params files respectively. The .trainset.in file
contains the training set data and tells the program how to calculate the cost function (Equation

98
59) which is used to optimize the force field parameters. The .ffield file defines the original force
field integrated to be optimized, the .geo file contains the training-set geometries (in our case the
adsorption configurations derived from DFT) and finally the .params file contains the
information of which training-set parameters should be optimized (e.g. bonds, atoms, angles).
2.11.5 ReaxFF validation-set
The validation-set has a very similar setting with the training-set previously described, with the
only exception given by the reference data added in it. The strategy adopted in this study was to
add a larger variety of molecular optimized configurations in the training-set to ensure a higher
capability of a correct prediction of the chemical systems for the new optimized force field.
Instead, we chose to add a more “restricted” variety of molecular data in the validation-set since
in this step the aim was to verify and possibly confirm that the optimized ReaxFF was fit good
enough to well describe the overall ensemble of our molecular systems.
Once confirmed that the optimized ReaxFF is able to correctly reproduce the training-set data, we
go towards the ReaxFF validation step. Here, if we observe that the ReaxFF estimations are not
accurate enough compared to the validation-set DFT data, then the iteration cycle of ReaxFF
reparametrization-optimization starts again. On the other hand, if the ReaxFF predictions proved
to be close to the reference values, then we validate ReaxFF and go forward to the ReaxFF data
production, which envisages the MD investigation of a surrogate liquid “fuel-oxygen” blend in
both homogeneous (i.e. liquid-phase) and heterogeneous (i.e. liquid/solid interface) conditions.
2.11.6 ReaxFF validation
Once verified that the optimized ReaxFF can well describe the molecular systems of the training-
set in terms of molecular structure (bonds and angles) and energies (adsorption energies), the
following step is the validation of the optimized force field. In this study, the ReaxFF validation
step was divided into two different parts: a “static” study and a “dynamic” study (as reported in
Figure 24).

99
The main stages of the “static” and “dynamic” studies carried out in our ReaxFF validation are
resumed in Figure 26.
Figure 26: Simplified scheme depicting the main “static” and “dynamic” studies envisaged in the ReaxFF
validation carried out in this study.
The “static” study is represented by two main categories of systems: the homogeneous (i.e. gas-
phase) and heterogeneous (gas/solid interface) systems, respectively.
For the homogeneous systems, we carry out the following calculations:
i. The ReaxFF geometry optimizations of the bulk lattice parameters for both α-Al2O3 and
α-Cr2O3 compared with the corresponding DFT results and experimental data.
ii. The ReaxFF geometry optimizations of the gas-phase reactions that describe the toluene
autoxidation mechanism compared with the corresponding DFT results.
For the heterogeneous systems, we carry out the ReaxFF calculations of the adsorption of
surrogates of deposit precursors (molecules not included in the previous training-set) on both α-
Al2O3 and α-Cr2O3 (in dry and hydroxylated conditions). These ReaxFF results are compared
with the corresponding DFT values to be validated.

100
The “dynamic” study envisages the ReaxFF MD calculation of the densities of common liquid
solvents selected among our model molecules: acetic acid, acetone and ethanol (as aliphatic
molecules) and benzaldehyde and benzyl alcohol (as aromatic molecules) at ambient conditions
(P = 1 bar and T = 20°C). Also water was included since it is hugely present in the systems
represented by the fully-hydroxylated surface layer. These ReaxFF densities are compared with
experimental data.
2.12 Molecular Dynamics
A Molecular Dynamics (MD) simulation consists of the numerical, step-by-step, solution of the
classical equation of motion, which for a simple atomic system may be written:
𝑚𝑖 (𝑑2𝒓𝑖𝑑𝑡2 ) = 𝒇𝑖 Equation 60
Where 𝑚𝑖 is the mass of the i-th particle, 𝒇𝑖is the force on it and 𝒓𝑖 represents its position
coordinates. The computation of the force 𝒇𝑖 involves the calculation of the derivative of the
interacting potential, 𝑈(𝒓1, 𝒓2, … , 𝒓𝑁):
𝒇𝑖 = − (𝜕𝑈(𝒓1, 𝒓2, … , 𝒓𝑁)𝜕𝒓𝑖 )
Equation 61
In each time step of the simulation, one needs to compute the force 𝒇𝑖 and, using this force, the
position𝒓𝑖 gets updated. To solve the second order differential equation as in Equation 60, there
are several numerical schemes available, which are based on finite difference methods. The
integration algorithms often include the Verlet algorithm, which several variations are the most
widely used in the MD calculation framework.

101
The integration of Equation 61 in the Verlet algorithm involves the computation of the positions
at different times using the Taylor expansion about 𝒓(𝑡), where ∆t is the time step. Thus:
𝒓(𝑡 + ∆𝑡 ) = 𝒓(𝑡) + ∆𝑡𝒗(𝑡) + 12 (∆𝑡2)𝜶(𝑡) + ⋯
Equation 62
𝒓(𝑡 − ∆𝑡 ) = 𝒓(𝑡) − ∆𝑡𝒗(𝑡) + 12 (∆𝑡2)𝜶(𝑡) − ⋯
Equation 63
Making use of these two expressions, the next step position𝒓(𝑡 + ∆𝑡 ) is easily found:
𝒓(𝑡 + ∆𝑡 ) = 2𝒓(𝑡) − 𝒓(𝑡 − ∆𝑡 ) + (∆𝑡2)𝜶(𝑡)
Equation 64
Although the velocities 𝒗(𝑡) are not required to compute trajectories, those are useful for the
computation of kinetic energy (hence, total energy) and the velocity auto-correlation functions.
We can then write:
𝒗(𝑡) = ( 12∆𝑡) [𝒓(𝑡 + ∆𝑡 ) − 𝒓(𝑡 − ∆𝑡 )] Equation 65
In the Verlet integration scheme, the errors in calculated positions 𝒓(𝑡) are of the order of ∆𝑡4,
while those in calculated velocities 𝒗(𝑡) are of the order of ∆𝑡2.
The integration of motion gives the constant-energy surface of the system. However, in most of
the cases, we seek to run MD simulations in a particular thermodynamic ensemble at a particular
state point (e.g. target energy, temperature and pressure). Under these conditions, the total energy
of system varies. To control the fluctuations in different state variables, different statistical
ensembles have been formulated. The state variables are defined as the energy (𝐸), temperature
(𝑇), volume (𝑉), number of particles (𝑁), enthalpy (𝐻) and pressure (𝑃). The structural, energetic

102
and several dynamic properties are calculated by taking average of these properties through all
the ensembles generated. Depending on the state variable maintained constant during the
simulation, we can define the following thermodynamic ensembles:
1. NVE ensemble, where the number of atoms, the volume and the energy remain constant
(micro-canonical ensemble).
2. NVT ensemble, where the number of atoms, the volume and the temperature remain
constant (canonical ensemble).
3. NPT ensemble, where the number of atoms, the pressure and the temperature remain
constant (isothermal-isobaric ensemble).
In the “dynamic” section of the ReaxFF validation, for the “physico-chemistry” study we
performed MD simulations through the implementation of the NPT ensemble since we wanted to
set a system where pressure and temperature were fixed (P = 1 bar and T = 20°C). In this way, we
could verify if the reparametrized FF could be able to describe some of the model molecules from
a macroscopic point of view (e.g. density).
On the other hand, for the “chemical reactivity” study, we run MD simulations through the NVT.
In both cases, we selected the Nosé-Hoover chain (NHC) [67] as thermostat, while in NPT case
we used the implemented Martina-Tobias-Klein (MTK) [68] barostat.
2.12.1 Radial distribution function (RDF)
In the MD simulations, we obtain the trajectory of the particles composing the molecular system.
We can make use of this obtained trajectory by calculating a structural quantity of the system,
such as the radial distribution function (RDF). The RDF is represented by the function g(r) and it
is defined as:
𝑔(𝑟) = 𝑉𝑁2 ⟨∑ ∑ 𝛿(𝑟 − 𝑟𝑖𝑗)𝑗𝑖 ⟩ Equation 66
where 𝑁 is the total number of particles present in a volume 𝑉, 𝑟𝑖𝑗 is the distance between a pair
of particles, 𝛿(𝑥) is a delta function and the angular brackets represent ensemble average. In the

103
MD simulations, we compute the 𝑟𝑖𝑗 values of all the particle pairs from the trajectories and this
is then used to calculate the RDF.
From the g(r), we can also calculate its integral, which corresponds to the mean number of atoms
around a specific type of atom at distance r. The integral is defined as:
𝑁(𝑟) = ∫ 4𝜋𝑟2𝑔(𝑟)𝜌 𝑑𝑟𝑟0
Equation 67
Where 𝜌 represents the atomic density of the surrounding atoms.

104
References
1 Warren J. Hehre (2003)A Guide to Molecular Mechanics and Quantum Chemical Calculations, 18401 Von Karman Ave., Suite 370 Irvine, CA 92612. ISBN: SBN 1-890661-18-X.
2 Parr R.G., Yang W. (1989)Density functional theory of atoms and molecules. 3 Perdew J. P, Wang J., Perdew, Wang (1992) Accurate and simple analytic representation of the electron-gas
correlation energy,Phys. Rev. B45, 23, 13244–13249. DOI: 10.1103/PhysRevB.45.13244. 4 John P. Perdew, K. Burke, M. Ernzerhof (1996) Generalized Gradient Approximation Made Simple,Phys. Rev.
Lett.77, 18, 3865–3868. DOI: 10.1103/PhysRevLett.77.3865. 5 Hafner J. (2008) Ab-initio simulations of materials using VASP: Density-functional theory and beyond,Journal
of computational chemistry29, 13, 2044–2078. DOI: 10.1002/jcc.21057. 6 Moroni E.G., Kresse G., Hafner J., Furthmüller J. (1997) Ultrasoft pseudopotentials applied to magnetic Fe, Co,
and Ni: From atoms to solids,Physical review. B, Condensed matter56, 24, 15629–15646. DOI: 10.1103/PhysRevB.56.15629.
7 R. Hafner et al. (2002) Ab initio local-spin-density study of oscillatory exchange coupling in Fe/Au multilayers,J. Phys.: Condens. Matter14, 4297–4307.
8 Sholl D.S., Steckel J.A. (eds.) (2009)Density functional theory: A practical introduction, Wiley, Hoboken N.J. 9 Vanderbilt D. (1997) First-principles based modelling of ferroelectrics,Curr Opin Solid State Mater Sci2, 6,
701–705. DOI: 10.1016/S1359-0286(97)80013-7. 10 Blöchl P.E (1994) Projector augmented-wave method,Phys. Rev. B50, 24, 17952–17979. DOI:
10.1007/BF02712785. 11 Kresse G., Joubert D. (1999) From ultrasoft pseudopotentials to the projector augmented-wave method,Phys.
Rev. B59, 3, 1758–1775. DOI: 10.1103/PhysRevB.59.1758. 12 Dudarev et al (1997) Electron-energy-loss spectra and the structural stability of nickel oxide: an LSDA+U
study,Phys. Rev. B57, 1505–1509. DOI: 10.1103/PhysRevB.57.1505. 13 Grimme S., Antony J., Ehrlich S., Krieg H. (2010) A consistent and accurate ab initio parametrization of density
functional dispersion correction (DFT-D) for the 94 elements H-Pu, J. Chem. Phys.132, 15, 154104. DOI: 10.1063/1.3382344.
14 Stephan Grimme (2006) Semiempirical GGA-type density functional constructed with a long-range dispersion correction,Journal of computational chemistryVolume 27, Issue 15, 1787–1799.
15 Henkelman G., Jónsson H. (2000) Improved tangent estimate in the nudged elastic band method for finding minimum energy path and saddle points // Improved tangent estimate in the nudged elastic band method for finding minimum energy paths and saddle points,J. Chem. Phys.113, 22, 9978–9985. DOI: 10.1063/1.1323224.
16 Hannes Jónsson, Greg Mills, Karsten W. Jacobsen (385)Nudged Elastic Band Method for Finding Minimum
Energy Paths of Transitions. 17 Uberuaga, Leskovar, Smith, Jonsson, Olmstead (2000) uuberu // Diffusion of Ge below the Si(100) surface:
theory and experiment,Physical Review Letters84, 11, 2441–2444. DOI: 10.1103/PhysRevLett.84.2441. 18 Shen T.-C., Steckel J.A., Jordan K.D. (2000) Electron-stimulated bond rearrangements on the H/Si(100)-3×1
surface,Surface Science446, 3, 211–218. DOI: 10.1016/S0039-6028(99)01147-4. 19 Mads R. Sorensen, 1 Karsten W. Jacobsen, 1, 2 and Hannes Jonsson 1, 3, Sorensen, Jacobsen, Jónsson (1996)
Thermal Diffusion Processes in Metal-Tip-Surface Interactions: Contact Formation and Adatom Mobility,Physical Review Letters77, 25, 5067–5070. DOI: 10.1103/PhysRevLett.77.5067.
20 Villarba M., Jónsson H. (1995) Atomic exchange processes in sputter deposition of Pt on Pt(111),Surface
Science324, 1, 35–46. DOI: 10.1016/0039-6028(94)00631-8. 21 M.J. Frisch, G.W. Trucks, H.B. Schlegel, G.E. Scuseria, M.A. Robb, J.R. Cheeseman, G. Scalmani, V. Barone,
G.A. Petersson, H. Nakatsuji, X. Li, M. Caricato, A.V. Marenich, J. Bloino, B.G. Janesko, R. Gomperts, B. Mennucci, H.P. Hratchian, J.V. Ortiz, Izmaylov, A. F., Sonnenberg, J. L., Williams, F. Ding, F. Lipparini, F. Egidi, J. Goings, B. Peng, A. Petrone, T. Henderson, D. Ranasinghe, V.G. Zakrzewski, J. Gao, N. Rega, G. Zheng, W. Liang, M. Hada, M. Ehara, K. Toyota, R. Fukuda, J. Hasegawa, M. Ishida, T. Nakajima, Y. Honda, O. Kitao, H. Nakai, T. Vreven, K. Throssell, J.A. Montgomery Jr., Peralta, J. E., F. Ogliaro, M.J. Bearpark,

105
Heyd, J. J., E.N. Brothers, K.N. Kudin, Staroverov, V. N., T.A. Keith, R. Kobayashi, J. Normand, K. Raghavachari, A.P. Rendell, J.C. Burant, S.S. Iyengar, J. Tomasi, M. Cossi, J.M. Millam, M. Klene, C. Adamo, R. Cammi, J.W. Ochterski, R.L. Martin, K. Morokuma, O. Farkas, J.B. Foresman, D.J. Fox (2016)Gaussian 16
Rev. C.01, Wallingford, E.U.A. 22 Kresse, Furthmüller (1996) Efficient iterative schemes for ab initio total-energy calculations using a plane-wave
basis set,Phys. Rev. B54, 16, 11169–11186. DOI: 10.1103/physrevb.54.11169. 23 Kresse G., Furthmuller J. (1996) Efficiency of ab-initio total energy calculations for metals and semiconductors
using a plane-wave basis set,Comput. Mater. Sci.6, 15–50. DOI: 10.1016/0927-0256(96)00008-0. 24 Hammer B., Hansen L.B., Nørskov J.K. (1999) Improved adsorption energetics within density-functional theory
using revised Perdew-Burke-Ernzerhof functionals,Phys. Rev. B59, 11, 7413–7421. DOI: 10.1103/PhysRevB.59.7413.
25 Armiento R., Mattsson A.E. (2005) Functional designed to include surface effects in self-consistent density functional theory,Phys. Rev. B72, 8. DOI: 10.1103/PhysRevB.72.085108.
26 W. Tang, E. Sanville, and G. Henkelman. (2009) A grid-based Bader analysis algorithm without lattice bias, J.
Phys.: Condens. Matter21, 084204.
27 Gouron A., Kittel J., Bruin T. de, Diawara B. (2015) Density Functional Theory Study of Monoethanolamine Adsorption on Hydroxylated Cr 2 O 3 Surfaces, J. Phys. Chem. C119, 40, 22889–22898. DOI: 10.1021/acs.jpcc.5b05375.
28 Costa D., Garrain P.-A., Baaden M. (2013) Understanding small biomolecule-biomaterial interactions: A review of fundamental theoretical and experimental approaches for biomolecule interactions with inorganic surfaces,J.
Biomed. Mater. Res. Part A101, 4, 1210–1222. DOI: 10.1002/jbm.a.34416. 29 Nigussa K.N., Nielsen K.L., Borck Ø., Støvneng J.A. (2011) Adsorption of hydrogen, chlorine, and sulfur
atoms on α-Cr2O3(0001) surfaces: A density functional theory investigation, Corros. Sci.53, 11, 3612–3622. DOI: 10.1016/j.corsci.2011.07.005.
30 van Duin A.C.T., Dasgupta S., Lorant F., Goddard W.A. (2001) ReaxFF: A Reactive Force Field for Hydrocarbons,J. Phys. Chem. A105, 41, 9396–9409. DOI: 10.1021/jp004368u.
31 Russo M.F., van Duin A.C. (2011) Atomistic-scale simulations of chemical reactions: Bridging from quantum chemistry to engineering,Nucl. Instrum. Methods Phys. Res269, 14, 1549–1554. DOI: 10.1016/j.nimb.2010.12.053.
32 Senftle T.P., Hong S., Islam M.M., Kylasa S.B., Zheng Y., Shin Y.K., Junkermeier C., Engel-Herbert R., Janik M.J., Aktulga H.M., Verstraelen T., Grama A., van Duin A.C.T. (2016) The ReaxFF reactive force-field: Development, applications and future directions,NPJ Comput. Mater.2, 1, 9396. DOI: 10.1038/npjcompumats.2015.11.
33 van Duin A.C., Damsté J.S. (2003) Computational chemical investigation into isorenieratene cyclisation,Org.
Geochem.34, 4, 515–526. DOI: 10.1016/S0146-6380(02)00247-4. 34 Chen N., Lusk M.T., van Duin A.C.T., Goddard W.A. (2005) Mechanical properties of connected carbon
nanorings via molecular dynamics simulation,Phys. Rev. B72, 8, 29. DOI: 10.1103/PhysRevB.72.085416. 35 Chenoweth K., van Duin A.C.T., Goddard W.A. (2008) ReaFF Potential Functions: Supporting Information for
the manuscript "A ReaxFF Reactive Force Field for Molecular Dynamics Simulations of Hydrocarbon Oxidation",J. Phys. Chem. A112, 5, 1–10. DOI: 10.1021/jp709896w.
36 Castro-Marcano F., Kamat A.M., Russo M.F., van Duin A.C., Mathews J.P. (2012) Combustion of an Illinois No. 6 coal char simulated using an atomistic char representation and the ReaxFF reactive force field,Combustion and Flame159, 3, 1272–1285. DOI: 10.1016/j.combustflame.2011.10.022.
37 Rahaman O., van Duin A.C.T., Goddard W.A., Doren D.J. (2011) Development of a ReaxFF reactive force field for glycine and application to solvent effect and tautomerization,The journal of physical chemistry. B115, 2, 249–261. DOI: 10.1021/jp108642r.
38 Monti S., Corozzi A., Fristrup P., Joshi K.L., Shin Y.K., Oelschlaeger P., van Duin A.C.T., Barone V. (2013) Exploring the conformational and reactive dynamics of biomolecules in solution using an extended version of the glycine reactive force field, Phys. Chem. Chem. Phys.15, 36, 15062–15077. DOI: 10.1039/c3cp51931g.
39 Raymand D., van Duin A.C., Spångberg D., Goddard W.A., Hermansson K. (2010) Water adsorption on stepped ZnO surfaces from MD simulation,Surface Science604, 9-10, 741–752. DOI: 10.1016/j.susc.2009.12.012.

106
40 Case D.A., Cheatham T.E., Darden T., Gohlke H., Luo R., Merz K.M., Onufriev A., Simmerling C., Wang B., Woods R.J. (2005) The Amber biomolecular simulation programs,Journal of computational chemistry26, 16, 1668–1688. DOI: 10.1002/jcc.20290.
41 B. R., Brooks C.L., Mackerell A.D., Nilsson L., Petrella R.J., Roux B., Won Y., Archontis G., Bartels C., Boresch S., Caflisch A., Caves L., Cui Q., Dinner A.R., Feig M., Fischer S., Gao J., Hodoscek M., Im W., Kuczera K., Lazaridis T., Ma J., Ovchinnikov V., Paci E., Pastor R.W., Post C.B., Pu J.Z., Schaefer M., Tidor B., Venable R.M., Woodcock H.L., Wu X., Yang W., York D.M., Karplus M. (2009) CHARMM: the biomolecular simulation program,Journal of computational chemistry30, 10, 1545–1614. DOI: 10.1002/jcc.21287.
42 Chenoweth K., van Duin A.C.T., Goddard W.A. (2009) The ReaxFF Monte Carlo reactive dynamics method for predicting atomistic structures of disordered ceramics: application to the Mo(3)VO(x) catalyst,Angewandte
Chemie (International ed. in English)48, 41, 7630–7634. DOI: 10.1002/anie.200902574. 43 Chenoweth K., van Duin A.C.T., Goddard W.A. (2008) ReaxFF reactive force field for molecular dynamics
simulations of hydrocarbon oxidation,J. Phys. Chem. A112, 5, 1040–1053. DOI: 10.1021/jp709896w. 44 Buehler M.J., Tang H., van Duin A.C.T., Goddard W.A. (2007) Threshold crack speed controls dynamical
fracture of silicon single crystals,Physical Review Letters99, 16, 165502. DOI: 10.1103/PhysRevLett.99.165502.
45 Jiang X., Hu Y., Ling L., Wang X. (2021) The initial wet oxidation process on Fe-Cr alloy surface: Insights from ReaxFF molecular dynamic simulations,Applied Surface Science548, 149159. DOI: 10.1016/j.apsusc.2021.149159.
46 Shin Y.K., Kwak H., Vasenkov A.V., Sengupta D., van Duin A.C. (2015) Development of a ReaxFF Reactive Force Field for Fe/Cr/O/S and Application to Oxidation of Butane over a Pyrite-Covered Cr 2 O 3 Catalyst, ACS Catal.5, 12, 7226–7236. DOI: 10.1021/acscatal.5b01766.
47 Dabaghmanesh S., Neek-Amal M., Partoens B., Neyts E.C. (2017) The formation of Cr2O3 nanoclusters over graphene sheet and carbon nanotubes,Chemical Physics Letters687, 188–193. DOI: 10.1016/j.cplett.2017.09.005.
48 Zeng H., Cheng X., Zhang C., Lu Z. (2018) Responses of Core–Shell Al/Al 2 O 3 Nanoparticles to Heating: ReaxFF Molecular Dynamics Simulations,J. Phys. Chem. C122, 16, 9191–9197. DOI: 10.1021/acs.jpcc.8b01088.
49 Soleymanibrojeni M., Shi H., Liu F., Han E.-H. (2019) Atomistic simulations of Epoxy/Water/Aluminum systems using the ReaxFF method,Computational Materials Science, 109424. DOI: 10.1016/j.commatsci.2019.109424.
50 Rüger R., Franchini M., Trnka T., Yakovlev A., van LentheAMS 2019, T. SCM, Theoretical Chemistry, Vrije Universiteit: Amsterdam, The Netherlands.
51 van Duin A.C.T., Baas J. M. A, van de Graal B. (1994) Delft molecular mechanics : a new approach to hydrocarbon force fields,J. Chem. Soc. Faraday Trans.90, 19, 2881–2895. DOI: 10.1039/FT9949002881.
52 Holland J.H. (1992)Adaptation in natural and artificial systems: An introductory analysis with applications to
biology, control, and artificial intelligence, The MIT Press, Cambridge (Mass.) London. ISBN: 9780262581110.
53 Larentzos J.P., Rice B.M., Byrd E.F.C., Weingarten N.S., Lill J.V. (2015) Parameterizing Complex Reactive Force Fields Using Multiple Objective Evolutionary Strategies (MOES). Part 1: ReaxFF Models for Cyclotrimethylene Trinitramine (RDX) and 1,1-Diamino-2,2-dinitroethene (FOX-7),J. Chem. Theory
Comput.11, 2, 381–391. DOI: 10.1021/ct500788c. 54 Deetz J.D., Faller R. (2014) Parallel optimization of a reactive force field for polycondensation of
alkoxysilanes,The journal of physical chemistry. B118, 37, 10966–10978. DOI: 10.1021/jp504138r. 55 Hu X., Schuster J., Schulz S.E. (2017) Multiparameter and Parallel Optimization of ReaxFF Reactive Force
Field for Modeling the Atomic Layer Deposition of Copper,J. Phys. Chem. C121, 50, 28077–28089. DOI: 10.1021/acs.jpcc.7b09948.
56 Iype E., Hütter M., Jansen A.P.J., Nedea S.V., Rindt C.C.M. (2013) Parameterization of a reactive force field using a Monte Carlo algorithm,Journal of computational chemistry34, 13, 1143–1154. DOI: 10.1002/jcc.23246.
57 Kirkpatrick S., Gelatt C. D., Vecchi M. P. (1983) Optimization by simulated annealing,Science220, 4598, 671–680. DOI: 10.1126/science.220.4598.671.

107
58 Lozano J.A., Larrañaga P., Inza I., Bengoetxea E. (2006)Towards a New Evolutionary Computation: Advances
in the Estimation of Distribution Algorithms, Springer Berlin Heidelberg, Berlin, Heidelberg. ISBN: 9783540324942.
59 Trnka T., Tvaroška I., Koča J. (2018) Automated Training of ReaxFF Reactive Force Fields for Energetics of Enzymatic Reactions,Journal of chemical theory and computation14, 1, 291–302. DOI: 10.1021/acs.jctc.7b00870.
60 G. Shchygol, A. Yakovlev, T. Trnka, A.C.T van Duin, T. Verstraelen ReaxFF parameter optimization with Monte Carlo and Evolutionary Algorithms: Guidelines and InsightsCenter for Molecular Modeling (CMM), Ghent University, Technologiepark 903, B-9052,
61 Hansen N., Ostermeier A. (2001) Completely derandomized self-adaptation in evolution strategies,Evolutionary
computation9, 2, 159–195. DOI: 10.1162/106365601750190398. 62 N. Hansen, S. Kern (2004)Evaluating the CMA Evolution Strategy on Multimodal Test Functions: Parallel
problem solving from nature, Springer, Berlin. ISBN: 978-3-540-23092-2. 63 A. Auger, N. Hansen (2005, 2003)Proceeding of the IEEE Congress on Evolutionary Computation, CEC 2005,
IEEE, Piscataway NJ. ISBN: 0-7803-9363-5. 64 Dürholt J.P., Fraux G., Coudert F.-X., Schmid R. (2019) Ab Initio Derived Force Fields for Zeolitic Imidazolate
Frameworks: MOF-FF for ZIFs,Journal of chemical theory and computation15, 4, 2420–2432. DOI: 10.1021/acs.jctc.8b01041.
65 Verstraelen T., Bultinck P. (2015) Can the electronegativity equalization method predict spectroscopic properties?,Spectrochimica acta. Part A, Molecular and biomolecular spectroscopy136 Pt A, 76–80. DOI: 10.1016/j.saa.2013.10.124.
66 Semino R., Dürholt J.P., Schmid R., Maurin G. (2017) Multiscale Modeling of the HKUST-1/Poly(vinyl alcohol) Interface: From an Atomistic to a Coarse Graining Approach,J. Phys. Chem. C121, 39, 21491–21496. DOI: 10.1021/acs.jpcc.7b07090.
67 W. G. Hoover, B. L. Holian (1996) Kinetic moments method for the canonical ensemble distribution,Phys. Rev.
A (Physical Review A)211, 253–257. DOI: 10.1016/0375-9601(95)00973-6. 68 Martyna G.J., Tuckerman M.E., Tobias D.J., Klein M.L. (1996) Explicit reversible integrators for extended
systems dynamics,Molecular Physics87, 5, 1117–1157. DOI: 10.1080/00268979600100761. 69 Kim, Y. M., Cho, K.-B., Cho, J., Wang, B., Li, C., Shaik, S., et al. (2013). A mononuclear non-heme high-spin
iron(III)–hydroperoxo complex as an active oxidant in sulfoxidation reactions. J. Am. Chem. Soc. 135, 8838–8841. doi: 10.1021/ja404152qX.
70 Shubin L., Research Computing Center, ITS University of North Carolina at Chapel Hill “Gaussia & GaussianView” (lecture), https://www.slideserve.com/vin/gaussian-gaussview.

108
Chapter 3. Studied surfaces
3.1 Choice of corundum α-Al2O3 and α-Cr2O3 surfaces
The major interest of this thesis is the study on the interactions occurring between an organic
liquid phase, surrogate of the deposit precursors, and a metal-oxide solid phase, representative of
the metallic materials commonly coating the engine injection systems.
In the previous sections, firstly we reported the bibliographic review on the occurrence of the
formation of liquid deposits, followed by an overview of the main experimental and theoretical
works centered on the adsorption of an organic phase above metal-oxide substrates. In this
section, we will focus more on the metallic surfaces considered in this study and how we chose to
model them accordingly in our simulations.
As metallic surfaces, we opted for aluminium and stainless steel since both materials are hugely
used as coatings in the transport sector. They both exhibit corrosion resistance due to the
presence of a protective passive oxide film [1, 2].
The aluminum oxide known as alumina (Al2O3) represents one of the most important materials in
earth’s surface while aluminium (Al) is one of the most abundant elements in the earth’s crust
[3]. Alumina has a high insulating property (ceramic) and structural stability over a large
temperature range and presents a versatility for a wide range of scientific and technological
applications [4, 5].
Alumina is found in nature in the crystallographic structure of corundum, represented as α-Al2O3.
In its pure form, α-Al2O3 (or corundum) is an important ceramic material. The α-Al2O3 is widely
used in a range of industrial areas, such as optics, electronics and ceramic applications [6]. For
instance, α-alumina is widely used as a substrate for the growth of thin metal, semiconductor and
insulator films in the microelectronics industry [7, 8].

109
The chromium oxide known as chromia (Cr2O3) is an antiferromagnetic insulator that can also be
found with the corundum crystallographic structure α-Cr2O3. Very similarly to its aluminium
counterpart, the corundum-type α-Cr2O3 has a variety of applications in various technologies, as
catalyst [9, 10], protective layer (corrosion and wear resistance of stainless steel [11]), as an
adhesion promoter [11] to cite a few of them. The protective passive film layer on Fe-Cr stainless
steel alloys is composed of an inner Cr2O3 oxide film layer and an outer hydroxylated layer [12];
also, according to ref. [12], model studies on monocrystalline Fe-22Cr alloys have evidenced the
formation of an inner α-Cr2O3 (0001) oxide film at the interface with water.
In the next paragraph, we proceed the description of these two metal-oxides with the introduction
of the α-(0001) Al2O3 and α-(0001) Cr2O3 surfaces.
3.2 Introduction to α-(0001) Al2O3 and α-Cr2O3 surfaces 3.2.1 Bulk structures of α-Al2O3 and α-Cr2O3
Bulk α-Al2O3 (space group R3c [13]) can be described as a hexagonal unit cell containing six
formula units. It is also frequently described by a rhombohedral unit cell containing two formula
units of Al2O3.
The structure of α-Al2O3 is closely related to the ideal corundum structure (c/a = 2√2) shown in
Figure 27a.

110
Figure 27: a) Idealized corundum structure for alumina showing the location of the aluminium and oxygen ions in the hexagonal unit cell. The angle between the x- and y- axes is 120°. The aluminium ions are located
on the heavy vertical lines, while the oxygen ions are located in the intersection of horizontal (dashed) lines. b) Cross-section of the idealized (white squares) and real (dark circles) arrangement of aluminium ions in the
hexagonal unit cell of alumina. The value c = 2a√2 is used for the idealized structure. Images taken from ref. [13].
Here, the Al3+ ions lie along the c-axis in coplanar layers, filling 2/3 of the octahedral holes
between layers of O2- ions. These oxide layers are equidistant from each other, spaced 1/6 of the
unit cell side c apart. In this structure, the Al3+ ions are situated halfway between two oxide
layers. In the oxygen layers themselves, the O2- ions are equidistant from each other, forming an
exactly hexagonal arrangement.
In reality, the Al3+ ions in Al2O3 do not form coplanar layers, but are buckled as shown in Figure
27b. As a result, the two neighboring oxide layers to each Al3+ ion are located at different
distances, as can be clearly seen in the cross-section shown in Figure 28b. This displacement
divides the six nearest neighbor oxygen ions into two triads of equivalent ions located in two
adjacent layers. In the oxide layers, the O2- ions are also slightly shifted laterally away from the
ideal positions. In the O2- layer furthest from Al3+ ion, each triad of oxide ions shrinks evenly
towards the c-axis. In the other layer, closest to Al3+ ion, each triad is expanded and twisted about
the c-axis (Figure 28a).
a) b)

111
Figure 28: Top (a) and cross-section (b) of a set of O-Al-O layers in the ideal and real alumina hexagonal unit cell showing the octahedron of the nearest O neighbors [idealized (*) and real (°) case] to an Al ion [idealized
(*) and real (●) case]. Image taken from ref. [13].
The α-Cr2O3 bulk is antiferromagnetic oxide with the corundum structure and space group R3c
[14] (same as α-Al2O3). Figure 29 shows the α-Cr2O3 unit cell comprised of a hexagonal closed-
packed O matrix where two thirds of the octahedral sites are occupied by Cr cations and one third
are vacant, similarly to what shown in Figure 27a for the α-Al2O3. An O anion in the crystal
structure is enclosed by four nearest neighboring Cr cations forming four-fold (tetrahedral)
coordination. The Cr ions in the α-Cr2O3 have an antiferromagnetic spin configuration below 307
K [15] and a magnetic structure corresponding to (+-+-) spin sequence along the [1111] axis and
overall zero magnetic moment for the unit cell [16].

112
Figure 29: Atomistic structure presenting α-Cr2O3 unit cell where unoccupied octahedral sites are shown in dashed circles. Image taken from ref. [17]
3.2.2 Surface terminations of α-(0001) Al2O3 and Cr2O3
Both α-Al2O3 and α-Cr2O3 corundum structure in the [0001] direction can be depicted as a
hexagonal planar layers of O being separated by two closely-spaced layers of M, where M
represents the metal cation characterizing the given metal oxide. For these corundum-type oxides,
in order to maintain the M2O3 stoichiometry in their (0001) surface, each O layer has to contain 3
times as many atoms as each M layer; thus in this (0001) direction, the stacking can be simply
represented as -O3-M-M-O3-M-M-.
In the case where the (0001) surface maintains a structure similar to the bulk, three potential
terminations can be found: metal-single-layer-terminated -M-O3-M-, oxygen-terminated -O3-M-
M, metal-bilayer-terminated -M-M-O3 (Figure 30 below).

113
Figure 30: Representations of three distinct surfaces that can be obtained by M2O3 (0001) perpendicular to the [0001] direction shown along [2110]: a) the stoichiometric, or metal-single-layer-terminated (-M-O3-M-);
b) the oxygen-rich, or oxygen-terminated (-O3-M-M-); c) The M-rich, or metal-bilayer-terminated (-M-M-O3). Large ball : Cr or Al, small balls : O. Image taken from ref.[18]
By exploring their electrostatic features, it can be found that both the -O3-M-M- and -M-M-O3
surfaces present polarity that lead to a divergent electrostatic potential in the bulk; by contrast,
the -M-O3-M- surface does not [18–22].
Corundum-type surfaces such as α-Cr2O3 andα-Al2O3 crystallize in a structure which can be
described by a conventional hexagonal unit with six M2O3 formula units (30 atoms). Each
hexagonal unit cell contains 12 metallic atoms, among which every four atoms form a subunit
corresponding to the rhombohedral primitive cell. For the hexagonal unit cell (Figure 31 below),
the atoms are stacked along the (0001) direction according to the sequence R-M-M-O3-M-M-O3-
R, where R represents the continuing sequence in the bulk.
Figure 31: Rhombohedral primitive cell of Cr2O3 and Al2O3 (left) together with the hexagonal unit cell (right). Smaller blue (lighter) spheres represent Cr/Al atoms; larger red (darker) spheres display the O atom. Figure
taken from ref. [35]

114
3.2.3 Experimental studies of α-(0001) Al2O3 and Cr2O3 surfaces
Even though the corundum surface α-Al2O3 covers a huge importance in many different usages,
the surface structure and even the structure stoichiometry still represents a matter of strong
controversy. According to ref. [22], the principal reason for this inconvenience is traceable from
the difficulty to prepare a clean and uniform surface with specific, well-defined structures and
stoichiometries.
For Goniakowski et al. [20], (0001) surfaces of alumina have been the subject of numerous
experimental and theoretical studies in the past. From the experimental point of view, earlier ion-
scattering [23, 24] and x-ray [24] experiments concluded that under UHV and ambient conditions
the surface was unreconstructed (1 × 1) and Al-terminated.
In their work, Ahn et al. [23] implemented the techniques of time-of-flight scattering and
recoiling spectrometry (TOF-SARS), LEED and classical ion trajectory simulations in their
analyses with the aim to characterize the elemental composition in the outermost two atomic
layers of α-Al2O3. From their analyses, they found that hydrogen was detected on the surface by
TOF-SARS and these H atoms were proposed to come from the bulk.
Soares et al. [25] confirmed from their LEED analysis on α-Al2O3 (0001) that hydrogen
adsorption on Al-terminated surface reduced the interlayer contraction at the surface, which was
also reported by Ahn et al. [23].
The conclusion on Al-terminated surface as the most stable surface termination under UHV and
ambient condition for corundum α-Al2O3 was also reached by the ion-scattering experiments
carried out by Suzuki et al. [26]. While earlier tensor-LEED analysis [13]proposed a mixture of
Al- and O- terminated terraces as a best fit of the experimental data, a more recent analysis [25,
27]strongly favors the Al termination.
About corundum-type α-Cr2O3 surface, Priyantha et al. [28] studied the epitaxial growth of
chromium oxide films on Ag(111) and characterized them through LEED, X-ray photoelectron
spectroscopy (XPS) and X-ray photoelectron diffraction (XPD). From their analyses, they found
that chromium oxide with thickness greater than approximately 12 Å show a pattern consistent

115
with α-Cr2O3 (0001) surface, conclusion further confirmed by their XPD results that identified
the surface termination as a single Cr layer with an inward relaxation of 50%.
In the work of Bikondoa et al. [29], surface X-ray diffraction (SXRD) was employed to
quantitatively assess the surface structure of α-Cr2O3 as a function of oxygen partial pressure at
room temperature. From their analysis, they found that the surface geometry can be modified in
the presence of oxygen at room temperature; a Cr0,22-Cr0,31-O3- termination was seen at UHV
conditions and a chromyl-topped O0,38=Cr0,38-O3- structure was observed at an O2 partial pressure
of 1x10⁻² mbar. However, they stated ab-initio theoretical calculations [30, 31] have not predicted
either of the two oxygen-terminated surfaces.
In the work of Rohr et al. [32], the surface structure of Cr2O3 (0001) was investigated by
quantitative LEED in UHV conditions and molecular dynamics simulations. From their LEED
analysis, the surface was found as chromium terminated and, furthermore, they found that both
experimental and numerical methods indicated the presence of strong vertical relaxations at and
near the surface. According to Rohr et al. [32], these relaxations were concomitant with a charge
reduction and depolarization, which stabilized the surface and yielded energies close to values
found for non-polar oxide surfaces.
3.2.4 DFT modeling of α-(0001) Cr2O3 and Al2O3 surfaces
In the literature, it is possible to find several theoretical studies carried out with the intent of
investigating about surface properties of Al2O3 and Cr2O3[18, 22, 30, 34–36]. The main objective
of these researches was to determine the surface terminations of α-(0001)Al2O3 and α-
(0001)Cr2O3 as a function of the chemical potential (corresponding to the partial pressure) of both
oxygen [22, 37] or water [34, 38].
The existence of one chromium or aluminium terminations is well established in the literature for
both α-Al2O3 and α-Cr2O3 surfaces [18, 22, 30, 35–37].
In their work Tepesch et al. [18] examined different α-(0001)Al2O3 surface terminations,
confirming that the α-(0001)Al2O3 stoichiometric surface is the lowest energy surface relative to
the oxygen-terminated or 2-Al-terminated surfaces and that their result was in agreement with

116
ion-scattering results by Ahn et al. [23]. Tepesch et al. [18] concluded their analysis by
confirming that the most stable surface termination for the α-Al2O3 represented by the Al-
terminated.
According to Wang et al.[22], for the systems containing just aluminum and oxygen the only one
low energy surface stoichiometry is given by the AlO3Al-R structure. They concluded that this
stability extends across the entire range of the oxygen chemical potential, even up to the limit
where an O2 condensate would form on the surface.
For surfaces like α-Cr2O3 and α-Fe2O3, the main interest lies in the role of their strong electronic
correlations that significantly characterize their physical properties since they have
antiferromagnetic and insulator features. However, it is well-known that DFT experiences
considerable difficulties when trying to achieve a correct description of such strongly-correlated
materials [30, 39]. To correct the strong electronic correlation describing these kind of materials,
the DFT+U method in the form proposed by Liechtenstein and Dudarev et al.[39–41] is generally
used (cf.§2.4.3).
Since the DFT+U method ensured to better depict the electronic and magnetic nature of chromia,
also for this thesis when speaking about the DFT method implemented, it will be implicitly
reminded to the DFT+U method.
The hexagonal lattice characterizing Cr2O3-Cr (0001) surface consists of three rhombohedral
primitive cells, in which only three antiferromagnetic spin configurations are possible: A (+ + −
−), B (+ − − +) and C (+ − + −). As verified in multiple works [30, 34, 37], the spin ground state
of Cr2O3 is identified with the (CCC), which results in a total magnetic moment equal to zero.
Rohrbach et el. [30] analyzed the structural, electronic and magnetic properties of the polar
(0001) surface of α-Cr2O3 through DFT+U approach, obtaining reasonable results for the
description of the behavior of 3d Cr electrons present in the band structure. In their work, they
concluded that the most stable surface of Cr2O3 is Cr-terminated [30].
In the work of Souvi et al. [37], different α-(0001)Cr2O3 surface terminations were considered in
order to find the most stable one. Their results confirmed that between the two stoichiometric
Cr2O3 configurations (the Cr-terminated and O-terminated respectively), the oxygen terminated
surface presented an energy surface greater than the chromium terminated, thus the latter being
the most stable.

117
From this literature study of α-(0001) Al2O3 and Cr2O3 surfaces, we decided in this thesis to
consider only the Al-terminated and Cr-terminated surfaces as reference for the study of the
adsorption of the organic molecules on the metallic surface.
Both references [37, 42] for α-Al2O3 and α-Cr2O3 conducted a theoretical studied by calculating
the Gibbs free energy of both (0001) surfaces in equilibrium with a realistic environment
containing both oxygen and hydrogen species. Their objective was to determine the stability of
the surface terminations of α-(0001) Al2O3 and α-(0001) Cr2O3 as a function of the partial
pressure of oxygen and hydrogen, respectively.
About the α-(0001)Al2O3 surface, Marmier et al. [42] confirmed that the O-terminated surface
can only be stabilized in the presence of hydrogen and this same conclusion was also made by
Wang et al. [22].
About the α-(0001)Cr2O3 surface, Souvi et al. [37] discovered that below 600 K the adsorption of
O2 is favored whatever the measured oxygen partial pressure and this would lead to the formation
of a chromyl termination CrO3-Cr-O. However, in case of low oxygen partial pressures, the Cr-
terminated surface remains the most stable one. Similarly, in case of higher temperature (>1200
K), the only stable termination surface is -CrO3-Cr whatever the oxygen partial pressure is
(Figure 32).
Figure 32: a) (P,T) phase diagram of chromia in presence of O2 and b) a zoom to show the domain stability of the 3 different chromia terminations. Dotted blue curve: -Cr-Cr-O3; Light-blue curve: -Cr-O3-Cr-O2; Green
curve: -Cr-O3-Cr-O. Figure taken from ref. [11]

118
3.2.5 Hydration condition
It is indeed well-known that, when certain oxide surfaces are exposed to water, they tend to react
with water molecules that in turn dissociate and form hydroxyl groups at the surface [43–45] and,
from what has been mentioned above, this behavior certainly concerns both the aluminum (which
is modeled by Al2O3) and the stainless steel (being its protective layer composed by Cr2O3 [34,
45–48]).
As already stated before, for Wang et al. [22] the addition of hydrogen to the surface dramatically
lowers the free energy and this new surface results to be much more stable than the O3-terminated
surface at all oxygen partial pressures. As observed in Figure 33, the saturation of all surface
oxygens with hydrogen as indicated by the H3O3Al-R line results in the lowest free energy and
greatest stability across the entire range of physically realistic conditions.
Figure 33: Surface energies of different Al2O3 (0001) surface terminations. The dashed vertical lines indicate the allowed range of the oxygen chemical potential, μO. Values in red indicate examples of higher
temperatures and pressures. The green and blue regions indicate the range where hydrogen on the surface is in equilibrium with H2 and H2O, respectively, from 0 K up to 1000 K and 1 atm pressure (red lines). Figure
taken from ref. [22]

119
For α-Al2O3 (0001) surface, many experimental works have been conducted to investigate the
structural changes in case of water adsorption, pointing out that the surface structure of α-Al2O3
could be fairly different under UHV and in ambient conditions [20].
An example is the study conducted by Eng et al. [49], where the structure of the hydrated α-
Al2O3 (0001) surface was determined in the presence of water vapor at 300 K by crystal
truncation rod (CTR) diffraction. From their analysis, it appeared that the structure of the
hydrated α-Al2O3 (0001) was found to correspond to a fully hydrogenated O-terminated surface,
with a 53% contracted double aluminium layer directly below (Figure 34).
This results obtained from Eng et al. [49] differed markedly from previous studies of the UHV-
prepared clean α-Al2O3 (0001) surface in which the best model was the single Al-terminated
surface [23]. However, it has also been shown that the clean α-Al2O3 (0001) surface readily
reacts with water [50].
A more recent work on the investigation of the adsorption and reaction of water on a single
crystal α-Al2O3 (0001) in UHV and ambient conditions was led by Petrik et al. [51]. For their
study, they employed TPD, infrared reflection absorption spectroscopy (IRAS) and diffuse
reflectance infrared Fourier transform spectra (DRIFTS) and other surface science techniques.
Figure 34: Slide view of a section of the α-Al2O3 unit cell showing the atomic layering sequence and layer spacings (d) along the [0001] direction of the best fit relaxed surface model for the oxygen terminated surface
from reference [49] including the oxygen overlayer.
From their results on water adsorption on α-Al2O3 (0001) in UHV, IR spectroscopy showed that
molecular water is present at coverages as low as 1 water molecule per surface aluminium ion,
but at the same time their results showed no evidence of the surface hydroxyls expected from

120
dissociation. Also, they found that water films completely cover the α-Al2O3 (0001) when the
coverage reached ~ 1ML and the films grew layer-by-layer for at least the first two layers. They
observed that water desorbed from α-Al2O3 (0001) over a wide temperature range, leaving a
hydroxyl-free surface after heating above ~ 800 K.
Along with the aforementioned experimental studies, in the last decades many ab-initio works
have been conducted on the hydration states of α-Al2O3 (0001) surface [38, 52, 53].
According to the work of Hass and coworkers [52] on the α-Al2O3 (0001) surface, both molecular
and dissociative H2O adsorption modes were identified, with the latter favored by ~ 10 kcal/mol.
Plus, they conducted simulations at intermediate H2O coverages, where the following trends were
reported: (1) spontaneous unimolecular and (2) H2O-mediated dissociation events, as well as (3)
the diffusion and hydrogen bonding of physisorbed H2O and (4) an additional proton transfer
reaction between adsorbed H2O and OH species. The authors also conducted ab initio molecular
dynamics [54] at the coverage of 1 ML (one water molecule per surface Al) during 1 ps at 300 K
(Figure 35).
Figure 35: Snapshot of the 300 K dynamical simulation of an α-Al2O3 (0001) surface plus nine H2O molecules taken after 1 ns. Red, blue and green spheres indicate O, interior Al and surface Al atoms respectively. Green
line indicates H bonds; orange arrows indicate the 1-4 chemisorbed species. Image taken from ref. [54].

121
They found that the molecular state of water was the most frequent. They also evidenced two
types of surface H bonds stabilizing the OH groups: a H bond acceptor from a proton adsorbed on
a surface oxygen, and also a H bond acceptor from a vicinal physisorbed water molecule. The
authors also observed that during the run, one H2O molecule “desorbed” early on from its
molecular adsorption site and began to diffuse laterally along the surface in a precursor-like
physisorbed state.
Łodziana et al. [53] implemented DFT calculations for the investigation of the stability of the
hydroxylated (0001) surface of α-Al2O3. They reported the most stable configurations at different
water coverages by using a (2x2) supercell (Figure 36 below).
Figure 36: Surface of corundum at various water coverages considered in reference [53]: (a) 2.6 OH/nm2, (b) 5 OH/nm2, (c) 10.0 OH/nm2, (d) gibbsite-like surface terminated by hydrogen. Large spheres represent oxygen,
small grey spheres are for aluminium and dark grey are hydrogen. The darker larger spheres represent adsorbed oxygen.
According to Łodziana et al. [53], for coverages lower than 1 ML, water dissociates on the
surface and also water adsorption creates a large surface distortion accompanied by migration of
the aluminium cations into the subsurface region. Plus, at 1 ML every surface Al cation is already
saturated with one OH group, giving a total coverage of 10 OH/nm2. This surface was referred to
as fully-hydroxylated surface [53]. In addition to the corundum hydroxylated surface, they
consider a gibbsite-like surface, named Al(OH)3. The authors also propose a phase diagram of the
different terminations [53] (Figure 37).

122
Figure 37: The phase diagram of the a-Al2O3 (0001) surface with respect to the pressure of water vapor and temperature. White region is a clean Al-terminated surface. The contours are plotted at every 1/5 ML. The black region represents thermodynamic conditions where the Al(OH)3 surface is dominating. Image taken
from ref. [53].
If we refer to the PH2O/P° value corresponding to the experimental conditions we are interested in
(e.g. water content of 1000ppm, which corresponds to a PH2O/P° = 0.0035 atm) in the temperature
range 400-500 K, we observe that the termination is the Al2O3+H2O, meaning that the surface is
of corundum type (i.e. Al terminated) covered with a mixed OH and water layer. For this reason,
in the framework of this thesis we decided to study the (0001)-Al2O3-Al(OH)3 surface where each
Als atom of the outermost surface layer is linked with three chemisorbed water molecules.
In addition, Łodziana et al. [53] calculated the heat of adsorption of water on the (0001)surface of
α-Al2O3 and Al(OH)3 that are reported in Figure 38 below. They observed two distinct regions
for the α-Al2O3 (0001) surface: below 1 ML, where water dissociates and forms a strong bond
with the surface and above 1 ML, where a rapid drop of adsorption energy reflects weakly
physisorbed molecules.
Figure 38: The differential heat of adsorption of water on the (0001) surface of α-Al2O3 (0001). Dissociation adsorption occurs at coverage from 0 to 10 OH/nm2 (0 to 1 ML); at higher coverages, molecular adsorption is
preferred. Image taken from ref.[53].

123
Another noteworthy ab-initio work to mention in the merits of DFT investigation of α-Al2O3
(0001) hydroxylation is the led by Ranea et al. [38]. They implemented progressive multiple
water dissociation steps starting from the hydrogen-free stoichiometric surface to the fully-
hydroxylated, gibbsite-like surface, aiming to report the different energies barriers calculated at
each successive hydroxylation step.
They reported an overall picture (Figure 39 below) which summarizes what they observed from
their DFT results. According to them [38], the hydrogen-free, dry α-Al2O3 (0001) surface readily
adsorbs and reacts one water per surface Al site with a nearly coverage-independent energy. This
obtained surface can then adsorb molecular water exothermically, but dissociative adsorption to a
more highly hydrated surface sites has a small thermodynamic driving force and is relatively
slow. The energetics of the final removal of fully reacted Als depends on the disposition of the
hydrated aluminium and could be endo- or exothermic. Once the surface becomes fully
hydroxylated, reconstitution of the dry surface proceeds only by transport of Al from the bulk or
solution; processes that are likely to have high activation energies.
Figure 39: Schematic of overall α-Al2O3 (0001) reaction landscape reported in ref. [38].
In the work of Henderson and Chambers [55] the interaction of water with the (0001) surface of
α-Cr2O3 was examined with temperature programmed desorption (TPD), high resolution electron
energy-loss spectroscopy (HREELS) and XPS. From their results, they observed that theα-Cr2O3

124
(0001) surface is very active for dissociation of water under UHV conditions, where it adsorbs on
α-Cr2O3 (0001) in both molecular and dissociative states, with the former desorbing in TPD at
295 K and the latter at 345 K. In addition, their TPD measurements and XPS data suggested that
each surface Cr+3 atom had the capacity to bind two water molecules, one in a molecular state
and one in a dissociative state. According to their HREELS analysis, the water in dissociative
state was observed to be comprised of two distinct OH groups, one of which is a terminal group
and the other of which is presumably a bridging group.
More recently, the research group of Ahmed et al. [56] employed the surface X-ray diffraction
(SXRD) to investigate the surface structure of α-Cr2O3 (0001) as a function of water partial
pressure at room temperature. They addressed that, till the date of their work, most of the
measurements have been conducted in ultra-high vacuum (UHV), limiting their relevance to the
understanding of corrosion performance of stainless steel alloys in engineering environments.
Ahmed et al. [56] compared their results to the theoretical work conducted by Sharkas el al. [34]
since they studied the structural changes of α-Cr2O3 (0001) surface as a function of both H2O
partial pressure and temperature through an ab-initio modeling approach. Ahmed et al. [56] stated
in their work that the theoretical structures obtained by Sharkas et al. [34] are found to be
consistent with experimental characterization conducted under UHV conditions in thin films of α-
Cr2O3 (0001) exposed to H2O at room temperature, observing that water dissociation was evident
in these conditions. In addition, the existence of two distinct OH species and of interadsorbate
hydrogen bonding seemed to be apparent from their vibrational data.
Figure 40: Cartoon of the variation in surface termination of α-Cr2O3 (0001) with water partial pressure, as determined through analysis of the SXRD data acquired from Cr2O3-H2OUHV and Cr2O3-H2O30mbar. Larger
(smaller) spheres are oxygen (chromium) atoms; the smallest spheres are hydrogen atoms, which are employed to indicate location of adsorbed OH/H2O [56].

125
With all these considerations, Ahmed et al. [56] tried to validate experimentally the validity of
the theoretical study of Costa et al. [34] and conducted a SXRD analysis at UHV and at H2O
partial pressure of 30 mbar on the α-Cr2O3 (0001) at room temperature, the first examined system
labeled as Cr2O3-H2OUHV and the second system as Cr2O3-H2O30mbar, respectively (see Figure 40
below).
From their SXRD data, they observed that in the presence of 30 mbar of water (i.e. Cr2O3-
H2O30mbar system), each under-coordinated surface Cr atom becomes decorated with a single atop
OH/H2O species; however, they observed an unexpected lack of OH/H2O on Cr2O3-H2OUHV
system since according to Henderson and Chambers [55] the presence of adsorbed OH at room
temperature was found even in the UHV in case of H2O adsorption on α-Cr2O3 (0001). Ahmed et
al. [56] hypothesized that this discrepancy could be due to the fact that the work mentioned in
reference [55] was undertaken on thin films of α-Cr2O3 (0001) rather than suitable oriented single
crystal, thus concluding that this difference in substrate could lead to variation in H2O adsorption,
i.e. thin films of α-Cr2O3 (0001) may display significant concentration of sites active for
dissociative adsorption of H2O that are not present to any significant extent on the single crystal
substrate.
Figure 41: a) (P,T) phase diagram of chromia in presence of H2O and b) a zoom to show the domain stability
of the 3 different chromia terminations. Figure taken from ref. [11]
The hydration states of α-(0001) Cr2O3 surface were also studied in the theoretical study of ref.
[37], where the chromia most stable terminations in the case of water adsorption were

126
investigated in detail (Figure 41). The results of Souvi et al. [37] showed that in the thermal
range of 300-900 K hydrated surfaces have to be necessarily considered and a new termination
notes as Cr-Cr-O3-H3 was identified as the most stable one. In this newfound configuration, the
two outermost chromium atoms will be saturated with OH groups, which will cause an
unavoidable decreasing of the acidic (Lewis) character of the chromia surface.
Considering the operating conditions of our interest as we did for the alumina case, we followed
the example of the work conducted by Benoit Darenne [57], where he traced a vertical red arrow
representing the fixed experimental conditions of the system (i.e. T = [298.15 K – 600 K], P = 1
atm and water content of 1000ppm) on the chromia phase diagrams of ref. [37] (Figure 42) to
find the corresponding hydrated surface termination.
Figure 42: Stability diagram of different hydrated surfaces at 298K (on the left) and at 600K (on the right) as
reported in ref. [37]. The red arrow corresponding to a log(PH2O/P°) = 2,5 marks the operating conditions describing our system.
In these conditions of temperature, pressure and water content (corresponding in our case to a
water pressure PH2O = 0,0035 atm), we can see on the phase diagram reported in Figure 42 that
for the chromia hydrated surface the most stable surface termination is depicted by the -Cr-Cr-
O3-H3 surface termination, confirming what was mentioned above.
However, because the more stable termination of α-Al2O3 is the –Al-(OH)3 one, also called the
corundum-H2O termination, we preferred to compare the results on chromia with those of
alumina for the same termination, i.e. the corundum one. This surface is documented in the work

127
of Sharkas et al. [34], where for each Cr atom of the Cr-terminated layer was saturated with three
water molecules (i.e. a water coverage θ = 14.1 H2O/nm2). In this configuration, the Cr
coordination sphere is saturated to six as in the bulk.
If we look at the phase diagram obtained by Sharkas et al. [34] and we trace again with red
arrows our P/P° ratio corresponding to 300 K (Figure 43), we fall in the (I) zone which
corresponds to the (0001)-Cr2O3-Cr(OH)3 surface. In the zone of experimental conditions, for T
around 400K-500K, we should take in consideration that the surface might be not totally
hydroxylated.
Figure 43: (T,P) phase diagram of the different surface terminations (I, II, III) for the (0001)-Cr-Cr2O3-water system. (I): -Cr(OH)3-like termination with water coverage of 14.1 H2O/nm2, (II): -Cr(OH)2 termination with
water coverage of 9.4 H2O/nm2, (III): dry Cr-terminated surface. Image taken from ref. [34].
We conclude this paragraph reaffirming that the behavior encountered for both metallic surfaces
when coming in contact with water is very significant for this thesis since, according to many
experimental studies related to injection systems performances, a certain water content has been
found inside the pipelines of fuel injection circuits[58–60]. For this reason, we decided to model
the reactivity of the stainless steel and aluminum in their hydration states with the fully-
hydroxylated -Cr(OH)3 and -Al(OH)3 terminated surfaces. To consider the possibility of
dehydration, we also address the dry surfaces, α-Al2O3 and α-Cr2O3.

128
References
1 Zhang C.-H., Liu M., Jin Y., Sun D.-B. The corrosive influence of chloride ions preference adsorption on α-
Al2O3 (0 0 0 1) surface,Applied Surface Science347 (2015), 386–391. DOI: 10.1016/j.apsusc.2015.04.088. 2 Massoud T., Maurice V., Klein L. H., Seyeux A., Marcus P. Nanostructure and local properties of oxide layers
grown on stainless steel in simulated pressurized water reactor environment, Corros. Sci.84 (2014), 198–203. DOI: 10.1016/j.corsci.2014.03.030.
3 Piispanen R. Principles and applications of Inorganic Geochemistry. A comprehensive textbook for geology students,Lithos29, 1-2 (1992), 160–161. DOI: 10.1016/0024-4937(92)90042-w.
4 Dingemans G., Kessels W.M.M. Status and prospects of Al 2 O 3 -based surface passivation schemes for silicon solar cells,Journal of Vacuum Science & Technology A: Vacuum, Surfaces, and Films30, 4 (2012), 40802. DOI: 10.1116/1.4728205.
5 French R.H. Electronic Band Structure of Al2O3, with Comparison to Alon and AIN,J. Am. Ceram. Soc.73, 3 (1990), 477–489. DOI: 10.1111/j.1151-2916.1990.tb06541.x.
6 Boettger J.C. High-precision, all-electron, full-potential calculation of the equation of state and elastic constants of corundum,Physical review. B, Condensed matter55, 2 (1997), 750–756. DOI: 10.1103/PhysRevB.55.750.
7 Godin, LaFemina Atomic and electronic structure of the corundum (alpha -alumina) (0001) surface,Physical
review. B, Condensed matter49, 11 (1994), 7691–7696. DOI: 10.1103/PhysRevB.49.7691. 8 T. Fujii, D. Alders, F.C. Voogt, T.Hibma, B.T. Thole, G.A. Sawatzky, Fujii T., Alders D., Voogt F.C., Hibma
T., Thole B.T., Sawatzky G.A. In situ RHEED and XPS studies of epitaxial thin α-Fe2O3 (0001) fims on sapphire // In situ RHEED and XPS studies of epitaxial thin α-Fe2O3(0001) films on sapphire,Surf. Sci.366, 3 (1996), 579–586. DOI: 10.1016/0039-6028(96)00844-8.
9 Huš M., Kopač D., Likozar B. Kinetics of non-oxidative propane dehydrogenation on Cr2O3 and the nature of catalyst deactivation from first-principles simulations, J. Catal.386 (2020), 126–138. DOI: 10.1016/j.jcat.2020.03.037.
10 Chang Q.-Y., Yin Q., Ma F., Zhu Y.-A., Sui Z.-J., Zhou X.-G., de Chen, Yuan W.-K. Tuning Adsorption and Catalytic Properties of α-Cr 2 O 3 and ZnO in Propane Dehydrogenation by Creating Oxygen Vacancy and Doping Single Pt Atom: A Comparative First-Principles Study,Ind. Eng. Chem. Res.58, 24 (2019), 10199–10209. DOI: 10.1021/acs.iecr.9b01143.
11 Marcus P.Corrosion Mechanisms in Theory and Practice, CRC Press (2011). ISBN: 9780429143564. 12 Maurice V., Yang W.P., Marcus P. XPS and STM Study of Passive Films Formed on Fe‐22Cr(110)
Single‐Crystal Surfaces,J. Electrochem. Soc.143, 4 (1996), 1182–1200. DOI: 10.1149/1.1836616. 13 Toofan J., Watson P. The termination of the α-Al2O3 (0001) surface: a LEED crystallography
determination,Surface Science401, 2 (1998), 162–172. DOI: 10.1016/S0039-6028(97)01031-5. 14 Finger L.W., Hazen R.M. Crystal structure and isothermal compression of Fe2O3, Cr2O3, and V2O3 to 50
kbars,J. Appl. Phys.51, 10 (1980), 5362. DOI: 10.1063/1.327451. 15 Shi S., Wysocki A.L., Belashchenko K.D. Magnetism of chromia,Phys. Rev. B79, 10 (2009), 537. DOI:
10.1103/PhysRevB.79.104404. 16 Bruce R.H., Cannell D.S. Specific heat of Cr2O3 near the Néel temperature,Phys. Rev. B15, 9 (1977), 4451–
4459. DOI: 10.1103/PhysRevB.15.4451. 17 Oware Sarfo K., Isgor O., Santala M.K., Tucker J.D., Árnadóttir L. Bulk Diffusion of Cl through O Vacancies
in α-Cr 2 O 3 : A Density Functional Theory Study,J. Electrochem. Soc.168, 7 (2021), 71503. DOI: 10.1149/1945-7111/ac0ec9.
18 Tepesch P. D., Quong A. A First‐Principles Calculations of α‐Alumina (0001) Surfaces Energies with and without Hydrogen, Phys. Stat. Sol (b)217, 377 (2000), 377–387. DOI: 10.1002/(SICI)1521-3951(200001)217:1%3C377:AID-PSSB377%3E3.0.CO;2-B.

129
19 Wysocki A.L., Shi S., Belashchenko K.D. Microscopic origin of the structural phase transitions at the Cr 2 O 3 (0001) surface,Phys. Rev. B86, 16 (2012). DOI: 10.1103/PhysRevB.86.165443.
20 Goniakowski J., Finocchi F., Noguera C. Polarity of oxide surfaces and nanostructures,Rep. Prog. Phys.71, 1 (2008), 16501. DOI: 10.1088/0034-4885/71/1/016501.
21 Kaspar T.C., Chamberlin S.E., Chambers S.A. Surface structure of α-Cr2O3(0001) after activated oxygen exposure,Surf. Sci.618 (2013), 159–166. DOI: 10.1016/j.susc.2013.09.005.
22 X-G. Wang, A. Chaka, M. Scheffler Effect of the Environment on alpha-Al2O3 (0001) Surface Structures,Phys.
Rev. Lett.84, 16 (2000), 3650–3653. DOI: 10.1103/PhysRevLett.84.3650. 23 J. Ahn J., W.Rabalais Composition and structure of the Al2O3{0001}-(1 × 1) surface,Surf. Sci388, Issue 1-3
(1997), 121–131. DOI: 10.1016/S0039-6028(97)00383-X. 24 Guenard P., Renaud G., Barbier A., Gautier-Soyer M. Determination Of The α-Al 2 O 3 (0001) Surface
Relaxation and Termination by Measurements of Crystal Truncation Rods,MRS Proc.437 (1996). DOI: 10.1557/PROC-437-15.
25 Soares E.A., van Hove M.A., Walters C.F., McCarty K.F. Structure of the α−Al2O3(0001) surface from low-energy electron diffraction: Al termination and evidence for anomalously large thermal vibrations,Phys. Rev.
B65, 19 (2002). DOI: 10.1103/PhysRevB.65.195405. 26 Suzuki T., Hishita S., Oyoshi K., Souda R. PII: S0039-6028(99)00706-2 // Structure of α-Al 2 O 3 (0001)
surface and Ti deposited on α-Al 2 O 3 (0001) substrate,Surface Science437, 3 (1999), 289–298. DOI: 10.1016/S0039-6028(99)00706-2.
27 Walters C.F., McCarty K.F., Soares E.A., van Hove M.A. The surface structure of α-Al2O3 determined by low-energy electron diffraction: aluminum termination and evidence for anomolously large thermal vibrations,Surface Science464, 2-3 (2000), L732-L738. DOI: 10.1016/S0039-6028(00)00687-7.
28 Priyantha W., Waddill G.D. Structure of chromium oxide ultrathin films on Ag(111),Surface Science578, 1-3 (2005), 149–161. DOI: 10.1016/j.susc.2005.01.028.
29 Bikondoa O., Moritz W., Torrelles X., Kim H.J., Thornton G., Lindsay R. Impact of ambient oxygen on the surface structure of α-Cr2O3(0001), Phys. Rev. B81, 205439 (2010). DOI: 10.1103/PhysRevB.81.205439.
30 Rohrbach A., Hafner J., Kresse G. Ab initio study of the (0001) surfaces of hematite and chromia: Influence of strong electronic correlations,Phys. Rev. B70, 12 (2004), 13. DOI: 10.1103/PhysRevB.70.125426.
31 Cline J.A., Rigos A.A., Arias T.A. Ab Initio Study of Magnetic Structure and Chemical Reactivity of Cr 2 O 3 and Its (0001) Surface,J. Phys. Chem. B104, 26 (2000), 6195–6201. DOI: 10.1021/jp9943474.
32 Rohr F., Bäumer M., Freund H.-J., Mejias J.A., Staemmler V., Müller S., Hammer L., Heinz K. Strong relaxations at the Cr2O3 (0001) surface as determined via low-energy electron diffraction and molecular dynamics simulations,Surf. Sci.372, 1-3 (1997), 291-197. DOI: 10.1016/S0039-6028(96)01255-1.
33 Henderson M.A., Chambers S.A. HREELS, TPD and XPS study of the interaction of water with the α-Cr2O3(001) surface,Surface Science449, 1-3 (2000), 135–150. DOI: 10.1016/S0039-6028(99)01246-7.
34 Costa D., Sharkas K., Islam M.M., Marcus P. Ab initio study of the chemical states of water on Cr2O3(0001): From the isolated molecule to saturation coverage, Surf. Sci.603, 16 (2009), 2484–2493. DOI: 10.1016/j.susc.2009.05.037.
35 Costa D., Marcus P. Electronic core levels of hydroxyls at the surface of chromia related to their XPS O 1s signature: A DFT+U study,Surf. Sci.604, 11-12 (2010), 932–938. DOI: 10.1016/j.susc.2010.02.023.
36 Siegel D.J., Hector L.G., Adams J.B. Adhesion, atomic structure, and bonding at the Al(111)/α−Al2O3(0001) interface: A first principles study, Phys. Rev. B65, 8 (2002). DOI: 10.1103/PhysRevB.65.085415.
37 Souvi S.M., Badawi M., Virot F., Cristol S., Cantrel L., Paul J.-F. Influence of water, dihydrogen and dioxygen on the stability of the Cr 2 O 3 surface: A first-principles investigation, Surf. Sci.666 (2017), 44–52. DOI: 10.1016/j.susc.2017.08.005.
38 Ranea V.A., Carmichael I., Schneider W.F. DFT Investigation of Intermediate Steps in the Hydrolysis of α-Al 2 O 3 (0001),J. Phys. Chem. C113, 6 (2009), 2149–2158. DOI: 10.1021/jp8069892.
39 Anisimov et al. First-principles calculations of the electronic structure and spectra of strongly correlated systems: the LDA+U method,J. Phys.: Condens. Matter9 (1997), 767–808. DOI: 10.1088/0953-8984/9/4/002.
40 S.L.Dudarev, A.I.Liechtenstein, M.R. Castell, G.A.D.Briggs, A.P. Sutton Surface states on NiO (100) and the origin of the contrast reversal in atomically resolved scanning tunnelling microscope images,Phys. Rev. B56, 8 (1997), 4900–4908. DOI: 10.1103/PhysRevB.56.4900.

130
41 Dudarev et al Electron-energy-loss spectra and the structural stability of nickel oxide: an LSDA+U study, Phys.
Rev. B57 (1997), 1505–1509. DOI: 10.1103/PhysRevB.57.1505. 42 Marmier A., Parker S.C. Ab initio morphology and surface thermodynamics of α−Al2O3,Phys. Rev. B69, 11
(2004). DOI: 10.1103/PhysRevB.69.115409. 43 Arrouvel C., Diawara B., Costa D., Marcus P. DFT Periodic Study of the Adsorption of Glycine on the
Anhydrous and Hydroxylated (0001) Surfaces of α-Alumina, J. Phys. Chem. C111, 49 (2007), 18164–18173. DOI: 10.1021/jp0741408.
44 Hémeryck A., Motta A., Swiatowska J., Pereira-Nabais C., Marcus P., Costa D. Diaminoethane adsorption and water substitution on hydrated TiO2: A thermochemical study based on first-principles calculations,Phys.
Chem. Chem. Phys.15, 26 (2013), 10824–10834. DOI: 10.1039/c3cp44498h. 45 Garrain P.-A., Costa D., Marcus P. Biomaterial−Biomolecule Interaction: DFT-D Study of Glycine Adsorption
on Cr 2 O 3,J. Phys. Chem. C115, 3 (2011), 719–727. DOI: 10.1021/jp109704b. 46 Gouron A., Kittel J., Bruin T. de, Diawara B. Density Functional Theory Study of Monoethanolamine
Adsorption on Hydroxylated Cr 2 O 3 Surfaces, J. Phys. Chem. C119, 40 (2015), 22889–22898. DOI: 10.1021/acs.jpcc.5b05375.
47 Dabaghmanesh S., Neyts E.C., Partoens B. van der Waals density functionals applied to corundum-type sesquioxides: Bulk properties and adsorption of CH3 and C6H6 on (0001) surfaces, Phys.Chem.Chem.Phys.18, 33 (2016), 23139–23146. DOI: 10.1039/c6cp00346j.
48 Lebreau F., Islam M.M., Diawara B., Marcus P. Structural, Magnetic, Electronic, Defect, and Diffusion Properties of Cr 2 O 3: A DFT+ U Study,J. Phys. Chem. C118, 31 (2014), 18133–18145. DOI: 10.1021/jp5039943.
49 Eng P.J., Trainor T.P., Brown G.E. JR., Waychunas G.A., Newville M., Sutton N.R., Rivers M., Eng, Trainor, Brown, Waychunas, Newville, Sutton, Ri -Al2O3 (0001) Surface Measured by Crystal Truncation Rod Diffraction // Structure of the hydrated alpha-Al(2)O(3) (0001) surface,Science288, 5468 (2000), 1029–1033. DOI: 10.1126/science.288.5468.1029.
50 Liu P., Kendelewicz T., Brown G.E., Nelson E.J., Chambers S.A. Reaction of water vapor with α-Al2O3(0001) and α-Fe2O3(0001) surfaces: synchrotron X-ray photoemission studies and thermodynamic calculations,Surface
Science417, 1 (1998), 53–65. DOI: 10.1016/S0039-6028(98)00661-X. 51 Petrik N.G., Huestis P.L., LaVerne J.A., Aleksandrov A.B., Orlando T.M., Kimmel G.A. Molecular Water
Adsorption and Reactions on α-Al 2 O 3 (0001) and α-Alumina Particles,J. Phys. Chem. C122, 17 (2018), 9540–9551. DOI: 10.1021/acs.jpcc.8b01969.
52 Hass K.C., Schneider W.F., Curioni A., Andreoni W. First-Principles Molecular Dynamics Simulations of H 2 O on α-Al 2 O 3 (0001),J. Phys. Chem. B104, 23 (2000), 5527–5540. DOI: 10.1021/jp000040p.
53 Łodziana Z., Nørskov J.K., Stoltze P. The stability of the hydroxylated (0001) surface of α-Al2O3,J. Chem.
Phys.118, 24 (2003), 11179–11188. DOI: 10.1063/1.1574798. 54 Hass, Schneider, Curioni, Andreoni The chemistry of water on alumina surfaces: reaction dynamics from first
principles, Science282, 5387 (1998), 265–268. DOI: 10.1126/science.282.5387.265. 55 Micheal A. Henderson HREELS, TPD and XPS study of the interaction of water with the Cr2O3(001)
surface,Surf. Sci.449 (2000), 135–150. DOI: 10.1016/S0039-6028(99)01246-7. 56 Ahmed M.H.M., Torrelles X., Treacy J.P.W., Hussain H., Nicklin C., Wincott P.L., Vaughan D.J., Thornton G.,
Lindsay R. Geometry of α-Cr2O3(0001) as a Function of H2O Partial Pressure,J. Phys. Chem. C119, 37 (2015), 21426–21433. DOI: 10.1021/acs.jpcc.5b04607.
57 Darenne B Modélisation de l'interaction des agrégats hydrocarbonés avec les parois,These de Doctorat, ENSPC-Chimie ParisTech (2018).
58 R. G. Larsen, R. E. Thorpe, and F. A. Armfield, Larsen R.G., Thorpe R.E., Armfield F.A. Oxidation Characteristics of Pure Hydrocarbons,Ind. Eng. Chem. Res.34, 2 (1942), 183-193. DOI: 10.1021/ie50386a012.
59 McCormick R.L., Ratcliff M., Moens L., Lawrence R. Several factors affecting the stability of biodiesel in standard accelerated tests,Fuel Processing Technology88, 7 (2007), 651–657. DOI: 10.1016/j.fuproc.2007.01.006.
60 M. Sicard, J. Boulicault, K. Coulon, C. Thomasset, K. Ancelle, B. Raepsaet, F. Ser (ed.)Oxidation stability of jet
fuel model molecules evaluated by rapid small scale oxidation tests: Handling and Use of Liquid Fuels 2013
IASH 2013, RHODES, Greece (2013).

131
Chapter 4. DFT study: analysis of gas-phase reactions and gas-solid interface interactions
4.1 Introduction
In the previous Chapter 3 we discussed about the features and properties of the metal-oxides
surfaces that were chosen in the framework of this thesis. In this chapter, we move the focus on
the theoretical study carried out to gain the necessary input data for ReaxFF optimization.
We focused our ab-initio study on two main systems:
i. The homogeneous systems represented by the gas-phase autoxidation reactions.
ii. The heterogeneous systems represented by the molecules/surfaces interactions.
For the study of the gas-phase phase reactions, we selected a set of reactions describing the
toluene autoxidation mechanism. The main objective was the obtention of the ΔEr energies of
these reactions in order to gain useful data on the molecular reactivity in the gas phase. The
reaction energies were calculated with Gaussian 16 [1].
For the study of the molecule-surface interactions, we chose model molecules as surrogates of the
deposit precursors and analyzed their reactivity when adsorbed on the α-Al2O3 and α-Cr2O3 either
in their anhydrous and hydroxylated state. In addition, two substitution reactions where the
organic adsorbates replace a surface H2O/OH are discussed. These calculations were
implemented with the VASP package [2]. Similarly to the gas-phase study, the main objective of
this study was to gain useful insights on the interface interactions occurring between the organic
gas-phase (i.e. deposit precursors) and the metallic solid phase (i.e. aluminium and stainless steel
surfaces).
Complementary thermodynamic calculations were implemented to corroborate the theoretical
results: the analysis of the desorption temperatures calculated for all the molecule/surface
configurations was carried out with Gaussian 16 [1] and the results are reported in Table A4-5 in
the Annex.

132
Both these studies provided important input data to implement for the successive ReaxFF: the
autoxidation reactions provided a mean for ReaxFF to predict the chemical reactivity in the gas-
phase, while the adsorption configurations contributed to aid the reactive force field to estimate
the nature of the gas-solid interface interactions. Both energetic data were fundamental for the
achievement of the ReaxFF optimization and validation implemented in this thesis.
In the next paragraph, we introduce the organic molecules that we selected as surrogates of the
oxygenated precursors of fuel deposits, on their autoxidation reaction pathway in the gas phase
and on their interactions on the dry and fully hydroxylated substrates. We will also address
certain thermodynamic properties of these molecules that we acquired in the course of the
preliminary theoretical study.
4.2 Model of deposit surrogate
As previously discussed, the main products sorted out from fuel autoxidation are oxygenated
compounds like alcohols, aldehydes, ketones, epoxides and carboxylic acids. Based on the
previous experimental work of K. Bacha [3], the XPS results of real biofuels deposits over
different surfaces (alumina, stainless steel, gold, polymer) showed that the chemical bond
between deposits and surface was made through the oxygenated head of the molecule under
study. In addition, the study conducted by Mei et al. [4] showed that the increase of the
adsorption energy of the fuel on the surface was exclusively dependent of the ester amount in the
fuel.
For these reasons, in the present study small oxygenated molecules have been preferred as model
molecules on the basis of their chemical functional group, i.e. ethanol for the alcohol family,
acetaldehyde and acetone to represent aldehydes and ketones respectively, 2-ethyl-3-
methyloxirane for the epoxides and acetic acid for the carboxylic acids.
In addition, three other types of chemical families have been considered:
(1) aromatic species since they are found in diesel refined from crude oil, and so they are present
in the diesel/biodiesel blends in the market. Here we consider benzene and toluene as model
aromatic compounds.

133
(2) ester species: methyl propionate, unsaturated methyl esters (e.g. methylacrylate and methyl-3-
trans-hexenoate), as representatives of deposits derived from biodiesel blends.
(3) alkanes since they are the main component of petrodiesel. Here we consider n-propane as
surrogate of alkyl-chain deposits produced from n-alkanes degradation.
The listed model molecules are reported in Table 2, where they have been matched with the
corresponding configuration optimized via DFT (last right column):
Table 2: Organic molecules selected as models for representing the precursors of the liquid deposits coming from the fuel autoxidation process.

134
In the next paragraph, we will introduce the main kinetic reaction steps related to the autoxidation
process in the gas phase that we studied through a theoretical approach and that we used in the
next MD study for ReaxFF parametrization.
4.3 Gas phase autoxidation reactions
We chose the model molecules, what we did as the next step was to choose a set of gas phase
reactions describing the autoxidation mechanism. Taking in mind the fuel autoxidation
mechanism introduced in section 1.3.1 (taken from ref. [3]), we firstly had to choose at which
point of the reaction phases we wanted to focus our analysis. Since we wanted to investigate on
oxygenated deposit precursors interacting either in their homogeneous liquid phase and in the
heterogeneous phase with the alumina and chromia surfaces, we focused on the propagation step
of the reaction mechanism, where alkyl radicals start reacting with molecular oxygen and then
proceeding to the formation of the peroxy-radical that transform into hydroperoxides species by
reacting with the present hydrocarbon compounds (Equation 6-Equation 7 in section 1.3.1).
In this thesis, we decided to correlate the referential reaction mechanism to the one describing the
toluene autoxidation (e.g. RH = toluene). This choice is due to the fact that aromatic compounds
represent a major constituent of petrodiesel and toluene is often in literature taken as model
molecule for fuel autoxidation studies [5–7]. The reactions are described in Eq. 68-Eq. 78 below.
Our focus in this reaction mechanism is centered on the hydroperoxide (C6H5)CH2O2H, which
corresponds to the ROOH species in reference to the mechanism mentioned in section 1.3.1. The
hydroperoxide species are fundamental in this mechanism since, starting from their
decomposition, the future oxygenated precursors are produced (e.g. alcohols, carboxylic acids,
aldehydes, etc.) [8].
Da Silva et al. [6] reported in their work a simplified scheme for the mechanism of benzyl +
HO2° reaction, which is reported below in Figure 44.
According to Da Silva et al. [6], the addition of HO2° to the methylene site in the benzyl radical
is calculated to be exothermic (-253 kJ/mol) and it corresponds to the most favorable HO2°
addition since the ones to the ortho and para ring sites produce weak adducts (-67 and -79.5

135
kJ/mol, respectively). The HO2° addition to the methylene site provides the formation of an
excited benzyl hydroperoxide adduct (denoted with the *), which possess a significant amount of
energy for use in further unimolecular isomerization and dissociation reactions.
From this activated benzyl hydroperoxide adduct, seven different reaction pathways are possible
according to Da Silva et al. [6]. These different pathways lead towards six different products.
(C6H5)CH2O2H → (C6H5)CH2O2° + H°
Eq.68
(C6H5)CH2O2H → (C6H5)CH2O° + HO° Eq. 69
(C6H5)CH2O2H → (C6H5)CH2° + HO2° Eq. 70
(C6H5)CH2O2H→ (C6H5)CH2° + H° + O2 Eq. 71
(C6H5)CH2O2H + H2O2 → (C6H5)CH2° + O2 + H2O + OH° Eq. 72
(C6H5)CH2O2H + HO2°→ (C6H5)CH2O2° + H2O2 Eq. 73
(C6H5)CH2O2H + HO2° → (C6H5)CH2° + H2O2 + O2 Eq. 74
(C6H5)CH2O2° → (C6H5)CH2° + O2 Eq. 75
(C6H5)CH2O2H + (C6H5)CH2° → (C6H5)CH3 + (C6H5)CH2O2° Eq. 76
HO2° → O2 + H° Eq. 77
2 (C6H5)CH2O2H → Dimer [(C6H5)CH2-OOH]2 Eq. 78
From Figure 44, we can observe that the activated benzyl hydroperoxide adduct can react to
produce the benzoxyl radical (C6H5CH2O°) + OH°. Concerning our study, this reaction pathway
leading to the formation of the benzoxyl radical + OH° represents one of the major focuses in the
analysis of the system reactivity.
4.3.1 Computational details
To calculate the reaction energies for the reactions reported in Eq. 68-Eq. 78, we implemented
calculations through Gaussian 16 package [1]. For these calculations, we implemented theM06-
2X functional coupled with the 6-311G(d,p) basis set with the following convergence criteria: 10-

136
8 Hartree for the energy, 0.0045 and 0.0030 Hartree/Bohr for the maximal and average forces,
0.018 and 0.0012 Bohr for the maximal and average displacement, respectively. We chose to
implement this hybrid meta-GGA functional for the calculation of the reaction energies since it
has been confirmed in recent studies about the thermochemistry of hydrocarbon radicals [25-26]
that the Minnesota functional M06-2X coupled with the 6-311G(d,p) basis set has been proven to
be one of the best performers in the prediction of the energetic data. A comparison between the
energetic results obtained with the M06-2X functional and the corresponding ones calculated
instead via the PBE-GGA functional has been reported in Table A4-3 in the Annex.
Firstly, we run geometry optimizations of each single species to obtain the corresponding
electronic energies and secondly we calculated the reaction energies for each specific reaction.
Figure 44: Elementary mechanism for the benzyl + HO2 reaction from reference [6].
We also calculated the relative bond dissociation energies for the scission of the (C6H5)CH2-OOH
and (C6H5)CH2O-OH bonds respectively. To acquire this result, we run the potential energy
surface (PES) scans with Gaussian 16 package [1] to obtain the energetic profile at varying bond
lengths.

137
4.3.2 Results and discussion
The results of the electronic reaction energies are reported in Table 3. The majority of these
reactions are linked to the bond dissociation of the benzyl hydroperoxide (C6H5)CH2O2H.
Table 3: Reaction energies (in kJ/mol) for the reaction mechanism of toluene autoxidation used in this thesis. The reaction 5) with four products is a non-elementary reaction.
Reactions ΔEr (kJ/mol) 1) (C6H5)CH2O2H → (C6H5)CH2O2° + H° 374,4 2) (C6H5)CH2O2H → (C6H5)CH2O° + HO° 194,7 3) (C6H5)CH2O2H → (C6H5)CH2° + HO2° 264,0 4) (C6H5)CH2O2H→ (C6H5)CH2° + H° + O2 638,3 5) (C6H5)CH2O2H + H2O2 → (C6H5)CH2° + O2 + H2O + OH° 353,8
6) (C6H5)CH2O2H + HO2°→ (C6H5)CH2O2° + H2O2 -2,7 7) (C6H5)CH2O2H + HO2° → (C6H5)CH2° + H2O2 + O2 261,2 8) (C6H5)CH2O2° → (C6H5)CH2° + O2 263,9 9) (C6H5)CH2O2H + (C6H5)CH2° → (C6H5)CH3 + (C6H5)CH2O2° -33,4 10) HO2° → O2 + H° 374,4 11) 2 (C6H5)CH2O2H → Dimer [(C6H5)CH2-OOH]2 -68,9
Figure 45 below reports the PES scans results for C-OOH and CO-OH bond dissociation
energies in the benzyl hydroperoxide molecules. We chose to run relaxed coordinate scans for
both cases.
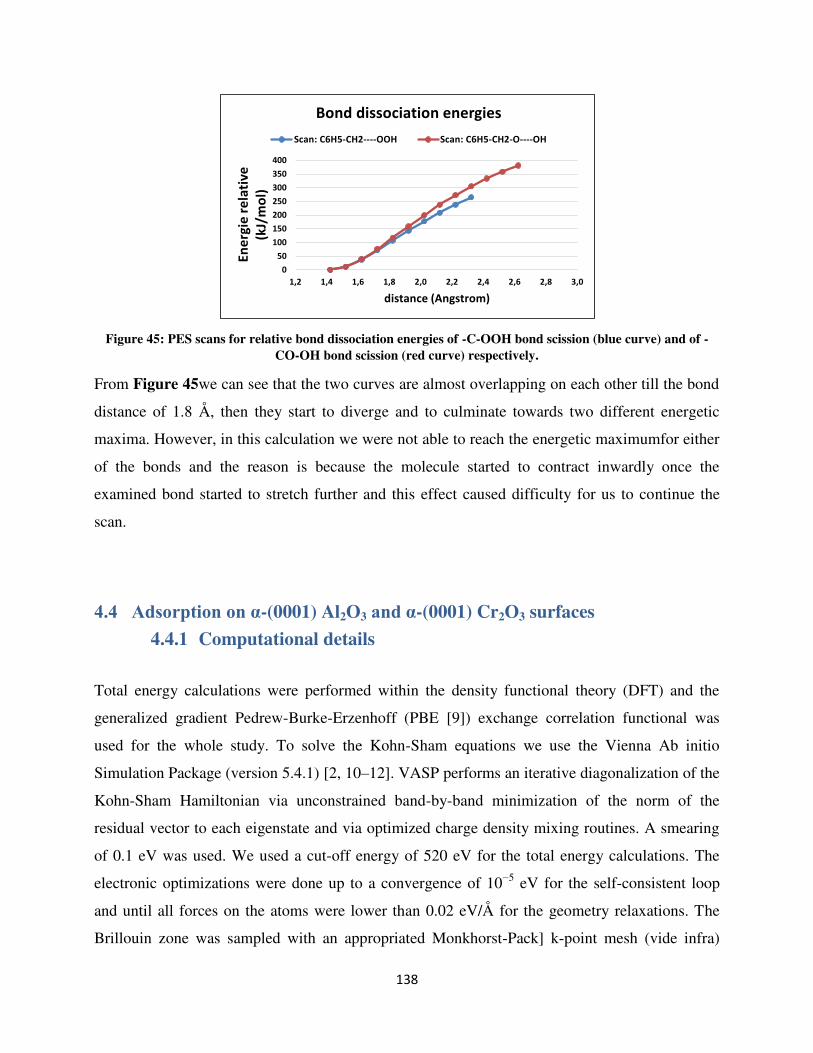
138
Figure 45: PES scans for relative bond dissociation energies of -C-OOH bond scission (blue curve) and of -CO-OH bond scission (red curve) respectively.
From Figure 45we can see that the two curves are almost overlapping on each other till the bond
distance of 1.8 Å, then they start to diverge and to culminate towards two different energetic
maxima. However, in this calculation we were not able to reach the energetic maximumfor either
of the bonds and the reason is because the molecule started to contract inwardly once the
examined bond started to stretch further and this effect caused difficulty for us to continue the
scan.
4.4 Adsorption on α-(0001) Al2O3 and α-(0001) Cr2O3 surfaces
4.4.1 Computational details
Total energy calculations were performed within the density functional theory (DFT) and the
generalized gradient Pedrew-Burke-Erzenhoff (PBE [9]) exchange correlation functional was
used for the whole study. To solve the Kohn-Sham equations we use the Vienna Ab initio
Simulation Package (version 5.4.1) [2, 10–12]. VASP performs an iterative diagonalization of the
Kohn-Sham Hamiltonian via unconstrained band-by-band minimization of the norm of the
residual vector to each eigenstate and via optimized charge density mixing routines. A smearing
of 0.1 eV was used. We used a cut-off energy of 520 eV for the total energy calculations. The
electronic optimizations were done up to a convergence of 10−5 eV for the self-consistent loop
and until all forces on the atoms were lower than 0.02 eV/Å for the geometry relaxations. The
Brillouin zone was sampled with an appropriated Monkhorst-Pack] k-point mesh (vide infra)
0
50
100
150
200
250
300
350
400
1,2 1,4 1,6 1,8 2,0 2,2 2,4 2,6 2,8 3,0
Ener
gie
rela
tive
(k
J/m
ol)
distance (Angstrom)
Bond dissociation energies
Scan: C6H5-CH2----OOH Scan: C6H5-CH2-O----OH

139
[13]. To account for the strong correlation between the d-electrons of the chromium, an on-site
coulomb repulsion U-term is added to the DFT Hamiltonian, turning into DFT + U method.
[14]Subsequently, this formalization impacts on the cell dimensions, band gap and, magnetic
moment. Herewith, we have considered U and J parameters to be 5 eV and 1 eV respectively as
reported in the literature [15, 16].
To account for the antiferromagnetic state of Cr2O3, spin-polarised calculations were performed.
The van der Waals corrections are calculated with DFT-D3 method of Grimme [17] at each
electronic step, implying that the geometry is optimized with the dispersion forces included.
The rhomboidal (R3c) unit cell of α-Al2O3 and α-Cr2O3 was taken as the starting point for the
calculations of the bulk oxide. For the corundum-type surfaces, the hexagonal unit cell reported
in Figure A41 in the Annex contains 12 metallic atoms among which every four atoms form a
subunit corresponding to the rhombohedral primitive cell. In particular for α-Cr2O3, only three
antiferromagnetic spin configurations are possible: A (+ + − −), B (+ − − +) and C (+ − + −). We
agree with Rohrbach et al. [16] and Costa et al. [18] about the spin ground state of Cr2O3, which
is (CCC) and results in a total magnetic moment equal to zero. The electronic energy
convergence was obtained with k-points grids of (3×3×1)for the bulk and of (1×1×1) for the
(4x4) supercell ofα-Al2O3 and α-Cr2O3. The unit cell was relaxed by alternating a cell parameter
optimization and ion relaxation until convergence criteria for the forces and energies were
obtained (vide supra). The results are shown in the Table A41-A42 (Annex).
For α-alumina and α-chromia, both the Al(Cr)-terminated dry surface (Bulk−Al−O−Al)
(respectively Bulk−Cr−O−Cr) and the fully hydrated Bulk-Al-O-Al-(OH)3 and Bulk-Cr-O-Cr-
(OH)3 surfaces were considered. The oxide slab thicknesses correspond to six and seven layers,
respectively. We validated our calculation methodology, by verifying that for the dry surfaces,
the calculated surface energy of αAl2O3 1.55 J/m2 is in good adequacy with the literature [19]
value of 1.66 J/m2.
The lattice parameters and surface areas for the examined surfaces are grouped in Table 4-Table
5. For the α-Cr2O3(0001)-Cr and α-Al2O3(0001)-Al surfaces, we considered a supercell (4×4)
large enough to adsorb molecules without lateral interactions (Table 4). Seen the large size of the
cells, the calculations were performed at the Gamma point.

140
The fully hydrated α-Al2O3-Al(OH)3 termination, corresponding to 8.7 OH/nm2, was considered
stable over a large temperature and partial water pressure range, based on the ones reported in the
literature [20]. According to Ranea et al. [21], the final configuration Al(OH)3 generated from
three successive water dissociations shows an approximately trigonal coordination on the Als
center and its formation energy from the dry surface is calculated to be –139.9 kJ/mol.
A (4×4) cell was used (Table 4), at the exception of the study of the substitution of water (OH)
by methyl propionate (respectively acetate) which was performed on (2×2) cells of the corundum
surfaces (Table 5). It should be noticed that in all molecule/surface interactions calculations, only
the four top layers were relaxed for α-alumina and α-chromia.
Table 4: Lattice parameters for the DFT computed (4x4) slabs for α-Cr2O3 (001) and α-Al2O3 (001) respectively.
Surfaces (4x4) slab
a
[Å]
b
[Å]
Number of layers
Supercell surface area
[Å2]
Slab
thickness
[Å]
Vacuum
thickness
[Å]
K-points mesh
α-Cr2O3 (0001) 20.29 20.29 6 356.58 13.85 14.59 1×1×1
α-Cr2O3 (001)-Cr(OH)3 20.29 20.29 7 356.58 15.27 13.17 1×1×1
α-Al2O3 (001) 19.14 19.14 6 317.25 13.07 14.51 1×1×1
α-Al2O3 (001)-Al(OH)3 19.14 19.14 7 317.25 14.71 12.86 1×1×1
Table 5: Lattice parameters for the DFT computed (2x2) slabs for the hydroxylated α-Cr2O3 (0001) and α-Al2O3 (0001).
Surfaces
(2x2) slabs
a
[Å]
b
[Å] Number of layers
Supercell surface area
[Å2]
Slab
thickness
[Å]
Vacuum
thickness
[Å]
K-points mesh
α-Cr2O3 (0001)-Cr(OH)3 10.15 10.15 6 89.15 15.27 13.17 1×1×1
α-Al2O3 (0001)-Al(OH)3 9.57 9.57 6 79.31 14.72 12.86 1×1×1
4.4.2 Results and discussion

141
To rigorously compare the reactivity of both corundum surfaces, the starting adsorption
configurations of the molecules on dry surfaces have been maintained identical.
First, we started our study by experimenting different molecule positions and orientations above
the oxide surfaces. In fact, some of the smaller molecules (such as ethanol, acetone and
acetaldehyde) were placed in a tilted fashion on top of the surface by promoting a stronger
interaction between the molecule O atom and the metallic surface layer and, at the same time, by
allowing the molecule hydrocarbon chain to also interact with the surface layer through weaker
dispersion forces.
For flatter molecules such as the aromatic compounds, we opted to arrange them parallel to the
surface layer in order to favor van der Waals interactions, which are prominent for polarizable
molecules.
In the case of bigger molecules, as methyl-3-trans-hexenoate and the 2-ethyloxirane, we chose to
arrange them perpendicular to the surface in a monodentate adsorption configuration, in this way
favoring the bonding between the adsorbate O atom and the outermost M cation.
In the case of dissociative adsorption, for both dry surfaces, the dissociated adsorption
configuration was formed by imposing from the beginning the transfer of the H atom on a Os
atom on the surface outermost layer. Several locations of the proton on surface Oxygens were
considered and the most stable are retained here.
A similar reasoning has been done to study the adsorption on the hydroxylated corundum-type
surfaces, since we wanted to explore the difference in reactivity of both substrates under the same
conditions of hydroxylation state and organic adsorbates. As a starting point, the molecules were
placed in a similar position as that obtained on the anhydrous surfaces, but farther from the
surface.
In the first part, we screen several model molecules on the dry and hydroxylated α-Al2O3 and α-
Cr2O3 surfaces. Then, we study whether some molecules might substitute surface OH groups.
The results are summarized in Figure 46-Figure 48.
Figure 46 shows the optimized configurations obtained for the molecules on the dry corundum
surfaces, respectively α-Al2O3 (a) and α-Cr2O3 (b). From Figure 46 it appears that the final
configurations are very similar for Al2O3 and Cr2O3. For both metal-oxide surfaces the strongest
interactions are represented by the metal-oxygen covalent bonds that are formed between the

142
oxygenated polar groups (hydroxyl and carbonyl groups), acting as a Lewis base, of the adsorbate
and the metallic atoms (Al/Cr), terminating the surfaces, acting as Lewis acids.
Apolar molecules such as alkanes (n-propane) and aromatic compounds (benzene and toluene) do
not form covalent bonds with the oxides and essentially associate by induction and dispersion
forces. Indeed, the Al-C and Cr-C bonds formed are 2.60 and 2.54 Å respectively, suggesting
weak interactions. These values are in good agreement with those calculated by Dabaghmanesh
et al. [22], 2.82 and 2.68 Å respectively. The adsorption energies calculated by the authors, -53.1
kJ/mol and -50.2 kJ/mol for Al2O3 and Cr2O3, are also in good correlation with our calculations, -
67.5 and -57.0 kJ/mol.
For water and acetic acid, both the associative (molecular) and dissociative adsorption have been
considered (Figure 47).On Al2O3 the non-dissociative adsorption evolves during the geometry
optimization towards a dissociative adsorption, through a proton transfer to a surface O atom (see
Figure 46). For the chromia case, acetic acid can adsorb molecularly and dissociatively, the
second case being more exothermic by 34.7 kJ/mol. The barrier from the molecular to the
dissociative adsorption was evaluated to 20.3 kJ/mol (the barrier was calculated using the
Nudged Elastic Band approach).

143
Figure 46: Optimized adsorption configurations on anhydrous surfaces with their corresponding adsorption
energies calculated via DFT approach of different model molecules on dry α-Al2O3 (a) and α-Cr2O3 (b) surfaces, respectively. The bond distances are reported in Angstrom [Å] and the adsorption energies in
[kJ/mol]. Color code: red = O; light-blue = C; white: H; grey = Al; brown = Cr.
We considered for the Al2O3 surface two different dissociative configurations: the “1-2”
dissociation for water and the “1-4” dissociation for acetic acid, cf. Figure A4-2 in the Annex for
the nomenclature. It appears that a small molecule like water, preferentially adsorbs in the 1-2
position, in agreement with literature data [81], while for the larger acetic acid, the 1-4 position is
most stable. In fact, the 1-2 (respectively 1-4) position maximizes the hydrogen bond interactions
between the O from the OH (respectively -COO) group and the adsorbed proton.
We report in Figure 47a the comparison between their initial configurations, in this way
highlighting the differences in their calculation starting-points.
a) Ethanol b)
ΔEads = -149.6 ΔEads = -55.0
Acetone
ΔEads = -126.4 ΔEads = -71.4
Benzenea) b)
ΔEads = -67.5 ΔEads = -57.0
Acetaldehyde
ΔEads = -112.9 ΔEads = -63.7
Toluene
ΔEads = -85.9 ΔEads = -56.9
Methyl acrylate
ΔEads = -151.5 ΔEads = -73.3
ΔEads = -163.1 ΔEads = -92.6
Acetic acid (Dissociative)
ΔEads = -194.9 ΔEads = -126.4 ΔEads = -91.7
Acetic acid (Molecular)
ΔEads = -44.4 ΔEads = -40.5
N-propane
ΔEads = -162.1 ΔEads = -87.8
Methyl propionate
ΔEads = -171.7 ΔEads = -80.1
2Ethyl-3-methyloxirane
b)a)Methyl-3-trans-hexenoate
a) b)a) b)
a) b) a) b)
a) b) a) b)
a) b) a) b)

144
Figure 47:a) Starting and final configurations of the acetic acid dissociative 1-4 and molecular adsorptions on dry α-Al2O3. b)configurations of the water dissociative and molecular adsorptions on dry α-Al2O3 and Cr2O3. The bond distances are reported in Angstrom [Å] and the adsorption energies in [kJ/mol]. Color code: red =
O; light-blue = C; white: H; grey = Al; brown = Cr.
From Figure 47a, we find the dissociation of the acetic acid on dry α-Al2O3 also in the molecular
adsorption case, leading us to the conclusion that the acetic acid spontaneously dissociates on α-
Al2O3. However, the same cannot be said for the acetic acid adsorbed on α-Cr2O3 (Figure 46),
where the dissociative and associative configurations show a marked difference in terms of
adsorption energies (-126.4 kJ/mol for the dissociative case against -91.7 kJ/mol for the
associative case) and also in terms of bond lengths.
dOC=O – Al dOOH – HOH dHOH – Os
1.42 1.44 0.98
Initial configuration (Acetic acid/ α-Al2O3 (0001))
Diss. Ads. 1-4
dOC=O – Al dOOH – HOH dHOH – Os
1.88 0.98 1.50
Initial configuration (Acetic acid/ α-Al2O3 (0001))
Mol. Ads.
dOC=O – Al dOOH – HOH dHOH – Os
1.83 1.42 1.09
Final configuration (Acetic acid/α-Al2O3 (0001))
Diss. Ads. 1-4
a)
dOw – Als ΔEads
1.97 -120.3
dOw – Als ΔEads
1.73 -158
dOw – Crs ΔEads
2.18 -89.4
H2O/α-Al2O3 (0001) (Mol. Ads.)
Ow
Als
H2O/α-Al2O3 (0001) (Diss. Ads. 1-2)
Ow
Als
H2O/α-Cr2O3 (0001) (Mol. Ads.)
Crs
Ow
b)

145
For water, (Figure 47b) we calculated associative and dissociative adsorption energy that fit well
with the literature data: -158 and -120.3 kJ/mol for dissociative and molecular adsorption of
water on Al2O3[23], and around -90 kJ/mol for water (molecular) adsorption on Cr2O3[18]. We
indeed found that for water adsorbed on Cr2O3, starting from the 1-4 dissociative adsorption, the
system evolves towards the molecular adsorption mode. This result agrees with that of Sharkas et
al. [18], where the molecular and dissociative adsorption modes of water were found iso
energetics.
Figure 48a compares for all molecules, the adsorption energies on Al2O3 and Cr2O3. It appears
clearly that Al2O3 is more reactive than Cr2O3 since it presents more negative adsorption energies
for all molecules.
a) b)
Figure 48: a) Adsorption energies on Cr2O3 versus Al2O3 (kJ/mol). The dashed line is the identity function (y=x). b) DFT interaction contribution (e.g. covalent and H-bonds) plotted against Al-O (grey squares) and
Cr-O (black squares) bonds respectively for oxygen-containing molecules adsorbed on anhydrous M2O3 (M=Al, Cr). Bader charge variation of the adsorbed O atom is reported (black circles: M=Cr; grey circles:
M=Al).
The M-O bond lengths formed for the O-containing adsorbates, are smaller for α-Al2O3 than for
α-Cr2O3. Figure 48b shows that the DFT energy contribution 𝑬𝒂𝒅𝒔𝑫𝑭𝑻 (thus without van der Waals
contributions)is well correlated to the M-O bond length: the shorter the bond length, the more
exothermic the adsorption energy. The slopes of the trends for α-Al2O3 and α-Cr2O3 are
different. For Al, the Al-O bond is in a narrow range around 1.9 Å, and 𝑬𝒂𝒅𝒔𝑫𝑭𝑻adsorption energies
are strong, (between -80 kJ/mol and -160 kJ/mol), while the slope is less steep for Cr2O3, where
-250
-200
-150
-100
-50
0-250 -200 -150 -100 -50 0
Ads
orpt
ion
ener
gy o
n C
r 2O
3 (k
J/m
ol)
Adsorption energy on Al2O3 (kJ/mol) -0,40
-0,30
-0,20
-0,10
0,00
0,10
0,20
0,30
0,40
0,50
-180
-160
-140
-120
-100
-80
-60
-40
-20
01,5 1,7 1,9 2,1 2,3 2,5
Oxy
gen
Bad
er c
harg
e va
riat
ion
(ele
ctro
n)
Ads
orpt
ion
Ene
rgy
DF
T o
nly
(kJ/
mol
)
M-O bond length (A)

146
the bond length interval is larger [2.1 Å – 2.3 Å] and associated with less exothermic𝑬𝒂𝒅𝒔𝑫𝑭𝑻
(between -20 kJ/mol and -60 kJ/mol).
The charge transfer Δρ from the surface to the molecules (including non O-containing
molecules)for each adsorbed molecule on dry α-Al2O3 andα-Cr2O3 is reported in Figure 49
below. At the exception of the dissociative adsorption of the acetic acid, the charge transfer to the
molecule is weak (see the detailed values in the inset below Figure 49). For acetic acid, for
which the adsorption is dissociative on alumina, the calculated charge is the charge variation of
the anionic part of the molecule (the charge difference of the proton from the molecule to the
adsorption on the surface is not considered). The charge transferred is higher (in absolute value)
for Al2O3 than Cr2O3, in line with the slightly larger electropositivity (or smaller
electronegativity: Χ=1.61) of Al with respect to Cr (Χ =1.66).
Figure 49:Electronic charge transfer Δρ (electron) of the molecules adsorbed on dry α-Al2O3 and (orange dots) and on dry α-Cr2O3 (blue dots) respectively. A minus charge corresponds to an increase in negative charge of
the molecule.
To understand the role of the water activity on the molecule/surface interaction, the adsorption of
the molecules on the hydroxylated surfaces is discussed. Figure 50 shows the optimized
configurations obtained for the molecules on the hydroxylated corundum surfaces. As for the dry
corundum-type surfaces, we placed the molecules on top of the surface in the same initial
arrangement to compare how the same molecule interacts with the two different substrates with
the same initial configuration.

147
Figure 50: Optimized adsorption configurations on hydroxylated surfaces with their corresponding
adsorption energies calculated via DFT approach of different model molecules on fully-hydroxylated α-Al2O3 (a) and α-Cr2O3 (b) surfaces. The bond distances are reported in Angstrom [Å] and the adsorption energies in
[kJ/mol]. Color code: red = O; light-blue = C; white: H; grey = Al; brown = Cr.
From Figure 50a it is noticed that the hydration layer attenuates the adsorption energies,
especially in the case of alumina. For chromia, the obtained trend is very similar to that observed
by Blanck et al, for hematite. The attenuation of the adsorption energy with the hydration layer
depends however on the nature of the molecule-surface interaction. This is, for example,
illustrated for the adsorption of ethanol. Whereas for the anhydrous surfaces adsorption energies
are calculated of –149.6 and –55 kJ/mol for alumina and chromia, respectively, these values
reduce to practically equal values of –40.5 and –45.3 kJ/mol for the fully hydrated surfaces.
Similar trends are observed for the aldehyde, ketone, epoxide, and esters, which coordinate with a
polar oxygen atom (or group) to the surface.
2Ethyl-3-methyloxirane
Ethanolb)
ΔEads = -40.5 ΔEads = -45.3
a)Acetaldehyde
b)
ΔEads = -42.5 ΔEads = -33.8
a)Acetone
a) b)
ΔEads = -68.5ΔEads = -47.3
ΔEads = -56 ΔEads = -42.3
b)a)Acetic acid
ΔEads = -51.1 ΔEads = -57.9
a) b)Benzene
a) b)
ΔEads = -50.2 ΔEads = -64.6
Toluene b)
ΔEads = -60.9 ΔEads = -52.1
Methyl acrylatea) b)
ΔEads = -51.1 ΔEads = -70.4 ΔEads = -69.5 ΔEads = -71.4
Methyl propionate
ΔEads = -63.1 ΔEads = -79.1
N-propane
ΔEads = -31.8 ΔEads = -36.7
a) a) Methyl-3-trans-hexenoate b)
a) b) a) b)

148
Such polar groups are missing in benzene and toluene, where the attenuation effect due to the
hydration layer is almost absent.
Figure 51b compares the adsorption energies on hydroxylated Cr2O3 and Al2O3. The average
value is very near the y = x line, suggesting that it is principally the hydration layer that now
determines the adsorption energy, and the underlying oxide only plays a secondary role. The
charge transfers between the surface and the adsorbed molecules have been calculated and are
found to be negligible, ranging between -0.03 and +0.02 electrons.
a) b)
Figure 51: a) Adsorption energies (kJ/mol) on the hydroxylated surfaces versus the anhydrous surfaces, black:
Cr, grey: Al; b) Adsorption energies (kJ/mol) on hydroxylated Cr2O3 versus hydroxylated Al2O3. The linear average curve is plotted in black, dotted line. The identity curve y = x is plotted in black, solid line.
4.5 Surface impact on intramolecular distortion
To have an idea on the effect of the surface on the adsorption process, in Table 6 below, we
report the intramolecular bonds of each compound that presented the highest distortion from the
consequent adsorption above the dry α-(0001) Al2O3.
We chose to report the values related to the adsorption on dry α-alumina since in our study this
substrate was observed to be the most reactive, thus the one that could provide the highest
variations between the pre and post-adsorption conditions. We can notice that the general trend
confirms the weak impact of surface on the intramolecular distortion, at the exception of the
dissociated case of the acetic acid, where indeed we see a ΔO-H = 0.44 Å, which confirms the
proton transfer from the molecule towards the surface oxygen atom (Figure 46).
-250
-200
-150
-100
-50
0-250 -200 -150 -100 -50 0
Ead
s hyd
roxy
late
d su
rfac
es (
kJ/m
ol)
Eads anhydrous surfaces (kJ/mol)
y = 1,0412x - 2,9066
y = x
-100
-80
-60
-40
-20
0-100 -80 -60 -40 -20 0
Ead
s hyd
roxy
late
d C
r 2O
3 su
rfac
e (
kJ/m
ol)
Eads hydroxylated Al2O3 surfaces (kJ/mol)

149
Table 6: Intramolecular bonds presenting the highest distortion after adsorption of each molecule on top of the dry α-(0001) Al2O3
Molecules MAX Δdmol (Ads - Gas) [Angstrom]
Intramol. Bond
Acetic acid (Diss. Ads) 0.44 O-H
Ethanol 0.05 C-O
Acetaldehyde 0.03 C-C
Acetone 0.03 C-C
Benzene 0.01 C=C
Toluene 0.01 C-C
Methyl Acrylate 0.03 C=O
Methyl-3T-Hexenoate 0.03 C=O
Methyl propionate 0.04 C=O
2Ethyl-3methyl-oxirane 0.04 C-O
N-propane 0.00 -
4.6 Water/OH substitution on corundum surfaces
In addition to the adsorption configurations reported in the previous paragraphs, in this work we
also treated another type of configuration, where a water molecule or a OH group is substituted
with an organic adsorbate. In our case, two cases were examined: the water substitution with an
acetate molecule and a OH substitution with a methyl propionate molecule.
4.6.1 Implemented scheme
The surface OH substitution can be described through an acid base mechanism resumed in the
equation below:
RH + Slab-HY(-OHs) Slab-R + H2O
Equation 79
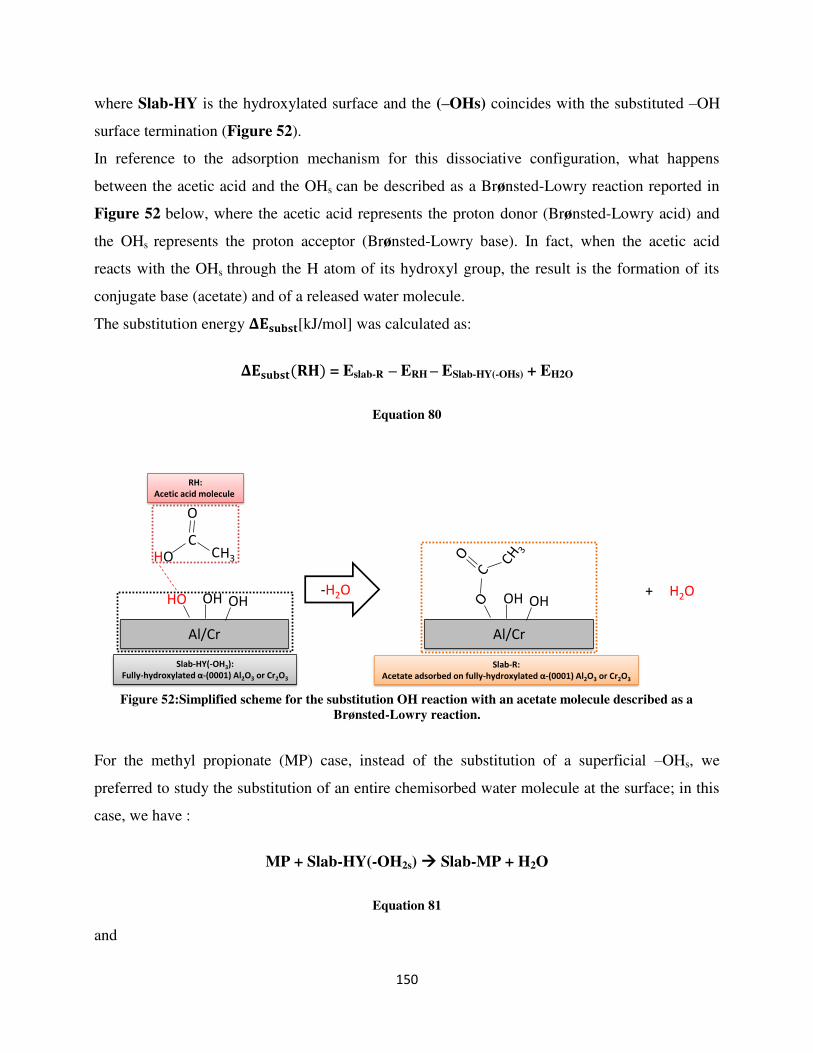
150
where Slab-HY is the hydroxylated surface and the (–OHs) coincides with the substituted –OH
surface termination (Figure 52).
In reference to the adsorption mechanism for this dissociative configuration, what happens
between the acetic acid and the OHs can be described as a Brønsted-Lowry reaction reported in
Figure 52 below, where the acetic acid represents the proton donor (Brønsted-Lowry acid) and
the OHs represents the proton acceptor (Brønsted-Lowry base). In fact, when the acetic acid
reacts with the OHs through the H atom of its hydroxyl group, the result is the formation of its
conjugate base (acetate) and of a released water molecule.
The substitution energy 𝚫𝐄𝐬𝐮𝐛𝐬𝐭[kJ/mol] was calculated as:
𝚫𝐄𝐬𝐮𝐛𝐬𝐭(𝐑𝐇) = Eslab-R – ERH – ESlab-HY(-OHs) + EH2O
Equation 80
Figure 52:Simplified scheme for the substitution OH reaction with an acetate molecule described as a
Brønsted-Lowry reaction.
For the methyl propionate (MP) case, instead of the substitution of a superficial –OHs, we
preferred to study the substitution of an entire chemisorbed water molecule at the surface; in this
case, we have :
MP + Slab-HY(-OH2s) Slab-MP + H2O
Equation 81
and
Al/Cr
HO OHOH
CCHO
O
H3
-H2O
Al/Cr
H2OOHOH +
RH:Acetic acid molecule
Slab-HY(-OH3):Fully-hydroxylated α-(0001) Al2O3 or Cr2O3
Slab-R:Acetate adsorbed on fully-hydroxylated α-(0001) Al2O3 or Cr2O3

151
𝚫𝐄𝐬𝐮𝐛𝐬𝐭= Eslab-MP – EMP - ESlab-HY(-OH2s)+ EH2O
Equation 82
where in this case the Slab-HY is characterized by a chemisorbed water termination (–OH2s).
We can analyze further these results in calculating the different components of the substitution
energy: water desorption energy and molecule/surface binding energy. We have, if X is the
adsorbed moiety, either R or MP,
Esubst= 𝑬𝑯𝟐𝑶𝒅𝒆𝒔𝒐𝒓𝒃 + 𝑬𝑺𝒍𝒂𝒃−𝑿𝒃𝒊𝒏𝒅𝒊𝒏𝒈 + 𝑬𝐒𝐥𝐚𝐛−𝐇𝐘−𝐦𝐢𝐧𝐮𝐬−𝐇𝟐𝐎𝒓𝒆𝒍𝒂𝒙𝒂𝒕𝒊𝒐𝒏
Equation 83
With
𝑬𝑯𝟐𝑶𝒅𝒆𝒔𝒐𝒓𝒃= ESlab-HY-minus-H2O - ESlab-HY + EH2O
Equation 84
And 𝑬𝑺𝒍𝒂𝒃−𝑿𝒃𝒊𝒏𝒅𝒊𝒏𝒈= 𝑬𝑺𝒍𝒂𝒃−𝑿𝒐𝒑𝒕𝒊𝒎𝒊𝒛𝒆𝒅 – 𝑬𝑿 – 𝑬𝐒𝐥𝐚𝐛−𝐇𝐘−𝐦𝐢𝐧𝐮𝐬−𝐇𝟐𝐎𝒊𝒏 𝒕𝒉𝒆 𝒈𝒆𝒐𝒎𝒆𝒕𝒓𝒚 𝒐𝒇 𝒕𝒉𝒆 𝒂𝒅𝒔𝒐𝒓𝒑𝒕𝒊𝒐𝒏
Equation 85
And
𝑬𝐒𝐥𝐚𝐛−𝐇𝐘−𝐦𝐢𝐧𝐮𝐬−𝐇𝟐𝐎𝒓𝒆𝒍𝒂𝒙𝒂𝒕𝒊𝒐𝒏 = 𝑬𝐒𝐥𝐚𝐛−𝐇𝐘−𝐦𝐢𝐧𝐮𝐬−𝐇𝟐𝐎𝒐𝒑𝒕𝒊𝒎𝒊𝒛𝒆𝒅 – 𝑬𝐒𝐥𝐚𝐛−𝐇𝐘−𝐦𝐢𝐧𝐮𝐬−𝐇𝟐𝐎𝒊𝒏 𝒕𝒉𝒆 𝒈𝒆𝒐𝒎𝒆𝒕𝒓𝒚 𝒐𝒇 𝒕𝒉𝒆 𝒂𝒅𝒔𝒐𝒓𝒑𝒕𝒊𝒐𝒏
Equation 86
4.6.2 Results and discussion

152
Now we will study explicitly acetic acid that has a marked affinity with the anhydrous surfaces,
to which extent water molecule can be exchanged. The results are compared with that on methyl
propionate, which, according to our first estimation, is not expected to substitute water at the
corundum surfaces. In Figure 53a-b are reported the optimized configurations of the dissociative
adsorptions of the acetic acid molecules on fully-hydroxylated α-Cr2O3-Cr(OH)3 and α-Al2O3-
Al(OH)3. The substitution reaction of an OH group by an acetate anion is described by Equation
80 and consists of an acid-base mechanism with formation of a Cr-molecule adduct and the
release of a water molecule in the gas phase. The substitution energy is -43.8 kJ/mol for chromia,
and -17.5 kJ/mol for Al2O3. The substitution of OH by acetate is thus an exothermic process for
both surfaces, a trend in agreement with the conclusions of the preceding paragraph.
The results of the substitution reaction of water by methyl propionate are shown in Figure 53c-d.
It can easily be observed that methyl propionate does not get very close to the surfaces. Starting
with the Cr-O and Al-O bond lengths obtained on the anhydrous surfaces, 1.88 Å for Al2O3 and
2.22 Å for Cr2O3 (Figure 46), we observe that the M-O distances increase on the hydroxylated
surfaces to 3.05 Å (Figure 53c) and 3.02 Å (Figure 53d), respectively. Complementary
calculations of adsorption on partially hydroxylated surfaces were performed in the case of
methyl propionate. We found that methyl propionate forms a bond with surface Al only in the
totally dehydrated case, but not on the Al-OH and Al-(OH)2 terminations, confirming that methyl
propionate binds a bond with Al4c (four fold coordinated) only. The substitution energies are -
34.7 and 17 kJ/mol for Cr2O3 and Al2O3, respectively. The water substitution by methyl
propionate is endothermic for Al2O3, as expected from the preceding paragraph, while slightly
exothermic on Cr2O3.
We can analyze further these results in calculating the different components of the substitution
energy: water desorption energy and molecule/surface binding energy, and Table A4-3 in the
Annex summarizes the values obtained for energy decomposition for MP and acetic acid.
a) b)

153
c) d)
Figure 53: a-b) Optimized adsorption configurations calculated via DFT approach of a substitution reaction between an acetic acid and a water molecule on fully hydroxylated corundum-type α-Al2O3-Al(OH)3 (a)and α-Cr2O3-Cr(OH)3 (b)respectively. The background atoms of both configurations have been removed for clarity.
Color code: Red = O; light-blue = C; white = H; Brown= Cr; Grey = Al. c-d) Optimized adsorption configurations calculated via DFT approach of a substitution reaction between a methylpropionate molecule and a water molecule on fully hydroxylated corundum-type α-Al2O3-Al(OH)3 (a) and α-Cr2O3-Cr(OH)3 (b)
respectively. The background atoms of both configurations have been removed for clarity.Colour code: Red = O; light-blue = C; white = H; Brown = Cr; Grey = Al.
4.7 Conclusion
To improve our understanding of undesired deposit formations observed for biodiesels in engine
fuel circuits, we have conducted a quantum mechanical study using density functional theory
calculations considering the molecular interactions established by these fuel deposits in both
homogeneous conditions (i.e. their gas-phase) and heterogeneous conditions (i.e. their contact
with the solid surfaces).
OC=O
– Als = 2.00 Å O
C=O – Cr
s = 2.08 Å
OC=O
– Als = 3.05 Å O
C=O – Cr
s = 3.02 Å

154
In regards of the deposits reactivity in the gas-phase, a set of representative reactions describing
the toluene autoxidation process was considered (Eq. 68-Eq. 78). We proposed the toluene
autoxidation mechanism because aromatic compounds represent a major constituent of
petrodiesel and toluene is often in literature taken as model molecule for fuel autoxidation studies
[5–7]. In this thesis, our focus was set on the hydroperoxide (C6H5)CH2O2H because, starting
from their decomposition, the future oxygenated precursors are produced (e.g. alcohols,
carboxylic acids, aldehydes, etc.) [8].
Through ab-initio calculations, we obtained the ΔEr of these autoxidation reactions. Also, we run
a PES scan for the for C-OOH and CO-OH bond dissociation energies in the benzyl
hydroperoxide molecules, where we found that the two curves almost overlap on each other till
the bond distance of 1.8 Å. However, the energetic maximum for either of the bonds was not
reached in our calculations because of intramolecular contractions that prevented us to analyze
further the stretching for both C-OOH and CO-OH bonds.
About the interface interactions occurring between the gas-phase molecules and the alumina and
chromia surfaces, we studied the adsorption of small representative organic molecules on
representative aluminum and stainless steel surfaces. The investigated organic compounds
comprise hydrocarbons like n-alkanes and aromatic molecules, as well as oxygen containing
molecules including an alcohol, aldehyde, ketone, epoxide, carboxylic acid, and esters. Whereas
the stainless-steel fuel circuit was represented by α-Cr2O3 and aluminum-based circuits by α-
Al2O3, in which each studied surface orientation was either anhydrous or fully hydroxylated.
From this heterogeneous study we determined that:
1. Anhydrous surfaces are more reactive towards the organic molecules than their fully
hydroxylated counterparts as seen from the more negative adsorption energies.
2. Aluminum anhydrous surfaces show a higher reactivity as compared to anhydrous
chromia, while this difference vanishes upon fully hydroxylating the surfaces.
3. Oxygen containing organic compounds show more negative adsorption energies
independent of the nature of the inorganic surface.
4. Except for the dissociative adsorption of acetic acid on anhydrous α-Al2O3 no other
significant geometrical changes, e.g. bond elongations, in the organic molecules were
observed due to adsorption on the oxide surfaces.

155
5. Bader charge analyses show that there are only weak charge transfers between the
different oxides and organic molecules, expect for the dissociative adsorption of acetic
acid on dry alumina.
Since under operational conditions each of the oxide surfaces is at least partially or fully
hydroxylated, the difference in nature of the oxides vanishes with respect to its reactivity towards
the investigated organic compounds. In other words, based on this study, stainless-steel circuits
which is the surface that is more problematic since it is material of injectors, would not play a
more important role in the autoxidation reactions as compared to aluminum-based circuits. This
finding is important since it corroborates that fuel oxidation product aggregates seem to be
mainly formed in the liquid phase further being deposited on a surface by different mechanisms
[24]. Furthermore, the relatively weak interactions (–30 to –70 kJ/mol) between surface and
molecule seem to be insufficient to provoke significant distortions in the organic molecule itself,
which in turn could lead to higher reactivity and rendering the molecule more prone to
autoxidation reactions in liquid phase.
We conclude this chapter by emphasizing that both homogeneous and heterogeneous studies
were carried out to provide important input data to use for the ReaxFF discussed in the next
chapter. The autoxidation reactions as a mean for ReaxFF to predict the chemical reactivity in the
gas-phase, while the adsorption configurations to aid the reactive force field to estimate the
nature of the gas-solid interface interactions. Both energetic data were fundamental for the
achievement of the ReaxFF optimization and validation implemented in this thesis.

156
References
1 M.J. Frisch, G.W. Trucks, H.B. Schlegel, G.E. Scuseria, M.A. Robb, J.R. Cheeseman, G. Scalmani, V. Barone,
G.A. Petersson, H. Nakatsuji, X. Li, M. Caricato, A.V. Marenich, J. Bloino, B.G. Janesko, R. Gomperts, B. Mennucci, H.P. Hratchian, J.V. Ortiz, Izmaylov, A. F., Sonnenberg, J. L., Williams, F. Ding, F. Lipparini, F. Egidi, J. Goings, B. Peng, A. Petrone, T. Henderson, D. Ranasinghe, V.G. Zakrzewski, J. Gao, N. Rega, G. Zheng, W. Liang, M. Hada, M. Ehara, K. Toyota, R. Fukuda, J. Hasegawa, M. Ishida, T. Nakajima, Y. Honda, O. Kitao, H. Nakai, T. Vreven, K. Throssell, J.A. Montgomery Jr., Peralta, J. E., F. Ogliaro, M.J. Bearpark, Heyd, J. J., E.N. Brothers, K.N. Kudin, Staroverov, V. N., T.A. Keith, R. Kobayashi, J. Normand, K. Raghavachari, A.P. Rendell, J.C. Burant, S.S. Iyengar, J. Tomasi, M. Cossi, J.M. Millam, M. Klene, C. Adamo, R. Cammi, J.W. Ochterski, R.L. Martin, K. Morokuma, O. Farkas, J.B. Foresman, D.J. Fox Gaussian 16 Rev.
C.01, Wallingford, E.U.A. (2016). 2 Kresse, Furthmüller Efficient iterative schemes for ab initio total-energy calculations using a plane-wave basis
set, Phys. Rev. B54, 16 (1996), 11169–11186. DOI: 10.1103/physrevb.54.11169. 3 Bacha K. These de Doctorat "Etude de l'interaction entre le carburant diesel et les composants su systèmes
d'injection diesel, Physique des matériaux, Université de Haute Alsace (2016). 4 Mei D., Dai S., Chen T., Wang H., Yuan Y. Absorption of fuel containing esters on iron surface based on
molecular simulation and its effects on lubricity,Energ. Sources, Part A (2020), 1–12. DOI: 10.1080/15567036.2020.1783395.
5 Mielczarek D.C., Matrat M., Amara A.B., Bouyou Y., Wund P., Starck L. Toward the Accurate Prediction of Liquid Phase Oxidation of Aromatics: A Detailed Kinetic Mechanism for Toluene Autoxidation,Energy
Fuels31, 11 (2017), 12893–12913. DOI: 10.1021/acs.energyfuels.7b00416. 6 da Silva G., Bozzelli J.W. Kinetic modeling of the benzyl+HO2 reaction,Proceedings of the Combustion
Institute32, 1 (2009), 287–294. DOI: 10.1016/j.proci.2008.05.040. 7 da Silva G., Hamdan M.R., Bozzelli J.W. Oxidation of the Benzyl Radical: Mechanism, Thermochemistry, and
Kinetics for the Reactions of Benzyl Hydroperoxide,Journal of chemical theory and computation5, 12 (2009), 3185–3194. DOI: 10.1021/ct900352f.
8 Bacha K., Ben-Amara A., Vannier A., Alves-Fortunato M., Nardin M. Oxidation Stability of Diesel/Biodiesel Fuels Measured by a PetroOxy Device and Characterization of Oxidation Products, Energy Fuels29, 7 (2015), 4345–4355. DOI: 10.1021/acs.energyfuels.5b00450.
9 John P. Perdew, K. Burke, M. Ernzerhof Generalized Gradient Approximation Made Simple, Phys. Rev. Lett.77, 18 (1996), 3865–3868. DOI: 10.1103/PhysRevLett.77.3865.
10 Kresse G., Hafner J. Ab initio molecular dynamics for liquid metals,Phys. Rev. B47, 558 (1993). DOI: 10.1103/PhysRevB.47.558.
11 Kresse G., Hafner J. Ab initio molecular-dynamics simulation of the liquid-metal-amorphous-semiconductor transition in germanium,Phys. Rev. B49, 20 (1994), 12252–14269. DOI: 10.1103/PhysRevB.49.14251.
12 Kresse G., Furthmuller J. Efficiency of ab-initio total energy calculations for metals and semiconductors using a plane-wave basis set, Comput. Mater. Sci.6 (1996), 15–50. DOI: 10.1016/0927-0256(96)00008-0.
13 Monkhorst H. J., Pack J. D Special points for Brouillon-zone integrations,Phys. Rev. B13 (1976), 5188–5192. DOI: 10.1103/PhysRevB.13.5188.
14 Anisimov et al. First-principles calculations of the electronic structure and spectra of strongly correlated systems: the LDA+U method, J. Phys.: Condens. Matter9 (1997), 767–808. DOI: 10.1088/0953-8984/9/4/002.
15 Souvi S.M., Badawi M., Virot F., Cristol S., Cantrel L., Paul J.-F. Influence of water, dihydrogen and dioxygen on the stability of the Cr 2 O 3 surface: A first-principles investigation, Surf. Sci.666 (2017), 44–52. DOI: 10.1016/j.susc.2017.08.005.
16 Rohrbach A., Hafner J., Kresse G. Ab initio study of the (0001) surfaces of hematite and chromia: Influence of strong electronic correlations, Phys. Rev. B70, 12 (2004), 13. DOI: 10.1103/PhysRevB.70.125426.
17 Grimme S., Antony J., Ehrlich S., Krieg H. A consistent and accurate ab initio parametrization of density functional dispersion correction (DFT-D) for the 94 elements H-Pu, J. Chem. Phys.132, 15 (2010), 154104. DOI: 10.1063/1.3382344.

157
18 Costa D., Sharkas K., Islam M.M., Marcus P. Ab initio study of the chemical states of water on Cr2O3(0001): From the isolated molecule to saturation coverage, Surf. Sci.603, 16 (2009), 2484–2493. DOI: 10.1016/j.susc.2009.05.037.
19 Arrouvel C., Diawara B., Costa D., Marcus P. DFT Periodic Study of the Adsorption of Glycine on the Anhydrous and Hydroxylated (0001) Surfaces of α-Alumina, J. Phys. Chem. C111, 49 (2007), 18164–18173. DOI: 10.1021/jp0741408.
20 Łodziana Z., Nørskov J.K., Stoltze P. The stability of the hydroxylated (0001) surface of α-Al2O3, The Journal
of Chemical Physics118, 24 (2003), 11179–11188. DOI: 10.1063/1.1574798. 21 Ranea V.A., Carmichael I., Schneider W.F. DFT Investigation of Intermediate Steps in the Hydrolysis of α-Al 2
O 3 (0001), J. Phys. Chem. C113, 6 (2009), 2149–2158. DOI: 10.1021/jp8069892. 22 Dabaghmanesh S., Neyts E.C., Partoens B. van der Waals density functionals applied to corundum-type
sesquioxides: Bulk properties and adsorption of CH3 and C6H6 on (0001) surfaces, Phys.Chem.Chem.Phys.18, 33 (2016), 23139–23146. DOI: 10.1039/c6cp00346j.
23 Heiden S., Usvyat D., Saalfrank P. Theoretical Surface Science Beyond Gradient-Corrected Density Functional Theory: Water at α-Al 2 O 3 (0001) as a Case Study, J. Phys. Chem. C123, 11 (2019), 6675–6684. DOI: 10.1021/acs.jpcc.9b00407.
24 Alves-Fortunato M., Ayoub E., Bacha K., Mouret A., Dalmazzone C. Fatty Acids Methyl Esters (FAME) autoxidation: New insights on insoluble deposit formation process in biofuels, Fuel268 (2020), 117074. DOI: 10.1016/j.fuel.2020.117074.
25 Wodrich M. D, Corminboeuf C., Wheeler S. E. Accurate Thermochemistry of Hydrocarbon Radicals via an Extended Generalized Bond Separation Scheme (2012) J. Phys. Chem. A, 116, 13, 3436–3447.DOI:10.1021/jp212209q
26 Zhao Y, Thrular D. G. Density Functional Theory for Reaction Energies: Test of Meta and Hybrid Meta Functionals, Range-Separated Functionals, and Other High-Performance Functionals (2011) J. Chem. Theory
Comput. 2011, 7, 3, 669–676. DOI: 10.1021/ct1006604

158
Chapter 5. ReaxFF development and validation
5.1 Introduction
As mentioned in the previous Chapter 4, the next step in our multi-scale molecular modeling
approach is the use of an empirical reactive force field, ReaxFF, to run molecular dynamics
simulations on systems that are larger and more representative than one could model with DFT.
As detailed in (cf.§2.11.1) there is no unique ReaxFF force field and its parameters often need to
be adjusted or optimized to accurately describe the chemistry of the system of interest. The
number of available force fields that can describe aluminum and chromium-based systems is very
limited in the literature [1–5]. In fact, in the PhD of Benoît Darenne [6] a force field describing
both alumina and chromia was put in place. Logically, we first tested its applicability to the
systems of our interest, by reproducing the adsorption energies for the molecules on chromia and
alumina (cf.§4.4.2). We refer to the implemented force field of the work [6] as FF0.
On the basis of these results (see Figure A5-3 in the Annex) and the observation of the formation
of lactones during molecular dynamics simulations of acetic acid on hydroxylated alumina, which
is highly endothermic at ambient temperatures (see A5.2.2-Figure A5-6 in the Annex), it was
decided to readjust certain ReaxFF parameters using the CMA-ES algorithm (cf.§2.11.3).
However, preliminary calculations with this optimized force field (see Annex A5.6.2) showed us
that it was not able to correctly reproduce adsorption geometries and energies for α-Cr2O3, as a
consequence of the fact that optimizing this FF to improve the description of α-Al2O3 decreased
the accuracy to describe α-Cr2O3 systems.
Therefore, in this chapter we start a new cycle of ReaxFF reparametrization by using two
different force fields: FFA for the Al2O3 systems and FFB for the Cr2O3 systems. These two
different force fields are both based on the force field of Benoît Darenne [6], with the difference
that in FFB we chose to substitute the ReaxFF parameters of H and O atoms by inserting the
values of the “CHON-2017_weak.ff” force field developed by Zhang and van Duin [18].
The FFA and FFB parametrizations will be discussed in the following paragraphs.

159
The quality of the obtained force fields is evaluated in two steps. In the first step, called training
set, we tested how the force field is able to reproduce a set of DFT data. In the second step, called
validation set, we tested how the force-field is able to reproduce the other DFT data(data that are
not included in the training set). The validation set includes the reproduction of the cell
parameters of the bulk, adsorption energies and curves of similar but different organic molecules
that were used in the training set, representative reactions of the autoxidation of toluene, and the
dynamic structuration of pure organic liquids (mass/volume density, radial distribution
functions). Since the latter requires molecular dynamic simulations that are relatively time
consuming as opposed to geometry optimizations, these MD simulations were only performed
once the preceding steps were validated.
A simplified scheme resuming the implemented ReaxFF parametrization and validation is
reported in Figure 24 (cf.§2.11.1), while another scheme detailing the “static” and “dynamic”
studies of the ReaxFF validation is reported in Figure 26 (cf.§2.11.6).
5.2 FFA and FFB reparametrizations
In this section, we discuss the new cycle of ReaxFF reparametrization by using these two
different force fields: FFA for the Al2O3 systems (cf.§4.4.2) and FFB for the Cr2O3 systems
(cf.§4.4.2). The choice to optimize two different force fields was to ensure a more reliable
description of the interactions on the two metal-oxide substrates, since they present different
features as well as different reactivities towards the organic adsorbates, as it was observed in the
previous Chapter 4.
In the next paragraph, we discuss how we carried out the optimization of both implemented force
fields, reporting the selection of the parameters that were reparametrized and the conclusion that
we reached from this optimization procedure.

160
5.2.1 Computational details
For the FFA training-set, all the DFT alumina adsorption configurations (cf.§4.4.2) were
considered, conversely for the FFB training-set, all the DFT chromia adsorption configurations
were taken into account (cf.§4.4.2), accompanied by the geometries of the single molecules
(cf.§4.2) and dry and hydroxylated surfaces (cf.§4.4.1). However, both training-sets shared some
DFT data, such as the lactone reaction coordinate (see Figure A5-6 in the Annex).
Aiming to reach a higher reproducibility of the surrogate/surface interactions for both
implemented force fields (see Annex A5.6.2), we selected the force field parameters that could
majorly impact on the molecule/surface interactions, characterizing these molecular systems in
order to reparametrize them. In Table 7-Table 8 we report the selected ReaxFF parameters.
For both FFA and FFB we selected the following parameters for the C-C, C-H and C-O bonds:
E(sigma), pbo1,pbo2, povun1 and pbe1 and pbe2. These parameters correspond to the sigma
bond dissociation energy E(sigma), the sigma bond orders pbo1 and pbo2 (cf.§2.11), the
overcoordination penalty povun1 and the bond energies pbe1 and pbe2. In the FFA case, we
selected only alumina-based parameters (e.g. C-Al and Al-O bonds) and conversely only
chromia-based parameters for FFB (e.g. C-Cr and Cr-O bonds). For the C-O, C-Al (C-Cr), H-O
and Al-O (Cr-O) bonds, we also selected the ReaxFF parameters linked to the van der Waals
dispersion forces: the vdW energy E(vdW), the vdW radius R(vdW), the vdW coefficient
Alpha(vdW) and the sigma bond length R(sigma). The formalism linked to these parameters is
taken from reference [13].
The decision behind this selection of parameters was made because we wanted to achieve a better
description of the interface. By “activating” the parameters linked to the bond orders and bond
energies for C-Cr, Cr-O, C-Al, Al-O and O-H, we thought that we could gain an improvement in
the ReaxFF description of the interface interactions since from the DFT calculations we observed
that the main interactions are established either through polar covalent bonds (e.g. oxygenated
molecules on dry substrates) or through vdW forces (e.g. hydrocarbon molecules like benzene,
toluene and n-propane) or finally H-bonds (e.g. molecules on both hydroxylated surfaces).

161
We imposed 1000 fit iterations for the CMA-ES FF optimizer. For supplementary information
regarding the functioning of the CMA-ES algorithm, see the Annex A5 section. For the geometry
optimization setup, we implemented the “Conjugate Gradient” (CG) algorithm and imposed the
number of maximum iterations up to 1000 iterations for the adsorption configurations.
Table 7: Reparametrized ReaxFF parameters for FFA.
Optimized parameters
C-C C-H C-O C-Al H-O Al-O
E(sigma) ✓ ✓ ✓ ✓ ✓ ✓
pbe1 ✓ ✓ ✓ ✓ ✓ ✓
povun1 ✓ ✓ ✓ ✓ ✓ ✓
pbe2 ✓ ✓ ✓ ✓ ✓ ✓
pbo1 ✓ ✓ ✓ ✓ ✓ ✓
pbo2 ✓ ✓ ✓ ✓ ✓ ✓
E(vdW) - - ✓ ✓ ✓ ✓
R(vdW) - - ✓ ✓ ✓ ✓
Alpha(vdW) - - ✓ ✓ ✓ ✓
R(sigma) - - ✓ ✓ ✓ ✓
Table 8: Reparametrized ReaxFF parameters for FFB.
Optimized parameters
C-C C-H C-O C-Cr H-O Cr-O
E(sigma) ✓ ✓ ✓ ✓ ✓ ✓
pbe1 ✓ ✓ ✓ ✓ ✓ ✓
povun1 ✓ ✓ ✓ ✓ ✓ ✓
pbe2 ✓ ✓ ✓ ✓ ✓ ✓
pbo1 ✓ ✓ ✓ ✓ ✓ ✓
pbo2 ✓ ✓ ✓ ✓ ✓ ✓
E(vdW) - - ✓ ✓ ✓ ✓
R(vdW) - - ✓ ✓ ✓ ✓
Alpha(vdW) - - ✓ ✓ ✓ ✓
R(sigma) - - ✓ ✓ ✓ ✓
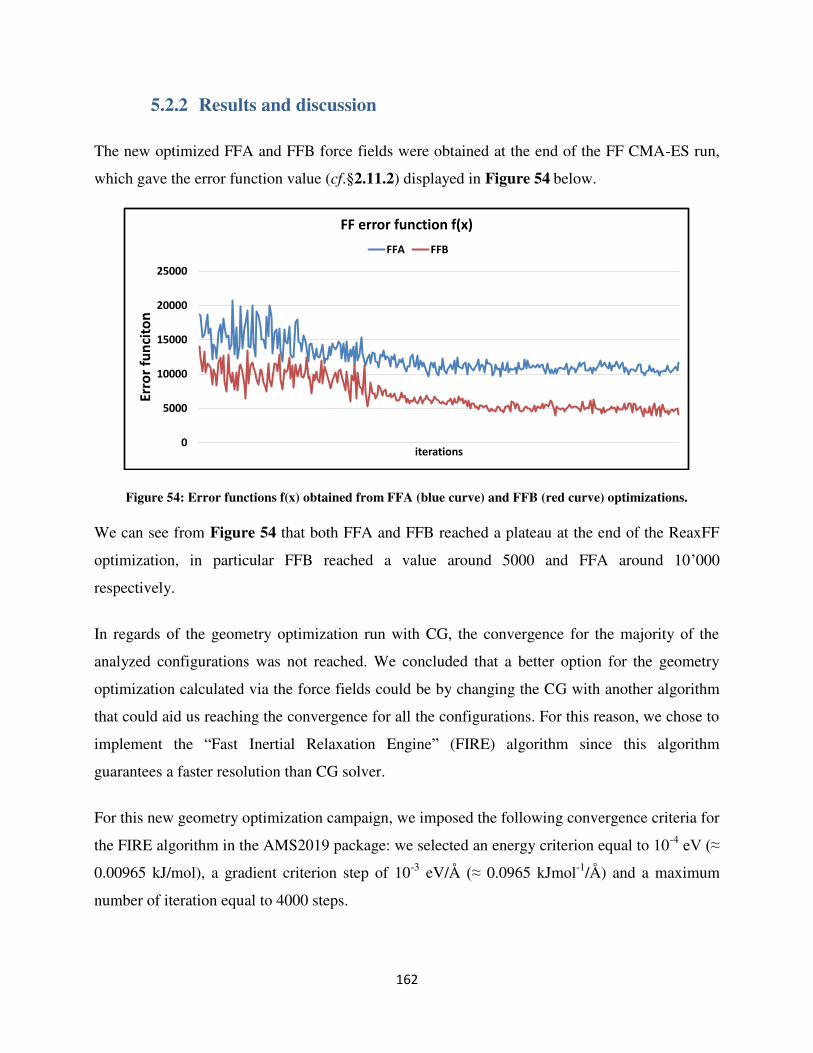
162
5.2.2 Results and discussion
The new optimized FFA and FFB force fields were obtained at the end of the FF CMA-ES run,
which gave the error function value (cf.§2.11.2) displayed in Figure 54 below.
Figure 54: Error functions f(x) obtained from FFA (blue curve) and FFB (red curve) optimizations.
We can see from Figure 54 that both FFA and FFB reached a plateau at the end of the ReaxFF
optimization, in particular FFB reached a value around 5000 and FFA around 10’000
respectively.
In regards of the geometry optimization run with CG, the convergence for the majority of the
analyzed configurations was not reached. We concluded that a better option for the geometry
optimization calculated via the force fields could be by changing the CG with another algorithm
that could aid us reaching the convergence for all the configurations. For this reason, we chose to
implement the “Fast Inertial Relaxation Engine” (FIRE) algorithm since this algorithm
guarantees a faster resolution than CG solver.
For this new geometry optimization campaign, we imposed the following convergence criteria for
the FIRE algorithm in the AMS2019 package: we selected an energy criterion equal to 10-4 eV (≈
0.00965 kJ/mol), a gradient criterion step of 10-3 eV/Å (≈ 0.0965 kJmol-1/Å) and a maximum
number of iteration equal to 4000 steps.
0
5000
10000
15000
20000
25000
Erro
r fu
nci
ton
iterations
FF error function f(x)
FFA FFB

163
In Figure 55, we reported the results of the optimized configurations for the training-set
molecules (cf.§4.2) when adsorbed on both dry α-surfaces. It is possible to observe that the FFB
predictions for the dry α-Cr2O3 configurations are fairly better than the FFA predictions for the
dry α-Al2O3.
Figure 55: Comparison of the adsorption energies of the training-set molecules (cf.§4.2) on dry α-surfaces calculated via ReaxFF geometry optimization (with FIRE algorithm) and DFT, respectively.
FFB accurately predicts the adsorption energies on dry α-Cr2O3 for acetaldehyde, acetic acid (in
both dissociative and molecular configurations), methyl propionate and n-propane, while FFA
accurately predicts the adsorption energies on dry α-Al2O3 for benzene, methyl propionate and n-
propane. The maximal energetic difference between ReaxFF predictions against DFT data was
equal to 20 kJ/mol for FFB (e.g. 2-ethyloxirane, ethanol and methyl-3-trans-hexenoate) and to 30
kJ/mol for FFA predictions (e.g. methyl acrylate and methyl-3-trans-hexenoate).
Given the fact that these maximal energetic differences observed for the dry surfaces refer to a
small portion of the overall training-set molecules, we decided to retain these results as valid for
the both reactive force field optimizations. This decision was further confirmed by the fact that
-250
-230
-210
-190
-170
-150
-130
-110
-90
-70
-50
-30
-10
Ad
sorp
tio
n e
ne
rgie
s [k
J/m
ol)
training-set molecules
ReaxFF vs DFT EadsDry α-surfaces
FFB DFT_Cr2O3 FFA DFT_Al2O3

164
we observed an average % error smaller than 25%, threshold that we decided beforehand as
criterion for a good approximation of the used force field when predicting the DFT results. In
particular, we measured a 13% and 17% average for the FFA predictions of DFT results related
to dry alumina configurations and for FFB predictions of the corresponding DFT results related
to dry chromia, respectively. With this result, we evaluated both force fields as well-fitted for this
training-set.
In Figure 56, we reported the results of the optimized configurations for the training-set
molecules (cf.§4.2) when adsorbed on hydroxylated α-Al2O3 surface. We can notice that the
majority of the FFA energetic estimations are not very close to DFT results, registering a
maximal energetic difference between FFA predictions and DFT data of 30 kJ/mol (e.g. acetic
acid dissociative case, ethanol and methyl acrylate).
Figure 56: Comparison of the adsorption energies of the training-set molecules (cf.§4.2) on hydroxylated α-Al2O3 surface calculated via ReaxFF geometry optimization (with FIRE algorithm) and DFT, respectively.
At the same time, representative surrogates such as acetone, acetic acid (molecular adsorption),
benzene, toluene, methyl-3-trans-hexenoate and methyl propionate show a good correspondence
between the two methods, confirming the FFA capacity to reproduce molecular systems with
these features.
-100
-80
-60
-40
-20
0
Ad
sorp
tio
n e
ne
rgie
s [k
J/m
ol]
Training-set molecules
ReaxFF vs DFT Eads
HY ɑ-Al2O3
DFT FFA

165
A similar tendency is depicted also in Figure 57, where this time the FFB estimations on the
fully-hydroxylated α-Cr2O3 surface are reported. Here we can still notice that some FFB
estimations are not on point with their DFT references, registering a maximal energetic difference
between FFA predictions and DFT data of 20 kJ/mol (e.g. acetic acid dissociative case, 2-ethyl-3-
methyloxirane and methyl acrylate).
At the same time, representative surrogates such as acetone, acetic acid (molecular adsorption),
methyl-3-trans-hexenoate, methyl propionate and n-propane show a good correspondence
between the two methods, confirming the FFB capacity to reproduce molecular systems with
these features.
Figure 57: Comparison of the adsorption energies of the training-set molecules (cf.§4.2) on hydroxylated α-Cr2O3 surface calculated via ReaxFF geometry optimization (with FIRE algorithm) and DFT, respectively.
Despite these non negligible energetic discrepancies between ReaxFF predictions and DFT data
observed for the hydroxylated surfaces, we decided to retain these results as valid for the both
reactive force field optimizations. Therefore, we proceed towards the next step: the ReaxFF
validation. As we did for the cases related to the dry surfaces, we considered as criterion for a
good approximation of the used force field when predicting the DFT results a maximal average %
error of 25%. In particular, we measured a 23% average for both FFA and FFB predictions of
-100
-80
-60
-40
-20
0
Ad
sorp
tio
n e
ne
rgie
s [k
J/m
ol]
Training-set molecules
ReaxFF vs DFT Eads
HY ɑ-Cr2O3
DFT FFB

166
DFT results related to both hydroxylated alumina and chromia configurations, respectively. With
this result, we evaluated both force fields as well-fitted for this training-set.
5.3 FFA and FFB validation: “Static” study
As already mentioned in section 5.1, the ReaxFF validation consists in the reproduction of the
data contained in the validation set, which were not included in the training set.
The reproduction of those new data goes by the following order (see Figure 26, cf.§2.11.6):
i. The homogeneous systems, which include: a) the cell parameters of the bulk of α-
Al2O3and α-Cr2O3 and b) the gas-phase reactions of toluene autoxidation.
ii. The heterogeneous systems, consisting in the adsorption energies of similar but different
organic molecules that were used in the training-set.
To achieve this goal, we added to both FFA and FFB validation-sets representative toluene
autoxidation reactions (cf.§4.3), reported in Table 9 and adsorption configurations of
supplementary deposit precursors surrogates ([22, 23]) reported in Table 10.
Table 9: Scheme of the toluene autoxidation reactions inserted in the training-set for ReaxFF optimization.
Reaction label Reactions ΔEr
(kJ/mol)
R1 (C6H5)CH2O2H + (C6H5)CH2° → (C6H5)CH3 + (C6H5)CH2O2° -33.4
R2 (C6H5)CH2O2H → (C6H5)CH2O° + HO° 194.7
R3 (C6H5)CH2O2H → (C6H5)CH2O2° + H° 374.4
R4 (C6H5)CH2O2H → (C6H5)CH2° + HO2° 264.0
R5 (C6H5)CH2O2H→ (C6H5)CH2° + H° + O2 638.3
R6 (C6H5)CH2O2H + HO2°→ (C6H5)CH2O2° + H2O2 -2.7
R7 (C6H5)CH2O2H + HO2° → (C6H5)CH2° + H2O2 + O2 261.2
R8 (C6H5)CH2O2° → (C6H5)CH2° + O2 263.9
R9 HO2° → O2 + H° 374.4

167
The surrogates adsorption on alumina were added to the FFA validation-set, while the ones
related to chromia were added to the FFB validation-set. For both cases, the alumina and chromia
surfaces were considered in both anhydrous and hydroxylated states, as for the surrogates of the
training-set.
Table 10: Organic molecules added to the validation-set as supplementary models for fuel deposit precursors.
Chemical family Model molecule Molecule 2-D structure
Aliphatic alcohol Isopropyl alcohol
Aromatic alcohol Benzyl alcohol
Phenol P-cresol
Aromatic aldehyde Benzaldehyde
Aromatic carboxylic acid Benzoic acid
Aliphatic ketone 2-butanone

168
5.3.1 Comparison of the lattice parameters
To validate the FFA and FFB, we verified if they were able to replicate the lattice parameters of
both bulk and surfaces of α-Al2O3and α-Cr2O3 respectively. We run geometry optimization
calculations for the α-Al2O3 via FFA and for the α-Cr2O3 via FFB.
5.3.1.1 Computational details
The geometry optimizations were carried out with AMS2019 package [7] with the
implementation of the FIRE algorithm. We selected the following convergence criteria: the
energy criterion of 10-5 Hartree (≈ 0.0263 kJ/mol), the gradient convergence of 10-3 Hartree/A (≈
2.626 kJmol-1/Å) and a maximum number of iterations of 5000 steps.
We proceeded by following this sequence of calculations: first, we run a geometry optimization
with FFA for the alumina bulk and surface and with FFB for the chromia bulk and surface. With
the obtained optimized geometry, we selected the option to optimize the lattice, in this way
obtaining new lattice parameters a, b, c and cell volume. The last step was to optimize this
updated lattice configuration but enabling the change in the atoms position inside the new
optimized lattice. This last configuration was compared with the original lattice optimized via
DFT for both α-Al2O3and α-Cr2O3 to verify if both force fields were able to reproduce the
surfaces relaxations.
For the bulk geometries, (1x1x1) cells were used for bulk α-Al2O3and α-Cr2O3, while for the
surface geometries we considered the (4x4) slabs used in our DFT study (cf.§4.4.1).
5.3.1.2 Results and discussion
The results of these geometry optimizations for the bulk lattices of α-Al2O3 and α-Cr2O3 are
resumed in Table 11 and Table 12, where in Table 11 we compared our DFT and ReaxFF
results for bulk α-Al2O3 lattice parameters with experimental values of references [19, 20] and
conversely in Table 12 we compared our DFT and ReaxFF results for bulk α-Cr2O3 lattice
parameters with experimental values of reference [21]. We found a good agreement between our
simulated results and the reported experimental data.

169
In Table 11 we report the a,b,c lattice vectors calculated via FFA for the bulk α-Al2O3. In this
case, we registered a further relaxation for the ReaxFF calculation, which resulted in a cell
volume difference between DFT and FFA of ΔVcell = 2.8%. Being this difference not too
impactful, we regarded the FFA as validated in regards of the Al2O3 bulk system.
In Table 12 we report the a,b,c lattice vectors calculated via FFB for the bulk α-Cr2O3. For this
case, we registered a cell volume difference between DFT and FFB of ΔVcell = 1.4%, which
allowed us to validate the FFB.
Table 11: Lattice parameters for bulk α-Al2O3: a) experimental data; b) DFT data and c) FFA data.
Bulk α-Al2O3
a) Experimental [19] b) Calc. Bulk DFT
(this work) c) Calc. Bulk FFA
(this work)
a = b (Å) 4.76 4.79 4.76
c (Å) 12.99 13.07 12.82
c/a (Å) 2.73 2.73 2.69
V (Å3) 254.93 259.11 251.80
Al-O1 (Å) 1.85[20] 1.87 1.87
Al-O2 (Å) 1.97[20] 1.98 1.93
Table 12: Lattice parameters for bulk α-Cr2O3: a) experimental data; b) DFT data and c) FFB data.
Bulk α-Cr2O3
a) Experimental [21]
b) Calc. Bulk DFT (this work)
c) Calc. Bulk FFB (this work)
a = b (Å) 4.95 5.07 5.08
c (Å) 13.57 13.85 14.02
c/a (Å) 2.74 2.73 2.76 V (Å3) - 308.75 313.10
Cr-O1 (Å) - 2.05 2.05
Cr-O2 (Å) - 2.01 2.03

170
Analogously, we also implemented the geometry optimizations for the lattice parameters of both
corundum surfaces, which are resumed in Table 13 and Table 14. In Table 13 we compared the
DFT calculatedα-Al2O3 lattice parameters with those calculated through FFA and in Table 14 we
compared instead the DFT calculatedα-Cr2O3 lattice parameters with those calculated through
FFB.
Table 13: Comparison of lattice parameters and surface energies of dry α-Al2O3 between: a) literature , b) DFT; c) FFA.
α-Al2O3 lattice
a) Literature
b) Calculated DFT (this work)
c) Calculated FFA (this work)
a = b (Å) 4.76[19] 4.79 4.76
Esurface (J/m2) 1.66 [28] 1.55 1.74
Table 14: Comparison of lattice parameters and surface energies of dry α-Cr2O3 between: a) literature , b) DFT; c) FFB.
α-Cr2O3 lattice
a) Literature
b) Calculated DFT (this work)
c) Calculated FFB (this work)
a = b (Å) 4.95[21] 5.07 5.08
Esurface (J/m2) 1.70 [29] 1.85 1.15
In Table 13 we can see that the a and b lattice parameters calculated via FFA for the α-
Al2O3surface did not differ a lot from the corresponding DFT values and neither did not the
surface energy.
In Table 14 we can observe that the a and b lattice parameters calculated via FFB α-Cr2O3
surface are very close to the corresponding DFT values and so does the surface energy.

171
From this analysis, we conclude that both force fields are able to accurately describe both bulk
and surface structures for α-Al2O3 and α-Al2O3, thus we continued our ReaxFF validation by
analyzing the energetics.
5.3.2 Comparison of the energies
In this paragraph, we proceed through the ReaxFF validation by the comparison between the
energetic data calculated via DFT and the one calculated via ReaxFF. We examined the energetic
data related to the gas-phase reactions (Table 9) and to the adsorptions of the supplementary
surrogates (Table 10) on the α-(0001) surfaces.
In support to these calculations, we also calculated the dissociation curves obtained from the
binding energies between the organic adsorbates and the dry α-Al2O3 surface.
5.3.2.1 Computational details
In regards of the calculation of the gas-phase reaction energies, geometry optimizations of the
molecules involved in the toluene oxidation mechanism were carried out. Since here only single
molecules were optimized, the following convergence criteria set by default in the AMS2019
were sufficient to reach the convergence of these systems: the energy criterion was set on the
default value of 10-5 Hartree (≈ 0.0263 kJ/mol) and the gradient convergence on the default value
of 10-3 Hartree/Å (≈ 2.626 kJmol-1/Å), with a maximum number of iteration set on 5000
iterations.
For the calculation of the adsorption energies, we imposed the following convergence criteria for
the FIRE algorithm in the AMS2019 package: we selected an energy criterion equal to 10-4 eV (≈
0.00965 kJ/mol), a gradient criterion step of 10-3 eV/Å (≈ 0.0965 kJmol-1/Å) and a maximum
number of iteration equal to 4000 steps.
Supplementary energetic calculations were carried out to better describe the molecule-surface
interactions, completing the study of the adsorption energies by a study of molecule-surface

172
binding energies. The dissociation curves of all the studied model molecules adsorbed on the dry
alumina were considered.
To conduct this study, we proceeded in this way: we fixed a rigid coordinate in the z direction
identifying the vertical molecule-surface bond distance, leaving the remaining molecules’ atoms
as relaxed. Instead, the surface structure was completely fixed. The rigid coordinate scan between
the molecule and the surface was gradually increased: we started from the optimized bond
distances of each adsorbate to the final molecule/surface distance of 6 Å.
We thereby define 𝑬𝒃𝒊𝒏𝒅𝒊𝒏𝒈as follows: 𝑬𝒃𝒊𝒏𝒅𝒊𝒏𝒈 = 𝑬𝒂𝒅𝒔𝒎𝒐𝒍∗ – 𝑬𝒔𝒖𝒓𝒇𝒂𝒄𝒆∗ − 𝑬𝒎𝒐𝒍 Equation 87
The energetic term𝑬𝒔𝒖𝒓𝒇𝒂𝒄𝒆∗ corresponds to the energy of the optimized fixed structure of the dry
alumina surface, while the energetic term 𝑬𝒎𝒐𝒍 identifies the energy of the optimized molecule.
The 𝑬𝒂𝒅𝒔𝒎𝒐𝒍∗is the energy of the system where the surface is completely fixed and the molecule’s
atoms are relaxed, at the exception of the atom involved in the molecule/surface bond. For
supplementary information regarding the definitions of the 𝑬𝒂𝒅𝒔𝒎𝒐𝒍∗, 𝑬𝒔𝒖𝒓𝒇𝒂𝒄𝒆∗and 𝑬𝒃𝒊𝒏𝒅𝒊𝒏𝒈
energetic terms, see the Annex A5 section.
5.3.2.2 Results and discussion
The first examined case is the calculation of the ΔEr of the gas-phase autoxidation reaction (R1 –
R9) (Table 9). These results are reported in Figure 58 for the FFA implementation and in Figure
59 for the one related to FFB.
We can see that both reactive force fields are capable to predict fairly well these reaction
energies, in particular the FFB appears to be even more precise than FFA (from R1 to R5
reactions). However, they both seem to have a remaining difficulty to approach to the last three
points (e.g. R7, R8 and R9 reactions).

173
The second examined case is the calculation of the adsorptions of the supplementary surrogates
(Table 10) on the α-surfaces. In the following figures, all the converged optimized configurations
are reported.
Figure 58: Comparison of the reaction energies of toluene oxydation mechanism obtained through ReaxFF geometry optimization (with FIRE algorithm) and DFT, respectively.
Figure 59: Comparison of the reaction energies of toluene oxydation mechanism obtained through ReaxFF
geometry optimization (with FIRE algorithm) and DFT, respectively.
In Figure 60 are shown the results of the adsorption energies for the dry α-(0001) surfaces
calculated with FFA and FFB.
-200
-100
0
100
200
300
400
500
600
r1 r2 r3 r4 r5 r6 r7 r8 r9
Rea
ctio
n e
ner
gies
(k
J/m
ol)
reactions
Gas reactions: toluene autoxidationFFA vs DFT
DFT FFA
-200
-100
0
100
200
300
400
500
600
r1 r2 r3 r4 r5 r6 r7 r8 r9
Rea
ctio
n e
ner
gies
(k
J/m
ol)
reactions
Gas reactions: toluene autoxidationFFB vs DFT
DFT FFB

174
Figure 60: Comparison of the adsorption energies on dry α-surfaces calculated via ReaxFF geometry optimization (with FIRE algorithm) and DFT, respectively.
In Figure 60, among the validation-set molecules (Table 10), we can notice a very accurate FFB
description for the adsorption on dry α-Cr2O3 of the benzaldehyde and the benzoic acid, while for
the FFA a very accurate description is noted for the adsorption on dry α-Al2O3 of the benzoic
acid and the p-cresol.
The maximal energetic difference between ReaxFF predictions against DFT data was equal to 20
kJ/mol for FFB (e.g. p-cresol and isopropyl alcohol) and to 25 kJ/mol for FFA predictions (e.g.
benzaldehyde and 2-butanone).
As we did for the cases related to the dry surfaces when considering the training-set molecules,
we considered as criterion for a good approximation of the used force field when predicting the
DFT results a maximal average % error of 25%. In particular, we measured a 9% for the FFA
predictions of DFT results related to dry alumina and 15% average and FFB predictions of DFT
results related to dry chromia configurations, respectively. With this result, we evaluated both
force fields as well-fitted for this training-set.
-220
-200
-180
-160
-140
-120
-100
-80
-60
-40
-20
0
Benzalaldehyde 2butanone Benzoic acid P-cresol Isopropyl alcohol Benzyl alcohol
Ad
sorp
tio
n e
ne
rgie
s [k
J/m
ol)
validation-set molecules
ReaxFF vs DFT EadsDry α (0001)-surfaces
FFB DFT_Cr2O3 FFA DFT_Al2O3

175
Figure 61 reports instead the results obtained from the geometry optimizations run with the FFA
for the fully-hydroxylated α-Al2O3 surface confronted with their corresponding DFT results.
Figure 61: Comparison of the adsorption energies on hydroxylated α-Al2O3 surfaces calculated via ReaxFF geometry optimization (with FIRE algorithm) and DFT, respectively.
Figure 62: Comparison of the adsorption energies on hydroxylated α-Cr2O3 surfaces calculated via ReaxFF geometry optimization (with FIRE algorithm) and DFT, respectively.
-100
-90
-80
-70
-60
-50
-40
-30
-20
-10
0
Benzalaldehyde 2butanone Benzoic acid P-cresol Isopropyl alcohol Benzyl alcohol
Ad
sorp
tio
n e
ne
rgie
s (k
J/m
ol)
Validation-set molecules
ReaxFF vs DFT Eads
HY ɑ-Al2O3
DFT FFA
-100
-90
-80
-70
-60
-50
-40
-30
-20
-10
0
Benzoic acid Benzyl alcohol P-cresol Benzalaldehyde 2butanone Isopropyl alcohol
Ad
sorp
tio
n e
ne
rgie
s (k
J/m
ol)
Validation-set molecules
ReaxFF vs DFT Eads
HY ɑ-Cr2O3
DFT FFB

176
Among the validation-set molecules (Table 10) we can notice a very accurate FFA description
for the adsorption on hydroxylated α-Al2O3 of the benzaldehyde, the 2-butanone and the benzoic
acid.
A similar tendency is depicted also in Figure 62, where this time the FFB estimations on the
fully-hydroxylated α-Cr2O3 surface are reported. Among the validation-set molecules (Table 10)
we can notice a very accurate FFB description for the adsorption on hydroxylated α-Cr2O3 of the
isopropyl alcohol and the benzoic acid.
The maximal energetic difference between ReaxFF predictions against DFT data was equal to 20
kJ/mol for both FFA (e.g. p-cresol) and FFB predictions (e.g. benzaldehyde and 2-butanone and
p-cresol).
Despite these non negligible energetic discrepancies between ReaxFF predictions and DFT data
observed for the hydroxylated surfaces, we decided to retain these results as valid for both
reactive force field validations. As we did for the cases related to the hydroxylated surfaces when
considering the training-set molecules, we considered as criterion for a good approximation of
the used force field when predicting the DFT results a maximal average % error of 25%. In
particular, we measured a 14% for the FFA predictions of DFT results related to hydroxylated
alumina and 21% average and FFB predictions of DFT results related to hydroxylated chromia
configurations, respectively. With this result, we evaluated both force fields as well-fitted for this
training-set.
We conclude this energetic analysis by reporting below the binding energy curves related to the
training-set molecules (cf.§4.2) and the validation-set molecules (Table 10) when adsorbed on
the dry α-Al2O3 surface. The curves referring to the training-set molecules are reported in Figure
63 and the ones calculated for the validation-set molecules are reported in Figure 64.

177
Figure 63: Dissociation curves obtained from the binding energies calculated between the training-set molecules (cf.§4.2) and the dry alumina surface. The binding energies calculated via DFT are reported in blue
dots, the values obtained via FFA in red dots.
-25
-15
-5
5
0 0.5 1 1.5 2 2.5 3 3.5 4 4.5 5 5.5 6 6.5 7
Dis
soci
atio
n e
ne
rgy
(kJ/
mo
l)
C-Al distance (Angstrom)
Benzene/αAl2O3
DFT ReaxFF
-25
-15
-5
5
0 0.5 1 1.5 2 2.5 3 3.5 4 4.5 5 5.5 6 6.5 7
Dis
soci
atio
n e
ne
rgy
(kJ/
mo
l)
Om-Al distance (Angstrom)
Ethanol/αAl2O3
DFT ReaxFF
-25
-15
-5
5
0 0.5 1 1.5 2 2.5 3 3.5 4 4.5 5 5.5 6 6.5 7
Dis
soci
atio
n e
ne
rgy
(kJ/
mo
l)
Om-Al distance (Angstrom)
Methylpropionate/αAl2O3
DFT ReaxFF
-25
-15
-5
5
0 0.5 1 1.5 2 2.5 3 3.5 4 4.5 5 5.5 6 6.5 7
Dis
soci
atio
n e
ne
rgy
(kJ/
mo
l)
Om-Al distance (Angstrom)
Acetone/αAl2O3
DFT ReaxFF
-25
-15
-5
5
0 0.5 1 1.5 2 2.5 3 3.5 4 4.5 5 5.5 6 6.5 7
Dis
soci
atio
n e
ne
rgy
(kJ/
mo
l)
C-Al distance (Angstrom)
N-propane/αAl2O3
DFT ReaxFF
-25
-15
-5
5
0 0.5 1 1.5 2 2.5 3 3.5 4 4.5 5 5.5 6 6.5 7
Dis
soci
atio
n e
ne
rgy
(kJ/
mo
l)
Om-Al distance (Angstrom)
Acetic Acid/αAl2O3
DFT ReaxFF
-25
-15
-5
5
0 0.5 1 1.5 2 2.5 3 3.5 4 4.5 5 5.5 6 6.5 7
Dis
soci
atio
n e
ne
rgy
(kJ/
mo
l)
C-Al distance (Angstrom)
Toluene/αAl2O3
DFT ReaxFF
-25
-15
-5
5
0 0.5 1 1.5 2 2.5 3 3.5 4 4.5 5 5.5 6 6.5 7
Dis
soci
atio
n e
ne
rgy
(kJ/
mo
l)
Om-Al distance (Angstrom)
Acetaldehyde/αAl2O3
DFT ReaxFF
-25
-15
-5
5
0 0.5 1 1.5 2 2.5 3 3.5 4 4.5 5 5.5 6 6.5 7
Dis
soci
atio
n e
ne
rgy
(kJ/
mo
l)
Om-Al distance (Angstrom)
2Ethyl-3methyl-oxirane/αAl2O3
DFT ReaxFF
-25
-15
-5
5
0 0.5 1 1.5 2 2.5 3 3.5 4 4.5 5 5.5 6 6.5
Dis
soci
atio
n e
ne
rgy
(kJ/
mo
l)
Om-Al distance (Angstrom)
Methyl-3trans-hexenoate/αAl2O3
DFT ReaxFF

178
Figure 64:Dissociation curves obtained from the binding energies calculated between the validation-set molecules (Table 10) and the dry alumina surface. The binding energies calculated via DFT are reported in
blue dots, the values obtained via FFA in red dots.
These binding energy calculations allowed us to scrutinize the attractive potential between the
surface and the molecule, a very important aspect if one is interested in finite temperature effects
as adsorption/desorption. We chose to calculate the binding energies for these adsorbates on dry
alumina because our prior DFT study (Chapter 4) evidenced a higher reactivity for this
molecule/substrate system rather than the one concerning the dry chromia. For this reason, we
wanted to further ascertain that our reactive force field was capable to accurately predict the
binding energies describing the molecule/dry alumina systems.
As shown by Figure 63, a very accurate FFA description is achieved for the following deposit
precursor surrogates: the acetaldehyde, the n-propane, the methyl acrylate, the methyl propionate
-25
-15
-5
5
0 0.5 1 1.5 2 2.5 3 3.5 4 4.5 5 5.5 6 6.5 7
Dis
soci
atio
n e
ne
rgy
(kJ/
mo
l)
Om-Al distance (Angstrom)
2-Butanone/αAl2O3
DFT ReaxFF
-25
-15
-5
5
0 0.5 1 1.5 2 2.5 3 3.5 4 4.5 5 5.5 6 6.5 7
Dis
soci
atio
n e
ne
rgy
(kJ/
mo
l)
Om-Al distance (Angstrom)
Benzaldehyde/αAl2O3
DFT ReaxFF
-25
-15
-5
5
0 0.5 1 1.5 2 2.5 3 3.5 4 4.5 5 5.5 6 6.5 7
Dis
soci
atio
n e
ne
rgy
(kJ/
mo
l)
Om-Al distance (Angstrom)
Benzoic Acid/αAl2O3
DFT ReaxFF
-25
-15
-5
5
0 0.5 1 1.5 2 2.5 3 3.5 4 4.5 5 5.5 6 6.5 7
Dis
soci
atio
n e
ne
rgy
(kJ/
mo
l)
Om-Al distance (Angstrom)
Benzyl Alcohol/αAl2O3
DFT ReaxFF
-25
-15
-5
5
0 0.5 1 1.5 2 2.5 3 3.5 4 4.5 5 5.5 6 6.5 7
Dis
soci
atio
n e
ne
rgy
(kJ/
mo
l)
Om-Al distance (Angstrom)
P-cresol/αAl2O3
DFT ReaxFF
-25
-15
-5
5
0 0.5 1 1.5 2 2.5 3 3.5 4 4.5 5 5.5 6 6.5 7
Dis
soci
atio
n e
ne
rgy
(kJ/
mo
l)
Om-Al distance (Angstrom)
Isopropyl alcohol/αAl2O3
DFT ReaxFF

179
and the acetic acid. For these training-set molecules, the FFA dissociation curve is almost
overlapped to the one calculate with DFT.
In Figure 64, the dissociative curves displaying the binding energies between the validation-set
molecules and the dry alumina surface are shown. Here, a particularly good accuracy of the FFA
estimation is reached for the benzoic acid, the 2-butanone and the isopropyl alcohol.
From the analysis of Figure 63-Figure 64, we can conclude that overall a very accurate
correspondence of the potential landscape obtained with FFA with respect to DFT was achieved,
thus further validating FFA.
5.3.3 Conclusion of the “static” study
In this section 5.3, procedures and corresponding results related to the “static” study of the two
force fields FFA and FFB validation were discussed. We recapitulate here the different steps we
followed in Figure 65.
The first “static” test (section5.3.1) envisaged geometry optimization runs for bulk and surface
structures of α-Al2O3 and α-Cr2O3, respectively, calculated through FFA and FFB. The objective
was to validate both force fields by verifying their capacity to reproduce the surface relaxation
states for both corundum surfaces. Our analysis point out a good correspondence between bulk
lattice parameters calculated via DFT and ReaxFF and also a good agreement with experimental
data.
The second “static” test (section5.3.2) envisaged geometry optimization runs with the aim to
calculate the energetics of our systems: the reaction energies of the gas-phase reactions (Table 9)
and the adsorption energies of the supplementary surrogates (Table 10) on the α-surfaces. We
also reported the dissociation curves obtained from the binding energies between the organic
adsorbates and the dry α-Al2O3 surface. All the geometry optimizations were carried out through
the implementation of the FIRE algorithm.

180
Figure 65: Simplified scheme of our ReaxFF validation strategy where the static study is evidenced with the dotted red square.
From the gas-phase reaction analysis, we found that both reactive force fields are capable to
predict fairly well the reaction energies, in particular the FFB appears to be even more precise
than FFA (from R1 to R5 reactions). However, they both seem to have a remaining difficulty to
approach to the last three points (e.g. R7, R8 and R9 reactions).
From the adsorption analysis, a good correspondence was achieved for the FFA description of the
alumina-based configurations and conversely for the FFB in correspondence of chromia-based
systems. For the dry surface configurations, the maximal energetic difference between ReaxFF
predictions against DFT data was equal to 20 kJ/mol for FFB (e.g. p-cresol and isopropyl
alcohol) and to 25 kJ/mol for FFA predictions (e.g. benzaldehyde and 2-butanone). For the
hydroxylated surface configurations, the maximal energetic difference between ReaxFF
predictions against DFT data was equal to 20 kJ/mol for both FFB (e.g. benzaldehyde and 2-
butanone and p-cresol) and FFA predictions (e.g. p-cresol). Despite these not negligible energetic
discrepancies between ReaxFF predictions and DFT data, we decided to retain these results as
valid for both reactive force field validations.

181
We concluded this energetic analysis with the results of the binding energy curves calculated
between all the studied model molecules and the dry α-Al2O3 surface. We observed a very
accurate correspondence of the potential landscape obtained with FFA and DFT.
Furthermore, we report here the FFA versus DFT set of results (Figure 66). One can observe that
FFA is able to fit DFT data on a wide range of energies. This gives us confidence that FFA can
produce semi-quantitative data with a safe predictive character.
Figure 66: Reaction energies calculated with FFA, versus the same reactions energies calculated with DFT for the alumina system.
We overall conclude this ReaxFF “static” analysis by validating both FFA and FFB. Now we
proceed to the successive “dynamic” validation step.
5.4 FFA and FFB validation: “Dynamic” study
In this section, we report the “dynamic” study of the ReaxFF validation, where we carried out
different MD calculations.
We carried out MD simulations where the densities of common liquid solvents at ambient
conditions (T = 20°C and P = 1 atm) were calculated through both FFA and FFB. The objective
of this test was to verify if both reactive force fields were able to reproduce the macroscopic
properties (e.g. density) of well-known compounds in realistic ambient conditions.
-100
-50
0
50
100
150
-100 -50 0 50 100 150
Rea
ctio
n e
ner
gy F
FA (
kJ/m
ol)
Reaction energy DFT (kJ/mol)

182
In addition, MD simulations where the desorption temperatures (Chapter 4) of certain model
molecules were calculated via ReaxFF are reported in the Annex-A5.8. The objective was to
confirm the validity and correspondence between the “static” dimension (e.g. DFT + atomistic
thermodynamics) and the “dynamic” one (e.g. MD).
5.4.1 Liquid-phase solvents at ambient conditions
Here, we carried out MD simulations where the densities of liquid solvents such as acetic acid,
acetone, ethanol, benzaldehyde, benzyl alcohol and water were calculated at ambient conditions
(T = 20°C and P = 1 atm) by employing both FFA and FFB.
5.4.1.1 Computational details
For the MD study on densities, we implemented the NPT ensemble. Here, we selected the
Martyna-Tobias-Klein (MTK) barostat [24] and the Nosé-Hoover Chain (NHC) thermostat [15].
We selected a pressure P = 1 atm and T = 293 K (= 20°C), with a damping constant of 500 fs for
the barostat and of 100 fs for the thermostat, respectively. The NHC length was set at 10
(coinciding with AMS2019 default value). The total number of steps was set to 2*106, with a
time step of 0.25 fs, obtaining a total calculation time of 500 ps. The initial temperature was set to
293 K.
The simulated MD boxes contained about 200 molecules of each compound at the exception of
the water, where instead we had 300 molecules.
For the production data of these simulations, we considered the average density value measured
on the last 100’000 steps.

183
5.4.1.2 Results and discussion
These results are reported in Table 15a-b below. Table 15a (on the left) includes the FFA
densities estimations. If we look at the percentage errors reported in the last column on the right,
we can notice that the maximal value is almost 9% and it is given by the FFA estimation of the
benzaldehyde density. Overall, we can observe that the FFA estimations appear close enough to
the experimental densities, in particular the acetic acid, acetone and water give a percentage error
below 5%.
Table 15b (on the right) includes instead the FFB densities estimations. Here we can see that the
percentage errors are higher than the FFA case, showing a weaker capacity for FFB to accurately
predict the same densities. Apart from the ethanol and water densities, FFB exhibits a very poor
estimation of the densities of both aliphatic and aromatic compounds, which are not acceptable.
We will see later in the manuscript that this force field does not give reasonable results.
Table 15: Densities of liquid solvents calculated at T=20°C and P=1atm with a) FFA force field (on the left), b) FFB force field (on the right).
Molecules Exp. Density
@ 1 bar, 20 °C
[g/cm3]
FFA Density @ 1 bar, 20 °C
[g/cm3]
Error% Exp. Density @
1 bar, 20 °C
[g/cm3]
FFB Density @ 1 bar, 20 °C
[g/cm3]
Error%
Acetic acid 1.05 [25] 1.05 0.3% 1.05[25] 1.62 54.2%
Acetone 0.79 [25] 0.81 2.7% 0.79 [25] 1.10 38.6%
Ethanol 0.79 [25] 0.74 6.1% 0.79 [25] 0.83 5.2%
Benzaldehyde 1.05 [16] 1.14 8.9% 1.05 [16] 1.28 22.5%
Benzyl alcohol 1.04[25] 1.11 7.1% 1.04 [25] 1.16 11.9%
Water 1.00[26] 0.97 3.1% 1.00 [26] 1.00 0.0%
To complement the density analysis through ReaxFF, we also calculated the radial distribution
function (RDF) g(r) (cf.§2.12.1) of the O-O bond of water (at T = 293 K and P = 1 atm) for both
FFA and FFB, showed in Figure 67a-b respectively. In a system of particles (atoms, molecules,
colloids, etc.), the RDF describes how density varies as a function of distance from a reference
particle.

184
Figure 67a (on the left) shows the RDF of the O-O bond of water calculated with the FFA. This
estimated RDF is compared with the experimental result reported in the work of Soper et al. [27],
where they obtained the water RDF at 315 K. We can notice that the orange line depicting the
RDF calculated with FFA almost overlaps the experimental reference, implying that FFA
accurately describes the structure of liquid water. The location of the peaks indicating first and
second neighbors are well reproduced, indicating a nice description of the H bonding. However,
the MAX/MIN ratio is higher than the experimental value. This overstructuration can be due to a
too short accumulation statistics of the dynamics. It could also be corrected by increasing gently
the temperature of simulation.
Figure 67: RDFs of the O-O bond of water calculated via: a) FFA (orange line on the left), b) and FFB (blue
line on the right) with the NPT ensemble at 293 K and 1 atm. The black line showed corresponds to the experimental RDF result taken from reference [27].
In Figure 68 below we report the RDF for O-O bond in water as measured by three different
ReaxFF in the study of Soleymanibrojeni et al. [5]. We overlapped above their figure our RDF
calculated with the FFA because we wanted to evaluate how accurate was our ReaxFF in
comparison to their different predictions. According to their results, the sharp peaks seen for the
ReaxFF-15 of the O-O pair indicate that the representation of water with the ReaxFF-15 at 298.2
K is an amorphous solid rather than a liquid, while the ReaxFF-13 and ReaxFF-18 seem to better
align with their referential experimental curve. The prediction made by our FFA overlaps the
curve defining ReaxFF-15 estimation, which resembles the behavior of an amorphous solid.
FF.A FF.B

185
Figure 68: RDF of the O-O pair of water calculated by Soleymanibrojeni et al. [5] with three different force fields: ReaxFF-13 (blue curve), ReaxFF-15 (green curve) and ReaxFF-18 red curve). The curve obtained in
our study with the FFA is defined by the orange curve.
Figure 67b (on the right) shows the RDF of the O-O bond of water calculated with the FFB. The
FFB estimation is again compared with the reference [27]. We can see that in this case, the first
peak indicating the first neighbor interaction in the RDF calculated with FFB is slightly shifted to
larger distances from the experimental reference, suggesting that the H bonds are too weak.
Moreover, the second neighbor seems to be at too short distances. Thus, albeit the overall water
density is correct (Table 15), the local water interactions are not correctly described.
From these results, we can conclude that the FFA is able to describe more accurately than FFB
the physicochemical properties of the liquid solvents by the evaluation of their densities.
Moreover, the examination of the O-O RDF of water reveals that the H bonds are correctly
described by FFA, and not by FFB.
For this reason, we evaluated FFA as fully validated and employable in the next MD production
study, while FFB cannot be considered as validated.
FF.AFFA

186
5.5 Final conclusion
In this chapter, we introduced our ReaxFF study aimed at the implementation of a reactive force
field able to describe the chemistry of the solid, the liquids, the gas phase and some interfacial
systems. To achieve this goal, we consider the obtained DFT results shown in Chapter 4 as input
data to parametrize ReaxFF. In this way, we “train” our reactive force field to reproduce the
energetics and molecular structures of the optimized DFT configurations. As a sort of a
preliminary step, we decided to “test” a force field (“FF0”) that was used in the work of Benoit
Darenne [1] since our context study and objective is aligned with his work.
However, preliminary results of this optimized force field (Annex A5.6.2) showed us that it was
not able to correctly reproduce adsorption geometries and energies for α-Cr2O3, as a consequence
of the fact that optimizing this FF to improve the description of α-Al2O3 decreased the accuracy
to describe α-Cr2O3 systems.
Therefore, we started a new cycle of ReaxFF reparametrization by using two different force
fields: FFA for the Al2O3 systems and FFB for the Cr2O3 systems. These two different force
fields are both based on the force field of Benoît Darenne [6], with the difference that in FFB we
chose to change the ReaxFF parameters of H and O atoms by inserting the values of the “CHON-
2017_weak.ff” force field developed by Zhang and van Duin [18].
The two force field optimizations were evaluated through the reproduction of the data in the
training set used to reparametrize the force fields. Here, the convergence for the majority of the
analyzed configurations was not reached. This result led us to run again geometry optimizations
with the FIRE algorithm since this algorithm guarantees a faster resolution than CG solver. In
this new geometry optimization campaign, we observed that the maximal energetic difference
between ReaxFF predictions against DFT data was equal to 20 kJ/mol for FFB and to 30 kJ/mol
for FFA predictions either in the anhydrous or hydroxylated surface condition. However, these
non negligible energetic discrepancies between ReaxFF predictions and DFT data were contained
only for a small portion of the training-set molecules, which led us to accept the two force fields
as optimized. We therefore proceed towards the next step: the ReaxFF validation.

187
The FFA and FFB validation was evaluated through the reproduction of data of a validation set
(data that are not included in the training set), which included the reproduction of the cell
parameters of the bulk, adsorption energies and curves of similar but different organic molecules
that were used in the training set, representative reactions of the autoxidation of toluene, and the
dynamic structuration of pure organic liquids (mass/volume density, radial distribution
functions). Supplementary calculations that provided the comparison between the desorption
temperatures of certain model molecules between DFT (Chapter 4) and FF were reported in the
Annex-A5.8.
Figure 69: Simplified scheme for the achieved ReaxFF validation of the FFA (sections 5.2-5.4).
Figure 70: Simplified scheme for the unachieved ReaxFF validation of the FFB (sections 5.2-5.4).

188
The achieved FFA validation and unachieved FFB validations are reported in the simplified
schemes in Figure 69 and Figure 70, respectively.
From the first “static” test (section 5.3.1), we concluded that both FFA and FFB gave a good
correspondence with bulk lattice values calculated via DFT, together with the experimental
values. Therefore, both force fields “passed” this first static validation test.
From the second “static” test (section 5.3.2), we found that both reactive force fields are capable
to predict fairly well the reaction energies, in particular the FFB appears to be even more precise
than FFA (from R1 to R5 reactions). However, they both seem to have a remaining difficulty to
approach to the last three points (e.g. R7, R8 and R9 reactions). In addition, a good
correspondence was achieved for the FFA description of the alumina-based configurations and
conversely for the FFB in correspondence of chromia-based systems. We concluded this
energetic analysis with the results of the binding energy curves calculated between the all the
studied model molecules and the dry α-Al2O3 surface, where a very accurate correspondence of
the potential landscape obtained with FFA with respect to DFT was also observed.
Therefore, both force fields “passed” this second static validation test.
We thereby concluded that both FFA and FFB are validated from our “static” study and can be
further employed for the successive “dynamic” validation step.
From section 5.4.1, overall we observed that the FFA density estimations appear close enough to
the experimental data. The same could not be said for FFB, since the percentage errors are higher
than for the FFA case, showing a weaker capacity for FFB to accurately predict experimental
densities. This trend is further confirmed by the water RDFs plotted for the O-O pair, where we
confirmed that the FFA estimation is more accurate than the one obtained with FFB.
Therefore, FFA “passed” this dynamic validation test, while FFB did not.
For this reason, only FFA will be further implemented in our successive ReaxFF study, where we
aim to describe the dynamic behavior of a surrogate “fuel-oxygen” blend either in homogeneous
conditions (e.g. only organic liquid phase) or in heterogeneous conditions (e.g. organic liquid
phase in contact with alumina surfaces).

189
References
1 Jiang X., Hu Y., Ling L., Wang X. The initial wet oxidation process on Fe-Cr alloy surface:
Insights from ReaxFF molecular dynamic simulations, Applied Surface Science548 (2021), 149159. DOI: 10.1016/j.apsusc.2021.149159.
2 Shin Y.K., Kwak H., Vasenkov A.V., Sengupta D., van Duin A.C. Development of a ReaxFF Reactive Force Field for Fe/Cr/O/S and Application to Oxidation of Butane over a Pyrite-Covered Cr 2 O 3 Catalyst, ACS
Catal.5, 12 (2015), 7226–7236. DOI: 10.1021/acscatal.5b01766. 3 Dabaghmanesh S., Neek-Amal M., Partoens B., Neyts E.C. The formation of Cr2O3 nanoclusters over graphene
sheet and carbon nanotubes, Chemical Physics Letters687 (2017), 188–193. DOI: 10.1016/j.cplett.2017.09.005. 4 Zeng H., Cheng X., Zhang C., Lu Z. Responses of Core–Shell Al/Al 2 O 3 Nanoparticles to Heating: ReaxFF
Molecular Dynamics Simulations, J. Phys. Chem. C122, 16 (2018), 9191–9197. DOI: 10.1021/acs.jpcc.8b01088.
5 Soleymanibrojeni M., Shi H., Liu F., Han E.-H. Atomistic simulations of Epoxy/Water/Aluminum systems using the ReaxFF method, Comput. Mater. Sci.173 (2020), 109424. DOI: 10.1016/j.commatsci.2019.109424.
6 Darenne B Modélisation de l'interaction des agrégats hydrocarbonés avec les parois, These de Doctorat, ENSPC-Chimie ParisTech (2018).
7 Rüger R., Franchini M., Trnka T., Yakovlev A., van Lenthe AMS 2019, T. SCM, Theoretical Chemistry, Vrije Universiteit: Amsterdam, The Netherlands.
8 Bitzek E., Koskinen P., Gähler F., Moseler M., Gumbsch P. Structural relaxation made simple,Physical review
letters97, 17 (2006), 170201. DOI: 10.1103/PhysRevLett.97.170201. 9 Berendsen H.J.C., Postma J.P.M., van Gunsteren W.F., DiNola A., Haak J.R. Molecular dynamics with
coupling to an external bath,The Journal of chemical physics81, 8 (1984), 3684–3690. DOI: 10.1063/1.448118. 10 T. W. Graham SolomonsOrganic Chemistry (11th Ed). 11 Bacha K. These de Doctorat "Etude de l'interaction entre le carburant diesel et les composants su systèmes
d'injection diesel, Physique des matériaux, Université de Haute Alsace (2016). 12 Kresse G., Joubert D. From ultrasoft pseudopotentials to the projector augmented-wave method, Phys. Rev.
B59, 3 (1999), 1758–1775. DOI: 10.1103/PhysRevB.59.1758. 13 van Duin A.C.T., Dasgupta S., Lorant F., Goddard W.A. ReaxFF: A Reactive Force Field for Hydrocarbons, J.
Phys. Chem. A105, 41 (2001), 9396–9409. DOI: 10.1021/jp004368u. 14 Mielczarek D.C., Matrat M., Amara A.B., Bouyou Y., Wund P., Starck L. Toward the Accurate Prediction of
Liquid Phase Oxidation of Aromatics: A Detailed Kinetic Mechanism for Toluene Autoxidation, Energy
Fuels31, 11 (2017), 12893–12913. DOI: 10.1021/acs.energyfuels.7b00416. 15 W. G. Hoover, B. L. Holian Kinetic moments method for the canonical ensemble distribution, Phys. Rev. A
(Physical Review A)211 (1996), 253–257. DOI: 10.1016/0375-9601(95)00973-6. 16 Chemical Hazards Response Information System (CHRIS) Hazardous Chemical Data. 17 Bacha K., Ben-Amara A., Vannier A., Alves-Fortunato M., Nardin M. Oxidation Stability of Diesel/Biodiesel
Fuels Measured by a PetroOxy Device and Characterization of Oxidation Products, Energy Fuels29, 7 (2015), 4345–4355. DOI: 10.1021/acs.energyfuels.5b00450.
18 Zhang W., van Duin A.C.T. Improvement of the ReaxFF Description for Functionalized Hydrocarbon/Water Weak Interactions in the Condensed Phase,J. Phys. Chem. B122, 14 (2018), 4083–4092. DOI: 10.1021/acs.jpcb.8b01127.
19 C. B. AlcockCrystallograhic data on minerals: CRC Handbook of Chemistry and Physics, FL (2003–2004). 20 Υ. M. DE HAAN Refinement of the a Al2O3, Ti2O3, V2O3 and Cr2O3 structures,Zeitschrift für
Kristallographie - Crystalline Materials, 1-6 (1962), 235–237.

190
21 Finger L.W., Hazen R.M. Crystal structure and isothermal compression of Fe2O3, Cr2O3, and V2O3 to 50 kbars,J. Appl. Phys.51, 10 (1980), 5362. DOI: 10.1063/1.327451.
22 Chatelain K., Nicolle A., Ben Amara A., Catoire L., Starck L. Wide Range Experimental and Kinetic Modeling Study of Chain Length Impact on n -Alkanes Autoxidation, Energy Fuels30 (2016), 1294–1303. DOI: 10.1021/acs.energyfuels.5b02470.
23 Mielczarek D.C., Matrat M., Amara A.B., Bouyou Y., Wund P., Starck L. Toward the Accurate Prediction of Liquid Phase Oxidation of Aromatics: A Detailed Kinetic Mechanism for Toluene Autoxidation,Energy
Fuels31, 11 (2017), 12893–12913. DOI: 10.1021/acs.energyfuels.7b00416. 24 Martyna G.J., Tuckerman M.E., Tobias D.J., Klein M.L. Explicit reversible integrators for extended systems
dynamics, Molecular Physics87, 5 (1996), 1117–1157. DOI: 10.1080/00268979600100761. 25 W.M. HaynesCRC handbook of chemistry and physics: A ready-reference book of chemical and physical data,
CRC Press, Boca Raton, Fla. (2013). 26 M. J. O'Neil The Merck Index: An Encyclopedia of Chemicals, Drugs, and Biologicals, 15th Edition Edited by
M.J.O'Neil, Royal Society of Chemistry, Cambridge, UK ISBN 9781849736701; 2708 pages. April 2013, $150 with 1-year free access to The Merck Index Online,Drug Dev. Res.74, 5 (2013), 339. DOI: 10.1002/ddr.21085.
27 A.K. Soper The radial distribution functions of water and ice from 220 to 673 K and at pressures up to 400 MPa,Chemical Physics, 121–137. DOI: 10.1016/S0301-0104(00)00179-8.
28 Arrouvel C., Diawara B., Costa D., Marcus P. DFT Periodic Study of the Adsorption of Glycine on the Anhydrous and Hydroxylated (0001) Surfaces of α-Alumina, J. Phys. Chem. C 111, 49 (2007), 18164–18173. DOI: 10.1021/jp0741408.
29 Costa D., Sharkas K., Islam M.M., Marcus P. Ab initio study of the chemical states of water on Cr2O3(0001): From the isolated molecule to saturation coverage, Surf. Sci. 603, 16 (2009), 2484–2493. DOI: 10.1016/j.susc.2009.05.037.

191
Chapter 6. ReaxFF study of biofuel-alumina interactions
6.1 Liquid-phase “fuel-oxygen” mixture
In the previous section, we provided the description of the NPT results for common liquid-phase
solvents like acetic acid, ethanol, water of which we compared the densities calculated through
FFA and FFB against the experimental values. In addition, we also reported the RDF of the O-O
pair of water for both FFA and FFB to verify if both reactive force fields were able to describe
the water density. From these two “dynamic” study, we concluded that only FFA can be further
implemented in the following ReaxFF study, where we aim to describe the dynamic behavior of a
surrogate “fuel-oxygen” blend either in homogeneous conditions (e.g. only organic liquid phase)
or in heterogeneous conditions (e.g. organic liquid phase in contact with alumina surfaces).
In the framework of this thesis, we examined a surrogate “fuel-oxygen” blend where the fuel (i.e.
the solvent) is modeled by toluene molecules, while the oxygen (i.e. the solute) is instead
modeled by benzyl hydroperoxide molecules (the skeletal structure of benzyl hydroperoxide
molecule is shown in Figure 44 in section 4.3.1).
The choice of these molecules defining our surrogate “fuel-oxygen” blend is given by the fact
that on one hand we wanted to simulate an organic blend that would be a good representation of a
liquid-phase fuel already undergoing an oxidative degradation and on the other hand we wanted
to link this phenomenon to the toluene autoxidation process. For this reason, we selected the
toluene as our solvent and the benzyl hydroperoxide, a well-known intermediate in the toluene
autoxidation process [1–3], as our solute.
The “fuel-oxygen” mixture simulated in this study is composed by a 95% mol of toluene and 5%
mol of benzyl hydroperoxide. For this “fuel-oxygen” composition, we took inspiration from the
predictions of the species concentration profiles calculated with the RMG model by Mielczarek
and Matrat [1], where both toluene and hydroperoxide profiles were seen right at the beginning of
the autoxidation mechanism. Our main objective was to observe the behavior of the fuel when the
autoxidation process is already seen at its propagation state (i.e. relevant intermediates are
already being formed, for example the benzyl hydroperoxide). The selection of the benzyl

192
hydroperoxide as intermediate for the toluene oxidation was studied in previous theoretical
studies such as for references [4, 5], where da Silva and coworkers tried to further investigate the
kinetic steps describing the toluene autoxidation.
6.1.1 Computational details
The simulated box contains 450 toluene molecules and 25 benzyl hydroperoxide molecules
respecting the 95:5 molar ratio. The cell used was a cell with an initial volume 𝑉0 fixed to 85184
Å3, corresponding to an initial liquid density 𝜌𝑙° ≈ 0.87 g/cm3 (i.e. toluene density at T = 25 °C
and P = 1atm [6]).
To verify the good reproducibility of the density through the implementation of both reactive
force fields, we run a NPT simulation where T= 298 K and P = 1 atm. We selected the MKT
barostat [7] and the NHC thermostat [8], with a damping constant of 500 fs and of 100 fs for the
barostat and thermostat, respectively. The torsion 2013-correction was not applied in this
simulation. The sample frequency was imposed to be registered every 500 steps. The total
number of steps was set to 1.25*106 with a time step of 0.25 fs, giving a total simulation time of
312.5 ps, where the first 62.5 ps were of equilibration and the final 250 ps of production. In other
words, we considered as valid the data results taken after the first 250’000 iterations, which in
our case coincided with the first 500 frames of the NPT simulations (see Annex-Figure A6-1).
6.1.2 Results and discussion: physico-chemical analysis
In Figure 71 we report the cubic box containing our “fuel-oxygen” mixture surrogate. In Figure
72 we report the plot of the bulk density as function of the NPT iterations for the FFA, where we
chose to take data after the first 250’000 steps (corresponding to the first 62.5 ps). As we
observed for the energy in the Annex-Figure A6-1, we can also see in Figure 72 that we reached
a plateau for the slab density in the equilibration phase. In the last 50’000 iterations, the bulk
density converged at the average value of 0.96 g/cm3 (Figure 72). We can then calculate a Δ𝜌𝑙%
= 9% between the new and the original density value.

193
Figure 71: Simulated cubic box containing the “fuel-oxygen” mixture of 95%mol toluene and 5% mol benzyl hydroperoxide.
Figure 72: Bulk density increase measured during the NPT simulation with the FFA implementation.
.
Similarly to the density plateau reported in Figure 72 in the equilibration phase, we also found a
plateau for the system temperature and pressure (see Annex-Figure A6-2).
Now we will discuss the analysis of the reactivity of this organic mixture, with a particular focus
on the benzyl hydroperoxides.
0,75
0,80
0,85
0,90
0,95
1,00
Den
sity
[g/
cm3 ]
iterations
Slab density of the liquid "fuel-oxygen" mixture
FFAEquilibration
phase
Bulk density of the liquid “fuel-oxygen mixture

194
6.1.3 Results and discussion: reactivity analysis
The aspect of the chemical reactivity was taken in consideration for this organic “toluene-benzyl
hydroperoxide” mixture, especially focusing on the oxygenated solute since it represents a well-
known reactive intermediate for the toluene autoxidation [1, 4]. In Figure 73 we report the RDF
and N(r) plots for the O-O and C-O intramolecular bonds of the benzyl hydroperoxides calculated
for the entire NPT calculation.
Figure 73: RDF and N (r) plots of benzyl hydroperoxide molecules regarding: a) O-O pair and b) C-O pair.
From Figure 73a, we observe the highest peak in correspondence of 1.5 Å, which coincides with
the O-O bond length for the benzyl hydroperoxides. Minor peaks are observed for 1.7 Å and 2.5
Å, which are representative of H-bonds. The g(r) integral, N(r), corresponds to the mean number

195
of atoms around a specific type of atom at a distance r; for the O-O pair, we obtained a mean
value of 1 for the O-O bond length of 1.7-1.8 Å, meaning that we have only one benzyl
hydroperoxide molecule in correspondence to that distance (i.e. no bond dissociation is
observed). Concerning the intramolecular C-O bond of benzyl hydroperoxides, from Figure 73b
we observe the highest peak in correspondence of 1.45 Å, which coincides with the C-O bond
length for the benzyl hydroperoxides. Again, minor peaks are observed for 2.55 Å and 3 Å,
representatives of weaker interactions. For the N(r), we obtained in this case a mean value of 0.5
for the C-O bond length of 1.45 Å, confirming again that we are in presence of only one benzyl
hydroperoxide molecule in correspondence to that distance and that no bond dissociation is
observed.
The absence of O-O and C-O bond dissociations for the benzyl hydroperoxides at 300 K can be
reconnected to the high activation and reaction energies that we calculated via DFT in Chapter
4, since they prove that higher temperatures are expected for these reactions to occur. On the
other hand, what was interesting to observe during this NPT calculation was the propensity of
benzyl hydroperoxide molecules to form binary or ternary complexes as the ones represented in
Figure 74. Also, we can notice that water molecules were also formed during this NPT
calculation.
Figure 74: Benzyl hydroperoxide molecules forming binary and ternary complexes in the liquid phase at 300 K. Color code: red = oxygen; grey: carbon; white: hydrogen.

196
This clusterisation between benzyl hydroperoxide molecules appears to open the possibility to the
formation of aggregate precursors, which represents one of the phenomenon of major interest for
this thesis.
From this dynamic analysis of the liquid “fuel-oxygen” mixture, we can conclude by remarking
that no bond dissociations were observed at 300 K in 312.5 ps of calculation time, but instead a
clusterisation phenomenon where solute molecules form binary and ternary complexes
resembling aggregates precursors was observed.
In the following section, three different heterogeneous systems are discussed: a) the dynamic
evolution of the hydroxylated alumina surface when heated up to 500 K, b) the adsorption of
liquid droplets of the surrogate “fuel-oxygen” blend interacting with dry and hydroxylated
alumina and c) the adsorption of the liquid-phase “fuel-oxygen” blend interacting with dry and
hydroxylated alumina.
6.2 Heating of hydroxylated alumina up to 500 K
In this paragraph, we examine the dynamic behavior of the hydroxylated α-Al2O3 when heated
from 1 K to 500 K. We compared the obtained MD results with literature works.
6.2.1 Computational details
We simulated hydroxylated α-Al2O3 surface considering an α-Al2O3(0001)(4x4) cell with a slab
volume of 22670 Å3 and a surface area of 337.7 Å2. A MD simulation was carried out through the
implementation of the NVT ensemble, where implementing the NHC thermostat [8] with a
damping constant of 100 fs. The torsion 2013-correction was not applied in this simulation. The
sample frequency was imposed to be registered every 1000 steps. The total number of steps was
set to 2*106 with a time step of 0.25 fs, giving a total simulation time of 500 ps.
For these NVT simulations, we set the following thermal regime: a linear T function from 1 K to
500 K. In terms of calculation time, the system was heated from 1 K to 500 K during 500 ps with
an increasing T rate of 1 K/ps.

197
A detailed analysis is carried out about the fate of the surface OH groups (hydroxyls and water
molecules) on the α-Al2O3 surface with temperature as well as a brief discussion about the OH-
surface distance with temperature and the H bonding network.
6.2.2 Results and Discussion
As observed from (Figure 75a), the average height deviation δz from the initial OH position is
very low, smaller than 0.2 Å. The analysis of the repartition of different δz values with
temperature (Figure 75b), where z varies from 1 to 5 Å, shows that OH and H2O molecules
begin to have larger z at T > 450 K, and the proportion of those molecules is very low, less than
1%. It is noteworthy that these molecules have a certain lateral mobility at the surface, as
illustrated by the Figure 75c showing the trace of the O (from the OH groups) along the (X,Y)
plane. It is visible in the upper left side that the molecule trace does a continuous patch instead of
discrete spots, illustrating surface diffusion.
a) b)
c) d)

198
Figure 75: Analysis of the OH positions with temperature. a) average z(O) position (with respect to the initial position), in Å b) proportion of atoms at different distances to the surface during the trajectory c) snapshot for the section 487-500 K, showing OH mobility at the surface d) radial distribution function recorded for the O
of the OH groups, and the H atoms. Black: range 400-500 K, grey : range 0-100 K.
The radial distribution function of the O-H distances (Figure 75d) shows little changes from the
beginning to the end of heating. At low temperature, a small peak at 1.6 Å is observed, due to
strong H bonding, and another at 2.2 Å, due to less strong H bonds. The first peak disappears at
500 K, and the second one is smaller than at low temperature. This means that for a certain
fraction of OH, there are less H bonds. Plus, the integral N(r) typical of the covalent bond (1.2 Å)
is slightly higher in intensity (1.55 at 500 K versus 1.45 at low temperature) for the first neighbor.
The value of 1.5 for the number of H first neighbors is typical of the situation of H sharing, where
one surface OH group is stabilized by a vicinal adsorbed water, and the proton is shared between
two OH groups. The slightly higher number of covalent bond O-H (~1.1 Å) at higher temperature
suggests that some O are turned to a water molecule, a trend in line with the lower amount of H
bonds observed. We attribute that to those OH groups that become water molecules and acquire
some degree of freedom at the surface.
In fact, several typical cases have been identified, and examples are reported here: Figure 76a
shows the O-H distances of an OH group receiving a strong H bond. It can be observed that at
250 K, this OH group transforms to water. The molecular state of water is maintained at
increasing temperature. Figure 76b shows another case, where a weak H bond received by a
surface OH group is lost at 340 K, illustrating the surface mobility (rotational degree of freedom)
acquired by heating. Finally, Figure 76c and Figure 76d illustrate different configurations of H

199
bonds received by one OH group at several moments of the trajectory. The O---H distances are
reported in Figure 76d. The OH group is transformed to a water molecule during 49% of the
trajectory. What happens is that the OH group and the vicinal OHs change their orientations and
that the OH binds to a vicinal H of different OH neighbors (Figure 76c). If we closely observe in
Figure 76d the blue and yellow curves for example, we can deduce that the proton jump
frequency increases with the temperature.
a) b)
c) d)
Figure76:a) OH distances during the trajectory, for an OH group that transforms to water, b) case of an OH group that looses an H bond with increasing temperature, c-d) case of an OH group that is stabilized by H
bonds with several vicinal OH, c) snapshots of several configurations, d) O---H distances showing the increase of frequency of H neighbor change with increasing temperature.

200
We finally analyze the evolution of location of H atoms during heating (Figure 77). A depletion
of H bonded to surface oxygen atoms is observed at around 270 K (a result in line with that of
Hass et al. [9]). This enrichment in molecular water in the “OH” layer results, with heating, in
water “desorption” and mobility at the surface, as already said, above 450 K.
Figure 77: repartition of the populations of the H atoms of different OH groups (H adsorbed on surface Os, terminal OH pointing down to the surface, H of OH in the OH layer and second water layer) during heating.
To summarize, heating up to 500 K induces an increased degree of freedoms of the surface OH
groups, with increased neighboring changes. In addition, some of the dissociated water (terminal
OH plus H on surface Os) get molecular at temperature above 270 K, and with temperature,
above 450 K, some water molecules (however in very small proportion, less than 1%) tend to
lose the bond with the surface (deviation of 0.2 Å) and get some lateral and rotational degree of
freedom.
Noteworthy, the event of some water molecule “desorption” and diffusion at the hydroxylated
surface was already observed by Hass et al. [9], at 300 K, who stated: “collective behavior was
observed in the vicinity of the Al–Oads bond that broke during the run; one H2O molecule
“desorbed” early on from its molecular adsorption site and began to diffuse laterally along the
surface in a precursor-like physisorbed state.” The authors also noted that this water molecule
was readily trapped into a H bond network of a neighboring molecule.

201
6.3 Droplets of liquid “fuel-oxygen” mixture adsorbed on alumina
In this paragraph, we examine the dynamic behavior of a “drop” of toluene “put” on the dry and
hydroxylated Al2O3 surfaces. The liquid composition was 95% mol toluene and 5% mol benzyl
hydroperoxides.
6.3.1 Computational details
For the dry alumina case, the simulated box contained 90 toluene molecules and 5 benzyl
hydroperoxide molecules, while for the hydroxylated alumina case the MD box contained 93
toluene molecules and 5 benzyl hydroperoxides molecules. Both simulated boxes approximately
respected the 95:5 molar composition of the “fuel-oxygen” mixture. We run these MD
simulations through the NVT ensemble, implementing the NHC thermostat [8] with a damping
constant of 100 fs. The torsion 2013-correction was not applied in this simulation. The sample
frequency was imposed to be registered every 500 steps. The total number of steps was set to
6.25*106 with a time step of 0.25 fs, giving a total simulation time of 1562.5 ps (≈ 1.6 ns), where
the first 62.5 ps were of equilibration and the final 1500 ps (= 1.5 ns) of production. In other
words, we considered as valid the data taken after the first 250’000 iterations (see Annex-Figure
A6-3).
For these NVT simulations, we set the following thermal regime: a) an equilibration phase where
T = 1 K for 62.5 ps and b) a production phase where we distinguished two thermal sub-regimes: a
first, linear T function from 1 K to 400 K and, second, a constant T function at 400 K. The final
temperature at T = 400 K was chosen since it is significant for autoxidation phenomena (Chapter
1). For the anhydrous case, a supplementary “cooling” sub-regime was studied, where the
temperature decreased linearly from 400 K to 1 K.
In terms of simulation time, after 62.5 ps at 1 K, the system was heated from 1 K to 400 K during
750 ps with an increasing T rate of 0.5 K/ps, then a trajectory at 400 K was accumulated during
750 ps, completing the 1.5 ns of total simulation time. For the additional cooling regime for the
dry alumina case, the system was cooled from 400 K to 1 K during 750 ps with a decreasing T
rate of 0.5 K/ps.

202
The dry α-Al2O3 cell used for this NVT simulation was a (8x8) cell, with a surface area of 1269
Å2, while for the hydroxylated case the α-Al2O3 cell was a (8x8) cell, with a surface area of 1352
Å2.
To verify the validity of the NVT results, supplementary simulations were carried out with the
“Born Oppenheimer Molecular Dynamics” (BOMD) method. Here, a trajectory was acquired
with BOMD at 400 K on the same system, but in a smaller (2x2) cell containing three toluene
molecules with a monolayer (ML) density of 3.79 molecule/nm2. Table 16 summarizes the
conditions for the MD performed with ReaxFF and with DFT (BOMD) for the system “fuel-
oxygen” adsorbed on α-Al2O3.
Table 16: Conditions for the MD performed with ReaxFF and with DFT for “fuel-oxygen”@ Al2O3.
System Cell Size and Surface Area
Calculation Method
Temperature (K) Time (ps)
« Fuel-O »@Al2O3 8x8 ; 1269Å2 ReaxFF (MD) 1 62.5 1 to 400 750
400 750 400 to 1 750
« Fuel-O »@Al2O3 2x2; 79 Å2 DFT (BOMD) 400 5.4 « Fuel-O »@Al2O3-HY 8x8 ; 1352Å2 ReaxFF (MD) 1 62.5
1 to 400 750 400 750
6.3.2 Results and Discussion
The initial configuration and snapshots of the three domains (equilibration, heating, plateau,
cooling) are shown in Figure 78-Figure 79 for the anhydrous surface. Figure 79 shows the
structure obtained after cooling from 400 K to 1 K.
We observed that at 1 K, the molecules (which were spread homogeneously in the box at the
beginning of the calculation, see Figure 78), gather together to form a drop. During heating, the
molecules acquired velocity and were spread out on the bottom surface in a stochastic orientation,
thus no initial preferential orientation was present on this surface. We observed the dispersion of
the molecules at the surfaces and the formation of layers, both on the top surface and on the
bottom surfaces.

203
During the plateau at 400 K, those layers are maintained, with some molecules desorbing from
the surfaces and readsorbing. During the subsequent cooling down to 1 K (Figure 79) no more
molecules desorb from the surface, and the two surfaces are covered by a full molecular layer.
Figure 78: Starting point and snapshots of the molecular dynamics of a toluene drop on dry Al2O3 surface.
Figure 79: Toluene monolayer formed on dry Al2O3 after T decreasing from 400 K to 1 K during 750 ps.
Figure 80 summarizes the events observed during the heating-plateau-cooling cycle.Now
analyzing with more details the behavior of the molecules at the surface and trying to characterize

204
the layer formed, first we follow the number of molecules adsorbed (in direct interaction with the
surface) during heating and at the plateau. We also try to estimate the monolayer density and the
tilt angle of the molecules in the formed layer. The molecule-surface interaction is scrutinized.
When relevant, we compare the results to those obtained on the hydroxylated surface. The layers
formed on α-Al2O3 after cooling are also analyzed.
Figure 80: Illustration of the “virtual drop evaporation” and adsorption onto the dry Al2O3 surfaces, and global events observed during the equilibration at 1 K, heating to 400 K, plateau and cooling to 1 K.
Figure 81 shows the density of toluene molecules at the surface during heating (the toluene
molecule length being 7 Å, we integrated the number of C atoms until 7 Å from the surface). We
observe that heating (between step 500 and step 6000) induces an increase of the molecules
density at the surfaces of both the anhydrous and the hydroxylated surfaces, then a slight decrease
at 400 K, until a plateau is reached for both surfaces. We observe that the surface density of
molecules (in molecule/nm2 units) reached on the anhydrous surface is significantly higher than
that on the hydroxylated surface (see Figure 81c). For the anhydrous surface, it is interesting to
estimate the density of the monolayer adsorbed. It estimated to 4 molecule/nm2. Such a layer
density is typical of self-assembled layers of benzenic ring molecules, such as gallic acid or 2-
mercaptobenzothiazole (MBT) or 2-mercaptobenzimidazole (MBI)[10].
The analysis of the molecule-surface tilt angle is not straightforward, as several phenomena occur
simultaneously at the surface that can alter the measurements such as surface diffusion and
desorption. On some molecules that neither diffuse on the surface nor desorb, we followed the tilt
1 K Heating and plateau 400 K 1 KHeating

205
angle of the molecule with the surface. The average angle between molecule and surface normal
measured at 400 K was 15°. Notice that this is an average value that does not consider that the
molecule cycle flips at the surface. Figure 81d shows that the tilt angle is in fact a compromise
between -60 and 60° of the surface normal.
Figure 81: Number of toluene in molecules/nm2 at the dry Al2O3 surface during the whole trajectory (number of steps), a) anhydrous surface (blue), b) hydroxylated surface (orange). c) Snapshot of comparison of the
anhydrous and hydroxylated surfaces during heating. d) Ratio of Z coordinates between the upper and lower C in a toluene cycle, indicating the cycle/surface tilt and its variations, on the anhydrous surface.
The behavior of the layers during the plateau at 400 K was thoroughly analyzed. Figure 82
reports the density of C atoms near the surface (we report as “near the surface” the atoms located
at less than 3 Å from the surface). We chose as a descriptor of the layer the percentage of the
surface effectively covered by C atoms. Here the scale is taken as an effective surface coverage,
i.e., the number of C atoms near the surface multiplied by the projected area of a C atom and
divided by the area of α-Al2O3 surface. Again, a huge difference between the anhydrous and the
hydroxylated surface is observed. First, less C atoms approach the surface as near as 3 Å on the
steps steps
a) b)
c) d)

206
hydroxylated surface. Second, Figure 82b shows that whereas these C atoms are rather fixed on
the anhydrous surface, they are mobile on the hydroxylated surface.
Figure 82: Analyses of the toluene layers at 400 K on the anhydrous and hydroxylated alumina surfaces. The “effective atomic coverage” is calculated as T (theta) = N(C)*π*Rat(C)2/Surface, where N(C) is the number of C atoms, Rat(C) is the C atomic radius. We considered Rat(C)=0.65 Å. a) Surface “effective atomic coverage” at 400 K; orange: anhydrous, blue: hydroxylated surface; b) Trace of one C atom displacement in the (X,Y) plane during the trajectory at 400K. This shows the lateral degree of freedom of C atoms on the anhydrous
(top figure) surface and hydroxylated (bottom figure) surfaces.
We notice that on the anhydrous surface, the effective atomic coverage of 0.25 is equivalent to
the surface coverage of Al (i.e. there is one molecule per each surface Al ion); in addition, the
molecules are immobile at the surface (Figure 82b). This suggests a strong interaction between
Al ions and C of toluene and raises the question of a possible Al-C bond formation. To answer
this point, we plotted the pair radial distribution function of Al and C, reported in Figure 83. We
a)
b)

207
notice a peak at 3.65 Å, with an integrated value corresponding to 0.65 C neighbor. This distance
of interaction is typical of van der Waals interactions.
The situation is totally different for the hydroxylated surface, with a low surface coverage and a
strong mobility of the molecules at the surface. The radial distribution function OH-C exhibits a
pronounced peak at the short distances at 1.45 Å, with however a very weak occurrence (each
OH group “sees” 0.03 C atom in average at this distance). An interaction at 2.55 Å is also noted,
and again, of weak occurrence. Finally, in average, each surface OH group “sees” one C atom in
a radius of 4Å, again, typical of weak interactions.
Figure 84a plots the radial distribution function Al-C during T decreasing, in the 150 K-1 K
range. We notice that this radial distribution function is very similar to that recorded at 400 K. At
3.65 Å, Al is “bound” to 0.65 C. This confirms that at 400 K, the toluene ML was equilibrated.
Figure 84b shows the molecule density in the toluene surface layer (distance to surface ≤7 Å)
and above this layer. From 150 K and below, one can consider that all molecules belong to the
surface layer. The (8x8) surface cell contains 47 molecules, corresponding to a layer density of
3.70 molecule/nm2. Among these 47 molecules, only five molecules (10%) have tilt angle greater
than 15° towards the surface normal. It might be possible that a somewhat denser layer can be
formed where all molecules adopt an orientation perpendicular to the surface.
Figure 83: Radial distribution function (blue) and integrated value (orange), of a) Al and C atoms, at 400 K, on Al2O3. We notice the formation of an Al-C interaction at 3.65 Å. In average, each Al binds 0.5 C atoms; b) Oxygen from OH groups and C atoms at 400 K on the hydroxylated surface. We notice a pronounced peak atshort distances at 1.45 which however displays a very weak occurrence (0.03 atom). An interaction at 2.55
Å is also noted, and again, of weak occurrence. In average, each surface OH group “sees” one C atom in a radius of 4 Å.
a) b)

208
Figure 84: a) radial distribution function Al-C during T decreasing from 150 to 1 K, with ReaxFF. B) Toluene coverage (in unit of molecules/nm2) in the first layer (blue) and above the first layer (orange). We notice that
under 150 K, this number is very small.
To confirm the monolayer stability at the surface, a trajectory was acquired with BOMD at 400 K
as shown in Figure 85.
Figure 85: Snapshot of the monolayer of toluene on Al2O3, trajectory at 400 K with BOMD. The simulation was performed with a (2x2) surface supercell of α-Al2O3 (0001).
During the BOMD trajectory, no molecule desorption is observed. We have a full toluene layer,
where we can analyze the molecule surface orientation. The angles chosen are shown in Figure
86.
a) b)

209
The Figure 87 gathers all data acquired during the BOMD trajectory. Figure 87a compares the C
density collected with respect to the distance to the surface with DFT (blue) and with ReaxFF
(purple). We notice that the C-surface distances found with ReaxFF and with DFT exhibit similar
profiles, albeit the maximum at 3.7 Å is marked with ReaxFF and not with BOMD. To this
respect, the ReaxFF trajectory and the DFT trajectory are compatible. Figure 87b shows the
angle of the toluene molecules C-C axis with the Z axis (DFT trajectory). The molecules C-C
axis are tilted by 20-30°. The analysis of the molecule plane-Z axis angle (Figure 87c, DFT
trajectory) reveals that the molecule plane can be also tilted and found oscillating between 10 and
40°.
The radial distribution function Al-C collected during the BOMD run is shown in Figure 87d. A
peak at 2.65 Å corresponds to 0.15 C neighbor. DFT calculations reveal that the Al-C distances
are shorter than the values of 3.65 Å found with ReaxFF. A closer examination of the Al-C
distances during the ReaxFF run reveals that the shortest Al-C distances are around 3.1 Å, but no
distances smaller than 3 Å are reported. This discrepancy between ReaxFF and DFT is the price
to pay for the fit of the average properties.
Figure 86: Illustration of the molecule surface tilt angles: angle between the axis of the molecule and the axis Z, and angle between the plane of the molecule and Z axis.

210
Figure 87: a) C proportion of the total C amount versus distance to the surface (blue, DFT, purple, ReaxFF) ; b) Variation of the angle α of the axis of the toluene molecule with the Z axis, acquired during the DFT
trajectory; c) dihedral angle θ between the molecular plane and the surface normal (DFT trajectory); d) pair correlation function Al-C for the BOMD of toluene on Al2O3 at 400 K (blue: g(r), black, N(r)).
In the preceding sections, we have investigated the organization and thermal behavior of a
toluene ML at the α-Al2O3 surface, with an organization in a dense layer where the molecules are
perpendicular or slightly tilted towards the surface. It is worth comparing this structure derived
from the ReaxFF study with the formation of toluene multilayers that are parallel to the surface.
Figure 88 shows the result of the DFT geometry optimization of such a multilayer. We found
that it was nearly isoenergetic (difference 0.1 eV/molecule ≈ 9.6 kJmol-1) to the perpendicular
ML.
To summarize, we find that starting from a toluene droplet deposited at the Al2O3 surface, and
heating up to 400 K, a dense monolayer of toluene is formed on the anhydrous surface, with a
molecular density of 3.7 molecule/nm2. The molecules are adsorbed in a slightly tilted orientation
to the surface. This layer is stable during 750 ps at 400 K on the anhydrous surface. The ML
found was confirmed to be stable at the anhydrous surface through a comparative DFT BOMD
a) b)
c) d)

211
study at 400K. The Al-C interaction is 2.65 Å with DFT and 3.65 Å with ReaxFF, pointing to a
discrepancy.
Figure 88: DFT geometry optimization of a) dense monolayer (Eads = -49.2 kJ/mol), b) two layers of toluene, (Eads = -58.9 kJ/mol) on Al2O3
Complementary DFT calculations also show that this dense ML is however nearly iso-energetic
to a bilayer of molecules adsorbed parallel to the surface. It is possible that for a longer
accumulation period, transitions between monolayer and multilayers could occur at the surface.
In contrast, no toluene layer forms when heating or during the plateau at 400 K on the
hydroxylated surface. In average, at 400 K, 0.2 ML is still present on the hydroxylated surface,
with significant surface diffusion of the molecules.
The reason of this different behavior lies in the differences in adsorption energies of toluene on
dry and hydroxylated α-Al2O3.
ReaxFF has allowed us to propose a valuable structure for the drop of toluene adsorbed on α-
Al2O3 surface and evidenced that hydroxylation strongly changes the toluene-surface interaction,
which is much weaker.
a) b)

212
Finally, the present results confirm the general view that a strong adsorption leads to the
immobilization of the molecules at the surface, whereas weak adsorption leads to surface
diffusion and desorption when the temperature rises up.
6.4 Liquid-phase “fuel-oxygen” mixture adsorbed on alumina
We do now a step further towards a realistic system. To investigate the behavior of the liquid
“fuel-oxygen” surrogate mixture when adsorbed on the alumina substrate, we created two
different systems represented in Figure 89, the one on the left identifying the adsorption of the
organic liquid phase on top of the dry Al2O3 surface, while the one on the right identifying the
same organic liquid phase on top of the hydroxylated overlayer of the alumina surface.
Figure 89: Simulated box containing the “fuel-oxygen” mixture of 95%mol toluene and 5% mol benzyl
hydroperoxide adsorbed on a) dry Al2O3 (on the left) and b) fully-hydroxylated Al2O3. Color code: grey: Al; red: O; dark grey: C; white: H.

213
For the organic liquid phase, we considered the same mixture as in the previous section 6.1, with
a 95:5 ratio of solvent (i.e. toluene) and of solute (i.e. benzyl hydroperoxide).
To analyze the trajectories obtained putting in contact the liquid phase and the surfaces, we report
in the following paragraphs the following analyses:
Behavior of the solvent (toluene) when put in contact with the surface : density and
organization (if any) at the surface.
Density and organization (if any) of the peroxide molecules at the surface.
Chemical reactions (if any).
6.4.1 Computational details
For the dry alumina case, the simulated box contained 400 toluene molecules and 20 benzyl
hydroperoxide molecules, while for the hydroxylated alumina case the MD box contained 470
toluene molecules and 25 benzyl hydroperoxides molecules. Both simulated boxes respected the
95:5 molar composition of the “fuel-oxygen” mixture.
We carried out a NPT simulation where we selected the MTK [7] as barostat and the NHC [8] as
thermostat, with a damping constant of 500 fs and of 100 fs for the barostat and thermostat,
respectively. The torsion 2013-correction was not applied in this simulation. The sample
frequency was imposed to be registered every 500 steps. The total number of steps was set to
4.5*106 with a time step of 0.25 fs, giving a total simulation time of 1125 ps (≈ 1.1 ns), where the
first 125 ps were of equilibration and the final 1000 ps (= 1 ns) of production. In other words, we
considered as valid the data results taken after the first 250’000 iterations (see Annex-Figure A6-
4).
For these NPT simulations, we set the following thermal regime: a) an equilibration phase where
T = 300 K for 125 ps and b) a production phase of 1000 ps where we distinguished four
sequential thermal sub-regimes:
A linear T function from 300 K to 400 K .
A constant T function at 400 K..

214
A linear T function from 400 K to 500 K.
A constant T function at 500 K.
The thermal range T = 400-500 K was chosen since it is significant for the occurring of
autoxidation phenomena (Chapter 1).
In terms of calculation time, after 125 ps at 300 K, the system was heated from 300 K to 400 K
during 250 ps with an increasing T rate of 0.4 K/ps, then it was stabilized at 400 K for 250 ps,
then reheated 400 K to 500 K during 250 ps with an increasing T rate of 0.4 K/ps and finally
stabilized at 500 K for the last 250 ps, completing 1 ns of total production data.
Our first objective was to observe how the liquid mixture would behave when interacting with
dry and hydroxylated alumina surface at ambient conditions and later see if changes in behavior
would be detected by gradually increasing the temperature, first at 400 K (≈ 130°C) and secondly
at 500 K (≈ 230 °C).
The dry α-Al2O3 cell used for this NPT simulation was a (8x8) cell with a surface area of 1260
Å2, while for the hydroxylated case the α-Al2O3 cell was a (8x8) cell with a surface area of 1351
Å2.
6.4.2 Results and discussion: toluene-surface interaction
We first analyze the equilibration runs. From the energy plot (see Figures A6-4-A6-5 in the
Annex), we notice that a plateau is quickly reached, after 1000 time frames (equal to 125 ps). It
came out that a structuration of the liquid phase occurred during the equilibration, so we will also
analyze this part.
In the starting configurations, the toluene molecules were located near the surface were in a highly
tilted orientation with 70° angle against the surface normal.
On the hydroxylated surface, during the equilibration, we observe no change of the average angle
of the surface layer to the surface normal (see Figure 90a). In the right panel (Figure 90b), the C
densities (in at/nm3) are reported for different distances to the surface. At very short distance (<
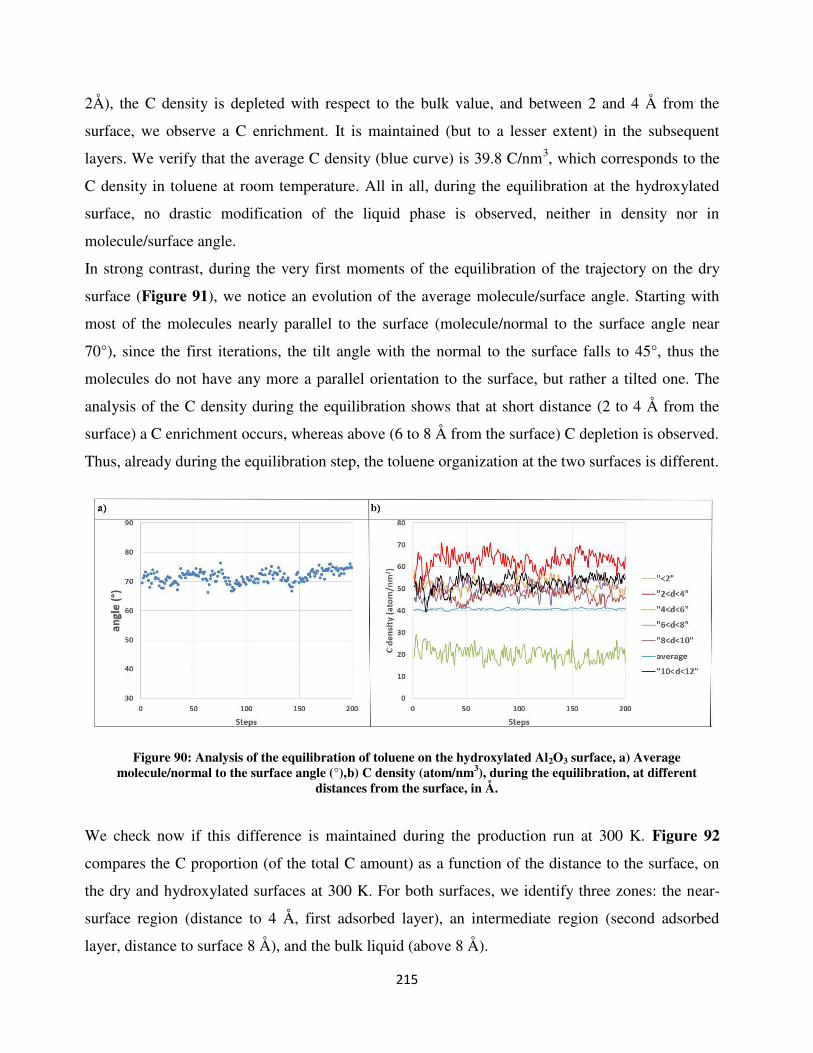
215
2Å), the C density is depleted with respect to the bulk value, and between 2 and 4 Å from the
surface, we observe a C enrichment. It is maintained (but to a lesser extent) in the subsequent
layers. We verify that the average C density (blue curve) is 39.8 C/nm3, which corresponds to the
C density in toluene at room temperature. All in all, during the equilibration at the hydroxylated
surface, no drastic modification of the liquid phase is observed, neither in density nor in
molecule/surface angle.
In strong contrast, during the very first moments of the equilibration of the trajectory on the dry
surface (Figure 91), we notice an evolution of the average molecule/surface angle. Starting with
most of the molecules nearly parallel to the surface (molecule/normal to the surface angle near
70°), since the first iterations, the tilt angle with the normal to the surface falls to 45°, thus the
molecules do not have any more a parallel orientation to the surface, but rather a tilted one. The
analysis of the C density during the equilibration shows that at short distance (2 to 4 Å from the
surface) a C enrichment occurs, whereas above (6 to 8 Å from the surface) C depletion is observed.
Thus, already during the equilibration step, the toluene organization at the two surfaces is different.
Figure 90: Analysis of the equilibration of toluene on the hydroxylated Al2O3 surface, a) Average molecule/normal to the surface angle (°),b) C density (atom/nm3), during the equilibration, at different
distances from the surface, in Å.
We check now if this difference is maintained during the production run at 300 K. Figure 92
compares the C proportion (of the total C amount) as a function of the distance to the surface, on
the dry and hydroxylated surfaces at 300 K. For both surfaces, we identify three zones: the near-
surface region (distance to 4 Å, first adsorbed layer), an intermediate region (second adsorbed
layer, distance to surface 8 Å), and the bulk liquid (above 8 Å).

216
Figure 91: Analysis of the equilibration of toluene on dry Al2O3 surface at 300 K: a) Average molecule/normal to the surface angle (°) ; b) C density (atom/nm3), during the equilibration, at various
distances from the surface (in Å).
However, the layer profiles are different, confirming that the toluene structuration at the two
surfaces is different. On both surfaces, the C density is larger than in the bulk, indicating
attraction by the surface and/or structuration of a layer at the surface, with a depletion at 4 Å,
indicating the formation of a toluene monolayer, especially in the case of the hydroxylated
surface. In contrast, on the dry surface, the C profile suggests more a bilayer formation than a
monolayer, thus a more important accumulation of molecules at the surface, with a more
important depletion, now at 8 Å from the surface.
The analysis layer by layer during the plateau at 300 K shows that the C density in the layers does
not vary significantly, suggesting that a stationary state was reached (see Annex- Figure A6-6).
We now analyze the effect of temperature increase on the toluene-surface interactions.
We found no significant change in the C profile on the dry surface, we observe that the bilayer
structuration at the surface is maintained at 400 K and 500 K (Figure 93). The persistence of this
bilayer structure at high temperatures suggests that this layer is strongly adsorbed at the surface.
A very different profile is obtained for the hydroxylated surface (Figure 94), where the profile at
400 K is similar as at 300 K but at 500 K, the toluene-surface interaction is less marked, certainly
because the molecules are more mobile at this temperature. This indicates that the toluene-
hydroxylated surface interaction is less intense than the toluene-dry surface.

217
Figure 92: C amount (proportion of the total amount) at 300 K for toluene on Al2O3 surfaces.
Figure 93: C proportion for toluene on dry Al2O3 surface, recorded at a) 400 K b) 500 K.
0
0,002
0,004
0,006
0,008
0,01
0,012
0,014
0,016
0,018
0,02
0 2 4 6 8 10 12 14 16 18 20
C p
rop
ort
ion
distance to surface (Å)
hydroxylated surface dry surface
C proportion (of the total C amount) as a function of the distance to the surfaces
0
0,005
0,01
0,015
0,02
0,025
0 5 10 15 20
C p
rop
ort
ion
distance to surface (Å)
00,0020,0040,0060,008
0,010,0120,0140,0160,018
0,02
0 5 10 15 20
C p
rop
ort
ion
distance to surface (Å)
a) b)

218
Figure 94: C proportion for toluene on hydroxylated Al2O3surface, recorded at a) 400 K b) 500 K.
6.4.3 Results and Discussion: benzyl hydroperoxides-surface interaction
Let us now focus on the behavior of the hydroperoxide molecules at the surface.
Figure 95reports in the case of the anhydrous surface, the O densities at distances up to 8 Å to
the surface.
Figure 95: variation of the peroxide oxygen concentration during the equilibration steps, case of the anhydrous surface.
00,0020,0040,0060,008
0,010,0120,0140,0160,018
0,02
0 5 10 15 20
C p
rop
ort
ion
distance to surface (Å)
0
0,002
0,004
0,006
0,008
0,01
0,012
0 5 10 15 20
C p
rop
ort
ion
distance to surface (Å)
a) b)
0
0,2
0,4
0,6
0,8
1
1,2
1,4
0 20 40 60 80 100 120 140 160 180 200
O concentration (atom/nm3) during equilibration (steps)
"<2 angst" "from 2 to 4angst" "from4to6" "from6to8"< 2 Å From 2 to 4 Å From 4 to 6 Å From 6 to 8 Å

219
We notice that the O density nearest the surface (< 2 Å, red curve) do not increase during the
equilibration time. A similar behavior was observed for the hydroxylated surface (not shown).
Figure 96: Hydroperoxide O proportion with respect to the distance to the surface, X axis: distance to surface (Å), Y axis: proportion.
During the trajectory at 300 K (Figure 96, top panels), similarly as for the C atoms, we notice for
the hydroperoxide oxygens a “single surface layer” regime on the hydroxylated surface, and a

220
“bi-layer regime” at the dry surface. Indeed, on the anhydrous surface, two peaks are visible at
the near surface, one at 2 and one at 3.4 Å, whereas one peak is noticeable on the hydroxylated
surface, at 1.8 Å.
On both surfaces, a first zone corresponds to the near surface region, from zero to 3 Å. Above
this zone, the hydroxylated surface exhibits a region without O species, and then hydroperoxide
accumulation seems to occur between 7 and 15 Å from the surface at 300 K. In contrast, the
hydroperoxide distribution above the bilayer seems to be more homogeneous above the dry
surface.
On the hydroxylated surface, it seems that at 400 and 500 K, the peroxide molecules are confined
in a cluster/layer in the bulk liquid. The hydroperoxide concentration seems to be depleted at the
surface at 500 K. On the anhydrous surface, the bilayer structure evolves towards a single layer,
where the molecules from the second layer could have diffused to the surface, and this will be
analyzed in the next section. The bulk liquid is depleted in peroxides.
Figure 97: Proportion of peroxide at the interface toluene/Al2O3. Orange: surface; grey: second layer; blue: liquid; temperature ranges: steps 0-2222: from 300 to 400 K; steps 2222-4444: 400 K; steps 4444-6666:from
400 to 500 K; above: 500 K.
0
0,1
0,2
0,3
0,4
0,5
0,6
0,7
0,8
0,9
1
0 1000 2000 3000 4000 5000 6000 7000 8000
O p
rop
ort
ion
Steps

221
This analysis is completed by the analysis of the proportion of O at different distances from the
anhydrous surface (Figure 97), recorded during the whole sequence (heating up to 400 K, plateau
at 400 K, heating to 500 K, plateau at 500 K). We observe that at the beginning, the
hydroperoxides are distributed equally in the three zones (near surface, second layer and “liquid”
phase). Then, the liquid zone is depleted and the second layer enriched. When the temperature
500 K is reached, the bulk and second layer zones are depleted and the molecules accumulate at
the surface.
To summarize, peroxides adopt at 300 K the bilayer structure of toluene, but at higher
temperature, a single surface layer is obtained. Very interestingly, the behavior with temperature
is dramatically different when comparing the hydroxylated and dry surfaces: whereas the
molecules tend to cluster in the liquid phase near hydroxylated surfaces, a liquid phase depletion
and accumulation of peroxides at the surface is observed on the dry surface.
6.4.4 Results and discussion: chemical reactivity
To have an idea of the reactivity of the benzyl hydroperoxides at the alumina surfaces, we tried to
comprehend their behavior in two different instances: a) when they interact above the alumina
surfaces and b) when they interact in the liquid medium above the alumina surfaces.
We start by discussing the mechanisms that we observed when the benzyl hydroperoxides come
in contact with the alumina surfaces.
Starting from the dry Al2O3 system, we registered two different types of solute-surface
interactions during the thermal range of 300 – 500 K: the O-O bond dissociation of a single
benzyl hydroperoxide molecule interacting with the outermost Als atom and the O-O bond
dissociation of this molecule on top of the surface while firstly interacting with other solute
molecules through H bonds.
The first solute-surface type of case is shown in Figure 98, where we traced the steps that led
towards the O-O bond breaking: we start from an original O-O bond distance of 1.44 Å that start
to stretch after the establishing of the covalent Omol-Als covalent bond, to finally break with a
bond distance of almost 5 Å. What we were able to observe from these MD steps was that the

222
surface appears to facilitate the O-O pair breaking once the solute molecule strongly interacts
with its metallic Al layer.
DFT calculations where the bond dissociation -CO---OH for a benzyl hydroperoxide occurs when
it adsorbs on dry alumina showed that this process is very favored (giving a ΔEtot = -232.5
kJ/mol).
The second solute-surface type of interaction is pictured instead in Figure 99, where this time we
observed a different behavior compared to the previous case: here solute molecules are firstly
interacting between them through H bonds established by their polar -OOH terminations, while at
a certain point one of the polar head of a benzyl hydroperoxides bonds with a Als atom causing
an instantaneous O-O bond breaking.
Figure 98: O-O bond dissociation for a benzyl hydroperoxide molecule on top of Al terminated surface layer of dry Al2O3 (at 300 K).
Figure 99: O-O bond dissociation for a benzyl hydroperoxide molecule on top of Al terminated surface layer of dry Al2O3 (at 500 K).
O-O = 1,44 A O-O = 1,87 A O-O = 4,57 A
Benzyl hydroperoxyde O-O bond dissociation on dry Al2O3 (@300K)
O-O = 1,50 A
Benzyl hydroperoxyde O-O bond dissociation on dry Al2O3 (@500K)
O-O = 3,02 A

223
The major difference of this second case with the first one is that here the solute molecule that
undergoes the O-O pair breaking comes from an already occurring solute-solute interaction (thus
in the liquid phase), which could have “weakened” the O-O bond, causing an easier bond rupture
for the benzyl hydroperoxide.
On the other hand, the discourse is different for the hydroxylated Al2O3 system. In fact in this
case, no bond dissociation was registered neither in the liquid phase nor above the surface. The -
OH groups that are found above the surface come from the hydroxylated layer of the surface that
start desorbing towards the reaching of 400 K.
Figure 100: RDF plots for the O-O bond of benzyl hydroperoxides present in the liquid phase in a) the anhydrous case and b) the hydroxylated case for the three different T: 300 K; 400 K and 500 K.

224
In Figure 100 (top side) we observed that the behavior of the oxygenated solute molecules in the
liquid medium is exactly the same as the one reported in Figure 73a for the liquid phase: we
observe again the highest peak at the O-O distance of 1.5 Å. In this case, we can conclude that
the benzyl hydroperoxides found in the liquid medium at distances > to 10 Å from the surface
behave as in the bulk liquid.
Figure 101: N(r) plots for the O-O bond of benzyl hydroperoxides present in the liquid phase in a) the
anhydrous case and b) the hydroxylated case for the three different T: 300 K; 400 K and 500 K.

225
This result is confirmed by plotting the integral of the g(r) (Figure 101), where at 300 K we
found again an average of one benzyl hydroperoxide molecule in correspondence of 1.7-1.8 Å
either in presence of the dry or hydroxylated alumina surface. It is also confirmed, integrating at
higher distances, that the amount of benzyl hydroperoxide in the liquid phase is temperature
dependent for each surface and is also surface-dependent, due to the accumulation of the benzyl
hydroperoxide at the surfaces.
To discover what happens when benzyl hydroperoxides interact in the liquid medium, we plotted
in Figure 100 the RDF for the O-O pair of the benzyl hydroperoxides that are found in the liquid
phase in both heterogeneous cases (in this case, the “liquid phase” is defined as the liquid at
distance to the surfaces > 10Å). For the cases taken at 300 K, we wanted to obtain a direct
connection with the studied case of section 6.1.3(bulk liquid).
Another important aspect to highlight is that the formation of binary and ternary complexes due
to the benzyl hydroperoxides interactions in the liquid phase were observed for both
heterogeneous cases too (not reported), as was the case in the bulk liquid.
6.4.5 Conclusion of ReaxFF study of liquid-phase “fuel-oxygen”
mixture-Al2O3 system
In this section 6.4,we presented the results of our MD study where we investigated the dynamic
evolution of a liquid organic solution adsorbed above the alumina, either in its anhydrous or
hydroxylated state. We summarize the main conclusions of these structural analyses as follows:
1. The toluene is structured at the surface in a monolayer (hydroxylated surface) and a
bilayer (dry surface); the tilt angle of the molecules towards the surface differs, the
toluene molecules on the anhydrous surface being tilted by 45° in average, whereas the
tilt is 30° on the hydroxylated surface.
2. The consequence of this tilt angle is that for the dry surface, a second toluene layer is
strongly adsorbed, as schematized in Figure 102.

226
3. The reason behind this difference lies in the difference in adsorption energy of toluene at
the surface. We have already observed (Chapter 5) that the toluene-dry surface
interaction induces the formation of a dense layer at the surface, and this is not the case on
the hydroxylated surface. This trend is observed also at the liquid-solid interface, the
toluene structuration being even reinforced with the formation of a dense bilayer at the
dry surface. This is a nice example of the complexity of the balance of the difference of
interaction at the atomic scale that induce different structuration patterns. This study also
allows us to make a bridge from the gas-surface interaction to the liquid-surface
interaction, and how the properties observed in the first system are maintained and
adapted in the second one.
4. The hydroperoxides tend to aggregate at the surfaces, again this effect being more marked
for the anhydrous surface, where it seems that the toluene bilayer structure also induces
the presence of peroxide in a bilayer structure. We also notice the tendency of peroxides
to form aggregates. It seems that there are less aggregates in the liquid phase on the dry
surface, due to the highest tendency to adsorb at the surface. This preliminary results must
however be confirmed/infirmed on larger systems.
5. The hydroperoxide molecules react with the alumina dry surface and not with the
hydroxylated surface.
6. The behavior of the benzyl hydroperoxides in the liquid medium is the same as the one
observed for the homogeneous case in section 6.1.3, meaning that no bond dissociations
occur when the solute molecules interact between each other.
7. The benzyl hydroperoxide clusterisation in the liquid medium provokes the formation of
binary and ternary complexes that resemble aggregate precursors and this is observed
even in case of the surface presence.

227
Figure 102: Simplified scheme of the toluene molecule layers and tilt angles on the hydroxylated alumina surface (on the left) and on dry alumina surface (on the right).
6.5 Conclusions
In this chapter, we reported the analyses and results of our ReaxFF study where the dynamic
behavior of a model liquid “fuel-oxygen” solution was investigated in two main instances: a)
when this liquid organic solution is isolated (e.g. homogeneous phase) and b) when this liquid
organic solution is put in contact with the alumina surface either in anhydrous or hydroxylated
conditions. The composition of this organic solution is the following: 95% mol toluene (e.g.
solvent) and 5% mol benzyl hydroperoxide (e.g. solute).
Our main objective was to verify if our validated force field FFA was able to “capture” and
describe accordingly the possible phenomena occurring in a slightly oxidized liquid fuel blend
either when treated as a solution at ambient conditions (section 6.1) or when interacting with a
metallic substrate such as aluminium covered with an oxide layer (sections 6.3-6.4). In addition,
the adsorption/desorption behavior of the water layer characterizing the alumina in its
hydroxylated state up to 500 K was also examined via FFA (section 6.2).
In section 6.1, we investigated via ReaxFF the behavior of the liquid oxidized fuel at ambient
condition through the implementation of the NPT ensemble. We created a simulated box that
α-Al2O3 α-Al2O3
Hydroxylated α-Al2O3 Dry α-Al2O3
Hydroxylated layer

228
would correspond to a liquid density of 0.87 g/cm3 (i.e. the experimental toluene density at
ambient T and P). We found that FFA reproduced quite accordingly the liquid density of the
organic solution, giving a liquid density of 0.96 g/cm3. We calculated a Δ𝜌𝑙% = 9% between the
experimental and simulated liquid densities, which we considered as a good estimation. We also
provided a study of the benzyl hydroperoxides reactivity in the organic medium, where we found
that no bond dissociation is register at 300 K (either for O-O or C-O intramolecular bonds).
However, formation of aggregates precursors starting from benzyl hydroperoxides clusterisation
was observed already at ambient conditions in 312.5 ps of time calculation.
From the homogeneous conditions, we proceeded towards the study of the heterogeneous cases,
starting from the MD study of the alumina hydroxylated surface when heated from 1 K to 500 K
(section 6.2). From this analysis, we found that heating the hydroxylated Al2O3 surface up to 500
K induces an increased degree of freedoms of the surface OH groups and, in addition, some of
the dissociated water (terminal OH plus H on surface Os) get molecular at temperature above 270
K. Our results are in good agreement with the work of Hass et al. [9], where they remarked
“premature” event of some water molecule “desorption” and diffusion at the hydroxylated
surface was observed already by at 300 K.
In section6.3, we investigated via NVT simulations the behavior of small droplets of liquid
oxidized fuel adsorbed on Al2O3surface in two thermal regimes: a first regime of heating from 1
K to 400 K and a second constant T regime at 400 K. For the dry Al2O3surface, we found that a
dense monolayer of toluene is formed during the heating stage and it remained stable at constant
T = 400 K. Complementary DFT BOMD simulations confirmed this result. For the hydroxylated
Al2O3surface, no toluene layer formed when heating or during the plateau at 400 K, showing an
average toluene coverage of 0.2 ML at 400 K with significant surface diffusion of the molecules.
We attributed this different behavior to the differences in adsorption energies of toluene on dry
and hydroxylated α-Al2O3.
Finally in section6.4, we investigated via NPT simulations the behavior of the liquid oxidized
fuel adsorbed on Al2O3surface in four sequential T regimes: a) a first heating phase from 300 to
400 K, b) constant T regime at 400 K, c) a second heating phase from 400 to 500 K and d) a final
constant T regime at 500 K. To better comprehend the reactivity of the solute molecules in this

229
section, we decided to distinguish two instances: a) solute/surface interactions and b)
solute/solute interactions in the liquid medium.
For the first instance, the NPT simulations showed a toluene structuration as a monolayer for the
hydroxylated Al2O3 surface and as bilayer for the dry Al2O3 surface. Similar to conclusion from
the previous section 6.3, we again attributed the reason behind this discrepancy to different
adsorption energies of toluene on the two surfaces. For the solute molecules, we found an
aggregation tendency for the benzyl hydroperoxides at the anhydrous alumina surface, where
they were found to react with the terminal surface Als atoms. However, such aggregation and
reactivity tendencies were not observed for the hydroxylated case. This preliminary study
suggests that the degree of hydroxylation of the aluminium surface plays a key role in the
aggregation at the surface of compounds of oxidation.
For the second instance, we studied the behavior of the benzyl hydroperoxides in their liquid
medium in order to find a connection with the case reported in section 6.1.3. What we found was
that, even in the presence of the alumina surface, the benzyl hydroperoxides interacting in the
organic medium at 300 K behave exactly in the same manner as when we only have the liquid
phase as in section 6.1.3: no bond dissociation is registered at 300 K and the formation of
aggregate precursors was again observed also for the heterogeneous cases. This behavior of the
benzyl hydroperoxides in the organic medium is conserved also for the 400 – 500 K thermal
range.
230
References
1 Mielczarek D.C., Matrat M., Amara A.B., Bouyou Y., Wund P., Starck L. Toward the Accurate Prediction of
Liquid Phase Oxidation of Aromatics: A Detailed Kinetic Mechanism for Toluene Autoxidation, Energy
Fuels31, 11 (2017), 12893–12913. DOI: 10.1021/acs.energyfuels.7b00416.
2 J.A.A. Hoorn, P.L. Alsters, G.F. Versteeg A Kinetic Model for Toluene Oxidation Comprising Benzylperoxy Benzoate Ester as Reactive Intermediate in the Formation of Benzaldehyde,International Journal of Chemical
Reactor Engineering3 (2005).
3 Hermans I., Peeters J., Vereecken L., Jacobs P.A. Mechanism of thermal toluene autoxidation,Chemphyschem :
a European journal of chemical physics and physical chemistry8, 18 (2007), 2678–2688. DOI: 10.1002/cphc.200700563.
4 da Silva G., Hamdan M.R., Bozzelli J.W. Oxidation of the Benzyl Radical: Mechanism, Thermochemistry, and Kinetics for the Reactions of Benzyl Hydroperoxide, Journal of chemical theory and computation5, 12 (2009), 3185–3194. DOI: 10.1021/ct900352f.
5 da Silva G., Bozzelli J.W. Kinetic modeling of the benzyl+HO2 reaction, Proceedings of the Combustion
Institute32, 1 (2009), 287–294. DOI: 10.1016/j.proci.2008.05.040.
6 W.M. Haynes CRC handbook of chemistry and physics: A ready-reference book of chemical and physical data, CRC Press, Boca Raton, Fla. (2013).
7 Martyna G.J., Tuckerman M.E., Tobias D.J., Klein M.L. Explicit reversible integrators for extended systems dynamics, Molecular Physics87, 5 (1996), 1117–1157. DOI: 10.1080/00268979600100761.
8 W. G. Hoover, B. L. Holian Kinetic moments method for the canonical ensemble distribution, Phys. Rev. A
(Physical Review A)211 (1996), 253–257. DOI: 10.1016/0375-9601(95)00973-6.
9 Hass, Schneider, Curioni, Andreoni The chemistry of water on alumina surfaces: reaction dynamics from first principles,Science (New York, N.Y.)282, 5387 (1998), 265–268. DOI: 10.1126/science.282.5387.265.
10 Tao J., Wang X., Han Z., Feng B., Xue L. Selection of solvent for the mechanical activation process: A molecular dynamics simulation and experiment study,Surf Interface Anal49, 11 (2017), 1147–1152. DOI: 10.1002/sia.6294.

231
General conclusions and Perspectives
The objective of this thesis was to better understand the phenomenology related to the formation
of deposits produced by the autoxidation process that occurs for fossil and renewable fuels and
the impact of the material in contact with the fuel.
To achieve this goal, a methodology combining two different numerical approaches was adopted:
an ab initio study conducted via Density Functional Theory (DFT) and a successive empirical
Molecular Dynamics (MD) approach carried out via the implementation of a reactive force field
(ReaxFF). The preliminary theoretical DFT study was carried out to acquire useful energetic data
(i.e. reaction and adsorption energies) from the geometry optimization of gas-phase and gas/solid
systems of interest, with the intention to use them as input data to train the empirical reactive
force field. The objective was to optimize and validate the reactive force field so that it would be
able to correctly predict the behavior of the chemical species involved, in both homogeneous and
heterogeneous phases. Once validated, MD simulations implementing the validated ReaxFF were
carried out, with the objective to obtain useful insights into the adsorption and deposition
processes while considering the degradation/oxidation phenomena occurring in the fuel liquid
phase.
From our DFT study (Chapter 4), we acquired important notions in regards of the deposits
reactivity either in their gas-phase or when they are adsorbed above aluminum and stainless steel
surfaces. From the homogeneous gas-phase study, we obtained the reaction energies of a set of
representative reactions describing the toluene autoxidation, while from the heterogeneous
gas/solid study, we obtained the adsorption energies of small representative organic molecules
(i.e. models of deposit precursors) on α-Al2O3 and α-Cr2O3 surfaces (i.e. representatives of
aluminum and stainless steel surfaces). Both anhydrous and hydrated surface states were
considered in our study. From this study, the scrutinized trend of the adsorption strength on dry
surfaces is the following: oxygenated molecules > aromatics > linear alkanes. The alumina
surface was found more reactive than the chromia surface. The adsorption on the two
hydroxylated surfaces were of similar characteristics, but for alumina a net difference in
reactivity between the dry and hydroxylated surface was considerably more pronounced, pointing
to the influence of the surface state on the adhesion properties.

232
In our ReaxFF study (Chapter 5) we carried out a ReaxFF study centered on the
reparametrization and validation of two different force fields, one describing alumina-based
systems (FFA) and the other chromia-based systems (FFB).
The two force field optimizations were evaluated through the reproduction of the data in the
training set used to reparametrize the force fields. Next, the quality of the FF was evaluated
through the reproduction of data from a validation set (data that are not included in the training
set), including the reproduction of the cell parameters of the bulk oxides, adsorption energies of
organic molecules, representative reactions of the autoxidation of toluene, and the dynamic
structuration of pure organic liquids (mass/volume density, radial distribution functions). At the
end of this study, FFA (for alumina-based systems) was validated, but not FFB for chromia-
based systems. For this reason, we decided to retain for our production study only the FFA force
field.
In our ReaxFF production study (Chapter 6), we conducted MD studies where the dynamic
behavior of a model liquid “fuel-oxygen” solution, composed of 95% mol toluene and 5% mol
benzyl hydroperoxide, was investigated in two main instances: a) when this liquid organic
solution is isolated (e.g. homogeneous phase) and b) when this liquid organic solution is put in
contact with the alumina surface either in anhydrous or hydroxylated conditions. Our main
objective was to verify if FFA was able to “capture” and describe accordingly the possible
phenomena occurring when examining the model blend as a solution at ambient conditions
(section 6.1), when put on the alumina surface at the solid-gas interface (section 6.3), or when
interacting with a metallic substrate such as aluminium covered with an oxide layer at the solid-
liquid interface (section 6.4). In addition, the adsorption/desorption behavior of the water layer
characterizing the alumina in its hydroxylated state up to 500 K was also examined via FFA
(section 6.2).
In section 6.1, we found that FFA reproduced quite well the liquid density of the organic solution
(that we approximated with the toluene density at ambient conditions), giving a Δ𝜌𝑙% = 9%
between the experimental and calculated value. We considered this difference between
experimental and simulated densities as a good estimation. We also found that no bond

233
dissociation is registered from the benzyl hydroperoxides (section 4.3.1) at 300 K, neither for O-
O nor C-O intramolecular bonds. However, formation of aggregates precursors starting from
benzyl hydroperoxides clusterisation was observed already at ambient conditions.
Regarding the solid-gas interfaces, in section 6.2, we found that heating the hydroxylated Al2O3
surface up to 500 K induces an increased degree of freedom of the surface OH groups and, in
addition, some of the dissociated water (terminal OH plus H on surface Os) get molecular at
temperature above 270 K. Our results are in good agreement with the work of Hass et al. [9],
where they remarked “premature” event of some water molecule “desorption” and diffusion at
the hydroxylated surface was already observed by at 300 K.
In section 6.3, we found that starting from a toluene “drop” at the surface, a dense monolayer of
toluene is formed during the heating stage and it remained stable at constant T = 400 K.
Complementary DFT BOMD simulations confirmed this result. For the hydroxylated
Al2O3surface, no toluene layer formed when heating or during the plateau at 400 K, showing an
average toluene coverage of20% at 400 K with significant surface diffusion of the molecules. We
attributed this different behavior to the differences in adsorption energies of toluene on dry and
hydroxylated α-Al2O3.
In section6.4, the solid-liquid interactions were captured with the MD conducted with FFA, thus
considering the biofuel-alumina interface. To better comprehend the reactivity of the solute
molecules in this section, we decided to distinguish two instances: a) solute/surface interactions
and b) solute/solute interactions in the liquid medium (more than 10 Å from the surface). In the
first instance, we observed a toluene structuration as a monolayer for the hydroxylated Al2O3
surface and as bilayer for the dry Al2O3 surface. As concluded from the previous section 6.3, we
again attributed the reason behind this difference to different adsorption energies of toluene on
the two surfaces. For the solute molecules, we found an aggregation tendency for the benzyl
hydroperoxides on both surfaces. At the anhydrous alumina surface, they were found to react
with the terminal surface Als atoms. However, these reactivity tendencies were not observed on
the hydroxylated surface. This preliminary study suggests that the degree of hydroxylation of the
aluminium surface plays a key role in the molecule-surface reactivity. In the second instance, we
found that, even in the presence of the alumina surface, the benzyl hydroperoxides interacting in
the organic medium at 300 K behave exactly in the same manner as when we only have the liquid

234
phase as in section 6.1.3:no bond dissociation is registered at 300 K and the formation of
aggregate precursors was again observed also for the heterogeneous cases. This behavior of the
benzyl hydroperoxides in the organic medium is conserved also for the 400 – 500 K thermal
range.
From this study, we have recognized that the combination of DFT and ReaxFF methods could be
a valuable asset for further investigations of the aggregation/deposition phenomena occurring in
the fuel liquid phase. We observed that the metallic aluminum surface does not influence per se
the aggregation phenomena of the liquid phase, however it can cause the formation of an
oxidized organic layer in case of anhydrous conditions.
However, our validated FFA force field need to be further tested and applied to bigger systems in
terms of both atomic-size and simulation time. In this way, possible new reactions could be seen
and a new prospective of the system reactivity could be envisaged. This statement is even more
emphasized on the FFB force field, which need to be further reoptimized with new suitable data
in order to achieve a validated form.

235
Annexes
Chapter 4
Bulk oxides
Figure A4-1: Slabs used to represent for the (0001) corundum surfaces: a-c) 4x4 cell; d-f): 2x2 cell. Grey: Al, Cr; red: O.
a) b) c)
d) e) f)

236
Figure A4-2: Nomenclature for adsorption and dissociation of protic molecules at corundum Al2O3 and Cr2O3 (0001) surfaces. Top-view of Al2O3 or Cr2O3 with a metal cation (grey) in the center of 3 oxygen atoms (blue). If the metal (Cr/Al) ion is considered at position 1, the blue (oxygen) atoms are at position 2, and the green (oxygen) at position 4.
Table A4-1: Calculated (VASP) versus experimental bulk structural parameters of α-Al2O3.
Bulk α-Al2O3
d) Experimental [19] e) Calc. Bulk DFT
(this work)
a = b (Å) 4.76 4.79
c (Å) 12.99 13.07
c/a (Å) 2.73 2.73
V (Å3) 254.93 259.11
Al-O1 (Å) 1.85[20] 1.87
Al-O2 (Å) 1.97[20] 1.98
Table A4-2: Calculated (VASP) versus experimental bulk structural parameters of α-Cr2O3.
Bulk α-Cr2O3
d) Experimental [21]
e) Calc. Bulk DFT (this work)
a = b (Å) 4.95 5.07
c (Å) 13.57 13.85
c/a (Å) 2.74 2.73
V (Å3) - 308.75
Cr-O1 (Å) - 2.05
Cr-O2 (Å) - 2.01

237
Comparison between Gaussian and VASP results for the reaction energies
In section 4.3.2, the values of the reaction energies calculated with the M06-2X functional have
been reported. Below, we report these aforementioned reaction energies results with the
corresponding values calculated in this case through the implementation of the PBE-GGA
functional (VASP).
Table A4-3: Comparison of the reaction energies ΔEr(kJ/mol) between the adopted M06-2X functional (Gaussian 16) and the PBE-GGA functional (VASP).
Reaction label
Reactions ΔEr Gaussian
(M06-2X)
(kJ/mol)
ΔEr VASP (PBE-GGA)
(kJ/mol) R1 (C6H5)CH2O2H + (C6H5)CH2° → (C6H5)CH3 + (C6H5)CH2O2° -31 -33.4
R2 (C6H5)CH2O2H → (C6H5)CH2O° + HO° 232.4 194.7
R3 (C6H5)CH2O2H → (C6H5)CH2O2° + H° 353 374.4
R4 (C6H5)CH2O2H → (C6H5)CH2° + HO2° 230.3 264.0
R5 (C6H5)CH2O2H→ (C6H5)CH2° + H° + O2 561.5 638.3
R6 (C6H5)CH2O2H + HO2°→ (C6H5)CH2O2° + H2O2 -6.7 -2.7
R7 (C6H5)CH2O2H + HO2° → (C6H5)CH2° + H2O2 + O2 201.8 261.2
R8 (C6H5)CH2O2° → (C6H5)CH2° + O2 206.4 263.9
R9 HO2° → O2 + H° 331.2 374.4
From Table A4-3 above, we can observe that the majority of the reaction energies are very
similar when comparing the use of the two different functionals, at the exception of the R2 and
R5, where a huge energetic gap can be seen between these two reactions.
Water/OH substitution on corundum surfaces Table A4-4: Energy decomposition for water/OH substitution by methyl propionate/acetate on hydroxylated Al2O3 and Cr2O3 (kJ/mol)
System
Water desorption (kJ/mol)
Equation 84
Binding energy molecule/surface
(kJ/mol) Equation 85
Erelax (kJ/mol)
Equation 86
Substitution energy
(kJ/mol) Equation 83
E(Al2O3-Cr2O3)
(kJ/mol)
Methyl propionate@Al2O3-HY
54.6 -46.6 9.0 17 51.7
Methyl propionate@Cr2O3-HY
22.6 -62.6 5.4 -34.7

238
Acetic acid@ Al2O3-HY 54.6 -285.1 213 -17.5 26.3
Acetic acid@ Cr2O3-HY 22.6 -307.18 240.8 -43.8
We observe that the substitutive adsorption of methyl propionate and acetic acid are favored on
Cr2O3 over Al2O3. This can be explained by the decomposition of the energy: firstly, water
desorption is less endothermic for Cr2O3 than Al2O3; secondly, the binding energy of MP is
slightly stronger for Cr2O3; thirdly, the relaxation energies are practically equivalent for both
surfaces.
We note in the case of acetate adsorption, both a strong molecule-surface interaction and a strong
component of the relaxation energy to accommodate the adsorbed anion.
Thermodynamic data
Table A4-5: Energy, ZPE contribution, Free energy and Entropy contributions of the free molecules
Molecule EEZPE G-(ESCF+EZPE) Stot Strans Srot Svib Selec
(Hartree) (Hartree) (cal/K.mol) (cal/K.mol) (cal/K.mol) (cal/K.mol) (cal/K.mol)
acetaldehyde 0.055205 -0.024933 62.655 37.273 21.639 3.744 0
propane 0.102984 -0.025003 64.139 37.275 21.311 5.552 0
oxirane 0.150382 -0.033482 90.23 39.306 26.871 22.676 1.377
ethanol 0.079745 -0.025375 64.412 37.406 22.313 4.692 0
toluene 0.127346 -0.030587 79.441 39.471 26.976 12.993 0
acetic acid 0.061692 -0.0271 68.594 38.196 23.846 6.551 0
benzene 0.100151 -0.027459 69.026 38.979 25.65 4.397 0 methyl-3-trans-
hexanoate 0.178943 -0.037844 104.663 40.456 29.879 34.328 0
methylacrylate 0.094708 -0.030746 80.689 39.27 26.595 14.824 0
acetone 0.083122 -0.029398 75.383 38.096 24.147 13.139 0
methylpropionate 0.117702 -0.031456 83.6 39.339 26.78 17.481 0
water 74.247 42.55 7.21 0.05 0

239
Desorption temperature calculations
To further confirm the trends observed in the previous paragraphs for the molecules interactions
on alumina and chromia surfaces, we decided to calculate the desorption temperatures (Tdes) for
all the molecules on the two substrates either in their anhydrous and hydrated states, respectively.
Computational details
The thermochemical calculations for the obtention of the Tdes values were performed with
Gaussian 16 [1]. The desorption temperatures Tdes were calculated using the thermodynamic
corrections of the molecules in the gas phase, while for the heterogeneous systems
“slab+molecule” only the electronic energies were used.
Finally, using atomistic thermodynamics allows us to evaluate the free energy of adsorption at
temperatures above 0 K, and we introduce the thermodynamics data for the molecule in the gas
phase, as explained in ref. [24]. The ΔG value of the system is given by:
ΔG = ΔE + Δμ
Equation 88
Where Δμ is the chemical potential of gaseous molecule. The thermodynamic data (H(T) and
S(T)) are calculated with the Gaussian 16 code [1] for the free molecule.
Upon considering the general desorption reaction:
Slab-Molecule = Slab + Molecule(gas)
Equation 89
At thermal equilibrium between the gas phase and the adsorbed molecule, we can write that
ΔGdesorp = ΔHdesorp – TΔSdesorp = 0
Equation 90
We now make three key assumptions:

240
1) ΔHdesorp ≈ ΔEdesorp. In other words, the corrections (zero-point energy, translational,
rotational and vibration internal energies and PV corrections) are equal for reactant and
product.
2) Upon adsorption of the organic molecule, the entropic contributions for translation and
rotation become zero. Thus: ∆Sdesorptiontransl. = Smolecule gazphasetransl. − Smolecule adsorbedtransl. = Smolecule gazphasetransl. − 0
Equation 91
and
∆Sdesorptionrot. = Smolecule gazphaserot. − Smolecule adsorbedrot. = Smolecule gazphaserot. − 0
Equation 92
3) Entropic contributions from the vibrations modes of the organic molecules remain
constant upon adsorption so ∆Sdesorpvib =0
These three assumptions allow us to write: ∆Gdes = ∆Hdes − Tdes∆𝑆des = 0
Equation 93 ∆Hdes = Tdes∆𝑆des = ∆Edeselectronic = Tdes(∆Sdestransl. + ∆Sdesrot. + ∆Sdesvib.)
Equation 94
Solving for Tdes:
Tdes = ∆Edeselectronic∆Sdestransl. + ∆Sdesrot. + ∆Sdesvib. = ∆EdeselectronicSmol. gas phasetransl. + Smol.gas phaserot. + 0
Equation 95
Consequently, we avoid the time-consuming vibrational frequencies calculations for the systems
in which the organic molecule is adsorbed on the slab.

241
Ideally, the entropic contributions should be calculated at the desorption temperature, but here we
used the values at 298 K and 1 atm.
Results and discussion
We also considered the free energies of the molecules in the gas phase and deduced the
desorption temperature from the surface which results are reported in Table A4-6. The gas phase
molecular thermochemical data are reported in Table A4-5.
Figure A4-3 reports the desorption temperature from the hydroxylated surface with respect to the
anhydrous one. The left-upper zone corresponds to molecules that have more affinity for the
hydroxylated than the anhydrous surface. The right lower zone corresponds to molecules that
have more affinity with the anhydrous surface than with the hydroxylated one, and the zone near
y = x to molecules that have equivalent affinity with the dry and hydroxylated surfaces. On Al2O3
molecules (especially oxygenated molecules) stick predominantly on the anhydrous Al2O3
surface until elevated temperatures (500-600 K), whereas most molecules are expected to detach
from the Cr2O3 surface at temperature above RT, independantly on the surface state
(hydroxylated versus anhydrous).
The present results suggest that at temperatures of the injection system, around 500 K, the
stainless steel surface should be free of residual molecules, but the aluminium surface could be
contaminated with water and some oxygenated molecules. Obviously in the operating conditions,
the chemical potentials of the diverse species have also to be considered in the thermochemistry
evaluations and some species could be further stabilized at the surface.
It is interesting to compare the adsorption of the different molecules with that of water. We
calculate water desorption temperatures around 750 K for Al2O3 and 450 K for Cr2O3. This
allows us to identify the molecules susceptible to substitute water at the surface. The results
suggest that only acetic acid, which desorption temperature is as high as water, is susceptible to
compete with water adsorption on chromia.

242
Molecule
propane benzene toluene water acetaldehyde acetone methylacrylate hexenoate methylpropionate ethanol oxirane acetic-acid
Tdesorb Al2O3
(K)
181.3
249.9
309.3
759.6
458.5
485.8
550.3
554.8
586.5
599.3
620.7
751.5
Tdesorb Al2O3-HY
(K)
129.9
185.8
219.3
192.3
172.6
181.8
185.6
236.4
228.3
162.2
202.4
197.0
Tdesorb Cr2O3
(K)
165.4
178.4
204.9
452.4
258.7
274.4
266.2
315.0
317.7
220.3
289.6
464.3
Tdesorb Cr2O3-HY
(K)
158.7
244.1
193.2
192.3
147.3
268.7
260.8
247.5
291.3
187.9
161.7
228.3
Table A4-6: Desorption temperature (K) calculated for the different molecules adsorbed on the M2O3, dry and hydroxylated. Figure A4-3: Desorption temperature on hydroxylated surfaces with respect to the anhydrous surfaces. The y = x line is plotted for a guide to the eye. Black : Cr2O3, grey : Al2O3.
0
200
400
600
800
0 200 400 600 800
Des
orpt
ion
Tem
pera
ture
on
the
hydr
oxyl
ated
sur
face
(K)
Desorption Temperature on the anhydrous surface (K)

243
Chapter 5
CMA-ES algorithm
In section 2.11.3 we have described the major features of the adopted FF optimizer used in this
thesis, namely the CMA-ES algorithm. However, more specific details regarding this algorithm
will be described in this following paragraph.
The CMA-ES algorithm is part of what are known as the “evolution strategies” approaches,
which are stochastic methods adopted for the optimization of non-linear or non-continuos
problems.
Figure A5-1:Illustration of CMA-ES algorithm. Small values of the cost function are represented in light colors. Image taken from ref.1.
Figure A5-1 resumes the principles according to which the CMA-ES algorithm is based on:
i. At the start, a random population is generated from the normal distribution (see the
ellipses in Figure A5-1).
ii. The error function f(x) is computed for all the points of the random population.
1Tan U., Rabaste O., Adnet C., Ovarlez J.-P. On the Eclipsing Phenomenon with Phase Codes 1–5, 2019 International Radar Conference (RADAR); DOI: 10.1109/RADAR41533.2019.171349

244
iii. Selection step: the best random population candidates (i.e. with lower f(x)) are selected
and this step is followed by an “update” of the normal distribution parameters.
iv. Generation step: from this distribution, a new population is generated.
v. This process is repeated until the convergence of the algorithm.
In the merits of the FF optimization, the “population” to which we are referring to in the above
description are the ReaxFF training-set parameters.
Among the main advantages of the CMA-ES algorithm we can recognize a good reliability for
the local minima and global optimizations. Instead, as main disadvantage we have that the CMA-
ES can be rather imprecise in the case of a single optimization run since this occurrence can
present a higher risk of obtaining parameters with high errors.
Binding energy calculations: dissociation curves
In section , we reported the calculated biding energies between the model molecules and the dry
alumina surface. Here in this section, we describe in further detail each one of the energetic
terms.
To calculate the binding energy 𝑬𝒃𝒊𝒏𝒅𝒊𝒏𝒈we have considered the three following terms:
𝑬𝒂𝒅𝒔𝒎𝒐𝒍∗: energy of the optimized fixed surface when considering the rigid z coordinate with the
relaxed molecule.
𝑬𝒔𝒖𝒓𝒇𝒂𝒄𝒆∗: energy of the optimized fixed structure of the dry alumina surface.
𝑬𝒎𝒐𝒍: energy of the optimized molecule in the gas phase.
We chose to calculate the binding energies in this manner because our objective was to observe
the molecular distortion when the molecule/surface bond has been fixed with the surface.
Below we report a clear example of this behavior, where we compared the optimized
configurations of the acetaldehyde adsorbed on the dry alumina surface obtained with VASP and
with FFA, respectively.

245
.
Figure A5-2: Optimized configurations of the acetaldehyde adsorption on dry ɑ-alumina calculated via DFT (blue square) and via FFA (orange square).
In Figure A5-2 we can see that the major difference between the two cases is given by the
rotation of the molecule obtained when simulating with FFA force field (on the right) from its
original configuration (i.e. DFT result on the left), which did not translate into a huge gap in
terms of binding energies values calculated with the two different approaches (see Figure 63).
Preliminary ReaxFF study
5.1 First “static” test: adsorption energies
The first step was to verify if FF0 was able to describe our DFT optimized configurations
(Chapter 4), so carried out geometry optimizations with AMS2019 [7] through the
implementation of FF0 and consequently compare them with our DFT results. However, in this
first stage we decided to consider only configurations related to the hydroxylated α-Cr2O3, since
this surface was not considered in the ReaxFF parametrization in the work [6].
5.1.1 Computational details
The FF0 geometry optimization were carried out with AMS2019 [7] using the implementation of
the “Fast Inertial Relaxation Engine” (FIRE) algorithm [8]. The cartesian coordinates were
optimized and the following convergence criteria were selected: a gradient and energy
DFT configuration FFA configuration

246
convergence criterion of 2.625 kJmol-1/Å and of 0.02625 kJmol-1 respectively (both coinciding
with the AMS2019 default values). The maximum number of steps was set to 5000 for the
adsorption configurations and 1000 steps for the single molecules.
5.1.2 Results and discussion of the 1st static test
Figure A5-3 below shows the comparison between the optimized configurations obtained with
FF0 and some of the DFT results shown in Chapter 4. We can notice that certain molecules are
well described by FF0 (e.g. the acetic acid in its molecular adsorption, the methyl-3-trans-
hexenoate and the toluene), i.e. the difference between DFT and FF0 result is less than 20%,
while others are either overestimated by FF0 (e.g. the acetic acid in its dissociated configuration
and the benzene) or either underestimated by FF0 (e.g. methylacrylate, 2-ethyl-3methyloxirane
and n-propane).
Figure A5-3: Comparison between the Eads calculated from FF0 and the Eads obtained from the previous DFT study.
From this first attempt of “static” analysis, we concluded that FF0 was able to decently describe
some of our model molecules. Thus, we decided to proceed to a first “dynamic” test in liquid
phase.
-120
-100
-80
-60
-40
-20
0
Ad
sorp
tio
n e
ner
gies
Ead
s [k
J/m
ol]
FF0 vs DFT
FF0 DFT

247
5.2 First “dynamic” test: acetic acid desorption from α-Cr2O3
In this first “dynamic” attempt, we chose to study the molecule/surface interaction behavior
between an acetic acid molecule and the hydroxylated α-Cr2O3 surface.
We simulated both the dissociative and molecular adsorptions of the acetic acid molecule by
setting a linear thermal regime, starting from T° = 0 K till Tfin = 1000 K.
5.2.1 Computational details
These MD simulations were run with the NVT ensemble with the implementation of the
Berendsen thermostat [9]. We started with a first 1000 non-reactive steps and the time step was
set to 0.25 fs and the temperature damping constant was set equal to 100 fs.
For the dissociative case of the acetic acid, the total number of iterations was set to 600’000,
while for the molecular case it was set to 500’000 iterations.
5.2.2 Results and discussion of dynamic test for acetic acid desorption from α-Cr2O3
This first MD study implemented for both molecular and dissociative adsorption of the acetic
acid on top of the hydroxylated α-Cr2O3 surface had the aim to observe the dynamic behavior of
this adsorbed organic molecule when the system temperature increases with a linear trend; the
choice of this thermal regime was to ascertain eventual strange behavior from the surface
structure when the temperature would hit a very high value, such as the happening of a disruption
of the outer layers or a rupture of the crystalline structure. None of these phenomena were
registered from these simulations, further ensuring the accuracy of FF0.
In Figure A5-4 below, we reported the dynamic evolution of the molecular adsorption of the
acetic acid molecule when an increasing linear T regime is set in this system.

248
Figure A5-4: Dynamic behavior of the molecular adsorption of the acetic acid molecule on hydroxylated
Cr2O3 when an increasing linear T regime is established.
The initial configuration at T° = 0 K corresponds to the optimized DFT configuration and the first
change of this configuration was registered at T = 236 K (~ - 37 °C), when a proton transfers
from the acetic acid molecule to the nearby OHs group, resulting in an adsorbed carboxylate
configuration. From this point on, this carboxylate configuration is maintained till reaching T =
960 K (~ 687 °C), where the original carboxylic acid configuration is restored.
In contrast, in the MD study of the dissociative adsorption of the acetic acid a different behavior
were detected. By starting again with the DFT optimized structure, we can observe from Figure
A5-5 that a new intermediate is formed, resembling an α-lactone molecule.
This event is very peculiar since the adsorbate changes somewhat its chemical nature, from a
carboxylate to a sort of lactone (e.g. cyclic carboxylic esters) [10]. What seems to have occurred
at this step is that one of the H atoms of the methyl group of the former carboxylate was
abstracted by an OHs that in turn becomes a water molecule and provokes the “closure” of the
molecule by forming an α-lactone molecule. This lactone intermediate seems to be stable with the
raising of temperature till T = 1000 K (~ 730 °C), where another H atom is abstracted from the
adsorbate molecule.

249
Figure A5-5: Dynamic behavior of the dissociative adsorption of the acetic acid on hydroxylated Cr2O3 when a linear T regime is established.
In previous experimental studies conducted at IFPEN [11], among the oxygenated products from
the biofuel degradation, molecules resembling lactones have been detected; thus, the
identification of an α-lactone molecule through MD simulations may be seen as a further
validation of these results.
Thus, we conclude this first “dynamic” analysis with the objective to “isolate” the formation of
this lactone intermediate to study it through DFT.
5.3 DFT study of the lactone intermediate
To calculate the energetic landscape of this lactone intermediate found in the previous MD study,
we implemented the Nudged Elastic Band (NEB) method (cf. §2.4.7). We report below the
settings and results obtained from this calculation.

250
5.3.1 Computational details
To obtain the energetic landscape of the lactone intermediate through the NEB method, we
selected the two molecules that in this case represent the reagent and the product of this reaction,
respectively: the acetic acid molecule (labeled as “AA”) and the lactone molecule (labeled as
“LACT”). We run the NEB calculation with VASP package [12], imposing to create 5 different
images of the transition state between the reactant (AA) and the product (LACT).
5.3.2 Results and discussion for lactone formation
Figure A5-6 below reports the minimum energy path profile of the lactone formation starting
from the dissociative adsorption of the acetic acid on the hydroxylated α-Cr2O3 surface. What
occurs in this reaction is the proton transfer from the -CH3 group belonging to the acetic acid
molecule to an-OHs group that gradually leads towards the formation of the lactone molecule
through the constitution of the O-ring.
Figure A5-6: Reaction coordinate diagram for the lactone formation starting from the proton transfer from the -CH3 group of the acetic acid to an -OHs group.
Figure A5-6 shows that the activation energy Ea of this reaction is very high (ENEB5 – ENEB0 =
653,1 kJ/mol) and that the reaction is very endothermic (ΔEr = ENEB6 – ENEB0 = 561,5 kJ/mol).
-1160
-1159
-1158
-1157
-1156
-1155
-1154
-1153
-1152
-1151
Ener
gies
(eV
)
r. c.
Lactone Reaction Coordinate
NEB1
NEB2
NEB3NEB4
NEB5
NEB0(reagent = AA)
NEB6(product = LACT)

251
This so high activation energy dramatically contradicts the reaction observed at 450 K with
ReaxFF and shows that the latter one is all but realistic. From this NEB analysis, we concluded
that the chemistry of this reaction was wrongfully reproduced by FF0, leaving us with no other
possibility than reparametrizing FF0 through the integration of this energetic curve.
5.4 First ReaxFF parametrization test
To achieve a good description of the chemistry related to the dissociative adsorption of the acetic
acid molecule on the hydroxylated α-Cr2O3 surface at increasing temperature, we chose to
reparametrize FF0 through the insertion of the DFT calculated energy path describing the lactone
formation (Figure A5-6) in the ReaxFF training-set. All the obtained DFT optimized adsorption
configurations related to the hydroxylated α-Cr2O3 surface (Chapter 4) were added in the
training-set to increase the possibility of an improved reproducibility of the energetic data from
the reparametrized force field.
5.4.1 Computational details
To ensure a good parametrization of FF0 through the inserted DFT data, we selected the
parameters describing the properties of the following atomic bonds: C-H, H-O, Cr-O. In Table
A5-1 below the reported parameters are listed and they are: the sigma bond dissociation energy
E(sigma), the sigma bond orders pbo1 and pbo2 (Chapter 2), the overcoordination penalty
povun1 and the bond energies pbe1 and pbe2 (Chapter 2). For H-O and Cr-O bonds, we
optimized the terms linked to the van der Waals dispersion forces: the vdW energy E(vdW), the
vdW radius R(vdW), the vdW coefficient Alpha(vdW) and the sigma bond length R(sigma). The
formalism linked to these parameters is taken from reference [13].
The choice to optimize the bond orders and energy terms for C-H bond was to achieve an
improved description of the C-H properties since the lactone formation from the adsorbed acetic
acid on the hydroxylated α-Cr2O3 surface showed a failed description in regards of the C-H bond.

252
About the O-H bond, the selection of all the aforementioned ReaxFF parameters was due to the
fact that this bond describes both the feature of intramolecular interactions (e.g. OH group
belonging to the acetic acid molecule or OH surface layer) and intermolecular interactions (e.g.
H-bonds established between molecules and OH surface layer), thus we believed that optimizing
these parameters could help us achieving a better descriptions of both kind of interactions.
Finally, for the Cr-O bond, we did not consider the bond order and energy terms in this first
round because we did not want to “touch” the parameters linked in the surface structure (at least
beforehand). On the other hand, we selected the vdW parameters because they contribute to the
establishing of the interface interactions between molecules and the hydroxylated chromia
surface.
Table A5-1: Training-set parameters selected for ReaxFF reparametrization.
Parameters C-H H-O Cr-O
E(sigma) [kcal/mol] ✓ ✓ -
pbe1 ✓ ✓ -
povun1 ✓ ✓ -
pbe2 ✓ ✓ -
pbo1 ✓ ✓ -
pbo2 ✓ ✓ -
E(vdW) [kcal/mol] - ✓ ✓
R(vdW) - ✓ ✓
Alpha(vdW) - ✓ ✓
R(sigma) - ✓ ✓
We imposed 1000 fit iterations for the CMA-ES FF optimizer. For the geometries setup, the
Conjugate Gradient (CG) algorithm was implemented and the DFT data of the training-set were
calculated as “geometry optimizations”, with their maximum number of iterations set to 50
iterations. Instead, the energetic steps composing the lactone formation (e.g. NEB0-6 in Figure
A5-6) were calculated as single points.

253
5.4.2 Results and discussion
The new optimized FF0 (labeled hereinafter as “FF1”) was obtained at the end of the CMA-ES
run, which gave the error function value (Chapter 2) displayed in Figure A5-7 below.
Figure A5-7: Error function f(x) obtained from FF0 optimization.
From Figure A5-7 we can see that the error function reached a plateau at around 5000 iterations
starting from an original error value f(x)° ≈ 70000, so it was reduced by one order of magnitude.
The ReaxFF results against the training-set DFT data is reported in Table A5-2.
Table A5-2: Comparison between the FF1 calculated energies and the DFT corresponding values.
Input data FF1
[kJ/mol] DFT
[kJ/mol] NEB1 - NEB0 50.0 82.0
NEB2 - NEB0 289.2 293.3
NEB3 - NEB0 496.0 538.4
NEB4 - NEB0 559.4 608.8
NEB5 - NEB0 435.9 653.2
NEB6 - NEB0 452.3 561.6
Acetaldehyde -48.6 -33.7
Acetic acid -60.1 -82.8
Acetone -178.9 -68.5
Benzene -24.6 -64.6
Ethanol -56.8 -48.2
Methylacrylate -221.5 -70.0
2Ethyl-3methyloxirane -199.7 -42.1
Toluene -75.0 -52.0
0
10000
20000
30000
40000
50000
60000
70000
80000
Erro
r fu
nci
ton
iterations
FF0 error function f(x)

254
From Table A5-2 we can see that the FF1 single point predictions are relatively decent with
respect to the DFT data, although they could be further improved. Regarding the geometry
optimizations, the majority of the reported FF1 predictions did not reach a convergence with the
imposed criterion of 50 maximum iteration for the CG. Taking this result in consideration, we
decided to augment the number of maximal iterations in the CG settings and to verify if this
solution could aid us obtaining converged configurations.
5.5 First ReaxFF MD test of a surrogate “fuel-oxygen” blend: Production set
To verify if the optimized FF1 was capable to simulate the dynamic behavior of molecular
systems representing surrogates of deposit precursors, we identified a preliminary “fuel-oxygen”
blend with the following composition: 95% mol toluene (C7H8), 3% mol benzyl hydroperoxide
(C7H8O2) and 2% mol benzyl radical (C7H7°). To describe the chemistry of this system, we
selected the following reaction as reference:
C7H7° + C6H5 − CH2OOH ↔ C7H8 + C6H5 − CH2OO°
Equation 96
ΔEr = -29.7 kJ/mol
Where the H atom is abstracted from -COOH of the benzyl hydroperoxide from the reactive
benzyl radical resulting in the formation of toluene and the benzyl peroxy radical (C6H5 −CH2OO°). The ΔEr of this reaction was calculated via DFT and its value is close to the one
reported in reference [14].
5.5.1 Computational details
To simulate the dynamics of our chosen preliminary “fuel-oxygen” blend, we implemented the
NVT ensemble with the Nosé-Hoover Chain (NHC) thermostat [15] and divided the MD study
into two different parts:

255
i. An equilibration phase, where the energy, temperature and pressure of the system
must reach a plateau (e.g. equilibrium of the system).
ii. A production phase, which follows the equilibration phase and coincides with the
simulation data that will be taken as final result.
For the equilibration phase, we selected a constant thermal regime at T = 1 K in order to
equilibrate the system and a maximum number of step equal to 500’000. The time step was set at
0.25 fs, thus obtaining a total of 125 ps of simulation time.
For the production phase we set two consecutive thermal regimes:
i. a linear T regime starting from T° = 1 K to Tfin = 500 K for the duration of 2*106
iterations. The time step is set to 0.25 fs, giving a total simulation time of 500 ps.
ii. A constant T regime at T = 500 K for the duration of 2*106 iterations. The time step is
set at 0.25 fs, giving a total simulation time of 500 ps.
The molecular box was composed of a total of 95 molecules, where 90 are toluene molecules, 3
are benzyl hydroperoxydes and 2 are of benzyl radical with a cell volume of 15813.3 Å3. This
molecular composition was chosen to simulate the liquid density of this blend at ambient
conditions (e.g. P = 1 atm and T = 20°C) taking the toluene density as reference since it
represents the solvent of the examined solution (e.g. 0,87 g/cm3[16]).
5.5.2 Results and discussion of ReaxFF MD test: “fuel-oxygen” blend
In Figure A5-8 we report the plateau obtained respectively from: the total energy, the
temperature, the pressure, and the number of molecules contained in this molecular box during
the equilibration phase. From Figure A5-8 we can deduce that 125 ps were enough to reach the
system equilibrium. Also, we can observe that no abnormal reactions took place in this time
fragment, since the number of molecules registered in this phase did not change. Thus, we farther
proceeded with the production phase.
During the first 250 ps of the linear T regime no reactions were detected, but at T ≈ 250 K (≈ -
23°C) we started to see the production of unexpected intermediates (Figure A5-9a).

256
The formation of these intermediates was not expected to occur at T ≈ 250 K since the
temperature are definitely too low to encourage the reactivity of this system towards this
direction. According to other works [11, 17], hydroperoxydes tend to react readily in the fuel
autoxidation process, but reactions take place for temperatures equal or slightly above the
ambient conditions.
During the constant thermal regime at T = 500 K, the previously observed intermediates continue
to interact, creating binary and ternary molecular complexes (Figure A5-9b).Since these
complexes are formed as a consequence of the interaction of unusual intermediates, we
concluded that the chemical reactivity of the whole system was not correctly described.
Figure A5-8: NVT equilibration phase plots of energy, temperature, pressure and number of molecules of the homogeneous system defined by the liquid “fuel-oxygen” mixture.

257
a) b)
Figure A5-9: Intermediates registered in the production phase during a) the linear T regime (around T = 250 K) and b) the constant T regime at T = 500 K.
5.6 Second “static” test: adsorption energies
In this second cycle of ReaxFF parametrization we decided to add to the training-set also the
DFT adsorption configurations of dry α-Cr2O3 and dry and hydroxylated α-Al2O3 (Chapter 4).
The strategy of this additional data contribution was to realize a new training-set as complete as
possible in order to achieve a higher accuracy for the new optimized ReaxFF.
5.6.1 Computational details
As to obtain a better dynamic description of our molecular systems, for the second cycle of
ReaxFF optimization we decided to test two different versions of FF1: the first coinciding with
the “original” FF1 optimized version and the second coinciding with a “changed” FF1, where
more precisely we chose to substitute the ReaxFF parameters of H and O atoms by inserting the
values coming from the “CHON-2017_weak.ff” force field developed by Zhang and van Duin
[18]; we called this second version as “FF2”.
For both force fields, the same DFT data and parameters were selected for the reparametrization;
the parameters are reported in Table A5-3 below.
In addition to the C-H bond, this time we also selected the C-C and the C-O bonds. In particular,
for the C-O bond, similarly to what was done for the O-H bond, the selection of all the
aforementioned ReaxFF parameters was due to the fact that the C-O bond also describes both the

258
feature of intramolecular interactions (e.g. C=O group belonging to the carbonylic compounds)
and intermolecular interactions (e.g. C-O vdW forces established between the molecular carbon
chain and the OH groups at the chromia surface). The choice to optimize again the bond orders
and energy terms for the C-H bond was to further increase the improvement of the description of
the C-H properties for the lactone configurations.
About the O-H bond, we reconducted to the selection of the E(sigma) value for O-H bond to
direct change the behavior of the OH groups on the hydroxylated chromia surface. For this
reason, in this new ReaxFF optimization, we decided to not select the bond order and energy
terms linked to the O-H bond, to verify if we could obtain an improvement of the description of
the interface interactions without altering these parameters.
For the C-Cr and C-Al bonds, only the vdW parameters were selected since these bonds represent
the interactions between the molecular carbon chain and the metallic atoms (e.g. Cr/Al)
terminating the dry chromia and alumina surfaces.
Table A5-3: Parameters selected for ReaxFF parametrization of both FF1 and FF2.
Optimized parameters
C-C C-H C-O H-O C-Cr C-Al Al-O Cr-O
E(sigma) ✓ ✓ ✓ - - - - -
pbe1 ✓ ✓ ✓ - - - - -
povun1 ✓ ✓ ✓ - - - - -
pbe2 ✓ ✓ ✓ - - - - -
pbo1 ✓ ✓ ✓ - - - - -
pbo2 ✓ ✓ ✓ - - - - -
E(vdW) - - ✓ ✓ ✓ ✓ ✓ ✓
R(vdW) - - ✓ ✓ ✓ ✓ ✓ ✓
Alpha(vdW) - - ✓ ✓ ✓ ✓ ✓ ✓
R(sigma) - - ✓ ✓ ✓ ✓ ✓ ✓
Finally, for the Cr-O and Al-O bonds, again we did not consider the bond order and energy terms
because we still did not want to alter the parameters linked in the surface structure (even though
these bonds can also describe the intermolecular interactions between the oxygenated molecules

259
and the Cr/Al-terminated dry chromia and alumina surfaces). Again, we only selected the vdW
parameters because they contribute to the establishing of the interface interactions between
molecules and the metal-oxide surfaces.
We imposed again 1000 fit iterations for the CMA-ES FF optimizer. For the geometry
optimization setup, we implemented again the CG algorithm and this time we augmented the
number of maximum iterations up to 100 iterations following what was mentioned in section
5.4.2.
5.6.2 Results and discussion of 2nd static test
We report below respectively in Figure A5-10 and Figure A5-11 the adsorption energies
calculated with both new optimized force fields compared with the DFT Cr2O3 data. The
optimized version of FF1 is labeled as FFA and the one for FF2 is labeled as FFB.
Figure A5-10: Comparison of the adsorption energies for dry α-Cr2O3 calculated for both FFA and FFB against the DFT values.
Figure A5-10 shows the results for the adsorption energies related to the dry α-Cr2O3
configurations. We can see easily here that the optimized FF1 (namely FFA) does not reproduce
satisfactorily certain configurations, in certain cases with a very high discrepancy compared to
DFT values (e.g. the dissociative and molecular adsorption of the acetic acid, the methylacrylate
-250
-200
-150
-100
-50
0
Ad
sorp
tio
n e
ner
gies
[k
J/m
ol]
Adsorption energies Dry-Cr2O3
FFA FFB DFT

260
and the methylpropionate adsorptions). On the other hand, the optimized FF2 (namely FFB) is
able to decently describe the majority of the adsorption configurations when compared to the
DFT results.
Figure A5-11 shows the results for the adsorption energies related to the hydroxylated α-Cr2O3
configurations. Here it appears even more clearly that the optimized FF1 (FFA) is not capable to
reproduce almost all the configurations, while on the other hand, the optimized FF2 (FFB) is able
to describe accordingly the majority of the adsorption configurations when compared to the DFT
results.
Figure A5-11:Comparison of the adsorption energies for hydroxylated α-Cr2O3 calculated for both FFA and FFB against the DFT values.
Even though the description of α-Cr2O3 configurations worsened for the FFA force field, we
found on the other hand that it was capable to decently reproduce the DFT data of dry α-Al2O3
configurations (Figure A5-12). A similar trend was found also for the hydroxylated α-Al2O3
configurations (not reported).
From these results, we acknowledged the newfound difficulty for FFA to reproduce accordingly
the α-Cr2O3 configurations, especially the ones related to the hydroxylated state and at the same
time to reproduce accurately enough the dry α-Al2O3 systems.
-250
-200
-150
-100
-50
0
Ad
sorp
tio
n e
ner
gies
[k
J/m
ol]
Adsorption energies HY-Cr2O3
FFA FFB DFT

261
For this reason, we decided that a good course of action could be to divide the ReaxFF
reproduction of α-Cr2O3 and α-Al2O3 towards two different reactive force fields: the FFA for the
description of alumina systems and FFB for the chromia systems.
In addition, the augmentation of the number of maximum iterations from 50 (section 5.4.2) to
100 was still not sufficient to reach a convergence for the majority of the analyzed
configurations. Therefore, we opted again to increase the number of maximal iterations in the CG
settings and to verify if this solution could aid in obtaining converged configurations.
Figure A5-12: Comparison of the adsorption energies for dryα-Al2O3 calculated for FFA against the DFT values.
5.7 Conclusion of the preliminary ReaxFF study
From the ReaxFF analysis conducted so far, we made the following conclusions:
i. To improve the ReaxFF reproducibility of DFT data, it is necessary to have a training-
set as conspicuous as possible. In our case, the systematic addition of adsorption
configurations (first only chromia-based, then with the addition of dry/hydroxylated
alumina configurations) confirmed this statement.
ii. To obtain a further confirmation for the good fitting of the reactive force fields, the
addition of supplementary tests for the ReaxFF validation-set (i.e. FF tests for the bulk
-250
-200
-150
-100
-50
0
Ad
sorp
tio
n e
ner
gies
(kJ/
mo
l)
Adsorption energiesDry alpha-Al2O3
FFA DFT

262
and surface geometries and gas phase reactions for the static study, liquid-phase
density analysis for the dynamic study) is necessary.
iii. From the results reported in paragraph 5.6.2, we decided to optimize two separate
force fields for α-Cr2O3 and α-Al2O3 systems respectively to ensure a higher
possibility for a good description of each systems.
5.8 Heterogeneous systems: Desorption temperature analysis
The next step consisted in studying the behavior of adsorbed molecules with temperature. One of
the advantage of the force field is that we can perform simulated heating and accumulate a
trajectory long enough to describe the system degrees of freedom as adsorption/desorption and
molecule diffusion at the surface.
To do this, we choose molecules of different chemical families, i.e. molecule adsorbing with
dissociation at the surface (acetic acid), molecules with a specific interaction with the surface
(ethanol, benzyl ethanol), and molecule with a weak, non-specific interaction with the surface
(benzene). Also, in Chapter 4, we have evidenced the difference in reactivity of the hydroxylated
versus anhydrous α-Al2O3 surfaces, and thus, the adsorption of the molecules on the hydroxylated
surface is also investigated. Thus, we compare different molecules on a given surface and
different surfaces for a given molecule.
5.8.1 Computational details
For this MD study on the desorption temperatures, we implemented the NVT ensemble, where
we selected the Nosé-Hoover Chain (NHC) thermostat [10]. We selected an initial T° = 0 K at the
start of these simulations, with a damping constant of 100 fs for the thermostat and setting the
NHC length at 10. The total number of steps was set to 6.5*106 for the acetic acid, ethanol and
benzyl alcohol and to 4.5*106 for the benzene. For all the cases, the time step was 0.25 fs,
corresponding to a total calculation time of 1625 ps ( ≈ 1.6 ns). For each case, we divided the
simulations into two stages: a first equilibration stage and a production stage. For the first stage,

263
we fixed T = 1 K thermal regime with a duration of 125 ps (= 5*105 steps). Once the system was
equilibrated by the end of the equilibration phase, we proceed to the production phase.
For the production phase, we divided the thermal regime into two different sub-regimes: a) a first
linear T increase from 1 K to 𝑇𝑑𝑒𝑠𝐷𝐹𝑇 and b) a second constant T regime where T = 𝑇𝑑𝑒𝑠𝐷𝐹𝑇. The
increasing T rate was equal to 0.8 K/ps for the ethanol, the acetic acid and the benzyl alcohol,
while it was set to 0.5 K/ps for the benzene.
In Table A4-4 we reported the gas phase entropy of the molecules, and in Chapter 4, we applied
these values together with the calculated adsorption energies to estimate the temperature of
molecule desorption, 𝑇𝑑𝑒𝑠𝐷𝐹𝑇, from the surface.
The Al2O3(0001) surface was described by a (4x4) cell and the number of adsorbate molecules
was equal to 4 on the alumina surface, two on each surface (top and bottom). This allowed a
weak surface coverage, with no molecule-molecule interaction, and to acquire more statistic data,
studying four molecules instead of one. In addition to these MD simulations, Born Oppenheimer
Molecular Dynamics was performed to compare both approaches.
5.8.2 Results and discussion
Table A5-4 summarizes the molecules studied, surface state and temperature applied at the
plateau.
Table A5-4: the molecules studied, surface state and temperature applied.
Surface
Molecule
Al2O3 𝑻𝒅𝒆𝒔𝑫𝑭𝑻 (K) Al2O3-HY 𝑻𝒅𝒆𝒔𝑫𝑭𝑻 (K)
Acetic acid 750 196
Ethanol 600 160
Benzyl alcohol 600 250
Benzene 250 186

264
Rising the temperature enhances, as expected, the molecules mobility. As a general trend, we did
not observe “desorption” when rising up the temperature, rather, we observed more diffusion of
the molecules on the surface, molecules rotation, and desorption/readsorption phenomena. All
these phenomena are not easy to describe. The first, intuitive descriptor, e.g. the molecule/surface
distance, turned to render a partial information. Thus, for the present study, we used several
descriptors and their combination:
i. The first descriptor is that of a “specific” molecule-surface interaction, if any. This
implies that we searched for the reactive moiety in the molecule–surface interaction, at
low temperature, and then followed its evolution with temperature increase.
ii. The second descriptor is that of the molecule mobility on the surface. Here, the
accumulated trajectories were not sufficient to calculate a diffusion coefficient of the
molecule at the surface, thus, we report a qualitative analysis of surface mobility.
iii. A third descriptor is the variation of the molecule/surface orientation, which is related
to molecule rotation at the surface. Again, the accumulated trajectories do not allow to
calculate a true “flip frequency” of the molecule at the surface, and when necessary we
report a semi-quantitative analysis.
For the anhydrous surface, Figure A5-13 shows the molecular signature, the C density versus the
distance to the surface, at different temperatures. For acetic acid, increasing temperature, the peak
at Al-C = 2.8 Å, attributed to the formation of an Al-O bond with the carboxylate O atom,
disappears and a peak at 3.3 Å appears. For ethanol, as soon as T > 100 K, the short range
interaction (C-Al = 2.6 ± 0.1 Å, due to the formation of the Al-alcohol O bond) is broken. A peak
at Al-C = 3.1 Å is maintained until 600 K. This peak at 3.1Å disappears at 600 K, with a
maximum at 3.7 Å, and a broad distribution of C localization. For benzyl alcohol, the peak Al-C
at 2.6 Å assigned to the Al-benzyl alcohol interaction decreases with increasing temperature and
vanishes at 𝑇𝑑𝑒𝑠𝐷𝐹𝑇 . Only in the case of benzene, the Al-C distance typical for the molecule-surface
interaction does not vanish at increasing temperature.

265
Acetic acid@Al2O3 Ethanol@Al2O3
Benzyl@Al2O3 Benzene@Al2O3
Figure A5-13: Evolution of the carbon amount (proportion of the total number of C atoms) of the adsorbed molecule with respect to the distance to the surface (Å) with increasing temperature.
In order to further understand the case of benzene adsorbed on Al2O3, we performed a Born Oppenheimer
Molecular Dynamics (BOMD) trajectory of benzene/Al2O3 system at 150, 250, 350 and 450 K. The cell
chosen for the BOMD was (2x2), with one molecule in the cell. The dynamics was a NVT, with a time
step of 1.5 fs. To save computational time, a cutoff of 300 eV (PREC = LOW) was used instead of 520 eV
(PREC = HIGH) in the geometry optimizations. The simulation time was 7.5 ps.

266
We report in Figure A5-14 the C amount versus the distance to surface, at 250 K, for FFA (orange) and
DFT (blue).
Figure A5-14: C amount of benzene at the Al2O3 surface (Å) during the plateau at 250 K (orange: FFA; blue: DFT).
We notice that the two curves exhibit the same profile, albeit the DFT curve has sharper peaks,
due to a much smaller accumulation time. We conclude to a good correspondence between FFA
and the DFT trajectory. In particular, the peak at 2.8 Å, typical of the Al-C interactions, is present
both in FFA and DFT profiles. The present result thus suggests that benzene is not desorbed from
the Al2O3 surface at 250 K, at least for short acquisition times accumulated here.
For the hydroxylated surface, we report in Figure A5-15 the C amount with respect to the surface
distance for ethanol and benzyl alcohol at the hydroxylated surface, two molecules able to form a
H-bond with the hydroxylated surface. For ethanol, because 𝑇𝑑𝑒𝑠𝐷𝐹𝑇 is low (160 K), we just
compare the C amounts at 1 K and at 𝑇𝑑𝑒𝑠𝐷𝐹𝑇, whereas for benzyl alcohol, we could follow the
progression with temperature increasing. Again, we find that at 𝑇𝑑𝑒𝑠𝐷𝐹𝑇, the signature of the
molecule-surface interaction has vanished: for ethanol, the C from the molecule is located at a
precise distance from the surface at 1 K, and the two C atoms of the molecule are distinguished.
In contrast, at 160 K, the molecule is slightly farther from the surface and the signal is broad,
indicating that the molecule has acquired some degrees of freedom. For the benzyl alcohol, the
disappearance of the C surface interaction appears clearly with the increasing temperature.
Distance to surface (Å)FFA
C
FFB

267
a) ethanol@Al2O3-HY b) Benzyl ethanol@Al2O3-HY
Figure A5-15: C amount with respect to the hydroxylated Al2O3 surface distance (Å) for a) ethanol: dashed line: 1K; plain line: 160K, and b) benzyl ethanol at different temperature ranges
In this second MD stage, only the FFA was implemented; this choice was due to the FFB
inaccuracy shown on the description of realistic dynamic behaviors. Thus, the only analyzed
substrate in this analysis was the alumina. From these MD simulations, we did not observe
“desorption” when rising up the temperature, but rather phenomena like molecular diffusion on
the surface, molecular rotation and desorption/readsorption combinations. For the anhydrous
alumina surface, the results of the molecular signature (either C or O) density versus the distance
to the surface, at different temperatures, for ethanol, acetic acid and benzyl alcohol showed a
good correspondence between ReaxFF and BOMD approaches, while for the benzene/Al2O3
supplementary calculations at higher temperatures revealed that the reason of the reminiscence of
the peak at short distances is due to a molecular flip frequency augmentation with temperature.
For the hydroxylated alumina surface, the C amount with respect to the surface distance for
ethanol and benzyl ethanol was reported. This analysis revealed that at 𝑇𝑑𝑒𝑠𝐷𝐹𝑇 = 160 K, the ethanol
molecule is slightly farther from the surface and the signal is broad, indicating that the molecule
has degrees of freedom, while for the benzyl alcohol, the disappearance of the C surface
interaction appears clearly with the increasing temperature.
0
0,02
0,04
0,06
0,08
0,1
0,12
0,14
0,16
0 2 4 6
C
distance to surface (Å)

268
Chapter 6
Liquid-phase “fuel-oxygen” mixture
Figure A6-1: Reached plateau for the system total energy by the end of the equilibration phase of the NPT
simulations (homogeneous phase of the “fuel-oxygen” mixture).
Figure A6-2: Reached plateau for the system temperature and pressure by the end of the equilibration phase of the NPT simulations (homogeneous phase of the “fuel-oxygen” mixture).

269
Droplets of liquid “fuel-oxygen” mixture adsorbed on alumina
Figure A6-3: NVT equilibration phase plots of energy, temperature, pressure and number of molecules (heterogeneous case of the adsorption of the liquid droplet of “fuel-oxygen” mixture on dry Al2O3 surface.

270
Liquid-phase “fuel-oxygen” mixture adsorbed on alumina
Figure A6-4: NVT equilibration phase plots of energy, temperature, pressure and number of molecules (heterogeneous case of the adsorption of the liquid droplets of “fuel-oxygen” mixture on hydroxylated Al2O3
surface.

271
Figure A6-4: NPT equilibration phase plots of energy, temperature, pressure and cell volume (heterogeneous case of the adsorption of the liquid-phase of “fuel-oxygen” mixture on dry Al2O3 surface).

272
Figure A6-5: NPT equilibration phase plots of energy, temperature, pressure and cell volume (heterogeneous case of the adsorption of the liquid-phase of “fuel-oxygen” mixture on hydroxylated Al2O3 surface).

273
C proportion (of the total C amount) as a function of the
distance to the surfaces
Layer by layer analysis of the C density
Hydroxylated surface
Layer by layer analysis of the C density Dry surface
Red: surface layer (up to 4 angst to the surface) Blue: liquid (more than 8 angst)
C density (atom/nm3), for the surface molecules (red), bulk molecules (blue), second layer (grey) and average (yellow)
Figure A6-6: C analysis at 300 K for toluene on alumina surfaces
0
0,005
0,01
0,015
0,02
0 5 10 15 20
C p
rop
ort
ion
distance to surface (angstroem
hydroxylated surface
dry surface0
10
20
30
40
50
60
70
80
90
0 200 400 600 800
0
10
20
30
40
50
60
0 500

274
This page is intentionally left blank

ABSTRACT
The use of biofuels is one of the main levers for the transport industry to meet the ambitious
environmental targets. However, one of their major drawbacks is their thermal and chemical
stability towards oxidation. Indeed oxidation causes hydrocarbon degradation, which results in the
formation of insoluble aggregates and deposits in the fuel system of automobiles and aircraft that
consequently leads to mechanical engine failures, such as injector blockage or filter plugging.
The objective of this thesis is to better understand the phenomenology related to the formation of
deposits produced by the autoxidation process that occurs for fossil and renewable fuels and the
impact of the metal surface in contact with the fuel. To achieve this goal, the methodology adopted
for this thesis is based on the combination of two different numerical approaches: ab initio Density
Functional Theory (DFT) and an empirical atomistic Reactive Force Field (ReaxFF) simulations.
MOTS CLÉS
DFT, Biocarburant, Adsorption, Dépôt, ReaxFF
RÉSUMÉ
L'utilisation de biocarburants est l'un des principaux leviers permettant au secteur des transports
d'atteindre les objectifs environnementaux ambitieux. Cependant, l'un de leurs inconvénients
majeurs est leur stabilité thermique et chimique vis-à-vis de l'oxydation. En effet, l'oxydation
provoque la dégradation des hydrocarbures, ce qui entraîne la formation d'agrégats et de dépôts
insolubles dans le système d'alimentation en carburant des automobiles et des avions, conduisant
ainsi à des défaillances mécaniques du moteur, telles que le blocage des injecteurs ou le colmatage
des filtres.
L'objectif de cette thèse est de mieux comprendre la phénoménologie liée à la formation de dépôts
produits par le processus d'autoxydation qui se produit pour les carburants fossiles et renouvelables
et l'impact de la surface métallique en contact avec le carburant. Pour atteindre cet objectif, la
méthodologie adoptée pour cette thèse est basée sur la combinaison de deux approches numériques
différentes: la théorie de la fonctionnelle de la densité ab initio (DFT) et une simulation empirique
atomistique par champ de force réactif (ReaxFF).
Traduit avec www.DeepL.com/Translator (version gratuite)
KEYWORDS
DFT, Biofuel, Adsorption, Deposit, ReaxFF
Copyright © 2022 FDOKUMEN