Underwater acoustic records from the March 2009 eruption of Hunga Ha'apai-Hunga Tonga volcano in the...
13
Underwater acoustic records from the March 2009 eruption of Hunga Ha'apai-Hunga Tonga volcano in the Kingdom of Tonga DelWayne R. Bohnenstiehl a, ⁎, Robert P. Dziak b , Haru Matsumoto b , T.-K. Andy Lau b a Department of Marine, Earth and Atmospheric Sciences, North Carolina State University, Raleigh NC 27695, USA b Oregon State University and the National Oceanic and Atmospheric Administration, Hatfield Marine Science Center, Newport OR 97365, USA abstract article info Article history: Received 25 June 2012 Accepted 20 August 2012 Available online 28 August 2012 Keywords: Hunga Ha'apai-Hunga Tonga Volcano Surtseyan eruption Acoustics Hydrophone monitoring Arc volcanism A network of autonomous underwater hydrophones is used to monitor acoustic activity associated with Hunga Ha'apai-Hunga Tonga volcano during a period of 15 months. The data provide a continuous record spanning a surtseyan eruption (VEI 2) in March of 2009, which input ~10 13 J of acoustic energy into the ocean soundscape. In the months before the eruption, the volcano can be identified as an intermittent source of ambient noise. The period of seismic unrest that precedes the eruption begins at 15:11 UTC on 16 March (04:11 LT on 17 March), approximately 7 h before the first satellite confirmation of eruptive activity and 14 h before the first eyewitness reports. The initial seismic activity, which includes a single 4.8 m b event at 15:25, evolves as a typical foreshock–mainshock–aftershock sequence. By 15:38, however, the rate of small earthquakes begins to increase, marking the onset of the seismic swarm. The period of highest-amplitude acoustic energy release between 16:40 and ~ 17:10 is interpreted to mark the opening of the volcanic conduit. By 19:00 on 16 March, the acoustic signature of the volcano is marked by a continuous wide-band (1–20 Hz) noise and a set of transient very-broadband (1–125 Hz) explosion signals. This activity is characteristic of the main surtseyan phase of the eruption. Both the intensity of explosions and the amplitude of the lower frequen- cy wide-band noise decay through time, and eruptive activity likely ends at ~09:00 on 19 March, ~2.7 days after the initiation of seismic activity. At this time the continuous low frequency noise decays to near back- ground levels and signal coherence drops suddenly. Low-level acoustic unrest persists through June of 2009, after which the volcano becomes acoustically dormant during the remaining ten months of monitoring. The analysis of volcano-acoustic signals associated with Hunga Ha'apai-Hunga Tonga volcano highlights the potential role of regional hydroacoustic monitoring in assessing volcanic hazards in arc settings. © 2012 Elsevier B.V. All rights reserved. 1. Introduction The Tofua volcanic arc is formed by the subduction of the Pacific Plate beneath the Tongan Plate of the extensional Lau Basin. The present-day plate tectonic configuration was initiated following the start of back arc spreading at 5–6 Ma (e.g., Parson and Hawkins, 1994; Parson and Wright, 1996; Taylor et al., 1996). At this time, rifting of the Lau Basin dissected the ancient arc system, forming the Lau and Tonga Ridges that mark the western and eastern boundaries of the basin, respectively. The active volcanic cones of the modern arc are built primarily along the western edge of the relict Tonga Ridge. Those volcanoes that immerge above sea level form young islands within the Tongan chain (Fig. 1). The uninhabited islands of Hunga Ha'apai and Hunga Tonga mark the western and northern subaerial rim of one such volcanic cone (Fig. 2). The islands are constructed from andesitic lava flows and alternating beds of scoria, lapilli and ash (Bryan et al., 1972). These layers dip gently away from the center of the cone, which is marked by a rocky shoal located ~2 km southeast of Hunga Ha'apai and ~3 km to the south of Hunga Tonga (Fig. 2)(Bryan et al., 1972). During inter-eruptive periods the islands become vegetated and serve as seabird breeding-grounds. Visitors include eco-tourists and sport fishermen. The closest population center is the Tongan capital city of Nuku'afola located 60 km to the south–southeast on Tongatapu Island. Historical eruptions of the Hunga Ha'apai-Hunga Tonga volcano occurred in 1912, 1937 and 1988 (Siebert et al., 2010). All three are reported to have been centered in the vicinity of the rocky shoal, with aerial observations during the 1988 eruption showing three separate vents aligned in a southwest trend and extending 100–200 m in length (Taylor, 2010). These historical eruptions lasted only a few days and sparse observations indicate volcanic explosivity indexes of VEI 2 for the 1912 and 1937 activity and VEI 0 for the 1988 eruption (Siebert et al., 2010). No new land was produced as a result of these historical erup- tions (Siebert et al., 2010; Taylor, 2010). The volcano erupted most recently in March of 2009, with the first reports of activity coming from commercial airline pilots and passengers at ~05:05 UTC on 17 March (18:05 LT) (Smithsonian Institution, 2009; Taylor, 2010; Vaughan and Webley, 2010). Spectacular images and Journal of Volcanology and Geothermal Research 249 (2013) 12–24 ⁎ Corresponding author. Tel.: +1 919 515 7449. E-mail address: [email protected] (D.R. Bohnenstiehl). 0377-0273/$ – see front matter © 2012 Elsevier B.V. All rights reserved. http://dx.doi.org/10.1016/j.jvolgeores.2012.08.014 Contents lists available at SciVerse ScienceDirect Journal of Volcanology and Geothermal Research journal homepage: www.elsevier.com/locate/jvolgeores
Transcript of Underwater acoustic records from the March 2009 eruption of Hunga Ha'apai-Hunga Tonga volcano in the...

Journal of Volcanology and Geothermal Research 249 (2013) 12–24
Contents lists available at SciVerse ScienceDirect
Journal of Volcanology and Geothermal Research
j ourna l homepage: www.e lsev ie r .com/ locate / jvo lgeores
Underwater acoustic records from the March 2009 eruption of Hunga Ha'apai-HungaTonga volcano in the Kingdom of Tonga
DelWayne R. Bohnenstiehl a,⁎, Robert P. Dziak b, Haru Matsumoto b, T.-K. Andy Lau b
a Department of Marine, Earth and Atmospheric Sciences, North Carolina State University, Raleigh NC 27695, USAb Oregon State University and the National Oceanic and Atmospheric Administration, Hatfield Marine Science Center, Newport OR 97365, USA
⁎ Corresponding author. Tel.: +1 919 515 7449.E-mail address: [email protected] (D.R. Bohnenst
0377-0273/$ – see front matter © 2012 Elsevier B.V. Allhttp://dx.doi.org/10.1016/j.jvolgeores.2012.08.014
a b s t r a c t
a r t i c l e i n f oArticle history:Received 25 June 2012Accepted 20 August 2012Available online 28 August 2012
Keywords:Hunga Ha'apai-Hunga Tonga VolcanoSurtseyan eruptionAcousticsHydrophone monitoringArc volcanism
A network of autonomous underwater hydrophones is used to monitor acoustic activity associated withHunga Ha'apai-Hunga Tonga volcano during a period of 15 months. The data provide a continuous recordspanning a surtseyan eruption (VEI 2) in March of 2009, which input ~1013 J of acoustic energy into theocean soundscape. In the months before the eruption, the volcano can be identified as an intermittent sourceof ambient noise. The period of seismic unrest that precedes the eruption begins at 15:11 UTC on 16 March(04:11 LT on 17 March), approximately 7 h before the first satellite confirmation of eruptive activity and14 h before the first eyewitness reports. The initial seismic activity, which includes a single 4.8 mb event at15:25, evolves as a typical foreshock–mainshock–aftershock sequence. By 15:38, however, the rate of smallearthquakes begins to increase, marking the onset of the seismic swarm. The period of highest-amplitudeacoustic energy release between 16:40 and ~17:10 is interpreted to mark the opening of the volcanic conduit.By 19:00 on 16 March, the acoustic signature of the volcano is marked by a continuous wide-band (1–20 Hz)noise and a set of transient very-broadband (1–125 Hz) explosion signals. This activity is characteristic of themain surtseyan phase of the eruption. Both the intensity of explosions and the amplitude of the lower frequen-cy wide-band noise decay through time, and eruptive activity likely ends at ~09:00 on 19 March, ~2.7 daysafter the initiation of seismic activity. At this time the continuous low frequency noise decays to near back-ground levels and signal coherence drops suddenly. Low-level acoustic unrest persists through June of2009, after which the volcano becomes acoustically dormant during the remaining ten months of monitoring.The analysis of volcano-acoustic signals associated with Hunga Ha'apai-Hunga Tonga volcano highlights thepotential role of regional hydroacoustic monitoring in assessing volcanic hazards in arc settings.
© 2012 Elsevier B.V. All rights reserved.
1. Introduction
The Tofua volcanic arc is formed by the subduction of the Pacific Platebeneath the Tongan Plate of the extensional Lau Basin. The present-dayplate tectonic configuration was initiated following the start of back arcspreading at 5–6 Ma (e.g., Parson and Hawkins, 1994; Parson andWright, 1996; Taylor et al., 1996). At this time, rifting of the Lau Basindissected the ancient arc system, forming the Lau and Tonga Ridgesthat mark the western and eastern boundaries of the basin, respectively.The active volcanic cones of the modern arc are built primarily along thewestern edge of the relict Tonga Ridge. Those volcanoes that immergeabove sea level form young islands within the Tongan chain (Fig. 1).
The uninhabited islands of Hunga Ha'apai andHunga Tongamark thewestern and northern subaerial rim of one such volcanic cone (Fig. 2).The islands are constructed from andesitic lava flows and alternatingbeds of scoria, lapilli and ash (Bryan et al., 1972). These layers dip gentlyaway from the center of the cone, which is marked by a rocky shoal
iehl).
rights reserved.
located ~2 km southeast of Hunga Ha'apai and ~3 km to the south ofHunga Tonga (Fig. 2) (Bryan et al., 1972). During inter-eruptive periodsthe islands become vegetated and serve as seabird breeding-grounds.Visitors include eco-tourists and sport fishermen. The closest populationcenter is the Tongan capital city of Nuku'afola located 60 km to thesouth–southeast on Tongatapu Island.
Historical eruptions of the Hunga Ha'apai-Hunga Tonga volcanooccurred in 1912, 1937 and 1988 (Siebert et al., 2010). All three arereported to have been centered in the vicinity of the rocky shoal, withaerial observations during the 1988 eruption showing three separatevents aligned in a southwest trend and extending 100–200 m in length(Taylor, 2010). These historical eruptions lasted only a few days andsparse observations indicate volcanic explosivity indexes of VEI 2 forthe 1912 and 1937 activity and VEI 0 for the 1988 eruption (Siebert etal., 2010). No new landwas produced as a result of these historical erup-tions (Siebert et al., 2010; Taylor, 2010).
The volcano erupted most recently in March of 2009, with the firstreports of activity coming from commercial airline pilots and passengersat ~05:05 UTC on 17 March (18:05 LT) (Smithsonian Institution, 2009;Taylor, 2010; Vaughan and Webley, 2010). Spectacular images and

−178˚ −177˚ −176˚ −175˚ −174˚
1
3
5
4
6
A
B
D
C
G
E
H
F
K
I
L
−7 −5 −3 −1 0−6 −4 −2
elevation (km)
−17˚
−16˚
−15˚
−18˚
−23˚
−22˚
−21˚
1 km
M3array
10
CLS
CE
LSC
PR FR
SC
MTJ
Tongan Plate
Australian Plate
Niuafo’ou Plate
Tong
a R
idge
Tofu
a A
rc
13D.R. Bohnenstiehl et al. / Journal of Volcanology and Geothermal Research 249 (2013) 12–24

1988 ERUPTION
HUNGA TONGA
HUNGA HA’APAI
South Vent
North Vent
-20o
34’
30”
-20o
33’
00”
-20o
31’
30”
-175o 24’ 54” -175o 21’ 54”-175o 23’ 26”
Fig. 2. Satellite image of Hunga Ha'apai and Hunga Tonga collected on 14 June 2009. Green outline shows approximate limits of Hunga Ha'apai prior to the March 2009 eruption. Awhite dashed line indicates the approximate location of the 1988 submarine eruption (Siebert et al., 2010; Taylor, 2010). (For interpretation of the references to color in this figurelegend, the reader is referred to the web version of this article.)
14 D.R. Bohnenstiehl et al. / Journal of Volcanology and Geothermal Research 249 (2013) 12–24
videos obtained by amateur photographers spurred both regionaland globalmedia attention. Although sparse in their temporal sampling,these reports are the primary record of ground-based observationsduring the episode. Passengers on small boats that approached theislands during the eruption reported two active area of venting, onealong the northwestern coastline of Hunga-Ha'apai and the other ap-proximately 100 m south of the island (Smithsonian Institution, 2009;Taylor, 2010) (Fig. 2). The interaction of rising magma with seawaterproduced a surtseyan eruption style, characterized by series of violentexplosions. The largest of these events sent ash and steam to an altitudeof 4–7.6 km (15,000–25,000 ft), making the plumes visible fromTongatapu Island and posing a hazard to regional air traffic (Vaughanand Webley, 2010).
During the time period spanning the eruption, Vaughan and Webley(2010) have analyzed data acquired by the satellite-based ASTER andMODIS imaging systems. Available cloud-free scenes constrain the onsetof eruptive activity to have occurred between 12:50 and 22:10 UTC on16 March (01:50 to 11:10 LT on 17 March). The data also indicate thatthe main phase of eruptive activity lasted only 3–5 days, with continuedsteam venting occurring for weeks afterwards. Using a time series of im-ages, Vaughan and Webley (2010) show that the land area of HungaHa'apai tripled during the eruption, before eroding to roughly twice its
Fig. 1. Regional bathymetric map and hydrophone array geometry. Red diamonds show theSOFAR channel at a depth of 1000 m below the sea surface. Labels refer to mooring numbedepicted in the center inset. White lines show MGL0309 cruise tracks (Dunn and Martinez,Plates that comprise the Lau Basin (Zellmer and Taylor, 2001). ELSC = Eastern Lau SpreadiCenter; PR = Peggy Ridge; MTJ = Mangatolu Triple Junction. The islands of the Tongan cwhich is the target area for our study, (B) Tongatapu, (C) Eua, (D) Kao and Tofua, (E)(K) Niuafo'ou. Marker (L) shows the location of the submarine West Mata Volcano (Resingsouth of this map, near 25.9° S, 177.2° W. (For interpretation of the references to color in t
original size within six months of the eruption (Fig. 2). Incorporatingthese land area changes and the area of rafted pumice fields, they reportthe total volume of eruptive material to be ~0.0176 km3. Based on theeruptive volume, height of the eruptive column and duration of activity,the eruption is classified as a VEI 2 event (Siebert et al., 2010; Vaughanand Webley, 2010).
This article examines the record of eruptive activity, as monitored byan array of sound-channel moored hydrophones deployed at ranges ofapproximaely100–500 km from Hunga Ha'apai. While both ship- andsatellite-based observations are intermittent, the hydrophone recordsprovide a continuous acoustic time series during a period of 15 monthsspanning the eruption. The focus of this paper is on documenting thetiming, style and underwater acoustic signature of the eruption and itsassociated seismic activity.
2. Lau hydrophone array
2.1. Overview of instrumentation
During the period of 20 January 2009–15 April 2010, an array ofmoored hydrophones was deployed within the Lau Basin between15–23° S and 173–178° W. At the time of the March 2009 eruption of
location of single element omni-directional hydrophones deployed near the axis of thers. The red square labeled M3 shows the position of the four element horizontal array2010). Black lines show the boundaries defining the Australian, Tongan and Niuafo'oung Center; CLSC = Central Lau Spreading Center; FRSC = Fonualei Rift and Spreadinghain are shaded in black, and are identified as (A) Hunga Ha'apai and Hunga Tonga,Ha'apai Group, (F) Vava'u, (G) Late, (H) Fonualei, (I) Niuatoputapu and Tafahi, andet al., 2011). Monawai volcano (Chadwick et al., 2008; Wright et al., 2008) lies to thehis figure legend, the reader is referred to the web version of this article.)

15D.R. Bohnenstiehl et al. / Journal of Volcanology and Geothermal Research 249 (2013) 12–24
Hunga Ha'apai‐Hunga Tonga, the array consisted of five single elementstations (M1,M4,M5,M6,M10) and a sixth that hosted a short baselinehorizontal array of four sensors deployed in a diamond-shaped config-uration (M3, Fig. 1). Each sensor package consisted of a single omni-directional ceramic hydrophone mounted on a titanium pressure casecontaining afilter/pre-amplifier stage, data logging computer, hard drivesand alkaline battery pack (Fox et al., 2001). To take advantage of theefficient propagation of sound in the deep ocean, these recorders weremoored by a float near the axis of the sound channel (1000±50 m),where they continuously sampled the ambient sound field at a rate of250 Hz.
The absolute timing for each instrument was maintained autono-mously using a microprocessor controlled temperature-correctingcrystal oscillator (MCXO) manufactured by the Q-tech Corporation,models QT2001 (single-element stations) and QT2010 (M3). Eachclock was synced with a GPS time before and after deployment. Mea-sured absolute drift rates averaged 1 s/yr for the QT2001clocks; where-as, the QT2010 clocks used for theM3-array drifted only 0.09–0.42 s/yr.The Q-tech clocks' 1-pulse-per-second (1PPS) signals were logged andpost-processed for more precise timekeeping, and clock drifts werecorrected linearly for each instrument.
Acoustic pressures are measured by removing the frequency-dependent instrument response, and are expressed in units of μPa(10−6 Pa) or decibels relative to a reference pressure of 1 μPa. Thisis the standard reference pressure for underwater acoustics. Readersmore familiar atmospheric acoustic measurements can make an ap-proximate conversion to equivalent atmospheric decibel levels bysubtracting 63 dB from the values reported.
2.2. Quad-array processing and calibration
The quad-array (M3) is used to estimate the back azimuth of in-coming acoustic energy using a plane wave fitting routine (e.g., DelPezzo and Giudicepietro, 2002; Chapp et al., 2005). The travel timedifferences between hydrophone pairs (tij) are estimated from thecross correlation of their low-frequency (2–20 Hz) band passed wave-forms. This analysis band exhibits the highest signal-to-noise ratio for Ter-tiary (T-) wave arrivals sourced from shallow submarine earthquakes(e.g., de Groot-Hedlin and Orcutt, 2001). Given the separation betweensensors (1.6–2.8 km), a window length of 5 s is used in all calculations.The horizontal slowness is found by solving the system of equations
Counter-ClockwiseBias
Azimuthal Offset (
Num
ber
of C
alib
ratio
n S
hots
−3 −2 −1 00
50
100
150
200
250
300
350 cc
AB
CD
Fig. 3. Horizontal array (M3) calibration using airgun shots from cruise MGL0309 (Dunn andlocations and the back-azimuth determined using the plane-wave fitting procedure. Results arvalue (cl) and velocity (v) returned by the inversion. The standard deviation, mean and medianwindows band-passed between 2 and 20 Hz.
Δp=t, where Δ represents a two-column matrix containing the offsetsin the x- and y-direction between sensor pairs, t is a column vector ofthe corresponding time delays, and the vector p represents the two com-ponent (px, py) horizontal slowness. The velocity (v) and azimuth (az) aregiven as v=1/|p| and az=tan−1 (px/py). Reported back-azimuths arefiltered for data quality based on the correlation coefficient (cc) betweenstations pairs, the closure value estimated by summing the lags, cl=t12+t23+t34+t41, which should be near zero, and the velocity (v)returned by the inversion,which is expected to be ~1485 m/s for acousticwaves traveling within the low-latitude sound channel.
The resolution and accuracy of the azimuth calculation is verified byusing a series of seismic airgun shots produced using the R/V Marcus G.Langseth between 27 January and 24 February 2009 (Dunn andMartinez, 2010; Schiep, 2012). The survey deployed thousands ofacoustic sources along the Eastern Lau Spreading Center (ELSC) at rangesof between 30 and 100 km from the M3 array and at back azimuths be-tween 80° and 135°, spanning the ~95° path to Hunga Ha'apai (Fig. 1).
Fig. 3 shows a histogram of the angular difference (°) between theazimuths returned by the inversion and true azimuth estimated fromthe shot meta-data. Cross-correlations are derived using a 2–20 Hzband-passed signal of 5 s duration capturing the initial arrival of thewater-borne phase at the hydrophone. To provide an estimate theazimuthal accuracy as a function of the data quality, the results are fil-tered based on the returned cc, v and cl values. Coherent arrivals havingcc>0.6, v=1485±50 m/s and |cl|b32 ms (Quality A) show a normaldistribution with a mean offset of 0.23° counter clockwise and 0.31°standard deviation. Relaxing these criteria to cc>0.5, v=1485±100 m/s and |cl|b64 ms (Quality B), the estimated azimuths have amean offset of 0.25° counter clockwise and 0.57° standard deviation.For arrivals with cc>0.4°, v=1485±150 m/s and |cl|b96 ms (QualityC), the mean angular offset is 0.30° and one standard deviation uncer-tainty rises to 0.93°. For all arrivals having cc>0.3, v=1485±200 m/sand |cl|b128 ms (Quality D), the mean angular offset is 0.25° and onestandard deviation uncertainty rises to 1.17°.
These errors may represent uncertainty in transponder-determinedpositions of the mooring anchors, drift of the hydrophones about theirwatch circles in response to currents, or non-linear drift among thefour autonomous clocks. It also should be noted that airgun sourcesdeployed near the sea surface propagate dominantly via sea bottomreflection (Schiep, 2012), likely degrading their coherence; whereas,volcano-acoustic sources positioned at greater depthsmay couple directly
Clockwise Biaso)
1 2 3
Cut-Off Criteria Error Statistics (o) , cl (ms), Δv (km/s) Std, Mean, Median
>0.3, < 128, 0.20 1.19, -0.25, -0.27
>0.4, < 096, 0.15 0.93, -0.30, -0.29
>0.5, < 064, 0.10 0.57, -0.25, -0.26
>0.6, < 032, 0.05 0.31, -0.23. -025
Martinez, 2010). Histogram depicts azimuthal difference between GPS-determined shote filtered at various levels of data quality based on the correlation coefficient (cc), closureoffset are tabulated. Time lags used in the inversion were determined using 5 s duration

16 D.R. Bohnenstiehl et al. / Journal of Volcanology and Geothermal Research 249 (2013) 12–24
into the sound channel. Nonetheless, these calibration results show thatthe method provides sufficient accuracy associate arrivals with theHunga Ha'apai‐Hunga Tonga volcanic edifice. The measured angular res-olution and accuracy of theM3-array are consistentwith published valuesfor equivalent three-element arrays deployed with a similar aperture aspart of the International Monitoring System (e.g., Graeber and Piserchia,2004; Hanson and Bowman, 2006).
3. Underwater acoustics of the March 2009 eruption
3.1. Ambient noise correlations
To evaluate long-term acoustic activity at Hunga Ha'apai-HungaTonga volcano, ambient noise recorded at station M3 is cross-correlatedusing a series of 5 s durationwindowswith 4 s (80%) overlap. An ambientnoise “detection” is declared for any window returning Quality Level C orbetter results (Fig. 4a). The results prior to theMarch eruption are compli-cated by the R/V Langseth survey, which manifests itself in Fig. 4a as aseries of stripes tracking the ship and airguns. Still evident in Fig. 4a, how-ever, are a series of well-correlated detections directed at the HungaHa'apai island. Although the number of Hunga Ha'apai-directed detec-tions is small, occupying only ~0.01% of the correlation windows exam-ined prior to 17 March 2009, they define a narrow band that stands outrelative to the seismic survey and background detection field (Fig. 4a).This result indicates that the volcano was acoustically active in themonths prior to the eruption.
The number of well-correlated noise windows begins to increaseat ~15:38 on 16 March, and the decreases sharply at ~08:50 on March19. During this time window an average of 91% of the all cross correla-tion windows report detections directed from Hunga Ha'apai, and 66%of these windows correlate above the Quality Level A threshold. Thisconstrains the primary eruptive period to be ~2.7 days in duration.
During this period, detection azimuths tend to cluster in two groups,with one peak at 95.7° and the other near 94.7° from the M3 array.Applying a correction for the ~0.30 counter-clockwise bias in the abso-lute azimuth, as determined from the airgun calibration (Section 2.2),the more southerly azimuth points toward the southern tip of thepre-eruptive island shoreline, and the northerly azimuth points just tothe north of the island. The observed angular separation from the M3array is slightly larger the ~0.7° difference between north and south
90
500
95
100
00 06 12 18 00 06 12 18 00 06 12 18 00
100 150 200 300250
Time (days) since 00:00:0
Azi
mut
h (d
egre
es)
16-Mar 17-Mar 18-Mar 19-MUTC Date (day-month) and Local Time = UT
Azi
mut
h (d
egre
es)
a
b
96
95
94
R/V Langseth
Fig. 4. a) Plot of azimuthal detection between 20 January 2009 and 15 April 2010. The results ahistogramof the detections between 00:00 on 16March and00:00 on21-March. (For interpretaof this article.)
vent sites (as observed at the sea surface). Their bimodal distribution,however, is consistent with energy coupling preferentially into thesound channel at two distinct locations along the flanks of the sub-merged volcanic edifice (Fig. 4b).
Initially, the recorded azimuths are aligned to the south (~95.7°),but focus toward the north (~94.7°) during the initial 6 h of activity.The detected azimuths remain focused to the north until ~15:00 on17 March 2009 UTC, after which two detection bands are observedsimultaneously during the next 19 h. After ~12:00 on 18 March 2009UTC, detections are again directed primarily to the south, where theyremain until the detection rate declines at ~08:50 onMarch 19 (Fig. 4b).
Following the initial drop in detection rate, there is a secondary dropat ~18:18. At this time, a large (Mw 7.6) earthquake occurs near 23.04°S, 174.66° W, and the acoustic energy radiated across a broad sectionof the Tonga Ridge from this event, and its aftershocks, temporallymasks the decreasingly small amplitude signals coming from HungaHa'apai. Through ~10 July (JD 161), however, the average rate of detec-tion is maintained at roughly three times the pre-eruptive rate. Thedetection rate declines through the remainder of July, after which thevolcano enters a quiet phase that persists through the AUH recoveryin April 2010 (Fig. 4a).
3.2. Initial earthquake activity
During the period 8–14March 2009, there were six earthquakes (M3.5–5.0) having seismically determined epicenters with ~30–100 kmrange ofHungaHa'apia Island. The largest of thesewas felt inNuku'alofa(International Seismological Centre, 2010). Independently locatingthese events using water-borne Tertiary (T-) wave arrivals detectedacross the Lau hydrophone array, confirms that they were positioneddistant to the islands.
The acoustic record shows that the earthquake activity immediatelypreceding the eruption began at 15:11 UTC on 16 March 2009, approx-imately 14 h before the first eyewitness reports of active volcanism.This seismic event, which is not reported by land-based networks, is aprecursor or foreshock to a nearly co-locatedmb 4.8 earthquake that oc-curred 14 min later (15:25 UTC on 16 March 2009). Using Tertiary(T)-wave arrivals recorded at all six stations, both events locate nearthe southern tip of Hunga Ha'api, with 90% confidence ellipses that en-compasses the island and western flank of the volcano (Fig. 5). The
06 12 18 00 06 12 18
350 400 450
0 01 Jan 2009
ar 20-Mar Time (hr) in 2009C + 13 hrs
20,000
Cut-Off Criteria
cc , cl (ms), +/-v (km/s)
>0.4, < 096, 0.15
>0.5, < 064, 0.10
>0.6, < 032, 0.05
# detections 16-20 March, 2009
10,000
re color-coded based on the quality of the detection (see legend). b) Zoomed in view andtion of the references to color in thisfigure legend, the reader is referred to theweb version

17D.R. Bohnenstiehl et al. / Journal of Volcanology and Geothermal Research 249 (2013) 12–24
International Seismological Centre (2010) locates this event 10 km tothe south–southeast of Hunga Ha'api, with the confidence ellipse thatspans the southwestern flank of the volcano and abuts T-wave errorellipse.
Although the T-wave data do not provide quantitative focal depthestimates, the leading earthquake arrivals are characterized by spectralenergy up to 50 Hz and the rise times of nomore than 6 and 27 s for the15:11 and 15:25 earthquakes, respectively (Fig. 5). These properties areconsistentwith the T-waves derived from shallow seismicity along oce-anic spreading centers and transforms (cf., Yang and Forsyth, 2003;Dziak et al., 2004) and suggest that the initial Hunga Ha'apia activityis sourced at similarly shallow depths (b~10 km) within overridingTofua Arc. By contrast, for deeper plate-interface events, which are com-mon along the subduction zone, higher frequency energy is preferential-ly stripped out as the signals traverse longer solid-Earth paths throughthe arc crust (e.g., Salzberg, 2006), and a broader zone T-wave conver-sion commonly gives rise to more emergent arrivals (e.g., Talandierand Okal, 2001).
The initial T-wave energy from these leading earthquakes yields aback azimuth directed toward Hunga Ha'api. Within the T-wave coda,the dominant back azimuth rotates first to the south (increases) be-fore swinging to the north (decreases). This tracks the reflected andbackscattered energy from along the south–southwest trending arc.A similar azimuthal pattern within the coda of both T-waves is ofcourse expected for two nearly co-located sources (Fig. 5d). These ini-tial T-wave arrivals are followed by a handful of smaller aftershocksthat occur during the next ~13 min, after which the rate and magni-tude of acoustic events begin to increase in a manner inconsistentwith the aftershock process (cf. Bohnenstiehl et al., 2002).
In the periods immediately prior to and between these two T-wavearrivals, cross correlation results show that the dominant ambient noisein the basin is coming from a back azimuth of 29° (Fig. 5d). This pointsdirectly toward West Mata volcano (Resing et al., 2011), which lies adistance of 640 km from the M3 array (Fig. 1). We observe West Matato be among the most persistent sound sources during the 15-monthdeployment. Its frequently erupting summit behaves as point sourcenear the axis of the sound channel, leading to a high rate of well-correlated ambient noise detections (Fig. 5d).
3.3. Evolution of the volcano-acoustic time series
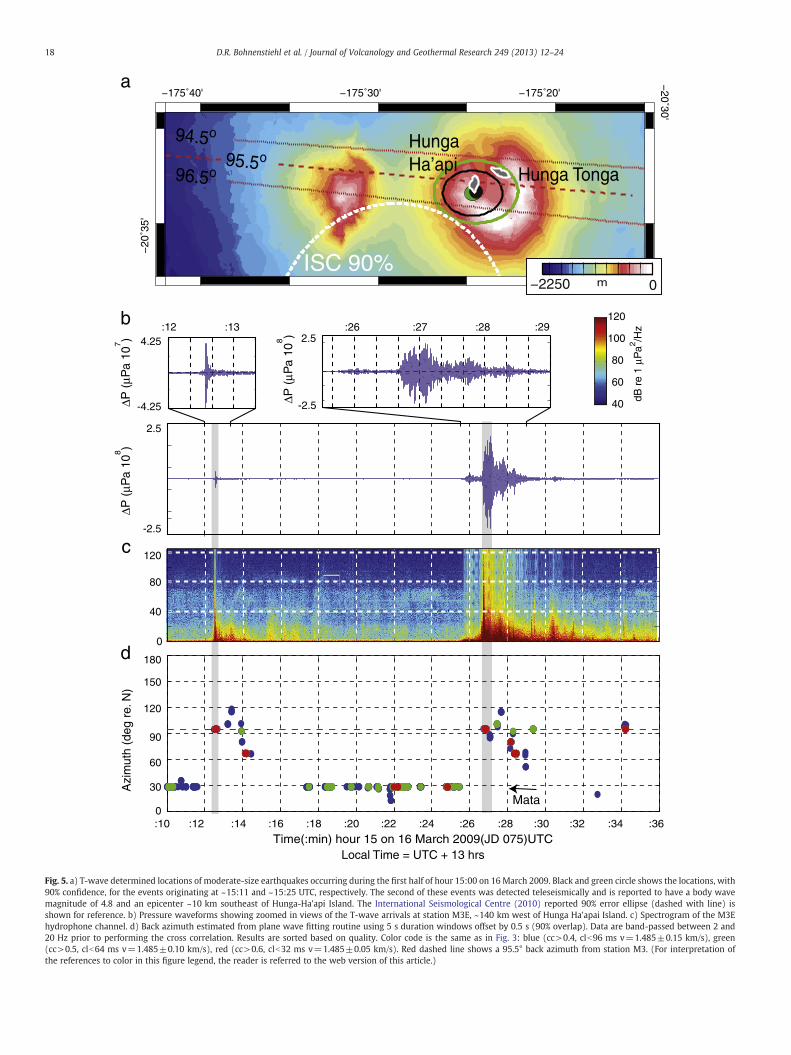
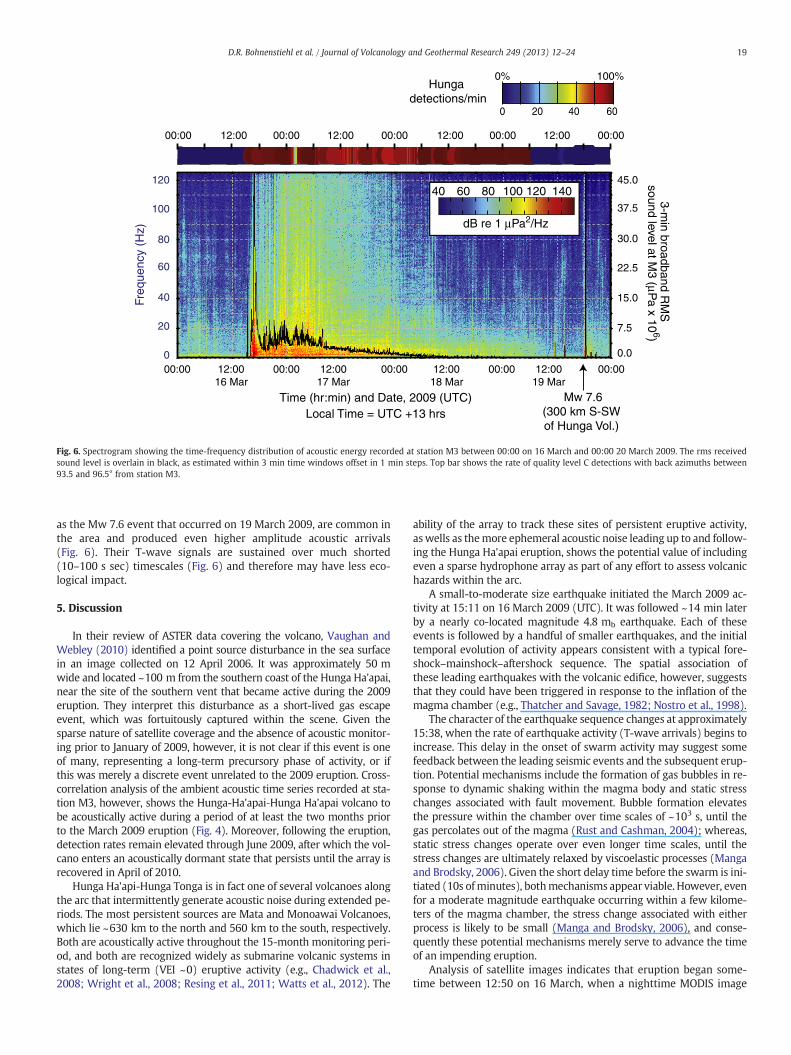
As it is difficult to identify individual acoustic ‘events’ during muchof the eruption, we instead track its intensity by examining thepressure amplitude time series (e.g., Tolstoy et al., 2006; Dziak etal., 2012). This is equivalent to the Real-time Seismic Amplitude Mea-surement (RSAM) approach widely used in volcano seismology (e.g.,Endo and Murray, 1991). Fig. 6 shows a spectral representation ofthese data, overlain by the root-mean-square (rms) pressure calculat-ed in a series of 3-min-duration windows offset by 1-min time steps.As the pressure data are omni-directional, the rate of ambient noisedetections (Quality Level C) directed toward Hunga Ha'apai also isdepicted. Fig. 7 shows a more detailed view of the rms and detectiontime series, and Fig. 8 shows a more detailed view of the spectral datawithin short time windows that track the evolution of the eruption.
Examining the initiation of activity, both the 15:11 and 15:25earthquake events generate an increase in rms amplitude and asmall number of the Hunga Ha'api directed detections (Figs. 5 and7). A series of small earthquakes follow these events, but rms pres-sure levels and detection rates remain low. After ~13 min, however,T-wave signals begin to arrive at progressively shorter intervals(Fig. 8a), and there is an associated rise in rms pressure levels andazimuthal detection rates (Fig. 7). There is an additional uptick inrms pressure levels just before 16:00 h, and within a few minutes,earthquake-generated T-waves arrive in such short succession thattheir codas overlap (Fig. 8b). Beginning at 16:38, the low-frequencyrms pressure levels increase rapidly, and detection rates rise to>80%.
Sound levels reach their peak level at 16:50 on 16 March 2009 UTC(Figs. 7 and 8c), but fall abruptly during the following 20 min.
As the rms levels decline, there is a period of sustained low-frequency (1–20 Hz) rumbling with few discrete T-wave signals(Fig. 8d). Beginning just before 19:00 on 16 March there begins a se-ries of discrete, very-broadband arrivals that are interpreted as explo-sions (Fig. 8e). These transient signals are superimposed on the lowfrequency energy and generate a more variable rms pressure time se-ries (Fig. 7). The variability of the rms pressure time series decreasesafter ~09:00 on 17 March; after which, there is an overall decline insignal amplitude during the next several days, with very-broadbandsignals become increasingly sparse (Figs. 7 and 8). By the afternoonof 18 March (UTC), the very-broadband signals have largely subsidedand the low frequency energy continues to decline. At ~08:52 on 19March, the detection rate drops below a few percent (Fig. 7f) as the1–20 Hz noise levels approach background levels.
4. Volcano-acoustic inputs into the ocean soundscape
Sound plays a key role in the oceans and is used by aquatic animalsfor life sustaining activities such as feeding, breeding and navigation(Au and Hastings, 2008). In recent years the potential impacts of in-creasing anthropogenic sound on the health of individuals and ecosys-tems have garnered much attention (e.g., National Research Council,2003; Soto et al., 2006; Parks et al., 2007). Natural sources of noise, how-ever, also may play a role in modulating both the long- and short-termtrends in ocean noise levels; yet, the acoustic inputs associated withsubmarine volcanism are poorly constrained.
To quantify the underwater acoustic energy released during theMarch 2009 eruption, a Range-dependent Acoustic Model (RAM)(Collins, 1993) is used to estimate the transmission loss betweenHunga Ha'apai and the M3 and M4 hydrophone receivers. Thesetwo stations have the least obstructed acoustic paths from the volca-no. We considered a suite of potential point source locations positionedat between 10 and 400 m in depth along the flank of the edifice down-slope from both the northern and southern vents. The result predicts aminimum transmission loss of 120.0 dB rel. 1 m to the M3 array and130.5 dB rel. 1 m to the M4 station. These values are consistent withthe average range dependence identified empirically by Schiep (2012)for airgun shots propagating along the deeper-water flanks of theELSC. Applying these minimum transmission loss values in calculatingthe energy flux density time series yields a minimum estimate for theacoustic energy release (see Appendix A).
The result shows that on the order of 1.7×10¹³ to 4.7×10¹³ J ofacoustic energy was radiated into the water column over the 1–125 Hzband range. By comparison, the R/V Langseth survey that occurred dur-ing a 27-day period (Fig. 1) deployed a total of 9,400 airgun shots fromits 36-gun acoustic array, representing on the order of 3×10¹⁰ J of ener-gy. Theminimum acoustic energy release by the Hunga Ha'apai eruptiontherefore exceeds this value by a factor of 103.
Hildebrand (2005, 2009) has made estimates of the annual contri-butions of various anthropogenic sources into the global ocean. This1013 J of energy is the same order of magnitude as the total energyreleased annually by all seismic survey vessels (air gunning), androughly an order of magnitude larger than the annual contributionfrom the global fleet of supertankers.
During the ~20 min of peak acoustic energy release, receivedlevels at the M3 array, which lie at a distance 140 km from the volca-no, are sustained in excess 150 dBrms re 1 μPa. They decline after-wards, but remain above 120 dB dBrms re 1 μPa over the course ofthe following day, throughout the period when very-broadband ex-plosion signals are most intense. These values are well above thelonger-term background level of ~90 dB re 1 μPa at M3 (Schiep,2012), and show that the 2009 eruption of Hunga-Ha'apai-HungaTonga volcano may have masked low-frequency bioacoustics signalson a basin scale. Although large subduction zone earthquakes, such
0
40
80
120
-2.5
2.5
:12 :134.25
:26 :27 :28
40
60
80
100
120
dB r
e 1
μPa2 /H
z
ΔP
(μP
a 10
7 )
ΔP
(μP
a 10
8 )
-4.25 -2.5
2.5:29
ΔP
(μP
a 10
8 )
c
0
30
60
90
120
150
180
Azi
mut
h (d
eg r
e. N
)
Time(:min) hour 15 on 16 March 2009(JD 075)UTC:10 :12 :14 :16 :18 :20 :22 :24 :26 :28 :30 :32 :34 :36
Local Time = UTC + 13 hrs
Mata
−175˚40' −175˚30' −175˚20'
−20
˚35'
−20˚30'
Hunga Ha’api Hunga Tonga
95.5o
ISC 90%
a
94.5o
96.5o
b
d
−2250 0m
Fig. 5. a) T-wave determined locations of moderate-size earthquakes occurring during the first half of hour 15:00 on 16 March 2009. Black and green circle shows the locations, with90% confidence, for the events originating at ~15:11 and ~15:25 UTC, respectively. The second of these events was detected teleseismically and is reported to have a body wavemagnitude of 4.8 and an epicenter ~10 km southeast of Hunga-Ha'api Island. The International Seismological Centre (2010) reported 90% error ellipse (dashed with line) isshown for reference. b) Pressure waveforms showing zoomed in views of the T-wave arrivals at station M3E, ~140 km west of Hunga Ha'apai Island. c) Spectrogram of the M3Ehydrophone channel. d) Back azimuth estimated from plane wave fitting routine using 5 s duration windows offset by 0.5 s (90% overlap). Data are band-passed between 2 and20 Hz prior to performing the cross correlation. Results are sorted based on quality. Color code is the same as in Fig. 3: blue (cc>0.4, clb96 ms v=1.485±0.15 km/s), green(cc>0.5, clb64 ms v=1.485±0.10 km/s), red (cc>0.6, clb32 ms v=1.485±0.05 km/s). Red dashed line shows a 95.5° back azimuth from station M3. (For interpretation ofthe references to color in this figure legend, the reader is referred to the web version of this article.)
18 D.R. Bohnenstiehl et al. / Journal of Volcanology and Geothermal Research 249 (2013) 12–24
0 20 40 60
00:00 12:0016 Mar
00:00 12:0017 Mar
00:00 12:0018 Mar
00:00 12:0019 Mar
00:00
00:00 12:00 00:00 12:00 00:00 12:00 00:00 12:00 00:00
Hunga detections/min
0% 100%
7.5
15.0
20
40
60
80
100
120
22.5
30.0
37.5
45.0
0.00
3-min broadband R
MS
sound level at M
3 (μPa x 10
6)Fr
eque
ncy
(Hz)
Time (hr:min) and Date, 2009 (UTC)Local Time = UTC +13 hrs
Mw 7.6(300 km S-SW of Hunga Vol.)
40 60 80 100 120 140
dB re 1 μPa2/Hz
Fig. 6. Spectrogram showing the time-frequency distribution of acoustic energy recorded at station M3 between 00:00 on 16 March and 00:00 20 March 2009. The rms receivedsound level is overlain in black, as estimated within 3 min time windows offset in 1 min steps. Top bar shows the rate of quality level C detections with back azimuths between93.5 and 96.5° from station M3.
19D.R. Bohnenstiehl et al. / Journal of Volcanology and Geothermal Research 249 (2013) 12–24
as the Mw 7.6 event that occurred on 19 March 2009, are common inthe area and produced even higher amplitude acoustic arrivals(Fig. 6). Their T-wave signals are sustained over much shorted(10–100 s sec) timescales (Fig. 6) and therefore may have less eco-logical impact.
5. Discussion
In their review of ASTER data covering the volcano, Vaughan andWebley (2010) identified a point source disturbance in the sea surfacein an image collected on 12 April 2006. It was approximately 50 mwide and located ~100 m from the southern coast of the Hunga Ha'apai,near the site of the southern vent that became active during the 2009eruption. They interpret this disturbance as a short-lived gas escapeevent, which was fortuitously captured within the scene. Given thesparse nature of satellite coverage and the absence of acoustic monitor-ing prior to January of 2009, however, it is not clear if this event is oneof many, representing a long-term precursory phase of activity, or ifthis was merely a discrete event unrelated to the 2009 eruption. Cross-correlation analysis of the ambient acoustic time series recorded at sta-tion M3, however, shows the Hunga-Ha'apai‐Hunga Ha'apai volcano tobe acoustically active during a period of at least the two months priorto the March 2009 eruption (Fig. 4). Moreover, following the eruption,detection rates remain elevated through June 2009, after which the vol-cano enters an acoustically dormant state that persists until the array isrecovered in April of 2010.
Hunga Ha'api-Hunga Tonga is in fact one of several volcanoes alongthe arc that intermittently generate acoustic noise during extended pe-riods. The most persistent sources are Mata and Monoawai Volcanoes,which lie ~630 km to the north and 560 km to the south, respectively.Both are acoustically active throughout the 15-month monitoring peri-od, and both are recognized widely as submarine volcanic systems instates of long-term (VEI ~0) eruptive activity (e.g., Chadwick et al.,2008; Wright et al., 2008; Resing et al., 2011; Watts et al., 2012). The
ability of the array to track these sites of persistent eruptive activity,aswells as themore ephemeral acoustic noise leading up to and follow-ing the Hunga Ha'apai eruption, shows the potential value of includingeven a sparse hydrophone array as part of any effort to assess volcanichazards within the arc.
A small-to-moderate size earthquake initiated the March 2009 ac-tivity at 15:11 on 16 March 2009 (UTC). It was followed ~14 min laterby a nearly co-located magnitude 4.8 mb earthquake. Each of theseevents is followed by a handful of smaller earthquakes, and the initialtemporal evolution of activity appears consistent with a typical fore-shock–mainshock–aftershock sequence. The spatial association ofthese leading earthquakes with the volcanic edifice, however, suggeststhat they could have been triggered in response to the inflation of themagma chamber (e.g., Thatcher and Savage, 1982; Nostro et al., 1998).
The character of the earthquake sequence changes at approximately15:38, when the rate of earthquake activity (T-wave arrivals) begins toincrease. This delay in the onset of swarm activity may suggest somefeedback between the leading seismic events and the subsequent erup-tion. Potential mechanisms include the formation of gas bubbles in re-sponse to dynamic shaking within the magma body and static stresschanges associated with fault movement. Bubble formation elevatesthe pressure within the chamber over time scales of ~103 s, until thegas percolates out of the magma (Rust and Cashman, 2004); whereas,static stress changes operate over even longer time scales, until thestress changes are ultimately relaxed by viscoelastic processes (Mangaand Brodsky, 2006). Given the short delay time before the swarm is ini-tiated (10s ofminutes), bothmechanisms appear viable. However, evenfor a moderate magnitude earthquake occurring within a few kilome-ters of the magma chamber, the stress change associated with eitherprocess is likely to be small (Manga and Brodsky, 2006), and conse-quently these potential mechanisms merely serve to advance the timeof an impending eruption.
Analysis of satellite images indicates that eruption began some-time between 12:50 on 16 March, when a nighttime MODIS image

0
10
20
30
40
14:0003/16
15:00 16:00 17:00 18:00 19:00 20:0003/16
a 50
0 20 40 60 Hunga detections/min
0% 100%
0
10
02:00 03:00 04:00 05:00 06:00 07:00 08:0003/1703/17
0
10
08:00 09:00 10:00 11:00 12:00 13:00 14:0003/1703/17
20:00 21:00 22:00 23:00 00:00 01:00 02:0003/1703/16
0
10
0
10
06:00 07:00 08:00 09:00 10:00 11:00 12:0003/1903/19
RM
S (
μPa
x 10
6 )
time (hr:min) and date (UTC)Local Time = UTC +13 hrs
c
b
d
f
... skip 8 hours ...
RM
S μ
Pa
x 10
6 )R
MS
μP
a x
106 )
RM
S μ
Pa
x 10
6 )R
MS
μP
a x
106 )
RM
S μ
Pa
x 10
6 )
e
... skip 24 hours ...
0
10
00:00 01:00 02:00 03:00 04:00 05:00 06:0003/1803/18
ba
c de
f
g
h
i
Fig. 7. Expanded view of the station M3 rms time series color-coded based on the rate of Hunga Ha'apai-directed quality level C detections. Letters refer to data examples shown inFig. 8. Note that only panels a–d are contiguous, and that the vertical scale is expanded in panels b–f, relative to panel a. (For interpretation of the references to color in this figurelegend, the reader is referred to the web version of this article.)
20 D.R. Bohnenstiehl et al. / Journal of Volcanology and Geothermal Research 249 (2013) 12–24
shows no evidence of eruptive activity, and 22:10 on 16 March (UTC),when island appears to be obscured by a cloud of steam and ash(Vaughan and Webley, 2010). From the acoustic time series, thisrange may be narrowed considerable. The earliest seismic activity oc-curs at 15:11 on 16 March, but swarm activity does not initiate until
15:38 and intense swarm activity,whichmaymark the initial breachingof the chamber walls and movement of magma into the conduit, doesnot begin until ~16:00. This is followed by a sharp increase in rms am-plitude and an abrupt transition toward higher (>80%) detection ratesis observed at 16:40 (16 March 2009).

04-19-09 06:30
0 1 2 3 4 5 60
50
100
60 80 1200
50
100
dB re 1 μPa2/Hz
Freq
. (hz
)
0 1 2 3 4 5 60
50
100
60 80 1200
50
100
Freq
. (hz
)
0 1 2 3 4 5 60
50
100
60 80 1200
50
100
Freq
. (hz
)0 1 2 3 4 5 6
0
50
100
60 80 1200
50
100
Freq
. (hz
)
0 1 2 3 4 5 60
50
100
60 80 1200
50
100
Freq
. (hz
)
0 1 2 3 4 5 60
50
100
60 80 1200
50
100
Freq
. (hz
)
0 1 2 3 4 5 60
50
100
60 80 1200
50
100
Freq
. (hz
)
0 1 2 3 4 5 60
50
100
60 80 1200
50
100
Freq
. (hz
)
0 1 2 3 4 5 60
50
100
60 80 1200
50
100
Freq
. (hz
)
Time in minutes
Freq
. (hz
)Fr
eq. (
hz)
Freq
. (hz
)Fr
eq. (
hz)
Freq
. (hz
)Fr
eq. (
hz)
Freq
. (hz
)Fr
eq. (
hz)
Freq
. (hz
)
04-16-09 16:50
04-16-09 15:45
04-16-09 16:05
04-16-09 17:35
04-16-09 19:00
04-17-09 05:05
04-17-09 11:00
04-18-09 03:00
a
b
c
d
e
f
g
h
i
dB re 1 μPa2/Hz
20 40 60 80 100 120
Fig. 8. Spectrograms showing data examples throughout the March 2009 eruptive event at Hunga Ha'apai-Hunga Tonga volcano. Panels on the right show the average spectra foreach 6 min duration data window. Time stamp indicates the start time (UTC) of each window. See text for discussion.
21D.R. Bohnenstiehl et al. / Journal of Volcanology and Geothermal Research 249 (2013) 12–24

22 D.R. Bohnenstiehl et al. / Journal of Volcanology and Geothermal Research 249 (2013) 12–24
Notably, changes in detection rate at M3 are not merely a function ofreceived level. Shallow crustal earthquake can produce high signal-to-noise arrivals; yet, as evident from the initial T-wave signals (Fig. 5),the detection rates can be low and the azimuth may vary as a functionof time throughout the T-wave coda. This reflects the fact that theT-wave packet is the summation of energy scatter at the seafloor inter-face above the earthquake hypocenter — with deeper events scatteringenergy over larger areas (e.g., Schreiner et al., 1995; Slack et al., 1999),producing less coherent arrivals at the quad array. By comparison, weak-er sources originating from the shallow, sound-channel-breaching sum-mit of West Mata Volcano (~1200 mbsl) often produce higher detectionrates and a more consistent range of azimuths (Fig. 5d). Consequently,the transition in detection rate is interpreted to track the migration ofacoustic sources into the shallow conduit.
The rms pressure time series shows a short duration (b1 h) periodof intense underwater acoustic energy release that occurs within thefirst two hours of the eruptive sequence (Figs. 6 and 7). This pattern issimilar to submarine eruptions record by in situ ocean bottom sensorsalong the East Pacific Rise (Tolstoy et al., 2006) and Axial Volcano onthe Juan de Fuca Ridge (Dziak et al., 2012). In both cases, brief periodsof high rms pressure or ground displacement have been interpretedto track the rise of the dike from the magma chamber through thebrittle fracturing of the overlying oceanic crust. Similarly, for theHunga-Ha'apai-Hunga Tonga eruption, this period is interpreted todelineate the opening or clearing of the volcanic conduit.
Once the conduit opens, brittle cracking and its associated acousticenergy release decline, and a continuous low-frequency signal can beobserved to dominate the spectra (Figs. 6 and 8). Whereas narrowband tremor, associated with resonance or repeating event behavior,has been widely reported in seismic and acoustic studies of subaerial(e.g., Johnson and Lees, 2000; McNutt and Nishimura, 2008) and sub-marine (e.g., Dziak and Fox, 2002) volcanoes; this signal is wide band(1–20 Hz) and continues for more than 2.5 days. It generates a coher-ent arrival at the M3 array, suggesting a shallow source, possibly asso-ciated with the motion of the conduit walls, as magma is transportedupwards, and/or material is erupted onto the seafloor.
By 19:00 on 16 March, as the wide-band low-frequency signal per-sists, a series of transient very-broadband (1–125 Hz) signals begin to ar-rive. These events are differentiated from earlier T-wave swarm activityby both their higher frequency content (>50 Hz) and more impulsecharacter. This style of activity is sustained through 22:10 on 16 March(UTC), when confirmation of the eruption is obtained using MODIS im-agery (Vaughan and Webley, 2010), and it persists during the next twodays when eyewitness observations from air (first at 05:05 UTC on 17March), land and sea report explosive activity. These very-broadbandsignals are interpreted to represent individual surtseyan explosiveevents.
After ~09:00 on 17 March, the rms pressure time series shows atransition toward less short-term variability and a gradual decliningamplitude (Fig. 7). Through time the maximum amplitudes of thetransient explosions decrease as the repose time between the eventsincreases (Fig. 8). By the afternoon of 18 March (UTC), these transientsignals become increasingly rare; but low-frequency signal persistsand the M3-detection rate remains high (>80%). The detection ratedrops suddenly just before 09:00 on 19 March 2009, as the low fre-quency noise continues to decline. Although small steam event arelikely during the following days (Vaughan and Webley, 2010), thisis interpreted to mark end of the main eruptive event.
Back azimuth calculations show two azimuthal peaks that varytemporally throughout the eruption sequence (Fig. 4). However, theinitial transition in azimuths from the south to the north beginsafter the surtseyan phase of the eruption is initiated, and changes inthe dominant azimuth direction are not clearly associated with dis-tinct changes in the acoustic signature. Ground and satellite-basedobservations are too intermittent to verify a shift in activity through-out the course of the eruption. However, eyewitness reports indicate
that both vent sites where active during the morning of 18 March UTC(afternoon LT), with the southern vent producing more spectaculareruptions (Taylor, 2010). This is near the tail end of the overlap peri-od when both acoustic source regions appear active simultaneously,with the greater number of detections originating from the south(Fig. 4b).
6. Summary
Underwater acoustic recordings from a regional hydrophone arrayare used to track the progression of seismo-acoustic and eruptive ac-tive at Hunga Ha'apai-Hunga Tonga volcano. The acoustic signals de-fine several phases of activity that summarize the sequence of eventssurrounding the March 2009 eruption.
Phase 1 (prior to 16March, 2009): From the beginning of the deploy-ment in January of 2009, the volcano generates low-level acousticnoise that can be identified by correlation analysis using a four-element horizontal hydrophone array (M3) at a range of ~140 kmfrom the volcano. While the rate of detection is low, this shows thevolcano to be in an acoustically active state during the months priorto the eruption.Phase 2 (15:11–15:38 UTC, 16 March): Seismic activity immedi-ately preceded the eruption of Hunga Ha'apai-Hunga Tonga volca-no begins at 15:11 UTC on 16 March. This event is a foreshock to anearly co-located mb 4.8 earthquake that occurs some 14 minlater (15:25 UTC on 16 March 2009). A few smaller aftershocksfollow both events.Phase 3 (15:38–16:38 UTC, 16 March): Beginning at 15:38, therate of earthquake activity begins to increase in a manner that isinconsistent with the aftershock process. A succession of smallamplitude T-waves arrive at progressively shorter intervals, untilindividual events can no longer be defined.Phase 4 (16:38–~17:10 UTC, 16 March): Beginning at 16:38, therms pressure levels increase by a factor of five, and the signal be-comes more coherent, with >80% of the M3 correlation windowsreporting Hunga-Ha'apai directed detections. Acoustic pressurereaches its peak value at ~16:50 and then drops rapidly in ampli-tude during the following 20 min. This period is interpreted tomark an intense period of brittle fracturing associated with the es-tablishment of the shallow volcanic conduit.Phase 5 (~17:10–18:50 UTC, 16March): As sound levels decline, theacoustic signature of the volcano is dominated by a wide-bandlow-frequency (1–20 Hz) signal with fewdiscrete events. The originof the signal is unclear, but it is well correlated across the M3 array,suggesting a shallow source, perhaps associatedwith themovementof magma in the shallow conduit or the extrusion of material ontothe seafloor. This wide-band signal persists through the morningof 19 March.Phase 6 (18:50 UTC, 16 March–09:00 UTC, 17 March): Around18:50 on 16 March, surtseyan-style explosive activity is initiatedand a series of very-broadband (1–125 Hz) transient acoustic sig-nals arrive superimposed on low frequency wide-band noise. Thisphase is delineated by a period of more variable rms amplitude(Figs. 6 and 7) that arises due to variability in the amplitude andclustering of these explosions.Phase 7 (09:00 UTC, 17 March–08:52 UTC, 19 March): At ~09:00on 17 March, there is a notable decrease in the rms pressure var-iability, which is sustained during the following two days. This isassociated with a decrease in the intensity of the explosive activi-ty. As the acoustic levels continue to decrease, explosive activityfades and at approximately 08:52 on 19 March the low frequency

23D.R. Bohnenstiehl et al. / Journal of Volcanology and Geothermal Research 249 (2013) 12–24
(1–20 Hz) noise drops to background levels and the rate of detec-tion at the M3 array drops suddenly.Phase 8 (08:52 UTC, 19 March–June 2009): After the main eruptionends, steam driven activity continues for as a much as a few weeks(Vaughan andWebley, 2010). During the next threemonths the vol-cano continues to be a source of ambient noise, with detection ratesthat are elevated slightly relative to the pre-eruptive period. By July2009, the volcano enters an acoustically dormant state, which per-sists until the array is recovered in April of 2010.
Although Hunga Ha'apai-Hunga Tonga volcano can be identified asan acoustically active source during the months leading up to its erup-tion, the volcanoprovided little short-termwarning prior to its eruptionin March of 2009. The volcanic conduit appears to have opened rapidly,within two hours of the initial seismic activity and explosive volcanismcommenced soon after, within four hours of the first seismic activity.
The eruption duration is constrained to be on the order of 2.7 days,during which time the low-frequency acoustic energy input into theocean is on the order of 1013 J. This value rivals the global annual acousticinputs associatedwith seismic surveying and supertanker shipping— twomuch publicized anthropogenic sources. Yet, the degree to whichmarineorganisms respond, or have become habituated, to volcano-acousticevents like theMarch 2009 eruption of Hunga-Ha'apai-Hunga Tonga vol-cano is unknown.
Acknowledgments
We thank the captain and crew of the R/V Marcus G. Langseth, R/VRoger Revelle and R/V Kilo Moana. Critical to the success of this projectwere NOAA field technicians J. Shanley and M. Fowler, who oversaw themooring deployment and recovery efforts, and NCSU graduate studentsJ. Bowman, K. Cook, P. Monigle, J. O'Connor, C. Scheip, and K. Warren.Themanuscript was improved based on the detailed comments providedby Dr.Won Sang Lee and an anonymous reviewer; their efforts are grate-fully acknowledged. This is NOAA-PMEL contribution # 3892. The workwas supported by the National Science Foundation grants OCE-0825295and OCE-1029278.
Appendix A. Underwater acoustic energy calculations
The underwater acoustic energy radiated during the March 2009eruption of Hunga-Ha'apai-Hunga Tonga Volcano is calculated over the1–125 Hz band following the procedures outlined by Hildebrand (2005,2009). From first principles, the source level pressure (referenced to arangeof 1 m) is converted to acoustic intensity (I) bydividing the squaredpressure (p) by acoustic impedance (ρc),
I ¼ p2
ρcin units ofW=m2
� �
where ρ is the density of the medium (1030 kg/m3 ) and c the soundspeed (1485 m/s). The acoustic power (P) is then given by the productof the intensity and a geometric factor, which is taken to be 2π (m2) fora near surface source radiating into a half-space.
P ¼ 2π � I in units of W ¼ J=sð Þ
Acoustic energy is then calculated as the linear product of the sig-nal power and duration (T).
E ¼ P � T in units of Jð Þ
This calculation is applied to a series of non-overlapping 1 s dura-tion windows that span the time period between 15:00 UTC on 16March 2009 and 09:00 UTC on 19 March 2009. After the energy con-tribution from the background acoustic field is removed (e.g., Holt et
al., 2009), the results are summed to estimate the total amount ofacoustic energy released during the eruption. The procedure is carriedout independently for stations M3 and M4, which are the station thatlie along the least obstructed acoustic paths from the volcano. The re-sults yield estimates of 1.7×10¹³ and 4.7×10¹³ J for the two respec-tive stations.
References
Au, W.W., Hastings, M.C., 2008. Principles of Marine Bioacoustics. Springer, p. 695.Bohnenstiehl, D.R., Tolstoy, M., Dziak, R.P., Fox, C.G., Smith, D.K., 2002. Aftershock se-
quences in the mid-ocean ridge environment: an analysis using hydroacousticdata. Tectonophysics 354, 49–70.
Bryan, W.B., Stice, G.D., Ewart, A., 1972. Geology, petrography, and geochemistry of thevolcanic islands of Tonga. Journal of Geophysical Research 77, 1566–1585.
Chadwick Jr., W.W., Wright, I.C., Schwarz-Schampera, U., Hyvernaud, O., Reymond, D.,de Ronde, C.E.J., 2008. Cyclic eruptions and sector collapses at Monowai submarinevolcano, Kermadec arc: 1998–2007. Geochemistry, Geophysics, Geosystems 9,Q10014 http://dx.doi.org/10.1029/2008GC002113.
Chapp, E., Bohnenstiehl, D.R., Tolstoy, M., 2005. Sound-channel observations of ice-generated tremor in the Indian Ocean. Geochemistry, Geophysics, Geosystems 6,Q06003 http://dx.doi.org/10.1029/2004GC000889.
Collins, M.D., 1993. A split-step Pade solution for the parabolic equation method. Jour-nal of the Acoustical Society of America 93, 1736–1742.
de Groot-Hedlin, C., Orcutt, J., 2001. Excitation of T-phases by seafloor scattering. Jour-nal of the Acoustical Society of America 109, 1944–1954.
Del Pezzo, E., Giudicepietro, F., 2002. Plane-wave fitting method for a plane, small ap-erture, short period seismic array: a MATHCAD program. Computers & Geosciences28, 59–64.
Dunn, R.A., Martinez, F., 2010. Contrasting crustal production and rapid mantle transi-tions beneath back-arc ridges. Nature 46, 198–202 http://dx.doi.org/10.1038/nature09690.
Dziak, R.P., Fox, C.G., 2002. Evidence of harmonic tremor from a submarine volcanodetected across the Pacific Ocean basin. Journal of Geophysical Research 107http://dx.doi.org/10.1029/2001JB000177.
Dziak, R.P., Smith, D.K., Bohnenstiehl, D.R., Fox, C.G., Desbruyeres, D., Matsumoto, H.,Tolstoy, M., Fornari, D.J., 2004. Evidence of a recent magma dike intrusion at theslow spreading Lucky Strike segment, Mid-Atlantic Ridge. Journal of GeophysicalResearch 109 http://dx.doi.org/10.1029/2004JB003141.
Dziak, R.P., Haxel, J.H., Bohnenstiehl, D.R., Chadwick Jr., W.W., Nooner, S.L., Fowler, M.J.,Matsumoto, H., 2012. Seismic precursors and magma ascent before the April 2011eruption at Axial Seamount. Nature Geoscience 5, 1–5 http://dx.doi.org/10.1038/ngeo1490.
Endo, E.T., Murray, T., 1991. Real-time seismic amplitude measurement (RSAM): a vol-cano monitoring and prediction tool. Bulletin of Volcanology 53, 533–545.
Fox, C., Matsumoto, H., Lau, T.-K., 2001. Monitoring Pacific Ocean seismicity from an au-tonomous hydrophone array. Journal of Geophysical Research 106, 4183–4206.
Graeber, F.M., Piserchia, P.-F., 2004. Zones of T-wave excitation in the NE Indian oceanmapped using variations in backazimuth over time obtained from multi-channelcorrelation of IMS hydrophone triplet data. Geophysical Journal International158, 239–256 http://dx.doi.org/10.1111/j.1365-246X.2004.02301.x.
Hanson, J.A., Bowman, J.R., 2006. Methods for monitoring hydroacoustic events usingdirect and reflected T-waves in the Indian Ocean. Journal of Geophysical Research111 http://dx.doi.org/10.1029/2004JB003609.
Hildebrand, J.A., 2005. Impacts of anthropogenic sound. In: Reynolds III, J.E., Perrin,W.F., Reeves, R.R., Montgomery, S., Ragen, T.J. (Eds.), Marine Mammal Research:Conservation Beyond Crisis. The Johns Hopkins University Press, Baltimore, Mary-land, pp. 101–124.
Hildebrand, J., 2009. Anthropogenic and natural sources of ambient noise in the ocean.Marine Ecology Progress Series 395, 5–20 http://dx.doi.org/10.3354/meps08353.
Holt, M.M., Noren, D.P., Veirs, V., Emmons, C.K., Veirs, S., 2009. Speaking up: killerwhales (Orcinus orca) increase their call amplitude in response to vessel noise.Journal of the Acoustical Society of America 125, EL27 http://dx.doi.org/10.1121/1.3040028.
International Seismological Centre, 2010. On-line Bulletin. http://www.isc.ac.uk Internatl.Seis. Cent., Thatcham, United Kingdom.
Johnson, J., Lees, J., 2000. Plugs and chugs — seismic and acoustic observations ofdegassing explosions at Karymsky, Russia and Sangay, Ecuador. Journal of Volca-nology and Geothermal Research 101, 67–82.
Manga, M., Brodsky, E., 2006. Seismic triggering of eruptions in the far field: volcanoesand geysers. Annual Review of Earth and Planetary Sciences 34, 263–291.
McNutt, S.R., Nishimura, T., 2008. Volcanic tremor during eruptions: temporal characteris-tics, scaling and constraints on conduit size and processes. Journal of Volcanology andGeothermal Research 178, 12–20 http://dx.doi.org/10.1016/j.jvolgeores.2008.03.010.
National Research Council, 2003. Ocean Noise and Marine Mammals. National Acade-mies Press, Washington DC, p. 208.
Nostro, C., Stein, R.S., Cocco, M., Belardinelli, M.E., Marzocchi, W., 1998. Two-way cou-pling between Vesuvius eruptions and southern Apennine earthquakes (Italy) byelastic stress transfer. Journal of Geophysical Research 103, 24,487–24,504.
Parks, S.E., Clark, C.W., Tyack, P.L., 2007. Short- and long-term changes in right whalecalling behavior: the potential effects of noise on acoustic communication. Journalof the Acoustical Society of America 122, 3725–3731 http://dx.doi.org/10.1121/1.2799904.

24 D.R. Bohnenstiehl et al. / Journal of Volcanology and Geothermal Research 249 (2013) 12–24
Parson, L.M., Hawkins, J.W., 1994. Two-stage ridge propagating and the geological his-tory of the Lau backarc basin. Proceeding of the Ocean Drilling Program, ScientificResults 135, 819–828.
Parson, L.M., Wright, I.C., 1996. The Lau-Havre-Taupo back-arc basin: a southward propa-gating, multi-stage evolution from rifting to spreading. Tectonophysics 263, 1–22.
Resing, J.A., Rubin, K.H., Embley, R.W., Lupton, J.E., Baker, E.T., Dziak, R.P., Baumberger,T., et al., 2011. Active submarine eruption of boninite in the northeastern Lau Basin.Nature Geoscience 4, 799–806 http://dx.doi.org/10.1038/ngeo1275.
Rust, A.C., Cashman, K.V., 2004. Permeability of vesicular silicic magma: inertial andhysteresis effects. Earth and Planetary Science Letters 228, 93–107.
Salzberg, D., 2006. Using T-phase spectra to estimate rupture depth and static offset ofthe seafloor. Journal of the Acoustical Society of America 119, 3252-3252.
Schiep, C.M., 2012. Acoustic Variability of a Seismic Airgun Survey in the Lau Back-ArcBasin, M.S. Thesis, North Carolina State University.
Schreiner, A.E., Fox, C.G., Dziak, R.P., 1995. Spectra and magnitudes of T-waves from the1993 earthquake swarm on the Juan de Fuca Ridge. Geophysical Research Letters22, 139–142.
Siebert, L., Simkin, T., Kimberly, P., 2010. Volcanoes of theWorld, 3rd edition. SmithsonianInstitution, p. 551.
Slack, P.D., Fox, C.G., Dziak, R.P., 1999. P wave detection thresholds, Pn velocity esti-mates, and T wave location uncertainty from oceanic hydrophones. Journal of Geo-physical Research 104, 13,061–13,072 http://dx.doi.org/10.1029/1999JB900112.
Smithsonian Institution, 2009. Hunga Tonga-Hunga Ha'apai. Bulletin of the Global Vol-canism Network (BGVN) 34 (03).
Soto, N.A., Johnson, M., Madsen, P.T., Tyack, P.L., Bocconcelli, A., Borsan, J.F., 2006. Doesintense ship noise disrupt foraging in deep-diving Cuvier's beaked whales (ZiphiusCavirostris)? Marine Mammal Science 22, 690–699 http://dx.doi.org/10.1111/j.1748-7692.2006.00044.x.
Talandier, J., Okal, E., 2001. Identification criteria for sources of T waves recorded inFrench Polynesia. Pure and Applied Geophysics 158, 567–603.
Taylor, P., 2010. The March 2009 eruption of the Hunga Tonga and Hunga Ha'apai Vol-cano, Kingdom of Tonga. SOPAC Report 717b, abstract 2010–46.
Taylor, B., Zellmer, K., Martinez, F., Goodliffe, A., 1996. Sea-floor spreading in the Lauback-arc basin. Earth and Planetary Science Letters 144, 35–40.
Thatcher, W., Savage, J.C., 1982. Triggering of large earthquakes by magma-chamber in-flation, Izu Peninsula, Japan. Geology 10, 637–640.
Tolstoy, M., Cowen, J.P., Baker, E.T., Fornari, D.J., Rubin, K.H., Shank, T.M., Waldhauser,F., Bohnenstiehl, D.R., Forsyth, D.W., Holmes, R.C., Love, B., Perfit, M.R., Weekly,R.T., Soule, S.A., Glazer, B., 2006. A seafloor spreading event captured by seismom-eters. Science 314, 1920–1922 http://dx.doi.org/10.1126/science.1133950.
Vaughan, R.G., Webley, P.W., 2010. Satellite observations of a surtseyan eruption:Hunga Ha'apai, Tonga. Journal of Volcanology and Geothermal Research 198,177–186 http://dx.doi.org/10.1016/j.jvolgeores.2010.08.017.
Watts, A.B., Peirce, C., Grevemeyer, I., Paulatto, M., Stratford, W., Bassett, D., Hunter, J.A.,et al., 2012. Rapid rates of growth and collapse of Monowai submarine volcano inthe Kermadec Arc. Nature Geoscience 5 http://dx.doi.org/10.1038/ngeo1473.
Wright, I.C., Chadwick, W.W., de Ronde, C.E.J., Reymond, D., Hyvernaud, O., Gennerich,H.H., Stoffers, P., Mackay, K., Dunkin, M.A., Bannister, S.C., 2008. Collapse and re-construction of Monowai submarine volcano, Kermadec arc, 1998–2004. Journalof Geophysical Research 113, 1–13.
Yang, Y., Forsyth, D.W., 2003. Improving epicentral and magnitude estimation of earth-quakes from T phases by considering the excitation function. Bulletin of the Seis-mological Society of America 93, 2106–2122.
Zellmer, K., Taylor, B., 2001. A three-plate kinematic model for Lau Basin opening. Geo-chemistry, Geophysics, Geosystems 2 http://dx.doi.org/10.1029/2000GC000106.