
Understanding the Process Small Businesses Use to Capture ...
174
Digital Commons @ George Fox University Doctor of Business Administration (DBA) eses and Dissertations 12-1-2016 Understanding the Process Small Businesses Use to Capture, Convert, and Integrate Survival Knowledge Frank Marshall George Fox University, [email protected] is research is a product of the Doctor of Business Administration (DBA) program at George Fox University. Find out more about the program. is Dissertation is brought to you for free and open access by the eses and Dissertations at Digital Commons @ George Fox University. It has been accepted for inclusion in Doctor of Business Administration (DBA) by an authorized administrator of Digital Commons @ George Fox University. For more information, please contact [email protected]. Recommended Citation Marshall, Frank, "Understanding the Process Small Businesses Use to Capture, Convert, and Integrate Survival Knowledge" (2016). Doctor of Business Administration (DBA). 11. hp://digitalcommons.georgefox.edu/dbadmin/11
-
Upload
khangminh22 -
Category
Documents
-
view
0 -
download
0
Transcript of Understanding the Process Small Businesses Use to Capture ...

Digital Commons @ George Fox University
Doctor of Business Administration (DBA) Theses and Dissertations
12-1-2016
Understanding the Process Small Businesses Use toCapture, Convert, and Integrate SurvivalKnowledgeFrank MarshallGeorge Fox University, [email protected]
This research is a product of the Doctor of Business Administration (DBA) program at George Fox University.Find out more about the program.
This Dissertation is brought to you for free and open access by the Theses and Dissertations at Digital Commons @ George Fox University. It has beenaccepted for inclusion in Doctor of Business Administration (DBA) by an authorized administrator of Digital Commons @ George Fox University. Formore information, please contact [email protected].
Recommended CitationMarshall, Frank, "Understanding the Process Small Businesses Use to Capture, Convert, and Integrate Survival Knowledge" (2016).Doctor of Business Administration (DBA). 11.http://digitalcommons.georgefox.edu/dbadmin/11

Understanding the Process Small Businesses Use to Capture, Convert, and Integrate
Survival Knowledge
by
Frank Marshall
A Dissertation Presented in Partial Fulfillment of the Requirements
for the Degree
Doctor of Business Administration
George Fox University School of Business
December 2016

ii
Understanding the Process Small Businesses Use to Capture, Convert, and Integrate
Survival Knowledge
by
Frank Marshall
has been approved as a
Dissertation for the Degree of
Doctor of Business Administration
George Fox University School of Business

iii
Understanding the Process Small Businesses Use to Capture, Convert, and Integrate
Survival Knowledge
by
Frank Marshall
George Fox University School of Business
Abstract
Many researchers have investigated the value of small businesses and have identified
generic attributes of survival. One noted aspect of survivability is the ability to learn.
Knowledge has long been recognized as a crucial competitive tool for organizational
survival and competition. Further, business leaders must implement learning into the
business for it to grow and survive. Capturing, converting, and integrating knowledge
into the business is a requisite for business survival and represents an important line of
inquiry. Since 2002, small businesses have accounted for more than 99% of all
businesses and for 63% of net new jobs between 1993 and 2011. Since 2007, failure
rates of small businesses have increased 40%. In California alone, more than 3 million
small businesses exist, contributing 37% to the California GDP. The current research
was used to add to the body of knowledge on learning and survivability using a multisite
case study involving specifically small businesses within San Diego County, California,
and answered the research question about how small businesses leaders implement a
process to capture, convert, and integrate knowledge for the business to survive. The

iv
research was delimited to San Diego County, California, and a multipoint sampling
strategy was used to obtain subject matter expertise.

v
Table of Contents
Abstract .............................................................................................................................. iii
Definitions of Terms ........................................................................................................... x
Table of Tables ................................................................................................................ viii
Table of Figures ................................................................................................................. ix
Chapter 1: Introduction ....................................................................................................... 1
Literature Review.................................................................................................... 3
Methodology ........................................................................................................... 4
Findings................................................................................................................... 8
Entrepreneurs Lead Integration of Knowledge ..................................................... 14
Conclusion ............................................................................................................ 16
Recommendations for Further Research ............................................................... 17
Chapter 2:Literature Review ............................................................................................. 19
Early Stages of Learning ....................................................................................... 20
Knowledge Management ...................................................................................... 21
The Learning Process ............................................................................................ 22
Small Business Characteristics ............................................................................. 26
Summary ............................................................................................................... 31
Purpose of the Research Study ............................................................................. 31
Chapter 3:Methodology .................................................................................................... 34
Research Design and Rationale ............................................................................ 34
Semistructured Interviews .................................................................................... 44
Research Questions ............................................................................................... 49

vi
Research Timeline ............................................................................................................ 55
Validation .......................................................................................................................... 80
Risks ...................................................................................................................... 86
Data Analysis ........................................................................................................ 87
Research Errors ..................................................................................................... 87
Ethics and Confidentiality..................................................................................... 88
Risks and Researcher Bias .................................................................................... 89
Delimitations ......................................................................................................... 90
Assumptions and Limitations ............................................................................... 91
Time and Budget ................................................................................................... 92
Researcher’s Perspective ...................................................................................... 92
Conclusion ............................................................................................................ 93
Chapter 4: Results ............................................................................................................. 94
Research Participants ............................................................................................ 94
Coding ................................................................................................................... 99
Findings............................................................................................................... 106
Conclusion .......................................................................................................... 115
Chapter 5: Discussion .................................................................................................... 117
Summary of the Study ........................................................................................ 117
Findings Related to the Literature....................................................................... 119
Founders Lead Integration of Knowledge .......................................................... 125
Surprises .............................................................................................................. 127
Conclusion .......................................................................................................... 128

vii
Implications for Action ....................................................................................... 129
Recommendations for Further Research ............................................................. 129
Limitations .......................................................................................................... 130
References ....................................................................................................................... 132
Appendix A. Call Script .................................................................................................. 149
Appendix B. E-Mail Sample ........................................................................................... 150
Appendix C. GFU Human Subject Consent Form ......................................................... 152

viii
Table of Tables
Table 1. Inside Prospects summary page of businesses in San Diego County, CA ........ 56
Table 2. Inside Prospects list of industry segments ......................................................... 57
Table 3. Random number generator using Stat-trek.com ................................................. 68
Table 4. Answers to criteria questions .............................................................................. 73
Table 5. Service industry segments of participants .......................................................... 96
Table 6. Breakdown of participants by zip code............................................................... 98
Table 7. Theme display by word counts ......................................................................... 101
Table 8. Themes by characteristics ................................................................................. 104

ix
Table of Figures
Figure 1. Theme process .................................................................................................. 84
Figure 3. Interactive model analysis ................................................................................ 87
Figure 4. Random number generation using Stat-trek.com ............................................. 95
Figure 5. Participants, age of business, and number of employees ................................. 97
Figure 6. Methods used to find participants..................................................................... 97
Figure 7. Map with letters representing location of participants ..................................... 99
Figure 8. Corporate life cycle stages…………………………………………………...121

x
Definitions of Terms
Business Owner
A business owner is an individual or entity that owns a business entity with the
goal to profit from the successful operations of the company. Generally, the business
owner has decision-making abilities and the first right to profits (Business
dictionary.com, n.d.).
Case Study
A case study is a “systematic inquiry into an event or a set of related events which
aims to describe and explain the phenomenon of interest” (Bromley, 1990, p. 302).
Cash Flow
Cash flow is used to assess the quality of company income. Cash flow refers to
when a business needs money. Although essentially the result of a firm's net income
(with depreciation added back), cash flow is affected by balance sheet changes, not
necessarily routed through the statement of profit and loss (Anand, 2013).
Collective Case Study
The study of a number of cases to inquire into a particular phenomenon (Stake,
1995).

xi
Corporate Life Cycle
Corporate life cycle is a progression of business development from birth to death.
As organizations grow and age, they progress through predictable lifecycle stages. Each
stage brings increased organizational complexity, and new and unique challenges.
Strategy, structure, levels of delegation, goals, rewards systems, and methods of
operating usually differ markedly in each stage of the organization lifecycle (Adizes,
1979).
Customer Focus
An organizational orientation toward satisfying the needs of potential and actual
customers. Members of the entire organization are involved to ensure customer
satisfaction (Bloomsbury Business Library, Business & Management Dictionary, 2007).
A customer focus strategy can be a competitive advantage for a small business if the
small business leaders can differentiate their products or services from their competitors
(Deshpande, Farley, & Webster, 1993).
Differentiate
Leaders of a small business who can differentiate their business from their
competitors by uniquely positioning the business to meet the needs of the customers can
charge a premium price over their competitors (Porter, 1985).
Employee
A person in the service of another under any contract of hire, expressed or
implied, oral or written, where the employer has the power and/or right to control and

xii
direct the employee in the material details of how the work is to be performed (Black’s
Law Dictionary, 1991, p. 363; Muhl, 2002).
Entrepreneur
A person who organizes and manages any enterprise, especially a business,
usually with considerable initiative and risk (Dictionary.com, n.d.). In the current study,
entrepreneurs or founders of businesses were sought who were still working at least one
day a week in the business. Entrepreneurs of a firm are unique, and are willing to engage
in speculative activity (Penrose, 1959).
Financial Prudence
The acceptance of a degree of caution in exercising judgment needed when
making required estimates under conditions of uncertainty (Pillai, Carlo, & D’Souza,
2012).
Integration
A process of disseminating knowledge from the founder/entrepreneur to the
employees in the organization (Breslin & Jones, 2012).
Learning
The set of routines and processes by which firm leaders acquire, assimilate,
transform, and exploit knowledge to produce a dynamic organizational capability (Zahra
& George, 2002).
xiii
Learning Process
In the current study, a learning process was a mechanism used to capture, convert,
and integrate ideas and knowledge (Zahra, 2015).
Mentorship
A mentor is an individual with expertise who can help develop the career of a
mentee. A mentor has two primary functions. The career related function establishes the
mentor as a coach who provides advice to enhance the mentee’s professional
performance and development. The psychosocial function establishes the mentor as a role
model and support system for the mentee (APA.org, 2006). The main outcome of
mentorship is what the mentee learns as a result of that relationship (Barrett, 2006; Cull,
2006).
Nonservice Industry Business
Any company selling a nonservice product, such as a cell phone, a weight scale,
or a computer.
Profitable Business
A profitable business yields profit or financial gain (Oxford Dictionary, n.d.). In
the current case study, a profitable business is defined as one that has accumulated profits
over the past three years, thus creating a financial gain.

xiv
Service Sector
Service sector is referred to by economists as the tertiary sector of industry. No
goods are produced, just services. For example, accounting is provided to businesses and
consumers. Federal, state, and local governments and colleges, universities, high
schools, middle schools, and grammar schools were excluded from the current study. All
business leaders should be interested in capturing knowledge, but especially within the
service industry, which has grown during the Information Age. Service companies
account for more than 50% of the businesses on the Standard & Poor’s 500 index, and for
70% of added value in the advanced industrial economies (Newman, 2010).
Small Business
Officials at the Small Business Administration defined a small business as a
business that employs fewer than 500 employees (SBA Office of Advocacy, 2012). For
the current, study the definition of a small business is an entity that employs fewer than
100 employees.
Survivable Small Business
Four factors are used to define a survivable small business. First, the business has
been in existence for at least 7 years. Businesses existing after the sixth year and
employing fewer than 500 employees represent only 39.8% of businesses (Phillips &
Kirchhoff, 1989). Across all sectors, 44% of the cohort survived through the fourth year
(the end of the previous study) and 31% to the seventh year (Knaup & Piazza, 2007).
Second, the business has a 5% revenue growth rate over a 3-year period. Birch (1979)
defined high growth enterprises as growing 20% per year over a 4-year period, thereby

xv
doubling in size every 4 years. Only 4% of all businesses qualify as high growth.
Industry overall grows about the same rate as the economy, which is 2%-3% in a good
year. Outstanding growth is considered with 20%+, and 7% to 8% growth per year is
higher than average (Berry, 2007). Third, the survivable small business has multiple
years of profitability over a 3-year period. Fourth, the leaders foresee no change in the
business so as to be survivable for an additional 5 years. The additional 5 years in
business added credibility to the study by the participating companies remaining in
business past the year of the interviews.
Trial and Error
Trial and error is a process, whereby focus is on experimentation and on solving a
particular challenge, which requires the establishment of practices and procedures (Rui,
Cuervo-Cazurra, & Annique, 2016).
Delimitations
Delimitations state the boundaries of the study (Roberts, 2010). The boundaries set
for the current study were:
Service sector small businesses in San Diego County, California.
Additionally, the service sector businesses must have increased revenue by 5%
over a 3-year period and must have profitability in 2 of the past 3 years.
Several criteria for the businesses needed to be included in the current study,
including: (a) the business had been in existence for at least seven years; (b) the
business had between 10 and 99 employees; (c) the business had established a
process to capture, convert, and integrate knowledge into the business; (d) the

xvi
business was located in San Diego County, CA; (e) the business was not a
government agency, hospital, school, college, or university whether for-profit or
not-for-profit; (f) the business was in the service sector; (g) the business had
profitability in 2 of the past 3 years; (h) the entrepreneur must have been an active
member of the business; (i) the business experienced a 5% growth in revenue in
the past 3 years; and (j) no foreseeable changes were indicated that would prevent
the business from surviving an additional 5 years.
1
Chapter 1: Introduction
Knowledge has long been recognized as a crucial competitive tool for
organizational survival and competition (Chan & Chee-Kwong, 2008). Therefore, all
business leaders, especially leaders of small businesses, are interested in increasing
efficiency, productivity, competiveness, and survivability, which are a function of
knowledge generation and information processing (Castells, 2001). Organization leaders
who are adept in leveraging and capitalizing their knowledge resources experience
business success and performance improvement (Chan & Chee-Kwong, 2008).
Converting and integrating knowledge is essential for learning and can lead to the
discovery and creation of opportunities (Zahra, 2008, 2015).
A common expectation is for business leaders to invest in fixed assets to make
production more efficient, but they also need to invest in the creation of knowledge that
will sustain their business (Leadbeater, 2000). “Research and practice need to go beyond
knowledge access and absorption in analyzing corporate entrepreneurship and also
examine and study knowledge conversion and integration” (Zahra, 2015, p. 733). In a
constantly changing business environment, leaders of small businesses have to
continually create knowledge and implement the knowledge through the business’
learning process to differentiate itself from its competitors (Eisenhardt & Martin 2000;
Teece, Pisano, & Shuen 1997; Tolstoy, 2009). As such, it is important to understand how
small business leaders implement a process to capture, convert, and integrate knowledge
to survive.

2
Economically, small businesses are important at the national, state, and local
levels because small businesses contribute at least half the gross domestic product (GDP),
the monetary value of all the finished goods and services produced within a country's
borders in a specific time period and employ at least half of all private sector employees
(Valadez, 2012). The creation of 63% of net new jobs between 1993 and 2011 has been
in small businesses (U.S. Small Business Administration, 2012); therefore, the
survivability of small businesses has a direct effect on the labor force at the national,
state, and local levels. Many researchers have identified generic attributes of survival
(Brickau, Chasters, & Mangles, 1994; Coopers & Lybrand 1994; New Zealand Trade
Development Board, 1990), yet small businesses continue to fail (Headd & Kirchhoff,
2009). Accordingly, the identification of more specific characteristics or processes in
successful small businesses possesses both theoretical and practical benefits.
Small businesses continue to fail despite the abundance of literature on small
business survival (Headd &Kirchhoff, 2009). Leaders in some businesses achieve
significant growth, while 50% of businesses do not survive their first 5 years (Clayton,
Sadeghi, Talan, & Spietzer, 2013; U.S. Department of Labor, U.S. Bureau of Labor
Statistics, 2010) and small businesses existing after the sixth year represent only 39.8%
of businesses (Phillips &Kirchhoff, 1989). Since 2007, failure rates of small businesses
have increased 40%, with California having the largest failure rate of 69% (Dun &
Bradstreet, 2011). As businesses fail, more than 21 million people in the United States
become unemployed or underemployed, (Goldstein, 2013), adding to the economic woes
at the national, state, and local levels. Knowledge conversion and integration are fast
becoming essential processes in transforming knowledge into business, mapping strategic
moves, and creating new market spaces (Zahra, 2015). To increase the likelihood of

3
survival, leaders of a small businesses must acquire and judiciously deploy limited
resources, such as financial, personnel, technology, or processes to implement a learning
process and ultimately, to survive (Rubalcaba, Gallego, & Hertog, 2010). Clearly, it is
important to understand businesses that survive to at least year 7, because their leaders,
unlike most leaders, have determined how to create a business that survives. The current
research will be used to add to the body of literature regarding business survivability by
documenting how a surviving small business implements a process to capture, convert,
and integrate knowledge to survive. Understanding the process might result in
transferrable principles and actions that could lower the mortality rate of small business.
Literature Review
Knowledge management is a “process that helps organizational leaders find,
select, organize, disseminate and transfer the important information and expertise
necessary for activities, such as problem solving, dynamic learning, strategic planning,
and decision making” (Gupta, Iyer, & Aronson, 2000, p. 17). Bollinger and Smith (2001)
and Meso and Smith (2000) described knowledge as a strategic asset, which is valuable,
rare, nonsubstitutable, and inimitable by competitors. Small business leaders leverage the
diverse expertise of their employees to create a value and a competitive advantage using
knowledge sharing (Grant, 1996).
Researchers, such as Zahra (2015), Agüero and Sánchez, (2010), and Senge
(1990) agreed that knowledge management is more than storage and manipulation of
information; it is a process that requires the commitment to create and disseminate
knowledge through the organization (Marshall, Prusak, & Shpilberg, 1996; Parikh, 2001).

4
Committing to creating a formalized process to capture knowledge is difficult for a small
business with limited resources and understanding (DeSouza, 2003). However, leaders of
small businesses must find a way to capture, convert, and integrate knowledge to survive
(Wong & Aspinwall. 2004). Knowledge, if properly captured, converted, and integrated,
is used to enable small business leaders to outperform their rivals, creating a competitive
edge.
Methodology
In the current research study, a qualitative method with a multisite case study
design was used to focus on how small businesses in San Diego County, California
implement a process to capture, convert, and integrate knowledge to survive within the
service industry. A collective case study was used to allow a researcher to draw
comparisons and explore differences (Yin, 2003) in determining how small business
leaders capture, convert, and integrate direct observations, participant observation, and
physical artifacts (Yin, 1994). In the current study, a collective or multisite case study of
15 small businesses bound by a set of criteria was used.
Inside Prospects, an aggregator of business data in San Diego, CA since 1977 was
used because they are conveniently located in San Diego, and they collect all business
data in San Diego County. The criteria for the businesses in the study were as follows:
(a) in business for at least 7 years; (b) employed between 10 and 99 employees; (c)
established a process to capture, convert, and integrate knowledge into the business; (d)
were located in San Diego County, CA; (e) were not a government agency, hospital,
school, college, or university, whether for-profit or not-for-profit; (f) were in the service
sector; (g) had profitability in 2 of the past 3 years; (h) the entrepreneur was an active

5
member of the business; (i) had experienced a 5% growth in revenue in the past 3 years;
and (j) there were no foreseeable changes that would prevent the business from surviving
an additional 5 years.
When the criteria set were filtered, a list of 14,140 small businesses was created.
The data set were too broad; therefore, more filters were applied to exclude franchises,
divisions, and branches, which filtered to only include small businesses with single
locations and headquarters in San Diego. The reason for excluding franchises, divisions,
and branches was that the founder/entrepreneur must be involved in the business. After
all filters were applied, 3,038 small businesses remained listed. From the list, the oldest
1,000 businesses were provided, sorted by date of incorporation.
Additional screening of the participants, using web searches, phone calls, and e-
mails was required to confirm that the potential participants met the criteria before
interviews could be scheduled. After the Microsoft™ Excel® spreadsheet was received,
Stat-trek® was used to generate a random number listing of the data provided by Inside
Prospects. The researcher did not know how many companies would be known by the
subject-matter experts (SMEs), so the random number listing would augment any known
companies and keep the research process moving forward.
Each participant received 22 qualitative questions prior to the interview date. The
researcher read the questions to the participants at each interview and recorded their
answers on field notes. Of the 22 qualitative questions, 2 questions became the most
important: (a) How does your organization learn? and (b) How do you transfer
knowledge to others in the business? The answers to these two questions are reported in
the findings and answer the research question: How do small businesses create a process
6
to capture, convert, and integrate knowledge for survival. The researcher primarily used
member checking as a means to validate the answers from the participants, in addition to
continually reading the interview notes.
In a qualitative study, the researcher is constantly asking if he or she is getting the
story right (Creswell. 2007). One of the ways the researcher mitigated risk included
restating participant answers and asking for confirmation that words were captured
correctly. Additionally, the researcher asked the participants to repeat key phrases during
the interviews. Restating the participants’ words and having the participants repeat key
phrases provided a means to check the accuracy of the interview notes prior to leaving
the interview.
Sampling
Convenience sampling was used by sharing the Inside Prospects’ list with the
SMEs. Convenience sampling was used by the researcher to establish a list of small
businesses that the researcher or the researcher’s SMEs had an established relationship.
Additionally, criterion and snowball sampling was used to establish participants in the
study. The SMEs were from four different service fields: legal, academia, insurance, and
business consulting. Each of the SMEs had at least 10 years of experience in their
respective field and were respected and connected in their respective service industries,
which helped identify potential participants. Additionally, each of the SMEs had worked,
or was working, in a small business and understood the struggles of a small business to
survive. Each SME understood potential participant bias because of their relationships
with the potential participants. Therefore, the subject-matter experts contacted the
participants, but did not answer any questions about the research. The initial contact with
7
the potential participants was made by the researcher or the researcher’s SMEs, providing
a warm introduction. A warm introduction has a perceived higher degree of the
researcher speaking with a potential participant because of the established relationship
(Barrie, 2011). Strauss and Corbin (1998) concluded saturation should be more
concerned with reaching a point where new discoveries do not add anything to the overall
story. Saturation was achieved within 15 interviews. Warm introductions aided the
researcher with 10 out of 15 interviews. The remaining participants were contacted using
random cold calls.
Some of the potential participants on the Insider Prospects list were eliminated
from consideration for several reasons, which included the following: (a) the company
was recently acquired, or (b) the founder was no longer a part of the company. These
companies were highlighted in red on the Excel® spreadsheet and the leaders were not
interviewed. Regardless of whether the potential participant was known by the
researcher or if the potential participant was a random call, the researcher called and left
voice mail messages two times and sent an e-mail, if the e-mail address was known. If
no call backs or no e-mails were returned, the researcher called more names from the list
using the random number listing.
Coding
The researcher relied on Strauss and Corbin’s (1998) coding methods after data
were collected and transcribed. Coding is the process of selecting, focusing, simplifying,
abstracting, and transforming the raw data written in field notes (Huberman & Miles,
1994) and in examining the data collected to search for emerging themes from the data
(Strauss & Corbin, 1998).
8
Three steps are involved in the coding process: open, axial, and selective. At each
stage of the coding process, the data are scrutinized for consistent themes. During the
coding stage, the researcher may uncover a theme that needs further examination
requiring more in-depth interviews. Interviews continue until no new themes exist.
Strauss and Corbin (1998) considered it the saturation point. An outcome of coding is
that the researcher is continually refining interview questions to uncover more themes
until a theory is developed.
A theory or theories emerged from the data at each stage of coding. The
researcher clarified any data that appeared to be conflicting or needed further clarification
with each participant. Emerging themes from the data were tested for their reliability and
their validity. At each stage of the coding process, member checking was used to
validate the results. Otherwise, the researcher would be left with interesting stories of
unknown truth and utility (Huberman & Miles, 1994). Once the data were fully coded, a
theory was generated to answer the research question: How do small businesses create a
process to capture, convert, and integrate knowledge for survival?
Findings
The researcher uncovered three main themes. Mentors were used by the founders
of the companies researched. In fact, not only did the founders use mentors, they needed
to find mentors at each stage of the business development, which was important, because
only 8% of small business owners use mentors (Palmieri, 2016). The next theme to
emerge was that the participants used a trial-and-error process with a feedback loop to
learn. Trial and error is not new, but using trial and error was used to aid the participants
to learn faster than their competitors. The last theme was that integration of knowledge

9
into the business was led by the founders. The founders transferred knowledge to others
in the business by one-on-one meetings, team meetings, lunch-and-learn meetings, and
lessons learned. Combining trial and error with utilizing mentors at each stage of
business development, along with integrating knowledge to others in the business,
allowed the small businesses to survive.
Mentors
Each of the founders in the study intentionally established mentors for their
business. Each participant of this study was classified in the researcher’s codebook as PA
with a corresponding number from 1 through 15. One being the first participant and 15
being the 15th participant. Throughout the document, quotes from participants were used
to tell their story as Strauss and Corbin (1998) suggested. Some of their comments
included:
“We learn through one-on-one mentoring” (PA 6).
“Mentorship from top down fosters learning” (PA 4).
“My brother is in the same business that we are in, but in Northern California.
We bounce ideas and issues off of each other. We have learned from each other” (PA
15).
Different stages of business development exist (Adizes, 1979) and different stages
of mentorship exist. In the beginning stages of the business, the founders used family
members and friends who could help the founders with ideas on computer systems,
banking relationships, finances, and customers.

10
PA11 stated:
My uncle was my mentor. He owns a business selling wood for homes in San
Diego. He told me early on business was a game much like gambling. I approach
the day with the idea that after 31 years, this is still a game. I need to take risks to
stay on top of my game.
PA 8 asserted, “My mentor early on told me to spend nickels like manhole
covers.”
As the businesses grew and became more complex, the founders intentionally
sought additional mentors who could help them with their stage of development.
PA 3 commented, “Mentors are the number one way I learn. Yes, I leaped frog
my mentor.”
PA 11 said, “I learn from other people’s businesses. I figure out what other
successful people are doing and copy them. I bring their ideas into my business.”
The mentors are a network of knowledge experts. Literature on mentoring
indicates that the main outcome of a mentoring relationship is what the mentee learns as a
result of that relationship (Barrett, 2006; Cull, 2006).
Learning from the mentors is essential to business survival. Ozgen and Baron
(2007) found mentors could help novice entrepreneurs. A mentor is an essential asset to
a growing company (Cull, 2006). Mentors can warn of problems, help craft solutions to
problems and opportunities, and be a sounding board for the entrepreneur. A mentor’s
many years of experience can save a business from major errors and costly mistakes with
just a few words (Cull, 2006). Meeting with their mentors monthly allowed the founders
to share ideas such as new business opportunities and to receive feedback from the

11
mentors on the ideas. Founders can try an idea, capture learnings from the idea, and then
talk over the results with their mentors. It is important to continually find mentors to fit
the stage of development of the business and who fits with the founder.
Learning Through Trial and Error
The founders learned using a trial-and-error process. In a trial-and-error
process, the focus is on experimentation and on solving a particular challenge that
requires the establishment of practices and procedures (Rui et al., 2016). Trial
and error was the process used by the businesses, aiding the founders to learn
faster than their competitors and leading to new sales opportunities. Several
participants commented.
PA 3 noted:
We learned to use trial and error by using a marketing and advertising
campaign built for one client’s vertical market then duplicating the
marketing and advertising campaign in another vertical market for a
different client and the sales flood gates have opened up. We have
increased the organization’s sales by adopting a marketing and advertising
campaign and using it in several vertical markets.
PA 6 said, “We learned faster to run the business side of our practice than
our competitor.”
PA 4 asserted, “Business opportunities....exploit before your competitor:
winning projects with budget driven pricing. Continuing to be open to different
kinds of projects, keeps us on our corporate toes, and the swiftness that projects
move through the office.”

12
PA 15 stated:
I watched our competitors fail. During the 2000 and 2008 recessions,
because we are financially frugal, we were able to make it through the
recessions when the competitors did not. We persevered while the
competitors dried up. I saw them drop by the wayside. The competitors
also did not give great customer service.
PA 7 said, “We control the entire process which gives us a competitive
advantage. Doing everything is our biggest asset.
PA 11 commented:
The Discovery Conference Centre. I was able to exploit this before my
competition. This has helped me with survival. I provide a place where
attorneys can hold depositions or have meetings in private. I provide a
physical space with Internet, video conferencing, a receptionist and
refreshments.
Learning is Accomplished Through Multimodal Learning:
PA 9 commented:
We learn from doing and observing. It is through our experience that we learn.
When we make mistakes we make adjustments. We read literature from people in
our industry. We look online for cleaning tips. We learn from outbidding our
competitors.
PA 13 stated:
We learn by example and through experience studying, and teaching. Interacting
with clients. I contact clients and talk to them. We talk through issues. We may
13
talk about an important piece of case law. We learn through the client experience
and interaction. Teaching others. You have to take time away from the business
to learn.
The participants failed at times through their trial-and-error process, learning from their
failures, capturing their learnings and integrating the knowledge, but kept moving
forward:
PA 11 pointed out, “Failure = success = business. Must fail at times but keep
moving forward and make decisions.”
PA 10 said, “If you are not failing, then you are not differentiating yourself and
are probably in the wrong area of business.”
Failing to maintain the business was not an option for any of the participants in
the study. PA 12 said, “From day 1, failure was not an option. You don’t go into a
business with the idea it will fail.”
PA 14 claimed, “I learn from experience and I learn from my and others’
mistakes.”
The feedback loop regarding failure involved capturing what was learned by the
failure, reflect, perform an after-action review, and then speak with mentors. The process
of trying and failing was used to provide learning to create a new idea, to create a new
process, or to implement the idea in a different manner. The feedback process worked
only if the mentor had more experience than the founder, which was why founders
needed to add mentors to match their stage of business development. Most importantly,
the mentors helped the founders understand the learning from the success or failure. The
failed solutions are useful sources of knowledge and learning (Rui et al., 2016). To do
14
what such trial runs are supposed to do—teach the firm whether a new product, process,
or market works—they should not be designed to fail, but should at least be designed to
discover everything that could go wrong, along with what might go right (Krohe, 2011).
Entrepreneurs Lead Integration of Knowledge
Leaders of organization learning must create a process not only to influence
learning but also to maintain and monitor processes to accelerate learning (Graham &
Nafukho, 2008). Integrating the knowledge into the business is the founder’s role.
Knowledge must move from the mind of the founder to others in the organization in
order for the business to survive (Breslin & Jones, 2012):
PA 12 asserted, “I lead the company. You must first do, in order to lead the
company.”
PA 2 pointed out, “Knowledge is captured through doing and transferred by me to
the employees in formal one-on-one meetings.”
PA 11 said, “I capture the data, which could be either verbal or through readings,
and then I use my experience to teach others how to do what I just learned.”
PA 15 asserted:
Information is gathered from suppliers of the equipment along with customer and
competitor information and is discussed at the owner meetings. The owners meet
regularly over lunch to discuss the business and the customers. Obviously, if a
customer has an issue it is immediately discussed. The information is then
transmitted to the remaining employees by me through formal meetings.
In addition to the founders integrating the knowledge to others in the organization
directly, the founders used vendors, industry organizations, other employees, and
15
consultants by hosting lunch-and-learn meetings, lessons learned, attending conferences,
webinars, and after-action reviews.
PA 4 noted:
Senior staff working closely with more junior staff, architect researching
architectural codes through Internet forums and subsequent updates, going
through a QA process for review of work product and having the staff member
who did not address a design issue 100% or accurately, learn by correcting his or
her own work. Mistakes or oversights are pointed out and expectation is
companywide learning from those types of experiences.
PA 7 pointed out they are “constantly looking at magazines, media, vendor
catalogues. The upstairs in our office is open so the designers are constantly talking to
each other, showing each other what they have learned. Very informal and they
constantly talk.”
PA 10 said, “We do lunch-and-learns with our vendors.”
PA 4 explained:
The company learns from lessons learned. The lessons learned are things that
happened that should not have [happened], and cost the company money. Things
that happened and had potential negative outcomes that did not cost the company
money, but could have and things that happened that generated positive outcomes
from lessons learned.
Entrepreneurs retain essential knowledge components in their minds, developing
simple rules of thumb to deal with issues, such as starting the business (Shane &
Venkataraman, 2000), learning from trial and error, mistakes, and interpreting

16
information from the small businesses’ external environments (Breslin & Jones, 2012).
Lotti (2007) found the “existence of a learning mechanism, which takes place once firms
are active: The more they are in the market, the more they learn about how staying in
business and how to increase their efficiency level” (p. 368). The competitiveness and
survivability of an organization relies on the successful creation and transfer of
knowledge (Syed-Ikhsan & Rowland, 2004).
Conclusion
The goal of the current study was to find how leaders of small businesses create a
process to capture, convert, and integrate knowledge for survival. In the current study, 15
small businesses from 12 different service businesses participated. Data saturation was
reached within 15 interviews. The small businesses’ years of operation ranged from 7
years to 40 years and the range of personnel was from 10 to 77 employees. The founders
established mentors early in their businesses. The founders were intentional in choosing
their mentors. Early on, the mentors were family and friends who operated businesses
and could provide advice on starting the business. As the businesses grew, the founders
intentionally sought mentors who could help them in the next phases of the business.
Based on the current research, learning is important and occurred through a trial
and error process. Founders thought of and vetted new ideas with their mentor(s). Then,
the founders implemented the ideas. Some ideas failed. The founders captured in writing
the knowledge of what they had learned from their failure. After reflection, creation of
an after-action review, and conferring with their mentors, changes were made to the idea
or the implementation tactic. Then, the new idea or new implementation tactic was
launched. The process occurred until the founders had success or decided to pursue a

17
different idea. The iterative process allowed the founders to learn faster than their
competitors. By learning faster, the founders were aided in finding new business
opportunities.
The founders were the genesis of integrating the knowledge in the business. They
shared their knowledge directly with their employees using after-action reviews and
formal meetings. Knowledge was also integrated using vendors, industry organizations,
and consultants by hosting lunch-and-learns, lessons learned, after-action reviews,
attending conferences, and webinars.
All the businesses survived because the founders were intentional in establishing
mentors, using trial and error methods to learn faster than their competitors, and
successfully integrating knowledge into the business through meetings, after-action
reviews, lessons learned, conferences, webinars, and lunch-and-learns. Establishing and
adding mentors as the businesses changed was an essential component to the survival of
the businesses in the current study. Founders of businesses with less than seven years of
operation could intentionally seek mentors, use trial and error processes, and lead the
integration of knowledge to increase the likelihood of survival.
Recommendations for Further Research
The process by which mentoring enables a mentee to identify new opportunities is
not well understood (Cull, 2006). Therefore, future researchers should study how
mentorship identifies new business opportunities. Future researchers should study
service sector businesses with 100 to 500 employees to determine if leaders of larger
companies had established mentor relationships with a trial and error process with
feedback loops. Also, a study of the manufacturing sector of companies with 10 to 99

18
employees, and that have been in operation at least seven years would be interesting. It
may reveal if the leaders of the manufacturing sector of business utilize a process similar
to that of the leaders of the service sector to capture, convert, and integrate knowledge for
survival. Is mentorship a requirement for small business survivability in other sectors or
geographic areas? Of the 15 participants in the current study, 14 participants reported
they learned faster than the competition. Future research could be used to study how
participants learn faster than their competitors. Is it the makeup of the entrepreneur, the
trial and error process, or do other characteristics exist that lead entrepreneurs to learn
faster than their competitors?

19
Chapter 2:Literature Review
Business survival is important to all stakeholders (Valadez, 2012). The
importance to stakeholders can suggest that researchers who discover how businesses
survive are crucial. In the literature used to analyze firm survival (Box, 2008;Carr et al.,
2010;Coeurderoy, Cowling, Licht, & Murray, 2012; Colombelli, Krafft, & Quatraro,
2013; Holmes, Hunt, & Stone, 2010), the importance of the following conditions were
highlighted: (a) businesses’ ability to create a learning process, (b) entrepreneurs, (c) age
of business, and (d) innovation. Implementing a process to capture, convert, and
integrate knowledge is necessary for business survival (Zahra, 2015). Knowledge has
long been recognized as a crucial competitive tool for organizational survival and
competition (Chan & Chee-Kwong, 2008). In practice, many organizational leaders are
adept in leveraging and capitalizing their knowledge resources, experience business
success and performance improvement (Chan & Chee-Kwong, 2008). Unfortunately,
more than 50% of small businesses do not survive beyond the first five years of
operations (Clayton et al., 2013; U.S. Department of Labor, U.S. Bureau of Labor
Statistics, 2010). The purpose of the current study was to build upon prior small business
research and to answer the following question: How do small businesses implement a
process to capture, convert, and integrate knowledge in order to survive, and what role
might the process have played in small business survival? The information in the current
study can be used to provide small-business entrepreneurs with ideas on how to
implement a process to capture and integrate internal and external environmental

20
information and possibly lead to lower business mortality rates. The purpose in the
literature review was to detail the significance of a process as it related to small business
survival.
Early Stages of Learning
Learning has been a concern dating back to Frederick Winslow Taylor (1911) and
scientific management (Taylor, 1911) Taylor believed each element of a man’s work
must be thoroughly examined and tested to find the one best method and to replace the
old rule-of-thumb method (Blake & Moseley, 2010). Taylor proposed that employers
spend time and money selecting and training each employee, rather than letting each
employee figure out the job for himself or herself, which would potentially lead to
inefficient choices (Blake & Moseley, 2010). In his next principle, Taylor called for the
worker’s scientific education and development (Blake & Moseley, 2010). Company
leaders should ensure employees continue to perform their jobs in accordance with the
scientific principles established for the particular employee (Blake & Moseley, 2010).
Using scientific management principles, business leaders were learning to capture
knowledge in a rudimentary learning process leading to increased efficiencies,
productivity, and profits, while the employees earned higher wages.
In time, information became an ever-increasing ingredient in the ability of
business leaders to create businesses that compete and survive (Newman, 2010).
Business leaders are interested in increasing efficiencies, thereby increasing productivity
and profitability (Chan & Chee-Kwong, 2008). The need for more information has led to
the Information Age, an age that is characterized neither by manufacturing, nor by
technology that replaces physical human labor (Chisholm, 2011). Rather, with the birth

21
of computers, software programs, and Cloud technologies, it is characterized by the
significant role innovation has played (Chisholm, 2011). Information increasingly affects
the ability of companies to compete, innovate, and make profits (Newman, 2010). How
the information is captured and retained in the business is essential business survival
(Zahra, 2015).
All business leaders should be interested in capturing knowledge, but in
particular, the service industry has grown during the Information Age. Service
companies account for more than 50% of the businesses on the Standard & Poor’s 500
and 70% of added value in the advanced industrial economies (Newman, 2010). For
many of the leaders of the firms, information, transmission, segmentation, or access has a
critical role in their business models (Newman, 2010). The next sections will be used to
address the importance of knowledge management, learning process, feedback loop, and
organizational learning to business survival.
Knowledge Management
Researchers have now agreed that knowledge management is more than mere
storage and manipulation of information, but is a process that requires the commitment to
create and disseminate knowledge through the organization (Chidambaranathan &
Swarooprani, 2015; Marshall et al., 1996; Parikh, 2001).
According to Gupta, Iyer, and Aronson (2000), “Knowledge management is a
process that helps organizations find, select, organize, disseminate and transfer important
information and expertise necessary for activities such as problem solving, dynamic
learning, strategic planning and decision making” (p. 17). Bollinger and Smith (2001)
and Meso and Smith (2000) described knowledge as a strategic asset that is valuable,
22
rare, nonsubstitutable, and inimitable by competitors. Small business leaders leverage the
diverse expertise of their employees to create a value and a competitive advantage
through knowledge sharing (Grant, 1996).
Zahra (2015), Agüero and Sánchez (2010), and Senge (1990) agreed that
knowledge management is more than storage and manipulation of information, but is a
process that requires the commitment to create and disseminate knowledge through the
organization (Marshall et al., 1996; Parikh, 2001). Committing to creating a formalized
process to capture knowledge is difficult for a small business leader with limited
resources and understanding (DeSouza, 2003). However, small business leaders must
find a way to capture, convert, and integrate knowledge to survive (Wong & Aspinwall,
2004). Knowledge, if properly captured, converted, and integrated, will enable small
business leaders to outperform their rivals, creating a competitive edge.
The Learning Process
The important elements in the learning process are exposure to opportunities and
access to resources, such as local contact networks, business friends and suppliers, the
personal constructs of owners/managers, and their translation into management action
and organizational learning (Anderson & Skinner, 1999). Small business leaders are
interested in implementing learning processes because of their proven effect on
productivity and profits (Chan & Chee-Kwong, 2008). Knowledge, together with capital
and labor, are becoming the key elements of developed economies (Egbu, 2004).
Implementing a learning process allows a small business leader to capture the required
knowledge to be competitive in the market and quite possibly create a competitive
advantage (Chan & Chee-Kwong, 2008). The challenge for a small business leader is

23
that employees and owners are so busy performing daily tactical activities that they never
document their knowledge (Rubalcaba et al., 2010). Many leaders of small firms do not
have the infrastructure, sophistication, or formal commitment to maintaining learning
processes (Rubalcaba et al., 2010). Hence, technology is generally not used in the
learning process to capture knowledge (Purcarea, Benavides Espinosa, & Apetrei, 2013).
To increase the likelihood of survival, leaders of small businesses must acquire and
judiciously deploy limited resources, such as financial, personnel, technology, or
processes, to implement a learning process and ultimately to survive (Rubalcaba et al.,
2010).
The method in which a small business leader deploys limited resources depends
on the individual business entrepreneur. Some entrepreneurs may, after every meeting,
journal the strengths and weaknesses of the meeting and then make the necessary changes
to limit the weaknesses before the next meeting. For leaders in other businesses, it may
be necessary to purchase data from a marketing or research firm on customer preferences
and then analyze the data for confirmation either that the business is meeting customer
expectations or that the business needs to make changes to remain competitive. The next
sections will be used to address the impact of learning and survivability on small
businesses.
Feedback Loop
The feedback loop is an error-and-correction process in group levels; broken into
single-loop and double-loop (Argryis & Schon, 1978). Once information is captured, it
needs to be evaluated for relevance, as does the information that already exists in the
business and, if there is no information in the business, the newer information needs to be

24
integrated into the business using a learning process. Capturing, converting, and
implementing information is critical to business survival, but a feedback loop must also
be present. The ability to “simultaneously run and reinvent” (Reeves, Levin, & Ueda,
2016, para. 32) a small business requires effective feedback loops that are “critical to
robustness in changing environments” (Reeves, Levin, & Ueda, 2016, para. 32). Two
types of feedback loops exist: single and double. Single-loop learning is any activity in
which learning is present, but does not result in a change in the business core values or
beliefs. Business leaders employing single-loop learning, as proposed by Argryis and
Schon, (1974), respond to changes in their internal and/or external environments by
detecting and correcting information (Barlow & Jashapara, 1998). In comparison,
double-loop learning occurs when leaders question business norms and assumptions to
establish a new set of norms (Barlow & Jashapara, 1998). In double-loop learning
symptoms are used as indicators of problems and focuses on addressing root causes
(Argyis, 1992). The result of double-loop learning should be increased effectiveness in
decision-making and better acceptance of failures and mistakes (Barlow & Jashapara,
1998). Without a feedback loop, a learning process would not be complete (Argryis &
Schon, 1978).
Organizational Learning
Organizational learning is defined as the process of achieving organizational
change and strategic renewal using a cyclical pattern of reaching out to explore new ideas
while, at the same time, implementing more familiar ideas that have become accepted by
individuals and groups within the organization (Crossan & Berdrow, 2003).

25
Adler and Cole (1993) stated, “A consensus is emerging that the hallmark of
tomorrow’s most effective organizations will be their capacity to learn” (p. 85). Learning
is a never-ending process, which is used to contribute significantly to organizational
growth, performance, and survival (March, 1996). Based on the benefits, significant
attention has been devoted to understanding how learning occurs (Argote, McEvily, &
Reagans, 2003). Organizational learning is the development of knowledge having the
potential to influence behavior (Mena & Chaboski, 2015) using a learning process.
Capturing, converting, and integrating data in an organization can increase the learning
potential of the organization (Fiol & Lyles, 1985; Mena & Chaboski, 2015).
Organizational learning occurs at three levels (a) individual, (b) group, and (c)
organization (Cangelosi & Dill 1965; Crossan & Berdrow 2003; Mena & Chaboski,
2015). As information is obtained, converted, and integrated, it can be stored for future
use by the organizational leaders. However, business leaders commonly lose information
when employees leave the business (Mena & Chaboski, 2015). Studies on medium and
large businesses have been used to reinforce the relationship of organizational learning to
innovation, competitive advantage, and financial performance (Ellinger, Ellinger, Yang,
& Howton, 2002; Graham & Nafukho, 2008; Khandekar & Sharma, 2005; Pérez López,
Manuel Montes Peón, & José Vázquez Ordás, 2004). The relationship with
organizational learning is one reason that entrepreneurs employ a learn-in-order-to-grow
philosophy to maintain a competitive advantage (Graham & Nafukho, 2008).
Organizational learning is important and is the reason a small business leader must learn
to capture, convert, and integrate knowledge into the business for survival.

26
Small Business Characteristics
“The entrepreneur’s or business owner-manager’s traits, motivation, and
capacity— along with other personality variables—are considered to explain a great part
of why some firms fail while others survive and, perhaps, grow” (Box, 2008, p. 379).
The behavior of the organization is dominated by the entrepreneur when studying small
businesses. Therefore, the study of the learning of the organization becomes inseparable
from the study of the learning at the level of the entrepreneur (Deakins & Freel, 1998;
Kim, 1993). An entrepreneur retains essential knowledge components in his or her mind
developing simple rules of thumb to deal with issues, such as starting the business (Shane
& Venkataraman, 2000), learning from trial and error, mistakes, and interpreting
information from the small business’s external environment (Breslin & Jones, 2012). It
is important to capture the information flow because the interactions of learning have an
impact on stakeholders of the small business, thereby affecting the finances of the small
business (Edvinsson, 1997). However, increased complexities of learning caused by
cross-functional integration, along with an increase in global competition and change,
may result in firms struggling to acquire, comprehend, and implement knowledge
associated with newly acquired competencies (Breslin & Jones, 2012; McKelvey, 1982).
The intensity of knowledge creation can be gradual, as in changing processes
within the business (Nelson & Winter, 1982; Tolstoy, 2009), or radical, as in creation of
new products or services (Cohen & Levinthal, 1990; Tolstoy, 2009). Striking a balance
between gradual and radical knowledge creation allows small business leaders to create
short-term profits while taking a long view by creating a competitive advantage (Tolstoy,
2009). In a constantly changing business environment, a small business leaders have to

27
create knowledge continually and implement the knowledge through the learning process
to differentiate the business from competitors (Eisenhardt & Martin 2000; Teece et al.,
1997; Tolstoy, 2009). As such, a learning process requires an infrastructure capable of
supporting identification, acquisition, application, sharing, development, creation,
preservation, and measurement (Yip, Hong, & Din, 2012). In addition to learning the
skills needed to exploit opportunities, entrepreneurs may develop unique ways of viewing
the world and, in so doing, spot underexploited opportunities (Breslin & Jones, 2012).
Gartner (1989) noted that successful entrepreneurs develop the skill of learning to learn,
with the successful entrepreneur becoming a faster learner than other business leaders.
An essential element in the development and survival of small businesses relates
not just to the entrepreneur, but to learning within the team of individuals who are
working in the small business. Learning organizations are “where people continually
expand their capacity to create the results they truly desire, where new and expansive
patterns of thinking are nurtured, where collective aspiration is set free, and where people
are continually learning to see the whole together” (Senge, 1990, p. 3). Survival skills
developed by the entrepreneur need to be transferred to others within the company
(Breslin & Jones, 2012). The entrepreneur is viewed as learning by doing, and the
transfer of knowledge is shown typically to involve a process of action learning. Thus,
individuals work together closely, sharing and interpreting collective experiences,
develop a distinct group identity through participation and socialization (Jones &
Macpherson, 2006). Leaders of small businesses that have a learning process that uses
working through teams have better results operationally, financially, and innovatively
(Tari & Garcia-Fernandez, 2012). As an entrepreneur learns new ideas to aid in business

28
survival, he or she must create a process of storing, retaining, and replicating the new
learning. If a small business leader does not have a process to capture, convert, and
integrate knowledge, that knowledge will be lost based on the forgetfulness of people
(Agüero & Sánchez, 2010).
The entrepreneur’s aim is to improve the accuracy of his or her understanding of
the industry and the interpretation of feedback from the industry. Researchers need to go
beyond capturing knowledge and study converting and integrating knowledge as a
learning process (Zahra, 2015). Knowledge conversion and integration are fast becoming
essential processes to transforming knowledge into business, mapping strategic moves,
and creating new market spaces (Zahra, 2015). Conversion and integration are essential
for learning and therefore can lead to the discovery and creation of opportunities (Zahra
2008). Integration gives the entrepreneur the opportunity to exploit knowledge, pursue
radically novel opportunities, and to understand how small businesses move from
knowledge destruction to knowledge construction (Zahra & Yavuz, 2008).
Without a process, it would be nearly impossible to convert and integrate
knowledge and ideas into the business. When a process exists, knowledge, generally,
will be retained within the small business, possibly increasing the value of the business
within its industry sector (Agüero & Sánchez, 2010). Arguably, not all knowledge will
be retained (Agüero & Sánchez, 2010). A breakdown of the process is possible with
information being lost, possibly forever (Agüero & Sánchez, 2010). As examples, the
breakdowns can occur because employees are not asked the right questions, or employees
refuse to provide information, or the information was captured, but not entered into the
learning process (Agüero & Sánchez, 2010). Researchers must delve deeper into the

29
small business, and identify and study the development of knowledge “vis-à-vis skills,
heuristics and frameworks” that are themselves modified and inherited over time (Breslin
& Jones, 2012, para. 12).
Age of Business
“The liabilities of newness perspective suggests that young businesses are at a
disadvantage and, therefore, are likely to face higher mortality rates than more well-
established firms (Carr et al., 2010, p. 186). How does the age of a business affect small
business survival and the learning process? As businesses age and move through the
corporate life cycle, the leaders will have encountered issues that either previously did
not exist or, at least were not relevant at inception of the business, such as creating a
global strategy, adapting products and services to customer needs as technology changes,
or creating a learning process for employees. While not an exhaustive list, small business
leader may encounter the issues as the business ages.
Knowing the issues and deciding how to act on the issues are very different
concepts and abilities. Entrepreneurs operate their businesses by learning over time how
to handle internal and external challenges. Lotti (2007) studied the Italian service sector
compared to the Italian manufacturing sector searching for the impact, if any, that the age
of a business has on its growth and survival. Lotti (2007) indicated the age of a firm does
have an impact on growth and survival, emphasizing the “existence of a learning
mechanism which takes place once firms are active: the more they are in the market, the
more they learn about how [to stay] in business and how to increase their efficiency
level” (Lotti, 2007, p. 368). Creating a learning process in a small business is important
(Lotti, 2007; Senge, 1990) to survivability. The question is how does a small business

30
leader implement a process to capture, convert, and integrate knowledge to survive. The
next section will be used to examine innovation as a means to small business survival.
Innovation
“Innovation enhances the survival likelihood of firms”(Colombelli, Krafft, &
Quatraro, 2013, p. 1). The ability of the leader of any firm to produce successful
innovations lies in the leader’s capability to make new combinations of knowledge and
expertise and to have a process in place to capture the knowledge (Abereijo, Adegbite,
Ilori, Adeniyi, & Aderemi, 2009). Within an innovative and entrepreneurial culture, the
leader has the vision to focus on the learning process and the value of knowledge, and
also generates confidence and communication and tolerates questioning and errors
(Purcarea et al., 2013). To remain competitive and to create long-term survival, small
businesses leaders must innovate (Petkovska, 2015).
Innovation is the introduction of new goods, new methods of production, the opening of
new markets, the conquest of new sources of supply, and the implementation of a new
organization in any industry (Schumpeter, 1934). Entrepreneurs use innovation to help
them exploit opportunities to deliver new products or services, changes in processes, or
starting new operations (Drucker, 1985). Knowledge-based innovation is used in an
attempt to create a competitive advantage by perceiving or discovering new and better
ways of competing in an industry, and bringing them to the market (Porter, 1990). One
outcome of innovation is that small business entrepreneurs can create a business model
providing a “temporary monopoly” (Petkovska, 2015, p. 64), allowing a company to
generate additional profits (Petkovska, 2015). Innovation can be either a slow
incremental process or a faster radical process. Regardless of the innovation, a small
31
business entrepreneur can experiment with a process or idea in an attempt to exploit an
opportunity. By experimenting with innovation, entrepreneurs increase small business
innovation rates per employee greater than rates of larger firms (Hof, Burrows, Hamm,
Brady, & Rowley, 2004). Learning must be implemented for the innovation to be
successful (Senge, 1990). If a small business entrepreneur can implement a process to
capture ideas on innovation, the small business has a better chance to grow and survive
(Petkovska, 2015).
Summary
Small businesses are complex entities in which entrepreneurs must continually
learn and capture knowledge from employees and the environment to remain competitive,
increase the valuation of the business (Rubalcaba et al., 2010) and ultimately survive.
Knowledge conversion and integration are fast becoming essential processes to
transforming knowledge into business, mapping strategic moves and creating new market
spaces (Zahra, 2015). Implementing a learning process is essential to business survival
(Lotti, 2007; Senge 1990). The current research will be used to add to the body of
literature on business survivability by documenting how a small business entrepreneurs
implement a process to capture, convert, and integrate knowledge to survive.
Understanding the process might result in transferable principles and actions that could
lower the mortality rate of small businesses.
Purpose of the Research Study
The purpose of the current research was to understand how small business leaders
have implemented a process to capture, convert, and integrate knowledge to survive.

32
When an entrepreneur has a business idea, he or she does some research to understand the
market, the competition, and potential customers. Based on the entrepreneur’s research
he or she gain knowledge, but something must be done with the knowledge. Knowledge
must be captured, converted, and integrated into the business for survival (Zahra, 2015).
A learning process can be used to capture knowledge, allowing small business leaders
and employees to continually find knowledge, capture it, and implement the knowledge
into the business (Lotti, 2007; Senge 1990).
Small businesses continue to fail more than 50% of the time the business has been
in operation 7 years (Phillips &Kirchhoff, 1989). The small business sector is especially
critical, because the bulk of small business entries and exits in the American and global
economy occur within these economies (Headd, 2010), and energizing the small business
sector has emerged as an essential policy challenge in the aftermath of the economic
downturn during the early part of the 2000s (Fadahunsi, 2012). The argument might be
presented that most firms are, by definition, small; therefore, they start small, have a
slim-to-fair chance of survival, and if they do survive, they invariably remain small.
Small business success and survivability will be critically dependent upon the
entrepreneur developing new resources, continually evolving the organization, and
creating new organizational forms (Sarason, Dean, & Dillard, 2006). Surviving small
business leaders must follow their fundamentals, yet continually change (Collins &
Porras, 1994). Business survivability is challenging. The statistics are predominantly in
favor of business failure (Phillips & Kirchhoff, 1989). Understanding how to implement
a process to capture, convert, and integrate knowledge to survive might result in

33
transferrable principles and actions that could lower the mortality rate of small
businesses.

34
Chapter 3:Methodology
Small businesses in San Diego County were important to research because of the
quantity of small businesses, their size, and most importantly their number of survival
years. The following paragraphs will outline the research methodology and sampling
methods used for the study, a listing of semi-structured research questions, and citations
from existing literature for each research question. The Inside Prospects data is displayed
in tabular form to show the how the researcher pared the data from the original list to the
ultimate sample of small businesses. The last section of the methodology is the coding
process and validation of results.
Research Design and Rationale
Small business leaders must continually learn from the business environment to
remain competitive (Collins & Porras, 1994). Ways to capture and implement knowledge
is critical to small business survival (Zahra, 2008). A learning process is necessary to
capture the knowledge of the employees as well as the external environment (Senge,
1990). The question the current research was developed to answer was how a small
business entrepreneurs implement a process to capture, convert, and integrate knowledge
to survive. The factors of the research question were unknown; therefore, a qualitative
method was used. Creswell (2003) noted that qualitative research is a humanistic
approach to research, whereby the researcher becomes very familiar with the
participants(s). Following the humanistic paradigm, the researcher sought to understand

35
the world or lived experience of the participants better and develop clear outcomes from
that enhanced understanding that might lead to action and change.
With the method known, the design to be used was determined. The design
choices for consideration included phenomenology, ethnography, grounded theory, case
study, and narrative. Each of the designs is inductive and exploratory. Based on the
principles posited by Yin (1994) and Stake (1995), case study design was used for the
current research study. Yin (1984) defined the case study research method as an
empirical inquiry that is used to investigate a contemporary phenomenon within its real-
life context when the boundaries between phenomenon and context are not clearly
evident and when multiple sources of evidence are used (p. 23). In the current multiple-
site case study, the attempt was made to determine the process to capture, convert, and
integrate data for survival by interviewing and observing founders of small businesses.
Small business entrepreneurs interviewed were individuals whose businesses met
the following criteria: (a) in existence for at least 7 years; (b) employed between 10 and
99 employees; (c) the entrepreneur had established a process to capture, convert, and
integrate knowledge into the business; (d) located in San Diego County, CA; (e) the
business was not a government agency, hospital, school, college, or university, whether
for-profit or not-for-profit; (f) in the service sector; (g) had profitability in 2 of the past 3
years (h) the entrepreneur was an active member of the business; (i) the business had
experienced a 5% growth in revenue in the past 3 years; and (j) the entrepreneur saw no
foreseeable changes that would prevent the business from surviving an additional 5 years
and believed the business was survivable.

36
The entrepreneurs were interviewed using a semistructured interview technique.
The interviews occurred at a setting convenient for the participants. Of the 15 interviews,
14 interviews were conducted at the participants’ businesses, and 1 interview was
conducted at a convenient location for the participant. The study was important because
since 2007, failure rates of small businesses have increased 40%, with California having
the largest business failure rate of 69% (Dun & Bradstreet, 2011). Understanding how
small business entrepreneurs implement a process to capture, convert, and integrate
knowledge to survive resulted in transferrable principles and actions that could be used to
lower the mortality rate of small businesses adding to the body of literature on business
survivability.
Case Study
In the current research study, a qualitative method with a case study design, was
used to focus on how a small business entrepreneur implements a process to capture,
convert, and integrate knowledge to survive in the service industry in San Diego County,
CA was used. According to Bromley (1990), a case study is a “systematic inquiry into an
event or a set of related events which aims to describe and explain the phenomenon of
interest” (p. 302). The unit of analysis can vary from an individual to a corporation
(Bromley, 1990).
According to Yin (1994), the case study design must have five components,
including: (a) the research question(s), (b) its propositions, (c) its unit(s) of analysis, (d) a
determination of how the data are linked to the propositions, and (e) criteria to interpret
the findings. Yin (1994) concluded that operationally defining the unit of analysis is used
to assist with replication and efforts at case comparison. Stake (1995) emphasized that

37
the number and type of case studies depends on the purpose of the inquiry: an
instrumental case study is used to provide insight into an issue; an intrinsic case study is
undertaken to gain a deeper understanding of the case; and a collective case study is the
study of a number of cases in order to inquire into a particular phenomenon. Yin (1994)
stated that case studies are the preferred strategy when “how” and “why” questions are
posed. Yin (2008) stated:
The case study method allows investigators to retain the holistic and meaningful
characteristics of real-life events–such as individual life cycles, small group
behavior, organizational and managerial processes, neighborhood change, school
performance, international relations, and the maturation of industries. (p. 4)
A collective case study is used to allow comparisons and differences to be
explored (Yin, 2003) in determining how small businesses capture, convert, and integrate
knowledge to survive. Data was largely from documentation, archival records,
interviews, direct observations, participant observation, and physical artifacts (Yin,
1994). The researcher used a collective or multisite case study of 15 small businesses
bound by a defined set of criteria. A multisite case study can be time-consuming and
costly (Baxter & Jack, 2008) to acquire, transcribe, code, analyze, and validate the data.
Strauss and Corbin (1998) concluded saturation should be more concerned with reaching
a point where new discoveries do not add anything to the overall story. In the current
study, 15 interviews were conducted to reach saturation. In addition to being able to
compare and predict small business survivability in San Diego, CA, data from the small
businesses provided robust and reliable evidence to understand how small business

38
entrepreneurs create a learning process to capture, convert, and integrate knowledge
(Baxter & Jack, 2008).
Procedure and Sampling
In the current study, criterion, convenience, snowball sampling techniques, and
delimited data were used from a U. S. perspective, to a state level based on the state of
California, and finally to the local level involving San Diego County.
United States. A small business is defined by officials at the Small Business
Administration (SBA) as an entity employing less than 500 employees (U.S. Small
Business Administration, 2011). In the United States, more than 28 million small
businesses exist, employing more than 55 million people out of 113 million people
employed in nonfarm labor (U.S. Census Bureau, 2011), accounting for 55% of all jobs,
and 66% of all net new jobs since 1970, while accounting for 54% of all U.S. sales (U.S.
Small Business Administration, 2011). Small businesses that employ between 10 and 99
employees account for more than half of the total small business employment, with 28
million people being employed (U.S. Small Business Administration, 2011). Small
businesses are important to the U.S. economy based on the number of people
economically supported, including stakeholders, such as vendors and community
economies. Thus, understanding how small business entrepreneurs implement a process
to capture, convert, and integrate knowledge to survive is critically important to the U.S.
economy.
California. By varying degrees, states within the United States influence the U.S.
economy, number of businesses, and stakeholder wealth. For example, California
business owners contribute nearly $2 trillion out of $13.8 trillion of the U.S. GDP

39
(Bureau of Economic Analysis, 2012). Historically, the California economy has ranked
between the eighth and ninth largest economy in the world, thus making California
businesses important to both the U.S. economy and the global economy.
The state of California has 58 counties. Each county contributes to the state’s
economy in varying degrees. More than 711,000 small businesses exist in California
(U.S. Small Business Administration 2011) from a total number of 849,316 nonfarm
businesses (U.S. Census Bureau, 2011). Small businesses comprise 83.5% of all
businesses in the state of California. More than 7 million people are employed by
California small businesses (U.S. Small Business Administration, 2011) out of a total
nonfarm labor force of 12.8 million people, approximately 54% of the nonfarm labor
force (U.S. Census Bureau, 2011). A total of 38 million people are living in California
(U.S. Census Bureau, 2013), with small business entrepreneurs employing more than
18% of all Californians. The statistics indicated that small businesses are important to
California’s economy for the creation of jobs and wealth for more than 18% of the people
of California.
San Diego County, California. San Diego County is the southernmost county
within California, with Mexico on the border. Few large companies are headquartered in
San Diego County. The most notable among them include Qualcomm and WD-40, both
with a global operations, strategy, and research. San Diego County has a large
concentration of federal government employees, including the United States Navy and
the United States Marine Corps. Additionally, private-sector small businesses are
plentiful in San Diego County, while a lack of large private-sector businesses exists. In
the current study, all government agencies, hospitals, schools, colleges or universities,

40
whether for-profit or not-for-profit and large businesses were excluded. One major
reason that San Diego County was chosen for the current study was because of the large
concentration of small businesses. Convenience was another reason that the current
study was focused in San Diego County, because the researcher lives in San Diego
County, CA.
More than 77,326 nonfarm businesses exist in San Diego County, California, of a
total of 291,124 businesses in San Diego County (U.S. Census Bureau, 2012). Of the
77,326 nonfarm businesses in San Diego County, 75,648 businesses have fewer than100
employees, 57,461 of those businesses have fewer than 10 employees, and 18,187 have
between 10 and 99 employees. In 2011, San Diego County businesses accounted for
$172 billion in GDP, compared to the State of California, which accounted for $2 trillion
in GDP, while the U. S. GDP accounted for $13.8 trillion (Bureau of Economic Analysis,
2012). Small businesses are important to San Diego County, comprising more than 26 %
of all business in the county and 97% of San Diego County small businesses have fewer
than 100 employees (U.S. Census Bureau, 2012). Based on the statistics, small
businesses are important to the economy of San Diego County. California is an
important economy in the United States based on the percentage of GDP contributed.
The current study was delimited to service sector organizations because the service sector
is an important segment of the San Diego County economy, representing 89% of all jobs
in the county (Bureau of Labor Statistics, 2015). San Diego County, California
businesses are comprised primarily of small businesses, thus San Diego County was a
suitable location to study small business survivability, particularly because small
businesses are critical to the local, state, and national economies.
41
Sampling Techniques
Criterion, convenience, and snowball sampling techniques were used to find and
qualify participants for inclusion in the current study. Each of the sampling techniques
was selected to acquire rich data from experts in the field. A list of 1,000 potential
participants was generated by the firm, Inside Prospects, an aggregator of business data in
San Diego, CA since 1977. Inside Prospects was used because of its convenient location
in San Diego and it is the source of the collection of all business data in San Diego
County, California. Employees at Inside Prospects created a list of potential participants,
using Microsoft Excel®, by filtering the data by date of incorporation, number of
employees, location, and type of business, excluding government agencies, schools, and
hospitals.
The filters did not include all criteria for the current study. Therefore, further
qualification of the potential participants’ list was required through phone calls and web
searches. The criteria for inclusion in the current study were as follows: (a) in existence
at least 7 years; (b) employed between 10 and 99 employees; (c) established a process to
capture, convert, and integrate knowledge into the business; (d) located in San Diego
County, CA; (e) not a government agency, hospital, school, college, or university,
whether for-profit or not-for-profit; (f) in the service sector; (g) had profitability in 2 of
the past 3 years (h) the entrepreneur was an active member of the business; (i)
experienced a 5% growth in revenue in the past 3 years; and (j) no foreseeable changes
that would prevent the business from surviving an additional 5years, Further qualification
of the potential participants list using phone calls and web searches was conducted.

42
After the filters were applied, the Inside Prospects list showed business names,
addresses, phone numbers, names of key personnel, number of employees, date of
incorporation, and e-mail addresses of key personnel for the business. The list was sorted
as needed.
Convenience sampling was used by sharing the Inside Prospect list with four
subject-matter experts (SMEs), known to the researcher, to establish a list of small
businesses with which the researcher or the researcher’s subject-matter experts have an
established relationship. The subject-matter experts were from four different service
fields as follows: legal, academia, insurance, and business consulting. Each of the
subject-matter experts who helped identify potential participants had at least 10 years of
experience in their respective fields, were respected professionals, and connected in their
respective service industries. Additionally, each of the subject-matter experts had
worked with or were working in a small business entity and understood the struggles of a
small business to survive. Each subject-matter expert understood potential participant
bias based on their relationships with the potential participants. Therefore, the subject-
matter experts contacted the participants, but did not answer any participant questions
regarding the research.
Each subject-matter expert looked at the list to determine what potential
participants that he or she might know to provide warm introductions to the researcher.
The initial contact with the potential participant was made by the researcher or the
researcher’s subject-matter experts, providing a warm introduction. A warm introduction
has a perceived higher-degree chance of the researcher speaking with a potential
participant because of the established relationship (Barrie, 2011).

43
Prior to first contact with any potential participant, the researcher looked at the
website of the identified small business to confirm it was a service business. If a website
did not exist, the potential participant was qualified during the initial contact by phone.
During the call, the researcher provided the potential participant with the purpose of the
current study (Appendix A). The purpose was stated as to understand how the small
business entrepreneur had created a process to capture, convert, and integrate knowledge
to survive. The Inside Prospects list contained some of the criteria, but the data could
also be collected with self-reporting by the participant. Based on the situation that
circumstances of the potential participant might change, all potential participants were
asked a list of criterion questions to validate inclusion in the current study. Additionally,
the questions were sent via email to the participant (see Appendix B). Criterion questions
to the entrepreneurs were:
How long have you been in business?
Where are you located?
Are you a government agency, hospital, school, college, or university, whether
for-profit or not-for-profit?
As the entrepreneur, are you still active in the business?
How many employees do you have?
Would you categorize your business as selling a service?
Have you established a process to capture, convert, and integrate knowledge?
In the past three years, has the business experienced multiple years of
profitability?
In the past three years, has the business grown by at least 5%?
44
Do you foresee any change that would prevent the business from surviving an
additional five years?
A date was scheduled to conduct face-to-face semi-structured interviews with all
participants who met the criteria and who agreed to be included in the current study. All
participants declined to be recorded, so interview notes were taken by the researcher.
The researcher informed the participants that the George Fox University human research
subject agreement (see Appendix C) was required to be signed. As a follow-up, an e-
mail was sent to each participant indicating the date, time, and location of the scheduled
interview, and the qualitative questions and the George Fox University human research
form. The researcher collected the signed George Fox University human research form
on the date of the interview or accepted a signed copy by e-mail.
Semistructured Interviews
Strauss and Corbin (2008) posited, “Perhaps the most data dense interviews are
those that are unstructured; that is, they are not dictated by any predetermined set of
questions” (p. 27). However, semistructured interviews are used to shape the direction of
the data-gathering process while allowing flexibility for new concepts, ideas, and themes
to emerge (Charmaz, 2014). During the design review defense, the researcher conducted
a pilot program with two or three participants to be sure the qualitative questions would
garner responses and viability. After the first two interviews, it was determined the
questions were on point and the research could continue.

45
Semistructured intensive interviewing (Charmaz, 2014) was used for each of the
participants. The use of semistructured intensive interviewing allowed the interviewer to
do the following:
Ask for an in-depth description of the phenomenon
Stop to explore a statement or topic
Request more detail or explanation
Ask about the participant’s thoughts, feelings, and actions
Keep the participant on subject
Review an earlier point
Restate the participant’s point as an accuracy check
Slow or quicken the pace
Shift the topic
Use observational skills to further the discussion
Thank the participant for their time. (Charmaz, 2014)
Some of the participant answers to the questions involved experiences over seven
years or more, and the individual participants may have needed to refresh their memories
prior to the interview. Thus, it was necessary to send the interview questions in advance.
Although, a risk existed that the information might be fuzzy to the participants, small
business culture incorporates unique stories, language, and customs. The stories,
language, and customs could help fill in the gaps and refresh the participant memories.
In all cases, regardless of the age of the business, the founders were able to answer the
semistructured questions without hesitation or confusion.

46
The researcher attempted to schedule two interviews per week with participant
companies’ founders until all participants had been interviewed. Interviews were
conducted with entrepreneurs who had implemented a process to capture, convert, and
integrate data to survive. In three cases, additional owners and partners were in the
interview process, adding details to the answers. In one case, the entrepreneur had the
current president in the interview, adding details to the research questions. The
researcher met each of the participants at a convenient place for the participant for
efficiency regarding the participant’s time. The researcher took handwritten notes. Each
participant provided thick data during the interview, and the researcher was attentive and
captured the data in his notes. The handwritten notes were kept in a composition journal,
using predetermined categories for the participating companies and individuals.
To safeguard handwritten notes, including participant interviews, a locked filing
cabinet in the garage of the researcher was used to store data. The filing cabinet was
located behind dead-bolted locked doors. The researcher and his wife were the only
people who knew location of the key used to open the filing cabinet. The key to the
filing cabinet was kept in a separate locked location in the researcher’s home.
Using semistructured interviews allowed the researcher to be efficient with both
his time and the participants’ time. The interviews were initiated by building rapport
with the participants using casual chatter and finding commonality. The researcher
thanked the participants for their time and asked the participants to explain their roles in
their businesses and how long they had lived in San Diego County, CA. If a participant
was not from San Diego County, the researcher asked why he or she decided to locate in
San Diego County. The questions were used to help build a rapport between the

47
participant and researcher. To start the interview, the researcher read the predetermined
list of questions sent to the participants in advance of the interviews.
The predetermined research questions were open-ended initially at a macrolevel,
but moved to a microlevel based on the researcher’s perspective. The process was used
to provide rich insight into how the entrepreneur’s process was implemented to capture,
convert, and integrate knowledge to survive. Individual participants were observed and
their reactions to questions were written in the field notes. The facial expressions, body
movements, tone of voice, a description of the physical layout of the office, and the
collaboration between the employees, if in sight of the researcher, were documented in
the field notes and transcribed at a later time within 24 hours of the interview.
Although the predetermined questions were used, the researcher asked probative
questions based on the facial expressions, body movements, and tone of voice of the
participant. For example, “What caused you to exhibit the reaction when you were just
talking?” Allowing the participant to become comfortable with the researcher prior to
answering questions and being attentive to body movements, including facial expressions
that the participant is unaware that he or she is communicating, can have an impact on the
richness of the experience being told by the participant. The story being told must be
authentic and the participant’s actions can add to the authenticity of the story.
Three of the participating company entrepreneurs provided newsletters and a list
of core values, and two of the participants showed the researcher the awards they had
received. Before the interview was concluded, the researcher asked each participant if
follow-up interview(s) could be conducted, as needed (Moustakas, 1994; Reismann,
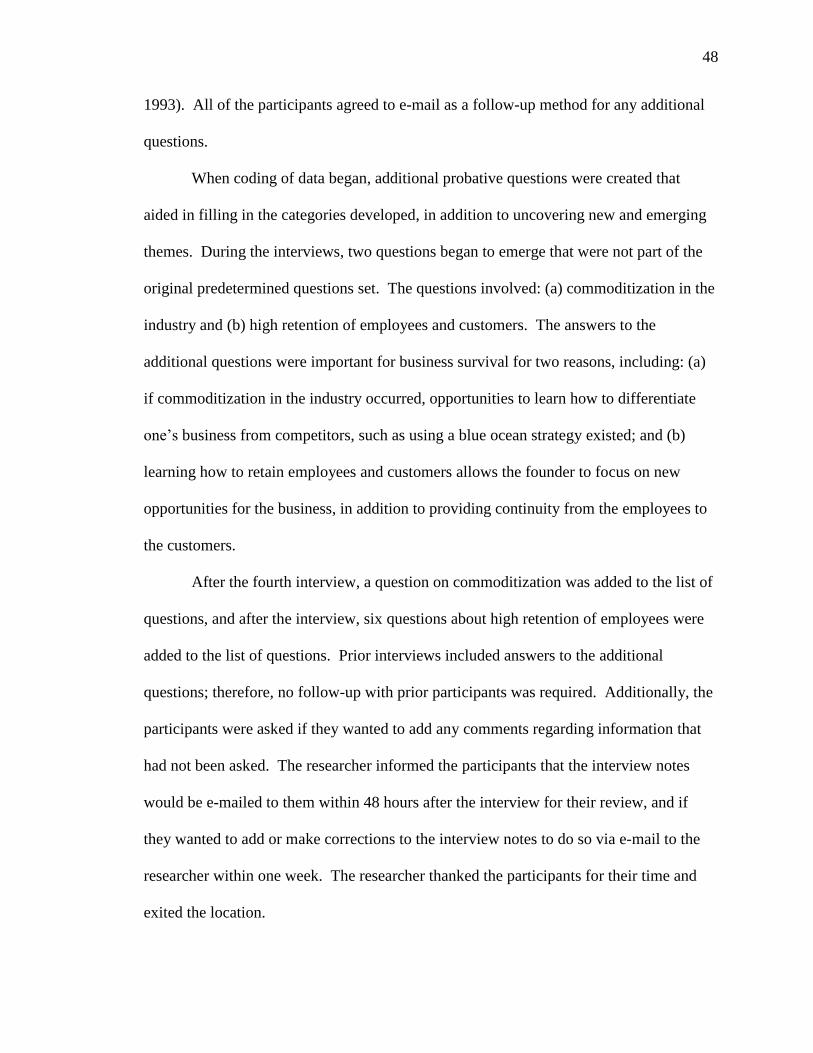
48
1993). All of the participants agreed to e-mail as a follow-up method for any additional
questions.
When coding of data began, additional probative questions were created that
aided in filling in the categories developed, in addition to uncovering new and emerging
themes. During the interviews, two questions began to emerge that were not part of the
original predetermined questions set. The questions involved: (a) commoditization in the
industry and (b) high retention of employees and customers. The answers to the
additional questions were important for business survival for two reasons, including: (a)
if commoditization in the industry occurred, opportunities to learn how to differentiate
one’s business from competitors, such as using a blue ocean strategy existed; and (b)
learning how to retain employees and customers allows the founder to focus on new
opportunities for the business, in addition to providing continuity from the employees to
the customers.
After the fourth interview, a question on commoditization was added to the list of
questions, and after the interview, six questions about high retention of employees were
added to the list of questions. Prior interviews included answers to the additional
questions; therefore, no follow-up with prior participants was required. Additionally, the
participants were asked if they wanted to add any comments regarding information that
had not been asked. The researcher informed the participants that the interview notes
would be e-mailed to them within 48 hours after the interview for their review, and if
they wanted to add or make corrections to the interview notes to do so via e-mail to the
researcher within one week. The researcher thanked the participants for their time and
exited the location.
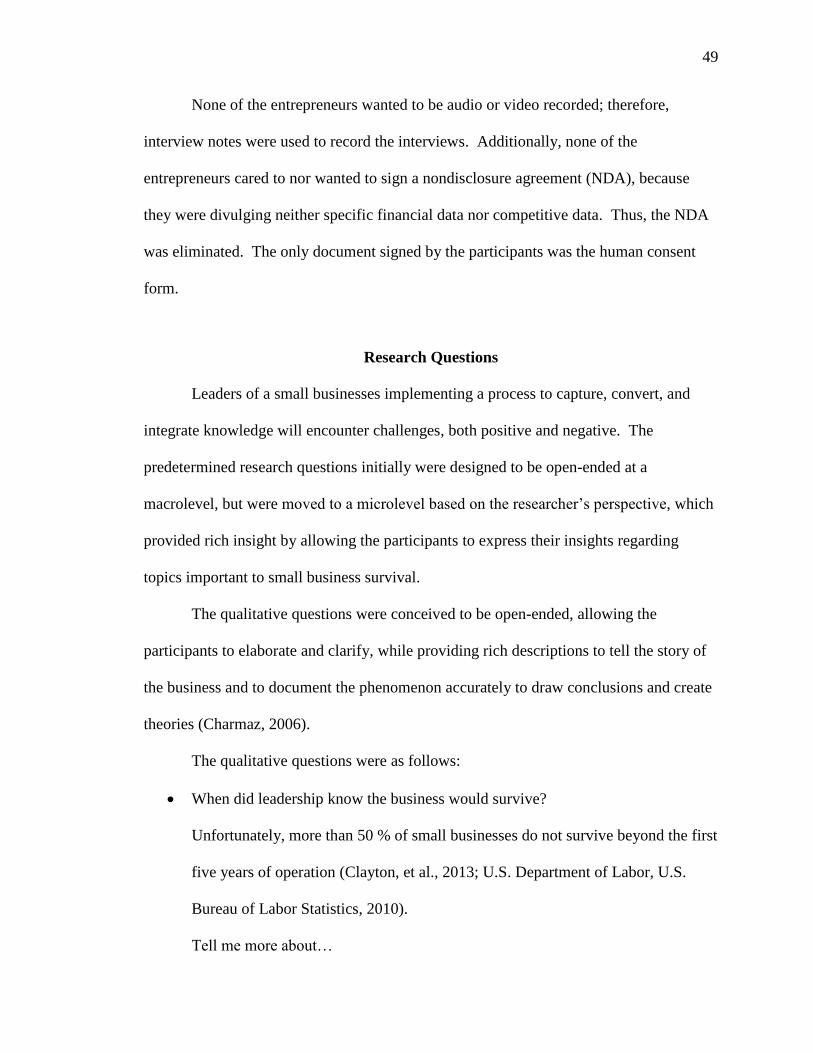
49
None of the entrepreneurs wanted to be audio or video recorded; therefore,
interview notes were used to record the interviews. Additionally, none of the
entrepreneurs cared to nor wanted to sign a nondisclosure agreement (NDA), because
they were divulging neither specific financial data nor competitive data. Thus, the NDA
was eliminated. The only document signed by the participants was the human consent
form.
Research Questions
Leaders of a small businesses implementing a process to capture, convert, and
integrate knowledge will encounter challenges, both positive and negative. The
predetermined research questions initially were designed to be open-ended at a
macrolevel, but were moved to a microlevel based on the researcher’s perspective, which
provided rich insight by allowing the participants to express their insights regarding
topics important to small business survival.
The qualitative questions were conceived to be open-ended, allowing the
participants to elaborate and clarify, while providing rich descriptions to tell the story of
the business and to document the phenomenon accurately to draw conclusions and create
theories (Charmaz, 2006).
The qualitative questions were as follows:
When did leadership know the business would survive?
Unfortunately, more than 50 % of small businesses do not survive beyond the first
five years of operation (Clayton, et al., 2013; U.S. Department of Labor, U.S.
Bureau of Labor Statistics, 2010).
Tell me more about…

50
Give me an example of…
What do you mean by…?
In your experience, what is important for small business survival?
Literature analyzing firm survival (Box, 2008; Carr et al., 2010; Coeurderoy et al.,
2012; Colombelli et al., 2013; Holmes et al., 2010) indicated the importance of the
following conditions: businesses ability to create a learning process, entrepreneurs, age of
business, and innovation.
Are there certain factors that seem most important?
Literature analyzing firm survival (Box, 2008; Carr, Haggard, Hmieleski, &
Zahra, 2010; Coeurderoy, et al., 2012; Colombelli, et al., 2013; Holmes, et al., 2010)
indicated the importance of the following conditions: businesses ability to create a
learning process, entrepreneurs, age of business, and innovation.
How important is learning for business survival? (The question was only asked if
the participant did not state that learning was important for survival in prior questions).
In time, information became an ever-increasing ingredient in ability of businesses
to compete and survive (Newman, 2010).
Tell me more about…
Give me an example of…
What do you mean by…?
How do you, the entrepreneur, learn?
Therefore, the study of learning of the organization becomes inseparable from the
study of the learning at the level of the entrepreneur (Deakins & Freel, 1998; Kim, 1993).
How does your personal learning approach affect organizational learning?
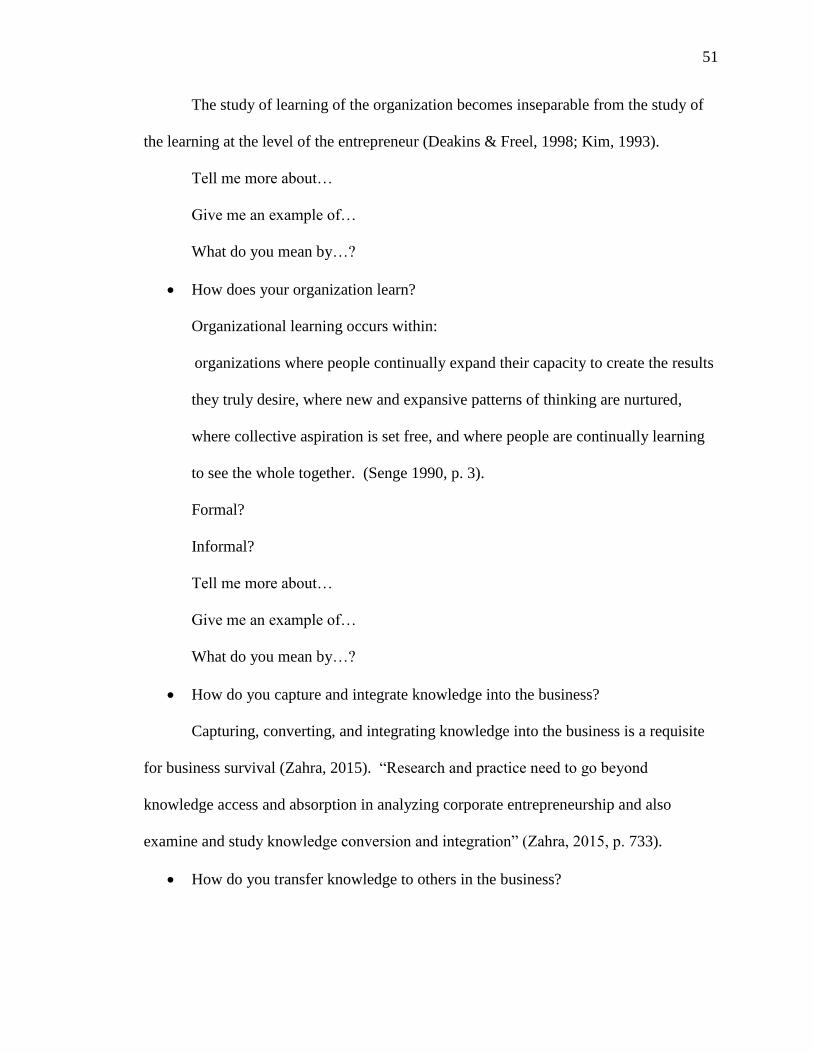
51
The study of learning of the organization becomes inseparable from the study of
the learning at the level of the entrepreneur (Deakins & Freel, 1998; Kim, 1993).
Tell me more about…
Give me an example of…
What do you mean by…?
How does your organization learn?
Organizational learning occurs within:
organizations where people continually expand their capacity to create the results
they truly desire, where new and expansive patterns of thinking are nurtured,
where collective aspiration is set free, and where people are continually learning
to see the whole together. (Senge 1990, p. 3).
Formal?
Informal?
Tell me more about…
Give me an example of…
What do you mean by…?
How do you capture and integrate knowledge into the business?
Capturing, converting, and integrating knowledge into the business is a requisite
for business survival (Zahra, 2015). “Research and practice need to go beyond
knowledge access and absorption in analyzing corporate entrepreneurship and also
examine and study knowledge conversion and integration” (Zahra, 2015, p. 733).
How do you transfer knowledge to others in the business?

52
Survival skills developed by the entrepreneur need to be transferred to others
within the company (Breslin & Jones, 2012).
Systemized/formal?
Informal?
Tell me more about…
Give me an example of…
What do you mean by…?
What do you do to allow employees to share and capture their experiences?
Leaders of learning organizations work on the assumption that learning is
valuable, continuous, and most effective when shared and that every experience is an
opportunity to learn (Kerka 1995).
Tell me more about…
Give me an example of…
What do you mean by…?
How do you decide the number of people and the amount of money or resources
to allocate toward capturing and integrating knowledge?
To increase the likelihood of survival, a small business must acquire and
judiciously deploy limited resources such as financial, personnel, technology, or
processes to implement a learning process and ultimately to survive (Rubalcaba, et al.,
2010).
Tell me more about…
Give me an example of…
What do you mean by…?
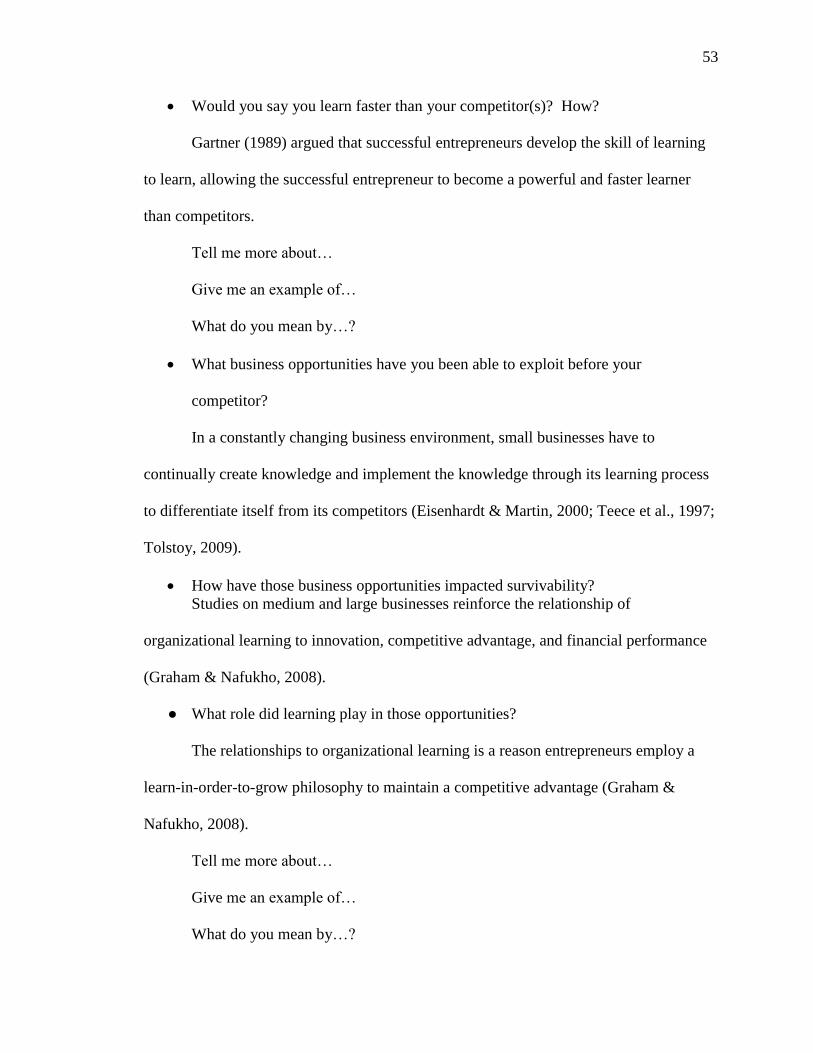
53
Would you say you learn faster than your competitor(s)? How?
Gartner (1989) argued that successful entrepreneurs develop the skill of learning
to learn, allowing the successful entrepreneur to become a powerful and faster learner
than competitors.
Tell me more about…
Give me an example of…
What do you mean by…?
What business opportunities have you been able to exploit before your
competitor?
In a constantly changing business environment, small businesses have to
continually create knowledge and implement the knowledge through its learning process
to differentiate itself from its competitors (Eisenhardt & Martin, 2000; Teece et al., 1997;
Tolstoy, 2009).
How have those business opportunities impacted survivability?
Studies on medium and large businesses reinforce the relationship of
organizational learning to innovation, competitive advantage, and financial performance
(Graham & Nafukho, 2008).
● What role did learning play in those opportunities?
The relationships to organizational learning is a reason entrepreneurs employ a
learn-in-order-to-grow philosophy to maintain a competitive advantage (Graham &
Nafukho, 2008).
Tell me more about…
Give me an example of…
What do you mean by…?

54
How do you interpret feedback and knowledge from the external environment
into the business?
Learning from trial and error, mistakes, and interpreting information from the
small businesses external environment (Breslin & Jones, 2012).
Tell me more about…
Give me an example of…
What do you mean by…?
How do you decide what information is important (Chan & Chee-Kwong, 2008)?
Knowledge has long been recognized as a crucial competitive tool for
organizational survival and competition (Chan & Chee-Kwong, 2008).
Tell me more about…
Give me an example of…
What do you mean by…?
How do you assess the impact or the effectiveness of your learning process?
Businesses are interested in increasing efficiencies thereby increasing productivity
and profitability (Chan & Chee-Kwong, 2008).
Tell me more about…
Give me an example of…
What do you mean by…?
Is there a commoditization in the industry? (Question emerged from interviews
and became a question after Interview 4).
Provide an example

55
Do you have a high retention rate of employees and customers? (Question
emerged from interviews and became a question after Interview 6).
How has your retention rate of employees and customers affected the
survivability of the firm?
Provide an example
Is there anything else you would like to add?
At the end of each interview, the researcher thanked the participants for their time
and reminded each participant that as coding begins there may be new questions that need
answering, requiring additional time from the participants.
Research Timeline
The research for the current study was conducted over 6 months. A timeline was
created to show what work was being accomplished during the 6 months. Initially, the
researcher worked with Inside Prospects to create criteria resulting in a list of qualifying
small businesses in San Diego County, CA. Additional criteria used to qualify small
businesses was obtained through phone calls and emails with each of the potential
participants. Tables and figures were used to highlight the starting point of the research
and the list of the final participants.
Month 1, Weeks 1 and 2
Acquiring usable data was an important first step. Having data that met the
criteria saved the researcher time and effort in qualifying potential participants who may
or may not have met the criteria. Inside Prospects, an aggregator of business data in San

56
Diego, CA since 1977 was used to provide data for the research. A list of 1,000 names
was purchased for $350. The main criteria given to Inside Prospects were businesses in
San Diego County with an employee count ranging between 10 and 99, and an
organization that was older than 7 years. Additionally, a filter was used to exclude from
the data all small businesses that were government agencies, hospitals, schools, colleges,
or universities, whether for-profit or not-for-profit. More small businesses were in the
first data set than were anticipated. When the criteria set were filtered, a list of 14,140
small businesses was created (see Table 1).
Table 1.
Inside Prospects Summary Page of Businesses in San Diego County, CA.
Analysis of Sizes and Site Types
Employees/Firm Firms Employment Key Persons
M. 1-4 0 0.0% 0 0.0% 0
N. 5-9 0 0.0% 0 0.0% 0
O. 10-19 7,248 51.2% 93,311 26.7% 11,238
P. 20-49 5,269 37.2% 148,439 42.6% 8,690
Q. 50-99 1,623 11.4% 106,610 30.6% 3,385
R. 100-249 0 0.0% 0 0.0% 0
S. 250-499 0 0.0% 0 0.0% 0
T. 500+ 0 0.0% 0 0.0% 0
14,140 100.0% 348,360 100.0% 23,313
Site Type Firms Employment Key Persons
Single locations 6,856 48.4% 147,990 42.4% 12,249
Headquarters 996 7.0% 30,843 8.8% 3,339
Franchises 1,265 8.9% 34,407 9.8% 1,420
Divisions 203 1.4% 6,780 1.9% 531
Branches 4,820 34.0% 128,340 36.8% 5,774
14,140 100.0% 348,360 100.0% 23,313
The researcher only paid for 1,000 names, and the data set was too broad;
therefore, more filters were applied to exclude franchises, divisions, and branches.
Franchises, divisions, and branches were excluded because one of the criteria was that the

57
founder/entrepreneur was still involved in the business. Franchises, divisions, and
branches may not have a founder present in their San Diego location. Table 2 shows a
list of categories including nonservice businesses. The list was reviewed to exclude
certain categories to narrow the list of potential participants since only 1,000 businesses
would be sent to the researcher.
Table 2.
List of Small Businesses by SIC Code and Number of Employees
EMPLOYEES & SIZE CODES
1-4 5-9 10-19 20-
49
50-
99
100-
249
250+
SIC DESCRIPTION TOTAL O N O P Q R S-T
Transport,
Telecom
Utilities
411 Local & suburban
transportation
0 0 17 17 9 0 0
412 Taxicabs 10 0 0 6 3 1 0 0
413 Intercity & rural bus
transportation
2 0 0 2 0 0 0 0
414 Bus charter services 5 0 0 5 04 5 0 0
415 School 6buses 6 0 0 1 3 2 0 0
41 Totals TRANSIT, TAXIS, &
BUSES
66 0 0 28 24 14 0 0
421 Trucking & courier
services
112 0 0 45 48 19 0 0
422 Public warehousing &
storage
19 0 0 9 8 2 0 0
42 Totals MOTOR FREIGHT &
WAREHOUSING
131 0 0 54 56 21 0 0
431 U.S. Postal Service 44 0 0 1 17 26 0 0
43 Totals U.S. POSTAL
SERVICE
44 0 0 1 17 26 0 0
441 Deep sea foreign
transportation
1 0 0 0 1 0 0 0
444 Water transportation of
freight
1 0 0 1 0 0 0 0
448 Water transportation of
passengers
2 0 0 2 0 0 0 0
449 Water transportation
services
17 0 0 8 7 2 0 0
44 Totals WATER
TRANSPORTATION
21 0 0 11 8 2 0 0
451 Air transportation
scheduled
18 0 0 2 16 0 0 0
452 Air transportation,
nonscheduled
6 0 0 2 4 0 0 0
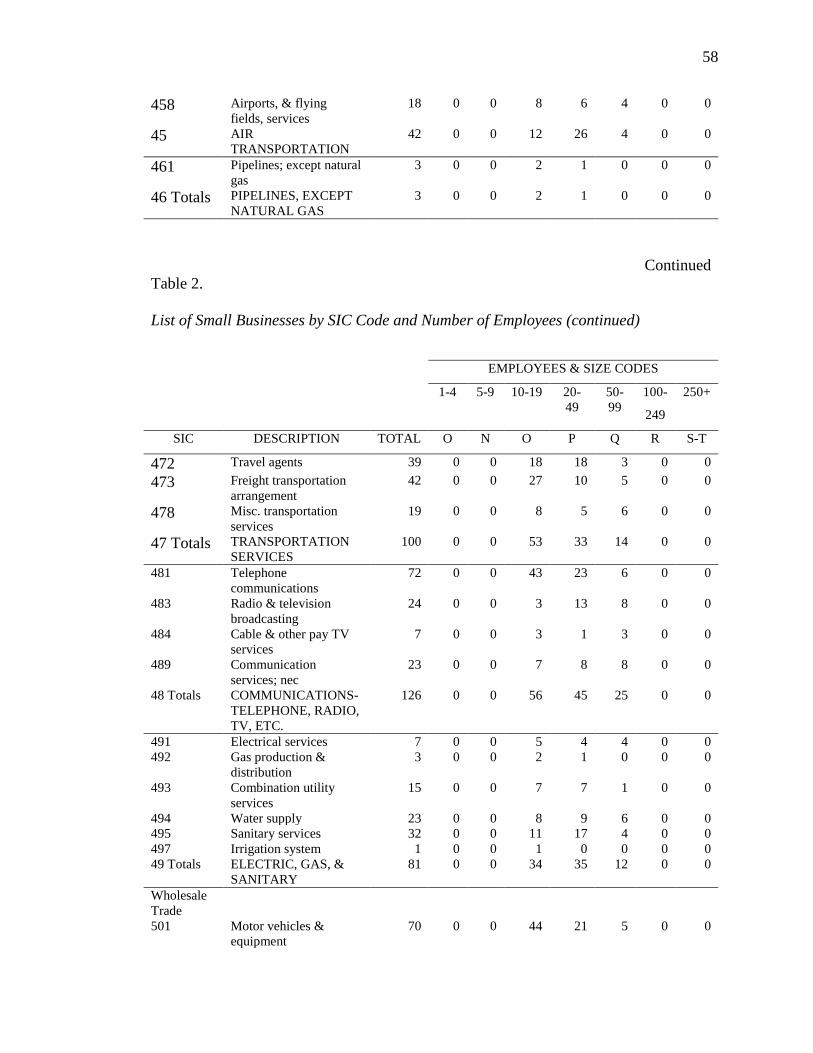
58
458 Airports, & flying
fields, services
18 0 0 8 6 4 0 0
45 AIR
TRANSPORTATION
42 0 0 12 26 4 0 0
461 Pipelines; except natural
gas
3 0 0 2 1 0 0 0
46 Totals PIPELINES, EXCEPT
NATURAL GAS
3 0 0 2 1 0 0 0
Continued
Table 2.
List of Small Businesses by SIC Code and Number of Employees (continued)
EMPLOYEES & SIZE CODES
1-4 5-9 10-19 20-
49
50-
99
100-
249
250+
SIC DESCRIPTION TOTAL O N O P Q R S-T
472 Travel agents 39 0 0 18 18 3 0 0
473 Freight transportation
arrangement
42 0 0 27 10 5 0 0
478 Misc. transportation
services
19 0 0 8 5 6 0 0
47 Totals TRANSPORTATION
SERVICES
100 0 0 53 33 14 0 0
481 Telephone
communications
72 0 0 43 23 6 0 0
483 Radio & television
broadcasting
24 0 0 3 13 8 0 0
484 Cable & other pay TV
services
7 0 0 3 1 3 0 0
489 Communication
services; nec
23 0 0 7 8 8 0 0
48 Totals COMMUNICATIONS-
TELEPHONE, RADIO,
TV, ETC.
126 0 0 56 45 25 0 0
491 Electrical services 7 0 0 5 4 4 0 0
492 Gas production &
distribution
3 0 0 2 1 0 0 0
493 Combination utility
services
15 0 0 7 7 1 0 0
494 Water supply 23 0 0 8 9 6 0 0
495 Sanitary services 32 0 0 11 17 4 0 0
497 Irrigation system 1 0 0 1 0 0 0 0
49 Totals ELECTRIC, GAS, &
SANITARY
81 0 0 34 35 12 0 0
Wholesale
Trade
501 Motor vehicles &
equipment
70 0 0 44 21 5 0 0
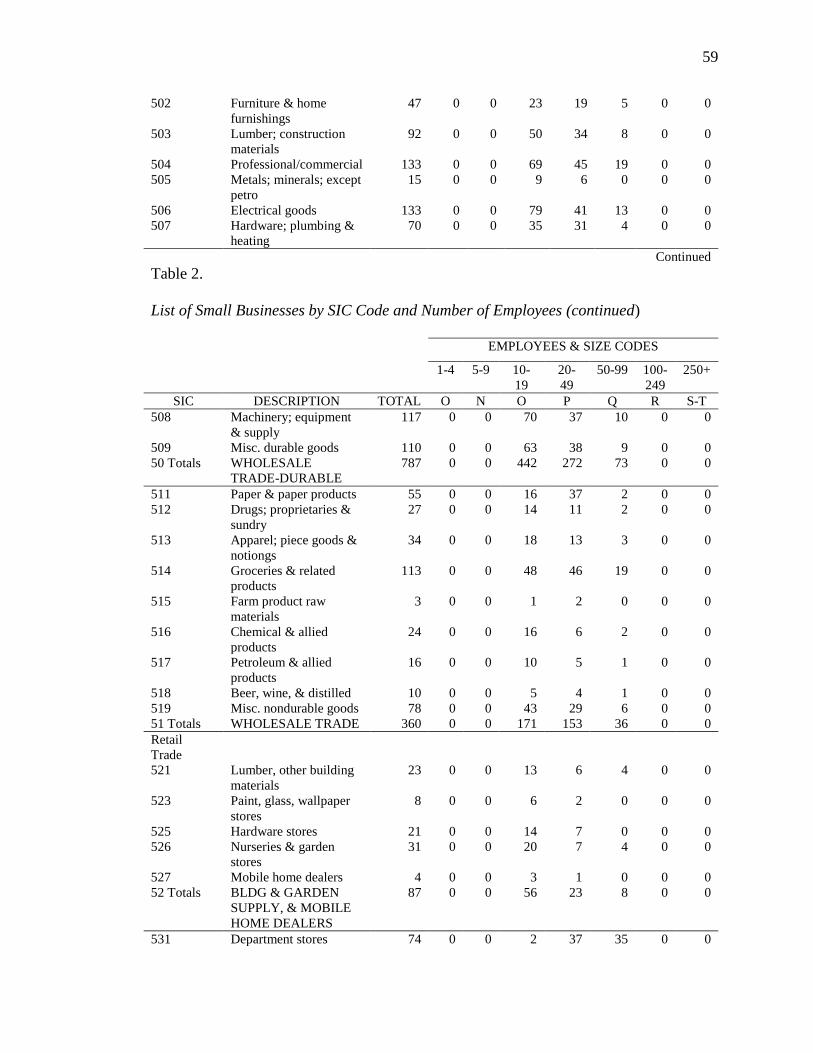
59
502 Furniture & home
furnishings
47 0 0 23 19 5 0 0
503 Lumber; construction
materials
92 0 0 50 34 8 0 0
504 Professional/commercial 133 0 0 69 45 19 0 0
505 Metals; minerals; except
petro
15 0 0 9 6 0 0 0
506 Electrical goods 133 0 0 79 41 13 0 0
507 Hardware; plumbing &
heating
70 0 0 35 31 4 0 0
Continued
Table 2.
List of Small Businesses by SIC Code and Number of Employees (continued)
EMPLOYEES & SIZE CODES
1-4 5-9 10-
19
20-
49
50-99 100-
249
250+
SIC DESCRIPTION TOTAL O N O P Q R S-T
508 Machinery; equipment
& supply
117 0 0 70 37 10 0 0
509 Misc. durable goods 110 0 0 63 38 9 0 0
50 Totals WHOLESALE
TRADE-DURABLE
787 0 0 442 272 73 0 0
511 Paper & paper products 55 0 0 16 37 2 0 0
512 Drugs; proprietaries &
sundry
27 0 0 14 11 2 0 0
513 Apparel; piece goods &
notiongs
34 0 0 18 13 3 0 0
514 Groceries & related
products
113 0 0 48 46 19 0 0
515 Farm product raw
materials
3 0 0 1 2 0 0 0
516 Chemical & allied
products
24 0 0 16 6 2 0 0
517 Petroleum & allied
products
16 0 0 10 5 1 0 0
518 Beer, wine, & distilled 10 0 0 5 4 1 0 0
519 Misc. nondurable goods 78 0 0 43 29 6 0 0
51 Totals WHOLESALE TRADE 360 0 0 171 153 36 0 0
Retail
Trade
521 Lumber, other building
materials
23 0 0 13 6 4 0 0
523 Paint, glass, wallpaper
stores
8 0 0 6 2 0 0 0
525 Hardware stores 21 0 0 14 7 0 0 0
526 Nurseries & garden
stores
31 0 0 20 7 4 0 0
527 Mobile home dealers 4 0 0 3 1 0 0 0
52 Totals BLDG & GARDEN
SUPPLY, & MOBILE
HOME DEALERS
87 0 0 56 23 8 0 0
531 Department stores 74 0 0 2 37 35 0 0

60
533 Variety stores 73 0 0 35 36 2 0 0
539 Misc. general
merchandise stores
10 0 0 9 0 1 0 0
53 Totals GENERAL
MERCHANDISE
STORES
157 0 0 46 73 38 0 0
Continued
Table 2.
List of Small Businesses by SIC Code and Number of Employees (continued)
EMPLOYEES & SIZE CODES
1-4 5-9 10-
19
20-
49
50-99 100-
249
250+
SIC DESCRIPTION TOTAL O N O P Q R S-T
541 Grocery stores 358 0 0 125 77 156 0 0
542 Meat markets & freezer
provisions
10 0 0 7 1 2 0 0
543 Fruit and vegetable
markets
7 0 0 6 1 0 0 0
544 Candy, nut, &
confections
3 0 0 2 1 0 0 0
545 Dairy product stores 10 0 0 9 1 0 0 0
546 Retail bakeries 56 0 0 40 16 0 0 0
549 Misc. food stores 14 0 0 9 3 2 0 0
54 Totals FOOD STORES 458 0 0 198 100 160 0 0
551 New & used car dealers 67 0 0 3 29 35 0 0
552 Used car dealers 23 0 0 9 12 2 0 0
553 Auto & home supply
stores
156 0 0 126 30 0 0 0
554 Gasoline service stations 40 0 0 36 5 0 0 0
555 Boat dealers 11 0 0 7 4 0 0 0
556 Recreation & utility
trailer dealers
4 0 0 2 2 0 0 0
557 Motorcycle dealers 18 0 0 5 10 3 0 0
559 Automotive dealers; nec 5 0 0 1 3 1 0 0
55 Totals AUTOMOTIVE
DEALERS & GAS
325 0 0 189 95 41 0 0
561 Men’s & boy’s clothing
& furnishings
34 0 0 24 9 1 0 0
562 Women’s clothing 89 0 0 60 25 4 0 0
563 Women’s accessory &
specialty
27 0 0 12 11 4 0 0
564 Children’s & infant’s
wear
34 0 0 24 8 2 0 0
565 Family clothing stores 151 0 0 70 66 15 0 0
566 Shoe stores 62 0 0 47 14 1 0 0
569 Misc. apparel &
accessories
28 0 0 20 8 0 0 0

61
56 Totals APPARELS &
ACCESSORY STORES
425 0 0 257 141 27 0 0
571 Furniture & home 122 0 0 66 46 10 0 0
572 Household appliance 19 0 0 014 4 1 0 0
573 Radio
television/computer
stores
33 0 0 21 5 7 0 0
57 Totals FURNITURE AND TV
- STEREO STORES
174 0 0 101 55 18 0 0
Continued
Table 2.
List of Small Businesses by SIC Code and Number of Employees (continued)
EMPLOYEES & SIZE CODES
1-4 5-9 10-
19
20-
49
50-99 100-
249
250+
SIC DESCRIPTION TOTAL O N O P Q R S-T
581 Restaurants & bars 2606 0 0 1117 1209 280 0 0
58 Totals EATING AND
DRINKING PLACES
2606 0 0 1117 1209 280 0 0
591 Drug stores &
proprietary stores
154 0 0 68 85 1 0 0
592 Liquor stores 21 0 0 17 4 0 0 0
593 Used merchandise stores 42 0 0 20 12 10 0 0
594 Misc. shopping goods 245 0 0 133 97 15 0 0
596 Nonstore retailers 7 0 0 5 1 1 0 0
598 Fuel & ice dealers 1 0 0 1 0 0 0 0
599 Stores; nec 127 0 0 83 37 7 0 0
59 Totals MISCELLANEOUS 597 0 0 327 236 34 0 0
Finance, Insurance, Real Estate
602 Commerical banks 331 0 0 248 75 8 0 0
603 Savings institutions 2 0 0 1 1 0 0 0
606 Credit unions 32 0 0 22 8 2 0 0
609 Functions related to
banking
21 0 0 16 1 4 0 0
60 Totals BANKING 386 0 0 287 85 14 0 0
611 Federal & fed-sponsored
credit
2 0 0 0 2 0 0 0
614 Personal credit
institutions
11 0 0 5 3 3 0 0
615 Business credit
institutions
9 0 0 5 3 1 0 0
616 Mortgage bankers &
brokers
103 0 0 56 37 10 0 0
61 Totals CREDIT AGENCIES
OTHER
125 0 0 66 45 14 0 0
621 Security brokers &
dealers
54 0 0 21 26 7 0 0
622 Commodity contracts 2 0 0 1 1 0 0 0

62
628 Security & commodity
services
91 0 0 58 26 7 0 0
62 Totals SECURITY &
COMMODITY
147 0 0 80 53 14 0 0
Continued
Table 2.
List of Small Businesses by SIC Code and Number of Employees (continued)
EMPLOYEES & SIZE CODES
1-4 5-9 10-
19
20-
49
50-99 100-
249
250+
SIC DESCRIPTION TOTAL O N O P Q R S-T
631 Life insurance 3 0 0 3 0 0 0 0
632 Medical & health
insurance
16 0 0 6 7 3 0 0
633 Fire, marine, & casualty
insurance
3 0 0 1 2 0 0 0
635 Surety insurance 9 0 0 8 1 0 0 0
636 Title insurance 9 0 0 3 5 1 0 0
637 Pension, health &
welfare funds
8 0 0 2 5 1 0 0
639 Insurance carriers; nec 4 0 0 1 2 1 0 0
63 Totals INSURANCE
CARRIERS
52 0 0 24 22 6 0 0
641 Insurance agents;
brokers & service
173 0 0 89 66 18 0 0
64 Totals INSURANCE
AGENTS, BROKERS
& SERVICE
173 0 0 89 66 18 0 0
651 Real estate operators &
lessors
154 0 0 92 51 11 0 0
653 Real estate agents &
managers
363 0 0 179 141 43 0 0
654 Title abstract offices 5 0 0 4 1 0 0 0
655 Subdividers &
developers
43 0 0 17 18 8 0 0
65 Totals REAL ESTATE 565 0 0 292 211 62 0 0
671 Holding offices 4 0 0 2 2 0 0 0
672 Investment offices 6 0 0 2 4 0 0 0
673 Investment trusts 3 0 0 3 0 0 0 0
679 Investment- misc.
investing
21 0 0 11 6 4 0 0
67 Totals HOLDING & OTHER 34 0 0 18 12 4 0 0

63
701 Lodging-hotels &
motels
286 0 0 102 131 53 0 0
702 Lodging-rooming &
boarding houses
2 0 0 2 0 0 0 0
703 Lodging-camps & trailer
parks
29 0 0 14 13 2 0 0
704 Lodging-membership
basis hotels
2 0 0 1 1 0 0 0
70 Totals LODGING PLACES 319 0 0 119 145 55 0 0
Continued
Table 2.
List of Small Businesses by SIC Code and Number of Employees (continued)
EMPLOYEES & SIZE
1-4 5-9 10-
19
20-
49
50-99 100-
249
250+
SIC DESCRIPTION TOTAL O N O P Q R S-T
721 Laundry cleaning &
garment services
47 0 0 25 17 5 0 0
722 Photographic studios;
portrait
8 0 0 7 1 0 0 0
723 Beauty shops 287 0 0 222 61 4 0 0
724 Barber shops 13 0 0 12 1 0 0 0
725 Shoe repair & shoeshine
parlors
1 0 0 0 0 1 0 0
726 Funeral servie &
crematories
12 0 0 5 3 4 0 0
729 Misc. personal services 104 0 0 56 43 5 0 0
72 Totals PERSONAL
SERVICES
472 0 0 327 126 19 0 0
731 Advertising 96 0 0 55 30 11 0 0
732 Credit reporting &
collection
21 0 0 7 11 3 0 0
733 Mailing, reproduction &
secretarial
68 0 0 37 27 4 0 0
734 Services to buildings 120 0 0 50 57 13 0 0
735 Misc equipment rental
& leasing
56 0 0 25 30 1 0 0
736 Personnel supply
services
94 0 0 48 29 17 0 0
737 Computer & data
processing
420 0 0 191 165 64 0 0
738 Miscellaneous business
services
218 0 0 115 84 19 0 0
73 Totals BUSINESS SERVICES 1093 0 0 528 433 132 0 0
751 Rentals; without drivers 34 0 0 14 16 4 0 0
752 Parking 17 0 0 7 7 3 0 0
753 Auto repair shops 178 0 0 118 56 4 0 0

64
754 Auto services; except
repair
103 0 0 59 40 4 0 0
75 Totals AUTO REPAIR,
SERVICES, AND
GARAGES
332 0 0 198 119 15 0 0
762 Repairs-electrical shops 14 0 0 8 4 2 0 0
764 Repairs-reupholstery &
furniture
2 0 0 2 0 0 0 0
769 Repairs-miscellaneous
repair shops
29 0 0 19 9 1 0 0
76 Totals MISCELLANEOUS
REPAIR
45 0 0 29 13 3 0 0
Continued
Table 2.
List of Small Businesses by SIC Code and Number of Employees (continued)
EMPLOYEES & SIZES
1-4 5-9 10-
19
20-
49
50-99 100-
249
250+
SIC DESCRIPTION TOTAL O N O P Q R S-T
781 Motion pictures-
production & services
15 0 0 8 6 1 0 0
783 Motion pictures-theaters 18 0 0 1 11 6 0 0
784 Motion pictures-video
tape rental
3 0 0 2 1 0 0 0
78 Totals MOTION PICTURES 36 0 0 11 18 7 0 0
791 Recreation-dance halls;
studios & school
13 0 0 11 2 0 0 0
792 Recreation-producers,
orchestra; entrtnrs
36 0 0 17 15 4 0 0
793 Recreation-bowling &
billiard establishments
8 0 0 1 4 3 0 0
794 Recreation-commercial
sports
16 0 0 9 5 2 0 0
799 Recreation-misc.
amusement; rec services
366 0 0 165 154 47 0 0
79 Totals RECREATION 439 0 0 203 180 56 0 0
Medical Other Health
801 Physicans 461 0 0 274 153 34 0 0
802 Dentists 187 0 0 162 23 2 0 0
804 Other health
practitioners
151 0 0 99 42 10 0 0
805 Nursing & personal care
facilities
93 0 0 15 34 44 0 0
Education, Social Services
806 Hospitals 7 0 0 3 4 0 0 0
807 Medical & Dental
Laboratories
46 0 0 23 19 4 0 0
808 Home Health Care
Facilities
75 0 0 25 31 19 0 0
809 Health allied services 209 0 0 690 401 138 0 0
Legal, Law Offices

65
811 Legal (Attorneys, etc.) 302 0 0 178 95 29 0 0
81 Totals LEGAL SERVICES 302 0 0 178 95 29 0 0
832 Social services-
individual & family
220 0 0 95 91 34 0 0
833 Social services-job
training & related
39 0 0 10 20 9 0 0
835 Social services-child
care
236 0 0 148 84 4 0 0
836 Social services-
residential care
62 0 0 22 30 10 0 0
839 Social services-social
service; nec
88 0 0 46 34 8 0 0
83 Totals SOCIAL SERVICES 645 0 0 321 259 65 0 0
Continued
Table 2.
List of Small Businesses by SIC Code and Number of Employees (continued)
EMPLOYEES & SIZES
1-4 5-9 10-
19
20-
49
50-99 100-
249
250+
SIC DESCRIPTION TOTAL O N O P Q R S-T
841 Museums & art galleries 28 0 0 10 12 6 0 0
842 Botanical & zoological
gardens
4 0 0 1 3 0 0 0
84 Totals MUSEUMS,
GALLERIES, &
ZOOLOGICAL
GARDENS
32 0 0 11 15 6 0 0
861 Membership
organizations-business
27 0 0 15 8 4 0 0
862 Membership
organizations-
professional
13 0 0 6 7 0 0 0
863 Membership
organizations-labor
17 0 0 11 6 0 0 0
864 Membership
organizations-civic &
social
42 0 0 24 16 2 0 0
865 Membership
organizations-political
1 0 0 1 0 0 0 0
866 Membership
organizations-religious
190 0 0 119 58 13 0 0
869 Membership
organizations- nec
18 0 0 7 8 3 0 0
86 Totals MEMBERSHIP
ORGANIZATIONS
308 0 0 183 103 22 0 0
Engineers,
Accounting,
R&D
871 Engineering &
architectural offices
343 0 0 186 110 47 0 0
872 Accounting &
bookkeeping
96 0 0 54 30 12 0 0

66
873 Research & testing 223 0 0 99 81 43 0 0
874 Management & public
relations
154 0 0 100 45 9 0 0
87 Totals ENGINEERING,
ACCOUNTING &
RESEARCH
816 0 0 439 266 111 0 0
GRAND TOTALS OF ALL 14140 0 0 7248 5269 1623 0 0
To reduce the size of the list to service businesses only, the following categories were
excluded:
Transit, taxis, and buses
U.S. Postal Service
Wholesale trade—durable goods
Wholesale trade—nondurable goods
Building and garden supply and mobile home dealers
General merchandise stores
Food stores
Automotive dealers and gas stations
Apparel and accessory stores
Furniture and television stores
Restaurants and bars
Miscellaneous retail
Auto repair, services, and garages
Miscellaneous repair services
Social services
Membership organizations
67
Once the criteria were excluded, 4,048 small businesses were listed. The list was
reviewed again to determine if any more exclusions for nonservice businesses that did not
meet the criteria, especially the founder of the business still working in the business were
possible. The following elements were in the final filter to obtain the best list possible
for the current research study:
Communication services including telephone, radio, and television.
Banks
Credit agencies other than banks
Real estate
Holding and other investment offices
Lodging places (hotels, motels, trailer parks, and room and boarding houses)
Amusement and recreations services
After the filter was applied, 3,038 small businesses were listed. The researcher
reviewed the categories one more time and decided the list contained possible
participants within the service sector, that were at least 7 years old, employed between 10
and 99 employees that were within San Diego County, and still had the entrepreneur
active in the business. Inside Prospects then provided a Microsoft Excel® list of the
oldest 1,000 small businesses from the list of 3,038 small businesses. The list included
the name and address of the business, phone numbers for the business, names of key
personnel, e-mail addresses of key personnel if available, number of employees, and date
the business began operations. The file was downloaded to the researcher’s computer
and saved to Cloud storage, a flash drive, and an external hard drive.

68
Before interviews could be set up, additional screening of the participants, using
web searches, phone calls, and emails were required to confirm the potential participants
met the criteria. After the Microsoft Excel® spreadsheet was received, the researcher
used Stat-trek® to generate a random number listing of the data provided by Inside
Prospects (see Table 1). The researcher did not know how many companies would be
known by the subject-matter experts and the researcher, so the random number listing
augmented any known companies and kept the research process moving forward.
Table 3
Random Number Generator using Stat-trek.com®
0472 0568 0280 0411 0549 0867 0383 0368 0678 0483 0536 0376 0857 0415 0006 0966 0618 0397 0793
0607 0429 0696 0895 0564 0558 0312 0314 0838 0002 0244 0784 0162 0763 0226 0571 0803 0575 0525
0408 0760 0703 0141 0827 0034 0148 0073 0297 0624 0643 0056 0084 0265 0720 0355 0921 0222 0849
0970 0340 0496 0293 0902 0810 0821 0788 0885 0596 0461 0600 0184 0699 0419 0728 0799 0853 0692
0173 0731 0323 0017 0934 0714 0109 0923 0746 0013 0212 0881 0874 0628 0365 0889 0318 0560 0835
0479 0814 0543 0622 0120 0891 0842 0724 0077 0019 0457 0878 0351 0464 0389 0614 0675 0959 0372
0400 0581 0771 0671 0237 0539 0899 0286 0656 0547 0344 0953 0126 0137 0105 0201 0913 0778 0917
0500 0750 0735 0045 0116 0169 0009 0489 0782 0639 0333 0985 0030 0425 0974 0062 0329 0528 0931
0190 0945 0682 0205 0635 0611 0152 0795 0130 0859 0938 0436 0942 0158 0041 0393 0336 0774 0194
0667 0515 0440 0664 0991 0276 0688 0451 0632 0088 0987 0553 0590 0216 0603 0707 0863 0660 0269
0443 0453 0421 0517 0963 0094 0233 0816 0066 0051 0361 0432 0485 0325 0806 0098 0955 0650 0301
0346 0742 0290 0379 0646 0579 0248 0507 0995 0998 0521 0686 0927 0468 0846 0447 0910 0254 0752
0258 0475 0357 0710 0387 0825 0511 0718 0831 0756 0981 0308 0592 0739 0767 0949 0404 0304 0870
0906 0532 0654 0023 0180 0977 0586 0493 0504 0118 0146 0327 0783 0417 0983 0285 0911 0032 0402
0964 0872 0883 0851 0947 0659 0524 0663 0246 0761 0481 0791 0861 0915 0755 0235 0385 0079 0996
0776 0171 0986 0808 0075 0274 0943 0936 0691 0428 0951 0381 0898 0541 0876 0605 0684 0182 0954

69
0904 0787 0139 0082 0520 0940 0413 0526 0452 0676 0737 0022 0434 0462 0644 0833 0733 0299 0601
0962 0349 0719 0609 0406 0015 0189 0199 0167 0263 0975 0840 0979 0562 0812 0797 0107 0178 0231
0071 0552 0844 0701 0396 0047 0092 0488 0036 0124 0391 0994 0253 0007 0744 0267 0697 0673 0214
0193 0922 1000 0498 0004 0221 0103 0456 0398 0836 0257 0729 0577 0502 0727 0054 0338 0751 0513
0695 0150 0050 0616 0652 0278 0665 0769 0926 0723 0331 0505 0516 0484 0580 0026 0157 0295 0879
Continued
Table 3.
Random Number Generator using Stat-trek.com® (continued)
0129 0114 0424 0494 0548 0868 0161 0018 0712 0363 0409 0804 0353 0441 0708 0641 0310 0569 0058
0060 0584 0748 0990 0530 0908 0509 0972 0317 0815 0321 0537 0772 0449 0887 0573 0780 0894 0819
0043 0370 0801 0829 0011 0466 0366 0932 0968 0594 0716 0086 0242 0039 0648 0556 0566 0534 0631
0342 0473 0612 0930 0445 0430 0740 0545 0598 0438 0919 0477 0068 0028 0680 0460 0855 0669 0492
0759 0958 0626 0620 0374 0377 0900 0064 0306 0847 0225 0289 0633 0866 0637 0588 0470 0823 0765
0203 0096 0210 0135 0359 0687 0705 0482 0305 0572 0433 0187 0713 0877 0119 0038 0638 0102 0446
0679 0450 0401 0283 0636 0578 0016 0948 0172 0518 0140 0230 0796 0845 0215 0371 0168 0777 0685
0337 0476 0059 0574 0294 0604 0048 0606 0198 0892 0809 0589 0984 0621 0888 0087 0749 0241 0764
0435 0711 0354 0689 0418 0497 0717 0952 0753 0339 0550 0247 0275 0647 0546 0112 0414 0775 0422
0219 0828 0012 0980 0076 0653 0792 0375 0625 0610 0920 0044 0884 0657 0514 0209 0860 0905 0403
0807 0820 0557 0080 0510 0486 1002 0670 0813 0311 0817 0916 0211 0649 0070 0542 0390 0315 0540
0151 0326 0508 0465 0091 0478 0582 0144 0839 0108 0307 0200 0681 0177 0617 0166 0454 0123 0382
0871 0873 0561 0343 0721 0322 0785 0134 0350 0585 0262 0700 0386 0593 0856 0183 0642 0824 0279
0179 0745 0781 0407 0529 0055 0852 0369 0347 0444 0155 0743 0243 0358 0412 0251 0732 0882 0841
0273 0668 0053 0946 0427 0271 0912 0869 0128 0619 0143 0089 0880 0978 0132 0378 0602 0929 0213
0388 0570 0025 0925 0491 0527 0153 0645 0207 0380 0455 0901 0754 0989 0423 0893 0587 0239 0284
0228 0316 0583 0185 0933 0459 0623 0865 0384 0848 0192 0690 0196 0324 0762 0448 0655 0694 0918
0245 0677 0886 0591 0961 0117 0914 0523 0431 0442 0410 0506 0217 0348 0487 0805 0320 0615 0420
0474 0794 0352 0944 0555 0335 0730 0367 0634 0495 0250 0252 0181 0722 0100 0164 0741 0463 0698
0085 0993 0021 0658 0292 0858 0160 0786 0758 0726 0822 0399 0538 0121 0356 0666 0790 0630 0111

70
0260 0651 0683 0950 0149 0818 0303 0826 0256 0773 0416 0480 0559 0057 0662 0957 0395 0288 0551
0613 0897 0519 0709 0175 0837 0224 0282 0890 0850 0715 0854 0236 0706 0052 0097 0330 0272 0597
0197 0661 0005 0503 0261 0490 0255 0223 0319 0031 0300 0133 0287 0127 0165 0757 0063 0065 0535
0554 0159 0394 0834 0471 0973 0599 0924 0768 0674 0069 0229 0565 0770 0208 0629 0101 0364 0426
0332 0522 0988 0037 0298 0095 0501 0240 0533 0736 0176 0725 0941 0956 0362 0693 0909 0266 0191
Continued
Table 3.
Random Number Generator using Stat-trek.com® (Continued)
0439 0738 0458 0020 0204 0268 0567 0802 0170 0531 0405 0345 0467 0093 0296 0779 0125 0576 0640
0110 0437 0078 0734 0035 0309 0106 0997 0512 0232 0544 0136 0830 0747 0702 0373 0627 0704 0832
0270 0277 0202 0099 0469 0360 0766 0939 0014 0313 0563 0982 0302 0595 0798 0843 0238 0875 0142
0341 0003 0965 0608 0672 0249 0971 0206 0328 0264 0800 0029 0234 0907 0046 0174 0138 0104 0392
0061 0811 0334 0499 0281 0067 0218 0122 0186 0083 0090 0115 0154 0992 0259 0227 0188 0024 0291
0131 0195 0156 0163 0976 0147 0862 0960 0903 0928 0999 0220 0935 0049 0864 0789 0967 0896 0033
0937 0072 0008 0001 0969 0040 0081 0074 0010 0145 0042 0113
Note: This table of 1,000 random numbers was produced according to the following specifications: (a)
numbers were randomly selected from within the range of 1 to 1000; (b) duplicate numbers were not
allowed. This table was generated on 4/1/2016 by the researcher.
Week 3
The list of 1,000 small businesses was sent to 4 subject-matter experts in the
following fields: legal, academia, insurance, and business consulting. Each of the
subject-matter experts (SMEs) had at least 10 years of experience in their respective field
and were respected and connected in their respective service industries. Using the SMEs
helped identify potential participants. Additionally, each of the SMEs had worked with
or was working in a small business and understood the struggles for survival of a small

71
business. Each SME understood potential participant bias because of their relationships
with the potential participants. Therefore, the SMEs contacted the participants, but did
not answer any questions regarding the research. The SMEs looked at the list to
determine who they might know to provide warm introductions for the researcher.
Additionally, the researcher looked at the list to determine how many companies were
known by the researcher. The researcher knew three companies and called the company
leaders to determine if they would be interested in participating in the research study.
Week 4
While waiting for the subject-matter experts to determine companies knew, the
researcher made a minimum of eight calls per week to companies using the random
number generated list. To keep track of the random numbers used from Stat-trek®, the
random number, once used, was highlighted in green. Additionally, the researcher made
a notation in Column C of the Microsoft Excel® spreadsheet regarding the random
number the company represented and how many voice mails or emails were left for the
potential participant.
Some of the potential participants on the Insider Prospect list were eliminated
from consideration. Reasons for exclusion included: (a) the company was recently
acquired, or (b) the founder was no longer a part of the company. The companies were
highlighted in red on the Excel® spreadsheet and the leaders were not interviewed. As
company leaders elected not to participate and informed the researcher, the companies
were also highlighted in red.
Regardless if the potential participant was known by the researcher or if the call to
the potential participant was a random call, the researcher called and left voice mail two

72
times and sent an e-mail, if the e-mail address was known. If no call backs or e-mails
were returned, the researcher moved on to call more names from the list using the random
number listing.
The researcher looked up each potential company participant on the Internet to
assure the potential participant was qualified as being in the service industry and learn
anything about the company using the “About Us” section of company websites. The
researcher called potential participants, talking to the businesses’ receptionists, indicating
to the individual that researcher was a doctoral candidate and was researching small
businesses in San Diego. Of responses, 93 declined to participate, or the receptionists
would send the call to voice mail and no one ever returned the call. Once a participant
agreed to participate, the researcher asked the potential participant the predetermined
criterion questions and, if the potential participant met the criteria, an e-mail was sent to
the participant containing the qualitative questions for him/her to prepare for the
interview. Table 4 shows the answers to the criteria questions.

73
Table 4.
Answers to Criteria Questions
Responses to Criteria Questions
Criteria SMB 1 SMB 2 SMB 3 SMB 4 SMB 5
Years in business 17 40 7 18 9
Location San Diego Pt. Loma Little Italy San Diego Kearny
Mesa
Govt, Hospital,
School
No No No No No
Active in Business Yes Yes Yes Yes Yes
# of employees 42 10 18 20 32
Selling a service Yes Yes Yes Yes Yes
Established learning
process
Yes Yes Yes Yes Yes
Profitability in past 3
years
Yes Yes Yes Yes Yes
5% business growth
in past 3 years
Yes Yes Yes Yes Yes
Forsee changes in
next 5 years
None at all No No No No
Criteria SMB 6 SMB 7 SMB 8 SMB 9 SMB 10
Years in business 10 18 18 31 25
Location San Diego Vista San Diego FallBrook San Diego
Govt, Hospital,
School
No No No No No
Active in Business Yes Yes Yes Yes Yes
# of employees 78 10 10 15 25
Selling a service Yes Yes Yes Yes Yes
Established learning
process
Yes Yes Yes Yes Yes
Profitability in past 3
years
Yes Yes Yes Yes Yes
5% business growth
in past 3 years
Yes Yes Yes Yes Yes
Forsee changes in
next 5 years
None No No None No
Continued

74
Table 4.
Answers to Criteria Questions (continued)
Responses to Criteria Questions
Citeria SMB 11 SMB 12 SMB 13 SMB 14 SMB 15
Years in business 31 18 26 13 17
Location San Diego Santee Mission
Valley
El Cajon San Diego
Govt, Hospital,
School
No No No No No
Active in business Yes Yes Yes Yes Yes
# of employees 40 25 13 10 10
Selling a service Yes Yes Yes Yes Yes
Established learning
process
Yes Yes Yes Yes Yes
Profitability in past 3
years
Yes Yes Yes Yes Yes
5% business growth
in past 3 years
Yes Yes Yes Yes Yes
Forsee changes in
next 5 years
No No No No No
All participants wanted to review the questions before an interview date and time
was determined. Within a day of emailing the questions, a date and time were sent to the
researcher to meet the participant. The companies were highlighted in green on the
Excel® spreadsheet. Additionally, a worksheet was created entitled Codebook, that
referenced the following: (a) the small to medium business number (SMB #X); (b)
company name; (c) if the participant was off the list or a snowball sample; (d) research
month; (e) known by researcher; (f) expert; (g) random participant off the list or
snowball; (h) interview date; (i) age of business; (j) number of employees; (k) type of
business; (l) zip code; (m) participant number (PA #X); and (n) the name of the
interviewee(s). In four cases, more than one person was present during the interview, for
example, the founder and the president, or if there was more than one founding partner,

75
the partners would be interviewed. Interview notes were read and re-read before coding
occurred. Each participant’s interview notes were coded by the researcher.
Month 2
The list of 1,000 small businesses was sent to 4 subject-matter experts in the
following fields: legal, academia, insurance, and business consulting. While waiting for
the subject-matter experts to determine companies they knew, the researcher continued
calling at least eight random companies per week using the Stat-trek® report, beginning
with the first random number that was not highlighted in green. The subject-matter
experts contacted names on the list they knew via phone calls and with a follow-up e-
mail. During Month 2, the subject-matter experts’ contacts began to contact the
participants by e-mail, indicating a desire to be interviewed. Once the potential
participant agreed to talk to the researcher, the researcher called the potential participant
and then e-mailed the participant. Additionally, some participants and the subject-matter
experts provided names of additional potential participants and sent the criterion
questions to the potential participants. If a potential participant met the criteria, the
participant was sent an e-mail with the qualitative questions to use to prepare for the
interview. All participants wanted to review the questions before an interview date and
time were set. Within a day of e-mailing the questions, a date and time were sent to the
researcher when he would meet the participant. A total of eight interviews were
conducted in Month 2 as follows: Week 1: no interviews; Week 2: two interviews; Week
3: one interview; Week 4: two interviews; and Week 5: three interviews.
Once at the interview, the researcher used the printed copy of the questions to
read them to participants. Once the interview was completed, the researcher transcribed

76
his field notes within 24 hours of the interview and then sent them to the participants to
validate. Three participants made editorial changes to the interview notes and e-mailed
them, including the changes, to the researcher. These three participants made no
substantive changes nor was anything new added to the notes. The interview notes with
changes were downloaded and saved to the researcher’s computer using a different file
name to distinguish between the original notes and the edited notes. Five other
participants agreed the notes were fine by sending an e-mail to the researcher, noting
such comments as “looks good”, “yes”, or “fine”. The original interview notes, with the
changes to the interview notes, and participant’s e-mails were saved to the researcher’s
computer and then saved to a Cloud storage, a flash drive, and an external hard drive.
During the interviews, the researcher noted two emerging questions: commoditization
and high retention of employees and customers. The answers to the questions were
important because (a) if there is commoditization in the industry, opportunities may exist
to learn how to differentiate one’s business from competitors, such as using a blue ocean
strategy, and (b) learning how to retain employees and customers allows the founder to
focus on new opportunities for the business, in addition to providing continuity from the
employees to the customers.
Ultimately, a business leader must learn how to make the business survive or it
will die. Learning to create a differentiation strategy and learning how to retain
employees and customers aids business survivability. All of the participants experienced
a commoditization in their industry. No question existed on the question list regarding
commoditization; therefore, after Interview 4, a question on the commoditization of the
industry was added to the list of qualitative questions. Additionally, all participants
77
experienced high retention of employees and customers. No qualitative question
regarding on high retention of employees and customers was asked; therefore, after
Interview 6, a question on high retention of employees was added to the list of qualitative
questions. No follow-up was required on these questions with prior participants, because
each participant had indicated there was commoditization and high retention of
employees and customers.
Interview notes were read and reread before coding occurred. Each participant’s
interview notes were coded by the researcher. Themes began to emerge from the coding
and the rereading of the interview notes. Although answers were similar, saturation was
not yet achieved and interviews continued. The researcher began to write Chapter 4 of
the dissertation by noting the changes made from the initial design and then documenting
the process.
Month 3
The researcher continued to call a minimum of eight companies per week from
the list provided by Inside Prospects using the random number generator starting at the
last number not highlighted in green.
The subject-matter experts were e-mailed to follow up on any more potential
participant contacts. When a potential participant met the criteria, an e-mail was sent to
them with the qualitative questions so they could prepare for the interviews. All
participants wanted to review the questions before an interview date and time were set.
Within a day of e-mailing the questions, dates and times were sent to the researcher for
meetings with the participants. An additional seven interviews were conducted in Month
3. Week 1: two interviews were conducted; Week 2: two interviews were conducted;
78
Week 3: no interviews; and Week 4: 3 interviews were conducted. Once at the interview,
the researcher read the questions as written from his printed copy of the questions.
Once the interview was completed, the researcher transcribed his field notes
within 24 hours of the interview and then sent them to the participants to verify. Two
participants made editorial changes to the interview notes and e-mailed the interview
notes including the changes to the researcher. The two participants did not make any
substantive changes nor was anything new added to the notes. The interview notes with
changes were downloaded and saved to the researcher’s computer using a different file
name to distinguish the original notes from the edited notes. Two other participants
agreed the notes were fine by sending an e-mail to the researcher noting that the notes
looked good. Three participants did not respond to the accuracy of the notes. Not having
a participant verify his or her words created the risk that the researcher may have
interpreted the participant’s words incorrectly or had written something incorrectly.
One of the ways the researcher mitigated the risk included restating participant
answers and asking for confirmation that words were captured correctly. Additionally,
the researcher asked the participant to repeat key phrases during the interview. Restating
the participants’ words and having the participants repeat key phrases were ways to check
the accuracy of the interview notes prior to leaving the interview. The original interview
notes, along with the changes to the interview notes, and participant’s e-mails were saved
to the researcher’s computer and then saved to a cloud storage, a flash drive, and an
external hard drive. Saturation was achieved when the researcher knew the answers to
the qualitative questions prior to interviewing the participants. In this study, saturation

79
was achieved within 15 interviews. The themes were sent to all the participants. A total
of four participants agreed the themes were on point.
Month 4
The dissertation was reviewed, edited, and sent for review and comment. A list of
final themes and a draft report was sent to the participants.
Month 5
The first draft of chapters 4 and 5 of the dissertation were completed. Corrections
were made as necessary, and the draft report was sent to the researcher’s committee.
Month 6
The committee sent comments for researcher to address. Revisions were made
and sent for review. It required time and effort to contact, schedule, and meet leaders
from 15 participating companies, transcribe the interviews, read, and recheck the data
before sending the transcribed data to the participants for verification of the accuracy of
the data collected while working a full-time job. The researcher was flexible and allowed
for more or less time, depending on the demands of the participants. A budget of $500
was established for the current study to acquire the dataset from Inside Prospects and
purchase a new external hard drive. The researcher used his own computer, but added an
external hard drive to transcribe the data and prepare the final report. Other resources
required were two white boards that were loaned to the researcher from one of the
subject-matter experts and the researcher’s time to collect, transcribe, code, validate, and
report the data.

80
Validation
All results must be validated. The researcher primarily used member checking as
a means to validate the answers from the participants in addition to continually reading
the interview notes. Additionally, one of the ways the researcher mitigated risk included
restating participant answers and asking for confirmation that words were captured
correctly. The researcher asked the participant to repeat key phrases during the
interview. Restating the participant’s words and having the participant repeat key
phrases were ways to check the accuracy of the interview notes prior to leaving the
interview (Charmaz, 2006). In a qualitative study, the researcher is constantly asking if
he or she is getting the story right (Creswell, 2007). Qualitative research collection is
very detailed and time consuming. Several methods are used to validate the data being
collected. Thick description and member checking were used in the current study.
Thick Description
Researchers commonly use thick description because the writer describes the
participants and the settings in detail, capturing their stories. Thick description “presents
detail, context, emotion, and the webs of social relationships” (Denzin, 1989, p. 83). The
“voices, feelings, actions, and meanings of interacting individuals are heard” (Denzin,
1989, p. 83). However, because the descriptions are so detailed, the reader perhaps can
feel the experience or the described events of the participants (Creswell, 2007). The
researcher continually read the interview notes while looking at the two white boards to
determine if anything had been missed. Additionally, the researcher’s continuous review
of the interview notes helped provide an understanding of the big picture through the
words of the participants. The researcher asked himself “how” and “why” questions

81
when transcribing and coding the data to be sure there was enough detail(s) to create a
story of how 15 small businesses created a process to capture, convert, and integrate data
for survival.
Member Checking
Lincoln and Guba (1985) regarded member checking as “the most critical
technique for establishing credibility” (p. 314). There were four intervals of member
checking during the current study.
Interval 1. To validate data, the researcher read his notes several times,
reviewing the data collected. The data could be misinterpreted if a researcher cannot read
his or her notes or wrote the wrong answer by the participant. The researcher clarified
any data that appeared to be conflicting or needed further clarification by contacting the
participants by e-mail or by phone, and asked the participant(s) exactly what he or she
meant for any data that was conflicting (Creswell, 2007). Once each interview was
concluded, following each individual interview but not later than 24 hours after the
interview, the interviews were reviewed and transcribed by the researcher using a Word®
document program on a computer immediately. The files were stored on the researcher’s
computer, a removable hard drive, a thumb drive, and a Cloud service.
A review consisted of reading the field notes several times. The notes must be
accurate and use the words of the participants without commentary or opinions from the
researcher. Once the interview notes were completed, a copy was sent electronically to
each participant to verify the accuracy of the interview notes. Modifications by the
participants added to the credibility of the interview. The participants who modified the
transcripts used track changes in Microsoft Word® to modify the interview notes. The
82
modified transcript was saved in the SMB (xx) file on the researcher’s computer and
saved to a Cloud, an external hard drive, and a thumb drive. Interview notes were read in
their entirety several times before coding began, as suggested by Agar (1980). Reading
the interview notes several times allowed the researcher to be immersed in the details of
the interview and to get a sense of the interview before beginning the coding process
(Agar, 1980, Creswell, 2007).
Interval 2. Coding of the data occurred while other participant interviews were
documented. There are different coding processes that can be used such as Huberman
and Miles (1994) five-step process to Strauss and Corbin’s (1998) three-step process.
Coding is the process of examining the data collected and searching for emerging themes
from the data (Strauss & Corbin, 1998). Codes for the small business (SMB1) and
individual participants (IP1) were used. A codebook detailing the actual businesses and
individual participant’s names along with their codes was maintained on the researcher’s
laptop and stored on an external hard drive, a Cloud, and a thumb drive. Each theme or
pattern was written on an index card. The index cards were then attached to a white
board. After several days, the index cards fell off the white board. The themes were then
written on the white board and also in a Microsoft Word® document. Additionally,
abbreviated answers to the research questions were also entered on a white board. The
detailed answers were captured in the interview notes, handwritten and typed into a
Microsoft Word® document creating a visual document, which provided the data display
as posited by Huberman and Miles (1994). The display was helpful to organize and
assemble information to depict how the themes may relate to each other, allowing
conclusion drawing and action taking (Huberman & Miles, 1994). By grouping themes

83
or patterns together during the coding stage, the researcher was able to see commonality
from the participant data as well as any outlier theme or pattern. No outlier themes or
patterns existed. An outcome of coding was the researcher continually refined interview
questions to uncover more themes or patterns until a theory was developed.
Only two additional research questions were added that emerged from data
collection, and all participants were asked the two additional questions. A list of themes
or patterns was sent to the participants for their feedback. In total, 10 participants
responded to the list of themes that the themes were on track or the participant did not see
anything wrong with the themes. The remaining five participants were followed up with
e-mails and phone calls. Four participants were reached by phone and agreed the themes
were fine.
During the interval, one participant questioned a theme presented by the
researcher, which required additional conversation with the participant. The researcher
questioned the individual participant first to be sure there was no misunderstanding of
terminology or definitions. The participant was satisfied with the answer from the
researcher by acknowledging his satisfaction via e-mail. As new themes was created, the
new list of themes was sent to the participants for their feedback. When there were no
new themes created and there were no additional questions from the participants, the
researcher began the process of assembling the final report. The process is shown in
Figure 1.

84
Figure 1. Theme process as the researcher coded, themes began to emerge. These themes
were then sent to the participants for validation. This process occurred until no new
themes emerged.
Interval 3. Once all interviews were coded, a final list of themes was sent to the
participants for their feedback. Twelve participants agreed the themes were accurate.
Three participants were followed up with e-mails and phone calls. The three participants
left voice mails with the researcher, saying there were no concerns with the themes.
There were no additional questions from the participants and, therefore, no additional
interviews were conducted.
Interval 4. Once the researcher had a final list of themes, he continued to analyze
the themes, comparing and narrowing the number of themes to create a final theory. The
researcher was attempting to answer the research question: understanding the process
small businesses use to capture, convert, and integrate survival knowledge.

85
A draft final report was sent to each participant with the theory that was created
from all the interviews and themes. The final theory presented to the participants
indicated a process was necessary to capture, convert, and integrate knowledge for
survival. Specifically, the participants established mentors for each stage of business
development, learned to use a trial-and-error process with a feedback loop back to the
mentors, and then the participants led the integration of knowledge to others in the
business.
The three themes answered the research question. The researcher contacted the
participants to discuss the final findings to be sure there were no final questions by the
participants, and the results were appropriate from the themes previously generated. All
the participants were e-mailed and the researcher left voice mails for the participants.
Eleven of the participants responded that they agreed with the business survivability
model and the process used to retain customers, as well as the process to enter new
markets by being financially prudent. Two of the participants sent minor grammatical
changes to the researcher, but did not change or have any issues with the report content.
They said they would not have survived as long as they had without a learning process.
The remaining four participants agreed with the draft report and its outcomes. Two of the
participants stated they learned something new from several of the participants’ quotes
and would look to implement this in their business. The participants did not have any
additional questions. A final report was to be sent to each participant. The positive
aspects of member checking were:
Provided an opportunity to understand and assess what the participant intended to
do through his or her actions

86
Gave participants the opportunity to correct errors and challenge what were
perceived as wrong interpretations
Provided the opportunity to volunteer additional information, which may be
stimulated by the playing back process
Provided an opportunity to get the respondent on the record with his or her reports
Provided an opportunity to summarize preliminary findings
Provided respondents the opportunity to assess adequacy of data and preliminary
results as well as to confirm particular aspects of the data by reviewing a copy of
the transcript in any manner the participant wanted to receive it as well as to
confirm emerging themes (Creswell, 2007).
Risks
Participants experienced minimal risk because the researcher conducted face-to-
face interviews with them, simply reading questions and recording their answers. None
of the participants had trouble remembering how he or she started the business or any
details of the questions asked by the researcher. The researcher works and has worked
primarily in small businesses, specifically in the service sector; therefore, the researcher’s
judgment could have been clouded when asking questions and drawing conclusions for
the participant being interviewed. One risk was that the initial qualifying data were
wrong or answers to questions from initial phone call were written down incorrectly.
Using participants from the researcher and the researcher’s subject-matter
expert’s relationships could have biased the participant’s answers. Based on a prior
relationship with either the interviewer or one of the subject-matter experts, a participant
may not have wanted to disclose all relevant information or could have tailored the
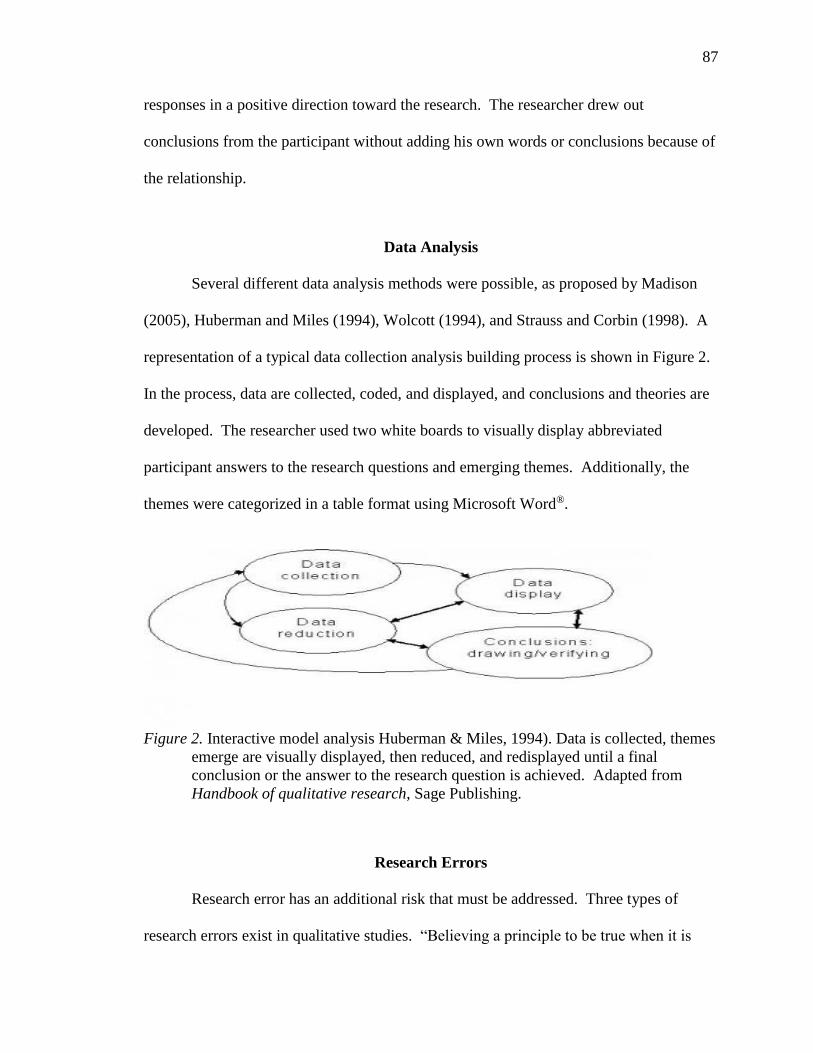
87
responses in a positive direction toward the research. The researcher drew out
conclusions from the participant without adding his own words or conclusions because of
the relationship.
Data Analysis
Several different data analysis methods were possible, as proposed by Madison
(2005), Huberman and Miles (1994), Wolcott (1994), and Strauss and Corbin (1998). A
representation of a typical data collection analysis building process is shown in Figure 2.
In the process, data are collected, coded, and displayed, and conclusions and theories are
developed. The researcher used two white boards to visually display abbreviated
participant answers to the research questions and emerging themes. Additionally, the
themes were categorized in a table format using Microsoft Word®.
Figure 2. Interactive model analysis Huberman & Miles, 1994). Data is collected, themes
emerge are visually displayed, then reduced, and redisplayed until a final
conclusion or the answer to the research question is achieved. Adapted from
Handbook of qualitative research, Sage Publishing.
Research Errors
Research error has an additional risk that must be addressed. Three types of
research errors exist in qualitative studies. “Believing a principle to be true when it is

88
not…is called ‘type one error.’ ‘Type two error’ is rejecting a principle when in fact it is
true. ‘Type three error’ is asking the wrong question” (Kirk & Miller, 1986, p. 30). The
errors may threaten the study validity, and such risk is best mitigated using multiple data
gathering iterations, which guides the researcher to the core theory via disparate steps and
processes (Kirk & Miller, 1986).
Ethics and Confidentiality
Ethics has an important part in a research study. Regardless of whether there are
humans or animals involved in the study, care must be given to treat the participants with
respect. In the case of human participants, researchers must keep each participant’s
answers confidential so that the answers cannot be traced back to the participant, which is
especially important in qualitative studies. Of the interviews, 17 were held on the
premises of an organization in the study, and 1 interview was held at a convenient place
for the participant.
The researcher shielded the results from the employees during the interview,
allowing for free flow of communication. The results of the study are dependent on
accurate data. In addition to participant identity, the data must be kept safe and secure.
Cloud technology was used by the researcher to store the data. There are questions
regarding the safety of the method to store data since the data storage device could be
hacked. To have multiple saved versions that could be retrieved the researcher used an
external hard drive and a thumb drive to store participant data. As required by George
Fox University officials’ research policy, all participants signed and dated a release form
signaling their willingness to participate in this study.

89
The notion of confidentiality is founded on the principle of respect for autonomy
(Creswell, 2007). Identifiable information about individuals collected during the process
of research will not be disclosed without permission. Confidentiality also means not
disclosing any information gained from an interviewee, deliberately or accidentally, in
ways that might identify an individual (Creswell, 2007). There are risks of disclosing
confidential information by accident when describing participants in a research study by
using thick rich description, which is referred to as a deductive breach of confidentiality
(Creswell, 2007). Qualitative researchers must describe in enough detail the participant’s
thoughts, actions, ideas, and questions but also maintain confidentiality of the participants
(Creswell, 2007). A fine line exists between describing a person’s story in enough detail
to tell their story accurately but yet not providing so much detail that someone could
guess the identity of the participant (Creswell, 2007).
Risks and Researcher Bias
Minimal risk was present for each participant, because the researcher conducted
face-to-face interviews with the participants, simply reading questions and manually
recording their answers on paper. None of the participants had difficulty remembering
how they started the business or any details of the questions asked by the researcher.
Since the researcher works and has worked primarily in small businesses, specifically in
the service sector, the researcher’s judgment could have been clouded when asking
questions and drawing conclusions for the participant being interviewed. A risk is that
the initial qualifying data were wrong or answers to questions from initial phone calls
were written down incorrectly. Using participants from the researcher and the
researcher’s subject-matter experts’ relationships could have biased the participants’

90
answers. Based on a prior relationship with either the interviewer or one of his subject-
matter experts, a participant may not want to disclose all relevant information or could
tailor the responses in a positive direction toward the research. The researcher must draw
out any conclusions from the participant without adding his own words or conclusions
because of the relationship.
Delimitations
Delimitations state the boundaries of the study (Roberts, 2010). The boundaries
set for the current study were as follows:
Service Sector small businesses in San Diego County, California.
The service sector organization must have increased revenue by 5% over a 3-year
period as well as having profitability in 2 of the past 3 years in the past 3 years.
Additionally, the organization: (a) had been in existence for at least 7 years; (b)
employed between 10 and 99 employees; (c) had established a process to capture,
convert, and integrate knowledge into the business; (d) was not a government
agency, hospital, school, college, or university whether for profit or not for profit;
(e) the entrepreneur was an active member of the business; and (f) there were no
foreseeable changes that would prevent the business from surviving an additional
five years.
All businesses should be interested in capturing knowledge, but in particular, the
service industry has grown during the Information Age. Service companies
account for more than 50% of the businesses on the Standard and Poor’s 500

91
Index and 70% of added value in the advanced industrial economies (Newman,
2010).
Assumptions and Limitations
Limitations are not controllable by the researcher and may affect the study in an
important way (Roberts, 2010). An assumption is something plausible and accepted as
true. For the current research, for a business to be part of the study, the following
assumptions were made: (a) there were at least 15 small businesses in the service sector
that were not government agencies, hospitals, schools, colleges, or universities whether
for profit or not for profit; (b) that the entrepreneur was still an active member of the
business; (c) that the business had between 10 and 99 employees; (d) that the business
had been in existence for at least 7 years, (e) that the business had multiple years of
profitability in the past 3 years; (f) that the business had experienced a 5% growth in
revenue in the past 3 years; (g) that the business had implemented a process to capture,
convert, and integrate knowledge; and (h) there were no foreseeable changes that would
prevent the business from surviving an additional 5 years, within San Diego County,
California.
Another assumption was that selected small business entrepreneurs would be
willing to share their ideas and strategies on how their process to capture, convert, and
integrate data was implemented. A limitation was that the study was centered in San
Diego County, California and, because of the specific geography; the findings may not be
generalizable with a limited number of participants. The current study was the
researcher’s first research project, making the researcher’s lack of experience, including
interviewing, transcribing, and coding, along with his limited relationships with small

92
business entrepreneurs, a research limitation. As with doing anything for the first time,
the time frames to conduct interviews, transcription, and coding were underestimated.
Time and Budget
The length of time from data collection to final theory development was six
months. The budget was $500 for the purchase of the Inside Prospects list and an
external hard drive for the researcher’s computer.
Researcher’s Perspective
Generally, small business leaders have limited resources, such as personnel,
finances, and technology, but need to allocate some resources toward implementation of a
learning process (Leadbeater, 2000). Small business leaders learn from their employees,
their competitors, their vendors, their customers, their advisors, and industry
organizations. Small business founders learn from mentors, customers, employees, and
their experience. Entrepreneurs capture knowledge from their customers through
feedback on pricing and service. Entrepreneurs learn and integrate new technology on
their own through trial and error as well as through vendors. Entrepreneurs capture
knowledge about their competitors from vendors, industry organizations, and customers
and integrate the knowledge to others in the business.
Senge (1990) and Lotti (2007) underscored the importance of implementing a
learning process for small business survivability. A learning process would enable the
small business’s leaders to create a competitive advantage. Knowledge may be lost if the
entrepreneur does not allocate resources to capture, convert, and integrate knowledge.
Understanding how small businesses entrepreneurs implement a process to capture,

93
convert, and integrate knowledge to survive will not only add to the existing body of
literature on small business survival, but also might result in transferrable principles and
actions that could lower the mortality rate of small businesses.
Conclusion
Qualitative researchers want to understand the motives, reasons, and goals that
make people do what they do (Creswell, 2007). In organizational studies, describing the
data may be more valuable than statistics (Creswell, 2007). Using thick rich description
would provide details of the organization through use of descriptive words better than a
statistical analysis would provide. A qualitative study used a multisite case study design
to identify how small businesses implement a learning process to move from a business
idea to business survivability in San Diego County, California. The participants were
identified using several sampling techniques including criterion, convenience, and
snowballing. Data collection was gathered using semistructured interviews. Interview
notes and coding were completed by the researcher.
Small business success and survivability will be critically dependent upon the
entrepreneur developing new resources, continually evolving the organization, including
implementing a learning process, and creating new organizational forms (Sarason, Dean,
& Dillard, 2006). Understanding how small business entrepreneurs implemented a
process to capture, convert, and integrate knowledge to survive resulted in transferrable
principles and actions that could lower the mortality rate of small businesses, specifically
small businesses six years old or younger.
94
Chapter 4: Results
Nothing happens unless first a dream (Carl Sandburg).
Entrepreneurs start with a dream. Some make the dream a reality by pursuing
their dream and creating a business. Small businesses account for more than 99% of all
businesses and created 63% of net new jobs (U.S. Small Business Administration, 2011).
Unfortunately, 50% of small businesses do not make it to year five, and only 31% make it
to year seven (Knaup & Piazza, 2007). Understanding how small businesses survive is
important because of their high mortality rate. Zahra (2015) posited a process to capture,
convert, and integrate knowledge as an essential component to small business
survivability. As such, the researcher was seeking answers to how small businesses
implement a process to capture, convert, and integrate knowledge to survive. The
following information is used to outline the changes from the original design, the results,
and the conclusion.
Research Participants
The research was aimed at discovering how small businesses create a process to
capture, convert, and integrate knowledge to survive. The researcher purchased a list of
1,000 small business names and utilized 4 subject-matter experts from legal, academic,
insurance, and business consulting. Additionally, snowball sampling was used to qualify
6 more participants for a total population of 1,006. From the list, using random numbers,
the subject-matter experts, and the snowballing, a review of 138 potential participants

95
was completed to arrive at 15 small businesses participants meeting the criteria and
agreeing to be interviewed. The researcher used the first 102 random numbers as
indicated in Figure 3.
0472 0568 0280 0411 0549 0867 0383 0368 0678 0483 0536 0376 0857 0415 0006 0966
0618 0397 0793 0607 0429 0696 0895 0564 0558 0312 0314 0838 0002 0244 0784 0162
0763 0226 0571 0803 0575 0525 0408 0760 0703 0141 0827 0034 0148 0073 0297 0624
0643 0056 0084 0265 0720 0355 0921 0222 0849 0970 0340 0496 0293 0902 0810 0821
0788 0885 0596 0461 0600 0184 0699 0419 0728 0799 0853 0692 0173 0731 0323 0017
0934 0714 0109 0923 0746 0013 0212 0881 0874 0628 0365 0889 0318 0560 0835 0479
0814 0543 0622 0120 0891 0842 0724 0077 0019 0457 0878
Figure 3. Random number generator using Stat-trek.com
Added to the list the researcher and the subject-matter experts identified 30 small
businesses on the list that did not meet at least one of the criteria, such as founder not
present or too many employees
Potential participants not meeting at least one part of the criteria were denoted in
red and the entrepreneur of any small business in red was not interviewed. Additionally,
there were 6 snowball participants, bringing the total potential participants to 138. Data
saturation was reached within 15 interviews. Of the 15 small businesses, 12 were from
different segments of the service industry, as shown in Table 5.
Table 5

96
Service Industry Segments of Participants.
Participant Type of Business
SMB 1 Benefits
SMB 2 Data Aggregator
SMB 3 Marketing Strategy
SMB 4 Commercial Interior Designers
SMB 5 Human Capital Management
SMB 6 Full serve Law firm
SMB 7 Residential Interior Design
SMB 8 Trial attorneys
SMB 9 House keeping
SMB 10 Architects
SMB 11 Court Reporting
SMB 12 Commercial Insurance
SMB 13 Title Insurance Law firm
SMB 14 Hybrid Dental Orthodontic
SMB 15 Legal Copy Service
Additionally, the participating companies had been in existing ranging from 7
years to 40 years and employed between 10 and 77 employees (see Figure 4). Figure 5
shows the method used to find the participants included in the study. Figure 4 shows
each small and medium sized business participant in the study, categorized by the age of
the business and the number of employees.

97
Figure 4. Participants, age of business, and number of employees
Figure 5 shows the methods used to identify participants for the current study.
Figure 5. Methods used to find participants. Participants were found because one of the
SMEs knew the participant, by random phone calls from the researcher, participant
known by the researcher, and through snowballing.
The researcher used subject-matter experts to aid in warm introductions. Warm
introductions aided the researcher with 10 out of 15 interviews. The warm introductions

98
occurred through e-mails, but when the researcher called, the participant was more than
willing to participate in the study. The remainder of the participants occurred through
random cold calls. The random cold call participants were curious about the research,
had an opening in their busy schedules, and treated the researcher as they would want to
be treated.
A breakdown of participants by zip code is provided in Table 6. Although half
the participants are in one San Diego, CA zip code area, representing downtown San
Diego, the other half covered a wide area within San Diego County.
Table 6
Breakdown of Participants by Zip Code
Row Labels Count of Participant
92020 2
92025 1
92028 1
92101 7
92106 1
92111 1
92123 1
92130 1
Grand Total 15
The zip codes were entered into Bing® Maps by Microsoft to provide a visual
representation where in San Diego County the participants’ small businesses were
located, as can be seen in Figure 6. Each letter represents a zip code, although more than
one participant existed in several zip codes, as indicated in Table 6. Figure 6 shows the
distribution of participants.

99
Figure 6. Map with letters representing location of participants. This is a visual
representation of where the small and medium sized businesses were located within San
Diego County, CA.
Coding
The researcher relied on Strauss and Corbin (1998) coding methods after data
were collected and transcribed. Coding is the process of selecting, focusing, simplifying,
abstracting, and transforming the raw data written in field notes (Huberman & Miles,
1994) and examining the data collected, searching for emerging themes from the data
(Strauss & Corbin, 1998).
Three steps exist in the coding process: open, axial, and selective. At each stage
of the coding process, the data is scrutinized for consistent themes. During the coding
stage, a researcher may uncover a theme needing further examination and requiring more

100
in-depth interviews. Interviews continue until no new themes are indicated. Strauss and
Corbin (1998) referred to this as the saturation point. An outcome of coding is that the
researcher continually refines interview questions to uncover more themes until a theory
is developed. A theory, or theories, begin to emerge from the data at each stage of
coding.
For the current study, the researcher clarified any data that appeared to be
conflicting or needed further clarification from each participant. Emerging themes from
the data were tested for their reliability and validity. At each stage of the coding process,
member checking was used to validate the results. Otherwise, only interesting stories of
unknown truth and utility would exist (Huberman & Miles, 1994). Once the data were
fully coded, a theory was generated to answer the research question: How do small
businesses create a process to capture, convert, and integrate knowledge for survival?
Open Coding
Open coding is the “part of the analysis that pertains specifically to the naming
and categorizing of phenomena through close examination of data” (Strauss & Corbin,
1990, p. 62). This is the initial stage of coding, breaking large data sets and interview
results into major categories or themes. For the current study, the interview notes were
read and reread before coding began. Coding of the data began with counting words
from the interview notes. The researcher circled repeating words and wrote the words on
a white board along with the word count. Table 7 shows themes uncovered during
coding along with how many times the word was used by the participants in their answers
to the questions. Additionally, the researcher documented when saturation occurred by
noting in which interview the researcher knew the answers before asking the participant

101
the qualitative questions as reflected in Table 7. Themes were derived from interview
notes with high word counts. The researcher added two interview questions based on
emerging themes.
Table 7.
Theme Display with Word Counts and When Saturation was Achieved.
Themes Word Count
Saturation
Interviews
Relationships 42 10 Values 20 10 High retention 20 9 Commoditization 20 9 Communication 53 10 Learning by doing 61 8 Learning online 25 11 Learning from Vendors 31 11 Asking questions 22 9 Listen to employees 19 11 Experiential learning 49 10 Learn through Trial and Error Process 30 10 Founders 22 11 Integration 35 11 Flexible and nimble 21 10 Mentorship 40 9 Customer focused 51 9 Listen to customers 28 9 Learning faster than
competitors 14 11
Financial prudence 31 10 Creating additional
business opportunities 22 9
Feedback 20 9 Informal
communication 15 10 Formal
communication 22 10
Lunch and Learns 12 11
Failing 32 10

102
The researcher sent the participants the initial list of themes electronically to be
sure the themes were representative of the participants’ answers. Ten participants
responded electronically that the themes reflected their words during the interview and
were on track. The remaining five participants were contacted by telephone and also
agreed the themes reflected their words during the interview and were accurate.
Axial Coding
According to Strauss and Corbin (1998), the purpose of axial coding is to “begin
the process of reassembling data that were fractured during open coding [and to] form
more precise and complete explanations about phenomena” (p. 124). Procedurally, axial
coding involves:
Identifying the variety of conditions, actions/interactions, and
consequences associated with a phenomenon; relating a category to its
subcategories through statements denoting how they are related to each
other; and looking for cues in the data that denote how major categories
might relate to each other. (Strauss & Corbin, 1998, p. 126)
During this stage of coding, the researcher began to look for cues in the data and
how major themes could be established. Beginning with the emerging themes from the
open coding stage, the researcher asked whether these themes answered the grand
research question. It was important to look at the themes developed in open coding and
begin to reassemble them into major categories. The themes were examined for
characteristics that appeared similar to begin grouping them into different categories: (a)
some themes implied relationships, (b) some themes others were different ways to learn,
(c) some themes implied competing, and (d) some themes were different ways to

103
communicate. Themes such as listening to customers and customer focus are important
to business survival but could be consolidated within relationship. The researcher then
began to look for connections between words and terms such as relationships, mentors,
learning, learning-by-doing, experiential learning, learning online, integration, and
founders as examples. Eventually, the researcher used word connections and class
inclusions along with a review of the interview notes for a sense of the participant
statements to create a shorter list of emerging themes. By grouping themes or patterns
together during axial coding, the researcher was able to see commonality from the
participant data as well as any outlier theme or pattern. A visual display is helpful in
organizing and assembling information to depict how the themes may relate to each
other, allowing conclusion drawing and action taking (Huberman & Miles, 1994).
Table 8 shows the four categories, creates relationships, different ways to learn,
competitive advantage, and communication paths, along with the themes that held similar
characteristics.

104
Table 8.
Themes Reassembled by Major Category and Similar Characteristics
Creates Relationships Different ways to learn Values Learning by doing High retention Learning online Customer focus Learning from vendors Listening to employees Asking questions Mentorship Learn through trial-and-error process
Listen to customers Experiential learning Communication Lunch and Learns
Relationships
Failing Flexible and nimble Informal Commoditization Formal Learn through trial-and-error process Feedback Learning faster than competitors Lunch and Learns Creating additional business opportunities Relationships Relationships Listen to customers Competitive advantage Communication paths
Mentorship Listen to employees
Listening to customers Mentorships
Customer focus Learning from vendors
Financial prudence Lunch and Learns
Integration Founders
Failing Integration
Learn by trial and error process
The researcher continued to review the categories while asking himself, how do
the themes relate to the grand research question, and how do small businesses create a
process to capture, convert, and integrate knowledge for survival? Several themes began
to emerge during axial coding: (a) mentorship, (b) learning through the trial-and-error
process, (c) learning by doing, (d) lunch-and-learns, (e) experiential learning, (f)
founders, (g) learning faster than the competition, (h) failing, and (i) integration. The
researcher electronically sent the participants the emerging themes from this stage of

105
coding to validate the themes. Participants responded by e-mail and telephone that the
themes were on track.
Selective Coding
During the last stage of coding, according to Creswell, Hanson, Plano, and
Morales (2007), the researcher reviews the model developed during axial coding and
develops statements or propositions that interrelate the categories or that assemble a story
that describes the interrelationship of the themes in the model. From the beginning of
data collection, the qualitative researcher decides what things mean, notes regularities,
patterns, explanations, possible configurations, causal flows, and propositions (Huberman
& Miles, 1994). The researcher continued to ask the question about whether the themes
answered the grand research question. Additionally, the researcher questioned if the
themes told the stories of the participants. The researcher continued to use word
connections and class inclusions along with a review of the interview notes to create a
story to answer the grand research question.
In the current study, to establish the final or selective themes, the researcher
created several questions relating to the grand research question. The researcher
attempted to answer the following questions: How do relationships affect the process to
capture, convert, and integrate knowledge along with what relationships aid in converting
knowledge? What type(s) of learning, aids in capturing knowledge? How did integration
of knowledge occur? Rereading the interview notes, the following elements it became
clear to the researcher: (a) the participants used their relationships with their mentors to
affirm the knowledge learned; (b) participants learned through trial-and-error processes;
(c) participants learned by failing at times during a trial-and-error process; (d) in the trial-

106
and-error plus failing process, continuing to move forward was how the participants were
able to learn faster than their competitors; (e) the participants used multimodal learning,
and (f) the founders directly led the process to integrate knowledge into the businesses.
Again, relating these six themes to the grand research question led the researcher
to three themes that best answered the grand question. The final themes were
representative of the story learned from the participants. The final themes were: (a)
mentors, (b) learning though trial and error, and (c) founders lead integration of
knowledge and were sent electronically to the participants to validate the results. In
addition to the three major themes, there were three subthemes: (a) multimodal learning,
(b) learning faster than competitors, and (c) failing but moving forward through trial-and-
error processes. Participants responded electronically and by telephone that the final
themes were representative of the answers provided by the participants. The key focus of
the selective coding process was, through analysis, to extend the theory beyond
description “to explain why, when, where, what, events or happenings occur” (Strauss &
Corbin, 1998, p. 19). The final themes answered the grand question, how do small
businesses create a process to capture, convert, and integrate knowledge for survival.
Findings
The researcher uncovered three main themes. Mentors were used by the founders
of the companies researched. In fact, not only did the founders use mentors, they needed
to find mentors at each stage of their business’s development, which was important
because only 8% of small business owners use mentors (Palmieri, 2016). The next theme
to emerge was that the participants used a trial-and-error process with a feedback loop to
learn. Trial-and-error is not new, but using trial and error aided the participants in
107
learning faster than their competitors. The last theme was that integration of knowledge
into the business was led by the founders. The founders transferred their own knowledge
to others in the business by one-on-one meetings, team meetings, lunch-and-learn
meetings, and lessons learned. Combining trial and error with utilizing mentors at each
stage of business development, along with integrating knowledge to others in the
business, allowed the small businesses to survive.
Mentors
Each of the founders in the study intentionally established mentors for their
business. Each participant of this study was classified in the researcher’s codebook as PA
with a corresponding number from 1 through 15. One being the first participant and 15
being the 15th participant. Throughout the document, quotes from participants were used
to tell their story as Strauss and Corbin (1998) suggest. Some of their comments
included:
PA 6: “We learn through one-on-one mentoring.”
PA 4: “Mentorship from top down fosters learning.”
PA 15: “My brother is in the same business that we are in but in Northern
California. We bounce ideas and issues off of each other. We have learned from each
other.”
Just as there are different stages of business development (Adizes, 1979), there
are different stages of mentorship. In the beginning stages of the business, the founders
used family members and friends who could help the founders with ideas on computer
systems, banking relationships, finances, and customers:

108
PA 11 said:
My uncle was my mentor. He owns a business selling wood for homes in San
Diego. He told me early on business was a game much like gambling. I approach
the day with the idea that after 31 years this is still a game. I need to take risks to
stay on top of my game.
PA 8 said, “My mentor early on told me to spend nickels like manhole covers”
As the businesses grew and became more complex, the founders intentionally sought
additional mentors who could help them with their stage of development:
PA 3 pointed out, “Mentors are the number one way I learn. Yes, I leaped frog
my mentor.”
PA 11 said:“I learn from other people businesses. I figure out what other
successful people are doing and copy them. I bring their ideas into my business.”
The mentors are a network of knowledge experts. The founders knew, once they
started their business, they had to sell.
According to PA 15, “Our focus in the first few years was to provide a great
product at the lowest price without compromising on customer service.”
PA 5 simply said, “Never stop selling.”
Then, the founders knew they would need to develop customers.
As PA 10 pointed out, “You have to meet a person, develop a relationship, then
trust builds, and eventually an opportunity arrives to ask the person for work. You must
listen, seek advice, and have mentors.”

109
Once the founder developed the customer, he or she knew the customer would provide
feedback, good and bad. The mentors’ advice to the founders was to listen to the
customers. Some of the participants’ comments included:
PA 2: “We listen to our customers when making changes to our software.”.
PA 9: “We listen to our customer’s feedback which we receive from talking to our
customers as well as from our customer evaluations.”
PA 5: “When our clients asked for more functionality, we heard them and created
more functionality in our system.”
PA 9: “Customer relationships cannot exist without delivering what you promised
to deliver, even if you lose a little money.”
Although, the mentors’ advice on finances was to be prudent, the founders knew
if they did not take care of the customers, including losing money on a deal, long-term
relationships might be in jeopardy.
As PA 11 pointed out, decisions were made based on “what is best for the
customer.” PA 1 agreed and said, “Keeping the best interests of the client over time
translates to well-rounded relationships.” Learning from the mentors is a key to survival.
PA 2 asserted, “We learn by doing.”
Meeting with their mentors monthly allowed the founders to share ideas such as
new business opportunities and to receive feedback from the mentors on the ideas. The
founders can try an idea, capture the learnings from the idea, and then talk over the
results with the mentors. It is important to continually find mentors to fit the stage of
development for the business and mentors who fit with the founder.

110
Learning through Trial and Error
The founders learned through a trial-and-error process with a feedback
loop back to the mentors. The trial-and-error process with feedback loop was
used by the businesses, helping the founders to learn faster than their competitors,
leading to new sales opportunities. The idea of learning faster than their
competitors was a subtheme that emerged during the axial coding process. Stata
(1989) pointed out that “The rate at which individuals and organizations learn
may become the only sustainable competitive advantage, especially in
knowledge-intensive industries” (p. 64).
PA 3 explained:
We learned to use trial and error by using a marketing and advertising
campaign built for one client’s vertical market then duplicating the
marketing and advertising campaign in another vertical market for a
different client, and the sales flood gates have opened up. We have
increased the organization’s sales by adopting a marketing and advertising
campaign and using it in several vertical markets.
PA 6 said, “We learned faster to run the business side of our practice than
our competitor.”
PA 4 added, “Business opportunities… exploit before your competitor:
winning projects with budget driven pricing. Continuing to be open to different
kinds of projects keeps us on our corporate toes, and the swiftness that projects
move through the office.”

111
According to PA 15:
I watched our competitors fail. During the 2000 and 2008 recessions
because we are financially frugal we were able to make it through the
recessions when the competitors did not. We persevered while the
competitors dried up. I saw them drop by the wayside. The competitors
also did not give great customer service.
PA 11 discussed the value of his company’s Discovery Conference Centre,
stating:
I was able to exploit this before my competition. This has helped me with
survival. I provide a place where attorneys can hold depositions or have
meetings in private. I provide a physical space with Internet, video
conferencing, a receptionist, and refreshments.
PA 7 said, “We control the entire process, which gives us a competitive
advantage. Doing everything is our biggest asset.”
Trial and error certainly aided the founders to learn faster than their
competitors. There were subthemes that emerged during coding that are worth
noting, including multimodal and failing. Another subtheme was learning, which
was accomplished through multimodal learning.
PA 9 pointed out:
We learn from doing and observing. It is through our experience that we learn.
When we make mistakes, we make adjustments. We read literature from people
in our industry. We look online for cleaning tips. We learn from outbidding our
competitors.

112
PA 13 explained:
We learn by example and through experience, studying, and teaching. Interacting
with clients. I contact clients and talk to them. We talk through issues. We may
talk about an important piece of case law. We learn through the client experience
and interaction. Teaching others. You have to take time away from the business
to learn.
Using multimodal learning provided the founders with relevant knowledge from their
industry groups, literature in their respective fields, and hands-on experience with
customers, employees, mentors, and vendors.
The last subtheme was that the participants failed at times through their trial-and-
error process. They learned from their failures, captured their learnings, integrated the
knowledge, and kept moving forward:
PA 11 explained, “Failure = success = business. Must fail at times but keep
moving forward and make decisions”.
PA 10 pointed out, “If you are not failing then you are not differentiating yourself
and are probably in the wrong area of business.”
Failing to maintain the business was not an option for any of the participants in
the study.
PA 12 asserted, “From Day 1, failure was not an option. You don’t go into a
business with the idea it will fail.”
PA 14 stated, “I learn from experience and I learn from my and others’ mistakes.”
PA 11 said, “We take what we learn, create a plan, create a strategy, then execute
and go get the deal” (PA 11).
113
The feedback loop upon failure is to capture what was learned by the failure,
reflect, perform an after-action review, and then speak with mentors. The process of
trying and failing provides learning to create a new idea or to create a new process or to
implement the idea in a different manner. The feedback process works only if the mentor
has more experience than the founder, which is why founders need to add mentors to
match their stage of business development.
Founders Lead Integration of Knowledge
Knowledge must move from the founder to others in the organization in order for
the business to survive (Breslin & Jones, 2012). Integrating the knowledge into the
business is the founder’s role:
PA 12 said, “I lead the company. You must first do, in order to lead the
company.”
PA 2 stated, “Knowledge is captured through doing and transferred by me to the
employees in formal one-on-one meetings.”
PA 11 agreed and said, “I capture the data, which could be verbal, or through
readings, and then I use my experience to teach others how to do what I just learned.”
According to PA 15:
Information is gathered from suppliers of the equipment along with customer and
competitor information and is discussed at the owner meetings. The owners meet
regularly over lunch to discuss the business and the customers. Obviously, if a
customer has an issue it is immediately discussed. The information is then
transmitted to the remaining employees by me through formal meetings.
114
How the founders chose to integrate the knowledge gained through vendors, industry
organizations, other employees, and consultants is by hosting lunch-and-learn meetings,
lessons learned, attending conferences, webinars, and after-action reviews:
PA 4 pointed out:
Senior staff working closely with more junior staff, architects researching
architectural codes through Internet forums and subsequent updates, going
through a Q&A process for review of work product, and having the staff member
who did not address a design issue 100% or accurately learn by correcting his or
her own work. Mistakes or oversights are pointed out and expectation is
companywide learning from those types of experiences.
PA 7 said, “Constantly looking at magazines, media, vendor catalogues. The
upstairs in our office is open so the designers are constantly talking to each other.
Showing each other what they have learned. Very informal and they constantly talk.”
PA 10 said, “We do lunch-and-learns with our vendors.”
PA 4 stated:
The company learns from lessons learned. The lessons learned are things that
happened that should not have and cost the company money. Things that
happened and had potential negative outcomes that did not cost the company
money but could have, and things that happened that generated positive outcomes
from lessons learned.
Senge (1990) stated organizational learning occurs within:
organizations where people continually expand their capacity to create the results
they truly desire, where new and expansive patterns of thinking are nurtured,

115
where collective aspiration is set free, and where people are continually learning
to see the whole together. (p. 3)
Learning organizations work on the assumption that learning is valuable,
continuous, and most effective when shared and that every experience is an opportunity
to learn (Kerka 1995). Senge (1990) posited that learning, if not implemented, could lead
to business failure. If a business does not learn and implement learning into the business
(Senge, 1990), the age of the firm may not matter to the growth and survival of the
business.
Conclusion
The aim of the current study was to find how small businesses create a process to
capture, convert, and integrate knowledge for survival. The current study involved 15
participating small businesses from 12 different service businesses. Data saturation was
reached within 15 interviews. The small businesses ranged in age from 7 years to 40
years and in number of employees from 10 to 77 employees. The businesses’ founders
established mentors early in their businesses. They were intentional in choosing their
mentors. Early on, the mentors were family and friends who ran businesses and could
provide advice on starting the businesses. As the businesses grew, the founders
intentionally sought mentors who could help them in the next phase of their businesses.
Learning is important and occurred through a trial-and-error process with a
feedback loop to the mentors. The founders thought of and vetted new ideas with their
mentors. Then, they implemented the idea. Some ideas failed. The founders captured
the knowledge in writing of what they had learned from their failures. After reflection
and conferring with their mentors, changes were made to the idea or the implementation

116
tactic. Then, the new idea was launched. The process occurred until the founders either
had success or decided to pursue a different idea. Using trial and error with a feedback
loop is one way the founders learned faster than their competitors. Learning faster aided
the founders in finding new business opportunities.
The founders were the genesis of integrating the knowledge into the business.
They shared their knowledge directly with their employees through after-action after
reviews, lessons learned, and formal meetings. Knowledge was also integrated through
vendors, industry organizations, and consultants by hosting lunch-and-learns, attending
conferences, and webinars.
All the businesses survived because the founders were intentional in establishing
mentors, using trial-and-error methods to learn faster than their competitors, and
successfully integrating knowledge into the business through meetings, after-action
reviews, conferences, webinars, and lunch-and-learns. Establishing mentors was a key
component to the survival of the businesses studied. Founders of businesses that were
less than seven years old could intentionally seek mentors, use trial-and-error processes,
and lead the integration of knowledge to increase the likelihood of survival.

117
Chapter 5: Discussion
The process to capture, convert, and integrate knowledge resulted from each of
the founders working with mentors throughout their corporate cycle along with using a
trial and error process with a loopback to the mentors, and the founders key role was to
integrate survival knowledge. Additional literature of these findings and future areas of
research conclude the study.
Summary of the Study
The aim in this study was to find how small businesses create a process to
capture, convert, and integrate knowledge for survival. The criteria for the business to be
involved in the current study were: (a) in existence for at least seven years; (b) employ
between 10 and 99 employees; (c) established a process to capture, convert, and integrate
knowledge into the business; (d) located in San Diego County, CA; (e) not a government
agency, hospital, school, college, or university whether for profit or not for profit; (f) in
the service sector; (g) had profitability in 2 of the past 3 years; (h) the entrepreneur was
an active member of the business; (i) experienced a 5% growth in revenue in the past
three years; and (j) no foreseeable changes that would prevent the business from
surviving an additional 5 years. There were 15 participating small businesses from 12
different service businesses. Strauss and Corbin (1998) concluded saturation should be
more concerned with reaching a point where new discoveries do not add anything to the
overall story. Data saturation was reached within 15 interviews. The small businesses
ranged in age from 7 years to 40 years and had from 10 to 77 employees.

118
Three themes emerged from the data. First, and essential, was the founders
intentionally created a network of mentors (Cull, 2006). At each stage of business, the
founders needed mentors who could assist and advise them on how to grow their
businesses, examine new business opportunities, implement new software, be financially
prudent, and brainstorm implementation of new ideas and business opportunities. The
founders outstripped their mentors’ capabilities, requiring new expertise as the businesses
grew and became more complex. All of the founders were intentional about who to use
as mentors. The mentors had to have experienced similar issues to what the founders
were experiencing and had to be a personality fit. The founder had to trust the mentor as
well as get along with the mentor since they met frequently.
The second theme was the founders used a trial-and-error process to learn. There
is nothing new about the trial-and-error process. In this study, 14 of 15 founders stated
they learned faster than their competitors. “The rate at which individuals and
organizations learn may become the only sustainable competitive advantage, especially in
knowledge-intensive industries” (Stata, 1989, p. 64). How the founders accomplished
this was through the trial-and-error process with a feedback loop. Trial and error is an
iterative process allowing the founder to learn from each “trial,” reflect on what was
learned, have an after-action review with the mentor, and then launch a new trial. The
feedback loop from the trial, to failure or success, capturing what was learned, and back
to the mentor is an important learning. This was not to say a trial-and-error process by
itself will not produce the results desired, but for this study, the feedback loop was key to
learning faster than the competitors. Learning faster created a competitive advantage for
the founders.
119
The final theme was that the founders were the genesis of integrating knowledge
into the businesses. It is important for the founders to transfer knowledge to others in
their organization. The founders would transfer knowledge themselves initially.
Eventually, as the businesses grew in revenue and headcount, the founders used vendors,
consultants, other employees, and industry experts to transfer knowledge to others in the
business, which was accomplished through lunch-and-learns, lessons learned, webinars,
conferences, and after-action reviews.
All of the businesses have survived. All of the businesses’ founders used
mentors, a trial-and-error process with a feedback loop, and led the transfer of knowledge
to others in the business. An important lesson for young businesses is to intentionally
seek mentors at each stage of the business process, use a trial-and-error process with a
feedback loop, and to lead the transfer of knowledge to others in the business. Using the
process can lead to a likelihood of small business survivability, lowering the overall
mortality rates of small business.
Findings Related to the Literature
As noted previously, the process to capture, convert, and integrate survival
knowledge was the participants used mentors throughout the life cycle. As the business
grew and new challenges were presented to the founders, new mentors were added by the
founders to aid in business survival. Secondly, the founders used a trial and error process
utilizing their mentors to discuss the outcomes and make appropriate changes to the
process before another attempt. Lastly, the founders integrated survival knowledge
themselves into the business. The findings are then substantiated through existing
literature.

120
Mentors
Each of the founders established mentors in the early years of the business and
added mentors as the business grew and entered new stages of development. The
literature on mentoring indicated that the main outcome of a mentoring relationship was
what the mentee learned as a result of that relationship (Barrett, 2006; Cull, 2006). When
a small business begins operations, during infancy the culture typically mirrors the
characteristics of the founder. In the beginnings of the business, there is hope, optimism,
and high energy. There is flexibility, but there may not be processes and controls in the
beginning of a business. The culture of a small business changes when the number of
employees reaches 20 and remains until the small business reaches 99 employees
(Kirchhoff, 1994). Between 20 and 99 employees, business founders begin to add
processes and control and may lose some flexibility. It is critical at this junction to
attempt to balance both flexibility and control (Adizes, 1979).
The initial mentors were family members or friends who also operated businesses,
providing advice on computer systems, finances, and customers, which was consistent
with the literature. Ozgen and Baron (2007) found mentors could help novice
entrepreneurs. A mentor is an essential asset to a growing company (Cull, 2006).
Mentors can warn of problems, help craft solutions to problems and opportunities, in
addition to being a sounding board for the entrepreneur (Cull, 2006). A mentor’s many
years of experience can save a business from major errors and costly mistakes with just a
few words (Cull, 2006).
Businesses have a typical life cycle pattern from the birth of an idea through
death. The age of a business does not dictate the progression of the business through the

121
lifecycle. Life cycle stages vary per model depending on how the researcher defines an
actual stage (Hanks, 1990). Adizes’s (1979) corporate life cycle is a 10-stage cycle
that not only shows the life cycles of an organization, but also shows why failure may
occur during the growth stages. Adizes’s (1979) 10-step model (see Figure 7) is to
show small business growth and survivability.
Figure 7. Corporate life cycle stages beginning at Courtship-an idea of a business
through the growth stages ending at Prime, and then proceeding to death unless changes
occur resulting in a prior life cycle stage. Adapted from “Organizational Passages:
Diagnosing And Treating Life-Cycle Problems In Organizations,” by I. Adizes, 1979,
Organizational Dynamics, 8(1), p.8. Copyright 1979 by I. Adizes.
The beginning stage of the corporate life cycle, courtship, is when an entrepreneur
has visions and dreams of his or her own business (Adizes, 1979). A dream can be
fleeting without action. If an entrepreneur does not act on his or her dream, then the
dream will die, and this stage is referred to as affair. The second stage of the corporate
life cycle is infancy (Adizes, 1979). During the infancy stage, the entrepreneur acts on
his or her dream. A business is formed and funded at the infancy stage. Infant mortality

122
occurs when there is a lack of funding and customers. The business cannot sustain itself
through this part of the cycle (Adizes, 1979). The go-go stage is when a business has
new products or services, customers, and cash flow (Adizes, 1979). The business is not
only sustaining itself, but is thriving. A go-go business struggles and fails if it cannot
break free from the founder of the company, which is the founder’s trap (Adizes, 1979).
A founder can stranglehold the business by making all decisions, ultimately holding back
future growth. When a business reaches adolescence, the main issue is finding its vision
apart from the founder’s original vision. An emotional struggle could occur, resulting in
compromise or the founder is displaced with a professional management team, resulting
in the unfulfilled entrepreneur stage, or the professional management team is displaced
by the founder resulting in a premature aging stage. The prime stage is where
survivability occurs (Adizes, 1979). A business that reaches prime has found a way to
balance flexibility and control. After prime, the remaining stages lead to the death of the
business. The remaining corporate life cycle stages are stable, aristocracy, early
bureaucracy, bureaucracy, and death (Adizes, 1979).
During each stage of development, founders need to add a mentor who has
experience in the stage of development. Based on the Adizes (1979) model, each stage
has its own set of issues and concerns. Process wise, the mentor’s cognitive framework,
which is more complex than that of the novice entrepreneur (Ozgen & Baron, 2007), is
shared with the latter using discussions, which may provide the opportunity for the
novice to sharpen his or her own cognitive framework, leading to better opportunity
recognition (Cull, 2006). An experienced mentor can advise a founder how to avoid the
traps at each stage of development.

123
Founders of a firm are unique and, by Penrose’s (1959) definition, willing to
engage in speculative activity. The willingness to speculate, thereby committing
resources, will drive the founders to seek knowledge with regard to how to deploy unused
resources (Connell, 2009). Planning and adapting to the different business environments
will take different organizational capabilities from the founders. Although founder
characteristics are to seek knowledge to plan and adapt, not all founders seek mentors.
What is interesting is only 8% of small business owners stated they have a mentor
(Palmieri, 2016). Several reasons exist why founders do not think they need a mentor,
including: founders are independent and do not believe they need a mentor, and they are
too busy working in the business (Palmieri, 2016). Hall (2003) argued that successful
mentoring requires the following key features: screening of prospective mentors,
matching of mentors on relevant criteria such as stage of business development, prematch
and ongoing training, and frequency of contact. McVey (1997) studied the impact of role
models within mentoring relationships and suggested that the presence of an
entrepreneurial role model can positively affect the level of entrepreneurial success.
Fortunately, each of the founders who participated in this study had a mentor and
ultimately survived.
Learning Through Trial and Error
The founders learned to use a trial-and-error process in which the focus is on
experimentation and on solving a particular challenge, and which requires the
establishment of practices and procedures (Rui, Cuervo-Cazurra, & Annique, 2016). In
the current study, part of the procedure was a feedback loop to the mentors to discuss
new ideas, new opportunities, failures, and successes. Failure is inevitable. Any
124
company founder can implement a trial-and-error process. Business founders employing
single loop learning, as proposed by Argryis and Schon, (1974), respond to changes in
their internal and/or external environments by detecting and correcting information
(Barlow & Jashapara, 1998).
What was different about these participating founders is they used their mentors
as sounding boards to advise them on next steps or things not to do. In comparison,
double-loop learning occurs when business norms and assumptions are questioned to
establish a new set of norms (Barlow & Jashapara, 1998). Double-loop learning uses
symptoms as indicators of problems and focuses on addressing root causes (Argryis,
1992). The end result of double loop learning should be increased effectiveness in
decision-making and better acceptance of failures and mistakes (Barlow & Jashapara,
1998). Without a feedback loop, a learning process would not be complete. Using a
feedback loop, the mentors helped the founders understand the learning from the success
or failure. The failed solutions are a useful source of knowledge and learning (Rui,
Cuervo-Cazurra, & Annique, 2016). Trial runs are intended to teach the firm leaders
whether a new product, process, or market works and should not be designed to fail, but
they should at least be designed to discover everything that could go wrong along with
what might go right (Krohe, 2011).
Small businesses are generally seen as flexible and fast adaptors to changes
supporting their survival (Salavou & Lioukas. 2003). The trial-and-error process with a
feedback loop, allowed the founders to learn faster than their competitors. Small
businesses whose founders can differentiate the business from their competitors by
uniquely positioning themselves to meet the needs of the customers can charge a

125
premium price over their competitors (Porter, 1985). All of the participants determined a
way to move away from their competitors. PA 10 stated, “If you are not failing then you
are not differentiating yourself and are probably in the wrong area of business.” The idea
of doing something different and being nimble enough to shift is a trait all participants
achieved. The participants were able either to shift when their larger competitors were
not able to do so or the participants outsmarted their competitors. Founders who have
used trial and error and failed know what went wrong because they captured and
integrated their learnings. Decision-making is improved by doing and learning, because
the founders established one more step in the process, this has afforded them the
opportunity to survive. Learning faster than their competitors provided the small
businesses the ability to survive by creating a competitive advantage and, in the end,
being able to command higher margins. PA 10 stated, “We have significantly higher
margins than our competitors. Our local competitors would not share with us but, on a
national average, we are more than 2 times higher than our competitors.” The survival
rates of businesses that operate to 15 years is 26% (Knaup & Piazza, 2007). On average,
these small businesses have survived 20 years. The participants are living business
survivability daily and have distinguished themselves from nonsurvivors.
Founders Lead Integration of Knowledge
Leadership is a top-down process, whereby the leader has the ability to influence
all the employees of the organization. Learning organization leaders must create a
process not only to influence learning but also to maintain and monitor processes to
accelerate learning (Graham & Nafukho, 2008). The founders of each company initiated
126
integrating knowledge into the business. As the leaders of their companies, it was
important to move knowledge from the founder to the employees of the business.
Knowledge must move from the founder to others in the organization in order for the
business to survive (Breslin & Jones, 2012). It was important for the founders to model
learning and teaching to the employees to influence the employees to become teachers as
well as learners (Graham & Nafukho, 2008). Each of the founders initially learned new
technology, new processes, and new ideas. Transferring knowledge from the founder to
the employees in the organization requires a willingness of the founder to transmit
knowledge as well as a willingness of the employees to absorb the knowledge (Davenport
& Prusak, 1998). Once the founders learned a new technology, new process, or new idea,
they disseminated the information to the employees in meetings both one-on-one and in
group meetings.
An organization’s competitiveness and survivability rely on the successful
creation and transfer of knowledge (Syed-Ikhsan & Rowland, 2004). Additionally,
transfer of knowledge by itself presents no value unless there is a change in behavior
(Davenport & Prusak, 1998). The founders’ and employees’ changes in behavior helped
to create higher margins than competitors in addition to learning from mistakes through
lessons learned. The founders created a learning environment allowing the employees to
learn, share, and collaborate with other employees as well as the founder. PA 7 stated,
“The upstairs in our office is open so the designers are constantly talking to each other.
Showing each other what they have learned.” Ultimately, the founders were successful in
transferring knowledge to the employees. The result was that the small businesses were
able to sustain their competitiveness and ultimately survive.
127
Surprises
The researcher was surprised by how many potential participants would not call,
after voice mails with return phone numbers were left, or e-mail the researcher of their
intent to not participate after an e-mail was sent after the phone call. Additionally, some
participants did not review the questions in advance, even though the questions were e-
mailed in advance of the interview, which did not impact the interview, but it took those
participants who did not read the qualitative questions in advance more time to think of a
response. On a positive note, the researcher was surprised by how many companies had a
high retention of employees and customers. This was not a consideration going into the
research. Another surprise was all the participants used mentors to share ideas and
receive feedback. A stereotypical entrepreneur does not want to admit he or she needs
help with his or her business. The business is their idea, their creation. No one knows
the business better than the founding entrepreneur. So, it was surprising that the
participants met monthly with their mentors. The last surprise was how many
participants came from random cold-calling. At the beginning of the research process,
the researcher believed the entire participant sampling would come from businesses
known by the researcher and the researcher’s subject-matter experts. Cold-calling, while
not hard, is an arduous process, talking to receptionists to convince their bosses to take a
call from a stranger doing research on small businesses. In the end, the participants who
took the call from the researcher were curious and had time to fit the researcher into their
busy schedules.
128
Conclusion
The current study was established to find how small business founders create a
process to capture, convert, and integrate knowledge for survival. The current study
comprised 15 participating small businesses from 12 different service businesses. The
small businesses ranged in age from 7 years to 40 years with 10 to 77 employees.
Learning occurred through trial and error, experience of being in business, learning from
successes and failures, and from mentors and advisors. Survival occurred because each
participant continuously learned and intentionally created a process to capture, convert,
and integrate knowledge.
The primary purpose of small businesses is to survive (Storey, 2000). Survival
skills developed by the entrepreneur need to be transferred to others within the company
(Breslin & Jones, 2012), which was exactly what the participants did. Participants
learned to survive by creating a process to capture, convert, and integrate knowledge.
The small business sector is especially critical because the bulk of small business entries
and exits in the American (and, indeed, global) economy occur within it (Headd, 2010),
and energizing this sector has emerged as an essential policy challenge in the aftermath of
the economic downturn of the early 2000s (Fadahunsi, 2012). Energizing the small
businesses is the role of the founder. PA 5 stated, “A founder is just a salesperson. You
must be selling all the time.” The current study was important because it was used to
highlight the importance of mentorship, trial and error, and integration of knowledge for
survival. The small business segment is an important part of the global economy.

129
Implications for Action
One implication is to take the business survivability model from the current study
and apply it to small businesses less than seven years of age. Entrepreneurs of small
businesses should be especially interested in how to create and maintain a survivable
business. Entrepreneurs should know how to create a process to capture, convert, and
integrate knowledge to survive. A learning process is essential in each step of the
business survivability model. The current study showed that entrepreneurs who
implemented the business survivability model survived beyond 7 years and, on average,
20 years. As noted, the survival rate of small businesses at age six is only 39.8%
(Phillips & Kirchhoff, 1989), and by year seven, the number is 31% (Knaup & Piazza,
2007). The numbers are not encouraging, yet applying the business survivability model
in a business is a good start to creating a survivable company and lowering the small
business mortality rate.
Recommendations for Further Research
The process by which mentoring enables a mentee in identifying new
opportunities is not well understood (Cull, 2006). Therefore, future researchers should
study how mentorship identifies new business opportunities. Future researchers should
study service sector businesses with 100 to 500 employees to determine if a larger
company had established a mentor relationship with a trial-and-error process with
feedback loop. Also, a study in the manufacturing sector of businesses with between 10
and 99 employees, with the age of the company at least seven years, would be interesting
to determine if the sector leaders utilize a process to capture, convert, and integrate
knowledge for survival similar to that used in the service sector. Is mentorship a

130
requirement for small business survivability in other sectors or geographic areas? In the
current study, 14 of 15 participants learned faster than the competition. Future
researchers could study how participants learn faster than their competitors. Is it the
makeup of the entrepreneur, the trial-and-error process, or are there other characteristics
leading entrepreneurs to learn faster than their competitors.
Limitations
Limitations are not controllable by the researcher and may affect the study in an
important way (Roberts, 2010). An assumption is something plausible and accepted as
true. For the current research, an assumption was made that at least 15 small businesses
in the service sector that were not government agencies, hospitals, schools, colleges, or
universities whether for profit or not for profit, in which the entrepreneurs were still
active members of the business, employing between 10 and 99 employees and the
business had been in existence at least seven years, with profitability in 2 of the past 3
years, and a 5% growth in revenue in the past three years, and that the company’s
entrepreneur had implemented a process to capture, convert, and integrate knowledge and
did not foresee any changes that would prevent the business from surviving an additional
five years. To be a part of the current study, the company must have been located within
San Diego County, California. Another assumption was that selected small businesses
would be willing to share their ideas and strategies on how their process to capture,
convert, and integrate data was implemented.
A limitation was that the study was centered in San Diego County, California.
Based on the specific geography, the findings might not be generalizable with a limited
number of participants. As the researcher’s first research project, his lack of experience,

131
including interviewing, transcribing, and coding, along with his limited relationships with
small business entrepreneurs was a research limitation. As with doing anything for the
first time, the time frames to conduct interviews, transcription, and coding were
underestimated.

132
References
Abereijo, I. O., Adegbite, S. A., Ilori, M. O., Adeniyi, A. A., & Aderemi, H. A. (2009).
Technological innovation sources and institutional supports for manufacturing
small and medium enterprises in Nigeria. Journal of Technology Management
and Innovation, 4(2), 82–89. doi:10.4067/s07181827242009000200007
Adizes, I. (1979). Organizational passages: Diagnosing and treating life-cycle problems
in organizations. Organizational Dynamics, 8(1) 3-25.
Adler, P. S., & Cole, R. E. (1993). Designed for learning: A tale of two plants', Sloan
Management Review, 34(3), 85-94.
Agar, M. H. (1980). The professional stranger: An informal introduction to ethnography.
San Diego, CA: Academic Press.
Agüero, C., & Sánchez, P. (2010). Intellectual capital and knowledge management in
collaborative networks. Proceedings Of The European Conference On Intellectual
Capital, 1-9.
American Psychological Association. (2006). Introduction to mentoring:A guide for
mentors and mentees. Retrieved from: http://www.apa.org/education/grad/intro-
mentoring.pdf
Anand, B. (2013). Best practices for managing cash flow. Law Practice Magazine: The
Business of Practicing Law, 39(6), 64–67.
Anderson, V., & Skinner, D. (1999). Organizational learning in practice: How do small
businesses learn to operate internationally? Human Resource Development
International, 2(3), 235–258. doi:10.1080/13678869900000025

133
Argote, L., McEvily, B., & Reagans, R. (2003). Managing knowledge in organizations:
An integrative framework and review of emerging themes. Management of
Science, 49(4), 571–582. doi:10.1289/mnsc.49.4.571,14424
Argyris, C. (1992). On organizational learning (2nd ed.). Oxford, UK: Blackwell
Publishers.
Argyris, C., & Schon, D. (1974). Theory in practice: Increasing professional
effectiveness. San Francisco, CA: Jossey Bass.
Argyris, C., & Schon, D. (1978). Organizational learning: A theory of action perspective.
Reading, MA: Addison Wesley.
Barlow, J., & Jashapara, A. (1998). Organisational learning and interfirm partnering in
the UK construction industry. The Learning Organization, 5(2), 86–98.
doi:10.1108/09696479810212051
Barrett, R. (2006). Small business learning through mentoring: Evaluating a project,
Education + Training, 48(8/9), 614–626. doi.org/10.1108/00400910610710047
Barrie, M. (2011, April). The lost art of earning a warm introduction. Senior Market
Advisor, 12(4), 34. Retrieved from: http://www.lifehealthpro.com/Retirement-
Advisor/2011-april
Baxter, P., & Jack, S. (2008). Qualitative case study methodology: Study design and
implementation for novice researchers. The Qualitative Report, 13(4), 544–559.
Retrieved from http://nsuworks.nova.edu/tqr/vol13/iss4/2
Berry, T. (2007). What is an acceptable rate of growth for a small business during the
first five years? Retrieved from https://www.entrepreneur.com/answer/221233

134
Birch, D. L. (1979). Job creation in America: How our smallest companies put the most
people to work. New York, NY: Free Press.
Black’s Law Dictionary. (1991). Employee (p. 363). St. Paul, MN: West Publishing.
Blake, A. A., & Moseley, J. M. (2010). One hundred years after the principles of
scientific management: Frederick Taylor's life and impact on the field of human
performance technology. Performance Improvement, 49(4), 27–34.
doi:10.1002/pfi.20141
Bloomsbury Business Library–Business & Management Dictionary. (2007). London, UK:
A & C Black Publishers.
Bollinger, A. S., & Smith, R.D. (2001). Managing organizational knowledge as a
strategic asset. Journal of Knowledge Management, 5(1), 8–18
Box, M. (2008). The death of firms: Exploring the effects of environment and birth
cohort on firm survival in Sweden. Small Business Economics, 31(4), 379–393.
doi:10.1007/s11187.007.9061-2
Brickau, R., Chasters, I., & Mangles, T. (1994). Factors influencing the performance of
SME food processing companies within the single European market. International
Business Review, 3(2), 165–178. doi:10.1016/0969-5931(94)9011-
Breslin, D., & Jones, C. (2012). The evolution of entrepreneurial learning. International
Journal of Organizational Analysis, 20(3), 294–308.
doi:10.1108/19348831211243811
Bromley, D. B. (1990). Academic contributions to psychological counselling: I. A
philosophy of science for the study of individual cases. Counselling Psychology
Quarterly, 3(3), 299–307.

135
Bureau of Economic Analysis. (2012). GDP by state. Retrieved from https:bea.gov
Business owner. Businessdictionary.com. Retrieved from:
http://www.businessdictionary.com/definition/business-owner.html
Cangelosi, V. E., & Dill, W. R. (1965). Organizational learning: Observations toward a
theory. Administrative Science Quarterly, 10(2), 175–203. doi:10.2307/2391412
Carr, J. C., Haggard, K. S., Hmieleski, K. M., & Zahra, S. A. (2010). A study of the
moderating effects of firm age at internationalization on firm survival and hurt-
term growth. Strategic Entrepreneurship Journal, 4(2),183–192.
doi:10.1002/sej.90
Castells, M. (2001). The internet galaxy: Reflections on the internet, business, and
society. New York, NY: Oxford University Press.
Chan, I., & Chee-Kwong, C. (2008). Knowledge management in small and medium-sized
enterprises. Communications of the ACM, 51(4), 83–88.
doi:10.1145/1330311.1330328
Charmaz, K. (2006). Constructing grounded theory: A practical guide through
qualitative analysis. Thousand Oaks, CA: Sage.
Charmaz, K. (2014). Constructing grounded theory (2nd ed.). Thousand Oaks, CA: Sage.
Chidambaranathan, K., & Swarooprani, B. (2015). Knowledge management as a
predictor of organizational effectiveness: The role of demographic and
employment factors. Journal of Academic Librarianship, 41(6), 758–763.
doi:10.1016/j.acalib.2015.08.015
Chisholm, M. (2011). The information age and nonmaterial reality. Information
Management (1521-2912), 21(3), 32-33

136
Clayton, R. L., Sadeghi, A., Talan, D. M., & Spietzer, J. R. (2013). High-employment-
growth firms: Defining and counting them. Monthly Labor Review, 136(6), 3–13.
Coeurderoy, R., Cowling, M., Licht, G., & Murray, G. (2012). Young firm
internationalization and survival: Empirical tests on a panel of “adolescent” new
technology-based firms in Germany and the UK. International Small Business
Journal, 30(5), 472–492. doi:10.1177/0266242610388542
Cohen, W., & Levinthal, D. (1990). Absorptive capacity: A new perspective on learning
and innovation. Administrative Science Quarterly, 35(1), 128–152.
doi:10.2307/2393553
Collins, J. C., & Porras, J. I. (1994). Built to last: Successful habits of visionary
companies. New York, NY: Harper Collins.
Colombelli, A., Krafft, J., & Quatraro, F. (2013). Properties of knowledge base and firm
survival: Evidence from a sample of French manufacturing firms. Technological
Forecasting and Social Change, 80(8), 1469–1483.
doi:10.1016/j.techfore.2013.03.003
Connell, C. M. (2009). Method, Structure and argument in Edith Penrose's theory of
growth. Review of Political Economy, 21(4), 549–566.
doi:10.1080/09538250903214842
Coopers and Lybrand. (1994). Made in the UK: The middle market survey. London, UK:
Author.
Creswell, J. W. (2003). Research design: Qualitative, quantitative, and mixed methods
approaches (2nd ed.). Thousand Oaks, CA: Sage.

137
Creswell, J. W. (2007). Qualitative inquiry and research design: Choosing among five
approaches (2nd ed.). Thousand Oaks, CA: Sage.
Creswell, J. W., Hanson, W. E., Plano, V. L., & Morales, A. (2007). Qualitative research
designs: Selection and implementation. The Counseling Psychologist, 35(2), 236–
264. doi:10.1177/08400006287390
Crossan, M. M., & Berdrow, I. (2003). Organizational learning and strategic renewal.
Strategic Management Journal, 24(11), 1087–1105. doi:10.1002/smj342
Cull, J. (2006). Mentoring young entrepreneurs: What leads to success? International
Journal of Evidence Based Coaching and Mentoring, 4(2), 8–18.
Deakins, D., & Freel, M. (1998). Entrepreneurial learning and the growth process in
SMEs, The Learning Organization, 5(3), 144–55.
Denzin, N. K. (1989). The research act (3rd ed.). Englewood Cliffs, NJ: Prentice Hall.
Deshpandé, R., Farley, J. U., & Webster, F. E. J. (1993). Corporate culture, customer
orientation, and innovativeness in Japanese firms: A quadrad analysis. Journal of
Marketing, 57(1), 23–27. doi:10.2307/1252055
DeSouza, K. C. (2003). Facilitating tacit knowledge exchange. Communication of ACM,
46(6), 85–88.
Drucker, P. F. (1985). Innovation and entrepreneurship: Practice and principles. New
York, NY: Harper & Row.
Dun & Bradstreet. (2011). The state of small businesses post great recession: An analysis
of small businesses between 2007 and 2011. Short Hills, NJ: Author. Retrieved
from http://www.dnb.com/content/dam/english/economic-and-industry-
insight/us_small_business_health_index_201105.pdf

138
Edvinsson, L. (1997). Developing intellectual capital at Skandia. Long Range Planning,
30(3), 366–373.
Egbu, C. O. (2004). Managing knowledge and intellectual capital for improved
organisational innovations in the construction industry: An examination of critical
success factors. Engineering, Construction and Architectural Management
(ECAM) Journal, 11(5), 301–315.
Eisenhardt, K. M., & Martin, J. A. (2000). Dynamic capabilities: what are they? Strategic
Management Journal, 21(10/11), 1105–1121.
Ellinger, A. D., Ellinger, A. E., Yang, B., & Howton, S. W. (2002). The relationship
between the learning organization concept and firms’ financial performance: An
Empirical Assessment. Human Resource Development Quarterly, 13(1). Malden,
MA: Spring Wiley Periodicals.
Entrepreneur. Dictionary.com. Retrieved from
http://www.dictionary.com/browse/entrepreneur
Fadahunsi, A. (2012). The growth of small business towards a research agenda. American
Journal of Economics and Business Administration, 4(1), 105–115.
Fiol, C. M., & Lyles, M. A. (1985). Organizational learning. Academy of Management
Review, 10(4), 803–813. doi:10.5465a,r/1985.4279103
Gartner, W. B. (1989). Who is an entrepreneur? Is the wrong question? Entrepreneurship
Theory & Practice, 13(4), 47–68.
Goldstein, J. (2013). 22 million Americans are unemployed or underemployed. Bureau of
Labor Statistics. Retrieved from http://www.npr.org/sections/money/2013/04/04/
175697813/23-million-americans-are-unemployed-or-underemployed

139
Graham, C. M., & Nafukho, F. M. (2008). Exploring organizational learning mechanisms
in small-size business enterprises. New Horizons in Adult Education & Human
Resource Development, 22(1), 4–23. doi:10.1002/nha3.10296
Grant, R. M. (1996, Winter). Toward a knowledge-based theory of the firm. Strategic
Management Journal, 17, 109–122.
Gupta, B., Iyer, L. S., & Aronson, J. E. (2000). Knowledge management: Practices and
challenges. Industrial Management & Data Systems, 100(1), 17–21.
Hall, J. (2003). Mentoring and young people. Glasgow, England: University of Glasgow:
The SCRE Centre.
Hanks, S. (1990). An empirical examination of the organizationai life cycle in high
technology firms. Doctoral dissertation. University of Utah.
Headd, B. (2010). An analysis of small business and jobs. (1st ed.). U.S. Small Business
Administration, Washington, D.C. Retrieved from https://www.sba.gov/sites/
default/files/files/an%20analysis%20of%20small%20business%20and%20jobs%
281%29.pdf
Headd, B., & Kirchhoff, B. (2009). The growth, decline and survival of small businesses:
An exploratory study of life cycles. Journal of Small Business Management,
47(4), 531–550. doi:10.1111/j.1540-627X.2009.00282.x
Hof, R. D., Burrows, P., Hamm, S., Brady, D., & Rowley, I. (2004). Building an idea
factory. Businessweek, (3903), 194–200.
Holmes, P., Hunt, A., & Stone, I. (2010). An analysis of new firm survival using a hazard
function. Applied Economics, 42(2), 185–195. doi:10.1080/00036846701579234
140
Huberman, A. M., & Miles, M. B. (1994). Data management and analysis methods. In N.
K. Denzin & Y. S. Lincoln (Eds.), Handbook of qualitative research (pp. 428–
444). Thousand Oaks, CA: Sage.
Jones, O., & Macpherson, A. (2006). Interorganizational learning and strategic renewal in
SMEs, Long Range Planning, 39, 155–175.
Khandekar, A., & Sharma, A. (2005). Organizational learning in Indian organizations: A
strategic HRM perspective, Journal of Small Business and Enterprise
Development, 12(2), 211–226. doi: 10.1108/14626000510594610
Kim, D. (1993). The link between individual and organizational learning, Sloan
Management Review, 35, 37–50.
Kirchhoff, B. A. (1994). Entrepreneurship and dynamic capitalism: The economics of
business firm formation and growth. Westport, CT: Praeger.
Kirk, J., & Miller, M. L. (1986). Reliability and validity in qualitative research.
Qualitative Methods Series 1. A Sage University Paper. Thousand Oaks, CA:
Sage Publishing.
Kerka, S., & ERIC Clearinghouse on Adult, C. O. (1995). The learning organization.
Myths and realities.
Knaup, A. E., & Piazza, M.C. (2007). Business employment dynamics data: Survival and
longevity, II. Monthly Labor Review, 3. Retrieved from
https://www.bls.gov/opub/mlr/2007/09/art1full.pdf
Krohe, J., Jr. (2011). Failing to learn from failure. Conference Board Review, 48(3), 19.
Leadbeater, C. (2000). Living on thin air: The new economy. London, UK: Penguin.
Lincoln, Y. S., & Guba, E. G. (1985). Naturalistic enquiry. Beverly Hills, CA: Sage.

141
Lotti, F. (2007). Firm dynamics in manufacturing and services: A broken mirror?
Industrial and Corporate Change, 16(3), 347–369. doi:10.1093/icc/dtm012
Madison, D. S. (2005). Critical ethnography: Methods, ethics, and performance.
Thousand Oaks, CA: Sage.
March, J. G. (1996). Continuity and change in theories of organizational action.
Administrative Science Quarterly, 41(2), 278–287. doi:10.2307/2393720
Marshall, C., Prusak, L., & Shpilberg, D. (1996). Financial risk and the need for superior
knowledge management. California Management Review, 38(3), 77–101.
doi:10.2307/41165844
McKelvey, B. (1982). Organizational systematics: Taxonomy, evolution, classification.
Berkeley, CA: University of California Press.
McVey, K. (1997). The impact of role models and mentoring relationships on the
development of small business: A northern Ontario perspective. Retrieved from:
http://www.laurentian.ca/commerce/SBRG/97‐ 2.htm
Mena, J. A., & Chabowski, B. R. (2015). The role of organizational learning in
stakeholder marketing. Journal of the Academy of Marketing Science, 43(4), 429–
452. doi:10.1007/s11747-015-0442-9
Meso, P., & Smith, R. (2000). A resource-based view of organizational knowledge
management systems. Journal of Knowledge Management, 4, 224–234.
doi:10.1108/13673270010350020
Moustakas, C. (1994). Phenomenological research methods. Thousand Oaks, CA: Sage.
doi:10.4135/978/4/2995658

142
Muhl, C. J. (2002). What is an employee? The answer depends on the federal law.
Monthly Labor Review, 125(1), 3–11.
Nelson, R. R., & Winter, S. G.(1982). An evolutionary theory of economic change.
Cambridge, MA: The Belknap Press of Harvard University Press.
Newman, A. L. (2010). What you want depends on what you know: Firm preferences in
an information age. Comparative Political Studies, 43(10), 1286–1312.
doi:10.1177/0010414010369068
New Zealand Trade Development Board, Wellington, New Zealand. (1990). Export
manufacturing ‐ framework for success. New Zealand Trade Development Board,
Wellington.
Ozgen, E., & Baron, R. A. (2007). Social sources of information in opportunity
recognition: Effects of mentors, industry networks, and professional forums.
Journal of Business Venturing, 22(2), 174–192.
doi:10.1016/j.jbusvent.2005.12.001
Palmieri, M. (2016). A no-brainer. Landscape Management, 55(7), 6.
Parikh, M. (2001). Knowledge management framework for high-tech research and
development. Engineering Management Journal, 13(3), 27–34.
doi:10.1080/10429247.2001.11415124
Penrose, E. (1959). The theory of the growth of the firm. Oxford, UK: Oxford University
Press.
Pérez López, S., Manuel Montes Peón, J., & José Vázquez Ordás, C. (2004). Managing
knowledge: The link between culture and organizational learning, Journal of
Knowledge Management, 8(6), 93–104. doi: 10.1108/13673270410567657

143
Petkovska, T. (2015). The role and importance of innovation in business of small and
medium enterprises. Economic Development/Ekonomiski Razvoj, 17(1/2), 55–74.
Pillai, K. R., Carlo, R., & D’souza, R. (2012). Financial prudence among youth. Journal
of Contemporary Management Research, 6(2), 52–68.
Phillips, B. D., & Kirchhoff, B. A. (1989). Formation, growth and survival: Small firm
dynamics in the U.S. economy. Small Business Economics, 1(1), 65–74.
Porter, M. E. (1985). Comparative advantage. New York, NY: Free Press.
Porter, M. E. (1990). The competitive advantage of nations. New York, NY: Free Press.
Profitable business. (n.d.). OxfordDictionaries.com. Retrieved from
https://en.oxforddictionaries.com/definition/profitable
Purcarea, I., Benavides Espinosa, M., & Apetrei, A. (2013). Innovation and knowledge
creation: Perspectives on the SMEs sector. Management Decision [serial online],
51(5):1096–1107. doi:10.1108/md-08-2012-0590
Reeves, M., Levin, S., & Ueda, D. (2016, January/February). Managing uncertainty: The
biology of corporate survival. Harvard Business Review, 46–55.
Roberts, C. M. (2010). The dissertation journey: A practical and comprehensive guide to
planning, writing, and defending your dissertation (2nd ed.). Thousand Oaks, CA:
Corwin Press.
Rubalcaba, L., Gallego, J., & Hertog, P. D. (2010). The case of market and system
failures in services innovation. Service Industries Journal [serial online], 30(4),
549–566.

144
Rui, H., Cuervo-Cazurra, A., & Annique Un, C. (2016). Learning-by-doing in emerging
market multinationals: Integration, trial and error, repetition, and extension.
Journal of World Business, 51(5), 686–699. doi:10.1016/j.jwb.2016.07.007
Salavou, H., & Lioukas, S. (2003). Radical product innovations in SMEs: The dominance
of entrepreneurial orientation. Creativity and Innovation Management, 12(2), 94–
108.
Sarason, Y., Dean, T., & Dillard, J. F. (2006). Entrepreneurship as the nexus of individual
and opportunity: A structuration view. Journal of Business Venturing, 21(3), 286–
305.
SBA Office of Advocacy (2012, September). Frequently asked questions. Retrieved from
https://www.sba.gov/sites/default/files/FAQ_Sept_2012.pdf
Schumpeter, J. A. (1934). The theory of economic development. Cambridge, MA:
Harvard University Press.
Senge, P. M. (1990). The fifth discipline: The art and practice of the learning
organization. New York, NY: Doubleday Currency.
Shane, S., & Venktaraman, S. (2000). The promise of entrepreneurship as a field of
research, Academy of Management Review, 25(1), pp. 217–226.
Stake, R. E. (1995). The art of case study research. Thousand Oaks, CA: Sage.
Stata, R. (1989). Organizational learning: The key to management innovation. Sloan
Management Review, 30(3), 63-74.
Statista. (n.d.). Real gross domestic product (GDP) of the federal state of California from
2000 to 2015. Retrieved from: http://www.statista.com/statistics/187834/gdp-of-
the-us-federal-state-of-california-since-1997/

145
Storey, D. (2000). Understanding the small business sector. London, UK: Thomson
Learning.
Strauss, A. L., & Corbin, J. (1990). Basics of qualitative research: Grounded theory
procedures and techniques. Newberry Park, CA: Sage.
Strauss, A. L., & Corbin, J. (1998). Basics of qualitative research: Techniques and
procedures for developing grounded theory (2nd ed.). Thousand Oaks, CA: Sage.
Strauss, A. L., & Corbin, J. (2008). Basics of qualitative research: Techniques to
developing grounded theory (3rd ed.). Los Angeles, CA: Sage.
Syed-lkhsan, S. S., & Rowland, F. (2004). Knowledge management in a public
organization: A study on the relationship between organizational elements and the
performance of knowledge transfer. Journal of Knowledge Management, 8(2),
95–111. doi:10.1108/13673270410529145
Tajeddini, K., Elg, U., & Trueman, M. (2013). Efficiency and effectiveness of small
retailers: The role of customer and entrepreneurial orientation. Journal of
Retailing and Consumer Services, 20(5), 453–462.
doi:10.1016/jretcomer.2013.05.104
Tari, J. J., & Garcia-Fernandez, M. (2012). Can knowledge management influence firms'
performance? Cuadernos de Gestión. doi:10.5295/cdg.100263jt
Taylor, F. W. (1911). The principles of scientific management. New York, NY: Harper &
Brothers.
Teece, D. J., Pisano, G., & Shuen, A. (1997). Dynamic capabilities and strategic
management. Strategic Management Journal, 18(7), 509–533.

146
Tolstoy, D. (2009). Knowledge combination and knowledge creation in a foreign-market
network. Journal of Small Business Management, 47(2), 202–220.
doi:10.1111/j.1540-627x.2009.00268x
U.S. Bureau of Labor Statistics. (2011). Employment by industry. Retrieved from
https://www.bls.gov/cps/tables.htm#empstat_m
U.S. Bureau of Labor Statistics. (2015). Labor force statistics from the current population
survey 1946 to present. Retrieved from
https://www.bls.gov/cps/tables.htm#empstat
U.S. Census Bureau. (2011). Number of firms, establishments, employment, and annual
payroll by enterprise employment size for the United States and states, Totals:
2011. Retrieved from
www2.census.gov/econ/susb/data/2011/us_state_totals_2011.xls
U.S. Census Bureau. (2012). Number of firms, establishments, employment, and annual
payroll by enterprise employment size for the United States and states, totals:
2012. Retrieved from
www2.census.gov/econ/susb/data/2012/us_state_totals_2012.xls
U.S. Census Bureau. (2013). Number of firms, establishments, employment, and annual
payroll by enterprise employment size for the United States and States, totals:
2013. Retrieved from
www2.census.gov/econ/susb/data/2013/us_state_totals_2013.xls
147
U.S. Department of Labor, U.S. Bureau of Labor Statistics. (2010, August). The role of
younger and older business establishments in the U.S. labor market. Issues in
Labor Statistics. Retrieved from http://www.bls.gov/opub/ils/pdf/opbils86.pdf
U.S. Small Business Administration. (2010). Small business trends. Retrieved from
https://www.sba.gov/managing-business/running-business/energy-
efficiency/sustainable-business-practices/small-business-trends
U.S. Small Business Administration. (2011). Small Business trends. Retrieved from:
https://www.sba.gov/managing-business/running-business/energy-
efficiency/sustainable-business-practices/small-business-trends
Valadez, R. M. (2012). The value proposition of small businesses: Economic engines for
job creation. Journal of Management & Marketing Research, 9, 1–11.
Wolcott, H. F. (1994. Transforming qualitative data: Description, analysis, and
interpretation. Thousand Oaks, CA: Sage.
Wong, K. Y., & Aspinwall, E. ( 2004). Characterizing knowledge management in the
small business environment. Journal of Knowledge Management,8(3), 44–61.
doi:10.1108/13673270410541033
Yin, R. (1994). Case study research: Design and methods (2nd ed.). Beverly Hills, CA:
Sage.
Yin, R. K. (1984). Case study research: Design and methods. Newbury Park, CA: Sage.
Yin, R. K. (2003). Case study research: Design and methods (3rd ed.). Thousand Oaks,
CA: Sage.
Yin, R. K. (2008). Case study research: Design and methods: Applied social research
methods. Thousand Oaks, CA: Sage.

148
Yip, M. W., Hong Ng, A. H., & Din, S. B. (2012). Knowledge management activities in
small and medium enterprises/industries: A conceptual framework. Proceedings:
2012 International Conference on Innovation and Information Management, 23–
26. Chengdu, China: Advanced Materials Research Journal.
Zahra, S. A. (2008). The virtuous cycle of discovery and creation of entrepreneurial
opportunities. Strategic Entrepreneurship Journal, 2(3), 243–257.
Zahra, S. A. (2015). Corporate entrepreneurship as knowledge creation and conversion:
The role of entrepreneurial hubs. Small Business Economics, 44(4), 727–735.
doi:10.1007/s11187-015-9650-4
Zahra, S. A., & George, G. (2002). Absorptive capacity: A review, reconceptualization,
and extension. Academy of Management Review, 27(2), 185–203.
doi:10.5465/AMR.2002.6587995
Zahra, S., & Yavuz, R. I. (2008). Competing at the intersection: Entrepreneurialism,
agility and organizational resilience. In D. Barry & H. Hansen (Eds.), The new
and emerging in management and organization studies (pp. 381–382). Thousand
Oaks, CA: Sage.
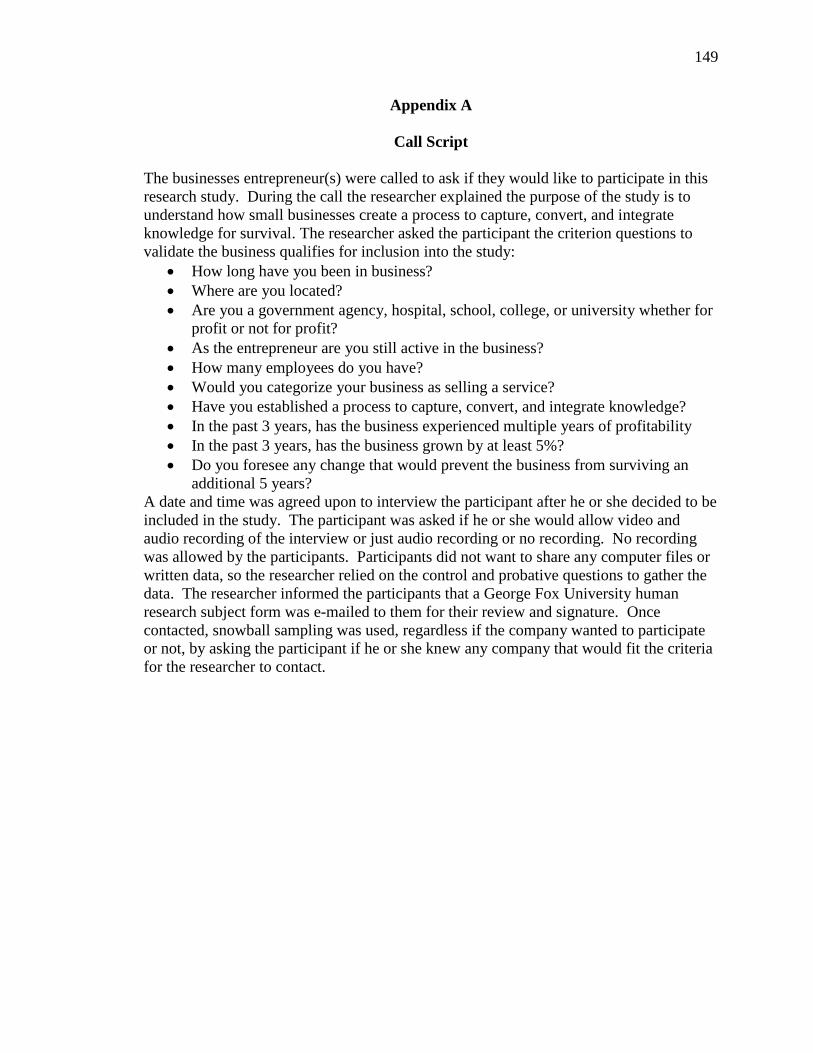
149
Appendix A
Call Script
The businesses entrepreneur(s) were called to ask if they would like to participate in this
research study. During the call the researcher explained the purpose of the study is to
understand how small businesses create a process to capture, convert, and integrate
knowledge for survival. The researcher asked the participant the criterion questions to
validate the business qualifies for inclusion into the study:
How long have you been in business?
Where are you located?
Are you a government agency, hospital, school, college, or university whether for
profit or not for profit?
As the entrepreneur are you still active in the business?
How many employees do you have?
Would you categorize your business as selling a service?
Have you established a process to capture, convert, and integrate knowledge?
In the past 3 years, has the business experienced multiple years of profitability
In the past 3 years, has the business grown by at least 5%?
Do you foresee any change that would prevent the business from surviving an
additional 5 years?
A date and time was agreed upon to interview the participant after he or she decided to be
included in the study. The participant was asked if he or she would allow video and
audio recording of the interview or just audio recording or no recording. No recording
was allowed by the participants. Participants did not want to share any computer files or
written data, so the researcher relied on the control and probative questions to gather the
data. The researcher informed the participants that a George Fox University human
research subject form was e-mailed to them for their review and signature. Once
contacted, snowball sampling was used, regardless if the company wanted to participate
or not, by asking the participant if he or she knew any company that would fit the criteria
for the researcher to contact.

150
Appendix B
E-mail Sample
E-mail sample to be used for research study
Frank Marshall<[email protected]>
to me
Thank you for agreeing to be a participant in my research study on small sustainable
businesses in San Diego. The purpose of the study is to understand how small
businesses implement a process to capture, convert, and integrate knowledge to survive
As we spoke on the phone, I am interested in interviewing you, the entrepreneur, to
understand how you capture, convert, and integrate knowledge.
I will meet you at your facility or a place that is convenient for you on the agreed upon
day and time. I have attached the non-disclosure agreement and the George Fox
University human research subject agreement. Please sign each agreement. I will pick-
up on the day of the interview.
These are the questions I will be asking you during our interview:
What is important for small business survival?
Is learning important for business survival? (Only asked if not part of the
first answer).
How do you, the entrepreneur, learn?
Would you say you learn faster than your competitor? How?
How do you transfer knowledge to others in the business?
How do you capture and integrate knowledge into the business?
How do you decide the number of people and the amount of money to
allocate toward capturing and integrating knowledge?
What business opportunities have you been able to exploit before your
competitor?
How do you interpret feedback and knowledge from the external
environment into the business?
What do you do to allow employees to share and capture their
experiences?
How do you decide what information is important?
When did leadership know the business would survive?
Is there anything else you would like to add?

151
We agreed that there would be audio taping of the interview. I will use my computer to
record the interview.
I would like to see any documentation you may have on your process to capture, convert,
and integrate knowledge as well as any financial data. I would simply view the
documents before or after the interview.
Thank you for participating in the study. Your time is valuable and I will be as efficient
as possible. I look forward to learning about your business.
1 Attachment
Preview attachment HSRC form rev C.rtf

152
Appendix C
GFU Human Subject Consent Form
HUMAN SUBJECTS REVIEW COMMITTEE PROTECTION OF HUMAN SUBJECTS INITIAL REVIEW QUESTIONNAIRE
[Note: Dissertation, or other formal research proposal, need not be submitted with this form. However, relevant section(s) may need to be attached in some cases, in addition to filling out this form completely, but only when it is not possible to answer these questions adequately in this format. Do not submit a proposal in lieu of filling out this form. In addition, review carefully the full text of the Human Subjects Research Committee Policies and Procedures on page 4 of the Research Manual.] Date submitted: Date received: Title of Proposed Research: _________________________________________________________________________ _________________________________________________________________________ Principal Researcher(s): _________________________________________________________________________ Degree Program _________________________ Rank/Academic Standing_________________________________ Other Responsible Parties (if a student, include faculty sponsor; list other involved parties and their role) ________________________________________________________________________ (**Please include identifying information on page 6 also.) (1) Characteristics of Subjects (including age range, status, how obtained, etc): GEORGE FOX UNIVERSITY HSRC INITIAL REVIEW QUESTIONNAIRE Page 2

153
(2) Describe any risks to the subjects (physical, psychological, social, economic, or discomfort/ inconvenience): (3) Are the risks to subjects minimized (a) by using procedures which are consistent with sound research design and which do not unnecessarily expose subjects to risk, and (b) whenever appropriate, by using procedures already being performed on the subjects for diagnostic or treatment purposes? Degree of risk: low 1 2 3 4 5 6 7 high (4) Briefly describe the objectives, methods and procedures used: GEORGE FOX UNIVERSITY HSRC INITIAL REVIEW QUESTIONNAIRE Page 3

154
(5) Briefly describe any instruments used in the study (attach a copy of each). (6) How does the research plan make adequate provision for monitoring the data collected so as to insure the safety, privacy and confidentiality of subjects? (7) Briefly describe the benefits that may be reasonably expected from the proposed study, both to the subject and to the advancement of scientific knowledge – are the risks to subjects reasonable in relation to anticipated benefits?

155
GEORGE FOX UNIVERSITY HSRC INITIAL REVIEW QUESTIONNAIRE Page 4 (8) Where some or all of the subjects are likely to be vulnerable to coercion or undue influence (such as children, persons with acute or severe physical or mental illness, or persons who are economically or educationally disadvantaged), what appropriate additional safeguards are included in the study to protect the rights and welfare of these individuals? (9) Does the research place participants "at risk"? _________ If so, describe the procedures employed for obtaining informed consent (in every case, attach copy of informed consent form; if none, explain).
156
GEORGE FOX UNIVERSITY HSRC INITIAL REVIEW QUESTIONNAIRE Page 5 COMMITTEE REVIEW Committee Use ONLY Recommend Recommend Not Signature Approval Conditional Recommended Approval Chair _____________________________ ________ ________ ________ Member___________________________ ________ ________ ________ Member ___________________________ ________ ________ ________ Member___________________________ ________ ________ ________ Member___________________________ ________ ________ ________ Member___________________________ ________ ________ ________ Member___________________________ ________ ________ ________ Comments (continue on back if necessary, use asterisk to identify):

157
GEORGE FOX UNIVERSITY HSRC INITIAL REVIEW QUESTIONNAIRE Page 6 Title: ___________________________________________________________________ ___________________________________________________________________ Principal Researcher(s):_______________________________________________________ Date application completed: _________________________________________________ COMMITTEE FINDING: 1) The proposed research makes adequate provision for safeguarding the health and dignity of the subjects and is therefore approved. 2) Due to the assessment of risk being questionable or being subject to change, the research must be periodically reviewed by the HRSC on a __________________________ basis throughout the course of the research or until otherwise notified. This requires resubmission of this form, with updated information, for each periodic review. 3) The proposed research evidences some unnecessary risk to participants and therefore must be revised to remedy the following specific area(s) of non-compliance: ___________________________________________________________________ ___________________________________________________________________ ___________________________________________________________________ ___________________________________________________________________ ____ 4) The proposed research contains serious and potentially damaging risks to subjects and is therefore not approved. Chair or designated member__________________________ Date______________