Understanding productivity through the lens of Finance - ADP ...
44
Understanding productivity through the lens of Finance
-
Upload
khangminh22 -
Category
Documents
-
view
0 -
download
0
Transcript of Understanding productivity through the lens of Finance - ADP ...

Understanding productivity through the lens of Finance

UNDERSTANDING PRODUCTIVITY THROUGH THE LENS OF FINANCE
ACKNOWLEDGEMENTS
We gratefully acknowledge the efforts of our survey respondents and our forum participants who took valuable time away from their day jobs to participate in this research. We are particularly grateful to our research partner, ADP Canada without whom this study would not have been possible.
Laura PachecoVice President, ResearchFEI Canada
Copyright 2017 by Canadian Financial Executives Research Foundation (CFERF).
No part of this publication may be reproduced, stored in a retrieval system or transmitted in any form or by any means, electronic, mechanical, photocopying, recording or otherwise, without the prior permission of the publisher.
This report is designed to provide accurate information on the general subject matter covered. This publication is provided with the understanding that the author and publisher shall have no liability for any errors, inaccuracies, or omissions of this publication and, by this publication, the author and publisher are not engaged in rendering consulting advice or other professional service to the recipient with regard to any specific matter. In the event that consulting or other expert assistance is required with regard to any specific matter, the services of qualified professionals should be sought.
First published in 2017 by CFERF. 1201-170 University Ave. Toronto, ON M5H 3B3
ISBN# 978-1-927568-26-2

CONTENTSExecutive summary
Research methodology and demographics
Who should be in charge of productivity?
Engaged employees are productive employees, discuss
Measuring productivity
Defining workforce productivity
What gets measured doesn’t always get managed
How benchmarking improves performance
Looking to future productivity
Conclusion
Appendix A: Demographics
Appendix B: Research Forum Participants
Acknowledgments
2
5
6
10
14
18
21
27
30
32
34
38
39

UNDERSTANDING PRODUCTIVITY THROUGH THE LENS OF FINANCE
/2
EXECUTIVE SUMMARY“Productivity isn’t everything, but in the long run, it is almost everything. A country’s ability to improve its standard of living over time depends almost entirely on its ability to raise its output per worker.”
— Paul Krugman, The Age of Diminishing Expectations (1994)
Productivity is a critical determinant of a country’s health and economic well-being. In its 2016-2017 The Global Competitiveness Report, the World Economic Forum states that Canada’s ranking has slipped from 13 to 15. Research carried out by ADP Canada, the sponsor of this CFERF research study, shows nearly one out of every two workers in Canada say they are less productive than they could be and yet there is little discussion about what is happening in Canada’s workforce and how to make things better.
This report aims to get that conversation started by asking finance executives to identify the extent to which they value productivity data, collect it and use it to drive performance. Areas of focus are the respective roles of finance and HR in managing worker productivity, and the Key Performance Indicators (KPIs) used to measure, monitor and drive it.
The top five takeaways are:• There is no one-size-fits-all definition of productivity. • Finance is typically responsible for at least some aspects of HR and productivity
and when it is, productivity metrics are more likely to be used to drive performance.
• The size of a company impacts how productivity is approached and whether or not it is measured.
• Even when productivity is measured, respondents report the KPIs being used are not relevant.
• The top focus areas to improve productivity in the next three years are employee training; improving engagement; improving workflow design and expanding/recalibrating the workforce.
Finance and HR are intrinsically linked and more often than not Finance is accountable for at least some aspect of the HR function. For example, 71% of respondents say payroll is handled by Finance. But it’s not just the transactional aspects of HR that fall to Finance. One-third of respondents report that the Finance function is also responsible for culture, employee staffing, and strategic planning.
/3
The story shifts when structure and size of an organization are taken into account. Larger publicly-listed organizations are more likely to report a clear dividing line between the Finance and HR functions as compared to their smaller, privately-held counterparts.
UNDERSTANDING PRODUCTIVITY THROUGH THE LENS OF FINANCE
At IBM the two functions have been separate for a very long time, but over the last three years the relationship between the two has completely changed. We have always had transparency and shared access to all of the productivity data but what’s happening now is, finance is doing the analytics and telling HR where to look based on where we think the business is growing.
Nadia Ahmad – Infrastructure Services Delivery Finance Manager, IBM Canada
“
”
I think a lot of companies fail to realize that HR is a strategic part of the organization, as opposed to an administrative function. As such, it makes more sense that it has a direct line to the CEO, as opposed to reporting to finance.
Pat Di Lillo – Vice President and CFO, Birks Group Inc.
“
”
While this likely speaks to a maturity and sophistication of processes that come with size, it is also true that one-third of total respondents report the Finance department’s oversight and responsibility for HR have increased in the past three years.
This is happening during a period when the Conference Board of Canada reports employee engagement—a key determinant of productivity—has plateaued. According to its report Employee Engagement: Leveraging the Science to Inspire Great Performance, only 27% of employees in Canada are highly engaged.
With that backdrop, the majority of respondents report employee engagement is a meaningful metric and measure it at least sporadically. Forty percent measure engagement annually or more than once a year. This is particularly true of larger organizations with more than 1,000 employees. However, almost half of respondents from smaller organizations with fewer than 250 employees are not measuring employee engagement at all. Yet when asked if they could improve just one aspect of HR reporting, the top answer cited by 29% of respondents was employee engagement.
When it comes to measuring productivity, the top analytics being used are vacation tracking (86%), payroll management (74%) and attendance (71%). Just one-third of respondents are measuring performance and providing 360-degree feedback to employees. This jumped to 44% for respondents from organizations with more than

UNDERSTANDING PRODUCTIVITY THROUGH THE LENS OF FINANCE
/4
1,000 employees and dropped to 30% for those from organizations with fewer than 250 employees. Regardless of size, only about 4% of total respondents are using predictive analytics. The majority of respondents define productivity through the lens of the bottom line and largely rely on financial metrics to measure productivity. The measure of “sales generated by full-time employees” was cited by 46% of respondents as a critical metric.
Cause for concern: 11% of respondents don’t know how their organization measures productivity and 41% have no plans to measure it. Again, size plays a role, as larger organizations with more than 1,000 employees are more likely to have KPIs in place around productivity than smaller organizations with fewer than 250 employees.
But are they using that information? While 64% of total respondents are using productivity data to inform their employee budgeting decisions, almost one in five are not using productivity data at all and 28% are not using this information to improve overall performance. This number jumps to 34% at organizations where Finance has no responsibility for HR and to 36% at organizations with fewer than 250 employees.
At issue: the KPIs being used are not meaningful. Roundtable participants and online respondents report there is definite room for improvement with respect to producing accurate HR data, measuring employee engagement, providing learning opportunities for employees and generating predictive analytics. Only 10% say the productivity KPIs they have in place strongly meet their organization’s needs. Fourteen percent say their metrics are not meeting their needs at all.
Looking to the future, it is clear respondents recognize they need to do a better job of engaging employees. As a result, when asked what would most foster productivity in the next three years, 38% cite upgrading employee training and skills, 21% cite increasing employee engagement, and 16% cite improving workflow design and expanding/recalibrating the workforce, respectively. Getting the metrics right and using the data to build engagement represents a real opportunity for organizations going forward.

UNDERSTANDING PRODUCTIVITY THROUGH THE LENS OF FINANCE
/5
RESEARCH METHODOLOGY AND DEMOGRAPHICSUnderstanding productivity through the lens of Finance was prepared by CFERF, the research arm of FEI Canada, together with its research sponsor, ADP Canada. It is based on an online survey of finance executives from across Canada. Of the 126 finance executives who responded, the majority (48%) are CFOs, 12% are vice presidents of finance or controllers, and 8% are directors of finance. The survey was conducted between November 9, 2016, and December 9, 2016.
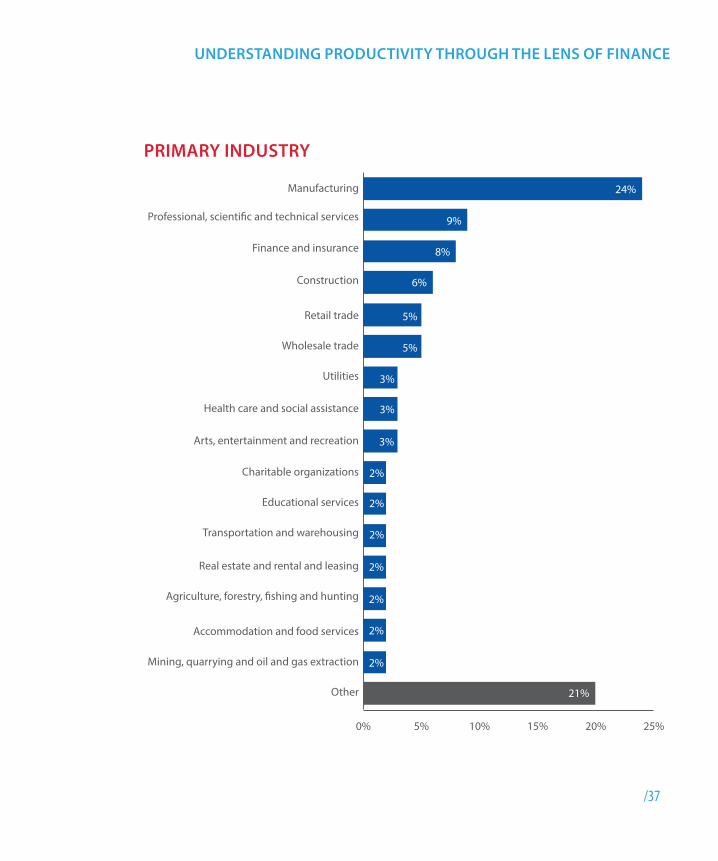
Almost half of respondents (47%) work at privately held companies, while 26% work at publicly traded or subsidiary companies, 7% work at not-for-profits and the rest are employed at government, Crown corporations and other organizations. A cross section of industry is represented, with almost one-quarter of respondents coming from the manufacturing sector.
The size of organizations also varies, as 53% of these organizations report annual revenues less than $100M, 37% between $100M and $1B and 10% report revenues of $1B or more. The majority of respondents (48%) have less than 250 employees and 24% have more than 1,000 employees. All respondents operate in Canada. More than one third have employees in the U.S. and about 15% have employees in Asia and Europe respectively.
The results of the online survey were enhanced by insights gained during a roundtable video-conference discussion held on November 17, 2016, with senior finance executives in Toronto and Montreal.
For more detailed demographic information, see Appendix A.

UNDERSTANDING PRODUCTIVITY THROUGH THE LENS OF FINANCE
/6
CHART 1: Do any of the following areas currently report into the finance department at your organization? Choose all that apply.
WHO SHOULD BE IN CHARGE OF PRODUCTIVITY?While no one would argue that increasing productivity isn’t critical to business success, there is some question as to where responsibility for delivering on that objective should reside: Finance or human resources? Part of the problem is the fact that there is no universal definition for productivity. Depending on the industry, productivity can be anything from output to sales per employee to profitability (see page 14).
CHART 2: Do you personally, either directly or indirectly, oversee any of the related human resources functions? Choose all that apply.
Other Human Resources related functions include: Health and SafetyInvestor Relations and Public RelationsSafetyRecruitment
Each dept head manages their team’s HR functionSuccession PlanningCommission Payments
0% 10% 20% 30% 40% 50% 60% 70% 80%
No, none of the HR-related functions report into the �nance department
Other Human Resources related function
Human Resources (including culture, ethics, compensation, sta�ng plans/strategic planning)
Bene�ts
Payroll 71%
53%
35%
29%
8%
0% 10% 20% 30% 40% 50% 60% 70% 80%
No, none of the HR-related functions report into the �nance department
Other Human Resources related function
Human Resources (including culture, ethics, compensation, sta�ng plans/strategic planning)
Bene�ts
Payroll 68%
52%
28%
8%
37%
UNDERSTANDING PRODUCTIVITY THROUGH THE LENS OF FINANCE
/7
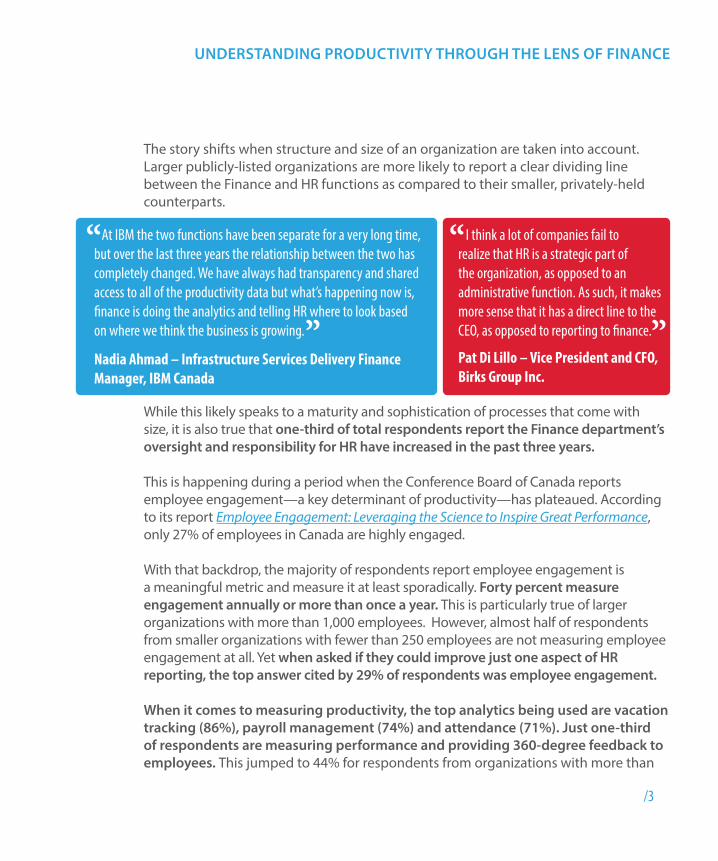
That said, for the majority of respondents (71%), at least the payroll aspect of the HR function reports directly to the finance department and 35% report culture, compensation, staffing and strategic planning do as well. Seventy-two percent of respondents say they personally oversee HR functions in some way. This likely speaks to the synergies between finance and HR and the cost-savings to be gained by combining the two. It may also explain why the majority of respondents (59%) report their organizations have maintained the status quo with respect to oversight of HR functions over the past three years.
CHART 3: In the last three years, with regards to human resources, payroll and other related human resources functional areas, has the finance department changed its oversight and responsibility of these areas?
During this same period, one-third of respondents say HR functions are increasingly becoming part of the finance portfolio while 7% report finance department oversight and accountability for these functions has decreased.
0% 10% 20% 30% 40% 50% 60%
Don't know
No, it has remained unchanged
Yes, the �nance department's oversight and respoonsibility has decreased in the last three years
Yes, the �nance department's oversight and responsibility has increased in the last three years
33%
59%
7%
1%

UNDERSTANDING PRODUCTIVITY THROUGH THE LENS OF FINANCE
/8
Why is Finance charged with overseeing HR? Explanations from online respondents point to a focus on controlling costs and developing affordable staffing models designed to drive profitability and growth as key reasons for making Finance responsible for HR.
But structure and size of organization likely also play a role. For example, respondents from private companies are almost three times more likely to report that at least one aspect of HR reports to finance as compared to their publicly listed counterparts. A similar story plays out for smaller companies as compared to larger organizations. The larger the company in terms of both number of employees and revenues, the more likely that no HR functions report to Finance. That said, 41% of respondents from organizations with more than 1,000 employees report oversight for HR has increasingly moved to the Finance department in the last three years.
Roundtable participants agree that the larger an organization becomes, the more sense it makes to separate HR functions from Finance and have HR report directly to the CEO. This was the case at independent grocery chain Longo’s, which has grown from 4,000 to 6,000 employees in the past three years.
“When the company was half the size as it is now, HR reported to the CFO,” says Mary Parniak, CFO of Longo’s. “However, as the size and scope of the company grew, there was a need to have HR in a senior role reporting into the CEO.”
As compliance and complexities increase, having a dedicated HR person/function able to identify issues before they become problems is critical. It’s no longer a choice.
Ajay Rao – CFO, Conros Corporation
“ ”

UNDERSTANDING PRODUCTIVITY THROUGH THE LENS OF FINANCE
/9
Some HR functions fit naturally in Finance, others don’t. It’s not an all or nothing proposition. One organization we’re working with is moving all transaction-driven aspects of HR to Finance. This includes payroll, attendance recording, and productivity. In this way, HR is able to focus on the strategic, the hiring, the training, the development.
Harold Hay – Principal, The Osborne Group
“
”
As companies grow, they tend to become more mature in terms of structure, process and resources, says Sunil Gandhi, CFO of Trophy Foods. “In many small or mid-sized organizations, finance tends to hold functions until the company develops enough scale to have those functions stand on their own. This usually coincides with when the company realizes that support functions need to be more strategically managed, not just administratively managed. For example, in our company we have historically managed payroll from an administrative perspective but now are looking at ways to utilize the information captured to improve our visibility to productivity metrics.”
IBM, which maintains finance and HR as two distinct functions, is doing just that. “Finance is now working with HR to set targets,” says Nadia Ahmad, Infrastructure Services Delivery Finance Manager, IBM Canada.

UNDERSTANDING PRODUCTIVITY THROUGH THE LENS OF FINANCE
/10
In an article for Forbes magazine, employee engagement expert Kevin Kruse defined employee engagement as “the emotional commitment the employee has to the organization and its goals. This emotional commitment means engaged employees actually care about their work and their company. They don’t work just for a paycheck, or just for the next promotion, but work on behalf of the organization’s goals. When employees care—when they are engaged—they use discretionary effort.”
It is precisely this extra effort that leads engaged workforces to outperform. Waterstone Human Capital, a Toronto-based executive search firm specializing in cultural assessment, has created Canada’s 10 Most Admired Corporate Cultures™ program, to showcase the power of strong corporate cultures to drive engagement and productivity. To that end, the performance of these organizations in terms of a three-year average revenue growth has outpaced the S&P/TSX 60 by more than 300%.
That engagement drives productivity is intuitive, but how do you prove it? I worked at a previous employer that took their low engagement scores seriously, developed action plans, talked openly with all of its employees and, over the course of eight years, our engagement scores improved dramatically and our profits quadrupled. Improved engagement wasn’t the only thing driving profitability, but it was a big piece of it.
Mary Parniak – CFO, Longo’s
“
”
ENGAGED EMPLOYEES ARE PRODUCTIVE EMPLOYEES: DISCUSS
But is employee engagement a meaningful metric to CFOs? It depends. For the majority of respondents (61%), the answer is yes. They are measuring employee engagement at least sporadically, and 40% measure engagement annually or more than once a year. This number climbs to 45% in larger organizations with more than 1,000 employees but drops to just 33% for respondents from organizations with fewer than 250 employees.
Conversely, more than one-third of respondents (39%) report they do not measure employee engagement at all. This number jumps to 49% for smaller firms with fewer than 250 employees. Only 11% of respondents from organizations with more than 1,000 employees do not measure employee engagement. And yet, when respondents were asked if they could improve one aspect of HR reporting, 29% of total respondents cite employee engagement reporting.
Why does size play such a significant role in whether or not employee engagement is measured? Roundtable respondents offered several suggestions but the consensus seemed to be that measuring engagement will only improve outcomes if leadership acts on the employee engagement results.

UNDERSTANDING PRODUCTIVITY THROUGH THE LENS OF FINANCE
/11
CHART 4: Does your company currently measure employee engagement?
CHART 5: If you could improve only one aspect of HR reporting in your organization, what would it be?
Surveys are one thing but it’s really what you do with the results. It can be very frustrating to employees when leadership asks for their feedback but then doesn’t act on the recommendations. That’s probably a lot of the difference between success and failure, and one of the reasons why smaller companies are less likely to implement employee engagement surveys. They may not have the right internal champion and/or the resources to do anything with the feedback.
Sunil Gandhi – CFO, Trophy Foods
“
”
0% 10% 20% 30% 40%
No, employee engagement is not measured
Yes, other
Yes, it is measured every two years
Yes, it is measured once a year (annually)
Yes, it is measured more than once a year 12%
28%
11%
11%
39%
0% 5% 10% 15% 20% 25% 30%
Time to hire (how long roles are open) reporting
Other
Detailed employee retention data reporting
Labour costs reporting
Succession planning for key roles reporting
Competitive comparisons reporting
Employee engagement reporting 29%
22%
22%
16%
6%
3%
2%

UNDERSTANDING PRODUCTIVITY THROUGH THE LENS OF FINANCE
/12
There is also another on-the-ground reality: smaller firms simply may not need to conduct formal polls with their employees because leadership work closely with employees day to day and have ongoing, open dialogue, providing an understanding of what is needed to earn discretionary effort. This is true theoretically and at the end of the day, it all depends on the leadership and culture of the organization.
We are a small studio with 25 people. If I have to survey my people to learn whether or not they’re engaged, that’s a problem. I face these people every day. I have lunch with them. We are always talking.
Jacques Paquin – COO, Side City Studios Inc.
“”
We’ve done engagement surveys and still struggled with attrition so we decided to do for ourselves what we do for our clients, which is something called Design Thinking. We picked groups of people and spent time with them to understand their core issues and tap into their insights. Out of that, employees came up with their own recommendations to improve their engagement. It was surprising from a leadership team perspective to learn the issues that were coming across in the engagement survey were not the real issues. The whole exercise led to a transparency that wasn’t there before.
Nadia Ahmad – Infrastructure Services Delivery Finance Manager, IBM Canada
“
”
Even in larger organizations that do conduct regular employee engagement surveys, the results may not actually reflect what employees need in order to feel more connected to their work.

UNDERSTANDING PRODUCTIVITY THROUGH THE LENS OF FINANCE
/13
The engagement survey is a score. It gives you a number but what does that exactly mean and do we really understand what the issues are? We’re digging deep trying to understand it to ensure we are taking actions that will have a meaningful and lasting impact.
David McIsaac – CFO, Canada & Trinidad, TransUnion
“”
Just as corporate culture starts at the top, so, too, does engagement. It is important to solicit comments from employees and use a third party to ensure anonymity – management can certainly learn a lot from the comments.
Engagement is contagious but it has to start at the top, with executives, management, middle management. The level of their engagement causes engagement for employees. I’ve seen it in all the companies that I’ve worked at. The smaller the company, the more opportunity managers have to build engagement because they are face to face with employees. You don’t have to measure it and people will do magic without being asked because they are following the example of the leaders. If you as a leader are not engaged, the team will never be engaged. It’s an unreasonable expectation.
Lida Sadrazodi – CFO, Kubra Data Transfer
“
”

UNDERSTANDING PRODUCTIVITY THROUGH THE LENS OF FINANCE
/14
When it comes to the tools used by respondents to measure productivity, they predominantly use spreadsheets (as reported by 33% of respondents); 22% use standard reports with some custom reports available and 21% use automated reports only. Larger organizations with more than 1,000 employees are significantly more likely to use automated reports, as cited by 33% of respondents. This compares to just 13% of respondents from organizations with fewer than 250 employees. Respondents also employed engagement surveys, balanced scorecards for specific key performance metrics and held regular employee meetings without direct superiors to understand how productive their workforce is. Surprisingly, 11% of respondents don’t know how their organization measures productivity.
MEASURING PRODUCTIVITY
CHART 6: Which statement best describes your organization’s approach to measuring HR, including productivity (including people, assets, inventory and capital)?
0% 5% 10% 15% 20% 25% 30% 35%
Prefer not to answer
Don't know
Other
We do all our HR measurement using spreadsheets
Standard reports with some custom reports available
Standard reports only (e.g. Excel or standard ERP system generated reports)
21%
22%
33%
9%
11%
3%

UNDERSTANDING PRODUCTIVITY THROUGH THE LENS OF FINANCE
/15
What analytics are being used? The most common are vacation tracking (86%), payroll management (74%) and attendance (71%). Only one-third of respondents are measuring performance and providing 360-degree feedback and just 4% use predictive employee analytics.
CHART 7: What HR reporting and analytics tools are currently used in your organization? (Select all that apply)
0% 2% 40% 60% 80% 100%
Employee lifecycle management*
Predictive employee analytics (leveraging HR data)
Succession planning
Career development planning
Applicant tracking
Self-service portal**
Recruiting management
Performance management including 360 degree feedback
Noti�cations (e.g. vacation remaining)
Training management
Compensation management
Employee database
Bene�ts management
Attendance management (timesheets)
Payroll management
Vacation/leave tracking
* Human resources model that identi�es stages in employees’ careers to help guide their management and optimize associated processes
86%
74%
71%
64%
55%
53%
50%
35%
33%
32%
32%
29%
26%
23%
4%
2%
**Employee management portal - e.g. look up vacation, T4 slips

UNDERSTANDING PRODUCTIVITY THROUGH THE LENS OF FINANCE
/16
I once worked at a small manufacturing company that generated about $4M in annual sales when I joined them. In order to get the most out of our production facility and avoid having to expand the plant, we constructed a productivity analysis on Excel spreadsheets that allowed us to measure the productivity of each machine, each mold, and each shift. Having that information helped us grow to a $40M dollar organization using the same physical plant.
Harold Hay – Principal, The Osborne Group
“
”
We in the finance organization spend a lot of time in analysis paralysis, debating why a certain metric doesn’t really mean what it’s intended to mean. As our business transforms, we’re going to the lowest common denominator and tracking things that will give us quick answers, such as how long has someone been in their job? If someone has been in the same role for 10-plus years, it’s easy to become complacent which impacts engagement and productivity. People want to work and want to give you 110% when they feel they’re given opportunity.
Nadia Ahmad – Infrastructure Services Delivery Finance Manager, IBM Canada
“
”
It’s clear there is no one right way to measure productivity. The metrics used often vary by industry. The challenge, however, is in being able to extract useful information regardless of how it is collected. Active management is critical. This was certainly the sentiment among many of the roundtable participants.
Eric Bouchard, CFO, Atrium Innovations, is in the midst of trying to determine the best metrics to employ. “I’m at a point where we are trying to determine what we can do as an organization and how to get there. For example, marketing is a big aspect of what we do but how do you establish KPIs for that function? Same thing for our important spending in quality.”

UNDERSTANDING PRODUCTIVITY THROUGH THE LENS OF FINANCE
/17
CHART 8: Would you like to measure productivity in the future?
When asked if they would like to measure productivity going forward, 59% said they have KPIs in place or are in the process of developing them but 41% stated they have no plans to measure productivity. The larger the organization in terms of revenue and number of employees, the more likely they have or are developing productivity KPIs as compared to smaller organizations.
No, there are currently no plans to measure productivity
Yes, the organization currently measures KPIs and will continue to do so moving forward
Yes, the organization is in the process of developing KPIs
Yes, it is part of the 'wish list' but there are no
de�nitive plans yet
36%
23%
27%
14%

UNDERSTANDING PRODUCTIVITY THROUGH THE LENS OF FINANCE
/18
According to the World Economic Forum, productivity sets the level of prosperity that a country can achieve. This view, that productivity is a key source of economic growth and competitiveness is undisputed, which is why governments and businesses are focused on doing everything possible to improve it. What is less clear is what exactly needs to be improved. There is no common definition of productivity.
For some, productivity is about how efficiently employees transform inputs into outputs. For others, it’s about driving profitability.
DEFINING WORKFORCE PRODUCTIVITY

UNDERSTANDING PRODUCTIVITY THROUGH THE LENS OF FINANCE
/19
CHART 9: How does your company define employee (workforce) productivity?
0% 10% 20% 30% 40% 50% 60%
Percentage of each function outsourced
Hires and lateral moves by career level and function
Retirement by career level and function***
Involuntary turnover***
Voluntary turnover***
Total compensation costs by career level and function
Percentage of employees by career level**
Organizational structure distribution (FTE compared to compensation)
Percentage of employees by function*
Pro�t per FTE
Operating expenses per FTE
Industry speci�c metrics
Percentage of revenue allocated to total compensation expenses
Sales or revenue per full time equivalent (FTE)
Ratio of executives to non-executives
Ratio of managers to individual contributors
Span of Control Metrics
Financial Metrics
Workforce Structure Metrics
Workforce Cost Metrics
Workforce Turnover Metrics
Workforce Flows Metrics
Functional Outsourcing Metrics
9%
3%
46%
23%
22%
22%
17%
23%
14%
7%
34%
57%
46%
22%
5%
7%
* Core functions/support functions mix) where core functions include: customer and after sales support, logistics and distribution, marketing and sales, operations, R&D and support functions include adminstrative support, communications, �nance, HR, IT and legal.
** Executive, management, professional, salaried clerical, and hourly paid.
*** Total/by function/ by career level
Employee (workforce) productivity metrics derived from Mercer Workforce Metrics Solution (see imercer.com/workforcemetrics)

UNDERSTANDING PRODUCTIVITY THROUGH THE LENS OF FINANCE
/20
The majority of respondents define workforce productivity through the lens of financial numbers. As a result, they rely on sales and the cost of generating sales. The top three financial metrics used are: sales generated per full-time employee (46%); percentage of revenue allocated to compensation (23%); operating expenses per full-time employee and industry-specific metrics, such as units produced per employee for manufacturing companies (22% respectively)
Span of control metrics, workforce structure metrics, turnover metrics, and flows metrics were employed far less. Further, 86% of respondents do not employ metrics to monitor the performance of outsourced functions.
We measure sales per employee, sales per sq foot, but we also measure cost of labour in relation to sales and gross margins. We are also careful with the cost of labour against sales, notably when margins are decreasing. So we also developed additional KPIs around the gross margin percentage.
Pat Di Lillo – Vice President and CFO, Birks Group Inc.
“
”
As a retail business, we define productivity as labour as a percent of sales. There’s nothing complex or sophisticated about the metric but it’s a good start. The objective is to continually improve that cost in order to stay competitive.
Mary Parniak – CFO of Longo’s
“”

UNDERSTANDING PRODUCTIVITY THROUGH THE LENS OF FINANCE
/21
Considering that respondents were largely CFOs, it is not surprising that the majority (64%) are using employee productivity to inform their employee budgeting decisions. That said, almost one in five respondents are not using productivity data at all. Equally disconcerting: more than one-quarter of respondents (28%) are not using this information to improve overall performance. This number increases to 34% when none of the HR functions report into Finance. Size also impacts whether or not employee productivity is used to drive performance, as 36% of respondents from organizations with fewer than 250 employees report they are not using this data to improve. This compares to 26% of respondents from companies with more than 1,000 employees.
WHAT GETS MEASURED DOESN’T ALWAYS GET MANAGED
CHART 10: How does your organization use its employee productivity for its employee planning? (Select all that apply)
CHART 11: To what extent, if any, is employee productivity information used to improve corporate performance? Information is:
0% 20% 40% 60% 80%
None of the above, company does not use it
Bottom up
Top down
Monthly/quarterly budget versus actual review
During budgeting process
During strategic planning process 35%
19%
11%
18%
44%
64%
0% 10% 20% 30% 40%
Employee productivity information is not used to improve corporate performance
Reviewed, other
Reviewed annually
Reviewed semi-annually
Reviewed quarterly
Reviewed monthly 35%
21%
7%
17%
28%
2%

UNDERSTANDING PRODUCTIVITY THROUGH THE LENS OF FINANCE
/22
During this time of slow growth when any gain in productivity can have a significant impact, this is a missed opportunity. Dig a little deeper and it’s clear that while the majority of respondents (72%) believe measuring productivity as a key performance indicator is important, only 10% say the productivity KPIs they have in place strongly meet their organization’s needs. Results are only slightly improved for larger organizations, with 15% stating their KPIs are meeting their needs. Fourteen percent of total respondents report their metrics are not meeting their needs at all.
CHART 12: To what extent do your current productivity measurement tools (KPI metrics) meet your organization’s needs?
CHART 13: How important is productivity measurement as a KPI to your company?
Does not meet at all Strongly meets
Somewhat does not meet
Somewhat meets
Neutral
11%
45%
20%
14%10%
0% 20% 40% 60% 80% 100%
Very importantSomewhat importantNeutralSo
mew
hat u
nim
port
ant
Not
impo
rtan
t at a
ll
9% 7% 12% 38% 34%

UNDERSTANDING PRODUCTIVITY THROUGH THE LENS OF FINANCE
/23
Everyone is pushing their productivity KPIs to get gross profit margins to where we want them to be, but that is only part of the story. We also have to be able to identify the point of diminishing returns and that requires qualitative KPIs. We need to take a more holistic approach to how we measure productivity.
Nadia Ahmad – Infrastructure Services Delivery Finance Manager, IBM Canada
“”
It’s very important to measure productivity but my biggest struggle is connecting productivity KPIs to what we see happening. Also, how that information is used is different for each manager and for each operation.
Eric Bouchard – CFO, Atrium Innovations
“”
CHART 14: How would you describe your organization’s ability to:
0% 20% 40% 60% 80% 100%
Produce accurate general HR data?
Measure employee engagement?
Help employees advance and grow through learning opportunities?
Generate workforce predictive analytics?
Industry leaderTop 25th percentileTop 25th-49th percentile
Median (50th percentile)51st-75th percentileBottom quartile (76th-100th percentile)
34% 30% 17%
13% 23% 28% 18%
11%
13%
28% 16% 22% 21% 7%
21%
7%
5%
6%
16% 24% 13% 25% 2%
1%

UNDERSTANDING PRODUCTIVITY THROUGH THE LENS OF FINANCE
If the KPIs around productivity aren’t meeting expectations, it’s not surprising that respondents point to a gap when it comes to producing accurate general HR data, measuring employee engagement, providing learning opportunities for employees to advance, and generating predictive analytics—all critical pieces of information to drive performance and productivity. There is definitely room for improvement.
Labour cost reporting is key for us but we don’t have a good metric that provides an accurate measure of the complete profitability of each product. We measure profitability as sales less product costs, but we’re not applying activity costing of the warehouse and other areas to get a true measure of how much profit we’re making or not on a particular product based on the handling and support that’s going on for each product and/or customer.
Bob Brabers – CFO, The Stevens Company Limited
“
”
HR reporting has to start with the basics—number of employees, attendance— before you can try to assess performance. But this basic information isn’t always easy to obtain.
Eric Bouchard – CFO, Atrium Innovations
“
”
/24

UNDERSTANDING PRODUCTIVITY THROUGH THE LENS OF FINANCE
/25
How do you handle more calls more efficiently with the same number of staff? That was the challenge facing Smart Start Canada about six months ago. A little background: the wholly owned subsidiary of U.S.-based Smart Start Canada installs and monitors alcohol interlock devices targeting drink-drive offenders. It launched in Edmonton just two years ago and has since grown from zero to 7,000 clients, with a network of 75 corporate and contracted shops across Western Canada as well as a call centre.
“On the surface, it looked like we needed more staff,” says company Controller Darla Selles. “But once we looked at the metrics and analytics we had in place to measure productivity, we were able to dig deeper.” The company looked specifically at call handling times, volume of calls and abandonment rate of calls (metrics all captured and tracked automatically via software) for each call centre employee. “Like an onion, we peeled everything back and said, OK, we can’t grow any more until we look at doing things better.” That meant more training. Today, even though the call centre receives substantially more calls, they are able to get through them quicker while limiting the number being dropped all without having to hire more people.
This improved productivity is helping to build engagement and even better results. “It’s exciting and motivating for staff because they are being told they are doing a good job and they know it because in the call centre, we have screens where minute by minute stats are posted showing where they are at and who the top performer for the day is,” says Selles. “They are receiving the feedback. Everything is transparent and it’s creating a direct line to profitability.” In fact, this year Smart Start Canada is being recognized with growth awards at the parent company’s annual awards gala.
BEST IN CLASS COMPANY PROFILE: SMART START CANADA

UNDERSTANDING PRODUCTIVITY THROUGH THE LENS OF FINANCE
B.C. Maritime Employers Association (BCMEA) is a not-for-profit member organization that provides on-demand labor via daily dispatch to the province’s terminal operators and ship owners. “We have between 60 and 80 members and about 6,000 employees. Our job is to ensure we are sending out qualified employees,” says Tony Keung, Senior Director, Finance and Payroll. “We are responsible for recruitment and training, as well as payroll administration, pensions and benefits.”
While those 6,000 employees are in training they work directly for BCMEA, which spends about $16 million or half of its annual organizational budget on training. “On any given day, we know that 67% of our workforce will show up for work. We just don’t know which 67%,” says John Beckett, Vice President Training, Safety & Recruitment. “We don’t want to over-recruit or over-train or under-recruit and under-train because productivity for us on a day-to-day basis comes down to dispatching the appropriately trained employees based on the requests of our member companies, which are different every day.”
In order to avoid shortages and surpluses, BCMEA established a metric to ensure it was training to the right level. That metric is what it calls the EDT measure (extensions, doubles and transfers). “We discovered if we can keep EDT below 2.5%, that’s our sweet spot. We conducted year over year analysis on each equipment operation training program and used that to determine who we should be training and improve our performance on dispatch,” says Beckett. The impact: “Our member companies are much more satisfied with our dispatch service and our organization is performing better than ever before because of the measures we now have in place.”
BEST IN CLASS COMPANY PROFILE: B.C. MARITIME EMPLOYERS ASSOCIATION
/26
UNDERSTANDING PRODUCTIVITY THROUGH THE LENS OF FINANCE
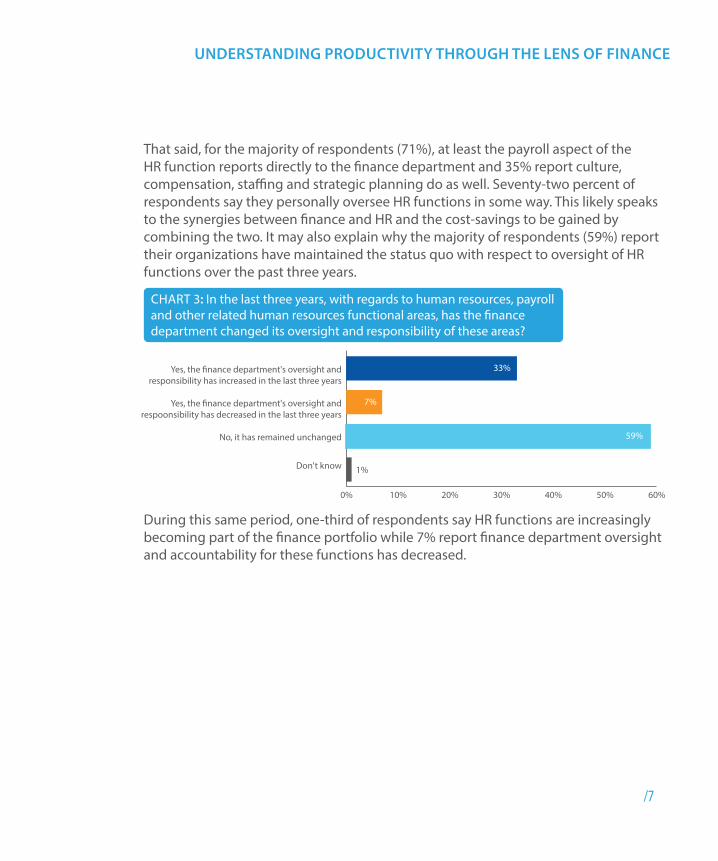
Almost half of total respondents (49%) report their organizations do not benchmark. When Finance is not accountable for any aspect of HR, this number increases to 56%. Respondents from organizations with fewer than 250 employees are also more likely to report their organizations do not benchmark (64%) as compared to 37% of respondents from organizations with more than 1,000 employees.
HOW BENCHMARKING IMPROVES PERFORMANCE
CHART 15: Does your organization benchmark? (Select all that apply)
CHART 16: How is your organization performing when compared to the benchmark?
0% 10% 20% 30% 40% 50%
No, my organization does not benchmark
Yes, other
Yes, to its industry group (multi-country group)
Yes, to its North American select group
Yes, to its Canadian peers 22%
13%
26%
49%
4%
Top quarti
le (top 25th
percentile
)
Second quarti
le (26-50th
percentile
)
At the m
edian (50th
percentile
)
Third quarti
le (51st
- 75th
percentile
)
Fourth quarti
le (76th
- 100 perce
ntile)
0% 20% 40% 60% 80% 100%
12% 27% 18% 37% 5%
Industry le
ader (top decil
e)
/27

UNDERSTANDING PRODUCTIVITY THROUGH THE LENS OF FINANCE
This represents a lost opportunity to improve. Of those respondents whose companies do benchmark, 37% report they are in the top quartile as compared to the benchmark. More importantly, 65% are acting on the benchmark data and 55% say they are getting better at what they do because they have this information.
Interestingly, smaller organizations that do benchmark are more likely to act on benchmark data and credit benchmarking with improving their overall performance than their larger counterparts.
We are beginning to benchmark our company’s profitability against external peers, which has led me to look at revenue per employee. As a result, we have realized that we can make improvements in productivity in order to better manage the scale of our business growth. By comparing ourselves to what is happening externally, we are now able to see where our productivity gaps were, and are investing in technology and processes to improve workflows and increase efficiency.
Sunil Gandhi – CFO, Trophy Foods
“
”
CHART 17: Benchmark data
0% 20% 40% 60% 80% 100%
Do you act on your benchmark data?
Do you feel results are enhanced as a result of having benchmark data?
Don't knowNoYes
55%
65%
18%
18% 17%
27%
/28

UNDERSTANDING PRODUCTIVITY THROUGH THE LENS OF FINANCE
Three years ago, one of the mandates I received from my audit committee was to provide a benchmark of our labour costs to our production. Through that exercise we identified that we were one of the higher labour costs per barrel of oil equivalent compared to our peers. That led us to identify areas we could automate and better control our labour costs.
David Bhumgara – CFO, Dundee Energy Limited
“”
However, 27% of respondents whose organizations benchmark performance report they don’t know if benchmarking has led to enhancements. This may be tied to the fact that 17% of respondents are unsure whether or not their organization is acting on benchmark data. It may also speak to the relevance of the benchmarks they are choosing to use.
I think it’s important to look externally and not get too internally focused, but it’s very challenging to find relevant information to benchmark. When it comes to the grocery industry, there is information about large retailers, but their scale is much greater than ours. Since joining Longos, I’ve joined a CFO share group of privately held, family-owned grocery retail companies that are similar to us. I have found this to be incredibly valuable.
Mary Parniak – CFO, Longo’s
“
”
/29

UNDERSTANDING PRODUCTIVITY THROUGH THE LENS OF FINANCE
After 125 years of being in the same location, Birks Group is moving its head office. It is using this opportunity to involve employees not only in the move but to gain their insights on the business and build engagement. “The information that management is getting is great”, says Pat Di Lillo, vice president and CFO, Birks Group Inc. “It’s helping us think about the future, where we want the organization to be in six months, in a year, and even ten years from now. In order to achieve our business objectives, employees need to have a clear path forward for their careers. We have to make sure they understand their place in the organization and get them involved in that decision-making process.”
LOOKING TO FUTURE PRODUCTIVITY
The changes that are taking hold at Birks reflect what many respondents are thinking about. When asked what would most foster productivity in the next three years, the top responses were all linked to fostering employee commitment by demonstrating corporate commitment to them. As a result, 38% of respondents cite upgrading employee training and skills, 21% cite increasing employee engagement and 16% cite improving workflow design and expanding/recalibrating the workforce, respectively.
CHART 18: What would most help foster productivity in your organization in the next three years?
0% 10% 20% 30% 40%
Globalize workforce
Workplace design (more open spaces)
Do more outsourcing to other companies
Use more casual labour, contractors
Expand/recalibrate workforce
Design of work�ow
Invest in employee engagement
Invest more in employee training and skills upgrading
21%
3%
16%
16%
38%
3%
2%
2%
/30
UNDERSTANDING PRODUCTIVITY THROUGH THE LENS OF FINANCE
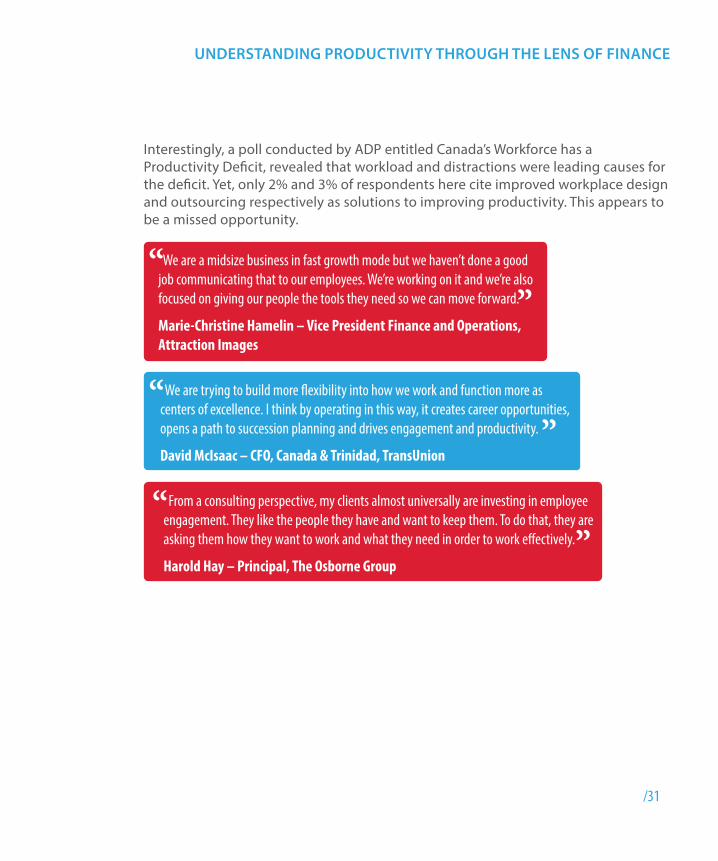
Interestingly, a poll conducted by ADP entitled Canada’s Workforce has a Productivity Deficit, revealed that workload and distractions were leading causes for the deficit. Yet, only 2% and 3% of respondents here cite improved workplace design and outsourcing respectively as solutions to improving productivity. This appears to be a missed opportunity.
We are a midsize business in fast growth mode but we haven’t done a good job communicating that to our employees. We’re working on it and we’re also focused on giving our people the tools they need so we can move forward.
Marie-Christine Hamelin – Vice President Finance and Operations, Attraction Images
“”
We are trying to build more flexibility into how we work and function more as centers of excellence. I think by operating in this way, it creates career opportunities, opens a path to succession planning and drives engagement and productivity.
David McIsaac – CFO, Canada & Trinidad, TransUnion
“”
From a consulting perspective, my clients almost universally are investing in employee engagement. They like the people they have and want to keep them. To do that, they are asking them how they want to work and what they need in order to work effectively.
Harold Hay – Principal, The Osborne Group
“”
/31

UNDERSTANDING PRODUCTIVITY THROUGH THE LENS OF FINANCE
Almost three-quarters of Canada’s workforce are not highly engaged. This is the finding from a recent study by Conference Board of Canada. And it has been the case for much of the slow-growth, jobless recovery that has taken hold post the 2008 financial crisis. It’s a finding that points to an untapped opportunity for business to improve productivity, profitability and to grow.
The question is how? It’s clear from the findings in this report that Finance is in a unique position to build employee engagement and address the country’s productivity gap. Across industries and sectors, finance and human resources are intertwined. The majority of respondents say Finance is accountable for at least some aspect of HR and this responsibility has been growing for at least one-third of respondents over the past three years.
We also know that CFOs value engagement and productivity metrics and that when HR functions do report to Finance, those metrics are more likely to be used to improve overall performance. The problem? Often the KPIs around productivity aren’t as useful as they could be. Roundtable respondents pointed to the complexity of the data being collected as problematic, creating “analysis paralysis” on the part of the finance team, which has to reconcile all the information coming in.
The result: while the majority of respondents (72%) believe measuring productivity as a key performance indicator is important, only 10% say the productivity KPIs they have in place strongly meet their organization’s needs. This is likely the reason that more than onequarter of respondents are not using productivity data to improve performance -- a missed opportunity in the continuing slow growth, highly competitive global economy where ever-tightening margins are the new norm.
Financial metrics specifically focused on sales per full-time employee were most employed by the majority of respondents. Span of control metrics, workforce structure metrics, turnover metrics and workflow metrics were employed far less if at all. This represents an opportunity. Research from a separate ADP survey of almost 1,600 Canadians revealed that 49% of Canadian workers say they are not as productive as they could be. Among the leading causes of this productivity deficit are distraction and process paralysis. In both cases, better workload and workflow management could improve productivity. Of course, this kind of information is only available if the right questions are asked.
CONCLUSION
/32

UNDERSTANDING PRODUCTIVITY THROUGH THE LENS OF FINANCE
Another key metric that could be employed both more widely and to greater effect is benchmarking. Almost half of respondents do not employ any form of benchmarking. Of those who do, the majority (55%), report they are performing better because they have this data.
The good news: when asked if they would like to measure productivity going forward, 59% said they have KPIs in place or are in the process of developing them. The larger the organization in terms of revenue and number of employees, the more likely they have or are developing productivity KPIs as compared to smaller organizations. In fact, the entire report points to the difference size and maturity make when it comes to prioritizing measuring productivity.
Measuring will only go so far. Organizations also have to act. In its report, Employee Engagement: Leveraging the Science to Inspire Great Performance, the Conference Board of Canada states: “Investing in leadership training, encouraging personal and professional growth, and interesting work that allows employees some flexibility and control are among strategies and practices that foster engagement.”
Respondents appear to have made the link between engagement and productivity. As a result, when asked what would help foster productivity in the next three years, they said investing in their people—an important step in the right direction.
/33

UNDERSTANDING PRODUCTIVITY THROUGH THE LENS OF FINANCE
/34
APPENDIX A – DEMOGRAPHICS
Other:Board memberPrincipalAnalystCorporate DirectorVP Procurement and Supply Chain
Other, director level or higher:Vice Chaiman and DirectorVice PresidentGeneral ManagerFinancial RegulatorInternal Audit DirectorExecutive Director, FinanceCorporate DirectorVP Business PerformanceDirector Audit & Compliance
0% 10% 20% 30% 40% 50%
Other, Director level or higher
Other
Treasurer
CEO
COO (Chief Operating O�cer)
Founder, Owner, President, Partner or Principal
Director of FInance
Controller
VP Finance
CFO 48%
12%
12%
8%
5%
2%
1%
1%
4%
7%
POSITION TITLE

UNDERSTANDING PRODUCTIVITY THROUGH THE LENS OF FINANCE
/35
CORPORATE STRUCTURE
NUMBER OF EMPLOYEES
1-250
251-500
501-1,000
1,001-3,000
3,001 or more
48%
18%
10%
15%
9%
Other
Crown corporation
Not for pro�t
Industry (public company or subsidiary of public company)
Industry (privately held, for pro�t, company)
47%
26%
7%
6%
14%

UNDERSTANDING PRODUCTIVITY THROUGH THE LENS OF FINANCE
/36
ANNUAL REVENUE
LOCATIONS OF OPERATIONS
0% 20% 40% 60% 80% 100%
Africa and Middle East
Central and South America and the Caribbean
Europe
Asia Paci�c
Oceania (Australia, New Zealand and Melanesia)
United States of America
Canada 100%
37%
16%
15%
13%
8%
8%
$5B or higher
$1B to less than $5B
$500M to less than $1B
$100M to less than $500M
$50M to less than $100M
$10M to less than $50M
Less than $10M
12%
25%
11%
25%
17%
4%6%
UNDERSTANDING PRODUCTIVITY THROUGH THE LENS OF FINANCE
/37
0% 5% 10% 15% 20% 25%
Other
Mining, quarrying and oil and gas extraction
Accommodation and food services
Agriculture, forestry, �shing and hunting
Real estate and rental and leasing
Transportation and warehousing
Educational services
Charitable organizations
Arts, entertainment and recreation
Health care and social assistance
Utilities
Wholesale trade
Retail trade
Construction
Finance and insurance
Professional, scienti�c and technical services
Manufacturing 24%
9%
8%
6%
5%
5%
3%
3%
3%
2%
2%
2%
2%
2%
2%
2%
21%
PRIMARY INDUSTRY
UNDERSTANDING PRODUCTIVITY THROUGH THE LENS OF FINANCE
/38
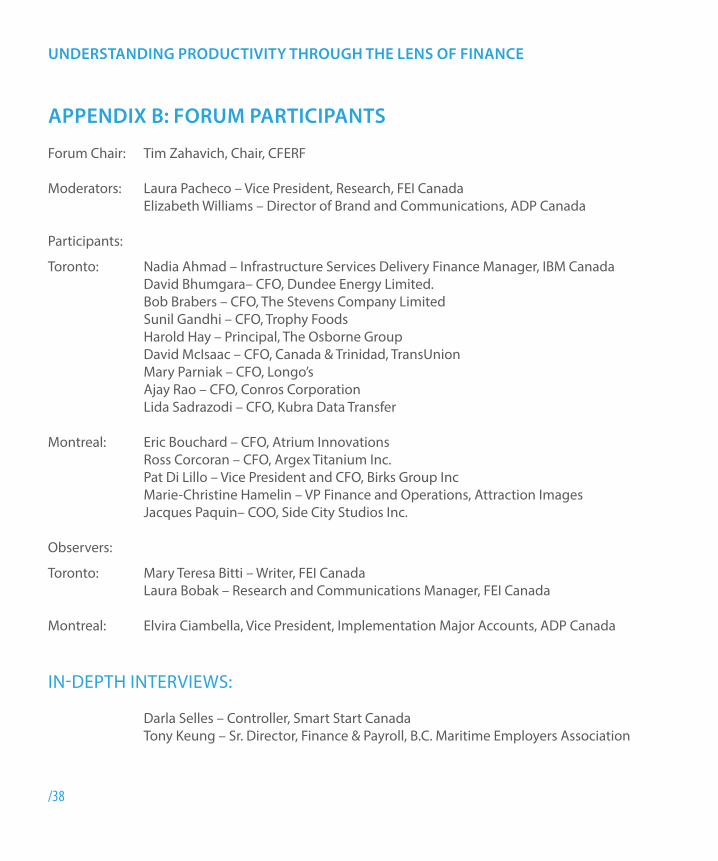
APPENDIX B: FORUM PARTICIPANTS
Forum Chair: Tim Zahavich, Chair, CFERF
Moderators: Laura Pacheco – Vice President, Research, FEI Canada Elizabeth Williams – Director of Brand and Communications, ADP Canada Participants:
Toronto: Nadia Ahmad – Infrastructure Services Delivery Finance Manager, IBM Canada David Bhumgara– CFO, Dundee Energy Limited. Bob Brabers – CFO, The Stevens Company Limited Sunil Gandhi – CFO, Trophy Foods Harold Hay – Principal, The Osborne Group David McIsaac – CFO, Canada & Trinidad, TransUnion Mary Parniak – CFO, Longo’s Ajay Rao – CFO, Conros Corporation Lida Sadrazodi – CFO, Kubra Data Transfer
Montreal: Eric Bouchard – CFO, Atrium Innovations Ross Corcoran – CFO, Argex Titanium Inc. Pat Di Lillo – Vice President and CFO, Birks Group Inc Marie-Christine Hamelin – VP Finance and Operations, Attraction Images Jacques Paquin– COO, Side City Studios Inc.
Observers: Toronto: Mary Teresa Bitti – Writer, FEI Canada Laura Bobak – Research and Communications Manager, FEI Canada Montreal: Elvira Ciambella, Vice President, Implementation Major Accounts, ADP Canada
IN-DEPTH INTERVIEWS:
Darla Selles – Controller, Smart Start Canada Tony Keung – Sr. Director, Finance & Payroll, B.C. Maritime Employers Association

UNDERSTANDING PRODUCTIVITY THROUGH THE LENS OF FINANCE
/39
ACKNOWLEDGMENTS
ABOUT FINANCIAL EXECUTIVES INTERNATIONAL CANADA (FEI CANADA) FEI Canada is the all-industry professional membership association for senior financial executives. With eleven chapters across Canada, FEI Canada provides its members thought leadership, advocacy services and extensive professional development opportunities – including its executive education offering, the CFO Leadership Beyond Finance program. The association membership, which consists of Chief Financial Officers, Audit Committee Directors and senior executives in the Finance, Controller, Treasury and Taxation functions, represents a significant number of Canada’s leading and most influential corporations. Further information can be found at www.feicanada.org. Follow us on Twitter at @FEICanada.
ABOUT THE CANADIAN FINANCIAL EXECUTIVES RESEARCH FOUNDATIONCFERF is the non-profit research institute of FEI Canada. The foundation’s mandate is to advance the profession and practices of financial management through research. CFERF undertakes objective research projects relevant to the needs of Canada’s senior financial executives in working toward the advancement of corporate efficiency in Canada. For more information, please visit www.feicanada.org.
ABOUT ADPADP Canada gives organizations of every size the tools to help their people thrive.. From basic payroll and processes to complex people management systems and analytics, we help business leaders make better decisions and focus on strategic priorities. Our clients trust ADP to manage critical back office functions, including payroll, time and attendance talent and performance management and reporting. Business leaders also look to ADP to provide strategic insights and expertise to help them build and inspire the workforce they need for long-term growth and success.
For more information call 1 866-228-9675, visit adp.ca or follow @ADP_CDA

UNDERSTANDING PRODUCTIVITY THROUGH THE LENS OF FINANCE
/40
CORPORATE DONORS:SILVER ($5,000-10,000):Suncor Energy Inc.
BRONZE ($1,000-5,000):Canadian Western Bank Group
FEI CANADA’S RESEARCH TEAM:
Michael Conway – President and Chief Executive Officer
Laura Pacheco – Vice President, Research
Laura Bobak – Research and Communications Manager
Mary Teresa Bitti – Writer


170 University Avenue, Suite 1201Toronto, ON M5H 3B3T 416.366.3007F 416.366.3008www.feicanada.org