
Understanding metro station usage using closed circuit television cameras analysis
15
ESEARCH R EP R ORT IDIAP Av. des Prés-Beudin 20 IDIAP Research Institute 1920 Martigny - Switzerland www.idiap.ch Tel: +41 27 721 77 11 Email: [email protected] P.O. Box 592 Fax: +41 27 721 77 12 Understanding Metro Station Usage Using Closed Circuit TeleVision Cameras Analysis C. Carincotte a M. Hick a X. Naturel b J.-M. Odobez b J. Yao b A. Bastide c B. Corbucci d IDIAP–RR 08-38 June 2008 a Multitel asbl, Rue Pierre et Marie Curie 2, 7000 Mons, Belgium b IDIAP Research Institute, Rue Marconi 19, 1920 Martigny, Switzerland. c ACIC s.a./n.v. Rue Ren´ e Descartes 2, 7000 Mons, Belgium d ATAC SpA, Via Ostiense, 131L 0154 Roma, Italy
-
Upload
independent -
Category
Documents
-
view
4 -
download
0
Transcript of Understanding metro station usage using closed circuit television cameras analysis

ES
EA
RC
HR
EP
RO
RT
ID
IA
P
Av. des Prés−Beudin 20
IDIAP Research Institute1920 Martigny − Switzerland
www.idiap.ch
Tel: +41 27 721 77 11 Email: [email protected]. Box 592Fax: +41 27 721 77 12
Understanding Metro StationUsage Using Closed CircuitTeleVision Cameras AnalysisC. Carincotte a M. Hick a X. Naturel b
J.-M. Odobez b J. Yao b A. Bastide c
B. Corbucci d
IDIAP–RR 08-38
June 2008
a Multitel asbl, Rue Pierre et Marie Curie 2, 7000 Mons, Belgiumb IDIAP Research Institute, Rue Marconi 19, 1920 Martigny, Switzerland.c ACIC s.a./n.v. Rue Rene Descartes 2, 7000 Mons, Belgiumd ATAC SpA, Via Ostiense, 131L 0154 Roma, Italy

IDIAP Research Report 08-38
Understanding Metro Station Usage Using Closed
Circuit TeleVision Cameras Analysis
C. Carincotte M. Hick X. Naturel J.-M. Odobez J. Yao
A. Bastide B. Corbucci
June 2008
Abstract. In this paper, we propose to show how video data available in standard CCTV trans-portation systems can represent a useful source of information for transportation infrastructuremanagement, optimization and planning if adequately analyzed (e.g. to facilitate equipment usageunderstanding, to ease diagnostic and planning for system managers). More precisely, we presenttwo algorithms allowing to estimate the number of people in a camera view and to measure theplatform time-occupancy by trains. A statistical analysis of the results of each algorithm provideinteresting insights regarding station usage. It is also shown that combining information fromthe algorithms in different views provide a finer understanding of the station usage. An end-userpoint of view confirms the interest of the proposed analysis.

2 IDIAP–RR 08-38
1 Introduction
Despite the legitimacy of a number of privacy issues, Closed Circuit TeleVision (CCTV) networks arenowadays commonly present in public environments such as transportation premises, city centers orcommercial establishments. In the meantime, automatic processing of video data is currently a fieldof activity stirring up the utmost attention in the pattern recognition community; state-of-the-artadvances in this area enable the reliable extraction of surveillance-like events such as person tracking,face/object recognition, abnormal behavior and abandoned luggage detection.
Apart from surveillance and safety issues, CCTV video streams may also represent a useful sourceof information for urban planning and resource optimization applications. Advanced video analysisdevices can indeed provide above physical sensors information and wide-area measurements that canreplace, or at least complement, many conventional physical detectors. In addition, video detectionperformance can be easily verified and detectors are easy to reconfigure interactively. In this context,very few works address the issue of using already deployed CCTV network to perform statisticsgathering (relatively unexplored problem), e.g. for maintenance/planning purposes (people counting,person classification, speed measurement. . . ). Indeed, most studies deal with surveillance-like eventdetection and scenario recognition [1], allowing for example to determine whether a human is crossingthe rails [2, 3], to detect overcrowding situation in the platform [4], or to produce an aggressionindication [5].
In this context, our contribution is threefold. We first propose two algorithms, one to estimatethe number of people in one camera view, and the other to measure the platform time-occupancy bytrains. The second contribution is to provide a statistical analysis on a large dataset of the results ofthese detectors, to provide a better understanding of transportation stations usage from the planningand resource optimization point of view. The goal of this statistical analysis is to provide long termanalysis of the station’s usage, patterns of activity, and detection of abnormal events. Eventually, thejoint analysis of different camera views also allows to provide a better analysis of people flow and ofthe station usage.
The structure of the article is as follows. Section 2 explains the algorithms for detecting peopleand train arrivals/departures. Section 3 provides an analysis on the results of each algorithm. Section4 uses the combined results to provide a joint analysis. Finally, in section 5, feedbacks on the practicalinterest of such an analysis from the user point of view are given.
2 Video detectors
In this section, we provide a brief theoretical description of the algorithms used to perform peopledetection and platform occupancy measure.
2.1 Human detection
We have developed a fast method to detect humans from videos captured in surveillance applications.It is based on a cascade of LogitBoost classifiers relying on features mapped from the Riemanianmanifold of region covariance matrices computed from input image features. The developed humandetector relies on the approach of Tuzel et al. [6], which was shown to provide good detectionperformance for human detection in still images. It was improved by extending in several ways[7]. First, as the mapping process is slow for high dimensional feature space, we propose to selectweak classifiers based on subsets of the complete image feature space. In addition, we propose tocombine these sub-matrix covariance features with the means of the image features computed withinthe same subwindow, which are readily available from the covariance extraction process. Finally,in the context of video acquired with stationary cameras, we propose to fuse image features fromthe spatial and temporal domains in order to jointly learn the correlation between appearance andforeground information based on background subtraction. Our developed method can process from

IDIAP–RR 08-38 3
5 to 20 frames/sec (for a 384x288 video) while achieving similar or better performance than existingmethods.
2.2 Train arrival/departure detection
The proposed method1 is mainly based on a tracking algorithm, which proved to be efficient invarious contexts (indoor/outdoor, metro/train, camera location. . . ). Furthermore, this approach doesnot use any background modelling estimation, thus preventing from context changes related issues,such as illumination, reflection. . . The main idea of the approach is to use trajectories from randomlydistributed particles in the image to perform the train arrival/departure detection (and correspondingplatform occupancy computation). Next paragraphs give an overview of the algorithm principle andstages.
The principle of the proposed method is to quickly locate moving objects in the scene, and todetermine whether their motions are compatible with the requirements of the train arrival/departure(location, direction, speed. . . ). To do so, particles are randomly initialized in a region of interest (i.e.“rails zone”), and tracking is activated for each particle when a defined criterion is met (roughly whenmotion is detected). Relevant trajectories can then be analyzed to compute useful information andeventually derive the final train arrival or departure decision.
Particle distribution Inactive particles are randomly distributed for each new image with a non-uniform rule using the calibration information, to take into account perspective over the region ofinterest (detection area).
Particle activation The activation criterion is based on an instantaneous motion detection, namelya thresholded frame-differencing operator. When an inactive particle is moved to a point where theframe-differencing operator is bigger than a defined threshold, the tracking for the concerned particlebegins.
Particle tracking After activation, a particle continuously tracks the motion of the underlyingobject using a block-matching algorithm. Particles associated with uninteresting trajectories arerecycled as detailed below.
Filtering of trajectories Trajectories are analyzed by computing a set of various features; linearityof track, track length, track duration, track direction, start/stop particle location. . . Trajectories arethen classified as relevant ones and uninteresting ones depending on the features values. An uninter-esting trajectory is then recycled while a a relevant one is kept active. Typically, trains/metros arecharacterized by well-defined trajectories, i.e. linear trajectories, mean direction parallel to the rails,speed linearly increasing/decreasing. . . On the other hands, passengers and tracking errors are mostlikely to have much more chaotic trajectories, which make them rejected.
Train arrival/departure detection All remaining trajectories are then scored; low values areattributed to trajectories of weak interest, while high scores are given to highly relevant ones. Thetotal score is compared to a threshold to decide whether a train is potentially arriving/departing;arrival/departure time are lastly estimated using a Finite State Machine (FSM), which allows todistinguish between arrival and departure, and to compute the resulting platform time-occupancy.
1Intelligent Video System Software, Copyright c©2008 ACIC. For further information, please visithttp://www.acic.eu/.

4 IDIAP–RR 08-38
3 Single view analysis
In this section, the video detectors are applied on large amounts of video, and the resulting detectionsare analyzed individually.
3.1 Data description
(a) “Turnstiles view” (b) “Platform view”
Figure 1: Processed camera views in Rome metro
Experiments were conducted using a dataset acquired for the CARETAKER project; videos comefrom 14 acquisition sessions performed in Roma metro on June 2007 (from 06.00 a.m. to 11.30 a.m.);the resolution of all sequences are PAL standard (720x576 pixels, 5 frames per second) and compressedusing MPEG-4. Two cameras are used, one monitoring the platform (Fig. 1-(b)) and one monitoringthe turnstiles to access the train platform (Fig. 1-(a)). In this view, several flows of people are mixingup. People can come from the left or from the top and go through the turnstiles to access the trainplatform, people can inquire at the desk (middle top of the image), and people that leave the platformare also seen at the bottom of the image. A small part of the platform can also be seen on the topright.
3.2 Monitoring activity in one camera view
People density estimation : We are interested in estimating the number of people over time inthe turnstiles view (Fig. 1-(a)). The human detector of section 2.1 is applied every second of the video(e.g. every 5 frames). A pre-processing step smooths the signal by averaging the number of peopleon a 3 minutes window. Figure 2 shows this smoothed signal, where each point is thus the averagenumber of people on a 3 min window. All the following analyses are done on this smoothed signal.Using the (smoothed) data count for all mornings, an analysis is conducted to extract and visualizethe global trend of activity, and see how the evolution over one morning fit into this average trend.We specifically distinguish between week days and week-ends, to see if week-ends stand out from weekdays. To do so, the average and standard deviation over week days are computed at each time instant,e.g. with ck(t) the smoothed number of counts for morning k at time t and N = 10 the number of
mornings, we compute m(t) = 1N
∑N
k=1 ck(t) and σ2(t) = 1N−1
∑N
k=1(ck(t) − m(t))2.Data analysis : Left of figure 3 shows the week average m(t) (in green), as well as its fit (blue),
and the fit +/- 2σ(t) (red). These curves characterize the usual usage of the station on week days,and the envelope of 2 standard deviations (red curves) indicates the area where the behavior canbe considered as ’normal’. A simple analysis shows that the average usage is more or less what wecould expect: traffic is low from 6 am to 7.30 am ; it then increases steadily until 9.30 am and slowly

IDIAP–RR 08-38 5
6h 7h 8h 9h 10h 11h0
5
10
15
Aver
age
num
ber o
f peo
ple
Time (h)
Wednesday
Figure 2: Average Number of people (on a 3 min window) over time on a Wednesday morning, inturnstiles view
6h 7h 8h 9h 10h 11h0
5
10
15
Aver
age
num
ber o
f peo
ple
Time (min)
Week average
6h 7h 8h 9h 10h 11h0
5
10
15
Time (h)
Aver
age
num
ber o
f peo
ple
Wednesday
Fit of week averagePeople count for wednesdayFit of people count for wednesdayFit of week average +/− 2 std
Figure 3: Left: average people density for week days, plus fit and standard deviation, Right: Peopledensity and fit on one Wednesday, compared to the week fit and std
decreases starting from 10.30 am. On the right of figure 3 is displayed an example of how a specificday (the one from Figure 2) fits into this week average, and how close its evolution (in magenta on thefigure) is from the week evolution (blue and red curves are simply reported from figure on the left).
Week ends are analyzed in Figure 4, where the average of the 2 Saturdays and Sundays is plottedtogether with the week average. It allows to show the difference in evolution of the number of peopleon Saturday and Sunday mornings, and especially that it does not fit into the week average curves.Saturday appears to be a busy day; there is an early start and it also does not comply with thedecrease around 10.30 am observed on week days. On the other hand Sunday is clearly less busy, andif the curve has approximately the same shape as the week days one, it is clearly shifted to the right,indicating that people are getting up late, as one might have expected.
Figure 5 shows an interesting example on a week day (Thursday). While the global trend followsthe week average, an unusual event stands out well of the 2 standard deviation envelope. This peakis due to a group of obviously lost tourists, which is staying still or wandering about, for quite a longtime, moving in and out of the camera view.
3.3 Monitoring train traffic
In this section, we present the evaluation and validation of the platform time-occupancy measurepresented in Sec. 2.2. The accuracy of the train stop estimation was measured using annotated data(ground truth), performed manually on the whole 14 sequences.
Figure 6 firstly shows the distribution of the train occupancy-time in the station, for both ground

6 IDIAP–RR 08-38
6h 7h 8h 9h 10h 11h0
5
10
15
Time (h)
Ave
rage
num
ber o
f peo
ple
Saturday average
6h 7h 8h 9h 10h 11h0
5
10
15
Time (h)
Ave
rage
num
ber o
f peo
ple
Sunday average
Figure 4: Saturday and Sunday averages (magenta), compared to the week average (blue).
Figure 5: People density on one Thursday, compared to the week average. An unusual event can bedetected around 10 am, corresponding to the frame on the left.
truth (GT) and processed data. It shows that the time-occupancy of the platform can have verydifferent durations; while the bulk of the detections are located around 30-50s (average value of 45s),a non-negligeable number of stops are far below (10s) or far above (up to 3 min, even 6 min).
0
5
10
15
20
25
30
35
0 50 100
150 200
250 300
350 400
450
Histogram of train-stop durations computed on all sequences
Ground truthDetection results
Figure 6: Histogram of the time spent by the train in the station.
In the transportation context, such outlying values can be explained by several phenomena; reg-ulation purposes, safety checks, incidents on platform, signal failures or break-down of systems. . . Inour case, most of these outliers come from regulation purposes and “incidents” on the platform ashighlighted in Fig. 7.
Taking into account this phenomena, the detection statistics (e.g. the standard deviation of the

IDIAP–RR 08-38 7
(a) 2007/06/10 - 100s (b) 2007/06/05 - 408s
“quad intrusion”. “regulation purpose”.
Figure 7: Screenshots corresponding to trainstop outlying values.
stops’ durations) have to be analysed carefully. Tab. 1 shows the detection rates obtained during theevaluation process. As highlighted in the table, the average detection rate on the overall sequencesis around 96.59% (710 detection on 735 stops in the GT), which demonstrates the effectiveness androbusteness of the proposed approach.
Table 1: Platform time-occupancy by metros: detection results
Day 07.06.02 (Sat) 07.06.03 (Sun) 07.06.04 (Mon) 07.06.05 (Tue) 07.06.06 (Wed) 07.06.07Detection rate (nb) 100% 97.36% 98.38% 96.77% 94.44%
(35/35) (37/38) (61/62) (60/62) (51/54) (62/62)Detection rate (time) 100% 95.90% 98.20% 97.89% 97.05%
Average stop duration (std)
- detection - 37.14 (10.53) 42.77 (35.73) 44.41 (16.86) 53.98 (52.92) 46.63 (15.87) 45.70- ground truth - 37.21 (10.45) 43.21 (35.40) 44.34 (16.84) 53.22 (52.21) 46.08 (15.98) 45.99
Mean arrival delay (s) 0.77 0.63 0.58 0.83 0.63Mean departure delay (s) 0.69 0.84 0.72 0.97 0.77
Day 07.06.09 (Sat) 07.06.10 (Sun) 07.06.11 (Mon) 07.06.12 (Tue) 07.06.13 (Wed) 07.06.14Detection rate (nb) 98.03% 97.22% 98.18% 98.18% 94% 91.80%
(50/51) (35/36) (54/55) (54/55) (47/50) (56/61)Detection rate (time) 97.86% 97.58% 97.79% 98.16% 95.05% 92.91%
Average stop duration (std)
- detection - 35.13 (15.08) 38.96 (22.73) 48.37 (32.60) 48.95 (17.59) 51.04 (30.45) 42.19- ground truth - 35.09 (14.91) 38.62 (22.22) 48.54 (32.41) 48.79 (17.51) 50.35 (29.82) 41.74
Mean arrival delay (s) 0.72 0.41 0.71 0.68 0.98Mean departure delay (s) 0.82 0.60 0.73 0.85 1.11
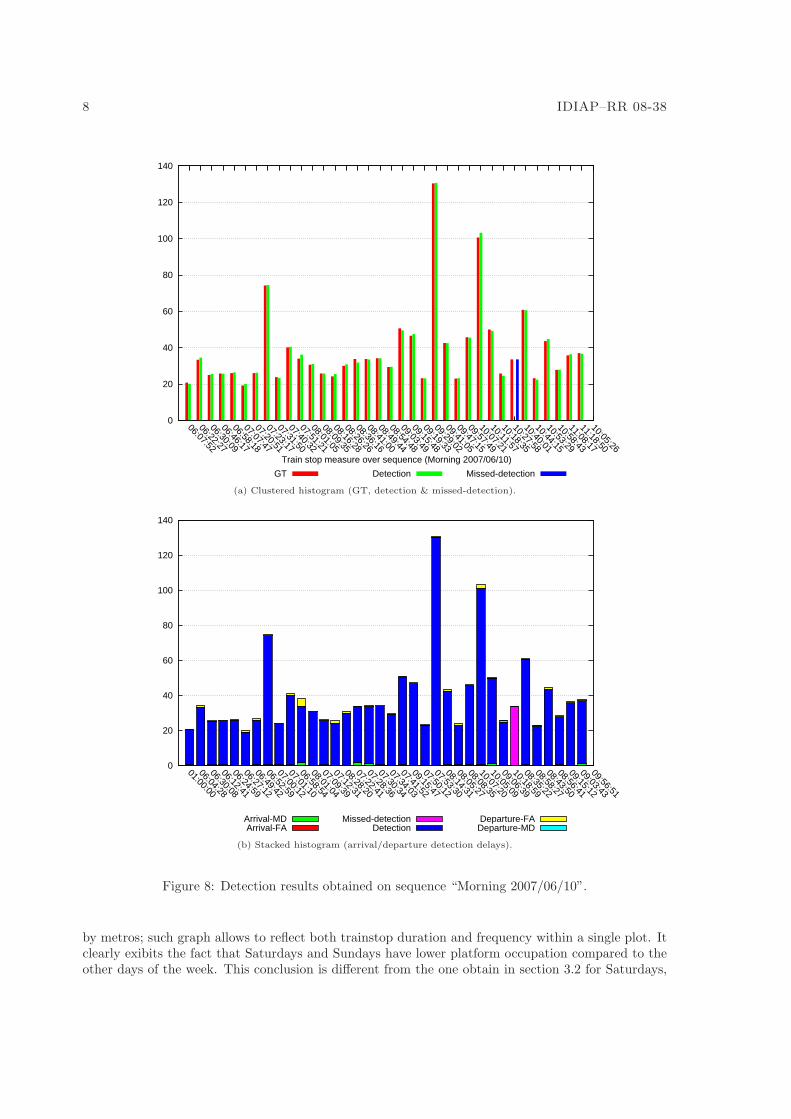
Regarding the detection delays at train arrival/departure, most of them are between 0.5s and 1swhich seems to be sufficient from the end-user point-of-view. Furthermore, as highlighted in Fig. 8-(b),such delays are quite negligible compared to the stop-duration itself.
From the metro operation point of view, Tab. 1 already allows to identify different behaviorsdepending on the days; e.g. week-days seems to have less metros and lower average detection thanweek-end days. So as to confirm this analysis, Fig. 9 presents cumulative plots of platform occupation
8 IDIAP–RR 08-38
0
20
40
60
80
100
120
140
06:07:52
06:22:27
06:30:09
06:46:17
06:58:18
07:07:47
07:20:51
07:23:17
07:31:50
07:40:32
07:51:21
08:01:05
08:09:35
08:16:28
08:26:26
08:36:16
08:41:00
08:49:44
08:54:48
09:03:49
09:15:48
09:19:33
09:29:02
09:41:05
09:47:15
09:57:49
10:07:21
10:11:57
10:18:35
10:27:58
10:40:01
10:44:15
10:53:29
10:58:43
11:08:17
11:18:50
10:05:26
GT Detection Missed-detection
Train stop measure over sequence (Morning 2007/06/10)
(a) Clustered histogram (GT, detection & missed-detection).
0
20
40
60
80
100
120
140
01:00:00
06:04:28
06:30:08
06:12:41
06:24:59
06:27:12
06:49:42
06:52:59
07:00:12
07:01:10
06:58:54
08:01:04
07:09:39
07:12:31
08:28:20
07:22:41
07:28:36
07:30:34
07:34:03
07:41:52
09:15:47
07:50:12
07:53:30
08:14:31
08:05:27
08:08:35
10:07:20
10:05:09
09:06:39
10:18:59
08:35:22
08:58:27
08:43:50
08:56:41
09:15:12
09:03:43
09:56:51
Arrival-FAArrival-MD
DetectionMissed-detection
Departure-MDDeparture-FA
(b) Stacked histogram (arrival/departure detection delays).
Figure 8: Detection results obtained on sequence “Morning 2007/06/10”.
by metros; such graph allows to reflect both trainstop duration and frequency within a single plot. Itclearly exibits the fact that Saturdays and Sundays have lower platform occupation compared to theother days of the week. This conclusion is different from the one obtain in section 3.2 for Saturdays,

IDIAP–RR 08-38 9
0
500
1000
1500
2000
2500
3000
3500
Morning 2007/06/02 (Sat)Morning 2007/06/03 (Sun)Morning 2007/06/04 (Mon)Morning 2007/06/05 (Tue)
Morning 2007/06/06 (Wed)Morning 2007/06/07 (Thu)
Morning 2007/06/08 (Fri)
Morning 2007/06/09 (Sat)Morning 2007/06/10 (Sun)Morning 2007/06/11 (Mon)Morning 2007/06/12 (Tue)
Morning 2007/06/13 (Wed)Morning 2007/06/14 (Thu)
Morning 2007/06/15 (Fri)
Figure 9: Plot of cumulative platform occupancy.
where we observed much more people in the turnstiles view. The next section investigates the jointusage of the two views, especially addressing this issue.
4 Multi view analysis
In this section, we investigate the joint usage of information coming from the two camera views, toprovide a more in-depth analysis and solve possible ambiguities.
4.1 Understanding peaks of activities
We are looking at the relation between the number of people in the turnstiles view of Fig. 1-(a), andthe train arrivals/departures, using results from sections 3.3 and 3.2. Fig. 10 shows an example of 9train arrivals and departures over one hour, with the corresponding number of people in the turnstilesview. In this case, the signal is not averaged, i.e. the values displayed are the actual number of peopleat each second. It shows quite clearly that the peaks of the number of people in the turnstiles viewcorrespond to instants where the train is present in the station. These peaks are due to people leavingthe train, and passing in front of the turnstiles camera view, towards the exit. On average, it wascomputed that there are 7.2 persons in the turnstiles view when a train is present, whereas there areonly 4.5 persons in average in the other case.

10 IDIAP–RR 08-38
7h30 8h000
5
10
15
20
25
30
Time
Nb o
f people
in fra
me
Number of people over time
People countsTrain presence
Figure 10: Detail of 9 train arrivals, plotted on the corresponding counts of people.
4.2 Understanding flows of persons
Another useful way of using the train presence information is to make the same analysis as in Fig. 3,with filtering out the instants where the train is present. More precisely, the number of people in thetime slot where the train is present is replaced by the average in the period where no train is in theplatform (e.g. when no flow of people is coming out of the platform). This filters out from the signalthe peaks due to people coming out from the train. The obtained signal thus characterizes the usualactivity in the turnstiles view, excluding the arrivals. Fig. 11 shows this filtered signal and its fit (in
6h 7h 8h 9h 10h 11h0
5
10
15
Time (min)
Aver
age
num
ber o
f peo
ple
Wednesday
6h 7h 8h 9h 10h 11h0
5
10
15
Time (min)
Aver
age
num
ber o
f peo
ple
Saturday average
People density without train arrivalsFit of people densityFit of people density without train arrivals
Figure 11: People density and its fit, with filtering out train arrivals. Comparison with the fit ofnon-filtered signal (Wednesday and Saturday)
magenta), compared with the fit of the non-filtered signal (in black). From this figure, it seems thatthe high variability in the number of people in the turnstiles view is not only due to train arrivals.This means that independently from train arrivals, the activity in the turnstiles view is itself veryirregular. This is confirmed by the computation of the average standard deviation, which is 3.1 forthe non-filtered people density signal and 2.6 for the filtered one, which is still quite high.
Another important remark is that the difference between filtered and non-filtered signals is quitenoticeable for week days (one Wednesday is shown on the left of figure 11) whereas it is barelynoticeable for Saturdays and Sundays (Saturdays average is shown on the right of figure 11). Thismeans that far less people are coming out of the trains on week-ends, and thus the traffic in theturnstiles view is mainly due to people passing by or going to the platform. This is confirmed byFig. 12, which shows the average number of people per morning, on train presence time (blue) and

IDIAP–RR 08-38 11
Table 2: Correlation between train staying duration and cumulative number of people in turnstilesview. Critical value at 5% risk
Days Mon Tue Med Thu Fri Sat Sun Mon Tue Wed Thu Fri Sat SunCorrelation 0.75 0.43 0.77 0.40 0.60 0.44 0.31 0.58 0.44 0.76 0.20 0.57 0.51 0.31
Critical value 0.25 0.25 0.28 0.26 0.27 0.33 0.27 0.27 0.25 0.27 0.25 0.25 0.32 0.32
on train absence (green). The difference between the 2 curves is clearly larger on week days (3.1 inaverage) than on week-ends (1.5 in average). This clearly shows a different behaviour of users onweek-ends.
In particular, the apparent contradictory results for Saturdays (more people in turnstiles view butless trains, and feedbacks from Rome operatives that Saturdays are less busy overall) are explained:the high people density is not related to train exits, but is due to people waiting or entering theplatform. Two hypothesis are proposed to explain this high density. Feedbacks from the video hinteda difference of behaviour between week days users (mostly people going to work) and week-ends users(occasional travellers), which tend to stay longer in the camera view, waiting or hesitating on the wayto go. The second one is that people takes different routes, and flows in this camera view are thusdifferent. This behaviour could not have been spotted by the monitoring of the turnstiles view alone.This analysis is a very useful information that highlights a difference of behaviour and station usageon specific days.
Sunday Tuesday Thursday Saturday Monday Wednesday Friday0
1
2
3
4
5
6
7
8
9
10
Days
Ave
rag
e n
um
be
r o
f p
eo
ple
Train in stationNo train
Figure 12: Average number of people per morning, train present or not
4.3 Analysing train staying duration and platform crowding
One of the interest of the metro operatives is to see whether too much people on the platform delaythe departure of the train. We thus try in this section to relate the estimated number of people on theplatform with the train staying duration. We are measuring the number of people in the turnstilesview (excluding instants where people leave, i.e. train present in station), which is just one entrypoint to the platform, the goal is thus more on catching the trend than on the exact estimation of thenumber of people.
To verify this hypothesis, the correlation between the train staying duration and the cumulativenumber of people in the turnstiles view (excluding train arrivals) is computed. The empirical correlatoncoefficient is given by
r =1
N − 1
N∑
k=1
(xk − x)(yk − y)
σxσy

12 IDIAP–RR 08-38
where N is the number of samples, and σ are the empirical standard deviations. Outliers, e.g. trainsthat stay more than 100s (2 times the maximum standard deviation of stop durations) are discarded.Results in Table 2 show that most of the days exhibit a correlation, which is in most of the casesabove the critical value2, under which we cannot reject the null hypothesis (e.g. the variable are notcorrelated). Exceptions are Sundays, where the correlation does not seem to be significant. Fig. 13
0 2000 4000 6000 8000 10000 120000
50
100
150
200
250
300
350
400
450
Cumulative counts of people
Tra
in s
tayi
ng d
urat
ion
(s)
Figure 13: Relation between cumulative number of people in turnstiles view, and time spent by thetrain in stationshows the relation between the average number of people during waiting time (time between a trainleaves and another arrives) and the time that the next train stays in station. It also confirms theresults of Table 2, that there seems to be a link between the two variables, but which cannot explainthe outliers. The platform crowding level can thus be an explanation for some delay and the trainirregularity, but cannot explain the observed variations.
5 User evaluation
CCTV has been traditionally installed in underground environment to support the operation man-agement with a view to enhance safety and security. Nowadays modern advance video processingtechnologies are opening a new role for CCTV. As Caretaker project is demonstrating, new algo-rithms can provide valuable information to underground and public transport operations and securitymanagers. The possibility to automatically process on-line and massive recorded data, within therespect of privacy regulation, can indeed help the security staff which can not have possibility toprocess such data. The algorithms described in this paper fulfill such requirements. The estimationof number of people in a camera view can help to alert the operator when anomalies may occur e.g.when a station reach its capacity limit that request the limitation of the number of people enteringthe station (in Rome this alert can be risen in some station during large events). As a long-termanalysis along with ticketing data fusion, it can help to provide a clear view of the trend of how thestation (or its specific part) is used. The algorithm that analyse the platform time occupancy bythe train can support the operations (that already have the signaling system). It can support theanalysis of anomalies, with a direct reference to the related video data, to improve in the longer termthe performances and regularity of the service. The most interesting thing, as shown in the previousparagraph is to combine the analysis of the two algorithms. The in depth analysis of such resultscould also lead to a redesign of the level of service provided by the underground, taking into also intoaccount the transportation demand. This is clearly the first attempt to analyze such information,which is very new in the transportation world and need some time to be integrated in the usual eval-uation. Furthermore the estimation of number of people in a camera view could provide more usefulinformation if the analysis is carried out in more cameras and potentially comparing different stations.
2Critical values are extracted for a 5% risk, from tables in [8]

IDIAP–RR 08-38 13
Also the analysis of the platform time occupancy by the train can provide more valuable informationif extended on several station, to understand the domino effect of potential delays.
6 Conclusion
A person detector and a train arrivals/departures detector have been used on a large amount of realvideo data of the Rome underground. It has been shown that a statistical analysis of the resultsprovides interesting information regarding station usage, allowing to characterize the usual behaviourof train users, distinguish trends between days of the week, and spot some unusual events. It also beenshown that the joint usage of the information coming from two views can solve possible ambiguitiesand can provide a better understanding of the station’s usage. This joint analysis can be extended toseveral views and to the size of a undergound network, to better understand the relationships betweenstations and their usage.
The exploitation of the potential of such technology, along with the comprehension and the analysisof results, could lead to a new way to exploit CCTV resources in the underground, to enhance bothsafety and security.
7 Acknowledegment
The work presented here is partially supported by the European Commission under the 6th FrameworkProgram through the IST FP6-027231 CARETAKER project. For further information about theCARETAKER project, please visit http://www.ist-caretaker.org/.
References
[1] C. Andrea, “Event detection in underground stations using multiple heterogeneous surveillancecameras,” in Advances in visual computing: ( First international symposium, ISVC 2005), vol.3804, Lake Tahoe, NV, USA, December 5-7 2005, pp. 535–542.
[2] S. Oh, S. Park, and C. Lee, “A platform surveillance monitoring system using image processingfor passenger safety in railway station,” in Control, Automation and Systems, 2007. ICCAS ’07.International Conference on, Seoul, 17-20 Oct. 2007, pp. 394–398.
[3] ——, “Vision based platform monitoring system for railway station safety,” in Telecommunications,2007. ITST ’07. 7th International Conference on ITS, Sophia Antipolis, 6-8 June 2007, pp. 1–5.
[4] B. Lo and S. Velastin, “Automatic congestion detection system for underground platforms,” inIntelligent Multimedia, Video and Speech Processing, 2001. Proceedings of 2001 International Sym-posium on, Hong Kong, China, 02-04 May 2001, pp. 158–161.
[5] W. Zajdel, J. Krijnders, T. Andringa, and D. Gavrila, “Cassandra: audio-video sensor fusion foraggression detection,” in Advanced Video and Signal Based Surveillance, 2007. AVSS 2007. IEEEConference on, vol. 3804, London, UK, 5-7 Sept. 2007, pp. 200–205.
[6] O. Tuzel, F. Porikli, and P. Meer, “Human detection via classification on riemannian manifolds,”in CVPR, 2007.
[7] J. Yao and J.-M. Odobez, “Fast human detection from videos using covariance features,” IDIAPResearch Institute, Tech. Rep. 07-68, 2007.
[8] G. Saporta, Probabilites, analyse des donnees et Statistique. Technip, 2006.